COLD.FORMED STEEL SECTIONS FOR TRANSMISSION ...
238
COLD.FORMED STEEL SECTIONS FOR TRANSMISSION TOWERS by David Odaisþ A Thesis Submitted to the Faculty of Graduate Studies in Partial Fulfilnent of the Requirements for the Degree of MASTER OF SCIENCE Departnent of Civil Engineering University of Manitoba Winnipeg, Manitoba Canada (c) February, 1994
-
Upload
khangminh22 -
Category
Documents
-
view
0 -
download
0
Transcript of COLD.FORMED STEEL SECTIONS FOR TRANSMISSION ...

COLD.FORMED STEEL SECTIONSFOR
TRANSMISSION TOWERS
by
David Odaisþ
A ThesisSubmitted to the Faculty of Graduate Studies
in Partial Fulfilnent of the Requirementsfor the Degree of
MASTER OF SCIENCE
Departnent of Civil EngineeringUniversity of Manitoba
Winnipeg, ManitobaCanada
(c) February, 1994

l*l N€t¡onal ubrary
Acquis¡tions andBibliographic Services Branch
395 Wellinglon StreetOtlawa, OnlarioK1A ON4
Bibliothèque nationaledu Canada
Direction des acquisitions etdes services bibliographiques
395, rue WellinglonOttawa (Onlaio)K1AON4
The author has granted anirrevocable non-exclusive licenceallowing the National Library ofCanada to reproduce, loan,distribute or sell copies ofhis/her thesis by any means andin any form or format, makingthis thesis available to interestedpersons.
The author retains ownershiP ofthe copyright in his/her thesis.Neither the thesis nor substantialextracts from it may be Printed orotherwise reproduced withouthis/her permission.
Outlile Nô¡t
L'auteur a accordé une licenceirrévocable et non exclusivepermettant à la Bibliothèquenationale du Canada dereproduire, prêter, distribuer ouvendre des copies de sa thèsede quelque manière et sousquelque forme que ce soit Pourmettre des exemplaires de cettethèse à la disposition despersonnes intéressées.
L'auteur conserve la propriété dudroit d'auteur qui protège sathèse. Ni la thèse ni des extraitssubstantiels de celle-ci nedoivent être imprimés ouautrement reproduits sans sonautorisation.
rsBN 0-315-92194-3
C,anadä

¡o.u hn.ziD O DRr lr-y .
Dktt¡ãioi Abtio¿t tl¡n*¡',onolß orronged by brood, generol sub jecl colegories. Pleose selecl lhe one subiect which most
neorly describes the content of your dissertotion. Enter lhe corresponding fourdigit code in the spoces provided.
Euat erltpo , e iuiL.---... qEtF U'M'ISUSIECT IERA,I SUBJECT CODE
ÌHE SCIENCEg AND EN@INEERINGBt0l0GtGt s(lt (Is
" cenero|..............................0473aoro¡omv .... .....................0285aËimolcí¡lture ond
Nurrilion ..........................0¿75animol Potho1oov................047ó¡æd science oñiJ
Txhnolw ...................... 0359Fo,erry onäwildlife ........... 0¿78Plonr Cult¡e .......................0¿79Plonr Pgtho|9sy ................... q480Pldnr Phvsioloov ........-......... OU ì /R"noe rtronoo-¡iment ............0772woöd Techn;josy............... 07¿ó
Bioloovdánerol .............................. 030óAnotomv . .. ......................0287Biosrorisi;c, ......................... 0308Bolonv.. ....-........................0309cell ..1.................................0379l'.ôlMv ..........t)J ZfEnromi!æv. ...................... 0353cenerics ::..........................03ó9Lìmno|oov........................... 0793Micrôhi;llÐ ...................... 041 0Molê.ulor :1........................ 0307Neuroscience...................... 031 7oceonooroohv.................... 0¿l óPhvsioloËv :...1..................... 0¿33Roiliorio;'............................ 0821Vere¡;nory Science............... 0778Zoolosy.'.............................0472
BìoDhvsics'Género|..............................078óMedicol .............................. 07ó0
tARTfl S(lfNCtSBiæshemisirv........................0¿25Geðchemisr.', .i......................... 099ó
Geodesv ..................................03709*r"si... ...............................Q12?Geoohvsrcs .........,-,.,,.,,.,,.,,.,....uJlJHvdio!øv............................ ...0388Mi^*"t#" o¿r lPolæboro"¡ív .............................0345PôfÊdôldiv 042óPoleonrolodí.............................041 IPolæzmloTv............................098sPolvnoloav:l........ .................... 0¿27PhJsicol öeooroohv.......... ....... 03ó8Phlskol Oceðnogr6phy ............ Or' ì 5
HTATTH AIID INVIROTI[IINIAI.s(ltN(ts

Disserlolion Abslrocls lnlernolional esf orgonisé en colégor¡es de sujels. Veuillez s,v.p, choìsir le suiet qui décrit le mieux volrelhèse et inscrivez le code numêrique opproprié dons l'espoce réservé ci-dessous.
|-|-l-n {JM.ISUJET
Cotégories por suiets
H¡'!AñA¡{¡IÊS ET SGIEN€ES SOGIAIEs
CODE DE SUJII
SE¡EN€85 ET INGÉNIER¡F
1ecrure.....................................0535Molhémorioues.................... 0280Musioue .1.. os22O¡¡eniorion êr conr!ho1ion....... .05ì9Philosoohie de l'éducotion ......... 0998Phvsio,ie 0523P¡óq¿mme! d érudes êr
enseionemenr .. .. 0727Psvcho!ãoie os255crences .................. ....... . .. . (J/ l4Sciences so<ioìes....................... 0534Sociolooie de l'èducorion........... 03¿0Technofôsie............... ......... .. 07ì0
I.ÂNGUT, TIflÉRAfURT TfUNGUT5Í0Utto¡gles. ,. _trenerolrlê! .................... .. .uôly
Ancieññes.... .... .................02891inouis|ioue...................... ..0290Mo?erne!.................. . 029t
LitlérolureGênêrolirés..................... ...04014nciennes........................... 029¿ComDorée ..........................0295Medíévo|e.... ......................02e2Moderne.............................0298Alricoine ............ .. .. . .......031óA¡éricoine ......................... 0591Anolôise....................... .. . 0593Asi¿lioue.-............. 0305conoúenne lAnoloisel ........ 03s2conodrenne lfronco,sel . ....0JJ5Ge¡monioue 03ì ìtorìno om'áricoine................ 03l 2Moyen.or;e.role......... .. 03r5Romõne 0313Slove êl €t.europænne .....0314
Çèolçie. . . 0372
Hvd;ol6oiå. ... o38sMi',¿¡olåoie or'ì ìOcèonosiophie physique . ... ....0415P.lèôhôrõ¡idL,ê O3¿5Poleðko|ooii........................ ..0¿2óP.lÉÒ¡r.ld:è or'l8Polèozooloäie...........................0985Polynolosie-........... .. .... ......... 0427
s(lt (ts Dt ta saNli It DtrrNvtR0 Ntft$NrÉconomie dome!rioue............. .. 038ó5c ences de I envroñnement 0/óaSciences de lo sontê
Générolirés .........................05óóA¿minislrorion des hìóitôux O7ó9Alimenrôlionelnukilitn . ..0570audiolø;e.... . o3oochimiôrÊ'érÒôie o99)Dênriterie..:...... .. ........ .....05ó7Déveloooementhrmoin 073AEnseioååmenr................ .. . 0350l.-,;"|""i. oga?1or5rrs.................................(J5/5Médecine du hovoilel
thérôó;e 035¿Mede¿ile er ¡hnu¡oie 05ó¿Obsréhioùe er ovñËcôlôôiê 0380oohrolmhlôore:i........ .:...... 038ìOhhoohonie-.. .... .. . .... OaóoPorhofooie O57lPhormocre .................... .....u5/2Pho¡mocolooie . .... .. . .... . .0a19Phv<iorhé¡oàie 0382RôiliôlMiÞ o57ÀSonré mËnrol-" . .... .... .........0347
5orn5 nlrrmreß ...............U5óvloxicologie . .... ..................0383
4ncienne...................-........ 0579Mediévo|e...... .... ...............0581Moderñe.......... .. ..........0582H¡roire des ¡oir'.... .... . .0328
Conodi€iñe........................033¿8rors.Unis ............... .......... 0337Eurooèenne 0335Movån-orienrole 0333Loti'no ornéricoiñe.... ........... 033óAsie, Aurrolie et Océonie....0332
Hisroire des sciences... 0585Loisìrs...................... . ........081¿Plonilicorion urboine ei
- régionole ........... .. . ....A999
çenero rles ..... ........ . uô l5Adrni¡irroiionÕuhlioùe 0617Droil et relôrio;!
internorionoles .............. ..0ól óSociolôo;e
Génirolites............... a626Aidê er bien.òrre sociol........ 0ó30
élobli";menisoénitenrioire3 O6t7
DémooroÞhie.......... .... ......0938Erudeidd l' indi"id, er
- de lo fomi |e........... .. .. ...0ó28ErL:des des relotions
inierethñ;ôùe3 erdes relorions rocioles 0ó31
Slruclure et develoooemenrso<iol.............11........ ozoo
Théorie er mérhodes ...........03¿¿TrovoileÌ relorions
industrie|jes......................0ó29Tronloorls ... . ..... 0709Tro'oìlsociol.................... 0¿52
Bioméd]co|e........... .. ..... .. 05alCholeur ei ther
modvnomioue.......... . .. .03¿8Condirìonne"i.*
{Embo |oqel .....................05¿9Gèñie oèroiooriol ...... . 0s38
Génie civil .:................... ...05¿3Génie élecìronioue et
elê(k;a!e . . .054aGénie inJurriel..... .. 05¡óGènie mèconioue................05a8çenenucleorre........... u5llMeconroùe ¡ôvôlê l)5Á/Mèro lurbie . .. .. o7Á3Science ðes rnorériou^ .... ....079aTechnioue du oèlrole . a765le.hnr.re mrnrÞrê (ì551Ìê.hni;1,ê( (ô.ir^i,êr pt
muni¿iooles.. .... .... . oss¿T€chnoloiie hvd¡oLJlioue.. . osa5
Mèconiouê ôåôliiuéê o:]r'¿,Céorechnoìosii . .......... O¿28
fTê¿h""!"l,i.l a7e5Recheiche ooé¡ãtiónnelle. . .. .. .079óTenieserris!us (Tech¡olosie) ....079¿
PSY(H0t0GtI(Jenerolrles |J621Pe¡sonnoliré............ .................0ó25Psvchobiolooie.... o3¿9Psicholøie-cl;nioue aó??Psicholdie d! c¿moo¡remenr o3B¿Pricholoãie du dev¿lÒóóéñênr 0ó20P!;choloãieexoérime;iirle.. 0ó23Psicholoðie in¿ur,ielle .. o62aPsicholoËie ohvsiolooioue........ 0989Psicholoãie lo.iole .: .:. . o¿51Psichom5r,ie .... .. ............ oó32
@
...0422
...........03r 0.........0454
...........0770
..........0272
..........0338
..........0578
o4730285
S(IINCTS PHYSIOUTS
Sciences Pu¡esChìmie
Genê¡ol'rés....... .................0¿85Biochimie . ............... .. ¿87Chi¡nie ooricole..... ....... . 07a9Chimie oñol¡io¡e 0Á86Chimie min¿'rolå........... .. . O¿8e(hrm e nucl-ÀoÍe ... . O/34Chim;e o¡oonioue ............... 0490Chimieohãrmoceurioue. 0491Phvsiouå... : oÄ9aPofvmCres ............. .... .. .0¿95Rodrolron.. .. . O/54
Molhémo1ioues..................... .. 0¿05
' c¿nè,olirés .........................oóosAcoulioLre.............. O98ó
orroohvlioue.-..... 0ó0óElecrroniqire èr élecrricir€ ...... Oó07rru des el Dlosmo......... . .. ..o/5yMéréo¡olobie . ....... . ...qéaqupnqu€,.,, -........................u/J2Porlicules {Phy!iquenucleonel.... ........0798Phvsioue orôñioùe 07 ÁgPhisiciue de l étår solide oól IPhísiciue moleculoire ........ .. oó09Pl,i¡iciuenuclæire.... 0óloRoijioi;on....... . .......025ó
Sloliliques ......................... .. . 04ó35ciences Appliqués Et
1nformorioJe........................ . .098¡lnqè¡ie¡ie
(Jenerolrles.. l)t.l/Asrico|e ................. .. .......0539Aulomobile . . 05r'O

COLD-FORüED STEEL SECTIONS FOR TRANSIT{ISSION TOWERS
BY
DAVID ODAISKI
A Thesis submitted to the Faculty of G¡aduate studies of the university of Manitobain partial fulfillment of the requirements of the degree of
}IASTER OB SCIENCE
@ 7994
Permission has been granted to the LIBRAI(Y OF THE IJNTÍERSITY OF IvIANTTOBAto lend o! setl copies of this thesis, to the NATIONAL LIBRARY OF CANADA to
mic¡ofilm this thesis and to lend or sell copies of the filn, and LIBRARYMICROFILMS to publish an abstsact of this thesis.
The author reserv€s other publication rights, and neithe¡ the thesis nor extens¡ve
€xtracts from it nay be printed or other-wise reproduced without the autho/s writtenpermission

ABSTRACT
Cold-formed steel sections are becoming more popular in the construction of
transmission towers, both in Europe and North America. In addition to
conventional 90' angles, a wide range of shapes can be produced, in sizes to suit
individual project requirements.
An investigative project was carried out at the University of Manitoba to examine
the axial compressive load capacity of a numbe¡ of cold-formed shapes suitable for
transmission tower construction.
Test parameters included: five different cross-sections, two steel grades, three
different slenderness ratios, and three temperature levels. Specimens were tested
in setups designed to simulate end conditions representative of actual web members
by loading through single legs bolted to gusset plates. Some sections \ryere tested as
axially loaded leg members with hinged end conditions. Three special test setups
were constructed to accommodate the wide range in length, which varied from 552
mm to 8200 mm. A total of 201 static tests were performed.
Test results were compared to predicted loads using the Canadian Standards
CAN/CSA-S136-M89 Cold For¡ned Steel Structural Members, and CAN/CSA-S37-
M86 Antennas, Towels, and Antenna Supporting Structures, ASCE Manual 52

ll
Guide for Design of Steel Transmission To\¡vers, and ECCS Recommendations for
Angles in l,attice Transmission Towers. Ultimate, and factored capacity curves were
prepared fo¡ each specimen shape, and for a wide range of slenderness ratios using
the above design methods. In general, test results were adequateþ predicted by the
design methods. Some discrepancies were observed, and simple modifications are
proposed to in order to avoid unconservative designs.
Cold temperature was observed to increase the capacity of tle sections. The
amount of increase varied with the specimen length and failure mode, but in any
case was not found to be detrimental.

iii
ACKNOWLEDGEMENTS
This research project was carried out under the direct supervision of Dr. Dimos
Polyzois. The author wishes to express his gratitude to Dr. Poþois for his advice,
guidance, encouragement, and support throughout the investigation.
The author also wishes to thank the project members: Mr. T. Jerome, Dr. G'
Morris, Mr. W.J. Muzyczka, Dr. S. Rizkalla, and Mr. C.W. Wong for bringing their
e4perience and knowledge to the project meetings during the investigation. Their
input and comments were gratefully appreciated.
Financial support provided by Manitoba Hydro, The Canadian Electric¿l
Association, and the University of Manitoba is gratefully acknowledged.
For their advice and assistance during testing, the author thanks Messrs. Ed Lemke,
and Rob Graham of the Civil Engineering Department.
The author also wishes to thank his fellow graduate students for their help.

TABLE OF CONTENTS
ABSTRACT i
ACKNOWLEDGEMENTS iii
TABLE OF CONTENTS
LISTOFTABLES ....... vüi
LIST OF FIGURES iX
CHAPTER 1, INTRODUCTION .. 1,
1.1 Gene¡al 1
1.2 Objectives 3
1.,3 Scope.. ,,....,. 4
CHAPTER 2 LITERATURE REVIEW
2,t General
2.2 Canadian Standard CAN/CSA-S136-M89 Cold-Formed Steel
Structural Members
6
6

CAN/CSA-S37-M86 Antennas, Towers, and Antenna-
Supporting Structures
ASCE Manual 52 Guide For Design of Steel Transmission
Towers
ECCS Recommendations for Angles in Lattice Transmission
Towers .
CHAPTER3 E)QERIMENTALPROGRAM .....,. 35
3.1 Introduction 35
3.2 Specimens 35
3.3 Test Setup and P¡ocedure ....... 37
3.3.1 TestSetupNo. 1..... 37
3.3.1..1 Test Procedure 41
3.3.2 TestSetupNo.2..... 42
3.3.2.1 Test P¡ocedure 43
3.3.3 TestSetupNo.3..... 44
3.3.3.1 Test P¡ocedure 46
CHAPTER 4 TESTRESULTS 47
4,L Introduction 47
4.2 Material Tests . 47
4.3 Dimensions and Section Properties 48
22
25
31
2.3
2.4
2.5

vi
484.4
CHAPTER 5
5.1
5.2
5.3
5.4
5.4
5.5
5.6
5.7
5.9
5.10
Static l,oad Results .
ANALYSIS AND DISCUSSION OF TEST RESULTS . . . . 49
Introduction 49
Material Properties 49
Effect of Temperature . 51
BAAndHBASpecirnens..... 52
BBAndHBBSpecimens...,. 59
BC and HBC Sections 6't
BG Sections 65
BN and HBN Sections 71'
Concentrically Loaded Angles . 78
Unstiffened Angles Bolted Through One l,eg 81
CHAPTER 6 SUMMARY, CONCLUSIONS, AND
RECOMMENDATIONS 85
6.L Summary 85
6.2 Conclusions 86
6.3 Recommendations .. 88
REFERENCES .... ,,.,,.. 92

vll
TABLES ....... 96
FIGURES I''.4
APPENDIX A .... L97
APPENDIX B ..... 212

TABLE
NO.
LIST OF TABLES
TITLE
1.1 - Test Parameters4.1 - Specified and Measured Yield Strengths4.2 - Average Section Properties . . . .
4.3 - Static Test Results Summary5.1 - Temperature Affect on Load Capacity5,2 - BA and HBA Sections Predicted Load Comparison . . . .
5.3 - BB and HBB Sections P¡edicted Load C,omparison . . . .
5.4 - BC and HBC Sections Predicted Load Comparison . . . .
5.5 - BG Section Predicted Load Comparison5.6 - BN and HBN Sectio¡s P¡edicted Load Comparison . . . .
5.7 - Concentrically Loaded Specimen Comparison5.8 - Proposed Upper Compressive Limit For Unstiffened Argles
Bolted through one Iæg
vüi
PAGE
NO.
979899
100106707i08109110111t12
113

LIST OF FIGTJRES
FIGURE TITLENO.
ix
PAGENO.
1.1 Transmission Towe¡ in Service . 115
t.2 Member Failure in a Tower Leg . . . LL63.7 BA and HBA Section Measurements L173.2 BB and HBB Section Measurements 1183,3 BC and HBC Section Measurements 1193.4 BG Section Measurements L203.5 BN and HBN Section Measu¡ements 1213.6 Test Setup No, One 1223.7 Tlpical Gusset Plates . 1233.8 BN-40EndFitting. ....... 1243.9 BG-40EndFitting. ...,... lU3.10 Motion Transducers at MidHeight of Specimen ........ 1253.11 Setup No.2: Cold Chamber and Load Frame . 1263.12 Setup No. 2: Tþical Angle Connection . . . . 1273.L3 Setup No.2: BN-100 End Fitting 1273.14 Setup No. 2: BG-100 End Fitting 1283.15 SetupNo.3.... 1293.16 Setup No.3: End Blocks . 1303.t7 Setup No. 3: Jack and Load Cell . . 131.
3.18 Setup No. 3: Gusset Plate Hinge 7313.19 Setup No. 3: Motion T¡ansducer at Midlength 7323.20 Schematic of Setup No. 1 . 1333.27 Schematic of Setup No. 2 . L343.22 Schematic of Setup No. 3 . 1353.23 Schematic of Gusset Plate for Angle Connections . . . 1363.24 Schematic of Gusset Plate for (H)BN Sections: Setup No. 1 ...... L373.25 Schematic of Gusset Plate fo¡ (H)BN Sections: Setup No. 2 & 3 . . . L373.26 Schematic of Gusset Plate for BG Sections 1385.1 Load vs, Temperature - BA Section 7395.2 Loadvs. Temperature -HBASection ......,. 1405.3 Load vs. Temperature - BB Section L475.4 Load vs. Temperature - HBB Section L425.5 Load vs. Temperature - BC Section 7435.6 Load vs. Temperature - HBC Section 7445.7 Load vs. Temperature - BG Section L455.8 Load vs. Temperature - BN Section 7465.9 Load vs. Temperature - HBN Section 1475.10 Average Failure Load Increase at -50" C
vs. Slenderness 148

5.11 Average Failure [,oad Increase at 0'Cvs. Slenderness
5.12 BA-40 Specimens at Failure5.13 BA-100 Specimen at Failu¡e5.14 BA-200 Specimen at Failure5.15 BA Section Analysis: CAN/CSA-S136-M89 . .
5.16 HBA Section Analysis: CAN/CSA-S136-M89 . .
5.17 BA Section Analysis: ASCE Manual 52 . . . .
5.18 HBA Section Analysis: ASCE Manual 52 . . . .
5.19 BASectionAnalysis: CAN/CSA-S37-M86 .... ;....5.20 HBA Section Analysis: CAN/CSA-S37-M865.2I BA Section Analysis: ECCS Recommendations5.22 HBA Section Analysis: ECCS Recommendations5.23 HBB-40 Specimen at Failure5.24 BB-100 Specimen at Failure5.25 BB-100 Midheight TÞist and l,ateral Deflection . . .
5.26 BB-100 Distortion at Cotrnection5.27 BB Section Analysis: CAN/CSA-S136-M89 .
5.28 HBB Section Analysis: CAN/CSA-S136-M89 . .
5.29 BB Section Analysis: ASCE Manual 52 . . . .
5.30 HBB Section Analysis: ASCE Manual 52 . . . .
5.3L BC-40 Sperimen at Failure5.32 BC-200 Specimen at Failure5.33 BC Section Analysis: CAN/CSA-S136-M89 .
5.34 HBC Section Analysis: CAN/CSA-S136-M89 . .
5.35 BC Section Anaþsis: ASCE Manual 52 . . . .
5.36 HBC Section Analysis: ASCE Manual 52 . . . .
5.37 BC Section Analysis: CAN/CSA-S37-M86 . .
5.38 HBC Section Analysis: CAN/CSA-S37-M86 . .
5.39 BG-40 Specimen at Failure5.40 BG-40: Distortion of Stiffened Flange at Failure .
5.4L BG-40 Specimen at Failu¡e5.42 BG-40: Distortion of Web at Failure5.43 BG-100 Specimen after Failure5.44 BG Section Analysis: CAN/CSA-S136-M89 . .
5.45 BG Section Analysis: CAN/CSA-S136-M89K =0'7 '
5.46 BG Section Analysis: ASCE Manual 52 . . .
5.47 BG Section Analysis: ASCE Manual 52& =0'z '5.48 BN-40 Specimen at Failu¡e
5.49 BN-40 Specimen Lip Distortion . . . . .
5.50 BN-100 Specimen at Failure5.51 BN-200 Specimen at Failure
149150151151r52153154155156Ls71s8159160160161't6L
1621631,64
165t66766167168169t7077L172t73173174r74175176
177t78
1791801801.81
181

5.525.53
5.545.55
BN Section Analysis: CAN/CSA-S136-M89 . .
BN Section Analysis: CAN/CSA-S136-M89Neglecting Tonional Buckling
HBN Section Analysis: CAN/CSA-S136-M89 . .
HBN Section Analysis: CAN/CSA-S136-M89Neglecting Torsional Buckling
5.56 BN Section Analysis: CAN/CSA-S16.1-M89 .
5.57 BN Section Analysis: CAN/CSA-S16.1-M89Neglecting Torsional Buckling
5.58 HBN Section Analysis: CAN/CSA-S16.1-M89 .
5.59 HBN Section Analysis: CAN/CSA-S16.1-M89Negecling Tonional Buctling .
5.60 BN Section Analysis: ASCE Manual 52 . . . .
5.61 BN Section Analysis: ASCE Manual 52
to
182
183L84
185186
787188
189190
191r92
193194
195196
198
199
200
207
202
203
2Ã4
20s
206
208209
Neglecting Tonional Buckling
5.62 HBN Section Analysis:5.63 HBN Section Analysis:
ASCE Manual 52 . ...ASCE Manual 52
Neglecting Tonional Buckling
5.64 BA-40 Specimen with Both Legs Connected . . . . .
5.65 Proposed Upper Compressive Limit fo¡ Unstiffened Angles LoadedThrough One Leg
5.66 Comparison of Experimental Results with Modified Manual 52 , , , .
4.1 Tþical Load-Displacement curves for Specimens BA-40 and HBA-40...
A.2 Tþical Load-Displacement curves for Specimens BA-100 and HBA-100 ..
4.3 Typical Load-Displacement curves fo¡ Specimens BA-200 and HBA-200 ..
A.4 Tþical Load-Displacement curves for Specimens BB-40 and HBB-40...
4.5 Tþical Load-Displacement curves for Specimens BB-L00 and HBB-100 .. .
A.ó Tþical Load-Displacement curves for Specimens BB-200 and HBB-200 ..
A.7 Tþical Load-Displacement curves for Specimens BC-40 and HBG40...
4.8 Tþical Load-Displacement curves fo¡ Specimens BC-100 and HBGL00 ..
4.9 Tþical Load-Displacement curves for Specimens BC-200 and HBC-200 ..
4,10 Tþical Load-Displacement curves for Specimens BG-40 and BG-100 .. .
4.11 Tþical Load-Displacement curves for Specimens BG-200

A,L2
A.13
A.14
Tlpical Load-Displacement curves for Specimens BN-40 and HBN40...Typical Load-Displacement curves fot Specimens BN-100 and HBN-1.00 ...Typical Load-Displacement curyes for Specimens BN'200
209
21027r
CHAPTER 1
INTRODUCTION
1.1 General
Hydro-electric transmission structures are traditionally built primarily of hot-rolled
angle sections of various sizes. Angles are advantageous for both main legs and web
members due to the simplicity of bolting membe¡s directþ together without the use
of gusset plates. Simplified fabrication and erection procedures help to reduce
ove¡all structure cost.
Cold-formed angles are becoming more popular as replacements for hot-rolled
angles, especially in the smaller angle sizes. In addition to conventional 90o angles,
a wide range of shapes can be produced, in sizes to suit individual project
requirenents. In particular, cold-forming can be used to provide stiffening lips to
prevent local buckling of thin, wide elements, to optimize shapes so that longer
unb¡aced lengths can be used, and to create shapes such as 60o angles for triangular
towers.
By using stiffened edges, the designer is able to increase the width of thin sections
without reductions for local buckling. Wider elements can lead to an inc¡ease in the
sections' moment of inertia and to a decrease in a members' slenderness. This
allows the use of longer unbraced lengths and reduces the number of bracing
membe¡s and connections. As a result, cost savings can be realized through

2
reductiors in the required weight of steel. Savings rtay also arise due to decreased
fabrication requirements, and reduced labour costs in tower erection, since a
reduction in the number of members, and bolted connections simplifies the tower
construction. In addition, the lips are beneficial in improving resistance to damage
in shipping and handling.
Lips have the disadvantage of preventing the nesting of sections, thus requiring more
volume in shipping. The lips also make connections to the inside of the leg difficult
compared to a plain angle which can be easiþ connected on either side of the leg.
Creating shapes such as the 60" angle to suit special applications, can simplify
fab¡ication details. In the case of triangular towets, the bracing members intersect
at 60o and cannot be bolted directly to a plain angle without using additional gusset
plates; however they can bolt directly to a 60' angle leg member. The 60" angle
offers another benefit in that it increases the minimum radius of gyration relative
to a 90o angle, thereby increasing the flexural buckling strength. The 60" angle has
the disadvantage of a ¡educed torsional-flexural buckling strength.
Web members in a towe¡ are most commonþ connected to legs members by simply
bolting through one leg. This is advantageous in simplifying construction and
fabrication, howeve¡ it results in eccentricity of load in the web membe¡. The
eccentricity reduces the axial load capacity, and must therefore be accounted fo¡ in

3
design. At the same time, tìe bolted connection provides some rotational restraint
to the web member, thus increasing the capacity. This benefit can be ac¡ounted for
to avoid excessively conservative designs.
A number of cold-formed shapes suitable for transmission tower construction are
examined in this project. Experimental work was perfonned to determine the axial
load capacity of these shapes.
t.2 Objectives
The main objective of the research work was to determi¡e the axial load capacity
of five different cold-formed steel sections suitable for transmission tower
construction.
The test results were compared to design capacities calculated using: Canadian
Standards CAN/CSA-S136-M89 Cold-Fonned Steel Structural Members (CSA 19E9),
henceforth referred to as CSA-S13ó, CAN/CSA-S37-M86 Antennas, Towers, and
Antenna Supporting Structures (CSA 1986) henceforth referred to as CSA-S37,
ASCE Manual 52 Guide for Design of Steel Transmission Towers (ASCE 1988)
henceforth refer¡ed to as Manual 52, and ECCS Recommendations for Angles in
Tlansmission Towers (European Convention for Constructional Steehryo¡k 1985)
henceforth ¡eferred to as the ECCS Recommendations.

4
13 Scope
The scope of the project included the testing of 189 cold-formed members. There
were four main parameters:
(1) shape
(2) Steel Grade
(3) Slenderness ratio
(4) Temperature
Table 1.1 summarizes the test program and indicates the number of tests perforrted
for each parameter. Each of tbese paramete¡s is discussed below.
Five different shapes were investigated:
1) BA: Plain 90" angle.
2) BB: Lipped 90o angle.
3) BC: 60" angle.
4) BG: T-Shape.
5) BN: Back-to-Back Lipped Channels.
Each shape was produced from two different types of steel. The first type, supplied
by SAE Towers of Milano, Itaþ, was 4715 Grade 60 with a specified feld strength
of 415 MPa. The second type was G40.21-300W and was selected in order to
represent a grade which is readily available in Canada.

5
Each shape was fabricated in th¡ee lengths in order to represent a wide range of
slenderness ratios. The lengths were selected to correspond to slenderness ratios of
approximately 40, 100, and 200. The exact slenderness ratios varied, so the values
shown in Table 1.1 are referred to as the "nominal slenderness ratios".
Specimens produced from the first steel type (4715) were tested at three
temperature levels; -50"C, OoC, and room temperature (approximately 20 to 23C),
The second set of specimens (G40.21 steel) were tested at -50oC, and room
temperature only. These are the specimens designated as HBA HBB, HBC, HBN.
The longest specimens, designated as BG-200, and BN-200 were only tested at room
temperature.
Three separate test setups were required to ac.ommodate the variety of shapes and
lengths. In addition, a large refrigeration unit was designed and built for the tests.
Material tests were also performed in a separate project (Poþois et al 1994).
project, dealing specifically with material tests. The results of these material tests
are refer¡ed to in this work. AII measured leld strength values are based on these
material tests.

CIIAPTER 2
LITERATURE REVIEW
2.1 General
The design and construction of steel transmission towers has evolved over the past
century from the simple use of windmill towers modified to carry wires, to, as an
extreme example, towers over 700 ft. high, spanning 12000 ft. across the Messina
Straits between Siciþ and the Italian mainland (Bergstrom et al.).
Transmission tower design differs from normal individual building design in that a
typical transmission line of considerable length makes use of the same tower many
times over. As a result of this repetition, there is room for significant cost savings
by attempting to achieve the utmost economy consistent with adequate safety. Since
transmission towers differ from typical structures, special standards have been
developed to provide specific guidance to tower designers. Conside¡able research
has been conducted in the a¡ea of transmission tower design and construction. The
majority of the research relates to plain, hot-rolled angles since these are the most
commonþ used. The use of cold-formed steel is also generating new areas of
research, In this chapter some of the literature related to t¡ansmission towers will
be reviewed, and some specific design guidelines which are available to the engineer
involved in transmission tower design will be examined.

I
Kravitz (1982) prepared a review of the state of the art and practice of transmission
line tower design. Topics covered included loading combinations, analysis
procedures, and member design using the ASCE Manual 52. In this refetence
comments on the design criteria in the manual are given and recommendations
regarding future resea¡ch and testing are made.
The work by Kraviø was extended by Cannon (1989), who conducted a wo¡ldwide
survey of tower analysis and design methods. In this survey, Cannon obtai¡ed
information from various tower designers regarding the predicted member forces
and member strengths of two ful1 scale experimental tower tests, He found
considerable variation in the predictions from country to country, company to
company, and designer to designer. ASCE Manual 52 was the choice o1607o of the
participants in this survey and was the most commonly referenced design guide.
There was also variation in the information supplied between participants who
utilized the recommendations of Manual 52. Can¡on concludes that a major factor
in tle design of transmission towers is the professional e4perience and judgement
of designers.
A brief summary of the relevant literatu¡e which was found to be useful in the study
is given below.

IMarsh (1969) conducted tests on small aluminum angles. The test setup consisted
of angles loaded eccentricalþ by bolting through one leg with one or two bolts. The
test specimens we¡e bolted to larger angles which resembled chord members in a
truss assembly. The use of two bolts was found to increase the member capacity
when compared to the capacity of sections connected with only one bolt. An
expression was developed which combined the effects of flexure about the weak axis
and twisting. This expression was later incorporated in Canadian Standa¡d 5136-
M89.
Adlu¡i and Madugula (1991) discussed the concept of schiffIerization of 90o angles
to form 60'angles. The similarities and differences between 60o and 90o angles were
presented. The current design practices in Canada were discussed, and the
limiøtions of the commonþ used design standard CAN/CSA-S37-M86 were also
examined. The process of bending the angle legs from 90o to 60o was found to
increase the minimum moment of inertia by approximately 20Vo to 50Vo. At the
same time, the¡e is a dec¡ease in the maximum moment of inertia by a similar
amount. The shear centre was also found to move slightþ away from the
inte¡section of the legs, resulting in an inc¡ease in the warping constant C*. Overall,
the 60" angles were found to be stronger in flexural buckling, and weaker in
torsional-flexural buckling when compared to a 90' angle. Due to the decreased
to¡sional-flexural buckling strength, 60o angles could be subject to torsional flexural
buckling at longer lengths than simila¡ sized 90o angles. In the design of 60o angles

9
according to the CSA-S37-M86 standard, the effect of torsional-flexural buckling is
not included. The authors intended to bring this to the attention of engineers
invoþed in tower design. In order to account for torsional flexural-buckling
properly, the authors proposed a modification to the existing design method used
in CSA-S37. Load capacity tables were presented for typical angle sizes and lengths,
where factored capacities according to the existing method and the proposed method
were compared. The authors also provided a number of expressions for calculating
the geometric properties of 60o angles.
Adluri, Madugula, and Monforton (1992) reported on the results of tests performed
on 18 concentricalþ loaded, schifflerized angles. Test results were compared to
predicted loads using the ASCE Manual 52 and AISC'LRFD specifications (1986).
In the paper the authors pointed out that there is a lack of published information
on the strength and behaviour of schifflerized angles. Emphasis was placed on
determining the appropriate width to be used in calculating the w/t ratio. The
AISC-LRFD (1986) specification, which accounts for torsional-flexural buckling, was
found to provide results which we¡e in good agreement with the test results. The
ASCE Manual 52, which is more comrtonly used in the design of lattice towers,
does not specifically account fo¡ torsional-flexural buckling. The results provided
by Manual 52 ove¡estimated test results which were governed by torsional'flexural
buckling. The authors proposed two modifications to the methods used by Manual
52 for predicting more accurateþ the capacity of schifflerized angles. The first

10
method proposed involved the use of the entire leg width in w/t calculations. The
second method, which was considered more rational by the authols, was to use the
width of the bent portion of the leg in the calculation of w/t' In addition, in the
second ¡nethod the values of both the flexural and the equivalent torsional-flexural
radii of gyration for the member are calculated and the ninimum of the two radii
is used to compute the slenderness ratio.
Bathon et al (1993) tested 75 equal and unequal leg hot rolled angles under
eccentric loads. The specimens were bolted to gusset Plates through one leg' The
gusset plates were attached to ball and socket suPPorts lubricated with high pressure
grease in order to ensure that no rotational restraint was provided by the support.
The experimental results were compared to predicted loads using ASCE Manual 52.
It was found that the predicted failu¡e loads were generally higher than the
experimental loads. However, the authors also refer¡ed to full'scale tower test
¡esults which showed that the capacity was ZVo to 10Vo higher than that predicted
by the ASCE Manual 52. The authors concluded that the design of towers may be
safely perfonned using the ASCE Manual 52, but that close attention should be paid
to the provisions limiting the eccentricity of applied load.
A small number of papers dealing specifically with cold-formed steel sections have
also been published. These are presented below:

11
Madugula, Prabhu, and Temple (1983) tested L6 concentrically loaded cold-fonned
angles with slenderness ratios ranging from 90 to 250. The magnitude and
distribution of residual stresses v,'ere also investigated. A finite element program
was also developed to predict the failure loads, taking into account initial out-of-
straightness. Failure loads were compared to results obtained from ASCE Manual
52 (197L), AISI specification (1980), CSA-S136 (1974), and the ECCS
Recommendations (1976). The ECCS Recommendations \ e¡e found to be
conservative fo¡ most cases, whereas the results obtained from ASCE Manual 52,
the AISI specifications, and CSA-S136-1974 were found to be slightly
unconservative. The maximum residual stress \ as found to be approximately 307o
of the yield stress. The magnitude and distribution of the residual stresses was
found to be similar to that observed in hot-rolled angles,
Madugula and Ray (1984) tested 24 equal and unequal leg cold-formed angles under
eccentric loads. In contrast to the tests performed by Bathon, these specimens were
tested in a setup designed to simulate one panel of one face of a latticed tower.
This setup therefore provided some degree of fixity to the ends of the specimens.
Three slende¡ness ratios we¡e examined,80, L20, and 170. Specimens were bolted
at the ends through one leg, with either one, two, or three bolts. The objectives of
the investigation we¡e to study the following: the effect of the number of bolts in
the end connections, the difference in strength of unequal leg angles with long leg
connected and with long leg ou! the effect of the assumed location of the shear
centre, and the effect of the magnitude of warping constant used. Test results were

L2
compared to loads computed from the general theory of torsional-flexural buckling,
the ASCE Manual 52, and the ECCS Recommendations. It was found that failure
loads computed according to the ECCS Recommendations were generally
conservative. For specimens with slenderness ratios less than 120 that were
connected with onþ one bolt, the ASCE Manual 52 predicted failure loads higher
than the experimental failu¡e loads. For specimens with slenderness ratios less than
120 which were connected by two or three bolts and for specimens with slenderness
ratios exceeding 120, the experimental failure loadswere in good agreement \áith the
loads computed according to the ASCE Manual 52, The strength of the members
was found to inc¡ease when the number of bolts in the end connection was
increased. Unequal leg angles were found to carry higher loads when the long leg
was unconnected. The authors also concluded that the exact location of the shear
centre, and magnitude of the warping constant have an insignificant effect on the
predicted failure loads.
Faggiano (1985) discussed the design philosophy of cold-formed steel towers, as
related to the potential member shapes, and tower configurations. A¡eas of
potential cost savings were highlighted and some limitations were addressed in the
reference. Some difficulties associated with cold-formed steel membe¡ detailing
we¡e also examined.

13
Gaylord and Wilhoite (1985) provided recommendations for the design of plain and
Iipped cold-formed angles used in transmission towers. The reference was of
considerable interest to other researchers in the field as evidenced by the discussion
given by Bryant M.E, Marsh C., Ray S.K., and Madugula K.S. The methods
provided allow the designer to use the same criteria used for the design of hot-¡olled
angles in t¡ansmission towers, as outlined in ASCE Manual 52. The authors verified
their recommendations through comparison with test results from four different
sources. The sources of test datâ included: Chajes, Fang, Pen, and Winter (1966),
Madugula, Prabhu, and Temple (1983), Technologic Papers of the Bureau of
Standards No. 218 Departrient of Commerce (7922), as well as unpublished data.
The effect of temperature and gahanization on the compressive strength of cold-
fonned angles was studied by Polyzois et al (i990). The study involved the testing
of 10 galvanized and 10 ungalvanized cold-formed steel angles with a slenderness
ratio of 70. Tests were perfonned at temperatures ranging from -45 to 25' C.
Angles were attached to gusset plates by bolting through one leg, In addition, 48
standard tension coupon tests were conducted at various temperatures. Several
observations were made by the authors, as summarized below. The capacity of
angles tested at -45' C was approximately ïVo higher than the capacity at room
temperature. Similar results were found for tension coupon tests. Corner coupons
were found to have yield strength ranging from 73Vo to 27Vo higher than the yield
sfiength of flat coupons. Galvanized atrgles were found to have ultimate

t4
compressive resistances 9Vo bigher than ungalvanized angles. Ultimate predicted
Ioads were calculated using Canadian standard 5136, and the American specification
(AISI 198ó). When the angles were treated as beam columns, it was found that the
predicted loads were very conservative. The ultimate test results were approximately
2.ó times higher than the predicted loads.
While the above papers dealt primarily with angle shaped members, cold-formed
shapes other than angles have also been investigated as alternatives for transmission
to\ er construction. Zavelani and Faggiano (1985) provided recommendations for
the design of cold-formed latticed transmission towers using shapes other than
angles. Their recommendations were based on the AISI Specification for the design
of cold-formed members, and on test experience. Recommendations regarding items
such as galvanizing, tolerances, and connections we¡e also p¡ovided. In addition,
several experimental testing programs which demonstrated the validity of the
¡ecommendations were reviewed in the reference. These included the work by:
Carpena who carried out a se¡ies of tests on open 600 lipped and unlipped channel
at the SAE Test Station (Italy) in 1964. The test setup consisted of a triangular
tower configuration, with the channels acting as the leg members. Horizontal
loading was applied at the top of the tower in order to induce compression in the
channels. The work of Fang who investigated torsional-flexural buckling of cold-
formed thi¡-walled columns in 1966 at Cornell University is also cited. In Fang's
work specimens were loaded concentricalþ rvith fixed end supports, and columns

15
were tested both in the elastic and inelastic range. An interaction equation which
combined twisting and bending was established. W-shaped post angles for use in
triangular towers lÃ'ere investigated by Cauzillo (1976). Specimens were tested with
flanged ends, and spherical supports. An experimental line was built using
triangular towers with W-shaped posts based on the results of the test program.
Casarico, Catenacci, and Faggiano investigated the use of back-to-back lipped
channels, and lipped T-shapes (1981). TWo experimental 500kV towers we¡e built
at the SA-E resea¡ch centre. Tests confirmed the validity of the design criteria based
on the AISI specifications. Tests on T-shaped specimens were performed by
rrVilhoite, Zandonini, and Zavelani (1984) at the Technical University of Milan.
The specimens were subjected to both concentric and eccentric loads, and were
loaded by bolting to gusset plates v¡ith ball bearing headings at each end.
Four experimental cold-formed steel towers were constructed by the American
Electric Power Research Institute (AEPRI) at their testing station near Fo¡t Worth
Texas, The towers utilized various shapes, including 90o angles, 60o angles, T-
shapes, back-to-back lipped chamels, and W-shapes. Catenacci, Finzi, and Rossi
(1989) reported on the design of these towers, and compared the towers to similar
configurations designed usitrg hot-rolled angles. The authors also ¡efe¡ to some
similar work performed in Italy (SAE and ENEL). The four experimental towers
we¡e found to have significant reductions in the total tower weigh! and in the
numbe¡ of members, plates, and bolts. These reductions wete said to result in

16
reductions in fabrication, packaging, transportation, and erection costs. The autho¡s
conclude that these towe¡s demonstrate that the use of cold-formed members in
electrical transmission towers is feasible, reliable, and economical.
An extensive lite¡ature review relating to hot-rolled and cold-formed angles was
prepared by Kennedy and Madugula (1982). The review included theo¡etical
analyses for flexural, to¡sional-flexural, and plate buckling of angles, experimental
investigations, and design practices in North America and Europe. The authors also
made a number of recommendations for further research.
In the follor¡¡ing section the various codes of practice which we¡e utilized in order
to analyze the test specimens a¡e reviewed.
2,2 Canadlan Ståndad CAN/CS4.S136.M89 Cold.Formed Steel Structural
Members
The basic column curve adopted by CSA-S136 consists of the Euler buckling curve
at stresses below 0.5 Fn and an approximation to a tangent modulus curve at stresses
above 0.5 F" The curve is specified in Clause 6.6.1.3 as follows:
When Fo > F¡2
, -, - ( Fr)'
-a -y 4Fo

l7
When Fo < F/2
F -F'a'p
Where
F, = Yield stress in Mp4 and
Fo = least value of elastic buckling stress for Euler-flexural, torsional, to¡sional-
flexural buckling (given in MPa), as specified by Clauses 6.6.2, 6.6.3, 6,6.7,
aûd 6.7.4, all of which are defined below.
The compressive resistance of the section is determined as:
cr-ø ^A.Fa
Where
F. is defined above
,\ = effective cross sectional a¡ea determined from Clause 5.6.2 using the stress
level = F" (which may be less than tle gross area).
þ, = 0.9 for doubly symmetric sections
= 0,75 for singly symmetric sectio¡s

18
The above provisions a¡e limited to sections 4.5 mm or less in thick¡ess. Fo¡
sections greater than 4.5 mm the axial stress is corrputed according to CSA
Standard 516,1.
Flexural Buckling
The critical flexural buckling stress is given by Clause 6.6.2
Fo = 0.833F"
where
F"
KLlr -K
t-
r¡2El(r<Lh)2
Maximum effective slenderness ratio
Effective length factor
radius of g)¡ration of fully effective area about the principal axes
The above e4pression is modified by Clause 6,6.7 lot built up sections connected at
discrete points. The sections have a reduced shear rigidity compared to sections
which are continuously joined. The critical stress is modified by combining the
member slenderness with the slenderness of an individual component between points
of connection. A modified slenderness ¡atio is thus created by combining the two
ratios.
Fp = o'833 4whe¡e
F -' ¡2 E" (xt / rl'* (a/ zr)2

l9
KL/r
a
fr
overall slenderness of the built-up section
spacing of fasteners between components
radius of gyration of individual section
fully effective area of membe¡
radii of gyration of fully effective area about centroidal principal axes
effective length factor for torsional buckling
unsupported length for twisting
Torsional and Torsional-flexural Buckling Clause 6.63,1
The critical buckling stress is given as the lesser of the reduced flexural buckling
stress Fo defined above, or the reduced torsional flexu¡al buckling stress given by
Fo = 0'833 F.'
where
F ": i þ | F u* F r- { ( F
"+ F ¿l
2 - 4 P F 6F t)
F"-n2E/ (xL/ r\2
- -2 c'¡:- 1 tt ttwgt
' , .' , ¡ ................ ]" Alro¡" - (K&¿)2
þ-t- (xo/ r )2
r"-,,f(ùF*1r¡4t
A
ft'fy
K
Ll

20
x" = distance between shear centre and cent¡oid
KL/r : effective slenderness ratio fo¡ bending about the axis of syn,metry
J = St. Venant's torsion constant
Local Buckling
The stress on sections with unstiffened flanges is further limited by the local
buckling limit imposed by Clause 6.6.3.2
^ öþnzrtL r ---------.:--'
l2(l-v^1il,
where
Ó. = 0'9
k = 0.43
A = fully effective section area
\ry -- flat width ratio of unstiffened flange
Single Angles Loaded Through One Iæg Clause 6,7.4
Angles loaded eccentricalþ fhrough one leg fail by combined bending about the
weak axis and twisting. An equivalent slenderness ¡atio which combines the modes
of buckling. The reduced sl¿sfiç þ¡çkling stress is given as
^ 0.833ßzEtr r-'P t(KUr)2+(sblt)21

where
L = unbraced length of the member
rv = least radius of gyration of the fully effective area
b = flat width of the leg
t = leg thickness
K = effective length factor depending on the connection
= 0.7 for translation fixed connections with two or more
bolts or welds
= 0.8 for translation fixed connections \¡¡ith a single bolt
The compressive resistance is given by Clause 6.6.1.3 using { = 0.75, but is limited
to 0.54F, for single bolted members, and 0.674F, for members connected by welds
or two or more bolts.
Efîective Areas
Clause 5.6.2 of the Standard specifies flat width limits beyond which a section's full
area is not effective. The basic flat width thickness limit is given as
wl^-},644/-W
When the limit is exceeded the ¡educed effective width is given by
B.o.ss,/-køyU-ryf E-n

22
where k and W depend on the section shape and toading conditions and a¡e
specified in detail in the standard, but will not be presented here. The value of f is
the calculated stress in the effective element.
2,3 CAN/CSA-S37.M86Antennas, Towers,andAntenna-supporting Stn¡ctures
Both the CSA-S37 and CSA-S136 standa¡ds are based on limit states design
principles which requires that the effect of facto¡ed loads must not exceed the
factored load resistance. The CSA-S37 standard allows cold formed steel angles to
be used as substitutes for hot ¡olled angles, but limits such angles to leg dimensions
of 55 mm or less. Although the sections used in the erperimental investigation
exceeded this limit the standard will still be examined.
According to the CSA-S37 standard, member resistances are based on the Canadian
standard CSA/CAN-S16.1-M84 Steel Structures for Buildings. This standard is
primarily intended for hot-rolled steel products. The basic axial stress is defined in
terms of the dimensionless parameter I defined as
The axial resistance is given by 516.1 Clause 13.3 as
L.EEr\r2E
C, = óÆy
C, = d,Alry(1.035 -0.20ÐL - 0.222L2)
for0<150.15
for.15<Â<1.0

23
c,
c,
c,
= óAFy(-0.111 + 0.6361L + .0871,¡) fo¡ 1.0 < I < 2.0
= dAFy(0.009 + 0,8771L) for 2.0 < )t < 3.6
= ôAF/L'z for 2.0 < I < 3.6
The values of K and @ depend on the member type, slenderness, and connection
type. For concentrically loaded leg members with maximum effective slenderness
less than 120, Clause ó.2 specifies K=1.0, and ó=0.9.
Clause 6.2.4 provides recommendations for \ eb members loaded through one leg
only, For members connected with two or more bolts (or equivalent in welding) the
standard neglects the eccentricity, and specifies K=0.9. The resistance factor
depends on the slenderness, i.e., for KL/r > 120 6=9.9. and for KLlr < 120
ô=0.12. The factored resistance below KL/r = 120 need not be less than the
resistance at KLlr : 120 with ó=0.9.
When members are connected with only one bolt the member is still treated as an
axially loaded nember except that no resûaint is considered, and K = 1.0. The
resistance factor is set at 0.72 for all slenderness ¡atios. (Clause 6.2.4.3)
From the above discussion it can be seen that the CSA-S37 standard recognizes the
end restraint provided by multþle bolt connections by specifying K. The effect of
eccentricity is accounted for by simply reducing the ¡esistance facto¡.

uAs mentioned, Standard S37 bases the axial resistance on the provisions of
Standard 516.1, which limits the width to thickness ratio of angle legs to 2001,/Fr.
For sections exceeding this limit 516.1 refers to the cold fonned steel standard CSA-
5136. In order to make the CSA-S37 standard more comprehensive, this limit was
modified to account fo¡ sections which may be subject to local buckling.
Amendment No. 12 (September 1992) was issued in order to account for local
buckling. A reduced effective yield stress is used when width-to-thickness ratios
excæed 200/,/Fy. The effective stress is calculated as follows:
2001'/F.. < t < 380/y'F.'It
F,ú-F"u.677 -.677 olt _l2æhlFy
for 380/y'F, < wlt 525
Fr-s&líl(wlt)2
Fo¡ cold formed 90' angles w is taken as the lesser of the flat wjdth o¡ the total leg
width less 3t. For schifflerized ó0o angles the standard specifies w as the flat rridth
to the bend line; but does not specifically refer to cold-formed 60. angles.
The calculated value of reduced effective yield shess is substituted for the yield
stress F, in the calculation of the compressive resistance.

25
This simple method of accounting for local buckling by reducing the effective yield
stress coÍtrasts with the more involved method of the CSA-S136 standard which
reduces the effective area of the section to account for local buckling.
2,4 ASCE Manual 52 Guide For Design of Steel ltansmission Towers
Developed by the American Society of Civil Engineers, this manual serves as a
major source of information fo¡ transmission tower design. Whe¡eas the previous
two standa¡ds are based on limit states design, the ASCE Manual 52 utilizes the
ultimate shength design. In the ultimate strength design, the specified loads are
multiplied by overload capacity factors depending on the loading type, and members
are designed to approach failure at these loads. In contrast to limit states design,
no perforrrance factors are applied to the membe¡ resistance. ASCE committees
are currently studying the feasibility of revising the recommendations to incorporate
load and ¡esistance factor design principles.
Allowable Compression (Section 4.6)
Section 4.6 of the manual specifies the following allowable compression stress (in
imperial units)
4+-+(fifi4 psy& 3ç"

26
ffiere F, - yield stress (ksi), E = modulus of elasticity = 29000 ksi, KL = effective
length (in.), and r = ¡adius of gyration (in.).
Angles
The Manual is limited for use to angles with b/t ratios less than 25. A reduced
effective yield stress is calculated when the flat width ratio exceeds (Vt)¡_ = 80/r'$.
4- 28Í9oo por& rç-' ,KL,¡ t "f
Fc,ü-11.677-o.íuffilrr rTr^.T.ffi
l4w
'14 t
- 9500' o (n¡t¡'
The effect of tle reduced local buckling strength on flexural buckling strength is
accounted for by substituting the reduced effective yield stress for F, in the
equations from section 4.6 listed above.

27
Section 4.7 of the Manual provides modified effective length formulas to account for
eccentricity and end restraint on angles members.
For membe¡s with a concent¡ic load at each end:
KL -L o<L<pnftr
Fo¡ members with a conce¡tric load at one end and nomral framing eccentricity at
the other end of the unsupported panel:
&+o*o.ls! o<L<norrt
For members with normal framing eccentricities at each end:
&-æ,,o.sl o<L<t2oÌtr
For members unrestrained against rotation at both ends:
KL -L no<!<2æfrr
For members partiaþ ¡estrained against rotation at one end:
&-zg.ø*o.tal no<L<zzsfrt
Fo¡ members partiaþ ¡estrained against rotation at each end:
&-u2*o.ets! nn<!<2so

28
For members unrestrained against rotation at both ends:
no<!<zúr
The manual limi¡ maximum modified effective lengths to KL/r< 150 for leg
members, KL|5200 for other compression members, and KLlr5250 for redundant
members. Members connected with onþ one bolt are not conside¡ed to be
restrained against rotation, whereas members con¡ected \¡¡ith two o¡ more bolts are
considered partially ¡estrained if the connection is to a member capable of resisting
rotation of the joint.
Lipped Angles
The w/t limits and reduced effective yield stress defined for plain angles do not
apply to lipped angles since the local buckling strength is inc¡eased by the lips. The
ratio w/t for the leg shall not exceed 60. The Manual neglects lateral torsional
buckling for the plain angle, and only considers flexural and local buckling. Lateral
to¡sional buckling must be considered for the lipped angle since it is no longer very
close in value to the local buckling shength. An equivalent radius of gyration for
to¡sional and flexural buckling is given in Section 4.8 as
KL -Lrf

29
2tl-r-+-+222r{ ft ru
(1-]:)'*+( "" )',í ,í rilp"
where
rrr : equivalent torsional flexu¡al radius of gyration
C- = warPing constant
J - St. Venant torsion constant
KL = effective length for warping
Luo
L
l"
= polar moment of inertia = I" + L + Au.'?
= distance between shear centre and centroid
= moment of inertia about axis symmetry
: moment of inertia about non-symmetrical axis
The axial stress is provided by section 4.6 using the larger of KLlr" or KLlr,,. The
effective length fonnulas of Section 4.7 may be applied to lipped angles, but Il listed
above must be then be set equal to 1.0. If the width-to-thickness ratio .lil/t of the leg
exceeds 220/{F! then the axial stress acts over a ¡educed effective area, calculated
according to section 4.5 of the manual.

30
For lips at 90o to úe leg the minimum required depth is specified in section 4.8.4
âs:
d-2.st(Ïf-;i >4.8'
For sections other than plain angles, the manual provides formulas for calculating
effective widths when flat \¡¡idths exceed the limits for stiffened or unstiffened
elements.
Doubly-Symmetric Sections (section 4.9.4)
The manual requires that doubly symmetric sections be designed fo¡ flexural
buckling using section 4.6, and for torsional buckling using the radius of gyration r,
defined above.
Slngly Symmetric Sectlons (section 4.9.5)
In addition to flexural buckling about the axis of symmetry, torsional flexu¡al
buckling should be checked using the equivalent radius of gyration r,t as provided
for lipped angles above.

31
2,5 ECCS Recommendations for Angles ln Lattice Transmission Towers
The effect of local and torsional buckling on the overall buckling strength of
members is accounted for by calculating a reduced effective feld stress when flat
width ratios exceed the specified limits. The approach taken is similar to ASCE
Manual 52, and CSA-S37, but differs in that the reductions differentiate between
cold formed and hot rolled angles. Ttvo reasons are given treating the angles
differentþ:
- Cold formed angles have a smaller torsional stiffness than hot rolled angles
due to the lack of a heel and fillet.
- Cold formed angles have an increased yield strength at the corners due to
the strain hardening caused by bending.
The effect of these factors is to ¡educe the buckling strength of cold fonned angles
with low b/t ratios and low slenderness compared to hot rolled angles. At higher b/t
arrd Llr ratios the inc¡eased yield at the corners offsets the lack of a heel, and the
two types of angles aÌe treated the same. The limits and ¡eduction formulas for the
cold formed angle are given by
tfu-o.sor^,lE

'-",r|-Z&t Íor rl*.þ,.1r1r*
*, ,1r1r1r^
whe¡e
ã = reduced effective yield stress
o, = yield stress (MPa)
E = modulus of elasticity, taken as 210000 MPa
Note that b is taken as the full leg width for these formulas, and not the flat width.
A basic non-dimensional column curve "ao" is adopted from the European
Convention for Constructional Steelwork. The curve is summarized in table format
in the ECCS Recomnendations for Angles. This curve is used as the basis for
design of concentricalþ loaded leg members, Eccentricalþ loaded web members are
designed using the same basic column curve by modifying the members slenderness
to take into account end füity, and eccentricity. This basic approach is very similar
to that taken by ASCE Manual 52. The ECCS approach is slightly different in that
it differentiates between which axis the buckling occurs about. Diffe¡ent slenderness
modifications are specified for buckling about the minor principle axis, and buckling
about geometric axes, The mode of buckling is determined by the bracing
32
¡28o--çr+\'z

33
configuration. The correction formulas listed below apply to the specimens tested
in this research program, based on the following conditions:
-eccentricity at both ends
-buckling about the v-v axis (minor principal axis)
-discontinuous membe¡s with 2 bolts at each end
-discontinuous members with single bolts at each end.
For ÀSy'2
Ã-o.s * 0.64ûL for2 bols at end
For lt > ,/2
Â-0.5 + O.64UL for 2 bols at end
Ã-l for single k'lts at ends
Where Ä = non dimensional slenderness ratio
.t^--(¡tlElo)
and I = slenderness ratio - Ur,

34
In these expressions it is implied that fo¡ non-dimensional slenderness ratios below
^ = ^/2 the eccentricity ¡educes the allowable load. For L > ,/2 the restraint
provided by a 2 bolt connection offsets the eccentricity and the allowable axial load
may be inc¡eased relative to an axially loaded pin ended member. Once the
modified non-dimensional slenderness ratio is evaluated, the value of allowable
stress is determined using the tables provided in the appendix of the ECCS
Recommendations.
The tables provide the ¡atio of the buckling stress to the ¡educed effective yield
stress as follows:.
N-yo

CIIAPTER 3
EXPERIMENTAL PROGRAM
3.1 Introduction
The objective of the program was to determine the axial load capacity of various
cold-formed steel shapes used in the construction of lattice transmission towers.
The experimental investigation included the scheduled testing of 189 galvanized,
cold-fonned steel sections under a variety of parameters. There were 5 extra
specimens tested under the same parameters. Finally, a total of 7 additional
specimens v/ere tested in o¡der to investigate a revised end connection condition.
In this chapter, the test specimens, test setups, and test ptocedures are discussed.
3.2 Specimens
SAE Towe¡s of Milano, Itaþ supplied 129 of the specimens used in the
investigation. These specimens were identified as BA, BB, BC, BG, AND BN.
Additional tests were performed on specimens fabricated locally, using a steel which
is more commonly used in Canada as an alternative to the 4715 steel. The
additional specimens are identified as HBA HBB, HBC, and HBN. The second
series of specimen was identical to the fi¡st one with the exception of the T-shaped
BG specimen could not be produced to acceptable tolerances.

36
AII the specimens used in this test program were hot-dip galvanized by the
fabricators (or their subcontractors) prior to delivery to us.
The following specimen designation system \pas used in this investigation:
(H)BA-40-1
The first letter, H is used to identify the second set of specimens which \ ere made
of a G40.21. steel, and is onþ indicated on these shapes. The second two letters
refer to the specimen shape as follows: BA for plain angles, BB for lipped angles,
BC for 60' angles, BG for T-shaped sections, and BN fo¡ back-to-back channels.
Figures 3.1 to 3.5 illustrate the shapes. The first number, 40 in this example, refers
to the nominal slenderness ratio ofthe specimen, and is eithe¡ 40, 100, or 200, The
Iast ¡umber refers to the individual specimen identification within each shape and
slenderness group. Under this system, each specimen has a unique identifying
number.
To simulate actual tower conditions, bolted connections we¡e used for load
application. Idealþ these bolt holes would be punched by the fabricator prior to
forming and gafuanizing. However, under the specimen procurement and project
scheduling conditions, this option was not possible. Therefore all bolt holes were
drilled in the lab. The bolt diameter of5/8" required 11/16" holes. This size ofhole
required that small pilot holes be drilled fust, before drilling to the final size.
Approximately 1500 holes were required, The BN and HBN specimens were to be

37
bolted back-to-back with Ll2" spacer plates. The specimens were conne¡ted at
approxinately the Ll4, LI2, and 3/4 length points with two 3/8" diameter bolts, The
connection design for each specimen was based on preliminary load capacity
calculations. The number of bolts used to conne¡t each specimen decreased.as the
predicted capacity decreased for each different shape and slenderness ratio. Onþ
as many bolts as required by design were used in the connections.
3.3 lest Setup and Pmcedure
Due to the very large number of samples, and variation in length (from 552 mm to
8245 mm) three separate test setups were required to perform the tests. Each setup
and procedure will be discussed separateþ.
3.3.1 Test Setup No. I
The fi¡st setup made consisted of an existing custom-built cold chamber used in
previous investigations. This setup was able to accommodate specimens ranging itr
length from 552 mm to 1950 mm.
The cold chamber measures 810 by 950 by 2440 mm tall, and has two 200 mm
diameter holes through the cooler floo¡ and ceiling to allow for loading. Tbe
chambe¡ is equipped with a full height, hinged door fo¡ access. The door has a
window, and the chamber has an interior light to allow for visual observations during
testing. Temperatu¡es of -50oC and 0"C could be achieved. Room temperature tests

38
were simply performed with the doo¡ left open. A steel platform was built in o¡der
to support the chamber within the loading machine, to prwide a working space for
installing the specimens, and to allow for periodic removal of the entire test setup
from the loading machine.
A 5000 kN capacity model 810 Closed Loop Testing System Machine was used to
apply loads. Loads were applied to the specimen by two 168 mm diameter steel
pipes connected to the MTS machine and extended through the holes in the top and
bottom of the cooler. The bottom pipe extension is fixed, and the top pipe moves
down vertically in order to apply load. T$o different top pipes were required in
order to accommodate the range in specimen length. Gusset plates were bolted to
the ends of the pipes, and the specimens were bolted to the gusset plates. Figure
3.6 illustrates the test setup features descnibed above, and figure 3.20 presents a
schematic of the setup.
Due to the large number of tests being performed, it was decided to bolt channel
shape extensions to the gusset plates to help prevent damaging the plates. If the
channels became damaged during testing they could be easiþ replaced. The main
gusset plate was stiffened at the base to help prevent excessive bending of the
vertical plate. Figures 3.7 and 3.23 illustrate the gusset plate setup used. Due to
height restrictions within the chamber, the channels had to be removed for testing
the (H)BB-100, and (H)BC-100 specimens. AII angle specimens were tested by

39
bolting to the gussets. Seven additional tests were performed by connecting bolting
both legs of the angles to the support. This was achieved by simply bolting a clip
angle to the main gusset plate, and then bolting the outstanding leg of the specimen
to the clip angle. The opposite leg was bolted to the gusset plate.
The BN, HBN, and BG specimens tested in the same setup we¡e also bolted to
gusset plates at each end, but in this case the gusset plates were not bolted to the
pipe extensions. Instead, these gusset plates had curved bottoms to act as hinges.
The specimens were thus free to rotate about the hinges at top and bottom. The
hinges were oriented about the weak principal axis of each section.
Figure 3.8 shows the (H)BN gusset plate and hinge. The vertical gusset extends into
the 12.7 mm gap between the backs of the channels, an additional plate is then
placed on each side of the webs, and the whole connection is secured by six 5/8"
diameter bolts. This connection is considered to provide a concentric load
condition. A schematic of the connectiotr is given in figure 3.24.
Figures 3.9 and 3.26 show the gusset plate used to connect the BG sections. The
vertical gusset plate extends itrto the gap between the two parallel webs, and three
bolts are installed. A clip angle is connected to the section flanges on each side of
the vertical gusse! and then the clip angles are bolted to the vertical gusset. Due
to its'shape, this section is difficult to con¡ect. Drilling holes at tle location of the

40
centroidal axis was impossible due to interference by the ends of the flanges. By
connecting through the web on one side of the centroid, and through the flanges at
the opposite side of the centroid it was assumed that centroidal loading was
achieved. In practice, of course, a truþ concentric load is unlikely to be achieved
with a section such as this.
Temperatures in the chambe¡ were controlled by thermosta! and monitored by a
thennocouple connected directly to the specimen. In addition, a thermometer was
placed near the window to confir¡r the thermocouple readings. The chamber
required approximately 3-4 hours to achieve -50"C, and approximately t hour to
reach 0'C.
Initially four Linear Variable Transducers (LVDTs) were placed at midheight of the
specimens to monitor the twist and lateral deflections. However, at cold
temperatures the LVDTs tended to freeze, and using plastic bags to p¡event
moisture from freezing also seemed to interfere with the free movement of the
LVDTs. This problem was solved by using wire extension displacement transduce¡s.
These were placed outside of the chamber to prevent freezing, and the wires run in
to the cooler using a system of fixed pulleys. Figure 3.1.0 illustrates how this system
was used to monito¡ the deflection of the extreme points of the specimens.

4t
During loading, the stroke of the MTS piston was monito¡ed and reccirded, and the
load was measured by a load cell attached to the pipe extension, A Hewlett Packard
Data Acquisition System was used to monitor and record the data during testing.
3.3.1.1 Test P¡ocedure
Prior to testing, the specimen dimensions and midlength out of straightness \pere
recorded. The average dimensions for each cross section are given in figures 3.1 to
3.5.
The gusset plates were aligned using a carpenter level, and after the specimens were
bolted in place, they were again checked for alignment using the level. The BG and
(H)BN specimens were installed by bolting the gusset plates onto the member on
the ground, hoisting tle specimens in place, aligning with the carpenter level, and
then applying a small load (approximately 5 to 10 kN) to hold the specimen in place.
Once, the specimens we¡e in place, the motion transducers were connected to the
specimen. The thermocouple lead was con¡e¡ted to the specimen fo¡ cold
temperature tests, and the chamber doo¡ closed and allowed to cool.
I¡ad was applied to the specimen using stroke control on the MTS machine. Stroke
was applied gradually at approximately 0.02 mm/second. A typical test required
approximately 10 minutes to reach maximum load. Stroke was increased until the
measured load peaked and began decreasing.

42
3.3.2 Test Setup No. 2
The first setup was too small to accommodate the longer specimens, and a second
setup had tobe designed and built. ln designing the second setup it was detennined
that it was not feasible to acconmodate the longest specimens of approximately 8000
mm length. It was the¡efore decided that the very long specimens would be tested
in a third, separate setup at room temperature onþ. Setup number two had to
accommodate specimens ranging in length from about 2000 mm to 4500 mm.
A new custom built chamber was built, measuring 1050 mm wide by 1420 mm deep
by 5300 mm high . It has similar features to the fi¡st chamber, including 200 nm
diameter access holes at the top and bottom for loading, interio¡ lighting, and a
window in the door to allow observation. The chamber is different in that economic
conside¡ations prevented using a simple hinged access door. Access is provided by
a full height ¡enovable front panel on the cooler. The door was bolted in place at
4 locations, and clasped at the very top. In order to allow installation by one
person, a special support system w¿rs designed allowing the door to be lifted with a
chain hoist and slid out of the way to provide access irside the chamber.
The enti¡e chamber was built within two 8230 mm tall steel columns which were
fixed to a structural floor and acted as the load frame. The top pipe extension into
the chamber was connected to cross beams bolted to the tops of the columns. The
botton pipe extension into the chamber rested on top of a load cell and hydraulic

43
jack which reacted directþ against the structural floor. Angle frames we¡e installed
at the top and bottom to provide lateral stability to the pipes. The bottom stabilizer
frame used teflon pads to allow the pipe to slide up and down freely. An LVDT
was placed between the jack and the bottom of the coole¡ support frame to measure
the vertical st¡oke of the jack during loading. Figure 3.11 illustrates the loading
frame and cooler, and frgare 3.22 shows a schematic representation of the setup.
T$o different top pipe extensions were required to accommodate the diffe¡ent
lengths. In addition, the top cross beams were designed to be raiseà o¡ lowered to
accommodate different specimen lengths.
The gusset plates were bolted to the pipe extensions, and the angles specimeDs were
bolted to the gussets. The gusset plates used in first setup were used in this setup
as well. The BN and HBN specimens were tested using roller hinges at the top and
bottom of the gusset plates as described in Setup no. 1. BG specimens were tested
in this setup firs! and were tested without any hinge system, that is the gusset plates
were bolted directþ to the pipe extensions. Figures 3.12 to 3.14 and figures 3.24 to
3.26 indicate the end fittings described above.
3.3.2.1 Test Pmcedure
Installation and removal of the specimens was performed with a chain hoist. An Im. high steel scaffold frame was required to access the top of the specimen.

44
Temperature control and monitoring was performed as described for Setup no. 1.
Midheight specimen late¡al movements \r/ere also monitored as in Setup no. 1.
Load was measured with a load cell placed between the jack and bottom pipe, and
an LVDT measured the stroke. Data was recorded using the Hewlett Packard Data
Acquisition System shown in figure 3,11.
The test procedures were similar to those described in Setup no. 1, except that the
load was applied using an 1800 kN capacity hydraulic jack. The load was increased
in small inc¡ements of about 2 to SVo of predicted specimen capacity. The stroke
of the jack was inc¡eased beyond the point of maximum load measurements until the
load dropped appronmately 10 Vo.
3.33 Test Setup No.3
Six specimens were tested in a third setup; three BG-200, and three BN-200
specimens. These specimens were approximately 8000 mm long. Tests were
perfonned at room temperature only, since the elastic buckling of these members
was unlikely to be affected by temperature, and they could not be accommodated
in the cold chambers.
A test setup which was previousþ used for testing long wooden poles was modified
to suit the specimens. These tests were perfonned with the membe¡s in a
horizontal position, as illushated in figures 3.15 and 3.22. T\e setup consists of two
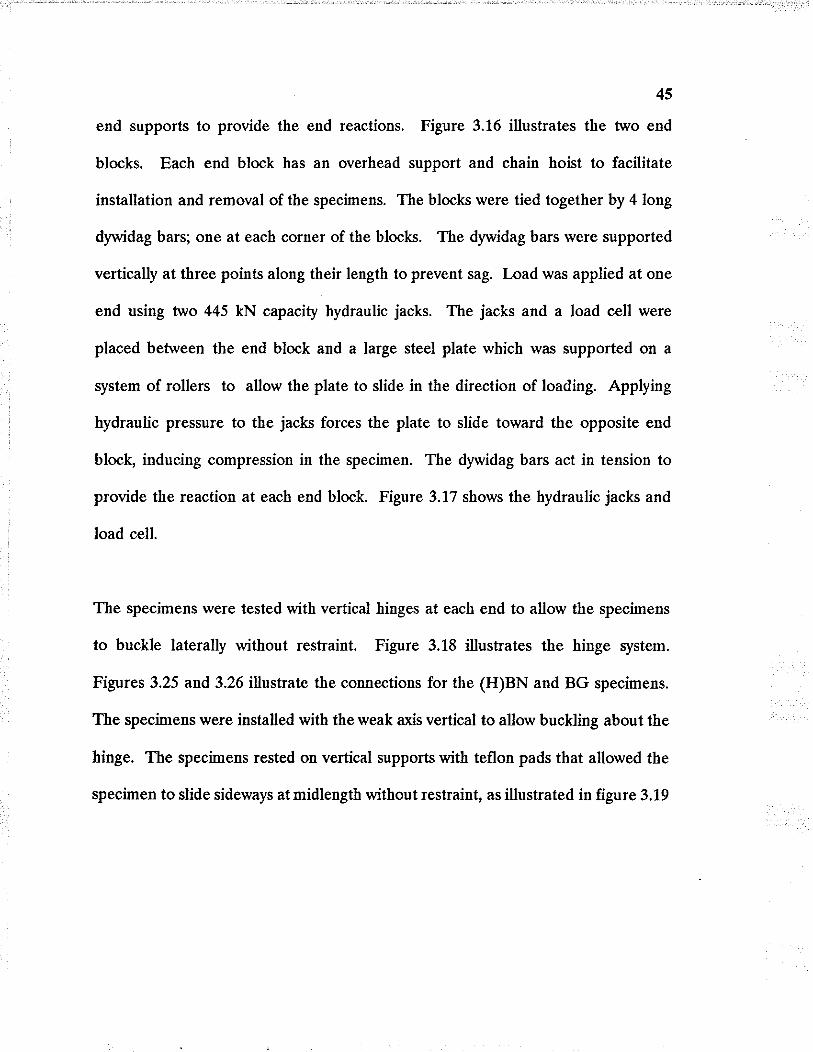
45
end supports to provide the end reactions. Figure 3.16 illustrates the two end
blocks. Each end block has an overhead support and chain hoist to facilitate
installation and removal of the specirnens. The blocks were tied together by 4 long
dywidag bars; one at each corner of the blocks. The dywidag bars were supported
vertically at three points along their length to prevent sag. Load was applied at one
end using two 445 kN capacity hydraulic jack. The jacks and a load cell were
placed between the end block and a large steel plate which was supported on a
system of rollers to allow the plate to slide in tle direction of loading. Apptying
hydraulic pressure to the jacks forces the plate to slide toward the opposite end
block, inducing compression in the specimen. The dywidag bars act in tension to
provide the reaction at each end block. Figure 3.17 shows the hydraulic jacks and
load cell.
The specimens were tested with vertical hinges at each end to allow the specimens
to buckle laterally without restraint. Figure 3.18 illust¡ates the hinge system.
Figures 3,25 and 3.26 illustrate the connections for the (H)BN and BG specimens.
The specimens were installed with the weak axis vertical to allow buckling about the
hinge. The specimens rested on vertical supports with teflon pads that allowed the
specimen to slide sideways at midlength without ¡estraint, as illustrated in figure 3,19

46
3.33.1 Test Pmcedurt
Before installing the test specimen, the end blocks were aligned by measuring the
perpendicular, and diagonal distances between the corners of each end block.
The specimens we¡e bolted to the gusset plates, lifted into.position, and aligned with
the centre points on each end block. A small load of about 5 to 10 kN was then
applied to hold the specimen in position. Position transduce¡s were connected to
the specimens at midlength as illustrated in figure 3.19. The axial displacement \ryas
measured with a motion transducer installed between the fixed end block, and the
sliding end plate as illust¡ated in figure 3.17. The load was applied in small
increments ol2 to sEo of the ultimate load.

47
CIIAPTER 4
TEST RESULTS
4,1 Introduction
In this chapter, the results of the experimental testing program are presented.
These results include: mate¡ial tests, measured dimensions, tabulated failure loads,
load-deflection curves, and results of additional static tests which were performed.
4.2 Material Tests
As discussed in Chapter 1, the material tests were performed as part of the
Gahanizing Errb¡ittlement studies, and the tests were not performed by tle author.
Standa¡d Tension C,oupon Tests were perfonned on coupons taken from flat and
co¡ner sections of the specimens. Tests were performed according to ASTM-E370
to obøin the yield strengths. The tests were performed at various temperature
levels, and both galvanized and ungalvanized specimens were examined. Full details
of these investigations can be seen in the Gahanizing Enbrittlement report
submitted as part of the CEA project 340 T 844 (Poþois et al 1994). The room
temperature results from flat section coupons are used in Chapter 5 of this report
and will the¡efore be summarized in this section.
Table 4.1 summarizes the leld strengths obøined from the room temperatu¡e, flat
coupon tension tests.

48
4,3 Dimensions and Secfion Properties
Figures 3.1 to 3.5 illustrate the average measu¡ed dimensions for each shape. The
figures identi$ the net dimension after deducting gaÏvanizing thicknesses.
Dimensions in parenthesis are the specified dimensions' Calculated section
properties listed in table 4.2 are based on the average measured dimensions rvith the
gahanizing deducted. Galvanizing thickness was approximately 0.1 mm on average.
The average section properties were used to calculate load capacities in Chapter 5.
Note that all of the specimens made from G40.2\ steel have specified thicknesses
of 4.5 mm, while the specimens made from ASTM 4715 grade 60 steel have
specified thicknesses of 4.0 mm, with the exception of the BN shapes which had a
thickness of 5.0 mm.
4.4 Static Load Results
Table 4.3 lists the results of all the static tests performed. This table represents a
total of 196 tests, and includes ¡esults from 7 ext¡a tests performed beyond the
planned 189 tests. The left column breaks the tests down into groups representing
each individual shape and length. The results are divided according to the
temperature at which each test was perfonned. The average load of each
temperature, length, and shape group is listed in the far right column'
Tþical plots of load vs, displacement fo¡ each shape and length are provided in
appendix A.

CHAPTER 5
ANALYSIS AND DISCUSSION OF TEST RESULTS
5.1 Infroduction
Ii this chapter, the results of the axial load tests and material tests are discussed.
The effect of cold temperature on the results is also examined.
The results of the material tests, and section properties based on the average of all
the section measurements will be used to analyze the sections. Sections will be
analyzed according to both the "specified" yield strengths, and the measured yield
strengths.
Each shape v¡ill be examined separately, and the results compared to predicted
capacities to determine the accuracy of different design approaches. The methods
of analysis were presented in Chapter 2. ln order to avoid redundancy, the
applicable for¡rulas used for the analysis of the results in this chapter will not be
listed again.
5,2 Material Prcperties
The leld strength used in this chapter was obtained from coupons taken from flat
portions of cold-formed members similar to those tested in the experinental
progr¿un. The material testing pro$am was extensive and the results are presented
elsewhere (Poþois 1994). A short summary of these results is given below.

50
In the material testing program, it was found that the feld strength of the test
coupons increased with decrease in temperature. The average increasè of all tension
tests at -50o C compared to tests at room temperature was approximately L07o,
It was also found that galvanizing affected the leld strengths of the tension
coupons. In general, the yield strength of the gafuanized coupons was greater than
the ungalvanized coupons. The inc¡ease ranged from a low of 7.5Vo for the 4715
steel to a high of 36.5Vo fo¡ the G40.21 steel. The results of tests on ungalvanized
4715 , and G40.21 steel specimens seem to confirm the specified leld strength of
415 MPa and 300 MPa respectively.
The results of tests on the G40.2L steel specimens also demonstrated a much larger
increase in leld strength when gahanized compared to the 4715 steel coupons.
From table 4,7, the average increase in yield strength for the 471.5 coupons due to
galvanizing was 8.5Vo; whereas the average increase in feld strength for the G40.21
coupons due to galvanizing was 36.37o. This increase in leld strength is quite large.
P¡evious testing at the University of Manitoba by Poþois, Charnvarnichborikarn,
and Rizkalla (1989) demonstrated an average inc¡ease due to gahanizitrg in the
range of IÙVo which agrees with the 4715 steel results above. It was felt that the
Iarge increase in leld strength lor the G40,21 steel may be attr¡buted to the
galvanizing process.

51
For each specimen shape, the coupon test result used in the analysis will be based
on the galvanized strengths listed in table 4.1, since the specimens themselves we¡e
all gahanized. The analysis will also consider the specified yield strength. The
specified yield strength of the 4715 steel is 415 MPa, while fo¡ the G40.2L steel the
specified leld strength was 300 MPa. Both values a¡e based on the ungalvanized
coupon strengths.
5.3 Effect of Temperature
The effect of temperature on the behaviour of the actual test specimens was
noticeable, but not as significant as observed fo¡ the material tests. Figures 5.1 to
5.9 demonstrate the relation between temperature and failure load for each
specimen shape and slenderness. A linear regression analysis was used to provide
a straight line relation for the measured data within the temperature ranges used.
The general trend of increased ultimate loads can be observed from these figures.
Table 5.1 summarizes the effect of temperature on the specimen ultimate load.
The table lists the average ultimate load fo¡ all specimens in each shape and length
category in column number two. The second (and third) column is the ratio of the
ave¡age ultimate load fo¡ tests performed at 0o C (and -50' C) divided by the
average results obtained at room tempeÌature. For example, for the BA-40
specimens, the test results at 0o C do not show any increase, and the test results at -
50o C show an average increase of.2Vo, The average inc¡ease for all the tests is

52
listed at the bottom of the tåble and is 1.3Vo at 0' C, and 3.8Vo at -50' C, When
reviewing the table it becomes apparent that the largest increases in strength at both
cold temperatures tend to occur for the smallest slende¡ness level for each shape.
For example, BB-40 specimens show an inc¡ease of 70Vo at -50" C and an increase
of. only ZVo for the longer BB-200 members. Figures 5.10 and 5.11 illustrate this
difference. These graphs compare the relative increase in strength at each
temperature level depending on the nominal slende¡ness ratio. In figure 5.10 it can
be seen that the shortest members show an average increase o1'7.4Vo at -50' C, and
the longest members (Llr=200) show aD avetage increase of only 2Vo.
This behaviour can be explained by the fact that as the members slenderness
increases into the elastic range, the members strength is not affected by an increase
in yield strength; whereas as the member becomes shorter, the capacity becomes
more affected by the material strength. It can also be observed that the largest
increases in strength at cold temperature oc¡urred in the BG, BN, and HBN-40
specimens. Failure in these specimens was chatacterized by material failure in the
form of local buckles at the stiffened edges.
5.4 BA And HBA Specimens
Behaviour
The angles we¡e loaded through one leg, bolted to a gusset plate. The specimens
began to bend and twist upon application of load, and increased until failure. The

53
atrgles with Ll¡= 40 were only 552 mm long, and measured 452 mm between
centroids of connections. Consequently, they did not deflect and twist as much as
longer specimens before failure. At maximum loading, buckles developed in the
bolted leg, resulting in a rapid drop in capacity. Figure 5,12 shows BA-40 test
specimens after failure, illustrating the local buckle in the bolted leg. Specimens
with L/¡= 100 demonstrated large¡ latetal deflections and twist at failure. The
specimens deflected primarily perpendicular to the bolted leg. Some of the
specimens still developed buckles in the bolted leg near the gusset plate. This
location coincides with a point of reverse curvature in the leg, caused by the
rotational ¡estraint of the bolted connection. The drop in load capacity after
ultimate was less rapid than for the shorter angles. Figure 5.13 illustrate a typical
specimen with L/r= 100. At U¡=200 the specimens twisted and deflected (primarily
perpendicular to the loaded leg), and did not develop any buckles in the loaded leg.
Figure 44.11 shows a typical load-deflection curve for these specimens, indicating
a gradual drop in load after ultimate. Figures 5.14 shows a specimen at ultimate.
CAN/CSA-S136.ME9 Analysis
Tbe angles were anaþed according to Clause 6.7.4 Single Angles Loaded Through
One Leg. This clause is discussed in Chapter 2. In using this clause, ,,b,' js taken
as the average leg flat width. The effective length factor K was taken as 0.7 for
slenderness ratios less than 150 to account for the füity provided by the two bolt
conDections. Beyond Llr=L50, onþ one bolt was used in testing, and K is taken as

54
0.8. The compressive stress limit F" is computed by Clause 6.6.L.3, lo account for
buckling in the inelastic range.
Once the compressive stress limit F" is known, the section must be checked to see
if the flat width ratios do not exceed the limits specified in Clause 5.6.2 . If the
limits a¡e exceeded, then the reduced effective area is calculated, and is used to
calculate the compressive strength of the section, as per Clause 6.6.1.3. It was found
that both BA and HBA specimens had reduced effective areas for slenderness ratios
less than about 100.
The capacity \ryas not found to be limited by the local buckling strength limit
imposed by clause 6.6.3.2, ot by the limits imposed by clause 6.7.4.
Figures 5.15 and 5.16 show the results of the analysis for BA and HBA specimens
respectively. Table 5.2 compares the average experimental ultimate loads with the
predicted loads at the slenderness ratios of the specimens, and provides some
detailed results not shown on the graphs (for example: factored capacity based on
coupon yield). In all cases, the factored predicted loads based on coupon feld
strengths, and specified strengths fall safely below the experimental loads. The
predicted ultimate loads fo¡ BA specimens agreed fairþ closely to the experimental
loads. However for the HBA specimens, test results at Lh=40 were only 82 Vo of
the ultimate predicted capacity based on the coupon yield, and 94 Vo based on the

55
specified fleld. For the HBA-200 specimens, the average test result was only 91 Vo
of the ultimate predicted load based on either yield value.
ASCE Manual 52
The specimens were analyzed in acco¡dance with section 4.7 Compression Members:
Angles. Flat u¡idth-to-thickness ratios of the angles exceeded the specified limit
values, above which, Iocal buckling may occu¡. Therefore the effective feld stresses
were reduced as per section 4.7.3 to account for the effect of reduced local buckling
stretrgth on the flexural buckling strength. BA section critical stress was reduced to
289 MPa and 281.3 MPa for lelds of 469 and 415 respectively. HBA stress was
reduced to 319.5 MPa and 272.9 }lPa for yields of 409 Mpa and 300 Mpa
respectively. The effective length used in calculating the capacity was determined
in acco¡dance with section 4.7.4.2 toaccount for eccentricity of load, and end fixity.
Allowable axial stresses on the gross section were computed as per section 4.6,
substituting the ¡educed critical stresses for Fr.
Figures 5.17 and 5.18 show the predicted capacities and experimental results for BA
and HBA shapes respectively. Note that although the effective slende¡ness used in
analysis may be larger or smaller than the actual value of L/r, the test results are still
plotted at the actual value L/r. The test results can be seen to fall near the
predicted loads for most of the results. The notable exception was the HBA-40
results which fell below the predicted values. Table 5,2 lists the predicted values at

56
the exact slenderness of the test specimens. The average experimental result for
HBA-40 tests was only 84 Vo and 94 Vo of the predicted value based on the coupon
yield strength and specified leld strength respectively. This discrepancy was not
evident for the BA-40 specimens where the average experimental load of 120 kN
was exactly equal to the predicted load.
CAN/CSÄ-S37.M86 Analysis
Specimen capacity was calculated using the standard's clause 6.2.4 Web Members.
Accordingl¡ a K value of 0.9 was assumed for members with trvo or more bolts,
and a K value of i..0 for membe¡s with onþ one bolt (assumed at L/r=1.50 in the
curves). The width-thickness ¡atios of the specimens exceeded the limits imposed
by clause 6.2.5, thereby requiring the calculation of a reduced effective feld stress
"F y". This value was equal to 271 MPa and 26ó.8 Mpa for yields of 469 and 415
MPa respectively for BA specimens; and equal to 300.6 Mpa and ZíLtrlpa for HBB
yields of409 and 300 MPa. The reduced effective yields and effective lengths were
then used in the axial compressive strength equations given in Clause 13.3.1 of CSA
Standard CAN3-S16.1.
Figures 5.19 and 5.20 show the ultimate loads calculated on the basis of this
standard. The facto¡ed curves are also shown. The value of the resistance factor
varies depending on ttre value of Lh, and the number of bolts: ö=0.72 fo¡ Lh <
120, 6=99 for L/r > 120 when 2 bolts are used, ó=0.72 when one bolt is used (at

57
Llr > 750 oD the curves). The ho¡izontal section on the factored capacity curve
relates to the point at which the resistance factor changes from 0.9 to 0.72. The
lower limit of the facto¡ed resistance is that obtained using {=9.9 atLlt=120. The
résults for both BA-40 and HBA-40 specimens fall below the predicted curve. This
can be explained by the fact that tle analysis does not implicitly take into account
the eccentricity of load. At short lengths, the end fixity is not as significant as the
eccentricity, thus the capacity is ove¡estimated. It must be noted, however, that in
all cases, the factored resistance falls conservatively below the average experimental
loads. The results at Ur = L00 and 200 fall above the ultimate capacity curve. It
can be seen that the resistance facto¡s have been reduced from the typical value of
0.9 to account for the eccentricity. For slenderness ratios gteater than 120, it is
implied that the beneficial effect of a two bolt connection ofßets the eccentricity,
and the member is assumed to be axially loaded, with ó=0.9. If onþ one bolt is
used than the standard neglects any end füity, and specifies þ=0.72.
Table 5.2 lists the predicted failure loads from the graphs discussed above. Again,
it can be seen that the facto¡ed capacities are all below the experimental results.
ECCS Recommendations
This method is very similar to the approach taken by Manual 52. Tlne width to
thickness ratio in this case is specified as the full leg width divided by thickness.
Both angles' b/t ratios exc€eded the specified limit. The¡efore a ¡educed effective

58
feld stress was calculated. For the BA specimens the width-thickness ratio
exceeded 3z(wlt)u^, and the effective feld stress was reduced to 253.2 Mpa. This
value depended onþ on the width-thickness ratio, and was independent of the actual
Ield strength. The HBA specimens had reduced effective yield stresses of 296.5
MPa and 258 MPa for yields of 409 MPa and 300 MPa respectively. It should be
noted that to be consistent with previous calculations, the modulus of elasticity was
taken as 200,000 MPa, and not 210,000 as specified by the ECCS.
The calculated curve is based on the following conditions identified in the ECCS
method: eccentric load at both ends of specimen, bending about the weak, non-
symmetric axis of the section, end fixity due to two or more bolts at each end (for
slenderness less than 120), members with slende¡ness greater than L20 are assumed
to be discontinuous, and connected with only one bolt.
Figures 5.21 and 5.22 show the predicted capacities using the ECCS
Recommendations for Angles in I¿ttice Transmission Towers. In general, the
experimental ¡esults fell above ttre predicted loads, with the exc€ption of some BA-
40 test results. The HBA-40 results once again did not reach as high as predicted.
Table 5.2 indicates that the HBA-40 average ¡esult of 123 kN was only 79 Vo of. the
predicted value of 156 kN (based on the measured feld srrength), and only 90 Vo
of tle predicted load based on the specified feìd.

5.4 BB And HBB Specimens
Behaviour
The lipped angles behaved similar to the plain angles, and began to bend and twist
upon application of loading. The specimens tended to deflect primarily
perpendicular to the plane of the gusset plate as did the plain angles, The most
significant difference in the member's behaviou¡ was that at short lengths the
specimens did not develop any local buckles in the loaded legs near the gusset plates
as did occur for all the short plain angles. During testing, the gusset plates could
be seen to be bending slightly in the direction of the member's lateral deflection.
Figures 5.23 through 5.26 illustrate the member behaviour during testing.
CAN/CSA-S136-M89
The sections were analyzed using the same method used for the plain angles as
given by clause 6.7.4, to detennine whethe¡ it could be safely used to predict the
Ioad capacity of lipped angles loaded through one leg. It is recognized, however,
that the method was developed for plain angles without the benefit of lips. The flat
width of the stiffened leg was used as "b". Both HBB and BB specimens we¡e found
to be adequateþ stiffened to allow fully effective areas.
Fþres 5.27 and 5.28 show the results of tle analysis, compared to the experimental
results. A significant diffe¡ence in performance can be seen between the HBB and
BB specimens. AII BB test results fell above the ultimate capacity based on the

60
measured feld strengths; whereas alnost all of the HBB test results fell below the
ultimate predicted loads based on the measured yield. For the HBB specimens, the
test results atLlr = 100 also fell below the ultimate capacity based on the specified
feld strength. The results do fall safely above the factored curves in all cases.
Table 5.3 lists the predicted loads and average ultimate experimental loads. This
also illustrates the discrepancy between the ultimate HBB-100 and HBB-40
experimental loads and the predicted loads.
ASCE Manual 52 Analysis
The sections were anaþed according to the same methods used for the plain angles,
using section 4.8 of the Guide. The dimensions of the lip were checked according
to section 4.8.4. Section BB's lip were found to be adequate. Section HBB's lips
were not adequate. They measured 25 mm overall, but we¡e required to be 27.9
mm. However, since the lip was very close to the required size, it was assumed to
be adequate. The sections satisfied the flat width-thickness ratios specified by
equation 4.9.3 of the Manual for stiffened elements This assumption seemed more
reasonable than completely neglecting the lip. The analysis of lipped angles is
diffe¡ent than plain angles in that in addition to checking the flexural buckling of
the specimen about the weak axis, torsional flexural buckling is also checked. An
equivalent radius of gyration is calculated as per section 4.8.3. In using the
e¡pressions for r,r, K was taken as 1,0 as specified. The allowable compression is

6t
then calculated using the minimum radius of gyration, and the effective lengths
provided by section 4.7.4,2.
Fo¡ nominal slenderness ratios of 40 and 100, it was found that rrr was smaller than
rr. Therefore the buckling shess was calculated using r,r. Figures 5.29 and 5.30
illustrate the design capacity curve. The predicted loads agree very closely with the
experimental results. The BB results all fall slightly above the predicted loads, and
the HBB results are centred on the curve. Table 5.3 summarizes the analysis.
5.5 BC and HBC Sections
Behavlour
specimen behaviour was very similar to the plain angles, characte¡ized by continuous
bending and twisting at loading. The sho¡t specimens developed buckles in the
loaded leg near the top or bottom gusset as indicated in figure 5.31. Intennediate
Iength specimens deflected laterally at mid-height and twisted approximately 30..
The lateral deflection was primarily perpendicular to the gusset plate. At ultimate
load, some specimens developed buckles in the loaded legs at the gusset plates in
the area of reverse curvature in the specimen. The longest specimens behaved
similarþ, but did not develop any buckles in the bolted legs. Figure 5.32 iltugl¡¿1sg
a 8C.200 specimen under load, denronstrating a large degree of twist.

62
Although 60'angles benefit from an inc¡eased flexural strength (due to an increased
minimum radius of gyration), they are subject to a decreased torsional-flexural
buckling strength relative to 90o angles. As the moment of inertia about the non-
sj¡nmetrical weak axis increases, the moment of inertia about the strong-symmetrical
axis decreases. The torsional-flexural buckling capacity decreases as the strong axis
inertia decreases. This effect was evidenced by the large amount of twist that
occurred during tests.
CANCSA.S136-M89 Analysis
As for the BB specimens, the sections were analyzed using Clause 6.7.4 for Single
Angles Loaded Through One leg to see how well it could predict the capacity. The
procedure is essentially the same as discussed for the plain angles. The flat width
value of "b" was taken as the flat leg width to the point of curvature as indicated on
figure 3.3. The effective area of the sections was found to be reduced for
slenderness values up to approximately 100.
Figures 5.33 and 5.34 show the results of the analysis. BC specimen test results fell
above the predicted capacities. HBC test ¡esults fell below the predicted capacity
at Llr = 40 and 100. At Llt:200, the average ¡esult fell on the curve. AII of the
test ¡esults were higher than the factored capacity based in the measured feldstrength. Table 5.4 summa¡izes the predicted capacities. The bottom row lists the
ratio of mean test result for all BC and HBC tests divided by the mean ultimate

63
predicted capacity. This value is 0.99 when the measured feld strength is used.
The ¡atio of mean test result divided by factored resistance based on measured yield
strength is 1.32. The comparable values calculated fo¡ BA and HBA specimens in
table 5.1 is 0.99 and 1.32 respectively. Based on the test results, it appears that
clause 6.7.4 wo¡ks as well fo¡ 60o angles as it does for 90o angles.
ASCE Manual 52
Manual 52 limits the use of the effective length provisions of section 7.4 which
account for eccentricity and füity to 90o angles. The reason for excluding 60o angles
is not indicated in the commentary. One reason may be the reduced torsional
flexural capacity of 60' angles compared to 90o angles. For simply supported 90o
angles free to warp at each end, the critical stress for local buckling and pure
torsional buckling a¡e the same, The stress for torsional-flexural buckling is close
to the torsional stress. For this reason 90o angles are nornalþ checked for flexu¡al
and local buckling only, neglecting torsional-flexu¡al buckling.
In using section 4.7 fo¡ the 60" angles, it is therefore unconservatively assumed that
the to¡sional-flexural buckling shength is equivalent to a plain angle.
In checking the specified width-thickness ratios, the flat width of the leg was taken
as indicated in figure 3.3. The ¡educed critical st¡ess for the BC specimen was 250.2
MPa and ?A9.7 lvIPa for lelds of 477 MPa and 415 Mpa respectively. Since rhey

uare so close in value, the difference was neglected, and a value of 250 MPa is
assumed. For the HBC specimens, the reduced critical stress was 269.5 MPa and
247.0 MPa for lelds of 415 and 300 MPa respectively.
Figures 5.35 and 5.36 show the results of the analysis. The BC test results fall close
to the predicted capacity. HBC test results at slenderness levels of 40 and 100 fall
below the predicted loads. The discrepancy is greatest at the nominal slenderness
ratio of 40. From table 5.4 it can be seen that the mean experimental load at
L/r:40 was only 78 Vo of the predicted capacity based on the measured feld
strength. ln addition, the ratio of mean test result to mean predicted capacity for
all BC and HBC tests listed fu the bottom row of table 5.4 is onþ 0.92. That is, on
average, the predicted capacity overestimates the failure loads by 8.5 Vo, Il. the
HBC-40 results are excluded, then the average predicted capacity overestimates the
mean failure load by only 2.8 Vo
CANCSA-S37.ME6 Analysls
The method of analysis was identical to that for the plain angles. The Standard
specifies a flat width value to use for schifflet'aed 60'angles, but does not specify
a similar value fo¡ cold-fonned angles. Following previous assumptions, and the
general approach followed for schitflerized angles, the width was simply taken as the
flat width up to the start of the bend. Based on the flat-width ratios, the effective
yield stress was reduced to 222.3 MPa and 226.4 MPa for BA yields of 477 and 475

65
MPa respectively. The reduced critical st¡ess was actually less when based on the
higher measured yield stress than when based on the specified leld stress. The
reduced st¡ess for the HBC specimens was 247.9 MPa and 227 .7 I[lPa for yields of
415 and 300 MPa respectively.
Figures 5.37 and 5.38 show the results of the analysis. The data is plotted at L/r,
where r is radius of gyration about the weak axis. Torsional-flexural buckling is not
considered in the analysis. Once again, it was found that the BC test results
generally fell above the predicted curve, and the HBC-40 and 100 results fell below
the ultimate predicted curve. The HBC-40 ¡esults showed the largest discrepancy,
\¡¡ith the average result being only 78 Vo of the predicted ultimate capacity. All but
one test result fell above the factored predicted capacity.
5.6 BG Sections
Behaviour
The hat-shaped BG sections are singly symmetric, and as such may be susceptible
to to¡sional-flexural buckling. During testing specimens were observed to twist and
deflect lateralþ.
Specimens with slenderness ratios of 40 remained fairþ straight during testing with
onþ slight late¡al deflection and twist. The specimens failed suddenþ as local
buckles developed in the stiffened 45o flange on one side of the section. The load

66
dropped quickly after the flaûge buckled. Figure 5.39 shows a specimen after
buckling at mid height; and figure 5.40 shows the distorted flange and stiffening lip
after failure. A different type of failure is shown in figure 5.41, where the member
failed by buckling of the web section near the bottom of the member. A closer vjew
of the buckled web is shown in figure 5.42. Table 5.1 shows that there was a l6Vo
increase in load resistance for these specimens when tested at -50. C as compared
to room temperatuÌe tests. The specimen material failure is directly affected by the
inc¡eased material strength at cold temperature.
The intermediate length specimens (L/r =100) twisted and deflected laterally about
the symmetric axis. Failure was sudden as the 45. flange buckled on the concave
side of the deflected member. The lateral deflection inc¡eased suddenly, and the
load dropped off substantially. This can be observed in a typical load-deflection
curye such as figure 44.106. Figure 5.43 illustrates a specimen afte¡ failure. These
specimens \rere tested using the same gusset plate as at the other two slenderness
ratios, except the base of the gusset was bolted down, and not allowed to hinge.
The BG-100 specimens were tested first. After performing these tests it was decided
to install a hinge on the gusset to allow rotation about the axis of symmetry for the
BG-40 and Bc-200 specimens.
The longest specimens \üere very long and noticeabþ flexible, especially. about the
axis of symmetry. The out of straightness about this axis ranged from 4 to 15 mm,

67
Specimens began to deflect laterally gradually as the load increased. Most of the
twist occur¡ed as the load approached the maximum. The load did not peak and
drop off quickþ, but rather was maintained at a near constant level while the lateral
deflection continued to inc¡ease. When the load was released, the specimen
returned very near to the original shape.
CAÌ.{\CSA.S136-M89 Analysis
The specimen was anaþed as a concentrically loaded, singly-symmetric section
according to section 6.6.3. Accordingly, the c¡itical stress is the lowe¡ of the
torsional-flexural stress provided in clause 6.6.3.1, or the flexural buckling stress of
Clause 6.ó.2. To¡sional flexural buckling was found to be the governing mode at all
test lengths considered.
In calculating the torsional buckling stress, the effective length factor for torsional
buckling "K" *"r initially taken as 1.0. The analysis was then repeated using an
assumed "K" =0.7 to reflect the warping restraint provided by the connection, Both
flanges of the section are bolted, and both thicknesses of web are con¡erted. It was
felt that this connection definitely provided some restraint, and that neglecting the
rest¡aint may be overly conservative.
Once the critical stress was evaluated, the effective area of the section is evaluated
using Clause 5.6.2 of the Standa¡d. The flat flange, and 45o flange we¡e both found

68
to be effective at the maximum stresses. ln evaluating the web, it was assumed that
it could be treated as being stiffened on each edge by a web or flange, and that the
curved radius connecting the two webs together combined with one web to stiffen
the opposite web. Using this assumption allowed the calculation of effective a¡ea
acco¡ding to Clause 5.6.2.2. Alternatively, the web could be simply assumed as
stiffened on one edge by a flange, and by a stiffene¡ on the othe¡ edge. However
then the "simple lip stiffener" would be made up of a completely curved section.
The standard onþ considers the flat width of a stiffener. Therefore the entire
stiffener would be neglected, and the web \ ould not be conside¡ed as stiffened.
This would be an overly conservative assumption since the radius does provide some
stiffening effect to the web. Using the first assumption, it was found that at the
maximum measured yield stress of 438 MPa, the web was alnost fully effective.
The total web area w¡rs theoretically reduced by 2.4 mm2. This small reduction was
ignored since it represented an amount of only 0.1. Vo of the gross area.
Figure 5.44 and 5.45 shows the results of the analysis using Iç =1.0 and 0.7
respectively. The capacities a¡e summarized in table 5.5. The experimental results
fall above the ultimate predicted capacities fo¡ both curyes. When K =0.7 was
used, the predicted results were higher (less conservative), particularþ for lowe¡
slender¡ess ratios. The results at Llt = 100 fall significantþ higher than the
predicted ultimate loads for both values of It. These specimens did not have an
actual hinge installed at the base of the gusset plate. It appears that neglecting the

69
reshaint provided by the gussets is overly conservative. F¡om table 5.5 it can be
seen that ratio of the mean test result to mean ultimate predicted load is 1.63 when
& = 1.0, and 1.37 when a less conservative value of IÇ = 0.7 was assumed. Table
5.5 also shows a capacity in parenthesis below the ¡esults for Il = 0.2. The results
in brackets are the predicted capacity fo¡ the L/r = 100 specimens if it is assumed
that 4 =ç = 0.7 to reflect both the torsional restraint, and the gusset plate füity.
The ultimate predicted capacity based on this assumption is 318 kN.
ASCE Manual 52
Section 4.9.5 of the Manual requires that the section be checked for flexural
buckling in the plane of symmetry and for torsional flexural buckling. An equivalent
radius of gyration is calculated as per Section 4.8.3. The value of I! was used as 1.0
and then as 0.7, consistent with the previous analysis. It should be noted that when
using equation 4.8-l from the manual to calculate rrr, the tenns l/r, and llru are
replaced with lçirr and Ç/ru to account fo¡ mixed end fixity conditions. used in this
forn the equation gives IÇr,¡. Torsional flexural buckling governed for all specimen
Iengths, and therefore the buckling stress is based on KL/r,,. The data, however, is
plotted at x-axis coordinates correspondin g to Llrn in o¡der to maintain a uniform
scale.
The effective area is calculated at the computed allowable compressive stress
(Section 4.6). The average dimension of the lþ measured 14.3 mm, and according

70
to section 4.8.4 the minimum lip depth should be 19.5 mm. If the lip is neglected
and the flange treated as unstiffened, the maximum allowable flat-width ratio at
maximum stresses is 36.1. The actual ratio is onþ slightþ larger at 38.4. Based on
this, and the fact that the lip does provide some benefit, the flange was considered
stiffened, and the full area was effective. The web was treated as stiffened at both
ends, and was found to have a reduced effective area at high stresses. The reduced
area \ryas taken into acaount in the capacity calculations.
Figures 5.46 and 5.47 show the ¡esults ofthe analysis. The results fall mostly above
the predicted cuwe. When K = 0.7 was used, the predicted loads increased, yet
were still conservative. Table 5.5 lists the predicted loads for each case. The table
also lists the predicted ultimate load using K :& = 0.7. This load is listed in
parenthesis below the predicted load at L/¡ = 100.
The predicted loads at Ut = L00 are very conservative. While the mean
experimental failure load was 470 kN, the ultimate predicted load varied from a
minimum of 256 kN to 384 kN depending on the effective length assumptions. In
the most conservative c¡rse, the predicted load is onþ 54 Vo of the ultimate.
A non-typical section such as this might best be utilized by performing prototype
tests to study the effect of various assumptions necessary for design. For example,
ifbased on these tests, a section was designed using less conservative effective length

7L
assumptions, the design capacity inc¡eases by 50 Vo from 256 to 384 kN. The
potential savings in steel may be substantial.
5.7 BN and HBN Sections
Behaviour
The back to back channel sections are doubly symmetric sections with relatively
large cross-sections. They would be suitable for very heavily loaded leg members.
The end fixity for these sections is likeþ to be less of a facto¡ in design than it is for
angles. Discontinuous ends of channel sections would likely be joined with web
connected gusset plates. The gusset plates would not provide as much rotational
restraint to the channels as they did for angles (since the channels are much stiffer).
The test specimens were loaded concentrically by bolting to a 12.7 mm tlick gusset
plate positioned in the gap between the backs of the channels. The first two BN-100
tests rvere performed \¡¡ith the gusset plates fixed at their base, by bolting down to
the pipe extensions. During testing, as the members buckled lateralþ, they bent the
gusset plates with them, leaving some permanent bend in the plates. It was then
decided to perform all remaining BN and HBN tests with pinned ends, free to rotate
about the weak axis.
Specimens with Lf = 40 remained fairþ straight during testing, v¡ith only slight
late¡al deflection. At ultimate, local buckles developed in the lips, at about
midheight on the concave side of the member, and the lateral deflection quickþ

increased, while the load dropped off quickly. Figures 5,48 and 5.49 ill"rrr"r" ;:behaviour of the membe¡, and show the buckles in the lips. Table 5.L shows that
these sections developed alnost L0 Vo higher loads at cold temperatures than at
room tempefatufe.
AtLlr = 100 the specimens displayed two distinct behaviour modes. The specimens
which developed the highest loads remained fairly straight right up until failure,
whereupon the specimens suddenly buckled laterally. The lips on the concave side
buckled slightly at about midheight. Unfortunately, the orientation of the specimen
in the cold chambe¡ sometimes prevented observing whether the local buckles
developed at ultimate load, or if they developed as the membe¡s lateral deflection
inc¡eased upon continued application ofload after failu¡e had occur¡ed. The second
type of behaviou¡ was characterized by gradually increasing lateral deflection, and
Iower ultimate loads. The lips did not ahnays disto¡t. The specimens gradual
increase in lateral deflection indicates imperfect member perfonnance. This may
be attributed to member out of straightness, small alignment errors, and lack of
perfect symmetry in the sections due to manufacturing tolerances. Although the
method of loading through the webs is reasonably concentric, in practice a purely
concentric load is highþ unlikely, thus creating moments in the section, and
reducing the axial capacity. The first type of failure may be unlikely to be achieved
for members of actual structures, at the lengths simila¡ used in testing. Figures 5.5
illust¡ates a typical test specimen behaviour. In some cases a small amount of twist

73
was observed during testing, but the ultimate failure was always in the form of
lateral buckling about the weak axis.
The test specimens with L/r = 200 were 8200 mm long, and had significant gut of
straightness (between 7 mm and 13 mm) about the weak axis. These specimens
began to deflect laterally upon application of load, and continued increasing to the
maximum load, at which point the deflection increased quickly. Figure 5.51
illustrates the behaviour of a BN-200 specimen.
CÀN/CSA-S136.M89 analysls
The BN specimens had a thickness of 5.0 rrm, and the HBN specimens were 4.5 mm
thick. This standard specifies that sections greater than 4.5 mm in thickness must
be designed for axial stresses provided by CSA Standard 516.1. Therefore CSA-
5136 is actually onþ applicable to the HBN specimens. For comparison pulposes,
both sections were analyzed using 516.1 and 5136.
Clause 6.6.7 provides a modification to the basic Euler buckling e¡pression to
account for the reduced shear rigidity of built-up sections joined together at discrete
points. In using Clause 6.6.7, K is taken as 1.0 (since the ends are hinged), L is the
distance between the hinges, r is the weak axis radius of gyration. using the critical
elastic buckling stress calculated by clause 6.6,7, the compressive stress rimit Fs is
calculated as per clause 6.6,1,3 for the elastic and inelastic ranges.

74
The above analysis assumes that the section is not critical in torsional buckling. For
shorter length specimens, torsional buckling may govern. Therefore the sections
were also checked for torsional buckling according to clause 6.6.3.1. In calculating
the torsional buckling stress Fr, the effective length factor IÇ was assumed equal to
1.0.
Using the compressive stress limits ûom above, calculated at each specific
slenderness ratio, the effective area can be calculated. Both BN and HBN sections
were found to be adequateþ stiffened to allow the full affective area to act.
Figures 5.52 and 5.54 illustrate the results of the analysis, and table 5.6 lists the
predicted capacities. BN-40, HBN-40, and HBN-100 section capacities we¡e found
to be governed by torsional buckling criticål stresses. Since the actual failu¡e modes
did not appear to be governed by torsional buckling, the section capacities based on
flexural bucking a¡e also indicated in parenthesis in table 5.6, and are shown on
figures 5.53 and 5.55. In general, the predicted capacities based on flexu¡al buckling
seemed to better predict the average failure load, but because of the scatter of test
results, some of the failure loads were overestimated. The ultimate predicted loads
based on torsional buckling we¡e all conseryative. In the event that to¡sional
buckling is neglected, as is normalþ the practice for doubly symmetric sectio¡s, the
predicted loads are generalþ still conservative.

75
caN/csa.16.1-M89
This standard applies when the section thickness is greater than 4.5 mm, as \ eÍe the
BN sections. Axial stress levels are computed according to CSA-S16.1 column
cúrves, and effective a¡eas are calculated according to csA-s136, at the level of axial
stress provided by CSA-S16.1. The sections we¡e all found to be fully effective. A
modified effective length was calculated to account for the reduced shear rigidity
due to the spacing of the back to back channel connections:
Modified&- 1&¡z*14 ¡z/lt
Where
KL/r = overall slenderness ratio of the entire
member (weak) axis. (K=1.0)
a = fastener spacing
rr = ¡adius of g¡rration of individual section
section about the built-up
This modified effective length was used to calculate the dimensionless slenderness
parameter l.
The sections were also checked fo¡ torsional buckling by substituting the equivalent
radius of gJnation r, for r in calculating the dimensionless parameter l. When
checking to¡sional buckling, the modified slenderness as discussed above was not

considered. The data was plotted at an X-axis coordinate of f-lrn ,"g"r01"., llwhether flexural or to¡sional buckling governed, but the curve itself does account for
the torsional buckling st¡ength as indicated.
The results are presented in figures 5.56 to 5.59, and in table 5.6. In general, this
method predicted lower loads at low and intermediate slenderness (40 and 100), and
higher loads at high slenderness ratios (Llr=200) rhan the Cold-Formed Steel
standard s136. For the BN sections which applied in this case, the flexu¡al buckling
predicted loads were unconservative for all the long members, and for two of the
intermediate length members. The torsional buckling predicted loads were generally
conservative. As indicated in table 5.6, the ratio of mean failure load to mean
predicted load was 1.28 when torsional buckling was considered, and 1.09 when only
flexural buckling was considered.
ASCE Manual 52
section 4'9.4 Doubly symmetric open cross sections requires that to¡sional
buckling be checked if the unsupported length for to¡sional buckling exceeds the
flexu¡al buckling length. For the test conditions it is assumed that the lengths are
the same, suggesting that onþ flexural buckring needs to be considered according
to the guide. Both modes we¡e considered. For BN-40 and HBN-40 sections the
equivalent radius of gyration r, was smaller than the weak axis radius of gyration,
and torsional buckling governed.

77
HBN sections were found to have fully effective areas. The lips on BN sections
measured 15.5 mm, and we¡e required to be 26.6 mm according to the minimum lip
depth requirements of section 4.8.4. The stiffening effect of the lips was neglected
in the analysis and a slightly reduced effective area \{as calculated at higher stresses.
The manual does not recognize the detrimental effect of the spacing of back to back
connections. Therefore, in contrast to the csA-s136 and s16.1 methods already
discussed, the effective length was taken simply as KLlr (with K = 1.0), and no
modification was applied. For comparison pulposes, the capacities were then also
calculated assuming that the modification did apply.
The ¡esults of the analysis are shown in figures 5.60 to 5.63, and in table 5.6.
Results listed under column two of the table were calculated using a modified
effective length as discussed above. Experimental failure loads generally fell below
the predicted curves for BN-100 and 200, and HBN-40 and 100 specimens when
torsional buckling was neglected. considering torsional buckling resulted in safe¡
Ioad predictions for members at Llr=40, when the modified slenderness was
considered, the predicted loads reduced to provide better predictions, yet were still
unconservative in some cases, particularþ for HBN-100 and BN-200 sections. For
these sections, the predicted loads we¡e the same for specified feld strengtb, and
measu¡ed yield strength.

/8
The ratio of mean test ¡esult to mean predicted load, based on measured yields, and
considering torsional buckling was only 0.98. By comparison, the comparable ratios
based on CSA-S16.1 and CSA-S136 were conservative at 1,27 and i..17 respectively.
The design method used in CSA-S136 provided better ultimate load predictions than
ASCE Manual 52. However, the primary diffe¡ence between the two methods
relates to the use of the modified slenderness ¡atio in calculating the elastic Euler
buckling stress, and in multipllng the buckling stress by a factor of 0.833.
5.9 Concentrically lnaded Angles
Seven additional tests were perforined on the angle shaped specimens in order to
examine the effect of bolting to both legs of the section. Clip angles were bolted
to the gusset plates so that the outstanding legs of the angles could be connected as
well. Figure 5.64 illustrates a BA-40 specimen connected in this manner.
Specimens behaviour \ as not completely as expected. In some cases the specimen
behaviour was no diffe¡ent than when only one leg was connected. Specimens
HBA-100-7, and HBG1@-7 were examples of this. The member ultimate loads
were very similar to the results with one leg bolted. Specimens were observed to
twist and deflect primarily perpendicular to the gusset plate, similar to the single leg
connected specimens, In cotrtrast, some sections were observed to deflect primarily
about the weak principal axis, v¡ith little twist. For these specimens the ultimate
Ioad was found to be higher than when connected by one leg.

79
The reason for the diffe¡ence between specimens is not clear, but the behaviour
does suggest that the conne¡tion did not consistently achieve concentric loading. If
the bolts connecting the leg directly to the main gusset plate \ryent into bearing
before the bolts to the outstanding leg, then the initial loading on the specimen is
as if loaded through one leg. Small differences in bolt end distances could cause
this. As the load is initially applied through the one leg, the specimen begins to
bend and deflect perpendicular to the gusset plate. In turn, the gusset plate tends
to bend slightly due to the end restraint. As the gusset plate rotates, the clip angle
also rotates, and the bolt holes in the clip angle move slightly down, away from the
load, thus forcing more load to the opposite leg. Under these circumstances the
membe¡ behaves as if loaded through one leg, aDd the connection to the clip angle
does not provide any benefit.
Specimens HBB-100-7 and 8, and HBA-100-9 we¡e tested by modifying the gusset
plate. The clip angle was bolted to the gusset plate, but it was located so that the
bottom of the clip angle was in bearing against the horizontal section of the gusset
plate. Any rotation induced in the main gusset plate was then prevented by the clip
angle. And similarly, the clip angle could not rotate ir the direction parallel to the
gusset plate as the length of the gusset plate provided substantial stiffness ir that
direction. As expected, the sections tested in this manne¡ reached much higher
loads than when connected by one leg. The results of these tests are listed in table
4.3, and are identified as being bolted through both legs.

EO
CAN/CSA-S136-M89: The sections were assumed to be concentricalþ loaded, and
Clause 6.7.4 r as Íot followed. Section capacity was checked according to Clause
6.6.3 Singþ Symmetric Sections. Accordingly, the section capacity is given by the
lower of the flexural buckling capacity about the weak axis, or the torsional flexural
buckling capacity. The latte¡ was found to be the limiting factor. The calculated
capacity is compared to the test results in table 5.7. TWo of the test results were
significantly overestimated; falling below even the facto¡ed capacity based on
specified feld strength. Section HBA-100-9 whichlpas tested with the more rigid
gusset plate (as described above), reached a higher ultimate load than predicted.
ASCE Manual 52: For sections bolted in both legs, effective length provisions of
section 4.7.4.2 assume a concentric load, and neglect any end fixity. Using the
specified effective length, the capacity is calculated exactly as for the members
loaded through a single leg. Predicted loads were lower than those of CSA-S136.
CAN/CSA-S37-M86: The sections were treated as leg members, and analyzed
according to Clause 6.2.3. The effective length factor K is taken as 1.0, and the
sections are anaþed as axially loaded sections. The section capacity is calculated
as for the eccentricalþ loaded sections, with two exceptions: the effective length
factor K is taken as 1.0, and the value of the ¡esistance factor is specified as 0.9. In
contrast, the single bolted leg analysis used K varying from 0.9 to 1..0, and the
resistance factor ranging ûom 0.72 to 0.9.

E1
ECCS: The analysis is similar to the ASCE Manual 52. 'Ihe sections are treated
as concentrically loaded, and no modification is made to the basic slenderness ratio
of L/r (K= 1), with the above modifications, section capacity is calculated as for the
eccentricalþ loaded angles.
Table 5.7 compares the experimental test results with the calculated capacities from
above. In general, the specimens that behaved as expected by buckling about the
weak principal axis with little twist, achieved loads higher than predicted by the
various methods. The sections that behaved similarly to thei¡ single bolted leg
counterparts reached loads significantly below the predicted loads. These failure
loads were very close to the loads achieved with onþ one bolted leg.
The method of testing does not closely simulate the condition of leg members butt
spliced at the ends or lap spliced together. Unconservative designs may result in a
situation where the designer may attempt to increase a web members capacity by
adding clip angles in order to bolt to both legs. The web nember connected in this
may not achieve the predicted strength in some cases.
5.10 Unstlffened Angles Bolted Through One Iæg
The experimental testing program indicated a tendency for unstiffened angles with
low slenderness ratios to develop disto¡tions in the bolted leg very close to the

82
gusset plate. Once the leg began to distorq the axial load resistance dropped. The
load in the angle immediateþ adjacent to the connection is primarily distributed in
the bolted leg onl¡ with very little load distributed to the outstanding leg. The
design methods which have been reviewed in the previous discussions consider
member buckling at the c¡itical midheight location, at which point a more uniform
stress distribution can be assumed. The actual stress in the angle at the connection,
involves both axial stresses and bending stresses, due to the rotational restraint
provided at the bolted connection. There is a general lack of test experience for
specimens in the lower slenderness ranges, and surprisingþ, not one of the design
methods reviewed takes into account the potential failure of an angle as described
above. In many cases, the specimens failed at loads significantly lower than
predicted by the design methods. It is therefore apparent that an additional limit
should be imposed on unstiffened angles loaded through one leg.
Based on correlation to the experimental test results, the following simple
modification is recommended to avoid premature failu¡e of such angles. An upper
limit to the compressive strength should be calculated as the product of the yield
strength multiplied by the area of the flat portion of the bolted leg for 90o angles,
or 90Vo of the a¡ea of the flat portion of the bolted leg for 60" angles. If the local
stress distribution in the bolted leg nea¡ the comection exceeds the yield stress, the
leg begins to buckle, leading to failure. The proposed compressive limit is defined
below

83
t
Fy
For 90o angles
c r*'Frnt
For 60o angles
C,^-Fr(0.9w)t
where
flat width of leg
leg thickness
feld strength
Although the method is simplistic, and does not necessarily account precisely for the
actual shess distribution in the vicinity of the connection, it does result in mo¡e
reasonable ultimate load predictions for very short angles than provided by any of
the design methods. It is the¡efore recommended that the upper limits defined
above be considered in addition to buckling loads defined in the design methods.
Table 5.8 compares the results of BA-40, HBA-40, BC-40, and HBC-40 tests, with
tle proposed upper compressive limits as defined above. The yield strengths for
each section were obtained from tension tests performed on flat portions of sections,
at the three temperature levels used in the static compression tests. The calculated

ucompressive limit fo¡ each specimen is based on the leld strength measured at the
same temperature as the static test. The mean ratio of the experimental failure
loads to the upper limit loads calculated for the BA-40, HBA-40, BC-40, and HBC-
40 angles is equal to 1.0, and the standard deviation is 0.058. Figure 5.65 provides
illustration to the results listed in table 5.8. Figure 5.66 compares the e4perimental
¡esults with the loads predicted using ASCE Manual 52's recommendations, with
two modifications. The first modification includes the proposed limit for short
unstiffened angles, The second modification is that the back-to-back channel
capacity is modified utilizing the recommendations of CSA-S136. By comparing the
data with the 1:1 correspondence line it can be seen that the experimental results
are predicted very well by the methods of ASCE Manual 52 (when modified as
described above). Data which falls below the 1:1 line indicates unconservative
predicted loads, and as evidenced on the figure, such instances are limited in
number of occur¡ences.

85
CIIAPTER 6
suMMÄRy, CONCLUSIONS, AND RECOMMENDATIONS
6.1 Summary
A research program was performed at the University of Manitoba to exaÍrine the
axial load carrying capacity of a numbe¡ of cold-formed shapes suitable for
transmission tower construction. The project was jointþ sponsored by The Canadian
Electrical Association, Manitoba Hydro, and The University of Manitoba.
The extensive testing program included a total of 201 axial load tests. The testing
was car¡ied out over a fifteen month period. Three different test setups were used
in this investigation.
Test parameters included: two t,?es of steel, five diffe¡ent shapes, three slenderness
ratios, and three temperatures. Specimens we¡e tested in setups designed to
simulate end conditions representative of tower members by loading through single
legs bolted to gusset plates. Some sections \ ere tested as axially loaded leg
members with hinged end conditions.
Test results \ ere compared to predicted loads using the Canadian Standards
CAN/CSA-S136-M89 Standard for Cold Formed Steel Structural Members, and
CAN/CSA-S37-M86 Standard A:rtennas, Towers, and Antenna Supporting
Structures, The ASCE Manual 52 Guide for Design of Steel Transmission Towers,

86
and the ECCS Recommendations for Angles in l-attice Transmission Towe¡s were
also used.
6.2 Conclusions
. The average of all experimental failure Ioads when tested at 0' C was 1.3 Vo
higher than at room tempetature.
o Tbe average of all experimental failu¡e loads when tested at -50" C was 3.8
Vo higher than at room temperature.
. The amount of load increase at -50o C was the largest for members with L/r
= 40. These specimens averaged loads 7.4 Vo higher than at room
temperature. Specimens with Lf - 100 and 200 onþ showed a L to 2 Vo
increase.
o For BA and HBA specimens, the ratio of mean e¡perimental failure load
divided by mean predicted ultimate load based on measured yield strength
was as follows:
CAN/CSA-S136-M89 ------- 0.99
CAN/CSA-S37-M86 -------- 0.99
ASCE MANUAJ,52 --------- 1.01
ECCS 1.03

87
For BB and HBB specimens, the ratio of mean experimental failure load
divided by mean predicted ultimate load based on measured yield strength
was as follows:
CAN/CSA-S136-M89 ------- 0.99
ASCE MANUAL 52 --------- 1.10
Fo¡ BC and HBC specimens, the ratio of mean experimental failure load
divided by mean predicted ultimate load based on measured yield strength
was as follows:
CAN/CSA-S136-M89 ------- 0.96
CAN/CSA-S37-M86 -------- 0.91
ASCE MANUAJ- 52 --------- 0.92
For BN and HBN specimens, the ratio of mean experimental failure load
divided by mean predicted ultimate load based on measu¡ed yield strength
was as follows:
CAN/CSA-S136-M89 ------- 1.18
CAN/CSA-S16.1-M89 ------ 7.28
ASCE MANUAL s2 --------- 0,98

88
For BG specimens, the ratio of mean experimental failure load divided by
mean predicted ultimate load based on measured yield strength was as
follows:
CAN/CSA-S136-M89 -------
ASCE MANUAJ- 52 ---------
Seven additional tests were performed with specimens bolted through one leg
to the gusset plate, and through the other leg to a clip angle in order to
simulate concentric load conditions. They did not behave consistently.
Failure loads varied substantially, from no inc¡ease in capacity, to capacities
in excess of concentric loading predictions.
6.3 Recommendatlons
Based on the results of the research and analysis, the following recommendations
are made:
The increase in axial load capacity at cold temperatures was variable,
depending on specimen length and failure mode. Within the test parameters,
tempelafure was not found to be detrimental, and may be conservatively
neglected in design,
1.63
7.45

89
Caution should be exercised in designing eccentricalþ loaded unstiffened
angles with slenderness ratios of approximately 40. Code prediction
reliability was much lower for these sections than for longer sections.
Membe¡s of this length are likely to be uncommon in transmission towers,
especially as eccentrically loaded web members. The test specimens of
concem ranged in length from 552 mm to 736 mm.
The proposed upper compressive limit to prevent premature failure near the
connection of short angles bolted through one leg was found to provide
better ultimate load predictions than the available design methods, and it is
recommended that it be included in design.
It should be recognized that Canadian Standards CSA-S136 and CSA-S37 are
intended to provide safe and economical design capacities. Therefore the
goal is to predict loads that membe¡s can support, but not necessarily the
loads at which the members will actualþ fail.
The ¡esistance factors (f) pÌovided by the Standards mentioned above, are
an integral part of the design resistance, reflecting the performance and
reliability of the member type, and not just simply the material strength. For
singly symmetric sections, and for eccentricalþ loaded members the standards
recognize the potential lack of conservatism in the guidelines, Consequently,

90
the resistance factors ranged from 0.72 to 0.9 depending on the section
shape, length, and connection type. When using the Canadian Standards, the
calculated factored resistances were found to be safe for 181 out of 189 tests
(based on the measured yield strength) When using the specified strengths,
the factored resistances were safe for 186 out of 189 tests.
CSA Standard CAN/CSA-S37-M86 presentþ limits the use of cold-formed
steel sections as a substitute fo¡ hot-rolled steel angles to angles with leg
dimensions of 52 mm or smalle¡. All of the sections used in this study were
larger than this. Consideration should be made to increasing this limit.
The method used in CSA Standa¡d CAN/CSA-S136-M89 to account for
eccentricity in angles loaded through one leg by bolts or welds, should be
generalized to account fo¡ 60'and lipped angles.
Although test results are limited, modifying a simple gusset plate with clip
angles in order to attach to both legs of a web nember did not provide
reliable increases in load capacity. Caution is advised against reþing on such
a detail to provide increases i¡ membe¡ capacity.
The design of back-to-back channels should include the affect of the spacing
of the back-to-back connections. Further, the elastic stress levels provided

91
by the Euler expression modified as such should be reduced by a factor of
0.833 as in the CSA-S136-M89.
In general, with the exceptions mentioned, the design methods reviewed in
this study provided acceptable results and appear to be adequate for the
design of cold-formed steel sections fo¡ transmission towers. However,
ASCE Manual 52 was found by the author to be the preferred guide. The
Manual is widely accepted by tower designers, and it's recommendations a¡e
supported by numerous laboratory and full-scale tests. In particular, the
effective length formulas used to design angles were found to accurately
account for both connection eccentricity and end füity.

92
REFERENCES
Adluri S.M.R., Madugula M.K.S., "Factored axial compressive resistance ofscìifflerized angles,r' Canadian Joumal of Civil Engineering Vol.18, 1991, pp.926-932.
Adluri S.M.R., Madugula M.K.S., Monforton G.R., "Schifflerized angle struts,"Joumøl of Strucaral Engineering ASCE, Vol 118, No.7L, July, 1992, pp.1920-1936.
American lron and Steel Institute, "specification fo¡ The Design of Cold-formedSteel Structural Members," Cold-formed Steel Design Manual-part I, 1986,Washington DC.
Arena J.R., Zar M., "Section 24 Towers and Transmission pole StructuÌes,,,Strucnral Engineering Handboolç Gaylord E,H., ed, Gaylord C.H., ed, McGraw-Hill,New York, Second Edition,1979, pp.24-1.
ASCE, "Electrical Transmission Line and Tower Design Guide,,' Report of the TaskCommittee on Tower Design of the Committee on Analysis and Design ofStructures, .Ioamal of the Structural Division, ASCE, Vol.93, No. ST 4, Augus! 1967,pp.245-282, see also closure Vol.95, No. 5T6, June, 1969, pp.736l-1372.
ASCE-Americ¿n Society of Civil Engineers, 1988. ,,Guide for Design of SteelTransmission Towers," ASCE Manuals and Reports on Engineering practice No. 52,Second Edition, New York, N.Y.
Bathon L., Mueller W.H., Kempner L., rrUltimate Load Capacity of Single SteelAogl"f,'l Joumal of Strucwral Engineering ASCE, Vol Ll9, No.l, January, 1.993,pp.279-300.
Bergstrom R.N., Arena J.R., Kramer J.M., "Design of Self Supported SteelT¡ansmission ToweÍs," Joumal of the Power Division, ASCE, Vol. 86, ño. pO 3, JuneL960, pp. 55-68.
Bryant M.E., "Transmission Towers: Design of Cold-Formed Angles," Joumal ofStructural Engineering Discussio4 ASCE, Vol 113, No.3, March, 1987, pp.649-650.
Cannon D., 'rVariation in Design P¡actice for l,attice Towers," Steel StructuresProceedings, ASCE Structures Congress, 1989.
Catenacci 4., Finzi M, Zavelani 4., "New Outlines for 500 kV Transmission Towersusing cold-Formed shapes: The Experimental Line of the American Electric powe¡Research Institute," Steel Structures Proceedings, ASCE Structures Congress, 19g9.

93
Chajes 4., Winter G., "To¡sional-Flexural Buckling of Thin-Walled Members,"Ioumal of the Structural Divisian, ASCE, Vol. 91, No.ST 4, August 1965, pp.I03-123.
CSA-Canadian Standards Association, 1986.'CANICSA-537-M86, Antennas towersand antenna supponing structures," National Standard of Canada, Rexdale, Ont.,Canada.
CSA-Canadian Standards Association, 1987. 'CANICSA-C22.3 No. 1-M87, OverheadSystems," National Standard of Canada, Rexdale, Ont., Canada.
CSA-Canadian Standards Association, l99l. " Special Publícation 5136.1-M1991Commentary on CAN/CSA-5136-M89, Cold formed steel smtctural members," NationalStandard of Canad4 Rexdale, Ont., Canada.
CSA-Canadian Standards Association, 1989. 'CANICSA-516.1-M89, Limit statesdesign of steel structures," National Standard of Canad4 Rexdale, Ont., Canada.
CSA-Canadian Standards Association, 1989. 'CANICSA-5136-M89, Cold formed steelsmtctural members," National Standard of Canada, Rexdale, Ont., Canada.
Davalath G.S.R, "Transmission Towers: Design of Cold-Fonned Angles," Iournal ofStrucrural Engineering Discnssio4 ASCE, Vol 113, No.3, March, 1987, pp.658-659.
Faggiano P., "I-attice Tower Design using Cold-Formed Shapes," Innovetions in theDesign of Electrical Transmßsion Structures, Proceedings of a ASCE Conference,Kansas City, Missouri, August 14-16, 1985,pp37-46.
European Convention For Constructional Steelwork, 1985. "Recommendations forAngles in Lanice Transmßsion Towers," ECCS - Technical Committee 8 - StructuralStability Technical Working Group 8.1 - Components, First Edition 1985 No. 39,Brussels, Belgium.
Gaylord 8.H., Wilhoitte G.M., "Transmission Towers: Design of Cold-FormedAngles," Joumal of Strucnral Engineering ASCE, Vol 111, No.8, August 1985,pp.1810-1825. See also Discussion, Vol 113, No. 3, March, L987, pp.654-657.
Kalyanaraman V., Pekoz T., Winter G., "Unstiffened Compression Elements,"foumal of the Strucaral Division" ASCE, Vol. 1.03, No. ST 9, September, 1977,pp,1833-1848.
Kennedy J.8., Madugula M.K.S., "Buckling of Angles: State of the A¡t." Joumal ofthe Strucmral Division, ASCE, Vo1.108, No. ST9, September, L982, pp.1967-1980.

94
Kennedy J., Madugula K.K.S., "Buckling of Steel Angle and Tee Struts," Iournal ofthe Structural Division, ASCE, Vol. 98, No.ST 11, November, 1972, pp.2507-2520.
Karren K.W., Winter G., "Effects of Cold-forming on Light Gage Steel Members,"Ioumal of the Strucwral Divisio4 ASCE, Vol. 93, No.ST 1, February, 1,967, pp.433-469.
Karren K.W., "Corne¡ Properties of Cold-formed Steel Shapes," Joumal of theStructural Divisiort ASCE, Vol. 93, No.ST 1, February, 7967, pp.40l-43L.
Knight G.M.S., Santhakumar 4.R., "Joint Effects on Behaviour of TransmissionTowers," Joumal of Strucnral Engineering ASCE, Vol 119, No.3, Ma¡ch, 1993,pp.698-712.
Kravitz R. 4., "Transmission Line Tower Analysis and Design in Review," /EEETransactinns on Power Apparatus and Systems, Vol. PAS-101, No. 11., Novembe¡7982, pp. 4350-4357.
Lui 8.M., "Behaviour of Single Angles under Compression and Biaxial Bending,"Steel Structures Proceedings, ASCE Structures Congress, 1989.
Madugula M.K.S., Ray K.S., "Ultimate strength of eccentrically loaded cold-formedangles," Canadian Joumal of Civil Engineering Vol.ll, 1984, pp.225-233.
Madugula M.K.S., Prabhu T.S., Temple M., "Ultimate strength of concentricallyloaded cold-fonned angles," Canadi.an Joumal of Civil Engineertng Vol.10, 1983,pp.60-68.
Madugula M.K.S., Ray K.S., "Cross-sectional properties of cold-fonned angles,"Canadian loumal of Civil Engineering Yol.ll, 1984, pp.649-655.
Madugula M.K.S., Ray K.S., "Biaxial bending of cold-formed angle members,"Canadinn loumal of Civil Engineering Vol.ll, 1984, pp.933-942.
Marsh C., "T¡ansmission Towe¡s: Design of Cold-Formed Angles," loumal ofStructural Engineering Discussio4 ASCE, Vol 113, No.3, March, 1987, pp.650-652.
Marsh C., "Factored axial compressive resistance of schifflerized angles: Discussion,,,and "Reply", Canadian Joumal of Civil En$neering Yol,20, 1993, pp,330-332.
Marsh C., "Single Algle Members in Tension and Compress ion," proceedings,Ioumal of the Strucaral Divisrìar, ASCE, Vol.95, No. ST5, February, 1969, pp,L043-L049.

95
Mulligan G.P., Pekoz T., "Locally Buckled Thin-Walled Columns", Joumal ofStrucatral Engineeing, ASCE, Vol. 110, No. 11, November L984, pp.2635-2654.
Pekoz T.8., Winter G., "Torsional-Flexural Buckling of Thin-Walled Sections underEccentric l-oad," Joumal of the Strucrural Divisia4 ASCE, Vol. 95, No.ST 5, May,1969, pp.94L-962.
Poþois D., Et Al., "Effect of temperature and gahanization on the compressivestrength of cold-formed angles," Cenadian loumal of Civil Engineering,Yol.l7,1990,pp.440-4s1.
Polyzois D., Et AI., "Use of Cold Formed Sections for Transmission Towe¡s inCanada," Technical Report No. 340 T 844, Canadian Electrical Association, Jan, 1994.
Ray S.K., Madugula M.K.S., "Transmission Towe¡s: Design of Cold-Forrred Angles,"Joumal of Slructutal Engineeing Discussio4 ASCE, Vol 113, No.3, March, 1987,pp.652-653.
Weng C.C., Lin C.P., "Study of Maximum Strength of Cold-Formed steel Columns,"Joumal of Strucrural Engineering ASCE, Vol 118, No.1, January, t992, pp.128-1,46.
Wei-Wen Yu, "Cold-formed Steel Desig!," John-Wiley and Sons, Inc, New York,1982.
Zavelani 4., "Design and Test of Cold Fonned Steel Members," Innovations in theDesign of Electrical Tlansmßsion Structures, Proceedings of a ASCE Conference,Kansas City, Missouri, August 14-16, 1985, pp.69-78.
Zavelani,4., Faggiano P., "Design of Cold-Fonned I¿tticed Tlansmission Towers,"Joumal of Structural Engineering ASCE, Vol 111, No.11, November, 1985, pp.2427-2445.

96
TABLES

97TABLE 2,1 Statlc Test Parameters
sEcTtot\ TYPE OFSTEEL
NOMINALSLENOERNESS LENGTH
NUMBER OF TESTS TOTAL NO.OF TESTSFOR E.ACH
SHAPE
TOTAL NO.FOR EACH
STEEL-50.c 0'c ROOM7t t¡E)
BA
LASTM
4715
GRADE
60
10't00,ôn
5s2
1380)7R
3
3â
3
31
3
3â
27
123
BB
L40'100
855
1950A)AN
3
3,¡
3
3?
3
3â
27
BC
L40
100,)ôlì
736
1E401^An
3
3I
3
3?,
3
3a
27
BG
'll-'40
100)ãn
1640
1120A)AR
3
3n
3
3ñ
3
3â
21
BNr 40
100)Ínl
1640
4105at1ñ
3
3
3
3n
3
32
21
HBA
LcsA
G40.21
GRADE
300 w
40
100)n^
552
1380)'ra
3
3L
0
0n
3
3
3
l8
ÞÞ
HBB
L¡t0
100)^
780
1950?oôn
3
3I
0
0
3
3î
18
HBC
L40
100t^d
736
18401^Âfì
3
3a
0
0
3
3
^
l8
HBNtr¡+0
100
1580
3950
3
3
0
0
3
3 12
TOTAL 72 39 78 189

98
Couoons at Room TTABLE 4.1 Tensile Material Properties of Flat
at Room Tem
SECTION SPECIFIEDSTRENGTH
lMPal
COUPON YIELD STRENGTHI MPa)
3ALVANIZEDI UNGALVANIZEDBA
BB
BC
BG
BN
HBA
HBB
HBC
HBN
415
415
415
415
300
300
300
300
300
469
445
477
438
481
409
418
415
401
424
418
434
419
434
289
311
315
290
Source: Polyzois et al (1994)

99
TABLE 4.2 Average Section PropeÉies
SECTION A I, lrJC*rrrv(mm2) (103 mm1) (103 mm4) (mm1) (mm6) (mm) (mm)
BA 530 434.34 98.076 2759 0 28.6 13.6
HBA 603 481.08 111.77 4073 0 28,2 13.6
BB 787 1132.30 327.4 s174 331 37.9 20.4
HBB 822 94'1.66 327.41 53s3 190 33.8 19.96
BC 595 345.53 201.38 3173 0 24j 18.4
HBC 700 423.02 260.14 4725 0 24.6 19.3
BG 1925 3376.65 3318,92 10266 3604 41.9 41.5
BN 2564 51 15.00 4394.53 21368 435/. 44.7 41 .5
HBN 2300 3966.00 3850.02 1553'1 5538 41 .5 40.9

TABLE 4.3 Static Test Results Summary 100
SPECIMEN
I.JLTIMATE LÕAD fKNì
TES' TEMP. LEVEL
AVERAGE-50"c 0"c ROOM
TEMP.BA.4G,IBA-40-2BA*40-3
BA-40-18BA.4G19
113126120118'lto
119
tsA-4U-4BA-40-5BA-40-6
116'125116
119
BA-40-7BA-40-8BA-40-9
BA-40-lS-'l
1ZZ110123127
121
RÂ-¿n-l o-t i 140BA-100-1BA-100-2BA-100-3
oâ
103'100
ôô
BA-100-4BA-100-5BA-100-6
10298100
100
BA-100-7BA-100-8BA-100-9
1Uþ
104lnn
103
BA-200-1BA-200-2RÄ-rnn-1
to32t9,
30
éA-zAg-4BA-200-5RÂ_tnn_A
2834?e
30
BA-200-7BA-200-8RÂ-rnô-q
2828
'A
28
HBA-40-1HBA-40-2HFrÂ-rn-î
1151184tñ
118
FtÉA-4U-4HBA-40-5uFrÂ_¿ô_^
131
129,t?4
't28
' Bolh leos of soecimen bolted

TABLE 4.3 Static Test Results Summary 101
SPECIMEN
IJLTIMATE LOAD IKNI
TESTTEMP. LEVELAVERAGE-50'c 0"c ROOM
TEMP.
HBA-10ù1HBA-100-2HBA-l O0-3
'119
112111
114
HBA-100-4HBA-100-5HBA-100-6
'120
117117
118
HBA-100-7'uFtÀ-1ñn-o r
1221s5
HBA-200-1HBA-200-2HBA-200-3
2930to
29
HBA-200-4HBA-200-5uFtÄ_rnô_A
3032q,l
31
BB-40-1BB-40-2BB-40-3
209203204
205
BB-40-4BB-40-5BB-40-6
214213213
2'13
BB-40-7BB-40-8ÞFì-án-o
223228tt7
¿¿o
BB-100-1BB-'t 00-2BB-100-3
13313212)
132
BB-100-4BB-100-5ÞR-í nñ-^
1331321aó,
'133
EB-] UU./BB-100-8RR-l nn-o
1361391Añ
138
Both leos of soecimen

TABLE 4.3 Static Test Results Summary rcz
SPECIMENULTIMATE LOAD (KN)
TES T TEMP EVEL
AVERAGE-50"c 0'c ROOM
TEMP.B&20G1B&20G2BB-200-3
4346A7
46
BE,-200-4B8-200-5HR-'NN.A
404646
46
óó-¿Ug-tB8-200-8RFL'NN.q
4t47
^7
47
HBB-40-1HB8-40-2HB8-40-3
196187íÂn
190
HBB-40-4HB8-40-5HBB-40-6
205202tñ
204
HBB-100-lHBB-100-2HBB-100-3
133121120
125
HBB-100-4HBB-100-5HBB-100-6
128128130
129
HBB-100-7'HBB-100-8 '
180lÂo 175
HB8-200-1HBB-200-2t{ RFì-rrìn-q
444545
45
t1éé-2UU-4HBB-200-5t.tFrR-rnn-Â
474847
47
BC'40-1BC-40-2Rf\-rn-?
1161211'16
118
Ëç-4U-4BC-40-5BC-40-6
119124120
121
BC-40-7BC-40-8BC-40-9
125119113
119
Both leos of specimen bc ,lted

TABLE 4.3 Static Test Results Summary 103
SPECIMEN
ULTIMATE LOAD IKN)
TES' TEMP EVEL
AVERAGE-50'c 0'c ROOM
TEMP.8c-100-1BC-100-2BC-100-3
92950t
93
BC-100-4BC-100-5FìC-l nn-A
vz98oq
96
ttu-1uu- /BC-100-8Rn-1nrì-o
v2100OA
vrt
BC-200-1BC-200-2Rn-rrìô-1
3235?Ã
34
óç-zUU-4BC-200-5Fìa-tnn-A
30313l
33
éç-zug-(BC-200-8Rn-rnô-o
3l31?'?
32
HBC-40-1HBC-40-2t ¡Flll-¿lì-?
110117l{o
115
t'ttsu-4u-4HBC-40-5HBC-40-6
1191201)A
122
HBC-100-1HBC-100-2HBC-'100-3
103103a ñ'l
102
l-rEc-100-4HBC-100-5l{Flrì-1nn-^
11U109106
108
HBC-100-7'HBC-100-8 -
107119
113
HBC-z00-1HBC-200-2HFìn-rnô-3
3738a7
37
HöU-ZUU.4HBC-200-5HRn-rnrì-A
594241
41
Both leôs of soecimen bt rlted

Tnelf 4.3 Static Test Results Summary ß4
SPECIMEN
ULTIMATE LOAD (KN)
TES' TEMP. LEVELAVERAGE-50'c 0'c ROOM
TEMP-
BN4SlBN40-2BN-¿fL3
99U1030I n?ô
1017
BN-40-4BN-40-5BN-40-6
10501115{ .f .1n
1092
BN-4G,7BN-40-8FtN-áO-q
116510151160
1113
BN-100-1BN-100-2BN-100-3
499427?,q7
428
BN-100-4BN-100-5BN-100-6
32V451¿?,n
403
BN-'100-7BN-100-8BN-100-9
432351419
401
BN-200-1BN-200-2RN-rnn-1
758579
80
HBN-40-1HBN-40-2HBN-40-3
734783 761
t-tBN-40-4HBN-40-51{FrN-Án-A
823819834
825
HBN-100-1HBN-100-2HBN-100-3
361360a6?
358
HBN-100-4HBN-100-5HBN-100-6
3:¿5306lto
317

TABLE 4.3 Static Test Results Summary 105
SPECIMEN
ULTIMATE LOAD IKN)
TES' TEMP. L=VEL AVERAGE-50"c 00c ROOM
TEMP.BG-40-1BG-40-2BG-¿0-3
67s72370Ã
73'l
BG-40-4BG-40-5BG-40-6
767796744
782
BG-40-7BG-40-8Rê-¿n-q
862803A7'
846
BG-100-1BG-100-2BG-100-3
BG-100-10BG-100-11
486441440463505
467
BG-100-4BG-100-5BG-100-6
459445481
462
BG-100-7BG-100-8Rê-l no-q
499515440
485
BG-200-1BG-200-2BG-200-3
949494
94

P test ave. (0'CìP test ave. (room temp.)
120.0123.0100.7116.029.230.0
1.00
1.01
1.0'1
LO4
1.01
1.00
214.7197.0134.3127.O46.346.O
119.31 18.595.0105.033.039.0
'1.03
1.03
0.97
1074.0793.0410.7337.280.0
TABLE 5.1 Temperature affect on Load Capacity
SpecimenGroup
BA-40HBA-40BA-100
HBA-1OOBA-200
BB4OHBB4OBB-100
HBB-1OOBB-200
HBB-2OO
BC40HBC4OBC-100
HBC-100BC-200
HBC-200
BG4OBG-100
-200
BN4OHBN4OBN-100
HBN-,IOOBN-200
lncreaseFor all tests
P test ave. (-50"C)
P test ave. (room temp.)
1.02r.081.041.040.941
1.101.071.051.031.021.O4
1.011.061.031.060.941 .11
1.161.04
1.091.080.940.89

t33
88
24
148
99
28
97
64
l8
121
75
20
135
88
24
169
105
28
lt8
78
25
137
90
28
1f8
78
25
156
98
28
TABLE 5.2 BA and HBA Predicted Load Comparison
ll8
88
26
131
99
30
o\¡
120
89
26
117
103
30
87
64
21
98
80
25
fl6
85
2S
131
l06
89
a+
21
112
82
25
fl9
85
28
150
109
33
5.05
3.4
2.1
5.8
3.4
1.1
SPECIMENGROUP
120
101
29
123
ll6
30
BA-40
BA-100
BA-200
HBA-40
HBA-1OO
HBA-2OO
of Mean Tes{

TABLE 5.3 BB and HBB Predicted Load Gomparisons
SPECIMENGROUP
:XPERIMENTALfKNì
BB4O
BB-100
B8-200
HBB4O
HBB-1OO
HBB-2OO
Mean StandardDeviation
214
UUUE PRIL'IC I ED LOADS (Kf\
CAN/CSA-S136-MB9Clause 6-7-4
o
1U
8.74
2.91
o.67
7.65
.6
46.3
ó =1.0
Fv Couoon '
197
198
.3
dr =O 75
126.7
46.0
Mean Tesl
120
Ratio of Mean Test Result toMean Code Predic{ions
148
39
4.68
1.41
* See Table 4.1
ó =1.0
90
't27.6
Fv Snêc¡f¡êd *
225
148
47
194
MeanPredicted
I na¡{
29
rh =ll 7\
120
169
111
35
145
l-yCouoon'
39
E MANUAL 52
129.5
90
186
144
47
147
o99
29
Fy
97.0
114
37
191
126
44
139
108
35
1U
1.32
121.7
114
1_05
37
91.0
168
126
44
1.40
116.5
1 .10
't12.2
1.14
oo

TABLE 5.4 BC end HBC Predicted Load Comparison
SPECIMENGROUP
EXPERIMENTALfkNl
BC-40
BC-100
BC-200
Mean
119
95.1
32.4
118.5
105.3
39
stancfardFlcviafinn
HBC40
HBC-100
HBC-200
3-65
3.11
UAN/ÇSA-S136-M89Clause 6 7 4
ú Mêâsr trêdó=l
117
86
31
147
111
40
CODE
ó =0.75
1.93
88
64
23
110
83
30
Fv Soec¡fiecl *
MeanTest
dì =l fl
4.70
3-30
1.92
116
86
31
13s
110
40
ASCE MANUAL 52SccJinn A IFy
llo¡cr rrar{ r
84.98
87
MeanPredicted
I oadTest Result to
64
121
94
FySoecifipd *
23
88.7
100
120
Fv Meâslrrêd '
30
151
118
39
ó =l-O
66.3
096
94
30
139
112
39
83
125
89
ó {)_7
86.0
1.28
30
90
64
20
118
83
26
-M86
V:
¡lr =l fl
64.5
1 10
2A
16.4
116
36
127
90
28
=0.
'l 32
92.2
91
65
20
109
79
26
o.92
89.0
151
110
36
0.95
93.0 66_8
n q.l
90.3
,l t7
65.0
0.94 1.3r

TABLE 5.5 BG Sect¡on Predicted Load Comparison
SPECIMENGROUP
EXPERIMENTALI ôÀrìe tLÀrì
BG4O
BGlOO
786.3
470.4
94_O
ÞIanoaro
BG-200
U/\N'UÞ/+51JtÈM69Cleuse 6-6-3 see foolnofe I
58.01
26.80
0.00
TestResult
r(arþ oT Mean I e$ ResultMean Code Prèdictions
542
450.2
214
406
MeanPredicted
Load
71
160
528
assumrng
GAN/CSA-S136-M89ehtleê^A? êóa f^^+^^+ô,
214
396
54
275.7
ô =1.0
655
257(318).
72
160
71
2æ.7
1.63
54
492
193(23e)'
54
271.O
1
21A
203.3
630
257(3r8).
72
1.66
328.0(348.3)
473
193(23er
54
2.21
246.3Qü.77
1.37
Kt=lóc1.0
590
319.7(340.0r
1.83n 72\.
256
687
309(384r
a7
52
240.O(2s5.3r
'1.41
86
57'l
1.88t1 7^\.
310.7
256
658
309(384r
a7
361.0(388.0r
1.45
86
1.2511 17t
304.3 351.3(376.3r
1.48 1.28

TABLE 5.6 BN and HBN Sect¡ons Pred¡cted Load Comparison
SPECIMENGROUP
EXPERIMËNTAL:all I lÞF I ñÀñq /LÀr
BN4O
BN-100
BN-200
1073.9
410.56
79.7
793
337.2
l)e,\r¡âf¡ôñ
HBN-40
HBN-1OO
61.14
51.32
4.'11
35.64
çAN/CSA-S16.1-M89nlârlêâ l? ?
729(es2r
355
Mean TestResult
656(8s7r
320
Mean Code Predictions
105
637(747).
2A6
681(849r
342
104
522(s87r
æ3I)A7Y
538.9
21
t see Table 4.1
o<
573(673).
258I)R1t
.44
613F64r
307
93
470(s2er
237tt4Rtr
MeanPred¡ctêd
uANrÇtrA-s13tt-MUgClâr leê
^ ^ 7
neglecting
843(103er
347
89
712(80sr
247
422.4494.4)'
759(s3s)"
313
80
641(7251.
25Atzg)\.
1.¿ó(1.0sr
380.4
773(91sr
347
89
572(624)'
287fî?5ìr
1.42(1.21)'
382.4'433.8Ì
696(827Y
313
80
515(s62r
258t)a)\.
Foôlnôlê
1.41(1.241'
344.O390.2)'
2. Calculated using a mod¡f¡ed slenderness as provided in CSA-S136 C1.6.6.2
907(1079r
481
124
773(æ8r
454
1.57(1.38)-
455.6(521.0r
ùee=ôôtñôfê i
as per Manual 52
Sec,t¡on 4
907(1060r
417
107
773(82sr
389
1.18(1.03r
410.2(472.61'
ùee
1.31(1.14)r
413.6160.8)
82.(es4r
48,1
124
606(643)'
424
1.JU('t.17',)"
372.4414.81
8z2(e40r
417
107
606(æsr
385
1-45(1.30r
547.A(5e5.2).
u.9ö(0.9rr
518.6(55e.6r
1.O4(0.e6r
492.2(526.0)
1.O9(1.02)'
467.4(496.8r
(1.08r

TABLE 5.7 Concentrlcally Loaded Speclmen Comparlson
SPECIMEN
HBA-10G7
HBA-100-8
:XPERIMENTALFAILURE
I ôÂna /l¿Àñ
HBB-100-7
12.
113
155
HBC-100-7
HBC-'| 0(L8
CAN/CSA.Clarrse
Fv (:ôllññn r
sl3ÈM89663n
180
16q
ó =O.75
MeanTest
143
Retio of Mean Tesl Result toMeân Codê Pred¡ct¡ons
trv Srìâr.ifiêrl r
107
119
ó =I -(l
127
" See Table 4.1
107
ASCE MANUAL 52SF.:ÎIôN Â ¿
127
NTìTìF ÞÞß
141
109
95
Fy
127
95
82
126.3
FySnecifieri '
110
124
109
94
I ,1,
* Calculated assum¡no Kv=0.7. Kt=1.0
.7
Fy
ECCS
14'l
82
121.0
114
1.49
FySñê.¡fiê.| i
114
95.7
139
't .17
110
1 .47
113
126
CAN/CSA-S37-M86
(a)
.3
ó =t,o
105
112
122-O
(a)
(a)
91
't t6
¡!
110.0
(a)
(a)
82 87
1.18
(a)
lâ) : nol âonl¡cát e
105
105.0
78
(a)
94
't.24
98.0
(a)
f01
88.0
1t^
9l
94.0
a all
84.5
131
N

LT3TABLE 5.8 Proposed upper limit capacity for short
unstiffened angles loaded through one leg
Section Test Coupon Test loadCrlimit I
TestLoad (lYield r
112.7 1.12112.7 1.0ô112.7 1.05112.7 1.06I 16.8 0.99116.8 1.07116.8 0.99124.8 0.98124.8 0.88124.8 0.99124.8 1.02
BA40-2BA40-3
BA-40-'18BA-40-19BA4O4BA40-5BA4O€BA40-7BA-40-8BA40-9
BA40-19-1
23232323000
-50-50-50-50
469469469469486486486519519519519
't26120''l18
120',l16
125116122110123127
HBA4O-1HBA4O-2HBA-40-3HBA-40-4HBA4O-5HBA-40€
232323-50-50-50
409409409511511511
115't18120131
129124
113.9 1.011 13.9 1 .O41'13.9 1.05142.3 0.92142.3 0.91142.3 0.87
BC-40-'lBÇ40-2BC40-38C404BC40-58C406BC40-7BC40-8BC-40-9
477477477488488488510510s10
232323000
-50-50-50
116121116119124120125119113
112.5 1.03112.5 1.08112.5 1.03115.1 1.03115.1 1.08115.1 1.04120.3 1.04120.3 0.99120.3 0.94
HBC40-1HBC40-2HBC40-3HBC404HBC40-5HBC-406
232323-50-50-50
415415415440440440
110117119119120126
'118.4 0.93118.4 0.99118.4 1.00125.5 0.95125.5 0.96't25.5 1.00Mean: 1.00
Standard deviation: 0.058* Obtained from tension coupons tested at room temp., OoC, and -50"C

tt4
FIGURES

FIGARE I.ITlansmíssion Tower ìn Semice

116
FIGURE 1.2Member FaíIure ín o fo"u t*g

FIGURE 3,1BA and HBA Sectíon Measuremenß

FIGARE 3.2BB and HBB Sectiøn Measuremenß

119
'/i_._.1
I
\l\\\
FIGURE 3.JBC and HBC Sectíon Measurements

r20
FIGURE 3.4BG Section Metsurcmzn*

FIGARE 3.5BN and HBN Sectíon Measuremenß

r22
FIGUNB 3.6Test Setup No, One

FIGUNN 3,7Tlpícal Gusset PlaÍcs

FIGURE 3.8BN-40 End Fining
FIGURE 3.9BG-40 End Fifüng

rzs
FIGURE 3.TO
Motion Transdacers at MidHeíght of Specimen

FIGURE 3.11Setup No.2: Cold Chamber and Load Frame

FIGURE 3.12Setup No. 2: þpical Angle Cowæction
FIGURE 3.13Setup No. 2: BN-100 End Fítring

128
FIGARE 3.14
-
Setup No. 2: BG-100 End Fiftìng

t29
FIGURE 3.15Setup No, 3

FIGURE 3.16Setup No. 3: .End Blacks

ErcaRE s.t8Sietup No. 3: Gusset plate Hinge
FIGURE 3.17Setup No. 3: løck ønd Load Cell

t32
FIGURE 3.19Setup No. 3: Motinn Transdacer at Midlenph

733
- Load eotuetor
- Load coll
- Pipâ âxtenslon
- Guss6t plalâ
- Cold chembar
- Tôst rpcclmonlsngth verlêE from552 mm to 1950 mm
Fìgure 3.20 Schemalíc of Setup No. I

734
Load fram6
Top pipo
€xtgnslon
Gusset platê
Cold chambor
Speclmenlength vsrlês
from 2000 to
1210 mrn
Gu88ot plets
Bottom pipo
ôxtenslon
Hydrâuliô Jeck
and loacl call
IIlt++
++++++
L_ilrl__r_Iilrl-T-lrtl
I
I-T-I
I
I
I
I
I
I-t-I
__J_
Figure 3.21 Schematíc of Test Setup No. 2

Hydraul¡c jackr (2)
End Block
r.- Load cell
.- Slldlng ond plate
I
| ¡'- Gusset plate
I i and ond h¡ngê
I Dywldag bars
-l Comptete wlth vðrtlcalI Supports at th¡rd po¡nts
fi
I
I
!
I
I
I
- Gusaet platec,,hr hinge
- End block
Figure 3.22 Schemafic of Setup Na 3
I'- Spocimon(Lôngth . 8210 mm to 8245 mm)
U)

736
Specimen bolted to channel
+-50 mm I+-25 mm l_
I
!
I
I
I
I
400 mmI
I
12.7m m thlckvêrticâlgussêt plel6
¡ L-l rr- ''i\-Channel bolted to I i
i vort¡cal gusË6t plato )(- - 1 78 mmPlan vlew
P¡pe êxtens¡on
Elêvâtlôn
Figure 3,23 Schematíc of Gusset Plate þr Angle Connectíons

t37
--- Back-to-b.ok channcla
,- 12.7 mm thlck gu¡.61 Þlåte
--- 12.7 mm !tltfân..! - --.¡ch ¡ld! of gu...tpl¡t.
--- - lô mm dl..4326 bo¡t
Curvad bottom .uleochlñgc ¡r¡embly
Fígure 3.24 Schemøtic ol QI)BN Gusset Pløte: Setup No. I
/-- Back-to-back chennElg
7 mm thick gus3et plate
l6 mm diâ. A325 bone--
mm o/co--
Fígure 3.25 Schematíc of QI)BN Gussa Pløte: Søup No. 2 & No, 3

138
/'-- T-shâped BG Bpeclmrn--'---\. Clip angl€s-. -:
,- 12.7 rîm th¡ck gusset-plat€/\.'j _ Clip enEl€s bolted to! i oach s¡d6 of v€rlical
gussel plete ancl toapeclm6n flenges
-- l6 mm die,4325 bolts
Plan view
Elevation
Fìgure 3,26 Schematìc of Gusset Pløte tor BG Connections
I Hlnge aê6embly es perI Fig, 3.24 for setup No, l,--l ând a8 per F19.3.25 forI Betup No.3. No hinge
I i,tjli. fo¡ lesta in s€rup

BA SECTION TEST RESULTS.VS. TEMFERATURE
z<t)l-Jfa,lrJfEt--s>lJlt-
-30 -20 -10 0TEMPERATURE (CELSIUS)
\o

HBA SECTION TEST RESULTS.VS. TEMPERATURE
25U)l-JfU'tufft--C"TUF
W-30 -20 -10 0
TEMPERATUBE (CELSIUS)
à

BB SECTION TEST RESULTS.VS. TEMPERATURE
25U)
ÌfU)IUff¡-U'ult-
FTGARES.J-_.--Lood vs. Tempemture - níÇuø,
-50 -30 -20 -10 0TEMPERATURE (CELSIUS)
È

220
200
180â
HBB SECTION TEST RESULTS.VS. TEMPERATURE
P 140J
A 12outtr tooFffisoF
60
FIGURE 5.4
-
Load vs. T"mpuot*" - HEIÇuíoo
-30 -20 -10 0TEMPERATURE (CELSIUS)
5l..J

1
1
1
2rgg,FJfU)ulÍrt-U)UJt-
BC SECTION TEST RESULTS.VS. TEMPERATURE
10
A
a_................ .. i
--'---9(--.
-60 -50 -40FIGARE 5.5Load vs. Temperature - BC Seaian
Ut =4O
iii
â
x)K
ll¡
-30 -20 -10 0TEMPERATURE (CELS|US)
^^.
)K
10 20
-.8.-.---

1
z.YIóFJ:)g)lIJfrt-s)trJF
.VS. TEMPERATURE
-60 -50 -40
FIGURE 5.6Laad vs. Temperût Ee - HBC Sectìon
-30 -20 -10 0TEMPERATURE (CELSIUS)
èè

BG SECTION TEST RESULTS.VS. TEMPERATURE
z5g)rfø)tllfEFct)lUt--
FIGURE 5.7Load vs. Tempcrature - BG Section è

BN SECTION TEST RESULTS.VS. TEMPERATURE
z.l¿CI'FJfa]Ufrt-ct)]UF
FIGANB 5.8Lood vs. Temperan*e - BN Section
-50 -40 -30 -2A -10 0TEMPERATURE (CELSIUS)
Ào\

HBN SECTION TEST RESULTS.VS. TEMPERATURE
1000-
900-
80o-
700-
60o-
500-
40o-
300-
200-
z5<t)t--Jf,U)lIJfrF-g)trJl-
FIGURE 5.9Load vs. Tenperufise - HBN Scction
-60 -50 -40 -30 -20 -10 0TEMPERATURE (CELS|US)
10 20
è\¡

AVERAGE INCREASE IN FAILURE LOAD OF ALL TESTS AT.5O O C
COMPARED TO ROOM TEMPERATURE TESTS
IooJ[rJ6fr:)Jsltz4tsg]UcÍ. 2oz
1\oo\
0
FrcuRE s.ro NOMINAL SLENDERNESS RATTO cROUp (L/r)Average Faiht¡e Load hrcrcase al -S(f Cvs. Slenderncss
40 100 200
èoo

AvERAGE ¡NcREAsE rN FATLURE LoAD oF ALL TEsrs @ o o
c
COMPARED TO ROOM TEMPERATURE TESTS
lfoJlUÉ.fJLL
zUJct)
tuÍ.ozòS
FIGURE 5,11Average Failure Load lrcrease at t Cvs. Sl¿ndcrncss
40 100 200NoMINAL SLENDERNESS RATIO cRoup (L/r) è\o

FÍGT]RE 5.12
BA-40 Specimerc at Failure

FIGURE 5,13BA-100 Specimen at Failure
FIGURE 5.14BA-200 Specimen at Failure

1
1
1
I
60
40
20
00
80
25ÈofL
C)ooJJ
X
BA SECTION TESTSGAN/CSA-S1 36-M89 ANALYSIS
02040FIGARE 5.15BA Section Anolysis: CANICSA-SI J6-Mg9
60 80 100 120 140 1
SLENDERNESS UT(L=CENTER TO CENTER OF CONNECTIONS)
1..)

?Y1
t-olt1oooJJ
X
HBA SECTION TESTSGAN/CSA-S1 36-M8e
SLENDERNESS UT
FIaARE 5.16 I=oENTER To CENTER oF coNNEcTtoNS)
HBA Section Analysis: CAN\CSA-SL 36-M89(¿)

160
140z.5 120
Èõ 1ooCL
6soo660JJE40x
20
BA SECTION TESTSASCE MANUAL 52
FIGURE 5.17BA S*tb" A""tytht '¿SCøfr7ruot SZ
60 80 100 120 140 160SLENDERNESS UT
(L= CENTEB TO CENTER OF CONNECTIONS)
180 200
è

HBA SEGTION TESTSASCE MANUAL 52
oo
80
60
40
20
0
SLENDEBNESS UTFIGURE S.I8nu s""ti"" ,l"ayt*t ,lscø uo"""152
;L= CENTER TO CENTEB OF CONNECTTONS)

1
z.jilPlfL
oooJJ
X
BA SECTION TESTSCAN/CSA S37-M86
FIGARE S.T9BA Section Analysìs: CANICSA-537-MB6
SLENDERNESS UT(L:CENTEB TO CENTER OF CONNECTONS)
o\

z.
t-C)
fL
oooJJ
X
1
1
1
1
HBA SECTION TESTSCAN/CSA S37-M86
20
FIGARE 5.2O
-
HBA Section Analysis: CANICSA-537-ME6
SLENDERNESS UT(L:CENIER TO CENTEB OF CONNECIONS) -J

25ÈofL
ocloJJ
x
BA SECTION ANALYSISECCS RECOMMENDATIONS
FIGARE S.2IBA Sectìon ,C""btkt ECCS R"*--"rrd"tit
60 80 100 120 140 160SLENDERNESS UT
L= CENTFE TO CENTRE OF coNNEcTloNs

1
1
1
1
1
80
60
40
20
oo
80
2
ËofL
oooJJ
x
HBA SECTION ANALYSISECCS RECOMMENDATIONS
0204060FTGURE 5.22HBA Sectíon Anaþsß: ECCS Recommendatiot¿s
80 100 120 140 160 180 200SLENDERNESS UT
\o

EIGUBEI¿sHBB-40 Specimen at Faílure
FIGARE 5.24BB-100 Specbnen at Faílure

FIGURE 5.25BB-100 Mídheight Tlt'ist and Lateral Defuction
FIGARE 5.26BB-100 Distortíon at Cowt¿ction

25ÈofL
oooJJ
X
BB SECTION TESTSCSA 3136 CLAUSE 6.7.4
0 20 40 60 80 100 120 140 1(SLENDERNESS UT
FIGARE 5.27 G=çENTERToçENTERoFcoNNEcloNs)BB Section Analysß: CAN ICSA-SI 36-Mg9
o\N)

z.
ÈofL
oJ
X
HBB SECTION TESTScsA sl36 CLAUSE 6.7.4
FIGURE 5.28
-
HBB Section Analysis: CANICSA-SI j6-MBg
60 80 100 120 140 160 1
SLENDERNESS UT(L : CENTER TO CENTER OF CONNECIONS)
o\

2i<È1of1C)ooJJ
X
BB SECTION TESTSASCE MANUAL 52
FIGUNN 5.29
-
BB Section ASCE Mønaal 52
SLENDERNESS UT
(L= CENTEH TO CENTEB OF CONNECTTONS) o\A

z.l<
ÈCoS1oooJJ
X
HBB SECTION TESTS
200
r60
120
80
ASCE MANUAL 52
FTGARE 5.30HBB SectÍon Anaþsís: ASCE Manual 52
60 80 100 1ào 140 1
SLENDERNESS UT(L= CENTER TO CENTEB OF CONNECTTONS) o\

FIGURE 5.31BC-40 Specimcn at Failare
FIGURE 5.32BC-200 Specimen at Faihre o\

1
1
zl¿ilõ1fL
oooJJ
X
60
40
20
o0
80
60
40
20
0
BC SECTION TESTSCAN/CSA-S136-M89
02040
FIGUNNR 5.i3BC Section CANTCSA-5136-M||
60 80 100 120 140 160 180SLENDERNESS UT
(L=CENTEB To CENTER oF cONNËcTtoNS)o\\¡

zl<I
5rfL .l
()c)
oJJ
x
HBC SECTION TESTSCAN/CSA-S136-M89
o 20 40 60 80 100 120 140 160SLENDERNESS UT
(L=CENTER To CENTER OF CONNECTToNS)FIGUNN 554HBC Seaían A""tt"¡tt CAN tC SA-SI j6-M8g
o\æ

1
1
l¿1I
1_
o1o_
oooJJ
X
BC SECTION TESTSASCE MANUAL 52
60 80 100 120 140 160 180SLENDERNESS UT
(L= CENTEB TO CENTER OF CONNECTIoNS)o\\o

zt¿
È()CL
()ooJJ
x
HBC SECTION TESTSASCE MANUAL 52
o2040
FIGARE 5.36HBC Section Anaþsís: ÀSCE Manaal 52
60 80 100 120 140SLENDEHNESS Ur
(L= CENTEH TO CENTEB OF CONNECTTONS) \ìo

1
z-:<'l
ÈõrfL
oooJJ
x
40
20
BC SECTION TESTSCAN/CSA S37-M86
o 20 40 60 80 100 120 140
FrcuRE s.r7 SLENDERNESS UrBC Sectian Analysís: CANIM$Z-fuftAO G=CEN'ÍER To oENTER oF coNNEcIoNs)

z1l<;r-1()fLl()c]
oJJ
X
HBC SECTION TESTSCAN/CSA S37-MS6
FIGURE 5.38HBC Sectíon And¡rsís: CANICSA-537-M86
60 80 100 120 140SLENDERNESS UT
(L=CEN'ÍEF To GENTER oF CoNNECIoNS) \¡l.)

FIGURE 5.39BG-40 Specimen at Failure
FIGURE 5.40BG-40: Dßtortion of Stiffened Flange at Failure

FIGUNB 5.41BG-40 Specimen at Failure FIGURE 5.42
BG-40: Dístufüan of Web af Failare

FIGURE 5.43BG-100 Specimen afier Failure

BG SPECIMEN ANALYSISCAN\CSA-S136-M89
zgf-õo_
OooJJ
X
FIGURE 5.44BG Section Analysís: CAN ICSA-5136-M89
{o\

z5t--OfL()ôoJJ
x
BG SPECIMEN ANALYSIS
500
400
300
200
100
0
CAN\CSA-SI36-M89
o2040FIGURE 5.45BG Seaían Analysis: CANICSA-SI 36-M894 =0-7
80 100 120 140SLENDERNESS L/Ty
-J-¡

?5Èoo_
oooJJ
x
BG SPECIMEN ANALYSISASCE MANUAL 52
0204060FIGURE 5.tt6BG Section ASCE Manual 52
80 100 120 140SLENDERNESS L/Ty
\¡æ

BG SPECIMEN ANALYSIS
2ètl--OfL()ooJJ
=
700
600
500
400
300
200
100
0
ASCE MANUAL 52
FIGARE 5.47BG Sectíon Analysís: ASCE Manaal 52& =o-7
80 100 120 140SLENDERNESS L/Ty
\¡\o

FIGURE 5.48BN-40 Specimen at Failure
FIGURE 5.49BN-40 Specímen Lip Distortion

rrcußø5.50BN-100 Specimen at Føilure
FIGURE 5.51BN-200 Specimen øt Faílure

1z5ooJJ
X
BN SECTION TESTSCAN/CSA-S136
800
700600
500
400300
200
100
o
FIGURE 5.52BN Sectian tuøl¡rsß: CAN ICSA-SI 36-M89
20 40 60 80 100 120 140 160 180 200 220SLENDERNESS UTy

14001300
120011001000
900800700600
z.
ooJ.J
x
BN SECTION TESTSCAN/CSA-S136
400300200100
0 02040FIGURE 5.53BN Section A4alysis: CAN ICSA-5136-M89Negloaing Toníonal BucHíng
60 80 100 120 140SLENDERNESS UTy
160 180
oo

1000
900
800
700
600
500
zl<ooJJsx
HBN SECTION TESTSCAN/CSA-S136
FIGURE 5.54HBN Sectian Anaþsis: CANICSA-5136-M89
80 1(SLEND
r0 120ERNESS
140Uty
ooÈ

zooJJ
x
HBN SECTION TESTSCAN/CSA-S136
FTGURE 5.55HBN Section Analysis: CÁN ICSA-SI 36-M89Negþcling TowionøI hrcHtug
SLENDERNESS Ury
@

zl<ooJJ
X
BN SECTION TESTS
700600500
CANs-S16.1
FIGARE 5.56BN Section CANICSA-516.1-MB|
80 100 120 140SLENDERNESS Ury
æo\

zooJJ
X
BN SECTION TESTS
700600500400300200100
o
cANs-S16.1
0204a60FIGURE 5.57BN Section Analysìs: CAN ICSA-SI6.I -M89Ne gb ding To nìo rul B ucHhg
80 100 120 140SLENDERNESS UT
160 180
æ-l

1000
900
800
z.
ooJJ
X
HBN SECTION TESTSCANs-S16.1
FIGURE 5.58HBN Section CANICSA-SI6.I-MB9 æ
oo

z.:¿
ooJJ
X
HBN SECTION TESTS
500
400
300
200
100
0
cANs-S16.1
Flcunn s.ss SLENDERNESS UryHBN Seaíon Analysis: CAN ICSA-516.1-M89Ns& ding To rsìo nal B rckling oo\o

14
1Í12
11
1Czl<ooJJ
X
BN SECTION TESTSASCE MANUAL 52
FIGURE 5.60BN Section Analysís: .ÁSCE Manual 52
SLENDERNESS UTy
\c)o

1
1
1
1
1
z.5ooJJ
X
BN SECTION TESTSASCE MANUAL 52
400300200100
o
FIGURE 5.61BN Section ASCE Manual 52Negbcting TonioruI hrcHhg
60 80 100 1
SLENDERNESS UTy
140 160 180 200 220
\c'

zYooJJ
X
HBN SECTION TESTSASCE MANUAL 52
FIGARE 5.62HBN Sectìon Analysis: ASCE Manual 52
80 100 120 140SLENDERNESS UTy
\ol.)

1000
900
800
700
600
500
400
zooJJ
X
HBN SECTION TESTSASCE MANUAL 52
o 20 40 60 80 100 120 140SLENDERNESS Ury
FIGARE 5.63HBN Section,tbulysß: ¿sõfrîrurat szNe gla c,ìng To nio rul BucHitg
160 180
\o(¡)

794
FIGARE 5.64BA-40 Specimen wíth Both l*gs Conructed

RATIO OF EXPERIMENTAL RESULTS TOPROPOSED UPPER LOAD LIMIT
FOB SHOBT UNSTIFFENED ANGLES
t.1I
0.90.8o.70.60.60,40,3o,20.1
o
¡¡E¡E.O^. _- ^a¡:^
E'
¡
Us¡ng coupon yield skength at room tempiUsing coupon y¡eld strength at cold temp,used for for 6tatic têeti
BA-/+0 HBA.40 BC-40 HBC.40SPECIMENS
PROPOSED COMPRESSIVE STRENGTH LIMITFOR UNSTIFFENED ANGLES LOADED THROUGH ONE LEG
FIGARE 5.65
Proposed A pper Limit Compressive Strength forUnstiftened Angles Inaded Through One Izg
.IEST DATA:
S'IFENGIH UMIT :

---1200zl9roooÞ
ë 8oo
E 600c(l)
E 400.E
8- 2ooXtrJ
0
Experimental .vs. Design CapacityBased On Modified ASCE Manual 52
0 200 400 600 800 1000 1200Predicted load (kN) 1
¡ design of back-to-back channels modified as per CSA-S136,I and capacity of unstiffened angles limited as per Fig. 5.65
FIGURE 5.66Co p**on
Line of ideal 1:1correspondence
\oo\

197
APPENDIX A

BA-40-1BOOM TEMPERATURE
liii---- - i.-.-----.-iiiiiii--*r*-__l_i_i_ii-_-r..---_..-_--Liiil¡i---]---i---ii
I
¡
I
I
I
--.--.t,_._..,I
198
VERTICAL STROKE (mm)
81VERTICAL STBOKE (mm)
HBA-40-2ROOM TEMPERATURE
zgooJJsx
ii-- --.--i-.-----i- ----_!i-1-i
A,l þpícal Load-Dìsplacement cunes Íot Specímens BA-40 ønd HBA.40

BA-100.1FìOOM TEMPERATURE 199
zsooJJEã
120
100
80
60
160 ¿6órbVERTIoAL STRoKE (mm)
HBA-100-2ROOM TEMPERATURE
46810VERTICAL STBOKE (mm)
A.2 Ilpícal Load-Displacement cunes for Specímens BA-100 and HBA-100

2Joo.JJ
x
BA-200-1ROOM TEMPERATURE
10 15VERTIoAL STRoKE (mm)
HBA-200-1ROOM TEMPERATURE
1s 10 15 20 25' VEBTICAL STROKE (mm)
A,3 \pícal Load-Displacement cunes lot Specímens BA-200 and HBA-200
25ooJJ
ã

BB-40-1ROOM TEMPERATURE
201
z:<ooJ)x
240
220
200
180
160
140
120
100
240
220
200
180
f60
HBB-40.2ROOM TEMPEMTUBE
2go9Jx
VEBTICAL STROKE (MM)
---:-_-j----i__-- --i -- i -__--i ---,-+--- i1iir'i_j._t-iz
I
" ----i-----
------ .¡....-,-.-.--,..--i
----- *-J''------I
-..._--_-_-¡_._...____
I
-------.¡---_--i
VERTICAL STBOKE (MM)
A,4 Ilpícøl Inad-Dìsplacemcnt cumes for Specimerc BB-40 and HBB'40

¡i
iiil___r .___i,__
tttiit
---- j------t--ti!t1 i./
-+-- V-iti /l
¡
--ì-----.
r.......i-_--li
/-r¡
---i:
z5ooJJgã
BB-100-1ROOM TEI\,IPER.AruHE 202
6 810 12 14 16VERTICAL STROKE (mm)
HBB-100-2ROOM TEMPERATURE
0246810 12 14 16 1820VERTICAL STRoKE (mm)
A,5 Tjpical Load-Disptacement cunes fot Specímens BB'100 and HBB'100
zooJJx
--|*. - i----i --'-j --:iii---j ---_i--_-i-----i---itiiii.ìi__ __-j___.jr____j, _ __ _.._ j.
-j-t- ji I lt
iii!ii
¡t
i_j__ji-_;¡ii:¡;¡i.-- -.--;.-.-.---r.-..-.--.--.1.__-_.iiiiiiti

HB8-200-1ROOM TEMPERATURE
BB-200-2ROOM TEMPERATUHE
203
2ooJJ
x
zoo.JJX
VERTICAL STRoKE (mm)
i.¿
A,6 IJpícøl Load-Dìsplacement cunes for Specímens BB'200 and HBB'200

BC-40-1ROOM TEMPERATURE
204
2ÕoJJx
4 6 I 10 12VERTICAL STROKE (mm)
HBC-40.1ROOM TEMPERATURE
iii--'*l iil,1\
---li -i,Z:¿ti
VERTICAL STBOKE (mm)
A.7 Tjpical Load-Displaceme,tt curves for Specímerc BC-40 and HBC-40

BC-100-1ROOM TEMPERATURE
205
120
100
8025ooJJX
?ooJJ
x
4 6 I 10VERTICAL STBOKE (mm)
o 2 .4 6 I 10 12 14 16. VERTICAL STBoKE (mm)
A,E fipícal Loød-Dßplacemcnf cunes þr Specímeæ BC-100 and HBC-100
HBC-100-1ROOM TEMPERATURE

2LôoJJx
BC-200-1ROOM TEMPERATURE
HBC-200-1ROOM TEMPERATURE
VERTICAL STROKE (mm)
A.9 Tjpícal Laød-Dßplacemenr cunes for Specímens BC-200 and HBC'200
zooJJ
x
VERTICAL STROKE (mm)

BG-40-fFTf,OÑI TEMPERATURE
--j-- i--i !--¡iil¡-...--.. ....i ---,1..-. .. .- i. --*-.i lEskNl i---f --t--
- i .
---j --- -i -..-i-\ i
it
"'v ----iI
IÌ-'ì-----f----l----
1200
t100
t 000
900
zooJJ
x
700
600
500
2ooJJx
BG-100-1ROOI\,I TEMPERATURE
iii-_-- j_ ----:_ ---!-- --.iii:it-----r- -__-_]-----j-------j---iit ---rt----
VEFTICAL STBOKE (mm)
A.10 Tjpìcnl Load-Dßplacemcnl cumes for Specimens BG-40 and BG-100

208
+o9J
x
BG-200-lFTf,OM IEMPERATURE
4 6 S 10 12 14 16 18 20 22HOBIZONTAL STROKE (mm)
A,ll \pícal Inad-Displacemen cunes for Specimerc BG-200

BN40-1ROOM TEMPERATUFE
1200
1 100
1000
900
800
700
600
;:--i-.-i---_.....___._.t_._.._-_.i- !¡ti--...---j--..---l ---i-..---: I !-/
----i - ----1--..--j--' --i-- -- r __ i- -- i----''1i i
._-. ._t_______.j_ i____,i- ; i
'iiiii-----i-----.1 -. j----llli---l-i--iti----i -- -i--'-j - --'
25o9JEx
209
6 810 12 14 16 18 20VERï|CAL STROKE (mm)
HBN4O-1ROOM TÊMPEFATURE
zooJ-)Ex
600
500
400
300
200
too
I
I
--!--*--i-----li -iI
I
VERTICAL STHOKE (mm)
A,10 Tjpical Load-Dßplacemenl cunes þr Specínæns BG-40 and 8G.100

BN-100.2ROOM TEMPEFAIURE 210
500
450
400
350zooJJ
x
10 12 14 6182022
z.¡<
oo)J
x
HBN-r00-1FOOM'TEMPERA'IURE
400
350
250
1
10 12 14
::i;iiii -----+----ti¡i
VERTICAL STBOKE (mm)
VEHT1CAL STFOKE (mm)
4,13 Ijpical l-oad-Dßplacemenf cu¡vesfor Specimcns BN-100 and HBN-100

211
2gooJJx
BN-200-tROOM IEMPERATURE
6 810 12 14 t6HOFIZONTAL STFOKE (mm)
A,14 Ilpícal Load-Displacement cunes foÌ Specímerc BN-200

212
APPENDIX B

2t3
DESIGN EXAMPLES
Determine the câpacity of section 84.40 using ASCE MANUÄL 52
Section properties:
Area = 530 mm2
Min radius of gyration : 13.6 mm
Width-thickness ratio w/t = 60,1ß.95 =15.2
Measured yield strength Fy = 469 MPa = 68 ksi
Determine ¡educed effective yield stress (Section 4'7.3)
(Vt)¡- = 80/ r'Fy (l$i) = 9.7
(Vt)-<w/t<L44/,/F,
Therefore F", = (7.677-0.677(Vt)/(Vt)¡,)Fr: 41.9 ksi
= 289 MPa
Determine effective length from Section 4.7,4.2
Length between centroid of bolted connections = 552-50-50
:452mm
Slenderness Ur = 452113.6 = 33.23
From irem 4.7-7:KLl¡ = 60 + 0.5 (Llr) = 76.6
(for members with normal framing ec¿enkicities at each end, and Llr < 120)
Allowable compression (Section 4.6)

, r "+ - t<ff¡2lF "* -227 MPa
C,-227 M P a * 530 nn2 I lW - lzßkÌ'l
Determine the capacity of section BA-200 using Manual 52
Reduced effective yield shess (Section 4.7.3)
F* = 295.5 MPa (as above)
Determine effective length from Section 4.7.4.2
Length between centroid of bolted connections = 2760-50
: 2710 nm
Slenderness Ut = 27701L3.6 = 199.3
From item 4.7-8: KLI¡ = (Lh) = L99.3
(for members unrestrained against rotation at both ends, and Llr > 120)
Allowable compression
KI"lr > C" therefore in the elastic range
4 = 286000(KLlr)2 - 7.2ksi = 49.7 MPa
C, = 49.7(530 mm)/1000 = 26 kN

zls
Detcrmine the capaclty of HBA-40-100 section using CSA-S136-M89 Clause 6.7.4
Use section properties provided in first example
Reduced critical buckling stress
- 0.833ß28'P
t64r)2+(5blt)21
F-- o'833'c29 -259.8MPøP
10.z *4sz¡ tz.6)2 + (5 +û.1 13.95)2
Calculate inelastic stress level
FrF, H-257.3MPa
when Fo>F/2
Check local buckling as per Clause 6.6.3.2
- k¡28 0.43*12,*200000f- '"' -335.8MPa- t2(t-v1(wlt)2 t2(t-0.92)(æ.U3.9Ð2

2t6
Local buckling critical st¡ess is greater than Fp, the¡efore it is not critical
Calculate effective area of section (Clause 5.6.2)
w$^-l.ffil-w - 0.644^I o'43j¿qooo - 11.79
W""r*r = 15.2 is greater than Wu,. Therefo¡e area is not fully effective
Reduced flat width
B-o.ssl-køff fr-ffi r*nr-n.os
Reduced effective area
Calculate axial ¡esistance
A "r
- 530mm2 -3.95mm*2*(15.2- 13.03)*3.95 -462.3mm2
C,-O ¿1 ¿. -0.7 5 * 462.3 +257.3M Pal l0fo- 89kl,l

Calculate axial ¡esistance of BC-100 Specimen using CSA-S37-M86
Section properties
Area = 595 mm2
r = 18.4
wlt :65.514=1.6.38
Fy : 477 MPa
Determine the reduced effective yield stress (Clause 6.2.5)
2æhlay <Y48ohl4
: F! - F,1t.677 -0.677 ( lffilt -222,6M Pa
Dinensionless slenderness parameter IK = 0.9 for trryo bolt connection
L = 1840-50-50 =1740 mm between centres ofbolt groups
^-KLE- -o.sr\l#E
From CSA-S16.1 for 0.15 < Â <1.0
c,- QA F r(1.035 - 0.2V2 L - 0.222'e)

2t8
For KL/r < 120, 6= 9.72
" C,- O'7 2 * 59 5 mm2 *222'& * (0.6ß)' eklt
Note: the capacity is also checked against a lower limit provided by the value of C,
at Llt =720, where { is increased to = 0.9. This value is found to be 61 kN.
Therefo¡e the factored compressive resistance is 64 kN.
Calculate Capacity of BG-200 section according to CSA.S136.M89
Section properties
A = L925 mm2 L : 8445 mm (between hinges)
rx = 41.88 mm (axis of symmetry, and rotation about hinge)
rY = 41'52 mm
:¡o = distance between cenûoid and shear centre :24.13 mm
ro =63,72mm þ =0.857
G = 78000 MPa J = 10256 mma
c.* =3.6*1oe L =781546mm3
F =438 MPa
Calculate the flexu¡al buckling c¡itical stress (Clause 6.6.2)

2L9
Note that although the radius of gyration r, is slightly smaller than rn the
slenderness ratio will be based on r, since the rotation ¿1 1¡s hinge occu¡s about this
axis.
- ¡28' (KLlr)2
"-- ¡2(zooooo) - 4B.6Mpa' (1.0(8445y41.88)'z
Calculate the torsional flexural buckling critical stress (Clause 6.6.3.1)
ro'fi V"*r,-,f
-4.r¡'-+r¡¡whe¡e
t ¡zEcF,- - IGJ+ *l, AQSZ' (Kþ)''
4-+t(7aoooxro26o * tc2z(3'ffixtql | 4ts,ZMpa' ty2s(63.72)z (1.0(8445)F

Fo-tlexural bucWing strength ahut axis of symmetry
F-- nzV -4g.6Mpa
(K4r)2
Substituting these values in the expression for F,, provides the torsional flexural
buckling shess as
4, = 44.1 MPa < F"
Therefore torsional flexural buckling governs. The critical elastic buckling stress is
given by
Fp =0.833F,, = 37.1 MPa
Since this stress is less than FrlL, the compressive stress is in the elastic region, and
4 = Fo = 37.1 MPa
The section should now be checked to detennine if any of the flat wjdths exceed the
limits imposed by Clause 5.6 of the Standard, However since the stress level is so
low, a quick check of the most conservative limit, assuming an unstiffened element,
with k=0.43 gives
wtu-0.Ø,16Æim 4t.o

221
Which equates to a flat width of 31.0(4.0 mm) = 1.24.0 mm. None of the elements
have a flat unstiffened v¡idth of this limit, therefore it can be seen that the section
area is fully effective.
The factored compressive resistance is then calculated as
C,'4 ¿{ ¿. -0J s(t92sr(37.1)/1000'54 *rv