Design parameters of stainless steel plates for maximizing high frequency ultrasound wave...
8
Design parameters of stainless steel plates for maximizing high frequency ultrasound wave transmission Mark Michaud a,b , Thomas Leong a,c , Piotr Swiergon a , Pablo Juliano a , Kai Knoerzer a,⇑ a CSIRO Food and Nutrition Flagship, 671 Sneydes Road, Werribee, VIC 3030, Australia b Institute of Biological and Chemical Engineering, University of Erlangen-Nuremberg, Germany c Mechanical and Product Design Engineering, Faculty of Science, Engineering and Technology, Swinburne University of Technology, Hawthorn, Australia article info Article history: Received 30 September 2014 Received in revised form 15 December 2014 Accepted 8 January 2015 Available online xxxx Keywords: Ultrasound Transmission Non-contact Transducer abstract This work validated, in a higher frequency range, the theoretical predictions made by Boyle around 1930, which state that the optimal transmission of sound pressure through a metal plate occurs when the plate thickness equals a multiple of half the wavelength of the sound wave. Several reactor design parameters influencing the transmission of high frequency ultrasonic waves through a stainless steel plate were examined. The transmission properties of steel plates of various thicknesses (1–7 mm) were studied for frequencies ranging from 400 kHz to 2 MHz and at different distances between plates and transduc- ers. It was shown that transmission of sound pressure through a steel plate showed high dependence of the thickness of the plate to the frequency of the sound wave (thickness ratio). Maximum sound pressure transmission of 60% of the incident pressure was observed when the ratio of the plate thickness to the applied frequency was a multiple of a half wavelength (2 MHz, 6 mm stainless steel plate). In contrast, minimal sound pressure transmission (10–20%) was measured for thickness ratios that were not a mul- tiple of a half wavelength. Furthermore, the attenuation of the sound pressure in the transmission region was also investigated. As expected, it was confirmed that higher frequencies have more pronounced sound pressure attenuation than lower frequencies. The spatial distribution of the sound pressure trans- mitted through the plate characterized by sonochemiluminescence measurements using luminol emis- sion, supports the validity of the pressure measurements in this study. Ó 2015 Elsevier B.V. All rights reserved. 1. Introduction Ultrasound is a versatile processing tool suitable for a range of industrial applications. Low frequency ultrasound (20–100 kHz), also known as power ultrasound is associated and characterized by intense physical phenomena arising from the violent collapse of bubbles due to acoustic cavitation, and is suitable for applica- tions such as homogenization [1], emulsification [2], crystallization [3] and extraction [4]. High frequency ultrasound (400 kHz– 2 MHz) on the other hand, is usually characterized by less violent bubble collapse, making it suitable for cleaning of sensitive compo- nents [5], sonochemical modification [6] and separation of multi- component mixtures [7,8]. In some industrial applications, the process can be at very high temperatures or involve corrosive and/or toxic chemicals that may be hazardous when placed in direct contact with a transducer surface. In such applications, it is desirable for an ultrasonic trans- ducer not to be placed in direct contact with the fluid medium. An example would be in the processing of high temperature fluids like petroleum and palm oil [9,10], as it would reduce the risk of heat damage and enable easier access for periodic cleaning and mainte- nance. Another example would be the treatment of toxic, non-aque- ous solvents, or corrosive materials, where direct contact with maintenance crew or sensitive material has to be avoided. For prod- ucts that are sensitive to harsh treatment (i.e., food, pharmaceuti- cals, etc.), known problems such as generation of high temperatures and release of metal particulates when transducers are positioned in direct contact with the fluid, should also be avoided. A possible solution to these problems is placing the transducer externally to the reactor such that there is a cavity where cooling liquid can be circulated between the ultrasonic transducer and the reactor walls. This however means that the emitted sound wave has to be transmitted through an additional layer of metal (i.e., a transmission plate). Information such as the pressure distribution of transducers positioned in large-scale systems is documented in a few selected http://dx.doi.org/10.1016/j.ultsonch.2015.01.007 1350-4177/Ó 2015 Elsevier B.V. All rights reserved. ⇑ Corresponding author. E-mail address: [email protected] (K. Knoerzer). Ultrasonics Sonochemistry xxx (2015) xxx–xxx Contents lists available at ScienceDirect Ultrasonics Sonochemistry journal homepage: www.elsevier.com/locate/ultson Please cite this article in press as: M. Michaud et al., Design parameters of stainless steel plates for maximizing high frequency ultrasound wave transmis- sion, Ultrason. Sonochem. (2015), http://dx.doi.org/10.1016/j.ultsonch.2015.01.007
Transcript of Design parameters of stainless steel plates for maximizing high frequency ultrasound wave...
Ultrasonics Sonochemistry xxx (2015) xxx–xxx
Contents lists available at ScienceDirect
Ultrasonics Sonochemistry
journal homepage: www.elsevier .com/locate /u l tson
Design parameters of stainless steel plates for maximizing highfrequency ultrasound wave transmission
http://dx.doi.org/10.1016/j.ultsonch.2015.01.0071350-4177/� 2015 Elsevier B.V. All rights reserved.
⇑ Corresponding author.E-mail address: [email protected] (K. Knoerzer).
Please cite this article in press as: M. Michaud et al., Design parameters of stainless steel plates for maximizing high frequency ultrasound wave trasion, Ultrason. Sonochem. (2015), http://dx.doi.org/10.1016/j.ultsonch.2015.01.007
Mark Michaud a,b, Thomas Leong a,c, Piotr Swiergon a, Pablo Juliano a, Kai Knoerzer a,⇑a CSIRO Food and Nutrition Flagship, 671 Sneydes Road, Werribee, VIC 3030, Australiab Institute of Biological and Chemical Engineering, University of Erlangen-Nuremberg, Germanyc Mechanical and Product Design Engineering, Faculty of Science, Engineering and Technology, Swinburne University of Technology, Hawthorn, Australia
a r t i c l e i n f o
Article history:Received 30 September 2014Received in revised form 15 December 2014Accepted 8 January 2015Available online xxxx
Keywords:UltrasoundTransmissionNon-contactTransducer
a b s t r a c t
This work validated, in a higher frequency range, the theoretical predictions made by Boyle around 1930,which state that the optimal transmission of sound pressure through a metal plate occurs when the platethickness equals a multiple of half the wavelength of the sound wave. Several reactor design parametersinfluencing the transmission of high frequency ultrasonic waves through a stainless steel plate wereexamined. The transmission properties of steel plates of various thicknesses (1–7 mm) were studiedfor frequencies ranging from 400 kHz to 2 MHz and at different distances between plates and transduc-ers. It was shown that transmission of sound pressure through a steel plate showed high dependence ofthe thickness of the plate to the frequency of the sound wave (thickness ratio). Maximum sound pressuretransmission of �60% of the incident pressure was observed when the ratio of the plate thickness to theapplied frequency was a multiple of a half wavelength (2 MHz, 6 mm stainless steel plate). In contrast,minimal sound pressure transmission (�10–20%) was measured for thickness ratios that were not a mul-tiple of a half wavelength. Furthermore, the attenuation of the sound pressure in the transmission regionwas also investigated. As expected, it was confirmed that higher frequencies have more pronouncedsound pressure attenuation than lower frequencies. The spatial distribution of the sound pressure trans-mitted through the plate characterized by sonochemiluminescence measurements using luminol emis-sion, supports the validity of the pressure measurements in this study.
� 2015 Elsevier B.V. All rights reserved.
1. Introduction
Ultrasound is a versatile processing tool suitable for a range ofindustrial applications. Low frequency ultrasound (20–100 kHz),also known as power ultrasound is associated and characterizedby intense physical phenomena arising from the violent collapseof bubbles due to acoustic cavitation, and is suitable for applica-tions such as homogenization [1], emulsification [2], crystallization[3] and extraction [4]. High frequency ultrasound (�400 kHz–2 MHz) on the other hand, is usually characterized by less violentbubble collapse, making it suitable for cleaning of sensitive compo-nents [5], sonochemical modification [6] and separation of multi-component mixtures [7,8].
In some industrial applications, the process can be at very hightemperatures or involve corrosive and/or toxic chemicals thatmay be hazardous when placed in direct contact with a transducersurface. In such applications, it is desirable for an ultrasonic trans-
ducer not to be placed in direct contact with the fluid medium. Anexample would be in the processing of high temperature fluids likepetroleum and palm oil [9,10], as it would reduce the risk of heatdamage and enable easier access for periodic cleaning and mainte-nance. Another example would be the treatment of toxic, non-aque-ous solvents, or corrosive materials, where direct contact withmaintenance crew or sensitive material has to be avoided. For prod-ucts that are sensitive to harsh treatment (i.e., food, pharmaceuti-cals, etc.), known problems such as generation of hightemperatures and release of metal particulates when transducersare positioned in direct contact with the fluid, should also beavoided.
A possible solution to these problems is placing the transducerexternally to the reactor such that there is a cavity where coolingliquid can be circulated between the ultrasonic transducer andthe reactor walls. This however means that the emitted soundwave has to be transmitted through an additional layer of metal(i.e., a transmission plate).
Information such as the pressure distribution of transducerspositioned in large-scale systems is documented in a few selected
nsmis-

2 M. Michaud et al. / Ultrasonics Sonochemistry xxx (2015) xxx–xxx
studies [11]. Horn and bath-type ultrasonic systems have beenwell characterized. There is, however, limited information avail-able in the public domain on the sound pressure distribution ofhigh frequency transducer plates (>400 kHz), particularly involvingtransmission through a transmission plate setup.
When a sound wave encounters a solid surface such as the wallof a reactor, a part of the wave energy is reflected, while a part pen-etrates through the solid material [12]. Once the sound wave pen-etrates to the other side of the solid, a portion of the sound wavewill again be reflected, and a part will be transmitted into the med-ium on the other side of the solid material. The extent of transmis-sion and reflection is dependent on the properties of the materialson both sides of the boundary, i.e., liquid/solid and solid/liquid orsolid/gas boundaries, with more reflection occurring at increasingdensity differences between the two materials.
Most of the existing literature determining transmission of soundwaves through materials is devoted to the study of sound in theaudible frequency range within building materials. Tadeu et al. madean experimental evaluation of the transmission of sound (0–7 kHz)in air through several solid plates of glass positioned in series. Hefound that transmission can be inhibited if the transmitted domainshave a very big change in properties, in this case glass and air com-partments [13]. Estrada et al. found different resonances in alumin-ium plates perforated with holes: Lattice resonances, Lamb modesand Fabry–Perot modes. In Fabry–Perot resonance only multiplesof the wavelengths of the resonator can be transmitted [14].
In the ultrasonic frequency range (64–359 kHz), Boyle et al.examined the transmission through steel plates where water wasthe liquid on both sides of the plates [12,15]. They showed thattransmission reaches a maximum when the thickness of the plateis a multiple of half the wavelength of the sound wave [15]. Thistheory was confirmed by Boyle et al. in the above mentioned rangefor a system with no impedance mismatch between the two sidesof the plate. Boyle et al. also derived a ratio that calculates the pro-portion of the incident sound energy reflected when the wave isnormal to a parallel partition that is infinitely extended (i.e., thick-ness is much less than the other dimensions) [15]. The resultobtained is expressed in the following equation:
R ¼Vq
V1q1� V1q1
Vq
� �2
4cot2 2plk1þ Vq
V1q1þ V1q1
Vq
� �2 ð1Þ
where R is the ratio of the energy reflected, V is the velocity of soundin the incident medium, V1 is the velocity of sound in the material ofthe partition, q is the density of the incident medium, q1 is the den-sity of the material of the partition, l is the thickness of the partitionand k is the wavelength of sound (within the partition).
If l = nk12 , then R = 0.
Eq. (1) also shows that the thickness of the plate influences thetransmission of the sound energy. A thicker plate may have lowerimpedance on the system than a thinner plate if the reflection ratiocalculated by Eq. (1) reaches a minimum (this occurs when thedenominator approaches a maximum). In this study, the onlyparameters of this equation that were varied are the thickness ofthe plate and the wavelength (i.e., the frequency). Therefore, theonly term to consider is the circular function. A minimum in thereflection occurs when the following term approaches infinity:
liml!xcot2 2plk¼ 1 ð2Þ
This term can be rearranged to get the ideal transmission at:
x ¼ nk2
ð3Þin which n is an integer. Thus, if the plate thickness equals a multi-ple of half of the wavelength, the impedance of the plate approaches0. On the other hand if:
Please cite this article in press as: M. Michaud et al., Design parameters of stainsion, Ultrason. Sonochem. (2015), http://dx.doi.org/10.1016/j.ultsonch.2015.01
x ¼ ak4
ð4Þ
in which a is an odd integer, then:
liml!xcot2 2plk¼ 0 ð5Þ
and the reflection ratio approaches a finite maximum.From these considerations, a thickness ratio d/k can be devised,
where d is the plate thickness and lambda is the wavelength of thesound wave. The transmission reaches a maximum every time thethickness ratio is reaching a multiple of 0.5.
From a strictly mathematical point, it should be noted that if theplate thickness equals zero times the wavelength (i.e., no transmis-sion plate) there will be maximum transmission.
While this holds true for an infinitesimal small transmissiondistance, it should be noted that even in the absence of a steelplate, the sound pressure decreases through attenuation, i.e., it ispartially absorbed by the liquid it passes through. This decay isdependent on the properties of the sound wave and the surround-ing fluid. Higher frequencies have a higher attenuation while trav-eling through fluids such as water [16]. Stokes [17] gives thefollowing equation for calculating the attenuation coefficient:
a ¼ 2lð2pf Þ2
3qmc3 ð6Þ
where l is the viscosity of the fluid, qm is the density of the fluid, cis the speed of sound in the medium and f is the frequency.
Given the robustness of stainless steel in various reactor designapplications, this study will experimentally extend the investiga-tions and experimental validations made by Boyle et al. [12] intothe ultrasonic frequency range of 400 kHz–2 MHz. In addition todetermining the transmission behavior, the spatial distributionsound pressure transmitted through the steel plate will be charac-terized using sonochemiluminescence and hydrophone pressuremeasurements. An improved understanding of the penetration ofthe ultrasound after transmission through the steel plate will pro-vide valuable information for the design of ultrasonic reactors thatmake use of transmission plate configurations. Other factors influ-encing the transmission of ultrasound through stainless steelplates, such as the distance of the plate from the transducer, thethickness of the plate, and the distance of the measuring devicefrom the transducer will also be studied.
Note that for practical reasons in this study, the angle of inci-dence is maintained at a constant 90�. It is known that transmis-sion behavior is also dependent on the angle of incidence asTakahashi et al. [18] and Fay and Fortier [19] have shown.
2. Materials and methods
2.1. Transducers
The transducers utilized in this study were submersible platetransducers (SONOSYS Ultraschallsysteme GmbH, Neuenbuerg,Germany) with nominal frequencies of 400 kHz, 1, and 2 MHz.The active area of the transducers tested were 110 � 75 mm (forthe 400 kHz system) and 100 � 100 mm (for the 1 and 2 MHzsystem).
2.2. Hydrophones
Two different hydrophones were used for the different ranges offrequencies investigated. A needle hydrophone (HNC-1000, Onda,Sunnyvale, CA, USA) was used to measure pressure levels for thesystems operating at a frequency of 1 and 2 MHz. Pressure levelsfor the lower frequency system operating at 400 kHz were mea-
less steel plates for maximizing high frequency ultrasound wave transmis-.007

M. Michaud et al. / Ultrasonics Sonochemistry xxx (2015) xxx–xxx 3
sured with an ultra-broadband spherical hydrophone (TC-4034,Reson, Slangerup, Denmark).
The peak-to-peak signals were recorded with an oscilloscope(GDS-1102, GW Instek, Taipei, Taiwan) and converted to soundpressure levels using Eq. (7).
P ¼ 20log10ðV rmsÞ � OCV ð7Þ
where Vrms is the root mean square voltage determined from thepeak-to-peak values measured, and OCV (Open Circuit receivedVoltage) is a measure of the hydrophone sensitivity, and wasobtained from the hydrophone calibration chart supplied by themanufacturer.
Note that both hydrophones measured a baseline noise of8 ± 4 mV when no ultrasound was applied, which may contributeup to an additional 0.3 kPa (Reson) or 3 kPa (Onda) to the calcu-lated pressure data. This value was not subtracted from the finalvalues reported.
2.3. Cavitation characterization
The pressure distribution in the vessel was characterized fromthe cavitation produced by the transmitted sound wave, whichwas probed by sonochemiluminescence in a dark room. A0.1 mM solution of Luminol (Aldrich, 97% purity) was made in0.1 M sodium hydroxide (VWR Chemicals, 99% purity) usingMilli-Q water. The sonochemiluminescence emitted was capturedusing a Digital SLR camera (Nikon D90, Japan) with a 18–55 mmlens (Nikkor, Japan) and fixed camera settings (f-stop value = f/5.6, exposure time = 30 s, ISO sensitivity = 3200, focallength = 18 mm). The resulting image was then imported to GNUImage Manipulation Program (GIMP-Team, Germany) and its con-trast, brightness and saturation levels were increased by 100%.
2.4. Experimental setup
Experiments were conducted in a cubic container made frompolycarbonate. Fig. 1 shows the dimensions of the container andthe coordinate system used in this work. The hydrophone, stainlesssteel reflector and transducer were fixed at specific positions(Fig. 2) in the setup.
As shown in Figs. 1 and 2, the surface of the transducer facingthe reflector was considered the zero-position of the x-axis. The
Fig. 1. Dimensions of the measurement cell. Wall and bottom thickness is equal forevery face of the container.
Please cite this article in press as: M. Michaud et al., Design parameters of stainsion, Ultrason. Sonochem. (2015), http://dx.doi.org/10.1016/j.ultsonch.2015.01
y-axis corresponded to the depth of liquid in the container. Thez-axis was normal to the other vectors and originated on the wallof the measurement tank.
Tap water was used for all experiments. Prior to each measure-ment, the water was left to equilibrate for 24 h at �15 ± 3 �C. Thehydrophone was immersed in the same water for at least 1 h tostabilize measurements. The transducer was locked to the wall ofthe tank with a metal clamp. The metal plate was fixed in placeusing either a plastic frame or metal clamp.
The transmitted sound pressure, ptx, was measured at fixedlocations within the vessel. A minimum of 20 peak-to-peak valueswere recorded for each position. Note that the values measuredduring the first few seconds were dismissed to ensure equilibriumconditions. The detection range from the oscilloscope was nar-rowed until only one wave was visible in the measurementspectrum.
The same was repeated for the pressure in front of the plate toobtain pi. p30 was obtained by measuring the pressure 30 mmbehind the plate for different plate positions.
The transmission ratio was calculated using:
sðxÞ ¼ ptxðxÞpi
ð8Þ
Table 1 lists the frequencies and stainless steel plate thicknessesthat were examined in this study. The ratio between the wave-length of the sound traveling through steel and the steel platethickness is also shown in Table 1. The theory developed by Boyle(Eq. (3)) suggests that maximal transmission of sound should occurthrough materials with a thickness equal to multiples of half thewavelength. Conversely, reflection is maximal (and hence trans-mission is minimal) for odd multiples of a quarter of the wave-length (Eq. (4)). Note that this theory assumes that thedimension of the plate thickness being considered is much lessthan its length and height.
Losses due to dissipation (e.g., through scattering of the wave)inside the stainless steel plate are not considered in this theory.
Preliminary studies conducted showed that the orientation(horizontal or vertical) of the hydrophone had no effect on themeasurement (results not shown). For the experiments reportedin this study, a vertical orientation was selected as it allowed mea-surements to be taken very close to the walls of the tank. Measure-ments in a corridor between the active area of the transducer(110 � 75 mm for the 400 kHz system and 100 � 100 mm for the1 and 2 MHz system) and the reflector plate delivered data abovebaseline values. Measurements outside this corridor delivered val-ues near to the baseline minimum. In this study all measurementswere obtained within the corridor of the active area.
To examine the influence of the distance between transducerand steel plate on the transmission, a metal plate was locked withmetal clamps at several distances while the hydrophone was in afixed position at 120 mm from the transducer. This series wasrepeated with the hydrophone always being 30 mm away fromthe steel plate.
Measurements were performed with different plate thicknessesat the various ultrasonic frequencies available. The electrical powerconsumption (determined by a power meter; Belkin InternationalInc., Playa Vista, CA, USA) was the same for all frequencies andset to 300 W. The position of the hydrophone was varied to deter-mine the transmission through the plate. Measurements were per-formed at the same location for all sets of experiments. The changein pressure in the absence of a transmission plate was also studiedfor comparison. In all studies, the y and z locations were held con-stant (y: 120 mm, z: 100 mm).
Further experiments were performed to visualize the spatialpressure distribution of sound transmitted through the steel plate.
less steel plates for maximizing high frequency ultrasound wave transmis-.007
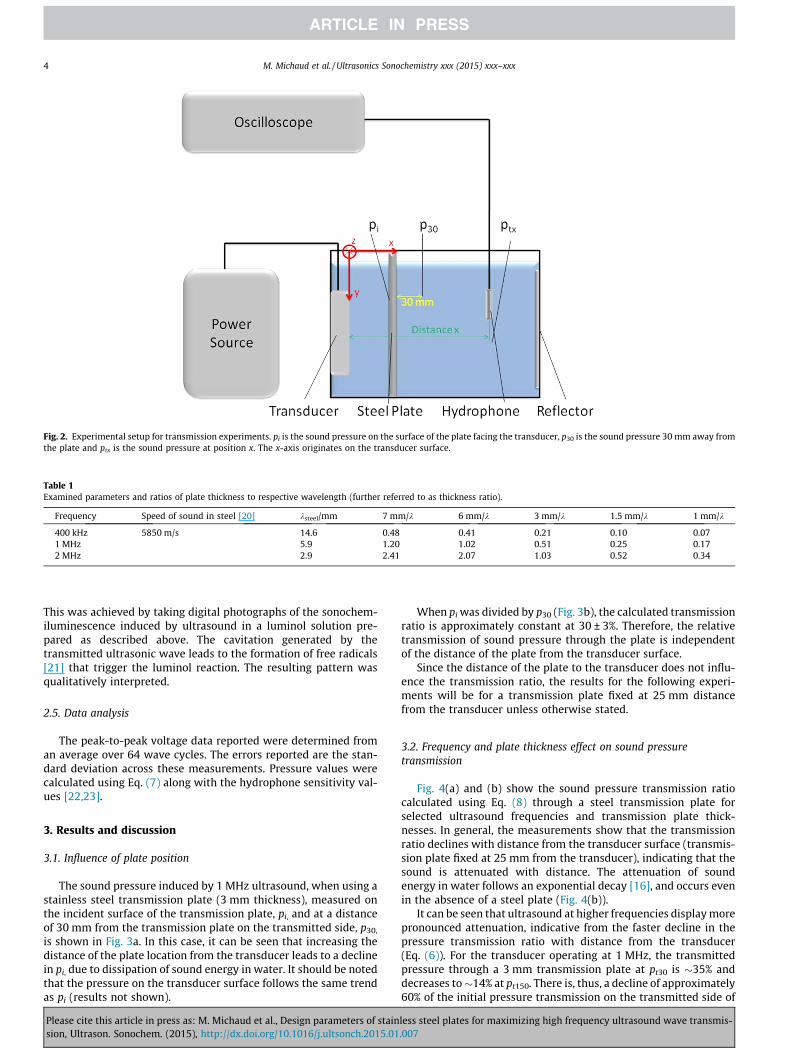
Fig. 2. Experimental setup for transmission experiments. pi is the sound pressure on the surface of the plate facing the transducer, p30 is the sound pressure 30 mm away fromthe plate and ptx is the sound pressure at position x. The x-axis originates on the transducer surface.
Table 1Examined parameters and ratios of plate thickness to respective wavelength (further referred to as thickness ratio).
Frequency Speed of sound in steel [20] ksteel/mm 7 mm/k 6 mm/k 3 mm/k 1.5 mm/k 1 mm/k
400 kHz 5850 m/s 14.6 0.48 0.41 0.21 0.10 0.071 MHz 5.9 1.20 1.02 0.51 0.25 0.172 MHz 2.9 2.41 2.07 1.03 0.52 0.34
4 M. Michaud et al. / Ultrasonics Sonochemistry xxx (2015) xxx–xxx
This was achieved by taking digital photographs of the sonochem-iluminescence induced by ultrasound in a luminol solution pre-pared as described above. The cavitation generated by thetransmitted ultrasonic wave leads to the formation of free radicals[21] that trigger the luminol reaction. The resulting pattern wasqualitatively interpreted.
2.5. Data analysis
The peak-to-peak voltage data reported were determined froman average over 64 wave cycles. The errors reported are the stan-dard deviation across these measurements. Pressure values werecalculated using Eq. (7) along with the hydrophone sensitivity val-ues [22,23].
3. Results and discussion
3.1. Influence of plate position
The sound pressure induced by 1 MHz ultrasound, when using astainless steel transmission plate (3 mm thickness), measured onthe incident surface of the transmission plate, pi, and at a distanceof 30 mm from the transmission plate on the transmitted side, p30,
is shown in Fig. 3a. In this case, it can be seen that increasing thedistance of the plate location from the transducer leads to a declinein pi, due to dissipation of sound energy in water. It should be notedthat the pressure on the transducer surface follows the same trendas pi (results not shown).
Please cite this article in press as: M. Michaud et al., Design parameters of stainsion, Ultrason. Sonochem. (2015), http://dx.doi.org/10.1016/j.ultsonch.2015.01
When pi was divided by p30 (Fig. 3b), the calculated transmissionratio is approximately constant at 30 ± 3%. Therefore, the relativetransmission of sound pressure through the plate is independentof the distance of the plate from the transducer surface.
Since the distance of the plate to the transducer does not influ-ence the transmission ratio, the results for the following experi-ments will be for a transmission plate fixed at 25 mm distancefrom the transducer unless otherwise stated.
3.2. Frequency and plate thickness effect on sound pressuretransmission
Fig. 4(a) and (b) show the sound pressure transmission ratiocalculated using Eq. (8) through a steel transmission plate forselected ultrasound frequencies and transmission plate thick-nesses. In general, the measurements show that the transmissionratio declines with distance from the transducer surface (transmis-sion plate fixed at 25 mm from the transducer), indicating that thesound is attenuated with distance. The attenuation of soundenergy in water follows an exponential decay [16], and occurs evenin the absence of a steel plate (Fig. 4(b)).
It can be seen that ultrasound at higher frequencies display morepronounced attenuation, indicative from the faster decline in thepressure transmission ratio with distance from the transducer(Eq. (6)). For the transducer operating at 1 MHz, the transmittedpressure through a 3 mm transmission plate at pt30 is �35% anddecreases to�14% at pt150. There is, thus, a decline of approximately60% of the initial pressure transmission on the transmitted side of
less steel plates for maximizing high frequency ultrasound wave transmis-.007

Fig. 3. (a) pi and p30, measured as a function of distance from the transducer. (b) Calculated transmission ratio as a function of distance from the transducer. An ultrasoundfrequency of 1 MHz and transmission plate thickness of 3 mm were used.
M. Michaud et al. / Ultrasonics Sonochemistry xxx (2015) xxx–xxx 5
the tank caused by attenuation. At an ultrasound frequency of2 MHz a similar behavior can be observed.
Less attenuation is seen in the case of an operating frequency of400 kHz, from �18% to 11%, which equals a decline of approxi-mately 39%. The transmission ratio and hence sound pressure inthis case declines to a lesser extent compared to the 1 and2 MHz frequencies, most noticeably after a distance of 75 mm fromthe transducer surface.
Interestingly, in some cases, such as for the 2 MHz ultrasound inFig. 4(a), it can be seen that the sound pressure increases towardsthe end of the tank. This phenomenon is likely due to reflectioneffects near the end reflector plate of the vessel. In Fig. 4(b), thescenario where no transmission plate is used, highlights thisbehavior, with measured pressure increasing sharply towards theend of the vessel.
The dependence of the transmission ratio to the thicknessratio also follows expected trends. In Fig. 4(a), there is highertransmission for both the 1 and 2 MHz frequency since at thesefrequencies the wavelength of sound in steel is approximately6 mm and, therefore, the steel plate has a thickness that is amultiple of half a wavelength (i.e., 2 wavelengths for 1 MHzand 1 wavelength for 2 MHz). The 400 kHz frequency exhibitslower transmission due to a non-optimal thickness of 0.2 k (seeTable 1).
In Fig. 5, it can be seen that the data for 1 and 2 MHz fits theexpected transmission ratio trends previously characterized byBoyle et al. [15]. For the 400 kHz ultrasound, however, sound pres-sure transmission appears to be low even with a thickness ratio of0.47 k, which resulted in a transmission ratio of 23%. The likely rea-
Please cite this article in press as: M. Michaud et al., Design parameters of stainsion, Ultrason. Sonochem. (2015), http://dx.doi.org/10.1016/j.ultsonch.2015.01
son for this is due to imprecise and non-uniform steel thicknessesused in the experimental tests.
Note that the maximum transmission ratio (pt30/pi) measured inthis study, where pt30 and pi are located at a distance of 30 and25 mm from the surface of the transducer, respectively, wasapproximately 60% (Fig. 5). This appears to be far from the idealsound pressure transmission case. However, as shown by Boyleet al. [15], it is difficult to achieve perfect transmission through asteel plate due to energy dissipated within the plate itself. Evenwith a precise plate thickness ratio for the incident sound wave(i.e., a multiple of half a wavelength), the maximum transmissionreported by Boyle et al. for a transmission plate parallel to the trans-ducer surface was in the order of 70%. The maximum transmissionsobserved in this present study suggest that we are operating withinthe narrow thickness ratio region for optimal transmission,although our system is likely subject to imperfections that are notcontrolled in the present setup (i.e., precise and uniform platethicknesses, influence of temperature on speed of sound, preciseangle of incidence, etc.). In practice, manufacturers of transmissionplate systems report >90% transmission efficiency [24] which is lar-gely due to precise manufacturing (i.e., accurate plate thicknessesover the entire plate area); and positioning of the transmissionplate at a slight angle to the transducer surface is also suggestedto minimize direct reflection of the sound wave back into the trans-ducer and thereby maximize the probability of sound pressuretransmission occurring. Other novel designs could also be incorpo-rated to maximize sound transmission, such as that recently dem-onstrated by Park et al. [25] using walls perforated with sub-wavelength holes that enabled >90% transmission of sound in air.
less steel plates for maximizing high frequency ultrasound wave transmis-.007

Fig. 4. Transmission ratio as a function of distance from the surface of the transducer for (a) varying ultrasonic frequency and fixed plate thickness and (b) varying platethickness and fixed ultrasonic frequency.
Fig. 5. Transmission as a function of thickness ratio. The transmission ratio was calculated using pt30/pi, where pt30 and pi are measured a distance of 30 and 25 mm from thesurface of the transducer, respectively.
6 M. Michaud et al. / Ultrasonics Sonochemistry xxx (2015) xxx–xxx
3.3. Transmission verification via luminol characterization
Fig. 6 shows the sonochemiluminescence occurring in thereflection and transmission region across a 3 mm stainless steeltransmission plate for an ultrasonic frequency of 1 MHz (thicknessratio = 0.5 k). The light intensity in the transmission region followsa decaying trend, and closely resembles the sound pressure trans-mission ratio plot in Fig. 4. This confirms the notion that the trans-
Please cite this article in press as: M. Michaud et al., Design parameters of stainsion, Ultrason. Sonochem. (2015), http://dx.doi.org/10.1016/j.ultsonch.2015.01
mitted sound energy decreases with increasing distance from thetransducer. Notably, in the large transmission region space, nostanding wave pattern is observed indicating that the sound waveis attenuated too strongly in the fluid to be reflected on the endplate of the vessel. However, in the region close to the transmissionplate, the pressure distribution appears to be spatially uniform. Togenerate a more uniform pressure distribution towards the end ofthis large vessel, a possible strategy could be to apply a second
less steel plates for maximizing high frequency ultrasound wave transmis-.007

Fig. 6. Photographed sonochemiluminescence of a luminol solution inside the experimental vessel using a frequency of 1 MHz and a 3 mm stainless steel transmission plate(thickness ratio = 0.5 k). The luminescence follows a similar behavior of decline as the sound pressure measured using a hydrophone.
M. Michaud et al. / Ultrasonics Sonochemistry xxx (2015) xxx–xxx 7
transducer with a similar transmission plate setup at the opposingvessel boundary. The sonochemiluminescence observed in thetransmission region for 1 MHz ultrasound and a 1 mm plate wasmuch less intense, indicating less transmission through a platewith a non-ideal thickness ratio (results not shown).
Note that only 1 MHz ultrasound was able to generate a suffi-ciently bright image in the transmission region in this study whenusing a 3 mm plate, even though the 2 MHz ultrasound shows sim-ilar levels of transmission through the same thickness. This isbecause the amount of radicals formed by cavitation (which is thecause of the light emission) is highly dependent on the ultrasonicfrequency [26]. Furthermore, 2 MHz ultrasound has a higher cavita-tion threshold. Bubbles that do form also collapse with less intensitycompared to the 1 MHz ultrasound due to a smaller resonance size.Therefore, cavitation bubbles formed at 2 MHz generate very fewradicals in comparison to 1 MHz cavitation bubbles when equiva-lent power levels (300 W), as is the case here, are used. The400 kHz ultrasound did not achieve sufficient transmission throughthe steel plates to generate sonochemiluminescence in the trans-mission region, even though the optimum frequency for sonochem-ical activity is in the range 400–800 kHz [27,28].
4. Conclusion
This study confirmed that the thickness of a steel plate signifi-cantly influences the transmission of sound pressure at ultrasonicfrequencies up to 2 MHz. A thicker plate may allow for greatertransmission than a thinner plate in some circumstances, sincethe sound pressure transmission is highly dependent on the thick-ness ratio of the steel plate relative to the wavelength of the incidentsound wave. The experimental results validated existing theory,indicating that maximal transmission occurs for a plate thicknessof a multiple of half a wavelength. However, measurements nearthe optimum thickness ratios did not achieve perfect transmission(i.e., 100%) due to a number of factors, such as imperfections inthe materials used (e.g., non-uniform and non-precise thickness),constant angle of incidence and gradual heating inside the measure-ment tank. Results also show that the sound pressure is attenuatedon the transmitted side of the transmission plate according to
Please cite this article in press as: M. Michaud et al., Design parameters of stainsion, Ultrason. Sonochem. (2015), http://dx.doi.org/10.1016/j.ultsonch.2015.01
expected trends both in the presence or absence of a steel transmis-sion plate as predicted by Leighton [16]. Slight manipulation of fre-quency, plate thickness, plate location or plate orientation could beperformed to maximize transmission. As such, the plate thickness,transducer-plate distance and reactor vessel dimension (i.e., plate-reactor distance wall) are important design parameters that mustbe considered to achieve the targeted sound pressure fields in highfrequency reactors used for industrial applications.
Acknowledgments
The authors wish to thank Joachim Straka and Johann Brunnerfrom Sonosys Ultraschallsysteme GmbH (Neuenbuerg, Germany)for their helpful technical discussions on aspects of high frequencyultrasound transmission in a commercial environment. Alsothanked is Michael Coventry for preliminary experiments on ultra-sound transmission which triggered the research presented in thispaper, as well as Dr Raymond Mawson and Dr Henry Sabarez fortheir internal review of this manuscript.
References
[1] H. Wu, G. Hulbert, J. Mount, Effects of ultrasound on milk homogenization andfermentation with yogurt starter, Innovative Food Sci. Emerg. Technol. 1 (3)(2000) 211–218.
[2] J. Canselier, H. Delmas, A. Wilhelm, Ultrasound emulsification—an overview, J.Dispersion Sci. Technol. 23 (1) (2010) 333–349.
[3] M. Luque de castro, F. Priego-Capote, Ultrasound-assisted crystallization(sonocrystallization), Ultrason. Sonochem. 14 (6) (2007) 717–724.
[4] S. Chemat, A. Lagha, H. AitAmar, P. Bartels, F. Chemat, Comparison ofconventional and ultrasound-assisted extraction of carvone and limonenefrom caraway seeds, Flavour Frag. J. 19 (3) (2004) 188–195.
[5] K. Jenderka, C. Koch, Investigation of spatial distribution of sound fieldparameters in ultrasound cleaning baths under the influence of cavitation,Ultrasonics 44 (22) (2006) e401–e406.
[6] M. Ashokkumar, D. Sunartio, S. Kentish, R. Mawson, L. Simons, K. Vilkhu, C.Versteeg, Modification of food ingredients by ultrasound to improvefunctionality: a preliminary study on a model system, Innovative Food Sci.Emerg. Technol. 9 (2) (2008) 155–160.
[7] T. Leong, L. Johansson, P. Juliano, R. Mawson, S. McArthur, R. Manasseh, Designparameters for the separation of fat from natural whole milk in an ultrasoniclitre-scale vessel, Ultrason. Sonochem. 21 (4) (2014) 1289–1298.
[8] F. Trujillo, S. Eberhardt, D. Moeller, J. Dual, K. Knoerzer, Multiphysics modellingof the separation of suspended particles via frequency ramping of ultrasonicstanding waves, Ultrason. Sonochem. 20 (2) (2012) 655–666.
less steel plates for maximizing high frequency ultrasound wave transmis-.007

8 M. Michaud et al. / Ultrasonics Sonochemistry xxx (2015) xxx–xxx
[9] P. Juliano, P. Swiergon, R. Mawson, K. Knoerzer, M. Augustin, Application ofultrasound for oil separation and recovery of palm oil, J. Am. Oil Chem. 90 (4)(2013) 579–588.
[10] P. Juliano, P. Swiergon, K.H. Lee, P.T. Gee, P.T. Clarke, M.A. Augustin, Effects ofpilot plant-scale ultrasound on palm oil separation and oil quality, J. Am. OilChem. 90 (8) (2013) 1253–1260.
[11] P. Gogate, V. Sutkar, A. Pandit, Sonochemical reactors: important design andscale up considerations, Chem. Eng. J. 166 (3) (2011) 1066–1082.
[12] R.W. Boyle, D.K. Froman, Reflection of sound energy and thickness of platereflector – ultrasonic method, Can. J. Res. 1 (5) (1929) 405–425.
[13] A.J.B. Tadeu, D.M.R. Mateus, Sound transmission through single, double andtriple glazing. Experimental evaluation, Appl. Acoust. 62 (3) (2001) 307–325.
[14] H. Estrada, J. Garcia de Abajo, P. Candelas, A. Uris, Angle-dependent ultrasonictransmission through plates with subwavelength hole arrays, Phys. Rev. Lett.102 (14) (2009).
[15] R. Boyle, D. Sproule, Transmission of sound energy and thickness of platetransmitter at normal incidence – ultrasonic method, Can. J. Res. 2 (1) (1930)3–12.
[16] T. Leighton, The Acoustic Bubble, Academic Press Limited, San Diego, CA, USA,1994.
[17] G. Stokes, On a difficulty in the theory of sound, Philos. Mag. 33 (1848) 349–356.
[18] D. Takahashi, Sound transmission through single plates with absorptivefacings, J. Acoust. Soc. Am. 83 (4) (1988) 1453–1457.
[19] R.D. Fay, O.V. Fortier, Transmission of sound through steel plates immersed inwater, J. Acoust. Soc. Am. 23 (3) (1951) 339–346.
Please cite this article in press as: M. Michaud et al., Design parameters of stainsion, Ultrason. Sonochem. (2015), http://dx.doi.org/10.1016/j.ultsonch.2015.01
[20] R.L. Joseph, Ultrasonic Waves in Solid Media, Press Syndicate of CambridgeUniversity, Cambridge, UK, 2004.
[21] R. Peter, D. Berndahl, C. Christman, Free radical generation by ultrasound inaqueous and nonaqueous solutions, Environ. Health. Persp. 64 (1985) 233–252.
[22] Ondacorp, Ondacorp brochures, Onda Corporation, 20 December 2012(online). Available: <http://www.ondacorp.com/images/brochures/Onda_HNC_DataSheet.pdf> (accessed 5.09.14).
[23] Teledyne Reson, Teledyne Reson WP contents, Teledyne Reson, 2005 (online).Available: <http://www.teledyne-reson.com/wp-content/uploads/2010/12/TC4034.pdf> (accessed 5.09.14).
[24] J. Brunner, J. Straka, New developments for indirect sonication at high frequencies,Pers. Commun. (2014)
[25] J.J. Park, K.J.B. Lee, O.B. Wright, M.K. Jung, S.H. Lee, Giant acoustic concentrationby extraordinary transmission in zero-mass metamaterials, Phys. Rev. Lett. 110(24) (2013) 244302-1–244302-5.
[26] J. Raea, M. Ashokkumar, O. Eulaerts, C. von Sonntag, J. Reisse, F. Grieser,Estimation of ultrasound induced cavitation bubble temperatures in aqueoussolutions, Ultrason. Sonochem. 12 (5) (2005) 325–329.
[27] S. Koda, T. Kimura, T. Kondo, H. Mitome, A standard method to calibratesonochemical efficiency of an individual reaction system, Ultrason. Sonochem.10 (3) (2003) 149–156.
[28] T. Mason, A. Cobley, J. Graves, D. Morgan, New evidence for the inversedependence of mechanical and chemical effects on the frequency ofultrasound, Ultrason. Sonochem. 18 (1) (2011) 226–230.
less steel plates for maximizing high frequency ultrasound wave transmis-.007