Dietary patterns for healthier cognitive ageing - WUR eDepot
194
Dietary paerns for healthier cognive ageing Agnes A.M. Berendsen
-
Upload
khangminh22 -
Category
Documents
-
view
1 -
download
0
Transcript of Dietary patterns for healthier cognitive ageing - WUR eDepot

Dietary patterns for healthier cognitive ageing
Agnes A.M. Berendsen
Dietary patterns for healthier cognitive ageingAgnes A.M
. Berendsen
INVITATION
You are cordially invited to attend the public defence
of the thesis entitled:
Dietary patterns for healthier cognitive
ageing
On Thursday, 31st of August, 2017 at 11:00 a.m. in the Aula
of Wageningen University, Generaal Foulkesweg 1a,
Wageningen
Agnes A.M. [email protected]
ParanymphsElske Brouwer-Brolsma
Johanna [email protected]


Dietary patterns for healthier cognitive ageing
Agnes A.M. Berendsen

Thesis committee Promotors Prof. Dr C.P.G.M. de Groot Personal chair at the Division of Human Nutrition Wageningen University & Research Prof. Dr E.J.M. Feskens Professor of Nutrition and Health over the Lifecourse Wageningen University & Research Co-promotor Dr O. van de Rest Assistant professor, Division of Human Nutrition Wageningen University & Research Other members Prof. Dr P. van ‘t Veer, Wageningen University & Research Prof. Dr M. Visser, VU Amsterdam Prof. Dr M.B. Breteler, German Centre for Neurodegenerative diseases, Bonn, Germany Prof. I. Tetens, Centre for Good Older Lives, University of Copenhagen, Denmark This thesis was conducted under auspices of the Graduate School VLAG (Advanced Studies in Food Technology, Agrobiotechnology, Nutrition and Health Sciences).
Dietary patterns for healthier cognitive ageing
Agnes A.M. Berendsen
Thesis
submitted in fulfillment of the requirements for the degree of doctor at Wageningen University
by the authority of the Rector Magnificus, Prof. Dr A.P.J. Mol,
in the presence of the Thesis Committee appointed by the Academic Board
to be defended in public on Thursday 31 August 2017
at 11 a.m. in the Aula.

Agnes A.M. Berendsen Dietary patterns for healthier cognitive ageing, 190 pages. PhD thesis, Wageningen University, Wageningen, the Netherlands (2017) With references, with summary in English ISBN: 978-94-6343-601-4 DOI: 10.18174/417204
The idea is to die young
as late as possible
Ashley Montagu (1905-1999)
American anthropologist

Table of contents Chapter 1 General introduction 9
Chapter 2 Conventional foods, followed by dietary supplements and fortified foods, are the key sources of vitamin D, vitamin B6, and selenium intake in Dutch participants of the NU-AGE study
21
Chapter 3 Dietary patterns, cognitive decline and dementia: a systematic review 39
Chapter 4 Association of adherence to a healthy diet with cognitive decline in European and American older adults: a meta-analysis within the CHANCES consortium
59
Chapter 5 The Dietary Approaches to Stop Hypertension diet, cognitive function, and cognitive decline in American older women
77
Chapter 6 Association of long-term adherence to the MIND diet with cognitive function and cognitive decline in American women
91
Chapter 7 A parallel randomized trial on the effect of a healthful diet on inflammageing and its consequences in European elderly people: design of the NU-AGE dietary intervention study
107
Chapter 8 Changes in dietary intake and adherence to the NU-AGE diet after a one-year dietary intervention among European older adults
123
Chapter 9 Effect of the NU-AGE dietary intervention on cognitive decline in Dutch older adults
139
Chapter 10 General discussion 153
Summary 175
Acknowledgements 179
About the author 183


Chapter 1General introduction

Chapter 1 | General introduction
10
Ageing It is well known that the world population is ageing. By the year 2050, 20% of the world population will be aged 60 years and above [1]. American and European people aged 65 years between 2000-2015 had a life expectancy of 20 years [2]. Moreover, as assessed in 2014, chronic diseases start to occur at 61.4 years for men and 61.8 years for women in the EU [3]. Thus, not only the population is ageing, but also the number of people living with chronic diseases is increasing.
Cognitive decline during ageing As part of the ageing process the brain ages as well, leading to a decline in cognitive functioning (figure 1). There is convincing evidence demonstrating that age-related cognitive decline starts from the late 20’s and continues throughout the lifespan [4]. A progressive – and usually chronic - decline in memory, language, problem-solving and other cognitive skills that affects a person’s ability to perform everyday activities leads to mild cognitive impairment (MCI) and may progress to dementia [5]. Dementia is caused by a variety of brain illnesses, of which Alzheimer’s Disease (AD), vascular dementia, dementia with Lewy bodies, and frontotemporal dementia are the most common. Dementia results in personal suffering, demands on the family for caregiving, and eventually leads to the need for institutionalized care. In 2015, 9.4 American and 10.5 million European people were living with dementia and this number is estimated to increase to 131.5 billion worldwide by 2050 [6]. Unfortunately, despite this increase in the number of people living with dementia, studies on novel drugs to treat dementia have been negative [7]. Thus, there is an urgent need to find modifiable strategies to postpone the onset of cognitive decline and dementia.
Figure 1. Progression from normal ageing to Alzheimer’s disease or another dementia (adapted from [8]).
0
2
4
6
8
10
12
1 2 3 4 5 6
Cog
nitiv
e D
eclin
e
Time (Years)
Normal Ageing Everyone experiences slight cognitive changes during ageing
Preclinical - Silent phase: brain changes without measurable symptoms
- Individual may notice changes, but not detectable on tests
- A stage where the patient knows, but the doctor doesn't
MCI - Cognitive changes are of concern to individual and/or family
- One or more cognitive domains impaired significantly
- Preserved activities of daily living
Dementia - Cognitive impairment severe enough to interfere with everyday abilities
Mild
Moderately severe
Severe
Moderate
11
Risk factors for cognitive decline There are many risk factors for cognitive decline comprising non-modifiable risk factors and modifiable risk factors. Non-modifiable risk factors include age [9], female sex [9], family history [10, 11] and genetic susceptibility (e.g., the presence of 1 or 2 copies of the apolipoprotein E (APOE) Ɛ4 allele) [9, 12]. Modifiable risk factors can be divided into cardiovascular risk factors (diabetes, mid-life obesity, mid-life hypertension, and hyperlipidaemia), lifestyle risk factors (current smoking, physical activity, diet, alcohol, cognitive training, and social engagement), and other risk factors (education, brain injury, depression and sleep) [13]. There is strong evidence for an increased risk of cognitive decline for brain injury, mid-life obesity and mid-life hypertension, current smoking and diabetes (figure 2).
Cognitive decline
Increases Risk
Decreases Risk
Years of formal education
Physical activity
Mediterranean diet
Cognitivetraining
Moderate alcohol
consumption
Social engagement
Traumatic brain injury
Mid-life obesity
Mid-life hypertension
Current smoking Diabetes
History ofdepression
Sleep disturbances
Strong evidence Moderate evidence Lower evidence Unclear evidence
Hyper-lipidemia
Figure 2. Strength of evidence on risk factors for cognitive decline (adapted from [13]) Nutrition and mechanisms in cognitive functioning Many of the risk factors described above can be modified by diet. To date, numerous studies have been conducted demonstrating a possible link between the intake of specific nutrients and foods on cognitive functioning. Examples include omega-3 fatty acids, vitamin D, vitamin B6, vitamin B12, folate, flavonoids, and vitamin E, but also foods, such as fish, nuts and seeds, and fruits and vegetables [14]. Omega-3 fatty acids have anti-inflammatory [15] and cardiovascular protective effects [16] and may therefore reduce the risk of atherothrombotic complications such as stroke [17] and subsequent cognitive decline. Furthermore, omega-3 fatty acids may improve the composition of cell membranes and therefore stimulate the development and regeneration of nerve cells [18]. Vitamin D plays a role in the prevention of neurological, autoimmune, and psychiatric diseases [19]. Folate, vitamin B6, and vitamin B12 are required for proper DNA methylation and to prevent the accumulation of homocysteine. Homocysteine is an intermediary amino acid that has been associated with cardiovascular disease and stroke, as well as cognitive decline [14]. Flavonoids and vitamin E have been proposed to have significant antioxidant and anti-inflammatory effects [14]. However, evidence from observational and intervention studies provide mixed results for the role of single nutrients on cognitive functioning.

1
Chapter 1 | General introduction
10
Ageing It is well known that the world population is ageing. By the year 2050, 20% of the world population will be aged 60 years and above [1]. American and European people aged 65 years between 2000-2015 had a life expectancy of 20 years [2]. Moreover, as assessed in 2014, chronic diseases start to occur at 61.4 years for men and 61.8 years for women in the EU [3]. Thus, not only the population is ageing, but also the number of people living with chronic diseases is increasing.
Cognitive decline during ageing As part of the ageing process the brain ages as well, leading to a decline in cognitive functioning (figure 1). There is convincing evidence demonstrating that age-related cognitive decline starts from the late 20’s and continues throughout the lifespan [4]. A progressive – and usually chronic - decline in memory, language, problem-solving and other cognitive skills that affects a person’s ability to perform everyday activities leads to mild cognitive impairment (MCI) and may progress to dementia [5]. Dementia is caused by a variety of brain illnesses, of which Alzheimer’s Disease (AD), vascular dementia, dementia with Lewy bodies, and frontotemporal dementia are the most common. Dementia results in personal suffering, demands on the family for caregiving, and eventually leads to the need for institutionalized care. In 2015, 9.4 American and 10.5 million European people were living with dementia and this number is estimated to increase to 131.5 billion worldwide by 2050 [6]. Unfortunately, despite this increase in the number of people living with dementia, studies on novel drugs to treat dementia have been negative [7]. Thus, there is an urgent need to find modifiable strategies to postpone the onset of cognitive decline and dementia.
Figure 1. Progression from normal ageing to Alzheimer’s disease or another dementia (adapted from [8]).
0
2
4
6
8
10
12
1 2 3 4 5 6
Cog
nitiv
e D
eclin
e
Time (Years)
Normal Ageing Everyone experiences slight cognitive changes during ageing
Preclinical - Silent phase: brain changes without measurable symptoms
- Individual may notice changes, but not detectable on tests
- A stage where the patient knows, but the doctor doesn't
MCI - Cognitive changes are of concern to individual and/or family
- One or more cognitive domains impaired significantly
- Preserved activities of daily living
Dementia - Cognitive impairment severe enough to interfere with everyday abilities
Mild
Moderately severe
Severe
Moderate
11
Risk factors for cognitive decline There are many risk factors for cognitive decline comprising non-modifiable risk factors and modifiable risk factors. Non-modifiable risk factors include age [9], female sex [9], family history [10, 11] and genetic susceptibility (e.g., the presence of 1 or 2 copies of the apolipoprotein E (APOE) Ɛ4 allele) [9, 12]. Modifiable risk factors can be divided into cardiovascular risk factors (diabetes, mid-life obesity, mid-life hypertension, and hyperlipidaemia), lifestyle risk factors (current smoking, physical activity, diet, alcohol, cognitive training, and social engagement), and other risk factors (education, brain injury, depression and sleep) [13]. There is strong evidence for an increased risk of cognitive decline for brain injury, mid-life obesity and mid-life hypertension, current smoking and diabetes (figure 2).
Cognitive decline
Increases Risk
Decreases Risk
Years of formal education
Physical activity
Mediterranean diet
Cognitivetraining
Moderate alcohol
consumption
Social engagement
Traumatic brain injury
Mid-life obesity
Mid-life hypertension
Current smoking Diabetes
History ofdepression
Sleep disturbances
Strong evidence Moderate evidence Lower evidence Unclear evidence
Hyper-lipidemia
Figure 2. Strength of evidence on risk factors for cognitive decline (adapted from [13]) Nutrition and mechanisms in cognitive functioning Many of the risk factors described above can be modified by diet. To date, numerous studies have been conducted demonstrating a possible link between the intake of specific nutrients and foods on cognitive functioning. Examples include omega-3 fatty acids, vitamin D, vitamin B6, vitamin B12, folate, flavonoids, and vitamin E, but also foods, such as fish, nuts and seeds, and fruits and vegetables [14]. Omega-3 fatty acids have anti-inflammatory [15] and cardiovascular protective effects [16] and may therefore reduce the risk of atherothrombotic complications such as stroke [17] and subsequent cognitive decline. Furthermore, omega-3 fatty acids may improve the composition of cell membranes and therefore stimulate the development and regeneration of nerve cells [18]. Vitamin D plays a role in the prevention of neurological, autoimmune, and psychiatric diseases [19]. Folate, vitamin B6, and vitamin B12 are required for proper DNA methylation and to prevent the accumulation of homocysteine. Homocysteine is an intermediary amino acid that has been associated with cardiovascular disease and stroke, as well as cognitive decline [14]. Flavonoids and vitamin E have been proposed to have significant antioxidant and anti-inflammatory effects [14]. However, evidence from observational and intervention studies provide mixed results for the role of single nutrients on cognitive functioning.

Chapter 1 | General introduction
12
Dietary patterns; a more powerful approach to study nutrition Because people do not consume single nutrients but rather a combination of nutrients and foods within a complete diet, the research field has shifted towards studying dietary patterns. Studying dietary patterns allows one to combine the synergistic effects of single nutrients [20-22]. Thus, studying dietary patterns could be a more powerful approach and also more relevant to the general public to unravel the role of diets for a healthier cognitive ageing.
For dietary patterns, roughly three main biological mechanisms have been proposed by which diet could potentially protect against dementia risk and cognitive decline, relating to: 1) the vascular system (e.g., aortic stiffness [23] or microvascular function [24]), 2) oxidative stress (e.g., free radicals and brain protection or damage [25], or loss of neuronal homeostasis and neurodegenerative diseases development [26]) and 3) attenuation of the inflammatory pathway (e.g., microglial priming [27, 28].
Dietary patterns have frequently been studied in relation to, for example, cardiovascular health, but studying the association between dietary patterns and cognitive functioning is relatively new and less frequently done. Especially intervention studies are lacking. As a result, the most effective dietary pattern that impacts brain health has not yet been found. Dietary patterns of interest include the Mediterranean diet [29], the Healthy Diet Indicator (HDI) [30], the Dietary Approaches to Stop Hypertension (DASH) diet [31], the Mediterranean-Dietary Approach to Systolic Hypertension diet intervention for neurodegenerative delay (MIND) diet [32], and the NUtrients and AGEing (NU-AGE) diet [33]. All these dietary patterns are based on prior knowledge – so called a priori or knowledge based dietary patterns – as opposed to a posteriori (data driven) dietary patterns. A priori dietary patterns can be based on the observation of a healthy dietary pattern within a population, for example the Mediterranean diet. Alternatively, a priori dietary patterns can be based on dietary recommendations (NU-AGE diet), or components that have been associated with certain health outcomes, such as the HDI, the DASH diet and the MIND diet. Table 1 provides an overview of dietary components included in each of the dietary patterns.
Mediterranean Diet The Mediterranean diet is an example of a healthful dietary pattern observed within a specific population as it is a collection of eating habits traditionally followed by people living in the Mediterranean. This diet is characterized by a high intake of olive oil, fruit, vegetables and legumes, a moderate intake of fish and red wine during meals [34] (table 1). The Mediterranean diet is one of the dietary patterns that is most frequently studied in relation to cognitive functioning.
At the start of this thesis in 2011, there were very few publications about the Mediterranean diet and cognitive decline or dementia. Nicolas Scarmeas was one of the first researchers reporting a reduced risk of AD among American older adults with the highest adherence to Mediterranean diet in a prospective study [35] and a case-control study [36]. In the same cohort, Scarmeas demonstrated a reduced risk of (MCI) with higher adherence to the Mediterranean diet [37]. A slower rate of cognitive decline was reported among another population of French older adults with the highest adherence to the Mediterranean diet [38] and the risk of incidence MCI or dementia was reduced in subjects with a high Mediterranean diet score in an Australian cohort [39].
13
Tabl
e 1.
Ove
rvie
w o
f die
tary
pat
tern
s and
thei
r com
pone
nts u
sed
in th
is th
esis
N
U-A
GE
Who
le g
rain
s, 4
-6/d
Fr
uits
, ≥2/
d Ve
geta
bles
, ≥30
0g/d
Legu
mes
, ≥20
0g/w
k
Nut
s, ≥
2/w
k
Low
-fat d
airy
, 500
ml/d
Low
-fat c
hees
e, 3
0g/d
Low
-fat m
eat a
nd p
oultr
y, 4
/wk
Fish
, 2/w
k
Eggs
, 2-4
/wk
Oliv
e oi
l, ≥2
0g/d
Swee
ts, l
imite
d us
e
Sodi
um, <
2000
mg/
d
Men
: ≤20
g, w
omen
: ≤10
g
≥150
0ml/d
10 u
g/d
(sup
plem
ent)
0-16
0
Abbr
evia
tions
: d; d
ay, w
k; w
eek,
m; m
eal,
tbs;
tabl
espo
on
a Med
iterr
anea
n ex
ampl
e fr
om P
anag
iota
kos
[40]
. Fre
quen
tly sc
orin
g m
etho
ds fo
r the
MeD
i inc
lude
qui
ntile
rank
s and
scor
es ra
ngin
g fr
om 1
-3, 4
-6 a
nd 7
-9 w
hen
9 M
eDi c
ompo
nent
s are
be
ing
used
. b T
he H
DI sc
ore
was
bas
ed o
n th
e W
HO g
uide
lines
for a
hea
lthy
diet
[30,
41]
, inc
ludi
ng se
ven
item
s for
whi
ch in
form
atio
n w
as a
vaila
ble
in a
ll st
udie
d co
hort
s, a
pply
ing
an a
dapt
ed c
ontin
uous
sc
orin
g sy
stem
[42]
c A
n al
tern
ate
DASH
scor
e w
as u
sed,
bas
ed o
n th
e pr
evio
usly
des
crib
ed D
ASH
scor
e [4
3], a
nd u
niqu
ely
addi
ng M
UFA
and
PU
FA to
the
orig
inal
DAS
H di
et. T
he sc
orin
g of
the
DASH
die
t was
ba
sed
on q
uint
ile ra
nks a
ccor
ding
to th
e po
pula
tion’
s int
ake
dist
ribut
ion.
The
plu
s sig
n in
dica
tes a
dequ
acy
com
pone
nts,
the
min
us si
gn in
dica
tes c
ompo
nent
s to
limit.
Val
ues i
n br
acke
ts a
re
mea
n in
take
val
ues i
n th
e fif
th q
uint
ile.
d MIN
D di
et a
dapt
ed fr
om M
orris
et a
l.[44
]
MIN
Dd
Who
le g
rain
s, ≥
3/d
Berr
ies,
≥2/
wk
Gree
n le
afy
vege
tabl
es, ≥
6/w
k
Oth
er v
eget
able
s, ≥
1/w
k
Nut
s, ≥
5/w
k
Bean
s, >
3mea
ls/w
k
Chee
se, <
1/w
k
Red
mea
t and
pro
duct
s, <
4 m
eals/
wk
Poul
try
(not
frie
d), ≥
2 m
eals/
wk
l/k
Fish
(not
frie
d), ≥
1
Oliv
e oi
l, pr
imar
y so
urce
Butt
er, m
arga
rine,
<1t
bs/d
Fast
frie
d fo
ods,
<1/
wk
Past
ries a
nd sw
eets
, <5/
wk
Win
e, 1
gla
ss/d
0-15
DASH
c
Who
le g
rain
s + (2
.1)
Frui
ts +
(3.4
) Ve
geta
bles
+ (4
.8)
Nut
s and
legu
mes
+ (1
.0)
Low
-fat d
airy
+ (1
.5)
Red
and
proc
esse
d m
eat –
(0.5
)
MU
FA p
lus P
UFA
, mg/
d +
(29.
4mg)
Swee
tene
d be
vera
ges –
(0.1
)
Sodi
um, m
g/d
– (2
168)
0-45
HDIb
Frui
ts a
nd v
eget
able
s ≥40
0g/d
Pr
otei
n 10
-15
en%
Satu
rate
d fa
tty
acid
s <10
en%
Chol
este
rol <
300m
g/d
PUFA
6-1
0 en
%
Mon
o-an
d di
sacc
harid
es <
10en
%
0-70
Med
iterr
anea
na
Non
-ref
ined
gra
ins,
>4/
d Fr
uits
, >3/
d Ve
geta
bles
>4/
d
Pota
toes
, >2/
d
Legu
mes
, nut
s and
bea
ns, ,
>6/
wk
Full-
fat d
airy
, ≤10
/wk
Red
mea
t, ≤1
/wk
Poul
try,
≤3/
wk
Fish
, >6/
wk
Oliv
e oi
l, ≥1
/d
Diet
ary
fibre
≥25
g/d
Alco
hol,
1-30
0ml/d
0-55
, 0-9
Com
pone
nts
Grai
ns
Frui
ts
Vege
tabl
es
Nut
s
Dairy
Mea
t
Fish
Prot
ein
Fat
Swee
ts
Fibr
e
Sodi
um
Alco
hol
Flui
d
Vita
min
D
Scor
e

1
Chapter 1 | General introduction
12
Dietary patterns; a more powerful approach to study nutrition Because people do not consume single nutrients but rather a combination of nutrients and foods within a complete diet, the research field has shifted towards studying dietary patterns. Studying dietary patterns allows one to combine the synergistic effects of single nutrients [20-22]. Thus, studying dietary patterns could be a more powerful approach and also more relevant to the general public to unravel the role of diets for a healthier cognitive ageing.
For dietary patterns, roughly three main biological mechanisms have been proposed by which diet could potentially protect against dementia risk and cognitive decline, relating to: 1) the vascular system (e.g., aortic stiffness [23] or microvascular function [24]), 2) oxidative stress (e.g., free radicals and brain protection or damage [25], or loss of neuronal homeostasis and neurodegenerative diseases development [26]) and 3) attenuation of the inflammatory pathway (e.g., microglial priming [27, 28].
Dietary patterns have frequently been studied in relation to, for example, cardiovascular health, but studying the association between dietary patterns and cognitive functioning is relatively new and less frequently done. Especially intervention studies are lacking. As a result, the most effective dietary pattern that impacts brain health has not yet been found. Dietary patterns of interest include the Mediterranean diet [29], the Healthy Diet Indicator (HDI) [30], the Dietary Approaches to Stop Hypertension (DASH) diet [31], the Mediterranean-Dietary Approach to Systolic Hypertension diet intervention for neurodegenerative delay (MIND) diet [32], and the NUtrients and AGEing (NU-AGE) diet [33]. All these dietary patterns are based on prior knowledge – so called a priori or knowledge based dietary patterns – as opposed to a posteriori (data driven) dietary patterns. A priori dietary patterns can be based on the observation of a healthy dietary pattern within a population, for example the Mediterranean diet. Alternatively, a priori dietary patterns can be based on dietary recommendations (NU-AGE diet), or components that have been associated with certain health outcomes, such as the HDI, the DASH diet and the MIND diet. Table 1 provides an overview of dietary components included in each of the dietary patterns.
Mediterranean Diet The Mediterranean diet is an example of a healthful dietary pattern observed within a specific population as it is a collection of eating habits traditionally followed by people living in the Mediterranean. This diet is characterized by a high intake of olive oil, fruit, vegetables and legumes, a moderate intake of fish and red wine during meals [34] (table 1). The Mediterranean diet is one of the dietary patterns that is most frequently studied in relation to cognitive functioning.
At the start of this thesis in 2011, there were very few publications about the Mediterranean diet and cognitive decline or dementia. Nicolas Scarmeas was one of the first researchers reporting a reduced risk of AD among American older adults with the highest adherence to Mediterranean diet in a prospective study [35] and a case-control study [36]. In the same cohort, Scarmeas demonstrated a reduced risk of (MCI) with higher adherence to the Mediterranean diet [37]. A slower rate of cognitive decline was reported among another population of French older adults with the highest adherence to the Mediterranean diet [38] and the risk of incidence MCI or dementia was reduced in subjects with a high Mediterranean diet score in an Australian cohort [39].
13
Tabl
e 1.
Ove
rvie
w o
f die
tary
pat
tern
s and
thei
r com
pone
nts u
sed
in th
is th
esis
N
U-A
GE
Who
le g
rain
s, 4
-6/d
Fr
uits
, ≥2/
d Ve
geta
bles
, ≥30
0g/d
Legu
mes
, ≥20
0g/w
k
Nut
s, ≥
2/w
k
Low
-fat d
airy
, 500
ml/d
Low
-fat c
hees
e, 3
0g/d
Low
-fat m
eat a
nd p
oultr
y, 4
/wk
Fish
, 2/w
k
Eggs
, 2-4
/wk
Oliv
e oi
l, ≥2
0g/d
Swee
ts, l
imite
d us
e
Sodi
um, <
2000
mg/
d
Men
: ≤20
g, w
omen
: ≤10
g
≥150
0ml/d
10 u
g/d
(sup
plem
ent)
0-16
0
Abbr
evia
tions
: d; d
ay, w
k; w
eek,
m; m
eal,
tbs;
tabl
espo
on
a Med
iterr
anea
n ex
ampl
e fr
om P
anag
iota
kos
[40]
. Fre
quen
tly sc
orin
g m
etho
ds fo
r the
MeD
i inc
lude
qui
ntile
rank
s and
scor
es ra
ngin
g fr
om 1
-3, 4
-6 a
nd 7
-9 w
hen
9 M
eDi c
ompo
nent
s are
be
ing
used
. b T
he H
DI sc
ore
was
bas
ed o
n th
e W
HO g
uide
lines
for a
hea
lthy
diet
[30,
41]
, inc
ludi
ng se
ven
item
s for
whi
ch in
form
atio
n w
as a
vaila
ble
in a
ll st
udie
d co
hort
s, a
pply
ing
an a
dapt
ed c
ontin
uous
sc
orin
g sy
stem
[42]
c A
n al
tern
ate
DASH
scor
e w
as u
sed,
bas
ed o
n th
e pr
evio
usly
des
crib
ed D
ASH
scor
e [4
3], a
nd u
niqu
ely
addi
ng M
UFA
and
PU
FA to
the
orig
inal
DAS
H di
et. T
he sc
orin
g of
the
DASH
die
t was
ba
sed
on q
uint
ile ra
nks a
ccor
ding
to th
e po
pula
tion’
s int
ake
dist
ribut
ion.
The
plu
s sig
n in
dica
tes a
dequ
acy
com
pone
nts,
the
min
us si
gn in
dica
tes c
ompo
nent
s to
limit.
Val
ues i
n br
acke
ts a
re
mea
n in
take
val
ues i
n th
e fif
th q
uint
ile.
d MIN
D di
et a
dapt
ed fr
om M
orris
et a
l.[44
]
MIN
Dd
Who
le g
rain
s, ≥
3/d
Berr
ies,
≥2/
wk
Gree
n le
afy
vege
tabl
es, ≥
6/w
k
Oth
er v
eget
able
s, ≥
1/w
k
Nut
s, ≥
5/w
k
Bean
s, >
3mea
ls/w
k
Chee
se, <
1/w
k
Red
mea
t and
pro
duct
s, <
4 m
eals/
wk
Poul
try
(not
frie
d), ≥
2 m
eals/
wk
l/k
Fish
(not
frie
d), ≥
1
Oliv
e oi
l, pr
imar
y so
urce
Butt
er, m
arga
rine,
<1t
bs/d
Fast
frie
d fo
ods,
<1/
wk
Past
ries a
nd sw
eets
, <5/
wk
Win
e, 1
gla
ss/d
0-15
DASH
c
Who
le g
rain
s + (2
.1)
Frui
ts +
(3.4
) Ve
geta
bles
+ (4
.8)
Nut
s and
legu
mes
+ (1
.0)
Low
-fat d
airy
+ (1
.5)
Red
and
proc
esse
d m
eat –
(0.5
)
MU
FA p
lus P
UFA
, mg/
d +
(29.
4mg)
Swee
tene
d be
vera
ges –
(0.1
)
Sodi
um, m
g/d
– (2
168)
0-45
HDIb
Frui
ts a
nd v
eget
able
s ≥40
0g/d
Pr
otei
n 10
-15
en%
Satu
rate
d fa
tty
acid
s <10
en%
Chol
este
rol <
300m
g/d
PUFA
6-1
0 en
%
Mon
o-an
d di
sacc
harid
es <
10en
%
0-70
Med
iterr
anea
na
Non
-ref
ined
gra
ins,
>4/
d Fr
uits
, >3/
d Ve
geta
bles
>4/
d
Pota
toes
, >2/
d
Legu
mes
, nut
s and
bea
ns, ,
>6/
wk
Full-
fat d
airy
, ≤10
/wk
Red
mea
t, ≤1
/wk
Poul
try,
≤3/
wk
Fish
, >6/
wk
Oliv
e oi
l, ≥1
/d
Diet
ary
fibre
≥25
g/d
Alco
hol,
1-30
0ml/d
0-55
, 0-9
Com
pone
nts
Grai
ns
Frui
ts
Vege
tabl
es
Nut
s
Dairy
Mea
t
Fish
Prot
ein
Fat
Swee
ts
Fibr
e
Sodi
um
Alco
hol
Flui
d
Vita
min
D
Scor
e

Chapter 1 | General introduction
14
Since then, the interest on the association between the Mediterranean diet and cognitive functioning has increased enormously. Dozens of publications were added, of which the majority of the observational studies demonstrated an association between higher adherence to the Mediterranean diet and cognitive function [45, 46], cognitive decline [47-49], AD [50], or (mild) cognitive impairment [46, 50, 51], and a few reported no association [52-54]. Only one intervention study has been conducted to date, reporting less cognitive decline among participants following the Mediterranean compared to a control group [55]. Another trial reported no association [56], but it was argued that this could be due to an enormous time gap between dietary assessment (1994-1996) and cognitive assessment (2007-2009) [57]. A review including studies up to January 2012 concluded that higher adherence to the Mediterranean diet was associated with better cognitive function, lower rates of cognitive decline and a reduced risk of AD in nine out of 12 studies whereas results for MCI were inconsistent [58]. A meta-analysis up to October 2012 including eight studies reported a lower risk of cognitive impairment for those with higher adherence to the Mediterranean diet [59] and another meta-analysis up to November 2012 including five studies on MCI or AD with a follow-up of at least one year reported a reduced risk of developing MCI and AD and a reduced risk for progressing from MCI to AD [60]. At last, the most recent review based on 14 different cohorts concluded that the role of a Mediterranean diet is not consistent across the many cohorts [61]. Given all this evidence, the Mediterranean diet seems a promising diet to postpone cognitive decline, however, results are mainly based on observational studies and not consistent yet.
Healthy Diet Indicator The Healthy Diet Indicator (HDI) [30] has been identified as another interesting dietary pattern to impact cognitive functioning. This indicator captures a more general healthy dietary pattern, mainly based on nutrients instead of foods, which is more globally applicable (table 1). The HDI is a tool to classify a healthy diet according to the guidelines of the World Health Organization published in 1990 [62], including high intakes of fruits, vegetables and fibre and limited intakes of saturated fatty acids, sodium and sugars. These guidelines were developed to reduce chronic diseases, such as hypertension. As hypertension has been shown to impact cognitive functioning [63-65], it has been hypothesized that the HDI could also reduce cognitive decline. The HDI has been cross-sectionally investigated in relation to cognitive functioning in 1998 and 2001 [66, 67], showing a tendency towards a lower prevalence of cognitive impairment with greater adherence to the HDI. Since then, the HDI has been updated [42] based on the latest scientific knowledge and lessons learned from implementing national intervention strategies to reduce the burden of chronic diseases [41]. The updated HDI has recently been investigated in relation to cardiovascular mortality demonstrating an inverse association with greater HDI adherence [42, 68-70]. However, the updated HDI has not yet been related to cognitive functioning. As cardiovascular health could be one strategy to impact cognitive functioning, the updated HDI seems to be a potential dietary pattern to contribute to healthier cognitive ageing.
15
Dietary Approach to Stop Hypertension diet A dietary pattern that has increasingly received attention is the Dietary Approach to Stop Hypertension (DASH) diet. The DASH diet specifies high intakes of fruits, vegetables, low-fat dairy products, whole grains, poultry, fish, and nuts and low intakes of fats, red meat, sweets and sugar-containing beverages [31, 71] (table 1), and has been shown to lower blood pressure [31, 72]. It has been hypothesized that the DASH diet could impact cognitive functioning, as high blood pressure is associated with higher risk of MCI [73], vascular dementia [74], and neurocognitive deficits [63]. Studies demonstrating an association between the DASH diet and cognitive functioning are limited. Two observational studies reported a slower cognitive decline rate with greater DASH adherence after 4.7 years [75] and 11 years of follow-up [76]. To date, there is only one trial on the effect of the DASH diet on cognitive functioning, demonstrating that there was an improvement in psychomotor speed compared with the usual diet control among sedentary and overweight/obese individuals with prehypertension and hypertension [77].
Mediterranean-DASH Intervention for Neurodegenerative Delay diet A more recently defined dietary pattern is the Mediterranean-dietary approach to stop hypertension (DASH) diet Intervention for Neurodegenerative Delay (MIND) diet that specifically captures dietary components shown to be neuroprotective [32]. This diet has been developed based on the most recent knowledge and evidence from mostly observational studies targeting brain health in humans and animal experiments. The MIND diet uniquely specifies the consumption of green leafy vegetables and berries (table 1). To date, two observational studies have been conducted demonstrating less cognitive decline [32] and a lower risk of AD [44] for those with the highest MIND diet scores [32, 44].
NU-AGE diet Given the many observational studies, but very limited number of intervention studies on healthful dietary patterns and cognitive functioning, there is a need for well-designed randomized dietary intervention studies. The NU-AGE (NUtrients and AGEing) dietary intervention study aimed to improve healthy ageing of a European population by means of a diet based on nutritional recommendations for the ageing population (table 1). This approach was taken because dietary intakes of adults aged 60 years and older are often below what is recommended. The prevalence of inadequate dietary intakes in European elderly was above 20% for vitamin D, folic acid, calcium, selenium and iodine [78]. With respect to malnutrition as assessed with the Mini Nutritional Assessment tool, 3% of people with mild to moderate AD were malnourished [79], up to 50% of patients with severe AD [80]. The NU-AGE study aimed at developing a dietary pattern that does not only meet the dietary habits and preferences of older adults but also uniquely targets the dietary recommendations of the ageing population.

1
Chapter 1 | General introduction
14
Since then, the interest on the association between the Mediterranean diet and cognitive functioning has increased enormously. Dozens of publications were added, of which the majority of the observational studies demonstrated an association between higher adherence to the Mediterranean diet and cognitive function [45, 46], cognitive decline [47-49], AD [50], or (mild) cognitive impairment [46, 50, 51], and a few reported no association [52-54]. Only one intervention study has been conducted to date, reporting less cognitive decline among participants following the Mediterranean compared to a control group [55]. Another trial reported no association [56], but it was argued that this could be due to an enormous time gap between dietary assessment (1994-1996) and cognitive assessment (2007-2009) [57]. A review including studies up to January 2012 concluded that higher adherence to the Mediterranean diet was associated with better cognitive function, lower rates of cognitive decline and a reduced risk of AD in nine out of 12 studies whereas results for MCI were inconsistent [58]. A meta-analysis up to October 2012 including eight studies reported a lower risk of cognitive impairment for those with higher adherence to the Mediterranean diet [59] and another meta-analysis up to November 2012 including five studies on MCI or AD with a follow-up of at least one year reported a reduced risk of developing MCI and AD and a reduced risk for progressing from MCI to AD [60]. At last, the most recent review based on 14 different cohorts concluded that the role of a Mediterranean diet is not consistent across the many cohorts [61]. Given all this evidence, the Mediterranean diet seems a promising diet to postpone cognitive decline, however, results are mainly based on observational studies and not consistent yet.
Healthy Diet Indicator The Healthy Diet Indicator (HDI) [30] has been identified as another interesting dietary pattern to impact cognitive functioning. This indicator captures a more general healthy dietary pattern, mainly based on nutrients instead of foods, which is more globally applicable (table 1). The HDI is a tool to classify a healthy diet according to the guidelines of the World Health Organization published in 1990 [62], including high intakes of fruits, vegetables and fibre and limited intakes of saturated fatty acids, sodium and sugars. These guidelines were developed to reduce chronic diseases, such as hypertension. As hypertension has been shown to impact cognitive functioning [63-65], it has been hypothesized that the HDI could also reduce cognitive decline. The HDI has been cross-sectionally investigated in relation to cognitive functioning in 1998 and 2001 [66, 67], showing a tendency towards a lower prevalence of cognitive impairment with greater adherence to the HDI. Since then, the HDI has been updated [42] based on the latest scientific knowledge and lessons learned from implementing national intervention strategies to reduce the burden of chronic diseases [41]. The updated HDI has recently been investigated in relation to cardiovascular mortality demonstrating an inverse association with greater HDI adherence [42, 68-70]. However, the updated HDI has not yet been related to cognitive functioning. As cardiovascular health could be one strategy to impact cognitive functioning, the updated HDI seems to be a potential dietary pattern to contribute to healthier cognitive ageing.
15
Dietary Approach to Stop Hypertension diet A dietary pattern that has increasingly received attention is the Dietary Approach to Stop Hypertension (DASH) diet. The DASH diet specifies high intakes of fruits, vegetables, low-fat dairy products, whole grains, poultry, fish, and nuts and low intakes of fats, red meat, sweets and sugar-containing beverages [31, 71] (table 1), and has been shown to lower blood pressure [31, 72]. It has been hypothesized that the DASH diet could impact cognitive functioning, as high blood pressure is associated with higher risk of MCI [73], vascular dementia [74], and neurocognitive deficits [63]. Studies demonstrating an association between the DASH diet and cognitive functioning are limited. Two observational studies reported a slower cognitive decline rate with greater DASH adherence after 4.7 years [75] and 11 years of follow-up [76]. To date, there is only one trial on the effect of the DASH diet on cognitive functioning, demonstrating that there was an improvement in psychomotor speed compared with the usual diet control among sedentary and overweight/obese individuals with prehypertension and hypertension [77].
Mediterranean-DASH Intervention for Neurodegenerative Delay diet A more recently defined dietary pattern is the Mediterranean-dietary approach to stop hypertension (DASH) diet Intervention for Neurodegenerative Delay (MIND) diet that specifically captures dietary components shown to be neuroprotective [32]. This diet has been developed based on the most recent knowledge and evidence from mostly observational studies targeting brain health in humans and animal experiments. The MIND diet uniquely specifies the consumption of green leafy vegetables and berries (table 1). To date, two observational studies have been conducted demonstrating less cognitive decline [32] and a lower risk of AD [44] for those with the highest MIND diet scores [32, 44].
NU-AGE diet Given the many observational studies, but very limited number of intervention studies on healthful dietary patterns and cognitive functioning, there is a need for well-designed randomized dietary intervention studies. The NU-AGE (NUtrients and AGEing) dietary intervention study aimed to improve healthy ageing of a European population by means of a diet based on nutritional recommendations for the ageing population (table 1). This approach was taken because dietary intakes of adults aged 60 years and older are often below what is recommended. The prevalence of inadequate dietary intakes in European elderly was above 20% for vitamin D, folic acid, calcium, selenium and iodine [78]. With respect to malnutrition as assessed with the Mini Nutritional Assessment tool, 3% of people with mild to moderate AD were malnourished [79], up to 50% of patients with severe AD [80]. The NU-AGE study aimed at developing a dietary pattern that does not only meet the dietary habits and preferences of older adults but also uniquely targets the dietary recommendations of the ageing population.

Chapter 1 | General introduction
16
Aim and outline of this thesis As outlined above, it is important to find dietary strategies for healthier cognitive ageing. There is quite some observational evidence demonstrating a link between diet and cognitive functioning. However, evidence from randomized controlled trials on the effect of a healthful diet on cognitive functioning is lacking. Moreover, it is not clear which dietary pattern is most suitable to impact cognitive functioning in an ageing population. The main aim of the thesis was to study the association of healthful dietary patterns with cognitive functioning. In addition, nutrient intake inadequacies were assessed and the potential to change dietary intake in older adults aged 65 years and older was studied. This thesis will add evidence to the link between dietary patterns and cognitive functioning by describing results from a wide range of studies, including a literature review, observational studies and an intervention study. Chapter 2 presents a cross-sectional description of current dietary intake in a Dutch population of adults aged 65 years and older. Chapter 3 includes a review about the current evidence on the association between dietary patterns, including the Mediterranean diet, the Dietary Approaches to Stop Hypertension (DASH) diet, and the Healthy Diet Indicator (HDI), with cognitive function and decline. In the following three chapters the HDI (chapter 4), the DASH diet (chapter 5) and the Mediterranean-DASH Intervention for Neurodegenerative Delay (MIND) diet (chapter 6) are prospectively studied in relation to cognitive function and decline within a large population including over 16,000 American women aged 70 years and older. The last chapters of this thesis cover the NU-AGE (NUtrients and AGEing) dietary intervention study. Chapter 7 provides an overview and the design of the NU-AGE dietary intervention study with the aim to improve dietary intakes of a European population aged 65 years and older for healthier ageing. Chapter 8 presents results of analyses to study if dietary intake of this European population of older adults shifts more towards their dietary recommendations. Additionally this paper describes the development and application of the NU-AGE diet index. The effects of the changes in the dietary intakes within the NU-AGE intervention on cognitive functioning are described in chapter 9. At last, chapter 10 gives an overall reflection on the studies that are presented in this thesis.
17
References 1. United Nations. Department of Economic and Social Affairs. Population Division. World Populations Prospects: The 2015
revision. Key Findings and Advance Tables. 2015. 2. Life expectancy - Data by WHO region [Internet]. 2016 [cited 01-03-2017]. Available from:
http://apps.who.int/gho/data/view.main.SDG2016LEXREGv?lang=en 3. Healthy life years statistics [Internet]. 2016 [cited 01-03-2017]. Available from: http://ec.europa.eu/eurostat/statistics-
explained/index.php/Healthy_life_years_statistics. 4. Salthouse TA. Major issues in cognitive aging. New York: Oxford University Press; 2010. 5. Alzheimer's Association. 2015 Alzheimer's disease facts and figures. Alzheimer's & Dementia. 2015;11(3):332-84. 6. Alzheimer’s disease international. World Alzheimer Report 2015. The Global Impact of Dementia An analysis of
prevalence, incidence, cost and trends. 2015. 7. Cummings JL, Morstorf T, Zhong K. Alzheimer's disease drug-development pipeline: few candidates, frequent failures.
Alzheimer's research & therapy. 2014;6(4):37. 8. UCI Institute for Memory Impairments and Neurological Disorders. UCI MIND 2015 [cited 2017 28-03-2017]. Available
from: https://www.mind.uci.edu/alzheimers-disease/what-is-alzheimers/mild-cognitive-impairment/. 9. Farrer LA, Cupples L, Haines JL, et al. Effects of age, sex, and ethnicity on the association between apolipoprotein e
genotype and alzheimer disease: A meta-analysis. JAMA. 1997;278(16):1349-56. 10. Fratiglioni L, Ahlbom A, Viitanen M, Winblad B. Risk factors for late- onset Alzheimer's disease: A population- based,
case-control study. Annals of neurology. 1993;33(3):258-66. 11. Green RC, Cupples L, Go R, et al. Risk of dementia among white and african american relatives of patients with
alzheimer disease. JAMA. 2002;287(3):329-36. 12. Saunders AM, Strittmatter WJ, Schmechel D, George-Hyslop PH, Pericak-Vance MA, Joo SH, et al. Association of
apolipoprotein E allele epsilon 4 with late-onset familial and sporadic Alzheimer's disease. Neurology. 1993;43(8):1467-72.
13. Baumgart M, Snyder HM, Carrillo MC, Fazio S, Kim H, Johns H. Summary of the evidence on modifiable risk factors for cognitive decline and dementia: A population-based perspective. Alzheimer's & dementia : the journal of the Alzheimer's Association. 2015;11(6):718-26.
14. Tucker KL. Nutrient intake, nutritional status, and cognitive function with aging. Ann N Y Acad Sci. 2016;1367(1):38-49. 15. Janssen CI, Kiliaan AJ. Long-chain polyunsaturated fatty acids (LCPUFA) from genesis to senescence: the influence of
LCPUFA on neural development, aging, and neurodegeneration. Progress in lipid research. 2014;53:1-17. 16. Holub DJ, Holub BJ. Omega-3 fatty acids from fish oils and cardiovascular disease. Molecular and cellular biochemistry.
2004;263(1):217-25. 17. He K, Song Y, Daviglus ML, Liu K, Van Horn L, Dyer AR, et al. Fish consumption and incidence of stroke: a meta-analysis
of cohort studies. Stroke. 2004;35(7):1538-42. 18. Newman PE. Alzheimer's disease revisited. Medical hypotheses. 2000;54(5):774-6. 19. Harms LR, Burne TH, Eyles DW, McGrath JJ. Vitamin D and the brain. Best practice & research Clinical endocrinology &
metabolism. 2011;25(4):657-69. 20. Michels KB, Schulze MB. Can dietary patterns help us detect diet-disease associations? Nutr Res Rev. 2005;18(2):241-8. 21. Jacques PF, Tucker KL. Are dietary patterns useful for understanding the role of diet in chronic disease? Am J Clin Nutr.
2001;73(1):1-2. 22. Satija A, Yu E, Willett WC, Hu FB. Understanding nutritional epidemiology and its role in policy. Advances in nutrition.
2015;6(1):5-18. 23. Benetos A, Watfa G, Hanon O, Salvi P, Fantin F, Toulza O, et al. Pulse wave velocity is associated with 1-year cognitive
decline in the elderly older than 80 years: the PARTAGE study. J Am Med Dir Assoc. 2012;13(3):239-43. 24. Khalil Z, LoGiudice D, Khodr B, Maruff P, Masters C. Impaired peripheral endothelial microvascular responsiveness in
Alzheimer's disease. J Alzheimers Dis. 2007;11(1):25-32. 25. Chakrabarti S, Munshi S, Banerjee K, Thakurta IG, Sinha M, Bagh MB. Mitochondrial Dysfunction during Brain Aging:
Role of Oxidative Stress and Modulation by Antioxidant Supplementation. Aging and disease. 2011;2(3):242-56. 26. Wang X, Wang W, Li L, Perry G, Lee HG, Zhu X. Oxidative stress and mitochondrial dysfunction in Alzheimer's disease.
Biochimica et biophysica acta. 2014;1842(8):1240-7. 27. Alzheimer's Disease International. Nutrition and dementia. A review of available research. London: Alzheimer's Disease
International, 2014. 28. Perry VH, Holmes C. Microglial priming in neurodegenerative disease. Nature reviews Neurology. 2014;10(4):217-24. 29. Bach-Faig A, Berry EM, Lairon D, Reguant J, Trichopoulou A, Dernini S, et al. Mediterranean diet pyramid today. Science
and cultural updates. Public Health Nutr. 2011;14(12A):2274-84. 30. Huijbregts P, Feskens E, Rasanen L, Fidanza F, Nissinen A, Menotti A, et al. Dietary pattern and 20 year mortality in
elderly men in Finland, Italy, and The Netherlands: longitudinal cohort study. BMJ. 1997;315(7099):13-7. 31. Appel LJ, Moore TJ, Obarzanek E, Vollmer WM, Svetkey LP, Sacks FM, et al. A clinical trial of the effects of dietary
patterns on blood pressure. DASH Collaborative Research Group. N Engl J Med. 1997;336(16):1117-24. 32. Morris MC, Tangney CC, Wang Y, Sacks FM, Barnes LL, Bennett DA, et al. MIND diet slows cognitive decline with aging.
Alzheimers Dement. 2015;11(9):1015-22.

1
Chapter 1 | General introduction
16
Aim and outline of this thesis As outlined above, it is important to find dietary strategies for healthier cognitive ageing. There is quite some observational evidence demonstrating a link between diet and cognitive functioning. However, evidence from randomized controlled trials on the effect of a healthful diet on cognitive functioning is lacking. Moreover, it is not clear which dietary pattern is most suitable to impact cognitive functioning in an ageing population. The main aim of the thesis was to study the association of healthful dietary patterns with cognitive functioning. In addition, nutrient intake inadequacies were assessed and the potential to change dietary intake in older adults aged 65 years and older was studied. This thesis will add evidence to the link between dietary patterns and cognitive functioning by describing results from a wide range of studies, including a literature review, observational studies and an intervention study. Chapter 2 presents a cross-sectional description of current dietary intake in a Dutch population of adults aged 65 years and older. Chapter 3 includes a review about the current evidence on the association between dietary patterns, including the Mediterranean diet, the Dietary Approaches to Stop Hypertension (DASH) diet, and the Healthy Diet Indicator (HDI), with cognitive function and decline. In the following three chapters the HDI (chapter 4), the DASH diet (chapter 5) and the Mediterranean-DASH Intervention for Neurodegenerative Delay (MIND) diet (chapter 6) are prospectively studied in relation to cognitive function and decline within a large population including over 16,000 American women aged 70 years and older. The last chapters of this thesis cover the NU-AGE (NUtrients and AGEing) dietary intervention study. Chapter 7 provides an overview and the design of the NU-AGE dietary intervention study with the aim to improve dietary intakes of a European population aged 65 years and older for healthier ageing. Chapter 8 presents results of analyses to study if dietary intake of this European population of older adults shifts more towards their dietary recommendations. Additionally this paper describes the development and application of the NU-AGE diet index. The effects of the changes in the dietary intakes within the NU-AGE intervention on cognitive functioning are described in chapter 9. At last, chapter 10 gives an overall reflection on the studies that are presented in this thesis.
17
References 1. United Nations. Department of Economic and Social Affairs. Population Division. World Populations Prospects: The 2015
revision. Key Findings and Advance Tables. 2015. 2. Life expectancy - Data by WHO region [Internet]. 2016 [cited 01-03-2017]. Available from:
http://apps.who.int/gho/data/view.main.SDG2016LEXREGv?lang=en 3. Healthy life years statistics [Internet]. 2016 [cited 01-03-2017]. Available from: http://ec.europa.eu/eurostat/statistics-
explained/index.php/Healthy_life_years_statistics. 4. Salthouse TA. Major issues in cognitive aging. New York: Oxford University Press; 2010. 5. Alzheimer's Association. 2015 Alzheimer's disease facts and figures. Alzheimer's & Dementia. 2015;11(3):332-84. 6. Alzheimer’s disease international. World Alzheimer Report 2015. The Global Impact of Dementia An analysis of
prevalence, incidence, cost and trends. 2015. 7. Cummings JL, Morstorf T, Zhong K. Alzheimer's disease drug-development pipeline: few candidates, frequent failures.
Alzheimer's research & therapy. 2014;6(4):37. 8. UCI Institute for Memory Impairments and Neurological Disorders. UCI MIND 2015 [cited 2017 28-03-2017]. Available
from: https://www.mind.uci.edu/alzheimers-disease/what-is-alzheimers/mild-cognitive-impairment/. 9. Farrer LA, Cupples L, Haines JL, et al. Effects of age, sex, and ethnicity on the association between apolipoprotein e
genotype and alzheimer disease: A meta-analysis. JAMA. 1997;278(16):1349-56. 10. Fratiglioni L, Ahlbom A, Viitanen M, Winblad B. Risk factors for late- onset Alzheimer's disease: A population- based,
case-control study. Annals of neurology. 1993;33(3):258-66. 11. Green RC, Cupples L, Go R, et al. Risk of dementia among white and african american relatives of patients with
alzheimer disease. JAMA. 2002;287(3):329-36. 12. Saunders AM, Strittmatter WJ, Schmechel D, George-Hyslop PH, Pericak-Vance MA, Joo SH, et al. Association of
apolipoprotein E allele epsilon 4 with late-onset familial and sporadic Alzheimer's disease. Neurology. 1993;43(8):1467-72.
13. Baumgart M, Snyder HM, Carrillo MC, Fazio S, Kim H, Johns H. Summary of the evidence on modifiable risk factors for cognitive decline and dementia: A population-based perspective. Alzheimer's & dementia : the journal of the Alzheimer's Association. 2015;11(6):718-26.
14. Tucker KL. Nutrient intake, nutritional status, and cognitive function with aging. Ann N Y Acad Sci. 2016;1367(1):38-49. 15. Janssen CI, Kiliaan AJ. Long-chain polyunsaturated fatty acids (LCPUFA) from genesis to senescence: the influence of
LCPUFA on neural development, aging, and neurodegeneration. Progress in lipid research. 2014;53:1-17. 16. Holub DJ, Holub BJ. Omega-3 fatty acids from fish oils and cardiovascular disease. Molecular and cellular biochemistry.
2004;263(1):217-25. 17. He K, Song Y, Daviglus ML, Liu K, Van Horn L, Dyer AR, et al. Fish consumption and incidence of stroke: a meta-analysis
of cohort studies. Stroke. 2004;35(7):1538-42. 18. Newman PE. Alzheimer's disease revisited. Medical hypotheses. 2000;54(5):774-6. 19. Harms LR, Burne TH, Eyles DW, McGrath JJ. Vitamin D and the brain. Best practice & research Clinical endocrinology &
metabolism. 2011;25(4):657-69. 20. Michels KB, Schulze MB. Can dietary patterns help us detect diet-disease associations? Nutr Res Rev. 2005;18(2):241-8. 21. Jacques PF, Tucker KL. Are dietary patterns useful for understanding the role of diet in chronic disease? Am J Clin Nutr.
2001;73(1):1-2. 22. Satija A, Yu E, Willett WC, Hu FB. Understanding nutritional epidemiology and its role in policy. Advances in nutrition.
2015;6(1):5-18. 23. Benetos A, Watfa G, Hanon O, Salvi P, Fantin F, Toulza O, et al. Pulse wave velocity is associated with 1-year cognitive
decline in the elderly older than 80 years: the PARTAGE study. J Am Med Dir Assoc. 2012;13(3):239-43. 24. Khalil Z, LoGiudice D, Khodr B, Maruff P, Masters C. Impaired peripheral endothelial microvascular responsiveness in
Alzheimer's disease. J Alzheimers Dis. 2007;11(1):25-32. 25. Chakrabarti S, Munshi S, Banerjee K, Thakurta IG, Sinha M, Bagh MB. Mitochondrial Dysfunction during Brain Aging:
Role of Oxidative Stress and Modulation by Antioxidant Supplementation. Aging and disease. 2011;2(3):242-56. 26. Wang X, Wang W, Li L, Perry G, Lee HG, Zhu X. Oxidative stress and mitochondrial dysfunction in Alzheimer's disease.
Biochimica et biophysica acta. 2014;1842(8):1240-7. 27. Alzheimer's Disease International. Nutrition and dementia. A review of available research. London: Alzheimer's Disease
International, 2014. 28. Perry VH, Holmes C. Microglial priming in neurodegenerative disease. Nature reviews Neurology. 2014;10(4):217-24. 29. Bach-Faig A, Berry EM, Lairon D, Reguant J, Trichopoulou A, Dernini S, et al. Mediterranean diet pyramid today. Science
and cultural updates. Public Health Nutr. 2011;14(12A):2274-84. 30. Huijbregts P, Feskens E, Rasanen L, Fidanza F, Nissinen A, Menotti A, et al. Dietary pattern and 20 year mortality in
elderly men in Finland, Italy, and The Netherlands: longitudinal cohort study. BMJ. 1997;315(7099):13-7. 31. Appel LJ, Moore TJ, Obarzanek E, Vollmer WM, Svetkey LP, Sacks FM, et al. A clinical trial of the effects of dietary
patterns on blood pressure. DASH Collaborative Research Group. N Engl J Med. 1997;336(16):1117-24. 32. Morris MC, Tangney CC, Wang Y, Sacks FM, Barnes LL, Bennett DA, et al. MIND diet slows cognitive decline with aging.
Alzheimers Dement. 2015;11(9):1015-22.

Chapter 1 | General introduction
18
33. Berendsen A, Santoro A, Pini E, Cevenini E, Ostan R, Pietruszka B, et al. Reprint of: A parallel randomized trial on the effect of a healthful diet on inflammageing and its consequences in European elderly people: design of the NU-AGE dietary intervention study. Mechanisms of ageing and development. 2014;136-137:14-21.
34. Trichopoulou A, Lagiou P. Healthy Traditional Mediterranean Diet: An Expression of Culture, History, and Lifestyle. Nutrition Reviews. 1997;55(11):383-9.
35. Scarmeas N, Stern Y, Tang MX, Mayeux R, Luchsinger JA. Mediterranean diet and risk for Alzheimer's disease. Annals of neurology. 2006;59(6):912-21.
36. Scarmeas N, Stern Y, Mayeux R, Luchsinger JA. Mediterranean diet, Alzheimer disease, and vascular mediation. Arch Neurol. 2006;63(12):1709-17.
37. Scarmeas N, Stern Y, Mayeux R, Manly JJ, Schupf N, Luchsinger JA. Mediterranean diet and mild cognitive impairment. Arch Neurol. 2009;66(2):216-25.
38. Féart C, Samieri C, Rondeau V, Amieva H, Portet F, Dartigues JF, et al. Adherence to a mediterranean diet, cognitive decline, and risk of dementia. JAMA. 2009;302(6):638-48.
39. Roberts RO, Geda YE, Cerhan JR, Knopman DS, Cha RH, Christianson TJ, et al. Vegetables, unsaturated fats, moderate alcohol intake, and mild cognitive impairment. Dementia and geriatric cognitive disorders. 2010;29(5):413-23.
40. Panagiotakos DB, Pitsavos C, Arvaniti F, Stefanadis C. Adherence to the Mediterranean food pattern predicts the prevalence of hypertension, hypercholesterolemia, diabetes and obesity, among healthy adults; the accuracy of the MedDietScore. Preventive medicine. 2007;44(4):335-40.
41. Nishida C, Uauy R, Kumanyika S, Shetty P. The joint WHO/FAO expert consultation on diet, nutrition and the prevention of chronic diseases: process, product and policy implications. Public Health Nutr. 2004;7(1a):245-50 http://www.who.int/nutrition/publications/public_health_nut9.pdf.
42. Jankovic N, Geelen A, Streppel MT, de Groot LC, Orfanos P, van den Hooven EH, et al. Adherence to a healthy diet according to the world health organization guidelines and all-cause mortality in elderly adults from europe and the United States. Am J Epidemiol. 2014;180(10):978-88.
43. Fung TT, Chiuve SE, McCullough ML, Rexrode KM, Logroscino G, Hu FB. Adherence to a DASH-style diet and risk of coronary heart disease and stroke in women. Arch Intern Med. 2008;168(7):713-20.
44. Morris MC, Tangney CC, Wang Y, Sacks FM, Bennett DA, Aggarwal NT. MIND diet associated with reduced incidence of Alzheimer's disease. Alzheimers Dement. 2015;11(9):1007-14.
45. Samieri C, Okereke OI, Devore EE, Grodstein F. Long-term adherence to the Mediterranean diet is associated with overall cognitive status, but not cognitive decline, in women. J Nutr. 2013;143(4):493-9.
46. Ye X, Scott T, Gao X, Maras JE, Bakun PJ, Tucker KL. Mediterranean diet, healthy eating index 2005, and cognitive function in middle-aged and older puerto rican adults. Journal of the Academy of Nutrition and Dietetics. 2013;113(2):276-81.
47. Tangney CC, Kwasny MJ, Li H, Wilson RS, Evans DA, Morris MC. Adherence to a Mediterranean-type dietary pattern and cognitive decline in a community population. Am J Clin Nutr. 2011;93(3):601-7.
48. Tangney CC, Li H, Wang Y, Barnes L, Schneider JA, Bennett DA, et al. Relation of DASH- and Mediterranean-like dietary patterns to cognitive decline in older persons. Neurology. 2014;83(16):1410-6.
49. Trichopoulou A, Kyrozis A, Rossi M, Katsoulis M, Trichopoulos D, La Vecchia C, et al. Mediterranean diet and cognitive decline over time in an elderly Mediterranean population. European journal of nutrition. 2014;9:9.
50. Gardener S, Gu Y, Rainey-Smith SR, Keogh JB, Clifton PM, Mathieson SL, et al. Adherence to a Mediterranean diet and Alzheimer's disease risk in an Australian population. Translational psychiatry. 2012;2:e164.
51. Tsivgoulis G, Judd S, Letter AJ, Alexandrov AV, Howard G, Nahab F, et al. Adherence to a Mediterranean diet and risk of incident cognitive impairment. Neurology. 2013;80(18):1684-92.
52. Cherbuin N, Anstey KJ. The Mediterranean diet is not related to cognitive change in a large prospective investigation: the PATH Through Life study. Am J Geriatr Psychiatry. 2012;20(7):635-9.
53. Samieri C, Grodstein F, Rosner BA, Kang JH, Cook NR, Manson JE, et al. Mediterranean diet and cognitive function in older age. Epidemiology (Cambridge, Mass). 2013;24(4):490-9.
54. Vercambre MN, Grodstein F, Berr C, Kang JH. Mediterranean diet and cognitive decline in women with cardiovascular disease or risk factors. Journal of the Academy of Nutrition and Dietetics. 2012;112(6):816-23.
55. Valls-Pedret C, Sala-Vila A, Serra-Mir M, Corella D, de la Torre R, Martinez-Gonzalez MA, et al. Mediterranean Diet and Age-Related Cognitive Decline: A Randomized Clinical Trial. JAMA internal medicine. 2015;175(7):1094-103.
56. Kesse-Guyot E, Andreeva VA, Lassale C, Ferry M, Jeandel C, Hercberg S, et al. Mediterranean diet and cognitive function: a French study. Am J Clin Nutr. 2013;97(2):369-76.
57. Aalbers T, Baars L, Rikkert MO. The Mediterranean diet as prevention strategy for dementia as a multicausal geriatric syndrome. Am J Clin Nutr. 2013;97(6):1411.
58. Lourida I, Soni M, Thompson-Coon J, Purandare N, Lang IA, Ukoumunne OC, et al. Mediterranean diet, cognitive function, and dementia: a systematic review. Epidemiology (Cambridge, Mass). 2013;24(4):479-89.
59. Psaltopoulou T, Sergentanis TN, Panagiotakos DB, Sergentanis IN, Kosti R, Scarmeas N. Mediterranean diet, stroke, cognitive impairment, and depression: A meta-analysis. Annals of neurology. 2013;74(4):580-91.
60. Singh B, Parsaik AK, Mielke MM, Erwin PJ, Knopman DS, Petersen RC, et al. Association of mediterranean diet with mild cognitive impairment and Alzheimer's disease: a systematic review and meta-analysis. J Alzheimers Dis. 2014;39(2):271-82.
19
61. Tangney CC. DASH and Mediterranean-type Dietary Patterns to Maintain Cognitive Health. Curr Nutr Rep. 2014;3(1):51-61.
62. World Health Organization. Diet, nutrition, and the prevention of chronic diseases. Report of a WHO Study Group. World Health Organ Tech Rep Ser. 1990;797:1-204.
63. Duron E, Hanon O. Hypertension, cognitive decline and dementia. Arch Cardiovasc Dis. 2008;101(3):181-9. 64. Singh-Manoux A, Marmot M. High blood pressure was associated with cognitive function in middle-age in the Whitehall
II study. J Clin Epidemiol. 2005;58(12):1308-15. 65. Waldstein SR, Brown JR, Maier KJ, Katzel LI. Diagnosis of hypertension and high blood pressure levels negatively affect
cognitive function in older adults. Ann Behav Med. 2005;29(3):174-80. 66. Correa Leite ML, Nicolosi A, Cristina S, Hauser WA, Nappi G. Nutrition and cognitive deficit in the elderly: a population
study. Eur J Clin Nutr. 2001;55(12):1053-8. 67. Huijbregts PP, Feskens EJ, Rasanen L, Fidanza F, Alberti-Fidanza A, Nissinen A, et al. Dietary patterns and cognitive
function in elderly men in Finland, Italy and The Netherlands. Eur J Clin Nutr. 1998;52(11):826-31. 68. Jankovic N, Geelen A, Streppel MT, de Groot LC, Kiefte-de Jong JC, Orfanos P, et al. WHO guidelines for a healthy diet
and mortality from cardiovascular disease in European and American elderly: the CHANCES project. Am J Clin Nutr. 2015;102(4):745-56.
69. Knoops KT, Groot de LC, Fidanza F, Alberti-Fidanza A, Kromhout D, van Staveren WA. Comparison of three differentdietary scores in relation to 10-year mortality in elderly European subjects: the HALE project. Eur J Clin Nutr. 2006;60(6):746-55.
70. Stefler D, Pikhart H, Jankovic N, Kubinova R, Pajak A, Malyutina S, et al. Healthy diet indicator and mortality in EasternEuropean populations: prospective evidence from the HAPIEE cohort. Eur J Clin Nutr. 2014;68(12):1346-52.
71. Sacks FM, Obarzanek E, Windhauser MM, Svetkey LP, Vollmer WM, McCullough M, et al. Rationale and design of the Dietary Approaches to Stop Hypertension trial (DASH). A multicenter controlled-feeding study of dietary patterns tolower blood pressure. Annals of epidemiology. 1995;5(2):108-18.
72. Sacks FM, Campos H. Dietary therapy in hypertension. N Engl J Med. 2010;362(22):2102-12. 73. Kilander L, Nyman H, Boberg M, Hansson L, Lithell H. Hypertension is related to cognitive impairment: a 20-year follow-
up of 999 men. Hypertension. 1998;31(3):780-6. 74. Launer LJ, Ross GW, Petrovitch H, Masaki K, Foley D, White LR, et al. Midlife blood pressure and dementia: the
Honolulu-Asia aging study. Neurobiol Aging. 2000;21(1):49-55. 75. Tangney CC. Accordance To Dietary Approaches to Stop Hypertension (DASH) is associated with slower cognitive
decline. Oral Sessions: O1-05: Public Health and Psychosocial Focus: Epidemiology I—Cardiovascular Risks 2013.76. Wengreen H, Munger RG, Cutler A, Quach A, Bowles A, Corcoran C, et al. Prospective study of Dietary Approaches to
Stop Hypertension- and Mediterranean-style dietary patterns and age-related cognitive change: the Cache County Study on Memory, Health and Aging. Am J Clin Nutr. 2013;98(5):1263-71.
77. Smith PJ, Blumenthal JA, Babyak MA, Craighead L, Welsh-Bohmer KA, Browndyke JN, et al. Effects of the dietary approaches to stop hypertension diet, exercise, and caloric restriction on neurocognition in overweight adults with highblood pressure. Hypertension. 2010;55(6):1331-8.
78. Roman Vinas B, Ribas Barba L, Ngo J, Gurinovic M, Novakovic R, Cavelaars A, et al. Projected prevalence of inadequate nutrient intakes in Europe. Annals of nutrition & metabolism. 2011;59(2-4):84-95.
79. Guerin O, Soto ME, Brocker P, Robert PH, Benoit M, Vellas B. Nutritional status assessment during Alzheimer's disease:results after one year (the REAL French Study Group). J Nutr Health Aging. 2005;9(2):81-4.
80. Vellas B, Lauque S, Gillette-Guyonnet S, Andrieu S, Cortes F, Nourhashemi F, et al. Impact of nutritional status on the evolution of Alzheimer's disease and on response to acetylcholinesterase inhibitor treatment. J Nutr Health Aging. 2005;9(2):75-80.

1
Chapter 1 | General introduction
18
33. Berendsen A, Santoro A, Pini E, Cevenini E, Ostan R, Pietruszka B, et al. Reprint of: A parallel randomized trial on the effect of a healthful diet on inflammageing and its consequences in European elderly people: design of the NU-AGE dietary intervention study. Mechanisms of ageing and development. 2014;136-137:14-21.
34. Trichopoulou A, Lagiou P. Healthy Traditional Mediterranean Diet: An Expression of Culture, History, and Lifestyle. Nutrition Reviews. 1997;55(11):383-9.
35. Scarmeas N, Stern Y, Tang MX, Mayeux R, Luchsinger JA. Mediterranean diet and risk for Alzheimer's disease. Annals of neurology. 2006;59(6):912-21.
36. Scarmeas N, Stern Y, Mayeux R, Luchsinger JA. Mediterranean diet, Alzheimer disease, and vascular mediation. Arch Neurol. 2006;63(12):1709-17.
37. Scarmeas N, Stern Y, Mayeux R, Manly JJ, Schupf N, Luchsinger JA. Mediterranean diet and mild cognitive impairment. Arch Neurol. 2009;66(2):216-25.
38. Féart C, Samieri C, Rondeau V, Amieva H, Portet F, Dartigues JF, et al. Adherence to a mediterranean diet, cognitive decline, and risk of dementia. JAMA. 2009;302(6):638-48.
39. Roberts RO, Geda YE, Cerhan JR, Knopman DS, Cha RH, Christianson TJ, et al. Vegetables, unsaturated fats, moderate alcohol intake, and mild cognitive impairment. Dementia and geriatric cognitive disorders. 2010;29(5):413-23.
40. Panagiotakos DB, Pitsavos C, Arvaniti F, Stefanadis C. Adherence to the Mediterranean food pattern predicts the prevalence of hypertension, hypercholesterolemia, diabetes and obesity, among healthy adults; the accuracy of the MedDietScore. Preventive medicine. 2007;44(4):335-40.
41. Nishida C, Uauy R, Kumanyika S, Shetty P. The joint WHO/FAO expert consultation on diet, nutrition and the prevention of chronic diseases: process, product and policy implications. Public Health Nutr. 2004;7(1a):245-50 http://www.who.int/nutrition/publications/public_health_nut9.pdf.
42. Jankovic N, Geelen A, Streppel MT, de Groot LC, Orfanos P, van den Hooven EH, et al. Adherence to a healthy diet according to the world health organization guidelines and all-cause mortality in elderly adults from europe and the United States. Am J Epidemiol. 2014;180(10):978-88.
43. Fung TT, Chiuve SE, McCullough ML, Rexrode KM, Logroscino G, Hu FB. Adherence to a DASH-style diet and risk of coronary heart disease and stroke in women. Arch Intern Med. 2008;168(7):713-20.
44. Morris MC, Tangney CC, Wang Y, Sacks FM, Bennett DA, Aggarwal NT. MIND diet associated with reduced incidence of Alzheimer's disease. Alzheimers Dement. 2015;11(9):1007-14.
45. Samieri C, Okereke OI, Devore EE, Grodstein F. Long-term adherence to the Mediterranean diet is associated with overall cognitive status, but not cognitive decline, in women. J Nutr. 2013;143(4):493-9.
46. Ye X, Scott T, Gao X, Maras JE, Bakun PJ, Tucker KL. Mediterranean diet, healthy eating index 2005, and cognitive function in middle-aged and older puerto rican adults. Journal of the Academy of Nutrition and Dietetics. 2013;113(2):276-81.
47. Tangney CC, Kwasny MJ, Li H, Wilson RS, Evans DA, Morris MC. Adherence to a Mediterranean-type dietary pattern and cognitive decline in a community population. Am J Clin Nutr. 2011;93(3):601-7.
48. Tangney CC, Li H, Wang Y, Barnes L, Schneider JA, Bennett DA, et al. Relation of DASH- and Mediterranean-like dietary patterns to cognitive decline in older persons. Neurology. 2014;83(16):1410-6.
49. Trichopoulou A, Kyrozis A, Rossi M, Katsoulis M, Trichopoulos D, La Vecchia C, et al. Mediterranean diet and cognitive decline over time in an elderly Mediterranean population. European journal of nutrition. 2014;9:9.
50. Gardener S, Gu Y, Rainey-Smith SR, Keogh JB, Clifton PM, Mathieson SL, et al. Adherence to a Mediterranean diet and Alzheimer's disease risk in an Australian population. Translational psychiatry. 2012;2:e164.
51. Tsivgoulis G, Judd S, Letter AJ, Alexandrov AV, Howard G, Nahab F, et al. Adherence to a Mediterranean diet and risk of incident cognitive impairment. Neurology. 2013;80(18):1684-92.
52. Cherbuin N, Anstey KJ. The Mediterranean diet is not related to cognitive change in a large prospective investigation: the PATH Through Life study. Am J Geriatr Psychiatry. 2012;20(7):635-9.
53. Samieri C, Grodstein F, Rosner BA, Kang JH, Cook NR, Manson JE, et al. Mediterranean diet and cognitive function in older age. Epidemiology (Cambridge, Mass). 2013;24(4):490-9.
54. Vercambre MN, Grodstein F, Berr C, Kang JH. Mediterranean diet and cognitive decline in women with cardiovascular disease or risk factors. Journal of the Academy of Nutrition and Dietetics. 2012;112(6):816-23.
55. Valls-Pedret C, Sala-Vila A, Serra-Mir M, Corella D, de la Torre R, Martinez-Gonzalez MA, et al. Mediterranean Diet and Age-Related Cognitive Decline: A Randomized Clinical Trial. JAMA internal medicine. 2015;175(7):1094-103.
56. Kesse-Guyot E, Andreeva VA, Lassale C, Ferry M, Jeandel C, Hercberg S, et al. Mediterranean diet and cognitive function: a French study. Am J Clin Nutr. 2013;97(2):369-76.
57. Aalbers T, Baars L, Rikkert MO. The Mediterranean diet as prevention strategy for dementia as a multicausal geriatric syndrome. Am J Clin Nutr. 2013;97(6):1411.
58. Lourida I, Soni M, Thompson-Coon J, Purandare N, Lang IA, Ukoumunne OC, et al. Mediterranean diet, cognitive function, and dementia: a systematic review. Epidemiology (Cambridge, Mass). 2013;24(4):479-89.
59. Psaltopoulou T, Sergentanis TN, Panagiotakos DB, Sergentanis IN, Kosti R, Scarmeas N. Mediterranean diet, stroke, cognitive impairment, and depression: A meta-analysis. Annals of neurology. 2013;74(4):580-91.
60. Singh B, Parsaik AK, Mielke MM, Erwin PJ, Knopman DS, Petersen RC, et al. Association of mediterranean diet with mild cognitive impairment and Alzheimer's disease: a systematic review and meta-analysis. J Alzheimers Dis. 2014;39(2):271-82.
19
61. Tangney CC. DASH and Mediterranean-type Dietary Patterns to Maintain Cognitive Health. Curr Nutr Rep. 2014;3(1):51-61.
62. World Health Organization. Diet, nutrition, and the prevention of chronic diseases. Report of a WHO Study Group. World Health Organ Tech Rep Ser. 1990;797:1-204.
63. Duron E, Hanon O. Hypertension, cognitive decline and dementia. Arch Cardiovasc Dis. 2008;101(3):181-9. 64. Singh-Manoux A, Marmot M. High blood pressure was associated with cognitive function in middle-age in the Whitehall
II study. J Clin Epidemiol. 2005;58(12):1308-15. 65. Waldstein SR, Brown JR, Maier KJ, Katzel LI. Diagnosis of hypertension and high blood pressure levels negatively affect
cognitive function in older adults. Ann Behav Med. 2005;29(3):174-80. 66. Correa Leite ML, Nicolosi A, Cristina S, Hauser WA, Nappi G. Nutrition and cognitive deficit in the elderly: a population
study. Eur J Clin Nutr. 2001;55(12):1053-8. 67. Huijbregts PP, Feskens EJ, Rasanen L, Fidanza F, Alberti-Fidanza A, Nissinen A, et al. Dietary patterns and cognitive
function in elderly men in Finland, Italy and The Netherlands. Eur J Clin Nutr. 1998;52(11):826-31. 68. Jankovic N, Geelen A, Streppel MT, de Groot LC, Kiefte-de Jong JC, Orfanos P, et al. WHO guidelines for a healthy diet
and mortality from cardiovascular disease in European and American elderly: the CHANCES project. Am J Clin Nutr. 2015;102(4):745-56.
69. Knoops KT, Groot de LC, Fidanza F, Alberti-Fidanza A, Kromhout D, van Staveren WA. Comparison of three differentdietary scores in relation to 10-year mortality in elderly European subjects: the HALE project. Eur J Clin Nutr. 2006;60(6):746-55.
70. Stefler D, Pikhart H, Jankovic N, Kubinova R, Pajak A, Malyutina S, et al. Healthy diet indicator and mortality in EasternEuropean populations: prospective evidence from the HAPIEE cohort. Eur J Clin Nutr. 2014;68(12):1346-52.
71. Sacks FM, Obarzanek E, Windhauser MM, Svetkey LP, Vollmer WM, McCullough M, et al. Rationale and design of the Dietary Approaches to Stop Hypertension trial (DASH). A multicenter controlled-feeding study of dietary patterns tolower blood pressure. Annals of epidemiology. 1995;5(2):108-18.
72. Sacks FM, Campos H. Dietary therapy in hypertension. N Engl J Med. 2010;362(22):2102-12. 73. Kilander L, Nyman H, Boberg M, Hansson L, Lithell H. Hypertension is related to cognitive impairment: a 20-year follow-
up of 999 men. Hypertension. 1998;31(3):780-6. 74. Launer LJ, Ross GW, Petrovitch H, Masaki K, Foley D, White LR, et al. Midlife blood pressure and dementia: the
Honolulu-Asia aging study. Neurobiol Aging. 2000;21(1):49-55. 75. Tangney CC. Accordance To Dietary Approaches to Stop Hypertension (DASH) is associated with slower cognitive
decline. Oral Sessions: O1-05: Public Health and Psychosocial Focus: Epidemiology I—Cardiovascular Risks 2013.76. Wengreen H, Munger RG, Cutler A, Quach A, Bowles A, Corcoran C, et al. Prospective study of Dietary Approaches to
Stop Hypertension- and Mediterranean-style dietary patterns and age-related cognitive change: the Cache County Study on Memory, Health and Aging. Am J Clin Nutr. 2013;98(5):1263-71.
77. Smith PJ, Blumenthal JA, Babyak MA, Craighead L, Welsh-Bohmer KA, Browndyke JN, et al. Effects of the dietary approaches to stop hypertension diet, exercise, and caloric restriction on neurocognition in overweight adults with highblood pressure. Hypertension. 2010;55(6):1331-8.
78. Roman Vinas B, Ribas Barba L, Ngo J, Gurinovic M, Novakovic R, Cavelaars A, et al. Projected prevalence of inadequate nutrient intakes in Europe. Annals of nutrition & metabolism. 2011;59(2-4):84-95.
79. Guerin O, Soto ME, Brocker P, Robert PH, Benoit M, Vellas B. Nutritional status assessment during Alzheimer's disease:results after one year (the REAL French Study Group). J Nutr Health Aging. 2005;9(2):81-4.
80. Vellas B, Lauque S, Gillette-Guyonnet S, Andrieu S, Cortes F, Nourhashemi F, et al. Impact of nutritional status on the evolution of Alzheimer's disease and on response to acetylcholinesterase inhibitor treatment. J Nutr Health Aging. 2005;9(2):75-80.


Chapter 2Conventional foods, followed by
dietary supplements and fortified foods, are the key sources of
vitamin D,vitamin B6 and selenium intake in Dutch participants
of the NU-AGE study
Agnes A.M. Berendsen, Lilou E.L.M. van Lieshout, Ellen G.H.M. van den Heuvel,
Christophe Matthys, Szabolcs Péter, Lisette C.P.G.M. de Groot
Nutrition Research, 2016,36:1171-1181

Chapter 2 | Key sources of nutrient intake in Dutch older adults
22
Abstract With aging, energy needs decrease, necessitating a more nutrient dense diet in order to meet nutritional needs. To bridge this gap, the use of nutrient dense foods, fortified foods and dietary supplements can be important. This observational study aims to describe current micronutrient intakes of Dutch elderly and to identify the contribution of nutrient dense foods, fortified foods and dietary supplements to the intake of micronutrients that are often inadequately consumed in Dutch elderly. Data of 245 Dutch volunteers from the NU-AGE study aged 65-80 years were used. Dietary intake was assessed by means of 7-day food records and dietary supplement use was recorded with an additional questionnaire. Information on fortified foods was obtained from the Dutch Food Composition Table 2011. Nutrient density of foods was evaluated using the Nutrient Rich Food 9.3 score. The percentages of participants not meeting their average requirement was high for vitamin D (99%), selenium (41%) and vitamin B6 (54%) based on conventional foods, and also when taking into account fortified foods (98%, 41%, 27%, respectively) and vitamin and mineral supplements (87%, 36%, 20%, respectively). Conventional foods were the main source of vitamin D, vitamin B6 and selenium intake (42%, 45%, 82% respectively), followed by vitamin and mineral supplements (41%, 44% and 18%) and fortified foods (17%, 11% and 1%). Foods with the highest nutrient density contributed most to total vitamin B6 intake only. In order to optimize nutrient intakes of elderly, combinations of natural food sources, fortified foods and dietary supplements should be considered.
23
Introduction Similarly to several other developed regions of the world, the European population is aging rapidly. It is expected that approximately 30 percent of the European population will be 65 years or older by the year 2050 [1]. With aging, energy needs decrease while micronutrient requirements remain or increase, necessitating a more nutrient dense diet in order to meet nutritional needs [2]. Inadequate nutrient intake may cause chronic metabolic disruption, including mitochondrial decay, resulting in acceleration of various degenerative diseases [3]. The prevalence of malnutrition and under nutrition is relatively high in both institutionalized (40-65%), and non-institutionalized elderly (5-10%) [2]. In Europe, more than 20% of the people aged 65 years and older have inadequate intakes of vitamin D, folate, calcium, selenium and iodine [4], and intakes of vitamin D, calcium, selenium, magnesium, thiamine, riboflavin are of possible public health concern [5].
These findings are in line with EURRECA outcomes for priority nutrients. EURRECA was an EU 6th Framework Programme funded Network of Excellence, aimed to align the micronutrient recommendations among Europe. EURRECA identified 10 priority micronutrients for elderly (vitamin D, folate, vitamin B12, vitamin C, iron, calcium, zinc, selenium, iodine and copper) based on heterogeneity in current recommendations, amount of new evidence and importance for public health [4].
Sources of micronutrients include conventional foods, fortified dietary sources and vitamin and mineral supplements. The intake of micronutrients can be limited resulting in nutrient inadequacies or deficiencies in the population. Over the last few decades, the consumption of nutrient-rich conventional foods (e.g., whole grains, vegetables and low-fat dairy products) has been partially shifted towards the consumption of nutrient-poor, but, at the same time, energy-dense foods (i.e., food with a high content of added sugar or solid fats)(6). This shift in food consumption patterns could be considered as another important factor of the observed insufficient dietary intakes of micronutrients.
Widespread nutrient intake shortfalls and associated deficiencies can be prevented or improved by means of nutritional advice on consumption patterns, but also by using fortified foods [7]. Fortification is the process of adding nutrients or non-nutrient bioactive components to food [7]. Food fortification could be considered a public health strategy to enhance nutrient intakes of a population. Additionally, dietary supplements can effectively counteract inadequate nutrient intakes and its consequences [3]. Besides estimating inadequate nutrient intakes, it is also important to take into account the possibility of excessive nutrient intakes as the availability of food fortification and dietary supplement intake increases [8].
This study aimed to describe current dietary intakes compared to nutritional requirements in Dutch elderly who were part of a cohort study and to explore which component - e.g. conventional foods, fortified foods or dietary supplements - is the main contributor to total dietary intakes of elderly. Because not much is known on how to classify conventional foods consumed by elderly based on their nutrient content, this study additionally aimed to explore if a concept of nutrient density can be used when studying the contribution of nutrient dense foods to total dietary intakes.
We hypothesized that by knowing how conventional foods, fortified foods or dietary supplements differ in their contribution to total dietary intakes, dietary advices can be targeted towards bridging the gap between dietary intakes and nutritional needs in elderly. Therefore, the objectives of this present study were: 1) to estimate dietary intakes from conventional foods, fortified foods and dietary supplements, 2) to compare these intakes to nutritional requirements of the elderly, and 3) to explore the use of a nutrient density score in this respect.

2
Chapter 2 | Key sources of nutrient intake in Dutch older adults
22
Abstract With aging, energy needs decrease, necessitating a more nutrient dense diet in order to meet nutritional needs. To bridge this gap, the use of nutrient dense foods, fortified foods and dietary supplements can be important. This observational study aims to describe current micronutrient intakes of Dutch elderly and to identify the contribution of nutrient dense foods, fortified foods and dietary supplements to the intake of micronutrients that are often inadequately consumed in Dutch elderly. Data of 245 Dutch volunteers from the NU-AGE study aged 65-80 years were used. Dietary intake was assessed by means of 7-day food records and dietary supplement use was recorded with an additional questionnaire. Information on fortified foods was obtained from the Dutch Food Composition Table 2011. Nutrient density of foods was evaluated using the Nutrient Rich Food 9.3 score. The percentages of participants not meeting their average requirement was high for vitamin D (99%), selenium (41%) and vitamin B6 (54%) based on conventional foods, and also when taking into account fortified foods (98%, 41%, 27%, respectively) and vitamin and mineral supplements (87%, 36%, 20%, respectively). Conventional foods were the main source of vitamin D, vitamin B6 and selenium intake (42%, 45%, 82% respectively), followed by vitamin and mineral supplements (41%, 44% and 18%) and fortified foods (17%, 11% and 1%). Foods with the highest nutrient density contributed most to total vitamin B6 intake only. In order to optimize nutrient intakes of elderly, combinations of natural food sources, fortified foods and dietary supplements should be considered.
23
Introduction Similarly to several other developed regions of the world, the European population is aging rapidly. It is expected that approximately 30 percent of the European population will be 65 years or older by the year 2050 [1]. With aging, energy needs decrease while micronutrient requirements remain or increase, necessitating a more nutrient dense diet in order to meet nutritional needs [2]. Inadequate nutrient intake may cause chronic metabolic disruption, including mitochondrial decay, resulting in acceleration of various degenerative diseases [3]. The prevalence of malnutrition and under nutrition is relatively high in both institutionalized (40-65%), and non-institutionalized elderly (5-10%) [2]. In Europe, more than 20% of the people aged 65 years and older have inadequate intakes of vitamin D, folate, calcium, selenium and iodine [4], and intakes of vitamin D, calcium, selenium, magnesium, thiamine, riboflavin are of possible public health concern [5].
These findings are in line with EURRECA outcomes for priority nutrients. EURRECA was an EU 6th Framework Programme funded Network of Excellence, aimed to align the micronutrient recommendations among Europe. EURRECA identified 10 priority micronutrients for elderly (vitamin D, folate, vitamin B12, vitamin C, iron, calcium, zinc, selenium, iodine and copper) based on heterogeneity in current recommendations, amount of new evidence and importance for public health [4].
Sources of micronutrients include conventional foods, fortified dietary sources and vitamin and mineral supplements. The intake of micronutrients can be limited resulting in nutrient inadequacies or deficiencies in the population. Over the last few decades, the consumption of nutrient-rich conventional foods (e.g., whole grains, vegetables and low-fat dairy products) has been partially shifted towards the consumption of nutrient-poor, but, at the same time, energy-dense foods (i.e., food with a high content of added sugar or solid fats)(6). This shift in food consumption patterns could be considered as another important factor of the observed insufficient dietary intakes of micronutrients.
Widespread nutrient intake shortfalls and associated deficiencies can be prevented or improved by means of nutritional advice on consumption patterns, but also by using fortified foods [7]. Fortification is the process of adding nutrients or non-nutrient bioactive components to food [7]. Food fortification could be considered a public health strategy to enhance nutrient intakes of a population. Additionally, dietary supplements can effectively counteract inadequate nutrient intakes and its consequences [3]. Besides estimating inadequate nutrient intakes, it is also important to take into account the possibility of excessive nutrient intakes as the availability of food fortification and dietary supplement intake increases [8].
This study aimed to describe current dietary intakes compared to nutritional requirements in Dutch elderly who were part of a cohort study and to explore which component - e.g. conventional foods, fortified foods or dietary supplements - is the main contributor to total dietary intakes of elderly. Because not much is known on how to classify conventional foods consumed by elderly based on their nutrient content, this study additionally aimed to explore if a concept of nutrient density can be used when studying the contribution of nutrient dense foods to total dietary intakes.
We hypothesized that by knowing how conventional foods, fortified foods or dietary supplements differ in their contribution to total dietary intakes, dietary advices can be targeted towards bridging the gap between dietary intakes and nutritional needs in elderly. Therefore, the objectives of this present study were: 1) to estimate dietary intakes from conventional foods, fortified foods and dietary supplements, 2) to compare these intakes to nutritional requirements of the elderly, and 3) to explore the use of a nutrient density score in this respect.

Chapter 2 | Key sources of nutrient intake in Dutch older adults
24
Methods Study design and population The present study was commissioned by the Nutrient Intake Optimization Task Force of the European Branch of the International Life Sciences Institute (ILSI Europe). Baseline data from Dutch NU-AGE participants were used. The NU-AGE study is a dietary intervention study among volunteers aged 65 years and older living in the Netherlands, the UK, Italy, Poland and France [9]. that focuses on the effect of nutrition on inflammageing, i.e. chronic low-grade inflammation, and its consequences on the aging process [10]. The NU-AGE dietary intervention study is a one-year randomized, single blind, controlled, parallel trial consisting of a control group and a diet group. The dietary intervention is specifically adapted to the nutritional needs of elderly and is described in detail elsewhere [9]. A total of 252 apparently healthy and independently living men and women, aged 65-80 years were recruited from the Dutch city of Wageningen and surroundings. Exclusion criteria were overt diseases, history of severe heart disease, organ failure, insulin dependent diabetes mellitus, chronic use of corticosteroids or recent use of antibiotics, undernourishment (BMI <18.5 kg/m2), and frailty. A screening questionnaire was used to verify current health, medical history and medication use. The presence of frailty was assessed with a test described by Fried et al.[11] The NU-AGE study has been approved by the Medical Ethical Committee from Wageningen University (NL37818.081.11) and all participants provided written informed consent. The baseline examinations started in April 2012 and continued until March 2013. Participants were visited by trained dieticians once to complete dietary and supplement intake data. Participants completed a questionnaire to collect information on lifestyle, social and economic status, food preferences and a supplement questionnaire. In the present study, we excluded participants who had not completed the supplement questionnaire (n=7), resulting in a population for analysis of 245 participants. Dietary intake assessment Micronutrient intake from foods Usual dietary intake was assessed by means of estimated food records [12] that were kept for seven consecutive days. Participants received both verbal and written instructions to keep pre-structured food records and were trained in advance on the description of foods, portion sizes and food preparation methods in order to obtain complete and accurate food records. The food record included eight meal occasions per day: before breakfast, breakfast, morning snacks, lunch, afternoon snacks, evening meal, evening snacks, night snacks. Portion sizes were reported in household measures, based on pictures or measured in grams or millilitres. The consumed foods were coded according to standardized coding procedures at the Department of Nutrition and Health from Wageningen University and converted to energy and micronutrient intake (mean per day) by use of the Dutch food composition table Nederlands Voedingsstoffenbestand (NEVO) 2011 [13]. This table was also used to create food groups and to classify foods as fortified if at least one micronutrient was added to the food, for example, fortified spreads, milk drinks and juices. No distinction was made between mandatory and voluntary fortified foods. Foods without any fortification were classified as conventional foods.
25
Micronutrient intake from dietary supplements Participants completed an additional questionnaire at home in which they indicated the use of pre-defined dietary supplements, i.e. multivitamin multimineral (MVMM), iron, vitamin D, vitamin B-complex, and folic acid supplements. For each supplement, the frequency was recorded in times per day, week or month. Additionally, the amount of tablets or drops, type, brand and name were recorded for each supplement. The reported brand and name of the supplements was used to further specify the type of supplements (e.g., vitamin B12 supplement vs. vitamin B complex supplement). The nutrient content of the supplements was based on the product label information obtained from the manufacturer or corresponding website. The average daily nutrient intake from supplements was calculated per participant by multiplying the frequency by the average amount of tablets per day times the nutrient content per supplement and added to the average daily nutrient intake from foods. Micronutrient intake from nutrient dense foods Another way to look at sources of micronutrients is to study foods with a high nutrient density [14]. Nutrient density can be defined as the ratio of the nutrient composition of a food to the nutrient requirements [15], although at the moment, there is no consensus on how best to define nutrient density [16]. One of the possible indices to define nutrient density is the Nutrient Rich Food (NRF) 9.3 score as proposed by Drewnowski [15]. This score is able to distinguish between foods and diets that are lower energy dense and more nutrient-rich [17] and it can provide a clear measure of the nutrient density of overall diets [18]. Furthermore, it has been shown to explain the highest percentage of variation in the Healthy Eating Index (HEI) [19] and it has been shown to correlate very well with the Dutch Healthy Diet Indicator [20], a diet score to rank individuals according to their adherence to the Dutch dietary guidelines for a healthy diet. These features make the NRF9.3 a suitable tool to study the contribution of naturally nutrient dense foods to adequate nutrient intake levels. The NRF9.3 score contains nine nutrients to encourage (NR9; protein, dietary fibre, vitamin A, vitamin C, vitamin E, calcium, magnesium, iron and potassium) and three nutrients to limit (LIM3; saturated fat, added sugar and sodium). Because only limited data on added sugar were available, total sugar was used instead.
To calculate the nutrient density of foods, firstly for each food item, the nutrient contents were calculated per 100 kcal resulting in a nutrient content per food item in 100-kcal edible portion. Secondly, for each participant, the nutrient content of all consumed food items were divided by the corresponding Recommended Daily Values (RDVs) [21-23] or Maximum Daily Values (MDV) [24] (table 1) and multiplied by 100, resulting in a nutrient score for each nutrient included in the algorithms below. These nutrient scores were capped at 100% avoiding the possibility of a food item with high amounts of a single nutrient to contain more than 100 percent of the RDV.
1) NR9100kcal ∑I = 1-9(Nutrienti/RDVi)*100 Nutrienti: content of beneficial nutrients protein, dietary fibre, vitamin A, vitamin C, vitamin E, calcium, magnesium, iron and potassium in 100-kcal edible portion; RDVi: recommended daily values for nutrienti
2) LIM3 ∑I = 1-9(Nutrienti/MDVi)*100 Nutrienti: content of limiting nutrients saturated fat, total sugar and sodium in 100-kcal edible portion; MDVi: maximum daily values for nutrienti
3) NRF9.3100kcal NR9100kcal - LIM3100kcal Difference between sums

2
Chapter 2 | Key sources of nutrient intake in Dutch older adults
24
Methods Study design and population The present study was commissioned by the Nutrient Intake Optimization Task Force of the European Branch of the International Life Sciences Institute (ILSI Europe). Baseline data from Dutch NU-AGE participants were used. The NU-AGE study is a dietary intervention study among volunteers aged 65 years and older living in the Netherlands, the UK, Italy, Poland and France [9]. that focuses on the effect of nutrition on inflammageing, i.e. chronic low-grade inflammation, and its consequences on the aging process [10]. The NU-AGE dietary intervention study is a one-year randomized, single blind, controlled, parallel trial consisting of a control group and a diet group. The dietary intervention is specifically adapted to the nutritional needs of elderly and is described in detail elsewhere [9]. A total of 252 apparently healthy and independently living men and women, aged 65-80 years were recruited from the Dutch city of Wageningen and surroundings. Exclusion criteria were overt diseases, history of severe heart disease, organ failure, insulin dependent diabetes mellitus, chronic use of corticosteroids or recent use of antibiotics, undernourishment (BMI <18.5 kg/m2), and frailty. A screening questionnaire was used to verify current health, medical history and medication use. The presence of frailty was assessed with a test described by Fried et al.[11] The NU-AGE study has been approved by the Medical Ethical Committee from Wageningen University (NL37818.081.11) and all participants provided written informed consent. The baseline examinations started in April 2012 and continued until March 2013. Participants were visited by trained dieticians once to complete dietary and supplement intake data. Participants completed a questionnaire to collect information on lifestyle, social and economic status, food preferences and a supplement questionnaire. In the present study, we excluded participants who had not completed the supplement questionnaire (n=7), resulting in a population for analysis of 245 participants. Dietary intake assessment Micronutrient intake from foods Usual dietary intake was assessed by means of estimated food records [12] that were kept for seven consecutive days. Participants received both verbal and written instructions to keep pre-structured food records and were trained in advance on the description of foods, portion sizes and food preparation methods in order to obtain complete and accurate food records. The food record included eight meal occasions per day: before breakfast, breakfast, morning snacks, lunch, afternoon snacks, evening meal, evening snacks, night snacks. Portion sizes were reported in household measures, based on pictures or measured in grams or millilitres. The consumed foods were coded according to standardized coding procedures at the Department of Nutrition and Health from Wageningen University and converted to energy and micronutrient intake (mean per day) by use of the Dutch food composition table Nederlands Voedingsstoffenbestand (NEVO) 2011 [13]. This table was also used to create food groups and to classify foods as fortified if at least one micronutrient was added to the food, for example, fortified spreads, milk drinks and juices. No distinction was made between mandatory and voluntary fortified foods. Foods without any fortification were classified as conventional foods.
25
Micronutrient intake from dietary supplements Participants completed an additional questionnaire at home in which they indicated the use of pre-defined dietary supplements, i.e. multivitamin multimineral (MVMM), iron, vitamin D, vitamin B-complex, and folic acid supplements. For each supplement, the frequency was recorded in times per day, week or month. Additionally, the amount of tablets or drops, type, brand and name were recorded for each supplement. The reported brand and name of the supplements was used to further specify the type of supplements (e.g., vitamin B12 supplement vs. vitamin B complex supplement). The nutrient content of the supplements was based on the product label information obtained from the manufacturer or corresponding website. The average daily nutrient intake from supplements was calculated per participant by multiplying the frequency by the average amount of tablets per day times the nutrient content per supplement and added to the average daily nutrient intake from foods. Micronutrient intake from nutrient dense foods Another way to look at sources of micronutrients is to study foods with a high nutrient density [14]. Nutrient density can be defined as the ratio of the nutrient composition of a food to the nutrient requirements [15], although at the moment, there is no consensus on how best to define nutrient density [16]. One of the possible indices to define nutrient density is the Nutrient Rich Food (NRF) 9.3 score as proposed by Drewnowski [15]. This score is able to distinguish between foods and diets that are lower energy dense and more nutrient-rich [17] and it can provide a clear measure of the nutrient density of overall diets [18]. Furthermore, it has been shown to explain the highest percentage of variation in the Healthy Eating Index (HEI) [19] and it has been shown to correlate very well with the Dutch Healthy Diet Indicator [20], a diet score to rank individuals according to their adherence to the Dutch dietary guidelines for a healthy diet. These features make the NRF9.3 a suitable tool to study the contribution of naturally nutrient dense foods to adequate nutrient intake levels. The NRF9.3 score contains nine nutrients to encourage (NR9; protein, dietary fibre, vitamin A, vitamin C, vitamin E, calcium, magnesium, iron and potassium) and three nutrients to limit (LIM3; saturated fat, added sugar and sodium). Because only limited data on added sugar were available, total sugar was used instead.
To calculate the nutrient density of foods, firstly for each food item, the nutrient contents were calculated per 100 kcal resulting in a nutrient content per food item in 100-kcal edible portion. Secondly, for each participant, the nutrient content of all consumed food items were divided by the corresponding Recommended Daily Values (RDVs) [21-23] or Maximum Daily Values (MDV) [24] (table 1) and multiplied by 100, resulting in a nutrient score for each nutrient included in the algorithms below. These nutrient scores were capped at 100% avoiding the possibility of a food item with high amounts of a single nutrient to contain more than 100 percent of the RDV.
1) NR9100kcal ∑I = 1-9(Nutrienti/RDVi)*100 Nutrienti: content of beneficial nutrients protein, dietary fibre, vitamin A, vitamin C, vitamin E, calcium, magnesium, iron and potassium in 100-kcal edible portion; RDVi: recommended daily values for nutrienti
2) LIM3 ∑I = 1-9(Nutrienti/MDVi)*100 Nutrienti: content of limiting nutrients saturated fat, total sugar and sodium in 100-kcal edible portion; MDVi: maximum daily values for nutrienti
3) NRF9.3100kcal NR9100kcal - LIM3100kcal Difference between sums

Chapter 2 | Key sources of nutrient intake in Dutch older adults
26
Table 1. Recommended (RDV) and Maximum (MDV) Daily Values for selected nutrients used in the NRF9.3 score. Nutrient RDV
a, b MDV
a, b
Nutrient-rich (NR) components Protein (g) 57 [23] Dietary fibre (g) 25 [22] Vitamin A (mcg) 800 [21] Vitamin C (mg) 80 [21] Vitamin E (mg) 12 [21] Calcium (mg) 800 [21] Iron (mg) 14 [21] Magnesium (mg) 375 [21] Potassium (mg) 2000 [21] Nutrients to limit (LIM) Saturated fat (g) 20 [24] Sugar (g) 90 [24] Sodium (mg) 2400 [24] a
Based on an intake of 2000 kcal per day. b Recommended daily allowances as set by the European Union [21], the labelling reference intakes values as set by the European Food Safety Authority [22] were used. Abbreviations: NR, nutrient rich; LIM, limiting nutrient; RDV, recommended Daily Values; MDV, Maximum Daily Values.
Table 2. Nutrient-rich scores (NR9), Limited nutrient scores (LIM3) and Nutrient Rich Food index scores (NRF9.3) per 100 kcal on food group level of consumed foods (n=1,107 foods)a
Food groupb No. food items NR9c LIM3c NRF9.3c Vegetables 130 249.8 17.2 232.6 Legumes 8 83.0 4.7 78.3 Fruits 74 88.7 23.4 65.3 Eggs 7 79.7 15.5 64.2 Alcoholic and non-alcoholic drinks 69 52.3 6.7 50.8 Potatoes 19 53.1 3.6 49.5 Fish 57 60.5 18.6 41.9 Soups 21 97.3 58.8 38.5 Milk and milk products 87 59.7 24.8 34.9 Mixed dishes 36 49.4 16.3 33.1 Meat, meat products and poultry 157 55.7 23.4 32.3 Nuts, seeds and snacks 60 37.4 13.1 24.3 Cereal products and binding agents 38 25.7 2.8 22.9 Savoury sandwich filling 6 33.8 11.5 22.3 Cheese 48 55.8 36.1 19.7 Bread 73 31.2 11.4 19.8 Fats, oils, savoury sauces 61 29.7 22.8 6.9 Pastry, cake and biscuits 83 19.0 19.9 -0.9 Sugar, confectionary, sweets 65 17.8 25.5 -7.7 Soy and vegetarian products 8 46.7 91.4 -44.7 a For Dutch elderly participants in NU-AGE study (n=245). b Food groups are based on the Dutch food composition table ‘Nederlands Voedingsstoffenbestand’ (NEVO) 2011 [13]. c Values are expressed as means per 100 kcal of a food group of consumed foods (n=1,107 foods). Abbreviations: NR(F), nutrient rich (food); LIM, limiting nutrient.
27
Thirdly, the NRF9.3 scores were calculated by subtracting the LIM3 scores from the NRF9 scores. Table 2 lists the mean NR9, LIM3 and NRF9.3 scores per food group of 1,107 consumed food items. Foods with a higher NRF9.3 score have a higher nutrient density per 100 kcal and were considered more nutrient dense than foods with a low NRF9.3 score. To distinguish between conventional foods with a low, middle and high nutrient density, food items were ranked upon their NRF9.3 score and divided into tertiles of nutrient density; 1) Low (NRF9.3 scores -116.7 (e.g. bouillon, gravy) to 9.3 (e.g., nougat, gingerbread), 2) Middle (NRF9.3 scores 9.4 (e.g., rusk, refined bread) to 42.5 (e.g., medium-fat cheese, soup with vegetables), and 3) High (NRF9.3 scores 42.5 (e.g. low-fat chocolate milk, low-fat minced meat) to 574.8 (e.g. canned or fresh spinach, turnip greens). Contribution of conventional foods, fortified foods and dietary supplements The relative contribution of nutrient dense conventional foods, fortified foods and dietary supplements to the total nutrient intake was calculated as the proportion of intakes from the different components at the group level and were expressed as percentages. For those micronutrients for which intake was inadequate in more than 20% of the study population, we also calculated the contribution of specific food groups to total intake. This was done by taking the ratio of the nutrient content per food group to the total nutrient intake. Comparison to Dietary Reference Values Intakes of nutrients identified to require special attention in elderly according to EURRECA [25] and a recent systematic review on inadequate intakes among community-dwelling elderly in Western countries [5], i.e. vitamin D, folate, vitamin B6, vitamin B12, selenium, iron, calcium, magnesium, zinc, iodine and copper, were compared to their dietary reference values. The Average Requirement (AR) from the European Food Safety Authority [26] was used as reference value for the comparison of most nutrients, as these were also the basis for calculating the NRF9.3 score. The AR represents the average daily nutrient intake level that meets the requirement of half of healthy individuals within a group. For vitamin D, we used the AR from the Health Council of the Netherlands [27], as it was the most up to date at the moment of the study [28]. To assess adequacy of individual nutrient intakes, the mean individual intakes were compared with the AR. The prevalence of inadequate intakes was calculated using the AR cut-point method by taking the proportion of participants with a mean intake below the AR. For magnesium, for which no European AR was set, a quantitative approach was used to estimate the prevalence of inadequacy i.e., a low estimated prevalence if mean population intake was well above the Adequate Intake (AI). The prevalence of usual intakes above the tolerable Upper intake Level (UL) was based on comparisons of mean population intakes with European UL’s [29]. For all comparisons, European gender and age-specific ARs and ULs were used. Statistical analyses Total nutrient intakes from foods and dietary supplements were calculated as means and standard deviations. Baseline characteristics of participants were compared between men and women using ANOVA for continuous variables and the χ2 statistics for categorical variables. All statistical analyses were performed using SAS software version 9.2 (SAS institute, Inc, Cary, NC).

2
Chapter 2 | Key sources of nutrient intake in Dutch older adults
26
Table 1. Recommended (RDV) and Maximum (MDV) Daily Values for selected nutrients used in the NRF9.3 score. Nutrient RDV
a, b MDV
a, b
Nutrient-rich (NR) components Protein (g) 57 [23] Dietary fibre (g) 25 [22] Vitamin A (mcg) 800 [21] Vitamin C (mg) 80 [21] Vitamin E (mg) 12 [21] Calcium (mg) 800 [21] Iron (mg) 14 [21] Magnesium (mg) 375 [21] Potassium (mg) 2000 [21] Nutrients to limit (LIM) Saturated fat (g) 20 [24] Sugar (g) 90 [24] Sodium (mg) 2400 [24] a
Based on an intake of 2000 kcal per day. b Recommended daily allowances as set by the European Union [21], the labelling reference intakes values as set by the European Food Safety Authority [22] were used. Abbreviations: NR, nutrient rich; LIM, limiting nutrient; RDV, recommended Daily Values; MDV, Maximum Daily Values.
Table 2. Nutrient-rich scores (NR9), Limited nutrient scores (LIM3) and Nutrient Rich Food index scores (NRF9.3) per 100 kcal on food group level of consumed foods (n=1,107 foods)a
Food groupb No. food items NR9c LIM3c NRF9.3c Vegetables 130 249.8 17.2 232.6 Legumes 8 83.0 4.7 78.3 Fruits 74 88.7 23.4 65.3 Eggs 7 79.7 15.5 64.2 Alcoholic and non-alcoholic drinks 69 52.3 6.7 50.8 Potatoes 19 53.1 3.6 49.5 Fish 57 60.5 18.6 41.9 Soups 21 97.3 58.8 38.5 Milk and milk products 87 59.7 24.8 34.9 Mixed dishes 36 49.4 16.3 33.1 Meat, meat products and poultry 157 55.7 23.4 32.3 Nuts, seeds and snacks 60 37.4 13.1 24.3 Cereal products and binding agents 38 25.7 2.8 22.9 Savoury sandwich filling 6 33.8 11.5 22.3 Cheese 48 55.8 36.1 19.7 Bread 73 31.2 11.4 19.8 Fats, oils, savoury sauces 61 29.7 22.8 6.9 Pastry, cake and biscuits 83 19.0 19.9 -0.9 Sugar, confectionary, sweets 65 17.8 25.5 -7.7 Soy and vegetarian products 8 46.7 91.4 -44.7 a For Dutch elderly participants in NU-AGE study (n=245). b Food groups are based on the Dutch food composition table ‘Nederlands Voedingsstoffenbestand’ (NEVO) 2011 [13]. c Values are expressed as means per 100 kcal of a food group of consumed foods (n=1,107 foods). Abbreviations: NR(F), nutrient rich (food); LIM, limiting nutrient.
27
Thirdly, the NRF9.3 scores were calculated by subtracting the LIM3 scores from the NRF9 scores. Table 2 lists the mean NR9, LIM3 and NRF9.3 scores per food group of 1,107 consumed food items. Foods with a higher NRF9.3 score have a higher nutrient density per 100 kcal and were considered more nutrient dense than foods with a low NRF9.3 score. To distinguish between conventional foods with a low, middle and high nutrient density, food items were ranked upon their NRF9.3 score and divided into tertiles of nutrient density; 1) Low (NRF9.3 scores -116.7 (e.g. bouillon, gravy) to 9.3 (e.g., nougat, gingerbread), 2) Middle (NRF9.3 scores 9.4 (e.g., rusk, refined bread) to 42.5 (e.g., medium-fat cheese, soup with vegetables), and 3) High (NRF9.3 scores 42.5 (e.g. low-fat chocolate milk, low-fat minced meat) to 574.8 (e.g. canned or fresh spinach, turnip greens). Contribution of conventional foods, fortified foods and dietary supplements The relative contribution of nutrient dense conventional foods, fortified foods and dietary supplements to the total nutrient intake was calculated as the proportion of intakes from the different components at the group level and were expressed as percentages. For those micronutrients for which intake was inadequate in more than 20% of the study population, we also calculated the contribution of specific food groups to total intake. This was done by taking the ratio of the nutrient content per food group to the total nutrient intake. Comparison to Dietary Reference Values Intakes of nutrients identified to require special attention in elderly according to EURRECA [25] and a recent systematic review on inadequate intakes among community-dwelling elderly in Western countries [5], i.e. vitamin D, folate, vitamin B6, vitamin B12, selenium, iron, calcium, magnesium, zinc, iodine and copper, were compared to their dietary reference values. The Average Requirement (AR) from the European Food Safety Authority [26] was used as reference value for the comparison of most nutrients, as these were also the basis for calculating the NRF9.3 score. The AR represents the average daily nutrient intake level that meets the requirement of half of healthy individuals within a group. For vitamin D, we used the AR from the Health Council of the Netherlands [27], as it was the most up to date at the moment of the study [28]. To assess adequacy of individual nutrient intakes, the mean individual intakes were compared with the AR. The prevalence of inadequate intakes was calculated using the AR cut-point method by taking the proportion of participants with a mean intake below the AR. For magnesium, for which no European AR was set, a quantitative approach was used to estimate the prevalence of inadequacy i.e., a low estimated prevalence if mean population intake was well above the Adequate Intake (AI). The prevalence of usual intakes above the tolerable Upper intake Level (UL) was based on comparisons of mean population intakes with European UL’s [29]. For all comparisons, European gender and age-specific ARs and ULs were used. Statistical analyses Total nutrient intakes from foods and dietary supplements were calculated as means and standard deviations. Baseline characteristics of participants were compared between men and women using ANOVA for continuous variables and the χ2 statistics for categorical variables. All statistical analyses were performed using SAS software version 9.2 (SAS institute, Inc, Cary, NC).

Chapter 2 | Key sources of nutrient intake in Dutch older adults
28
Results General characteristics of the study population are presented in table 3. The population’s mean age was 70.9 ± 4.0 years. Compared to women, men tended to have a higher BMI, were slightly higher educated, were more likely to have ever smoked, had higher absolute energy, protein, fat, carbohydrate and micronutrient intakes. Macronutrient intakes expressed as percentage of total energy intake were similar between men and women. Of the total population, 43% used dietary supplements, of which MVMMs were most frequently used (24%), followed by vitamin D supplements (10%). Compared to men, the percentage of supplement users was higher in women (57% vs. 26%), particularly for vitamin D supplements (16% vs. 2%). Table 3. Baseline characteristicsa, b Characteristic Total population
(n=245) Men
(n=111) Women (n=134)
Age, years 70.9 ± 4.0 70.9 ± 4.3 71.0 ± 3.9 BMI, kg/m2* 26.0 ± 3.6 26.7 ± 3.6 25.5 ± 3.6 Education, years* 12.2 ± 3.8 12.7 ± 3.8 11.7 ± 3.6 Smoking status, n (% of total)*
Never 126 (50) 44 (39) 82 (59) Former 118 (47) 65 (57) 53 (38) Current 8 (3) 4 (4) 4 (3)
Macronutrient intakes Energy, kcal* 1912 ± 418 2100 ± 476 1756 ± 280 Protein, gram 76.3 ± 16.0 82.5 ± 17.0 71.2 ± 13.1 Protein, EN% 16.1 ± 2.4 15.9 ± 2.2 16.3 ± 2.5 Fat, gram* 73.1 ± 19.9 78.7 ± 23.0 68.4 ± 15.5 Fat, EN%* 34.3 ±5.0 33.5 ± 4.5 35.0 ± 5.3 Carbohydrates, gram* 202 ± 54.4 222 ± 61.8 185 ± 40.2 Carbohydrates, EN% 42.1 ± 5.9 42.2 ± 5.8 42.0 ± 6.0
Micronutrient intakes Iron, mg* 10.9 ± 2.48 11.6 ± 2.80 10.31 ± 2.00 Magnesium, mg* 335 ± 78.1 354 ± 93.5 320 ± 58.7 Zinc, mg* 9.91 ± 2.32 10.7 ± 2.55 9.29 ± 1.91 Iodine, mg* 164 ± 58.6 179 ± 49.9 151 ± 62.4 Calcium, mg 969 ± 310 980 ± 361 960 ± 261 Copper, mg* 1.18 ± 0.32 1.24 ± 0.38 1.14 ± 0.26 Selenium, ug* 44.5 ± 12.8 47.29 ± 12.63 42.11 ± 12.47 Vitamin B6, ug* 1.63 ± 0.52 1.77 ± 0.62 1.51 ± 0.38 Vitamin B12, mg* 5.00 ± 2.68 5.39 ± 3.06 4.68 ± 2.27 Folate, ug 256 ± 71.5 259 ± 78.11 253 ± 65.65 Vitamin D, ug* 3.56 ± 2.09 4.09 ± 2.51 3.12 ± 1.55
Use of dietary supplements Any supplements, n (% of total)* 106 (43) 29 (26) 77 (57) Multivitamin multimineral, n (% of total) 59 (24) 22 (20) 37 (28) Vitamin D, n (% of total) 24 (10) 2 (2) 22 (16) Calcium, n (% of total)* 6 (2) 0 (0) 8 (6) Calcium/Vitamin D complex, n (% of total) 13 (5) 3 (3) 10 (8) Vitamin B12, n (% of total) 1 (<1) 0 (0) 1 (1) Vitamin B-complex, n (% of total) 7 (3) 0 (0) 7 (5) Folic acid, n (% of total) 6 (2) 0 (0) 6 (5) Iron, n (% of total)* 1 (<1) 1 (1) 0 (0)
a For Dutch elderly participants in NU-AGE study (n=245). b Values are presented as means ± SD per day, number (percentage for EN% per day and amount of people (% of total)). * Statistical significant differences between men and women (p < 0.05). Abbreviations: BMI, body mass index; kcal, kilocalories; EN%, energy percentage.
29
Based on the intake of conventional foods only, 99% of participants did not meet their average requirement of vitamin D. Based on the intake of conventional foods plus fortified foods still 98% did not meet their AR. Taking into account foods plus the intake from vitamin and mineral supplements, 87% did not meet their AR, as shown in table 4. For selenium and vitamin B6, based on the intake conventional foods, 41% and 54% did not meet their AR. These percentages of inadequate intakes decreased to 36% and 20% when taking into account the intake from fortified foods and vitamin and mineral supplements. Other nutrients studied showed no or smaller percentages of inadequate intakes when including conventional foods, fortified foods and dietary supplements (folate 17%, copper 8%, iodine 7%, calcium 6%, zinc 5%, vitamin B12 2%, and 0% for iron and magnesium. No nutrient intakes reached levels above the UL. Table 4. Usual nutrient intakes from conventional foods, fortified foods and dietary supplements compared to Dietary Reference Valuesa, b Nutrient
Intakec AR % participants with intakes < AR
UL % participants with intakes > UL
Vitamin D (ug/day) 10 ug [27] 100 ug [29] Conventional foods 2.49 ± 1.91 99.2 % Fortified foods 1.06 ± 0.95 All foods 3.56 ± 3.09 98.4 % 0 % Supplements 2.47 ± 6.19 Foods+supplements 6.04 ± 6.59 86.5 % 0 %
Selenium (ug/day) 40 ug [26] 300 ug [29] Conventional foods 44.2 ± 12.8 41.2 % Fortified foods 0.22 ± 0.53 All foods 44.5 ± 12.8 41.2 % 0 % Supplements 9.47±31.38 Foods+supplements 53.9 ± 33.8 35.9 % 0.4 %
Vitamin B6 (ug/day) 1.3 mg [26] 25 mg [29] Conventional foods 1.34 ± 0.32 53.5 % Fortified foods 0.29 ± 0.39 All foods 1.63 ± 0.52 26.5 % 0 % Supplements 1.21 ± 5.71 Foods+supplements 2.83 ± 5.73 20.0 % 0.8 %
Folate (ug/day) 200 ug [26] 1000 ug [29] Conventional foods 252.7 ± 70.7 24.1 % Fortified foods 3.29 ± 9.32 All foods 256.0 ± 71.5 22.9 % 0 % Supplements 60.38±155.78 Foods+supplements 316.7±170.5 16.7 % 1.2 %
Copper (mg/day) 0.8 mg [26] 5 mg [29] Conventional foods 1.17 ± 0.32 8.9 % Fortified foods 0.01 ± 0.03 All foods 1.18 ± 0.32 7.8 % 0 % Supplements 0.18 ± 0.65 Foods+supplements 1.36 ± 0.72 7.8 % 0.8 %
Iodine (mg/day) 100 ug [26] 600 ug [29] Conventional foods 162.7 ± 58.5 8.6 % 0.4 % Fortified foods 0.97 ± 3.04 All foods 163.7 ± 58.6 7.8 % 0 % Supplements 15.06 ± 55.96 Foods+supplements 178.7 ± 81.2 6.5 % 0.8 %
Calcium (mg/day) 550 mg [26] 2500 mg [29] Conventional foods 936.4 ± 304.4 7.8 % Fortified foods 32.7 ± 69.9 All foods 969.2 ± 309.9 6.1 % 0 % Supplements 56.54±196.24 Foods+supplements 1026.3±370.8 5.7 % 0.4 %

2
Chapter 2 | Key sources of nutrient intake in Dutch older adults
28
Results General characteristics of the study population are presented in table 3. The population’s mean age was 70.9 ± 4.0 years. Compared to women, men tended to have a higher BMI, were slightly higher educated, were more likely to have ever smoked, had higher absolute energy, protein, fat, carbohydrate and micronutrient intakes. Macronutrient intakes expressed as percentage of total energy intake were similar between men and women. Of the total population, 43% used dietary supplements, of which MVMMs were most frequently used (24%), followed by vitamin D supplements (10%). Compared to men, the percentage of supplement users was higher in women (57% vs. 26%), particularly for vitamin D supplements (16% vs. 2%). Table 3. Baseline characteristicsa, b Characteristic Total population
(n=245) Men
(n=111) Women (n=134)
Age, years 70.9 ± 4.0 70.9 ± 4.3 71.0 ± 3.9 BMI, kg/m2* 26.0 ± 3.6 26.7 ± 3.6 25.5 ± 3.6 Education, years* 12.2 ± 3.8 12.7 ± 3.8 11.7 ± 3.6 Smoking status, n (% of total)*
Never 126 (50) 44 (39) 82 (59) Former 118 (47) 65 (57) 53 (38) Current 8 (3) 4 (4) 4 (3)
Macronutrient intakes Energy, kcal* 1912 ± 418 2100 ± 476 1756 ± 280 Protein, gram 76.3 ± 16.0 82.5 ± 17.0 71.2 ± 13.1 Protein, EN% 16.1 ± 2.4 15.9 ± 2.2 16.3 ± 2.5 Fat, gram* 73.1 ± 19.9 78.7 ± 23.0 68.4 ± 15.5 Fat, EN%* 34.3 ±5.0 33.5 ± 4.5 35.0 ± 5.3 Carbohydrates, gram* 202 ± 54.4 222 ± 61.8 185 ± 40.2 Carbohydrates, EN% 42.1 ± 5.9 42.2 ± 5.8 42.0 ± 6.0
Micronutrient intakes Iron, mg* 10.9 ± 2.48 11.6 ± 2.80 10.31 ± 2.00 Magnesium, mg* 335 ± 78.1 354 ± 93.5 320 ± 58.7 Zinc, mg* 9.91 ± 2.32 10.7 ± 2.55 9.29 ± 1.91 Iodine, mg* 164 ± 58.6 179 ± 49.9 151 ± 62.4 Calcium, mg 969 ± 310 980 ± 361 960 ± 261 Copper, mg* 1.18 ± 0.32 1.24 ± 0.38 1.14 ± 0.26 Selenium, ug* 44.5 ± 12.8 47.29 ± 12.63 42.11 ± 12.47 Vitamin B6, ug* 1.63 ± 0.52 1.77 ± 0.62 1.51 ± 0.38 Vitamin B12, mg* 5.00 ± 2.68 5.39 ± 3.06 4.68 ± 2.27 Folate, ug 256 ± 71.5 259 ± 78.11 253 ± 65.65 Vitamin D, ug* 3.56 ± 2.09 4.09 ± 2.51 3.12 ± 1.55
Use of dietary supplements Any supplements, n (% of total)* 106 (43) 29 (26) 77 (57) Multivitamin multimineral, n (% of total) 59 (24) 22 (20) 37 (28) Vitamin D, n (% of total) 24 (10) 2 (2) 22 (16) Calcium, n (% of total)* 6 (2) 0 (0) 8 (6) Calcium/Vitamin D complex, n (% of total) 13 (5) 3 (3) 10 (8) Vitamin B12, n (% of total) 1 (<1) 0 (0) 1 (1) Vitamin B-complex, n (% of total) 7 (3) 0 (0) 7 (5) Folic acid, n (% of total) 6 (2) 0 (0) 6 (5) Iron, n (% of total)* 1 (<1) 1 (1) 0 (0)
a For Dutch elderly participants in NU-AGE study (n=245). b Values are presented as means ± SD per day, number (percentage for EN% per day and amount of people (% of total)). * Statistical significant differences between men and women (p < 0.05). Abbreviations: BMI, body mass index; kcal, kilocalories; EN%, energy percentage.
29
Based on the intake of conventional foods only, 99% of participants did not meet their average requirement of vitamin D. Based on the intake of conventional foods plus fortified foods still 98% did not meet their AR. Taking into account foods plus the intake from vitamin and mineral supplements, 87% did not meet their AR, as shown in table 4. For selenium and vitamin B6, based on the intake conventional foods, 41% and 54% did not meet their AR. These percentages of inadequate intakes decreased to 36% and 20% when taking into account the intake from fortified foods and vitamin and mineral supplements. Other nutrients studied showed no or smaller percentages of inadequate intakes when including conventional foods, fortified foods and dietary supplements (folate 17%, copper 8%, iodine 7%, calcium 6%, zinc 5%, vitamin B12 2%, and 0% for iron and magnesium. No nutrient intakes reached levels above the UL. Table 4. Usual nutrient intakes from conventional foods, fortified foods and dietary supplements compared to Dietary Reference Valuesa, b Nutrient
Intakec AR % participants with intakes < AR
UL % participants with intakes > UL
Vitamin D (ug/day) 10 ug [27] 100 ug [29] Conventional foods 2.49 ± 1.91 99.2 % Fortified foods 1.06 ± 0.95 All foods 3.56 ± 3.09 98.4 % 0 % Supplements 2.47 ± 6.19 Foods+supplements 6.04 ± 6.59 86.5 % 0 %
Selenium (ug/day) 40 ug [26] 300 ug [29] Conventional foods 44.2 ± 12.8 41.2 % Fortified foods 0.22 ± 0.53 All foods 44.5 ± 12.8 41.2 % 0 % Supplements 9.47±31.38 Foods+supplements 53.9 ± 33.8 35.9 % 0.4 %
Vitamin B6 (ug/day) 1.3 mg [26] 25 mg [29] Conventional foods 1.34 ± 0.32 53.5 % Fortified foods 0.29 ± 0.39 All foods 1.63 ± 0.52 26.5 % 0 % Supplements 1.21 ± 5.71 Foods+supplements 2.83 ± 5.73 20.0 % 0.8 %
Folate (ug/day) 200 ug [26] 1000 ug [29] Conventional foods 252.7 ± 70.7 24.1 % Fortified foods 3.29 ± 9.32 All foods 256.0 ± 71.5 22.9 % 0 % Supplements 60.38±155.78 Foods+supplements 316.7±170.5 16.7 % 1.2 %
Copper (mg/day) 0.8 mg [26] 5 mg [29] Conventional foods 1.17 ± 0.32 8.9 % Fortified foods 0.01 ± 0.03 All foods 1.18 ± 0.32 7.8 % 0 % Supplements 0.18 ± 0.65 Foods+supplements 1.36 ± 0.72 7.8 % 0.8 %
Iodine (mg/day) 100 ug [26] 600 ug [29] Conventional foods 162.7 ± 58.5 8.6 % 0.4 % Fortified foods 0.97 ± 3.04 All foods 163.7 ± 58.6 7.8 % 0 % Supplements 15.06 ± 55.96 Foods+supplements 178.7 ± 81.2 6.5 % 0.8 %
Calcium (mg/day) 550 mg [26] 2500 mg [29] Conventional foods 936.4 ± 304.4 7.8 % Fortified foods 32.7 ± 69.9 All foods 969.2 ± 309.9 6.1 % 0 % Supplements 56.54±196.24 Foods+supplements 1026.3±370.8 5.7 % 0.4 %

Chapter 2 | Key sources of nutrient intake in Dutch older adults
30
Nutrient
Intakec AR % participants with intakes < AR
UL % participants with intakes > UL
Zinc (mg/day) 7.5mg men, 5.5mg women[26]
45mg [29]
Conventional foods 9.84 ± 2.34 5.3 % Fortified foods 0.07 ± 0.16 All foods 9.91 ± 2.32 4.9 % 0 % Supplements 1.74 ± 5.96 Foods+supplements 11.7 ± 6.2 4.5 % 0.4 %
Vitamin B12 (mg/day) 2.0 ug [26] N/Ad Conventional foods 4.75 ± 2.67 4.1 % Fortified foods 0.25 ± 0.32 All foods 5.00 ± 2.68 3.3 % 0 % Supplements 4.53 ± 19.92 Foods+supplements 9.53 ± 20.1 2.0 % N/A
Iron (mg/day) 7ug men, 6ug women [26]
75 mg [40]
Conventional foods 10.7 ± 2.4 1.2 % Fortified foods 0.21 ± 0.89 All foods 10.9 ± 2.5 1.2 % 0 % Supplements 1.50 ± 5.79 Foods+supplements 12.4 ± 6.1 0 % 0.4 %
Magnesium (mg/day) 150-500 mg[26] 250 mg [26]e Conventional foods 329.8 ± 76.3 0.4 % Fortified foods 5.40 ± 14.38 All foods 335.2 ± 78.1 0 % 0.0 % Supplements 39.55 ± 55.96 Foods+supplements 375.5 ± 251.8 0 % 0.0 %
a For Dutch elderly participants in NU-AGE study (n=245) b Recommended daily allowances as set by European Union [21], the labelling reference intakes values as set by the European Food Safety Authority [22-24], average requirements and tolerable upper intake levels as set by the Health Council of the Netherlands [27,40] and the European Union were used [26,29,41]. c Values are expressed as means ± SD
d For vitamin B12 no UL of safe intakes was established e
The UL for magnesium does not include magnesium normally present in foods and beverages Abbreviations: AR, average requirement; UL, upper intake level The contributions of dietary supplements, fortified foods and conventional foods to total nutrient intakes are presented in figure 1. Almost half of the total vitamin D, vitamin B6 and more than half of total selenium intake came from conventional foods (42%, 45%, 82%, respectively), followed by dietary supplements (41% , 44%, 18%, respectively) and fortified foods (17%, 11%, 1%, respectively).
When comparing the contribution of low, middle and high nutrient dense foods to total nutrient intakes, high nutrient dense foods contributed most to the total vitamin B6 intake (23%), followed by the middle nutrient dense group (19%) (figure 1). For vitamin D and selenium, the middle NRF9.3 group contributed most to total vitamin D and selenium intake (18% and 39%). When comparing the contribution of the different nutrient density groups to the nutrient intake from conventional foods only, half of this intake came from the highest NRF9.3 group for vitamin B6 (50%) while half of the intakes from vitamin D and selenium came from the middle NRF9.3 group (44% and 47%). For all nutrients, the lowest NRF9.3 group contributed least to both total nutrient intake as well as the nutrient intake from conventional foods only. Of the food groups, fish contributed most to vitamin D intake, followed by eggs, meat (products) and poultry (figure 2). Fish, meat (products) and poultry, and bread contributed most to the intake of selenium. For vitamin B6, meat (products) and poultry, followed by potatoes, and (non-) alcoholic drinks contributed most to the intake.
31
Figure 1. Contribution of dietary supplements, fortified foods and conventional foods categorized into nutrient density scores to the total nutrient intakea, b
a For Dutch elderly participants in NU-AGE study (n=245). b Values are presented as percentage of total intake per micronutrient
Figure 2. Food groups sorted by their NRF9.3 score (high NRF9.3 on the left to low NRF9.3 on the right) and their relative contribution to nutrient intakes (vitamin D, vitamin B6 and selenium)a, b
a For Dutch elderly participants in NU-AGE study (n=245) b Values are presented as percentage of total intake of each micronutrient

2
Chapter 2 | Key sources of nutrient intake in Dutch older adults
30
Nutrient
Intakec AR % participants with intakes < AR
UL % participants with intakes > UL
Zinc (mg/day) 7.5mg men, 5.5mg women[26]
45mg [29]
Conventional foods 9.84 ± 2.34 5.3 % Fortified foods 0.07 ± 0.16 All foods 9.91 ± 2.32 4.9 % 0 % Supplements 1.74 ± 5.96 Foods+supplements 11.7 ± 6.2 4.5 % 0.4 %
Vitamin B12 (mg/day) 2.0 ug [26] N/Ad Conventional foods 4.75 ± 2.67 4.1 % Fortified foods 0.25 ± 0.32 All foods 5.00 ± 2.68 3.3 % 0 % Supplements 4.53 ± 19.92 Foods+supplements 9.53 ± 20.1 2.0 % N/A
Iron (mg/day) 7ug men, 6ug women [26]
75 mg [40]
Conventional foods 10.7 ± 2.4 1.2 % Fortified foods 0.21 ± 0.89 All foods 10.9 ± 2.5 1.2 % 0 % Supplements 1.50 ± 5.79 Foods+supplements 12.4 ± 6.1 0 % 0.4 %
Magnesium (mg/day) 150-500 mg[26] 250 mg [26]e Conventional foods 329.8 ± 76.3 0.4 % Fortified foods 5.40 ± 14.38 All foods 335.2 ± 78.1 0 % 0.0 % Supplements 39.55 ± 55.96 Foods+supplements 375.5 ± 251.8 0 % 0.0 %
a For Dutch elderly participants in NU-AGE study (n=245) b Recommended daily allowances as set by European Union [21], the labelling reference intakes values as set by the European Food Safety Authority [22-24], average requirements and tolerable upper intake levels as set by the Health Council of the Netherlands [27,40] and the European Union were used [26,29,41]. c Values are expressed as means ± SD
d For vitamin B12 no UL of safe intakes was established e
The UL for magnesium does not include magnesium normally present in foods and beverages Abbreviations: AR, average requirement; UL, upper intake level The contributions of dietary supplements, fortified foods and conventional foods to total nutrient intakes are presented in figure 1. Almost half of the total vitamin D, vitamin B6 and more than half of total selenium intake came from conventional foods (42%, 45%, 82%, respectively), followed by dietary supplements (41% , 44%, 18%, respectively) and fortified foods (17%, 11%, 1%, respectively).
When comparing the contribution of low, middle and high nutrient dense foods to total nutrient intakes, high nutrient dense foods contributed most to the total vitamin B6 intake (23%), followed by the middle nutrient dense group (19%) (figure 1). For vitamin D and selenium, the middle NRF9.3 group contributed most to total vitamin D and selenium intake (18% and 39%). When comparing the contribution of the different nutrient density groups to the nutrient intake from conventional foods only, half of this intake came from the highest NRF9.3 group for vitamin B6 (50%) while half of the intakes from vitamin D and selenium came from the middle NRF9.3 group (44% and 47%). For all nutrients, the lowest NRF9.3 group contributed least to both total nutrient intake as well as the nutrient intake from conventional foods only. Of the food groups, fish contributed most to vitamin D intake, followed by eggs, meat (products) and poultry (figure 2). Fish, meat (products) and poultry, and bread contributed most to the intake of selenium. For vitamin B6, meat (products) and poultry, followed by potatoes, and (non-) alcoholic drinks contributed most to the intake.
31
Figure 1. Contribution of dietary supplements, fortified foods and conventional foods categorized into nutrient density scores to the total nutrient intakea, b
a For Dutch elderly participants in NU-AGE study (n=245). b Values are presented as percentage of total intake per micronutrient
Figure 2. Food groups sorted by their NRF9.3 score (high NRF9.3 on the left to low NRF9.3 on the right) and their relative contribution to nutrient intakes (vitamin D, vitamin B6 and selenium)a, b
a For Dutch elderly participants in NU-AGE study (n=245) b Values are presented as percentage of total intake of each micronutrient

Chapter 2 | Key sources of nutrient intake in Dutch older adults
32
Discussion In this cross-sectional analysis of 245 Dutch elderly persons based on the consumption of conventional foods, the percentage of inadequate intake was high for vitamin D and moderate for vitamin B6 and selenium. Including the consumption of fortified foods and dietary supplements substantially lowered the percentage of nutrient inadequacy for vitamin B6, but not for vitamin D and selenium without affecting risk of excessive intakes. High nutrient dense foods contributed most to total vitamin B6 intake, whereas middle nutrient dense foods contributed most to total vitamin D and selenium intake. Our finding of a high percentage of inadequate vitamin D intake is in line with other dietary intake surveys among Dutch (the Dutch National Food Consumption Survey 2010-2012, DNFCS 2010-2012) and Irish elderly, showing percentages of inadequate vitamin D intake ranging from 81% to 100% [30,31] also when including fortified foods and dietary supplements. For selenium, the mean prevalence of inadequate intake in European elderly was above 20%, which mirrored our study (36%) [4]. The low prevalence of inadequate intakes observed for zinc, vitamin B12, and iron is in line with previous Dutch [31] and European findings [31]; showing a mean prevalence of inadequacy below 11% for these nutrients. In contrast, the proportion of elderly with inadequate vitamin B6 intakes was reported as being below 15% in the Netherlands in a previous study [31], compared to 20% in the present study. Additionally, a higher prevalence of inadequate intakes in European elderly were observed for copper (11-20%), folate, calcium, and iodine (all above 20%) [4]. As in the present study, the European survey did not find substantial percentages of excessive intakes of vitamin D, selenium and vitamin B6 [32]. The observed natural main sources of vitamin D (e.g., fish, eggs, and meat), and fortified foods are in line with other studies in Europe [33], as well as the main sources of selenium (e.g., fish, meat and cereals [31,32] and vitamin B6 (e.g., meat, potatoes) [31].
The difference in the prevalence of inadequate intakes between the present study and previous European studies could be explained by differences in study populations and methodological differences. First, the NU-AGE study aimed to recruit independently living, apparently healthy elderly, which resulted in a generally healthy (50% never smoked), and highly educated (12.2 years of education) study population. This could have resulted in better dietary intakes and lower percentages of inadequate intakes compared to other community-dwelling Dutch [31] and European populations [4]. Second, supplement intake or food fortification was not taken into account in the European study [4], possibly overestimating the true percentages of inadequate intakes compared to the present study population. Third, different dietary requirements have been used as cut-off values to define nutrient adequacy. For example, for calcium, the European study used guidelines from the Institute of Medicine (IOM) for North American populations (EAR 800 mg) [28] compared to the EAR from the European Commission (EC) for European populations used in the present study (EAR 550 mg) [26]. If we would have used the IOM guidelines, the prevalence of inadequacy for calcium would have been higher, namely 64% instead of 8% in the current study. With respect to the relative contribution of fortified foods to total nutrient intakes, our findings are comparable to the DNFCS 2010-2012, showing the smallest contribution for selenium and a highest contribution for vitamin D and vitamin B6 (between 15-8% in DNFCS 2010-2012 [31] and 19% and 12% in the current study, respectively). In contrast, the Irish ingest three times as much vitamin D from fortified foods compared to participants in the present study [30]. This difference in vitamin D intake from fortified foods in the present study compared to the Irish study might be due to the fact that fortification with vitamin D is mandatory in Ireland, but not in the Netherlands [33].
33
To the best of our knowledge, this is the first study to estimate the contribution of high, medium and low nutrient dense foods to total nutrient intakes. With this approach, we aimed to identify which kind of foods substantially contribute to total nutrient intakes and which foods should be encouraged in elderly people to improve their nutritional intakes to meet nutritional requirements. Using the NRF9.3 score as developed by Drewnowski et al. [15], the current study has shown that the contribution of nutrient dense foods varied between the nutrients investigated. A first explanation could be that we have divided the continuum of NRF9.3 scores in tertiles, based on the distribution of consumed foods. As the positioning of foods categories along the spectrum is arbitrary, this could have led to a ranking of food categories rather than a continuous scale [34]. A second explanation could be related to the fact the NRF 9.3 does not take into account the actual frequency and amount consumption of a food. Although legumes do have a high NRF 9.3 score, they do not substantially contribute to the total nutrient intake as their actual intake is relatively low. At last, the NRF9.3 algorithms include nutrients that are not specifically of interest for the elderly, resulting in poorly fitting nutrient algorithms for this study population [34]. In order to increase the applicability of the NRF9.3 score to diets of the elderly, it might be worthwhile to adapt the NRF9.3 score to nutrients of concern for older populations [15], such as by including vitamin D, vitamin B12, folate and vitamin B6 and other priority micronutrients as proposed by EURRECA. In addition, more detailed nutritional information on current available fortified foods should be collected to optimize estimation of micronutrient intakes via fortified foods; also the list of fortified foods should be updated regularly as new products may be fortified in the future or products may be reformulated.
A strength of the present study includes the extensive information of vitamin intakes from both foods and vitamin and mineral supplements. The food records that were used are based on actual intake. In contrast to food frequency questionnaires (FFQs) and 24-h recalls, the use of food records has the advantage in older populations in that it minimizes reliance on memory, as food intake was recorded by participants at the time the foods were consumed [35]. After completion of the food records, they were extensively reviewed and checked for completeness by trained research dieticians. This method, in combination with information from the NEVO 2011 [13], allowed us to estimate comprehensively nutrient intakes from conventional foods as well as from fortified foods. Because of the detailed information solicited with the extensive supplement questionnaire (e.g., name, brand, frequency, number of tablets, and label information), we were able to collect the specific nutrient contents of all the predefined dietary supplements used.
A limitation of the present study is the generalizability of our study population, because the participants of the NU-AGE study had to be willing to change their dietary habits for the dietary intervention, and as such, it is very likely that particularly health-conscious people were included. Additionally, our sample mainly consisted of highly-educated, non-Hispanic Whites, former smokers, and normal/underweight, which have all been shown to be related to a higher use of dietary supplements [36]. When extrapolating our findings, it should be taken into consideration that results of our study population probably underestimate the prevalence of inadequate micronutrient intakes in the general population, and overestimate the contribution of supplements to micronutrient intake. This further highlights the importance of addressing nutrition inadequacy in the general population and of encouraging the consumption of nutrient-dense and/or fortified foods. Another limitation of the present study concerns the estimation of nutrient adequacy based on dietary intake alone. Taking into account micronutrient bioavailability, bio-accessibility and micronutrient status would better reflect the nutrient adequacy, also capturing different changes in nutrient status for fortified foods or supplement intakes. Some supplements taken separately from food, for example,

2
Chapter 2 | Key sources of nutrient intake in Dutch older adults
32
Discussion In this cross-sectional analysis of 245 Dutch elderly persons based on the consumption of conventional foods, the percentage of inadequate intake was high for vitamin D and moderate for vitamin B6 and selenium. Including the consumption of fortified foods and dietary supplements substantially lowered the percentage of nutrient inadequacy for vitamin B6, but not for vitamin D and selenium without affecting risk of excessive intakes. High nutrient dense foods contributed most to total vitamin B6 intake, whereas middle nutrient dense foods contributed most to total vitamin D and selenium intake. Our finding of a high percentage of inadequate vitamin D intake is in line with other dietary intake surveys among Dutch (the Dutch National Food Consumption Survey 2010-2012, DNFCS 2010-2012) and Irish elderly, showing percentages of inadequate vitamin D intake ranging from 81% to 100% [30,31] also when including fortified foods and dietary supplements. For selenium, the mean prevalence of inadequate intake in European elderly was above 20%, which mirrored our study (36%) [4]. The low prevalence of inadequate intakes observed for zinc, vitamin B12, and iron is in line with previous Dutch [31] and European findings [31]; showing a mean prevalence of inadequacy below 11% for these nutrients. In contrast, the proportion of elderly with inadequate vitamin B6 intakes was reported as being below 15% in the Netherlands in a previous study [31], compared to 20% in the present study. Additionally, a higher prevalence of inadequate intakes in European elderly were observed for copper (11-20%), folate, calcium, and iodine (all above 20%) [4]. As in the present study, the European survey did not find substantial percentages of excessive intakes of vitamin D, selenium and vitamin B6 [32]. The observed natural main sources of vitamin D (e.g., fish, eggs, and meat), and fortified foods are in line with other studies in Europe [33], as well as the main sources of selenium (e.g., fish, meat and cereals [31,32] and vitamin B6 (e.g., meat, potatoes) [31].
The difference in the prevalence of inadequate intakes between the present study and previous European studies could be explained by differences in study populations and methodological differences. First, the NU-AGE study aimed to recruit independently living, apparently healthy elderly, which resulted in a generally healthy (50% never smoked), and highly educated (12.2 years of education) study population. This could have resulted in better dietary intakes and lower percentages of inadequate intakes compared to other community-dwelling Dutch [31] and European populations [4]. Second, supplement intake or food fortification was not taken into account in the European study [4], possibly overestimating the true percentages of inadequate intakes compared to the present study population. Third, different dietary requirements have been used as cut-off values to define nutrient adequacy. For example, for calcium, the European study used guidelines from the Institute of Medicine (IOM) for North American populations (EAR 800 mg) [28] compared to the EAR from the European Commission (EC) for European populations used in the present study (EAR 550 mg) [26]. If we would have used the IOM guidelines, the prevalence of inadequacy for calcium would have been higher, namely 64% instead of 8% in the current study. With respect to the relative contribution of fortified foods to total nutrient intakes, our findings are comparable to the DNFCS 2010-2012, showing the smallest contribution for selenium and a highest contribution for vitamin D and vitamin B6 (between 15-8% in DNFCS 2010-2012 [31] and 19% and 12% in the current study, respectively). In contrast, the Irish ingest three times as much vitamin D from fortified foods compared to participants in the present study [30]. This difference in vitamin D intake from fortified foods in the present study compared to the Irish study might be due to the fact that fortification with vitamin D is mandatory in Ireland, but not in the Netherlands [33].
33
To the best of our knowledge, this is the first study to estimate the contribution of high, medium and low nutrient dense foods to total nutrient intakes. With this approach, we aimed to identify which kind of foods substantially contribute to total nutrient intakes and which foods should be encouraged in elderly people to improve their nutritional intakes to meet nutritional requirements. Using the NRF9.3 score as developed by Drewnowski et al. [15], the current study has shown that the contribution of nutrient dense foods varied between the nutrients investigated. A first explanation could be that we have divided the continuum of NRF9.3 scores in tertiles, based on the distribution of consumed foods. As the positioning of foods categories along the spectrum is arbitrary, this could have led to a ranking of food categories rather than a continuous scale [34]. A second explanation could be related to the fact the NRF 9.3 does not take into account the actual frequency and amount consumption of a food. Although legumes do have a high NRF 9.3 score, they do not substantially contribute to the total nutrient intake as their actual intake is relatively low. At last, the NRF9.3 algorithms include nutrients that are not specifically of interest for the elderly, resulting in poorly fitting nutrient algorithms for this study population [34]. In order to increase the applicability of the NRF9.3 score to diets of the elderly, it might be worthwhile to adapt the NRF9.3 score to nutrients of concern for older populations [15], such as by including vitamin D, vitamin B12, folate and vitamin B6 and other priority micronutrients as proposed by EURRECA. In addition, more detailed nutritional information on current available fortified foods should be collected to optimize estimation of micronutrient intakes via fortified foods; also the list of fortified foods should be updated regularly as new products may be fortified in the future or products may be reformulated.
A strength of the present study includes the extensive information of vitamin intakes from both foods and vitamin and mineral supplements. The food records that were used are based on actual intake. In contrast to food frequency questionnaires (FFQs) and 24-h recalls, the use of food records has the advantage in older populations in that it minimizes reliance on memory, as food intake was recorded by participants at the time the foods were consumed [35]. After completion of the food records, they were extensively reviewed and checked for completeness by trained research dieticians. This method, in combination with information from the NEVO 2011 [13], allowed us to estimate comprehensively nutrient intakes from conventional foods as well as from fortified foods. Because of the detailed information solicited with the extensive supplement questionnaire (e.g., name, brand, frequency, number of tablets, and label information), we were able to collect the specific nutrient contents of all the predefined dietary supplements used.
A limitation of the present study is the generalizability of our study population, because the participants of the NU-AGE study had to be willing to change their dietary habits for the dietary intervention, and as such, it is very likely that particularly health-conscious people were included. Additionally, our sample mainly consisted of highly-educated, non-Hispanic Whites, former smokers, and normal/underweight, which have all been shown to be related to a higher use of dietary supplements [36]. When extrapolating our findings, it should be taken into consideration that results of our study population probably underestimate the prevalence of inadequate micronutrient intakes in the general population, and overestimate the contribution of supplements to micronutrient intake. This further highlights the importance of addressing nutrition inadequacy in the general population and of encouraging the consumption of nutrient-dense and/or fortified foods. Another limitation of the present study concerns the estimation of nutrient adequacy based on dietary intake alone. Taking into account micronutrient bioavailability, bio-accessibility and micronutrient status would better reflect the nutrient adequacy, also capturing different changes in nutrient status for fortified foods or supplement intakes. Some supplements taken separately from food, for example,

Chapter 2 | Key sources of nutrient intake in Dutch older adults
34
may result in a rapid increase in plasma concentrations of the supplemented nutrient, whereas consuming a food fortified with the same nutrient may have a more gradual effect on blood concentrations because of the presence of the food matrix, as has been shown for zinc [37]. For other micronutrients, such as folate, changes in serum values could be higher in food fortification than through supplementation [38].
Because the aim of food fortification is to beneficially impact population health, both the total additional intake and the quality of the nutrient or nutrients supplied must be taken into account, not just the intake of the vehicle (fortified food) alone [7]. Future studies investigating the contribution of dietary supplements, nutrient dense foods and fortified foods to total nutrient intakes should consider the bioavailability and bio-accessibility and include status markers indicating adequacy of intakes, as defined using the EURRECA guidelines [39].
To conclude, the intake of vitamin D was inadequate in the vast majority of this Dutch elderly population, and nutrient intakes of vitamin B6 and selenium are of concern. The inadequacy of vitamin D could be confirmed via biomarkers of vitamin D status. Conventional foods were the main source of vitamin D, B6 and selenium intake, followed by vitamin and mineral supplements and fortified foods. Although fortified foods and vitamin and mineral supplements importantly contributed to the total intake of vitamin D and B6 intake, the use of these components did not necessarily lead to adequate intakes of nutrients that are of concern for older populations. Foods with the highest nutrient density contributed the most to total vitamin B6 intake only. In order to optimize nutrient intakes of elderly, combinations of conventional foods, fortified foods and dietary supplements need to be considered.
Acknowledgments The present work was commissioned by the Nutrient Intake Optimisation Task Force of the European branch of the International Life Sciences Institute (ILSI Europe). Industry members of this task force can be found online on www.ilsi.eu. This publication was coordinated by Lilou van Lieshout, and Alessandro Chiodini, Scientific Project Managers at ILSI Europe. For further information about ILSI Europe, please email [email protected] or call +32 2 771 00 14. The opinions expressed herein and the conclusions of this publication are those of the authors and do not necessarily represent the views of ILSI Europe nor those of its member companies. We would also like to acknowledge using the raw data from the NU-AGE project is supported by the European Union’s Seventh Framework Program under grant agreement no. 266486 (‘NU-AGE: New dietary strategies addressing the specific needs of the elderly population for healthy aging in Europe’). The Authors thank the coordinator Claudio Franceschi and all principal investigators and collaborators. We especially thank all of the participants for their valuable cooperation.
35
References 1. Eurostat (2011) EUROPOP2010 - Convergence scenario, national level - Assumptions.
http://epp.eurostat.ec.europa.eu/portal/page/portal/population/data/database.(Accessed September 13, 2015). 2. van Staveren WA & de Groot L. Evidence-based dietary guidance and the role of dairy products for appropriate
nutrition in the elderly. J Am Coll Nutr 2011;30:429S-437S. 3. Ames BN. Low micronutrient intake may accelerate the degenerative diseases of aging through allocation of scarce
micronutrients by triage. Proc Natl Acad Sci U S A 2006;103:17589-17594. 4. Roman Vinas B, Ribas Barba L, Ngo J, et al. Projected prevalence of inadequate nutrient intakes in Europe. Ann Nutr
Metab 2011;59:84-95. 5. ter Borg S, Verlaan S, Hemsworth J, et al. Micronutrient intakes and potential inadequacies of community-dwelling
older adults: a systematic review. Br J Nutr 2015;113: 1195-1206. 6. Popkin BM. Global nutrition dynamics: the world is shifting rapidly toward a diet linked with noncommunicable
diseases. Am J Clin Nutr 2006;84:289-298. 7. Dwyer JT, Wiemer KL, Dary O, et al. Fortification and health: challenges and opportunities. Adv Nutr 2015;6:124-131. 8. Skeie G, Braaten T, Hjartåker A, et al. Use of dietary supplements in the European Prospective Investigation into Cancer
and Nutrition calibration study. Eur J Clin Nutr 2009;63:S226-S238. 9. Berendsen A, Santoro A, Pini E, et al. Reprint of: A parallel randomized trial on the effect of a healthful diet on
inflammaging and its consequences in European elderly people: Design of the NU-AGE dietary intervention study. Mech Ageing Dev 2014;136-137:14-21.
10. Santoro A, Pini E, Scurti M, et al. Combating "inflammaging" through a Mediterranean whole diet approach: the NU-AGE project rationale. Free Radic Biol Med 2013;136-137:S3-S4.
11. Fried LP, Tangen CM, Walston J, et al. Frailty in older adults evidence for a phenotype. J Gerontol A Biol Sci Med Sci 2001;56:M146-M157.;’
12. Willett WC. Nutritional Epidemiology. 3rd ed. Oxford: Oxford University Press; 2013. 13. RIVM (2011) NEVO-online versie 2011. http://nevo-online.rivm.nl/ (accessed September 13, 2015). 14. Löwik MR, van den Berg H, Schrijver J, et al. Marginal nutritional status among institutionalized elderly women as
compared to those living more independently (Dutch Nutrition Surveillance System). J Am Coll Nutr 1992;11:673-681. 15. Drewnowski A. Defining nutrient density: development and validation of the nutrient rich foods index. J Am Coll Nutr
2009;28:421S-426S. 16. Nicklas TA, Drewnowski A & O’Neil CE. The nutrient density approach to healthy eating: challenges and opportunities.
Public Health Nutr 2014;17:2626-2636. 17. Drewnowski A & Fulgoni VL. Nutrient density: principles and evaluation tools. Am J Clin Nutr 2014;99:1223S-1228S. 18. Miller GD, Drewnowski A, Fulgoni V, et al. It is time for a positive approach to dietary guidance using nutrient density as
a basic principle. J Nutr 2009;139:1198-1202. 19. Fulgoni VL, Keast DR & Drewnowski A. Development and validation of the nutrient-rich foods index: a tool to measure
nutritional quality of foods. J Nutr 2009;139:1549-1554. 20. Sluik D, Streppel MT, van Lee L, et al. Evaluation of a nutrient-rich food index score in the Netherlands. J Nutr Sci
2015;4:e14. 21. EU Commission. Amending Council Directive 90/496/EEC on nutrition labelling for foodstuffs as regards recommended
daily allowances, energy conversion factors and definitions. Off J Eur Union 2008;51:9-12. 22. European Food Safety Authority. Scientific Opinion on Dietary Reference Values for Carbohydrate and ` Dietary Fibre.
EFSA J 2010;1008:14. 23. European Food Safety Authority. Scientific Opinion on Dietary Reference Values for Protein. EFSA J 2012;10:2557. 24. European Food Safety Authority.Scientific opinion of the Panel on Dietetic Products Nutrition and Allergies on a request
from the European Commission on the review of labelling reference intake values for selected nutritional elements. EFSA J 2009;1008:1-14.
25. Cavelaars AE, Doets EL, Dhonukshe-Rutten RA, et al. Prioritizing micronutrients for the purpose of reviewing their requirements: a protocol developed by EURRECA. Eur J Clin Nutr 2010;64(Suppl 2):S19-30.
26. Commission of the European Communities. Nutrient and energy intakes for the European Community. Scientific Committee for Food. http://aei.pitt.edu/40840/1/31st_food.pdf., 1993 [accessed September 13, 2015].
27. Health Council of the Netherlands. Evaluation of dietary reference values for vitamin D no. U-7310/RW/db/877-D, http://www.gezondheidsraad.nl/sites/default/files/201215EEvaluationDietaryReferenceVitaminD.pdf.; 2012 [accessed October 1, 2015]
28. Institute of Medicine (US) Committee to Review Dietary Review Intakes for Vitamin D and Calcium Dietary Reference Intakes for Calcium and Vitamin D. Washington DC: National Academies Press; 2011.
29. European Food Safety Authority (EFSA), Scientific Committee on Food, Scientific Panel on Dietetic Products, Nutrition and Allergies. Tolerable upper intake levels for vitamins and minerals. http://www.efsa.europa.eu/sites/default/files/efsa_rep/blobserver_assets/ndatolerableuil.pdf, 2006 [accessed October 1, 2015].
30. Black LJ, Walton J, Flynn A, Cashman KD & Kiely M. Small Increments in Vitamin D Intake by Irish Adults over a Decade Show That Strategic Initiatives to Fortify the Food Supply Are Needed. J Nutr 2015;145:969-976.

2
Chapter 2 | Key sources of nutrient intake in Dutch older adults
34
may result in a rapid increase in plasma concentrations of the supplemented nutrient, whereas consuming a food fortified with the same nutrient may have a more gradual effect on blood concentrations because of the presence of the food matrix, as has been shown for zinc [37]. For other micronutrients, such as folate, changes in serum values could be higher in food fortification than through supplementation [38].
Because the aim of food fortification is to beneficially impact population health, both the total additional intake and the quality of the nutrient or nutrients supplied must be taken into account, not just the intake of the vehicle (fortified food) alone [7]. Future studies investigating the contribution of dietary supplements, nutrient dense foods and fortified foods to total nutrient intakes should consider the bioavailability and bio-accessibility and include status markers indicating adequacy of intakes, as defined using the EURRECA guidelines [39].
To conclude, the intake of vitamin D was inadequate in the vast majority of this Dutch elderly population, and nutrient intakes of vitamin B6 and selenium are of concern. The inadequacy of vitamin D could be confirmed via biomarkers of vitamin D status. Conventional foods were the main source of vitamin D, B6 and selenium intake, followed by vitamin and mineral supplements and fortified foods. Although fortified foods and vitamin and mineral supplements importantly contributed to the total intake of vitamin D and B6 intake, the use of these components did not necessarily lead to adequate intakes of nutrients that are of concern for older populations. Foods with the highest nutrient density contributed the most to total vitamin B6 intake only. In order to optimize nutrient intakes of elderly, combinations of conventional foods, fortified foods and dietary supplements need to be considered.
Acknowledgments The present work was commissioned by the Nutrient Intake Optimisation Task Force of the European branch of the International Life Sciences Institute (ILSI Europe). Industry members of this task force can be found online on www.ilsi.eu. This publication was coordinated by Lilou van Lieshout, and Alessandro Chiodini, Scientific Project Managers at ILSI Europe. For further information about ILSI Europe, please email [email protected] or call +32 2 771 00 14. The opinions expressed herein and the conclusions of this publication are those of the authors and do not necessarily represent the views of ILSI Europe nor those of its member companies. We would also like to acknowledge using the raw data from the NU-AGE project is supported by the European Union’s Seventh Framework Program under grant agreement no. 266486 (‘NU-AGE: New dietary strategies addressing the specific needs of the elderly population for healthy aging in Europe’). The Authors thank the coordinator Claudio Franceschi and all principal investigators and collaborators. We especially thank all of the participants for their valuable cooperation.
35
References 1. Eurostat (2011) EUROPOP2010 - Convergence scenario, national level - Assumptions.
http://epp.eurostat.ec.europa.eu/portal/page/portal/population/data/database.(Accessed September 13, 2015). 2. van Staveren WA & de Groot L. Evidence-based dietary guidance and the role of dairy products for appropriate
nutrition in the elderly. J Am Coll Nutr 2011;30:429S-437S. 3. Ames BN. Low micronutrient intake may accelerate the degenerative diseases of aging through allocation of scarce
micronutrients by triage. Proc Natl Acad Sci U S A 2006;103:17589-17594. 4. Roman Vinas B, Ribas Barba L, Ngo J, et al. Projected prevalence of inadequate nutrient intakes in Europe. Ann Nutr
Metab 2011;59:84-95. 5. ter Borg S, Verlaan S, Hemsworth J, et al. Micronutrient intakes and potential inadequacies of community-dwelling
older adults: a systematic review. Br J Nutr 2015;113: 1195-1206. 6. Popkin BM. Global nutrition dynamics: the world is shifting rapidly toward a diet linked with noncommunicable
diseases. Am J Clin Nutr 2006;84:289-298. 7. Dwyer JT, Wiemer KL, Dary O, et al. Fortification and health: challenges and opportunities. Adv Nutr 2015;6:124-131. 8. Skeie G, Braaten T, Hjartåker A, et al. Use of dietary supplements in the European Prospective Investigation into Cancer
and Nutrition calibration study. Eur J Clin Nutr 2009;63:S226-S238. 9. Berendsen A, Santoro A, Pini E, et al. Reprint of: A parallel randomized trial on the effect of a healthful diet on
inflammaging and its consequences in European elderly people: Design of the NU-AGE dietary intervention study. Mech Ageing Dev 2014;136-137:14-21.
10. Santoro A, Pini E, Scurti M, et al. Combating "inflammaging" through a Mediterranean whole diet approach: the NU-AGE project rationale. Free Radic Biol Med 2013;136-137:S3-S4.
11. Fried LP, Tangen CM, Walston J, et al. Frailty in older adults evidence for a phenotype. J Gerontol A Biol Sci Med Sci 2001;56:M146-M157.;’
12. Willett WC. Nutritional Epidemiology. 3rd ed. Oxford: Oxford University Press; 2013. 13. RIVM (2011) NEVO-online versie 2011. http://nevo-online.rivm.nl/ (accessed September 13, 2015). 14. Löwik MR, van den Berg H, Schrijver J, et al. Marginal nutritional status among institutionalized elderly women as
compared to those living more independently (Dutch Nutrition Surveillance System). J Am Coll Nutr 1992;11:673-681. 15. Drewnowski A. Defining nutrient density: development and validation of the nutrient rich foods index. J Am Coll Nutr
2009;28:421S-426S. 16. Nicklas TA, Drewnowski A & O’Neil CE. The nutrient density approach to healthy eating: challenges and opportunities.
Public Health Nutr 2014;17:2626-2636. 17. Drewnowski A & Fulgoni VL. Nutrient density: principles and evaluation tools. Am J Clin Nutr 2014;99:1223S-1228S. 18. Miller GD, Drewnowski A, Fulgoni V, et al. It is time for a positive approach to dietary guidance using nutrient density as
a basic principle. J Nutr 2009;139:1198-1202. 19. Fulgoni VL, Keast DR & Drewnowski A. Development and validation of the nutrient-rich foods index: a tool to measure
nutritional quality of foods. J Nutr 2009;139:1549-1554. 20. Sluik D, Streppel MT, van Lee L, et al. Evaluation of a nutrient-rich food index score in the Netherlands. J Nutr Sci
2015;4:e14. 21. EU Commission. Amending Council Directive 90/496/EEC on nutrition labelling for foodstuffs as regards recommended
daily allowances, energy conversion factors and definitions. Off J Eur Union 2008;51:9-12. 22. European Food Safety Authority. Scientific Opinion on Dietary Reference Values for Carbohydrate and ` Dietary Fibre.
EFSA J 2010;1008:14. 23. European Food Safety Authority. Scientific Opinion on Dietary Reference Values for Protein. EFSA J 2012;10:2557. 24. European Food Safety Authority.Scientific opinion of the Panel on Dietetic Products Nutrition and Allergies on a request
from the European Commission on the review of labelling reference intake values for selected nutritional elements. EFSA J 2009;1008:1-14.
25. Cavelaars AE, Doets EL, Dhonukshe-Rutten RA, et al. Prioritizing micronutrients for the purpose of reviewing their requirements: a protocol developed by EURRECA. Eur J Clin Nutr 2010;64(Suppl 2):S19-30.
26. Commission of the European Communities. Nutrient and energy intakes for the European Community. Scientific Committee for Food. http://aei.pitt.edu/40840/1/31st_food.pdf., 1993 [accessed September 13, 2015].
27. Health Council of the Netherlands. Evaluation of dietary reference values for vitamin D no. U-7310/RW/db/877-D, http://www.gezondheidsraad.nl/sites/default/files/201215EEvaluationDietaryReferenceVitaminD.pdf.; 2012 [accessed October 1, 2015]
28. Institute of Medicine (US) Committee to Review Dietary Review Intakes for Vitamin D and Calcium Dietary Reference Intakes for Calcium and Vitamin D. Washington DC: National Academies Press; 2011.
29. European Food Safety Authority (EFSA), Scientific Committee on Food, Scientific Panel on Dietetic Products, Nutrition and Allergies. Tolerable upper intake levels for vitamins and minerals. http://www.efsa.europa.eu/sites/default/files/efsa_rep/blobserver_assets/ndatolerableuil.pdf, 2006 [accessed October 1, 2015].
30. Black LJ, Walton J, Flynn A, Cashman KD & Kiely M. Small Increments in Vitamin D Intake by Irish Adults over a Decade Show That Strategic Initiatives to Fortify the Food Supply Are Needed. J Nutr 2015;145:969-976.

Chapter 2 | Key sources of nutrient intake in Dutch older adults
36
31. Ocke MC, Buurma-Rethans EJM, De Boer EJ, et al. Diet of community-dwelling older adults: Dutch National Food Consumption Survey Older Adults 2010-2012. RIVM rapport 050413001, 2013.
32. Flynn A, Hirvonen T, Mensink GB, et al. Intake of selected nutrients from foods, from fortification and from supplements in various European countries. Food Nutr Res 53. http://www.ncbi.nlm.nih.gov/pmc/articles/PMC2791664/, 2009 [accessed October 1, 2015].
33. Spiro A & Buttriss JL (2014) Vitamin D: An overview of vitamin D status and intake in Europe. Nutr Bull 2014;39:322-350.
34. Scarborough P & Rayner M. When nutrient profiling can (and cannot) be useful. Public Health Nutr 2014;17:2637-2640. 35. Willett W (2013) Nutritional Epidemiology. Oxford: Oxford University Press. 36. Bailey RL, Fulgoni Vl III, Keast DR, et al. Dietary supplement use is associated with higher intakes of minerals from food
sources. http://ajcn.nutrition.org/content/early/2011/09/28/ajcn.111.020289.full.pdf+html, 2011 [accessed October 1, 2015].
37. Brown KH, Lopez de Romana D, Arsenault JE, et al. Comparison of the effects of zinc delivered in a fortified food or a liquid supplement on the growth, morbidity, and plasma zinc concentrations of young Peruvian children. Am J Clin Nutr 2007;85:538-47.
38. Dary O. Nutritional interpretation of folic acid interventions. Nutr Rev 2009;67: 235-44 39. Matthys C, van't Veer P, De Groot LCPG, et al. EURRECA's approach for estimating micronutrient requirements. Int J
Vitam Nutr Res 2011;81:256. 40. Netherlands Food and Nutrition Council. Nederlandse Voedingsnormen 1989. Den Haag: Voorlichtingsbureau voor de
Voeding, 1992. 41. European Food Safety Authority. Scientific opinion on the tolerable upper intake level of vitamin D. EFSA J
2012;10:2813-2858.
37

2
Chapter 2 | Key sources of nutrient intake in Dutch older adults
36
31. Ocke MC, Buurma-Rethans EJM, De Boer EJ, et al. Diet of community-dwelling older adults: Dutch National Food Consumption Survey Older Adults 2010-2012. RIVM rapport 050413001, 2013.
32. Flynn A, Hirvonen T, Mensink GB, et al. Intake of selected nutrients from foods, from fortification and from supplements in various European countries. Food Nutr Res 53. http://www.ncbi.nlm.nih.gov/pmc/articles/PMC2791664/, 2009 [accessed October 1, 2015].
33. Spiro A & Buttriss JL (2014) Vitamin D: An overview of vitamin D status and intake in Europe. Nutr Bull 2014;39:322-350.
34. Scarborough P & Rayner M. When nutrient profiling can (and cannot) be useful. Public Health Nutr 2014;17:2637-2640. 35. Willett W (2013) Nutritional Epidemiology. Oxford: Oxford University Press. 36. Bailey RL, Fulgoni Vl III, Keast DR, et al. Dietary supplement use is associated with higher intakes of minerals from food
sources. http://ajcn.nutrition.org/content/early/2011/09/28/ajcn.111.020289.full.pdf+html, 2011 [accessed October 1, 2015].
37. Brown KH, Lopez de Romana D, Arsenault JE, et al. Comparison of the effects of zinc delivered in a fortified food or a liquid supplement on the growth, morbidity, and plasma zinc concentrations of young Peruvian children. Am J Clin Nutr 2007;85:538-47.
38. Dary O. Nutritional interpretation of folic acid interventions. Nutr Rev 2009;67: 235-44 39. Matthys C, van't Veer P, De Groot LCPG, et al. EURRECA's approach for estimating micronutrient requirements. Int J
Vitam Nutr Res 2011;81:256. 40. Netherlands Food and Nutrition Council. Nederlandse Voedingsnormen 1989. Den Haag: Voorlichtingsbureau voor de
Voeding, 1992. 41. European Food Safety Authority. Scientific opinion on the tolerable upper intake level of vitamin D. EFSA J
2012;10:2813-2858.
37


Chapter 3Dietary patterns, cognitive decline and dementia: a systematic review
Agnes A.M. Berendsen*, Ondine van de Rest*, Annemien Haveman-Nies, and Lisette C.P.G.M. de Groot
*Shared first authorship
Advances in Nutrition, 2015, 6(2):154-168

Chapter 3 | Dietary patterns, cognitive decline and dementia; a systematic review
40
Abstract Nutrition is an important modifiable risk factor that plays a role in the strategy to prevent or delay onset of dementia. Research on nutritional effects has till now mainly focused on the role of individual nutrients and bioactive components. However, the evidence for combined effects, such as multi-nutrient approaches or a healthy dietary pattern such as the Mediterranean diet is growing. These approaches incorporate the complexity of the diet and possible interaction and synergy between nutrients. Over the last few years dietary patterns are increasingly investigated to better understand the link between diet, cognitive decline, and dementia. In this systematic review we provide an overview of the literature on human studies up to May 2014 that examined the role of dietary patterns (both a priori as well as a posteriori derived) in relation to cognitive decline or dementia. The results suggest that better adherence to a Mediterranean diet is associated with less cognitive decline, dementia or AD, as shown by four out of six cross-sectional studies, six out of 12 longitudinal studies, one trial and three meta-analyses. Other Healthy dietary patterns, both a priori (e.g. HDI, HEI and PNNS-GS) and a posteriori derived (e.g. factor analysis, cluster analysis and RRR), have shown to be associated with reduced cognitive decline and/or a reduced risk of dementia as shown by all six cross-sectional studies and six out of eight longitudinal studies. To come to more targeted and detailed guidelines to prevent or postpone cognitive decline more conclusive evidence is needed.
41
Introduction It has been estimated that worldwide 44 million people lived with dementia in 2013. With the ageing of the population and with an estimated 7.7 million new cases per year this number doubles every 20 years and will reach 135 million dementia patients by 2050 [1]. The impact of dementia worldwide and the public health importance has been described by the World Health Organization (WHO) and Alzheimer’s Disease International (ADI) [2]. They propose to make dementia a global health priority, which underlines the importance to find strategies to prevent dementia. Since there is currently still no effective treatment to modify the course of dementia, prevention is an urgent priority, both to reduce incidence and to slow down progression. Important risk factors need to be further identified and in particular the factors that can be modified, such as lifestyle factors. In this systematic review we focus on the risk factor nutrition, for which promising indications exist that it can contribute in reducing the risk of developing dementia. Over the last years the attention is shifting from the role of single nutrients or foods to the role of dietary patterns, such as the promising association of the Mediterranean diet with cognitive decline and dementia. A dietary pattern approach better reflects the complexity of the diet and our daily eating behavior [3-6]. Multiple reviews and meta-analyses have been written in the last years summarizing the evidence of a substantial number of studies investigating the influence of a Mediterranean diet on cognitive decline and dementia [7-13]. Besides the Mediterranean diet, there are several other knowledge based (a priori) dietary patterns, such as the Healthy Diet Index (HDI), Healthy Eating Index-2005 (HEI-2005) and empirically (a posteriori) derived dietary patterns (e.g. using factor analysis or principal component analysis) that could be associated to cognitive decline and dementia. So far, there has only been one review summarizing the literature on different dietary patterns and cognitive aging until 2011 [14]. Therefore, the reviews describing studies on the Mediterranean diet and cognitive decline can be updated with several new studies that have been published since that review.
The aim of the present systematic review is to summarize and evaluate available evidence from studies investigating dietary patterns, both a priori and a posteriori, in relation to cognitive decline and dementia in older adults and elderly people. Although underlying biological mechanisms will be touched upon briefly, this review is not intended to provide an extended description of mechanisms underlying the association between dietary patterns and cognitive performance. Instead, our specific goals are 1) to summarize papers that have studied the Mediterranean diet 2) to summarize papers that have studied other dietary patterns 3) to critically evaluate and summarize all evidence emerging from these studies on associations between dietary patterns and cognitive performance and/or dementia.
Methods
Search strategy The role of a healthy diet (Mediterranean diet, dietary patterns) in the development of cognitive decline and dementia has been the subject of several recent systematic reviews which were the starting point of the current review. Medline databases and the Cochrane database were searched up to May 2014 for additional, recently published studies. The search strategies used text words and relevant indexing (MeSH terms) to capture studies investigating the association between healthy diet (Mediterranean diet, dietary patterns) with cognitive decline and dementia. When no systematic

3
Chapter 3 | Dietary patterns, cognitive decline and dementia; a systematic review
40
Abstract Nutrition is an important modifiable risk factor that plays a role in the strategy to prevent or delay onset of dementia. Research on nutritional effects has till now mainly focused on the role of individual nutrients and bioactive components. However, the evidence for combined effects, such as multi-nutrient approaches or a healthy dietary pattern such as the Mediterranean diet is growing. These approaches incorporate the complexity of the diet and possible interaction and synergy between nutrients. Over the last few years dietary patterns are increasingly investigated to better understand the link between diet, cognitive decline, and dementia. In this systematic review we provide an overview of the literature on human studies up to May 2014 that examined the role of dietary patterns (both a priori as well as a posteriori derived) in relation to cognitive decline or dementia. The results suggest that better adherence to a Mediterranean diet is associated with less cognitive decline, dementia or AD, as shown by four out of six cross-sectional studies, six out of 12 longitudinal studies, one trial and three meta-analyses. Other Healthy dietary patterns, both a priori (e.g. HDI, HEI and PNNS-GS) and a posteriori derived (e.g. factor analysis, cluster analysis and RRR), have shown to be associated with reduced cognitive decline and/or a reduced risk of dementia as shown by all six cross-sectional studies and six out of eight longitudinal studies. To come to more targeted and detailed guidelines to prevent or postpone cognitive decline more conclusive evidence is needed.
41
Introduction It has been estimated that worldwide 44 million people lived with dementia in 2013. With the ageing of the population and with an estimated 7.7 million new cases per year this number doubles every 20 years and will reach 135 million dementia patients by 2050 [1]. The impact of dementia worldwide and the public health importance has been described by the World Health Organization (WHO) and Alzheimer’s Disease International (ADI) [2]. They propose to make dementia a global health priority, which underlines the importance to find strategies to prevent dementia. Since there is currently still no effective treatment to modify the course of dementia, prevention is an urgent priority, both to reduce incidence and to slow down progression. Important risk factors need to be further identified and in particular the factors that can be modified, such as lifestyle factors. In this systematic review we focus on the risk factor nutrition, for which promising indications exist that it can contribute in reducing the risk of developing dementia. Over the last years the attention is shifting from the role of single nutrients or foods to the role of dietary patterns, such as the promising association of the Mediterranean diet with cognitive decline and dementia. A dietary pattern approach better reflects the complexity of the diet and our daily eating behavior [3-6]. Multiple reviews and meta-analyses have been written in the last years summarizing the evidence of a substantial number of studies investigating the influence of a Mediterranean diet on cognitive decline and dementia [7-13]. Besides the Mediterranean diet, there are several other knowledge based (a priori) dietary patterns, such as the Healthy Diet Index (HDI), Healthy Eating Index-2005 (HEI-2005) and empirically (a posteriori) derived dietary patterns (e.g. using factor analysis or principal component analysis) that could be associated to cognitive decline and dementia. So far, there has only been one review summarizing the literature on different dietary patterns and cognitive aging until 2011 [14]. Therefore, the reviews describing studies on the Mediterranean diet and cognitive decline can be updated with several new studies that have been published since that review.
The aim of the present systematic review is to summarize and evaluate available evidence from studies investigating dietary patterns, both a priori and a posteriori, in relation to cognitive decline and dementia in older adults and elderly people. Although underlying biological mechanisms will be touched upon briefly, this review is not intended to provide an extended description of mechanisms underlying the association between dietary patterns and cognitive performance. Instead, our specific goals are 1) to summarize papers that have studied the Mediterranean diet 2) to summarize papers that have studied other dietary patterns 3) to critically evaluate and summarize all evidence emerging from these studies on associations between dietary patterns and cognitive performance and/or dementia.
Methods
Search strategy The role of a healthy diet (Mediterranean diet, dietary patterns) in the development of cognitive decline and dementia has been the subject of several recent systematic reviews which were the starting point of the current review. Medline databases and the Cochrane database were searched up to May 2014 for additional, recently published studies. The search strategies used text words and relevant indexing (MeSH terms) to capture studies investigating the association between healthy diet (Mediterranean diet, dietary patterns) with cognitive decline and dementia. When no systematic

Chapter 3 | Dietary patterns, cognitive decline and dementia; a systematic review
42
reviews were found, narrative reviews were used and both checked and updated using a combination of MeSH and text-based terms. (“Diet, Mediterranean”[Mesh] OR “Mediterranean diet” OR (“Mediterranean” AND “Diet”)) OR “Dietary pattern” AND ((“memory”[MeSH Terms] OR “memory”[All Fields]) OR (“cognition”[MeSH Terms] OR “cognition”[All Fields]) OR cognitive[All Fields] ((“alzheimer disease”[MeSH Terms] OR “alzheimer”[All Fields] AND “disease”[All Fields]) OR (“alzheimer disease”[All Fields] OR “alzheimer”[All Fields]) OR (“dementia”[MeSH Terms] OR “dementia”[All Fields])) AND “humans”[MeSH Terms]) We only included studies performed in older adults and elderly people and of which full papers were published. Study selection process Our search strategy resulted in 65 hits on studies, reviews and meta-analyses on diet and cognition and an additional search via reference lists of reviews and meta-analysis resulted in 33 more studies. This resulted in a total of 98 studies, of which 36 studies were selected based on full abstracts and papers. In total, we found 26 studies on the Mediterranean diet and cognitive function or dementia and 15 on other dietary patterns in relation to cognitive function (figure 1). Five studies performed analyses on both the Mediterranean diet and other patterns [15-19]. Study selection, data extraction, and quality assessment were performed independently by two reviewers.
Figure 1. Flowchart of selection process resulting in 36 studies included in the review, of which five studies performed analyses on both the Mediterranean diet and other dietary patterns
43
Results Specification and potential underlying mechanisms In table 1 characteristics of frequently reported a priori [20-25] and a posteriori [3, 7, 26-28] dietary patterns are shown. The majority of a priori dietary patterns consist of adequacy components - such as fruits, vegetables, cereals, fatty fish and dairy - and limitation components - such as total fat, saturated fatty acids, cholesterol and sodium. In an a posteriori data driven approach data are reduced into dietary patterns either based upon differences in intakes between subjects or upon inter-correlations between dietary items [29]. Usually this results in dietary patterns consisting of combinations of high or low loadings of similar components as defined by the a priori methods. It has been proposed that these components in combination could impact on several biological mechanisms that may explain how certain healthy dietary patterns can exert their effects on cognitive health and decline. Prevailing mechanisms which are believed to play a role in the pathogenesis of age-related diseases, including cognitive impairment and AD, are oxidative stress, inflammation and vascular risk factors, mechanisms that are ideal targets for nutritional intervention with dietary patterns, such as the Mediterranean diet, that are abundant in antioxidants and monounsaturated fatty acids and have a balanced ratio of essential n-6:n-3 fatty acids. Based on the multiple plausible biological mechanisms, there is a strong theoretical basis that the intake and status of these nutrients may affect the known mechanisms for neurodegeneration.

3
Chapter 3 | Dietary patterns, cognitive decline and dementia; a systematic review
42
reviews were found, narrative reviews were used and both checked and updated using a combination of MeSH and text-based terms. (“Diet, Mediterranean”[Mesh] OR “Mediterranean diet” OR (“Mediterranean” AND “Diet”)) OR “Dietary pattern” AND ((“memory”[MeSH Terms] OR “memory”[All Fields]) OR (“cognition”[MeSH Terms] OR “cognition”[All Fields]) OR cognitive[All Fields] ((“alzheimer disease”[MeSH Terms] OR “alzheimer”[All Fields] AND “disease”[All Fields]) OR (“alzheimer disease”[All Fields] OR “alzheimer”[All Fields]) OR (“dementia”[MeSH Terms] OR “dementia”[All Fields])) AND “humans”[MeSH Terms]) We only included studies performed in older adults and elderly people and of which full papers were published. Study selection process Our search strategy resulted in 65 hits on studies, reviews and meta-analyses on diet and cognition and an additional search via reference lists of reviews and meta-analysis resulted in 33 more studies. This resulted in a total of 98 studies, of which 36 studies were selected based on full abstracts and papers. In total, we found 26 studies on the Mediterranean diet and cognitive function or dementia and 15 on other dietary patterns in relation to cognitive function (figure 1). Five studies performed analyses on both the Mediterranean diet and other patterns [15-19]. Study selection, data extraction, and quality assessment were performed independently by two reviewers.
Figure 1. Flowchart of selection process resulting in 36 studies included in the review, of which five studies performed analyses on both the Mediterranean diet and other dietary patterns
43
Results Specification and potential underlying mechanisms In table 1 characteristics of frequently reported a priori [20-25] and a posteriori [3, 7, 26-28] dietary patterns are shown. The majority of a priori dietary patterns consist of adequacy components - such as fruits, vegetables, cereals, fatty fish and dairy - and limitation components - such as total fat, saturated fatty acids, cholesterol and sodium. In an a posteriori data driven approach data are reduced into dietary patterns either based upon differences in intakes between subjects or upon inter-correlations between dietary items [29]. Usually this results in dietary patterns consisting of combinations of high or low loadings of similar components as defined by the a priori methods. It has been proposed that these components in combination could impact on several biological mechanisms that may explain how certain healthy dietary patterns can exert their effects on cognitive health and decline. Prevailing mechanisms which are believed to play a role in the pathogenesis of age-related diseases, including cognitive impairment and AD, are oxidative stress, inflammation and vascular risk factors, mechanisms that are ideal targets for nutritional intervention with dietary patterns, such as the Mediterranean diet, that are abundant in antioxidants and monounsaturated fatty acids and have a balanced ratio of essential n-6:n-3 fatty acids. Based on the multiple plausible biological mechanisms, there is a strong theoretical basis that the intake and status of these nutrients may affect the known mechanisms for neurodegeneration.

Chapter 3 | Dietary patterns, cognitive decline and dementia; a systematic review
44
Table 1. Characterization of most investigated a priori and a posteriori defined dietary patterns in relation to neurodegeneration Dietary patterns Characterization A priori (hypothesis driven approach) Mediterranean diet (MeDi) [25]
Based on traditional eating habits in Crete, South Italy and other Mediterranean countries High in fruits, vegetables, cereals and legumes Low in saturated fats, olive oil main fat source Moderate in fish Low to moderate in dairy products Low in red meat and meat products Moderate in alcohol (wine)
Healthy Diet Indicator (HDI) [21]
Based on the World Health Organization recommendations for the prevention of chronic diseases Saturated fatty acids ≤10en% Polyunsaturated fatty acids 3-7en% Protein 10-15en% Complex carbohydrates 50-70en% Dietary fiber 27-40 g/day Fruits and vegetables >400 g/day Pulses, nuts and seeds >30 g/day Oligo-/mono- and disaccharides ≤10en% Cholesterol ≤300 mg/day
Healthy Eating Index (HEI) [23]
Based on the food patterns found in MyPyramid and is a sum of 10 individual components: Adequacy of total whole fruits, vegetables, dark green and orange vegetables and legumes,
total grains, whole grains, milk, meat and beans, oil Low intakes of saturated fat, sodium and calories from solid fats, alcoholic beverages and
added sugars Recommended Food score (RFS) [22]
Based on the Dietary Guidelines for Americans and calculated as the sum of 23 items that are consumed at least once a week. 1) Apples or pears, 2) Oranges, 3) Cantaloupe, 4) Orange or grapefruit juice, 5) Grapefruit, 6) Other fruit juices, 7) Dried beans, 8) Tomatoes, 9) Broccoli, 10), Spinach, 11), Mustard, turnip, or collard greens, 12) Carrots or mixed vegetables with carrots, 13) Green salad, 14) Sweet potatoes, yams, 15) Other potatoes, 16) Baked or stewed chicken or turkey, 17) Baked or broiled fish, 18) Dark breads like whole wheat, rye or pumpernickel, 19) Cornbread, tortillas, and grits, 20) High fibre cereals, such as bran, granola, or shredded wheat, 21) Cooked cereals, 22) 2% Milk and beverages with 2% milk, 23) 1% or skim milk
Dietary Approaches to Stop Hypertension (DASH) Trial [24]
Based on in intakes of nutrients hypothesized to alter blood pressure levels Rich in fruits and vegetables Rich in low-fat dairy food Reduced amounts of saturated fat, total fat, and cholesterol
French National Nutrition and Health Program (Program National Nutrition Santé) Guideline Score (PNNS-GS) [20]
Based on French National Nutrition and Health Program recommendations to improve the health status of the general population Fruits and vegetables at least 5/day Bread, cereals, potatoes, and legumes, at each meal Choose whole-grain food and whole-grain bread more often Milk and dairy products 3/d Meat and poultry, seafood, eggs 1-2/d Seafood at least twice per week Limit consumption of added fats Favor fats of vegetable origin Drink water as desired Limit sweetened beverages Limit salt consumption At least 30 min of brisk walking or equivalent/day of physical activity
A posteriori (exploratory approach) Cluster analysis [3, 7, 27]
Classification technique, which aggregates subjects with similar defined variables such as dietary pattern and the energy contribution of each food group
Principal Component Analysis (PCA) [7, 15]
Common approach of factor analysis do define dietary patterns, aggregates highly correlated food items to identify underlying dietary patterns
Reduced Rank Regression [7, 26, 28]
Mix of an exploratory and hypothesis-driven approach, involves the element of a priori approach to derive dietary patterns
Abbreviations: en%, percent of energy intake
45
Mediterranean diet The role of the Mediterranean diet on cognitive decline and dementia risk has only recently been systematically reviewed by Lourida et al in 2013 [8]. This review included literature published until January 2012. In addition, Alzheimer’s Disease International published a report on the available evidence on this subject in the beginning of 2014 [30]. However, because this area of research is developing rapidly the results of these two reviews can already be updated by adding at least 10 new studies on the Mediterranean diet and cognition and dementia. We have found a total of six cross-sectional studies, 15 prospective studies and one intervention trial. The characteristics of these studies are summarized in table 2. Observational evidence Four out of the six cross-sectional studies showed an inverse association of the Mediterranean diet with cognitive functioning [16, 19, 31] or Alzheimer’s Disease (AD) [31, 32] in American, Puerto Rican, and Australian older adults and elderly people. One cross-sectional study in Greek elderly observed a protective association with one unit increase in Mediterranean diet in men (OR 0.88; 95%CI 0.80-0.98), but contrarily a suggestion for an increased risk of cognitive impairment in women (OR 1.11; 95%CI 1.00-1.22) [33]. A study in Hong Kong did not find associations in either men or women (ORT3vsT1 0.89; 95%CI 0.56-1.41 and 1.02; 95%CI 0.75-1.41) [15]. Of the 12 prospective studies on adherence to the Mediterranean diet and better cognitive performance, six studies observed a beneficial association after 3 to 7.6 years of follow-up [17, 18, 34-37]. Of these studies five were performed in the USA [17, 18, 35-37] and one in France [34]. All five studies performed in the USA showed marginally, but significant associations. The French study showed that a one point increase in the Mediterranean diet was associated with fewer MMSE errors, but only marginally significant across categories of the Mediterranean diet (βT3vsT1 -0.02, p-value 0.06). In the other six studies, of which three were performed in the USA [38-40] and the others in France [41], Australia [42] and Greece [43], the association was beneficial, but not significant after 2-3 years of follow-up [38-43]. With respect to dementia and AD four out of six studies showed a reduced risk of AD with better adherence to the Mediterranean diet after 3-5.4 years of follow-up in US populations (HR 0.91; 95%CI 0.83-0.98 [44], HR 0.87; 95%CI 0.78-0.97 [45], HR 0.60; 95%CI 0.42-0.97) [46], and a lower risk of developing AD after MCI (HR 0.71; 95%CI 0.53-0.95) [36]. Two studies, performed in a France [34] and US population [38], did not find associations. Trial evidence The only trial up until now investigating the effect of a Mediterranean type diet either rich in olive oil or rich in nuts has been performed in 522 participants with a high cardiovascular risk profile. After 6.5 years of intervention, participants in both types of the Mediterranean diet had higher cognitive performance compared to the control group (adjusted differences for MSSE +0.62; 95%CI +0.18 to +1.05, p-value 0.005 and +0.57 (95%CI +0.11 to +1.03), p-value 0.015) [47]. In a smaller subgroup (n=285) of this same trial only the Mediterranean diet with olive oil showed better results for five out of 16 specific cognitive tests and mild cognitive impairment (OR 0.34; 95%CI 0.12-0.97) [48].

3
Chapter 3 | Dietary patterns, cognitive decline and dementia; a systematic review
44
Table 1. Characterization of most investigated a priori and a posteriori defined dietary patterns in relation to neurodegeneration Dietary patterns Characterization A priori (hypothesis driven approach) Mediterranean diet (MeDi) [25]
Based on traditional eating habits in Crete, South Italy and other Mediterranean countries High in fruits, vegetables, cereals and legumes Low in saturated fats, olive oil main fat source Moderate in fish Low to moderate in dairy products Low in red meat and meat products Moderate in alcohol (wine)
Healthy Diet Indicator (HDI) [21]
Based on the World Health Organization recommendations for the prevention of chronic diseases Saturated fatty acids ≤10en% Polyunsaturated fatty acids 3-7en% Protein 10-15en% Complex carbohydrates 50-70en% Dietary fiber 27-40 g/day Fruits and vegetables >400 g/day Pulses, nuts and seeds >30 g/day Oligo-/mono- and disaccharides ≤10en% Cholesterol ≤300 mg/day
Healthy Eating Index (HEI) [23]
Based on the food patterns found in MyPyramid and is a sum of 10 individual components: Adequacy of total whole fruits, vegetables, dark green and orange vegetables and legumes,
total grains, whole grains, milk, meat and beans, oil Low intakes of saturated fat, sodium and calories from solid fats, alcoholic beverages and
added sugars Recommended Food score (RFS) [22]
Based on the Dietary Guidelines for Americans and calculated as the sum of 23 items that are consumed at least once a week. 1) Apples or pears, 2) Oranges, 3) Cantaloupe, 4) Orange or grapefruit juice, 5) Grapefruit, 6) Other fruit juices, 7) Dried beans, 8) Tomatoes, 9) Broccoli, 10), Spinach, 11), Mustard, turnip, or collard greens, 12) Carrots or mixed vegetables with carrots, 13) Green salad, 14) Sweet potatoes, yams, 15) Other potatoes, 16) Baked or stewed chicken or turkey, 17) Baked or broiled fish, 18) Dark breads like whole wheat, rye or pumpernickel, 19) Cornbread, tortillas, and grits, 20) High fibre cereals, such as bran, granola, or shredded wheat, 21) Cooked cereals, 22) 2% Milk and beverages with 2% milk, 23) 1% or skim milk
Dietary Approaches to Stop Hypertension (DASH) Trial [24]
Based on in intakes of nutrients hypothesized to alter blood pressure levels Rich in fruits and vegetables Rich in low-fat dairy food Reduced amounts of saturated fat, total fat, and cholesterol
French National Nutrition and Health Program (Program National Nutrition Santé) Guideline Score (PNNS-GS) [20]
Based on French National Nutrition and Health Program recommendations to improve the health status of the general population Fruits and vegetables at least 5/day Bread, cereals, potatoes, and legumes, at each meal Choose whole-grain food and whole-grain bread more often Milk and dairy products 3/d Meat and poultry, seafood, eggs 1-2/d Seafood at least twice per week Limit consumption of added fats Favor fats of vegetable origin Drink water as desired Limit sweetened beverages Limit salt consumption At least 30 min of brisk walking or equivalent/day of physical activity
A posteriori (exploratory approach) Cluster analysis [3, 7, 27]
Classification technique, which aggregates subjects with similar defined variables such as dietary pattern and the energy contribution of each food group
Principal Component Analysis (PCA) [7, 15]
Common approach of factor analysis do define dietary patterns, aggregates highly correlated food items to identify underlying dietary patterns
Reduced Rank Regression [7, 26, 28]
Mix of an exploratory and hypothesis-driven approach, involves the element of a priori approach to derive dietary patterns
Abbreviations: en%, percent of energy intake
45
Mediterranean diet The role of the Mediterranean diet on cognitive decline and dementia risk has only recently been systematically reviewed by Lourida et al in 2013 [8]. This review included literature published until January 2012. In addition, Alzheimer’s Disease International published a report on the available evidence on this subject in the beginning of 2014 [30]. However, because this area of research is developing rapidly the results of these two reviews can already be updated by adding at least 10 new studies on the Mediterranean diet and cognition and dementia. We have found a total of six cross-sectional studies, 15 prospective studies and one intervention trial. The characteristics of these studies are summarized in table 2. Observational evidence Four out of the six cross-sectional studies showed an inverse association of the Mediterranean diet with cognitive functioning [16, 19, 31] or Alzheimer’s Disease (AD) [31, 32] in American, Puerto Rican, and Australian older adults and elderly people. One cross-sectional study in Greek elderly observed a protective association with one unit increase in Mediterranean diet in men (OR 0.88; 95%CI 0.80-0.98), but contrarily a suggestion for an increased risk of cognitive impairment in women (OR 1.11; 95%CI 1.00-1.22) [33]. A study in Hong Kong did not find associations in either men or women (ORT3vsT1 0.89; 95%CI 0.56-1.41 and 1.02; 95%CI 0.75-1.41) [15]. Of the 12 prospective studies on adherence to the Mediterranean diet and better cognitive performance, six studies observed a beneficial association after 3 to 7.6 years of follow-up [17, 18, 34-37]. Of these studies five were performed in the USA [17, 18, 35-37] and one in France [34]. All five studies performed in the USA showed marginally, but significant associations. The French study showed that a one point increase in the Mediterranean diet was associated with fewer MMSE errors, but only marginally significant across categories of the Mediterranean diet (βT3vsT1 -0.02, p-value 0.06). In the other six studies, of which three were performed in the USA [38-40] and the others in France [41], Australia [42] and Greece [43], the association was beneficial, but not significant after 2-3 years of follow-up [38-43]. With respect to dementia and AD four out of six studies showed a reduced risk of AD with better adherence to the Mediterranean diet after 3-5.4 years of follow-up in US populations (HR 0.91; 95%CI 0.83-0.98 [44], HR 0.87; 95%CI 0.78-0.97 [45], HR 0.60; 95%CI 0.42-0.97) [46], and a lower risk of developing AD after MCI (HR 0.71; 95%CI 0.53-0.95) [36]. Two studies, performed in a France [34] and US population [38], did not find associations. Trial evidence The only trial up until now investigating the effect of a Mediterranean type diet either rich in olive oil or rich in nuts has been performed in 522 participants with a high cardiovascular risk profile. After 6.5 years of intervention, participants in both types of the Mediterranean diet had higher cognitive performance compared to the control group (adjusted differences for MSSE +0.62; 95%CI +0.18 to +1.05, p-value 0.005 and +0.57 (95%CI +0.11 to +1.03), p-value 0.015) [47]. In a smaller subgroup (n=285) of this same trial only the Mediterranean diet with olive oil showed better results for five out of 16 specific cognitive tests and mild cognitive impairment (OR 0.34; 95%CI 0.12-0.97) [48].

Chapter 3 | Dietary patterns, cognitive decline and dementia; a systematic review
46
Table 2. Characteristics of included studies on Mediterranean diet, cognitive decline and dementia Author, year, country, study name
Population (sample size, mean age)
Follow-up
Exposure/ Intervention measure
Outcome measure
Effect measure
Cross-sectional studies Samieri et al., 2013 [16] USA, NHS
n=10,670 59y
- FFQ, A-MeDi score
Cognitive decline (TICS), mental health (SF-36)
No significant association between the A-MeDi and mental health or cognitive impairment (ORQ5vsQ1 1.12; 95%CI 1.01-1.20, p-trend <0.001 and OR 0.97; 95%CI 0.95-1.00, p-trend 0.020, resp.)
Chan et al., 2013 [15] Hong Kong
n=3,670 71.8y
- FFQ, MeDi score
Cognitive function (CSI-D)
No significant association between the MeDi and cognitive function in either men or women (ORT3vsT1 0.89; 95%CI 0.56-1.41, p-trend 0.882 and OR 1.02; 95%CI 0.75-1.41, p-trend 0.952, resp.).
Ye et al., 2013 [19] Puerto Rico, BPRHS
n=1,269 57.3y
- FFQ, MeDi score
Cognitive function and cognitive impairment (MMSE)
A significant association between a higher MeDi score higher MMSE scores (p-trend 0.012) and a lower risk of cognitive impairment (OR 0.80; 95%CI 0.80-0.94, p-value <0.001)
Katsiardanis et al., 2013 [33] Greece, Velestino Study
n=557 >65y
157-item FFQ, MeDi score
Cognitive impairment (MMSE)
Significant lower risk of cognitive impairment in men per one unit increase in adherence to the MeDi (OR 0.88; 95%CI 0.80-0.98, p-value 0.02) but a higher risk in women (OR 1.11; 95%CI 1.00-1.22, p-value 0.04)
Gardener et al., 2012 [31] Australia, AIBL study
n=970 >60y
- 74-item CCVFFQ, MeDi score
MCI (MMSE), AD (DSM-IV, NINCDS-ADRDA)
Each unit increase in MeDi score was significantly associated with a reduced risk of MCI or AD (OR 0.87; 95%CI 0.75-1.00, p-value <0.05 and OR 0.81; 95%CI 0.71-0.92, p-value <0.01, respectively).
Scarmeas et al., 2006 [32] USA, WHICAP
n=1,984 76.3y
nested case control
61-item FFQ, MeDi score
Prevalent Alzheimer’s disease (NINCDS-ADRDA)
Better adherence to the MeDi was significantly associated with lower risk of AD (OR 0.76; 95%CI 0.67-0.87, p-value <0.01, ORT3vsT1 0.32; 95%CI 0.17-0.59, p-trend <0.001)
Longitudinal studies Wengreen et al., 2013 [18], USA, CCMS
n=3,831 74.1y
11y 142-item FFQ, MeDi score
Cognitive impairment (3MS)
Better adherence to MeDiet was significantly associated with higher 3MS scores (MeDietQ5vsQ1 0.94±0.29, p-trend 0.0022)
Tsivgoulis et al., 2013 [37], USA, REGARDS study
n=17,478 64.6y
4y FFQ, MeDi score
Incident cognitive impairment (SIS)
Higher adherence to MeDiet was significantly associated with a lower likelihood of ICI (OR 0.87; 95%CI 0.76-1.00), especially in non-diabetic participants (OR 0.81; 95%CI 0.70-0.94, p-value 0.0066), but not in diabetic participants (OR 1.27; 95%CI 0.95-1.71, p-value 0.1063)
Samieri et al., 2013 [35] USA, NHS
n=16,058 74.3y
6y 116-item FFQ, A-MeDi score
Cognitive status and cognitive decline (TICS), verbal memory, global cognition
Highest adherence to MeDi was significantly associated with cognitive status at older ages (adjusted mean differences in z-scores Q5vsQ1 were 0.06; 95%CI 0.01-0.11, p-trend 0.004 for TICS, 0.05; 95%CI 0.01-0.08, p-trend 0.002 for Global score and 0.06; 95%CI 0,03-0.10, p-trend <0.001 for Verbal memory score), but not with cognitive decline (0.004; 95%CI -0.011-0.019, p-trend 0.31), -0.001; 95%CI -0.010-0.007, p-trend 0.84, -0.001; 95%CI -0.011-0.010, p-trend 0.70)
47
Samieri et al., 2013 [39] USA, Women’s Health Study
n=6,174 72y
2y 131-item FFQ, A-MeDi score
Cognitive decline (TICS), global cognition, verbal memory
No significant associations between higher A-MeDi scores and mean differences in averaged measures of global cognition and verbal memory (Q5vsQ1 0.02; 95%CI -0.03-0.06, p-trend 0.63 and 0.03; 95%CI -0.02-0.07, p-trend 0.44, respectively), neither over time (p for quintiles medians-x-time interaction = 0.26 for global score and 0.40 for score and cognitive decline)
Kesse-Guyot et al., 2013 [41] France, SU.VI.MAX
n=3,083 65.4y
13y Repeated 24h records, MeDi score and MSDPS
Cognitive function; episodic and lexical-semantic memory, mental flexibility
No significant association between higher adherence to MeDi and MSDPS and cognitive scores, except for a lower phonemic fluency (-1.00; 95%CI -1.85,-0.15, p-value 0.048) with decreasing MSDPS and lower backward digit with decreasing MDS (-0.64; 95%CI -1.60-0.32, p-value 0.03)
Vercambre et al., 2012 [40] USA, WACS
n=2,504 72.3y
5.4y 116-item FFQ, MeDi score
Cognitive decline (TICS), verbal memory, category fluency score
No significant association between higher adherence to MeDi and adjusted mean differences in annual rates of cognitive decline (T3vsT1 0.00; 95%CI -0.02-0.01, p-value 0.88 for global cognition, -0.03; 95%CI -0.11-0.05, p-value 0.53 for TICS, 0.00; 95%CI -0.02-0.02, p-value 0.97 for verbal memory and -0.03; 95%CI -0.14-0.08, p-value 0.64 for category fluency)
Cherbuin et al., 2012 [42] Australia, PATH
n=1,528 62.5y
4y 215-item FFQ, MeDi score
Mild cognitive impairment, cognitive decline, any MCD (ICC, CDR)
No significant association between the MeDiet and transition from normal aging to MCI, CDR 0.5 and any-MCD (OR 1.41; 95%CI (0.95-2.10), OR 1.18; 95%CI 0.88-1.57 and OR 1.20; 95%CI 0.98-1.47, respectively)
Tangney et al., 2011 [17] USA, CHAP
n=3,790 75.4y
7.6y 139-item FFQ, MeDi score
Global cognitive function (MMSE, EBMT, SDMT)
Higher MeDi scores were significantly associated with better global cognitive scores at baseline (β 0.0070; SEE 0.0022, p-value 0.0013) and with slower rates of decline over time (β 0.0014; SEE 0.0004, p-value 0.0004)
Roberts et al., 2010 [38] USA, MCSA
n=1,233 79.6y
2.2y 128-item FFQ, MeDi score
Mild cognitive impairment (CDR)
A high MeDi score was not statistically associated with risk of incident MCI or dementia (HRT3vsT1 0.75; 95%CI 0.46-1.21, p-value 0.24)
Gu et al., 2010 [45] USA, WHICAP
n=1,219 76.7y
3.8y 61-item SFFQ, MeDi score
Alzheimer’s disease (NINCDS-ADRDA)
Better adherence to MeDi was borderline significantly associated with lower risk for AD in fully adjusted model (HR 0.87; 95%CI 0.78-0.97, p-value 0.01 and HRT3vsT1 0.68; 95%CI 0.42-1.08, p-trend 0.06)
Scarmeas et al., 2009 [36] USA, WHICAP
n=1,393 76.9y
4.5y FFQ, MeDi score
Mild cognitive impairment (DSM-III-R), Alzheimer’s disease (NINCDS-ADRDA)
Better adherence to MeDi was significantly associated with a lower risk of MCI (HR 0.85; 95%CI 0.72-1.00, p-trend 0.05, HRT3vsT1 0.72; 95%CI 0.52-1.00, p-value 0.05) and a lower risk of developing AD after MCI (HR 0.71; 95%CI 0.53-0.95, p-trend 0.02, HRT3vsT1 0.52; 95%CI 0.30-0.91, p-value 0.02)
Scarmeas et al., 2009 [46] USA, WHICAP
n=1,880 77.2y
5.4y 61-item FFQ, MeDi score
Alzheimer’s disease (NINCDS-ADRDA)
Better MeDi adherence was significantly associated with lower AD risk (HRT3vsT1 0.60; 95%CI 0.42-0.97, p-trend 0.008)

3
Chapter 3 | Dietary patterns, cognitive decline and dementia; a systematic review
46
Table 2. Characteristics of included studies on Mediterranean diet, cognitive decline and dementia Author, year, country, study name
Population (sample size, mean age)
Follow-up
Exposure/ Intervention measure
Outcome measure
Effect measure
Cross-sectional studies Samieri et al., 2013 [16] USA, NHS
n=10,670 59y
- FFQ, A-MeDi score
Cognitive decline (TICS), mental health (SF-36)
No significant association between the A-MeDi and mental health or cognitive impairment (ORQ5vsQ1 1.12; 95%CI 1.01-1.20, p-trend <0.001 and OR 0.97; 95%CI 0.95-1.00, p-trend 0.020, resp.)
Chan et al., 2013 [15] Hong Kong
n=3,670 71.8y
- FFQ, MeDi score
Cognitive function (CSI-D)
No significant association between the MeDi and cognitive function in either men or women (ORT3vsT1 0.89; 95%CI 0.56-1.41, p-trend 0.882 and OR 1.02; 95%CI 0.75-1.41, p-trend 0.952, resp.).
Ye et al., 2013 [19] Puerto Rico, BPRHS
n=1,269 57.3y
- FFQ, MeDi score
Cognitive function and cognitive impairment (MMSE)
A significant association between a higher MeDi score higher MMSE scores (p-trend 0.012) and a lower risk of cognitive impairment (OR 0.80; 95%CI 0.80-0.94, p-value <0.001)
Katsiardanis et al., 2013 [33] Greece, Velestino Study
n=557 >65y
157-item FFQ, MeDi score
Cognitive impairment (MMSE)
Significant lower risk of cognitive impairment in men per one unit increase in adherence to the MeDi (OR 0.88; 95%CI 0.80-0.98, p-value 0.02) but a higher risk in women (OR 1.11; 95%CI 1.00-1.22, p-value 0.04)
Gardener et al., 2012 [31] Australia, AIBL study
n=970 >60y
- 74-item CCVFFQ, MeDi score
MCI (MMSE), AD (DSM-IV, NINCDS-ADRDA)
Each unit increase in MeDi score was significantly associated with a reduced risk of MCI or AD (OR 0.87; 95%CI 0.75-1.00, p-value <0.05 and OR 0.81; 95%CI 0.71-0.92, p-value <0.01, respectively).
Scarmeas et al., 2006 [32] USA, WHICAP
n=1,984 76.3y
nested case control
61-item FFQ, MeDi score
Prevalent Alzheimer’s disease (NINCDS-ADRDA)
Better adherence to the MeDi was significantly associated with lower risk of AD (OR 0.76; 95%CI 0.67-0.87, p-value <0.01, ORT3vsT1 0.32; 95%CI 0.17-0.59, p-trend <0.001)
Longitudinal studies Wengreen et al., 2013 [18], USA, CCMS
n=3,831 74.1y
11y 142-item FFQ, MeDi score
Cognitive impairment (3MS)
Better adherence to MeDiet was significantly associated with higher 3MS scores (MeDietQ5vsQ1 0.94±0.29, p-trend 0.0022)
Tsivgoulis et al., 2013 [37], USA, REGARDS study
n=17,478 64.6y
4y FFQ, MeDi score
Incident cognitive impairment (SIS)
Higher adherence to MeDiet was significantly associated with a lower likelihood of ICI (OR 0.87; 95%CI 0.76-1.00), especially in non-diabetic participants (OR 0.81; 95%CI 0.70-0.94, p-value 0.0066), but not in diabetic participants (OR 1.27; 95%CI 0.95-1.71, p-value 0.1063)
Samieri et al., 2013 [35] USA, NHS
n=16,058 74.3y
6y 116-item FFQ, A-MeDi score
Cognitive status and cognitive decline (TICS), verbal memory, global cognition
Highest adherence to MeDi was significantly associated with cognitive status at older ages (adjusted mean differences in z-scores Q5vsQ1 were 0.06; 95%CI 0.01-0.11, p-trend 0.004 for TICS, 0.05; 95%CI 0.01-0.08, p-trend 0.002 for Global score and 0.06; 95%CI 0,03-0.10, p-trend <0.001 for Verbal memory score), but not with cognitive decline (0.004; 95%CI -0.011-0.019, p-trend 0.31), -0.001; 95%CI -0.010-0.007, p-trend 0.84, -0.001; 95%CI -0.011-0.010, p-trend 0.70)
47
Samieri et al., 2013 [39] USA, Women’s Health Study
n=6,174 72y
2y 131-item FFQ, A-MeDi score
Cognitive decline (TICS), global cognition, verbal memory
No significant associations between higher A-MeDi scores and mean differences in averaged measures of global cognition and verbal memory (Q5vsQ1 0.02; 95%CI -0.03-0.06, p-trend 0.63 and 0.03; 95%CI -0.02-0.07, p-trend 0.44, respectively), neither over time (p for quintiles medians-x-time interaction = 0.26 for global score and 0.40 for score and cognitive decline)
Kesse-Guyot et al., 2013 [41] France, SU.VI.MAX
n=3,083 65.4y
13y Repeated 24h records, MeDi score and MSDPS
Cognitive function; episodic and lexical-semantic memory, mental flexibility
No significant association between higher adherence to MeDi and MSDPS and cognitive scores, except for a lower phonemic fluency (-1.00; 95%CI -1.85,-0.15, p-value 0.048) with decreasing MSDPS and lower backward digit with decreasing MDS (-0.64; 95%CI -1.60-0.32, p-value 0.03)
Vercambre et al., 2012 [40] USA, WACS
n=2,504 72.3y
5.4y 116-item FFQ, MeDi score
Cognitive decline (TICS), verbal memory, category fluency score
No significant association between higher adherence to MeDi and adjusted mean differences in annual rates of cognitive decline (T3vsT1 0.00; 95%CI -0.02-0.01, p-value 0.88 for global cognition, -0.03; 95%CI -0.11-0.05, p-value 0.53 for TICS, 0.00; 95%CI -0.02-0.02, p-value 0.97 for verbal memory and -0.03; 95%CI -0.14-0.08, p-value 0.64 for category fluency)
Cherbuin et al., 2012 [42] Australia, PATH
n=1,528 62.5y
4y 215-item FFQ, MeDi score
Mild cognitive impairment, cognitive decline, any MCD (ICC, CDR)
No significant association between the MeDiet and transition from normal aging to MCI, CDR 0.5 and any-MCD (OR 1.41; 95%CI (0.95-2.10), OR 1.18; 95%CI 0.88-1.57 and OR 1.20; 95%CI 0.98-1.47, respectively)
Tangney et al., 2011 [17] USA, CHAP
n=3,790 75.4y
7.6y 139-item FFQ, MeDi score
Global cognitive function (MMSE, EBMT, SDMT)
Higher MeDi scores were significantly associated with better global cognitive scores at baseline (β 0.0070; SEE 0.0022, p-value 0.0013) and with slower rates of decline over time (β 0.0014; SEE 0.0004, p-value 0.0004)
Roberts et al., 2010 [38] USA, MCSA
n=1,233 79.6y
2.2y 128-item FFQ, MeDi score
Mild cognitive impairment (CDR)
A high MeDi score was not statistically associated with risk of incident MCI or dementia (HRT3vsT1 0.75; 95%CI 0.46-1.21, p-value 0.24)
Gu et al., 2010 [45] USA, WHICAP
n=1,219 76.7y
3.8y 61-item SFFQ, MeDi score
Alzheimer’s disease (NINCDS-ADRDA)
Better adherence to MeDi was borderline significantly associated with lower risk for AD in fully adjusted model (HR 0.87; 95%CI 0.78-0.97, p-value 0.01 and HRT3vsT1 0.68; 95%CI 0.42-1.08, p-trend 0.06)
Scarmeas et al., 2009 [36] USA, WHICAP
n=1,393 76.9y
4.5y FFQ, MeDi score
Mild cognitive impairment (DSM-III-R), Alzheimer’s disease (NINCDS-ADRDA)
Better adherence to MeDi was significantly associated with a lower risk of MCI (HR 0.85; 95%CI 0.72-1.00, p-trend 0.05, HRT3vsT1 0.72; 95%CI 0.52-1.00, p-value 0.05) and a lower risk of developing AD after MCI (HR 0.71; 95%CI 0.53-0.95, p-trend 0.02, HRT3vsT1 0.52; 95%CI 0.30-0.91, p-value 0.02)
Scarmeas et al., 2009 [46] USA, WHICAP
n=1,880 77.2y
5.4y 61-item FFQ, MeDi score
Alzheimer’s disease (NINCDS-ADRDA)
Better MeDi adherence was significantly associated with lower AD risk (HRT3vsT1 0.60; 95%CI 0.42-0.97, p-trend 0.008)

Chapter 3 | Dietary patterns, cognitive decline and dementia; a systematic review
48
Feart et al., 2009 [34] France, 3C study
n=1,410 75.9y
5y FFQ and 24-HR, MeDi score
Cognitive performance, dementia risk and Alzheimer’s disease risk (MMSE, DSM-III-R)
A one point increase in the MeDi was significantly associated with fewer MMSE errors (β -0.006, p-value 0.04), and borderline significant across categories of MeDi (βT3vsT1 -0.02, p-value 0.06). There was no significant association with dementia risk and AD risk (HR 1.06; 95%CI 0.92-1.21, p-value 0.43, HRT3vsT1 1.12; 95%CI 0.60-2.10, p-value 0.72 and HR 1.00; 95%CI 0.85-1.19, p-value 0.96, HRT3vsT1 0.86; 95%CI 0.39-1.88, p-value 0.71, respectively)
Psaltopoulou et al., 2008 [43] Greece, EPIC
n=732 >60y
8y 150-food FFQ, MeDi score
Cognitive decline, MMSE
No significant association per one unit increase in MeDi and MSSE (β 0.05; 95%CI -0.09 – 0.19, p-value 0.485)
Scarmeas et al., 2006 [44] USA, WHICAP
n=2,258 77.2y
4y 61-item SFFQ, MeDi score
Alzheimer’s disease (NINCDS-ADRDA)
Better adherence to MeDi was associated with lower risk for AD (HR 0.91; 95%CI 0.83-0.98, p-value 0.015, HRT3vsT1 0.60; 95% CI 0.42-0.87, p-trend 0.007)
Randomized controlled trials Martinez et al. 2013 [47], [48] Spain, PREDIMED-Navarra
n=522 [47] 74.6y
6.5y 137-item FFQ. MedDiet intervention 3 arms:
- MeDi+olive oil - MeDi + nuts - Low-fat diet
Cognitive performance (MMSE, CDT)
Participants in the MeDi + olive oil and the MeDi + nuts group showed better cognitive performance compared to the control group for MMSE and CDT (adjusted differences: 0.62; 95%CI 0.18-1.05, p-value 0.005 and 0.57; 95%CI 0.11-1.03, p-value 0.015 for MMSE, 0.51; 95%CI 0.20-0.82, p-value 0.001 and 0.33; 95%CI 0.003-0.67, p-value 0.048 for CDT)
Martinez et al. 2013 [47], [48] Spain, PREDIMED-Navarra
n=268 [48] 74.1yr
6.5y 137-item FFQ. MedDiet intervention 3 arms:
- MeDi+olive oil - MeDi + nuts
Low-fat diet
Cognitive performance, MCI
MeDi with olive oil was related to better cognitive performance (for 5/16 tests) and lower MCI (OR 0.34; 95%CI 0.12-0.97), compared to control group MeDi with nuts was not related to better cognitive performance or MCI (OR 0.56; 95%CI 0.22-1.43)
Abbreviations: 3C, Three-City; 3MS, Modified Mini-Mental State Examination; 24-HR, 24-hour dietary recall; AD, Alzheimer’s Disease; AIBL, Australian Imaging, Biomarkers and Lifestyle Study of Ageing cohort; A-MeDi, alternate MeDi; BPRHS, Boston Puerto Rican Health Study; CCMS, Cache County Memory Study; CDR, Clinical Dementia Rating; CDT, Clock Drawing Test; CHAP, Chicago Health and Aging Project; CSI-D, Community Screening Instrument for Dementia; DSM, Diagnostic and Statistical Manual of Mental Disorders; EBMT, East Boston Memory Test; EPIC, European Prospective Investigation into Cancer and Nutrition; FFQ, Food Frequency Questionnaire; ICC, International Consensus Criteria; MCD, Mild Cognitive Disorder; MCI, Mild Cognitive Impairment; MCSA, Mayo Clinic Study of Aging: MeDi, Mediterranean Diet; MMSE, Mini Mental State Examination; MSDPS, Mediterranean Style Dietary Pattern Score; NHS, Nurses’ Health Study; NINCDS-ADRDA, National Institute of Neurological and Communicative Disorders and Stroke-Alzheimer Disease and Related Disorders Association; PATH, Personality and Total Health Through Life Project; PREDIMED, PREvencion con DIeta MEDiterranea; REGARDS, Reasons for Geographic and Racial Differences in Stroke; SDMT, Symbol Digit Modalities Test; SEE, Standard Error Estimate; SF-36, Medical Outcomes Short-Form 36 Health Survey; SIS, Six-item Screener; SU.VI.MAX, Supplementation en VItamines et Mineraux Anti-oXydants; TICS, Telephone Interview for Cognitive Status; WACS, Women’s Antioxidant Cardiovascular Study; WHICAP, Washington Heights-Inwood Columbia Aging Project
49
Meta-analyses An updated systematic review and meta-analysis from 2010 pooled data of prospective cohort studies on adherence to the Mediterranean diet and risk of AD, Parkinson’s disease, cognitive decline, dementia and mild cognitive impairment and showed an inverse association between a 2-point increase of adherence to the Mediterranean diet and neurodegenerative diseases (RR 0.87; 95%CI 0.81-0.94, I2 0%, p-value 0.73 [12]; table 3). Another meta-analysis [9] pooled data of 2 case-control studies, 5 longitudinal studies and 5 cross-sectional studies on moderate and high adherence to the Mediterranean diet and risk of cognitive impairment, which resulted in inverse associations (RR 0.79; 95%CI 0.67-0.94, I2 28.3% and RR 0.60; 95%CI 0.43-0.83, I2 76.4%, p-value0.000). A more recent systematic review and meta-analysis by Singh et al. [11] analysed data of prospective cohort studies with at least 1 year follow-up on the Mediterranean diet and cognitive outcomes (MCI or AD). Based on two longitudinal studies performed in the US, there was an association with high adherence to the Mediterranean diet (HRT3vsT1 0.73; 95%CI 0.56-0.96, I2 0%), but there was no association with moderate adherence compared to poor adherence (HRT2vsT1 0.82 (95%CI 0.64-1.05, I2 0%), nor per one unit increase in the Mediterranean diet score (HR 0.95; 95%CI 0.84-1.08, I2 33%). Pooled analyses of two other longitudinal studies showed an inverse association between adherence to the Mediterranean diet (both continuous and categorical) and risk of AD among cognitively normal individuals (HR 0.92 (95%CI 0.85-0.99), I2 0% and HRT3vsT1 0.64 (95%CI 0.46-0.89), I2 0%). When combining all data this resulted in an inverse association between a better adherence to the Mediterranean diet and cognitive impairment (HR 0.92 (95%CI 0.88-0.97), I2 0%, HRT2vsT1 0.80 (95%CI 0.67-0.95), I2 0%, HRT3vsT1 0.67 (95%CI 0.55-0.81), I2 0%). Table 3. Characteristics of included reviews and meta-analyses on Mediterranean diet, cognitive decline and dementia Reference Studies
included Update until
Exposure Outcomes measure Effect
Singh et al. 2014 [11]
Five prospective cohort studies with at least 1y follow-up
Nov. 2012
MeDi score
From normal to mild cognitive impairment, from normal to Alzheimer’s disease, cognitive impairment
Better adherence to MeDi was associated with a lower risk of MCI (HRT3vsT1 0.73; 95%CI 0.56-0.96, I2 0%, HR 0.98; 95%CI 0.84-1.08, I2 33%), AD (HR 0.92; 95%CI 0.85-0.99, HRT2vsT1 0.87; 95%CI 0.66-1.14, HRT3vsT1 0.64; 95%CI 0.46-0.89) and cognitive impairment (HR 0.92; 95%CI 0.88-0.97, HRT2VsT1 0.80; 95%CI 0.67-0.95, HRT3vsT1 0.67; 95%CI 0.55-0.81, I2 0%)
Psaltopoulou et al. 2013 [9]
9 studies; case-control, longitudinal, cross-sectional
Oct 31st 2012
MeDi score
Cognitive impairment, depression
Both a moderate and a high adherence to MeDi were associated with a reduced risk of cognitive impairment and depression (RR 0.79; 95%CI 0.67-0.94, I2 28.3%, p-value 0.19 vs. RR 0.60; 95%CI 0.43-0.83, I2 76.4%, p-value 0.00 and RR 0.77; 95%CI 0.62-0.95, I2 54.4% vs. RR 0.68; 95%CI 0.54-0.86, I2 53.4%, respectively).
Sofi et al. 2010 [12]
Five prospective cohort studies
June 2010
MeDi score
Neurodegenerative diseases (cognitive decline, risk of dementia, MCI, AD Parkinson’s disease)
Per 2-point increase of adherence to the MeDi score the risk of incidence of neurodegenerative diseases decreased (RR 0.87; 95%CI 0.81-0.94).

3
Chapter 3 | Dietary patterns, cognitive decline and dementia; a systematic review
48
Feart et al., 2009 [34] France, 3C study
n=1,410 75.9y
5y FFQ and 24-HR, MeDi score
Cognitive performance, dementia risk and Alzheimer’s disease risk (MMSE, DSM-III-R)
A one point increase in the MeDi was significantly associated with fewer MMSE errors (β -0.006, p-value 0.04), and borderline significant across categories of MeDi (βT3vsT1 -0.02, p-value 0.06). There was no significant association with dementia risk and AD risk (HR 1.06; 95%CI 0.92-1.21, p-value 0.43, HRT3vsT1 1.12; 95%CI 0.60-2.10, p-value 0.72 and HR 1.00; 95%CI 0.85-1.19, p-value 0.96, HRT3vsT1 0.86; 95%CI 0.39-1.88, p-value 0.71, respectively)
Psaltopoulou et al., 2008 [43] Greece, EPIC
n=732 >60y
8y 150-food FFQ, MeDi score
Cognitive decline, MMSE
No significant association per one unit increase in MeDi and MSSE (β 0.05; 95%CI -0.09 – 0.19, p-value 0.485)
Scarmeas et al., 2006 [44] USA, WHICAP
n=2,258 77.2y
4y 61-item SFFQ, MeDi score
Alzheimer’s disease (NINCDS-ADRDA)
Better adherence to MeDi was associated with lower risk for AD (HR 0.91; 95%CI 0.83-0.98, p-value 0.015, HRT3vsT1 0.60; 95% CI 0.42-0.87, p-trend 0.007)
Randomized controlled trials Martinez et al. 2013 [47], [48] Spain, PREDIMED-Navarra
n=522 [47] 74.6y
6.5y 137-item FFQ. MedDiet intervention 3 arms:
- MeDi+olive oil - MeDi + nuts - Low-fat diet
Cognitive performance (MMSE, CDT)
Participants in the MeDi + olive oil and the MeDi + nuts group showed better cognitive performance compared to the control group for MMSE and CDT (adjusted differences: 0.62; 95%CI 0.18-1.05, p-value 0.005 and 0.57; 95%CI 0.11-1.03, p-value 0.015 for MMSE, 0.51; 95%CI 0.20-0.82, p-value 0.001 and 0.33; 95%CI 0.003-0.67, p-value 0.048 for CDT)
Martinez et al. 2013 [47], [48] Spain, PREDIMED-Navarra
n=268 [48] 74.1yr
6.5y 137-item FFQ. MedDiet intervention 3 arms:
- MeDi+olive oil - MeDi + nuts
Low-fat diet
Cognitive performance, MCI
MeDi with olive oil was related to better cognitive performance (for 5/16 tests) and lower MCI (OR 0.34; 95%CI 0.12-0.97), compared to control group MeDi with nuts was not related to better cognitive performance or MCI (OR 0.56; 95%CI 0.22-1.43)
Abbreviations: 3C, Three-City; 3MS, Modified Mini-Mental State Examination; 24-HR, 24-hour dietary recall; AD, Alzheimer’s Disease; AIBL, Australian Imaging, Biomarkers and Lifestyle Study of Ageing cohort; A-MeDi, alternate MeDi; BPRHS, Boston Puerto Rican Health Study; CCMS, Cache County Memory Study; CDR, Clinical Dementia Rating; CDT, Clock Drawing Test; CHAP, Chicago Health and Aging Project; CSI-D, Community Screening Instrument for Dementia; DSM, Diagnostic and Statistical Manual of Mental Disorders; EBMT, East Boston Memory Test; EPIC, European Prospective Investigation into Cancer and Nutrition; FFQ, Food Frequency Questionnaire; ICC, International Consensus Criteria; MCD, Mild Cognitive Disorder; MCI, Mild Cognitive Impairment; MCSA, Mayo Clinic Study of Aging: MeDi, Mediterranean Diet; MMSE, Mini Mental State Examination; MSDPS, Mediterranean Style Dietary Pattern Score; NHS, Nurses’ Health Study; NINCDS-ADRDA, National Institute of Neurological and Communicative Disorders and Stroke-Alzheimer Disease and Related Disorders Association; PATH, Personality and Total Health Through Life Project; PREDIMED, PREvencion con DIeta MEDiterranea; REGARDS, Reasons for Geographic and Racial Differences in Stroke; SDMT, Symbol Digit Modalities Test; SEE, Standard Error Estimate; SF-36, Medical Outcomes Short-Form 36 Health Survey; SIS, Six-item Screener; SU.VI.MAX, Supplementation en VItamines et Mineraux Anti-oXydants; TICS, Telephone Interview for Cognitive Status; WACS, Women’s Antioxidant Cardiovascular Study; WHICAP, Washington Heights-Inwood Columbia Aging Project
49
Meta-analyses An updated systematic review and meta-analysis from 2010 pooled data of prospective cohort studies on adherence to the Mediterranean diet and risk of AD, Parkinson’s disease, cognitive decline, dementia and mild cognitive impairment and showed an inverse association between a 2-point increase of adherence to the Mediterranean diet and neurodegenerative diseases (RR 0.87; 95%CI 0.81-0.94, I2 0%, p-value 0.73 [12]; table 3). Another meta-analysis [9] pooled data of 2 case-control studies, 5 longitudinal studies and 5 cross-sectional studies on moderate and high adherence to the Mediterranean diet and risk of cognitive impairment, which resulted in inverse associations (RR 0.79; 95%CI 0.67-0.94, I2 28.3% and RR 0.60; 95%CI 0.43-0.83, I2 76.4%, p-value0.000). A more recent systematic review and meta-analysis by Singh et al. [11] analysed data of prospective cohort studies with at least 1 year follow-up on the Mediterranean diet and cognitive outcomes (MCI or AD). Based on two longitudinal studies performed in the US, there was an association with high adherence to the Mediterranean diet (HRT3vsT1 0.73; 95%CI 0.56-0.96, I2 0%), but there was no association with moderate adherence compared to poor adherence (HRT2vsT1 0.82 (95%CI 0.64-1.05, I2 0%), nor per one unit increase in the Mediterranean diet score (HR 0.95; 95%CI 0.84-1.08, I2 33%). Pooled analyses of two other longitudinal studies showed an inverse association between adherence to the Mediterranean diet (both continuous and categorical) and risk of AD among cognitively normal individuals (HR 0.92 (95%CI 0.85-0.99), I2 0% and HRT3vsT1 0.64 (95%CI 0.46-0.89), I2 0%). When combining all data this resulted in an inverse association between a better adherence to the Mediterranean diet and cognitive impairment (HR 0.92 (95%CI 0.88-0.97), I2 0%, HRT2vsT1 0.80 (95%CI 0.67-0.95), I2 0%, HRT3vsT1 0.67 (95%CI 0.55-0.81), I2 0%). Table 3. Characteristics of included reviews and meta-analyses on Mediterranean diet, cognitive decline and dementia Reference Studies
included Update until
Exposure Outcomes measure Effect
Singh et al. 2014 [11]
Five prospective cohort studies with at least 1y follow-up
Nov. 2012
MeDi score
From normal to mild cognitive impairment, from normal to Alzheimer’s disease, cognitive impairment
Better adherence to MeDi was associated with a lower risk of MCI (HRT3vsT1 0.73; 95%CI 0.56-0.96, I2 0%, HR 0.98; 95%CI 0.84-1.08, I2 33%), AD (HR 0.92; 95%CI 0.85-0.99, HRT2vsT1 0.87; 95%CI 0.66-1.14, HRT3vsT1 0.64; 95%CI 0.46-0.89) and cognitive impairment (HR 0.92; 95%CI 0.88-0.97, HRT2VsT1 0.80; 95%CI 0.67-0.95, HRT3vsT1 0.67; 95%CI 0.55-0.81, I2 0%)
Psaltopoulou et al. 2013 [9]
9 studies; case-control, longitudinal, cross-sectional
Oct 31st 2012
MeDi score
Cognitive impairment, depression
Both a moderate and a high adherence to MeDi were associated with a reduced risk of cognitive impairment and depression (RR 0.79; 95%CI 0.67-0.94, I2 28.3%, p-value 0.19 vs. RR 0.60; 95%CI 0.43-0.83, I2 76.4%, p-value 0.00 and RR 0.77; 95%CI 0.62-0.95, I2 54.4% vs. RR 0.68; 95%CI 0.54-0.86, I2 53.4%, respectively).
Sofi et al. 2010 [12]
Five prospective cohort studies
June 2010
MeDi score
Neurodegenerative diseases (cognitive decline, risk of dementia, MCI, AD Parkinson’s disease)
Per 2-point increase of adherence to the MeDi score the risk of incidence of neurodegenerative diseases decreased (RR 0.87; 95%CI 0.81-0.94).

Chapter 3 | Dietary patterns, cognitive decline and dementia; a systematic review
50
Other dietary patterns Fewer studies have been performed on other dietary patterns than the Mediterranean diet. So far, there has only been one review summarizing the literature of studies on different dietary patterns and cognitive aging until 2011 and this review included a total of 13 studies [14]. We have found a total of 16 studies of which eight cross-sectional studies, seven prospective studies and one trial investigating a priori derived dietary patterns and a posteriori derived dietary patterns in relation to cognitive decline (table 4).
Observational evidence Of the six cross-sectional studies, four used a priori knowledge to study dietary patterns. Better adherence to the Healthy Diet Indicator was associated with a lower prevalence of cognitive deficit (OR 0.85; 95%CI 0.77-0.93[50]) and a reduced risk of cognitive impairment (OR 0.75; 95%CI 0.58-0.97 in an Italian cohort, but not in a Dutch cohort (OR 0.81; 95%CI 0.63-1.04[51]). Higher adherence to the Healthy Eating Index of 2005 (HEI-2005) was associated with a lower risk of cognitive impairment in a Puerto Rican population (OR 0.86; 95%CI 0.74-0.99[19]), but this was not found for higher adherence to the alternative HEI of 2010 in a US population (ORQ5vsQ1 0.99; 95%CI 0.97-1.01 [16]). Two studies used an empirical approach such as Principal Component Analysis [15] or cluster analysis [49]. One study observed less errors on the MMSE with better adherence to a healthy dietary pattern in both men and women (respectively, β -0.11; 95%CI -0.22 to -0.0004 and β -0.13; 95%CI -0.22 to -0.04 [49]). The other study found a beneficial association only in Chinese women with a higher ‘Vegetables-Fruits’ and ‘Snacks-Drinks-Milk products’ pattern score and cognitive function, but not in men [15]. Of the eight prospective studies, five studies used a priori defined dietary scores [17, 18, 52, 55, 56] and three studies used data driven approaches [26, 53, 54]. Results from studies using a priori diet scores showed mixed results with higher cognitive function scores for the Dietary Approaches to Stop Hypertension (DASH) diet (3MS score DASHQ5vsQ1 0.97±0.29) [18] and less cognitive declines for the Recommended Food Score (RFS) after 11 years of follow-up (3MS score RFSQ4vsQ1 1.79) [56], while there was no association between the HEI-2005 (β 0.00002, p-value 0.214) [17] and the C-HEI (β 0.00008, p-value 0.852) [55] and cognitive decline after respectively 7.6 and 3 years of follow-up. A better adherence to the French guidelines (PNNS-GS) was associated with better cognitive function, as measured with a great number of specific cognitive function tests [52]. The other three of the seven studies used data driven approaches showing consistent beneficial associations between dietary patterns and risk of dementia [53], cognitive function [54] and AD [26, 53]. Two studies used Reduced Rank Regression of which one study observed a typical ‘Japanese’ pattern and the other study reported a ‘Healthy’ pattern. After 15 years of follow-up the ‘Japanese’ pattern was association with a reduced risk of dementia (HR 0.66; 95%CI 0.46-0.95), AD (HR 0.65; 95%CI 0.40-1.06) and vascular dementia (HR 0.45; 95%CI 0.22-0.91[53]). The ‘Healthy’ pattern was strongly associated with a lower AD risk (HRT3vsT1 0.62; 95%CI 0.43-0.89) after 3.9 years of follow-up [26]. The other study used factor analysis and reported higher cognitive function scores in the ‘Healthy’ pattern compared to a ‘Traditional’ pattern (50.1±0.7 vs 48.9±0.7, p-trend 0.001) after 13 years of follow-up [54].
Trial evidence The single trial that has been performed observed better scores on one out of nine cognitive function tests (psychomotor speed; Cohen’s D = 0.440, p-value 0.036) after 4-months intervention with the DASH diet compared to the usual diet control group in 124 overweight adults with high blood pressure [57].
51
Table 4. Characteristics of included studies on dietary patterns other than Mediterranean diet, cognitive decline and dementia Author, year, country, study name
Population (sample size, mean age)
Follow-up
Exposure/ Intervention measure
Outcome measure
Effect measure
Cross-sectional studies Ye et al., 2013 y [19] Puerto Rico, BPRHS
n=1,269 57.3y
- FFQ, HEI-2005 Cognitive function and cognitive impairment (MMSE)
A higher HEI-2005 score was significant associated with a higher MMSE score (p-trend 0.011) and lower risk of cognitive impairment (OR10points 0.86; 95%CI 0.74-0.99, p-value 0.033)
Chan et al., 2013 [15] Hong Kong
n=1,926 71.8y
FFQ, Factor analysis, 3 patterns; ‘Vegetables-Fruits’, ‘Snacks-Drinks-Milk products’, ‘Meat-Fish’
Cognitive function (CSI-D)
A higher ‘Vegetables-Fruits’ and ‘Snacks-Drinks-Milk products’ pattern score was significantly associated with a reduced risk of cognitive impairment in women (ORQ4vsQ1 0.73; 95%CI 0.54-1.00, p-trend 0.018 and ORQ4vsQ1 0.65; 95%CI 0.47-0.90, p-trend 0.003, respectively), but not in men.
Samieri et al., 2013 [16] USA, NHS
n=10,670 59y
- FFQ, AHEI-2010 Cognitive decline, (TICS), mental health (SF-36)
The AHEI-2010 was significantly associated with greater likelihood of no major limitations in mental health (ORQ5vsQ1 1.31; 95%CI 1.05-1.22, p-trend <0.001) and marginally associated with no cognitive impairment (ORQ5vsQ1 0.99; 95%CI 0.97-1.01, p-trend 0.09)
Samieri et al., 2008 [49] France, 3C
n=1,724 76.0y
- FFQ, Cluster analysis, five patterns; ‘Small eaters’, ‘Biscuits and Snacking’, ‘Healthy’, ‘Charcuterie, Meat and Alcohol’, ‘Pasta eaters’
Cognitive function (MMSE)
Better adherence to the ‘Healthy’ dietary pattern was significantly associated with less errors in MMSE (β -0.11; CI -0.22 to -0.004 in men and β -0.13; CI -0.22 to -0.04 in women)
Corrēa Leite et al., 2001 [50] Pavia, Italy
n=1,651 76.6y
- 180-item FFQ, HDI Cognitive deficit (NPT)
Better adherence to the HDI was associated with a lower prevalence of cognitive deficit (OR 0.85; 95%CI 0.77-0.93)
Huijbregts et al., 1998 [51] Seven Countries Study
n=1,049 76.1y
- Cross-check dietary history, HDI
Cognitive impairment (MMSE)
Better adherence to the HDI has a protective effect on cognitive impairment, though not consistent over all cohorts (Zutphen OR 0.81; 95%CI 0.63-1.04, Italian OR 0.75; 95%CI 0.58-0.97)
Longitudinal studies Wengreen et al., 2013 [18] USA, CCMS
n=3,831 74.1y
11y 142-item FFQ, DASH score
Cognitive impairment, 3MS
Better adherence to DASH diet was significantly associated with higher 3MS scores (DASHQ5vsQ1 0.97±0.29 points, p-trend 0.0001)
Kesse-Guyot et al., 2011 [52] France, SU.VI.MAX
n=2,135 65.5y
12y Repeated 24-HR, PNNS-GS scores
Verbal memory, executive functioning
Better adherence to nutritional recommendations was significantly associated with the verbal memory factor (β 0.41; 95%CI 0.17-0.64), whereas no association was shown with the executive functioning factor
Ozawa et al., 2013 [53] Japan,
n=1,006 68.5y
15y 70-item FFQ, RRR, 7 patterns; only ‘Japanese’
Dementia risk, Alzheimer’s disease,
Better adherence to the ‘Japanese’ pattern was associated with a reduced risk of dementia (all cause

3
Chapter 3 | Dietary patterns, cognitive decline and dementia; a systematic review
50
Other dietary patterns Fewer studies have been performed on other dietary patterns than the Mediterranean diet. So far, there has only been one review summarizing the literature of studies on different dietary patterns and cognitive aging until 2011 and this review included a total of 13 studies [14]. We have found a total of 16 studies of which eight cross-sectional studies, seven prospective studies and one trial investigating a priori derived dietary patterns and a posteriori derived dietary patterns in relation to cognitive decline (table 4).
Observational evidence Of the six cross-sectional studies, four used a priori knowledge to study dietary patterns. Better adherence to the Healthy Diet Indicator was associated with a lower prevalence of cognitive deficit (OR 0.85; 95%CI 0.77-0.93[50]) and a reduced risk of cognitive impairment (OR 0.75; 95%CI 0.58-0.97 in an Italian cohort, but not in a Dutch cohort (OR 0.81; 95%CI 0.63-1.04[51]). Higher adherence to the Healthy Eating Index of 2005 (HEI-2005) was associated with a lower risk of cognitive impairment in a Puerto Rican population (OR 0.86; 95%CI 0.74-0.99[19]), but this was not found for higher adherence to the alternative HEI of 2010 in a US population (ORQ5vsQ1 0.99; 95%CI 0.97-1.01 [16]). Two studies used an empirical approach such as Principal Component Analysis [15] or cluster analysis [49]. One study observed less errors on the MMSE with better adherence to a healthy dietary pattern in both men and women (respectively, β -0.11; 95%CI -0.22 to -0.0004 and β -0.13; 95%CI -0.22 to -0.04 [49]). The other study found a beneficial association only in Chinese women with a higher ‘Vegetables-Fruits’ and ‘Snacks-Drinks-Milk products’ pattern score and cognitive function, but not in men [15]. Of the eight prospective studies, five studies used a priori defined dietary scores [17, 18, 52, 55, 56] and three studies used data driven approaches [26, 53, 54]. Results from studies using a priori diet scores showed mixed results with higher cognitive function scores for the Dietary Approaches to Stop Hypertension (DASH) diet (3MS score DASHQ5vsQ1 0.97±0.29) [18] and less cognitive declines for the Recommended Food Score (RFS) after 11 years of follow-up (3MS score RFSQ4vsQ1 1.79) [56], while there was no association between the HEI-2005 (β 0.00002, p-value 0.214) [17] and the C-HEI (β 0.00008, p-value 0.852) [55] and cognitive decline after respectively 7.6 and 3 years of follow-up. A better adherence to the French guidelines (PNNS-GS) was associated with better cognitive function, as measured with a great number of specific cognitive function tests [52]. The other three of the seven studies used data driven approaches showing consistent beneficial associations between dietary patterns and risk of dementia [53], cognitive function [54] and AD [26, 53]. Two studies used Reduced Rank Regression of which one study observed a typical ‘Japanese’ pattern and the other study reported a ‘Healthy’ pattern. After 15 years of follow-up the ‘Japanese’ pattern was association with a reduced risk of dementia (HR 0.66; 95%CI 0.46-0.95), AD (HR 0.65; 95%CI 0.40-1.06) and vascular dementia (HR 0.45; 95%CI 0.22-0.91[53]). The ‘Healthy’ pattern was strongly associated with a lower AD risk (HRT3vsT1 0.62; 95%CI 0.43-0.89) after 3.9 years of follow-up [26]. The other study used factor analysis and reported higher cognitive function scores in the ‘Healthy’ pattern compared to a ‘Traditional’ pattern (50.1±0.7 vs 48.9±0.7, p-trend 0.001) after 13 years of follow-up [54].
Trial evidence The single trial that has been performed observed better scores on one out of nine cognitive function tests (psychomotor speed; Cohen’s D = 0.440, p-value 0.036) after 4-months intervention with the DASH diet compared to the usual diet control group in 124 overweight adults with high blood pressure [57].
51
Table 4. Characteristics of included studies on dietary patterns other than Mediterranean diet, cognitive decline and dementia Author, year, country, study name
Population (sample size, mean age)
Follow-up
Exposure/ Intervention measure
Outcome measure
Effect measure
Cross-sectional studies Ye et al., 2013 y [19] Puerto Rico, BPRHS
n=1,269 57.3y
- FFQ, HEI-2005 Cognitive function and cognitive impairment (MMSE)
A higher HEI-2005 score was significant associated with a higher MMSE score (p-trend 0.011) and lower risk of cognitive impairment (OR10points 0.86; 95%CI 0.74-0.99, p-value 0.033)
Chan et al., 2013 [15] Hong Kong
n=1,926 71.8y
FFQ, Factor analysis, 3 patterns; ‘Vegetables-Fruits’, ‘Snacks-Drinks-Milk products’, ‘Meat-Fish’
Cognitive function (CSI-D)
A higher ‘Vegetables-Fruits’ and ‘Snacks-Drinks-Milk products’ pattern score was significantly associated with a reduced risk of cognitive impairment in women (ORQ4vsQ1 0.73; 95%CI 0.54-1.00, p-trend 0.018 and ORQ4vsQ1 0.65; 95%CI 0.47-0.90, p-trend 0.003, respectively), but not in men.
Samieri et al., 2013 [16] USA, NHS
n=10,670 59y
- FFQ, AHEI-2010 Cognitive decline, (TICS), mental health (SF-36)
The AHEI-2010 was significantly associated with greater likelihood of no major limitations in mental health (ORQ5vsQ1 1.31; 95%CI 1.05-1.22, p-trend <0.001) and marginally associated with no cognitive impairment (ORQ5vsQ1 0.99; 95%CI 0.97-1.01, p-trend 0.09)
Samieri et al., 2008 [49] France, 3C
n=1,724 76.0y
- FFQ, Cluster analysis, five patterns; ‘Small eaters’, ‘Biscuits and Snacking’, ‘Healthy’, ‘Charcuterie, Meat and Alcohol’, ‘Pasta eaters’
Cognitive function (MMSE)
Better adherence to the ‘Healthy’ dietary pattern was significantly associated with less errors in MMSE (β -0.11; CI -0.22 to -0.004 in men and β -0.13; CI -0.22 to -0.04 in women)
Corrēa Leite et al., 2001 [50] Pavia, Italy
n=1,651 76.6y
- 180-item FFQ, HDI Cognitive deficit (NPT)
Better adherence to the HDI was associated with a lower prevalence of cognitive deficit (OR 0.85; 95%CI 0.77-0.93)
Huijbregts et al., 1998 [51] Seven Countries Study
n=1,049 76.1y
- Cross-check dietary history, HDI
Cognitive impairment (MMSE)
Better adherence to the HDI has a protective effect on cognitive impairment, though not consistent over all cohorts (Zutphen OR 0.81; 95%CI 0.63-1.04, Italian OR 0.75; 95%CI 0.58-0.97)
Longitudinal studies Wengreen et al., 2013 [18] USA, CCMS
n=3,831 74.1y
11y 142-item FFQ, DASH score
Cognitive impairment, 3MS
Better adherence to DASH diet was significantly associated with higher 3MS scores (DASHQ5vsQ1 0.97±0.29 points, p-trend 0.0001)
Kesse-Guyot et al., 2011 [52] France, SU.VI.MAX
n=2,135 65.5y
12y Repeated 24-HR, PNNS-GS scores
Verbal memory, executive functioning
Better adherence to nutritional recommendations was significantly associated with the verbal memory factor (β 0.41; 95%CI 0.17-0.64), whereas no association was shown with the executive functioning factor
Ozawa et al., 2013 [53] Japan,
n=1,006 68.5y
15y 70-item FFQ, RRR, 7 patterns; only ‘Japanese’
Dementia risk, Alzheimer’s disease,
Better adherence to the ‘Japanese’ pattern was associated with a reduced risk of dementia (all cause

Chapter 3 | Dietary patterns, cognitive decline and dementia; a systematic review
52
Hisayama Study
presented Vascular dementia (HDS, HDSR, MMSE)
dementia HR 0.66; 95%CI 0.46-0.95, AD HR 0.65; 95%CI 0.40-1.06 and VaD HR 0.45; 95%CI 0.22-0.91)
Kesse-Guyot et al., 2012, [54] France, SU.VI.MAX
n=3,054 65.4y
13y Repeated 24h dietary records, Factor analysis, 2 patterns; ‘Healthy’, ‘Traditional’
Global cognitive function, verbal memory, executive functioning
Significant higher cognitive function scores were found with better adherence to the ‘Healthy’ pattern vs. ‘Traditional’ pattern (adjusted means ±SD 50.1±0.7 vs 48.9±0.7, p-trend 0.001 for global cognitive function, 49.7±0.4 vs. 48.7±0.4, p-trend 0.01 for verbal memory)
Shatenstein et al., 2012 [55] Canada, NuAge
n=1,488 74.2y
3y 78-item FFQ, C-HEI Cognitive decline (3MS)
There was no significant association between global diet quality (total C-HEI/100) and cognitive decline after 3-years follow-up (β0.00008, p-value 0.852)
Tangney et al., 2011 [17] USA, CHAP
n=3,790 75.4y
7.6y 139-item FFQ, HEI-2005
Cognitive function (MMSE)
HEI-2005 was neither associated with better global cognitive score at baseline, nor with changes in global cognitive score at follow-up (β-0.0011±0.001, p-value 0.236 and β 0.00002±0.0002, p-value 0.214, respectively)
Gu et al., 2010 [26] USA, WHICAP
n=2,148 77.2y
3.9y FFQ, RRR, 7 patterns; DP1-DP7
Alzheimer’s disease (DSM)
Better adherence to the ‘Healthy’ pattern was significantly associated with a lower AD risk (HRT3vsT1 0.62; 95%CI 0.43-0.89)
Wengreen et al., 2009 [56] USA, Cache County
n=3,634 74.7y
11y 142-item FFQ, RFS versus non-RFS
Cognitive decline, 3MS
Better adherence to RFS at baseline was associated with less decline in 3MS scores after 11 years of follow-up (RFST3vsT1 1.79 point, p-value 0.0013)
Randomized controlled trials Smith et al., 2010 [57] USA, ENCORE
n=124 52.3y
4m DASH diet 3-arms: - DASH Alone - DASH Weight
Management - Usual Care
Cognitive functioning
DASH diet alone resulted in better psychomotor speed (Cohen’s D=0.440; p-value 0.036) compared to control group in subjects with high blood pressure.
Abbreviations: 3C, Three-City; 3MS, Modified Mini-Mental State Examination; 24-HR, 24-hour dietary recall; AD, Alzheimer’s Disease; AHEI-2010, Alternative Healthy Eating Index-2010; BPRHS, Boston Puerto Rican Health Study; CCMS, Cache County Memory Study; CHAP, Chicago Health and Aging Project; CHEI, Canadian Healthy Eating Index; CSI-D, Community Screening Instrument for Dementia; DASH, Dietary Approaches to Stop Hypertension; DSM, Diagnostic and Statistical Manual of Mental Disorders; ENCORE, Exercise and Nutrition Interventions for Cardiovascular Health Study; FFQ, Food Frequency Questionnaire; HDI, Healthy Diet Indicator; HDS, Hasegawa Dementia Scale; HDSR, Hasegawa Dementia Scale-Revised; HEI, Healthy Eating Index, MMSE, Mini-Mental State Examination; NHS, Nurses’ Health Study; NPT, neuropsychological test; NuAge, Longitudinal Study on Nutrition and Successful Aging; PNNS-GS, Program National Nutrition Santé Guideline Score; RFS, Recommended Food Score; RRR, Reduced Rank Regression; SF-36, Medical Outcomes Short-Form 36 Health Survey; SU.VI.MAX, Supplementation en VItamines et Mineraux Anti-oXydants; TICS, Telephone Interview for Cognitive Status; VaD, vascular dementia; WHICAP, Washington Heights-Inwood Columbia Aging Project
53
Discussion We reviewed the current evidence from observational studies and intervention trials investigating healthy dietary patterns in relation to cognitive decline and dementia. Overall, the results of all types of dietary pattern approaches suggest that better adherence to a healthy dietary pattern is associated with less cognitive decline and/or a lower risk of dementia. However, most studies are observational and evidence from intervention trials is limited to two trials, of which one investigated the effect of the Mediterranean diet [47, 48] and one the effect of the DASH diet [57]. There are several different methodological factors between the studies. This heterogeneity hinders comparison between studies; therefore the most important points are discussed below. Both a priori and a posteriori approaches to define dietary patterns [3, 7, 58] have been used in studies included in this review and each method has its strengths and limitations. A limitation of a priori indexes is that they are based on current scientific knowledge on what a healthy diet comprises. Evolutions in knowledge should be considered each time the index is applied, which also changes the index over time [59]. Also few cues about how to weight food groups or guidelines have been proposed. A limitation of both a priori and a posteriori approaches is that complex correlations of food matrixes are not taken into account, neither are all components specifically related to cognitive outcomes. Indexes described in this review are mainly based on improving overall health status [20-23, 25] or blood pressure [60], rather than improving cognitive health specifically. A limitation of a posteriori methods is the limited comparability and reproducibility in other study samples because dietary patterns are based on food behavior in specific study samples [61]. Another limitation of a posteriori methods is that good skills in multidimensional statistical methods are required to select the best components of which the choice is subjective [62]. Another subjective choice, which could be confusing, is the naming of the dietary patterns. Therefore, for studies performed in different populations, the food consumption characterizing the pattern should be described clearly. Populations studied were almost all Western populations, mostly from the US and the Mediterranean countries in Europe and a few studies have been performed in Australia, China or Japan. According to Solfrizzi et al the components of the Mediterranean diet in Western countries could be different from the traditional Mediterranean diet, in particular for the high intakes of olive oil and regular consumption of wine with meals [63]. In general, a healthy dietary pattern comprises a diet high in fruits, vegetables, other plant-derived products, and fish and lower intakes of meat, saturated fats, and added refined sugar. We found no clear differences in associations between healthy dietary patterns and cognitive decline and dementia across countries. Also Singh and colleagues did not find any heterogeneity in their analysis, however, this could be due to the fact that they included three US studies and one French study [11]. Dietary intake can be assessed with different methods such as food records, 24 hour recalls or food frequency questionnaires (FFQ), of which the latter has been mostly used in the studies included in the current review. Different intake methods not only limit comparisons between studies, but also impacts on the number of variables to be used for dietary pattern analyses. This could affect both the number of derived dietary patterns as well as the dietary patterns itself [62]. It has been shown in studies using principle component analyses that this could lead to attenuated disease odds [62, 64]. The outcome measures that were included in our review ranged from cognitive performance in cross-sectional studies to cognitive decline and risk of AD or dementia in longitudinal studies. There are many differences in the way cognitive outcomes have been measured and reported. This makes comparison between studies more difficult and limits comparison of studies in a meta-

3
Chapter 3 | Dietary patterns, cognitive decline and dementia; a systematic review
52
Hisayama Study
presented Vascular dementia (HDS, HDSR, MMSE)
dementia HR 0.66; 95%CI 0.46-0.95, AD HR 0.65; 95%CI 0.40-1.06 and VaD HR 0.45; 95%CI 0.22-0.91)
Kesse-Guyot et al., 2012, [54] France, SU.VI.MAX
n=3,054 65.4y
13y Repeated 24h dietary records, Factor analysis, 2 patterns; ‘Healthy’, ‘Traditional’
Global cognitive function, verbal memory, executive functioning
Significant higher cognitive function scores were found with better adherence to the ‘Healthy’ pattern vs. ‘Traditional’ pattern (adjusted means ±SD 50.1±0.7 vs 48.9±0.7, p-trend 0.001 for global cognitive function, 49.7±0.4 vs. 48.7±0.4, p-trend 0.01 for verbal memory)
Shatenstein et al., 2012 [55] Canada, NuAge
n=1,488 74.2y
3y 78-item FFQ, C-HEI Cognitive decline (3MS)
There was no significant association between global diet quality (total C-HEI/100) and cognitive decline after 3-years follow-up (β0.00008, p-value 0.852)
Tangney et al., 2011 [17] USA, CHAP
n=3,790 75.4y
7.6y 139-item FFQ, HEI-2005
Cognitive function (MMSE)
HEI-2005 was neither associated with better global cognitive score at baseline, nor with changes in global cognitive score at follow-up (β-0.0011±0.001, p-value 0.236 and β 0.00002±0.0002, p-value 0.214, respectively)
Gu et al., 2010 [26] USA, WHICAP
n=2,148 77.2y
3.9y FFQ, RRR, 7 patterns; DP1-DP7
Alzheimer’s disease (DSM)
Better adherence to the ‘Healthy’ pattern was significantly associated with a lower AD risk (HRT3vsT1 0.62; 95%CI 0.43-0.89)
Wengreen et al., 2009 [56] USA, Cache County
n=3,634 74.7y
11y 142-item FFQ, RFS versus non-RFS
Cognitive decline, 3MS
Better adherence to RFS at baseline was associated with less decline in 3MS scores after 11 years of follow-up (RFST3vsT1 1.79 point, p-value 0.0013)
Randomized controlled trials Smith et al., 2010 [57] USA, ENCORE
n=124 52.3y
4m DASH diet 3-arms: - DASH Alone - DASH Weight
Management - Usual Care
Cognitive functioning
DASH diet alone resulted in better psychomotor speed (Cohen’s D=0.440; p-value 0.036) compared to control group in subjects with high blood pressure.
Abbreviations: 3C, Three-City; 3MS, Modified Mini-Mental State Examination; 24-HR, 24-hour dietary recall; AD, Alzheimer’s Disease; AHEI-2010, Alternative Healthy Eating Index-2010; BPRHS, Boston Puerto Rican Health Study; CCMS, Cache County Memory Study; CHAP, Chicago Health and Aging Project; CHEI, Canadian Healthy Eating Index; CSI-D, Community Screening Instrument for Dementia; DASH, Dietary Approaches to Stop Hypertension; DSM, Diagnostic and Statistical Manual of Mental Disorders; ENCORE, Exercise and Nutrition Interventions for Cardiovascular Health Study; FFQ, Food Frequency Questionnaire; HDI, Healthy Diet Indicator; HDS, Hasegawa Dementia Scale; HDSR, Hasegawa Dementia Scale-Revised; HEI, Healthy Eating Index, MMSE, Mini-Mental State Examination; NHS, Nurses’ Health Study; NPT, neuropsychological test; NuAge, Longitudinal Study on Nutrition and Successful Aging; PNNS-GS, Program National Nutrition Santé Guideline Score; RFS, Recommended Food Score; RRR, Reduced Rank Regression; SF-36, Medical Outcomes Short-Form 36 Health Survey; SU.VI.MAX, Supplementation en VItamines et Mineraux Anti-oXydants; TICS, Telephone Interview for Cognitive Status; VaD, vascular dementia; WHICAP, Washington Heights-Inwood Columbia Aging Project
53
Discussion We reviewed the current evidence from observational studies and intervention trials investigating healthy dietary patterns in relation to cognitive decline and dementia. Overall, the results of all types of dietary pattern approaches suggest that better adherence to a healthy dietary pattern is associated with less cognitive decline and/or a lower risk of dementia. However, most studies are observational and evidence from intervention trials is limited to two trials, of which one investigated the effect of the Mediterranean diet [47, 48] and one the effect of the DASH diet [57]. There are several different methodological factors between the studies. This heterogeneity hinders comparison between studies; therefore the most important points are discussed below. Both a priori and a posteriori approaches to define dietary patterns [3, 7, 58] have been used in studies included in this review and each method has its strengths and limitations. A limitation of a priori indexes is that they are based on current scientific knowledge on what a healthy diet comprises. Evolutions in knowledge should be considered each time the index is applied, which also changes the index over time [59]. Also few cues about how to weight food groups or guidelines have been proposed. A limitation of both a priori and a posteriori approaches is that complex correlations of food matrixes are not taken into account, neither are all components specifically related to cognitive outcomes. Indexes described in this review are mainly based on improving overall health status [20-23, 25] or blood pressure [60], rather than improving cognitive health specifically. A limitation of a posteriori methods is the limited comparability and reproducibility in other study samples because dietary patterns are based on food behavior in specific study samples [61]. Another limitation of a posteriori methods is that good skills in multidimensional statistical methods are required to select the best components of which the choice is subjective [62]. Another subjective choice, which could be confusing, is the naming of the dietary patterns. Therefore, for studies performed in different populations, the food consumption characterizing the pattern should be described clearly. Populations studied were almost all Western populations, mostly from the US and the Mediterranean countries in Europe and a few studies have been performed in Australia, China or Japan. According to Solfrizzi et al the components of the Mediterranean diet in Western countries could be different from the traditional Mediterranean diet, in particular for the high intakes of olive oil and regular consumption of wine with meals [63]. In general, a healthy dietary pattern comprises a diet high in fruits, vegetables, other plant-derived products, and fish and lower intakes of meat, saturated fats, and added refined sugar. We found no clear differences in associations between healthy dietary patterns and cognitive decline and dementia across countries. Also Singh and colleagues did not find any heterogeneity in their analysis, however, this could be due to the fact that they included three US studies and one French study [11]. Dietary intake can be assessed with different methods such as food records, 24 hour recalls or food frequency questionnaires (FFQ), of which the latter has been mostly used in the studies included in the current review. Different intake methods not only limit comparisons between studies, but also impacts on the number of variables to be used for dietary pattern analyses. This could affect both the number of derived dietary patterns as well as the dietary patterns itself [62]. It has been shown in studies using principle component analyses that this could lead to attenuated disease odds [62, 64]. The outcome measures that were included in our review ranged from cognitive performance in cross-sectional studies to cognitive decline and risk of AD or dementia in longitudinal studies. There are many differences in the way cognitive outcomes have been measured and reported. This makes comparison between studies more difficult and limits comparison of studies in a meta-

Chapter 3 | Dietary patterns, cognitive decline and dementia; a systematic review
54
analysis, which would provide a more quantitative understanding of the relation between dietary patters and cognitive impairment. Length of follow-up time of longitudinal studies ranged from 2 years to 15 years. To capture changes in cognitive functioning several years of follow-up are needed, but how long exactly is sufficient and what the best period to start follow-up would be is not clear. It is nowadays suggested to already start at middle-age. Some of the inconsistency in findings may be explained by the general considerations that should be taken into account when interpreting results of observational studies, such as residual confounding, possible over-adjustment and the fact that different covariates were included across the studies. Another important issue with observational studies is that they do not allow causal inference. This can be overcome with well-designed intervention studies. However, the only trial on the effect of the Mediterranean diet and cognitive decline did not measure cognition at baseline but only at follow-up, which limits the possibility to really study cause-effect relations.
Another point to take into account when interpreting results could be effect modification by sex as suggested by findings from Chan and colleagues who found that higher intakes of ‘vegetables-fruit’ and ‘snacks-drinks-milk’ patterns were associated with reduced risk of cognitive impairment in women, but no association was observed in men [15]. In contrast, a Greek study reported an increased risk of cognitive impairment with better adherence to the Mediterranean diet in women, but a reduced risk in men [33]. As eating behavior may differ between men and women it should be taken into account that dietary patterns could have been derived for men and women separately. Unfortunately, none of the included studies have examined dietary patterns by gender. These possible sex-specific differences merit further investigation and clarification.
The results suggest that better adherence to a Mediterranean diet is associated with less cognitive decline, dementia or AD, as shown by four out of six cross-sectional studies, six out of 12 longitudinal studies, one trial and three meta-analyses. Other Healthy dietary patterns, both a priori (e.g. HDI, HEI and PNNS-GS) and a posteriori derived (e.g. factor analysis, cluster analysis and RRR), have shown to be associated with reduced cognitive decline and/or a reduced risk of dementia as shown by all seven cross-sectional studies and five out of seven longitudinal studies.
Investigating whole diet approaches instead of individual nutrients is an attractive strategy, because combined effects may yield larger results since effects of individual nutrients may be small. Furthermore, a whole diet approach is more comparable to dietary intake in daily life. A dietary index specifically aimed at improving cognitive performance would be desirable. To further advance this field of research, more intervention trials of sufficient sample size investigating what type of dietary pattern is favorable with respect to prevention of cognitive decline are recommended. In this respect findings of the ongoing NU-AGE dietary intervention study, in which the effect of a 1-year healthful diet on cognitive performance is investigated, are to be awaited [65]. Furthermore, more observational studies starting at middle-aged adults and with a sufficient duration of at least >10-15 years of follow-up are warranted. Those studies should, if possible, take into account the methodological issues as pointed out above and should aim for more homogeneity in for example cognitive outcomes and composition of dietary patterns to facilitate comparison between studies. Also, the suggestion for differences in associations between men and women needs further investigation. If effects of certain dietary approaches will be proven, it will be a challenging task to change people’s dietary habits, but it is important to take up the challenge now in order to provide (pre-) dementia patients some perspective of treatment or delay of the disease process and to come to clear recommendations in the future for a cost-effective, safe, and sustainable solution. This is of special importance, since there are currently no curative treatments for this disease.
55
References 1. Alzheimer's Disease International. Policy Brief for Heads of Government: The Global Impact of Dementia 2013-2050.
London: Alzheimer's Disease International, 2013. 2. World Health Organization and Alzheimer’s Disease International. Dementia: a public health priority. United Kingdom:
World Health Organization and Alzheimer's Disease International, 2012 Contract No.: 19-05-2012. 3. Hu FB. Dietary pattern analysis: a new direction in nutritional epidemiology. Current opinion in lipidology. 2002;13(1):3-
9. 4. Jacobs DR, Jr., Steffen LM. Nutrients, foods, and dietary patterns as exposures in research: a framework for food
synergy. Am J Clin Nutr. 2003;78(3 Suppl):508S-13S. 5. Jacques PF, Tucker KL. Are dietary patterns useful for understanding the role of diet in chronic disease? Am J Clin Nutr.
2001;73(1):1-2. 6. Kant AK. Indexes of overall diet quality: a review. J Am Diet Assoc. 1996;96(8):785-91. 7. Alles B, Samieri C, Feart C, Jutand MA, Laurin D, Barberger-Gateau P. Dietary patterns: a novel approach to examine the
link between nutrition and cognitive function in older individuals. Nutr Res Rev. 2012:207-22. 8. Lourida I, Soni M, Thompson-Coon J, Purandare N, Lang IA, Ukoumunne OC, et al. Mediterranean diet, cognitive
function, and dementia: a systematic review. Epidemiology (Cambridge, Mass). 2013;24(4):479-89. 9. Psaltopoulou T, Sergentanis TN, Panagiotakos DB, Sergentanis IN, Kosti R, Scarmeas N. Mediterranean diet, stroke,
cognitive impairment, and depression: A meta-analysis. Annals of neurology. 2013;74(4):580-91. 10. Roman B, Carta L, Martinez-Gonzalez MA, Serra-Majem L. Effectiveness of the Mediterranean diet in the elderly. Clinical
interventions in aging. 2008;3(1):97-109. 11. Singh B, Parsaik AK, Mielke MM, Erwin PJ, Knopman DS, Petersen RC, et al. Association of mediterranean diet with mild
cognitive impairment and Alzheimer's disease: a systematic review and meta-analysis. J Alzheimers Dis. 2014;39(2):271-82.
12. Sofi F, Abbate R, Gensini GF, Casini A. Accruing evidence on benefits of adherence to the Mediterranean diet on health: an updated systematic review and meta-analysis. Am J Clin Nutr. 2010;92(5):1189-96.
13. Sofi F, Macchi C, Abbate R, Gensini GF, Casini A. Effectiveness of the Mediterranean diet: can it help delay or prevent Alzheimer's disease? J Alzheimers Dis. 2010;20(3):795-801.
14. Gu Y, Scarmeas N. Dietary patterns in Alzheimer's disease and cognitive aging. Current Alzheimer research. 2011;8(5):510-9.
15. Chan R, Chan D, Woo J. A cross sectional study to examine the association between dietary patterns and cognitive impairment in older Chinese people in Hong Kong. J Nutr Health Aging. 2013;17(9):757-65.
16. Samieri C, Sun Q, Townsend MK, Chiuve SE, Okereke OI, Willett WC, et al. The association between dietary patterns at midlife and health in aging: an observational study. Ann Intern Med. 2013;159(9):584-91.
17. Tangney CC, Kwasny MJ, Li H, Wilson RS, Evans DA, Morris MC. Adherence to a Mediterranean-type dietary pattern and cognitive decline in a community population. Am J Clin Nutr. 2011;93(3):601-7.
18. Wengreen H, Munger RG, Cutler A, Quach A, Bowles A, Corcoran C, et al. Prospective study of Dietary Approaches to Stop Hypertension- and Mediterranean-style dietary patterns and age-related cognitive change: the Cache County Study on Memory, Health and Aging. Am J Clin Nutr. 2013;98(5):1263-71.
19. Ye X, Scott T, Gao X, Maras JE, Bakun PJ, Tucker KL. Mediterranean diet, healthy eating index 2005, and cognitive function in middle-aged and older puerto rican adults. Journal of the Academy of Nutrition and Dietetics. 2013;113(2):276-81.
20. Estaquio C, Kesse-Guyot E, Deschamps V, Bertrais S, Dauchet L, Galan P, et al. Adherence to the French Programme National Nutrition Sante Guideline Score is associated with better nutrient intake and nutritional status. J Am Diet Assoc. 2009;109(6):1031-41.
21. Huijbregts P, Feskens E, Rasanen L, Fidanza F, Nissinen A, Menotti A, et al. Dietary pattern and 20 year mortality in elderly men in Finland, Italy, and The Netherlands: longitudinal cohort study. BMJ. 1997;315(7099):13-7.
22. Kant AK, Schatzkin A, Graubard BI, Schairer C. A prospective study of diet quality and mortality in women. JAMA. 2000;283(16):2109-15.
23. Kennedy ET, Ohls J, Carlson S, Fleming K. The Healthy Eating Index: design and applications. J Am Diet Assoc. 1995;95(10):1103-8.
24. Sacks FM, Obarzanek E, Windhauser MM, Svetkey LP, Vollmer WM, McCullough M, et al. Rationale and design of the Dietary Approaches to Stop Hypertension trial (DASH). A multicenter controlled-feeding study of dietary patterns to lower blood pressure. Annals of epidemiology. 1995;5(2):108-18.
25. Trichopoulou A, Kouris-Blazos A, Wahlqvist ML, Gnardellis C, Lagiou P, Polychronopoulos E, et al. Diet and overall survival in elderly people. BMJ. 1995;311(7018):1457-60.
26. Gu Y, Nieves JW, Stern Y, Luchsinger JA, Scarmeas N. Food combination and Alzheimer disease risk: a protective diet. Arch Neurol. 2010;67(6):699-706.
27. Reedy J, Wirfalt E, Flood A, Mitrou PN, Krebs-Smith SM, Kipnis V, et al. Comparing 3 dietary pattern methods--cluster analysis, factor analysis, and index analysis--With colorectal cancer risk: The NIH-AARP Diet and Health Study. Am J Epidemiol. 2010;171(4):479-87.
28. Hoffmann K, Schulze MB, Schienkiewitz A, Nothlings U, Boeing H. Application of a new statistical method to derive dietary patterns in nutritional epidemiology. Am J Epidemiol. 2004;159(10):935-44.

3
Chapter 3 | Dietary patterns, cognitive decline and dementia; a systematic review
54
analysis, which would provide a more quantitative understanding of the relation between dietary patters and cognitive impairment. Length of follow-up time of longitudinal studies ranged from 2 years to 15 years. To capture changes in cognitive functioning several years of follow-up are needed, but how long exactly is sufficient and what the best period to start follow-up would be is not clear. It is nowadays suggested to already start at middle-age. Some of the inconsistency in findings may be explained by the general considerations that should be taken into account when interpreting results of observational studies, such as residual confounding, possible over-adjustment and the fact that different covariates were included across the studies. Another important issue with observational studies is that they do not allow causal inference. This can be overcome with well-designed intervention studies. However, the only trial on the effect of the Mediterranean diet and cognitive decline did not measure cognition at baseline but only at follow-up, which limits the possibility to really study cause-effect relations.
Another point to take into account when interpreting results could be effect modification by sex as suggested by findings from Chan and colleagues who found that higher intakes of ‘vegetables-fruit’ and ‘snacks-drinks-milk’ patterns were associated with reduced risk of cognitive impairment in women, but no association was observed in men [15]. In contrast, a Greek study reported an increased risk of cognitive impairment with better adherence to the Mediterranean diet in women, but a reduced risk in men [33]. As eating behavior may differ between men and women it should be taken into account that dietary patterns could have been derived for men and women separately. Unfortunately, none of the included studies have examined dietary patterns by gender. These possible sex-specific differences merit further investigation and clarification.
The results suggest that better adherence to a Mediterranean diet is associated with less cognitive decline, dementia or AD, as shown by four out of six cross-sectional studies, six out of 12 longitudinal studies, one trial and three meta-analyses. Other Healthy dietary patterns, both a priori (e.g. HDI, HEI and PNNS-GS) and a posteriori derived (e.g. factor analysis, cluster analysis and RRR), have shown to be associated with reduced cognitive decline and/or a reduced risk of dementia as shown by all seven cross-sectional studies and five out of seven longitudinal studies.
Investigating whole diet approaches instead of individual nutrients is an attractive strategy, because combined effects may yield larger results since effects of individual nutrients may be small. Furthermore, a whole diet approach is more comparable to dietary intake in daily life. A dietary index specifically aimed at improving cognitive performance would be desirable. To further advance this field of research, more intervention trials of sufficient sample size investigating what type of dietary pattern is favorable with respect to prevention of cognitive decline are recommended. In this respect findings of the ongoing NU-AGE dietary intervention study, in which the effect of a 1-year healthful diet on cognitive performance is investigated, are to be awaited [65]. Furthermore, more observational studies starting at middle-aged adults and with a sufficient duration of at least >10-15 years of follow-up are warranted. Those studies should, if possible, take into account the methodological issues as pointed out above and should aim for more homogeneity in for example cognitive outcomes and composition of dietary patterns to facilitate comparison between studies. Also, the suggestion for differences in associations between men and women needs further investigation. If effects of certain dietary approaches will be proven, it will be a challenging task to change people’s dietary habits, but it is important to take up the challenge now in order to provide (pre-) dementia patients some perspective of treatment or delay of the disease process and to come to clear recommendations in the future for a cost-effective, safe, and sustainable solution. This is of special importance, since there are currently no curative treatments for this disease.
55
References 1. Alzheimer's Disease International. Policy Brief for Heads of Government: The Global Impact of Dementia 2013-2050.
London: Alzheimer's Disease International, 2013. 2. World Health Organization and Alzheimer’s Disease International. Dementia: a public health priority. United Kingdom:
World Health Organization and Alzheimer's Disease International, 2012 Contract No.: 19-05-2012. 3. Hu FB. Dietary pattern analysis: a new direction in nutritional epidemiology. Current opinion in lipidology. 2002;13(1):3-
9. 4. Jacobs DR, Jr., Steffen LM. Nutrients, foods, and dietary patterns as exposures in research: a framework for food
synergy. Am J Clin Nutr. 2003;78(3 Suppl):508S-13S. 5. Jacques PF, Tucker KL. Are dietary patterns useful for understanding the role of diet in chronic disease? Am J Clin Nutr.
2001;73(1):1-2. 6. Kant AK. Indexes of overall diet quality: a review. J Am Diet Assoc. 1996;96(8):785-91. 7. Alles B, Samieri C, Feart C, Jutand MA, Laurin D, Barberger-Gateau P. Dietary patterns: a novel approach to examine the
link between nutrition and cognitive function in older individuals. Nutr Res Rev. 2012:207-22. 8. Lourida I, Soni M, Thompson-Coon J, Purandare N, Lang IA, Ukoumunne OC, et al. Mediterranean diet, cognitive
function, and dementia: a systematic review. Epidemiology (Cambridge, Mass). 2013;24(4):479-89. 9. Psaltopoulou T, Sergentanis TN, Panagiotakos DB, Sergentanis IN, Kosti R, Scarmeas N. Mediterranean diet, stroke,
cognitive impairment, and depression: A meta-analysis. Annals of neurology. 2013;74(4):580-91. 10. Roman B, Carta L, Martinez-Gonzalez MA, Serra-Majem L. Effectiveness of the Mediterranean diet in the elderly. Clinical
interventions in aging. 2008;3(1):97-109. 11. Singh B, Parsaik AK, Mielke MM, Erwin PJ, Knopman DS, Petersen RC, et al. Association of mediterranean diet with mild
cognitive impairment and Alzheimer's disease: a systematic review and meta-analysis. J Alzheimers Dis. 2014;39(2):271-82.
12. Sofi F, Abbate R, Gensini GF, Casini A. Accruing evidence on benefits of adherence to the Mediterranean diet on health: an updated systematic review and meta-analysis. Am J Clin Nutr. 2010;92(5):1189-96.
13. Sofi F, Macchi C, Abbate R, Gensini GF, Casini A. Effectiveness of the Mediterranean diet: can it help delay or prevent Alzheimer's disease? J Alzheimers Dis. 2010;20(3):795-801.
14. Gu Y, Scarmeas N. Dietary patterns in Alzheimer's disease and cognitive aging. Current Alzheimer research. 2011;8(5):510-9.
15. Chan R, Chan D, Woo J. A cross sectional study to examine the association between dietary patterns and cognitive impairment in older Chinese people in Hong Kong. J Nutr Health Aging. 2013;17(9):757-65.
16. Samieri C, Sun Q, Townsend MK, Chiuve SE, Okereke OI, Willett WC, et al. The association between dietary patterns at midlife and health in aging: an observational study. Ann Intern Med. 2013;159(9):584-91.
17. Tangney CC, Kwasny MJ, Li H, Wilson RS, Evans DA, Morris MC. Adherence to a Mediterranean-type dietary pattern and cognitive decline in a community population. Am J Clin Nutr. 2011;93(3):601-7.
18. Wengreen H, Munger RG, Cutler A, Quach A, Bowles A, Corcoran C, et al. Prospective study of Dietary Approaches to Stop Hypertension- and Mediterranean-style dietary patterns and age-related cognitive change: the Cache County Study on Memory, Health and Aging. Am J Clin Nutr. 2013;98(5):1263-71.
19. Ye X, Scott T, Gao X, Maras JE, Bakun PJ, Tucker KL. Mediterranean diet, healthy eating index 2005, and cognitive function in middle-aged and older puerto rican adults. Journal of the Academy of Nutrition and Dietetics. 2013;113(2):276-81.
20. Estaquio C, Kesse-Guyot E, Deschamps V, Bertrais S, Dauchet L, Galan P, et al. Adherence to the French Programme National Nutrition Sante Guideline Score is associated with better nutrient intake and nutritional status. J Am Diet Assoc. 2009;109(6):1031-41.
21. Huijbregts P, Feskens E, Rasanen L, Fidanza F, Nissinen A, Menotti A, et al. Dietary pattern and 20 year mortality in elderly men in Finland, Italy, and The Netherlands: longitudinal cohort study. BMJ. 1997;315(7099):13-7.
22. Kant AK, Schatzkin A, Graubard BI, Schairer C. A prospective study of diet quality and mortality in women. JAMA. 2000;283(16):2109-15.
23. Kennedy ET, Ohls J, Carlson S, Fleming K. The Healthy Eating Index: design and applications. J Am Diet Assoc. 1995;95(10):1103-8.
24. Sacks FM, Obarzanek E, Windhauser MM, Svetkey LP, Vollmer WM, McCullough M, et al. Rationale and design of the Dietary Approaches to Stop Hypertension trial (DASH). A multicenter controlled-feeding study of dietary patterns to lower blood pressure. Annals of epidemiology. 1995;5(2):108-18.
25. Trichopoulou A, Kouris-Blazos A, Wahlqvist ML, Gnardellis C, Lagiou P, Polychronopoulos E, et al. Diet and overall survival in elderly people. BMJ. 1995;311(7018):1457-60.
26. Gu Y, Nieves JW, Stern Y, Luchsinger JA, Scarmeas N. Food combination and Alzheimer disease risk: a protective diet. Arch Neurol. 2010;67(6):699-706.
27. Reedy J, Wirfalt E, Flood A, Mitrou PN, Krebs-Smith SM, Kipnis V, et al. Comparing 3 dietary pattern methods--cluster analysis, factor analysis, and index analysis--With colorectal cancer risk: The NIH-AARP Diet and Health Study. Am J Epidemiol. 2010;171(4):479-87.
28. Hoffmann K, Schulze MB, Schienkiewitz A, Nothlings U, Boeing H. Application of a new statistical method to derive dietary patterns in nutritional epidemiology. Am J Epidemiol. 2004;159(10):935-44.

Chapter 3 | Dietary patterns, cognitive decline and dementia; a systematic review
56
29. Newby PK, Tucker KL. Empirically derived eating patterns using factor or cluster analysis: a review. Nutr Rev. 2004;62(5):177-203.
30. Alzheimer's Disease International. Nutrition and dementia. A review of available research. London: Alzheimer's Disease International, 2014.
31. Gardener S, Gu Y, Rainey-Smith SR, Keogh JB, Clifton PM, Mathieson SL, et al. Adherence to a Mediterranean diet and Alzheimer's disease risk in an Australian population. Translational psychiatry. 2012;2:e164.
32. Scarmeas N, Stern Y, Mayeux R, Luchsinger JA. Mediterranean diet, Alzheimer disease, and vascular mediation. Arch Neurol. 2006;63(12):1709-17.
33. Katsiardanis K, Diamantaras AA, Dessypris N, Michelakos T, Anastasiou A, Katsiardani KP, et al. Cognitive impairment and dietary habits among elders: the Velestino Study. Journal of medicinal food. 2013;16(4):343-50.
34. Féart C, Samieri C, Rondeau V, Amieva H, Portet F, Dartigues JF, et al. Adherence to a mediterranean diet, cognitive decline, and risk of dementia. JAMA. 2009;302(6):638-48.
35. Samieri C, Okereke OI, Devore EE, Grodstein F. Long-term adherence to the Mediterranean diet is associated with overall cognitive status, but not cognitive decline, in women. J Nutr. 2013;143(4):493-9.
36. Scarmeas N, Stern Y, Mayeux R, Manly JJ, Schupf N, Luchsinger JA. Mediterranean diet and mild cognitive impairment. Arch Neurol. 2009;66(2):216-25.
37. Tsivgoulis G, Judd S, Letter AJ, Alexandrov AV, Howard G, Nahab F, et al. Adherence to a Mediterranean diet and risk of incident cognitive impairment. Neurology. 2013;80(18):1684-92.
38. Roberts RO, Geda YE, Cerhan JR, Knopman DS, Cha RH, Christianson TJ, et al. Vegetables, unsaturated fats, moderate alcohol intake, and mild cognitive impairment. Dementia and geriatric cognitive disorders. 2010;29(5):413-23.
39. Samieri C, Grodstein F, Rosner BA, Kang JH, Cook NR, Manson JE, et al. Mediterranean diet and cognitive function in older age. Epidemiology (Cambridge, Mass). 2013;24(4):490-9.
40. Vercambre MN, Grodstein F, Berr C, Kang JH. Mediterranean diet and cognitive decline in women with cardiovascular disease or risk factors. Journal of the Academy of Nutrition and Dietetics. 2012;112(6):816-23.
41. Kesse-Guyot E, Andreeva VA, Lassale C, Ferry M, Jeandel C, Hercberg S, et al. Mediterranean diet and cognitive function: a French study. Am J Clin Nutr. 2013;97(2):369-76.
42. Cherbuin N, Anstey KJ. The Mediterranean diet is not related to cognitive change in a large prospective investigation: the PATH Through Life study. Am J Geriatr Psychiatry. 2012;20(7):635-9.
43. Psaltopoulou T, Kyrozis A, Stathopoulos P, Trichopoulos D, Vassilopoulos D, Trichopoulou A. Diet, physical activity and cognitive impairment among elders: the EPIC-Greece cohort (European Prospective Investigation into Cancer and Nutrition). Public Health Nutr. 2008;11(10):1054-62.
44. Scarmeas N, Stern Y, Tang MX, Mayeux R, Luchsinger JA. Mediterranean diet and risk for Alzheimer's disease. Annals of neurology. 2006;59(6):912-21.
45. Gu Y, Luchsinger JA, Stern Y, Scarmeas N. Mediterranean diet, inflammatory and metabolic biomarkers, and risk of Alzheimer's disease. J Alzheimers Dis. 2010;22(2):483-92.
46. Scarmeas N, Luchsinger JA, Schupf N, Brickman AM, Cosentino S, Tang MX, et al. Physical activity, diet, and risk of Alzheimer disease. JAMA. 2009;302(6):627-37.
47. Martinez-Lapiscina EH, Clavero P, Toledo E, Estruch R, Salas-Salvado J, San Julian B, et al. Mediterranean diet improves cognition: the PREDIMED-NAVARRA randomised trial. Journal of neurology, neurosurgery, and psychiatry. 2013;84(12):1318-25.
48. Martinez-Lapiscina EH, Clavero P, Toledo E, San Julian B, Sanchez-Tainta A, Corella D, et al. Virgin olive oil supplementation and long-term cognition: the PREDIMED-NAVARRA randomized, trial. J Nutr Health Aging. 2013;17(6):544-52.
49. Samieri C, Jutand MA, Feart C, Capuron L, Letenneur L, Barberger-Gateau P. Dietary patterns derived by hybrid clustering method in older people: association with cognition, mood, and self-rated health. J Am Diet Assoc. 2008;108(9):1461-71.
50. Correa Leite ML, Nicolosi A, Cristina S, Hauser WA, Nappi G. Nutrition and cognitive deficit in the elderly: a population study. Eur J Clin Nutr. 2001;55(12):1053-8.
51. Huijbregts PP, Feskens EJ, Rasanen L, Fidanza F, Alberti-Fidanza A, Nissinen A, et al. Dietary patterns and cognitive function in elderly men in Finland, Italy and The Netherlands. Eur J Clin Nutr. 1998;52(11):826-31.
52. Kesse-Guyot E, Amieva H, Castetbon K, Henegar A, Ferry M, Jeandel C, et al. Adherence to nutritional recommendations and subsequent cognitive performance: findings from the prospective Supplementation with Antioxidant Vitamins and Minerals 2 (SU.VI.MAX 2) study. Am J Clin Nutr. 2011;93(1):200-10.
53. Ozawa M, Ninomiya T, Ohara T, Doi Y, Uchida K, Shirota T, et al. Dietary patterns and risk of dementia in an elderly Japanese population: the Hisayama Study. Am J Clin Nutr. 2013;97(5):1076-82.
54. Kesse-Guyot E, Andreeva VA, Jeandel C, Ferry M, Hercberg S, Galan P. A healthy dietary pattern at midlife is associated with subsequent cognitive performance. J Nutr. 2012;142(5):909-15.
55. Shatenstein B, Ferland G, Belleville S, Gray-Donald K, Kergoat MJ, Morais J, et al. Diet quality and cognition among older adults from the NuAge study. Exp Gerontol. 2012;47(5):353-60.
56. Wengreen HJ, Neilson C, Munger R, Corcoran C. Diet quality is associated with better cognitive test performance among aging men and women. J Nutr. 2009;139(10):1944-9.
57
57. Smith PJ, Blumenthal JA, Babyak MA, Craighead L, Welsh-Bohmer KA, Browndyke JN, et al. Effects of the dietary approaches to stop hypertension diet, exercise, and caloric restriction on neurocognition in overweight adults with highblood pressure. Hypertension. 2010;55(6):1331-8.
58. Schulze MB, Hoffmann K. Methodological approaches to study dietary patterns in relation to risk of coronary heartdisease and stroke. Br J Nutr. 2006;95(5):860-9.
59. Waijers PM, Feskens EJ, Ocke MC. A critical review of predefined diet quality scores. Br J Nutr. 2007;97(2):219-31. 60. Appel LJ, Moore TJ, Obarzanek E, Vollmer WM, Svetkey LP, Sacks FM, et al. A clinical trial of the effects of dietary
patterns on blood pressure. DASH Collaborative Research Group. N Engl J Med. 1997;336(16):1117-24. 61. Tucker KL. Dietary patterns, approaches, and multicultural perspective. Applied physiology, nutrition, and metabolism =
Physiologie appliquee, nutrition et metabolisme. 2010;35(2):211-8. 62. Fransen HP, May AM, Stricker MD, Boer JM, Hennig C, Rosseel Y, et al. A Posteriori Dietary Patterns: How Many
Patterns to Retain? J Nutr. 2014.63. Solfrizzi V, Panza F. Mediterranean diet and cognitive decline. A lesson from the whole-diet approach: what challenges
lie ahead? J Alzheimers Dis. 2014;39(2):283-6. 64. McCann SE, Marshall JR, Brasure JR, Graham S, Freudenheim JL. Analysis of patterns of food intake in nutritional
epidemiology: food classification in principal components analysis and the subsequent impact on estimates forendometrial cancer. Public Health Nutr. 2001;4(5):989-97.
65. Berendsen A, Santoro A, Pini E, Cevenini E, Ostan R, Pietruszka B, et al. Reprint of: A parallel randomized trial on the effect of a healthful diet on inflammageing and its consequences in European elderly people: design of the NU-AGEdietary intervention study. Mechanisms of ageing and development. 2014;136-137:14-21.

3
Chapter 3 | Dietary patterns, cognitive decline and dementia; a systematic review
56
29. Newby PK, Tucker KL. Empirically derived eating patterns using factor or cluster analysis: a review. Nutr Rev. 2004;62(5):177-203.
30. Alzheimer's Disease International. Nutrition and dementia. A review of available research. London: Alzheimer's Disease International, 2014.
31. Gardener S, Gu Y, Rainey-Smith SR, Keogh JB, Clifton PM, Mathieson SL, et al. Adherence to a Mediterranean diet and Alzheimer's disease risk in an Australian population. Translational psychiatry. 2012;2:e164.
32. Scarmeas N, Stern Y, Mayeux R, Luchsinger JA. Mediterranean diet, Alzheimer disease, and vascular mediation. Arch Neurol. 2006;63(12):1709-17.
33. Katsiardanis K, Diamantaras AA, Dessypris N, Michelakos T, Anastasiou A, Katsiardani KP, et al. Cognitive impairment and dietary habits among elders: the Velestino Study. Journal of medicinal food. 2013;16(4):343-50.
34. Féart C, Samieri C, Rondeau V, Amieva H, Portet F, Dartigues JF, et al. Adherence to a mediterranean diet, cognitive decline, and risk of dementia. JAMA. 2009;302(6):638-48.
35. Samieri C, Okereke OI, Devore EE, Grodstein F. Long-term adherence to the Mediterranean diet is associated with overall cognitive status, but not cognitive decline, in women. J Nutr. 2013;143(4):493-9.
36. Scarmeas N, Stern Y, Mayeux R, Manly JJ, Schupf N, Luchsinger JA. Mediterranean diet and mild cognitive impairment. Arch Neurol. 2009;66(2):216-25.
37. Tsivgoulis G, Judd S, Letter AJ, Alexandrov AV, Howard G, Nahab F, et al. Adherence to a Mediterranean diet and risk of incident cognitive impairment. Neurology. 2013;80(18):1684-92.
38. Roberts RO, Geda YE, Cerhan JR, Knopman DS, Cha RH, Christianson TJ, et al. Vegetables, unsaturated fats, moderate alcohol intake, and mild cognitive impairment. Dementia and geriatric cognitive disorders. 2010;29(5):413-23.
39. Samieri C, Grodstein F, Rosner BA, Kang JH, Cook NR, Manson JE, et al. Mediterranean diet and cognitive function in older age. Epidemiology (Cambridge, Mass). 2013;24(4):490-9.
40. Vercambre MN, Grodstein F, Berr C, Kang JH. Mediterranean diet and cognitive decline in women with cardiovascular disease or risk factors. Journal of the Academy of Nutrition and Dietetics. 2012;112(6):816-23.
41. Kesse-Guyot E, Andreeva VA, Lassale C, Ferry M, Jeandel C, Hercberg S, et al. Mediterranean diet and cognitive function: a French study. Am J Clin Nutr. 2013;97(2):369-76.
42. Cherbuin N, Anstey KJ. The Mediterranean diet is not related to cognitive change in a large prospective investigation: the PATH Through Life study. Am J Geriatr Psychiatry. 2012;20(7):635-9.
43. Psaltopoulou T, Kyrozis A, Stathopoulos P, Trichopoulos D, Vassilopoulos D, Trichopoulou A. Diet, physical activity and cognitive impairment among elders: the EPIC-Greece cohort (European Prospective Investigation into Cancer and Nutrition). Public Health Nutr. 2008;11(10):1054-62.
44. Scarmeas N, Stern Y, Tang MX, Mayeux R, Luchsinger JA. Mediterranean diet and risk for Alzheimer's disease. Annals of neurology. 2006;59(6):912-21.
45. Gu Y, Luchsinger JA, Stern Y, Scarmeas N. Mediterranean diet, inflammatory and metabolic biomarkers, and risk of Alzheimer's disease. J Alzheimers Dis. 2010;22(2):483-92.
46. Scarmeas N, Luchsinger JA, Schupf N, Brickman AM, Cosentino S, Tang MX, et al. Physical activity, diet, and risk of Alzheimer disease. JAMA. 2009;302(6):627-37.
47. Martinez-Lapiscina EH, Clavero P, Toledo E, Estruch R, Salas-Salvado J, San Julian B, et al. Mediterranean diet improves cognition: the PREDIMED-NAVARRA randomised trial. Journal of neurology, neurosurgery, and psychiatry. 2013;84(12):1318-25.
48. Martinez-Lapiscina EH, Clavero P, Toledo E, San Julian B, Sanchez-Tainta A, Corella D, et al. Virgin olive oil supplementation and long-term cognition: the PREDIMED-NAVARRA randomized, trial. J Nutr Health Aging. 2013;17(6):544-52.
49. Samieri C, Jutand MA, Feart C, Capuron L, Letenneur L, Barberger-Gateau P. Dietary patterns derived by hybrid clustering method in older people: association with cognition, mood, and self-rated health. J Am Diet Assoc. 2008;108(9):1461-71.
50. Correa Leite ML, Nicolosi A, Cristina S, Hauser WA, Nappi G. Nutrition and cognitive deficit in the elderly: a population study. Eur J Clin Nutr. 2001;55(12):1053-8.
51. Huijbregts PP, Feskens EJ, Rasanen L, Fidanza F, Alberti-Fidanza A, Nissinen A, et al. Dietary patterns and cognitive function in elderly men in Finland, Italy and The Netherlands. Eur J Clin Nutr. 1998;52(11):826-31.
52. Kesse-Guyot E, Amieva H, Castetbon K, Henegar A, Ferry M, Jeandel C, et al. Adherence to nutritional recommendations and subsequent cognitive performance: findings from the prospective Supplementation with Antioxidant Vitamins and Minerals 2 (SU.VI.MAX 2) study. Am J Clin Nutr. 2011;93(1):200-10.
53. Ozawa M, Ninomiya T, Ohara T, Doi Y, Uchida K, Shirota T, et al. Dietary patterns and risk of dementia in an elderly Japanese population: the Hisayama Study. Am J Clin Nutr. 2013;97(5):1076-82.
54. Kesse-Guyot E, Andreeva VA, Jeandel C, Ferry M, Hercberg S, Galan P. A healthy dietary pattern at midlife is associated with subsequent cognitive performance. J Nutr. 2012;142(5):909-15.
55. Shatenstein B, Ferland G, Belleville S, Gray-Donald K, Kergoat MJ, Morais J, et al. Diet quality and cognition among older adults from the NuAge study. Exp Gerontol. 2012;47(5):353-60.
56. Wengreen HJ, Neilson C, Munger R, Corcoran C. Diet quality is associated with better cognitive test performance among aging men and women. J Nutr. 2009;139(10):1944-9.
57
57. Smith PJ, Blumenthal JA, Babyak MA, Craighead L, Welsh-Bohmer KA, Browndyke JN, et al. Effects of the dietary approaches to stop hypertension diet, exercise, and caloric restriction on neurocognition in overweight adults with highblood pressure. Hypertension. 2010;55(6):1331-8.
58. Schulze MB, Hoffmann K. Methodological approaches to study dietary patterns in relation to risk of coronary heartdisease and stroke. Br J Nutr. 2006;95(5):860-9.
59. Waijers PM, Feskens EJ, Ocke MC. A critical review of predefined diet quality scores. Br J Nutr. 2007;97(2):219-31. 60. Appel LJ, Moore TJ, Obarzanek E, Vollmer WM, Svetkey LP, Sacks FM, et al. A clinical trial of the effects of dietary
patterns on blood pressure. DASH Collaborative Research Group. N Engl J Med. 1997;336(16):1117-24. 61. Tucker KL. Dietary patterns, approaches, and multicultural perspective. Applied physiology, nutrition, and metabolism =
Physiologie appliquee, nutrition et metabolisme. 2010;35(2):211-8. 62. Fransen HP, May AM, Stricker MD, Boer JM, Hennig C, Rosseel Y, et al. A Posteriori Dietary Patterns: How Many
Patterns to Retain? J Nutr. 2014.63. Solfrizzi V, Panza F. Mediterranean diet and cognitive decline. A lesson from the whole-diet approach: what challenges
lie ahead? J Alzheimers Dis. 2014;39(2):283-6. 64. McCann SE, Marshall JR, Brasure JR, Graham S, Freudenheim JL. Analysis of patterns of food intake in nutritional
epidemiology: food classification in principal components analysis and the subsequent impact on estimates forendometrial cancer. Public Health Nutr. 2001;4(5):989-97.
65. Berendsen A, Santoro A, Pini E, Cevenini E, Ostan R, Pietruszka B, et al. Reprint of: A parallel randomized trial on the effect of a healthful diet on inflammageing and its consequences in European elderly people: design of the NU-AGEdietary intervention study. Mechanisms of ageing and development. 2014;136-137:14-21.


Chapter 4Association of adherence to a
healthy diet with cognitive decline in European and American older
adults: a meta-analysis within the CHANCES consortium
Agnes A.M. Berendsen, Jae H. Kang, Ondine van de Rest, Nicole Jankovic, Ellen Kampman, Jessica C. Kiefte-de Jong,
Oscar H. Franco, M. Arfan Ikram, Hynek Pikhart, Lena Maria Nilsson, Hermann Brenner, Paolo Boffetta,
Snorri Bjorn Rafnsson, Deborah Gustafson, Andreas Kyrozis, Antonia Trichopoulou, Edith J.M. Feskens, Francine Grodstein,
Lisette C.P.G.M. de Groot
Dementia and Geriatric Cognitive Disorders, 2017, 43:215–227

Chapter 4 | Healthy Diet Indicator and cognitive functioning
60
Abstract Aim: To examine the association between a healthy diet, assessed by the Healthy Diet Indicator (HDI), and cognitive decline in older adults. Methods: Data from 21,837 participants aged ≥55 years from 3 cohorts (Survey in Europe on Nutrition and the Elderly, a Concerted Action [SENECA], Rotterdam Study [RS], Nurses’ Health Study [NHS]) were analyzed. HDI scores were based on intakes of saturated fatty acids, polyunsaturated fatty acids, mono- and disaccharides, protein, cholesterol, fruits and vegetables, and fiber. The Telephone Interview for Cognitive Status in NHS and Mini-Mental State Examination in RS and SENECA were used to assess cognitive function from multiple repeated measures. Using multivariable-adjusted, mixed linear regression, mean differences in annual rates of cognitive decline by HDI quintiles were estimated. Results: Multivariable-adjusted differences in rates in the highest versus the lowest HDI quintile were 0.01 (95% CI –0.01, 0.02) in NHS, 0.00 (95% CI –0.02, 0.01) in RS, and 0.00 (95% CI –0.05, 0.05) in SENECA with a pooled estimate of 0.00 (95% CI –0.01, 0.01), I2 = 0%. Conclusions: A higher HDI score was not related to reduced rates of cognitive decline in European and American older adults.
61
Introduction The world’s population aged over 60 years is predicted to double from 11% to 22% between 2000 and 2050 [1]. This demographic shift is likely to further increase the prevalence of age-related diseases and disabilities in the near future. In 2013, there were 44.4 million people with dementia worldwide and this number will increase to an estimated 135.5 million in 2050 [2]. Identifying modifiable risk factors for cognitive decline as a precursor of dementia is likely to be an important strategy for delaying the onset, and reducing the number of people with dementia [3]; a healthy diet is hypothesized to reduce risk [4].
A common approach to explore the impact of nutrition is studying dietary patterns comprising combinations of nutrients and foods. A frequently studied dietary pattern is the Mediterranean Diet, which is rich in fruits and vegetables and unsaturated fatty acids. Greater adherence to the Mediterranean Diet has been associated with a lower rate of cognitive decline in a number of observational and intervention studies [5]. However, there is a need to jointly study information from multiple studies to establish clear associations between a healthful dietary pattern, cognitive function and cognitive decline.
Recommending dietary patterns at an international level requires the operationalization of globally applicable dietary guidelines. Therefore, the 1990 World Health Organization (WHO) guidelines for a healthy diet [6] were translated into the Healthy Diet Indicator (HDI) [7, 8]. These guidelines were developed to reduce chronic diseases, such as hypertension. As hypertension has been shown to impact cognitive function [9-11], it has been hypothesized that the HDI could reduce cognitive function decline.
The HDI based on initial WHO recommendations has been associated with a lower prevalence of cognitive impairment [12, 13], however, the association between updated WHO guidelines and cognitive decline has not been quantified. We therefore prospectively examined the association between baseline HDI and cognitive decline at older age among 21,837 men and women from Europe and the United States (US) by conducting a meta-analysis of individual participant data from three population-based cohorts involved in the Consortium on Health and Ageing: Network of Cohorts in Europe and the United States (CHANCES) [14]. We hypothesized that a higher HDI score would be related to less cognitive decline.
Materials and methods Data assessment and harmonization The aim of CHANCES is to combine prospective cohort studies to produce, improve, and clarify the evidence on the distribution and risk factors of chronic diseases in the elderly and on their socioeconomic impact (www.chancesfp7.eu). Data standardization and harmonization procedures were largely based upon the experience from the MORGAM project and previous experiences of project partners [15]. Data assessment procedures included examination of availability and comparability of cohort data, questionnaires and measurement procedures used in the individual cohorts, and methods for collection of data on health outcomes [14, 16]. For the present study, CHANCES cohorts were selected with harmonized variables on dietary intake, cognitive function and covariates according to predefined rules.

4
Chapter 4 | Healthy Diet Indicator and cognitive functioning
60
Abstract Aim: To examine the association between a healthy diet, assessed by the Healthy Diet Indicator (HDI), and cognitive decline in older adults. Methods: Data from 21,837 participants aged ≥55 years from 3 cohorts (Survey in Europe on Nutrition and the Elderly, a Concerted Action [SENECA], Rotterdam Study [RS], Nurses’ Health Study [NHS]) were analyzed. HDI scores were based on intakes of saturated fatty acids, polyunsaturated fatty acids, mono- and disaccharides, protein, cholesterol, fruits and vegetables, and fiber. The Telephone Interview for Cognitive Status in NHS and Mini-Mental State Examination in RS and SENECA were used to assess cognitive function from multiple repeated measures. Using multivariable-adjusted, mixed linear regression, mean differences in annual rates of cognitive decline by HDI quintiles were estimated. Results: Multivariable-adjusted differences in rates in the highest versus the lowest HDI quintile were 0.01 (95% CI –0.01, 0.02) in NHS, 0.00 (95% CI –0.02, 0.01) in RS, and 0.00 (95% CI –0.05, 0.05) in SENECA with a pooled estimate of 0.00 (95% CI –0.01, 0.01), I2 = 0%. Conclusions: A higher HDI score was not related to reduced rates of cognitive decline in European and American older adults.
61
Introduction The world’s population aged over 60 years is predicted to double from 11% to 22% between 2000 and 2050 [1]. This demographic shift is likely to further increase the prevalence of age-related diseases and disabilities in the near future. In 2013, there were 44.4 million people with dementia worldwide and this number will increase to an estimated 135.5 million in 2050 [2]. Identifying modifiable risk factors for cognitive decline as a precursor of dementia is likely to be an important strategy for delaying the onset, and reducing the number of people with dementia [3]; a healthy diet is hypothesized to reduce risk [4].
A common approach to explore the impact of nutrition is studying dietary patterns comprising combinations of nutrients and foods. A frequently studied dietary pattern is the Mediterranean Diet, which is rich in fruits and vegetables and unsaturated fatty acids. Greater adherence to the Mediterranean Diet has been associated with a lower rate of cognitive decline in a number of observational and intervention studies [5]. However, there is a need to jointly study information from multiple studies to establish clear associations between a healthful dietary pattern, cognitive function and cognitive decline.
Recommending dietary patterns at an international level requires the operationalization of globally applicable dietary guidelines. Therefore, the 1990 World Health Organization (WHO) guidelines for a healthy diet [6] were translated into the Healthy Diet Indicator (HDI) [7, 8]. These guidelines were developed to reduce chronic diseases, such as hypertension. As hypertension has been shown to impact cognitive function [9-11], it has been hypothesized that the HDI could reduce cognitive function decline.
The HDI based on initial WHO recommendations has been associated with a lower prevalence of cognitive impairment [12, 13], however, the association between updated WHO guidelines and cognitive decline has not been quantified. We therefore prospectively examined the association between baseline HDI and cognitive decline at older age among 21,837 men and women from Europe and the United States (US) by conducting a meta-analysis of individual participant data from three population-based cohorts involved in the Consortium on Health and Ageing: Network of Cohorts in Europe and the United States (CHANCES) [14]. We hypothesized that a higher HDI score would be related to less cognitive decline.
Materials and methods Data assessment and harmonization The aim of CHANCES is to combine prospective cohort studies to produce, improve, and clarify the evidence on the distribution and risk factors of chronic diseases in the elderly and on their socioeconomic impact (www.chancesfp7.eu). Data standardization and harmonization procedures were largely based upon the experience from the MORGAM project and previous experiences of project partners [15]. Data assessment procedures included examination of availability and comparability of cohort data, questionnaires and measurement procedures used in the individual cohorts, and methods for collection of data on health outcomes [14, 16]. For the present study, CHANCES cohorts were selected with harmonized variables on dietary intake, cognitive function and covariates according to predefined rules.

Chapter 4 | Healthy Diet Indicator and cognitive functioning
62
Study design and population We included participants aged ≥55 years from three cohorts, namely the cognitive sub-study of the Nurses’ Health Study (NHS) from the United States (US) [17]; the Rotterdam Study (RS) from the Netherlands [18]; and the Survey in Europe on Nutrition and the Elderly, a Concerted Action (SENECA) Study from Europe (Belgium, Denmark, France, Italy, The Netherlands, Portugal, Spain, Switzerland, and Poland) [19].
NHS began in 1976, with 121,700 female registered nurses aged 30-55 years [17]. During 1995–2001, women aged ≥70 years were invited to participate in a telephone-based study of cognitive function. For the first interview, 93% of eligible women participated (n=19,415). Follow-up assessments were performed up to 3 times at 2-year intervals. RS began baseline measures between 1990 and 1993 in 7,983 men and women aged ≥55 years [20]. The first follow-up examination took place between 1993 and 1994 in 6,315 participants (follow-up 88%) and continued in 1997, 1999 and 2001. The total SENECA population consisted of 2,585 European men and women aged 70-75 years at inclusion in 1988, and 124 participants were additionally added in a second wave in 1993. Follow-up measures were performed in 1993 and 1998 [19]. In all cohorts, the collaborative research procedures were in accordance with the ethical standards of the responsible institutional or regional committees on human experimentation and informed consent was obtained from all participants. Dietary assessment Information on dietary intake was obtained with a validated 116-item semi quantitative Food Frequency Questionnaire (FFQ) in NHS in 1994 and 1998 [17] and a validated 170-item FFQ in RS at baseline (1990-1993) [20]. In SENECA, dietary intake was assessed in 1988 (n=2,585) and 1993 (n=1,301) by means of a dietary history method including a three-day food record and a frequency checklist of foods [19]. Participants were interviewed by a dietician about their usual food consumption per day during the past month. Food intake estimations were converted into nutrient intakes by multiplying the consumption of each food by its nutrient content, using the US Department of Agriculture database in NHS and the Dutch food composition table (NEVO) [21] in RS and SENECA. The FFQs and dietary history method provided information allowing to estimate usual dietary intake per day during a specified period of time. Healthy Diet Indicator We used dietary intake immediately preceding the first cognitive assessment (ranging from zero to three years across the three cohorts) to estimate daily energy intake and to assess adherence to the updated WHO dietary guidelines in 2003 [8]. From 15 dietary items listed in the guidelines, seven items from which information was available across all cohorts were included in the HDI. This resulted in a HDI including saturated fatty acids, polyunsaturated fatty acids (PUFAs), mono- and disaccharides, protein, cholesterol, fruits and vegetables, and dietary fiber. Not included in the score were the intake of n-3 PUFAs, n-6 PUFAs, trans fatty acids, and sodium due to unavailability of data across cohorts. Furthermore, as suggested before [7], we excluded total fat and total carbohydrates from the HDI score calculation to avoid duplicating weights for these 2 components by the component factors and excluded non-starch polysaccharide as it also overlapped with the recommendation for total dietary fibre. We also excluded MUFAs, because the WHO guideline does not clearly specify the recommended intake of MUFAs in contrast to other fats. We applied a recently developed continuous HDI scoring system [22] with scores ranging from 0-10 per dietary component to provide greater variation between individuals and to overcome the use of definite cut-
63
offs [22]. Intakes below the lower cut-off were assigned 0 points and intakes above the upper cut-off were assigned 10 points. Within a given range of intakes for each component, the range was divided into 10 and points were given in proportion to the distance from the 0 point cut-off. The scoring criteria, as well as the median component scores by cohort are shown in table 1. Total HDI scores were divided into sex- and cohort-specific quintiles based on study population intake distributions. Assessment of cognitive function In NHS, the Telephone Interview of Cognitive Status (TICS) [23], a telephone adaptation of the Mini-Mental State Examination (MMSE) was administered first at baseline (1995-2001), then at approximately two-year intervals, with up to three repeated measures. The TICS contains measures of orientation, immediate verbal recall, registration, opposites, current events, serial subtraction, counting and other elements and assesses global cognitive performance, with scores ranging from 0 to 41.
The MMSE [24] assessed global cognitive function in RS in 1990, 1993, 1997, 1999 and 2001 and in SENECA in 1993 and 1999. The MMSE includes questions on orientation to time and place, registration, attention and calculation, recall, language and visual construction, resulting in a score from 0 to 30. A correlation of 0.94 between TICS and MMSE and a high test–retest reliability for TICS (r = 0.97) was reported [23]. Higher TICS or MMSE scores indicate better cognitive performance. We calculated z-scores at each time point using cohort-specific distributions of scores at first cognitive assessment allowing comparability of findings across cohorts. Other variables Demographic, health and lifestyle information were obtained from self-administered questionnaires. Height and weight were measured at baseline in RS and SENECA and self-reported in NHS [25]. Physical activity was assessed by validated questionnaires for elderly by estimating mean energy expended per week in NHS (in metabolic equivalent-hours, METs) and as being vigorously physically active in SENECA and RS. In RS, physical activity was assessed six years after baseline as no baseline measure was available. Prevalence of diabetes mellitus, myocardial infarction, high blood pressure, depression, and hypercholesterolemia was obtained by questionnaires. In SENECA, hypercholesterolemia was estimated on use of dyslipidemia medications. Population for analysis We excluded participants with incomplete dietary intake data (n=2,144 NHS, n=2 RS, n=16 SENECA), without at least one cognitive assessment (n=1,771 RS, n=1,676 SENECA), and missing data for physical activity (n=111 NHS, n=1,769 RS), resulting in a total population of 21,837 participants (17,160 NHS, 3,660 RS, and 1,017 SENECA).

4
Chapter 4 | Healthy Diet Indicator and cognitive functioning
62
Study design and population We included participants aged ≥55 years from three cohorts, namely the cognitive sub-study of the Nurses’ Health Study (NHS) from the United States (US) [17]; the Rotterdam Study (RS) from the Netherlands [18]; and the Survey in Europe on Nutrition and the Elderly, a Concerted Action (SENECA) Study from Europe (Belgium, Denmark, France, Italy, The Netherlands, Portugal, Spain, Switzerland, and Poland) [19].
NHS began in 1976, with 121,700 female registered nurses aged 30-55 years [17]. During 1995–2001, women aged ≥70 years were invited to participate in a telephone-based study of cognitive function. For the first interview, 93% of eligible women participated (n=19,415). Follow-up assessments were performed up to 3 times at 2-year intervals. RS began baseline measures between 1990 and 1993 in 7,983 men and women aged ≥55 years [20]. The first follow-up examination took place between 1993 and 1994 in 6,315 participants (follow-up 88%) and continued in 1997, 1999 and 2001. The total SENECA population consisted of 2,585 European men and women aged 70-75 years at inclusion in 1988, and 124 participants were additionally added in a second wave in 1993. Follow-up measures were performed in 1993 and 1998 [19]. In all cohorts, the collaborative research procedures were in accordance with the ethical standards of the responsible institutional or regional committees on human experimentation and informed consent was obtained from all participants. Dietary assessment Information on dietary intake was obtained with a validated 116-item semi quantitative Food Frequency Questionnaire (FFQ) in NHS in 1994 and 1998 [17] and a validated 170-item FFQ in RS at baseline (1990-1993) [20]. In SENECA, dietary intake was assessed in 1988 (n=2,585) and 1993 (n=1,301) by means of a dietary history method including a three-day food record and a frequency checklist of foods [19]. Participants were interviewed by a dietician about their usual food consumption per day during the past month. Food intake estimations were converted into nutrient intakes by multiplying the consumption of each food by its nutrient content, using the US Department of Agriculture database in NHS and the Dutch food composition table (NEVO) [21] in RS and SENECA. The FFQs and dietary history method provided information allowing to estimate usual dietary intake per day during a specified period of time. Healthy Diet Indicator We used dietary intake immediately preceding the first cognitive assessment (ranging from zero to three years across the three cohorts) to estimate daily energy intake and to assess adherence to the updated WHO dietary guidelines in 2003 [8]. From 15 dietary items listed in the guidelines, seven items from which information was available across all cohorts were included in the HDI. This resulted in a HDI including saturated fatty acids, polyunsaturated fatty acids (PUFAs), mono- and disaccharides, protein, cholesterol, fruits and vegetables, and dietary fiber. Not included in the score were the intake of n-3 PUFAs, n-6 PUFAs, trans fatty acids, and sodium due to unavailability of data across cohorts. Furthermore, as suggested before [7], we excluded total fat and total carbohydrates from the HDI score calculation to avoid duplicating weights for these 2 components by the component factors and excluded non-starch polysaccharide as it also overlapped with the recommendation for total dietary fibre. We also excluded MUFAs, because the WHO guideline does not clearly specify the recommended intake of MUFAs in contrast to other fats. We applied a recently developed continuous HDI scoring system [22] with scores ranging from 0-10 per dietary component to provide greater variation between individuals and to overcome the use of definite cut-
63
offs [22]. Intakes below the lower cut-off were assigned 0 points and intakes above the upper cut-off were assigned 10 points. Within a given range of intakes for each component, the range was divided into 10 and points were given in proportion to the distance from the 0 point cut-off. The scoring criteria, as well as the median component scores by cohort are shown in table 1. Total HDI scores were divided into sex- and cohort-specific quintiles based on study population intake distributions. Assessment of cognitive function In NHS, the Telephone Interview of Cognitive Status (TICS) [23], a telephone adaptation of the Mini-Mental State Examination (MMSE) was administered first at baseline (1995-2001), then at approximately two-year intervals, with up to three repeated measures. The TICS contains measures of orientation, immediate verbal recall, registration, opposites, current events, serial subtraction, counting and other elements and assesses global cognitive performance, with scores ranging from 0 to 41.
The MMSE [24] assessed global cognitive function in RS in 1990, 1993, 1997, 1999 and 2001 and in SENECA in 1993 and 1999. The MMSE includes questions on orientation to time and place, registration, attention and calculation, recall, language and visual construction, resulting in a score from 0 to 30. A correlation of 0.94 between TICS and MMSE and a high test–retest reliability for TICS (r = 0.97) was reported [23]. Higher TICS or MMSE scores indicate better cognitive performance. We calculated z-scores at each time point using cohort-specific distributions of scores at first cognitive assessment allowing comparability of findings across cohorts. Other variables Demographic, health and lifestyle information were obtained from self-administered questionnaires. Height and weight were measured at baseline in RS and SENECA and self-reported in NHS [25]. Physical activity was assessed by validated questionnaires for elderly by estimating mean energy expended per week in NHS (in metabolic equivalent-hours, METs) and as being vigorously physically active in SENECA and RS. In RS, physical activity was assessed six years after baseline as no baseline measure was available. Prevalence of diabetes mellitus, myocardial infarction, high blood pressure, depression, and hypercholesterolemia was obtained by questionnaires. In SENECA, hypercholesterolemia was estimated on use of dyslipidemia medications. Population for analysis We excluded participants with incomplete dietary intake data (n=2,144 NHS, n=2 RS, n=16 SENECA), without at least one cognitive assessment (n=1,771 RS, n=1,676 SENECA), and missing data for physical activity (n=111 NHS, n=1,769 RS), resulting in a total population of 21,837 participants (17,160 NHS, 3,660 RS, and 1,017 SENECA).

Chapter 4 | Healthy Diet Indicator and cognitive functioning
64
Tabl
e 1.
Sco
ring
crite
ria o
f the
Hea
lthy
Diet
Indi
cato
r com
pone
nts b
ased
on
the
WHO
’s 2
003
guid
elin
es fo
r a h
ealth
y di
et a
nd m
ean
com
pone
nt in
take
s by
coho
rt a
nd se
x
SEN
ECA
wom
en
14.8
(4.4
)
20.3
(7.1
)
272.
0 (1
21.9
)
6.2
(3.2
)
15.1
(3.2
)
18.5
(6.6
)
497.
3 (2
13.5
)
Abbr
evia
tions
: HDI
, Hea
lthy
Diet
Indi
cato
r; W
HO, W
orld
Hea
lth O
rgan
izatio
n; N
HS, N
urse
s’ H
ealth
Stu
dy; R
S, R
otte
rdam
Stu
dy; e
n%, e
nerg
y pe
rcen
t. Va
lues
are
mea
n (S
D)
a St
anda
rd in
acc
orda
nce
with
WHO
gui
delin
es. T
he jo
int W
HO F
ood
and
Agric
ultu
re O
rgan
izatio
n of
the
Uni
ted
Nat
ions
gui
delin
es o
f 200
3 do
not
cle
arly
indi
cate
fibe
r cut
off v
alue
s.
Fulfi
llmen
t of t
he fr
uit a
nd v
eget
able
reco
mm
enda
tion
and
cons
umpt
ion
of w
hole
gra
ins s
houl
d su
m to
20
g of
non
-sta
rch
poly
sacc
harid
es, w
hich
equ
als a
ppro
xim
atel
y 25
g o
f die
tary
fibe
r. To
tal f
at, a
nd to
tal c
arbo
hydr
ates
wer
e ex
clud
ed to
avo
id o
verla
p w
ith o
ther
com
pone
nts o
f the
scor
e b
Calc
ulat
ed w
ithou
t ene
rgy
from
alc
ohol
. c Th
e cu
toff
valu
e at
whi
ch a
par
ticip
ant w
ould
scor
e 0
poin
ts w
as b
ased
on
the
85th
per
cent
ile o
f the
pop
ulat
ion’
s int
ake
dist
ribut
ion.
Cal
cula
tion
of p
oint
s for
die
tary
inta
ke b
etw
een
the
uppe
r lim
it an
d th
e st
anda
rd in
take
for m
axim
um n
umbe
r of p
oint
s: 1
0-(in
take
- rec
omm
enda
tion
uppe
r lim
it)*(
10/s
tand
ard
uppe
r lim
it-re
com
men
datio
n up
per l
imit)
). d
Mon
o- a
nd d
isacc
harid
es w
ere
stud
ied
inst
ead
of fr
ee su
gars
e
The
rang
e w
as d
ivid
ed in
to 1
0 an
d th
en p
oint
s wer
e gi
ven
in p
ropo
rtio
n to
the
dist
ance
from
the
0 po
int c
ut-o
ff.
men
14.3
(4.4
)
19.1
(6.5
)
314.
9 (1
32.2
)
6.2
(3.9
)
15.1
(2.7
)
22.2
(7.7
)
563.
3 (2
57.5
)
RS
wom
en
14.7
(3.3
)
22.7
(5.9
)
215.
5 (6
9.2)
6.9
(2.8
)
17.9
(3.2
)
16.2
(4.5
)
461.
8 (1
80.1
)
men
14.9
(3.1
)
21.6
(6.2
)
259.
1 (8
8.8)
7.6
(2.9
)
17.0
(2.9
)
18.3
(5.3
)
429.
0 (1
70.3
)
NH
S
wom
en
9.3
(2.8
)
27.3
(7.3
)
181.
5 (8
8.4)
5.6
(1.8
)
17.0
(3.2
)
5.4
(2.2
)
400.
8 (2
06.6
)
10 p
oint
s
0-<1
0
0-<1
0
0-<3
00
≥6-≤
10
≥10-≤1
5
≥25
≥400
0 - 1
0 po
ints
e
≥10-≤1
5
≥10-≤3
0
≥300
-≤40
0
0-<6
0-<1
0 or
>1
5-≤2
0
0-<2
5
0-<4
00
0 po
ints
>15
>30
>400
>10
>20 0 0
HDI c
ompo
nent
a
Satu
rate
d fa
tty
acid
s, e
n%b,
c
Mon
o- a
nd d
isac
char
ides
, en%
b,c,
d
Chol
este
rol,
mg/
dayc
Poly
unsa
tura
ted
fatt
y ac
ids,
en%
b,c
Prot
ein,
en%
b
Tota
l die
tary
fibr
e, g
/day
Frui
ts a
nd v
eget
able
s, g
/day
65
Statistical analyses Means and standard deviations were calculated for normally distributed continuous variables and numbers and percentages were calculated for categorical variables. In the primary approach, we modelled trajectories of repeated cognitive measures using linear mixed models [26], with follow-up time from baseline as the time metameter. The linear model included an intercept representing the baseline level of cognitive score and a slope representing annual cognitive change as well as a random intercept and random slope accounting for inter-individual variability. Linear trends across quintiles of HDI score were examined using a continuous variable in which participants in a given HDI quintile were assigned the median value. In a secondary approach, all repeated measures of cognitive function were averaged to create an outcome representing long-term cognitive status. Averaging repeated measures of cognition attenuates variability in each single cognitive assessment, which may be helpful when cognition is measured over a relatively short follow-up period with a modest decline over time in healthy, educated participants in NHS, RS and SENECA [17, 27]. Mean differences in cognitive status across quintiles of HDI score were modelled using linear regression. Adjustments were made for confounding factors that have been related to both dietary intake and cognitive function: age, sex, education (low, middle, high) (model 1), and employment history (employed, housekeeper, unemployed/retired), BMI (<22, 22-25, ≥25-30, ≥30 kg/m2), smoking status (never, former, current), energy intake (cohort specific quintiles), alcohol intake (<1, 1-14.9, ≥15 g/day), physical activity (yes/no vigorous exercise in RS and SENECA, quintiles of METS in NHS) and depression (yes/no) (model 2). Vascular conditions (history of diabetes (yes/no), myocardial infarction (yes/no), high blood pressure (yes/no), and hypercholesterolemia (yes/no)) were tested as mediators by adding them to the full model (model 3). In the linear regression model studying long-term cognitive status, a study center variable was added for SENECA to adjust for differences in baseline MMSE score between study centers. For BMI, 4.4% was missing in NHS; for employment, data were missing for 3.7% in RS; in SENECA data were missing for education (5.9%) and depression (15%), thus a specific missing category was created for these 4 variables. For all other covariates, participants with missing information were <1% of the sample and were assigned to the reference group. In subgroup analyses, we repeated our primary analyses while stratifying by sex (not applicable in NHS), baseline cognitive function (worst 10% versus best 90%), age (median split), BMI (<25 versus ≥25 kg/m2) and having any major cardiovascular risk factor (high blood pressure, hypercholesterolemia, myocardial infarction). As a sensitivity analysis, we determined the potential impact on our estimates of a learning effect when participants are administered the same cognitive tests multiple times by averaging the first two cognitive assessment within NHS and RS to derive a more robust baseline measure variable as first cognitive assessment and then repeating our analysis. Subsequently, we summarized the multivariable-adjusted mean differences in slopes of the fifth quintile versus first quintile per cohort by random-effects pooling by using DerSimonian and Laird random-effects models [28], accounting for differences in sample size and the possibility of statistical heterogeneity among the studies. Between-study heterogeneity was assessed via the I2 statistic [29], expressing the percentage of variation attributable to between-study heterogeneity. All statistical analyses were carried out using SAS, version 9.3, software (SAS Institute Inc., Cary, North Carolina, USA). For random-effects meta-analyses, we used the metaphor package in R, version 3.2.0 (R Foundation for Statistical Computing, Vienna, Austria). P-values < 0.05 were considered significant.

4
Chapter 4 | Healthy Diet Indicator and cognitive functioning
64
Tabl
e 1.
Sco
ring
crite
ria o
f the
Hea
lthy
Diet
Indi
cato
r com
pone
nts b
ased
on
the
WHO
’s 2
003
guid
elin
es fo
r a h
ealth
y di
et a
nd m
ean
com
pone
nt in
take
s by
coho
rt a
nd se
x
SEN
ECA
wom
en
14.8
(4.4
)
20.3
(7.1
)
272.
0 ( 1
21.9
)
6.2
(3.2
)
15.1
(3.2
)
18.5
(6.6
)
497.
3 ( 2
13.5
)
Abbr
evia
tions
: HDI
, Hea
lthy
Diet
Indi
cato
r; W
HO, W
orld
Hea
lth O
rgan
izatio
n; N
HS, N
urse
s’ H
ealth
Stu
dy; R
S, R
otte
rdam
Stu
dy; e
n%, e
nerg
y pe
rcen
t. Va
lues
are
mea
n (S
D)
a St
anda
rd in
acc
orda
nce
with
WHO
gui
delin
es. T
he jo
int W
HO F
ood
and
Agric
ultu
re O
rgan
izatio
n of
the
Uni
ted
Nat
ions
gui
delin
es o
f 200
3 do
not
cle
arly
indi
cate
fibe
r cut
off v
alue
s.
Fulfi
llmen
t of t
he fr
uit a
nd v
eget
able
reco
mm
enda
tion
and
cons
umpt
ion
of w
hole
gra
ins s
houl
d su
m to
20
g of
non
-sta
rch
poly
sacc
harid
es, w
hich
equ
als a
ppro
xim
atel
y 25
g o
f die
tary
fibe
r. To
tal f
at, a
nd to
tal c
arbo
hydr
ates
wer
e ex
clud
ed to
avo
id o
verla
p w
ith o
ther
com
pone
nts o
f the
scor
e b
Calc
ulat
ed w
ithou
t ene
rgy
from
alc
ohol
. c Th
e cu
toff
valu
e at
whi
ch a
par
ticip
ant w
ould
scor
e 0
poin
ts w
as b
ased
on
the
85th
per
cent
ile o
f the
pop
ulat
ion’
s int
ake
dist
ribut
ion.
Cal
cula
tion
of p
oint
s for
die
tary
inta
ke b
etw
een
the
uppe
r lim
it an
d th
e st
anda
rd in
take
for m
axim
um n
umbe
r of p
oint
s: 1
0-(in
take
- rec
omm
enda
tion
uppe
r lim
it)*(
10/s
tand
ard
uppe
r lim
it-re
com
men
datio
n up
per l
imit)
). d
Mon
o- a
nd d
isacc
harid
es w
ere
stud
ied
inst
ead
of fr
ee su
gars
e
The
rang
e w
as d
ivid
ed in
to 1
0 an
d th
en p
oint
s wer
e gi
ven
in p
ropo
rtio
n to
the
dist
ance
from
the
0 po
int c
ut-o
ff.
men
14.3
(4.4
)
19.1
(6.5
)
314.
9 (1
32.2
)
6.2
(3.9
)
15.1
(2.7
)
22.2
(7.7
)
563.
3 ( 2
57.5
)
RS
wom
en
14.7
(3.3
)
22.7
(5.9
)
215.
5 ( 6
9.2)
6.9
(2.8
)
17.9
(3.2
)
16.2
(4.5
)
461.
8 ( 1
80.1
)
men
14.9
(3.1
)
21.6
(6.2
)
259.
1 ( 8
8.8)
7.6
(2.9
)
17.0
(2.9
)
18.3
(5.3
)
429.
0 (1
70.3
)
NH
S
wom
en
9.3
(2.8
)
27.3
(7.3
)
181.
5 ( 8
8.4)
5.6
(1.8
)
17.0
(3.2
)
5.4
(2.2
)
400.
8 ( 2
06.6
)
10 p
oint
s
0-<1
0
0-<1
0
0-<3
00
≥6-≤
10
≥10-≤1
5
≥25
≥400
0 - 1
0 po
ints
e
≥10-≤1
5
≥10-≤3
0
≥300
-≤40
0
0-<6
0-<1
0 or
>1
5-≤2
0
0-<2
5
0-<4
00
0 po
ints
>15
>30
>400
>10
>20 0 0
HDI c
ompo
nent
a
Satu
rate
d fa
tty
acid
s, e
n%b,
c
Mon
o- a
nd d
isac
char
ides
, en%
b,c,
d
Chol
este
rol,
mg/
dayc
Poly
unsa
tura
ted
fatt
y ac
ids,
en%
b,c
Prot
ein,
en%
b
Tota
l die
tary
fibr
e, g
/day
Frui
ts a
nd v
eget
able
s, g
/day
65
Statistical analyses Means and standard deviations were calculated for normally distributed continuous variables and numbers and percentages were calculated for categorical variables. In the primary approach, we modelled trajectories of repeated cognitive measures using linear mixed models [26], with follow-up time from baseline as the time metameter. The linear model included an intercept representing the baseline level of cognitive score and a slope representing annual cognitive change as well as a random intercept and random slope accounting for inter-individual variability. Linear trends across quintiles of HDI score were examined using a continuous variable in which participants in a given HDI quintile were assigned the median value. In a secondary approach, all repeated measures of cognitive function were averaged to create an outcome representing long-term cognitive status. Averaging repeated measures of cognition attenuates variability in each single cognitive assessment, which may be helpful when cognition is measured over a relatively short follow-up period with a modest decline over time in healthy, educated participants in NHS, RS and SENECA [17, 27]. Mean differences in cognitive status across quintiles of HDI score were modelled using linear regression. Adjustments were made for confounding factors that have been related to both dietary intake and cognitive function: age, sex, education (low, middle, high) (model 1), and employment history (employed, housekeeper, unemployed/retired), BMI (<22, 22-25, ≥25-30, ≥30 kg/m2), smoking status (never, former, current), energy intake (cohort specific quintiles), alcohol intake (<1, 1-14.9, ≥15 g/day), physical activity (yes/no vigorous exercise in RS and SENECA, quintiles of METS in NHS) and depression (yes/no) (model 2). Vascular conditions (history of diabetes (yes/no), myocardial infarction (yes/no), high blood pressure (yes/no), and hypercholesterolemia (yes/no)) were tested as mediators by adding them to the full model (model 3). In the linear regression model studying long-term cognitive status, a study center variable was added for SENECA to adjust for differences in baseline MMSE score between study centers. For BMI, 4.4% was missing in NHS; for employment, data were missing for 3.7% in RS; in SENECA data were missing for education (5.9%) and depression (15%), thus a specific missing category was created for these 4 variables. For all other covariates, participants with missing information were <1% of the sample and were assigned to the reference group. In subgroup analyses, we repeated our primary analyses while stratifying by sex (not applicable in NHS), baseline cognitive function (worst 10% versus best 90%), age (median split), BMI (<25 versus ≥25 kg/m2) and having any major cardiovascular risk factor (high blood pressure, hypercholesterolemia, myocardial infarction). As a sensitivity analysis, we determined the potential impact on our estimates of a learning effect when participants are administered the same cognitive tests multiple times by averaging the first two cognitive assessment within NHS and RS to derive a more robust baseline measure variable as first cognitive assessment and then repeating our analysis. Subsequently, we summarized the multivariable-adjusted mean differences in slopes of the fifth quintile versus first quintile per cohort by random-effects pooling by using DerSimonian and Laird random-effects models [28], accounting for differences in sample size and the possibility of statistical heterogeneity among the studies. Between-study heterogeneity was assessed via the I2 statistic [29], expressing the percentage of variation attributable to between-study heterogeneity. All statistical analyses were carried out using SAS, version 9.3, software (SAS Institute Inc., Cary, North Carolina, USA). For random-effects meta-analyses, we used the metaphor package in R, version 3.2.0 (R Foundation for Statistical Computing, Vienna, Austria). P-values < 0.05 were considered significant.

Chapter 4 | Healthy Diet Indicator and cognitive functioning
66
Results General characteristics Median HDI scores were 44.6 (range 13.3-62.5) in NHS, 45.5 (range 14.4-62.9) in RS, and 47.9 (range 20.6-69.9) in SENECA. At the first cognitive assessment, mean age of participants was 74.2 (2.3) years in NHS, 65.7 (7.3) in RS, and 78.0 (2.8) in SENECA. Across all cohorts, participants with a higher HDI score were more likely to be physically active, higher educated, never smokers, normal weight, to have higher energy intakes, and a history of myocardial infarction and to be less likely to have a history of diabetes (table 2). Relation between HDI score and cognitive decline A higher HDI score was not associated with cognitive decline in the basic adjusted model (adjusted mean differences in rates between extreme quintiles = 0.005 (95%CI -0.005,0.016), P-trend=0.17 in NHS, 0.001 (95%CI -0.014,0.015), P-trend=0.69 in RS and 0.008 (95%CI -0.041,0.052), P-trend=0.49 in SENECA), nor in the multivariable-adjusted model (0.005, [95%CI -0.006,0.016]), P-trend=0.20 in NHS, -0.002 (95%CI -0.016,0.013), P-trend=0.98 in RS and 0.002 (95%CI -0.047,0.052), P-trend=0.52 in SENECA (table 3)). Pooled analyses showed no association between highest HDI scores and cognitive decline (pooled multivariable-adjusted mean difference = 0.002 (95%CI: -0.006,0.011), I2=0%), (figure 1). Adding mediators to the model (type 2 diabetes mellitus, myocardial infarction, hypertension and hypercholesterolemia) did not affect the estimates (adjusted mean differences in rates between extreme quintiles 0.006 (95%CI -0.005,0.017), P-trend=0.15 in NHS, -0.002 (95%CI -0.017,0.012), P-trend=0.98 in RS, and -0.001 (95%CI -0.049,0.048), P-trend=0.56 in SENECA, respectively). Subgroup analyses by sex, baseline cognitive function, age, and BMI did not show differences by strata or statistical interaction. Among those with a history of cardiovascular risk factors there was less cognitive decline with the highest HDI score in SENECA (P-trend=0.03, P-interaction=0.03, table 4). Furthermore, in sensitivity analyses to address practice effects, in the Rotterdam Study and NHS where >2 repeated measures were available, we used models where the average of the first two cognitive assessments was considered as the new baseline from which cognitive change was evaluated; results did not differ from the main analyses (data not shown). Relation between the HDI score and cognitive status The HDI score was not associated with cognitive status in NHS, RS and SENECA in the basic adjusted model (P-trend=0.28 in NHS, 0.19 in RS, and 0.34 in SENECA), nor in the multivariable-adjusted model (P-trend=0.87 in NHS, 0.27 in RS, and 0.25 in SENECA), table 5.
67
Table 2. Baseline characteristics of participants in the Nurses’ Health Study (n=17,160), Rotterdam Study (n=3,660) and SENECA study (n=1,017) by extreme cohort- and sex-specific quintiles of HDI scorea NHS RS SENECA Quintile 1 Quintile 5 Quintile 1 Quintile 5 Quintile 1 Quintile 5 35.7
(32.6-37.7) n=3,422
52.7 (51.4-54.4) n=3,431
36.4 (33.8-38.2)
n=731
53.2 (51.9-55.2)
n=731
38.1 (35.4-40.2)
n=202
57.1 (55.3-59.23)
n=203 Age 74.1 (2.3) 74.4 (2.4) 66.3 (7.4) 65.6 (6.3) 77.8 (2.8) 78.0 (2.8) Men (%) N/A N/A 40.8 40.8 49.0 48.8 Educational level (%)
Low 78 77 34 29 53 49 Middle 16 16 57 60 30 33 High 6 6 8 11 10 10
BMI (%) ≤21, kg/m2 19 22 8 11 9 12 22-24, kg/m2 24 27 28 34 22 20 25-29, kg/m2 33 34 50 44 43 44 ≥30, kg/m2 20 14 15 12 20 14
Physical activityb 13.8 (18.7) 18.3 (22.1) 83% 89% 8% 9% Employment (%)
Employed 5 4 79 78 75 78 Homemaker 7 7 11 9 17 12 Other/retired 88 89 10 13 9 10
Smoking (%) Never 44 48 30 36 55 60 Former 44 46 39 46 30 30 Current 12 6 31 18 15 10
History of disease (%) Myocardial infarction 6 5 9 11 24 32 Hypertension 56 55 36 37 32 37 Hypercholesterolemia 60 67 2 3 11 6 Diabetes 11 9 9 6 16 13 Depression 10 9 9 9 19 19 Dietary variables
Energy intake, kcal 1518 (572) 1806 (497) 2007 (609) 2053 (414) 1897 (618) 2071 (607) Alcohol, g 5.3 (10.4) 4.6 (8.6) 12.1 (15.8) 7.46 (10.6) 12.6 (18.1) 10.7 (8.9)
HDI components Saturated fatty acids
11.7 (3.2) 8.1 (1.7) 16.9 (3.1) 13.1 (2.5) 16.6 (4.4) 12.2 (3.6)
Polyunsaturated fatty acids
5.5 (2.3) 6.3 (1.4) 6.5 (3.6) 7.7 (1.7) 6.3 (4.1) 6.4 (2.2)
Mono- and disaccharides
26.2 (7.8) 26.2 (6.1) 21.5 (6.1) 23.2 (6.0) 20.8 (7.3) 17.9 (6.3)
Protein 18.5 (3.5) 15.0 (1.9) 18.6 (3.3) 16.2 (2.4) 16.9 (3.9) 13.9 (1.7) Cholesterol, g 221 (121) 166 (68) 285 (105) 204 (55) 351 (144) 239 (78.5) Fruit and vegetables, g
286 (172) 505 (205) 395 (193) 500 (149) 465 (246) 604 (255)
Dietary fiber, g 4.1 (1.9) 6.8 (2.3) 14.6 (4.7) 20.1 (4.4) 17.0 (6.9) 23.9 (7.5) MMSE/TICS 33.8 (2.7) 33.8 (2.7) 27.9 (1.5) 28.1 (1.6) 26.9 (2.7) 26.3 (2.7) Abbreviations: HDI, Healthy Diet Indicator; NHS, Nurses’ Health Study; RS, Rotterdam Study; MET-hours=metabolic equivalent-hours, PUFAs, polyunsaturated fatty acids. a Values are mean (SD) or percentage (%) b Physical activity in NHS represented in MET-hours, in RS and SENECA as % vigorous physical activity. HDI scores [median (IQR)] are provided in brackets for each quintile. Dietary variables represent mean intakes per day expressed in energy percentages, unless otherwise noted.

4
Chapter 4 | Healthy Diet Indicator and cognitive functioning
66
Results General characteristics Median HDI scores were 44.6 (range 13.3-62.5) in NHS, 45.5 (range 14.4-62.9) in RS, and 47.9 (range 20.6-69.9) in SENECA. At the first cognitive assessment, mean age of participants was 74.2 (2.3) years in NHS, 65.7 (7.3) in RS, and 78.0 (2.8) in SENECA. Across all cohorts, participants with a higher HDI score were more likely to be physically active, higher educated, never smokers, normal weight, to have higher energy intakes, and a history of myocardial infarction and to be less likely to have a history of diabetes (table 2). Relation between HDI score and cognitive decline A higher HDI score was not associated with cognitive decline in the basic adjusted model (adjusted mean differences in rates between extreme quintiles = 0.005 (95%CI -0.005,0.016), P-trend=0.17 in NHS, 0.001 (95%CI -0.014,0.015), P-trend=0.69 in RS and 0.008 (95%CI -0.041,0.052), P-trend=0.49 in SENECA), nor in the multivariable-adjusted model (0.005, [95%CI -0.006,0.016]), P-trend=0.20 in NHS, -0.002 (95%CI -0.016,0.013), P-trend=0.98 in RS and 0.002 (95%CI -0.047,0.052), P-trend=0.52 in SENECA (table 3)). Pooled analyses showed no association between highest HDI scores and cognitive decline (pooled multivariable-adjusted mean difference = 0.002 (95%CI: -0.006,0.011), I2=0%), (figure 1). Adding mediators to the model (type 2 diabetes mellitus, myocardial infarction, hypertension and hypercholesterolemia) did not affect the estimates (adjusted mean differences in rates between extreme quintiles 0.006 (95%CI -0.005,0.017), P-trend=0.15 in NHS, -0.002 (95%CI -0.017,0.012), P-trend=0.98 in RS, and -0.001 (95%CI -0.049,0.048), P-trend=0.56 in SENECA, respectively). Subgroup analyses by sex, baseline cognitive function, age, and BMI did not show differences by strata or statistical interaction. Among those with a history of cardiovascular risk factors there was less cognitive decline with the highest HDI score in SENECA (P-trend=0.03, P-interaction=0.03, table 4). Furthermore, in sensitivity analyses to address practice effects, in the Rotterdam Study and NHS where >2 repeated measures were available, we used models where the average of the first two cognitive assessments was considered as the new baseline from which cognitive change was evaluated; results did not differ from the main analyses (data not shown). Relation between the HDI score and cognitive status The HDI score was not associated with cognitive status in NHS, RS and SENECA in the basic adjusted model (P-trend=0.28 in NHS, 0.19 in RS, and 0.34 in SENECA), nor in the multivariable-adjusted model (P-trend=0.87 in NHS, 0.27 in RS, and 0.25 in SENECA), table 5.
67
Table 2. Baseline characteristics of participants in the Nurses’ Health Study (n=17,160), Rotterdam Study (n=3,660) and SENECA study (n=1,017) by extreme cohort- and sex-specific quintiles of HDI scorea NHS RS SENECA Quintile 1 Quintile 5 Quintile 1 Quintile 5 Quintile 1 Quintile 5 35.7
(32.6-37.7) n=3,422
52.7 (51.4-54.4) n=3,431
36.4 (33.8-38.2)
n=731
53.2 (51.9-55.2)
n=731
38.1 (35.4-40.2)
n=202
57.1 (55.3-59.23)
n=203 Age 74.1 (2.3) 74.4 (2.4) 66.3 (7.4) 65.6 (6.3) 77.8 (2.8) 78.0 (2.8) Men (%) N/A N/A 40.8 40.8 49.0 48.8 Educational level (%)
Low 78 77 34 29 53 49 Middle 16 16 57 60 30 33 High 6 6 8 11 10 10
BMI (%) ≤21, kg/m2 19 22 8 11 9 12 22-24, kg/m2 24 27 28 34 22 20 25-29, kg/m2 33 34 50 44 43 44 ≥30, kg/m2 20 14 15 12 20 14
Physical activityb 13.8 (18.7) 18.3 (22.1) 83% 89% 8% 9% Employment (%)
Employed 5 4 79 78 75 78 Homemaker 7 7 11 9 17 12 Other/retired 88 89 10 13 9 10
Smoking (%) Never 44 48 30 36 55 60 Former 44 46 39 46 30 30 Current 12 6 31 18 15 10
History of disease (%) Myocardial infarction 6 5 9 11 24 32 Hypertension 56 55 36 37 32 37 Hypercholesterolemia 60 67 2 3 11 6 Diabetes 11 9 9 6 16 13 Depression 10 9 9 9 19 19 Dietary variables
Energy intake, kcal 1518 (572) 1806 (497) 2007 (609) 2053 (414) 1897 (618) 2071 (607) Alcohol, g 5.3 (10.4) 4.6 (8.6) 12.1 (15.8) 7.46 (10.6) 12.6 (18.1) 10.7 (8.9)
HDI components Saturated fatty acids
11.7 (3.2) 8.1 (1.7) 16.9 (3.1) 13.1 (2.5) 16.6 (4.4) 12.2 (3.6)
Polyunsaturated fatty acids
5.5 (2.3) 6.3 (1.4) 6.5 (3.6) 7.7 (1.7) 6.3 (4.1) 6.4 (2.2)
Mono- and disaccharides
26.2 (7.8) 26.2 (6.1) 21.5 (6.1) 23.2 (6.0) 20.8 (7.3) 17.9 (6.3)
Protein 18.5 (3.5) 15.0 (1.9) 18.6 (3.3) 16.2 (2.4) 16.9 (3.9) 13.9 (1.7) Cholesterol, g 221 (121) 166 (68) 285 (105) 204 (55) 351 (144) 239 (78.5) Fruit and vegetables, g
286 (172) 505 (205) 395 (193) 500 (149) 465 (246) 604 (255)
Dietary fiber, g 4.1 (1.9) 6.8 (2.3) 14.6 (4.7) 20.1 (4.4) 17.0 (6.9) 23.9 (7.5) MMSE/TICS 33.8 (2.7) 33.8 (2.7) 27.9 (1.5) 28.1 (1.6) 26.9 (2.7) 26.3 (2.7) Abbreviations: HDI, Healthy Diet Indicator; NHS, Nurses’ Health Study; RS, Rotterdam Study; MET-hours=metabolic equivalent-hours, PUFAs, polyunsaturated fatty acids. a Values are mean (SD) or percentage (%) b Physical activity in NHS represented in MET-hours, in RS and SENECA as % vigorous physical activity. HDI scores [median (IQR)] are provided in brackets for each quintile. Dietary variables represent mean intakes per day expressed in energy percentages, unless otherwise noted.

Chapter 4 | Healthy Diet Indicator and cognitive functioning
68
Table 3. Multivariable-adjusted mean differences in annual rates of cognitive change by cohort- and sex-specific quintiles of baseline HDI scorea Model 1b Model 2c NHS (n = 17,160) Quintile 1 Ref Ref Quintile 2 -0.004 (-0.014, 0.006) -0.004 (-0.014, 0.007) Quintile 3 0.013 ( 0.003, 0.023) 0.012 ( 0.002, 0.023) Quintile 4 0.002 (-0.008, 0.012) 0.002 (-0.009, 0.012) Quintile 5 0.005 (-0.005, 0.016) 0.005 (-0.006, 0.016) p-trend 0.17 0.20
RS (n = 3,660) Quintile 1 Ref Ref Quintile 2 0.000 (-0.014, 0.015) 0.000 (-0.015, 0.014) Quintile 3 0.012 (-0.003, 0.026) 0.010 (-0.004, 0.025) Quintile 4 0.004 (-0.011, 0.018) 0.002 (-0.013, 0.016) Quintile 5 0.001 (-0.014, 0.015) -0.002 (-0.016, 0.013) p-trend 0.69 0.98
SENECA (n = 1,017) Quintile 1 Ref Ref Quintile 2 -0.015 (-0.063, 0.034) -0.029 (-0.079, 0.019) Quintile 3 0.022 (-0.028, 0.071) 0.017 (-0.033, 0.066) Quintile 4 0.006 (-0.043, 0.055) 0.000 (-0.049, 0.049) Quintile 5 0.008 (-0.041, 0.057) 0.002 (-0.047, 0.052) p-trend 0.49 0.52 Abbreviations: HDI, Healthy Diet Indicator; NHS, Nurses’ Health Study; RS, Rotterdam Study; Ref, reference a Values are mean differences (95% confidence interval). b Adjusted for age, gender, education c Additionally adjusted for employment status, BMI, smoking status, energy intake, alcohol intake, physical activity, and depression
Table 4. Multivariable-adjusted mean differences in annual rates of cognitive change by cohort- and sex-specific quintiles of baseline HDI score by cardiovascular risk factor history in SENECAa,b No cardiovascular risk factor Cardiovascular risk factor SENECA n = 495 n = 522 Quintile 1 Ref Ref Quintile 2 -0.077 (-0.149, -0.005) 0.022 (-0.045, 0.087) Quintile 3 -0.053 (-0.128, 0.021) 0.076 (0.010, 0.142) Quintile 4 -0.061 (-0.132, 0.010) 0.076 (0.009, 0.143) Quintile 5 -0.048 (-0.122, 0.027) 0.056 (-0.009, 0.121) p-trend 0.23 0.03
p-interaction 0.03 Abbreviations: HDI, Healthy Diet Indicator; Ref, reference. Cardiovascular risk factor or disease included high blood pressure, hypercholesterolemia or myocardial infarction. a Values are mean differences (95% confidence interval). b Adjusted for age, education, study centre, employment status, BMI, smoking status, energy intake, alcohol intake, physical activity and depression.
69
Figure 1. Cohort- and sex-specific and pooled mean differences in the annual rate of cognitive change in relation to highest vs. lowest quintile of adherence to the WHO guidelines and cognitive decline. Adjusted for age, gender (TS and SENECA), education, employment status, BMI, smoking status, calorie intake, alcohol intake, physical activity, and depression in the Consortium on Health and Ageing: Network of Cohorts in Europe and the United States (CHANCES), 1988–2011. Cohorts are ordered according to cohort size, beginning with the largest cohort. I2 is expressed as the percentage of total variability caused by heterogeneity. All data were obtained from CHANCES (www.chancesfp7.eu). Bars indicate 95% confidence intervals (CIs). NHS, Nurses’ Health Study; RS, Rotterdam Study; SENECA, Survey in Europe on Nutrition and the Elderly, a Concerted Action.
Table 5. Multivariable-adjusted mean differences in average cognitive status by cohort- and sex-specific quintiles of baseline HDI scorea Model 1b Model 2c NHS (n = 16,807) Quintile 1 Ref Ref Quintile 2 0.00 (-0.04, 0.05) -0.02 (-0.06, 0.03) Quintile 3 0.04 (-0.01, 0.08) 0.01 (-0.03, 0.06) Quintile 4 0.00 (-0.04, 0.05) -0.02 (-0.07, 0.02) Quintile 5 0.03 (-0.02, 0.07) 0.00 (-0.04, 0.04) p-trend 0.28 0.87
RS (n = 3,660) Quintile 1 Ref Ref Quintile 2 0.02 (-0.08, 0.12) 0.01 (-0.09, 0.11) Quintile 3 0.06 (-0.04, 0.16) 0.04 (-0.06, 0.14) Quintile 4 0.06 (-0.04, 0.15) 0.04 (-0.06, 0.14) Quintile 5 0.06 (-0.04, 0.15) 0.06 (-0.04, 0.15) p-trend 0.19 0.27
SENECA (n = 1,017) Quintile 1 Ref Ref Quintile 2 0.00 (-0.19, 0.19) -0.02 (-0.21, 0.18) Quintile 3 0.25 ( 0.06, 0.45) 0.25 ( 0.05, 0.44) Quintile 4 0.01 (-0.19, 0.20) -0.01 (-0.20, 0.19) Quintile 5 -0.12 (-0.31, 0.08) -0.14 (-0.34, 0.06) p-trend 0.34 0.25 Abbreviations: HDI, Healthy Diet Indicator; NHS, Nurses’ Health Study; RS, Rotterdam Study
a Variables are mean differences (95% confidence interval). b Adjusted for age, gender, education, study centre (SENECA only) c Additionally adjusted for employment status, BMI, smoking status, energy intake, alcohol intake, physical activity, and depression

4
Chapter 4 | Healthy Diet Indicator and cognitive functioning
68
Table 3. Multivariable-adjusted mean differences in annual rates of cognitive change by cohort- and sex-specific quintiles of baseline HDI scorea Model 1b Model 2c NHS (n = 17,160) Quintile 1 Ref Ref Quintile 2 -0.004 (-0.014, 0.006) -0.004 (-0.014, 0.007) Quintile 3 0.013 ( 0.003, 0.023) 0.012 ( 0.002, 0.023) Quintile 4 0.002 (-0.008, 0.012) 0.002 (-0.009, 0.012) Quintile 5 0.005 (-0.005, 0.016) 0.005 (-0.006, 0.016) p-trend 0.17 0.20
RS (n = 3,660) Quintile 1 Ref Ref Quintile 2 0.000 (-0.014, 0.015) 0.000 (-0.015, 0.014) Quintile 3 0.012 (-0.003, 0.026) 0.010 (-0.004, 0.025) Quintile 4 0.004 (-0.011, 0.018) 0.002 (-0.013, 0.016) Quintile 5 0.001 (-0.014, 0.015) -0.002 (-0.016, 0.013) p-trend 0.69 0.98
SENECA (n = 1,017) Quintile 1 Ref Ref Quintile 2 -0.015 (-0.063, 0.034) -0.029 (-0.079, 0.019) Quintile 3 0.022 (-0.028, 0.071) 0.017 (-0.033, 0.066) Quintile 4 0.006 (-0.043, 0.055) 0.000 (-0.049, 0.049) Quintile 5 0.008 (-0.041, 0.057) 0.002 (-0.047, 0.052) p-trend 0.49 0.52 Abbreviations: HDI, Healthy Diet Indicator; NHS, Nurses’ Health Study; RS, Rotterdam Study; Ref, reference a Values are mean differences (95% confidence interval). b Adjusted for age, gender, education c Additionally adjusted for employment status, BMI, smoking status, energy intake, alcohol intake, physical activity, and depression
Table 4. Multivariable-adjusted mean differences in annual rates of cognitive change by cohort- and sex-specific quintiles of baseline HDI score by cardiovascular risk factor history in SENECAa,b No cardiovascular risk factor Cardiovascular risk factor SENECA n = 495 n = 522 Quintile 1 Ref Ref Quintile 2 -0.077 (-0.149, -0.005) 0.022 (-0.045, 0.087) Quintile 3 -0.053 (-0.128, 0.021) 0.076 (0.010, 0.142) Quintile 4 -0.061 (-0.132, 0.010) 0.076 (0.009, 0.143) Quintile 5 -0.048 (-0.122, 0.027) 0.056 (-0.009, 0.121) p-trend 0.23 0.03
p-interaction 0.03 Abbreviations: HDI, Healthy Diet Indicator; Ref, reference. Cardiovascular risk factor or disease included high blood pressure, hypercholesterolemia or myocardial infarction. a Values are mean differences (95% confidence interval). b Adjusted for age, education, study centre, employment status, BMI, smoking status, energy intake, alcohol intake, physical activity and depression.
69
Figure 1. Cohort- and sex-specific and pooled mean differences in the annual rate of cognitive change in relation to highest vs. lowest quintile of adherence to the WHO guidelines and cognitive decline. Adjusted for age, gender (TS and SENECA), education, employment status, BMI, smoking status, calorie intake, alcohol intake, physical activity, and depression in the Consortium on Health and Ageing: Network of Cohorts in Europe and the United States (CHANCES), 1988–2011. Cohorts are ordered according to cohort size, beginning with the largest cohort. I2 is expressed as the percentage of total variability caused by heterogeneity. All data were obtained from CHANCES (www.chancesfp7.eu). Bars indicate 95% confidence intervals (CIs). NHS, Nurses’ Health Study; RS, Rotterdam Study; SENECA, Survey in Europe on Nutrition and the Elderly, a Concerted Action.
Table 5. Multivariable-adjusted mean differences in average cognitive status by cohort- and sex-specific quintiles of baseline HDI scorea Model 1b Model 2c NHS (n = 16,807) Quintile 1 Ref Ref Quintile 2 0.00 (-0.04, 0.05) -0.02 (-0.06, 0.03) Quintile 3 0.04 (-0.01, 0.08) 0.01 (-0.03, 0.06) Quintile 4 0.00 (-0.04, 0.05) -0.02 (-0.07, 0.02) Quintile 5 0.03 (-0.02, 0.07) 0.00 (-0.04, 0.04) p-trend 0.28 0.87
RS (n = 3,660) Quintile 1 Ref Ref Quintile 2 0.02 (-0.08, 0.12) 0.01 (-0.09, 0.11) Quintile 3 0.06 (-0.04, 0.16) 0.04 (-0.06, 0.14) Quintile 4 0.06 (-0.04, 0.15) 0.04 (-0.06, 0.14) Quintile 5 0.06 (-0.04, 0.15) 0.06 (-0.04, 0.15) p-trend 0.19 0.27
SENECA (n = 1,017) Quintile 1 Ref Ref Quintile 2 0.00 (-0.19, 0.19) -0.02 (-0.21, 0.18) Quintile 3 0.25 ( 0.06, 0.45) 0.25 ( 0.05, 0.44) Quintile 4 0.01 (-0.19, 0.20) -0.01 (-0.20, 0.19) Quintile 5 -0.12 (-0.31, 0.08) -0.14 (-0.34, 0.06) p-trend 0.34 0.25 Abbreviations: HDI, Healthy Diet Indicator; NHS, Nurses’ Health Study; RS, Rotterdam Study
a Variables are mean differences (95% confidence interval). b Adjusted for age, gender, education, study centre (SENECA only) c Additionally adjusted for employment status, BMI, smoking status, energy intake, alcohol intake, physical activity, and depression

Chapter 4 | Healthy Diet Indicator and cognitive functioning
70
Discussion In the present consortium study, including 21,837 older men and women from Europe and the US, we found that a healthier diet adhering to the most recent WHO guidelines was not associated with a slower rate of cognitive decline, nor with cognitive status at older ages, which is in contrast to the findings between other dietary patterns [30-32] and cognition. As the HDI is developed to prevent chronic diseases, we hypothesized that it could also impact cognitive function. Previously, two cross-sectional studies assessed the association between a higher HDI score and cognitive impairment and reported a lower prevalence of cognitive impairment in 1,049 Italian older men (odds ratio 0.75 (95%CI 0.58-0.97) [13]) and in a group of 1,651 Italian older men and women (odds ratio 0.85 (95%CI 0.77-0.93) [12]). Our study, using a much larger population, a prospective design, and using the updated HDI guidelines, did not confirm previous findings. The lack of significant associations could be a result of low variability in cognitive function as measured by the MMSE and TICS due to the ceiling effects of these tests. Future studies on cognitive functioning should preferably include tests that are able to measure areas of cognition most affected by common dementing illnesses, such as memory, attention, language and visuospatial abilities [33]. However, in our cohorts, we have observed associations between major risk factors and cognitive change based on TICS [34-38]. Two previous studies examining the initial HDI guidelines used the MMSE [13] and an extended and validated version of the MMSE, namely the 0-70 point neuropsychological test (NPT) [12], to assess cognitive function. Although these tests are comparable to the tests that we used, the outcome was differently defined. We studied cognitive function and cognitive decline, whereas the previous studies evaluated cognitive impairment based on predefined cut-offs. This latter approach does not allow a distinction between initial level and change [33]. Furthermore, as our cohorts included relatively healthy, well-educated participants compared to the other populations [12, 13], it is possible that our participants reported healthy diets at baseline with an overall good cognitive functioning, limiting the ability to detect an association between the HDI and cognitive decline. Nonetheless, we had extremely high ability to identify even modest associations given our very large sample size. At last, previous studies used the initial HDI including pulses and nuts, which were not part of the updated HDI. While we didn’t include nuts and pulses from the original HDI, the nutrients that would be neuroprotective from these foods, such as MUFAs, PUFAs, protein and fiber, would have been captured by the updated HDI, making it less likely that the omission of these two foods would explain the null findings. Another point to consider is that due to the limited amount of dietary information across the three cohort studies we included seven out of ten HDI components. However, we aimed to increase variability within the HDI score by using the recently developed continuous calculation system based on seven dietary components (range 0-70 points) as proposed by Jankovic et.al. [22]. It has been shown that using seven components rather than ten HDI components (where instead of polyunsaturated fat in the 7 component HDI model, n-3 PUFAs, n-6 PUFAs are used in addition to trans fatty acids and sodium) resulted in less heterogeneity when studying the HDI in multiple cohort studies [22]. To test the effect of using seven HDI components only compared to using ten HDI components, we studied ten HDI components in NHS and found similar null findings, indicating this probably does not explain our null-findings.
71
Other dietary patterns that have been shown to be related to cognitive function and decline in European and American observational studies in older adults include the Mediterranean diet [17, 39-46], the Dietary Approaches to Stop Hypertension (DASH) diet [42, 44, 47] and the Healthy Eating Index (HEI) [45, 48]. Dietary intervention studies with the Mediterranean diet [30, 31] and the DASH diet [32] confirmed these findings. These food based scores include high intakes of vegetables, fruits, legumes, whole grains, nuts, fish, monounsaturated fatty acids (MUFAs), polyunsaturated fatty acids (PUFAs), moderate amounts of low-fat dairy products and alcohol and low amounts of red and processed meats, and the MUFA-to-saturated fats ratio.
More recently, dietary components linked to neuroprotection and cognitive function have been summarized into one dietary pattern score, namely the Mediterranean-DASH Intervention for Neurodegenerative Delay (MIND) diet [49]. The MIND diet is a hybrid of the Mediterranean-DASH diets and includes high intakes of green leafy vegetables, other vegetables, nuts, berries, beans, whole grains, fish, poultry, olive oil, and wine and low amounts of red meats, butter and stick margarine, cheese, pastries and sweets, and fried/fast food. This diet has been related to slower cognitive ageing in a single study of 960 older adults (mean age 81.4 years) of the Memory and Aging Project [49]. As the HDI does not include the majority of these components [8], nor specific components shown to be associated with cognitive function, such as green leafy vegetables [36, 50] and berries [34] it could be that the HDI was well-designed to reduce risk of chronic diseases in general, but not cognitive function. On the contrary, the inclusion of very specific food items limits the possibility to jointly study effect estimates of multiple studies and to target multiple diseases at once by means of one dietary pattern, as does the HDI.
In stratified analyses, we observed less cognitive function decline with higher HDI scores in participants reporting a history of cardiovascular risk factors in SENECA. As the HDI has been developed to prevent chronic diseases, including hypertension, and as hypertension has been associated with a worse cognitive function [9-11], it was hypothesized that this high risk group for cognitive decline would benefit from a healthy diet as the HDI. Biologically, the blood pressure lowering effect of the HDI reduces thickening of the vessel wall, leading to less vascular narrowing, resulting in less thickening of the media and atheromatous plaques within larger cerebral arteries. This could result in a lower risk of rupture of these plaques which could cause complete occlusion of arteries and infarction of surrounding tissues [51].
The availability of harmonized dietary intake variables is a major strength of the present study. Furthermore, the use of harmonized outcome variables and covariates reduces heterogeneity. Additionally, four HDI components are expressed as energy percentage, increasing the comparability of diet between different cohorts using different dietary assessment methods. Another advantage is the relatively long follow-up time of cognitive function with multiple repeated measures (NHS and SENECA 6 years, RS 10 years), which could have been sufficient to measure changes in cognitive function, as other studies were able to measure changes in cognitive function after 4 to 5 years of follow-up [39, 52]. Another strength is that we were able to study changes in cognitive function over time, allowing us to use all available data of all cohorts using a comparable measure across cohorts. Finally, studying dietary intake prior to the cognitive assessments including many years of follow-up minimized possible reverse causation.

4
Chapter 4 | Healthy Diet Indicator and cognitive functioning
70
Discussion In the present consortium study, including 21,837 older men and women from Europe and the US, we found that a healthier diet adhering to the most recent WHO guidelines was not associated with a slower rate of cognitive decline, nor with cognitive status at older ages, which is in contrast to the findings between other dietary patterns [30-32] and cognition. As the HDI is developed to prevent chronic diseases, we hypothesized that it could also impact cognitive function. Previously, two cross-sectional studies assessed the association between a higher HDI score and cognitive impairment and reported a lower prevalence of cognitive impairment in 1,049 Italian older men (odds ratio 0.75 (95%CI 0.58-0.97) [13]) and in a group of 1,651 Italian older men and women (odds ratio 0.85 (95%CI 0.77-0.93) [12]). Our study, using a much larger population, a prospective design, and using the updated HDI guidelines, did not confirm previous findings. The lack of significant associations could be a result of low variability in cognitive function as measured by the MMSE and TICS due to the ceiling effects of these tests. Future studies on cognitive functioning should preferably include tests that are able to measure areas of cognition most affected by common dementing illnesses, such as memory, attention, language and visuospatial abilities [33]. However, in our cohorts, we have observed associations between major risk factors and cognitive change based on TICS [34-38]. Two previous studies examining the initial HDI guidelines used the MMSE [13] and an extended and validated version of the MMSE, namely the 0-70 point neuropsychological test (NPT) [12], to assess cognitive function. Although these tests are comparable to the tests that we used, the outcome was differently defined. We studied cognitive function and cognitive decline, whereas the previous studies evaluated cognitive impairment based on predefined cut-offs. This latter approach does not allow a distinction between initial level and change [33]. Furthermore, as our cohorts included relatively healthy, well-educated participants compared to the other populations [12, 13], it is possible that our participants reported healthy diets at baseline with an overall good cognitive functioning, limiting the ability to detect an association between the HDI and cognitive decline. Nonetheless, we had extremely high ability to identify even modest associations given our very large sample size. At last, previous studies used the initial HDI including pulses and nuts, which were not part of the updated HDI. While we didn’t include nuts and pulses from the original HDI, the nutrients that would be neuroprotective from these foods, such as MUFAs, PUFAs, protein and fiber, would have been captured by the updated HDI, making it less likely that the omission of these two foods would explain the null findings. Another point to consider is that due to the limited amount of dietary information across the three cohort studies we included seven out of ten HDI components. However, we aimed to increase variability within the HDI score by using the recently developed continuous calculation system based on seven dietary components (range 0-70 points) as proposed by Jankovic et.al. [22]. It has been shown that using seven components rather than ten HDI components (where instead of polyunsaturated fat in the 7 component HDI model, n-3 PUFAs, n-6 PUFAs are used in addition to trans fatty acids and sodium) resulted in less heterogeneity when studying the HDI in multiple cohort studies [22]. To test the effect of using seven HDI components only compared to using ten HDI components, we studied ten HDI components in NHS and found similar null findings, indicating this probably does not explain our null-findings.
71
Other dietary patterns that have been shown to be related to cognitive function and decline in European and American observational studies in older adults include the Mediterranean diet [17, 39-46], the Dietary Approaches to Stop Hypertension (DASH) diet [42, 44, 47] and the Healthy Eating Index (HEI) [45, 48]. Dietary intervention studies with the Mediterranean diet [30, 31] and the DASH diet [32] confirmed these findings. These food based scores include high intakes of vegetables, fruits, legumes, whole grains, nuts, fish, monounsaturated fatty acids (MUFAs), polyunsaturated fatty acids (PUFAs), moderate amounts of low-fat dairy products and alcohol and low amounts of red and processed meats, and the MUFA-to-saturated fats ratio.
More recently, dietary components linked to neuroprotection and cognitive function have been summarized into one dietary pattern score, namely the Mediterranean-DASH Intervention for Neurodegenerative Delay (MIND) diet [49]. The MIND diet is a hybrid of the Mediterranean-DASH diets and includes high intakes of green leafy vegetables, other vegetables, nuts, berries, beans, whole grains, fish, poultry, olive oil, and wine and low amounts of red meats, butter and stick margarine, cheese, pastries and sweets, and fried/fast food. This diet has been related to slower cognitive ageing in a single study of 960 older adults (mean age 81.4 years) of the Memory and Aging Project [49]. As the HDI does not include the majority of these components [8], nor specific components shown to be associated with cognitive function, such as green leafy vegetables [36, 50] and berries [34] it could be that the HDI was well-designed to reduce risk of chronic diseases in general, but not cognitive function. On the contrary, the inclusion of very specific food items limits the possibility to jointly study effect estimates of multiple studies and to target multiple diseases at once by means of one dietary pattern, as does the HDI.
In stratified analyses, we observed less cognitive function decline with higher HDI scores in participants reporting a history of cardiovascular risk factors in SENECA. As the HDI has been developed to prevent chronic diseases, including hypertension, and as hypertension has been associated with a worse cognitive function [9-11], it was hypothesized that this high risk group for cognitive decline would benefit from a healthy diet as the HDI. Biologically, the blood pressure lowering effect of the HDI reduces thickening of the vessel wall, leading to less vascular narrowing, resulting in less thickening of the media and atheromatous plaques within larger cerebral arteries. This could result in a lower risk of rupture of these plaques which could cause complete occlusion of arteries and infarction of surrounding tissues [51].
The availability of harmonized dietary intake variables is a major strength of the present study. Furthermore, the use of harmonized outcome variables and covariates reduces heterogeneity. Additionally, four HDI components are expressed as energy percentage, increasing the comparability of diet between different cohorts using different dietary assessment methods. Another advantage is the relatively long follow-up time of cognitive function with multiple repeated measures (NHS and SENECA 6 years, RS 10 years), which could have been sufficient to measure changes in cognitive function, as other studies were able to measure changes in cognitive function after 4 to 5 years of follow-up [39, 52]. Another strength is that we were able to study changes in cognitive function over time, allowing us to use all available data of all cohorts using a comparable measure across cohorts. Finally, studying dietary intake prior to the cognitive assessments including many years of follow-up minimized possible reverse causation.

Chapter 4 | Healthy Diet Indicator and cognitive functioning
72
It may be considered a limitation that we used one dietary intake assessment, assuming stable diets over time. Additional analyses confirmed that dietary intakes were similar over multiple time points in NHS and SENECA (data not shown). Furthermore, FFQ’s rely on participants’ estimates of food intake which can lead to misclassification of dietary pattern adherence. This is a common limitation of studies of diet and our results from SENECA using a dietary history method did not result in different conclusions. Lastly, although we have tried to differentiate between a healthy lifestyle and a healthy diet by extensively adjusting for risk factors for cognitive decline, residual confounding remains possible due to unmeasured or imprecisely measured covariates. We demonstrated that greater adherence to the WHO dietary guidelines for a healthy diet was not associated with reduced rates of cognitive decline in European and American older adults.
Acknowledgements The research leading to these results has received funding from the European Union Seventh Framework Programme (FP7/2007-2013) under grant agreement no. HEALTH –F3-2010-242244 as part of the Consortium on Health and Ageing (CHANCES) project. The CHANCES project is coordinated by the Hellenic Health Foundation, Greece. We would like to acknowledge all CHANCES partners involved in the data harmonization. Participants, staff and investigators of the NHS are gratefully acknowledged.
73
References 1. United Nations. Department of Economic and Social Affairs. Population Division. World Population Ageing 2013. 2013
Contract No.: ST/ESA/SER.A/348. 2. Alzheimer’s disease international. World Alzheimer Report 2015. The Global Impact of Dementia An analysis of
prevalence, incidence, cost and trends. 2015. 3. Alzheimer's Association. 2015 Alzheimer's disease facts and figures. Alzheimer's & Dementia. 2015;11(3):332-84. 4. Gustafson DR, Clare Morris M, Scarmeas N, Shah RC, Sijben J, Yaffe K, et al. New Perspectives on Alzheimer's Disease
and Nutrition. J Alzheimers Dis. 2015;46(4):1111-27. 5. van de Rest O, Berendsen AM, Haveman-Nies A, de Groot CPGM. Dietary patterns, cognitive decline, and dementia: a
systematic review. Adv Nutr. 2015;6(2):154-68. 6. World Health Organization. Diet, nutrition, and the prevention of chronic diseases. Report of a WHO Study Group.
World Health Organ Tech Rep Ser. 1990;797:1-204. 7. Huijbregts P, Feskens E, Rasanen L, Fidanza F, Nissinen A, Menotti A, et al. Dietary pattern and 20 year mortality in
elderly men in Finland, Italy, and The Netherlands: longitudinal cohort study. BMJ. 1997;315(7099):13-7. 8. Nishida C, Uauy R, Kumanyika S, Shetty P. The joint WHO/FAO expert consultation on diet, nutrition and the prevention
of chronic diseases: process, product and policy implications. Public Health Nutr. 2004;7(1a):245-50 http://www.who.int/nutrition/publications/public_health_nut9.pdf.
9. Duron E, Hanon O. Hypertension, cognitive decline and dementia. Arch Cardiovasc Dis. 2008;101(3):181-9. 10. Singh-Manoux A, Marmot M. High blood pressure was associated with cognitive function in middle-age in the
Whitehall II study. J Clin Epidemiol. 2005;58(12):1308-15. 11. Waldstein SR, Brown JR, Maier KJ, Katzel LI. Diagnosis of hypertension and high blood pressure levels negatively affect
cognitive function in older adults. Ann Behav Med. 2005;29(3):174-80. 12. Correa Leite ML, Nicolosi A, Cristina S, Hauser WA, Nappi G. Nutrition and cognitive deficit in the elderly: a population
study. Eur J Clin Nutr. 2001;55(12):1053-8. 13. Huijbregts PP, Feskens EJ, Rasanen L, Fidanza F, Alberti-Fidanza A, Nissinen A, et al. Dietary patterns and cognitive
function in elderly men in Finland, Italy and The Netherlands. Eur J Clin Nutr. 1998;52(11):826-31. 14. Boffetta P, Bobak M, Borsch-Supan A, Brenner H, Eriksson S, Grodstein F, et al. The Consortium on Health and Ageing:
Network of Cohorts in Europe and the United States (CHANCES) project-design, population and data harmonization of a large-scale, international study. Eur J Epidemiol. 2014;29(12):929-36.
15. Evans A, Salomaa V, Kulathinal S, Asplund K, Cambien F, Ferrario M, et al. MORGAM (an international pooling of cardiovascular cohorts). Int J Epidemiol. 2005;34(1):21-7.
16. Contributors from Partners of the Consortium on Health and Ageing: Network of Cohorts in Europe and the United States (CHANCES). CHANCES cohort descriptions, assessment of the availability and quality of data, and definitions of variables. : MORGAM Project e-publications [Internet]; 2015 [cited 2016 09/13/2016]. Available from: http://www.thl.fi/publications/morgam/chances_d9/index.html.
17. Samieri C, Okereke OI, Devore EE, Grodstein F. Long-term adherence to the Mediterranean diet is associated with overall cognitive status, but not cognitive decline, in women. J Nutr. 2013;143(4):493-9.
18. Hofman A, Brusselle GG, Darwish Murad S, van Duijn CM, Franco OH, Goedegebure A, et al. The Rotterdam Study: 2016 objectives and design update. Eur J Epidemiol. 2015;30(8):661-708.
19. Van 't Hof - Hautvast JG, Hautvast - Schroll M, Schroll - Vlachonikolis IG, Vlachonikolis IG. Design, methods and participation. Euronut SENECA investigators. Eur J Clin Nutr. 1991;3:5-22.
20. Hofman A, Grobbee - de Jong PT, de Jong - van den Ouweland FA, van den Ouweland FA. Determinants of disease and disability in the elderly: the Rotterdam Elderly Study. Eur J Epidemiol. 1991;7(4):403-22.
21. RIVM. NEVO-online versie 2011. Bilthoven: RIVM; 2011. 22. Jankovic N, Geelen A, Streppel MT, de Groot LC, Orfanos P, van den Hooven EH, et al. Adherence to a healthy diet
according to the world health organization guidelines and all-cause mortality in elderly adults from europe and the United States. Am J Epidemiol. 2014;180(10):978-88.
23. Brandt J, Spencer M, Folstein M. The telephone interview for cognitive status. Neuropsychiatry Neuropsychol Behav Neurol. 1988;1:111-7.
24. Folstein MF, Folstein SE, McHugh PR. "Mini-mental state". A practical method for grading the cognitive state of patients for the clinician. J Psychiatr Res. 1975;12(3):189-98.
25. Rimm EB, Stampfer MJ, Colditz GA, Chute CG, Litin LB, Willett WC. Validity of self-reported waist and hip circumferences in men and women. Epidemiology. 1990;1(6):466-73.
26. Dubois B, Feldman HH, Jacova C, Cummings JL, Dekosky ST, Barberger-Gateau P, et al. Revising the definition of Alzheimer's disease: a new lexicon. Lancet Neurol. 2010;9(11):1118-27.
27. Devore EE, Kang JH, Stampfer MJ, Grodstein F. The association of antioxidants and cognition in the Nurses' Health Study. Am J Epidemiol. 2013;177(1):33-41.
28. DerSimonian R, Laird N. Meta-analysis in clinical trials revisited. Contemp Clin Trials. 2015;45:139-45. 29. Higgins JP, Thompson SG. Quantifying heterogeneity in a meta-analysis. Stat Med. 2002;21(11):1539-58. 30. Martinez-Lapiscina EH, Clavero P, Toledo E, Estruch R, Salas-Salvado J, San Julian B, et al. Mediterranean diet improves
cognition: the PREDIMED-NAVARRA randomised trial. Journal of neurology, neurosurgery, and psychiatry. 2013;84(12):1318-25.

4
Chapter 4 | Healthy Diet Indicator and cognitive functioning
72
It may be considered a limitation that we used one dietary intake assessment, assuming stable diets over time. Additional analyses confirmed that dietary intakes were similar over multiple time points in NHS and SENECA (data not shown). Furthermore, FFQ’s rely on participants’ estimates of food intake which can lead to misclassification of dietary pattern adherence. This is a common limitation of studies of diet and our results from SENECA using a dietary history method did not result in different conclusions. Lastly, although we have tried to differentiate between a healthy lifestyle and a healthy diet by extensively adjusting for risk factors for cognitive decline, residual confounding remains possible due to unmeasured or imprecisely measured covariates. We demonstrated that greater adherence to the WHO dietary guidelines for a healthy diet was not associated with reduced rates of cognitive decline in European and American older adults.
Acknowledgements The research leading to these results has received funding from the European Union Seventh Framework Programme (FP7/2007-2013) under grant agreement no. HEALTH –F3-2010-242244 as part of the Consortium on Health and Ageing (CHANCES) project. The CHANCES project is coordinated by the Hellenic Health Foundation, Greece. We would like to acknowledge all CHANCES partners involved in the data harmonization. Participants, staff and investigators of the NHS are gratefully acknowledged.
73
References 1. United Nations. Department of Economic and Social Affairs. Population Division. World Population Ageing 2013. 2013
Contract No.: ST/ESA/SER.A/348. 2. Alzheimer’s disease international. World Alzheimer Report 2015. The Global Impact of Dementia An analysis of
prevalence, incidence, cost and trends. 2015. 3. Alzheimer's Association. 2015 Alzheimer's disease facts and figures. Alzheimer's & Dementia. 2015;11(3):332-84. 4. Gustafson DR, Clare Morris M, Scarmeas N, Shah RC, Sijben J, Yaffe K, et al. New Perspectives on Alzheimer's Disease
and Nutrition. J Alzheimers Dis. 2015;46(4):1111-27. 5. van de Rest O, Berendsen AM, Haveman-Nies A, de Groot CPGM. Dietary patterns, cognitive decline, and dementia: a
systematic review. Adv Nutr. 2015;6(2):154-68. 6. World Health Organization. Diet, nutrition, and the prevention of chronic diseases. Report of a WHO Study Group.
World Health Organ Tech Rep Ser. 1990;797:1-204. 7. Huijbregts P, Feskens E, Rasanen L, Fidanza F, Nissinen A, Menotti A, et al. Dietary pattern and 20 year mortality in
elderly men in Finland, Italy, and The Netherlands: longitudinal cohort study. BMJ. 1997;315(7099):13-7. 8. Nishida C, Uauy R, Kumanyika S, Shetty P. The joint WHO/FAO expert consultation on diet, nutrition and the prevention
of chronic diseases: process, product and policy implications. Public Health Nutr. 2004;7(1a):245-50 http://www.who.int/nutrition/publications/public_health_nut9.pdf.
9. Duron E, Hanon O. Hypertension, cognitive decline and dementia. Arch Cardiovasc Dis. 2008;101(3):181-9. 10. Singh-Manoux A, Marmot M. High blood pressure was associated with cognitive function in middle-age in the
Whitehall II study. J Clin Epidemiol. 2005;58(12):1308-15. 11. Waldstein SR, Brown JR, Maier KJ, Katzel LI. Diagnosis of hypertension and high blood pressure levels negatively affect
cognitive function in older adults. Ann Behav Med. 2005;29(3):174-80. 12. Correa Leite ML, Nicolosi A, Cristina S, Hauser WA, Nappi G. Nutrition and cognitive deficit in the elderly: a population
study. Eur J Clin Nutr. 2001;55(12):1053-8. 13. Huijbregts PP, Feskens EJ, Rasanen L, Fidanza F, Alberti-Fidanza A, Nissinen A, et al. Dietary patterns and cognitive
function in elderly men in Finland, Italy and The Netherlands. Eur J Clin Nutr. 1998;52(11):826-31. 14. Boffetta P, Bobak M, Borsch-Supan A, Brenner H, Eriksson S, Grodstein F, et al. The Consortium on Health and Ageing:
Network of Cohorts in Europe and the United States (CHANCES) project-design, population and data harmonization of a large-scale, international study. Eur J Epidemiol. 2014;29(12):929-36.
15. Evans A, Salomaa V, Kulathinal S, Asplund K, Cambien F, Ferrario M, et al. MORGAM (an international pooling of cardiovascular cohorts). Int J Epidemiol. 2005;34(1):21-7.
16. Contributors from Partners of the Consortium on Health and Ageing: Network of Cohorts in Europe and the United States (CHANCES). CHANCES cohort descriptions, assessment of the availability and quality of data, and definitions of variables. : MORGAM Project e-publications [Internet]; 2015 [cited 2016 09/13/2016]. Available from: http://www.thl.fi/publications/morgam/chances_d9/index.html.
17. Samieri C, Okereke OI, Devore EE, Grodstein F. Long-term adherence to the Mediterranean diet is associated with overall cognitive status, but not cognitive decline, in women. J Nutr. 2013;143(4):493-9.
18. Hofman A, Brusselle GG, Darwish Murad S, van Duijn CM, Franco OH, Goedegebure A, et al. The Rotterdam Study: 2016 objectives and design update. Eur J Epidemiol. 2015;30(8):661-708.
19. Van 't Hof - Hautvast JG, Hautvast - Schroll M, Schroll - Vlachonikolis IG, Vlachonikolis IG. Design, methods and participation. Euronut SENECA investigators. Eur J Clin Nutr. 1991;3:5-22.
20. Hofman A, Grobbee - de Jong PT, de Jong - van den Ouweland FA, van den Ouweland FA. Determinants of disease and disability in the elderly: the Rotterdam Elderly Study. Eur J Epidemiol. 1991;7(4):403-22.
21. RIVM. NEVO-online versie 2011. Bilthoven: RIVM; 2011. 22. Jankovic N, Geelen A, Streppel MT, de Groot LC, Orfanos P, van den Hooven EH, et al. Adherence to a healthy diet
according to the world health organization guidelines and all-cause mortality in elderly adults from europe and the United States. Am J Epidemiol. 2014;180(10):978-88.
23. Brandt J, Spencer M, Folstein M. The telephone interview for cognitive status. Neuropsychiatry Neuropsychol Behav Neurol. 1988;1:111-7.
24. Folstein MF, Folstein SE, McHugh PR. "Mini-mental state". A practical method for grading the cognitive state of patients for the clinician. J Psychiatr Res. 1975;12(3):189-98.
25. Rimm EB, Stampfer MJ, Colditz GA, Chute CG, Litin LB, Willett WC. Validity of self-reported waist and hip circumferences in men and women. Epidemiology. 1990;1(6):466-73.
26. Dubois B, Feldman HH, Jacova C, Cummings JL, Dekosky ST, Barberger-Gateau P, et al. Revising the definition of Alzheimer's disease: a new lexicon. Lancet Neurol. 2010;9(11):1118-27.
27. Devore EE, Kang JH, Stampfer MJ, Grodstein F. The association of antioxidants and cognition in the Nurses' Health Study. Am J Epidemiol. 2013;177(1):33-41.
28. DerSimonian R, Laird N. Meta-analysis in clinical trials revisited. Contemp Clin Trials. 2015;45:139-45. 29. Higgins JP, Thompson SG. Quantifying heterogeneity in a meta-analysis. Stat Med. 2002;21(11):1539-58. 30. Martinez-Lapiscina EH, Clavero P, Toledo E, Estruch R, Salas-Salvado J, San Julian B, et al. Mediterranean diet improves
cognition: the PREDIMED-NAVARRA randomised trial. Journal of neurology, neurosurgery, and psychiatry. 2013;84(12):1318-25.

Chapter 4 | Healthy Diet Indicator and cognitive functioning
74
31. Martinez-Lapiscina EH, Clavero P, Toledo E, San Julian B, Sanchez-Tainta A, Corella D, et al. Virgin olive oil supplementation and long-term cognition: the PREDIMED-NAVARRA randomized, trial. J Nutr Health Aging. 2013;17(6):544-52.
32. Smith PJ, Blumenthal JA, Babyak MA, Craighead L, Welsh-Bohmer KA, Browndyke JN, et al. Effects of the dietary approaches to stop hypertension diet, exercise, and caloric restriction on neurocognition in overweight adults with high blood pressure. Hypertension. 2010;55(6):1331-8.
33. Morris MC, Evans DA, Hebert LE, Bienias JL. Methodological issues in the study of cognitive decline. Am J Epidemiol. 1999;149(9):789-93.
34. Devore EE, Kang JH, Breteler MM, Grodstein F. Dietary intakes of berries and flavonoids in relation to cognitive decline. Annals of neurology. 2012;72(1):135-43.
35. Kalmijn S, Janssen JA, Pols HA, Lamberts SW, Breteler MM. A prospective study on circulating insulin-like growth factor I (IGF-I), IGF-binding proteins, and cognitive function in the elderly. J Clin Endocrinol Metab. 2000;85(12):4551-5.
36. Kang JH, Ascherio A, Grodstein F. Fruit and vegetable consumption and cognitive decline in aging women. Ann Neurol. 2005;57(5):713-20.
37. Kang JH, Logroscino G, De Vivo I, Hunter D, Grodstein F. Apolipoprotein E, cardiovascular disease and cognitive function in aging women. Neurobiol Aging. 2005;26(4):475-84.
38. Vercambre MN, Okereke OI, Kawachi I, Grodstein F, Kang JH. Self-Reported Change in Quality of Life with Retirement and Later Cognitive Decline: Prospective Data from the Nurses' Health Study. J Alzheimers Dis. 2016;52(3):887-98.
39. Féart C, Samieri C, Rondeau V, Amieva H, Portet F, Dartigues JF, et al. Adherence to a mediterranean diet, cognitive decline, and risk of dementia. JAMA. 2009;302(6):638-48.
40. Gardener S, Gu Y, Rainey-Smith SR, Keogh JB, Clifton PM, Mathieson SL, et al. Adherence to a Mediterranean diet and Alzheimer's disease risk in an Australian population. Translational psychiatry. 2012;2:e164.
41. Tangney CC, Kwasny MJ, Li H, Wilson RS, Evans DA, Morris MC. Adherence to a Mediterranean-type dietary pattern and cognitive decline in a community population. Am J Clin Nutr. 2011;93(3):601-7.
42. Tangney CC, Li H, Wang Y, Barnes L, Schneider JA, Bennett DA, et al. Relation of DASH- and Mediterranean-like dietary patterns to cognitive decline in older persons. Neurology. 2014;83(16):1410-6.
43. Tsivgoulis G, Judd S, Letter AJ, Alexandrov AV, Howard G, Nahab F, et al. Adherence to a Mediterranean diet and risk of incident cognitive impairment. Neurology. 2013;80(18):1684-92.
44. Wengreen H, Munger RG, Cutler A, Quach A, Bowles A, Corcoran C, et al. Prospective study of Dietary Approaches to Stop Hypertension- and Mediterranean-style dietary patterns and age-related cognitive change: the Cache County Study on Memory, Health and Aging. Am J Clin Nutr. 2013;98(5):1263-71.
45. Ye X, Scott T, Gao X, Maras JE, Bakun PJ, Tucker KL. Mediterranean diet, healthy eating index 2005, and cognitive function in middle-aged and older puerto rican adults. Journal of the Academy of Nutrition and Dietetics. 2013;113(2):276-81.
46. Trichopoulou A, Kyrozis A, Rossi M, Katsoulis M, Trichopoulos D, La Vecchia C, et al. Mediterranean diet and cognitive decline over time in an elderly Mediterranean population. Eur J Nutr. 2015;54(8):1311-21.
47. Berendsen AA, Kang JH, van de Rest O, Feskens EJ, de Groot LC, Grodstein F. The Dietary Approaches to Stop Hypertension Diet, Cognitive Function, and Cognitive Decline in American Older Women. J Am Med Dir Assoc. 2017;18:427-32.
48. Samieri C, Sun Q, Townsend MK, Chiuve SE, Okereke OI, Willett WC, et al. The association between dietary patterns at midlife and health in aging: an observational study. Ann Intern Med. 2013;159(9):584-91.
49. Morris MC, Tangney CC, Wang Y, Sacks FM, Barnes LL, Bennett DA, et al. MIND diet slows cognitive decline with aging. Alzheimers Dement. 2015;11(9):1015-22.
50. Morris MC, Evans DA, Tangney CC, Bienias JL, Wilson RS. Associations of vegetable and fruit consumption with age-related cognitive change. Neurology. 2006;67(8):1370-6.
51. Swales JD. Pharmacological treatment of hypertension. Lancet. 1994;344(8919):380-5. 52. Scarmeas N, Stern Y, Mayeux R, Manly JJ, Schupf N, Luchsinger JA. Mediterranean diet and mild cognitive impairment.
Arch Neurol. 2009;66(2):216-25.
75

4
Chapter 4 | Healthy Diet Indicator and cognitive functioning
74
31. Martinez-Lapiscina EH, Clavero P, Toledo E, San Julian B, Sanchez-Tainta A, Corella D, et al. Virgin olive oil supplementation and long-term cognition: the PREDIMED-NAVARRA randomized, trial. J Nutr Health Aging. 2013;17(6):544-52.
32. Smith PJ, Blumenthal JA, Babyak MA, Craighead L, Welsh-Bohmer KA, Browndyke JN, et al. Effects of the dietary approaches to stop hypertension diet, exercise, and caloric restriction on neurocognition in overweight adults with high blood pressure. Hypertension. 2010;55(6):1331-8.
33. Morris MC, Evans DA, Hebert LE, Bienias JL. Methodological issues in the study of cognitive decline. Am J Epidemiol. 1999;149(9):789-93.
34. Devore EE, Kang JH, Breteler MM, Grodstein F. Dietary intakes of berries and flavonoids in relation to cognitive decline. Annals of neurology. 2012;72(1):135-43.
35. Kalmijn S, Janssen JA, Pols HA, Lamberts SW, Breteler MM. A prospective study on circulating insulin-like growth factor I (IGF-I), IGF-binding proteins, and cognitive function in the elderly. J Clin Endocrinol Metab. 2000;85(12):4551-5.
36. Kang JH, Ascherio A, Grodstein F. Fruit and vegetable consumption and cognitive decline in aging women. Ann Neurol. 2005;57(5):713-20.
37. Kang JH, Logroscino G, De Vivo I, Hunter D, Grodstein F. Apolipoprotein E, cardiovascular disease and cognitive function in aging women. Neurobiol Aging. 2005;26(4):475-84.
38. Vercambre MN, Okereke OI, Kawachi I, Grodstein F, Kang JH. Self-Reported Change in Quality of Life with Retirement and Later Cognitive Decline: Prospective Data from the Nurses' Health Study. J Alzheimers Dis. 2016;52(3):887-98.
39. Féart C, Samieri C, Rondeau V, Amieva H, Portet F, Dartigues JF, et al. Adherence to a mediterranean diet, cognitive decline, and risk of dementia. JAMA. 2009;302(6):638-48.
40. Gardener S, Gu Y, Rainey-Smith SR, Keogh JB, Clifton PM, Mathieson SL, et al. Adherence to a Mediterranean diet and Alzheimer's disease risk in an Australian population. Translational psychiatry. 2012;2:e164.
41. Tangney CC, Kwasny MJ, Li H, Wilson RS, Evans DA, Morris MC. Adherence to a Mediterranean-type dietary pattern and cognitive decline in a community population. Am J Clin Nutr. 2011;93(3):601-7.
42. Tangney CC, Li H, Wang Y, Barnes L, Schneider JA, Bennett DA, et al. Relation of DASH- and Mediterranean-like dietary patterns to cognitive decline in older persons. Neurology. 2014;83(16):1410-6.
43. Tsivgoulis G, Judd S, Letter AJ, Alexandrov AV, Howard G, Nahab F, et al. Adherence to a Mediterranean diet and risk of incident cognitive impairment. Neurology. 2013;80(18):1684-92.
44. Wengreen H, Munger RG, Cutler A, Quach A, Bowles A, Corcoran C, et al. Prospective study of Dietary Approaches to Stop Hypertension- and Mediterranean-style dietary patterns and age-related cognitive change: the Cache County Study on Memory, Health and Aging. Am J Clin Nutr. 2013;98(5):1263-71.
45. Ye X, Scott T, Gao X, Maras JE, Bakun PJ, Tucker KL. Mediterranean diet, healthy eating index 2005, and cognitive function in middle-aged and older puerto rican adults. Journal of the Academy of Nutrition and Dietetics. 2013;113(2):276-81.
46. Trichopoulou A, Kyrozis A, Rossi M, Katsoulis M, Trichopoulos D, La Vecchia C, et al. Mediterranean diet and cognitive decline over time in an elderly Mediterranean population. Eur J Nutr. 2015;54(8):1311-21.
47. Berendsen AA, Kang JH, van de Rest O, Feskens EJ, de Groot LC, Grodstein F. The Dietary Approaches to Stop Hypertension Diet, Cognitive Function, and Cognitive Decline in American Older Women. J Am Med Dir Assoc. 2017;18:427-32.
48. Samieri C, Sun Q, Townsend MK, Chiuve SE, Okereke OI, Willett WC, et al. The association between dietary patterns at midlife and health in aging: an observational study. Ann Intern Med. 2013;159(9):584-91.
49. Morris MC, Tangney CC, Wang Y, Sacks FM, Barnes LL, Bennett DA, et al. MIND diet slows cognitive decline with aging. Alzheimers Dement. 2015;11(9):1015-22.
50. Morris MC, Evans DA, Tangney CC, Bienias JL, Wilson RS. Associations of vegetable and fruit consumption with age-related cognitive change. Neurology. 2006;67(8):1370-6.
51. Swales JD. Pharmacological treatment of hypertension. Lancet. 1994;344(8919):380-5. 52. Scarmeas N, Stern Y, Mayeux R, Manly JJ, Schupf N, Luchsinger JA. Mediterranean diet and mild cognitive impairment.
Arch Neurol. 2009;66(2):216-25.
75


Chapter 5The Dietary Approaches to Stop
Hypertension diet, cognitive function, and cognitive decline
in American older women
Agnes A.M. Berendsen, Jae H. Kang, Ondine van de Rest, Edith J.M. Feskens, Lisette C.P.G.M. de Groot, Francine Grodstein
Journal of the American Medical Directors Association, 2017, 18:427-432

Chapter 5 | The Dietary Approaches to Stop Hypertension diet, cognitive function and decline
78
Abstract Objectives: To examine the association between long-term adherence to the Dietary Approaches to Stop Hypertension (DASH) diet with cognitive function and decline in older American women. Setting: The Nurses’ Health Study (NHS), a cohort of registered nurses residing in 11 U.S. states. Participants: A total of 16,144 women from NHS, aged ≥70 years, who underwent cognitive testing a total of 4 times by telephone from 1995-2001 (baseline), with multiple dietary assessments between 1984 and the first cognitive exam. DASH adherence for each individual was based on scoring of intakes of nine nutrient or food components. Measurements: Long-term DASH adherence was calculated as the average DASH adherence score from up to five repeated measures of diet. Primary outcomes were cognitive function calculated as the average scores of the four repeated measures, as well as cognitive change of the Telephone Interview for Cognitive Status (TICS) score and composite scores of global cognition and verbal memory. Results: Greater adherence to long-term DASH score was associated with better average cognitive function, irrespective of apolipoprotein E (APOE) ε4 allele status (multivariable-adjusted differences in mean z-scores between extreme DASH quintiles = 0.04 (95% CI 0.01-0.07), p-trend=0.009 for global cognition; 0.04 (95%CI 0.01-0.07), p-trend=0.002 for verbal memory, and 0.16 (95%CI 0.03–0.29), p-trend=0.03 for TICS, p-interaction >0.24). These differences were equivalent to being one year younger in age. Adherence to the DASH score was not associated with change in cognitive function over six years. Conclusion: Our findings in the largest cohort on dietary patterns and cognitive function to date indicate that long-term adherence to the DASH diet is important to maintain cognitive function at older ages.
79
Introduction
With the aging population, it is important to find modifiable risk factors to prevent cognitive decline and reduce the number of people with dementia [1]. One hypothesized factor is nutrition, and specifically dietary patterns in which combinations of nutrients and foods are studied simultaneously [2]. A frequently studied dietary pattern is the Mediterranean Diet, which has been associated with a lower rate of cognitive decline [3]. Another dietary pattern of interest is the Dietary Approaches to Stop Hypertension (DASH) diet. The DASH diet specifies higher intakes of fruits, vegetables, low-fat dairy products, whole grains, poultry, fish, and nuts and low intakes of fats, red meat, sweets and sugar-containing beverages [4]. This diet has been shown to lower blood pressure in pre-hypertensive and hypertensive adults [5]. It has been hypothesized that the DASH diet could impact cognitive function, as high blood pressure is associated with higher risk mild cognitive impairment [6], vascular dementia [7], and neurocognitive deficits [8]. A few observational studies have evaluated the DASH diet in relation to cognitive function and reported that the DASH diet was associated with a better cognitive function in elderly men and women (n=3,831) in the United States (U.S.) over an 11-year period [9], and with less cognitive decline among elderly American men and women (n=826) after 4.1 years of follow-up [10]. A dietary intervention study (n=124) demonstrated that four months on the DASH diet improved psychomotor speed in hypertensive American adults [11]. We examined the association of long-term DASH diet adherence to cognitive function and 6-year cognitive decline among 16,144 women.
Materials and methods Study population The Nurses’ Health Study (NHS) began in 1976, with 121,700 female, registered nurses, aged 30-55 years, residing in 11 U.S. states. Participants completed a mailed questionnaire about their health and lifestyle. Follow-up questionnaires are sent every two years; follow-up of the cohort remains ~90% to date. In 1984, participants completed a 116-item semi-quantitative food frequency questionnaire (FFQ) [12] and similar FFQs were sent in 1986 and every four years thereafter. During 1995–2001, women who were ≥70 years old and free of stroke were invited to participate in their first telephone-based study of cognitive function. For the first interview, 93% of eligible women participated (n=19,415). Follow-up assessments were performed three times at two-year intervals until 2008, with a high participation rate (>90% among those remaining alive at each follow-up point). The study was approved by the Institutional Review Board of Brigham and Women’s Hospital (Boston, MA). In the present study, we excluded those who had not completed at least one of the two initial FFQs in 1984 or 1986 (n=2,892), without at least one complete cognition battery at follow-up (n=334), had no data for physical activity (n=36), or no information on energy intake (n=9), resulting in a total population for analysis of 16,144 participants.

5
Chapter 5 | The Dietary Approaches to Stop Hypertension diet, cognitive function and decline
78
Abstract Objectives: To examine the association between long-term adherence to the Dietary Approaches to Stop Hypertension (DASH) diet with cognitive function and decline in older American women. Setting: The Nurses’ Health Study (NHS), a cohort of registered nurses residing in 11 U.S. states. Participants: A total of 16,144 women from NHS, aged ≥70 years, who underwent cognitive testing a total of 4 times by telephone from 1995-2001 (baseline), with multiple dietary assessments between 1984 and the first cognitive exam. DASH adherence for each individual was based on scoring of intakes of nine nutrient or food components. Measurements: Long-term DASH adherence was calculated as the average DASH adherence score from up to five repeated measures of diet. Primary outcomes were cognitive function calculated as the average scores of the four repeated measures, as well as cognitive change of the Telephone Interview for Cognitive Status (TICS) score and composite scores of global cognition and verbal memory. Results: Greater adherence to long-term DASH score was associated with better average cognitive function, irrespective of apolipoprotein E (APOE) ε4 allele status (multivariable-adjusted differences in mean z-scores between extreme DASH quintiles = 0.04 (95% CI 0.01-0.07), p-trend=0.009 for global cognition; 0.04 (95%CI 0.01-0.07), p-trend=0.002 for verbal memory, and 0.16 (95%CI 0.03–0.29), p-trend=0.03 for TICS, p-interaction >0.24). These differences were equivalent to being one year younger in age. Adherence to the DASH score was not associated with change in cognitive function over six years. Conclusion: Our findings in the largest cohort on dietary patterns and cognitive function to date indicate that long-term adherence to the DASH diet is important to maintain cognitive function at older ages.
79
Introduction
With the aging population, it is important to find modifiable risk factors to prevent cognitive decline and reduce the number of people with dementia [1]. One hypothesized factor is nutrition, and specifically dietary patterns in which combinations of nutrients and foods are studied simultaneously [2]. A frequently studied dietary pattern is the Mediterranean Diet, which has been associated with a lower rate of cognitive decline [3]. Another dietary pattern of interest is the Dietary Approaches to Stop Hypertension (DASH) diet. The DASH diet specifies higher intakes of fruits, vegetables, low-fat dairy products, whole grains, poultry, fish, and nuts and low intakes of fats, red meat, sweets and sugar-containing beverages [4]. This diet has been shown to lower blood pressure in pre-hypertensive and hypertensive adults [5]. It has been hypothesized that the DASH diet could impact cognitive function, as high blood pressure is associated with higher risk mild cognitive impairment [6], vascular dementia [7], and neurocognitive deficits [8]. A few observational studies have evaluated the DASH diet in relation to cognitive function and reported that the DASH diet was associated with a better cognitive function in elderly men and women (n=3,831) in the United States (U.S.) over an 11-year period [9], and with less cognitive decline among elderly American men and women (n=826) after 4.1 years of follow-up [10]. A dietary intervention study (n=124) demonstrated that four months on the DASH diet improved psychomotor speed in hypertensive American adults [11]. We examined the association of long-term DASH diet adherence to cognitive function and 6-year cognitive decline among 16,144 women.
Materials and methods Study population The Nurses’ Health Study (NHS) began in 1976, with 121,700 female, registered nurses, aged 30-55 years, residing in 11 U.S. states. Participants completed a mailed questionnaire about their health and lifestyle. Follow-up questionnaires are sent every two years; follow-up of the cohort remains ~90% to date. In 1984, participants completed a 116-item semi-quantitative food frequency questionnaire (FFQ) [12] and similar FFQs were sent in 1986 and every four years thereafter. During 1995–2001, women who were ≥70 years old and free of stroke were invited to participate in their first telephone-based study of cognitive function. For the first interview, 93% of eligible women participated (n=19,415). Follow-up assessments were performed three times at two-year intervals until 2008, with a high participation rate (>90% among those remaining alive at each follow-up point). The study was approved by the Institutional Review Board of Brigham and Women’s Hospital (Boston, MA). In the present study, we excluded those who had not completed at least one of the two initial FFQs in 1984 or 1986 (n=2,892), without at least one complete cognition battery at follow-up (n=334), had no data for physical activity (n=36), or no information on energy intake (n=9), resulting in a total population for analysis of 16,144 participants.

Chapter 5 | The Dietary Approaches to Stop Hypertension diet, cognitive function and decline
80
Dietary assessment and DASH diet score For each item of the FFQ, responses ranged from ‘never or <1 time/month’ to ‘≥6 times/day’; a standardized portion size was specified for each food item to estimate quantities consumed daily. Food intake estimations were converted into nutrient intakes by multiplying the frequency of consumption of each food by its nutrient content by using the U.S. Department of Agriculture database. In this study, we used the 1984, 1986, 1990, 1994 and 1998 FFQs to estimate daily energy intake and to construct, at each of these time points, an alternate DASH 9-point score [13]. This score enhances the original DASH score by Appel et al. [4]. and is based on 8 criteria: high intake of fruits, vegetables, nuts and legumes, whole grains, low-fat dairy products, and low intake of sodium, red and processed meats and sweetened beverages [13]. As the DASH diet also aims for lower amounts of saturated fat and cholesterol with higher levels of unsaturated fatty acids, the component monounsaturated fatty acids (MUFA) plus polyunsaturated fatty acids (PUFA) has been added to the original score, resulting in a total of 9 components. For each of the components, we classified women into quintiles according to their intake ranking. Component scores were the women’s quintile ranking; one point was given for the lowest quintile of intake and five points for the highest intake. The scoring was reversed for components to limit (sodium, red and processed meat and sweetened beverages). Long-term dietary habits are likely most relevant because cognitive decline develops over many years [14]. Therefore, long-term DASH score was computed as the mean of up to five DASH scores from all dietary assessments from 1984 (or 1986, if 1984 FFQ was missing) to the questionnaire immediately preceding the first cognitive exam. Total long-term DASH scores were divided into quintiles based on the study population distribution. Cognitive assessment Cognitive testing was performed by trained interviewers using validated telephone interviews. The cognitive battery included: 1) the Telephone Interview for Cognitive Status (TICS) [15]; 2) immediate; and 3) delayed recalls of the East Boston Memory test (EBMT) [16]; 4) delayed recall of the TICS 10-word list; 5) category fluency; and 6) digit span-backward. In the initial cognitive interview, we administered only the TICS and gradually added the five other tests. Thus, the sample size slightly differs across tests, but the participation rate remained identical for all tests. The TICS [15] (range 0–41 points) is a telephone adaptation of the Mini-Mental State Examination [17], which assesses global cognitive performance. The immediate and delayed recalls of the EBMT[16] (range 0–12 points) assess verbal (episodic) memory. The delayed recall of the TICS 10-word list (range 0–10 points) also assesses verbal memory. A category fluency test assesses language and executive function [18] by scoring performance on naming as many animals as possible in one minute. Finally, the digit-span backward test (range 0–12 points), in which participants repeat backwards and increasingly long series of digits, assesses working memory and attention. The primary outcomes were the TICS and composite scores of global cognition and verbal memory. A global cognition score was computed as the mean of Z-scores of all six cognitive tests in the cognitive battery. A verbal memory score was calculated as the mean of Z-scores of the four tests assessing verbal memory (i.e., immediate and delayed recalls of both the EBMT and the TICS 10-word list). We calculated Z-scores at each time point using the distribution of scores at the first cognitive assessment.
81
Other variables Socio-demographic, lifestyle and health-related information were obtained from the questionnaires. Using cumulative and updated information from 1976, covariates were determined at the time of the first cognitive interview, except physical activity and energy intake, for which values were averaged across multiple assessments over time, similar to diet. Physical activity was assessed in 1986, 1988 and 1992, and every 2 years thereafter by estimating mean energy expended per week (in metabolic equivalent-hours, mets). In a randomly selected subsample of 5,822 participants, data on apolipoprotein E (APOE) ε4 polymorphisms was available from cheek cell specimens (n=3,469) and genome wide association studies (n=2,353). Statistical analyses Relation between long-term DASH adherence, cognitive function and decline. Statistical analyses utilized two complementary approaches. As primary analyses, we averaged the four repeated measures of cognitive function to create an outcome representing average cognitive function at older ages and modelled the association of long-term DASH score with average cognitive status using linear regression models. Averaging repeated measures of cognition was relevant to our data, as it attenuates variability in each single cognitive assessment, which may be helpful when cognition is measured over a relatively short follow-up period in largely healthy, educated participants [19]. In another approach, we modelled trajectories of the four repeated cognitive scores using linear mixed models [20]. The linear mixed models included an intercept that represented the level of cognitive score at baseline and a slope that represented the annual change in scores over time as well as a random intercept and random slope to account for inter-individual variability. We examined linear trends across quintiles using a continuous variable in which participants in a given category were assigned the median value of the long-term DASH score. Adjustments were made for possible confounding factors age and education (registered nurse, bachelor, master or doctorate) (crude, model 1), and subsequently for long-term energy intake (quintiles) and physical activity (MET-hours/week, quintiles), body mass index (BMI, kg/m2, ≤21, 22-24, 25-29, ≥30), smoking status (never, former, current), alcohol intake (<1, 1-15, ≥15 g), history of depression (yes/no), multivitamin use (yes/no), and cardiovascular risk factors / disease (history of diabetes (yes/no), hypertension (yes/no), hypercholesterolemia (yes/no), and myocardial infarction (yes/no)) (Model 2). Estimates did not change after adjusting for ApoE ε4 within the subsample, therefore, ApoE ε4 was not included in the multivariable adjusted model. Because for BMI and multivitamin use, data was missing for >4% of the sample (4.4 and 7.1%, respectively); a specific missing category was created for these two variables. For other covariates, participants with missing data were <1% and were assigned to the reference group. Effect modification was tested adding an interaction term for DASH quintiles with age (median), high blood pressure (yes/no), and presence of the ApoE ε4 allele (yes/no, within the ApoE ε4 subsample). Relative contribution of DASH-components and cognitive function. To examine the relative importance of individual DASH components, we recalculated separate long-term DASH scores excluding one DASH component at a time while including this specific component as covariate in the model to adjust for this specific component (as quintiles of intake). All statistical analyses were carried out using SAS software version 9.2 (SAS Institute Inc., Cary, NC, USA). A two-sided p-value of <0.05 was considered significant.

5
Chapter 5 | The Dietary Approaches to Stop Hypertension diet, cognitive function and decline
80
Dietary assessment and DASH diet score For each item of the FFQ, responses ranged from ‘never or <1 time/month’ to ‘≥6 times/day’; a standardized portion size was specified for each food item to estimate quantities consumed daily. Food intake estimations were converted into nutrient intakes by multiplying the frequency of consumption of each food by its nutrient content by using the U.S. Department of Agriculture database. In this study, we used the 1984, 1986, 1990, 1994 and 1998 FFQs to estimate daily energy intake and to construct, at each of these time points, an alternate DASH 9-point score [13]. This score enhances the original DASH score by Appel et al. [4]. and is based on 8 criteria: high intake of fruits, vegetables, nuts and legumes, whole grains, low-fat dairy products, and low intake of sodium, red and processed meats and sweetened beverages [13]. As the DASH diet also aims for lower amounts of saturated fat and cholesterol with higher levels of unsaturated fatty acids, the component monounsaturated fatty acids (MUFA) plus polyunsaturated fatty acids (PUFA) has been added to the original score, resulting in a total of 9 components. For each of the components, we classified women into quintiles according to their intake ranking. Component scores were the women’s quintile ranking; one point was given for the lowest quintile of intake and five points for the highest intake. The scoring was reversed for components to limit (sodium, red and processed meat and sweetened beverages). Long-term dietary habits are likely most relevant because cognitive decline develops over many years [14]. Therefore, long-term DASH score was computed as the mean of up to five DASH scores from all dietary assessments from 1984 (or 1986, if 1984 FFQ was missing) to the questionnaire immediately preceding the first cognitive exam. Total long-term DASH scores were divided into quintiles based on the study population distribution. Cognitive assessment Cognitive testing was performed by trained interviewers using validated telephone interviews. The cognitive battery included: 1) the Telephone Interview for Cognitive Status (TICS) [15]; 2) immediate; and 3) delayed recalls of the East Boston Memory test (EBMT) [16]; 4) delayed recall of the TICS 10-word list; 5) category fluency; and 6) digit span-backward. In the initial cognitive interview, we administered only the TICS and gradually added the five other tests. Thus, the sample size slightly differs across tests, but the participation rate remained identical for all tests. The TICS [15] (range 0–41 points) is a telephone adaptation of the Mini-Mental State Examination [17], which assesses global cognitive performance. The immediate and delayed recalls of the EBMT[16] (range 0–12 points) assess verbal (episodic) memory. The delayed recall of the TICS 10-word list (range 0–10 points) also assesses verbal memory. A category fluency test assesses language and executive function [18] by scoring performance on naming as many animals as possible in one minute. Finally, the digit-span backward test (range 0–12 points), in which participants repeat backwards and increasingly long series of digits, assesses working memory and attention. The primary outcomes were the TICS and composite scores of global cognition and verbal memory. A global cognition score was computed as the mean of Z-scores of all six cognitive tests in the cognitive battery. A verbal memory score was calculated as the mean of Z-scores of the four tests assessing verbal memory (i.e., immediate and delayed recalls of both the EBMT and the TICS 10-word list). We calculated Z-scores at each time point using the distribution of scores at the first cognitive assessment.
81
Other variables Socio-demographic, lifestyle and health-related information were obtained from the questionnaires. Using cumulative and updated information from 1976, covariates were determined at the time of the first cognitive interview, except physical activity and energy intake, for which values were averaged across multiple assessments over time, similar to diet. Physical activity was assessed in 1986, 1988 and 1992, and every 2 years thereafter by estimating mean energy expended per week (in metabolic equivalent-hours, mets). In a randomly selected subsample of 5,822 participants, data on apolipoprotein E (APOE) ε4 polymorphisms was available from cheek cell specimens (n=3,469) and genome wide association studies (n=2,353). Statistical analyses Relation between long-term DASH adherence, cognitive function and decline. Statistical analyses utilized two complementary approaches. As primary analyses, we averaged the four repeated measures of cognitive function to create an outcome representing average cognitive function at older ages and modelled the association of long-term DASH score with average cognitive status using linear regression models. Averaging repeated measures of cognition was relevant to our data, as it attenuates variability in each single cognitive assessment, which may be helpful when cognition is measured over a relatively short follow-up period in largely healthy, educated participants [19]. In another approach, we modelled trajectories of the four repeated cognitive scores using linear mixed models [20]. The linear mixed models included an intercept that represented the level of cognitive score at baseline and a slope that represented the annual change in scores over time as well as a random intercept and random slope to account for inter-individual variability. We examined linear trends across quintiles using a continuous variable in which participants in a given category were assigned the median value of the long-term DASH score. Adjustments were made for possible confounding factors age and education (registered nurse, bachelor, master or doctorate) (crude, model 1), and subsequently for long-term energy intake (quintiles) and physical activity (MET-hours/week, quintiles), body mass index (BMI, kg/m2, ≤21, 22-24, 25-29, ≥30), smoking status (never, former, current), alcohol intake (<1, 1-15, ≥15 g), history of depression (yes/no), multivitamin use (yes/no), and cardiovascular risk factors / disease (history of diabetes (yes/no), hypertension (yes/no), hypercholesterolemia (yes/no), and myocardial infarction (yes/no)) (Model 2). Estimates did not change after adjusting for ApoE ε4 within the subsample, therefore, ApoE ε4 was not included in the multivariable adjusted model. Because for BMI and multivitamin use, data was missing for >4% of the sample (4.4 and 7.1%, respectively); a specific missing category was created for these two variables. For other covariates, participants with missing data were <1% and were assigned to the reference group. Effect modification was tested adding an interaction term for DASH quintiles with age (median), high blood pressure (yes/no), and presence of the ApoE ε4 allele (yes/no, within the ApoE ε4 subsample). Relative contribution of DASH-components and cognitive function. To examine the relative importance of individual DASH components, we recalculated separate long-term DASH scores excluding one DASH component at a time while including this specific component as covariate in the model to adjust for this specific component (as quintiles of intake). All statistical analyses were carried out using SAS software version 9.2 (SAS Institute Inc., Cary, NC, USA). A two-sided p-value of <0.05 was considered significant.

Chapter 5 | The Dietary Approaches to Stop Hypertension diet, cognitive function and decline
82
Results General characteristics At first cognitive assessment, the mean age of participants was 74.3±2.3 years, and the mean TICS score was 33.8±2.7 points (maximum=41). The median long-term DASH score was 28.0 points (range 12-41) with a large variation in intake of the individual DASH components across all quintiles. Women with higher long-term DASH adherence had lower BMI, greater physical activity, higher education (table 1), and better scores for global cognition, verbal memory and TICS (table 2). They were less likely to report a history of myocardial infarction and to be current smokers. They were more likely to use a multivitamin supplement and slightly more likely to have a history of hypercholesterolemia. Table 1. Baseline characteristics of the participants in the Nurses’ Health Study by quintiles of long-term adherence to the DASH score (n=16,144) Quintile 1
23.0 (12.0-24.7)
n =3,176
Quintile 2 25.8
(24.8-26.8) n =3,107
Quintile 3 28.0
(27.0-28.8) n =3,325
Quintile 4 29.8
(29.0-30.8) n =3,184
Quintile 5 32.3
(31.0-41.0) n =3,345
Age 74.0 ± 2.3 74.2 ± 2.3 74.3 ± 2.3 74.4 ± 2.3 74.5 ± 2.3 BMI
≤21, kg/m2 666 (21.0) 586 (18.9) 597 (18.0) 617 (19.4) 724 (21.6) 22-24, kg/m2 752 (23.7) 755 (24.3) 893 (26.9) 805 (25.3) 921 (27.5) 25-29, kg/m2 1,056 (33.2) 1,082 (34.8) 1,107 (33.3) 1,098 (34.5) 1,028 (30.7) ≥30, kg/m2 566 (17.8) 543 (17.5) 585 (17.6) 536 (16.8) 514 (15.4)
Long-term physical activity 12.4 ± 12.7 14.9 ± 13.9 17.4 ± 16.0 18.9 ± 15.5 22.3 ± 19.0 Educational level
Registered nurse 2,672 (84.1) 2,494 (80.3) 2,621 (78.8) 2,385 (74.9) 2,332 (69.7) Bachelor 373 (11.7) 448 (14.4) 503 (15.1) 577 (18.1) 732 (21.9) Master or doctorate 131 (4.1) 165 (5.3) 201 (6.0) 222 (7.0) 281 (8.4)
Smoking Never 1,366 (43.0) 1,385 (44.6) 1,547 (46.5) 1,533 (48.1) 1,685 (50.4) Former 1,350 (42.5) 1,434 (46.2) 1,573 (47.3) 1,471 (46.2) 1,538 (46.0) Current 460 (14.5) 288 (9.3) 205 (6.2) 180 (5.7) 122 (3.6)
Disease history Myocardial infarction 215 (6.8) 203 (6.5) 191 (5.7) 186 (5.8) 179 (5.4) Hypertension 1,770 (55.7) 1,706 (54.9) 1,855 (55.8) 1,777 (55.8) 1,828 (54.6) Hypercholesterolemia 1,997 (62.9) 2,033 (65.4) 2,179 (65.5) 2,130 (66.9) 2,210 (66.1) Diabetes 315 (9.9) 326 (10.5) 335 (10.1) 316 (9.9) 329 (9.8) Depression 290 (9.1) 313 (10.1) 309 (9.3) 315 (9.9) 297 (8.9)
Multivitamin use 1,603 (50.5) 1,761 (56.7) 2,027 (61.0) 1,985 (62.3) 2,235 (66.8) Long-term dietary variables (servings per day unless otherwise noted)
Daily energy intake, kcal 1,640 ± 432 1,635 ± 436 1,698 ± 433 1,746 ± 420 1,800 ± 401 Alcohol, g/day 7.2 ± 11.5 5.9 ± 9.1 5.4 ± 8.2 5.0 ± 7.5 4.5 ± 6.9 DASH components
Fruit 1.8 ± 1.0 2.3 ± 1.0 2.6 ± 1.0 3.0 ± 1.2 3.4 ± 1.2 Vegetables 2.4 ± 1.0 3.0 ± 1.2 3.5 ± 1.3 4.0 ± 1.5 4.8 ± 1.7 Nuts and legumes 0.5 ± 0.3 0.6 ± 0.4 0.7 ± 0.4 0.8 ± 0.4 1.0 ± 0.5 Sodium, mg 2,093 ± 660 2,064 ± 659 2,132 ± 661 2,158 ± 648 2,168 ± 631 Red and processed meat 0.9 ± 0.4 0.8 ± 0.4 0.7 ± 0.4 0.6 ± 0.4 0.5 ± 0.3 Whole grains 0.8 ± 0.6 1.1 ± 0.7 1.4 ± 0.8 1.7 ± 0.9 2.1 ± 1.0 Sweetened beverages 0.4 ± 0.5 0.3 ± 0.3 0.2 ± 0.3 0.1 ± 0.2 0.1 ± 0.2 Low-fat dairy 0.5 ± 0.6 0.8 ± 0.7 1.0 ± 0.7 1.2 ± 0.8 1.5 ± 0.8 MUFA+PUFA, mg 32.3 ± 5.0 31.6 ± 4.9 31.0 ± 5.0 30.2 ± 5.1 29.4 ± 5.5
DASH score 22.4 ± 1.9 25.8 ± 0.6 27.9 ± 0.6 29.8 ± 0.6 32.7 ± 1.5 Values are means ± SD or number (%) All dietary variables are in servings per day, unless otherwise indicated
83
Table 2. Baseline cognitive function and average cognitive function of the participants in the Nurses’ Health Study by quintiles of long-term adherence to the DASH score (n=16,144) Quintile 1 Quintile 2 Quintile 3 Quintile 4 Quintile 5 Animal naming score 16.6 ± 4.7 16.9 ± 4.6 17.0 ± 4.6 17.2 ± 4.6 17.2 ± 4.8 Digit backward test 6.6 ± 2.3 6.7 ± 2.4 6.7 ± 2.4 6.8 ± 2.4 6.8 ± 2.5 East Boston memory test
Immediate recall 9.4 ± 1.7 9.5 ± 1.7 9.4 ± 1.7 9.4 ± 1.9 9.4 ± 1.7 Delayed recall 9.0 ± 2.0 9.0 ± 2.0 8.9 ± 2.0 8.9 ± 1.9 8.9 ± 2.1
TICS word list Immediate recall 4.5 ± 1.6 4.6 ± 1.7 4.6 ± 1.7 4.7 ± 1.7 4.7 ± 1.8 Delayed recall 2.2 ± 1.9 2.3 ± 1.9 2.3 ± 2.0 2.4 ± 1.9 2.4 ± 2.1
TICS score, total 33.6 ± 2.7 33.8 ± 2.6 33.8 ± 2.7 33.8 ± 2.8 33.9 ± 2.8 Composite scores
Global cognition -0.04 ± 0.60 -0.00 ± 0.59 -0.01 ± 0.61 0.01 ± 0.61 0.02 ± 0.62 Verbal memory -0.04 ± 0.68 -0.01 ± 0.68 -0.01 ± 0.69 -0.00 ± 0.69 0.01 ± 0.71
Average cognitive function Global cognition -0.08 ± 0.59 -0.05 ± 0.60 -0.05 ± 0.60 -0.03 ± 0.62 -0.02 ± 0.64 Verbal memory -0.03 ± 0.63 -0.01 ± 0.66 -0.02 ± 0.70 0.01 ± 0.67 0.02 ± 0.69 TICS 33.5 ± 2.6 33.6 ± 2.5 33.6 ± 2.6 33.6 ± 2.7 33.7 ± 2.6
Values are means ± SD Average cognitive function Greater adherence to the long-term DASH score was linearly related to better average cognitive function, comprising the mean of the four repeated measures of cognitive function, in both the crude and the multivariable-adjusted model (mean differences in global cognition, verbal memory and TICS scores between the top and bottom quintiles of the DASH score in the fully adjusted model were 0.04, p-trend=0.009, 0.04, p-trend=0.002 and 0.16, p-trend=0.03 in model 2, table 3). There was no interaction between long-term DASH score and age (p-interaction=0.67, 0.80, 0.36 for global cognition, verbal memory and TICS, respectively), high blood pressure (p-interaction=0.85, 0.66, 0.53 for global cognition, verbal memory and TICS, respectively), or ApoE ε4 status (p-interaction=0.35, 0.32, 0.24 for global cognition, verbal memory and TICS, respectively). The association between long-term DASH score and average cognitive function was not mediated by high blood pressure as the effect estimates remained exactly the same when taking out high blood pressure from the multivariable-adjusted model (data not shown). Cognitive decline over time After 4.1 years, long-term DASH score was not associated with change over the four repeated measures of global cognition, verbal memory, and TICS, in neither the crude, nor in the multivariable-adjusted model (p-trend=0.51, 0.68, and 0.98, for global cognition, verbal memory and TICS, respectively in model 2) (table 4). DASH-components and average cognitive function. Taking out the vegetables or the nuts plus legumes component of the total long-term DASH score attenuated the associations between long-term DASH score and average cognitive function (p-trends across the DASH score categories of excluding the vegetables component were 0.27, 0.96, 0.09, and 0.18, 0.19, and 0.04 while excluding the nuts plus legumes component, for global cognition, verbal memory and TICS, respectively).

5
Chapter 5 | The Dietary Approaches to Stop Hypertension diet, cognitive function and decline
82
Results General characteristics At first cognitive assessment, the mean age of participants was 74.3±2.3 years, and the mean TICS score was 33.8±2.7 points (maximum=41). The median long-term DASH score was 28.0 points (range 12-41) with a large variation in intake of the individual DASH components across all quintiles. Women with higher long-term DASH adherence had lower BMI, greater physical activity, higher education (table 1), and better scores for global cognition, verbal memory and TICS (table 2). They were less likely to report a history of myocardial infarction and to be current smokers. They were more likely to use a multivitamin supplement and slightly more likely to have a history of hypercholesterolemia. Table 1. Baseline characteristics of the participants in the Nurses’ Health Study by quintiles of long-term adherence to the DASH score (n=16,144) Quintile 1
23.0 (12.0-24.7)
n =3,176
Quintile 2 25.8
(24.8-26.8) n =3,107
Quintile 3 28.0
(27.0-28.8) n =3,325
Quintile 4 29.8
(29.0-30.8) n =3,184
Quintile 5 32.3
(31.0-41.0) n =3,345
Age 74.0 ± 2.3 74.2 ± 2.3 74.3 ± 2.3 74.4 ± 2.3 74.5 ± 2.3 BMI
≤21, kg/m2 666 (21.0) 586 (18.9) 597 (18.0) 617 (19.4) 724 (21.6) 22-24, kg/m2 752 (23.7) 755 (24.3) 893 (26.9) 805 (25.3) 921 (27.5) 25-29, kg/m2 1,056 (33.2) 1,082 (34.8) 1,107 (33.3) 1,098 (34.5) 1,028 (30.7) ≥30, kg/m2 566 (17.8) 543 (17.5) 585 (17.6) 536 (16.8) 514 (15.4)
Long-term physical activity 12.4 ± 12.7 14.9 ± 13.9 17.4 ± 16.0 18.9 ± 15.5 22.3 ± 19.0 Educational level
Registered nurse 2,672 (84.1) 2,494 (80.3) 2,621 (78.8) 2,385 (74.9) 2,332 (69.7) Bachelor 373 (11.7) 448 (14.4) 503 (15.1) 577 (18.1) 732 (21.9) Master or doctorate 131 (4.1) 165 (5.3) 201 (6.0) 222 (7.0) 281 (8.4)
Smoking Never 1,366 (43.0) 1,385 (44.6) 1,547 (46.5) 1,533 (48.1) 1,685 (50.4) Former 1,350 (42.5) 1,434 (46.2) 1,573 (47.3) 1,471 (46.2) 1,538 (46.0) Current 460 (14.5) 288 (9.3) 205 (6.2) 180 (5.7) 122 (3.6)
Disease history Myocardial infarction 215 (6.8) 203 (6.5) 191 (5.7) 186 (5.8) 179 (5.4) Hypertension 1,770 (55.7) 1,706 (54.9) 1,855 (55.8) 1,777 (55.8) 1,828 (54.6) Hypercholesterolemia 1,997 (62.9) 2,033 (65.4) 2,179 (65.5) 2,130 (66.9) 2,210 (66.1) Diabetes 315 (9.9) 326 (10.5) 335 (10.1) 316 (9.9) 329 (9.8) Depression 290 (9.1) 313 (10.1) 309 (9.3) 315 (9.9) 297 (8.9)
Multivitamin use 1,603 (50.5) 1,761 (56.7) 2,027 (61.0) 1,985 (62.3) 2,235 (66.8) Long-term dietary variables (servings per day unless otherwise noted)
Daily energy intake, kcal 1,640 ± 432 1,635 ± 436 1,698 ± 433 1,746 ± 420 1,800 ± 401 Alcohol, g/day 7.2 ± 11.5 5.9 ± 9.1 5.4 ± 8.2 5.0 ± 7.5 4.5 ± 6.9 DASH components
Fruit 1.8 ± 1.0 2.3 ± 1.0 2.6 ± 1.0 3.0 ± 1.2 3.4 ± 1.2 Vegetables 2.4 ± 1.0 3.0 ± 1.2 3.5 ± 1.3 4.0 ± 1.5 4.8 ± 1.7 Nuts and legumes 0.5 ± 0.3 0.6 ± 0.4 0.7 ± 0.4 0.8 ± 0.4 1.0 ± 0.5 Sodium, mg 2,093 ± 660 2,064 ± 659 2,132 ± 661 2,158 ± 648 2,168 ± 631 Red and processed meat 0.9 ± 0.4 0.8 ± 0.4 0.7 ± 0.4 0.6 ± 0.4 0.5 ± 0.3 Whole grains 0.8 ± 0.6 1.1 ± 0.7 1.4 ± 0.8 1.7 ± 0.9 2.1 ± 1.0 Sweetened beverages 0.4 ± 0.5 0.3 ± 0.3 0.2 ± 0.3 0.1 ± 0.2 0.1 ± 0.2 Low-fat dairy 0.5 ± 0.6 0.8 ± 0.7 1.0 ± 0.7 1.2 ± 0.8 1.5 ± 0.8 MUFA+PUFA, mg 32.3 ± 5.0 31.6 ± 4.9 31.0 ± 5.0 30.2 ± 5.1 29.4 ± 5.5
DASH score 22.4 ± 1.9 25.8 ± 0.6 27.9 ± 0.6 29.8 ± 0.6 32.7 ± 1.5 Values are means ± SD or number (%) All dietary variables are in servings per day, unless otherwise indicated
83
Table 2. Baseline cognitive function and average cognitive function of the participants in the Nurses’ Health Study by quintiles of long-term adherence to the DASH score (n=16,144) Quintile 1 Quintile 2 Quintile 3 Quintile 4 Quintile 5 Animal naming score 16.6 ± 4.7 16.9 ± 4.6 17.0 ± 4.6 17.2 ± 4.6 17.2 ± 4.8 Digit backward test 6.6 ± 2.3 6.7 ± 2.4 6.7 ± 2.4 6.8 ± 2.4 6.8 ± 2.5 East Boston memory test
Immediate recall 9.4 ± 1.7 9.5 ± 1.7 9.4 ± 1.7 9.4 ± 1.9 9.4 ± 1.7 Delayed recall 9.0 ± 2.0 9.0 ± 2.0 8.9 ± 2.0 8.9 ± 1.9 8.9 ± 2.1
TICS word list Immediate recall 4.5 ± 1.6 4.6 ± 1.7 4.6 ± 1.7 4.7 ± 1.7 4.7 ± 1.8 Delayed recall 2.2 ± 1.9 2.3 ± 1.9 2.3 ± 2.0 2.4 ± 1.9 2.4 ± 2.1
TICS score, total 33.6 ± 2.7 33.8 ± 2.6 33.8 ± 2.7 33.8 ± 2.8 33.9 ± 2.8 Composite scores
Global cognition -0.04 ± 0.60 -0.00 ± 0.59 -0.01 ± 0.61 0.01 ± 0.61 0.02 ± 0.62 Verbal memory -0.04 ± 0.68 -0.01 ± 0.68 -0.01 ± 0.69 -0.00 ± 0.69 0.01 ± 0.71
Average cognitive function Global cognition -0.08 ± 0.59 -0.05 ± 0.60 -0.05 ± 0.60 -0.03 ± 0.62 -0.02 ± 0.64 Verbal memory -0.03 ± 0.63 -0.01 ± 0.66 -0.02 ± 0.70 0.01 ± 0.67 0.02 ± 0.69 TICS 33.5 ± 2.6 33.6 ± 2.5 33.6 ± 2.6 33.6 ± 2.7 33.7 ± 2.6
Values are means ± SD Average cognitive function Greater adherence to the long-term DASH score was linearly related to better average cognitive function, comprising the mean of the four repeated measures of cognitive function, in both the crude and the multivariable-adjusted model (mean differences in global cognition, verbal memory and TICS scores between the top and bottom quintiles of the DASH score in the fully adjusted model were 0.04, p-trend=0.009, 0.04, p-trend=0.002 and 0.16, p-trend=0.03 in model 2, table 3). There was no interaction between long-term DASH score and age (p-interaction=0.67, 0.80, 0.36 for global cognition, verbal memory and TICS, respectively), high blood pressure (p-interaction=0.85, 0.66, 0.53 for global cognition, verbal memory and TICS, respectively), or ApoE ε4 status (p-interaction=0.35, 0.32, 0.24 for global cognition, verbal memory and TICS, respectively). The association between long-term DASH score and average cognitive function was not mediated by high blood pressure as the effect estimates remained exactly the same when taking out high blood pressure from the multivariable-adjusted model (data not shown). Cognitive decline over time After 4.1 years, long-term DASH score was not associated with change over the four repeated measures of global cognition, verbal memory, and TICS, in neither the crude, nor in the multivariable-adjusted model (p-trend=0.51, 0.68, and 0.98, for global cognition, verbal memory and TICS, respectively in model 2) (table 4). DASH-components and average cognitive function. Taking out the vegetables or the nuts plus legumes component of the total long-term DASH score attenuated the associations between long-term DASH score and average cognitive function (p-trends across the DASH score categories of excluding the vegetables component were 0.27, 0.96, 0.09, and 0.18, 0.19, and 0.04 while excluding the nuts plus legumes component, for global cognition, verbal memory and TICS, respectively).

Chapter 5 | The Dietary Approaches to Stop Hypertension diet, cognitive function and decline
84
Table 3. Multivariable-adjusted mean differences in average cognitive function over the follow-up period by quintiles of long-term DASH score in 16,144 older womena Model 1b p Model 2c p Global cognitive score Quintile 1 Ref Ref Quintile 2 0.03 (0.00,0.06) 0.07 0.02 (-0.01,0.05) 0.20 Quintile 3 0.03 (0.00,0.06) 0.03 0.01 (-0.02,0.04) 0.40 Quintile 4 0.06 (0.03,0.09) <0.01 0.03 (0.00,0.06) 0.02 Quintile 5 0.06 (0.03,0.09) <0.01 0.04 (0.01,0.07) 0.01 p-trend <0.001 0.009
Verbal memory score Quintile 1 Ref Ref Quintile 2 0.02 (-0.01,0.06) 0.14 0.02 (-0.01,0.05) 0.29 Quintile 3 0.02 (-0.01,0.05) 0.19 0.00 (-0.03,0.04) 0.82 Quintile 4 0.05 (0.02,0.08) <0.01 0.03 (0.00,0.07) 0.05 Quintile 5 0.06 (0.03,0.09) <0.01 0.04 (0.01,0.07) 0.01 p-trend <0.001 0.002
TICS score Quintile 1 Ref Ref Quintile 2 0.13 (0.01,0.26) 0.04 0.10 (-0.03,0.22) 0.12 Quintile 3 0.16 (0.03,0.28) 0.01 0.08 (-0.05,0.20) 0.24 Quintile 4 0.18 (0.05,0.30) <0.01 0.09 (-0.04,0.22) 0.17 Quintile 5 0.27 (0.14,0.39) <0.01 0.16 (0.03,0.29) 0.02 p-trend <0.001 0.03 a Values are mean (95% Confidence Interval). b Adjusted for age and education c Adjusted for age, education, physical activity, calorie intake, alcohol intake, smoking status, depression, multivitamin use, BMI, and history of, high blood pressure, hypercholesterolemia, myocardial infarction, and diabetes mellitus.
Table 4. Multivariable-adjusted mean differences in slopes of cognitive change by quintiles of long-term DASH score in 16,144 older womena Model 1b p Model 2c p Global cognitive score Quintile 1 Ref Ref Quintile 2 0.000 (-0.008,0.008) 0.96 -0.002 (-0.010,0.006) 0.64 Quintile 3 0.001 (-0.007,0.008) 0.87 -0.002 (-0.010,0.006) 0.29 Quintile 4 -0.001 (-0.009,0.006) 0.74 -0.004 (-0.012,0.004) 0.62 Quintile 5 0.002 (-0.006,0.010) 0.64 -0.002 (-0.010,0.006) 0.68 p-trend 0.77 0.51
Verbal memory score Quintile 1 Ref Ref Quintile 2 -0.003 (-0.013,0.006) 0.52 -0.005 (-0.014,0.005) 0.31 Quintile 3 -0.002 (-0.011,0.007) 0.66 -0.004 (-0.014,0.005) 0.36 Quintile 4 -0.002 (-0.011,0.007) 0.68 -0.005 (-0.014,0.005) 0.35 Quintile 5 0.001 (-0.008,0.010) 0.83 -0.003 (-0.012,0.007) 0.61 p-trend 0.77 0.68
TICS score Quintile 1 Ref Ref Quintile 2 -0.006 (-0.038,0.027) 0.73 -0.011 (-0.043,0.022) 0.52 Quintile 3 -0.002 (-0.034,0.029) 0.89 -0.009 (-0.041,0.023) 0.57 Quintile 4 -0.001 (-0.033,0.031) 0.89 -0.007 (-0.039,0.026) 0.69 Quintile 5 0.006 (-0.025,0.038) 0.69 -0.001 (-0.034,0.032) 0.94 p-trend 0.89 0.98 a Values are mean (95% Confidence Interval). b Adjusted for age and education c Adjusted for age, education, physical activity, calorie intake, alcohol intake, smoking status, multivitamin use, BMI, and history of depression, high blood pressure, hypercholesterolemia, myocardial infarction, and diabetes mellitus.
85
Discussion In this large longitudinal study, long-term adherence to the DASH diet was associated with a higher average global cognitive function, verbal memory and TICS score at older ages. To put these results into perspective, the effect estimates we found for long-term DASH adherence were cognitively equivalent to ~1 year of aging. No associations were observed between long-term DASH adherence and cognitive change after 4.1 years. We found that long-term greater adherence to the DASH diet was associated with better average TICS score, global cognitive function and verbal memory, which is a strong predictor of Alzheimer’s Disease (AD) [21]. Previous longitudinal studies showed that greater adherence to a DASH diet was associated with better global cognitive function in the Cache County Study (3MS score quintile 5 versus quintile 1 = 0.97, p-trend<0.001)[9] and with a slower rate of cognitive decline in the Memory and Aging Project (0.007, p-trend=0.003 per unit increase in DASH score) [10]. The only trial on the effect of the DASH diet on cognition did not study global cognition, verbal memory or TICS, but showed better psychomotor speed after 4 months on the DASH diet, compared to control group (Cohen’s D = 0.440, p = 0.036) [11]. Other dietary patterns emphasizing foods and nutrients similar to those in our DASH score (e.g., fruits, vegetables, whole grains), have been associated with less cognitive decline, such as the extensively investigated (alternate) Mediterranean diet [9, 22-25], the alternate Healthy Eating Index 2005 and 2010 [25], and the Healthy Diet Indicator [26]. In previous studies investigating the effect of single components, interactions between the remaining diet score components have been ignored. We studied the relative contribution of individual components to the DASH score to the association with average cognitive function. Using this approach, excluding vegetables and nuts plus legumes attenuated the association, indicating that these two components are the most important contributors to the overall DASH score in relation to average cognitive function. Other studies have demonstrated that nuts [19, 27] and nuts plus legumes [9] are associated with better average cognitive status, ignoring the relative contribution of these components. Future research should further explore the relative instead of the absolute contribution of components in the context of diet pattern scores. Biologically, the DASH diet could be linked with cognitive function by influencing blood pressure, thereby lowering vascular dementia risk and corresponding cognitive decline. The DASH diet lowered blood pressure in an 8-week randomized controlled trial (RCT) in middle-aged normotensive American men and women [4] and in a 6-month multi-centre RCT in middle-aged pre-hypertensive or hypertensive American men and women [28]. Given this blood pressure-lowering effect, and the fact that blood pressure is an important risk factor for cognitive decline and late-life dementia [29], there is a clear basis for hypothesizing that the DASH diet may be inversely associated with cognitive outcomes. Genetically, carrying one or more copies of the ApoE-ε4 allele is associated with an increased AD risk and cognitive function decline [30-33]. This supports the importance of finding strategies to prevent cognitive decline especially among ApoE-ε4 carriers. However, we did not observe an interaction between the DASH diet and ApoE-ε4 status. Other studies investigating the interaction between dietary patterns and cognitive function have shown inconsistent findings, with studies reporting better cognitive function among non-carriers [34, 35], others showing relations in carriers [36], and studies finding no interaction [35, 37, 38]. Overall, no consistent conclusion on the role of the ApoE4 ε4 allele with diet and cognitive function can be drawn and this requires further research.

5
Chapter 5 | The Dietary Approaches to Stop Hypertension diet, cognitive function and decline
84
Table 3. Multivariable-adjusted mean differences in average cognitive function over the follow-up period by quintiles of long-term DASH score in 16,144 older womena Model 1b p Model 2c p Global cognitive score Quintile 1 Ref Ref Quintile 2 0.03 (0.00,0.06) 0.07 0.02 (-0.01,0.05) 0.20 Quintile 3 0.03 (0.00,0.06) 0.03 0.01 (-0.02,0.04) 0.40 Quintile 4 0.06 (0.03,0.09) <0.01 0.03 (0.00,0.06) 0.02 Quintile 5 0.06 (0.03,0.09) <0.01 0.04 (0.01,0.07) 0.01 p-trend <0.001 0.009
Verbal memory score Quintile 1 Ref Ref Quintile 2 0.02 (-0.01,0.06) 0.14 0.02 (-0.01,0.05) 0.29 Quintile 3 0.02 (-0.01,0.05) 0.19 0.00 (-0.03,0.04) 0.82 Quintile 4 0.05 (0.02,0.08) <0.01 0.03 (0.00,0.07) 0.05 Quintile 5 0.06 (0.03,0.09) <0.01 0.04 (0.01,0.07) 0.01 p-trend <0.001 0.002
TICS score Quintile 1 Ref Ref Quintile 2 0.13 (0.01,0.26) 0.04 0.10 (-0.03,0.22) 0.12 Quintile 3 0.16 (0.03,0.28) 0.01 0.08 (-0.05,0.20) 0.24 Quintile 4 0.18 (0.05,0.30) <0.01 0.09 (-0.04,0.22) 0.17 Quintile 5 0.27 (0.14,0.39) <0.01 0.16 (0.03,0.29) 0.02 p-trend <0.001 0.03 a Values are mean (95% Confidence Interval). b Adjusted for age and education c Adjusted for age, education, physical activity, calorie intake, alcohol intake, smoking status, depression, multivitamin use, BMI, and history of, high blood pressure, hypercholesterolemia, myocardial infarction, and diabetes mellitus.
Table 4. Multivariable-adjusted mean differences in slopes of cognitive change by quintiles of long-term DASH score in 16,144 older womena Model 1b p Model 2c p Global cognitive score Quintile 1 Ref Ref Quintile 2 0.000 (-0.008,0.008) 0.96 -0.002 (-0.010,0.006) 0.64 Quintile 3 0.001 (-0.007,0.008) 0.87 -0.002 (-0.010,0.006) 0.29 Quintile 4 -0.001 (-0.009,0.006) 0.74 -0.004 (-0.012,0.004) 0.62 Quintile 5 0.002 (-0.006,0.010) 0.64 -0.002 (-0.010,0.006) 0.68 p-trend 0.77 0.51
Verbal memory score Quintile 1 Ref Ref Quintile 2 -0.003 (-0.013,0.006) 0.52 -0.005 (-0.014,0.005) 0.31 Quintile 3 -0.002 (-0.011,0.007) 0.66 -0.004 (-0.014,0.005) 0.36 Quintile 4 -0.002 (-0.011,0.007) 0.68 -0.005 (-0.014,0.005) 0.35 Quintile 5 0.001 (-0.008,0.010) 0.83 -0.003 (-0.012,0.007) 0.61 p-trend 0.77 0.68
TICS score Quintile 1 Ref Ref Quintile 2 -0.006 (-0.038,0.027) 0.73 -0.011 (-0.043,0.022) 0.52 Quintile 3 -0.002 (-0.034,0.029) 0.89 -0.009 (-0.041,0.023) 0.57 Quintile 4 -0.001 (-0.033,0.031) 0.89 -0.007 (-0.039,0.026) 0.69 Quintile 5 0.006 (-0.025,0.038) 0.69 -0.001 (-0.034,0.032) 0.94 p-trend 0.89 0.98 a Values are mean (95% Confidence Interval). b Adjusted for age and education c Adjusted for age, education, physical activity, calorie intake, alcohol intake, smoking status, multivitamin use, BMI, and history of depression, high blood pressure, hypercholesterolemia, myocardial infarction, and diabetes mellitus.
85
Discussion In this large longitudinal study, long-term adherence to the DASH diet was associated with a higher average global cognitive function, verbal memory and TICS score at older ages. To put these results into perspective, the effect estimates we found for long-term DASH adherence were cognitively equivalent to ~1 year of aging. No associations were observed between long-term DASH adherence and cognitive change after 4.1 years. We found that long-term greater adherence to the DASH diet was associated with better average TICS score, global cognitive function and verbal memory, which is a strong predictor of Alzheimer’s Disease (AD) [21]. Previous longitudinal studies showed that greater adherence to a DASH diet was associated with better global cognitive function in the Cache County Study (3MS score quintile 5 versus quintile 1 = 0.97, p-trend<0.001)[9] and with a slower rate of cognitive decline in the Memory and Aging Project (0.007, p-trend=0.003 per unit increase in DASH score) [10]. The only trial on the effect of the DASH diet on cognition did not study global cognition, verbal memory or TICS, but showed better psychomotor speed after 4 months on the DASH diet, compared to control group (Cohen’s D = 0.440, p = 0.036) [11]. Other dietary patterns emphasizing foods and nutrients similar to those in our DASH score (e.g., fruits, vegetables, whole grains), have been associated with less cognitive decline, such as the extensively investigated (alternate) Mediterranean diet [9, 22-25], the alternate Healthy Eating Index 2005 and 2010 [25], and the Healthy Diet Indicator [26]. In previous studies investigating the effect of single components, interactions between the remaining diet score components have been ignored. We studied the relative contribution of individual components to the DASH score to the association with average cognitive function. Using this approach, excluding vegetables and nuts plus legumes attenuated the association, indicating that these two components are the most important contributors to the overall DASH score in relation to average cognitive function. Other studies have demonstrated that nuts [19, 27] and nuts plus legumes [9] are associated with better average cognitive status, ignoring the relative contribution of these components. Future research should further explore the relative instead of the absolute contribution of components in the context of diet pattern scores. Biologically, the DASH diet could be linked with cognitive function by influencing blood pressure, thereby lowering vascular dementia risk and corresponding cognitive decline. The DASH diet lowered blood pressure in an 8-week randomized controlled trial (RCT) in middle-aged normotensive American men and women [4] and in a 6-month multi-centre RCT in middle-aged pre-hypertensive or hypertensive American men and women [28]. Given this blood pressure-lowering effect, and the fact that blood pressure is an important risk factor for cognitive decline and late-life dementia [29], there is a clear basis for hypothesizing that the DASH diet may be inversely associated with cognitive outcomes. Genetically, carrying one or more copies of the ApoE-ε4 allele is associated with an increased AD risk and cognitive function decline [30-33]. This supports the importance of finding strategies to prevent cognitive decline especially among ApoE-ε4 carriers. However, we did not observe an interaction between the DASH diet and ApoE-ε4 status. Other studies investigating the interaction between dietary patterns and cognitive function have shown inconsistent findings, with studies reporting better cognitive function among non-carriers [34, 35], others showing relations in carriers [36], and studies finding no interaction [35, 37, 38]. Overall, no consistent conclusion on the role of the ApoE4 ε4 allele with diet and cognitive function can be drawn and this requires further research.

Chapter 5 | The Dietary Approaches to Stop Hypertension diet, cognitive function and decline
86
We did not find an association between the long-term DASH diet and cognitive change over time. Possibly our participants had higher education than participants in the Cache County Study [9] and Memory and Aging Project [10], with relatively slower cognitive decline over time. This could have resulted in a more narrow distribution of average cognitive function and cognitive change, reducing the magnitude of association in our study. Participants in our study were followed for a relatively short period, compared to the Cache County Study (11 years) [9]. Additionally, participants in the DASH-trial were obese, younger, and had above-normal blood pressure, compared to our relatively healthy older population [11]. At last, our modest association may be due to lower long-term adherence to the DASH diet compared to participants of the DASH-trial who received controlled feeding for exact DASH diet compliance, resulting in a vegetable intake of 5.7 [5] compared to 4.8 servings/day in the highest long-term DASH score quintile in our study.
Several potential limitations of our study should be discussed. First, the FFQ was not designed to provide precise measurements of some dietary components, such as sodium. However, it is a hallmark of the DASH-Sodium trial; thus, using the quintile approach would be least prone to misclassification. Using the actual cut-off approach for number of servings weakened our results, likely owing to greater misclassification. Hence, we chose to award points for adhering to what the DASH diet emphasizes rather than precise compliance to the DASH recommendations in number of servings. Although these population-specific cut-offs limits generalizability to other populations, this approach addresses the focus of the DASH diet and allows for adequate variation in adherence to examine any association with cognitive function. Second, as this was an observational study, residual confounding might influence analyses of average cognition due to factors that persist over time (e.g., education) and affect the cognitive level a person achieves more than a person’s cognitive trajectory in later life. However, we carefully adjusted for many potentially confounding variables. These adjustments did not meaningfully change our results for average cognition, suggesting that residual confounding would be unlikely to completely explain our findings. Third, cognitive function was assessed with use of telephone assessment, possibly causing some misclassification of cognitive function. A validation study, however, has shown that telephone-based cognitive batteries perform well compared with in-person interviews (ρ=0.81 comparing the two models) [39]. At last, as participants of this cohort are cognitively relatively healthy, middle-aged nurses, we expect a limited generalizability of our results to American women, and men.
The long follow-up allowed us to assess long-term associations between the DASH score and cognitive function. By averaging repeated measures of diet to obtain a better assessment of long-term overall diet we accounted for within-person change in intake and reduced measurement error, as previously documented by our group [40]. Measurement error in cognitive function assessments has also been limited by averaging all repeated measures into a more robust measure of average cognitive function at older ages. The prospective nature reduces the probability of recall bias and selection bias. In addition, a high follow-up rate reduced potential loss of follow-up bias. Nevertheless, our results need to be replicated in other populations.
Conclusion Our findings in the largest cohort on dietary patterns and cognitive function to date indicate that long-term adherence to the DASH diet is important to maintain global cognitive function, verbal memory and TICS scores at older ages. Future studies should focus on participants at risk of poorer cognitive function, to elucidate the role of healthy diets on cognitive decline over time.
87
Acknowledgements Participants, staff and investigators of the NHS are gratefully acknowledged. This work was supported by the National Institutes of Health who provided funding for the Nurses’ Health Study (NHS) (grant P01 CA87969). The NHS, the cognitive function data and the genetic data collection were supported by the following: the National Cancer Institute (NCI, UM1 CA186107, P01CA087969, P01CA049449, R01CA137178), the National Institute of Diabetes and Digestive and Kidney Diseases (NIDDK, R01DK058845), National Institute of Aging (R01AG015424, R29AG013482) and the National Heart, Lung, and Blood Institute (NHLBI, R01HL35464), with additional support for the collection and management of genetic data. The NHS Breast Cancer GWAS (dbGaP:phs000147.v1.p1) was performed as part of the Cancer Genetic Markers of Susceptibility initiative of the NCI (R01CA40356, U01CA98233). The NHS type 2 diabetes (T2D, dbGaP:phs000091.v2.p1) and open-angle glaucoma (GA, dbGaP:phs000308.v1.p1) GWAS were funded as part of the Gene Environment-Association Studies (GENEVA) project under the NIH Genes, Environment, and Health Initiative (T2D: U01HG004399, GA: U01HG004728). Genotyping for the NHS coronary heart disease GWAS was supported by Merck/Rosetta Research Laboratories, North Wales, PA. The NHS kidney stone GWAS (dbGaP:phs000460.v1.p1) was supported by NIDDK (5P01DK070756). The NHS colon cancer GWAS (dbGAP: in progress) was funded as part of the Colorectal Cancer GWAS Consortium funded by the NCI (U01 CA137088, R01CA059045).

5
Chapter 5 | The Dietary Approaches to Stop Hypertension diet, cognitive function and decline
86
We did not find an association between the long-term DASH diet and cognitive change over time. Possibly our participants had higher education than participants in the Cache County Study [9] and Memory and Aging Project [10], with relatively slower cognitive decline over time. This could have resulted in a more narrow distribution of average cognitive function and cognitive change, reducing the magnitude of association in our study. Participants in our study were followed for a relatively short period, compared to the Cache County Study (11 years) [9]. Additionally, participants in the DASH-trial were obese, younger, and had above-normal blood pressure, compared to our relatively healthy older population [11]. At last, our modest association may be due to lower long-term adherence to the DASH diet compared to participants of the DASH-trial who received controlled feeding for exact DASH diet compliance, resulting in a vegetable intake of 5.7 [5] compared to 4.8 servings/day in the highest long-term DASH score quintile in our study.
Several potential limitations of our study should be discussed. First, the FFQ was not designed to provide precise measurements of some dietary components, such as sodium. However, it is a hallmark of the DASH-Sodium trial; thus, using the quintile approach would be least prone to misclassification. Using the actual cut-off approach for number of servings weakened our results, likely owing to greater misclassification. Hence, we chose to award points for adhering to what the DASH diet emphasizes rather than precise compliance to the DASH recommendations in number of servings. Although these population-specific cut-offs limits generalizability to other populations, this approach addresses the focus of the DASH diet and allows for adequate variation in adherence to examine any association with cognitive function. Second, as this was an observational study, residual confounding might influence analyses of average cognition due to factors that persist over time (e.g., education) and affect the cognitive level a person achieves more than a person’s cognitive trajectory in later life. However, we carefully adjusted for many potentially confounding variables. These adjustments did not meaningfully change our results for average cognition, suggesting that residual confounding would be unlikely to completely explain our findings. Third, cognitive function was assessed with use of telephone assessment, possibly causing some misclassification of cognitive function. A validation study, however, has shown that telephone-based cognitive batteries perform well compared with in-person interviews (ρ=0.81 comparing the two models) [39]. At last, as participants of this cohort are cognitively relatively healthy, middle-aged nurses, we expect a limited generalizability of our results to American women, and men.
The long follow-up allowed us to assess long-term associations between the DASH score and cognitive function. By averaging repeated measures of diet to obtain a better assessment of long-term overall diet we accounted for within-person change in intake and reduced measurement error, as previously documented by our group [40]. Measurement error in cognitive function assessments has also been limited by averaging all repeated measures into a more robust measure of average cognitive function at older ages. The prospective nature reduces the probability of recall bias and selection bias. In addition, a high follow-up rate reduced potential loss of follow-up bias. Nevertheless, our results need to be replicated in other populations.
Conclusion Our findings in the largest cohort on dietary patterns and cognitive function to date indicate that long-term adherence to the DASH diet is important to maintain global cognitive function, verbal memory and TICS scores at older ages. Future studies should focus on participants at risk of poorer cognitive function, to elucidate the role of healthy diets on cognitive decline over time.
87
Acknowledgements Participants, staff and investigators of the NHS are gratefully acknowledged. This work was supported by the National Institutes of Health who provided funding for the Nurses’ Health Study (NHS) (grant P01 CA87969). The NHS, the cognitive function data and the genetic data collection were supported by the following: the National Cancer Institute (NCI, UM1 CA186107, P01CA087969, P01CA049449, R01CA137178), the National Institute of Diabetes and Digestive and Kidney Diseases (NIDDK, R01DK058845), National Institute of Aging (R01AG015424, R29AG013482) and the National Heart, Lung, and Blood Institute (NHLBI, R01HL35464), with additional support for the collection and management of genetic data. The NHS Breast Cancer GWAS (dbGaP:phs000147.v1.p1) was performed as part of the Cancer Genetic Markers of Susceptibility initiative of the NCI (R01CA40356, U01CA98233). The NHS type 2 diabetes (T2D, dbGaP:phs000091.v2.p1) and open-angle glaucoma (GA, dbGaP:phs000308.v1.p1) GWAS were funded as part of the Gene Environment-Association Studies (GENEVA) project under the NIH Genes, Environment, and Health Initiative (T2D: U01HG004399, GA: U01HG004728). Genotyping for the NHS coronary heart disease GWAS was supported by Merck/Rosetta Research Laboratories, North Wales, PA. The NHS kidney stone GWAS (dbGaP:phs000460.v1.p1) was supported by NIDDK (5P01DK070756). The NHS colon cancer GWAS (dbGAP: in progress) was funded as part of the Colorectal Cancer GWAS Consortium funded by the NCI (U01 CA137088, R01CA059045).

Chapter 5 | The Dietary Approaches to Stop Hypertension diet, cognitive function and decline
88
References 1. Nelson L, Tabet N. Slowing the progression of Alzheimer's disease; what works? Ageing Res Rev. 2015;23:193-209. 2. USDA. Scientific Report of the 2015 Dietary Guidelines Advisory Committee. Washington: USDA, 2015. 3. van de Rest O, Berendsen AM, Haveman-Nies A, de Groot CPGM. Dietary patterns, cognitive decline, and dementia: a
systematic review. Adv Nutr. 2015;6(2):154-68. 4. Appel LJ, Moore TJ, Obarzanek E, Vollmer WM, Svetkey LP, Sacks FM, et al. A clinical trial of the effects of dietary
patterns on blood pressure. DASH Collaborative Research Group. N Engl J Med. 1997;336(16):1117-24. 5. Blumenthal JA, Babyak MA, Hinderliter A, Watkins LL, Craighead L, Lin PH, et al. Effects of the DASH diet alone and in
combination with exercise and weight loss on blood pressure and cardiovascular biomarkers in men and women with high blood pressure: the ENCORE study. Arch Intern Med. 2010;170(2):126-35.
6. Kilander L, Nyman H, Boberg M, Hansson L, Lithell H. Hypertension is related to cognitive impairment: a 20-year follow-up of 999 men. Hypertension. 1998;31(3):780-6.
7. Launer LJ, Ross GW, Petrovitch H, Masaki K, Foley D, White LR, et al. Midlife blood pressure and dementia: the Honolulu-Asia aging study. Neurobiol Aging. 2000;21(1):49-55.
8. Duron E, Hanon O. Hypertension, cognitive decline and dementia. Arch Cardiovasc Dis. 2008;101(3):181-9. 9. Wengreen H, Munger RG, Cutler A, Quach A, Bowles A, Corcoran C, et al. Prospective study of Dietary Approaches to
Stop Hypertension- and Mediterranean-style dietary patterns and age-related cognitive change: the Cache County Study on Memory, Health and Aging. Am J Clin Nutr. 2013;98(5):1263-71.
10. Tangney CC, Li H, Wang Y, Barnes L, Schneider JA, Bennett DA, et al. Relation of DASH- and Mediterranean-like dietary patterns to cognitive decline in older persons. Neurology. 2014;83(16):1410-6.
11. Smith PJ, Blumenthal JA, Babyak MA, Craighead L, Welsh-Bohmer KA, Browndyke JN, et al. Effects of the dietary approaches to stop hypertension diet, exercise, and caloric restriction on neurocognition in overweight adults with high blood pressure. Hypertension. 2010;55(6):1331-8.
12. Willett WC, Sampson L, Stampfer MJ, Rosner B, Bain C, Witschi J, et al. Reproducibility and validity of a semiquantitative food frequency questionnaire. Am J Epidemiol. 1985;122(1):51-65.
13. Fung TT, Chiuve SE, McCullough ML, Rexrode KM, Logroscino G, Hu FB. Adherence to a DASH-style diet and risk of coronary heart disease and stroke in women. Arch Intern Med. 2008;168(7):713-20.
14. Launer LJ. The epidemiologic study of dementia: a life-long quest? Neurobiol Aging. 2005;26(3):335-40. 15. Brandt J, Spencer M, Folstein M. The telephone interview for cognitive status. Neuropsychiatry Neuropsychol Behav
Neurol. 1988;1:111-7. 16. Albert M, Smith LA, Scherr PA, Taylor JO, Evans DA, Funkenstein HH. Use of brief cognitive tests to identify individuals
in the community with clinically diagnosed Alzheimer's disease. Int J Neurosci. 1991;57(3-4):167-78. 17. Folstein MF, Folstein SE, McHugh PR. "Mini-mental state". A practical method for grading the cognitive state of patients
for the clinician. J Psychiatr Res. 1975;12(3):189-98. 18. Morris JC, Heyman A, Mohs RC, Hughes JP, van Belle G, Fillenbaum G, et al. The Consortium to Establish a Registry for
Alzheimer's Disease (CERAD). Part I. Clinical and neuropsychological assessment of Alzheimer's disease. Neurology. 1989;39(9):1159-65.
19. Samieri C, Okereke OI, Devore EE, Grodstein F. Long-term adherence to the Mediterranean diet is associated with overall cognitive status, but not cognitive decline, in women. J Nutr. 2013;143(4):493-9.
20. Laird NM, Ware JH. Random-effects models for longitudinal data. Biometrics. 1982;38(4):963-74. 21. Dubois B, Feldman HH, Jacova C, Cummings JL, Dekosky ST, Barberger-Gateau P, et al. Revising the definition of
Alzheimer's disease: a new lexicon. Lancet Neurol. 2010;9(11):1118-27. 22. Féart C, Samieri C, Rondeau V, Amieva H, Portet F, Dartigues JF, et al. Adherence to a mediterranean diet, cognitive
decline, and risk of dementia. JAMA. 2009;302(6):638-48. 23. Samieri C, Grodstein F, Rosner BA, Kang JH, Cook NR, Manson JE, et al. Mediterranean diet and cognitive function in
older age. Epidemiology (Cambridge, Mass). 2013;24(4):490-9. 24. Tangney CC, Kwasny MJ, Li H, Wilson RS, Evans DA, Morris MC. Adherence to a Mediterranean-type dietary pattern and
cognitive decline in a community population. Am J Clin Nutr. 2011;93(3):601-7. 25. Ye X, Scott T, Gao X, Maras JE, Bakun PJ, Tucker KL. Mediterranean diet, healthy eating index 2005, and cognitive
function in middle-aged and older puerto rican adults. Journal of the Academy of Nutrition and Dietetics. 2013;113(2):276-81.
26. Correa Leite ML, Nicolosi A, Cristina S, Hauser WA, Nappi G. Nutrition and cognitive deficit in the elderly: a population study. Eur J Clin Nutr. 2001;55(12):1053-8.
27. O'Brien J, Okereke O, Devore E, Rosner B, Breteler M, Grodstein F. Long-term intake of nuts in relation to cognitive function in older women. J Nutr Health Aging. 2014;18(5):496-502.
28. Lin PH, Appel LJ, Funk K, Craddick S, Chen C, Elmer P, et al. The PREMIER intervention helps participants follow the Dietary Approaches to Stop Hypertension dietary pattern and the current Dietary Reference Intakes recommendations. J Am Diet Assoc. 2007;107(9):1541-51.
29. Grodstein F. Cardiovascular risk factors and cognitive function. Alzheimers Dement. 2007;3(2 Suppl):S16-22. 30. Corder EH, Saunders AM, Strittmatter WJ, Schmechel DE, Gaskell PC, Small GW, et al. Gene dose of apolipoprotein E
type 4 allele and the risk of Alzheimer's disease in late onset families. Science. 1993;261(5123):921-3.
89
31. Saunders AM, Strittmatter WJ, Schmechel D, George-Hyslop PH, Pericak-Vance MA, Joo SH, et al. Association ofapolipoprotein E allele epsilon 4 with late-onset familial and sporadic Alzheimer's disease. Neurology. 1993;43(8):1467-72.
32. Feskens EJ, Havekes LM, Kalmijn S, de Knijff P, Launer LJ, Kromhout D. Apolipoprotein e4 allele and cognitive decline inelderly men. BMJ. 1994;309(6963):1202-6.
33. Wilson RS, Schneider JA, Barnes LL, Beckett LA, Aggarwal NT, Cochran EJ, et al. The apolipoprotein E epsilon 4 allele anddecline in different cognitive systems during a 6-year period. Arch Neurol. 2002;59(7):1154-60.
34. Barberger-Gateau P, Raffaitin C, Letenneur L, Berr C, Tzourio C, Dartigues JF, et al. Dietary patterns and risk ofdementia: the Three-City cohort study. Neurology. 2007;69(20):1921-30.
35. Martinez-Lapiscina EH, Galbete C, Corella D, Toledo E, Buil-Cosiales P, Salas-Salvado J, et al. Genotype patterns at CLU, CR1, PICALM and APOE, cognition and Mediterranean diet: the PREDIMED-NAVARRA trial. Genes Nutr. 2014;9(3):393-7.
36. Gardener SL, Rainey-Smith SR, Barnes MB, Sohrabi HR, Weinborn M, Lim YY, et al. Dietary patterns and cognitive decline in an Australian study of ageing. Mol Psychiatry. 2015;20(7):860-6.
37. Cherbuin N, Anstey KJ. The Mediterranean diet is not related to cognitive change in a large prospective investigation:the PATH Through Life study. Am J Geriatr Psychiatry. 2012;20(7):635-9.
38. Roberts RO, Geda YE, Cerhan JR, Knopman DS, Cha RH, Christianson TJ, et al. Vegetables, unsaturated fats, moderate alcohol intake, and mild cognitive impairment. Dementia and geriatric cognitive disorders. 2010;29(5):413-23.
39. Devore EE, Kang JH, Breteler MM, Grodstein F. Dietary intakes of berries and flavonoids in relation to cognitive decline. Annals of neurology. 2012;72(1):135-43.
40. Hu FB, Stampfer MJ, Rimm E, Ascherio A, Rosner BA, Spiegelman D, et al. Dietary fat and coronary heart disease: acomparison of approaches for adjusting for total energy intake and modeling repeated dietary measurements. Am J Epidemiol. 1999;149(6):531-40.

5
Chapter 5 | The Dietary Approaches to Stop Hypertension diet, cognitive function and decline
88
References 1. Nelson L, Tabet N. Slowing the progression of Alzheimer's disease; what works? Ageing Res Rev. 2015;23:193-209. 2. USDA. Scientific Report of the 2015 Dietary Guidelines Advisory Committee. Washington: USDA, 2015. 3. van de Rest O, Berendsen AM, Haveman-Nies A, de Groot CPGM. Dietary patterns, cognitive decline, and dementia: a
systematic review. Adv Nutr. 2015;6(2):154-68. 4. Appel LJ, Moore TJ, Obarzanek E, Vollmer WM, Svetkey LP, Sacks FM, et al. A clinical trial of the effects of dietary
patterns on blood pressure. DASH Collaborative Research Group. N Engl J Med. 1997;336(16):1117-24. 5. Blumenthal JA, Babyak MA, Hinderliter A, Watkins LL, Craighead L, Lin PH, et al. Effects of the DASH diet alone and in
combination with exercise and weight loss on blood pressure and cardiovascular biomarkers in men and women with high blood pressure: the ENCORE study. Arch Intern Med. 2010;170(2):126-35.
6. Kilander L, Nyman H, Boberg M, Hansson L, Lithell H. Hypertension is related to cognitive impairment: a 20-year follow-up of 999 men. Hypertension. 1998;31(3):780-6.
7. Launer LJ, Ross GW, Petrovitch H, Masaki K, Foley D, White LR, et al. Midlife blood pressure and dementia: the Honolulu-Asia aging study. Neurobiol Aging. 2000;21(1):49-55.
8. Duron E, Hanon O. Hypertension, cognitive decline and dementia. Arch Cardiovasc Dis. 2008;101(3):181-9. 9. Wengreen H, Munger RG, Cutler A, Quach A, Bowles A, Corcoran C, et al. Prospective study of Dietary Approaches to
Stop Hypertension- and Mediterranean-style dietary patterns and age-related cognitive change: the Cache County Study on Memory, Health and Aging. Am J Clin Nutr. 2013;98(5):1263-71.
10. Tangney CC, Li H, Wang Y, Barnes L, Schneider JA, Bennett DA, et al. Relation of DASH- and Mediterranean-like dietary patterns to cognitive decline in older persons. Neurology. 2014;83(16):1410-6.
11. Smith PJ, Blumenthal JA, Babyak MA, Craighead L, Welsh-Bohmer KA, Browndyke JN, et al. Effects of the dietary approaches to stop hypertension diet, exercise, and caloric restriction on neurocognition in overweight adults with high blood pressure. Hypertension. 2010;55(6):1331-8.
12. Willett WC, Sampson L, Stampfer MJ, Rosner B, Bain C, Witschi J, et al. Reproducibility and validity of a semiquantitative food frequency questionnaire. Am J Epidemiol. 1985;122(1):51-65.
13. Fung TT, Chiuve SE, McCullough ML, Rexrode KM, Logroscino G, Hu FB. Adherence to a DASH-style diet and risk of coronary heart disease and stroke in women. Arch Intern Med. 2008;168(7):713-20.
14. Launer LJ. The epidemiologic study of dementia: a life-long quest? Neurobiol Aging. 2005;26(3):335-40. 15. Brandt J, Spencer M, Folstein M. The telephone interview for cognitive status. Neuropsychiatry Neuropsychol Behav
Neurol. 1988;1:111-7. 16. Albert M, Smith LA, Scherr PA, Taylor JO, Evans DA, Funkenstein HH. Use of brief cognitive tests to identify individuals
in the community with clinically diagnosed Alzheimer's disease. Int J Neurosci. 1991;57(3-4):167-78. 17. Folstein MF, Folstein SE, McHugh PR. "Mini-mental state". A practical method for grading the cognitive state of patients
for the clinician. J Psychiatr Res. 1975;12(3):189-98. 18. Morris JC, Heyman A, Mohs RC, Hughes JP, van Belle G, Fillenbaum G, et al. The Consortium to Establish a Registry for
Alzheimer's Disease (CERAD). Part I. Clinical and neuropsychological assessment of Alzheimer's disease. Neurology. 1989;39(9):1159-65.
19. Samieri C, Okereke OI, Devore EE, Grodstein F. Long-term adherence to the Mediterranean diet is associated with overall cognitive status, but not cognitive decline, in women. J Nutr. 2013;143(4):493-9.
20. Laird NM, Ware JH. Random-effects models for longitudinal data. Biometrics. 1982;38(4):963-74. 21. Dubois B, Feldman HH, Jacova C, Cummings JL, Dekosky ST, Barberger-Gateau P, et al. Revising the definition of
Alzheimer's disease: a new lexicon. Lancet Neurol. 2010;9(11):1118-27. 22. Féart C, Samieri C, Rondeau V, Amieva H, Portet F, Dartigues JF, et al. Adherence to a mediterranean diet, cognitive
decline, and risk of dementia. JAMA. 2009;302(6):638-48. 23. Samieri C, Grodstein F, Rosner BA, Kang JH, Cook NR, Manson JE, et al. Mediterranean diet and cognitive function in
older age. Epidemiology (Cambridge, Mass). 2013;24(4):490-9. 24. Tangney CC, Kwasny MJ, Li H, Wilson RS, Evans DA, Morris MC. Adherence to a Mediterranean-type dietary pattern and
cognitive decline in a community population. Am J Clin Nutr. 2011;93(3):601-7. 25. Ye X, Scott T, Gao X, Maras JE, Bakun PJ, Tucker KL. Mediterranean diet, healthy eating index 2005, and cognitive
function in middle-aged and older puerto rican adults. Journal of the Academy of Nutrition and Dietetics. 2013;113(2):276-81.
26. Correa Leite ML, Nicolosi A, Cristina S, Hauser WA, Nappi G. Nutrition and cognitive deficit in the elderly: a population study. Eur J Clin Nutr. 2001;55(12):1053-8.
27. O'Brien J, Okereke O, Devore E, Rosner B, Breteler M, Grodstein F. Long-term intake of nuts in relation to cognitive function in older women. J Nutr Health Aging. 2014;18(5):496-502.
28. Lin PH, Appel LJ, Funk K, Craddick S, Chen C, Elmer P, et al. The PREMIER intervention helps participants follow the Dietary Approaches to Stop Hypertension dietary pattern and the current Dietary Reference Intakes recommendations. J Am Diet Assoc. 2007;107(9):1541-51.
29. Grodstein F. Cardiovascular risk factors and cognitive function. Alzheimers Dement. 2007;3(2 Suppl):S16-22. 30. Corder EH, Saunders AM, Strittmatter WJ, Schmechel DE, Gaskell PC, Small GW, et al. Gene dose of apolipoprotein E
type 4 allele and the risk of Alzheimer's disease in late onset families. Science. 1993;261(5123):921-3.
89
31. Saunders AM, Strittmatter WJ, Schmechel D, George-Hyslop PH, Pericak-Vance MA, Joo SH, et al. Association ofapolipoprotein E allele epsilon 4 with late-onset familial and sporadic Alzheimer's disease. Neurology. 1993;43(8):1467-72.
32. Feskens EJ, Havekes LM, Kalmijn S, de Knijff P, Launer LJ, Kromhout D. Apolipoprotein e4 allele and cognitive decline inelderly men. BMJ. 1994;309(6963):1202-6.
33. Wilson RS, Schneider JA, Barnes LL, Beckett LA, Aggarwal NT, Cochran EJ, et al. The apolipoprotein E epsilon 4 allele anddecline in different cognitive systems during a 6-year period. Arch Neurol. 2002;59(7):1154-60.
34. Barberger-Gateau P, Raffaitin C, Letenneur L, Berr C, Tzourio C, Dartigues JF, et al. Dietary patterns and risk ofdementia: the Three-City cohort study. Neurology. 2007;69(20):1921-30.
35. Martinez-Lapiscina EH, Galbete C, Corella D, Toledo E, Buil-Cosiales P, Salas-Salvado J, et al. Genotype patterns at CLU, CR1, PICALM and APOE, cognition and Mediterranean diet: the PREDIMED-NAVARRA trial. Genes Nutr. 2014;9(3):393-7.
36. Gardener SL, Rainey-Smith SR, Barnes MB, Sohrabi HR, Weinborn M, Lim YY, et al. Dietary patterns and cognitive decline in an Australian study of ageing. Mol Psychiatry. 2015;20(7):860-6.
37. Cherbuin N, Anstey KJ. The Mediterranean diet is not related to cognitive change in a large prospective investigation:the PATH Through Life study. Am J Geriatr Psychiatry. 2012;20(7):635-9.
38. Roberts RO, Geda YE, Cerhan JR, Knopman DS, Cha RH, Christianson TJ, et al. Vegetables, unsaturated fats, moderate alcohol intake, and mild cognitive impairment. Dementia and geriatric cognitive disorders. 2010;29(5):413-23.
39. Devore EE, Kang JH, Breteler MM, Grodstein F. Dietary intakes of berries and flavonoids in relation to cognitive decline. Annals of neurology. 2012;72(1):135-43.
40. Hu FB, Stampfer MJ, Rimm E, Ascherio A, Rosner BA, Spiegelman D, et al. Dietary fat and coronary heart disease: acomparison of approaches for adjusting for total energy intake and modeling repeated dietary measurements. Am J Epidemiol. 1999;149(6):531-40.


Chapter 6Association of long-term adherence
to the MIND diet with cognitive function and cognitive decline in
American women
Agnes A.M. Berendsen, Jae H. Kang, Edith J.M. Feskens, Lisette C.P.G.M. de Groot, Francine Grodstein,
Ondine van de Rest
The Journal of Nutrition, Health & Aging, 2017, 1-8

Chapter 6 | The MIND diet, cognitive function and decline
92
Abstract Objectives: There is increasing attention for dietary patterns as a potential strategy to prevent cognitive decline. We examined the association between adherence to a recently developed Mediterranean-DASH Intervention for Neurodegenerative Delay (MIND) diet with cognitive function and cognitive decline, taking into account the interaction between the apolipoprotein E ε4 genotype and the MIND diet. Design: Population-based prospective cohort study. Participants: A total of 16,058 older women aged 70 and over from the Nurses’ Health Study. Measurements: Dietary intake was assessed five times between 1984 and 1998 with a 116-item Food Frequency Questionnaire. The MIND score includes ten brain-healthy foods and five unhealthy foods. Cognition was assessed four times by telephone from 1995 to 2001 with the Telephone Interview for Cognitive Status (TICS) and by calculating composite scores of verbal memory and global cognition. Linear regression modelling and linear mixed modelling were used to examine the associations of adherence to the MIND diet with average cognitive function and cognitive change over six years, respectively. Results: Greater long-term adherence to the MIND diet was associated with a better verbal memory score (multivariable-adjusted mean differences between extreme MIND quintiles=0.04 (95%CI 0.01-0.07), p-trend=0.006), but not with cognitive decline over 6 years in global cognition, verbal memory or TICS. Conclusion: Long-term adherence to the MIND diet was moderately associated with better verbal memory in later life. Future studies should address this association within populations at greater risk of cognitive decline.
93
Introduction The proportion of the world’s population over 60 years is expected to double from 11% in 2010 to 22% by 2050 [1]. With population ageing, there will be an increase in the prevalence of age-related diseases and disabilities, such as dementia [2]. As, to date, there is no effective treatment for dementia [3], it is important to identify disease-modifying risk factors to prevent cognitive decline. One of these factors could be nutrition. Especially studying dietary patterns as a potential strategy to prevent cognitive decline has increasingly received attention in recent years. The Mediterranean diet (MeDi) is a frequently studied dietary pattern which has been shown to be associated with a slower rate of cognitive decline [4]. A less studied dietary pattern in relation to cognition is the Dietary Approaches to Stop Hypertension (DASH) diet. So far, three observational studies and one intervention study have demonstrated that higher adherence to the DASH diet was associated with less cognitive decline [5-8]. However, the MeDi and DASH diets do not include specific dietary components that optimize brain health.
Recently, a hybrid of these two dietary patterns has been developed by Morris et al. [9], namely the Mediterranean-DASH Intervention for Neurodegenerative Delay (MIND) diet. Similar to the MeDi and DASH diets, the MIND diet emphasizes natural plant-based foods and limited intakes of animal and high saturated fat foods. Uniquely, it also specifies the consumption of berries and green leafy vegetables [9], which have been demonstrated to have antioxidant and anti-inflammatory properties and inhibit β-amyloid deposition and neurotoxic death [10]. Greater adherence to the MIND diet was associated with slower rates of cognitive decline in the only study conducted to date [10].
Besides lifestyle factors, the apolipoprotein E ε4 (ApoE ε4) allele has been shown to be a major genetic risk factor for more rapid cognitive decline and earlier onset of Alzheimer’s Disease (AD) [11, 12]. The few human studies that have investigated an interaction between dietary patterns and cognitive function showed inconsistent findings [13-17]. Overall, the contribution of the ApoE ε4 allele in the association between dietary patterns and cognitive function is unclear.
We evaluated the association between long-term adherence to the MIND diet with cognitive function and cognitive decline during 6 years in 16,058 women from the Nurses’ Health Study. Additionally, we examined the interaction between the ApoE ε4 genotype and the MIND diet in relation to cognitive function.
Methods Study population The Nurses’ Health Study (NHS) began in 1976, with 121,700 female registered nurses aged 30-55 years and resided in 11 U.S. states. Participants completed a mailed questionnaire about their health and lifestyle. Follow-up questionnaires are sent every two years. To date, follow-up of the cohort remains ~90%. In 1984, participants completed a 116-item semi-quantitative food frequency questionnaire (FFQ) and similar FFQs were sent in 1986 and every 4 years thereafter [18]. During 1995–2001, women who were ≥70 years old and free of stroke were invited to participate in the first telephone-based study of cognitive function. A total of 19,415 eligible women completed the first interview (93%). Follow-up assessments were performed three times at two-year intervals until 2008, with a participation rate of >90% among those who remained alive and could be contacted at

6
Chapter 6 | The MIND diet, cognitive function and decline
92
Abstract Objectives: There is increasing attention for dietary patterns as a potential strategy to prevent cognitive decline. We examined the association between adherence to a recently developed Mediterranean-DASH Intervention for Neurodegenerative Delay (MIND) diet with cognitive function and cognitive decline, taking into account the interaction between the apolipoprotein E ε4 genotype and the MIND diet. Design: Population-based prospective cohort study. Participants: A total of 16,058 older women aged 70 and over from the Nurses’ Health Study. Measurements: Dietary intake was assessed five times between 1984 and 1998 with a 116-item Food Frequency Questionnaire. The MIND score includes ten brain-healthy foods and five unhealthy foods. Cognition was assessed four times by telephone from 1995 to 2001 with the Telephone Interview for Cognitive Status (TICS) and by calculating composite scores of verbal memory and global cognition. Linear regression modelling and linear mixed modelling were used to examine the associations of adherence to the MIND diet with average cognitive function and cognitive change over six years, respectively. Results: Greater long-term adherence to the MIND diet was associated with a better verbal memory score (multivariable-adjusted mean differences between extreme MIND quintiles=0.04 (95%CI 0.01-0.07), p-trend=0.006), but not with cognitive decline over 6 years in global cognition, verbal memory or TICS. Conclusion: Long-term adherence to the MIND diet was moderately associated with better verbal memory in later life. Future studies should address this association within populations at greater risk of cognitive decline.
93
Introduction The proportion of the world’s population over 60 years is expected to double from 11% in 2010 to 22% by 2050 [1]. With population ageing, there will be an increase in the prevalence of age-related diseases and disabilities, such as dementia [2]. As, to date, there is no effective treatment for dementia [3], it is important to identify disease-modifying risk factors to prevent cognitive decline. One of these factors could be nutrition. Especially studying dietary patterns as a potential strategy to prevent cognitive decline has increasingly received attention in recent years. The Mediterranean diet (MeDi) is a frequently studied dietary pattern which has been shown to be associated with a slower rate of cognitive decline [4]. A less studied dietary pattern in relation to cognition is the Dietary Approaches to Stop Hypertension (DASH) diet. So far, three observational studies and one intervention study have demonstrated that higher adherence to the DASH diet was associated with less cognitive decline [5-8]. However, the MeDi and DASH diets do not include specific dietary components that optimize brain health.
Recently, a hybrid of these two dietary patterns has been developed by Morris et al. [9], namely the Mediterranean-DASH Intervention for Neurodegenerative Delay (MIND) diet. Similar to the MeDi and DASH diets, the MIND diet emphasizes natural plant-based foods and limited intakes of animal and high saturated fat foods. Uniquely, it also specifies the consumption of berries and green leafy vegetables [9], which have been demonstrated to have antioxidant and anti-inflammatory properties and inhibit β-amyloid deposition and neurotoxic death [10]. Greater adherence to the MIND diet was associated with slower rates of cognitive decline in the only study conducted to date [10].
Besides lifestyle factors, the apolipoprotein E ε4 (ApoE ε4) allele has been shown to be a major genetic risk factor for more rapid cognitive decline and earlier onset of Alzheimer’s Disease (AD) [11, 12]. The few human studies that have investigated an interaction between dietary patterns and cognitive function showed inconsistent findings [13-17]. Overall, the contribution of the ApoE ε4 allele in the association between dietary patterns and cognitive function is unclear.
We evaluated the association between long-term adherence to the MIND diet with cognitive function and cognitive decline during 6 years in 16,058 women from the Nurses’ Health Study. Additionally, we examined the interaction between the ApoE ε4 genotype and the MIND diet in relation to cognitive function.
Methods Study population The Nurses’ Health Study (NHS) began in 1976, with 121,700 female registered nurses aged 30-55 years and resided in 11 U.S. states. Participants completed a mailed questionnaire about their health and lifestyle. Follow-up questionnaires are sent every two years. To date, follow-up of the cohort remains ~90%. In 1984, participants completed a 116-item semi-quantitative food frequency questionnaire (FFQ) and similar FFQs were sent in 1986 and every 4 years thereafter [18]. During 1995–2001, women who were ≥70 years old and free of stroke were invited to participate in the first telephone-based study of cognitive function. A total of 19,415 eligible women completed the first interview (93%). Follow-up assessments were performed three times at two-year intervals until 2008, with a participation rate of >90% among those who remained alive and could be contacted at

Chapter 6 | The MIND diet, cognitive function and decline
94
each follow-up point. The study was approved by the Institutional Review Board of Brigham and Women’s Hospital (Boston, MA) and all participants consented.
In the present study, we excluded those who had not completed at least one of the two initial FFQs in 1984 and 1986 (n=2,990), without at least one complete cognition battery at follow-up (n=331), or had no data for physical activity (n=36), resulting in a total population for analysis of 16,058 participants. Dietary assessment and MIND diet score For each item of the FFQ, possible responses ranged from ‘never or <1 time/month’ to ‘≥6 times/day’, and specific standardized portion sizes. Food intake estimations were converted into nutrient intakes by multiplying the frequency of consumption of each food by its nutrient content by using the U.S. Department of Agriculture database and other sources of updated supplementary information.
In this study, we used the 1984, 1986, 1990, 1994 and 1998 FFQs to estimate daily energy intake and to construct a MIND diet score at each of these time points using the methodology described by Morris et al. [9]. The MIND score is based on 10 brain-healthy foods groups: namely, higher intake of green leafy vegetables (spinach, lettuce, kale), other vegetables, berries (blueberries, strawberries), nuts, whole grains, fish, beans, poultry, limited intake of wine (red and white wine), and use of olive oil as primary source of fat; and 5 unhealthy foods: namely, lower intakes of butter and margarine, cheese, red meat and products, fast fried foods, and pastries and sweets [9] (table 1). For healthy components, we assigned 0, 0.5 or 1 point for higher intakes, and for unhealthy components the scoring was reversed (total score 0 to 15 points). As long-term dietary habits are likely most relevant because cognitive decline develops over many years [19], long-term MIND score was computed as the mean of up to five MIND scores from all dietary assessments from 1984 (or 1986, if 1984 FFQ was missing) to the questionnaire immediately preceding the first cognitive interview. Total MIND scores were divided into quintiles based on the study population distribution. Table 1. Components and scoring of the MIND diet within the Nurses’ Health Study Score MIND component 0 0.5 1 Green leafy vegetables ≤2 servings/week >2 to <6/week ≥6 servings/week Other vegetables <5 servings/week 5 to <7/week ≥1 serving/day Berries <1 serving/week 1-2/week ≥2 servings/week Nuts <1/month 1/month to <5/week ≥5 servings/week Olive Oil Not primary oil Primary oil used Butter, margarine >2 table spoon/day 1-2 table spoon/day <1 table spoon/day Cheese ≥7 servings/week ≥1-<7/week <1 serving/week Whole grains <1 serving/day ≥1-<3/day ≥3 servings/day Fish (not fried) Rarely 1-3/month ≥1 meals/week Beans <1 meal/week 1-3/week >3 meals/week Poultry (not fried) <1 meal/week ≥1-<2/week ≥2 meals/week Red meat and products >6 meals/week ≥4-≤6/week <4 meals/week Fast fried foods ≥4 times/week 1-<4/week <1 time/week Pastries and sweets ≥7 servings/week ≥5-<7/week <5 servings/week Wine >1 glass/day or never 1/month to 6/week 1 glass/day Total score 0 7.5 15
95
Cognitive assessment Cognitive testing was performed by trained interviewers using validated telephone interviews. The cognitive battery included: 1) the Telephone Interview for Cognitive Status (TICS) [20]; 2) immediate; and 3) delayed recalls of the East Boston Memory test (EBMT) [21]; 4) delayed recall of the TICS 10-word list; 5) category fluency; and 6) digit span-backward test. The sample size slightly differs across tests as in the initial stage of the first cognitive interview only the TICS was administered and gradually five other tests were added. The participation rate remained identical for all tests.
The TICS [20] (0–41 points) is a telephone adaptation of the Mini-Mental State Examination [22] and assesses overall cognitive performance. The EBMT [21] (0–12 points) and delayed recall of the TICS 10-word list (0–10 points) assesses verbal (episodic) memory. The category fluency test assesses language and executive function [23]; performance is based on naming as many animals as possible in one minute. Finally, the digit-span backward test (0–12 points) assesses working memory and attention, where participants repeat backwards an increasingly long series of digits.
The primary outcomes were the TICS and composite scores of global cognition and verbal memory. A global cognitive score was computed as the mean of z-scores of all six cognitive tests. A verbal memory score was calculated as the mean of z-scores of four tests assessing verbal memory (i.e., immediate and delayed recalls of both the EBMT and the TICS 10-word list). We calculated z-scores at each follow-up using means and standard deviations of scores at the first cognitive assessment. Other variables Socio-demographic, lifestyle and health-related information were obtained from questionnaires. Using cumulative and updated information from 1976, covariates were determined at the time of the first cognitive exam. For physical activity and energy intake values were averaged across multiple assessments over time, similar to diet. Physical activity was assessed in 1986, 1988 and 1992, and every 2 years thereafter by estimating mean energy expended per week (in metabolic equivalent-hours, Met-hrs). In a randomly selected subsample (n=5,822), data on ApoE polymorphisms was available from cheek cell specimens (n=3,469) and genome wide association studies (n=2,353). Statistical analyses Long-term MIND adherence, cognitive function and decline Statistical analyses consisted of two complementary approaches. As primary analyses, we averaged the four repeated measures of cognitive function to create an outcome representing overall cognitive status at older ages. Averaging repeated measures of cognition was relevant to our data, as it attenuates variability in each single cognitive assessment, which may be helpful when cognition is measured over a relatively short follow-up period in largely healthy, educated participants, as described in previous studies [24, 25]. The association of long-term MIND score with cognitive status was modelled using linear regression models.
As secondary approach, we modelled trajectories of the four repeated cognitive scores using linear mixed models [26]. The linear mixed models included an intercept representing the level of cognitive score at baseline and a slope representing the annual change in scores over time, as well as a random intercept and random slope to account for inter-individual variability.
Adjustments were made for confounding factors age and education (registered nurse, bachelor, master or doctorate) (Model 1), and additionally for long-term energy intake (quintiles) and physical activity (Met-hrs/week, quintiles), body mass index (BMI, ≤21, 22-24, 25-29, ≥30 kg/m2),

6
Chapter 6 | The MIND diet, cognitive function and decline
94
each follow-up point. The study was approved by the Institutional Review Board of Brigham and Women’s Hospital (Boston, MA) and all participants consented.
In the present study, we excluded those who had not completed at least one of the two initial FFQs in 1984 and 1986 (n=2,990), without at least one complete cognition battery at follow-up (n=331), or had no data for physical activity (n=36), resulting in a total population for analysis of 16,058 participants. Dietary assessment and MIND diet score For each item of the FFQ, possible responses ranged from ‘never or <1 time/month’ to ‘≥6 times/day’, and specific standardized portion sizes. Food intake estimations were converted into nutrient intakes by multiplying the frequency of consumption of each food by its nutrient content by using the U.S. Department of Agriculture database and other sources of updated supplementary information.
In this study, we used the 1984, 1986, 1990, 1994 and 1998 FFQs to estimate daily energy intake and to construct a MIND diet score at each of these time points using the methodology described by Morris et al. [9]. The MIND score is based on 10 brain-healthy foods groups: namely, higher intake of green leafy vegetables (spinach, lettuce, kale), other vegetables, berries (blueberries, strawberries), nuts, whole grains, fish, beans, poultry, limited intake of wine (red and white wine), and use of olive oil as primary source of fat; and 5 unhealthy foods: namely, lower intakes of butter and margarine, cheese, red meat and products, fast fried foods, and pastries and sweets [9] (table 1). For healthy components, we assigned 0, 0.5 or 1 point for higher intakes, and for unhealthy components the scoring was reversed (total score 0 to 15 points). As long-term dietary habits are likely most relevant because cognitive decline develops over many years [19], long-term MIND score was computed as the mean of up to five MIND scores from all dietary assessments from 1984 (or 1986, if 1984 FFQ was missing) to the questionnaire immediately preceding the first cognitive interview. Total MIND scores were divided into quintiles based on the study population distribution. Table 1. Components and scoring of the MIND diet within the Nurses’ Health Study Score MIND component 0 0.5 1 Green leafy vegetables ≤2 servings/week >2 to <6/week ≥6 servings/week Other vegetables <5 servings/week 5 to <7/week ≥1 serving/day Berries <1 serving/week 1-2/week ≥2 servings/week Nuts <1/month 1/month to <5/week ≥5 servings/week Olive Oil Not primary oil Primary oil used Butter, margarine >2 table spoon/day 1-2 table spoon/day <1 table spoon/day Cheese ≥7 servings/week ≥1-<7/week <1 serving/week Whole grains <1 serving/day ≥1-<3/day ≥3 servings/day Fish (not fried) Rarely 1-3/month ≥1 meals/week Beans <1 meal/week 1-3/week >3 meals/week Poultry (not fried) <1 meal/week ≥1-<2/week ≥2 meals/week Red meat and products >6 meals/week ≥4-≤6/week <4 meals/week Fast fried foods ≥4 times/week 1-<4/week <1 time/week Pastries and sweets ≥7 servings/week ≥5-<7/week <5 servings/week Wine >1 glass/day or never 1/month to 6/week 1 glass/day Total score 0 7.5 15
95
Cognitive assessment Cognitive testing was performed by trained interviewers using validated telephone interviews. The cognitive battery included: 1) the Telephone Interview for Cognitive Status (TICS) [20]; 2) immediate; and 3) delayed recalls of the East Boston Memory test (EBMT) [21]; 4) delayed recall of the TICS 10-word list; 5) category fluency; and 6) digit span-backward test. The sample size slightly differs across tests as in the initial stage of the first cognitive interview only the TICS was administered and gradually five other tests were added. The participation rate remained identical for all tests.
The TICS [20] (0–41 points) is a telephone adaptation of the Mini-Mental State Examination [22] and assesses overall cognitive performance. The EBMT [21] (0–12 points) and delayed recall of the TICS 10-word list (0–10 points) assesses verbal (episodic) memory. The category fluency test assesses language and executive function [23]; performance is based on naming as many animals as possible in one minute. Finally, the digit-span backward test (0–12 points) assesses working memory and attention, where participants repeat backwards an increasingly long series of digits.
The primary outcomes were the TICS and composite scores of global cognition and verbal memory. A global cognitive score was computed as the mean of z-scores of all six cognitive tests. A verbal memory score was calculated as the mean of z-scores of four tests assessing verbal memory (i.e., immediate and delayed recalls of both the EBMT and the TICS 10-word list). We calculated z-scores at each follow-up using means and standard deviations of scores at the first cognitive assessment. Other variables Socio-demographic, lifestyle and health-related information were obtained from questionnaires. Using cumulative and updated information from 1976, covariates were determined at the time of the first cognitive exam. For physical activity and energy intake values were averaged across multiple assessments over time, similar to diet. Physical activity was assessed in 1986, 1988 and 1992, and every 2 years thereafter by estimating mean energy expended per week (in metabolic equivalent-hours, Met-hrs). In a randomly selected subsample (n=5,822), data on ApoE polymorphisms was available from cheek cell specimens (n=3,469) and genome wide association studies (n=2,353). Statistical analyses Long-term MIND adherence, cognitive function and decline Statistical analyses consisted of two complementary approaches. As primary analyses, we averaged the four repeated measures of cognitive function to create an outcome representing overall cognitive status at older ages. Averaging repeated measures of cognition was relevant to our data, as it attenuates variability in each single cognitive assessment, which may be helpful when cognition is measured over a relatively short follow-up period in largely healthy, educated participants, as described in previous studies [24, 25]. The association of long-term MIND score with cognitive status was modelled using linear regression models.
As secondary approach, we modelled trajectories of the four repeated cognitive scores using linear mixed models [26]. The linear mixed models included an intercept representing the level of cognitive score at baseline and a slope representing the annual change in scores over time, as well as a random intercept and random slope to account for inter-individual variability.
Adjustments were made for confounding factors age and education (registered nurse, bachelor, master or doctorate) (Model 1), and additionally for long-term energy intake (quintiles) and physical activity (Met-hrs/week, quintiles), body mass index (BMI, ≤21, 22-24, 25-29, ≥30 kg/m2),

Chapter 6 | The MIND diet, cognitive function and decline
96
smoking status (never, former, current), alcohol intake (<1, 1-15, ≥15 g/d), history of depression (yes/no), multivitamin use (yes/no), and cardiovascular risk factors (history of diabetes, hypertension, hypercholesterolemia, and/or myocardial infarction (yes/no) (Model 2). Because for BMI and multivitamin use data was missing for >4% of the sample (4.4 and 7.1%, respectively); a missing category was created. For other covariates, participants with missing data were <1% of the sample and were assigned to the reference group. Effect modification was tested by adding an interaction term for MIND score quintiles with age (median split), BMI (<25/≥25 kg/m2), high blood pressure (yes/no), hypercholesterolemia (yes/no), myocardial infarction (yes/no). In a subset of 5,822 participants, a variable indicating the product of the number of ApoE ε4 alleles (0,1,2) was used to test for effect modification by ApoE ε4 genotype. MIND-components and cognitive function To examine the relative importance of the individual MIND components, we recalculated separate MIND scores by excluding one MIND component at a time while including this component as covariate (in quintiles of intake). All statistical analyses were carried out using SAS software version 9.2 (SAS Institute Inc., Cary, NC, USA). A two-sided p-value of <0.05 was considered significant. We examined linear trends across quintiles of the MIND score using a continuous variable in which participants in a given category were assigned the median value.
Results General characteristics At the first cognitive assessment, the mean age of participants was 74.3 ± 2.3 years (mean ± SD), and the mean TICS score was 33.8 ± 2.7 points. The median MIND score was 6.4 points (range 2.6–11.0) with a large variation in intake of individual MIND components across quintiles of the average MIND score of 4.4 dietary assessments over 12.9 years (table 2). Women with greater long-term MIND adherence were more likely to have a lower BMI, to be more physically active, to be higher educated, to use a multivitamin supplement, to report a history of hypercholesterolemia and were less likely to be current smokers and to report a history of depression. Average cognitive function Greater long-term adherence to the MIND score was linearly related to significantly higher verbal memory scores, comprising the mean of the 4 repeated measures of cognitive function, in both the age and education adjusted model and the multivariable-adjusted model (p-trend <0.0001 for model 1, 0.006 for model 2), but not with a better global cognition or TICS score (table 3). The mean difference in mean verbal memory between the top and bottom quintiles of the MIND score in the fully adjusted model was 0.04 standard units.
97
Table 2. Baseline characteristics of the participants in the Nurses’ Health Study by quintiles of long-term adherence to the MIND score (n=16,058)a Quintile 1
4.9 (2.6-5.4) n = 3,339
Quintile 2 5.8 (5.5-6.1) n = 3,259
Quintile 3 6.4 (6.1-6.7) n = 2,962
Quintile 4 7.0 (6.7-7.3) n = 3,261
Quintile 5 7.9 (7.4-11.0)
n = 3,237 Age at first cognitive exam 74.3 ± 2.3 74.2 ± 2.3 74.3 ± 2.3 74.3 ± 2.4 74.3 ± 2.3 BMI at first cognitive exam ≤21, kg/m2 709 (21.2) 612 (18.8) 561 (18.9) 602 (18.5) 686 (21.2) 22-24, kg/m2 780 (23.4) 771 (23.7) 829 (28.0) 866 (26.6) 860 (26.6) 25-29, kg/m2 1,138 (34.1) 1,090 (33.4) 955 (32.2) 1,127 (34.6) 1,041 (32.2) ≥30, kg/m2 592 (17.7) 647 (19.9) 488 (16.5) 526 (16.1) 476 (14.7)
Long-term physical activity 12.5 ± 12.6 15.0 ± 13.8 17.2 ± 14.7 18.7 ± 15.9 23.1 ± 1 9.8 Educational level
Registered nurse 2,785 (83.4) 2,589 (79.4) 2,325 (78.5) 2,445 (75.0) 2,304 (71.2) Bachelor 403 (12.1) 505 (15.5) 459 (15.5) 588 (18.0) 657 (20.3) Master or doctorate 151 (4.5) 165 (5.1) 178 (6.0) 228 (7.0) 276 (8.5)
Smoking Never 1,582 (47.4) 1,554 (47.7) 1,360 (45.9) 1,512 (46.4) 1,466 (45.3) Former 1,376 (41.2) 1,408 (43.2) 1,377 (46.5) 1,552 (47.6) 1,627 (50.3) Current 381 (11.4) 297 (9.1) 225 (7.6) 197 (6.0) 144 (4.4)
History of: Myocardial infarction 214 (6.4) 197 (6.0) 180 (6.1) 196 (6.0) 182 (5.6) Hypertension 1,860 (55.7) 1,810 (55.5) 1,634 (55.2) 1,829 (56.1) 1,757 (54.3) Hypercholesterolemia 2,107 (63.1) 2,122 (65.1) 1,942 (65.6) 2,179 (66.8) 2,152 (66.5) Diabetes 331 (9.9) 336 (10.3) 329 (11.1) 326 (10.0) 289 (8.9) Depression 346 (10.4) 315 (9.7) 273 (9.2) 305 (9.4) 271 (8.4)
Multivitamin use 1,736 (54.5) 1,888 (58.8) 1,925 (58.7) 1,983 (61.6) 2,026 (64.1) Long-term dietary variables (servings per day unless otherwise noted) Energy intake, kcal/day 1,646 ± 440 1,686 ± 428 1,694 ± 421 1,712 ± 409 1,783 ± 420 Alcohol, g/day 4.6 ± 8.8 5.2 ± 8.9 5.8 ± 9.0 6.1 ± 8.8 6.3 ± 8.4 MIND components
Green leafy vegetablesb 3.4 ± 5.2 5.0 ± 6.7 6.5 ± 8.6 7.4 ± 8.6 9.6 ± 10.1 Other vegetables 2.0 ± 1.8 2.6 ± 2.3 3.1 ± 2.9 3.4 ± 2.9 4.2 ± 3.7 Berriesb 0.8 ± 2.7 1.3 ± 3.5 1.6 ± 4.1 1.8 ± 4.0 2.4 ± 4.7 Nutsb 1.5 ± 2.6 2.1 ± 3.9 2.6 ± 4.7 2.6 ± 4.8 3.4 ± 6.1 Primarily vegetable oil 0.2 ± 0.3 0.3 ± 0.4 0.3 ± 0.4 0.4 ± 0.5 0.6 ± 0.5 Butter, margarine 1.4 ± 1.0 1.2 ± 0.9 1.1 ± 0.9 1.0 ± 0.8 0.8 ± 0.8 Cheeseb 5.9 ± 7.9 5.4 ± 7.2 5.5 ± 7.6 5.3 ± 7.3 5.2 ± 7.6 Whole grains 1.0 ± 1.2 1.4 ± 1.6 1.7 ± 2.1 1.8 ± 2.1 2.4 ± 2.6 Fish (not fried)b 1.1 ± 2.8 1.8 ± 3.8 2.3 ± 4.8 2.6 ± 5.0 3.3 ± 5.2 Beansb 0.6 ± 2.2 1.2 ± 3.4 1.5 ± 4.1 1.8 ± 4.6 2.3 ± 5.4 Poultry (not fried)b 2.3 ± 3.8 3.0 ± 4.7 3.5 ± 4.8 3.7 ± 4.8 4.3 ± 5.2 Red meat and productsb 6.7 ± 6.0 6.3 ± 6.9 6.1 ± 7.6 5.8 ± 8.8 5.4 ± 9.6 Fast fried foodsb 8.0 ± 1.6 8.0 ± 1.7 8.2 ± 1.7 8.3 ± 1.7 8.3 ± 1.9 Pastries and sweetsb 15.1 ± 15.0 14.3 ± 17.8 14.2 ± 21.5 13.0 ± 22.2 13.0 ± 27.4 Wine 0.1 ± 0.4 0.2 ± 0.6 0.3 ± 0.6 0.3 ± 0.6 0.3 ± 0.7
Abbreviation: MIND= Mediterranean-DASH Intervention for Neurodegenerative Delay a Values are means ± SD or number (%) b Servings per week

6
Chapter 6 | The MIND diet, cognitive function and decline
96
smoking status (never, former, current), alcohol intake (<1, 1-15, ≥15 g/d), history of depression (yes/no), multivitamin use (yes/no), and cardiovascular risk factors (history of diabetes, hypertension, hypercholesterolemia, and/or myocardial infarction (yes/no) (Model 2). Because for BMI and multivitamin use data was missing for >4% of the sample (4.4 and 7.1%, respectively); a missing category was created. For other covariates, participants with missing data were <1% of the sample and were assigned to the reference group. Effect modification was tested by adding an interaction term for MIND score quintiles with age (median split), BMI (<25/≥25 kg/m2), high blood pressure (yes/no), hypercholesterolemia (yes/no), myocardial infarction (yes/no). In a subset of 5,822 participants, a variable indicating the product of the number of ApoE ε4 alleles (0,1,2) was used to test for effect modification by ApoE ε4 genotype. MIND-components and cognitive function To examine the relative importance of the individual MIND components, we recalculated separate MIND scores by excluding one MIND component at a time while including this component as covariate (in quintiles of intake). All statistical analyses were carried out using SAS software version 9.2 (SAS Institute Inc., Cary, NC, USA). A two-sided p-value of <0.05 was considered significant. We examined linear trends across quintiles of the MIND score using a continuous variable in which participants in a given category were assigned the median value.
Results General characteristics At the first cognitive assessment, the mean age of participants was 74.3 ± 2.3 years (mean ± SD), and the mean TICS score was 33.8 ± 2.7 points. The median MIND score was 6.4 points (range 2.6–11.0) with a large variation in intake of individual MIND components across quintiles of the average MIND score of 4.4 dietary assessments over 12.9 years (table 2). Women with greater long-term MIND adherence were more likely to have a lower BMI, to be more physically active, to be higher educated, to use a multivitamin supplement, to report a history of hypercholesterolemia and were less likely to be current smokers and to report a history of depression. Average cognitive function Greater long-term adherence to the MIND score was linearly related to significantly higher verbal memory scores, comprising the mean of the 4 repeated measures of cognitive function, in both the age and education adjusted model and the multivariable-adjusted model (p-trend <0.0001 for model 1, 0.006 for model 2), but not with a better global cognition or TICS score (table 3). The mean difference in mean verbal memory between the top and bottom quintiles of the MIND score in the fully adjusted model was 0.04 standard units.
97
Table 2. Baseline characteristics of the participants in the Nurses’ Health Study by quintiles of long-term adherence to the MIND score (n=16,058)a Quintile 1
4.9 (2.6-5.4) n = 3,339
Quintile 2 5.8 (5.5-6.1) n = 3,259
Quintile 3 6.4 (6.1-6.7) n = 2,962
Quintile 4 7.0 (6.7-7.3) n = 3,261
Quintile 5 7.9 (7.4-11.0)
n = 3,237 Age at first cognitive exam 74.3 ± 2.3 74.2 ± 2.3 74.3 ± 2.3 74.3 ± 2.4 74.3 ± 2.3 BMI at first cognitive exam ≤21, kg/m2 709 (21.2) 612 (18.8) 561 (18.9) 602 (18.5) 686 (21.2) 22-24, kg/m2 780 (23.4) 771 (23.7) 829 (28.0) 866 (26.6) 860 (26.6) 25-29, kg/m2 1,138 (34.1) 1,090 (33.4) 955 (32.2) 1,127 (34.6) 1,041 (32.2) ≥30, kg/m2 592 (17.7) 647 (19.9) 488 (16.5) 526 (16.1) 476 (14.7)
Long-term physical activity 12.5 ± 12.6 15.0 ± 13.8 17.2 ± 14.7 18.7 ± 15.9 23.1 ± 1 9.8 Educational level
Registered nurse 2,785 (83.4) 2,589 (79.4) 2,325 (78.5) 2,445 (75.0) 2,304 (71.2) Bachelor 403 (12.1) 505 (15.5) 459 (15.5) 588 (18.0) 657 (20.3) Master or doctorate 151 (4.5) 165 (5.1) 178 (6.0) 228 (7.0) 276 (8.5)
Smoking Never 1,582 (47.4) 1,554 (47.7) 1,360 (45.9) 1,512 (46.4) 1,466 (45.3) Former 1,376 (41.2) 1,408 (43.2) 1,377 (46.5) 1,552 (47.6) 1,627 (50.3) Current 381 (11.4) 297 (9.1) 225 (7.6) 197 (6.0) 144 (4.4)
History of: Myocardial infarction 214 (6.4) 197 (6.0) 180 (6.1) 196 (6.0) 182 (5.6) Hypertension 1,860 (55.7) 1,810 (55.5) 1,634 (55.2) 1,829 (56.1) 1,757 (54.3) Hypercholesterolemia 2,107 (63.1) 2,122 (65.1) 1,942 (65.6) 2,179 (66.8) 2,152 (66.5) Diabetes 331 (9.9) 336 (10.3) 329 (11.1) 326 (10.0) 289 (8.9) Depression 346 (10.4) 315 (9.7) 273 (9.2) 305 (9.4) 271 (8.4)
Multivitamin use 1,736 (54.5) 1,888 (58.8) 1,925 (58.7) 1,983 (61.6) 2,026 (64.1) Long-term dietary variables (servings per day unless otherwise noted) Energy intake, kcal/day 1,646 ± 440 1,686 ± 428 1,694 ± 421 1,712 ± 409 1,783 ± 420 Alcohol, g/day 4.6 ± 8.8 5.2 ± 8.9 5.8 ± 9.0 6.1 ± 8.8 6.3 ± 8.4 MIND components
Green leafy vegetablesb 3.4 ± 5.2 5.0 ± 6.7 6.5 ± 8.6 7.4 ± 8.6 9.6 ± 10.1 Other vegetables 2.0 ± 1.8 2.6 ± 2.3 3.1 ± 2.9 3.4 ± 2.9 4.2 ± 3.7 Berriesb 0.8 ± 2.7 1.3 ± 3.5 1.6 ± 4.1 1.8 ± 4.0 2.4 ± 4.7 Nutsb 1.5 ± 2.6 2.1 ± 3.9 2.6 ± 4.7 2.6 ± 4.8 3.4 ± 6.1 Primarily vegetable oil 0.2 ± 0.3 0.3 ± 0.4 0.3 ± 0.4 0.4 ± 0.5 0.6 ± 0.5 Butter, margarine 1.4 ± 1.0 1.2 ± 0.9 1.1 ± 0.9 1.0 ± 0.8 0.8 ± 0.8 Cheeseb 5.9 ± 7.9 5.4 ± 7.2 5.5 ± 7.6 5.3 ± 7.3 5.2 ± 7.6 Whole grains 1.0 ± 1.2 1.4 ± 1.6 1.7 ± 2.1 1.8 ± 2.1 2.4 ± 2.6 Fish (not fried)b 1.1 ± 2.8 1.8 ± 3.8 2.3 ± 4.8 2.6 ± 5.0 3.3 ± 5.2 Beansb 0.6 ± 2.2 1.2 ± 3.4 1.5 ± 4.1 1.8 ± 4.6 2.3 ± 5.4 Poultry (not fried)b 2.3 ± 3.8 3.0 ± 4.7 3.5 ± 4.8 3.7 ± 4.8 4.3 ± 5.2 Red meat and productsb 6.7 ± 6.0 6.3 ± 6.9 6.1 ± 7.6 5.8 ± 8.8 5.4 ± 9.6 Fast fried foodsb 8.0 ± 1.6 8.0 ± 1.7 8.2 ± 1.7 8.3 ± 1.7 8.3 ± 1.9 Pastries and sweetsb 15.1 ± 15.0 14.3 ± 17.8 14.2 ± 21.5 13.0 ± 22.2 13.0 ± 27.4 Wine 0.1 ± 0.4 0.2 ± 0.6 0.3 ± 0.6 0.3 ± 0.6 0.3 ± 0.7
Abbreviation: MIND= Mediterranean-DASH Intervention for Neurodegenerative Delay a Values are means ± SD or number (%) b Servings per week

Chapter 6 | The MIND diet, cognitive function and decline
98
Table 3. Multivariable-adjusted mean differencesa in cognition averaged over the follow-up period across quintiles of the MIND score in 16,058 older women participating in the Nurses’ Health Study Model 1b Model 2c Global cognitive score Quintile 1 Ref Ref Quintile 2 0.02 (-0.01,0.05) 0.00 (-0.02,0.03) Quintile 3 0.02 (-0.01,0.05) 0.00 (-0.03,0.03) Quintile 4 0.02 (-0.01,0.05) 0.00 (-0.03,0.03) Quintile 5 0.03 (0.00,0.06) 0.00 (-0.03,0.03) p-trend 0.03 0.88
Verbal memory score Quintile 1 Ref Ref Quintile 2 0.02 (-0.01,0.06) 0.01 (-0.02,0.05) Quintile 3 0.03 (0.00,0.07) 0.02 (-0.01,0.05) Quintile 4 0.04 (0.01,0.08) 0.02 (-0.01,0.06) Quintile 5 0.06 (0.03,0.09) 0.04 (0.01,0.07) p-trend <0.0001 0.02
TICS score Quintile 1 Ref Ref Quintile 2 -0.01 (-0.13,0.11) -0.05 (-0.18,0.07) Quintile 3 0.06 (-0.07,0.19) 0.00 (-0.13,0.12) Quintile 4 0.07 (-0.05,0.19) -0.02 (-0.14,0.11) Quintile 5 0.02 (-0.10,0.14) -0.09 (-0.21,0.04) p-trend 0.44 0.31 Abbreviations: MIND= Mediterranean-DASH Intervention for Neurodegenerative Delay; TICS= Telephone interview of cognitive status a Values are mean difference in score (95% confidence interval) b Model 1: adjusted for age and education c Model 2: additionally adjusted physical activity, calorie intake, alcohol intake, smoking status, multivitamin use, BMI, depression, and history of high blood pressure, hypercholesterolemia, myocardial infarction, and diabetes mellitus The associations did not change when additionally adjusting for family history of dementia and socio- economic variables such as income, job, and marital status (data not shown). There was no interaction between adherence to the MIND diet and age, BMI, high blood pressure or ApoE ε4 status for global cognition, verbal memory or TICS (p-interaction age: 0.45, 0.70, 0.82, BMI: 0.63, 0.61, 0.69, high blood pressure: 0.90, 0.70, 0.85, ApoE ε4 status: 0.38, 0.40, 0.27 for global cognition, verbal memory and TICS, respectively). The association between the MIND diet and cognitive function was not mediated by high blood pressure as the effect estimates remained exactly the same when taking out high blood pressure from the multivariable adjusted model (data not shown).
99
Cognitive decline over time Long-term adherence to the MIND score was not significantly associated with change over time in the global cognitive score, verbal memory score, or the TICS score, in either the age and education adjusted models, or in the multivariable-adjusted model (p-trend 0.95, 0.98, and 0.73 for global cognition, verbal memory and TICS, respectively) (table 4). Table 4. Multivariable-adjusted mean differencesa in slopes of cognitive change by quintiles of long-term MIND-score in 16,058 older women Model 1b Model 2c Global cognitive score Quintile 1 Ref Ref Quintile 2 0.002 (-0.005,0.010) 0.001 (-0.007,0.009) Quintile 3 -0.002 (-0.010,0.006) -0.004 (-0.011,0.004) Quintile 4 0.000 (-0.009,0.008) -0.002 (-0.010,0.006) Quintile 5 0.004 (-0.003,0.012) 0.001 (-0.007,0.009) p-trend 0.44 0.95
Verbal memory score Quintile 1 Ref Ref Quintile 2 0.002 (-0.007,0.011) 0.000 (-0.009,0.009) Quintile 3 -0.005 (-0.015,0.004) -0.007 (-0.017,0.002) Quintile 4 -0.001 (-0.010,0.008) -0.003 (-0.013,0.006) Quintile 5 0.005 (-0.004,0.015) 0.002 (-0.008,0.011) p-trend 0.44 0.98
TICS score Quintile 1 Ref Ref Quintile 2 0.017 (-0.015,0.048) 0.014 (-0.018,0.045) Quintile 3 0.007 (-0.025,0.039) 0.003 (-0.030,0.035) Quintile 4 -0.007 (-0.039,0.024) -0.011 (-0.043,0.020) Quintile 5 0.011 (-0.021,0.042) 0.004 (-0.028,0.036) p-trend 0.95 0.73 Abbreviations: MIND= Mediterranean-DASH Intervention for Neurodegenerative Delay; TICS= Telephone interview of cognitive status a Values are mean difference in score (95% confidence interval) b Model 1: adjusted for age and education c Model 2: additionally adjusted for physical activity, calorie intake, alcohol intake, smoking status, multivitamin use, BMI, depression and history of high blood pressure, hypercholesterolemia, myocardial infarction, and diabetes mellitus. MIND-components and cognitive function Excluding the component ‘Butter and margarine’ and ‘Pastries and sweets’ attenuated the association between the MIND score and average verbal memory (adjusted mean differences between extreme quintiles of intake were 0.02 (95%CI -0.02,0.05) for ‘Butter and margarine’ and 0.03 (95%CI -0.01,0.06) for ‘Pastries and sweets, p-trends across categories of intake = 0.14 for both components), demonstrating that these components were the most important contributors to the association, as part of the MIND diet.

6
Chapter 6 | The MIND diet, cognitive function and decline
98
Table 3. Multivariable-adjusted mean differencesa in cognition averaged over the follow-up period across quintiles of the MIND score in 16,058 older women participating in the Nurses’ Health Study Model 1b Model 2c Global cognitive score Quintile 1 Ref Ref Quintile 2 0.02 (-0.01,0.05) 0.00 (-0.02,0.03) Quintile 3 0.02 (-0.01,0.05) 0.00 (-0.03,0.03) Quintile 4 0.02 (-0.01,0.05) 0.00 (-0.03,0.03) Quintile 5 0.03 (0.00,0.06) 0.00 (-0.03,0.03) p-trend 0.03 0.88
Verbal memory score Quintile 1 Ref Ref Quintile 2 0.02 (-0.01,0.06) 0.01 (-0.02,0.05) Quintile 3 0.03 (0.00,0.07) 0.02 (-0.01,0.05) Quintile 4 0.04 (0.01,0.08) 0.02 (-0.01,0.06) Quintile 5 0.06 (0.03,0.09) 0.04 (0.01,0.07) p-trend <0.0001 0.02
TICS score Quintile 1 Ref Ref Quintile 2 -0.01 (-0.13,0.11) -0.05 (-0.18,0.07) Quintile 3 0.06 (-0.07,0.19) 0.00 (-0.13,0.12) Quintile 4 0.07 (-0.05,0.19) -0.02 (-0.14,0.11) Quintile 5 0.02 (-0.10,0.14) -0.09 (-0.21,0.04) p-trend 0.44 0.31 Abbreviations: MIND= Mediterranean-DASH Intervention for Neurodegenerative Delay; TICS= Telephone interview of cognitive status a Values are mean difference in score (95% confidence interval) b Model 1: adjusted for age and education c Model 2: additionally adjusted physical activity, calorie intake, alcohol intake, smoking status, multivitamin use, BMI, depression, and history of high blood pressure, hypercholesterolemia, myocardial infarction, and diabetes mellitus The associations did not change when additionally adjusting for family history of dementia and socio- economic variables such as income, job, and marital status (data not shown). There was no interaction between adherence to the MIND diet and age, BMI, high blood pressure or ApoE ε4 status for global cognition, verbal memory or TICS (p-interaction age: 0.45, 0.70, 0.82, BMI: 0.63, 0.61, 0.69, high blood pressure: 0.90, 0.70, 0.85, ApoE ε4 status: 0.38, 0.40, 0.27 for global cognition, verbal memory and TICS, respectively). The association between the MIND diet and cognitive function was not mediated by high blood pressure as the effect estimates remained exactly the same when taking out high blood pressure from the multivariable adjusted model (data not shown).
99
Cognitive decline over time Long-term adherence to the MIND score was not significantly associated with change over time in the global cognitive score, verbal memory score, or the TICS score, in either the age and education adjusted models, or in the multivariable-adjusted model (p-trend 0.95, 0.98, and 0.73 for global cognition, verbal memory and TICS, respectively) (table 4). Table 4. Multivariable-adjusted mean differencesa in slopes of cognitive change by quintiles of long-term MIND-score in 16,058 older women Model 1b Model 2c Global cognitive score Quintile 1 Ref Ref Quintile 2 0.002 (-0.005,0.010) 0.001 (-0.007,0.009) Quintile 3 -0.002 (-0.010,0.006) -0.004 (-0.011,0.004) Quintile 4 0.000 (-0.009,0.008) -0.002 (-0.010,0.006) Quintile 5 0.004 (-0.003,0.012) 0.001 (-0.007,0.009) p-trend 0.44 0.95
Verbal memory score Quintile 1 Ref Ref Quintile 2 0.002 (-0.007,0.011) 0.000 (-0.009,0.009) Quintile 3 -0.005 (-0.015,0.004) -0.007 (-0.017,0.002) Quintile 4 -0.001 (-0.010,0.008) -0.003 (-0.013,0.006) Quintile 5 0.005 (-0.004,0.015) 0.002 (-0.008,0.011) p-trend 0.44 0.98
TICS score Quintile 1 Ref Ref Quintile 2 0.017 (-0.015,0.048) 0.014 (-0.018,0.045) Quintile 3 0.007 (-0.025,0.039) 0.003 (-0.030,0.035) Quintile 4 -0.007 (-0.039,0.024) -0.011 (-0.043,0.020) Quintile 5 0.011 (-0.021,0.042) 0.004 (-0.028,0.036) p-trend 0.95 0.73 Abbreviations: MIND= Mediterranean-DASH Intervention for Neurodegenerative Delay; TICS= Telephone interview of cognitive status a Values are mean difference in score (95% confidence interval) b Model 1: adjusted for age and education c Model 2: additionally adjusted for physical activity, calorie intake, alcohol intake, smoking status, multivitamin use, BMI, depression and history of high blood pressure, hypercholesterolemia, myocardial infarction, and diabetes mellitus. MIND-components and cognitive function Excluding the component ‘Butter and margarine’ and ‘Pastries and sweets’ attenuated the association between the MIND score and average verbal memory (adjusted mean differences between extreme quintiles of intake were 0.02 (95%CI -0.02,0.05) for ‘Butter and margarine’ and 0.03 (95%CI -0.01,0.06) for ‘Pastries and sweets, p-trends across categories of intake = 0.14 for both components), demonstrating that these components were the most important contributors to the association, as part of the MIND diet.

Chapter 6 | The MIND diet, cognitive function and decline
100
Discussion In this large observational study in 16,058 older women, we observed that greater long-term adherence to the MIND diet was associated with a better verbal memory score, irrespective of ApoE ε4 status. We did not find evidence of an association between MIND diet adherence with global cognition or the TICS score, nor with cognitive change over time in any of the domains. To put our results into perspective, we observed that each increase of one year of age of participants in this study population was associated with a mean difference of -0.05 standard units for verbal memory score. To provide a more clinical interpretation of the findings, this means that the effect estimate we found for MIND adherence was cognitively equivalent to being approximately one year younger. The Memory and Aging Project (MAP), an open prospective cohort study in 960 older persons, demonstrated that the MIND diet was associated with slower decline in the global cognitive score and also in each of the five cognitive domains studied. The difference in rate of decline for highest adherence to the MIND diet compared to the lowest adherence was equivalent to that seen in women who were 7.5 years apart in age [10]. To date, there have been no other studies on the MIND diet and cognitive function. A possible explanation for the difference in the strength of associations as reported in the MAP study and the present study could be related to different population characteristics of the two cohorts. Compared to NHS participants, MAP study participants were on average ten years older than NHS participants, had a lower education level, mainly lived in retirement houses, were more likely to have ever smoked and more likely to have reported high blood pressure, diabetes and myocardial infarction. This would suggest that MAP participants were at higher risk of poor cognitive function and faster cognitive decline compared to NHS participants, resulting in a stronger association between the MIND diet and cognitive decline over time. Another explanation may relate to a difference in the cohort design, specifically the number and timing of dietary and cognitive assessments. First, the MAP study used 19 cognitive tests ten times over a period of nine years to compute a global measure of cognitive function and five cognitive domains, whereas the NHS used six cognitive tests four times during six years to construct a global measure of cognitive function and three cognitive domains. It could be that the MAP study was better able to detect differences in cognitive change with the more extensive cognitive assessment battery over a longer period of follow-up. Second, in the NHS study, we used all dietary assessments prior to the first cognitive assessment to create a measure of long-term dietary intake capturing changes in dietary intake over time, whereas the MAP study used the first dietary assessment to study cognitive change from that point forward. Hence, it could be that MAP study participants with good cognitive function at baseline may have reported healthier dietary intakes, which could have led to less decline in cognitive function at follow-up. On the other hand, those with poor cognitive function at baseline probably reported worse dietary intakes, resulting in a stronger association between the MIND diet and cognitive decline. These two issues could also explain why we were not able to find any association with cognitive change over time. We additionally examined the relative contribution of individual components when excluding one component from the MIND score at a time, while including it as a covariate into the regression models. Using this approach, we observed that butter plus margarine and pastries plus sweets were the main components as part of the total MIND diet driving the association between the MIND diet
101
and verbal memory within the NHS population. So far, no other studies have taken into account the relative contribution of these components to cognitive function. Future research should further explore the relative contribution of components of dietary patterns to better understand underlying mechanisms. There are several biological mechanisms by which the MIND diet could impact cognitive function. First, by keeping the intake low for items such as butter and margarine or pastries and sweets, the consumption of saturated fats and trans-fatty acids would be kept low, resulting in a better fat composition of the diet that can improve the blood-brain barrier function and decrease Aβ aggregation [27]. Second, in an Alzheimer’s disease mouse model, higher intakes of long-chain n-3 fatty acids from fish has been shown to reduce Aβ formation and oxidative damage and increase synaptic proteins and dendritic spine density [28, 29]. Finally, the components of berries and green leafy vegetables provide high amounts of vitamin E, flavonoids, folate and carotenoids, which, in rodents, have been shown to have antioxidant and anti-inflammatory properties [30, 31] and to inhibit Aβ deposition [30, 32-35]. Thus, there is a solid biological basis that the MIND diet could impact brain health. Genetically, carrying one or more copies of the ApoE ε4 is associated with an increased risk of Alzheimer’s disease (AD) and cognitive function decline [11, 36]. Observational studies have demonstrated the largest cognitive decline among homozygous and an intermediate cognitive decline in heterozygous ApoE ε4 carriers after three years [37] and a more rapid decline in all cognitive domains in those carrying at least one ApoE ε4 allele [12]. This evidence supports the importance of finding strategies to prevent cognitive decline especially among ApoE ε4 carriers. However, we were not able to demonstrate an interaction between the MIND diet and ApoE ε4 status. Additionally, adding the ApoE ε4 genotype to our fully adjusted model did not result in different or stronger associations. Other studies investigating an interaction between different dietary patterns and cognitive function have shown inconsistent findings, with studies reporting better cognitive function among non-carriers [13, 14], one study reporting an association among carriers [15], and three studies presenting no interaction [14, 16, 17]. Overall, no consistent conclusion on the role of the ApoE4 ε4 allele between diet and cognitive function can be drawn and this requires further research. This study has several limitations to consider. First, the FFQ did not specifically ask if olive oil was the primary source of fat, as this is not commonly consumed in this US population. As a best estimate, we chose to study the use of primarily vegetable oil instead of butter or margarine. Second, cognitive function was assessed by telephone assessment, possibly leading to some misclassification of cognitive function. A validation study, however, has shown that telephone-based cognitive battery performed well compared with detailed, in-person interviews (ρ = 0.81 comparing the two modes of assessment) [38]. Third, participants were relatively healthy and highly educated, limiting the generalizability of the results to other populations. It could be that a healthy diet is not so beneficial in the NHS population, whereas it may be more beneficial in the general population with more risk factors for poorer health and a lower educational level. Finally, we cannot exclude the possibility of residual confounding by unmeasured variables within this cohort, although we have adjusted for many potential confounders.

6
Chapter 6 | The MIND diet, cognitive function and decline
100
Discussion In this large observational study in 16,058 older women, we observed that greater long-term adherence to the MIND diet was associated with a better verbal memory score, irrespective of ApoE ε4 status. We did not find evidence of an association between MIND diet adherence with global cognition or the TICS score, nor with cognitive change over time in any of the domains. To put our results into perspective, we observed that each increase of one year of age of participants in this study population was associated with a mean difference of -0.05 standard units for verbal memory score. To provide a more clinical interpretation of the findings, this means that the effect estimate we found for MIND adherence was cognitively equivalent to being approximately one year younger. The Memory and Aging Project (MAP), an open prospective cohort study in 960 older persons, demonstrated that the MIND diet was associated with slower decline in the global cognitive score and also in each of the five cognitive domains studied. The difference in rate of decline for highest adherence to the MIND diet compared to the lowest adherence was equivalent to that seen in women who were 7.5 years apart in age [10]. To date, there have been no other studies on the MIND diet and cognitive function. A possible explanation for the difference in the strength of associations as reported in the MAP study and the present study could be related to different population characteristics of the two cohorts. Compared to NHS participants, MAP study participants were on average ten years older than NHS participants, had a lower education level, mainly lived in retirement houses, were more likely to have ever smoked and more likely to have reported high blood pressure, diabetes and myocardial infarction. This would suggest that MAP participants were at higher risk of poor cognitive function and faster cognitive decline compared to NHS participants, resulting in a stronger association between the MIND diet and cognitive decline over time. Another explanation may relate to a difference in the cohort design, specifically the number and timing of dietary and cognitive assessments. First, the MAP study used 19 cognitive tests ten times over a period of nine years to compute a global measure of cognitive function and five cognitive domains, whereas the NHS used six cognitive tests four times during six years to construct a global measure of cognitive function and three cognitive domains. It could be that the MAP study was better able to detect differences in cognitive change with the more extensive cognitive assessment battery over a longer period of follow-up. Second, in the NHS study, we used all dietary assessments prior to the first cognitive assessment to create a measure of long-term dietary intake capturing changes in dietary intake over time, whereas the MAP study used the first dietary assessment to study cognitive change from that point forward. Hence, it could be that MAP study participants with good cognitive function at baseline may have reported healthier dietary intakes, which could have led to less decline in cognitive function at follow-up. On the other hand, those with poor cognitive function at baseline probably reported worse dietary intakes, resulting in a stronger association between the MIND diet and cognitive decline. These two issues could also explain why we were not able to find any association with cognitive change over time. We additionally examined the relative contribution of individual components when excluding one component from the MIND score at a time, while including it as a covariate into the regression models. Using this approach, we observed that butter plus margarine and pastries plus sweets were the main components as part of the total MIND diet driving the association between the MIND diet
101
and verbal memory within the NHS population. So far, no other studies have taken into account the relative contribution of these components to cognitive function. Future research should further explore the relative contribution of components of dietary patterns to better understand underlying mechanisms. There are several biological mechanisms by which the MIND diet could impact cognitive function. First, by keeping the intake low for items such as butter and margarine or pastries and sweets, the consumption of saturated fats and trans-fatty acids would be kept low, resulting in a better fat composition of the diet that can improve the blood-brain barrier function and decrease Aβ aggregation [27]. Second, in an Alzheimer’s disease mouse model, higher intakes of long-chain n-3 fatty acids from fish has been shown to reduce Aβ formation and oxidative damage and increase synaptic proteins and dendritic spine density [28, 29]. Finally, the components of berries and green leafy vegetables provide high amounts of vitamin E, flavonoids, folate and carotenoids, which, in rodents, have been shown to have antioxidant and anti-inflammatory properties [30, 31] and to inhibit Aβ deposition [30, 32-35]. Thus, there is a solid biological basis that the MIND diet could impact brain health. Genetically, carrying one or more copies of the ApoE ε4 is associated with an increased risk of Alzheimer’s disease (AD) and cognitive function decline [11, 36]. Observational studies have demonstrated the largest cognitive decline among homozygous and an intermediate cognitive decline in heterozygous ApoE ε4 carriers after three years [37] and a more rapid decline in all cognitive domains in those carrying at least one ApoE ε4 allele [12]. This evidence supports the importance of finding strategies to prevent cognitive decline especially among ApoE ε4 carriers. However, we were not able to demonstrate an interaction between the MIND diet and ApoE ε4 status. Additionally, adding the ApoE ε4 genotype to our fully adjusted model did not result in different or stronger associations. Other studies investigating an interaction between different dietary patterns and cognitive function have shown inconsistent findings, with studies reporting better cognitive function among non-carriers [13, 14], one study reporting an association among carriers [15], and three studies presenting no interaction [14, 16, 17]. Overall, no consistent conclusion on the role of the ApoE4 ε4 allele between diet and cognitive function can be drawn and this requires further research. This study has several limitations to consider. First, the FFQ did not specifically ask if olive oil was the primary source of fat, as this is not commonly consumed in this US population. As a best estimate, we chose to study the use of primarily vegetable oil instead of butter or margarine. Second, cognitive function was assessed by telephone assessment, possibly leading to some misclassification of cognitive function. A validation study, however, has shown that telephone-based cognitive battery performed well compared with detailed, in-person interviews (ρ = 0.81 comparing the two modes of assessment) [38]. Third, participants were relatively healthy and highly educated, limiting the generalizability of the results to other populations. It could be that a healthy diet is not so beneficial in the NHS population, whereas it may be more beneficial in the general population with more risk factors for poorer health and a lower educational level. Finally, we cannot exclude the possibility of residual confounding by unmeasured variables within this cohort, although we have adjusted for many potential confounders.

Chapter 6 | The MIND diet, cognitive function and decline
102
The relatively long follow-up allowed us to assess long-term associations between the MIND score and cognitive function. By averaging repeated measures of diet to obtain an assessment of long-term overall diet, we accounted for within-person change in intake and reduced measurement error (as previously documented by our group [39]). The same approach has been taken to limit measurement error in cognitive function assessments, by averaging all repeated measures into a more robust measure of cognitive function at older ages. The prospective nature of this analysis reduces the probability of recall bias and selection bias. In addition, a high follow-up rate reduced potential bias due to loss of follow-up. Nevertheless, our results need to be replicated in other populations at risk of poorer health to clarify the relevance of this association within populations at risk of cognitive decline. To summarize, long-term adherence to the MIND diet, with high intakes of berries, green leafy vegetables and low intakes of pastries and sweets, was associated with a better verbal memory in later life, but not with global cognitive function, TICS score or cognitive decline.
Acknowledgements Participants, staff and investigators of the NHS are gratefully acknowledged. This work was supported by the National Institutes of Health who provided funding for the Nurses’ Health Study (NHS) (grant UM1 CA186107). The NHS cognitive assessment was supported by: R01 AG015424 and R01 AG015424. The NHS and the genetic data collection were supported by the following: the National Cancer Institute (NCI, UM1 CA186107, P01CA087969, P01CA049449, R01CA137178), the National Institute of Diabetes and Digestive and Kidney Diseases (NIDDK, R01DK058845), and the National Heart, Lung, and Blood Institute (NHLBI, R01HL35464), with additional support for the collection and management of cognitive and genetic data. The NHS assessment of cognitive function was supported by R01 AG015424 from the National Institute of Aging. The NHS Breast Cancer GWAS (dbGaP:phs000147.v1.p1) was performed as part of the Cancer Genetic Markers of Susceptibility initiative of the NCI (R01CA40356, U01CA98233). The NHS type 2 diabetes (T2D, dbGaP:phs000091.v2.p1) and open-angle glaucoma (GA, dbGaP:phs000308.v1.p1) GWAS were funded as part of the Gene Environment-Association Studies (GENEVA) project under the NIH Genes, Environment, and Health Initiative (T2D: U01HG004399, GA: U01HG004728). Genotyping for the NHS coronary heart disease GWAS was supported by Merck/Rosetta Research Laboratories, North Wales, PA. The NHS kidney stone GWAS (dbGaP:phs000460.v1.p1) was supported by NIDDK (5P01DK070756). The NHS colon cancer GWAS (dbGAP: in progress) was funded as part of the Colorectal Cancer GWAS Consortium funded by the NCI (U01 CA137088, R01CA059045).
103
References 1. United Nations. Department of Economic and Social Affairs. Population Division. World Population Ageing 2013. 2013
Contract No.: ST/ESA/SER.A/348. 2. World Health Organization. 10 facts on ageing and the life course Geneva, Switzerland, 2012 [cited 2015 15-06-2015].
Available from: http://www.who.int/features/factfiles/ageing/ageing_facts/en/index3.html. 3. Nelson L, Tabet N. Slowing the progression of Alzheimer's disease; what works? Ageing Res Rev. 2015;23:193-209. 4. van de Rest O, Berendsen AM, Haveman-Nies A, de Groot CPGM. Dietary patterns, cognitive decline, and dementia: a
systematic review. Adv Nutr. 2015;6(2):154-68. 5. Smith PJ, Blumenthal JA, Babyak MA, Craighead L, Welsh-Bohmer KA, Browndyke JN, et al. Effects of the dietary
approaches to stop hypertension diet, exercise, and caloric restriction on neurocognition in overweight adults with high blood pressure. Hypertension. 2010;55(6):1331-8.
6. Tangney CC, Li H, Wang Y, Barnes L, Schneider JA, Bennett DA, et al. Relation of DASH- and Mediterranean-like dietary patterns to cognitive decline in older persons. Neurology. 2014;83(16):1410-6.
7. Wengreen H, Munger RG, Cutler A, Quach A, Bowles A, Corcoran C, et al. Prospective study of Dietary Approaches to Stop Hypertension- and Mediterranean-style dietary patterns and age-related cognitive change: the Cache County Study on Memory, Health and Aging. Am J Clin Nutr. 2013;98(5):1263-71.
8. Berendsen AM, Kang JH, Van de Rest O, Feskens E, De Groot CPGM, Grodstein F. Adherence to the Dietary Approaches to Stop Hypertension diet, cognitive function and cognitive decline in American older women. unpublished results.
9. Morris MC, Tangney CC, Wang Y, Sacks FM, Bennett DA, Aggarwal NT. MIND diet associated with reduced incidence of Alzheimer's disease. Alzheimers Dement. 2015;11(9):1007-14.
10. Morris MC, Tangney CC, Wang Y, Sacks FM, Barnes LL, Bennett DA, et al. MIND diet slows cognitive decline with aging. Alzheimers Dement. 2015;11(9):1015-22.
11. Corder EH, Saunders AM, Strittmatter WJ, Schmechel DE, Gaskell PC, Small GW, et al. Gene dose of apolipoprotein E type 4 allele and the risk of Alzheimer's disease in late onset families. Science. 1993;261(5123):921-3.
12. Wilson RS, Schneider JA, Barnes LL, Beckett LA, Aggarwal NT, Cochran EJ, et al. The apolipoprotein E epsilon 4 allele and decline in different cognitive systems during a 6-year period. Arch Neurol. 2002;59(7):1154-60.
13. Barberger-Gateau P, Raffaitin C, Letenneur L, Berr C, Tzourio C, Dartigues JF, et al. Dietary patterns and risk of dementia: the Three-City cohort study. Neurology. 2007;69(20):1921-30.
14. Martinez-Lapiscina EH, Galbete C, Corella D, Toledo E, Buil-Cosiales P, Salas-Salvado J, et al. Genotype patterns at CLU, CR1, PICALM and APOE, cognition and Mediterranean diet: the PREDIMED-NAVARRA trial. Genes Nutr. 2014;9(3):393-7.
15. Gardener SL, Rainey-Smith SR, Barnes MB, Sohrabi HR, Weinborn M, Lim YY, et al. Dietary patterns and cognitive decline in an Australian study of ageing. Mol Psychiatry. 2015;20(7):860-6.
16. Cherbuin N, Anstey KJ. The Mediterranean diet is not related to cognitive change in a large prospective investigation: the PATH Through Life study. Am J Geriatr Psychiatry. 2012;20(7):635-9.
17. Roberts RO, Geda YE, Cerhan JR, Knopman DS, Cha RH, Christianson TJ, et al. Vegetables, unsaturated fats, moderate alcohol intake, and mild cognitive impairment. Dementia and geriatric cognitive disorders. 2010;29(5):413-23.
18. Willett WC, Sampson L, Stampfer MJ, Rosner B, Bain C, Witschi J, et al. Reproducibility and validity of a semiquantitative food frequency questionnaire. Am J Epidemiol. 1985;122(1):51-65.
19. Launer LJ. The epidemiologic study of dementia: a life-long quest? Neurobiol Aging. 2005;26(3):335-40. 20. Brandt J, Spencer M, Folstein M. The telephone interview for cognitive status. Neuropsychiatry Neuropsychol Behav
Neurol. 1988;1:111-7. 21. Albert M, Smith LA, Scherr PA, Taylor JO, Evans DA, Funkenstein HH. Use of brief cognitive tests to identify individuals in
the community with clinically diagnosed Alzheimer's disease. Int J Neurosci. 1991;57(3-4):167-78. 22. Folstein MF, Folstein SE, McHugh PR. "Mini-mental state". A practical method for grading the cognitive state of patients
for the clinician. J Psychiatr Res. 1975;12(3):189-98. 23. Morris JC, Heyman A, Mohs RC, Hughes JP, van Belle G, Fillenbaum G, et al. The Consortium to Establish a Registry for
Alzheimer's Disease (CERAD). Part I. Clinical and neuropsychological assessment of Alzheimer's disease. Neurology. 1989;39(9):1159-65.
24. Devore EE, Kang JH, Stampfer MJ, Grodstein F. The association of antioxidants and cognition in the Nurses' Health Study. Am J Epidemiol. 2013;177(1):33-41.
25. Samieri C, Okereke OI, Devore EE, Grodstein F. Long-term adherence to the Mediterranean diet is associated with overall cognitive status, but not cognitive decline, in women. J Nutr. 2013;143(4):493-9.
26. Laird NM, Ware JH. Random-effects models for longitudinal data. Biometrics. 1982;38(4):963-74. 27. Morris MC, Tangney CC. Dietary fat composition and dementia risk. Neurobiol Aging. 2014;35(Suppl 2):S59-64. 28. Calon F, Lim GP, Yang F, Morihara T, Teter B, Ubeda O, et al. Docosahexaenoic acid protects from dendritic pathology in
an Alzheimer's disease mouse model. Neuron. 2004;43(5):633-45. 29. Lim GP, Calon F, Morihara T, Yang F, Teter B, Ubeda O, et al. A diet enriched with the omega-3 fatty acid
docosahexaenoic acid reduces amyloid burden in an aged Alzheimer mouse model. J Neurosci. 2005;25(12):3032-40. 30. Jiang Q, Ames BN. Gamma-tocopherol, but not alpha-tocopherol, decreases proinflammatory eicosanoids and
inflammation damage in rats. FASEB J. 2003;17(8):816-22.

6
Chapter 6 | The MIND diet, cognitive function and decline
102
The relatively long follow-up allowed us to assess long-term associations between the MIND score and cognitive function. By averaging repeated measures of diet to obtain an assessment of long-term overall diet, we accounted for within-person change in intake and reduced measurement error (as previously documented by our group [39]). The same approach has been taken to limit measurement error in cognitive function assessments, by averaging all repeated measures into a more robust measure of cognitive function at older ages. The prospective nature of this analysis reduces the probability of recall bias and selection bias. In addition, a high follow-up rate reduced potential bias due to loss of follow-up. Nevertheless, our results need to be replicated in other populations at risk of poorer health to clarify the relevance of this association within populations at risk of cognitive decline. To summarize, long-term adherence to the MIND diet, with high intakes of berries, green leafy vegetables and low intakes of pastries and sweets, was associated with a better verbal memory in later life, but not with global cognitive function, TICS score or cognitive decline.
Acknowledgements Participants, staff and investigators of the NHS are gratefully acknowledged. This work was supported by the National Institutes of Health who provided funding for the Nurses’ Health Study (NHS) (grant UM1 CA186107). The NHS cognitive assessment was supported by: R01 AG015424 and R01 AG015424. The NHS and the genetic data collection were supported by the following: the National Cancer Institute (NCI, UM1 CA186107, P01CA087969, P01CA049449, R01CA137178), the National Institute of Diabetes and Digestive and Kidney Diseases (NIDDK, R01DK058845), and the National Heart, Lung, and Blood Institute (NHLBI, R01HL35464), with additional support for the collection and management of cognitive and genetic data. The NHS assessment of cognitive function was supported by R01 AG015424 from the National Institute of Aging. The NHS Breast Cancer GWAS (dbGaP:phs000147.v1.p1) was performed as part of the Cancer Genetic Markers of Susceptibility initiative of the NCI (R01CA40356, U01CA98233). The NHS type 2 diabetes (T2D, dbGaP:phs000091.v2.p1) and open-angle glaucoma (GA, dbGaP:phs000308.v1.p1) GWAS were funded as part of the Gene Environment-Association Studies (GENEVA) project under the NIH Genes, Environment, and Health Initiative (T2D: U01HG004399, GA: U01HG004728). Genotyping for the NHS coronary heart disease GWAS was supported by Merck/Rosetta Research Laboratories, North Wales, PA. The NHS kidney stone GWAS (dbGaP:phs000460.v1.p1) was supported by NIDDK (5P01DK070756). The NHS colon cancer GWAS (dbGAP: in progress) was funded as part of the Colorectal Cancer GWAS Consortium funded by the NCI (U01 CA137088, R01CA059045).
103
References 1. United Nations. Department of Economic and Social Affairs. Population Division. World Population Ageing 2013. 2013
Contract No.: ST/ESA/SER.A/348. 2. World Health Organization. 10 facts on ageing and the life course Geneva, Switzerland, 2012 [cited 2015 15-06-2015].
Available from: http://www.who.int/features/factfiles/ageing/ageing_facts/en/index3.html. 3. Nelson L, Tabet N. Slowing the progression of Alzheimer's disease; what works? Ageing Res Rev. 2015;23:193-209. 4. van de Rest O, Berendsen AM, Haveman-Nies A, de Groot CPGM. Dietary patterns, cognitive decline, and dementia: a
systematic review. Adv Nutr. 2015;6(2):154-68. 5. Smith PJ, Blumenthal JA, Babyak MA, Craighead L, Welsh-Bohmer KA, Browndyke JN, et al. Effects of the dietary
approaches to stop hypertension diet, exercise, and caloric restriction on neurocognition in overweight adults with high blood pressure. Hypertension. 2010;55(6):1331-8.
6. Tangney CC, Li H, Wang Y, Barnes L, Schneider JA, Bennett DA, et al. Relation of DASH- and Mediterranean-like dietary patterns to cognitive decline in older persons. Neurology. 2014;83(16):1410-6.
7. Wengreen H, Munger RG, Cutler A, Quach A, Bowles A, Corcoran C, et al. Prospective study of Dietary Approaches to Stop Hypertension- and Mediterranean-style dietary patterns and age-related cognitive change: the Cache County Study on Memory, Health and Aging. Am J Clin Nutr. 2013;98(5):1263-71.
8. Berendsen AM, Kang JH, Van de Rest O, Feskens E, De Groot CPGM, Grodstein F. Adherence to the Dietary Approaches to Stop Hypertension diet, cognitive function and cognitive decline in American older women. unpublished results.
9. Morris MC, Tangney CC, Wang Y, Sacks FM, Bennett DA, Aggarwal NT. MIND diet associated with reduced incidence of Alzheimer's disease. Alzheimers Dement. 2015;11(9):1007-14.
10. Morris MC, Tangney CC, Wang Y, Sacks FM, Barnes LL, Bennett DA, et al. MIND diet slows cognitive decline with aging. Alzheimers Dement. 2015;11(9):1015-22.
11. Corder EH, Saunders AM, Strittmatter WJ, Schmechel DE, Gaskell PC, Small GW, et al. Gene dose of apolipoprotein E type 4 allele and the risk of Alzheimer's disease in late onset families. Science. 1993;261(5123):921-3.
12. Wilson RS, Schneider JA, Barnes LL, Beckett LA, Aggarwal NT, Cochran EJ, et al. The apolipoprotein E epsilon 4 allele and decline in different cognitive systems during a 6-year period. Arch Neurol. 2002;59(7):1154-60.
13. Barberger-Gateau P, Raffaitin C, Letenneur L, Berr C, Tzourio C, Dartigues JF, et al. Dietary patterns and risk of dementia: the Three-City cohort study. Neurology. 2007;69(20):1921-30.
14. Martinez-Lapiscina EH, Galbete C, Corella D, Toledo E, Buil-Cosiales P, Salas-Salvado J, et al. Genotype patterns at CLU, CR1, PICALM and APOE, cognition and Mediterranean diet: the PREDIMED-NAVARRA trial. Genes Nutr. 2014;9(3):393-7.
15. Gardener SL, Rainey-Smith SR, Barnes MB, Sohrabi HR, Weinborn M, Lim YY, et al. Dietary patterns and cognitive decline in an Australian study of ageing. Mol Psychiatry. 2015;20(7):860-6.
16. Cherbuin N, Anstey KJ. The Mediterranean diet is not related to cognitive change in a large prospective investigation: the PATH Through Life study. Am J Geriatr Psychiatry. 2012;20(7):635-9.
17. Roberts RO, Geda YE, Cerhan JR, Knopman DS, Cha RH, Christianson TJ, et al. Vegetables, unsaturated fats, moderate alcohol intake, and mild cognitive impairment. Dementia and geriatric cognitive disorders. 2010;29(5):413-23.
18. Willett WC, Sampson L, Stampfer MJ, Rosner B, Bain C, Witschi J, et al. Reproducibility and validity of a semiquantitative food frequency questionnaire. Am J Epidemiol. 1985;122(1):51-65.
19. Launer LJ. The epidemiologic study of dementia: a life-long quest? Neurobiol Aging. 2005;26(3):335-40. 20. Brandt J, Spencer M, Folstein M. The telephone interview for cognitive status. Neuropsychiatry Neuropsychol Behav
Neurol. 1988;1:111-7. 21. Albert M, Smith LA, Scherr PA, Taylor JO, Evans DA, Funkenstein HH. Use of brief cognitive tests to identify individuals in
the community with clinically diagnosed Alzheimer's disease. Int J Neurosci. 1991;57(3-4):167-78. 22. Folstein MF, Folstein SE, McHugh PR. "Mini-mental state". A practical method for grading the cognitive state of patients
for the clinician. J Psychiatr Res. 1975;12(3):189-98. 23. Morris JC, Heyman A, Mohs RC, Hughes JP, van Belle G, Fillenbaum G, et al. The Consortium to Establish a Registry for
Alzheimer's Disease (CERAD). Part I. Clinical and neuropsychological assessment of Alzheimer's disease. Neurology. 1989;39(9):1159-65.
24. Devore EE, Kang JH, Stampfer MJ, Grodstein F. The association of antioxidants and cognition in the Nurses' Health Study. Am J Epidemiol. 2013;177(1):33-41.
25. Samieri C, Okereke OI, Devore EE, Grodstein F. Long-term adherence to the Mediterranean diet is associated with overall cognitive status, but not cognitive decline, in women. J Nutr. 2013;143(4):493-9.
26. Laird NM, Ware JH. Random-effects models for longitudinal data. Biometrics. 1982;38(4):963-74. 27. Morris MC, Tangney CC. Dietary fat composition and dementia risk. Neurobiol Aging. 2014;35(Suppl 2):S59-64. 28. Calon F, Lim GP, Yang F, Morihara T, Teter B, Ubeda O, et al. Docosahexaenoic acid protects from dendritic pathology in
an Alzheimer's disease mouse model. Neuron. 2004;43(5):633-45. 29. Lim GP, Calon F, Morihara T, Yang F, Teter B, Ubeda O, et al. A diet enriched with the omega-3 fatty acid
docosahexaenoic acid reduces amyloid burden in an aged Alzheimer mouse model. J Neurosci. 2005;25(12):3032-40. 30. Jiang Q, Ames BN. Gamma-tocopherol, but not alpha-tocopherol, decreases proinflammatory eicosanoids and
inflammation damage in rats. FASEB J. 2003;17(8):816-22.

Chapter 6 | The MIND diet, cognitive function and decline
104
31. Yamada K, Tanaka T, Han D, Senzaki K, Kameyama T, Nabeshima T. Protective effects of idebenone and alpha-tocopherol on beta-amyloid-(1-42)-induced learning and memory deficits in rats: implication of oxidative stress in beta-amyloid-induced neurotoxicity in vivo. Eur J Neurosci. 1999;11(1):83-90.
32. Chan A, Shea TB. Folate deprivation increases presenilin expression, gamma-secretase activity, and Abeta levels in murine brain: potentiation by ApoE deficiency and alleviation by dietary S-adenosyl methionine. J Neurochem. 2007;102(3):753-60.
33. Katayama S, Ogawa H, Nakamura S. Apricot carotenoids possess potent anti-amyloidogenic activity in vitro. J Agric Food Chem. 2011;59(23):12691-6.
34. Nishida Y, Ito S, Ohtsuki S, Yamamoto N, Takahashi T, Iwata N, et al. Depletion of vitamin E increases amyloid beta accumulation by decreasing its clearances from brain and blood in a mouse model of Alzheimer disease. J Biol Chem. 2009;284(48):33400-8.
35. Obulesu M, Dowlathabad MR, Bramhachari PV. Carotenoids and Alzheimer's disease: an insight into therapeutic role of retinoids in animal models. Neurochem Int. 2011;59(5):535-41.
36. Saunders AM, Strittmatter WJ, Schmechel D, George-Hyslop PH, Pericak-Vance MA, Joo SH, et al. Association of apolipoprotein E allele epsilon 4 with late-onset familial and sporadic Alzheimer's disease. Neurology. 1993;43(8):1467-72.
37. Feskens EJ, Havekes LM, Kalmijn S, de Knijff P, Launer LJ, Kromhout D. Apolipoprotein e4 allele and cognitive decline in elderly men. BMJ. 1994;309(6963):1202-6.
38. Devore EE, Kang JH, Breteler MM, Grodstein F. Dietary intakes of berries and flavonoids in relation to cognitive decline. Annals of neurology. 2012;72(1):135-43.
39. Hu FB, Stampfer MJ, Rimm E, Ascherio A, Rosner BA, Spiegelman D, et al. Dietary fat and coronary heart disease: a comparison of approaches for adjusting for total energy intake and modeling repeated dietary measurements. Am J Epidemiol. 1999;149(6):531-40.
105

6
Chapter 6 | The MIND diet, cognitive function and decline
104
31. Yamada K, Tanaka T, Han D, Senzaki K, Kameyama T, Nabeshima T. Protective effects of idebenone and alpha-tocopherol on beta-amyloid-(1-42)-induced learning and memory deficits in rats: implication of oxidative stress in beta-amyloid-induced neurotoxicity in vivo. Eur J Neurosci. 1999;11(1):83-90.
32. Chan A, Shea TB. Folate deprivation increases presenilin expression, gamma-secretase activity, and Abeta levels in murine brain: potentiation by ApoE deficiency and alleviation by dietary S-adenosyl methionine. J Neurochem. 2007;102(3):753-60.
33. Katayama S, Ogawa H, Nakamura S. Apricot carotenoids possess potent anti-amyloidogenic activity in vitro. J Agric Food Chem. 2011;59(23):12691-6.
34. Nishida Y, Ito S, Ohtsuki S, Yamamoto N, Takahashi T, Iwata N, et al. Depletion of vitamin E increases amyloid beta accumulation by decreasing its clearances from brain and blood in a mouse model of Alzheimer disease. J Biol Chem. 2009;284(48):33400-8.
35. Obulesu M, Dowlathabad MR, Bramhachari PV. Carotenoids and Alzheimer's disease: an insight into therapeutic role of retinoids in animal models. Neurochem Int. 2011;59(5):535-41.
36. Saunders AM, Strittmatter WJ, Schmechel D, George-Hyslop PH, Pericak-Vance MA, Joo SH, et al. Association of apolipoprotein E allele epsilon 4 with late-onset familial and sporadic Alzheimer's disease. Neurology. 1993;43(8):1467-72.
37. Feskens EJ, Havekes LM, Kalmijn S, de Knijff P, Launer LJ, Kromhout D. Apolipoprotein e4 allele and cognitive decline in elderly men. BMJ. 1994;309(6963):1202-6.
38. Devore EE, Kang JH, Breteler MM, Grodstein F. Dietary intakes of berries and flavonoids in relation to cognitive decline. Annals of neurology. 2012;72(1):135-43.
39. Hu FB, Stampfer MJ, Rimm E, Ascherio A, Rosner BA, Spiegelman D, et al. Dietary fat and coronary heart disease: a comparison of approaches for adjusting for total energy intake and modeling repeated dietary measurements. Am J Epidemiol. 1999;149(6):531-40.
105


Chapter 7A parallel randomized trial on
the effect of a healthful diet on inflammageing and its
consequences in European elderly people: design of the NU-AGE
dietary intervention study
Agnes A.M. Berendsen, Aurelia Santoro, Elisa Pini, Elisa Cevenini, Rita Ostan, Barbara Pietruszka, Katarzyna Rolf, Noël Cano, Aurélie Caille, Noëlle Lyon-Belgy, Susan Fairweather-Tait,
Edith Feskens, Claudio Franceschi, C.P.G.M. de Groot
Mechanisms of Ageing and Development, 2014, 136(137):14-21

Chapter 7 | Design NU-AGE dietary intervention study
108
Abstract Background: The proportion of European elderly is expected to increase to 22% in 2050. Specific individual dietary components may reduce disease risk and improve quality of life in elderly. Combining dietary components may modulate many processes involved in ageing and so it is likely that a whole diet approach might have greater impact on age-related decline than individual components. This intervention studies the effects of a whole diet on health and quality of life in European elderly. Methods: The NU-AGE study is a randomized one year intervention in 1250 apparently healthy, independently living European subjects aged 65 to 80 years. Subjects are randomised into either the diet group or the control group. Participants in the diet group received dietary advice aimed at meeting the nutritional requirement of the ageing population. Special attention was paid to nutrients that may be inadequate or limiting in diets of elderly. Discussion: The NU-AGE study is the first dietary intervention investigating the effect of a whole diet and providing targeted nutritional recommendations for optimal health and quality of life in apparently healthy European elderly. Results of this intervention will provide evidence on the effect of a whole diet on the prevention of age related decline.
109
Introduction The number of people aged 65 years and older is continuously increasing. By the year 2050 the proportion of elderly in Europe will be approximately 22% [1]. This demographic shift will most probably increase age-related diseases and disabilities; therefore it is of critical importance to find strategies that decrease morbidity by slowing down the ageing process and thereby increasing the number of European elderly in good health.
The ageing process is currently defined as a dynamic process involving the continual adaptation of the body to life-long exposure to internal and external stressors, conceptualised as the ‘remodelling theory of ageing’[2]. It is a complex process involving interactions between environmental, stochastic and genetic-epigenetic variables. One of the basic molecular mechanisms of ageing is the development of a chronic, low-grade inflammatory status, also referred to as ‘inflammageing’ [3-5]. Inflammageing plays a role in the onset of age-related chronic diseases, such as atherosclerosis and type 2 diabetes mellitus, and geriatric conditions, such as sarcopenia, frailty and disability [3-5]. Of all variables involved in inflammageing, diet and lifestyle appear to be the most modifiable. Dietary patterns of the elderly can be inappropriate [6-11] and intake of vitamin D, folate, iron, vitamin B12 and calcium [12] are often below what is recommended.
Results from randomized controlled trials, meta-analyses and reviews have shown that certain foods and nutrients can reduce the risk of disease and improve the quality of life of the elderly. Monounsaturated fatty acids (MUFA), polyunsaturated fatty acids (PUFA), olive oil or oily fish have been shown to have beneficial effects on blood pressure, inflammatory processes and inflammatory bowel diseases, cognitive function, mood and depression [13-15]. Whole grains and some cereals positively influenced diabetes, BMI, cardiovascular disease and blood lipids [16-20]. To reduce the development of sarcopenia, meat and protein have shown to be important [21]. Other components frequently studied, such as fruits, vegetables, vitamin C, vitamin D, vitamin B12 and folate, improved nutritional status and markers of inflammation, beneficially affected type 2 diabetes mellitus [22-24], risk of falls [25], and were shown to improve bone health and reduce fractures [26-29]. Manipulating dietary patterns can be a more powerful approach than single nutrients or foods because these may have synergistic or antagonistic effects when consumed in combination [30, 31]. Many studies have shown that altering dietary patterns is more effective than effects of single dietary components on reducing disease risk [32-37]. A frequently studied dietary pattern is the Mediterranean diet. Observational and intervention studies have shown that the Mediterranean diet increases survival among older people [35, 37] and in patients with a history of myocardial infarction [33], reduces incidence of cardiovascular events in patients at risk [38], improves anthropometric and metabolic parameters in subjects aged 51-59 years [36], influences cardiovascular risk factors [34] and lowers risk of cognitive function decline in older individuals [32]. Besides the impact on survival [33], anthropometric and metabolic parameters [36], cardiovascular risk factors [34] and cognitive function [32], a whole diet approach might also have impact on the ageing process and inflammatory parameters [39]. However, apart from one study showing that components of the Mediterranean-type food pattern influence serum inflammatory markers [40] there appear to be no studies on the effects of a whole diet on the ageing process in an

7
Chapter 7 | Design NU-AGE dietary intervention study
108
Abstract Background: The proportion of European elderly is expected to increase to 22% in 2050. Specific individual dietary components may reduce disease risk and improve quality of life in elderly. Combining dietary components may modulate many processes involved in ageing and so it is likely that a whole diet approach might have greater impact on age-related decline than individual components. This intervention studies the effects of a whole diet on health and quality of life in European elderly. Methods: The NU-AGE study is a randomized one year intervention in 1250 apparently healthy, independently living European subjects aged 65 to 80 years. Subjects are randomised into either the diet group or the control group. Participants in the diet group received dietary advice aimed at meeting the nutritional requirement of the ageing population. Special attention was paid to nutrients that may be inadequate or limiting in diets of elderly. Discussion: The NU-AGE study is the first dietary intervention investigating the effect of a whole diet and providing targeted nutritional recommendations for optimal health and quality of life in apparently healthy European elderly. Results of this intervention will provide evidence on the effect of a whole diet on the prevention of age related decline.
109
Introduction The number of people aged 65 years and older is continuously increasing. By the year 2050 the proportion of elderly in Europe will be approximately 22% [1]. This demographic shift will most probably increase age-related diseases and disabilities; therefore it is of critical importance to find strategies that decrease morbidity by slowing down the ageing process and thereby increasing the number of European elderly in good health.
The ageing process is currently defined as a dynamic process involving the continual adaptation of the body to life-long exposure to internal and external stressors, conceptualised as the ‘remodelling theory of ageing’[2]. It is a complex process involving interactions between environmental, stochastic and genetic-epigenetic variables. One of the basic molecular mechanisms of ageing is the development of a chronic, low-grade inflammatory status, also referred to as ‘inflammageing’ [3-5]. Inflammageing plays a role in the onset of age-related chronic diseases, such as atherosclerosis and type 2 diabetes mellitus, and geriatric conditions, such as sarcopenia, frailty and disability [3-5]. Of all variables involved in inflammageing, diet and lifestyle appear to be the most modifiable. Dietary patterns of the elderly can be inappropriate [6-11] and intake of vitamin D, folate, iron, vitamin B12 and calcium [12] are often below what is recommended.
Results from randomized controlled trials, meta-analyses and reviews have shown that certain foods and nutrients can reduce the risk of disease and improve the quality of life of the elderly. Monounsaturated fatty acids (MUFA), polyunsaturated fatty acids (PUFA), olive oil or oily fish have been shown to have beneficial effects on blood pressure, inflammatory processes and inflammatory bowel diseases, cognitive function, mood and depression [13-15]. Whole grains and some cereals positively influenced diabetes, BMI, cardiovascular disease and blood lipids [16-20]. To reduce the development of sarcopenia, meat and protein have shown to be important [21]. Other components frequently studied, such as fruits, vegetables, vitamin C, vitamin D, vitamin B12 and folate, improved nutritional status and markers of inflammation, beneficially affected type 2 diabetes mellitus [22-24], risk of falls [25], and were shown to improve bone health and reduce fractures [26-29]. Manipulating dietary patterns can be a more powerful approach than single nutrients or foods because these may have synergistic or antagonistic effects when consumed in combination [30, 31]. Many studies have shown that altering dietary patterns is more effective than effects of single dietary components on reducing disease risk [32-37]. A frequently studied dietary pattern is the Mediterranean diet. Observational and intervention studies have shown that the Mediterranean diet increases survival among older people [35, 37] and in patients with a history of myocardial infarction [33], reduces incidence of cardiovascular events in patients at risk [38], improves anthropometric and metabolic parameters in subjects aged 51-59 years [36], influences cardiovascular risk factors [34] and lowers risk of cognitive function decline in older individuals [32]. Besides the impact on survival [33], anthropometric and metabolic parameters [36], cardiovascular risk factors [34] and cognitive function [32], a whole diet approach might also have impact on the ageing process and inflammatory parameters [39]. However, apart from one study showing that components of the Mediterranean-type food pattern influence serum inflammatory markers [40] there appear to be no studies on the effects of a whole diet on the ageing process in an

Chapter 7 | Design NU-AGE dietary intervention study
110
elderly population. Therefore NU-AGE focuses on nutrition as a major modulator of inflammageing and other age-related functional outcomes.
The NU-AGE dietary intervention will investigate whether a newly designed, personally tailored, whole diet, designed to meet the nutritional needs of people over 65 years of age can counteract or slow down the decline of function at the level of different organs and systems which occurs with age. This approach will allow an evaluation of the whole-organism response using a systems biology approach. It will consider several tissues and systems as a functional network instead of assessing the single tissue and organ responses separately.
Materials and methods Study design The NU-AGE project involves a consortium of 30 partners from 17 European countries. A detailed description of this project has been described in the paper of Santoro et al. in this special issue. The NU-AGE dietary intervention comprises a one-year, randomized, parallel trial with two arms – control and intervention - carried out in five European study centres (Clermont Ferrand in France, Bologna in Italy, Wageningen in the Netherlands, Warsaw in Poland and Norwich in the United Kingdom). Each centre aimed to recruit 250 subjects to end up with a combined total of 1250 subjects. Inclusion and exclusion criteria of eligible participants can be found in table 1. Table 1. Inclusion and exclusion criteria for participants of the NU-AGE dietary intervention study Inclusion criteria Exclusion criteria Men and women Overt disease such as cancer or dementia Aged 65 to 79 years History of severe heart disease Free of disease compromising 2–year survival Unstable organ failure Free and independent living Organ failure necessitating a special diet Competent to make own decisions Diabetes Mellitus Type I Diabetes Mellitus Type 2 with insulin therapy Chronic use of corticosteroid medication Recent use of antibiotics Change in habitual medication use Malnutrition Presence of frailty All participants signed informed consent prior to their inclusion in the study. Recruitment started in April 2012 and will continue until October 2013. We used screening questionnaires to verify that none of the exclusion criteria were present. In case of recent use of corticosteroids or antibiotics or change in use of habitual medication we postponed inclusion for 1, 2 or 3 months, respectively. Presence of frailty was assessed with a test described by Fried et al. [41] combining measures of height, weight, BMI, hand grip strength, gait speed, depression and physical activity. Participants were randomly allocated to the intervention or control group to a 1:1 ratio after stratification by gender, age (65-72 or 73-79 years), frailty status (pre-frail or non-frail) and BMI (<25 or ≥25 kg/m2). Randomization was performed by entering the described variables of a subject into a program that automatically randomly allocates and
111
generates a unique ID-code. Participants were informed about their intervention group after the randomisation. Only technicians performing the laboratory analyses were blinded to the group assignment. All eligible participants were invited for baseline measurements at the research centre for a blood withdrawal, urine and faeces collection, anthropometric measurements, completion of a general questionnaire, DEXA-scan, physical performance and cognitive function tests. All measures were taken by trained research assistants. Trained dieticians/research nutritionists assessed dietary intake. After 4 and 8 months all participants were contacted by telephone to complete a follow-up questionnaire. After one year intervention all measurements were repeated (table 2). The NU-AGE study is registered with clinicialtrials.gov since December 21st 2012, NCT01754012. The study protocol is approved by the South-East 6 Person Protection Committee (France), Independent Ethics Committee of the S. Orsola-Malpighi Hospital Bologna (Italy), the Wageningen University Medical Ethics Committee (Netherlands), the National Research Ethics Committee - East of England (UK) and the Bioethics Committee of the Polish National Food and Nutrition Institute (Poland). Table 2. Measurements over time (months) Measurements Timeline (months) 0 4 8 12 Blood X X Urine X X Faeces X X Anthropometric measurements X X DEXA-scan X X Physical activity X X Physical performance X X General questionnaire X X Follow-up questionnaire X X X Dietary intake X Xa Xa X a Dietary intake at 4 month and month 8 is assessed only in participants in the diet group Dietary intake assessment Average usual food and nutrient intake of all participants at baseline and after one year follow-up was estimated from 7-day food records. These take into account the dietary pattern, infrequently consumed foods that can be important sources of specific nutrients, and portion sizes [42-44]. Within two weeks after baseline measurements records were collected by means of a paper-based self-administered pre-formatted food diary. This diary includes 8 meal occasions (before breakfast, breakfast, morning snacks, lunch, afternoon snacks, evening meal, evening snacks, night snacks) referring to the current day. Portion sizes of frequently consumed foods were estimated with real-life models. Other portion sizes were estimated in household measures, based on pictures or measured in gram or millilitres. Participants received oral and written instructions about the level of detail required to describe foods and amounts consumed, including the name of food, preparation methods, recipes for mixed foods and portion sizes [45]. Whenever possible, a trained dietician/research nutritionist visited the participants at their homes (in the Netherlands and the UK) to review the records and to check frequently used household measures; otherwise this meeting took place at the research unit (in France, Italy and Poland). If participants did not prepare the meals themselves, the one in charge of meal preparation was consulted. Dieticians/research nutritionists were familiar with basic rules of communication and

7
Chapter 7 | Design NU-AGE dietary intervention study
110
elderly population. Therefore NU-AGE focuses on nutrition as a major modulator of inflammageing and other age-related functional outcomes.
The NU-AGE dietary intervention will investigate whether a newly designed, personally tailored, whole diet, designed to meet the nutritional needs of people over 65 years of age can counteract or slow down the decline of function at the level of different organs and systems which occurs with age. This approach will allow an evaluation of the whole-organism response using a systems biology approach. It will consider several tissues and systems as a functional network instead of assessing the single tissue and organ responses separately.
Materials and methods Study design The NU-AGE project involves a consortium of 30 partners from 17 European countries. A detailed description of this project has been described in the paper of Santoro et al. in this special issue. The NU-AGE dietary intervention comprises a one-year, randomized, parallel trial with two arms – control and intervention - carried out in five European study centres (Clermont Ferrand in France, Bologna in Italy, Wageningen in the Netherlands, Warsaw in Poland and Norwich in the United Kingdom). Each centre aimed to recruit 250 subjects to end up with a combined total of 1250 subjects. Inclusion and exclusion criteria of eligible participants can be found in table 1. Table 1. Inclusion and exclusion criteria for participants of the NU-AGE dietary intervention study Inclusion criteria Exclusion criteria Men and women Overt disease such as cancer or dementia Aged 65 to 79 years History of severe heart disease Free of disease compromising 2–year survival Unstable organ failure Free and independent living Organ failure necessitating a special diet Competent to make own decisions Diabetes Mellitus Type I Diabetes Mellitus Type 2 with insulin therapy Chronic use of corticosteroid medication Recent use of antibiotics Change in habitual medication use Malnutrition Presence of frailty All participants signed informed consent prior to their inclusion in the study. Recruitment started in April 2012 and will continue until October 2013. We used screening questionnaires to verify that none of the exclusion criteria were present. In case of recent use of corticosteroids or antibiotics or change in use of habitual medication we postponed inclusion for 1, 2 or 3 months, respectively. Presence of frailty was assessed with a test described by Fried et al. [41] combining measures of height, weight, BMI, hand grip strength, gait speed, depression and physical activity. Participants were randomly allocated to the intervention or control group to a 1:1 ratio after stratification by gender, age (65-72 or 73-79 years), frailty status (pre-frail or non-frail) and BMI (<25 or ≥25 kg/m2). Randomization was performed by entering the described variables of a subject into a program that automatically randomly allocates and
111
generates a unique ID-code. Participants were informed about their intervention group after the randomisation. Only technicians performing the laboratory analyses were blinded to the group assignment. All eligible participants were invited for baseline measurements at the research centre for a blood withdrawal, urine and faeces collection, anthropometric measurements, completion of a general questionnaire, DEXA-scan, physical performance and cognitive function tests. All measures were taken by trained research assistants. Trained dieticians/research nutritionists assessed dietary intake. After 4 and 8 months all participants were contacted by telephone to complete a follow-up questionnaire. After one year intervention all measurements were repeated (table 2). The NU-AGE study is registered with clinicialtrials.gov since December 21st 2012, NCT01754012. The study protocol is approved by the South-East 6 Person Protection Committee (France), Independent Ethics Committee of the S. Orsola-Malpighi Hospital Bologna (Italy), the Wageningen University Medical Ethics Committee (Netherlands), the National Research Ethics Committee - East of England (UK) and the Bioethics Committee of the Polish National Food and Nutrition Institute (Poland). Table 2. Measurements over time (months) Measurements Timeline (months) 0 4 8 12 Blood X X Urine X X Faeces X X Anthropometric measurements X X DEXA-scan X X Physical activity X X Physical performance X X General questionnaire X X Follow-up questionnaire X X X Dietary intake X Xa Xa X a Dietary intake at 4 month and month 8 is assessed only in participants in the diet group Dietary intake assessment Average usual food and nutrient intake of all participants at baseline and after one year follow-up was estimated from 7-day food records. These take into account the dietary pattern, infrequently consumed foods that can be important sources of specific nutrients, and portion sizes [42-44]. Within two weeks after baseline measurements records were collected by means of a paper-based self-administered pre-formatted food diary. This diary includes 8 meal occasions (before breakfast, breakfast, morning snacks, lunch, afternoon snacks, evening meal, evening snacks, night snacks) referring to the current day. Portion sizes of frequently consumed foods were estimated with real-life models. Other portion sizes were estimated in household measures, based on pictures or measured in gram or millilitres. Participants received oral and written instructions about the level of detail required to describe foods and amounts consumed, including the name of food, preparation methods, recipes for mixed foods and portion sizes [45]. Whenever possible, a trained dietician/research nutritionist visited the participants at their homes (in the Netherlands and the UK) to review the records and to check frequently used household measures; otherwise this meeting took place at the research unit (in France, Italy and Poland). If participants did not prepare the meals themselves, the one in charge of meal preparation was consulted. Dieticians/research nutritionists were familiar with basic rules of communication and

Chapter 7 | Design NU-AGE dietary intervention study
112
interviewing, composition of local menus and standard recipes and encoding or entering of data. The consumed foods were coded according to standardized coding procedures and translated into nutrients by use of local food composition tables (NEVO 2011 in The Netherlands, WISP in The UK, INRAN and IEO in Italy, NFNI in Poland and CIQUAL French food composition table in France). Dietary intervention All participants had an interview with a trained dietician/research nutritionist to complete the 7-day food records. At the end of the interview participants randomised into the control group received only a leaflet with general national dietary guidelines that are freely available in France, Italy, the Netherlands, Poland and the United Kingdom [46-50]. Participants randomised to the diet group received individually tailored dietary advice aiming to meet on average the nutritional requirements for the elderly. The advice was based on FBDG’s and recommended daily allowances (RDA’s) from the countries of the 5 participating study centres [46, 48, 51-56], on the modified MyPyramid for Older Adults [57, 58], European Commission [59] and Institute of Medicine [60] to ensure no risk of inadequate or excessive intakes in the diet group. Adequacy components of the NU-AGE diet included consumption of 4-6 servings of whole grain products per day (25g of bread or 50g breakfast cereal/serving); 2 servings of fresh fruits per day (including fresh fruit juices, dried fruits and frozen fruits); 3 servings of vegetables per day (100g of salad or cooked vegetables/serving and 2 servings of legumes per week (100g/serving); up to 500g low-fat calcium-enriched dairy per day (of which 30g of low-fat cheese); 2 servings of fish or seafood per week (125g/serving, at least one serving of fatty fish); 4 servings of lean meat or poultry per week (125g/serving); 2 or more servings nuts per week (20g/serving); 3 servings of potatoes (50g/serving), or 1 serving of whole-grain rice, or 1 serving pasta per day (80g/serving) of which at least 2 times per week whole grain rice or pasta; 2-4 eggs per week; total oils and fat consumption of 50g per day (of which at least 20g olive oil and a maximum of 30g margarine rich in MUFA and PUFA); alcohol consumption of maximum 2 glasses per day for men and 1 glass per day for women; 1500 ml of fluids. Components of the NU-AGE diet that were restricted included salt where intake was reduced to 5g per day (eliminate or limit adding salt and ready-made meals) and sweets and sweet drinks (e.g., sweet pastries, cookies, carbonated and/or sugared beverages).
The dietary advice was based on individual education using the Motivational Interview technique taking into account the Stages of changes theory model and goal setting [61]. To improve compliance to the NU-AGE diet this individually-tailored dietary advice, either given face-to-face or by telephone, was administered nine times during one year and supported by mail or e-mail (table 3). A trained dietician/research nutritionist adapted the dietary advice to personal situations and dietary preferences, habits and beliefs. Table 3. Frequency of dietary advice Timeline (months) 0 1 2 3 4 5 6 7 8 9 10 11 12 Control DA T T DA Intervention DA T/E E T/E FR/V T/E E T/E FR/V T/E E T/E DA DA = Dietary Assessment (7-day food records), including leaflet containing general healthy eating guidelines for the control group and motivational interview fostering the NU-AGE diet for the diet group. E = e-mail with recipes, daily menus; T = Telephone contact for motivational interview; FR/V = 3-day food records prior to study centre Visit to verify compliance by the dietician/research nutritionist and for motivational interview.
113
To standardise the dietary counselling each dietician/research nutritionist followed the same process (table 4). The dietary counselling covered a total of fifteen dietary goals, including the vitamin D supplement. During the first meeting (month 0) the dietician/research nutritionist and participant agreed on 5 dietary goals to work on. After one month, the participant could choose 5 other dietary goals to work on until month 3. At month 3, the dietician/research nutritionist called the participant to evaluate the first 10 goals and to implement the last set of 5 dietary goals. To measure compliance participants were asked to keep 3-day food records (3d-FR’s) before month 4. Based on the 3d-FR, months 5, 6 and 7 were used to optimise compliance to the NU-AGE diet. Compliance was measured again in month 8 with 3d-FR’s. Months 9, 10 and 11 were used to motivate the participant to continue the NU-AGE diet. In between, additional information was sent out on topics that were considered important to achieve the NU-AGE FBDG’s (e.g. fish consumption, food labelling, fruit and vegetable consumption, variation in foods, protein intake). Finally, at month 12 habitual intake and compliance was measured by means of 7-day food records.
Meeting NU-AGE’s FBDG’s by means of a normal diet can be a challenge in terms of financial resources and food availability. Therefore, participants in the diet group received commercially available foods meeting the criteria of the NU-AGE dietary guidelines. Most products - cheese, wholegrain pasta, olive oil and margarine - were provided for free and to all study centres to obtain diets as similar as possible across all five study centres. Italy additionally provided vegetable soup to their participants. If a product could not be included in the diet, a similar product was chosen in consultation with the dietician/research nutritionist. Each participant in the diet group received their first allocation of products – sufficient for the first four months – at the first meeting with the dietician/research nutritionist. During the research unit visit after 4 and 8 months the participants received a new allocation of products.
It is well-known that achieving an adequate vitamin D intake from diet alone is merely impossible [53, 62] because vitamin D is only present in a limited number of foods and the vitamin requirement for elderly is set at a high level. To ensure the NU-AGE diet reached the recommended vitamin D intake of 15-20 μg, participants in the diet group received a vitamin D supplement of 10 μg produced by MCO Health, the Netherlands. Each participant in the diet group received a bottle containing vitamin D supplements for 4 months during the first meeting with the dietician/research nutritionist. After 4 and 8 months during the research unit visits another bottle of vitamin D was provided to the participants in the diet group. The compliance was evaluated by counting the remaining vitamin D capsules, which were returned simultaneously with the 3d-FR at month 4 and 8.
Compliance in all participants was enhanced through newsletters, contact via e-mail and with regular telephone calls - bimonthly for participants in the diet group and once per 4 months for participants in the control group.

7
Chapter 7 | Design NU-AGE dietary intervention study
112
interviewing, composition of local menus and standard recipes and encoding or entering of data. The consumed foods were coded according to standardized coding procedures and translated into nutrients by use of local food composition tables (NEVO 2011 in The Netherlands, WISP in The UK, INRAN and IEO in Italy, NFNI in Poland and CIQUAL French food composition table in France). Dietary intervention All participants had an interview with a trained dietician/research nutritionist to complete the 7-day food records. At the end of the interview participants randomised into the control group received only a leaflet with general national dietary guidelines that are freely available in France, Italy, the Netherlands, Poland and the United Kingdom [46-50]. Participants randomised to the diet group received individually tailored dietary advice aiming to meet on average the nutritional requirements for the elderly. The advice was based on FBDG’s and recommended daily allowances (RDA’s) from the countries of the 5 participating study centres [46, 48, 51-56], on the modified MyPyramid for Older Adults [57, 58], European Commission [59] and Institute of Medicine [60] to ensure no risk of inadequate or excessive intakes in the diet group. Adequacy components of the NU-AGE diet included consumption of 4-6 servings of whole grain products per day (25g of bread or 50g breakfast cereal/serving); 2 servings of fresh fruits per day (including fresh fruit juices, dried fruits and frozen fruits); 3 servings of vegetables per day (100g of salad or cooked vegetables/serving and 2 servings of legumes per week (100g/serving); up to 500g low-fat calcium-enriched dairy per day (of which 30g of low-fat cheese); 2 servings of fish or seafood per week (125g/serving, at least one serving of fatty fish); 4 servings of lean meat or poultry per week (125g/serving); 2 or more servings nuts per week (20g/serving); 3 servings of potatoes (50g/serving), or 1 serving of whole-grain rice, or 1 serving pasta per day (80g/serving) of which at least 2 times per week whole grain rice or pasta; 2-4 eggs per week; total oils and fat consumption of 50g per day (of which at least 20g olive oil and a maximum of 30g margarine rich in MUFA and PUFA); alcohol consumption of maximum 2 glasses per day for men and 1 glass per day for women; 1500 ml of fluids. Components of the NU-AGE diet that were restricted included salt where intake was reduced to 5g per day (eliminate or limit adding salt and ready-made meals) and sweets and sweet drinks (e.g., sweet pastries, cookies, carbonated and/or sugared beverages).
The dietary advice was based on individual education using the Motivational Interview technique taking into account the Stages of changes theory model and goal setting [61]. To improve compliance to the NU-AGE diet this individually-tailored dietary advice, either given face-to-face or by telephone, was administered nine times during one year and supported by mail or e-mail (table 3). A trained dietician/research nutritionist adapted the dietary advice to personal situations and dietary preferences, habits and beliefs. Table 3. Frequency of dietary advice Timeline (months) 0 1 2 3 4 5 6 7 8 9 10 11 12 Control DA T T DA Intervention DA T/E E T/E FR/V T/E E T/E FR/V T/E E T/E DA DA = Dietary Assessment (7-day food records), including leaflet containing general healthy eating guidelines for the control group and motivational interview fostering the NU-AGE diet for the diet group. E = e-mail with recipes, daily menus; T = Telephone contact for motivational interview; FR/V = 3-day food records prior to study centre Visit to verify compliance by the dietician/research nutritionist and for motivational interview.
113
To standardise the dietary counselling each dietician/research nutritionist followed the same process (table 4). The dietary counselling covered a total of fifteen dietary goals, including the vitamin D supplement. During the first meeting (month 0) the dietician/research nutritionist and participant agreed on 5 dietary goals to work on. After one month, the participant could choose 5 other dietary goals to work on until month 3. At month 3, the dietician/research nutritionist called the participant to evaluate the first 10 goals and to implement the last set of 5 dietary goals. To measure compliance participants were asked to keep 3-day food records (3d-FR’s) before month 4. Based on the 3d-FR, months 5, 6 and 7 were used to optimise compliance to the NU-AGE diet. Compliance was measured again in month 8 with 3d-FR’s. Months 9, 10 and 11 were used to motivate the participant to continue the NU-AGE diet. In between, additional information was sent out on topics that were considered important to achieve the NU-AGE FBDG’s (e.g. fish consumption, food labelling, fruit and vegetable consumption, variation in foods, protein intake). Finally, at month 12 habitual intake and compliance was measured by means of 7-day food records.
Meeting NU-AGE’s FBDG’s by means of a normal diet can be a challenge in terms of financial resources and food availability. Therefore, participants in the diet group received commercially available foods meeting the criteria of the NU-AGE dietary guidelines. Most products - cheese, wholegrain pasta, olive oil and margarine - were provided for free and to all study centres to obtain diets as similar as possible across all five study centres. Italy additionally provided vegetable soup to their participants. If a product could not be included in the diet, a similar product was chosen in consultation with the dietician/research nutritionist. Each participant in the diet group received their first allocation of products – sufficient for the first four months – at the first meeting with the dietician/research nutritionist. During the research unit visit after 4 and 8 months the participants received a new allocation of products.
It is well-known that achieving an adequate vitamin D intake from diet alone is merely impossible [53, 62] because vitamin D is only present in a limited number of foods and the vitamin requirement for elderly is set at a high level. To ensure the NU-AGE diet reached the recommended vitamin D intake of 15-20 μg, participants in the diet group received a vitamin D supplement of 10 μg produced by MCO Health, the Netherlands. Each participant in the diet group received a bottle containing vitamin D supplements for 4 months during the first meeting with the dietician/research nutritionist. After 4 and 8 months during the research unit visits another bottle of vitamin D was provided to the participants in the diet group. The compliance was evaluated by counting the remaining vitamin D capsules, which were returned simultaneously with the 3d-FR at month 4 and 8.
Compliance in all participants was enhanced through newsletters, contact via e-mail and with regular telephone calls - bimonthly for participants in the diet group and once per 4 months for participants in the control group.

Chapter 7 | Design NU-AGE dietary intervention study
114
Table 4. Structure and main topics per contact moment Month Occasion Topic 0 Home visit or
Research Unit visit
Assess dietary intake (7–day estimated food records) Agree on first set of five dietary goals (vitamin D supplement should at least be included) Hand out information of the first set of 5 dietary goals and hand out vitamin D supplement plus products
1 Telephone Evaluate first set of five dietary goals and agree on second set of five dietary goals for the next month
E-mail/post Send out tips and/or recipes for second set of five dietary goals 2 E-mail/post Send out additional information of the first two sets of five dietary goals and about
fish consumption 3 Telephone Evaluate second set of five dietary goals and agree on third set of five dietary goals
Explain keeping the 3d-FR and make an appointment for the Research Unit visit in month 4
E-mail/post Send out information regarding the third set of dietary goals and the 3d-FR plus explanation
4 Research Unit visit
Receive bottle with remaining vitamin D tablets and go through the 3d-FR. Evaluate compliance to the dietary goals and agree on goals that need extra attention. Hand out the vitamin D supplement and foods for the next 4 months plus info about goals that were not met yet. Hand out additional information regarding food labelling, recipes, variation
5 Telephone Evaluate goals that needed more attention and determine which goals need extra information/attention
E-mail/post Send out appropriate info sheet belonging to goals that need extra attention/ were not obtained.
6 E-mail/post Send out additional information regarding fruit and vegetable consumption 7 Telephone Evaluate goals that needed more attention and determine which goals need extra
information/attention Explain keeping the 3d-FR and make an appointment for the Research Unit visit in month 8
E-mail/post Send out additional information regarding goals that were not met yet and the 3d-FR plus explanation
8 Research Unit visit
Receive bottle with remaining vitamin D tablets and go through the 3d-FR. Evaluate compliance to the dietary goals and agree on goals that need extra attention. Hand out the vitamin D supplement and foods for the next 4 months plus info about goals that were not met yet.
9 Telephone Evaluate goals that needed more attention and determine which goals need extra attention during the last months
E-mail/post Send out appropriate info sheet belonging to goals that need extra attention/ were not obtained.
10 E-mail/post Send out additional information regarding protein intake 11 Telephone Evaluate goals that were not met yet and agree on goals that need extra attention in
the last month Explain keeping the 7d-FR and make appointment for the Research Unit visit in month 12
E-mail/post Send out the 7d-FR plus explanation 12 Home visit or
Research Unit visit
Assess dietary intake (7-day Estimated Food Record)
Topics in bold are additional information regarded as important for compliance to NU-AGE FBDG’s
115
Standardisation and training In order to perform all measurements in the same standardized way across the five study centres, all questionnaires, procedures and tests were practiced and discussed during a training session prior to the start of the intervention. These training sessions took place in December 2011 in Warsaw and in January 2012 in Wageningen. From each study centre at least one research assistant was required to attend this training. Based on these training sessions standard operating procedures were developed and standardized across all research centres. Outcome measures Several health outcomes were measured to investigate whether adhering to the NU-AGE diet impacts on age-related diseases and functional decline, and thereby contribute to improved health and quality of life in the ageing population in Europe.
The primary outcome measure of the intervention is inflammatory status measured as plasma levels of C-reactive protein (hsCRP). Secondary measures of inflammatory status include plasma levels of IL-1Beta, IL-12, INF gamma, IL-6, sIL-6R, IL-1RA, TNFalpha, IL-17, IL-8, IL-10 and TGF-beta1.
Additionally, a limited number of basic parameters for describing the function of several domains, e.g. metabolism, bone, heart, muscle, intestine, cognition, mood, anthropometry were measured before and after dietary intervention. These parameters include measures of insulin sensitivity, liver function status, hormonal function status, bone health, cardiovascular health, cognitive status, mental health, quality of life, physical functioning, digestive health, anthropometry and measures of nutritional status. Also genetic analysis will be performed on DNA to characterize volunteers for polymorphisms involved in nutrition, ageing and inflammageing, in order to explain the individual variability of the effect of dietary intervention. Further details on the outcome measurements can be found in the paper of Santoro et al. in this special issue.
Discussion To the best of our knowledge, the NU-AGE study is the first dietary intervention study investigating the effect of a whole diet targeted on the nutritional requirements of the elderly with respect to optimal health and quality of life in an apparently healthy elderly European population. Currently, dietary advice specifically adapted to the elderly population is not standard included in public health care practices in Europe. Therefore this intervention is an excellent opportunity to investigate the effect of a whole diet approach on the prevention of ageing related decline in a European ageing population across cultural differences. Positive findings from this study might prevent age-related decline and so facilitate longer healthy lives in the elderly. Implementation of structured dietary advice in health care of the elderly might therefore contribute to a reduction in health-care related costs. Adequate dietary intakes of individual macro- and micronutrients and food groups have been shown to positively influence several organ systems and diseases, [13, 15, 16, 18, 19, 21, 26, 63] but until now, there are not many studies investigating the effect of a whole dietary intervention on inflammageing and overall age-related decline at the cellular, organ and whole body level. There have been studies showing positive effects of certain dietary patterns, such as the Mediterranean diet, on

7
Chapter 7 | Design NU-AGE dietary intervention study
114
Table 4. Structure and main topics per contact moment Month Occasion Topic 0 Home visit or
Research Unit visit
Assess dietary intake (7–day estimated food records) Agree on first set of five dietary goals (vitamin D supplement should at least be included) Hand out information of the first set of 5 dietary goals and hand out vitamin D supplement plus products
1 Telephone Evaluate first set of five dietary goals and agree on second set of five dietary goals for the next month
E-mail/post Send out tips and/or recipes for second set of five dietary goals 2 E-mail/post Send out additional information of the first two sets of five dietary goals and about
fish consumption 3 Telephone Evaluate second set of five dietary goals and agree on third set of five dietary goals
Explain keeping the 3d-FR and make an appointment for the Research Unit visit in month 4
E-mail/post Send out information regarding the third set of dietary goals and the 3d-FR plus explanation
4 Research Unit visit
Receive bottle with remaining vitamin D tablets and go through the 3d-FR. Evaluate compliance to the dietary goals and agree on goals that need extra attention. Hand out the vitamin D supplement and foods for the next 4 months plus info about goals that were not met yet. Hand out additional information regarding food labelling, recipes, variation
5 Telephone Evaluate goals that needed more attention and determine which goals need extra information/attention
E-mail/post Send out appropriate info sheet belonging to goals that need extra attention/ were not obtained.
6 E-mail/post Send out additional information regarding fruit and vegetable consumption 7 Telephone Evaluate goals that needed more attention and determine which goals need extra
information/attention Explain keeping the 3d-FR and make an appointment for the Research Unit visit in month 8
E-mail/post Send out additional information regarding goals that were not met yet and the 3d-FR plus explanation
8 Research Unit visit
Receive bottle with remaining vitamin D tablets and go through the 3d-FR. Evaluate compliance to the dietary goals and agree on goals that need extra attention. Hand out the vitamin D supplement and foods for the next 4 months plus info about goals that were not met yet.
9 Telephone Evaluate goals that needed more attention and determine which goals need extra attention during the last months
E-mail/post Send out appropriate info sheet belonging to goals that need extra attention/ were not obtained.
10 E-mail/post Send out additional information regarding protein intake 11 Telephone Evaluate goals that were not met yet and agree on goals that need extra attention in
the last month Explain keeping the 7d-FR and make appointment for the Research Unit visit in month 12
E-mail/post Send out the 7d-FR plus explanation 12 Home visit or
Research Unit visit
Assess dietary intake (7-day Estimated Food Record)
Topics in bold are additional information regarded as important for compliance to NU-AGE FBDG’s
115
Standardisation and training In order to perform all measurements in the same standardized way across the five study centres, all questionnaires, procedures and tests were practiced and discussed during a training session prior to the start of the intervention. These training sessions took place in December 2011 in Warsaw and in January 2012 in Wageningen. From each study centre at least one research assistant was required to attend this training. Based on these training sessions standard operating procedures were developed and standardized across all research centres. Outcome measures Several health outcomes were measured to investigate whether adhering to the NU-AGE diet impacts on age-related diseases and functional decline, and thereby contribute to improved health and quality of life in the ageing population in Europe.
The primary outcome measure of the intervention is inflammatory status measured as plasma levels of C-reactive protein (hsCRP). Secondary measures of inflammatory status include plasma levels of IL-1Beta, IL-12, INF gamma, IL-6, sIL-6R, IL-1RA, TNFalpha, IL-17, IL-8, IL-10 and TGF-beta1.
Additionally, a limited number of basic parameters for describing the function of several domains, e.g. metabolism, bone, heart, muscle, intestine, cognition, mood, anthropometry were measured before and after dietary intervention. These parameters include measures of insulin sensitivity, liver function status, hormonal function status, bone health, cardiovascular health, cognitive status, mental health, quality of life, physical functioning, digestive health, anthropometry and measures of nutritional status. Also genetic analysis will be performed on DNA to characterize volunteers for polymorphisms involved in nutrition, ageing and inflammageing, in order to explain the individual variability of the effect of dietary intervention. Further details on the outcome measurements can be found in the paper of Santoro et al. in this special issue.
Discussion To the best of our knowledge, the NU-AGE study is the first dietary intervention study investigating the effect of a whole diet targeted on the nutritional requirements of the elderly with respect to optimal health and quality of life in an apparently healthy elderly European population. Currently, dietary advice specifically adapted to the elderly population is not standard included in public health care practices in Europe. Therefore this intervention is an excellent opportunity to investigate the effect of a whole diet approach on the prevention of ageing related decline in a European ageing population across cultural differences. Positive findings from this study might prevent age-related decline and so facilitate longer healthy lives in the elderly. Implementation of structured dietary advice in health care of the elderly might therefore contribute to a reduction in health-care related costs. Adequate dietary intakes of individual macro- and micronutrients and food groups have been shown to positively influence several organ systems and diseases, [13, 15, 16, 18, 19, 21, 26, 63] but until now, there are not many studies investigating the effect of a whole dietary intervention on inflammageing and overall age-related decline at the cellular, organ and whole body level. There have been studies showing positive effects of certain dietary patterns, such as the Mediterranean diet, on

Chapter 7 | Design NU-AGE dietary intervention study
116
cardiovascular health [64-66], metabolic syndrome [67, 68], survival [37] and mortality [35]. However, none of these studies investigated health in such a broad way as the NU-AGE study. Therefore the broad range of outcomes measured in the NU-AGE study is unique, and will clarify the potential synergistic effects of many different food constituents, and the interaction between the different organ systems.
We expected the effect of a whole dietary intervention to be most effective and efficient in generally healthy elderly. We therefore only included elderly people without major medical conditions and with a maximum frailty score of one [41]. As a consequence, findings from this study in generally healthy subjects cannot be generalized to the total elderly population which includes less healthy and more fragile elderly. Another reason that results cannot be generalised is the fact that potential participants were informed in advance that there was a chance that they would have to change their dietary intake depending on the randomisation. This could have contributed to the inclusion of health-conscious individuals who have an above average interest in diet and health. Participants in the diet group were given frequent dietary advice, foods and a vitamin supplement aiming to meet the nutritional requirements of the elderly. Because it is practically not possible to provide participants in the control group with placebo advice and placebo foods they were only given a leaflet with general dietary guidelines instead. As a consequence the diet group does not only differ in dietary intake and advice but also in received attention compared to the control group. This could result in a better rating of health in this group, rather than an improvement in their diet. In order to reduce this bias to some extent participants in both control and diet group were assessed every 4 months and fulfilled a follow-up questionnaire to check for health status, unexpected events and treatment changes.
The major strength of this study is its whole diet approach specifically adapted to target the nutritional requirements for the elderly with a strong Mediterranean Diet influence. This allows us to study the synergy of multiple nutrients and adequacy of single nutrients. Although nutritional requirements for elderly people in all five participating countries have been merged into NU-AGE dietary guidelines flexibility was allowed for country specific food based dietary habits.
Other strengths include the use of Motivational Interviewing in the dietary counselling. Motivational Interviewing focuses on exploring and resolving ambivalence and centres on motivational processes within the individual that facilitate change [61]. Quarterly administration of a motivational interview has been shown to improve adherence to a Mediterranean-type diet [66]. By administering this interview nine times during one year we strived for an optimal compliance with the dietary advice.
The provision of foods and a vitamin supplement were also used to improve compliance. It has been shown that free provision of foods is effective in improving dietary habits [66, 69, 70]. Both the counselling and free provision of foods most likely will result to the best possible strategy to promote dietary change in participants in the diet group.
The one year duration of the dietary intervention is long enough for participants in the diet group to change their dietary habits over time, and avoids any seasonal-dependent changes in outcome measures. A nutrition education trial of 15 weeks and a primary prevention trial of 12 months have both been shown to be effective in improving dietary intakes [36, 66]. Within six months and one year respectively, it would also be possible to measure changes in health outcomes such as a reduction in systolic blood pressure [71] and change in reduction of bone mineral density [72]. Within even five
117
weeks of consuming a Mediterranean Diet it has shown to be possible to reduce inflammatory status (CRP) with 26.1% in men with metabolic syndrome [73].
The use of 7-day food records instead of a dietary history or 24-hour recall is another strength of this study. Keeping 7-day food records does not rely on the memory of the elderly participants thus minimising the possible recall bias [45]. Also keeping 7-day food records helps participants to become aware of what they eat and represents a useful tool to encourage participants in the diet group to change dietary habits.
The NU-AGE dietary intervention study is the biggest randomized trial ever conducted on the effect of a whole diet targeting the nutritional requirements of elderly and counteracting inflammageing, age related decline and contributing to increase the healthy lifespan in the elderly
Acknowledgments This project is supported by the European Union’s Seventh Framework Program under grant agreement no. 266486 (‘NU-AGE: New dietary strategies addressing the specific needs of the elderly population for healthy ageing in Europe’). The Authors thank all principal investigators and collaborators. We especially thank all of the participants for their valuable cooperation.

7
Chapter 7 | Design NU-AGE dietary intervention study
116
cardiovascular health [64-66], metabolic syndrome [67, 68], survival [37] and mortality [35]. However, none of these studies investigated health in such a broad way as the NU-AGE study. Therefore the broad range of outcomes measured in the NU-AGE study is unique, and will clarify the potential synergistic effects of many different food constituents, and the interaction between the different organ systems.
We expected the effect of a whole dietary intervention to be most effective and efficient in generally healthy elderly. We therefore only included elderly people without major medical conditions and with a maximum frailty score of one [41]. As a consequence, findings from this study in generally healthy subjects cannot be generalized to the total elderly population which includes less healthy and more fragile elderly. Another reason that results cannot be generalised is the fact that potential participants were informed in advance that there was a chance that they would have to change their dietary intake depending on the randomisation. This could have contributed to the inclusion of health-conscious individuals who have an above average interest in diet and health. Participants in the diet group were given frequent dietary advice, foods and a vitamin supplement aiming to meet the nutritional requirements of the elderly. Because it is practically not possible to provide participants in the control group with placebo advice and placebo foods they were only given a leaflet with general dietary guidelines instead. As a consequence the diet group does not only differ in dietary intake and advice but also in received attention compared to the control group. This could result in a better rating of health in this group, rather than an improvement in their diet. In order to reduce this bias to some extent participants in both control and diet group were assessed every 4 months and fulfilled a follow-up questionnaire to check for health status, unexpected events and treatment changes.
The major strength of this study is its whole diet approach specifically adapted to target the nutritional requirements for the elderly with a strong Mediterranean Diet influence. This allows us to study the synergy of multiple nutrients and adequacy of single nutrients. Although nutritional requirements for elderly people in all five participating countries have been merged into NU-AGE dietary guidelines flexibility was allowed for country specific food based dietary habits.
Other strengths include the use of Motivational Interviewing in the dietary counselling. Motivational Interviewing focuses on exploring and resolving ambivalence and centres on motivational processes within the individual that facilitate change [61]. Quarterly administration of a motivational interview has been shown to improve adherence to a Mediterranean-type diet [66]. By administering this interview nine times during one year we strived for an optimal compliance with the dietary advice.
The provision of foods and a vitamin supplement were also used to improve compliance. It has been shown that free provision of foods is effective in improving dietary habits [66, 69, 70]. Both the counselling and free provision of foods most likely will result to the best possible strategy to promote dietary change in participants in the diet group.
The one year duration of the dietary intervention is long enough for participants in the diet group to change their dietary habits over time, and avoids any seasonal-dependent changes in outcome measures. A nutrition education trial of 15 weeks and a primary prevention trial of 12 months have both been shown to be effective in improving dietary intakes [36, 66]. Within six months and one year respectively, it would also be possible to measure changes in health outcomes such as a reduction in systolic blood pressure [71] and change in reduction of bone mineral density [72]. Within even five
117
weeks of consuming a Mediterranean Diet it has shown to be possible to reduce inflammatory status (CRP) with 26.1% in men with metabolic syndrome [73].
The use of 7-day food records instead of a dietary history or 24-hour recall is another strength of this study. Keeping 7-day food records does not rely on the memory of the elderly participants thus minimising the possible recall bias [45]. Also keeping 7-day food records helps participants to become aware of what they eat and represents a useful tool to encourage participants in the diet group to change dietary habits.
The NU-AGE dietary intervention study is the biggest randomized trial ever conducted on the effect of a whole diet targeting the nutritional requirements of elderly and counteracting inflammageing, age related decline and contributing to increase the healthy lifespan in the elderly
Acknowledgments This project is supported by the European Union’s Seventh Framework Program under grant agreement no. 266486 (‘NU-AGE: New dietary strategies addressing the specific needs of the elderly population for healthy ageing in Europe’). The Authors thank all principal investigators and collaborators. We especially thank all of the participants for their valuable cooperation.

Chapter 7 | Design NU-AGE dietary intervention study
118
References 1. United Nations. Population Division. Department of Economics and Social Affairs. World Population Ageing: 1950-2050.
2002. 2. Franceschi C, Valensin S, Bonafè M, Paolisso G, Yashin AI, Monti D, et al. The network and the remodeling theories of aging:
Historical background and new perspectives. Experimental Gerontology. 2000;35(6-7):879-96. 3. Cevenini E, Monti D, Franceschi C. Inflamm-ageing. Curr Opin Clin Nutr Metab Care. 2013;16(1):14-20. 4. Franceschi C, Bonafè M, Valensin S, Olivieri F, De Luca M, Ottaviani E, et al. Inflamm-aging: An Evolutionary Perspective on
Immunosenescence. Annals of the New York Academy of Sciences. 2000;908(1):244-54. 5. Franceschi C, Capri M, Monti D, Giunta S, Olivieri F, Sevini F, et al. Inflammaging and anti-inflammaging: a systemic
perspective on aging and longevity emerged from studies in humans. Mechanisms of ageing and development. 2007;128(1):92-105.
6. Carriere I, Delcourt C, Lacroux A, Gerber M. Nutrient intake in an elderly population in southern France (POLANUT): deficiency in some vitamins, minerals and omega-3 PUFA. Int J Vitam Nutr Res. 2007;77(1):57-65.
7. Elmadfa I, Freisling H. Nutritional status in Europe: methods and results. Nutr Rev. 2009;67 Suppl 1:S130-4. 8. Rodriguez Sangrador M, Beltran de Miguel B, Quintanilla Murillas L, Cuadrado Vives C, Moreiras Tuny O. [The contribution
of diet and sun exposure to the nutritional status of vitamin D in elderly Spanish women: the five countries study (OPTIFORD Project)]. Nutr Hosp. 2008;23(6):567-76.
9. Tokarz A, Stawarska A, Kolczewska M. [Nutritional habits and supplementation of elderly people with cardiovascular diseases from Warsaw]. Rocz Panstw Zakl Hig. 2008;59(4):467-72.
10. van Dam RM, Snijder MB, Dekker JM, Stehouwer CD, Bouter LM, Heine RJ, et al. Potentially modifiable determinants of vitamin D status in an older population in the Netherlands: the Hoorn Study. Am J Clin Nutr. 2007;85(3):755-61.
11. Vinas BR, Barba LR, Ngo J, Gurinovic M, Novakovic R, Cavelaars A, et al. Projected prevalence of inadequate nutrient intakes in Europe. Annals of nutrition & metabolism. 2011;59(2-4):84-95.
12. Cavelaars AE, Doets EL, Dhonukshe-Rutten RA, Hermoso M, Fairweather-Tait SJ, Koletzko B, et al. Prioritizing micronutrients for the purpose of reviewing their requirements: a protocol developed by EURRECA. Eur J Clin Nutr. 2010;64 Suppl 2:S19-30.
13. Alonso A, Ruiz-Gutierrez V, Martinez-Gonzalez MA. Monounsaturated fatty acids, olive oil and blood pressure: epidemiological, clinical and experimental evidence. Public Health Nutr. 2006;9(2):251-7.
14. Calder PC. Polyunsaturated fatty acids, inflammatory processes and inflammatory bowel diseases. Molecular Nutrition and Food Research. 2008;52(8):885-97.
15. Kraguljac NV, Montori VM, Pavuluri M, Chai HS, Wilson BS, Unal SS. Efficacy of omega-3 fatty acids in mood disorders - a systematic review and metaanalysis. Psychopharmacology bulletin. 2009;42(3):39-54.
16. de Munter JS, Hu FB, Spiegelman D, Franz M, van Dam RM. Whole grain, bran, and germ intake and risk of type 2 diabetes: a prospective cohort study and systematic review. PLoS Med. 2007;4(8):e261.
17. Donini LM, Savina C, Cannella C. Nutrition in the elderly: role of fiber. Arch Gerontol Geriatr. 2009;49 Suppl 1:61-9. 18. Gaesser GA. Carbohydrate quantity and quality in relation to body mass index. J Am Diet Assoc. 2007;107(10):1768-80. 19. Mellen PB, Walsh TF, Herrington DM. Whole grain intake and cardiovascular disease: a meta-analysis. Nutr Metab
Cardiovasc Dis. 2008;18(4):283-90. 20. Pan A, Yu D, Demark-Wahnefried W, Franco OH, Lin X. Meta-analysis of the effects of flaxseed interventions on blood lipids.
Am J Clin Nutr. 2009;90(2):288-97. 21. Paddon-Jones D, Rasmussen BB. Dietary protein recommendations and the prevention of sarcopenia. Curr Opin Clin Nutr
Metab Care. 2009;12(1):86-90. 22. Bermejo LM, Aparicio A, Andres P, Lopez-Sobaler AM, Ortega RM. The influence of fruit and vegetable intake on the
nutritional status and plasma homocysteine levels of institutionalised elderly people. Public Health Nutr. 2007;10(3):266-72. 23. Hamer M, Chida Y. Intake of fruit, vegetables, and antioxidants and risk of type 2 diabetes: systematic review and meta-
analysis. J Hypertens. 2007;25(12):2361-9. 24. Wannamethee SG, Lowe GD, Rumley A, Bruckdorfer KR, Whincup PH. Associations of vitamin C status, fruit and vegetable
intakes, and markers of inflammation and hemostasis. Am J Clin Nutr. 2006;83(3):567-74; quiz 726-7. 25. Bischoff-Ferrari HA, Dawson-Hughes B, Staehelin HB, Orav JE, Stuck AE, Theiler R, et al. Fall prevention with supplemental
and active forms of vitamin D: a meta-analysis of randomised controlled trials. BMJ. 2009;339:b3692. 26. Andres E, Serraj K, Mecili M, Ciobanu E, Vogel T, Weitten T. [Update of oral vitamin B12]. Ann Endocrinol (Paris).
2009;70(6):455-61. 27. Hin H, Clarke R, Sherliker P, Atoyebi W, Emmens K, Birks J, et al. Clinical relevance of low serum vitamin B12 concentrations
in older people: the Banbury B12 study. Age Ageing. 2006;35(4):416-22. 28. Sato Y, Honda Y, Iwamoto J, Kanoko T, Satoh K. Effect of folate and mecobalamin on hip fractures in patients with stroke: a
randomized controlled trial. JAMA. 2005;293(9):1082-8. 29. Vaes BL, Lute C, Blom HJ, Bravenboer N, de Vries TJ, Everts V, et al. Vitamin B(12) deficiency stimulates osteoclastogenesis
via increased homocysteine and methylmalonic acid. Calcif Tissue Int. 2009;84(5):413-22.
119
30. Jacobs DR, Jr., Steffen LM. Nutrients, foods, and dietary patterns as exposures in research: a framework for food synergy. Am J Clin Nutr. 2003;78(3 Suppl):508S-13S.
31. Jacques PF, Tucker KL. Are dietary patterns useful for understanding the role of diet in chronic disease? Am J Clin Nutr. 2001;73(1):1-2.
32. Alles B, Samieri C, Feart C, Jutand MA, Laurin D, Barberger-Gateau P. Dietary patterns: a novel approach to examine the link between nutrition and cognitive function in older individuals. Nutr Res Rev. 2012:207-22.
33. de Lorgeril M, Renaud S, Mamelle N, Salen P, Martin JL, Monjaud I, et al. Mediterranean alpha-linolenic acid-rich diet in secondary prevention of coronary heart disease. Lancet. 1994;343(8911):1454-9.
34. Estruch R, Martinez-Gonzalez MA, Corella D, Salas-Salvado J, Ruiz-Gutierrez V, Covas MI, et al. Effects of a Mediterranean-style diet on cardiovascular risk factors: a randomized trial. Ann Intern Med. 2006;145(1):1-11.
35. McNaughton SA, Bates CJ, Mishra GD. Diet quality is associated with all-cause mortality in adults aged 65 years and older. J Nutr. 2012;142(2):320-5.
36. Panunzio MF, Caporizzi R, Antoniciello A, Cela EP, Ferguson LR, D'Ambrosio P. Randomized, controlled nutrition education trial promotes a Mediterranean diet and improves anthropometric, dietary, and metabolic parameters in adults. Ann Ig. 2011;23(1):13-25.
37. Trichopoulou A, Orfanos P, Norat T, Bueno-de-Mesquita B, Ocke MC, Peeters PH, et al. Modified Mediterranean diet and survival: EPIC-elderly prospective cohort study. BMJ. 2005;330(7498):991.
38. Estruch R, Ros E, Salas-Salvado J, Covas MI, Pharm D, Corella D, et al. Primary Prevention of Cardiovascular Disease with a Mediterranean Diet. N Engl J Med. 2013;368:1279-90.
39. Franceschi C. Inflammaging as a major characteristic of old people: can it be prevented or cured? 40. Salas-Salvado J, Garcia-Arellano A, Estruch R, Marquez-Sandoval F, Corella D, Fiol M, et al. Components of the
Mediterranean-type food pattern and serum inflammatory markers among patients at high risk for cardiovascular disease. Eur J Clin Nutr. 2008;62(5):651-9.
41. Fried LP, Tangen CM, Walston J, Newman AB, Hirsch C, Gottdiener J, et al. Frailty in older adults: evidence for a phenotype. J Gerontol A Biol Sci Med Sci. 2001;56(3):M146-56.
42. Day N, McKeown N, Wong M, Welch A, Bingham S. Epidemiological assessment of diet: a comparison of a 7-day diary with a food frequency questionnaire using urinary markers of nitrogen, potassium and sodium. Int J Epidemiol. 2001;30(2):309-17.
43. Prentice RL, Mossavar-Rahmani Y, Huang Y, Van Horn L, Beresford SA, Caan B, et al. Evaluation and comparison of food records, recalls, and frequencies for energy and protein assessment by using recovery biomarkers. Am J Epidemiol. 2011;174(5):591-603.
44. Bingham SA, Gill C, Welch A, Day K, Cassidy A, Khaw KT, et al. Comparison of dietary assessment methods in nutritional epidemiology: weighed records v. 24 h recalls, food-frequency questionnaires and estimated-diet records. Br J Nutr. 1994;72(4):619-43.
45. Coulston AM, Boushey CJ. Nutrition in the prevention and treatment of disease. 2nd ed. Coulston AM, editor. Burlingotn, USA: Elsevier Academie Press; 2008 2008.
46. Department of Health. Report on Health & Social Subjects 41 Dietary reference values for food energy and nutrients for the United Kingdom. London: 1991.
47. Health council of the Netherlands. Guidelines for a healthy diet 2006. The Hague: 2006. 48. Jarosz M, Bulhak-Jachymczyk B. Normy zywienia czlowieka. Podstawy prewencji otylosci i chorob niezakaznych / Nutrition
recommendations. Basis for the prevention of obesity and non-communicable dieseases. Warsaw: Wydawnictwo Lekarskie PZWL / National Food and Nutrition Institute 2008.
49. Ministère du Travail dlEedlS. French National Nutrition and Health Program 2011-2015 2011. Available from: http://www.sante.gouv.fr/IMG/pdf/French_National_Nutrition_and_Health_Program_2011-2015.pdf.
50. Istituto Nazionale di Ricerca per gli Alimenti e la Nutrizione. Istituto Nazionale di Ricerca per gli Alimenti e la Nutrizione 2003 [cited 2012 03-08-2011]. Italian Dietary Guidelines]. Available from: http://www.inran.it/.
51. AFSSA, CNERNA-CNRS. Apports Nutritionnels conseillés pour la population française. 3 ed. Martin A, editor. Paris: Tec et Doc Lavoisier; 2001. 608 p.
52. Food and Nutrition Council. Nederlandse normen 1989 / Dutch dietary reference values 1989. The Hague: 1992. 53. Health council of the Netherlands. Dietary reference intakes: calcium, vitamin D, thiamin, riboflavin, niacin, pantothenic
acid, and biotin. The Hague: 2000. 54. Health council of the Netherlands. Dietary Reference Intakes: energy, proteins, fats and digestible carbohydrates. . The
Hague 2001 55. Health council of the Netherlands. Dietary Reference Intakes: vitamin B6, folic acid, and vitamin B12. The Hague: 2003. 56. Health council of the Netherlands. Guideline for dietary fiber intake. The Hague: 2006. 57. Peregrin T. Getting to Know the Modified MyPyramid for Older Adults. Journal of the American Dietetic Association.
2008;108(6):937-8. 58. Shelnutt KP, Bobroff LB, Diehl DC. MyPyramid for Older Adults. Journal of Nutrition Education and Behavior.41(4):300-2.

7
Chapter 7 | Design NU-AGE dietary intervention study
118
References 1. United Nations. Population Division. Department of Economics and Social Affairs. World Population Ageing: 1950-2050.
2002. 2. Franceschi C, Valensin S, Bonafè M, Paolisso G, Yashin AI, Monti D, et al. The network and the remodeling theories of aging:
Historical background and new perspectives. Experimental Gerontology. 2000;35(6-7):879-96. 3. Cevenini E, Monti D, Franceschi C. Inflamm-ageing. Curr Opin Clin Nutr Metab Care. 2013;16(1):14-20. 4. Franceschi C, Bonafè M, Valensin S, Olivieri F, De Luca M, Ottaviani E, et al. Inflamm-aging: An Evolutionary Perspective on
Immunosenescence. Annals of the New York Academy of Sciences. 2000;908(1):244-54. 5. Franceschi C, Capri M, Monti D, Giunta S, Olivieri F, Sevini F, et al. Inflammaging and anti-inflammaging: a systemic
perspective on aging and longevity emerged from studies in humans. Mechanisms of ageing and development. 2007;128(1):92-105.
6. Carriere I, Delcourt C, Lacroux A, Gerber M. Nutrient intake in an elderly population in southern France (POLANUT): deficiency in some vitamins, minerals and omega-3 PUFA. Int J Vitam Nutr Res. 2007;77(1):57-65.
7. Elmadfa I, Freisling H. Nutritional status in Europe: methods and results. Nutr Rev. 2009;67 Suppl 1:S130-4. 8. Rodriguez Sangrador M, Beltran de Miguel B, Quintanilla Murillas L, Cuadrado Vives C, Moreiras Tuny O. [The contribution
of diet and sun exposure to the nutritional status of vitamin D in elderly Spanish women: the five countries study (OPTIFORD Project)]. Nutr Hosp. 2008;23(6):567-76.
9. Tokarz A, Stawarska A, Kolczewska M. [Nutritional habits and supplementation of elderly people with cardiovascular diseases from Warsaw]. Rocz Panstw Zakl Hig. 2008;59(4):467-72.
10. van Dam RM, Snijder MB, Dekker JM, Stehouwer CD, Bouter LM, Heine RJ, et al. Potentially modifiable determinants of vitamin D status in an older population in the Netherlands: the Hoorn Study. Am J Clin Nutr. 2007;85(3):755-61.
11. Vinas BR, Barba LR, Ngo J, Gurinovic M, Novakovic R, Cavelaars A, et al. Projected prevalence of inadequate nutrient intakes in Europe. Annals of nutrition & metabolism. 2011;59(2-4):84-95.
12. Cavelaars AE, Doets EL, Dhonukshe-Rutten RA, Hermoso M, Fairweather-Tait SJ, Koletzko B, et al. Prioritizing micronutrients for the purpose of reviewing their requirements: a protocol developed by EURRECA. Eur J Clin Nutr. 2010;64 Suppl 2:S19-30.
13. Alonso A, Ruiz-Gutierrez V, Martinez-Gonzalez MA. Monounsaturated fatty acids, olive oil and blood pressure: epidemiological, clinical and experimental evidence. Public Health Nutr. 2006;9(2):251-7.
14. Calder PC. Polyunsaturated fatty acids, inflammatory processes and inflammatory bowel diseases. Molecular Nutrition and Food Research. 2008;52(8):885-97.
15. Kraguljac NV, Montori VM, Pavuluri M, Chai HS, Wilson BS, Unal SS. Efficacy of omega-3 fatty acids in mood disorders - a systematic review and metaanalysis. Psychopharmacology bulletin. 2009;42(3):39-54.
16. de Munter JS, Hu FB, Spiegelman D, Franz M, van Dam RM. Whole grain, bran, and germ intake and risk of type 2 diabetes: a prospective cohort study and systematic review. PLoS Med. 2007;4(8):e261.
17. Donini LM, Savina C, Cannella C. Nutrition in the elderly: role of fiber. Arch Gerontol Geriatr. 2009;49 Suppl 1:61-9. 18. Gaesser GA. Carbohydrate quantity and quality in relation to body mass index. J Am Diet Assoc. 2007;107(10):1768-80. 19. Mellen PB, Walsh TF, Herrington DM. Whole grain intake and cardiovascular disease: a meta-analysis. Nutr Metab
Cardiovasc Dis. 2008;18(4):283-90. 20. Pan A, Yu D, Demark-Wahnefried W, Franco OH, Lin X. Meta-analysis of the effects of flaxseed interventions on blood lipids.
Am J Clin Nutr. 2009;90(2):288-97. 21. Paddon-Jones D, Rasmussen BB. Dietary protein recommendations and the prevention of sarcopenia. Curr Opin Clin Nutr
Metab Care. 2009;12(1):86-90. 22. Bermejo LM, Aparicio A, Andres P, Lopez-Sobaler AM, Ortega RM. The influence of fruit and vegetable intake on the
nutritional status and plasma homocysteine levels of institutionalised elderly people. Public Health Nutr. 2007;10(3):266-72. 23. Hamer M, Chida Y. Intake of fruit, vegetables, and antioxidants and risk of type 2 diabetes: systematic review and meta-
analysis. J Hypertens. 2007;25(12):2361-9. 24. Wannamethee SG, Lowe GD, Rumley A, Bruckdorfer KR, Whincup PH. Associations of vitamin C status, fruit and vegetable
intakes, and markers of inflammation and hemostasis. Am J Clin Nutr. 2006;83(3):567-74; quiz 726-7. 25. Bischoff-Ferrari HA, Dawson-Hughes B, Staehelin HB, Orav JE, Stuck AE, Theiler R, et al. Fall prevention with supplemental
and active forms of vitamin D: a meta-analysis of randomised controlled trials. BMJ. 2009;339:b3692. 26. Andres E, Serraj K, Mecili M, Ciobanu E, Vogel T, Weitten T. [Update of oral vitamin B12]. Ann Endocrinol (Paris).
2009;70(6):455-61. 27. Hin H, Clarke R, Sherliker P, Atoyebi W, Emmens K, Birks J, et al. Clinical relevance of low serum vitamin B12 concentrations
in older people: the Banbury B12 study. Age Ageing. 2006;35(4):416-22. 28. Sato Y, Honda Y, Iwamoto J, Kanoko T, Satoh K. Effect of folate and mecobalamin on hip fractures in patients with stroke: a
randomized controlled trial. JAMA. 2005;293(9):1082-8. 29. Vaes BL, Lute C, Blom HJ, Bravenboer N, de Vries TJ, Everts V, et al. Vitamin B(12) deficiency stimulates osteoclastogenesis
via increased homocysteine and methylmalonic acid. Calcif Tissue Int. 2009;84(5):413-22.
119
30. Jacobs DR, Jr., Steffen LM. Nutrients, foods, and dietary patterns as exposures in research: a framework for food synergy. Am J Clin Nutr. 2003;78(3 Suppl):508S-13S.
31. Jacques PF, Tucker KL. Are dietary patterns useful for understanding the role of diet in chronic disease? Am J Clin Nutr. 2001;73(1):1-2.
32. Alles B, Samieri C, Feart C, Jutand MA, Laurin D, Barberger-Gateau P. Dietary patterns: a novel approach to examine the link between nutrition and cognitive function in older individuals. Nutr Res Rev. 2012:207-22.
33. de Lorgeril M, Renaud S, Mamelle N, Salen P, Martin JL, Monjaud I, et al. Mediterranean alpha-linolenic acid-rich diet in secondary prevention of coronary heart disease. Lancet. 1994;343(8911):1454-9.
34. Estruch R, Martinez-Gonzalez MA, Corella D, Salas-Salvado J, Ruiz-Gutierrez V, Covas MI, et al. Effects of a Mediterranean-style diet on cardiovascular risk factors: a randomized trial. Ann Intern Med. 2006;145(1):1-11.
35. McNaughton SA, Bates CJ, Mishra GD. Diet quality is associated with all-cause mortality in adults aged 65 years and older. J Nutr. 2012;142(2):320-5.
36. Panunzio MF, Caporizzi R, Antoniciello A, Cela EP, Ferguson LR, D'Ambrosio P. Randomized, controlled nutrition education trial promotes a Mediterranean diet and improves anthropometric, dietary, and metabolic parameters in adults. Ann Ig. 2011;23(1):13-25.
37. Trichopoulou A, Orfanos P, Norat T, Bueno-de-Mesquita B, Ocke MC, Peeters PH, et al. Modified Mediterranean diet and survival: EPIC-elderly prospective cohort study. BMJ. 2005;330(7498):991.
38. Estruch R, Ros E, Salas-Salvado J, Covas MI, Pharm D, Corella D, et al. Primary Prevention of Cardiovascular Disease with a Mediterranean Diet. N Engl J Med. 2013;368:1279-90.
39. Franceschi C. Inflammaging as a major characteristic of old people: can it be prevented or cured? 40. Salas-Salvado J, Garcia-Arellano A, Estruch R, Marquez-Sandoval F, Corella D, Fiol M, et al. Components of the
Mediterranean-type food pattern and serum inflammatory markers among patients at high risk for cardiovascular disease. Eur J Clin Nutr. 2008;62(5):651-9.
41. Fried LP, Tangen CM, Walston J, Newman AB, Hirsch C, Gottdiener J, et al. Frailty in older adults: evidence for a phenotype. J Gerontol A Biol Sci Med Sci. 2001;56(3):M146-56.
42. Day N, McKeown N, Wong M, Welch A, Bingham S. Epidemiological assessment of diet: a comparison of a 7-day diary with a food frequency questionnaire using urinary markers of nitrogen, potassium and sodium. Int J Epidemiol. 2001;30(2):309-17.
43. Prentice RL, Mossavar-Rahmani Y, Huang Y, Van Horn L, Beresford SA, Caan B, et al. Evaluation and comparison of food records, recalls, and frequencies for energy and protein assessment by using recovery biomarkers. Am J Epidemiol. 2011;174(5):591-603.
44. Bingham SA, Gill C, Welch A, Day K, Cassidy A, Khaw KT, et al. Comparison of dietary assessment methods in nutritional epidemiology: weighed records v. 24 h recalls, food-frequency questionnaires and estimated-diet records. Br J Nutr. 1994;72(4):619-43.
45. Coulston AM, Boushey CJ. Nutrition in the prevention and treatment of disease. 2nd ed. Coulston AM, editor. Burlingotn, USA: Elsevier Academie Press; 2008 2008.
46. Department of Health. Report on Health & Social Subjects 41 Dietary reference values for food energy and nutrients for the United Kingdom. London: 1991.
47. Health council of the Netherlands. Guidelines for a healthy diet 2006. The Hague: 2006. 48. Jarosz M, Bulhak-Jachymczyk B. Normy zywienia czlowieka. Podstawy prewencji otylosci i chorob niezakaznych / Nutrition
recommendations. Basis for the prevention of obesity and non-communicable dieseases. Warsaw: Wydawnictwo Lekarskie PZWL / National Food and Nutrition Institute 2008.
49. Ministère du Travail dlEedlS. French National Nutrition and Health Program 2011-2015 2011. Available from: http://www.sante.gouv.fr/IMG/pdf/French_National_Nutrition_and_Health_Program_2011-2015.pdf.
50. Istituto Nazionale di Ricerca per gli Alimenti e la Nutrizione. Istituto Nazionale di Ricerca per gli Alimenti e la Nutrizione 2003 [cited 2012 03-08-2011]. Italian Dietary Guidelines]. Available from: http://www.inran.it/.
51. AFSSA, CNERNA-CNRS. Apports Nutritionnels conseillés pour la population française. 3 ed. Martin A, editor. Paris: Tec et Doc Lavoisier; 2001. 608 p.
52. Food and Nutrition Council. Nederlandse normen 1989 / Dutch dietary reference values 1989. The Hague: 1992. 53. Health council of the Netherlands. Dietary reference intakes: calcium, vitamin D, thiamin, riboflavin, niacin, pantothenic
acid, and biotin. The Hague: 2000. 54. Health council of the Netherlands. Dietary Reference Intakes: energy, proteins, fats and digestible carbohydrates. . The
Hague 2001 55. Health council of the Netherlands. Dietary Reference Intakes: vitamin B6, folic acid, and vitamin B12. The Hague: 2003. 56. Health council of the Netherlands. Guideline for dietary fiber intake. The Hague: 2006. 57. Peregrin T. Getting to Know the Modified MyPyramid for Older Adults. Journal of the American Dietetic Association.
2008;108(6):937-8. 58. Shelnutt KP, Bobroff LB, Diehl DC. MyPyramid for Older Adults. Journal of Nutrition Education and Behavior.41(4):300-2.

Chapter 7 | Design NU-AGE dietary intervention study
120
59. Commission of the European Communities. Nutrient and energy intakes for the European Community. Luxembourg: European Food Safety Authority (EFSA), Scientific Committee for Food, 1993.
60. Medicine Io. Dietary Reference Intakes. The essential guide to nutrient requirements. Otten J, Pitzi Hellwig, J. Meyers L, editors. Washington: The National Academies Press; 2006.
61. Miller WR, Rollnick S. Motivational interviewing : preparing people for change. New York [etc.]: The Guilford Press; 2002. 62. Health council of the Netherlands. Towards an adequate intake of vitamin D. The Hague: 2008. 63. Bischoff-Ferrari HA, Kiel DP, Dawson-Hughes B, Orav JE, Li R, Spiegelman D, et al. Dietary calcium and serum 25-
hydroxyvitamin D status in relation to BMD among U.S. adults. J Bone Miner Res. 2009;24(5):935-42. 64. Richard C, Couture P, Desroches S, Charest A, Lamarche B. Effect of the Mediterranean diet with and without weight loss on
cardiovascular risk factors in men with the metabolic syndrome. Nutrition, Metabolism and Cardiovascular Diseases. 2011;21(9):628-35.
65. Vincent-Baudry S, Defoort C, Gerber M, Bernard MC, Verger P, Helal O, et al. The Medi-RIVAGE study: reduction of cardiovascular disease risk factors after a 3-mo intervention with a Mediterranean-type diet or a low-fat diet. Am J Clin Nutr. 2005;82(5):964-71.
66. Zazpe I, Sanchez-Tainta A, Estruch R, Lamuela-Raventos RM, Schroder H, Salas-Salvado J, et al. A large randomized individual and group intervention conducted by registered dietitians increased adherence to Mediterranean-type diets: the PREDIMED study. J Am Diet Assoc. 2008;108(7):1134-44; discussion 45.
67. Babio N, Bullo M, Basora J, Martinez-Gonzalez MA, Fernandez-Ballart J, Marquez-Sandoval F, et al. Adherence to the Mediterranean diet and risk of metabolic syndrome and its components. Nutr Metab Cardiovasc Dis. 2009;19(8):563-70.
68. Kastorini CM, Milionis HJ, Esposito K, Giugliano D, Goudevenos JA, Panagiotakos DB. The effect of Mediterranean diet on metabolic syndrome and its components: a meta-analysis of 50 studies and 534,906 individuals. J Am Coll Cardiol. 2011;57(11):1299-313.
69. Martinez-Gonzalez MA, Corella D, Salas-Salvado J, Ros E, Covas MI, Fiol M, et al. Cohort profile: design and methods of the PREDIMED study. Int J Epidemiol. 2012;41(2):377-85.
70. Troyer JL, Racine EF, Ngugi GW, McAuley WJ. The effect of home-delivered Dietary Approach to Stop Hypertension (DASH) meals on the diets of older adults with cardiovascular disease. Am J Clin Nutr. 2010;91(5):1204-12.
71. Svetkey LP, Erlinger TP, Vollmer WM, Feldstein A, Cooper LS, Appel LJ, et al. Effect of lifestyle modifications on blood pressure by race, sex, hypertension status, and age. J Hum Hypertens. 2005;19(1):21-31.
72. Dawson-Hughes B, Harris SS, Krall EA, Dallal GE. Effect of calcium and vitamin D supplementation on bone density in men and women 65 years of age or older. N Engl J Med. 1997;337(10):670-6.
73. Richard C, Couture P, Desroches S, Lamarche B. Effect of the mediterranean diet with and without weight loss on markers of inflammation in men with metabolic syndrome. Obesity (Silver Spring, Md). 2013;21(1):51-7.
121

7
Chapter 7 | Design NU-AGE dietary intervention study
120
59. Commission of the European Communities. Nutrient and energy intakes for the European Community. Luxembourg: European Food Safety Authority (EFSA), Scientific Committee for Food, 1993.
60. Medicine Io. Dietary Reference Intakes. The essential guide to nutrient requirements. Otten J, Pitzi Hellwig, J. Meyers L, editors. Washington: The National Academies Press; 2006.
61. Miller WR, Rollnick S. Motivational interviewing : preparing people for change. New York [etc.]: The Guilford Press; 2002. 62. Health council of the Netherlands. Towards an adequate intake of vitamin D. The Hague: 2008. 63. Bischoff-Ferrari HA, Kiel DP, Dawson-Hughes B, Orav JE, Li R, Spiegelman D, et al. Dietary calcium and serum 25-
hydroxyvitamin D status in relation to BMD among U.S. adults. J Bone Miner Res. 2009;24(5):935-42. 64. Richard C, Couture P, Desroches S, Charest A, Lamarche B. Effect of the Mediterranean diet with and without weight loss on
cardiovascular risk factors in men with the metabolic syndrome. Nutrition, Metabolism and Cardiovascular Diseases. 2011;21(9):628-35.
65. Vincent-Baudry S, Defoort C, Gerber M, Bernard MC, Verger P, Helal O, et al. The Medi-RIVAGE study: reduction of cardiovascular disease risk factors after a 3-mo intervention with a Mediterranean-type diet or a low-fat diet. Am J Clin Nutr. 2005;82(5):964-71.
66. Zazpe I, Sanchez-Tainta A, Estruch R, Lamuela-Raventos RM, Schroder H, Salas-Salvado J, et al. A large randomized individual and group intervention conducted by registered dietitians increased adherence to Mediterranean-type diets: the PREDIMED study. J Am Diet Assoc. 2008;108(7):1134-44; discussion 45.
67. Babio N, Bullo M, Basora J, Martinez-Gonzalez MA, Fernandez-Ballart J, Marquez-Sandoval F, et al. Adherence to the Mediterranean diet and risk of metabolic syndrome and its components. Nutr Metab Cardiovasc Dis. 2009;19(8):563-70.
68. Kastorini CM, Milionis HJ, Esposito K, Giugliano D, Goudevenos JA, Panagiotakos DB. The effect of Mediterranean diet on metabolic syndrome and its components: a meta-analysis of 50 studies and 534,906 individuals. J Am Coll Cardiol. 2011;57(11):1299-313.
69. Martinez-Gonzalez MA, Corella D, Salas-Salvado J, Ros E, Covas MI, Fiol M, et al. Cohort profile: design and methods of the PREDIMED study. Int J Epidemiol. 2012;41(2):377-85.
70. Troyer JL, Racine EF, Ngugi GW, McAuley WJ. The effect of home-delivered Dietary Approach to Stop Hypertension (DASH) meals on the diets of older adults with cardiovascular disease. Am J Clin Nutr. 2010;91(5):1204-12.
71. Svetkey LP, Erlinger TP, Vollmer WM, Feldstein A, Cooper LS, Appel LJ, et al. Effect of lifestyle modifications on blood pressure by race, sex, hypertension status, and age. J Hum Hypertens. 2005;19(1):21-31.
72. Dawson-Hughes B, Harris SS, Krall EA, Dallal GE. Effect of calcium and vitamin D supplementation on bone density in men and women 65 years of age or older. N Engl J Med. 1997;337(10):670-6.
73. Richard C, Couture P, Desroches S, Lamarche B. Effect of the mediterranean diet with and without weight loss on markers of inflammation in men with metabolic syndrome. Obesity (Silver Spring, Md). 2013;21(1):51-7.
121


Chapter 8Changes in dietary intake and
adherence to the NU-AGE diet after a one-year dietary intervention
among European older adults
Agnes A.M. Berendsen, Edith J.M. Feskens, Ondine van de Rest, Aurelia Santoro, Rita Ostan, Barbara Pietruszka,
Anna Brzozowska, Agnieszka Stelmaszczyk-Kusz, Amy Jennings, Rachel Gillings, Aedin Cassidy, Aurélie Caille, Elodie Caumon,
Corinne Malpuech-Brugere, Claudio Franceschi, LisetteC.P.G.M. de Groot
Submitted Frontiers in Physiology, section Integrative Physiology
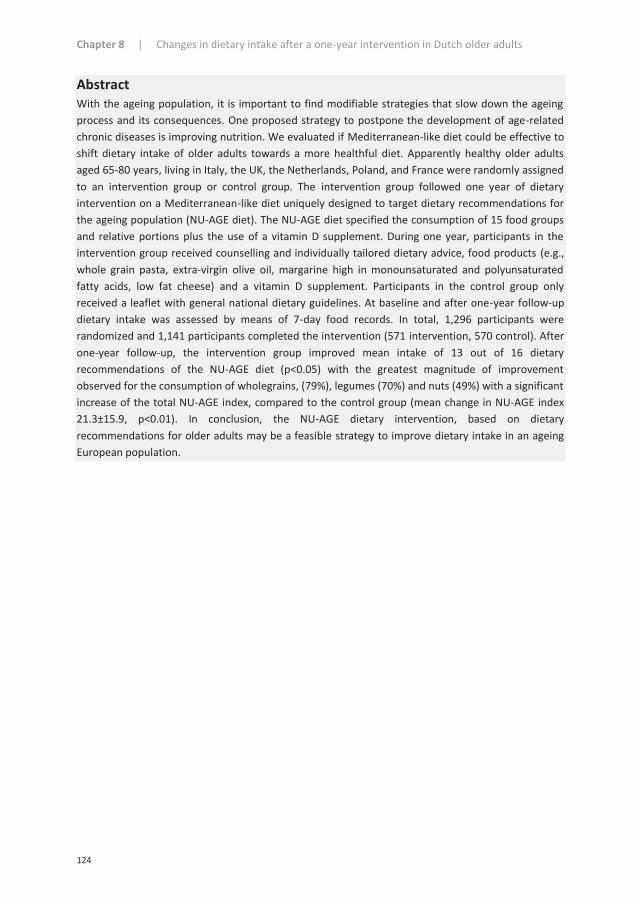
Chapter 8 | Changes in dietary intake after a one-year intervention in Dutch older adults
124
Abstract With the ageing population, it is important to find modifiable strategies that slow down the ageing process and its consequences. One proposed strategy to postpone the development of age-related chronic diseases is improving nutrition. We evaluated if Mediterranean-like diet could be effective to shift dietary intake of older adults towards a more healthful diet. Apparently healthy older adults aged 65-80 years, living in Italy, the UK, the Netherlands, Poland, and France were randomly assigned to an intervention group or control group. The intervention group followed one year of dietary intervention on a Mediterranean-like diet uniquely designed to target dietary recommendations for the ageing population (NU-AGE diet). The NU-AGE diet specified the consumption of 15 food groups and relative portions plus the use of a vitamin D supplement. During one year, participants in the intervention group received counselling and individually tailored dietary advice, food products (e.g., whole grain pasta, extra-virgin olive oil, margarine high in monounsaturated and polyunsaturated fatty acids, low fat cheese) and a vitamin D supplement. Participants in the control group only received a leaflet with general national dietary guidelines. At baseline and after one-year follow-up dietary intake was assessed by means of 7-day food records. In total, 1,296 participants were randomized and 1,141 participants completed the intervention (571 intervention, 570 control). After one-year follow-up, the intervention group improved mean intake of 13 out of 16 dietary recommendations of the NU-AGE diet (p<0.05) with the greatest magnitude of improvement observed for the consumption of wholegrains, (79%), legumes (70%) and nuts (49%) with a significant increase of the total NU-AGE index, compared to the control group (mean change in NU-AGE index 21.3±15.9, p<0.01). In conclusion, the NU-AGE dietary intervention, based on dietary recommendations for older adults may be a feasible strategy to improve dietary intake in an ageing European population.
125
Introduction With the ageing population [1], it is important to find modifiable strategies that slow down the ageing process and its consequences in order to increase the number of years in good health in European elderly.
The ageing process can be described as a chronic low-grade inflammatory process, which is referred to as inflammageing. Inflammageing impacts many organ systems and domains and plays a role in the onset of age-related chronic diseases [2-4]. One proposed strategy to postpone the development of age-related chronic diseases is improving nutrition. Evidence shows, that especially monounsaturated fatty acids, polyunsaturated fatty acids [5, 6], protein [7], vitamin D [8], vitamin B12 [9], folate [10], and anti-oxidants [11] can impact age-related health outcomes.
At the same time, it is known that with increasing age, elderly people are at higher risk of low nutrient intakes [12]. At the food group level, diets of elderly are lacking in multiple food groups, such as fruit, vegetables, and fish [13]. On the other hand diets of elderly are exceeding the requirements for saturated fatty acids [13]. Manipulating dietary patterns can be a more powerful approach than changing single nutrients or foods, because these may have synergistic or antagonistic effects when consumed in combination [14, 15]. Many studies have shown that altering dietary patterns is more effective than altering single nutrients on reducing disease risk [16-21].
To bridge the gap between current dietary intakes and a healthful pattern in an ageing population, the NU-AGE study was started. The NU-AGE study aimed to improve health of the ageing population by means of a dietary intervention specifically targeting the dietary recommendations of older adults [22].
The aim of the current study was to evaluate if the NU-AGE dietary intervention is effective to shift the dietary intake of apparently healthy elderly subjects more towards the NU-AGE guidelines for a healthful diet. Additionally, we evaluated if adherence to the NU-AGE guidelines is comparable at five European sites involved within the NU-AGE study.
Materials and methods Study design This study was performed using baseline and follow-up data of the NU-AGE dietary intervention study. The NU-AGE study is a one-year, randomized, parallel trial to investigate whether a newly designed, personally tailored diet, designed to target dietary recommendations of people over 65 years of age can counteract or slow down the decline of function at the level of different organs and systems. The study was carried out in five European study centres (Bologna in Italy, Norwich in the UK, Wageningen in the Netherlands, Warsaw in Poland, and Clermont-Ferrand in France). Recruitment started in in April 2012 and finished in January 2014 including 1,296 apparently healthy European men and women aged 65-80 years. The rationale and design of this intervention study are described in detail elsewhere [22, 23]. In short, participants completed questionnaires about their health and lifestyle and a 7-day food record to obtain information about their dietary intake. Tests were conducted to measure a wide range of health outcomes. All questionnaires and measurements were repeated after one year. The study protocol was approved by local medical ethics committees at all study sites and the NU-AGE study is registered with clinicialtrials.gov since December 21st 2012, NCT01754012.

8
Chapter 8 | Changes in dietary intake after a one-year intervention in Dutch older adults
124
Abstract With the ageing population, it is important to find modifiable strategies that slow down the ageing process and its consequences. One proposed strategy to postpone the development of age-related chronic diseases is improving nutrition. We evaluated if Mediterranean-like diet could be effective to shift dietary intake of older adults towards a more healthful diet. Apparently healthy older adults aged 65-80 years, living in Italy, the UK, the Netherlands, Poland, and France were randomly assigned to an intervention group or control group. The intervention group followed one year of dietary intervention on a Mediterranean-like diet uniquely designed to target dietary recommendations for the ageing population (NU-AGE diet). The NU-AGE diet specified the consumption of 15 food groups and relative portions plus the use of a vitamin D supplement. During one year, participants in the intervention group received counselling and individually tailored dietary advice, food products (e.g., whole grain pasta, extra-virgin olive oil, margarine high in monounsaturated and polyunsaturated fatty acids, low fat cheese) and a vitamin D supplement. Participants in the control group only received a leaflet with general national dietary guidelines. At baseline and after one-year follow-up dietary intake was assessed by means of 7-day food records. In total, 1,296 participants were randomized and 1,141 participants completed the intervention (571 intervention, 570 control). After one-year follow-up, the intervention group improved mean intake of 13 out of 16 dietary recommendations of the NU-AGE diet (p<0.05) with the greatest magnitude of improvement observed for the consumption of wholegrains, (79%), legumes (70%) and nuts (49%) with a significant increase of the total NU-AGE index, compared to the control group (mean change in NU-AGE index 21.3±15.9, p<0.01). In conclusion, the NU-AGE dietary intervention, based on dietary recommendations for older adults may be a feasible strategy to improve dietary intake in an ageing European population.
125
Introduction With the ageing population [1], it is important to find modifiable strategies that slow down the ageing process and its consequences in order to increase the number of years in good health in European elderly.
The ageing process can be described as a chronic low-grade inflammatory process, which is referred to as inflammageing. Inflammageing impacts many organ systems and domains and plays a role in the onset of age-related chronic diseases [2-4]. One proposed strategy to postpone the development of age-related chronic diseases is improving nutrition. Evidence shows, that especially monounsaturated fatty acids, polyunsaturated fatty acids [5, 6], protein [7], vitamin D [8], vitamin B12 [9], folate [10], and anti-oxidants [11] can impact age-related health outcomes.
At the same time, it is known that with increasing age, elderly people are at higher risk of low nutrient intakes [12]. At the food group level, diets of elderly are lacking in multiple food groups, such as fruit, vegetables, and fish [13]. On the other hand diets of elderly are exceeding the requirements for saturated fatty acids [13]. Manipulating dietary patterns can be a more powerful approach than changing single nutrients or foods, because these may have synergistic or antagonistic effects when consumed in combination [14, 15]. Many studies have shown that altering dietary patterns is more effective than altering single nutrients on reducing disease risk [16-21].
To bridge the gap between current dietary intakes and a healthful pattern in an ageing population, the NU-AGE study was started. The NU-AGE study aimed to improve health of the ageing population by means of a dietary intervention specifically targeting the dietary recommendations of older adults [22].
The aim of the current study was to evaluate if the NU-AGE dietary intervention is effective to shift the dietary intake of apparently healthy elderly subjects more towards the NU-AGE guidelines for a healthful diet. Additionally, we evaluated if adherence to the NU-AGE guidelines is comparable at five European sites involved within the NU-AGE study.
Materials and methods Study design This study was performed using baseline and follow-up data of the NU-AGE dietary intervention study. The NU-AGE study is a one-year, randomized, parallel trial to investigate whether a newly designed, personally tailored diet, designed to target dietary recommendations of people over 65 years of age can counteract or slow down the decline of function at the level of different organs and systems. The study was carried out in five European study centres (Bologna in Italy, Norwich in the UK, Wageningen in the Netherlands, Warsaw in Poland, and Clermont-Ferrand in France). Recruitment started in in April 2012 and finished in January 2014 including 1,296 apparently healthy European men and women aged 65-80 years. The rationale and design of this intervention study are described in detail elsewhere [22, 23]. In short, participants completed questionnaires about their health and lifestyle and a 7-day food record to obtain information about their dietary intake. Tests were conducted to measure a wide range of health outcomes. All questionnaires and measurements were repeated after one year. The study protocol was approved by local medical ethics committees at all study sites and the NU-AGE study is registered with clinicialtrials.gov since December 21st 2012, NCT01754012.

Chapter 8 | Changes in dietary intake after a one-year intervention in Dutch older adults
126
In the present study, we excluded those who had not completed both 7-day food records at baseline and follow-up (n=145), those with missing data on vitamin D supplement use (n=3), incomplete diet data (n=4) and those with an energy intake below 500 kcal (n=0) or exceeding 3500 kcal (n=3)[32], resulting in a total population for analysis of 1,141 participants (figure 1) of which 241 participants were from Italy, 252 from the UK, 241 from the Netherlands, 220 from Poland, and 187 from France.
Figure 1. Flow chart of recruitment process NU-AGE participants Dietary intervention Participants randomized into the intervention group received monthly counselling from a trained dietician/research nutritionist and individually tailored dietary advice aiming to meet the NU-AGE Food Based Dietary Guidelines (FBDG’s) (table 1). To achieve changes in dietary intake by means of intrinsic motivation the dietary advice was based on the Motivational Interview technique [24] and the Stages of Changes model [25]. Dietary advice was provided nine times during one year, either face-to-face or by telephone [22] using standardized procedures. To sustain compliance to the NU-AGE FBDG’s, participants in all five study centres received commercially available foods meeting the NU-AGE dietary guidelines, namely low-fat and low-salt cheese, wholegrain pasta, olive oil and margarine rich in monounsaturated fatty acids (MUFA) and polyunsaturated fatty acids (PUFA). Italy additionally provided vegetable soup to their participants. Additionally, participants received a vitamin D supplement, because it is not possible to achieve an adequate vitamin D intake from diet alone [26, 27]. Participants in the control group received a leaflet with national dietary guidelines that are generally available in Italy [28], the United Kingdom, the Netherlands [29], Poland [30] and France [31].
127
Table 1. Components and scoring of the NU-AGE diet index Scoring Component Servings Minimum
score (0) Range (1-10) Maximum
score (10) Upper range
(10-1) Wholemeal bread, wholegrain pasta and rice
4-6 servings/day (140-210g/day) Rice/pasta 2x80 g/week (23g/day)
max 1-163g 163-233 g 233-max
Fruitsa 2 servings/day (240 gram)
0g 0-240g ≥240
Vegetables 300 gram/day 0g 0-300g ≥300g Legumes 200 gram/week
(29g/day) 0g 0-200g ≥200g
Low-fat dairy 500 ml /day 0g 0-500g ≥500g Low-fat cheese 30 gram/day 0g 0-30g ≥30g Fish 2 times 125g/week
(36g/day) 0g 0-36g ≥36g
Low-fat meat and poultry
4 times 125g/week (71g/day)
Max 0-71g 71-125 125-max
Nutsb 2 times 20g/week (6g/day)
0g 0-6g >6g
Eggs 2-4/week (14-26g/day)
0g 0-14g >14g
Olive oil 20 gram/day 0ml 0-20ml ≥20ml Alcohol 2 for men
1 for women >10g women
>20g men ≤10 women
≤20 men
Fluid 1.5 litre/day <1000ml 1000-1500ml
>1500ml
Salt 5 grams/day (1200 mg sodium)
≥85th 0-1500 mg 1500-2000mg 2000-85th
Sweets Limited use ≥85th 0 0-85th Vitamin D Use supplement No Yes a Fruit: maximum 1 glass of fresh fruit juices (120 ml) can be counted as one portion of fruit. b Nuts: includes salted and unsalted nuts
Dietary assessment Dietary intake was estimated by means of 7-day food records completed by the participants. During a one hour interview with dieticians the food record was checked to obtain more detailed information about types of foods, preparation methods and recipes and to estimate portion sizes by using real-life models and pictures. Consumed foods were coded according to standardized coding procedures and translated into nutrients by use of local food composition tables (NEVO 2011 in The Netherlands [33], WISP in The UK, INRAN and IEO in Italy, NFNI in Poland and CIQUAL French food composition table in France). Data on supplement use are obtained by means of a self-reported supplement questionnaire and checked by a trained dietician/research nutritionist. Other variables Data on smoking status (current, former), educational level (years), employment (defined as 1) employed, 2) retired, or 3) other, and medical history (prevalence of hypertension [yes/no], heart disease [yes/no], diabetes mellitus type II [yes/no], hypercholesterolemia [yes/no], neurological diseases [yes/no], osteoporosis [yes/no]) were obtained by means of questionnaires. Frailty status (non-frail/pre-frail) was assessed using the frailty criteria from Fried et al. [34]. Height was measured

8
Chapter 8 | Changes in dietary intake after a one-year intervention in Dutch older adults
126
In the present study, we excluded those who had not completed both 7-day food records at baseline and follow-up (n=145), those with missing data on vitamin D supplement use (n=3), incomplete diet data (n=4) and those with an energy intake below 500 kcal (n=0) or exceeding 3500 kcal (n=3)[32], resulting in a total population for analysis of 1,141 participants (figure 1) of which 241 participants were from Italy, 252 from the UK, 241 from the Netherlands, 220 from Poland, and 187 from France.
Figure 1. Flow chart of recruitment process NU-AGE participants Dietary intervention Participants randomized into the intervention group received monthly counselling from a trained dietician/research nutritionist and individually tailored dietary advice aiming to meet the NU-AGE Food Based Dietary Guidelines (FBDG’s) (table 1). To achieve changes in dietary intake by means of intrinsic motivation the dietary advice was based on the Motivational Interview technique [24] and the Stages of Changes model [25]. Dietary advice was provided nine times during one year, either face-to-face or by telephone [22] using standardized procedures. To sustain compliance to the NU-AGE FBDG’s, participants in all five study centres received commercially available foods meeting the NU-AGE dietary guidelines, namely low-fat and low-salt cheese, wholegrain pasta, olive oil and margarine rich in monounsaturated fatty acids (MUFA) and polyunsaturated fatty acids (PUFA). Italy additionally provided vegetable soup to their participants. Additionally, participants received a vitamin D supplement, because it is not possible to achieve an adequate vitamin D intake from diet alone [26, 27]. Participants in the control group received a leaflet with national dietary guidelines that are generally available in Italy [28], the United Kingdom, the Netherlands [29], Poland [30] and France [31].
127
Table 1. Components and scoring of the NU-AGE diet index Scoring Component Servings Minimum
score (0) Range (1-10) Maximum
score (10) Upper range
(10-1) Wholemeal bread, wholegrain pasta and rice
4-6 servings/day (140-210g/day) Rice/pasta 2x80 g/week (23g/day)
max 1-163g 163-233 g 233-max
Fruitsa 2 servings/day (240 gram)
0g 0-240g ≥240
Vegetables 300 gram/day 0g 0-300g ≥300g Legumes 200 gram/week
(29g/day) 0g 0-200g ≥200g
Low-fat dairy 500 ml /day 0g 0-500g ≥500g Low-fat cheese 30 gram/day 0g 0-30g ≥30g Fish 2 times 125g/week
(36g/day) 0g 0-36g ≥36g
Low-fat meat and poultry
4 times 125g/week (71g/day)
Max 0-71g 71-125 125-max
Nutsb 2 times 20g/week (6g/day)
0g 0-6g >6g
Eggs 2-4/week (14-26g/day)
0g 0-14g >14g
Olive oil 20 gram/day 0ml 0-20ml ≥20ml Alcohol 2 for men
1 for women >10g women
>20g men ≤10 women
≤20 men
Fluid 1.5 litre/day <1000ml 1000-1500ml
>1500ml
Salt 5 grams/day (1200 mg sodium)
≥85th 0-1500 mg 1500-2000mg 2000-85th
Sweets Limited use ≥85th 0 0-85th Vitamin D Use supplement No Yes a Fruit: maximum 1 glass of fresh fruit juices (120 ml) can be counted as one portion of fruit. b Nuts: includes salted and unsalted nuts
Dietary assessment Dietary intake was estimated by means of 7-day food records completed by the participants. During a one hour interview with dieticians the food record was checked to obtain more detailed information about types of foods, preparation methods and recipes and to estimate portion sizes by using real-life models and pictures. Consumed foods were coded according to standardized coding procedures and translated into nutrients by use of local food composition tables (NEVO 2011 in The Netherlands [33], WISP in The UK, INRAN and IEO in Italy, NFNI in Poland and CIQUAL French food composition table in France). Data on supplement use are obtained by means of a self-reported supplement questionnaire and checked by a trained dietician/research nutritionist. Other variables Data on smoking status (current, former), educational level (years), employment (defined as 1) employed, 2) retired, or 3) other, and medical history (prevalence of hypertension [yes/no], heart disease [yes/no], diabetes mellitus type II [yes/no], hypercholesterolemia [yes/no], neurological diseases [yes/no], osteoporosis [yes/no]) were obtained by means of questionnaires. Frailty status (non-frail/pre-frail) was assessed using the frailty criteria from Fried et al. [34]. Height was measured

Chapter 8 | Changes in dietary intake after a one-year intervention in Dutch older adults
128
with a stadiometer to the nearest 0.1 cm. Weight was measured to the nearest 0.1 kg with a calibrated scale while wearing light clothes. Body Mass Index (BMI) was calculated as weight/height2. All measures were taken by trained research assistants. NU-AGE index Food based dietary guidelines for the elderly population The NU-AGE index is meant to reflect adherence to guidance based on nutrient reference values and food based dietary guidelines for elderly from Italy [28], the UK [35], the Netherlands [26, 36-39], Poland [30], and France [40], on the modified MyPyramid for Older Adults [41, 42], and nutrient requirements from the European Community [43], and from the Institute of Medicine [44]. These recommendations were jointly integrated into NU-AGE food based dietary guidelines in order to inform participants on a food level on what they should consume (table 1). The NU-AGE index comprises recommendations of minimum amounts to consume for fruits, vegetables, legumes, low-fat dairy, low-fat cheese, fish, low-fat meat and poultry, nuts, olive oil, fluids, and vitamin D (from a supplement). Two recommendations give a definition of minimum and maximum intake frequencies for whole grains and eggs and three recommendations refer to components to limit (alcohol, salt and sweets). Definition of food groups Specific NU-AGE food groups were created based on the underlying principles of the NU-AGE diet (e.g. low-fat, low-sodium, high MUFA and PUFA, high fibre), using country-specific food grouping systems as starting point (e.g. INRAN from Italy, WISP from the UK, NEVO from the Netherlands, DIETA-5 from Poland, and SUVIMAX from France). To reach consensus on the NU-AGE food groups, expert meetings with trained dieticians/research nutritionists from all five study centres were held. All individually consumed foods were grouped into NU-AGE food groups in each country, resulting in comparable food groups across countries. Choice of cut-offs and scoring A continuous scoring system was created to assign participants a score according to their level of adherence to each of the 16 NU-AGE components. This continuous scoring system allows us to better observe changes in dietary intake compared to a dichotomous scoring system [45]. Cut-off values for each NU-AGE component were based on the NU-AGE food based dietary guidelines. For the adequacy components (whole grains, fruits, vegetables, legumes, low-fat dairy, low-fat cheese, fish, low-fat meat and poultry, nuts, olive oil, fluids) a score ranging from 0 to 10 could be obtained for greater intakes of a specific food component. For moderation components (alcohol, sodium and sweets) participants with lower intakes received 10 points, ranging to 0 points for participants with greater intakes. For several components an maximum level of intake was established based on the country-specific population’s intake distribution (i.e., 85th pct. for sodium and sweets, 100th pct. for whole grains and low-fat meat). In total, the NU-AGE index ranged from 0 to 160 points, ranking participants according to their compliance to the NU-AGE diet. Components and their cut-off values are shown in table 1.
129
Statistical analyses Population characteristics are reported as mean and standard deviation (SD), or percentages (number). To compare nutrient intake changes from baseline to follow-up and differences in changes between intervention groups, a t-test was used, and the chi-squared test was used for vitamin D supplement use. The magnitude of differences in change in dietary intake was calculated as the percentage in change from baseline intake in the diet group. Two categories of adherence to the NU-AGE guidelines at follow-up were established; the first if the intake fell below the NU-AGE guideline and the second if the intake was equal or greater than the guideline. All statistical analyses were carried out using SAS software version 9.2 (SAS Institute Inc., Cary, NC, USA). A two-sided p-value of <0.05 was considered significant.
Results The mean age of NU-AGE participants was 71.0±4.0 years, with a BMI of 26.7±3.9, and 45% were men (table 2). History of hypertension was most frequently reported in both control and intervention group (39% and 42% respectively) and 18% of the control group were pre-frail compared to 24% in the intervention group. Table 2. Baseline characteristics of the NU-AGE participants by intervention group (n=1,141) Control
(n=570) Intervention
(n=571) Men 262 (46.0) 248 (43.3) Age, years 71.1±3.9 70.7±4.0 Current occupationa
Employed 19 (3.4) 24 (4.2) Retired 540 (94.7) 541 (94.7) Other 11 (2.1) 6 (1.1)
Education, years 12.6±3.6 12.7±3.6 BMI, kg/m2 26.7±3.7 26.7±4.1 Physical activity, pase score 135.1±57.4 132.5±54.9 Multivitamin use, yes 67 (11.8) 86 (15.1) Nutrient intake
Energy, Kcal 1899±448 1854±432 Carbohydrates, en% 46.9±7.9 47.3±7.2 Protein, en% 16.3 ± 2.4 16.5±2.8 Fat, en% 34.3±5.4 34.1±5.5
Current smokers 21 (7.9) 26 (9.7) Pre-frail 101 (17.8) 137 (24.0) Prevalence of diseases
Hypertension 222 (39.0) 242 (42.4) Heart disease 97 ( 17.0) 94 ( 16.5) Diabetes Mellitus type II 26 ( 4.6) 29 ( 5.1) Hypercholesterolemia 142 (24.9) 154 (27.0) Neurological disease 12 ( 2.1) 17 (3.0) Osteoporosis 59 (10.4) 70 (12.3)
Values are mean SD or number (percentage), en% = energy percent a Current occupation was defined as 1) employed (including part-time, 2) full-time and self-employed), 3) retired (including fully retired and semi-retired), or 4) other (including disability pension and other)

8
Chapter 8 | Changes in dietary intake after a one-year intervention in Dutch older adults
128
with a stadiometer to the nearest 0.1 cm. Weight was measured to the nearest 0.1 kg with a calibrated scale while wearing light clothes. Body Mass Index (BMI) was calculated as weight/height2. All measures were taken by trained research assistants. NU-AGE index Food based dietary guidelines for the elderly population The NU-AGE index is meant to reflect adherence to guidance based on nutrient reference values and food based dietary guidelines for elderly from Italy [28], the UK [35], the Netherlands [26, 36-39], Poland [30], and France [40], on the modified MyPyramid for Older Adults [41, 42], and nutrient requirements from the European Community [43], and from the Institute of Medicine [44]. These recommendations were jointly integrated into NU-AGE food based dietary guidelines in order to inform participants on a food level on what they should consume (table 1). The NU-AGE index comprises recommendations of minimum amounts to consume for fruits, vegetables, legumes, low-fat dairy, low-fat cheese, fish, low-fat meat and poultry, nuts, olive oil, fluids, and vitamin D (from a supplement). Two recommendations give a definition of minimum and maximum intake frequencies for whole grains and eggs and three recommendations refer to components to limit (alcohol, salt and sweets). Definition of food groups Specific NU-AGE food groups were created based on the underlying principles of the NU-AGE diet (e.g. low-fat, low-sodium, high MUFA and PUFA, high fibre), using country-specific food grouping systems as starting point (e.g. INRAN from Italy, WISP from the UK, NEVO from the Netherlands, DIETA-5 from Poland, and SUVIMAX from France). To reach consensus on the NU-AGE food groups, expert meetings with trained dieticians/research nutritionists from all five study centres were held. All individually consumed foods were grouped into NU-AGE food groups in each country, resulting in comparable food groups across countries. Choice of cut-offs and scoring A continuous scoring system was created to assign participants a score according to their level of adherence to each of the 16 NU-AGE components. This continuous scoring system allows us to better observe changes in dietary intake compared to a dichotomous scoring system [45]. Cut-off values for each NU-AGE component were based on the NU-AGE food based dietary guidelines. For the adequacy components (whole grains, fruits, vegetables, legumes, low-fat dairy, low-fat cheese, fish, low-fat meat and poultry, nuts, olive oil, fluids) a score ranging from 0 to 10 could be obtained for greater intakes of a specific food component. For moderation components (alcohol, sodium and sweets) participants with lower intakes received 10 points, ranging to 0 points for participants with greater intakes. For several components an maximum level of intake was established based on the country-specific population’s intake distribution (i.e., 85th pct. for sodium and sweets, 100th pct. for whole grains and low-fat meat). In total, the NU-AGE index ranged from 0 to 160 points, ranking participants according to their compliance to the NU-AGE diet. Components and their cut-off values are shown in table 1.
129
Statistical analyses Population characteristics are reported as mean and standard deviation (SD), or percentages (number). To compare nutrient intake changes from baseline to follow-up and differences in changes between intervention groups, a t-test was used, and the chi-squared test was used for vitamin D supplement use. The magnitude of differences in change in dietary intake was calculated as the percentage in change from baseline intake in the diet group. Two categories of adherence to the NU-AGE guidelines at follow-up were established; the first if the intake fell below the NU-AGE guideline and the second if the intake was equal or greater than the guideline. All statistical analyses were carried out using SAS software version 9.2 (SAS Institute Inc., Cary, NC, USA). A two-sided p-value of <0.05 was considered significant.
Results The mean age of NU-AGE participants was 71.0±4.0 years, with a BMI of 26.7±3.9, and 45% were men (table 2). History of hypertension was most frequently reported in both control and intervention group (39% and 42% respectively) and 18% of the control group were pre-frail compared to 24% in the intervention group. Table 2. Baseline characteristics of the NU-AGE participants by intervention group (n=1,141) Control
(n=570) Intervention
(n=571) Men 262 (46.0) 248 (43.3) Age, years 71.1±3.9 70.7±4.0 Current occupationa
Employed 19 (3.4) 24 (4.2) Retired 540 (94.7) 541 (94.7) Other 11 (2.1) 6 (1.1)
Education, years 12.6±3.6 12.7±3.6 BMI, kg/m2 26.7±3.7 26.7±4.1 Physical activity, pase score 135.1±57.4 132.5±54.9 Multivitamin use, yes 67 (11.8) 86 (15.1) Nutrient intake
Energy, Kcal 1899±448 1854±432 Carbohydrates, en% 46.9±7.9 47.3±7.2 Protein, en% 16.3 ± 2.4 16.5±2.8 Fat, en% 34.3±5.4 34.1±5.5
Current smokers 21 (7.9) 26 (9.7) Pre-frail 101 (17.8) 137 (24.0) Prevalence of diseases
Hypertension 222 (39.0) 242 (42.4) Heart disease 97 ( 17.0) 94 ( 16.5) Diabetes Mellitus type II 26 ( 4.6) 29 ( 5.1) Hypercholesterolemia 142 (24.9) 154 (27.0) Neurological disease 12 ( 2.1) 17 (3.0) Osteoporosis 59 (10.4) 70 (12.3)
Values are mean SD or number (percentage), en% = energy percent a Current occupation was defined as 1) employed (including part-time, 2) full-time and self-employed), 3) retired (including fully retired and semi-retired), or 4) other (including disability pension and other)

Chapter 8 | Changes in dietary intake after a one-year intervention in Dutch older adults
130
Changes in dietary intake by intervention group Baseline mean dietary intake did not differ between the two treatment groups (e.g., NU-AGE index was 82.6±16.5 in both the control and intervention group (range 36-132), except for low-fat dairy (155±155g versus 173±163g, respectively, table 3). A significant increase in the NU-AGE diet score was found in the intervention group compared to the control group (mean change 21.3g (±15.9), p<0.01, (table 3). Dietary intake of thirteen out of sixteen NU-AGE guidelines improved in the intervention group compared to the control group (p <0.05), except for low-fat meat and poultry (p=0.53), eggs (p=0.16) and sodium (p=0.34). Major differences in changes expressed as percentages of dietary intake in the intervention group compared to the control group were observed for whole grains (79%), legumes (70%), nuts (49%), low-fat cheese (46%), fish (42%), low-fat dairy (30%), and olive oil (29%) (figure 2). Adherence to the NU-AGE guidelines by intervention group After one year intervention, the number of NU-AGE guidelines to which participants in the intervention group completely adhered to was 6.2±1.9 (range 1-12) compared to 4.5±1.7 out of 16 guidelines in the control group. The highest percentage adherence in both control and intervention group was obtained for fluid (90% and 94%, respectively), followed by alcohol (77% and 81%, respectively) and eggs (54% and 67%, respectively) (figure 3). The largest differences in percentage adherence to the guidelines between the intervention and control group was observed for vitamin D (69%), fish (18%) and nuts (16%). For low-fat meat and poultry the intervention group had a lower adherence at follow-up compared to the control group, possible demonstrating an overall reduction in meat intake. Changes in dietary intake by country At baseline, the mean NU-AGE index of participants was 84.6±15.3 in Italy, 80.8±14.0 in the UK, 74.5±15.6 in the Netherlands, 85.4±15.9 in Poland and 89.8±14.4 in France (data not shown). Within each country, baseline dietary intake for the control and intervention group were similar (table 4), whereas between countries baseline dietary intakes were different (e.g. wholegrains 30.8±42.9g in Italy vs. 74.2±61.1g in Poland, vegetables 165±83.9g in the Netherlands vs. 282±170g in Poland, low-fat dairy 74.0±93.1g in Poland vs. 264±162g in the UK, olive oil 16.8±8.5g in Italy vs. 2.4±3.5g in the Netherlands). Overall, the NU-AGE diet score significantly improved in intervention diet group compared to the control group in all countries (p<0.01). Of all study centres, French participants in the intervention group changed 12 out of 16 NU-AGE guidelines, followed by the Netherlands (11 out of 16), Italy and Poland (8 out of 16), and the UK (6 out of 16).
131
Tabl
e 3.
Cha
nges
in d
ieta
ry in
take
of N
U-A
GE
diet
com
pone
nts i
n 1,
141
part
icip
ants
in th
e N
U-A
GE
stud
y
p
<0.0
1
<0.0
1
<0.0
1
<0.0
1
<0.0
1
<0.0
1
<0.0
1
0.53
<0.0
1
0.16
<0.0
1
0.02
<0.0
1
0.34
<0.0
1
<0.0
1
<0.0
1
Valu
es a
re m
ean
valu
es a
nd st
anda
rd d
evia
tions
, unl
ess o
ther
wise
indi
cate
d.
Diffe
renc
e
43.3
±64.
7
24.4
±127
.3
27.9
±110
.6
7.5±
25.6
54.1
±131
.8
5.3±
23.1
12.3
±32.
4
-1.3
±34.
7
2.8±
11.1
1.5±
18.4
2.6±
8.0
-0.9
2±6.
6
182±
469
-72.
1±12
71
15.8
±91.
7
370
(67.
9)
21.3
±15.
9
p
<0.0
1
0.02
<0.0
1
<0.0
1
<0.0
1
<0.0
1
<0.0
1
0.26
<0.0
1
0.13
<0.0
1
<0.0
1
<0.0
1
<0.0
1
<0.0
1
<0.0
1
<0.0
1
inte
rven
tion
grou
p (n
=571
)
Chan
ge
51.5
±62.
5
20.1
±140
.1
19.7
±107
.3
7.2±
21.5
57.3
±168
.9
4.9±
25.8
8.7±
26.7
-2.0
±29.
8
2.5±
10.1
1.4±
15.9
2.2±
9.1
-1.6
±9.7
154±
664
-245
±125
4
-23.
6±93
.7
445
(77.
9)
23.1
±16.
2
Follo
w-u
p
107.
2±66
.4
268.
2±14
0.0
234.
2±10
3.7
17.6
±21.
9
230.
3±17
4.4
17.6
±24.
9
37.1
±28.
1
38.5
±27.
9
8.3±
9.4
18.7
±13.
9
11.3
±8.9
7.2±
9.1
2482
±657
2309
±946
63.6
±82.
8
529
(92.
6)
105.
7±17
.6
Base
line
55.7
±58.
3
248.
2±14
0.2
214.
5±11
0.8
10.4
±20.
9
173.
0±16
3.2
12.7
±26.
6
28.4
±25.
3
40.5
±31.
6
5.7±
10.7
17.3
±17.
6
9.1±
9.2
8.8±
10.3
2329
±671
2554
±150
0
87.2
±103
.5
84 (1
4.7)
82.6
±15.
3
p 0.02
0.64
0.26
0.77
0.74
0.75
0.02
0.71
0.65
0.90
0.50
0.31
0.46
<0.0
1
0.22
<0.0
1
0.05
Cont
rol g
roup
(n
=570
)
Chan
ge
8.1±
57.4
-4.3
±156
.3
-8.2
±123
.2
-0.3
±19.
6
3.2±
166.
4
-0.3
9±20
.8
-3.5
±26.
4
-0.7
1±32
.4
-0.3
1±11
.4
-0.1
3±17
.1
-0.3
9±9.
9
-0.6
6±10
.9
-28.
8±65
2
-173
±118
2
-7.8
±108
.1
75 (1
0)
1.9±
16.3
Follo
w-u
p
62.6
±60.
7
255.
7±15
4.0
213.
2±12
5.7
10.8
±19.
2
158.
2±17
7.5
11.6
±19.
6
24.9
±23.
2
40.5
±31.
4
6.1±
9.9
17.3
±17.
2
8.9±
9.9
8.9±
10.9
2282
±651
2455
±965
76.3
±102
.3
138
(24.
2)
84.6
±16.
1
Base
line
54.4
±53.
9
260.
0±15
8.7
221.
4±12
0.7
11.1
±20.
0
155.
0±15
4.6
11.9
±21.
9
28.4
±29.
3
41.2
±33.
4
6.4±
12.8
17.5
±17.
0
9.4±
9.9
9.6±
10.9
2311
±654
2628
±136
5
84.1
±113
.7
81 (1
4.2)
82.6
±16.
5
NU
-AG
E co
mpo
nent
s
Who
le g
rain
s
Frui
ts
Vege
tabl
es
Legu
mes
Low
-fat d
airy
Low
-fat c
hees
e
Fish
Low
-fat m
eat a
nd p
oultr
y
Nut
s
Eggs
Oliv
e oi
l
Alco
hol
Flui
d
Sodi
um
Swee
ts
Vita
min
D, n
(%)
NU
-AG
E in
dex

8
Chapter 8 | Changes in dietary intake after a one-year intervention in Dutch older adults
130
Changes in dietary intake by intervention group Baseline mean dietary intake did not differ between the two treatment groups (e.g., NU-AGE index was 82.6±16.5 in both the control and intervention group (range 36-132), except for low-fat dairy (155±155g versus 173±163g, respectively, table 3). A significant increase in the NU-AGE diet score was found in the intervention group compared to the control group (mean change 21.3g (±15.9), p<0.01, (table 3). Dietary intake of thirteen out of sixteen NU-AGE guidelines improved in the intervention group compared to the control group (p <0.05), except for low-fat meat and poultry (p=0.53), eggs (p=0.16) and sodium (p=0.34). Major differences in changes expressed as percentages of dietary intake in the intervention group compared to the control group were observed for whole grains (79%), legumes (70%), nuts (49%), low-fat cheese (46%), fish (42%), low-fat dairy (30%), and olive oil (29%) (figure 2). Adherence to the NU-AGE guidelines by intervention group After one year intervention, the number of NU-AGE guidelines to which participants in the intervention group completely adhered to was 6.2±1.9 (range 1-12) compared to 4.5±1.7 out of 16 guidelines in the control group. The highest percentage adherence in both control and intervention group was obtained for fluid (90% and 94%, respectively), followed by alcohol (77% and 81%, respectively) and eggs (54% and 67%, respectively) (figure 3). The largest differences in percentage adherence to the guidelines between the intervention and control group was observed for vitamin D (69%), fish (18%) and nuts (16%). For low-fat meat and poultry the intervention group had a lower adherence at follow-up compared to the control group, possible demonstrating an overall reduction in meat intake. Changes in dietary intake by country At baseline, the mean NU-AGE index of participants was 84.6±15.3 in Italy, 80.8±14.0 in the UK, 74.5±15.6 in the Netherlands, 85.4±15.9 in Poland and 89.8±14.4 in France (data not shown). Within each country, baseline dietary intake for the control and intervention group were similar (table 4), whereas between countries baseline dietary intakes were different (e.g. wholegrains 30.8±42.9g in Italy vs. 74.2±61.1g in Poland, vegetables 165±83.9g in the Netherlands vs. 282±170g in Poland, low-fat dairy 74.0±93.1g in Poland vs. 264±162g in the UK, olive oil 16.8±8.5g in Italy vs. 2.4±3.5g in the Netherlands). Overall, the NU-AGE diet score significantly improved in intervention diet group compared to the control group in all countries (p<0.01). Of all study centres, French participants in the intervention group changed 12 out of 16 NU-AGE guidelines, followed by the Netherlands (11 out of 16), Italy and Poland (8 out of 16), and the UK (6 out of 16).
131
Tabl
e 3.
Cha
nges
in d
ieta
ry in
take
of N
U-A
GE
diet
com
pone
nts i
n 1,
141
part
icip
ants
in th
e N
U-A
GE
stud
y
p
<0.0
1
<0.0
1
<0.0
1
<0.0
1
<0.0
1
<0.0
1
<0.0
1
0.53
<0.0
1
0.16
<0.0
1
0.02
<0.0
1
0.34
<0.0
1
<0.0
1
<0.0
1
Valu
es a
re m
ean
valu
es a
nd st
anda
rd d
evia
tions
, unl
ess o
ther
wise
indi
cate
d.
Diffe
renc
e
43.3
±64.
7
24.4
±127
.3
27.9
±110
.6
7.5±
25.6
54.1
±131
.8
5.3±
23.1
12.3
±32.
4
-1.3
±34.
7
2.8±
11.1
1.5±
18.4
2.6±
8.0
-0.9
2±6.
6
182±
469
-72.
1±12
71
15.8
±91.
7
370
(67.
9)
21.3
±15.
9
p
<0.0
1
0.02
<0.0
1
<0.0
1
<0.0
1
<0.0
1
<0.0
1
0.26
<0.0
1
0.13
<0.0
1
<0.0
1
<0.0
1
<0.0
1
<0.0
1
<0.0
1
<0.0
1
inte
rven
tion
grou
p (n
=571
)
Chan
ge
51.5
±62.
5
20.1
±140
.1
19.7
±107
.3
7.2±
21.5
57.3
±168
.9
4.9±
25.8
8.7±
26.7
-2.0
±29.
8
2.5±
10.1
1.4±
15.9
2.2±
9.1
-1.6
±9.7
154±
664
-245
±125
4
-23.
6±93
.7
445
(77.
9)
23.1
±16.
2
Follo
w-u
p
107.
2±66
.4
268.
2±14
0.0
234.
2±10
3.7
17.6
±21.
9
230.
3±17
4.4
17.6
±24.
9
37.1
±28.
1
38.5
±27.
9
8.3±
9.4
18.7
±13.
9
11.3
±8.9
7.2±
9.1
2482
±657
2309
±946
63.6
±82.
8
529
(92.
6)
105.
7±17
.6
Base
line
55.7
±58.
3
248.
2±14
0.2
214.
5±11
0.8
10.4
±20.
9
173.
0±16
3.2
12.7
±26.
6
28.4
±25.
3
40.5
±31.
6
5.7±
10.7
17.3
±17.
6
9.1±
9.2
8.8±
10.3
2329
±671
2554
±150
0
87.2
±103
.5
84 (1
4.7)
82.6
±15.
3
p 0.02
0.64
0.26
0.77
0.74
0.75
0.02
0.71
0.65
0.90
0.50
0.31
0.46
<0.0
1
0.22
<0.0
1
0.05
Cont
rol g
roup
(n
=570
)
Chan
ge
8.1±
57.4
-4.3
±156
.3
-8.2
±123
.2
-0.3
±19.
6
3.2±
166.
4
-0.3
9±20
.8
-3.5
±26.
4
-0.7
1±32
.4
-0.3
1±11
.4
-0.1
3±17
.1
-0.3
9±9.
9
-0.6
6±10
.9
-28.
8±65
2
-173
±118
2
-7.8
±108
.1
75 (1
0)
1.9±
16.3
Follo
w-u
p
62.6
±60.
7
255.
7±15
4.0
213.
2±12
5.7
10.8
±19.
2
158.
2±17
7.5
11.6
±19.
6
24.9
±23.
2
40.5
±31.
4
6.1±
9.9
17.3
±17.
2
8.9±
9.9
8.9±
10.9
2282
±651
2455
±965
76.3
±102
.3
138
(24.
2)
84.6
±16.
1
Base
line
54.4
±53.
9
260.
0±15
8.7
221.
4±12
0.7
11.1
±20.
0
155.
0±15
4.6
11.9
±21.
9
28.4
±29.
3
41.2
±33.
4
6.4±
12.8
17.5
±17.
0
9.4±
9.9
9.6±
10.9
2311
±654
2628
±136
5
84.1
±113
.7
81 (1
4.2)
82.6
±16.
5
NU
-AG
E co
mpo
nent
s
Who
le g
rain
s
Frui
ts
Vege
tabl
es
Legu
mes
Low
-fat d
airy
Low
-fat c
hees
e
Fish
Low
-fat m
eat a
nd p
oultr
y
Nut
s
Eggs
Oliv
e oi
l
Alco
hol
Flui
d
Sodi
um
Swee
ts
Vita
min
D, n
(%)
NU
-AG
E in
dex

Chapter 8 | Changes in dietary intake after a one-year intervention in Dutch older adults
132
Figure 2. Percentage of differences in change from baseline to follow-up in the intervention group compared to the control group
Figure 3. Percentage of participants in the control and intervention group meeting the NU-AGE guidelines
133
Tabl
e 4.
Mea
n ba
selin
e an
d ch
ange
s in
diet
ary
inta
ke o
f NU
-AG
E di
et c
ompo
nent
s by
inte
rven
tion
grou
p st
ratif
ied
by st
udy
cent
re (n
=1,1
41)
Fran
ce
(n=1
00 c
ontr
ol, 8
7 di
et)
Chan
ge
-1.7
±41.
9 10
4±54
.12,
b -2
5.4±
153
37.2
±142
b -3
0.9±
97.6
1 31
.6±8
4.22,
b -4
.2±1
9.6
17.9
±18.
12,b
-10.
0±13
4 12
8±15
62,b
1.5±
17.3
5.
0±14
.31
-11.
0±22
.22
12.5
±21.
52,b
1.3±
33.4
0.
45±2
9.4
-2.7
±13.
8 1.
5±12
.3a
-0.1
±13.
5 0.
0±15
.3
-3.6
±9.6
2 4.
2±10
.22,
b -0
.1±1
1.7
-3.1
±10.
4b 25
.3±5
95
378±
5462,
b -4
89±1
7111
-695
±216
61 0.
4±91
.8
-23.
2±51
.62,
a 8
(8.0
) 68
(78.
2)2,
b -5
.4±1
3.42
35.6
±16.
02,b
1, 2
Sig
nific
ant c
hang
e fr
om b
asel
ine
to fo
llow
-up
(1 p<0
.05,
2 p<0
.01)
a,
b Si
gnifi
cant
diff
eren
ce in
cha
nge
in th
e di
et g
roup
com
pare
d to
the
cont
rol g
roup
(a p<0
.05,
b p<0
.01)
Base
line
31.8
±42.
4 28
.2±4
2.3
290±
167
273±
151
249±
101
217±
87.6
12
.9±2
1.3
8.6±
15.1
12
7±13
8 13
4±14
0 21
.3±1
5.9
17.5
±15.
4 35
.8±2
3.3
31.0
±21.
2 60
.3±3
4.1
56.1
±33.
2 7.
6±16
.7
8.4±
14.9
16
.9±1
2.9
20.2
±17.
7 14
.9±1
0.8
13.2
±11
.8
10.6
±11.
7 9.
5±12
.1
2367
±553
21
89±5
29
3289
±228
2 29
68±2
988
51.1
±77.
9 56
.4±5
8.2
7 (7
.0)
13 (1
4.9)
91
.2±1
2.9
88.2
±15.
8
Pola
nd
(n=1
06 c
ontr
ol, 1
14 d
iet)
Ch
ange
2.
2±64
.4
38.3
±73.
22,b
-24.
4±15
2 9.
5±12
9a -1
7.6±
183
11.3
±137
0.
3±18
.0
8.4±
26.1
1,a
-20.
9±11
0 61
.3±1
3122,
b -4
.6±3
0.6
10.0
±41.
6a -8
.9±3
3.4
12.2
±33.
12,b
-0.3
6±33
.4
-3.7
±31.
6 0.
9±8.
2 3.
3±8.
62,a
-2.8
±21.
0 -4
.9±1
9.2
0.13
±11.
9 2.
1±8.
7 -0
.7±6
.1
-1.7
±4.9
1 -6
8.9±
603
127±
580b
-68.
5±11
10
-122
±114
4 -1
0.6±
97.7
-2
1.6±
102
17 (1
6.0)
2 83
(72.
7)2,
b 0.
53±1
6.5
21.4
±15.
22,b
Base
line
74.2
±61.
1 78
.9±7
0.0
228±
159
198±
121
282±
170
261±
146
4.8±
14.1
10
.2±2
9.5
74.0
±93.
1 96
.5±1
02
30.2
±32.
9 38
.8±4
6.8
31.4
±40.
7 31
.0±3
1.2
33.3
±36.
2 34
.2±3
2.3
4.1±
8.4
4.6±
8.2
30.7
±20.
3 28
.4±2
2.9
11.9
±10.
7 10
.4±8
.9
3.9±
6.4
3.7±
5.8
2405
±605
24
51±5
93
3495
±111
8 35
23±1
143
96.3
±111
10
4±11
3 22
(20.
8)
22 (1
9.3)
84
.7±1
7.2
86.1
±14.
8
Net
herla
nds
(n=1
24 c
ontr
ol, 1
17 d
iet)
Ch
ange
12
.7±6
0.2
34.1
±67.
22,b
6.8±
145
43.2
±129
2,a
-6.9
±80.
9 25
.5±7
8.12,
b 1.
5±12
.1
6.5±
17.2
2,a
8.0±
177
40.9
±183
a -0
.6±1
9.2
7.7±
11.9
2,b
-3.0
±25.
5 5.
3±22
.9a
-0.7
±24.
8 -1
.66±
23.3
0.
2±10
.8
3.6±
11.1
1,a
0.86
±17.
4 2.
9±14
.4
0.19
±3.6
1.
9±4.
52,b
0.0±
12.8
0.
8±11
.5
-71.
7±60
7 11
6±57
4b -1
75±6
771
-54.
5±57
7 -1
6.8±
82.4
-5
.3±1
06
8 (6
.6)
88 (7
5.2)
2,b
3.6±
16.6
20
.3±1
5.52,
b
Base
line
71.4
±61.
7 82
.5±6
4.2
234±
146
235±
127
165±
83.9
16
2±77
.9
3.8±
12.6
3.
4±11
.9
196±
166
256±
183
9.6±
21.6
6.
5±10
.6
22.3
±26.
2 23
.9±2
4.9
32.5
±25.
4 31
.2±2
4.3
6.3±
11.6
6.
8±11
.0
16.8
±17.
3 14
.8±1
5.2
2.4±
3.5
3.2±
3.9
13.4
±12.
5 11
.9±1
1.2
2438
±614
23
56±5
61
2435
±670
23
23±6
18
83.6
±93.
5 79
.5±1
02
15 (1
2)
16 (1
3.7)
72
.9±1
5.8
76.1
±15.
4
UK
(n=1
26 c
ontr
ol, 1
26 d
iet)
Ch
ange
23
.5±5
4.42
34.2
±54.
52 -2
.2±1
36
2.4±
140
15.0
±97.
2 10
.1±1
06
2.2±
20.9
3.
9±25
.4
31.2
±175
31
.4±1
68
1.3±
8.2
1.42
±7.5
5.
2±22
.3
2.3±
23.4
a -0
.83±
26.3
-1
.7±2
8.6
-0.1
9±11
.2
4.1±
8.72,
b -0
.64±
15.2
6.
7±15
.12,
b -0
.16±
2.73
2.
0±3.
92,b
-1.4
±10.
7 -1
.6±9
.4
-80.
5±63
3 66
.7±7
19b
-162
±801
-2
95±6
692
-11.
7±15
6 -4
9.8±
1072,
b 7
(5.6
) 10
8 (8
5.7)
2,b
6.7±
15.5
2 20
.8±1
3.92,
b
Base
line
60.3
±41.
1 61
.9±4
6.4
259±
137
259±
139
208±
91.6
21
8±10
5 17
.4±2
2.4
19.9
±25.
9 26
4±16
2 27
8±16
5 2.
2±6.
5 2.
76±6
.65
24.7
±23.
5 29
.5±2
4.3
33.7
±26.
6 33
.4±3
1.8
6.1±
11.8
5.
3±8.
3 16
.6±1
5.5
17.2
±15.
4 2.
85±2
.97
2.5±
2.5
10.9
±10.
8 9.
6±10
.1
2565
±623
27
21±7
32
2376
±879
23
57±6
79
137±
166
132±
129
12 (9
.5)
11 (8
.7)
79.9
±15.
2 81
.5±1
2.7
Italy
(n
=114
con
trol
, 127
die
t)
Chan
ge
0.52
±39.
4 60
.4±4
1.52,
b 18
.3±1
82
14.0
±144
-6
.7±1
12
23.2
±96.
3a -2
.3±2
1.9
2.7±
13.2
b 1.
1±10
8 45
.8±9
9.92,
b 0.
18±2
.15
0.93
±5.2
7 -2
.2±2
6.3
17.1
±27.
52,b
-2.6
±34.
8 -2
.1±2
7.4
-0.1
4±12
.6
0.00
±9.2
1.
7±10
.2
1.5±
7.9
1.0±
8.3
1.2±
6.6
-1.1
±9.6
-2
.6±8
.81
64.9
±552
14
4±58
41 -3
.2±5
43
-173
±615
1,a
2.3±
56.7
-1
6.6±
61.7
1,a
17 (1
4.9)
1
83 (6
5.4)
2,b
2.5±
14.7
21
.2±1
4.42,
b
Base
line
30.8
±42.
9 23
.1±3
2.3
293±
177
278±
149
216±
113
216±
101
16.5
±23.
1 8.
7±10
.9
89.7
±103
87
.6±9
3.7
0.17
±1.0
1.
46±4
.87
29.9
±28.
8 27
.1±2
3.1
49.8
±35.
9 51
.4±2
8.9
8.1±
14.4
4.
3±10
.7
7.3±
8.7
7.8±
7.7
16.8
±8.5
17
.1±6
.7
8.1±
9.9
9.0±
9.9
1756
±542
19
01±5
88
1731
±545
18
09±6
98
43.6
±51.
2 55
.5±6
7.7
25 (2
1.9)
22
(17.
3)
86.9
±14.
9 82
.5±1
5.4
Gro
up
Cont
rol
Diet
Co
ntro
l Di
et
Cont
rol
Diet
Co
ntro
l Di
et
Cont
rol
Diet
Co
ntro
l Di
et
Cont
rol
Diet
Co
ntro
l Di
et
Cont
rol
Diet
Co
ntro
l Di
et
Cont
rol
Diet
Co
ntro
l Di
et
Cont
rol
Diet
Co
ntro
l Di
et
Cont
rol
Diet
Co
ntro
l Di
et
Cont
rol
Diet
NU
-AG
E Co
mpo
nent
s W
hole
grai
ns
Frui
ts
Vege
tabl
es
Legu
mes
Lo
w-fa
t dai
ry
Low
-fat c
hees
e Fi
sh
Low
-fat m
eat &
pou
ltry
Nut
s Eg
gs
Oliv
e oi
l Al
coho
l Fl
uid
Salt
Swee
ts
Vita
min
D
NU
-AGE
inde
x

8
Chapter 8 | Changes in dietary intake after a one-year intervention in Dutch older adults
132
Figure 2. Percentage of differences in change from baseline to follow-up in the intervention group compared to the control group
Figure 3. Percentage of participants in the control and intervention group meeting the NU-AGE guidelines
133
Tabl
e 4.
Mea
n ba
selin
e an
d ch
ange
s in
diet
ary
inta
ke o
f NU
-AG
E di
et c
ompo
nent
s by
inte
rven
tion
grou
p st
ratif
ied
by st
udy
cent
re (n
=1,1
41)
Fran
ce
(n=1
00 c
ontr
ol, 8
7 di
et)
Chan
ge
-1.7
±41.
9 10
4±54
.12,
b -2
5.4±
153
37.2
±142
b -3
0.9±
97.6
1 31
.6±8
4.22,
b -4
.2±1
9.6
17.9
±18.
12,b
-10.
0±13
4 12
8±15
62,b
1.5±
17.3
5.
0±14
.31
-11.
0±22
.22
12.5
±21.
52,b
1.3±
33.4
0.
45±2
9.4
-2.7
±13.
8 1.
5±12
.3a
-0.1
±13.
5 0.
0±15
.3
-3.6
±9.6
2 4.
2±10
.22,
b -0
.1±1
1.7
-3.1
±10.
4b 25
.3±5
95
378±
5462,
b -4
89±1
7111
-695
±216
61 0.
4±91
.8
-23.
2±51
.62,
a 8
(8.0
) 68
(78.
2)2,
b -5
.4±1
3.42
35.6
±16.
02,b
1, 2
Sig
nific
ant c
hang
e fr
om b
asel
ine
to fo
llow
-up
(1 p<0
.05,
2 p<0
.01)
a,
b Si
gnifi
cant
diff
eren
ce in
cha
nge
in th
e di
et g
roup
com
pare
d to
the
cont
rol g
roup
(a p<0
.05,
b p<0
.01)
Base
line
31.8
±42.
4 28
.2±4
2.3
290±
167
273±
151
249±
101
217±
87.6
12
.9±2
1.3
8.6±
15.1
12
7±13
8 13
4±14
0 21
.3±1
5.9
17.5
±15.
4 35
.8±2
3.3
31.0
±21.
2 60
.3±3
4.1
56.1
±33.
2 7.
6±16
.7
8.4±
14.9
16
.9±1
2.9
20.2
±17.
7 14
.9±1
0.8
13.2
±11
.8
10.6
±11.
7 9.
5±12
.1
2367
±553
21
89±5
29
3289
±228
2 29
68±2
988
51.1
±77.
9 56
.4±5
8.2
7 (7
.0)
13 (1
4.9)
91
.2±1
2.9
88.2
±15.
8
Pola
nd
(n=1
06 c
ontr
ol, 1
14 d
iet)
Ch
ange
2.
2±64
.4
38.3
±73.
22,b
-24.
4±15
2 9.
5±12
9a -1
7.6±
183
11.3
±137
0.
3±18
.0
8.4±
26.1
1,a
-20.
9±11
0 61
.3±1
3122,
b -4
.6±3
0.6
10.0
±41.
6a -8
.9±3
3.4
12.2
±33.
12,b
-0.3
6±33
.4
-3.7
±31.
6 0.
9±8.
2 3.
3±8.
62,a
-2.8
±21.
0 -4
.9±1
9.2
0.13
±11.
9 2.
1±8.
7 -0
.7±6
.1
-1.7
±4.9
1 -6
8.9±
603
127±
580b
-68.
5±11
10
-122
±114
4 -1
0.6±
97.7
-2
1.6±
102
17 (1
6.0)
2 83
(72.
7)2,
b 0.
53±1
6.5
21.4
±15.
22,b
Base
line
74.2
±61.
1 78
.9±7
0.0
228±
159
198±
121
282±
170
261±
146
4.8±
14.1
10
.2±2
9.5
74.0
±93.
1 96
.5±1
02
30.2
±32.
9 38
.8±4
6.8
31.4
±40.
7 31
.0±3
1.2
33.3
±36.
2 34
.2±3
2.3
4.1±
8.4
4.6±
8.2
30.7
±20.
3 28
.4±2
2.9
11.9
±10.
7 10
.4±8
.9
3.9±
6.4
3.7±
5.8
2405
±605
24
51±5
93
3495
±111
8 35
23±1
143
96.3
±111
10
4±11
3 22
(20.
8)
22 (1
9.3)
84
.7±1
7.2
86.1
±14.
8
Net
herla
nds
(n=1
24 c
ontr
ol, 1
17 d
iet)
Ch
ange
12
.7±6
0.2
34.1
±67.
22,b
6.8±
145
43.2
±129
2,a
-6.9
±80.
9 25
.5±7
8.12,
b 1.
5±12
.1
6.5±
17.2
2,a
8.0±
177
40.9
±183
a -0
.6±1
9.2
7.7±
11.9
2,b
-3.0
±25.
5 5.
3±22
.9a
-0.7
±24.
8 -1
.66±
23.3
0.
2±10
.8
3.6±
11.1
1,a
0.86
±17.
4 2.
9±14
.4
0.19
±3.6
1.
9±4.
52,b
0.0±
12.8
0.
8±11
.5
-71.
7±60
7 11
6±57
4b -1
75±6
771
-54.
5±57
7 -1
6.8±
82.4
-5
.3±1
06
8 (6
.6)
88 (7
5.2)
2,b
3.6±
16.6
20
.3±1
5.52,
b
Base
line
71.4
±61.
7 82
.5±6
4.2
234±
146
235±
127
165±
83.9
16
2±77
.9
3.8±
12.6
3.
4±11
.9
196±
166
256±
183
9.6±
21.6
6.
5±10
.6
22.3
±26.
2 23
.9±2
4.9
32.5
±25.
4 31
.2±2
4.3
6.3±
11.6
6.
8±11
.0
16.8
±17.
3 14
.8±1
5.2
2.4±
3.5
3.2±
3.9
13.4
±12.
5 11
.9±1
1.2
2438
±614
23
56±5
61
2435
±670
23
23±6
18
83.6
±93.
5 79
.5±1
02
15 (1
2)
16 (1
3.7)
72
.9±1
5.8
76.1
±15.
4
UK
(n=1
26 c
ontr
ol, 1
26 d
iet)
Ch
ange
23
.5±5
4.42
34.2
±54.
52 -2
.2±1
36
2.4±
140
15.0
±97.
2 10
.1±1
06
2.2±
20.9
3.
9±25
.4
31.2
±175
31
.4±1
68
1.3±
8.2
1.42
±7.5
5.
2±22
.3
2.3±
23.4
a -0
.83±
26.3
-1
.7±2
8.6
-0.1
9±11
.2
4.1±
8.72,
b -0
.64±
15.2
6.
7±15
.12,
b -0
.16±
2.73
2.
0±3.
92,b
-1.4
±10.
7 -1
.6±9
.4
-80.
5±63
3 66
.7±7
19b
-162
±801
-2
95±6
692
-11.
7±15
6 -4
9.8±
1072,
b 7
(5.6
) 10
8 (8
5.7)
2,b
6.7±
15.5
2 20
.8±1
3.92,
b
Base
line
60.3
±41.
1 61
.9±4
6.4
259±
137
259±
139
208±
91.6
21
8±10
5 17
.4±2
2.4
19.9
±25.
9 26
4±16
2 27
8±16
5 2.
2±6.
5 2.
76±6
.65
24.7
±23.
5 29
.5±2
4.3
33.7
±26.
6 33
.4±3
1.8
6.1±
11.8
5.
3±8.
3 16
.6±1
5.5
17.2
±15.
4 2.
85±2
.97
2.5±
2.5
10.9
±10.
8 9.
6±10
.1
2565
±623
27
21±7
32
2376
±879
23
57±6
79
137±
166
132±
129
12 (9
.5)
11 (8
.7)
79.9
±15.
2 81
.5±1
2.7
Italy
(n
=114
con
trol
, 127
die
t)
Chan
ge
0.52
±39.
4 60
.4±4
1.52,
b 18
.3±1
82
14.0
±144
-6
.7±1
12
23.2
±96.
3a -2
.3±2
1.9
2.7±
13.2
b 1.
1±10
8 45
.8±9
9.92,
b 0.
18±2
.15
0.93
±5.2
7 -2
.2±2
6.3
17.1
±27.
52,b
-2.6
±34.
8 -2
.1±2
7.4
-0.1
4±12
.6
0.00
±9.2
1.
7±10
.2
1.5±
7.9
1.0±
8.3
1.2±
6.6
-1.1
±9.6
-2
.6±8
.81
64.9
±552
14
4±58
41 -3
.2±5
43
-173
±615
1,a
2.3±
56.7
-1
6.6±
61.7
1,a
17 (1
4.9)
1
83 (6
5.4)
2,b
2.5±
14.7
21
.2±1
4.42,
b
Base
line
30.8
±42.
9 23
.1±3
2.3
293±
177
278±
149
216±
113
216±
101
16.5
±23.
1 8.
7±10
.9
89.7
±103
87
.6±9
3.7
0.17
±1.0
1.
46±4
.87
29.9
±28.
8 27
.1±2
3.1
49.8
±35.
9 51
.4±2
8.9
8.1±
14.4
4.
3±10
.7
7.3±
8.7
7.8±
7.7
16.8
±8.5
17
.1±6
.7
8.1±
9.9
9.0±
9.9
1756
±542
19
01±5
88
1731
±545
18
09±6
98
43.6
±51.
2 55
.5±6
7.7
25 (2
1.9)
22
(17.
3)
86.9
±14.
9 82
.5±1
5.4
Gro
up
Cont
rol
Diet
Co
ntro
l Di
et
Cont
rol
Diet
Co
ntro
l Di
et
Cont
rol
Diet
Co
ntro
l Di
et
Cont
rol
Diet
Co
ntro
l Di
et
Cont
rol
Diet
Co
ntro
l Di
et
Cont
rol
Diet
Co
ntro
l Di
et
Cont
rol
Diet
Co
ntro
l Di
et
Cont
rol
Diet
Co
ntro
l Di
et
Cont
rol
Diet
NU
-AG
E Co
mpo
nent
s W
hole
grai
ns
Frui
ts
Vege
tabl
es
Legu
mes
Lo
w-fa
t dai
ry
Low
-fat c
hees
e Fi
sh
Low
-fat m
eat &
pou
ltry
Nut
s Eg
gs
Oliv
e oi
l Al
coho
l Fl
uid
Salt
Swee
ts
Vita
min
D
NU
-AGE
inde
x

Chapter 8 | Changes in dietary intake after a one-year intervention in Dutch older adults
134
Discussion The NU-AGE study is a one-year randomized dietary intervention with a healthful diet targeting the dietary recommendations of the ageing population versus a control diet to reduce inflammageing, optimise health and quality of life in European older adults. In the current study we demonstrated that following a one-year dietary intervention, comprising dietary counselling, provision of free foods and a vitamin D supplement, the dietary intake of an elderly European population shifts more towards the NU-AGE guidelines for a healthful diet.
Changes in in dietary intake in elderly populations has been reported in previous studies. For example, a dietary intervention study of a personalized nutrition program consisting of home visits, phone calls and newsletters observed that after 6 months of intervention in participants aged 70 years and above, their fruit, vegetables and dairy intake improved [46]. A one-year trial demonstrated favourable changes in dietary intakes for olive oil, nuts, vegetables, legumes, fruits, meat and pastries, cakes and sweets in persons aged 55 to 80 years of age [47].
However, none of these studies investigated a dietary pattern that was specifically developed to target the dietary recommendations for the ageing population. To date, dietary recommendations for the elderly population to improve healthy ageing at a global level are lacking. Our study, investigating a diet that was specifically designed at targeting the dietary recommendations of elderly people could fill this knowledge gap. Besides incorporating the dietary recommendations, also nutrients related to various ageing related health outcomes and nutrients involved in inflammageing have been taken into account when designing the NU-AGE diet, including monounsaturated fatty acids, polyunsaturated fatty acids, olive oil or oily fish (inflammatory processes [5] and inflammatory bowel diseases [48]), protein (sarcopenia [7]), vitamin D (falling [8]), vitamin B12 (cognitive impairment [9]), vitamin C and fruit (CRP [11]), and whole grains (type 2 diabetes [49], cardiovascular disease [50], BMI [51], and blood lipids [52]). Thus, a solid basis of evidence was used to develop the NU-AGE diet for healthier ageing.
The NU-AGE diet seems to be feasible to implement in the increasingly ageing population. As demonstrated in the present study, following one year of intervention, participants in the intervention group had a 21 point higher NU-AGE diet score compared to the control group. Compared to a trial studying the Mediterranean diet in which 2 points (out of a 14) change has been achieved resulting in a reduction of cardiovascular risk factors, e.g., decreased blood pressure, blood glucose levels, and cholesterol-HDL cholesterol ratio and increased HDL cholesterol levels [18], the effects of the changes in dietary intake within the NU-AGE dietary intervention seem promising to improve health at a European level.
An important strength of the dietary intervention is the approach to change the entire dietary pattern, rather than single foods or nutrients. Changing an entire dietary pattern has been shown to be the preferred method as it is easier to change a dietary pattern rather than focussing on specific nutrients [53]. Moreover, we were able to achieve changes in dietary intake by making use of dietary counselling, the provision of free foods and a vitamin D supplement only. It has been demonstrated by a review that the provision of free foods is effective to improve adherence [54]. The use of Motivational Interviewing [24] in the dietary counselling could be the key of success in this intervention. A systematic review and meta-analysis has demonstrated that interventions incorporating behaviour change techniques are effective ingredients of interventions to change dietary intakes [55]. The provision of free foods and a vitamin D supplement were also used to improve compliance. It has been shown that free provision of foods is effective in improving dietary habits [56, 57]. Thus, with relatively less effort, without making use of a controlled feeding trial, the
135
NU-AGE intervention seemed to be successful in making older adults change their dietary habits - even after only one year of follow-up. Additionally, the construction of the NU-AGE diet index is another strength of this study, as this enables us to rank participants according to their adherence to the NU-AGE diet. This approach will allow us to study the effects of the changes in dietary intake on health outcomes using an intention to treat analysis (efficacy), but also by using a per protocol analysis (efficiency). Furthermore, to make sure that all outcome measurements were conducted in the same standardized way across the five study centres, all questionnaires, procedures and tests were practiced and discussed during training sessions prior to the start of the intervention period. At last, the use of standardized and harmonized food based dietary guidelines across five study centres in Europe enabled us to provide a comparable dietary advice and to implement the same dietary principles at a large scale.
Our study has limitations. Firstly, the use of country specific food composition databases and nutrient calculation systems could have resulted in differences in intake between the countries caused by a different food composition database rather than a real-life difference in intake. We have improved the comparability in calculations by organizing training sessions in which all research dieticians of each research centre participated. Secondly, we had losses to follow-up - primarily pre-frail participants in the control group - likely because participants did not receive food incentives and their frailty status could have limited their ability to comply to the intervention. Finally, participants were apparently healthy, well-educated, which limits the generalizability of our findings to the general elderly population. Our results show that the NU-AGE diet, based on dietary recommendations of older adults, is feasible to achieve favourable changes in dietary intake in an elderly population. Evidence on the effects from this diet on health outcomes will contribute to the development of European-wide dietary guidelines for healthier ageing across Europe.
Acknowledgments This project is supported by the European Union’s Seventh Framework Program under grant agreement no. 266486 (‘NU-AGE: new dietary strategies addressing the specific needs of the elderly population for healthy ageing in Europe’). Participants, staff and investigators of NU-AGE are gratefully acknowledged. FrieslandCampina, Unilever, Lesieur, COOP, MCO Health are acknowledged for the provision of low-fat low-salt cheese, margarine, olive oil, whole grain pasta and vitamin D supplement, respectively.

8
Chapter 8 | Changes in dietary intake after a one-year intervention in Dutch older adults
134
Discussion The NU-AGE study is a one-year randomized dietary intervention with a healthful diet targeting the dietary recommendations of the ageing population versus a control diet to reduce inflammageing, optimise health and quality of life in European older adults. In the current study we demonstrated that following a one-year dietary intervention, comprising dietary counselling, provision of free foods and a vitamin D supplement, the dietary intake of an elderly European population shifts more towards the NU-AGE guidelines for a healthful diet.
Changes in in dietary intake in elderly populations has been reported in previous studies. For example, a dietary intervention study of a personalized nutrition program consisting of home visits, phone calls and newsletters observed that after 6 months of intervention in participants aged 70 years and above, their fruit, vegetables and dairy intake improved [46]. A one-year trial demonstrated favourable changes in dietary intakes for olive oil, nuts, vegetables, legumes, fruits, meat and pastries, cakes and sweets in persons aged 55 to 80 years of age [47].
However, none of these studies investigated a dietary pattern that was specifically developed to target the dietary recommendations for the ageing population. To date, dietary recommendations for the elderly population to improve healthy ageing at a global level are lacking. Our study, investigating a diet that was specifically designed at targeting the dietary recommendations of elderly people could fill this knowledge gap. Besides incorporating the dietary recommendations, also nutrients related to various ageing related health outcomes and nutrients involved in inflammageing have been taken into account when designing the NU-AGE diet, including monounsaturated fatty acids, polyunsaturated fatty acids, olive oil or oily fish (inflammatory processes [5] and inflammatory bowel diseases [48]), protein (sarcopenia [7]), vitamin D (falling [8]), vitamin B12 (cognitive impairment [9]), vitamin C and fruit (CRP [11]), and whole grains (type 2 diabetes [49], cardiovascular disease [50], BMI [51], and blood lipids [52]). Thus, a solid basis of evidence was used to develop the NU-AGE diet for healthier ageing.
The NU-AGE diet seems to be feasible to implement in the increasingly ageing population. As demonstrated in the present study, following one year of intervention, participants in the intervention group had a 21 point higher NU-AGE diet score compared to the control group. Compared to a trial studying the Mediterranean diet in which 2 points (out of a 14) change has been achieved resulting in a reduction of cardiovascular risk factors, e.g., decreased blood pressure, blood glucose levels, and cholesterol-HDL cholesterol ratio and increased HDL cholesterol levels [18], the effects of the changes in dietary intake within the NU-AGE dietary intervention seem promising to improve health at a European level.
An important strength of the dietary intervention is the approach to change the entire dietary pattern, rather than single foods or nutrients. Changing an entire dietary pattern has been shown to be the preferred method as it is easier to change a dietary pattern rather than focussing on specific nutrients [53]. Moreover, we were able to achieve changes in dietary intake by making use of dietary counselling, the provision of free foods and a vitamin D supplement only. It has been demonstrated by a review that the provision of free foods is effective to improve adherence [54]. The use of Motivational Interviewing [24] in the dietary counselling could be the key of success in this intervention. A systematic review and meta-analysis has demonstrated that interventions incorporating behaviour change techniques are effective ingredients of interventions to change dietary intakes [55]. The provision of free foods and a vitamin D supplement were also used to improve compliance. It has been shown that free provision of foods is effective in improving dietary habits [56, 57]. Thus, with relatively less effort, without making use of a controlled feeding trial, the
135
NU-AGE intervention seemed to be successful in making older adults change their dietary habits - even after only one year of follow-up. Additionally, the construction of the NU-AGE diet index is another strength of this study, as this enables us to rank participants according to their adherence to the NU-AGE diet. This approach will allow us to study the effects of the changes in dietary intake on health outcomes using an intention to treat analysis (efficacy), but also by using a per protocol analysis (efficiency). Furthermore, to make sure that all outcome measurements were conducted in the same standardized way across the five study centres, all questionnaires, procedures and tests were practiced and discussed during training sessions prior to the start of the intervention period. At last, the use of standardized and harmonized food based dietary guidelines across five study centres in Europe enabled us to provide a comparable dietary advice and to implement the same dietary principles at a large scale.
Our study has limitations. Firstly, the use of country specific food composition databases and nutrient calculation systems could have resulted in differences in intake between the countries caused by a different food composition database rather than a real-life difference in intake. We have improved the comparability in calculations by organizing training sessions in which all research dieticians of each research centre participated. Secondly, we had losses to follow-up - primarily pre-frail participants in the control group - likely because participants did not receive food incentives and their frailty status could have limited their ability to comply to the intervention. Finally, participants were apparently healthy, well-educated, which limits the generalizability of our findings to the general elderly population. Our results show that the NU-AGE diet, based on dietary recommendations of older adults, is feasible to achieve favourable changes in dietary intake in an elderly population. Evidence on the effects from this diet on health outcomes will contribute to the development of European-wide dietary guidelines for healthier ageing across Europe.
Acknowledgments This project is supported by the European Union’s Seventh Framework Program under grant agreement no. 266486 (‘NU-AGE: new dietary strategies addressing the specific needs of the elderly population for healthy ageing in Europe’). Participants, staff and investigators of NU-AGE are gratefully acknowledged. FrieslandCampina, Unilever, Lesieur, COOP, MCO Health are acknowledged for the provision of low-fat low-salt cheese, margarine, olive oil, whole grain pasta and vitamin D supplement, respectively.

Chapter 8 | Changes in dietary intake after a one-year intervention in Dutch older adults
136
References 1. Eurostat. EUROPOP2010 - Convergence scenario, national level - Assumptions [Internet]. 2011 [updated 06-03-2012;
cited 2013 25-09-2013]. Population projections]. Available from: http://epp.eurostat.ec.europa.eu/portal/page/portal/population/data/database.
2. Cevenini E, Monti D, Franceschi C. Inflamm-ageing. Curr Opin Clin Nutr Metab Care. 2013;16(1):14-20. 3. Franceschi C, Bonafè M, Valensin S, Olivieri F, De Luca M, Ottaviani E, et al. Inflamm-aging: An Evolutionary Perspective
on Immunosenescence. Annals of the New York Academy of Sciences. 2000;908(1):244-54. 4. Franceschi C, Capri M, Monti D, Giunta S, Olivieri F, Sevini F, et al. Inflammaging and anti-inflammaging: a systemic
perspective on aging and longevity emerged from studies in humans. Mechanisms of ageing and development. 2007;128(1):92-105.
5. Bouwens M, van de Rest O, Dellschaft N, Bromhaar MG, de Groot LC, Geleijnse JM, et al. Fish-oil supplementation induces antiinflammatory gene expression profiles in human blood mononuclear cells. Am J Clin Nutr. 2009;90(2):415-24.
6. Kraguljac NV, Montori VM, Pavuluri M, Chai HS, Wilson BS, Unal SS. Efficacy of omega-3 fatty acids in mood disorders - a systematic review and metaanalysis. Psychopharmacology bulletin. 2009;42(3):39-54.
7. Paddon-Jones D, Rasmussen BB. Dietary protein recommendations and the prevention of sarcopenia. Curr Opin Clin Nutr Metab Care. 2009;12(1):86-90.
8. Bischoff-Ferrari HA, Dawson-Hughes B, Staehelin HB, Orav JE, Stuck AE, Theiler R, et al. Fall prevention with supplemental and active forms of vitamin D: a meta-analysis of randomised controlled trials. BMJ. 2009;339:b3692.
9. Hin H, Clarke R, Sherliker P, Atoyebi W, Emmens K, Birks J, et al. Clinical relevance of low serum vitamin B12 concentrations in older people: the Banbury B12 study. Age Ageing. 2006;35(4):416-22.
10. Sato Y, Honda Y, Iwamoto J, Kanoko T, Satoh K. Effect of folate and mecobalamin on hip fractures in patients with stroke: a randomized controlled trial. JAMA. 2005;293(9):1082-8.
11. Wannamethee SG, Lowe GD, Rumley A, Bruckdorfer KR, Whincup PH. Associations of vitamin C status, fruit and vegetable intakes, and markers of inflammation and hemostasis. Am J Clin Nutr. 2006;83(3):567-74; quiz 726-7.
12. Vinas BR, Barba LR, Ngo J, Gurinovic M, Novakovic R, Cavelaars A, et al. Projected prevalence of inadequate nutrient intakes in Europe. Annals of nutrition & metabolism. 2011;59(2-4):84-95.
13. Ocke MC B-RE, de Boer EJ, Wilson-van den Hooven C, Etemad-Ghameslou Z, Drijvers JJMM, van Rossum CTM. Diet of community-dwelling older adults: Dutch National Food Consumption Survey Older adults 2010-2012. RIVM, 2013 Contract No.: 050413001.
14. Jacobs DR, Jr., Steffen LM. Nutrients, foods, and dietary patterns as exposures in research: a framework for food synergy. Am J Clin Nutr. 2003;78(3 Suppl):508S-13S.
15. Jacques PF, Tucker KL. Are dietary patterns useful for understanding the role of diet in chronic disease? Am J Clin Nutr. 2001;73(1):1-2.
16. Alles B, Samieri C, Feart C, Jutand MA, Laurin D, Barberger-Gateau P. Dietary patterns: a novel approach to examine the link between nutrition and cognitive function in older individuals. Nutr Res Rev. 2012:207-22.
17. de Lorgeril M, Renaud S, Mamelle N, Salen P, Martin JL, Monjaud I, et al. Mediterranean alpha-linolenic acid-rich diet in secondary prevention of coronary heart disease. Lancet. 1994;343(8911):1454-9.
18. Estruch R, Martinez-Gonzalez MA, Corella D, Salas-Salvado J, Ruiz-Gutierrez V, Covas MI, et al. Effects of a Mediterranean-style diet on cardiovascular risk factors: a randomized trial. Ann Intern Med. 2006;145(1):1-11.
19. McNaughton SA, Bates CJ, Mishra GD. Diet quality is associated with all-cause mortality in adults aged 65 years and older. J Nutr. 2012;142(2):320-5.
20. Panunzio MF, Caporizzi R, Antoniciello A, Cela EP, Ferguson LR, D'Ambrosio P. Randomized, controlled nutrition education trial promotes a Mediterranean diet and improves anthropometric, dietary, and metabolic parameters in adults. Ann Ig. 2011;23(1):13-25.
21. Trichopoulou A, Orfanos P, Norat T, Bueno-de-Mesquita B, Ocke MC, Peeters PH, et al. Modified Mediterranean diet and survival: EPIC-elderly prospective cohort study. BMJ. 2005;330(7498):991.
22. Berendsen A, Santoro A, Pini E, Cevenini E, Ostan R, Pietruszka B, et al. Reprint of: A parallel randomized trial on the effect of a healthful diet on inflammageing and its consequences in European elderly people: design of the NU-AGE dietary intervention study. Mechanisms of ageing and development. 2014;136-137:14-21.
23. Santoro A, Pini E, Scurti M, Palmas G, Berendsen A, Brzozowska A, et al. Combating inflammaging through a Mediterranean whole diet approach: The NU-AGE project's conceptual framework and design. Mechanisms of ageing and development. 2014;136-137:3-13.
24. Miller WR, Rollnick S. Motivational interviewing : preparing people for change. New York [etc.]: The Guilford Press; 2002.
25. Prochaska JO, DiClemente CC. Transtheoretical therapy: Toward a more integrative model of change. . Psychotherapy: Theory, Research & Practice. 1982;19(3):276-88.
26. Health council of the Netherlands. Dietary reference intakes: calcium, vitamin D, thiamin, riboflavin, niacin, pantothenic acid, and biotin. The Hague: 2000.
27. Health council of the Netherlands. Towards an adequate intake of vitamin D. The Hague: 2008. 28. Istituto Nazionale di Ricerca per gli Alimenti e la Nutrizione. Istituto Nazionale di Ricerca per gli Alimenti e la Nutrizione
2003 [cited 2012 03-08-2011]. Italian Dietary Guidelines]. Available from: http://www.inran.it/.
137
29. Health council of the Netherlands. Guidelines for a healthy diet 2006. The Hague: 2006.30. Jarosz M, Bulhak-Jachymczyk B. Normy zywienia czlowieka. Podstawy prewencji otylosci i chorob niezakaznych /
Nutrition recommendations. Basis for the prevention of obesity and non-communicable dieseases. Warsaw:Wydawnictwo Lekarskie PZWL / National Food and Nutrition Institute 2008.
31. Ministère du Travail dlEedlS. French National Nutrition and Health Program 2011-2015 2011. Available from:http://www.sante.gouv.fr/IMG/pdf/French_National_Nutrition_and_Health_Program_2011-2015.pdf.
32. Rhee JJ, Sampson L, Cho E, Hughes MD, Hu FB, Willett WC. Comparison of methods to account for implausible reporting of energy intake in epidemiologic studies. Am J Epidemiol. 2015;181(4):225-33.
33. RIVM/Voedingscentrum. NEVO-tabel; Nederlands Voedingsstoffenbestand 2011. Den Haag2011. 34. Fried LP, Tangen CM, Walston J, Newman AB, Hirsch C, Gottdiener J, et al. Frailty in older adults: evidence for a
phenotype. J Gerontol A Biol Sci Med Sci. 2001;56(3):M146-56. 35. Department of Health. Report on Health & Social Subjects 41 Dietary reference values for food energy and nutrients for
the United Kingdom. London: 1991. 36. Food and Nutrition Council. Nederlandse normen 1989 / Dutch dietary reference values 1989. The Hague: 1992.37. Health council of the Netherlands. Dietary Reference Intakes: energy, proteins, fats and digestible carbohydrates. The
Hague 200138. Health council of the Netherlands. Dietary Reference Intakes: vitamin B6, folic acid, and vitamin B12. The Hague: 2003.39. Health council of the Netherlands. Guideline for dietary fiber intake. The Hague: 2006.40. AFSSA, CNERNA-CNRS. Apports Nutritionnels conseillés pour la population française. 3 ed. Martin A, editor. Paris: Tec et
Doc Lavoisier; 2001. 608 p. 41. Peregrin T. Getting to Know the Modified MyPyramid for Older Adults. Journal of the American Dietetic Association.
2008;108(6):937-8. 42. Shelnutt KP, Bobroff LB, Diehl DC. MyPyramid for Older Adults. Journal of Nutrition Education and Behavior.41(4):300-2. 43. Commission of the European Communities. Nutrient and energy intakes for the European Community. Luxembourg:
European Food Safety Authority (EFSA), Scientific Committee for Food, 1993.44. Institute of Medicine. Dietary Reference Intakes. The essential guide to nutrient requirements. Otten J, Pitzi Hellwig, J.
Meyers L, editors. Washington: The National Academies Press; 2006.45. van Lee L, Geelen A, van Huysduynen EJ, de Vries JH, van't Veer P, Feskens EJ. The Dutch Healthy Diet index (DHD-
index): an instrument to measure adherence to the Dutch Guidelines for a Healthy Diet. Nutrition journal. 2012;11:49.46. Bernstein A, Nelson ME, Tucker KL, Layne J, Johnson E, Nuernberger A, et al. A home-based nutrition intervention to
increase consumption of fruits, vegetables, and calcium-rich foods in community dwelling elders. J Am Diet Assoc. 2002;102(10):1421-7.
47. Zazpe I, Sanchez-Tainta A, Estruch R, Lamuela-Raventos RM, Schroder H, Salas-Salvado J, et al. A large randomizedindividual and group intervention conducted by registered dietitians increased adherence to Mediterranean-type diets:the PREDIMED study. J Am Diet Assoc. 2008;108(7):1134-44.
48. Calder PC. Polyunsaturated fatty acids, inflammatory processes and inflammatory bowel diseases. Molecular Nutritionand Food Research. 2008;52(8):885-97.
49. de Munter JS, Hu FB, Spiegelman D, Franz M, van Dam RM. Whole grain, bran, and germ intake and risk of type 2diabetes: a prospective cohort study and systematic review. PLoS Med. 2007;4(8):e261.
50. Mellen PB, Walsh TF, Herrington DM. Whole grain intake and cardiovascular disease: a meta-analysis. Nutr MetabCardiovasc Dis. 2008;18(4):283-90.
51. Gaesser GA. Carbohydrate quantity and quality in relation to body mass index. J Am Diet Assoc. 2007;107(10):1768-80. 52. Pan A, Yu D, Demark-Wahnefried W, Franco OH, Lin X. Meta-analysis of the effects of flaxseed interventions on blood
lipids. Am J Clin Nutr. 2009;90(2):288-97. 53. Maillot M, Issa C, Vieux F, Lairon D, Darmon N. The shortest way to reach nutritional goals is to adopt Mediterranean
food choices: evidence from computer-generated personalized diets. Am J Clin Nutr. 2011;94(4):1127-37. 54. Wibisono C, Probst Y, Neale E, Tapsell L. Impact of food supplementation on weight loss in randomised-controlled
dietary intervention trials: a systematic review and meta-analysis. Br J Nutr. 2016;115(8):1406-14. 55. Lara J, Evans EH, O'Brien N, Moynihan PJ, Meyer TD, Adamson AJ, et al. Association of behaviour change techniques
with effectiveness of dietary interventions among adults of retirement age: a systematic review and meta-analysis ofrandomised controlled trials. BMC Med. 2014;12(177).
56. Martinez-Gonzalez MA, Corella D, Salas-Salvado J, Ros E, Covas MI, Fiol M, et al. Cohort profile: design and methods ofthe PREDIMED study. Int J Epidemiol. 2010;41(2):377-85.
57. Troyer JL, Racine EF, Ngugi GW, McAuley WJ. The effect of home-delivered Dietary Approach to Stop Hypertension(DASH) meals on the diets of older adults with cardiovascular disease. Am J Clin Nutr. 2010;91(5):1204-12.

8
Chapter 8 | Changes in dietary intake after a one-year intervention in Dutch older adults
136
References 1. Eurostat. EUROPOP2010 - Convergence scenario, national level - Assumptions [Internet]. 2011 [updated 06-03-2012;
cited 2013 25-09-2013]. Population projections]. Available from: http://epp.eurostat.ec.europa.eu/portal/page/portal/population/data/database.
2. Cevenini E, Monti D, Franceschi C. Inflamm-ageing. Curr Opin Clin Nutr Metab Care. 2013;16(1):14-20. 3. Franceschi C, Bonafè M, Valensin S, Olivieri F, De Luca M, Ottaviani E, et al. Inflamm-aging: An Evolutionary Perspective
on Immunosenescence. Annals of the New York Academy of Sciences. 2000;908(1):244-54. 4. Franceschi C, Capri M, Monti D, Giunta S, Olivieri F, Sevini F, et al. Inflammaging and anti-inflammaging: a systemic
perspective on aging and longevity emerged from studies in humans. Mechanisms of ageing and development. 2007;128(1):92-105.
5. Bouwens M, van de Rest O, Dellschaft N, Bromhaar MG, de Groot LC, Geleijnse JM, et al. Fish-oil supplementation induces antiinflammatory gene expression profiles in human blood mononuclear cells. Am J Clin Nutr. 2009;90(2):415-24.
6. Kraguljac NV, Montori VM, Pavuluri M, Chai HS, Wilson BS, Unal SS. Efficacy of omega-3 fatty acids in mood disorders - a systematic review and metaanalysis. Psychopharmacology bulletin. 2009;42(3):39-54.
7. Paddon-Jones D, Rasmussen BB. Dietary protein recommendations and the prevention of sarcopenia. Curr Opin Clin Nutr Metab Care. 2009;12(1):86-90.
8. Bischoff-Ferrari HA, Dawson-Hughes B, Staehelin HB, Orav JE, Stuck AE, Theiler R, et al. Fall prevention with supplemental and active forms of vitamin D: a meta-analysis of randomised controlled trials. BMJ. 2009;339:b3692.
9. Hin H, Clarke R, Sherliker P, Atoyebi W, Emmens K, Birks J, et al. Clinical relevance of low serum vitamin B12 concentrations in older people: the Banbury B12 study. Age Ageing. 2006;35(4):416-22.
10. Sato Y, Honda Y, Iwamoto J, Kanoko T, Satoh K. Effect of folate and mecobalamin on hip fractures in patients with stroke: a randomized controlled trial. JAMA. 2005;293(9):1082-8.
11. Wannamethee SG, Lowe GD, Rumley A, Bruckdorfer KR, Whincup PH. Associations of vitamin C status, fruit and vegetable intakes, and markers of inflammation and hemostasis. Am J Clin Nutr. 2006;83(3):567-74; quiz 726-7.
12. Vinas BR, Barba LR, Ngo J, Gurinovic M, Novakovic R, Cavelaars A, et al. Projected prevalence of inadequate nutrient intakes in Europe. Annals of nutrition & metabolism. 2011;59(2-4):84-95.
13. Ocke MC B-RE, de Boer EJ, Wilson-van den Hooven C, Etemad-Ghameslou Z, Drijvers JJMM, van Rossum CTM. Diet of community-dwelling older adults: Dutch National Food Consumption Survey Older adults 2010-2012. RIVM, 2013 Contract No.: 050413001.
14. Jacobs DR, Jr., Steffen LM. Nutrients, foods, and dietary patterns as exposures in research: a framework for food synergy. Am J Clin Nutr. 2003;78(3 Suppl):508S-13S.
15. Jacques PF, Tucker KL. Are dietary patterns useful for understanding the role of diet in chronic disease? Am J Clin Nutr. 2001;73(1):1-2.
16. Alles B, Samieri C, Feart C, Jutand MA, Laurin D, Barberger-Gateau P. Dietary patterns: a novel approach to examine the link between nutrition and cognitive function in older individuals. Nutr Res Rev. 2012:207-22.
17. de Lorgeril M, Renaud S, Mamelle N, Salen P, Martin JL, Monjaud I, et al. Mediterranean alpha-linolenic acid-rich diet in secondary prevention of coronary heart disease. Lancet. 1994;343(8911):1454-9.
18. Estruch R, Martinez-Gonzalez MA, Corella D, Salas-Salvado J, Ruiz-Gutierrez V, Covas MI, et al. Effects of a Mediterranean-style diet on cardiovascular risk factors: a randomized trial. Ann Intern Med. 2006;145(1):1-11.
19. McNaughton SA, Bates CJ, Mishra GD. Diet quality is associated with all-cause mortality in adults aged 65 years and older. J Nutr. 2012;142(2):320-5.
20. Panunzio MF, Caporizzi R, Antoniciello A, Cela EP, Ferguson LR, D'Ambrosio P. Randomized, controlled nutrition education trial promotes a Mediterranean diet and improves anthropometric, dietary, and metabolic parameters in adults. Ann Ig. 2011;23(1):13-25.
21. Trichopoulou A, Orfanos P, Norat T, Bueno-de-Mesquita B, Ocke MC, Peeters PH, et al. Modified Mediterranean diet and survival: EPIC-elderly prospective cohort study. BMJ. 2005;330(7498):991.
22. Berendsen A, Santoro A, Pini E, Cevenini E, Ostan R, Pietruszka B, et al. Reprint of: A parallel randomized trial on the effect of a healthful diet on inflammageing and its consequences in European elderly people: design of the NU-AGE dietary intervention study. Mechanisms of ageing and development. 2014;136-137:14-21.
23. Santoro A, Pini E, Scurti M, Palmas G, Berendsen A, Brzozowska A, et al. Combating inflammaging through a Mediterranean whole diet approach: The NU-AGE project's conceptual framework and design. Mechanisms of ageing and development. 2014;136-137:3-13.
24. Miller WR, Rollnick S. Motivational interviewing : preparing people for change. New York [etc.]: The Guilford Press; 2002.
25. Prochaska JO, DiClemente CC. Transtheoretical therapy: Toward a more integrative model of change. . Psychotherapy: Theory, Research & Practice. 1982;19(3):276-88.
26. Health council of the Netherlands. Dietary reference intakes: calcium, vitamin D, thiamin, riboflavin, niacin, pantothenic acid, and biotin. The Hague: 2000.
27. Health council of the Netherlands. Towards an adequate intake of vitamin D. The Hague: 2008. 28. Istituto Nazionale di Ricerca per gli Alimenti e la Nutrizione. Istituto Nazionale di Ricerca per gli Alimenti e la Nutrizione
2003 [cited 2012 03-08-2011]. Italian Dietary Guidelines]. Available from: http://www.inran.it/.
137
29. Health council of the Netherlands. Guidelines for a healthy diet 2006. The Hague: 2006.30. Jarosz M, Bulhak-Jachymczyk B. Normy zywienia czlowieka. Podstawy prewencji otylosci i chorob niezakaznych /
Nutrition recommendations. Basis for the prevention of obesity and non-communicable dieseases. Warsaw:Wydawnictwo Lekarskie PZWL / National Food and Nutrition Institute 2008.
31. Ministère du Travail dlEedlS. French National Nutrition and Health Program 2011-2015 2011. Available from:http://www.sante.gouv.fr/IMG/pdf/French_National_Nutrition_and_Health_Program_2011-2015.pdf.
32. Rhee JJ, Sampson L, Cho E, Hughes MD, Hu FB, Willett WC. Comparison of methods to account for implausible reporting of energy intake in epidemiologic studies. Am J Epidemiol. 2015;181(4):225-33.
33. RIVM/Voedingscentrum. NEVO-tabel; Nederlands Voedingsstoffenbestand 2011. Den Haag2011. 34. Fried LP, Tangen CM, Walston J, Newman AB, Hirsch C, Gottdiener J, et al. Frailty in older adults: evidence for a
phenotype. J Gerontol A Biol Sci Med Sci. 2001;56(3):M146-56. 35. Department of Health. Report on Health & Social Subjects 41 Dietary reference values for food energy and nutrients for
the United Kingdom. London: 1991. 36. Food and Nutrition Council. Nederlandse normen 1989 / Dutch dietary reference values 1989. The Hague: 1992.37. Health council of the Netherlands. Dietary Reference Intakes: energy, proteins, fats and digestible carbohydrates. The
Hague 200138. Health council of the Netherlands. Dietary Reference Intakes: vitamin B6, folic acid, and vitamin B12. The Hague: 2003.39. Health council of the Netherlands. Guideline for dietary fiber intake. The Hague: 2006.40. AFSSA, CNERNA-CNRS. Apports Nutritionnels conseillés pour la population française. 3 ed. Martin A, editor. Paris: Tec et
Doc Lavoisier; 2001. 608 p. 41. Peregrin T. Getting to Know the Modified MyPyramid for Older Adults. Journal of the American Dietetic Association.
2008;108(6):937-8. 42. Shelnutt KP, Bobroff LB, Diehl DC. MyPyramid for Older Adults. Journal of Nutrition Education and Behavior.41(4):300-2. 43. Commission of the European Communities. Nutrient and energy intakes for the European Community. Luxembourg:
European Food Safety Authority (EFSA), Scientific Committee for Food, 1993.44. Institute of Medicine. Dietary Reference Intakes. The essential guide to nutrient requirements. Otten J, Pitzi Hellwig, J.
Meyers L, editors. Washington: The National Academies Press; 2006.45. van Lee L, Geelen A, van Huysduynen EJ, de Vries JH, van't Veer P, Feskens EJ. The Dutch Healthy Diet index (DHD-
index): an instrument to measure adherence to the Dutch Guidelines for a Healthy Diet. Nutrition journal. 2012;11:49.46. Bernstein A, Nelson ME, Tucker KL, Layne J, Johnson E, Nuernberger A, et al. A home-based nutrition intervention to
increase consumption of fruits, vegetables, and calcium-rich foods in community dwelling elders. J Am Diet Assoc. 2002;102(10):1421-7.
47. Zazpe I, Sanchez-Tainta A, Estruch R, Lamuela-Raventos RM, Schroder H, Salas-Salvado J, et al. A large randomizedindividual and group intervention conducted by registered dietitians increased adherence to Mediterranean-type diets:the PREDIMED study. J Am Diet Assoc. 2008;108(7):1134-44.
48. Calder PC. Polyunsaturated fatty acids, inflammatory processes and inflammatory bowel diseases. Molecular Nutritionand Food Research. 2008;52(8):885-97.
49. de Munter JS, Hu FB, Spiegelman D, Franz M, van Dam RM. Whole grain, bran, and germ intake and risk of type 2diabetes: a prospective cohort study and systematic review. PLoS Med. 2007;4(8):e261.
50. Mellen PB, Walsh TF, Herrington DM. Whole grain intake and cardiovascular disease: a meta-analysis. Nutr MetabCardiovasc Dis. 2008;18(4):283-90.
51. Gaesser GA. Carbohydrate quantity and quality in relation to body mass index. J Am Diet Assoc. 2007;107(10):1768-80. 52. Pan A, Yu D, Demark-Wahnefried W, Franco OH, Lin X. Meta-analysis of the effects of flaxseed interventions on blood
lipids. Am J Clin Nutr. 2009;90(2):288-97. 53. Maillot M, Issa C, Vieux F, Lairon D, Darmon N. The shortest way to reach nutritional goals is to adopt Mediterranean
food choices: evidence from computer-generated personalized diets. Am J Clin Nutr. 2011;94(4):1127-37. 54. Wibisono C, Probst Y, Neale E, Tapsell L. Impact of food supplementation on weight loss in randomised-controlled
dietary intervention trials: a systematic review and meta-analysis. Br J Nutr. 2016;115(8):1406-14. 55. Lara J, Evans EH, O'Brien N, Moynihan PJ, Meyer TD, Adamson AJ, et al. Association of behaviour change techniques
with effectiveness of dietary interventions among adults of retirement age: a systematic review and meta-analysis ofrandomised controlled trials. BMC Med. 2014;12(177).
56. Martinez-Gonzalez MA, Corella D, Salas-Salvado J, Ros E, Covas MI, Fiol M, et al. Cohort profile: design and methods ofthe PREDIMED study. Int J Epidemiol. 2010;41(2):377-85.
57. Troyer JL, Racine EF, Ngugi GW, McAuley WJ. The effect of home-delivered Dietary Approach to Stop Hypertension(DASH) meals on the diets of older adults with cardiovascular disease. Am J Clin Nutr. 2010;91(5):1204-12.


Chapter 9Effect of the NU-AGE dietary
intervention on cognitivedecline in Dutch older adults
Agnes A.M. Berendsen, Ondine van de Rest, Edith J.M. Feskens, Lisette C.P.G.M de Groot

Chapter 9 | Effect of the NU-AGE dietary intervention on cognitive decline
140
Abstract The Mediterranean diet may affect cognitive functioning in older adults, but results are inconsistent. The present study aimed to examine the effect of the NU-AGE diet - a Mediterranean-like dietary pattern for older adults - on cognitive functioning. Between April 2012 and March 2013, a total of 252 independently living non-frail and pre-frail participants from the Netherlands (mean age 71.0±4.0 years) were enrolled into the NU-AGE parallel, randomized dietary intervention study. Participants were randomly assigned to the NU-AGE diet group (n=123) or to the control diet group (n=129). The primary outcome was one-year change in global cognition and in four cognitive domains as measured through a comprehensive neuropsychological test battery. Data were analysed using mixed-effects linear regression models for the effect of the NU-AGE intervention on cognitive change over time. Comparing the intervention with the control group, there was no effect of the intervention on cognitive functioning. Estimated mean change in global cognition z-score at 1 year was 0.33 (95%CI 0.21,0.45) in the intervention group and 0.42 (95%CI 0.29,0.54) in the control group, with a mean difference of -0.10 (-0.45,0.25, p group × time = 0.56). Additionally, the intervention was not related to change over time for any of the cognitive domains. The results of this study suggest that a one year intervention with the NU-AGE diet did not improve cognitive functioning in Dutch older adults aged 65 years and older.
141
Introduction Life expectancy continues to rise due to technical and medical developments, which results in a shift towards an ageing population. The proportion of adults aged over 60 years will be more than 20% of the world population by 2050 [1]. This increase in older adults will result in a higher prevalence of age-related diseases and disabilities, such as the occurrence of dementia [2]. In 2015, 46.8 million people were living with dementia and it is estimated that this number will increase to 74.7 million in 2030 and 131.5 million in 2050 [3].Therefore, the delay of onset of dementia or cognitive impairment is a major public health priority [4]. It has been estimated that a third of all Alzheimer’s disease (AD) cases might be attributable to modifiable risk factors, including hypertension, obesity and diabetes [5]. Nutritional components might play a role in the prevention of cognitive decline by impacting these modifiable risk factors. A combination of nutrients might have even stronger beneficial effects on cognitive health, due to interactive or cumulative effects. Therefore, the interest in the relationship between dietary patterns and cognitive health has increased.
One of the dietary patterns which is of great interest is the Mediterranean diet, characterized by a high consumption of plant based foods including vegetables and fruits and low consumption of red meat and sugary or high-fat food products [6]. Two meta-analyses on longitudinal studies reported that a higher adherence to the Mediterranean diet is associated with a reduced risk of Mild Cognitive Impairment (MCI) and AD [7, 8]. One randomized trial reported that a Mediterranean diet supplemented with nuts or olive oil was associated with improved cognitive function among older Spanish participants [9]. However, data from additional randomized controlled trials are lacking.
Additionally, to date, there is no study investigating the effect of a diet that is based on dietary recommendations for the ageing population. The NU-AGE dietary intervention study investigates the effect of a Mediterranean-like dietary pattern specifically adjusted to the dietary recommendations of elderly people on health outcomes. The present study aimed to study the effect of the NU-AGE intervention on cognitive change over one year in Dutch adults aged 65-80.
Materials and methods
Study design and participants The NU-AGE study is a randomized one-year dietary intervention study conducted in five European countries: Italy, the United Kingdom (UK), the Netherlands, France, and Poland [10, 11]. For the present analyses we used data from the Dutch cohort. The design of the study has been extensively described elsewhere [10]. In short, between April 2012 and March 2013 a total of 252 apparently healthy non-frail and pre-frail older adults aged 65-80 years were recruited in the surroundings of Wageningen, the Netherlands. At baseline and after one year follow-up participants completed questionnaires, and a cognitive assessment and physical examination were conducted. Dietary intake was assessed by means of a 7-day food record at baseline and follow-up. All foods consumed during the day, including their portion sizes, were reported. Written informed consent was obtained from all participants. The study protocol was approved by the Medical Ethics Committee of Wageningen University and the NU-AGE study is registered at clinicialtrials.gov since December 21st 2012, NCT01754012.

9
Chapter 9 | Effect of the NU-AGE dietary intervention on cognitive decline
140
Abstract The Mediterranean diet may affect cognitive functioning in older adults, but results are inconsistent. The present study aimed to examine the effect of the NU-AGE diet - a Mediterranean-like dietary pattern for older adults - on cognitive functioning. Between April 2012 and March 2013, a total of 252 independently living non-frail and pre-frail participants from the Netherlands (mean age 71.0±4.0 years) were enrolled into the NU-AGE parallel, randomized dietary intervention study. Participants were randomly assigned to the NU-AGE diet group (n=123) or to the control diet group (n=129). The primary outcome was one-year change in global cognition and in four cognitive domains as measured through a comprehensive neuropsychological test battery. Data were analysed using mixed-effects linear regression models for the effect of the NU-AGE intervention on cognitive change over time. Comparing the intervention with the control group, there was no effect of the intervention on cognitive functioning. Estimated mean change in global cognition z-score at 1 year was 0.33 (95%CI 0.21,0.45) in the intervention group and 0.42 (95%CI 0.29,0.54) in the control group, with a mean difference of -0.10 (-0.45,0.25, p group × time = 0.56). Additionally, the intervention was not related to change over time for any of the cognitive domains. The results of this study suggest that a one year intervention with the NU-AGE diet did not improve cognitive functioning in Dutch older adults aged 65 years and older.
141
Introduction Life expectancy continues to rise due to technical and medical developments, which results in a shift towards an ageing population. The proportion of adults aged over 60 years will be more than 20% of the world population by 2050 [1]. This increase in older adults will result in a higher prevalence of age-related diseases and disabilities, such as the occurrence of dementia [2]. In 2015, 46.8 million people were living with dementia and it is estimated that this number will increase to 74.7 million in 2030 and 131.5 million in 2050 [3].Therefore, the delay of onset of dementia or cognitive impairment is a major public health priority [4]. It has been estimated that a third of all Alzheimer’s disease (AD) cases might be attributable to modifiable risk factors, including hypertension, obesity and diabetes [5]. Nutritional components might play a role in the prevention of cognitive decline by impacting these modifiable risk factors. A combination of nutrients might have even stronger beneficial effects on cognitive health, due to interactive or cumulative effects. Therefore, the interest in the relationship between dietary patterns and cognitive health has increased.
One of the dietary patterns which is of great interest is the Mediterranean diet, characterized by a high consumption of plant based foods including vegetables and fruits and low consumption of red meat and sugary or high-fat food products [6]. Two meta-analyses on longitudinal studies reported that a higher adherence to the Mediterranean diet is associated with a reduced risk of Mild Cognitive Impairment (MCI) and AD [7, 8]. One randomized trial reported that a Mediterranean diet supplemented with nuts or olive oil was associated with improved cognitive function among older Spanish participants [9]. However, data from additional randomized controlled trials are lacking.
Additionally, to date, there is no study investigating the effect of a diet that is based on dietary recommendations for the ageing population. The NU-AGE dietary intervention study investigates the effect of a Mediterranean-like dietary pattern specifically adjusted to the dietary recommendations of elderly people on health outcomes. The present study aimed to study the effect of the NU-AGE intervention on cognitive change over one year in Dutch adults aged 65-80.
Materials and methods
Study design and participants The NU-AGE study is a randomized one-year dietary intervention study conducted in five European countries: Italy, the United Kingdom (UK), the Netherlands, France, and Poland [10, 11]. For the present analyses we used data from the Dutch cohort. The design of the study has been extensively described elsewhere [10]. In short, between April 2012 and March 2013 a total of 252 apparently healthy non-frail and pre-frail older adults aged 65-80 years were recruited in the surroundings of Wageningen, the Netherlands. At baseline and after one year follow-up participants completed questionnaires, and a cognitive assessment and physical examination were conducted. Dietary intake was assessed by means of a 7-day food record at baseline and follow-up. All foods consumed during the day, including their portion sizes, were reported. Written informed consent was obtained from all participants. The study protocol was approved by the Medical Ethics Committee of Wageningen University and the NU-AGE study is registered at clinicialtrials.gov since December 21st 2012, NCT01754012.

Chapter 9 | Effect of the NU-AGE dietary intervention on cognitive decline
142
Dietary intervention Participants were randomized to either the intervention or control group. The intervention group received individual dietary counselling including motivational interviewing nine times during one year to improve adherence to the NU-AGE diet. The NU-AGE diet is based on nutrient reference values and food based dietary guidelines for elderly from Italy [12], the UK [13], the Netherlands [14-18], Poland [19], and France [20], on the modified MyPyramid for Older Adults [21, 22], and nutrient requirements from the European Community [23], and the Institute of Medicine [24]. Specific products – e.g. low-salt low-fat cheese, whole grain pasta, margarine, olive oil and a vitamin D supplement (10 μg) – were provided for free to the intervention group to facilitate adherence to the diet. The control group received a leaflet with general nutritional guidelines. Cognitive functioning Cognitive functioning was measured at baseline and follow-up by trained research assistants following standardized procedures. The comprehensive neuropsychological test battery included the Consortium to Establish a Registry for Alzheimer Disease (CERAD) [25] test battery (Verbal Fluency Category [26], Boston Naming Test [27], Constructional Praxis [28], Word List Memory [25], Word List Delayed Recall [25], and Word List Recognition [25]), plus five additional tests; 1) Babcock Story Recall [29], 2) Trail Making Test A (TMT-A) [30], 3) Trail Making Test B (TMT-B) [30], 4) Number Cancellation [31], and 5) Pattern Comparison [32]. Covariates Information on age, sex, educational level (years), smoking status (non-smoker vs. current smoker), medical history (hypertension, hypercholesterolemia, diabetes mellitus type 2 with no insulin therapy, myocardial infarction, and heart disease) was collected using questionnaires. A history of either myocardial infarction or heart disease was evaluated as having a history of cardiovascular disease (CVD). Body weight, height, subjective cognitive complaints (range 0-10), Mini-Mental State Examination (MMSE, range 0-30) [33], and frailty status (non-frail or pre-frail [34], were examined by trained research assistants following standardized procedures. Physical activity was measured using a validated version of the Physical Activity Scale for Elderly [35]. Energy intake was derived from the means of the 7-day food records. Depressive symptoms were categorized as having two or more points on the Geriatric Depression Scale [36], to differentiate subjects with no and a few depressive symptoms. Statistical analyses Data are expressed as mean±SD for continuous variables, or as number (percentage) for categorical variables. Baseline characteristics were compared between treatment groups using analysis of variances (ANOVA) for continuous and Pearson χ2 or Fisher’s exact test for categorical variables. Z-scores for each cognitive test at each time point were standardized to the baseline mean and standard deviation. Higher Z-scores represent a higher cognitive test outcome. Z-scores for TMT-A and TMT-B were reversed, as for these tests higher test outcomes represented lower cognitive functioning. An interference measure for TMT-A was calculated (TMT-B/TMT-A), to control for the effect of motor speed on performance [37]. CERAD Z-score was calculated based on the sum of individual tests. Z-scores for cognitive tests were clustered into compound scores for four cognitive domains, namely 1) episodic memory, 2) executive functioning, 3) information processing speed and 4) visuospatial ability:
143
Episodic memory = ZWordList Immediate + ZWordList Delayed Recall + ZWordList Recognition + ZBabcock Story Recall immediate + ZBabcock Story Recall delayed) / 5 Executive functioning = ZVerbalFluencyCategory + -ZTrailMakingTest B/A / 2 Information processing speed = -ZTrailMakingTestA + ZNumberCancellation + ZPatternComparison / 3 Visuospatial ability = ZConstructionalPraxis + ZContructionalPraxis recall / 2 Tests included in the four cognitive domains are specified in table 1. Table 1. Cognitive domains and included tests in the NU-AGE study Domain Test Description Scoring Episodic memory Word list memory Recall of 10 presented words in 3 sessions 0-30 Word list delayed recall Delayed recall of the 10 presented words
in the Word list memory test 0-10
Word list recognition Recognition of the 10 presented words in the Word list memory test in a list of 20 words
0-20
Babcock story immediate recall Recall of a brief story 0-21 Babcock story delayed recall Delayed recall of the brief story in
Babcock story recall 0-21
Executive functioning Verbal fluency category Mention as many words of a category in
60 seconds 0 - ∞
Trail Making Test B / A B: Draw lines sequentially, connecting 13 numbers and letters in order 1 A 2 B etc., as fast as possible A: Draw lines sequentially connecting 25 encircled numbers, as fast as possible Outcome ratio of TMT B and TMT A
0-300 seconds
Information processing speed Trail Making Test A A: Draw lines sequentially connecting 25
encircled numbers, as fast as possible 0-300 seconds
Number cancellation Cross out all number ‘4’ from a list of numbers, as fast as possible
0-30
Pattern comparison Same/different decisions about pairs of patterns needs to be made, as fast as possible in 2 sessions
0-60
Visuospatial ability Constructional praxis Drawing of presented figures 0-11 Constructional praxis recall Recall of drawn figures on blank paper 0-14 Mixed-effects linear regression models were used to study the effect of the NU-AGE intervention on cognitive change over time as a function of intervention, time and intervention × time interaction. This analysis was based on an intention-to-treat approach in which all randomized participants were included in the analysis. Sensitivity analyses were performed by excluding all participants with missing values for cognitive outcomes and stratified analyses by sex and age (median) were performed. Stratified analyses were relevant because beneficial effects of Mediterranean-like dietary patterns were reported in women [9], and in subjects with a higher age [16], while no effects were reported in men [19] and in subjects with a lower age [18]. Two-sided p-values <0.05 were considered significant for all tests. All statistical analyses were performed using SAS version 9.3.

9
Chapter 9 | Effect of the NU-AGE dietary intervention on cognitive decline
142
Dietary intervention Participants were randomized to either the intervention or control group. The intervention group received individual dietary counselling including motivational interviewing nine times during one year to improve adherence to the NU-AGE diet. The NU-AGE diet is based on nutrient reference values and food based dietary guidelines for elderly from Italy [12], the UK [13], the Netherlands [14-18], Poland [19], and France [20], on the modified MyPyramid for Older Adults [21, 22], and nutrient requirements from the European Community [23], and the Institute of Medicine [24]. Specific products – e.g. low-salt low-fat cheese, whole grain pasta, margarine, olive oil and a vitamin D supplement (10 μg) – were provided for free to the intervention group to facilitate adherence to the diet. The control group received a leaflet with general nutritional guidelines. Cognitive functioning Cognitive functioning was measured at baseline and follow-up by trained research assistants following standardized procedures. The comprehensive neuropsychological test battery included the Consortium to Establish a Registry for Alzheimer Disease (CERAD) [25] test battery (Verbal Fluency Category [26], Boston Naming Test [27], Constructional Praxis [28], Word List Memory [25], Word List Delayed Recall [25], and Word List Recognition [25]), plus five additional tests; 1) Babcock Story Recall [29], 2) Trail Making Test A (TMT-A) [30], 3) Trail Making Test B (TMT-B) [30], 4) Number Cancellation [31], and 5) Pattern Comparison [32]. Covariates Information on age, sex, educational level (years), smoking status (non-smoker vs. current smoker), medical history (hypertension, hypercholesterolemia, diabetes mellitus type 2 with no insulin therapy, myocardial infarction, and heart disease) was collected using questionnaires. A history of either myocardial infarction or heart disease was evaluated as having a history of cardiovascular disease (CVD). Body weight, height, subjective cognitive complaints (range 0-10), Mini-Mental State Examination (MMSE, range 0-30) [33], and frailty status (non-frail or pre-frail [34], were examined by trained research assistants following standardized procedures. Physical activity was measured using a validated version of the Physical Activity Scale for Elderly [35]. Energy intake was derived from the means of the 7-day food records. Depressive symptoms were categorized as having two or more points on the Geriatric Depression Scale [36], to differentiate subjects with no and a few depressive symptoms. Statistical analyses Data are expressed as mean±SD for continuous variables, or as number (percentage) for categorical variables. Baseline characteristics were compared between treatment groups using analysis of variances (ANOVA) for continuous and Pearson χ2 or Fisher’s exact test for categorical variables. Z-scores for each cognitive test at each time point were standardized to the baseline mean and standard deviation. Higher Z-scores represent a higher cognitive test outcome. Z-scores for TMT-A and TMT-B were reversed, as for these tests higher test outcomes represented lower cognitive functioning. An interference measure for TMT-A was calculated (TMT-B/TMT-A), to control for the effect of motor speed on performance [37]. CERAD Z-score was calculated based on the sum of individual tests. Z-scores for cognitive tests were clustered into compound scores for four cognitive domains, namely 1) episodic memory, 2) executive functioning, 3) information processing speed and 4) visuospatial ability:
143
Episodic memory = ZWordList Immediate + ZWordList Delayed Recall + ZWordList Recognition + ZBabcock Story Recall immediate + ZBabcock Story Recall delayed) / 5 Executive functioning = ZVerbalFluencyCategory + -ZTrailMakingTest B/A / 2 Information processing speed = -ZTrailMakingTestA + ZNumberCancellation + ZPatternComparison / 3 Visuospatial ability = ZConstructionalPraxis + ZContructionalPraxis recall / 2 Tests included in the four cognitive domains are specified in table 1. Table 1. Cognitive domains and included tests in the NU-AGE study Domain Test Description Scoring Episodic memory Word list memory Recall of 10 presented words in 3 sessions 0-30 Word list delayed recall Delayed recall of the 10 presented words
in the Word list memory test 0-10
Word list recognition Recognition of the 10 presented words in the Word list memory test in a list of 20 words
0-20
Babcock story immediate recall Recall of a brief story 0-21 Babcock story delayed recall Delayed recall of the brief story in
Babcock story recall 0-21
Executive functioning Verbal fluency category Mention as many words of a category in
60 seconds 0 - ∞
Trail Making Test B / A B: Draw lines sequentially, connecting 13 numbers and letters in order 1 A 2 B etc., as fast as possible A: Draw lines sequentially connecting 25 encircled numbers, as fast as possible Outcome ratio of TMT B and TMT A
0-300 seconds
Information processing speed Trail Making Test A A: Draw lines sequentially connecting 25
encircled numbers, as fast as possible 0-300 seconds
Number cancellation Cross out all number ‘4’ from a list of numbers, as fast as possible
0-30
Pattern comparison Same/different decisions about pairs of patterns needs to be made, as fast as possible in 2 sessions
0-60
Visuospatial ability Constructional praxis Drawing of presented figures 0-11 Constructional praxis recall Recall of drawn figures on blank paper 0-14 Mixed-effects linear regression models were used to study the effect of the NU-AGE intervention on cognitive change over time as a function of intervention, time and intervention × time interaction. This analysis was based on an intention-to-treat approach in which all randomized participants were included in the analysis. Sensitivity analyses were performed by excluding all participants with missing values for cognitive outcomes and stratified analyses by sex and age (median) were performed. Stratified analyses were relevant because beneficial effects of Mediterranean-like dietary patterns were reported in women [9], and in subjects with a higher age [16], while no effects were reported in men [19] and in subjects with a lower age [18]. Two-sided p-values <0.05 were considered significant for all tests. All statistical analyses were performed using SAS version 9.3.

Chapter 9 | Effect of the NU-AGE dietary intervention on cognitive decline
144
Results Between April 2012 and March 2013, 350 individuals were screened and 252 were randomly assigned to the intervention group (n=123) or control group (n=129), figure 1. A total of 244 (97%) participants completed the follow-up assessments. The intervention was completed in March 2014. The analyses included 250 participants (99% of enrolled participants). Dropout rates were similar in the intervention (4 [3%] participants) and control (4 [3%] participants) groups. Main reasons for drop-out were difficulties adhering to the intervention (n=1), health related (n=3), and difficulties in arranging participation (n=3). One participant in the control group died during the study.
Figure 1. Flow chart of Dutch NU-AGE participants
145
The mean age of the population was 71.0 (±4.1) years and MMSE score was 27.7±1.8. Compared to the control group those in the intervention group were more likely to be women (57% vs. 54%), were higher educated (12.8 vs. 11.8% years), had a lower BMI (25.4±3.7 vs. 26.5±3.5 kg/m2) and had a higher prevalence of depressive symptoms (26.2% vs. 19.5%; table 2). Table 2. Baseline characteristics of Dutch participants in the NU-AGE study Intervention group (n=122) Control group (n=128) Demographic characteristics
Age at baseline, years 70.9 ± 4.2 71.0 ± 3.9 Women 70 (57.0) 69 (54.0) Education, years 12.8 ± 3.7 11.8 ± 3.6
Vascular factors Systolic blood pressure, mmHg 130.0 ± 19.1 136.3 ± 18.0 Diastolic blood pressure, mmHg 69.4 ± 9.5 71.0 ± 10.3 Body mass index, kg/m2a 25.4 ± 3.7 26.5 ± 3.5
Lifestyle factors Physical activity, met 137.1 ± 51.7 137.9 ± 55.5 Pre-frail 26 (21.3) 28 (21.9) Current smokers 6 (4.9) 2 (1.6) Energy intake, kcal 1902 ± 369 1911 ± 432
Self-reported medical disorders Hypertension 38 (31.1) 44 (34.4) Hypercholesterolemia 28 (23) 34 (26.6) Diabetes Mellitus, type II 3 (2.5) 6 (4.8) Cardiovacular disease 17 (14.0) 15 (11.7) Depressive symptoms 32 (26.2) 25 (19.5)
Cognition MMSE (0-30) 27.8 ± 1.8 27.6 ± 1.8 SCC (0-10) 2.9 ± 1.8 2.9 ± 1.9
Data are mean ± SD, or n (%) MMSE = Mini-Mental State Examination; SCC = Subjective Cognitive Complaints a p-value <0.05 Estimated mean change in CERAD total z-score at one year was 0.33 (95%CI 0.21; 0.45) in the intervention group and 0.42 (95%CI 0.29; 0.54) in the control group. The mean difference between groups (group × time interaction) in change of cognitive function per year was -0.10 (95%CI -0.45; 0.25), p=0.56; table 3. There was no significant intervention effect over time for the cognitive domains episodic memory (p=0.56), executive function (p=0.58), information processing speed (p=0.75), and visuospatial ability (p=0.30). The results remained unchanged when adjusting for potential confounding variables and while excluding subjects with missing data in cognitive outcomes (n=5). No interaction was observed for sex, age or energy intake (data not shown).

9
Chapter 9 | Effect of the NU-AGE dietary intervention on cognitive decline
144
Results Between April 2012 and March 2013, 350 individuals were screened and 252 were randomly assigned to the intervention group (n=123) or control group (n=129), figure 1. A total of 244 (97%) participants completed the follow-up assessments. The intervention was completed in March 2014. The analyses included 250 participants (99% of enrolled participants). Dropout rates were similar in the intervention (4 [3%] participants) and control (4 [3%] participants) groups. Main reasons for drop-out were difficulties adhering to the intervention (n=1), health related (n=3), and difficulties in arranging participation (n=3). One participant in the control group died during the study.
Figure 1. Flow chart of Dutch NU-AGE participants
145
The mean age of the population was 71.0 (±4.1) years and MMSE score was 27.7±1.8. Compared to the control group those in the intervention group were more likely to be women (57% vs. 54%), were higher educated (12.8 vs. 11.8% years), had a lower BMI (25.4±3.7 vs. 26.5±3.5 kg/m2) and had a higher prevalence of depressive symptoms (26.2% vs. 19.5%; table 2). Table 2. Baseline characteristics of Dutch participants in the NU-AGE study Intervention group (n=122) Control group (n=128) Demographic characteristics
Age at baseline, years 70.9 ± 4.2 71.0 ± 3.9 Women 70 (57.0) 69 (54.0) Education, years 12.8 ± 3.7 11.8 ± 3.6
Vascular factors Systolic blood pressure, mmHg 130.0 ± 19.1 136.3 ± 18.0 Diastolic blood pressure, mmHg 69.4 ± 9.5 71.0 ± 10.3 Body mass index, kg/m2a 25.4 ± 3.7 26.5 ± 3.5
Lifestyle factors Physical activity, met 137.1 ± 51.7 137.9 ± 55.5 Pre-frail 26 (21.3) 28 (21.9) Current smokers 6 (4.9) 2 (1.6) Energy intake, kcal 1902 ± 369 1911 ± 432
Self-reported medical disorders Hypertension 38 (31.1) 44 (34.4) Hypercholesterolemia 28 (23) 34 (26.6) Diabetes Mellitus, type II 3 (2.5) 6 (4.8) Cardiovacular disease 17 (14.0) 15 (11.7) Depressive symptoms 32 (26.2) 25 (19.5)
Cognition MMSE (0-30) 27.8 ± 1.8 27.6 ± 1.8 SCC (0-10) 2.9 ± 1.8 2.9 ± 1.9
Data are mean ± SD, or n (%) MMSE = Mini-Mental State Examination; SCC = Subjective Cognitive Complaints a p-value <0.05 Estimated mean change in CERAD total z-score at one year was 0.33 (95%CI 0.21; 0.45) in the intervention group and 0.42 (95%CI 0.29; 0.54) in the control group. The mean difference between groups (group × time interaction) in change of cognitive function per year was -0.10 (95%CI -0.45; 0.25), p=0.56; table 3. There was no significant intervention effect over time for the cognitive domains episodic memory (p=0.56), executive function (p=0.58), information processing speed (p=0.75), and visuospatial ability (p=0.30). The results remained unchanged when adjusting for potential confounding variables and while excluding subjects with missing data in cognitive outcomes (n=5). No interaction was observed for sex, age or energy intake (data not shown).

Chapter 9 | Effect of the NU-AGE dietary intervention on cognitive decline
146
Tabl
e 3.
Bas
elin
e co
gniti
ve te
st sc
ores
and
one
-yea
r cha
nge
by st
udy
grou
p
p gr
oup
x tim
ea
0.56
0.
95
0.86
0.76
0.21
0.42
0.87
0.54
0.62
0.56
0.87
0.29
0.29
0.56
0.58
0.75
0.30
CERA
D =
Cons
ortiu
m to
Est
ablis
h a
Regi
stry
for A
lzhei
mer
Dis
ease
; TM
T =
Trai
l Mak
ing
Test
a p
-val
ue b
y m
eans
of m
ixed
-effe
cts l
inea
r reg
ress
ion
mod
els
b Low
er sc
ores
indi
cate
impr
ovem
ent
Scor
es o
n ep
isod
ic m
emor
y, e
xecu
tive
func
tion,
info
rmat
ion
proc
essi
ng sp
eed
and
visu
ospa
tial a
bilit
y ar
e m
ean
valu
es o
f z-s
core
s of t
he c
ogni
tive
test
s inc
lude
d in
ea
ch c
ogni
tive
outc
ome,
with
hig
her s
core
s sug
gest
ing
bett
er p
erfo
rman
ce
Mea
n di
ffere
nce
-0.1
0 (-0
.45;
0.25
) -0
.04
(-1.3
4;1.
25)
-0.0
6 (-0
.69;
0.57
)
0.09
(-0.
49;0
.69)
0.65
(-0.
37;1
.67)
0.52
(-0.
75;1
.79)
0.17
(-1.
82;2
.16)
-0.0
8 (-0
.34;
0.17
)
0.98
(-2.
92;4
.88)
-0.4
0 (-1
.76;
0.95
)
0.15
(-1.
64;1
.93)
-0.2
3 (-0
.67;
0.21
)
-0.1
9 (-0
.56;
0.17
)
0.08
(-0.
19;0
.35)
0.07
(-0.
18;0
.33)
-0.0
4 (-0
.32;
0.23
)
-0.1
6 (-0
.47;
0.15
)
Cont
rol
pa
<0.0
1 <0
.01
<0.0
1
0.93
<0.0
1
<0.0
1
0.05
<0.0
1
0.96
0.41
<0.0
1
0.05
0.25
0.96
<0.0
1
0.02
0.52
Chan
ge
0.42
(0.2
9;0.
54)
1.63
(1.0
4;2.
22)
0.73
(0.4
4;1.
01)
0.02
(-0.
37;0
.41)
-1.2
8 (-
1.80
;-0.7
5)
-1.6
1 (-2
.27;
-0.9
5)
0.92
(0.0
2;1.
83)
-0.2
8 (-0
.43;
-0.1
3)
0.06
(-1.
93;2
.04)
0.25
(-0.
35;0
.86)
1.46
(0.7
4;2.
19)
-0.2
3 (-0
.46;
-0.0
0)
0.25
(-0.
17;0
.66)
-0.0
0 (-0
.11;
0.10
)
0.25
(0.1
2;0.
37)
0.12
(0.0
2;0.
21)
-0.0
5 (-0
.19;
0.09
)
Base
line
-0.0
0±0.
98
19.2
9±3.
40
6.76
±1.7
3
19.3
7±1.
11
8.09
±2.7
8
11.1
4±3.
47
22.7
0±5.
88
2.34
±0.7
8
40.9
7±12
.64
19.3
4±3.
79
27.4
5±5.
01
9.84
±1.3
3
8.25
±2.2
6
0.02
±0.7
2
0.04
±0.7
6
-0.0
1±0.
82
-0.0
5±0.
90
Inte
rven
tion
pa
<0.0
1 <0
.01
<0.0
1
0.44
<0.0
1
<0.0
1
0.01
<0.0
1
0.12
0.73
<0.0
1
<0.0
1
0.99
0.05
<0.0
1
0.13
0.01
Chan
ge
0.33
(0.2
1;0.
45)
1.66
(1.1
3;2.
19)
0.67
(0.4
2;0.
92)
0.13
(-0.
20;0
.46)
-0.6
1 (-1
.18;
-0.0
3)
-1.0
2 (-1
.71;
-0.3
3)
1.09
(0.2
5;1.
94)
-0.3
7 (-0
.52;
-0.2
2)
1.24
(-0.
30;2
.78)
-0.1
1 (-0
.74;
0.52
)
1.69
(0.9
9;2.
41)
-0.4
4 (-0
.67;
-0.2
1)
0.00
(-0.
39;0
.39)
0.09
(-0.
00;0
.19)
0.33
(0.2
1;0.
44)
0.07
(-0.
02;0
.17)
-0.1
8 (-0
.33;
-0.0
4)
Base
line
0.00
±1.0
2
19.2
4±3.
76
6.69
±1.8
2
19.3
5±1.
01
7.84
±3.0
9
11.0
1±4.
07
22.5
8±5.
49
2.43
±0.8
7
Info
rmat
ion
proc
essi
ng sp
eed
39.0
2±10
.41
19.0
9±3.
37
27.4
3±4.
96
9.98
±1.0
7
8.50
±2.3
2
-0.0
2±0.
76
-0.0
4±0.
81
0.02
±0.7
2
0.06
±0.7
6
CERA
D z-
scor
e Ep
isod
ic m
emor
y
Wor
d lis
t mem
ory
Wor
d Li
st R
ecal
l
Wor
d lis
t rec
ogni
tion
Babc
ock
stor
y re
call
Babc
ock
stor
y de
laye
d re
call
Exce
cutiv
e fu
nctio
ning
Verb
al fl
uenc
y
TMT
B/Ab
TMT
Ab
Num
ber c
ance
llatio
n
Patt
ern
com
paris
on
Visu
ospa
tial a
bilit
y
Cons
truc
tiona
l pra
xis
Cons
truc
tiona
l pra
xis r
ecal
l
Dom
ain
spec
ific Z
-sco
res
Epis
odic
mem
ory
Exec
utiv
e fu
nctio
n
Info
rmat
ion
proc
essi
ng sp
eed
Visu
ospa
tial a
bilit
y
147
Discussion We investigated the effect of the one-year NU-AGE dietary intervention on cognitive functioning in 252 non-frail and pre-frail Dutch older adults. Compared to the control diet, the NU-AGE intervention did not improve global cognition or the cognitive domains episodic memory, executive function, information processing speed, and visuospatial ability. To the best of our knowledge, this is the first dietary intervention study investigating the effect of a diet specifically targeting dietary recommendations for the elderly population on cognitive functioning in non-frail and pre-frail older adults aged 65-80 years of age.
Other dietary patterns that have been investigated in relation to cognitive functioning include the Mediterranean diet and the DASH diet. The effect of a Mediterranean diet has been investigated in a dietary intervention study with three arms (Mediterranean diet supplemented with mixed nuts (30 g/d), or extra virgin olive oil (1 L/week), or control) in 447 cognitively healthy volunteers. Compared to the control group, the Mediterranean diet plus olive oil group had a better RAVLT test score (p=0.049) and memory composite score (p=0.04), and participants in the Mediterranean diet plus nuts group had a better frontal cognition composite score and global cognition score [9]. The less frequently studied DASH diet has been shown to result in a better psychomotor speed after four months intervention in 124 participants with elevated blood pressure randomized to the DASH diet compared to a control group [38].
The most recent developed dietary pattern specifically capturing dietary components shown to be neuroprotective is the ‘Mediterranean-dietary approach to stop hypertension diet Intervention for Neurodegenerative Delay’ (MIND) diet. The MIND diet was prospectively associated with slower decline in global cognitive score; participants with highest adherence to the MIND diet were cognitively 7.5 years younger in age compared to those with the lowest adherence after 4.7 years of follow-up [39].
However, dietary intervention studies on the effect of a dietary pattern specifically targeting nutritional recommendations and dietary habits of the ageing population on cognitive functioning are scarce. Very recently, a two-year multi-domain intervention including diet, exercise, cognitive training and vascular risk monitoring, or a control group (general health advice) was conducted [40]. The intervention group received dietary advice based on the Finnish Nutrition Recommendations in three individual sessions and seven to nine group sessions. In addition they received a physical exercise program, cognitive training and metabolic and vascular risk factors were managed. After two years of intervention, mean change in neuropsychological test battery (NTB) z-score was 0.20±0.51 in the intervention group and 0.16±0.51 in the control group with a between group difference in change per year of 0.022 (95% CI 0.002-0.042, p = 0.030). It was concluded that this multi-domain approach could improve or maintain cognitive function in at-risk elderly people [41]. Thus, a multi-domain approach could be more effective in achieving beneficial changes in cognitive functioning than targeting dietary recommendations only as in the current intervention study.
To investigate the effect of the NU-AGE intervention on cognitive functioning, we included an extensive cognitive test battery of 14 sensitive neuropsychological tests covering the domains most affected by aging, which is a major strength of the current study. As recommended by previous research [42], we have clustered data of the individual neuropsychological tests by standardizing values to z-scores in order to construct more robust cognitive domain scores. All tests were conducted by trained research assistants in a valid and standardized way following a strict protocol.

9
Chapter 9 | Effect of the NU-AGE dietary intervention on cognitive decline
146
Tabl
e 3.
Bas
elin
e co
gniti
ve te
st sc
ores
and
one
-yea
r cha
nge
by st
udy
grou
p
p gr
oup
x tim
ea
0.56
0.
95
0.86
0.76
0.21
0.42
0.87
0.54
0.62
0.56
0.87
0.29
0.29
0.56
0.58
0.75
0.30
CERA
D =
Cons
ortiu
m to
Est
ablis
h a
Regi
stry
for A
lzhei
mer
Dis
ease
; TM
T =
Trai
l Mak
ing
Test
a p
-val
ue b
y m
eans
of m
ixed
-effe
cts l
inea
r reg
ress
ion
mod
els
b Low
er sc
ores
indi
cate
impr
ovem
ent
Scor
es o
n ep
isod
ic m
emor
y, e
xecu
tive
func
tion,
info
rmat
ion
proc
essi
ng sp
eed
and
visu
ospa
tial a
bilit
y ar
e m
ean
valu
es o
f z-s
core
s of t
he c
ogni
tive
test
s inc
lude
d in
ea
ch c
ogni
tive
outc
ome,
with
hig
her s
core
s sug
gest
ing
bett
er p
erfo
rman
ce
Mea
n di
ffere
nce
-0.1
0 (-0
.45;
0.25
) -0
.04
(-1.3
4;1.
25)
-0.0
6 (-0
.69;
0.57
)
0.09
(-0.
49;0
.69)
0.65
(-0.
37;1
.67)
0.52
(-0.
75;1
.79)
0.17
(-1.
82;2
.16)
-0.0
8 (-0
.34;
0.17
)
0.98
(-2.
92;4
.88)
-0.4
0 (-1
.76;
0.95
)
0.15
(-1.
64;1
.93)
-0.2
3 (-0
.67;
0.21
)
-0.1
9 (-0
.56;
0.17
)
0.08
(-0.
19;0
.35)
0.07
(-0.
18;0
.33)
-0.0
4 (-0
.32;
0.23
)
-0.1
6 (-0
.47;
0.15
)
Cont
rol
pa
<0.0
1 <0
.01
<0.0
1
0.93
<0.0
1
<0.0
1
0.05
<0.0
1
0.96
0.41
<0.0
1
0.05
0.25
0.96
<0.0
1
0.02
0.52
Chan
ge
0.42
(0.2
9;0.
54)
1.63
(1.0
4;2.
22)
0.73
(0.4
4;1.
01)
0.02
(-0.
37;0
.41)
-1.2
8 (-
1.80
;-0.7
5)
-1.6
1 (-2
.27;
-0.9
5)
0.92
(0.0
2;1.
83)
-0.2
8 (-0
.43;
-0.1
3)
0.06
(-1.
93;2
.04)
0.25
(-0.
35;0
.86)
1.46
(0.7
4;2.
19)
-0.2
3 (-0
.46;
-0.0
0)
0.25
(-0.
17;0
.66)
-0.0
0 (-0
.11;
0.10
)
0.25
(0.1
2;0.
37)
0.12
(0.0
2;0.
21)
-0.0
5 (-0
.19;
0.09
)
Base
line
-0.0
0±0.
98
19.2
9±3.
40
6.76
±1.7
3
19.3
7±1.
11
8.09
±2.7
8
11.1
4±3.
47
22.7
0±5.
88
2.34
±0.7
8
40.9
7±12
.64
19.3
4±3.
79
27.4
5±5.
01
9.84
±1.3
3
8.25
±2.2
6
0.02
±0.7
2
0.04
±0.7
6
-0.0
1±0.
82
-0.0
5±0.
90
Inte
rven
tion
pa
<0.0
1 <0
.01
<0.0
1
0.44
<0.0
1
<0.0
1
0.01
<0.0
1
0.12
0.73
<0.0
1
<0.0
1
0.99
0.05
<0.0
1
0.13
0.01
Chan
ge
0.33
(0.2
1;0.
45)
1.66
(1.1
3;2.
19)
0.67
(0.4
2;0.
92)
0.13
(-0.
20;0
.46)
-0.6
1 (-1
.18;
-0.0
3)
-1.0
2 (-1
.71;
-0.3
3)
1.09
(0.2
5;1.
94)
-0.3
7 (-0
.52;
-0.2
2)
1.24
(-0.
30;2
.78)
-0.1
1 (-0
.74;
0.52
)
1.69
(0.9
9;2.
41)
-0.4
4 (-0
.67;
-0.2
1)
0.00
(-0.
39;0
.39)
0.09
(-0.
00;0
.19)
0.33
(0.2
1;0.
44)
0.07
(-0.
02;0
.17)
-0.1
8 (-0
.33;
-0.0
4)
Base
line
0.00
±1.0
2
19.2
4±3.
76
6.69
±1.8
2
19.3
5±1.
01
7.84
±3.0
9
11.0
1±4.
07
22.5
8±5.
49
2.43
±0.8
7
Info
rmat
ion
proc
essi
ng sp
eed
39.0
2±10
.41
19.0
9±3.
37
27.4
3±4.
96
9.98
±1.0
7
8.50
±2.3
2
-0.0
2±0.
76
-0.0
4±0.
81
0.02
±0.7
2
0.06
±0.7
6
CERA
D z-
scor
e Ep
isod
ic m
emor
y
Wor
d lis
t mem
ory
Wor
d Li
st R
ecal
l
Wor
d lis
t rec
ogni
tion
Babc
ock
stor
y re
call
Babc
ock
stor
y de
laye
d re
call
Exce
cutiv
e fu
nctio
ning
Verb
al fl
uenc
y
TMT
B/Ab
TMT
Ab
Num
ber c
ance
llatio
n
Patt
ern
com
paris
on
Visu
ospa
tial a
bilit
y
Cons
truc
tiona
l pra
xis
Cons
truc
tiona
l pra
xis r
ecal
l
Dom
ain
spec
ific Z
-sco
res
Epis
odic
mem
ory
Exec
utiv
e fu
nctio
n
Info
rmat
ion
proc
essi
ng sp
eed
Visu
ospa
tial a
bilit
y
147
Discussion We investigated the effect of the one-year NU-AGE dietary intervention on cognitive functioning in 252 non-frail and pre-frail Dutch older adults. Compared to the control diet, the NU-AGE intervention did not improve global cognition or the cognitive domains episodic memory, executive function, information processing speed, and visuospatial ability. To the best of our knowledge, this is the first dietary intervention study investigating the effect of a diet specifically targeting dietary recommendations for the elderly population on cognitive functioning in non-frail and pre-frail older adults aged 65-80 years of age.
Other dietary patterns that have been investigated in relation to cognitive functioning include the Mediterranean diet and the DASH diet. The effect of a Mediterranean diet has been investigated in a dietary intervention study with three arms (Mediterranean diet supplemented with mixed nuts (30 g/d), or extra virgin olive oil (1 L/week), or control) in 447 cognitively healthy volunteers. Compared to the control group, the Mediterranean diet plus olive oil group had a better RAVLT test score (p=0.049) and memory composite score (p=0.04), and participants in the Mediterranean diet plus nuts group had a better frontal cognition composite score and global cognition score [9]. The less frequently studied DASH diet has been shown to result in a better psychomotor speed after four months intervention in 124 participants with elevated blood pressure randomized to the DASH diet compared to a control group [38].
The most recent developed dietary pattern specifically capturing dietary components shown to be neuroprotective is the ‘Mediterranean-dietary approach to stop hypertension diet Intervention for Neurodegenerative Delay’ (MIND) diet. The MIND diet was prospectively associated with slower decline in global cognitive score; participants with highest adherence to the MIND diet were cognitively 7.5 years younger in age compared to those with the lowest adherence after 4.7 years of follow-up [39].
However, dietary intervention studies on the effect of a dietary pattern specifically targeting nutritional recommendations and dietary habits of the ageing population on cognitive functioning are scarce. Very recently, a two-year multi-domain intervention including diet, exercise, cognitive training and vascular risk monitoring, or a control group (general health advice) was conducted [40]. The intervention group received dietary advice based on the Finnish Nutrition Recommendations in three individual sessions and seven to nine group sessions. In addition they received a physical exercise program, cognitive training and metabolic and vascular risk factors were managed. After two years of intervention, mean change in neuropsychological test battery (NTB) z-score was 0.20±0.51 in the intervention group and 0.16±0.51 in the control group with a between group difference in change per year of 0.022 (95% CI 0.002-0.042, p = 0.030). It was concluded that this multi-domain approach could improve or maintain cognitive function in at-risk elderly people [41]. Thus, a multi-domain approach could be more effective in achieving beneficial changes in cognitive functioning than targeting dietary recommendations only as in the current intervention study.
To investigate the effect of the NU-AGE intervention on cognitive functioning, we included an extensive cognitive test battery of 14 sensitive neuropsychological tests covering the domains most affected by aging, which is a major strength of the current study. As recommended by previous research [42], we have clustered data of the individual neuropsychological tests by standardizing values to z-scores in order to construct more robust cognitive domain scores. All tests were conducted by trained research assistants in a valid and standardized way following a strict protocol.

Chapter 9 | Effect of the NU-AGE dietary intervention on cognitive decline
148
Moreover, randomization was used to obtain two equally balanced intervention groups. However, despite the randomization participants in the intervention group were more likely to be women (i.e. 57% vs. 54%) and had a lower BMI compared to the control group (i.e. 25.4±3.7 vs. 26.5±3.5 kg/m2). Though, we have performed multivariate adjusted linear mixed model regression analyses including these and other factors and the results did not change. Importantly, with respect to the exposure and outcome variables participants in both groups were comparable at baseline.
Furthermore, we were able to conduct stratified analyses to explore if the intervention would be effective in the oldest participants. This was relevant as studies in older populations (e.g., mean age 81.5 years) demonstrated a relation of the DASH and MIND diet with cognitive decline [8, 43]. Our stratified analyses by age, however, did not result in differences between age groups (data not shown).
At last, adherence to the NU-AGE guidelines did substantially improve over time in the intervention group compared to the control group and it was concluded that the NU-AGE dietary intervention was feasible to make elderly people change their dietary intakes more towards their nutritional needs (Berendsen 2017, in preparation, Chapter 8 in this thesis).
Our relatively short follow-up time is a limitation of our study and could be an explanation for our null-findings. It has been recommended to conduct trials with a duration of at least 18 months to study effects on cognitive functioning [44]. However, it was expected that the follow-up period would be sufficient to impact cognitive functioning in our population including a proportion of older adults at greater risk of cognitive function decline (i.e. the pre-frail). Another explanation for our null finding of the NU-AGE diet could be the lack of power, as the sample size was not calculated to detect an effect on cognitive functioning. The required sample size has been calculated to be at least 600 participants per intervention group to detect a 50% difference change in the Neuropsychological Test Battery score between two intervention groups over two years [45]. The effect of the NU-AGE diet on cognitive functioning will be further investigated in the total NU-AGE sample including over 1,250 participants.
Summarizing, this study did not find an effect of the NU-AGE intervention on cognitive change over time. Longer-term randomized controlled trials with a sufficient sample size and multiple repeated measures of cognitive function are needed to study the effect of a dietary pattern specifically targeting dietary recommendations, but also incorporating components that have been shown to impact brain health of older adults at risk of cognitive impairment.
149
References 1. United Nations. Department of Economic and Social Affairs. Population Division. World Populations Prospects: The
2015 revision. Key Findings and Advance Tables. 2015. 2. World Health Organization. The global burden of disease: 2004 update. World Health Organization, 2008. 3. Alzheimer’s disease international. World Alzheimer Report 2015. The Global Impact of Dementia An analysis of
prevalence, incidence, cost and trends. 2015. 4. World Health Organization and Alzheimer’s Disease International. Dementia: a public health priority. United Kingdom:
World Health Organization and Alzheimer's Disease International, 2012 Contract No.: 19-05-2012. 5. Norton S, Matthews FE, Barnes DE, Yaffe K, Brayne C. Potential for primary prevention of Alzheimer's disease: an
analysis of population-based data. Lancet neurology. 2014;13(8):788-94. 6. Bach-Faig A, Berry EM, Lairon D, Reguant J, Trichopoulou A, Dernini S, et al. Mediterranean diet pyramid today. Science
and cultural updates. Public Health Nutr. 2011;14(12A):2274-84. 7. Psaltopoulou T, Sergentanis TN, Panagiotakos DB, Sergentanis IN, Kosti R, Scarmeas N. Mediterranean diet, stroke,
cognitive impairment, and depression: A meta-analysis. Annals of neurology. 2013;74(4):580-91. 8. Singh B, Parsaik AK, Mielke MM, Erwin PJ, Knopman DS, Petersen RC, et al. Association of mediterranean diet with mild
cognitive impairment and Alzheimer's disease: a systematic review and meta-analysis. J Alzheimers Dis. 2014;39(2):271-82.
9. Valls-Pedret C, Sala-Vila A, Serra-Mir M, Corella D, de la Torre R, Martinez-Gonzalez MA, et al. Mediterranean Diet and Age-Related Cognitive Decline: A Randomized Clinical Trial. JAMA internal medicine. 2015;175(7):1094-103.
10. Berendsen A, Santoro A, Pini E, Cevenini E, Ostan R, Pietruszka B, et al. Reprint of: A parallel randomized trial on the effect of a healthful diet on inflammageing and its consequences in European elderly people: design of the NU-AGE dietary intervention study. Mechanisms of ageing and development. 2014;136-137:14-21.
11. Santoro A, Pini E, Scurti M, Palmas G, Berendsen A, Brzozowska A, et al. Combating inflammaging through a Mediterranean whole diet approach: The NU-AGE project's conceptual framework and design. Mechanisms of ageing and development. 2014;136-137:3-13.
12. Istituto Nazionale di Ricerca per gli Alimenti e la Nutrizione. Istituto Nazionale di Ricerca per gli Alimenti e la Nutrizione 2003 [cited 2012 03-08-2011]. Italian Dietary Guidelines]. Available from: http://www.inran.it/.
13. Department of Health. Report on Health & Social Subjects 41 Dietary reference values for food energy and nutrients for the United Kingdom. London: 1991.
14. Food and Nutrition Council. Nederlandse normen 1989 / Dutch dietary reference values 1989. The Hague: 1992. 15. Health council of the Netherlands. Dietary reference intakes: calcium, vitamin D, thiamin, riboflavin, niacin,
pantothenic acid, and biotin. The Hague: 2000. 16. Health council of the Netherlands. Dietary Reference Intakes: energy, proteins, fats and digestible carbohydrates. The
Hague 2001 17. Health council of the Netherlands. Dietary Reference Intakes: vitamin B6, folic acid, and vitamin B12. The Hague: 2003. 18. Health council of the Netherlands. Guideline for dietary fiber intake. The Hague: 2006. 19. Jarosz M, Bulhak-Jachymczyk B. Normy zywienia czlowieka. Podstawy prewencji otylosci i chorob niezakaznych /
Nutrition recommendations. Basis for the prevention of obesity and non-communicable dieseases. Warsaw: Wydawnictwo Lekarskie PZWL / National Food and Nutrition Institute 2008.
20. AFSSA, CNERNA-CNRS. Apports Nutritionnels conseillés pour la population française. 3 ed. Martin A, editor. Paris: Tec et Doc Lavoisier; 2001. 608 p.
21. Peregrin T. Getting to Know the Modified MyPyramid for Older Adults. Journal of the American Dietetic Association. 2008;108(6):937-8.
22. Shelnutt KP, Bobroff LB, Diehl DC. MyPyramid for Older Adults. Journal of Nutrition Education and Behavior.41(4):300-2.
23. Commission of the European Communities. Nutrient and energy intakes for the European Community. Luxembourg: European Food Safety Authority (EFSA), Scientific Committee for Food, 1993.
24. Institute of Medicine. Dietary Reference Intakes. The essential guide to nutrient requirements. Otten J, Pitzi Hellwig, J. Meyers L, editors. Washington: The National Academies Press; 2006.
25. Morris JC, Heyman A, Mohs RC, Hughes JP, van Belle G, Fillenbaum G, et al. The Consortium to Establish a Registry for Alzheimer's Disease (CERAD). Part I. Clinical and neuropsychological assessment of Alzheimer's disease. Neurology. 1989;39(9):1159-65.
26. Rosen WG. Verbal fluency in aging and dementia. Journal of Clinical Neuropsychology. 1980;2(2):135-46. 27. Kaplan E GH, Weintraub S. The Boston Naming Test. Boston: E Kaplan and H Goodglass. 1978. 28. Rosen WG, Mohs RC, Davis KL. A new rating scale for Alzheimer's disease. The American journal of psychiatry.
1984;141(11):1356-64. 29. Babcock H, & Levy, L. The measurement of efficiency of mental functioning (revised examination): Test and manual of
directions. . Chicago: C H Stoelting. 1940. 30. Reitan RM. Valitidy of the trail making test as an indicator of organic brain damage. Perceptual and Motor Skills.
1958;8:271-6. 31. Lewis SJ, Heaton KW. Stool form scale as a useful guide to intestinal transit time. Scand J Gastroenterol.
1997;32(9):920-4.

9
Chapter 9 | Effect of the NU-AGE dietary intervention on cognitive decline
148
Moreover, randomization was used to obtain two equally balanced intervention groups. However, despite the randomization participants in the intervention group were more likely to be women (i.e. 57% vs. 54%) and had a lower BMI compared to the control group (i.e. 25.4±3.7 vs. 26.5±3.5 kg/m2). Though, we have performed multivariate adjusted linear mixed model regression analyses including these and other factors and the results did not change. Importantly, with respect to the exposure and outcome variables participants in both groups were comparable at baseline.
Furthermore, we were able to conduct stratified analyses to explore if the intervention would be effective in the oldest participants. This was relevant as studies in older populations (e.g., mean age 81.5 years) demonstrated a relation of the DASH and MIND diet with cognitive decline [8, 43]. Our stratified analyses by age, however, did not result in differences between age groups (data not shown).
At last, adherence to the NU-AGE guidelines did substantially improve over time in the intervention group compared to the control group and it was concluded that the NU-AGE dietary intervention was feasible to make elderly people change their dietary intakes more towards their nutritional needs (Berendsen 2017, in preparation, Chapter 8 in this thesis).
Our relatively short follow-up time is a limitation of our study and could be an explanation for our null-findings. It has been recommended to conduct trials with a duration of at least 18 months to study effects on cognitive functioning [44]. However, it was expected that the follow-up period would be sufficient to impact cognitive functioning in our population including a proportion of older adults at greater risk of cognitive function decline (i.e. the pre-frail). Another explanation for our null finding of the NU-AGE diet could be the lack of power, as the sample size was not calculated to detect an effect on cognitive functioning. The required sample size has been calculated to be at least 600 participants per intervention group to detect a 50% difference change in the Neuropsychological Test Battery score between two intervention groups over two years [45]. The effect of the NU-AGE diet on cognitive functioning will be further investigated in the total NU-AGE sample including over 1,250 participants.
Summarizing, this study did not find an effect of the NU-AGE intervention on cognitive change over time. Longer-term randomized controlled trials with a sufficient sample size and multiple repeated measures of cognitive function are needed to study the effect of a dietary pattern specifically targeting dietary recommendations, but also incorporating components that have been shown to impact brain health of older adults at risk of cognitive impairment.
149
References 1. United Nations. Department of Economic and Social Affairs. Population Division. World Populations Prospects: The
2015 revision. Key Findings and Advance Tables. 2015. 2. World Health Organization. The global burden of disease: 2004 update. World Health Organization, 2008. 3. Alzheimer’s disease international. World Alzheimer Report 2015. The Global Impact of Dementia An analysis of
prevalence, incidence, cost and trends. 2015. 4. World Health Organization and Alzheimer’s Disease International. Dementia: a public health priority. United Kingdom:
World Health Organization and Alzheimer's Disease International, 2012 Contract No.: 19-05-2012. 5. Norton S, Matthews FE, Barnes DE, Yaffe K, Brayne C. Potential for primary prevention of Alzheimer's disease: an
analysis of population-based data. Lancet neurology. 2014;13(8):788-94. 6. Bach-Faig A, Berry EM, Lairon D, Reguant J, Trichopoulou A, Dernini S, et al. Mediterranean diet pyramid today. Science
and cultural updates. Public Health Nutr. 2011;14(12A):2274-84. 7. Psaltopoulou T, Sergentanis TN, Panagiotakos DB, Sergentanis IN, Kosti R, Scarmeas N. Mediterranean diet, stroke,
cognitive impairment, and depression: A meta-analysis. Annals of neurology. 2013;74(4):580-91. 8. Singh B, Parsaik AK, Mielke MM, Erwin PJ, Knopman DS, Petersen RC, et al. Association of mediterranean diet with mild
cognitive impairment and Alzheimer's disease: a systematic review and meta-analysis. J Alzheimers Dis. 2014;39(2):271-82.
9. Valls-Pedret C, Sala-Vila A, Serra-Mir M, Corella D, de la Torre R, Martinez-Gonzalez MA, et al. Mediterranean Diet and Age-Related Cognitive Decline: A Randomized Clinical Trial. JAMA internal medicine. 2015;175(7):1094-103.
10. Berendsen A, Santoro A, Pini E, Cevenini E, Ostan R, Pietruszka B, et al. Reprint of: A parallel randomized trial on the effect of a healthful diet on inflammageing and its consequences in European elderly people: design of the NU-AGE dietary intervention study. Mechanisms of ageing and development. 2014;136-137:14-21.
11. Santoro A, Pini E, Scurti M, Palmas G, Berendsen A, Brzozowska A, et al. Combating inflammaging through a Mediterranean whole diet approach: The NU-AGE project's conceptual framework and design. Mechanisms of ageing and development. 2014;136-137:3-13.
12. Istituto Nazionale di Ricerca per gli Alimenti e la Nutrizione. Istituto Nazionale di Ricerca per gli Alimenti e la Nutrizione 2003 [cited 2012 03-08-2011]. Italian Dietary Guidelines]. Available from: http://www.inran.it/.
13. Department of Health. Report on Health & Social Subjects 41 Dietary reference values for food energy and nutrients for the United Kingdom. London: 1991.
14. Food and Nutrition Council. Nederlandse normen 1989 / Dutch dietary reference values 1989. The Hague: 1992. 15. Health council of the Netherlands. Dietary reference intakes: calcium, vitamin D, thiamin, riboflavin, niacin,
pantothenic acid, and biotin. The Hague: 2000. 16. Health council of the Netherlands. Dietary Reference Intakes: energy, proteins, fats and digestible carbohydrates. The
Hague 2001 17. Health council of the Netherlands. Dietary Reference Intakes: vitamin B6, folic acid, and vitamin B12. The Hague: 2003. 18. Health council of the Netherlands. Guideline for dietary fiber intake. The Hague: 2006. 19. Jarosz M, Bulhak-Jachymczyk B. Normy zywienia czlowieka. Podstawy prewencji otylosci i chorob niezakaznych /
Nutrition recommendations. Basis for the prevention of obesity and non-communicable dieseases. Warsaw: Wydawnictwo Lekarskie PZWL / National Food and Nutrition Institute 2008.
20. AFSSA, CNERNA-CNRS. Apports Nutritionnels conseillés pour la population française. 3 ed. Martin A, editor. Paris: Tec et Doc Lavoisier; 2001. 608 p.
21. Peregrin T. Getting to Know the Modified MyPyramid for Older Adults. Journal of the American Dietetic Association. 2008;108(6):937-8.
22. Shelnutt KP, Bobroff LB, Diehl DC. MyPyramid for Older Adults. Journal of Nutrition Education and Behavior.41(4):300-2.
23. Commission of the European Communities. Nutrient and energy intakes for the European Community. Luxembourg: European Food Safety Authority (EFSA), Scientific Committee for Food, 1993.
24. Institute of Medicine. Dietary Reference Intakes. The essential guide to nutrient requirements. Otten J, Pitzi Hellwig, J. Meyers L, editors. Washington: The National Academies Press; 2006.
25. Morris JC, Heyman A, Mohs RC, Hughes JP, van Belle G, Fillenbaum G, et al. The Consortium to Establish a Registry for Alzheimer's Disease (CERAD). Part I. Clinical and neuropsychological assessment of Alzheimer's disease. Neurology. 1989;39(9):1159-65.
26. Rosen WG. Verbal fluency in aging and dementia. Journal of Clinical Neuropsychology. 1980;2(2):135-46. 27. Kaplan E GH, Weintraub S. The Boston Naming Test. Boston: E Kaplan and H Goodglass. 1978. 28. Rosen WG, Mohs RC, Davis KL. A new rating scale for Alzheimer's disease. The American journal of psychiatry.
1984;141(11):1356-64. 29. Babcock H, & Levy, L. The measurement of efficiency of mental functioning (revised examination): Test and manual of
directions. . Chicago: C H Stoelting. 1940. 30. Reitan RM. Valitidy of the trail making test as an indicator of organic brain damage. Perceptual and Motor Skills.
1958;8:271-6. 31. Lewis SJ, Heaton KW. Stool form scale as a useful guide to intestinal transit time. Scand J Gastroenterol.
1997;32(9):920-4.

Chapter 9 | Effect of the NU-AGE dietary intervention on cognitive decline
150
32. Salthouse T, Babcock R. Decomposing adult age differences in working memory. Developmental Psychology,.27(5): 763-76.
33. Folstein MF, Folstein SE, McHugh PR. "Mini-mental state". A practical method for grading the cognitive state of patients for the clinician. J Psychiatr Res. 1975;12(3):189-98.
34. Fried LP, Tangen CM, Walston J, Newman AB, Hirsch C, Gottdiener J, et al. Frailty in older adults: evidence for a phenotype. J Gerontol A Biol Sci Med Sci. 2001;56(3):M146-56.
35. Washburn RA, Smith KW, Jette AM, Janney CA. The Physical Activity Scale for the Elderly (PASE): development and evaluation. J Clin Epidemiol. 1993;46(2):153-62.
36. Yesavage JA, Sheikh JI. 9/Geriatric Depression Scale (GDS). Clinical Gerontologist. 1986;5(1-2):165-73. 37. Hausdorff JM, Yogev G, Springer S, Simon ES, Giladi N. Walking is more like catching than tapping: gait in the elderly as
a complex cognitive task. Experimental brain research. 2005;164(4):541-8. 38. Smith PJ, Blumenthal JA, Babyak MA, Craighead L, Welsh-Bohmer KA, Browndyke JN, et al. Effects of the dietary
approaches to stop hypertension diet, exercise, and caloric restriction on neurocognition in overweight adults with high blood pressure. Hypertension. 2010;55(6):1331-8.
39. Morris MC, Tangney CC, Wang Y, Sacks FM, Barnes LL, Bennett DA, et al. MIND diet slows cognitive decline with aging. Alzheimers Dement. 2015;11(9):1015-22.
40. Ngandu T, Lehtisalo J, Levalahti E, Laatikainen T, Lindstrom J, Peltonen M, et al. Recruitment and baseline characteristics of participants in the Finnish Geriatric Intervention Study to Prevent Cognitive Impairment and Disability (FINGER)-a randomized controlled lifestyle trial. Int J Environ Res Public Health. 2014;11(9):9345-60. doi: 10.3390/ijerph110909345.
41. Ngandu T, Lehtisalo J, Solomon A, Levalahti E, Ahtiluoto S, Antikainen R, et al. A 2 year multidomain intervention of diet, exercise, cognitive training, and vascular risk monitoring versus control to prevent cognitive decline in at-risk elderly people (FINGER): a randomised controlled trial. Lancet. 2015;385(9984):2255-63.
42. Vellas B, Andrieu S, Sampaio C, Coley N, Wilcock G. Endpoints for trials in Alzheimer's disease: a European task force consensus. Lancet neurology. 2008;7(5):436-50.
43. Tangney CC, Li H, Wang Y, Barnes L, Schneider JA, Bennett DA, et al. Relation of DASH- and Mediterranean-like dietary patterns to cognitive decline in older persons. Neurology. 2014;83(16):1410-6.
44. Vellas B, Andrieu S, Sampaio C, Wilcock G. Disease-modifying trials in Alzheimer's disease: a European task force consensus. Lancet neurology. 2007;6(1):56-62.
45. Kivipelto M, Solomon A, Ahtiluoto S, Ngandu T, Lehtisalo J, Antikainen R, et al. The Finnish Geriatric Intervention Study to Prevent Cognitive Impairment and Disability (FINGER): study design and progress. Alzheimers Dement. 2013;9(6):657-65.
151

9
Chapter 9 | Effect of the NU-AGE dietary intervention on cognitive decline
150
32. Salthouse T, Babcock R. Decomposing adult age differences in working memory. Developmental Psychology,.27(5): 763-76.
33. Folstein MF, Folstein SE, McHugh PR. "Mini-mental state". A practical method for grading the cognitive state of patients for the clinician. J Psychiatr Res. 1975;12(3):189-98.
34. Fried LP, Tangen CM, Walston J, Newman AB, Hirsch C, Gottdiener J, et al. Frailty in older adults: evidence for a phenotype. J Gerontol A Biol Sci Med Sci. 2001;56(3):M146-56.
35. Washburn RA, Smith KW, Jette AM, Janney CA. The Physical Activity Scale for the Elderly (PASE): development and evaluation. J Clin Epidemiol. 1993;46(2):153-62.
36. Yesavage JA, Sheikh JI. 9/Geriatric Depression Scale (GDS). Clinical Gerontologist. 1986;5(1-2):165-73. 37. Hausdorff JM, Yogev G, Springer S, Simon ES, Giladi N. Walking is more like catching than tapping: gait in the elderly as
a complex cognitive task. Experimental brain research. 2005;164(4):541-8. 38. Smith PJ, Blumenthal JA, Babyak MA, Craighead L, Welsh-Bohmer KA, Browndyke JN, et al. Effects of the dietary
approaches to stop hypertension diet, exercise, and caloric restriction on neurocognition in overweight adults with high blood pressure. Hypertension. 2010;55(6):1331-8.
39. Morris MC, Tangney CC, Wang Y, Sacks FM, Barnes LL, Bennett DA, et al. MIND diet slows cognitive decline with aging. Alzheimers Dement. 2015;11(9):1015-22.
40. Ngandu T, Lehtisalo J, Levalahti E, Laatikainen T, Lindstrom J, Peltonen M, et al. Recruitment and baseline characteristics of participants in the Finnish Geriatric Intervention Study to Prevent Cognitive Impairment and Disability (FINGER)-a randomized controlled lifestyle trial. Int J Environ Res Public Health. 2014;11(9):9345-60. doi: 10.3390/ijerph110909345.
41. Ngandu T, Lehtisalo J, Solomon A, Levalahti E, Ahtiluoto S, Antikainen R, et al. A 2 year multidomain intervention of diet, exercise, cognitive training, and vascular risk monitoring versus control to prevent cognitive decline in at-risk elderly people (FINGER): a randomised controlled trial. Lancet. 2015;385(9984):2255-63.
42. Vellas B, Andrieu S, Sampaio C, Coley N, Wilcock G. Endpoints for trials in Alzheimer's disease: a European task force consensus. Lancet neurology. 2008;7(5):436-50.
43. Tangney CC, Li H, Wang Y, Barnes L, Schneider JA, Bennett DA, et al. Relation of DASH- and Mediterranean-like dietary patterns to cognitive decline in older persons. Neurology. 2014;83(16):1410-6.
44. Vellas B, Andrieu S, Sampaio C, Wilcock G. Disease-modifying trials in Alzheimer's disease: a European task force consensus. Lancet neurology. 2007;6(1):56-62.
45. Kivipelto M, Solomon A, Ahtiluoto S, Ngandu T, Lehtisalo J, Antikainen R, et al. The Finnish Geriatric Intervention Study to Prevent Cognitive Impairment and Disability (FINGER): study design and progress. Alzheimers Dement. 2013;9(6):657-65.
151


Chapter 10General discussion

Chapter 10 | General discussion
154
Aim and main findingsThe main aim of this thesis was to study the association of healthful dietary patterns with cognitive functioning. In addition, nutrient intake inadequacies were assessed and the potential to change dietary intake in older adults aged 65 years and older was studied. This was done using data of a cross-sectional study, by conducting a literature review, by analysing data of several prospective studies, and by conducting a dietary intervention study.
The findings of these studies are summarized in table 1. A high percentage of inadequate intake was observed for the nutrients vitamin D, selenium, and vitamin B6 in Dutch adults aged 65 years and older (chapter 2). Of all dietary patterns studied in our systematic literature review we found most evidence for the Mediterranean dietary pattern to be associated with less cognitive decline, dementia or Alzheimer’s Disease (AD) risk in older adults, demonstrated by many observational studies and the first intervention study conducted to date (chapter 3). Whilst the Healthy Diet Indicator (HDI) was not associated with cognitive decline or functioning at older ages in European and American populations (chapter 4), greater adherence to the Dietary Approach to Stop Hypertension (DASH) was associated with better cognitive functioning (chapter 5), and the Mediterranean-DASH Intervention for Neurodegenerative Delay (MIND) diet with a better verbal memory score at older ages (chapter 6). Although the NU-AGE (NUtrients and AGEing) diet was specially designed at targeting the dietary recommendations for the ageing population (chapter 7) and considering the dietary habits of elderly people (chapter 8), it did not result in a better cognitive functioning after one year intervention in a Dutch population aged 65 years and older (chapter 9).
155
Table 1. Summary of main findings Exposure Study Design and study population Results Chapter Nutrients NU-AGE Cross-sectional study; 252 Dutch
men and women ≥65 years High prevalence of inadequate dietary intakes for vitamin D (99%), selenium (41%) and vitamin B6 (54%).
2
Dietary patterns
Review Cross-sectional, prospective, interventions, reviews, meta-analyses
Better adherence to a Mediterranean diet is likely to be associated with less cognitive decline, dementia, or AD.
3
Healthy Diet Indicator (HDI)
NHS, RS, SENECA
Meta-analysis of three cohort studies; 17,160 women ≥70 years, 3,660 men and women ≥55 years, 1,017 men and women ≥70 years
A higher HDI score is not related to reduced rates of cognitive decline in European and American older adults
4
DASH NHS Prospective cohort study; 16,144 women ≥70 years
Long-term adherence to the DASH diet is important to maintain cognitive functioning (global cognition, verbal memory and TICS) at older ages
5
MIND NHS Prospective cohort study; 16,058 women ≥70 years
Long-term adherence to the MIND diet is moderately associated with better verbal memory in later life
6
Healthful diet
NU-AGE
Design of a one-year randomized dietary intervention study in 1,250 European adults aged 65-80 years
Results of this intervention will provide evidence on the effect of a healthful diet on the prevention of age related decline
7
One-year randomized dietary intervention study; 1,250 European adults aged 65-80 years
The NU-AGE diet, specifically targeting nutritional recommendations for older adults, is feasible to achieve favourable changes in dietary intake in an ageing European population
8
One-year randomized dietary intervention study; sub-population of 252 Dutch adults aged 65-80 years
After one year, the NU-AGE diet did not improve cognitive functioning in Dutch older adults aged 65 years and older
9
Abbreviations: AD, Alzheimer’s Disease; DASH, Dietary Approach to Stop Hypertension; HDI, Healthy Diet Indicator; MIND, Mediterranean-DASH Intervention for Neurodegenerative Delay; NHS, Nurses’ Health Study; NU-AGE, NUtrients and AGEing; RS, Rotterdam Study; TICS, Telephone Interview for Cognitive Status

10
Chapter 10 | General discussion
154
Aim and main findingsThe main aim of this thesis was to study the association of healthful dietary patterns with cognitive functioning. In addition, nutrient intake inadequacies were assessed and the potential to change dietary intake in older adults aged 65 years and older was studied. This was done using data of a cross-sectional study, by conducting a literature review, by analysing data of several prospective studies, and by conducting a dietary intervention study.
The findings of these studies are summarized in table 1. A high percentage of inadequate intake was observed for the nutrients vitamin D, selenium, and vitamin B6 in Dutch adults aged 65 years and older (chapter 2). Of all dietary patterns studied in our systematic literature review we found most evidence for the Mediterranean dietary pattern to be associated with less cognitive decline, dementia or Alzheimer’s Disease (AD) risk in older adults, demonstrated by many observational studies and the first intervention study conducted to date (chapter 3). Whilst the Healthy Diet Indicator (HDI) was not associated with cognitive decline or functioning at older ages in European and American populations (chapter 4), greater adherence to the Dietary Approach to Stop Hypertension (DASH) was associated with better cognitive functioning (chapter 5), and the Mediterranean-DASH Intervention for Neurodegenerative Delay (MIND) diet with a better verbal memory score at older ages (chapter 6). Although the NU-AGE (NUtrients and AGEing) diet was specially designed at targeting the dietary recommendations for the ageing population (chapter 7) and considering the dietary habits of elderly people (chapter 8), it did not result in a better cognitive functioning after one year intervention in a Dutch population aged 65 years and older (chapter 9).
155
Table 1. Summary of main findings Exposure Study Design and study population Results Chapter Nutrients NU-AGE Cross-sectional study; 252 Dutch
men and women ≥65 years High prevalence of inadequate dietary intakes for vitamin D (99%), selenium (41%) and vitamin B6 (54%).
2
Dietary patterns
Review Cross-sectional, prospective, interventions, reviews, meta-analyses
Better adherence to a Mediterranean diet is likely to be associated with less cognitive decline, dementia, or AD.
3
Healthy Diet Indicator (HDI)
NHS, RS, SENECA
Meta-analysis of three cohort studies; 17,160 women ≥70 years, 3,660 men and women ≥55 years, 1,017 men and women ≥70 years
A higher HDI score is not related to reduced rates of cognitive decline in European and American older adults
4
DASH NHS Prospective cohort study; 16,144 women ≥70 years
Long-term adherence to the DASH diet is important to maintain cognitive functioning (global cognition, verbal memory and TICS) at older ages
5
MIND NHS Prospective cohort study; 16,058 women ≥70 years
Long-term adherence to the MIND diet is moderately associated with better verbal memory in later life
6
Healthful diet
NU-AGE
Design of a one-year randomized dietary intervention study in 1,250 European adults aged 65-80 years
Results of this intervention will provide evidence on the effect of a healthful diet on the prevention of age related decline
7
One-year randomized dietary intervention study; 1,250 European adults aged 65-80 years
The NU-AGE diet, specifically targeting nutritional recommendations for older adults, is feasible to achieve favourable changes in dietary intake in an ageing European population
8
One-year randomized dietary intervention study; sub-population of 252 Dutch adults aged 65-80 years
After one year, the NU-AGE diet did not improve cognitive functioning in Dutch older adults aged 65 years and older
9
Abbreviations: AD, Alzheimer’s Disease; DASH, Dietary Approach to Stop Hypertension; HDI, Healthy Diet Indicator; MIND, Mediterranean-DASH Intervention for Neurodegenerative Delay; NHS, Nurses’ Health Study; NU-AGE, NUtrients and AGEing; RS, Rotterdam Study; TICS, Telephone Interview for Cognitive Status

Chapter 10 | General discussion
156
From single nutrients to combinations of nutrients Chapter 2 describes nutrient intake inadequacies for vitamin D, vitamin B6 and selenium in a population of Dutch adults aged 65-80 years. Additionally, to simultaneously study the intake of several nutrients and to rank foods based on their nutrient density, we explored the possibility of applying the Nutrient Rich Food (NRF) 9.3 score [1]. The NRF9.3 score includes nine nutrients to encourage and three nutrients to limit, based on current regulatory frameworks and dietary guidance in the US [2]. The NRF9.3 was of interest as it was demonstrated in an observational study that adults aged 55 years and older with a higher NRF9.3 score had a lower risk of all-cause mortality [3]. As such, we were interested to know if this score could be used in a population of older adults aged 65 years and older to cluster nutrients of concern within foods and to study nutrient intake inadequacy in relation to cognitive outcomes. We confirmed that this score was able to rank foods based on their nutrient density, however, these foods did not necessarily contain high amounts of nutrients that were inadequate in this Dutch population of older adults. Thus, the score at its present form had limited applicability to study combinations of nutrients in older adults in this thesis.
Dietary patterns and cognitive functioning In chapters 3 to 9, methodological considerations specific for the respective chapters have been addressed. The following paragraphs will discuss how the main findings of this thesis fit with the existing literature and overarching methodological considerations are receiving due attention. First, a reflection is given on issues related to dietary patterns and cognitive functioning, followed by a discussion about the study population. Finally, suggestions for further research and public health implications will be presented together with a final conclusion.
Dietary patterns; assessment, construction and evaluation In this thesis we focussed on dietary patterns derived using so called a priori diet scores based on existing knowledge of healthful dietary components, namely the Mediterranean diet (chapter 3), the HDI (chapter 4), the DASH diet (chapter 5), the MIND diet (chapter 6), and the NU-AGE diet (chapter 7-9). When evaluating associations between dietary patterns and health outcomes, one should take into account the dietary assessment method used, the origin of the included foods and components, the cut-offs and scoring system used, and the applied weighting factors. We will discuss each of these factors in the paragraphs below. Table 2 provides an overview of all these aspects of the studied dietary patterns in this thesis.
Assessment of dietary intake Dietary patterns are based on dietary intake data assessed by means of several dietary assessment methods. Food frequency questionnaires (FFQ) have most frequently been used to assess dietary intake to derive the Mediterranean diet (chapter 3), the HDI (Rotterdam Study, Nurses’ Health Study, chapter 4), the DASH diet (chapter 5), and the MIND diet (chapter 6), table 2. A dietary history method and a 7-day food record were used to assess dietary intake to construct the HDI in SENECA (chapter 4) and the NU-AGE index, respectively (chapters 7-9).
157
Table 2. Overview of dietary assessment methods, selection of dietary components, cut-off values and scoring systems used to define dietary patterns in this thesis Dietary pattern
Dietary assessment
Basis of included components Basis of cut-off values Scoring
Mediterranean Mostly FFQ Healthful dietary pattern in the Mediterranean region
Population’s intake distribution
Quintiles, 0-3,4-6,7-9
HDI FFQ (NHS, RS), dietary history (SENECA)
Recommendations to prevent chronic diseases
Pre-defined & Population‘s intake distribution
Continuous
DASH FFQ Recommendations to lower blood pressure
Population’s intake distribution
Quintiles
MIND FFQ Literature/human/animal studies on neuroprotection
Pre-defined 0, 0.5, 1
NU-AGE 7-day food record
European dietary guidelines for the ageing population, inflammation
Pre-defined & Population’s intake distribution
Continuous
Abbreviations: DASH, Dietary Approach to Stop Hypertension; FFQ, Food Frequency Questionnaire; HDI, Healthy Diet Indicator; MIND, Mediterranean-DASH Intervention for Neurodegenerative Delay; NHS, Nurses’ Health Study; NU-AGE, NUtrients and Ageing; RS, Rotterdam Study All these dietary assessment methods rely on self-report and may be influenced by socially desirable answers, the participant’s ability to recall dietary intake (except for the 7-day food record), and to estimate portion sizes correctly, possibly resulting in random and systematic errors [4]. Random errors lead to a correct – but less precise – estimate of the mean dietary pattern score if the sample size is large enough. Systematic under- or overreporting of dietary intake results in a biased mean dietary pattern score which is of concern when comparing the intake of the population to dietary guidelines. However, as systematic errors do not influence the ranking of participants, they do not attenuate diet-disease associations as assessed in this thesis. Differential under- or overreporting on the other hand may influence the ranking of participants [5]. For example, obese people tend to underreport energy intake and overreport fruit intake more than normal weight people do, and sex seems to differentially result in an over- or underestimation of energy intake [6, 7], resulting in a biased mean dietary pattern score. At the same time, obesity is a risk factor for cognitive decline [8] and thus this misclassification could lead to a biased association between dietary patterns and cognitive functioning. Using correction factors (e.g., calculated from summary questions on for example fruit consumption to correct fruit consumption obtained from the sum of questions on individual fruit items) does not necessarily improve estimates of dietary intake, yet [9]. By adding BMI and sex to the multivariable adjusted models, this bias was taken into account to some extent.
Dietary intake data are prone to errors, which will be reflected in dietary patterns. This is important to consider when evaluating study results, especially from observational studies when comparing dietary intakes to dietary guidelines.

10
Chapter 10 | General discussion
156
From single nutrients to combinations of nutrients Chapter 2 describes nutrient intake inadequacies for vitamin D, vitamin B6 and selenium in a population of Dutch adults aged 65-80 years. Additionally, to simultaneously study the intake of several nutrients and to rank foods based on their nutrient density, we explored the possibility of applying the Nutrient Rich Food (NRF) 9.3 score [1]. The NRF9.3 score includes nine nutrients to encourage and three nutrients to limit, based on current regulatory frameworks and dietary guidance in the US [2]. The NRF9.3 was of interest as it was demonstrated in an observational study that adults aged 55 years and older with a higher NRF9.3 score had a lower risk of all-cause mortality [3]. As such, we were interested to know if this score could be used in a population of older adults aged 65 years and older to cluster nutrients of concern within foods and to study nutrient intake inadequacy in relation to cognitive outcomes. We confirmed that this score was able to rank foods based on their nutrient density, however, these foods did not necessarily contain high amounts of nutrients that were inadequate in this Dutch population of older adults. Thus, the score at its present form had limited applicability to study combinations of nutrients in older adults in this thesis.
Dietary patterns and cognitive functioning In chapters 3 to 9, methodological considerations specific for the respective chapters have been addressed. The following paragraphs will discuss how the main findings of this thesis fit with the existing literature and overarching methodological considerations are receiving due attention. First, a reflection is given on issues related to dietary patterns and cognitive functioning, followed by a discussion about the study population. Finally, suggestions for further research and public health implications will be presented together with a final conclusion.
Dietary patterns; assessment, construction and evaluation In this thesis we focussed on dietary patterns derived using so called a priori diet scores based on existing knowledge of healthful dietary components, namely the Mediterranean diet (chapter 3), the HDI (chapter 4), the DASH diet (chapter 5), the MIND diet (chapter 6), and the NU-AGE diet (chapter 7-9). When evaluating associations between dietary patterns and health outcomes, one should take into account the dietary assessment method used, the origin of the included foods and components, the cut-offs and scoring system used, and the applied weighting factors. We will discuss each of these factors in the paragraphs below. Table 2 provides an overview of all these aspects of the studied dietary patterns in this thesis.
Assessment of dietary intake Dietary patterns are based on dietary intake data assessed by means of several dietary assessment methods. Food frequency questionnaires (FFQ) have most frequently been used to assess dietary intake to derive the Mediterranean diet (chapter 3), the HDI (Rotterdam Study, Nurses’ Health Study, chapter 4), the DASH diet (chapter 5), and the MIND diet (chapter 6), table 2. A dietary history method and a 7-day food record were used to assess dietary intake to construct the HDI in SENECA (chapter 4) and the NU-AGE index, respectively (chapters 7-9).
157
Table 2. Overview of dietary assessment methods, selection of dietary components, cut-off values and scoring systems used to define dietary patterns in this thesis Dietary pattern
Dietary assessment
Basis of included components Basis of cut-off values Scoring
Mediterranean Mostly FFQ Healthful dietary pattern in the Mediterranean region
Population’s intake distribution
Quintiles, 0-3,4-6,7-9
HDI FFQ (NHS, RS), dietary history (SENECA)
Recommendations to prevent chronic diseases
Pre-defined & Population‘s intake distribution
Continuous
DASH FFQ Recommendations to lower blood pressure
Population’s intake distribution
Quintiles
MIND FFQ Literature/human/animal studies on neuroprotection
Pre-defined 0, 0.5, 1
NU-AGE 7-day food record
European dietary guidelines for the ageing population, inflammation
Pre-defined & Population’s intake distribution
Continuous
Abbreviations: DASH, Dietary Approach to Stop Hypertension; FFQ, Food Frequency Questionnaire; HDI, Healthy Diet Indicator; MIND, Mediterranean-DASH Intervention for Neurodegenerative Delay; NHS, Nurses’ Health Study; NU-AGE, NUtrients and Ageing; RS, Rotterdam Study All these dietary assessment methods rely on self-report and may be influenced by socially desirable answers, the participant’s ability to recall dietary intake (except for the 7-day food record), and to estimate portion sizes correctly, possibly resulting in random and systematic errors [4]. Random errors lead to a correct – but less precise – estimate of the mean dietary pattern score if the sample size is large enough. Systematic under- or overreporting of dietary intake results in a biased mean dietary pattern score which is of concern when comparing the intake of the population to dietary guidelines. However, as systematic errors do not influence the ranking of participants, they do not attenuate diet-disease associations as assessed in this thesis. Differential under- or overreporting on the other hand may influence the ranking of participants [5]. For example, obese people tend to underreport energy intake and overreport fruit intake more than normal weight people do, and sex seems to differentially result in an over- or underestimation of energy intake [6, 7], resulting in a biased mean dietary pattern score. At the same time, obesity is a risk factor for cognitive decline [8] and thus this misclassification could lead to a biased association between dietary patterns and cognitive functioning. Using correction factors (e.g., calculated from summary questions on for example fruit consumption to correct fruit consumption obtained from the sum of questions on individual fruit items) does not necessarily improve estimates of dietary intake, yet [9]. By adding BMI and sex to the multivariable adjusted models, this bias was taken into account to some extent.
Dietary intake data are prone to errors, which will be reflected in dietary patterns. This is important to consider when evaluating study results, especially from observational studies when comparing dietary intakes to dietary guidelines.

Chapter 10 | General discussion
158
Constructing dietary patterns relevant for cognitive functioning There are different ways to construct dietary patterns and many decisions have to be taken in doing so, such as which components to include, which cut-offs to use and how to score the components. Selecting dietary components When comparing the components of the dietary patterns studied in this thesis (see table 1, chapter 1) it should be noted that there are different dietary components included, but also some similar components, such as whole grains, fruits, vegetables, nuts and legumes.
Of all dietary patterns studied, the MIND diet uniquely emphasizes dietary components and servings linked to neuroprotection and dementia prevention (table 2, [10]). As there was no evidence for an association between fruit consumption and cognitive decline [11-15] the MIND diet does not specify daily fruit servings - in contrast to the Mediterranean diet and the DASH diet. The MIND diet did include a component for berry consumption [10] as there was evidence for a positive association between intakes of blueberries and strawberries with slower cognitive decline [16], supported by a number of rodent models [17-20]. Additionally, green leafy vegetables were included in the MIND diet based on studies reporting less cognitive decline with a greater consumption of green leafy vegetables [12, 13].
Although the inclusion of such specific components can be considered a unique feature of the MIND diet, this feature introduces a limited applicability of this score in other studies, especially in studies using a FFQ. In a FFQ, individual foods (e.g., berries) are normally clustered into food groups (e.g., fruits) to reduce the total number of foods. This limits the possibility to obtain intake data of those specific foods. Adding these specific and relevant components to optimize brain health to FFQs should be considered in future studies investigating the association between diet and cognitive functioning.
This problem has been overcome within the NU-AGE study by using food records with which it is possible to assess and revisit the intake of an almost infinite number of specific foods within each country, as opposed to a FFQ. Moreover, as the NU-AGE study is an international study, it was necessary to construct food groups that are comparable across the different countries. To achieve a comparable food group classification, we created standardized rules to assign individual foods to food groups in each of the five study centres. Additionally, the underlying concepts (e.g., a nutrient dense diet based on dietary recommendations for older adults, table 2) of the NU-AGE diet were taken into account when constructing food groups enabling us to distinguish for example low-fat or high-fat dairy and low-fibre or high-fibre products. This allowed us to study culturally different dietary intakes with similar food groups using an internationally comparable dietary index.
Another advantage of the NU-AGE diet is that it has a wider scope by implementing different cultures from five European countries, as opposed to the Mediterranean diet that is based on a healthful dietary pattern observed in the Mediterranean. Despite the demonstrated health benefits of the Mediterranean diet (e.g., cardiovascular prevention [21, 22], cancer [23], and mortality [22]), strong intrinsic Western socio-cultural values, traditions and norms may hamper the feasibility of adhering to the Mediterranean diet in non-Mediterranean countries [24], such as to the high consumption of olive oil, fish and legumes. When designing a dietary pattern relevant for cognitive functioning, components should be selected that; 1) are related to neuroprotection, 2) can be assessed by means of commonly used dietary assessment methods, and 3) that are feasible to be consumed within the population of study.
159
Cut-off values, scoring systems and weighting of dietary components Cut-off values either represent the required levels of intake to receive the maximum number of points for adequacy components, or the amount of food at which zero points are given in case of maximum levels of intake (e.g., components to limit).
When comparing the cut-off values used for the dietary patterns studied in this thesis it should be noted that two different approaches towards cut-off values have been used, namely pre-defined cut-off values and cut-off values based on the intake distribution in a population (table 2). Pre-defined cut-off values are either based on literature or derived from healthy dietary patterns observed in a population (e.g., in the Mediterranean). If no biological references are available for maximum levels of intake, cut-off values based on the intake distribution in a population can be used. For example, to define maximum levels of intake for a component to limit, such as sodium, the 85th percentile of the population’s intake distribution can be used.
Both the HDI and the NU-AGE diet score include a combination of cut-off values. Pre-defined cut-off values were based on worldwide (WHO; HDI, chapter 4) or European (NU-AGE, chapters 7-9) dietary guidelines. The cut-off values for maximum levels of intake were derived from the populations’ intake distributions within a country to optimally fit the intake within the study populations and to obtain a maximum variation in scores.
The MIND diet includes pre-defined cut-off values based on literature only. We were able to demonstrate an association between the MIND diet and verbal memory in the Nurses’ Health Study, but the effect sizes were smaller compared to results from the Memory and Aging Project (MAP) [25]. The use of predefined cut off values can be considered an advantage as they are comparable among different study populations. However, if these cut-off values do not match dietary intake of another study population, this could result in less variation in dietary exposure causing a weaker association, as observed in the Nurses’ Health Study (chapter 6). Dietary components within a dietary pattern can be scored using a dichotomous, continuous or proportional scoring system. A continuous (e.g., HDI, NU-AGE) or proportional scoring system (e.g., DASH; quintiles of intake), results in a larger variation in dietary component scores covering a wide range of adherence and a higher sensitivity and specificity achieving maximum diagnostic accuracy, compared to a dichotomous scoring system [26, 27]. However, proportional scoring of intakes above the maximum level of intake could result in less variation in the component scores. This could have caused a weakened association of the NU-AGE diet with cognitive functioning.
On the contrary, the MIND diet uses a dichotomous-like scoring system assigning participants 0, 0.5, or 1 point depending on the degree of adherence. A dichotomous-like scoring system is easier to apply in clinical practice and to translate the dietary goals to the general public.
A general limitation of all used scoring systems is that they do not take into account that certain food groups might need different cut-offs as not all components show a linear relation with cognitive functioning. As such, the possibility that some associations of dietary components with cognitive functioning could be non-linear (e.g., J-shaped or U-shaped), has not been taken into account. In the dietary patterns studied, all dietary components received equal weights, assuming that each component is equally important for cognitive functioning. However, it is very likely that some components are more important. Therefore, some authors have suggested applying weighting factors when constructing dietary pattern scores, such as relative risks or odds ratios for specific food

10
Chapter 10 | General discussion
158
Constructing dietary patterns relevant for cognitive functioning There are different ways to construct dietary patterns and many decisions have to be taken in doing so, such as which components to include, which cut-offs to use and how to score the components. Selecting dietary components When comparing the components of the dietary patterns studied in this thesis (see table 1, chapter 1) it should be noted that there are different dietary components included, but also some similar components, such as whole grains, fruits, vegetables, nuts and legumes.
Of all dietary patterns studied, the MIND diet uniquely emphasizes dietary components and servings linked to neuroprotection and dementia prevention (table 2, [10]). As there was no evidence for an association between fruit consumption and cognitive decline [11-15] the MIND diet does not specify daily fruit servings - in contrast to the Mediterranean diet and the DASH diet. The MIND diet did include a component for berry consumption [10] as there was evidence for a positive association between intakes of blueberries and strawberries with slower cognitive decline [16], supported by a number of rodent models [17-20]. Additionally, green leafy vegetables were included in the MIND diet based on studies reporting less cognitive decline with a greater consumption of green leafy vegetables [12, 13].
Although the inclusion of such specific components can be considered a unique feature of the MIND diet, this feature introduces a limited applicability of this score in other studies, especially in studies using a FFQ. In a FFQ, individual foods (e.g., berries) are normally clustered into food groups (e.g., fruits) to reduce the total number of foods. This limits the possibility to obtain intake data of those specific foods. Adding these specific and relevant components to optimize brain health to FFQs should be considered in future studies investigating the association between diet and cognitive functioning.
This problem has been overcome within the NU-AGE study by using food records with which it is possible to assess and revisit the intake of an almost infinite number of specific foods within each country, as opposed to a FFQ. Moreover, as the NU-AGE study is an international study, it was necessary to construct food groups that are comparable across the different countries. To achieve a comparable food group classification, we created standardized rules to assign individual foods to food groups in each of the five study centres. Additionally, the underlying concepts (e.g., a nutrient dense diet based on dietary recommendations for older adults, table 2) of the NU-AGE diet were taken into account when constructing food groups enabling us to distinguish for example low-fat or high-fat dairy and low-fibre or high-fibre products. This allowed us to study culturally different dietary intakes with similar food groups using an internationally comparable dietary index.
Another advantage of the NU-AGE diet is that it has a wider scope by implementing different cultures from five European countries, as opposed to the Mediterranean diet that is based on a healthful dietary pattern observed in the Mediterranean. Despite the demonstrated health benefits of the Mediterranean diet (e.g., cardiovascular prevention [21, 22], cancer [23], and mortality [22]), strong intrinsic Western socio-cultural values, traditions and norms may hamper the feasibility of adhering to the Mediterranean diet in non-Mediterranean countries [24], such as to the high consumption of olive oil, fish and legumes. When designing a dietary pattern relevant for cognitive functioning, components should be selected that; 1) are related to neuroprotection, 2) can be assessed by means of commonly used dietary assessment methods, and 3) that are feasible to be consumed within the population of study.
159
Cut-off values, scoring systems and weighting of dietary components Cut-off values either represent the required levels of intake to receive the maximum number of points for adequacy components, or the amount of food at which zero points are given in case of maximum levels of intake (e.g., components to limit).
When comparing the cut-off values used for the dietary patterns studied in this thesis it should be noted that two different approaches towards cut-off values have been used, namely pre-defined cut-off values and cut-off values based on the intake distribution in a population (table 2). Pre-defined cut-off values are either based on literature or derived from healthy dietary patterns observed in a population (e.g., in the Mediterranean). If no biological references are available for maximum levels of intake, cut-off values based on the intake distribution in a population can be used. For example, to define maximum levels of intake for a component to limit, such as sodium, the 85th percentile of the population’s intake distribution can be used.
Both the HDI and the NU-AGE diet score include a combination of cut-off values. Pre-defined cut-off values were based on worldwide (WHO; HDI, chapter 4) or European (NU-AGE, chapters 7-9) dietary guidelines. The cut-off values for maximum levels of intake were derived from the populations’ intake distributions within a country to optimally fit the intake within the study populations and to obtain a maximum variation in scores.
The MIND diet includes pre-defined cut-off values based on literature only. We were able to demonstrate an association between the MIND diet and verbal memory in the Nurses’ Health Study, but the effect sizes were smaller compared to results from the Memory and Aging Project (MAP) [25]. The use of predefined cut off values can be considered an advantage as they are comparable among different study populations. However, if these cut-off values do not match dietary intake of another study population, this could result in less variation in dietary exposure causing a weaker association, as observed in the Nurses’ Health Study (chapter 6). Dietary components within a dietary pattern can be scored using a dichotomous, continuous or proportional scoring system. A continuous (e.g., HDI, NU-AGE) or proportional scoring system (e.g., DASH; quintiles of intake), results in a larger variation in dietary component scores covering a wide range of adherence and a higher sensitivity and specificity achieving maximum diagnostic accuracy, compared to a dichotomous scoring system [26, 27]. However, proportional scoring of intakes above the maximum level of intake could result in less variation in the component scores. This could have caused a weakened association of the NU-AGE diet with cognitive functioning.
On the contrary, the MIND diet uses a dichotomous-like scoring system assigning participants 0, 0.5, or 1 point depending on the degree of adherence. A dichotomous-like scoring system is easier to apply in clinical practice and to translate the dietary goals to the general public.
A general limitation of all used scoring systems is that they do not take into account that certain food groups might need different cut-offs as not all components show a linear relation with cognitive functioning. As such, the possibility that some associations of dietary components with cognitive functioning could be non-linear (e.g., J-shaped or U-shaped), has not been taken into account. In the dietary patterns studied, all dietary components received equal weights, assuming that each component is equally important for cognitive functioning. However, it is very likely that some components are more important. Therefore, some authors have suggested applying weighting factors when constructing dietary pattern scores, such as relative risks or odds ratios for specific food

Chapter 10 | General discussion
160
groups and health outcomes [26, 28, 29]. However, taking this approach would result in different dietary patterns for each possible cognition outcome, limiting the general applicability and comparability of these dietary patterns. Although certain components within a dietary pattern are correlated (e.g., fruits, vegetables and dietary fibre [30]), we did not apply weighting factors in any of the dietary patterns studied. Because of this collinearity, these components indirectly weigh more heavily within the dietary pattern than other components. Dietary patterns including cut-off values based on the population’s intake distribution and a continuous scoring system allow capturing the full range of variation in diet scores relevant when studying diet disease associations. Dietary patterns using pre-defined cut-off values and a dichotomous scoring system are easier to apply and understand for the general public.
Evaluating dietary patterns As the MIND diet and NU-AGE diet are newly developed dietary patterns their validity needs to be evaluated. There are various aspects to consider, namely 1) association with nutrient intake, 2) content validity, 3) construct validity, and 4) reliability [31].
Firstly, the association with nutrient intakes among several degrees of adherence can be studied. For the NU-AGE and MIND diet we observed that nutrient intake increased with higher diet scores without increasing energy intake (e.g., for NU-AGE, mean energy intake was ~1,900 kcal across tertiles, PUFA intake was 10.9g, 11,3g and 12.9g, and fibre intake was 19.3g, 21.9g, and 25.8g).
Secondly, content validity assesses if the dietary pattern captures all aspects of the specific dietary patterns. Both the MIND diet score and the NU-AGE diet score qualitatively capture the various components relevant for both diets.
Thirdly, construct validity includes a check if the dietary pattern score provides the maximum range to discriminate participants according to their adherence. Another part of construct validity is the possibility to distinguish between groups with known differences in dietary quality, e.g., across levels of education. The range of the MIND diet score was 2.6-11 (out of 0-15) in our study (chapter 6) and 36-132 (out of 0-160) for the NU-AGE diet score (chapter 8), indicating that both indexes are able to measure a wide range of adherence. For the MIND diet score the ability to distinguish between populations with known differences in dietary intake has been confirmed; participants with the lowest MIND scores had lower education, were more likely to be obese and to have diabetes, and reported fewer hours of physical activity and more depressive symptoms [10].
At last, reliability evaluates if a dietary pattern score performs the same at different time points and which dietary components have most influence on the overall dietary pattern score. We have calculated the relative contribution of the MIND diet components, demonstrating that some components had more influence on the total MIND diet score (e.g., ‘Butter and margarine’ and ‘Pastries and sweets’). To evaluate the NU-AGE diet score, it could be studied in relation to markers of inflammation, as it was targeted to impact inflammation. Moreover, reliability of both the MIND diet score and the NU-AGE diet score should be tested using different dietary assessment methods. Although the newly developed MIND diet and NU-AGE diet are based on components relevant for (brain) health and include cut-off values and a scoring system relevant for studying diet disease associations, their validity needs to be confirmed.
161
Biomarkers to assess dietary pattern adherence Ideally, adherence to dietary patterns should be quantifiable; therefore, the use of biomarkers to assess dietary pattern intake should be considered. Biomarkers of dietary intake are less prone to misclassification bias in older adults with and without mild cognitive impairment (MCI) compared to conventional methods of dietary assessment, e.g., food frequency questionnaires [32]. One cross-sectional study explored the use of nutrient status to construct nutrient biomarker patterns to examine the relation with psychometric and imaging indices of brain health (Magnetic Resonance Imaging; MRI) in dementia free women [33]. Two nutrient biomarker patterns (one high in plasma vitamins B (B1, B2, B6, folate, and B12), C, D, and E, and another high in plasma omega-3 fatty acids) were associated with more favourable cognitive and brain MRI measures. In contrast, a third pattern (high in trans-fat) was associated with less favourable cognitive functioning and less total cerebral brain volume. Despite this interesting finding, it remains questionable if dietary patterns can be captured by nutrient biomarker pattern analysis, as nutrient status only does not cover the large diversity of food within a dietary pattern. Additionally, currently only a limited number of validated biomarkers is available [34]. When creating dietary patterns many decisions need to be taken based on the aim of the study and – preferably – the inclusion of biomarkers should be considered to improve and validate estimates of dietary pattern exposure.
Cognitive functioning; assessment and challenges Cognitive functioning can be measured by means of a broad range of neuropsychological tests. These tests capture different cognitive processes that are important to maintain activities in daily life. Studies described in this thesis include commonly used and validated paper-pencil tests, but also telephone based methods to assess cognitive functioning. An overview of included tests is given in table 3, thereby indicating in which chapters they have been used. Roughly, these tests can be divided into screening tools as a global measure of cognitive function and tests that are able to assess specific cognitive domains.
Screening tools for cognitive functioning In large prospective observational studies it is common to use the Mini Mental State Examination (MMSE) [35], or its telephone version; the Telephone Interview of Cognitive Status (TICS) [36], as a screening tool for cognitive functioning. The MMSE and the TICS were used in chapter 4 to study the association between the Healthy Diet Indicator (HDI) and cognitive functioning in three cohort studies. Although we used harmonized exposure and outcome variables we were not able to demonstrate an association between the HDI and reduced rates of cognitive decline in European and American adults aged 65 years and older. The MIND diet (chapter 5), the DASH diet (chapter 6) and the NU-AGE diet (chapter 9) were also not associated with the TICS or MMSE in this thesis. An important limitation of the MMSE and TICS is that they are both very global tests that have originally been developed to grade cognitive functioning of patients with relatively severe cognitive deficits [36].

10
Chapter 10 | General discussion
160
groups and health outcomes [26, 28, 29]. However, taking this approach would result in different dietary patterns for each possible cognition outcome, limiting the general applicability and comparability of these dietary patterns. Although certain components within a dietary pattern are correlated (e.g., fruits, vegetables and dietary fibre [30]), we did not apply weighting factors in any of the dietary patterns studied. Because of this collinearity, these components indirectly weigh more heavily within the dietary pattern than other components. Dietary patterns including cut-off values based on the population’s intake distribution and a continuous scoring system allow capturing the full range of variation in diet scores relevant when studying diet disease associations. Dietary patterns using pre-defined cut-off values and a dichotomous scoring system are easier to apply and understand for the general public.
Evaluating dietary patterns As the MIND diet and NU-AGE diet are newly developed dietary patterns their validity needs to be evaluated. There are various aspects to consider, namely 1) association with nutrient intake, 2) content validity, 3) construct validity, and 4) reliability [31].
Firstly, the association with nutrient intakes among several degrees of adherence can be studied. For the NU-AGE and MIND diet we observed that nutrient intake increased with higher diet scores without increasing energy intake (e.g., for NU-AGE, mean energy intake was ~1,900 kcal across tertiles, PUFA intake was 10.9g, 11,3g and 12.9g, and fibre intake was 19.3g, 21.9g, and 25.8g).
Secondly, content validity assesses if the dietary pattern captures all aspects of the specific dietary patterns. Both the MIND diet score and the NU-AGE diet score qualitatively capture the various components relevant for both diets.
Thirdly, construct validity includes a check if the dietary pattern score provides the maximum range to discriminate participants according to their adherence. Another part of construct validity is the possibility to distinguish between groups with known differences in dietary quality, e.g., across levels of education. The range of the MIND diet score was 2.6-11 (out of 0-15) in our study (chapter 6) and 36-132 (out of 0-160) for the NU-AGE diet score (chapter 8), indicating that both indexes are able to measure a wide range of adherence. For the MIND diet score the ability to distinguish between populations with known differences in dietary intake has been confirmed; participants with the lowest MIND scores had lower education, were more likely to be obese and to have diabetes, and reported fewer hours of physical activity and more depressive symptoms [10].
At last, reliability evaluates if a dietary pattern score performs the same at different time points and which dietary components have most influence on the overall dietary pattern score. We have calculated the relative contribution of the MIND diet components, demonstrating that some components had more influence on the total MIND diet score (e.g., ‘Butter and margarine’ and ‘Pastries and sweets’). To evaluate the NU-AGE diet score, it could be studied in relation to markers of inflammation, as it was targeted to impact inflammation. Moreover, reliability of both the MIND diet score and the NU-AGE diet score should be tested using different dietary assessment methods. Although the newly developed MIND diet and NU-AGE diet are based on components relevant for (brain) health and include cut-off values and a scoring system relevant for studying diet disease associations, their validity needs to be confirmed.
161
Biomarkers to assess dietary pattern adherence Ideally, adherence to dietary patterns should be quantifiable; therefore, the use of biomarkers to assess dietary pattern intake should be considered. Biomarkers of dietary intake are less prone to misclassification bias in older adults with and without mild cognitive impairment (MCI) compared to conventional methods of dietary assessment, e.g., food frequency questionnaires [32]. One cross-sectional study explored the use of nutrient status to construct nutrient biomarker patterns to examine the relation with psychometric and imaging indices of brain health (Magnetic Resonance Imaging; MRI) in dementia free women [33]. Two nutrient biomarker patterns (one high in plasma vitamins B (B1, B2, B6, folate, and B12), C, D, and E, and another high in plasma omega-3 fatty acids) were associated with more favourable cognitive and brain MRI measures. In contrast, a third pattern (high in trans-fat) was associated with less favourable cognitive functioning and less total cerebral brain volume. Despite this interesting finding, it remains questionable if dietary patterns can be captured by nutrient biomarker pattern analysis, as nutrient status only does not cover the large diversity of food within a dietary pattern. Additionally, currently only a limited number of validated biomarkers is available [34]. When creating dietary patterns many decisions need to be taken based on the aim of the study and – preferably – the inclusion of biomarkers should be considered to improve and validate estimates of dietary pattern exposure.
Cognitive functioning; assessment and challenges Cognitive functioning can be measured by means of a broad range of neuropsychological tests. These tests capture different cognitive processes that are important to maintain activities in daily life. Studies described in this thesis include commonly used and validated paper-pencil tests, but also telephone based methods to assess cognitive functioning. An overview of included tests is given in table 3, thereby indicating in which chapters they have been used. Roughly, these tests can be divided into screening tools as a global measure of cognitive function and tests that are able to assess specific cognitive domains.
Screening tools for cognitive functioning In large prospective observational studies it is common to use the Mini Mental State Examination (MMSE) [35], or its telephone version; the Telephone Interview of Cognitive Status (TICS) [36], as a screening tool for cognitive functioning. The MMSE and the TICS were used in chapter 4 to study the association between the Healthy Diet Indicator (HDI) and cognitive functioning in three cohort studies. Although we used harmonized exposure and outcome variables we were not able to demonstrate an association between the HDI and reduced rates of cognitive decline in European and American adults aged 65 years and older. The MIND diet (chapter 5), the DASH diet (chapter 6) and the NU-AGE diet (chapter 9) were also not associated with the TICS or MMSE in this thesis. An important limitation of the MMSE and TICS is that they are both very global tests that have originally been developed to grade cognitive functioning of patients with relatively severe cognitive deficits [36].

Chapter 10 | General discussion
162
Tabl
e 3.
Ove
rvie
w o
f neu
rops
ycho
logi
cal t
ests
and
cog
nitiv
e do
mai
ns u
sed
in th
is th
esis
Chap
ter
4 4, 5
, 6
9 9 9 9 9 9 9 9 9 9 9 9 5, 6
5,
6
5, 6
5,
6
5, 6
5, 6
a In
the
Nur
ses’
Hea
lth S
tudy
, (ch
apte
r 5 a
nd 6
) glo
bal c
ogni
tion
was
cal
cula
ted
by a
vera
ging
z-s
core
s fro
m 1
) TIC
S, 2
) im
med
iate
and
3) d
elay
ed re
calls
of t
he E
ast B
osto
n M
emor
y te
st
(EBM
T), 4
) del
ayed
reca
ll of
the
TICS
10-
wor
d lis
t; 5)
cat
egor
y flu
ency
; and
6) d
igit
span
-bac
kwar
d te
st
Scor
ing
0-30
poi
nts
0-41
poi
nts
Sum
of a
ll te
sts
0-30
poi
nts
0-10
poi
nts
0-20
poi
nts
0-21
poi
nts
0-21
poi
nts
0 - ∞
poi
nts
0-30
0 se
cond
s
0-30
0 se
cond
s 0-
30 p
oint
s 0-
60 p
oint
s
0-11
poi
nts
0-14
poi
nts
Rang
e 0-
12 p
oint
s Ra
nge
0-12
poi
nts
Rang
e 0-
10 p
oint
s Ra
nge
0-10
poi
nts
Num
ber o
f ani
mal
s
Num
ber o
f rec
alls
Expl
anat
ion
test
Basic
scre
enin
g to
ol in
clud
ing
a va
riety
of q
uest
ions
and
task
s Te
leph
one
adap
tatio
n of
the
MM
SE
Cons
ortiu
m to
Est
ablis
h a
Regi
stry
for A
lzhei
mer
Dise
ase
(CER
AD) t
est i
nclu
ding
; Ver
bal
Flue
ncy
Cate
gory
, Bos
ton
Nam
ing
Test
, Con
stru
ctio
nal P
raxi
s, W
ord
List
Mem
ory,
Wor
d Li
st d
elay
ed re
call
and
Wor
d Li
st R
ecog
nitio
n. B
osto
n Na
min
g Te
st: N
amin
g of
obj
ects
pr
esen
ted
as li
ne d
raw
ings
(0-1
5) [3
8]. O
ther
test
s are
spec
ified
bel
ow.
Reca
ll of
10
pres
ente
d w
ords
in 3
sess
ions
De
laye
d re
call
of th
e 10
pre
sent
ed w
ords
in th
e W
ord
list m
emor
y te
st
Reco
gniti
on o
f the
10
pres
ente
d w
ords
in th
e W
ord
list m
emor
y te
st in
a li
st o
f 20
wor
ds
Reca
ll of
a b
rief s
tory
De
laye
d re
call
of th
e br
ief s
tory
in B
abco
ck st
ory
reca
ll
Men
tion
as m
any
wor
ds o
f a ca
tego
ry in
60
seco
nds
A: D
raw
line
s seq
uent
ially
con
nect
ing
25 e
ncirc
led
num
bers
, as f
ast a
s pos
sible
B:
Dra
w li
nes s
eque
ntia
lly c
onne
ctin
g 13
num
bers
and
lett
ers i
n or
der,
as fa
st a
s pos
sible
Draw
line
s seq
uent
ially
con
nect
ing
25 e
ncirc
led
num
bers
, as f
ast a
s po
ssib
le
Cros
s out
all
num
ber ‘
4’ fr
om a
list
of n
umbe
rs, a
s fas
t as p
ossib
le
Sam
e/di
ffere
nt d
ecisi
ons a
bout
pai
rs o
f pat
tern
s, a
s fas
t as p
ossib
le in
2 se
ssio
ns
Draw
ing
of p
rese
nted
figu
res
Reca
ll of
dra
wn
figur
es o
n bl
ank
pape
r
Reca
ll th
ree
sent
ence
s De
laye
d re
call
thre
e se
nten
ces
Imm
edia
te re
call
of 1
0 pr
esen
ted
wor
ds
Dela
yed
reca
ll of
10
pres
ente
d w
ords
Nam
ing
as m
any
uniq
ue a
nim
als a
s pos
sible
in o
ne m
inut
e
Repe
atin
g ba
ckw
ards
and
incr
easin
gly
long
serie
s of d
igits
Cogn
itive
dom
ains
and
test
s Sc
reen
ing
tool
s for
cogn
itive
func
tioni
ng
Min
i Men
tal S
tate
Exa
min
atio
n (M
MSE
) [35
] Te
leph
one
Inte
rvie
w fo
r Cog
nitiv
e St
atus
(TIC
S) [3
6]
Glob
al co
gniti
ona
CERA
D [3
7]
Episo
dic m
emor
y W
ord
list m
emor
y [3
7]
Wor
d lis
t del
ayed
reca
ll [3
7]
Wor
d lis
t rec
ogni
tion
[37]
Ba
bcoc
k st
ory
imm
edia
te re
call
[39]
Ba
bcoc
k st
ory
dela
yed
reca
ll [3
9]
Exec
utiv
e fu
nctio
ning
Ve
rbal
flue
ncy
cate
gory
[40]
Tr
ail m
akin
g Te
st B
/ A
[41]
Info
rmat
ion
proc
essin
g sp
eed
Trai
l mak
ing
Test
A [4
1]
Num
ber c
ance
llatio
n [4
2]
Patt
ern
com
paris
on [4
3]
Visu
ospa
tial a
bilit
y Co
nstr
uctio
nal p
raxi
s [4
4]
Cons
truc
tiona
l pra
xis r
ecal
l [44
] Ve
rbal
mem
ory
East
Bos
ton
Mem
ory
test
(EBM
T), i
mm
edia
te re
call
[45,
46]
Ea
st B
osto
n M
emor
y te
st (E
BMT)
, del
ayed
reca
ll [4
5, 4
6]
TICS
10-
wor
d lis
t, im
med
iate
reca
ll [3
6]
TICS
10-
wor
d lis
t, de
laye
d re
call
[36]
La
ngua
ge a
nd e
xecu
tive
func
tion
Cate
gory
flue
ncy
[37]
W
orki
ng m
emor
y an
d at
tent
ion
Digi
t spa
n-ba
ckw
ard
[47]
163
Thus, a possible explanation for the lack of an association of the HDI, DASH, MIND and NU-AGE diet with the MMSE and TICS is that these tests are not sensitive and specific enough to detect subtle cognitive differences in cognitive domains within generally healthy study participants. Commonly used screening tools for cognitive functioning are useful to characterize a study population for their level of cognitive functioning, however, these tests are not sensitive and specific enough to detect differences or decline in cognitive functioning in a relatively healthy study population.
Specific cognitive domains The use of more specific cognitive tests as compared to the MMSE or TICS enables detection of smaller differences in specific cognitive domains, such as verbal memory, information processing speed, and executive functioning. For example, impaired verbal memory is part of the typical memory-dominant dementia syndrome in AD [48], and thus relevant to measure.
In chapters 5, 6 and 9 we were able to use many neuropsychological tests to construct cognitive domains. Greater adherence to the DASH diet was associated with a better global cognitive function - a composite score based on six cognitive tests - and with better verbal memory at older ages in the Nurses’ Health Study (chapter 5). This was in line with the few observational studies reporting that the DASH diet was associated with less cognitive decline among elderly American men and women (n=826) after 4.1 years of follow-up using 19 cognitive tests combined into a global measure of cognition [49]. A dietary intervention study in hypertensive American adults (n=124) demonstrated that four months on the DASH diet improved psychomotor speed [50].
Greater adherence to the MIND diet was moderately associated with a better verbal memory at older ages (chapter 6). In a prospective cohort study, the MIND diet was associated with slower decline in global cognitive function (a composite score of 19 cognitive tests) [25] and a lower risk of AD [10] over 4.7 and 4.5 years in 960 and 923 American men and women from the Memory and Aging Project (MAP) study. We were not able to confirm this association with global cognitive function in a sample of 16,058 American women living in the Boston area (chapter 6). A possible explanation could be the timing of dietary and cognitive assessment, as cognitive assessment (starting in 1997) preceded dietary assessment (2004-2013) in the MAP study, whereas dietary assessment preceded cognitive assessment in the NHS study, importantly limiting the effect of reversed causation.
Although we used specific cognitive tests within the NU-AGE study as well, we were not able to demonstrate an effect of the NU-AGE diet on any of the cognitive domains in the Dutch NU-AGE cohort (chapter 9). This could be due to the relatively short period of follow-up, as it has been proposed that it takes at least 1.5 years to induce and detect changes in cognitive functioning [51]. Another important explanation for our null finding for the NU-AGE diet could be the lack of power, as the sample size was not calculated to detect an effect on cognitive functioning. The required sample size has been calculated to be at least 600 participants per intervention group to detect a 50% difference change in the Neuropsychological Test Battery score between two intervention groups over two years [52]. The effect of the NU-AGE diet on cognitive functioning will be further investigated in the total NU-AGE sample including ~1,250 participants.
As outlined above, the use of specific cognitive tests allows to detect small differences within a study population and to study specific cognitive domains. However, the lack of harmonized construction of these domains limits the comparability of findings from different studies. This also

10
Chapter 10 | General discussion
162
Tabl
e 3.
Ove
rvie
w o
f neu
rops
ycho
logi
cal t
ests
and
cog
nitiv
e do
mai
ns u
sed
in th
is th
esis
Chap
ter
4 4, 5
, 6
9 9 9 9 9 9 9 9 9 9 9 9 5, 6
5,
6
5, 6
5,
6
5, 6
5, 6
a In
the
Nur
ses’
Hea
lth S
tudy
, (ch
apte
r 5 a
nd 6
) glo
bal c
ogni
tion
was
cal
cula
ted
by a
vera
ging
z-s
core
s fro
m 1
) TIC
S, 2
) im
med
iate
and
3) d
elay
ed re
calls
of t
he E
ast B
osto
n M
emor
y te
st
(EBM
T), 4
) del
ayed
reca
ll of
the
TICS
10-
wor
d lis
t; 5)
cat
egor
y flu
ency
; and
6) d
igit
span
-bac
kwar
d te
st
Scor
ing
0-30
poi
nts
0-41
poi
nts
Sum
of a
ll te
sts
0-30
poi
nts
0-10
poi
nts
0-20
poi
nts
0-21
poi
nts
0-21
poi
nts
0 - ∞
poi
nts
0-30
0 se
cond
s
0-30
0 se
cond
s 0-
30 p
oint
s 0-
60 p
oint
s
0-11
poi
nts
0-14
poi
nts
Rang
e 0-
12 p
oint
s Ra
nge
0-12
poi
nts
Rang
e 0-
10 p
oint
s Ra
nge
0-10
poi
nts
Num
ber o
f ani
mal
s
Num
ber o
f rec
alls
Expl
anat
ion
test
Basic
scre
enin
g to
ol in
clud
ing
a va
riety
of q
uest
ions
and
task
s Te
leph
one
adap
tatio
n of
the
MM
SE
Cons
ortiu
m to
Est
ablis
h a
Regi
stry
for A
lzhei
mer
Dise
ase
(CER
AD) t
est i
nclu
ding
; Ver
bal
Flue
ncy
Cate
gory
, Bos
ton
Nam
ing
Test
, Con
stru
ctio
nal P
raxi
s, W
ord
List
Mem
ory,
Wor
d Li
st d
elay
ed re
call
and
Wor
d Li
st R
ecog
nitio
n. B
osto
n Na
min
g Te
st: N
amin
g of
obj
ects
pr
esen
ted
as li
ne d
raw
ings
(0-1
5) [3
8]. O
ther
test
s are
spec
ified
bel
ow.
Reca
ll of
10
pres
ente
d w
ords
in 3
sess
ions
De
laye
d re
call
of th
e 10
pre
sent
ed w
ords
in th
e W
ord
list m
emor
y te
st
Reco
gniti
on o
f the
10
pres
ente
d w
ords
in th
e W
ord
list m
emor
y te
st in
a li
st o
f 20
wor
ds
Reca
ll of
a b
rief s
tory
De
laye
d re
call
of th
e br
ief s
tory
in B
abco
ck st
ory
reca
ll
Men
tion
as m
any
wor
ds o
f a ca
tego
ry in
60
seco
nds
A: D
raw
line
s seq
uent
ially
con
nect
ing
25 e
ncirc
led
num
bers
, as f
ast a
s pos
sible
B:
Dra
w li
nes s
eque
ntia
lly c
onne
ctin
g 13
num
bers
and
lett
ers i
n or
der,
as fa
st a
s pos
sible
Draw
line
s seq
uent
ially
con
nect
ing
25 e
ncirc
led
num
bers
, as f
ast a
s po
ssib
le
Cros
s out
all
num
ber ‘
4’ fr
om a
list
of n
umbe
rs, a
s fas
t as p
ossib
le
Sam
e/di
ffere
nt d
ecisi
ons a
bout
pai
rs o
f pat
tern
s, a
s fas
t as p
ossib
le in
2 se
ssio
ns
Draw
ing
of p
rese
nted
figu
res
Reca
ll of
dra
wn
figur
es o
n bl
ank
pape
r
Reca
ll th
ree
sent
ence
s De
laye
d re
call
thre
e se
nten
ces
Imm
edia
te re
call
of 1
0 pr
esen
ted
wor
ds
Dela
yed
reca
ll of
10
pres
ente
d w
ords
Nam
ing
as m
any
uniq
ue a
nim
als a
s pos
sible
in o
ne m
inut
e
Repe
atin
g ba
ckw
ards
and
incr
easin
gly
long
serie
s of d
igits
Cogn
itive
dom
ains
and
test
s Sc
reen
ing
tool
s for
cogn
itive
func
tioni
ng
Min
i Men
tal S
tate
Exa
min
atio
n (M
MSE
) [35
] Te
leph
one
Inte
rvie
w fo
r Cog
nitiv
e St
atus
(TIC
S) [3
6]
Glob
al co
gniti
ona
CERA
D [3
7]
Episo
dic m
emor
y W
ord
list m
emor
y [3
7]
Wor
d lis
t del
ayed
reca
ll [3
7]
Wor
d lis
t rec
ogni
tion
[37]
Ba
bcoc
k st
ory
imm
edia
te re
call
[39]
Ba
bcoc
k st
ory
dela
yed
reca
ll [3
9]
Exec
utiv
e fu
nctio
ning
Ve
rbal
flue
ncy
cate
gory
[40]
Tr
ail m
akin
g Te
st B
/ A
[41]
Info
rmat
ion
proc
essin
g sp
eed
Trai
l mak
ing
Test
A [4
1]
Num
ber c
ance
llatio
n [4
2]
Patt
ern
com
paris
on [4
3]
Visu
ospa
tial a
bilit
y Co
nstr
uctio
nal p
raxi
s [4
4]
Cons
truc
tiona
l pra
xis r
ecal
l [44
] Ve
rbal
mem
ory
East
Bos
ton
Mem
ory
test
(EBM
T), i
mm
edia
te re
call
[45,
46]
Ea
st B
osto
n M
emor
y te
st (E
BMT)
, del
ayed
reca
ll [4
5, 4
6]
TICS
10-
wor
d lis
t, im
med
iate
reca
ll [3
6]
TICS
10-
wor
d lis
t, de
laye
d re
call
[36]
La
ngua
ge a
nd e
xecu
tive
func
tion
Cate
gory
flue
ncy
[37]
W
orki
ng m
emor
y an
d at
tent
ion
Digi
t spa
n-ba
ckw
ard
[47]
163
Thus, a possible explanation for the lack of an association of the HDI, DASH, MIND and NU-AGE diet with the MMSE and TICS is that these tests are not sensitive and specific enough to detect subtle cognitive differences in cognitive domains within generally healthy study participants. Commonly used screening tools for cognitive functioning are useful to characterize a study population for their level of cognitive functioning, however, these tests are not sensitive and specific enough to detect differences or decline in cognitive functioning in a relatively healthy study population.
Specific cognitive domains The use of more specific cognitive tests as compared to the MMSE or TICS enables detection of smaller differences in specific cognitive domains, such as verbal memory, information processing speed, and executive functioning. For example, impaired verbal memory is part of the typical memory-dominant dementia syndrome in AD [48], and thus relevant to measure.
In chapters 5, 6 and 9 we were able to use many neuropsychological tests to construct cognitive domains. Greater adherence to the DASH diet was associated with a better global cognitive function - a composite score based on six cognitive tests - and with better verbal memory at older ages in the Nurses’ Health Study (chapter 5). This was in line with the few observational studies reporting that the DASH diet was associated with less cognitive decline among elderly American men and women (n=826) after 4.1 years of follow-up using 19 cognitive tests combined into a global measure of cognition [49]. A dietary intervention study in hypertensive American adults (n=124) demonstrated that four months on the DASH diet improved psychomotor speed [50].
Greater adherence to the MIND diet was moderately associated with a better verbal memory at older ages (chapter 6). In a prospective cohort study, the MIND diet was associated with slower decline in global cognitive function (a composite score of 19 cognitive tests) [25] and a lower risk of AD [10] over 4.7 and 4.5 years in 960 and 923 American men and women from the Memory and Aging Project (MAP) study. We were not able to confirm this association with global cognitive function in a sample of 16,058 American women living in the Boston area (chapter 6). A possible explanation could be the timing of dietary and cognitive assessment, as cognitive assessment (starting in 1997) preceded dietary assessment (2004-2013) in the MAP study, whereas dietary assessment preceded cognitive assessment in the NHS study, importantly limiting the effect of reversed causation.
Although we used specific cognitive tests within the NU-AGE study as well, we were not able to demonstrate an effect of the NU-AGE diet on any of the cognitive domains in the Dutch NU-AGE cohort (chapter 9). This could be due to the relatively short period of follow-up, as it has been proposed that it takes at least 1.5 years to induce and detect changes in cognitive functioning [51]. Another important explanation for our null finding for the NU-AGE diet could be the lack of power, as the sample size was not calculated to detect an effect on cognitive functioning. The required sample size has been calculated to be at least 600 participants per intervention group to detect a 50% difference change in the Neuropsychological Test Battery score between two intervention groups over two years [52]. The effect of the NU-AGE diet on cognitive functioning will be further investigated in the total NU-AGE sample including ~1,250 participants.
As outlined above, the use of specific cognitive tests allows to detect small differences within a study population and to study specific cognitive domains. However, the lack of harmonized construction of these domains limits the comparability of findings from different studies. This also

Chapter 10 | General discussion
164
limited us to study the TICS and MMSE only, instead of including specific cognitive domains as well within the three cohorts used to study the relation of the HDI with cognitive functioning (chapter 4). Moreover, the use of many different cognitive tests between studies complicates drawing an overall conclusion based on multiple studies. For example, although four meta-analyses reported an inverse association of the Mediterranean diet with cognitive functioning based on pooled analysis of observational studies [53-56] we concluded in chapter 3 that better adherence to the Mediterranean diet is likely associated with less cognitive decline, dementia or AD. Our conclusion is more conservative in comparison to the meta-analyses as the results of the studies are mixed, studies reporting an association were mainly conducted in the US, many different measures of global cognition were used, and because evidence from intervention studies is limited.
Standardised neuropsychological test batteries and harmonized rules to construct specific cognitive domains are needed, covering the domains on which effects of the respective intervention can be expected and that are sensitive to ageing.
Biological markers to assess cognitive functioning Another possibility to study cognitive functioning would be to include biological markers as outcome measures (e.g., biomarkers and imaging techniques). Examples of brain imaging techniques are (fluorodeoxyglucose) positron emission tomography (f)(PET) (to detect tracers of fibrillary amyloid [57]) and MRI [58]. Cerebrospinal fluid (CSF) can be used to measure biomarkers of disease type and progression (e.g., levels of amyloid-β protein (Aβ1-42), total tau (tTau) or phosphorylated tau (pTau)181 [59]. With these measures early stages of AD can be diagnosed. Few studies have prospectively investigated the association between dietary patterns and these more objective measures of brain health. One cross-sectional study demonstrated that adherence to the Mediterranean diet was associated with a lower white matter hyperintensity volume in 1,090 non-demented participants (mean age 72 years) [60], which is a marker of small vessel damage in the brain. A prospective study reported that lower adherence to the Mediterranean diet was associated with greater 3-year reduction in total brain volume [61]. Higher adherence to the Mediterranean diet was found to be cross-sectionally associated with larger cortical thickness in 672 cognitively normal participants) mean age 79.8) [62], which was not confirmed in a prospective study including 323 older aged 73 to 76 years of age [61]. Less brain atrophy was observed in 674 participants without dementia (mean age 80.1)in a cross-sectional study – with an effect similar to 5 years of ageing [63]. A prospective study in 146 participants (mean age 73 years) reported that adherence to the Mediterranean diet was associated with preserved white matter microstructure, nine years after completion of a FFQ [64]. Novel biomarkers and imaging techniques for early clinical stages of dementia need to be further developed, applied and consensus needs to be reached on which of these biological markers is best to use for specific purposes.
165
Populations to study To demonstrate a relation between diet and cognitive functioning, a study population should be selected that is either at risk of suboptimal dietary intake or status, or at risk of cognitive impairment, providing an optimal window of opportunity (figure 1).
Figure 1. Window of opportunity within a hypothetical model of dynamic biomarkers and nutritional status across the dementia spectrum (adapted from Mi, Nutrition 2013) [65]
Cognitive functioning The age at which cognitive decline becomes evident remains a subject of debate [66-68]. Although some authors demonstrated that there is no decline before the age of 60 years [69], it has been demonstrated that cognitive decline is already evident in middle age (age 45-49 years) [70]. Prior to the diagnosis of dementia, many years of underlying brain damage have been present [71, 72]. Moreover, it is relevant to consider risk factors of cognitive decline when selecting study participants, e.g., low educational level, obesity and Apolipoprotein E (APOE) genotype, to study cognitive decline or MCI occurrence. In intervention studies, when targeting populations with preclinical symptoms of cognitive decline, it might be of concern whether the brain damage is reversible. Given this information, there is a general consensus that nutritional intervention studies should aim at prevention rather than treatment of cognitive decline. Thus middle-aged people should be targeted before brain function is too comprised for substantial benefit, thereby focussing on the earliest stages of the disease [71, 73].
Participants in the NU-AGE study (chapters 7-9) were aged 65 to 80 years, potentially allowing us to detect changes in cognitive functioning. Besides the follow-up time being relatively short and the fact that the NU-AGE study was not powered to detect an effect on cognitive functioning – as mentioned above – another explanation for our null-finding could be that the NU-AGE participants were apparently healthy individuals at a relatively good cognitive function level limiting the possibility to detect a decline in cognitive functioning within the study period. Although
Window of opportunity

10
Chapter 10 | General discussion
164
limited us to study the TICS and MMSE only, instead of including specific cognitive domains as well within the three cohorts used to study the relation of the HDI with cognitive functioning (chapter 4). Moreover, the use of many different cognitive tests between studies complicates drawing an overall conclusion based on multiple studies. For example, although four meta-analyses reported an inverse association of the Mediterranean diet with cognitive functioning based on pooled analysis of observational studies [53-56] we concluded in chapter 3 that better adherence to the Mediterranean diet is likely associated with less cognitive decline, dementia or AD. Our conclusion is more conservative in comparison to the meta-analyses as the results of the studies are mixed, studies reporting an association were mainly conducted in the US, many different measures of global cognition were used, and because evidence from intervention studies is limited.
Standardised neuropsychological test batteries and harmonized rules to construct specific cognitive domains are needed, covering the domains on which effects of the respective intervention can be expected and that are sensitive to ageing.
Biological markers to assess cognitive functioning Another possibility to study cognitive functioning would be to include biological markers as outcome measures (e.g., biomarkers and imaging techniques). Examples of brain imaging techniques are (fluorodeoxyglucose) positron emission tomography (f)(PET) (to detect tracers of fibrillary amyloid [57]) and MRI [58]. Cerebrospinal fluid (CSF) can be used to measure biomarkers of disease type and progression (e.g., levels of amyloid-β protein (Aβ1-42), total tau (tTau) or phosphorylated tau (pTau)181 [59]. With these measures early stages of AD can be diagnosed. Few studies have prospectively investigated the association between dietary patterns and these more objective measures of brain health. One cross-sectional study demonstrated that adherence to the Mediterranean diet was associated with a lower white matter hyperintensity volume in 1,090 non-demented participants (mean age 72 years) [60], which is a marker of small vessel damage in the brain. A prospective study reported that lower adherence to the Mediterranean diet was associated with greater 3-year reduction in total brain volume [61]. Higher adherence to the Mediterranean diet was found to be cross-sectionally associated with larger cortical thickness in 672 cognitively normal participants) mean age 79.8) [62], which was not confirmed in a prospective study including 323 older aged 73 to 76 years of age [61]. Less brain atrophy was observed in 674 participants without dementia (mean age 80.1)in a cross-sectional study – with an effect similar to 5 years of ageing [63]. A prospective study in 146 participants (mean age 73 years) reported that adherence to the Mediterranean diet was associated with preserved white matter microstructure, nine years after completion of a FFQ [64]. Novel biomarkers and imaging techniques for early clinical stages of dementia need to be further developed, applied and consensus needs to be reached on which of these biological markers is best to use for specific purposes.
165
Populations to study To demonstrate a relation between diet and cognitive functioning, a study population should be selected that is either at risk of suboptimal dietary intake or status, or at risk of cognitive impairment, providing an optimal window of opportunity (figure 1).
Figure 1. Window of opportunity within a hypothetical model of dynamic biomarkers and nutritional status across the dementia spectrum (adapted from Mi, Nutrition 2013) [65]
Cognitive functioning The age at which cognitive decline becomes evident remains a subject of debate [66-68]. Although some authors demonstrated that there is no decline before the age of 60 years [69], it has been demonstrated that cognitive decline is already evident in middle age (age 45-49 years) [70]. Prior to the diagnosis of dementia, many years of underlying brain damage have been present [71, 72]. Moreover, it is relevant to consider risk factors of cognitive decline when selecting study participants, e.g., low educational level, obesity and Apolipoprotein E (APOE) genotype, to study cognitive decline or MCI occurrence. In intervention studies, when targeting populations with preclinical symptoms of cognitive decline, it might be of concern whether the brain damage is reversible. Given this information, there is a general consensus that nutritional intervention studies should aim at prevention rather than treatment of cognitive decline. Thus middle-aged people should be targeted before brain function is too comprised for substantial benefit, thereby focussing on the earliest stages of the disease [71, 73].
Participants in the NU-AGE study (chapters 7-9) were aged 65 to 80 years, potentially allowing us to detect changes in cognitive functioning. Besides the follow-up time being relatively short and the fact that the NU-AGE study was not powered to detect an effect on cognitive functioning – as mentioned above – another explanation for our null-finding could be that the NU-AGE participants were apparently healthy individuals at a relatively good cognitive function level limiting the possibility to detect a decline in cognitive functioning within the study period. Although
Window of opportunity

Chapter 10 | General discussion
166
intervention studies are considered to be the standard for providing evidence, assessing long-term effects of nutritional factors with intervention studies is considered to be too expensive and difficult [71]. In this respect, prospective studies with long-term follow-up will provide useful information on the role of nutritional compounds on cognitive functioning [71]. An important advantage of prospective studies is the possibility to follow participants for a long period of time. For example, a recent study demonstrated that cumulative burden of cardiovascular risk factors, such as high blood pressure, from childhood (3-18 years) was associated with worse midlife cognitive performance after 31 years of follow-up [74]. Another important advantage of prospective studies is the selection of cohorts with a specific exposure, such as APOE genotype, allowing the comparison of disease development.
Participants within the Nurses’ Health Study (NHS) (chapters 4-6) comprised relatively healthy adults aged 70 years and older without a major decline in cognitive function over 4.1 years of follow-up. Studying populations that remain at optimal brain health do not provide enough variation in the outcome to detect an association between diet and cognitive functioning. To overcome the limited variation in cognitive functioning all measures were averaged to create a measure of cognitive status at older ages in chapter 5 and 6. Despite this method, we demonstrated a smaller effect size of the MIND diet with cognitive functioning in the NHS compared to the Memory and Aging Project study (MAP) (e.g., one year difference in cognitive age in NHS versus 7.5 years in MAP). Compared to NHS, MAP participants were on average ten years older than NHS participants, had a lower educational level, mainly lived in retirement houses, were more likely to have ever smoked and more likely to have reported high blood pressure, diabetes and myocardial infarction demonstrating that MAP participants were at higher risk of poor cognitive function and faster cognitive decline compared to NHS participants.
Thus, ideally, a life course approach would be needed to study changes in cognitive functioning, already starting before the preclinical stages of dementia, e.g., by including a heterogeneous population aged 60 years and older followed for a period of up to 20 to 30 years. When designing intervention or prospective studies, participants at risk, or at a very early stage, of cognitive decline should be included and followed for a sufficient period – ranging from at least 1.5 year in intervention studies to ideally 20 to 30 years for prospective studies.
Nutrient intake and/or nutrient status Nutrient intake and/or status in elderly populations is relevant to consider, as with aging, energy needs decrease while nutrient requirements remain or increase, necessitating a more nutrient dense diet [75]. Inadequate nutrient intake may cause chronic metabolic disruption, including mitochondrial decay, resulting in acceleration of various degenerative diseases [76]. The prevalence of inadequate intakes is relatively high in both institutionalized (40-65%), and non-institutionalized older adults (5-10%) [75]. In Europe, over 20% of adults aged 65 years and older have inadequate intakes of vitamin D, folate, calcium, selenium and iodine [77]. Importantly, low nutrient status is highly prevalent in MCI and AD patients. Lower plasma levels of folate and vitamin A, vitamin B12, vitamin C, vitamin E [78], omega-3 fatty acids [79], and selenium [80] were reported in AD patients compared to cognitively healthy controls. In patients with MCI, nutrient status was low for folate [81], vitamin A, vitamin C, vitamin E, lutein, zeaxanthin, α-carotene [82, 83] and DHA [79]. Such
167
compromised nutritional status may result from alteration in nutrient intake, uptake, metabolism, and utilization [65]. Thus, low nutrient status is a consistent finding during disease progression [65] (figure 1). For intervention studies reporting a null association between a single nutrient and cognitive functioning, the lack of taking baseline nutrient status into account may be a possible explanation for their null findings. Studying apparently healthy individuals with optimal nutrient status has the disadvantage that there is not much room for improvement on the exposure side and thus no effects between nutrients and cognitive outcomes can be detected. Thus, participants who are likely to be sensitive and gain most benefit from the intervention should be included. In the NU-AGE study, plasma and serum values of nutrient have been measured, although not used as an inclusion criterion to specifically select participants at risk of suboptimal nutrient intake or status. As the NU-AGE participants were relatively healthy, it is very well likely that we have included participants with adequate nutrient intake and status, thus resulting in less room for improvement with respect to changes in nutrient intake and status. Despite the relevance of nutrient intake and/or status in older adults, a major obstacle of long-term intervention studies is the lack of information about history of deficiencies, e.g., whether the deficiency is a chronic state or just a snapshot of temporary physiological state [71]. Conducting prospective studies with a long follow-up period including measures of nutrient intake and/or status could provide insights to this. Additionally, within a study population a large variety in dietary intake should be covered to study combinations of nutrients or dietary patterns in relation to cognitive functioning. Studying a study population with limited variation in dietary intake could hamper the detection of diet-disease associations. For example, we observed a weaker association of the MIND diet with cognitive functioning in the NHS compared to the MAP study, possibly caused by a limited variation in MIND diet score, e.g., total MIND score was 7.4 (range 2.5-12.5 in MAP [10] versus 6.4 (2.6-11.0) in NHS (chapter 6). When selecting participants for intervention studies, low baseline nutrient intake and/or status should be considered as an inclusion criterion. For prospective studies, including a population with a wide range of dietary intake and status allows the detection of diet-cognition associations.

10
Chapter 10 | General discussion
166
intervention studies are considered to be the standard for providing evidence, assessing long-term effects of nutritional factors with intervention studies is considered to be too expensive and difficult [71]. In this respect, prospective studies with long-term follow-up will provide useful information on the role of nutritional compounds on cognitive functioning [71]. An important advantage of prospective studies is the possibility to follow participants for a long period of time. For example, a recent study demonstrated that cumulative burden of cardiovascular risk factors, such as high blood pressure, from childhood (3-18 years) was associated with worse midlife cognitive performance after 31 years of follow-up [74]. Another important advantage of prospective studies is the selection of cohorts with a specific exposure, such as APOE genotype, allowing the comparison of disease development.
Participants within the Nurses’ Health Study (NHS) (chapters 4-6) comprised relatively healthy adults aged 70 years and older without a major decline in cognitive function over 4.1 years of follow-up. Studying populations that remain at optimal brain health do not provide enough variation in the outcome to detect an association between diet and cognitive functioning. To overcome the limited variation in cognitive functioning all measures were averaged to create a measure of cognitive status at older ages in chapter 5 and 6. Despite this method, we demonstrated a smaller effect size of the MIND diet with cognitive functioning in the NHS compared to the Memory and Aging Project study (MAP) (e.g., one year difference in cognitive age in NHS versus 7.5 years in MAP). Compared to NHS, MAP participants were on average ten years older than NHS participants, had a lower educational level, mainly lived in retirement houses, were more likely to have ever smoked and more likely to have reported high blood pressure, diabetes and myocardial infarction demonstrating that MAP participants were at higher risk of poor cognitive function and faster cognitive decline compared to NHS participants.
Thus, ideally, a life course approach would be needed to study changes in cognitive functioning, already starting before the preclinical stages of dementia, e.g., by including a heterogeneous population aged 60 years and older followed for a period of up to 20 to 30 years. When designing intervention or prospective studies, participants at risk, or at a very early stage, of cognitive decline should be included and followed for a sufficient period – ranging from at least 1.5 year in intervention studies to ideally 20 to 30 years for prospective studies.
Nutrient intake and/or nutrient status Nutrient intake and/or status in elderly populations is relevant to consider, as with aging, energy needs decrease while nutrient requirements remain or increase, necessitating a more nutrient dense diet [75]. Inadequate nutrient intake may cause chronic metabolic disruption, including mitochondrial decay, resulting in acceleration of various degenerative diseases [76]. The prevalence of inadequate intakes is relatively high in both institutionalized (40-65%), and non-institutionalized older adults (5-10%) [75]. In Europe, over 20% of adults aged 65 years and older have inadequate intakes of vitamin D, folate, calcium, selenium and iodine [77]. Importantly, low nutrient status is highly prevalent in MCI and AD patients. Lower plasma levels of folate and vitamin A, vitamin B12, vitamin C, vitamin E [78], omega-3 fatty acids [79], and selenium [80] were reported in AD patients compared to cognitively healthy controls. In patients with MCI, nutrient status was low for folate [81], vitamin A, vitamin C, vitamin E, lutein, zeaxanthin, α-carotene [82, 83] and DHA [79]. Such
167
compromised nutritional status may result from alteration in nutrient intake, uptake, metabolism, and utilization [65]. Thus, low nutrient status is a consistent finding during disease progression [65] (figure 1). For intervention studies reporting a null association between a single nutrient and cognitive functioning, the lack of taking baseline nutrient status into account may be a possible explanation for their null findings. Studying apparently healthy individuals with optimal nutrient status has the disadvantage that there is not much room for improvement on the exposure side and thus no effects between nutrients and cognitive outcomes can be detected. Thus, participants who are likely to be sensitive and gain most benefit from the intervention should be included. In the NU-AGE study, plasma and serum values of nutrient have been measured, although not used as an inclusion criterion to specifically select participants at risk of suboptimal nutrient intake or status. As the NU-AGE participants were relatively healthy, it is very well likely that we have included participants with adequate nutrient intake and status, thus resulting in less room for improvement with respect to changes in nutrient intake and status. Despite the relevance of nutrient intake and/or status in older adults, a major obstacle of long-term intervention studies is the lack of information about history of deficiencies, e.g., whether the deficiency is a chronic state or just a snapshot of temporary physiological state [71]. Conducting prospective studies with a long follow-up period including measures of nutrient intake and/or status could provide insights to this. Additionally, within a study population a large variety in dietary intake should be covered to study combinations of nutrients or dietary patterns in relation to cognitive functioning. Studying a study population with limited variation in dietary intake could hamper the detection of diet-disease associations. For example, we observed a weaker association of the MIND diet with cognitive functioning in the NHS compared to the MAP study, possibly caused by a limited variation in MIND diet score, e.g., total MIND score was 7.4 (range 2.5-12.5 in MAP [10] versus 6.4 (2.6-11.0) in NHS (chapter 6). When selecting participants for intervention studies, low baseline nutrient intake and/or status should be considered as an inclusion criterion. For prospective studies, including a population with a wide range of dietary intake and status allows the detection of diet-cognition associations.

Chapter 10 | General discussion
168
Further research The increase in life expectancy and its accompanying decline in cognitive functioning and increased risk of dementia call for research on dietary strategies that impact brain health, especially as effective medicines to prevent or cure dementia are lacking. Based on the current evidence and as outlined above, there is need for both well-designed intervention studies and prospective studies, which should include: - Dietary assessment methods that are able to assess intake of specific foods relevant for the
dietary pattern of interest - Biomarkers of dietary patterns or cognitive functioning - Harmonized cognitive test batteries allowing the construction of specific cognitive domains - Imaging techniques (e.g., MRI or fMRI) - Sufficient follow-up time, e.g., at least 1.5 years for intervention studies, and ideally up to 20 to
30 years in prospective studies - Participants either at risk of cognitive decline or with suboptimal nutrient intake and/or status
for intervention studies, or a heterogeneous population for prospective studies. Additionally, to define guidelines for healthier cognitive ageing a holistic approach should be used considering multi-domain exposures. For example, the Finnish Geriatric Intervention Study to Prevent Cognitive Impairment and Disability (FINGER) study not only focussed on a healthy diet, but also included exercise, cognitive training and social activity, and management of metabolic and vascular risk factors [52] observed promising effects on cognitive functioning [84]. On the other hand, long-term prospective studies simultaneously studying multiple health outcomes should be used to better understand why some people develop age-related diseases while others age more healthily. An example is the Rhineland study, which envisages to include up to 30.000 participants from Bonn in which both mental and physical health are uniquely being assessed over their lifespan - starting at age 30 [85].
169
Conclusions and public health implications This thesis described results from a literature review, a cross-sectional study, observational studies and an intervention study on the relation between diet and cognitive functioning. The Mediterranean diet seems to be most consistently associated with less cognitive decline, dementia or AD (chapter 3). Although we did not find an association between the Healthy Diet Indicator or the NU-AGE diet with global cognitive function (chapter 4 & 9), we demonstrated that participants with the highest adherence to the DASH diet and MIND diet were cognitively one year younger compared to participants with the lowest adherence (chapter 5 & 6). Although previous studies showed that dietary intakes of elderly are rather stable [86, 87], chapter 8 importantly adds to this knowledge, by demonstrating that adults aged 65 years and older are able to change their dietary intakes. This is an encouraging finding, demonstrating that diet is a modifiable and feasible risk factor for cognitive decline prevention - even at older ages. This last chapter demonstrates that there are many aspects to consider when studying dietary patterns in relation to cognitive functioning. This thesis adds scientific evidence to ultimately define the optimal dietary pattern to preserve cognitive functioning, describing results from multiple study designs. Additionally, this thesis does provide important insights into methodological considerations and suggestions for further research. When grading the reported associations in previous studies and studies in this thesis [88], we can conclude that there is probable evidence for a role of the Mediterranean diet on cognitive functioning. For the DASH and MIND diet there is a possible link with cognitive functioning; for the HDI and the NU-AGE diet there is no sufficient evidence yet to conclude that there is a relation with cognitive functioning. We do call for communication strategies to the general public about the consumption of healthier dietary patterns to not only impact cardiovascular but also potentially impact brain health. We should not only invest in further studies, but also invest in communication to the general public, as many individuals will face progressive cognitive decline and the sooner they can act the more benefit they may have. A first step was the inclusion of dementia as one of the targeted diseases in the updated Dutch food based dietary guidelines [89], and subsequently the ‘Wheel of five’ (in Dutch: Richtlijnen Schijf van Vijf) [90] has been updated. However, evidence on dementia was included in only one of the guidelines. Therefore, a next step would be the inclusion of findings from further research to be used for nutrition education in the Netherlands.

10
Chapter 10 | General discussion
168
Further research The increase in life expectancy and its accompanying decline in cognitive functioning and increased risk of dementia call for research on dietary strategies that impact brain health, especially as effective medicines to prevent or cure dementia are lacking. Based on the current evidence and as outlined above, there is need for both well-designed intervention studies and prospective studies, which should include: - Dietary assessment methods that are able to assess intake of specific foods relevant for the
dietary pattern of interest - Biomarkers of dietary patterns or cognitive functioning - Harmonized cognitive test batteries allowing the construction of specific cognitive domains - Imaging techniques (e.g., MRI or fMRI) - Sufficient follow-up time, e.g., at least 1.5 years for intervention studies, and ideally up to 20 to
30 years in prospective studies - Participants either at risk of cognitive decline or with suboptimal nutrient intake and/or status
for intervention studies, or a heterogeneous population for prospective studies. Additionally, to define guidelines for healthier cognitive ageing a holistic approach should be used considering multi-domain exposures. For example, the Finnish Geriatric Intervention Study to Prevent Cognitive Impairment and Disability (FINGER) study not only focussed on a healthy diet, but also included exercise, cognitive training and social activity, and management of metabolic and vascular risk factors [52] observed promising effects on cognitive functioning [84]. On the other hand, long-term prospective studies simultaneously studying multiple health outcomes should be used to better understand why some people develop age-related diseases while others age more healthily. An example is the Rhineland study, which envisages to include up to 30.000 participants from Bonn in which both mental and physical health are uniquely being assessed over their lifespan - starting at age 30 [85].
169
Conclusions and public health implications This thesis described results from a literature review, a cross-sectional study, observational studies and an intervention study on the relation between diet and cognitive functioning. The Mediterranean diet seems to be most consistently associated with less cognitive decline, dementia or AD (chapter 3). Although we did not find an association between the Healthy Diet Indicator or the NU-AGE diet with global cognitive function (chapter 4 & 9), we demonstrated that participants with the highest adherence to the DASH diet and MIND diet were cognitively one year younger compared to participants with the lowest adherence (chapter 5 & 6). Although previous studies showed that dietary intakes of elderly are rather stable [86, 87], chapter 8 importantly adds to this knowledge, by demonstrating that adults aged 65 years and older are able to change their dietary intakes. This is an encouraging finding, demonstrating that diet is a modifiable and feasible risk factor for cognitive decline prevention - even at older ages. This last chapter demonstrates that there are many aspects to consider when studying dietary patterns in relation to cognitive functioning. This thesis adds scientific evidence to ultimately define the optimal dietary pattern to preserve cognitive functioning, describing results from multiple study designs. Additionally, this thesis does provide important insights into methodological considerations and suggestions for further research. When grading the reported associations in previous studies and studies in this thesis [88], we can conclude that there is probable evidence for a role of the Mediterranean diet on cognitive functioning. For the DASH and MIND diet there is a possible link with cognitive functioning; for the HDI and the NU-AGE diet there is no sufficient evidence yet to conclude that there is a relation with cognitive functioning. We do call for communication strategies to the general public about the consumption of healthier dietary patterns to not only impact cardiovascular but also potentially impact brain health. We should not only invest in further studies, but also invest in communication to the general public, as many individuals will face progressive cognitive decline and the sooner they can act the more benefit they may have. A first step was the inclusion of dementia as one of the targeted diseases in the updated Dutch food based dietary guidelines [89], and subsequently the ‘Wheel of five’ (in Dutch: Richtlijnen Schijf van Vijf) [90] has been updated. However, evidence on dementia was included in only one of the guidelines. Therefore, a next step would be the inclusion of findings from further research to be used for nutrition education in the Netherlands.

Chapter 10 | General discussion
170
References 1. Drewnowski A. Defining nutrient density: development and validation of the nutrient rich foods index. J Am Coll Nutr.
2009;28(4):421S-6S. 2. Fulgoni VL, 3rd, Keast DR, Drewnowski A. Development and validation of the nutrient-rich foods index: a tool to
measure nutritional quality of foods. J Nutr. 2009;139(8):1549-54. 3. Streppel MT, Sluik D, van Yperen JF, Geelen A, Hofman A, Franco OH, et al. Nutrient-rich foods, cardiovascular diseases
and all-cause mortality: the Rotterdam study. Eur J Clin Nutr. 2014. 4. Willett WC. Nutritional Epidemiology. third ed: Oxford [etc.] : Oxford University Press; 2013. 529 p. 5. Kipnis V, Subar AF, Midthune D, Freedman LS, Ballard-Barbash R, Troiano RP, et al. Structure of dietary measurement
error: results of the OPEN biomarker study. Am J Epidemiol. 2003;158(1):14-21. 6. Stice E, Palmrose CA, Burger KS. Elevated BMI and Male Sex Are Associated with Greater Underreporting of Caloric
Intake as Assessed by Doubly Labeled Water. J Nutr. 2015;145(10):2412-8. 7. Johnson RK, Goran MI, Poehlman ET. Correlates of over- and underreporting of energy intake in healthy older men and
women. Am J Clin Nutr. 1994;59(6):1286-90. 8. Baumgart M, Snyder HM, Carrillo MC, Fazio S, Kim H, Johns H. Summary of the evidence on modifiable risk factors for
cognitive decline and dementia: A population-based perspective. Alzheimer's & dementia : the journal of the Alzheimer's Association. 2015;11(6):718-26.
9. Bogers RP, Dagnelie PC, Westerterp KR, Kester AD, van Klaveren JD, Bast A, et al. Using a correction factor to correct for overreporting in a food-frequency questionnaire does not improve biomarker-assessed validity of estimates for fruit and vegetable consumption. J Nutr. 2003;133(4):1213-9.
10. Morris MC, Tangney CC, Wang Y, Sacks FM, Bennett DA, Aggarwal NT. MIND diet associated with reduced incidence of Alzheimer's disease. Alzheimers Dement. 2015;11(9):1007-14.
11. Chen X, Huang Y, Cheng HG. Lower intake of vegetables and legumes associated with cognitive decline among illiterate elderly Chinese: a 3-year cohort study. J Nutr Health Aging. 2012;16(6):549-52.
12. Kang JH, Ascherio A, Grodstein F. Fruit and vegetable consumption and cognitive decline in aging women. Ann Neurol. 2005;57(5):713-20.
13. Morris MC, Evans DA, Tangney CC, Bienias JL, Wilson RS. Associations of vegetable and fruit consumption with age-related cognitive change. Neurology. 2006;67(8):1370-6.
14. Nooyens AC, Bueno-de-Mesquita HB, van Boxtel MP, van Gelder BM, Verhagen H, Verschuren WM. Fruit and vegetable intake and cognitive decline in middle-aged men and women: the Doetinchem Cohort Study. Br J Nutr. 2011;106(5):752-61.
15. Roberts RO, Geda YE, Cerhan JR, Knopman DS, Cha RH, Christianson TJ, et al. Vegetables, unsaturated fats, moderate alcohol intake, and mild cognitive impairment. Dementia and geriatric cognitive disorders. 2010;29(5):413-23.
16. Devore EE, Kang JH, Breteler MM, Grodstein F. Dietary intakes of berries and flavonoids in relation to cognitive decline. Annals of neurology. 2012;72(1):135-43.
17. Joseph JA, Denisova NA, Arendash G, Gordon M, Diamond D, Shukitt-Hale B, et al. Blueberry supplementation enhances signaling and prevents behavioral deficits in an Alzheimer disease model. Nutritional neuroscience. 2003;6(3):153-62.
18. Joseph JA, Shukitt-Hale B, Denisova NA, Bielinski D, Martin A, McEwen JJ, et al. Reversals of age-related declines in neuronal signal transduction, cognitive, and motor behavioral deficits with blueberry, spinach, or strawberry dietary supplementation. The Journal of neuroscience : the official journal of the Society for Neuroscience. 1999;19(18):8114-21.
19. Shukitt-Hale B, Cheng V, Joseph JA. Effects of blackberries on motor and cognitive function in aged rats. Nutritional neuroscience. 2009;12(3):135-40.
20. Shukitt-Hale B, Lau FC, Carey AN, Galli RL, Spangler EL, Ingram DK, et al. Blueberry polyphenols attenuate kainic acid-induced decrements in cognition and alter inflammatory gene expression in rat hippocampus. Nutritional neuroscience. 2008;11(4):172-82.
21. Estruch R, Ros E, Salas-Salvado J, Covas MI, Pharm D, Corella D, et al. Primary Prevention of Cardiovascular Disease with a Mediterranean Diet. N Engl J Med. 2013;368:1279-90.
22. Sofi F, Macchi C, Abbate R, Gensini GF, Casini A. Mediterranean diet and health status: an updated meta-analysis and a proposal for a literature-based adherence score. Public Health Nutr. 2013:1-14.
23. Giacosa A, Barale R, Bavaresco L, Gatenby P, Gerbi V, Janssens J, et al. Cancer prevention in Europe: the Mediterranean diet as a protective choice. European journal of cancer prevention : the official journal of the European Cancer Prevention Organisation (ECP). 2013;22(1):90-5.
24. Knight A, Bryan J, Murphy K. Is the Mediterranean diet a feasible approach to preserving cognitive function and reducing risk of dementia for older adults in Western countries? New insights and future directions. Ageing Res Rev. 2016;25:85-101.
25. Morris MC, Tangney CC, Wang Y, Sacks FM, Barnes LL, Bennett DA, et al. MIND diet slows cognitive decline with aging. Alzheimers Dement. 2015;11(9):1015-22.
26. Arvaniti F, Panagiotakos DB. Healthy indexes in public health practice and research: a review. Critical reviews in food science and nutrition. 2008;48(4):317-27.
171
27. Kourlaba G, Panagiotakos D. The diagnostic accuracy of a composite index increases as the number of partitions of the components increases and when specific weights are assigned to each component. Journal of Applied Statistics. 2010;37(4):537-54.
28. Kourlaba G, Panagiotakos DB. Dietary quality indices and human health: a review. Maturitas. 2009;62(1):1-8. 29. Waijers PM, Feskens EJ, Ocke MC. A critical review of predefined diet quality scores. Br J Nutr. 2007;97(2):219-31. 30. van Lee L, Feskens EJ, Hooft van Huysduynen EJ, de Vries JH, van 't Veer P, Geelen A. The Dutch Healthy Diet index as
assessed by 24 h recalls and FFQ: associations with biomarkers from a cross-sectional study. J Nutr Sci. 2013;2:e40. 31. Ocke MC. Evaluation of methodologies for assessing the overall diet: dietary quality scores and dietary pattern analysis.
The Proceedings of the Nutrition Society. 2013;72(2):191-9. 32. Bowman GL, Shannon J, Ho E, Traber MG, Frei B, Oken BS, et al. Reliability and validity of food frequency questionnaire
and nutrient biomarkers in elders with and without mild cognitive impairment. Alzheimer disease and associated disorders. 2011;25(1):49-57.
33. Bowman GL, Silbert LC, Howieson D, Dodge HH, Traber MG, Frei B, et al. Nutrient biomarker patterns, cognitive function, and MRI measures of brain aging. Neurology. 2012;78(4):241-9.
34. Hedrick VE, Dietrich AM, Estabrooks PA, Savla J, Serrano E, Davy BM. Dietary biomarkers: advances, limitations and future directions. Nutrition journal. 2012;11:109.
35. Folstein MF, Folstein SE, McHugh PR. "Mini-mental state". A practical method for grading the cognitive state of patients for the clinician. J Psychiatr Res. 1975;12(3):189-98.
36. Brandt J, Spencer M, Folstein M. The telephone interview for cognitive status. Neuropsychiatry Neuropsychol Behav Neurol. 1988;1:111-7.
37. Morris JC, Heyman A, Mohs RC, Hughes JP, van Belle G, Fillenbaum G, et al. The Consortium to Establish a Registry for Alzheimer's Disease (CERAD). Part I. Clinical and neuropsychological assessment of Alzheimer's disease. Neurology. 1989;39(9):1159-65.
38. Kaplan E GH, Weintraub S. The Boston Naming Test. Boston: E Kaplan and H Goodglass. 1978. 39. Babcock H, & Levy, L. The measurement of efficiency of mental functioning (revised examination): Test and manual of
directions. . Chicago: C H Stoelting. 1940. 40. Rosen WG. Verbal fluency in aging and dementia. Journal of Clinical Neuropsychology. 1980;2(2):135-46. 41. Reitan RM. Valitidy of the trail making test as an indicator of organic brain damage. Perceptual and Motor Skills.
1958;8:271-6. 42. Lewis R, Kupke T. The Lafayette clinic repeatable neuropsychological test battery: its development and research
applications. . Proceedings of annual meeting of the southeastern psychological association. 1977 Hollywood, FL. 43. Salthouse T, Babcock R. Decomposing adult age differences in working memory. Developmental Psychology,.27(5): 763-
76. 44. Rosen WG, Mohs RC, Davis KL. A new rating scale for Alzheimer's disease. The American journal of psychiatry.
1984;141(11):1356-64. 45. Albert M, Smith LA, Scherr PA, Taylor JO, Evans DA, Funkenstein HH. Use of brief cognitive tests to identify individuals in
the community with clinically diagnosed Alzheimer's disease. Int J Neurosci. 1991;57(3-4):167-78. 46. Scherr PA, Albert MS, Funkenstein HH, Cook NR, Hennekens CH, Branch LG, et al. Correlates of cognitive function in an
elderly community population. Am J Epidemiol. 1988;128(5):1084-101. 47. Monsch AU, Bondi MW, Butters N, Salmon DP, Katzman R, Thal LJ. Comparisons of verbal fluency tasks in the detection
of dementia of the Alzheimer type. Arch Neurol. 1992;49(12):1253-8. 48. McKhann GM, Knopman DS, Chertkow H, Hyman BT, Jack CR, Jr., Kawas CH, et al. The diagnosis of dementia due to
Alzheimer's disease: recommendations from the National Institute on Aging-Alzheimer's Association workgroups on diagnostic guidelines for Alzheimer's disease. Alzheimer's & dementia : the journal of the Alzheimer's Association. 2011;7(3):263-9.
49. Tangney CC, Li H, Wang Y, Barnes L, Schneider JA, Bennett DA, et al. Relation of DASH- and Mediterranean-like dietary patterns to cognitive decline in older persons. Neurology. 2014;83(16):1410-6.
50. Smith PJ, Blumenthal JA, Babyak MA, Craighead L, Welsh-Bohmer KA, Browndyke JN, et al. Effects of the dietary approaches to stop hypertension diet, exercise, and caloric restriction on neurocognition in overweight adults with high blood pressure. Hypertension. 2010;55(6):1331-8.
51. Vellas B, Andrieu S, Sampaio C, Wilcock G. Disease-modifying trials in Alzheimer's disease: a European task force consensus. Lancet neurology. 2007;6(1):56-62.
52. Kivipelto M, Solomon A, Ahtiluoto S, Ngandu T, Lehtisalo J, Antikainen R, et al. The Finnish Geriatric Intervention Study to Prevent Cognitive Impairment and Disability (FINGER): study design and progress. Alzheimers Dement. 2013;9(6):657-65.
53. Cao L, Tan L, Wang HF, Jiang T, Zhu XC, Lu H, et al. Dietary Patterns and Risk of Dementia: a Systematic Review and Meta-Analysis of Cohort Studies. Mol Neurobiol. 2015;9:9.
54. Psaltopoulou T, Sergentanis TN, Panagiotakos DB, Sergentanis IN, Kosti R, Scarmeas N. Mediterranean diet, stroke, cognitive impairment, and depression: A meta-analysis. Annals of neurology. 2013;74(4):580-91.
55. Singh B, Parsaik AK, Mielke MM, Erwin PJ, Knopman DS, Petersen RC, et al. Association of mediterranean diet with mild cognitive impairment and Alzheimer's disease: a systematic review and meta-analysis. J Alzheimers Dis. 2014;39(2):271-82.

10
Chapter 10 | General discussion
170
References 1. Drewnowski A. Defining nutrient density: development and validation of the nutrient rich foods index. J Am Coll Nutr.
2009;28(4):421S-6S. 2. Fulgoni VL, 3rd, Keast DR, Drewnowski A. Development and validation of the nutrient-rich foods index: a tool to
measure nutritional quality of foods. J Nutr. 2009;139(8):1549-54. 3. Streppel MT, Sluik D, van Yperen JF, Geelen A, Hofman A, Franco OH, et al. Nutrient-rich foods, cardiovascular diseases
and all-cause mortality: the Rotterdam study. Eur J Clin Nutr. 2014. 4. Willett WC. Nutritional Epidemiology. third ed: Oxford [etc.] : Oxford University Press; 2013. 529 p. 5. Kipnis V, Subar AF, Midthune D, Freedman LS, Ballard-Barbash R, Troiano RP, et al. Structure of dietary measurement
error: results of the OPEN biomarker study. Am J Epidemiol. 2003;158(1):14-21. 6. Stice E, Palmrose CA, Burger KS. Elevated BMI and Male Sex Are Associated with Greater Underreporting of Caloric
Intake as Assessed by Doubly Labeled Water. J Nutr. 2015;145(10):2412-8. 7. Johnson RK, Goran MI, Poehlman ET. Correlates of over- and underreporting of energy intake in healthy older men and
women. Am J Clin Nutr. 1994;59(6):1286-90. 8. Baumgart M, Snyder HM, Carrillo MC, Fazio S, Kim H, Johns H. Summary of the evidence on modifiable risk factors for
cognitive decline and dementia: A population-based perspective. Alzheimer's & dementia : the journal of the Alzheimer's Association. 2015;11(6):718-26.
9. Bogers RP, Dagnelie PC, Westerterp KR, Kester AD, van Klaveren JD, Bast A, et al. Using a correction factor to correct for overreporting in a food-frequency questionnaire does not improve biomarker-assessed validity of estimates for fruit and vegetable consumption. J Nutr. 2003;133(4):1213-9.
10. Morris MC, Tangney CC, Wang Y, Sacks FM, Bennett DA, Aggarwal NT. MIND diet associated with reduced incidence of Alzheimer's disease. Alzheimers Dement. 2015;11(9):1007-14.
11. Chen X, Huang Y, Cheng HG. Lower intake of vegetables and legumes associated with cognitive decline among illiterate elderly Chinese: a 3-year cohort study. J Nutr Health Aging. 2012;16(6):549-52.
12. Kang JH, Ascherio A, Grodstein F. Fruit and vegetable consumption and cognitive decline in aging women. Ann Neurol. 2005;57(5):713-20.
13. Morris MC, Evans DA, Tangney CC, Bienias JL, Wilson RS. Associations of vegetable and fruit consumption with age-related cognitive change. Neurology. 2006;67(8):1370-6.
14. Nooyens AC, Bueno-de-Mesquita HB, van Boxtel MP, van Gelder BM, Verhagen H, Verschuren WM. Fruit and vegetable intake and cognitive decline in middle-aged men and women: the Doetinchem Cohort Study. Br J Nutr. 2011;106(5):752-61.
15. Roberts RO, Geda YE, Cerhan JR, Knopman DS, Cha RH, Christianson TJ, et al. Vegetables, unsaturated fats, moderate alcohol intake, and mild cognitive impairment. Dementia and geriatric cognitive disorders. 2010;29(5):413-23.
16. Devore EE, Kang JH, Breteler MM, Grodstein F. Dietary intakes of berries and flavonoids in relation to cognitive decline. Annals of neurology. 2012;72(1):135-43.
17. Joseph JA, Denisova NA, Arendash G, Gordon M, Diamond D, Shukitt-Hale B, et al. Blueberry supplementation enhances signaling and prevents behavioral deficits in an Alzheimer disease model. Nutritional neuroscience. 2003;6(3):153-62.
18. Joseph JA, Shukitt-Hale B, Denisova NA, Bielinski D, Martin A, McEwen JJ, et al. Reversals of age-related declines in neuronal signal transduction, cognitive, and motor behavioral deficits with blueberry, spinach, or strawberry dietary supplementation. The Journal of neuroscience : the official journal of the Society for Neuroscience. 1999;19(18):8114-21.
19. Shukitt-Hale B, Cheng V, Joseph JA. Effects of blackberries on motor and cognitive function in aged rats. Nutritional neuroscience. 2009;12(3):135-40.
20. Shukitt-Hale B, Lau FC, Carey AN, Galli RL, Spangler EL, Ingram DK, et al. Blueberry polyphenols attenuate kainic acid-induced decrements in cognition and alter inflammatory gene expression in rat hippocampus. Nutritional neuroscience. 2008;11(4):172-82.
21. Estruch R, Ros E, Salas-Salvado J, Covas MI, Pharm D, Corella D, et al. Primary Prevention of Cardiovascular Disease with a Mediterranean Diet. N Engl J Med. 2013;368:1279-90.
22. Sofi F, Macchi C, Abbate R, Gensini GF, Casini A. Mediterranean diet and health status: an updated meta-analysis and a proposal for a literature-based adherence score. Public Health Nutr. 2013:1-14.
23. Giacosa A, Barale R, Bavaresco L, Gatenby P, Gerbi V, Janssens J, et al. Cancer prevention in Europe: the Mediterranean diet as a protective choice. European journal of cancer prevention : the official journal of the European Cancer Prevention Organisation (ECP). 2013;22(1):90-5.
24. Knight A, Bryan J, Murphy K. Is the Mediterranean diet a feasible approach to preserving cognitive function and reducing risk of dementia for older adults in Western countries? New insights and future directions. Ageing Res Rev. 2016;25:85-101.
25. Morris MC, Tangney CC, Wang Y, Sacks FM, Barnes LL, Bennett DA, et al. MIND diet slows cognitive decline with aging. Alzheimers Dement. 2015;11(9):1015-22.
26. Arvaniti F, Panagiotakos DB. Healthy indexes in public health practice and research: a review. Critical reviews in food science and nutrition. 2008;48(4):317-27.
171
27. Kourlaba G, Panagiotakos D. The diagnostic accuracy of a composite index increases as the number of partitions of the components increases and when specific weights are assigned to each component. Journal of Applied Statistics. 2010;37(4):537-54.
28. Kourlaba G, Panagiotakos DB. Dietary quality indices and human health: a review. Maturitas. 2009;62(1):1-8. 29. Waijers PM, Feskens EJ, Ocke MC. A critical review of predefined diet quality scores. Br J Nutr. 2007;97(2):219-31. 30. van Lee L, Feskens EJ, Hooft van Huysduynen EJ, de Vries JH, van 't Veer P, Geelen A. The Dutch Healthy Diet index as
assessed by 24 h recalls and FFQ: associations with biomarkers from a cross-sectional study. J Nutr Sci. 2013;2:e40. 31. Ocke MC. Evaluation of methodologies for assessing the overall diet: dietary quality scores and dietary pattern analysis.
The Proceedings of the Nutrition Society. 2013;72(2):191-9. 32. Bowman GL, Shannon J, Ho E, Traber MG, Frei B, Oken BS, et al. Reliability and validity of food frequency questionnaire
and nutrient biomarkers in elders with and without mild cognitive impairment. Alzheimer disease and associated disorders. 2011;25(1):49-57.
33. Bowman GL, Silbert LC, Howieson D, Dodge HH, Traber MG, Frei B, et al. Nutrient biomarker patterns, cognitive function, and MRI measures of brain aging. Neurology. 2012;78(4):241-9.
34. Hedrick VE, Dietrich AM, Estabrooks PA, Savla J, Serrano E, Davy BM. Dietary biomarkers: advances, limitations and future directions. Nutrition journal. 2012;11:109.
35. Folstein MF, Folstein SE, McHugh PR. "Mini-mental state". A practical method for grading the cognitive state of patients for the clinician. J Psychiatr Res. 1975;12(3):189-98.
36. Brandt J, Spencer M, Folstein M. The telephone interview for cognitive status. Neuropsychiatry Neuropsychol Behav Neurol. 1988;1:111-7.
37. Morris JC, Heyman A, Mohs RC, Hughes JP, van Belle G, Fillenbaum G, et al. The Consortium to Establish a Registry for Alzheimer's Disease (CERAD). Part I. Clinical and neuropsychological assessment of Alzheimer's disease. Neurology. 1989;39(9):1159-65.
38. Kaplan E GH, Weintraub S. The Boston Naming Test. Boston: E Kaplan and H Goodglass. 1978. 39. Babcock H, & Levy, L. The measurement of efficiency of mental functioning (revised examination): Test and manual of
directions. . Chicago: C H Stoelting. 1940. 40. Rosen WG. Verbal fluency in aging and dementia. Journal of Clinical Neuropsychology. 1980;2(2):135-46. 41. Reitan RM. Valitidy of the trail making test as an indicator of organic brain damage. Perceptual and Motor Skills.
1958;8:271-6. 42. Lewis R, Kupke T. The Lafayette clinic repeatable neuropsychological test battery: its development and research
applications. . Proceedings of annual meeting of the southeastern psychological association. 1977 Hollywood, FL. 43. Salthouse T, Babcock R. Decomposing adult age differences in working memory. Developmental Psychology,.27(5): 763-
76. 44. Rosen WG, Mohs RC, Davis KL. A new rating scale for Alzheimer's disease. The American journal of psychiatry.
1984;141(11):1356-64. 45. Albert M, Smith LA, Scherr PA, Taylor JO, Evans DA, Funkenstein HH. Use of brief cognitive tests to identify individuals in
the community with clinically diagnosed Alzheimer's disease. Int J Neurosci. 1991;57(3-4):167-78. 46. Scherr PA, Albert MS, Funkenstein HH, Cook NR, Hennekens CH, Branch LG, et al. Correlates of cognitive function in an
elderly community population. Am J Epidemiol. 1988;128(5):1084-101. 47. Monsch AU, Bondi MW, Butters N, Salmon DP, Katzman R, Thal LJ. Comparisons of verbal fluency tasks in the detection
of dementia of the Alzheimer type. Arch Neurol. 1992;49(12):1253-8. 48. McKhann GM, Knopman DS, Chertkow H, Hyman BT, Jack CR, Jr., Kawas CH, et al. The diagnosis of dementia due to
Alzheimer's disease: recommendations from the National Institute on Aging-Alzheimer's Association workgroups on diagnostic guidelines for Alzheimer's disease. Alzheimer's & dementia : the journal of the Alzheimer's Association. 2011;7(3):263-9.
49. Tangney CC, Li H, Wang Y, Barnes L, Schneider JA, Bennett DA, et al. Relation of DASH- and Mediterranean-like dietary patterns to cognitive decline in older persons. Neurology. 2014;83(16):1410-6.
50. Smith PJ, Blumenthal JA, Babyak MA, Craighead L, Welsh-Bohmer KA, Browndyke JN, et al. Effects of the dietary approaches to stop hypertension diet, exercise, and caloric restriction on neurocognition in overweight adults with high blood pressure. Hypertension. 2010;55(6):1331-8.
51. Vellas B, Andrieu S, Sampaio C, Wilcock G. Disease-modifying trials in Alzheimer's disease: a European task force consensus. Lancet neurology. 2007;6(1):56-62.
52. Kivipelto M, Solomon A, Ahtiluoto S, Ngandu T, Lehtisalo J, Antikainen R, et al. The Finnish Geriatric Intervention Study to Prevent Cognitive Impairment and Disability (FINGER): study design and progress. Alzheimers Dement. 2013;9(6):657-65.
53. Cao L, Tan L, Wang HF, Jiang T, Zhu XC, Lu H, et al. Dietary Patterns and Risk of Dementia: a Systematic Review and Meta-Analysis of Cohort Studies. Mol Neurobiol. 2015;9:9.
54. Psaltopoulou T, Sergentanis TN, Panagiotakos DB, Sergentanis IN, Kosti R, Scarmeas N. Mediterranean diet, stroke, cognitive impairment, and depression: A meta-analysis. Annals of neurology. 2013;74(4):580-91.
55. Singh B, Parsaik AK, Mielke MM, Erwin PJ, Knopman DS, Petersen RC, et al. Association of mediterranean diet with mild cognitive impairment and Alzheimer's disease: a systematic review and meta-analysis. J Alzheimers Dis. 2014;39(2):271-82.

Chapter 10 | General discussion
172
56. Sofi F, Abbate R, Gensini GF, Casini A. Accruing evidence on benefits of adherence to the Mediterranean diet on health: an updated systematic review and meta-analysis. Am J Clin Nutr. 2010;92(5):1189-96.
57. Herholz K, Ebmeier K. Clinical amyloid imaging in Alzheimer's disease. Lancet neurology. 2011;10(7):667-70. 58. Dubois B, Feldman HH, Jacova C, Cummings JL, Dekosky ST, Barberger-Gateau P, et al. Revising the definition of
Alzheimer's disease: a new lexicon. Lancet Neurol. 2010;9(11):1118-27. 59. Blennow K, Hampel H, Weiner M, Zetterberg H. Cerebrospinal fluid and plasma biomarkers in Alzheimer disease. Nature
reviews Neurology. 2010;6(3):131-44. 60. Gardener H, Scarmeas N, Gu Y, Boden-Albala B, Elkind MS, Sacco RL, et al. Mediterranean diet and white matter
hyperintensity volume in the northern Manhattan study. Arch Neurol. 2012;69(2):251-6. 61. Luciano M, Corley J, Cox SR, Valdes Hernandez MC, Craig LC, Dickie DA, et al. Mediterranean-type diet and brain
structural change from 73 to 76 years in a Scottish cohort. Neurology. 2017;88(5):449-55. 62. Staubo SC, Aakre JA, Vemuri P, Syrjanen JA, Mielke MM, Geda YE, et al. Mediterranean diet, micronutrients and
macronutrients, and MRI measures of cortical thickness. Alzheimer's & dementia : the journal of the Alzheimer's Association. 2017;13(2):168-77.
63. Gu Y, Brickman AM, Stern Y, Habeck CG, Razlighi QR, Luchsinger JA, et al. Mediterranean diet and brain structure in a multiethnic elderly cohort. Neurology. 2015;21(10).
64. Pelletier A, Barul C, Feart C, Helmer C, Bernard C, Periot O, et al. Mediterranean diet and preserved brain structural connectivity in older subjects. Alzheimer's & dementia : the journal of the Alzheimer's Association. 2015;11(9):1023-31.
65. Mi W, van Wijk N, Cansev M, Sijben JW, Kamphuis PJ. Nutritional approaches in the risk reduction and management of Alzheimer's disease. Nutrition. 2013;29(9):1080-9.
66. Salthouse TA. When does age-related cognitive decline begin? Neurobiol Aging. 2009;30(4):507-14. 67. Finch CE. The neurobiology of middle-age has arrived. Neurobiol Aging. 2009;30(4):515-20; discussion 30-33. 68. Nilsson LG, Sternang O, Ronnlund M, Nyberg L. Challenging the notion of an early-onset of cognitive decline. Neurobiol
Aging. 2009;30(4):521-4; discussion 30-3. 69. Hedden T, Gabrieli JD. Insights into the ageing mind: a view from cognitive neuroscience. Nature reviews Neuroscience.
2004;5(2):87-96. 70. Singh-Manoux A, Kivimaki M, Glymour MM, Elbaz A, Berr C, Ebmeier KP, et al. Timing of onset of cognitive decline:
results from Whitehall II prospective cohort study. Bmj. 2012;344:d7622. 71. de Jager CA, Kovatcheva A. Summary and discussion: Methodologies to assess long-term effects of nutrition on brain
function. Nutr Rev. 2010;68 Suppl 1:S53-8. 72. Kamphuis PJ, Scheltens P. Can nutrients prevent or delay onset of Alzheimer's disease? J Alzheimers Dis.
2010;20(3):765-75. 73. Aisen PS. Alzheimer's disease therapeutic research: the path forward. Alzheimer's research & therapy. 2009;1(1):2. 74. Rovio SP, Pahkala K, Nevalainen J, Juonala M, Salo P, Kahonen M, et al. Cardiovascular Risk Factors From Childhood and
Midlife Cognitive Performance: The Young Finns Study. J Am Coll Cardiol. 2017;69(18):2279-89. 75. van Staveren WA, de Groot LC. Evidence-based dietary guidance and the role of dairy products for appropriate nutrition
in the elderly. J Am Coll Nutr. 2011;30(5 Suppl 1):429s-37s. 76. Ames BN. Low micronutrient intake may accelerate the degenerative diseases of aging through allocation of scarce
micronutrients by triage. Proc Natl Acad Sci U S A. 2006;103(47):17589-94. 77. Roman Vinas B, Ribas Barba L, Ngo J, Gurinovic M, Novakovic R, Cavelaars A, et al. Projected prevalence of inadequate
nutrient intakes in Europe. Annals of nutrition & metabolism. 2011;59(2-4):84-95. 78. Lopes da Silva S, Vellas B, Elemans S, Luchsinger J, Kamphuis P, Yaffe K, et al. Plasma nutrient status of patients with
Alzheimer's disease: Systematic review and meta-analysis. Alzheimer's & dementia : the journal of the Alzheimer's Association. 2014;10(4):485-502.
79. Conquer JA, Tierney MC, Zecevic J, Bettger WJ, Fisher RH. Fatty acid analysis of blood plasma of patients with Alzheimer's disease, other types of dementia, and cognitive impairment. Lipids. 2000;35(12):1305-12.
80. Cardoso BR, Ong TP, Jacob-Filho W, Jaluul O, Freitas MI, Cozzolino SM. Nutritional status of selenium in Alzheimer's disease patients. Br J Nutr. 2010;103(6):803-6.
81. Quadri P, Fragiacomo C, Pezzati R, Zanda E, Forloni G, Tettamanti M, et al. Homocysteine, folate, and vitamin B-12 in mild cognitive impairment, Alzheimer disease, and vascular dementia. Am J Clin Nutr. 2004;80(1):114-22.
82. Rinaldi P, Polidori MC, Metastasio A, Mariani E, Mattioli P, Cherubini A, et al. Plasma antioxidants are similarly depleted in mild cognitive impairment and in Alzheimer's disease. Neurobiol Aging. 2003;24(7):915-9.
83. Baldeiras I, Santana I, Proenca MT, Garrucho MH, Pascoal R, Rodrigues A, et al. Peripheral oxidative damage in mild cognitive impairment and mild Alzheimer's disease. J Alzheimers Dis. 2008;15(1):117-28.
84. Ngandu T, Lehtisalo J, Solomon A, Levalahti E, Ahtiluoto S, Antikainen R, et al. A 2 year multidomain intervention of diet, exercise, cognitive training, and vascular risk monitoring versus control to prevent cognitive decline in at-risk elderly people (FINGER): a randomised controlled trial. Lancet. 2015;385(9984):2255-63.
85. Deutsches Zentrum für Neurodegenerative Erkrankungen in der Helmholtz-Gemeinschaft. Rhineland Study 2017 [10-05-2017]. Available from: https://www.dzne.de/en/research/research-areas/population-health-sciences/rhineland-study.html.
86. Newby PK, Weismayer C, Akesson A, Tucker KL, Wolk A. Long-term stability of food patterns identified by use of factor analysis among Swedish women. J Nutr. 2006;136(3):626-33.
173
87. Weismayer C, Anderson JG, Wolk A. Changes in the stability of dietary patterns in a study of middle-aged Swedishwomen. J Nutr. 2006;136(6):1582-7.
88. Grossklaus R. Codex recommendations on the scientific basis of health claims. European journal of nutrition. 2009;48Suppl 1:S15-22.
89. Kromhout D, Spaaij CJ, de Goede J, Weggemans RM. The 2015 Dutch food-based dietary guidelines. Eur J Clin Nutr. 2016;70(8):869-78.
90. Netherlands Nutrition Centre. Wheel of Five (Schijf van Vijf) Den Haag2016 [28-04-2017]. Available from:http://www.voedingscentrum.nl/Assets/Uploads/voedingscentrum/Documents/Professionals/SchijfvanVijf/VoedingscentrumRichtlijnenSchijfvanVijf2016.pdf.

10
Chapter 10 | General discussion
172
56. Sofi F, Abbate R, Gensini GF, Casini A. Accruing evidence on benefits of adherence to the Mediterranean diet on health: an updated systematic review and meta-analysis. Am J Clin Nutr. 2010;92(5):1189-96.
57. Herholz K, Ebmeier K. Clinical amyloid imaging in Alzheimer's disease. Lancet neurology. 2011;10(7):667-70. 58. Dubois B, Feldman HH, Jacova C, Cummings JL, Dekosky ST, Barberger-Gateau P, et al. Revising the definition of
Alzheimer's disease: a new lexicon. Lancet Neurol. 2010;9(11):1118-27. 59. Blennow K, Hampel H, Weiner M, Zetterberg H. Cerebrospinal fluid and plasma biomarkers in Alzheimer disease. Nature
reviews Neurology. 2010;6(3):131-44. 60. Gardener H, Scarmeas N, Gu Y, Boden-Albala B, Elkind MS, Sacco RL, et al. Mediterranean diet and white matter
hyperintensity volume in the northern Manhattan study. Arch Neurol. 2012;69(2):251-6. 61. Luciano M, Corley J, Cox SR, Valdes Hernandez MC, Craig LC, Dickie DA, et al. Mediterranean-type diet and brain
structural change from 73 to 76 years in a Scottish cohort. Neurology. 2017;88(5):449-55. 62. Staubo SC, Aakre JA, Vemuri P, Syrjanen JA, Mielke MM, Geda YE, et al. Mediterranean diet, micronutrients and
macronutrients, and MRI measures of cortical thickness. Alzheimer's & dementia : the journal of the Alzheimer's Association. 2017;13(2):168-77.
63. Gu Y, Brickman AM, Stern Y, Habeck CG, Razlighi QR, Luchsinger JA, et al. Mediterranean diet and brain structure in a multiethnic elderly cohort. Neurology. 2015;21(10).
64. Pelletier A, Barul C, Feart C, Helmer C, Bernard C, Periot O, et al. Mediterranean diet and preserved brain structural connectivity in older subjects. Alzheimer's & dementia : the journal of the Alzheimer's Association. 2015;11(9):1023-31.
65. Mi W, van Wijk N, Cansev M, Sijben JW, Kamphuis PJ. Nutritional approaches in the risk reduction and management of Alzheimer's disease. Nutrition. 2013;29(9):1080-9.
66. Salthouse TA. When does age-related cognitive decline begin? Neurobiol Aging. 2009;30(4):507-14. 67. Finch CE. The neurobiology of middle-age has arrived. Neurobiol Aging. 2009;30(4):515-20; discussion 30-33. 68. Nilsson LG, Sternang O, Ronnlund M, Nyberg L. Challenging the notion of an early-onset of cognitive decline. Neurobiol
Aging. 2009;30(4):521-4; discussion 30-3. 69. Hedden T, Gabrieli JD. Insights into the ageing mind: a view from cognitive neuroscience. Nature reviews Neuroscience.
2004;5(2):87-96. 70. Singh-Manoux A, Kivimaki M, Glymour MM, Elbaz A, Berr C, Ebmeier KP, et al. Timing of onset of cognitive decline:
results from Whitehall II prospective cohort study. Bmj. 2012;344:d7622. 71. de Jager CA, Kovatcheva A. Summary and discussion: Methodologies to assess long-term effects of nutrition on brain
function. Nutr Rev. 2010;68 Suppl 1:S53-8. 72. Kamphuis PJ, Scheltens P. Can nutrients prevent or delay onset of Alzheimer's disease? J Alzheimers Dis.
2010;20(3):765-75. 73. Aisen PS. Alzheimer's disease therapeutic research: the path forward. Alzheimer's research & therapy. 2009;1(1):2. 74. Rovio SP, Pahkala K, Nevalainen J, Juonala M, Salo P, Kahonen M, et al. Cardiovascular Risk Factors From Childhood and
Midlife Cognitive Performance: The Young Finns Study. J Am Coll Cardiol. 2017;69(18):2279-89. 75. van Staveren WA, de Groot LC. Evidence-based dietary guidance and the role of dairy products for appropriate nutrition
in the elderly. J Am Coll Nutr. 2011;30(5 Suppl 1):429s-37s. 76. Ames BN. Low micronutrient intake may accelerate the degenerative diseases of aging through allocation of scarce
micronutrients by triage. Proc Natl Acad Sci U S A. 2006;103(47):17589-94. 77. Roman Vinas B, Ribas Barba L, Ngo J, Gurinovic M, Novakovic R, Cavelaars A, et al. Projected prevalence of inadequate
nutrient intakes in Europe. Annals of nutrition & metabolism. 2011;59(2-4):84-95. 78. Lopes da Silva S, Vellas B, Elemans S, Luchsinger J, Kamphuis P, Yaffe K, et al. Plasma nutrient status of patients with
Alzheimer's disease: Systematic review and meta-analysis. Alzheimer's & dementia : the journal of the Alzheimer's Association. 2014;10(4):485-502.
79. Conquer JA, Tierney MC, Zecevic J, Bettger WJ, Fisher RH. Fatty acid analysis of blood plasma of patients with Alzheimer's disease, other types of dementia, and cognitive impairment. Lipids. 2000;35(12):1305-12.
80. Cardoso BR, Ong TP, Jacob-Filho W, Jaluul O, Freitas MI, Cozzolino SM. Nutritional status of selenium in Alzheimer's disease patients. Br J Nutr. 2010;103(6):803-6.
81. Quadri P, Fragiacomo C, Pezzati R, Zanda E, Forloni G, Tettamanti M, et al. Homocysteine, folate, and vitamin B-12 in mild cognitive impairment, Alzheimer disease, and vascular dementia. Am J Clin Nutr. 2004;80(1):114-22.
82. Rinaldi P, Polidori MC, Metastasio A, Mariani E, Mattioli P, Cherubini A, et al. Plasma antioxidants are similarly depleted in mild cognitive impairment and in Alzheimer's disease. Neurobiol Aging. 2003;24(7):915-9.
83. Baldeiras I, Santana I, Proenca MT, Garrucho MH, Pascoal R, Rodrigues A, et al. Peripheral oxidative damage in mild cognitive impairment and mild Alzheimer's disease. J Alzheimers Dis. 2008;15(1):117-28.
84. Ngandu T, Lehtisalo J, Solomon A, Levalahti E, Ahtiluoto S, Antikainen R, et al. A 2 year multidomain intervention of diet, exercise, cognitive training, and vascular risk monitoring versus control to prevent cognitive decline in at-risk elderly people (FINGER): a randomised controlled trial. Lancet. 2015;385(9984):2255-63.
85. Deutsches Zentrum für Neurodegenerative Erkrankungen in der Helmholtz-Gemeinschaft. Rhineland Study 2017 [10-05-2017]. Available from: https://www.dzne.de/en/research/research-areas/population-health-sciences/rhineland-study.html.
86. Newby PK, Weismayer C, Akesson A, Tucker KL, Wolk A. Long-term stability of food patterns identified by use of factor analysis among Swedish women. J Nutr. 2006;136(3):626-33.
173
87. Weismayer C, Anderson JG, Wolk A. Changes in the stability of dietary patterns in a study of middle-aged Swedishwomen. J Nutr. 2006;136(6):1582-7.
88. Grossklaus R. Codex recommendations on the scientific basis of health claims. European journal of nutrition. 2009;48Suppl 1:S15-22.
89. Kromhout D, Spaaij CJ, de Goede J, Weggemans RM. The 2015 Dutch food-based dietary guidelines. Eur J Clin Nutr. 2016;70(8):869-78.
90. Netherlands Nutrition Centre. Wheel of Five (Schijf van Vijf) Den Haag2016 [28-04-2017]. Available from:http://www.voedingscentrum.nl/Assets/Uploads/voedingscentrum/Documents/Professionals/SchijfvanVijf/VoedingscentrumRichtlijnenSchijfvanVijf2016.pdf.


Summary

Summary
176
With ageing of our population and the accompanying increase in the number of people living with dementia, it is important to find modifiable risk factors to postpone the onset of cognitive decline. Diet has been proposed such a modifiable risk factor. To date, numerous studies have been conducted demonstrating a possible role of specific nutrients and foods in cognitive functioning. However, as people do not consume single nutrients, the research field has shifted towards studying dietary patterns in which synergistic effects of single nutrients and/or foods can be studied. The main aim of this thesis was to study the association of healthful dietary patterns with cognitive functioning. In addition, nutrient intake inadequacies were assessed and the potential to change dietary intake in older adults aged 65 years and older was studied.
Chapter 2 describes nutrient intake of 245 Dutch adults aged 65-80 years. We identified the contribution of nutrient dense foods, fortified foods and dietary supplements to the total intake of micronutrients. Nutrient density of foods was evaluated using the Nutrient Rich Food score 9.3. Nutrient intake inadequacies were observed for vitamin D, vitamin B6 and selenium. Conventional foods were the main source of vitamin D, vitamin B6 and selenium intake. Foods with the highest nutrient density contributed most to total vitamin B6 intake. In order to optimize nutrient intakes of elderly, combinations of natural food sources, fortified foods and dietary supplements should be considered.
Chapter 3 provides a systematic review of the literature on human studies up to May 2014 that examined the role of dietary patterns in relation to cognitive decline or dementia. The results demonstrate that better adherence to a Mediterranean diet was associated with less cognitive decline, dementia or Alzheimer’s Disease (AD) in four out of six cross-sectional studies, six out of 12 longitudinal studies, one trial and three meta-analyses. Other healthy dietary patterns, among which the Healthy Diet Indicator, have shown to be associated with reduced cognitive decline and/or a reduced risk of dementia in all six cross-sectional studies and six out of eight longitudinal studies. The conclusion of this literature review was that more conclusive evidence is needed to come to more targeted and detailed dietary guidelines to prevent or postpone cognitive decline.
In chapter 4 the association between the Healthy Diet Indicator (HDI) and cognitive functioning in older adults from three different cohort studies was investigated. The cohorts included in total 21,837 subjects from Europe (SENECA and the Rotterdam Study [RS]) and the Unites States (Nurses’ Health Study [NHS]). Cognitive functioning was measured using the Mini-Mental State Examination (MMSE) in SENECA and RS, and the Telephone Interview for Cognitive Status (TICS) in NHS. In all three cohorts, the HDI was not significantly associated with cognitive decline, nor with cognitive function.
In chapter 5 the association of long-term adherence to the Dietary Approaches to Stop Hypertension (DASH) diet with cognitive function and decline in older American women was examined. A total of 16,144 women from the Nurses’ Health Study, aged ≥70 years, who underwent cognitive testing a total of 4 times by telephone from 1995-2001 (baseline), with multiple dietary assessments between 1984 and the first cognitive exam were studied. Greater adherence to long-term DASH score was significantly associated with better average global cognition, verbal memory and TICS score at older ages, but not with cognitive decline.
177
In chapter 6, the same cohort as in chapter 5 was studied to examine the association between long-term adherence to a recently developed Mediterranean-DASH Intervention for Neurodegenerative Delay (MIND) diet with cognitive function and decline. Higher MIND diet scores were associated with better verbal memory at older ages, but not with cognitive decline over 6 years in global cognition, verbal memory or TICS.
Chapter 7 provides an overview of the NU-AGE (NUtrients and AGEing) dietary intervention study. The NU-AGE study is a randomized one-year intervention in 1,250 apparently healthy, independently living European subjects aged 65 to 80 years. Subjects were randomised into either the intervention group or the control group. Participants in the intervention group received dietary advice aimed at meeting the dietary recommendations of the ageing population. At the start of this thesis, the NU-AGE study was the first dietary intervention investigating the effect of a whole diet and providing targeted dietary recommendations for optimal health and quality of life in apparently healthy European elderly.
In chapter 8, we evaluated if the NU-AGE intervention could be effective to shift the dietary intake of apparently healthy older adults aged 65-80 years living in Italy, the UK, the Netherlands, Poland, and France towards a more healthful diet. The NU-AGE index was created to assess adherence to the NU-AGE diet. At baseline and after one-year follow-up dietary intake was assessed by means of 7-day food records. In total, 1,296 participants were randomized and 1,145 participants completed the intervention (571 in intervention group, 570 in control group). After one-year follow-up, the intervention group improved mean intake of 13 out of 16 dietary recommendations of the NU-AGE diet (p<0.05) with a significant increase of the total NU-AGE index, compared to the control group (mean change in NU-AGE index 21.3±15.9, p<0.01). The NU-AGE dietary intervention, based on dietary recommendations for older adults, may be a feasible strategy to improve dietary intake in an ageing European population.
Chapter 9 shows the results of the NU-AGE parallel randomized dietary intervention study on cognitive functioning in the Dutch NU-AGE subpopulation, including 252 older adults aged 65-80 years (123 intervention, 129 control). The primary outcome was one-year change in global cognition and in four cognitive domains as measured through a comprehensive neuropsychological test battery. Comparing the intervention with the control group, there was no effect of the intervention on cognitive functioning.
In chapter 10 the main findings of this thesis were summarized and a reflection on methodological aspects was given. When grading the reported associations in previous studies and studies in this thesis, it was concluded that there is probable evidence for a role of the Mediterranean diet on cognitive functioning. For the DASH and MIND diet there is a possible link with cognitive functioning; for the HDI and the NU-AGE diet there is no sufficient evidence yet to conclude that there is a relation with cognitive functioning. Not only is there a need for well-designed intervention and prospective studies, we also call for communication strategies to the general public about the consumption of healthier diets to not only impact cardiovascular but also potentially impact brain health as many individuals will face progressive cognitive decline in the near future.


AcknowledgementsDankwoord

Acknowledgements, Dankwoord
180
Dit zijn de allerlaatste pagina’s om een enorm leerzame, motiverende, uitdagende en unieke periode in mijn leven af te sluiten; mijn proefschrift is af! Natuurlijk heb ik dit niet alleen kunnen doen en daarom wil ik iedereen hieronder bedanken.
Allereerst wil ik mijn promotoren, Edith en Lisette, bedanken. Bedankt dat jullie mij zagen toen ik na mijn afstuderen werkte als onderzoeks- en onderwijsassistent bij B-PROOF en EURRECA. Jullie vonden het geen probleem dat ik deze werkzaamheden eerst netjes wilde afronden terwijl ik ondertussen aan mijn PhD bij NU-AGE begon. En zo is het ook precies de afgelopen 6 jaar gegaan; naast NU-AGE heb ik met veel plezier – en met jullie volste vertrouwen – aan diverse andere projecten mogen werken die zowel leerzaam als uitdagend waren. Zo ben ik niet recht op mijn doel afgegaan, maar heb ik door veel verschillende zijwegen nóg meer kunnen leren. Ondanks dat ik er op het eind van mijn PhD onverwacht ‘even tussenuit’ was hebben jullie er altijd vertrouwen in gehad dat mijn proefschrift af zou komen. En het resultaat mag er wezen – al zeg ik het zelf! Ja, het is jullie eindelijk gelukt om mij trots te laten zijn op mijn eigen werk!
Ondine, jij kwam er in een latere fase van mijn PhD traject bij toen de NU-AGE studie zo goed als afgerond was. Maar, zoals een goed Europees project betaamt was het werk daarmee nog lang niet klaar. Jij was er om mij tot het eind te helpen het project helemaal af te ronden en om mij te stimuleren om vooral ook naar de wereld búiten NU-AGE te kijken. Jij hebt mij gemotiveerd om een paar maanden ervaring op te doen in Boston en je hebt mij geleerd dat er met creatief vliegwerk een gezin met een boeiende carrière gecombineerd kan worden.
Jae Hee and Fran, although I have spent only a few months in Boston, it feels like you have become my co-supervisors as well. Thank you very much for having me with you in Boston. It was an amazing period in my – not only scientific – life! It has been a period that I will never forget!
De leden van de promotiecommissie, Pieter, Marjolein, Monique en Inge, wil ik graag bedanken voor het lezen van mijn proefschrift en het voeren van de oppositie. Monique and Inge, thank you for coming to the Netherlands to be part of my thesis committee.
Een groot deel van mijn promotieonderzoek – de NU-AGE studie – was niet mogelijk geweest zonder de hulp van vele mensen. De NU-AGE studie was gestart als een enorm ambitieus project en er waren heel wat vrouwkrachten nodig om de studie op de rit te krijgen: Adriënne, Rosalie, Esmee en Truus, bedankt voor jullie financiële, praktische, organisatorische, politieke en administratieve begeleiding in de eerste jaren. Johanna en Jorien wil ik bedanken voor de praktische ondersteuning; zonder jullie had ik deze studie niet zo succesvol – en op tijd – kunnen opzetten en afronden. Alle diëtisten bedankt voor de adviezen (Jeanne), de trainingen (Els), de talloze huisbezoeken (Yvonne, Marlous, Merel, Milou en Annemieke), en het ‘uitdraaien’ van de enorme hoeveelheid data waar soms nachten overheen gingen (Corine). Alle onderzoeksondersteuning (Anita, Jantien, Diana, Paul, Christoph, Henriëtte) bedankt voor het plannen, prikken, meedenken, screenen van deelnemers, en voor de DEXA-trainingen. Anita, ik wil jou speciaal bedanken; ik heb enorm veel van jou geleerd over het opzetten, plannen en organiseren van een onderzoek; ik heb heel fijn met je samengewerkt! Sophie, Huizhi en Mechteld, bedankt dat jullie je wilden inwerken in het onmogelijk ingewikkelde PBMC protocol.
181
Zonder de hulp van alle studenten was de NU-AGE studie niet mogelijk geweest; Chantal, Huizhi, Rebecca, Eline, Daphne, Leyla, Rinske, Anica, Fusta, Irma, Teuni en Jonneke, bedankt voor al jullie enthousiasme en hulp. Nog meer dank ben ik mijn deelnemers verschuldigd; zonder jullie deelname was er überhaupt geen onderzoek geweest. Dank voor jullie deelname!
Dames van het secretariaat, bedankt voor het plannen van – soms onmogelijke – afspraken, mij wegwijs maken in van alles en nog wat en voor jullie ondersteuning bij de laatste loodjes.
Zonder lieve, leuke en gezellige collega’s had ik het niet zo lang volgehouden. Anouk, kamergenootje en luisterend oor; bedankt voor het aanhoren van mijn frustraties en voor de gezellige momenten! De ‘Agro-(gang) genootjes’, Laura, Elske, Nikita, Maaike, Yfke, Monique, Janne, Marije, Sandra, Canan, Nicole, Pim, Rieneke, Anneleen; bedankt voor de gezellige onderbrekingen van het werk! De PhD tour commissie 2013, Annemarie, Nikkie, Inge, Swetlana, Lieke, Anouk, Laura, bedankt voor de uitdagende maar succesvolle reis naar Australië.
ENLP-meiden, Janne, Nikkie, Grace en Anouk, bedankt voor de toffe en gezellige reis naar Luxemburg; wat hebben we samen veel gedeeld en geleerd! Thank you ENLP-2016 for letting me learn as much as I did!
Cora, bijzonder hoe onze paden elkaar de afgelopen 7 jaar steeds hebben gekruist; ik ben als groentje begonnen bij EURRECA en heb met jouw begeleiding mooie onderwijsmodules mogen maken. Ik vond het erg fijn dat jij mij wegwijs hebt willen maken in het onderwijs. Jouw passie, deskundigheid en oog voor innovatie hebben mij geïnspireerd om verder te willen met onderwijs.
Mijn lieve paranimfen wil ik speciaal bedanken. Johanna, nogmaals dank voor al je hulp tijdens mijn PhD. Ik vind het super stoer dat je een PhD in Duitsland bent gaan doen en dat je al zo ver bent. Elske, wat hebben we veel hoogte- maar ook dieptepunten meegemaakt de afgelopen jaren. Ik vind het heel bijzonder dat ik dat allemaal met jou heb mogen beleven. Het is mooi om deze periode vandaag af te sluiten met jullie naast mij op het podium. Bedankt voor al jullie steun!
Als laatste wil ik mijn familie en schoonfamilie bedanken voor jullie vertrouwen, interesse en geduld de afgelopen jaren. Vooral jullie steun in de laatste fase van mijn PhD toen Mees plotseling werd geboren is onbetaalbaar. Zonder jullie hulp en oppas-momentjes was dit proefschrift nu nog niet klaar geweest. Alex, bedankt voor de mooie persoonlijke omslag.
Lieve Jasper, mijn liefde, rots in de branding en fantastische vader van onze Mees; woorden schieten tekort om jou te bedanken. Jij liet mij een pas op de plaats maken als dat weer eens nodig was en hebt mij geweldig geholpen met de laatste PhD loodjes. Ik kijk enorm uit naar onze toekomst samen - zónder proefschrift-stress! .
Agnes


About the author

About the author
184
Curriculum VitaeAgnes Berendsen was born on May 22nd, 1985 in Arnhem, the Netherlands. After completing secondary school at the ‘Candea College’ in Duiven in 2001, she started her higher vocational education ‘Nutrition and Dietetics’ at the HAN, Nijmegen. For her first clinical internship she worked with a private dietician in Eindhoven and Waalre. Agnes completed her second clinical internship at the St. Antonius hospital in Nieuwegein. For her research thesis she went to Umeå University in Sweden, where she studied the dietetic treatment of coeliac disease patients. After graduating as registered dietician, Agnes worked several years as a clinical dietician in the St. Antonius hospital in Nieuwegein, the Mesos Medisch centrum in Utrecht and later on in Rijnstate hospital in Arnhem. Because Agnes was highly interested to learn more about the scientific evidence behind dietary guidelines, she decided to go back to college to study Nutrition and Health in Wageningen in 2008. For her first MSc thesis, she went to the Radboud University Medical Centre to study the association between B-vitamin intake and bladder cancer risk. She completed her second MSc thesis at the division of Human Nutrition, on the association between the use of vitamin supplements and colorectal cancer recurrence. In 2010, she completed her Masters with the specialization Epidemiology and Public Health. After this, Agnes worked on a large randomized trial – the B-PROOF study - at the Division of Human Nutrition. Soon, she was appointed as Educational Developer within EURRECA - a European project. In July 2011, Agnes started her PhD project at the group of Nutritional Epidemiology and Public Health of the Division of Human Nutrition of Wageningen University under supervision of Prof. Lisette de Groot, Prof. Edith Feskens, and Dr. Ondine van de Rest. Her research was part of a large European project entitled; “New dietary strategies addressing the specific needs of elderly population for a healthy ageing in Europe, NU-AGE”, funded by the European Commission. During her PhD, she closely collaborated with researchers from the University of East Anglia (the UK), UNIBO in Bologna (Italy), CRNH in Clermont-Ferrand (France), and WULS-SGGW in Warsaw (Poland). In addition, she visited Harvard T.H. Chan School of Public Health, to work with a large observational dataset, resulting in three publications. Furthermore, she was part of an expert panel within the “Nutrient Intake Optimisation” task force from ILSI Europe, resulting in one publication. The results of her PhD project and other collaborations are described in this thesis entitled “Dietary patterns for healthier cognitive ageing”. During her PhD Agnes supervised fifteen students working on their BSc and MSc thesis. Besides working on her PhD research, Agnes contributed to an external scientific report of EFSA on the collection and analysis of published scientific information as preparatory work for the setting of Dietary Reference Values for vitamin D. Furthermore, Agnes was responsible for the design and teaching of epidemiology courses for the online Master Nutritional Epidemiology and Public Health. Moreover, she coordinated the kick-off meeting and other meetings for FOODBALL, a JPI HDHL program. At last, she participated in organising a study tour to Australia for 25 PhD students from the division of Human Nutrition. In 2015, Agnes was third prize winner of the Foppe ten Hoor Award during the Dutch Nutritional Science Days. In 2016, she was selected to participate in the 22nd seminar of the European Nutrition Leadership Platform, and she was one of the five price winners of the Writing Competition. Currently, Agnes continues her work as a researcher to identify the most efficient lifestyle pattern for the prevention of type-2 diabetes. Additionally, she will continue her educational tasks for several bachelor and master courses on epidemiology.
185
List of publications Peer reviewed publications 1. Berendsen AM, Kang JH, van de Rest O, Jankovic N, Kampman E, Kiefte-de Jong JC, et al.
Association of Adherence to a Healthy Diet with Cognitive Decline in European and American Older Adults: A Meta-Analysis within the CHANCES Consortium. Dementia and geriatric cognitive disorders. 2017;43(3-4):215-27.
2. Berendsen AM, Kang JH, van de Rest O, Feskens EJ, de Groot LC, Grodstein F. The Dietary Approaches to Stop Hypertension Diet, Cognitive Function, and Cognitive Decline in American Older Women. J Am Med Dir Assoc. 2017;18:427-32.
3. Berendsen AM, Kang JH, Feskens EJM, de Groot CPGM, Grodstein F, van de Rest O. Association of long-term adherence to the mind diet with cognitive function and cognitive decline in American women. The journal of nutrition, health & aging. 2017:1-8.
4. Vaes AM, Brouwer-Brolsma EM, van der Zwaluw NL, van Wijngaarden JP, Berendsen AM, van Schoor N, et al. Food sources of vitamin D and their association with 25-hydroxyvitamin D status in Dutch older adults. The Journal of steroid biochemistry and molecular biology. 2016.
5. Brouwer-Brolsma EM, Berendsen AM, Vaes AMM, Dullemeijer C, de Groot CPGM, Feskens EJM. Collection and analysis of published scientific information as preparatory work for the setting of Dietary Reference Values for Vitamin D. . 2016 March 2016. Report No.
6. Berendsen AM, van Lieshout LE, van den Heuvel EG, Matthys C, Peter S, de Groot LC. Conventional foods, followed by dietary supplements and fortified foods, are the key sources of vitamin D, vitamin B6, and selenium intake in Dutch participants of the NU-AGE study. Nutrition research. 2016;36:1171-81.
7. Berendsen AM, van de Rest O, Haveman-Nies A, de Groot CPGM. Dietary patterns, cognitive decline, and dementia: a systematic review. Adv Nutr. 2015;6(2):154-68.
8. Santoro A, Pini E, Scurti M, Palmas G, Berendsen AM, Brzozowska A, et al. Combating inflammaging through a Mediterranean whole diet approach: The NU-AGE project's conceptual framework and design. Mechanisms of ageing and development. 2014;136-137:3-13.
9. Berendsen AM, Santoro A, Pini E, Cevenini E, Ostan R, Pietruszka B, et al. Reprint of: A parallel randomized trial on the effect of a healthful diet on inflammageing and its consequences in European elderly people: design of the NU-AGE dietary intervention study. Mechanisms of ageing and development. 2014;136-137:14-21.
Abstracts and presentations 1. Berendsen AM, van de Rest O, Haveman-Nies A, de Groot CPGM. Dietary patterns, cognitive
decline, and dementia: a systematic review. JNHA. 2015. Barcelona, Spain. Poster presentation. 2. Berendsen AM, van de Rest O, de Groot CPGM, Feskens EJM. Dietary patterns and Cognitive
Ageing. Annual Dutch Nutritional Science Days. 2012, 2015 (Foppe ten Hoor). Deurne, The Netherlands. Oral presentation.
3. Berendsen AM, de Groot CPGM, Feskens EJM. Compliane and changes in dietary intake among elderly people in five EU countries. NU-AGE Final conference. 2015. Brussel, Belgium. Oral presentation.

About the author
186
Overview of completed training activities Discipline specific activities Courses - Nutritional and lifestyle epidemiology, graduate school VLAG, Wageningen, 2011 - Summer school ‘Why and How we age’, Leyden Academy, Leiden, 2011 - Nutrient Density of Milk, Milk Genomics and Health Benefits of Dairy, VLAG/WIAS/NZO,
Wageningen, 2011 - Epigenesis and Epigenetics (2nd edition), VLAG, Wageningen, 2011 - Analysis using R, VLAG/WUR, Wageningen, 2012 - Confounding, VLAG, Wageningen, 2014 - Biomarkers for intake of foods and food groups, WUR, Wageningen, 2014
Conferences and meetings: - Health Benefits of foods. From emerging science to innovative products, ILSI, Prague, Czech,
2011 - Annual NU-AGE meetings, 2011 (Norwich, UK), 2013 (Granada, Spain), 2014 (Spetses, Greece),
2015 (Cork, Ireland), 20161 (Brussels, Belgium) - NU-AGE Training for recruitment, dietary intervention and measurements1,3, WULS-SGGW/WUR,
Warsaw, Poland, 2011-2012 - Annual Dutch Nutritional Science Days, NWO, Deurne, 2012, 20151 (Foppe ten Hoor) - International conference on Aging & Cognition, Dortmund, Germany, 2013 - International Congress of Nutrition, IUNS, Granada, Spain, 2013 - Gezonde voeding, gezond ouder worden - 25 jaar voedingsonderzoek bij ouderen in
Wageningen2, Wageningen, 2013 - Ageing Research@NL2, NCHA, Den Haag, 2013 - ILSI expert group meetings, ILSI, Brussels, Belgium, 20141, 20161 - Nutrition for the ageing brain, ILSI, Milan, Italy, 2014 - Mix & Match meeting, Alzheimer Nederland, Utrecht, 2015 - International Academy Nutrition & Aging congress2, Barcelona, Spain, 2015 - Voeding Nederland - Wetenschap en praktijk, Utrecht, 2015 - Challenges in translational research to promote healthy ageing2, DUSRA/KNAW, Leiden, 2017
General courses - Scientific Writing Workshop, VLAG, Wageningen, 2011 - Wet- en regelgeving voor klinisch onderzoek, ZGV, Ede, 2011 - Competence Assessment, WGS, Wageningen, 2012 - VLAG PhD week (26th edition), Baarlo, 2012 - Supervising MSc thesis, ESD/WUR, Wageningen, 2012 - Project and Time Management, WGS, Wageningen, 2012 - Stress Identification and management, VLAG, Wageningen, 2013 - Philosophy and Ethics of Food Science and Technology, VLAG, Wageningen, 2013 - Data management, VLAG, Wageningen, 2014 - PhD Workshop carrousel, VLAG, Wageningen, 2014
187
- European Nutrition Leadership Program, Luxembourg, Luxembourg, 2016 - Teaching an online course, ESD/WUR, Wageningen, 2017
Optional courses and activities - Preparation PhD research proposal, Wageningen, 2011 - PhD study tour3, Division of Human Nutrition, Melbourne/Sydney, Australia, 2013 - Epi-research meetings, HNE, Wageningen, 2011-2015 - Methodology Club, HNE, Wageningen, 2011-2015 - Rothman lunches, HNE, Wageningen, 2013-2016
1 Oral presentation given; 2 Poster presentation given, 3 Member of the organizing committee

Notes
188
Notes
189

Notes
188
Notes
189

190
Colophon
The research described in this thesis was financially supported by NU-AGE, which is financed by the European Commission in the 7th Framework Programme, Theme 2, Grant agreement no: 266486.
Financial support from Wageningen University for printing this thesis is gratefully acknowledged.
Cover photo Alex A.A.H. Berendsen Printing ProefschriftMaken
© Agnes A. M. Berendsen, 2017


Dietary patterns for healthier cognitive ageing
Agnes A.M. Berendsen
Dietary patterns for healthier cognitive ageingAgnes A.M
. Berendsen
INVITATION
You are cordially invited to attend the public defence
of the thesis entitled:
Dietary patterns for healthier cognitive
ageing
On Thursday, 31st of August, 2017 at 11:00 a.m. in the Aula
of Wageningen University, Generaal Foulkesweg 1a,
Wageningen
Agnes A.M. [email protected]
ParanymphsElske Brouwer-Brolsma
Johanna [email protected]