Nestlé. Enhancing quality of life and contributing to a healthier ...
Upload
khangminh22Category
view
3download
0
Making America Healthier for All: Challenges and Opportunities
David R. Williams, PhD, MPHFlorence & Laura Norman Professor of Public Health
Professor of African & African American Studies and of SociologyHarvard University

Patterns of American’s Health
What are the Problems?

We Are Not the Healthiest • U.S. ranks near the bottom of industrialized
countries on health, and we are losing ground
• 1980 = 11th on Life Expectancy
• 2006 = 33rd , tied with Slovenia
• U.S. Ranked behind Cyprus, United Arab Emirates, South Korea, Costa Rica and Portugal
• And it is not just the minorities doing badly!
• In 2006, White America would be = 30th
• In 2006, Black America would be 58th

A Larger Context for Disparities
There are large racial, socioeconomic, and geographic disparities in health but they should be understood within the context of the larger national disparity
All Americans are far less healthy than we could, and should be


Geographic Variations in Health
Health in America often varies dramatically from: -- one zip code to another-- one county to another-- even one train stop to another

ZIP CODE VS. GENETIC CODE

Health is Local: One County -100 year Gap • King County, home of Seattle & Starbucks, has good
health, only a couple years behind the best countries on LE• If we look at the census tract level, the county’s overall
“good” average hides huge disparities• Some census tracts in King County are 40 years ahead of
the best performing countries’ average life expectancy• Other nearby census tracts, are almost 60 years behind• There is much more variation by census tract within King
County than there is by county within the U.S. • Compared to the healthiest nations, it would take 100 years
for the census tract with the lowest life expectancy in King County to catch up to where the highest ones are today
David W. Fleming , Director, Public Health, Seattle and King County

Socioeconomic Status (SES) is a central determinant of the
distribution of valuable resources in society

SAT Scores by Income
Source: (ETS) Mantsios; N=898,596
Family Income Median ScoreMore than $100,000 1129$80,000 to $100,000 1085$70,000 to $80,000 1064$60,000 to $70,000 1049$50,000 to $60,000 1034$40,000 to $50,000 1016$30,000 to $40,000 992$20,000 to $30,000 964$10,000 to $20,000 920Less than $10,000 873

Socioeconomic Status and HealthLife in America isn’t just better at the top….
It’s also healthier and longer

Relative Risk of Premature Death by Family Income (U.S.)
0.0
0.5
1.0
1.5
2.0
2.5
3.0
3.5
4.0
<10K 10-19K 20-29K 30-39K 40-49K 50-99K 100+K
Rel
ativ
e R
isk
Family Income in 1980 (adjusted to 1999 dollars)
9-year mortality data from the National Longitudinal Mortality Survey

Low SES: Multiple Disadvantages• Poor education in childhood and adolescence
• Insecure employment or unemployment
• Stuck in hazardous or dead-end jobs
• Living in poor housing
• Living in neighborhoods with fewer resources
• Trying to raise a family in difficult circumstances
• Living on an inadequate pension
• Eat poorly, forgo exercise, skip medicationsWHO: The Solid Facts

Median Household Income and Race, 2009
U.S. Census Statistical Abstracts. 2012. Table 691

Median Household Income and Race, 2009
Racial Differences in Income are Substantial:
U.S. Census Statistical Abstracts. 2012. Table 691
1 dollar 1.26 dollar 73 cents 63 cents
White Asian Hispanic Black

Median Wealth and Race, 2007
Wolff, 2010

Median Wealth and Race, 2007
• For every dollar of wealth that Whites have,
Blacks and Latinos have only 6 cents • If we exclude home equity, and only look at
other financial assets, Blacks and Latinos have one penny for every dollar of financial wealth that Whites have.
Wolff.2010

Race and Health: Two Patterns • Racial groups with a long history characterized by
economic exploitation, social stigmatization, and geographic marginalization have markedly elevated levels of poor health outcomes:
-- Blacks or African Americans-- American Indians and Alaskan Natives-- Native Hawaiians and other Pacific Islanders
• Immigrant groups tend to have better health than the U.S. average, but their health tends to worsen over time and across subsequent generations:
-- Asians -- Hispanics or Latinos

Lifetime Prevalence of Psychiatric Disorder,by Race and Generational Status (%)
Williams et al. 2007; Alegria et al 2007; Takeuchi et al. 2007
19.4
35.3
30.1
24.0
54.6
43.4
25.6
15.2
23.8
0
10
20
30
40
50
60
Caribbean Black Latino Asian
First
Second
Third or later

Allostatic Load10 biomarkers High-risk thresholds *1. Systolic blood pressure 127 mm HG2. Diastolic blood pressure 80 mm HG3. Body Mass Index 30.94. Glycated hemoglobin 5.4%5. Albumin 4.2 g/dL6. Creatinine clearance 66 mg/dL7. Triglycerides 168 mg/dL8. C-reactive protein 0.41 mg/dL9. Homocysteine 9 μmol/L 10. Total cholesterol 225* = < 25th percentile for creatinine clearance; >75th percentile for others
Geronimus, et al., AJPH, 2006

Kaestner, et al., Social Science Quarterly, 2009
Mean Allostatic Load, by Race & Nativity

Research & Policy Challenge
What interventions, if any, can reverse the downward health trajectory of immigrants with length of stay in the U.S.?

Challenges to Understand• Accelerated aging – earlier onset of disease• Racial differences in the severity and progression
of disease• Persistence of a residual effect of race when SES is
controlled• Role of elevated exposure to psychosocial stressors
and to experiences of discrimination and institutional racism
• Health is affected not only by current SES but by exposure to social and economic adversity over the life course

Life Expectancy Lags, 1950-2006
40
60
80
Life
Exp
ecta
ncy
1950 1960 1970 1980 1990 2000 2006
WhiteBlack
NCHS, Health United States, 2010
63.6
70.6
60.8
69.1
74.476.1
69.168.2
71.7
64.1
71.473.2
78.277.6

Racial/Ethnic Disparities in Health:
More than just Socioeconomic Status

Life Expectancy At Age 25
Group White Black Difference
All 53.4 48.4 5.0
Murphy, NVSS 2000

Life Expectancy At Age 25
Group White Black Difference
AllEducation
53.4 48.4 5.0
a. 0-12 Years 50.1b. 12 Years 54.1c. Some College 55.2d. College Grad 56.5
Difference 6.4
Murphy, NVSS 2000; Braveman et al. AJPH; 2010, NLMS 1988-1998

Life Expectancy At Age 25
Group White Black Difference
AllEducation
53.4 48.4 5.0
a. 0-12 Years 50.1 47.0b. 12 Years 54.1 49.9c. Some College 55.2 50.9d. College Grad 56.5 52.3
Difference 6.4 5.3
Murphy, NVSS 2000; Braveman et al. AJPH; 2010, NLMS 1988-1998

Life Expectancy At Age 25
Group White Black Difference
AllEducation
53.4 48.4 5.0
a. 0-12 Years 50.1 47.0 3.1b. 12 Years 54.1 49.9 4.2c. Some College 55.2 50.9 4.3d. College Grad 56.5 52.3 4.2
Difference 6.4 5.3
Murphy, NVSS 2000; Braveman et al. AJPH; 2010, NLMS 1988-1998

Infant Mortality by Mother’s Education
9.9
6.5
5.14.2
17.3
14.8
12.311.4
6 5.9 5.44.4
5.7 5.5 5.14
12.7
7.9
5.7
0
2
4
6
8
10
12
14
16
18
20
<12 12 13-15 16+Years of Education
Infa
nt M
orta
lity
NH White Black Hispanic API AmI/AN

Meharry vs Johns HopkinsA 1958- 65, all Black, cohort of Meharry Medical
College MDs was compared with a 1957- 64, all White, cohort of Johns Hopkins MDs. 23-25 years later, the Black MDs had: higher risk of CVD (RR=1.65) earlier onset of disease incidence rates of diabetes & hypertension that
were twice as high higher incidence of coronary artery disease (1.4
times) higher case fatality (52% vs 9%)
Thomas et al., 1997 J. Health Care for Poor and Underserved

Why Race Still Matters1. Health is affected not only by current SES but by
exposure to adversity over the life course.
2. All indicators of SES are non-equivalent across race. Compared to whites, blacks & Hispanics receive less income at the same levels of education, have less wealth at the equivalent income levels, and have less purchasing power (at a given income level) because of higher costs of goods and services.
3. Personal experiences of discrimination and institutional racism are added pathogenic factors that can affect the health in multiple ways.
4. Higher Exposure to multiple stressors

Racism and Health: Mechanisms• Institutional discrimination can restrict socioeconomic
attainment and group differences in SES and health.
• Segregation can create pathogenic residential conditions.
• Discrimination can lead to reduced access to desirable goods and services.
• Internalized racism (acceptance of society’s negative characterization) can adversely affect health.
• Racism can create conditions that increase exposure to traditional stressors (e.g. unemployment).
• Experiences of discrimination may be a neglected psychosocial stressor.

Discrimination Persists
• Pairs of young, well-groomed, well-spoken college men with identical resumes apply for 350 advertised entry-level jobs in Milwaukee, Wisconsin. Two teams were black and two were white. In each team, one said that he had served an 18-month prison sentence for cocaine possession.
• The study found that it was easier for a white male with a felony conviction to get a job than a black male whose record was clean.
Devah Pager; Am J Sociology, 2004
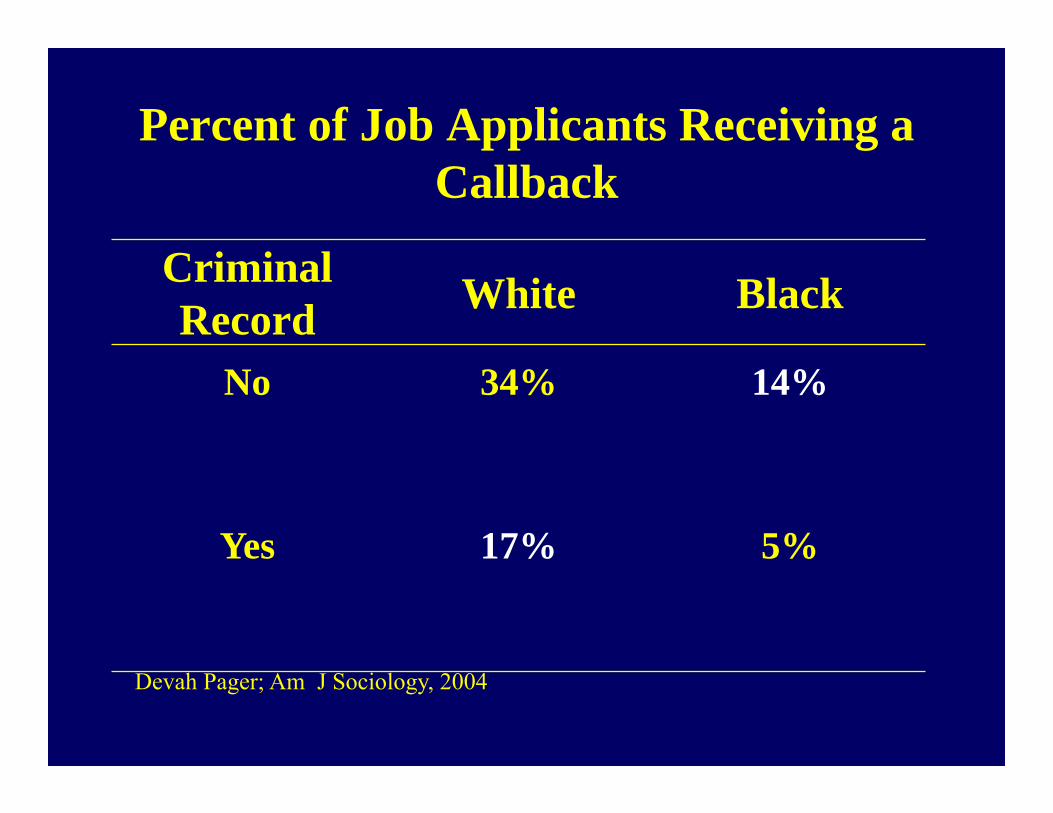
Percent of Job Applicants Receiving a Callback
Criminal Record White Black
No 34% 14%
Yes 17% 5%
Devah Pager; Am J Sociology, 2004

Race, Criminal Record, and Entry-level Jobs in NY, 2004
1315
17
0
10
20
White felon Latino (clean record) Black (clean record)
Posi
tive
Res
pons
e (%
)
Devah Pager et al Am Soc Review, 2009; 169 employers

Perceived Discrimination:
Experiences of discrimination are a neglected psychosocial stressor

Every Day DiscriminationIn your day-to-day life how often have any of the following things happened to you?
• You are treated with less courtesy than other people.• You are treated with less respect than other people.• You receive poorer service than other people at restaurants
or stores.• People act as if they think you are not smart.• People act as if they are afraid of you.• People act as if they think you are dishonest.• People act as if they’re better than you are.• You are called names or insulted.• You are threatened or harassed.What do you think was the main reason for these experiences?

Dr. Tene Lewis Discrimination & Health: An Example

• Everyday Discrimination: positively associated with:-- coronary artery calcification (Lewis et al., Psy Med, 2006)
-- C-reactive protein (Lewis et al., Brain Beh Immunity, 2010)
-- blood pressure (Lewis et al., J Gerontology: Bio Sci & Med Sci 2009)
-- lower birth weight (Earnshaw et al., Ann Beh Med, 2013)
-- cognitive impairment (Barnes et al., J Intl Neuro Psy Soc, 2012)
-- poor sleep [objective & subjective] (Lewis et al, Hlth Psy, 2012)
-- mortality (Barnes et al., J Gerontology: Bio Sci & Med Sci, 2008).
-- visceral fat (Lewis et al., Am J Epidemiology, 2011)
Discrimination & Health: Tene Lewis et al

Residential Segregation
Place Matters!Geographic location determines
exposure to risk factors and resources that affect health.

Residential Segregation is a place-based example of
Institutional Discrimination that has pervasive adverse effects on
health

Segregation in the 2000 Census• Dissimilarity index declined from .70 in 1990 to .66 in
2000• Decline in segregation due to blacks moving to
formerly all white census tracts• Segregation declined most in small growing cities
where the percentage of blacks is small• Between 1990 and 2000, number of census tracts
where over 80% of the population was black remained constant
• The decline in segregation has had no impact on a) very high percentage black census tracts, b) the residential isolation of most African Americans, and c) the concentration of urban poverty.
Source: Glaeser & Vigdor, 2001

Racial Segregation Is …1. …"basic" to understanding racial inequality in
America (Myrdal 1944) .2. …key to understanding racial inequality (Kenneth
Clark, 1965) . 3. …the "linchpin" of U.S. race relations and the source
of the large and growing racial inequality in SES (Kerner Commission, 1968) .
4. …"one of the most successful political ideologies" of the last century and "the dominant system of racial regulation and control" in the U.S (John Cell, 1982).
5. …"the key structural factor for the perpetuation of Black poverty in the U.S." and the "missing link" in efforts to understand urban poverty (Massey and Denton, 1993).

How Segregation Can Affect Health
1. Segregation determines quality of education and employment opportunities.
2. Segregation can create pathogenic neighborhood and housing conditions.
3. Conditions linked to segregation can constrain the practice of health behaviors and encourage unhealthy ones.
4. Segregation can adversely affect access to high-quality medical care.
Source: Williams & Collins , 2001

Residential Segregation and SESA study of the effects of segregation on young African American adults found that the elimination of segregation would erase black-white differences in Earnings High School Graduation Rate Unemployment
And reduce racial differences in single motherhood by two-thirds
Cutler, Glaeser & Vigdor, 1997

Race and Job LossEconomic Downturn of 1990-1991
Wall Street Journal analysis of EEOC reports of 35,242 companies
Racial Group Net Gain or Loss
BLACKS 59,479 LOSS
WHITES 71,144 GAIN
ASIANS 55,104 GAIN
HISPANICS 60,040 GAIN

Race and Job Loss
Source: Sharpe, 1993: Wall Street Journal
Percent BlackCompany Work
ForceLosses Reason
Sears 16 54Closed distribution centers in inner-cities; relocated to suburbs
Pet 14 35 Two Philadelphia plants shutdown
Coca-Cola 18 42 Reduced blue-collar workforce
American Cyanamid 11 25 Sold two facilities in the
South
Safeway 9 16 Reduced part-time work; more suburban stores

Our Neighborhood Affects Our Health
Unhealthy Community Healthy Communityvs
Exposure to toxic air, hazardous waste Clean air and environment
Unsafe even in daylight Safe neighborhoods, safe schools, safe walking routes
No parks/areas for physical activity
Well-equipped parks and open/spaces/organized community recreation
Limited affordable housing is run-down; linked to crime
ridden neighborhoods
High-quality mixed income housing, both owned and
rental
Convenience/liquor stores, cigarettes and liquor
billboards, no grocery store
Well-stocked grocery stores offering nutritious foods

Our Neighborhood Affects Our Health
Burned-out homes, littered streets
Well-kept homes and tree-lined streets
Streets and sidewalks in disrepair
Clean streets that are easy to navigate
No culturally sensitive community centers, social services or opportunities to engage with neighbors in community
life
Organized multicultural community programs, social services, neighborhood
councils or other opportunities for participation in community life
No local health care servicesPrimary care through
physicians’ offices or health center; school-based health
programs
Lack of public transportation, walking or biking paths
Accessible, safe public transportation, walking and
bike paths
Unhealthy Community Healthy Communityvs

Disturbing Trend
Increasing levels of residential segregation and isolation of Hispanics in the U.S.
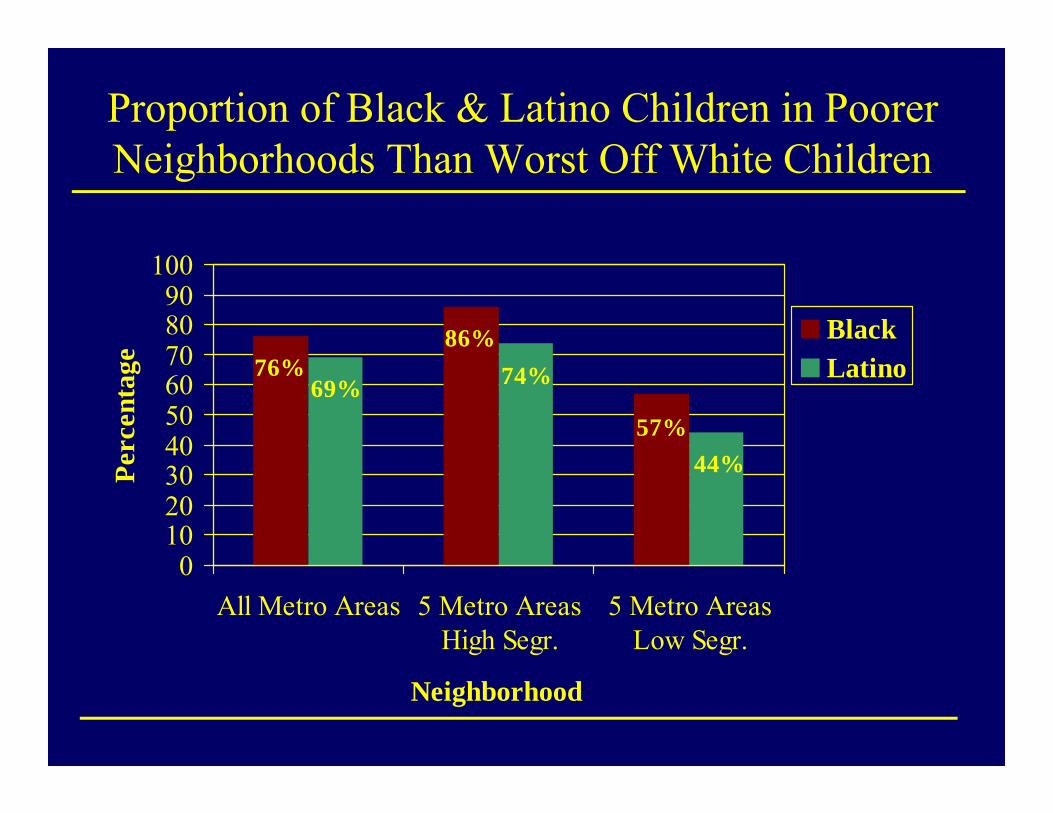
Proportion of Black & Latino Children in Poorer Neighborhoods Than Worst Off White Children
76%86%
57%44%
74%69%
0102030405060708090
100
All Metro Areas 5 Metro AreasHigh Segr.
5 Metro AreasLow Segr.
Neighborhood
Perc
enta
ge
BlackLatino
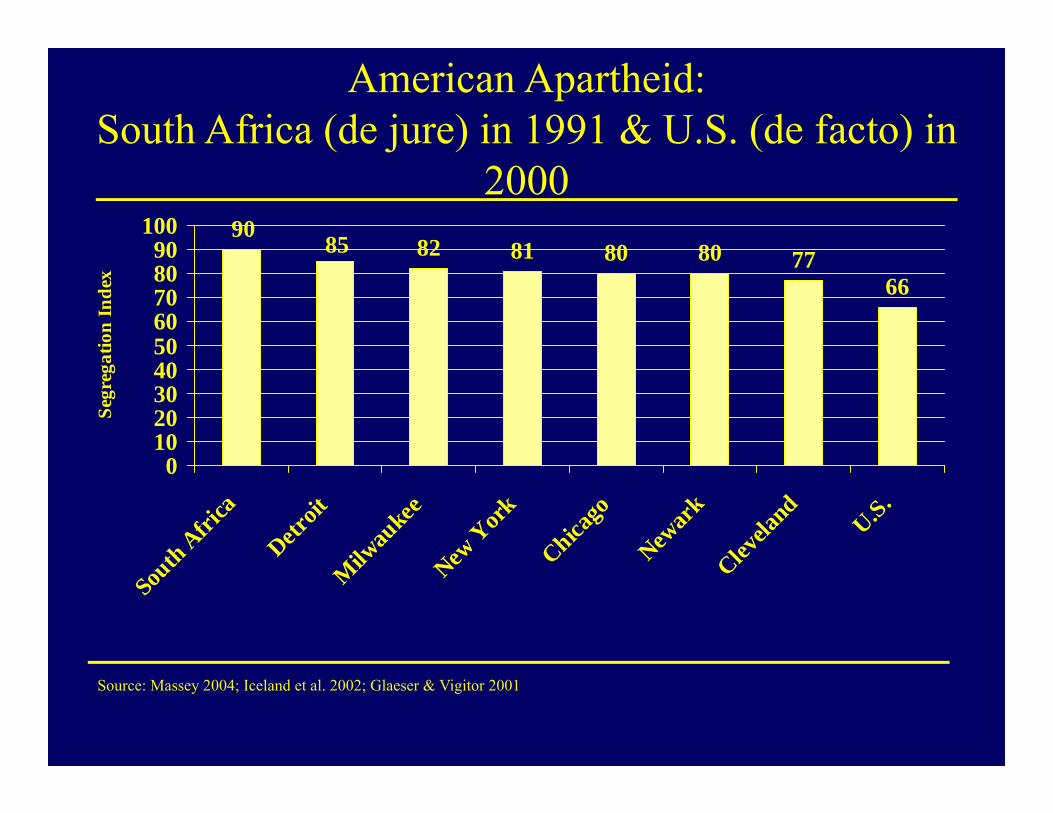
American Apartheid:South Africa (de jure) in 1991 & U.S. (de facto) in
200082 81 80 80 77
66
8590
0102030405060708090
100
South A
frica
Detroit
Milw
aukee
New Y
ork
Chicago
Newar
kClev
eland
U.S.
Segr
egat
ion
Inde
x
Source: Massey 2004; Iceland et al. 2002; Glaeser & Vigitor 2001

Improving American’s Health
What Can We Do?

Moving UpstreamEffective Policies to reduce inequalities in health must: Address fundamental non-medicaldeterminantsFocus on Place-based solutions, in addition to people-based solutions

Centrality of the Social Environment
An individual’s chances of getting sick are largely unrelated to the receipt of medical care
Where we live, learn, work, play and worship determine our opportunities and chances for being healthy
Social Policies can make it easier or harder to make healthy choices

Redefining Health Policy
Health Policies include policies in all sectors of society that affect opportunities to choose health, including, for example,
• Housing Policy
• Employment Policies
• Community Development Policies
• Income Support Policies
• Transportation Policies
• Environmental Policies

Needed Steps• The best way to improve America’s health
and reduce our medical bills would be to invest in:– Schools– Sidewalks– Produce markets– Preschool programs– Parks– Jobs– Housing– Transportation

Improving America’s Health
Enhancing neighborhood and Housing quality to Improve health

3 Major HUD Initiatives in 1990s • Residential Relocation: Moving to Opportunity:
helping poor families move from high-poverty public housing
• In-Place Services and Incentives: Jobs-Plus: saturating public housing with high-quality employment services and rent-based financial incentives
• Suburban Job Linkage: Bridges to Work: help residents of high-poverty, central-city communities find jobs in opportunity-rich suburban areas

Lessons from HUD Initiatives • Interventions can increase income, improve safety
and security and improve physical and mental health
• Families will respond to real opportunities• Meaningful change requires sustained effort over
time• People need help in finding jobs and in keeping
jobs (retention, adavancement, commuting costs, child care)
• Programs must tackle all of the major barriers: housing, safety, health, employment, education
Turner & Rawlings, Urban Institute, 2005 “Overcoming Concentrated Poverty…

Moving to Opportunity• The Moving to Opportunity Program
randomized families with children in high poverty neighborhoods to move to less poor neighborhoods.
• Three years later, there were improvements in the mental health of both parents and sons who moved to the low-poverty neighborhoods
• 10 to 15 years later, movers had lower levels of obesity, severe obesity & diabetes risk (HbA1c)
Leventhal and Brooks-Gunn, 2003; Ludwig et al. NEJM, 2011

Yonkers Housing InterventionCity-wide de-concentration of public housing Half of public housing residents selected via a
lottery to move to better housing 2 years later, movers reported better overall
health, less substance abuse, neighborhood disorder and violence than those who stayed
Movers also reported greater satisfaction with public transportation, recreation facilities and medical care
Movers had higher rates of employment and lower welfare use
Fauth et al. Social Science and Medicine, 2004

Improving Residential Circumstances• Policies need to address the concentration of economic disadvantage and the lack of an infrastructure that promotes opportunity that co-occurs with segregation for African Americans, American Indian reservations and increasingly for Latinos •Nothing inherently negative about living next those of one’s own race• Major infusion of economic capital to improve the social, physical, and economic infrastructure of disadvantaged communities•One should not have to move to live in a better neighborhoodWilliams and Collins 2004
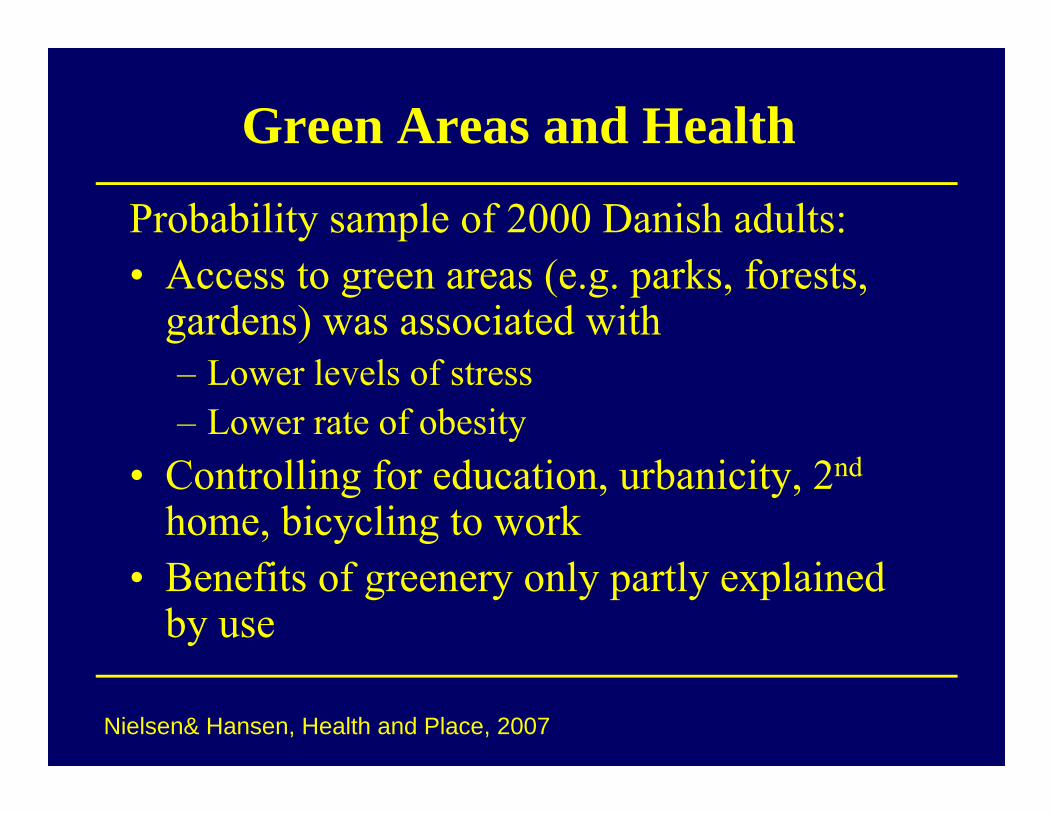
Green Areas and Health
Probability sample of 2000 Danish adults:• Access to green areas (e.g. parks, forests,
gardens) was associated with– Lower levels of stress– Lower rate of obesity
• Controlling for education, urbanicity, 2nd
home, bicycling to work• Benefits of greenery only partly explained
by use
Nielsen& Hansen, Health and Place, 2007

Built Environment, Travel and BMIAtlanta study of 10,878 adults:• Each additional hour spent driving
associated with 6% increase in obesity• Each kilometer walked/day associated with
5% reduction in obesity• Residents in areas of more commercial non-
residential land walk more• Each quartile increase in land use mix was
associated with 12% reduction in obesity
Frank et al. 2004; Am J Prev Med.

1996 Olympic Games
• Residents of Atlanta reduce driving to reduce downtown traffic congestion
• Peak traffic volumes decrease by 23%• ER visits for asthma decline by 44%• Peak ozone levels drop by 28%• Levels returned to normal days after
Olympics end
Friedman et al. 2001, JAMA

Benefits of High Gas Prices?• In March and April 2008:
– Spike in gas prices– Decrease in gas sales (3%)– Decline in miles drive (4%)– Motor vehicle deaths plummet (22%)
– Less driving on risky roads? Greater declines by risky drivers? Driving slower to save gas?
U of MI, Transportation Research Institute, July 2008

Walking to Public TransitCDC study of 3,312 commuters who use mass
transit• Commuters get plenty of physical exercise
walking to and from the bus or train• 30% get recommended dose of physical
activity by walking to and from transit• Transportation policy is health policy
Besser& Dannenberg, 2005, Am J Prev Med.

Factors that Affect Walking
• Good infrastructure• Nearby destinations• Greenery• Other people walking• Absence of crime

Leave No Child Inside• National movement to reconnect children to
the natural world• Giving kids a break from TV and the
computer• Re-connecting kids to the outdoors• Fun-family outdoor activities• Encouraging the building of residential
areas that connect kids with nature

Built Environment & Childhood Obesity• 2007 National Survey of 91,642 children from
birth to age 17 • Rates of childhood obesity was 20-60% higher in
neighborhoods with unfavorable social conditions
• Perceptions of neighborhood safety, trash, rundown housing and graffiti all correlated with increased obesity
• No access to sidewalks, parks, recreation centers and libraries predicted higher rates of obesity
Singh et al. 2010, Health Affairs

Built Environment & Childhood Obesity• Girls aged 10-11 most vulnerable: in neighborhoods
with few health promoting amenities, they were 276% more likely to be obese and 121% more likely to be overweight than those in areas with most amenities
• 27% of parents all US children reported no access to sidewalks, 19% no access to parks, 35% no access to recreation centers and 14% no access to libraries
• Children living in least health-promoting neighborhoods were 61% more likely to be physically inactive and 25% more likely to watch more than 2 hours of TV every day
Singh et al. 2010, Health Affairs

Purpose Built CommunitiesInstead of addressing poverty, urban blight, failing schools, crime and unemployment piecemeal, community activists and philanthropists in Atlanta took them on at once (integrative strategies include cradle-to-college educational opportunities, mixed-income housing, early child development, recreational opportunities).
Atlanta’s East Lake District results: A 95% reduction in crime since its launch in 1995 Employment rate of low-income: from 13% to 70% Striking school achievement: East Lake students at or
above grade level increase from 5% at start to 96% Purpose Built Communities in Atlanta, New Orleans,
Indianapolis, Charlotte, among others.

Improving American’s Health
Improve economic well-being

Improving Economic Well-Being
• 2007 Task Force Report from the Center for American Progress, (“From Poverty to Prosperity”) outlines a roadmap to cut poverty in half in 10 years. These include:
• Promoting inner-city revitalization, unionization, employment of ex-offenders
• Expanding Pell Grants, tax credits for low-income• Encouraging savings for education, home
ownership, retirement• Connecting vulnerable youth to school and work • Raising min. wage, providing child assistance

Increased Household Income and Health• A study by Hoynes et al. used variation in the federal
Earned Income Tax Credit (EITC) over time and the presence of state EITC’s to examine the effect of these cash awards on birth outcomes
• Findings: income from EITC reduced the rate of low birth weight and increased mean birth weight
• These effects were evident for both blacks and whites but were larger for blacks.
• Another study by Strully et al. using changes in state EITC as a natural experiment found that state EITCs increased birth weights and reduced maternal smoking
Hoynes, et al. 2012, Nat Bur of Econ Research Working Paper Series. Strully, et al. 2010, American Sociological Review

Social Security and the Health of the Elderly
• An analysis of the impact of the social security program in increasing the SES of the elderly was conducted
• It found that the initial implementation of the program was associated with mortality declines for the elderly
• Subsequent increases in the level of social security benefits were also associated with mortality declines for the elderly
Arno, Peter, House, James et al (2011). Journal of Public Health Policy

Great Smoky Mountain Study, NC• A natural experiment assessed the impact of additional
income on the health of American Indians who were to 9 to 13 years old at baseline
• During this longitudinal study Indian households received extra income due to the opening of a Casino
• The study found declining rates of deviant and aggressive behavior among adolescents whose families received additional income.
• After four years of cash supplements, the level of psychiatric symptoms was similar to those of adolescents who had never been poor.
• Lower risk of psychiatric disorders in adolescence when youth lived at home persisted into young adulthood when most had moved out of their childhood home.
Costello et al., JAMA , 2003; Costello, et al, JAMA , 2010. .

Great Smoky Mountain Study, NC
• This study also found that the additional income received by adolescents was associated with higher levels of education and lower incidence of minor criminal offenses in young adulthood and the elimination of racial disparities on both of these outcomes
• These effects existed only for the households that were poor at the time of the inception of income supplements. Improved parenting appears to be responsible for the effects.
Akee, et al ….Costello, E. J. (2010). Am Econ Journal: Applied Economics.

Conditional Cash Transfer (CCT) Programs
Provide cash payments to low income families contingent on regular health care visits, school
attendance or participation in educational programs.
• A program in Mexico in which families had been randomized to receive cash transfers led to:– Reduced illness rates and child stunting (Rawlings &
Rubio, 2005)– Increased the quality of prenatal care (Barber & Gerter,
2009)– Reduced rural infant mortality by 17% (Barham, 2011)
Rawlings & Rubio, 2005, The WB Research Observer; Barber & Gertler, 2009, Hlth Poli & Plan; Barham, 2011, J of Dev Econ.

Economic Policy is Health Policy
In the last 60 years, black-white differences in health have narrowed and widened with black-white differences in income

Health Effects of Civil Rights Policy I• Civil Rights policies narrowed black-white
economic gap• Gains greater for women than men• Black women had larger gains in life
expectancy during 1965 - 74 than other groups (3 times as large as those in the decade before)
• Between 1968 and 1978, black males and females, aged 35-74, had larger absolute and relative declines in mortality than whites
Kaplan et al. 2008; Cooper et al. 1981

Health Effects of Civil Rights Policy II
• Black women born 1967 - 69 had lower risk factor rates as adults and were less likely to have infants with low-birth weight and low APGAR scores than those born 1961- 63
• Desegregation of Southern hospitals enabled 5,000 to 7,000 additional Black babies to survive infancy between 1965 to 1975
Almond & Chay, 2006; Almond et al. 2006

Median Family Income of Blacks per $1 of Whites
0.540.550.560.570.580.59
0.60.610.62
Cents
1978 1980 1982 1984 1986 1988 1990 1992 1994 1996
Year
Source: Economic Report of the President, 1998

U.S. Life Expectancy at Birth, 1984-1992
75.3 75.3 75.4 75.6 75.6 75.9 76.1 76.3 76.5
69.5 69.3 69.1 69.1 68.9 68.8 69.1 69.3 69.6
60
65
70
75
80
1984 1985 1986 1987 1988 1989 1990 1991 1992Year
Life
Exp
ecte
ncy
(Yea
r)
White Black
NCHS, 1995

Policy Area
Family StructureConsequences for SES and Health
Neighborhood Conditions & Place?

Family Structure and SESCompared to children raised by 2 parents those
raised by a single parent are more likely to:
• grow up poor• drop out of high school• be unemployed in young adulthood• not enroll in college • have an elevated risk of juvenile delinquency and
participation in violent crime.
McLanahan & Sandefur 1994; Sampson 1987

• Economic marginalization of males (high unemployment & low wage rates) is the central determinant of high rates of female-headed households.
• Marriage rates are positively related to average male earnings.
• Marriage rates are inversely related to male unemployment.
Determinants of Family Structure
Bishop 1980; Testa et al. 1993; Wilson & Neckerman 1986

Social Context of Homicide1. Lack of access to jobs produces high male
unemployment and underemployment2. This in turn leads to high rates of out of wedlock births,
female-headed households and the extreme concentration of poverty.
3. Single-parent households lead to lower levels of social control and guardianship
4. The association between family structure and violent crime is identical in sign and magnitude for whites and blacks.
5. Racial differences at the neighborhood level in availability of jobs, family structure, opportunities for marriage and concentrated poverty underlie racial differences in crime and homicide.Sampson 1987
Racial Differences in Residential Environment• “The sources of violent crime…are remarkably
invariant across race and rooted instead in the structural differences among communities, cities, and states in economic and family organization,”p. 41
• In the 171 largest cities in the U.S., there is not even one city where whites live in ecological equality to blacks in terms of poverty rates or rates of single-parent households.
• “The worst urban context in which whites reside is considerably better than the average context of black communities.” p.41
Sampson & Wilson 1995

Policy Matters
Social Policy can cushion the negative effects of family structure on
poverty and child outcomes

Source: UNICEF (United Nations Children’s Fund), 2000
% Children Child Poverty (%)Country 1 Parent
HH1 Parent Other
Spain 2 32 12
Italy 3 22 20
Mexico 4 28 26
France 8 26 6
Ireland 8 48 14
Germany 10 51 6
United States 19 55 16
United Kingdom 20 46 13
Sweden 21 7 2

Source: UNICEF (United Nations’ Children’s Fund), 2000
Child Poverty RatesCountry Before Taxes After TaxesNetherlands 16.0 7.7Spain 21.1 12.3Sweden 23.4 2.6Canada 24.6 15.5Italy 24.6 20.5United States 26.7 22.4Australia 28.1 12.6France 28.7 7.9United Kingdom 36.1 19.8Poland 44.4 15.4

Learning from the Military • Black men in the military earn more than civilian peers• The command and control, bureaucratic structure of
the military has created a more race-blind environment than larger society
• Military benefits include family housing, day care centers, school-age activity centers
• Active duty military service promotes marriage over cohabitation, increased the likelihood of 1st marriage, and leads to greater stability of marriage. Effects greater for blacks than for whites
• Economic resources eliminates disparities in marriage Teachman 2007; Teachman and Tedrow 2008; Teachman 2009

Policy Matters
Investments in early childhood programs in the U.S. have been
shown to have decisive beneficial effects

High/Scope Perry Preschool
Program: Black children, living in poverty & at risk of school failure
• Random assignment• Daily classes and weekly home visits
Reynolds et al. 2007; Muennig et al. 2009
At age 40, those who received the program:• Were more likely to graduated from high school • Had higher employment, income, savings, home
ownership• Had fewer arrests for violent, property and drug crimes• Cost-benefit: $17 return for every dollar invested

What we need Now
American Innovation at its Best

Addressing ‘Food Deserts’ in PA
The Food Trust – Building strong communities through healthy foods-- Farmer’s markets, Co-ops, school initiatives
Fresh Food Financing Initiative’s Supermarket Campaign in collaboration with the Reinvestment Fund and the Philadelphia Urban Affairs Coalition (a public private partnership)
58 new supermarkets in urban and rural underserved areas

An Angel in Pennsylvania?

Jeffrey Brown & ShopRite• Operates 10 stores• Half in urban under-served areas• Opened a 65K sq ft supermarket store in inner-
city, AA, low income area last summer• Area had been without a supermarket for 30
years• Same price in all stores• Same hours as other stores (7am-11pm)• All stores have community rooms (free)

Innovation• Customized customer service: market research with
churches and community organizations • Good community citizen• All company managers on local community boards• Respect for customers, e.g. Shopping Carts (not
metal; no physical barriers, electronic fence) • Support entrepreneurship with minority businesses• 40 of 280 employees are ex-offenders (technical and
life-skills training)• Quarterly: gifts for guns prog. ($100 cert) (400 guns)

Shattering Myths
• No higher level of shrinkage in inner-city supermarkets
• High training costs but low turn-over
• Same volume of fruit and vegetables sales
• Higher poultry and fish sales

Supermarkets: Engine of economic re-vitalization?
• Property values increase• Stimulates other retail shopping• Seniors can walk to store• Attracts more capital• Community resource and outreach center
(health screening; WIC, CHIP, Food Stamps outreach)

Keys to Success• Show respect, treat all with dignity• Good shopping experience: food safety and
cleanliness• Customized service• Community responsibility• Affordability• Listening to and working with the community• Cookie-cutter approach will not work• Public and Private partnership (training costs,
acquiring the land)

It is About All of Us
• The Health of America depends on the health of all Americans
• Yet, too many Americans are sicker and dying younger than they should
• Millions of Americans are suffering from diseases that should be avoided
• America’s health problems hurt our productivity • When people are sick, they don’t do as well at
school, at home or at work• Improving America’s Health will not only improve
the economy, it will improve the quality of life for millions of Americans

Resources

RWJF.org/Commission.

Recommendations:
Make investing in America’s youngest children a high priority.
Fundamentally integrate health into community development.
Broaden our from treating illness to helping people lead healthy lives.
1
2
3

110www.countyhealthrankings.org


112www.countyhealthrankings.org
Taxes, Clean Indoor Air Policies
Menu labeling, School Food Policies
Reduce alcohol outlet density
Partner referral services
Work force development
Minimum wage, Paid family/medical leave
Expand early childhood programs
Nurse home visiting programs Zoning/incentives for mixed‐use
development
Reducing bus emissions
Pedestrian/cycling in master plans
Coverage, medical homes
EHRs, Public Reporting, Payment Reform
Tobacco use
HEALTH BEHAVIORS (30%)
Diet & exercise
Alcohol use
Sexual activity
CLINICAL CARE (20%)Access to care
Quality of care
SOCIAL & ECONOMIC FACTORS (40%)
Education
Employment
Income
Family & social support
Community safety
PHYSICAL ENVIRONMENT (10%)
Environmental quality
Built environment
MORTALITY (LENGTH OF LIFE): 50%
MORBIDITY (QUALITY OF LIFE): 50%
HEALTH OUTCOMES
HEALTH FACTORS
POLICIES & PROGRAMS

A 7-part documentary series & public impact campaignwww.unnaturalcauses.org
Produced by California Newsreel with Vital PicturesPresented on PBS by the National Minority Consortia of Public Television
Impact Campaign in association with the Joint Center Health Policy Institute

Conclusions• Inequalities in health are created by inequalities in
society -- place-based inequalities are central • Opportunities for health and barriers to healthy
choices are shaped by neighborhood and other contextual factors
• We need new place-based initiatives to make healthy choices easier in the built environment – housing, schools, parks, neighborhood and transportation
• Our greatest need is for political will and a new commitment to use current knowledge to improve health
• Now is the time

A Call to Action
“The only thing necessary for the triumph [of evil] is for good men to
do nothing.”
Edmund Burke, Irish Philosopher
Copyright © 2022 FDOKUMEN