A vision for a cleaner, healthier world - Johnson Matthey
228
A vision for a cleaner, healthier world Annual Report and Accounts 2022
-
Upload
khangminh22 -
Category
Documents
-
view
0 -
download
0
Transcript of A vision for a cleaner, healthier world - Johnson Matthey

A vision for a cleaner, healthier world
Annual Report and Accounts 2022

Strategic report 01
2022 Summary performance 01Chair’s statement 02Chief Executive’s statement and strategic review 04Our business model 07Our purpose and vision 10Realising our vision 12Market review 18Chief Financial Officer’s review 20Financial performance review 22Key performance indicators 31Engaging with our stakeholders 32Sustainability 34
Products and services 36Operations 41People 49
Taskforce for Climate-related Financial Disclosures 60Risk report 70Going concern and Viability 80Non-Financial Information and section 172 statement 81
Governance 83
Chair’s introduction 84Board at a glance 85Board of Directors 86Our governance structure 88Corporate governance report 90Board activities 92Section 172 statement 94Board and committee effectiveness 96Societal Value Committee report 98Nomination Committee report 100Audit Committee report 104Remuneration Committee report 111Directors’ report 131Responsibilities of directors 136
Financial statements 137
Other information 214
Front Cover: Paul Wright, Principal Researcher, working at our syngas generation rig in Chilton, UK.
Contents
Johnson Matthey’s vision is for a world that is cleaner and healthier, today and for future generations. Our contribution to that world is based on the transformative power of platinum group metal (PGM) chemistry, where our 200-year history gives us a unique advantage.
Drawing on that expertise in PGM chemistry, catalysis and process design, we create technologies and processes that help power our customers’ products – principally in the automotive, chemicals and energy markets. It’s this expertise that has helped remove harmful emissions from vehicles for almost 50 years and is now enabling the rapid commercialisation and scale-up of low- and zero-carbon technologies – like sustainable fuels and green hydrogen – to catalyse the world’s transition to net zero.
Our position as the world’s largest recycler of secondary PGMs means we also have a distinctive role in the circular economy, ensuring our businesses and customers have access to a reliable, sustainable supply of these scarce precious resources.
Following our announcement on 26th May 2022, we have changed the name of our Group Management Committee to the Group Leadership Team (GLT). Given this change, this report refers to the GLT throughout.
In addition, we may also refer to our Efficient Natural Resources business throughout this report as we report against it for the financial year. Going forward, this will be reported as our PGM Services and Catalyst Technologies businesses.
Catalysing the net zero transition
Visit matthey.com to learn more
Cautionary statementThe Strategic report and certain other sections of this annual report contain forward looking statements that are subject to risk factors associated with, among other things, the economic and business circumstances occurring from time to time in the countries and sectors in which the group operates. It is believed that the expectations reflected in these statements are reasonable, but they may be affected by a wide range of variables which could cause actual results to differ materially from those currently anticipated.

2022 Summary performance
Revenue
£16,025m
Sales contributing to four priority UN SDGs
83.8%2020/21: 84.7%
Scope 1 and 2 GHG emissions
399,906CO2 tonnes equivalent
2020/21: 385,4553 CO2 tonnes equivalent
Total recordable injury and illness rate
0.592020/21: 0.55
4%2020/21: £15,435m
(Loss) / earnings per share
-52.6pN/A as loss this year
2020/21: 106.5p
Sales
£3,778m3%2020/21: £3,685m
Gross R&D spend contributing to four priority UN SDGs
88.1%2020/21: 87.3%
Upstream Scope 3 GHG emissions (purchased goods and services)
3.01mCO2 tonnes equivalent
2020/21: 2.85 million CO2 tonnes equivalent
Diversity and inclusion
27%women across all management levels
2020/21: 27%
Underlying earnings per share
213.2p26%2020/21: 168.9p
Operating profit
£255m-17%2020/21: £309m
Ordinary dividend per share1
77.0p10%2020/21: 70.0p
Underlying operating profit
£553m17%2020/21: £473m
Free cash flow
£221m-25%2020/21: £295m2
Financial performance
Non-financial performance
Products and services Operations People
1. The board recommends a final dividend for the year ended 31st March 2022 of 55.0 pence per ordinary share of 11049/53, which if approved, will be paid on 2nd August 2022 to all ordinary shareholders on the register at theclose of business on 10th June 2022. An interim dividend of 22.0 pence was paid on 1st February 2022.
2. Restated to exclude Health.3. Restated from the prior year, please see page 215 for more information.
Johnson Matthey | Annual Report and Accounts 2022 1
STRATEG
IC REPORT

2
“This has been a very challenging year for Johnson Matthey and our shareholders. We took important and necessary strategic decisions with regard to the business portfolio, with the exit from Battery Materials and divestment of Health. I know many of our stakeholders were very disappointed, but these were essential actions to enable us to focus on attractive, high-growth opportunities that have a vital role to play in the acceleration towards net zero. I, the rest of the board and the executive team are determined that we will restore value to our shareholders.”
Chair’s statement
Welcoming our new Chief Executive Looking ahead, Johnson Matthey has a strong foundation from which to build, and we have delivered a robust set of underlying results in the year. I am delighted to welcome our new Chief Executive, Liam Condon, who joined JM in March 2022, following Robert MacLeod’s decision to retire. Liam brings with him natural commercial acumen and a talent for building relationships and partnerships, and the board and I are pleased that he has settled in so quickly, and has already injected pace and commercial thinking into JM to drive a more performance-oriented culture. We have been impressed with the progress he and his leadership team have made in a few short months during their review of our strategy.
Liam shares the outcome of that review in his statement on pages 4 to 9, so I won’t repeat everything he says, but instead share a few high-level observations.
JM has world-class scientific skills, great technology and incredibly talented people. That hasn’t changed. But what became clear during the board’s discussions with Liam and
the Group Leadership Team (GLT) is that some of our historical portfolio choices – like Battery Materials and Health – were never a logical fit. That’s because they were not borne out of JM’s foundation: our expertise in platinum group metal (PGM) chemistry, catalysis and process design.
The review has, therefore, underlined the need to strengthen our commercial focus to ensure that we concentrate on the technologies and markets where we have the greatest strength and competitive advantage.
This is important because the technologies that the world needs to decarbonise rely on PGMs, which means JM has a huge opportunity to help accelerate the journey to net zero. But to do that, we must transform our culture, becoming a simpler, more agile organisation in order to drive that commercial focus into everything we do.
It takes a lot of work to review a company’s strategy – and some tough conversations – but I speak for the whole board when I say that we have enjoyed working with Liam and his team during this process, and fully endorse the revised strategy Liam has proposed.
Johnson Matthey | Annual Report and Accounts 2022

Chair’s statement continued
Exiting Battery Materials and Health to protect JM’s future In many ways, our decisions to exit Battery Materials and Health were the forerunners for this strategic work. These weren’t decisions we took lightly but they were the right ones for JM’s future.
The battery materials sector is changing more quickly than we anticipated, with car manufacturers looking for the cheapest technology. So while some of our automotive customers have told me that we were making market-leading components, we were unable to sell them at the right price. The more the board and GLT looked at the numbers, the clearer it became that JM would need to invest billions to keep up. In time, this would have compromised our ability to develop our other growth businesses.
I have spoken to a lot of shareholders this year and I know that some are frustrated by the decision. I share their disappointment, but given the battery material market’s rapid commoditisation, we moved quickly to avoid further investment. Since then, Nano One, a clean technology innovator in battery materials, has agreed to acquire 100% of the shares of Johnson Matthey Battery Materials Canada, while we have also agreed to sell part of the Battery Materials business to EV Metals Group, a global battery chemicals and technology business. As well as £50 million cash, JM will receive a minority equity stake in EV Metals Group.
In Health, meanwhile, we were disappointed by the reduced sale price we received, but it reflects the fact that the business was hit by a series of external
factors, including pricing pressure and shortages in supply and labour. However, we have retained a c. 30% minority stake. I am heartened by those investors who believe JM is now a stronger investment proposition.
A robust set of results despite a challenging year It’s worth noting that this decision has had minimal impact on our underlying financial performance this year. In fact, I am pleased to report that JM has delivered another robust set of full-year results, in line with market expectations.
This is a great achievement and I would like to thank Robert for his steady leadership during an incredibly volatile year that has included COVID-19-related supply chain disruption, and rising inflation.
The external landscape has, of course, become even more challenging given the tragic events that have unfolded since Russia invaded Ukraine in February 2022. Russia’s actions are a violation of international law, specifically the sovereignty of an independent country, and JM continues to stand united with Ukraine. We are not doing any new business in Russia and Belarus for the time being and have suspended production operations in Russia indefinitely. We have also set up a fund to help our Ukrainian employees working in Poland access money to cover accommodation and living costs for family and friends seeking refuge. And we have looked after our Russian employees, continuing to pay them during this time.
JM has navigated this uncertainty well. Russia represents around 1% of 2021/22 group sales, and, thanks to our position as
the world’s leading recycler of secondary PGMs, we have a highly diversified supply of metal. Russia supplies a significant quantity of the world’s precious metals, particularly palladium. And although companies adjusted quickly to meet international sanctions, those sanctions have made an already scarce resource harder to buy.
We also successfully executed our £200 million share buyback this year and completed the sale of our Advanced Glass Technologies business. Like Health, this is an excellent business in its own right, but does not fit naturally in our more focused portfolio.
As a result of all this, we are pleased to announce a dividend of 77 pence this year. This reflects the strength of our balance sheet and capital allocation priorities.
A new energy to help accelerate net zeroJM’s continued financial strength will be essential as we look to the future. We will need to combine that strength with our new commercial focus and more efficient culture in order to execute our strategy.
But we’ll also need to draw on certain aspects that have helped make this 200-year-old company so special, such as our values and purpose. Throughout its history, JM has shown that it can pivot its focus, while staying true to what matters most: using its science and engineering skills to do the right thing. Now we must pivot again to help the world accelerate towards net zero. Our planet is already feeling the effects of climate change, and we have a duty to get more of our products and services, such as technologies that help make sustainable aviation fuels, into the market more quickly.
It is a duty that I know everyone at JM shares, having had the privilege once again to talk to employees, as part of the board’s ongoing commitment to employee engagement. JM has worked hard in the past couple of years to set out its sustainability agenda, including committing to net zero by 2040. And it has taken further steps this year to increase its engagement, including a new board-level Societal Value Committee. You can read more about the Committee’s remit from page 98, but I welcome the move and believe it will strengthen our governance and help JM meet its sustainability commitments.
A clear path to the futureNavigating change is never easy. But JM is a resilient company built on great technology, talented people and enormous integrity. This, allied with a new commercial focus, led by Liam and his team, gives me great confidence that we have an exciting, prosperous future ahead of us. This future is firmly focused on investing in the technologies where we have the greatest strength and competitive advantage to help decarbonise society as fast as possible – and the board and I look forward to supporting Liam and his team in pursuing this future to restore and drive value creation for our shareholders and wider stakeholders.
Patrick ThomasChair
Johnson Matthey | Annual Report and Accounts 2022 3
STRATEG
IC REPORT

Chief Executive’s statement and strategic review
Find out more, visit matthey.com/strategy
“Throughout my career, I have only ever worked for companies that combine science with a strong sense of purpose. Science fuels progress, it’s how the world grows. But, for me, that progress needs to be purposeful, it needs to make the world a better place. That desire to combine science and purpose resulted in me spending 20 years of my life working in human health and 10 years in animal and plant health. Now, I am delighted to lead a company that is focused on using science to protect our planet’s health.”
And what tremendous science and purpose Johnson Matthey has. Since becoming Chief Executive in March 2022, I have been struck by how passionate JM’s people are about using their expertise in platinum group metal (PGM) chemistry, catalysis and process design to create a cleaner, healthier world – expertise that has developed world-class technology and market-leading positions. However, it is also clear that we have not performed well in recent years and, from a shareholder point of view, have done a poor job of value creation, which is something that my new team and I are committed to changing.
Robust underlying resultsWhile our share price clearly suffered in the past year, our people’s expertise means that the operational business has remained relatively strong and delivered another set of robust underlying full-year results in a year of market volatility and global uncertainty. This is testament to the hard work and commitment of every single employee at JM. I would like to thank everyone for their dedication, resilience and ongoing passion to keep innovating.
“Our strategy is to catalyse the net zero transition for our customers in automotive, chemicals and energy”
Johnson Matthey | Annual Report and Accounts 20224

Most of my time so far has been spent talking with employees, customers and investors, while, in parallel, reviewing our strategy. Through these conversations, I have heard a consistent message: JM is a great company – with great people and technology. But we need a much clearer strategy that outlines how the company will create more value, both for shareholders and society going forward as we help the world accelerate progress to net zero. We also need to set out how we will allocate resources in a more disciplined manner and transform our culture to enable successful strategic execution.
Three things have become clearer to me. The first is that we already have the core talent and technology to accelerate progress towards net zero. In fact, as the world looks to decarbonise, the markets for our products will increase significantly, opening up tremendous new growth opportunities for JM. We just need to define where we want to focus our energy and resources.
A truly purpose-driven organisationBeing a catalyst to help make our world cleaner and healthier is deeply engrained in JM’s DNA, and is hugely motivational for our people. This includes our own commitment to reach net zero in our operations by 2040.
An impressive and highly relevant technology portfolioOnly science can solve the climate crisis and enable the net zero transition. We have cutting-edge research across our sectors with innovations in the pipeline that the world really needs to accelerate progress.
My second observation is that our complex business structure and lack of commercial focus is getting in the way of our ability to create significant value. Our customers have told us that they love our technology – and very often consider our products to be best in class – but we don’t make the most of our opportunities. That’s why we need to simplify and drive stronger emphasis on accountability and faster decision-making.
The third observation is that in new growth ventures, JM has often been playing ‘not to lose’, as opposed to ‘playing to win’. To succeed in a hyper-competitive, ultra-fast and very volatile world, JM needs to play to win. That requires developing a strong performance culture that is disciplined in executing our strategy and delivers consistent results.
Our vision for a cleaner, healthier world drives our strategy and mirrors society’s need to create a more sustainable future. JM will catalyse the net zero transition for our customers in automotive, chemicals and energy, and thereby create significant value for shareholders and society.
Talented and innovative peopleWe employ some of the world’s brightest and best: our 13,000+ people are talented and passionate about making a difference through innovation. We combine science with purpose to help drive progress in the world.
Chief Executive’s statement and strategic review continued
Revised strategy to drive value creation FocusJM needs more strategic clarity and to focus resources where we can win. Where JM has faltered historically has typically been due to a lack of focus on core competencies, a lack of understanding of new market dynamics and an overly inward focus. Going forward, we will focus on our core competencies, with a business structure that is in line with our strategic ambitions and allows us to maximise group synergies. We will exit non-core businesses, which will also ensure better resource allocation.
SimplifyJM needs to become simpler, more agile, and more cost effective. And we must reduce complexity across our entire organisation. This means leaner processes, less duplication and clear lines of accountability. This will help unlock JM’s potential, by increasing the speed with which we make decisions, eliminating duplication and reducing costs.
ExecuteOur strategy will be underpinned by a rigorous performance culture. We are launching a transformation programme to drive stronger execution, unlock near-term cost opportunity and position us strategically to more strongly drive growth.
We will strengthen our capabilities in two particular ways:
• Capital project execution: clear governance, accountability and enhanced capabilities will ensure we are highly disciplined in capital allocation and much stronger in execution.
• Commercial skills: strengthening capabilities and cross-group commercial synergies, with a strong focus on value creation and more strategic partnerships.
Our core strengths
Johnson Matthey | Annual Report and Accounts 2022 5
STRATEG
IC REPORT

Chief Executive’s statement and strategic review continued
Focus
Focusing our portfolio on core strengthsOur expertise in PGM chemistry and catalysis, combined with our process technology skills, is the beating heart of this company. It is that expertise that has helped remove harmful emissions from vehicles for almost 50 years. And that same expertise is essential for decarbonising our world: we are enabling low- and zero-carbon technologies in Catalyst Technologies and Hydrogen Technologies, enabling the automotive, chemical and energy industries to transition from carbon-intensive fossil fuels to sustainable fuels and energy.
All of which means that JM is well positioned to be a market leader in sustainable technologies across multiple industries. Beyond the PGMs synergies across our group, we also have significant technology and extensive customer-related synergies, since our customers all need to transition to a more sustainable world.
PGM Services – the backbone of our businessJM is the world’s largest recycler of secondary PGMs and is around twice the size of our nearest competitor. PGM Services provides the flexible metal sourcing and price risk management that we need to run the rest of JM, and is key to the trust our customers place in us. For example, our Clean Air and Hydrogen Technologies customers depend on PGM Services for access to a reliable supply of sustainable, scarce precious metals and recycling services to support a circular economy. We have a competitive advantage that is both very hard to replicate and essential for helping the world reach net zero.
Our PGM Services backbone will support our other three focused business divisions Clean Air, Catalyst Technologies and Hydrogen Technologies, which in turn enable PGM Services to maintain its scale and leadership.
1. Clean Air – continuing to play a leading role in the autocatalyst marketClean Air will remain a significant business well into the next decade even as the world transitions towards lower and zero-carbon technologies. That transition will take time, and in the meantime governments around the world intend to roll out more stringent air quality regulations, which offer new opportunities for our innovative technology. Clean Air will create significant value and we are highly confident that we will generate at least £4 billion of cash over the decade to 2030/31, with more thereafter.
2. Catalyst Technologies – decarbonising chemicals and creating sustainable fuelsWe are already an established, leading provider of process technology and catalysts to the chemicals and energy sectors, especially in synthesis gas (syngas). Our Catalyst Technologies business will strengthen our focus on the syngas value chain, growing our existing business alongside newer opportunities in blue hydrogen, sustainable fuels and low-carbon solutions. Fueled by the net zero transition,
we expect these markets to grow rapidly in the medium term as future production needs to decarbonise. We intend to move quickly and strengthen our leading positions across Catalyst Technologies to deliver high single digit growth over the medium term.
3. Hydrogen Technologies – decarbonising transport and energy Combining our PGM and catalysis expertise with our fuel cell and green hydrogen activities, our Hydrogen Technologies business will help decarbonise the transport and energy sectors and create very significant growth in the medium-longer term. We already have an established hydrogen business, having been active in fuel cells for over 20 years. Importantly, we already have customer contracts and partnerships today with leading hydrogen players including a major German automotive supplier for the supply of next generation catalyst coated membranes into the global automotive market.
We have taken the next step in our strategic partnership with Plug Power, a leading provider of cutting-edge green hydrogen
and fuel cell solutions, with JM bringing extensive precious metals and catalysis expertise and potential to develop a closed-loop PGM recycling system. The partnership extends across advanced components for both fuel cells and electrolysis and embodies a commitment to rapidly scale up to meet accelerating market demand, combining the strengths of both businesses to drive the capacity needed to 2030 and beyond. The collaboration is expected to generate significant value.
In addition, we expanded our presence in green hydrogen by investing into Enapter, a pioneer and commercial leader in anion exchange membrane (AEM) electrolysis. Our partnership encompasses joint development of advanced components, supply of specialist catalysts and we are jointly investigating opportunities for recycling.
We aim to become the market leader in high value performance components that are essential to power fuel cells and green hydrogen electrolysers. We are targeting more than £200 million of sales in Hydrogen Technologies by the end of 2024/25.
Johnson Matthey | Annual Report and Accounts 20226

Chief Executive’s statement and strategic review continued
Clean Air autocatalysts that remove harmful
pollutants
Automotive
Chemicals
Energy
Hydrogen Technologies
components that enable the hydrogen
economy
Catalyst Technologies
components that decarbonise the
chemical industry
Common customers and partnersAs our customers transition to net zero, new market opportunities are opening up for JM through existing customers. For instance, we have automotive customers in Clean Air today who are becoming Hydrogen Technologies customers for fuel cells. We are also building cross-business offers, such as our Catalyst Technologies and Hydrogen Technologies businesses working together to create an integrated value proposition for customers in blue and green hydrogen. Also, our presence in several net zero transition technologies, such as blue and green hydrogen, reduces our risk and ensures our position as a market leader, regardless of which technology becomes dominant at any given point in time.
Key markets
Shared technology capabilities We have common technology capabilities across all our businesses, with more than 5,000 patents granted and around 1,500 patent applications pending. With PGM chemistry expertise at our core, we can take advantage of our unique heritage at scale across engineering, design, synthesis and catalysis. Because of this, our people have shared core skills that we can invest in and grow since we use them across the whole of JM. This also gives us the opportunity to accelerate our product development thanks to our integrated position in the value chain.
A shared PGM ecosystemOur PGM Services business is our backbone. That means we can ensure around 80% of the PGMs that are used in our products are refined within the group. This demonstrates the physical flow between our businesses and provides a strong foundation for the whole of JM. This integration give us and our customers many advantages, including superior insights and market edge from an integrated view of PGMs supply and demand, along with resilience in our metals supply and increased customer trust. We also have a unique position in the circular economy, given our internal refining skills. This is especially important to ensure we have a highly competitive integrated offer as we move through the next wave of emissions control legislation. We can also optimise supply and demand, which lowers exposure to PGMs price risk for both JM and our customers. And we deploy more efficient working capital, since our integrated position means we can be more flexible in the way that we source and supply metal.
c.70%Intake from
secondary supply
PGM Services(Platinum Group Metals Services)
#1Global refined
PGM supplier
A leading recycler and hub of precious metals
c.80% PGMs used in our products are internally refined
Simplify
Simplifying our business structure – our business modelWe will serve our global customer base through our four businesses: the current core business of Clean Air, together with our growth businesses, Catalyst Technologies and Hydrogen Technologies, all built on our foundational PGM Services business, which supplies and enables the other businesses. These businesses are tightly linked by three reinforcing synergies: common customers and partners, shared technology capabilities, and a shared PGM ecosystem that enables dependable supply and circularity.
Johnson Matthey | Annual Report and Accounts 2022 7
STRATEG
IC REPORT

Transforming our culture and executing at pacePlaying to win not only means we need to focus on where we can win, but also do things differently. We need to transform our culture and execute at pace. We need a leaner, more efficient and more agile culture, with a strong commercial approach, to help unlock the full potential of our leading technology. We’re going to change the way we work based on three cultural principles, which we will embed across the business:
1. More efficient, less bureaucratic – simpler, more efficient processes and clearer internal accountabilities that will enable us to work at pace and deliver £150 million in annualised cost efficiencies by 2024/25. This reflects simplification in corporate, global functions, procurement, site infrastructure and other costs.
2. A high-performance, commercial mindset – a fast-paced, bolder culture, one focused on winning in our chosen markets. That means we need to strengthen our commercial skills, set ourselves clearer business objectives and rigorously track performance against them.
3. A more external outlook – creating new ventures and strategic partnerships at the technology and commercial ends of our business to accelerate growth and unlock greater value.
Chief Executive’s statement and strategic review continued
ExecuteAt the start of our strategic review, as well as listening to shareholder feedback we asked JM employees to tell us what they think through a programme I launched in March called The Big Listen. Our people shared many great ideas for improvement with us, and told us they want both clear strategic direction and a more efficient organisation that gives them space to realise their full potential. I believe our new strategy will deliver on both of these requests and deliver significant value for our shareholders.
Disciplined capital allocation to drive successAs we execute our strategy, we will maintain a strong balance sheet and ensure we allocate capital in a very disciplined way. That means: investing for growth and attractive returns, and ensuring a reliable dividend, while returning excess capital to shareholders.
For the next three years to 2024/25, we expect cumulative capital expenditure to be around £1 billion. This will be focused on our core activities where we have a right to win and need to invest to drive growth: our PGM refineries, Catalyst Technologies and Hydrogen Technologies. We may also consider acquisitions, but we will be highly selective in our approach, with a focus on bolt-on deals to acquire technology or accelerate growth in our core growth businesses. For our shareholders, we will at least maintain and aim to grow the
dividend, targeting a 40% pay-out ratio over the medium term. Our aim is to maintain a strong balance sheet with our target level of net debt to EBITDA of 1.5-2.0 times.
Embedding sustainability into everything we doWe have a unique opportunity to play a leading role in the net zero transition, but we must also ensure we make our products in ways that minimise our own impact on the planet. JM already has a strong sustainability framework in place, with targets that focus on current and future technologies that we know will be fundamental to addressing the climate challenge.
We remain committed to reaching net zero by 2040, underpinned by a series of 2030 goals arranged under three key pillars: products and services, operations and people. See pages 34 to 59 for our sustainability report.
We are also a signatory to the UN Global Compact’s Business Ambition for 1.5°C and our greenhouse gas (GHG) emissions targets have been independently verified by the Science Based Targets initiative:
• Absolute reduction in Scope 1 and Scope 2 GHGs of at least 33% by 2030 (baseline 2019/20).
• Absolute reduction of Scope 3 GHGs of at least 20% by 2030 (baseline 2019/20).1
One of the great things about JM is the energy our people all have for our sustainability agenda. This gives me confidence that we can do even more – and we should – by designing ever more stringent sustainability standards into our products that will ultimately give us a competitive advantage by leading the way. We have created a new Chief Sustainability Officer role, reporting directly to me, and I’m delighted that Anne Chassagnette joined JM in May 2022. Anne will play a key role in driving JM’s sustainability agenda, ensuring our sustainability objectives are fully integrated into the company’s strategic and operational decisions.
1. Scope 1 covers direct greenhouse emissions from owned or controlled sources. Scope 2 covers indirect emissions from the generation of purchased electricity, steam, heating and cooling consumed by the reporting company. Scope 3 includes purchased goods and services.
Johnson Matthey | Annual Report and Accounts 20228
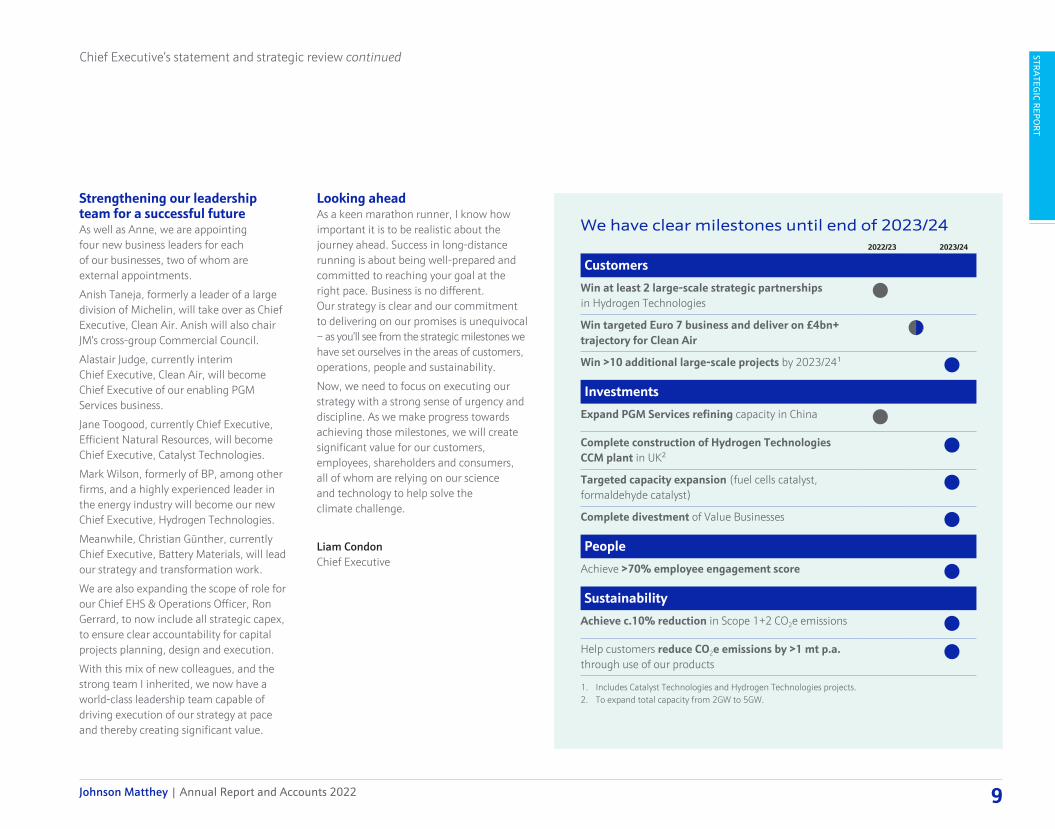
We have clear milestones until end of 2023/242022/23 2023/24
CustomersWin at least 2 large-scale strategic partnerships in Hydrogen Technologies
Win targeted Euro 7 business and deliver on £4bn+ trajectory for Clean Air
Win >10 additional large-scale projects by 2023/24¹
InvestmentsExpand PGM Services refining capacity in China
Complete construction of Hydrogen Technologies CCM plant in UK²
Targeted capacity expansion (fuel cells catalyst, formaldehyde catalyst)
Complete divestment of Value Businesses
PeopleAchieve >70% employee engagement score
SustainabilityAchieve c.10% reduction in Scope 1+2 CO2e emissions
Help customers reduce CO2e emissions by >1 mt p.a. through use of our products
1. Includes Catalyst Technologies and Hydrogen Technologies projects.2. To expand total capacity from 2GW to 5GW.
Chief Executive’s statement and strategic review continued
Strengthening our leadership team for a successful futureAs well as Anne, we are appointing four new business leaders for each of our businesses, two of whom are external appointments.
Anish Taneja, formerly a leader of a large division of Michelin, will take over as Chief Executive, Clean Air. Anish will also chair JM’s cross-group Commercial Council.
Alastair Judge, currently interim Chief Executive, Clean Air, will become Chief Executive of our enabling PGM Services business.
Jane Toogood, currently Chief Executive, Efficient Natural Resources, will become Chief Executive, Catalyst Technologies.
Mark Wilson, formerly of BP, among other firms, and a highly experienced leader in the energy industry will become our new Chief Executive, Hydrogen Technologies.
Meanwhile, Christian Günther, currently Chief Executive, Battery Materials, will lead our strategy and transformation work.
We are also expanding the scope of role for our Chief EHS & Operations Officer, Ron Gerrard, to now include all strategic capex, to ensure clear accountability for capital projects planning, design and execution.
With this mix of new colleagues, and the strong team I inherited, we now have a world-class leadership team capable of driving execution of our strategy at pace and thereby creating significant value.
Looking aheadAs a keen marathon runner, I know how important it is to be realistic about the journey ahead. Success in long-distance running is about being well-prepared and committed to reaching your goal at the right pace. Business is no different. Our strategy is clear and our commitment to delivering on our promises is unequivocal – as you’ll see from the strategic milestones we have set ourselves in the areas of customers, operations, people and sustainability.
Now, we need to focus on executing our strategy with a strong sense of urgency and discipline. As we make progress towards achieving those milestones, we will create significant value for our customers, employees, shareholders and consumers, all of whom are relying on our science and technology to help solve the climate challenge.
Liam CondonChief Executive
Johnson Matthey | Annual Report and Accounts 2022 9
STRATEG
IC REPORT

Our purpose and vision
Inspiring science, enhancing life
Johnson Matthey | Annual Report and Accounts 202210

Our vision is for a world that is cleaner and healthier, today and for future generations.
Realising our visionOur expertise in PGM chemistry, catalysis and process design has never been more relevant or so urgently needed.
Supported by our valuesOur purpose and vision are underpinned by our values and delivered every day by our incredible people across the world.
Protecting people and the planet
Acting with integrity Innovating and improving
Working together Owning what we do
As laid out on pages 5-9, we have revised our strategy to focus on the technologies and processes with the biggest potential to catalyse the transition to net zero and realise our vision for a cleaner, healthier world.
Decarbonising air travelPage 14
Cleaner air, healthier peoplePage 12
Unlocking the potential of hydrogenPage 16
Accelerating zero emissions transportSee more on matthey.com/fuel-cell-story
Over the next six pages, we share a few examples of the work we’re doing to help make that vision a reality – from five decades of automotive catalysts that clean the air, to catalyst technologies that make sustainable aviation fuel from surprising sources, to hydrogen technologies that can help decarbonise modern life. And we meet some of our incredible people using their skills and creativity to make all this happen.
Our purpose and vision continued
Johnson Matthey | Annual Report and Accounts 2022 11
STRATEG
IC REPORT

Cleaner air, healthier people
For almost 50 years, Johnson Matthey has used its expertise in PGM chemistry and catalysis to make a product that has helped save countless lives: the catalytic converter.
Back in the 1970s, cities like Los Angeles and Tokyo were shrouded in a haze of harmful pollution known as smog. Research showed this smog was largely caused by an atmospheric reaction between nitrogen oxides (NOx) and hydrocarbons, mostly from car exhausts. To combat the problem, authorities around the world began introducing new air quality legislation.
That’s where we came in. Thanks to our unique heritage, we understood better than anyone the chemical properties of PGMs and their potential to address vehicle emissions. Five decades later, one in every three new cars on the roads use our catalytic converters. In the process, we created the world’s first circular economy by recycling and reusing the PGMs inside those catalysts.
But today, despite significant improvements in air quality, around 4.2 million lives are still cut short every year by conditions like lung cancer and stroke directly caused by outdoor air pollution.
So we need to continue helping to clean internal combustion engine vehicles while road transport evolves to include a growing share of zero-emission vehicles, such as battery electric and fuel cell electric vehicles. That’s why we’re developing the next generation of catalytic converters to help our customers prepare for the toughest ever regulations, coming first in places like Europe and the USA.
We cracked the code for cleaner air back in 1974. Almost 50 years later, we’re still hard at work using our expertise to help the world breathe more easily.
1 in 3new cars on the roads
contain a catalytic converter made by JM
Realising our vision
Johnson Matthey | Annual Report and Accounts 202212

Sabrina Elix, Industrialisation LeadI’m part of JM’s process development team, which takes the work we do in our labs and scales it up for full production. It’s my job to help make our manufacturing plants more efficient. Just recently, I helped build and commission a production line for a brand-new catalyst.
JM is a real pioneer in the autocatalyst market: we actually created the world’s first commercial autocatalyst at our plant in Royston, UK, almost 50 years ago. It’s amazing to think about how many people have worked on, and improved, this
technology over the years. And as new, even tougher air regulations come into effect, we’re already working hard to innovate again. It’s pretty exciting.
What makes working for JM so special is that the focus isn’t just on trying to get as many parts out of a manufacturing plant as possible. It’s all about finding ways to work together to create something that’s going to bring benefit to the world. That’s really rewarding. Every day I feel like the work I do is actually making a difference.
“JM is a real pioneer in the autocatalyst market... and as new, tougher air regulations come into effect, we’re already working hard to innovate again. It’s pretty exciting.”
See Sabrina’s story online, visit matthey.com/clean-air-story
Realising our vision continued
Johnson Matthey | Annual Report and Accounts 2022 13
STRATEG
IC REPORT

Decarbonising air travel
Since commercial flights began, we’ve relied on fossil fuels to power our aeroplanes. Now, we’re designing new technologies that are helping to change that.
Today, aviation is responsible for around 12% of all transport-related CO2 emissions. The lack of alternative fuels means it’s been hard to decarbonise air travel. Until now.
Using our expertise in PGM chemistry and catalysis, we’ve designed clever ways to make sustainable aviation fuel (SAF) from alternative feedstocks. For example, our award-winning FT CANSTM technology, developed in partnership with bp, converts synthesis gas (a mixture of hydrogen and carbon monoxide, also known as syngas), made from household waste, into synthetic crude oil. Refiners can upgrade this crude oil into SAF.
From 2022, our technology will begin helping Fulcrum Bioenergy make millions of gallons of synthetic crude, while diverting thousands of tonnes of waste from landfills every year.
We also launched our HyCOgenTM technology in January 2022, which captures CO2 from existing emissions or from the air, and reacts it with zero-carbon ‘green’ hydrogen to generate syngas that can be turned into SAF.
We can now combine HyCOgenTM and FT CANSTM technology to create an end-to-end, low-carbon process to make synthetic crude. And in May 2022, Aramco and Repsol selected both for a new synthetic fuels plant in Bilbao, Spain. Once online in 2024, the plant will make a sustainable synthetic ‘drop-in’ fuel that can be blended for a variety of vehicles, including planes.
The SAF market will grow quickly. The International Air Transport Association (IATA), which represents major airlines in 120 countries, wants members to increase the amount of SAF they use from 5% in 2030 to 65% by 2050. The good news is our technologies are ready today to help meet that growing demand.
IATA wants members (airlines from 120 countries) to increase from
65% 2030
5%
by 2050
SAF use in 2030 to
Realising our vision continued
Johnson Matthey | Annual Report and Accounts 202214

Amelia Cook, Senior EngineerI’m leading the development of our new HyCOgenTM technology. It’s really exciting. The technology captures carbon dioxide that would otherwise be released into the atmosphere, which you can then react with hydrogen to make synthesis gas – a mixture of hydrogen and carbon monoxide. This gas can then be used to make more sustainable fuels and chemicals.
The fact that JM has been able to bring this to market in just a couple of years, and during a global pandemic as well, is amazing. It’s been a fascinating challenge.
JM’s vision to build a cleaner, healthier world aligns with my own passions. We’ve got to do something or time is going to run out. JM gives me the opportunity to use my engineering skills to tackle climate change and protect our planet. I want us all to have a sustainable future, and JM gives me the chance to actively contribute. I feel like I can personally make a difference for future generations.
“JM’s vision to build a cleaner, healthier world aligns with my own passions... it gives me the opportunity to use my engineering skills to tackle climate change and protect our planet. I feel like I can personally make a difference for future generations.”
See Amelia’s story online, visit matthey.com/saf-story
Realising our vision continued
Johnson Matthey | Annual Report and Accounts 2022 15
STRATEG
IC REPORT
Unlocking the potential of hydrogen
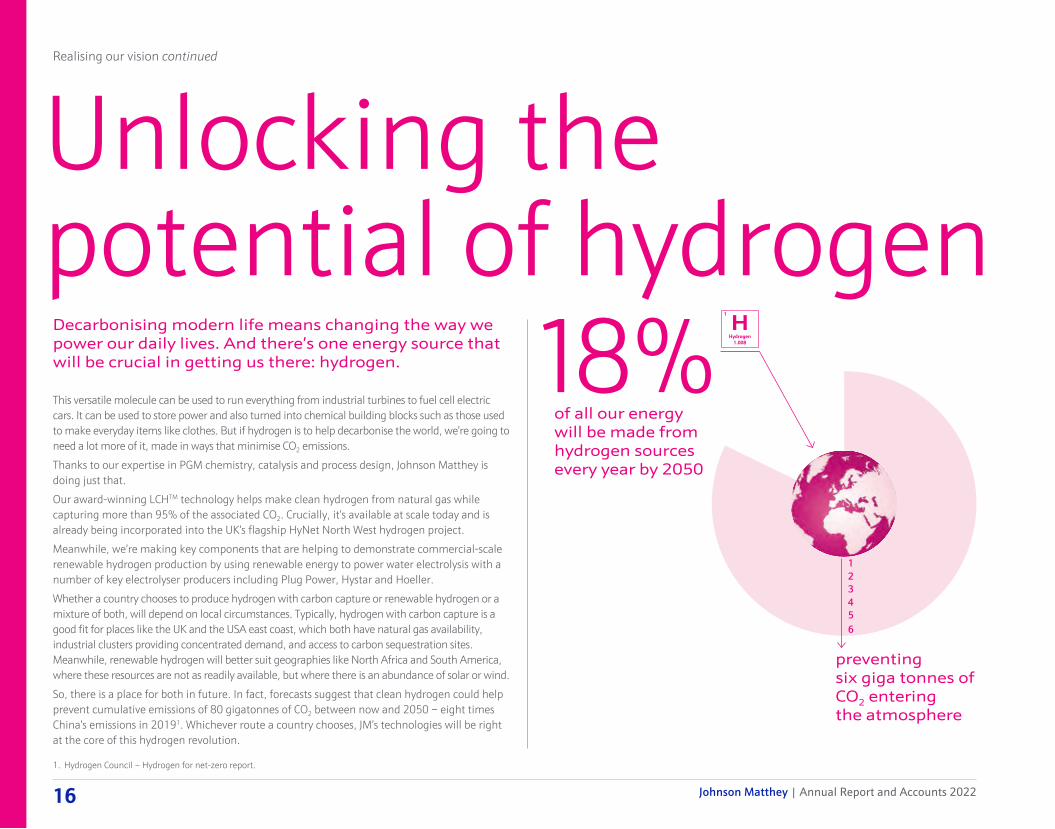
Decarbonising modern life means changing the way we power our daily lives. And there’s one energy source that will be crucial in getting us there: hydrogen.
This versatile molecule can be used to run everything from industrial turbines to fuel cell electric cars. It can be used to store power and also turned into chemical building blocks such as those used to make everyday items like clothes. But if hydrogen is to help decarbonise the world, we’re going to need a lot more of it, made in ways that minimise CO2 emissions.
Thanks to our expertise in PGM chemistry, catalysis and process design, Johnson Matthey is doing just that.
Our award-winning LCHTM technology helps make clean hydrogen from natural gas while capturing more than 95% of the associated CO2. Crucially, it’s available at scale today and is already being incorporated into the UK’s flagship HyNet North West hydrogen project.
Meanwhile, we’re making key components that are helping to demonstrate commercial-scale renewable hydrogen production by using renewable energy to power water electrolysis with a number of key electrolyser producers including Plug Power, Hystar and Hoeller.
Whether a country chooses to produce hydrogen with carbon capture or renewable hydrogen or a mixture of both, will depend on local circumstances. Typically, hydrogen with carbon capture is a good fit for places like the UK and the USA east coast, which both have natural gas availability, industrial clusters providing concentrated demand, and access to carbon sequestration sites. Meanwhile, renewable hydrogen will better suit geographies like North Africa and South America, where these resources are not as readily available, but where there is an abundance of solar or wind.
So, there is a place for both in future. In fact, forecasts suggest that clean hydrogen could help prevent cumulative emissions of 80 gigatonnes of CO2 between now and 2050 – eight times China’s emissions in 20191. Whichever route a country chooses, JM’s technologies will be right at the core of this hydrogen revolution.
Realising our vision continued
1. Hydrogen Council – Hydrogen for net-zero report.
18%of all our energy will be made from hydrogen sources every year by 2050
preventing six giga tonnes of CO2 entering the atmosphere
123456
Johnson Matthey | Annual Report and Accounts 202216

Will McDonnell, Research ScientistI help make the key component that fits into our customer’s electrolysers – the catalyst-coated membrane. That component is where the clever chemistry happens, splitting water into hydrogen. Combine that with renewable energy and you can make hydrogen with no resulting CO2 emissions.
Creating a cleaner, healthier world is so important. Everyone’s worried about climate change, and chemistry can play a big part in ensuring we still enjoy the only planet we have.
I work with some of the best scientists and engineers that walk the earth. We know we’re making a positive contribution to help make the planet a better place to live.
Mark McKenna, Process Technology ManagerI’m involved in designing the technology and processes that help make hydrogen using our LCHTM technology. That means taking natural gas, the same kind we might use for cooking or heating our homes, and transforming it into hydrogen while capturing as much of the associated CO2 as possible. We’re proud that our technology is among the best in the world, capturing more than 95% of the CO2 that would’ve gone into the atmosphere.
For me, JM’s purpose means I can make an impact, so that in 2050 we’re in a better place. It means I can look my grandson – who will be in his 30s by then – in the eye and say I did my bit.
“For me, JM’s purpose means I can make an impact, so that in 2050 we’re in a better place. It means I can look my grandson – who will be in his 30s by then – in the eye and say I did my bit.”
See Will and Mark’s story online, visit matthey.com/hydrogen-story
Realising our vision continued
preventing six giga tonnes of CO2 entering the atmosphere
Johnson Matthey | Annual Report and Accounts 2022 17
STRATEG
IC REPORT
Market review
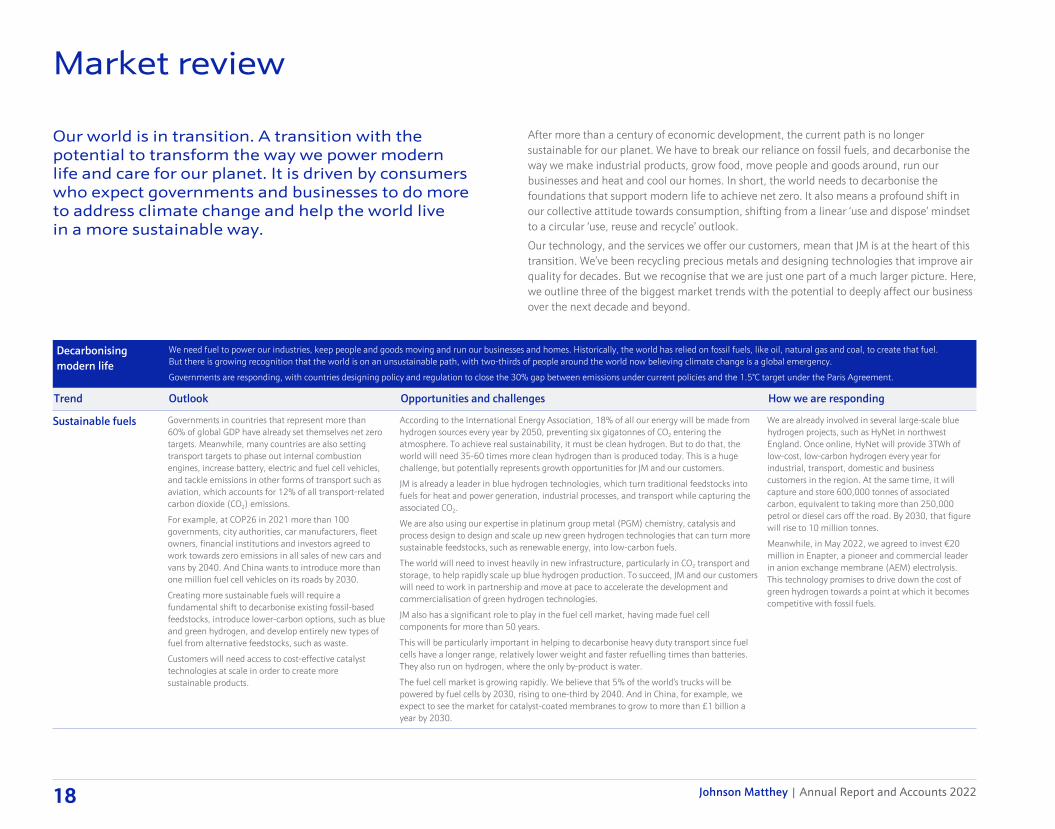
Our world is in transition. A transition with the potential to transform the way we power modern life and care for our planet. It is driven by consumers who expect governments and businesses to do more to address climate change and help the world live in a more sustainable way.
After more than a century of economic development, the current path is no longer sustainable for our planet. We have to break our reliance on fossil fuels, and decarbonise the way we make industrial products, grow food, move people and goods around, run our businesses and heat and cool our homes. In short, the world needs to decarbonise the foundations that support modern life to achieve net zero. It also means a profound shift in our collective attitude towards consumption, shifting from a linear ‘use and dispose’ mindset to a circular ‘use, reuse and recycle’ outlook.
Our technology, and the services we offer our customers, mean that JM is at the heart of this transition. We’ve been recycling precious metals and designing technologies that improve air quality for decades. But we recognise that we are just one part of a much larger picture. Here, we outline three of the biggest market trends with the potential to deeply affect our business over the next decade and beyond.
Decarbonising modern life
We need fuel to power our industries, keep people and goods moving and run our businesses and homes. Historically, the world has relied on fossil fuels, like oil, natural gas and coal, to create that fuel. But there is growing recognition that the world is on an unsustainable path, with two-thirds of people around the world now believing climate change is a global emergency.
Governments are responding, with countries designing policy and regulation to close the 30% gap between emissions under current policies and the 1.5°C target under the Paris Agreement.
Trend Outlook Opportunities and challenges How we are responding
Sustainable fuels Governments in countries that represent more than 60% of global GDP have already set themselves net zero targets. Meanwhile, many countries are also setting transport targets to phase out internal combustion engines, increase battery, electric and fuel cell vehicles, and tackle emissions in other forms of transport such as aviation, which accounts for 12% of all transport-related carbon dioxide (CO2) emissions.
For example, at COP26 in 2021 more than 100 governments, city authorities, car manufacturers, fleet owners, financial institutions and investors agreed to work towards zero emissions in all sales of new cars and vans by 2040. And China wants to introduce more than one million fuel cell vehicles on its roads by 2030.
Creating more sustainable fuels will require a fundamental shift to decarbonise existing fossil-based feedstocks, introduce lower-carbon options, such as blue and green hydrogen, and develop entirely new types of fuel from alternative feedstocks, such as waste.
Customers will need access to cost-effective catalyst technologies at scale in order to create more sustainable products.
According to the International Energy Association, 18% of all our energy will be made from hydrogen sources every year by 2050, preventing six gigatonnes of CO2 entering the atmosphere. To achieve real sustainability, it must be clean hydrogen. But to do that, the world will need 35-60 times more clean hydrogen than is produced today. This is a huge challenge, but potentially represents growth opportunities for JM and our customers.
JM is already a leader in blue hydrogen technologies, which turn traditional feedstocks into fuels for heat and power generation, industrial processes, and transport while capturing the associated CO2.
We are also using our expertise in platinum group metal (PGM) chemistry, catalysis and process design to design and scale up new green hydrogen technologies that can turn more sustainable feedstocks, such as renewable energy, into low-carbon fuels.
The world will need to invest heavily in new infrastructure, particularly in CO2 transport and storage, to help rapidly scale up blue hydrogen production. To succeed, JM and our customers will need to work in partnership and move at pace to accelerate the development and commercialisation of green hydrogen technologies.
JM also has a significant role to play in the fuel cell market, having made fuel cell components for more than 50 years.
This will be particularly important in helping to decarbonise heavy duty transport since fuel cells have a longer range, relatively lower weight and faster refuelling times than batteries. They also run on hydrogen, where the only by-product is water.
The fuel cell market is growing rapidly. We believe that 5% of the world’s trucks will be powered by fuel cells by 2030, rising to one-third by 2040. And in China, for example, we expect to see the market for catalyst-coated membranes to grow to more than £1 billion a year by 2030.
We are already involved in several large-scale blue hydrogen projects, such as HyNet in northwest England. Once online, HyNet will provide 3TWh of low-cost, low-carbon hydrogen every year for industrial, transport, domestic and business customers in the region. At the same time, it will capture and store 600,000 tonnes of associated carbon, equivalent to taking more than 250,000 petrol or diesel cars off the road. By 2030, that figure will rise to 10 million tonnes.
Meanwhile, in May 2022, we agreed to invest €20 million in Enapter, a pioneer and commercial leader in anion exchange membrane (AEM) electrolysis. This technology promises to drive down the cost of green hydrogen towards a point at which it becomes competitive with fossil fuels.
Johnson Matthey | Annual Report and Accounts 202218

Decarbonising modern life (cont)
Trend Outlook Opportunities and challenges How we are responding
Sustainable chemicals
Industry underpins economic growth but it, too, has been built on fossil fuels. This is particularly true in the chemicals industry, where oil, gas and coal provide the chemical building blocks to make other products, such as plastics, medicine and clothing.
While demand for primary chemicals is set to grow by 25% by 2030, the industry currently accounts for 18% of the world’s CO2 emissions. So, as it grows, it must do so in ways that reduce those emissions.
Increasingly, customers are looking to combine alternative, sustainable feedstocks, such as biomass and waste, with catalyst technologies that can turn them into useful products, such as sustainable aviation fuel.
For decades, JM’s catalyst and process technologies have turned traditional feedstocks into synthesis gas (syngas), an essential part of the value chain for key chemical building blocks such as methanol and ammonia. In fact, we are a global market leader in the supply of syngas process technology.
Syngas is essential in enabling the decarbonisation of chemical processes, since it can also be made from alternative, more sustainable feedstocks, such as biomass, waste and captured CO2 using our catalyst technologies. From there, syngas can be turned into green products such as sustainable aviation fuel. In other words, the chemical processes we support today could help make the fuels of tomorrow.
However, we still need to invest in innovation to design the next generation of advanced catalysts and demonstrate their use at scale to keep up with the rapidly developing emerging sustainable fuels market.
That means we need to make choices about partnerships, projects and technology pathways today when it is not yet clear which partners and technologies will be most successful.
The industry will also need to invest heavily in existing chemical infrastructure to enable the switch to new feedstocks.
We are a partner in Chile’s Haru Oni project, which will become the world’s first large-scale commercial plant producing climate-neutral e-methanol and e-gasoline from green hydrogen and CO2 recovered by direct air capture. JM is licensing methanol technology and supplying the engineering, catalyst and equipment for the project. By 2026, the plant will produce 550 million litres of e-fuels, enough for approximately 220,000 gasoline vehicles.
In May 2022, our co-developed Fischer Tropsch (FT) CANS™ technology and HyCOgen™ technology were selected for use by Aramco and Repsol at a new synthetic fuels plant in Bilbao, Spain. The plant will be commissioned in 2024 and make a sustainable synthetic drop-in fuel that can be blended for existing road vehicle engines, planes and ships.
Creating a circular economy
There is growing recognition that the world needs to move from a linear to a circular system, where recycling and reuse are incorporated into products while still on the drawing board.
Trend Outlook Opportunities and challenges How we are responding
Designing for recycling and reuse
Designing products in ways that make it easier to recycle and reuse their constituent parts is especially important given how much of our modern world – from smart phones to electric vehicles – depends on scarce metals such as platinum and cobalt.
Customers have relied on our recycling skills for centuries and will continue to need our expertise, particularly since the PGMs recycling industry is expected to grow annually by 3-5%.
JM has a significant market share of the global PGM recycling business, with 99.95% purity. And since the amount of carbon embedded in an ounce of recycled PGM is 50 times lower than newly mined PGM, there is significant opportunity to use our recycling skills to help the world achieve net zero without damaging economic growth.
We can apply our longstanding recycling expertise to emerging PGM technologies, including fuel cell and electrolyser stacks to help enable the hydrogen economy. We’re investing in our infrastructure and developing our processes to further strengthen those capabilities, so that when fuel cell stacks and hydrogen electrolysers reach their end of life, we will be ready to efficiently recover and refine the PGMs to a very high purity – just as we do today with production scrap. These critical materials can then be reused, creating an endless loop of PGM availability.
Because JM operates in different parts of the value chain, we understand the full life cycle of our products. That means we can design them in a way that makes it more efficient to recycle, and refine them at the end of their life.
Cleaner air, healthier people
Today, 50% of the global population live in urban centres. By 2050, that’s expected to hit 70%. In the EU alone, lorries, buses and coaches represent around one-quarter of all road transport emissions. Countries and regions are setting ever more stringent air quality regulations.
Trend Outlook Opportunities and challenges How we are responding
Tackling air quality issues caused by rising urbanisation
Increasing urbanisation is likely to put even more pressure on local air quality, which is why countries and regions are setting ever more stringent air quality regulations.
Customers need us to design the next generation of emission control technologies so that they are ready to meet local standards as soon as they come into force.
It simply isn’t possible to switch the world’s transport system to more sustainable fuels overnight, and we know that regions like the European Union plan to introduce tougher air quality legislation over the next few years. What’s more, automotive catalysts may still be needed even as alternative fuel sources, such as biofuels and hydrogen, grow in stature. So there is enormous potential for our Clean Air business to help reduce emissions further and keep growing over the next decade.
That said, we are likely to see demand for existing autocatalysts in light duty vehicles fall over the longer term, as the world’s transport systems begin to make the transition to lower-carbon options. This will eventually have an impact on our Clean Air business.
Today, one in three cars carries JM’s emission control technology. And we continue to invest and innovate to ensure that our technologies help customers meet new legislation. For example, our latest technology for heavy duty vehicles ensured customers were ready for China’s tough new NOx emissions standard which came into force in July 2021 (see page 39 for more information on this).
Market review continued
Johnson Matthey | Annual Report and Accounts 2022 19
STRATEG
IC REPORT

Of course, the challenge of transforming Johnson Matthey is why I joined the company, and I remain just as optimistic – if not more so – about our future as the day I started in April last year. However, the scale of the opportunity ahead has only increased the urgency with which we must commercialise our science and technology. And the need to transform our business is even more pressing than I had first anticipated.
Battery Materials exit: a difficult decision That urgency has meant some tough decisions this year. The biggest was exiting our Battery Materials business. I am acutely aware of the detrimental impact that this has had on JM’s value, our shareholders and our employees. Because of that impact, I and other members of our leadership team will see a clawback in our incentive package.
While not an easy decision, exiting Battery Materials was absolutely necessary to protect JM’s future. Last autumn, we carried out a detailed review of the business, with support from the board and in advance of several critical investment milestones. Together, we
concluded that the potential returns from Battery Materials were not adequate for us to justify further investment.
What became very clear during that review is that the transition to electric vehicles was accelerating faster than JM had envisaged, bringing with it rapid commoditisation of battery materials. Car manufacturers are looking for the cheapest technology, giving bulk chemicals manufacturers the biggest advantage.
JM is not a bulk speciality chemicals business; our heritage in PGM chemistry, catalysis and process design means we work best when focused on high value, complex solutions. This exposed JM’s lack of commercial experience and ability to execute large-scale capital projects.
This has been a humbling experience for everyone at JM and we have learned some tough, necessary and valuable lessons. Not least, the urgent need to strengthen our commercial focus and simplify our portfolio so that we can focus on the markets where we have a right to win.
In addressing this through the exit of Battery Materials announced in November 2021, and subsequently the sale of our non-core Health
“My first full year at Johnson Matthey has certainly brought a lot of challenge and unexpected surprises – with difficult portfolio choices and the need to react to highly volatile global markets.”
Chief Financial Officer’s review
Johnson Matthey | Annual Report and Accounts 202220

business in December, we began to set JM on the path that our new Chief Executive, Liam, has developed through the strategic review, laid out in his statement on pages 4 to 9. We are moving quickly to execute that strategy, simplify JM and restore the lost value and trust for all our stakeholders.
We have made progress since deciding to exit, with announcements in May 2022 that Nano One will acquire 100% of the shares in Johnson Matthey Battery Materials Canada and that we have agreed to sell part of the Battery Materials business to EV Metals Group for £50 million cash. JM will also receive a minority state in EV Metals Group to help capture future upside in this market.
Robust results despite external challengesTurning to our financial performance this year. JM has delivered a robust set of results, with group underlying operating profit from continuing operations of £553 million.
But it has been a financial year of two halves – a strong recovery in the first six months, offset by a weaker second half with the effects of automotive supply chain disruption in Clean Air. The performance of Health was particularly disappointing, affected by pricing pressure and acute labour shortages. This reduced the value we received on selling the business, and why, like Battery Materials, we have retained a 30% minority stake to benefit from future upside.
Our Clean Air business saw a partial recovery in demand, with sales up 5% and operating profit up 17% as we benefited from improved volumes and our efficiency programme. A strong recovery in the automotive sector early in the year was later hampered by a global shortage in semi-conductor chips that has severely limited vehicle production.
While supply chains are adjusting to this challenge, the early effects of the impact of Russia’s war in Ukraine and COVID-19-related lockdowns in China are now affecting the business.
Despite all this, Clean Air saw strong cash generation of around £800 million which we used to reduce metal leases and increase metal holdings to ensure security of supply for our customers in these volatile times.
We saw a good performance in our Efficient Natural Resources (ENR) division, with sales up 9% and operating profit up 33%. This was primarily driven by higher PGM prices, and a good operating performance in our refineries. Catalyst Technologies (CT) saw continued recovery in sales and has an exciting pipeline of opportunities in sustainable fuels, blue hydrogen and other low-carbon solutions that will drive future growth.
In our Other Markets division, we saw sales of £25 million in our Hydrogen Technologies business. This was lower than in previous years because we are diverting capacity to qualifying products for new customers. We are working hard to install additional capacity and scale the business to meet rapidly increasing customer demand for our technologies.
Turning to the work we’ve done this year to drive down internal costs, I am pleased to see that we continued to make good progress here and also to reduce our working capital. This is thanks, in particular, to the teams in Clean Air and our PGM refineries. We delivered £87 million in efficiency savings in the year from a total annualised programme target of £100 million excluding Health, by 2023/24. Reduced working capital led to lower than expected net debt of around £856 million and we ended the year with a strong balance sheet, and with free cash flow of £221 million.
We expect the sale of Health to complete in May and we recently announced the sale of our Battery Materials assets, which closes the chapter to exit that business. We also completed the sale of our Advanced Glass Technologies business (AGT) in January 2022 for a total consideration of £178 million. The combined exits from Health and Battery Materials have resulted in a significant and painful one-off loss of £363 million (£325 million impairment and £38 million restructuring charge). This has been partially offset by the gain on sale of AGT of £106 million, and £42 million of one-off net benefits from legal settlements. We also recorded combined impairment and restructuring charges of £77 million in relation to our exposures in Russia and a lower than expected value of our Diagnostic Services business.
We now have a focused portfolio comprising our four key businesses, Clean Air, Catalyst Technologies, Hydrogen Technologies, and PGM Services, that will be supported by streamlined corporate functions.
Drawing on our strengths to restore value and trustThis combination of simplified portfolio and strong balance sheet are essential for us to restore JM’s value, build back shareholder trust and realise the full potential of our businesses. As Liam mentions, JM’s expertise means we already have many of the technologies that the world needs to decarbonise at speed. That gives us a distinct competitive advantage. Indeed, we are already market leaders in many of our chosen technologies, and we see opportunities to scale our growth businesses with levels of capital intensity and returns that JM is familiar with.
As I mentioned at the start, the speed and scale at which we need to transform in order to realise these opportunities is even greater than I anticipated when I joined. We need to work quickly to build our commercial muscle, strengthen our ability to scale capital projects, further reduce our cost base and transform our culture.
I continue to be hugely impressed by the quality of our people and I have inherited a fantastic team. Together, we are already making good progress to help create a more efficient, high-performing culture. In my direct areas of finance and IT, we continue to invest to upgrade our processes and systems, and in 2022 we launched our new digital HR platform. This is a big milestone in our transformation as it will give us better data to help us run our businesses effectively, understand and manage our people’s strengths and gaps, and simplify the way we work together. We still have further work to do to upgrade our systems and processes in other areas of the business.
A challenging, but exciting year ahead As we execute our strategy and transform our culture over the coming months, we must do so while continuing to navigate ongoing global political and economic uncertainty. The combination of combating inflation, the ongoing effects of COVID-19 and the effects of Russia’s war in Ukraine are likely to make the next 12 months just as challenging for JM as the previous 12 months.
Nonetheless, I truly believe JM is entering an exciting new era. We have a once-in-a-lifetime opportunity to transform our company and play a leading role in the journey to net zero. We have a lot of work ahead of us, but I am as excited as I was on the day I joined to play my part.
Stephen OxleyChief Financial Officer
Chief Financial Officer’s review continued
Johnson Matthey | Annual Report and Accounts 2022 21
STRATEG
IC REPORT

Financial performance review
Reported results Underlying results (continuing)1,2
Year ended 31st March %
change
Year ended 31st March %
change% change,
constant FX rates2022 20212 2022 20212
Revenue £m 16,025 15,435 +4Sales excluding precious metals4 £m 3,778 3,685 +3 +5Operating profit £m 255 309 -17 553 473 +17 +21Profit before tax £m 195 224 -13 493 388 +27Profit after tax (continuing) £m 116 194 -40 407 326 +25(Loss) / profit after tax (discontinued) £m (217) 11 n/a(Loss) / earnings per share pence (52.6) 106.5 n/a 213.2 168.9 +26Ordinary dividend per share pence 77.0 70.0 +10
Underlying performance – continuing operations1,2,3
• Robust underlying results for 2021/22, in line with market expectations5
• Sales of £3.8 billion, up 5%, driven by a partial recovery in Clean Air and good performance in Efficient Natural Resources
• Underlying operating profit of £553 million, up 21%, driven by good performance in Clean Air and Efficient Natural Resources, higher average PGM prices and efficiencies
• Underlying earnings per share up 26% due to stronger operational results and lower net finance charges
• Free cash flow of £221 million, moderately down on the prior year• Strong balance sheet with net debt of £856 million reflecting continued strong
management of working capital; net debt to EBITDA of 1.2 times
Notes:1. Underlying is before profit or loss on disposal of businesses, gain or loss on significant legal proceedings together with associated legal costs, amortisation of acquired intangibles, major impairment and restructuring charges and, where
relevant, related tax effects. For definitions and reconciliations of other non-GAAP measures, see pages 210 to 213.2. 2020/21 is restated to reflect the group’s updated reporting segments and removal of inter-segment copper zeolite sales in Efficient Natural Resources as well as the classification of Health as a discontinued operation.3. Unless otherwise stated, sales and operating profit commentary refers to performance at constant exchange rates. Growth at constant rates excludes the translation impact of foreign exchange movements, with 2020/21 results converted
at 2021/22 average rates. In 2021/22, the translational impact of exchange rates on group sales and underlying operating profit was an adverse impact of c.£101 million and c.£17 million respectively.4. Revenue excluding sales of precious metals to customers and the precious metal content of products sold to customers.5. Vara consensus for full year group underlying operating profit in 2021/22 was £545 million (range: £532 million to £561 million) as at 25th May 2022. 2020/21 group underlying operating profit was £504 million.
Reported results2
• Revenue up 4% primarily driven by higher average precious metal prices• Operating profit declined 17% to £255 million, largely reflecting the one-off impairment
and exit costs for Battery Materials• Profit before tax declined 13% to £195 million, reflecting lower operating profit which
was largely impacted by the one-off impairment in Battery Materials• Loss after tax on discontinued operations of £217 million including Health underlying
operating profit of £3 million and an impairment and restructuring charge of £242 million relating to its sale that is expected to complete at the end of May
• Reported loss per share of 52.6 pence• Cash inflow from operating activities of £605 million (2020/21: £769 million)• Ordinary dividend of 77.0 pence per share, up 10%• Share buyback of £200 million now complete
Johnson Matthey | Annual Report and Accounts 202222

Reporting structure changesTo provide greater transparency and reflect how we manage our businesses, we are changing our reporting structure for 2022/23. Under this basis, we have provided sales and underlying operating profit for 2021/22 and 2020/21 below:
Sales (£ million) 2022
Year ended 31st March
2021¹% change,
constant FX rates
Clean Air 2,457 2,412 +5PGM Services 587 531 +13Catalyst Technologies 454 443 +5Hydrogen Technologies 25 41 -39Value Businesses¹ 280 274 +8Eliminations (99) (113)Total sales (adjusted) 3,704 3,588 +6Adjustments² 236 334Total sales 3,940 3,922 +3
Underlying operating profit (£ million) 2022
Year ended 31st March
2021¹% change,
constant FX rates
Clean Air 302 269 +17PGM Services 308 244 +28Catalyst Technologies 50 32 +67Hydrogen Technologies (33) 1 n/aValue Businesses¹ 18 5 +260Corporate (86) (73)Total operating profit (adjusted) 559 478 +21Adjustments³ (3) 26Total operating profit 556 504 +14
Notes:1. Includes Battery Systems, Medical Device Components and Diagnostic Services.2. Sales adjustments reflect removal of Health (2021/22: £162m, 2020/21: £237m), Advanced Glass Technologies
(2021/22: £62m, 2020/21: £66m), Battery Materials (2021/22: £12m, 2020/21: £14m) and Other – Water and Atmosphere Control Technologies (2021/22: nil, 2020/21: £17m).
3. Underlying operating profit adjustments reflect removal of Health (2021/22: £3m, 2020/21: £31m), Advanced Glass Technologies (2021/22: £16m, 2020/21: £17m), Battery Materials (2021/22: -£22m, 2020/21: -£23m) and Other – Water and Atmosphere Control Technologies (2021/22: nil, 2020/21: £1m).
Summary of underlying operating results from continuing operationsUnless otherwise stated, commentary refers to performance at constant rates. Percentage changes in the tables are calculated on rounded numbers
Sales (£ million) 2022
Year ended 31st March
2021¹ % change% change,
constant FX rates
Clean Air 2,457 2,412 +2 +5Efficient Natural Resources 1,041 974 +7 +9Other Markets 379 412 -8 -4Eliminations (99) (113)Sales (continuing) 3,778 3,685 +3 +5Health (discontinued) 162 237 -29Total sales 3,940 3,922 - +3
Underlying operating profit (£ million) 2022
Year ended 31st March
2021¹ % change% change,
constant FX rates
Clean Air 302 269 +12 +17Efficient Natural Resources 358 276 +30 +33Other Markets (21) 1 n/a n/aCorporate (86) (73)Underlying operating profit (continuing) 553 473 +17 +21Health (discontinued) 3 31 -90Total underlying operating profit 556 504 +10 +14
Reconciliation of underlying operating profit (continuing) to operating profit (£ million) 2022
Year ended 31st March
2021¹
Underlying operating profit (continuing) 553 473Profit on disposal of businesses 106 -Gains and losses on significant legal proceedings² 42 -Amortisation of acquired intangibles (6) (10)Major impairment and restructuring charges² (440) (154)Operating profit 255 309
Notes:1. 2020/21 is restated to reflect the group’s updated reporting segments and removal of inter-segment copper
zeolite sales in Efficient Natural Resources as well as the classification of Health as a discontinued operation. 2. For further detail on these items please see page 169.
Financial performance review continued
Johnson Matthey | Annual Report and Accounts 2022 23
STRATEG
IC REPORT

Financial performance review continued
Clean Air
Sales up driven by a partial recovery in demand • Sales were up 5% driven by a partial recovery in demand, although volumes were
constrained by supply chain disruption, principally shortages of semi-conductor chips • Underlying operating profit increased 17%. Margins increased driven by operational
leverage and benefits from our transformation programme, but were held back by the impact of chip shortages and inflation
• Strong cash generation of around £800 million in the year¹Year ended 31st March
% change
% change, constant FX rates
2022 £ million
2021 £ million
Sales Light duty diesel 1,005 1,017 -1 +2Light duty gasoline 574 624 -8 -7Heavy duty diesel 878 772 +14 +17Total sales 2,457 2,412 +2 +5
Underlying operating profit 302 269 +12 +17Underlying margin 12.3% 11.2%Reported operating profit 273 165
A partial recovery in demand, still impacted by supply chain disruptionClean Air provides catalysts for emission control after-treatment systems used in light and heavy duty vehicles powered by internal combustion engines.
Sales were up 5%, supported by increased activity in autos due to a partial recovery in demand. This was driven by heavy duty diesel and to a lesser extent by light duty diesel, with a decline in light duty gasoline. However, supply chain disruption and semi-conductor shortages continue to act as a constraint on vehicle production and this was more pronounced during the second half. This, in combination with strong demand in the second half of last year resulted in 2H sales being 9% lower year-on-year.
We are making good progress on our Clean Air transformation programme. We are continuing to rebalance production into our most efficient plants (notably from the UK into Poland and Macedonia) and have started manufacturing at our site in India, the last of our new highly efficient plants to be completed.
We remain focused on driving efficiency and cash generation across our Clean Air operations, having generated around £800¹ million of cash this year. We have a plan to deliver at least £4 billion of cash by 2030/31² and remain confident in the significant profitability and cash generation of the business beyond this period. We continued to win the Euro 7 and equivalent business we have targeted and remain positive on our bidding for further platforms to meet this legislation.
Light duty catalysts – diesel and gasolineLight duty dieselIn light duty diesel global sales were slightly up, outperforming the overall light duty diesel market. We saw good performance in the Americas and Asia, offset by a weak European market which represents around 65% of our total light duty diesel sales. In both the Americas and Asia, we saw strong sales growth ahead of the market as we won new business. In Europe, sales declined due to the weak market, although we benefited from a favourable platform mix.
Light duty gasolineGlobal sales in light duty gasoline were down 7% with declines across all regions, underperforming the overall light duty gasoline market due to the impact of previous platform losses in Europe and the Americas. We have been investing in light duty gasoline to support future platform wins and are confident our technology and commercial offering is now competitive.
Heavy duty diesel catalysts Heavy duty diesel sales grew 17% during the year, in line with the overall market, with double-digit growth across all regions. In the Americas, we saw strong sales growth in line with market production driven by a cyclical recovery in the US Class 8 truck cycle. In Europe, heavy duty sales growth outperformed market production, benefiting from a favourable platform mix. In Asia, sales grew strongly in a market that declined, supported by market share gains and increased value per vehicle due to tighter legislation in China.
Underlying operating profitUnderlying operating profit increased 17% and margin increased to 12.3%, driven by operational leverage and benefits from our transformation programme, but were held back by the impact of chip shortages and inflation.
Notes:1. Delivered around £800 million of cash at actual precious metal prices, which equates to just over £600 million at
constant prices (March 2021). 2. At least £4 billion of cash under our range of scenarios from 1st April 2021 to 31st March 2031. Cash target pre-tax
and post restructuring costs.
Johnson Matthey | Annual Report and Accounts 202224

Efficient Natural Resources
Good performance driven by PGM Services and recovery in Catalyst Technologies• Good performance with sales up 9%. PGM Services grew strongly primarily benefiting
from higher average precious metal prices. Catalyst Technologies also grew driven by higher refill catalysts across industrial and consumer, principally in methanol
• Underlying operating profit up 33% and margin expanded 6.1 percentage points driven by strong growth in PGM Services
Year ended 31st March
% change
% change, constant FX rates
2022 £ million
2021¹ £ million
Sales PGM Services 587 531 +11 +13Catalyst Technologies 454 443 +2 +5Total sales 1,041 974 +7 +9
PGM Services 308 244 +26 +28Catalyst Technologies 50 32 +56 +67Underlying operating profit 358 276 +30 +33
Underlying margin 34.4% 28.3%Reported operating profit 385 250
1. Restated following change to reporting segments and removal of inter-segment Copper Zeolites sales.
PGM ServicesPGM Services is the world’s largest secondary recycler of platinum group metals (PGMs). This business has an important role in enabling the energy transition through providing circular solutions as demand for scarce critical materials increases. PGM Services also provides a strategic service to the group, supporting Clean Air, Catalyst Technologies and Hydrogen Technologies with security of metal supply in a volatile market.
Strong growth, benefiting from good performance in our refining businessSales grew 13% reflecting good performance in our refining business primarily benefiting from higher average PGM prices. Sales were partly offset by reduced activity in our trading business which had a strong prior year.
Across our other businesses, performance was good. Life Science Technologies, which provides advanced PGM based catalysts to the pharmaceutical and agricultural chemicals markets, performed strongly reflecting new product launches from our customers.
Refining backlogs remain at low levelsRefinery backlogs remain at low levels, which reflects our continued strong operational focus and efficient management of precious metal working capital. This supports the group’s balance sheet efficiency.
Catalyst TechnologiesCatalyst Technologies is focused on enabling the decarbonisation of chemical value chains and we have leading positions in syngas: methanol, ammonia, hydrogen and formaldehyde. Catalyst Technologies serves three key end markets: industrial and consumer, traditional fuels and the nascent sustainable fuels market. Our revenue streams comprise refill catalysts, first fill catalysts and licensing income. In the year, sales were up 5% primarily driven by higher demand for refill catalysts.
Industrial and consumer: good growth in refills, particularly methanol Industrial and consumer includes our methanol, ammonia, formaldehyde offerings as well as the majority of our licensing business. Overall, sales in industrial and consumer were up in the period and, within that, refill catalysts grew double digit. This largely reflected higher demand in methanol where we benefited from a pick-up in market demand.
Licensing and first fill sales, which are driven by the start-up of new plants and are lumpy by nature, were lower following particularly strong performance in the prior year in ammonia and oxoalcohols.
Financial performance review continued
Johnson Matthey | Annual Report and Accounts 2022 25
STRATEG
IC REPORT

Financial performance review continued
Traditional fuels: refills and additives flatTraditional fuels includes our refining additives, hydrogen and natural gas purification offerings. Refills and additives, which make up the majority of sales in this segment, were flat. First fill sales were down, largely driven by hydrogen where we saw strong performance in the prior year as new plants came on stream.
Sustainable fuels: first sales relating to new sustainable technologiesWe are developing new technologies to enable the new, fast-growing sustainable fuels markets which include our blue hydrogen, sustainable fuels and low carbon solutions offerings. Although small in value at this stage, sales were supported by the supply of the first methanol catalyst for the Haru Oni project in Chile, the world’s first integrated and commercial large-scale plant to produce climate neutral e-methanol and e-gasoline from wind power. In addition, we also supplied the first catalyst used by our Fischer Tropsch (FT) CANS™ technology to Fulcrum for one of the world’s first plants for the production of sustainable fuel from municipal solid waste.
Pipeline of future opportunities – driving growth from sustainable technologiesLicensing activity remains good and we signed four new licences in the period
(2020/21: nine licences)¹. We are working with customers on a number of future opportunities focused on our decarbonisation technology, including sustainable aviation fuel, blue hydrogen and low carbon solutions. Across these exciting growth areas, we have a strong and growing pipeline with more than 70 potential projects.
Underlying operating profitUnderlying operating profit up 33% and margin expanded 6.1 percentage points, primarily driven by strong growth in PGM Services.
• PGM Services was up 28%, benefiting from higher average PGM prices (c.£45 million), partly offset by reduced activity in our trading business.
• In Catalyst Technologies, profit grew 67%, primarily reflecting a recovery in our refill catalyst business, as well as the absence of one-off impairments recognised in the prior year. Towards the end of the year, we saw an impact from the cessation of our activities in Russia. We expect the loss of business into Russia to have a c.£10 million impact year-on-year on Catalyst Technologies operating profit in 2022/23.
Other MarketsInvesting to support growth in Hydrogen Technologies whilst driving value from non-core businesses
• Performance in Hydrogen Technologies reflected increased investment to support growth and manufacturing constraints as we scale up the business and utilised capacity to qualify new customer products
• Completed the sale of Advanced Glass Technologies on 31st January 2022 for a total consideration of £178 million
• Shortly completing our exit from our Battery Materials businessYear ended 31st March
% change% change,
constant FX rates2022
£ million2021¹
£ million
SalesNew Markets 37 55 -33 -33Value Businesses 342 357 -4 +1Total sales 379 412 -8 -4
New Markets (55) (22) n/a n/aValue Businesses 34 23 +48 +55Underlying operating loss (21) 1 n/a n/a
Underlying margin -5.5% 0.2%Reported operating loss (309) (9)
1. Restated following change to reporting segments.
Notes:1. 2020/21 and 2021/22 numbers exclude low value licences.
Johnson Matthey | Annual Report and Accounts 202226

New MarketsIn the year, New Markets comprised Hydrogen Technologies (Fuel Cells and Green Hydrogen) and Battery Materials. In Hydrogen Technologies, we provide catalyst coated membranes that are essential for fuel cells and green hydrogen electrolysers.
New Markets sales decreased 33% in the period. We are experiencing manufacturing constraints in Hydrogen Technologies as we scale up the business and utilise capacity for new customer qualification. Work is ongoing to expand our manufacturing capacity in the UK and China with the first phase expected to commence production in early 2023. In Green Hydrogen, we are commercialising at pace and generated our first sales in April 2022.
We are shortly completing our exit from Battery Materials and have impaired the carrying value of the assets to fair value, and communicated associated exit costs net of anticipated proceeds from asset sales. Together, these resulted in an exceptional item outside underlying operating profit of £363 million.
Value BusinessesValue Businesses is managed to drive shareholder value from activities considered to be non-core to JM, and comprises Battery Systems, Medical Device Components and Diagnostic Services. Advanced Glass Technologies was divested during the year.
Sales were broadly flat¹ in the period. We saw good sales performance in Medical Devices and Diagnostic Services which benefited from actions taken to drive improved business performance as well as improved demand following COVID-19. This was offset by weaker sales in Battery Systems, which was impacted by the global shortage of semi-conductor chips.
Underlying operating lossOther Markets reported an underlying operating loss of £21 million, reflecting an operating loss of £55 million in New Markets partially offset by an operating profit of £34 million in Value Businesses.
Within New Markets, we accelerated our investment in the scale up of Hydrogen Technologies during the period resulting in loss for that business of £33 million. Battery Materials operating losses were £22 million.
CorporateCorporate costs were £86 million, an increase of £13 million from the prior period, primarily due to building capability across our group functions and upgrading our core IT systems, as well as an increase in the pension service cost.
Discontinued operations: Health
Performance impacted by lower demand and pricing pressure in Generics, US labour shortage and supply chain constraints• Sale of Health to Altaris Capital Partners agreed on 17th December 2021, with the
transaction expected to complete at the end of May• Performance impacted by lower demand and pricing pressure in opioid analgesics
(Generics), labour shortages in the US pharma market and global supply chain constraintsYear ended 31st March
% change% change,
constant FX rates2022
£ million2021
£ million
Sales Generics 77 146 -47 -46Innovators 86 91 -5 -1Total sales 163 237 -31 -29
Underlying operating profit (discontinued) 3 31 -90 -90Underlying margin (discontinued) 1.8% 13.1%Reported operating (loss) / profit (239) 14
Update on sale to Altaris Capital PartnersOn 17th December 2021, we announced the sale of Health to Altaris Capital Partners. The transaction is expected to complete at the end of May. As previously announced, we will retain approximately a 30% equity stake in the business. We have recorded a major impairment and restructuring charge of £242 million based on the amount expected to be recovered through the sale.
Sales performanceOverall sales were down 29% in the period, driven by weaker performance in Generics. Within Generics, sales of opioid addiction therapies decreased reflecting lower demand and pricing pressure in the US as the market genericises, whilst demand for opioid analgesics was impacted by the postponement of elective medical procedures. In addition, we saw manufacturing delays in some areas due to US labour shortages and supply chain constraints. Innovators sales were broadly flat in the year, with sales constrained by labour and raw material shortages in the US which negatively impacted our operations.
Underlying operating profit (discontinued)Underlying operating profit declined 90%, reflecting weaker sales in Generics and manufacturing challenges in both businesses due to temporary US labour market shortages and supply chain disruption.
Financial performance review continued
Notes:1. The sale of Advanced Glass Technologies was completed on 31st January 2022. On a continuing basis (excluding
Advanced Glass Technologies and other divested businesses in 2020/21 from both 2020/21 and 2021/22), sales in Value Businesses increased 8%.
Johnson Matthey | Annual Report and Accounts 2022 27
STRATEG
IC REPORT

Financial performance review continued
Efficiency savingsOur efficiency programme in relation to the consolidation of our Clean Air manufacturing footprint and the implementation of a new group operating model, which targeted savings of £100 million per annum (excluding Health) by 2023/24, is now largely complete.
£ million Delivered to
2020/21 Delivered in
2021/22¹Annualised benefits by
2023/24²
Total active efficiency programmes 37 87 100
Following the strategic review, we have now commenced our new group transformation programme as part of which we expect to deliver further efficiencies of £150 million by 2024/25. Associated costs to deliver the programme – all of which are cash – are around £100 million.Notes:1. Savings achieved in 2021/22 exclude £7 million relating to Health.2. Annualised benefits by 2023/24 exclude £10 million relating to Health.
Items outside underlying operating profit
Non-underlying charge/income (£ million)As at
31st March 2022As at
31st March 2021
Major impairments and restructuring (440) (154)Battery Materials (363) –Russia – Ukraine conflict (32) –Diagnostic Services (45) –Gains and losses on significant legal proceedings 42 –Disposal of Advanced Glass Technologies 106 –Amortisation of acquired intangibles (6) (10)Total (298) (164)
Major impairment and restructuring costsFollowing the announcement of our intention to exit our Battery Materials business we have impaired the carrying value of the assets to fair value and communicated associated exit costs, which is net of anticipated proceeds from asset sales. Together, these resulted in an exceptional item outside underlying operating profit of £363 million.
As announced on 7th March 2022, we discontinued with immediate effect all new commercial activities in Russia and Belarus in light of the ongoing conflict with Ukraine. Our operations in Russia include a small Clean Air manufacturing plant, and a small Catalyst Technologies office. We have fully impaired the assets associated with both businesses resulting in a charge of £32 million.
As part of our annual impairment testing of goodwill, we updated our long-term market assumptions for the oil and gas industry in which Diagnostic Services serves its customers.
The growth rate and discount rate assumptions for Diagnostic Services have also been updated to reflect the faster paced transition to non-carbon intensive industries and the simplification of our portfolio to focus on core markets. This resulted in an impairment to goodwill of £45 million.
Financial review – continuing operations
Research and development (R&D)R&D spend (excluding Health) was £201 million in the year, including £22 million of capitalised R&D. This was up from £185 million in the prior period and represents c.5% of sales excluding precious metals. The increase was mainly due to investment in Hydrogen Technologies as we commercialise our fuel cell and green hydrogen offerings, as well as continued investment in our Clean Air business ahead of new emissions regulations. Investment in Battery Materials, which was largely capitalised, also drove the increase in spend in the year.
Foreign exchange The calculation of growth at constant rates excludes the impact of foreign exchange movements arising from the translation of overseas subsidiaries’ profit into sterling. The group does not hedge the impact of translation effects on the income statement. The principal overseas currencies, which represented 78% of the non-sterling denominated underlying operating profit in year ended 31st March 2022, were:
Share of 2021/22 non-sterling denominated
underlying operating profit
Average exchange rate Year ended 31st March
% change2022 2021
US dollar 30% 1.36 1.31 +4Euro 29% 1.18 1.12 +5Chinese renminbi 19% 8.75 8.85 -1
For the year, the impact of exchange rates decreased sales by £101 million and underlying operating profit by £17 million.
If current exchange rates (£:$ 1.23, £:€ 1.18, £:RMB 8.31) are maintained throughout the year ending 31st March 2023, foreign currency translation will have a positive impact of approximately £25 million on underlying operating profit. A one cent change in the average US dollar and euro exchange rates each have an impact of approximately
£1 million and £2 million respectively on full year underlying operating profit, and a ten fen change in the average rate of the Chinese renminbi has an impact of approximately £1 million.
Johnson Matthey | Annual Report and Accounts 202228

Gains and losses on significant legal proceedingsDuring the period, the group recognised a net gain of £42 million largely reflecting damages and interest from a company found to have unlawfully copied one of JM’s technology designs.
Disposal of Advanced Glass TechnologiesOn 31st January 2022, the group completed the sale of its Advanced Glass Technologies business for a total consideration of £178 million and recognised a non-underlying gain of £106 million.
Discontinued operations – HealthWe announced the sale of Health on 17th December 2021 to Altaris Capital Partners. The expected proceeds fair value less costs to sell is £272 million leading to an impairment to Health’s net assets of £228 million. The non-underlying impairment has been recognised in 2021/22 upon reclassing Health to ‘held for sale’ and discontinued operations. Non-underlying transaction and separation costs of c.£14 million have been incurred and expensed in the current year.
Finance chargesNet finance charges in the period amounted to £60 million, down from £85 million last year. Finance costs on metal borrowings have decreased due to lower metal borrowings and the focus across the group on reducing precious metal working capital.
Taxation The tax charge on underlying profit before tax for the year ended 31st March 2022 was £86 million, an effective underlying tax rate of 17.4%, slightly up from 16.3% in 2020/21.
The effective tax rate on reported loss for the year ended 31st March 2022 was 56.4%, from 13.9% in the prior period. This represents a tax charge of £57 million, compared with
£33 million in the prior year. The increased effective rate is due to major impairments and disposals arising in the year where no tax relief is available.
We currently expect the tax rate on underlying profit for the year ending 31st March 2023 to be around 19%, and then increase progressively to around 21% by 2024/25 reflecting rising corporate tax rates.
Post-employment benefitsIFRS – accounting basisAt 31st March 2022, the group’s net post-employment benefit position, excluding bond assets held in a special purpose vehicle, was a surplus of around £283 million.
The cost of providing post-employment benefits in the year was £62 million, down from £65 million last year. The prior year charge included a £3 million credit, compared to a £11 million credit this year.
Capital expenditureCapital expenditure (excluding Health) was £446 million in the year, 2.6 times depreciation and amortisation (excluding amortisation of acquired intangibles). In the period, projects included:
• In Efficient Natural Resources, investing to increase the resilience and capacity of our PGM refining assets
• Development and commercialisation of eLNO, our portfolio of high nickel cathode materials within Battery Materials
• Upgrading our core IT business systems
Strong balance sheetNet debt (excluding Health) at 31st March 2022 was £856 million, an increase from
£770 million from 31st March 2021. Net debt is £25 million higher at £881 million when post tax pension deficits are included. The group’s net debt (including post tax pension deficits) to EBITDA was 1.2 times (31st March 2021: 1.3 times), slightly below our target range of 1.5 to 2.0 times.
We use short-term metal leases as part of our mix of funding for working capital, which are outside the scope of IFRS 16 as they qualify as short-term leases. These amounted to £140 million as at 31st March 2022 (31st March 2021: £437 million).
Free cash flow and working capitalFree cash flow was £221 million in the year, compared to £295 million in the prior period, largely reflecting a non-precious metal working capital outflow.
Excluding precious metal, average working capital days to 31st March 2022 decreased to 36 days compared to 45 days to 31st March 2021. The prior period was higher due to the lower average sales volume through the period.
Financial performance review continued
Johnson Matthey | Annual Report and Accounts 2022 29
STRATEG
IC REPORT

Outlook for the year ending 31st March 2023For 2022/23, we are facing a period of greater political and economic uncertainty with a combination of factors that may affect the year ahead. Our performance for the full year will continue to correlate closely to levels of auto production and precious metal prices.
In Clean Air, although end customer demand remains robust, there continues to be supply chain disruption affecting many of our automotive customers constraining their production volumes, most recently with COVID-19 lockdowns in China and sourcing components from Ukraine. We expect conditions to ease through the year and Clean Air performance to improve with levels of auto production, although visibility remains low. For the year 2022/23 external data currently suggests auto production will be 5% higher than 2021/22. In this scenario, we would anticipate Clean Air operating performance to be broadly in line with 2021/22 with cost inflation being offset by further efficiencies. Clean Air has a flexible cost base, enabling us to manage different levels of activity, with around 75% of costs before mitigation being variable.
PGM Services continues to benefit from relatively high and volatile precious metals prices, albeit current prices are slightly below the prior year. If they were to remain at their current level1 for the rest of this year, we would expect the adverse impact on the full year to be around £25 million2. We are also expecting slightly lower refinery intake volumes due to lower scrap levels with the semi-conductor chip shortage supporting a buoyant second-hand car market.
Catalyst Technologies end markets remain robust. As reported previously, we have limited operations in Russia representing around only 1% of group sales and a slightly higher proportion of group operating profit, mainly in Catalyst Technologies. The profit impact in Catalyst Technologies in 2022/23 of c.£10 million will be compensated by new business elsewhere thereafter.
In Hydrogen Technologies we are investing to enable us to scale at pace, to capture value from the significant opportunities rapidly growing hydrogen markets present. Consequently, we expect a larger operating loss in 2022/23.
At current foreign exchange rates3, translational foreign exchange movements for the year ending 31st March 2023 are expected to benefit underlying operating profit by around £25 million.
As a result, whilst visibility is low and the outcome for the year remains uncertain, we currently expect operating performance to be in the lower half of the consensus range.4
Longer term, we expect the current geopolitical situation to drive a significant acceleration towards a net zero carbon economy, with corresponding investment to position us strongly for significant growth opportunities from our sustainable technology portfolio.
Dividend and share buybackThe board will propose a final ordinary dividend for the year of 55.0 pence at the Annual General Meeting on 21st July 2022. Together with the interim dividend of 22.0 pence per share, this gives a total ordinary dividend of 77.0 pence representing a 10% increase on the prior year. Subject to approval by shareholders, the final dividend will be paid on 2nd August 2022, with an ex-dividend date of 9th June 2022. Our previously announced £200 million share buyback completed on 13th May 2022.
Financial performance review continued
1. Based on average precious metal prices in May 2022 (month to date).2. A $100 change in the average annual platinum, palladium and rhodium metal prices each have an impact of approximately £1 million, £1.5 million and £1 million respectively on full year underlying operating profit.3. Based on foreign exchange rates in May 2022 (month to date).4. Vara consensus for full year group underlying operating profit in 2022/23 was £562 million (range: £491 million to £641 million) as at 25th May 2022. 2021/22 group underlying operating profit on an adjusted basis was £559 million
(adjusted for disposals of Health, Battery Materials and Advanced Glass Technologies).
Johnson Matthey | Annual Report and Accounts 202230

Indicator 2022 progress
Overall strategyProducts and services for a cleaner, healthier world% sales from products contributing to our four priority UN SDGs 83.8%
(2021: 84.7%)
Progress against our financial targets from continuing operations1
Sales excluding precious metals (sales) £3,778m(2021: £3,685m)
Underlying operating profit margin 14.6%(2021: 12.8%)
Underlying earnings per share 213.2p(2021: 168.9p)
Average working capital days (excluding precious metals) 36 days(2021: 45 days)
Progress against our strategic objectives
Invest in growth areas targeted at climate change and circularity
Gross research and development expenditure from continuing operations £201m
(2021: £185m)
Manage our established businesses to support growth
Clean Air cash flowDelivered £772 million of cash at actual precious metal prices £772m
Indicator 2022 progress
Progress against our strategic objectives continued
Promote a fast-paced, efficient business and high-performance culture
Annualised cost savings from transformation programme £104m +181%(2021: £37m)
Progress for a sustainable business
For our products and services
Drive lower global greenhouse gas emissions2030 target: 50 million tonnes of greenhouse gas emissions avoided during year by our customers using technologies enabled by our products and solutions, compared to conventional offerings
489,000tonnes
For our operations
Achieve net zero by 20402030 target: 33% reduction in Scope 1 and Scope 2 GHG emissions
2%increase from 2019/20 baseline
For our people
Create a diverse, inclusive and engaged company2030 target: achieve more than 40% of female representation across all management levels
27%
Key performance indicators
+ Read more about our financial KPIs on pages 20 to 30 and our non-financial KPIs on pages 34 to 591. These numbers exclude our Health business which is reported as a discontinued operation
Our key performance indicators (KPIs) measure progress against our financial aims, our strategy and our 2030 sustainability targets. The KPIs reported here are those we reported on last year, since they were in place at the start of this financial year. We will report KPIs against our new strategy next year.
Johnson Matthey | Annual Report and Accounts 2022 31
STRATEG
IC REPORT

Key stakeholder groups Why we engage How we engage
EmployeesMany thousands of JM employees work in our labs, production sites and offices to deliver great services and quality products to our customers
» To create a safe and inclusive working environment for all our employees, wherever they are based.
» Improve customer experience. » Ensure our employees have the skills and
knowledge they need to deliver high-quality services now and in the future.
» We invite employee feedback on a variety of subjects, from how we can better manage our channels and content (survey and focus groups run in November 2021) to listening activity such as The Big Listen, which our new CEO, Liam Condon, launched in March 2022. During the month, we invited our global workforce to share their opinions to feed into Liam’s strategy review. Employees were asked to share details about the things that make them proud to work at JM, as well as to help identify areas for improvement.
Customers and partnersWe need to understand our customers’ and partners’ needs and be able to respond quickly
» Improve customer experience and satisfaction.
» Adapt quickly to changing customer needs and requirements.
» Help customers deliver own decarbonisation and sustainability commitments.
» Our customer satisfaction rating improved in Efficient Natural Resources for the fourth year running (0.6ppts up versus previous year), driven by technical expertise, responsiveness, and quality.
» Our latest Clean Air customer satisfaction saw a consistent good overall score and improvement on scores from our largest customers, despite a challenging market environment, highlighting in particular our technology capabilities and cooperative approach. JM received supplier awards for cost reduction excellence and also best delivery performance.
InvestorsWe regularly engage with our investors to help them make informed investment decisions and to ensure we are fully aware of the range of views from our shareholders
» Keep investors informed and well briefed on key business activities and decisions.
» Listen and respond to concerns, questions and interests.
» Strengthen the long-term success of JM.
» We regularly update the market on the company’s financial and operational performance, including at the Annual General Meeting, first half and full year results.
» We held roundtable teach-ins for investors and analysts on both Clean Air and Catalyst Technologies, providing greater insights into the sectors and their cash generation and growth targets respectively.
» Held multiple investor meetings and calls with our Chair, CEO, CFO and / or the investor relations department through the year.
Understanding the views and concerns of our stakeholders is an important way in which we develop and carry out our strategy. Their perspectives help us identify the topics that are most material to our business and inform our decisions.
This table highlights our key stakeholder groups and some of the ways we’ve worked with them this year.
Engaging with our stakeholders
Johnson Matthey | Annual Report and Accounts 202232

Engaging with our stakeholders continued
Key stakeholder groups Why we engage How we engage
Government bodiesStrong relationships and engagement with government bodies around the world are essential to JM
» To share our expertise in sustainable technologies.
» To play an active role in policy and regulatory discussions, advocating for solutions that support the transition to a cleaner, healthier world.
» To garner support for our plants and operations at a local level.
» The CEO of our Efficient Natural Resources business is the co-chair (alongside the Secretary of State for Business, Energy and Industrial Strategy) of the UK Government’s Hydrogen Advisory Council, on which JM is separately represented. In this capacity we have contributed to the UK government’s development and implementation of its hydrogen strategy.
» We discussed our sustainable technologies directly with the Directorates-General at the European Commission to explain how they can support the European Green Deal, including the ‘Fit for 55’ package of legislative initiatives.
» In China, we joined the UK / China Hydrogen Alliance and HK / China Hydrogen Working Group to contribute to central government and industry collaboration on hydrogen policy.
Industry and scientific institutionsCreating strong relationships with our partners and peers is important in helping to accelerate the net zero transition.
» Work alongside our partners and peers to create a unified industry voice in policy discussions.
» Help accelerate the energy transition. » Share expertise and improve our own
knowledge and understanding of specific issues.
» We play an active role in a number of important global associations, including the Chemical Industries Association, the International Platinum Group Metals Association, the Royal Society of Chemistry and the Faraday Institute. We are also a founding member of the Society of Chemical Industry.
» We also play a leading role in hydrogen-related associations, including being a board member of the H2 Council, Hydrogen UK, UK Fuel Cells Association and the International Hydrogen Energy Centre, and we are a member of the Prince of Wales’ Sustainable Markets Initiative Hydrogen Taskforce.
SuppliersWe work with suppliers of all sizes across the globe to access goods and services that help us deliver value to our customers and investors.
» Monitor, manage and mitigate supply chain risks.
» Optimise our supply base, to drive value for our customers and investors, managed through our Supplier Relationship Management (SRM) framework.
» Ensure that we drive inclusive and diverse relationships with innovative suppliers to help broaden our thinking.
» We implemented our SRM framework with our strategic suppliers for Facilities Management and Security, to help us reduce the number of suppliers that we work with and optimise our specifications. This delivered approximately £1.5 million in savings in the past 12 months.
» We are piloting our diversity approach across our professional services supply base to develop a strategy to ensure we are inclusive and diverse in our engagements. The pilot covers over 2,000 suppliers globally. The outputs will provide a roadmap for embedding of inclusive procurement throughout JM by building a baseline of spend with diverse suppliers and capturing the value they are delivering.
Communities We place huge importance on giving back to our communities and connecting our employees with projects they care about.
» Keep our position at the heart of our communities.
» To understand the issues our neighbours face so that we can build our engagement activities and respond to their needs.
» In California, JM employees volunteered more than 450 hours at Martha’s Kitchen, preparing and serving warm meals for families facing difficulties, many of whom were teachers, nurses and part-time workers.
» In South Africa, we contributed 990 food parcels to the local community near our Germiston site. We also held a weekly sandwich drive, which supported more than 1,127 children. More than 500 families received a food parcel, many of whom are living with HIV / AIDS.
Johnson Matthey | Annual Report and Accounts 2022 33
STRATEG
IC REPORT

Sustainable business
SustainabilityOur products and services are the clearest demonstration of our vision for a cleaner, healthier world. And their biggest positive impact occurs when our customers use them in their products. But we also want to ensure we make them in ways that minimise our impact on the planet and our local communities. We rely on our talented employees and supply chain partners to help us do that. To reflect our commitment in these areas and support our target to reach net zero by 2040, we organise our sustainability priorities around three pillars:
Sustainability ratingsDuring 2021/22, we were pleased to receive several validations of our environmental, social and governance (ESG) performance:
EcoVadis: Platinum rating, putting JM in the top 1% of all companies rated by the organisation.
MSCI: AAA, is the highest possible rating, placing us above our speciality chemicals industry peers.
We retained our membership of the Dow Jones Sustainability Index (Europe), which places us in the top six European chemical companies and 92nd percentile globally.
A high score of 4.1 out of 5 on the FTSE4Good Europe Index, which recognises leading all-round ESG performance.
OperationsPeopl
e
Products and services
Accelerating a cleaner,
healthier world
Read more on page 36
Read more on page 41 Read more on page 49
Our three sustainability pillars are underpinned by a series of 11 goals and 17 targets, 14 of which we announced in June 2021. During 2021/22, we defined our remaining three targets, which seek to quantify the unique societal value of the products and technologies that form our business strategy. We also began to develop our net zero roadmap. To continue strengthening our sustainability governance, we set up a new board-level Societal Value Committee in May 2021 (see page 98 for more information about this committee), and recruited our first Chief Sustainability Officer who joined JM in May 2022.
Our approach to reportingThis report has been prepared in accordance with Global Reporting Initiative (GRI) reporting standard, Core option. More information about our materiality assessment of which sustainability issues are important to our business and the full GRI index disclosure can be found at matthey.com/GRI-2022. This year’s report also aligns with the Sustainability Accounting Standards Board (SASB) chemical sector reporting requirements (version 2018-10). Our Task Force on Climate-related Financial Disclosures (TCFD) report is included within this section of the report, where we provide a summary report on the progress made during the year against each of the four pillars of the TCFD framework. The numbers included in this section cover the entire Johnson Matthey group, including Health, which is reported as a discontinued operation.
+ See page 60 for our TCFD report.
Johnson Matthey | Annual Report and Accounts 202234
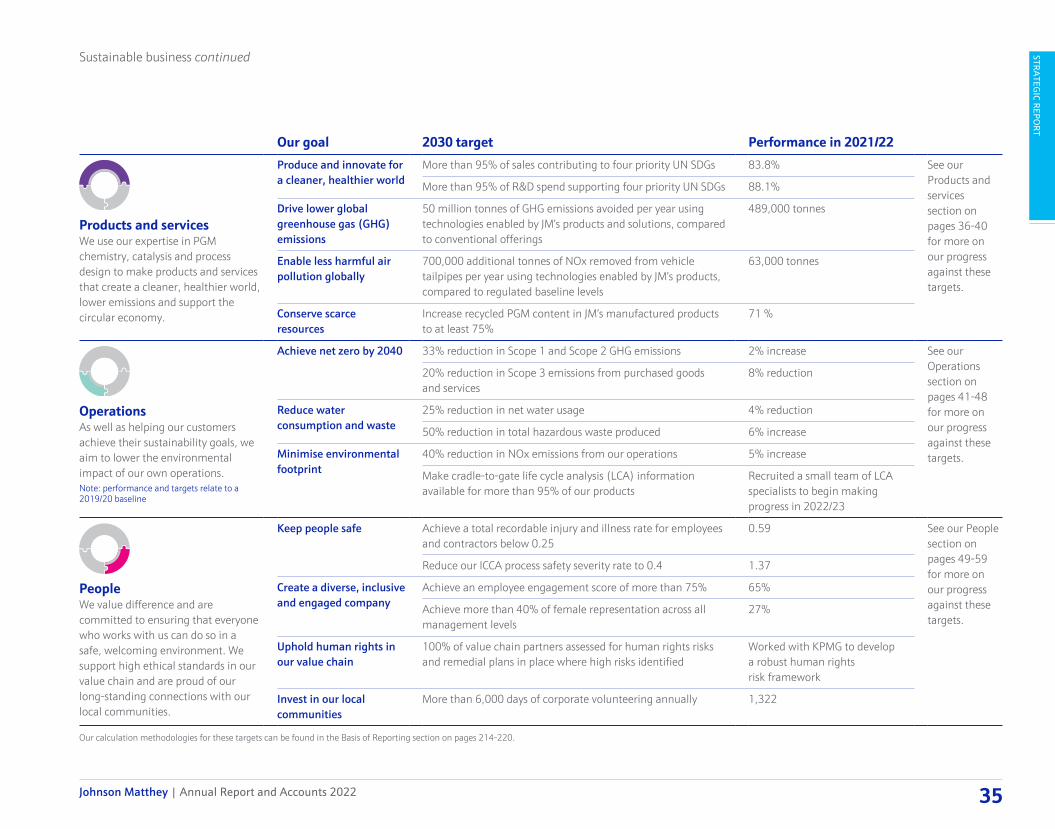
Our goal 2030 target Performance in 2021/22
Products and servicesWe use our expertise in PGM chemistry, catalysis and process design to make products and services that create a cleaner, healthier world, lower emissions and support the circular economy.
Produce and innovate for a cleaner, healthier world
More than 95% of sales contributing to four priority UN SDGs 83.8% See our Products and services section on pages 36-40 for more on our progress against these targets.
More than 95% of R&D spend supporting four priority UN SDGs 88.1%
Drive lower global greenhouse gas (GHG) emissions
50 million tonnes of GHG emissions avoided per year using technologies enabled by JM’s products and solutions, compared to conventional offerings
489,000 tonnes
Enable less harmful air pollution globally
700,000 additional tonnes of NOx removed from vehicle tailpipes per year using technologies enabled by JM’s products, compared to regulated baseline levels
63,000 tonnes
Conserve scarce resources
Increase recycled PGM content in JM’s manufactured products to at least 75%
71 %
OperationsAs well as helping our customers achieve their sustainability goals, we aim to lower the environmental impact of our own operations.Note: performance and targets relate to a 2019/20 baseline
Achieve net zero by 2040 33% reduction in Scope 1 and Scope 2 GHG emissions 2% increase See our Operations section on pages 41-48 for more on our progress against these targets.
20% reduction in Scope 3 emissions from purchased goods and services
8% reduction
Reduce water consumption and waste
25% reduction in net water usage 4% reduction
50% reduction in total hazardous waste produced 6% increase
Minimise environmental footprint
40% reduction in NOx emissions from our operations 5% increase
Make cradle-to-gate life cycle analysis (LCA) information available for more than 95% of our products
Recruited a small team of LCA specialists to begin making progress in 2022/23
PeopleWe value difference and are committed to ensuring that everyone who works with us can do so in a safe, welcoming environment. We support high ethical standards in our value chain and are proud of our long-standing connections with our local communities.
Keep people safe Achieve a total recordable injury and illness rate for employees and contractors below 0.25
0.59 See our People section on pages 49-59 for more on our progress against these targets.
Reduce our ICCA process safety severity rate to 0.4 1.37
Create a diverse, inclusive and engaged company
Achieve an employee engagement score of more than 75% 65%
Achieve more than 40% of female representation across all management levels
27%
Uphold human rights in our value chain
100% of value chain partners assessed for human rights risks and remedial plans in place where high risks identified
Worked with KPMG to develop a robust human rights risk framework
Invest in our local communities
More than 6,000 days of corporate volunteering annually 1,322
Our calculation methodologies for these targets can be found in the Basis of Reporting section on pages 214-220.
Sustainable business continued
Johnson Matthey | Annual Report and Accounts 2022 35
STRATEG
IC REPORT

1. Produce and innovate for a cleaner, healthier worldWhile we are proud of our legacy, we keep looking forward and using our skills to create the next generation of products and services that will help the world tread a more sustainable path. Over the past five years, we have tracked our progress by assessing our products and services against the United Nations Sustainable Development Goals (SDGs). In 2021, we refined our approach to concentrate on the four UN SDGs where we can have the most material impact because they are closely aligned with our purpose and business strategy.
We have set ourselves two 2030 targets to increase sales and our R&D investment against these four priority UN SDGs:
UN SDG Examples of JM products and services that support each goal
3. Good health and wellbeing
• Emission control technologies that remove harmful oxides of nitrogen (NOx) and particulates from vehicle tailpipes and stationary engines
• Purification technologies that remove harmful contaminants, such as mercury, from industrial processes
• Refinery additives to mitigate NOx and oxides of sulphur (SOx) emissions
• Catalysts used to make pharmaceutical ingredients
7. Affordable and clean energy
• Blue hydrogen technologies that are available today to help make low-carbon hydrogen at scale
• Green hydrogen technologies that will support the drive to zero-carbon hydrogen production using renewable energy and electrolysis
12. Responsible consumption and production
• PGM recycling to recover and reuse scarce natural resources
13. Climate action
• Technologies that turn high sources of carbon, such as household waste, into sustainable aviation fuels
• Fuel cell components for low-carbon transportation and distributed power units
Sustainable business continued
Products and servicesIn this sectionIntroduction 361. Produce and innovate for a cleaner, healthier world 36
Progress against our priority UN SDGs 372. Drive lower global greenhouse gas emissions 38
Innovating to help the world transition to net zero 383. Enable less harmful air pollution globally 39
Continuing to drive innovation to reduce vehicle air pollution 394. Conserve scarce resources 40
JM at the heart of the PGM market 40
We use our expertise in platinum group metal (PGM) chemistry, catalysis and process design to research, design and make products, services and solutions that support our vision for a cleaner, healthier world. From automotive catalysts that prevent harmful pollutants entering the atmosphere, to catalysts that help turn household waste into sustainable fuels, and from technologies that help make clean hydrogen to world-class recycling skills that help recover and reuse scarce precious metals. And we use our science and innovation skills to maintain a pipeline of new and improved products that will help the world accelerate towards net zero.
This year, we set important new 2030 targets to measure how much our products benefit society as they address global greenhouse gas emissions and air pollution, and to advance the circular economy as we increase the amount of recycled PGMs in our technologies.
Johnson Matthey | Annual Report and Accounts 202236

Progress against our priority UN SDGsSetting targets for sales of sustainable products that are aligned with our strategic aim to support four priority UN SDGs is only part of the journey. To deliver this, we must also make sure that our R&D and innovation activities are aligned with those UN SDGs in order to deliver our sales target by the end of the decade. At the same time, we must continue to focus on innovation – both in-house and in partnership with others – to ensure that we maintain a steady pipeline of new and improved products to support our growth businesses beyond 2030, as the pace picks up globally to reach net zero.
2030 target
>95%2021/22
83.8%2020/21
84.7%
Progress against our 2030 targetsSales1 contributing to our four priority UN SDGs
% sales from products contributing to priority UN SDGs (2021/22)1
SDG 3
SDG 7
SDG 12
SDG 13
Not assigned to priority SDGs
72.7%
0.0%
6.1%
5.0%
16.2%
% sales from productscontributing to priority UN SDGs
Sustainable business continuedProducts and services continued
1. Sales excluding precious metals. See Note 2 for more information.
2030 target
>95%2021/22
88.1%2020/21
87.3%
Progress against our priority UN SDGs – R&D spend % R&D spend contributing to four priority UN SDGs
% R&D spend from products contributing to priority UN SDGs (2021/22)
SDG 3
SDG 7
SDG 12
SDG 13
Not assigned to priority SDGs
58.5%
3.4%
6.8%
19.4%
11.9%
% R&D spendassigned
We saw a slight fall in sales against our priority UN SDGs this year, primarily because of proportionally higher sales in Catalyst Technologies, which is where most of our unassigned sales reside. However, we are encouraged that a higher percentage of our R&D budget was aligned with our priority UN SDGs, particularly SDG 7 and SDG 13 where we have worked to align our spend within our strategic growth platforms of decarbonisation, circularity and hydrogen technologies.
To achieve this, we spent £215 million on R&D in 2021/22, which includes £33 million of capitalised R&D. We employ a corporate R&D team of around 400 employees to work alongside our customer-facing R&D and commercial teams to create a balanced portfolio of short-, medium- and long-term research opportunities and a pipeline of new and improved products and technologies for our customers.
We have also identified our revenues that align with the SASB Chemicals Sustainability Accounting Standard’s definition of products that, when used, improve energy efficiency, eliminate or reduce GHG emissions, reduce raw materials consumption, lower water consumption and / or increase product life. In 2021/22, those sales were £812 million.
Our methodology is described in Basis for Reporting, on pages 214-220.
Johnson Matthey | Annual Report and Accounts 2022 37
STRATEG
IC REPORT

Sustainable business continued Products and services continued
In 2020/21, our technologies helped avoid 211,000 tonnes carbon dioxide (CO2) equivalent entering the atmosphere compared to conventional technologies. This mostly arose from the sale of fuel cell components for hydrogen-powered distributed power generation systems. Given this is the baseline year for our target, it only captures the operational impact of our technologies sold in 2020/21. Our 2021/22 result represents the impact from all technologies sold since the start of our baseline year, that are still operating in 2021/22. This year’s figure is more than double that of the previous year because we sold more fuel cell components for distributed power systems this year versus 2020/21.
Innovating to help the world transition to net zeroIn the coming years, we expect to be adding many new product lines to our ‘avoided GHG emissions’ target, with the majority connected to the growing hydrogen economy. Producing low-carbon hydrogen will be key to a net zero future, but to make that future a reality, the world will need eight times more hydrogen by 2050, than is produced today. For example, the UK’s HyNet project will use our LCHTM technology to produce low-carbon ‘blue’ hydrogen at scale, while capturing up to 98% of the associated CO2 emissions. Once online, the facility will capture the same amount of CO2 every year as taking more than 250,000 petrol or diesel cars off the road.
We are also aiming to become the number one supplier of the highly efficient catalyst-coated membranes that are essential to the workings of ‘green’ hydrogen electrolysers. We’re working with companies such as Plug Power, a leading provider of green hydrogen solutions, to accelerate the development and scale-up of electrolyser technology to make green hydrogen using renewable energy.
JM is already an established, leading provider of process technology and catalysts to the chemicals and energy sectors especially in synthesis gas (a mixture of hydrogen and carbon monoxide, also known as syngas). Our new HyCOgenTM technology, launched in January 2022, is one of the best examples of this. This catalyst technology converts green hydrogen and CO2 into carbon monoxide, which is then combined with additional hydrogen to create syngas. When used alongside our award-winning Fischer Tropsch catalyst technology (FT CANSTM), developed in collaboration with bp, HyCOgen creates a highly efficient, scalable process that can turn most of the CO2 into high-quality synthetic crude oil. This can then be processed in a refinery to make more sustainable fuels, including renewable diesel, naphtha and aviation fuels – key to helping governments and airlines tackle emissions in the aviation industry.
Our new target for 2030
Greenhouse gas emissions avoided during year by our customers using technologies enabled by our products and solutions, compared to conventional offerings
2030 target
50 milliontonnes
2021/22
489,000tonnes
2020/21
211,000tonnes
2. Drive lower global greenhouse gas emissionsThe world will need a range of low-carbon solutions if we are to decarbonise our transport, energy and industrial systems and reach net zero. Our products and services already help our customers avoid GHG emissions every year and, over the next decade, we aim to increase our impact considerably. During the year, we finalised our methodology to quantify these benefits. We set ourselves the target for 2030 that JM technologies operating globally will contribute towards avoiding 50 million tonnes of greenhouse gases entering the earth’s atmosphere per year, compared to conventional technologies in 2020. This is equivalent to preventing half of all UK GHG emissions from road transport in 2019.
Since there are no ‘off-the-shelf’ methodologies available for setting this target, we developed our own. We based our methodology on guidelines for calculating and reporting avoided GHG emissions developed by the World Resources Institute, as well as by the World Business Council for Sustainable Development and the International Council of Chemical Associations.
We also appointed EcoAct to review and validate our GHG-avoidance methodology for all our product families that are contributing towards our target. EcoAct concluded that our approach complied with recognised public guidelines, and considered our calculations to be both fairly stated and representative of a balanced view of our contribution in enabling avoided emissions through relevant technologies. EcoAct also determined that our calculations follow industry best practice for measurement.
Johnson Matthey | Annual Report and Accounts 202238

3. Enable less harmful air pollution globally We have worked with automotive manufacturers for decades, using our catalyst expertise to design emission control systems that help them meet strict air quality regulations. For the past four decades, those systems have helped prevent millions of tonnes of harmful emissions, such as carbon monoxide, NOx and particulates, from entering the atmosphere, improving the health of millions of people living and working in cities around the world. Today, around one-third of all new cars in the world are fitted with one of our catalytic converters, and we believe that they are collectively removing around seven million tonnes of NOx from the atmosphere.
While diesel and gasoline vehicles won’t be around forever, most vehicles on our roads will continue to run on an internal combustion or hybrid engine for some years to come. That’s why regions like Europe, the USA and China are introducing their toughest air quality regulations yet. We believe that NOx emissions standards can go even lower, and our R&D scientists have been working hard to create the catalysts to enable this.
Sustainable business continued Products and services continued
Our new target for 2030
Additional NOx removed from tailpipes by JM technology during year compared to that achievable with 2020 technology
2030 target
700,000tonnes
2021/22
63,000tonnes
1. Adapted from the ICCT paper Comments and Technical Recommendations on Future Euro 7/VII Emission Standards, 2021, in which 4.2 million tonnes of NOx is approximately equal to 35,000 premature deaths.
Our new target for continuing to reduce NOx emissions globally over the next decade takes the additional NOx removed from tailpipes by JM technology compared to that achievable with 2020 technology. In other words, we take the combined tailpipe emissions of vehicles containing JM technology operating at 2020 regulatory standards as a baseline, and then count all additional NOx emissions removed by using JM automotive catalysts, where they meet tighter emission regulations in subsequent years.
Continuing to drive innovation to reduce vehicle air pollution Our target to remove an additional 700,000 tonnes of NOx specifically captures the impact of the scientific advances we expect to make over the next decade to meet tightening tailpipe emissions regulations. This is equivalent to 2.5 times the NOx emissions from UK road transport in 2019.
For example, we designed our latest emission control catalyst for heavy duty vehicles so that customers were ready for the new China VI-a emission standards introduced in July 2021. This standard slashed China’s NOx limit from 2,000 milligrams per kilowatt hour (mg/kWh) to 460 mg/kWh. Our calculations show that for every heavy duty vehicle in China that is fitted with one of our latest emission control catalysts, we help remove more than 180 kg of additional NOx in the first year of use.
We also expect Europe to introduce its latest level of regulation in the next four years, so we’re already at work designing a new generation of automotive catalysts to comply with the new Euro 7 regulations as soon as they are launched.
Using an externally verified calculation, we estimate that an additional 700,000 tonnes of NOx removed will help to avoid 5,800 additional premature deaths, demonstrating the impact our emission control technologies have on UN SDG 3 – Good health and wellbeing.1
Our emission control catalysts can also be used to help remove harmful emissions in stationary applications, such as data storage centres, waste incinerators, as well as in shipping, agriculture and mining operations.
Johnson Matthey | Annual Report and Accounts 2022 39
STRATEG
IC REPORT

4. Conserve scarce resourcesMany of our technologies rely on PGMs. Yet these metals are hard to extract from the earth’s crust, typically only being present in concentrations of less than 10 ppm. Studies show that the carbon footprint associated with recycled (or ‘secondary’) PGMs is an order of magnitude lower than that of newly mined virgin metals.2
JM is already the world’s largest recycler of secondary PGMs, so this expertise is one of the most important ways we can help the world to create more circular economies for scarce resources. As part of our role in the PGM industry we want to encourage all stakeholders to consider the carbon footprint and circularity of their PGM supply. So we are setting a target for recycled content for the PGMs in the products that we make. While additional new supply of PGMs may be necessary to support growing uses of these important materials in the transition to net zero for some years, we aim to have at least 75% of all the PGMs that we use in manufacturing to have come from recycled sources by 2030, with the majority of this secondary material purified in our own refineries. This reflects the need to focus on bringing important resources, such as PGMs, back around the loop, while recognising that these unique metals have an important role as the transition occurs, a role that may not be completely fulfilled by the available recycled supply.
Sustainable business continued Products and services continued
Our new target for 2030Average % of recycled PGM content in products manufactured by JM during year.*
2030 target
>75%2021/22 result
71% * Average across all use of five PGMs in JM manufacturing: platinum, palladium, rhodium, iridium
and ruthenium.
2. See International Platinum Group Metals Association, Life cycle assessment, Second IPA LCA Study (2017 data).
We see this new target as a step in our journey. It encourages the use of secondary supply, and designing this into our products from the outset. It also encourages industry dialogue on where PGMs come from and the relevant sustainability considerations for those sources. To support this increased dialogue, we’re also looking at how provenance could be digitally traced and are working with our customers to understand what their needs are for PGM provenance so that we can continue to encourage greater sustainability in PGM supply. And our industry-leading market research team are helping us forecast what future recycling flows will look like over the next two decades. This will help us focus both our innovation work and investment plans.
Platinum
Rhodium
Iridium
Ruthenium
#1global refined PGM supplier
#1secondary recycler
c.2xcapacity of nearest competitor
Autocatalysts
Industrial applications
Fuel cells
Palladium
Green hydrogen technologies
At the heart of the PGM market
Johnson Matthey | Annual Report and Accounts 202240

While our products can help deliver our vision for a cleaner, healthier world, we must ensure we make them in ways that lower our own environmental impact. Last year, we committed to reaching net zero by 2040 and developed a series of 2030 targets to set us on our way. We also joined the UN Global Compact’s Business Ambition for 1.5°C.
Managing our environmental performance Our Sustainability Council is responsible for agreeing our overall approach to environmental performance.
We have group policies, processes and systems that help us achieve a high level of environmental performance. We also have a number of corporate standards that cover the following environmental aspects:
• Waste • Energy • Emissions to atmosphere• Discharge to surface and ground waters• Protection of waste water discharge systems
We assess our sites against these standards as part of our ongoing audit work. All our sites are assessed by our centralised internal audit team at least once every three years.
In all, 86% of our manufacturing sites use environmental management systems that meet ISO 14001. Many of our operations are covered by environmental permits or licences and, as a minimum, we ensure we comply with all regulations in the locations where we operate.
We expect all our sites to report any incident that affects the environment to their local authorities. We classify any spills that occur on unmade ground or near drinking water sources as significant. We reported no significant spills during 2021/22. We had one reportable environmental fine of £12,000 in China.
We measure progress against our key performance indicators (KPIs) monthly and use the data to improve performance. The details behind the methodologies used for our KPIs and the third-party assurance certificate can be found at the end of this report at page 221.
OperationsIn this sectionIntroduction 41
Managing our environmental performance 411. Achieve net zero by 2040 42
Our performance in 2021/22 42Developing our net zero roadmap 44Using energy more efficiently 45Making progress towards our renewable electricity target 45
2. Reduce water consumption and waste 45Performance on water 45Water stress analysis to identify our priorities 46Performance on waste 46
3. Minimise environmental footprint 47Other operational air emissions 47Performance 47Improving our management of NOx 47Product life cycle management 47Maintaining high standards to meet changing regulation 47Working with industry bodies to meet regulations 48Finding safer alternatives and reducing risk 48Developing life cycle analysis for our products 48
Sustainable business continued
Johnson Matthey | Annual Report and Accounts 2022 41
STRATEG
IC REPORT

1. Achieve net zero by 2040In June 2021, we publicly committed to achieve net zero by 2040 and, in October, our intermediate targets to reduce Scope 1, 2 and 3 emissions by 2030 were validated by the Science Based Targets initiative (SBTi), providing important confirmation that they are in line with the ‘well-below 2°C trajectory’ of the UN Paris Agreement.
Our Scope 1 and 2 GHG emissions come from our manufacturing operations and represent the part of our footprint that we can directly influence by changing the way we use energy in our facilities. Our Scope 1 and 2 GHG emissions data is verified to ISAE3000 standard by a third party – see page 221. The full assurance statement can be found online at: matthey.com/assurance-statement-2022.
Scope 3 GHG emissions represent 90% of our footprint and mostly result from the raw materials we buy.
This year, 14% of our energy consumption came from certified renewable sources. Four of our largest manufacturing sites also make electricity using combined heat and power plants (CHPs). Although these run off natural gas, they are a more climate-friendly way of generating electricity, if the heat is also used in the manufacturing facility. In 2021/22, our CHPs generated 28,825 MWh of electricity.
Our Scope 1 emissions rose broadly in line with the increase in natural gas use. Meanwhile, our Scope 2 emissions remained broadly flat because the impact on our carbon emissions from using more electricity was offset by the strides we have made to increase the amount of renewable electricity our facilities use. This year, we purchased 18% more renewable electricity than last year.
Overall, our Scope 3 GHG emissions rose 7.7% in 2021/22 versus the previous year because we procured more raw materials, although this is still 8% lower than our 2019/20 baseline. Some 86% of our Scope 3 footprint comes from our purchased goods and services category. These emissions rose more slowly than our volumes of procured raw material, as we have started to see the carbon intensity of the operations of some of our strategic suppliers fall. While Scope 3 GHG emissions from business travel emissions have also gone up, our employee commuting emissions are significantly lower, because more of our employees have worked flexibly from home since the start of the COVID-19 pandemic.
We have made some adjustments to our calculation methodology during the year to strengthen the quality of our data, and on the advice of the SBTi assessors. Details can be found in the Basis for Reporting section on pages 214-220.
Sustainable business continued Operations continued
Progress against our 2030 targetsReduce Scope 1 and 2 GHG emissions by 33% from 2019/20 baseline
2021/22
399,906tonnes2% increase from baseline
Reduce Scope 3 emissions from purchased goods and services by 20% from 2019/20 baseline
2021/22
3,008,648 tonnes8% decrease from baseline
Our performance in 2021/22 We use various energy sources, from renewable electricity to power our plants, to natural gas to generate heat for triggering chemical reactions. This year, we saw a 5% rise in our use of energy and 4% rise in our Scope 1 and 2 GHG emissions, and a 3% rise in our carbon intensity as our manufacturing output rose at a lower rate. Our energy efficiency performance shows a similar trend. This decline in performance occurred because we brought two new large facilities online in our Clean Air business. It is normal, at start-up, to operate at reduced throughput as you start to validate parts and finish commissioning equipment. As the sites move to full production, we expect our efficiency will improve again.
Energy mix (MWh)
Non-renewable, grid-supplied electricity (348,993)
Certified renewable electricity from the grid (186,422)
Renewable electricity generated locally andnot grid connected (solar power) (7,239)
Natural gas used on site (709,582)
Non-renewable fuels used on site (93,474)
Non-renewable steam procured (24,294)
Non-renewable fuel used on public roadsby vehicles on company business (10,230)
Total: 1,380,234
25.3%
13.5%
0.5%
51.4%
6.8%
1.8%
0.7%
Johnson Matthey | Annual Report and Accounts 202242

Sustainable business continued Operations continued
Scope 1 and 2 greenhouse gas (GHG) footprint and energy efficiency2020/21 2021/22
Global UK onlyGlobal
(excl UK) Global UK onlyGlobal
(excl UK)% change
(global)
Scope 1 (tonnes CO2 eq) 203,930 66,634 137,296 219,846 68,282 151,564 +7.8%Scope 2 – market based method (tonnes CO2 eq) 181,525* 3,969 181,005 180,060 1,488 178,572 -0.8%Scope 2 – location based method (tonnes CO2 eq) 227,381 34,871 192,510 240,897 29,768 211,129 +5.9%Total operational carbon footprint – Scope 1 and 2 market based method (tonnes CO2 eq) 385,455* 70,603 318,301 399,906 69,770 330,136 +3.8%Total operational carbon footprint – Scope 1 and 2 location based method (tonnes CO2 eq) 431,311 101,505 329,806 460,742 98,049 362,693 +6.8%Total Scope 1 and 2 carbon intensity – market based (tonnes CO2 eq/tonnes sales) 3.4 7.1 3.1 3.5 13.0 3.0 +2.9%
2020/21 2021/22
Global UK onlyGlobal
(excl UK) Global UK onlyGlobal
(excl UK)% change
(global)
Total energy consumption (MWh) 1,312,084 431,466 880,618 1,380,234 422,225 958,009 +5.2%Total energy efficiency (MWh/tonne) 11.5 43.4 8.5 12.1 78.7 8.8 +2.5%
Scope 3 GHG emissions by category(tonnes of CO2 equivalent) Category Category number 2021/22 2020/21 2019/20
Purchased goods and services 1 3,008,648 2,851,616 3,282,096Capital goods 2 349,214 308,835 399,630Fuel and energy-related activities 3 46,990 39,725 41,425Upstream transportation and distribution 4 168,750 102,552 102,552Waste generated in operations 5 5,775 5,257 5,303Business travel 6 1,336 67 9,202Employee commuting 7 15,718 29,957 29,957Upstream leased assets 8 698 602 5,094Use of sold products* 11 0 0 0Investments** 14 16 665 10,997Total 3,597,145 3,339,276 3,886,256
* We have removed Use of sold products from our footprint by agreement with SBTi, as it determined that the emissions we reported in this category were ‘indirect’ and should not, therefore, be included. ** Investments category accounts for JM’s Joint Ventures only.
Five-year performance table 2021/22 2020/21 2019/20 2018/19 2017/18
Total energy consumption (MWh) 1,380,234 1,312,084 1,355,295 1,444,890 1,431,360Total Scope 1 and Scope 2 (market based) GHG emission (tonnes CO2 eq) 399,906 385,455 391,459 423,130 445,509Total Scope 3 GHG emission(tonnes CO2 eq) 3,597,145 3,339,276 3,886,256 – –
For more information on our methodology, please see pages 214-220 in Basis for Reporting.
Johnson Matthey | Annual Report and Accounts 2022 43
STRATEG
IC REPORT

Sustainable business continued Operations continued
Developing our net zero roadmapTo realise our net zero ambition, each of our businesses is developing a roadmap to prioritise the work we’ll need to do to improve energy efficiency, switch to lower-carbon forms of energy and eliminate or abate the GHG emissions that our chemical processes generate. It is important we tackle these challenges in a cost-effective way, so we aim to manage large equipment replacements as part of our ongoing capital renewal programme.
Our roadmaps help us identify the short-, medium- and long-term steps we need to take to meet our 2030 targets. In the coming year, we will be working with our supply chain partners to extend it to include tackling our scope 3 GHG emissions as well.
Managing our energy mix, switching to more low-carbon power and improving energy efficiency are all key ways we can realise our net zero ambition in the near term.
Energy efficiency
Renewable electricity
Abate process GHG emissions
Natural gas replacement
Pilot SMART metering pilots at key sites
ISO50001 accreditation at top energy-using sites
Energy efficiency improvements through continuous improvement and equipment upgrades
Footprint rationalisation to scale down old and less efficient assets
Energy efficiency improvements continued • Continuous improvement optimisation and
equipment upgrades
Carbon capture and storage ‘discovery’ work• CO2 emissions data profiling on key sites• Partner to establish appropriate CCS technology solutions at JM strategic locations• Switch to alternative process chemistry
CO2 process emissions • Eliminate through process chemistry change or
capture (CCS)
Assess equipment-level gas usage and suitability for conversion to sustainable fuel sources
Develop natural gas replacement roadmap• Overlay green energy developments
and asset replacement / upgrade plans
Phase out use of other fossil fuels in India and CA test facilities
Natural gas replacement projects • CapEx – Electricifcation of lower-grade heat ovens at high-usage sites • Conversion to biomethane / hydrogen or add carbon capture technology
N2O abatement technical studies
N2O process emissions abatement projects
Switch to renewable electricity in the USA and Europe
Switch plants to renewable electricity in India and China
Switch to low carbon fuel or switch off gas-fired CHP generators
Renewable electricity sourcing in remaining locations
-10%
-5%
-25%
-5%
Five principles for net zero
Baseline Target: 60% renewable power
Target: -33% GHGs
Target: -100% GHGs
2020 2030 20402025
Grow manufacturing footprint for Hydrogen Technologies and other new businesses on 100% renewable energyNet zero growth
-10%
-10%
-10%
-15%
0%
Underpinning work Delivery
Net zero roadmap for Scope 1 & 2 GHGs
-5%
-5%
Johnson Matthey | Annual Report and Accounts 202244

2. Reduce water consumption and wasteClimate change and a growing population are set to put more stress on global consumption and the security of the water supply, which is why we have set a target to use less by 2030. We use water to make some of our products and for heating and cooling. We aim to use it responsibly and we look for ways to recycle and reuse it wherever possible.
Meanwhile, our operations create waste, which must be treated in line with local regulations. But beyond that we are committed to disposing of it responsibly, particularly important given that 63% contains hazardous materials. Here, too, we have set ourselves a target to reduce this type of waste. And we work with specialist treatment companies to ensure this waste is managed safely, and we look for ways to reduce and recycle waste.
Performance on waterWe source 93% from mains supplies, extracting the rest from groundwater sources. In 2021/22, we used 6% more water than the previous year and our water efficiency declined slightly to 19.5 m3 of water per tonne of product sold. This was an accumulation of a number of local effects. For example, one of our sites in India operated a specific manufacturing process more frequently this year, which requires more water to work efficiently. At another of our sites, in Malaysia, a fire hydrant leak led to a rise in water use. However, our water use remains 4.2% lower than our 2020 baseline.
Using energy more efficientlyIt is important that we continually improve the efficiency of all manufacturing facilities, and recent global energy price rises have made this even more urgent. To accelerate our progress, during the year, we have assessed our top 20 energy-consuming sites against the following criteria to better understand how they are working to reduce energy consumption:
• Energy management systems • Metering, forecasting and monitoring • Key performance indicators, goals and targets• Energy saving programmes• Employee communications.
Many sites scored well in monitoring, energy saving, metering and goals. We also identified areas for improvement, including use of energy management systems. Currently, 20% of our top 20 sites are certified with the ISO 50001 energy management standard, which provides the best framework for evaluating and measuring energy management. The remaining 80% of these sites plan to work towards certification, and we will be training our operational teams globally during the next year to achieve this.
In 2021, our procurement team ran a UK pilot project on mitigating commodity energy price risks, which insulated our UK businesses from around 80% of the rapid price rises seen in the global energy market during the year. We have since used lessons learned from the pilot to develop new energy procurement methodology, which we are now rolling out across JM globally. We spent £85 million on energy versus £64 million in 2020/21.
In addition, in our Clean Air business, we have continued to find ways to improve our production cycle times and run equipment at optimal temperatures for maximum efficiency at existing plants. And we are improving our ‘right first time’ rate to maintain high product standards while reducing the quantity of raw materials we use. Similarly, in Catalyst Technologies, we have carried out operational assessments to identify projects to drive greater efficiency. For example, some sites are carrying out feasibility studies to see how we could better integrate sources of heat to reduce the amount of energy we use.
Making progress towards our renewable electricity targetWe are making good progress towards our target to buy 60% of our electricity from certified renewable sources by 2025. In 2021/22, we reached 34% from sources with a renewable energy guarantee of origin, up from 30% last year. A total of four sites switched to grid-supplied renewable electricity contracts this year, including our new Clean Air manufacturing site in Poland.
To accelerate our progress to source renewable electricity in countries where it is not so readily available in the market, we employee third-party specialists, South Pole Group. So far, they have worked with our sites that use the most energy in Europe, the USA and India to identify new low-carbon energy opportunities. These include power purchase agreements, electricity from certified renewable sources and on-site electricity generation, with particular focus on sites that could have the most impact on our 2030 target.
Sustainable business continued Operations continued
Progress against our 2030 targetReduce net water use by 25%
2021/22
2,160,000 m34.2% reduction from 2019/20 baseline
We discharged 1.64 million wastewater, 92% to municipal treatment plants and the remainder back to its original source after treatment. Our waste water had an average chemical oxygen demand (COD) of 182 mg/L. We treated 1.167 million m3 of waste water onsite, of which we recycled 22.4% back into our manufacturing processes instead of discharging.Net fresh water consumption 000’s m3
2021/22 2,1602020/21 2,0392019/20 2,254
Johnson Matthey | Annual Report and Accounts 2022 45
STRATEG
IC REPORT

Type of wasteType of waste (tonnes) 2021/22 2020/21 % change
Liquid hazardous waste 57,478 54,171 +6.1Solid hazardous waste 2,992 3,042 -1.6Liquid non-hazardous waste 19,367 18,166 +6.6Solid non-hazardous waste 16,448 12,167 +35.2Total waste 96,286 87,546 +10
Waste treatmentType of treatment (tonnes) 2021/22 2020/21 % change
Reuse 1,692 1,895 -10.7Recycling 40,526 25,845 +56.8Offsite incineration with energy recovery 4,380 3,314 +32.2Incineration or other offsite treatment 45,446 52,891 -14.1Landfill 4,242 3,601 +17.8Total 96,286 87,546 +10
Sustainable business continued Operations continued
Progress against our 2030 targetReduce total hazardous waste sent offsite for third-party treatment by 50%
2021/22
60,470tonnes
6.5% increase from 2019/20 baseline
Water stress analysis to identify our priorities To understand where we need to act most quickly for most benefit, we used the World Resource Institute’s (WRI) Water Risk Atlas tool to analyse usage at our sites. The tool identified 16 facilities that are located in regions with a high or extremely high baseline water stress level, which means that they are at higher risk of declining water availability or increased cost in the future due to drought or groundwater table decline. They represent 24% of total water consumption.
From this analysis, we have developed group-wide guidance to help sites adopt effective water management plans, improve measurement and reduce water consumption. We are rolling this out to all our sites during 2022 and plan to run awareness sessions to help employees understand the role they play in driving towards our water target.
This work is part of our broader climate risk assessment work aligned with the Taskforce for Climate-related Financial Disclosures (TCFD) framework. See pages 60-69 for our full TCFD report.
Performance on wasteIn 2021/22, the total amount of waste we produced and sent for treatment by third parties rose to 96,286 tonnes. Within this number, we saw rises in both our hazardous waste and our total waste sent to landfill categories, which we are keen to address. These rises are due in large part to the fact that we brought two new sites online that began producing waste, but it is also a result of changes in our product mix at some of our other sites.
Of this hazardous waste, we recycled and reused 47% this year. That is a 74% increase on 2020/21, thanks to a waste vendor recycling a particular liquid hazardous waste stream from one of our effluent treatment plants in Royston, UK.
Johnson Matthey | Annual Report and Accounts 202246

3. Minimise environmental footprint
Other operational air emissionsSome of our operations produce other air emissions as by-products of chemical reactions, including nitrogen oxides (NOx), sulphur oxides (SOx) and volatile organic compounds (VOCs). All our permitted sites monitor these emissions to ensure they comply with local regulations. When we design and build new facilities, we carry out an environmental impact assessment, which highlights the emissions abatement technology that we need to install.
PerformanceIn 2021/22, we saw a small increase in our year-on-year NOx emissions, in line with our new sites coming online and the associated rise in production levels.
Our VOCs and SOx emissions both increased this year as well. We do not emit VOCs and SOx at every site, and our product mix at the sites that do produce these emissions has a large effect on our reported numbers.
We are investigating how best to monitor and report on other hazardous air pollutants (HAP) and hope to include a fuller report on our HAP emissions next year.
2021/221 2020/212 2019/201
NOx (tonnes) 379 375 360SOx (tonnes) 79 49 28VOCs (tonnes) 92 83 99% sites covered for NOx reporting 79% 74% 67%
1. 2% sites not included are those due to divest or close in 2022.2. Restated as explained below.
For example, at one US site we are installing ‘selective catalytic reduction’ technology, which uses ammonia and a catalyst to reduce NOx emissions. We expect the new system to come online later in 2022.
Improving our management of NOx Our foundational work towards achieving our 2030 target has been to ensure we are measuring all the NOx that our manufacturing plants produce globally in a standard manner. Measuring and reporting our NOx emissions has always been a challenge, because of the complex chemistries in the products we make. This programme to standardise our NOx reporting has led us to restate our last three years of data (see opposite) and the only sites not yet covered are those that have been announced as earmarked for divestment in the near future. We believe this now gives us a firm foundation on which to prioritise where to add specialist equipment to help reduce NOx emissions.
Product life cycle managementTo realise our vision for a cleaner, healthier world our products must be made in ways that are as safe as possible for people and the planet. Some of the materials we use and the products we make are inherently hazardous, so our licence to operate depends on high standards of product stewardship. As well as supporting our Environment, Health and Safety teams to identify and manage the chemical risks in our own operations, we consider a product’s full life cycle to ensure the risks are addressed at every stage.
Our Innovation team also works with our businesses to ensure new products are designed with safety and sustainability in mind. Together, they use key questions, such as ‘are there any elements of the product that cannot be recycled or degraded?’ or ‘are any substances in the product included on substances of concern lists?’ to determine whether product development should continue.
+ See page 49 in People, for more information on keeping our employees and contractors safe when handling hazardous chemicals.
Our product stewardship policies define our key requirements, processes and responsibilities to ensure we comply with relevant laws and regulations. They also support our commitment to Responsible Care®, a voluntary industry-wide initiative to support safe chemicals management.
Maintaining high standards to meet changing regulationWe work in several highly regulated industries, which means we must adhere to strict requirements, such as notifying or registering products and following certain rules on manufacture and use. Our Product Stewardship Centre of Expertise works with our businesses to ensure we comply with these rules. The team is also designing a new IT tool to help assess the potential impact that proposed regulatory changes or new hazard information could have on our portfolio.
Our product stewards also monitor changes around the world and assess their potential impact on our supply chain. This year, we prepared for new chemicals regulation in Turkey, India, South Korea, Latin America and the Eurasian Economic Union. For example, in advance of India’s widely anticipated Chemicals Management and Safety Rule, we prepared a substance inventory check for chemicals we make and import into the country.
Sustainable business continued Operations continued
Progress against our 2030 targetReduce NOx emissions from our operations by 40%
2021/22
379tonnes
5% increase from 2019/20 baseline
Johnson Matthey | Annual Report and Accounts 2022 47
STRATEG
IC REPORT
Finding safer alternatives and reducing riskWhere possible (and always where legally required), we strive to replace ‘high hazard’ substances – chemicals that may pose a significant risk to human health or the environment – with safer and economic alternatives. In cases where we need to use these substances in new products or technology projects, a senior site or operations leader must approve a risk assessment. Approvals are time-limited (varying by project) to ensure our R&D team continues work to identify less hazardous alternatives.
Where replacement in existing products isn’t possible, we conduct detailed safety assessments for each use and ensure that our operations and customers have robust risk management processes in place. This may include site visits, co-developing site-specific exposure scenarios to ensure appropriate risk management measures are in place, or requiring written confirmation of conformance.
The number of substances we use that are regulated1 or are considered to be of international concern2 is limited. Approximately 5% of our sales come from products that are made using or containing such substances.
Working with genetically engineered microorganismsGenetically engineered microorganisms in our biocatalysts (enzymes) represent just 0.01% of our sales. These products do not contain live organisms at the point of supply. Biocatalysts are important because they can help us make more of a desired chemical product with fewer undesirable by-products.
Our policy on animal testingAs a chemicals company, we must comply with international legislation to provide toxicity information to assure the safety of our products for humans, wildlife and the environment. Sometimes, this means we have to use animal testing. We are committed to ethical principles of animal protection and always look for other options first, such as computer modelling and non-animal testing methods.
Where no data or alternative methods exist, and a study is required by law, we seek to limit new testing and avoid duplication by working in collaboration with industrial partners with the same data needs. We only use fully accredited contract research organisations and we do not carry out in-house testing.
We also look for opportunities to use non-animal testing where regulation allows. For example, we are currently working with SenzaGen AB to assess the use of its non-animal testing methods to identify hazardous properties of difficult-to-test metallic products.
For more information on our animal testing policy, visit: matthey.com/product-stewardship
Developing life cycle analysis for our products Product life cycle analysis (LCA) is an important way in which we can demonstrate how the environmental benefits of our products outweigh the impact of making them in the first place.
We have also set ourselves a 2030 target to make cradle-to-gate LCA information available for more than 95% of our product families, and in 2022 we recruited a small, dedicated LCA team to help us get to work.
1. Such as substances of very high concern under REACH and the EU’s Restriction of Hazardous Substances Directive or substances listed under California Prop 65.2. Such as substances controlled by the Montreal Protocol, Stockholm and Rotterdam Conventions, GHS category 1A/1B carcinogens, mutagens or reprotoxins.
We have also continued to work on our compliance programmes in China. And in the UK, we are working with the government, directly and through the Chemicals Industry Association (CIA), on potential revisions to the UK’s Registration, Evaluation, Authorisation and Restriction of Chemicals (UK REACH) regulation.
Our product stewardship reporting programme helps us track operational and product performance every year. This year, the programme found no reports of significant health effects from the use of our products. It also confirmed we continue to comply with health and safety, labelling and marketing regulations, and voluntary codes. There were no transportation incidents with significant impact on the environment reported either.
Reassuring customers on product safetyWe assess all the potential chemical hazards in our products and provide customers with legally compliant safety data sheets. These contain information on the chemical and its hazards, along with guidelines on safe handling and what to do in the event of a spill or emergency. We also submit this information to national poison centres around the world.
We work closely with our customers to understand how they use our products to see if we can further control or minimise risks and to better understand any adverse effects on human or animal health, or on the environment. For example, this year JM assisted customers in Oman to obtain trans-frontier shipment notifications to enable the safe and appropriate treatment and disposal of mercury waste.
Working with industry bodies to meet regulationsAs well as ensuring we maintain the highest standards of product stewardship in our business, we work with our industry to foster sound product safety assessments and support proportionate government regulation.
For example, we belong to voluntary European industry initiatives such as the Cefic/ECHA REACH Dossier Improvement Action Plan, designed to improve the quality of hazard and risk management information that chemicals companies like JM must submit under the EU REACH regulation. This year, we re-evaluated, and where necessary, updated almost 90 EU registration documents, six of which JM is the sole or lead registrant.
We also belong to a variety of industry bodies so that we can make our voice heard in discussions about new regulation, and to help us better understand, and plan for, potential changes. For example, in the UK, we belong to the CIA, and in Europe we are members of the European Chemical Industry Council (Cefic) and Eurometaux. We are also members of the European Precious Metals Federation (EPMF) and the Cobalt Institute.
In 2021, JM ranked fifth in the non-governmental organisation ChemSec’s latest Chemscore report. The report assessed the world’s 50 largest chemicals companies against several criteria, including toxicity of product portfolio and transparency. While our overall score is the same as 2020, we were pleased to retain our top five ranking despite the report expanding from 35 to 50 companies.
Sustainable business continued Operations continued
Johnson Matthey | Annual Report and Accounts 202248

Sustainable business continued
PeopleIn this section
1. Keep people safe 49Our approach to health and safety 49Occupational health and safety performance 50Protecting our people from different types of risk 51Process safety 51Strengthening our audit programme 52
2. High-performing, inclusive and engaged company 52Building skills and career paths for a successful future 52Enabling our people navigate change 53Diversity and inclusion 53Our equal opportunities policy 54Employee engagement 55Transforming our culture 55Ethics and compliance 55
Our progress this year 55Campaigns and training to strengthen employee engagement 55Encouraging a ‘speak-up’ culture 56
3. Uphold human rights in our value chain 56Strengthening our commitment to human rights 56Our approach to human rights - Modern Slavery Statement 57Our raw materials supply chain 57Doing business in higher-risk jurisdictions 58What we expect when working with our suppliers 58
4. Invest in our local communities 59Our performance in 2021/22 59Connecting young people with science through Science and Me 59
Our Group Environment, Health and Safety (EHS) policy, available in local languages, guides everything we do and is underpinned by eight lifesaving policies, such as working in confined spaces. We give our sites guidance on how to implement these policies and put local processes in place to meet them. We also monitor compliance through EHS audits.
We recognise that the changes we’re making in our portfolio have created uncertainty for employees this year. And we know that uncertainty can make it harder to stay vigilant. As a result, we have seen a
higher number of incidents in some areas. To combat this and get everyone back on track, we have launched our ‘Take 5’ programme to help employees carry out simple safety checks to identify hazards and controls before starting any activity.
Nonetheless, our people continued to demonstrate care for one another throughout the ongoing challenges of COVID-19. We continued to monitor the site measures and controls we have in place to protect our operational employees and rolled out regular lateral flow testing at our UK sites. We are pleased to say that we have had no fatalities of employees or contractors in the last seven years.
Our approach to health and safetyTo keep our people, plants and sites safe, we focus on:
• Occupational health and safety to track, report and address more frequent, but typically less severe incidents, such as slips, trips and falls.
• Process safety – to manage our most hazardous processes and ensure we design, operate and maintain safe factories.
1. Keep people safeEveryone in JM is responsible for keeping themselves and each other safe. We also rely on the skills and diligence of our operational and safety teams to keep our plants and sites running safely and efficiently.
Johnson Matthey | Annual Report and Accounts 2022 49
STRATEG
IC REPORT

Occupational health and safety performanceWe want everyone to go home safe and well at the end of every day. We use several leading and lagging indicators, such as lost time injury and illness rates (LTIIR), to help us track performance and make improvements.
Of our recordable injuries, 42% occurred in the USA, where some sites faced resourcing difficulties, leading to more overtime and fatigue. A couple of our sites also had more ergonomic injuries related to old equipment that is not ergonomically designed. These sites now have plans to address the issues and, in 2022, most of our sites will have carried out gap assessments against our behaviour standard which we relaunched in 2021. While our overall recordable injury and illness rate deteriorated slightly this year, our severity rate improved by 29%. This means that those injuries were less serious and resulted in fewer lost working days.
Occupational illness incident cases per 200,000hrs worked
Progress against our 2030 targetsTotal recordable injury and illness rate – employees and contractors (per 200,000 hours worked)2030 target
below 0.252021/22
0.59
ICCA process severity rate (per 200,000 hours worked)
2030 target
0.42021/22
1.37
Recordable injury and illness rates for employees and contractorsLost time injury and illness rate and total recordable injury and illness rate (all per 200,000 working hours in a rolling year)
2021/22 2020/21 2019/20 2018/19 2017/18
All personnel - LTIIR 0.29 0.28 0.34 0.56 0.54All personnel - TRIIR 0.59 0.55 0.79 0.97 0.99Employees and temporary employees - LTIIR 0.29 0.29 0.35 0.57 0.52Employees and temporary employees - TRIIR 0.61 0.56 0.79 1.01 0.96Contractors - LTIIR 0.27 0.23 0.27 0.40 0.74Contractors - TRIIR 0.49 0.45 0.80 0.53 1.29
* Note: all personnel above means employees, temporary employees, and contractors
During the year, we continued to embed new tools, including ‘golden rules’ to support our lifesaving policies. For example, when working at height one of our rules states: ‘I will always wear a secured harness where the risk of a fall cannot be eliminated’.
Our ‘Take 5’ programme helps employees carry out simple safety checks to identify hazards and controls before starting any activity. We have also relaunched our behaviour standard as part of our ongoing Work Safe, Home Safe campaign. This helps sites assess safety culture between different employee levels, identifying why those differences exist and developing plans to close gaps.
In the coming year, we plan to introduce training to help improve the quality of safety observations and conversations at our sites. The training will help our people learn how to ask open ended questions, ask each other what could go wrong before carrying out an activity, and remind everyone of their responsibility to stop and report any unsafe practices.
Keeping our contracting community safeThis year, we continued work on several large capital investment projects across the group, which meant we had many more contractors on site than usual. With our contracting partners, we helped them to understand our EHS expectations and regularly monitored their compliance. This meant our contractor LTIIR for the past 12 months increased only slightly, from 0.23 to 0.27, as did our our total recordable injury and illness rate (TRIIR), from 0.45 to 0.49. Our five-year contractor LTIIR and TRIIR performance can be found in the table above.
Sustainable business continued People continued
0.00
0.03
0.06
0.09
0.12
0.15
2021/222020/212019/202018/192017/18
Johnson Matthey | Annual Report and Accounts 202250

Protecting our people from different types of riskAt JM, our EHS standard and guidelines help us assess, monitor and reduce employee and contractor exposure to hazardous materials. These cover a range of issues, including how to manage exposure to chemical, physical and biological risks.
Every site has its own monitoring plans to identify potential exposure against regulatory and internal JM limits, and to set out its control measures to either reduce or remove exposure.
Our group EHS team regularly audits sites against our EHS standard. It also shares good practice and tools to improve safety standards, and frequently reviews our industrial hygiene exposure risk evaluation and control programmes.
Our Group industrial hygiene and occupational health team also carries out regular site reviews to assess health management programmes and, when needed, support improvement plans.
In the next year, we will continue to focus on our ergonomics programme – one of our biggest occupational health challenges. And we plan to introduce a central database to record exposure risk assessments and exposure monitoring data. We also work through industry associations, such as the International Platinum Group Metals Association and European Precious Metals Association to support industry health studies.
Our central team continues to support new projects across JM with appropriate advice on health risk management, including risk assessment, containment and control, and ongoing health management.
+ See pages 47-48 in Products for more information on our broader approach to product life cycle management and safety.
Process safety Keeping our plants and equipment in good working order helps reduce the risk of failures that could cause significant injury or harm the environment. Process safety relies on well-designed facilities, strong engineering skills, regular maintenance programmes and clear, consistent training.
Our performance in 2021/22Our main lagging indicator for process safety is the severity score of loss of primary containment (LOPC) incidents, based on the International Council of Chemical Associations (ICCA) standard. Our performance declined this year. Two factors contributed to this year’s results: two significant LOPC incidents, and more and accurate reporting from our sites. When compared with our pre-pandemic 2019/20 statistics, our figures for this year are broadly flat.
We investigate every process safety event to understand the root causes and put measures in place to correct the problem. In 2021/22, our most serious incident occurred when a road tanker carrying 50% caustic soda was accidentally offloaded to a storage tank that was out of service for maintenance. This resulted in the release of a small amount of corrosive liquid outside the containment area. The spill was contained on site and no one was harmed, since the area was empty. Our root cause analysis revealed failures in the tanker offloading procedure, including a process that meant a critical lock on the connection between the tanker and the storage tank was removed too early. We shared the lessons from this incident via a video presentation to our operations community. And we carried out a gap assessment at all sites that receive chemical bulk deliveries to ensure they are following good practice to prevent offloading errors.
We also completed a group-wide gap assessment on design for selected chemical processes that could cause excess flammable gas. The sites with these processes now have plans in place to address gaps.
Our Tier 1 process safety events increased from five in 2020/21 to 11 in 2021/22. This was partly due to better reporting of LOPC events from our sites. See Basis for Reporting on pages 214-220 for a definition of a Tier 1 event.
In 2021/22, 93% of operations-based staff completed our process safety training, designed to help employees understand their part in keeping our equipment in good working order. In addition, we launched a new process safety technical training website and ran 15 online courses for more than 200 participants on a range of process safety topics.
We relaunched our process safety performance indicators with clear requirements for lagging indicators, including our LOPC rate. These also look at leading indicators that focus on areas such as overdue inspections on safety-critical equipment and process safety-related near misses.
We also carried out individual process safety competency assessments for 150 managers and engineers in process safety-critical roles at facilities rated ‘high hazard’. We will complete the remaining 37 assessments throughout 2022/23.
ICCA process safety severity rate (PSER)
PSER per 200,000 hours worked
Year Rate
2021/22 1.372020/21 0.812019/20 1.202018/19 1.54
Sustainable business continued
Johnson Matthey | Annual Report and Accounts 2022 51
STRATEG
IC REPORT

Sustainable business continued People continued
Strengthening our audit programmeDespite ongoing COVID-19 restrictions in the first half of the year, we audited eight of our sites across Europe and Asia during 2021/22, either in person or remotely. We also completed face-to-face audits at seven of our North American operating facilities, in line with our proposed schedule. Our audits in Europe and Asia identified gaps in our programmes to implement lifesaving policies. In North America, we found issues around contractor management, the control of hazardous energy and managing change programmes. All our audited facilities now have remedial action plans in place to address these gaps and we will track those plans until they are completed.
This year, we introduced a new audit rating to better illustrate a site’s progress against its EHS risks, while our sector EHS leaders introduced more rigour for acting on audit findings and identifying work that requires capital investment.
Another key development was a new methodology for deep dive audits on risk management events that could lead to catastrophic incidents. This will help ensure we have the right controls to reduce the likelihood of an event happening. In 2021/22, we audited three sites and plan to audit the remainder in 2022.
As we continue to transform, we know we must do even more to help our people stay safe. Continuing our programme of site process safety hazard reviews is key, and we have now assessed 74% of our high-hazard processes, all of which have plans to act on the recommendations. We’re also working to reduce our LOPC statistics, including introducing more automated fail-safe instruments.
We are also planning further improvements over the next 18 months, including completing work to verify safety instrumented systems, such as trips and interlocks for high-hazard critical events. And we will continue to improve group support for incident investigations and sharing lessons learnt across JM from serious process safety incidents.
JM people around the world Total employees by region
Monthly average number of employees
UK
Rest of Europe
North America
Asia
Rest of World
14,4211
34%
24%
20%
18%
4%
2. High-performing, inclusive and engaged companyWe are proud of our talented people. They kept each other and our facilities safe throughout the ongoing COVID-19 pandemic, while showing determination to continue winning business and driving results. They also demonstrated resilience as we carry out important work to simplify our portfolio, while delivering our ongoing business.
Building skills and career paths for a successful futureWe have deep technological expertise, particularly in platinum group metal (PGM) chemistry, catalysis and process design, and have leading positions in many of our chosen markets. To make the most of this competitive edge and unlock the greatest value for our customers and JM, we are focusing on strengthening our in-house commercial capabilities. During the year, we set up a Commercial Council to accelerate this work, making progress in several areas, including cross-sector accounts management, introducing a new customer relationship management approach and exploring the use of sales incentives. Our Sales Academy was core to this strong progress.
Supporting leaders throughout their careerOur ‘Aspire’ leadership development programmes are designed to support leaders at all levels of JM, from first-time team leaders to senior managers. Since launching the programmes, close to half of all JM leaders have taken training modules. Course evaluations were consistently positive, with scores well above 80% in all key categories, such as the relevance of content to people’s jobs.
1. This includes 924 agency staff.
Johnson Matthey | Annual Report and Accounts 202252

To support our leaders as we transform our business, we also launched several new global coaching programmes and leadership masterclasses on topics such as empowering teams. Our Boost programme, for example, has helped to embed a coaching culture at our manufacturing sites, while driving process and efficiency improvements. In 2022, we aim to establish new learning and development analytics to provide individuals and groups with more targeted development opportunities. And we established a new JM capability framework to give employees clarity on how to develop and manage their career at JM. In 2022, we aim to establish new learning and development analytics to provide individuals and groups with more targeted development opportunities.
Creating clear career paths This year, we developed more detailed functional skills resources, particularly for our Commercial and Human Resources functions, and promoted our MyCareer digital career site. In 2022, we will also develop new skills and careers resources for our innovation and engineering functions to help them identify cross-sector opportunities and grow their JM career.
Enabling our people to navigate change The world is changing at an extraordinary rate and JM is adapting to ensure our business is fit for the future. In the past year, our portfolio review and ongoing transformation programme have caused short-term uncertainty for our people, including some roles being made redundant. We have, however, a re-deployment programme to help affected colleagues take up roles in other parts of JM. Where this is not possible, we provide financial and career support.
COVID-19 and a tightening labour market, particularly in the USA, have also affected our employee turnover this year. Our total turnover decreased slightly from 15.7% to 15.4% compared to last year. However, our voluntary turnover rate increased from 9.0% in 2021/22 to 11.6%.
We respect and promote the rights of people to freedom of association. In 2021/22, and 23% of our people globally were covered by collective bargaining agreements and represented by trade unions.
We work collaboratively with 10 trade unions across JM, focusing on a range of topics, such as safety, wellbeing and improving the way we work at our local sites. Together, we discuss site, sector and business performance, environment, health and safety issues, working practices, business change needs, employee training and reskilling. We also support engagement at regional and national levels where needed.
Change of any kind can be unsettling, and it is more important than ever that we help our people look after their health and wellbeing. During the year, we ran a number of sessions for all employees across the organisation.
Across JM, we also looked for ways to promote physical wellbeing in 2021. This included launching a global step challenge in July. More than 2,200 employees joined the challenge, taking more than one billion steps. We followed this with a global wellbeing festival, running more than 50 different sessions on a range of mental and physical wellbeing topics. We saw over 3,500 registrations and received positive feedback from employees.
The future of work – a more agile approachAs part of our ongoing transformation programme, we rolled out several global processes to simplify and standardise our business. We are also rolling out new digital tools and processes, including Workday. This HR platform will give us better quality data to help us run our businesses effectively, understand our talent and simplify how we do things.
We also introduced hybrid working policies at several offices around the world. This gives our people greater flexibility to choose where, when and how they do their jobs. In some locations we reconfigured our offices to make it easier for people to work together.
Diversity and inclusion We continued to make progress in our diversity and inclusion agenda this year, introducing a new diversity, inclusion and belonging roadmap built on five pillars: leadership accountability; developing and attracting talent; engaging employees; supplier diversity; and community engagement.
It is underpinned by inclusive policies and procedures designed to create a fair workplace for all. It will also guide our actions as we work to build an organisation that realises the benefits of diverse thinking, as well as greater inclusion and belonging.
Sustainable business continued People continued
Progress against our 2030 target
Female representation across all management levels.
2030 target
>40%2021/22
27%
Johnson Matthey | Annual Report and Accounts 2022 53
STRATEG
IC REPORT

Sustainable business continued People continued
Our equal opportunities policyJohnson Matthey recruits, trains and develops employees who are best suited to the requirements of the job, regardless of gender, ethnic origin, age, religion or belief, marriage or civil partnership, pregnancy or maternity, sexual orientation, gender identity or disability.
To support our HR colleagues and leaders, we ran training sessions on key diversity, inclusion and belonging topics. We also launched our first global, mandatory diversity and inclusion training for all employees, covering topics such as creating a respectful workplace and unconscious bias.
In 2021/22, we launched several new employee resource groups (ERGs), including a family group, a veterans’ network and an Asian network – all sponsored by senior JM leaders, who champion and advocate for these groups in their businesses. As part of our ongoing employee engagement programme, we worked with our ERGs to run webinars on important topics ranging from autism to menopause to LGBTQ+ Pride month.
We remain committed to increasing racial diversity in senior leadership. In the UK, we participated in a cross-company talent acceleration programme, run by the Black British Business Awards.
We plan to focus more on ethnic diversity with our new Workday HR system, which will give us the opportunity to measure ethnic representation across the business and track future progress. From 2022/23, we will encourage employees to share diversity demographics in Workday, which will enable us to set UK and US ethnicity targets.
We also joined Valuable 500, which aims to encourage business leaders to address disability and inclusion, and have made several commitments to drive inclusion across the business.
During the year, we partnered with Microsoft to run a series of accessibility in IT webinars. These explored visible and invisible disabilities and demonstrated IT features and support for people with disabilities, as well as how others can work more inclusively.
Meanwhile, as part of our commitment to be recognised in global LGBTQ+ indices, we were delighted to receive a Silver Employer Award from Stonewall. Our score rose significantly from 2019, reflecting the work we have done in the past few years to help our employees feel they can be themselves at work.
Progress on gender diversityAs at 31st March 2022, women represented 33% of Board members (2020/21: 34%) and 37% of all senior managers.
However, female representation across all management levels has remained at the same as 2020/21 at 27%. Achieving our 2030 gender target for this group of employees is a long-term process that is both structural and behavioural. It all starts at the beginning of our people development pipeline and we are delighted that this year women made up 58% of our new graduates and 56% of our talent acceleration programme. In 2022/23, we will introduce a development programme for leaders and people managers to ensure they understand why diverse teams, supported by inclusive cultures, are essential for business.
Gender diversity statisticsAs at 31st March 2022 Men Women Total % men % women
Board 6 3 9 67% 33%GLT 6 2 8 75% 25%Subsidiary Directors 100 17 117 85% 15%Senior managers* 38 22 60 63% 37%All management levels 1,303 487 1,789 73% 27%New recruits 1,355 718 2,073 71% 35%All employees 9,532 3,898 13,430 71% 29%
* Within JM our senior managers are defined as direct reports of the GLT. The UK Corporate Governance Code 2018 requires companies to disclose the gender balance of senior management, which is defined in the Code as a company’s executive committee and the Company Secretary, the statistics for this are included in the GLT row above. Some individuals are included in more than one category.
Gender pay gapWe have made excellent progress. Our latest combined UK gender pay gap is 5.4%, an improvement on 6.7% in 2020/21. We continue to perform well against the national average of 15.4%.
Increasing diversity in all its formsWe want our teams to represent the communities in which we operate, which means going beyond gender.
This year, we have focused on building awareness and education among our employees to enable us to develop a culture of inclusion and belonging. This work is designed to increase our people’s skills and confidence when talking about diversity and inclusion. In partnership with our Black Employee and Pride networks, we arranged 23 reverse mentoring relationships. This gave JM leaders the opportunity to be mentored by more junior colleagues and hear first-hand experiences from underrepresented communities while also providing their mentors with advice on career progression.
Johnson Matthey | Annual Report and Accounts 202254

Ethics and complianceWe expect everyone who works with JM to live by our value to ‘act with integrity’. That means upholding the highest ethical standards in everything we do – from how we treat one another to how we do business. Our Code of Ethics helps everyone to understand what doing the right thing means at JM.
Our progress this year We have had an active year, rolling out a series of tools to give senior leaders better visibility of the ethics and compliance issues within their areas and across JM. This information will help drive greater business ownership and, where needed, support remedial plans that directly address their business issues.
For example, we:
• Share anonymised information and notable examples of Speak Ups and ethical dilemmas with the board, GLT and our Societal Value Committee. We also provide sector leaders with an annual or biannual breakdown of ethics and compliance issues and trends in their business (see ‘Encouraging a speak up culture’ on page 56).
• Introduced new tools (such as an ethical culture heat map) to help us strengthen the way we analyse and report ethics and compliance data back to the business.
• Regularly communicate with employees on compliance risks, including anti-bribery and corruption, competition, export controls and sanctions, data protection, conflicts of interest and supply chain compliance.
• Joined the UN Global Compact for Human Rights in January 2022 and supported Principle 10 (working against corruption in all its forms). We do this through training, encouraging teams to share ‘ethics moments’ at the start of meetings, updating our central bank of ethics scenarios and continued focus on the way in which we bring on board and monitor our third-party intermediaries.
Campaigns and training to strengthen employee engagementIn June 2021, we ran a four-week campaign to raise awareness of the impact that change and uncertainty can have on behaviour in the workplace. It aimed to remind employees about the importance of good, ethical decision-making and that we always encourage people to speak up and ask for help if faced with a problem.
In October, more than 50 sites took part in our annual Ethics Week celebrations, with employees around the world at all levels sharing videos about what ethics means to them. We also heard from a customer who discussed the importance of ethics in their supply chain. Feedback was positive, with participants telling us they liked the employee-led approach.
In 2021/22, 77.5% of our employees completed our Code of Ethics training. This is the third year in a row that we have seen a rise in our training statistics. In future, our new digital tools, including Workday, will help us roll out more tailored training.
As reported last year, we were pleased to see a rise in the number of employees who responded to our biennial yourSay survey in 2021. Later in 2022, we will use Workday to move to a continuous listening programme, pulse survey approach providing more frequent, detailed insights on the issues our employee face.
This year, we also ran structured leadership-led listening programmes, including regular sector and function-specific townhalls, to help leaders better understand their strengths and areas for improvement, and conducted several pulse surveys. And we introduced an engagement programme for our top 400 leaders giving them the chance to hear regularly from the GLT, discuss the challenges the company faces, ask questions about JM and help shape the company’s future.
Our board held a number of employee engagement sessions across seven countries, focusing on sustainability with a very high level of employee engagement, see page 91 for more information.
Transforming our culture Johnson Matthey’s culture has evolved over the company’s long history and we have tremendous strength that we will build on. However, we know that to successfully execute our strategy we need to transform elements of our culture. We are very excited about the next stage of our culture journey. We know there are many aspects of how we work that influence culture and we will be addressing all of these to help JM to be a truly high-performing organisation.
To do that, we intend to change the way we work based on three cultural principles:
1. More efficient, less bureaucratic – introduce simpler, more efficient ways of working and clearer internal accountabilities to help us work at pace.
2. A high-performance, commercial mindset – strengthen our commercial skills and set clearer business objectives to create a fast-paced, bolder culture focused on winning in our chosen markets.
3. A more external outlook – create new ventures and partnerships with customers, industry and governments to accelerate growth and the transition to net zero.
Employee engagement
Progress against our 2030 target Employee engagement
2030 target
>75%2021/22
65%For 2020/21, we did not complete a yourSay survey. The number included in the progress against our target is therefore from 2019/20.
Sustainable business continued People continued
Johnson Matthey | Annual Report and Accounts 2022 55
STRATEG
IC REPORT

3. Uphold human rights in our value chain
We work in a global, multi-tiered supply chain and rely on our suppliers to provide raw materials, including PGMs, and goods and services like engineering support and process equipment, and utilities, catering and security for our facilities. We also buy transport services to move materials and products around the world and rely on corporate support, such as travel, IT and finance. As a result, our procurement teams work with thousands of suppliers, and in 2021/22 we spent £2.8 billion (excluding PGMs) with them.
In 2021/22, we had to manage additional supply chain complexity, including disruptions caused by the ongoing COVID-19 pandemic and logistical delays caused by bad weather events, such as Hurricane Ida, and the Suez Canal blockage. To help us move key materials in a more timely fashion in future, Procurement is developing new methodology to mitigate supply interruption from known weather events.
We are proud of our strong relationships with our suppliers and will rely on them even more as we work towards our sustainability targets while navigating the challenges of rising inflation and geopolitical tensions. Despite those challenges, we remain committed to working with our supply chain partners to uphold human rights and the highest standards in raw materials procurement.
Strengthening our commitment to human rightsTo make progress against our 2030 target, we worked with a third-party specialist to identify the human rights risks that we will focus on, and developed a tailored risk assessment framework to segment our value chain and prioritise actions. As part of this process, we are also looking at risk in our own operations. We will begin to implement this framework during 2022/23.
As part of our people commitments, we also joined the UN Global Compact in January 2022, which demonstrates our support for internationally proclaimed human rights.
Progress against our 2030 target• 2030 – assess 100% of our value chain partners for human rights risks and put
remedial plans in place where high risks are identified• 2021/22 – identified human rights risk areas of focus and developed a tailored
risk assessment framework to segment our value chain and prioritise actions
Sustainable business continued People continued
Encouraging a ‘speak-up’ cultureIt is essential that employees feel they can speak up when they have a concern. We encourage them to do this via their manager, ethics ambassador, HR or legal representative. Or, they can contact our independent ‘Speak Up’ helpline. Where local law permits, these conversations can be anonymous.
This year, we received 158 Speak Ups – our highest ever number. While an increase, the number is in line with external benchmarks. We see this as a positive sign that our people feel comfortable raising concerns in JM and have faith in our process. Our Ethics Panel oversees all Speak Ups and appropriate action is taken where necessary. The panel also reports back to the board.
Speak Up reports in 2021/22 Concern/allegation Number of cases investigated
Bribery and corruption 12Business and financial reporting 0Competition / anti-trust 0Confidential information and intellectual property 0Conflict of interest 10Discrimination, including harassment and retaliation 51Employee rights 56Enquiry 7Environmental protection, product stewardship or health and safety 17Insider trading 0Misconduct or inappropriate behaviour 2Physical assets 1Theft 0Violence or threats 0Computer, email and internet use 1Substance abuse 1Total 158
Johnson Matthey | Annual Report and Accounts 202256

Our approach to human rights We support the principles of the Universal Declaration of Human Rights and the International Labour Organization (ILO) Core Conventions, and align ourselves with key frameworks that define human rights principles for businesses. These include the UN Global Compact, UN Guiding Principles on Business and Human Rights and the Organisation for Economic Co-operation and Development (OECD) Guidelines for Multinational Enterprises.
Our independent Speak Up helpline is available for anyone wishing to raise a human rights concern. See page 56 for more information on this helpline.
Modern Slavery StatementWe are committed to ensuring no modern slavery exists in our business and to identifying and resolving any issues we find in our value chain. We publish our Modern Slavery Statement annually to demonstrate our progress. Our full 2021 statement is online at matthey.com/modern-slavery
Our raw materials supply chainWe source raw materials from around the world, some of which are only available from a small number of countries. It is essential that we understand and manage the associated supply chain risks. As a result of changes in our portfolio, the quantity of some raw materials that we source will not grow as anticipated, such as cobalt and lithium. We also expect to stop sourcing narcotic raw materials in mid-2022.
Where we source strategic raw materialsMaterial Country
Primary PGMs Canada, USA, South Africa
Secondary PGMs USA, Germany, UK, Singapore, Italy
Rare earth materials Brazil, China
Zeolites USA, China, Japan
Ceramic substrates Peru, France, China, India
Narcotic raw materials Spain, Australia
* We ceased sourcing from Russia in line with government sanctions from February 2022.
Sustainable business continued People continued
Responsible sourcing of PGMsWe work with our customers and with industry associations, such as the International Platinum Group Metals Association (IPA), to ensure we source our PGMs in an ethical way.
We expect our PGM suppliers and refining customers to adhere to equivalent practices such as those set out in our platinum and palladium supply chain policy statement and to carry out appropriate due diligence on the counterparties from whom they source PGM material.
Our full policy statement is online at: matthey.com/responsible-sourcing-policy
Our primary and secondary metal needs are diversified in type and geography, so we have very little exposure to Russian PGM supply. However, we did ensure we had entirely ceased sourcing from Russia early in 2022.
Our UK and USA refineries are on the London Platinum and Palladium Market’s (LPPM) ‘Good Delivery’ lists for platinum and palladium and are subject to its Responsible Platinum and Palladium Guidance (RPPG). We are audited annually and, following a successful second audit, we received new LPPM certificates in August 2021 confirming our ongoing compliance. Our annual LPPM compliance statement can be found at matthey.com/LPP-compliance
Conflict mineralsThe term ‘conflict minerals’ refers to tin, tungsten, tantalum and gold (3TGs). They often originate in mines in parts of the world affected by conflict, particularly areas of military conflict where mining is often illegal and linked to serious human rights abuses, including modern slavery and child labour. We use small quantities of these metals in some of our products, most notably tungsten in some of our automotive catalysts, of which total expenditure is less than 0.1% of our procurement spend.
We are committed to sourcing these minerals to the highest standard, as outlined in our conflict minerals policy, which is aligned with the OECD’s Due Diligence Guidance for Responsible Supply Chains of Minerals from Conflict-Affected and High-Risk Areas. This includes keeping records that allow us to track the suppliers of all the raw materials we use that contain 3TGs and identify which refiners and smelters the 3TGs came from. We only use materials from refiners and smelters that meet the Responsible Minerals Assurance Process (RMAP) assessment protocols and that are listed on the Responsible Minerals Initiative database.
In September 2021, we published our first annual conflict minerals disclosure, outlining how we reviewed our 3TG suppliers against our policy commitments during the year.
+ Read our policy and statement on our website, matthey.com/sustainability-governance.
Johnson Matthey | Annual Report and Accounts 2022 57
STRATEG
IC REPORT

Sustainable business continued People continued
Area of concern that led to low EcoVadis rating for JM suppliers due to lack of governance or regulatory fines reported in media in the past three years
Number of suppliers
Environmental Environmental 6Labour practices and human rights
Labour practices and workers’ rights 3Health and safety 3Child labour 0
Ethics Anti-bribery and corruption 2Anti-competition 4Inadequate ethics governance 3
Procurement practices Lack of responsible sourcing governance 1
In early 2022, Procurement also began introducing a programme to support our commitment to work with more businesses that are owned and run by people from diverse and under-represented communities, as well as other companies that are committed to promoting diversity in their business. This includes a pilot project with more than 500 suppliers, primarily in professional services in the UK and USA, to strengthen our procurement process and ensure our sourcing processes are more inclusive. It will also help JM identify and address areas where we can make it easier for suppliers to work with us. We will continue to roll out this programme across JM during 2022. We are also working with MSD UK, which connects ethnic minority businesses with global corporations to widen our access to diverse suppliers.
Doing business in higher-risk jurisdictions Some of our customers, suppliers and other partners are based in parts of the world that represent a higher legal or reputational risk. Our policy, ‘doing business in higher-risk jurisdictions’, sets out how we manage these risks using enhanced due diligence. In 2021/22, we carried out this due diligence on 488 counterparties. While this figure is less than 1% of all our counterparties, they are the ones that present some of our highest risks from an ethics and compliance perspective. As a result, we put remedial measures in place and declined business in select instances.
Our Group Ethics and Compliance team actively monitors the geopolitical landscape to ensure we comply with all regulations, including international export control and sanctions regimes. For example, this year we actively managed the situation involving Russia, Belarus and Ukraine to ensure we comply with our legal obligations, act consistently with our values and minimise any impact on business continuity.
What we expect when working with our suppliers Our Supplier Code of Conduct, sets out our expectations on key issues, including health and safety, environmental management and human rights.
During 2021/22, Procurement began a phased roll out of our due diligence framework to strengthen our supplier relationships and simplify the way we work with them. We now require all new suppliers to complete an online self-assessment to demonstrate their alignment with our Supplier Code. We review these assessments as part of our supplier onboarding process and follow up with additional actions, as appropriate. More than 300 new suppliers participated in this process this year.
We have also started assessing our existing suppliers using EcoVadis, the world’s largest provider of business sustainability ratings. To date, 25% of our total procurement spend is with suppliers who have an active EcoVadis rating and good governance in all aspects of our Supplier Code. The nature of the concerns highlighted by the EcoVadis assessment are shown in the table below.EcoVadis rating % procurement spend
Spend with suppliers who have current EcoVadis medal 25%Suppliers with a good score on alignment with our Supplier Code of Conduct but no medal due to adverse media in the past three years 1.5%Suppliers with current rating but no medal 0.2%Suppliers without an active EcoVadis rating or not yet requested 73%
Johnson Matthey | Annual Report and Accounts 202258

Our performance in 2021/22Our employees volunteered 1,322 days during 2021/22, significantly higher than last year, which is testament to their commitment to the organisations they care about. Research also shows that volunteering has a significant impact on mental wellbeing. That’s why we focused our internal communications on the idea of reconnecting with our communities. Of course, some parts of the world kept their COVID-19 restrictions in place for longer, and some people have not felt as comfortable returning to in-person activities as quickly as others. This is why our number currently remains lower than our baseline.
We saw a strong response to our third annual International Volunteer Day campaign in December 2021, with around 500 employees donating time worth 430 days. During the summer in North Macedonia, more than 50% of employees helped to clean two local cities over two days.
We manage the bulk of our donation to charity via our Charities Aid Foundation (CAF) account. During the COVID-19 pandemic, we have donated to this account at a faster rate than we drew on it and so took the decision not to top it up this year. This year, we did use our CAF account to donate £302,612. Around £60,000 was used to match donations made by more than 400 employees to help the people of Ukraine, following Russia’s invasion in February 2022. JM also set up a special fund to help our Ukrainian employees working in Poland cover accommodation and living costs for family and friends seeking refuge over the border.
2030 target
>6,0002021/22 progress
1,322
Progress against our 2030 targets
4. Invest in our local communitiesCommunity investment helps us connect with each other and our local communities, and we are proud of the connections we have made over the years via our global volunteering and match funding programmes.
Community investment summaryInvestment
2021/22 £’000
Investment 2020/21
£’000 % change
Direct expenditure 168 1,374 -88Indirect expenditure 283 32 +790Total 451 1,406 -99
Connecting young people with science through Science and MeWe gave grants to 12 new projects during the first full year of our Science and Me programme. For example, in North Macedonia we funded a project to build a chemistry lab for socially vulnerable primary and secondary school students. In the UK and USA, we supported a digital project that allows young people to talk to scientists directly about their careers. We also funded three projects that help Black and Asian minority students develop new skills to support science, technology, engineering and mathematics (STEM) careers.
In the UK, we ran another successful virtual work experience week involving around 80 students and 70 employees, including our former Chief Executive, Robert MacLeod, and our Chief Technology Officer, Maurits van Tol. In total, our employees spent 20 hours with the students over the week. In December, GLT members talked to students about their careers and what else businesses could do to create a more sustainable world.
We also took part in Green Skills Week, a campaign launched by the charity Speakers for Schools, welcoming 104 students to three days of online talks about green technology. Out of those students, 46 were selected to take part in a challenge to present their ideas on new green technologies linked to plastic, air pollution and carbon emissions. The students presented to a panel of internal and external judges, including our Director of Technology, Liz Rowsell.
days of corporate volunteering every year
Sustainable business continued People continued
Johnson Matthey | Annual Report and Accounts 2022 59
STRATEG
IC REPORT

Taskforce for Climate-related Financial Disclosures
In this section Introduction 60Governance 60Strategy 61Risk management 68Metrics and targets 69
IntroductionClimate change is one of the most pressing threats facing our planet today. It is affecting our environment and poses a growing risk for people and businesses alike. We recognise that what we do at JM has impacts – both positive and negative. Our products and services remove harmful air emissions and recycle scarce metals, and we are designing new technologies so that we can help accelerate the transition to a low-carbon future. But the manufacturing and chemical processes we use have their own environmental impact, creating greenhouse gas emissions, using water, and producing waste.
Our strategy is shaped, therefore, around the opportunities and the risks that our changing climate presents. And we have set ourselves the ambition of achieving net zero by 2040 with a series of challenging intermediate targets for 2030, to ensure we keep driving up the benefits of our products while reducing their environmental impact (see page 35 for a full table of targets).
The requirement to report using the framework of the Task Force on Climate-related Financial Disclosures (TCFD) is a useful tool in this process. It helps us think holistically about the future impact that climate change and the transition to a low-carbon world could have on us and, during the year, we continued to work with global sustainability consultancy Environmental Resources Management (ERM) to develop our approach. We have organised our report under the headings of the four pillars of TCFD framework because we believe that it’s most useful for our stakeholders to include our response to TCFD as a standalone section within our annual report. In doing so, we have reported consistent with the framework, although we are still working on quantifying the climate-related impact of some of our risks.
GovernanceGiven the nature of our business, and how closely aligned our strategy is to a warming world, climate-related risks and opportunities have been on the board’s agenda for many years. In May 2021, we announced the creation of a new board committee, the Societal Value Committee (SVC), to help the board focus more closely on the governance of sustainability matters including response to climate change. Nonetheless, the SVC is only part of the wider governance arrangements that support the board in discharging these responsibilities, as summarised in the diagram on page 61.
Role of the board and its committees The board is responsible for setting and overseeing the implementation of the group’s strategy, including the annual budget and detailed business plans. In doing so, it considers climate-related issues, including when approving requests for capital expenditure or new initiatives.
The SVC meets at least three times a year. It supports the board by overseeing the delivery of our sustainability strategy, and monitoring and overseeing progress against our sustainability goals and targets, with regular updates from the Chief EHS and Operations Officer. Jane Griffiths, the SVC Chair, reports to the board after each meeting, including bringing forward any recommendations from the committee. Given how fast society’s response to climate change is developing, the SVC receives papers on emerging issues at each meeting, such as legislation and stakeholders’ expectations. It also invites external experts to get an ‘outside-in’ view on our sustainability plans, and other emerging topics, which this year included diversity and inclusion, and human rights for more on the SVC’s work, see page 98.
During the year, the wider board received an update on climate-related legislation and a training session on the implementation of TCFD recommendations.
Together with the Nomination Committee, the board ensures that, among the directors, it has the necessary sustainability and climate-related expertise. For more details of our non-executive directors’ skills and experience, see pages 86-87.
As an initial step, the Audit Committee has this year reviewed the internal assurance in respect of TCFD. It will continue to assess the level of assurance over TCFD and climate-related issues as we continue to develop our reporting in this area. The Audit Committee is also responsible for reviewing the effectiveness of internal control and risk management, which includes climate-related risk.
This year, the Remuneration Committee reviewed the role of sustainability and climate-related targets within the group’s remuneration approach. Measures will be included within the Performance Share Plan, reflecting our intent to contribute to an acceleration of the transition to a net zero world. For more details, see page 69.
As a result of our internal board effectiveness review, the responsibilities of the board and its committees in relation to climate-related issues and the broader sustainability agenda have been refined and clarified.
Role of managementThe board delegates responsibility for running the business to the Chief Executive; this includes overall responsibility for climate-related issues, which resides with the Chief Executive, assisted by the Group Leadership Team (GLT). The Chief Executive is supported by the Chief EHS and Operations Officer who is responsible for day-to-day climate-related matters and provides updates to the GLT on the steps taken to develop or implement our sustainability strategy, including key metrics, risks and opportunities. The Chief EHS and Operations Officer is in turn supported by the Sustainability Council. The Sustainability Council is made up of managers from across our sectors and functions who, together, develop our sustainability vision, goals and targets. To prioritise driving our sustainability agenda and threading all elements into our business, we appointed a new Chief Sustainability Officer with effect from 16th May 2022. The Chief Sustainability Officer will report to the Chief Executive and be a member of the GLT.
Johnson Matthey | Annual Report and Accounts 202260
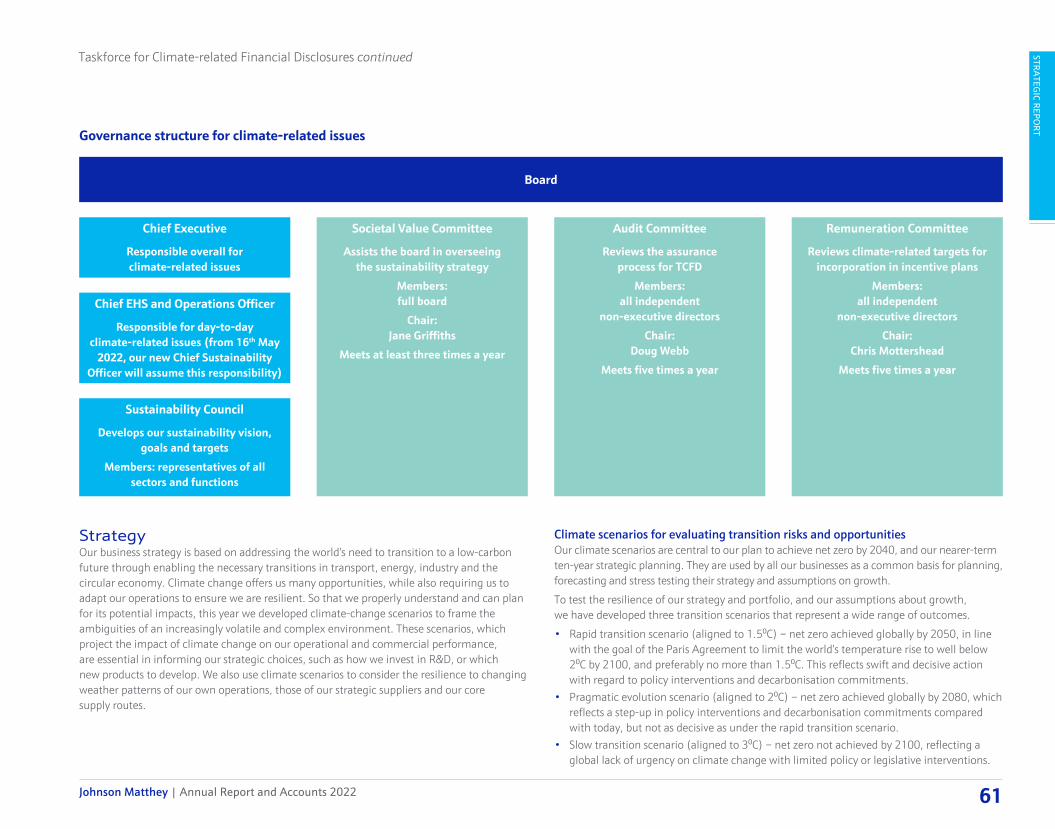
StrategyOur business strategy is based on addressing the world’s need to transition to a low-carbon future through enabling the necessary transitions in transport, energy, industry and the circular economy. Climate change offers us many opportunities, while also requiring us to adapt our operations to ensure we are resilient. So that we properly understand and can plan for its potential impacts, this year we developed climate-change scenarios to frame the ambiguities of an increasingly volatile and complex environment. These scenarios, which project the impact of climate change on our operational and commercial performance, are essential in informing our strategic choices, such as how we invest in R&D, or which new products to develop. We also use climate scenarios to consider the resilience to changing weather patterns of our own operations, those of our strategic suppliers and our core supply routes.
Climate scenarios for evaluating transition risks and opportunitiesOur climate scenarios are central to our plan to achieve net zero by 2040, and our nearer-term ten-year strategic planning. They are used by all our businesses as a common basis for planning, forecasting and stress testing their strategy and assumptions on growth.
To test the resilience of our strategy and portfolio, and our assumptions about growth, we have developed three transition scenarios that represent a wide range of outcomes.
• Rapid transition scenario (aligned to 1.5⁰C) – net zero achieved globally by 2050, in line with the goal of the Paris Agreement to limit the world’s temperature rise to well below 2⁰C by 2100, and preferably no more than 1.5⁰C. This reflects swift and decisive action with regard to policy interventions and decarbonisation commitments.
• Pragmatic evolution scenario (aligned to 2⁰C) – net zero achieved globally by 2080, which reflects a step-up in policy interventions and decarbonisation commitments compared with today, but not as decisive as under the rapid transition scenario.
• Slow transition scenario (aligned to 3⁰C) – net zero not achieved by 2100, reflecting a global lack of urgency on climate change with limited policy or legislative interventions.
Governance structure for climate-related issues
Chief Executive
Responsible overall for climate-related issues
Board
Chief EHS and Operations Officer
Responsible for day-to-day climate-related issues (from 16th May
2022, our new Chief Sustainability Officer will assume this responsibility)
Sustainability Council
Develops our sustainability vision, goals and targets
Members: representatives of all sectors and functions
Societal Value Committee
Assists the board in overseeing the sustainability strategy
Members: full board
Chair: Jane Griffiths
Meets at least three times a year
Audit Committee
Reviews the assurance process for TCFD
Members: all independent
non-executive directors
Chair: Doug Webb
Meets five times a year
Remuneration Committee
Reviews climate-related targets for incorporation in incentive plans
Members: all independent
non-executive directors
Chair: Chris Mottershead
Meets five times a year
Taskforce for Climate-related Financial Disclosures continued
Johnson Matthey | Annual Report and Accounts 2022 61
STRATEG
IC REPORT

Taskforce for Climate-related Financial Disclosures continued
We developed our climate scenarios internally with support from an external expert, reflecting the latest available research from internationally recognised sources such as the International Energy Agency (IEA). The IEA research we used included three scenarios: the Net Zero Emissions Scenario, the Sustainable Development Scenario, and the Stated Policies Scenario. Our methodology breaks down the different energy sources (electricity, hydrogen, gas, coal, oil, renewables, biomass and others) and considers forecasts for each source by demand type: transport, buildings, industry, power and heat, and feedstocks for materials. We developed in-house forecasts for specific source /demand combinations close to our areas of expertise in automotive, chemicals, hydrogen and other industries, while ensuring that, at a macro level, we remained within IEA’s forecasts. This methodology allowed us to develop an economy-wide view, while also including enough detail about our key markets to inform our specific strategies for different parts of the business.
Total anthropogenic emissions (GtCO2/yr)
We update the scenarios at least annually to reflect any changes in external drivers. In these updates, we incorporate the latest from internationally recognised sources alongside our own forecasts, which take into account policy developments, technology evolution and the rate of public and private investment in new plants and infrastructure.
We model scenarios up to 2100 (see chart below), but look at shorter-term horizons, specifically 2030 and 2040, to inform our strategic and operational decisions. The table below details the main qualitative and quantitative assumptions we used for our 2040 scenarios, given that this is our target date to achieve net zero. We use the pragmatic evolution scenario as our base case for our strategic planning.
Market Sector Metric (2040) Unit Rapid transition Pragmatic evolution Slow transition
Global Total primary energy demand EJ 500-550 550-600 690-740
Renewables supply % of total energy supply c.55% c. 40% c. 25%
Automotive Global sales of zero-emissions vehicles % of total automotive sales c. 90% c. 70% c. 40%
Global sales of fuel cell electric vehicles % of total automotive sales c. 20% c. 15% c. 10%
Hydrogen Global hydrogen production Mt p.a 350-400 200-250 150-200
IEA’s NZE and SDS scenarios are used to inform our rapid and pragmatic transition scenarios, respectively. Both rely on policy interventions beyond current pledges to reduce fossil fuel-related emissions. The NZE assumes a wider range of interventions and stronger implementation rates, including in terms of near-term support to early deployment of key innovative technologies and supporting infrastructure. The NZE also assumes substantial energy efficiency gains through stronger standards for appliances and fuel economy, among other levers.
Pragmatic evolutionSlow transition Rapid transition
-10
0
10
20
30
40
50
2020 21002060 2065 2070 2075 2080 2085 2090 20952050 205520452040203520302025
Johnson Matthey | Annual Report and Accounts 202262

Our transition risks and opportunitiesThrough our scenario work, we identified four distinct potential climate-related impacts, which represent both risks and opportunities for our business. We have added the first climate impact risk to our principal risks because it is of strategic importance to our business (see page 74).
We have used our climate scenarios to evaluate these risks and opportunities in the short (0–3 years), medium (3–10 years) and long term (10+ years), in line with our usual business planning timescales. We believe the pragmatic evolution climate scenario is most likely to occur, so have used it as the base case for assessing our transition impacts, and the other two scenarios to stress test the sensitivity and resilience of our business plans.
Climate impact Description of the transition risk and opportunity
1 Changing customer and consumer demand for our products
Increasing awareness of the impacts of a warming climate is changing consumer habits, leading to lower demand for some of our existing products and higher demand for new products. We need to carefully match supply as demand changes, and to identify new markets for our solutions catalysing the net zero transition for our customers to avoid negative financial impacts and realise opportunities for our revenue, cash flow and profitability.
2 Increasing demand for low-carbon manufacturing and recycling of key materials
Customers and policy makers are increasingly interested in the carbon footprint of our products, demanding a lower carbon footprint and specifying recycled content for key raw materials. We need to make the right capital investment decisions to transition our operations to net-zero emissions in line with market demand, and use low-carbon raw materials to increase our competitive advantage and avoid the potential issue of stranded assets.
3 Increasing carbon taxation An increasing number of governments are introducing or considering introducing a carbon tax or trading schemes. This could raise the costs of energy, water and waste both for us and our suppliers, and also the cost of transport and logistics, which may be affected by international border carbon tax mechanisms. If this results in higher prices for our products, our customers may be less willing to buy them.
4 Increasing stakeholder expectations of corporate climate policy and performance
Market expectations are rising and corporate policy / performance regarding climate-related targets are under increasing scrutiny. If we do not meet our stated net-zero commitments and strategy, or our commitments do not keep pace with societal / market expectations of net zero, we could suffer from a loss of stakeholder and / or shareholder confidence, loss of reputation, shareholder action and climate-related litigation. Conversely, if we outperform our competitors in how we adapt to climate change, we could attract new shareholders and customers.
Climate transition impact
Primary driver of impact
Opportunities (with time horizons)
Risks (with time horizons)
Management of impacts Financial impacts (after management)
KPIs to monitor impacts
1. Changing customer and consumer demand for products
Regulation• Emissions standards for
vehicles• Emissions standards for
energy production• Requirements for use
of bio-based feedstocks
Markets• Shifts in consumer
preferences• Uncertainty over
which technologies will prevail.
Sustained sales of existing products for internal combustion engine vehicles in the short and medium term, as tighter emissions standards demand state-of-the-art technology for exhaust pipe catalysts.
Opportunities for new products in the medium and long term:
• Lower carbon energy sources (blue and green hydrogen).
• Hydrogen-powered vehicles (fuel cells) and sustainable aviation fuels.
• Low-carbon solutions for the chemicals industry.
Without adaptation of our portfolio, there is a long-term risk that we may not have a financially viable future business model and / or capability as society transitions away from fossil fuels.
• Reduced demand for existing autocatalyst products for light duty vehicles (long term).
• Uncertainty in the rate of market evolution from existing to new technology options which could affect profitability (medium / long term).
• Ability to scale up rapidly to manufacture new products for new markets (short / medium term).
We focus on managing our existing businesses effectively, while pivoting away from fossil fuels-based industries to ones based on sustainable chemicals, fuels and clean energy as markets develop.
• We are closely monitoring the changing market environment, updating our climate scenarios at least once a year to inform our strategic decisions.
• We keep investing in innovation to make sure we have products that differentiate us in all our markets.
• For our maturing businesses, we have a plan to reduce our cost base to improve efficiency and cash flow
• For some of our growth businesses, we plan to invest in production assets and to make sure our capital projects are implemented effectively through our capital expenditure control programme.
GrowthAccelerating profit growth, with low double-digit growth rate towards end of decade1 and c. 40% of profit coming from businesses related to the net zero transition by 2031/32. Clean Air remain a cash generative business of scale, with sales2 c. £2bn in base case by end of decade.
Costsc. £300m of cumulative capital expenditures dedicated to businesses related to the net zero transition over 2022/23-2024/25. £100m-£200m fixed cost savings from Clean Air by 2030/31.1. At constant 2021/22 average PGM
prices and FX rates2. Sales excluding precious metals
Progress towards our 2030 sustainability targets for products and services:
• Sales, R&D and revenues aligned with SDG7 and SDG13.
• Tonnes of GHGs avoided by customers using our products.
Economic activity aligned with EU taxonomy regulation - climate delegate act.
Market evolution forecasts• Automotive emissions
regulation changes• Market forecasts for vehicle
sales by type and region• Governments’ investments in
hydrogen infrastructure• Evolution of the use of
sustainable aviation fuels
Taskforce for Climate-related Financial Disclosures continued
Johnson Matthey | Annual Report and Accounts 2022 63
STRATEG
IC REPORT

Taskforce for Climate-related Financial Disclosures continued
Climate transition impact
Primary driver of impact Opportunities (with time horizons)
Risks (with time horizons)
Management of impacts Financial impacts (after management)
KPIs to monitor impacts
2. Increased demand for low-carbon manufacturing and recycling
Markets• Shift in consumer preferences
towards products with a low-carbon footprint
Regulation• Emerging rules on recycled
content of consumer goods and the need for companies to declare the carbon footprint of their products
As the world’s largest recycler of secondary PGMs, we could benefit from the increased demand for goods with low-carbon and / or recycled critical raw material content (short / medium term).
Opportunity to expand our knowledge of metal recycling into new markets, particularly lithium, nickel and cobalt, which are required by the electric vehicle industry to meet the EU‘s directive on battery recycling (medium / long term).
Commercial advantage if we adapt our manufacturing plants to low carbon operation faster than our competitors.
Medium-term risk that we cannot transition our operations for net zero at the correct pace to meet customer demand of low carbon products.
• Loss of customers and failure to attract new customers (medium / long term).
• Greater capital required to transition our assets to low-carbon manufacturing (medium / long term).
• Inability to access the alternative renewable energy sources needed to decarbonise our operations (medium / long term).
• We have set challenging recycling, and net zero targets to decarbonise our manufacturing operations
• We have established a cross-functional Sustainability Council to drive progress towards these targets
• In 2022, we will introduce an internal carbon price for our capital investment decisions to help us make the right choices for decarbonising our operations for net zero in the long term
• We are developing a roadmap to net zero by 2040, which we plan to publish in 2023
Work is under way to quantify the financial impact of our commitment to net zero manufacturing by 2040.
Progress towards our 2030 sustainability targets for products and services:
• % recycled PGM content in our products.
• % reduction in Scope 1, 2 and 3 GHG emissions % products with a cradle-to-gate LCA available to our customers
• Number of customer requests for low-carbon and recycled content in products.
3. Increasing carbon taxation
Regulation• Carbon pricing
mechanisms
Increasing regulations and the introduction of carbon taxes will accelerate growth in our new target markets – sustainable chemicals, sustainable fuels and clean energy (medium term).
Many jurisdictions are implementing carbon pricing mechanisms with rates increasing over time.
• Increased costs to us and our suppliers of goods and logistics due to carbon taxation on raw materials and fossil-fuel derived energy (medium term).
• Loss of competitive advantage due to the increasing price of our products (medium / long term).
• Reputational damage if we do not transition fast enough to cleaner energy solutions in our operations (medium / long term).
We are tracking carbon price risks through:
• An annual exercise with the help of outside experts to forecast the effect of long-term carbon prices on our portfolio.
• Working to embed carbon prices within our three- and ten-year planning cycles going forwards.
• In 2022, we will introduce an internal carbon price for our capital investment decisions to help us make the right choices for decarbonising our operations.
Work under way to quantify financial impacts to our portfolio.
Potential exposure to carbon taxation in 2030 by Scope 1, 2 and 3
Johnson Matthey | Annual Report and Accounts 202264

Climate transition impact
Primary driver of impact Opportunities (with time horizons)
Risks (with time horizons)
Management of impacts Financial impacts (after management)
KPIs to monitor impacts
4. Increasing stakeholder expectations of corporate climate policy and performance
Reputation• Increased concerns or
negative feedback from stakeholders
Legal• Exposure to litigation
Developing and delivering robust climate policy will increase our long-term business resilience, attracting shareholders and employees aligned with our values.
Delivering our net zero commitment and science based targets will help us demonstrate sustainability leadership, and increase our profile with new customers and shareholders.
Investors, employees and wider society are scrutinising companies’ sustainability commitments ever more closely. Failing to meet their expectations could damage our reputation, losing us customers, making it difficult to attract and retain staff, and ultimately increasing the risk of shareholder action. (medium / long term)
• Our climate policy, net zero ambitions and sustainability targets do not keep up with stakeholder expectations.
• Our plans for meeting these commitments are not deemed sufficiently detailed or credible.
• We fail to meet these commitments.
We continue to monitor and manage the expectations of our stakeholders as follows:
• Formed SVC and Sustainability Council to enhance our governance of climate- related issues.
• Close monitoring of the latest case law and developments in climate litigation.
• Developing and monitoring net zero roadmaps to 2040.
• Maintaining regular dialogue with investors.
• Market scanning and benchmarking of targets to ensure our climate-related polices and commitments meet the highest expectations.
Reputation risk is not easily quantified.
Progress towards our 2030 sustainability targets:
• % reduction in Scope 1, 2 and 3 emissions.
How we score on leading ESG platforms:
• CDP Investor score.
• DJSI, Sustainalytics and MSCI climate sections.
• Employee engagement score.
Taskforce for Climate-related Financial Disclosures continued
Johnson Matthey | Annual Report and Accounts 2022 65
STRATEG
IC REPORT

Climate scenarios for evaluating physical risks Changing weather patterns as the climate warms may result in physical risks to our assets and supply chains. During the year, we worked with Zurich Resilience Solutions to evaluate the exposure of all our assets and those of our strategic suppliers to these risks. To support this work, we used the Shared Socio-economic Pathways (SSPs), the latest climate change modelling scenarios from the Intergovernmental Panel on Climate Change (IPCC). The SSPs produce forward-looking climate data by running climate models driven by assumptions about future global GHG emissions, together with plausible future socio-economic development metrics (economic growth / GDP, demographics, land use and urbanisation), and incorporating the likely implementation of adaptation and mitigation measures.
We looked at three SSPs for the locations of all our own operations and those of our strategic suppliers. We considered four time horizons - 2020 (our baseline), 2030, 2040 and 2050 to identify the top hazards and how they are likely to change. SSP 1-2.6 assumes the lowest temperature rise, and therefore the least physical impact, disruption and adaptation costs; SSP 2-4.5 is the middle temperature rise; and SSP 5-8.5 assumes the highest temperature rise, and therefore the greatest physical impact, and disruption adaptation costs.
Given its potential severity, for scenario SSP 5-8.5, the resilience of our most critical sites. SSP5-8.5 is an extreme scenario that is unlikely to arise, but it is useful for stress testing. We then used it to test the resilience of our top 10 most critical sites. The site criticality ranking included financial criteria such as external sales and total asset value, as well as those climate-related perils ranked highly for increases in 2050. The ranking also took into account commercial factors and those sites considered to be of significant strategic importance to us. In looking at location-specific hazards, we also used various forward-looking climate data, including Jupiter Intelligence’s Climate Score Global.
Scenario Assumed temperature increase (relative to 1850-1900)
SSP 1-2.6 Best estimate of 1.7⁰C warming by 2041-2060, and 1.8⁰C by 2081-2100
SSP 2-4.5 Best estimate of 2.0⁰C warming by 2041-2060, and 2.7⁰C by 2081-2100
SSP 5-8.5 Best estimate of 2.4⁰C warming by 2041-2060, and 4.4⁰C by 2081-2100
Our physical risksThe physical risks of climate change can be grouped into two categories:
• Acute, which are extreme events such as tropical cyclones, severe flooding events, heatwaves and fires.
• Chronic, which are gradual changes like rising sea levels that damage coastal property, or sustained changes to temperature and rainfall.
In total, we investigated eight weather-related perils across these two types of risk: temperature, rainfall, thunderstorms, flood, drought, wind, wildfire and hail. We looked at them in two ways:
• Risk to our own assets, which could damage our sites and disrupt production, leading to loss of sales and increased costs, as well as posing risks to our employees.
• Risk to our suppliers and value chain, which could hamper our access to strategic raw materials (including metals) and products, and increase costs.
Analysis of our ten most critical locations shows that there is no material financial impact from climate change risks on the quantifiable hazards (flood and windstorm) on the medium time horizon (to 2030) in any of the scenarios. The most significant impact predicted by the models out to 2030, under the worst case scenario, was an additional 35% of our physical asset value to be subject to a high rainfall hazard. This includes our facilities in Skopje (N. Macedonia), Devon (USA), Manesar (India) and Royston (UK). Over time, drought may also become more significant. We have evaluated the impact this could have on water availability to our operations using the World Resource Institute's (WRI) Water Risk Atlas tool see page 46 for more information about this.
For risks to our supply chains, we concluded that our precious metal suppliers, on horizon of 2030 climate change under the worst case scenario of SSP5-8.5 could become subject to a high or very high rainfall hazard, and additionally a high or very high heat stress. This includes PGM mines and the processing operations in the Rustenburg region in South Africa, mines in Zimbabwe and some smelters in central USA.
For our other suppliers, on the shorter-term horizon of 2030, climate change under the worst case scenario of SSP5-8.5 is expected to cause a small number of our strategic suppliers’ locations to be subject to a high rainfall hazard, heat stress or high or very high drought. In particular, this includes suppliers’ locations in Vietnam, India, and USA.
Going forward into the next year, we will start to use this information to communicate with our strategic suppliers about their climate adaption plans and resilience.
Taskforce for Climate-related Financial Disclosures continued
Johnson Matthey | Annual Report and Accounts 202266

Physical climate impact
Primary driver of impact Opportunities (with time horizons)
Risks (with time horizons)
Management of impacts Financial impacts (after management)
KPIs to monitor impacts
5. Disruption to our operations resulting in damage to or loss of assets, increased costs and harm to our employees.
Physical risks (acute and chronic).
Increased frequency, severity and variability of extreme weather events and natural disasters.
Competitive advantage by improving our business resilience and controls through diligent climate-related screening of assets, and integration with business continuity plans. (medium term, three to ten years)
Damage to our key sites, equipment or stock from severe weather (wind, rain and drought) if any increased risk is not prioritised and there is no formal planning of climate-change mitigation and / or adaptation measures. (medium term)
Insurance of our sites could become inadequate, more expensive or even unavailable, if a site is at very high risk of weather-related damage.(medium term)
Integration of weather-related risks in business continuity plans and follow-up action plans.(medium term)
We regularly review the type and limit of insurance available for climate risks to our portfolio. See more in risk 8 Asset failure on page 77. (medium term)
Climate change considered as part of new investments, including new sites with the business in transition e.g. China – fuel cell vehicles growth market, which reduces our operating costs. (medium term)
Zurich’s analysis of our ten most critical locations shows that there is no material financial impact from climate change risks on the quantifiable hazards (flood and windstorm in the medium term).
We are currently assessing whether we will need to do any mitigation to improve asset resilience in the medium term.
We use the WRI tool to monitor where clean water availability could be at risk in the long term (see page 46).
Proportion of physical asset value exposed to a climate change related high or very high hazard levels by 2030:
• Number of sites in water-stressed areas.
• Amount of water consumed in areas or high or extremely high baseline water stress.
6. Disruption to our supply chain (upstream and downstream) hampering our access to strategic raw materials (including metals) and products, and increasing costs.
Physical risks (acute and chronic).
Increased frequency, severity and variability of extreme weather events and natural disasters.
Engaging with our suppliers to help them manage climate risks to their sites could enhance our relationships with them and save us money. (medium term)
Increase in business resilience through more diligent and frequent screening of our suppliers’ assets (e.g. through integration with business continuity plans). (medium term)
Disruption of supply of key raw materials risks our ability to deliver goods on time to customers, resulting in loss of sales and future business and damage to our reputation. (medium term)
Insurance cover of suppliers is inadequate, and uncertainty over the future level of increased risk responsibility that will be assumed by suppliers and / or JM relating to climate risks, or if physical risks should be transferred. (medium term, three to ten years)
We work with strategic suppliers to integrate specific climate mitigating actions for strategic and extreme cases. (medium term)
We ensure that the type and limit of our suppliers’ insurance is in line with our own risks and external obligations. (medium term)
We work with suppliers to prioritise and integrate forward-looking potential climate risk actions and costs reductions in alignment with JM timeframe and ambitions. (medium term)
Not yet quantified.
We are currently assessing whether we need to do any mitigation work in partnership with our strategic suppliers to improve their resilience or switch to alternative partners for high-risk delivery routes. (short / medium term)
We are working on developing these indicators as part of our broader supplier risk management (see principal risk 4 on page 75).
Next steps • Our own assets – Building on the group-wide assessment, we will carry out local site assessments to determine their resilience and, if necessary,
develop plans to mitigate their specific climate-related risks.• Suppliers – We will continue to work with our suppliers, particularly those at highest risk from climate change, to develop plans to mitigate these risks.
Taskforce for Climate-related Financial Disclosures continued
Johnson Matthey | Annual Report and Accounts 2022 67
STRATEG
IC REPORT

Risk managementThis year, we set up a cross-functional working group to help us identify, assess and manage the impact of climate on our business. The group includes representatives from our finance, strategy, sustainability and risk teams, and is supported by sustainability consultancy ERM.
Identifying climate-related risksThrough a series of workshops, the cross-functional working group identified six potentially significant climate-related risks, covering both the physical (extreme events, slow-onset hazards) and transitional (policy, legal, market, technology and reputation) aspects of climate change. We have yet to fully develop our monetary definition of material financial impact. However, in the context for our risk identification exercise, materiality was defined as a matter that in the short, medium or long term could significantly influence our ability to meet our strategic objectives.
As part of our work with ERM this year, they provided detailed guidance on how to carry out a thorough assessment of climate-change risk. During the identification stage of this process, we used a range of inputs, including:
• The TCFD risk taxonomy, including physical and transitional climate risks.• Expert judgement within our TCFD working group, including technical experts
from our finance, strategy, sustainability and risk teams. • Consideration of risks in the context of our climate scenarios used for businesses
strategic planning.• An external review of risks disclosed by industry peers.
We documented what drives these risks, what their potential effects might be, and what mitigating actions we need to take to manage them. We also had the risks validated by ERM. We will continue to develop and refine our response to risk and target our mitigating actions towards the root causes of those risks.
Assessing those risksJM’s group risk framework provides guidance on the tools and processes required to manage and assess all risk types, including climate-related risks. During the year, with the help of EY, and approved for use by ERM, we developed a standardised group risk impact scoring methodology. We have since used this to conduct initial qualitative assessments of our transitional climate-related risks.
Our working group helps us assess climate-related risks across the whole organisation. The group manages each risk, making them part of our principal risk agenda, and drives meaningful discussion and actions around risk at all levels.
From our physical risk assessments, we can see that we need to put a time scale on specific risks that might affect our business – and we need to align those risks with the climate-change scenarios we consider in our strategic planning. To help us, Zurich Resilience
Solutions provided a detailed analysis of which locations and suppliers we should prioritise, in the short and long term, as discussed on page 66 – climate scenarios section. We will refine these first assessments with assessments on site, which will help us better understand what mitigating actions we need to consider and when.
We have also made significant progress in assessing future product demand and carbon taxation risks, and have begun quantifying the potential financial impacts of these risks and opportunities, aligned with our climate scenarios.
Integrating those risksIt is essential that we integrate climate-related risks and opportunities into our strategic decision making, and our risk management framework guides us on the tools and processes we need to manage all risk types, including those related to climate. We want considering climate change to be an everyday part of how we operate, so we’ve included climate in our bottom-up operational risk management process, giving us a clear view of climate-related risks across the organisation. We’ve aligned our climate change work with the TCFD risk taxonomy to make sure we’re covering physical and transitional climate risks.
This focused climate-change work now sees us aligning strategic growth with the transition to a low-carbon economy and including this as a standalone principal risk. We’re also embedding what we’ve learnt from our early assessments of physical climate risk into our principal risk of asset failure and supply failure. Prioritising climate by incorporating it into our principal risk process means it will be reviewed formally, twice a year, by the GLT and the board – on top of the more detailed and focused review already done by the SVC.
In the coming year, we aim to:
• Continue to integrate the six climate-related risks we’ve identified. • Strengthen our overall governance of climate-related risks.• Ensure we are properly monitoring the risks themselves, and how we are mitigating them,
by tracking progress against the targets we have set.
Managing those risksThe board SVC committee oversees our sustainability strategy, including climate-related risks. Our climate risks may have a direct or indirect impact on our principal risks and are therefore managed alongside and integrated within our principal risk process. Each of our climate risks has been assigned a risk coordinator. These individuals are senior stakeholders who are accountable for reviewing, monitoring and assessing the magnitude of the risk as well as overseeing the implementation of appropriate mitigations to treat the risk.
But truly managing risk effectively throughout the business has to be a collective endeavour by all our people. We hold quarterly risk knowledge-sharing forums to raise awareness and understanding of risks throughout the business. Our Clean Air and ENR sectors have established sustainability steering committees to help drive our sustainability agenda and improve the governance of climate-related risks in their areas.
Taskforce for Climate-related Financial Disclosures continued
Johnson Matthey | Annual Report and Accounts 202268

EU taxonomy eligibility As supporting global decarbonisation is one our strategic aims, we have assessed how our portfolio is aligned with the EU Green Taxonomy Regulation (EU) 2020/852. The first delegated act to the Taxonomy Regulation, the ‘Climate Delegated Act’, was adopted in June 2021 and addresses the first two environmental objectives, Climate Change Mitigation and Climate Change Adaptation. Our activities in our growth businesses, particularly Hydrogen Technologies meet the eligibility criteria for this activity.
We have evaluated what percentage of our financial activity meets the eligibility criteria for these activities.
Another delegated act, the ‘Environmental Delegated Act’, addressing the remaining four environmental objectives of the EU Taxonomy Regulation, has not yet been adopted. Once the remaining four criteria are published, we expect our percentage alignment to increase substantially.
Remuneration Committee integration of targets into PSPThe Remuneration Committee has agreed to include a sustainability performance measure into its long-term Performance Share Plan (PSP) for the first time in 2022. This sustainability measure will represent 20% of the total award, with the balance of the award focused on financial performance measures. The sustainability measure will consist of a scorecard of
quantitative measures that cover the three areas of our sustainability ambition, namely Products & Services, Operations, and People. Further details on the specific targets will be published on our website during June.
Introducing internal carbon pricing In the next year, we will be introducing a shadow carbon price to our capital investment business case assessment process, as recommended by the Bank of England. This will incentivise us to reach net zero, by ensuring all investments are made for a low-carbon world where the price of carbon is higher than it is today. Although the ICP is not a real cost of the investment, it demonstrates what the impact would be of carbon taxation forecast for 2030 and beyond, and we will use it to evaluate and compare potential investments. At this stage, we plan to apply the ICP only to emissions related to the asset when operational (including raw material and supply chain impacts emissions). We do not plan to apply them to emissions related to the development of the project itself, such as equipment manufacture, or to construction-related emissions, since such emissions are both short term and generally minor in relation to the overall life of the assets.
Metrics and targetsWe have reflected on appropriate metrics and targets to help us manage our climate risks and opportunities effectively. They were identified in climate-impact tables on pages 63-65 and their values are summarised here. We are still considering additional metrics and targets that would be most useful in helping us monitor our physical risks. We have had our Scope 1, 2 and 3 GHG targets independently verified by the Science-based Targets initiative to ensure that our level of ambition is aligned with the UN Paris agreement on climate change's Well below 20C scenario (WB2DS).
Metric description Alignment Target type Baseline year Baseline value FY2029/30 target 2022 progress More on page
Tonnes GHGs avoided by customers when using our technologies 1 Absolute 2020/21 211,000 50 million 489,000 38
% sales aligned with SDG7 and SDG13 1 Intensity 2020/21 6.1% No target 5% 37
% R&D spend aligned with SDG7 and SDG13 1 Intensity 2020/21 22.3% No target 22.8% 37
Scope 1 and Scope 2 GHG (tonnes) 2, 4 Absolute 2019/20 391,459 260,973 399,905 42
Scope 3 GHG purchased goods and services (tonnes) 2, 4 Absolute 2019/20 3,282,096 2,625,269 3,008,648 42
% recycled PGM content in our products 2 Intensity 2021/22 71% 75% 71% 40
Potential exposure to carbon taxation in 2030 3 Intensity 2021/22 Not disclosed Not disclosed Not disclosed
CDP climate score 4 Absolute 2019/20 B A B 66
% physical asset value exposed to high weather-related hazard by 2030 5 Intensity 2020/21 35% No target 35% 66
Water consumed in regions of high baseline water stress (m3) 5 Absolute 2020/21 531,000 No target 499,000 46
Taskforce for Climate-related Financial Disclosures continued
Johnson Matthey | Annual Report and Accounts 2022 69
STRATEG
IC REPORT

Risk report
Managing risks effectivelyOur long-term success, and how we achieve our strategic objectives, is grounded in how well we manage the risks our business faces. To do that well, we’ve made managing those risks an integral part of how we are governed and of how we work at all levels of the organisation. We keep ahead of potential risks by training our people and investing in awareness campaigns. We’ve also established an integrated governance, risk and compliance (GRC) platform – called JMProtect – to help us oversee our risks, processes and controls.
Although it was a difficult decision to divest our Health and Battery Materials businesses last year, it has meant reducing our exposure to risk in those areas. It has also meant we can now deliver more growth in a more focused way and make consistent capital investments. We are conscious of the uncertainty this decision has created for our people, so our senior management are actively managing this change.
COVID-19 still presents significant challenges to our global operations and employees, which is why we’ve continued to work hard to keep our employees safe, our operations running and our customers served. Volatility in the supply chain, especially the shortage of semi-conductor chips, has affected production for several of our automotive and truck customers. This has reduced the automotive industry’s demand for precious metals overall, which has meant prices have declined. We have successfully navigated – and continue to navigate – these uncertainties, some of which are unavoidable: we’ve worked to better understand the risks, closely collaborated with our suppliers and customers, and taken actions to reduce their impact on how we operate. Our strong management team and robust risk and controls framework have been crucial to this.
Climate-related risks and opportunitiesWe support the recommendations of the Task Force on Climate-related Financial Disclosures (TCFD) and continue to disclose how effectively we are managing climate-related risks and opportunities. Our working group for TCFD has focused on the key themes relevant to our business, both in terms of the opportunities climate change brings and its effect on our strategy and operations. Its work will continue as we learn more about the specific impacts our business might face, and when and how adequate our mitigations are.
We are beginning to embed climate and broader environmental, social and governance (ESG) risks into our principal risks, and our operational risk management processes, by:
• Reviewing our principal risks and:
• Updating our strategic growth risk to make sure we can still execute our strategy while moving to a low-carbon economy.
• Including physical climate-related risks within our supply (metal and non-metal) and asset failure risks.
• Updating our risk universe, which means including climate change within this framework and embedding it within JMProtect, so that risks are recorded and reported across the business.
• Aligning and embedding sustainability ambitions, metrics and 2030 targets into our principal risks, so they can be managed and monitored.
Johnson Matthey | Annual Report and Accounts 202270

How we manage risk Our risk management process does two important things: it identifies key risks, and it provides reasonable assurance that we understand and are managing those risks in line with our defined risk appetite. Our people are at the core of our risk process, taking business and operational decisions every day, which is why it’s crucial to provide them with the relevant support.
We operate a three-lines-of-defence risk assurance model. The first line represents operational management – the people who own and manage risk on a day-to-day basis, using effective internal controls. Group functions and sectors monitor and oversee these activities, representing governance and compliance – the second line. The third line is the independent assurance over these activities that our Group Assurance function and other third parties provide. We continue to strengthen this model and mature how we manage our assurance activities.
The board has overall responsibility and accountability for risk management and internal controls – and it reviews their effectiveness at least once a year. Supported by the Group Leadership Team (GLT), the board’s reviews are done against the principal and emerging risks facing the business. This makes sure that the risks identified are relevant to our goals and strategic objectives. The Audit Committee helps the board monitor how effective our risk management and internal control policies, procedures and systems are.
Our risk management framework uses a top-down approach – that is, from board level down, to identify our principal risks; and a bottom-up approach – that is, from a day-to-day level up, to identify operational risks. These work in parallel, and we continue to improve the connections and alignment between them.
Individual GLT members take the lead on our principal risks as risk sponsors. They regularly review their risks by considering emerging risks, current activities and actions needed to operate within our defined risk appetite. The GLT undertakes ad hoc deep-dive reviews to support relevant strategic topics. Reviewing risk is part of each business’s or function’s review process, which makes sure that risks are considered in the context of our values and strategic priorities.
Functions, sectors and site teams are responsible for identifying, assessing and prioritising their risks. They also consider how likely it is that a risk will happen and what effect that would have on our objectives. This includes reviewing whether a risk has changed, how strong the controls we use to manage the risk are, and whether mitigating actions are in place. We use a self-assessment process to report, at least once a year, on whether the most relevant controls are still appropriate.
To decide where we need insurance cover, we continue to focus on the most significant areas of risk, where we have a legal or contractual requirement – but we also use insurance as a risk mitigation tool, where it’s available on commercially reasonable terms from leading insurance companies. This year, despite a more challenging external insurance market, we have maintained a similar level of insurance. We use a captive insurance company to cover some of the risks we retain. This makes sure there’s balance of risk between us and our external insurers that is appropriate and makes financial sense.
We review the type and limit of our insurance to make sure it’s aligned with where we think our risks are and with our external obligations: for example, we mitigate the potential financial impact of extreme weather events through our property damage and business interruption insurance programme. Where appropriate, we get advice from industry to help us assess risks and develop mitigation plans. We’ve partnered with Zurich Resilience Solutions, for example, to assess our existing and future physical climate risks. This has helped us to better understand the potential effects of climate change on our assets and across our supply chain. For more detail, see our TCFD disclosures on pages 60-69.
Risk report continued
Johnson Matthey | Annual Report and Accounts 2022 71
STRATEG
IC REPORT
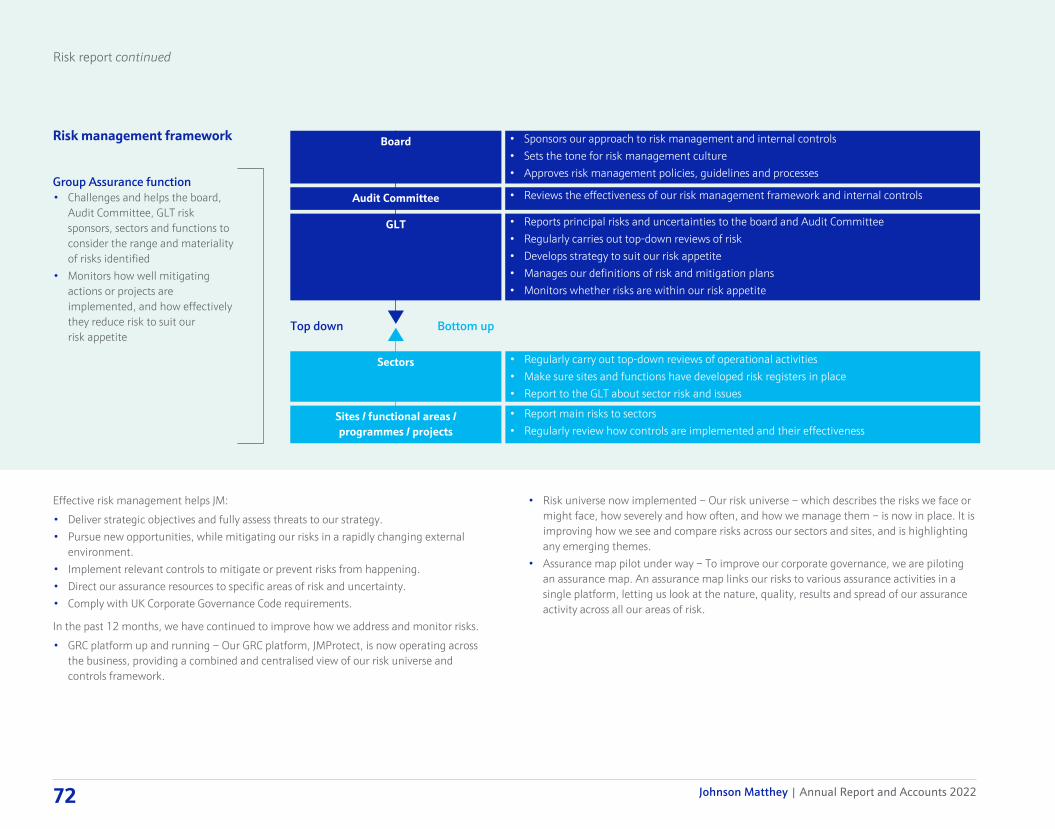
Risk management framework
Effective risk management helps JM:
• Deliver strategic objectives and fully assess threats to our strategy.• Pursue new opportunities, while mitigating our risks in a rapidly changing external
environment.• Implement relevant controls to mitigate or prevent risks from happening.• Direct our assurance resources to specific areas of risk and uncertainty.• Comply with UK Corporate Governance Code requirements.
In the past 12 months, we have continued to improve how we address and monitor risks.
• GRC platform up and running – Our GRC platform, JMProtect, is now operating across the business, providing a combined and centralised view of our risk universe and controls framework.
Risk report continued
• Risk universe now implemented – Our risk universe – which describes the risks we face or might face, how severely and how often, and how we manage them – is now in place. It is improving how we see and compare risks across our sectors and sites, and is highlighting any emerging themes.
• Assurance map pilot under way – To improve our corporate governance, we are piloting an assurance map. An assurance map links our risks to various assurance activities in a single platform, letting us look at the nature, quality, results and spread of our assurance activity across all our areas of risk.
Group Assurance function• Challenges and helps the board,
Audit Committee, GLT risk sponsors, sectors and functions to consider the range and materiality of risks identified
• Monitors how well mitigating actions or projects are implemented, and how effectively they reduce risk to suit our risk appetite
Board
Sectors
GLT
Sites / functional areas / programmes / projects
• Sponsors our approach to risk management and internal controls• Sets the tone for risk management culture• Approves risk management policies, guidelines and processes
• Regularly carry out top-down reviews of operational activities• Make sure sites and functions have developed risk registers in place• Report to the GLT about sector risk and issues
• Report main risks to sectors• Regularly review how controls are implemented and their effectiveness
Audit Committee • Reviews the effectiveness of our risk management framework and internal controls
• Reports principal risks and uncertainties to the board and Audit Committee• Regularly carries out top-down reviews of risk• Develops strategy to suit our risk appetite• Manages our definitions of risk and mitigation plans• Monitors whether risks are within our risk appetite
Top down Bottom up
Johnson Matthey | Annual Report and Accounts 202272

Emerging risks and opportunitiesWe use our risk management framework to identify emerging risks. We carry out top-down reviews across the business and validate these with bottom-up analysis within our sectors. We track and flag key risk indicators, and then consider them alongside our climate scenarios – in 2021, we identified significant emerging risks around ransomware and climate activism, for example.
Identifying emerging opportunities relies on how well we understand the context of the markets we operate in – in particular, the transition to a low-carbon economy. We use our internal climate scenarios to model how the transition might play out in industries like automotive and hydrogen.
We also consider trends – such as carbon pricing and regulations – that could affect the bigger picture, globally and regionally. Understanding market context feeds into our strategy, too. It’s an exercise that helps us see opportunities to strengthen our existing growth businesses and find new opportunities.
Given the challenges we have faced with COVID-19, remote working, cybersecurity and socio-political risks, we now need to refine our approach to business resilience. A new strategy and a simplified business model will help to focus our work here. Strengthening our capabilities around operational resilience more broadly will make sure we can endure times of high stress and significant change.
We established a taskforce to monitor the developing situation between Russia and Ukraine and manage our response to Russia’s invasion. This encompassed all aspects of our work in the region, including people, operations and supply chain.
Principal risks and uncertaintiesAs a group, we are affected by risk factors, including macroeconomic and industry-specific risk factors, that are outside our control. We detail our principal risks on the following pages, and included commentary about how we mitigate them. We also discuss the threats and opportunities driven by climate change, although not in any particular order of materiality or likelihood. Indeed, there may be other risks – currently unknown or considered immaterial – that could become material. Any of these risks could affect our performance, assets, liquidity, capital resources and reputation.
We review our principal risks regularly to make sure we’re meeting the challenges facing the business and our strategic priorities. To understand our current risk universe, our GLT risk sponsors assess changes to their risks. They prioritise principal risks as needed, and create focused mitigation plans. Our risk management process – facilitated by our Group Assurance function – makes this possible.
We’ve continued to shape our risk coverage, and clarify opportunities and actions, in the past year:
• We created a new strategic risk – Strategic growth: business transition to low-carbon economy – to replace the Existing market outlook and Future growth risks set out in last year’s annual report. This single risk specifically covers climate change and our transition to a low-carbon economy, reducing the total number of principal risks.
• Scenario planning around climate change continues to be an important part of our risk management process, given the rate and extent of change in our key markets. Climate change drives some of our principal risks, such as environment, health and safety and supply failure. We must manage these risks effectively to deliver our growth strategy, to inspire confidence in our stakeholders and to report against TCFD requirements.
• Due to the divestment of our Health business, which will be completed in early June, we have removed two of the principal risks discussed in last year’s annual report: Product quality and Security of metal / highly regulated substances, which were driven by exposure to the health sector. We will monitor any remaining impacts of these risks through our operational risk process.
• We have replaced the Security of metal / highly regulated substances risk with a risk specifically focused on Managing our metal commitments. This risk covers all metal elements, including sourcing, prices, availability and physical security. The Precious Metal Management team has strengthened our metal governance and improved how we manage our metal commitments. We’re also continuing to reduce refinery backlogs.
• Cyberattacks continue to pose a significant risk to all businesses and organisations, given the rapid evolution of technology and the rise in the number of attacks – particularly ransomware attacks. Under our Information technology and cybersecurity risk, we continue to assess and develop our controls to respond to such threats and maintain industry best practice.
• In the next reporting cycle, we will decide whether a separate business resilience risk, covering aspects of security of assets and business continuity, needs to be made a standalone principal risk.
The following table sets out our principal risks and uncertainties, and details the actions in place to mitigate them. These risks, either individually or in combination, could have a material adverse effect on our business. We continually analyse our mitigation plans, recognising that our risk profile and the potential impact of each risk will change over time.
Risk report continued
Johnson Matthey | Annual Report and Accounts 2022 73
STRATEG
IC REPORT

Risk report continued
1. Strategic growth: business transition to low-carbon economy
GLT sponsor: Liam Condon
Risks, opportunities and impact Key mitigations Changes since 2021 annual report Links with climate change and sustainability
Our strategy is focused on managing our existing businesses effectively, while pivoting away from fossil fuel-based industries to those based on sustainable chemicals and fuels, and clean energy.
Our overall risk is that we may not have a financially viable future business model and / or capability as we transition to a low-carbon economy and are unable to make and / or sell the products and services our customers demand.
Our growth platforms include:
• Green hydrogen and fuel cells within hydrogen technologies.
• Low-carbon hydrogen, sustainable aviation fuels and low-carbon solutions within catalyst technologies.
• We continue to monitor the changing market environment and our customers’ requirements. Using this information, we can update our strategic plans and actions where needed
• We keep investing in innovation to make sure we have products that differentiate us in all our markets
• For our maturing businesses, we have a plan to reduce our cost base to improve efficiency and cash flow
• For our growth businesses, we plan to invest in production assets and to make sure our capital projects are implemented effectively through our capital expenditure control programme
We have revised this risk to reflect our ability to create value in line with the global transition to a low-carbon economy.
We have increased our investment in growth platforms – in particular, hydrogen technologies – and exited our Battery Materials business, a decision based on looking again at the likelihood of success in an increasingly competitive market.
To be successful in our growth platforms, we are making sure we:
• Understand the market by regularly engaging with customers and other external parties – and by assessing market demand, key customers’ requirements and the competitive environment. We use this data to update our climate scenarios and then embed this into our business-planning process.
• Effectively deliver our capital projects.
• Have sufficient investment in key, next-generation, low-carbon technologies within our innovation platforms.
• Have a strong new-product introduction process to bring quality commercial products to market.
We have consolidated our strategic risks so we can focus on executing our strategy during a transition to a low-carbon economy. This also focuses our thinking about how to do business in the face of changing risks and the opportunities presented by megatrends – global shifts in the way we live and do business. To execute our strategy, we are focused on effectively delivering capital projects on time and on cost, investing in the correct technology areas and innovation platforms, and commercialising new products.
Our products and services are where we can make most progress towards a cleaner, healthier world. We are committed to investing in technologies that address our four priority UN Sustainable Development Goals.
2. Maintaining competitive advantage of our products and operations
GLT sponsor: Maurits van Tol
Risks, opportunities and impact Key mitigations Changes since 2021 annual report Links with climate change and sustainability
This risk addresses failing to maintain our competitive advantage in our markets and not meeting our customers’ evolving needs as effectively and profitably as our competitors can. This could reduce the value of our brand.
Customers use our products in a wide range of their own end products, processes and systems. It is crucial then that our products work properly and meet the established quality criteria.
Performance failure or quality defects could harm consumers or leave us open to liability claims. This could lead to loss of future business and our licence to operate, and to reputational damage.
• We maintain strong customer relationships through our technical proposition, good market reputation and high level of technical service
• We adopt the quality by design-concept for introducing new products or changing existing ones
• We maintain a strong portfolio of innovative products and services, using our new technology platform and product development process
• We carry out technology readiness reviews to make sure we launch robust platforms and solutions
• We use standardised processes to make sure our manufacturing and preventative maintenance systems are robust
We have broadened this risk to include our ability to be innovative and create industry-leading technical solutions, while still becoming more efficient.
We are actively looking for ways to improve our processes. Our R&D and manufacturing teams closely collaborate across the whole innovation process, to increase overall innovation success rate.
Our biggest opportunity to have an impact on climate change and societal sustainability is through the benefits and impacts of our products and services – one of the three pillars of our sustainability strategy. Delivering reliable, quality products lets us and our customers and consumers:
• Drive lower global greenhouse gas emissions
• Cause less harmful air pollution
• Conserve scarce resources
• Create and produce products for a cleaner, healthier world
Link to strategy Change in risk Invest in growth areas targeted at climate change and circularity Increased since 2021 annual report
Manage our established businesses to support growth No change
Promote a fast-paced, efficient business and high-performance culture Decreased since 2021 annual report
Risk movement not applicable as new risk
Johnson Matthey | Annual Report and Accounts 202274

3.Environment, health and safety (EHS)
GLT sponsor: Ron Gerrard
Risks, opportunities and impact Key mitigations Changes since 2021 annual report Links with climate change and sustainability
Like other high-hazard manufacturing companies, our business is controlled by a wide range of challenging health, safety and environmental laws, standards and regulations, which are set by governments and regulatory agencies around the world.
If we fail to operate safely, we could injure people, incur significant financial loss or breach applicable laws, which could have a negative effect on our reputation, our people or the environment. This could also mean we lose production time and attract negative interest from the media and regulators, which could lead to fines and penalties.
• We have a strong health and safety culture across the business. This is based on clear policies, guidelines and standards, continual training and awareness activities and audits. Together, we can keep improving how we work
• We regularly review process safety hazards at relevant sites
• We thoroughly investigate incidents or accidents to find their root cause, and then develop plans to remediate the problem
• We monitor our environmental risk, report on environmental data associated with our sites and always look for opportunities to improve
• We regularly review our regulatory and reputational risks and put mitigation plans in place where we need to
The health and safety of our people is still our priority. COVID-19 has changed the way many of our people work, so we have adapted our processes to make sure that training, online hazard studies and other assessments can continue remotely.
Because of the pandemic’s long duration and travel restrictions, our senior management haven’t been able to visit, monitor or give personal support to as many sites as usual. We know this has affected our EHS performance.
Our 2030 sustainability targets aim to reduce our environmental footprint by:
• Reducing Scope 1, 2 and 3 GHG emissions in line with our ambition to be net zero by 2040.
• Reducing our net water consumption and hazardous waste production.
• Reducing NOx and assessing the environmental effects of the life cycle of our products.
The People pillar of our sustainability strategy also focuses on our employees’ and contractors’ safety. We are committed to reducing our rates for total recordable injury, illness and the International Council of Chemical Associations’ process safety metric. We manage this risk through line management responsibility and the application of our EHS management system.
We monitor restricted substances lists, including the EU’s substances of very high concern list. Through our product stewardship programme and our new product introduction process, we aim to reduce or eliminate our use of high-concern substances.
4. Supply failure (excluding platinum group metals – see risk 6 Managing our metal commitments)
GLT sponsor: Ron Gerrard
Risks, opportunities and impact Key mitigations Changes since 2021 annual report Links with climate change and sustainability
Given the types of products and services we develop, there are only a few suppliers from which we can source certain important raw materials.
If there was a significant breakdown in their supply, we would be unable to manufacture our products and satisfy customer demand.
Our work on the effects of climate change means we understand that more frequent extreme weather events and natural disasters may disrupt our supply and value chains, upstream and downstream. Getting raw materials and delivering products would be harder and costs would increase.
• We regularly review our relationships with our suppliers. We talk to them about their constraints and how they are identifying and mitigating risks to our supply chain and our quality management processes. This also helps us manage the resilience of our supply chain
• Where it’s appropriate, we carry strategic stocks of raw materials and regularly monitor those stock levels against changes in the business environment
• We regularly investigate alternative materials to use, as part of our research and development work
• We conduct ongoing market research to understand and monitor how short-term events could affect the long-term supply of materials and services critical to our business
We are continuing to implement our procurement strategy. We have improved our understanding of the supply chains across our sectors, especially for capital projects.
In line with the strategy for our product portfolio, we continue to review our direct suppliers of critical raw materials.
The pandemic has highlighted the volatility of supply chains and caused interruptions in the supply of materials. But our relationships with our suppliers and key partners means we’ve been able to jointly identify short-term risks and potential mitigations, making sure we can still supply our customers.
Because we source our chemical and process suppliers from around the world, many of them are located in adverse weather zones, and so may be affected by climate change in the future.
An increase in severe weather events or changes to weather patterns may be serious enough to interrupt supply. That could mean suppliers:
• Losing assets or equipment, or having buildings damaged.
• Losing stored input and output materials.
• Seeing total loss, or damage or severe delays to in-transit materials.
By looking at weather patterns in key supplier locations, we are assessing how physical climate change risks – acute and chronic – could cause supply failure. We also review what mitigations suppliers are taking.
Risk report continued
Johnson Matthey | Annual Report and Accounts 2022 75
STRATEG
IC REPORT

5. People, culture and leadership
GLT sponsor: Annette Kelleher
Risks, opportunities and impact Key mitigations Changes since 2021 annual report Links with climate change and sustainability
Culture is essential to executing our strategy, delivering growth and being more efficient. High-quality leaders can create inclusive, engaged and diverse teams, and inspire and motivate them.
We will make sure we have the capability to identify new business, capture opportunities and grow.
• We conduct regular employee engagement surveys and develop targeted action plans
• We run programmes to attract and keep key talent
• We are building a more inclusive environment so that we can attract, engage and make the most of diverse talent
• We have put in place a digital human resources platform – Workday, which includes some automation – to give us standard HR processes and meaningful insights into our business
• We regularly review how we work across the business to find ways of working more simply and efficiently
Divesting our Health and Battery Materials businesses has had a significant impact on our employees and structure of our business. However, we recognise the importance of managing our internal talent and have worked to retain and redeploy key capabilities.
Our new HR platform globally will mean we can focus on developing and engaging talent.
We have improved our talent review processes – particularly our approach to diversity and inclusion – so that we’re creating the right environment and capabilities for the next phase of our people strategy.
We continue to prioritise our people’s health, safety and wellbeing.
We have improved our approach to employee engagement and continue to invest significantly in our people.
To achieve our vision, we need the right people throughout our company and value chain – and we will treat them and our communities in an ethical and respectful way.
The People pillar of our sustainability strategy sets out that we will reach our goals and 2030 ambitions by creating a diverse and engaged company and investing in our local communities.
Our targets against these goals will be tracked through this, our People, culture and leadership risk.
6. Managing our metal commitments
GLT sponsor: Jane Toogood
Risks, opportunities and impact Key mitigations Changes since 2021 annual report Links with climate change and sustainability
Our products contain precious metals sourced from either primary, secondary (recycled) or financial institutions. There is a risk that we have insufficient metal for our manufacturing businesses and metal commitments. Our primary and secondary metal supply are diversified in type and geography, and we have very little exposure to Russian PGM supply.
Our PMM business ensures the group has sufficient metal to meet business demands and manages our metal liquidity levels. There is a risk that we do not have sufficient metal available. We operate within tight trading limits and defined liquidity levels to manage the demand volatility. Metal price volatility affects how much our Trading business earns.
We hedge all our metal transactions centrally through looking at the overall group supply and demand. Accordingly, we do not carry significant exposure to price risk. Our Refining business earnings also depend on metal price; a fall in price reduces revenue and operating profit. Any metal gains or losses that are generated through the refining process are settled regularly to ensure we are not exposed to short-term price fluctuations.
In addition, a failure of our security management systems may result in a loss of or theft of precious metal, which could lead to financial loss and / or a failure to satisfy our customers. This could reduce customer confidence or result in legal action.
• We continue to improve the control environment within our PMM team, which is our metal trading business. This includes introducing a Trading Risk Committee
• We have refreshed our internal metal policies and updated our risk management for metal controls. We’ve also completed several metal training courses to improve awareness across the organisation
• We have continued to implement our security improvement roadmap
• We have appropriate insurance cover in place
As result of our exit from the Health and Battery Materials businesses we have described our metal risk differently.
We have also continued to strengthen the control environment to ensure we have a proportionate control structure to manage and optimise our metal holdings.
As a result of our mitigating actions and diverse portfolio, we have not been significantly affected by the Russia–Ukraine conflict.
For details about how we’re assessing the risks of physical climate change to our metal suppliers, see risk 4 Supply failure.
Risk report continued
Link to strategy Change in risk Invest in growth areas targeted at climate change and circularity Increased since 2021 annual report
Manage our established businesses to support growth No change
Promote a fast-paced, efficient business and high-performance culture Decreased since 2021 annual report
Risk movement not applicable as new risk
Johnson Matthey | Annual Report and Accounts 202276

7. Intellectual property management
GLT sponsor: Maurits van Tol
Risks, opportunities and impact Key mitigations Changes since 2021 annual report Links with climate change and sustainability
By not adequately managing our own or third-party intellectual property (IP), knowledge and information, we risk losing business advantage.
This could happen through:
• Loss of IP
• Failing to protect and exploit our investment in research and development
• Loss of freedom to operate
• Reputational damage associated with litigation
• Each year, we review our IP portfolio against our strategic priorities to make sure they are aligned
• We actively manage our IP portfolio, including our trade secrets, and use digital tools to support governance
• We provide training to raise awareness of IP, including in management of confidential information
• We have processes in place to make sure no IP is disclosed outside JM without appropriate approval
• IP lawyers provide us with specialist guidance, including about using IP as a business tool
The IP landscape for each technology we use continues to be inherently challenging – sustainable technology development, for example, is a very dynamic space.
To reduce our risk, we have developed a trade secret management procedure. We’ve also launched and populated a platform to record and manage our key trade secrets and know-how. This will let us better manage our IP and guard against loss, whether it’s inadvertent or deliberate.
JMProtect has given us better visibility of how IP controls operate in our sectors. This is helping us to reduce IP risk and move it closer to our defined risk appetite.
We have considered this principal risk in the context of the climate transition. At this stage, it does not have a clear effect on how we manage and protect our IP.
8. Asset failure
GLT sponsor: Ron Gerrard
Risks, opportunities and impact Key mitigations Changes since 2021 annual report Links with climate change and sustainability
A critical asset failure may have a material effect on our supply chains, performance, share value and reputation.
Our work on the effects of climate change means we understand that more frequent extreme weather events and natural disasters may disrupt our operations and increase our costs.
• We continue to monitor and prioritise critical spare parts and capital expenditure for any ageing assets and infrastructure
• We prioritise actions from key insurance reviews, and business continuity planning
• We continue to implement robust mitigations at our sites, including business impact assessments, business continuity plans, asset management programmes, and rigorous support systems for our operational technology
Even with mitigations in place, there is work needed to reach our risk appetite.
We assess this risk based on the high level of exposure faced by our PGM Services business. The nature of this business means it would feel the greatest potential effect of a critical asset failure.
We continue to progress a multi year capital investment programme across PGM Services to renew assets that are approaching the end of their life and need replacing.
Increasing temperatures, and the severity and frequency of extreme weather events, could have an effect across our global assets. These may also have a significant effect on the health and safety of our people.
In line with the scenario-based risk analysis recommended by the TCFD, we are currently completing phase one of our climate-related physical risk assessment. By looking at weather patterns, we are assessing how physical climate change risks – acute and chronic – could cause interruptions across our production sites and key supplier locations.
Risk report continued
Johnson Matthey | Annual Report and Accounts 2022 77
STRATEG
IC REPORT

9. Ethics and compliance
GLT sponsor: Nick Cooper
Risks, opportunities and impact Key mitigations Changes since 2021 annual report Links with climate change and sustainability
If we fail to comply with ethical and regulatory standards, we could face reputational damage, and leave the company or individuals open to potential criminal or legal action.
• We are creating a culture of ‘doing the right thing’ by embedding our Code of Ethics. We promote our code at all levels of the organisation through tailored training, an ethics ambassador network, and organisation-wide events like Ethics Week
• We promote issues and trends and organise activities supported by senior management to encourage every business to own its risks and mitigations
• We help our employees to understand their obligations by regularly training them in policies and procedures. We make sure these are refreshed to reflect legislative changes, updated regulatory guidance and lessons learnt
• We employ internal and external subject matter experts to identify risks, set standards and provide advice and counsel
• We carry out due diligence on third parties to assess and manage the risks associated with various counterparty relationships
• We promote our Speak Up facility for employees to raise concerns through their site management and our network of ethics ambassadors. Our Ethics Panel investigates reported issues and recommends actions to address them
Competition enforcement cases globally are growing. That’s why we have put significant effort into evaluating our specific risks in this area, raising awareness of them and updating training and reference materials, in terms of both content and approach.
We continue to monitor the geopolitical environment, particularly its effect on export controls and sanctions and reputational risks – in the past year, we’ve implemented higher thresholds for approving transactions in certain jurisdictions.
We continue to implement our data protection programme in the Americas and Asia Pacific. Relevant legislative changes across the world mean we are updating guidance, contractual terms, templates and training materials. We’ve provided data protection support to help the rollout of Workday and other key programmes.
Using ethics scenarios in our training, we have increased awareness of the ethical dilemmas we face and how we resolve them responsibly – maintaining confidentiality and anonymity where appropriate. We discuss these issues regularly with the Societal Value Committee, GLT, Ethics Panel and our wider employee base.
We have also developed a dashboard report to highlight data-driven measures of ethical culture at each of our larger sites. This helps to engage employees before issues are reported. We are looking at this for our smaller sites.
As climate change puts developing and low-lying countries under increased environmental and economic pressure, we will face challenges in many of the markets we operate in.
Competition for resources and associated economic growth mean we will need to be even more vigilant with respect to anti-bribery and corruption, competition, sanctions, modern slavery and resource exploitation issues. Similarly, our ethical standards will be as important as ever in helping to inform our approach.
Our Group Ethics and Compliance function is responsible for delivering the human rights target within our sustainability goals: that we will uphold human rights throughout our value chain and, by 2030, 100% of our value chain partners will be assessed for human rights risks, with remedial plans in place where high risks are identified.
10. Business transformation
GLT sponsor: Liam Condon
Risks, opportunities and impact Key mitigations Changes since 2021 annual report Links with climate change and sustainability
If we fail to manage and deliver business change in a controlled manner, we may not achieve the business benefits.
If we don’t effectively implement the efficiencies of a simpler and more streamlined business structure, we may not see the cultural improvements and new ways of working we expect.
• We have embedded project management and a business change framework across all key initiatives, which is overseen by the GLT and led by the Chief Financial Officer
• We have established a second line of assurance for key technology-enabled programmes
• We are undertaking independent assurance on key change programmes
The changes we made to the group during the year mean we need to reduce cost and simplify the way we work. We have an established cost-reduction programme, which we have added to during the year.
Our new global HR system, Workday, has been rolled out and will let us see data more clearly and make decisions quickly.
We have considered this principal risk in the context of the climate transition. At this stage, it does not have a clear effect on how we manage and protect our business transformation.
Risk report continued
Link to strategy Change in risk Invest in growth areas targeted at climate change and circularity Increased since 2021 annual report
Manage our established businesses to support growth No change
Promote a fast-paced, efficient business and high-performance culture Decreased since 2021 annual report
Risk movement not applicable as new risk
Johnson Matthey | Annual Report and Accounts 202278

11. Information technology and cybersecurity
GLT sponsor: Stephen Oxley
Risks, opportunities and impact Key mitigations Changes since 2021 annual report Links with climate change and sustainability
If we fail to adapt our IT systems to changing business requirements or suffer a significant disruption to those systems or a major cybersecurity incident, we could see our financial position and reputation harmed, or face regulatory penalties, or unintentionally break the law.
• We have enhanced cybersecurity technologies to improve our ability to predict, prevent, detect and respond to cyberthreats. We have increased controls in areas where we see a heightened risk
• We continue to deploy regular cybersecurity awareness initiatives across the company. This is a key preventative control, which supplements our technology and process controls
• We continue to invest in refreshing and standardising our core systems and applications, to reduce reliance on legacy systems
• We have initiated a multi year programme of work to create a single system for our operational technology and IT
• Dedicated IT projects have supported our divestment activities, helping us to balance the value of the sale against the risk – including cybersecurity risks
This risk now includes innovation and digital areas – and, in line with good industry practice, we continue to proactively track and update it to reflect wider IT risks.
We continue to focus heavily on our cybersecurity and IT core controls, including a deep review of IT general controls. This is allowing us better visibility and governance of these – and is supporting a more efficient and standardised business IT landscape.
We are maintaining frequent communication and awareness activities to keep our employees alert to the external risks of COVID-19 fraud.
We work closely with our business security teams to protect our key physical assets and manage incidents of all kinds in a connected way.
Our IT function is supporting our sustainability targets by introducing new technologies and running its services more efficiently.
We are reducing our energy consumption by decommissioning legacy infrastructure, deploying more energy-efficient network devices, and standardising power settings within our computing environment. And, using better collaboration tools has meant we’ve reduced business travel and enabled remote working across the organisation.
12. Customer contract liability
GLT sponsor: Nick Cooper
Risks, opportunities and impact Key mitigations Changes since 2021 annual report Links with climate change and sustainability
Unfavourable customer contract terms could lead to significant loss or damage and expose us to high or unlimited liability.
Quality management needs to be effective across the entire end-to-end process within our business, i.e. from raw material supply through to product delivery to customer expectations.
It could also lead to broader negative consequences, such as damage to our reputation or losing customers.
• We continue to operate our quality management programmes
• We continue to provide legal training to raise awareness of this risk
• Our in-house legal and commercial teams work together to negotiate terms and liabilities for our customer contracts
• Our Legal Risk Committee reviews and approves contracts that meet specific high-risk triggers
• The general counsel for each sector are part of our sector executive committees. They advise senior management on legal risk within their sectors
We continue to proactively monitor and track this risk. We work closely with each business to identify opportunities to improve the risk profile of our customer contracts. And, where possible, we implement a standardised methodology to manage that.
This is supported by a robust governance framework that helps us align and oversee contracts. We are maintaining frequent communication and training efforts to keep our people aware and engaged with contract liability.
The physical effects of climate change on our assets and supply chains could mean we’re unable to meet our contractual obligations to supply our customers.
For details about how we’re assessing the risks of physical climate change to our operations and supply base, see risk 4 Supply failure and risk 8 Asset failure.
Risk report continued
Johnson Matthey | Annual Report and Accounts 2022 79
STRATEG
IC REPORT

Risk report continued
Going concernIn adopting the going concern basis for preparing the accounts, the directors have considered the business activities as set out in the Strategic report and Financial review on pages 1-82 as well as the group’s principal risks and uncertainties as set out on pages 74-79. As part of this assessment, we have considered a base case and severe but plausible trading scenario. Both scenarios showed sufficient headroom under our committed facilities and financial covenants.
The directors are therefore of the opinion that the group has adequate resources to fund its operations for the period of 12 months following the date of this announcement, and so determine that it is appropriate to prepare the accounts on a going concern basis.
Further details on going concern, viability and facilities can be found in Note 1 on page 154 respectively of the accounts.
ViabilityWe have assessed how viable we are as a business over a three-year period, in line with our annual planning horizon. During the year, the board carried out a robust assessment of the principal and emerging risks affecting our business, particularly those that could threaten our business model. The risks, and the actions taken to mitigate them, are described in the Risk report on pages 70-79.
We assess our prospects through our annual strategic and business planning process. This process includes a review of assumptions made and our ongoing assessment of annual and longer-term plans – as well as an appraisal of our strategy and significant capital investment decisions. The Group Chief Executive and Chief Financial Officer lead these reviews, in conjunction with the chief executives of each sector.
The board also reviews each sector’s strategy throughout the year, looking at our current position and prospects for the coming years. This allows us to reaffirm our overall strategy and reassess the risks that could affect executing it successfully.
We do not expect climate change risks to have a material near-term effect on our forward-looking forecasts for going concern or viability. See scenarios below for more details of our analysis.
Analysis through four stress scenarios In making the viability assessment, we have analysed each of the principal risks facing the group – as described in the Risk report on pages 74-79 – and identified the items within each principal risk category that might significantly affect cash flow and viability. We have then modelled these in four stress scenarios.
Scenario 1 – Strategic growth: business transition to low-carbon economy In this viability scenario, we considered a smaller light duty market and a faster transition from internal-combustion-engine to zero-emission vehicles, which would lead to a decrease in sales between 2022/23 and 2024/25 in our Clean Air business compared to the base case.
In this scenario within Efficient Natural Resources, there is a decrease in sales in our PGM Services business as metal prices are assumed to be lower than the base case. This is partially offset by increased sales in Catalyst Technologies.
With faster transition to low carbon, we also considered the effect of higher carbon prices because of new government legislation. This is partially offset by improvements to working capital as a result of decreased metal prices.
Scenario 2 – Maintaining competitive advantage of our products and operationsThis scenario considers the failure to maintain our competitive advantage in existing markets, mostly because of poor execution of key initiatives or operations. It includes the effect of delays to key capital projects; failure to deliver the transformation savings and associated higher costs throughout the period; and failure of a refinery, which leads to higher working capital and lower profits.
Scenario 3 – Managing our metal commitmentsThis scenario considers the failure to source sufficient metal to manage and satisfy our internal and external obligations. We modelled a shortage in the supply of metal, an increase in individual metal prices to 2021 highs of our key metals, and an increase in our metal holdings.
Scenario 4 – Other risksThis scenario includes the effect of all our other principal risks – outlined in the Risk report on page 74-79. For each risk, we have estimated a financial effect, which considers the impact and likelihood of the risk. Given the wide range of risks we face, we have then applied an overall probability weighting to this set of nine risks, from which we can derive a potential financial impact. This scenario also considers the physical risk of climate change – including the effect of extreme weather events at a sample strategic site, based on internal and external analysis (see page 154).
Conclusion In evaluating our viability under each of these scenarios, we considered our current financing arrangements (see page 154) and assumed we would not refinance any maturing debt – although, in practice, we would expect to refinance our debts well ahead of maturity thereby increasing headroom. Our stress testing shows that, under each of the scenarios described above, we had headroom under our committed facilities and financial covenants.
As a final review, given we are entering a period of greater political and economic certainty, we have also undertaken a reverse stress test to identify what additional or alternative scenarios and circumstances would threaten our financial covenants or headroom. This shows that we have headroom against either further decline in profitability, well beyond the severe-but-plausible scenario, or a very significant increase in borrowings. In this unlikely scenario, we still have other mitigating actions available, including reducing capital expenditure, renegotiating payment terms or reducing our dividend.
Based on this assessment, the directors have a reasonable expectation that the company and group will be able to continue operating, and meet its liabilities as they fall due, for at least three years.
Johnson Matthey | Annual Report and Accounts 202280

Non-Financial Information Statement
The table below outlines how we meet the non-financial reporting requirements set out in the Companies Act 2006. Our business model is set out on page 7. Our purpose set out on page 10 and our sustainability strategy on pages 34-59 set out how we act as a responsible business. Our non-financial key performance indicators which support the delivery of our strategic priorities are shown on pages 31 and 35. We have a range of different policies and standards in place to manage our principal risks (pages 70-79), which form part of our internal control framework.
Reporting requirement Information necessary to understand our business, policies and due diligence activities and outcomes Policies, guidance and standards which govern our approach. Some of which are only published internally
Environmental matters Sustainability – see pages 34-59 Environment, Health and Safety Policy
Task Force on Climate-related Financial Disclosures – see pages 60-69 Procurement Policy
Societal Value Committee Report – see pages 98-99 Supplier Code of Conduct
Employees Culture – see pages 55 and 90 Code of Ethics
Mental wellbeing commitment – see page 53 Flexible Working Policy
Health and safety – see pages 49-52 Board Diversity Policy
Employee engagement – see pages 55 Environment, Health and Safety Policy
Gender pay gap report – see pages 54
Board diversity – see pages 54 and 103
Speak Up process – see page 56
Human Rights Suppliers – see page 58 Code of Ethics
Diversity and inclusion – see pages 53-54 Modern Slavery Statement
Modern Slavery – see page 57 Data Protection Policy and Employee Privacy Notice
Procurement Policy
Supplier Code of Conduct
Social matters Our stakeholders – see pages 32-33 Employee Volunteering Policy
Anti-bribery and corruption
Suppliers – see page 58 Anti-Bribery and Corruption Policy
Our people – see pages 55-56 Code of Ethics
Tax strategy – see page 29 Modern Slavery Statement
Supplier Code of Conduct
Financial Crime Policy
Conflicts of Interest Policy
Johnson Matthey | Annual Report and Accounts 2022 81
STRATEG
IC REPORT
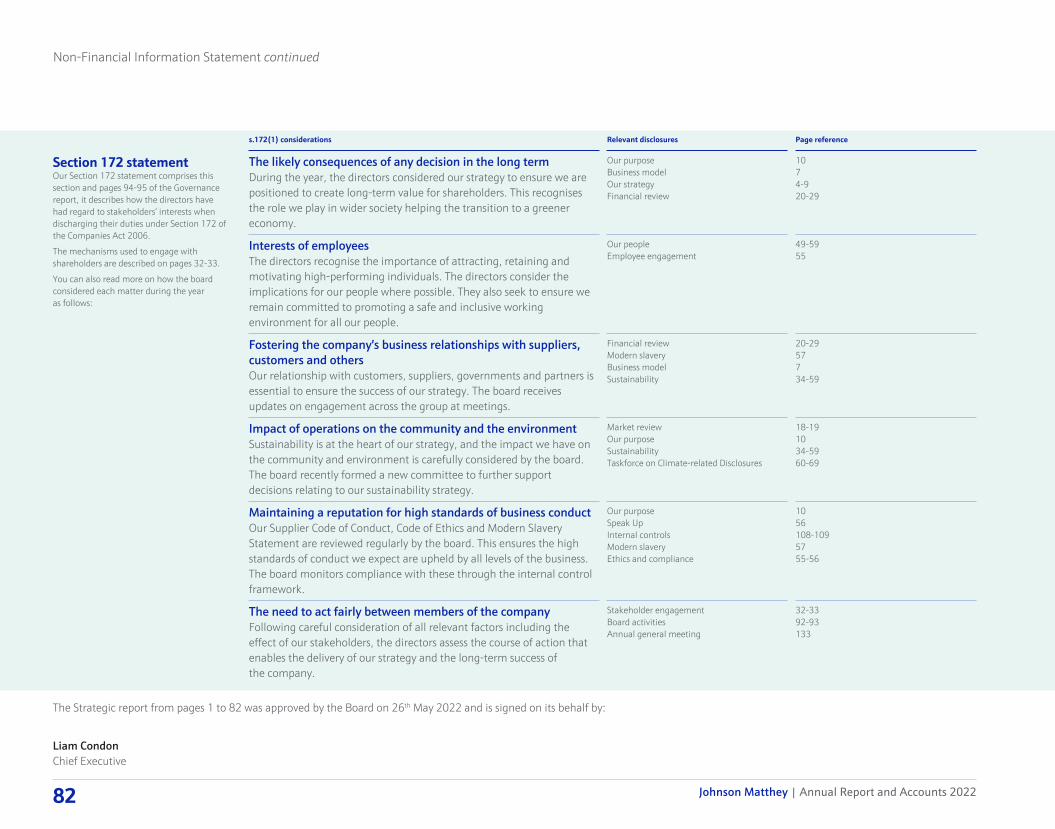
s.172(1) considerations Relevant disclosures Page reference
Section 172 statement Our Section 172 statement comprises this section and pages 94-95 of the Governance report, it describes how the directors have had regard to stakeholders’ interests when discharging their duties under Section 172 of the Companies Act 2006.
The mechanisms used to engage with shareholders are described on pages 32-33.
You can also read more on how the board considered each matter during the year as follows:
The likely consequences of any decision in the long termDuring the year, the directors considered our strategy to ensure we are positioned to create long-term value for shareholders. This recognises the role we play in wider society helping the transition to a greener economy.
Our purpose Business model Our strategy Financial review
10 7 4-9 20-29
Interests of employeesThe directors recognise the importance of attracting, retaining and motivating high-performing individuals. The directors consider the implications for our people where possible. They also seek to ensure we remain committed to promoting a safe and inclusive working environment for all our people.
Our people Employee engagement
49-59 55
Fostering the company’s business relationships with suppliers, customers and othersOur relationship with customers, suppliers, governments and partners is essential to ensure the success of our strategy. The board receives updates on engagement across the group at meetings.
Financial review Modern slavery Business model Sustainability
20-29 57 7 34-59
Impact of operations on the community and the environmentSustainability is at the heart of our strategy, and the impact we have on the community and environment is carefully considered by the board. The board recently formed a new committee to further support decisions relating to our sustainability strategy.
Market review Our purpose Sustainability Taskforce on Climate-related Disclosures
18-19 10 34-59 60-69
Maintaining a reputation for high standards of business conductOur Supplier Code of Conduct, Code of Ethics and Modern Slavery Statement are reviewed regularly by the board. This ensures the high standards of conduct we expect are upheld by all levels of the business. The board monitors compliance with these through the internal control framework.
Our purpose Speak Up Internal controls Modern slavery Ethics and compliance
10 56 108-109 57 55-56
The need to act fairly between members of the companyFollowing careful consideration of all relevant factors including the effect of our stakeholders, the directors assess the course of action that enables the delivery of our strategy and the long-term success of the company.
Stakeholder engagement Board activities Annual general meeting
32-33 92-93 133
Non-Financial Information Statement continued
The Strategic report from pages 1 to 82 was approved by the Board on 26th May 2022 and is signed on its behalf by:
Liam CondonChief Executive
Johnson Matthey | Annual Report and Accounts 202282

Compliance with the UK Corporate Governance Code 83Chair’s introduction 84Board at a glance 85Board of directors 86Our governance structure 88Corporate governance report 90Board activities 92Section 172 statement 94Board and committee effectiveness review 96Societal Value Committee report 98Nomination Committee report 100Audit Committee report 104Remuneration Committee report 111
Remuneration at a glance 114Remuneration Policy 115Annual report on remuneration 119
Directors’ report 131Responsibilities of directors 136
Governance
Compliance with the UK Corporate Governance Code 2018During the year under review, we have applied all the principles and complied with all the provisions of the 2018 UK Corporate Governance Code (the Code) except for provision 41– engagement with the workforce on alignment of executive pay with the wider company pay policy. While we inform our employees of global changes to pay and benefits, we have not actively sought a two-way dialogue over executive pay. We benchmark remuneration against our peers to ensure we offer competitive pay and benefits, so we continue to attract and retain the highest calibre candidates. We will review our remuneration policy and engagement mechanisms as part of our triennial review.
+ The Code is publicly available on the Financial Reporting Council (FRC) website, frc.org.uk
How we apply the principles of the Code
Board leadership and company purpose
The role of the board Pages 88, 92-93
Purpose and culture Pages 10-11, 90-91
Resources and controls Pages 90, 108
Stakeholder engagement Pages 32-33, 92-95
Workforce engagement Page 91
Division of responsibilities
Role of the Chair, non-executive directors and Company Secretary Page 88
Composition of the board Pages 86-87
Composition, succession and evaluation
Appointments to the board and succession planning Pages 100-103
Skills, experience and knowledge of the board Pages 86-87
Board evaluation Pages 96-97
Audit, risk and internal control
Audit Committee report Pages 104-110
Risk report Pages 70-79
Remuneration
Remuneration Committee report Page 111-130
Fair, balanced and understandableIn accordance with the Code, the board considers that, taken as a whole, the 2021/22 Annual Report and Accounts is fair, balanced and understandable, and provides the information necessary for shareholders to assess JM’s position, performance, business model and strategy. The Audit Committee assesses the process that management uses to support the recommendation to the board. More details are on page 108.
Johnson Matthey | Annual Report and Accounts 2022 83
GO
VERNA
NCE

Chair’s introduction
We all worked through the challenging and unusual times of COVID-19 in 2020/21. This year, our board continued to face some of those challenges but also made some difficult decisions in pursuing opportunities more aligned with our core capabilities – including our decision to exit our Battery Materials business.
As I mentioned in my statement in the Strategic Report (pages 2-3), that decision was not an easy one. It had a big impact on our talented colleagues – and on our investors. We deeply regret that.
Our aim, though, was – and always is – to drive long-term value for our shareholders. That’s why we also approved divesting our Health and Advanced Glass Technologies businesses, neither of which played to our core capabilities.
When we took these difficult decisions, we had to make sure they would promote the long-term success of the company – but we also carefully considered the opposing views and potential impacts on each of our stakeholder groups.
+ Read more in our Section 172 statement on pages 94 and 95
Having Liam Condon join us as Chief Executive on 1st March 2022 has already had a significant and positive impact on the company’s future. His vision for JM, and his focus on people, purpose and opportunity, will enable us to make the most of our unique opportunity to be a leader in sustainable technologies.
Similarly, our new Societal Value Committee, set up in May 2021 and chaired by Jane Griffiths, has really helped the board oversee the initiatives behind our sustainability targets, while also monitoring our progress in making JM a company of greater diversity, inclusion and belonging.
+ More information about our Societal Value Committee’s work is on page 98
I’ve also been so pleased that some board members were able to meet in person this year, as travel restrictions eased. We’ve embraced a hybrid meeting model so anyone unable to attend in person can take part virtually. And, since we’ve been unable to regularly meet in person with our colleagues, our virtual employee engagement sessions have provided us with valuable touch points. These sessions make sure we understand the diverse views of those people fundamental to delivering our strategic priorities.
+ Read more about how the board engaged with our people on page 91
During the year, we’ve also focused on succession planning. As well as Liam Condon, we’ve welcomed Stephen Oxley as Chief Financial Officer and Rita Forst as a Non-Executive Director, which further enhances our board’s skills and experience.
Robert MacLeod retired as Chief Executive on 28th February 2022, after 13 years with JM. Robert significantly evolved JM during his tenure and his legacy creates a platform for the next stage of our growth. I would personally like to thank Robert for his valued contributions.
Patrick ThomasChair
Governance highlights• Created the Societal Value Committee, a new board committee that ensures
sustainability, diversity and inclusion, and ethics are at the forefront of the board’s agenda. Read more on page 98
• Assessed the group’s strategy and made key decisions on divesting non-core businesses and exiting Battery Materials
• Developed and enhanced succession plans, including the appointment of several new board and Group Leadership Team (GLT) members. Read more from page 100 onwards
• Responded to the Department for Business, Energy and Industrial Strategy white paper ‘Restoring trust in audit and corporate governance’
+ Read more about the board’s activities during the year on page 92-93
“Our strong governance made sure we assessed shareholder and stakeholder interests with the long-term sustainable success of the company in mind.”
Johnson Matthey | Annual Report and Accounts 202284

Board and committee attendanceBoard attendance Board Societal Value
CommitteeNomination Committee
Audit Committee
Remuneration Committee
Patrick Thomas 8/8 2/3 6/6 – 8/8
Robert MacLeod1 8/8 3/3 – – –
Liam Condon2 – – – – –
Stephen Oxley 8/8 3/3 – – –
Rita Forst3 5/5 1/1 2/2 3/3 5/5
Jane Griffiths 8/8 3/3 6/6 5/5 8/8
John O’Higgins 8/8 3/3 6/6 5/5 8/8
Xiaozhi Liu 8/8 3/3 6/6 5/5 8/8
Chris Mottershead 8/8 3/3 6/6 5/5 8/8
Doug Webb 8/8 3/3 6/6 5/5 7/8
1. Robert MacLeod retired from the board on 28th February 2022.2. Liam Condon joined the board on 1st March 2022 and there were no board or committee meetings that month.3. Rita Forst joined the board on 4th October 2021.
Due to the strategic review, we held two additional board meetings during the year under review.
Non-executive director industry leadership and experiencePatrick
ThomasRita
ForstJane
GriffithsJohn
O’HigginsXiaozhi
LiuChris
MottersheadDoug Webb
Automotive
Battery technologies
Chemicals
Energy
Oil and gas
Pharmaceuticals
Manufacturing
Professional services
Technology
Sustainability
Female directors: 3
Male directors: 6
33%
67%
Gender diversity
0–3 years: 4
4–7 years: 3
57%
43%
Chair and non-executive director tenure
Chair: 1
Executive: 2
Non-executive: 6
11%
22%
67%
Role
British: 5
Irish: 2
German: 2
56%
22%
22%
Nationality
Board composition
Board at a glanceas at 31st March 2022
Johnson Matthey | Annual Report and Accounts 2022 85
GO
VERNA
NCE

Appointed to the board: June 2018
NS R
Skills and experienceBetween 2015 and May 2018, Patrick was Chief Executive Officer and Chair of the Board of Management at Covestro AG. Between 2007 and 2015, he was Chief Executive Officer of its predecessor, Bayer MaterialScience, before its demerger from Bayer AG. He is a fellow of the Royal Academy of Engineering.
ContributionPatrick has deep experience of leading international speciality chemical businesses. He also has a track record in driving growth through science and innovation across global markets, with a strong focus on sustainability.
External appointmentsNon-Executive Director at Akzo Nobel N.V. and member of Covestro AG’s Supervisory Board.
Board of Directors
Appointed to the board: March 2022
S
Skills and experienceLiam was appointed Chief Executive in March 2022. Previously he was a member of the Board of Management of Bayer AG and President of the Crop Science Division, a role he held for nine years. He has also served in senior roles at Schering AG and Bayer HealthCare.
ContributionLiam is a dynamic and values-driven leader, with an impressive track record of leading science-based businesses while delivering consistent high-quality performance. He balances commercial ability with a strong strategic perspective. He has a proven track record of driving growth, as well as modernising organisations.
Appointed to the board: April 2021
S
Skills and experienceStephen joined from KPMG, where he was a Partner. He’s experienced in both audit and advisory roles for large, complex, international companies across sectors including FMCG, healthcare, natural resources and industrials. He’s worked with major global FTSE 100 and private companies. Stephen is a chartered accountant.
ContributionStephen brings operational and technical understanding of JM and significant experience working with companies going through major change programmes.
External appointmentsTrustee of Care International UK and Chair of its Finance and Audit Committee.
Appointed to the board: October 2021
NS A R
Skills and experienceRita has spent more than 35 years at the Opel European division of General Motors in senior engineering, product development and management positions, including Vice President, Engineering for General Motors Europe. She was also a member of Opel’s Management Board from 2010 to 2012. Rita was responsible for the development of new generations of engines and car models for Opel and General Motors, as well as European research and development activities.
ContributionRita has a deep understanding of the automotive and powertrain sectors. Her extensive knowledge includes research and development of conventional and alternative powertrains, as well as future vehicle technologies.
External appointmentsNon-Executive Director of Westport Fuel Systems Inc, Non-Executive Director of AerCap Holdings N.V., Member of the Supervisory Board of Norma Group SE, and Member of the Advisory Board of iwis SE & Co.KG.
Patrick ThomasChair
Liam Condon Chief Executive
Stephen OxleyChief Financial Officer
Appointed to the board: January 2017
NS A R
Skills and experienceJane held various roles at Johnson & Johnson (J&J) from 1982 until her retirement in 2019, with experience in international and affiliate strategic marketing, sales management, product management, general management and clinical research. Most recently, she was Global Head of Actelion, a Janssen pharmaceutical subsidiary of J&J.
ContributionJane has significant experience and understanding of global strategy management, particularly across the pharmaceutical sector, and also a strong interest in sustainability and diversity.
External appointmentsChair of Redx Pharma Plc, Non-Executive Director and Sustainability Committee Chair of BAE Systems plc, Non-Executive Director of TB Alliance and Chair of RareiTi Advisory Board.
Jane GriffithsIndependent Non-Executive Director
Rita ForstIndependent Non-Executive Director
Johnson Matthey | Annual Report and Accounts 202286
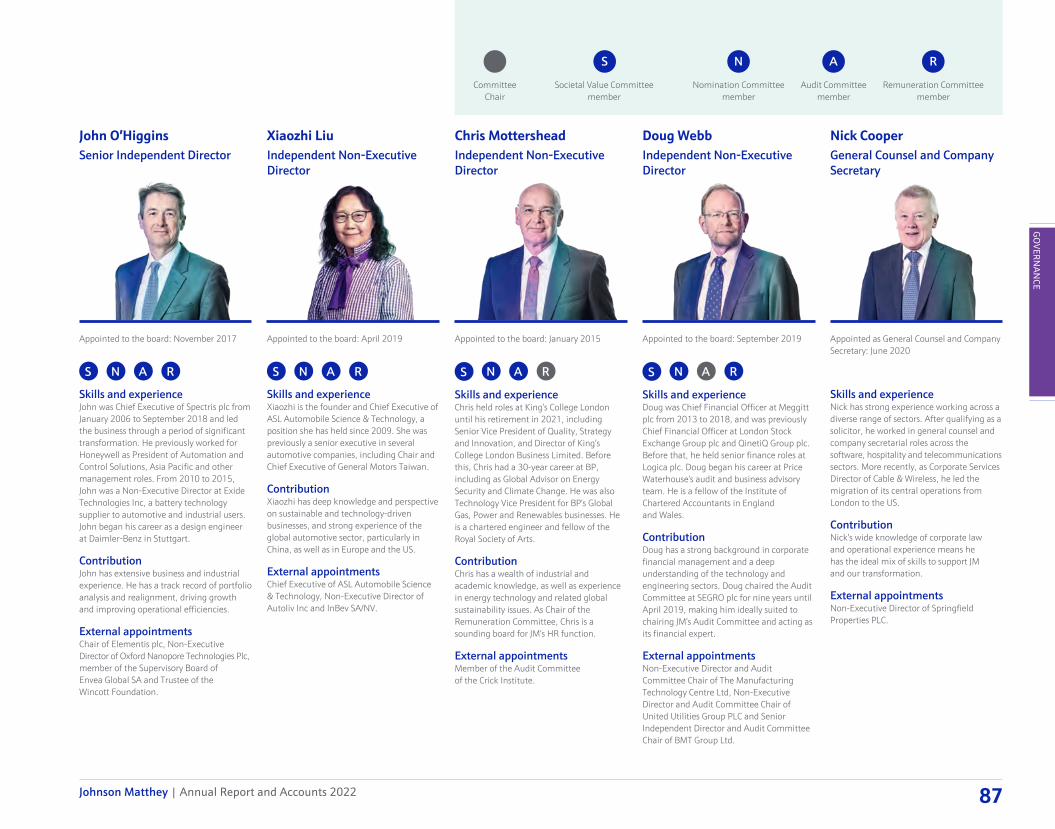
Appointed to the board: September 2019
NS A R
Skills and experienceDoug was Chief Financial Officer at Meggitt plc from 2013 to 2018, and was previously Chief Financial Officer at London Stock Exchange Group plc and QinetiQ Group plc. Before that, he held senior finance roles at Logica plc. Doug began his career at Price Waterhouse’s audit and business advisory team. He is a fellow of the Institute of Chartered Accountants in England and Wales.
ContributionDoug has a strong background in corporate financial management and a deep understanding of the technology and engineering sectors. Doug chaired the Audit Committee at SEGRO plc for nine years until April 2019, making him ideally suited to chairing JM’s Audit Committee and acting as its financial expert.
External appointmentsNon-Executive Director and Audit Committee Chair of The Manufacturing Technology Centre Ltd, Non-Executive Director and Audit Committee Chair of United Utilities Group PLC and Senior Independent Director and Audit Committee Chair of BMT Group Ltd.
Appointed as General Counsel and Company Secretary: June 2020
Skills and experience Nick has strong experience working across a diverse range of sectors. After qualifying as a solicitor, he worked in general counsel and company secretarial roles across the software, hospitality and telecommunications sectors. More recently, as Corporate Services Director of Cable & Wireless, he led the migration of its central operations from London to the US.
Contribution Nick’s wide knowledge of corporate law and operational experience means he has the ideal mix of skills to support JM and our transformation.
External appointmentsNon-Executive Director of Springfield Properties PLC.
Committee Chair
A
Audit Committee member
N
Nomination Committee member
R
Remuneration Committee member
S
Societal Value Committee member
Appointed to the board: November 2017
NS A R
Skills and experienceJohn was Chief Executive of Spectris plc from January 2006 to September 2018 and led the business through a period of significant transformation. He previously worked for Honeywell as President of Automation and Control Solutions, Asia Pacific and other management roles. From 2010 to 2015, John was a Non-Executive Director at Exide Technologies Inc, a battery technology supplier to automotive and industrial users. John began his career as a design engineer at Daimler-Benz in Stuttgart.
ContributionJohn has extensive business and industrial experience. He has a track record of portfolio analysis and realignment, driving growth and improving operational efficiencies.
External appointmentsChair of Elementis plc, Non-Executive Director of Oxford Nanopore Technologies Plc, member of the Supervisory Board of Envea Global SA and Trustee of the Wincott Foundation.
John O’HigginsSenior Independent Director
Doug WebbIndependent Non-Executive Director
Nick CooperGeneral Counsel and Company Secretary
Appointed to the board: January 2015
NS A R
Skills and experienceChris held roles at King’s College London until his retirement in 2021, including Senior Vice President of Quality, Strategy and Innovation, and Director of King’s College London Business Limited. Before this, Chris had a 30-year career at BP, including as Global Advisor on Energy Security and Climate Change. He was also Technology Vice President for BP’s Global Gas, Power and Renewables businesses. He is a chartered engineer and fellow of the Royal Society of Arts.
ContributionChris has a wealth of industrial and academic knowledge, as well as experience in energy technology and related global sustainability issues. As Chair of the Remuneration Committee, Chris is a sounding board for JM’s HR function.
External appointmentsMember of the Audit Committee of the Crick Institute.
Chris MottersheadIndependent Non-Executive Director
Appointed to the board: April 2019
NS A R
Skills and experienceXiaozhi is the founder and Chief Executive of ASL Automobile Science & Technology, a position she has held since 2009. She was previously a senior executive in several automotive companies, including Chair and Chief Executive of General Motors Taiwan.
ContributionXiaozhi has deep knowledge and perspective on sustainable and technology-driven businesses, and strong experience of the global automotive sector, particularly in China, as well as in Europe and the US.
External appointmentsChief Executive of ASL Automobile Science & Technology, Non-Executive Director of Autoliv Inc and InBev SA/NV.
Xiaozhi LiuIndependent Non-Executive Director
Johnson Matthey | Annual Report and Accounts 2022 87
GO
VERNA
NCE

Our board of directorsThe board is collectively responsible for JM’s long-term success. It provides leadership, direction and monitors the group’s culture and values. The board also sets our strategy and oversees its implementation, ensuring we’re managing risks appropriately and giving due regard to all stakeholders and their views.
Responsibilities our board does not delegate are included in the matters reserved for the board in our Governance Framework.
+ Read our Governance Framework on our website, matthey.com/governance-framework
Board composition and rolesOur six non-executive directors are determined to be independent by the board, in accordance with the Code’s criteria. The board believes their respective skills, experience and knowledge enable them to discharge their respective duties and responsibilities effectively. The Chair was considered independent on appointment.
Our governance structure
Chair: Patrick ThomasKey responsibilities• Leads the board• Ensures an effective board, including welcoming
contributions and challenges from directors• Maintains regular and effective shareholder
communications and ensures the board has a clear understanding of their views
• Chairs the Nomination Committee, initiating change and succession planning for the board and senior management
• Promotes highest standards of integrity, probity and corporate governance throughout the group
Senior Independent Director: John O’HigginsKey responsibilities• Provides a sounding board for the Chair• Acts, if necessary, as a focal point and intermediary
for the other directors• Ensures any key issues not being addressed by the Chair
or senior management are taken up• Is available to shareholders should they have concerns• Leads the annual appraisal of the Chair’s performance
Chief Financial Officer: Stephen OxleyKey responsibilities• Has day-to-day responsibility for managing the finance
and IT functions• Leads the group’s finance activities, risks and controls
Independent Non-Executive Directors: Rita Forst, Jane Griffiths, Xiaozhi Liu, Chris Mottershead and Doug WebbKey responsibilities• Constructively challenge the executive directors• Scrutinise management’s performance• Develop strategy proposals• Satisfy themselves on the integrity of financial
information and on the effectiveness of financial controls and risk management systems
• Determine appropriate executive director remuneration
Chief Executive: Liam CondonKey responsibilities• Has day-to-day responsibility for running the
group’s operations• Recommends and implements group strategy• Applies group policies• Promotes the company’s culture and standards
General Counsel and Company Secretary: Nick CooperKey responsibilities• Together with the Chair, keeps the effectiveness of the
company’s and the board’s governance processes under review
• Provides advice on corporate governance matters
Johnson Matthey | Annual Report and Accounts 202288

Finance and Administration CommitteeResponsible for the approval of certain group finance and corporate restructuring matters.
Metal Steering CommitteeManages risk and mitigating actions in relation to the group’s precious metal.
+ More detail on the role and responsibilities of our committees and the division of responsibilities between the Chair and Chief Executive can be found in our Governance Framework, which is available on our website, matthey.com/governanceframework
Legal Risk CommitteeReviews group contract and litigation risk.
Audit Committee Remuneration Committee
+ Read more on pages 111 - 130+ Read more
on pages 104 - 110 + Read more on pages 98 - 99 + Read more
on pages 100 - 103
Nomination Committee
Societal Value Committee
+ Details of GLT members and their experience are on our website, matthey.com/GLT
Group Leadership TeamThe board delegates responsibility for implementing operational decisions and for the day-to-day management of the business to the Chief Executive, who is supported by the GLT. The GLT is supported by the three committees, each chaired by a GLT member. Our Delegation of Authorities Framework sets out levels of authority for decision making throughout the business.
Our board committeesAll independent non-executive directors are members of the principal board committees. The Chair is a member of the Remuneration Committee and the Societal Value Committee, and chairs the Nomination Committee.
Disclosure CommitteeIdentifies and controls inside information. Determines how or when that information is disclosed, in accordance with applicable legal and regulatory requirements.
Ethics PanelOversees concerns raised related to our Speak Up process and ensures the effective review and investigation of these concerns.
Other committeesThe board has delegated specific responsibilities to the Disclosure Committee and Ethics Panel. These committees comprise executive directors or Group Leadership team (GLT) members and relevant senior management.
Our governance structure continued
Johnson Matthey | Annual Report and Accounts 2022 89
GO
VERNA
NCE

Our board and its committeesAt the date of this report, the board comprises nine directors: the Chair, two executive directors, the Senior Independent Director and five independent non-executive directors. Details of their names, responsibilities and contribution are on pages 86-87.
The number of board and committee meetings held during the financial year is included on page 85. There were additional meetings during the year, as a result of the strategic review. The board keeps the number of meetings under review to ensure that non-executive directors have sufficient time to discharge their duties.
All our board directors regularly go on site visits to engage with all levels of the business and gain a better understanding of the culture at our sites. Unfortunately, COVID-19 restrictions meant that the full board could not undertake planned site visits during 2021, but several non-executive directors did visit a number of UK sites, as described below.
Training As part of the board’s continuous development, Herbert Smith Freehills (HSF) provided an update on the Market Abuse Regulation. This was supported by the Company Secretarial team following a review and refresh of our processes and policies. HSF also updated the board on the emerging risk of climate litigation. In October 2021, our Platinum Group Metals (PGM) leadership team provided a ‘teach-in’ on the PGM market outlook, scenarios and price forecasts. In addition, all board members receive training on climate-related issues through the Societal Value Committee, where we invite an external specialist to present at each meeting.
PwC presented a regulatory update to the Audit Committee, covering the key changes for the next financial year. All directors also complete mandatory training modules, covering environment, health and safety, and ethics and compliance matters. They also receive regular legal and governance updates from the General Counsel and Company Secretary.
We regularly assess the skills and experience of our board members to ensure they continue to be well placed to assess the purpose and strategy of JM. This review, alongside the annual board effectiveness review, helps to inform our training agenda for the year.
Purpose and cultureHaving the right culture is essential to achieving good governance and delivering on our strategy. Our purpose and vision are underpinned by our values and drive our culture. Read more on pages 10-11.
The board monitors culture through many different metrics, including our global employee engagement survey, engagement focus groups, customer satisfaction scores, customer behaviour statistics, health and safety reports, financial results, internal audit report, and progress against our key transformation project milestones. Our Speak Up process is also the formal channel for our employees to raise concerns. Any material issues or key themes arising from Speak Ups are discussed by the Ethics Panel and Societal Value Committee and escalated to the board as appropriate.
Corporate governance report
Stephen OxleyChief Financial Officer
InductionAll new directors receive a comprehensive and tailored formal induction plan during their first year at JM and, when circumstances allow, make site visits across various sectors to gain a deeper understanding of JM. During the year, three new directors joined: Stephen Oxley, Rita Forst and Liam Condon.
We adapt each induction plan, to ensure it supports each director in meeting their statutory duties and understand our strategic priorities, as well as to provide insight into our purpose, values and culture.
As part of their induction, each director meets a wide range of senior managers, who are responsible for day-to-day management of the business, as well as key external advisers.
Where site visits were not possible due to travel restrictions, virtual site visits and introductions were facilitated.
Following their induction, each director receives regular briefings from external advisers or teach-ins on items of strategic importance as part of regular board training.
During the year under review, we continued to transform our culture and embed our values and behaviours, with a focus on leadership capability, engagement and enablement. The pandemic affected the board’s ability to oversee JM’s culture first-hand, and site visits were limited. Several non-executive directors visited UK sites including Royston, Sonning and Oxford, to meet local leadership teams and learn more about our businesses.
Our Chief Executive has focused on the key themes of people, culture and morale in his board reports throughout the year. This provides us with a valuable insight into JM’s day-to-day operations and the cultural context in which our colleagues work. During the pandemic, this was an important part of understanding how our employees were coping with changes to their working environment and with the group’s ongoing transformation. As part of the strategic review, the board spent a lot of time considering culture. It was recognised that our purpose and values still drive the right behaviours but that cultural change would underpin the delivery of our strategy. As such, we set new cultural priorities aligned to our purpose and values, to drive a simpler, higher performing and more commercial organisation.
“Despite the pandemic’s restrictions, I had a thorough induction to JM. It’s clear how our values and purpose are embedded throughout JM’s operations and how we work.”
Johnson Matthey | Annual Report and Accounts 202290

More information on our strategy and cultural priorities is detailed on pages 4-9.
To enhance the board’s assessment of our culture, we will introduce key engagement and enablement KPIs which will be reported to the board through the Chief Executive’s reports throughout the year.
Our board committees play an important role in monitoring our culture:
• The Societal Value Committee ensures we are a truly inclusive organisation with a diverse workforce to support our culture, and it monitors any key themes and issues arising from our Speak Up process (see page 98-99).
• The Nomination Committee makes sure succession planning supports our culture and promotes diversity (see pages 100-103).
• The Audit Committee has oversight of internal controls that safeguard our culture (see pages 104-110).
• The Remuneration Committee determines the group’s approach to reward and benefits to ensure it promotes our culture and JM’s long-term success (see pages 111-130).
Employee engagementThe board is committed to engaging with employees to better understand our culture, issues and challenges across our business. The board has considered employee engagement methods specified by the Code, but feels that, given our global and diverse employee network, we need a different approach. We hold engagement focus groups in countries where JM has a significant footprint and each session is attended by a director. We believe our engagement focus groups provide us with a wide range of views from our colleagues around the world.
In 2021, we created new employee engagement groups in North Macedonia, Poland and India, building on previous engagement sessions. Each session is led by a local senior leader with diverse colleagues from different sectors and functions, job types, ages and tenures. This year, we centred around the topic of sustainability in JM, with a view to understanding how our sustainability agenda is resonating across the business. We sought feedback and suggestions on what sustainability means to individuals, sectors and functions, and the goals that colleagues could focus on.
The focus groups were held virtually as a result of continued travel restrictions. Separate breakout sessions were also held to encourage open and frank discussion. Directors reported back to the board, and key actions arising were continually monitored through the year by regular reports.
Since March, the board has been focused on the strategic review, and as part of that, considered the employee feedback from The Big Listen. This was not a traditional engagement survey; it was designed to uncover strengths and barriers to our success from the bottom up and provided valuable insight to the board and senior management.
More details on how we engaged employees as part of The Big Listen can be found on page 8.
Board attendance at employee engagement sessions
Country Director
USA Jane Griffiths
Germany Patrick Thomas
India Doug Webb
China Xiaozhi Liu
UK Chris Mottershead
North Macedonia John O’Higgins
Poland Stephen Oxley
Key themes from employee engagement sessionsInternal awarenessWhile everyone is aware of our sustainability agenda, the level of understanding and depth of knowledge varies greatly. It was suggested that colleagues would benefit from training and greater communications on what they can do to support the initiatives at a local, team and individual level.
Engaging our peopleThe focus on our people is paramount, both in terms of resource, retention and development, but also in delivering our sustainability agenda. There is a huge desire among our people to do more to deliver our sustainability agenda and get involved, and there is a recognition that small everyday changes can make a big impact. There is, however, recognition that it would be helpful to have more dedicated resource to support our sustainability agenda.
CollaborationThere is a desire to increase cross-site responses and solutions to sustainability issues. Employees have recommended the introduction of cross-site knowledge sharing and competitions.
Corporate governance report continued
Johnson Matthey | Annual Report and Accounts 2022 91
GO
VERNA
NCE

Our annual agenda plan reflects our strategy, and gives us sufficient time to discuss and develop strategic proposals and monitor board performance. Below, we have set out some matters we considered during the year, different stakeholder groups central to those decisions and the outcomes. Our Section 172 statement on pages 82, 94 and 95, illustrates how the board considers stakeholder views and the outcome of those considerations.
+ Read more about how we manage risk on pages 70-79 and our strategy on pages 4-9
Matters considered Stakeholders consideredHow the board received stakeholder feedback Outcomes Principal risks
Strategy and execution
Our strategic discussions included:
• Business transformation• Battery Materials• Divesting non-core businesses• Reviewing JM’s overall
group strategy• Future growth areas
• Customers and innovation partners
• Our people• Investors• Suppliers• Governments and trade
associations• Communities
• Chief Executive updates• Sector updates• M&A updates• Capital project updates• Strategic review papers
• Received detailed updates on the transformation programme
• Conducted deep dives into each sector’s strategy
• Agreed the sale of the Health, Advanced Glass Materials businesses
• Agreed the exit of Battery Materials and approved the subsequent divestments to Nano One and EV Metals
• Clarified our group strategy and changed our culture ambition to support the delivery of the strategy
• Risks 1: Strategic growth: business transition to low-carbon economy
• Risk 2: Maintaining competitive advantage of our products and operations
• Risk 4: Supply failure (excluding platinum group metals)
• Risk 10: Business transformation
Financial oversight
Scrutinised and monitored financial data and performance, including:
• Trading and performance• Full-year and half-year results• Going concern and viability
statements• Dividend payments• Annual Report and Accounts,
including reporting against the Task Force on Climate-related Financial Disclosure requirements
• Customers and innovation partners
• Our people• Investors• Suppliers
• Chief Financial Officer updates
• PGM reports • Regular broker reports• Feedback following results
presentations
• Reviewed in detail the group’s financial position, including working capital and net debt
• Agreed the budget for 2022/23 and our three-year plan
• Assessed the proposed dividend payment
• Approved the going concern and viability statements
• Approved the commencement of a share buyback programme
• Reviewed and approved the full-year and half-year results and annual report
• Risks 1: Strategic growth: business transition to low-carbon economy
• Risk 4: Supply failure (excluding platinum group metals)
• Risk 6: Managing our metal commitments
• Risk 8: Asset failure
Operational management
We received regular updates from the Chief Executive on:
• Group operations• Capital project execution• EHS performance • Business continuity and ongoing
site management• Supply chain management
• Customers and innovation partners
• Our people• Investors• Suppliers• Governments and trade
associations• Communities
• Procurement update• Payment practices reporting• EHS updates• Modern Slavery Statement
and Conflict Minerals Disclosure
• Received detailed updates on group operations, including capital projects, procurement, security, EHS and IT
• Monitored and discussed the impact of COVID-19 and reviewed responses and actions taken at site level
• Received detailed updates on the group’s performance against EHS targets and significant events
• Received updates relating to the Russia - Ukraine conflict
• Risk 3: EHS • Risk 4: Supply failure
(excluding PGMs)• Risk 5: People, culture
and leadership• Risk 6: Managing our
metal commitments• Risk 7: IP management• Risk 10: Business transformation• Risk 11: Customer contract liability
Board activities
Johnson Matthey | Annual Report and Accounts 202292

Matters considered Stakeholders consideredHow the board received stakeholder feedback Outcomes Principal risks
Governance Governance is at the heart of the board agenda, including consideration of:
• Stakeholder engagement mechanisms
• Board effectiveness• Our Governance Framework• Policies and processes
• Customers and innovation partners
• Our people• Investors• Suppliers• Governments and trade
associations• Communities
• Attendance and engagement at the AGM
• Stakeholder perception survey (every two years)
• Feedback following investor meetings and direct engagement through investor calls
• Review material news or regulatory announcements through the Disclosure Committee
• Governance updates
• Reviewed and assessed our key stakeholder groups and how we engage with them
• Progressed the actions from the externally facilitated board effectiveness review and conducted an internal board effectiveness review
• Implemented changes to improve the Governance Framework, simplified committees at GLT level and created a new Societal Value Committee
• Approved updates to policies to ensure alignment to best practice
• Risk 5: People, culture and leadership
• Risk 9: Ethics and compliance• Risk 11: Information technology
and cybersecurity• Risk 12: Customer contract liability
People and culture
The board focused on:
• Our people strategy and culture• Diversity and inclusion• Employee engagement forums• Speak Up reports
• Our people• Communities
• Board reports on insights and actions from engagement focus groups
• Director attendance at, and feedback from engagement, focus groups
• Annual talent review by the Nomination Committee
• People strategy and culture updates from the Chief HR Officer
• Results and feedback from our internal engagement surveys and The Big Listen
• Considered the next phase of our people strategy, including mental wellbeing
• Reviewed the feedback from the employee engagement forums and surveys and The Big Listen, and received status updates on progress against agreed actions
• Reviewed notable Speak Up matters and discussed mitigating actions
• Refreshed our culture ambition to support our strategy
• Risk 3: Environment, health and safety
• Risk 5: People, culture and leadership
• Risk 9: Ethics and compliance• Risk 10: Business transformation
Risk The board reviewed the group’s approach to risk management and completed deep dives into each principal risk
• Customers and innovation partners
• Our people• Investors• Suppliers• Governments and trade
associations
• Board reports on the full-year and half-year risk reviews
• Deep dive reports into certain principal risks and areas of emerging risks
• Considered any emerging risks as a result of the external environment
• Reviewed each principal risk to ensure they remained appropriate
• Approved the risk appetite for each principal risk
• Reviewed mitigating activities
• Risks 1: Strategic growth: business transition to low-carbon economy
• Risk 2: Maintaining competitive advantage of our products and operations
• Risk 3: Environment, health and safety
• Risk 4: Supply failure (excluding platinum group metals)
• Risk 5: People, culture and leadership
• Risk 6: Managing our metal commitments
• Risk 7: Intellectual property management
• Risk 8: Asset failure• Risk 9: Ethics and compliance• Risk 10: Business transformation• Risk 11: Customer contract liability
Board activities continued
Johnson Matthey | Annual Report and Accounts 2022 93
GO
VERNA
NCE

We believe stakeholder engagement is vital to building a sustainable business. The board recognises the need to foster positive business relationships with suppliers, customers and governments. Our key stakeholder groups and the details of the engagement that we had as a wider company are detailed on pages 32 and 33, and our Section 172 statement of compliance is on page 82. Every year, we review our stakeholder groups and the ways that we engage to ensure they remain relevant and effective. The details of how, we as a board, engage with stakeholders are in the board activities table on pages 92-93.
More details on how the directors have fulfilled their duties are in the following case studies. No matter under consideration is equally relevant to each stakeholder, and sometimes stakeholders may have conflicting interests. We aim to consider the key issues relevant to each stakeholder group, and our decisions will ultimately promote the group’s long-term success and support our vision, purpose and strategy. In making decisions, we consider the interests of stakeholders across the company – not just at board level.
Focusing on our core capabilitiesThroughout 2021, the board considered divesting non-core businesses that do not complement JM’s core capabilities. We announced the sale of our Advanced Glass Technologies and Health businesses in the second half of the financial year, following careful review of the prospects of both businesses and considering a range of strategic options.
Stakeholder considerationsOur people: an inevitable part of the divestment process is the effect it has on our people. We recognise the uncertainty it brings and, where possible, endeavoured to mitigate this. We considered prospective purchasers on the basis that their core capabilities were aligned to the Health and Advance Glass Technologies businesses. We also consulted with the Works Council as part of the process.
Investors: the divestments would simplify JM’s business model, enabling greater focus on our core capabilities. Fenzi, a manufacturer and supplier of materials for flat glass processing, bought Advanced Glass Technologies for £178 million. JM used the funds from the sale to deliver greater value for shareholders and commenced a share buyback in November 2021.
The Health business required restructuring and the board deemed Altaris, a turnaround specialist in healthcare, the right partner to drive this transformation. JM has retained a circa 30% stake, allowing shareholders to keep significant future upside value.
Customers: the board considered the impact on our customers of both divestments. It agreed that bespoke short-term distribution agreements should be put in place to ensure that the businesses would be able to continue to serve customers while the divestments were completed.
Outcomes and impact on our long-term success
These divestments support our transformation to a simpler, more focused business, which in turn will help us deliver on our strategic priorities and drive cultural change. As a board, we believe this restructuring will be fundamental to our long-term success.
Fit for future, transforming our business We announced our transformation programme in June 2020 to modernise, simplify and drive greater efficiency and cost savings. The board has oversight of transformation workstreams so it can consider the effect on different stakeholders, with updates provided at each board meeting.
Stakeholder considerationsOur people: the board understands the stretch and demand that various transformation workstreams place on our people, and works to balance the pace of change with the desired outcome and the levels of employee engagement. We have also closely considered the impact of job losses in consultation with trade unions.
Investors: we recognise that this part of our strategic growth plan, with its emphasis on simplification, can be challenging for investors in the short term. While returns may not be maximised in the short term, we believe that modernisation and transformation are critical to our long-term success.
Suppliers: as we automate systems and simplify how we contract and engage with our suppliers, we aim to improve forecast demand using historic data and current market conditions. The board and the Audit Committee have monitored changes to our internal controls and systems that will help deliver these improvements.
Customers: by automating systems, we deliver greater value and efficiency for our customers. We understand that automation will not always go smoothly, so we monitor this to make sure we are serving our customers needs.
Outcomes and impact on our long-term success
Our transformation will deliver greater stakeholder value and ultimately supports our strategic priorities. The simplification of the group will also result in greater efficiency, improved employee engagement and the ability to adapt and change alongside our markets.
Section 172 statement
Johnson Matthey | Annual Report and Accounts 202294

Our decision to exit Battery MaterialsIn November 2021, we announced our intention to exit Battery Materials. The board and management undertook a detailed review of the business ahead of reaching a number of critical investment milestones. It was ultimately concluded that the potential returns from our Battery Materials business would not be adequate to justify additional investment. The board understood that exiting Battery Materials would have a significant impact on our people and investors.
Stakeholder considerationsOur people: we recognise and deeply regret the considerable impact of exiting Battery Materials on our people. We considered mitigating actions to retain as many colleagues within the group as we could, by transferring people into different roles that match their skills and experience. The sale of some of the Battery Material assets to EV Metals Group will also save around 80 roles, and the sale of our Canadian site will also safeguard additional roles.
Investors: we determined that potential returns from our Battery Materials business failed to meet shareholder expectations due to the high capital intensity compared to commodity providers. While the initial impact on our shareholders of exiting the Battery Materials business is significant, we feel it’s the most prudent decision. It will accelerate our growth in other areas such as hydrogen and decarbonisation for the chemicals value chain, and ultimately provide greater long-term returns for our shareholders. As part of the sale to EV Metals Group, JM will receive a minority stake which will also help retain future value for our investors.
Suppliers: our exit from Battery Materials has meant that we no longer need some of the licensed IP and supply commitments that we had previously entered into. We are in the process of negotiating exits to relevant agreements with our suppliers, and some agreements will transfer to EV Metals Group and / or Nano One as applicable.
Communities: the initial decision to invest in areas like Konin, Poland has had a significant impact on local communities. We engaged extensively with local governments and know that our decision to exit will have some impact on future employment in those areas. As a result of our initial investment, though, additional industries have chosen to locate in similar regions and will help drive future employment. Through the sale of our assets to EV Metals Group and Nano One, the facilities will continue to provide a benefit to the local communities in which they serve.
Outcomes and impact on our long-term success
While the board believed that Battery Materials could be a viable and promising future sector, it’s clear that although we have competitive technology, cell manufacturers and OEMs are driving down costs of production, which is putting pressure on pricing and expected returns. The board recognises that we don’t want to be a large commodity chemical producer. It decided that JM should pursue growth opportunities that complement our skillset and experience, rather than invest further into Battery Materials. Subsequently we also approved the sale of our Canadian assets to Nano One.
Company strategy Following the appointment of our new Chief Executive, the board undertook a strategic review to ensure we are focused on maximising our core capabilities and delivering shareholder return.
Stakeholder considerationsOur people: an employee survey, The Big Listen, was launched as part of the strategic review. This helped the board understand the cultural starting point and highlighted what our people value most. It also provided valuable insights into the changes of behaviour and barriers to success that the board and GLT reviewed alongside developing our strategic priorities.
Investors: following the announcement of our exit from Battery Materials, it was clear that we needed to define a strategy that played to our key strengths, with clear milestones in businesses where we have a clear right to win. As part of the strategic review, the board assessed the synergies of our portfolio and the rigour needed to deliver on our strategic priorities.
Customers: since joining, the Chief Executive met a number of our top customers to hear first-hand why they value JM and our offering. Through this feedback, the board determined that we have a very clear role to catalyse the net zero transition for our customers.
Communities: the board sees the role we have to play in wider society clearly; the net zero transition provides an unprecedented opportunity for JM. We have a favourable starting point, and several areas where we are active today will become greener and more relevant tomorrow.
Outcomes and impact on our long-term success
Our strategy, underpinned by our transformation programme and cultural change, will revitalise JM for near-term returns, and deliver on long-term growth. Our strength comes from operating together as a group with a shared ecosystem, technology capabilities and customers. The strategy will help us deliver our vision for a world that’s cleaner and healthier, today and for future generations.
Section 172 statement continued
Johnson Matthey | Annual Report and Accounts 2022 95
GO
VERNA
NCE

Each year, the board reviews performance and effectiveness, including that of its committees and individual directors, to identify areas for improvement and ensure it is well placed to provide constructive challenge.
Last year, the review was externally facilitated by Manchester Square Partners. We have made good progress against the outcomes of the review, as shown in the table below.
The Chair led this year’s board review, supported by the General Counsel and Company Secretary. The board review involved a questionnaire seeking input on a range of topics including leadership, strategy, dynamics and culture. Compiled by Independent Audit Limited, a specialist corporate governance consultancy, the questionnaire was circulated to all board members, regular attendees and certain external advisers. This year, we asked a wider stakeholder group to complete the questionnaire, to provide a more diverse perspective on the performance of the board. The Chair discussed themes emerging from the
questionnaire findings and individual performance with each board member. The results of the review were compiled by the Chair, with the support of the General Counsel and Company Secretary, and presented to the board on an unattributed basis.
OutcomeThe review concluded that the board and its committees continue to be effective, working in a spirit of trust, openness and inclusivity. There was recognition of the board and Audit Committee’s strong financial oversight and the positive relationships between the Nomination and Remuneration committees and their advisers. The review highlighted the importance of having clarity on the overarching strategy and the board’s role in monitoring culture to drive the strategy.
Action 2020/21 2021/22 progress and insightEnsure regular focus on sustainability matters through establishing a Societal Value Committee
Established the Societal Value Committee in May 2021. More details on the Committee’s role and responsibilities are on pages 98-100.
Enhance key metrics to support the board in monitoring progress in delivering our strategy In light of the appointment of our new Chief Executive followed by our strategic review in early 2022, we will review our key metrics in 2022/23.
Embed risk management throughout JM and continue to monitor the risk framework The board reviewed progress on improving the risk culture, through operational risk reviews and ensuring clarity of responsibilities, supported by enabling technology on our risk universe and controls framework.
Focus on talent and succession plans for senior leaders below the GLT The Nomination Committee discussed high performers below the GLT and their potential successors. Individuals below the GLT presented to the board, increasing the board’s exposure to and engagement with talented individuals.
Review the board calendar, including the number of meetings held and their location Board time has been optimised and the number of scheduled meetings was reduced from ten meetings a year to six. The Chief Executive and Chief Financial Officer update the board on matters of significance between meetings, as needed. Due to COVID-19 restrictions, board meetings were held at our London office or virtually, and a number of our non-executive directors visited some of our UK sites. We have a number of site visits planned for 2022/23.
Board and committee effectiveness
Johnson Matthey | Annual Report and Accounts 202296

The following actions were identified as part of this year’s board effectiveness review:
Action ResponsibilityConsider the output of the strategic review on the board’s processes, including agenda planning and the skills of the board
Patrick Thomas
Review how culture is monitored in order to drive our strategy Liam Condon
Review the principal risks and their prioritisation in light of the strategic review to continue to embed risk management across JM
Stephen Oxley
Clarify the roles and responsibilities of the various board committees with a particular focus on climate-related issues
Nick Cooper
Create a greater focus on executive succession planning through the Nomination Committee Patrick Thomas
Review of the Chair’s performanceLed by John O’Higgins, the Senior Independent Director, the Non-executive directors met without Patrick Thomas to discuss his performance as Chair. They consider he provides robust leadership for the board and facilitates open and constructive challenge.
Board and committee effectiveness continued
Johnson Matthey | Annual Report and Accounts 2022 97
GO
VERNA
NCE

I’m delighted to have been asked to chair our new Societal Value Committee. Sustainability has been at the core of our business for a long time and as the impact of climate change becomes more apparent, the part we play in building a cleaner, healthier world has increased.
In June 2021, we announced ambitious sustainability commitments to help our customers achieve their net zero goals and continue our journey of becoming a more sustainable business. The creation of our Societal Value Committee brings focus and oversight to our sustainability strategy, together with performance goals and targets, which are imperative in meeting our sustainability commitments.
During 2021, the committee worked on defining our sustainability goals in more detail and reviewed the plans and actions we need to execute and deliver on our commitments. We understand how important social and environmental challenges are to our customers, suppliers, investors, communities and other stakeholders. To bring different perspectives to our business and sustainability plans, we’ve invited external guests to speak at our meetings throughout the year, and we’ve examined the industry landscape, benchmarking and future trends.
We supported the board in its review of climate-related risks through the Task Force on Climate-related Financial Disclosures (TCFD). We are strengthening our internal processes to embed climate risk within the risk framework and ensure these are considered in all strategic business decisions. See pages 60-69 for our TCFD disclosures.
Following the completion of the strategic review, the committee will work with senior management to ensure our sustainability agenda is integrated with our strategic priorities.
Jane GriffithsSocietal Value Committee Chair
MembershipThe committee comprises all members of the board. Members’ attendance at committee meetings over the year is on page 85.
Regular attendees at committee meetings:• Chief HR Officer• Chief EHS and Operations Officer• Corporate Affairs Director• General Counsel and Company
Secretary• Group Sustainability Director
Our focus areas for 2022/23:• Continue to develop and progress
our climate transition action plans• Prepare a stakeholder report
for 2022/23
+ The committee’s Terms of Reference set out its full responsibilities. matthey.com/governance-framework
Societal Value Committee report
“Societal value is about understanding how a company’s operations and capabilities truly affect society and the environment, for which we are all responsible.” Sustainability disclosures
We oversee the presentation of sustainability disclosures by management. The committee reviewed and recommended to the board the approval of the disclosures in the Sustainable report on pages 34-59, including our TCFD disclosures on pages 60-69.
Additional case studies on sustainability topics and a databook of Johnson Matthey’s sustainability data is available at, matthey.com/ESG.
Johnson Matthey | Annual Report and Accounts 202298

The committee’s formationLast year, the board reviewed our sustainability strategy and committed to achieving net zero by 2040, supported by ambitious sustainability commitments and targets for 2030. The board considered the positive societal contributions of our key growth platforms and the importance of upholding high social and environmental standards throughout our operations. Given the central role of sustainability to our overall strategy, we created this new committee to bring continual focus to this area, with full board membership.
The committee’s roleSocietal value encompasses a range of topics on economic, social and environmental matters. To ensure we remain focused, the committee’s responsibilities centre on assisting the board in overseeing the group sustainability strategy, including net zero commitments and science-based greenhouse gas (GHG) targets; driving a truly inclusive organisation; overseeing the group’s ethical conduct; and keeping up to date with societal value topics, including stakeholder expectations. We will keep these responsibilities under review.
More information on the governance of sustainability matters beyond the committee can be found within our TCFD disclosures on pages 60-69.
How we delivered on our responsibilities
Our responsibility What we did OutcomesSustainability • Oversaw plans and actions to execute the group
sustainability strategy and key initiatives, including engaging the workforce to ensure understanding of the vision and to promote internal engagement.
• Discussed how other companies have led and managed sustainability strategies, sharing knowledge and experience.
• Discussed the development of a carbon pricing policy, to be developed and trialled starting from 1st April 2022.
• Received regular horizon scanning updates, including climate-change legislation and litigation.
• Confirmed support for our sustainability strategy.• Agreed and recommended to the board the
definitions of our sustainability goals in more detail, including the GHG targets and NOx emissions to be reduced through our technology.
Diversity and inclusion
• Reviewed our diversity and inclusion (D&I) gender target for 2030 and initiatives to support its achievement.
• Received a presentation from Accenture on challenges faced around D&I, innovation in this area and how the committee can drive our D&I agenda.
• Challenged management on our D&I target and provided feedback on ways to improve diversity, inclusion and belonging.
• Agreed action plans for the next financial year, which continue to build on our diversity, inclusion and belonging journey.
Ethics and compliance
• Reviewed actions to continue promoting an ethical culture across JM, including our ‘making good decisions’ campaign.
• Received updates on Speak Up themes and trends.
• Recommended approval of our Modern Slavery Statement and Conflict Minerals Disclosure to the Board.
Reporting • Received a briefing on TCFD requirements from ERM, a sustainability consultancy firm, and the work being done to ensure readiness for TCFD reporting.
• Reviewed and recommended that the board approve the Sustainable business section of the 2022 annual report.
Societal Value Committee report continued
Johnson Matthey | Annual Report and Accounts 2022 99
GO
VERNA
NCE

It’s been a year of considerable change for the board as we’ve focused on ensuring we have the right leaders to drive performance for the group’s long-term success.
We began the financial year by welcoming Stephen Oxley as Chief Financial Officer on 1st April 2021 (details of the search process for Stephen’s role are outlined in last year’s report). The committee also oversaw the search for a successor to Robert MacLeod. We were delighted to welcome Liam Condon, who joined as our new Chief Executive on 1st March 2022, after a formal and rigorous search process. This involved a thorough discussion of the skills, experience and leadership behaviours we considered were needed to lead JM into the future (more details are on pages 4-9). Liam’s appointment enhances the board’s skillset, and he brings deep experience of commerciality, growth and transformation.
In addition to these key executive appointments, we strengthened the board’s composition with the appointment of Rita Forst as an independent Non-Executive Director on 4th October 2021. Rita’s knowledge of conventional and alternative powertrains, and future vehicle technologies will help the board as it addresses its growth strategies in these areas.
During the year, we reviewed our senior talent so we have a strong pipeline for future board-level and Group Leadership Team (GLT) appointments. We also analysed our succession and development plans for other senior roles, as well as understanding more about our global graduates, with a focus on high-potential talents. We found that JM has invested significantly in senior leadership capability,
with a global approach to talent reviews, and we’re confident this enables us to identify a diverse pipeline of upcoming talent and those with high potential.
There were a number of changes to the GLT. In December 2021, Joan Braca stepped down as Sector Chief Executive, Clean Air, after two years reshaping our Clean Air strategy. And in January 2022, Mark Su joined as our China President – a crucial role for our future strategic ambitions in the region.
Three new leaders were appointed: Anne Chassagnette, JM’s first ever Chief Sustainability Officer; Anish Taneja, Chief Executive, Clean Air; and Mark Wilson, Chief Executive, Hydrogen Technologies.
There were a number of leadership changes within the existing GLT, with Jane Toogood (currently Chief Executive, Efficient Natural Resources) moving to lead our Catalyst Technologies business and Alastair Judge (currently interim Chief Executive, Clean Air) moving to lead our PGM Services business. Christian Günther will lead our strategy and transformation work to ensure rigour and alignment.
I am pleased to confirm that following an internal review of the effectiveness of our board and its committees, the committee continues to operate effectively, particularly in reviewing the board’s composition against our short-term and long-term strategy.
Nomination Committee report
Patrick ThomasNomination Committee Chair
MembershipThe committee comprises the Chair and all independent non-executive directors. Details of members’ attendance at committee meetings is on page 85.
Regular attendees at committee meetings:• Chief Executive• Chief HR Officer
Our focus areas for 2022/23:• Oversee the Chief Executive’s
induction • Ensure succession plans are in
place for all GLT roles and critical roles below GLT in order to execute our refreshed strategy
• Oversee our cultural change, ensuring the appropriate leadership behaviours are embedded to drive performance through our values and strategy
+ The Committee’s Terms of Reference set out its full responsibilities. matthey.com/governance-framework
“The committee’s activities have focused on equipping our leadership team with the skills needed to support the long-term success of the group and its strategic priorities.”
Johnson Matthey | Annual Report and Accounts 2022100

How we delivered on our responsibilities
Our responsibility What we did Outcomes
Board composition • Discussed and recommended proposed appointments to the board and its committees. • Approved the appointments of Liam Condon as Chief Executive, Rita Forst as Independent Non-Executive Director, and Jane Griffiths as Chair of our Societal Value Committee.
Tenure of directors • Discussed and reviewed the tenure of directors. • Recommended the re-appointment of Patrick Thomas for a second three-year term, subject to annual re-election by shareholders.
Election of directors • Evaluated the performance of individual board members, their contributions to the board, tenure and time commitment.
• Recommended that the Chair and all directors are elected or re-elected at the 2022 AGM.
Succession planning and senior leadership appointments
• Reviewed the succession plans for the most senior roles and ensured plans were in place to meet future succession needs.
• Oversaw the appointment of Mark Su as China President and a member of the GLT from 1st January 2022.
Talent management framework • Reviewed and discussed the approach to talent and leadership development for the GLT and senior leaders.
• Non-executive directors provided insights and feedback to management on successful methods of developing a high-performance culture.
Diversity and inclusion • Reviewed the directors’ combined skills, experience and diversity through self-assessment, to identify areas for development and ensure they can drive our strategic priorities.
• Reviewed our Board Diversity Policy.
• Identified areas for development to ensure the directors can drive our strategic priorities.
• Agreed an updated Board Diversity Policy reflecting our commitments to maintain a level of 33% of females appointed to the board and at least one director from an ethnic minority group.
Performance and effectiveness review • Considered the outcomes of the internal effectiveness review with regard to board composition, talent management and succession planning.
• Agreed that a review of the board skills should be undertaken following the strategic review.
Nomination Committee report continued
Johnson Matthey | Annual Report and Accounts 2022 101
GO
VERNA
NCE

Nomination Committee report continued
Our search for a new Chief ExecutiveSuccession planningOne of our main responsibilities is to ensure we are led by a diverse, high-quality board, with the appropriate skills, knowledge and experience to support the group’s strategic priorities.
The committee recognises the importance of developing a diverse pipeline of potential successors for key management roles. We routinely consider succession plans for board-level roles, the GLT and other senior leaders. We review actions that accelerate our ‘high potentials’ and balance internal succession planning with the need to bring different and external perspectives to the board and GLT. During 2021, Egon Zehnder supported our succession planning. Egon Zehnder provides senior-level recruitment services, including assessment and people development services. It has no other connection with the company or any other directors.
In accordance with the Code, the committee monitors the tenure of JM’s non-executive directors against the recommended nine-year term to ensure an orderly succession. The tenures of our non-executive directors, Senior Independent Director and the Chair are on page 85.
The committee discussed the key responsibilities, experience and personal qualities required for the role.
We sought key skills including
commerciality, team leadership, a track record of growth and delivering performance, as well as stakeholder management.
Candidate specification
The committee engaged Egon Zehnder, a third-party search and recruitment specialist, to assist with the search.
A diverse longlist of potential candidates was drawn up from a range of backgrounds.
Longlist and shortlist review
Selected candidates were interviewed by the Chair, non-executive directors and the Chief HR Officer.
As well as assessment against the job description, we carried out psychometric assessments and considered behavioural traits to align with our values and leadership expectations.
Interviews
Once shortlisted, we undertook extensive due diligence on each candidate.
We also vetted candidates against their interest in the role, and their commitment to our sustainability ambitions, driving change and developing people.
Due diligence
The committee evaluated the final list of candidates and determined that Liam Condon possessed the desired capabilities.
The committee recommended Liam’s appointment to the board in November 2021. The board approved his appointment with effect from 1st March 2022.
Recommendation
Planned activities in Liam’s induction include:
• Briefings on directors’ duties• Pre-reading board and relevant
committee papers• Sector and business leadership team
introductions• Financial briefings
• Visits to our key sites to meet employees• Meeting key customers• Meeting the external auditor, brokers and
company advisers• Training on health and safety and
compliance topics
Induction
Johnson Matthey | Annual Report and Accounts 2022102

Diversity and inclusionWe aim to promote an inclusive culture and ensure a diverse pipeline of talent. The board fully supports the recommendations of the Hampton-Alexander Review on gender diversity and the Parker Review on ethnic diversity.
Our Board Diversity Policy ensures that the importance of diversity and inclusion is set from the top, recognising that diversity in its broadest sense is essential to drive and challenge business performance. Specific objectives are set out in this policy, including our 33% female representation on the board and one director from an ethnic minority group. Following the appointment of Rita Forst, we successfully met the targets set out in the policy.
The board also supports the terms of the Enhanced Voluntary Code of Conduct for executive search firms, and all our appointed executive search firms are required to secure a diverse longlist of candidates, including BAME talent. While meeting these targets is important, the board recognises that there is always more to be done and remains committed to driving progress in diversity and inclusion.
Beyond the board, we aspire to have gender balance across all levels of the business and one of our key milestones is to achieve greater than 40% of female representation across professional management by 2030. We promote a culture of diversity, inclusion and belonging, to create a fair workplace for everyone and believe that the talent pipeline and succession planning is key in this area.
More details about our approach to diversity throughout the organisation, including our Equal Opportunities Policy and the gender balance of senior management, are on page 54.
Board skills As part of the internal board effectiveness review, we looked at the board’s collective skillset by asking each non-executive director to identify their strengths, scoring their level of expertise on a scale of one to five. The table on page 85 shows the skills held by our non-executive directors that are most relevant to their role at JM. This assessment helps us identify any gaps that need to be strengthened through future appointments or additional training. As a result of the strategic review, the committee will consider the board’s skills matrix to ensure it continues to be aligned to our strategy.
Nomination Committee report continued
Johnson Matthey | Annual Report and Accounts 2022 103
GO
VERNA
NCE

It’s been a challenging year for JM; the board made some difficult decisions as relating to the exit of Battery Materials and divesting non-core businesses. The committee has played a critical role in ensuring robust and prudent financial reporting throughout the year around these matters and the wider business. We continue to ensure that both JM’s management and PwC, our external auditor, are appropriately challenged and held to account. Management and PwC have worked hard during the year to ensure the integrity of our financial reporting and I’ve maintained regular dialogue with management, the Group Assurance and Risk Director, and PwC.
During the year, we reviewed the development of our internal controls financial reporting framework and fraud risk management programme in readiness for the anticipated outcome of the Department for Business, Energy and Industrial Strategy (BEIS) white paper on restoring trust in audit and corporate governance. In preparation for this year’s annual report, the committee reviewed our progress in reporting against the Task Force for Climate-related Financial Disclosures (TCFD) and the impact of climate change on assumptions in the financial statements.
Together with the board, the committee spent a significant amount of time discussing capital projects and exploring the control and assurance framework that supports them. The Group IT team presented a deep dive into JM’s approach to cyber risk management, which gave an insight into how we are enhancing JM’s cyber controls and how we monitor the evolving cyber risk landscape. The committee also reviewed the findings and recommendations of the External Quality Assessment of the Group Assurance function, undertaken by EY. It was very pleasing to see the positive feedback from the assessment as a whole as well as the internal stakeholders that were engaged as part of the process.
I’m pleased our internal board effectiveness review confirmed that the committee continues to operate well and remains informed of relevant changes and developments in the external audit market. As a result of the review, we will continue to work to define the respective key responsibilities of the Societal Value Committee and Audit Committee in relation to climate-related activities and TCFD reporting.
+ Read more about the board effectiveness review on page 96 and 97
Doug WebbAudit Committee Chair
Audit Committee Report
Doug WebbAudit Committee Chair
MembershipThe Audit Committee comprises all our independent directors. Doug Webb, our Committee Chair, has recent and relevant financial experience: he’s a chartered accountant and was previously Chief Financial Officer at the London Stock Exchange, QinetiQ and Meggitt.
The committee’s membership and attendance during the year is on page 86.
Other regular attendees at Committee meetings:• Chief Executive • Chief Financial Officer• General Counsel and Company
Secretary• Group Assurance and Risk Director• Director of Group Finance• PwC Audit Partner
Our focus areas for 2022/23:• Oversee the group’s integrated
assurance project, which will consolidate and map assurance activities
• Monitor the ongoing transformation of the Group Finance function
• Implement necessary changes as a result of the outcome of the BEIS white paper
• Review the control assurance over climate-related disclosures in the annual report
+ The committee’s Terms of Reference set out its full responsibilities. matthey.com/governance-framework
“The committee has played a critical role in ensuring robust and prudent financial reporting throughout a year of significant change.”
Johnson Matthey | Annual Report and Accounts 2022104

How we delivered on our responsibilities
Our responsibility What we did Outcomes
Published financial information
To monitor the integrity of the reported financial information, and review significant financial considerations and judgements.
• Reviewed the group’s full-year results and half-year results, and considered the significant accounting policies, principal estimates and accounting judgements used in their preparation.
• Reviewed the impairments around the announcement to exit the Battery Materials business and the divestment of our Health business.
• Reviewed the matters, assumptions and sensitivities in support of preparing the accounts on a going concern basis and assessed the long-term viability of the group.
• Considered the impact of scenario testing on financial disclosures in relation to TCFD.
• Reviewed the financial reporting framework of the company’s financial statements.
• Assessed the process management used to support the board when giving its assurance that the 2021/22 Annual Report and Accounts, taken as a whole, is fair, balanced and understandable (FBU).
• Reviewed reports from the General Counsel and Company Secretary on group litigation and disputes.
• Reviewed reports on credit controls and credit risks.
• Approved the 2021/22 Audit Committee report.
• Reviewed and recommended to the board the approval of elements of the 2021/22 Annual Report and Accounts.
• Reviewed and challenged JM and certain UK subsidiaries’ payment practices, policies and performance.
• Recommended the approval of the half-year and full-year results to the board, following a thorough review, and challenging management assumptions.
• Agreed that the full value of the Battery Materials business should be impaired at the half-year results, following a detailed assessment and debate with management and PwC.
• Reviewed the going concern and viability statements in depth and assessed scenarios with management, before recommending the approval of both statements to the board.
• Determined that the FBU process undertaken by management for the annual report was effective.
• Reviewed credit controls and risks in the context of challenging market conditions.
Risk management and internal control
To review the group’s internal financial controls and its risk management systems, and to monitor the effectiveness of the group assurance function.
• Received reports from the Group Assurance and Risk Director on group assurance, risk reviews and risk management processes.
• Monitored progress against the 2021/22 group assurance and risk plan; this included changes to the plan as a result of COVID-19, the divestment of some of our non-core businesses, and exit from Battery Materials.
• Agreed the 2022/23 group assurance and risk plan.
• Following the completion of the first internal control self-assessments on JMProtect, the new governance, risk and compliance solution, the committee reviewed an assessment of the results and the overall internal control environment.
• Monitored the effectiveness of the Group Assurance and Risk function, including commissioning an external review.
• Reviewed precious metal governance and controls.
• Received presentations from the Cyber Risk and Capital Projects teams.
• Met the Group Assurance and Risk Director without management present.
• Reviewed a summarised appraisal of the operation of the group’s year-end control environment that assessed if there were any control issues identified.
• Determined that risk management and internal controls effectively meet the group’s needs and manage risk exposure.
• Assessed if changes to the internal audit plan were correct to adapt to the changing needs of the business as a result of COVID-19 and announced divestments.
• Determined that the internal controls could be relied on and the introduction of JMProtect had enhanced the group’s internal control framework.
• Assessed findings and recommendations from the External Quality Assessment of the Group Assurance and Risk function, and determined that it was effective.
• Agreed with management’s determination that there were no significant control weaknesses or lack of adherence to policies and procedures identified.
Our external auditor
To oversee the relationship with the external auditor, to monitor the external auditor’s independence and objectivity, to approve its fees, recommend its re-appointment or not, and to ensure it delivers a high-quality effective audit, based on a sound plan.
• Considered reports from PwC including their views on our accounting judgements and control observations.
• Met PwC without management present.
• Considered and reviewed indicators of audit quality.
• Assessed PwC’s independence and objectivity.
• Reviewed the non-audit fees incurred during the year and the non-audit fee policy.
• Approved, after due challenge and discussion, PwC’s audit plan and fees for 2021/22.
• Determined a good quality, comprehensive audit was completed, following a review of PwC’s regular reports to the committee, the outcome of PwC’s FRC Audit Quality Review, and feedback from the Independent Quality Review Partner.
• Recommended the re-appointment of PwC as auditor.
Audit Committee Report continued
Johnson Matthey | Annual Report and Accounts 2022 105
GO
VERNA
NCE

Audit Committee Report continued
Financial reportingSignificant issues considered by the committee in relation to the group’s and company’s accountsIt is a fundamental part of the committee’s role that we act independently from management to ensure that the interests of shareholders are properly protected in relation to financial reporting. When the accounts are being prepared, there are areas where management exercises a particular judgement or a high degree of estimation. The committee assesses whether the judgements and estimates made by management are reasonable and appropriate. In the process of applying the group’s accounting policies, management also makes judgements and estimates that have a significant effect on the amounts recognised in the financial statements. The group’s key accounting judgements discussed and challenged by the Audit Committee are set out below.
Significant current year considerations in relation to the accounts
Work undertaken / outcome
Russia / Ukraine conflictThe Russian invasion of Ukraine has caused the adoption of comprehensive sanctions by governments, which restrict a wide range of trade and financial dealings with Russia / Belarus and Russian / Belarussian persons.As announced on 7th March 2022, we discontinued with immediate effect all new commercial activities in Russia and Belarus. Our operations in Russia include one small Clean Air manufacturing plant, and a small Catalyst Technologies office. Overall, for the group, around 1% of 2021/22 sales related to Russia.
We received regular briefings and a report from management which explains the accounting and disclosure implications of the Russia / Ukraine conflict. The report was reviewed and discussed with management and PwC to ensure that the committee was satisfied with its conclusions.We challenged how the impact of the Russian invasion of Ukraine and sanctions response from governments has been considered for forecasts and impairment assessments. The impact is considered in management’s forecasts used for the viability and going concern assessment and the annual goodwill impairment review. Following an assessment of the recoverability of assets held in Russia, management took an impairment and restructuring charge of £32 million comprising inventories (£17 million), receivables (£13 million) and other (£2 million).We concluded that the financial impact of the Russia / Ukraine conflict has been appropriately accounted for and disclosed in the group’s accounts.
Major impairment and restructuring activities.Key judgements in relation to impairment testing relate primarily to estimates in assessing recoverable value against carrying value.Key judgements in relation to restructuring provisions relate primarily to estimates of future cost.
We received a report from management which explains the basis of recognition and estimate for restructuring provisions. The report also detailed asset impairments as management seeks to simplify its portfolio through the exit from Battery Materials and sale of Health.We considered and debated the nature of the provisions recognised, the identification of impairment triggers across the group’s asset portfolio, and valuation of those assets as part of the impairment testing.We challenged the rationale behind the presentation of the charges as non-underlying (see note 6 on page 171).We focused on the following major impairments and restructuring charges that required judgement, with the remainder mostly relating to cash spend during the year:Battery Materials. Following a detailed review of our Battery Materials business, the group concluded that the potential future returns from the business would not be adequate to justify further investment. Accordingly, on 11th November 2021, the group announced the decision to pursue the sale of all or parts of the business. An impairment charge of £314 million was taken at 30th September 2022 to a net book value to £ nil based on our estimate of the recoverable amount at that time. For the full year, we have determined a further impairment charge of £11 million to £325 million based on our estimate of fair value less cost to sell upon classification to held for sale (see note 27). Our estimate of fair value is based on offers that are currently under review. The impairment charge comprises property, plant and equipment (£237 million), right-of-use assets (£4 million), other intangible assets (£70 million) and trade and other receivables (£6 million). A further £8 million was impaired in relation to associated intangible assets held in Corporate. The Battery Materials restructuring charge was £38 million for exit costs including redundancies.Health. The sale of the Health business to Altaris Capital Partners was driven by the board’s decision to focus. On the strategic fit of JM’s investments. On reclassification to ‘held for sale’ and ‘discontinued operations’, an impairment charge of £228 million was incurred along with restructuring charges of £14 million. The impairment was taken to goodwill (£144 million), property, plant and equipment (£55 million), other intangible assets (£23 million), inventories (£5 million) and right-of-use assets (£1 million). Diagnostic Services. Long-term market assumptions for the oil and gas industry, the faster paced transition to non-carbon intensive industries and the group’s decision to focus its portfolio on core and strategic markets has resulted in a £45 million impairment to goodwill. Other, the Russia / Ukraine conflict. See section above.
Gain and losses on significant legal proceedingsSignificant progress was made during the year with the settlement of legal proceedings requiring accounting consideration.
We reviewed a report from management which summarises the outcomes of and accounting for legal proceedings, resulting in a net gain of £42 million for during the year ended 31st March 2022. In the first half, the group recognized a gain of £44 million in relation to damages and interest, an additional gain of £6 million was recognised in relation to Battery Materials, this was offset by a £8 million charge for environmental and other costs. The report also detailed the nature of legal provisions. We considered the rationale behind the presentation of the net gains as non-underlying.
Johnson Matthey | Annual Report and Accounts 2022106

Significant current year considerations in relation to the accounts
Work undertaken / outcome
Profit on disposal of businessesOn 31st January 2022, the group completed the sale of its Advanced Glass Technologies business for a total consideration of £178 million.
We concluded that management’s key assumptions and disclosures on significant legal proceedings are reasonable and appropriate.We reviewed and discussed the accounting for this transaction. With net assets of £39 million, a non-underlying gain of £106 million has been recognised in the year to 31st March 2022 after deal costs and FX recycling.We concluded that management’s key assumptions and disclosures on the profit on disposal of businesses are reasonable and appropriate.
Impairment of goodwill, other intangibles and other assetsKey judgements are made in determining the appropriate level of cash generating unit (CGU) for the group’s impairment analysis. Key estimates are made in relation to the assumptions used in calculating discounted cash flow projections to value the CGUs containing goodwill, to value other intangible assets not yet being amortised, and to value other assets when there are indications that they may be impaired. The key assumptions are management’s estimates of budgets and plans for how the relevant businesses will develop or how the relevant assets will be used in the future, as well as discount rates and long-term average growth rates for each CGU.
We reviewed a report from management which explains the methodology used, assumptions made and significant changes from those used in prior years, including the impact of climate change on the group’s long-term plans, especially within Clean Air and carbon pricing impacts. We challenged management on the rationale behind the key assumptions and sensitivities such as discount rates and growth rates in the calculations to ensure we were satisfied on their reasonableness.The impairment reviews were an area of focus for PwC who reported their findings to us.Management identified impairments to goodwill of £189 million for Heath and Diagnostic Services as part of the annual impairment tests (see above). For the remaining material CGUs, the headroom over the carrying value of the net assets has not significantly changed from the prior period. Further information on this can be found in note 5 of the accounts.We concluded that management’s key assumptions and disclosures are reasonable and appropriate.
Refining process and stock takesWhen agreeing commercial terms with customers and establishing process loss provisions, key estimates are made of the amount of precious metal that may be lost during the refining and fabrication processes. Refining stock takes involve key estimates regarding the volumes of precious metal-bearing material in the refining system and the subsequent sampling and assaying to assess the precious metal content.
We received a report from management which summarises the results of the refinery stock take in the US. The report was reviewed to ensure that the results were in line with expectations and historic trends and, where this was not the case, explanations were provided by management.The refining process and stock takes were also an area of focus for PwC who reported their findings to us. We concluded that management’s accounting for refining stock take gains and losses was in accordance with the agreed methodology.
Post-employment benefitsKey estimates are made in relation to the assumptions used to value post-employment benefit obligations, including the discount rate and inflation.The key assumptions are based on recommendations from independent qualified actuaries.
We received a report from management which summarises the key assumptions used to value the liabilities of the main post-employment benefit plans. The assumptions were compared with those made by other companies and PwC’s assessment of the reasonableness of the assumptions was considered.We concluded that the assumptions used, and accounting treatment, are appropriate for the group’s post-employment benefit plans.
Tax provisionsKey estimates are made in determining the tax charge in the accounts where the precise impact of tax laws and regulations is unclear.
We received a report from management which explains the issues in dispute, or at risk of this, with tax authorities across the business, the calculation of tax provisions and relevant disclosures. We also considered the sensitivities around the provisions and debated the circumstances in arriving at the key provisions.Tax provisioning was an area of focus for PwC who reported their findings to us.We concluded that management’s key assumptions and disclosures are reasonable and appropriate.
Provisions and contingent liabilitiesKey estimates are made in determining provisions in the accounts for disputes and claims which arise from time to time in the ordinary course of business. Key judgements are made in determining appropriate disclosures in respect of contingent liabilities.
We received a report from management which provides information in respect of disputes and claims and identifies the accounting and disclosure implications which were challenged and discussed. Provisioning for, and disclosure of, disputes and claims was an area of focus for PwC who reported their findings to us.We concurred with management’s conclusions regarding provisioning and contingent liability disclosures.
Audit Committee Report continued
Johnson Matthey | Annual Report and Accounts 2022 107
GO
VERNA
NCE

Going concern and viability statementThe committee reviewed the matters, assumptions and sensitivities being used to assess both the going concern basis and the long-term viability of the group. This included assessing risks that would threaten JM’s business model, our current funding position, and different stress scenarios and mitigating actions. Further details on our going concern and viability, and the scenarios considered, are on page 80.
Following our review and recommendation, the board concluded that JM and the group are able to continue operating and can meet liabilities over at least three years, which remains the most appropriate timespan.
Fair, balanced and understandableWe review and assess management’s process to support the board, so it can give its assurance that the 2021/22 Annual Report, taken as a whole, is fair, balanced and understandable (FBU) and provides the information necessary for shareholders to assess JM’s position and performance, business model and strategy.
Management selected four individuals across JM to form an FBU panel to carry out a detailed review of the annual report. To help provide an objective view of the annual report, the FBU panel members were not involved in drafting the 2021/22 annual report, but all were familiar with our strategy and business model. The FBU panel members were also briefed on the role and provided with detailed notes on what to consider in the course of their review. The FBU panel, PwC and annual report project team together determined whether key messages aligned with the group’s position, performance and strategy, and whether the narrative sections and financial statements were consistent.
The FBU panel then presented a report to the board, highlighting the key themes from the review and discussion points. The Disclosure Committee reviewed the verification process dealing with the report’s factual content to further support the board’s review.
Risk management and internal controlWe assist the board in its overall responsibility for the group’s internal controls by reviewing the adequacy and effectiveness of control and risk management systems. The group’s internal controls over financial reporting include policies and procedures designed to ensure the accuracy of our financial statements. Our control self-assessment and sector filing assurance provide management with a view of the operation of those controls, and the results of these are presented to the committee as part of their assessment of the year-end control environment. These controls can only provide reasonable and not absolute assurance against material misstatement or loss.
The Group Assurance and Risk Director is responsible for independently assuring that our risk management and internal control processes are operating effectively. She provides regular oversight of risk matters that affect our business, makes recommendations to address key issues, and ensures that any mitigating actions are properly tracked, challenged and reported.
Audit Committee Report continued
During the year, our co-sourcing partnership with Deloitte ensured we had access to additional specialist skills and expertise.
The committee is satisfied that the group’s internal financial controls operated effectively throughout the year.
Control self-assessmentIn preparation for possible new regulation for internal controls, management focused on the design of the risk-prioritised controls framework and our new governance, risk and compliance solution, JMProtect. We conducted the first annual control self-assessment in 2021, which replaced the key control questionnaire process. The bottom-up process requires managers in our material businesses to certify the existence and effectiveness of the controls over JM’s relevant key risks. Self-assessment is a critical component of our governance and assurance framework and details the minimum controls we need to keep our people safe, ensure compliance with our standards and regulations, and protect our physical and intellectual assets. The committee assessed the effectiveness of the process, considered the key identified control gaps, and assessed how management planned to address the findings. Our assurance teams will further consider the veracity of self-assessment and how effective self-reporting is with the view of future assurance and, potentially more structured, internal controls testing requirements.
Group assurance and riskThe Group Assurance and Risk Director provides regular reports on internal audit reviews, including key findings, actions needed and progress on their implementation. We focus on local, sector and executive managers’ engagement levels in implementing corrective actions and in strengthening the control framework across all our sites.
We continually review the effectiveness of the Group Assurance and Risk function, using inputs including audit reports, management’s response to audit actions and discussions over risk exposures. We consider whether the Group Assurance and Risk function has adequate standing across the group, whether it is free from management influence or other restrictions, and if it is sufficiently resourced.
This year, the committee commissioned an independent external quality assessment (EQA) of the Internal Audit function within Group Assurance and Risk, undertaken by EY. The objective of the EQA was to independently assess the quality and effectiveness of Internal Audit, in line with the International Standards for the Professional Practice of Internal Auditing (which recommend that an EQA is performed at least every five years), and the UK Code of Practice for Internal Audit. This is the first time this review had been performed in JM and the result has been very positive, confirming excellent compliance with the standards and position of the function in the organisation. As part of the process, internal stakeholders were interviewed to obtain their views on the Internal Audit function and the team was benchmarked against industry standards and peer organisations. The committee carefully considered all these inputs and concluded that the Group Assurance and Risk team is effective.
Johnson Matthey | Annual Report and Accounts 2022108

Further actions were also agreed to ensure the function continues to be aligned with the changing shape of the group.
We have been encouraged by progress on integrated assurance mapping which will allow us in due course to have a fuller understanding and visibility of risk coverage in a consistent manner across the organisation. Our aim is to have a clearly articulated link between levels of assurance and risk appetite across key organisational and strategic risks.
Group assurance and risk annual planWe spend a significant amount of time reviewing the group assurance and risk annual plan to ensure it is comprehensive, that it reflects challenges and changes to our business, and that it provides the appropriate level of assurance over the group’s key risks.
When we reviewed the 2022/23 plan, we considered the continued impact of COVID-19 travel restrictions and the context of business as usual at JM, the macroeconomic environment, and business transformation. The group assurance and risk annual plan is based on a risk-based audit universe broken into three groups of risks: operational, financial and IT. We consider a wide range of risks that fall into those areas including level of change and transformation in the group and organisational culture. Close collaboration with the business ensures it adds value to management with pragmatic and manageable action plans. The plan also allows greater flexibility to ensure that the Group Assurance and Risk team has capacity to deal with unexpected events.
We believe the 2022/23 plan addresses JM’s key risks and identifies any need for additional assurance, and is appropriately comprehensive for the group’s size and nature.
Risk managementWe work with the board to review and refine the risk assurance processes (including the integrated assurance framework and control self-assessment). We concentrate on reviewing the mitigating controls and the levels of assurance, while the board is directly responsible for managing risks and establishing levels of risk appetite for the group’s principal risks. The Group Assurance and Risk function carries out any additional assurance and reports back to the committee.
Speak Up processEvery year, we review JM’s Speak Up (whistleblowing) process to ensure procedures are proportionate and independent. We reviewed the process and agreed that the procedures allow proportionate and independent investigation and appropriate effective follow-up action. We report the findings of this review to the board as appropriate. In addition, the Societal Value Committee reviews the outcomes of any investigations and the associated remedial actions.
+ More information on Speak Up can be found on page 56
External auditorTenureOur shareholders appointed PwC as the group’s external auditor in July 2018, following a formal tender process. This is the fourth year that PwC has audited the group, with Mark Gill as lead audit partner. We confirm ongoing compliance with the Competition and Markets Authority’s Statutory Audit Services Order.
External audit planIn developing the external audit plan for 2021/22, PwC carried out a risk assessment to identify potential risks of material misstatement in the financial statements. This risk assessment considered the nature, magnitude and likelihood of each identified risk, together with relevant controls, to identify audit risks. We refer to key audit matters in the independent auditor’s report on pages 137-139, which formed the basis of the external audit plan.
In determining the scope of coverage, we considered management reporting, the group’s legal entity structure, the financial results as at 31st March 2021 and the financial forecast for 2021/22. We set out details of the coverage and the agreed scope in the independent auditor’s report on page 143. Materiality was agreed at approximately 5% of the three-year average profit before tax adjusted for loss on business disposals, loss on significant legal proceedings, major impairment and restructuring charges.
Following discussion and challenge, we conclude the proposed external audit plan is sufficiently comprehensive for the group’s accounts audit, and approved the proposed fee.
How we reviewed PwC’s performanceThroughout the year, we review the ongoing effectiveness and quality of PwC, our external auditor, and the audit process. We base our review on several factors: the auditor’s reports to the committee; Mark Gill and the PwC team’s performance in and outside committee meetings; how the PwC team interacts with and challenges management; and on PwC’s efforts at building relationships with our internal audit teams.
We consider how PwC challenged management’s judgements and assumptions on matters highlighted on pages 137-147, and asked PwC to confirm if those matters had been addressed correctly by management. Following detailed analysis of the assurance completed, PwC agreed with management’s judgements and assumptions.
We also seek direct feedback from the independent Quality Review Partner to review its assessment of PwC’s key planning judgements and the execution of PwC’s response to significant risks and reporting. In addition, we feel it’s important to understand management’s opinion of audit quality and effectiveness: the executive directors and senior management complete a questionnaire on the external auditor each year.
Audit Committee Report continued
Johnson Matthey | Annual Report and Accounts 2022 109
GO
VERNA
NCE

How we gather feedback on the effectiveness of our external auditor and external audit processThird-party reviews• External reviews of PwC by the FRC’s Audit Quality Review team and the Quality Assurance
Department of the ICAEW
Information provided by the auditor• Details on the audit plan delivery, any changes to the scope of work• Assurance on the operation of PwC’s audit quality control procedures and insight into their
outcomes as they relate to the audit and key audit team members
Management feedback• Survey audit quality and effectiveness by executive directors and senior management.
This includes recommendations for improvement• Seek assurance on the disclosure process for the provision of information to the auditor
Committee assessment• Quality of regular audit reports• Feedback from committee members and regular attendees, including the Director of
Group Finance and Group Assurance and Risk Director
Provision of non-audit servicesOur Non-Audit Services Policy ensures the provision of non-audit services is no threat to PwC’s independence and objectivity as an auditor. In accordance with the FRC’s Revised Ethical Standard 2019, the auditor can only provide additional services directly linked to the audit.
Our policy sets out how approval should be obtained before PwC is engaged to provide a permitted non-audit service. We’ve pre-approved non-audit services up to £100,000. Services likely to cost £25,000 or less must be approved by the Chief Financial Officer; services likely to cost more than £25,000 but less than £100,000 must be approved by the committee Chair. Services likely to cost over £100,000 must be approved by the committee.
We reviewed compliance with the Non-Audit Services Policy, the provision of non-audit services, details of the non-audit services provided by PwC and associated fees. Audit-related assurance services reported as non-audit services, related to the review of half-year financial information and reporting amounted to £310,000. Other non-audit services in the year were £59,000, compared with audit fees of £4.54 million, representing 8% of the audit fee. More information on fees incurred by PwC for non-audit services, as well as the split between PwC’s audit and non-audit fees, are in note 4 to the accounts, on page 169.
Objectivity and independenceWe’re responsible for monitoring and reviewing the objectivity and independence of PwC. We considered the information provided by PwC, confirming that no PwC employees involved with the audit have links or connections to JM, and that they complied with the FRC’s Revised Ethical Standard. We conclude that PwC is independent.
Proposed re-appointment of PwCFollowing our work to assess PwC’s performance and independence, we agree that PwC provides a robust audit and valuable technical knowledge, and is free from third-party influence and restrictive contractual clauses. As a result, we’ve included a resolution proposing PwC’s re-appointment as auditor, and authorised the committee to determine PwC’s remuneration in our Notice of AGM.
Audit Committee Report continued
Johnson Matthey | Annual Report and Accounts 2022110

Remuneration Committee report
“Aligning performance and reward, the committee’s purpose is to ensure the remuneration structure and policies motivate and reward fairly and responsibly with a clear link to performance and the delivery of long-term strategy and value.”
This annual report on remuneration sets out how we applied the Remuneration Policy in 2021/22 and how we intend to apply it in 2022/23.
Robust performance in challenging timesThe COVID-19 pandemic has continued to affect many businesses. This has included disruption to supply chains, labour shortages and persistence in the semi-conductor chip shortage, which has has had an impact on production across the global automotive market and consequently affected our Clean Air business.
Despite the challenging environment, the company has delivered a robust underlying financial performance. This outcome was possible thanks to the collective hard work of the entire organisation to address and meet customer requirements in a complex and ever-evolving environment.
We saw growth during the year due to improved performance in Clean Air, where we saw the automotive market partially recovering in the second half of the year, and the benefits of delivering our Clean Air transformation programme. In addition, Efficient Natural Resources delivered strong performance due to higher average metal prices, while in Hydrogen Technologies we continued to invest in the scale-up of this business.
In November 2021, following a detailed review and ahead of reaching a number of critical investment milestones, the board concluded that the potential returns from our Battery Materials business were not adequate to justify more investment. As a result, the decision was taken to pursue the sale of all, or parts, of this business with the ultimate
intention of exiting. This was a difficult decision, but the board and executive team believe this was the right decision for the long-term interests of our shareholders.
In addition, as we focus the group towards our core growth areas, the board continues to take an active approach to capital allocation and review our portfolio to focus on the areas of greatest opportunity with returns that are attractive to shareholders. This resulted in the decision to sell our Advanced Glass Technologies business to Fenzi, which was completed in January 2022. We also decided to sell our Health business to Altaris Capital Partners, which is expected to complete in May 2022.
It is clear that we are entering a period of greater political and economic uncertainty with both the ongoing disruptive effects of COVID-19 and the impacts of the conflict in Ukraine. As an organisation, we have learned a lot from the challenges we faced over the past year, which we will take with us into the future to help us strengthen our company.
Our approach to remunerationThe overall objective of Johnson Matthey is to deliver sustained superior shareholder value using our world-class science and our competitive strengths, contributing to a cleaner, healthier world.
As the world ‘builds back greener’ following the pandemic, we recognise that we have an important role to play in helping society address climate change through our sustainable technologies, products and services. As such, to enable us to continue to invest and meet our strategic objectives, we remain focused on efficiencies and driving cash flow from our more established businesses.
Our focus areas for 2022/23:• Triennial review of the Directors’
Remuneration Policy and its effect on culture
• Review our short- and long-term incentives and their alignment to the company’s strategy
• Review broader employee total reward, including pay equity and benchmarking
• Review our employee equity plans
+ The committee’s Terms of Reference set out our full responsibilities. matthey.com/governance-framework
Chris MottersheadRemuneration Committee Chair
MembershipAll six of our independent non-executive directors sit on the Remuneration Committee. The committee’s membership and attendance during the year is on page 85.
Regular attendees at committee meetings:• Chief Executive• Chief HR Officer• Group Total Reward, Wellbeing
& People Services Director
Johnson Matthey | Annual Report and Accounts 2022 111
GO
VERNA
NCE

Remuneration Committee report continued
We are excited about commercialising our sustainable technologies, including our portfolio of hydrogen technologies, that will enable decarbonisation and enhance circularity.
Our remuneration strategy focuses on motivating our people to achieve our strategic objectives, delivering on customer commitments, inspiring employees and driving value for our shareholders through long-term success and growth. This long-term focus is supported by our Remuneration Policy, which includes an incentive structure that is purposefully weighted towards long-term performance and includes meaningful shareholding guidelines for executive directors during and after employment.
Board changesWe announced in November 2021 that, after nearly eight years, Robert MacLeod advised the board of his intention to retire. Robert stepped down as Chief Executive and from the board on 28th February 2022, but will stay on to support the transition to his successor until our annual general meeting (AGM) on 21st July 2022. No special remuneration arrangements were agreed with Robert on leaving. All the details of Robert’s leaving arrangements are provided on page 126.
Liam Condon was appointed as Chief Executive on 1st March 2022. Liam was previously a member of the Board of Management of Bayer AG and President of the Crop Science Division, a role he held for nine years.
Liam’s remuneration was set in line with our Remuneration Policy and after the board unanimously concluding that Liam was the standout candidate to take Johnson Matthey through its next phase of development. When setting his remuneration, the committee considered the remuneration of Robert MacLeod, Liam’s remuneration package at Bayer AG, and market rates of pay in companies of a comparable size and complexity listed in the UK, Europe and North America.
Liam’s remuneration at Bayer AG was greater than that of Robert MacLeod but within the range of the external market data considered. The committee was comfortable setting a remuneration package for Liam that was commensurate to his Bayer AG package albeit in line with the existing Johnson Matthey Remuneration Policy. This ensured that Liam’s total target remuneration was maintained, with both his fixed pay and total target incentive opportunity mirroring what he had in place at Bayer AG. We highlighted the remuneration terms of Liam’s appointment in our consultation with shareholders during the year, but the details are also shown on page 126.
Performance in the yearIn the face of a challenging environment brought on by COVID-19, our Chief Executive, Robert MacLeod, and the senior leadership team have delivered a robust underlying financial performance, exceeding targets set in many areas, and made difficult strategic decisions in relation to our Battery Materials business that will ultimately be in shareholders’ interests in the long term.
Following the ongoing disruption from COVID-19, we saw a strong start to the financial year. This reflected increased activity in the automotive industry and other key end markets, as well as the actions taken to transform our business, including tight cost management and the increase in precious metal prices. Our strong operational performance has also enabled us to continue to invest in our strategic growth projects, including our hydrogen technologies.
The committee always seeks to ensure that there is a clear link between pay and performance. Additionally, we will continue to focus on setting stretching performance targets and consider the performance of the wider business and individual accomplishment over the period, including how the performance was delivered. In that context, we believe that the payments outlined in this report fairly reflect the performance achieved.
2021/22 incentive plan outcomesDue to strong underlying financial performance, the formulaic outcome of our Annual Incentive Plan (AIP) would imply a bonus of 84% of maximum is payable to Robert MacLeod and a bonus of 90% of maximum is payable to Stephen Oxley. However, in determining the bonus payable, the committee considered other factors beyond the formulaic determination. Given the experience of shareholders and the broader workforce over the performance period, the committee agreed with the executive directors to reduce the formula-based bonus awards, such that the bonus payable to Robert MacLeod would be reduced by 50% and the bonus payable to Stephen Oxley would be reduced by 20%.
Therefore, the bonus payable to Robert MacLeod is 42% of maximum and for Stephen Oxley is 72% of maximum. One-half of the bonus payable will be deferred in shares for a period of three years. More details on the performance against the annual targets and strategic objectives are set out on page 123.
The formulaic outcome for the vesting of the long-term Performance Share Plan (PSP) awards granted on 1st August 2019 was zero. It was not felt appropriate to adjust the outcome, so there is no PSP vesting for the executive directors.
The outcome for the PSP for those below board was the same as for the executive directors. However, employees below the board received AIP awards that, as a percentage of maximum, were greater than the executive directors, because they were not reduced from the formulaic outcome.
Sustainability performance measureGiven Johnson Matthey’s unique value proposition and purpose of delivering a ‘world that is cleaner and healthier today and for future generations’, we are committed to broadening the way we measure our long-term success. As part of our Remuneration Policy, approved by shareholders at our AGM in 2020, we committed to introducing a third performance measure into our long-term incentive plan, which focuses on sustainability. We consulted with a number of our shareholders on this in the past year.
Johnson Matthey | Annual Report and Accounts 2022112

Remuneration Committee report continued
This third performance measure will be a scorecard of sustainability metrics that will make up 20% of the award. The metrics and targets are fully aligned with our value proposition and our strategy and focus on creating products and services to enable a cleaner and healthier net zero world – tackling the environmental footprint of our own operations, and having a positive impact on the people and communities in which we operate.
Applying the Remuneration Policy in 2022/23The company’s general approach to senior executive salaries is to consider the performance and experience of an individual in the context of comparable rates of pay in similar-sized organisations. Executive directors are considered for an increase set at the typical rate of increase applied to the wider workforce in their geographical location. Given Robert’s stated intent to retire, he was not eligible for a pay review in 2022, and Liam Condon is not eligible for a pay review until April 2023. However, Stephen Oxley received an increase on 1st April 2022 of 3.0%, in line with the typical rate of increases awarded across the UK workforce.
The AIP for the 2022/23 financial year is expected to operate on a similar basis as the plan operated for 2021/22. As a result, Liam Condon and Stephen Oxley will continue to be eligible to participate in the plan, with a maximum bonus opportunity of 180% of base salary and 150% of base salary, respectively. The plan will have performance conditions based on a combination of financial (80%) and non-financial (20%) performance.
The 2022–25 PSP award will incorporate the sustainability measure for the first time. This sustainability measure will make up 20% of the award, with the remaining 80% being based on key financial performance metrics. It is currently envisaged that the financial measures will be earnings per share (EPS) growth and relative total shareholder return (TSR). However, the committee has decided to delay its decision on the exact performance measures, weightings and targets until the business strategy review – being undertaken by Liam and the board – is completed, to ensure there is clear alignment between strategy and reward. The final performance measures and targets will be communicated on our website before the award on 1st August 2022.
It is currently expected that the PSP award level to be granted to the Chief Executive in 2022 will be 250% of base salary and 175% of base salary for the Chief Financial Officer. The award level to be granted to the Chief Executive is consistent with the level agreed in connection with his appointment and will apply on an ongoing basis so that his total remuneration opportunity remains commensurate with his remuneration at Bayer AG. The award to the Chief Financial Officer is in line with the company’s Remuneration Policy. While the committee intends to review the number of shares associated with these awards, given the reduction in the company’s share price during the year, it does not currently expect to reduce the award – but it does intend to include a windfall gain provision to ensure that outcomes will appropriately reflect underlying performance. Given the delay in granting the awards versus the company’s
normal timetable, a final decision on the terms of the awards will be taken at the time of grant. The details of any windfall gain provision would, as a minimum, be subject to retrospective disclosure at the time the awards vest.
Chair and non-executive director feesThe fees payable to the Chair and non-executive directors are reviewed annually. Given the experience of shareholders during the year, the Chair and non-executive directors all agreed that they should receive no increase in 2022.
Wider employee remunerationPaying our employees fairly relative to their role, skills, experience and performance is central to our approach to remuneration, and our reward framework and policies support us in doing this.
Equal pay is also critical, and we review our pay levels on an ongoing basis to ensure that employees are paid fairly. We are also committed to the real living wage and narrowing the gender pay gap that exists among our employees, and to tackling the root causes of gender imbalance to ensure a truly inclusive culture that supports diversity. Our commitment in this area has resulted in a reduction in our gender pay gap from 6.7% to 5.4%.
+ Read our full report, which includes details of what we are doing to eliminate the gap. matthey.com/gender-pay-report-2021
When making pay decisions for the wider workforce for 2022, the management has been especially sensitive to the wage trends being experienced across the globe. The committee realises that these are inflationary times, so supported a larger budget for pay increases for the wider workforce this year, confirming our long-held aim to align jobs with market rates.
We aspire to offer a well-balanced, progressive and structured approach to reward, with appropriate variation by location. We also find that the non-financial reward elements are essential to a supportive culture, with the wellbeing of staff and family playing an increasingly prominent part in our employment proposition.
2022 AGMI would like to thank shareholders for their input and engagement during the year in relation to the sustainability measures within our PSP and on Liam’s remuneration. We believe that our policy remains simple, transparent and effective, strongly supporting our business strategy with remuneration outcomes aligned to the shareholder experience.
I ask you to support our 2021/22 annual report on remuneration at our AGM on 21st July 2022. We welcome an open dialogue with our shareholders and I will be available at the meeting to answer any questions about the work of the Remuneration Committee.
Chris MottersheadChair of the Remuneration Committee
Johnson Matthey | Annual Report and Accounts 2022 113
GO
VERNA
NCE

Remuneration at a glance
Aligning remuneration with strategyWe will use our deep knowledge of metals chemistry to help our customers address the complex technical challenges of the four transitions – transport, energy, decarbonising chemicals production and a circular economy – by delivering sustainable products, services and technologies.
KPIs
Group profit before tax Annual Incentive Plan
Group working capital days Annual Incentive Plan
Earnings per share Performance Share Plan
Total shareholder return Performance Share Plan1
Return on invested capital Performance Share Plan
1. Measure included in awards from 2020 onwards.
Our strategic objectivesInvest in growth areas targeted at climate change and circularityManage our established businesses to support growthPromote a fast-paced, efficient business and high-performance culture
Outcomes of variable remuneration4
Weighting
Robert MacLeod Stephen Oxley
Formulaic outcome(% base salary) Discretion applied
Outcome after discretion(% base salary)
Formulaic outcome(% base salary) Discretion applied
Outcome after discretion(% base salary)
Annual bonusProfit before tax 60% 108% (50%) 54% 90% (20%) 72%Working capital days (excluding PGMs) 10% 18% (50%) 9% 15% (20%) 12%Working capital days (including PGMs) 10% 12% (50%) 6% 10% (20%) 8%Strategic Objectives 20% 14% (50%) 7% 19% (20%) 15%Total 100% 152% (50%) 76% 134% (20%) 107%
Performance Share PlanCompound annual growth rate in earnings per share 100% 0% 0% 0% – – –
4. Liam Condon and Stephen Oxley did not hold any 2019–22 Performance Share Plan awards and Liam Condon was not eligible for the 2021/22 Annual Incentive Plan.
Robert MacLeod1 — former Chief Executive Stephen Oxley3 — Chief Financial OfficerLiam Condon2 — current Chief Executive
2022 pay outcomesThe pay breakdowns for the executive directors in 2020/21 and 2021/22 are set out below:
Element 2020/21 2021/22
Fixed pay (£’000)Salary 838 784Benefits 22 20Pension 193 157
Variable pay (£’000)Annual Incentive Plan 1,479 596Performance Share Plan 0 0
1. Robert MacLeod stepped down from the board on 28th February 2022. All figures are for the period 1st April 2021 to 28th February 2022.
Element 2020/21 2021/22
Fixed pay (£’000)Salary 0 79Benefits 0 24Pension 0 12
Variable pay (£’000)Annual Incentive Plan 0 0Performance Share Plan 0 0
2. Liam Condon was appointed Chief Executive on 1st March 2022.
Element 2020/21 2021/22
Fixed pay (£’000)Salary 0 565Benefits 0 15Pension 0 85
Variable pay (£’000)Annual Incentive Plan 0 607Performance Share Plan 0 0
3. Stephen Oxley was appointed Chief Financial Officer on 1st April 2021.
20/21
21/22
1,053
961
1,479
596
20/21
21/22 115
0 20/21
21/22 607
0
665
Johnson Matthey | Annual Report and Accounts 2022114

Remuneration Policy
The Directors’ Remuneration Policy was approved at the 2020 AGM and remains in effect until the 2023 AGM. The full policy can be found at matthey.com/rem-policy and includes:
• Policy table.• Approach to recruitment remuneration.• Policy on payment for loss of office.• Details of executive service contracts and non-executive letters of appointment. Note that executive service contracts have no fixed term.
A summary of our policy is set out below.
Element Policy summary Maximum opportunity
Base salary Reviewed annually, with any changes normally taking effect from 1st April each year. The Remuneration Committee will consider performance, knowledge, contribution in role, length of time in post and any additional responsibilities, alongside the level of salary increase awarded to the wider workforce.
No salary increase will be awarded that results in a base salary that exceeds the competitive market range.
Benefits Includes medical, life and income protection, company car, relocation benefits relating to business moves, and assistance with tax advice and compliance services where appropriate.
In general, benefits will be restricted to the typical level in the relevant market for an executive director. Car benefits will not exceed a total of £25,000 per annum and the cost of medical insurance for an individual executive director and dependants will not exceed £20,000 per annum.
Pension Cash supplement as a percentage of base salary. 15% for all new executive directors and, for existing executive directors, the percentage is reducing to 15% by 1st April 2022, to align with the cost of providing pension benefits to other employees in the UK.
Annual Incentive Plan (AIP)
The AIP provides a strong incentive aligned to strategy in the short term. It allows the board to drive and reward both financial and non-financial metrics, including leadership behaviours, to deliver sustainable growth in shareholder value.
A substantial portion will be based on key financial measures, including underlying profit before tax (PBT).
Paid equally in cash and deferred shares. Deferred shares vest after three years.
Maximum 180% of base salary for the Chief Executive, and 150% for other executive directors, with awards of:
• 15% of maximum for threshold.• 50% of maximum for on target.• 100% of maximum for outstanding performance.
Performance Share Plan (PSP)
The PSP is designed to ensure that executives take decisions in the interest of the longer-term success of the group.
Vesting is based on performance over three years, with between 15% and 25% vesting for threshold performance, depending on the performance measure. Shares are required to be held for two years after vesting.
At least two-thirds of awards should be subject to financial and / or total shareholder return targets.
Granted at maximum of 250% of base salary for the Chief Executive, and 175% for other executive directors.
Shareholding requirements
Shareholding to be built up over a reasonable period and to be held for a two-year period after employment ends.
250% of base salary for the Chief Executive and 200% of base salary for other executive directors.
Johnson Matthey | Annual Report and Accounts 2022 115
GO
VERNA
NCE

Remuneration Policy continued
When developing our policy, the committee considered the six factors set out in the Corporate Governance Code 2018 and believes that our Remuneration Policy is well-aligned with these areas.
Clarity Remuneration arrangements have defined parameters which can be transparently communicated to shareholders and other stakeholders.
Simplicity Remuneration arrangements for Executive Directors consist of:
• Salary, benefits, and a fixed pension contribution – set to reflect the typical rate provided to the UK workforce.• AIP, a portion of which is deferred into shares.• Annual long-term incentive plan awards which provide focus over the longer-term performance.
Unnecessary complexity is avoided by the committee in operating the arrangements.
Risk The remuneration arrangements are designed to have a robust link between pay and performance, thereby mitigating the risk of excessive reward. In addition, behavioural risks are considered when setting targets for performance-related pay, and the arrangements have safeguards to ensure that pay remains appropriate, including committee discretion to adjust incentive outturns, deferral of incentive payments in shares, recovery provisions and share ownership requirements.
Predictability The committee set specific targets for different levels of performance which are communicated to the individuals and disclosed to shareholders.
Proportionality The AIP and long-term incentive plans have performance metrics that are aligned with the company’s KPIs, and the payouts reflect achievement against the targets. The committee may reduce payouts under the AIP and long-term incentive plan if they are not considered aligned with underlying performance. Safeguards are identified to ensure that poor performance is not rewarded.
Alignment to culture The directors’ remuneration arrangements are cascaded through the organisation ensuring that there are common goals. The committee reviews remuneration arrangements throughout the company and take these into account when setting directors’ remuneration.
Johnson Matthey | Annual Report and Accounts 2022116

Remuneration scenarios Below is an illustration of the potential future remuneration that could be received by each executive director for the year starting 1st April 2022, both in absolute terms and as a proportion of the total package under different performance scenarios. The value of the PSP is based on the award that will be granted in August 2022.
In developing the scenarios, the following assumptions have been made:
Below threshold Only fixed elements of remuneration (base salary, pension and benefits) are payable
Threshold Fixed elements of remuneration plus 15% of maximum bonus and 20% vesting of PSP award are payable
Target Fixed elements of remuneration plus 50% of maximum bonus and 60% vesting of PSP award are payable
Maximum Fixed elements of remuneration plus 100% of maximum bonus and 100% vesting of PSP award are payable
Maximum plus 50% share price appreciation Maximum plus a 50% share price appreciation on the PSP award and Deferred Bonus Plan (DBP) award
0 1,000 2,000 3,000 4,000 5,000 6,000 7,000 8,000
Maximum with50% share price appreciation
Maximum
Target
Threshold
Below threshold
0% 20% 40% 60% 80% 100%
Maximum with50% share price appreciation
Maximum
Target
Threshold
Below threshold
Value £000
0 500 1,000 1,500 2,000 2,500 3,000 3,500
Maximum with50% share price appreciation
Maximum
Target
Threshold
Below threshold
0% 20% 40% 60% 80% 100%
Maximum with50% share price appreciation
Maximum
Target
Threshold
Below threshold
Value £000
Liam Condon
Stephen Oxley
Value of package Composition of package
Base salary Benefits Pension Bonus DBP share price appreciation PSP PSP share price appreciation
Remuneration Policy continued
Johnson Matthey | Annual Report and Accounts 2022 117
GO
VERNA
NCE

The table below sets out how our remuneration arrangements cascade through the organisation:Executive directors Senior managers Middle managers Managers Wider workforce
Base salary Base salary is set with reference to the relevant local market and takes account of the employee’s knowledge, experience and contribution to the role. Base salaries are usually reviewed annually and take into account local salary norms, local inflation and business conditions. Increases in base salary for directors will take into account the level of salary increases granted to all employees within the group.
Base salary is either subject to negotiation with local trade unions or follows the market pay approach outlined for managers.
Pension and benefits Employment-related benefits are offered in line with local market conditions.
Short-term incentives Annual incentive based 70% on financial metrics and 30% on strategic objectives. Compulsory deferral into shares for three years.
Annual incentive based on 70% financial or strategic business objectives and 30% individual performance. Compulsory deferral into shares for three years for certain levels within this category.
Annual incentive based on 70% financial or strategic business objectives and 30% individual performance.
Annual incentive is either subject to negotiation with local trade unions or follows the standard AIP framework with financial, non-financial and individual performance measures used.
Long-term incentives Eligible employees may participate in JM’s Share Incentive Plan (ShareMatch). Two free matching shares are awarded for every one partnership share purchased by the employee, subject to an annual maximum employee contribution of £1,500.
PSP awards are subject to a three-year performance period and a two-year holding period. Performance conditions are designed to drive company financial performance and align with stakeholder interests.
PSP awards are subject to a three-year performance period. Performance conditions are designed to drive company financial performance and align with stakeholder interests.
Both PSP and Restricted Share Plan (RSP) awards are made depending on level.
PSP awards are subject to a three-year performance period and are designed to drive company financial performance and align with stakeholder interests.
RSP awards are typically subject to a three-year service condition.
RSP awards may be granted as special recognition or to motivate and retain key talent. They are typically subject to a three-year service condition.
Remuneration Committee report continued
Remuneration in contextThe Remuneration Committee considers the directors’ remuneration, along with the remuneration of the Group Leadership Team (GLT), in the context of the wider employee population, and is kept regularly updated on pay and conditions across the group. This year, all employees were able to provide their feedback on a range of matters, including remuneration, through The Big Listen. This provided valuable employee context to decision making.
The general principle for remuneration in Johnson Matthey is to pay a competitive package of pay and benefits in all markets and at all job levels to attract and retain high-quality and diverse employees. The proportion of variable pay increases with progression through management levels, with the highest proportion of variable pay at executive director level, as defined by the Remuneration Policy.
Read more at matthey.com/corporate-governance
Johnson Matthey | Annual Report and Accounts 2022118

Annual report on remuneration
This section provides details of how the Directors’ Remuneration Policy was implemented during 2021/22 and how we intend to apply it in 2022/23.
About the Remuneration CommitteeAll the independent non-executive directors sit on the Remuneration Committee, including the group Chair, Patrick Thomas. Details of attendance at committee meetings during the year ended 31st March 2022 are shown below.
Date of appointment to committee
Number of meetings eligible to
attend
Number of meetings attended % attended
Chris Mottershead 27th January 2015 8 8 100%Jane Griffiths 1st January 2017 8 8 100%John O’Higgins 16th November 2017 8 8 100%Patrick Thomas 1st June 2018 8 8 100%Xiaozhi Liu 2nd April 2019 8 8 100%Doug Webb 2nd September 2019 8 7 87.5%Rita Forst 4th October 2021 5 5 100%
The Remuneration Committee’s Terms of Reference can be found at matthey.com/REM-terms-of-reference. These include determination of fair remuneration for the Chief Executive, the other executive directors and the group Chair (the group Chair does not participate in discussions of his own remuneration). In addition, the committee receives recommendations from the Chief Executive on the remuneration of those reporting to him, as well as advice from the Chief HR Officer, who acts as secretary to the committee.
Advisers to the committeeThe committee appoints and receives advice from independent remuneration consultants on the latest developments in corporate governance and market trends in pay and incentive arrangements. The committee appointed Korn Ferry as adviser to the Remuneration Committee after a competitive tender process in 2017. The total fees paid to Korn Ferry in respect of its services to the committee during the year were £46,150 plus VAT. The fees paid to Korn Ferry are based on the standard time and materials market rates Korn Ferry has for remuneration committee advisory services.
Korn Ferry also provides consultancy services to the company in relation to certain employee HR and benefit matters to those below the board. Korn Ferry is a signatory to the Remuneration Consultants Group Code of Conduct.
The committee is satisfied that the advice provided by Korn Ferry was independent and objective and that the provision of additional services did not compromise that independence. The committee is also satisfied that the team who provided that advice does not have any connection to Johnson Matthey that may impair their independence and objectivity.
Herbert Smith Freehills is the committee’s legal adviser. There was no requirement during 2021/22 for Herbert Smith Freehills to provide advice to the committee. The committee is aware that Herbert Smith Freehills is one of a number of legal firms that provide legal advice and services to the company on a range of matters.
A statement regarding the use of remuneration consultants for the year ended 31st March 2022 is available at
matthey.com/corporate-governance
Johnson Matthey | Annual Report and Accounts 2022 119
GO
VERNA
NCE

Annual report on remuneration continued
Key areas of remuneration committee focus in 2021/22
Wider workforce remuneration Executive director and GLT remuneration Governance Stakeholder management
Reviewed the proposed increases to the broader workforce, relative to the executive directors.
Reviewed, discussed and agreed the 2021 pay awards and 2020/21 AIP payments.
Reviewed the effectiveness of the committee. Discussed shareholder consultation feedback and overview of remuneration policy reaction.
Considered the 2021/22 Annual Incentive Plan (AIP) structures below executive director and GLT level.
Discussed, shaped and agreed the 2021/22 AIP measures, including executive director and GLT strategic objectives.
Approved the 2021 remuneration report. Engaged shareholders on the introduction of a sustainability measure into the long-term incentive.
Discussed, shaped and agreed new Chief Executive remuneration, leaving arrangements of the outgoing Chief Executive and joining and leaving arrangements for GLT members.
Approved changes to the Deferred Bonus Plan rules to update terms in line with best practice.
Engaged shareholders on new Chief Executive remuneration terms.
Statement of shareholder votingWe carefully monitor shareholder voting on our Remuneration Policy and its implementation. We recognise the importance of our shareholders’ continued support for our remuneration arrangements.
The next table shows the results of the polls taken on the resolution to approve the Remuneration Policy at the 2020 AGM and Annual Report on Remuneration at the 2021 AGM.
Resolution Number of votes cast For Against Votes withheld
Remuneration Policy 148,233,329
126,978,681 (85.66%)1
21,183,260 (14.29%)1 1,552,871
Annual Report on Remuneration 152,710,766
141,933,387 (92.94%)
10,777,379 (7.06%) 382,639
1. Percentage of votes cast, excluding votes withheld.
The Remuneration Committee believes that the 85.66% vote in favour of the Remuneration Policy at the 2020 AGM and the 92.94% vote in favour of the Annual Report on Remuneration at the 2021 AGM showed strong shareholder support for the group’s remuneration arrangements at that time.
Johnson Matthey | Annual Report and Accounts 2022120

Annual report on remuneration continued
Remuneration for the year ended 31st March 2022Single figure table of remuneration (audited)Our Remuneration Policy operated as intended over the year, and the table below sets out the total remuneration and breakdown of the elements each director received in relation to the years ended 31st March 2022 and 31st March 2021. An explanation of how the figures are calculated follows the table.
Base salary / fees £’000
Benefits £’000
Pension1 £’000
Total fixed remuneration £’000
Annual incentive £’000
Long-term incentive £’000
Total variable remuneration £’000
Total remuneration £’000
2022 2021 2022 2021 2022 2021 2022 2021 2022 2021 2022 2021 2022 2021 2022 2021
Executive directorsRobert MacLeod (former Chief Executive)2 784 838 20 22 157 193 961 1,053 596 1,479 – – 596 1,479 1,557 2,532Liam Condon (current Chief Executive)3 79 – 24 – 12 – 115 – – – – – – – 115 –Stephen Oxley4 565 – 15 – 85 – 665 – 607 – – – 607 – 1,272 –Non-executive directorsPatrick Thomas 376 369 – – – – 376 369 – – – – – – 376 369Jane Griffiths5 83 67 – – – – 83 67 – – – – – – 83 67Chris Mottershead 86 84 – – – – 86 84 – – – – – – 86 84John O’Higgins 87 79 – – – – 87 79 – – – – – – 87 79Xiaozhi Liu 68 67 – – – – 68 67 – – – – – – 68 67Doug Webb 89 81 – – – – 89 81 – – – – – – 89 81Rita Forst6 33 – – – – – 33 – – – – – – – 33 –
1. Represents a cash allowance in lieu of a pension and the increase in Robert MacLeod’s UK pension scheme accrual (details can be found on page 125).2. Robert MacLeod stepped down from the board as Chief Executive on 28th February 2022. All figures in the table for Robert MacLeod are for the period 1st April 2021 to 28th February 2022.3. Liam Condon was appointed to the board as Chief Executive on 1st March 2022.4. Stephen Oxley was appointed to the board as Chief Financial Officer on 1st April 2021.5. Jane Griffiths was appointed chair of the Societal Value Committee on 1st June 2021.6. Rita Forst was appointed to the board on 4th October 2021
Explanation of figuresBase salary / fees Salary paid during the year to executive directors and fees paid during the year to non-executive directors.
BenefitsAll taxable benefits, such as medical and life insurance, service and car allowances, mobility allowances, matching shares under the all-employee share incentive plan and assistance with tax advice and tax compliance services, where appropriate.
PensionThe amounts shown represent the value of the increase over the year of any defined benefit pension the executive director may have in the Johnson Matthey Employees Pension Scheme (JMEPS) plus any cash supplements paid in lieu of pension membership.
Annual incentives Annual bonus awarded for the year ended 31st March 2022. The figure includes any amounts deferred and awarded as shares.
Long-term incentivesThe 2022 figure represents the value of shares that satisfied performance conditions on 31st March 2022. The 2021 figure represents the value of shares that satisfied performance conditions on 31st March 2021.
Johnson Matthey | Annual Report and Accounts 2022 121
GO
VERNA
NCE

Annual report on remuneration continued
Annual bonus for the year ended 31st March 2022 (audited)Robert MacLeod and Stephen Oxley were eligible for a maximum annual bonus of 180% of base salary and 150% of base salary, respectively. The target bonus opportunity was set at 50% of maximum and the threshold bonus opportunity was 15% of maximum. Liam Condon was not eligible to participate in the 2021/22 bonus because he had less than three months service in the year.
The performance measures and weightings for the annual bonus were as follows:Percentage of bonus available
Group underlying PBT
Group working capital days1
Strategic objectives
Robert MacLeod (former Chief Executive) 60% 20% 20%Stephen Oxley 60% 20% 20%
1. Group working capital days is split 50% total working capital (including PGMs) and 50% total working capital days (excluding PGMs).
Performance targets were set by looking at:
• Previous year financial performance.• Budgets and business plans for the 2021/22 year. These are built from the bottom up and
are subject to thorough challenge before being finalised by the board.• Consensus of industry analysts’ forecasts, provided by Vara Research.
The committee also considered the performance range for the group profit measures and concluded that given the decrease in uncertainty in the market at the time the targets were set, the range should return to between 95% and 105% of target performance. The absolute level of profit needing to be achieved was also reset to better reflect the more positive outlook at the beginning of the year. The 2021/22 targets are considered similarly challenging, if not more challenging than those set in 2020/21.
The strategic objectives were set based on well-defined key deliverables that support our strategy relating to science, customers, operations and people.
Bonus outcomesBased on performance against the targets, total bonuses for the year ended 31st March 2022 were:
Financial measures formulaic outcome
(% base salary)
Strategic measures formulaic outcome
(% base salary)Total bonus outcome
(% base salary)
Total value of bonus before discretion
(£) Discretion applied
Total value of bonus after discretion (% base salary)
Total value of bonus after discretion 1
(£)
Robert MacLeod 137.7% 14.4% 152.1% 1,300,750 (50%) 76.1% 650,3752
Stephen Oxley 114.7% 19.5% 134.2% 758,456 (20%) 107.0% 606,765
1. 50% of this figure is deferred into conditional shares subject to a three-year vesting period with no other performance conditions.2. This figure represents the full bonus paid for the year. The amount related to Robert MacLeod’s time as Chief Executive is £596,177, as shown in the single figure table.
We have seen strong financial performance in the year resulting in a good formulaic bonus outcome. However, when determining the final bonus outcome, the committee also considered the experience of shareholders and the broader workforce over the performance period.
Given the experience of shareholders and the broader workforce over the performance period, the committee agreed with the executive directors to reduce the formula-based bonus awards, such that the bonus payable to Robert MacLeod would be reduced by 50% and the bonus payable to Stephen Oxley would be reduced by 20%.
The detailed breakdown of performance against the financial targets and strategic objectives is set out in the next tables.
Johnson Matthey | Annual Report and Accounts 2022122

Financial measures
Performance measureBonus
weighting Threshold Target Maximum Actual
Robert MacLeod1 Stephen Oxley
Maximum bonus available
(% base salary)
Formulaic outcome
(% base salary)
Outcome after discretion
(% base salary)
Maximum bonus available
(% base salary)
Formulaic outcome
(% base salary)
Outcome after discretion
(% base salary)
Group underlying PBT260% £536m£530m £505m£480m 108 108 54 90 90 72
Group working capital days (including PGMs)2
10% 24 days27 days28 days30 days 18 18 9 15 15 12
Group working capital days (excluding PGMs)2
10% 46 days45 days47 days49 days 18 11.7 5.8 15 9.7 7.8Total bonus for financial measures 144 137.7 68.8 120 114.7 91.8
1. Values for Robert MacLeod represent the full bonus payable for the period 1st April 2021 to 31st March 2022. 2. Group underlying PBT and group working capital days are measured using Johnson Matthey’s budgeted foreign exchange rates.
Strategic objectives
Weighting Objective AssessmentMaximum bonus (% base salary)
Formulaic outcome
(% base salary)
Outcome after discretion (%
base salary)
Robert MacLeod5%
Lead a cultural change programme that will embed OneJM mindset and expected leadership behaviours.
Good progress has been made in creating an externally focused environment to drive performance, building on OneJM synergies. The adjustment to the capital plan was successfully delivered.
36% 14.4% 7.2%
5%Define of our future sustainability and ESG strategy.
The 2030 sustainability strategy has been successfully defined and publicly communicated on our website. This includes three clear sustainability pillars, each with explicit near- and long-term targets.
5%Define, drive and deliver new business growth opportunities in areas of core strength such as hydrogen and catalyst technologies.
Building on JM’s foundation in hydrogen, a plan to accelerate growth was established. Progress made, both in business wins and strategic partnerships.
5%Review Battery Materials strategy and options for de-risking and execute on plan.
Following a rigorous board strategy review and exploration of de-risking options, the difficult decision to exit the Battery Materials business was made.
Stephen Oxley5%
Lead a cultural change programme that will embed OneJM mindset and expected leadership behaviours.
Good progress has been made in creating an externally focused environment to drive performance, building on OneJM synergies. The adjustment to the capital plan was successfully delivered.
30% 19.5% 15.6%
5%Define of our future sustainability and ESG strategy.
The 2030 sustainability strategy has been successfully defined and publicly communicated. This includes three clear sustainability pillars, each with explicit near- and long-term targets.
5%Investor engagement and clear articulation of capital allocation and equity story.
Good quality relationships have been developed. A process for aligning on capital allocation has been put in place.
5%Transformation of finance function. Finance transformation is progressing. Savings identified for FY23
and FY24. Financial controls, assurance and risk management have been improved.
Annual report on remuneration continued
Johnson Matthey | Annual Report and Accounts 2022 123
GO
VERNA
NCE

Annual report on remuneration continued
Long-term incentivesPSP awards vesting for the three-year performance period ended 31st March 2022 (audited)The 2019 PSP awards were made in August 2019 and performance was measured over the period 1st April 2019 to 31th March 2022. After the performance period, shares are no longer subject to performance conditions, and where the performance conditions are met, the shares will vest in equal instalments on the third, fourth and fifth anniversaries of the award. The awards vest on a straight-line basis between threshold (15% vesting) and maximum (100% vesting). The performance condition for the 2019 award and the actual performance achieved are shown below.
Weighting Threshold Target Maximum Actual
Compound annual growth rate in earnings per share 100% 4% 7% 10% -2%
The committee also considers return on invested capital (ROIC) when assessing the PSP vesting. This assessment did not change the vesting outcome, which is detailed in the table below.
Executive directors1 % base salary awarded Shares awarded % award to vest Shares to vest Estimated value on vesting £
Robert MacLeod 200 53,324 – – –
1. Liam Condon and Stephen Oxley did not have 2019 PSP awards.
PSP awards granted in the year ended 31st March 2022 (audited)The next table provides details of the PSP awards made to executive directors in the year ended 31st March 2022.
Executive directors Award date Award type Award size (% of base salary) Number of shares awarded Face value2 % vesting at threshold3 End of performance period End of holding period
Robert MacLeod 1st August 2021 Conditional shares 200 54,829 £1,710,489 20% 1st August 2024 1st August 2026Liam Condon1 1st March 2022 Conditional shares 250 52,867 £1,649,281 20% 1st August 2024 1st August 2026Stephen Oxley 1st August 2021 Conditional shares 175 31,693 £988,720 20% 1st August 2024 1st August 2026
1. Liam Condon was awarded a pro-rated 2021/22 award. The value of the award was calculated as 25/36ths of his normal award level to reflect his service over the performance period. 2. Face value is calculated using the award share price of 3,119.68 pence, which is the average closing share price over the four-week period starting on 27th May 2021.3. Threshold vesting is 15% for the earnings per share (EPS) measure and 25% for the relative total shareholder return (TSR) measure. The value shown is the average threshold vesting for the award.
To quickly align Liam with the interests of shareholders and the performance of Johnson Matthey, an award of 52,867 shares was made under the PSP, with the same performance conditions as attached to 2021 PSP awards. This award represents Liam’s standard annual PSP award of 250% of base salary but is pro-rated to reflect the period that he will be contributing to the performance period.
The performance targets and vesting ranges for the 2021 award are set out below.50% of performance condition 50% of performance condition
Compound annual growth rate in earnings per share Relative total shareholder return
Performance Proportion of shares vesting Performance Proportion of shares vesting<4% 0% Below median 0%4% 15% Median 25%12% 100% Upper quartile 100%Between 4% and 12% Straight line between 15% and 100% Between median and upper quartile Straight line between 25% and 100%
In addition to the EPS and TSR performance conditions, the Remuneration Committee considers the performance of ROIC over the performance period to ensure that earnings growth is achieved in a sustainable and efficient manner.
Other awards granted in the year ended 31st March 2022 (audited)The next table provides details of the buy-out award made to Stephen Oxley in the year ended 31st March 2022, to compensate for the loss of his KPMG long-term deferred cash awards. This award is not subject to performance conditions and was disclosed in last year’s annual report. Executive director Award date Award type Number of shares awarded Face value1 Vest date
Stephen Oxley 1st August 2021 Conditional shares 41,500 £1,294,667 1st August 2024
1. Face value is calculated using the award share price of 3,119.68 pence, which is the average closing share price over the four-week period commencing on 27th May 2021.
Johnson Matthey | Annual Report and Accounts 2022124

Statement of directors’ shareholding (audited)The table below shows the directors’ interests in the shares of the company, together with their unvested scheme interests, effective 31st March 2022.
Ordinary shares1
Subject to ongoing performance
conditions2
Not subject to further
performance conditions3
Executive directorsRobert MacLeod (former Chief Executive)4 71,267 187,568 43,491Liam Condon (current Chief Executive) 20,000 52,867 –Stephen Oxley 14,394 31,693 41,500
Non-executive directorsPatrick Thomas 13,194 – –Jane Griffiths 2,671 – –Chris Mottershead 5,500 – –John O’Higgins 1,500 – –Xiaozhi Liu 4,000 – –Doug Webb 6,500 – –Rita Forst 1,000 – –
1. Includes shares held by the director and / or connected persons, including those in the all-employee share matching plan. Shares in the all-employee share matching plan may be subject to forfeiture in accordance with the rules of the plan.
2. Represents unvested PSP shares within three years of the date of award.3. Represents unvested deferred bonus shares that are not subject to service conditions and the buy-out award made
to Stephen Oxley on joining JM, which is subject to ongoing service conditions.4. Values for Robert MacLeod are effective 28th February 2022 when he stepped down from the board.
Directors’ interests as at 25 May 2022 were unchanged from those listed above, other than that the trustees of the all-employee share matching plan have purchased another 57 shares for Robert MacLeod (for the period 1st March to 26th May 2022) and 15 shares for Stephen Oxley.
Executive directors are expected to achieve a shareholding guideline of 250% of base salary for the Chief Executive and 200% for other executive directors, within a reasonable timeframe. The director’s total shareholding for the purposes of comparing it with the minimum shareholding requirement includes shares held beneficially by the director and any connected persons (as recognised by the Remuneration Committee), together with the shares awarded under the Deferred Bonus Plan (DBP), for which there are no further performance or service conditions.
From 1st April 2020, a post-cessation shareholding guideline applies that requires the executives to retain future vested shares to the value of the current share ownership guidelines for two years from the date of employment ending. Shares that count towards achieving the post-cessation guideline include the same as those while an executive director, except that only shares owned after 1st April 2021 count towards the post-cessation guideline. Executive directors are expected to retain at least 50% of the net (after tax) vested shares that are released under the PSP and DBP until the required levels of shareholding are achieved.
Executive director shareholdings as at 31st March 2022 as a percentage of base salary1 are shown below:
Requirement Achievement
Robert MacLeod (former Chief Executive)2
252%250%
Liam Condon (current Chief Executive)3
39%250%
Stephen Oxley4
48%200%
1. Value of shares as a percentage of base salary is calculated using a share value of 1,875.56 pence, which was the average share price prevailing between 1st January 2022 and 31st March 2022.
2. Shareholding effective 28th February 2022, when Robert MacLeod stepped down from the board.3. Liam Condon was appointed Chief Executive on 1st March 2022 and will build his shareholding over a
reasonable timeframe.4. Stephen Oxley was appointed Chief Financial Officer on 1st April 2021 and will build his shareholding over a
reasonable timeframe.
Pension entitlements (audited)No director is currently accruing any pension benefit in the group’s pension schemes. Both Liam Condon and Stephen Oxley receive an annual cash payment in lieu of pension membership, equal to 15% of base salary. This is in line with pension provision for the wider workforce. Robert MacLeod received an annual cash payment in lieu of pension membership of 20% in 2021/22, which reduced to 15% of base salary from 1st April 2022. Robert MacLeod also has accrued a pension entitlement in respect of a prior previous of pensionable service in one or more of the group’s pension arrangements.
Robert MacLeod ceased pensionable service in JMEPS on 31st March 2011. Details of the accrued pension benefits of the executive directors effective 31st March 2022 in the UK pension scheme are given below:
Total accrued annual pension entitlement at 31st March 2022 £’0002
Robert MacLeod1 11Liam Condon –Stephen Oxley –
1. Pension payable from age 65 based on pensionable service in the UK pension scheme up to 31st March 2011.2. No director would gain any additional benefit by retiring early in line with the scheme rules.
Annual report on remuneration continued
Johnson Matthey | Annual Report and Accounts 2022 125
GO
VERNA
NCE

Annual report on remuneration continued
Payments to former directors (audited)There were no payments made to, or in respect of, any former director in 2021/22 that have not been previously disclosed.
Payments for loss of office (audited)Robert MacLeod will receive no payments for loss of office on retiring from Johnson Matthey on 21st July 2022.
Salary, pension allowance and benefitsRobert will receive his normal salary, pension allowance and benefits between stepping down from the board until his retirement date. The total received by Robert for the period 1st to 31st March 2022 was £87,353 (comprising, £71,271 for salary, £1,801 for benefits and £14,281 for pension). We will disclose the amount received for the period 1st April 2022 to 21st July 2022 in next year’s report as a payment to a former director.
AIPRobert MacLeod is eligible to receive a full-year bonus under the 2021/22 AIP. The bonus payable in relation to the full year is £650,375. Of this amount, £54,198 relates to the period 1st March to 31st March, when he was not Chief Executive. 50% of the total bonus will be awarded under the DBP and will be released in August 2025. He is not eligible to participate in the 2022/23 AIP.
Robert MacLeod was awarded 10,493 shares under the DBP in 2019, 9,292 shares under the DBP in 2020 and 23,706 shares under the DBP in 2021. These shares will be released on their normal release dates in August 2022, August 2023 and August 2024 respectively. Dividend-equivalent shares will accrue on all deferred bonus awards during the relevant vesting period.
PSPThe 2019 PSP award of 53,324 shares did not satisfy the performance conditions and so will lapse in full.
Robert MacLeod has the following outstanding awards under the PSP, which will be pro-rated based on the number of complete months from the start of the relevant performance period to his retirement date, in accordance with the good-leaver treatment for retirement. They will vest, subject to the performance conditions as follows:Award date Shares awarded Shares retained Normal vesting date Holding period end date
1st August 2020 79,415 59,561 1st August 2023 1st August 20251st August 2021 54,829 22,845 1st August 2024 1st August 2026
Dividends accruing to vested shares in a holding period will be reinvested in Johnson Matthey shares.
No PSP award will be made to Robert MacLeod in 2022.
Remuneration arrangements for Liam CondonLiam Condon joined Johnson Matthey on 1st March 2022 as Chief Executive. His remuneration arrangements are set out below.
Base salary £950,000 per annum.
Pension 15% cash supplement.
Benefits Standard UK benefits, in line with remuneration policy, including car allowance, medical insurance and health screening, life assurance and ill-health benefits, holiday and eligibility to join ShareMatch on the same terms as all UK employees.
In addition, Liam will receive the following temporary allowances to reflect that his permanent home will be in Germany but he will work in the UK:
• Accommodation allowance of £180,000 per year for up to three years.
• Schooling and Family Disturbance Allowance of £70,000 per year for up to three years.
These allowances are subject to normal income tax and social security deductions.
Annual Incentive Plan
Maximum opportunity of 180% of base salary, with 50% of any award being deferred into shares for three years.
Performance Share Plan
Maximum opportunity of 250% of base salary. Subject to performance conditions over a three-year period, with any vested shares subject to another two-year holding period.
Shareholding requirement
250% of base salary, expected to be achieved within four years.
Liam Condon purchased 20,000 shares in the open market on 16th March 2022 (with a purchase value of £375,924.11) to begin building his shareholding in Johnson Matthey.
Johnson Matthey | Annual Report and Accounts 2022126

Performance graph and comparison to Chief Executive’s remunerationJohnson Matthey and FTSE 100 total shareholder return rebased to 100The following chart illustrates the total cumulative shareholder return of the company for the ten-year period from 1st April 2012 to 31st March 2022 against the FTSE 100 as the most appropriate comparator group when considering our market capitalisation over the period, rebased to 100 at 1st April 2012.
FTSE 100 Johnson Matthey
March 2022March 2021March 2020March 2019March 2018March 2017March 2016March 2015March 2014March 2013March 201250
100
150
200
250
300
Historical data regarding Chief Executive’s remuneration2012/13 2013/141 2014/152 2015/163 2016/17 2017/18 2018/19 2019/20 2020/21 2021/224
Single total figure of remuneration (£000) 3,025 3,855 2,539 1,429 1,971 2,013 2,784 1,462 2,532 1,672Annual incentives (% of maximum) – 71 54 15 40 69 45 26 98 42Long-term incentives (% of award vesting)5 100 75 – 33 28 – 67 – – –
1. Figures before to 2014/15 are in respect of Neil Carson.2. The figures for 2014/15 are in respect of both Robert MacLeod and Neil Carson, who both held the position of Chief Executive in the year. The single total figure of £2,539 comprises £1,594 for Robert MacLeod and £945 for Neil Carson.3. Figures from 2015/16 to 2020/21 are in respect of Robert MacLeod.4. The figures for 2021/22 are in respect of both Robert MacLeod and Liam Condon, who both held the position of Chief Executive in the year. The single total figure of £1,672 comprises £1,557 for Robert MacLeod and £115 for
Liam Condon. The value shown for annual incentives relates to Robert MacLeod only because Liam Condon was not eligible to participate in the AIP in 2021/22.5. Vesting of long-term incentive awards whose three-year performance period ended in the financial year shown.
Annual report on remuneration continued
Johnson Matthey | Annual Report and Accounts 2022 127
GO
VERNA
NCE

Annual report on remuneration continued
Change in directors’ remunerationThe table below shows how the remuneration of directors, both executive and non-executive, has changed over the year ended 31st March 2022. This is then compared to employees of Johnson Matthey Plc.
2022 2021
Salary Bonus Benefits Salary Bonus Benefits
Executive directorsRobert MacLeod1 2% -56 0% 0% 377% 0%Liam Condon2 – – – – – –Stephen Oxley3 – – – – – –Non-executive directorsPatrick Thomas 2% 0% 0% 0% 0% 0%Jane Griffiths 24%4 0% 0% 0% 0% 0%Chris Mottershead 2% 0% 0% 0% 0% 0%John O’Higgins 10%5 0% 0% 27%4 0% 0%Xiaozhi Liu 2% 0% 0% 0% 0% 0%Doug Webb 10%6 0% 0% 31%5 0% 0%Rita Forst7 – – – – – –Comparator groupJM Plc employees 6%8 4%9 0%10 2%8 312%9 0%10
1. Figures are based on a comparison of 2021 against the full 12-month data for 2022 (not the 11 months as Chief Executive), to allow for accurate comparison. 2. Liam Condon was appointed Chief Executive on 1st March 2022, so no change in compensation can be calculated for 2021 or 2022.3. Stephen Oxley was appointed Chief Financial Officer on 1st April 2021, so no change in compensation can be calculated for 2021 or 2022.4. Represents the additional fee received for taking the Societal Value Committee Chair position on 1st June 2021 and annual fee review. 5. Represents the additional fee received for taking the Senior Independent Director role on 23rd July 2020 and annual fee review.6. Represents the additional fee received for taking the Audit Committee Chair role on 23rd July 2020 and annual fee review.7. Rita Forst was appointed to the board on 4th October 2021, so no change in compensation can be calculated for 2021 or 2022.8. Includes promotions and market adjustments.9. The percentage change in bonus was calculated based on the change in bonus accrual taken for Johnson Matthey Plc (JM Plc) employees, excluding the directors, for the 2020/21 and 2021/22 years and for the 2019/20 and 2020/21
years, respectively.10. There has been no change to the benefits policy for JM Plc employees, therefore a 0% change has been reported.
Johnson Matthey | Annual Report and Accounts 2022128

Relative spend on payThe table below shows the absolute and relative amounts of distributions to shareholders and the total remuneration for the group for the years ended 31st March 2021 and 31st March 2022.
Year ended 31st March 2021
£ million
Year ended 31st March 2022
£ million % change
Payments to shareholders – special dividends – – –Payments to shareholders – ordinary dividends 99 139 40.9%Share buyback2 – 155Total remuneration (all employees)1 776 782 0.1%
1. Figure is for all operations (including Health) and excludes termination benefits.2. On 24th November, we announced a share buyback of ordinary shares for an aggregate purchase price of up to
£200 million. In the year ended 31st March 2022, £162 million of shares had been purchased.
Chief Executive to employee pay ratioThe table below shows the ratio of Chief Executive to employee pay for 2020 to 2022. We have compared the single total figure of remuneration for the Chief Executive to the total pay and benefits of UK employees, on a full-time equivalent basis, who are ranked at the lower quartile, median and upper quartile across all UK employees effective 31st March 2022.
We believe that using total pay and benefits for the year ending 31st March 2022 provides a like-for-like comparison to the Chief Executive pay data.Chief Executive pay ratio 2020 20211 2022
Method
A – total pay and benefits in
2019/20
A – total pay and benefits in
2020/21
A – total pay and benefits in
2021/22
Chief Executive single figure £1,462,000 £2,532,000 £1,672,0002
Upper quartile 22:1 35:1 26:1Median 28:1 45:1 34:1Lower quartile 36:1 57:1 41:1
1. Chief Executive pay ratio revised to include employee bonuses payable in relation to 2020/21. This changed upper quartile from 39:1 to 35:1, median from 50:1 to 45:1 and lower quartile from 63:1 to 57:1.
2. The Chief Executive single figure for 2021/22 is in respect of both Robert MacLeod and Liam Condon, who both held the position of Chief Executive in the year. The single total figure of £1,672,000 comprises £1,557,000 for Robert MacLeod and £115,000 for Liam Condon.
Bonus data for UK employees was left out of the 2022 calculation because it was not administratively possible to calculate these bonuses before the publication of this report. However, the calculation will be revised to include these bonuses once available and will be disclosed in the 2023 report. Excluding the 2021/22 bonus payable to the Chief Executive from the calculation would result in the following pay ratios: lower quartile – 27:1, median – 22:1 and upper quartile – 16:1.
The salary and total pay for the individuals identified at the lower quartile, median and upper quartile positions in 2022 are set out below:2022 Salary1 Total pay
Upper quartile individual £55,175 £65,453Median individual £42,143 £49,618Lower quartile individual £34,262 £40,301
1. Includes shift allowance.
Our principles for pay setting and progression are consistent across the organisation. Underpinning our principles is a need to provide a competitive total reward to enable the attraction and retention of high-calibre individuals and giving the opportunity for individual development and career progression. The pay ratios reflect the difference in role accountabilities that are recognised through our pay structures and the greater variable pay opportunity for more senior positions. The Chief Executive’s variable pay opportunity is higher than those employees noted in the table reflecting the weighting towards long-term value creation and alignment with shareholder interests inherent in this role.
The movement in our Chief Executive to employee pay ratio between 2020 and 2022 is driven by the different bonus outcomes for the Chief Executive in each of these years. 2022 is lower than 2021 because the bonus received in 2022 is much lower than 2021. While 2022 is higher than 2020 because the bonus received in 2022 is higher than 2020. This reflects the greater proportion of variable pay opportunity at the Chief Executive level. There have been no other changes to remuneration arrangements for our UK employees that would affect the CEO pay ratio.
We are satisfied that the median pay ratio is consistent with our wider pay, reward and progression policies for employees. All our employees have the opportunity for annual pay increases, career progression and development opportunities.
Annual report on remuneration continued
Johnson Matthey | Annual Report and Accounts 2022 129
GO
VERNA
NCE

Implementing the Directors’ Remuneration Policy for 2022/23The table below sets out how the Remuneration Committee intends to apply the Directors’ Remuneration Policy for the year ended 31st March 2023.
Salary The Chief Executive is not eligible for a salary increase until 1st April 2023.
The Chief Financial Officer received a pay increase of 3%, in line with the pay increases given to our UK management employees but below that given to our non-management employees.
Benefits No change to policy applied in 2022/23.
Pension All executive directors will have a maximum pension cash supplement of 15%.
Annual incentives The maximum bonus opportunity for 2022/23 remains unchanged at 180% of salary for the Chief Executive and 150% of salary for the Chief Financial Officer.
2022/23 bonus will be based on underlying profit before tax (50%), working capital (20%) and strategic and transformation objectives (30%). Targets for the Chief Executive and Chief Financial Officer will be based on group performance. The increase from 20% to 30% in respect of strategic and transformation objectives will be accompanied by specific metrics associated with the business transformation and more detailed disclosure against these metrics.
The 2022/23 targets are considered similarly challenging, if not more challenging to those set in 2021/22, when accounting for the divestments in the year and uncertain economic outlook. The recalibration of targets has been set taking this into account as well as internal and external planning. The Remuneration Committee considers the forward looking targets to be commercially sensitive but full retrospective disclosure of the actual targets will be included in next year’s Directors’ Remuneration report.
50% of any bonus paid will be deferred in shares for three years and the payment of any bonus is subject to appropriate malus and clawback provisions.
Long-term incentives The Chief Executive award level is 250% of base salary and the Chief Financial Officer award level is 175% of base salary. These award levels are in line with our remuneration policy.
The long-term Performance Share Plan will be based on EPS growth targets (40% of the award), relative TSR performance (40% of the award) and specific and measurable sustainability metrics (20% of award). The vesting level is also subject to achieving a satisfactory level of return on capital invested.
The range of annualised EPS growth targets that the committee intends to set for the FY 2022/23 awards is 3% per annum growth for threshold (15%) vesting, rising to 8% per annum growth for maximum vesting (100%). Vesting will be on a straight-line basis between 3% and 8%. The committee considered the effect of metal price volatility on potential outcomes and, as a result, earnings will be assessed 50% against actual metal prices and 50% against constant metal prices. The committee believes that this will allow for a more accurate assessment of underlying business performance.
The TSR target will be 25% vesting for median performance, increasing on a straight-line basis to 100% vesting for upper quartile performance. The TSR peer group will be the FTSE 31 – 100 (excluding financial services companies). The committee considers that this comparator group remains the most appropriate given our current market capitalisation.
The sustainability scorecard will consist of three equally weighted metrics, each related to a pillar of our sustainability framework. Threshold vesting will be 25%, increasing on a straight-line basis to 100% at maximum. The three metrics are as follows:
• Products and services – tonnes of greenhouse gases (GHG) avoided during the period using technologies enabled by our products and solutions, compared to conventional solutions, where threshold vesting will be 5.2 million tonnes GHG avoided and maximum will be 6.0 million tonnes GHG avoided.
• Operations – reduction in Scope 1 and 2 GHG emissions (from the FY20 baseline), where threshold vesting will be achieved for a 12% reduction in GHG emissions and maximum vesting for a 14% reduction in GHG emissions.
• People – percentage of female representation across our management levels, where threshold vesting will be achieved at 31% female representation at management levels and maximum at 32% female representation at management levels.
Awards vest in year three and are then subject to a two-year holding period.
Chairman and Non-executive director fees
The Chair and non-executive directors will not receive a fee increase in 2022/23 to recognise the recent experience of shareholders.
This Remuneration Report was approved by the Board of Directors on 26th May 2022 and signed on its behalf by:
Chris MottersheadChair of the Remuneration Committee
Annual report on remuneration continued
Johnson Matthey | Annual Report and Accounts 2022130

Statutory and other informationThe Directors’ Report required under the Companies Act 2006 (2006 Act) comprises the Governance Report (pages 83 to 130), including the Sustainability report for our disclosure of carbon emissions, which is included in the Strategic report (pages 34 to 59). The management report required under Disclosure Guidance and Transparency Rule 4.1.8R comprises the Strategic Report (pages 1-82), which includes the risks relating to our business and the Directors’ Report.
Index of disclosures referred to elsewhere in the reportBusiness model 7 Employee engagement 55, 91
Dividends 193 Diversity and employment of disabled persons 54
Results 22-30, 148 Greenhouse gas emissions 43
Research and development activities 18-19, 28 Human rights and anti-bribery and corruption 56-58
Future developments 18-19 Modern slavery and human trafficking statement 56 / matthey.com
Non-financial key performance indicators 31 Whistleblowing (speak up) 58
Directors 86-87 Use of financial instruments 155-156
Directors’ interests 125 Related party transactions 205
Corporate governance statement 83-130 Share capital 193-195
Section 172 statement and stakeholder engagement 82, 94-95
Other disclosures
Dividend reinvestment plan
A dividend reinvestment plan is available. This allows shareholders to purchase additional shares in JM Plc with their dividend payment. Further information and a mandate can be obtained from our registrar, Equiniti, and on our website: matthey.com
Directors’ indemnities and insurance
JM Plc has granted indemnities to each JM Plc director and the directors of the group’s subsidiaries in respect of certain liabilities arising against them in the course of their duties, in relation to the affairs of JM Plc or any group company. Neither JM Plc nor any subsidiary has indemnified any director of the company or a subsidiary in respect of any liability that they may incur to a third party in relation to a relevant occupational pension scheme. The company maintains appropriate directors’ and officers’ liability insurance.
Conflicts of interest The board has a policy for identifying and managing directors’ conflicts of interest, which extends to cover close family members. The board annually reviews external appointments to consider any potential or actual conflict of interest. If a conflict of interest is declared, the board will review the authorisation and terms associated, to ensure that all matters presented to the board are considered solely with a view to promoting JM’s business success. For the year under review, there were no potential or actual conflicts of interest.
External appointments
The board approves all external appointments in advance of acceptance. If an external appointment arises between meetings, this is considered by the Chair and Chief Executive, with the assistance of the Company Secretary. In approving each additional external appointment, the board assess time commitment to ensure that no directors are considered over boarded.
During the year, the board considered additional external appointments for Jane Griffiths (Non-Executive Chair at Redx Pharma Plc) and John O’Higgins (Non-Executive Director at Oxford Nanopore Technologies Plc). The board agreed that the proposed appointments would enhance individual skills and experience while allowing sufficient time to discharge their role at JM.
Listing Rule 9.8.4R
Details of the disclosures to be made under Listing Rule 9.8.4R are listed below.
• Interest capitalised 177
• Allotments of equity securities for cash
134
• Dividend waiver 134
There are no other applicable disclosures.
Directors’ Report
Johnson Matthey | Annual Report and Accounts 2022 131
GO
VERNA
NCE

Directors’ reappointment
Johnson Matthey Plc’s Articles of Association (the Articles) provide the rules on director appointments and are consistent with the recommendation contained within the code. All directors retire and are eligible for re-election at each AGM (except any director appointed after the notice of an AGM meeting is published and before that AGM is held).
Directors’ powers The powers of the directors are determined by the Articles, UK legislation including the 2006 Act, and any directions given by the company in general meetings. The directors are authorised by the company’s Articles to issue and allot ordinary shares and to make market purchases of its own shares. These powers are referred to shareholders for renewal at each AGM. Further information is set out below under ‘Authority to purchase own shares’.
Constitution
Articles of Association
The Articles may only be amended by a special resolution at a general meeting of the company. The Articles were adopted on 17th July 2019 and are available on our website: matthey.com/corporate-governance.
Branches The company and its subsidiaries have established branches in a number of different countries in which they operate.
Change of control As at 31st March 2022 and as at the date of approval of this annual report, there were no significant agreements, to which the company or any subsidiary was or is a party to, that take effect, alter or terminate on a change of control of the company, whether following a takeover bid or otherwise.
However, the company and its subsidiaries were, as at 31st March 2022, and as at the date of approval of this annual report, party to a number of commercial agreements. These may allow counterparties to alter or terminate the commercial agreements on a change of control of JM following a takeover bid. These are not deemed significant in terms of their potential effect on the group.
The group also has a number of loan notes and borrowing facilities that may require prepayment of principal and payment of accrued interest and breakage costs if there is a change of control of JM. The group has entered into a series of financial instruments to hedge its currency, interest rate and metal price exposures, which provide for termination or alteration if a change of control at JM materially weakens the creditworthiness of the group.
The executive directors’ service contracts each contain a provision to the effect that, if the contract is terminated by the company within one year after a change of control of the company, JM will pay an amount equivalent to one year’s gross base salary and other contractual benefits, less the period of any notice given by the company, to the director as liquidated damages.
The rules of the company’s employee share schemes set out the consequences of a change of control of the company on participants’ rights under the schemes. Generally, the rights will vest and become exercisable on a change of control, subject to the satisfaction of relevant performance conditions. As at 31st March 2022, and as at the date of approval of this annual report, there were no other agreements between the company, any subsidiaries and directors or employees, providing compensation for loss of office or employment (through resignation, purported redundancy or otherwise) that occurs due to a takeover bid.
Stakeholders and policies
Suppliers We recognise the importance of good supplier relationships to our overall success. Further information on our payment practices is on the UK government’s reporting portal.
Read more about our Supplier Code of Conduct and our engagement with suppliers during the year on page 58.
Political donations No political donations or contributions to political parties under the Companies Act 2006 have been made during the year. The group policy is that no political donations be made or political expenditure incurred.
Events occurring after the reporting period
There have been no important events affecting JM Plc or any subsidiary between 31st March 2022 and the date of approval of this annual report, 26th May 2022.
Directors’ Report continued
Johnson Matthey | Annual Report and Accounts 2022132

Directors’ Report continued
Shareholders and share capital
AGM Our 2022 AGM will be held on Thursday 21st July 2022 at 11.00 am in the PLR Room at Herbert Smith Freehills, Exchange House, 12 Primrose Street, London
EC2A 2EG. We will provide a live webcast and telephone conference so shareholders can also participate virtually and ask questions in real time. Details on how to join are included in the Notice of AGM. In the Notice, we propose separate resolutions on each substantially separate issue. For each resolution, shareholders may direct their proxy to vote either for or against or to withhold their vote. A ‘vote withheld’ is not legally a vote and will not be counted in the calculation of the proportion of the votes cast. All AGM resolutions are decided with an electronic poll, with the results announced as soon as possible and posted on our website. This poll with show votes for and against, as well as votes withheld.
Authority to purchase own shares
At the 2021 AGM, shareholders authorised JM Plc to make market purchases of up to 19,353,343 ordinary shares of 110 49/53 pence each, representing 10% of the then issued share capital of the company (excluding treasury shares). Any shares so purchased by JM may be cancelled or held as treasury shares. This authority will cease at the conclusion of the 2022 AGM, and shareholders will be asked to give a similar authority at the AGM.
We announced our intention to conduct a share buyback programme of JM Plc ordinary shares for up to a maximum consideration of £200m on 24th November 2021. Purchases were made in two tranches, with shares purchased in the first tranche held in treasury to be used to meet obligations arising from employee share option programmes and shares purchased in the second tranche cancelled to reduce the share capital of the company. The purchase of ordinary shares under the programme was effected within certain pre-set parameters and in accordance with JM’s general authority to repurchase ordinary shares granted by its shareholders at the 2021 AGM, the Market Abuse Regulation 596/2014 (as incorporated into UK domestic law by the European Union (Withdrawal) Act 2018), and Chapter 12 of the Financial Conduct Authority’s Listing Rules.
The first tranche of the share buyback programme of up to £100 million was launched on 21st December 2021 and completed on 28th January 2022. A total of 5,060,409 ordinary shares with a total nominal value of 110 49/53 pence (representing 2.73% of the company’s total issued share capital, excluding treasury shares, as at 31 March 2022) were purchased, which are now held in treasury. The total price of the shares purchased was £99,999,944.18.
The second tranche of the share buyback programme of up to £100m commenced on 14th February 2022 and completed on 13th May 2022. A total of 5,350,761 ordinary shares with a total nominal value of 110 49/53 pence (representing 2.89% of the company’s total issued share capital, excluding treasury shares, as at 31 March 2022) were repurchased for the total price of £99,999,975.57 and all shares purchased in the second tranche have been cancelled.
There were no share allotments during the year.
Johnson Matthey | Annual Report and Accounts 2022 133
GO
VERNA
NCE

Directors’ Report continued
Shareholders and share capital (cont.)
Rights and obligations attaching to shares
The rights and obligations attaching to the ordinary shares in JM Plc are set out in the Articles.
As at 31st March 2022, and as at the date of approval of this annual report, there were no restrictions on the transfer of ordinary shares in the company, no limitations on the holding of securities and no requirements to obtain the approval of the company, or of other holders of securities in JM Plc, for a transfer of securities – except as referred to below. The directors may, in certain circumstances, refuse to register the transfer of a share in certificated form that is not fully paid up, where the instrument of transfer does not comply with the requirements of the company’s Articles, or if entitled under the Uncertificated Securities Regulations 2001. As at 31st March 2022 and as at the date of approval of this report:
• No person held securities in JM Plc carrying any special rights with regard to control of the company.• There were no restrictions on voting rights (including any limitations on voting rights of holders of a given percentage or number of votes or deadlines for
exercising voting rights), except that a shareholder can only vote in respect of a share if it is fully paid.• There were no arrangements by which, with the company’s cooperation, financial rights carried by shares in the company are held by a person other than the
holder of the shares.• There were no agreements known to the company between holders of securities that may result in restrictions on the transfer of securities or on voting rights.
Nominees, financial assistance and liens
During the year:
• No shares in JM Plc were acquired by the company’s nominee, or by a person with financial assistance from the company, in either case where the company has a beneficial interest in the shares (and no person acquired shares in the company in any previous financial year in its capacity as the company’s nominee or with financial assistance from the company).
• The company did not obtain or hold a lien or other charge over its own shares.
Allotment of securities for cash and placing of equity securities
During the year JM Plc has not allotted, nor has any major subsidiary undertaking of the company allotted, equity securities for cash. During the year we’ve not participated in any equity securities’ placing.
American Depositary Receipt programme
JM has a sponsored Level 1 American Depositary Receipt (ADR) programme, which BNY Mellon administers and for which it acts as Depositary. Each ADR represents two ordinary JM shares. The ADRs trade on the US over-the-counter market under the symbol JMPLY. When dividends are paid to shareholders, the Depositary converts those dividends into US dollars, net of fees and expenses, and distributes the net amount to ADR holders.
Employee share schemes
At 31st March 2022, 4,309 current and former employees were shareholders in JM through the group’s employee share schemes. Through these schemes, current and former employees held 2,908,777 ordinary shares or 1.57% of issued share capital, excluding treasury shares as at 31st March 2022. Also as at 31st March 2022, 2,689,904 ordinary shares had been awarded but had not yet vested, under the company’s long-term incentive plans, to 389 current and former employees.
Shares acquired by employees through JM’s employee share schemes rank equally with the other shares in issue and have no special rights. Voting rights in respect of shares held through the company’s employee share schemes are not exercisable directly by employees. However, employees can direct the trustee of the schemes to exercise voting rights on their behalf. The trustee of the company’s Employee Share Ownership Trust (ESOT) has waived its right to dividends on shares held by the ESOT, which have not yet vested unconditionally to employees.
Johnson Matthey | Annual Report and Accounts 2022134

Shareholders and share capital (cont.)
Interests in voting rights
The following information has been disclosed to the company under the FCA’s Disclosure Guidance and Transparency Rules in respect of notifiable interests in the voting rights in JM Plc’s issued share capital:
Natureof holding
Totalvoting rights1
% of totalvoting rights2
As at 31st March 2022:BlackRock, Inc. Indirect3 18,577,911 9.98%Schroders Plc Direct 10,638,209 5.496%
Indirect3 55,072 0.028%
1. Total voting rights attaching to the issued ordinary share capital of the company (excluding treasury shares) at the time of disclosure to the company.2. % of total voting rights at the date of disclosure to the company.3. Indirect holdings include qualifying financial instruments and contract for differences.
Other than as stated above, as far as the company is aware, there is no person with a significant direct or indirect holding of securities in JM Plc. This information was correct at the date of notification. However, since notification of any change is not required until the next notifiable threshold is crossed, these holdings are likely to have changed. Between 31st March 2022 and the date of this report, 26th May 2022, the company has been notified of changes in the following interests:
Natureof holding
Totalvoting rights1
% of totalvoting rights2
Blackrock, Inc. Indirect3 20,125,541 10.92Jefferies Financial Group Direct 8,563,153 4.64%
Indirect3 2,000,000 1.08Standard Latitude Master Fund Indirect 9,655,039 5.23%
1. Total voting rights attaching to the issued ordinary share capital of the company (excluding treasury shares) at the time of disclosure to the company.2. % of total voting rights at the date of disclosure to the company.3. Indirect holdings include qualifying financial instruments and contract for differences.
Contracts with controlling shareholders
During the year there were no contracts of significance (as defined in the FCA’s Listing Rules) between any group undertaking and a controlling shareholder and no contracts for the provision of services to any group undertaking by a controlling shareholder.
Directors’ Report continued
Johnson Matthey | Annual Report and Accounts 2022 135
GO
VERNA
NCE

Statement of directors’ responsibilities in respect of the Annual Report and AccountsThe directors are responsible for preparing the Annual Report and Accounts and the financial statements in accordance with applicable law and regulation.
Company law requires the directors to prepare financial statements for each financial year. Under that law the directors have prepared the group and the parent company financial statements in accordance with UK-adopted international accounting standards.
Under company law, directors must not approve the financial statements unless they are satisfied that they give a true and fair view of the state of affairs of the group and parent company and of the profit or loss of the group for that period. In preparing the financial statements, the directors are required to:
• select suitable accounting policies and then apply them consistently;• state whether applicable UK-adopted international accounting standards have been
followed, subject to any material departures disclosed and explained in the financial statements;
• make judgements and accounting estimates that are reasonable and prudent; and• prepare the financial statements on the going concern basis unless it is inappropriate to
presume that the group and parent company will continue in business.
The directors are responsible for safeguarding the assets of the group and parent company and hence for taking reasonable steps for the prevention and detection of fraud and other irregularities.
The directors are also responsible for keeping adequate accounting records that are sufficient to show and explain the group’s and parent company’s transactions and disclose with reasonable accuracy at any time the financial position of the group and parent company and enable them to ensure that the financial statements and the Directors’ Remuneration Report comply with the Companies Act 2006.
The directors are responsible for the maintenance and integrity of the parent company’s website. Legislation in the United Kingdom governing the preparation and dissemination of financial statements may differ from legislation in other jurisdictions.
Responsibilities of Directors
Directors’ confirmationsThe directors consider that the Annual Report and Accounts and accounts, taken as a whole, is fair, balanced and understandable and provides the information necessary for shareholders to assess the group’s and parent company’s position and performance, business model and strategy.
Each of the directors, whose names and functions are listed in the Governance section of the Annual Report and Accounts confirm that, to the best of their knowledge:
• the group and parent company financial statements, which have been prepared in accordance with UK-adopted international accounting standards, give a true and fair view of the assets, liabilities and financial position of the group and parent company, and of the loss of the group; and
• the Strategic Report includes a fair review of the development and performance of the business and the position of the group and parent company, together with a description of the principal risks and uncertainties that it faces.
In the case of each director in office at the date the directors’ report is approved:
• so far as the director is aware, there is no relevant audit information of which the group’s and parent company’s auditors are unaware; and
• they have taken all the steps that they ought to have taken as a director in order to make themselves aware of any relevant audit information and to establish that the group’s and parent company’s auditors are aware of that information.
The Directors’ report and responsibilities statement was approved by the board on 26th May 2022 and is signed on its behalf by:
Nick CooperGeneral Counsel and Company Secretary
Johnson Matthey | Annual Report and Accounts 2022136

Independent auditors’ report to the members of Johnson Matthey Plc
Report on the audit of the financial statements
OpinionIn our opinion:
• Johnson Matthey Plc’s group financial statements and company financial statements (the “financial statements”) give a true and fair view of the state of the group’s and of the company’s affairs as at 31 March 2022 and of the group’s loss and the group’s cash flows for the year then ended;
• the group financial statements have been properly prepared in accordance with UK-adopted international accounting standards;
• the company financial statements have been properly prepared in accordance with United Kingdom Generally Accepted Accounting Practice (United Kingdom Accounting Standards, comprising FRS 101 “Reduced Disclosure Framework”, and applicable law); and
• the financial statements have been prepared in accordance with the requirements of the Companies Act 2006.
We have audited the financial statements, included within the Annual Report, which comprise: the Consolidated and Parent Company Balance Sheets as at 31 March 2022; the Consolidated Income Statement and Consolidated Statement of Total Comprehensive Income; the Consolidated Cash Flow Statement and the Consolidated and Parent Company Statement of Changes in Equity for the year then ended; and the notes to the financial statements, which include a description of the significant accounting policies.
Our opinion is consistent with our reporting to the Audit Committee.
Basis for opinionWe conducted our audit in accordance with International Standards on Auditing (UK) (“ISAs (UK)”) and applicable law. Our responsibilities under ISAs (UK) are further described in the Auditors’ responsibilities for the audit of the financial statements section of our report. We believe that the audit evidence we have obtained is sufficient and appropriate to provide a basis for our opinion.
IndependenceWe remained independent of the group in accordance with the ethical requirements that are relevant to our audit of the financial statements in the UK, which includes the FRC’s Ethical Standard, as applicable to listed public interest entities, and we have fulfilled our other ethical responsibilities in accordance with these requirements.
To the best of our knowledge and belief, we declare that non-audit services prohibited by the FRC’s Ethical Standard were not provided.
Other than those disclosed in note 4, we have provided no non-audit services to the company in the period under audit.
Our audit approachOverviewAudit scope• We conducted a full scope audit or specified procedures at 63 business units which
together account for 84% of group revenue and more than 75% of group underlying profit before tax from continuing operations.
• We maintained regular contact with our component teams and evaluated the outcome of their audit work.
Key audit matters• Carrying value of goodwill (group and parent)• Refinery metal accounting (group and parent)• Divestment of the Health business (group and parent)• Battery Materials exit (group and parent)• Uncertain tax provisions (group and parent)
Materiality• Overall group materiality: £21.8 million (2021: £22.6 million) based on approximately
5% of the three year average profit before tax from continuing operations, adjusted for loss on disposal of businesses, gains and losses on significant legal proceedings, major impairment and restructuring charges.
• Overall company materiality: £60 million (2021: £70 million) based on approximately 1% of total assets. However the materiality is capped at £20 million (2021: £20 million) for the purpose of the audit of the consolidated financial statements, this being the maximum allocation of group materiality to a component.
• Performance materiality: £16.3 million (2021: £16.9 million) (group) and £15 million (2021: £15 million) (company).
The scope of our auditAs part of designing our audit, we determined materiality and assessed the risks of material misstatement in the financial statements.
Johnson Matthey | Annual Report and Accounts 2022 137
FINA
NCIA
L STATEM
ENTS

Key audit mattersKey audit matters are those matters that, in the auditors’ professional judgement, were of most significance in the audit of the financial statements of the current period and include the most significant assessed risks of material misstatement (whether or not due to fraud) identified by the auditors, including those which had the greatest effect on: the overall audit strategy; the allocation of resources in the audit; and directing the efforts of the engagement team. These matters, and any comments we make on the results of our procedures thereon, were addressed in the context of our audit of the financial statements as a whole, and in forming our opinion thereon, and we do not provide a separate opinion on these matters.
This is not a complete list of all risks identified by our audit.
Divestment of the Health business and Battery Materials exit are new key audit matters this year. COVID-19, Claims, uncertainties and other provisions, and Carrying value of Property, plant and equipment and Other intangible assets associated with the transformation programme, which were key audit matters last year, are no longer included because they were of less significance to the audit in the current year. We have also removed the capitalised development costs as these related to Health and Battery Materials which are now considered as separate key audit matters.
Key audit matter How our audit addressed the key audit matter
Carrying value of goodwill (group and parent)Refer to the Significant issues considered by the Audit Committee within the Audit Committee Report and notes 1, 5 and 12 to the financial statements.
The group holds goodwill of £366 million (2021: £554 million) at 31 March 2022. Of which, £113 million (2021: £115 million) is held within the parent company.
The group has significant goodwill arising from the acquisition of businesses and the carrying value is dependent on the financial performance of the cash generating unit (CGU) to which it relates.
The impairment assessments prepared by management reflect its best estimates of future cashflows. These estimates contain significant uncertainty and are inherently judgemental in nature, where changes in the key assumptions can result in materially different impairment charges or available headroom. As set out in note 1 management has considered the impacts of climate change in their models. This is therefore an area of focus in our audit procedures.
In the year, an impairment charge of £189 million was recorded against goodwill (Health: £144 million and Diagnostic Services: £45 million).
The goodwill of £144 million held in the two CGUs in the Health business (Generics and Innovators) was fully impaired. This arose as a result of the planned divestment of the Health business following the announcement in December 2021, as the fair value of the proceeds less costs to dispose was lower than the carrying value. See also the key audit matter on ‘Divestment of the Health business’ below.
Goodwill of £45 million held in the Diagnostic Services CGU was impaired as a result of lower growth forecasts and a higher discount rate applied to future cashflows in management’s value in use models, which reflect the faster paced transition to non-carbon intensive industries and management’s strategic decision that the business is ‘non-core’.
Management’s assessment of the goodwill in the other CGUs concluded that no impairment was required.
Management included disclosures to explain its key judgements and estimates as part of notes 1 and 5.
We obtained management’s value in use goodwill impairment models and agreed the forecast cash flows to board-approved budgets, assessed how these budgets are compiled, confirmed data accuracy and understood key related judgements and estimates.
We assessed management’s historical forecasting accuracy by comparing the prior year forecasts with actual results. This informed our independent sensitivity analysis.
We performed work over each material CGU. The nature and extent of work was commensurate with the level of headroom and sensitivity of the CGU to impairment. Our testing was focused on the key assumptions in the board-approved three year forecasts and we corroborated the assumptions to supporting evidence which included both internal and external sources of evidence. In addition, we assessed the appropriateness and impact of the specific growth assumptions applied by management for the period after the year three forecast but before a long term growth rate is applied (typically year ten).
Management has included certain key assumptions relating to climate change. These include restricting the useful economic life applied in modelling Heavy Duty Catalysts to 2040, and the application of a negative growth rate from 2033. Working with our valuation experts we have considered external market outlooks and information on emission legislation to corroborate these assumptions.
We engaged our valuations experts to assess the long term growth rate and discount rate for each CGU by comparison with third party information, past performance and relevant risk factors. Our procedures also included considering the overall level of risk in the future cash flow projections.
We audited the £45 million impairment charge on the Diagnostic Services CGU. Our procedures included testing the basis for management’s revised business plans and expectations in line with the group’s latest strategy and considering the latest industry outlooks used by management.
We tested the mathematical integrity of the forecasts and of the value in use model, audited the allocation of central costs to the CGUs and agreed the carrying values in management’s impairment models to underlying accounting records.
We assessed management’s sensitivity analysis and performed our own independent sensitivity analysis to assess whether a reasonable downside change in the key assumptions could give rise to a material impairment.
Based on the procedures performed, we noted no material issues arising from our work.
Independent auditors’ report to the members of Johnson Matthey plc continued
Johnson Matthey | Annual Report and Accounts 2022138

Independent auditors’ report to the members of Johnson Matthey plc continued
Key audit matter How our audit addressed the key audit matter
Refinery metal accounting (group and parent)Refer to the Significant issues considered by the Audit Committee within the Audit Committee Report and note 1 to the financial statements.
As part of its refining activities the group processes a significant amount of metal on behalf of third parties, whereby the group must return pre-agreed recoverable quantities of refined metal to those parties at an agreed date. Any metal in excess of this pre-agreed quantity is retained by the group. As such, the group makes an estimate of how much metal it will recover as part of its refining operations.
The majority of metal processed at refineries is owned by customers and is not held on the financial balance sheet of the group. As such, the group performs a metal balance sheet reconciliation to ensure quantities of precious metals held at year-end are appropriately understood, classified as either owned by Johnson Matthey or the customer and reconciled to its financial position.
This ensures that only the group-owned inventory is recorded on the balance sheet and that the price allocated to this owned inventory is at the lower of cost and net realisable value.
During the refining process there are a series of complex estimates including:
i. Estimation of the level of metal contained in the carrier material entering the refining process, the refined metal that leaves the refining process, and the residual metal in the refining process at year-end;
ii. Estimates of the process losses of precious metals that may be lost during the refining and fabrication process, and the adequacy of these provisions;
iii. Estimates of the metal in the refinery process as informed by refinery stocktakes, and the subsequent sampling and assaying to assess the precious metal content in stocktake samples; and
iv. Estimates of the net realisable value of unhedged metal held at year-end.
Each of these estimates impacts different areas of the audit. The refining process and its associated estimates are an area of focus for our audit due to the inherent complexity of the accounting and amount of metal processed.
We evaluated the design and operation of key controls at the main refining locations over refinery stocktakes and metal assaying procedures.
We tested that the metal balance sheet was prepared and reviewed on a monthly basis.
We tested the classification of precious metals at year-end on the metal balance sheet, to determine if metal was owned by the group or the customer. Our procedures included sending confirmations to customers, and testing the balance of customer metal that was in the refining process, but not contractually due.
We assessed management’s policy for recognising stocktake gains and losses arising from stocktakes. We attended physical stock counts at sites where these were performed by management. The purpose was to verify the existence of inventory and adherence to the group’s stocktake processes, and the reasonableness of stocktake gains and losses at these sites.
We assessed the underlying controls that have been implemented by management, to monitor potential inventory gains or losses through the refining process and stocktake results, to assess the likelihood and quantum of process losses (if any) of metal between the date of the stocktake and the year-end date. We assessed process loss provisions compared to historical metal gain revenue and refinery stocktake results.
We tested that all unhedged metal was held at the lower of cost and net realisable value, on an individual metal by metal methodology, with reference to external metal price data.
We considered the adequacy of the group’s disclosures about the degree of estimation involved in arriving at the value of metal inventory.
Based on the procedures performed, we noted no material issues arising from our work.
Johnson Matthey | Annual Report and Accounts 2022 139
FINA
NCIA
L STATEM
ENTS

Independent auditors’ report to the members of Johnson Matthey plc continued
Key audit matter How our audit addressed the key audit matter
Divestment of the Health business (group and parent)Refer to the Significant issues considered by the Audit Committee within the Audit Committee Report and primarily notes 1 and 27. The impact of presenting Health as Assets held for sale and Discontinued operations has a pervasive impact across the primary statements and the Notes and management has included footnotes throughout the disclosures to highlight and explain the impact.
Following the announcement in December 2021 of the planned divestment of the Health business, the associated assets and liabilities were reclassified and presented as held for sale as at 31 March 2022 and the results for this business have been presented as discontinued operations.
Upon reclassifying the assets and liabilities as held for sale, management has performed an impairment assessment of the Health business. As the fair value of the proceeds less costs to dispose was lower than the carrying value, an impairment charge of £228 million was recorded. This was allocated in line with IAS 36; first £144 million against Goodwill (notes 5 and 12), then pro-rata against the other assets held in the Health business: £55 million against Property, plant and equipment (note 11), £23 million against Other intangible assets (note 13), £5 million against Inventories (note 16) and £1 million against Right-of-use assets (note 25).
Given the size and importance of the disposal of Health, and the impairment charge recorded, this was therefore an area of focus for our audit.
We have reviewed the sale agreements for the divestment of the Health business and agree with management’s conclusion that the criteria in IFRS 5 Non-current Assets Held for Sale and Discontinued Operations – including that the sale is highly probable – are met. We also agree that the Health business meets the definition of a discontinued operation given its size and importance to the group.
We have assessed management’s presentation of Health as a discontinued operation and asset held for sale in the disclosures and are satisfied these are in accordance with IFRS.
We have audited management’s assessment of the fair value less costs to sell. We have agreed the cash amounts to be received to the underlying contracts; we have assessed management’s calculation of the vendor loan note according to the underlying contract; and, together with our valuations experts, we have assessed the valuation of the group’s 30% stake in the new business.
We have confirmed the resulting impairment charge has been recorded appropriately and that the disclosures are compliant with IFRS.
Johnson Matthey | Annual Report and Accounts 2022140

Independent auditors’ report to the members of Johnson Matthey plc continued
Key audit matter How our audit addressed the key audit matter
Battery Materials exit (group and parent)Refer to the Significant issues considered by the Audit Committee within the Audit Committee Report and primarily notes 1, 6, 11, 13 and 25.
As a result of the announcements of the intention to exit Battery Materials in November 2021 and January 2022, an impairment charge of £325 million (note 6) has been recorded. The impairment charge comprises Property, plant and equipment (£237 million); Right of use assets (£4 million); Other intangible assets (£78 million); and Trade and other receivables (£6 million). In addition, a restructuring charge of £38 million was recorded for exit costs including redundancies.
The impairment recognised is based on management’s best estimate of the recoverable amount of the assets at 31 March 2022 based on selling certain parts of the business to an identified third party.
Given the magnitude of the impairment and associated exit costs, and the estimation uncertainty related to the recoverable value and exit costs this has been a key area of audit focus.
To audit the impairment charge we obtained evidence of the timing of the decision to exit the Battery Materials business and expected recoverable value. To support the recoverable amount we obtained the purchase agreement which included the agreed purchase price and obtained evidence of the initial consideration paid.
The exit costs comprise redundancy provisions and the settlement of contractual liabilities and closure and abandonment costs. We have obtained evidence of management’s intentions with respect to closure of the sites, including correspondence with employees. Where material, we audited the restructuring and other costs by corroborating key assumptions used in management estimates as well as testing the mathematical accuracy of the models or by testing the actual costs incurred.
We have confirmed the resulting impairment charge and exit costs have been recorded appropriately and that the disclosures are compliant with IFRS.
Johnson Matthey | Annual Report and Accounts 2022 141
FINA
NCIA
L STATEM
ENTS

Independent auditors’ report to the members of Johnson Matthey plc continued
Key audit matter How our audit addressed the key audit matter
Uncertain tax provisions (group and parent)Refer to the Significant issues considered by the Audit Committee and note 1 to the financial statements.
The group operates in a number of international jurisdictions, and as a result there is risk of uncertain tax exposures arising around the group, as well as heightened risk around estimates in determining the tax effect of cross border transactions including transfer pricing arrangements.
As at 31 March 2022 the group had provisions for uncertain tax liabilities of £103 million (2021: £102 million). Management’s estimate of the range of possible outcomes is an increase in those liabilities by £83 million (2021: £97 million) to a decrease of £93 million (2021: £78 million).
Where the precise impact of the tax laws and regulations on taxes payable with respect to profit arising in those jurisdictions is unclear, the group seeks to make reasonable estimates to determine the most likely amount in a range of possible outcomes.
There is inherent judgement and estimation uncertainty involved in determining provisions for uncertain tax positions, as described by management in the accounting policies to the financial statements. Our audit focused on the most significant of exposures based on both the provision recorded and maximum possible exposure.
We engaged our tax specialists in support of our audit of tax and obtained an understanding of the group’s tax strategy and risks. We recalculated the group’s tax provisions and determined whether the treatments adopted were in line with the group’s tax policies and had been applied consistently.
We evaluated the key underlying assumptions and judgements, including considering the status of tax authority audits and enquiries through examining the latest correspondence and enquiring of management, and where applicable management’s advisors. We considered the basis and support in particular for provisions not subject to tax audit, in comparison with our experience of similar situations.
We discussed the recognition of specific uncertain tax positions with third-party tax advisors appointed by management to verify the key assumptions, judgements and likely outcome with respect to specific uncertain tax positions recognised. We confirmed the appropriateness of management’s application of either a single best estimate, or a weighted average range of outcomes, for each exposure, as driven by the facts and circumstances under IFRIC 23.
We evaluated the consistency of management’s approach to identifying triggering events to reassess or record a provision for an exposure.
We also evaluated the consistency of management’s approach to establishing or changing prior provision estimates and validated that changes in provisions established in previous periods reflected a change in facts and circumstances.
We are satisfied that the group’s provisions with respect to uncertain tax matters have been prepared on a reasonable basis that represent management’s current best estimate of the most likely outcome.
We consider the disclosures with respect to tax matters to be appropriate.
Johnson Matthey | Annual Report and Accounts 2022142

Independent auditors’ report to the members of Johnson Matthey plc continued
How we tailored the audit scopeWe tailored the scope of our audit to ensure that we performed enough work to be able to give an opinion on the financial statements as a whole, taking into account the structure of the group and the company, the accounting processes and controls, and the industry in which they operate.
The group is structured across four sectors: Clean Air, Efficient Natural Resources, Health and Other markets, as well as the Corporate central unit.
The financial statements are a consolidation of approximately 310 business units. We have identified each individual business unit, or a series of business units where they map to a single legal statutory entity, as a component. These components comprise the group’s operating businesses and holding companies across the four sectors and Corporate.
Based on our risk and materiality assessments, we determined which components required an audit of their complete financial information having considered the relative significance of each entity to the group, locations with significant inherent risks and the overall coverage obtained over each material line item in the consolidated financial statements.
We identified 50 business units which, in our view, required an audit of their complete financial information, due to size or risk characteristics. We performed specified procedures over certain line items that were most material to the group (revenue, cost of sales, accounts receivable, cash, inventory) and tested manual journal entries. The residual line items not subject to audit were not material in the context of the group audit.
In addition to the business units in full scope, we performed specified procedures at 13 business units over specific financial statement line items including revenue, trade and other receivables and deferred income, cash, inventory, metal inventory, accruals, fixed assets and depreciation, cost of sales and operating expenses. This ensured that appropriate audit procedures were performed to achieve sufficient coverage over these financial statement line items.
The total 63 in-scope business units are located in numerous countries around the world. We used local teams in these countries to perform the relevant audit procedures. Of these, 9 business units have been determined to be financially significant based on their contribution to the group. These financially significant components are located in the UK, China and North Macedonia.
The group consolidation, financial statement disclosures and corporate functions were audited by the group audit team. This included our work over the consolidation, litigation provisions, centrally recognised tax balances, goodwill, post-retirement benefits, earnings per share and treasury related balances. This scope of work, together with additional procedures performed at the group level, accounted for 84% of group revenue and more than 75% of group underlying profit before taxation from continuing operations. This provided the evidence we needed for our opinion on the consolidated financial statements taken as a whole. This was before considering the contribution to our audit evidence from performing audit work at the group level, including disaggregated analytical review procedures, which covers certain of the group’s smaller and lower risk components that were not directly included in our group audit scope.
Climate changeClimate change is expected to present both risks and opportunities for the group. As explained in the Sustainability section of the Strategic Report, the group is mindful of its impact on the environment and is focussed on ways to reduce climate-related impacts as management continues to develop its plans towards a net zero pathway by 2040. Management’s climate change initiatives and commitments will impact the group in a variety of ways, and while the group has started to quantify some of the impacts that may arise on its net zero pathway, the future financial impacts are clearly uncertain given the medium to long term horizon. Disclosure of the impact of climate change risk based on management’s current assessment is incorporated in the Task Force on Climate-related Financial Disclosures (‘TCFD’) section of the Annual Report.
As part of our audit, we made enquiries of management to understand the extent of the potential impact of climate change on the group’s business and the financial statements, including reviewing management’s climate change risk assessment which was prepared with support from an external expert. We used our knowledge of the group and we engaged with our climate change experts to evaluate the risk assessment performed by management.
We assessed that the key areas in the financial statements which are more likely to be materially impacted by climate change are those areas that are based on future cash flows. As a result, we particularly considered how climate change risks and the impact of climate commitments made by the group would impact the assumptions made in the forecasts prepared by management that are used in the group’s impairment analysis (see also key audit matter on Carrying value of goodwill) and for going concern purposes. We challenged how management had considered longer term physical risks such as severe weather related impacts, and shorter-term transitional risks such as the introduction of carbon taxes. Our procedures did not identify any material impact on our audit for the year ended 31 March 2022. We also checked the consistency of the disclosures in the TCFD section of the Annual Report with the relevant financial statement disclosures, including note 1 and the Going concern section of the Accounting policies, and with our understanding of the business and knowledge obtained in the audit.
We confirmed with management and the Audit Committee that the estimated financial impacts of climate change will be reassessed prospectively and our expectation is that climate change disclosures will evolve as the understanding of the actual and potential impacts on the group’s future operations are established with greater certainty.
Johnson Matthey | Annual Report and Accounts 2022 143
FINA
NCIA
L STATEM
ENTS

Independent auditors’ report to the members of Johnson Matthey plc continued
Materiality
The scope of our audit was influenced by our application of materiality. We set certain quantitative thresholds for materiality. These, together with qualitative considerations, helped us to determine the scope of our audit and the nature, timing and extent of our audit procedures on the individual financial statement line items and disclosures and in evaluating the effect of misstatements, both individually and in aggregate on the financial statements as a whole.
Based on our professional judgement, we determined materiality for the financial statements as a whole as follows:
Financial statements – group Financial statements – company
Overall materiality £21.8 million (2021: £22.6 million). £60 million (2021: £70 million).
How we determined it
approximately 5% of the three year average profit before tax from continuing operations, adjusted for loss on disposal of businesses, gains and losses on significant legal proceedings, major impairment and restructuring charges
approximately 1% of total assets. However the materiality is capped at £20 million (2021: £20 million) for the purpose of the audit of the consolidated financial statements, this being the maximum allocation of group materiality to a component
Rationale for benchmark applied
Adjusted (underlying) profit before tax from continuing operations is used as the materiality benchmark excluding amortisation of acquired intangibles. Management uses this measure as it believes that it reflects the underlying performance of the group and this is how the directors and key management personnel are measured on their performance. We did not adjust profit before tax to add back amortisation of acquired intangibles as in our view this is a recurring item. In 2022, the Health business is held for sale, and consequently the materiality benchmark has been adjusted to exclude the Health results.
We considered total assets to be an appropriate benchmark for the parent company given that, whilst it does include trading businesses, it is the ultimate holding company, incurs corporate costs and enters into financing on behalf of the group. The materiality level was capped at £20 million given overall group materiality for the purposes of the audit of the consolidated financial statements, this being the maximum allocation of group materiality to a component.
For each component in the scope of our group audit, we allocated a materiality that is less than our overall group materiality. The range of materiality allocated across components was between £1 million and £20 million. Certain components were audited to a local statutory audit materiality that was also less than our overall group materiality.
We use performance materiality to reduce to an appropriately low level the probability that the aggregate of uncorrected and undetected misstatements exceeds overall materiality. Specifically, we use performance materiality in determining the scope of our audit and the nature and extent of our testing of account balances, classes of transactions and disclosures, for example in determining sample sizes. Our performance materiality was 75% (2021: 75%) of overall materiality, amounting to £16.3 million (2021: £16.9 million) for the group financial statements and £15 million (2021: £15 million) for the company financial statements.
In determining the performance materiality, we considered a number of factors – the history of misstatements, risk assessment and aggregation risk and the effectiveness of controls – and concluded that an amount at the upper end of our normal range was appropriate.
We agreed with the Audit Committee that we would report to them misstatements identified during our audit above £1 million (group audit) (2021: £1.1 million) and £1 million (company audit) (2021: £1.1 million) as well as misstatements below those amounts that, in our view, warranted reporting for qualitative reasons.
Johnson Matthey | Annual Report and Accounts 2022144

Independent auditors’ report to the members of Johnson Matthey plc continued
Conclusions relating to going concernOur evaluation of the directors’ assessment of the group’s and the company’s ability to continue to adopt the going concern basis of accounting included:
• Evaluation of management’s base case and downside case scenarios, understanding and evaluating the key assumptions, including assumptions related to the ongoing impacts of COVID-19 and other macro-economic factors;
• Validation that the cash flow forecasts used to support management’s impairment, going concern and viability assessments were consistent;
• Assessment of the historical accuracy and reasonableness of management’s forecasting;• Consideration of the group’s available financing and debt maturity profile;• Testing of the mathematical integrity of management’s liquidity headroom, covenant
compliance, sensitivity and stress testing calculations;• Assessment of the reasonableness of management’s planned or potential mitigating
actions; and• Review of the related disclosures in the Annual Report.
Based on the work we have performed, we have not identified any material uncertainties relating to events or conditions that, individually or collectively, may cast significant doubt on the group’s and the company’s ability to continue as a going concern for a period of at least twelve months from when the financial statements are authorised for issue.
In auditing the financial statements, we have concluded that the directors’ use of the going concern basis of accounting in the preparation of the financial statements is appropriate.
However, because not all future events or conditions can be predicted, this conclusion is not a guarantee as to the group’s and the company’s ability to continue as a going concern.
In relation to the directors’ reporting on how they have applied the UK Corporate Governance Code, we have nothing material to add or draw attention to in relation to the directors’ statement in the financial statements about whether the directors considered it appropriate to adopt the going concern basis of accounting.
Our responsibilities and the responsibilities of the directors with respect to going concern are described in the relevant sections of this report.
Reporting on other informationThe other information comprises all of the information in the Annual Report other than the financial statements and our auditors’ report thereon. The directors are responsible for the other information, which includes reporting based on the Task Force on Climate-related Financial Disclosures (TCFD) recommendations. Our opinion on the financial statements does not cover the other information and, accordingly, we do not express an audit opinion or, except to the extent otherwise explicitly stated in this report, any form of assurance thereon.
In connection with our audit of the financial statements, our responsibility is to read the other information and, in doing so, consider whether the other information is materially inconsistent with the financial statements or our knowledge obtained in the audit, or otherwise appears to be materially misstated. If we identify an apparent material inconsistency or material misstatement, we are required to perform procedures to conclude whether there is a material misstatement of the financial statements or a material misstatement of the other information. If, based on the work we have performed, we conclude that there is a material misstatement of this other information, we are required to report that fact. We have nothing to report based on these responsibilities.
With respect to the Strategic report and Directors’ report, we also considered whether the disclosures required by the UK Companies Act 2006 have been included.
Based on our work undertaken in the course of the audit, the Companies Act 2006 requires us also to report certain opinions and matters as described below.
Strategic report and Directors’ reportIn our opinion, based on the work undertaken in the course of the audit, the information given in the Strategic report and Directors’ report for the year ended 31 March 2022 is consistent with the financial statements and has been prepared in accordance with applicable legal requirements.
In light of the knowledge and understanding of the group and company and their environment obtained in the course of the audit, we did not identify any material misstatements in the Strategic report and Directors’ report.
Directors’ RemunerationIn our opinion, the part of the Annual Report on Remuneration to be audited has been properly prepared in accordance with the Companies Act 2006.
Corporate governance statementThe Listing Rules require us to review the directors’ statements in relation to going concern, longer-term viability and that part of the corporate governance statement relating to the company’s compliance with the provisions of the UK Corporate Governance Code specified for our review. Our additional responsibilities with respect to the corporate governance statement as other information are described in the Reporting on other information section of this report.
Johnson Matthey | Annual Report and Accounts 2022 145
FINA
NCIA
L STATEM
ENTS

Independent auditors’ report to the members of Johnson Matthey plc continued
Based on the work undertaken as part of our audit, we have concluded that each of the following elements of the corporate governance statement is materially consistent with the financial statements and our knowledge obtained during the audit, and we have nothing material to add or draw attention to in relation to:
• The directors’ confirmation that they have carried out a robust assessment of the emerging and principal risks;
• The disclosures in the Annual Report that describe those principal risks, what procedures are in place to identify emerging risks and an explanation of how these are being managed or mitigated;
• The directors’ statement in the financial statements about whether they considered it appropriate to adopt the going concern basis of accounting in preparing them, and their identification of any material uncertainties to the group’s and company’s ability to continue to do so over a period of at least twelve months from the date of approval of the financial statements;
• The directors’ explanation as to their assessment of the group’s and company’s prospects, the period this assessment covers and why the period is appropriate; and
• The directors’ statement as to whether they have a reasonable expectation that the company will be able to continue in operation and meet its liabilities as they fall due over the period of its assessment, including any related disclosures drawing attention to any necessary qualifications or assumptions.
Our review of the directors’ statement regarding the longer-term viability of the group was substantially less in scope than an audit and only consisted of making inquiries and considering the directors’ process supporting their statement; checking that the statement is in alignment with the relevant provisions of the UK Corporate Governance Code; and considering whether the statement is consistent with the financial statements and our knowledge and understanding of the group and company and their environment obtained in the course of the audit.
In addition, based on the work undertaken as part of our audit, we have concluded that each of the following elements of the corporate governance statement is materially consistent with the financial statements and our knowledge obtained during the audit:
• The directors’ statement that they consider the Annual Report, taken as a whole, is fair, balanced and understandable, and provides the information necessary for the members to assess the group’s and company’s position, performance, business model and strategy;
• The section of the Annual Report that describes the review of effectiveness of risk management and internal control systems; and
• The section of the Annual Report describing the work of the Audit Committee.
We have nothing to report in respect of our responsibility to report when the directors’ statement relating to the company’s compliance with the Code does not properly disclose a departure from a relevant provision of the Code specified under the Listing Rules for review by the auditors.
Responsibilities for the financial statements and the auditResponsibilities of the directors for the financial statementsAs explained more fully in the Statement of directors’ responsibilities in respect of the Annual Report and Accounts, the directors are responsible for the preparation of the financial statements in accordance with the applicable framework and for being satisfied that they give a true and fair view. The directors are also responsible for such internal control as they determine is necessary to enable the preparation of financial statements that are free from material misstatement, whether due to fraud or error.
In preparing the financial statements, the directors are responsible for assessing the group’s and the company’s ability to continue as a going concern, disclosing, as applicable, matters related to going concern and using the going concern basis of accounting unless the directors either intend to liquidate the group or the company or to cease operations, or have no realistic alternative but to do so.
Auditors’ responsibilities for the audit of the financial statementsOur objectives are to obtain reasonable assurance about whether the financial statements as a whole are free from material misstatement, whether due to fraud or error, and to issue an auditors’ report that includes our opinion. Reasonable assurance is a high level of assurance, but is not a guarantee that an audit conducted in accordance with ISAs (UK) will always detect a material misstatement when it exists. Misstatements can arise from fraud or error and are considered material if, individually or in the aggregate, they could reasonably be expected to influence the economic decisions of users taken on the basis of these financial statements.
Irregularities, including fraud, are instances of non-compliance with laws and regulations. We design procedures in line with our responsibilities, outlined above, to detect material misstatements in respect of irregularities, including fraud. The extent to which our procedures are capable of detecting irregularities, including fraud, is detailed below.
Based on our understanding of the group and industry, we identified that the principal risks of non-compliance with laws and regulations related to international tax regulations, environmental regulations, health and safety regulations (EHS), and anti bribery and corruption laws, and we considered the extent to which non-compliance might have a material effect on the financial statements. We also considered those laws and regulations that have a direct impact on the financial statements such as the Companies Act 2006. We evaluated management’s incentives and opportunities for fraudulent manipulation of the financial statements (including the risk of override of controls), and determined that the principal risks were related to posting inappropriate journal entries, management bias in accounting estimates, expected credit losses, timing of recognition of litigation provisions and metal gains and losses. The group engagement team shared this risk assessment with the component auditors so that they could include appropriate audit procedures in response to such risks in their work. Audit procedures performed by the group engagement team and/
Johnson Matthey | Annual Report and Accounts 2022146

Independent auditors’ report to the members of Johnson Matthey plc continued
or component auditors included:
• Discussions with management, internal audit and the group’s legal advisors, and the head of ethics and compliance including consideration of known or suspected instances of non-compliance with laws and regulations and fraud;
• Reading the minutes of board meetings and the Ethics Committee, and assessment of “Speak Up” matters through the ethics reporting line and the results of management’s investigation into these matters;
• Reviewing financial statement disclosures to supporting documentation to assess compliance with applicable laws and regulations;
• Challenging management’s significant judgements and estimates in particular those relating to the carrying value of goodwill, other intangibles and other assets, post-employment benefits, tax provisions, deferred tax assets, refining processes and stocktakes, climate change, metal accounting and provisions and contingent liabilities; and
• Identifying and testing manual journal entries, in particular any journal entries posted with unusual account combinations, and all material consolidation journals.
There are inherent limitations in the audit procedures described above. We are less likely to become aware of instances of non-compliance with laws and regulations that are not closely related to events and transactions reflected in the financial statements. Also, the risk of not detecting a material misstatement due to fraud is higher than the risk of not detecting one resulting from error, as fraud may involve deliberate concealment by, for example, forgery or intentional misrepresentations, or through collusion.
Our audit testing might include testing complete populations of certain transactions and balances, possibly using data auditing techniques. However, it typically involves selecting a limited number of items for testing, rather than testing complete populations. We will often seek to target particular items for testing based on their size or risk characteristics. In other cases, we will use audit sampling to enable us to draw a conclusion about the population from which the sample is selected.
A further description of our responsibilities for the audit of the financial statements is located on the FRC’s website at: www.frc.org.uk/auditorsresponsibilities. This description forms part of our auditors’ report.
Use of this reportThis report, including the opinions, has been prepared for and only for the company’s members as a body in accordance with Chapter 3 of Part 16 of the Companies Act 2006 and for no other purpose. We do not, in giving these opinions, accept or assume responsibility for any other purpose or to any other person to whom this report is shown or into whose hands it may come save where expressly agreed by our prior consent in writing.
Other required reporting
Companies Act 2006 exception reportingUnder the Companies Act 2006 we are required to report to you if, in our opinion:
• we have not obtained all the information and explanations we require for our audit; or• adequate accounting records have not been kept by the company, or returns adequate for
our audit have not been received from branches not visited by us; or• certain disclosures of directors’ remuneration specified by law are not made; or• the company financial statements and the part of the Annual Report on Remuneration to
be audited are not in agreement with the accounting records and returns.
We have no exceptions to report arising from this responsibility.
AppointmentFollowing the recommendation of the Audit Committee, we were appointed by the members on 18 July 2018 to audit the financial statements for the year ended 31 March 2019 and subsequent financial periods. The period of total uninterrupted engagement is four years, covering the years ended 31 March 2019 to 31 March 2022.
Other matterIn due course, as required by the Financial Conduct Authority Disclosure Guidance and Transparency Rule 4.1.14R, these financial statements will form part of the ESEF-prepared annual financial report filed on the National Storage Mechanism of the Financial Conduct Authority in accordance with the ESEF Regulatory Technical Standard (‘ESEF RTS’). This auditors’ report provides no assurance over whether the annual financial report will be prepared using the single electronic format specified in the ESEF RTS.
Mark Gill (Senior Statutory Auditor)for and on behalf of PricewaterhouseCoopers LLP Chartered Accountants and Statutory Auditors London
26 May 2022
Johnson Matthey | Annual Report and Accounts 2022 147
FINA
NCIA
L STATEM
ENTS

The notes on pages 154 to 213 form an integral part of the accounts.
Consolidated Income Statement for the year ended 31st March 2022
2022 2021 Notes £ million £ million*
Revenue 2,3 16,025 15,435 Cost of sales (14,971) (14,481)Gross profit 1,054 954 Distribution costs (101) (103)Administrative expenses (400) (377)Profit / (loss) on disposal of businesses 28 106 (1)Amortisation of acquired intangibles 4 (6) (10)Gains and losses on significant legal proceedings 4 42 – Major impairment and restructuring charges 6 (440) (154)Operating profit 2,4 255 309 Finance costs 8 (101) (158)Finance income 8 41 73 Profit before tax from continuing operations 195 224 Tax expense 9 (79) (30)Profit for the year from continuing operations 116 194 (Loss) / profit after tax from discontinued operations 27 (217) 11 (Loss) / profit for the year (101) 205
pence pence
(Loss) / earnings per ordinary share Basic 10 (52.6) 106.5 Diluted 10 (52.6) 106.4 Earnings per ordinary share from continuing operations Basic 10 60.9 100.9 Diluted 10 60.8 100.8
* Restated to reflect classification of the Health segment as discontinued operations (see note 27).
Johnson Matthey | Annual Report and Accounts 2022148

The notes on pages 154 to 213 form an integral part of the accounts.
Consolidated Statement of Total Comprehensive Income for the year ended 31st March 2022
2022 2021 Notes £ million £ million*
(Loss) / profit for the year (101) 205 Other comprehensive income Items that will not be reclassified to the income statement Remeasurements of post-employment benefit assets and liabilities 24 177 (141) Fair value (losses) / gains on equity investments at fair value through other comprehensive income (5) 5 Tax on items that will not be reclassified to the income statement1 (35) 28 Total items that will not be reclassified to the income statement 137 (108) Items that may be reclassified to the income statement Exchange differences on translation of foreign operations 26 75 (144) Exchange differences on translation of discontinued foreign operations 26, 27 5 (18) Amounts (charged) / credited to hedging reserve (36) 3 Fair value (losses) / gains on net investment hedges (2) 12 Tax on above items taken directly to or transferred from equity2 10 – Total items that may be reclassified to the income statement 52 (147) Other comprehensive income / (expense) for the year 189 (255) Total comprehensive income / (expense) for the year 88 (50) Total comprehensive income / (expense) for the year arises from:
Continuing operations 300 (43) Discontinued operations 27 (212) (7)
88 (50)
1. The tax (charge) / credit on other comprehensive income / (expense) of £(35) million (2021: £28 million) relates to remeasurements of post-employment benefit assets and liabilities. 2. The tax credit on other comprehensive income that may be reclassified to the income statement of £10 million (2021: £nil) relates to tax on amounts charged to hedging reserve and tax on exchange differences on translation of foreign operations.
* Restated to reflect classification of the Health segment as discontinued operations (see note 27).
Johnson Matthey | Annual Report and Accounts 2022 149
FINA
NCIA
L STATEM
ENTS

The notes on pages 154 to 213 form an integral part of the accounts.
Consolidated and Parent Company Balance Sheets as at 31st March 2022
Group Parent company 2022 2021 2022 2021 Notes £ million £ million £ million £ million
Assets Non-current assets Property, plant and equipment 11 1,238 1,424 322 307 Right-of-use assets 25 61 74 7 15 Goodwill 12 366 554 113 115 Other intangible assets 13 267 359 233 265 Investments in subsidiaries 14 – – 1,921 1,921 Investments in joint ventures and associates 2 2 – – Investments at fair value through other comprehensive income 30 45 53 – – Other receivables 17 42 50 1,598 1,315 Interest rate swaps 15 11 20 11 20 Deferred tax assets 23 98 140 2 52 Post-employment benefit net assets 24 352 194 351 186 Total non-current assets 2,482 2,870 4,558 4,196 Current assets Inventories 16 1,549 1,814 566 579 Current tax assets 18 13 31 – Trade and other receivables 17 1,796 2,422 1,941 2,297 Cash and cash equivalents 1 391 581 200 502 Interest rate swaps 15 1 – 1 – Other financial assets 18 27 44 27 45 Assets classified as held for sale 27 402 – 17 – Total current assets 4,184 4,874 2,783 3,423 Total assets 6,666 7,744 7,341 7,619
Group Parent company
2022 2021 2022 2021 Notes £ million £ million £ million £ million
Liabilities Current liabilities Trade and other payables 19 (2,563) (3,325) (4,258) (4,537)Lease liabilities 25 (10) (11) (3) (3)Current tax liabilities (97) (147) – (36)Cash and cash equivalents – bank overdrafts (37) (36) (34) (25)Borrowings and related swaps 20 (265) (26) (255) – Other financial liabilities 18 (44) (18) (46) (22)Provisions 22 (56) (35) (162) (187)Liabilities classified as held for sale 27 (80) – (5) – Total current liabilities (3,152) (3,598) (4,763) (4,810)Non-current liabilities Borrowings and related swaps 20 (899) (1,252) (899) (1,252)Lease liabilities 25 (40) (51) (7) (13)Deferred tax liabilities 23 (18) (28) – – Interest rate swaps 15 (2) – (2) – Employee benefit obligations 24 (72) (98) (27) (14)Other financial liabilities 18 (12) – (12) – Provisions 22 (28) (27) (16) (18)Other payables 19 (2) (5) (268) (268)Total non-current liabilities (1,073) (1,461) (1,231) (1,565)Total liabilities (4,225) (5,059) (5,994) (6,375)Net assets 2,441 2,685 1,347 1,244 Equity Share capital 26 218 221 218 221 Share premium 148 148 148 148 Shares held in employee share ownership trust (ESOT) (24) (29) (24) (29)Other reserves 26 50 – (19) 4 Retained earnings1 2,049 2,345 1,024 900 Total equity 2,441 2,685 1,347 1,244
1. The parent company’s profit for the year is £334 million (2021: £60 million).
The accounts were approved by the Board of Directors on 26th May 2022 and signed on its behalf by:
LL CCoonnddoonn SS OOxxlleeyy Directors
Johnson Matthey | Annual Report and Accounts 2022150

The notes on pages 154 to 213 form an integral part of the accounts.
Consolidated Cash Flow Statement for the year ended 31st March 2022
2022 2021
Notes £ million £ million*
Cash flows from operating activities Profit before tax from continuing operations 195 224 (Loss) / profit before tax from discontinued operations 27 (239) 14 Adjustments for: (Profit) / loss on disposal of businesses 28 (106) 1 Depreciation 151 158 Amortisation 39 32 Impairment losses 632 122 Loss on sale of non-current assets 2 4 Share-based payments 8 9 Decrease in inventories 123 19 Decrease / (increase) in receivables 588 (430)(Decrease) / increase in payables (783) 607 Increase in provisions 25 41 Contributions in excess of employee benefit obligations charge (2) (7)Changes in fair value of financial instruments 19 (45)Net finance costs 60 85 Income tax paid (107) (65)Net cash inflow from operating activities 605 769 Cash flows from investing activities Interest received 32 66 Purchases of property, plant and equipment (358) (304)Purchases of intangible assets (95) (77)Proceeds from sale of non-current assets 1 5 Net proceeds from sale of businesses 160 19 Net cash outflow from investing activities (260) (291)
2022 2021
Notes £ million £ million*
Cash flows from financing activities Purchase of treasury shares 26 (155) – Proceeds from borrowings 9 368 Repayment of borrowings (140) (298) Dividends paid to equity shareholders 26 (139) (99) Interest paid (111) (159) Principal element of lease payments (14) (14) Net cash outflow from financing activities (550) (202) Change in cash and cash equivalents (205) 276 Exchange differences on cash and cash equivalents 6 (4) Cash and cash equivalents at beginning of year 545 273 Cash and cash equivalents at end of year 346 545 Cash and deposits 254 119 Money market funds 137 462 Bank overdrafts (37) (36) Bank overdrafts transferred to liabilities classified as held for sale 27 (8) – Cash and cash equivalents 346 545
* For cash flows of discontinued operations see note 27.
Johnson Matthey | Annual Report and Accounts 2022 151
FINA
NCIA
L STATEM
ENTS

The notes on pages 154 to 213 form an integral part of the accounts.
Consolidated Statement of Changes in Equity for the year ended 31st March 2022
Share
capital
Share premium
account
Shares held in
ESOT
Other reserves
(note 26) Retained earnings
Total equity
£ million £ million £ million £ million £ million £ million
At 1st April 2020 221 148 (32) 142 2,345 2,824 Profit for the year – – – – 205 205 Remeasurements of post-employment benefit assets and liabilities – – – – (141) (141)Fair value gains on investments at fair value through other comprehensive income – – – 5 – 5 Exchange differences on translation of foreign operations – – – (162) – (162)Amounts credited to hedging reserve – – – 3 – 3 Fair value gains on net investment hedges taken to equity – – – 12 – 12 Tax on other comprehensive income – – – – 28 28 Total comprehensive (expense) / income – – – (142) 92 (50)Dividends paid (note 26) – – – – (99) (99)Share-based payments – – – – 16 16 Cost of shares transferred to employees – – 3 – (10) (7)Tax on share-based payments – – – – 1 1 At 31st March 2021 221 148 (29) – 2,345 2,685 Loss for the year – – – – (101) (101)Remeasurements of post-employment benefit assets and liabilities – – – – 177 177 Fair value losses on investments at fair value through other comprehensive income – – – (5) – (5)Exchange differences on translation of foreign operations – – – 80 – 80 Amounts charged to hedging reserve – – – (36) – (36)Fair value losses on net investment hedges taken to equity – – – (2) – (2)Tax on other comprehensive income – – – 10 (35) (25)Total comprehensive income – – – 47 41 88 Dividends paid (note 26) – – – – (139) (139)Purchase of treasury shares (note 26) (3) – – 3 (200) (200)Share-based payments – – – – 15 15 Cost of shares transferred to employees – – 5 – (13) (8)At 31st March 2022 218 148 (24) 50 2,049 2,441
Johnson Matthey | Annual Report and Accounts 2022152

The notes on pages 154 to 213 form an integral part of the accounts.
Parent Company Statement of Changes in Equity for the year ended 31st March 2022
Share
capital
Share premium
account
Shares held in
ESOT
Other reserves
(note 26) Retained earnings
Total equity
£ million £ million £ million £ million £ million £ million
At 1st April 2020 221 148 (32) 10 1,041 1,388 Profit for the year – – – – 60 60 Remeasurements of post-employment benefit assets and liabilities – – – – (135) (135) Impairment losses on equity investments through other comprehensive income – – – (3) – (3) Amounts charged to hedging reserve – – – (3) – (3) Tax on other comprehensive income – – – – 26 26 Total comprehensive income – – – (6) (49) (55) Dividends paid (note 26) – – – – (99) (99) Share-based payments – – – – 15 15 Cost of shares transferred to employees – – 3 – (9) (6) Tax on share-based payments – – – – 1 1 At 31st March 2021 221 148 (29) 4 900 1,244 Profit for the year – – – – 334 334 Remeasurements of post-employment benefit assets and liabilities – – – – 156 156 Amounts charged to hedging reserve – – – (34) – (34) Tax on other comprehensive income / (expense) – – – 8 (30) (22) Total comprehensive (expense) / income – – – (26) 460 434 Dividends paid (note 26) – – – – (139) (139) Purchase of treasury shares (note 26) (3) – – 3 (200) (200) Share-based payments – – – – 11 11 Cost of shares transferred to employees – – 5 – (8) (3) At 31st March 2022 218 148 (24) (19) 1,024 1,347
Johnson Matthey | Annual Report and Accounts 2022 153
FINA
NCIA
L STATEM
ENTS

Notes on the Accounts for the year ended 31st March 2022
1 Accounting policies The Company and the Group Johnson Matthey plc (the ‘Company’) is a public company limited by shares incorporated under the Companies Act 2006 and domiciled in England in the United Kingdom. The consolidated accounts of the company for the year ended 31st March 2022 consist of the audited consolidation of the accounts of the Company and its subsidiaries (together referred to as the ‘Group’), together with the employee share ownership trust and the group’s interest in joint ventures and associates.
Basis of accounting and preparation – group On 31st December 2020, IFRS as adopted by the European Union at that date was brought into UK law and became UK-adopted International Accounting Standards, with future changes being subject to endorsement by the UK Endorsement Board. The group transitioned to UK-adopted International Accounting Standards in its consolidated financial statements on 1st April 2021. This change constitutes a change in accounting framework. However, there is no impact on recognition, measurement or disclosure in the period reported as a result of the change in framework.
The financial statements of the group have been prepared in accordance with UK-adopted International Accounting Standards and with the requirements of the Companies Act 2006 as applicable to companies reporting under those standards.
The accounts are prepared on the historical cost basis, except for certain assets and liabilities which are measured at fair value as explained below.
The group accounts comprise the accounts of the parent company and its subsidiaries, including the employee share ownership trust, and include the group’s interest in joint ventures and associates. Entities the group controls are accounted for as subsidiaries. Entities that are joint ventures or associates are accounted for using the equity method of accounting. Transactions and balances between group companies are eliminated. No profit is recognised on transactions between group companies.
The results of businesses acquired or disposed of in the year are consolidated from or up to the effective date of acquisition or disposal, respectively. The net assets of businesses acquired are recognised in the consolidated accounts at their fair values at the date of acquisition.
Going concern As at 31st March 2022, the group maintains a strong balance sheet with around £1.5 billion of available cash and undrawn committed facilities. Cash generation was strong during the period with free cash flow of £221 million. Net debt increased by £86 million since 31st March 2021 to £856 million (excluding Health) driven by the share buyback and repayment of metal leases. Net debt (including post tax pension deficits) to EBITDA, was below our target range at 1.2 times.
The group has a robust funding position comprising a range of long-term debt and a committed revolving credit facility (RCF). In March 2022, the group signed agreements for £667 million of additional long-term debt and extended the RCF for a further year to 2027. At 31st March 2022 none of these were drawn and there was £137 million of cash held in money market funds.
The recent financing in March covers debt maturing in the period to 2024, around £400 million, which has been included in our going concern modelling. As a long time, highly rated issuer in the US private placement market, the group expects to be able to access further additional funding in its existing markets should it need to. The group also has a number of additional sources of funding available including uncommitted lease facilities that support precious metal funding. Whilst we would fully expect to be able to utilise the metal lease facilities, they are excluded from our going concern modelling.
The review of going concern used both a base case and severe but plausible downside case to stress test key assumptions. The severe but plausible scenario also considered the impact from carbon pricing costs, metal price volatility and increases in the amount of metal that we hold. Whilst the combined impact would reduce profitability and increase debt against our latest forecast, our balance sheet remains strong, and the group maintains sufficient liquidity throughout the period of assessment without the use of mitigating actions. Applying a significant economic slowdown scenario to the base case scenario generates a severe but plausible case scenario. At a macro level, we have used forecasts from a range of external parties together with our own insights into expected volumes to derive the scenarios.
Clean Air For Clean Air, the base case assumes that supply chain disruption and shortage ease through the second half of the financial year, supported by demand from Asia and US markets.
In our severe but plausible case scenario, we test the impact of a slower recovery from reduced vehicle production and/or market/consumer demand disruption and/or a greater share of zero emission vehicles in the market, assumed to result in a 10% drop in sales.
Efficient Natural Resources For purposes of assessing going concern, the base case forecast for Efficient Natural Resources had lower operating profit compared to year end 31st March 2022 driven by assuming increased inflation, lower metal prices, and lower trading associated with Russia’s war in Ukraine. Under a severe but plausible scenario a slower recovery is assumed in our end customers’ markets.
Conclusion Under all scenarios above, the group has sufficient headroom against committed facilities and key financial covenants are not in breach during the going concern period.
We are entering a period of greater political and economic uncertainty with both the ongoing disruptive effects of COVID-19, impacts of the war in Ukraine and a potential recession. To give further assurance on liquidity, we have also undertaken a reverse stress test to identify what additional or alternative scenarios and circumstances would threaten our current financing arrangements. This shows that we have headroom against a further decline in profitability beyond the severe-but-plausible scenario or a significant increase in borrowings. Furthermore, the group has a range of levers which it could utilise to protect headroom including reducing capital expenditure, renegotiating payment terms and reducing future dividend distributions.
Johnson Matthey | Annual Report and Accounts 2022154

Notes on the Accounts continued
1 Accounting policies (continued) Basis of preparation (continued) Conclusion (continued) The directors are therefore of the opinion that the group and the company have adequate resources to fund its operations for the period of at least twelve months from the date of approving these financial statements and so it is appropriate to prepare the accounts on a going concern basis.
Basis of accounting and preparation – parent company The accounts are prepared on a going concern basis in accordance with Financial Reporting Standard (FRS) 101, Reduced Disclosure Framework, issued in September 2015 and the Companies Act 2006 applicable to companies reporting under FRS 101. The parent company applies the recognition, measurement and disclosure requirements of international accounting standards in conformity with the requirements of the Companies Act 2006, but makes amendments where necessary to comply with the Act and has set out below the FRS 101 disclosure exemptions taken by the parent company:
• the requirements of paragraphs 45(b) and 46 to 52 of IFRS 2, Share-based Payment; • the requirements of IFRS 7, Financial Instruments: Disclosures; • the requirements of paragraphs 91 to 99 of IFRS 13, Fair Value Measurement; • the requirements of the second sentence of paragraph 110 and paragraphs 113(a), 114, 115,
118, 119(a) to (c), 120 to 127 and 129 of IFRS 15, Revenue from Contracts with Customers; • the requirement in paragraph 38 of IAS 1, Presentation of Financial Statements, to present
comparative information in respect of: paragraph 73(e) of IAS 16, Property, Plant and Equipment; and paragraph 118(e) of IAS 38, Intangible Assets;
• the requirements of paragraphs 10(d), 38A, 38B, 40A, 40B, 40C, 40D, 111 and 134 to 136 of IAS 1, Presentation of Financial Statements;
• the requirements of IAS 7, Statement of Cash Flows; • the requirements of paragraphs 30 and 31 of IAS 8, Accounting Policies, Changes in
Accounting Estimates and Errors; • the requirements of paragraph 17 of IAS 24, Related Party Disclosures; • the requirements in IAS 24, Related Party Disclosures, to disclose related party transactions
entered into between two or more members of a group, provided that any subsidiary which is a party to the transaction is wholly owned by such a member; and
• the requirements of paragraphs 130(f)(ii), 130(f)(iii), 134(d), 134(f) and 135(c) to 135(e) of IAS 36, Impairment of Assets.
The accounts are prepared on the historical cost basis, except for certain assets and liabilities which are measured at fair value as explained below.
The parent company has not presented its own income statement, statement of total comprehensive income and related notes as permitted by Section 408(3) of the Companies Act 2006. Profit for the year is disclosed in the parent company balance sheet and statement of changes in equity.
In the parent company balance sheet, businesses acquired from other group companies are recognised at book value at the date of acquisition. The difference between the consideration paid and the book value of the net assets acquired is reflected in retained earnings.
Significant accounting policies The group’s and parent company’s accounting policies have been applied consistently during the current and prior year, other than where new policies have been adopted (see below). The group’s and parent company’s significant accounting policies are as follows:
Revenue Revenue represents income derived from contracts for the provision of goods and services by the parent company and its subsidiaries to customers in exchange for consideration in the ordinary course of the group’s activities.
Performance obligations Upon approval by the parties to a contract, the contract is assessed to identify each promise to transfer either a distinct good or service or a series of distinct goods or services that are substantially the same and have the same pattern of transfer to the customer. Goods and services are distinct and accounted for as separate performance obligations in the contract if the customer can benefit from them either on their own or together with other resources that are readily available to the customer and they are separately identifiable in the contract.
The group typically sells licences of its intellectual property together with other goods and services and, since these licences are not generally distinct in the context of the contract, revenue recognition is considered at the level of the performance obligation of which the licence forms part. Revenue in respect of performance obligations containing bundles of goods and services in which a licence with a sales or usage-based royalty is the predominant item is recognised when sales or usage occur.
Transaction price At the start of the contract, the total transaction price is estimated as the amount of consideration to which the group expects to be entitled in exchange for transferring the promised goods and services to the customer, excluding sales taxes. Variable consideration, such as trade discounts, is included based on the expected value or most likely amount only to the extent that it is highly probable that there will not be a reversal in the amount of cumulative revenue recognised. The transaction price does not include estimates of consideration resulting from contract modifications until they have been approved by the parties to the contract. The total transaction price is allocated to the performance obligations identified in the contract in proportion to their relative stand-alone selling prices. Many of the group’s and parent company’s products and services are bespoke in nature and, therefore, stand-alone selling prices are estimated based on cost plus margin or by reference to market data for similar products and services.
Johnson Matthey | Annual Report and Accounts 2022 155
FINA
NCIA
L STATEM
ENTS

Notes on the Accounts continued
1 Accounting policies (continued) Significant accounting policies (continued) Revenue recognition Revenue is recognised as performance obligations are satisfied as control of the goods and services is transferred to the customer.
For each performance obligation within a contract, the group and parent company determine whether it is satisfied over time or at a point in time. Performance obligations are satisfied over time if one of the following criteria is satisfied:
• the customer simultaneously receives and consumes the benefits provided by the group’s and parent company’s performance as they perform;
• the group’s and parent company’s performance creates or enhances an asset that the customer controls as the asset is created or enhanced; or
• the group’s and parent company’s performance does not create an asset with an alternative use to the group and parent company and they have an enforceable right to payment for performance completed to date.
For more detail of our revenue recognition policy see note 3.
In the event that the group and parent company enter into bill-and-hold transactions at the specific request of customers, revenue is recognised when the goods are ready for transfer to the customer and when the group and parent company are no longer capable of directing those goods to another use.
Revenue includes sales of precious metal to customers and the precious metal content of products sold to customers.
Linked contracts under which the group and parent company sell or buy precious metal and commit to repurchase or sell the metal in the future are accounted for as finance transactions and no revenue is recognised in respect of the sale leg.
No revenue is recognised by the group or parent company in respect of non-monetary exchanges of precious metal on the basis that the counterparties are in the same line of business.
Consideration payable to customers Consideration payable to customers in advance of the recognition of revenue in respect of the goods and services to which it relates is capitalised and recognised as a deduction to the revenue recognised upon transfer of the goods and services to the customer.
Costs to fulfil a contract Contract fulfilment costs in respect of over time contracts are expensed as incurred. Contract fulfilment costs in respect of point in time contracts are accounted for under IAS 2, Inventories.
Contract receivables Contract receivables represent amounts for which the group and parent company have an unconditional right to consideration in respect of unbilled revenue recognised at the balance sheet date.
Contract liabilities Contract liabilities represent the obligation to transfer goods or services to a customer for which consideration has been received, or consideration is due, from the customer.
Foreign currencies Foreign currency transactions are recorded in the functional currency of the relevant subsidiary, joint venture, associate or branch at the exchange rate at the date of the transaction. Foreign currency monetary assets and liabilities are retranslated into the relevant functional currency at the exchange rate at the balance sheet date.
Income statements and cash flows of overseas subsidiaries, joint ventures, associates and branches are translated into sterling at the average rates for the year. Balance sheets of overseas subsidiaries, joint ventures, associates and branches, including any fair value adjustments and related goodwill, are translated into sterling at the exchange rates at the balance sheet date.
Exchange differences arising on the translation of the net investment in overseas subsidiaries, joint ventures, associates and branches, less exchange differences arising on related foreign currency financial instruments which hedge the group’s net investment in these operations, are taken to other comprehensive income. On disposal of the net investment, the cumulative exchange difference is reclassified from equity to operating profit.
Other exchange differences are recognised in operating profit.
Finance costs and finance income Finance costs that are directly attributable to the construction of an asset that necessarily takes a substantial period of time to get ready for its intended use are capitalised as part of the cost of that asset. Other finance costs and finance income are recognised in the income statement in the year incurred.
Research and development Research expenditure is charged to the income statement in the year incurred. Development expenditure is charged to the income statement in the year incurred unless it meets the recognition criteria for capitalisation. When the recognition criteria have been met, any further development expenditure is capitalised as an intangible asset.
Property, plant and equipment Property, plant and equipment is stated at cost less accumulated depreciation and any provisions for impairment. Depreciation is provided at rates calculated to write-off the cost less estimated residual value of each asset over its useful life. Certain buildings and plant and equipment are depreciated using the units of production method as this more closely reflects their expected consumption. All other assets are depreciated using the straight-line method. The useful lives vary according to the class of the asset, but are typically:
• buildings – 30 years; and • plant and machinery – 4 to 10 years. • land is not depreciated.
Johnson Matthey | Annual Report and Accounts 2022156

Notes on the Accounts continued
1 Accounting policies (continued) Significant accounting policies (continued) Goodwill and other intangible assets Goodwill arises on the acquisition of a business when the fair value of the consideration exceeds the fair value attributed to the net assets acquired (including contingent liabilities). It is subject to annual impairment reviews. Acquisition-related costs are charged to the income statement as incurred. The group and parent company have taken advantage of the exemption allowed under IFRS 1 and, therefore, goodwill arising on acquisitions made before 1st April 2004 is included at the carrying amount at that date less any subsequent impairments.
Other intangible assets are stated at cost less accumulated amortisation and any provisions for impairment. Customer contracts are amortised when the relevant income stream occurs. All other intangible assets are amortised by using the straight-line method over the useful lives from the time they are first available for use. The estimated useful lives vary according to the specific asset, but are typically:
• customer contracts and relationships – 1 to 15 years; • capitalised computer software – 3 to 10 years; • patents, trademarks and licences – 3 to 20 years; • acquired research and technology – 4 to 10 years; and • capitalised development currently being amortised – 3 to 8 years.
Intangible assets which are not yet being amortised are subject to annual impairment reviews.
Investments in subsidiaries Investments in subsidiaries are stated in the parent company’s balance sheet at cost less any provisions for impairment. If a distribution is received from a subsidiary, the investment in that subsidiary is assessed for an indication of impairment.
Leases Leases are recognised as a right-of-use asset, together with a corresponding lease liability, at the date at which the leased asset is available for use.
The right-of-use asset is initially measured at cost, which comprises the initial value of the lease liability, lease payments made (net of any incentives received from the lessor) before the commencement of the lease, initial direct costs and restoration costs. The right-of-use asset is depreciated on a straight-line basis over the shorter of the asset’s useful life and the lease term in operating profit.
The lease liability is initially measured as the present value of future lease payments discounted using the interest rate implicit in the lease or, where this rate is not determinable, the group’s incremental borrowing rate, which is the interest rate the group would have to pay to borrow the amount necessary to obtain an asset of similar value in a similar economic environment with similar terms and conditions. Interest is charged to finance costs at a constant rate of interest on the outstanding lease liability over the lease term.
Payments in respect of short-term leases, low-value leases and precious metal leases are charged to the income statement on a straight-line basis over the lease term in operating profit.
The group leases precious metals to fund temporary peaks in metal requirements provided market conditions allow. These leases are from banks for specified periods (less than 12 months) and the group pays a fee which is expensed on a straight-line basis over the lease term in finance costs. The group holds sufficient precious metal inventories to meet all the obligations under these lease arrangements as they fall due.
Inventories Precious metal Inventories of gold, silver and platinum group metals are valued according to the source from which the metal is obtained. Metal which has been purchased and committed to future sales to customers is valued at the price at which it is contractually committed, adjusted for unexpired contango and backwardation. Other precious metal inventories owned by the group, which are unhedged, are valued at the lower of cost and net realisable value using the weighted average cost formula.
Other Non-precious metal inventories are valued at the lower of cost, including attributable overheads, and net realisable value. Except where costs are specifically identified, the first-in, first-out cost formula is used to value inventories.
Cash and cash equivalents Cash and deposits comprise cash at bank and in hand and short-term deposits with a maturity date of three months or less from the date of acquisition. Money market funds comprise investments in funds that are subject to an insignificant risk of changes in fair value. The group and parent company routinely use short-term bank overdraft facilities, which are repayable on demand, as an integral part of their cash management policies and, therefore, cash and cash equivalents include cash and deposits, money market funds and bank overdrafts. Offset arrangements across group businesses have been applied to arrive at the net cash and overdraft figures.
At 31st March 2022 cash and cash equivalents includes £111 million (31st March 2021: £nil) of restricted amounts relating to cash held in South Africa. The cash has been restricted as a result of a change in company residency status. The group anticipates extracting and/or utilising this in the near term and is reviewing options.
Financial instruments Investments and other financial assets The group and parent company classify their financial assets in the following measurement categories:
• those measured at fair value either through other comprehensive income or through profit or loss; and
• those measured at amortised cost.
Johnson Matthey | Annual Report and Accounts 2022 157
FINA
NCIA
L STATEM
ENTS

Notes on the Accounts continued
1 Accounting policies (continued) Financial instruments (continued) Investments and other financial assets (continued) At initial recognition, the group and parent company measure financial assets at fair value plus, in the case of financial assets not measured at fair value through profit or loss, transaction costs that are directly attributable to their acquisition.
The group and parent company subsequently measure equity investments at fair value and have elected to present fair value gains and losses on equity investments in other comprehensive income. There is, therefore, no subsequent reclassification of cumulative fair value gains and losses to profit or loss following disposal of the investments.
The group and parent company subsequently measure trade and other receivables and contract receivables at amortised cost, with the exception of trade receivables that have been designated as at fair value through other comprehensive income because the group has certain operations with business models to hold trade receivables for collection or sale. All other financial assets, including short-term receivables, are measured at amortised cost less any impairment provision.
For the impairment of trade and contract receivables, the group and parent company apply the simplified approach permitted by IFRS 9, Financial Instruments, which requires expected lifetime losses to be recognised from initial recognition.
Derivative financial instruments The group and parent company use derivative financial instruments, in particular forward currency contracts, currency swaps, interest rate swaps and commodity derivatives to manage the financial risks associated with their underlying business activities and the financing of those activities. The group and parent company do not undertake any speculative trading activity in derivative financial instruments.
Derivative financial instruments are measured at their fair value. Derivative financial instruments may be designated at inception as fair value hedges, cash flow hedges or net investment hedges if appropriate. For currency swaps designated as instruments in cash flow or net investment hedging relationships, the impact from currency basis spreads is included in the hedge relationship and may be a source of ineffectiveness recognised in the income statement.
Derivative financial instruments which are not designated as hedging instruments are classified as at fair value through profit or loss, but are used to manage financial risk. Changes in the fair value of any derivative financial instruments that are not designated as, or are not determined to be, effective hedges are recognised immediately in the income statement. The vast majority of forward precious metal price contracts are entered into and held for the receipt or delivery of precious metal and, therefore, are not recorded at fair value.
Cash flow hedges Changes in the fair value of derivative financial instruments designated as cash flow hedges are recognised in other comprehensive income to the extent that the hedges are effective. Ineffective portions are recognised in the income statement immediately. If the hedged item results in the recognition of a non-financial asset or liability, the amount previously recognised in other comprehensive income is transferred out of equity and included in the initial carrying amount of the asset or liability. Otherwise, the amount previously recognised in other comprehensive income is transferred to the income statement in the same period that the hedged item is recognised in the income statement. If the hedging instrument expires or is sold, terminated or exercised or the hedge no longer meets the criteria for hedge accounting, amounts previously recognised in other comprehensive income remain in equity until the forecast transaction occurs. If a forecast transaction is no longer expected to occur, the amounts previously recognised in other comprehensive income are transferred to the income statement. If a forward precious metal price contract will be settled net in cash, it is designated and accounted for as a cash flow hedge.
Fair value hedges Changes in the fair value of derivative financial instruments designated as fair value hedges are recognised in the income statement, together with the related changes in the fair value of the hedged asset or liability. Fair value hedge accounting is discontinued if the hedging instrument expires or is sold, terminated or exercised or the hedge no longer meets the criteria for hedge accounting.
Net investment hedges For hedges of net investments in foreign operations, the effective portion of the gain or loss on the hedging instrument is recognised in other comprehensive income, while the ineffective portion is recognised in the income statement. Amounts taken to other comprehensive income are reclassified from equity to the income statement when the foreign operations are sold or liquidated.
Financial liabilities Borrowings are measured at amortised cost. Those borrowings designated as being in fair value hedge relationships are remeasured for the fair value changes in respect of the hedged risk with these changes recognised in the income statement. All other financial liabilities, including short-term payables, are measured at amortised cost.
Precious metal sale and repurchase agreements The group and parent company undertake linked contracts to sell or buy precious metal and commit to repurchase or sell the metal in the future. An asset representing the metal which the group and parent company have committed to sell or a liability representing the obligation to repurchase the metal are recognised in trade and other receivables or trade and other payables, respectively.
Johnson Matthey | Annual Report and Accounts 2022158

Notes on the Accounts continued
1 Accounting policies (continued) Taxation Current and deferred tax are recognised in the income statement, except when they relate to items recognised directly in equity, in which case the related tax is also recognised in equity.
Current tax is the amount of income tax expected to be paid in respect of taxable profits using the tax rates that have been enacted or substantively enacted at the balance sheet date.
Deferred tax is provided in full, using the liability method, on temporary differences arising between the tax bases of assets and liabilities and their carrying amounts in the balance sheet. It is provided using the tax rates that are expected to apply in the period when the asset or liability is settled, based on tax rates that have been enacted or substantively enacted at the balance sheet date.
Deferred tax assets are recognised to the extent that it is probable that future taxable profits will be available against which the temporary differences can be utilised. No deferred tax asset or liability is recognised in respect of temporary differences associated with investments in subsidiaries and branches where the group is able to control the timing of the reversal of the temporary difference and it is probable that the temporary difference will not reverse in the foreseeable future.
Provisions and contingencies Provisions are recognised when the group has a present obligation as a result of a past event and a reliable estimate can be made of a probable adverse outcome, for example warranties, environmental claims and restructuring. Otherwise, material contingent liabilities are disclosed unless the probability of the transfer of economic benefits is remote. Contingent assets are only disclosed if an inflow of economic benefits is virtually certain.
The parent company considers financial guarantees of its subsidiaries’ borrowings and precious metal leases to be insurance contracts.
Share-based payments and employee share ownership trust (ESOT) The fair value of shares awarded to employees under the performance share plan, restricted share plan, long term incentive plan and deferred bonus plan is calculated by adjusting the share price on the date of allocation for the present value of the expected dividends that will not be received. The resulting cost is charged to the income statement over the relevant performance periods, adjusted to reflect actual and expected levels of vesting where appropriate.
The group and parent company provide finance to the ESOT to purchase company shares in the open market. Costs of running the ESOT are charged to the income statement. The cost of shares held by the ESOT is deducted in arriving at equity until they vest unconditionally with employees.
Post-employment benefits The costs of defined contribution plans are charged to the income statement as they fall due.
For defined benefit plans, the group and parent company recognise the net assets or liabilities of the plans in their balance sheets. Assets are measured at their fair value at the balance sheet date. Liabilities are measured at present value using the projected unit credit method and a discount rate
reflecting yields on high quality corporate bonds. The changes in plan assets and liabilities, based on actuarial advice, are recognised as follows:
• The current service cost is deducted in arriving at operating profit. • The net interest cost, based on the discount rate at the beginning of the year, contributions paid
in and the present value of the net defined benefit liabilities during the year, is included in finance costs.
• Past service costs and curtailment gains and losses are recognised in operating profit at the earlier of when the plan amendment or curtailment occurs and when any related restructuring costs or termination benefits are recognised.
• Gains or losses arising from settlements are included in operating profit when the settlement occurs.
• Remeasurements, representing returns on plan assets, excluding amounts included in interest, and actuarial gains and losses arising from changes in financial and demographic assumptions, are recognised in other comprehensive income.
Assets held for sale and discontinued operations Non-current assets and disposal groups are classified as held for sale, if available for sale in its present condition and a sale is considered highly probable within 12 months. They are measured at the lower of their carrying amount and fair value less costs to sell. Assets and liabilities classified as held for sale are presented separately on the Balance Sheet. The assets are not depreciated or amortised while they are classified as held for sale.
An impairment loss is recognised in the Income Statement for any initial or subsequent write-down of the asset or disposal group to fair value less costs to sell. A gain is recognised for any subsequent increases in fair value less costs to sell of an asset or disposal group, but not in excess of any cumulative impairment loss previously recognised. A gain or loss not previously recognised by the date of the sale of the non-current asset (or disposal group) is recognised at the date of de-recognition.
A discontinued operation is a component of the group’s business that either has been disposed of, or that is classified as held for sale and represents a separate major line of business or geographical area of operations, is part of a single co-ordinated plan to dispose of a separate major line of business or geographical area of operations or is a subsidiary acquired exclusively with a view to resale.
Classification as a discontinued operation occurs at the earlier of disposal or when the operation meets the criteria to be classified as held for sale. The results of discontinued operations are presented separately in the Income Statement. When an operation is classified as a discontinued operation, the comparative Income Statement and Statement of Total Comprehensive Income is restated as if the operation had been discontinued from the start of the comparative year.
Sources of estimation uncertainty Determining the carrying amounts of certain assets and liabilities at the balance sheet date requires estimation of the effects of uncertain future events. In the event that actual outcomes differ from those estimated, there may be an adjustment to the carrying amounts of those assets and liabilities within the next financial year. Other significant risks of material adjustment are the valuation of the liabilities of the defined benefit pension plans and tax provisions.
Johnson Matthey | Annual Report and Accounts 2022 159
FINA
NCIA
L STATEM
ENTS
Notes on the Accounts continued
1 Accounting policies (continued) Sources of estimation uncertainty (continued) The group and parent company have considered the refining process and stocktakes and provisions and contingent liabilities and, whilst not deemed to represent a significant risk of material adjustment to the group’s and parent company’s financial position during the year ending 31st March 2022, represent important accounting estimates.
Goodwill, other intangibles and other assets The group and parent company have significant intangible assets from both business acquisitions and investments in new products and technologies. Some of those acquisitions and investments are at an early stage of commercial development and, therefore, carry a greater risk that they will not be commercially viable. Goodwill and intangible assets not yet ready for use are not amortised, but are subject to annual impairment reviews. Other intangible assets are amortised from the time they are first ready for use and, together with other assets, are assessed for impairment when there is a triggering event that provides evidence that they are impaired.
The impairment reviews require the use of estimates of future profit and cash generation based on financial budgets and plans approved by management, generally covering a three-year period and then extrapolated using long term growth rates, and the pre-tax discount rates used in discounting projected cash flows.
Post-employment benefits The group’s and parent company’s defined benefit plans are assessed annually by qualified independent actuaries. The estimate of the liabilities of the plans is based on a number of actuarial assumptions.
There is a range of possible values for each actuarial assumption and the point within that range is estimated to most appropriately reflect the group’s and parent company’s circumstances. Small changes in these assumptions can have a significant impact on the estimate of the liabilities of the plans. A description of those discount rate and inflation assumptions, together with sensitivity analysis, is set out in note 24 to the group and parent company accounts.
Tax provisions Tax provisions are determined based on the tax laws and regulations that apply in each of the jurisdictions in which the group operates. Tax provisions are recognised where the impact of those laws and regulations is unclear and it is probable that there will be a tax adjustment representing a future outflow of funds to a tax authority or a consequent adjustment to the carrying value of a tax asset.
Provisions are measured using the best estimate of the most likely amount, being the most likely amount in a range of possible outcomes. The resolution of tax positions taken by the group can take a considerable period of time to conclude and, in some cases, it is difficult to predict the outcome. Group current income tax liabilities at 31st March 2022 of £97 million (2021: £147 million) include tax provisions of £103 million (2021: £102 million) and the estimation of the range of possible outcomes is an increase in those liabilities by £83 million (2021: £97 million) to a
decrease of £93 million (2021: £78 million). The estimates made reflect where the group faces routine tax audits or is in ongoing disputes with tax authorities; has identified potential tax exposures relating to transfer pricing; or is contesting the tax deductibility of certain business costs.
Deferred tax assets Deferred tax assets are recognised to the extent it is probable that future taxable profits will be available, against which the deductible temporary difference can be utilised, based on management’s assumptions relating to future taxable profits.
Determination of future taxable profits requires application of judgement and estimates, including: market share, expected changes to selling prices, product profitability, precious metal prices and other direct input costs, based on management’s expectations of future changes in the markets using external sources of information where appropriate. The estimates take account of the inherent uncertainties, constraining the expected level of profit as appropriate. Changes in these estimates will affect future profits and therefore the recoverability of the deferred tax assets.
Refining process and stocktakes The group’s and parent company’s refining businesses process significant quantities of precious metal and there are uncertainties regarding the actual amount of metal in the refining system at any one time. The group’s refining businesses process over five million ounces of platinum group metals per annum with a market value of around £11 billion. The majority of metal processed is owned by customers and the group and parent company must return pre-agreed quantities of refined metal based on assays of starting materials and other contractual arrangements, such as the timing of the return of metal. The group and parent company calculate the profits or losses of their refining operations based on estimates, including the extent to which process losses are expected during refining. The risk of process losses or stock take gains depends on the nature of the starting material being refined, the specific refining processes applied, the efficiency of those processes and the contractual arrangements.
Stocktakes are performed at regular intervals to determine the volume of metal within the refining system compared with the estimated volumes with the outcome being an adjustment to revenue (see note 3 for more detail). Stocktakes are, therefore, a key control in the assessment of the accuracy of the profit or loss of refining operations. Whilst refining is a complex, large-scale industrial process, the group and parent company have appropriate processes and controls over the movement of material in their refineries.
Climate change The impact of climate change presented in the group’s Strategic Report (see pages 60 to 69) and the stated net zero targets have been considered in preparing the group accounts.
The following considerations were made:
Impact on the going concern period and viability of the group over the next three years. The latest forecasts reflect the continuous investment in sustainable technologies including commercialisation of our products used in green hydrogen production and higher performance fuel cell components for a range of automotive, non-automotive and stationary applications.
Johnson Matthey | Annual Report and Accounts 2022160

Notes on the Accounts continued
1 Accounting policies (continued) Sources of estimation uncertainty (continued) The potential impact of climate change on a number of areas within the financial statements has been considered, including:
• The forecasts of cash flows used in impairment assessments for the carrying value of non-current assets including goodwill (see note 5).
• Recoverability of deferred tax assets. • The expected lives of fixed assets and their exposure to the physical risk posed by climate change.
The expected lives of property, plant and equipment tends to be short to medium term, as such the physical risk posed by climate change in the long term is low.
Assets held for sale Our estimate for the fair value less costs to sell of the Battery Materials business (£50 million) is with reference to a signed agreement with EV Metals Group plc. At 25th May 2022 the Group had received £20 million with remainder of the consideration due on completion.
Judgements made in applying accounting policies Metal The group and parent company use precious metal owned by customers in their production processes. It has been determined that this metal is not controlled by the group or parent company and, therefore, it is not recognised on the balance sheet.
The group and parent company manage precious metal inventories by entering into physically settled forward sales and purchases of metal positions in line with a well-established hedging policy. The own use exemption has been adopted for these transactions and, therefore, the group and parent company do not fair value such physically settled contracts.
The group undertakes linked contracts to sell or buy precious metal and commits to repurchase or sell the metal in the future to manage inventory levels. Accordingly, cash flows in respect of sale and repurchase agreements are shown as cash flows from operating activities in the cash flow statement rather than cash flows from financing activities.
Provisions and contingent liabilities The group is involved in various disputes and claims which arise from time to time in the course of its business including, for example, in relation to commercial matters, product quality or liability, employee matters and tax audits. The group is also involved from time to time in the course of its business in legal proceedings and actions, engagement with regulatory authorities and in dispute resolution processes. Judgement is required to determine if an outflow of economic resources is probable, or possible but not probable for such events. Where it is probable, a liability is recognised and further judgement is used to determine the amount of the provision. Where it is possible but not probable, further judgement is used to determine if the likelihood is remote, in which case no disclosures are provided; if the likelihood is not remote then judgement is required to determine the contingent liability disclosed. Provisions and contingent liabilities are set out in notes 22 and 33, respectively.
In the course of preparing the accounts, no other judgements have been made in the process of applying the group’s and parent company’s accounting policies, other than those involving estimations, that have had a significant effect on the amounts recognised in the accounts.
Changes in accounting policies Interest Rate Benchmark Reform Phase 2 – Amendments to IFRS 9, IAS 39, IFRS 7, IFRS 4 and IFRS 16 The IBOR reform, Phase 2 amendments were effective for annual periods beginning on or after the 1st January 2021. The Phase 2 amendments address issues that arise from implementation of the reforms, including the replacement of one benchmark with an alternative one. A practical expedient is provided such that the change to contractual cash flows for financial assets and liabilities (including lease liabilities) is accounted for prospectively by revising the effective interest rate. In addition, hedge accounting will not be discontinued solely because of the IBOR reform. The amendments did not have a material impact on the results or financial position of the group and there has been no change to the group’s interest policy.
The group has one IFRS 9 designated hedge relationship: the 3.26% $150 million Bonds 2022 which have been swapped into floating rate US dollars. This swap references six-month US dollar LIBOR, however the swap matures in 2022, before the amendments are effective for the group. The group does have access to a revolving credit facility which remains undrawn, the contract was amended so that USD and GBP drawings are subject to the new Secured Overnight Financing Rate (SOFR) and Sterling Overnight Index Average (SONIA) respectively from 30th November 2021. The implications on the wider business of IBOR reform have been assessed and there are no other arrangements that are materially impacted.
Other amendments to accounting standards The IASB ratified the IFRIC update on Configuration and Customisation (‘CC’) costs in a Cloud Computing Arrangement (IAS 38, Intangible Assets) in April 2021. The group reports ‘CC’ in cloud computing arrangements in compliance with these updates.
The IASB has issued other amendments resulting from improvements to IFRS that the group considers do not have any impact on the accounting policies, financial position or performance of the group. The group has not early adopted any standard, interpretation or amendment that was issued but is not yet effective.
Non-GAAP measures The group uses various measures to manage its business which are not defined by generally accepted accounting principles (GAAP). The group’s management believes these measures provide valuable additional information to users of the accounts in understanding the group’s performance. The group’s non-GAAP measures are defined and reconciled to GAAP measures in note 36.
Johnson Matthey | Annual Report and Accounts 2022 161
FINA
NCIA
L STATEM
ENTS

Notes on the Accounts continued
2 Segmental information Revenue, sales and underlying operating profit by sector We have implemented small changes to our reporting segments to reflect how we are managing the business and increase visibility of our new growth businesses. Efficient Natural Resources now includes Life Science Technologies (formerly part of Other Markets) and excludes Diagnostic Services and Advanced Glass Technologies1 (now part of Other Markets). Excluding Corporate costs, the group has three reporting segments, aligned to the needs of our customers and the global challenges we are tackling.
Clean Air – provides catalysts for emission control after-treatment systems to remove harmful emissions from vehicles and non-road equipment powered by diesel and gasoline.
Efficient Natural Resources – provides products and processing services for the efficient use and transformation of critical natural resources including oil, gas, biomass and platinum group metals to enable the decarbonisation of chemical value chains and provide circular economy solutions.
Other Markets – a portfolio of businesses with particular focus on potential growth and value realisation opportunities. This includes Battery Systems, Fuel Cells, Diagnostic Services, Battery Materials2 and Green Hydrogen.
The Group Leadership Team (the chief operating decision maker as defined by IFRS 8, Operating Segments) monitors the results of these operating sectors to assess performance and make decisions about the allocation of resources. Each operating sector is represented by a member of the Group Leadership Team. These operating sectors represent the group’s reportable segments and their principal activities are described on pages 24 to 27. The performance of the group’s operating sectors is assessed on sales and underlying operating profit (see note 36). Sales between segments are made at market prices, taking into account the volumes involved.
The Health segment is considered a discontinued operation as at 31st March 2022, the underlying profit for the year is £3 million. Information about this discontinued segment is provided in note 27.
Year ended 31st March 2022
Clean AirEfficient Natural
Resources Other Markets Corporate EliminationsTotal from
continuing operations £ million £ million £ million £ million £ million £ million
Revenue from external customers 7,085 8,461 479 – – 16,025 Inter-segment revenue 4 4,555 1 – (4,560) – Revenue 7,089 13,016 480 – (4,560) 16,025 External sales 2,455 945 378 – – 3,778 Inter-segment sales 2 96 1 – (99) – Sales3 2,457 1,041 379 – (99) 3,778 Underlying operating profit / (loss)3 302 358 (21) (86) – 553
Year ended 31st March 2021*
Clean AirEfficient Natural
Resources (restated) Other Markets
(restated) CorporateEliminations
(restated)Total from
continuing operations £ million £ million £ million £ million £ million £ million
Revenue from external customers 6,985 7,952 498 – – 15,435 Inter-segment revenue 2 4,877 1 – (4,880) – Revenue 6,987 12,829 499 – (4,880) 15,435 External sales 2,412 862 411 – – 3,685 Inter-segment sales – 112 1 – (113) – Sales3 2,412 974 412 – (113) 3,685 Underlying operating profit / (loss)3 269 276 1 (73) – 473
1. The sale of Advanced Glass Technologies was completed during the year (see note 28). 2. The group announced its intention to exit Battery Materials during the year (see note 6). 3. Sales and underlying operating profit are non-GAAP measures (see note 36). Sales excludes the sale of precious metals. Underlying operating profit excludes profit or loss on disposal of businesses, gain or loss on significant legal proceedings,
together with associated legal costs, amortisation of acquired intangibles and major impairment and restructuring charges.
* The comparative period is restated to reflect the group’s updated reporting segments and revised inter-segment revenue and sales for Efficient Natural Resources and eliminations for copper zeolite sales. Also restated to reflect classification of the Health segment as discontinued operations (see note 27).
Johnson Matthey | Annual Report and Accounts 2022162

Notes on the Accounts continued
2 Segmental information (continued) Reconciliation from underlying operating profit to operating profit by sector Year ended 31st March 2022
Clean AirEfficient Natural
Resources Other Markets CorporateTotal from
continuing operations £ million £ million £ million £ million £ million
Underlying operating profit / (loss)1 302 358 (21) (86) 553 Profit on disposal of businesses (note 28) – – 106 – 106 Gains and losses on significant legal proceedings – 36 6 – 42 Amortisation of acquired intangibles (2) (4) – – (6) Major impairment and restructuring charges (note 6) (27) (5) (400) (8) (440) Operating profit / (loss) 273 385 (309) (94) 255
Year ended 31st March 2021*
Clean Air Efficient Natural
Resources (restated) Other Markets
(restated) Corporate Total from
continuing operations £ million £ million £ million £ million £ million
Underlying operating profit / (loss)1 269 276 1 (73) 473 Amortisation of acquired intangibles (2) (6) (2) – (10) Major impairment and restructuring charges (note 6) (102) (20) (8) (24) (154) Operating profit / (loss) 165 250 (9) (97) 309
1. Sales and underlying operating profit are non-GAAP measures (see note 36). Sales excludes the sale of precious metals. Underlying operating profit excludes profit or loss on disposal of businesses, gain or loss on significant legal proceedings, together with associated legal costs, amortisation of acquired intangibles and major impairment and restructuring charges.
* The comparative period is restated to reflect the group’s updated reporting segments and revised inter-segment revenue and sales for Efficient Natural Resources and eliminations for copper zeolite sales. Also restated to reflect classification of the Health segment as discontinued operations (see note 27).
Johnson Matthey | Annual Report and Accounts 2022 163
FINA
NCIA
L STATEM
ENTS

Notes on the Accounts continued
2 Segmental information (continued) Other segmental information Year ended 31st March 2022
Clean AirEfficient Natural
Resources Other Markets Corporate Total £ million £ million £ million £ million £ million
Segmental net assets 2,108 41 220 330 2,699 Net debt (note 36) (856)Post-employment benefit net assets and liabilities 280 Deferred tax net assets 80 Provisions and non-current other payables (86)Investments in joint ventures and associates 2 Net assets held for sale 322 Net assets 2,441 Property, plant and equipment 71 89 180 17 357 Intangible assets 1 9 26 53 89 Capital expenditure 72 98 206 70 446 Depreciation 63 47 15 13 138 Amortisation 2 7 1 29 39 Impairment losses (notes 5 and 6) 26 7 363 8 404 Total 91 61 379 50 581
Year ended 31st March 2021*
Clean Air Efficient Natural
Resources Other Markets Corporate (restated) (restated) Health (restated) (restated) Total £ million £ million £ million £ million £ million £ million
Segmental net assets 2,686 (668) 469 476 354 3,317 Net debt (775)Post-employment benefit net assets and liabilities 96 Deferred tax net assets 112 Provisions and non-current other payables (67)Investments in joint ventures and associates 2 Net assets 2,685 Property, plant and equipment 94 65 24 89 11 283 Intangible assets 1 4 5 21 44 75 Capital expenditure 95 69 29 110 55 358 Depreciation 67 45 20 16 10 158 Amortisation 8 8 1 2 13 32 Impairment losses (notes 5 and 6) 51 34 11 4 22 122 Total 126 87 32 22 45 312
* The comparative period is restated to reflect the group’s updated reporting segments, and also restated to allocate precious metal inventory to segments in line with how the business is managed. The overall group total is as previously reported.
Johnson Matthey | Annual Report and Accounts 2022164

Notes on the Accounts continued
3 Revenue Products and services The group’s principal products and services by operating sector and sub-sector are disclosed in the table below, together with information regarding performance obligations and revenue recognition. Revenue is recognised by the group as contractual performance obligations to customers are completed.
Sub-sector Primary industry Principal products and services Performance obligations Revenue recognition
Clean Air Light Duty Catalysts Automotive Catalysts for cars and other light duty vehicles Point in time On despatch or delivery Heavy Duty Catalysts Automotive Catalysts for trucks, buses and non-road equipment Point in time On despatch or delivery Efficient Natural Resources Catalyst Technologies
Chemicals / oil and gas Speciality catalysts and additives Point in time On despatch or delivery Process technology licences Over time Based on costs incurred or straight-line
over the licence term1 Engineering design services Over time Based on costs incurred
Platinum Group Metal Services
Various Platinum Group Metal refining and recycling services Over time Based on output Other precious metal products Point in time On despatch or delivery Platinum Group Metal chemical and industrial products Point in time On despatch or delivery
Health (discontinued operation – see note 27) Generics Pharmaceuticals Manufacture of active pharmaceutical ingredients Point in time On despatch or delivery Innovators Pharmaceuticals Development and manufacture of active pharmaceutical
ingredients Over time Based on costs incurred
Other Markets Other Markets (excluding Diagnostic Services)
Various Precious metal pastes and enamels, battery materials and systems, fuel cell technologies and products found in devices used in medical procedures
Point in time On despatch or delivery
Diagnostic Services Oil and gas Detection, diagnostic and measurement solutions Over time Based on costs incurred
1. Revenue recognition depends on whether the licence is distinct in the context of the contract.
Johnson Matthey | Annual Report and Accounts 2022 165
FINA
NCIA
L STATEM
ENTS

Notes on the Accounts continued
3 Revenue (continued) Revenue judgements Over time revenue Over time revenue recognition predominantly occurs in Efficient Natural Resources (Refining Services) and Health, see criteria for over time recognition as defined by the group’s accounting policies in note 1.
Refining Services The majority of the metal processed by the group and parent company’s refining businesses is owned by customers and, therefore, revenue is recognised over time on the basis that the group and parent company are providing a service to enhance an asset controlled by the customer. The customer controls the metal throughout the refining process, the key indicators being legal ownership, metal price risk and that the customer has the right to claim the equivalent metal at all stages of processing.
The performance obligation contained in all refining contracts is a service arrangement to refine customer metal to a specified quality and volume by a certain date. For a contract that has multiple metals, the refinement of each metal is a separate performance obligation. We receive the contracted cash fee which is set with reference to market price at the start of the contract. We may also retain a percentage of the refined metal at settlement, this represents non-cash consideration and is recognised as part of revenue at fair value.
Revenue from refining services is recognised using an output method by estimating the progress of the metal in the refining process. Once the customer metal is in the refining process it is commingled with metal from other customers and it is not separately identifiable. Because we have a consistent volume of metal flowing through the refinery process, we estimate that all of the metal in the refinery is on average 50% of the way through the process. We therefore recognise up to 50% of the revenue (cash service fee and non-cash consideration) for our services when metal enters the refining process. Since refining each type of metal is a separate performance obligation, once we have returned the metal to the customer, we recognise the remaining 50% of revenue for that particular metal while other metal may still be due to the same customer.
Where refinery stocktakes indicate that metal recoveries have been lower than anticipated and/or allowed for in process loss provisioning, refined metal gain revenue is reduced accordingly. Where refinery stocktakes indicate that metal recoveries have been higher than anticipated, any incremental refining metal gain revenue is only recognised once it is highly probable that a reversal in the amount of cumulative revenue recognised will not occur and the metal has been sold.
Revenue from external customers by principal products and services Year ended 31st March 2022
Continuing operations
Clean Air
Efficient Natural
ResourcesOther
Markets TotalHealth
(discontinued)£ million £ million £ million £ million £ million
Metal 4,630 7,516 101 12,247 3 Heavy Duty Catalysts 849 – – 849 – Light Duty Catalysts 1,578 – – 1,578 – Catalyst Technologies – 508 – 508 – Platinum Group Metal Services – 437 – 437 – Generics – – – – 77 Innovators – – – – 84 Fuel Cells – – 25 25 – Battery Materials – – 12 12 – Battery Systems – – 151 151 – Advanced Glass Technologies – – 62 62 – Diagnostic Services – – 54 54 – Medical Device Components – – 74 74 – Other 28 – – 28 – Revenue 7,085 8,461 479 16,025 164
Johnson Matthey | Annual Report and Accounts 2022166

Notes on the Accounts continued
3 Revenue (continued) Revenue from external customers by principal products and services (continued) Year ended 31st March 2021
Continuing operations
Clean Air
Efficient Natural
Resources (restated)
Other Markets
(restated) Total
(restated) Health
(discontinued) £ million £ million* £ million* £ million* £ million
Metal 4,573 7,090 87 11,750 2 Heavy Duty Catalysts 741 – – 741 – Light Duty Catalysts 1,641 – – 1,641 – Catalyst Technologies – 487 – 487 – Platinum Group Metal Services – 375 – 375 – Generics – – – – 146 Innovators – – – – 90 Fuel Cells – – 41 41 – Battery Materials – – 14 14 – Battery Systems – – 169 169 – Advanced Glass Technologies – – 66 66 – Diagnostic Services – – 43 43 – Medical Device Components – – 60 60 – Other 30 – 18 48 – Revenue 6,985 7,952 498 15,435 238
Revenue from external customers by point in time and over time performance obligations Year ended 31st March 2022
Continuing operations
Clean Air
Efficient Natural
ResourcesOther
Markets TotalHealth
(discontinued) £ million £ million £ million £ million £ million
Revenue recognised at a point in time 7,085 8,087 453 15,625 89 Revenue recognised over time – 374 26 400 75 Revenue 7,085 8,461 479 16,025 164
Year ended 31st March 2021 Continuing operations
Clean Air
Efficient Natural
Resources (restated)
Other Markets
(restated) Total
(restated) Health
(discontinued) £ million £ million* £ million* £ million* £ million
Revenue recognised at a point in time 6,985 7,651 457 15,093 157 Revenue recognised over time – 301 41 342 81 Revenue 6,985 7,952 498 15,435 238
* The comparative period is restated to reflect the group’s updated reporting segments. Also restated to reflect classification of the Health segment as discontinued operations (see note 27).
Johnson Matthey | Annual Report and Accounts 2022 167
FINA
NCIA
L STATEM
ENTS

Notes on the Accounts continued
3 Revenue (continued) Geographical analysis of revenue from external customers and non-current assets The group’s country of domicile is the UK. Revenue from external customers based on the customer’s location and non-current assets based on the location of the assets are disclosed below.
Revenue from
external customers Non-current assets 2022 2021 2022 2021 £ million £ million* £ million £ million
UK 2,845 3,330 733 990 Germany 1,600 1,493 244 251 Rest of Europe 2,001 2,001 292 384 USA 2,756 2,320 280 422 Rest of North America 597 613 40 46 China (including Hong Kong) 2,326 2,631 221 216 Rest of Asia 2,517 1,993 145 135 Rest of World 1,383 1,054 21 19 1,976 2,463 Investments at fair value through other comprehensive income 45 53 Interest rate swaps 11 20 Deferred income tax assets 98 140 Post-employment benefit net assets 352 194 Total 16,025 15,435 2,482 2,870
* Restated to reflect classification of the Health segment as discontinued operations (see note 27).
Major customers The group received £1.7 billion of revenue from one external customer in the Clean Air sector which represents more than 10% of the group’s revenue from external customers during the year ended 31st March 2022 (2021: £1.9 billion of revenue from one external customer in the Clean Air sector).
Unsatisfied performance obligations At 31st March 2022, for contracts that had an original expected duration of more than one year, the group had unsatisfied performance obligations of £1,039 million (2021: £921 million), representing contractually committed revenue to be recognised at a future date. Of this amount, £244 million (2021: £361 million) is expected to be recognised within one year and £795 million (2021: £560 million) is expected to be recognised after one year.
Payment terms The group and parent company supply goods and services on payment terms that are consistent with those standard across the industry and it does not have any customer contracts with a material financing component. Where revenue is recognised over time, payment terms are generally consistent with the timeframe over which revenue is recognised.
Johnson Matthey | Annual Report and Accounts 2022168

Notes on the Accounts continued
4 Operating profit Operating profit from continuing operations is arrived at after charging / (crediting):
2022 2021 £ million £ million*
Total research and development expenditure 201 185 Less: Development expenditure capitalised (22) (17)Research and development expenditure charged to the income statement 179 168 Less: External funding received – from governments (18) (12)Net research and development expenditure charged to the income statement 161 156 Inventories recognised as an expense 14,121 13,638 Write-down of inventories recognised as an expense 26 20 Reversal of write-down of inventories from increases in net realisable value (16) (10)Net gains on foreign exchange (2) (56)Net losses on foreign currency forwards at fair value through profit or loss 6 58 Past service credit (11) (3)Depreciation of: Property, plant and equipment 125 126 Right-of-use assets 13 13 Depreciation 138 139 Amortisation of: Internally generated intangible assets 1 2 Acquired intangibles 6 10 Other intangible assets 32 19 Amortisation 39 31 Gains and losses on significant legal proceedings (42) – Profit on disposal of businesses (note 28) (106) – Impairment losses included in administrative expenses 3 31 Impairment losses (note 5) 3 31 Impairment losses included in major impairment and restructuring charges 401 80 Restructuring charges included in major impairment and restructuring charges 39 74 Major impairment and restructuring charges (note 6) 440 154
* Restated to reflect classification of the Health segment as discontinued operations (see note 27).
Profit on disposal of businesses On 31st January 2022, the group completed the sale of its Advanced Glass Technologies business for a cash consideration of £173 million. With net assets of £39 million, a non-underlying gain of £106 million has been recognised in the year to 31st March 2022 after deal costs and FX recycling. See note 28.
Gains and losses on significant legal proceedings During the year, the group recognised a gain of £44 million in relation to damages and interest from a company found to have unlawfully copied one of our technology designs. An additional gain of £6 million was recognised following conclusion of legal proceedings associated to investments in Battery Materials, this was partially offset by a £8 million charge for environmental and other costs. The net gain is reported as non-underlying, see note 36.
2022 2021 £ million £ million
Fees payable to the company’s auditor and its associates for: The audit of these accounts 2.1 2.0 The audit of the accounts of the company’s subsidiaries 2.4 2.3 The audit of prior period accounts 0.2 0.7 Total audit fees 4.7 5.0 Audit-related assurance services 0.4 0.3 Total non-audit fees 0.4 0.3 Total fees payable to the company’s auditor and its associates 5.1 5.3
No audit fees were paid to other auditors (2021: £nil).
Audit-related assurance services predominantly comprise of reviews of interim financial information.
5 Impairment losses During the year ended 31st March 2022, as part of our review for impairment triggers an impairment loss has been recognised in the group income statement within underlying operating profit. These losses are stated below:
2022 2021 £ million £ million*
Other intangible assets 1 8 Property, plant and equipment 2 2 Investments in joint ventures and associates – 21 Total impairment losses included in administrative expenses 3 31
Total impairment losses incurred for the year of £632 million comprises major impairment losses of £401 million (see note 6), impairment losses incurred by discontinued operations of £228 million (see note 27) and £3 million of impairment losses included within administrative expenses.
Johnson Matthey | Annual Report and Accounts 2022 169
FINA
NCIA
L STATEM
ENTS

Notes on the Accounts continued
5 Impairment losses (continued) Goodwill Impairment testing The group and parent company test goodwill annually for impairment or more frequently if there are indications that goodwill might be impaired. The recoverable amounts of the cash-generating units (CGUs) are determined using value in use calculations which generally use cash flow projections based on financial budgets and plans covering a three-year period approved by management. The budgets and plans are based on a number of assumptions, including market share, impact of carbon pricing, expected changes to selling prices, product profitability, precious metal prices and other direct input costs, based on past experience and management’s expectations of future changes in the markets using external sources of information where appropriate. We also considered the physical risk of climate change – including the effect of extreme weather events at sample strategic sites, based on internal and external analysis.
Significant CGUs Goodwill arising on the acquisition of businesses is allocated, at acquisition, to the CGUs that are expected to benefit from that business combination. These CGUs represent the smallest identifiable groups of assets that generate cash inflows that are largely independent of the cash inflows from other groups of assets. Goodwill allocated to the significant CGUs is as follows:
Group Parent company 2022 2021 2022 2021 £ million £ million £ million £ million
Clean Air • Heavy Duty Catalysts 83 83 – – Efficient Natural Resources • Catalyst Technologies 265 264 113 113 • Diagnostic Services1 4 49 – – • Other 2 2 – – Health2 • Generics3 – 117 – – • Innovators – 26 – 2 Other Markets4 12 13 – – Total carrying amount at 31st March (note 12) 366 554 113 115
1. Diagnostic Services goodwill has been impaired by £45 million. Refer to note 6 for further information. 2. Health goodwill has been fully impaired upon reclassification of the business to held for sale. Refer to note 27 for
further information. 3. Goodwill recognised on the acquisition of Macfarlan Smith is allocated to the Generics CGU which comprises both the
legacy Macfarlan Smith business and the group’s other generics businesses reflecting the way that the group monitors and manages its operations.
4. Other Markets comprises CGUs with goodwill balances individually less than £5 million.
Unallocated corporate costs are split between CGUs based on their share of contribution. The three-year cash flows are extrapolated using the long term average growth rates for the relevant products, industries and countries in which the CGUs operate.
The expected economic life of the Heavy Duty Catalysts has been restricted to 2040 reflecting internal climate change targets and impact of legislation changes. In the medium term, growth will come from tightening emissions legislation driving demand for more sophisticated catalyst systems. Beyond the medium term, the world will increasingly use alternatives to the internal combustion engine which is reflected in the long-term decline rate used in our modelling.
Pre-tax discount rates, derived from the group’s post-tax weighted average cost of capital of 7.7% (2021: 6.3%), adjusted for the risks applicable to each CGU are used to discount these projected risk-adjusted cash flows.
The key assumptions are:
Discount rate Long term growth rate 2022 2021 2022 2021
Clean Air • Heavy Duty Catalysts 11.6% 9.3% -15.1% -1.2% Efficient Natural Resources • Catalyst Technologies 10.2% 8.7% 3.0% 2.5% • Diagnostic Services 14.1% 9.2% -1.3% 1.3%
Different long term growth rates are used for the Clean Air – Heavy Duty Catalysts CGU because of expected macroeconomic trends in the industry in which the business operates. The growth rate for years four to ten is expected to be 2.7% (2021: 0%). After that, growth is expected to decline and, therefore, the long term growth rate above is used for year eleven onwards.
The growth rate and discount rate assumptions for Diagnostic Services have also been updated to reflect the faster paced transition to non-carbon intensive industries and the simplification of our portfolio to focus on core markets.
Johnson Matthey | Annual Report and Accounts 2022170

Notes on the Accounts continued
5 Impairment losses (continued) Sensitivity analysis The headroom for the significant CGUs, calculated as the difference between net assets including allocated goodwill at 31st March 2022 and the value in use calculations, is shown below. The table also shows, for each significant CGU, the headroom assuming a 1% decrease in the growth rate assumptions and a 1% increase in the discount rate assumption used in the value in use calculations.
Headroom as at 31st March 2022
Headroom assuming a 1% decrease in the
growth rate
Headroom assuming a 1% increase in the
discount rate £ million £ million £ million
Clean Air • Heavy Duty Catalysts 440 398 383 Efficient Natural Resources • Catalyst Technologies 701 513 501
A reduction in the Heavy Duty Catalysts CGU’s expected economic life by one year to 2039, reduces headroom by approximately £10 million from £440 million.
A reduction in the Diagnostics Services CGU’s growth rate or increase in discount rate by 1% would increase the impairment of £45 million at 31st March 2022 by approximately £3 million.
6 Major impairment and restructuring charges The below amounts are excluded from the underlying operating profit of the group from continuing operations.
2022 2021 £ million £ million*
Property, plant and equipment 238 26 Right-of-use assets 4 1 Goodwill 45 – Other intangible assets 78 53 Inventories 17 – Trade and other receivables 19 – Impairment losses 401 80 Restructuring charges 39 74 Total major impairments and restructuring charges 440 154
* Restated to reflect classification of the Health segment as discontinued operations (see note 27).
Major impairment and restructuring charges are shown separately on the face of the income statement and excluded from underlying operating profit (see note 36).
Battery Materials – Following a detailed review of our Battery Materials business the group concluded that the potential future returns from the business would not be adequate to justify further investment. Accordingly on 11th November 2021, the group announced the decision to pursue the sale of all or parts of the business. An impairment charge of £314 million was taken at 30th September 2021 to a net book value to £nil based on our estimate of the recoverable amount at that time. For the full year, we have determined a further impairment charge of £11 million to £325 million based on fair value less costs to sell. The 31st March 2022 impairment charge comprises property, plant and equipment (£237 million), right-of-use assets (£4 million), other intangible assets (£70 million) and trade and other receivables (£6 million). A further £8 million was impaired in relation to associated intangible assets held in Corporate. The Battery Materials restructuring charge was £38 million for exit costs including redundancies.
Diagnostic Services – We updated our long term market assumptions for the oil and gas industry in which the Diagnostic Services business serves customers and considered faster paced transition to non-carbon intensive industries and alignment with the group’s overall strategy. This has resulted in an impairment to goodwill of £45 million. Please see note 12.
Russia/Ukraine conflict – As announced on 7th March 2022, we discontinued with immediate effect all new commercial activities in Russia and Belarus in light of the ongoing conflict in Ukraine. Our operations in Russia include one small Clean Air manufacturing plant which has been written down to £nil, and a small Catalyst Technologies office. We have determined an impairment and restructuring charge of £32 million comprising of inventories (£17 million), receivables (£13 million), property, plant and equipment (£1 million) and a restructuring charge (£1 million).
In the prior year, excluding the Health segment, the group incurred non-underlying major impairment and restructuring charges of £154 million. The charges were in relation to efficiency initiatives that are transforming our organisation to create a more simple and efficient group allowing us to act with greater agility and pace in a dynamic external environment. There have been no further charges in relation to these initiatives in the current year.
Johnson Matthey | Annual Report and Accounts 2022 171
FINA
NCIA
L STATEM
ENTS

Notes on the Accounts continued
7 Employee information Employee numbers
2022 2021*
Clean Air 5,846 5,602 Efficient Natural Resources 3,321 3,540 Health (discontinued) 900 914 Other Markets 2,171 2,367 Corporate1 1,259 1,137 Monthly average number of employees 13,497 13,560
* The comparative year is restated to reflect the group’s updated reporting segments. The overall group total is as previously reported.
2022 £ million
2021 £ million**
Wages and salaries 583 563 Social security costs 60 64 Post-employment costs (note 24) 62 65 Share-based payments (note 31) 13 14 Termination benefits 3 3 Employee benefits expense from continuing operations 721 709
** Restated to reflect classification of the Health segment as discontinued operations (see note 27).
1. The Corporate segment includes global functions serving our business units including procurement, HR, IT and shared service centres
8 Net finance costs 2022 2021
£ million £ million
Net loss on remeasurement of foreign currency swaps held at fair value through profit or loss (19) (8)Interest payable on financial liabilities held at amortised cost and interest on related swaps (45) (53)Interest payable on other liabilities1 (35) (94)Interest payable on lease liabilities (2) (3)Total finance costs (101) (158)Net gain on remeasurement of foreign currency swaps held at fair value through profit or loss 6 – Interest receivable on financial assets held at amortised cost 2 4 Interest receivable on other assets1 31 64 Interest on post-employment benefits 2 5 Total finance income 41 73 Net finance costs from continuing operations (60) (85)
1. Interest payable and receivable on other liabilities and assets mainly comprises interest on precious metal leases and the amortisation of contango and backwardation on precious metal inventory and sale and repurchase agreements.
Johnson Matthey | Annual Report and Accounts 2022172

Notes on the Accounts continued
9 Tax expense 2022 2021
£ million £ million
Current tax Corporation tax on profit for the year 55 131 Adjustment for prior years (5) (4)Total current tax 50 127 Deferred tax Origination and reversal of temporary differences (1) (92)Adjustment for prior years 8 (2)Total deferred tax (note 23) 7 (94)Tax expense 57 33
The tax expense can be reconciled to profit before tax in the income statement as follows:
2022 2021 £ million £ million
Profit before tax from continuing operations 195 224 (Loss) / profit before tax from discontinued operations (239) 14 (Loss) / profit before tax (44) 238 Tax (credit)/expense at UK corporation tax rate of 19% (2021: 19%) (8) 45 Effects of:
Overseas tax rates 13 4 Expenses not deductible for tax purposes 9 2 Losses and other temporary differences not recognised 1 5 Impairment and restructuring charges 70 – Recognition or utilisation of previously unrecognised tax assets (1) (7)Adjustment for prior years 3 (6)Patent box / Innovation box (10) (14)Other tax incentives (5) (4)Tax rate adjustments (1) – Disposal of businesses (28) – Irrecoverable withholding tax 9 – Other 5 8
Tax expense 57 33 Tax expense from continuing operations 79 30 Tax (credit)/expense from discontinued operations (22) 3 Tax expense 57 33
In the March 2021 Budget the UK Government announced that legislation will be introduced in Finance Bill 2021 to increase the main rate of UK corporation tax from 19% to 25%, effective 1st April 2023. Included in the tax charge is a deferred tax charge of £1 million in relation to the UK rate change from 19% to 25%, which was enacted on 24th May 2021. In addition, there is a tax credit to other comprehensive income of £9 million in respect of the impact of the rate change on post-employment assets.
Included in the current year results is a profit on the disposal of the AGT business the majority of which has been treated as non-taxable.
Adjustment for prior years includes current and deferred tax adjustments in respect of the UK, US, Japan and Germany, as well as adjustments in respect of provisions for uncertain tax positions.
Other tax incentives includes research and development tax incentives in the US and China and other tax incentives in Poland.
Other movements mainly includes movements in respect of provisions for uncertain tax positions.
10 (Loss) / earnings per ordinary share (Loss) / earnings per ordinary share have been calculated by dividing loss or profit for the year by the weighted average number of shares in issue during the year.
2022 2021 pence pence
(Loss) / earnings per share Basic (52.6) 106.5 Diluted (52.6) 106.4 Basic from continuing operations 60.9 100.9 Diluted from continuing operations 60.8 100.8
See note 27 for the earnings per ordinary share from discontinued operations.
2022 2021
(Loss) / earnings (£ million) Basic and diluted (loss) / earnings (101) 205 Weighted average number of shares in issue Basic 191,568,756 192,711,413 Dilution for long-term incentive plans 585,024 260,753 Diluted 192,153,780 192,972,166
Presented (loss) / earnings per ordinary share have been calculated using unrounded numbers.
Johnson Matthey | Annual Report and Accounts 2022 173
FINA
NCIA
L STATEM
ENTS

Notes on the Accounts continued
11 Property, plant and equipment Group
Land
and buildings Leasehold
improvements Plant and
machinery Assets in the course
of construction Total £ million £ million £ million £ million £ million
Cost At 1st April 2020 627 24 2,171 486 3,308 Additions 1 – 28 254 283 Transfers from assets in the course of construction 78 10 247 (335) – Disposals (1) (1) (29) (6) (37)Disposal of businesses – (1) (10) – (11)Exchange adjustments (38) (1) (97) (22) (158)At 31st March 2021 667 31 2,310 377 3,385 Additions 1 1 38 339 379 Transferred to assets classified as held for sale (note 27) (107) (5) (392) (282) (786)Transfers from assets in the course of construction 11 1 120 (132) – Disposals (1) – (25) (1) (27)Disposal of businesses (note 28) (13) (1) (44) (1) (59)Exchange adjustments 12 – 48 4 64 At 31st March 2022 570 27 2,055 304 2,956 Accumulated depreciation and impairment At 1st April 2020 317 17 1,554 17 1,905 Charge for the year 20 1 123 – 144 Impairment losses (notes 5, 6 and 27) 3 – 27 3 33 Disposals (2) (1) (26) (1) (30)Disposal of businesses – – (7) – (7)Exchange adjustments (17) – (65) (2) (84)At 31st March 2021 321 17 1,606 17 1,961 Charge for the year 18 2 117 – 137 Impairment losses (notes 5, 6 and 27) 21 – 64 210 295 Transferred to assets classified as held for sale (note 27) (91) (4) (335) (210) (640)Disposals (1) – (23) – (24)Disposal of businesses (note 28) (8) (2) (38) – (48)Exchange adjustments 5 1 33 (2) 37 At 31st March 2022 265 14 1,424 15 1,718 Carrying amount at 31st March 2022 305 13 631 289 1,238 Carrying amount at 31st March 2021 346 14 704 360 1,424 Carrying amount at 1st April 2020 310 7 617 469 1,403
Finance costs capitalised were £5 million (2021: £5 million) and the capitalisation rate used to determine the amount of finance costs eligible for capitalisation was 4.2% (2021: 2.9%).
Johnson Matthey | Annual Report and Accounts 2022174

Notes on the Accounts continued
11 Property, plant and equipment (continued) During the year, the group recognised impairments of £295 million. The impairment charge compromises of £2 million included in administrative expenses, see note 5, and £238 million included in non-underlying expenses, see note 6. A further £55 million of impairment charges were incurred in relation to the Health segment, see note 27. During the prior year, the group recognised impairments in respect of four sites and plants, Clean Air (£18 million), Efficient Natural Resources (£4 million), Health (£5 million), and New Markets (£4 million), which were included in major impairment and restructuring charges, and additional impairments of £2 million, which were recognised in underlying operating profit.
The total capital expenditure in the year for discontinued operations equalled £22 million (2021: £24 million).
The depreciation charge for the year for discontinued operations equalled £12 million (2021: £20 million).
Parent company
Land
and buildings Leasehold
improvements Plant and
machinery
Assets in the course of construction Total
£ million £ million £ million £ million £ million
Cost At 31st March 2021 127 2 627 122 878 Additions – 1 20 82 103 Transferred to assets classified as held for sale – – 49 (49) – Reclassification (1) – (30) (20) (51)Disposals – – (6) (5) (11)Disposals of businesses – – (2) – (2)At 31st March 2022 126 3 658 130 917 Accumulated depreciation and impairment At 31st March 2021 81 2 489 (1) 571 Charge for the year 3 – 29 – 32 Impairment losses 1 – 22 18 41 Transferred to assets classified as held for sale (1) – (27) (17) (45)Disposals – – (2) – (2)Disposals of businesses – – (2) – (2)At 31st March 2022 84 2 509 – 595 Carrying amount at 31st March 2022 42 1 149 130 322 Carrying amount at 31st March 2021 46 – 138 123 307
Finance costs capitalised were £1 million (2021: £1 million) and the capitalisation rate used to determine the amount of finance costs eligible for capitalisation was 4.2% (2021: 2.9%).
During the year, the parent company recognised impairments resulting from its intention to exit Battery Materials, determining an impairment charge based on our estimate of the recoverable amount of the assets at 31st March 2022.
12 Goodwill Group
Parent company
£ million £ million
Cost At 1st April 2020 598 123 Disposal of business (9) – Exchange adjustments (17) – At 31st March 2021 572 123 Disposal of businesses (note 28) (2) – Exchange adjustments 3 – At 31st March 2022 573 123 Impairment At 1st April 2020 18 8 At 31st March 2021 18 8 Impairment losses (notes 5 and 27) 189 2 At 31st March 2022 207 10 Carrying amount at 31st March 2022 366 113 Carrying amount at 31st March 2021 554 115 Carrying amount at 1st April 2020 580 115
During the year, the Health segment was fully impaired by £144 million upon reclassification to assets held for sale. Refer to note 27 for further information. The Diagnostic Services goodwill was impaired by £45 million. Refer to note 5 for further information.
Johnson Matthey | Annual Report and Accounts 2022 175
FINA
NCIA
L STATEM
ENTS

Notes on the Accounts continued
13 Other intangible assets Group
Customer contracts
and relationships Computer
software Patents, trademarks
and licences Acquired research
and technology Development
expenditure Total £ million £ million £ million £ million £ million £ million
Cost At 1st April 2020 146 321 64 50 218 799 Additions – 53 – – 22 75 Disposals – (3) (2) – (4) (9)Reclassification – – 5 (5) – – Disposal of businesses (9) – – (1) – (10)Exchange adjustments (4) (4) (2) (2) (10) (22)At 31st March 2021 133 367 65 42 226 833 Additions – 66 1 – 33 100 Transferred to assets classified as held for sale (note 27) – (15) (20) (5) (127) (167)Disposal of businesses (note 28) (1) (2) – – – (3)Exchange adjustments – 3 1 – 3 7 At 31st March 2022 132 419 47 37 135 770 Accumulated amortisation and impairment At 1st April 2020 113 71 40 39 140 403 Charge for the year 5 19 1 4 3 32 Impairment losses (notes 5, 6 and 27) – 58 9 – – 67 Disposals – (2) (1) – (4) (7)Disposal of businesses (4) – – (1) – (5)Exchange adjustments (6) (2) (3) (1) (4) (16)At 31st March 2021 108 144 46 41 135 474 Charge for the year 4 31 1 2 1 39 Impairment losses (notes 5, 6 and 27) – 15 12 – 75 102 Transferred to assets classified as held for sale (note 27) – (13) (18) (5) (79) (115)Reclassification – – 2 (2) – – Disposal of businesses (note 28) (1) (2) – – – (3)Exchange adjustments 1 3 1 – 1 6 At 31st March 2022 112 178 44 36 133 503 Carrying amount at 31st March 2022 20 241 3 1 2 267 Carrying amount at 31st March 2021 25 223 19 1 91 359 Carrying amount at 1st April 2020 33 250 24 11 78 396
Johnson Matthey | Annual Report and Accounts 2022176

Notes on the Accounts continued
13 Other intangible assets (continued) During the year, the group recognised impairments of £102 million. The impairment charge compromises of £1 million included in administrative expenses, see note 5, and £78 million included in non-underlying expenses, see note 6. A further £23 million of impairment charges were incurred in relation to the Health segment, see note 27. During the prior year, the group recognised impairments in respect of licences (£3 million) as part of a site closure in Efficient Natural Resources and information systems (£56 million), which were included in major impairment and restructuring charges, and additional impairments of £8 million, which were recognised in underlying operating profit.
The total capital expenditure in the year for the discontinued operations equalled £11 million (2021: £5 million).
The total amortisation charge in the year for discontinued operations equalled £nil (2021: £1 million).
Parent company
Computer
software
Patents, trademarks
and licences
Acquired research and
technology Development
expenditure Total £ million £ million £ million £ million £ million
Cost At 31st March 2021 322 32 5 51 410 Additions 63 1 – 22 86 Transferred to assets classified as held for sale (3) (14) – (60) (77)At 31st March 2022 382 19 5 13 419 Accumulated amortisation and impairment At 31st March 2021 108 13 7 17 145 Charge for the year 31 1 (1) – 31 Impairment losses 12 13 – 52 77 Transferred to assets classified as held for sale (2) (11) (2) (52) (67)At 31st March 2022 149 16 4 17 186 Carrying amount at 31st March 2022 233 3 1 (4) 233 Carrying amount at 31st March 2021 214 19 (2) 34 265
During the year, the parent company recognised impairments of £77 million, £75 million resulting from our decision to exit Battery Materials and £2 million in respect of Health.
14 Investments in subsidiaries Parent company
Cost of investments in
subsidiariesAccumulated
impairmentCarrying amount
£ million £ million £ million
At 31st March 2021 and 31st March 2022 2,183 (262) 1,921
The parent company’s subsidiaries are shown in note 35.
15 Interest rate swaps Group Parent company 2022 2021 2022 2021
£ million £ million £ million £ million
Cross currency interest rate swaps designated as cash flow hedges 11 8 11 8 Interest rate swaps designated as fair value hedges – 12 – 12 Interest rate swaps – non current assets 11 20 11 20 Interest rate swaps designated as fair value hedges 1 – 1 – Interest rate swaps – current assets 1 – 1 – Interest rate swaps designated as fair value hedges (2) – (2) – Interest rate swaps – non-current liabilities (2) – (2) –
16 Inventories Group Parent company
2022 2021 2022 2021 £ million £ million £ million £ million
Raw materials and consumables 331 286 45 45 Work in progress 932 1,213 488 481 Finished goods and goods for resale 286 315 33 53 Inventories 1,549 1,814 566 579
Work in progress includes £0.7 billion (31st March 2021: £0.9 billion) of precious metal which is committed to future sales to customers and valued at the price at which it is contractually committed.
Johnson Matthey | Annual Report and Accounts 2022 177
FINA
NCIA
L STATEM
ENTS

Notes on the Accounts continued
17 Trade and other receivables Group Parent company
2022 2021 2022 2021 £ million £ million £ million £ million
Current Trade receivables 1,393 1,571 141 310 Contract receivables 88 181 16 60 Amounts receivable from subsidiaries – – 1,604 1,438 Prepayments 75 88 26 34
Value added tax and other sales tax receivable 89 119 23 34 Advance payments to customers 10 11 – – Amounts receivable under precious metal sale and repurchase agreements1 114 308 114 307 Other receivables 27 144 17 114 Trade and other receivables 1,796 2,422 1,941 2,297 Non-current Amounts receivable from subsidiaries – – 1,598 1,312 Value added tax and other sales tax receivable 3 2 – – Prepayments – 3 – 3 Advance payments to customers 39 45 – – Other receivables 42 50 1,598 1,315
1. The fair value of the precious metal contracted to be sold by the group under sale and repurchase agreements is £108 million (2021: £407 million).
Of the parent company’s amounts receivable from subsidiaries, £441 million is impaired (2021: £153 million). The parent company recognised an impairment during the year of £214 million in respect of amounts receivable from the Health segment and £74 million in relation to amounts receivable from the Battery Materials business. Future expected credit losses on intercompany receivables are immaterial.
The group enters into factoring type arrangements in a small number of countries as part of normal business due to longer than standard payment terms, we seek to collect payments in the month following sale. As at 31st March 2022, the level of these arrangements was approximately £200 million (31st March 2021: approximately £300 million).
Trade receivables and contract receivables are net of expected credit losses (see note 29). Of the total trade and contract receivables balance £114 million is past due (2021: £78 million), against which an allowance for credit losses of £3 million (2021: £3 million) have been recorded.
18 Other financial assets and liabilities Group Parent company
2022 2021 2022 2021 £ million £ million £ million £ million
Forward foreign exchange contracts designated as cash flow hedges 5 12 5 12 Forward foreign exchange contracts and currency swaps at fair value through profit or loss 22 32 22 33 Other financial assets 27 44 27 45 Current liabilities Forward foreign exchange contracts designated as cash flow hedges (9) (4) (11) (8) Forward precious metal price contracts designated as cash flow hedges (20) (8) (20) (8) Forward foreign exchange contracts and currency swaps at fair value through profit or loss (15) (6) (15) (6) Other financial liabilities (44) (18) (46) (22) Non-current liabilities Forward precious metal price contracts designated as cash flow hedges (12) – (12) – Other financial liabilities (12) – (12) –
19 Trade and other payables Group Parent company 2022 2021 2022 2021
£ million £ million £ million £ million
Current Trade payables 753 996 222 321 Contract liabilities 273 184 35 78 Amounts payable to subsidiaries – – 2,869 2,354 Accruals 439 369 220 167 Amounts payable under precious metal sale and repurchase agreements1 793 1,442 684 1,371 Other payables 305 334 228 246 Current trade and other payables 2,563 3,325 4,258 4,537 Non-current Amounts payable to subsidiaries – – 267 267 Other payables 2 5 1 1 Non-current other payables 2 5 268 268
1. The fair value of the precious metal contracted to be repurchased by the group under sale and repurchase agreements is £782 million (2021: £1,766 million).
The amount of the contract liabilities balance at 31st March 2021 which was recognised in revenue during the year ended 31st March 2022 for the group company was £113 million (2021: £91 million).
Johnson Matthey | Annual Report and Accounts 2022178
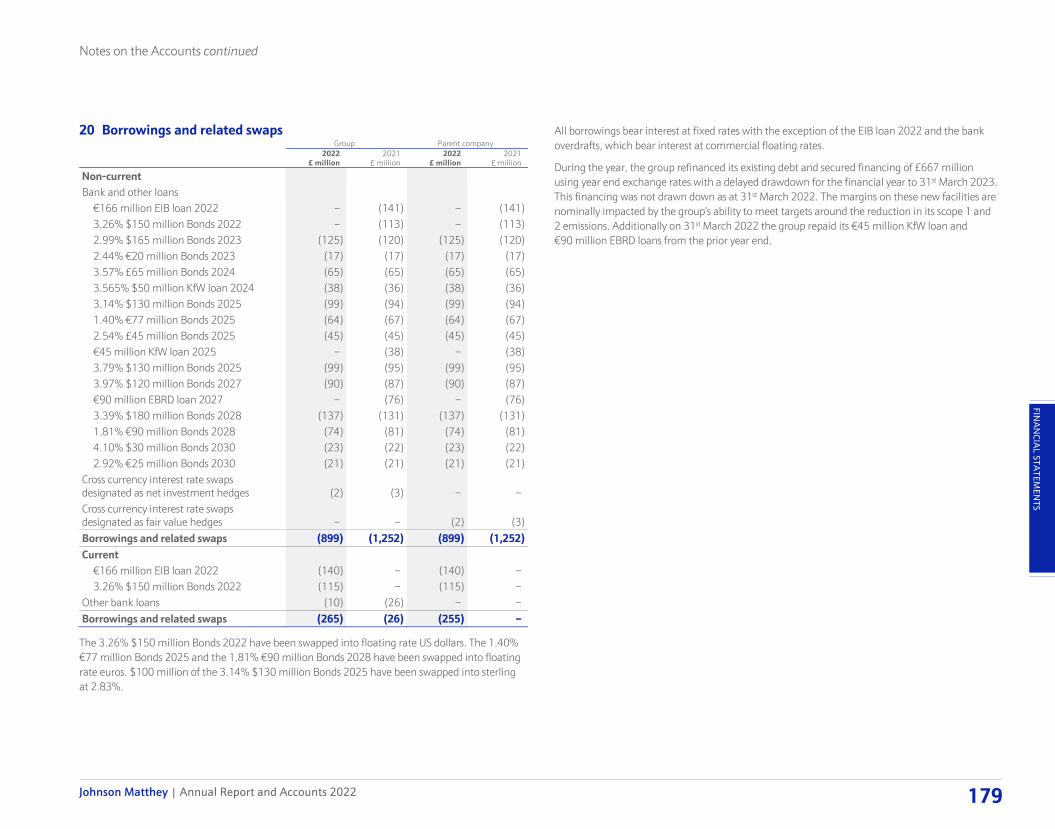
Notes on the Accounts continued
20 Borrowings and related swaps Group Parent company 2022 2021 2022 2021 £ million £ million £ million £ million
Non-current Bank and other loans
€166 million EIB loan 2022 – (141) – (141)3.26% $150 million Bonds 2022 – (113) – (113)2.99% $165 million Bonds 2023 (125) (120) (125) (120)2.44% €20 million Bonds 2023 (17) (17) (17) (17)3.57% £65 million Bonds 2024 (65) (65) (65) (65)3.565% $50 million KfW loan 2024 (38) (36) (38) (36)3.14% $130 million Bonds 2025 (99) (94) (99) (94)1.40% €77 million Bonds 2025 (64) (67) (64) (67)2.54% £45 million Bonds 2025 (45) (45) (45) (45)€45 million KfW loan 2025 – (38) – (38)3.79% $130 million Bonds 2025 (99) (95) (99) (95)3.97% $120 million Bonds 2027 (90) (87) (90) (87)€90 million EBRD loan 2027 – (76) – (76)3.39% $180 million Bonds 2028 (137) (131) (137) (131)1.81% €90 million Bonds 2028 (74) (81) (74) (81)4.10% $30 million Bonds 2030 (23) (22) (23) (22)2.92% €25 million Bonds 2030 (21) (21) (21) (21)
Cross currency interest rate swaps designated as net investment hedges (2) (3) – – Cross currency interest rate swaps designated as fair value hedges – – (2) (3)Borrowings and related swaps (899) (1,252) (899) (1,252)Current
€166 million EIB loan 2022 (140) – (140) – 3.26% $150 million Bonds 2022 (115) – (115) –
Other bank loans (10) (26) – – Borrowings and related swaps (265) (26) (255) –
The 3.26% $150 million Bonds 2022 have been swapped into floating rate US dollars. The 1.40% €77 million Bonds 2025 and the 1.81% €90 million Bonds 2028 have been swapped into floating rate euros. $100 million of the 3.14% $130 million Bonds 2025 have been swapped into sterling at 2.83%.
All borrowings bear interest at fixed rates with the exception of the EIB loan 2022 and the bank overdrafts, which bear interest at commercial floating rates.
During the year, the group refinanced its existing debt and secured financing of £667 million using year end exchange rates with a delayed drawdown for the financial year to 31st March 2023. This financing was not drawn down as at 31st March 2022. The margins on these new facilities are nominally impacted by the group’s ability to meet targets around the reduction in its scope 1 and 2 emissions. Additionally on 31st March 2022 the group repaid its €45 million KfW loan and €90 million EBRD loans from the prior year end.
Johnson Matthey | Annual Report and Accounts 2022 179
FINA
NCIA
L STATEM
ENTS

Notes on the Accounts continued
21 Movements in assets and liabilities arising from financing activities Non-cash movements
2021 Cash (inflow) /
outflow Transfers Transfers to held for sale
Foreign exchange movements
Fair value and other
movements 2022£ million £ million £ million £ million £ million £ million £ million
Non-current assets Interest rate swaps 20 – (12) – – 3 11 Non-current liabilities Borrowings and related swaps (1,252) 114 254 – (26) 11 (899)Interest rate swaps – – 8 – – (10) (2)Lease liabilities (51) – 15 7 – (11) (40)Current assets Interest rate swaps – – 4 – – (3) 1 Current liabilities Borrowings and related swaps (26) 17 (254) – (5) 3 (265)Lease liabilities (11) 14 (15) 2 – – (10)Net movements in assets and liabilities arising from financing activities – 145 – 9 (31) (7) Dividends paid to equity shareholders – 139 Interest paid – 111 Purchase of treasury shares – 155 Net cash outflow from financing activities – 550
Non-cash movements
2020 Cash (inflow) /
outflow Transfers Foreign exchange
movements Fair value and
other movements 2021 £ million £ million £ million £ million £ million £ million
Non-current assets Interest rate swaps 34 – – – (14) 20 Non-current liabilities Borrowings and related swaps (994) (366) – 100 8 (1,252)Lease liabilities (64) – 14 1 (2) (51)Current liabilities Borrowings and related swaps (331) 296 – 9 – (26)Lease liabilities (12) 14 (14) 1 – (11)Net movements in assets and liabilities arising from financing activities – (56) – 111 (8) Dividends paid to equity shareholders – 99 Interest paid – 159 Net cash outflow from financing activities – 202
Johnson Matthey | Annual Report and Accounts 2022180

Notes on the Accounts continued
22 Provisions Group
Restructuring
provisions
Warranty and technology provisions
Other provisions Total
£ million £ million £ million £ million
At 1st April 2020 2 9 9 20 Charge for the year 69 2 7 78 Utilised (23) – (4) (27)Released (6) (3) (1) (10)Exchange adjustments – – 1 1 At 31st March 2021 42 8 12 62 Charge for the year 18 – 26 44 Utilised (15) (1) (1) (17)Released – (2) – (2)Transferred to liabilities classified as held for sale (note 27) (3) – – (3)At 31st March 2022 42 5 37 84
2022 2021 £ million £ million
Current 56 35 Non-current 28 27 Total provisions 84 62
Restructuring The restructuring provisions are part of the group’s efficiency initiatives (see note 6).
Warranty and technology The warranty and technology provisions represent management’s best estimate of the group’s liability under warranties granted and remedial work required under technology licences based on past experience in Clean Air, Efficient Natural Resources and Other Markets. Warranties generally cover a period of up to three years.
Other The other provisions include environmental and legal provisions arising across the group. Amounts provided reflect management’s best estimate of the expenditure required to settle the obligations at the balance sheet date.
Parent company Restructuring
provisions Other
provisions Total £ million £ million £ million
At 1st April 2020 – 86 86 Charge for the year 53 – 53 Net sale of metal – 86 86 Utilised (14) – (14) Released (6) – (6) At 31st March 2021 33 172 205 Charge for the year 7 3 10 Net sale of metal – (28) (28) Utilised (7) – (7) Released (2) – (2) At 31st March 2022 31 147 178
2022 2021 £ million £ million
Current 162 187 Non-current 16 18 Total provisions 178 205
The restructuring provisions are part of the parent company’s efficiency initiatives.
The other provisions include provisions to buy metal to cover short positions created by the parent company selling metal to cover price risk on metal owned by subsidiaries. Amounts provided reflect management’s best estimate of the expenditure required to settle the obligations at the balance sheet date.
The parent company also guarantees some of its subsidiaries’ borrowings and its exposure at 31st March 2022 was £4 million (2021: £35 million).
Johnson Matthey | Annual Report and Accounts 2022 181
FINA
NCIA
L STATEM
ENTS

Notes on the Accounts continued
23 Deferred tax Group
Property, plant and
equipment
Post- employment
benefits Provisions Inventories Intangibles Other
Total deferred tax
(assets) / liabilities £ million £ million £ million £ million £ million £ million £ million
At 1st April 2020 25 52 (26) (51) 12 (4) 8 Charge / (credit) to the income statement (22) 2 (25) (45) (9) 5 (94)Tax on items taken directly to or transferred from equity – (28) – – – (1) (29)Exchange adjustments (2) 1 3 2 (1) – 3 At 31st March 2021 1 27 (48) (94) 2 – (112)Charge / (credit) to the income statement (note 9) (39) 23 7 44 (3) (25) 7 Tax on items taken directly to or transferred from equity – 35 – – – (8) 27 Exchange adjustments 1 – (3) 1 (1) – (2)At 31st March 2022 (37) 85 (44) (49) (2) (33) (80)
2022 2021 £ million £ million
Deferred tax assets (98) (140)Deferred tax liabilities 18 28 Net amount (80) (112)
Deferred tax has not been recognised in respect of tax losses of £135 million (2021: £165 million) and other temporary differences of £24 million (2021: £22 million). Of the total tax losses, £41 million (2021: £43 million) is expected to expire within 5 years, £12 million within 5 to 10 years (2021: £18 million), £38 million after 10 years (2021: £35 million) and £43 million carry no expiry (2021: £68 million). These deferred tax assets have not been recognised on the basis that their future economic benefit is not probable.
In addition, the group’s overseas subsidiaries have net unremitted earnings of £820 million (2021: £1,764 million), resulting in temporary differences of £585 million (2021: £479 million). No deferred tax has been provided in respect of these differences since the timing of the reversals can be controlled and it is probable that the temporary differences will not reverse in the foreseeable future.
The recognition of deferred tax assets has been determined by the recoverability of those assets against future tax liabilities as determined by budgets and plans that are showing profits in relevant businesses. The majority of the deferred tax assets and liabilities noted above are anticipated to be realised after more than 12 months.
Johnson Matthey | Annual Report and Accounts 2022182

Notes on the Accounts continued
23 Deferred tax (continued) Parent company
Property, plant and
equipment
Post- employment
benefits Provisions Inventories Intangibles Other
Total deferred tax
(assets) / liabilities £ million £ million £ million £ million £ million £ million £ million
At 1st April 2020 (3) 65 – (43) 1 12 32 (Credit) / charge to the income statement (14) 1 (5) (40) – – (58) Tax on items taken directly to or transferred from equity – (25) – – – (1) (26) At 31st March 2021 (17) 41 (5) (83) 1 11 (52) (Credit) / charge to income statement (27) 21 1 38 (1) (4) 28 Tax on items taken directly to or transferred from equity – 30 – – – (8) 22 At 31st March 2022 (44) 92 (4) (45) – (1) (2)
Deductible temporary differences, unused tax losses and unused tax credits not recognised on the balance sheet are £6 million (2021: £6 million) and have no expiry date.
24 Post-employment benefits Group Background Pension plans The group operates a number of post-employment retirement and medical benefit plans around the world. The retirement plans in the UK, US and other countries include both defined contribution and defined benefit plans.
For defined contribution plans, retirement benefits are determined by the value of funds arising from contributions paid in respect of each employee and the investment returns on those contributions prior to retirement.
For defined benefit plans, which include final salary, career average and other types of plans with committed pension payments, the retirement benefits are based on factors, such as the employee’s pensionable salary and length of service. The majority of the group’s final salary and career average defined benefit retirement plans are closed to new entrants, but remain open to ongoing accrual for current members.
Regulatory framework and governance The UK pension plan, the Johnson Matthey Employees Pension Scheme (JMEPS), is a registered arrangement established under trust law and, as such, is subject to UK pension, tax and trust legislation. It is managed by a corporate trustee, JMEPS Trustees Limited. The trustee board includes representatives appointed by both the parent company and employees, and includes an independent chairman.
Although the parent company bears the financial cost of the plan, the trustee directors are responsible for the overall management and governance of JMEPS, including compliance with all applicable legislation and regulations. The trustee directors are required by law to act in the interests of all relevant beneficiaries and: to set certain policies; to manage the day-to-day administration of the benefits; and to set the plan’s investment strategy following consultation with the parent company.
UK pensions are regulated by the Pensions Regulator whose statutory objectives and regulatory powers are described on its website: www.thepensionsregulator.gov.uk
The JMEPS Trustee Board considers how climate risk is integrated within investment processes when appointing, monitoring and withdrawing from investment managers using the investment consultant’s Environmental, Social and Governance (ESG) ratings. The ESG ratings include consideration of climate risk management policies. On a periodic basis, JMEPS will review the ESG ratings assigned to the underlying investments based on the investment consultant’s ESG research.
The US pension plans are qualified pension arrangements and are subject to the requirements of the Employee Retirement Income Security Act, the Pension Protection Act 2006 and the Department of Labor and Internal Revenue. The plans are managed by a pension committee which acts as the fiduciary and, as such, is ultimately responsible for: the management of the plans’ investments; compliance with all applicable legislation and regulations; and overseeing the general management of the plans.
Other trustee or fiduciary arrangements that have similar responsibilities and obligations are in place for the group’s other funded defined benefit pension plans outside of the UK and US.
Johnson Matthey | Annual Report and Accounts 2022 183
FINA
NCIA
L STATEM
ENTS

Notes on the Accounts continued
24 Post-employment benefits (continued) Group (continued) Background (continued) Benefits The UK defined benefit pension plan is segregated into two sections – a legacy section which provides final salary and career average pension benefits and a cash balance section.
The legacy section provides benefits to members in the form of a set level of pension payable for life based on the member’s length of service and final pensionable salary at retirement or averaged over their career with the company. The majority of the benefits attract inflation-related increases both before and after retirement. The final salary element of the legacy section was closed to future accrual of benefits from 1st April 2010 and the career average element of the legacy section was closed to new entrants on 1st October 2012, but remains open to future accrual for existing members.
The cash balance section provides benefits to members at the point of retirement in the form of a cash lump sum. The benefits attract inflation-related increases before retirement but, following the payment of the retirement lump sum benefit, the plan has no obligation to pay any further benefits to the member. All new employees join the cash balance section of the plan.
The group operates two defined benefit pension plans in the US. The hourly pension plan is for unionised employees and provides a fixed retirement benefit for life based upon years of service. The salaried pension plan provides retirement benefits for life based on the member’s length of service and final pensionable salary (averaged over the last five years). The salaried plan benefits attract inflation-related increases before leaving, but are non-increasing thereafter. On retirement, members in either plan have the option to take the cash value of their benefit instead of a lifetime annuity in which case the plan has no obligation to pay any further benefits to the member.
The US salaried pension plan was closed to new entrants on 1st September 2013, and the US hourly pension plan was closed to new entrants on 1st January 2019, but both plans remains open to future accrual for existing members. All new US employees now join a defined contribution plan.
Other post-employment benefits The group’s principal post-employment medical plans are in the UK and US, and are unfunded arrangements that have been closed to new entrants for over ten years.
Maturity profile The estimated weighted average durations of the defined benefit obligations of the main plans as at 31st March 2022 are:
Weighted average
durationYears
Pensions: UK 20 US 12
Post-retirement medical benefits: UK 10 US 10
Funding Introduction The group’s principal defined benefit retirement plans are funded through separate fiduciary or trustee administered funds that are independent of the sponsoring company. The contributions paid to these arrangements are jointly agreed by the sponsoring company and the relevant trustee or fiduciary body after each funding valuation and in consultation with independent qualified actuaries. The plans’ assets, together with the agreed funding contributions, should be sufficient to meet the plans’ future pension obligations.
UK valuations UK legislation requires that pension plans are funded prudently and that, when undertaking a funding valuation (every three years), assets are taken at their market value and liabilities are determined based on a set of prudent assumptions set by the trustee following consultation with their appointed actuary. The assumptions used for funding valuations may, therefore, differ to the actuarial assumptions used for IAS 19, Employee Benefits, accounting purposes.
In January 2013, a special purpose vehicle (SPV), Johnson Matthey (Scotland) Limited Partnership, was set up to provide deficit reduction contributions and greater security to the trustee. The group invested £50 million in a bond portfolio which is beneficially held by the SPV. The income generated by the SPV is used to make annual distributions of £3.5 million to JMEPS for a period of up to 25 years. These annual distributions are only payable if the legacy section of JMEPS continues to be in deficit, on a funding basis. This bond portfolio is held as a non-current investment at fair value through other comprehensive income and the group’s liability to pay the income to the plan is not a plan asset under IAS 19 although it is for actuarial funding valuation purposes. The SPV is exempt from the requirement to prepare audited annual accounts as it is included on a consolidated basis in these accounts.
Johnson Matthey | Annual Report and Accounts 2022184

Notes on the Accounts continued
24 Post-employment benefits (continued) Funding (continued) UK valuations (continued) A funding valuation of JMEPS was carried out as at 1st April 2021 and showed that there was a deficit of £9 million in the legacy section of the plan, or a surplus of £24 million after taking account of the future additional deficit contributions from the SPV. The valuation also showed a deficit in the cash balance section of the plan of £1 million. The next triennial actuarial valuation of JMEPS will be carried out as at 1st April 2024 with the results known later in the year. The assumptions used for funding valuations may differ to the actuarial assumptions used for IAS 19 accounting purposes.
In accordance with the governing documentation of JMEPS, any future plan surplus would be returned to the parent company by way of a refund assuming gradual settlement of the liabilities over the lifetime of the plan. As such, there are no adjustments required in respect of IFRIC 14, IAS 19 – The Limit on a Defined Benefit Asset, Minimum Funding Requirements and their Interaction.
US valuations The last annual review of the US defined benefit pension plans was carried out by a qualified actuary as at 1st July 2021 and showed that there was a surplus of $9 million on the projected funding basis.
The assumptions used for funding valuations may differ to the actuarial assumptions used for IAS 19 accounting purposes.
Other valuations Similar funding valuations are undertaken on the group’s other defined benefit pension plans outside of the UK and US in accordance with prevailing local legislation.
Risk management The group is exposed to a number of risks relating to its post-retirement pension plans, the most significant of which are: Risk Mitigation
Market (investment) risk Asset returns may not move in line with the liabilities and may be subject to volatility.
The group’s various plans have highly diversified investment portfolios, investing in a wide range of assets that provide reasonable assurance that no single security or type of security could have a material adverse impact on the plan. A de-risking strategy is in place to reduce volatility in the plans as a result of the mismatch between the assets and liabilities. As the funding level of the plans improve and hit pre-agreed triggers, plan investments are switched from return-seeking assets to liability-matching assets. The plans implement partial currency hedging on their overseas assets to mitigate currency risk.
Interest (discount) rate risk Liabilities are sensitive to movements in bond yields (interest rates), with lower interest rates leading to an increase in the valuation of liabilities, albeit the impact on the plan’s funding level will be partially offset by an increase in the value of its bond holdings.
The group’s defined benefit plans hold a high proportion of their assets in government or corporate bonds, which provide a natural hedge against falling interest rates. In the UK, this interest rate hedge is extended by the use of interest rate swaps, such that approximately 80% of the plan’s interest rate risk is currently hedged. The swaps are held with several banks to reduce counterparty risk.
Inflation risk Liabilities are sensitive to movements in inflation, with higher inflation leading to an increase in the valuation of liabilities.
Where plan benefits provide inflation-related increases, the plan holds some inflation-linked assets which provide a natural hedge against higher than expected inflation increases. In the UK, this inflation hedge is extended by the use of inflation swaps, such that approximately 80% of the plan’s inflation risk is currently hedged. The swaps are held with several banks to reduce counterparty risk.
Longevity risk The majority of the group’s defined benefit plans provide benefits for the life of the member, so the liabilities are sensitive to life expectancy, with increases in life expectancy leading to an increase in the valuation of liabilities.
The group has closed most of its defined benefit pension plans to new entrants, replacing them with either a cash balance plan or defined contribution plans, both of which are unaffected by life expectancy. For the plans where a benefit for life continues to be payable, prudent mortality assumptions are used that appropriately allow for a future improvement in life expectancy. These assumptions are reviewed on a regular basis.
Johnson Matthey | Annual Report and Accounts 2022 185
FINA
NCIA
L STATEM
ENTS

Notes on the Accounts continued
24 Post-employment benefits (continued) Contributions During the year, total contributions to the group’s post-employment defined benefit plans were £43 million (2021: £49 million). It is estimated that the group will contribute approximately £40 million to the post-employment defined benefit plans during the year ending 31st March 2023.
IAS 19 accounting Principal actuarial assumptions Qualified independent actuaries have updated the IAS 19 valuations of the group’s major defined benefit plans to 31st March 2022. The assumptions used are chosen from a range of possible actuarial assumptions which, due to the long-term nature of the plans, may not necessarily be borne out in practice.
Financial assumptions 2022 2022 2022 2021 2021 2021
UK plan US plans Other plans UK plan US plans Other plans % % % % % %
First year’s rate of increase in salaries 3.85 3.00 2.20 3.40 3.00 2.06 Ultimate rate of increase in salaries 3.85 3.00 2.20 3.40 3.00 2.06 Rate of increase in pensions in payment 3.20 – 2.11 3.05 – 1.70 Discount rate 2.80 3.70 2.13 2.10 3.00 1.53 Inflation – 2.20 2.15 – 2.20 1.64 • UK Retail Prices Index (RPI) 3.60 – – 3.20 – – • UK Consumer Prices Index (CPI) 3.10 – – 2.65 – – Current medical benefits cost trend rate 5.40 – – 5.40 2.20 – Ultimate medical benefits cost trend rate 5.40 – – 5.40 2.20 –
Demographic assumptions The mortality assumptions are based on country-specific mortality tables and, where appropriate, include an allowance for future improvements in life expectancy. In addition, where credible data exists, actual plan experience is taken into account. The group’s most substantial pension liabilities are in the UK and the US where, using the mortality tables adopted, the expected lifetime of average members currently at age 65 and average members at age 65 in 25 years’ time (i.e. members who are currently aged 40 years) is respectively:
Currently age 65 Age 65 in 25 years UK plan US plans UK plan US plans
Male 87 85 89 87 Female 90 87 92 89
Johnson Matthey | Annual Report and Accounts 2022186

Notes on the Accounts continued
24 Post-employment benefits (continued) Financial information Plan assets Movements in the fair value of plan assets during the year were:
UK pension –
legacy section
UK pension – cash balance
section US
pensions
US post- retirement
medical benefits Other Total
£ million £ million £ million £ million £ million £ million
At 1st April 2020 2,027 90 368 – 55 2,540 Administrative expenses (3) – (1) – – (4) Interest income 46 2 10 – 2 60 Return on plan assets excluding interest 125 11 (4) – 3 135 Employee contributions 3 7 1 1 – 12 Company contributions 9 21 16 1 1 48 Benefits paid (65) (3) (32) (2) (2) (104) Exchange adjustments – – (38) – (3) (41) At 31st March 2021 2,142 128 320 – 56 2,646 Administrative expenses (2) – (1) – – (3) Interest income 44 3 10 – 1 58 Return on plan assets excluding interest 27 (2) (15) – (1) 9 Employee contributions 3 7 1 1 – 12 Company contributions 9 22 9 1 1 42 Benefits paid (63) (2) (27) (2) (3) (97) Disposal of business1 – – – – (46) (46) Exchange adjustments – – 13 – – 13 At 31st March 2022 2,160 156 310 – 8 2,634
1. The reduction in assets relates to the disposal of the Advanced Glass Technologies business.
Johnson Matthey | Annual Report and Accounts 2022 187
FINA
NCIA
L STATEM
ENTS

Notes on the Accounts continued
24 Post-employment benefits (continued) Financial information (continued) Plan assets (continued) The fair values of plan assets are analysed as follows:
2022 2021 2022
UK pension – legacy section
UK pension – cash balance
section2022
US pensions2022
Other
2021 UK pension –
legacy section
UK pension – cash balance
section 2021
US pensions 2021Other
£ million £ million £ million £ million £ million £ million £ million £ million
Quoted corporate bonds 924 93 87 5 829 84 199 6 Inflation and interest rate swaps 3 – – – (52) – – – Quoted government bonds 452 – 201 – 698 – 97 – Cash and cash equivalents 289 6 4 1 113 2 4 – Quoted equity 340 57 18 1 442 42 20 1 Unquoted equity 74 – – – 46 – – – Property 73 – – – 63 – – – Insurance policies – – – 1 – – – 49 Other 5 – – – 3 – – – Plan assets 2,160 156 310 8 2,142 128 320 56
The UK plan’s unquoted equities are assets within a pooled infrastructure fund where the underlying assets are a broad range of private infrastructure investments, diversified by geographic region, infrastructure sector, underlying asset type and development stage. These infrastructure assets are valued using widely recognised valuation techniques which use market data and discounted cash flows. The same valuation approach is used to determine the value of the swaps and insurance policies.
The UK plan’s property represents an investment in the Blackrock UK Property Fund, which is a unitised fund where the underlying assets are taken at market value. The valuation of the fund is independently audited by KPMG on an annual basis.
The defined benefit pension plans do not invest directly in Johnson Matthey Plc shares and no property or other assets owned by the pension plans are used by the group.
Johnson Matthey | Annual Report and Accounts 2022188

Notes on the Accounts continued
24 Post-employment benefits (continued) Financial information (continued) Defined benefit obligation Movements in the defined benefit obligation during the year were:
UK pension –
legacy section
UK pension – cash balance
section
UK post- retirement
medical benefits
US pensions
US post- retirement
medical benefits Other Total
£ million £ million £ million £ million £ million £ million £ million
At 1st April 2020 (1,721) (87) (12) (392) (34) (84) (2,330) Current service cost (6) (20) – (9) (1) (1) (37) Past service credit (1) – 4 – – – 3 Interest cost (39) (3) – (11) (1) (2) (56) Employee contributions (3) (7) – (1) (1) – (12) Remeasurements due to changes in:
Financial assumptions (259) (20) – (2) (1) (4) (286) Demographic assumptions 8 – – 2 1 1 12
Benefits paid 65 3 – 32 2 2 104 Exchange adjustments – – – 41 4 5 50 At 31st March 2021 (1,956) (134) (8) (340) (31) (83) (2,552) Current service cost (8) (26) – (9) (1) (1) (45) Past service credit – – – – 11 – 11 Interest cost (40) (4) – (10) (1) (1) (56) Employee contributions (3) (7) – (1) (1) – (12) Remeasurements due to changes in:
Financial assumptions 196 11 – 35 2 2 246 Demographic assumptions – – (1) 1 6 (1) 5 Experience adjustments (61) (16) – – – – (77)
Benefits paid 63 2 – 27 2 3 97 Disposal of business1 – – – – – 46 46 Exchange adjustments – – – (15) – – (15) At 31st March 2022 (1,809) (174) (9) (312) (13) (35) (2,352)
1. The reduction in liabilities relates to the disposal of the Advanced Glass Technologies business.
Johnson Matthey | Annual Report and Accounts 2022 189
FINA
NCIA
L STATEM
ENTS

Notes on the Accounts continued
24 Post-employment benefits (continued) Financial information (continued) Reimbursement rights A government subsidy is receivable under the US Medicare legislation as the US post-retirement medical benefits plan is actuarially equivalent to the Medicare Prescription Drug Act and there is an insurance policy taken out to reinsure the pension commitments of one of the small pension plans which does not meet the definition of a qualifying insurance policy. These are accounted for as reimbursement rights and are shown on the balance sheet in post-employment benefit net assets.
Movements in the reimbursement rights during the year were:
US post- retirement
medical benefits Other Total
£ million £ million £ million
At 1st April 2020 7 1 8 Return on assets excluding interest (1) (1) (2)At 31st March 2021 6 – 6 Return on assets excluding interest (6) – (6)Exchange adjustments – 1 1 At 31st March 2022 – 1 1
Johnson Matthey | Annual Report and Accounts 2022190

Notes on the Accounts continued
24 Post-employment benefits (continued) Financial information (continued) Net post-employment benefit assets and liabilities The net post-employment benefit assets and liabilities are:
UK pension –
legacy section
UK pension – cash balance
section
UK post- retirement
medical benefits US
pensions
US post- retirement
medical benefits Other Total £ million £ million £ million £ million £ million £ million £ million
At 31st March 2022 Defined benefit obligation (1,809) (174) (9) (312) (13) (35) (2,352) Fair value of plan assets 2,160 156 – 310 – 8 2,634 Reimbursement rights – – – – – 1 1 Net post-employment benefit assets and liabilities 351 (18) (9) (2) (13) (26) 283 At 31st March 2021 Defined benefit obligation (1,956) (134) (8) (340) (31) (83) (2,552) Fair value of plan assets 2,142 128 – 320 – 56 2,646 Reimbursement rights – – – – 6 – 6 Net post-employment benefit assets and liabilities 186 (6) (8) (20) (25) (27) 100
These are included in the balance sheet as follows:
2022 Post-employment benefit net assets
2022 Employee benefit
net obligations2022 Total
2021 Post-employment benefit net assets
2021 Employee benefit
net obligations 2021 Total
£ million £ million £ million £ million £ million £ million
UK pension – legacy section 351 – 351 186 – 186 UK pension – cash balance section – (18) (18) – (6) (6) UK post-retirement medical benefits – (9) (9) – (8) (8) US pensions – (2) (2) – (20) (20) US post-retirement medical benefits – (13) (13) 6 (31) (25) Other 1 (27) (26) 2 (29) (27) Total post-employment plans 352 (69) 283 194 (94) 100 Other long-term employee benefits (3) (4) Total long-term employee benefit obligations (72) (98)
Johnson Matthey | Annual Report and Accounts 2022 191
FINA
NCIA
L STATEM
ENTS
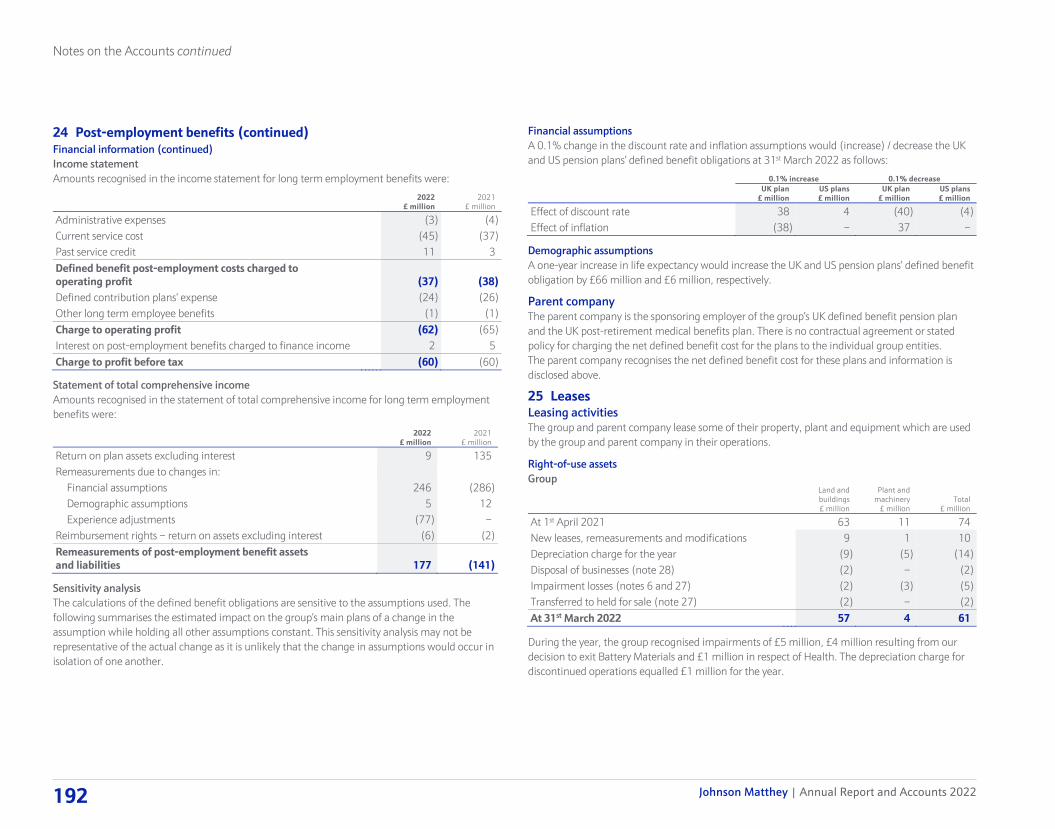
Notes on the Accounts continued
24 Post-employment benefits (continued) Financial information (continued) Income statement Amounts recognised in the income statement for long term employment benefits were:
2022 2021 £ million £ million
Administrative expenses (3) (4)Current service cost (45) (37)Past service credit 11 3 Defined benefit post-employment costs charged to operating profit (37) (38)Defined contribution plans’ expense (24) (26)Other long term employee benefits (1) (1)Charge to operating profit (62) (65)Interest on post-employment benefits charged to finance income 2 5 Charge to profit before tax (60) (60)
Statement of total comprehensive income Amounts recognised in the statement of total comprehensive income for long term employment benefits were:
2022 2021 £ million £ million
Return on plan assets excluding interest 9 135 Remeasurements due to changes in:
Financial assumptions 246 (286)Demographic assumptions 5 12 Experience adjustments (77) –
Reimbursement rights – return on assets excluding interest (6) (2)Remeasurements of post-employment benefit assets and liabilities 177 (141)
Sensitivity analysis The calculations of the defined benefit obligations are sensitive to the assumptions used. The following summarises the estimated impact on the group’s main plans of a change in the assumption while holding all other assumptions constant. This sensitivity analysis may not be representative of the actual change as it is unlikely that the change in assumptions would occur in isolation of one another.
Financial assumptions A 0.1% change in the discount rate and inflation assumptions would (increase) / decrease the UK and US pension plans’ defined benefit obligations at 31st March 2022 as follows:
0.1% increase 0.1% decreaseUK plan US plans UK plan US plans
£ million £ million £ million £ million
Effect of discount rate 38 4 (40) (4)Effect of inflation (38) – 37 –
Demographic assumptions A one-year increase in life expectancy would increase the UK and US pension plans’ defined benefit obligation by £66 million and £6 million, respectively.
Parent company The parent company is the sponsoring employer of the group’s UK defined benefit pension plan and the UK post-retirement medical benefits plan. There is no contractual agreement or stated policy for charging the net defined benefit cost for the plans to the individual group entities. The parent company recognises the net defined benefit cost for these plans and information is disclosed above.
25 Leases Leasing activities The group and parent company lease some of their property, plant and equipment which are used by the group and parent company in their operations.
Right-of-use assets Group
Land and buildings
Plant and machinery Total
£ million £ million £ million
At 1st April 2021 63 11 74 New leases, remeasurements and modifications 9 1 10 Depreciation charge for the year (9) (5) (14)Disposal of businesses (note 28) (2) – (2)Impairment losses (notes 6 and 27) (2) (3) (5)Transferred to held for sale (note 27) (2) – (2)At 31st March 2022 57 4 61
During the year, the group recognised impairments of £5 million, £4 million resulting from our decision to exit Battery Materials and £1 million in respect of Health. The depreciation charge for discontinued operations equalled £1 million for the year.
Johnson Matthey | Annual Report and Accounts 2022192

Notes on the Accounts continued
25 Leases (continued) Parent company
Land and buildings
Plant and machinery Total
£ million £ million £ million
At 1st April 2021 11 4 15 New leases, remeasurements and modifications 1 – 1 Depreciation charge for the year (3) (1) (4)Impairment losses (1) (3) (4)Transferred to held for sale (1) – (1)At 31st March 2022 7 – 7
During the year, the parent company recognised impairments of £4 million resulting from our decision to exit Battery Materials.
Lease liabilities Group Parent company
2022 2021 2022 2021 £ million £ million £ million £ million
Current 10 11 3 3 Non-current 40 51 7 13 Total liabilities 50 62 10 16
Group Parent company 2022 2021 2022 2021 £ million £ million £ million £ million
Interest expense 2 3 1 1
The weighted average incremental borrowing rate applied to the group’s lease liabilities was 4.1% (2021: 4.5%) and 4.0% (2021: 4.3%) for the parent company.
A maturity analysis of lease liabilities is disclosed in note 29.
Other Group Parent company
2022 2021 2022 2021 £ million £ million £ million £ million
Total cash outflow for leases 16 17 3 4
The expense relating to low-value and short-term leases is immaterial.
26 Share capital and other reserves Share capital
Number £ million
Issued and fully paid ordinary shares At 1st April 2020 and 31st March 2021 198,940,606 221 Share buyback (3,078,841) (3) At 31st March 2022 195,861,765 218
Details of outstanding allocations under the company’s long term incentive plans and awards under the deferred bonus which have yet to mature are disclosed in note 31.
On 18th November 2021, the board approved a share buyback of around £200 million which commenced on 21st December 2021 and was completed on 13th May 2022. During the year the company purchased 8,139,250 shares at a cost of £155 million and recognised £45 million in trade and other payables. Of these shares, 5,060,409 are being held as treasury shares with 3,078,841 of the shares cancelled. Distributable reserves have been reduced by £200 million, being the total amount of the share buyback. The total number of treasury shares held was 10,467,585 (2021: 5,407,176) at a total cost of £192 million (2021: £92 million).
The group and parent company’s employee share ownership trust (ESOT) also buys shares on the open market and holds them in trust for employees participating in the group’s executive long term incentive plans. At 31st March 2022, the ESOT held 737,566 shares (2021: 894,670 shares) which had not yet vested unconditionally to employees. Computershare Trustees (CI) Limited, as trustee for the ESOT, has waived its dividend entitlement
Dividends 2022 2021 £ million £ million
2019/20 final ordinary dividend paid – 31.125 pence per share – 60 2020/21 interim ordinary dividend paid – 20.00 pence per share – 39 2020/21 final ordinary dividend paid – 50.00 pence per share 96 – 2021/22 interim ordinary dividend paid – 22.00 pence per share 43 – Total dividends 139 99
A final dividend of 55.0 pence per ordinary share has been proposed by the board which will be paid on 2nd August 2022 to shareholders on the register at the close of business on 10th June 2022, subject to shareholders’ approval. The estimated amount to be paid is £102 million and has not been recognised in these accounts.
The board is responsible for the group’s capital management including the approval of dividends. This includes an assessment of both the level of reserves legally available for distribution and consideration as to whether Johnson Matthey Plc would be solvent and maintain sufficient liquidity following any proposed distribution. The board has assessed the level of distributable profits as at 31st March 2022 and is satisfied that they are sufficient to support the proposed dividend.
Johnson Matthey | Annual Report and Accounts 2022 193
FINA
NCIA
L STATEM
ENTS

Notes on the Accounts continued
26 Share capital and other reserves (continued) Other reserves Capital redemption reserve, The capital redemption reserve represents the cumulative nominal value of the company’s ordinary shares repurchased and subsequently cancelled.
Foreign currency translation reserve, The foreign currency translation reserve comprises all foreign currency differences arising from the translation of the financial statements of foreign operations.
Fair value through other comprehensive income reserve, The fair value through other comprehensive income reserve represents the equity movements on financial assets held within this category.
Hedging reserve, The hedging reserve comprises the effective portion of the cumulative net change in the fair value of cash flow hedging instruments.
The Foreign currency translation reserves includes £3 million (2021: £5 million) in relation to continuing hedge relationships and £3 million (2021: £3 million) in relation to discontinued hedge relationships. All cash flow hedge reserves balances relate to continuing hedge relationships.
Group Hedging reserve
Capital redemption
reserve
Foreign currency
translation reserve
Fair value through other
comprehensive income reserve
Forward currency contracts
Cross currency contracts
Forward metal
contracts
Total other
reserves£ million £ million £ million £ million £ million £ million £ million
At 1st April 2020 7 139 – (7) 1 2 142 Cash flow hedges – gains / (losses) gains taken to equity – – – 7 (10) (8) (11)Cash flow hedges – transferred to revenue (income statement) – – – 1 – – 1 Cash flow hedges – transferred to foreign exchange (income statement) – – – – 9 – 9 Cash flow hedges – transferred to inventory (balance sheet) – – – 6 – (2) 4 Fair value gains on net investment hedges taken to equity – 12 – – – – 12 Fair value gains on investments at fair value through other comprehensive income – – 5 – – – 5 Exchange differences on translation of foreign operations taken to equity – (162) – – – – (162)At 31st March 2021 7 (11) 5 7 – (8) – Cash flow hedges – (losses) / gains taken to equity – – – (14) 3 (31) (42)Cash flow hedges – transferred to revenue (income statement) – – – 2 – – 2 Cash flow hedges – transferred to foreign exchange (income statement) – – – – (3) – (3)Cash flow hedges – transferred to inventory (balance sheet) – – – – – 7 7 Fair value losses on net investment hedges taken to equity – (2) – – – – (2)Fair value losses on investments at fair value through other comprehensive income – – (5) – – – (5)Exchange differences on translation of foreign operations taken to equity – 80 – – – – 80 Cancelled ordinary shares from share buyback 3 – – – – – 3 Tax on above items taken directly to or transferred from equity – 2 – – – 8 10 At 31st March 2022 10 69 – (5) – (24) 50
Johnson Matthey | Annual Report and Accounts 2022194

Notes on the Accounts continued
26 Share capital and other reserves (continued) Other reserves (continued) Parent company
Hedging reserve
Capital redemption
reserve
Foreign currency
translation reserve
Fair value through other
comprehensive income reserve
Forward currency
contracts
Cross currency
swaps
Forward metal
contracts
Total other
reserves £ million £ million £ million £ million £ million £ million £ million
At 1st April 2020 7 – 3 (3) 1 2 10 Cash flow hedges – gains / (losses) taken to equity – – – 6 (10) (8) (12) Cash flow hedges – transferred to revenue (income statement) – – – (1) – – (1) Cash flow hedges – transferred to foreign exchange (income statement) – – – – 9 – 9 Cash flow hedges – transferred to inventory (balance sheet) – – – 3 – (2) 1 Other movements – – (3) – – – (3) At 31st March 2021 7 – – 5 – (8) 4 Cash flow hedges – (losses) / gains taken to equity – – – (12) 3 (31) (40) Cash flow hedges – transferred to revenue (income statement) – – – 2 – – 2 Cash flow hedges – transferred to foreign exchange (income statement) – – – – (3) – (3) Cash flow hedges – transferred to inventory (balance sheet) – – – – – 7 7 Cancelled ordinary shares from share buyback 3 – – – – – 3 Tax on items taken directly to or transferred from equity – – – – – 8 8 At 31st March 2022 10 – – (5) – (24) (19)
Capital The group’s policy for managing capital is to maintain an efficient balance sheet to ensure that the group always has sufficient resources to be able to invest in future growth. The group uses Return on Invested Capital to provide a measure of its efficiency in allocating the capital under its control to profitable investments (see note 36). Capital employed is defined as total equity, excluding post tax pension net assets, plus net debt. During the year, the group complied with all externally imposed capital requirements to which it is subject.
Johnson Matthey | Annual Report and Accounts 2022 195
FINA
NCIA
L STATEM
ENTS

Notes on the Accounts continued
27 Discontinued operations and assets and liabilities classified as held for sale The group strategically drives for efficiency and disciplined capital allocation to enhance returns, as such we continue to actively manage our portfolio. In line with this strategy, during the year the board decided to sell the Health segment.
On 17th December, the group announced the sale of its Health segment to Altaris Capital Partners. The assets and liabilities have been classified as ‘held for sale’ at fair value less costs to sell (£272 million). The amount is lower than book value as a result of the deterioration of trading performance through this financial year that ultimately impacted Altaris Capital Partners’ valuation of the business, consequentially this has resulted in an impairment charge of £228 million and a restructuring charge of £14 million. The impairment charge comprises goodwill (£144 million), property, plant and equipment (£55 million), right-of-use assets (£1 million), other intangible assets (£23 million) and inventories (£5 million). The business is classified as a discontinued operation and presented separately in the income statement and presented within assets held for sale on the balance sheet.
The Health segment was not classified as held for sale or as a discontinued operation as at 31st March 2021. The comparative statement of profit or loss and other comprehensive income has been restated to show the discontinued operations separately from continuing operations.
Financial information relating to the Health discontinued operations for the year is set out below.
2022 2021 £ million £ million
Revenue 164 238 Expenses (161) (207)Underlying operating profit from discontinued operations 3 31 Major impairment and restructuring costs from discontinued operations (242) (17)(Loss) / profit before tax from discontinued operations (239) 14 Tax credit / (expense) 22 (3)(Loss) / profit after tax from discontinued operations (217) 11 Exchange differences on translation of discontinued operations 5 (18)Other comprehensive income / (expense) from discontinued operations 5 (18)Total comprehensive expense from discontinued operations (212) (7)Net cash inflow from operating activities 33 43 Net cash outflow from investing activities (30) (29)Net cash outflow from financing activities (6) (12)Net (decrease) / increase in cash generated by the discontinued operations (3) 2
pence pence
(Loss) / earnings per ordinary share from discontinued operations Basic (loss) / earnings per ordinary share from discontinued operations (113.5) 5.6Diluted (loss) / earnings per ordinary share from discontinued operations (113.5) 5.6
In the prior year, the Health segment incurred non-underlying major impairment and restructuring charges of £17 million. The charges were in relation to efficiency initiatives. There have been no further charges in relation to these initiatives in the current year.
During the year, the group decided to sell parts or all of its Battery Materials business. As at 31st March 2022, the proceeds less costs to sell for the Battery Materials business was estimated to be £50 million and so an impairment of £325 million has been recognised, see note 6. The business is classified as a disposal group held for sale.
The major classes of assets and liabilities comprising the businesses classified as held for sale as at 31st March 2022 are:
HealthBattery
Materials Total£ million £ million £ million
Non-current assets Property, plant and equipment 107 39 146 Right-of-use assets 1 1 2 Other intangible assets 41 11 52 Current assets Inventories 137 1 138 Current tax assets 1 – 1 Trade and other receivables 59 4 63 Assets classified as held for sale 346 56 402 Current liabilities Trade and other payables (60) – (60)Lease liabilities (1) (1) (2)Cash and cash equivalents – bank overdrafts (8) – (8)Provisions (2) – (2)Non-current Lease liabilities (2) (5) (7)Provisions (1) – (1)Liabilities classified as held for sale (74) (6) (80)Net assets of disposal group 272 50 322
Johnson Matthey | Annual Report and Accounts 2022196

Notes on the Accounts continued
28 Disposals Advanced Glass Technologies On 31st January 2022, the group completed the sale of its Advanced Glass Technologies business for a cash consideration of £173 million. The business was disclosed as a disposal group held for sale as at 30th September 2021.
Advanced Glass Technologies £ million
Proceeds Cash consideration 173 Cash and cash equivalents disposed (3)Net cash consideration 170 Disposal costs paid (10)Net cash inflow 160
Assets and liabilities disposed Non-current assets Property, plant and equipment 11 Right-of-use assets 2 Goodwill 2 Current assets Inventories 17 Trade and other receivables 14 Cash and cash equivalents – cash and deposits 3 Current liabilities Trade and other payables (10)Net assets disposed 39
The profit on disposal of businesses totalled £106 million.
AdvancedGlass
Technologies£ million
Cash consideration 173 Less: carrying amount of net assets sold (39)Less: disposal costs (10)Cumulative currency translation gain recycled from other comprehensive income
(18)
Profit recognised in the income statement 106
29 Financial risk management The group’s activities expose it to a variety of financial risks, including credit risk, market risk and liquidity risk. Market risk includes foreign currency risk, interest rate risk and price risk. The financial risks are managed by the group, under policies approved by the board. The financial risk management is carried out by a centralised group treasury function. Group Treasury’s role is to optimise the group’s liquidity, mitigate financial risks and provide treasury services to the group’s operating businesses. The group uses derivative financial instruments, including forward currency contracts, interest rate swaps and currency swaps, to manage the financial risks associated with its underlying business activities and the financing of those activities. Some derivative financial instruments used to manage financial risk are not designated as hedges and, therefore, are classified as at fair value through profit or loss. The group does not undertake any speculative trading activity in financial instruments.
Credit risk Within certain businesses, the group derives a significant proportion of its revenue from sales to major customers. Sales to individual customers are large if the value of precious metals is included in the price. The failure of any such company to honour its debts could materially impact the group’s results. The group derives significant benefit from trading with its customers and manages the risk at many levels. Each sector has a credit committee that regularly monitors its exposure. The Audit Committee receives a report every six months that details all significant credit limits, amounts due and overdue within the group, and the relevant actions being taken. At 31st March 2022, trade receivables for the group amounted to £1,393 million (2021: £1,571 million), excluding £29 million classified as held for sale, of which £1,167 million (2021: £1,317 million) are in Clean Air which mainly supplies car and truck manufacturers and component suppliers in the automotive industry. Although Clean Air has a wide range of customers, the concentrated nature of this industry means that amounts owed by individual customers can be large and, in the event that one of those customers experiences financial difficulty, there could be a material adverse impact on the group. Other parts of the group tend to sell to a larger number of customers and amounts owed tend to be lower. At 31st March 2022, no single outstanding balance exceeded 2% (2021: 2%) of revenue.
Johnson Matthey | Annual Report and Accounts 2022 197
FINA
NCIA
L STATEM
ENTS

Notes on the Accounts continued
29 Financial risk management (continued) Credit risk (continued) The credit profiles of the group’s customers are obtained from credit rating agencies where possible and are closely monitored. The scope of these reviews includes amounts overdue and credit limits. The group’s exposure to credit risk is influenced mainly by the individual characteristics of each customer. However, risk associated with the industry and country in which customers operate may also influence the credit risk. The credit quality of customers is assessed against the appropriate credit ratings, trading experience and market position to define credit limits. Controls and risk mitigants include daily monitoring of exposures, investing in counterparties with investment grade ratings, restricting the amount that can be invested with one counterparty and credit-rating mitigation techniques. Generally, payments are made promptly in the automotive industry and in the other markets in which the group operates.
A provision matrix is used to calculate lifetime expected credit losses using historical loss rates based on days past due and a broad range of forward-looking information, including country and market growth forecasts. This year, expected credit losses on unimpaired trade and contract receivables have decreased to £16 million (2021: £23 million) reflecting the risk profile as at the year end.
Trade receivables are specifically impaired when the amount is in dispute, customers are in financial difficulty or for other reasons which imply there is doubt over the recoverability of the debt. They are written off when there is no reasonable expectation of recovery, based on an estimate of the financial position of the counterparty.
Movements in the allowance for credit losses on trade and contract receivables are as follows:
Group 2022 2021
£ million £ million
At beginning of year 30 37 Charge for year 18 7 Utilised (1) (5)Released (10) (9)At end of year 37 30
The group’s maximum exposure to default on trade and contract receivables is £1,575 million (2021: £1,782 million), of which £57 million is classified as held for sale.
The group’s financial assets included in other receivables are all current and not impaired.
The credit risk on cash and deposits and derivative financial instruments is limited because the counterparties with significant balances are banks with strong credit ratings. The exposure to individual banks is monitored frequently against internally-defined limits, together with each bank’s credit rating and credit default swap prices. At 31st March 2022, the maximum net exposure with a single bank for cash and deposits was £105 million (2021: £26 million), whilst the largest mark to market exposure for derivative financial instruments to a single bank was £7 million
(2021: £9 million). The group also uses money market funds to invest surplus cash thereby further diversifying credit risk and, at 31st March 2022, the group’s exposure to these funds was £137 million (2021: £462 million). The amounts on deposit at the year end represent the group’s maximum exposure to credit risk on cash and deposits. Expected credit losses on cash and cash equivalents are immaterial.
Foreign currency risk The group operates globally with a significant amount of its profit earned outside the UK. The main impact of movements in exchange rates on the group’s results arises on translation of overseas subsidiaries’ profits into sterling. The largest exposure is to the US dollar and a 5% (6.8 cent (2021: 6.5 cent)) movement in the average exchange rate for the US dollar against sterling would have had a £10 million (2021: £7 million) impact on underlying operating profit. The group is also exposed to the euro and a 5% (5.9 cent (2021: 5.6 cent)) movement in the average exchange rate for the euro against sterling would have had a £9 million (2021: £9 million) impact on underlying operating profit. This exposure is part of the group’s economic risk of operating globally which is essential to remain competitive in the markets in which it operates.
The group matches foreign currency assets and liabilities (where these differ to the functional currency of the relevant subsidiary) to avoid the risk of a material impact on the income statement resulting from movements in exchange rates. The group does, however, have foreign exchange exposure on movements through equity related to cash flow and net investment hedges. A 10% depreciation or appreciation in the US dollar and euro exchange rates against sterling would increase / (decrease) other reserves as follows:
10% depreciation 10% appreciation 2022 2021 2022 2021 £ million £ million £ million £ million
Cash flow hedges 5 12 (7) (14)Net investment hedges 20 12 (25) (15)
For the net investment hedges, these movements would be fully offset in reserves by an opposite movement on the retranslation of the net assets of the overseas subsidiaries.
Investments in foreign operations To protect the group’s sterling balance sheet and reduce cash flow risk, the group has financed most of its investment in the US and Europe by borrowing US dollars and euros, respectively. Although much of this funding is obtained by directly borrowing the relevant currency, a part is achieved through currency swaps which can be more efficient and reduce costs.
The group has designated US dollar and euro loans and a cross currency swap as hedges of net investments in foreign operations as they hedge changes in the value of the subsidiaries’ net assets against movements in exchange rates. The change in the value of the net investment hedges from movements in foreign currency exchange rates is recognised in equity and is offset by an equal and opposite movement in the carrying value of the net assets of the subsidiaries. All critical terms of the hedging instruments and hedged items matched during the year and, therefore, hedge ineffectiveness was immaterial. The hedge ratio is 1:1.
Johnson Matthey | Annual Report and Accounts 2022198

Notes on the Accounts continued
29 Financial risk management (continued) Foreign currency risk (continued) Year ended 31st March 2022
US dollar and
euro loans1
Cross currency
swap2 Total £ million £ million £ million
Carrying value of hedging instruments at 31st March 2022 (156) (2) (158)Change in carrying value of hedging instruments recognised in equity during the year (3) 1 (2)Change in fair value of hedged items during the year used to determine hedge effectiveness 3 (1) 2
Year ended 31st March 2021
US dollar and
euro loans1 Cross currency
swap2 Total £ million £ million £ million
Carrying value of hedging instruments at 31st March 2021 (69) (3) (72)Change in carrying value of hedging instruments recognised in equity during the year 9 3 12 Change in fair value of hedged items during the year used to determine hedge effectiveness (9) (3) (12)
1. The designated hedging instruments are the $75 million of the 3.26% $150 million Bonds 2022, €17 million of the 2.44% €20 million Bonds 2023, €90 million of the 1.81% €90 million Bonds 2028 and €10 million of the 2.92% €25 million Bonds 2030.
2. The designated hedging instrument is a cross currency swap expiring in 2025 whereby the group pays 2.609% fixed on €77 million and receives 2.83% fixed on £65 million.
Forecast receipts and payments in foreign currencies The group uses forward foreign exchange contracts to hedge foreign exchange exposures arising on forecast receipts and payments in foreign currencies. These are designated and accounted for as cash flow hedges. The group’s policy is to hedge between 50% and 80% of forecast receipts and payments in foreign currencies over the next 12 months.
For hedges of forecast receipts and payments in foreign currencies, the critical terms of the hedging instruments match exactly with the terms of the hedged items and, therefore, the group performs a qualitative assessment of effectiveness. Ineffectiveness may arise if the timing of the forecast transaction changes from what was originally estimated or if there are changes in the credit risk of the group or the derivative counterparty. Hedge ineffectiveness was immaterial during the year. The hedge ratio is 1:1.
Year ended 31st March 2022 Sterling / US dollar Sterling / euro Other Total £ million £ million £ million £ million
Carrying value of hedging instruments at 31st March 2022 • assets – – 5 5 • liabilities (5) – (4) (9) Change in carrying value of hedging instruments recognised in equity during the year (8) 16 (3) 5 Change in fair value of hedged items during the year used to determine hedge effectiveness 8 (16) 3 (5) Notional amount1 209 53 11 –
Year ended 31st March 2021
Sterling / US
dollar Sterling / euro Other Total £ million £ million £ million £ million
Carrying value of hedging instruments at 31st March 2021 • assets 3 4 5 12 • liabilities (1) – (3) (4) Change in carrying value of hedging instruments recognised in equity during the year 2 7 (2) 7 Change in fair value of hedged items during the year used to determine hedge effectiveness (2) (7) 2 (7) Notional amount1 97 91 13 –
1. The notional amount is the sterling equivalent of the net currency amount purchased or sold.
The weighted average exchange rates on sterling / US dollar and sterling / euro forward foreign exchange contracts are 1.35 and 0.85 (2021: 1.34 and 0.89), respectively. The hedged, highly probable forecast transactions denominated in foreign currencies are expected to occur over the next 12 months.
Johnson Matthey | Annual Report and Accounts 2022 199
FINA
NCIA
L STATEM
ENTS

Notes on the Accounts continued
29 Financial risk management (continued) Foreign currency borrowings The group has designated a US dollar fixed interest rate to sterling fixed interest rate cross currency swap as a cash flow hedge. This swap hedges the movement in the cash flows on $100 million of the 3.14% $130 million bonds 2025 attributable to changes in the US dollar / sterling exchange rate. The currency swap has similar critical terms as the hedged item, such as reference rate, reset dates, payment dates, maturity and notional amount. As all critical terms matched during the year, hedge ineffectiveness was immaterial. The hedge ratio is 1:1. The interest element of the swap is recognised in the income statement each year.
Cross currency swap2022 2021
£ million £ million
Carrying value of hedging instruments at 31st March1 11 8 Change in carrying value of hedging instruments recognised in equity during the year 3 (11)Change in fair value of hedged items during the year used to determine hedge effectiveness (3) 11
1. The designated hedging instrument is a cross currency swap expiring in 2025 whereby the group pays 2.83% fixed on £65 million and receives 3.14% fixed on $100 million.
Interest rate risk The group’s interest rate risk arises from fixed rate borrowings (fair value risk) and floating rate borrowings (cash flow risk) as well as cash deposits and short term investments. Its policy is to optimise interest cost and reduce volatility in reported earnings and equity. The group manages its risk by reviewing the profile of debt regularly and by selectively using interest rate swaps to maintain borrowings at competitive rates. At 31st March 2022, 66% (2021: 60%) of the group’s borrowings and related swaps was at fixed rates with an average interest rate of 3.5% (2021: 3.5%). The remaining debt is floating rate. Based on the group’s borrowings and related swaps at floating rates, after taking into account the effect of the swaps, a 1% change in all interest rates during the current year would have a £4 million impact on the group’s profit before tax (2021: £5 million).
The group has designated four (2021: four) fixed rate to floating interest rate swaps as fair value hedges as they hedge the changes in fair value of bonds attributable to changes in interest rates. All hedging instruments have maturities in line with the repayment dates of the hedged bonds and the cash flows of the instruments are consistent. All critical terms of the hedging instruments and hedged items matched during the year and, therefore, hedge ineffectiveness was immaterial.
2022 2021
£ million £ million
Carrying value of hedging instruments at 31st March1 (1) 12 Amortised cost (256) (251)Fair value adjustment 3 (10)Carrying value of hedged items at 31st March1 (253) (261)Change in carrying value of hedging instruments recognised in profit or loss during the year (13) (3)Change in fair value of hedged items during the year used to determine hedge effectiveness 13 5
1. The hedged items are the 3.26% $150 million Bonds 2022, 1.40% €77 million Bonds 2025 and 1.81% €90 million Bonds 2028. Interest rate swaps have been contracted with aligned notional amounts and maturities to the bonds with the effect that the group pays an average floating rate of six-month LIBOR plus 0.64% on the US dollar bonds and six-month EURIBOR plus 0.94% on the euro bonds.
Price risk Fluctuations in precious metal prices have an impact on the group’s financial results. Our policy for all manufacturing businesses is to limit this exposure by hedging against future price changes where such hedging can be done at acceptable cost. The group enters into forward precious metal price contracts for the receipt or delivery of precious metal. The group does not take material price exposures on metal trading. A proportion of the group’s precious metal inventories are unhedged due to the ongoing risk over security of supply.
Liquidity risk The group’s funding strategy includes maintaining appropriate levels of working capital, undrawn committed facilities and access to the capital markets. We regularly review liquidity levels and sources of cash, and we maintain access to committed credit facilities and debt capital markets. At 31st March 2022, the group had borrowings under committed bank facilities of £nil (2021: £nil). The group also has a number of uncommitted facilities and overdraft lines at its disposal.
During the year the group extended the maturity date of its sustainability-linked £1 billion revolving credit facility by one year to March 2027. This £1 billion revolving credit facility includes Environmental, Social and Governance KPIs which provides the group with a nominal interest saving or cost depending on our performance.
During the financial year the group signed a sustainable financing agreement through UK Export Finance’s (UKEF) Export Development Guarantee scheme for £403 million using year end exchange rates. These facilities are all undrawn as at 31st March 2022 and have maturity dates in March 2027. In addition, the group also signed its first sustainability-linked private placements notes with a delayed drawdown to June 2022. These facilities are for €225 million, £35 million and $50 million.
Johnson Matthey | Annual Report and Accounts 2022200

Notes on the Accounts continued
29 Financial risk management (continued) Liquidity risk (continued)
2022 2021 £ million £ million
Expiring in more than one year 1,403 1,000 Undrawn committed bank facilities 1,403 1,000
The maturity analyses for financial liabilities showing the remaining contractual undiscounted cash flows, including future interest payments, at current year exchange rates and assuming floating interest rates remain at the latest fixing rates, are:
At 31st March 2022
Within 1 year
1 to 2 years
2 to 5 years
After 5years Total
£ million £ million £ million £ million £ million
Bank overdrafts 37 – – – 37 Bank overdrafts classified as held for sale 8 – – – 8 Bank and other loans – principal 264 142 412 348 1,166 Bank and other loans – interest payments 29 25 47 13 114 Lease liabilities – principal 10 8 13 19 50 Lease liabilities – principal – classified as held for sale 2 2 1 4 9 Lease liabilities – interest payments 2 2 3 9 16 Financial liabilities in trade and other payables 2,290 2 – – 2,292 Financial liabilities in trade and other payables classified as held for sale 23 – – – 23
Total non-derivative financial liabilities 2,665 181 476 393 3,715 Forward foreign exchange contracts – payments 473 45 26 – 544 Forward foreign exchange contracts – receipts (466) (43) (25) – (534)Currency swaps – payments 2,050 – – – 2,050 Currency swaps – receipts (2,053) – – – (2,053)Cross currency interest rate swaps – payments 2 65 – – 67 Cross currency interest rate swaps – receipts (2) (65) – – (67)Interest rate swaps – payments 1 1 67 77 146 Interest rate swaps – receipts (2) (2) (71) (79) (154)Total derivative financial liabilities 3 1 (3) (2) (1)
At 31st March 2021
Within 1 year
1 to 2 years
2 to 5 years
After 5 years Total
£ million £ million £ million £ million £ million
Bank overdrafts 36 – – – 36 Bank and other loans – principal 26 250 575 414 1,265 Bank and other loans – interest payments 32 29 61 24 146 Lease liabilities – principal 11 10 17 25 63 Lease liabilities – interest payments 3 2 5 8 18 Financial liabilities in trade and other payables 3,141 1 – 3 3,145 Total non-derivative financial liabilities 3,249 292 658 474 4,673 Forward foreign exchange contracts – payments 289 – – – 289 Forward foreign exchange contracts – receipts (284) – – – (284) Currency swaps – payments 821 – – – 821 Currency swaps – receipts (816) – – – (816) Cross currency interest rate swaps – payments 2 2 68 – 72 Cross currency interest rate swaps – receipts (2) (2) (68) – (72) Total derivative financial liabilities 10 – – – 10
Offsetting financial assets and liabilities The group offsets financial assets and liabilities when it currently has a legally enforceable right to offset the recognised amounts and it intends to either settle on a net basis or realise the asset and settle the liability simultaneously. The following financial assets and liabilities are subject to offsetting or enforceable master netting arrangements:
At 31st March 2022
Gross financial
assets / (liabilities)
Amounts set off
Net amounts
in balance sheet
Amounts not set off1 Net
£ million £ million £ million £ million £ million
Non-current interest rate swaps 11 – 11 (3) 8 Cash and cash equivalents 392 (1) 391 – 391 Other financial assets 27 – 27 (24) 3 Cash and cash equivalents – bank overdrafts (38) 1 (37) – (37) Other financial liabilities – current (44) – (44) 24 (20) Non-current borrowings and related swaps (899) – (899) 3 (896)
Johnson Matthey | Annual Report and Accounts 2022 201
FINA
NCIA
L STATEM
ENTS

Notes on the Accounts continued
29 Financial risk management (continued) Offsetting financial assets and liabilities (continued)
At 31st March 2021
Gross financial
assets / (liabilities)
Amounts set off
Netamounts
in balance sheet
Amounts not set off1 Net
£ million £ million £ million £ million £ million
Non-current interest rate swaps 20 – 20 (3) 17 Cash and cash equivalents 582 (1) 581 – 581 Other financial assets 44 – 44 (9) 35 Cash and cash equivalents – bank overdrafts (37) 1 (36) – (36)Other financial liabilities (18) – (18) 9 (9)Non-current borrowings and related swaps (1,252) – (1,252) 3 (1,249)
1. Agreements with derivative counterparties are based on an ISDA Master Agreement. Under these arrangements, whilst the group does not have a legally enforceable right of set off, where certain credit events occur, such as default, the net position receivable from or payable to a single counterparty in the same currency would be taken as owing and all the relevant arrangements terminated.
30 Fair values Fair value hierarchy Fair values are measured using a hierarchy where the inputs are:
• Level 1 – quoted prices in active markets for identical assets or liabilities. • Level 2 – not level 1 but are observable for that asset or liability either directly or indirectly. • Level 3 – not based on observable market data (unobservable).
Fair value of financial instruments Certain of the group’s financial instruments are held at fair value. The fair value of a financial instrument is the price that would be received to sell an asset or paid to transfer a liability in an orderly transaction between market participants at the balance sheet date.
The fair value of forward foreign exchange contracts, interest rate swaps, forward precious metal price contracts and currency swaps is estimated by discounting the future contractual cash flows using forward exchange rates, interest rates and prices at the balance sheet date.
The fair value of trade and other receivables measured at fair value is the face value of the receivable less the estimated costs of converting the receivable into cash.
The fair value of money market funds is calculated by multiplying the net asset value per share by the investment held at the balance sheet date.
There were no transfers of any financial instrument between the levels of the fair value hierarchy during the current or prior years.
2022 £ million
2021 £ million
Fair value hierarchy
Level Note
Financial instruments measured at fair value Non-current Investments at fair value through other comprehensive income1 45 53 1 – Interest rate swaps – assets 11 20 2 15 Interest rate swaps – liabilities (2) – 2 15 Borrowings and related swaps (2) (3) 2 20 Other financial liabilities2 (12) – 2 18 Current Trade receivables3 492 423 2 17 Other receivables4 44 58 2 17 Cash and cash equivalents – money market funds 137 462 2 Other financial assets2 27 44 2 18 Interest rate swaps 1 – 2 15 Other financial liabilities2 (44) (18) 2 18 Financial instruments not measured at fair value Non-current Borrowings and related swaps (897) (1,249) – 20 Lease liabilities (40) (51) – 25 Current Amounts receivable under precious metal sale and repurchase agreements 114 308 – 17 Amounts payable under precious metal sale and repurchase agreements (793) (1,442) – 19 Cash and cash equivalents – cash and deposits 254 119 – Cash and cash equivalents – bank overdrafts (37) (36) – Borrowings and related swaps (265) (26) – 20 Lease liabilities (10) (11) 25
1. Investments at fair value through other comprehensive income are quoted bonds purchased to fund pension deficit. 2. Includes forward foreign exchange contracts, forward precious metal price contracts and currency swaps. 3. Trade receivables held in a part of the group with a business model to hold trade receivables for collection or sale. The
remainder of the group operates a hold to collect business model and receives the face value, plus relevant interest, of its trade receivables from the counterparty without otherwise exchanging or disposing of such instruments.
4. Other receivables with cash flows that do not represent solely the payment of principal and interest.
Johnson Matthey | Annual Report and Accounts 2022202

Notes on the Accounts continued
30 Fair values (continued) The fair value of financial instruments, excluding accrued interest, is approximately equal to book value except for:
2022 2021
Carrying amount
Fair value
Carrying amount
Fair value
£ million £ million £ million £ million
US Dollar Bonds 2022, 2023, 2025, 2027, 2028 and 2030 (688) (662) (662) (689)Euro Bonds 2023, 2025, 2028 and 2030 (176) (179) (186) (193)Sterling Bonds 2024 and 2025 (110) (107) (110) (116)KfW US Dollar loan 2024 (38) (36) (36) (39)
The fair values are calculated using level 2 inputs by discounting future cash flows to net present values using appropriate market interest rates prevailing at the year end.
31 Share-based payments The total expense recognised during the year in respect of equity-settled share-based payments was £15 million (2021: £16 million). The expense recognised in respect of equity-settled share-based payments for continuing operations was £13 million (2021: £14 million), and £2 million (2021: £2 million) for discontinued operations.
The group currently operates various share-based payment schemes; a Performance share plan (PSP), a Restricted share plan (RSP), a Long-term incentive plan (LTIP), a Deferred bonus scheme and a Share Incentive Plan (SIP). Further details of the directors’ remuneration under share-based payment plans are given in the Remuneration Report.
PSP From 2017, shares are awarded to certain of the group’s executive directors and senior managers under the PSP based on a percentage of salary and are subject to performance targets over a three-year period. The performance targets are based on underlying EPS growth, and Total Shareholder Return.
Awards to the executive directors are also subject to a deferred release whereby a third is released on the third anniversary of the award date and the remaining vested shares are released in equal instalments on the fourth and fifth anniversaries of the award date. The Remuneration Committee is entitled to claw back the awards to the executive directors in cases of misstatement or misconduct.
RSP From 2017, shares are awarded to certain of the group’s executive directors and senior managers under the RSP based on a percentage of salary. Awards under the RSP are not subject to performance targets. The shares are subject only to the condition that the employee remains employed by the group on the vesting date (three years after the award date).
LTIP Prior to 2017, shares were awarded to approximately 1,300 of the group’s executive directors, senior managers and middle managers under the LTIP based on a percentage of salary and were subject to performance targets over a three-year period.
Awards to the executive directors are subject to a deferred release whereby a third is released on the third anniversary of the award date and the remaining vested shares are released in equal instalments on the fourth and fifth anniversaries of the award date. The Remuneration Committee is entitled to claw back the awards to the executive directors in cases of misstatement or misconduct.
All outstanding awards on this scheme were released in August 2021.
Deferred bonus A proportion of the bonus payable to executive directors and senior managers is awarded as shares and deferred for three years. The Remuneration Committee is entitled to claw back the deferred element in cases of misstatement or misconduct or other relevant reason as determined by it.
All employee share incentive plan (SIP) – UK and overseas Under the SIP, all employees with at least one year of service with the group and who are employed by a participating group company are entitled to contribute up to 2.5% of base pay each month, subject to a £125 per month limit. The SIP trustees buy shares (partnership shares) at market value each month with the employees’ contributions. For each partnership share purchased, the group purchases two shares (matching shares) which are awarded to the employee.
In the UK SIP, if the employee sells or transfers partnership shares within three years of the date of award, the linked matching shares are forfeited.
In the overseas SIP, partnership shares and matching shares are subject to a three-year holding period and cannot be sold or transferred during that time.
During the year, 287,320 (2021: 284,808) matching shares under the SIP were awarded to employees. These are nil cost awards on which performance conditions are substantially completed at the date of grant and, consequently, the fair value of these awards is based on the market value of the shares at that date.
Johnson Matthey | Annual Report and Accounts 2022 203
FINA
NCIA
L STATEM
ENTS

Notes on the Accounts continued
31 Share-based payments (continued) Year ended 31st March 2022 Year ended 31st March 2021
PSP RSP LTIP Deferred Bonus PSP RSP LTIP Deferred Bonus
Outstanding at the start of the year 1,267,198 680,364 23,808 113,084 1,037,536 247,021 71,277 105,530 Awarded during the year 588,027 761,954 – 75,964 723,758 534,516 553 34,264 Forfeited during the year (420,314) (95,172) – – (494,096) (29,587) – – Released during the year – (88,448) (23,808) (39,912) – (65,782) (24,357) (26,710)Expired during the year – – – – – (5,804) (23,665) – Outstanding at the end of the year 1,434,911 1,258,698 – 149,136 1,267,198 680,364 23,808 113,084
Year ended 31st March 2022 Year ended 31st March 2021
PSPExceptional
PSP1 RSP Exceptional
RSP1 Deferred Bonus PSP RSP Deferred Bonus
Fair value of shares awarded (pence) 2,767.7 1,652.5 2,767.7 1,839.7 2,703.4 2,078.9 2,078.9 2,028.2 Share price at the date of award (pence) 2,970.2 1,813.5 2,970.2 1,962.5 2,970.2 2,239.0 2,239.0 2,239.0 Dividend rate 2.36% 3.86% 2.36% 3.92% 2.36% 2.48% 2.48% 2.48%
1. The group awarded an exceptional RSP scheme on 17th December 2021, and an exceptional PSP scheme on 1st March 2022 all other schemes have grant dates on 1st August each year.
The fair value of shares awarded was calculated using a modified Black Scholes model based on the share price at the date of award adjusted for the present value of the expected dividends that will not be received at an expected dividend rate.
At 31st March 2022, the weighted average remaining contracted life of the awarded PSP shares is 1.2 years (2021: 1.3 years) and 1.4 years (2021: 1.7 years) for the awarded RSP shares.
Johnson Matthey | Annual Report and Accounts 2022204
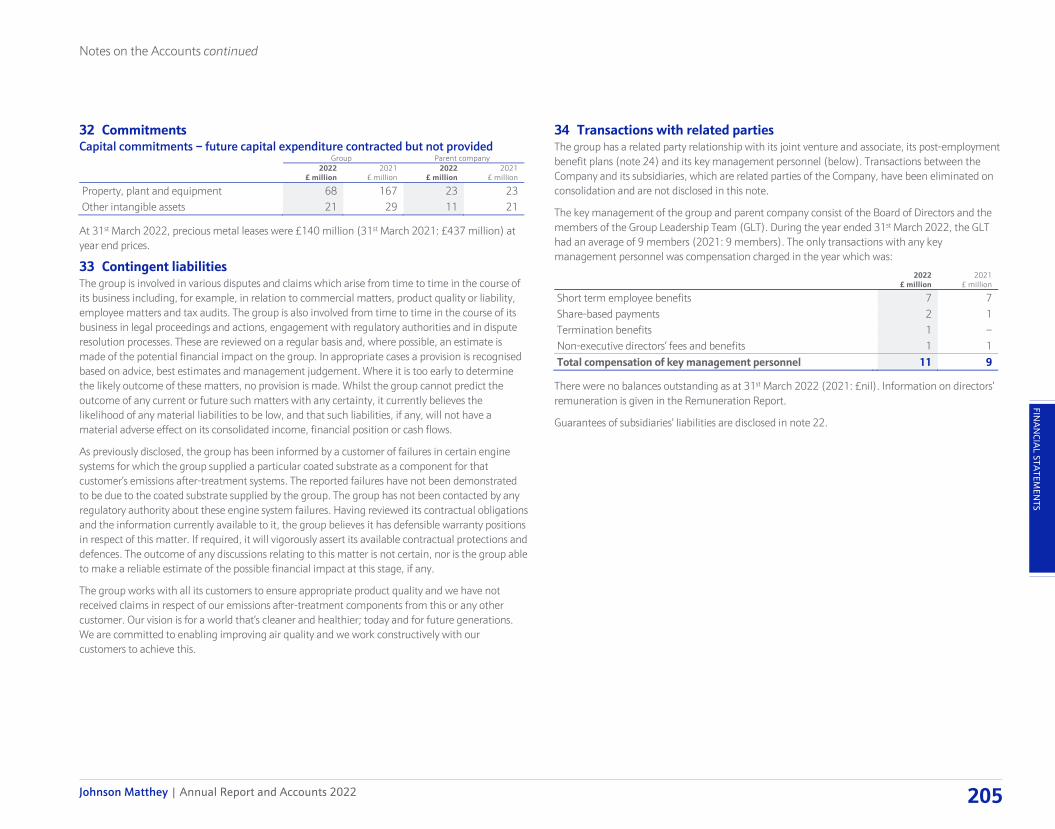
Notes on the Accounts continued
32 Commitments Capital commitments – future capital expenditure contracted but not provided
Group Parent company 2022 2021 2022 2021 £ million £ million £ million £ million
Property, plant and equipment 68 167 23 23 Other intangible assets 21 29 11 21
At 31st March 2022, precious metal leases were £140 million (31st March 2021: £437 million) at year end prices.
33 Contingent liabilities The group is involved in various disputes and claims which arise from time to time in the course of its business including, for example, in relation to commercial matters, product quality or liability, employee matters and tax audits. The group is also involved from time to time in the course of its business in legal proceedings and actions, engagement with regulatory authorities and in dispute resolution processes. These are reviewed on a regular basis and, where possible, an estimate is made of the potential financial impact on the group. In appropriate cases a provision is recognised based on advice, best estimates and management judgement. Where it is too early to determine the likely outcome of these matters, no provision is made. Whilst the group cannot predict the outcome of any current or future such matters with any certainty, it currently believes the likelihood of any material liabilities to be low, and that such liabilities, if any, will not have a material adverse effect on its consolidated income, financial position or cash flows.
As previously disclosed, the group has been informed by a customer of failures in certain engine systems for which the group supplied a particular coated substrate as a component for that customer’s emissions after-treatment systems. The reported failures have not been demonstrated to be due to the coated substrate supplied by the group. The group has not been contacted by any regulatory authority about these engine system failures. Having reviewed its contractual obligations and the information currently available to it, the group believes it has defensible warranty positions in respect of this matter. If required, it will vigorously assert its available contractual protections and defences. The outcome of any discussions relating to this matter is not certain, nor is the group able to make a reliable estimate of the possible financial impact at this stage, if any.
The group works with all its customers to ensure appropriate product quality and we have not received claims in respect of our emissions after-treatment components from this or any other customer. Our vision is for a world that’s cleaner and healthier; today and for future generations. We are committed to enabling improving air quality and we work constructively with our customers to achieve this.
34 Transactions with related parties The group has a related party relationship with its joint venture and associate, its post-employment benefit plans (note 24) and its key management personnel (below). Transactions between the Company and its subsidiaries, which are related parties of the Company, have been eliminated on consolidation and are not disclosed in this note.
The key management of the group and parent company consist of the Board of Directors and the members of the Group Leadership Team (GLT). During the year ended 31st March 2022, the GLT had an average of 9 members (2021: 9 members). The only transactions with any key management personnel was compensation charged in the year which was:
2022 2021 £ million £ million
Short term employee benefits 7 7 Share-based payments 2 1 Termination benefits 1 – Non-executive directors’ fees and benefits 1 1 Total compensation of key management personnel 11 9
There were no balances outstanding as at 31st March 2022 (2021: £nil). Information on directors’ remuneration is given in the Remuneration Report.
Guarantees of subsidiaries’ liabilities are disclosed in note 22.
Johnson Matthey | Annual Report and Accounts 2022 205
FINA
NCIA
L STATEM
ENTS

Notes on the Accounts continued
35 Related undertakings A full list of related undertakings at 31st March 2022 (comprising subsidiaries, joint ventures and associates) is set out below. Those held directly by the parent company are marked with an asterisk (*) and those held jointly by the parent company and a subsidiary are marked with a cross (+). All the companies are wholly owned unless otherwise stated. All the related undertakings are involved in the principal activities of the group. Unless otherwise stated, the share class of each related undertaking comprises ordinary shares only.
Entity Registered address+ Johnson Matthey Argentina S.A. Tucumán 1, Piso 4, C1049AAA, Buenos Aires, Argentina Johnson Matthey (Aust.) Ltd 64 Lillee Crescent, Tullamarine VIC 3043, Australia + Johnson Matthey Holdings Limited 64 Lillee Crescent, Tullamarine VIC 3043, Australia + Johnson Matthey Belgium BVBA Pegasuslaan 5, 1831 Diegem, Belgium + Tracerco Europe BVBA Zone 3, Doorneveld 115, 1731 Zellik, Brussels, Belgium The Argent Insurance Co. Limited Power House, 7 Par-la-Ville Road, Hamilton HM11, Bermuda Johnson Matthey Brasil Ltda Avenida Macuco, 726, 12th Floor, Edifício International Office, CEP04523-001, Brazil Tracerco do Brasil – Diagnosticos de Processos Industriais Ltda Estrada dos Bandeirantes, 1793, Curicica, Jacarepagua, Rio de Janeiro, Brazil Johnson Matthey Battery Materials Ltd. McCarthy Tetrault LLP, Le Complexe St-Amable, 1150, rue de Claire- Fontaine, 7e étage, Quebec G1R 5G4, Canada Tracerco Radioactive Diagnostic Services Canada Inc. 8908 60 Avenue NW, Edmonton AB, T6E 6A6, Canada Johnson Matthey Argillon (Shanghai) Emission Control Technologies Ltd. Ground Floor, Building 2, No. 298, Rongle East Road, Songjiang Industrial Zone, Shanghai 201613, China Johnson Matthey Battery Materials (Changzhou) Co., Ltd. 1 Xin Wei Liu Road, Changzhou Export Processing Zone, Changzhou, Jiangsu Province, China Johnson Matthey Chemical Process Technologies (Shanghai) Company Limited Room 1066, Building 1, No 215 Lian He Bei Lu, Fengxian District, Shanghai, China Johnson Matthey (China) Trade Co., Ltd 1st, 2nd and 3rd Floor, Building 2, No. 598 Dongxing Road, Songjiang Industrial Zone, Shanghai, China Johnson Matthey Clean Energy Technologies (Beijing) Co., Ltd 20th Floor, Tower F, Phoenix Place, No.21 Building, Shuguangxi Lane A5, Chaoyang District, Beijing 100028, China Johnson Matthey Process Technologies (Beijing) Co., Ltd. 20th Floor, Tower F, Phoenix Place, No.21 Building, Shuguangxi Lane A5, Chaoyang District, Beijing 100028, China Johnson Matthey Pharmaceutical Services (Yantai) Co., Ltd. No. 9 Wuxi Road, Yantai Economic and Technology Development Zone, Yantai, Shandong Province, China Johnson Matthey (Shanghai) Catalyst Co., Ltd. 586 Dongxing Road, Songjiang Industry Zone, Shanghai, 201613, China Johnson Matthey (Shanghai) Chemicals Limited 588 and 599 Dongxing Road, Songjiang Industry Zone, Shanghai, 201613, China Johnson Matthey (Shanghai) Trading Limited Room 1615B, No. 118 Xinling Road, Shanghai Pilot Free Trade Zone, China Johnson Matthey (Tianjin) Chemical Co., Ltd. Room 1-1201, Borun Commercial Plaza, Tianjin Development Zone, China Johnson Matthey (Zhangjiagang) Environmental Protection Technology Co., Ltd No. 9 Dongxin Road, Jiangsu Yangtze River International Chemical Industrial Park, Jiangsu Province, China Johnson Matthey (Zhangjiagang) Precious Metal Technology Co., Ltd. No. 48, the west of Beijing Road, Jingang Town, Yangtze River International Chemical Industrial Park, Jiangsu, China Qingdao Johnson Matthey Hero Catalyst Company Limited (51.0%) Shiyuan Road, Jihongtan Street, Chengyang District, Qingdao, 200331, China Shanghai Bi Ke Clean Energy Technology Co Ltd (11.1%) Room 8708, No. 315 Emei Road, Hongkou District, Shanghai, China Shanghai Johnson Matthey Applied Materials Technologies Co., Ltd5 Area A, 1st Floor, Building 7, 298 East Rongle Road, Songjiang District, Shanghai, China Tracerco China Process Diagnostics & Instrumentation (Shanghai) Co., Ltd. Area G, 2nd Floor, Building 7, 298 East Rongle Road, Songjiang District, Shanghai, China Johnson Matthey A/S c/o Lundgrens Advokatpartnerselskab, Tuborg Boulevard 12, 4., 2900 Hellerup, Denmark * AG Holding Ltd 5th Floor, 25 Farringdon Street, London, EC4A 4AB, England * Cascade Biochem Limited1 5th Floor, 25 Farringdon Street, London, EC4A 4AB, England Ilumink Limited 5th Floor, 25 Farringdon Street, London, EC4A 4AB, England * JMEPS Trustees Limited 5th Floor, 25 Farringdon Street, London, EC4A 4AB, England
Johnson Matthey | Annual Report and Accounts 2022206

Notes on the Accounts continued
35 Related undertakings (continued) Entity Registered address
Johnson Matthey Battery Systems Engineering Limited 5th Floor, 25 Farringdon Street, London, EC4A 4AB, England * Johnson Matthey Battery Materials Limited 5th Floor, 25 Farringdon Street, London, EC4A 4AB, England Johnson Matthey Davy Technologies International Limited (in Liquidation) 30 Finsbury Square, London, EC2A 1AG * Johnson Matthey Davy Technologies Limited 5th Floor, 25 Farringdon Street, London, EC4A 4AB, England * Johnson Matthey Fuel Cells Limited 5th Floor, 25 Farringdon Street, London, EC4A 4AB, England Johnson Matthey Investments Limited 5th Floor, 25 Farringdon Street, London, EC4A 4AB, England * Johnson Matthey (Nominees) Limited 5th Floor, 25 Farringdon Street, London, EC4A 4AB, England * Johnson Matthey Precious Metals Limited 5th Floor, 25 Farringdon Street, London, EC4A 4AB, England Johnson Matthey South Africa Holdings Limited 5th Floor, 25 Farringdon Street, London, EC4A 4AB, England Johnson Matthey Tianjin Holdings Limited 5th Floor, 25 Farringdon Street, London, EC4A 4AB, England Matthey Finance Limited 5th Floor, 25 Farringdon Street, London, EC4A 4AB, England * Matthey Holdings Limited 5th Floor, 25 Farringdon Street, London, EC4A 4AB, England * Tracerco Limited 5th Floor, 25 Farringdon Street, London, EC4A 4AB, England Johnson Matthey Finland Oy (in liquidation) Autokatu 6, 20380 Turku, Finland Johnson Matthey SAS Les Diamants – Immeuble B, 41 rue Delizy, 93500 Pantin, France Johnson Matthey Battery Materials GmbH Ostenriederstrasse 15, 85368 Moosburg a.d. Isar, Germany Johnson Matthey Catalysts (Germany) GmbH Bahnhofstrasse 43, 96257 Redwitz an der Rodach, Germany Johnson Matthey Chemicals GmbH Wardstrasse 17, D-46446 Emmerich am Rhein, Germany Johnson Matthey GmbH & Co. KG2,7 Otto-Volger-Strasse 9b, 65843 Sulzbach, Germany Johnson Matthey Holding GmbH7 Bahnhofstrasse 43, 96257 Redwitz an der Rodach, Germany Johnson Matthey Management GmbH Otto-Volger-Strasse 9b, 65843 Sulzbach, Germany Johnson Matthey Piezo Products GmbH Bahnhofstrasse 43, 96257 Redwitz an der Rodach, Germany Johnson Matthey Redwitz Real Estate (Germany) B.V. & Co. KG2,8 Bahnhofstrasse 43, 96257 Redwitz an der Rodach, Germany Johnson Matthey Hong Kong Limited (dissolved) Room 802-6 , 909 Cheung Sha Wan Road, Kowloon , Hong Kong Johnson Matthey Pacific Limited3 Room 802-6 , 909 Cheung Sha Wan Road, Kowloon , Hong Kong Johnson Matthey Process Technologies Holdings Hong Kong Limited Room 802-6 , 909 Cheung Sha Wan Road, Kowloon , Hong Kong Johnson Matthey Tracerco Holdings Hong Kong Limited Room 802-6 , 909 Cheung Sha Wan Road, Kowloon , Hong Kong Macfarlan Smith (Hong Kong) Limited Room 802-6 , 909 Cheung Sha Wan Road, Kowloon , Hong Kong Johnson Matthey Chemicals India Private Limited Plot No 6A, MIDC Industrial Estate, Taloja, District Raigad, Maharashtra 410208, India Johnson Matthey India Private Limited 5th Floor, Regus Business Centre, 1st Floor, M-4, South Extension-II, New Dehli, 110049, India Johnson Matthey Limited 13-18 City Quay, Dublin 2, D02 ED70, Ireland Johnson Matthey Italia S.r.l. Corso Trapani 16, 10139, Torino, Italy Johnson Matthey Fuel Cells Japan Limited 5123-3 Kitsuregawa, Sakura-shi, Tochigi, 329-1412, Japan Johnson Matthey Japan Godo Kaisha 5123-3 Kitsuregawa, Sakura-shi, Tochigi, 329-1412, Japan Johnson Matthey DOOEL Skopje TIDZ Skopje 1, 1041 Ilinden, Macedonia
Johnson Matthey | Annual Report and Accounts 2022 207
FINA
NCIA
L STATEM
ENTS

Notes on the Accounts continued
35 Related undertakings (continued) Entity Registered address
* Johnson Matthey Sdn. Bhd. Suite 16-03, Level 16, Wisma UOA II, 21 Jalan Pinang, 50450 Kuala Lumpur, Malaysia Johnson Matthey Services Sdn. Bhd. Suite 16-03, Level 16, Wisma UOA II, 21 Jalan Pinang, 50450 Kuala Lumpur, Malaysia Tracerco Asia Sdn. Bhd. Suite 16-03, Level 16, Wisma UOA II, 21 Jalan Pinang, 50450 Kuala Lumpur, Malaysia Tracerco Asia Services Sdn. Bhd. Suite 16-03, Level 16, Wisma UOA II, 21 Jalan Pinang, 50450 Kuala Lumpur, Malaysia Johnson Matthey de Mexico, S. de R.L. de C.V. c/o Cacheaux, Cavazos and Newton, No. 437 Col. Colinas del Cimatario, CP 76090 Queretaro, Mexico Johnson Matthey Servicios, S. de R.L. de C.V. c/o Cacheaux, Cavazos and Newton, No. 437 Col. Colinas del Cimatario, CP 76090 Queretaro, Mexico Macfarlan Smith B.V.6 Javastraat 12, 3016 CE Rotterdam, The Netherlands Intercat Europe B.V. Offices KB103, Gelissendomein 8-10/93, 6229 GJ Maastricht, Netherlands Johnson Matthey Advanced Glass Technologies B.V.5 Fregatweg 38, 6222 NZ Maastricht, Netherlands Johnson Matthey B.V. Otto-Volger-Strasse 9b, 65843 Sulzbach/Ts. Germany Johnson Matthey Holdings B.V. Offices KB103, Gelissendomein 8-10/93, 6229 GJ Maastricht, Netherlands Johnson Matthey Netherlands 2 B.V. Offices KB103, Gelissendomein 8-10/93, 6229 GJ Maastricht, Netherlands Matthey Finance B.V.1 Offices KB103, Gelissendomein 8-10/93, 6229 GJ Maastricht, Netherlands Tracerco Norge AS Kokstadflaten 35, 5257 Kokstad, Norway Johnson Matthey Battery Systems Spólka z ograniczoną odpowiedzialnocścią Ul. Alberta Einsteina 6, 44-109, Gliwice, Poland Johnson Matthey Poland Spólka z ograniczoną odpowiedzialnocścią Ul. Alberta Einsteina 6, 44-109, Gliwice, Poland Johnson Matthey Battery Materials Poland spółka z ograniczona odpowiedzialnosci Ul. Hutnicza 1, 62-510 Konin, Poland Macfarlan Smith Portugal, Lda Largo de São Carlos 3, 1200-410 Lisboa, Portugal Johnson Matthey Catalysts LLC 1 Transportny Proezd, 660027 Krasnoyarsk, Russia International Diol Company (4.3%) PO Box 251, Riyadh 11411, Saudi Arabia * Johnson Matthey General Partner (Scotland) Limited 10 Wheatfield Road, Edinburgh, Midlothian, EH11 2QA, Scotland * Johnson Matthey (Scotland) Limited Partnership2 10 Wheatfield Road, Edinburgh, Midlothian, EH11 2QA, Scotland * Macfarlan Smith Limited 10 Wheatfield Road, Edinburgh, Midlothian, EH11 2QA, Scotland * Meconic Limited (in Liquidation) 7 Exchange Crescent, Conference Square, Edinburgh, EH3 8AN Johnson Matthey Singapore Private Limited 50 Raffles Place, #19-00, Singapore Lane Tower, Singapore 048623 Johnson Matthey Arabia for Business Services6 PO Box 26090, Riyadh 11486, Saudi Arabia Johnson Matthey (Proprietary) Limited Corner Henderson and Premier Roads, Germiston South Ext 7, Gauteng, South Africa Johnson Matthey Research South Africa (Proprietary) Limited Corner Henderson and Premier Roads, Germiston South Ext 7, Gauteng, South Africa Johnson Matthey Salts (Proprietary) Limited Corner Henderson and Premier Roads, Germiston South Ext 7, Gauteng, South Africa Johnson Matthey Catalysts Korea Limited A-dong 2906-ho, 13 Heungdeok 1-ro, Giheung-gu, Yongin-si, Gyeonggi-do, South Korea Johnson Matthey Korea Limited 101-2803, Lotte Castle, 109, Mapo-daero, Mapo-gu Seoul, South Korea Johnson Matthey AB Viktor Hasselblads gata 8, 421 31 Västra Frölunda, Göteborg, Sweden Johnson Matthey Formox AB SE-284 80, Perstorp, Sweden Johnson Matthey & Brandenberger AG Glatttalstrasse 18, 8052 Zurich, Switzerland Johnson Matthey Finance GmbH Hertensteinstrasse 51, 6004 Lucerne, Switzerland Johnson Matthey Finance Zurich GmbH Glatttalstrasse 18, 8052 Zurich, Switzerland LiFePO4+C Licensing AG Hertensteinstrasse 51, 6004 Lucerne, Switzerland
Johnson Matthey | Annual Report and Accounts 2022208
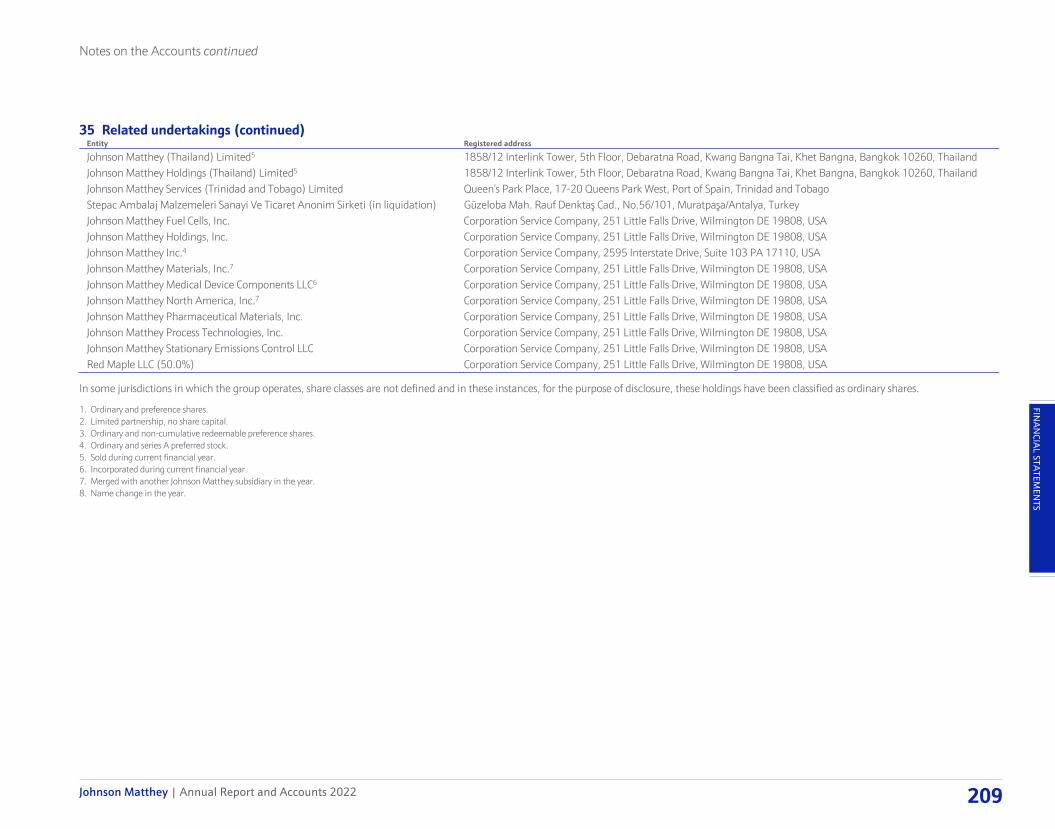
Notes on the Accounts continued
35 Related undertakings (continued) Entity Registered address
Johnson Matthey (Thailand) Limited5 1858/12 Interlink Tower, 5th Floor, Debaratna Road, Kwang Bangna Tai, Khet Bangna, Bangkok 10260, Thailand Johnson Matthey Holdings (Thailand) Limited5 1858/12 Interlink Tower, 5th Floor, Debaratna Road, Kwang Bangna Tai, Khet Bangna, Bangkok 10260, Thailand Johnson Matthey Services (Trinidad and Tobago) Limited Queen’s Park Place, 17-20 Queens Park West, Port of Spain, Trinidad and Tobago Stepac Ambalaj Malzemeleri Sanayi Ve Ticaret Anonim Sirketi (in liquidation) Güzeloba Mah. Rauf Denktaş Cad., No.56/101, Muratpaşa/Antalya, Turkey Johnson Matthey Fuel Cells, Inc. Corporation Service Company, 251 Little Falls Drive, Wilmington DE 19808, USA Johnson Matthey Holdings, Inc. Corporation Service Company, 251 Little Falls Drive, Wilmington DE 19808, USA Johnson Matthey Inc.4 Corporation Service Company, 2595 Interstate Drive, Suite 103 PA 17110, USA Johnson Matthey Materials, Inc.7 Corporation Service Company, 251 Little Falls Drive, Wilmington DE 19808, USA Johnson Matthey Medical Device Components LLC6 Corporation Service Company, 251 Little Falls Drive, Wilmington DE 19808, USA Johnson Matthey North America, Inc.7 Corporation Service Company, 251 Little Falls Drive, Wilmington DE 19808, USA Johnson Matthey Pharmaceutical Materials, Inc. Corporation Service Company, 251 Little Falls Drive, Wilmington DE 19808, USA Johnson Matthey Process Technologies, Inc. Corporation Service Company, 251 Little Falls Drive, Wilmington DE 19808, USA Johnson Matthey Stationary Emissions Control LLC Corporation Service Company, 251 Little Falls Drive, Wilmington DE 19808, USA Red Maple LLC (50.0%) Corporation Service Company, 251 Little Falls Drive, Wilmington DE 19808, USA
In some jurisdictions in which the group operates, share classes are not defined and in these instances, for the purpose of disclosure, these holdings have been classified as ordinary shares.
1. Ordinary and preference shares. 2. Limited partnership, no share capital. 3. Ordinary and non-cumulative redeemable preference shares. 4. Ordinary and series A preferred stock. 5. Sold during current financial year. 6. Incorporated during current financial year. 7. Merged with another Johnson Matthey subsidiary in the year. 8. Name change in the year.
Johnson Matthey | Annual Report and Accounts 2022 209
FINA
NCIA
L STATEM
ENTS

Notes on the Accounts continued
36 Non-GAAP measures The group uses various measures to manage its business which are not defined by generally accepted accounting principles (GAAP). The group’s management believes these measures provide valuable additional information to users of the accounts in understanding the group’s performance. Certain of these measures are financial Key Performance Indicators which measure progress against our strategy. All non-GAAP measures are on a continuing operations basis.
Definitions Measure
Definition
Purpose
Sales1 Revenue excluding sales of precious metals to customers and the precious metal content of products sold to customers.
Provides a better measure of the growth of the group as revenue can be heavily distorted by year on year fluctuations in the market prices of precious metals and, in many cases, the value of precious metals is passed directly on to customers.
Underlying operating profit2 Operating profit excluding non-underlying items. Provides a measure of operating profitability that is comparable over time. Underlying operating profit margin1, 2 Underlying operating profit divided by sales. Provides a measure of how we convert our sales into underlying operating profit and
the efficiency of our business. Underlying profit before tax2 Profit before tax excluding non-underlying items. Provides a measure of profitability that is comparable over time. Underlying profit for the year2 Profit for the year excluding non-underlying items and related tax
effects. Provides a measure of profitability that is comparable over time.
Underlying earnings per share1, 2 Underlying profit for the year divided by the weighted average number of shares in issue.
Our principal measure used to assess the overall profitability of the group.
Return on invested capital (ROIC)1 Annualised underlying operating profit divided by the 12 month average equity, excluding post tax pension net assets, plus average net debt for the same period.
Provides a measure of the group’s efficiency in allocating the capital under its control to profitable investments.
Average working capital days (excluding precious metals)1
Monthly average of non-precious metal related inventories, trade and other receivables and trade and other payables (including any classified as held for sale) divided by sales for the last three months multiplied by 90 days.
Provides a measure of efficiency in the business with lower days driving higher returns and a healthier liquidity position for the group.
Free cash flow Net cash flow from operating activities after net interest paid, net purchases of non-current assets and investments, dividends received from joint ventures and associates and the principal element of lease payments.
Provides a measure of the cash the group generates through its operations, less capital expenditure.
Net debt (including post tax pension deficits) to underlying EBITDA
Net debt, including post tax pension deficits and quoted bonds purchased to fund the UK pension (excluded when the UK pension plan is in surplus) divided by underlying EBITDA for the same period.
Provides a measure of the group’s ability to repay its debt. The group has a long-term target of net debt (including post tax pension deficits) to underlying EBITDA of between 1.5 and 2.0 times, although in any given year it may fall outside this range depending on future plans.
1. Key Performance Indicator. 2. Underlying profit measures are before profit or loss on disposal of businesses, gain or loss on significant legal proceedings, together with associated legal costs, amortisation of acquired intangibles, major impairment and restructuring charges and,
where relevant, related tax effects. These items have been excluded by management as they are not deemed to be relevant to an understanding of the underlying performance of the business.
Underlying profit measures exclude the following non-underlying items which are shown separately on the face of the income statement:
• Amortisation of acquired intangibles, Amortisation and impairment of intangible assets which arose on the acquisition of businesses totalled £6 million (2021: £10 million). • Major impairment and restructuring charges, The group recognised £440 million in major impairment and restructuring charges (2021: £154 million), see note 6. • Profit on disposal of businesses, The group recognised £106 million profit on the disposal of businesses (2021: £nil), see note 28. • Gains and losses on significant legal proceedings, The group recognised a £42 million net gain on the settlement of significant legal proceedings, see note 4.
Johnson Matthey | Annual Report and Accounts 2022210

Notes on the Accounts continued
36 Non-GAAP measures (continued) Reconciliations to GAAP measures Sales See note 2.
Underlying profit measures Year ended 31st March 2022
Operating
profitProfit before
taxTax
expenseProfit for the year
£ million £ million £ million £ million
Underlying 553 493 (86) 407 Profit on disposal of businesses 106 106 (4) 102 Gains and losses on significant legal proceedings 42 42 (6) 36 Amortisation of acquired intangibles (6) (6) 1 (5)Major impairment and restructuring charges (440) (440) 16 (424)Reported 255 195 (79) 116
The major impairments and restructuring charges result in a tax credit in the UK and US but not in other territories. The tax credit on these impairments have been offset by a provision for potential tax risks relating to historic transactions in South Africa. The tax provision has been booked in non-underlying due to its size and because it relates to historic transactions which do not reflect the underlying performance of the current or prior year.
Year ended 31st March 2021*
Operating
profit Profit before
tax Tax expense Profit for the year
£ million £ million £ million £ million
Underlying 473 388 (62) 326 Amortisation of acquired intangibles (10) (10) 2 (8)Major impairment and restructuring charges (154) (154) 30 (124)Reported 309 224 (30) 194
Underlying earnings per share 2022 2021*
Underlying profit for the year (£ million) 407 326 Weighted average number of shares in issue (number) 191,568,756 192,711,413 Underlying earnings per share (pence) 213.2 168.9
Return on invested capital (ROIC) – unaudited 2022 2021
£ million £ million*
Underlying operating profit 553 473 Average net debt 877 1,291 Average equity 2,467 2,481 Average capital employed 3,344 3,772 Less: Average pension net assets (221) (261) Less: Average related deferred taxation 48 47 Average capital employed (excluding post tax pension net assets) 3,171 3,558 ROIC (excluding post tax pension net assets) 17.4% 13.3% ROIC 16.5% 12.5%
Average working capital days (excluding precious metals) – unaudited 2022 2021
£ million £ million*
Inventories 1,549 1,814 Trade and other receivables 1,796 2,422 Trade and other payables (2,563) (3,325) 782 911 Working capital balances relating to discontinued operations – (152) Total working capital 782 759 Less: Precious metal working capital (562) (552) Add: Precious metal working capital relating to discontinued operations – 21 Working capital (excluding precious metals) 220 228 Average working capital days (excluding precious metals) 36 45
* Restated to reflect classification of the Health segment as discontinued operations (see note 27).
Johnson Matthey | Annual Report and Accounts 2022 211
FINA
NCIA
L STATEM
ENTS

Notes on the Accounts continued
36 Non-GAAP measures (continued) Free cash flow from continuing operations
2022 2021 £ million £ million*
Net cash inflow from operating activities 605 769 Interest received 32 66 Interest paid (111) (159)Purchases of property, plant and equipment (358) (304)Purchases of intangible assets (95) (77)Net proceeds from sale of businesses 160 19 Proceeds from sale of non-current assets 1 5 Principal element of lease payments (14) (14)Less: Free cash outflow / (inflow) from discontinued operations 1 (10)Free cash flow 221 295
Net debt (including post tax pension deficits) to underlying EBITDA 2022 2021
£ million £ million*
Cash and deposits 254 119 Money market funds 137 462 Bank overdrafts (37) (36)Bank overdrafts transferred to liabilities classified as held for sale (8) – Cash and cash equivalents 346 545 Less: Cash and cash equivalents – bank overdrafts from discontinued operations 8 4 Cash and cash equivalents from continuing operations 354 549 Interest rate swaps – current assets 1 – Interest rate swaps – non-current assets 11 20 Interest rate swaps – non-current liabilities (2) – Borrowings and related swaps – current (265) (26)Borrowings and related swaps – non-current (899) (1,252)Lease liabilities – current (10) (11)Lease liabilities – non-current (40) (51)Lease liabilities – current – transferred to liabilities classified as held for sale (2) – Lease liabilities – non-current transferred to liabilities classified as held for sale (7) – Less: Lease liabilities relating to discontinued operations 3 1 Net debt (856) (770)
2022 2021
£ million £ million*
(Decrease) / increase in cash and cash equivalents (205) 276 Less: Decrease / (increase) in cash and cash equivalents from discontinued operations 3 (2)Less: Decrease / (increase) in borrowings 131 (70)Less: Principal element of lease payments 14 14 Less: Principal element of lease payments from discontinued operations (1) (1)(Increase) / decrease in net debt resulting from cash flows (58) 217 New leases, remeasurements and modifications (9) (3)Less: New leases, remeasurements and modifications from discontinued operations 3 – Other lease movements – 1 Exchange differences on net debt (24) 107 Other non-cash movements 2 (6)Movement in net debt (86) 316 Net debt at beginning of year (770) (1,086)Net debt at end of year (856) (770)Net debt (856) (770)Add: Pension deficits (29) (49)Add: Related deferred tax 4 9 Net debt (including post tax pension deficits) (881) (810)Underlying operating profit 553 473 Add back: Depreciation and amortisation excluding amortisation of acquired intangibles 171 160 Underlying EBITDA 724 633 Net debt (including post tax pension deficits) to underlying EBITDA 1.2 1.3
* Restated to reflect classification of the Health segment as discontinued operations (see note 27).
Johnson Matthey | Annual Report and Accounts 2022212

Notes on the Accounts continued
36 Non-GAAP measures (continued) 2022 2021 £ million £ million*
Underlying EBITDA 724 633 Depreciation and amortisation (177) (170)Gains and losses on significant legal proceedings 42 – Major impairment and restructuring charges (440) (154)Profit on disposal of businesses 106 – Finance costs (101) (158)Finance income 41 73 Income tax expense (79) (30)Profit for the year from continuing operations 116 194
* Restated to reflect classification of the Health segment as discontinued operations (see note 27).
37 Events after the balance sheet date On 25th May 2022, the group announced an agreement to enter into a €20 million minority investment in Enapter AG.
On 25th May 2022, the group agreed to sell parts of the Battery Materials business to EV Metals Group plc and Nano One Materials Corp.
Johnson Matthey | Annual Report and Accounts 2022 213
FINA
NCIA
L STATEM
ENTS

Basis of reporting – non-financial dataThis integrated report has been prepared in accordance with the GRI Standard: Core option.
It covers the period from 1st April 2021 to 31st March 2022. Our last annual report was published in June 2022.
Johnson Matthey compiles, assesses and discloses non-financial information for a number of reasons:
• where there is a legal obligation (UK Companies Act, UK Stream-lined Energy and Carbon reporting (SECR) regulations, UK Modern Slavery Act);
• to help drive improved business performance;• to demonstrate to institutional investors that Johnson Matthey’s business approach is
responsible, ethical, sustainable and offers a sound value proposition;• to demonstrate to our customers that Johnson Matthey’s business conduct meets or
exceeds all of the required standards and expectations;• to demonstrate to other stakeholders that Johnson Matthey conducts its business in an
ethical, responsible and sustainable manner; and• to benchmark our corporate performance against peer group companies.
This report has been developed to incorporate the group’s significant economic, environmental and social impacts and is set within the context of the United Nations Brundtland definition of sustainability (1987) and our own sustainable business goals to 2030. The principles of inclusivity, materiality and responsiveness help to shape the structure of the report and in setting priorities for reporting. The report also explains how we are continuing to build sustainability into our business planning and decision making processes and how, through our governance processes, we manage social, environmental and ethical matters across the group.
Performance data covers all sites that are under the financial control of the group, including all manufacturing, research and warehousing operations of the parent company and its subsidiaries. Joint ventures are not included.
For the purposes of reporting, separate business units resident at the same location are counted as separate sites.
Data from 83 sites was included in this report, 53 are manufacturing sites, 18 are R&D sites and 16 are offices.
Data from new facilities is included from the point at which the facility becomes owned by the company and operational. All non-financial performance data is reported on a financial year basis unless otherwise stated.
The process in place to independently verify the reported non-financial data are described on page 221. Certain employee data is included in the financial accounts and is also subject to the financial data third party audit see page 221.
Other information
Basis of reporting – non-financial data 214Independent greenhouse gas and health and safety assurance statement 221Shareholder information 222Glossary of key terms 224Company details 226
Johnson Matthey | Annual Report and Accounts 2022214
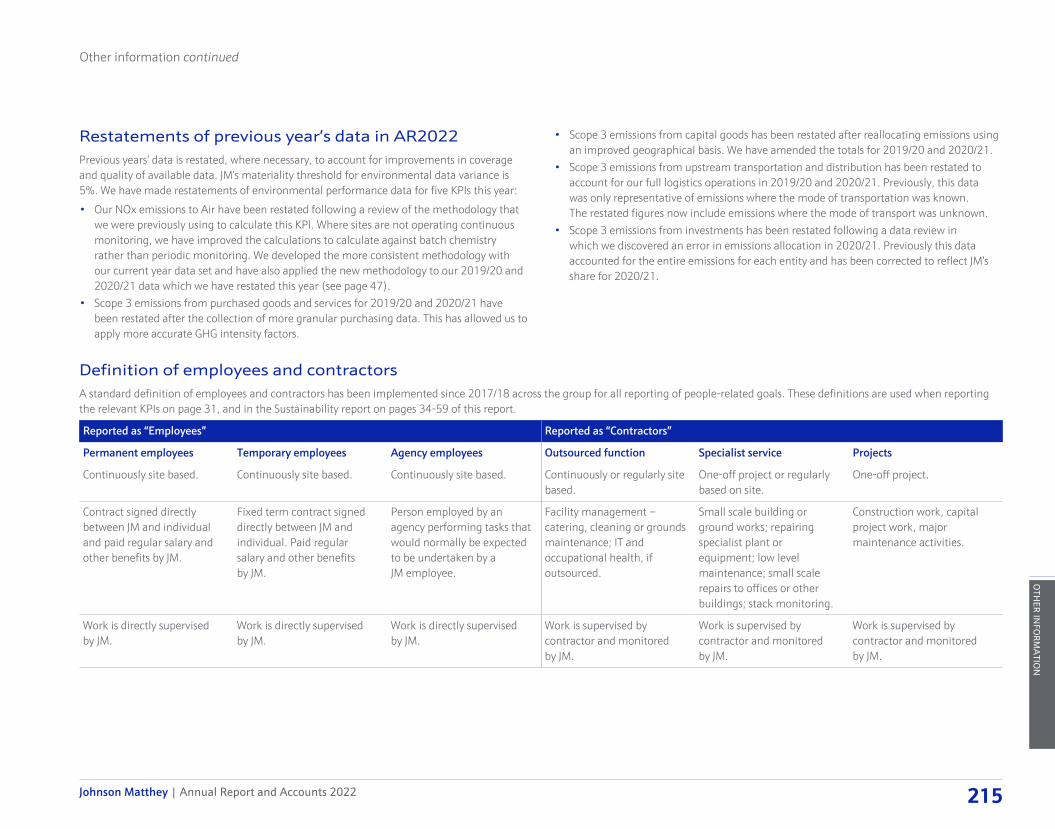
Restatements of previous year’s data in AR2022Previous years’ data is restated, where necessary, to account for improvements in coverage and quality of available data. JM’s materiality threshold for environmental data variance is 5%. We have made restatements of environmental performance data for five KPIs this year:
• Our NOx emissions to Air have been restated following a review of the methodology that we were previously using to calculate this KPI. Where sites are not operating continuous monitoring, we have improved the calculations to calculate against batch chemistry rather than periodic monitoring. We developed the more consistent methodology with our current year data set and have also applied the new methodology to our 2019/20 and 2020/21 data which we have restated this year (see page 47).
• Scope 3 emissions from purchased goods and services for 2019/20 and 2020/21 have been restated after the collection of more granular purchasing data. This has allowed us to apply more accurate GHG intensity factors.
• Scope 3 emissions from capital goods has been restated after reallocating emissions using an improved geographical basis. We have amended the totals for 2019/20 and 2020/21.
• Scope 3 emissions from upstream transportation and distribution has been restated to account for our full logistics operations in 2019/20 and 2020/21. Previously, this data was only representative of emissions where the mode of transportation was known. The restated figures now include emissions where the mode of transport was unknown.
• Scope 3 emissions from investments has been restated following a data review in which we discovered an error in emissions allocation in 2020/21. Previously this data accounted for the entire emissions for each entity and has been corrected to reflect JM’s share for 2020/21.
Definition of employees and contractorsA standard definition of employees and contractors has been implemented since 2017/18 across the group for all reporting of people-related goals. These definitions are used when reporting the relevant KPIs on page 31, and in the Sustainability report on pages 34-59 of this report.
Reported as “Employees” Reported as “Contractors”
Permanent employees Temporary employees Agency employees Outsourced function Specialist service Projects
Continuously site based. Continuously site based. Continuously site based. Continuously or regularly site based.
One-off project or regularly based on site.
One-off project.
Contract signed directly between JM and individual and paid regular salary and other benefits by JM.
Fixed term contract signed directly between JM and individual. Paid regular salary and other benefitsby JM.
Person employed by an agency performing tasks that would normally be expected to be undertaken by a JM employee.
Facility management – catering, cleaning or grounds maintenance; IT and occupational health, if outsourced.
Small scale building or ground works; repairing specialist plant or equipment; low level maintenance; small scale repairs to offices or other buildings; stack monitoring.
Construction work, capital project work, major maintenance activities.
Work is directly supervised by JM.
Work is directly supervised by JM.
Work is directly supervised by JM.
Work is supervised by contractor and monitored by JM.
Work is supervised by contractor and monitored by JM.
Work is supervised by contractor and monitored by JM.
Other information continued
Johnson Matthey | Annual Report and Accounts 2022 215
OTH
ER INFO
RMA
TION

Other information continued
Calculation methodologies for KPIs relating to our sustainable business goals to 2030
Products and servicesGoal: Produce and innovate products for a cleaner, healthier worldWe measure and track the positive impact of our products towards a cleaner, healthier world, aligned with our strategic aims. We focus on the products in our portfolio that support our four priority UN Sustainable Development Goals (SDGs): SDG 3 (Good Health and Wellbeing), SDG 7 (Affordable and Clean Energy), SDG 12 (Responsible Consumption and Production) and SDG 13 (Climate Action).
We use a financial lens to quantify impacts in two ways:i. We measure the correlation and classification of annualised sales of our products,
services and technologies against our four priority UN SDGs. Sales are excluding precious metals. By increasing the percentage of JM’s sales that contribute to our priority UN SDGs we will be increasing our societal value.
ii. We classify all our R&D spend according to the contribution any resulting commercial offering would bring to society in line with our four priority UN SDGs.
A judgement is made as to whether our products or R&D activities contribute to our four priority UN SDGs, either directly or by enabling others to contribute. This is done by considering the attributes of the products, or the intended outcome of the R&D work, and cross-referencing these against the priority UN SDGs and their accompanying targets.
Goal: Drive lower greenhouse gas emissionsThis KPI is a measure of the tonnes of greenhouse gas (GHG) emissions avoided during the year using technologies enabled by JM’s products and solutions, compared to conventional offerings. The KPI is expressed as tonnes of carbon dioxide equivalent (CO2 eq) and captures one year’s impact for all qualifying technologies that have been operational during the year, as sold since 2020/21.
Our methodology for calculating avoided GHG emissions was developed in-house. For each qualifying technology, we first determine its functional unit, which is a quantified description of the performance requirements that our product or solution enables the technology to fulfil. The functional unit is then used as a reference to consider the boundary of the analysis, to ensure that the scope of the calculation covers the relevant life-cycle stages leading to the avoided emissions.
Performance comparisons are made against identified counterfactuals, which represent actual and significant products and solutions in the market, thus preventing us from overstating the avoided emissions. The lifetime of the technology is also considered to discount any impacts from the sale of previous years’ technologies if these are no longer operational and, where applicable, adjustments to capture changing performance over time are made.
No allocation between value chain partners is applied, since there are no established guidelines for this; however, our products and solutions are vital to realising the benefits of the technologies being used, and our KPI aims to accurately reflect JM’s role, in that we enable avoided GHG emissions via the use of such technologies.
We have also identified revenues aligned to the SASB Chemicals Sustainability Accounting Standard definition of products designed for use-phase resource efficiency, which includes products that “through their use – can be shown to improve energy efficiency, eliminate or lower greenhouse gas (GHG) emissions, reduce raw materials consumption, increase product longevity, and/or reduce water consumption”. Qualifying products are those that either:
• increase the efficiency of a product during its use phase (for example, our battery materials and fuel cell components); or
• increase the efficiency of the manufacturing process used to make a product (for example, our catalysts and additives for the chemical, oil and gas industries).
Products beyond the scope of this assessment include those specifically designed to meet environmental regulatory requirements, our pharmaceutical and medical-related products, and any product where a use-phase resource efficiency benefit is unclear. Revenues aligned to the use-phase resource efficiency criteria represent sales excluding precious metals.
Goal: Enable less harmful air pollution globallyThis KPI is a measure of the additional tonnes of nitrogen oxides (NOx) removed from vehicle tailpipes during the year using technologies enabled by JM’s products, compared to the regulated tailpipe limits in 2020/21. The KPI captures one year’s impact for all products that have been sold during the year to meet tighter tailpipe NOx limits, as enforced by different geographical regions for different vehicle categories.
Our methodology for calculating the additional NOx removed was developed in-house. For each qualifying technology, we consider the vehicles that the technology is fitted to, and any change in tailpipe NOx regulations enforced during the year; this determines the difference between the tailpipe NOx limits in the baseline year and the current year, for every vehicle where a new NOx limit must be met. Any difference in the tailpipe NOx limit is then multiplied by the corresponding number of vehicles that have been fitted with JM’s products during the year. The corresponding number of vehicles is calculated from our market share of the number of vehicles sold each year, which is based on the number of emission control systems we supply to each geographical region and vehicle category. Lastly, we apply different vehicle characteristics, including annual distances, kilowatts per cycle and drive speed, to accurately represent the additional NOx being removed from the different vehicles included in the calculation. For vehicles sold since 2020/21 still operating in the current year, an adjustment may also be applied to the annual distances, depending on the age of the vehicle.
Johnson Matthey | Annual Report and Accounts 2022216

No allocation between value chain partners is applied, since there are no established guidelines to determine this; however, our products are vital to realising the benefits of the technologies being used, and our KPI aims to accurately reflect JM’s role, in that we enable additional NOx removal via the use of such technologies.
Goal: Conserve Scarce ResourcesOur KPI to monitor how we are advancing the circular economy is a measurement of all % recycled platinum group metals in our manufactured goods on a mass basis. We include use of five PGMs – platinum, palladium, rhodium, ruthenium and iridium in our target. This is defined as the weighted global average of all goods manufactured in our plants over the course of the reporting year and includes metal that is both sourced and funded by JM and metal sourced and funded by our customers.
We define primary metal as metal from a mine or originating outside of the refining loop. This is measured by recording the amount of metal matching this description that has been used in product manufacturing over the given time-period.
We define recycled metal as metal from non-primary sources. This makes up the balance of metal that has been used in product manufacturing over the given time-period.
OperationsGoal: Achieve net zero by 2040Our operational carbon footprint, reported in tonnes of carbon dioxide (CO2) equivalent, includes Scope 1 and Scope 2 emissions.
Our Scope 1 greenhouse gas (GHG) emissions are calculated in tonnes CO2 equivalent using conversion factors for each energy source as published by Defra in July 2020. We include carbon dioxide (CO2), nitrous oxide (N2O), refrigerant and methane (CH4) process emissions to air in our Scope 1 calculations.
Our Scope 2 emissions are calculated using the ‘dual reporting’ methodology outlined in the GHG Protocol corporate standard 2015 revision, www.ghgprotocol.org. For the location based method of Scope 2 accounting, for all facilities outside of the US, we use national carbon intensity factors related to the consumption of grid electricity in 2019 made available in the 2021 edition of the world CO2 emissions database of the International Energy Agency. They were purchased under licence in February 2022 for sole use in company reporting. For US facilities we use regional carbon factors published by the Environmental Protection Agency in January 2022 edition of, eGRID data 2020. For the market based method of Scope 2 accounting, we have applied the hierarchy of sources for determination of appropriate carbon intensity factors, as outlined in Table 6.3 on page 43 of the GHG Protocol 2015 edition guidance. We have successfully obtained carbon intensity factors directly from our grid electricity suppliers in the EU, USA and Australia. However, it has not been possible to obtain this from suppliers in China, India, South Africa and non-OECD Europe.
Our total operational carbon footprint is based on:
• Scope 1 emissions – generated by the direct burning of fuel (predominantly natural gas) and process derived greenhouse gas emissions (CO2, N2O, CH4 and refrigerants) on our premises and company-owned or leased vehicles.
• Scope 2 emissions – generated from grid electricity and steam procured from third parties for use at our facilities.
Under the UK Stream-lined Energy and Carbon Reporting (SECR) April 2019 requirements, we are required to ensure that the quantification of GHG emissions and data reliability are sufficient to meet our obligation under the UK Companies Act 2006 (Strategic and Directors’ Reports) Regulations 2013. The legislation indicates that all fuel used in company-owned and leased vehicles driven on public roads should be included and we report this in our 2021/22 Scope 1 data.
Scope 3 GHG emissionsOur annual Scope 3 GHG emissions are reported according to the methodology of the GHG Protocol Corporate Value Chain (Scope 3) Accounting and Reporting Standard. A variety of accounting techniques were used depending on the availability of data. All value chain emissions over which JM has financial control are included; the key exclusion from this is raw materials where JM is a toll manufacturer i.e. when raw materials being used in our factories but remain in the financial ownership of our customer at all times.
When calculating the GHG footprint of each Scope 3 category, our principle of using the most accurate data sources was applied in the following order:
1. GHG footprint data obtained directly from value chain partners.2. Mass based calculations using carbon intensity factors from respected databases,
such as Defra’s GHG reporting conversion factors and EcoInvent.3. Financial allocation based using Avieco’s proprietary Input-Output model (EIO).
This combines economic data from central banks and treasury departments with research data from the World Bank, OECD and other leading environmental agencies.
Other information continued
Johnson Matthey | Annual Report and Accounts 2022 217
OTH
ER INFO
RMA
TION

Other information continued
Scope 3 GHG category as defined by GHG Protocol Calculation methodology
1. Purchased goods and services Where mass of purchased goods was available, this was used in combination with GHG intensity factors obtained either from suppliers or EcoInvent. For the remaining goods and for purchased services a financial allocation (EEIO model) was used
2. Capital goods Financial allocation (EEIO model) using geographical breakdown of data shown in Accounting note 12 “Property, plant & equipment” on page 174
3. Fuel- and energy-related activities Defra’s GHG reporting conversion factors 2021 were used to calculate well-to-tank GHG emissions from fuel usage, transmission and distribution losses from purchased electricity, and well-to-tank and transmission and distribution losses of energy from steam
4. Upstream transportation and distribution Emissions data was provided by our suppliers where available. Where only mass and distance of goods transported was available, this was used in combination with Defra’s GHG reporting conversion factors 2021. Otherwise, a financial allocation was made based on spend and intensity factors from the EEIO model
5. Waste generated in operations Where GHG footprints were available from waste service providers they were used, otherwise Defra’s GHG reporting conversion factors 2021 were used according to mass of waste disposal by destination see page 46
6. Business travel Footprint business travel for air and rail was obtained from our business travel service providers. Where available mileage for personal car, taxi and public transport use was used in combination with Defra’s GHG reporting conversion factors 2021. In the absence of mileage, a financial allocation was made based on expenses spend and intensity factors from the EEIO model. Accounting is by date of financial transaction
7. Employee commuting Data is obtained by employee survey of miles travelled per week by modes of transport. Defra’s GHG reporting conversion factors 2021 are used to calculate the GHG intensity of each transport type
8. Upstream leased assets Financial allocation (EEIO model) using floor space and geographical location
9. Downstream transportation and distribution Where JM takes responsibility for the downstream distribution of goods, it was included in the upstream category calculation. Where our customers takes responsibility, no data is available
10. Processing of sold products No quantitative data available, but not expected to be material based on our knowledge of how our customers use our products
11. Use of sold products We have removed Use of sold products from our footprint by agreement with SBTi, as it determined that the emissions we reported in this category were ‘indirect’ and should not, therefore, be included.
12. End of life treatment of sold products Many of JM’s products are returned to the company for recovery of the precious metals and thus end of life treatment is included in our Scope 1 + 2 footprint. JM does not have visibility of other end of life treatments
13. Downstream leased assets Included in Upstream leased assets category
14. Investments Financial allocation (EEIO model) using geographical breakdown of investment revenues from each entity
Johnson Matthey | Annual Report and Accounts 2022218

Goal: Reduce water consumption and wasteNet fresh water consumptionThis KPI is a record of how much water we withdraw through our operations. The KPI includes all freshwater sources – mains supplied water that we receive from municipalities, public or private utility companies, ground water that is extracted from below the earth’s surface and fresh surface water that we extract from rivers, wetlands, lakes etc. We do not include rainwater or any brackish surface water. We subtract any water that is returned to the source from which it is extracted at the same or better quality.
Hazardous wasteThis KPI is a record of how much hazardous waste we generate from our operations that can no longer be used by Johnson Matthey and has to be sent off site for treatment. We define hazardous waste in line with local regulatory requirements in the particular territory where the waste is generated. For example, in Europe we consider the EU Waste Framework Directive (Directive 2008/98/EC of the European Parliament and of the Council). We measure the amount of solid and liquid hazardous waste and report in metric tonnes of material. We measure the total weights sent off site, including any entrained water, and we consider all material waste no longer of use to Johnson Matthey. We categorise its destination in the following ways:
• Sent outside JM for beneficial reuse.• Sent outside JM for recycling.• Sent outside JM for incineration with energy recovery.• Sent outside JM for incineration or treatment without energy recovery.• Sent outside JM for landfill disposal.
NOx emissionsThis KPI is a record of direct emissions of harmful nitrogen oxides to the environment from our manufacturing facilities. NOx is a generic term which includes nitric oxide (NO) and nitrogen dioxide (NO2), but excludes nitrous oxide (N2O). We measure this KPI in metric tonnes. The value is derived from continuous monitoring equipment where present, or from stoichiometric calculations based on our knowledge of NOx generation from our chemical processes. We consider all sources of NOx from the combustion of fuel in steam boilers to the gaseous output of our processes that emit NOx. We report the value after any abatement or treatment has taken place within our chimney stacks.
PeopleGoal: Keep people safeTotal recordable injury and illness rate (TRIIR) is defined as the number of recordable cases per 200,000 hours worked in a rolling year and includes cases affecting both our employees and contractors.
A recordable case (as defined under the US Occupational Safety and Health Administration (OSHA) Regulations) is defined as a work related accident or illness that results in one or more of the following: absence of more than one day; medical treatment beyond first aid; death; loss of consciousness and restricted work or transfer to another job.
The OSHA severity rate is a calculation that gives a company an average of the number of lost days and restricted days per recordable incident.
OSHA severity rate = (total lost days and restricted days in the year x 200,000 ÷ total hours worked during the year).
Process safety rate definitionJohnson Matthey has adopted International Council of Chemical Association’s (ICCA) process safety metric. The metric first requires a determination that the event is to be included in the process safety event severity rate (PSESR) calculation and then determining the severity using the severity table.
In determining this rate, 1 point is assigned for each Level 4 incident attribute, 3 points for each Level 3 attribute, 9 points for each Level 2 attribute, and 27 points for each Level 1 attribute. The PSESR is recorded as a 12 month rolling number. Total worker hours include employees, temporary employees and contractors.
Theoretically, a process safety event could be assigned a minimum of 1 point (i.e. the incident meets the attributes of a Level 4 incident in only one category) or a maximum of 135 points (i.e. the incident meets the attributes of a Level 1 incident in each of the five categories).
A Tier 1 Process Safety Event (T-1 PSE) is a loss of primary containment (LOPC) with the greatest consequence as defined American Petroleum Institute recommended practice 754.
ICCA process safety severity rate (Level 1 to Level 4) =
Total severity score for all events per 200,000 hrs worked
Other information continued
Johnson Matthey | Annual Report and Accounts 2022 219
OTH
ER INFO
RMA
TION

Other information continued
Goal: A diverse, inclusive and engaged companyJohnson Matthey invites all its permanent and fixed term contract employees to voluntarily complete its employee survey every one to two years to determine the wellbeing of its staff using a standard methodology defined and audited by Korn Ferry. All responses are submitted confidentially to a third party and results are independently analysed and reported back to JM management. Through the survey we measure attributes on a scale of 0 to 100%:
• employee engagement = how committed and motivated employees are to give their best to Johnson Matthey; and
• employee enablement = how well employees’ jobs and work environment support peak performance in Johnson Matthey.
Goal: Invest in our local communitiesOur target KPI is an annual record of the total number of employee volunteering days undertaken by permanent employees within their local communities, in accordance with JM’s global Employee Volunteering Policy.
The volunteering is recorded in days, assuming that the standard full-time equivalent employee day is 8 hours. The recorded volunteering days may have been completed either on company time or on paid company leave. Volunteering done on unpaid leave, or outside normal working hours, is not included in the reported numbers.
In determining the in-kind contribution of employees’ volunteering we take the number of volunteering days reported in the year and multiply it by the group average cost of one day of employee time.
Calculation for indirect expenditure in community investment
Number of working days in a year is five days per week for 50 weeks per year.
Average cost of one day of employee time =
Total employee benefits expense in year
Number of working days in year x Average number of permanent employees
Johnson Matthey | Annual Report and Accounts 2022220
Independent greenhouse gas, environment and health & safety assurance statement
Independent Assurance In 2021/22 we appointed sustainability consultancy Avieco to provide independent external assurance of our 2021/22 GHG emissions and our key metrics quantifying our environmental, health and safety performance. Avieco has provided the following summary assurance statement:
“Avieco confirms that Johnson Matthey’s global reported Scope 1, 2 and 3 greenhouse gas (GHG) emissions, specified environmental performance indicators related to total and source of energy consumption, waste disposed, water consumption, emissions to air and specified health and safety indicators have received limited assurance for the time period: 1st April 2021 to 31st March 2022. The engagement was performed in accordance with the requirements of the International Standard on Assurance Engagements (ISAE) 3000 revised, ‘Assurance engagements other than audits or reviews of historical financial information’, including the specificities of ISAE 3410 for assuring GHG emissions data, and key health and safety definitions from the OHSA Regulations.”
Objectives And Methodology The objectives of this engagement were to ensure that the Johnson Matthey values in scope were free of material misstatements within an acceptable, agreed materiality threshold and to provide the relevant, material information required by stakeholders for the purpose of decision making.
Johnson Matthey’s GHG inventory and quantification of environmental performance indicators has been completed in accordance with the WRI / WBCSD GHG Corporate Accounting and Reporting Standard (revised) best practice reporting principles of relevance, completeness, consistency, transparency, accuracy. The subject matter also adheres to the ISAE 3410 principles related to both the quantification of emissions and presentation of disclosures.
Avieco has been independently appointed by Johnson Matthey and no member of the assurance team has a business reason for bias with regards to the limited assurance engagement. Avieco applies quality control and management approaches equivalent to ISO 9001 International Standard as encompassed its Quality and Ethics Policies.
Assurance Conclusion Based on the assurance procedures followed by Avieco on the scope of Johnson Matthey’s data across the 2020/21 reporting period, we have found no material evidence to suggest that the data is not:
• Prepared in accordance with the WRI / WBCSD GHG Corporate Accounting and Reporting Standard (revised) and OHSA Regulations as relevant.
• Prepared in accordance with Johnson Matthey’s relevant internal health and safety and environmental data collection guidelines.
• Materially correct and a fair representation of their GHG emissions, specified environmental impacts and health and safety incident rates.
• Worthy of the award of limited assurance
This conclusion should be read in conjunction with Avieco’s full assurance statement available at matthey.com/product-stewardship
Sustainability. More than a word.
Other information continued
Johnson Matthey | Annual Report and Accounts 2022 221
OTH
ER INFO
RMA
TION
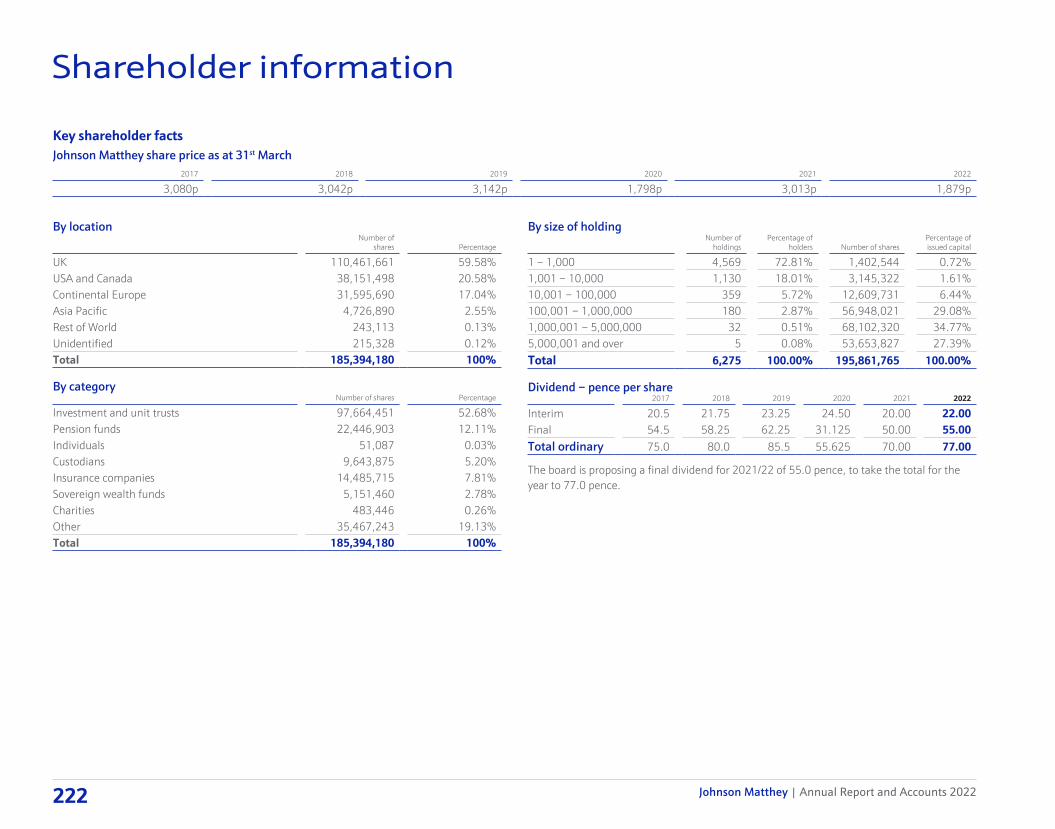
Key shareholder factsJohnson Matthey share price as at 31st March
2017 2018 2019 2020 2021 2022
3,080p 3,042p 3,142p 1,798p 3,013p 1,879p
Shareholder information
By size of holdingNumber of
holdingsPercentage of
holders Number of sharesPercentage of issued capital
1 – 1,000 4,569 72.81% 1,402,544 0.72%1,001 – 10,000 1,130 18.01% 3,145,322 1.61%10,001 – 100,000 359 5.72% 12,609,731 6.44%100,001 – 1,000,000 180 2.87% 56,948,021 29.08%1,000,001 – 5,000,000 32 0.51% 68,102,320 34.77%5,000,001 and over 5 0.08% 53,653,827 27.39%Total 6,275 100.00% 195,861,765 100.00%
Dividend – pence per share2017 2018 2019 2020 2021 2022
Interim 20.5 21.75 23.25 24.50 20.00 22.00Final 54.5 58.25 62.25 31.125 50.00 55.00Total ordinary 75.0 80.0 85.5 55.625 70.00 77.00
The board is proposing a final dividend for 2021/22 of 55.0 pence, to take the total for the year to 77.0 pence.
By locationNumber of
shares Percentage
UK 110,461,661 59.58%USA and Canada 38,151,498 20.58%Continental Europe 31,595,690 17.04%Asia Pacific 4,726,890 2.55%Rest of World 243,113 0.13%Unidentified 215,328 0.12%Total 185,394,180 100%
By categoryNumber of shares Percentage
Investment and unit trusts 97,664,451 52.68%Pension funds 22,446,903 12.11%Individuals 51,087 0.03%Custodians 9,643,875 5.20%Insurance companies 14,485,715 7.81%Sovereign wealth funds 5,151,460 2.78%Charities 483,446 0.26%Other 35,467,243 19.13%Total 185,394,180 100%
Johnson Matthey | Annual Report and Accounts 2022222
Shareholder information continued
Electronic communicationsWe’re encouraging our shareholders to receive their shareholder information by email and via our website. This allows us to provide you with information quicker and helps us to be more sustainable by reducing paper and printing materials.
To register for electronic shareholder communications, visit our registrar’s website shareview.co.uk.
DividendsDividends can be paid directly into shareholders’ bank or building society accounts. This allows you to receive your dividend immediately and is cost-effective for your company. To take advantage of this, please contact Equiniti via shareview.co.uk or complete the dividend mandate form you receive with your next dividend cheque. A Dividend Reinvestment Plan is also available which allows shareholders to purchase additional shares in the company.
Matthey.comYou can find information about the company quickly and easily on our website matthey.com. Here you will find information on the company’s current share price together with copies of the group’s full-year and half-year reports and major presentations to analysts and institutional shareholders.
EnquiriesShareholders who wish to contact Johnson Matthey Plc on any matter relating to their shareholding are invited to contact the company’s registrars, Equiniti. Their contact details are included below. Equiniti also offer a share dealing service by telephone: 0345 603 7037 or online shareview.co.uk/dealing.
By phone: 0371 384 2344* (in the UK); +44 121 415 0804 (outside the UK)
Telephone lines are open 8.30am to 5.30pm Monday to Friday excluding public holidays in England
By post: Equiniti, Aspect House, Spencer Road, Lancing, West Sussex BN99 6DA
Online: shareview.co.uk
Shareholders may also contact the company directly using the details below.
By phone: +44 20 7269 8400
By email: [email protected]
By post: The Company Secretary, Johnson Matthey Plc, 5th Floor 25 Farringdon Street, London EC4A 4AB
American Depositary ReceiptsJohnson Matthey has a sponsored Level 1 American Depositary Receipt (ADR) programme which BNY Mellon administers and for which it acts as Depositary. Each ADR represents two Johnson Matthey ordinary shares. The ADRs trade on the US over-the-counter (OTC) market under the symbol JMPLY. When dividends are paid to shareholders, the Depositary converts those dividends into US dollars, net of fees and expenses, and distributes the net amount to ADR holders.
For enquiries, BNY Mellon can be contacted on 1-888-BNY-ADRS (1-888-269-2377) toll free if you are calling from within the US. Alternatively, they can be contacted by e-mail at [email protected] or via their website at www.adrbnymellon.com.
Financial calendar 20229th JuneEx dividend date
10th JuneFinal dividend record date
21st JulyAnnual General Meeting (AGM)
2nd AugustPayment of final dividend subject to the approval of shareholders at the AGM
23rd NovemberAnnouncement of results for the six months ending 30th September 2022
Johnson Matthey | Annual Report and Accounts 2022 223
OTH
ER INFO
RMA
TION

Glossary of key terms
CAGR Compound annual growth rate
Capital expenditure to depreciation ratio
Capital expenditure divided by depreciation Depreciation is the depreciation charge of property, plant and equipment plus the amortisation charge of other intangible assets excluding amortisation of acquired intangibles
CCM Catalyst coated membrane
CDP Carbon Disclosure Project
CEFIC The Council of European Chemical Industry
CGU Cash-generating unit
CH4 Methane
CO2 Carbon dioxide
COD Chemical oxygen demand
D&I Diversity and inclusion
EBITDA Earnings before interest, tax, depreciation and amortisation
EHS Environment, health and safety
eLNO® JM’s family of nickel rich advanced battery cathode materials
EPS Earnings per share
ESG Environment, social and governance
ESOT Employee Share Ownership Trust
EU European Union
FCA Financial Conduct Authority
FRC Financial Reporting Council
Free cash flow Net cash flow from operating activities, after net interest paid, net purchases of non-current assets and investments and dividends received from joint venture
Fuel cell Technology which converts hydrogen or other fuels (methanol, natural gas) into clean electricity
GAAP Generally accepted accounting principles
GHG
GLT
Greenhouse gas
Group Leadership Team
GRI Global Reporting Initiative
IAS International Accounting Standards
IASB International Accounting Standards Board
IFRIC International Financial Reporting
IFRS International Financial Reporting Standards
ISA International Standards on Auditing
ISO 14000 Internationally recognised series of standards which specify the requirements for an environmental management system
ISO 31000 International standard giving guidelines on risk management
ISO 50001 International standard giving guidelines on an energy management system
ISO 9001 International standard giving guidelines on ethics policies
JM Johnson Matthey
JMEPS Johnson Matthey Employees Pension Scheme
KPI Key performance indicator
LCA Lifecycle analysis
LTIIR Lost time injury and illness rate
LTIP Long term incentive plan
OEM Original equipment manufacturer
Margin Underlying operating profit divided by sales excluding precious metals
NOx Oxides of nitrogen
OSHA Occupational Safety and Health Administration
PBT Profit before tax
PEM Proton exchange membrane
PILON Payments in lieu of notice
PSP Performance share plan
Johnson Matthey | Annual Report and Accounts 2022224

R&D Research and development
REACH Registration, Evaluation, Authorisation and Restriction of Chemicals Regulation
ROIC Return on invested capital
RPI Retail price index
RSP Restricted share plan
SAICM Strategic Approach to International Chemicals Management
Sales Sales excluding the value of precious metals
SASB Sustainability Accounting Standards Board
SBT Science based target
SIP Share incentive plan
SOx Oxides of sulphur
SPV Special purpose vehicle
TCFD Task Force on Climate-related Financial Disclosures
The Code The UK Corporate Governance Code 2018, issued by the FRC
TRIIR Total recordable injury and illness rate
UN United Nations
UN SDGs United Nations Sustainable Development Goals
VOC Volatile organic compound
Working capital days
Non-precious metal related inventories, trade and other receivables and trade and other payables (including any classified as held for sale) divided by sales excluding precious metals for the last three months multiplied by 90 days
Glossary of key terms continued
Designed and produced by Black Sun Plc.
This Report is printed on Edixion Offset which has been independently certified according to the rules of the Forest Stewardship Council® (FSC®).
Printed in the UK by Pureprint, a CarbonNeutral® company.
Both manufacturing paper mill and the printer are registered to the Environmental Management System ISO 14001:2004 and are Forest Stewardship Council® (FSC) chain-of-custody certified.

matthey.com/AR22
Registered Office Johnson Matthey Plc
5th Floor 25 Farringdon Street London EC4A 4AB
Johnson Matthey Plc is a public company limited by shares registered in England and Wales with the registered number 33774.