Cleaner Production/Pollution Prevention Risk Reduction ...
47
Working with IndUSlo/ 10 PrOI(ICI The cnvironmenr Cleaner Production/Pollution Prevention Risk Reduction Measurement Model Development Technical Report No. 99/13 November 1999 Submitted by: Chemonics International, Inc. Under Contract No. 492-C-00-98-00029-00 Associated Number 492-0444 United States Agency for International Development 8EST AVAILABLE COpy , liSE is an initiative of the Republic of the Philippines, funded by the U. S. Agency for International Development (USAJD) and managed by Chemonics International. Inc. /
-
Upload
khangminh22 -
Category
Documents
-
view
1 -
download
0
Transcript of Cleaner Production/Pollution Prevention Risk Reduction ...

Working with IndUSlo/ 10 PrOI(ICI The cnvironmenr
Cleaner Production/Pollution PreventionRisk Reduction Measurement
Model Development
Technical Report No. 99/13
November 1999
Submitted by:
Chemonics International, Inc.
Under Contract No. 492-C-00-98-00029-00Associated Number 492-0444
United States Agency for International Development
8ESTAVAILABLE COpy
,liSE is an initiative of the Republic of the Philippines, funded by the U. S. Agency for International Development (USAJD) and managed by Chemonics International. Inc.
/

Working with tndvsfry 10 Prated The EmifOflmetl!
November 1999
Ms. Priscilla P. RubioCoguizant Technical OfficerOffice ofthe Environmental ManagementU.S. Agency for International DevelopmentRamon Magsaysay Building1680 Roxas Boulevard, Malate 1004Manila, Philippines
Subject
Project
Cleaner ProductionlPollution Prevention Risk ReductionMeasurement Model Development
Industrial Initiatives for a Sustainable Environment (liSE)Contract No. 492-C-OO-98-00029-00
Dear Ms. Rubio:
In accordance with the requirements ofthe subject contracts, we are pleased to submit theCleaner ProductionIPollution Prevention Risk Reduction Measurement ModelDevelopment prepared by the lISE Technical Program Consultant, Dale Rice.
This Cleaner ProductionIPollution Prevention Risk Reduction Measurement ModelDevelopment comprises a portion of the work undertaken by the Project's TechnicalProgram component in conjunction with our efforts to achieve project targets.
Ifyou have any questions regarding this report, please do not hesitate to contact me.
Sincerely,
~eLtoN'/John A. Dorr, Ph.D.ChiefofParty
Enclosures
Cc: see report distribution list
CEau OFFICE:2JF Block A, Mactan Marina MallAirport Road, lapu lapu City 6015Mactan, Cebu, PhilippinesTel: (032) 340·8827Fax: (032) 340-8829
MANILA OFFICE:GIF Macondray Centre2263 Pasong Tamo ExtensionMakati City 1200, PhilippinesTel: (632) 819-0296 to 98Fax: (632) 813-3822
DAVAO OFACE:4th Floor Philam BuildingRizal StreetDavao City, PhilippinesTel: (082) 224-3810 to 12Fax: (082) 224-3813
e-moil: inb@iise_otgweb~;fe: I:tb·(lw....wllre.org
liSE Is an Initiative of the Republic of the Philippines, funded by the U. S. Agency for International Development (USAIO) and managed by Chemonics IntemationaJ,I~

REPORT DISTRIBUTION LIST
Funding AgencyUS Agency for International Development
Government PartnersDepartment ofEnvironment and Natural ResourcesDepartment ofTrade and IndustryPhilippine Coast Guard
Other lISE Intermediate Results Team MembersAcademe (AEMC, UP, NEC)Industry (CCCI, PCCI)NGO (pPDHRRA, GOLD PHIDDRA)
USAID S04 ProjectsCoastal Resource Management ProjectForest Resource Management Project
Chemonics lISE TeamChemonics International, Inc.
SubcontractorsECODITEnvironmental Resource Management, Inc.EnviroNet, Inc.Resource Management International, Inc.R.M. Towill CorporationSchema KonsuIt, Inc.The GREEN Group
Institutional Partner OrganizationsAsian Institute ofManagementCenter for Research and Communication Foundation, Inc.Development Academy of the PhilippinesJoseph Slavin & AssociatesPhilippine Business for Social ProgressPhilippine Business for the EnvironmentPollution Control Association of the Philippines

Executive Summary
The model proposed to be used for the measurement of pollution reduction in thePhilippines under the Industrial Initiatives for a Sustainable Environment (lISE) project hasbeen developed by Millennium Science & Engineering (MSE). The approach used by themodel is based on the relative environmental risk of an industrial process in comparison toalternatives. This ensures that all the environmental pollution pathways are considered,implementing multi-media pollution reduction. The model measures PotentialEnvironmental Impact (PEl) of the output streams ofthe process.
A fundamental task of the project is to conduct in-plant PZ/CP assessments. Toaccomplish the project's pollution reduction goal, a "baseline" must be established at eachfacility that documents the current hazardous waste streams. These data and informationwill be gathered by teams of appropriately trained personnel including those familiar ,viththe processes being evaluated and PZ engineers, at a minimum. After gathering facilityinformation, the PZ engineer will evaluate the data, establish the pollution baseline, andprepare an "alternatives evaluation." Following implementation of PZ/CP alternatives, theupdated potential risk would be compared to the baseline level.
The model developed for this project is the Risk Reduction Measurement Model(R2M2). The model is based on earlier work performed by the US EnvironmentalProtection Agency (US EPA). This earlier work, the Waste Reduction (WAR) algorithm,examines all the waste streams of a process for targeted chemicals, and quantifies the riskbased on the chemicals present and mass loading of each chemical. Risk is quantified forthe following categories:
1. Global warming potential,
Z. Acid rain potential,
3. Photochemical oxidation potential,
4. Ozone depletion potential,
s. Aquatic toxicity potential,
6. Terrestrial toxicity potential,
7. Human toxicity potential by ingestion, and
8. Human toxicity potential by inhalation or dermal exposure.
One modification made to the WAR algorithm is the inclusion of an additionalparameter, fl, which introduces the probability to the calculation of potential environmentalimpact. The parameter fl is used to account for the reduction of risk of release ofchemicalsto the environment. This parameter would be used, for example, where exposure to theworker is reduced by the implementation of the workers wearing PPE or better wastemanagement practices (i.e., an example of implementation of principles of "environmentalmanagement systems or EMS) that would lessen the probability of release to anenvironmental medium.
ddn connnents on risk. reduction measurement modd2 i 12!299
R2M2 is proposed to be used for the evaluation of processes. In instances wherethe resources are not available to perform a complete risk reduction approach using R2M2,or the process does not contain targeted chemicals in any of the waste streams, a secondmodel, the Mass Tracking Model (MTM), is proposed for used. This model would simplytrack reduction in waste stream loading ofa gross parameter or a specific chemicaL
The following conclusions are presented with respect to P2/CP measurement modeldevelopment:
I. The lISE Project assumes that environmental risk is an appropriate parameterfor measuring P2/CP progress.
2. Reduction of environmental risk can be quantified in a relative sense bycomparing baseline risk to the risk determined following implementation of P2alternatives. The proposed methodology for measurement is based on researchconducted by the US EPA.
3. US EPA's "WAR" algorithm is suitable for use in the lISE project and can beenhanced by incorporating a probability factor. The proposed R2M2 algorithmallows the user to insert a coefficient that I ilduces the calculated potentialenvironmental impact for cases in which probability of environmental impact isreduced.
4. Not all of P2/CP assessments will use the R2M2. Where lISE-targetedchemicals are not present, a waste loading model, MTM, will be used.
The following recommendations are proposed for the next steps in the P2/CPportion of the lISE project:
I. The lISE team should develop consensus with project stakeholders on using theR2M2/MTM approach for the P2/CP assessment task MSE should beauthorized to meet with USEPA within the next month to review MSE'sapproach and obtain EPA' support.
2. The R2M2 conceptual model should be fully developed into a user-friendly toolthat can be used by the P2/CP the lISE team. Specifically, Visual Basic or othercommonly available software can be used to write the R2M2 program that walksthe user through the P2/CP evaluation process. This task should be authorizedby Chemonics International prior to the conduct offurther P2/CP training. MSEis prepared to lead the model preparation.
3. MSE should be authorized to further expand the beta table, consulting with thelISE technical team in Cebu.
4. The P2/CP assessment training should be continued by MSE. The trainingshould incorporate general information on P2, R2M2, and MTM. The courseshould be "hands-on" in the nature allowing participants to walk through theevaluation process for actual lISE project participants.
ddn oonunents on risk reduction measurement modeJ2 ii 12'2i99

Table of Contentspage
Executive Summary i
Table ofContents iii
List ofTables iv
List of Figures iv
SECTION 1 INTRODUCTION 1-1
1.1 Background 1-1
1.2 Proposed Use of Models 1-1
1.3 Purpose ofReport 1-2
1.4 Report Organization 1-2
SECTION 2 RISK REDUCTION MEASUREMENT MODEL 2-1
2.1 Purpose of the Mode!... 2-1
2.2 Description of the WAR Algorithm 2-1
2.3 R2M2 Description 2-3
2.4 R2M2 Inputs 2-4
2.5 Examples of Use ofR2M2 2-42.5.1 Painting Process 2-42.5.2 Kerosene Bath 2-5
SECTION 3 MASS TRACKING MODEL 3-1
3.1 Introduction 3-1
3.2 Description ofMTM 3-1
SECTION 4 CONCLUSIONS AND RECOMMENDATIONS .4-14.1 Conclusions 4-1
4.2 Recomendations Error! Bookmark not defined.
Appendices
A Papers on the WAR Algorithm
B Database Values Used in the WAR Algorithm
C R2M2 Example Calculations
ddn conunents on risk reduction measurement mod<:l2 iii

List of Tables
Table
1.1 lISE Target Chemicals
2.1 Description ofParameters Used to Deve!op 'P Values
2.2 Preliminary R2M2 Beta Values
2.3 Example Calculation: PEl of a Painting Process
2.4 Example Calculation: PEl of a Kerosene Bath Process
List of Figures
Figure
2.1 Process Flow Diagram
2.2 R2M2 Logic Diagram
2.3 R2M2 Baseline Data Collection Flow Sheet
page
1-3
2-7
2-8
2-11
2-12
page
2-6
2-9
2-10
ddn conunents on risk reduction measurement modet2 iv
SECTION 1
INTRODUCTION
1.1 Background
Chemonics was awarded the Municipal Coastal Environmental Initiative (MCEI)contract by the United States Agency for International Development on 24 July 1998. Thiscontract, subsequently renamed IISE (Industrial Initiatives for a Sustainable Environment),will operate in the Visayas and Mindanao regions of the Philippines, with support from theproject field headquarters in Manila. To accomplish the objectives of the project, the IISEteam will work closely with its partners to create a self-sustaining, multi-stakeholderprogram that will encourage adoption of environmental management systems andapplication of pollution prevention I cleaner production (P2/CP) technologies.
A fundamental task of the project is to conduct in-plant P2/CP assessments. TheIISE project will result in the conduct of P2/CP assessments at 400 firms and a 20%reduction in pollution. To accomplish this, a "baseline" must be established at each facilitythat documents the current characteristics and flow of its hazardous waste streams. Thesedata and information will be gathered by teams of appropriately trained personnel includingthose familiar with the processes being evaluated and P2 engineers, at a minimum. Aftergathering facility information, the P2 engineer will evaluate the data, establish the pollutionbaseline, and prepare an "alternatives evaluation." Following implementation of P2/CPalternatives, the updated potential risk would be compared to the baseline level.
1.2 Proposed Use ofModels
A proposed method for establishing the baseline and measuring progress wasconceptualized. The basic approach is to "measure" the level of potential risk for eachchemical appearing in any of a facility's waste streams. Two models are proposed to beutilized. The first model, the Risk Reduction Measurement Model (R2M2), would be usedwhere the waste streams of the process contain IISE-targeted chemicals. All processeswould be investigated using the R2M2 unless the waste streams in the process do notcontain target chemicals or chemicals likely to be added to the list of targeted compounds.Targeted chemicals are currently those on the Philippines list of 28 chemicals (RP 28) fromRA 6969 and the Priority Organic Pollutants (POPs) list. These chemicals are listed inTable 1.1. (Note that tables and figures are located at the end of each section.) Additionalchemicals may be added to the target list later as needed to expand the use of the riskreduction model.
ddn comments on risk reduction measurement rnodel2 1-1 122'99
The second model that is proposed is the Mass Tracking Model (MTM). Thismodel would be used to measure reduction of chemicals contained in waste streams of aprocess that do not contain targeted chemicals. This model accounts for sheer reduction inmass flow rates of waste streams. The MTM would be used when the process does notcontain targeted chemicals in any of the waste streams, or does not contain chemicals likelyto be added to the list of targeted chemicals in any ofthe waste streams.
1.3 Purpose of Report
This report documents how R2M2 will be used as the key P2/CP measurement toolfor the lISE project. The algorithm is based on the U.S. Environmental ProtectionAgency's (EPA) Sustainable Technology Division Office (Cincinnati) research with theWaste !Seduction (WAR) algorithm, which is documented in the articles included inAppendix A. Discussions between MSE and the EPA authors, Young and Cabezas,indicated the appropriateness of EPA's WAR algorithm to the lISE project. MSErequested that EPA provide a limited matrix of data used in the WAR algorithm toaccommodate the chemicals that will be evaluated in the lISE project. (These data areincluded in Appendix B).
The R2M2 will be developed by modifYing the WAR algorithm to accommodate theobjectives of the project. The WAR algorithm includes relative risk values (health andenvironmental impact categories) for a number ofchemicals, including most ofthe RP 28.
1.4 Report Organization
This report is divided into four sections and appendices. Following this section,Section 2 provides a description of the WAR algorithm and the development of R2M2,along with some examples. A description of the MTM is contained in Section 3. Finally,conclusions and recommendations from this task are included in Section 4.
Appendix A contains copies of articles on the development of the WAR algorithm.Appendix B contains a copy of the database values used to develop the potentialenvironmental impact of each chemical. Appendix C contains calculations used in theexamples shown in the report.
ddn comments on risk reduction measurement model2 1-2 12;2;99

00 I800n.xls
Table l.1-IISE Target Chemicals
Chemical Category
Aldrin POPsArsenic RP28Asbestos RP28Benzene RP28Beryllium
-RP28
Cadmium RP28Carbon Tetrachloride RP28Chlordane POPsChlorinated Ethers RP28Chlorofluorocarbons RP28Chloroform RP28Chromium RP28Cyanide RP28DDT POPsDieldrin POPsDioxins POPs1,2-Diphenylhydrazine RP28Endrin POPsEthylene Dibromide RP28Ethylene Oxide RP28Furans POPsHalons RP28Heptachlor POPsHexachlorobenzene RP28 & POPsHexachloroethane RP28Lead RP28Mercury RP28Mirex RP28 & POPsPentachlorophenol RP28Phosgene RP28Polybrominated Biphenyls RP28Polychlorinated Biphenyls (PCBs) RP28 & POPsSelenium RP28Toxaphene POPsTributyltin RP28I, I, I-Trichloroethane RP28Vinyl Chloride RP28
Notes:
RP 28 - Philippines list of28 chemicals from RA 6969POPs - Priority Organic Pollutants list
1li12i99
(D

SECTION 2
RISK REDUCTION MEASUREMENT MODEL
2.1 Purpose of the Model
A model is proposed for quantification of pollution-related risk reduction as afunction of environmental impact for the chemicals of concern. Use of an algorithmensures consistent application of the parameters selected for measurement. Given thenumber of facilities and processes that are to be investigated, consistency in theassignment of relative risk is critical to successful measurement. The model proposedfor the lISE P2/CP project is based on the WAR algorithm.2.2 Description of theWAR Algorithm
EPA's WAR algorithm has been designed to evaluate the relationship of competingprocess alternatives. The WAR algorithm considers input and output streams of a process.Figure 2.1 illustrates typical streams to and from a generic process. For a given process,several input streams (which may be comprised of material in the solid, liquid, or gaseousphase) are used in an effort to generate a product. The process typically also will haveseveral non-product streams (which may be comprised of material in the solid, liquid, orgaseous phase) that result from the process. The portion of the WAR algorithm discussedbelow deals with the product stream and non-product output streams.
The WAR algorithm was developed primarily for comparison of processalternatives; however, one can apply the concepts of the WAR algorithm to establish animpact baseline and measure improvement over time. The algorithm assumes that eachchemical stream entering and exiting a process possesses an inherent property, its so-called"potential environmental impact""PEI". The impact of chemicals found in industrialprocesses and in their associated waste streams is evaluated for several different impactcategories. These include:
1. Global warming potential,
2. Acid rain potential,
3. Photochemical oxidation potential,
4. Ozone depletion potential,
S. Aquatic toxicity potential,
6. Terrestrial toxicity potential,
ddn comments on risk reduction measurement mode12 2-1
/I

7. Human toxicity potential by ingestion, and
8. Human toxicity potential by inhalation or dermal exposure.
The first four categories represent atmospheric impact categories. The remaining fourrepresent local toxicological impact categories.
The PEls for input and output streams are evaluated separately. For example, thePEl associated with the output streams of a process is calculated by analyzing each of thewaste streams generated from the process. Each of the specific chemicals for each wastestream are evaluated. Based upon the impact category values associated with eachchemical, the concentration of the chemical in the waste stream, and the mass flow rate ofthe waste stream, the PEl is determined for each chemical in each waste stream. The PEl ofthe process is the sum of the PEl for all the chemicals in all the waste streams of theprocess.
The PEl for each chemical is based upon a specific score for each of the eightimpact categories. Table 2.1 provides the methodology for determining scores for eachcategory. For example, the human toxicity potential by ingestion is based upon the lethaldose that produced death in 50% of rats by oral ingestion (LDso). The human toxicitypotential by inhalation or dermal exposure is based on the time-weighted average of thethreshold limit value. Scores for atmospheric categories are based upon the ratio of thechemical's adsorption/release/reaction rate compared to the reaction/release/adsorption rateof a chemical standard.
After the scores for each chemical are determined, they are normalized within eachcategory. Normalization ensures that, on average, the impact potential for differentcategories will have equivalent values. The normalized values are represented by theparameter 'P. 'P is calculated by dividing each chemical score by the average of all thechemical scores within that category. (The database currently contains chemical scores forover 1600 chemicals.) Therefore, it is not the absolute 'P value for each chemical that isimportant, but rather, the chemical's 'P value relative to other chemicals' 'P values.Without normalization, implicit weighting could be present in the chemical database causingunintentional bias in the calculation of the PEl indexes. Normalizing each category by theaverage value of entries in that category insures that the average value in that category willbe unity. The units of '¥ are potential environmental impact (PEl) per kilogram (kg) ofchemical.
The WAR algorithm also allows the user to weigh each of the eight impactcategories above in order of importance. This weighting factor, represented by theparameter a., is a value between zero and ten. The parameter a. is dimensionless. Forpurposes of the lISE, a. is proposed to have a value of I for all categories.
The overall PEl per kg of chemical j, '¥,. is calculated using the following equation:
where the summation k is taken over all impact categories.
The overall PEl of the process, lout, is given by the following equation:
(I)
ddn comments on risk reduction measurement model2 2-2 12i2i99
J~

1 = "1'=) = ,,~(~," r.'PcurLJ, k-1L IJJj
(2)
where the summation i and j are taken over all waste streams and chemicals,respectively, I~O"t) is the PEl of waste stream i, MlOUI) is the mass flow rate of the
waste stream i in units of kg per time, and xij is the mass fraction of component j inwaste stream i. The units of I.ut are PEl/time. 2.3 R2M2 Description
One ofthe limitations of the WAR algorithm is that the relative risk or probability ofenvironmental impact is not addressed. For example, consideration is not given between thescenario where a waste stream enters the environment uncontrolled and another whereproper waste management practices are in place. The former situation represents a higherrisk than the latter. For the lISE project, risk reduction is a key objective for the P2/CPprogram; progress measurements, therefore, should be a function in terms of risk reduction.
The Risk Reduction Measurement Model is proposed as a useful variation of theWAR algorithm to accommodate the need to account for such risk reduction. Amodification to the WAR algorithm for this project incorporates a new parameteraccounting for the probability of the waste stream being released to the environment incertain cases. The disposition of the waste stream is important because, for example, theenvironmental impact of the discharge of a liquid waste stream to the site soil andgroundwater is much greater than the impact of the same liquid stream captured in drumsand treated in an approved manner or in the future, at an approved treatment facility. Thus,the relative risk posed by PEl in a process can be reduced if a waste stream can be moreeffectively managed.
The introduction of a risk coefficient, fJ, is proposed to modify the WAR equation.Incorporation of fJ modifies the result of the WAR algorithm to yield a term PEI*, whichcan be called "risk-reduced potential environmental impact." The overall PEI* of achemical is given by the equation:
(3)
The PEI* of the process is calculated using Equation 2. An example of theusefulness of the risk coefficient is illustrated in the case of personnel protective equipment(PPE) that is implemented in a painting process. Appropriate PPE reduces the humantoxicity potential by inhalation or dermal exposure; fJ can be used to distinguish the relativerisk of a hazardous solvent and/or metallic pigment in the breathing zone of the workerversus the case where the worker wears PPE. Thus in this case, a fJ value less than 1(assumed for PPE usage in that the risk of exposure to the user is reduced) would reducethe net PEI* level. A value of fJ can be assumed for each relevant environmental impactcategory.
In general, fJ would be assigned a value of 1 in the baseline scenario. If a processchange (or housekeeping change) is made, the value of fJ would be adjusted to a value lessthan 1 as appropriate. The parameter is meant to be more of a "fine tune" adjustment to
ddn conunents on risk. reduction measurement model2 2-3

PEI*, and is not expected to have as much significance as, for example, those processeswhere highly toxic chemicals are replaced with those less toxic. Rather, it will serve as atool to accommodate reduction in risk where changes in housekeeping or disposition ofwastes may be the only possible alternatives available at a facility. Preliminary examples of,8 values are shown in Table 2.2.
The model logic is shown in Figure 2.2. This logic is a necessary preliminary designstep prior to construction of the program that will be used to calculate the PEI* of theprocess. The logic of the model begins by identification of the process. Next, a wastestream and its characteristics, such as mass flow rate and management/disposition of thewaste, are identified. The appropriate ,8 value for the disposition/exposure is retrieved.Then, each chemical is identified, and its '¥ values are retr;eved. The concentration of thechemical in the waste stream is input, and the PEI* of the chemical is calculated. This isrepeated for any additional chemicals. The PEI* value of all chemicals is summed todetermine the waste stream PEl*' This procedure is repeated for each waste stream fromthe process. The PEI* ofthe waste streams is summed to determine the overall PEI* of theprocess.
2.4 R2M2 Inputs
PEI* must be calculated for each process in which R2M2 is employed. Eachprocess may be comprised of several waste streams, and several chemicals may be found ineach waste stream. Figure 2.3 illustrates the flow logic of identifYing all the informationinputs required for the algorithm.
After the processes at the facility have been identified and chosen for evaluation inthe R2M2, the process must be looked at in detail in an effort to identitY all the wastestreams in the process and the waste stream flow rates. Each waste stream is theninvestigated to determine the chemicals in the waste stream and their concentrations. Onlychemicals on the target list (or those that are likely to be added to the target list) will beinvestigated.
2.2 Examples of Use ofR2M2
2.2.1 Painting Process
In this first example, a pamtmg process uses a paint containing toluene, 1,2,4trimethylbenzene, and zinc oxide. All the VOCs in the paint are assumed to act as carriersand volatize to the atmosphere. Output streams for this process are the VOC stream (to theatmosphere) and paint overspray. The amount of paint overspray depends on the efficiencyof the paint gun and the experience of the painter. The overspray contains the pigment inthe paint.
Table 2.3 shows a summary table of the calculations used in determining the processPEI* . Calculations for determining the percent of each chemical in each of the wastestreams is shown in Appendix C. While the concentration of toluene and 1,2,4trimethylbenzene in the paint is 9 percent and 1 percent, respectfully, the concentrationsincrease to 19.6 percent and 2.2 percent in the VOC stream. The concentration of zinc
ddn conunents on risk. reduction measurement model2 2-4 1212'99

oxide increases from 3 percent in the paint to 5.3 percent in the pigment waste stream.
Similarly, the mass of paint used by the process in~. year is 235.8 kg. The mass ofthe VOC waste stream is 101.4 kg per year, and the mass of the pigment waste stream is67.2 kg per year. The material applied to the product accounts for the balance of thepigment.
In the baseline case, the values of beta are set to a value of 1. The PEI* of eachchemical is calculated, and then the PEI* of all the chemicals in all the waste streams issummed to give the process PEI*. The annual process PEI* for this process is calculated tobe 40.
The alternative case utilizes a paint that does not contain any targeted chemicals.Therefore, the PEI* ofthe alternative is 0, and the PEI* reduction is 100 percent.
2.2.2 Kerosene Bath
Kerosene is often used to keep away insects in furniture manufacturing in thePhilippines. Bamboo stock may be submersed in a kerosene bath for preservation. In thisexample, a 450 gallon bath is used to submerse the bamboo until needed in the process.Currently, the bath is emptied and refilled with kerosene every thirty days. Therecommendations to reduce pollution are to cover the bath and ensure it is located out ofdirect sunlight in effort to reduce evaporative losses. These methods are expected to allowthe bath to be emptied and refilled every 40 days. The calculated annual PEI*s of4,500 and3,400 for the Baseline and P2 Alternative 1, respectively, are shown in Table 2.4.
The second P2 alternative for this process is for the workers to wear PPE. Wearingof gloves when handling the bath and treated bamboo would reduce the value of p to 0.5.The annual PEl for Alternative 2 is 3,800.
The third alternative is to combine Alternatives 1 and 2. The annual PEI* forAlternative 3 is 2,900. This represents a 36 percent reduction in annual PEl from thebaseline case.
ddn comments on risk reduction measurement mode12 2-5 12i2199
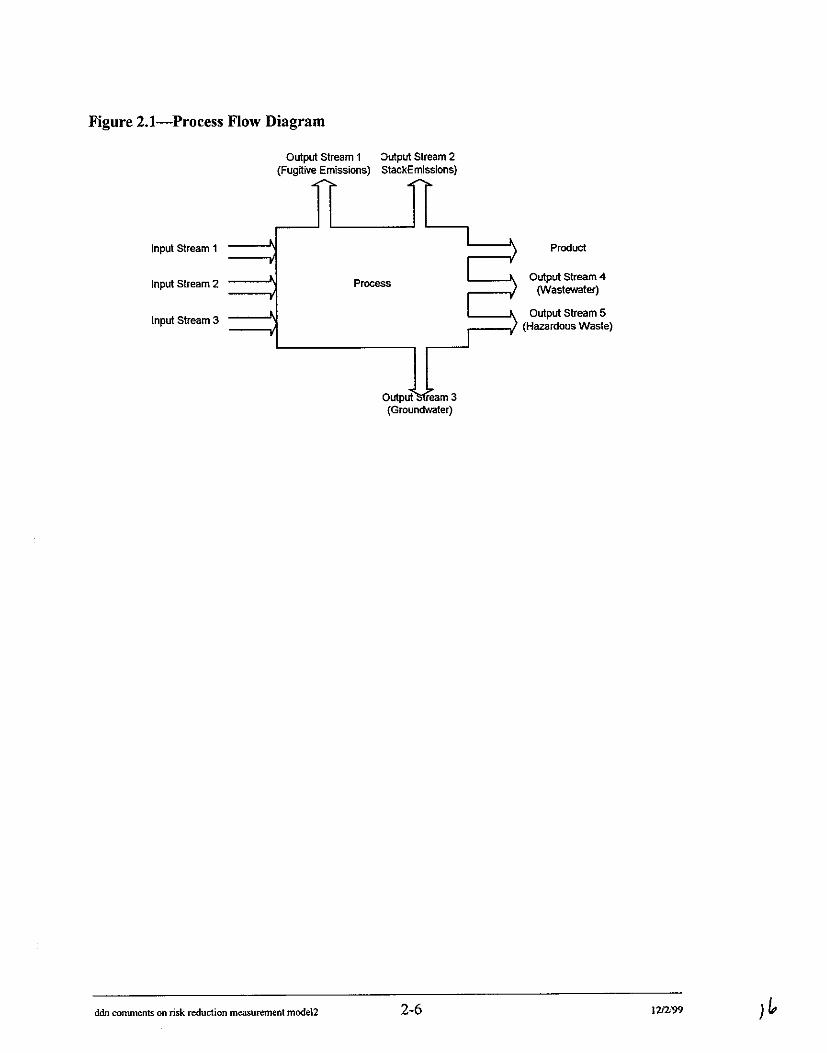
Figure 2.t-Process Flow Diagram
Output Stream 1 :Jutput Stream 2(Fugitive Emissions) StackEmissions)
Input Stream 1
Input Stream 2
Input Stream 3
~ .
I •)
I ••Process )
I •• •
),I ·
i.Output l;lream 3(Groundwater)
Product
Output Stream 4(Wastewater)
Output Stream 5(Hazardous Waste)
ddn comments on risk reduction measurement mode12 2-6 1212/99 )f"
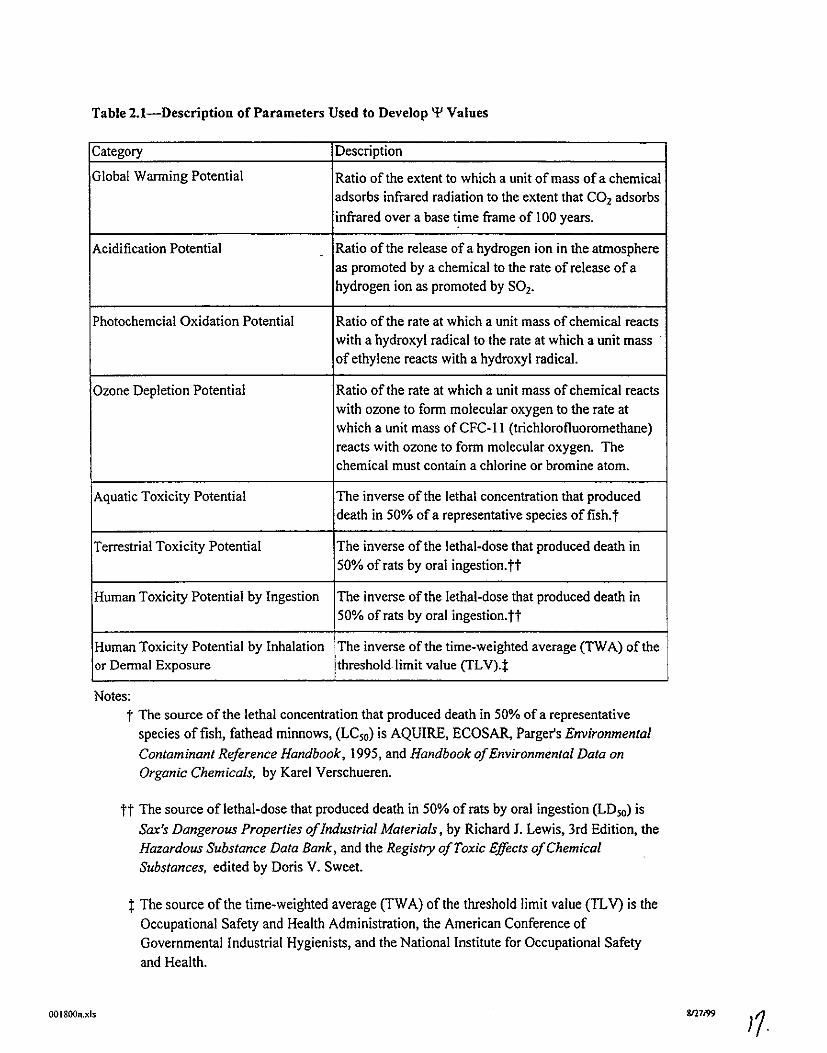
Table 2.1-Description of Parameters Used to Develop 'P Values
Category Description
Global Warming Potential Ratio of the extent to which a unit of mass ofa chemicaladsorbs infrared radiation to the extent that CO2 adsorbs
infrared over a base time frame of 100 years.
Acidification Potential - Ratio of the release of a hydrogen ion in the atmosphere
as promoted by a chemical to the rate of release ofa
hydrogen ion as promoted by S02'
Photochemcial Oxidation Potential Ratio of the rate at which a unit mass ofchemical reacts
with a hydroxyl radical to the rate at which a unit massof ethylene reacts with a hydroxyl radical.
Ozone Depletion Potential Ratio of the rate at which a unit mass ofchemical reacts
with ozone to form molecular oxygen to the rate atwhich a unit mass of CFC-II (trichlorofluoromethane)reacts with ozone to form molecular oxygen. The
chemical must contain a chlorine or bromine atom.
Aquatic Toxicity Potential The inverse of the lethal concentration that produceddeath in 50% ofa representative species of fish. t
Terrestrial Toxicity Potential The inverse of the lethal-dose that produced death in
50% of rats by oral ingestion.tt
Human Toxicity Potential by Ingestion The inverse of the lethal-dose that produced death in
50% ofrats by oral ingestion.tt
Human Toxicity Potential by Inhalation The inverse of the time-weighted average (TWA) of theor Dermal Exposure threshold limit value (TLV).t
Notes:t The source of the lethal concentration that produced death in 50% ofa representative
species of fish, fathead minnows, (LCse) is AQUIRE, ECOSAR, Parger's Environmental
Contaminant Reference Handbook, 1995, and Handbook ofEnvironmental Data onOrgonic Chemicals, by Karel Verschueren.
tt The source of lethal-dose that produced death in 50% of rats by oral ingestion (LDse) is
Sax's Dangerous Properties ofIndustrial Materials, by Richard 1. Lewis, 3rd Edition, theHazardous Substance Data Bank, and the Registry ofToxic Effects ofChemicalSubstances, edited by Doris V. Sweet.
t The source of the time-weighted average (TWA) of the threshold limit value (TLV) is the
Occupational Safety and Health Administration, the American Conference of
Governmental Industrial Hygienists, and the National Institute for Occupational Safety
and Health.
00 ISoon.xls 8f17f99

Table 2.2-Preliminary R2M2 Beta Values
Impact CategoryCondition HTPI HTPE ATP TIP GWP aop pca AP
Process Pollution ControlPPC-1 Replace Paint Booth Water Curtain
wi Dry Filter 1 1 0.5 1 1 1 1 1PPC-2 Improve Paint Booth Overspray
Collection.
0.7 0.7 1 0.5 0.9 0.9 0.9 0.9PPC-3 Combine PPC-1 and PPC-2 0.7 0.7 0.5 0.5 0.9 0.9 0.9 0.9
Waste Management PracticesWMP-1 Install Secondary Containment 1 0.7 0.5 0.5 1 1 1 1WMP-2 Instau \;neCK valves on water
Supply System In Vicinity ofProcess Waste Lines 0.5 0.9 0.9 1 1 1 1 1
WMP-3 Install Pressure Relief Valve onPressure Vessel 1 0.5 1 1 0.7 ·0.7 0.7 0.7
Personal Protection EquipmentPPE-1 Use Appropriate Respirator 1 • 0.5 1 1 1 1 1 1PPE-2 Use Appropriate Splash Protection
(Boots, Gloves, etc.) 0.7 0.7 1 1 1 1 1 1General Housekeeping Practices
GHP-1 Segregate Waste Streams 0.7 0.7 0.7 0.7 0.9 0.9 0.9 0.9GHP-2 Establish I Implement Waste
Handling Procedures 0.9 0.9 0.9 0.9 0.9 0.9 0.9 0.9
otes:HTPI = Human toxicity potential by ingestionHTPE = Human toxicity potential by inhalation or demeral exposureATP = Aquatic toxicity potentialTIP = Terrestrial toxicity potential (same method as HTPI)GWP = Global warming potentialOOP =Ozone depletion potentialpeo = Photochemcial oxidation potentialAP = Acid rain potential

Figure 2.2--R2M2 Logic Diagram
(~St---.-art_)
p= 1 for Allcategories
Identify Waste StreamContaining Targeted
Chemical{s)
Is this theBaseline
Evaluation?
Identify ConditionsReducing Probability of
a ReleaselExposureFollowing Facility P2
Implementation
ccategory Matrix
Retrieve Impactcategory't' Values
for Chemical
UltlPly ach't' a ueby Its Respectivecr.
and p Values for EachImpact category
Multiply the Sum by thConcentration of the
Chemical in the Wastesteam
y~
Arethere any other
,_~>< Targeted ChemicalS inthisWas1eStream?
Determine the PEl forthe Waste Stream bySumming PEl Values
for All TargetedChemicals in theWaste stream
Are thereenyolher
Waste StreamsContaining Targeted
Chemicals in thisProcess?
ermine e orthe Chemical by
Multiplying the proouctl- _by the Mass Flow Rateof the Waste Stream
ddn comments on risk reduction measurement model2 2-9 1212>99
11

Figure 2.3- R2M2 Baseline Data Collection Flow Sheet
Identify Chemicals inProcess Waste
Streams Yes
IsChemical onthe Target
List?
Yes
NoIs Chemical
Likely to be Added toTarget List?
No
Me thereany more Chemicals
in Process WasteStream?
YesIdentify
Concentration of~-----.IChemical in Waste 1.----------'
Stream
Yes
Are thereMore Target
Chemicals/ChemicalsLikely to be Added to
Target Listin this Waste
Stream?
Are thereMore Waste
Streams in theProcess?
o
No
ddn comments on risk reduction measurement mode12 2-10 12''2/99

Table 2.3-Example Calculation: PEl of a Painting Process
Waste RP28/IPsi Values (impacVkg chemical) lBeta Values (dimensionless) I E~a'l' X X E~a'l' M PElCase Stream Chemical POPs HTPI I HTPE ATP TIP GWPIOOPI PCO API HTPI HTPEIATP TIP GWP OOP PCO APkimoacVk<chemical (%) (imDactlkR:) (kg/year) (impact/year)
BaselineVOC Toluene n 0.0781 0.0004 0.0845 0.078 1.157 1 1 1 1 1 1 1 1 1.4 19.6% 0.270 101.4 27VOC 1.2,4-Trimethylbenzene n 0.0781 0.0024 0.2863 0.078 2.466 1 1 1 1 1 1 1 1 2.9 2.2% 0.084 101.4 6.5
Pigment Zinc Oxide n 0.7632 0.0591 0.001 0.763 1 1 1 1 1 1 1 1 1.6 5.3% 0.084 67.2 5.6Process PEl 40
Alternative: Use of a Hlah Acrylic Coa~ng that does not contain targeted compoundsT-rINone I I I I I I I I I I I I I I I I 0
Process PEl 0
-- -
'------- PEl Reduction Between Alternative and Baseline 100%.. __.._-- _..._--
Notes:HTPI = Human toxicIty potential by IngestionHTPE = Human tOXicity potential by Inhalation or demeral exposureATP =Aquatic toxicity potentialTIP =Terrestrial toxicity potential (same method as HTPI)GWP =Global warming potentialODP = Ozone depletion potentialpeo = Photochemclal oxidation potentialAP = Acid rain potential
OOIBOOn J>;l,
t9-/8/27/99

Table 2.4-Example Calculation: PEl' of a Kerosene Bath Process
Notes.HTPI =Human tOXicity potential by ingestionHTPE =Human toxicity potential by inhalation or demeral exposureATP =Aquatic toxicity potentialTIP = Terrestrial toxicity potential (same method as HTPI)GWP =Global warming potentialOOP = Ozone depletion potentialPCO = Photochemcial oxidation potentialAP = Acid rain potential
I 111~P28/1PSi Values (impactlkg chemical) IBeta Values (dimensionless) I Epa'!' 11;( 11;( EPa'!':)1 M III PElCase Chemical POPsl HTPII HTPEI ATPI TIP I GWPI OOPI PCOI API HTPII HTPEIATPITIPI GWPI OOPI peol APJ(impactlkg chemical (%) (impactlkg) (kg/year) (impact/year)
BaselineIKerosenel n I 0.081 01 0.11 0.08 I 01 01 01 01 1 I 11111111111111 0.3 199.0%1 0.278 I 16,158 1 4,499Process PEl' 4,500
Alternative 1: Covering Bath, Moving out of direct Sunlight. extends life of Kerosene and maintains volume such that bath Is replaced every 40 days instead of 30 days.1Kerosene I n I 0.081 01 0.11 0.081 01 01 01 01 1 I 11111111111111 0.3 199.0%1 0.278 I 12,119 1 3,374Process PEl' 3,400
Alternative 2: Workers begin wearing PPE (gloves and respirators) when handling material in bath and treated Bamboo stock.IKerosene1 n I 0.081 01 0.11 0.081 01 01 01 01 0.5 1 0.5 1 1 1 1 1 1 _I 1 1 1 I 1 1 0.2 199.0%1 0.236 I 16,158 1 3,809Process PEl' 3,800
Alternative 3: Combine Alternatives 1 & 21Kerosene I n I 0.081 01 0.11 0.081 01 01 01 01 0.5 I 0.5 I 1 I 1 I 1 I 1 1 1 I 1 I 0.2 199.0%1 0.236 1 12,119 I 2,857Process PEl' 2,900
PEl Reduction Between Alternative 3 and Baseline PEl Reduction = 36%10.1_ ..___
OOI800n.xls 8/27/99
0?-2-

SECTION 3
MASS TRACKING MODEL
3.1 Introduction
The MTM is proposed for tracking pollution reduction for processes where theR2M2 is not used. The MTM can be used to address either a gross parameter, such asbiological oxygen demand (BOD), or a specific chemical. As stated in Section 1.2, theMTM would only be used when the process does not contain targeted chemicals in the anyof the waste streams, or does not contain any chemicals likely to be added to the list oftargeted chemicals in the any of the waste streams. MTM is designed as a less rigorousapproach to measuring pollution reduction than R2M2.
3.2 Description of MTM
The MTM is proposed to be used to measure reduction of mass loading of selecteda parameter. The concentration of a chemical in the waste stream multiplied by the flowrate would determine the mass loading for that chemical in the wastestream. Summing themass loading from each waste stream yields the mass loading from the process. Nonchemical specific parameters that could be used for the MTM include BOD, total organiccarbon (TOC), and chemical oxygen demand (COD). These chemicals would not generallyinclude lISE-targeted chemicals, since the R2M2 would be utilized for targeted chemicals.Similar to R2M2, a baseline scenario would be established for each process evallJated.
ddn corrur.ents on risk reduction measurement mode12 3-1
23

SECTION 4
CONCLUSIONS AND RECOMMENDATIONS
4.1 Conclusions
The following conclusions are presented with respect to P2/CP measurement modeldevelopment:
I. The lISE Project assumes that environmental risk is an appropriate parameterfor measuring P2/CP progress.
2. Reduction of environmental risk can be quantified in a relative sense bycomparing baseline risk to the risk determined following implementation of P2alternatives. The proposed methodology for measurement is based on researchconducted by the US EPA.
3. US EPA's "WAR" algorithm is suitable for use in the lISE project and can beenhanced by incorporating a probability factor. The proposed R2M2 algorithmallows the user to insert a coefficient that reduces the calculated potentialenvironmental impact for cases in which probability of environmental impact isreduced.
4. Not all of P2/CP assessments will use the R2M2. Where IISE-targetedchemicals are not present, a waste loading model, MTM, will be used.
4.2 Recommendations
The following recommendations are proposed for the next steps in the P2/CPportion ofthe IISE project:
[DALE: I CAN'T FIX THE NUMBERS ON TIDS At'ID I'M TOO BURNEDOUT (AND NO ONE IS HERE AT THE OFFICE AT TIDS HOUR TO HELP). SORRY.DDN
5. The lISE team should develop concensus with project stakeholders on using theR2M2/MTM approach for the P2/CP assessment task. MSE should beauthorized to meet with USEPA within the next month to review MSE'sapproach and obtain EPA'ssupport.
6. The R2M2 conceptual model should be fully developed into a user-friendly tool
ddn comments on risk reduction measurement mode12 4-1 12'2'99

that can be used by the P2/CP the lISE team. Specifically, Visual Basic or othercommonly available software can be used to write the R2M2 program that walksthe user through the P2/CP evaluation process. This task should be authorizedby Chemonics International prior to the conduct offurther P2/CP training. MSEis prepared to lead the model preparation.
7. MSE should be authorized to further expand the beta table, consulting with thelISE technical team in Cebu.
8. The P2/CP assessment training should be continued by MSE. The trainingshould incorporate general information on P2, R2M2, and MTM. The courseshould be "hands-on" in the nature allowing participants to walk through theevaluation process for actual lISE project participants.
ddn conunents on risk reduction measurement mode12 4-2 12/2/99

Appendix A

nvironmental Manager
Heriberto Cabezas andJ . S· 1· Douglas YoungS g m at u.s. EnvironmentalIn 1 U . Ion sust~~::~~~~~~:;D"'.
~or Pollution Prevention
NOMENCLATURE
~ Th. moss froction of ecch nonproduct chemical component, I: in.lTeam i, kglkg
.,J • Th. overoll environmental impactof chemicol component. i, P8/kg
• A w.ighting factor thot ollows on.1'0 assign relah>te lmportonce toeach of the eight en....ironmenrol~impact cotegorie~. k. used by ~eWAR Algorithm
• Specific impact of chemlcol component. i. in impact ~o:tegor"l. k....... "
'''I
Mt'.M~ • M= Rewrole of each inputond output for each .Ireotn. i. I<glh
tion indexes, to compare differentprocess alternatives. The lower thevalue of these indexes, the better theprocess's environmental perfonnance.
The output inde::es include the rateof PEr output, i ou,. and the amoWlt ofPEL output per kilogram of product.lout- These indexes allow comparisonof the potential impact of various out·put streams on human health and theenvironment. jaut is given by:
i,,,, = la;lp (2)
where:p = The rate at which the process produces products, kglh
The generation inde::es are the rateof PEr generation. 1.en• and theamount of PEr generated per kilogram of product. i~..n.' They allow comparison of proce;~ alternatives. interms of the generation of net PELIgen is given by:
• l"",-t.I .... = p . (3)
To compute the four indexes for a
l", • The role of input of PEl, pEl/hi"", • Th. role of output of PEl. PS/h. =- The rote of P8 generation insideI.... the process. PEI/h r. .•.. th. differ
enc. between l", ond 1""')j "'" • Th. ornount of PEl output/kg of
productP • Th. role ot which th. process pro'
duces product. kg/hj.... • Th. omount of PEl generoted/kg
of product-in1i • Th. PE! input per kg of product.
For each indi ....idoal input ~tr~m. iC .i~ "" The PEl rote of each indi.... ldualinour and cum", dr........... : De,fl.
The goal is to design or modify chemical processesto minimize their environmental impact
The WAR AlgorithmThis methodology'assumes that eachstream entering and exiting a processpossesses an inherent property, its potential environmental impact (PEn.WAll. generates four indexes (discussed below), which can be used tocompare the environmental impact ofvarious process alternatives. For asteady-state process, one can write abalance equation for PEr:
o =t.-l"",+lg.. (1)where:iin = The rate ofPEr input, PEIth (theimpact on the environment if all feedstreams were to be released at once)iou, =The rate of PEr output, PEIIh.(the impact on the environment if alloutput streams were to be released)ilien = The rate of PEr generation bythe process, PEIIh (the difference between lout and jin; igtlt can be positiveor negative. because a given processcan either create or consume PEn
From Equation I, one can generatetwo output inaexes and two genera-
e ?r-oeesa ln~tion methodololO' he. beenlemaLized by Mauu l.n~aon. £nCo (~V::l.l. The Uuaa!'/enlon o(the WAR al~nthmnt: Incorporated Into the :llmulalOr productCAl) (\' f"lm Chenut.l.t1on•. [nco IHouston.11'11" .luUlon" ~lonn:~redoes not endOf":'\r.:. of [ht:'~ '.nmmerneJ pmdUI,;t3 or cornpntUes.r'lf fllor" ,In '..m"I ....."' ... _.. - - ,.",
r he ability to design or modifychemical processes in a waythat minimizes the formationof Wlwanted byproducts is an
;oing goal for process engineers.o simulation and design methods. discussed here: Process Integral (PD. developed by EI-HalwagiI Manousiouthakis (1] at UCLA,I El-Halwagi (2J at Auburn univer'; and the Waste Reduction (WARl·orithm. developed at the U.S. Enmmental Protection Agencyacinnati. Ohio). and made commer.ly available through a Cooperative;earch and Development Agreelt (Crada) under the Federal Tech)gy Transfer Act of 1986.1'I is concerned with improvingcess efficiency and keeping tar,d components from leaving theoem. PI is essentially the practicallication of the mass-exchange net·ks (MENl, as detailed in (l.2J,ch try to remove pollutants fromiuct streams and segregate them, concentrated waste streams.y comparison. the WAll. Algorithm:oncemed with evaluating and reojng the potential environmentalact of a process (31- a key design;ideration. Consider Process A,ch emits 1 tonlh of a given poIluo. and Process B. which emits 2;Jh of a different pollutant. Whenie two processes are compared onbasis of pollutant mass alone, oned logically conclude that Process Areferable. However. because someJtants are more toxic than others,process comparison needs to asthe human·health and environ·
.tal impacts.
-,-'-'--"'-- -- ._.'--'~
(S
gory k (discussed below), in units ,PEIIkg. This is given by,
i", arll"'l ar,lI.'·lr:s:;;It' i aiii
I Ml"lr",;;Ia.'I'~i ;.\
i_:rll-) =I Ml-) I:S:;;'I'i=......--:: i i ;
"f.' -.• GUll·' sr..} ,_.' I""jIa,'I',.i',--,· i·"
where:CI.~ = ~~ weighting factor for each irr:pact c:ltegory k
.-;~ -1.2 I
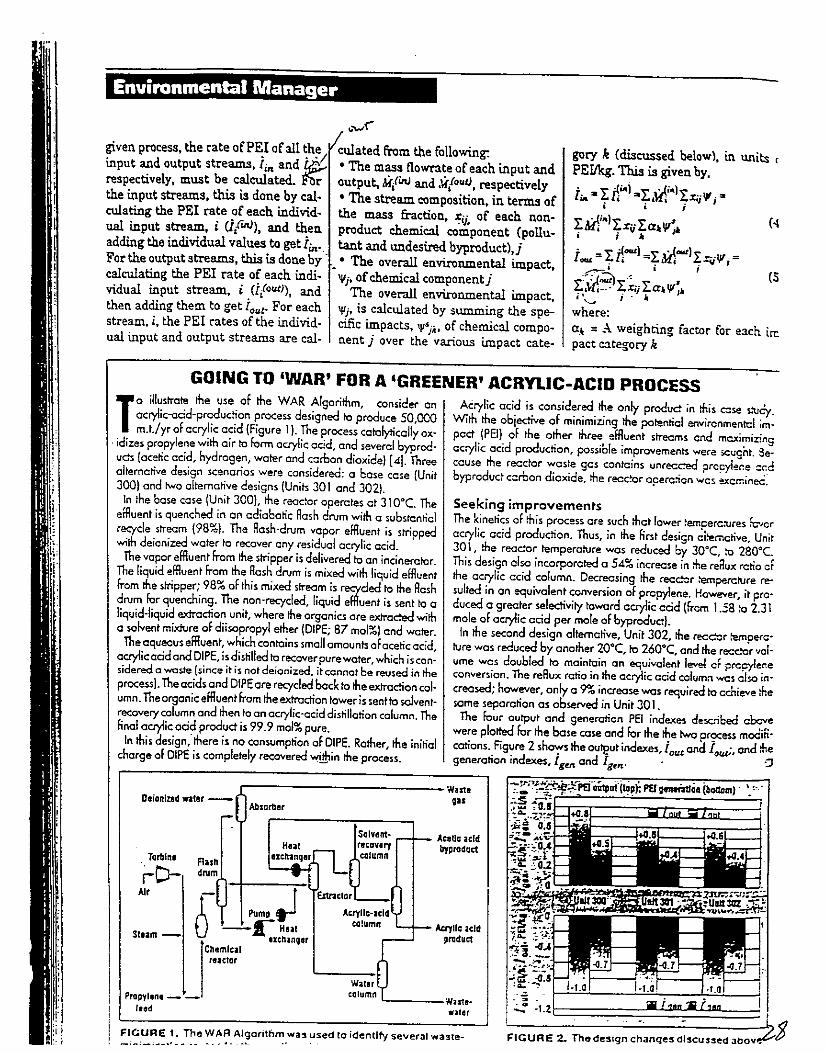
FICURE 2. ~h&de~ig~c~~nQes~scu:s:sedahoY # $
Acrylic acid is considered the only product in Ihis cose s:UCy.With the objective of minimizing the po!'enticl environmentcl impact (pEl) of the other three .ffluent streams and maximizingacrylic acid production, possible improvements were scugnt. 3ecause the reector WQste gcs contains unrecced' prc!=y1er:e ::r.dbyprcduc~ c~rbon dioxide, :he recc~r operc:ion wcs excminecL
Acrylic acIdproduct
Solventflc:avtrycolumn
Waltr
column '----_WOlst".walet
E.l1n".r,-__!Acrylic-acid
c:o~uml1
Hutelcrulnqer
Absartler
Aash'rum
r Pum• .JU -CHUllIc:tunQer
Chemicalteactat
Deionized water -
. Tartlln'
i-D-Atr
$lum-
FICiURE 1. The WAR Algorithm was used to identify sever;]1 'Naste-
Seeking improvementsThe kinetics of this process ere such rl1ct lewer ~emFerc:ures ~cr
acrylic acid production. Thus, in the first design ci~mctive. Unit301, the reac:or lemperature was reduced by 30'C, :0 280·C.This design also incorporated a 540% increase in ~e reaux retio dthe acrylic acid column. Decreasing the reecer :empercture resulted in on equivalent conversion of propylene. However, it pro·duced a grealer selectivity toward acrylic acid (frem 1.58 :0 2.31mole of acrylic acid per mole of byproduct).
In the second design alternative, Unit 302. the reecer iempere'ture was reduced by another 20·C. 10 260·C. and the recC:Or volume was doubled to maintain an equivalent level of prcpyleneconversion. The reRux ratio in the acrylic ccid column wcs elsa increased; however, only a 9% increase was required ro achieve ~esame separatian as observed in Unit 301.
The four output and generation PEl indexes desc.:ibed abovewere plolted for the bese case and for the the two precess modifi·cations. Figure 2 shows the cuteut indexes. lou< and 10u<;' and lhegeneration indexes, i gm and Ig~n.' .. .j
'----------------------w-,-..-,-, ~~,.~~~:c.t~~P'E:fOitput·(lGPt.pg~aa tbottDmJ - ~ t,.'
qas _::~ ..::..~~~'·~I~~~· .~~~~~~~~~.~'.• ~ .a.5 +08
~~··~:5 -,.Autlc acId ~~- A"~bypro"" - !i/Sa,/
':I: .i'iJ.z:=:.:-. -'. 'L-
~i·~ .~~.~ ZJtm-...·_~--
~~~~~~~~~~;~ .;., .• : I.... 0. ~ ':1;.
~.:.:q.A:_ 3. __~ :-w:.~~~:;:o.'~~
To illustrate the use of the WAR Algorithm, cansider onacrylic-ocid-production process designed 10 produce 50,000m.t./yr of acrylic acid (Figure 1). The precess catolytically ox
. idize$ propylene with air to form acryfic acid, and several byproducts (acetic acid, hycrogen, woler ond corbon dioxidel [41. Threealternotive design scenarios were considered: a base case (Unit300) and Iwo alternative designs (Units 301 and 3021.
In the base cose (Unit 300). the reactor operetes at 31 O·c. Theeffluent is quenched in on adiabatic Rash drum with a substcnticlrecycle stream (98%). The Rash·drum vapar effluent is strippedwith deionized water to recover cny residucl acrylic acid.
The vapor efRuent From the stripper is delivered to an incinerater.The liquid effluent from the Rash drum is mixed with liquid effluentfrom the stripper; 98% of this mixed stream is recycled 10 the Rashdrum for quenching. The non-recycled, liquid effluent is sent to aliquid-liquid extraction unit, where the organics are e.xtroeed witha solvent mixture of diisopropyl ether (DIPE; 87 mal%! and weter.
The aqueous emuent, which contains small amounts ofacetic acid,acryficacidond DIPE, is distilled to recover purewater, which is con·sidered a WC$te {$ince it i$ not deionized, it cannot be reused in theprecess!. The acids and DIPE are recycled beck 10 the extraction cal·umn. Theorganic effluent From the extraction tower is sent to soIventrecovery column and then to an acrylic'acid distillation column. Thefinal acrylic acid product is 99.9 mol% pure.
In this design: there is no consumption of DIPE. Rather, the initialcharge of DIPE is completely recovered W®in the process.
given process, the rate ofPE.l ofall ~h~/ culated from the following:input and output streams, [in and~ • The mass flownte ofeach input andrespectively, must be calculated. ~r output,M{inJ and .\f{oul). respectivelythe input streams, this is done by cal· • The stream composition, in terms ofculating the PEl rate of each individ· the mass fraction, "'ii. of each non·ua! input stream, i <i{tni), and then product chemical component (poUu·adding the individual values to getiin•. tant and undesired byproduct),jFor the output streams, this is done by' • The overall environmental impact.calculating the PEl rate of each indio • 'Vj. ofchemical componentjvidual input stream, i (i{ou,I), and The overall environmental impact,then adding them to get lou,. For each 'IIj, is calculated by summing the spestream, i, the PEl rates of the individ· cific impacts, 'II'j>. of chemical compo,ual input and output streams are cal- nent j over the various impact cate-
GOING TO 'WAR' FOR A 'GREENER' ACRYliC-ACID PROCESS
Environmental Manager

•
AnaIysis ofMENsThe first step in designing an ME:that will simulate a process is to dEfine the problem to be solved - how t
increase production rates, reduce polution emission, reduce utility coesumption (such as cooling water) a.L.
so on - and to list any associated corstraints. such as product specific'tions, pollutant concentrations cflowrates, and so on. The nen step:to define the target components those chemica[,. that need to be identtied to address the problem statemer.and constraints. For example. watEwould be a target component in a sy'tem where you are trjing to reduccooling-water consumption; hydrogewould be a target component in a d.hydrogenation process where the go'is to trim gas emissions. The graphic'tools used in the MEN analysis foCtiaround these components.
The source-sirtk diagraM (Figur3) plots the composition of the ta!get species (shown as mass fra'tionJ against flowrate to identify (f_
cycle oppo['tunities. The red circlerepl'"~sent all sources or strp.:al!land describe the relattonshlp b" 1~.", ... ",,, n ........... ro:> ..... ..; rho:> r ............."irlf:2 .
l\rIENs also use stream-m.anagement techniques. such a:ii recycling ~
a sink, stream miring to acbieve a dEsired flowrate or composition. ar:stream segregation to avoid mi"ting cstreams that would reqci..re fi.mhetreat:nent downstream. Temperarur,pressure and flowrate can also be atjusted to enhance perfor:nance.
FIGURE 4.. As this species·path diagram shows. streams(such as Streams 3 and .I) with a high target-species ccmposi~
ticn. a high f1owrate, or both. are generally the most economlcal candidates for a mass~xchange operation. Stream 2 is al~
ready undergoing such an operation (stripping)
•Wutl,tr..m
.... :.:~,~
••. -. .': . Slplntor'
Components ofMENsIn a mass-e::tchange netw"ork. thewaste streams are referred to assources and unit operations, includingreactors. distillation columns andtreatment units, are referred to assinks. In a given process, various output streams. and any waste· or massseparating agents, can be either emitted. recycled back to a unit operation(sink), recycled to a processingstream, or sent for post-treatment.
The mass-transfer and separationportions ofaMEN typically relyon mass-exchange equipment - including absorbers, strippers. liquid-liquid extraction units, adsorbers, ion exchangersand leaching systems - which separateand concentrate the waste streams.Mass-separating agents (MSAl - includingsolvents used in liquid-liquid extraction or gas absorption, granulatedactivated carbon. ion-~:<change resins,and gases LLSed in 3tripping operation3- are often added to ~nhilnce the recov~rv ()f the useful comonn~nr:1
tegration simulation methodology, reduces the anlOlmt of waste generatedin a process by concentrating the nonuseful byproducts into waste streams,and capturing and recycling productsand useful byproducts back to appropriate downstream unit operations. AMEN allows a designer to simulateany process design to determine whatunit operations, if any, are needed.The analysis or optimization of a series of MENs can be performed numerically or graphically; the graphicaltechnique is demonstrated below.
•
BOllndaries rtpl"enntGPtraUn; "n:strtlnts
Stream Z•
Stream notusodattd
IIIIIIR......11
Rash
•S1ream 1
• •R.aaar
-.._-.-...~ ..-.'-.
FIGURE 3. In a source-sink diagram, the mass fraction at thetarget species is plotted against f1owrate. As shown, Stream Acan be recycled directly back to the nash unit
Environmental Manager
Process IntegrationThe PI methodology considers the in·tricate relationships among flow,treams. unit operations, operatingparameters, and performance requirements, and then uses these relationships during process design to determine the ideal order of the unitoperations and mass and energystreaffi.3; to calculate mass and energybalances for proper equipment sizing;and to optimize an existing process,increasing product flow, or reduce energy use and waste generation.
The Mass-Exchanl(e Network(ME0n. at the heart 'Jf the Proces3 (n-
The current version of the WAR Algorithm considers eight health- andenvironmental-impact categories. k:ozone-depletion potential; globalwanning potential; acid-rain paten·tia1; photochemical-oxidation or smogformation potential; human-toncitypotential by ingestion; human-toxicitypotential by inhalation or dermal exposure; aquatic-toxicity potential; terrestrial-toxicity potential. The weighting factor, rJ.k' allows us to assignrelative importance to each of theeight categories. A default value of 5for rJ.k can be assumed, but it can beadjusted between 0 and 10 to betterrepresent the process and locale.
nValues for ''''p. can be obtained froma database developed by the authors,or from the database within theChemCAD N chemical-process simu-
I, lator. The Box on p. 118 shows howthe WAR Algonthm unproved an..
I.... acrylic-acid process.

We Made A Long Story -
Another graphical tool, the path. cagram (Figure 4), shows the flow ofspecific component (i.e.• a process ractant) through a process. Such a digram is used to dete~.inewhere alaexchange could be used co C:lpt""rre t}
target species and remove ±em frothe system.
FlGURE 5. In !hIs maUillncll dleS"'r1/11' curves on the left show tile ability ctwo different masa-se~rallng 09en13(MSA) In s given mass~changounltttremove Pollutant X Irom s given wastestream or streams.. The composite C\lrv
on the right shows the range of feasibilfor removing Pollutant X tram a Comblrtlon of streams. The pinch point (Wherethe two curves are closest) shows thebest point at which to apply the MS,I. 01tlons for removIng Pollutant X. tram aneconomic and thermodynamic standpo
used to identify streams that can becombined and then recycled. For instance, in Figure 3. combiningStreams 1 and 2 will increase theflowrate to an appropriate level, andadjust the composition to an acceptable level. allowillg the combinedstream to be recycled back to the flashunit sink shown within the bOL
Similarly, if a source lies to theright of a sink but is still within itsflowrate constraints. the stream canbe recycled back to that sink - butonly after the target-species composition has been reduced to meet theuiut's constraints. The compositioncan be altered by using a stripper, absorber. or other mass.exchange unit.
The distance that a source lies tothe right of a sink also provides information as to which units can be usedto accomplish the desired deg!"ee ofseparation..-\. source that lies above asink must reduce its flowrate before itcan be reC'fcied to that sink.
Environmental Manager
of the target species in that stream.The current operating condition of
each sink (unit operation) is shown bya blue circle. The values plotted inFigure 3 represent the flowratethrough the sink versus the composition of the target species inside thatsink. For sinb that have variable con::·centrations, an average composition isshown. A source-sink diagram can bedrawn for each target species.
Each sink has physical constraintsthat limit the compositions andflowrates within which it can operate.These are shown as box·like boundaries in Figure 3. These constraints Ilimit the feasible operating conditions .that may be considered during simulation in a "'greener" design alternative. Any source that lies within thisbox can be recycled back to any sinkwithin the box. While Figure 3 onlyhighlights one sink, such a graphicalanalysis should be done for each sink.
A source·sink diagram can also be
IlISA .. m.sa-....~ -tt-=============~====::--------l::
~
;.J PlAta• paInt
.! - ....,..'1i: "Mild...• ......XI..:\I . ~ '1fR&ceatIAf.~,~ , 1..1. .,....... _
'':'>:0 ~:-.r~·_llIdl..· "-'-1!:-"::::"~~~.:..:;.. w· o
: 5Wi~:..

Figure 4 shows a section of a hypohetical process design, and onlyhows the streams that contain thearget species. The arrows representhe flow. More than one arrow arisingrom a single souree represents theeparation of the stream into multiple,treams, and implies that the target;pecies is in each. Multiple arrowsnto a single souree means severallows are feeding a ali"er or reactor.
In general, streams with higher tar;et+species compositions or higher
flowrates - such as Streams 3 and 4in Figure 4 - are the most-<:ost-effective candidates for mass exchange orstream-management techniques.
When the goal is to reduce the concentration ofa target species (Le., Pollutant X) from a souree (waste) streamor streanu -ilSing a mass-e."changesystem, a mass-pinch di4gram (Figure 5) can be used to evaluate the options. While construction of such a diagram is beyond the scope of thisarticle, a discussion of Figure 5 may
be illustrative. In that figure. thecurves on the lett show the feasibilityranges for two different MSAs (interms of the amount of Pollutant Xeach can remove). The curve on theright shows the feasible range overwhich Pollutant Xcan be reduced in agiven combination of souree streams.The pinch point, where the two curvesare closest, is the most cost-effective,thermodynamically desirable point atwhich to apply mass exchange. •
Edited by Suzanne Shelley
Douglas M. Young is 9.
cheClica.l engin~r at me U.S.Environmental Protec:icaA.gency. He works at the )lational Risk ~anagerneQt Rtsearc.h Labontory' in the SustaiDable Technology DivisicQlEP.\.. 26 w. Martie LutherKing Dr.. Cincinnati. OE45268: Phone: 5130$69-762';':·F3-"(; 513-569-ill1; E-cail:YOlL'[email protected].
gov>. He holds a Ph.D. from :be Univem~ ofArizona. an M.S. frot::l the University oi )(ot:'eDame. and a B.S. from the Universi:,! of ~c..~.gan, all three in chemical engineering.
".AuthorsHenDertoC~ua~emical eo.gin~r at the U.S. Environmental Protection Agency,where he leads the Simulationand Design Team at the :'fationaJ Risk ~~ment Research Laboratory in the Swbinable Tedmology Division{EPA. 26 W. ).(actin LutherKing Dr.. Cinc.ncaD.. OH~268; Phone: 513-569·7350;Fax: 513-.569-7111: E-mail:
[email protected]. He holds aPh.D. from the University of F1orida. an :M.S. fromthe University of Florida. and a B.S. from the :-f.J.Inst. ofTec.1mology, all in chemical engio.eering.
Referencesl. El·Halwagi. MX. and Manousiouthakis. v..
Synthesu of m.a.sa exchange oetworb.AiChE JolJJ"1t41" VoL 35. pp. l.233-1244. 1989.
Z. El-Halwagi. M.){.. -Pollution PreventionThrough ?ro<:ess IntegratiOQ.~ AcademicPress. San Diego, Calif.• 1997.
3. Cabezas, H.. Sare. J.e., and ~allick. S.K.. Pollurioo. prevention with chemical ?rocess simulators: The generalized Waste Reduction{WARl Algorithm,· Compo Cke. Eng., Vol. 21.pp. 5305-5310. 1997.
4. Turtoc.. R., et ai.• "Analysis, Synthesis, andDesign of Chemical Processes," PrenticeHall. Upper Saddle River, N.J.• 1998.
r----- Short
roducing the remarkable stainless steellp Valve Station. It integrates a steam trap1valves in one simple unit to reduce costsener!!y installation and maintenance. Samec'
iable inverted bucket...with a few new twists.
:it our web site at www.armstrong-intl.comdownload the TVS catalog or to learn more?ut [he complete Armstrong product line.
1\Armstrong-
Armstrong International. Inc.Three Rivers. :vtichig30 ~9(9). USA1616, "73·l4l5 F»<: (6l61 "78-6555
Lu=;;e. Beh;ium (()4) ~4()9090 Fu: {04J !4IHJMwww.arTlhlrnng-lnllxom '3/

-
-r ...... ~~- <..~~
Computers 81: Chemical Eogtneertng, in oress. ---?'<: _
Pollution Prevention ,vith Chemical Process~Simulators: The Generalized vVaste
Reduction (\'VAR) Algorithm-Full Version
Heriberto Cabezas·, Jane C. Bare, and Subir K. Mallickt
U,S. Environmental Protection Agency, National Risk Management Research LaboratorySustainable Teclnl0logy Division, Systems Analysis Branch
25 West Martin Luther King Drive, Cincinnati, Ohio 45258, USA
Abstract· A genenl theory for the flow and the generation of potential environmental impact through a chemicalprocess has been developed. The theory defines si.x potential environmental impact inde,xes that characterize thegeneration ofpotential impact within a process, and the output ofpotential impact from a process. The indexes are used
. to quantify pollution reduction and to develop pollution reducing changes to process flow sheets using processsimulators, The potential environmental impacts are calculated from stream mass flow rates, stream composition, anda relative potential environmental impact score lbr each chemical present. The chemical impact scores include acomprehensive set of nine effects ranging from ozone depletion potential to human toxicity and ecotoxicity. Tneresulting Waste Reduction methodology or WAR Algorithm is illustrated with two case studies using the chemicalprocess simulator Chemcad ill (Use does not imply USEPA .<:dorsemeo.t or approval of Chemcad ill).
INTRODUCTIONTo.ere is currently a great deal of interest in thedevelopment ofmethods that can be used to prevent or atleast minjmize the generation of pollution; and there arenumerous efforts underway in this area (Lederman andWeber, 1991; EI-Halwagi, etal. 1992; Fonyo, etal., 1994;Rossiter, 1995; Manousiouthakis and Allen, 1995;Mallick et aI., 1996), This interest stems from the beliefthat pollution prevention is likely to lead to the creation oftechnOlogies that have a much more benign impact onhuman health and the environment. Because thistec:mology is inhe:ently less polluting, it is likely to bemore robust and economical than simply adding pollutioncontrol devices to conventional designs, In chemicalmanufacturing, these pollution prevention methods takethe form ofan effort to design process plants that generateas little pollution as possible. Since chemical processsimulators are widely used in the design and operation ofchemical manufacturing plants, the development of apollution prevention methodology for chemical processsimulators is likely to have a significant impact on thepollution generated by the chemical industry. At theNationalRiskManagementResearchLaboratory,researchefforts are underway to develop a methodology forcommercial chemical process simulators. The researcheffort is called the WAste B,eduction or WAR Algorithmafter Hilaly and Sikdar(1994) who performed some oftheearly work in this area.This paper presents a generalization of the WAR
*' Corresponding author; Fax; 513-569- 7111; E-mail:[email protected]
t Post Doctonl Research FeUow, Oak Ridge fnstitute forScience and Education; Present Acdress: SimulationC' .... ; ............. f ... r ,t:;{\1 t::::nllth V~I ... n(';:1 A'/PrlIIP Ar~.1
Algorithm, discusses the methodology for evaltia6gpotential environmental impac~, and illustrates the 'JSe cEthe method in the design or ,,"edification of che:::J.icalprocesses with two case studies,
ENVIRONMENtAL IMPACT THEORYPoteo.tial eo.vironmental impact is the unrealized effect orimpact that the emission ofmass and e:>ergy would haveon the ""vironment on average. It is, therefore, esserrtiallya probability function for the realization of a poteo.tialeffect. Thus, the potential environment!! impacts ofchemicalmanufacturingprocesses aregenerallycausedbythe energy and material that the proc::ss ta.!<es from cremits to the environmeo.t. Potential environmental iI::pactis aconceptual quantity that can not be directly measured,i.e., there are no potential environmental impact meters.However, one can calculate potential environmentalimpactfrom related measurablequantitiesusing functionalrelations between the two, This situation is ·co=on inscience and engine";.ng. For example, the energy of afluid cannot be directly measured, butitcanbe calculatedfrom temperature and pressure by the use of heatcapacities and equations ofstate, Exactly how to performa calculation for potential environmental impacts will bediscussed later in this paper.
Conservation EquationTraditioo.ally, chemical process design has been based onthe creative application ofmass and energy balances alongwith thermodynamics, chemical reactionengineering, andengineering economics, Our methodology proposes toadd a conservation relation over potential envircr.meatalimpact to the aforementioned two balance equations. Tnecooserntion equation for impacts is based on anaccour.ting of the flow ofpotential environc::ental impactin ~nrl nllr of rr.~ nrncesses. Tais tlowofimcact is rdated

(4)
Impact IndexesFor steJdy scate precesses one can use Equation (2) todefine two categories of indexes for the environmentalimpact ofchemical manufacturing. The first category ofindexes measures the generation of potentialenvironmental impact within precesses, and the secondone measures the potential environmental impact emittedby precesses. There arc various indexes that can bedefined within each category. However, only the sL-<:indexes, three from each category, that seem most usefulfor waste reduction will be treated here.Following Hilaly and Sikdar (1994), all non-products areconsidered to be pollutants and the potentialenvironmental impact of all produces is set to zero, i.e.,1Jr,.Q for all products j. These assumptions are consiste.'ltWIth the objective of this paper which is to p=ent 3.
methodology for waste reduction, i.e., the primary conce..-=.is reducing the impact and the amount of the nonproducts. The broader implications of Equation (I),including other impact indexes for which ¥j-O fcrproducts j and further conjectures on the implications forsustainabiliey, will the subject of future publications.Tne fust mdex of the first category of indexes ('~pac:
generation) is obtained by solving Equation (2) for i",and adding the superscript NP for ~on-.!:roduc'5 ,0 give.
/'iote tbt Equation (3) lS :l first crder Jpproximation ~'ut
does not loclude the synergistic effects that can occ::owhen multiple chemicJ1s Jre present.
(7.)
(1)
:
a • i", - io'" .. if<"
which implies that no potential environmental impactaccumulates in the system. Also note that Equations (1)and (2) serve as definitions of the function if!'"The significance ofpotential environmental unpacts canbe better understood by considering the foU.owingdefinitions. Ifone were to dump into the environment allof the mass and energy flows entering a process, theresulting impact on the environment would equal to I",; ifone were to also dump into the environment all of themass and energy flows exiting a process the resultinglmcact on the environment would be eoual to I .
.- "\ Olll
However, due to chemical transformations and changes instate conditions (temperature and pressure), I;. is neverexactly equal to Iou" and consequently I... is neverexactly equal to zero for steady state processes.
where I is the eotential environment:J.I impact ccntentinside a'P;ocess, I", is the ~putrate of impact, i.... is theoutput rate of impact, and Ip. is the rate at which impactis generated in the system by chemical =ctions or othermeans. Note that processes can also consume potentialenvironmental impactso that i can, in fact, be negative.For steady state precesses, ~ conservation equationreduces to,
to the :JlJSS and energy flows but it lS not equiv:J.!ee.t tothem. The impact conservaticn equation is
dI"", • i - i .. iT itt Qut t""
(5)
Chemical ProcessesApplication of either Equation (1) or (2) to chemicalmanufacturing processes requires an expression thatrelates the conceptual potential environmental impact tomeasurable quantities. Potential environmental impactsare caused by energy and material inputs and outputs to orfrom the environment. But, as a first approach, thistreatment is restricted to potential impacts due to materialflows while neglecting any impacts due to energy. Effectsdue to energy flows can be incorporated into the analysisby extending the boundary Over which the impact balanceis done to include the energy generation process. Effectsdue to resource depletion are also negiected mainlybecause there is no effective methodology for measuringthem. This is consistentwith the focus ofchis work whichis the chemicalprocess plant rather than agloballife-cycletype of analysis. The expression relating potentialchemical environmental impacts to measurables is
where i NP and jHP are the potential envirocmel1t2lout 111
impacts due to non-products, i.e., pollutants in the outputSand inputs, respectively. Equation (3) is used to give
li . . ~ ['NP • [·NP. allexp Cit expressIons ,or '''' ana '" wnereComponents, products and non-preduces, are included inthe summation, but where tjrj'O for all products j whicaeffectively, removes allproducts from the summatiOll. Tneindex, j P t measures the total rate at which the processgeaerat;;' potential environmental impact due to 0.00.
products (HP). i;': has units ofpotential enviromnec.t2limpact generated per time.The secondindex, r: ,ofthe first category is obtainedbydividing Equation (4) by the rate at which the processgenerates products to give a specific impact generation,
-liP °NP -/II'-NP. I.".., Iavl - liltI&~,. = -"'--"'-
'E,Pp 'E,PpP p
(3)if = 'E,i/'l • 'E,M/~'E,:VjrJ .....J J •
where the sum over j is taken over the streams of input ior output i, the sum over kis taken over all chemicals Ie, ifis the rate of potential environmental impact either in(i=in) or out of the process (i=out), ii'l is the rate ofpotential environmental impact for strearnjwhich may bean input or an ourput. ~(~ is the mass flow rate ofstre:u;nj wtuch may agaul be eLther an mput or an ourput, "" LS
the =s frJc:ion ofchemical k in streJm j, and "', is the
where thesum overpis takenoverall the nroductsp, and PCHi' P
is the mass floweate of product p. I... measures thepotential impact created by all non-products inmanufacturing a unit mass of all the products p. Thelodex, rp
, has units of potential environmental impactpo
per mass of products.The third mdex of the first category, M'::, is obtainedfrom Equation (5) by setting the potentia! envirccme:ltalimpact (tjt ) of all produces to zero and that of all <lcnproducts t6 one. Tnis has the effect ofassigning :he s=.potential environmental impJct to all non-prccuc~. T::e

(i)
(8)
prcc::S:i, i.t!.t it gives the ratio .of mJ,Ss converted to .lI1
undesinble form to IDJSS converted to :l desinble fOrnl.The e."(pression for ,U;: is
"M'(,"')" HP _ " M(l.)" HPL., J L., r'l L., J L., r'l
,oJ'v, = I • j • (6)<'" '[Pp
p
where the summation over ~('..) ~ ~en only overoutput str=, the summation over ~(~) is taken only
. dth· HP· takover mput streams, an e summation over r'j IS enonlX over all non-products Ie in stream j. The units ofM 'P are mass of non-products per mass ofproducts.'I'he'first index ofthe second category of indeXes (impactemission) I:: is simply the total rate of potentialenvironmental impact output due to non-products. I:: iscalculated from Equation j3) subject to 1jr.=0 for allproducts j; The index, i::;' , is a measure of the rate atwhich the process emits potential environmental impact,and it has units of potential environmental impact perrime. ~
The secondindex ofthe second category, t::, is obtainedby dividing the rate of potential environmental impactoutput due to non-products by the output rate ofproductsto give,
t'YP = i HP/" PClut Or.Lt £...J P
P
Tne index, t;:, has units of potential environme:ltalimpact per mass of products. TIlls expression gives thepollution index <t> of Mallick et al. (1996) whicn.measures the potential environmental impact emitted inmanufacroring a unit mass of products.Tne third index ofthe second category, M::, is obtainedfrom Equation (7) by setting the potential environmentalimpact (1jr.) of all products to zero and that of all nonproducts t~ one. Tne resulting expression is,
" M'(,",)~ _H'L..J 1 L, "'kj
MHP= j •,,"
which is related to the pollution index 4J. ofHilaly andSikdar (1994) by,
(9)
where the summation is taken over all products n. M::measures the amount of non-product or pollutant masselllitted in manufacroring a unit mass ofproducts, and ithas units ofnon-product mass per mass ofproducts. It isalso a mass inefficiency measure.
Significance ofImpact Inderes'NfI "HP "'HP
Tne first category of indexes, e.g., f••• , I••• , and M••• 'characterize some aspects of the generation of potentialenvironmental impact within a manufacroring process.Taey are most useful in addressing questions related to theintemal environmeatal efficiency of:he process plant, i.e.,the ability of the plant to produce desired products while
. r • ,
new pot~:.ti:ll environmentJl impJ.c~ is c:-e:ltcd. :-esourc:::ssuch JS po(entially costly remedi:ltiondforts willlikdy cerequired to prevent the potential impact from beiI)J!~ed. Obviously, the smaller the values of j''', r ,
d ,r'VP th . _It ffi' th .... <'"an "" e ,=ore enVtronmen,.....y e clent e process,and, aiFothers fuctors such as economics heing equal, thea:ore des~le. i; would he us,:ful in COPJlarin&different designs on an absolute basIS, while I ~ andM;':would he useful in comparing different ~ignsinaependently ofmanufacturing plant size.
• fi1' "HPThe second category of indexes, e.g., I • I ,and.. N1' ow owM_ characterize. some aspects of the emission ofpotential environmental impact from a manufacturingprocess. Their principal use is in addressing questionsrelated to the external environmental efficiency of theprocess plant, Le., the ahility of the plant to producedesired products while inflicting On the environmC:lt aminimum ofundesired potential environmental imoact. Itis again obvious that the smaller the values of j'V?, rp
,.. NP ClUf ora
and M,,,, the more environment:illy efficient the process,and all other factors such as economics being equal, themore desirable it is. Since i~: is a total rate of imoact
0- •
output, it could be useful in deciding whether a giveplant is compatible with a particular site. For eX3r:J."Ie, :twould be unwise to locate a plant with a hig."- j''''in anecologically sensitive area. i;'; could also b;~ed illmatching the size of a plant to the capaclty of ~'1e
surroundin!! environment to dissipate enviroomecral. I' ,'l? d'r,v, ful . .LClpact. ow an t¥.Loul are more use t !D. compa!"'..cg ±epotential environmental impact of alternative processesinde;>endently ofplant size.
CHEMICAL ENVIRONlvlENTAL IMPACTApplication ofthe methOdology so far developed requiresthat the potential e:lvironmental impacts ofchelll.icals beestimated. Further, it is required that a relative impac!number 1jr/ be given for each chemical j over a wicerange ofdifferent chemical environmental impacts. Taisis, unf'ortur.ately. not a trivial matter because chemica!impacts are measured on different relative scales that C<!:l
not be simply added without some form ofaor=,lizarion.
Chemical Impact ErpressionTo apply the WAR methodology to chemical processes,the following expression for 0/1 has been developed(Mallick et al., 1996),
(10)
where the sum is taken over categories of potentialchemical environmental impacts, e.g., ozone depletionpotential, human health, etc. listed below underClassification ofImpacts. ttl is arelativeweigltting factorfor impact oftype Iindependent ofchemical j, and 1!f;'1 isthe specific potential environmental impact of chemicalj for an impact of type l. tt, has units of potentialenvironmental impact per mass.The relative weighting factor tt, allows Equation (to) :0
be customized to specific or local conditions. Tc.esuggested procedure is to initially set all the a-is to samevalue of say one, and to allow users to V3rJ In<ii'Jicuai

Table 1: Normalized Chemical Imoact Scores
Pl~J:ie c.ote rhJ.t fer ~ relJ.rive comparison, the Jbsolutevalue is not critical. For ex:unple, photochemicalo:cidation poteatial would be weighted mare heavily thanother impacts in :m area that suffers from smog. There is:m effort underway in our research group to develop maresophisticated methods ofdetermining values for the ",os.The values for the W;'I were obtained from the relativerankings or scores for chemicals by normalizingaccording to,
Classification ofImpactsThe classification ofchemical environI:lentai impacts andthe values for the (Score), .were adopted from the studyof Heijungs et al. (1992)..J and normalized according toEquaiicn(ll)tocbtlintbe 1JT;'/s. IntbecclCJ1alicn of «(Score),).and 0., the chemical scores for dioxin, chromium VI, andvinyl ~hloride were excluded. The reason is that the scorenumbers for these three chemicals were several orders ofmagnitude higher that those for all other chemicals, andincluding them in the normalization process would havemade the normalization meaningless. Tnerefore, thenormalized Ijr' , for these three chemicals would appear asoutliers whicf they, in fact, are.
_ 17a:u.S3d
~@
Figure 1. Base process flaw diagram for the productionof methyl ethyl ketone from secondary butyl alcohol.
Base FlowsheetFigure 1 shows the base process flow diagrun for tl;eproduction ofMEK from SBA. SBA is fed to a hye:oge:J.sc:ubber where the feed SBA sc:ubs residual MEK fro:!!the hye:ogen stream. The SBA feed is ;he:J. pUI:lped ~p ,0
reaction pressure ar.d heated to reaction temper.m::e ",~o.
a heat exchanger and a heater. Tne heated SBA is fed .0
the reactor where the chemical tl"'..nsiormation OCC'.l!'S.T~e
CA.SE STUDY nl: MEK PRODUCTIONTo illustrate the use of the gener;ilized WAR Algoril!u:l,a case study from the production of methyl ethyl ketone(ME...T() from secondary butyl alcohol (SBA) is presented.The case study was adopted from the Chemcad ill(Chemstations, Inc.) chemical process simulator, and allthe material and energy balances were performed usingChemcad III. However, any commercial processsimulator could have beenused. This case study presentsa typical chemical engineering process for the productionof a commodity chemical that involves several unitprocesses such as reactors, separators, mixers, divido.-s,and heate:<changers. It is, therefore, sufficiently comple:<to illustrate the WA..'t Algorithm but still treatable withi.,the space of this paper. Essentially, the chemical processconsists ofa SBA dehydrogenation reactor followed by aMEK purification train and associated equipment.
is m.ol~ca1Jr cir:rog~n. A.r ~s J.tgcc., CH4 is met..~mc. J...i...i
NH3 is =oni:l. These acronyms will be usedthroughout the rest of the paper.
(11)
NH3
0.93
H2O
o
CH4
7.4E-3
SBA
4.1E-4
oAt'
0.42
MEK
N2
o
H2
o
(Score),.1Wi~ =..,....."':"---..,.:..::L_
«(Score),), + 201
where (Score)IJ is the relative scare of c1iemical i ansome arbitrary scale within impact category j,((Score)r).is the arithmetic average of the scores of allcliemicalSJ i within impact category j, and 0, is thestaodard deviation of all the chemical scares in impactcategory j. The normalizing factor ((Score),) + 201assures that about 75% of the normalized chemic.a scorenumbers 1JT'1 will be between 0 and I irrespective.of thestatistical distribution of the initial scores as expectedfrom Chebyshev's theorem(Lapin, 1975). Ifthe chemicalscores happen to fallow a normal distribution, then thenormalization range extends to approximately 95% ofthescores.
There are nine different impact categories. These can be Table 2: MEK Production Flow Summary (k!¥br)subdivided into four environmental physical potential Input & Outout: Base Processeffects (acidification, greenhouse enhancement, ozone
Stream #1 #2 n12 # 13 # 14depletion, and photochemical oxidant formation), three
(State) (L) (G) (L) (L) (G)human toxicity effects (air, water, and soil), and twaecotoxicity effects (aquatic and terrestrial). SBA 3362 19 3 2670 1The normalized chemical scores used in the two casestudies presented in the next sections are given in Table MEK 0 0 567 13 . 111 above where H2 is hydroge:!, MEK is methyl ethyl
0 0 8ketone, SBA is secondarj burjlalcohol, H2O is water, N2 H2O 8 0

re:lc~cr output stre:lW. is seat to J. hC::lt exc~Jllger where it,s ~artiJ1ly eOlldeased. The mixture of o.[EK, hydrogen,and uncollverted SBA is cooled further 3.lld sent to ase~Jr:ltorwhere the nydrogen is flashed off. The nydrogenis then SCl1lbbed and the liquid ~nase fed to a rvlEK~urification system. The mass flow rates and the state ofthe various input and output streams as calculated byChemcad ill are listed in Table 2 above.
Modified FlowsheetElCJIllinatioll of the base process indicates that wastestream 13 contains large amounts ofunreacted SBA andsmall amounts of~K. It is, therefore, logical to try torecover the SBA and MEr< as the first step··in a wastereduction strategy. Consequently, the process flowdiagram was modified by the addition of a recycle from
T'.le proc~ss ClQdi5cJtion inc:-~:lScd the 3Cou.......~~\,)f prcdt:.~~by approximately 73% wrule reducing the =o""t ofwaste SBA in stream 1g by about 20%.It is important to Ilote that ane.'(:un.ination ofTables 2, 3,and 4 will incti::ate that waste was gellerally reduced, mdthat envirollment:ll impact was probably also reduced.However, the information so fur consid=d is notsufficient to allowa qualltitative comparison ofthe overallwaste aIldenvirollment:li impactreductionassociatedwitheach of the three cases studied h=. For this comparisonaile must calculate the impact indexes already described.For the modified process with 100% recycle, the massflow rates aIld the state of the various input and outputstreams are listed inTable 4 below. Note that increasingthe recycle increased the amount of product by 269%while simultaneously reducing the amount ofwaste SBAin stre3lIl 13 to zero.
(J)~" ... Fu'. SlM (])
HlSUtlb'r:r Miul"
I~
Frul> (,al3
l 8(,ltr
Table 4:~K Production Flow Summary (kglhr)Input & Outout: Modified Process (100% Recycle)
Stream II I #2 #12 # 14(State) (L) (G) (L) (G)
SBA 3362 1117 II 1
MEK a 11 2094 59
H2O 8 3 a 5
H2 0 60 a a
Table 3:~K Production Flow Summary (kglbr)Input & Output: Modified Process (50% Recycle)
Stream III #2 # 12 1114 1118(State) (L) (G) (L) (G) (L)
Figure 2. Modified process flow diagram for theproduction ofmethyl ethyl ketone from secondarY butylalcono!.
stream 13 to the feed, stream 1. Two cases were studiedwith this modification, recycling 50% and 100% ofstream13. Recycling 100% ofstream 13, i.e., closing offstream18, is appropriate for this illustration. But, it is clearly notpractical because stream 18 is the only liquid waste streamin the modified process aIld the only means ofpurging thesystemofliquidimpurities. Without this purge, impuritieswould build up inside the process causing iUo eventuallycease to function. Figure 2 above shows the flowdiagram for the modified process. The mass flow rates andthe state of the various input aIld output streams for themodified process with 50% recycle are listed in Table 3
Impact Inde::: Calc-.dationsSix differe"t impact indexes were calculated for the basecase and the two modified processes each. Tne indexeswere obtained using Equations (3) to (8), the flow ratesfrom Tables 2, 3, and 4, Equation (10), and thenor:nalized chemical impact scores of Table 1. Tilerelative weighting factors, al' were all set to cne for lb.esecalculations.The first categorY indexes, i.e., the impact gene.-atlon_ -HP ""JlP "" HP _ ...mdexes, I If' I J and M If' are shown on Figure J
below. It si;oullbe noted~M;:' is anegative numbe:since some of the input mass IS always converted toproduct, aIld the products are not included in thesummation ofthe outputs. The specific indexes, j"P and""~ ~
M • were multiplied by a factor of 100 so that theyf"" -NP
could be shown on the same scale as the rate indexIZ'" •
The second category indexes, i.e., the impact output"NP ""Nfl" .. HI
indexes I... , I. ,and M... ' are shown in Figure 4. Tilespecific index I '!IP was multiplied by afactor of I000, andthe specific ind~ M~:was multipliedby a factor oflO so
Q- -~
that they could both be shown on the same scale as I"", .The largest source ofuncertainty in the calculation of theimpact indexes is the environmental impactscores. Thesemeasurements are probably accurate to no more than onesignificant figure or an order of magnitude. It is.therefore, prudent to assume that impact indexc:llculations are also accurate to no more thac or.esignificant figure. Two significant figures are used ,,,
Figures 3 aIld 4 in oreer to help the reade:> to reproduceo
2124
10
o
I
6
o
64
a
5
980
o29
2
168
o
8
o
MEK
H2O
H2
SBA 3362

o Base Case g:jj 50% Recycle
tSl 100% Recycle
Figure 3. Impact generation indexes for the productionofmethyl ethyl ketone from secondary butyl alcohol:j'VP in impact units per hour, j'VP in imoact units perf!1I ... vplU' ~
kilogram ofproduct, and -M' in kilograms of ".pollutants per kilogram ofpr~uct
impact output from non-prodl:cts ;:or kilogram of"raJuctdecreases by .S% for 50% recyc!c and by 73% for 100%recycle, and (3) the output of kilograms of non-praduceper kilogram of product decreases by 60% for 50%recycle;u,d by 33% for 100% recycle. rt is worth notingthat the output ofimpact and waste decreasedas measuredby all the inde:'Ces. The most signifiC3llt index in this caseis the impact output per kilogram of product. Thedeaease in this index is consistent with the decrease inthe impact generationpermass ofproductindexdiscussedin the paragraph above. This deaease is also a reflectionof the inCreased productivity ofthe plant.The decreases in the indexes are sufliciently large suchthat theyrepresent significantreductions inpollution. Theconsistent decrease in the impact generation per mass ofproduct (48% to 77%) and the impact output per mass ofproduct (48% to 78%), simply means that the modifiedplant can meet the needs ofa much larger market withoutincreasing its generation or its output of poee::.tialenvironmental impact It also means that a modified plantthat is. 48% to 77% smaller than the base case can meetthe needs of the same market that the base plant~designed for.
Imptkg xE2 -i<SJI<gx~Impt1lr
ti 20a.§
/ "
.J/..
/100
100~Q ,~
~ 80.s;c: 60
/~I!
,Q
40c::0~
o Base Case ~ 50% Recycle
CSl 100% Recycle
Figure 4. Impact output indexes for the production ?tpmethyl ethyl ketone from secondary butyl alcohol: Iin impact units ofpollutants per hour, r: in impact"'
(J .. NPunits ofpollutants per kilogram ofproducts, and M.",in kilograms of pollutants per kilogram ofproducts.
DISCUSSION OF CASE STUDY #1The impact generation indexes ofFigure 3 show that: (l)the rate of impact generation by non-products decreasesby 13% for 50% recycle and by 20% for 100% recycle,(2) the impact generated by non-products per kilogram ofproduct decreases by 48% for 50% recojcle and by 77%for 100% recycle, and (3) the kilograms of non-productsgenerated perkilogramofproduct remains nearly constantat -lOO. The most significant index in this case is theimpact generated per kilogram of product. The decreaseof this index reflects the increase in the productivi!'j 0 f theplant, i.e., the increase in product flow rate.The empact output indexes of Figure 4 show that: (I) the~ .. ~ ... ";;""n"l"'~ n,I"""IIt" tTf'lrT1 n,",n_nrnrillrf": r.~,.,..p~<::~~hv 1,% 37
• Sl,ltCC1=t
+-=---_----11
Preluct &r,w
- Dmi" tH~ yO'
__ Ifau _ co:!::
D~J• 'l'"--
p'''''' C.oIutC,mp''''''FWA_
~"' ..'" D~i' ;'w u H," Xu
CDFai
C,.
CASE STUDYi:2: AJ.'vlMONL'\ PRODUCTIONTo fur'.her illustrate the use of the generalized WA...~
Algorithm, a second case study from :he prodcc~on ofammonia from synthesis gas is presented. The case srudywas also adopted from the Cllemcad III (Cb.-.,.staricns,IllC.) chemical process simulator, and all the material andenergy balances were performed using Ch=caa Ill.However, any commercial process simulatcr could agaL"lhave been used. Just as Case Study Ill, this case srudyalso presents a typical chemical engineering process thatinvolves several unit processes such. as reactors,separators, mixers, dividers, and heat exchangers. It isalso sufficiently complex to illustrate the WAR algorithmbut still treatable within the space of this paper.
w,@
Base FlowsheetFigure 5 shows the base process flow diagram for reeprocess. Essentially, the overall process is based. on thereaction ofnitrogen and hydrogen to produce ammonia.Tae mixture ofhydrogen and nitrogen is compressed and
Fia1Jrl"''::; R:l.<::p' .,rnr.~<:-; flow dia2!"'3l:1 for r.r..e ~rocuc~icc
Implkg xE3 kglkg xEIImpt1lr

Table 5: Ammonia Production Flow Summary (1cWhr)Input &. Outout: Base Process (Purge Ratio =0.1)
Stream II 1 1111 II 19'·(State) (a) (a) (L)
•I.,iM::"
Di'liiu tM"""
tSf4 .~Ulc:~r.+__---11
Caolu
Jruu
Caala C~wtprar(JfCDFwi
prescnt :n :he ,:roduc: st:CJIn. This chmged trem "bu,,:2% impurities \.a the base C3se ~o 30/0 fur the :educ:dpurge modified case.Figure 6 shows the flow diagrJlll for the modified processwith reduced ?urge and addition of a flash drum withstream 17 as the feed. Undet this configuration, stream 25is used to purge impurities from the system. Without thispurge, impurities would again buildup inside the process,and it would eventually cease to function. StreJ.m 24which consists ofessentially pure ammonia is mi..~edwithstream 19 to form a new product stream, stream 26.
Table 7: Ammonia Production Flow Summary (kg/hr)Input & Output: Modified Process(purge Ratio =0.02 &. Flash Drum)
Stream 1/ I 1/25 II 26(State) (a) (a) (L)
Figure 6. Modified process flow diagram for dleproduction ofammonia from synthesis gas with reducedpurge ratio and added flash drJID..
Tne mass flow rates and the state of the various input andoutput streams are listed in Table 7. Note that adding theflash drum in addition to reducing the purge five foldincreased the amount ofproduct by 26% as compared :0the base case. This is very close :0 the 25% increase inproduct that was obtained by simply reducing the purge.However, the amount ofwaste ammonia in stream 25 wasreduced by 91%, and the amount of total waste in str=25 was reduced by 78%, both compared to the base case.As compared to the reduced purge process, the addition ofthe flash drum increased the amount of product by ameager 1%, but it reduced the amount ofWaste ammoniaby 61% and total amount ofwaste by 18%, both in stream25. Therefore, the principal effect of adding the flashdrum was the reduction ofwaste.
217
404
16
351
38001
176
13
112
137
30453
199
281
446
856
5060
423
H20
700
3696
603
7196
805
o
33,334 1162
603
7196
805
o
33,334
N2
AI
H2
CH4
NH3
N2
AI
H2
CH4
NH3
,'vlodified FlowsheetExamination of the base process indicates that wastestream 17 contains ammonia and some unreactd feed. rtis, therefore, logical to try to recover the ammonia and theunreacted feed as an obvious first step in a wastereduction strategy. Consequently, the process flowdiagram was modified in two ways. First, the purge ratiowas reduced five fold from 0.1 to 0.02, Le., the flow ofstream 11 was reduced five fold. Second, in addition toreducing the purge, a flash drum was added with stream17 as the feed to recover some of the ammonia
Table 6: Ammonia Production Flow Summary (kg/hr)Input & Outout: Modified Process (Purge Ratio =0.02)
Stream III 1117 1/ 19(State) (a) (a) (L)
ceokd .lIld feed to a senes 0 f three reacters through J.
tlJ.sh drum. SevaJ! reactors Jre nonnJlly used the tolIlJ.."<imi::e the conversion of feed to products which forthis process is difficult to do. 11lis flash drum Jlso servesto sopante the J.mrIlonia product from the unreJ.cted gJ.Seswhich Jre feed back into the system. The J.mrIlonia isrecovered as an anhydrous liquid under modest pressure.The mass flow tates and the state of the input and outputstreams as calculated by Chemcad ill are all listed inTable 5.
Figure 5 shows the configuration of the flow diagram for N2 33,334 ll62 217the reduced purge modified process which is identical to
AI 603 199 404that ofthe base process. The mass flow rates and the stateof the input and output streams for the reduced purge
H2 7196 281 16modified process are listed in Table 6. Tne processmodification increased the amount of product by CH4 805 447 3<',tapproximately 25% while reducing dle amoum of waste
37_____ :_ :_ ~ .... ___ I '7 ~" ... h"" .. '770/. r.. :........ ,-th ... ,.,t;nfT 10.1,.1"" n 11< , '2 <:') T

c3.ku1J.tlvClS J.r~ ::lisa :lCcur::uc to no more fum one:signilic:mt figure. Two signific:mt figures are ?resentedin Figures 1 and 3 in order to allow readers to reproducethe calcubtions ifnecessary.
Imp1<g x£:4 kglkg X£:4Imp!hr
22 Base Case: PR=O.1
8:! PR=O.02
~ PR=O.02 & Flash
Figure 8. Impact output inde.xes for the productioa ofammonia from synthesis gas: i:: in impact units ofpollutants per hour, tv.: in imp~ct units of pollutams
kil - d d u,VP. kil 'per. ogram or pre llCts, an ";Y..LOUl
1...'1. og:-ams orpollutants per kilogram of products. PR is the pu:geratio.
4000
:3500
~ 3000.52500~2000 .
<31500
~ 1000
.§ 5O~jl/~~J<~~~~~3~~~~~~~
Impact Inde:t: CalculationsA,,~ si.'C different impact inde.xes werecalculatedfor thebase aad the two modified processes. The indexes werealso obtaiaed using EquatiollS (3) to (8), the .flow ratesfrom Tables 5, 6, aad 7, Equation (10), aad theaormalized chemical impact scores of Table 1. Therelalive weighting factors cr.,were all set to one for thesecalculatiollS.The first c31egolY indexes, i.e., the impact generatioa• 'NP ',V~ d M' ,YP h F' 7mdexes, I ,I , all iJ1" ' are s own on 19ur.e . Itshould bt~oter that M~" is a negative aumber sincesome of the input mass IS always converted to product,and the oroduc:s are aot included in the summation of theoutouts: The soecific index,i'vP , was multiplied by a. . ~.~
factor of 10,000, aad the index, M'on' was multiplied bya factor of 1,000 so that they could'botlJ. be shown on the
'NPsame scale as the rate index I,on .
.'..."ox:mU.nltion ot'T"bl<s 5, 6, md 7wilbg:lin show thllwaste W'JS gener:illy reduced, thlt the u::.ount of productmlde W'JS incre:lSed, :md thlt environmeauL impact oftheprocess W3S problbly also reduced. However, one findsthlt it is aot sufficieat to :illow a quantiutive comparisoaof the over:ill waste:md eavlroameatal impact associatedwith each of the three C:lSes. In a simple e.x:lIIlple suchthis one the task is coafusing, but for comple.x chemicalprocess it can become impossible. For this comparisoaoae must calcul31e the impact indexes.
" 3500•~ 3000
"S 2500e,g 2000
~ 1500
~ 1000U
,.. 5GO§ a
Imp!hr Imp1<g xE4 -kglkg xE3
eJ Base Case: PR=O.1
~ PR=O.02
&'l PR=O.02 & Flash
Figure 7. Impact generation indexes for the productionofammonia from synthesis gas: i;:' in impact units perhour, jNP in impact units per kilogram of product,and-~ in kilograms ofpollUlants per kilogram of
l'. .product PR IS the purge ratio.
The secoad category indexe; i.e., the impact output"NP "''Iff ... Nt' . F'indexes, I , I ,and M,", ' are shown Ul 19ure 8.dl&l DIU -NP .. 'liP
The specific index I,", aad the specific index M,", wereboth multiplied by a factor ofIJ,I000 so that they could beshown on the same scale as I.", .Tne largest source ofuncertainty in the calc:J1ation of theimpact indexes are again the enviroamental impact scores.Taese measurements are probably accurate to no more.L ~:_:t:: ~ h ., .4 ; ., ;nlrl :1"~
DISCUSSION OF CASE STUDY #2Tile impact generatioa indexes ofFigure 7 show rh3!: (1)the rate of impact genecation by aon-products de""easesby 77% when the purge ratio is decreased from 0.1 to 0.02and by 91% whea the purge ratio is decreased as aboveaad a flash drum is added to recover waste ammoaia, (2)the impact generated by noa-products per kilogram ofproductdecreases by 81% when the purge ratio is reducedfrom 0.1 to 0.05 aad by 93% when the purge :atio isdecreased as above and a flash dr= is added, and (3) thekilograms of noa-products generated per kilogram ofproduct remained nearly COllStallt at ,1 for all cases. Themost significaat index in this case is the impact ge::eratedper kilogram of product. The decrease of this indexreflects primarily the recovery ofthe waste productand toa smaller extent the increase in the productivity of theplant, t e., the increase in product flow rate.The impact output indexes ofFigure 8 show that: (1) therate ofimpact output fromnoa-products decreases by16%when the purge ratio is decreased from 0.1 to 0.02 and by91% whea the purge ratio is decreased as above and aflash drum is added to recover waste ammoma, (2) theimpact output from aon-products per kilogram ofproductdecreases by 81% when the purge ratio is reduced from0.1 to 0.05 aad by 93% whea the purge ratio is decreasedas above and a flash. drum is added, and (3) the output ofkilograms of non-product per kilogram of prcduc:dec,eases by 73% when the purge ratio is reducd froc0.1 to 0.05 and by 76% when the purge ratio is dec:easedas abo'le and a flasn drum is added. It is again 'NO'-u'!

in this c:lSe is the impact output per \dogrJra of product.The dec:e:lSe in this index w:lS the s=e JS that for theequivalent generation index. This is a reflection of thechange in the inde-x beingprimarily driven by the recoveryofwaste product rather than incre:lSed productivity.The decreases in the inde-xes are again sufficiently largethat they represent sigoificant reductions in pollution.The consistentd=e in the impact generation permassofproduct and impactoutput permass ofproduct (81% to93%) implies that the modified plant can meet the needsof a moderately larger market with much. less impact onthe environment The decrease in the rate of impactgeneration and impact output (76% to 91%) means thatthe modified process has an enviroomental impact that isroughly one tenth that of the base plant Lastly, thede=ase in the output ofwaste mass per mass ofproductindicates that the modified plant will lose less valuablematerial in its operation.
FUTURE WORKIn addition to the topics already mentioned, there are twoother issues that need to be further mentioned in relationto the WAR Algorithm: Engineering Economics andComputer AidedProcess Design. However, both oftheseare beyond the scope ofthis paper which is to present thebasic generalizedwaste reduction or WARAlgorithm mdto illustrate its use. Eng'.neering Economics andComputerAidedProcess Design are the subject ofpresentand future research, and they are included here only forcompleteness and to aid '.nterested readers apply'.ng themethod and furthering the work.
Engineering EconomicsWhenever a process is modified to reduce waste, there isa consequent change in the economics associated with itEconomic changes are generally due to: (1) the addition orremoval ofcapital equipment, (2) an increase or decreasein energy consumption. (3) a change in the rate ofconsumption offeed material; and (4) a change in the rateofproduct generation. When a process is modified, all ofthe above are frequently affected. There are wellestablished methods for estimating the economics ofchemical processes either manually (peters andTimmerhous, 1968; Richardson EIigineeril}g Services,1997) or with the aid of a computer (ICARUS, 1997;Aspen Technology, 1997).Modification of a chemical process using the WARAlgorithm needs to be done along with an evaluation ofthe economic consequences of any proposed processmodifications, i.e., one needs to simultaneously compareboth the potential enviroomental impact and the cost ofalternate process flowsheets. The reason is that theultimate objective is always that of developing costeffective reductions in pollution. Unfortunately, there areno consensus criteria for cost effective waste reduction.Although one possibility, consistent with traditionalprocess design procedures, is to require that the sum ofthecapital and operating costs should not increase withproposed process modifications from the baseconfiguration. Tnis can be expressed as,
\~h~re C~ is u'1~ vp~rJting cost..l1lJ Cc is the c:J~i~J1..:o:st
that C:ln be estimated by one of the aforeme::.ticnedmet.i.ods or some another proprietary method. Equation(12) can then be used jointly with Equations (4) to (8) toevaluate J!tem~:ive process flowsheets.
Computer Aided Process DesignWhile it is often possible to devise pollution reducingmodifications from an inspectionofthe process flowsheet,there are many situations where a more systematicapproach such. as computer aided process design andoptimization may be required. This is particularlyimportant with very complex processes that are difficultto analyze by inspection. The WAR. Algorithm = beused in computer aided process design and optimi23lion.This can be done by employing the indexes ofEquations(4) to (8) as objective functions in a matt.e:naticaloptimization subject to a cost constraint such as Equation(12). For e.xample, one could minimjze the output ofpotential environmental impact per mass ofproduct givenby Equation (i) subject to \ceeping the total cost fromincreasing. This can be expressed as,
,\1inimize JNP = I"P(M(aw) .NP x,vp .'VP D) (I')ow ow Ie) '"'""2 , •••tell,L- J
subject to Equation (12) where !tt'" is the vector ofmassflowrates for all the output streams, :;:,vp is the vector ofmass fractions for !lon-product comoonent i in all outDt:tstreams, and f. is the vector of~s i!owrates for' allproducts. The optimization could involve the variationofoperating variables and modification of the flowshee:configuration both. In this way one can syste:naticallyreduce the pollution indexes even in very complexprocesses. There are several robust algorithms such assimulated annealing (Kirkpatrick et al., 1983; vanLaarhoven and Aarts, 1987) that can be successfully usedalong with mixed integer programing (Grossmann, 1985;Grossmann, 1990) here.
CONCLUSIONSA general theory and a me~'1odology for incorporatingpollution reduction :nto chemical process desigo.has bee:!.presented. Tne work is still at an early stage ofdevelopment particularly with respect to its application.However, the fundamental bases along which future wotkwill proceed have been established.When used in conjunction with chemical processsimulators, the WAR Algorithm offers a powerfulmethodology for evaluating the potential environmentalimpact of alternative process flow sheets.. Although, theWAR Algorithm is intended for use as part ofa good faitheffort to reduce the environmental foot print of processplants, and it does not obviate the need to make judiciousengineering and environmental decisions. For example,there is no completely unambiguous way ofsetting valuesfor the impact weighting factors or (1.,'5. The reason isthat the (1.,'5 represent the value that society places onparticular types of environmental impacts, and this willvary across 10Cltions, cultures, and even time. Oneshould point out, however, that enginee:'.ng desig::lpractice has always used human judgemenr inde:er.nini..,g

REFERENCES
AspenTechnology, 1997,AspenPlus.AspenTechnology,
Inc.;Cambridge, Massacnusetts.
Chemstations, 1997, ChemcadllI. Ver. 3.2. Chemstations.Inc.; Houston, Texas.
El-Halwagi, M. M.; EI-Halwagi, A. M.; Manousioutha.'<is.
V., 1992, Optimal Design of Dephenolization Networks
for Petroleum-Refinery Wastes. Trans.L Chem.E.70b, 131.
Fonyo, Z.; Kurum, S.; Rippin, D. W. T., 1994, Process
Development for Waste ~finimization: Tne RetroEtting
Problem. Computers Chem. Eng. 18, S591.
Grossmann, LE., 1985, Mixed-Integer Progr=ing
Approach for the Synthesis of Integrated Process
Flowsheets, Camp. Chem. Eng. 9,463.
Grossmann, I.E., 1990, Mixed-Integer Non-LinearProgramming Techniques for the Synthesis of
Engineering Systems, Res. Eng. Des. 1,205.
Heijungs, R. (Final Ed.); Guinee, J.B.; Huppes, G.;
Lankreijer, R.M.; Udo de Haes, HA.; Wegener Sleeswijk,A., 1992, Environmental Life Cycle ksessmenr of
Products Guide - October 1992, Centre ofEnvironmental
Science, Leiden.HiIaly, A.K.; Sikdar, S.K., 1994, Pollution Balance: New
Methodology for Minimizing Waste Production inManufacturing Processes. J. Air & Waste Manage. Assoc.
44, 1303.ICARUS CO'1'oration, 1997,ICARUSSoftware. ICARUS
Corporation; Rockville, Maryland.Lapin, L.L., 1975, Statistics - Meaning and Method.
Harcourt-Brace-Jovanovich; New York.
Kirkpatrick, S.; Gelatt, C.; Vecchi, M., 1983,
Optimization by Simulated Annealing. Science, 220, 670.
Lederman, P. B.; Weaver, 1.. 1991, Pollution Prevention
Through Process Modification: The Challenge of the
Decade. AlChE Annual Meeting, LA, Paper 244a.
Mallick, S.K.; Cabezas H.; Bare I.e.; Sikdar. S.K., 1996,
APollution Reduction Methodology for Chemical ?roce~s
Simulators.Ind. Eng. Chern. Res., 35,411&.
for impet of type I. impactlkJ!ogram
'D, Pollution index. kilogramSikilogram
oJ Standard deviation of all chemical scor::s Ul
impact category j, no wtits
'lsj Ove:-::Jl potential environmental impact of
chemicalj, impactlkilogrnm
'ls;., Specific (s) potential environmental impact ofchemic:llj for impact of type I, impactikilogram
(Score)jJRelative potential impact score ofchemic:ll iforimpact of type j, no wtit
«Score))jArithmetic average of the scores for allchemicals i in impact category j, no wtits
LIST OF SYMBOLSCapital costs associated witha cnemical process,monetaryOperating costs associated with a chemicalprocess,monetaryPotential environmental impact content ofsystem, impactPotential environmental impact input rate,impactlhourPotential environmental impact output rate,impactlhourPotential environmental impact generation rate,impactlhourPotential environmental impact flow ofstreamjinput (i=in) or output (i=out), impactlhourPotential environmental impact generation rateby non-products, impactlhourPotential environmental impact output rate dueto non-products, impactlhourPotential environmental impact input rate due tonon-products, impactlhourSpecific potential environmental impactgeneration from non-products, impact! kilogramSpecific output of potential environmentalimpact due to non-products, impactlkilogramMass flow rate ofstreamj, input (i=in) or output(i=out), kilogram.sJhourVector ofmass f10wrates for all output streams,kilograms/r hourSpecific generation of non-product mass,kilogramslkilogramSpecific output of non-product mass,kilogramslkilogramMass output rate of product p, kilogram.sJhour
Vector of mass f10wrates for all products,
kilogramslhourMass fraction ofchemical k in stream j
Mass fraction of non-product k in stream j
Vector of mass fractions for non-product
component in all output streams,
kilogramsf«ilogramsChemical independent relative weighting factor<1.,
C.
I""
ACKNOWLEDGMENTSThe authors wish to acknowledge the support ofChemstations, Inc., Houston, Texas under a CooperativeResearch and Development Agreement with the U.S.EnvironmentalProtectionAgency. The authors.also thankDr. Douglas Young at the U.S. Environmental ProtectionAgency for critiquing the manuscript.
thal.:fore. this Jilc::mm~ is not nt::w.N~ ....er tht:: less. there is J.. need to further improve t..'1t:methodology for estimating potential envirorunentalimpacts and the weighting factors, there is a need toinc0'1'0rate economics into the analysis, and there is aneed to include computer aided process design andoptimiz:ltion. Future work will address these issues. Thecase studies, nowever, do illustrate that even in its presentstate the methodology is a useful process design tool.

MJnousiouth:L'<is, V.; Allen, 0.,1995, Process Synthesis
for W3Ste Minimiz:ltion. A[ChE Symp. Ser. 30., 72.
Peters, M.S.; Timmerhaus, K.D., 1963, Plant Design andEconomics for Chemical Engineers. McGnw-Hill; New
York.Richardson Engineering Services, 1997, Process. PlantConstr~ction Estimating Standards. RichardsonEngineering Services, Inc.; Mesa, Arizona.Rossiter, A.P., 1995, Waste M'lIlimization ThroughProcess Design. McGraw-Hill; New York.Van Laarhoven, P.JM.; Aarts, E.HL., 1987, SimulatedAnnealing: Theory and Applications. ReiderPublishing
Co.; Holland.

Appendix B
•
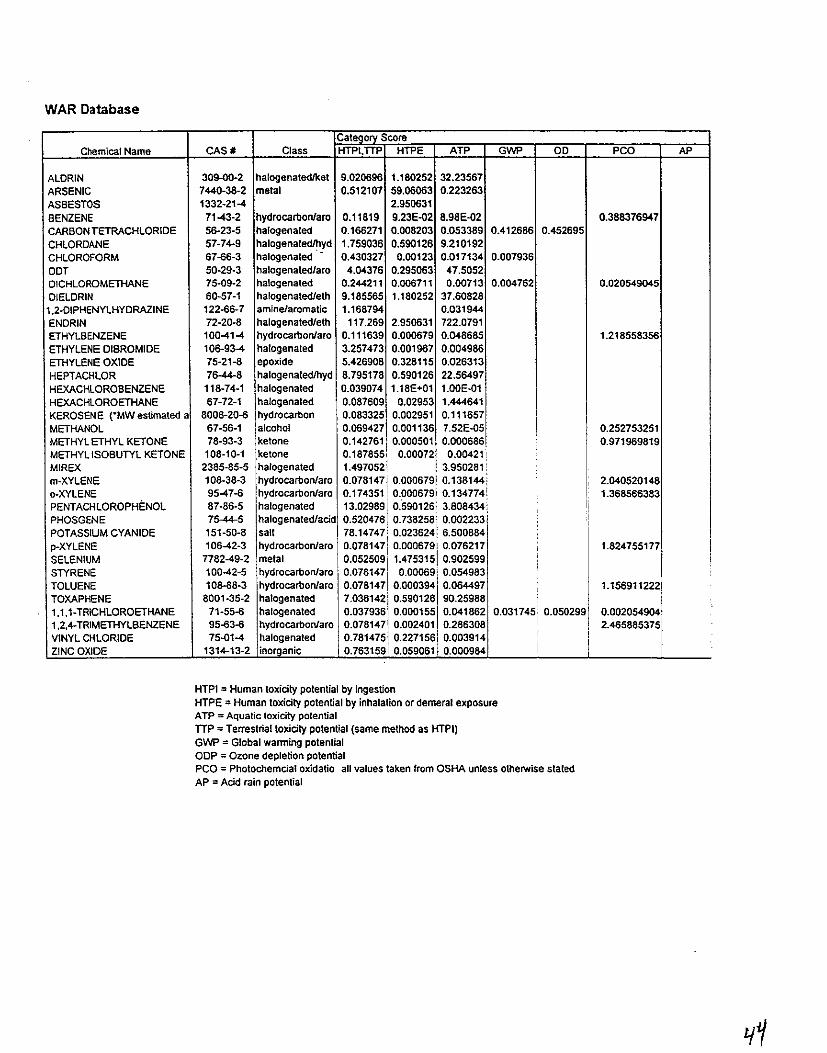
WAR Database
Cate<lOry ScoreChemical Name CAS_ Class HTPI.TTP HTPE ATP GWP 00 PCO AP
ALDRIN 309-00-2 halogenatedlket 9.020696 1.180252 32.23567
ARSENIC 7440-36-2 metal 0.512107 59.06063 0.223263
ASBESTOS 1332-21-4 2.950631
BENZENE 71-43-2 hydrocarbon/ara 0.11819 9.23E.o2 8.98E.o2 0.388376947CARBON TETRACHLORIDE 56-23-5 halogenated 0.166271 0.008203 0.053389 0.412686 0.452695
CHLORDANE 57-74-9 halogenatedJ!1yd 1.759036 0.590126 9.210192CHLOROFORM 67-66-3 halogenated - 0.430327 0.00123 0.017134 0.007936
DDT 50-29-3 halogenated/aro 4.04376 0.295063 47.5052OICHLOROMETHANE 75.09-2 halogenated 0.244211 0.006711 0.00713 0.004762 0.020549045DIELDRIN 60-57-1 halogenated/eth 9.185565 1.180252 37.608281.2-0IPHENYLHYORAZINE 122-66-7 amine/aromatic 1.168794 0.031944ENORIN 72-20-8 halogenated/eth 117.269 2.950631 722.0791ETHYLBENZENE 100-41-4 hydrocarbon/ara 0.111639 0.000679 0.048685 1.218558356ETHYLENE DIBROMIDE 106-93-4 halogenated 3.257473 0.001967 0.004986ETHYLENE OXIDE 75-21-8 epoxide 5.426908 0.328115 0.026313HEPTACHLOR 76-44-8 halogenale<!lhyd 8.795178 0.590126 22.56497
HEXACHLOROBENZENE 118-74-1 halogenated 0.039074 1.18E+Ol 1.ooE.ol
HEXACHLOROETHANE 67-72-1 jhalogenated 0.087609 0.02953 1.444641KEROSENE (OMWesUmated a 8008-20-6 hydrocarbon 0.083325 0.002951 0.111657
METHANOL 67-56-1 alcohol 0.069427 0.001136 7.52E-Q5 0.252753251METHYL ETHYL KETONE 76-93-3 ketone 0.142761 0.000501 0.000686 0.971969819METHYL ISOBUTYL KETONE 108-10-1 ketone 0.187855 0.00072 0.00421MIREX 2385-85-5 halogenated 1.497052 3.950281 :m-XYLENE 108-38-3 hydrocarbon/arc 0.078147 0.000679 0.138144: 2.040520148o-XYLENE 95-47-6 hydrocarbon/ara 0.174351 0.000679 0.134n4' 1.368566383PENTACHLOROPHENOL 87-86-5 Ihalogenated 13.02989 0.590126 3.608434, "'IPHOSGENE 75-44-5 halogenated/acid 0.520476 0.738258 0.002233! :1
I
POTASSIUM CYANIOE 151-50-8 salt 78.14747 0.023624 6.5008841p-XYLENE 106-42·3 hydrocarbon/ara I 0.078147 0.000679 0.076217 1.824755177SELENIUM 7782-49-2 :metal 0.052509 1.475315 0.902599STYRENE 100-42-5 Ihydrocarbonlaro' 0.078147 0.00069 0.054983TOLUENE 106-88-3 hydrocarbon/ara 0.078147 0.000394 0.064497 1.156911222TOXAPHENE 8001-35-2 halogenated 7.036142 0.590126 90.259881.1.1-TRICHLOROETHANE 71-55-6 halogenated 0.037936 0.000155 0.041862 0.031745: 0.050299 0.0020549041.2.4-TRIMETHYLBENZENE 95-63-6 hydrocarbon/ara 0.078147 0.002401 0.286308 , 2.465885375,VINYL CHLORIDE 75.01-4 halogenated 0.781475 0.227156 0.003914
, I
ZINC OXIDE 1314-13-2 inorganic 0.763159 0.059061 0.000984 : i
HTPI = Human toxicity potential by ingestionHTPE = Human toxicity potential by inhalation or demeral exposureAT? = Aquatic toxicity potentialITP = Terrestrial toxicity potential (same method as HlPI)GINP = Global warming potentialODP = Ozone depletion potentialpea = Photochemcial oxidatio all values taken from OSHA unless otherwise slaledAP = Acid rain potential
Appendix C

(Jog L)
(J.35. g kj /f€4\\
q~ 1,
~Ol Mf\'ct u~ ~ Ii ~"
))y-\' (j'.lf5'rs, :: 5'19,1) (hirc/;\~\
r--v'P.t.-vp: 5iC!. 7') Ibkl~' 'tJ/ ~ JJj.5i~.jtl.. ( leJ.4 k~/H6\j
P~11J1lL ,;... ~ce.. 1N64t.~: IM'/.
fi\d]1.').i \jce... 6Jutv.-~\L{(;".: ddS.Slb/lI... ·IOO i.-=iJ:J3,:sIb/tfL (Itl.if~/!t)
~f'J~ 4~~e.. LJ~~ :, ./1, !L _ IG ( '!\OIUil-..(. 4& - "J'

,,i!-,I,j!~j