
Morphological, Physiological and Anatomical Adaptations in ...
Upload
khangminh22Category
view
0download
0

Auteur: Krzysztof Gałkowski
Titre: Propriétés magnéto-optiques et microscopiques de perovskites organique –
halogénure de plomb
Directeurs de Thèse: Paulina PLOCHOCKA-MAUDE et Piotr KOSSACKI
Spécialité: Physique de la matière
Résumé
Les perovskites hybrides organique-halogénure de plomb représentent une classe de
matériaux émergents, proposés en tant qu’absorbeur de lumière dans le cadre d’une
nouvelle génération de cellules solaires. La formule chimique de ces composés est ABX3, où
A est un cation organique, X représente un anion halogénure (normalement Cl-, Br-, ou l-,
ou alors un alliage composé par ces éléments). Les perovskite hybrides combinent
d’excellentes propriétés d’absorption avec une grande longueur de diffusion et des longues
durée de vie des porteurs de charge, ce qui permet d’atteindre des efficacités de conversion
de photons de 22%. Un autre avantage est représenté par leur bas coût de fabrication. Par
conséquent, avec le développement de cette classe de matériaux, le photovoltaïque basé sur
les perovskites sera potentiellement capable d’améliorer fortement les performances de la
technologie photovoltaïque actuelle, basée sur le silicium.
Dans cette thèse, nous utilisons des méthodes optiques pour étudier les propriétés
électroniques de base et la morphologie de couches minces de plusieurs représentants des
perovskites. Nous étudions notamment des composés ayant le methylammonium et le
formamidinium en tant que cations organiques ainsi que les iodures et les bromures à large
bande interdite et nous montrons comment la composition chimique influence les
paramètres étudiés.
Par magnéto-transmission, nous déterminons directement l’énergie de liaison de l’exciton et
sa masse réduite. Nous trouvons que les énergies de liaison à T = 2K sont comprises de 14 à
25 meV, plus petites ou comparables à l’énergie thermique moyenne à la température
ambiante (25meV). De plus, ces valeurs diminuent à T=160K jusqu’à 10-24meV. Suite à ces
résultats, nous concluons que les porteurs photocréés dans les perovskites peuvent être
considérés ionisés thermiquement à la température ambiante. Les valeurs de masse effective
sont comprises entre 0.09-0.13 de la masse de l’électron libre. Nous montrons également que
l’énergie de liaison de l’exciton ainsi que la masse effective dépendent linéairement de la
valeur de la bande interdite. Nos résultats permettent donc d’estimer la valeur de ces
paramètres des nouveaux composés perovskites.
Nous avons étudié la morphologie de couches minces de perovskite par photoluminescence
résolue spatialement avec une résolution micrométrique. Cette technique nous a permis
d’observer des grains cristallins uniques. Nous démontrons que la transitions de la phase
tétragonale à orthorhombique à basse température est incomplète dans tous les matériaux
étudiés, comme montré par les résidus de phase tétragonale trouvés à T =4K. En étudiant
structurellement régions endommagées et photo-recuites, nous montrons que la présence
de la phase tétragonale à basse température est augmentée, causée par une déplétion de
l’halogène.
Mots-clés: perovskites hybrides, photovoltaïque, énergie de liaison de l’exciton, masse
effective, transition de phase.


Author: Krzysztof Gałkowski
Title: Magneto-optical and microscopic properties of organo lead halide perovskites
Supervisors: Paulina Płochocka-Maude, Piotr Kossacki
Specialty: Solid state physics
Abstract
The hybrid organo-lead halide perovskites are an emerging class of materials,
proposed for use as light absorbers in a new generation of photovoltaic solar cells. The
chemical formula for these materials is APbX3, where A is an organic cation and X
represents halide anions (most commonly Br-, Cl- or I-, or alloyed combination of these). The
hybrid perovskites combine excellent absorption properties with large diffusion lengths and
long lifetime of the carriers, resulting in photon conversion efficiencies as high as 22%.
Another advantage is the inexpensiveness of the fabrication process. Therefore, with the
rapid development of this class of materials, the perovskite photovoltaics has perspectives
to outperform the well-established silicon technology.
Here, we use optical methods to investigate the basic electronic properties and
morphology in the thin films of several representatives of the hybrid perovskites. We study
the compounds based on Methylammonium and Formamidinium organic cations; the
iodides and wide band-gap bromides, showing how the chemical composition influences
the investigated parameters.
Using magneto-transmission, we directly determine the values of exciton binding
energy and reduced mass. We find that the exciton binding energies at T = 2 K, varying
from 14 to 25 meV, are smaller or comparable to the average thermal energy at room
temperature (≈25 meV). Moreover, these values fall further at T = 160 K, to 10–24 meV.
Based on that we conclude that the carriers photocreated in a perovskite material can be
considered to be thermally ionized at room temperature. The measured reduced masses are
in the range of 0.09-0.13 of the electron rest mass. We also show that both exciton binding
energy and reduced mass depend linearly on the band gap energy. Therefore, the values of
these parameters can be easily estimated for the synthesis of new perovskite compounds.
Using spatially resolved photoluminescence, we probe the morphology of
perovskite films with micrometer resolution, which enables us to observe single crystalline
grains. The resulting maps show that all investigated thin films are composed from the dark
and bright crystalline grains. We demonstrate that the low temperature phase transition
from tetragonal to orthorhombic phase is incomplete in all studied materials, as the remains
of the tetragonal phase are found even at T = 4 K. By investigating structurally damaged
and photo annealed regions, where the occurrence of the tetragonal phase at low
temperatures is enhanced, we attribute its presence to the depleted halide content.
Keywords: hybrid perovskites, photovoltaics, exciton binding energy, effective mass, phase
transition

Autor: Krzysztof Gałkowski
Tytuł: Magnetooptyczne i mikroskopowe właściwości perowskitów – halogenków ołowiu i
kationu organicznego
Promotorzy: Paulina Płochocka-Maude, Piotr Kossacki
Dyscyplina: Fizyka ciała stałego
Streszczenie Hybrydowe perowskity – halogenki ołowiu i kationu organicznego - stanowią nową klasę
materiałów, mogących znaleźć zastosowanie jako konwertery energii słonecznej w kolejnej
generacji ogniw fotowoltaicznych. Struktura chemiczna tych materiałów opisywana jest
wzorem APbX3, gdzie A jest kationem organicznym a X anionem halogenkowym
(najczęściej Br-, Cl- lub I-, lub ich kombinacją). Hybrydowe perowskity charakteryzują się
efektywną absorpcją światła w szerokim zakresie spektralnym, długimi drogami dyfuzji
oraz długimi czasami życia nośników. Własności te przekładają się na wysoką wydajność
konwersji fotonów, która w przypadku najlepszych ogniw perowskitowych sięga 22%.
Niski koszt wytwarzania oraz szybki rozwój tej klasy materiałów stawia fotowoltaikę
opartą na perowskitach wśród potencjalnych rozwiązań zastępujących obecnie wiodącą
technologię krzemową.
Niniejsza praca poświęcona jest optycznym badaniom własności elektronowych oraz
morfologii cienkich warstw hybrydowych perowskitów. Wykorzystano związki oparte na
kationie metylamoniowym lub formamidynie, z jodem lub bromem jako anionami
dominującymi. Uzyskane wyniki pozwalają określić wpływ składu chemicznego na badane
parametry materiału.
Na podstawie pomiarów magnetotransmisji bezpośrednio wyznaczono wartość energii
wiązania ekscytonu i masy zredukowanej. Energie wiązania ekscytonu w temperaturze T =
2 K wynoszą od 14 do 25 meV. Są to wartości mniejsze lub porównywalne do średniej
energii termicznej w temperaturze pokojowej (25 meV). Co więcej, wartości te maleją wraz
ze wzrostem temperatury, do 10-24 meV w T = 160 K. Tym samym wnioskujemy, że nośniki
wzbudzone światłem w temperaturze pokojowej można uznać za termicznie zjonizowane.
Zmierzone wartości masy zredukowanej mieszczą się w zakresie 0.09-0.13 masy
spoczynkowej elektronu. Pokazaliśmy również, że zarówno energia wiązania ekscytonu,
jak i jego masa zredukowana zależą w przybliżeniu liniowo od wartości przerwy
energetycznej. Uzyskane zależności pozwalają w łatwy sposób oszacować wartości tych
parametrów dla nowo zsyntetyzowanych związków perowskitowych.
Metodą przestrzennie rozdzielonej fotoluminescencji zbadano morfologię warstw
perowskitowych z mikrometrową rozdzielczością, co pozwoliło zaobserwować pojedyncze
ziarna krystaliczne. Otrzymane mapy luminescencji powierzchni próbek pokazują, że
wszystkie badane warstwy składają się z ciemnych i jasnych ziaren. Pokazujemy, że w
niskotemperaturowa przemiana z fazy tetragonalnej w ortorombiczną jest niepełna, a
pozostałości fazy tetragonalnej są obserwowane nawet w T = 4 K. Zauważając zwiększone
występowanie tych inkluzji w okolicach obszarów uszkodzonych strukturalnie, korelujemy
obecność niskotemperaturowej fazy tetragonalnej z lokalnymi zubożeniami zawartości
halogenków.
Słowa kluczowe: hybrydowe perowskity, fotowoltaika, energia wiązania ekscytonu, masa
efektywna, przemiana fazowa

Acknowledgements
My first words of gratitude are directed to my supervisors, Paulina
Plochocka-Maude and Piotr Kossacki. I owe a lot to their support – both
on the professional or personal level - continuing until the very last
moment of my PhD course. I also acknowledge a significant support from
Duncan K. Maude, reflecting in both scientific and editorial advice. And
the numerous problems have become clearer after long discussions with
Robin J. Nicholas (Clarendon Laboratory, University of Oxford).
I also would like to thank all my colleagues from both the National
Laboratory of High Magnetic Fields (LNCMI-Toulouse, France) and
Solid State Physics Division, University of Warsaw, Poland. They were
always there – to give a piece of advice, to provide some urgent help, or to
enjoy the out-of-the-lab moments. For the greatest contribution to this
particular work, Anatoilie Mitioglou, Alessandro Surrente and Zhuo Yang
should be named. It is also an opportunity to thank to the technical staffs
of both laboratories - always helpful and responsive.
Last but not least, my loved ones were extremely understanding and
supportive during those periods of my limited availability.
The financing for the co-tutelle program was approved by the French
Embassy in Warsaw and supported my permanent scholarship provided
by the University of Warsaw. I would also like to thank to the authorities
of the LNCMI-Toulouse for an additional contract, which enabled an
extension to my stay there.
Toulouse and Warsaw,
January 2017


Contents
1 Introduction 31.1 Interband absorption in the semiconductors: excitons . . . . . . . . . 31.2 Perovskite structure . . . . . . . . . . . . . . . . . . . . . . . . . . . 61.3 Hybrid perovskites . . . . . . . . . . . . . . . . . . . . . . . . . . . . 9
1.3.1 The role of halides: the inorganic cage . . . . . . . . . . . . . 91.3.2 The role of organic cations: hydrogen bonds and octahedra
tilting . . . . . . . . . . . . . . . . . . . . . . . . . . . . . . . 101.3.3 Temperature dependence of the structural properties . . . . . 111.3.4 Stability of organic-inorganic perovskites . . . . . . . . . . . . 13
1.4 Electronic properties of hybrid organic-inorganic perovskites . . . . . 151.4.1 Band structure . . . . . . . . . . . . . . . . . . . . . . . . . . 151.4.2 Carrier diffusion lengths and mobilities . . . . . . . . . . . . . 18
1.5 The evolution of hybrid perovskite materials . . . . . . . . . . . . . . 201.5.1 Towards the perovskite solar cells: the requirements for the
photoactive material . . . . . . . . . . . . . . . . . . . . . . . 201.5.2 The perovskite light absorbers beyond MAPbI3 . . . . . . . . 211.5.3 A key to the stability: mixed-cation mixed-halide hybrid per-
ovskites . . . . . . . . . . . . . . . . . . . . . . . . . . . . . . 22
2 Experimental techniques 252.1 Spectroscopy in high magnetic field . . . . . . . . . . . . . . . . . . . 25
2.1.1 Pulsed magnetic field generation . . . . . . . . . . . . . . . . 252.1.2 Transmission measurements . . . . . . . . . . . . . . . . . . . 282.1.3 Temporal synchronization . . . . . . . . . . . . . . . . . . . . 31
2.2 Micro-Photoluminescence measurements . . . . . . . . . . . . . . . . 32
3 Preparation and characterization of the samples 353.1 Description of samples . . . . . . . . . . . . . . . . . . . . . . . . . . 353.2 Fabrication of the samples . . . . . . . . . . . . . . . . . . . . . . . . 363.3 Maintaining the perovskite phase . . . . . . . . . . . . . . . . . . . . 383.4 Sample characterization . . . . . . . . . . . . . . . . . . . . . . . . . 40
4 Magneto transmission 454.1 Introduction . . . . . . . . . . . . . . . . . . . . . . . . . . . . . . . . 45
4.1.1 Electronic transitions in magnetic field . . . . . . . . . . . . . 464.2 Low - temperature magneto-spectroscopy . . . . . . . . . . . . . . . 51
4.2.1 Iodine-based compounds: MAPbClxI3−x and FAPbI3 . . . . . 514.2.2 Tri-bromides: FAPbBr3 and MAPbBr3 . . . . . . . . . . . . . 534.2.3 Analysis . . . . . . . . . . . . . . . . . . . . . . . . . . . . . . 54
4.3 High temperature magneto-spectroscopy . . . . . . . . . . . . . . . . 60

ii Contents
4.4 Discussion . . . . . . . . . . . . . . . . . . . . . . . . . . . . . . . . . 634.5 Conclusions . . . . . . . . . . . . . . . . . . . . . . . . . . . . . . . . 66
5 Spatially resolved micro - photoluminescence studies of organo-leadhalide perovskites 675.1 Introduction . . . . . . . . . . . . . . . . . . . . . . . . . . . . . . . . 675.2 Temperature dependence studies . . . . . . . . . . . . . . . . . . . . 685.3 Spatially resolved µ-PL at room temperature . . . . . . . . . . . . . 715.4 Spatially resolved µ-PL below the phase transition temperatures . . 72
5.4.1 MAPbI3 and FAPbI3 . . . . . . . . . . . . . . . . . . . . . . . 725.4.2 MAPbClxI3−x . . . . . . . . . . . . . . . . . . . . . . . . . . . 755.4.3 FAPbBr3 . . . . . . . . . . . . . . . . . . . . . . . . . . . . . 76
5.5 The coexistence of crystalline phases in the proximity of strain ordefects . . . . . . . . . . . . . . . . . . . . . . . . . . . . . . . . . . . 77
5.6 Conclusions . . . . . . . . . . . . . . . . . . . . . . . . . . . . . . . . 80
6 Caesium lead halide perovskites - characterization and magneto-optical studies 816.1 Fully inorganic caesium-based perovskite compounds . . . . . . . . . 816.2 Characterization of the samples . . . . . . . . . . . . . . . . . . . . . 836.3 Low-temperature magneto - transmission . . . . . . . . . . . . . . . . 846.4 Discussion . . . . . . . . . . . . . . . . . . . . . . . . . . . . . . . . . 87
7 Conclusions 89
A Publications 91
B Résumé de la thèse en français 93B.1 Introduction . . . . . . . . . . . . . . . . . . . . . . . . . . . . . . . . 93B.2 Techniques expérimentales . . . . . . . . . . . . . . . . . . . . . . . . 93B.3 La description et caractérisation des échantillons . . . . . . . . . . . 94B.4 Magnéto-transmission . . . . . . . . . . . . . . . . . . . . . . . . . . 96B.5 Études de micro-photoluminescence résolues en temps de pérovskites
d’halogénure d’organo-plomb . . . . . . . . . . . . . . . . . . . . . . 104B.6 Les pérovskites halogénure d’plomb - et études magneto-optique . . . 109B.7 Conclusions . . . . . . . . . . . . . . . . . . . . . . . . . . . . . . . . 110
Bibliography 113

List of Figures
1.1 Energy states of an exciton . . . . . . . . . . . . . . . . . . . . . . . 51.2 Ideal cubic structure in perovkites . . . . . . . . . . . . . . . . . . . 71.3 Comparison of orthorhombic, tetragonal and cubic crystal structures 81.4 Influence of the halide composition on the band gap energy . . . . . 101.5 Schematic representation of Methylammonium and Formamidinium
cations . . . . . . . . . . . . . . . . . . . . . . . . . . . . . . . . . . . 111.6 Temperature dependence of the crystal structure in MAPbI3, MAPbBr3
and MAPbCl3 . . . . . . . . . . . . . . . . . . . . . . . . . . . . . . . 121.7 Hydration in perovskites . . . . . . . . . . . . . . . . . . . . . . . . . 141.8 Band structure of MAPBI3 . . . . . . . . . . . . . . . . . . . . . . . 161.9 Comparison of absorption coefficients of MAPbI3, GaAs and c-Si . . 171.10 Lifetimes of the carries in MAPbI3 and MAPbClxI3−x with and in
the absence of electron/hole absorbing layers . . . . . . . . . . . . . 19
2.1 High magnetic field installation of the LNCMI laboratory . . . . . . 262.2 Temporal profiles of typical magnetic field pulses . . . . . . . . . . . 272.3 The elements of high magnetic field coils . . . . . . . . . . . . . . . . 282.4 Schematic representation of the setup used for transmission measure-
ments in pulsed magnetic fields . . . . . . . . . . . . . . . . . . . . . 292.5 Magneto-transmission probe . . . . . . . . . . . . . . . . . . . . . . . 302.6 Temporal synchronization of the magnetic field pulse and the acqui-
sition of optical signal . . . . . . . . . . . . . . . . . . . . . . . . . . 322.7 Schematic diagram of synchronization sequence . . . . . . . . . . . . 332.8 Schematic drawing of the µPL experimental setup . . . . . . . . . . 34
3.1 Photograph showing the typical Formamidinium - based samples withdifferent halide content . . . . . . . . . . . . . . . . . . . . . . . . . . 36
3.2 Sequence of procedures in the one-step perovskite deposition method 373.3 Schematic representation of the two-step deposition method . . . . . 373.4 Decomposed MAPbI3 sample . . . . . . . . . . . . . . . . . . . . . . 383.5 Micro-PL spectra for pristine and degraded MAPbI3 . . . . . . . . . 393.6 Typical transmission spectra for MAPbI3 measured at different tem-
peratures and absorption energies plotted as the function of temperature 413.7 Typical transmission spectra measured at different temperatures for
MAPbClxI3−x, FAPbI3, FAPbBr3 and MAPbBr3 . . . . . . . . . . . 423.8 The energies of near band edge absorption as a function of tempera-
ture for different perovskite materials . . . . . . . . . . . . . . . . . . 43
4.1 A schematic view of the Landau levels in the valence and conductionband. . . . . . . . . . . . . . . . . . . . . . . . . . . . . . . . . . . . . 48

iv List of Figures
4.2 Schematic view of energies of 1s, 2s and 2p hydrogen - like statescalculated in magnetic field . . . . . . . . . . . . . . . . . . . . . . . 50
4.3 The Zeeman band splitting . . . . . . . . . . . . . . . . . . . . . . . 514.4 Typical magneto-absorption spectra for MAPbClxI3−x and FAPbI3
at 2 K . . . . . . . . . . . . . . . . . . . . . . . . . . . . . . . . . . . 524.5 Typical magneto-absorption spectra for FAPbBr3 and MAPbBr3 at
2 K . . . . . . . . . . . . . . . . . . . . . . . . . . . . . . . . . . . . . 544.6 An example of typical magneto-transmission data with a fit of the
excitonic and Landau transitions . . . . . . . . . . . . . . . . . . . . 554.7 Magneto-transmission results for the low temperature orthorhombic
phase (T ≈ 2 K) . . . . . . . . . . . . . . . . . . . . . . . . . . . . . 574.8 Comparison of magnetio-transmission results for FAPbBr3 and MAPbBr3 584.9 Zeeman splitting and Lande factors for MAPbClxI3−x and FAPbI3 . 594.10 Typical magneto-absorption spectra for the tetragonal phase (T ≈
160 K) . . . . . . . . . . . . . . . . . . . . . . . . . . . . . . . . . . . 604.11 Magneto-transmission results for the tetragonal phase (T ≈ 160 K) . 614.12 Reduced mass and binding energy in hybrid perovskites as the func-
tion of the band gap energy . . . . . . . . . . . . . . . . . . . . . . . 63
5.1 Temperature dependence of absorption and micro-photoluminescencespectra in MAPbI3 . . . . . . . . . . . . . . . . . . . . . . . . . . . . 69
5.2 Temperature dependence of micro-photoluminescence spectra in MAPbClxI3−xand FAPbBr3 . . . . . . . . . . . . . . . . . . . . . . . . . . . . . . . 70
5.3 Spatially resolved micro-photoluminescence for MAPbI3, MAPbClxI3−xand FAPbBr3 at 300 K . . . . . . . . . . . . . . . . . . . . . . . . . . 72
5.4 Spatially resolved micro-photoluminescence for MAPbI3 at 2 K . . . 735.5 Spatially resolved micro-photoluminescence for FAPbI3 at 2 K . . . . 745.6 Spatially resolved micro-photoluminescence for MAPbClxI3−x at 2 K 765.7 Spatially resolved micro-photoluminescence for FAPbBr3 at 2 K . . . 775.8 Tetragonal and orthorhombic phases in MAPbClxI3−x in the region
exposed to the focused laser spot . . . . . . . . . . . . . . . . . . . . 785.9 Schematic drawn of photo-annealing induced distribution of iodine
ions as a function of the distance from the point of exposure . . . . . 795.10 Tetragonal and orthorhombic phases in FAPbI3 in the vicinity of a
structural defect . . . . . . . . . . . . . . . . . . . . . . . . . . . . . 80
6.1 Two polymorphs of CsPbI3 . . . . . . . . . . . . . . . . . . . . . . . 826.2 Temperature-dependent transmission for Cs-based compounds . . . . 846.3 Magneto-transmission spectra for Cs-based compounds . . . . . . . . 866.4 [Magnetotransmission results at low temperature (T ≈ 2 K) . . . . . 876.5 Reduced mass and binding energy as the function of the band gap
energy in hybrid and CsPbX3 perovskites at T = 2 K . . . . . . . . . 88
B.1 . . . . . . . . . . . . . . . . . . . . . . . . . . . . . . . . . . . . . . . 94
List of Figures v
B.2 . . . . . . . . . . . . . . . . . . . . . . . . . . . . . . . . . . . . . . . 95B.3 . . . . . . . . . . . . . . . . . . . . . . . . . . . . . . . . . . . . . . . 96B.4 . . . . . . . . . . . . . . . . . . . . . . . . . . . . . . . . . . . . . . . 97B.5 . . . . . . . . . . . . . . . . . . . . . . . . . . . . . . . . . . . . . . . 98B.6 . . . . . . . . . . . . . . . . . . . . . . . . . . . . . . . . . . . . . . . 100B.7 . . . . . . . . . . . . . . . . . . . . . . . . . . . . . . . . . . . . . . . 101B.8 . . . . . . . . . . . . . . . . . . . . . . . . . . . . . . . . . . . . . . . 102B.9 . . . . . . . . . . . . . . . . . . . . . . . . . . . . . . . . . . . . . . . 105B.10 . . . . . . . . . . . . . . . . . . . . . . . . . . . . . . . . . . . . . . . 106B.11 . . . . . . . . . . . . . . . . . . . . . . . . . . . . . . . . . . . . . . . 107B.12 . . . . . . . . . . . . . . . . . . . . . . . . . . . . . . . . . . . . . . . 108B.13 . . . . . . . . . . . . . . . . . . . . . . . . . . . . . . . . . . . . . . . 109


Preface
The hybrid organo-lead halide perovskites are an emerging class of materials, pro-posed for use as the light absorbers in a new generation of photovoltaic solar cells.The chemical formula for these materials is APbX3, where A is a monovalent or-ganic cation and X represents halide anions (most commonly Br−,Cl− or I−, oralloyed combination of these). In contrast with state of the art photovoltaic materi-als, such as silicon or gallium arsenide, hybrid perovskites offer wide possibilities tomanipulate the chemical composition, resulting in an advanced tunability of the op-toelectronic properties. Another advantage is the inexpensiveness of the depositionprocess used to obtain thin perovskite films for solar cell applications. Further-more, these compounds combine excellent absorption properties with large diffusionlengths and long lifetime of the carriers, while the high recombination rate of thephotocreated carriers limits the photovoltaic photon conversion efficiencies in otherlow-temperature processed materials. For the hybrid perovskites, record efficienciesas high as 22% have been demonstrated in structurally stable compounds. Therefore,with the rapid development of this class of materials, the perovskite photovoltaicshas perspectives to outperform the well-established silicon technology.
Despite the extensive research efforts since the first demonstration of a perovskitesolar cell in 2009, many questions concerning the fundamental properties of hybridperovskites remain unanswered. Among them is the value of exciton binding energy,determining the nature of the photocreated carriers. It is also important to preciselydefine the role of morphology, in particular the differences in optical quality betweenthe adjacent crystalline grains within the perovskite thin films, on the performanceof the photovoltaic devices.
In this thesis, we use optical methods to investigate the basic electronic proper-ties and morphology in several representatives of the hybrid perovskites. We studythe compounds based on Methylammonium and Formamidinium organic cations;the iodides and wide band-gap bromides. Using magneto-transmission, we deter-mine the values of exciton binding energy and reduced mass with an improvedaccuracy surpassing previously reported results, obtained with indirect methods.Using spatially resolved photoluminescence, we investigate the morphology of per-ovskite films between 4 K and the room temperature with 1 µm resolution, whichenables us to observe single crystalline grains. Our results determine the influenceof chemical composition on the studied parameters, which is crucial for the synthesisand optimization of new perovskite hybrid compounds.
Chapter 1 introduces the topic of the thesis, starting from the properties of theexcitons. Then, the general information about the perovskite crystalline structureare provided. Further sections are devoted to the hybrid perovskites; we discuss theinfluence of chemical composition on the structural and optoelectronic properties,the band structure, carrier diffusion lengths and lifetimes, and structural stabilityof these compounds. Finally, we present the advantages and disadvantages of the
2
most popular hybrid perovskite compounds synthesized until now, showing also amost probable evolution of this research field.
Chapter 2 presents the experimental techniques and equipment used for themeasurements in this thesis. In Chapter 3, we describe the investigated thin-filmsamples and the methods of their fabrication. We also characterize the samples, per-forming temperature-dependent transmission. We demonstrate that the progress ofthe phase transition from the low-temperature orthorhombic phase to the tetragonalphase with increasing temperature depends on the chemical composition.
Chapter 4 is devoted to high-field magneto-spectroscopy. First, we discuss theinfluence of magnetic field on the optical transitions. Then, we present our magneto-transmission studies in the low temperature, orthorhombic phase and higher temper-ature tetragonal phase. We extract the exciton binding energies and reduced masses,showing that these parameters depend linearly on the band gap energy, without theinfluence of the type of the organic cation. We find that the exciton binding ener-gies at low temperatures are smaller or comparable to the average thermal energy atroom temperature, and that these values fall further at higher temperatures. Basedon that we conclude that the carriers photocreated in a perovskite solar cell can beconsidered to be thermally ionized at room temperature.
In Chapter 5, we present our results on spatially-resolved photoluminescence. Wedemonstrate that all investigated perovskite thin films are composed from the darkand bright crystalline grains. We show that the low temperature transition fromthe tetragonal to orthorhombic phase is incomplete, as the remains of the tetragonalphase are found even at T = 4 K. The size of the tetragonal phase inclusion iscomparable to the dimensions of single crystalline grains, while macroscopic phasedomains, containing hundreds of single grains, have been observed only in the highband-gap tri-bromide compound. Furthermore, we find that the occurrence of thetetragonal phase inclusions is enhanced in structurally damaged and photo annealedregions.
Chapter 6 contains our preliminary results from studies of fully inorganic, caesium-based CsPbX3 compounds. By comparing the exciton binding energies and reducedmasses in the inorganic and hybrid compounds, we aim at understanding the role ofthe organic cation in determining the properties of organo-lead halide perovskites.
Chapter 1
Introduction
Contents1.1 Interband absorption in the semiconductors: excitons . . . 3
1.2 Perovskite structure . . . . . . . . . . . . . . . . . . . . . . . . 6
1.3 Hybrid perovskites . . . . . . . . . . . . . . . . . . . . . . . . 9
1.3.1 The role of halides: the inorganic cage . . . . . . . . . . . . . 9
1.3.2 The role of organic cations: hydrogen bonds and octahedratilting . . . . . . . . . . . . . . . . . . . . . . . . . . . . . . . 10
1.3.3 Temperature dependence of the structural properties . . . . . 11
1.3.4 Stability of organic-inorganic perovskites . . . . . . . . . . . . 13
1.4 Electronic properties of hybrid organic-inorganic perovskites 15
1.4.1 Band structure . . . . . . . . . . . . . . . . . . . . . . . . . . 15
1.4.2 Carrier diffusion lengths and mobilities . . . . . . . . . . . . . 18
1.5 The evolution of hybrid perovskite materials . . . . . . . . . 20
1.5.1 Towards the perovskite solar cells: the requirements for thephotoactive material . . . . . . . . . . . . . . . . . . . . . . . 20
1.5.2 The perovskite light absorbers beyond MAPbI3 . . . . . . . . 21
1.5.3 A key to the stability: mixed-cation mixed-halide hybrid per-ovskites . . . . . . . . . . . . . . . . . . . . . . . . . . . . . . 22
1.1 Interband absorption in the semiconductors: exci-tons
In the semiconductor material, the interband absorption of a photon promotes anelectron from the valence band to the conduction band. The resulting electron- hole pair, interacting via the attractive Coulomb force, is known as the neu-tral exciton. Excitons have been predicted theoretically in 1930s [Frenkel 1931,Peierls 1932, Wannier 1937] and observed for the first time in the absorption spectraof Cu2O [Hayashi 1950]. The properties of excitons in semiconductor materials havebeen summarized, among other works, in the book of Yu and Cardona [Yu 2010],used here as the reference.
Due to an analogy of the electron - hole pair to the electron - proton pair, theexcitons can be described within a hydrogen atom - like model. However, in a

4 Chapter 1. Introduction
crystal, the presence of mobile charges screens the Coulomb interaction between theelectron-hole pair, thus, the relative dielectric constant εr is larger than 1. Therefore,when compared to the hydrogen atom, the binding energy of the exciton is lowered,leading to an increase of the Bohr radius. Depending on the ratio of the Bohrradius to the size of the unit cell in the crystal, the Frenkel or Wannier- Mottexcitons are considered. The excitons in semiconductors are usually large-radiusWannier-Mott excitons [Liang 1970, Yu 2010], in contrast to tightly bound Frenkelexcitons, observed e.g. in the organic semiconductors and ionic crystals [Muto 1958,Lidzey 2000].
Below, we discuss the properties of Wanier-Mott excitons within the effectivemass approximation, assuming parabolic, non-degenerate bands of isotropic disper-sion. In this approach, the motion of the electron and hole can be described usingseparable coordinates of the excitonic center of the mass ~R and the relative coordi-nates of electron and hole ~r:
~R =m∗e ~re +m∗h ~rhm∗e +m∗h
~r = ~re − ~rh, (1.1)
where ~re, ~rh and m∗e,m∗h are vectors of the positions and effective masses of electronand hole, respectively. The ~R coordinate describes the motion of a particle of a massM = m∗e + m∗h. The Coulomb interaction between the electron and hole dependsonly on the relative coordinate ~r. The envelope of the excitonic wavefunction isgiven by [Yu 2010]:
Ψ(~re, ~rh) = N−1/2 exp(i ~K ~R
)φ(‖~r‖), (1.2)
where ~K = ~ke + ~kh is the exciton wavevector and N is the unit cell volume. Theground state of an exciton is described with a wavefunction analogous to the wave-function of the 1s state of hydrogen atom:
φ(‖~r‖) =1√πa∗B
3exp
(−‖~r‖a∗B
)(1.3)
where a∗B = ~2εµe2
is the excitonic Bohr radius. Here, e and ε = ε0εr are the fun-damental electric charge and the effective dielectric constant of the semiconductor,respectively, while µ is the reduced excitonic mass, related to the effective massesof the electron and hole as:
1
µ=
1
m∗e+
1
m∗h(1.4)
In a material with the band gap energy Eg, the energy of the nth excitonic level hasa following form:
En( ~K) = Eg +~2 ~K2
2M− R∗
n2. (1.5)
The second term in the Equation 1.5 corresponds to the kinetic energy of the ex-citonic center of the mass, while the last term is the exciton binding energy, equal
1.1. Interband absorption in the semiconductors: excitons 5
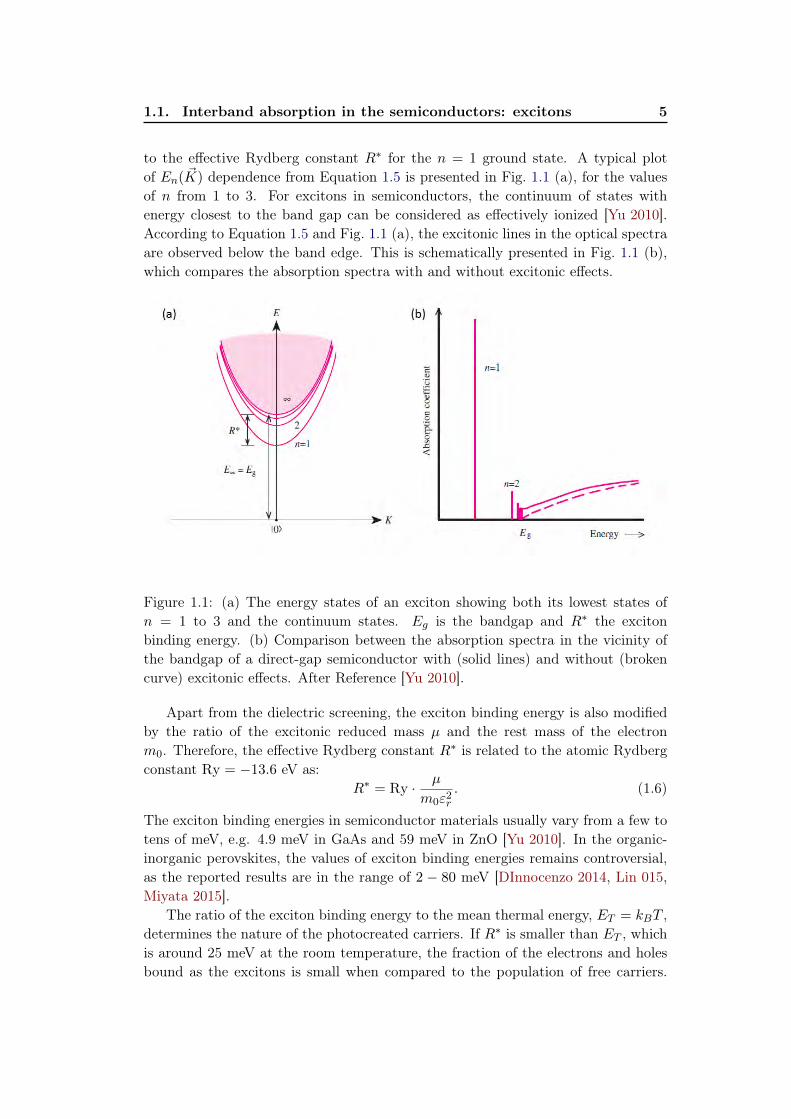
to the effective Rydberg constant R∗ for the n = 1 ground state. A typical plotof En( ~K) dependence from Equation 1.5 is presented in Fig. 1.1 (a), for the valuesof n from 1 to 3. For excitons in semiconductors, the continuum of states withenergy closest to the band gap can be considered as effectively ionized [Yu 2010].According to Equation 1.5 and Fig. 1.1 (a), the excitonic lines in the optical spectraare observed below the band edge. This is schematically presented in Fig. 1.1 (b),which compares the absorption spectra with and without excitonic effects.
Figure 1.1: (a) The energy states of an exciton showing both its lowest states ofn = 1 to 3 and the continuum states. Eg is the bandgap and R∗ the excitonbinding energy. (b) Comparison between the absorption spectra in the vicinity ofthe bandgap of a direct-gap semiconductor with (solid lines) and without (brokencurve) excitonic effects. After Reference [Yu 2010].
Apart from the dielectric screening, the exciton binding energy is also modifiedby the ratio of the excitonic reduced mass µ and the rest mass of the electronm0. Therefore, the effective Rydberg constant R∗ is related to the atomic Rydbergconstant Ry = −13.6 eV as:
R∗ = Ry · µ
m0ε2r
. (1.6)
The exciton binding energies in semiconductor materials usually vary from a few totens of meV, e.g. 4.9 meV in GaAs and 59 meV in ZnO [Yu 2010]. In the organic-inorganic perovskites, the values of exciton binding energies remains controversial,as the reported results are in the range of 2 − 80 meV [DInnocenzo 2014, Lin 015,Miyata 2015].
The ratio of the exciton binding energy to the mean thermal energy, ET = kBT ,determines the nature of the photocreated carriers. If R∗ is smaller than ET , whichis around 25 meV at the room temperature, the fraction of the electrons and holesbound as the excitons is small when compared to the population of free carriers.

6 Chapter 1. Introduction
This has a particular significance for the photovoltaic devices, where the efficientextraction of the photoexcited carriers substantially contributes to the photon con-version efficiency. In contrast, if R∗ > ET , the electron-hole pair remains bound bythe Coulomb interaction.
Apart from the neutral excitons, more complex excitonic systems can be formedin the semiconductors. The electrically neutral potential traps, such as the intrinsicor intentionally introduced impurity atoms or defects, capture the free excitons. Dueto such localization, a free exciton becomes a bound exciton [Pelant 2012, Yu 2010].If the binding impurities are not electrically neutral, the Coulomb interactions withthe electron-hole pair further increases the binding energy. Therefore, as in e.g. theluminescence spectra of GaAs, the bound excitons are detected at energies lowerthan the free exciton, and the emission energy of the excitons bound on the chargedimpurities is lower than those formed on electrically neutral traps.Due to the large Bohr radius of the Wannier-Mott excitons, the cross section for thelocalization on the impurities is high. Therefore, the photoluminescence spectra canbe dominated by the bound exciton emission even for materials with a low impuritylevel.
In a semiconductor which is doped n- or p-type (with excess of free carriers),the charged excitons (also known as trions) can be created. When compared to theneutral exciton, the trions have an additional electron or hole, thus their net chargeis −e (negative trion) or +e (positive trion). The existence of charged excitonshas been predicted by Lampert [Lampert 1958] with a suggested first demonstra-tion in bulk silicon and germanium [Kawabata 1977, Thomas 1977]. However, asthe binding energy for the additional charged particle is relatively low, the con-finement resulting from a reduced dimensionality of the semiconductor structure iscrucial for the observation of the trions. The first observation of spectrally well-resolved absorption lines corresponding to the trions has been reported in mod-ulation doped CdTe quantum wells by Kheng et al. [Kheng 1993]. Apart fromthe quantum wells, the trions have been observed in low-dimensional structures asquantum dots [Kossacki 2000, Jha 2009, Gong 2015], and two dimensional transi-tion metal dichalcogenides [Mak 2012, Mitioglu 2013]. Another excitonic complexcharacteristic for the low-dimensional structures is a biexciton, a state composed oftwo neutral excitons, observed at high excitation power densities [Kalt 2013].
1.2 Perovskite structure
The perovskites are a class of compounds which have the same crystal structure ascalcium titanate (CaTiO3), the mineral originally named perovskite. The generalchemical formula of perovskites is ABX3, as the unit cell consists of two cations (alarge cation A and smaller cation B) and three anions, denoted by X. A remark-able perovskite material is lead zirconate titanate Pb[ZrxTi1−x]O3, known also asPZT, a ferroelectric compound which has dominated the industry of piezoelectric de-vices [Uchino 2015]. The perovskites are also investigated, among other applications,

1.2. Perovskite structure 7
as superconductors [He 2001, Gordon 2016] or topological insulators [Haldane 1988,Jin 2012].
The perovskite structure in its simplest, cubic form, is schematically presentedin Fig. 1.2. Such structure can be described as cubic close packed lattice of A andX ions, with B ions in a 6-fold coordination, as they are located at the octahedralvacancies of the X ions [Johnsson 2007]. Therefore, the B and X ions form a grid ofcorner-sharing BX6 octahedra, with the A cations incorporated inbetween the grid.The A cation is then surrounded by cuboctahedron of anions (12-fold coordination).
Figure 1.2: The ideal cubic perovskite structure: corner-sharing BX6 octahredra (B= blue spheres, X = red spheres) and the A cation (violet sphere) in the center of theunit cell in 12-fold cuboctahedral coordination. After Reference [Johnsson 2007].
In the ideal perovskite cubic structure, the length of the unit cell a is equal to:
a =√
2(rA + rX) = 2(rB + rX), (1.7)
where rA,B,X are the ionic radii of A,B and X ions, respectively. However, this iden-tity relation is not fulfilled for the majority of perovskite compounds. This causesa tilt or rotation of the BX6 octahedra in order to fill in the space. As a result, thesymmetry of the crystal structure is lowered. Two examples of such distorted lat-tices, orthorhombic and tetragonal, are schematically shown in Fig. 1.3 (a) and (b),respectively. The undistorted cubic structure for comparison is shown in panel (c).In order to determine the degree of distortion, a parameter named Goldschmidt’stolerance factor t [Johnsson 2007, Amat 2014, Kieslich 2015] is commonly used:
t =
√2(rA + rX)
2(rB + rX). (1.8)

8 Chapter 1. Introduction
Figure 1.3: The crystal structures of the (a) orthorhombic, (b) tetragonal and (c)cubic phases of MAPbI3. The upper and lower panels are oriented through <
100 > and < 001 >, respectively. The PbI6 octahedra are shaded grey. AfterReference [Brivio 2015].
It is a ratio of the lengths of the unit cell from Equation 1.7. The SrTiO3 is anideal cubic perovskite with t = 1 [Johnsson 2007]. The cubic structure is expectedto be stable in the range of 0.89 < t ≤ 1. For lower values of t, the perovskitesform the tetragonal 0.81 < t < 0.87 and orthorhombic t < 0.81 structures. Thehexagonal phase occurs for t > 1 (e.g. BANiO3) [Johnsson 2007]. It should benoticed, that Goldschmidt’s tolerance factor is only a rough approximation for thedistortion effects. As this parameter considers exclusively the ionic bonds, it be-comes highly inaccurate in the case when the molecules are incorporated into theperovskite lattice [Johnsson 2007, Amat 2014, Kieslich 2015].
Moreover, the relative cation size is only one of the factors influencing the lat-tice symmetry. Among the others are e.g. the distortions due to deviation fromthe ideal ABX3 formula. This is most common in the perovskite oxides, where dueto oxygen vacancies, less symmetric structures are formed instead of the BX6 oc-tahedra [Vidyasagar 1985, Yang 2003]. Also, in perovskites with transition metalions incorporated in the B position, the Jahn-Teller effect can be observed if the d

1.3. Hybrid perovskites 9
orbitals are unevenly occupied. This results in the elongation of the BX6 octahedra,leading to their rotation, as observed in LaMnO3 [Johnsson 2007, Aguado 2012].
It is also important to note that the perovskite structure depends on the tem-perature. Due to the differences in the temperature evolution of particular latticeconstants, the level of distortion changes, inducing transitions between differentcrystal structures. As an example, BaTiO3 exhibits three phase transitions (con-secutively the rhombohedral, orthorhombic, tetragonal and cubic phases) between-90 C and 120 C [Johnsson 2007]. The temperature dependence of the crystalsstructure of organic-inorganic perovskites is further discussed in Section 1.3.3.
1.3 Hybrid perovskites
In the hybrid perovskites, the large cation (A in the ABX3 general formula) is anorganic molecule. The most common organic compounds are Methylammonium(MA: CH3NH+
3 ) or Formamidinium (FA: CH(NH2)+2 ). Usually, the lead ions Pb2+
are incorporated in the small-cation B positions (lead-free materials, containing tin,B=Sn2+, have also been investigated [Noel 2014, Anaraki 2016]). The X positionsare occupied by the anions of group VII halides (Br−,Cl−,I−), either in homoge-nous or mixed compositions. The most recognized representative of this family isMAPbI3, used for the first demonstration of a perovskite solar cell [Kojima 2009].This widely investigated compound is now being surpassed by newly synthesizedmaterials, as the large number of available combinations in the ionic content allowsan advanced tailoring of the perovskites’ properties [Amat 2014, Hoke 2015], whichwill be briefly discussed below.
1.3.1 The role of halides: the inorganic cage
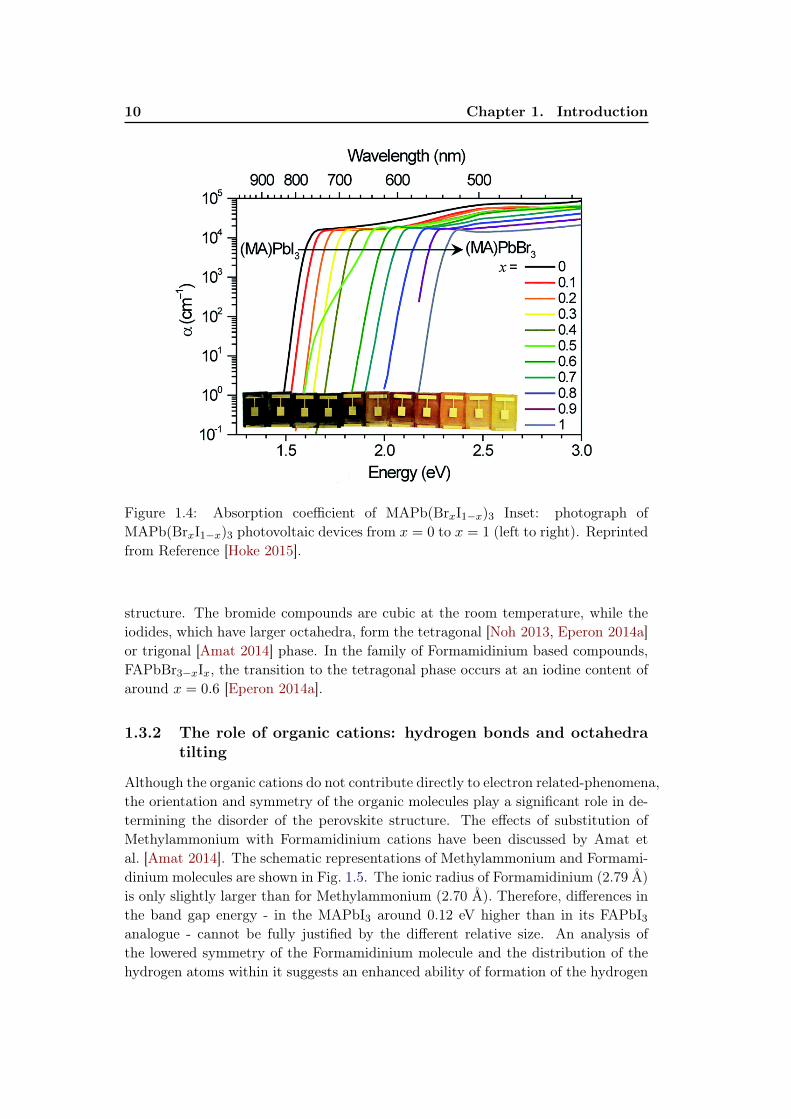
In hybrid perovskites, the conduction and valence band originate from the or-bitals of the inorganic lattice [Umebayashi 2003]. Therefore, the chemical com-position of the octahedral anionic cage has a significant impact on the electronicproperties of perovskites, in particular, the band gap energy. Substitution- par-tial or total - of the halide anions in the perovskite lattice with lighter halides(thus, the elements of higher electronegativity), results in an increase of the bandgap [Kulkarni 2014, Hoke 2015, yi Huang 2016]. Such an evolution of the band gapenergy is demonstrated in Fig. 1.4, which contains a photograph of the Methylam-monium - based photovoltaic devices of different halide content. This figure showsa sequential change from pure tri-iodide to pure tri-bromide from left to right, withcorresponding absorption coefficients as the function of wavelength/energy. TheMAPbI3 has a band gap Eg ' 1.6 eV, which blue-shifts to the visible range as theiodine ions are gradually substituted with bromine (Eg ' 2.2 eV for MAPbBr3).Introducing the lightest chlorine ions, it is possible to increase the band gap evento the UV range (Eg ' 3.1 eV for MAPbCl3 [Suarez 2014]).
The influence of the halide composition on the lattice parameters reflects inthe size-induced alignment of the BX6 octahedra, leading to changes in the crystal
10 Chapter 1. Introduction
Figure 1.4: Absorption coefficient of MAPb(BrxI1−x)3 Inset: photograph ofMAPb(BrxI1−x)3 photovoltaic devices from x = 0 to x = 1 (left to right). Reprintedfrom Reference [Hoke 2015].
structure. The bromide compounds are cubic at the room temperature, while theiodides, which have larger octahedra, form the tetragonal [Noh 2013, Eperon 2014a]or trigonal [Amat 2014] phase. In the family of Formamidinium based compounds,FAPbBr3−xIx, the transition to the tetragonal phase occurs at an iodine content ofaround x = 0.6 [Eperon 2014a].
1.3.2 The role of organic cations: hydrogen bonds and octahedratilting
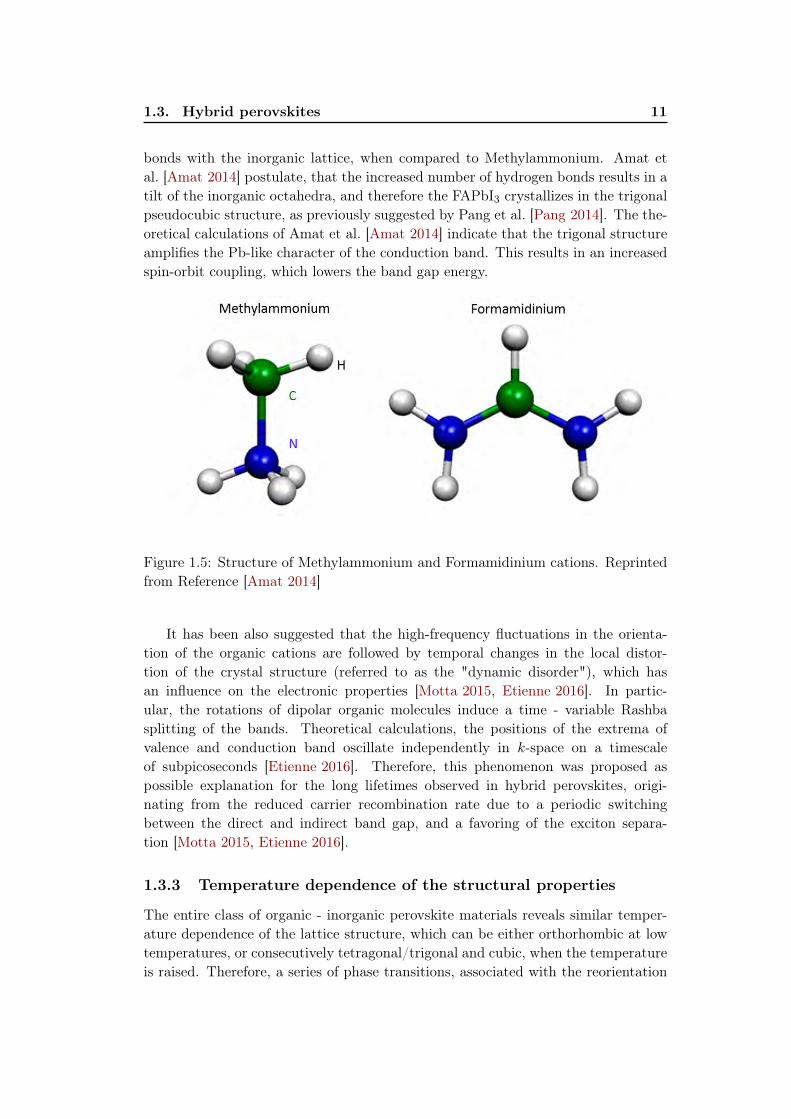
Although the organic cations do not contribute directly to electron related-phenomena,the orientation and symmetry of the organic molecules play a significant role in de-termining the disorder of the perovskite structure. The effects of substitution ofMethylammonium with Formamidinium cations have been discussed by Amat etal. [Amat 2014]. The schematic representations of Methylammonium and Formami-dinium molecules are shown in Fig. 1.5. The ionic radius of Formamidinium (2.79 Å)is only slightly larger than for Methylammonium (2.70 Å). Therefore, differences inthe band gap energy - in the MAPbI3 around 0.12 eV higher than in its FAPbI3analogue - cannot be fully justified by the different relative size. An analysis ofthe lowered symmetry of the Formamidinium molecule and the distribution of thehydrogen atoms within it suggests an enhanced ability of formation of the hydrogen
1.3. Hybrid perovskites 11
bonds with the inorganic lattice, when compared to Methylammonium. Amat etal. [Amat 2014] postulate, that the increased number of hydrogen bonds results in atilt of the inorganic octahedra, and therefore the FAPbI3 crystallizes in the trigonalpseudocubic structure, as previously suggested by Pang et al. [Pang 2014]. The the-oretical calculations of Amat et al. [Amat 2014] indicate that the trigonal structureamplifies the Pb-like character of the conduction band. This results in an increasedspin-orbit coupling, which lowers the band gap energy.
Figure 1.5: Structure of Methylammonium and Formamidinium cations. Reprintedfrom Reference [Amat 2014]
It has been also suggested that the high-frequency fluctuations in the orienta-tion of the organic cations are followed by temporal changes in the local distor-tion of the crystal structure (referred to as the "dynamic disorder"), which hasan influence on the electronic properties [Motta 2015, Etienne 2016]. In partic-ular, the rotations of dipolar organic molecules induce a time - variable Rashbasplitting of the bands. Theoretical calculations, the positions of the extrema ofvalence and conduction band oscillate independently in k-space on a timescaleof subpicoseconds [Etienne 2016]. Therefore, this phenomenon was proposed aspossible explanation for the long lifetimes observed in hybrid perovskites, origi-nating from the reduced carrier recombination rate due to a periodic switchingbetween the direct and indirect band gap, and a favoring of the exciton separa-tion [Motta 2015, Etienne 2016].
1.3.3 Temperature dependence of the structural properties
The entire class of organic - inorganic perovskite materials reveals similar temper-ature dependence of the lattice structure, which can be either orthorhombic at lowtemperatures, or consecutively tetragonal/trigonal and cubic, when the temperatureis raised. Therefore, a series of phase transitions, associated with the reorientation

12 Chapter 1. Introduction
of the BX6 octahedra, can be observed in these compounds [Oku 2015, Frost 2016].The temperature ranges corresponding to the particular phase transitions, on theexample of the family of Methylammonium-based compounds - MAPbI3, MAPbBr3and MAPbCl3, are presented in Fig. 1.6.
Figure 1.6: Temperature dependence of the crystal structure in MAPbI3,MAPbBr3 and MAPbCl3. Data after the Reference [Oku 2015], figure reprintedfrom [da Silva 2015]
At the low temperature orthorhombic phase, the sublattice of the organic cationsis ordered, with their motion being limited to vibrations without a reorientation ofthe C-N bonds [Ong 2015, Frost 2016]. The increasing temperature induces a rela-tively large expansion of the out-of-plane c lattice constant, eventually enabling therotation of the entire organic molecule. At this point, the orientation of the organiccations can be distributed between eight disordered states, which is followed by areorientation of the inorganic octahedra. This changes are associated with the trans-formation to the tetragonal phase [Weller 2015, Ong 2015]. This first order phasetransition, reported to occur in the range between 140 K and 170 K for differentcompounds (see Fig. 1.6), has a significant influence on the optoelectronic proper-ties of hybrid perovskites. One of the consequences of the transformation from theorthorhombic to tetragonal structure is a decrease in the band gap energy, which isin the range of 10 - 90 meV depending of the compound [Wang 2015a, Kong 2015].The libration of the organic molecules, quenched at lower temperatures, becomesallowed in the tetragonal phase [Ong 2015]. As a result, the contribution of theorganic sublattice to the electric field screening increases. The resulting increasein the low-frequency dielectric constant leads to a drop in the exciton binding en-ergy [Even 2014b].
Remarkably, microscopic studies have revealed that in the polycrystalline films

1.3. Hybrid perovskites 13
the phase transition between the orthorhombic and tetragonal structure does nothappen uniformly over the film. The remains of the tetragonal phase can be foundeven at temperatures as low as 4 K, which is also discussed in this work. Thetemperatures at which the entire film is converted to the tetragonal phase, usu-ally attributed to the phase transition point, are similar between the differentreports. Only in the perovskite materials composed of small (< 500 nm) crys-talline grains, the temperature of this structural transformation was shown to begrain size dependent [Li 2016]. Depending on the compound, the phase tran-sition was reported to develop over the temperature range of a few to tens ofKelvin [Wang 2015a, Kong 2015]. This process has been thoughtfully studied inthe archetypal MAPbI3 [Osherov 2016]. It has been shown that in this material,the ratio of the orthorhombic and tetragonal phase domains within the film at giventemperature depends on the direction and rate of the temperature change. Theexistence of such hysteresis has been confirmed by the optical and crystallographicstudies [Osherov 2016].
The parameters of the tetragonal lattice become more isotropic with furtherincrease of the temperature above the phase transition point, resulting in the sec-ond order transition to the cubic phase. This structural change can be observedwith the temperature-dependent studies of neutron [Weller 2015] or X-ray diffrac-tion [Swainson 2003, Wang 2015b] and specific heat capacity [Onoda-Yamamuro 1990].As shown in Fig. 1.6, the temperature of transition from the tetragonal to cubicphase is influenced by the size of the halide atoms. The elongation of the relativelylarge inorganic cage along the c axis suppresses the formation of the cubic phase inMAPbI3 until 327 K, while the compounds containing smaller bromine and chlorineatoms undergo this process at around 240 K and 178 K, respectively.
1.3.4 Stability of organic-inorganic perovskites
The long term stability of organic-inorganic perovskite compounds is the biggestchallenge for the perovskite-based photovoltaics. Below, we discuss the most impor-tant factors which influence the lifetime of the perovskite-based solar devices.The photoactive and photo - inactive phases. Some of the hybrid perovskitescan simultaneously form different polymorphic phases. This is, for example, thecase of FAPbI3, which crystallizes either in the photoactive, "black" perovskiteα-phase, or the photo inactive, "yellow" non-perovskite δ-phase [Stoumpos 2013,Eperon 2014b]. The black phase is stable above 60 C; below this temperature,it gradually converts into the photo-inactive polymorph. This process is catalyzedby the presence of humidity [Jeon 2015]. Although the transition to the δ-phase isreversible by annealing [Stoumpos 2013, Jeon 2015], without a permanent stabiliza-tion of the α-phase the optoelectronic properties of FAPbI3 will constantly worsenwith the increasing number of the non-perovskite inclusions.Air and humidity. The hybrid perovskites easily react with water and other polarsolvents [Kojima 2009]. The hydration of MAPbI3 was found to be reversible underthe dry air, however the long exposure to humidity enhances the irreversible sepa-
14 Chapter 1. Introduction
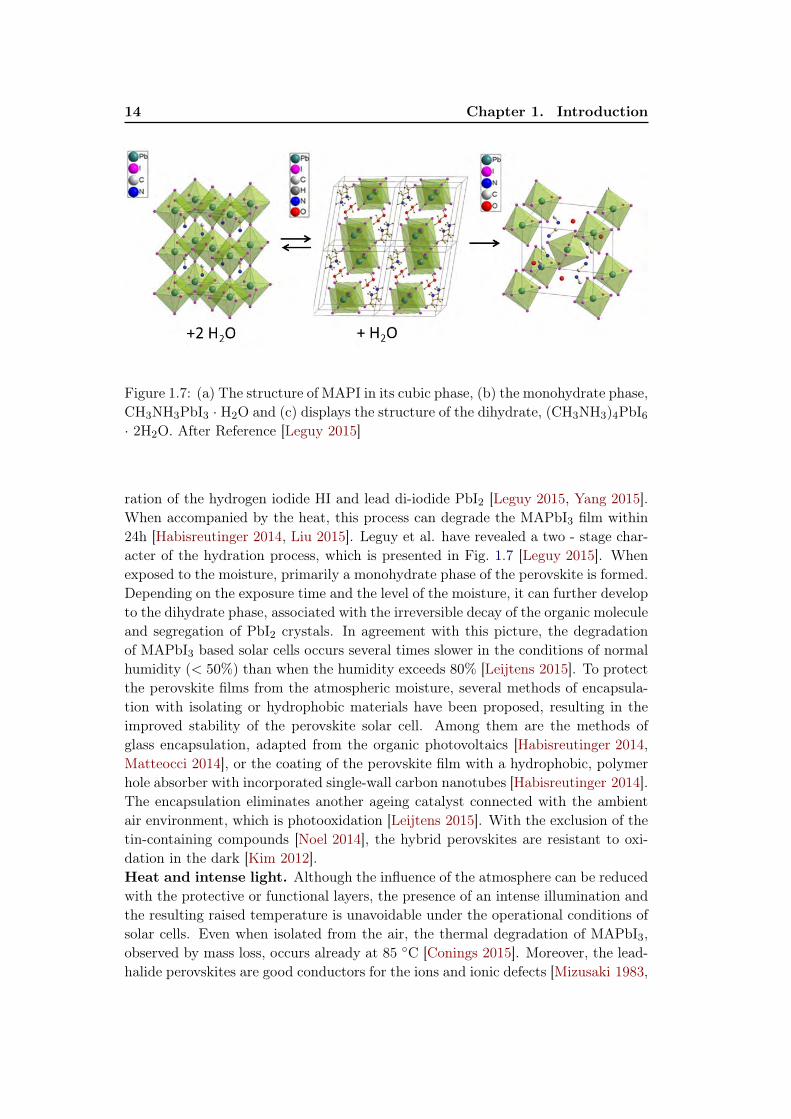
Figure 1.7: (a) The structure of MAPI in its cubic phase, (b) the monohydrate phase,CH3NH3PbI3 · H2O and (c) displays the structure of the dihydrate, (CH3NH3)4PbI6· 2H2O. After Reference [Leguy 2015]
ration of the hydrogen iodide HI and lead di-iodide PbI2 [Leguy 2015, Yang 2015].When accompanied by the heat, this process can degrade the MAPbI3 film within24h [Habisreutinger 2014, Liu 2015]. Leguy et al. have revealed a two - stage char-acter of the hydration process, which is presented in Fig. 1.7 [Leguy 2015]. Whenexposed to the moisture, primarily a monohydrate phase of the perovskite is formed.Depending on the exposure time and the level of the moisture, it can further developto the dihydrate phase, associated with the irreversible decay of the organic moleculeand segregation of PbI2 crystals. In agreement with this picture, the degradationof MAPbI3 based solar cells occurs several times slower in the conditions of normalhumidity (< 50%) than when the humidity exceeds 80% [Leijtens 2015]. To protectthe perovskite films from the atmospheric moisture, several methods of encapsula-tion with isolating or hydrophobic materials have been proposed, resulting in theimproved stability of the perovskite solar cell. Among them are the methods ofglass encapsulation, adapted from the organic photovoltaics [Habisreutinger 2014,Matteocci 2014], or the coating of the perovskite film with a hydrophobic, polymerhole absorber with incorporated single-wall carbon nanotubes [Habisreutinger 2014].The encapsulation eliminates another ageing catalyst connected with the ambientair environment, which is photooxidation [Leijtens 2015]. With the exclusion of thetin-containing compounds [Noel 2014], the hybrid perovskites are resistant to oxi-dation in the dark [Kim 2012].Heat and intense light. Although the influence of the atmosphere can be reducedwith the protective or functional layers, the presence of an intense illumination andthe resulting raised temperature is unavoidable under the operational conditions ofsolar cells. Even when isolated from the air, the thermal degradation of MAPbI3,observed by mass loss, occurs already at 85 C [Conings 2015]. Moreover, the lead-halide perovskites are good conductors for the ions and ionic defects [Mizusaki 1983,

1.4. Electronic properties of hybrid organic-inorganic perovskites 15
Leijtens 2015]. The ion migration freezes out at lower temperatures [Xiao 2014,Yuan 2015], while at room temperature and under applied bias voltage, a devel-opment of a non-stoichiometric distribution of the ions was reported [Zhao 2015,Zhang 2015]. Also, the illumination - induced reversible segregation of the halideions into bromine and iodine rich domains was observed in MAPbBrxI3−x, resultingin the local fluctuations of the band gap energy [Hoke 2015].
The numerous attempts to limit the problems stated above have been made,based mainly on the manipulation of the chemical composition of perovskite ma-terials. The stability of these novel compounds is further discussed in Section 1.5,with Section 1.5.3 being devoted to the most robust, mixed-cation materials.
1.4 Electronic properties of hybrid organic-inorganic per-ovskites
A deep understanding of the fundamental phenomena responsible for the high pho-ton conversion efficiencies in hybrid perovskite solar cells is required for the further,controlled development of these materials. In this section, we summarize the lit-erature concerning the perovskite band structure and the carrier diffusion lengths,explaining the origins of the strong broadband absorption and the efficient extractionof photocreated carriers.
1.4.1 Band structure
The band structure of the hybrid perovskites is commonly derived from the densityfunctional theory (DFT) simulations [Even 2012, Even 2014b, Umari 2014, Zhou 2014].The selected calculations for the cubic MAPbI3, performed by Even et al. [Even 2014b],are summarized below. These results can be extended to the room temperaturetetragonal phase due to the relevance in the symmetry analysis for the structureswith a group-subgroup relationship [Even 2014a].
A schematic view of the reciprocal space of the cubic lattice with the first Bril-louin zone is drawn in Fig. 1.8 (a). Point Γ corresponds to the center of the Brillouinzone, while points M and R are the centers of cube edges and vertices of the cube,respectively. Fig 1.8 (b) presents a plot of the Fermi surface in the Brillouin zone.This isoenergy surface (at E = −0.5 eV) connects the valleys of the Brillouin zone,centered at the R points, with the saddle - like M points. Therefore, the holesphotocreated at the edges of Brillouin zone can migrate towards R.
The band structure calculated for the cubic phase MAPbI3 at the different pointsof the Brillouin zone is shown in Fig. 1.8 (c).The conduction and valence bands arerelatively symmetric, leading to similar values of the effective masses for electronsand holes. Two direct band gaps are found at the R (primary band gap) and M(secondary band gap) points of the Brillouin zone. The character of the conductionband is dominated by lead p orbitals, while the valence band consists of iodine p -with some component of lead s orbitals [Umebayashi 2003, Even 2012, Umari 2014].

16 Chapter 1. Introduction
Figure 1.8: (a) Reciprocal space 3D view showing the first Brillouin zone. (b)Fermi surface (E = −0.5 eV) in the first Brillouin zone Z. R and M are connectedalong the zone edges, highlighting the saddle nature of the point M. (c) Electronicband diagram of the high temperature cubic phase of MAPBI3 taking the spin-orbitcoupling into account. An upward energy shift of 1.4 eV has been applied to matchthe experimental bandgap value at R. The relaxation of the carriers excited alongthe M → R path is sketched. After Reference [Even 2014b].
The contribution of heavy lead atom in both valence and conduction bands enhancesthe spin-orbit interaction. The resulting band splitting is more pronounced in theconduction band, being at ≈ 1.3 eV at the R point. The corresponding value forthe valence band is ' 0.6 eV. Therefore, the spin-orbit interaction has a signifi-cant contribution to reducing the band gap energy, thus the energy of the primaryE1/2,g → E1/2,u optical transition.1 It is also the reason behind the positive tem-
1Although the DFT calculations reproduce well the shape of the bands, the band gap valuesobtained with this method are often significantly underestimated [Onida 2002]. Therefore, the

1.4. Electronic properties of hybrid organic-inorganic perovskites 17
perature coefficient of the band gap, which is in contrast with the majority of semi-conductor materials. Due to a large volume coefficient for the thermal expansion(' 1.35× 10⁻⁴ K−1 50 times more than in the crystalline silicon), the interactionswithin the inorganic lattice are significantly weakened with increasing temperature.The resulting increase of separation between the band extrema leads to a blue-shiftof the band gap [Huang 2013, Singh 2016].
As a result of the saddle-point nature of the M point, the carriers created byphotons of different energies at M point and along M → R path can relax towardsthe R point. This is schematically presented in Fig 1.8 (c). As proposed by Even etal. [Even 2014b], this process can be assisted by the acoustic phonons or couplingto collective molecular rotations. As the secondary F3/2,g → E1/2,u, E1/2,g → F3/2,u
transitions are also optically allowed, is assumed that part of the carriers generatedby light at the R point can remain trapped in spin-orbit split F3/2,g and F3/2,u states.For these states, Even et al. propose optical phonon assisted intraband relaxationprocesses F3/2,g → E1/2,g and F3/2,u → E1/2,u. Such hot-carrier-cooling has beenalready observed in time resolved studies of MAPBI3 [Stranks 2013].
Similar, symmetric band structures with direct band gaps were obtained from thecalculations performed for other cubic phase Methylammonium lead trihalides [Even 2014b,Even 2014a] and for fully inorganic CsPbI3 [Even 2013]. A close analogy to theMAPbI3 band structure has been demonstrated for MAPbCl3, reproducing bandgaps at the R and M points of the Brillouin zone [Even 2014b].
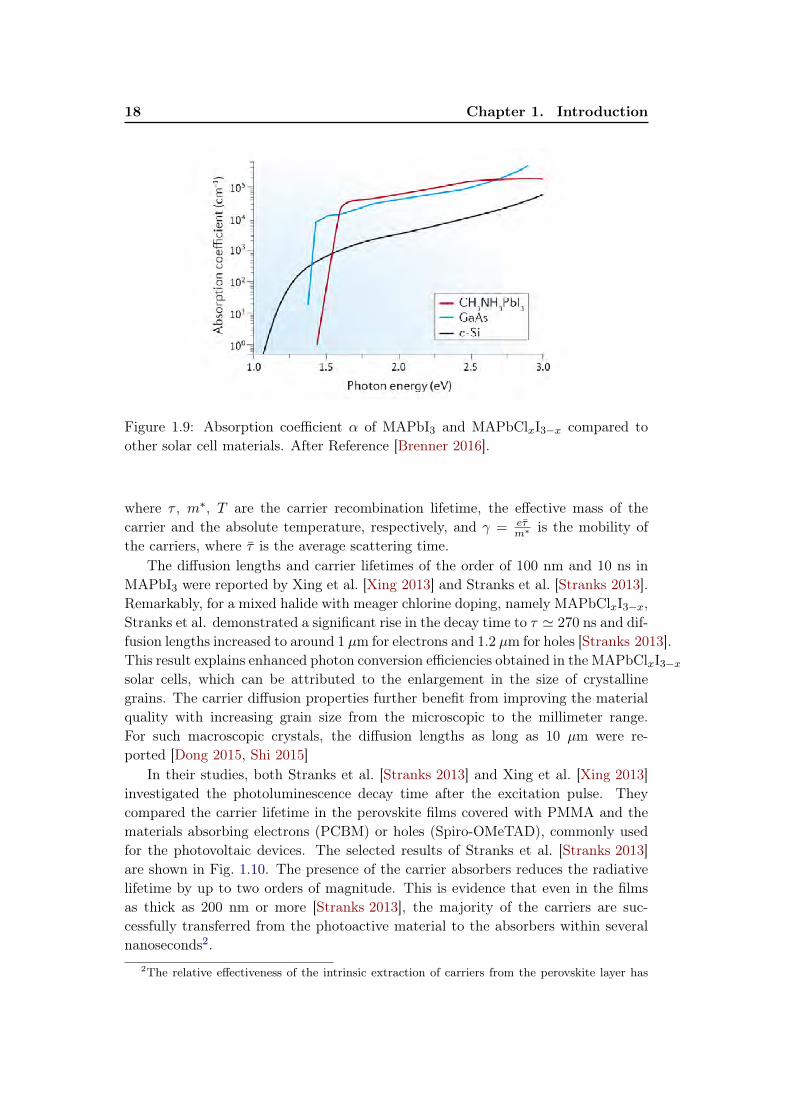
Such multivalley and multiple band gap band structure in organic-inorganic per-ovskites explains the efficient broadband absorption reported for these compounds.The theoretical calculations described above are confirmed with numerous measure-ments of the absorption coefficient, which reveal the existence of both low- andhigh-energy band gaps [Green 2015b, Brenner 2016]. The experimentally deter-mined room-temperature absorption coefficient of MAPbI3 is presented in Fig. 1.9,compared with the results obtained for c-Si and GaAs, the reference photovoltaicmaterials. Due to relatively high band gap, the infrared absorption of the MAPbI3is low. However, in the visible spectral range, where the energy density of the solarradiation is highest, the absorption coefficient of MAPbI3 is comparable to that fromGaAs, and is more than order of magnitude larger than in Si. Therefore, the lightabsorbing perovskite layers in solar cells can have relatively low thickness, whichallows to design semi-transparent photovoltaic devices.
1.4.2 Carrier diffusion lengths and mobilities
The parameter determining the ability of photocreated free carriers to move withinthe crystal is the diffusion length, given by:
L =
√eτγ
kBT(1.9)
bands in Fig. 1.8 (b) have been shifted upwards by 1.4 eV in order to correspond to the experimentalvalue for the low-energy bandgap at the R-point [Even 2014b].
18 Chapter 1. Introduction
Figure 1.9: Absorption coefficient α of MAPbI3 and MAPbClxI3−x compared toother solar cell materials. After Reference [Brenner 2016].
where τ , m∗, T are the carrier recombination lifetime, the effective mass of thecarrier and the absolute temperature, respectively, and γ = eτ
m∗ is the mobility ofthe carriers, where τ is the average scattering time.
The diffusion lengths and carrier lifetimes of the order of 100 nm and 10 ns inMAPbI3 were reported by Xing et al. [Xing 2013] and Stranks et al. [Stranks 2013].Remarkably, for a mixed halide with meager chlorine doping, namely MAPbClxI3−x,Stranks et al. demonstrated a significant rise in the decay time to τ ' 270 ns and dif-fusion lengths increased to around 1 µm for electrons and 1.2 µm for holes [Stranks 2013].This result explains enhanced photon conversion efficiencies obtained in the MAPbClxI3−xsolar cells, which can be attributed to the enlargement in the size of crystallinegrains. The carrier diffusion properties further benefit from improving the materialquality with increasing grain size from the microscopic to the millimeter range.For such macroscopic crystals, the diffusion lengths as long as 10 µm were re-ported [Dong 2015, Shi 2015]
In their studies, both Stranks et al. [Stranks 2013] and Xing et al. [Xing 2013]investigated the photoluminescence decay time after the excitation pulse. Theycompared the carrier lifetime in the perovskite films covered with PMMA and thematerials absorbing electrons (PCBM) or holes (Spiro-OMeTAD), commonly usedfor the photovoltaic devices. The selected results of Stranks et al. [Stranks 2013]are shown in Fig. 1.10. The presence of the carrier absorbers reduces the radiativelifetime by up to two orders of magnitude. This is evidence that even in the filmsas thick as 200 nm or more [Stranks 2013], the majority of the carriers are suc-cessfully transferred from the photoactive material to the absorbers within severalnanoseconds2.
2The relative effectiveness of the intrinsic extraction of carriers from the perovskite layer has

1.4. Electronic properties of hybrid organic-inorganic perovskites 19
Figure 1.10: Time-resolved PL measurements taken at the peak emission wavelengthof the MAPbI3 (a) and MAPbClxI3−x (b) an electron (PCBM; blue triangles) orhole (Spiro-OMeTAD; red circles) quencher layer, along with stretched exponentialfits to the PMMA data (black squares) and fits to the quenching samples by usingthe one- dimensional diffusion model. Inset: comparison of the PL decay of the twoperovskites (with PMMA) on a longer time scale. After Reference [Stranks 2013].
On the other hand, the experimental estimations for the electron mobility in thehybrid perovskites are only≤ 100 cm2V−1s−1 either in the thin films [Stoumpos 2013]or high-quality macroscopic monocrystals [Dong 2015, Shi 2015]. Therefore, in theterms of mobility, even the high quality organic - inorganic perovskites are posi-tioned closer to the other solution-processed materials than the epitaxially grownsemiconductors, despite low effective masses [Brenner 2015].
This leads to the conclusion that the large diffusion lengths (Equation 1.9) in the
been demonstrated with the simplified, hole-absorber-free design of MAPbI3 solar cell, revealingthe efficiency of 5.5% [Etgar 2012]
20 Chapter 1. Introduction
hybrid perovskites originate from the long carrier lifetimes due to the low recombina-tion rates (see Section 1.3.2 for proposed cation-dynamics related mechanism for theenhanced carrier lifetime). Reaching up to 10 µm, the diffusion lengths observed inthe high quality perovskites crystals are comparable to those reported for the dopedGaAs [Aukerman 1967, Edelman 1992], one of the leading photovoltaic materials,achieving record PCEs close to 29% [Green 2015a]. Therefore, considering the car-rier extraction efficiency, the hybrid perovskites are better than other inexpensivelow-temperature solution-processed materials, where the poor crystalline qualityis the limiting factor [Facchetti 2011, Selinsky 2013]. The diffusion lengths in theorganic conjugated compounds are of the order of only 10 nm [Haugeneder 1999,Shaw 2008, Kroeze 2003]. Thus, the PCEs in such dye sensitized materials, suf-fering from carrier scattering and recombination loses, are limited to 12% despitethe efficient light absorption [Wang 2015c, Han 2012, Chiba 2006]. The record PCErecently reported for a mixed-cation perovskite device is approximately two timeshigher [Saliba 2016b].
1.5 The evolution of hybrid perovskite materials
The undergoing development of hybrid perovskite materials is driven by the re-quirements of the photovoltaic applications. Two most important aims can be dis-tinguished:1) Further improvement of the photon conversion efficiency (PCE) by the adjust-ment of the band gap energy either for the single or multiple junction architectureand optimizing the material’s optoelectronic properties and improving its morphol-ogy.2) Achievement of the long-term structural stability under operational conditions.
1.5.1 Towards the perovskite solar cells: the requirements for thephotoactive material
The optimal band gap energy. The band gap of silicon (1.1 eV) is considered tobe the optimal band gap for a single junction solar cell [Shockley 1961]. Therefore,for a further increase of the PCEs in the single-junction architectures, the rela-tively high band gaps of the hybrid perovskites (e.g. 1.6 eV in MAPbI3)) should betuned towards lower values by varying the ionic composition. On the other hand, aconcept of a tandem silicon-perovskite solar cell was recently proposed in order tofully exploit the perovskites’ excellent absorption properties in the visible spectralrange [Sivaram 2015, Bailie 2015]. In such architecture, the top, thin perovskite filmcell harvests the high-energy part of the solar spectrum, while the silicon cell belowabsorbs the low energy range. The combined PCEs for these tandem devices areexpected to reach 30%[Sivaram 2015, McMeekin 2016]. The current-match of bothjunctions requires a perovskite band gap of 1.75 eV [Shah 1999], which, as shownbefore, can be tuned to this value simply by manipulation of the halide content (seeSection 1.3.1).
1.5. The evolution of hybrid perovskite materials 21
The role of the morphology: homogeneity and structural defects. The im-portance of the material morphology in the microscopic scale has been demonstratedwith the recent studies of the high quality, millimeter-sized Methylammonium tri-halide crystals [Valverde-Chavez 2015, Dong 2015, Shi 2015]. Grown from solutionin the epitaxial regime, these structures show significantly improved electronic prop-erties when compared to thin films (see also Section 1.4.2) [Dong 2015, Shi 2015].Films, due to their spin-coated nature, reveal a higher level of inhomogeneity andlarger density of defects at the surface or grain boundaries [Shkrob 2014]. Apartfrom disturbing the charge diffusion properties, the non-optimized crystal morphol-ogy results in the limited reproducibility of the perovskite solar cells. The PCEs ofthe perovskite-based devices usually vary around several per cents from the averagevalue, even for the units fabricated in the same series [Jeon 2014].Therefore, it is crucial to optimize both material properties and preparation tech-niques, in order to obtain possibly uniform, defect-free perovskite thin layers.Long-term stability of the perovskite structure. The most important mech-anisms causing the degradation of the hybrid perovskite materials are presented inSection 1.3.4. Sensitive to the humidity, light and raised temperatures, the majorityof the hybrid perovskites degrade within days to weeks even if incorporated into afull solar cell architecture [Leijtens 2015]. As the commercial demand is a solar cellstable at temperatures as high as 85 C over a period of 25 years [Leijtens 2015], itis essential to develop significantly more stable perovskite materials. Moreover, thisrobustness has to be combined with excellent electronic properties, resulting in thePCEs not worse than in the silicon-based competitors.
1.5.2 The perovskite light absorbers beyond MAPbI3
With the band gap of 1.6 eV and a poor resistance towards raised temperature andatmospheric factors, the archetypal MAPbI3 compound does not reveal the desiredproperties of the photovoltaic absorber listed above. Therefore, the possibilities ofapplying alternative hybrid perovskite compounds have been explored. Here, wepresent several of these materials, which have been investigated in this thesis. Webriefly discuss their properties, pointing out the advantages and disadvantages withrespect to the photovoltaic applications.The materials derived from MAPbI3. The mixed halide MAPbClxI3−x is ob-tained through the synthesis of the MAPbI3 in the presence of chlorine-containingprecursors [Dar 2014, Deschler 2014]. As the introduced chlorine atoms are rela-tively small and the level of doping is intentionally low, the band gap of the mixedhalide should intuitively be slightly higher than in the MAPbI3. Instead, a red-shiftof around 50 meV is observed. Additionally, the carrier diffusion lengths are largerby an order of magnitude with respect to the MAPbI3, along with the increased sizeof the crystalline grains (see also Section 1.4.2). The exact mechanism responsiblefor such a significant change in the electronic properties and the amount of effec-tively incorporated chlorine atoms are still under debate [Dar 2014, wook Park 2015,Binek 2016]. One of the proposed explanations suggests the initial crystallization

22 Chapter 1. Introduction
of the MAPbCl3 on the substrate. This induces the growth of the MAPbI3 withmodified lattice properties, resulting in a band gap value lowered towards the single-junction optimum and improved morphology [Binek 2016]. Therefore, the efficien-cies of such mixed-halide based solar devices exceed the results obtained for theconventional MAPbI3 units by 2 % on average.
Encouraging results were also obtained by introducing small metal Al3+ cationsinto the MAPbI3 lattice [Wang 2016]. At the doping level of 0.1%, the band gapremains unchanged, while the increased PCE of MAPbI3:Al solar cells (the recordvalue of 19.1 %) results from the improved uniformity and surface smoothness inthe film [Wang 2016].
Therefore, with the proper control of the morphology and electronic properties,there are perspectives for exceeding 20 % PCE with the devices based on iodine-and Methylammonium-rich materials. However, it is important to note that theirthermal stability is similarly insufficient as in the MAPbI3 archetype.
FAPbI3. The perspectives for the further improvement of the electronic prop-erties arise with the substitution of Methylammonium with Formamidinium cations(see also Section 1.3.2). Compared to MAPbI3, the Formamidinium analogue FAPbI3has a band gap significantly lowered towards the single-junction optimum (≈ 1.5 eV)and diffusion lengths increased by at least the factor of two (>200 µm) [Eperon 2014b].Moreover, this compound is capable of resisting temperatures of 160 C [Koh 2014].However, the formation of the photoinactive δ-phase inclusions in FAPbI3 can-not be completely avoided during the synthesis, and its amount increases withtime [Pellet 2014, Jeon 2015]. As a result, both absorption and carrier diffusionproperties suffer from the presence of the non-perovskite fraction, limiting the pho-ton conversion efficiency to around 16 % [Eperon 2014b, Koh 2014].
Tri-bromides: MAPbBr3 and FAPbBr3. In contrast, the organo lead tri-bromides MAPbBr3 and FAPbBr3, forming the cubic phase of the low distortionlevel, reveal both structural stability and low degradation rate under the operationalconditions [Noh 2013, Zheng 2016]. Though, with the band gap energies of around2.2-2.3 eV, the PCEs of solar cells based on the these materials will be significantlyworse than in the silicon devices.
Therefore, neither the archetypal MAPbI3 and its derivatives, nor the homogenous-cation perovskite compounds can offer both durability and perspectives for the highefficiency. A considerable progress was achieved with the stabilization of the pho-toactive structure in the most promising candidate for the photovoltaic applications,FAPbI3, by alloying it with the robust representatives of the hybrid perovskite fam-ily. As further shown, the approach of combining both different cations and anionsallows to join the advantages of the pure-ion materials, while the propagation of thefactors which limit the PCEs is reduced.
1.5. The evolution of hybrid perovskite materials 23
1.5.3 A key to the stability: mixed-cation mixed-halide hybrid per-ovskites
In order to stabilize the perovskite phase of the FAPbI3, the level of the structuraldistortion must be reduced, resulting in more a cubic-like character of the lattice.This can be achieved by the partial substitution of Formamidinium with smallercations, like the Methylammonium molecules or caesium atoms. Following thisidea, the (FAPbI3)1−x(MAPbBr3)x alloys were intensively studied during the lasttwo years. Jeon et al. have reported the stabilization of the photoactive perovskitephase already at x = 0.15 [Jeon 2015]. Soon after, the (FAPbI3)0.83(MAPbBr3)0.17
was reported as the composition of the optimal stoichiometric proportions of thehost and substituting ions [Correa Baena 2015], which has been reproduced in thelater studies [Bi 2016, Saliba 2016c, Saliba 2016b]. All this work acknowledges thenumerous advantages of such alloys over the pure FAPbI3, resulting in the superiorPCEs (the record yields 21 % [Green 2015a]) despite the bromine-induced blueshiftof the band gap to around 1.65 eV. Among these benefits are the increased photocur-rents and small hysteresis in the J − V curves.. Moreover, the FAPbI3-MAPbBr3compounds reveal improved crystal morphology when compared to FAPbI3, revealedin smoother surface with reduced voids between the grain boundaries [Jeon 2015].
Consequently, the triple-cation mixed compounds containing relatively smallcaesium atoms were proposed as the next step towards the ideal, undistorted cubicstructure. Saliba et al. have investigated the Csx(MA0.17FA0.83)100−xBr0.17I0.83 ma-terials, determining the optimal caesium content at x = 0.05 [Saliba 2016b]. Suchcomposition leads to further reduction of the photoinactive inclusions, resulting insuperior reproducibility of the solar cells and low degradation rate [Eperon 2014a,Saliba 2016b].
In parallel, the caesium - organic cation mixed compounds, the Cs/FA andCs/MA, are developed for tandem silicon - perovskite solar cell applications [Lee 2015,Beal 2016, McMeekin 2016]. According to the studies of the Cs0.17FA0.83(BrxI1−x)3family by McMeekin et al., the optimal 1.74 eV band gap is reached at x =
0.4 [McMeekin 2016]. The band gap energy is widened partially by the presenceof small Cs atoms with reduced bromine content. This allows to avoid the prob-lem of structural stability and crystalline quality at around x = 0.6, where thelattice transforms to bromide-like cubic phase [Rehman 2015]. Simultaneously, thesignificance of the halide segregation (see also Section 1.3.1) is reduced.
One of the most recent works reports on the incorporation of an additional ele-ment, rubidium, into the lattices of previously studied hybrid perovskites [Saliba 2016a].The compound of four mixed A-cations (Cs-Rb-MA-FA) was found capable of pass-ing the standardized durability tests required for the photovoltaic devices. Moreover,it was suggested that the observed degradation originates from a non-optimized ar-chitecture rather than insufficient stability of the perovskite absorber. This stronglysuggests, that the development of complex, multi-cation materials is currently theleading trend towards the commercialization of perovskite-based photovoltaics. Nev-ertheless, to predict the properties of newly designed compounds, a full understand-

24 Chapter 1. Introduction
ing of the fundamental properties and morphology in the pioneering, prototypecompounds is required, which is the aim of this thesis.
Chapter 2
Experimental techniques
Contents2.1 Spectroscopy in high magnetic field . . . . . . . . . . . . . . 25
2.1.1 Pulsed magnetic field generation . . . . . . . . . . . . . . . . 252.1.2 Transmission measurements . . . . . . . . . . . . . . . . . . . 282.1.3 Temporal synchronization . . . . . . . . . . . . . . . . . . . . 31
2.2 Micro-Photoluminescence measurements . . . . . . . . . . . 32
This chapter describes the experimental techniques used to obtain the resultspresented in this thesis. In the first part, the generation of the pulsed magnetic fieldsand the magneto transmission measurements are presented. In the second part, themicro-photoluminescence measurements performed in the absence of magnetic fieldare discussed.
2.1 Spectroscopy in high magnetic field
All measurements in pulsed magnetic fields have been performed in the Labora-toire National des Champs Magnetiques Intenses (LNCMI), Centre National de laRecherche Scientifique (CNRS), Toulouse, France. The LNCMI in Toulouse is one ofthe worlds leading facilities in pulsed magnetic field generation. Pulsed techniquesallow to obtain magnetic field intensities beyond the limits of the superconducting(22 T) and resistive DC field magnets (38 T). Currently, LNCMI produces magneticfields exceeding 90 T with non-destructive long pulses, and up to 150 T using thesemi - destructive, ultrashort pulses. The laboratory serves as a user facility, provid-ing access to high magnetic fields for users from laboratories around the world. Themain research topic is solid state physics, including superconductivity and the elec-tronic properties of semiconductors, investigated with transport and spectroscopicmethods in the temperature range from 100 mK to 300 K. Additionally, the highaccuracy measurements of magnetic birefringence of vacuum and the investigationthe atomic levels in rubidium gas for the future applications in magnetometery arebeing developed.
2.1.1 Pulsed magnetic field generation
The elements of pulsed magnetic field installation in Toulouse are presented in Fig2.1. The pulsed magnetic field is obtained by an electric discharge into a resistive
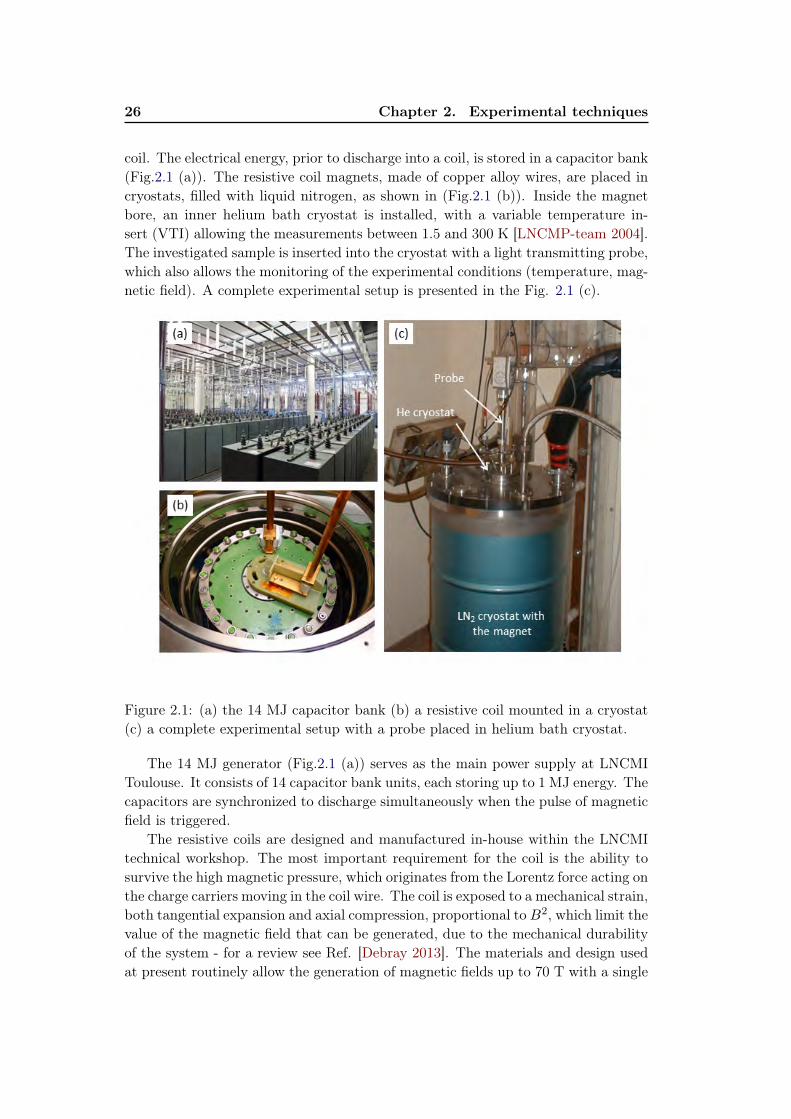
26 Chapter 2. Experimental techniques
coil. The electrical energy, prior to discharge into a coil, is stored in a capacitor bank(Fig.2.1 (a)). The resistive coil magnets, made of copper alloy wires, are placed incryostats, filled with liquid nitrogen, as shown in (Fig.2.1 (b)). Inside the magnetbore, an inner helium bath cryostat is installed, with a variable temperature in-sert (VTI) allowing the measurements between 1.5 and 300 K [LNCMP-team 2004].The investigated sample is inserted into the cryostat with a light transmitting probe,which also allows the monitoring of the experimental conditions (temperature, mag-netic field). A complete experimental setup is presented in the Fig. 2.1 (c).
Figure 2.1: (a) the 14 MJ capacitor bank (b) a resistive coil mounted in a cryostat(c) a complete experimental setup with a probe placed in helium bath cryostat.
The 14 MJ generator (Fig.2.1 (a)) serves as the main power supply at LNCMIToulouse. It consists of 14 capacitor bank units, each storing up to 1 MJ energy. Thecapacitors are synchronized to discharge simultaneously when the pulse of magneticfield is triggered.
The resistive coils are designed and manufactured in-house within the LNCMItechnical workshop. The most important requirement for the coil is the ability tosurvive the high magnetic pressure, which originates from the Lorentz force acting onthe charge carriers moving in the coil wire. The coil is exposed to a mechanical strain,both tangential expansion and axial compression, proportional toB2, which limit thevalue of the magnetic field that can be generated, due to the mechanical durabilityof the system - for a review see Ref. [Debray 2013]. The materials and design usedat present routinely allow the generation of magnetic fields up to 70 T with a single

2.1. Spectroscopy in high magnetic field 27
coil. An energy discharge exceeding the construction limit for the particular coilcauses an abrupt burst of the magnet, resulting in a destructive explosion. To gobeyond the 70 T limit in the non-destructive long pulse experiment, magnetic fieldsgenerated by multiple, coaxial coils are combined. At present, the magnetic fieldintensities in the region of 90 T are available with a dual coil installation.
Typical temporal profiles of the magnetic field, generated with several long pulsecoils available at LNCMI Toulouse are presented in Fig. 2.2. The duration of thesingle coil pulse varies from a few tens to several hundred of milliseconds, dependingon the coil size and design. The temporal profile of a dual coil magnet has ashort and a long component, associated with the discharges in the inner and outercoil, respectively [Jones 2004], as shown with the red curve on Fig. 2.2. The dualcoil system requires two synchronized generators: 12 MJ energy from the maingenerator supplies the outer coil (maximally 34 T at 700 ms pulse duration), whilethe inner coil (maximally 62 T, pulse duration of 25 ms) is powered with 1.15 MJfrom the additional, 6 MJ capacitor bank [Béard 2012]. The maxima of the pulsesare synchronized, inducing 91 T in an effective 9.5 ms combined pulse. All theresults presented in this work were obtained with the 70 T magnet (the typicaltemporal profiles are shown with orange and blue curves).
Figure 2.2: Temporal profiles of typical magnetic field pulses. Magnetic field as afunction of time obtained for different coil systems at the maximal energies availablefor each system. The curves are offset horizontally for clarity.
The solutions used in the design of the pulsed magnetic field coils are presentedin Fig. 2.3. Panel (a) shows a copper alloy fiber of rectangular cross-section usedto wind the coil with approximately 1000 turns. The wires are additionally rein-

28 Chapter 2. Experimental techniques
forced with an outer shell of Zylon fibres. Such wires combine mechanical durability[Spencer 2004] with low electrical resistivity, typically of the order of ρ = 10−9Ω ·mat liquid nitrogen temperature. For a further reinforcement of the magnet con-struction, and to minimize the impact of a possible explosion due to the magneticpressure, the coil is placed in a cage of metallic rods (Fig.2.3 (b)), supported bybottom and top flanges.
Figure 2.3: The coil construction details: (a) a rectangular cross-section coppercomposite wire, (b) a dual- coil magnet system in flanges and reinforcing cage, (c)top flange with copper cooling fingers.
In order to reduce the time between the high-energy magnetic field pulses, a fast-cooling design of the magnet has been developed [Frings 2008]. Due to the energydissipation caused by resistive losses in the coil wire, the temperature of the magnetrises considerably after each pulse. For example, during the electric discharge at avoltage of 20 kV, the temperature of the 70 T coil (resistance 50 mΩ at T = 77 K)rises by more than 100 K. As a result, the coil resistance increases approximately bya factor of 2. The cooling time ranges from several minutes to 3 hours, depending onthe energy of the pulse, coil type and size. The fast-cooling design uses the coolingfingers for improved thermal contact (Fig.2.3 (c)) and vertical channels for enhancednitrogen circulation. As a result, the time between the 70 T pulses is shortened byhalf, to around 60 minutes, which is a significant advantage for measurements. Thecooling time can be further reduced by decreasing the temperature of the liquidnitrogen, for example by pumping.
2.1.2 Transmission measurements
In the magneto - transmission measurements, white light is passed through a sampleplaced in the magnetic field. A schematic representation of the transmission setup ispresented in Fig. 2.4. The sample is mounted on a probe, which is placed in a heliumbath cryostat, inserted into the magnet bore. The available temperature range isfrom 1.5 K (pumped helium conditions) to 300 K. The incoming and outgoing beamsare transmitted using optical fibres. The signal is dispersed in a monochromator
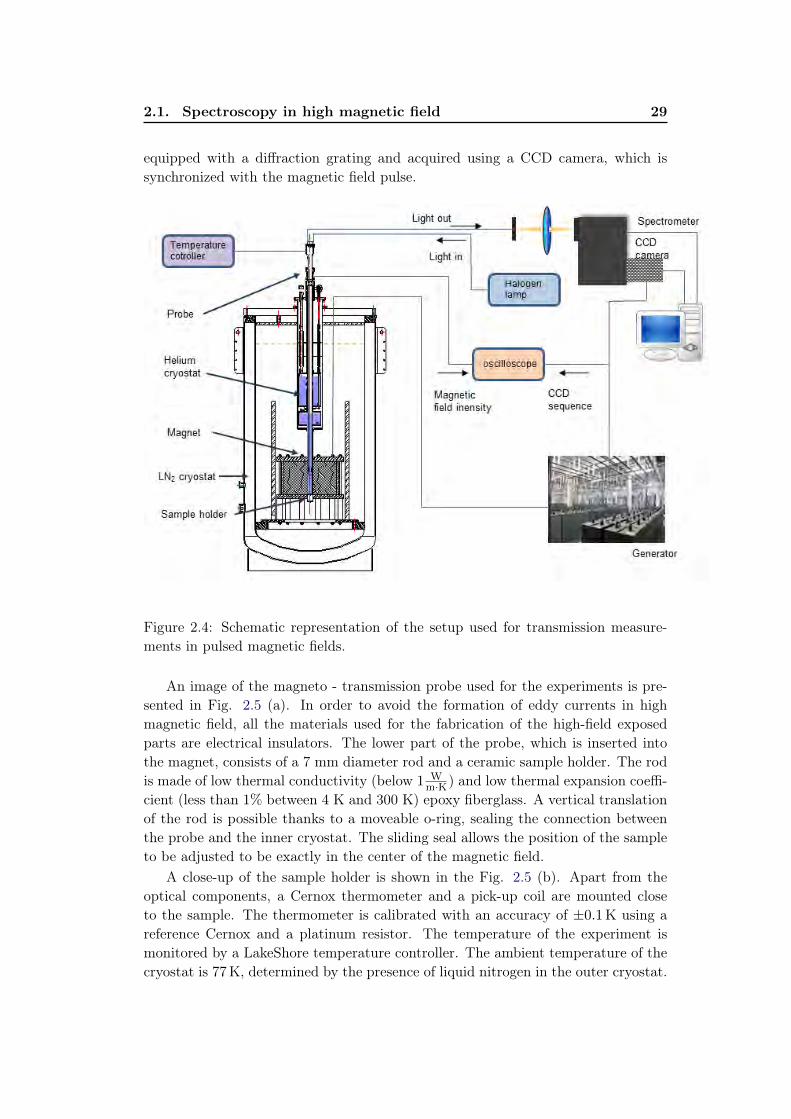
2.1. Spectroscopy in high magnetic field 29
equipped with a diffraction grating and acquired using a CCD camera, which issynchronized with the magnetic field pulse.
Figure 2.4: Schematic representation of the setup used for transmission measure-ments in pulsed magnetic fields.
An image of the magneto - transmission probe used for the experiments is pre-sented in Fig. 2.5 (a). In order to avoid the formation of eddy currents in highmagnetic field, all the materials used for the fabrication of the high-field exposedparts are electrical insulators. The lower part of the probe, which is inserted intothe magnet, consists of a 7 mm diameter rod and a ceramic sample holder. The rodis made of low thermal conductivity (below 1 W
m·K) and low thermal expansion coeffi-cient (less than 1% between 4 K and 300 K) epoxy fiberglass. A vertical translationof the rod is possible thanks to a moveable o-ring, sealing the connection betweenthe probe and the inner cryostat. The sliding seal allows the position of the sampleto be adjusted to be exactly in the center of the magnetic field.
A close-up of the sample holder is shown in the Fig. 2.5 (b). Apart from theoptical components, a Cernox thermometer and a pick-up coil are mounted closeto the sample. The thermometer is calibrated with an accuracy of ±0.1K using areference Cernox and a platinum resistor. The temperature of the experiment ismonitored by a LakeShore temperature controller. The ambient temperature of thecryostat is 77K, determined by the presence of liquid nitrogen in the outer cryostat.
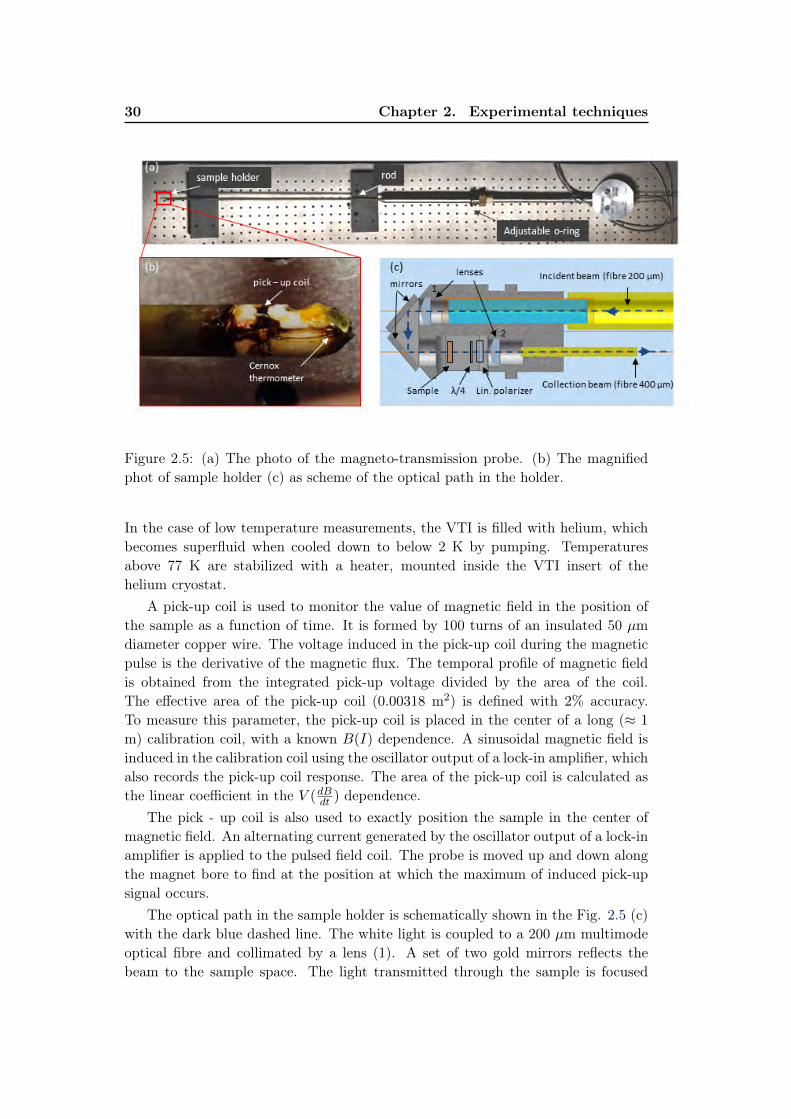
30 Chapter 2. Experimental techniques
Figure 2.5: (a) The photo of the magneto-transmission probe. (b) The magnifiedphot of sample holder (c) as scheme of the optical path in the holder.
In the case of low temperature measurements, the VTI is filled with helium, whichbecomes superfluid when cooled down to below 2 K by pumping. Temperaturesabove 77 K are stabilized with a heater, mounted inside the VTI insert of thehelium cryostat.
A pick-up coil is used to monitor the value of magnetic field in the position ofthe sample as a function of time. It is formed by 100 turns of an insulated 50 µmdiameter copper wire. The voltage induced in the pick-up coil during the magneticpulse is the derivative of the magnetic flux. The temporal profile of magnetic fieldis obtained from the integrated pick-up voltage divided by the area of the coil.The effective area of the pick-up coil (0.00318 m2) is defined with 2% accuracy.To measure this parameter, the pick-up coil is placed in the center of a long (≈ 1
m) calibration coil, with a known B(I) dependence. A sinusoidal magnetic field isinduced in the calibration coil using the oscillator output of a lock-in amplifier, whichalso records the pick-up coil response. The area of the pick-up coil is calculated asthe linear coefficient in the V (dBdt ) dependence.
The pick - up coil is also used to exactly position the sample in the center ofmagnetic field. An alternating current generated by the oscillator output of a lock-inamplifier is applied to the pulsed field coil. The probe is moved up and down alongthe magnet bore to find at the position at which the maximum of induced pick-upsignal occurs.
The optical path in the sample holder is schematically shown in the Fig. 2.5 (c)with the dark blue dashed line. The white light is coupled to a 200 µm multimodeoptical fibre and collimated by a lens (1). A set of two gold mirrors reflects thebeam to the sample space. The light transmitted through the sample is focused

2.1. Spectroscopy in high magnetic field 31
by a second lens (2) onto the 400 µm multimode fibre, which guides the signalto the spectrometer. To obtain polarization resolved data, a circular polarizationanalyzer is placed in the optical beam between the sample and lens (2). The analyzerconsists of a lambda quarter waveplate, the axis of which is rotated by (45 ± 2)
with respect to the axis of a linear polarizer. For each spectral region, a suitableanalyzer, with circular polarization degree of at least 90 %, is mounted. To measureboth σ± circular polarizations, the direction of the magnetic field is reversed. Thelow thickness (below 0.3 mm) of the polarization optics limits the impact of theFaraday effect. Additionally, the transmission probe was also used for temperaturedependence transmission measurements in the absence of magnetic field.
2.1.3 Temporal synchronization
As the 70 T pulse lasts only 150 ms, the time to acquire spectra at a particularvalue of magnetic field is limited to several milliseconds. Therefore, the temporalsynchronization of magnetic pulse with the data collection is crucial. An exampleof a spectral acquisition series recorded during a 68 T magnetic pulse is presentedin Fig. 2.6. The sequence of 30 CCD acquisitions, each lasting 3 ms (CCD triggeris indicated by the blue line) and the pick-up coil signal (orange curve) are plottedas a function of time. The pulse is triggered at t = 0. After the integration of thepick-up coil signal, the temporal profile of magnetic field is obtained (black curve).Each acquisition in the sequence can be then associated with the correspondingmagnetic field intensity, which is calculated as an average of the values recordedat the beginning and the end of the acquisition frame. The duration of a singleacquisition cannot be below 3 ms, as the CCD triggering becomes unstable forshorter times. The fast read-out time of the CCD detector (13 ms repetition ratewith 3 ms acquisition) enables the collection of up to a dozen spectra at differentmagnetic field values during a single 150 ms pulse.
Synchronization of the magnetic field with the data collection is achieved bysetting the delay of the magnetic field pulse with respect to the start of the CCDacquisitions. The exact value of the delay time is fixed with the precision of 0.1 msduring a series of test pulses, where the delay is adjusted so that the maximum ofthe magnetic field occurs in the middle of one of the acquisition frames (see inset inFig. 2.6). This ensures that a spectrum is acquired at the maximum of the magneticfield. We use a synchronization sequence as shown in the 2.7. The CCD camerais used as a master trigger. The measurement starts when the generator sends apre-trigger pulse to the CCD. Afterwards, the CCD camera produces a series ofacquisition pulses, which is passed to the waveform generator to be formed into aTTL compatible rise signal. Simultaneously, the CCD shutter series is recorded onthe oscilloscope together with the pick-up coil signal. The delay unit retards theTTL signal in order to record the first three acquisition frames without the presenceof magnetic field. Finally, the magnetic pulse is released by a thyristor switch.
The temporal derivative of the magnetic field varies with the evolution of thepulse, as presented in Fig 2.6. The absolute value of this parameter is lowest at the
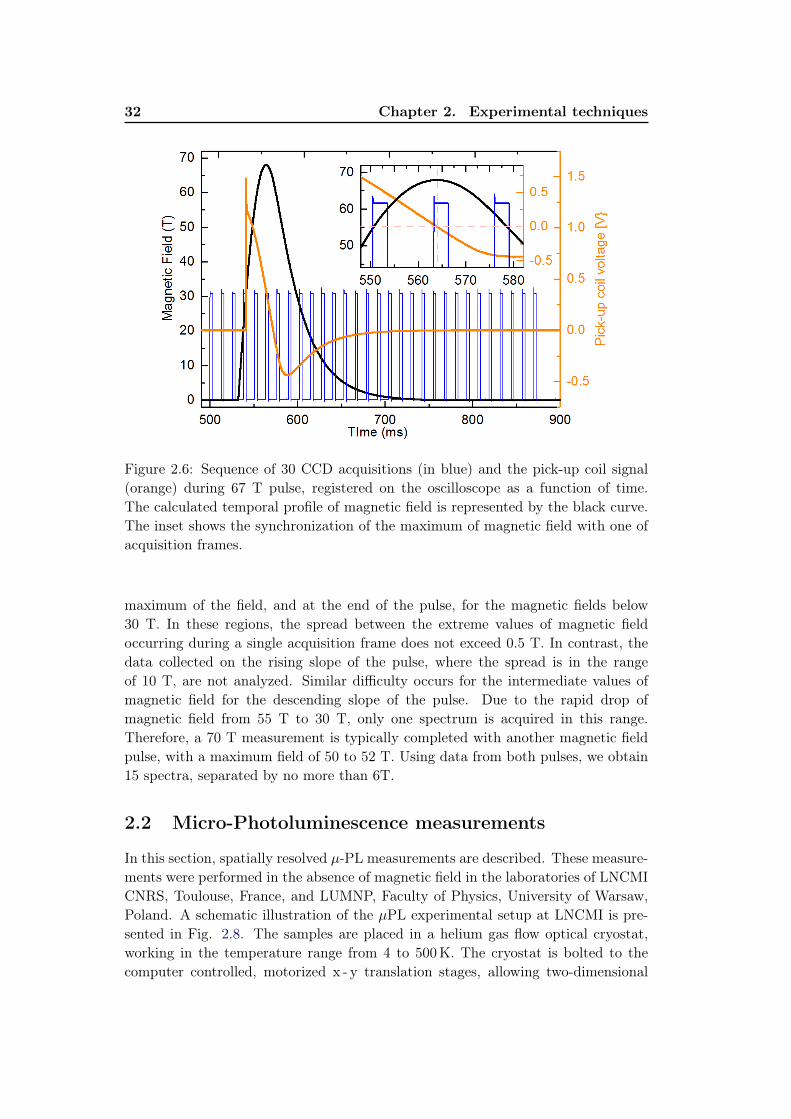
32 Chapter 2. Experimental techniques
Figure 2.6: Sequence of 30 CCD acquisitions (in blue) and the pick-up coil signal(orange) during 67 T pulse, registered on the oscilloscope as a function of time.The calculated temporal profile of magnetic field is represented by the black curve.The inset shows the synchronization of the maximum of magnetic field with one ofacquisition frames.
maximum of the field, and at the end of the pulse, for the magnetic fields below30 T. In these regions, the spread between the extreme values of magnetic fieldoccurring during a single acquisition frame does not exceed 0.5 T. In contrast, thedata collected on the rising slope of the pulse, where the spread is in the rangeof 10 T, are not analyzed. Similar difficulty occurs for the intermediate values ofmagnetic field for the descending slope of the pulse. Due to the rapid drop ofmagnetic field from 55 T to 30 T, only one spectrum is acquired in this range.Therefore, a 70 T measurement is typically completed with another magnetic fieldpulse, with a maximum field of 50 to 52 T. Using data from both pulses, we obtain15 spectra, separated by no more than 6T.
2.2 Micro-Photoluminescence measurements
In this section, spatially resolved µ-PL measurements are described. These measure-ments were performed in the absence of magnetic field in the laboratories of LNCMICNRS, Toulouse, France, and LUMNP, Faculty of Physics, University of Warsaw,Poland. A schematic illustration of the µPL experimental setup at LNCMI is pre-sented in Fig. 2.8. The samples are placed in a helium gas flow optical cryostat,working in the temperature range from 4 to 500K. The cryostat is bolted to thecomputer controlled, motorized x - y translation stages, allowing two-dimensional

2.2. Micro-Photoluminescence measurements 33
Figure 2.7: The schematic diagram of synchronization sequence for optical measure-ments in pulsed fields.
in-plane motion. The position of the stages is controlled with micrometer screws,either manually or by automatized stepper motors. It allows a macro-scale mappingof the sample surface with micrometer resolution. The effects of a motor backlash(≈ 10µm) is minimized by acquiring the spectra while always scanning in the samedirection - in a similar manner as the scanning of a cathode ray tube television. Theresolution of the system is not limited by the minimal step of the motor, which is100 nm, but rather by the 1 µm spot size of the excitation.
Free beam optics in a backscattering configuration is used. The laser beam usedfor the excitation is split by a non-polarizing 50/50 cube or a dichroic filter. Forexcitation and collection of the signal, a microscope objective with long workingdistance (7 mm) is used. The objective has a numerical aperture of NA = 0.55and the magnification is 50×. The size of the laser spot on the sample surface is ofthe order of 1 µm. The photoluminescence signal is focused on a monochromatorslit, then dispersed by a diffraction grating and acquired by nitrogen cooled CCDcamera. The PL is excited with a semiconductor continuous wave 532 nm laser. Forthe materials with a higher band gap, Optical Parameter Oscillator (OPO) pumpedby a tunable Ti:sapph laser is used for the excitation.
The µPL experimental setup in Warsaw is similar: The cryostat translationstages have a 45 mm of travel and are controlled manually with micrometer screws.For automatized surface mapping, the microscope objective is moved by piezo-controlled stages with a 160 µm range. The objective of NA = 0.9 numerical aperturehas a 13 mm working distance and 100× magnification. The CDD camera is cooledwith the Peltier cell.

34 Chapter 2. Experimental techniques
Figure 2.8: Schematic drawing of the µPL experimental setup at LNCMI-T

Chapter 3
Preparation and characterizationof the samples
Contents3.1 Description of samples . . . . . . . . . . . . . . . . . . . . . . 35
3.2 Fabrication of the samples . . . . . . . . . . . . . . . . . . . . 36
3.3 Maintaining the perovskite phase . . . . . . . . . . . . . . . . 38
3.4 Sample characterization . . . . . . . . . . . . . . . . . . . . . 40
In this chapter, we describe the fabrication of perovskite thin-film samples andhow we characterize them prior to the measurements in magnetic field. First, weintroduce the investigated compounds and the details of solution-process depositionmethods used to synthesize the samples. Then, we discuss the procedures for con-serving the thin films in the perovskite phase and discrimination between the pristineand degraded material. Finally, we present the results of the sample characterization,where we investigate the dependence of the band gap energy on the temperature.
3.1 Description of samples
The studies presented in this work were performed on several representatives ofhybrid perovskite family. These were mostly recently synthesized materials, de-veloped to improve the performance of the perovskite solar cells. We investigatethe compounds based on Methylammonium (MA = CH2NH+
2 ) or Formamidinium(FA = CH(NH2)+2 ) organic cations. We also distinguish two main groups withrespect to the halide content: the iodine - based compounds and high band gap tri-bromides. Among the first group are the archetypal MAPbI3, its Formamidiniumanalogue FAPbI3 and the mixed halide MAPbClxI3−x. Bromine - based materi-als are FAPbBr3 and MAPbBr3. All the samples were fabricated in the group ofProfessor Henry Snaith of the Clarendon Laboratory at the University of Oxford.The synthesis was performed by Giles E. Eperon, Thomas Stergiopoulous and JacobTse-Wei Wang.
The samples investigated in this thesis are thin films of the perovskite materialdeposited on glass substrates. The films are around 350 nm thick, which is com-parable to the penetration depth of the visible light [Stranks 2013]. The thicknessis uniform across the sample, and the material is free of pinhole-like defects. The

36 Chapter 3. Preparation and characterization of the samples
Figure 3.1: Photograph showing the typical Formamidinium - based samples withdifferent halide content.
thickness of the substrate is 1 mm. In Fig 3.1 we present a photograph of threetypical Formamidinium based samples used for our research. The differences in thehalide content - changing from pure iodine to pure bromine - are responsible for theobserved change in colour.
3.2 Fabrication of the samples
In this section, we present the techniques commonly used for the synthesis of theperovskite thin films. We focus on the description of the most popular, spin-coatingmethods, which were used to fabricate all the samples provided by the ClarendonLaboratory. A two-step approach was applied in the case of MAPbI3 thin films, whilethe rest of the investigated compounds were obtained with a one-step deposition.
Solution deposition technique: one-step approach. In this process, theperovskite thin film is synthesized from a solution, containing the the salt precursors,which are the halide of organic cation AX and the lead di-halide PbX2. The sequenceof procedures in the simplest, one-step approach is presented in Fig. 3.2. The organicsolvent with precursor salts is dripped onto the cleaned glass substrate. The mixtureis then uniformly spread on the substrate through spin-coating. The subsequentanneal, in temperatures of the order of 100 C, leads to the evaporation of thesolvent and formation of the perovskite film.
The simplicity of spin-coating procedure comes along with the drawbacks ofincomplete substrate coverage, leading mainly to pinhole-like defects and variablefilm thickness. These problems can be reduced by the proper control of the process-ing conditions, such as performing the film formation in nitrogen atmosphere, andlowering the annealing temperature to below 90 C [Stranks 2013, Eperon 2014a].Moreover, the size of the grains which form the perovskite film, can be increased byan order of magnitude, up to a few micrometers, by a rapid post-annealing procedure

3.2. Fabrication of the samples 37
at higher temperatures [Saliba 2014].
Figure 3.2: The sequence of procedures in the one-step perovskite depositionmethod. After the reference [Jeon 2014]
Solution deposition technique: two-step approach. A further improve-ment of the film morphology and increased coverage is provided by the two-stepsequential deposition approach. In this process, the solvents with precursor saltsare spin-coated one after another, which is schematically presented for the MAPbI3film formation in Fig 3.3. First, the layer of PbI2 is spread on the substrate anddried. Then, the solution with MAI is spin-coated upon it, and the MAPbI3 filmthen forms in several seconds.
Figure 3.3: A schematic representation of the two-step deposition method.Reprinted the reference [Stranks 2015]
Other synthesis methods At present, several derivative or related synthesisprocesses have been reported. An evolution of the two-step approach, namely theinterdiffusion method based on sequential deposition of stacked bi-layers of precursorsalts, was demonstrated to improve the surface smoothness [Xiao 2014, Chen 2014a].The variation in the thickness can be minimized with evaporation techniques, whichalso enables the design of multijunction architectures [Liu 2013, Green 2014]. Anoverview on these and other current state-of-art perovskite synthesis methods isprovided in the review article of S. D. Stranks et al. [Stranks 2015].
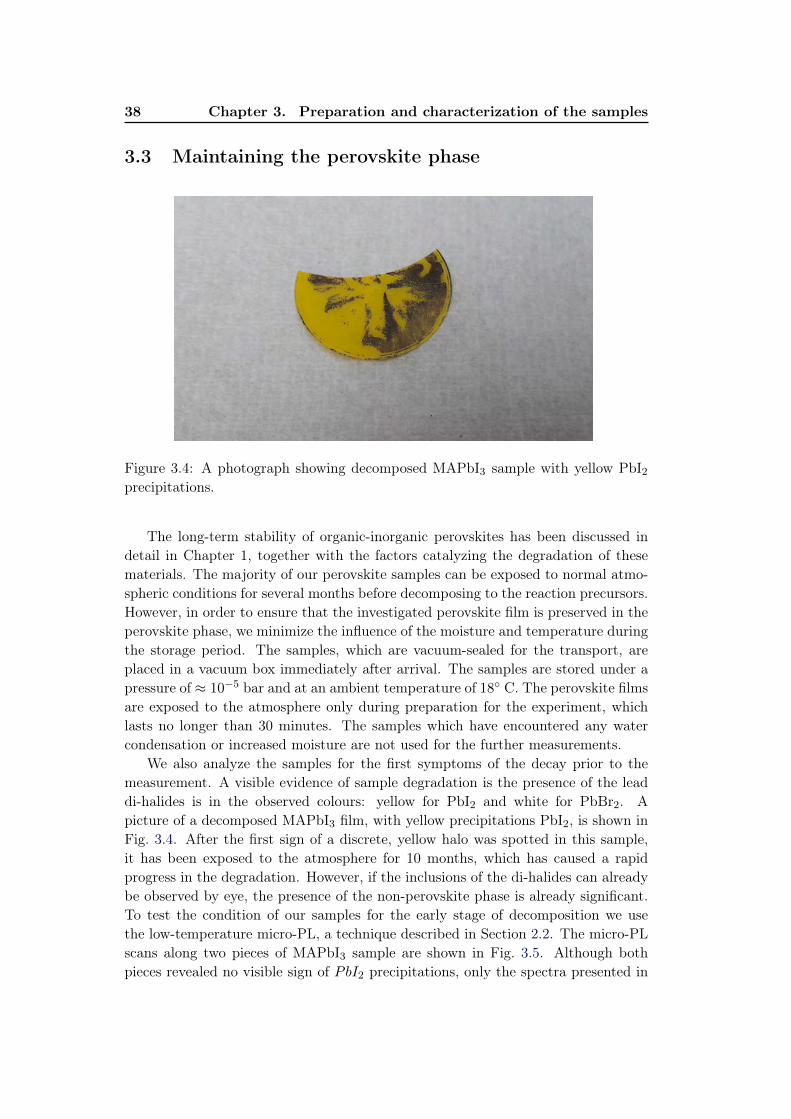
38 Chapter 3. Preparation and characterization of the samples
3.3 Maintaining the perovskite phase
Figure 3.4: A photograph showing decomposed MAPbI3 sample with yellow PbI2precipitations.
The long-term stability of organic-inorganic perovskites has been discussed indetail in Chapter 1, together with the factors catalyzing the degradation of thesematerials. The majority of our perovskite samples can be exposed to normal atmo-spheric conditions for several months before decomposing to the reaction precursors.However, in order to ensure that the investigated perovskite film is preserved in theperovskite phase, we minimize the influence of the moisture and temperature duringthe storage period. The samples, which are vacuum-sealed for the transport, areplaced in a vacuum box immediately after arrival. The samples are stored under apressure of ≈ 10−5 bar and at an ambient temperature of 18 C. The perovskite filmsare exposed to the atmosphere only during preparation for the experiment, whichlasts no longer than 30 minutes. The samples which have encountered any watercondensation or increased moisture are not used for the further measurements.
We also analyze the samples for the first symptoms of the decay prior to themeasurement. A visible evidence of sample degradation is the presence of the leaddi-halides is in the observed colours: yellow for PbI2 and white for PbBr2. Apicture of a decomposed MAPbI3 film, with yellow precipitations PbI2, is shown inFig. 3.4. After the first sign of a discrete, yellow halo was spotted in this sample,it has been exposed to the atmosphere for 10 months, which has caused a rapidprogress in the degradation. However, if the inclusions of the di-halides can alreadybe observed by eye, the presence of the non-perovskite phase is already significant.To test the condition of our samples for the early stage of decomposition we usethe low-temperature micro-PL, a technique described in Section 2.2. The micro-PLscans along two pieces of MAPbI3 sample are shown in Fig. 3.5. Although bothpieces revealed no visible sign of PbI2 precipitations, only the spectra presented in
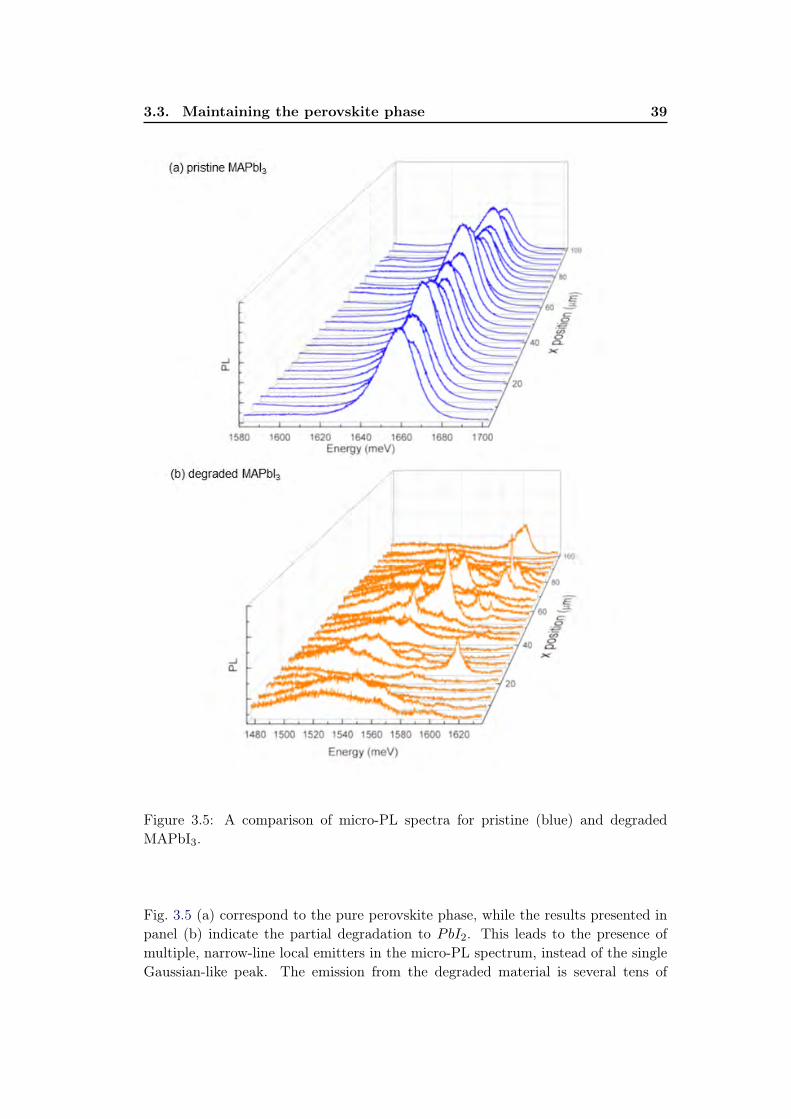
3.3. Maintaining the perovskite phase 39
Figure 3.5: A comparison of micro-PL spectra for pristine (blue) and degradedMAPbI3.
Fig. 3.5 (a) correspond to the pure perovskite phase, while the results presented inpanel (b) indicate the partial degradation to PbI2. This leads to the presence ofmultiple, narrow-line local emitters in the micro-PL spectrum, instead of the singleGaussian-like peak. The emission from the degraded material is several tens of

40 Chapter 3. Preparation and characterization of the samples
meV lower in energy than the emission from the pristine material. These lines areattributed to the local inclusions of non-perovskite phase, which preferably collectthe photocreated carriers. Remarkably, such phenomenon can be observed onlyat low temperatures, at around 120 K and below, as this trapping becomes moreefficient, when the diffusion length for the carriers decreases (see Section 5.6 forthe reference). At higher temperatures, the emission occurs through the perovskitephase.
3.4 Sample characterization
For the initial characterization of the samples, we measure the energy of the near-band-gap absorption as a function of the temperature. In these studies we use thebroad-band macro-transmission, performed in the absence of magnetic field withthe setup described in detail in Section 2.1.2. The experimental temperature range,between 4 K and 300 K, covers the phase transition from the low temperature,orthorhombic, to the higher temperature, tetragonal phase, which was already dis-cussed in Chapter 1. This allows an exact determination of the low-temperaturephase transition point. Such a characterization is crucial prior to the high mag-netic field measurements, which are performed in both orthorhombic and tetragonalphase.
MAPbI3. First, we will refer to the measurements of the archetypal MAPbI3compound. The typical transmission spectra acquired at different temperatures areshown in Fig. 3.6 (a). The temperature is increased in steps of 5 K, reduced to2 K in the phase transition region. The spectra, divided by the spectrum of thelamp, are dominated by a single strong absorption minimum. Our further magneto- transmission studies (see Chapter 4) show that this absorption corresponds to the1s excitonic transition. We extract the absorption energies from the transmissionspectra by looking for the center of the absorption shape. These energies are plottedas the function of temperature in Fig. 3.6 (b). With the increasing temperature,we observe the blue-shift and broadening of the absorption resonance. The positivetemperature coefficient of the band gap is characteristic for all hybrid perovskites(which was discussed in Section 1.4.1).
Above 145 K, we find the first evidence of the phase transition developing withinthe MAPbI3 film. A second minimum, which we attribute to the absorption oftetragonal phase (TP) inclusions is observed at the energy around 90 meV lowerthan the minimum of the orthorhombic phase (OP). As the conversion from theorthorhombic to tetragonal phase proceeds with increasing temperature, the low-energy minimum becomes more pronounced, while the absorption corresponding tothe orthorhombic phase weakens. As can be seen in Fig. 3.6 (b), no significantchanges in the absorption energies are observed for temperatures up to 20 K abovethe onset of the phase transition. At 169 K the conversion is complete, as we detectonly the absorption corresponding to the tetragonal phase. Raising the tempera-ture above 169 K, we again observe a constant increase of absorption energy and

3.4. Sample characterization 41
Figure 3.6: (a)Typical transmission spectra for MAPbI3 measured at different tem-peratures and (b) the energies corresponding to the observed transitions plotted asthe function of temperature. Points and dashed lines are added to ease the followingof the transitions.
broadening of its shape.Other organic-inorganic compounds. Similar characterization measure-
ments were performed for all the investigated compounds. The spectra for otherrepresentatives of Methylammonium and Formamidinium families are presentedFig 3.7. As for MAPbI3, the absorption minima blue-shift and broaden with in-creasing temperature. However, as the phase transition progresses, the separateabsorption minimum corresponding to the tetragonal phase is not detected. In-stead, we observe a continuous change of the energy of a single absorption mini-mum. Initially, as the material gradually converts into the tetragonal phase, thisminimum moves towards lower energies. After the turning point, when the conver-sion is complete and the absorption energy corresponds to the tetragonal phase, afurther increase of temperature again results in the increase of the transition energy.
We can compare in detail the development of the phase transition in all theinvestigated materials by analyzing their absorption energies plotted as a functionof temperature. These are summarized in Fig. 3.8. An abrupt change in the absorp-tion energy (evidence of the low-temperature phase transition) is observed only forMAPbI3. The difference in the absorption energies between the orthorhombic andtetragonal phases in the MAPbClxI3−x mixed halide, of around 70 meV, is slightlylower than the 90 meV difference observed in the pure tri-iodide. However, in themixed halide the phase transition develops over a temperature range of ≈ 50 K, andis completed at a considerably higher temperature, only above 200 K. In the For-mamidinium analogue, the FAPbI3, the conversion into the tetragonal phase alsoprogresses slowly, over a range of ≈ 30 K, and completes at the temperature of

42 Chapter 3. Preparation and characterization of the samples
Figure 3.7: Typical transmission spectra measured at different temperatures for(a) MAPbClxI3−x, (b) FAPbI3, (c) FAPbBr3 and (d) MAPbBr3. The data forMAPbClxI3−x have been measured by Anatolie Mitioglou.
around 150 K. In comparison to other iodide based materials, the energy redshift atthe phase transition point in FAPbI3 is few times smaller, not exceeding 10 meV. Asimilar value for the transition-induced redshift is observed in the tri-bromides. Inthese high band gap materials, the phase transition develops for only around 15 K.The turning points are at 165 K for FAPbBr3 and at 145 K for MAPbBr3. Thephase transition from tetragonal to cubic phase, which is expected in bromides ataround 240 K, does not induce any recognizable change in the transmission spectra.

3.4. Sample characterization 43
Figure 3.8: The energies of near band edge absorption as a function of temperaturefor all studied materials.

Chapter 4
Magneto transmission
Contents4.1 Introduction . . . . . . . . . . . . . . . . . . . . . . . . . . . . 45
4.1.1 Electronic transitions in magnetic field . . . . . . . . . . . . . 46
4.2 Low - temperature magneto-spectroscopy . . . . . . . . . . . 51
4.2.1 Iodine-based compounds: MAPbClxI3−x and FAPbI3 . . . . 51
4.2.2 Tri-bromides: FAPbBr3 and MAPbBr3 . . . . . . . . . . . . 53
4.2.3 Analysis . . . . . . . . . . . . . . . . . . . . . . . . . . . . . . 54
4.3 High temperature magneto-spectroscopy . . . . . . . . . . . 60
4.4 Discussion . . . . . . . . . . . . . . . . . . . . . . . . . . . . . . 63
4.5 Conclusions . . . . . . . . . . . . . . . . . . . . . . . . . . . . . 66
In this chapter, we present the results of magneto-transmission studies performedon the family of organic-inorganic perovskites, based on Methylammonium or For-mamidinium organic cations. By fitting the observed excitonic and free - electrontransitions with a hydrogen-like model and Landau levels, respectively, we determinethe values of the exciton binding energy (R∗) and reduced mass (µ). From ourlow-temperature studies we conclude that in all investigated materials R∗ is smalleror comparable with the mean thermal energy at room temperature. Moreover, theexciton binding energy is found to decrease at high temperatures. Therefore, thephoto-created carriers in the perovskite-based devices can be considered to be ther-mally ionized at room temperature. Finally, we show that both R∗ and µ scale linearlywith the band gap of the material. The results presented in this chapter have beenpublished in Environmental & Energy Science 6, 245442 (2016).
4.1 Introduction
The basic electronic parameters in organic-inorganic perovskites, such as excitonbinding energy R∗ and reduced mass µ, have been the object of intense debate inthe literature. The value of R∗ determines the nature of photo created carriers and istherefore a matter of special interest for photovoltaics. However, either the picturesof bound or fully ionized carriers in the iodine-based perovskite compounds havebeen proposed basing on various indirect experimental methods. While the meanthermal energy at the room temperature is kBT ' 26 meV, values of R∗ as low as
46 Chapter 4. Magneto transmission
2 meV were reported in the studies of the optical constants (n, k) [Lin 015]. In con-trast, the temperature dependence of the absorption band edge has lead D’Innocenzoet al. to estimate a much larger value of R∗ ' 50 meV [DInnocenzo 2014]. In 2015,Miyata et al. using magneto-transmission measurements have demonstrated that theexciton binding energy in the archetypal perovskite photovoltaic compound MAPbI3is at the lower end of that range [Miyata 2015]. In magnetic field, they observed upto seven electronic transitions, originating from excitonic and free electron states,which allowed to directly determine the low-temperature, upper bound for R∗ tobe equal to 16 meV. This value was found to further decrease to around 10 meV inthe higher temperature, tetragonal phase [Miyata 2015]. In agreement with recenttheoretical calculations [Even 2014b], this result proves that at room temperatureno additional energy is required to separate the photoexcited carriers. The earliermagneto-spectroscopy on MAPbI3, first demonstrated in 1994, revealed the evolu-tion of only the 1s excitonic state in magnetic field [Hirasawa 1994, Tanaka 2003].However, as it will be further shown in this chapter, only the observation of multipleexcitonic transitions (in particular, both 1s and 2s) and the transitions between theLandau levels enables the direct and precise measurement of R∗ and µ, which makesmagneto - spectroscopy superior to other, indirect methods.
In this work, we extend the magneto - transmission studies on organic-inorganicperovskites to other, newly synthesized materials of this family. We investigatethe dependence of the exciton binding energy and reduced mass on the materialcomposition and band gap. We perform the first magneto - optical studies on thematerials containing the Formamidinium organic cation and the high band gap tri-bromides. The band gaps for the studied materials range from 1.5 eV to 2.3 eV. Foreach of them, we determine the exciton binding energy and reduced mass for both thelow temperature, orthorhombic phase, and the high temperature tetragonal phase.In all investigated compounds, the exciton binding energies are less or comparableto the mean thermal energy at room temperature. We also find that both theexciton binding energy and the reduced mass increase proportionally to the energyof the band gap. Moreover, the values of the reduced mass are consistent with asimple two band k.p perturbation approach for the band structure. Importantly,these conclusions can be generalized to predict the values of the reduced mass andbinding energy for the other members of the family of hybrid perovskites.
4.1.1 Electronic transitions in magnetic field
This section gives a brief introduction to the influence of magnetic field on theinterband optical transitions observed in bulk semiconductors. The magnetic fieldinteracts with the orbital motion and the spin of the electron, resulting in a shift ofthe energy levels and a splitting of the spin states. Below, we summarize the theoryof magnetic field evolution of the energy of free carrier and free exciton levels inthe presence of a magnetic field. We limit our considerations to the effective massapproximation near the extrema of the parabolic, spherically symmetric bands.
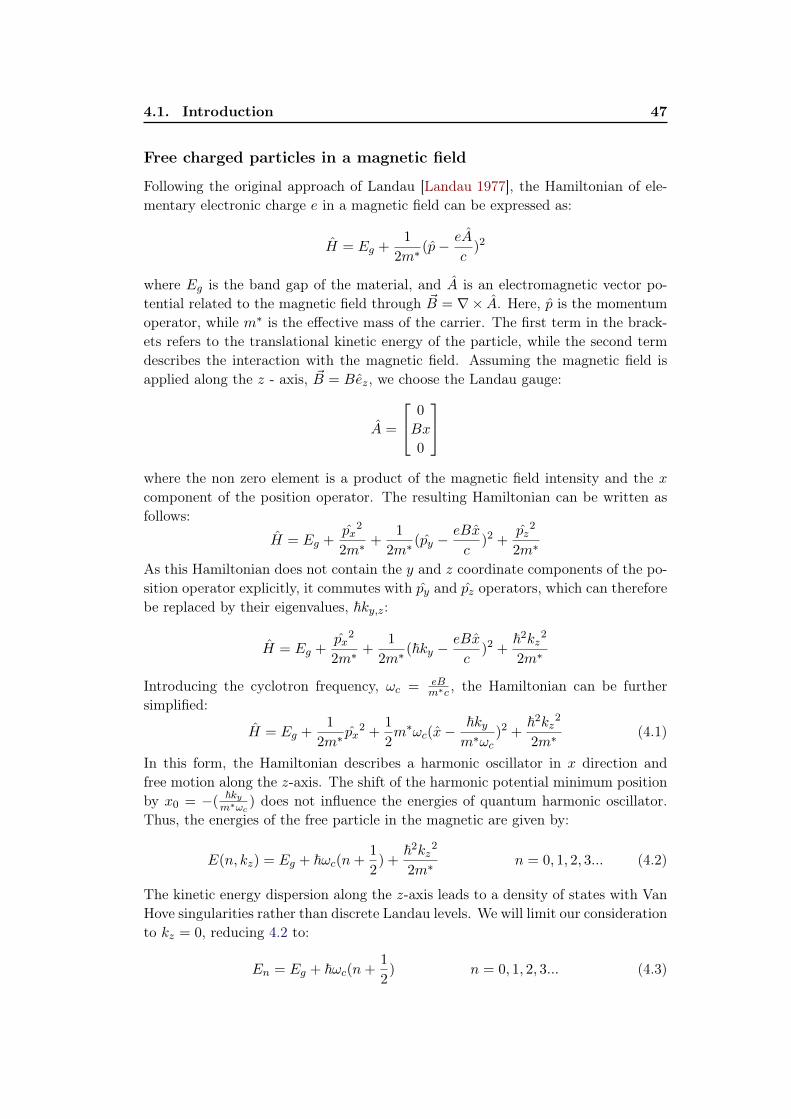
4.1. Introduction 47
Free charged particles in a magnetic field
Following the original approach of Landau [Landau 1977], the Hamiltonian of ele-mentary electronic charge e in a magnetic field can be expressed as:
H = Eg +1
2m∗(p− eA
c)2
where Eg is the band gap of the material, and A is an electromagnetic vector po-tential related to the magnetic field through ~B = ∇× A. Here, p is the momentumoperator, while m∗ is the effective mass of the carrier. The first term in the brack-ets refers to the translational kinetic energy of the particle, while the second termdescribes the interaction with the magnetic field. Assuming the magnetic field isapplied along the z - axis, ~B = Bez, we choose the Landau gauge:
A =
0
Bx
0
where the non zero element is a product of the magnetic field intensity and the xcomponent of the position operator. The resulting Hamiltonian can be written asfollows:
H = Eg +px
2
2m∗+
1
2m∗(py −
eBx
c)2 +
pz2
2m∗
As this Hamiltonian does not contain the y and z coordinate components of the po-sition operator explicitly, it commutes with py and pz operators, which can thereforebe replaced by their eigenvalues, ~ky,z:
H = Eg +px
2
2m∗+
1
2m∗(~ky −
eBx
c)2 +
~2kz2
2m∗
Introducing the cyclotron frequency, ωc = eBm∗c , the Hamiltonian can be further
simplified:
H = Eg +1
2m∗px
2 +1
2m∗ωc(x−
~kym∗ωc
)2 +~2kz
2
2m∗(4.1)
In this form, the Hamiltonian describes a harmonic oscillator in x direction andfree motion along the z-axis. The shift of the harmonic potential minimum positionby x0 = −(
~kym∗ωc
) does not influence the energies of quantum harmonic oscillator.Thus, the energies of the free particle in the magnetic are given by:
E(n, kz) = Eg + ~ωc(n+1
2) +
~2kz2
2m∗n = 0, 1, 2, 3... (4.2)
The kinetic energy dispersion along the z-axis leads to a density of states with VanHove singularities rather than discrete Landau levels. We will limit our considerationto kz = 0, reducing 4.2 to:
En = Eg + ~ωc(n+1
2) n = 0, 1, 2, 3... (4.3)

48 Chapter 4. Magneto transmission
The harmonic oscillator energy term in 4.3, ~ωc(n+ 12), corresponds to the cyclotron
motion in a circle in the xy-plane, about the center in (x0, y0) = (− pym∗ωc
,− pxm∗ωc
).As Equation 4.1 does not contain the y component of momentum operator, py canassume a continuous sequence of the values. Therefore, the states En, called Landaulevels, are degenerate. This degeneracy is finite, when motion in the xy plane islimited to a finite area A = LxLy. The maximal number of electrons on eachspin Landau level is then limited to the ratio of magnetic flux to the fundamentalquantum of flux:
N =Φ
Φ0=
BA
h/2e
Each of the Landau levels is doubly degenerate with respect to spin, which will bediscussed further.
Figure 4.1: A schematic view of the Landau levels in the valence and conductionband. The interband absorptions are marked with arrows.
A schematic representation of Landau levels for n 6 3 in the valence and conduc-tion bands is shown in Fig. 4.1. The black arrows indicate the absorption interbandtransitions between the corresponding Landau levels, allowed by the ∆n = 0 se-lection rule for dipole allowed transitions in hybrid perovskites. The energy of themeasured free-electron absorption is the difference of the energies of the Landaulevels in the valence and conduction band, characterized by the same value of n.The cyclotron frequencies for the valence and conduction band, given by ωvc = eB
m∗hc
and ωcc = eBm∗
ec, respectively, correspond to different effective masses of hole m∗h and
electron m∗e. Using Equation 4.3, the energy of the intraband transition will be thenequal to:
En = Eg + ~(ωcc + ωvc )(n+1
2) = Eg + ~ωrc (n+
1
2) n = 0, 1, 2, 3... (4.4)

4.1. Introduction 49
with ωrc = eBµc .
Free excitons in a magnetic field
We now turn to the influence of magnetic field on a photocreated electron-holepair interacting via the Coulomb force, namely the exciton (see Section 1.1 for thereference). In analogy to the hydrogen atom, the energy of the nth 3D excitoniclevel in the absence of magnetic field scales as:
En = Eg −R∗
n2. (4.5)
where R∗ is the effective Rydberg constant. Compared to the case of the freeparticle, the Hamiltonian for an exciton in a magnetic field contains an additionalterm, corresponding to the Coulomb interaction between the electron and hole:
H = Eg +1
2µ∗(p− eA
c)2 − e2
εeff‖~r‖(4.6)
where ~r = ~re − ~rh is the relative position of electron and hole. This Hamiltoniancan be expressed in cylindrical coordinates (ρ, φ, z), r =
√ρ2 + z2. The ~B = Bez
condition is now fulfilled by a choice of a cylindrical gauge A = 12( ~B × ~r). Finally,
we obtain:
H = Eg +−∇2 − 2
r− iγ ∂
∂φ+
1
4γ2ρ2 (4.7)
where γ = 12~ωc/R
∗ is a dimensionless parameter, which is the ratio of cyclotronenergy and the effective Rydberg constant.
There are no exact analytical solutions for the hydrogen atom in a magnetic field,therefore its energy levels have to be derived using numerical methods. The energiesof hydrogen-like states in the magnetic field, based on the variational method, werecalculated by Makado and McGill in 1986 [Makado 1986]. They solved Equation 4.7using trial wavefunctions of defined z - parity and symmetry. Their solutions arethe energies of excitonic states En(γ), calculated for n up to 4 and a γ range from 0to 10. En(γ) are given as the energy shifts with the respect to the band gap energyEg, in the effective Rydberg units.
For given values of µ and R∗, γ(µ,R∗, B) is a function of magnetic field only,γ(B), and therefore En(γ) → En(B). This is presented in Fig. 4.2, where we useMakado and McGill’s solutions to calculate several representative En(B) energiesrelative to Eg = 0. The 1s, 2s and 2p excitonic state energies are calculated usingR∗ = 15 meV and µ = 0.1 me. Each of these states is doubly degenerate withrespect to the spin, and the lift of this degeneracy at high magnetic fields is indicatedwith the solid and dashed lines. The inset presents the model for lower values ofmagnetic field, where the hydrogen-like states reveal a diamagnetic behaviour. Athigher fields, the excitonic states have a linear, free-carrier-like dependence.

50 Chapter 4. Magneto transmission
Figure 4.2: The energies of 1s, 2s and 2p hydrogen - like states calculated forR∗ = 15 meV and µ = 0.1 me. The solid/dashed lines correspond to spin up/spindown states, respectively. The energy level of the band gap is marked with graydashed line. After [Makado 1986].
The Zeeman effect
Finally, we will discuss the degeneracy of the excitonic and free-electron states withrespect to spin. This has not been included in the previous considerations, as dueto the separation of variables, the spin Hamiltonian can be studied separately fromthe main/orbital Hamiltonians in Equations 4.1 and 4.6. The electronic states inboth valence and conduction band are characterized by the spin quantum numberj = 1
2 , which results in two possible values mj = ±12 of its projection on the
quantization axis. Without the presence of the magnetic field, the energies of both∣∣12 ,−
12
⟩and
∣∣12 ,
12
⟩states are degenerate, as schematically presented in Fig. 4.3. As
further shown, applied magnetic field, interacting with the spin of the carriers, liftsthis degeneracy. The energies of
∣∣12 ,±
12
⟩states shift by the value of the Zeeman
energy:
EZ = ±1
2geffµBB
where geff is the effective gyromagnetic factor and µB is the Bohr magneton. Fig. 4.3shows the selection rules for optical interband transitions, fulfilling the requirementof momentum conservation upon photon absorption ∆mj = ±1. The red and bluearrows correspond to σ+ and σ− circularly polarized light, respectively. Thesestates, detected at the same energy at B = 0T, split in the magnetic field by∆E = geffµBB.

4.2. Low - temperature magneto-spectroscopy 51
Figure 4.3: The Zeeman band splitting and the selection rules for both σ+ and σ−
polarizations in the magnetic field .
4.2 Low - temperature magneto-spectroscopy
The low-temperature magneto - spectroscopy studies were performed at the LNCMICNRS laboratory in Toulouse using a long magnetic pulse technique. The detailsof the experimental setup are given in Section 2.1. The investigated materials wereiodine based MAPbClxI3−x and FAPbI3 and high band gap tri-bromides, FAPbBr3and MAPbBr3. We measured the broadband transmission spectra using a whitehalogen lamp in pumped liquid helium conditions (T ' 2 K) in magnetic fields upto 70 T, observing multiple optical transitions for each compound.
4.2.1 Iodine-based compounds: MAPbClxI3−x and FAPbI3
First, we discuss the results obtained for the iodine - based compounds, namelyMAPbClxI3−x and FAPbI3. The measurements on MAPbClxI3−x have been per-formed by Anatolie Mitioglou in LNCMI. Typical magneto - transmission spectra,measured at different values of magnetic field, are presented in Fig. 4.4 (a) and(c). This experiment was performed using polarization optics, and the blue and redcurves correspond to σ− and σ+ circular polarizations, respectively. The points anddashed lines are added as a guide to the eye to follow the evolution of the absorptionenergies in magnetic field. The spectra in panel (a) and (c) show a well developedminimum at around 1.58 eV and 1.49 eV, respectively. As it will be later demon-strated, these absorptions correspond to the 1s state of the neutral exciton. In thecase of MAPbClxI3−x, a second, weaker minimum develops in fields above 20 T,around 1.6 eV, as can be seen in Fig. 4.4 (a). This transition will later be attributedto the 2s state. Both 1s and 2s absorptions reveal a clear Zeeman splitting.

52 Chapter 4. Magneto transmission
Figure 4.4: (a),(c): typical low temperature transmission data for MAPbClxI3−xand FAPbI3 obtained using a long pulse technique. Red and blue lines correspondto two σ+ and σ− polarized light respectively. The blue/red points and dashed linesare added to ease the following of the 1s and 2s transitions. (b),(d): The spectra atdifferent magnetic fields divided by the spectrum acquired at 0 T.
We extend the measurements into the visible light spectral range, where for theanalysis we plot the spectra in the magnetic field divided by the spectrum takenat zero field, as shown in Fig. 4.4 (b) and (d). As the spin splitting is not wellresolved over such a large energy scale due to a limited spectral range of the usedpolarization optics, these data are not polarization resolved. The first, low-energyspectral feature visible in panels (b) - (d) is a result of dividing the signal overthe region of the magnetically shifted 1s state. Within this differential feature, weobserve the minima corresponding to the 2s state. Remarkably, in FAPbI3 thistransition is resolved only in the divided spectra, for the region of the intermediatemagnetic fields between 20 T to 45 T. For both of the compounds, we detect asequence of additional minima of considerably weaker absorption, which are marked
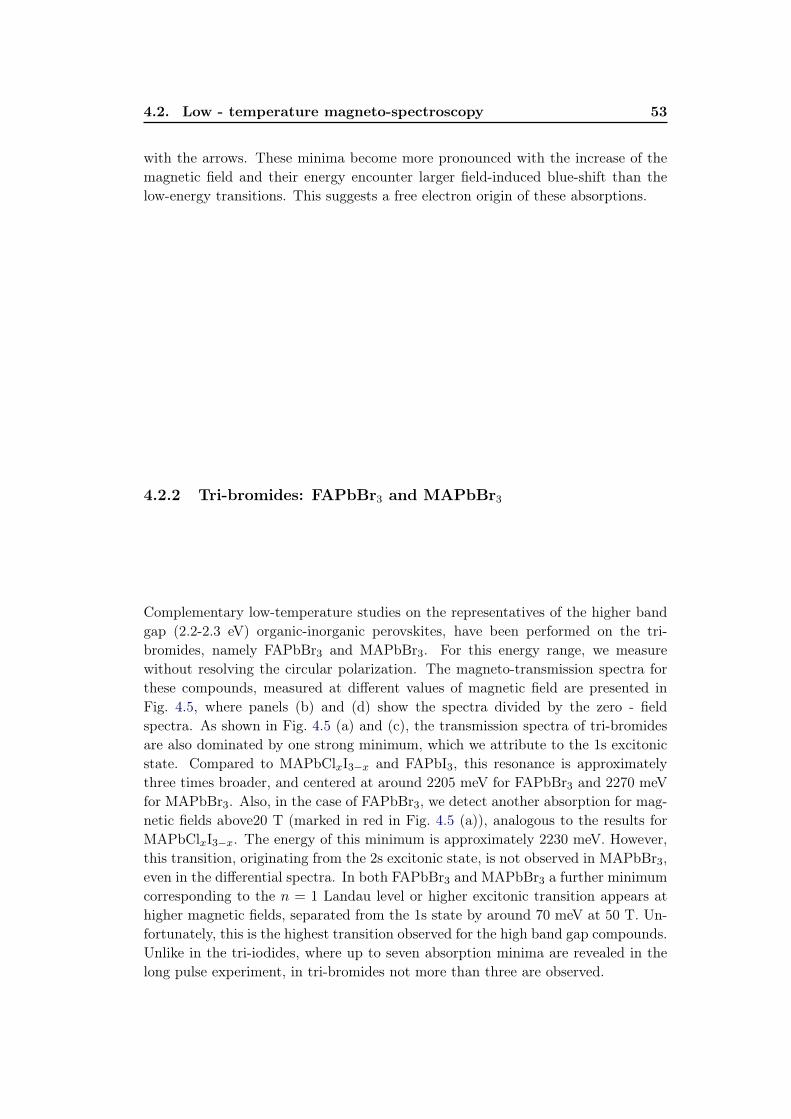
4.2. Low - temperature magneto-spectroscopy 53
with the arrows. These minima become more pronounced with the increase of themagnetic field and their energy encounter larger field-induced blue-shift than thelow-energy transitions. This suggests a free electron origin of these absorptions.
4.2.2 Tri-bromides: FAPbBr3 and MAPbBr3
Complementary low-temperature studies on the representatives of the higher bandgap (2.2-2.3 eV) organic-inorganic perovskites, have been performed on the tri-bromides, namely FAPbBr3 and MAPbBr3. For this energy range, we measurewithout resolving the circular polarization. The magneto-transmission spectra forthese compounds, measured at different values of magnetic field are presented inFig. 4.5, where panels (b) and (d) show the spectra divided by the zero - fieldspectra. As shown in Fig. 4.5 (a) and (c), the transmission spectra of tri-bromidesare also dominated by one strong minimum, which we attribute to the 1s excitonicstate. Compared to MAPbClxI3−x and FAPbI3, this resonance is approximatelythree times broader, and centered at around 2205 meV for FAPbBr3 and 2270 meVfor MAPbBr3. Also, in the case of FAPbBr3, we detect another absorption for mag-netic fields above20 T (marked in red in Fig. 4.5 (a)), analogous to the results forMAPbClxI3−x. The energy of this minimum is approximately 2230 meV. However,this transition, originating from the 2s excitonic state, is not observed in MAPbBr3,even in the differential spectra. In both FAPbBr3 and MAPbBr3 a further minimumcorresponding to the n = 1 Landau level or higher excitonic transition appears athigher magnetic fields, separated from the 1s state by around 70 meV at 50 T. Un-fortunately, this is the highest transition observed for the high band gap compounds.Unlike in the tri-iodides, where up to seven absorption minima are revealed in thelong pulse experiment, in tri-bromides not more than three are observed.

54 Chapter 4. Magneto transmission
Figure 4.5: (a),(c): typical low temperature transmission data taken using a longpulse technique for FAPbBr3 and MAPbBr3. The blue/red points and dashed linesare added to ease the following of 1s and 2s transitions, respectively. (b),(d): Thespectra at the magnetic field divided by the spectrum acquired at 0 T.
4.2.3 Analysis
To extract the binding energy and the reduced mass of the exciton from the magneto-transmission data, we fit the observed transitions with the theoretical hydrogen-likeand free electron models presented in Section 4.1.1. The procedure of the analysiswill be presented in detail for the example of MAPbClxI3−x.
The transmission spectra for each value of the magnetic field are analyzed tofind the energies of the particular absorption minima. We perform this by lookingfor the center of the absorption shape, assuming a Gaussian-like symmetry. Alldata points obtained for MAPbClxI3−x - the absorption energies for both σ− andσ+ circular polarizations, plotted as a function of the magnetic field, are presentedin Fig. 4.6 (a). An observation of the alignment of the data points allows us to dis-criminate between the particular transitions. Already at this stage, the significant
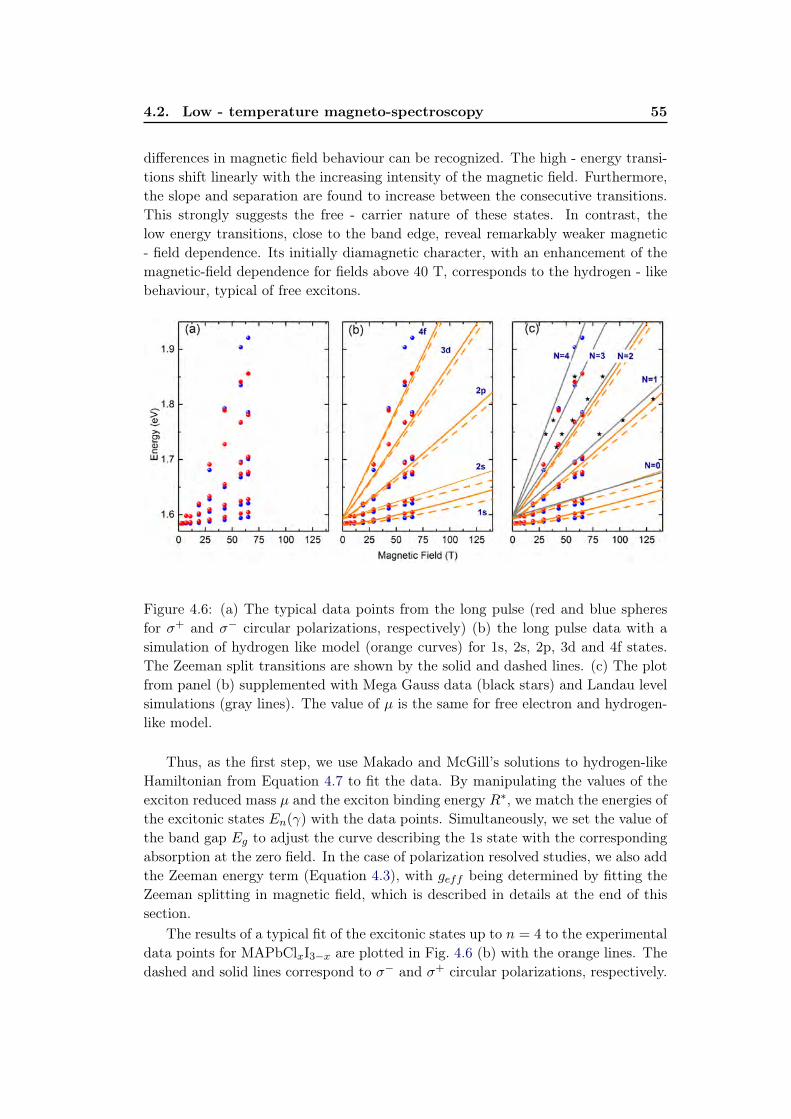
4.2. Low - temperature magneto-spectroscopy 55
differences in magnetic field behaviour can be recognized. The high - energy transi-tions shift linearly with the increasing intensity of the magnetic field. Furthermore,the slope and separation are found to increase between the consecutive transitions.This strongly suggests the free - carrier nature of these states. In contrast, thelow energy transitions, close to the band edge, reveal remarkably weaker magnetic- field dependence. Its initially diamagnetic character, with an enhancement of themagnetic-field dependence for fields above 40 T, corresponds to the hydrogen - likebehaviour, typical of free excitons.
Figure 4.6: (a) The typical data points from the long pulse (red and blue spheresfor σ+ and σ− circular polarizations, respectively) (b) the long pulse data with asimulation of hydrogen like model (orange curves) for 1s, 2s, 2p, 3d and 4f states.The Zeeman split transitions are shown by the solid and dashed lines. (c) The plotfrom panel (b) supplemented with Mega Gauss data (black stars) and Landau levelsimulations (gray lines). The value of µ is the same for free electron and hydrogen-like model.
Thus, as the first step, we use Makado and McGill’s solutions to hydrogen-likeHamiltonian from Equation 4.7 to fit the data. By manipulating the values of theexciton reduced mass µ and the exciton binding energy R∗, we match the energies ofthe excitonic states En(γ) with the data points. Simultaneously, we set the value ofthe band gap Eg to adjust the curve describing the 1s state with the correspondingabsorption at the zero field. In the case of polarization resolved studies, we also addthe Zeeman energy term (Equation 4.3), with geff being determined by fitting theZeeman splitting in magnetic field, which is described in details at the end of thissection.
The results of a typical fit of the excitonic states up to n = 4 to the experimentaldata points for MAPbClxI3−x are plotted in Fig. 4.6 (b) with the orange lines. Thedashed and solid lines correspond to σ− and σ+ circular polarizations, respectively.

56 Chapter 4. Magneto transmission
It is important to note that only the hydrogen-like states with n 6 3 describewell the data, while no reliable match is possible with the same parameters for thehigh energy absorptions, observed at high magnetic fields. To fit this data range,we use the Equation 4.4 for the energies of the intrerband transitions between theLandau levels. Here, we support the analysis with the data from extended magneticfield range of 70-150 T , which is relevant for the free-carrier transitions. Theseresults were obtained by Atsuhiko Miyata in the ultrashort pulse, extreme magneticfield Mega Gauss experiment, performed at LNCMI. These studies are based onmonochrome light transmission, performed without the polarization optics. As aresult, we neglect the Zeeman energy term in our modelling of the free electronstates.
The full fan chart for MAPbClxI3−x, now supplemented with the model of tran-sitions between the Landau levels (gray lines) and Mega Gauss data (black stars) isshown in Fig. 4.6 (c). The free - electron calculations are performed for the samevalue of µ as used for the excitonic states, providing a good description for thehigh energy transitions. Thus, by the simultaneous application of both hydrogen-like and free electron models with agreed value for the reduced mass, it is possibleto model the magneto-transmission data over the full energy range. Similarly toMAPbClxI3−x, in other compounds we observe usually three: 1s, 2s and 2p exci-tonic transitions, and Landau levels up to n = 4.
As the reduced mass is the only fitting parameter for the Landau levels, thehigh energy, high magnetic field transitions provide a strong constraint for the de-termination of µ. Introducing the accurate value of µ, obtained from the modelingof the free electron states, into the hydrogen -like model, it is possible to refinethe adjustment of R∗. However, to precisely determine the exciton binding energy,the simultaneous observation of the 1s and 2s transitions is paramount. Both ofthese states originate from the same Landau level, at same time being spectrallywell resolved from free electron transitions. According to Equation 4.5, the energiescorresponding to 1s and 2s absorption are separated by E2s−E1s = 3
4R∗. Therefore,
adjusting the value of R∗ to reproduce the experimentally observed 1s-2s splitting,we obtain a direct evaluation of the exciton binding energy.
We have performed similar modelling for all the compounds studied at low tem-peratures, namely MAPbClxI3−x, FAPbI3, FAPbBr3 and MAPbBr3. The corre-sponding fan charts, consisting of experimental data, and the simulations for boththe excitonic transitions (orange curves) and the Landau states (gray lines) areshown in Fig. 4.7; panels (a),(b),(c) and (d) for MAPbClxI3−x, FAPbI3, FAPbBr3and MAPbBr3, respectively. The resulting parameters: Eg, R∗, µ and geff arecollected in Table 4.1. The values for effective dielectric constant, εeff , have beencalculated from Equation 1.6. We estimate the errors by comparison of accuracyof the fits performed with different parameters. To extend our analysis, we addthe earlier results for the archetypal MAPbI3 compound, obtained with the sameexperimental and analysis methods [Miyata 2015].

4.2. Low - temperature magneto-spectroscopy 57
Figure 4.7: (a)-(d) Transition energies obtained from the experimental data andresults of the fit to the data for MAPbClxI3−x, FAPbI3, FAPbBr3 and MAPbBr3respectively. The red and blue points correspond to the polarization resolved minimain the absorption for σ+ and σ− respectively. The stars are the data obtained duringthe short pulsed measurements, where polarization was not used. The long pulseddata are also not polarization resolved for the FAPbBr3 and MAPbBr3 samples.The results of the theoretical fit are shown by grey and orange lines. Grey linescorrespond to the interband transitions between Landau levels in the valence andconduction bands. The orange lines show the strongly bound levels of the hydrogen-like exciton. In (a) and (b) the Zeeman split transitions are shown by the solid anddashed lines. Below each graph the low field and low energy part of the full fanchart diagram is enlarged.

58 Chapter 4. Magneto transmission
2K, orthorhombic phase
Compound Eg R∗ µ εeff geff(meV) (meV) (me)
FAPbI3 1501 14± 1 0.09± 0.01 9.35 2.3MAPbI3−xClx 1596 14± 1 0.10± 0.01 9.85 2.3MAPbI3 1652 16± 1 0.104± 0.01 9.4FAPbBr3 2233 22± 2 0.115± 0.01 8.42MAPbBr∗3 2292 25± 5 0.117± 0.01 7.5
Table 4.1: The parameters of the fit full Landau fan chart for four different com-pounds in the low temperature, orthorhombic phase. ∗The data for the MAPbBr3do not show a detectable 2s state and therefore have a significant error of around±20% for R∗.
Both R∗ and µ are found to depend on the band gap, increasing as the gapincreases. The differences are particularly small between the iodides. Although theband gap of FAPbI3 (1501 meV) is almost 100 meV smaller than for the mixedhalide, the fitting results for both materials are very similar, giving the same valueof R∗ = 14 meV. A slight distinction is observed in the reduced masses, which are0.09 m0 and 0.10 m0 for FAPbI3 and MAPbClxI3−x, respectively.
Figure 4.8: The low temperature data and corresponding fits for FAPbBr3 (red)and MAPbBr3 (black). The equal energy scales are the same for both compounds,shifted to match the band gaps.
In FAPbBr3, for the band gap of 2233 meV, the increase of R∗ to 22 meVis followed by the increase of µ to 0.115 m0. For MAPbBr3, no observation of

4.2. Low - temperature magneto-spectroscopy 59
the 2s transition and limited reliability of the low-field 2p state data results inhigher uncertainties of the derived parameters. For this compound, characterizedby the highest band gap Eg = 2392 meV, we estimate R∗ to be of the order of(25 ± 5) meV and µ = (0.117 ± 10%) m0. The uncertainty of R∗ is limited dueto the accurate determination of the value of µ obtained by fitting the high fieldfree electron transitions (see Fig. 4.7 (d)). To further confirm the reliability ofthe results obtained for MAPbBr3, in Fig. 4.8 we compare the data and fits forMAPbBr3 and FAPbBr3. Both plots have the same scale, shifted to match theband gap. We observe a similarity in the curve profiles and slopes, thus we concludethat the exciton binding energy and reduced mass are indeed comparable in thetri-bromides.
To find the exact values of the gyromagnetic factor, we investigate the differenceof energies for σ+ and σ− transitions, ∆E = Eσ
+ − Eσ− . These are plotted as thefunction of the magnetic field in Fig. 4.9, for the 1s states of MAPbClxI3−x andFAPbI3, in panels (a) and (b) respectively. The errors of ∆E are determined to beequal to 0.5 meV for MAPbClxI3−x and 0.8 meV for FAPbI3. We fit the data pointswith the Zeeman splitting term:
∆E = geffµBB
The fits are plotted in Fig. 4.9 with the red lines. We obtained geff = 2.34 ± 0.06
and geff = 2.30 ± 0.10 for MAPbClxI3−x and FAPbI3, respectively. Such valuesfor geff are slightly larger than reported previously [Tanaka 2003]. The data iswell reproduced by a linear spin splitting and therefore shows no evidence for aRashba splitting which has been suggested for some crystal structures in the hightemperature phase [Kim 2014, Even 2015].
Figure 4.9: The differences in energies of σ+ and σ− transitions, ∆E = Eσ+ −Eσ− ,
plotted as a function of magnetic field for MAPbClxI3−x and FAPbI3 in panels (a)and (b), respectively. The linear fits are presented with the red lines.
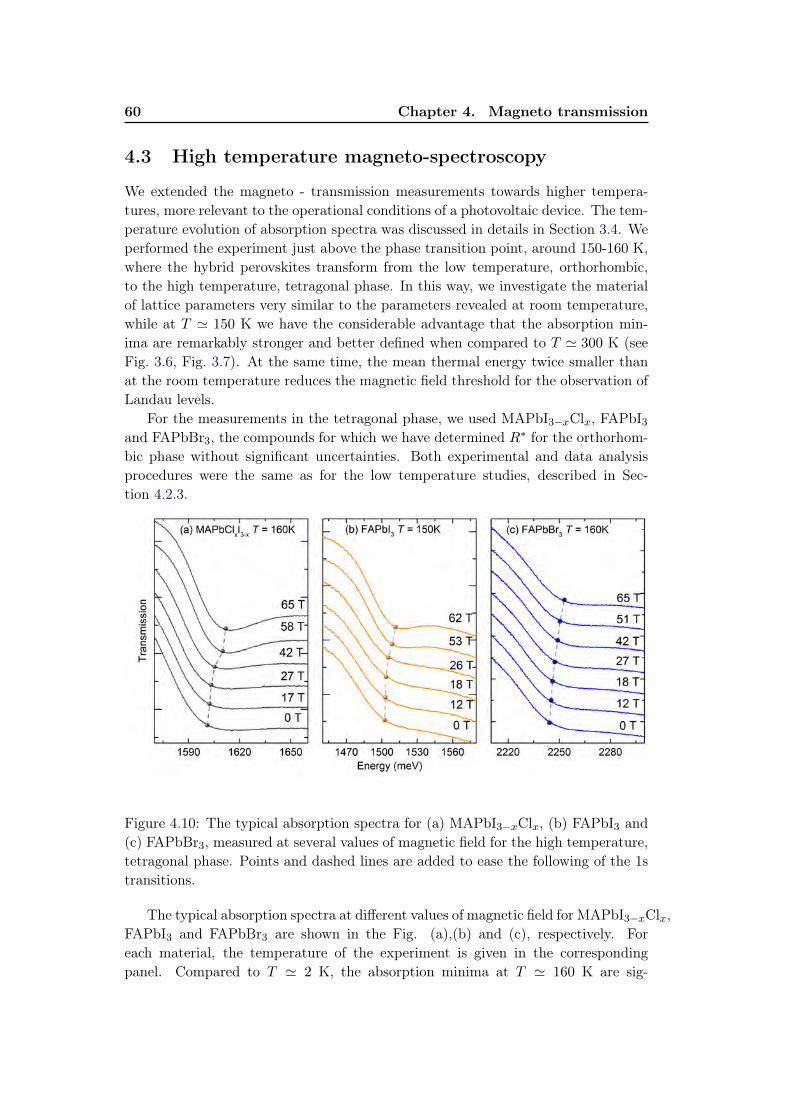
60 Chapter 4. Magneto transmission
4.3 High temperature magneto-spectroscopy
We extended the magneto - transmission measurements towards higher tempera-tures, more relevant to the operational conditions of a photovoltaic device. The tem-perature evolution of absorption spectra was discussed in details in Section 3.4. Weperformed the experiment just above the phase transition point, around 150-160 K,where the hybrid perovskites transform from the low temperature, orthorhombic,to the high temperature, tetragonal phase. In this way, we investigate the materialof lattice parameters very similar to the parameters revealed at room temperature,while at T ' 150 K we have the considerable advantage that the absorption min-ima are remarkably stronger and better defined when compared to T ' 300 K (seeFig. 3.6, Fig. 3.7). At the same time, the mean thermal energy twice smaller thanat the room temperature reduces the magnetic field threshold for the observation ofLandau levels.
For the measurements in the tetragonal phase, we used MAPbI3−xClx, FAPbI3and FAPbBr3, the compounds for which we have determined R∗ for the orthorhom-bic phase without significant uncertainties. Both experimental and data analysisprocedures were the same as for the low temperature studies, described in Sec-tion 4.2.3.
Figure 4.10: The typical absorption spectra for (a) MAPbI3−xClx, (b) FAPbI3 and(c) FAPbBr3, measured at several values of magnetic field for the high temperature,tetragonal phase. Points and dashed lines are added to ease the following of the 1stransitions.
The typical absorption spectra at different values of magnetic field for MAPbI3−xClx,FAPbI3 and FAPbBr3 are shown in the Fig. (a),(b) and (c), respectively. Foreach material, the temperature of the experiment is given in the correspondingpanel. Compared to T ' 2 K, the absorption minima at T ' 160 K are sig-

4.3. High temperature magneto-spectroscopy 61
nificantly broader (on average by a factor of three). Therefore, in the long pulsemeasurements we detect only the 1s transition. The weaker transitions at higherenergies are not resolved due to thermal broadening. Moreover, the direct obser-vation of higher excitonic states is further disturbed by the expected increase ofεeff [Even 2014b, Miyata 2015], resulting in a reduced spectral separation of thesestates.
Similarly as in the case of low-temperature measurements, we add to our long-pulse results the data obtained in the extreme magnetic field Mega Gauss exper-iment, performed by A. Miyata. We plot all data points obtained with long andshort pulse techniques on fan charts in Fig. 4.11. In the analogy to Fig. 4.10, panels(a),(b) and (c) correspond to MAPbI3−xClx, FAPbI3 and FAPbBr3, respectively.Following the procedure for the low temperature studies, we simulate the hydrogen-like and free electron transitions to extract the values of the exciton binding energyR∗ and reduced mass µ. The results are drawn in Fig. 4.11, in orange for the exci-tonic states and in gray for Landau levels. The fitting parameters are summarizedin Table 4.2.
Figure 4.11: (a)-(c) Transition energies obtained from the experimental data andresults of the fit to the data for MAPbClxI3−x, FAPbI3 and FAPbBr3, respectively.The stars are the data obtained during the short pulsed measurements. The resultsof the theoretical fit are shown by grey and orange lines. Grey lines correspondto the interband transitions between Landau levels in the valence and conductionbands. The orange lines represent the energy levels of the hydrogen-like exciton.
In the tetragonal phase, the interband transitions between the Landau levels areobserved only in the Mega Gauss experiment, even in the case of MAPbI3−xClx andFAPbI3, where at T ' 2 K such transitions were detected in the long pulse even

62 Chapter 4. Magneto transmission
below 40 T. Although the number of data points is reduced, we are able to obtaina good linear fits for the high energy transitions. Therefore, we conclude that thevalues of µ increased slightly to (0.095 − 0.13 ± 0.01) m0. The biggest increase isobserved for the tri-bromide, which is in the agreement with the increase in the bandgap with respect to the low temperature value. This difference is around 60 meV forFAPbBr3, and considerably lower (20 meV) for FAPbI3, while the band gap remainsalmost unchanged for the mixed halide.
High temperature tetragonal phase
Compound Eg R∗ µ εeff Temperature(meV) (meV) (me) (K)
FAPbI3 1521 10± 2 0.095± 0.01 11.4 140-160MAPbI3−xClx 1600 10± 2 0.105± 0.01 11.9 190-200MAPbI3 1608 12± 4 0.104± 0.01 10.9 155-190FAPbBr3 2294 24± 6 0.13± 0.01 8.6 160-170
Table 4.2: The parameters of the fit of the full Landau fan chart for four differentcompounds in the higher temperature, tetragonal phase.
The estimations for R∗ have larger errors, as we see no trace of absorption corre-sponding to the 2s state in the intermediate field range of 10-65 T, where it is usuallyobserved. In the iodides, the exciton binding energies are found to be reduced atthe tetragonal phase to R∗ = 10±3 meV, with a corresponding increase in εeff . Bycontrast, in the FAPbBr3 we estimate R∗ = 24± 4 meV, which is a slightly highervalue than measured for the low temperature, orthorhombic phase. However, it isimportant to note that fitting of the low field data for the 1s state with parameterscorresponding to the high - field points is problematic. Below 50 T, the values of theexperimental points for this transition in the iodides are up to 12 meV larger thanthe results of fit for hydrogen-like model, which is most visible in the absence of mag-netic field. We attribute this differences to the low accuracy in the determination ofthe 1s absorption energy to thermal broadening of absorption shape. In the temper-ature range of phase transitions, the mean thermal energy is larger or comparableto exciton binding energies in the iodides, thus the band-edge absorption includesalso higher and ionized states, and no single transition is resolved 4.10. A morediscrete 1s minimum is observed only in higher magnetic fields, due to the increasedseparation between the states and enhanced oscillator strengths. In agreement withthis picture, the differences between the values of low-field data and the model areless pronounced in the bromide. In this material, the exciton binding energy, thus,the separation between the states is around two times larger, and the shape of theabsorption minimum does not change significantly in the magnetic field. Therefore,in our analysis we mainly focus on the high-field data. However, such observationsmay also indicate that the phonon contribution to the dielectric screening is reducedin the magnetic field, as it has been discussed previously [Miyata 2015]. Thus, thevalues obtained for R∗ in magneto-optical studies will be an overestimate of the

4.4. Discussion 63
zero-field values.
4.4 Discussion
In this section, we will perform a detailed analysis of the low- and high-temperaturemagneto-spectroscopy results, included in Table 4.1 and Table 4.2, respectively. Thecrucial electronic parameters - the reduced mass µ and exciton binding energy R∗
measured at the low temperature, orthorhombic phase, are plotted as a functionof the bandgap of the material in the Fig. 4.12 (a). Both parameters are found toweakly increase with the band gap.
Figure 4.12: (a) and (b) Reduced mass and binding energy at T = 2 K as a functionof the energy gap respectively. Black (red) symbols mark results for FA (MA)iodides (full symbols) and bromides (open symbols). Green circles show results forthe mixed halide MAPbI3−xClx. The black solid lines show a linear fit to the data.(c) and (d) The low temperature data plot together with the values deduced for thehigher temperature tetragonal phase (with squares) for the FA (blue), MA (orange)and mixed halide (purple) materials, measured in the temperature ranges given inTable 4.2
The values of reduced excitonic mass in studied materials are between 0.090 to0.117 of mass of the free electron. In particular, for iodine dominated compounds,this range is limited to 0.095 - 0.105 m0, which is in a good agreement (µ = 0.09−0.1m0) with the recent density functional theorem (DFT) calculations, adjusted tofit the experimental value of the band gap for MAPbI3 [Menéndez-Proupin 2014,Umari 2014]. As the organo-lead halide perovskites are characterized by relativelysimple band structure, a simple semi-empirical two band k.p Hamiltonian approach
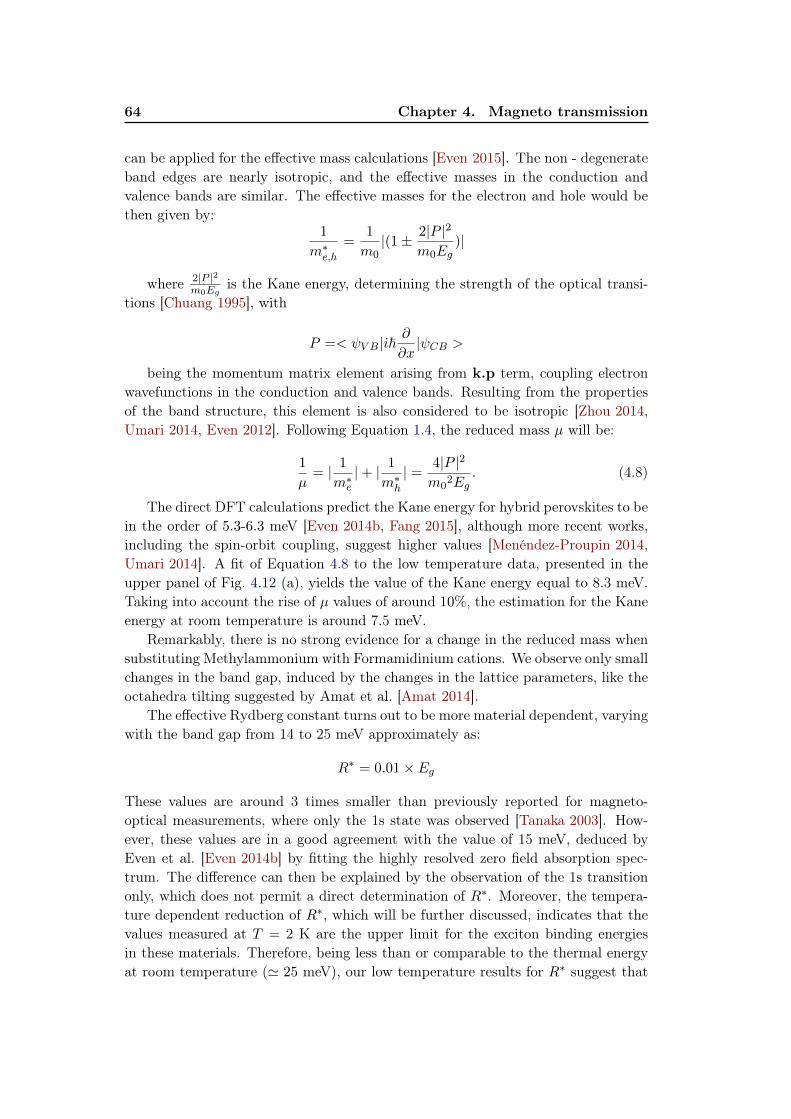
64 Chapter 4. Magneto transmission
can be applied for the effective mass calculations [Even 2015]. The non - degenerateband edges are nearly isotropic, and the effective masses in the conduction andvalence bands are similar. The effective masses for the electron and hole would bethen given by:
1
m∗e,h=
1
m0|(1± 2|P |2
m0Eg)|
where 2|P |2m0Eg
is the Kane energy, determining the strength of the optical transi-tions [Chuang 1995], with
P =< ψV B|i~∂
∂x|ψCB >
being the momentum matrix element arising from k.p term, coupling electronwavefunctions in the conduction and valence bands. Resulting from the propertiesof the band structure, this element is also considered to be isotropic [Zhou 2014,Umari 2014, Even 2012]. Following Equation 1.4, the reduced mass µ will be:
1
µ= | 1
m∗e|+ | 1
m∗h| = 4|P |2
m02Eg
. (4.8)
The direct DFT calculations predict the Kane energy for hybrid perovskites to bein the order of 5.3-6.3 meV [Even 2014b, Fang 2015], although more recent works,including the spin-orbit coupling, suggest higher values [Menéndez-Proupin 2014,Umari 2014]. A fit of Equation 4.8 to the low temperature data, presented in theupper panel of Fig. 4.12 (a), yields the value of the Kane energy equal to 8.3 meV.Taking into account the rise of µ values of around 10%, the estimation for the Kaneenergy at room temperature is around 7.5 meV.
Remarkably, there is no strong evidence for a change in the reduced mass whensubstituting Methylammonium with Formamidinium cations. We observe only smallchanges in the band gap, induced by the changes in the lattice parameters, like theoctahedra tilting suggested by Amat et al. [Amat 2014].
The effective Rydberg constant turns out to be more material dependent, varyingwith the band gap from 14 to 25 meV approximately as:
R∗ = 0.01× Eg
These values are around 3 times smaller than previously reported for magneto-optical measurements, where only the 1s state was observed [Tanaka 2003]. How-ever, these values are in a good agreement with the value of 15 meV, deduced byEven et al. [Even 2014b] by fitting the highly resolved zero field absorption spec-trum. The difference can then be explained by the observation of the 1s transitiononly, which does not permit a direct determination of R∗. Moreover, the tempera-ture dependent reduction of R∗, which will be further discussed, indicates that thevalues measured at T = 2 K are the upper limit for the exciton binding energiesin these materials. Therefore, being less than or comparable to the thermal energyat room temperature (' 25 meV), our low temperature results for R∗ suggest that

4.4. Discussion 65
in the entire family of the hybrid tri-halide perovskites the photocreated carriersare expected to be thermally ionized at 300 K. This goes a long way to explain theexcellent efficiencies of perovskite photovoltaic devices.
The values of effective dielectric constant εeff from Table 4.1 have been derivedwith a conventional formula for the effective Rydberg (Equation 1.6). The εeff ,which takes into account the Coulomb potential screening by the lattice, is foundto be in the range of 7.5 - 9.8. between the low ε0 = 25.7 [Wehrenfennig 2014a]and high ε∞ = 5.6 frequency values [Umari 2014, Brivio 2014]. A slight decreaseof εeff is observed with the rise of R∗ and µ, resulting from the reduction in sizeof the exciton Bohr radius and changes in the lattice parameters induced by vary-ing halide content. Such behaviour is characteristic for highly polar materials withstrong electron - phonon coupling, which was first demonstrated by Pollman andButtner [Pollman 1975] and by Kane [Kane 1978] for II-VI and I-VII materials. Giv-ing an example of TlCl, a I-VII compound with comparable parameters (ε0 = 37.6,ε∞ = 5.4, µ = 0.18 m0) it was found that εeff = 2.48ε∞. Although in perovskitesthe simulations of the dielectric constant are more complicated due to the presenceof the multiple polar phonon modes, such rotational motion of the Methylammo-nium cations, the recent results suggest again the values of εeff being intermediatebetween ε0 and ε∞ [Even 2014b, Umari 2014, Brivio 2014, Wehrenfennig 2014a].
It is noticeable that the values for εeff are significantly lower for the tri-bromides,where the higher reduced masses cause the binding energy to be larger, with aconsequent reduction in the strength of the screening. Due to the higher uncertaintyin the values of R∗ for the MAPbBr3, at present we cannot consider the significancein the difference in εeff between the Methylammonium and Formamidinium tri-bromides.
The results for the crucial electronic parameters obtained at low temperaturesmay be now compared with our studies for the materials transformed to higher tem-perature tetragonal phase, characterized by an enhanced symmetry. To discuss thechanges, in Fig. 4.12(b), we supplement the low temperature band-gap dependenceof µ and R, previously presented in panel (a), with the values obtained for thetetragonal phase. The phase transition seems to have limited impact on the value ofthe reduced mass µ, which has been suggested in the previous studies of MAPbI3,where no change was observed. Although our results indicate that after the phasetransition the µ may increase by up to 10 % with respect to the 2 K values, this isstill at the limit of the accuracy of the high temperature results. We then conclude,that the whole family of organo - lead trihalide perovskites may be described withEquation 4.8 in the terms of single parameter - the band gap energy, regardless ofthe crystalline phase or the temperature.
However, the effective dielectric constant εeff and consequently the exciton bind-ing energy R∗ are more affected by the transformation from orthorhombic to tetrag-onal phase. This is connected with additional collective rotational motion of theorganic cations, allowed at higher temperatures, and further increasing the screen-ing of the Coulomb potential [Poglitsch 1987]. The reduction of the εeff in thetetragonal phase has been suggested in several theoretical works. In a previously
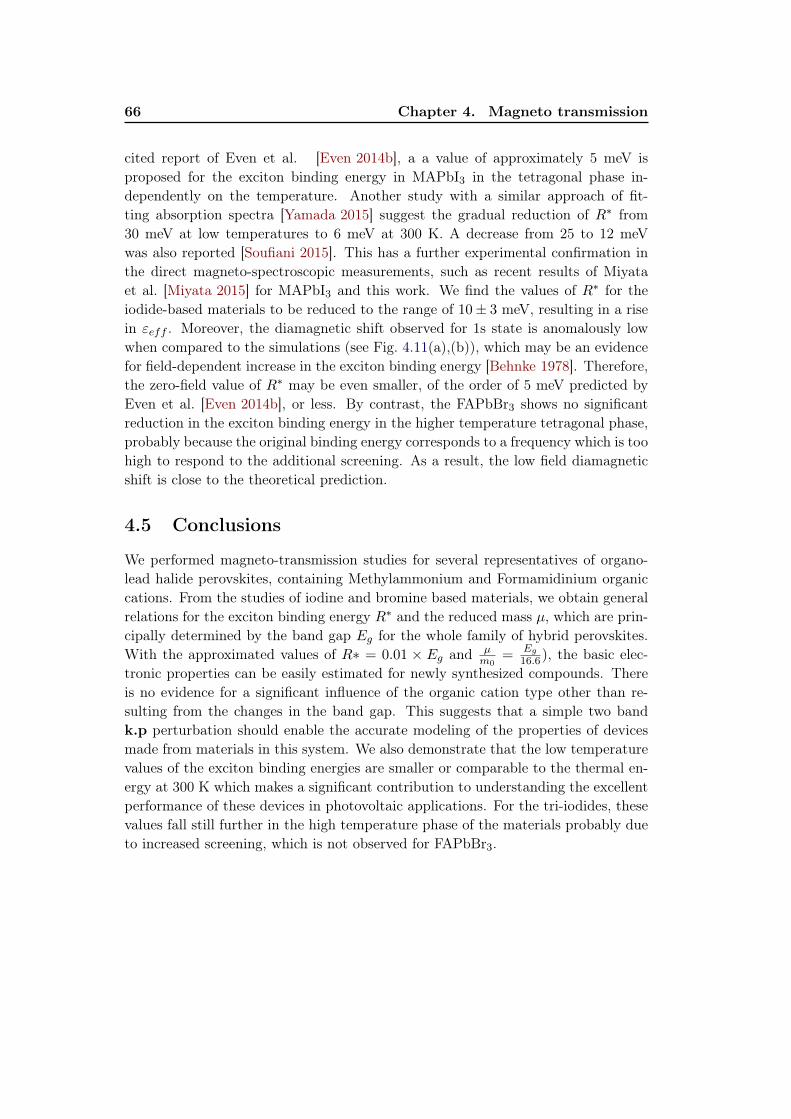
66 Chapter 4. Magneto transmission
cited report of Even et al. [Even 2014b], a a value of approximately 5 meV isproposed for the exciton binding energy in MAPbI3 in the tetragonal phase in-dependently on the temperature. Another study with a similar approach of fit-ting absorption spectra [Yamada 2015] suggest the gradual reduction of R∗ from30 meV at low temperatures to 6 meV at 300 K. A decrease from 25 to 12 meVwas also reported [Soufiani 2015]. This has a further experimental confirmation inthe direct magneto-spectroscopic measurements, such as recent results of Miyataet al. [Miyata 2015] for MAPbI3 and this work. We find the values of R∗ for theiodide-based materials to be reduced to the range of 10± 3 meV, resulting in a risein εeff . Moreover, the diamagnetic shift observed for 1s state is anomalously lowwhen compared to the simulations (see Fig. 4.11(a),(b)), which may be an evidencefor field-dependent increase in the exciton binding energy [Behnke 1978]. Therefore,the zero-field value of R∗ may be even smaller, of the order of 5 meV predicted byEven et al. [Even 2014b], or less. By contrast, the FAPbBr3 shows no significantreduction in the exciton binding energy in the higher temperature tetragonal phase,probably because the original binding energy corresponds to a frequency which is toohigh to respond to the additional screening. As a result, the low field diamagneticshift is close to the theoretical prediction.
4.5 Conclusions
We performed magneto-transmission studies for several representatives of organo-lead halide perovskites, containing Methylammonium and Formamidinium organiccations. From the studies of iodine and bromine based materials, we obtain generalrelations for the exciton binding energy R∗ and the reduced mass µ, which are prin-cipally determined by the band gap Eg for the whole family of hybrid perovskites.With the approximated values of R∗ = 0.01 × Eg and µ
m0=
Eg
16.6), the basic elec-tronic properties can be easily estimated for newly synthesized compounds. Thereis no evidence for a significant influence of the organic cation type other than re-sulting from the changes in the band gap. This suggests that a simple two bandk.p perturbation should enable the accurate modeling of the properties of devicesmade from materials in this system. We also demonstrate that the low temperaturevalues of the exciton binding energies are smaller or comparable to the thermal en-ergy at 300 K which makes a significant contribution to understanding the excellentperformance of these devices in photovoltaic applications. For the tri-iodides, thesevalues fall still further in the high temperature phase of the materials probably dueto increased screening, which is not observed for FAPbBr3.
Chapter 5
Spatially resolved micro -photoluminescence studies of
organo-lead halide perovskites
Contents5.1 Introduction . . . . . . . . . . . . . . . . . . . . . . . . . . . . 675.2 Temperature dependence studies . . . . . . . . . . . . . . . . 685.3 Spatially resolved µ-PL at room temperature . . . . . . . . 715.4 Spatially resolved µ-PL below the phase transition temper-
atures . . . . . . . . . . . . . . . . . . . . . . . . . . . . . . . . 725.4.1 MAPbI3 and FAPbI3 . . . . . . . . . . . . . . . . . . . . . . . 725.4.2 MAPbClxI3−x . . . . . . . . . . . . . . . . . . . . . . . . . . 755.4.3 FAPbBr3 . . . . . . . . . . . . . . . . . . . . . . . . . . . . . 76
5.5 The coexistence of crystalline phases in the proximity ofstrain or defects . . . . . . . . . . . . . . . . . . . . . . . . . . 77
5.6 Conclusions . . . . . . . . . . . . . . . . . . . . . . . . . . . . . 80
This chapter describes the investigation of the morphology in several represen-tatives of the organo lead halide perovskite family using spatially resolved µ-PL per-formed at different temperatures. We demonstrate that the perovskite thin film has acrystalline grain structure. Dark and bright grains are observed independently of thetemperature in all studied materials. We also show, that the low temperature phasetransition, from the tetragonal to orthorhombic crystal structure, is not uniformacross the perovskite film. The remains of the high temperature tetragonal phase canbe found even at very low temperatures. This suggests that the observed inhomo-geneities result from the varying halide content, a hypothesis which is supported bythe enhanced occurrence of tetragonal inclusions in the halide-depleted regions.
5.1 Introduction
Due to their spin-coated nature, perovskite thin films have a limited uniformity [Chen 2014b,Zhou 2014, Eperon 2014b]. The structural defects and non-stoichiometrical inclu-sions, formed during the solvent evaporation, can adversely influence the device per-formance. However, to date there is a limited number of investigations of the impact
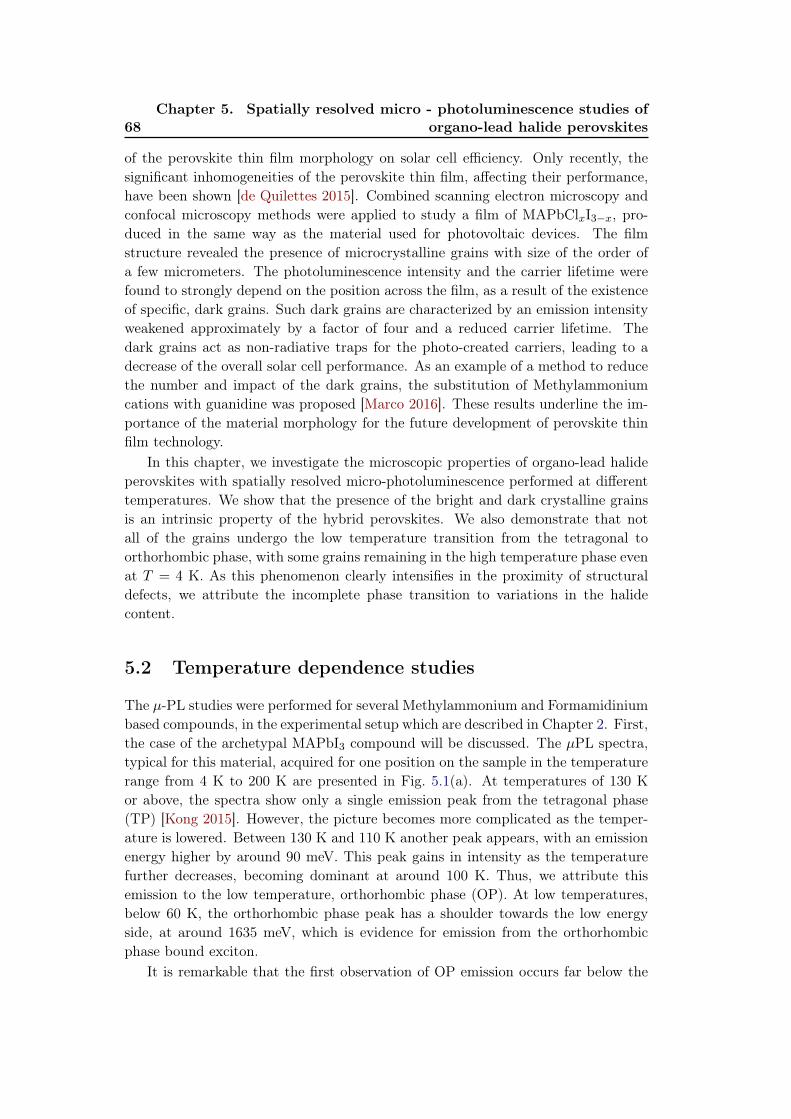
68Chapter 5. Spatially resolved micro - photoluminescence studies of
organo-lead halide perovskites
of the perovskite thin film morphology on solar cell efficiency. Only recently, thesignificant inhomogeneities of the perovskite thin film, affecting their performance,have been shown [de Quilettes 2015]. Combined scanning electron microscopy andconfocal microscopy methods were applied to study a film of MAPbClxI3−x, pro-duced in the same way as the material used for photovoltaic devices. The filmstructure revealed the presence of microcrystalline grains with size of the order ofa few micrometers. The photoluminescence intensity and the carrier lifetime werefound to strongly depend on the position across the film, as a result of the existenceof specific, dark grains. Such dark grains are characterized by an emission intensityweakened approximately by a factor of four and a reduced carrier lifetime. Thedark grains act as non-radiative traps for the photo-created carriers, leading to adecrease of the overall solar cell performance. As an example of a method to reducethe number and impact of the dark grains, the substitution of Methylammoniumcations with guanidine was proposed [Marco 2016]. These results underline the im-portance of the material morphology for the future development of perovskite thinfilm technology.
In this chapter, we investigate the microscopic properties of organo-lead halideperovskites with spatially resolved micro-photoluminescence performed at differenttemperatures. We show that the presence of the bright and dark crystalline grainsis an intrinsic property of the hybrid perovskites. We also demonstrate that notall of the grains undergo the low temperature transition from the tetragonal toorthorhombic phase, with some grains remaining in the high temperature phase evenat T = 4 K. As this phenomenon clearly intensifies in the proximity of structuraldefects, we attribute the incomplete phase transition to variations in the halidecontent.
5.2 Temperature dependence studies
The µ-PL studies were performed for several Methylammonium and Formamidiniumbased compounds, in the experimental setup which are described in Chapter 2. First,the case of the archetypal MAPbI3 compound will be discussed. The µPL spectra,typical for this material, acquired for one position on the sample in the temperaturerange from 4 K to 200 K are presented in Fig. 5.1(a). At temperatures of 130 Kor above, the spectra show only a single emission peak from the tetragonal phase(TP) [Kong 2015]. However, the picture becomes more complicated as the temper-ature is lowered. Between 130 K and 110 K another peak appears, with an emissionenergy higher by around 90 meV. This peak gains in intensity as the temperaturefurther decreases, becoming dominant at around 100 K. Thus, we attribute thisemission to the low temperature, orthorhombic phase (OP). At low temperatures,below 60 K, the orthorhombic phase peak has a shoulder towards the low energyside, at around 1635 meV, which is evidence for emission from the orthorhombicphase bound exciton.
It is remarkable that the first observation of OP emission occurs far below the
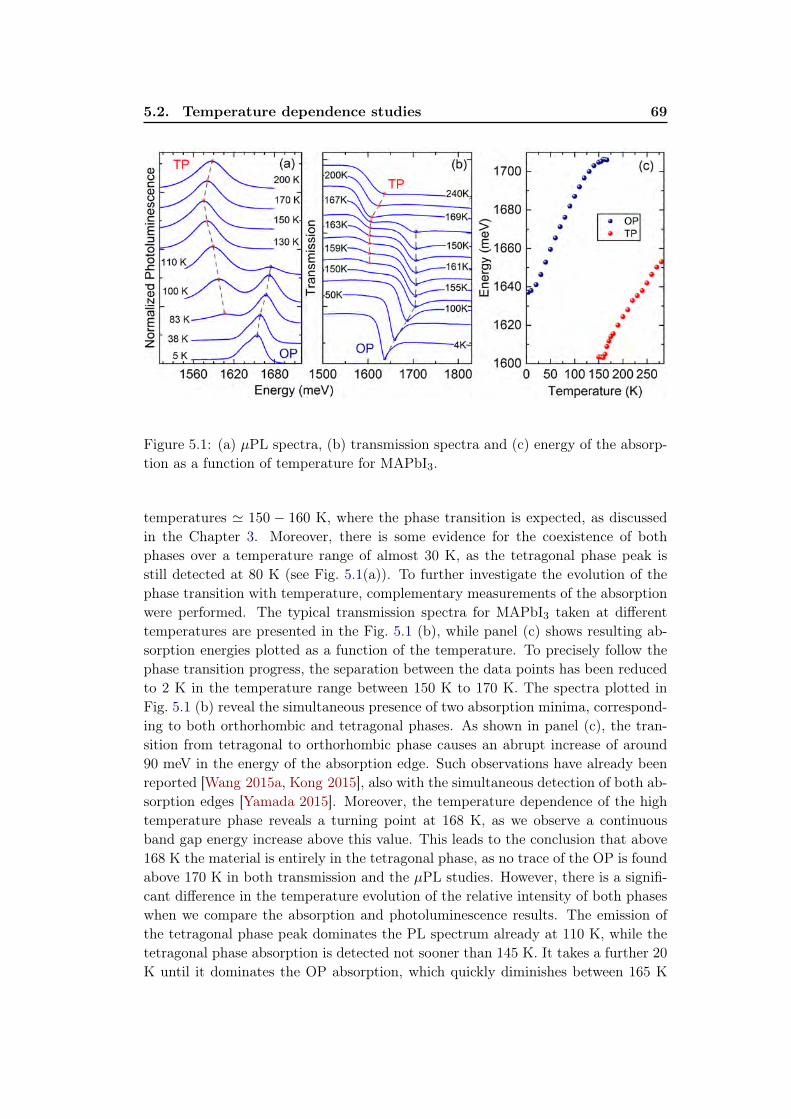
5.2. Temperature dependence studies 69
Figure 5.1: (a) µPL spectra, (b) transmission spectra and (c) energy of the absorp-tion as a function of temperature for MAPbI3.
temperatures ' 150 − 160 K, where the phase transition is expected, as discussedin the Chapter 3. Moreover, there is some evidence for the coexistence of bothphases over a temperature range of almost 30 K, as the tetragonal phase peak isstill detected at 80 K (see Fig. 5.1(a)). To further investigate the evolution of thephase transition with temperature, complementary measurements of the absorptionwere performed. The typical transmission spectra for MAPbI3 taken at differenttemperatures are presented in the Fig. 5.1 (b), while panel (c) shows resulting ab-sorption energies plotted as a function of the temperature. To precisely follow thephase transition progress, the separation between the data points has been reducedto 2 K in the temperature range between 150 K to 170 K. The spectra plotted inFig. 5.1 (b) reveal the simultaneous presence of two absorption minima, correspond-ing to both orthorhombic and tetragonal phases. As shown in panel (c), the tran-sition from tetragonal to orthorhombic phase causes an abrupt increase of around90 meV in the energy of the absorption edge. Such observations have already beenreported [Wang 2015a, Kong 2015], also with the simultaneous detection of both ab-sorption edges [Yamada 2015]. Moreover, the temperature dependence of the hightemperature phase reveals a turning point at 168 K, as we observe a continuousband gap energy increase above this value. This leads to the conclusion that above168 K the material is entirely in the tetragonal phase, as no trace of the OP is foundabove 170 K in both transmission and the µPL studies. However, there is a signifi-cant difference in the temperature evolution of the relative intensity of both phaseswhen we compare the absorption and photoluminescence results. The emission ofthe tetragonal phase peak dominates the PL spectrum already at 110 K, while thetetragonal phase absorption is detected not sooner than 145 K. It takes a further 20K until it dominates the OP absorption, which quickly diminishes between 165 K

70Chapter 5. Spatially resolved micro - photoluminescence studies of
organo-lead halide perovskites
and 170 K. These phenomena can be explained by a concurrent collection of photocreated carriers in grains of different crystalline phases, which is further discussedin the Section 5.3.
Figure 5.2: (a),(b) Temperature dependence of the µPL for two different spot po-sitions on MAPbClxI3−x corresponding to the domains of the orthorhombic andtetragonal phases, respectively. (c) Temperature dependence of the µPL spectra forFAPbBr3
In the case of the mixed halide material, MAPbClxI3−x, the presence of thetetragonal phase at low temperatures is even more significant than in the puretriiodide. In this compound, both phases can be fully resolved, leading to theobservation of areas, where exclusively one of the phases is detected. The typicalspectra acquired at two such positions, measured as a function of the temperature,are shown in Fig. 5.2 (a) and (b). Panel (a) represents the transition from thetetragonal to orthorhombic phase, whereas panel (b) refers to the region whichremains in the tetragonal phase even at T = 4 K. In the Fig. 5.2 (a), the tetragonalphase emission totally vanishes below 120 K. The remaining orthorhombic phasepeak has a high energy shoulder at ≈ 1600 meV, which is attributed to orthorhombicphase free exciton emission. Below 60 K, the intensity of the orthorhombic phasefree exciton considerably decreases, and the emission is dominated by the peakaround 1560 meV, which corresponds to the orthorhombic phase bound excitonstate. In contrast, the spectra in Fig. 5.2 (b) show the dominance of the tetragonalphase peak, which starts already at the phase transition temperature. With furthertemperature decrease, the orthorhombic phase peak is consequently weakened, andno remains of it are found at temperatures of 30 K or below. The emission energyof tetragonal phase peak at low temperatures is at ≈ 1525 meV, reproducing theenergy shift between tetragonal and orthorhombic phases identified at the phase
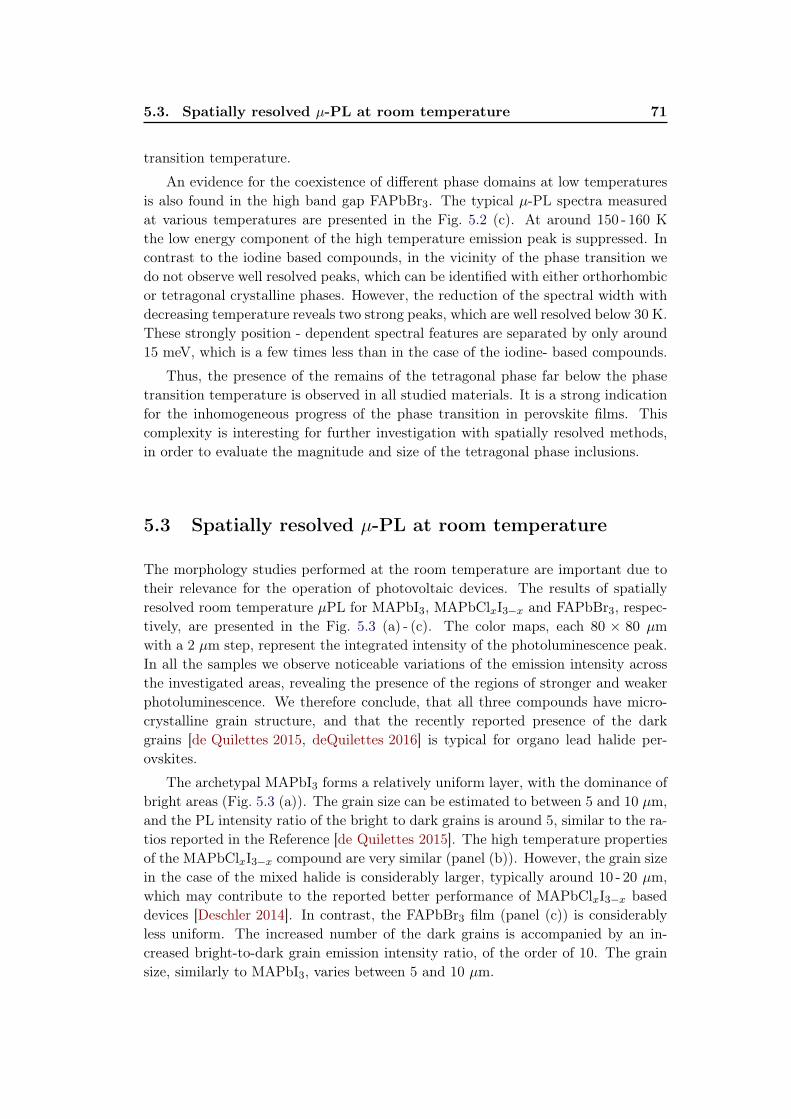
5.3. Spatially resolved µ-PL at room temperature 71
transition temperature.
An evidence for the coexistence of different phase domains at low temperaturesis also found in the high band gap FAPbBr3. The typical µ-PL spectra measuredat various temperatures are presented in the Fig. 5.2 (c). At around 150 - 160 Kthe low energy component of the high temperature emission peak is suppressed. Incontrast to the iodine based compounds, in the vicinity of the phase transition wedo not observe well resolved peaks, which can be identified with either orthorhombicor tetragonal crystalline phases. However, the reduction of the spectral width withdecreasing temperature reveals two strong peaks, which are well resolved below 30 K.These strongly position - dependent spectral features are separated by only around15 meV, which is a few times less than in the case of the iodine- based compounds.
Thus, the presence of the remains of the tetragonal phase far below the phasetransition temperature is observed in all studied materials. It is a strong indicationfor the inhomogeneous progress of the phase transition in perovskite films. Thiscomplexity is interesting for further investigation with spatially resolved methods,in order to evaluate the magnitude and size of the tetragonal phase inclusions.
5.3 Spatially resolved µ-PL at room temperature
The morphology studies performed at the room temperature are important due totheir relevance for the operation of photovoltaic devices. The results of spatiallyresolved room temperature µPL for MAPbI3, MAPbClxI3−x and FAPbBr3, respec-tively, are presented in the Fig. 5.3 (a) - (c). The color maps, each 80 × 80 µmwith a 2 µm step, represent the integrated intensity of the photoluminescence peak.In all the samples we observe noticeable variations of the emission intensity acrossthe investigated areas, revealing the presence of the regions of stronger and weakerphotoluminescence. We therefore conclude, that all three compounds have micro-crystalline grain structure, and that the recently reported presence of the darkgrains [de Quilettes 2015, deQuilettes 2016] is typical for organo lead halide per-ovskites.
The archetypal MAPbI3 forms a relatively uniform layer, with the dominance ofbright areas (Fig. 5.3 (a)). The grain size can be estimated to between 5 and 10 µm,and the PL intensity ratio of the bright to dark grains is around 5, similar to the ra-tios reported in the Reference [de Quilettes 2015]. The high temperature propertiesof the MAPbClxI3−x compound are very similar (panel (b)). However, the grain sizein the case of the mixed halide is considerably larger, typically around 10 - 20 µm,which may contribute to the reported better performance of MAPbClxI3−x baseddevices [Deschler 2014]. In contrast, the FAPbBr3 film (panel (c)) is considerablyless uniform. The increased number of the dark grains is accompanied by an in-creased bright-to-dark grain emission intensity ratio, of the order of 10. The grainsize, similarly to MAPbI3, varies between 5 and 10 µm.
72Chapter 5. Spatially resolved micro - photoluminescence studies of
organo-lead halide perovskites
Figure 5.3: Integrated intensity of the µPL peak as a function of the position for(a) MAPbI3, spot illumination intensity 40 nW (4W/cm2), (b) MAPbClxI3−x, spotillumination intensity 60 nW (6W/cm2), and (c) FAPbBr3, spot illumination inten-sity 100 nW (10W/cm2), respectively at 300K. The integrated intensity increasesfrom white to blue. The scanning step is 2µm.
5.4 Spatially resolved µ-PL below the phase transitiontemperatures
5.4.1 MAPbI3 and FAPbI3
The low temperature (T = 4 K) spatially resolved µPL for MAPbI3 is presentedin the Fig. 5.4. Panel (a) shows photoluminescence from the low temperature, or-thorhombic phase. Similarly to the room temperature results (Fig. 5.3 (a)), theemission is fairly uniform, with some variation on a few µm scale related to themicrocrystalline structure of the perovskite film. Nevertheless, we still observe thedark and bright grains. Remarkably, the low energy peak, corresponding to thehigh temperature tetragonal phase, accompanies the orthorhombic emission at cer-tain positions across the sample. The typical spectra acquired for two differentpositions on the sample are presented in the panel (c). The spectrum drawn withthe blue curve represents a position, where only the orthorhombic peak occurs.The red curve corresponds to the position, where both orthorhombic and tetrago-nal phase peaks are detected simultaneously. The difference in the emission energybetween the tetragonal and orthorhombic phase peaks is the same as the change inthe band gap observed at the phase transition temperature (see Fig. 2.5), where thetetragonal phase absorption is lower in energy by approximately 90 meV. Althoughthe intensity of the tetragonal phase emission is always lower than the intensity ofdominant orthorhombic phase peak, the occurrence of the tetragonal phase peakappears to decrease the intensity of the OP peak. The integrated intensity of thetetragonal phase peak, indicated with the red color, is superimposed upon the inte-grated intensity of orthorhombic phase peak in Fig. 5.4 (b). The tetragonal phase

5.4. Spatially resolved µ-PL below the phase transition temperatures73
emission is found within rather infrequent, isolated areas of typical size of 1 to 5µm, where the orthorhombic phase peak is usually weaker. To precisely determine,if there is a correlation between the emission intensities of the two phases, we an-alyze the proportions of the total emission in each peak IOP,TP
ITP +ITPas a function of
the emission intensity of the tetragonal phase peak (ITP ). The results, presentedin Fig. 5.4 (d) reveal an anti-correlation: as the proportion of the emission in thetetragonal phase peak (orange points) rises, the OP phase falls progressively.
Figure 5.4: Spatially resolved micro-photoluminescence for MAPbI3: (a) Integratedintensity of the high energy (OP) peak as a function of position. The intensityincreases from white to dark blue. (b) A second map of the low energy (TP) peak issuperimposed onto the map shown in (a). The intensity increases from white to red.(c) Typical spectra for positions where only the OP peak was observed (blue) andwhere both peaks were observed (red). (d) Correlation of the integrated intensityof the TP (orange) and OP (black) peaks versus intensity of the low energy TPpeak. All the measurements have been performed at T = 4 K, with the scanningstep 2 µm and spot illumination intensity 5 nW (0.5W/cm2).
A similar behaviour is found in a Formamidinium triiodide. The low temperatureµPL map for the FAPbI3 sample is presented in Fig. 5.5. Similarly to MAPbI3, theintensity of the orthorhombic phase peak (indicated with the blue color in panel (a))is relatively uniform across the sample, with isolated inclusions of the tetragonalphase (superimposed upon the orthorhombic phase map with the red color in panel(b)). Again, the regions of the occurrence of the emission from the tetragonal phaseare few µm in size. However, in FAPbI3, the relative intensity of the tetragonalphase is increased, and at certain positions is comparable with the intensity of theorthorhombic phase peak. An example of such behaviour is presented in the panel(c), containing typical spectra, which correspond to the positions of the dominanceof the orthorhombic phase peak (the blue curve) and a significant presence of thetetragonal phase peak (the red curve). The IOP,TP
ITP +ITPratios plotted in the panel (d)
confirm that both phases can similarly contribute to the total emission.The results obtained on the triiodides strongly indicate the coexistence of two
crystalline phases at low temperatures, proving that although the majority of thefilm transforms into the orthorhombic phase, certain perovskite grains remain in

74Chapter 5. Spatially resolved micro - photoluminescence studies of
organo-lead halide perovskites
Figure 5.5: (a) Integrated intensity of the high energy (OP) peak as a functionof position for FAPbI3. The intensity increases from white to dark blue. (b) Asecond map of the low energy (TP) peak is superimposed onto the map shown in(a). The intensity increases from white to red. (c) Typical spectra for positionswhere only the OP peak was observed (blue) and where both peaks were observed(red). (d) Correlation of the integrated intensity of the TP (orange) and OP (black)peaks versus intensity of the low energy TP peak. All the measurements have beenperformed at T = 4 K, with the scanning step 2 µm and spot illumination intensity5 nW (0.5W/cm2).
the tetragonal phase far below the phase transition temperature. The phase do-mains collect the photo created carriers concurrently, which is revealed in the posi-tive/negative intensity correlation. Due to the lower band gap, the micro-domains ofthe high temperature tetragonal phase might preferably collect the carriers excitedin the orthorhombic phase regions, as it was suggested previously for MAPbClxI3−x[Wehrenfennig 2014b]. This is consistent with the comparison of photoluminescenceand transmission measured as a function of temperature (see Fig. 5.2 and Fig. 5.1 ).The tetragonal phase peak dominates the PL for temperatures significantly belowthe phase transition, while remaining undetectable in absorption. The separationsof the tetragonal inclusions are typically of the order of 10 - 20 µm. This is an indi-cation that the diffusion length in these materials remain at a comparable value untilthe temperature falls below 80 K, where we can completely resolve both phases. Italso suggests the importance of the inter grain diffusion in this temperature range.Since the diffusion lengths are expected to be proportional to
√T at low temper-
atures, and PL is excited by the laser spot of approximately 1 µm diameter, thelow temperature maps give an upper limit to the size of the tetragonal phase do-mains. This limit is in the range of a few µm, which is comparable with the sizeof individual crystallites. However, the tetragonal domains may be even smaller.As the perovskite materials are characterized by relatively long diffusion lengths[Stranks 2013, Xing 2013], the excitons can be supposedly collected over compara-ble distances even by the microscopic scale regions of a smaller band gap material.As a consequence, these small regions can dominate the PL response without re-
5.4. Spatially resolved µ-PL below the phase transition temperatures75
vealing a detectable absorption in the transmission measurements. Thus, the overallproportion of the high temperature tetragonal phase, estimated with the spatiallyresolved PL images to be not higher than a few per cent of the total area, may besignificantly smaller.
5.4.2 MAPbClxI3−x
We turn now to the material synthesized in the presence of chloride precursors,namely MAPbClxI3−x. The µPL maps measured at 4 K and 150 K are presentedin Fig. 5.6. Panels (a) - (d) contain the results of the low temperature scan, whilepanels (e) - (h) refer to data acquired at 150 K, over a different region of the sample.The integrated intensity of the orthorhombic phase peak (panels (a) and (e) for 4Kand 150K, respectively) show similar structure as in the room temperature scan(Fig. 5.3 (b)), with a grain structure of the typical size in the order of 5 - 10 µm.However, when we superimpose the map of tetragonal phase emission upon theOP distribution, we find a strong positive/ negative correlation between both thephases, as presented in the panels (b) and (f). In the regions of tetragonal phaseinclusions, the intensity of the orthorhombic phase peak is significantly weakenedor completely suppressed. Furthermore, the size of the phase domains, considerablylarger than in the pure iodides, is scalable with the size of crystalline grains. Thisallows the orthorhombic and tetragonal phases to be completely resolved. This effectis especially clear at 4 K, where we practically do not observe simultaneous emissionfrom both phases. This anti correlation is additionally proved by the IOP,TP
ITP +ITPratios,
plotted in the panels (d) and (h). The positive / negative correlation of integratedPL is clear in both cases: the maximum for the orthorhombic phase peak correspondsto the minimum for the tetragonal phase peak.
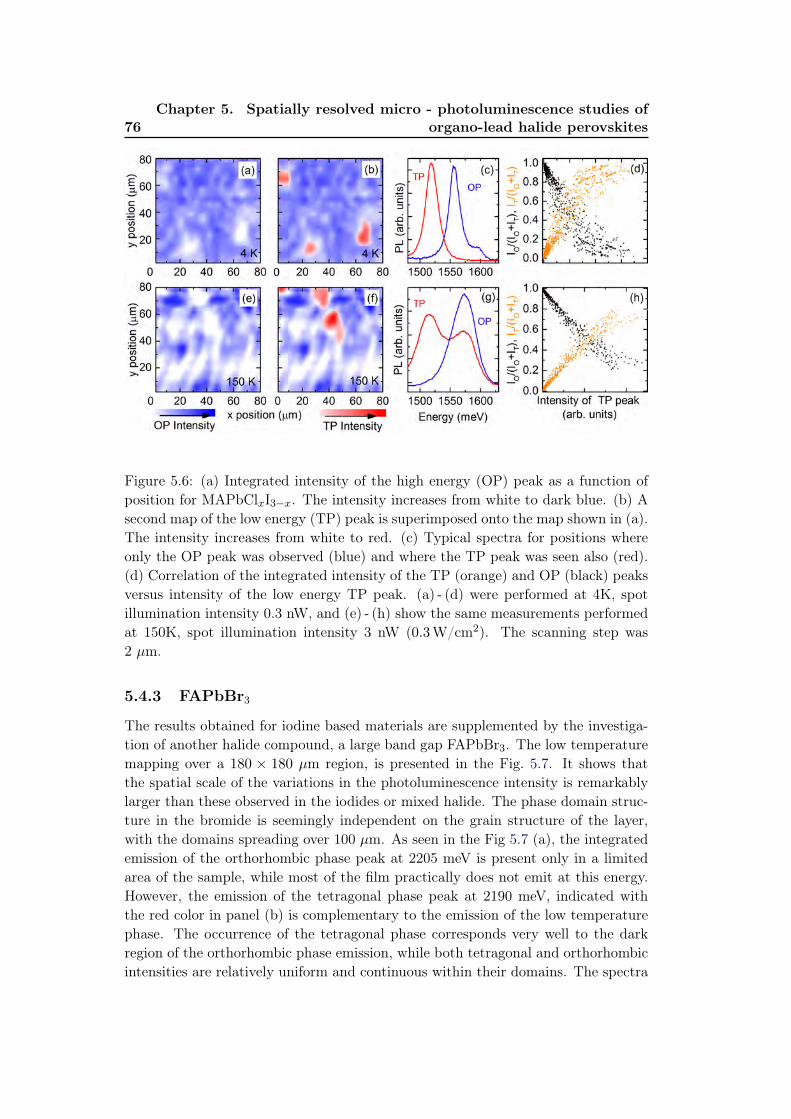
76Chapter 5. Spatially resolved micro - photoluminescence studies of
organo-lead halide perovskites
Figure 5.6: (a) Integrated intensity of the high energy (OP) peak as a function ofposition for MAPbClxI3−x. The intensity increases from white to dark blue. (b) Asecond map of the low energy (TP) peak is superimposed onto the map shown in (a).The intensity increases from white to red. (c) Typical spectra for positions whereonly the OP peak was observed (blue) and where the TP peak was seen also (red).(d) Correlation of the integrated intensity of the TP (orange) and OP (black) peaksversus intensity of the low energy TP peak. (a) - (d) were performed at 4K, spotillumination intensity 0.3 nW, and (e) - (h) show the same measurements performedat 150K, spot illumination intensity 3 nW (0.3W/cm2). The scanning step was2 µm.
5.4.3 FAPbBr3
The results obtained for iodine based materials are supplemented by the investiga-tion of another halide compound, a large band gap FAPbBr3. The low temperaturemapping over a 180 × 180 µm region, is presented in the Fig. 5.7. It shows thatthe spatial scale of the variations in the photoluminescence intensity is remarkablylarger than these observed in the iodides or mixed halide. The phase domain struc-ture in the bromide is seemingly independent on the grain structure of the layer,with the domains spreading over 100 µm. As seen in the Fig 5.7 (a), the integratedemission of the orthorhombic phase peak at 2205 meV is present only in a limitedarea of the sample, while most of the film practically does not emit at this energy.However, the emission of the tetragonal phase peak at 2190 meV, indicated withthe red color in panel (b) is complementary to the emission of the low temperaturephase. The occurrence of the tetragonal phase corresponds very well to the darkregion of the orthorhombic phase emission, while both tetragonal and orthorhombicintensities are relatively uniform and continuous within their domains. The spectra

5.5. The coexistence of crystalline phases in the proximity of strain ordefects 77
from both regions are well resolved, as seen in the Fig 5.7(c). This marked posi-tive/negative correlation is also revealed in the IOP,TP
ITP +ITPratios, plotted as a function
of orthorhombic phase peak intensity in the Fig. 5.7(d).
Figure 5.7: (a) Integrated intensity of the high energy (OP) peak for FAPbBr3: asa function of position. The intensity increases from white to dark blue. . (b) Asecond map of the low energy (TP) peak is superimposed onto the map shown in(a). The intensity increases from white to red. (c) Typical spectra for positionswhere only the OP peak was observed (blue) and where both peaks were observed(red). (d) Correlation of the integrated intensity of the TP (orange) and OP (black)peaks versus intensity of the TP peak. All the measurements have been performedat T = 4 K, with the scanning step 2 µm and spot illumination intensity 5 nW(0.5W/cm2).
The presence of the macroscopic domains possibly originates from a relativelysmall difference between the emission energy of the two phases, which is only 15 meV.This suggests that the difference in the band structure or the free energy betweenthe two phases may also be smaller, as has been shown previously [Kunugita 2015].This would facilitate the propagation of a particular structure towards adjacentgrains, creating domains of 100 µm in size or greater.
5.5 The coexistence of crystalline phases in the proxim-ity of strain or defects
Naturally formed defects in the perovskite thin film are the first candidates to beconsidered as the cause of the observed inhomogeneities in the progression of thephase transition. Here, we will discuss the coexistence of the orthorhombic andtetragonal phases within damaged or strained material. In the proximity of suchdefects, we observe an enhanced occurrence of the tetragonal phase at low temper-atures, which brings further insight into the origin of domain-formation behaviourobserved in the organic/inorganic perovskites.
To investigate this, we intentionally introduced a defect in the perovskite thinfilm material by exposing it to a focused laser spot. It has been shown, that photo -
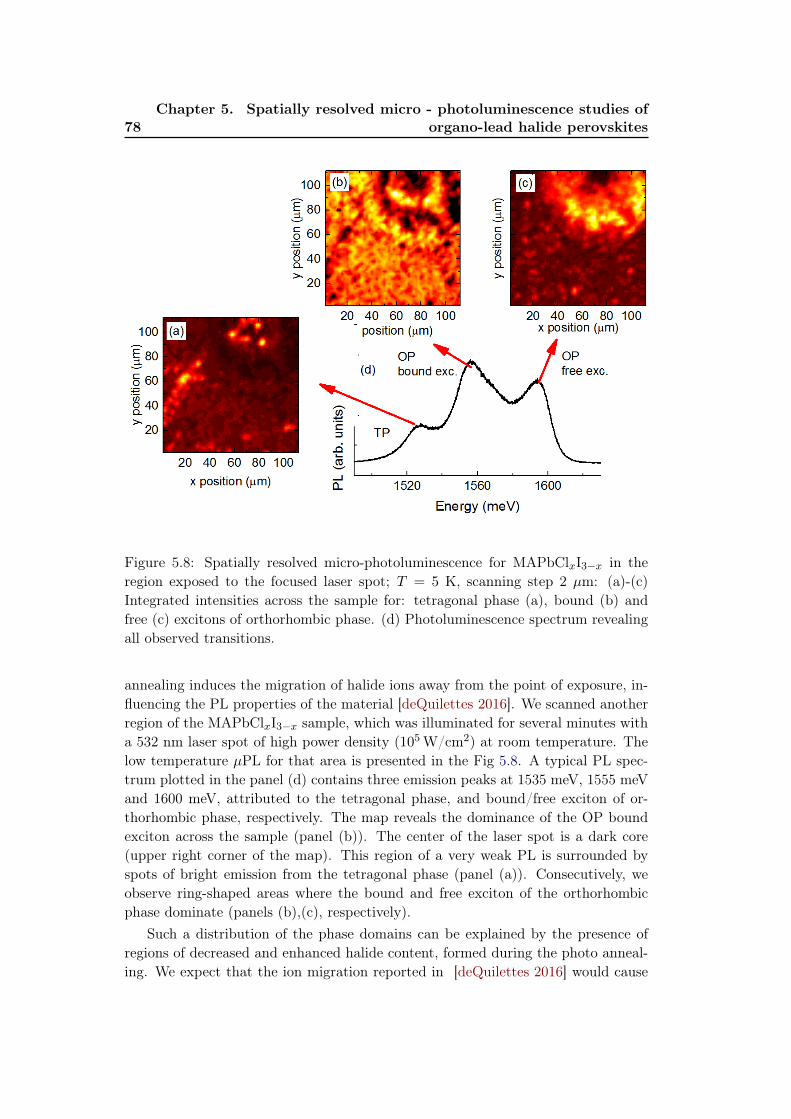
78Chapter 5. Spatially resolved micro - photoluminescence studies of
organo-lead halide perovskites
Figure 5.8: Spatially resolved micro-photoluminescence for MAPbClxI3−x in theregion exposed to the focused laser spot; T = 5 K, scanning step 2 µm: (a)-(c)Integrated intensities across the sample for: tetragonal phase (a), bound (b) andfree (c) excitons of orthorhombic phase. (d) Photoluminescence spectrum revealingall observed transitions.
annealing induces the migration of halide ions away from the point of exposure, in-fluencing the PL properties of the material [deQuilettes 2016]. We scanned anotherregion of the MAPbClxI3−x sample, which was illuminated for several minutes witha 532 nm laser spot of high power density (105 W/cm2) at room temperature. Thelow temperature µPL for that area is presented in the Fig 5.8. A typical PL spec-trum plotted in the panel (d) contains three emission peaks at 1535 meV, 1555 meVand 1600 meV, attributed to the tetragonal phase, and bound/free exciton of or-thorhombic phase, respectively. The map reveals the dominance of the OP boundexciton across the sample (panel (b)). The center of the laser spot is a dark core(upper right corner of the map). This region of a very weak PL is surrounded byspots of bright emission from the tetragonal phase (panel (a)). Consecutively, weobserve ring-shaped areas where the bound and free exciton of the orthorhombicphase dominate (panels (b),(c), respectively).
Such a distribution of the phase domains can be explained by the presence ofregions of decreased and enhanced halide content, formed during the photo anneal-ing. We expect that the ion migration reported in [deQuilettes 2016] would cause

5.5. The coexistence of crystalline phases in the proximity of strain ordefects 79
a non - uniform halide distribution in the exposed area, as schematically presentedin Fig. 5.9. The intensive light creates a depleted region, surrounded by the regionwith iodine excess. The crystalline phases are correlated with the halide content,which is in agreement with the pattern of domains observed in the colour maps fromFig. 5.8. The depleted region in the center of the laser spot has a weak photolumi-nescence. Moving away from that center (with increasing iodine content) we observesequentially the rings of emission from the tetragonal phase (a), orthorhombic phasebound excitons (b), orthorhombic phase free excitons (c). The unaffected regions arecharacterized by the emission of the orthorhombic phase bound exciton. Thus, theorthorhombic phase bound exciton emission characterizes the standard iodine con-tent, while the presence of the tetragonal phase indicates a deficiency of the halide.The orthorhombic phase free excitons are only dominant at low temperatures in theregions of enhanced iodine content.
Figure 5.9: The schematic drawn of photo-annealing induced distribution of iodineions as a function of the distance from the point of exposure.
The picture of the emission being controlled by the iodine content is supportedby the further results of low temperature µPL mapping on the FAPbI3 sample,shown in the Fig. 5.10. It presents a selected region in the proximity of a darkribbon of approximately 100 µm length, which is probably a crack or a fissure.In comparison with the homogenous region pictured in Fig. 5.5, we observe anintensified presence of the high temperature tetragonal phase (compare the red areasin the panels (b) of Fig. 5.5 and Fig. 5.10), which is localized mainly at the ribbonborders. The tetragonal phase domain grains in the proximity of the dark regionare also significantly larger than in the uniform parts of the sample. Furthermore,the positive / negative correlation of the orthorhombic and tetragonal phase peaks(panel (d)) is here more highlighted than in the uniform region. This observation,featuring enhanced presence of tetragonal phase around the weakly emitting region,can be considered as a 1D analogy to the photo annealing. This is also consistentwith the the iodine content being significantly perturbed close to the edges of cracksformed during film deposition.

80Chapter 5. Spatially resolved micro - photoluminescence studies of
organo-lead halide perovskites
Figure 5.10: Spatially resolved micro-photoluminescence for FAPbI3 in the proxim-ity of a dark ribbon: (a) Integrated intensity of the high energy (OP) peak as afunction of position. The intensity increases from white to dark blue. (b) A secondmap of the low energy (TP) peak is superimposed onto the map shown in (a). Theintensity increases from white to red. (c) Typical spectra for positions where onlythe OP peak was observed (blue) and where both peaks were observed (red). (d)Correlation of the integrated intensity of the TP (orange) and OP (black) peaksversus intensity of the low energy TP peak. All the measurements have been per-formed at T = 4 K, with the scanning step 2 µm and spot illumination intensity 5nW (0.5W/cm2).
5.6 Conclusions
We performed temperature-dependent spatially resolved micro-Photoluminescenceon different representatives of organo - lead halide perovskite family. The result-ing maps show that perovskite thin films are composed from the dark and brightcrystalline grains, which are around few micrometer in size, and up to 20 µm in thecase of the mixed halide MAPbClxI3−x. We demonstrate that the low temperaturephase transition from tetragonal to orthorhombic phase is incomplete in all studiedmaterials, as the remains of the tetragonal phase are found even at T = 4 K. Thisis most evident in the FAPbBr3, where macroscopic domains of both orthorhombicand tetragonal phases coexist at low temperatures. In other compounds, the areaof tetragonal inclusions is limited to the size of single crystalline grains. These in-clusions can be even smaller, as due to the long carrier diffusion lengths reportedfor the perovskites, the lower band gap tetragonal material can preferably collectthe carriers over large regions, which gives a rise to a relatively strong PL peakcorresponding to the tetragonal phase. By investigating damaged and photo an-nealed regions, where the occurrence of the tetragonal phase at low temperatures isenhanced, we attribute its presence to the depleted halide content.

Chapter 6
Caesium lead halide perovskites -characterization and
magneto-optical studies
Contents6.1 Fully inorganic caesium-based perovskite compounds . . . . 81
6.2 Characterization of the samples . . . . . . . . . . . . . . . . . 83
6.3 Low-temperature magneto - transmission . . . . . . . . . . . 84
6.4 Discussion . . . . . . . . . . . . . . . . . . . . . . . . . . . . . . 87
In this chapter, we briefly discuss our preliminary results obtained for the familyof fully inorganic caesium lead halide perovskites. First, we describe the samplesand the characterization of the temperature dependence of the band gap. Then, wepresent the low-temperature measurements of exciton binding energy and effectivemass determined usinge magneto-spectroscopy.
6.1 Fully inorganic caesium-based perovskite compounds
The family of caesium lead halides has also been investigated as potential perovskitelight absorbers [Eperon 2015, Kulbak 2015, Beal 2016]. In particular, the CsPbI3,characterized by a band gap of around 1.73 eV is considered as a suitable candi-date for the top solar cell in tandem architectures [Beal 2016]. The main advantageof the fully inorganic CsPbX3 materials over their hybrid, organic A-cation ana-logues is their resistance to high temperatures, up to their melting point at around450 C [Møller 1958, da Silva 2015, Kulbak 2016]. However, the relatively smallionic radius of the Cs+ cation (1.73 Å, comparable to the size of I− anion) results inrather low values of the Goldschmidt’s tolerance factor. Therefore, the CsPbX3 com-pounds reveal a high level of structural distortion, while the relatively symmetric cu-bic structures are formed only at temperatures far above the operational conditionsof the photovoltaic devices. In CsPbI3, the perovskite, "black" cubic phase is stableabove≈ 320 C [Møller 1958, Eperon 2015, da Silva 2015]. When the temperature islowered, a transformation to the non-perovskite, orthorhombic "yellow" polymorph(Eg ≈ 2.8 eV) occurs, which is schematically presented in Fig 6.1 [Møller 1958,
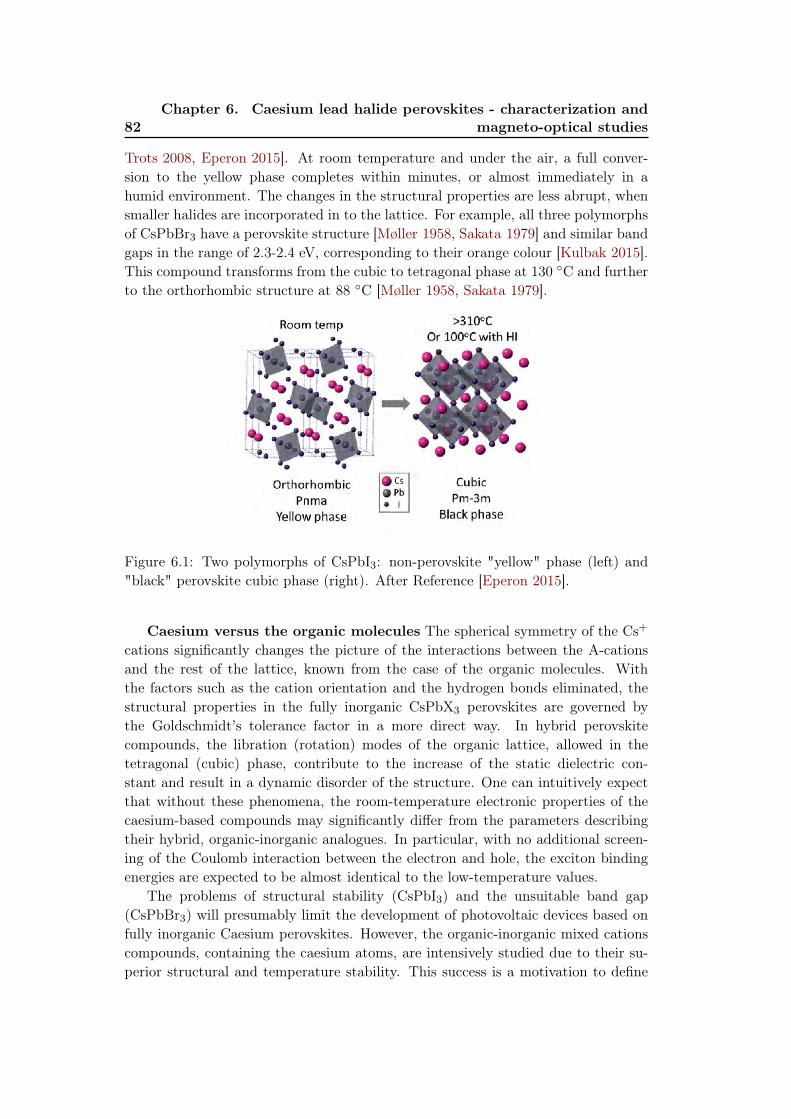
82Chapter 6. Caesium lead halide perovskites - characterization and
magneto-optical studies
Trots 2008, Eperon 2015]. At room temperature and under the air, a full conver-sion to the yellow phase completes within minutes, or almost immediately in ahumid environment. The changes in the structural properties are less abrupt, whensmaller halides are incorporated in to the lattice. For example, all three polymorphsof CsPbBr3 have a perovskite structure [Møller 1958, Sakata 1979] and similar bandgaps in the range of 2.3-2.4 eV, corresponding to their orange colour [Kulbak 2015].This compound transforms from the cubic to tetragonal phase at 130 C and furtherto the orthorhombic structure at 88 C [Møller 1958, Sakata 1979].
Figure 6.1: Two polymorphs of CsPbI3: non-perovskite "yellow" phase (left) and"black" perovskite cubic phase (right). After Reference [Eperon 2015].
Caesium versus the organic molecules The spherical symmetry of the Cs+
cations significantly changes the picture of the interactions between the A-cationsand the rest of the lattice, known from the case of the organic molecules. Withthe factors such as the cation orientation and the hydrogen bonds eliminated, thestructural properties in the fully inorganic CsPbX3 perovskites are governed bythe Goldschmidt’s tolerance factor in a more direct way. In hybrid perovskitecompounds, the libration (rotation) modes of the organic lattice, allowed in thetetragonal (cubic) phase, contribute to the increase of the static dielectric con-stant and result in a dynamic disorder of the structure. One can intuitively expectthat without these phenomena, the room-temperature electronic properties of thecaesium-based compounds may significantly differ from the parameters describingtheir hybrid, organic-inorganic analogues. In particular, with no additional screen-ing of the Coulomb interaction between the electron and hole, the exciton bindingenergies are expected to be almost identical to the low-temperature values.
The problems of structural stability (CsPbI3) and the unsuitable band gap(CsPbBr3) will presumably limit the development of photovoltaic devices based onfully inorganic Caesium perovskites. However, the organic-inorganic mixed cationscompounds, containing the caesium atoms, are intensively studied due to their su-perior structural and temperature stability. This success is a motivation to define
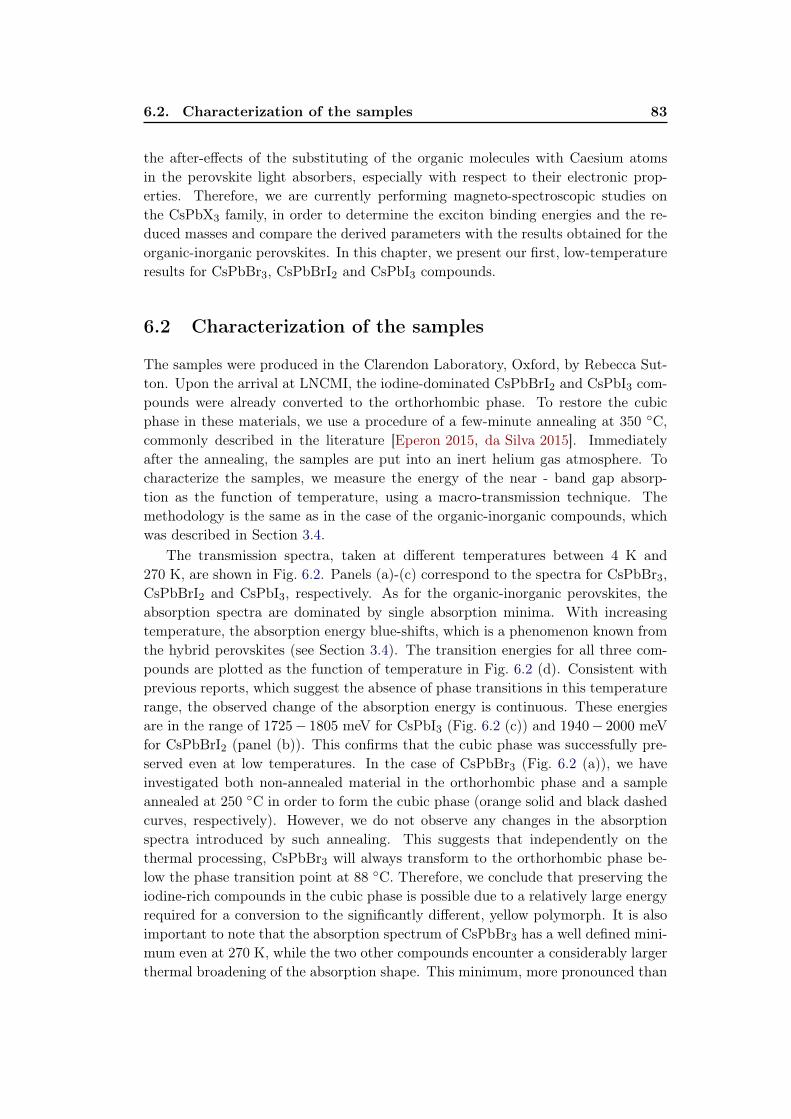
6.2. Characterization of the samples 83
the after-effects of the substituting of the organic molecules with Caesium atomsin the perovskite light absorbers, especially with respect to their electronic prop-erties. Therefore, we are currently performing magneto-spectroscopic studies onthe CsPbX3 family, in order to determine the exciton binding energies and the re-duced masses and compare the derived parameters with the results obtained for theorganic-inorganic perovskites. In this chapter, we present our first, low-temperatureresults for CsPbBr3, CsPbBrI2 and CsPbI3 compounds.
6.2 Characterization of the samples
The samples were produced in the Clarendon Laboratory, Oxford, by Rebecca Sut-ton. Upon the arrival at LNCMI, the iodine-dominated CsPbBrI2 and CsPbI3 com-pounds were already converted to the orthorhombic phase. To restore the cubicphase in these materials, we use a procedure of a few-minute annealing at 350 C,commonly described in the literature [Eperon 2015, da Silva 2015]. Immediatelyafter the annealing, the samples are put into an inert helium gas atmosphere. Tocharacterize the samples, we measure the energy of the near - band gap absorp-tion as the function of temperature, using a macro-transmission technique. Themethodology is the same as in the case of the organic-inorganic compounds, whichwas described in Section 3.4.
The transmission spectra, taken at different temperatures between 4 K and270 K, are shown in Fig. 6.2. Panels (a)-(c) correspond to the spectra for CsPbBr3,CsPbBrI2 and CsPbI3, respectively. As for the organic-inorganic perovskites, theabsorption spectra are dominated by single absorption minima. With increasingtemperature, the absorption energy blue-shifts, which is a phenomenon known fromthe hybrid perovskites (see Section 3.4). The transition energies for all three com-pounds are plotted as the function of temperature in Fig. 6.2 (d). Consistent withprevious reports, which suggest the absence of phase transitions in this temperaturerange, the observed change of the absorption energy is continuous. These energiesare in the range of 1725− 1805 meV for CsPbI3 (Fig. 6.2 (c)) and 1940− 2000 meVfor CsPbBrI2 (panel (b)). This confirms that the cubic phase was successfully pre-served even at low temperatures. In the case of CsPbBr3 (Fig. 6.2 (a)), we haveinvestigated both non-annealed material in the orthorhombic phase and a sampleannealed at 250 C in order to form the cubic phase (orange solid and black dashedcurves, respectively). However, we do not observe any changes in the absorptionspectra introduced by such annealing. This suggests that independently on thethermal processing, CsPbBr3 will always transform to the orthorhombic phase be-low the phase transition point at 88 C. Therefore, we conclude that preserving theiodine-rich compounds in the cubic phase is possible due to a relatively large energyrequired for a conversion to the significantly different, yellow polymorph. It is alsoimportant to note that the absorption spectrum of CsPbBr3 has a well defined mini-mum even at 270 K, while the two other compounds encounter a considerably largerthermal broadening of the absorption shape. This minimum, more pronounced than
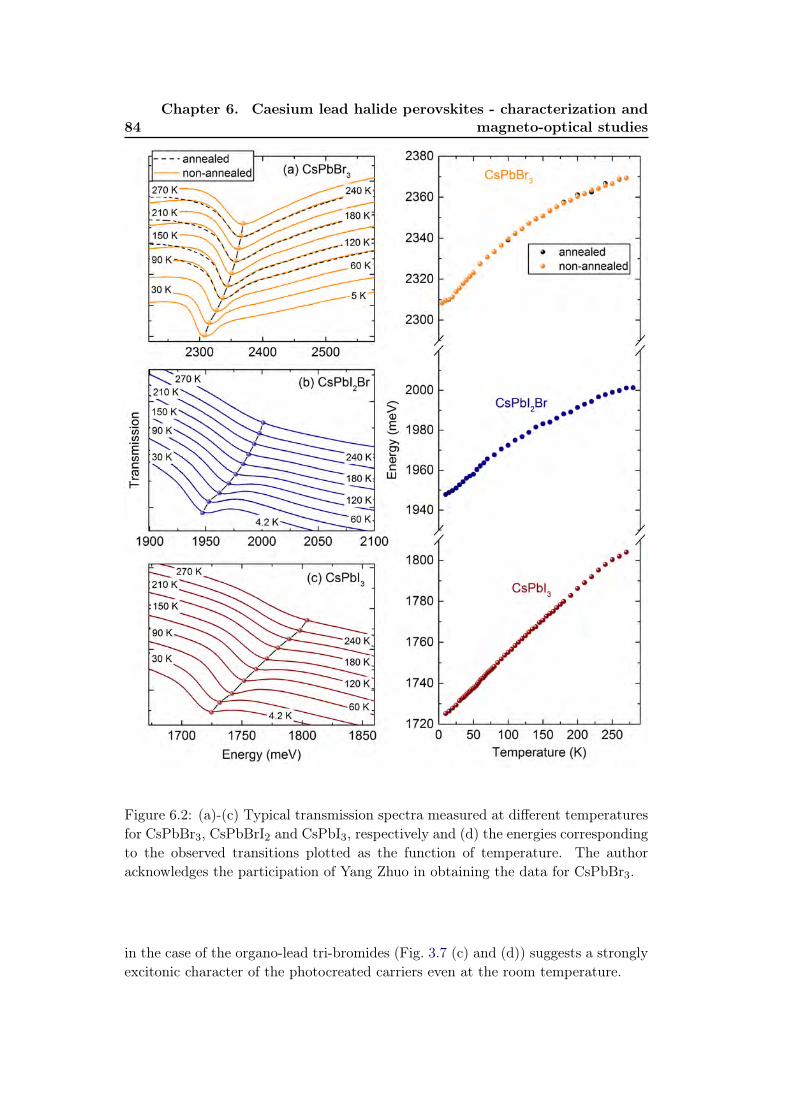
84Chapter 6. Caesium lead halide perovskites - characterization and
magneto-optical studies
Figure 6.2: (a)-(c) Typical transmission spectra measured at different temperaturesfor CsPbBr3, CsPbBrI2 and CsPbI3, respectively and (d) the energies correspondingto the observed transitions plotted as the function of temperature. The authoracknowledges the participation of Yang Zhuo in obtaining the data for CsPbBr3.
in the case of the organo-lead tri-bromides (Fig. 3.7 (c) and (d)) suggests a stronglyexcitonic character of the photocreated carriers even at the room temperature.

6.3. Low-temperature magneto - transmission 85
6.3 Low-temperature magneto - transmission
To determine the exciton binding energies and reduced masses we applied analogousmeasurement techniques and analysis methods as previously used for the studies ofthe organic-inorganic compounds (Chapter 4). Typical magneto-transmission spec-tra measured at T = 2 K are shown in Fig. 6.3 for CsPbI3, CsPbI2Br and CsPbBr3.The left column (panels (a),(c) and (e)) presents the raw transmission spectra atdifferent values of magnetic field. Similarly as in the organic-inorganic compounds,when magnetic field is increased, we observe a blue-shift of the 1s transition withthe appearance of weaker minima corresponding to the higher transitions. In orderto more precisely determine their energies, we analyze the magnetic field spectraratioed by the spectrum acquired at 0 T, presented in Fig. 6.3 (b),(d) and (f). Forthe CsPbI3, at 65 T we detect up to 5 transitions, including the crucial 2s stateabsorption. This weak minimum appears at the right top of the differential feature,resulting from in the ratioing in the region of the 1s absorption (inset in Fig. 6.3(b)). In agreement with the hybrid FAPbBr3 bromide, where three excitonic transi-tions were observed in the long pulse, the number of minima detected for CsPbBr3is also reduced to three, which suggest a higher value of the exciton binding energy.In this compound, the 2s absorption is particularly well resolved. In contrast, onlytwo transitions are observed for the CsPbI2Br mixed halide, with no trace of theabsorption minimum corresponding to the 2s state. This can be explained by thelower optical quality of this sample, revealed in the relatively weak minimum of the1s transition. Such a problem may indicate either worsened morphology reportedin the mixed halide perovskite compounds, or a need for further optimization of theannealing procedure.
To extract the effective Rydberg constant R∗ and reduced mass µ, we plot theabsorption energies as the function of magnetic field and describe particular tran-sitions within the terms of the hydrogren-like atom or free carrier models. Theresults of such analysis, obtained for all three investigated compounds, are shown inFig. 6.4. The blue spheres correspond to the long-pulse experimental data points.We support our analysis with the short pulse, extreme magnetic field data, mea-sured by A. Miyata with the Mega Gauss installation, and marked with the blackstars. The orange curves and gray lines are the transition energies for the excitonicstates and Landau levels, respectively.
The number of the Mega Gauss data points for CsPbI3 (Fig. 6.4 (a)) is limitedto only three. This originates from the lifetime of the material in the cubic phase,shorter than the duration of the sample installation procedure, which is performedin the air. Despite this problem, five transitions observed in the long pulse mea-surement allow a satisfying fit for both models, which enables us to determine thevalues of R∗ = 15 meV and µ = 0.115m0. The situation is reversed for the CsPbI2Brmixed halide (Fig. 6.4 (b)); the longer lifetime of the cubic phase in air allows thecollection of the numerous short-pulse data points. Their lowered slopes suggestconsiderably higher value of the reduced mass, µ = 0.126m0. The relatively lownumber of the long pulse data, with no observable trace of the 2s transition, limits

86Chapter 6. Caesium lead halide perovskites - characterization and
magneto-optical studies
Figure 6.3: (a),(c),(e): Typical low temperature transmission data taken using along pulse technique for CsPbI3, CsPbI2Br and CsPbBr3, respectively. (b),(d),(f):The spectra in magnetic field divided by the spectrum acquired at 0 T.
the precision of extracting the effective Rydberg constant. We obtain the best fit forR∗ = 15 meV, which is the same value as for the pure tri-iodide. In the case of thewide-bandgap CsPbBr3 (Fig. 6.4 (c)) both long and short pulse data sets are com-plete, resulting in a good accuracy of the derived electronic parameters. The excitonbinding energy is as high as R∗ = 30 meV. If this value remains unchanged up tothe room temperature, then a substantial fraction of the photocreated electron-holepairs is bound as the excitons. This is suggested by the well developed absorption

6.4. Discussion 87
minima observed in our temperature-dependence characterization studies. On theother hand, the reduced mass µ = 0.127 m0 is only slightly higher than the resultobtained for CsPbI2Br.
Figure 6.4: (a)(c) Transition energies obtained from the experimental data andresults of the fit to the data for CsPbI3, CsPbI2Br and CsPbBr3, respectively. Thestars are the data obtained during the short pulsed measurements. The results ofthe theoretical fit are shown by grey and orange lines. Grey lines correspond to theinterband transitions between Landau levels in the valence and conduction bands.The orange lines represent the energy levels of the hydrogenlike exciton.
Compound Phase Eg R∗ µ εeff(meV) (meV) (me)
CsPbI3 cubic 1730 15± 1 0.115± 0.02 10.0CsPbI2Br cubic 1965 15± 3 0.126± 0.01 10.7CsPbBr3 orthorhombic 2350 30± 3 0.127± 0.01 7.6
Table 6.1: The parameters of the fit of the full Landau fan chart for caesium-basedcompounds at T = 2 K.
6.4 Discussion
The results of the full fits for all three compounds are summarized in Table 6.1, wherewe also calculate the effective dielectric constant εeff , using Equation 1.6. Further
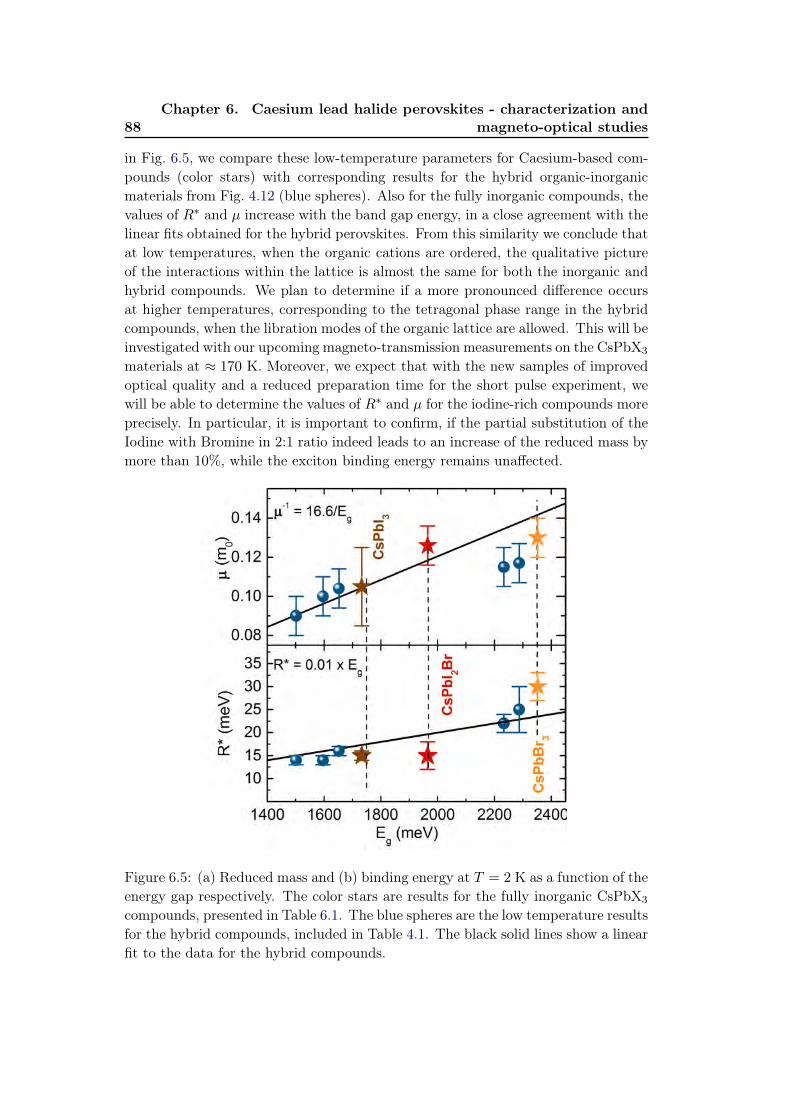
88Chapter 6. Caesium lead halide perovskites - characterization and
magneto-optical studies
in Fig. 6.5, we compare these low-temperature parameters for Caesium-based com-pounds (color stars) with corresponding results for the hybrid organic-inorganicmaterials from Fig. 4.12 (blue spheres). Also for the fully inorganic compounds, thevalues of R∗ and µ increase with the band gap energy, in a close agreement with thelinear fits obtained for the hybrid perovskites. From this similarity we conclude thatat low temperatures, when the organic cations are ordered, the qualitative pictureof the interactions within the lattice is almost the same for both the inorganic andhybrid compounds. We plan to determine if a more pronounced difference occursat higher temperatures, corresponding to the tetragonal phase range in the hybridcompounds, when the libration modes of the organic lattice are allowed. This will beinvestigated with our upcoming magneto-transmission measurements on the CsPbX3
materials at ≈ 170 K. Moreover, we expect that with the new samples of improvedoptical quality and a reduced preparation time for the short pulse experiment, wewill be able to determine the values of R∗ and µ for the iodine-rich compounds moreprecisely. In particular, it is important to confirm, if the partial substitution of theIodine with Bromine in 2:1 ratio indeed leads to an increase of the reduced mass bymore than 10%, while the exciton binding energy remains unaffected.
Figure 6.5: (a) Reduced mass and (b) binding energy at T = 2 K as a function of theenergy gap respectively. The color stars are results for the fully inorganic CsPbX3
compounds, presented in Table 6.1. The blue spheres are the low temperature resultsfor the hybrid compounds, included in Table 4.1. The black solid lines show a linearfit to the data for the hybrid compounds.
Chapter 7
Conclusions
The organo - lead halide perovskites are promising candidates for light absorbersin a new generation of low-cost, high efficiency solar cells and high-performancelight emitting devices. Recently, it has been demonstrated that the solar cells basedon the multiple-cation hybrid perovskites can achieve photon conversion efficienciesup to 22% and are stable under the operational conditions. This indicates thatthe future of perovskite - based photovoltaics is determined by the development ofnew alloyed compounds. Therefore, further optimization of performance of thesematerials requires an advanced control of both electronic properties and morphol-ogy, originating from an understanding how these parameters change with chemicalcomposition. In this thesis, we use optical methods to investigate basic electronicparameters, namely the exciton binding energy and reduced mass, as well as themorphology in several representatives of organo-lead halide perovskites. By study-ing compounds based on the Methylammonium or Formamidinium organic cationsand different halides, we determine how these parameters are influenced by the typeof accommodated ions.
Prior to the measurements in a magnetic field, we characterize our samples usingtemperature dependent macro-transmission. These studies, performed at tempera-tures ranging from 4 to 300 K, allow us to follow the changes of the band gap energywith the increase of the temperature. In particular, we analyze the development ofthe structural transition from the orthorhombic to tetragonal phase, occurring ataround 160 K. We conclude that conversion to the tetragonal phase always leadsto a drop in the band gap energy, in the range of 15 − 90 meV for different com-pounds. Another difference is the temperature range for which the phase transitionprogresses, varying from 15 K to 50 K. This is an indication that the phase transi-tion is not uniform within the film; precisely, particular crystalline grains encounterthe phase transition at different temperatures.
Further, we investigate the values of the exciton binding energy and reducedmass performing magneto-transmission in long-pulse high magnetic fields up to67 T. Additionally, we support our analysis with the data points obtained fromthe short-pulse Mega Gauss experiment in the fields up to 150 T (in cooperationwith A. Myiata, LNCMI). We analyze the magnetic field evolution of energies ofthe interband transitions between the excitonic and free-carrier states. We extractR∗ and µ by fitting particular transitions with the hydrogen - like atom model inmagnetic field (excitonic states) and Landau levels (free carrier states). This directmethod enables an accuracy of derived parameters surpassing previously reportedresults, obtained by indirect measurements. We find general relations for the exciton
90 Chapter 7. Conclusions
binding energy R∗ and the reduced mass µ, which are principally determined by theband gap Eg for the whole family of hybrid perovskites. With the approximatedvalues of R∗ = 0.01 × Eg and µ
m0=
Eg
16.6), basic electronic properties can be easilyestimated for newly synthesized compounds. There is no evidence for a significantinfluence of organic cation type other than resulting from the changes in the bandgap. This suggests that simple two band k.p perturbation theory should enable theaccurate modeling of the properties of devices made from hybrid perovskites. Wealso demonstrate that the low temperature values of the exciton binding energiesare smaller or comparable to the thermal energy at 300 K which makes a significantcontribution to understanding the excellent performance of these devices in photo-voltaic applications. For the tri-iodides, these values are further reduced in the hightemperature phases of these materials. This is in agreement with the contributionof librations of the dipolar organic cations to the dielectric screening, suggestedearlier in the literature for high temperature crystal structures. Remarkably, thisphenomenon is not observed in the tri-bromide, characterized by a wider bandgap.The possible explanation is that the exciton binding energy in this compound, signif-icantly larger than the energy of phonons corresponding to the librations of organiccations, is presumably too high to be effectively reduced by the cation - relatedphenomena.
In order to confirm the role of the organic cations in reducing the exciton bind-ing energy at higher temperatures, we are currently performing the magnetoopti-cal studies of fully inorganic, caesium-based compounds. Our preliminary resultwere obtained at low temperatures, at which the movements of organic lattice arequenched. In such conditions, the picture of electron-hole interactions is very similarfor both hybrid and inorganic families of perovskite compounds.
Finally, we perform temperature-dependent spatially resolved micro - photolu-minescence. The resulting maps show that perovskite thin films are composed fromthe dark and bright crystalline grains, which are around few micrometer in size,and up to 20 µm in the case of the mixed halide MAPbClxI3−x. We demonstratethat the low temperature phase transition from tetragonal to orthorhombic phaseis incomplete in all studied materials, as the remains of the tetragonal phase arefound even at T = 4 K. This is most evident in the FAPbBr3, where macroscopicdomains of the tetragonal phase, spreading over hundreds of adjacent grains, areobserved. In other compounds, the area of tetragonal inclusions is limited to thesize of single crystalline grains. These inclusions can be even smaller, as due tothe long carrier diffusion lengths reported for the perovskites, the lower band gaptetragonal material can preferably collect the carriers over large regions, which givesa rise to a relatively strong PL peak corresponding to the tetragonal phase. By in-vestigating structurally damaged and photo annealed regions, where the occurrenceof the tetragonal phase at low temperatures is enhanced, we attribute its presenceto the depleted halide content. Therefore, the spatially resolved photoluminescenceperformed at low temperatures enables to detect meager inhomogeneities within theperovskite films, which are not observable at the room temperature.
Appendix A
Publications
Publications based on the results of this thesis:
1. K. Galkowski, A. A. Mitioglu, A. Surrente, Z. Yang, D. K. Maude, G. E.Eperon, J. T-W. Wang, H. J. Snaith, P. Plochocka and R. J. Nicholas“Spatially resolved studies of the phases and morphology of methylammoniumand formamidinium lead tri-halide perovskites”Submitted to NanoLetters
2. K. Galkowski, A. A. Mitioglu, A. Miyata, P. Plochocka, O. Portugall, G. E.Eperon, J. T-W. Wang, T. Stergiopoulos, S. D. Stranks, H. J. Snaith R. J.Nicholas“Determination of the exciton binding energy and effective masses for methy-lammonium and formamidinium lead tri-halide perovskite semiconductors”Energy and Enviromental Science 9(3), 962-970 (2016)
Other publications:
1. A. Osherov, E. M. Hutter, K. Galkowski, R. Brenes, D. K. Maude, R. J.Nicholas, P. Plochocka, V. Bulovic, T. J. Savenije and S.D. Stranks“The Impact of Phase Retention on the Structural and Optoelectronic Proper-ties of Metal Halide Perovskites”Advanced Materials, available online, (2016)
2. A. Surrente, A. A. Mitioglu, K. Galkowski, L. Klopotowski, W Tabis, B.Vignolle, D. K. Maude and P. Plochocka“Onset of exciton-exciton annihilation in single layer black phosphorus”Physical Review B 94(7), 075425 (2016)
3. A. A. Mitioglu,K. Galkowski, A. Surrente, L. Klopotowski, D. O. Dumcenco,A. Kis, D. K. Maude and P. Plochocka“Magnetoexcitons in large area CVD-grown monolayer MoS2 and MoSe2 onsapphire”Physical Review B 93(16), 164412 (2015)
4. A. Surrente, A. A. Mitioglu, K. Galkowski, W Tabis, D. K. Maude and P.Plochocka“Excitons in atomically thin black phosphorus”Physical Review B 93(12), 121405 (2015)

92 Appendix A. Publications
5. K. Galkowski P. Wojnar, E. Janik, J. Papierska, K. Sawicki, P. Kossacki andJ. Suffczynski‘’Exciton dynamics in individual semimagnetic (Zn,Mn)Te/(Zn,Mg)Te nanowires”Journal of Applied Physics 118, 095704 (2015)
6. K. Sawicki, F. K. Malinowski, K. Galkowski, T. Jakubczyk, P. Kossacki, W.Pacuski and J. Suffczynski“Single-color, in situ photolithography marking of individual CdTe/ZnTe quan-tum dots”Applied Physics letters 106(1), 012101 (2015)
7. A. Derkachova, K. P. Korona, J. Binder, K. Galkowski, L. Wachnicki, M.Godlewski, T. Dietl and J. Suffczynski“Modification of Emission Properties of ZnO Layers due to Plasmonic Near-Field Coupling to Ag Nanoislands”Plasmonics 8, 913-919 (2013)

Appendix B
Résumé de la thèse en français
Dans cette annexe, nous présentons un résumé en français de ce travail de thèse.Le lecteur ne trouvera aucune nouvelle information et les figures utilisées sont lesmêmes que dans la version anglaise.
B.1 Introduction
Le premier chapitre introduis la physique de base des excitons de Wannier-Mottexciton et résume l’état actuel des connaissances sur les pérovskites hybrides.
Les pérovskites hybrides organiques-halogénure de plomb représentent une classede matériaux émergents, proposés comme absorbeurs de lumière dans le cadre descellules solaires de troisième génération. La formule chimique de ces composés estABX3, ou A est un cation organique, X représente un anion halogénure (normale-ment Cl-, Br-, ou l-, ou bien, un alliage composé par ces éléments).La structurepérovskite, dans sa forme cubique la plus simple, est schématiquement représentéesur la Figure. B.1.
Les pérovskites hybrides combinent d’excellentes propriétés d’absorption avecune grande longueur de diffusion des porteurs de charge ainsi de longues durée de vie,ce qui permet d’atteindre des efficacités de conversion de photons de 22%. Un autreavantage est leur bas cout de fabrication. Par conséquent, avec le développementde cette classe de matériaux, le photovoltaique basé sur les pérovskites peut poten-tiellement améliorer fortement les performances des technologies actuelles, basée surle silicium.
Les objectifs de ce travail sont, d’une part, d’étudier les propriétés électroniquesde base de pérovskites hybrides, ainsi que leur morphologie.
B.2 Techniques expérimentales
Le deuxième chapitre décrit les techniques expérimentales qui ont été utilisées pourétudier les propriétés de pérovskites hybrides. Deux types des techniques sont util-isés. D’une part, la spectroscope d’absorption optique inter-bande en champs mag-nétiques intenses a été utilisée pour obtenir les résultats présentés dans les chapitresA4 et A6. D’autre part, la micro photoluminescence(µPL) a été utilisée pour étudierla morphologie des couches minces de plusieurs types de pérovskites (chapitre A5).
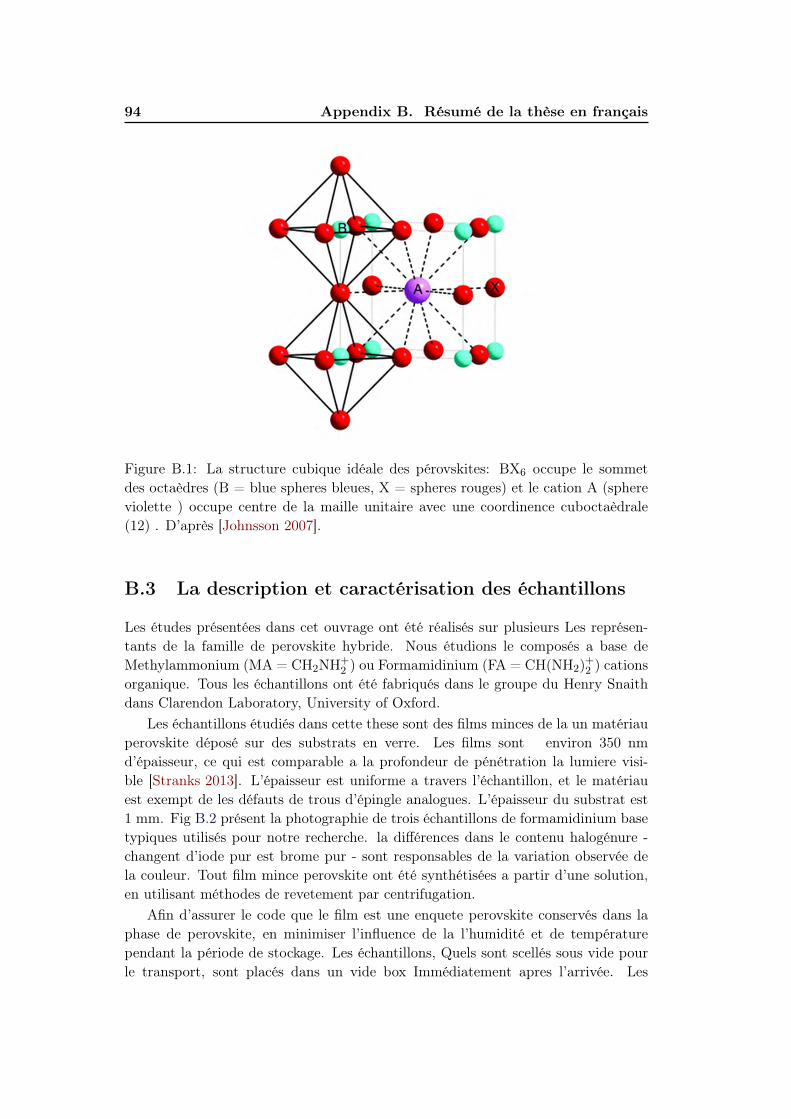
94 Appendix B. Résumé de la thèse en français
Figure B.1: La structure cubique idéale des pérovskites: BX6 occupe le sommetdes octaèdres (B = blue spheres bleues, X = spheres rouges) et le cation A (sphereviolette ) occupe centre de la maille unitaire avec une coordinence cuboctaèdrale(12) . D’après [Johnsson 2007].
B.3 La description et caractérisation des échantillons
Les études présentées dans cet ouvrage ont été réalisés sur plusieurs Les représen-tants de la famille de perovskite hybride. Nous étudions le composés a base deMethylammonium (MA = CH2NH+
2 ) ou Formamidinium (FA = CH(NH2)+2 ) cationsorganique. Tous les échantillons ont été fabriqués dans le groupe du Henry Snaithdans Clarendon Laboratory, University of Oxford.
Les échantillons étudiés dans cette these sont des films minces de la un matériauperovskite déposé sur des substrats en verre. Les films sont environ 350 nmd’épaisseur, ce qui est comparable a la profondeur de pénétration la lumiere visi-ble [Stranks 2013]. L’épaisseur est uniforme a travers l’échantillon, et le matériauest exempt de les défauts de trous d’épingle analogues. L’épaisseur du substrat est1 mm. Fig B.2 présent la photographie de trois échantillons de formamidinium basetypiques utilisés pour notre recherche. la différences dans le contenu halogénure -changent d’iode pur est brome pur - sont responsables de la variation observée dela couleur. Tout film mince perovskite ont été synthétisées a partir d’une solution,en utilisant méthodes de revetement par centrifugation.
Afin d’assurer le code que le film est une enquete perovskite conservés dans laphase de perovskite, en minimiser l’influence de la l’humidité et de températurependant la période de stockage. Les échantillons, Quels sont scellés sous vide pourle transport, sont placés dans un vide box Immédiatement apres l’arrivée. Les
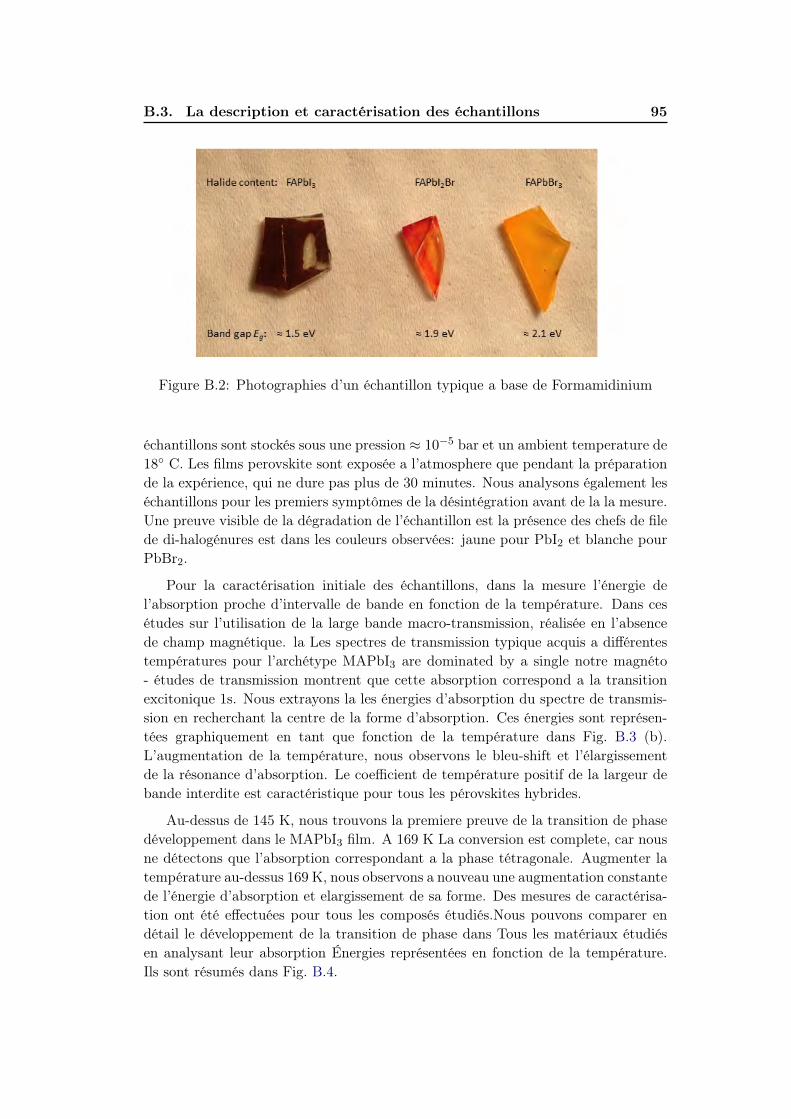
B.3. La description et caractérisation des échantillons 95
Figure B.2: Photographies d’un échantillon typique a base de Formamidinium
échantillons sont stockés sous une pression ≈ 10−5 bar et un ambient temperature de18 C. Les films perovskite sont exposée a l’atmosphere que pendant la préparationde la expérience, qui ne dure pas plus de 30 minutes. Nous analysons également leséchantillons pour les premiers symptômes de la désintégration avant de la la mesure.Une preuve visible de la dégradation de l’échantillon est la présence des chefs de filede di-halogénures est dans les couleurs observées: jaune pour PbI2 et blanche pourPbBr2.
Pour la caractérisation initiale des échantillons, dans la mesure l’énergie del’absorption proche d’intervalle de bande en fonction de la température. Dans cesétudes sur l’utilisation de la large bande macro-transmission, réalisée en l’absencede champ magnétique. la Les spectres de transmission typique acquis a différentestempératures pour l’archétype MAPbI3 are dominated by a single notre magnéto- études de transmission montrent que cette absorption correspond a la transitionexcitonique 1s. Nous extrayons la les énergies d’absorption du spectre de transmis-sion en recherchant la centre de la forme d’absorption. Ces énergies sont représen-tées graphiquement en tant que fonction de la température dans Fig. B.3 (b).L’augmentation de la température, nous observons le bleu-shift et l’élargissementde la résonance d’absorption. Le coefficient de température positif de la largeur debande interdite est caractéristique pour tous les pérovskites hybrides.
Au-dessus de 145 K, nous trouvons la premiere preuve de la transition de phasedéveloppement dans le MAPbI3 film. A 169 K La conversion est complete, car nousne détectons que l’absorption correspondant a la phase tétragonale. Augmenter latempérature au-dessus 169 K, nous observons a nouveau une augmentation constantede l’énergie d’absorption et elargissement de sa forme. Des mesures de caractérisa-tion ont été effectuées pour tous les composés étudiés.Nous pouvons comparer endétail le développement de la transition de phase dans Tous les matériaux étudiésen analysant leur absorption Énergies représentées en fonction de la température.Ils sont résumés dans Fig. B.4.

96 Appendix B. Résumé de la thèse en français
Figure B.3: (a)Spectre de transmsission typique pour MAPbI3 mesuré a différentestempératures (b) Energies des transitions observées en fonction de la température.Les points et les tirets on été ajoutés pour suivre les transitions
B.4 Magnéto-transmission
Le chapitre 4 décrit des études de magnéto-photoluminescence, fournissant des in-formations sur les paramètres électroniques de base - l’énergie de liaison de l’excitonset la masse réduite. Il introduit également l’influence du champ magnétique sur lestransitions optiques.
Les paramètres électroniques de base des pérovskites organiques-inorganiques,comme l’énergie de liaison de l’exciton R∗ et la masse réduite µ, ont fait l’objetd’un débat intense dans la littérature. Les images des porteurs soit liés, soit com-plètement ionisés dans les composés de pérovskite à base d’iode ont été proposéesen se fondant sur diverses méthodes expérimentales indirectes. Alors que l’énergiethermique moyenne à la température ambiante est kBT ' 26 meV, des valeurs deR∗ dans la gamme de 2 − 50 meV ont été reportées. En 2015, Miyata et al., enutilisant des mesures de magnéto-transmission, a démontré que l’énergie de liaisonde l’exciton dans le composé photovoltaïque archétype de la pérovskite MAPbI3 setrouve à l’extrémité inférieure de cette gamme [Miyata 2015].
Dans ce travail, nous étendons les études de magnéto-transmission sur des pérovskitesorganiques-inorganiques à d’autres matériaux de cette famille nouvellement syn-thétisés. Dans tous les composés étudiés, les énergies de liaison des excitons sontinférieures ou comparables à l’énergie thermique moyenne à température ambiante.Nous constatons aussi que l’énergie de liaison de l’exciton ainsi que la masse réduiteaugmentent proportionnellement à l’énergie de la bande interdite. Les valeurs de lamasse réduite sont cohérentes avec une approche de perturbation k.p à deux ban-des simples pour la structure de bande. Ces conclusions peuvent être généralisées

B.4. Magnéto-transmission 97
Figure B.4: Les énergies d’absorption des bords proches de la bande en fonction detempérature pour tous les matériaux étudiés.
pour prédire les valeurs de la masse réduite et de l’énergie de liaison pour les autresmembres de la famille des pérovskites hybrides.
Nous avons mesuré les spectres de transmission à large bande en utilisant unelampe halogène blanche, dans de l’hélium liquide pompé (T ' 2 K) sous champsmagnétiques allant jusqu’à 70 T, en observant de multiples transitions optiques pourchaque composé. Les résultats de transmission typiques obtenus pour les composés àbase d’iodine, à savoir MAPbClxI3−x et FAPbI3 sont présentés sur la Fig. B.5. Cetteexpérience a été effectuée en utilisant de l’optique de polarisation, et les courbesbleues et rouges correspondent respectivement aux polarisations circulaires σ− andσ+. Les spectres présentés sur les figures (a) et (c) montrent un minimum bienmarqué à environ 1.58 eV et 1.49 eV respectivement. Ces absorptions correspondentà l’état 1s de l’exciton neutre. Dans le cas de MAPbClxI3−x, un second minimumplus faible à environ 1.6 eV apparait dans les champs au-dessus de 20 T. Cettetransition est attribuée aux états 2s. Les absorptions 1s et 2s révèlent une séparation

98 Appendix B. Résumé de la thèse en français
de Zeeman claire.
Figure B.5: (a),(c): données typiques de transmission à basse températureMAPbClxI3−x et FAPbI3 obtenues en utilisant la technique de pulse long. Leslignes rouges et bleues correspondent à deux lumières polarisées respectivement σ+
et σ−. Les points bleus/rouges et les lignes en pointillés sont ajoutées afin de fa-ciliter le suivi des transitions 1s et 2s. (b), (d): Les spectres à différents champsmagnétiques divisés par le spectre acquis à 0 T.
Nous étendons les mesures dans la gamme spectrale de la lumière visible, oùnous traçons pour l’analyse les spectres en champ magnétique divisés par le spectrepris à zéro champ, comme indiqué dans la Fig. B.5, (b) et (d). Ces données ne sontpas résolues en polarisation. La première caractéristique spectrale à basse énergievisible dans les figures (b) et (d) est le résultat de la division du signal sur la régionde l’état 1s décalé magnétiquement. Selon cette caractéristique différentielle, nousobservons les minima correspondant à l’état 2s également dans FAPbI3. Des étudescomplémentaires à basse température, sur les bandes interdites supérieures (2.2-

B.4. Magnéto-transmission 99
2.3 eV) représentatives des pérovskites organiques-inorganiques, ont été effectuéessur des tri-bromures, à savoir FAPbBr3 et MAPbBr3. Pour cette gamme d’énergie,nous effectuons les mesures sans résoudre la polarisation circulaire.
Les spectres de transmission pour chaque valeur du champ magnétique sontanalysés afin de trouver les énergies des minimums d’absorption particuliers. Nouseffectuons ces analyses en recherchant le centre de la géométrie d’absorption, ensupposant une symétrie de type gaussien. Des données supplémentaires prises enchamps jusqu’à 150 T sont fournies par la technique expérimentale de MegaGauss,réalisée par A. Miyata au LNCMI. Dans le but d’extraire l’énergie de liaison etla masse réduite de l’exciton à partir des données de magnéto-transmission, nousanalysons les transitions observées avec les modèles de la théorie des hydrogénées etcelui des électrons libres. Comme la masse réduite est le seul paramètre d’ajustementpour les niveaux de Landau, les transitions à haute énergie et champ magnétiqueélevé constituent une forte contrainte pour la détermination de µ. Pour déterminerprécisément l’énergie de liaison de l’exciton, l’observation simultanée des transitions1s et 2s est primordiale. Les données recueillies et les ajustements correspondantssont résumés sur la Fig. B.6. Les deux paramètres R∗ et µ dépendent de la bandeinterdite, augmentant au fur et à mesure que le gap augmente.

100 Appendix B. Résumé de la thèse en français
Figure B.6: (a)-(d) Les énergies de transition obtenues à partir des données expéri-mentales et des résultats de l’ajustement aux données pour MAPbClxI3−x, FAPbI3,FAPbBr3 et MAPbBr3, respectivement. Les points rouges et bleus correspondentaux minima résolus en polarisation dans l’absorption pour σ+ et σ− respectivement.Les étoiles sont les données obtenues lors de courtes mesures pulsées, où la polari-sation n’a pas été utilisée. Les données prises en longs pulses ne sont pas non plusrésolues en polarisation pour les échantillons FAPbBr3 et MAPbBr3. Les résultatsde l’ajustement théorique sont indiqués par les lignes grises et orange. Les lignesgrises correspondent aux transitions interbandes entre les niveaux de Landau dansles bandes de valence et de conduction. Les lignes oranges montrent les niveauxfortement liés de l’exciton de type hydrogène. Dans (a) et (b), les transitions deséparation de Zeeman sont représentées par les lignes pleines et en pointillés. Au-dessous de chaque graphique, la partie bas champ et basse énergie du diagrammecomplet est agrandie.

B.4. Magnéto-transmission 101
Nous avons étendu les mesures de magnéto-transmission à des températures plusélevées, plus pertinentes pour les conditions opérationnelles d’un dispositif photo-voltaïque. Nous avons effectué l’expérience juste au-dessus du point de transition dephase, autour de 150-160 K, où les pérovskites hybrides se transforment de, la phaseorthorhombique à basse température, à la phase tétragonale à haute température.De cette façon, nous étudions un matériau de paramètres du réseau très semblablesaux paramètres révélés à température ambiante, alors qu’à T ' 150 K nous avonsl’avantage considérable que les minima d’absorption sont remarquablement plus fortset mieux définis par rapport à T ' 300 K. Le résultat de la magnéto-transmission àhaute température avec des ajustements correspondants est présenté sur la Fig. B.7
Figure B.7: (a)-(c) Les énergies de transition obtenues à partir des données expéri-mentales et des résultats de l’ajustement aux données pour MAPbClxI3−x, FAPbI3et FAPbBr3, respectivement. Les étoiles sont les données obtenues lors des mesuresde pulse court. Les résultats de l’ajustement théorique sont représentés par deslignes grises et oranges. Les lignes grises correspondent aux transitions interbandesentre les niveaux de Landau dans les bandes de valence et de conduction. Les lignesoranges représentent les niveaux d’énergie de l’exciton de type hydrogène.
Les valeurs de µ ont augmenté légèrement à (0.095 − 0.13 ± 0.01) m0. La plusforte augmentation est observée pour le tri-bromure, ce qui est en accord avecl’augmentation de la bande interdite par rapport à la valeur basse température.Dans les iodures, nous trouvons que les énergies de liaison des excitons sont réduitesà la phase tétragonale à R∗ = 10 ± 3 meV, avec une augmentation correspondantede εeff . En revanche, pour FAPbBr3 nous estimons R∗ = 24 ± 4 meV, ce qui estune valeur légèrement plus élevée que celle mesurée pour la phase orthorhombiquebasse température.

102 Appendix B. Résumé de la thèse en français
Les paramètres électroniques essentiels - la masse réduite µ et l’énergie de liaisonde l’exciton R∗ mesurées à la basse température, phase orthorhombique, sont tracéesen fonction de la bande interdite du matériau dans le champ Fig. 4.12 (a). Onconstate que les deux paramètres augmentent faiblement avec la bande interdite.
Figure B.8: (a) et (b) masse réduite et énergie de liaison à T = 2 K en fonction dugap d’énergie respectivement. Les symboles noirs (rouges) indiquent les résultatspour les iodures FA (MA) (symboles complets) et les bromures (symboles ouverts).Les cercles verts montrent des résultats pour l’halogénure mixte MAPbI3−xClx. Leslignes pleines noires montrent un ajustement linéaire aux données. (c) et d) Legraphique des données à basse température ainsi que les valeurs déduites pour laphase tétragonale à température plus élevée (avec carrés) pour les matériaux FA(bleu), MA (orange) et mixte (violet), mesurées dans la gamme de températuresdonnées dans le tableau 4.2
Les valeurs de masse excitonique réduite dans les matériaux étudiés sont com-prises entre 0.090 et 0.177 fois la masse de l’électron libre. Comme les pérovskites àl’halogénure d’organo-plomb sont caractérisées par une structure de bandes relative-ment simple, nous pouvons appliquer une approche Hamiltonienne semi-empiriqueà deux bandes k.p pour les calculs efficaces de masse [Even 2015]. La masse réduiteµ sera :
1
µ= | 1
m∗e|+ | 1
m∗h| = 4m0|P |2
Eg. (B.1)
Où 2(|P |2)m0
est l’énergie de Kane, déterminant la force des transitions optiques [Chuang 1995],avec
P =< ψV B|i~∂
∂x|ψCB >
B.4. Magnéto-transmission 103
étant l’élément de la matrice de la quantité de mouvement provenant du termek.p, c’est-à-dire du couplage des fonctions d’ondes électroniques dans les bandes deconduction et de valence. Un ajustement de l’équation B.1 aux données de bassetempérature, présenté dans l’encadré supérieur de la Fig. B.8 (a), donne la valeur del’énergie de Kane égale à 8.3 meV. Compte tenu de l’augmentation de µ d’environ10%, l’estimation de l’énergie de Kane à température ambiante est d’environ 7.5meV.
Fait remarquable, il n’existe aucune preuve solide d’un changement de la masseréduite lors de la substitution de Méthylammonium par des cations de Formami-dinium. Nous n’observons que de petits changements dans la bande interdite, in-duits par les changements dans les paramètres du réseau, comme l’inclinaison desoctaèdres suggérée par Amat et al. [Amat 2014].
La constante efficace de Rydberg se révèle être plus dépendante du matériau,variant avec la bande interdite de 14 à 25 meV approximativement comme:
R∗ = 0.01× Eg.
Les valeurs mesurées sont en bon accord avec la valeur de 15 meV, déduite pourMAPbI3 par Even et al. [Even 2014b]. La réduction de R∗ dépendant de la tem-pérature indique que les valeurs mesurées à T = 2 K sont la limite supérieuredes énergies de liaison des excitons dans ces matériaux. Par conséquent, étant in-férieures ou comparables à l’énergie thermique à température ambiante (' 25 meV),nos résultats à basse température pour R∗ suggèrent que dans toute la famille despérovskites hybrides tri-halogénés, les porteurs photocréés sont espérés être ther-miquement ionisés à 300 K. Cela explique en grande partie les excellentes efficacitésdes dispositifs pérovskites photovoltaïques.
Les valeurs de la constante diélectrique effective εeff se trouvent dans la gammede 7.5 - 9.8, entre les valeurs de basse ε0 = 25.7 [Wehrenfennig 2014a] et hauteε∞ = 5.6 valeurs de fréquence [Umari 2014, Brivio 2014]. Une légère baisse de εeffest observée avec la montée de R∗ et µ. Ce type de comportement est caractéristiquepour les matériaux fortement polaires avec un fort couplage électron-phonon. Lesvaleurs de εeff sont significativement plus faibles pour les tri-bromures, où les massesréduites plus élevées font que l’énergie de liaison est plus grande, avec une réductionconséquente de la résistance d’écrantage.
La transition de phase semble avoir un impact limité sur la valeur de la masse ré-duite µ. Nos résultats indiquent qu’après la transition de phase, le µ peut augmenterjusqu’à 10 % par rapport aux valeurs obtenues 2 K. Nous concluons que toute lafamille des pérovskites organo-halogénures de trihalogénures peut être décrite parl’équation 4.8 en termes de paramètre unique - l’énergie de bande interdite, quelleque soit la phase cristalline ou la température. La constante diélectrique effec-tive εeff et par conséquent l’énergie de liaison exciton R∗ sont plus affectées parla transformation de la phase orthorhombique, à la phase tétragonale. Ceci estlié à un mouvement de rotation collectif supplémentaire des cations organiques,autorisé à des températures plus élevées, et augmentant encore l’écrantage du po-tentiel Coulombien [Poglitsch 1987]. Nous trouvons que les valeurs de R∗ pour les
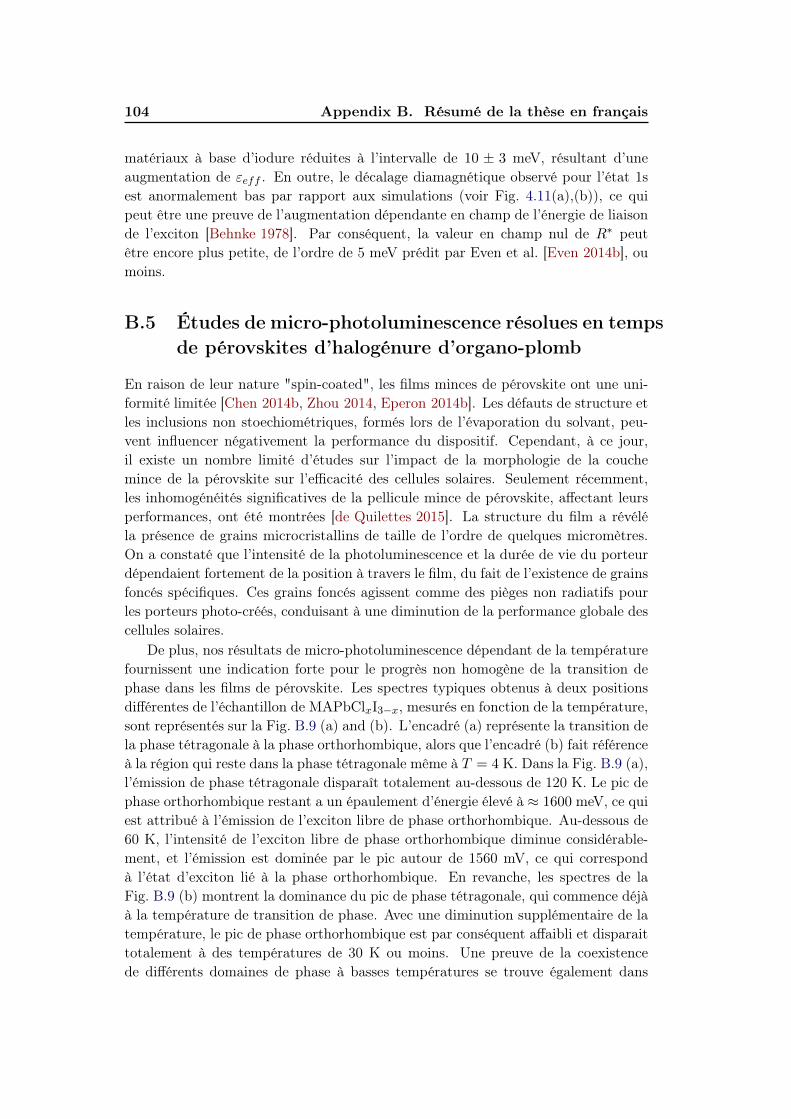
104 Appendix B. Résumé de la thèse en français
matériaux à base d’iodure réduites à l’intervalle de 10 ± 3 meV, résultant d’uneaugmentation de εeff . En outre, le décalage diamagnétique observé pour l’état 1sest anormalement bas par rapport aux simulations (voir Fig. 4.11(a),(b)), ce quipeut être une preuve de l’augmentation dépendante en champ de l’énergie de liaisonde l’exciton [Behnke 1978]. Par conséquent, la valeur en champ nul de R∗ peutêtre encore plus petite, de l’ordre de 5 meV prédit par Even et al. [Even 2014b], oumoins.
B.5 Études de micro-photoluminescence résolues en tempsde pérovskites d’halogénure d’organo-plomb
En raison de leur nature "spin-coated", les films minces de pérovskite ont une uni-formité limitée [Chen 2014b, Zhou 2014, Eperon 2014b]. Les défauts de structure etles inclusions non stoechiométriques, formés lors de l’évaporation du solvant, peu-vent influencer négativement la performance du dispositif. Cependant, à ce jour,il existe un nombre limité d’études sur l’impact de la morphologie de la couchemince de la pérovskite sur l’efficacité des cellules solaires. Seulement récemment,les inhomogénéités significatives de la pellicule mince de pérovskite, affectant leursperformances, ont été montrées [de Quilettes 2015]. La structure du film a révéléla présence de grains microcristallins de taille de l’ordre de quelques micromètres.On a constaté que l’intensité de la photoluminescence et la durée de vie du porteurdépendaient fortement de la position à travers le film, du fait de l’existence de grainsfoncés spécifiques. Ces grains foncés agissent comme des pièges non radiatifs pourles porteurs photo-créés, conduisant à une diminution de la performance globale descellules solaires.
De plus, nos résultats de micro-photoluminescence dépendant de la températurefournissent une indication forte pour le progrès non homogène de la transition dephase dans les films de pérovskite. Les spectres typiques obtenus à deux positionsdifférentes de l’échantillon de MAPbClxI3−x, mesurés en fonction de la température,sont représentés sur la Fig. B.9 (a) and (b). L’encadré (a) représente la transition dela phase tétragonale à la phase orthorhombique, alors que l’encadré (b) fait référenceà la région qui reste dans la phase tétragonale même à T = 4 K. Dans la Fig. B.9 (a),l’émission de phase tétragonale disparaît totalement au-dessous de 120 K. Le pic dephase orthorhombique restant a un épaulement d’énergie élevé à ≈ 1600 meV, ce quiest attribué à l’émission de l’exciton libre de phase orthorhombique. Au-dessous de60 K, l’intensité de l’exciton libre de phase orthorhombique diminue considérable-ment, et l’émission est dominée par le pic autour de 1560 mV, ce qui correspondà l’état d’exciton lié à la phase orthorhombique. En revanche, les spectres de laFig. B.9 (b) montrent la dominance du pic de phase tétragonale, qui commence déjàà la température de transition de phase. Avec une diminution supplémentaire de latempérature, le pic de phase orthorhombique est par conséquent affaibli et disparaittotalement à des températures de 30 K ou moins. Une preuve de la coexistencede différents domaines de phase à basses températures se trouve également dans

B.5. Études de micro-photoluminescence résolues en temps depérovskites d’halogénure d’organo-plomb 105
Figure B.9: (a), (b) dépendance en température de la muPL pour deux posi-tions différentes sur MAPbClxI3−x correspondant respectivement aux domaines desphases orthorhombique et tétragonale. (c) Dépendance en température des spectresde muPL pour FAPbBr3.
la haute bande interdite FAPbBr3 (Fig. B.9 (c)). A environ 150 - 160 K la com-posante basse énergie du pic d’émission à haute température est supprimée. Deuxpics d’émission sont bien résolus en-dessous de 30 K.
Les inhomogénéités décrites ci-dessus sont notre motivation à étudier les pro-priétés microscopiques des pérovskites organo-plomb- halogénures avec micro- pho-toluminescence résolue spatialement, réalisées à différentes températures. Les résul-tats des mesures à température ambiante pour MAPbI3, MAPbClxI3−x et FAPbBr3respectivement, sont présentés dans la Fig. 5.3 (a) - (c). Les cartographies chroma-tiques, chaque 80×80 µm avec des pas de 2 µm, représentent l’intensité intégrée dupic de photoluminescence. Dans tous les échantillons, nous observons des variationsnotables de l’intensité d’émission dans les zones étudiées, révélant la présence desrégions de photoluminescence plus forte et plus faible. Nous concluons donc queles trois composés ont une structure granulaire microcristalline et que la présencerécemment remarquée des grains foncés [de Quilettes 2015, deQuilettes 2016] esttypique des pérovskites organo-halogénures de plomb. Les résultats µPL à tem-pérature ambiante résolue spatialement pour MAPbI3, MAPbClxI3−x et FAPbBr3respectivement, sont présentés sur la Fig. B.10 (a) - (c). Les cartographies chroma-tiques, chaque 80×80 µm avec des pas de 2 µm, représentent l’intensité intégrée dupic de photoluminescence. Dans tous les échantillons, nous observons des variationsnotables de l’intensité d’émission dans les zones étudiées, révélant la présence desrégions de photoluminescence plus forte et plus faible. Nous concluons donc que les

106 Appendix B. Résumé de la thèse en français
trois composés ont une structure de grains microcristallins et que la présence récem-ment signalée des grains foncés est typique pour les pérovskites organo-halogénuresde plomb.
Figure B.10: Intensité intégrée du pic de µPL en fonction de la position pour (a)MAPbI3, intensité d’illumination du spot 40 nW (4W/cm2), (b) MAPbClxI3−x,intensité d’illumination du spot 60 nW (6W/cm2), et (c) FAPbBr3, intensitéd’illumination du spot 100 nW (10W/cm2), respectivement à 300K. L’intensité in-tégrée passe du blanc au bleu. L’étape de numérisation est de 2µm.
La µPL spatialement résolue à basse température (T = 4 K) pour MAPbI3 estprésentée dans la Fig. L’encadré (a) montre la photoluminescence de la phase or-thorhombique à basse température. De même que les résultats de la températureambiante, l’émission est assez uniforme, avec une certaine variation sur une échellede quelques µm liée à la structure microcristalline du film de pérovskite. Néan-moins, nous observons toujours les grains sombres et lumineux. Remarquablement,le pic de faible énergie, correspondant à la phase tétragonale à haute température,accompagne l’émission orthorhombique à certaines positions à travers l’échantillon.Les spectres typiques acquis pour deux positions différentes sur l’échantillon sontprésentés dans l’encadré (c). Le spectre tracé en bleu représente une position où seulle pic orthorhombique se produit. La courbe rouge correspond à la position où lespics de phase orthorhombique et tétragonale sont détectés simultanément. Bien quel’intensité de l’émission de la phase tétragonale soit toujours inférieure à l’intensitédu pic de phase orthorhombique dominante, l’apparition du pic de la phase tétrag-onale semble diminuer l’intensité du pic OP. L’intensité intégrée du pic de la phasetétragonale, indiquée par la couleur rouge, est superposée à l’intensité intégrée dupic de phase orthorhombique sur la Fig. 5.4 (b). L’émission de la phase tétragonalese trouve dans des zones isolées, peu fréquentes, de taille typique de 1 à 5 µm, où lepic de phase orthorhombique est généralement plus faible. Pour déterminer précisé-ment s’il existe une corrélation entre les intensités d’émission des deux phases, nousanalysons les proportions de l’émission totale dans chaque pic IOP,TP
ITP +ITPen fonction
de l’intensité d’émission du pic de phase tétragonale (ITP ). Les résultats, présentés
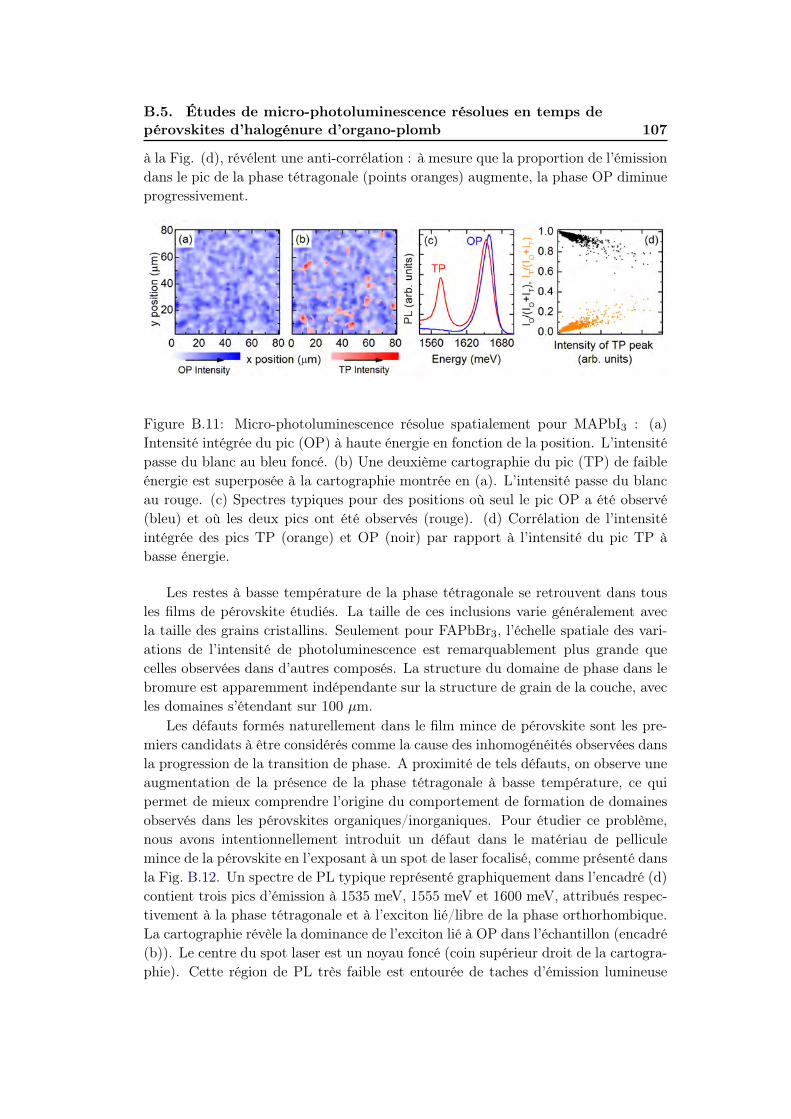
B.5. Études de micro-photoluminescence résolues en temps depérovskites d’halogénure d’organo-plomb 107
à la Fig. (d), révélent une anti-corrélation : à mesure que la proportion de l’émissiondans le pic de la phase tétragonale (points oranges) augmente, la phase OP diminueprogressivement.
Figure B.11: Micro-photoluminescence résolue spatialement pour MAPbI3 : (a)Intensité intégrée du pic (OP) à haute énergie en fonction de la position. L’intensitépasse du blanc au bleu foncé. (b) Une deuxième cartographie du pic (TP) de faibleénergie est superposée à la cartographie montrée en (a). L’intensité passe du blancau rouge. (c) Spectres typiques pour des positions où seul le pic OP a été observé(bleu) et où les deux pics ont été observés (rouge). (d) Corrélation de l’intensitéintégrée des pics TP (orange) et OP (noir) par rapport à l’intensité du pic TP àbasse énergie.
Les restes à basse température de la phase tétragonale se retrouvent dans tousles films de pérovskite étudiés. La taille de ces inclusions varie généralement avecla taille des grains cristallins. Seulement pour FAPbBr3, l’échelle spatiale des vari-ations de l’intensité de photoluminescence est remarquablement plus grande quecelles observées dans d’autres composés. La structure du domaine de phase dans lebromure est apparemment indépendante sur la structure de grain de la couche, avecles domaines s’étendant sur 100 µm.
Les défauts formés naturellement dans le film mince de pérovskite sont les pre-miers candidats à être considérés comme la cause des inhomogénéités observées dansla progression de la transition de phase. A proximité de tels défauts, on observe uneaugmentation de la présence de la phase tétragonale à basse température, ce quipermet de mieux comprendre l’origine du comportement de formation de domainesobservés dans les pérovskites organiques/inorganiques. Pour étudier ce problème,nous avons intentionnellement introduit un défaut dans le matériau de pelliculemince de la pérovskite en l’exposant à un spot de laser focalisé, comme présenté dansla Fig. B.12. Un spectre de PL typique représenté graphiquement dans l’encadré (d)contient trois pics d’émission à 1535 meV, 1555 meV et 1600 meV, attribués respec-tivement à la phase tétragonale et à l’exciton lié/libre de la phase orthorhombique.La cartographie révèle la dominance de l’exciton lié à OP dans l’échantillon (encadré(b)). Le centre du spot laser est un noyau foncé (coin supérieur droit de la cartogra-phie). Cette région de PL très faible est entourée de taches d’émission lumineuse

108 Appendix B. Résumé de la thèse en français
provenant de la phase tétragonale (encadré (a)). Consécutivement, on observe deszones de formes annulaires où les excitons liés et libres de la phase orthorhombiquedominent (encadrés (b), (c), respectivement).
Figure B.12: (a) distribution des ions iodés en fonction de la distance par rapport aupoint d’exposition. (b) - (d) les cartographies d’intensité intégrées de l’échantilloncorrespondant à : (b) haute température, du pic TP et des pics d’exciton lié (c)et libre de l’OP à basse température. (e) Spectre de photoluminescence montranttoutes les transitions observées.
Une telle répartition des domaines de phase peut être expliquée par la présence derégions en teneur d’halogénure diminuée et augmentée, formées lors du photo-recuit.Nous nous attendons à ce que la migration ionique signalée dans [deQuilettes 2016]entraîne une distribution non-uniforme des halogénures dans la zone exposée, commele montre schématiquement la Fig. (a). La lumière intense crée une région appau-vrie, entourée par la région avec un excès d’iode. Les phases cristallines sont cor-rélées avec la teneur en halogénure, ce qui est en accord avec le modèle des domainesobservés dans les cartographies chromatiques. Les régions non-affectées sont carac-térisées par l’émission de l’exciton lié à la phase orthorhombique. Ainsi, l’émissiond’excitons liée à la phase orthorhombique caractérise la teneur en iode standard,alors que la présence de la phase tétragonale indique une déficience de l’halogénure.

B.6. Les pérovskites halogénure d’plomb - et études magneto-optique109
B.6 Les pérovskites halogénure d’plomb - et études magneto-optique
Dans le dernier chapitre, nous décrivons brievement nos résultats préliminairesobtenu pour la famille de totalement inorganique halogénure de césium plomb pérovskites.Tout d’abord, nous décrivons les échantillons et la caractérisation études - la dépen-dance en température de la bande interdite. Ensuite, dans le présent mesures del’énergie de liaison de l’exciton et efficace masse déterminée a basse température , al’aide magnéto-spectroscopie. A basse température, lorsque les cations organiquessont ordonnées, l’image qualitative de la les interactions au sein du réseau est presquela meme pour les deux des composés inorganiques ou hybrides. Nous prévoyons dedéterminer si un plus différence marquée Survient a des températures plus élevées,correspondant a la gamme de phase tétragonale dans les composés hybrides, lorsquele modes du treillis organiques de libration sont autorisés. Ce sera étudié avec nosprochaines mesures magnéto-transmission sur la CsPbX3 materiaux à ≈ 170 K.
Figure B.13: (a) et (b) masse réduite et énergie de liaison à T = 2 K en fonctiondu gap d’énergie respectivement pour CsPbX3. Les symboles bleues indiquent lesrésultats pour les perovskites hybrides

110 Appendix B. Résumé de la thèse en français
B.7 Conclusions
Les perovskites organo-métalliques a base d’halogénure de plomb sont des candi-dats prometteurs comme absorbeurs de lumiere dans les cellules solaires a faiblecout et a haut rendement, ainsi que pour les OLEDS. Il a été récemment démon-tré, que le rendement de conversion des cellules basées sur les pérovskites hybrides acations multiples peuvent atteindre jusqu’a 22 % et sont stables en conditions réelles.Cela indique que l’avenir des pérovskites pour le photovoltaique est déterminé par ledéveloppement de nouveaux alliages. Par conséquent, une optimisation plus pousséedes performances de ces matériaux nécessite un contrôle avancé a la fois des pro-priétés électronique et de la morphologie. Pour cela, ils faut une compréhension finede l’évolution ces parametres avec la composition chimique. Dans cette these, nousutilisons des méthodes optiques pour étudier les parametres électroniques de base:l’énergie de liaison de l’exciton et sa masse réduite en fonction de la morphologiechez plusieurs perovskites organo-métalliques a base d’halogénure de plomb. Enétudiant des composés basés sur les cations organiques tels que le méthylammoniumou le formamidinium ainsi que différents halides, nous déterminons comment cesparametres sont influencés par le type d’ions.
Avant les mesures dans en champ magnétique, nous caractérisons notre échantil-lons utilisant la dépendance en température de la transmission optique UV-VIS. Cesétudes, réalisées a des températures allant de 4 a 300K, nous permettent de suivre leschangements de l’énergie de bande interdite avec l’augmentation de la température.En particulier, nous analysons le développement de la transition structurelle de laphase orthorhombique a la phase tétragonale, se produisant a environ 160K. Nousmontrons que l’apparition la phase tétragonale conduit toujours a une baisse del’énergie de bande interdite, dans la gamme de 15− 90 meV pour les différents com-posés. Une autre différence est la plage de température pour laquelle la transitionde phase progresse, variant de 15K a 50K. Ceci est une indication que la transitionde phase n’est pas uniforme dans le film a cause de la distribution de temperaturede transition des différents grains cristallins.
En outre, nous étudions les valeurs de l’énergie de liaison exciton et masse ré-duite mesurant la magnéto-transmission en champs magnétiques intense jusqu’a 67T. De plus, nous étayons notre analyse avec des mesures obtenus lors l’impulsioncourte Mega Gauss dans les champs jusqu’a 150T (en coopération avec A. Myiata,LNCMI). Nous analysons l’évolution du champ magnétique des énergies des transi-tions interbandes entre les états excitoniques et libres. Nous extrayons R∗ et µ enajustant ces transitions particulieres avec le modele de l ’atome d’ hydrogene dansun champ magnétique (états excitoniques) et Landau (États de porteurs libres).Cette méthode directe permet une meilleure précision d’estimation des ces parame-tres comparés a ceux obtenus par des mesures indirectes. Nous obtenons ainsi desrelations générale pour l’énergie de liaison des exciton R∗ et la masse réduite µ, quisont principalement déterminés par la bande interdite Eg pour toute la famille despérovskites hybrides: R∗ = 0, 01× Eg et µ
m0=
Eg
16.6),Les propriétés électroniques de base peuvent ainsi etre facilement estimées pour

B.7. Conclusions 111
de nouveau composés synthétisés. Il n’y a pas de preuve d’une importante influencedu type de cations organiques autre que celle résultant de changements dans l’énergiede bande interdite. Cela suggere un modele a deux bandes simples en théorie desperturbations k.p qui devrait permettre la modélisation précise des propriétés desdispositifs fabriqués a partir de pérovskites hybrides. Nous avons aussi démontréque les valeurs de l’énergie de liaison des excitons sont plus petites ou compara-bles a l’énergie thermique a 300K, ce qui apporte une contribution significative ala compréhension des excellente performance de ces matériaux dans les dispositifsphotovoltaiques.
Pour les tri-iodures, ces valeurs sont encore réduites dans les les phases a hautetempérature de ces matériaux. Ceci est en accord avec le contribution de la librationsdes cations organiques polaire sur l’écrantage diélectrique, suggéré dans la littéra-ture pour structures cristallines a haute température. Par contre, ce phénomenen’est pas observé dans le tri-bromure, caractérisé par une bande interdite plus large.Une explication possible est que l’énergie de liaison exciton dans ce composé, sig-nificativement plus grande que l’énergie des phonons correspondant aux librationsdes cations organiques, est probablement trop élevée pour etre efficacement réduitpar le cation lié.
Afin de confirmer le rôle des cations organiques dans la réduction de l’énergiede liaison exciton a haute température, nous effectuons actuellement, des étudesmagnéto-optiques de composés totalement inorganique, a base de césium. Nos ré-sultats préliminaires ont été obtenus a basse températures, au cours de laquelle lesmouvements du réseau organique sont réduites. Dans de telles conditions, les inter-actions électrons-trous sont tres similaires pour les familles hybrides et inorganiquesdes perovskite.
Enfin, nous avons effectués de la micro-photoluminescence dépendant de la tem-pérature. Les cartes résultantes montrent que les films mince de pérovskite sontcomposés a partir des grains cristallins sombres et brillants, avec des tailles com-prises entre 1 et 20 micrometres dans le cas de l’halogénure mixte MAPbCl x I 3−x.Nous démontrons que la transition de phase a basse température de tétragonalea orthorhombique est incomplete dans tous les matériaux étudiés, car des restesde la phase tétragonale se trouve meme a T = 4 K. Ceci est le plus évident dansle FAPbBr 3, ou les domaines macroscopiques de la phase tétragonale, s’étendantsur des centaines de grains adjacents. Dans d’autre composés, la surface des inclu-sions tétragonales est limitée a la taille de grains monocristallins. Ces inclusionspeuvent etre encore plus petites, en raison des grandes longueurs de diffusion desporteurs dans les perovskites. Les matériau tétragonaux a faible bande interditepeut collecter des porteurs sur de grandes régions, ce qui donne lieu a un pic PLrelativement fort correspondant a la phase tétragonale. En étudiant les régionsstructurellement endommagées et photo-recuites, ou l’apparition de la phase tétrag-onale a basse température est renforcée, nous attribuons sa présence a la teneurréduite en halogénures.
En effet, la micro-photoluminescence a basse températures permettent de dé-tecter de faibles inhomogénéités dans le films de pérovskite, qui ne sont pas observ-

112 Appendix B. Résumé de la thèse en français
ables a température ambiante.

Bibliography
[Aguado 2012] Fernando Aguado, Fernando Rodríguez, Rafael Valiente, Jean-PaulItiè and Michael Hanfland. Pressure effects on Jahn-Teller distortion in per-ovskites: The roles of local and bulk compressibilities. Phys. Rev. B, vol. 85,page 100101, Mar 2012. (Cited on page 8.)
[Amat 2014] Anna Amat, Edoardo Mosconi, Enrico Ronca, Claudio Quarti, PaoloUmari, Md. K. Nazeeruddin, Michael Grätzel and Filippo De Angelis.Cation-Induced Band-Gap Tuning in Organohalide Perovskites: Interplay ofSpin-Orbit Coupling and Octahedra Tilting. Nano Letters, vol. 14, no. 6,pages 3608–3616, 2014. PMID: 24797342. (Cited on pages 7, 8, 9, 10, 11, 64and 103.)
[Anaraki 2016] Elham Halvani Anaraki, Ahmad Kermanpur, Ludmilla Steier, Kon-rad Domanski, Taisuke Matsui, Wolfgang Tress, Michael Saliba, AntonioAbate, Michael Gratzel, Anders Hagfeldt and Juan-Pablo Correa-Baena.Highly efficient and stable planar perovskite solar cells by solution-processedtin oxide. Energy Environ. Sci., pages –, 2016. (Cited on page 9.)
[Aukerman 1967] L. W. Aukerman. Diffusion Lengths of Electrons and Holes inGaAs. J. Appl. Phys., vol. 38, no. 2, page 685, 1967. (Cited on page 18.)
[Bailie 2015] Colin D. Bailie, M. Greyson Christoforo, Jonathan P. Mailoa, An-drea R. Bowring, Eva L. Unger, William H. Nguyen, Julian Burschka, Nor-man Pellet, Jungwoo Z. Lee, Michael Gratzel, Rommel Noufi, Tonio Buonas-sisi, Alberto Salleo and Michael D. McGehee. Semi-transparent perovskitesolar cells for tandems with silicon and CIGS. Energy Environ. Sci., vol. 8,pages 956–963, 2015. (Cited on page 20.)
[Beal 2016] Rachel E. Beal, Daniel J. Slotcavage, Tomas Leijtens, Andrea R.Bowring, Rebecca A. Belisle, William H. Nguyen, George F. Burkhard,Eric T. Hoke and Michael D. McGehee. Cesium Lead Halide Perovskiteswith Improved Stability for Tandem Solar Cells. J. Phys. Chem. Lett., vol. 7,no. 5, pages 746–751, mar 2016. (Cited on pages 23 and 81.)
[Béard 2012] J. Béard, J. Billette, P. Frings, M. Suleiman and F. Lecouturier. Spe-cial Coils Development at the National High Magnetic Field Laboratory inToulouse. Journal of Low Temperature Physics, vol. 170, no. 5, pages 442–446, 2012. (Cited on page 27.)
[Behnke 1978] G. Behnke, H. Buttner and J. Pollmann. Ground state energy ofthe exciton-phonon system in a magnetic field. Solid State Communications,vol. 20, pages 873–876, 1978. (Cited on pages 66 and 104.)
114 Bibliography
[Bi 2016] D. Bi, W. Tress, M. I. Dar, P. Gao, J. Luo, C. Renevier, K. Schenk,A. Abate, F. Giordano, J.-P. Correa Baena, J.-D. Decoppet, S. M. Zakeerud-din, M. K. Nazeeruddin, M. Gra tzel and A. Hagfeldt. Efficient lumines-cent solar cells based on tailored mixed-cation perovskites. Science Advances,vol. 2, no. 1, pages e1501170–e1501170, jan 2016. (Cited on page 22.)
[Binek 2016] Andreas Binek, Irene Grill, Niklas Huber, Kristina Peters, Alexan-der G. Hufnagel, Matthias Handloser, Pablo Docampo, Achim Hartschuhand Thomas Bein. Control of Perovskite Crystal Growth by Methylammo-nium Lead Chloride Templating. Chem. Asian J., vol. 11, no. 8, pages 1199–1204, mar 2016. (Cited on page 21.)
[Brenner 2015] Thomas M. Brenner, David A. Egger, Andrew M. Rappe, LeeorKronik, Gary Hodes and David Cahen. Are Mobilities in Hybrid Organic-Inorganic Halide Perovskites Actually High? The Journal of Physical Chem-istry Letters, vol. 6, no. 23, pages 4754–4757, 2015. PMID: 26631359. (Citedon page 18.)
[Brenner 2016] Thomas M. Brenner, David A. Egger, Leeor Kronik, Gary Hodes andDavid Cahen. Hybrid organic-inorganic perovskites: low-cost semiconductorswith intriguing charge-transport properties. Nature Reviews Materials, vol. 1,no. 1, page 15007, jan 2016. (Cited on page 17.)
[Brivio 2014] F. Brivio, K.T. Butler, A. Walsh and M. van Schilfgaarde. Relativisticquasiparticle self-consistent electronic structure of hybrid halide perovskitephotovoltaic absorbers. Phys. Rev. B, vol. 89, page 155204, 2014. (Cited onpages 65 and 103.)
[Brivio 2015] Federico Brivio, Jarvist M. Frost, Jonathan M. Skelton, Adam J. Jack-son, Oliver J. Weber, Mark T. Weller, Alejandro R. Goñi, Aurélien M. A.Leguy, Piers R. F. Barnes and Aron Walsh. Lattice dynamics and vibrationalspectra of the orthorhombic, tetragonal, and cubic phases of methylammo-nium lead iodide. Phys. Rev. B, vol. 92, page 144308, Oct 2015. (Cited onpage 8.)
[Chen 2014a] Chang-Wen Chen, Hao-Wei Kang, Sheng-Yi Hsiao, Po-Fan Yang, Kai-Ming Chiang and Hao-Wu Lin. Efficient and Uniform Planar-Type Per-ovskite Solar Cells by Simple Sequential Vacuum Deposition. Advanced Ma-terials, vol. 26, no. 38, pages 6647–6652, 2014. (Cited on page 37.)
[Chen 2014b] Qi Chen, Huanping Zhou, Tze-Bin Song, Song Luo, Ziruo Hong, Hsin-Sheng Duan, Letian Dou, Yongsheng Liu and Yang Yang. Controllable Self-Induced Passivation of Hybrid Lead Iodide Perovskites toward High Perfor-mance Solar Cells. Nano Letters, vol. 14, no. 7, pages 4158–4163, 2014.PMID: 24960309. (Cited on pages 67 and 104.)

Bibliography 115
[Chiba 2006] Yasuo Chiba, Ashraful Islam, Yuki Watanabe, Ryoichi Komiya, NaokiKoide and Liyuan Han. Dye-Sensitized Solar Cells with Conversion Effi-ciency of 11.1%. Japanese Journal of Applied Physics, vol. 45, no. 7L, pageL638, 2006. (Cited on page 19.)
[Chuang 1995] S. Chuang. Physics of optoelectronic devices. Wiley: New York„1995. (Cited on pages 64 and 102.)
[Conings 2015] Bert Conings, Jeroen Drijkoningen, Nicolas Gauquelin, AslihanBabayigit, Jan DHaen, Lien DOlieslaeger, Anitha Ethirajan, Jo Verbeeck,Jean Manca, Edoardo Mosconi, Filippo De Angelis and Hans-Gerd Boyen.Intrinsic Thermal Instability of Methylammonium Lead Trihalide Perovskite.Advanced Energy Materials, vol. 5, no. 15, page 1500477, jun 2015. (Citedon page 14.)
[Correa Baena 2015] Juan Pablo Correa Baena, Ludmilla Steier, Wolfgang Tress,Michael Saliba, Stefanie Neutzner, Taisuke Matsui, Fabrizio Giordano,T. Jesper Jacobsson, Ajay Ram Srimath Kandada, Shaik M. Zakeerud-din, Annamaria Petrozza, Antonio Abate, Mohammad Khaja Nazeeruddin,Michael Gratzel and Anders Hagfeldt. Highly efficient planar perovskite solarcells through band alignment engineering. Energy Environ. Sci., vol. 8, pages2928–2934, 2015. (Cited on page 22.)
[da Silva 2015] E. Lora da Silva, Jonathan M. Skelton, Stephen C. Parker and AronWalsh. Phase stability and transformations in the halide perovskite CsSnI3.Phys. Rev. B, vol. 91, page 144107, Apr 2015. (Cited on pages 12, 81 and 83.)
[Dar 2014] M. Ibrahim Dar, Neha Arora, Peng Gao, Shahzada Ahmad, MichaelGrätzel and Mohammad Khaja Nazeeruddin. Investigation Regarding theRole of Chloride in Organic–Inorganic Halide Perovskites Obtained fromChloride Containing Precursors. Nano Letters, vol. 14, no. 12, pages 6991–6996, dec 2014. (Cited on page 21.)
[de Quilettes 2015] Dane W. de Quilettes, Sarah M. Vorpahl, Samuel D. Stranks,Hirokazu Nagaoka, Giles E. Eperon, Mark E. Ziffer, Henry J. Snaith andDavid S. Ginger. Impact of microstructure on local carrier lifetime in per-ovskite solar cells. Science, vol. 348, no. 6235, pages 683–686, 2015. (Citedon pages 68, 71, 104 and 105.)
[Debray 2013] Francois Debray and Paul Frings. State of the art and developmentsof high field magnets at the Laboratoire National des Champs MagnetiquesIntenses. Comptes Rendus Physique, vol. 14, no. 1, pages 2 – 14, 2013.(Cited on page 26.)
[deQuilettes 2016] Dane W. deQuilettes, Wei Zhang, Victor M. Burlakov, Daniel J.Graham, Tomas Leijtens, Anna Osherov, Vladimir Bulović, Henry J. Snaith,David S. Ginger and Samuel D. Stranks. Photo-induced halide redistribution

116 Bibliography
in organic–inorganic perovskite films. Nature Communications, vol. 7, page11683, may 2016. (Cited on pages 71, 78, 105 and 108.)
[Deschler 2014] Felix Deschler, Michael Price, Sandeep Pathak, Lina E. Klintberg,David-Dominik Jarausch, Ruben Higler, Sven Hüttner, Tomas Leijtens,Samuel D. Stranks, Henry J. Snaith, Mete Atatüre, Richard T. Phillips andRichard H. Friend. High Photoluminescence Efficiency and Optically PumpedLasing in Solution-Processed Mixed Halide Perovskite Semiconductors. TheJournal of Physical Chemistry Letters, vol. 5, no. 8, pages 1421–1426, 2014.PMID: 26269988. (Cited on pages 21 and 71.)
[DInnocenzo 2014] Valerio DInnocenzo, Giulia Grancini, Marcelo J.P. Alcocer, AjayRam Srimath Kandada, Samuel D. Stranks, Michael M. Lee, Guglielmo Lan-zani, Henry J. Snaith and Annamaria Petrozza. Excitons versus free chargesin "organo-lead tri-halide" perovskites. Nature Communications, vol. 5, April2014. (Cited on pages 5 and 46.)
[Dong 2015] Qingfeng Dong, Yanjun Fang, Yuchuan Shao, Padhraic Mulligan, JieQiu, Lei Cao and Jinsong Huang. Electron-hole diffusion lengths > 175 µmin solution-grown CH3NH3PbI3 single crystals. Science, vol. 347, no. 6225,pages 967–970, 2015. (Cited on pages 18 and 20.)
[Edelman 1992] P Edelman, W Henley and J Lagowski. Photoluminescence andminority carrier diffusion length imaging in silicon and GaAs. SemiconductorScience and Technology, vol. 7, no. 1A, page A22, 1992. (Cited on page 18.)
[Eperon 2014a] Giles E. Eperon, Victor M. Burlakov, Pablo Docampo, AlainGoriely and Henry J. Snaith. Morphological Control for High Performance,Solution-Processed Planar Heterojunction Perovskite Solar Cells. AdvancedFunctional Materials, vol. 24, no. 1, pages 151–157, 2014. (Cited on pages 9,23 and 36.)
[Eperon 2014b] Giles E. Eperon, Samuel D. Stranks, Christopher Menelaou,Michael B. Johnston, Laura M. Herz and Henry J. Snaith. Formamidiniumlead trihalide: a broadly tunable perovskite for efficient planar heterojunctionsolar cells. Energy Environ. Sci., vol. 7, pages 982–988, 2014. (Cited onpages 13, 21, 22, 67 and 104.)
[Eperon 2015] Giles E. Eperon, Giuseppe M. Paternò, Rebecca J. Sutton, AndreaZampetti, Amir Abbas Haghighirad, Franco Cacialli and Henry J. Snaith.Inorganic caesium lead iodide perovskite solar cells. J. Mater. Chem. A,vol. 3, no. 39, pages 19688–19695, 2015. (Cited on pages 81, 82 and 83.)
[Etgar 2012] Lioz Etgar, Peng Gao, Zhaosheng Xue, Qin Peng, Aravind KumarChandiran, Bin Liu, Md. K. Nazeeruddin and Michael Grätzel. Meso-scopic CH3NH3PbI3/TiO2 Heterojunction Solar Cells. Journal of the Amer-ican Chemical Society, vol. 134, no. 42, pages 17396–17399, 2012. PMID:23043296. (Cited on page 18.)

Bibliography 117
[Etienne 2016] Thibaud Etienne, Edoardo Mosconi and Filippo De Angelis. Dynam-ical Origin of the Rashba Effect in Organohalide Lead Perovskites: A Key toSuppressed Carrier Recombination in Perovskite Solar Cells? J. Phys. Chem.Lett., vol. 7, no. 9, pages 1638–1645, may 2016. (Cited on page 11.)
[Even 2012] J. Even, L Pedesseau, A. Dupertuis M, J.-M Jancu and C. Katan.Electronic model for self-assembled hybrid organic/perovskite semiconduc-tors: Reverse band edge electronic states ordering and spin-orbit coupling.Phys. Rev. B, vol. 86, page 205301, 2012. (Cited on pages 15 and 64.)
[Even 2013] Jacky Even, Laurent Pedesseau, Jean-Marc Jancu and Claudine Katan.Importance of Spin-Orbit Coupling in Hybrid Organic/Inorganic Perovskitesfor Photovoltaic Applications. The Journal of Physical Chemistry Letters,vol. 4, no. 17, pages 2999–3005, 2013. (Cited on page 17.)
[Even 2014a] Jacky Even, Laurent Pedesseau, Jean-Marc Jancu and ClaudineKatan. DFT and k · p modelling of the phase transitions of lead and tinhalide perovskites for photovoltaic cells. physica status solidi (RRL) RapidResearch Letters, vol. 8, no. 1, pages 31–35, 2014. (Cited on pages 15 and 17.)
[Even 2014b] Jacky Even, Laurent Pedesseau and Claudine Katan. Analysis ofMultivalley and Multibandgap Absorption and Enhancement of Free CarriersRelated to Exciton Screening in Hybrid Perovskites. The Journal of PhysicalChemistry C, vol. 118, no. 22, pages 11566–11572, 2014. (Cited on pages 12,15, 16, 17, 46, 61, 64, 65, 66, 103 and 104.)
[Even 2015] Jacky Even, Laurent Pedesseau, Claudine Katan, Mikaël Kepenekian,Jean-Sébastien Lauret, Daniel Sapori and Emmanuelle Deleporte. Solid-StatePhysics Perspective on Hybrid Perovskite Semiconductors. J. Phys. Chem.C, vol. 119, no. 19, pages 10161–10177, may 2015. (Cited on pages 59, 63and 102.)
[Facchetti 2011] Antonio Facchetti. π-Conjugated Polymers for Organic Electronicsand Photovoltaic Cell Applications. Chemistry of Materials, vol. 23, no. 3,pages 733–758, 2011. (Cited on page 19.)
[Fang 2015] H-H. Fang, R. Raissa, M. Abdu-Aguye, S. Adjokatse, G.R. Blake,J. Even and M.A. Loi. Photophysics of Organic-Inorganic Hybrid Lead Io-dide Perovskite Single Crystals. Adv. Funct. Mater., vol. 25, no. 16, pages2378–2385, APR 22 2015. (Cited on page 64.)
[Frenkel 1931] J. Frenkel. On the Transformation of light into Heat in Solids. I.Phys. Rev., vol. 37, pages 17–44, Jan 1931. (Cited on page 3.)
[Frings 2008] Paul Frings, Holger Witte, Harry Jones, Jérome Béard and ThomasHermannsdoerfer. Rapid Cooling Methods for Pulsed Magnets. IEEE Trans-actions on Applied Superconductivity, vol. 18, no. 2, pages 612–615, 2008.(Cited on page 28.)

118 Bibliography
[Frost 2016] J.M. Frost and A. Walsh. Organic-inorganic halide perovskite photo-voltaics, chapitre 3, pages 2–6. Springer Nature, 2016. (Cited on page 11.)
[Gong 2015] Ke Gong and David F. Kelley. Surface Charging and Trion Dynamicsin CdSe-Based Core/Shell Quantum Dots. The Journal of Physical Chem-istry C, vol. 119, no. 17, pages 9637–9645, 2015. (Cited on page 6.)
[Gordon 2016] Elijah E. Gordon, Ke Xu, Hongjun Xiang, Annette Bussmann-Holder, Reinhard K. Kremer, Arndt Simon, Jürgen Köhler and Myung-HwanWhangbo. Structure and Composition of the 200 K-Superconducting Phaseof H2S at Ultrahigh Pressure: The Perovskite (SH− )(H3S+). AngewandteChemie International Edition, vol. 55, no. 11, pages 3682–3684, feb 2016.(Cited on page 6.)
[Green 2014] Martin A. Green, Anita Ho-Baillie and Henry J. Snaith. The emer-gence of perovskite solar cells. Nature Photonics, vol. 8, pages 506–514, 2014.(Cited on page 37.)
[Green 2015a] Martin A. Green, Keith Emery, Yoshihiro Hishikawa, Wilhelm Wartaand Ewan D. Dunlop. Solar cell efficiency tables (version 47). Prog. Pho-tovolt: Res. Appl., vol. 24, no. 1, pages 3–11, nov 2015. (Cited on pages 19and 22.)
[Green 2015b] Martin A. Green, Yajie Jiang, Arman Mahboubi Soufiani and AnitaHo-Baillie. Optical Properties of Photovoltaic Organic-Inorganic Lead HalidePerovskites. The Journal of Physical Chemistry Letters, vol. 6, no. 23, pages4774–4785, 2015. and other references cited there. (Cited on page 17.)
[Habisreutinger 2014] Severin N. Habisreutinger, Tomas Leijtens, Giles E. Eperon,Samuel D. Stranks, Robin J. Nicholas and Henry J. Snaith. Carbon Nan-otube/Polymer Composites as a Highly Stable Hole Collection Layer in Per-ovskite Solar Cells. Nano Letters, vol. 14, no. 10, pages 5561–5568, oct 2014.(Cited on pages 13 and 14.)
[Haldane 1988] F. D. M. Haldane. Model for a Quantum Hall Effect without LandauLevels: Condensed-Matter Realization of the "Parity Anomaly". PhysicalReview Letters, vol. 61, no. 18, pages 2015–2018, oct 1988. (Cited on page 6.)
[Han 2012] Liyuan Han, Ashraful Islam, Han Chen, Chandrasekharam Mala-paka, Barreddi Chiranjeevi, Shufang Zhang, Xudong Yang and MasatoshiYanagida. High-efficiency dye-sensitized solar cell with a novel co-adsorbent.Energy Environ. Sci., vol. 5, pages 6057–6060, 2012. (Cited on page 19.)
[Haugeneder 1999] A. Haugeneder, M. Neges, C. Kallinger, W. Spirkl, U. Lemmer,J. Feldmann, U. Scherf, E. Harth, A. Gügel and K. Müllen. Exciton diffusionand dissociation in conjugated polymer/fullerene blends and heterostructures.Phys. Rev. B, vol. 59, pages 15346–15351, Jun 1999. (Cited on page 19.)

Bibliography 119
[Hayashi 1950] Masakazu Hayashi and Kiichiro Katsuki. Absorption Spectrum ofCuprous Oxide. Journal of the Physical Society of Japan, vol. 5, no. 5, pages380B–381, sep 1950. (Cited on page 3.)
[He 2001] T. He, Q. Huang, A. P. Ramirez, Y. Wang, K. A. Regan, N. Rogado,M. A. Hayward, M. K. Haas, J. S. Slusky, K. Inumara, H. W. Zandbergen,N. P. Ong and R. J. Cava. Superconductivity in the non-oxide perovskiteMgCNi3. Nature, vol. 411, no. 6833, pages 54–56, may 2001. (Cited onpage 6.)
[Hirasawa 1994] M. Hirasawa, T. Ishihara, T. Goto, K. Uchida and N. Miura.Magnetoabsorption of the lowest exciton in perovskite-type compound(CH3NH3)PbI3. Physica B: Condensed Matter, vol. 201, pages 427–430,jul 1994. (Cited on page 46.)
[Hoke 2015] Eric T. Hoke, Daniel J. Slotcavage, Emma R. Dohner, Andrea R.Bowring, Hemamala I. Karunadasa and Michael D. McGehee. Reversiblephoto-induced trap formation in mixed-halide hybrid perovskites for photo-voltaics. Chem. Sci., vol. 6, pages 613–617, 2015. (Cited on pages 9, 10and 14.)
[Huang 2013] Ling-yi Huang and Walter R. L. Lambrecht. Electronic band struc-ture, phonons, and exciton binding energies of halide perovskites CsSnCl3,CsSnBr3 , and CsSnI3. Physical Review B, vol. 88, no. 16, oct 2013. (Citedon page 16.)
[Jeon 2014] Nam Joong Jeon, Jun Hong Noh, Young Chan Kim, Woon Seok Yang,Seungchan Ryu and Sang Il Seok. Solvent engineering for high-performanceinorganic–organic hybrid perovskite solar cells. Nature materials, vol. 13,no. 9, pages 897–903, 2014. (Cited on pages 20 and 37.)
[Jeon 2015] Nam Joong Jeon, Jun Hong Noh, Woon Seok Yang, Young Chan Kim,Seungchan Ryu, Jangwon Seo and Sang Il Seok. Compositional engineeringof perovskite materials for high-performance solar cells. Nature, vol. 517,no. 7535, pages 476–480, jan 2015. (Cited on pages 13 and 22.)
[Jha 2009] Praket P. Jha and Philippe Guyot-Sionnest. Trion Decay in ColloidalQuantum Dots. ACS Nano, vol. 3, no. 4, pages 1011–1015, 2009. PMID:19341263. (Cited on page 6.)
[Jin 2012] Hosub Jin, Jino Im and Arthur J. Freeman. Topological insulator phasein halide perovskite structures. Phys. Rev. B, vol. 86, no. 12, sep 2012. (Citedon page 6.)
[Johnsson 2007] Mats Johnsson and Peter Lemmens. Crystallography and chemistryof perovskites. John Wiley & Sons, Ltd, 2007. and other cited there. (Citedon pages 6, 7, 8, 9 and 94.)

120 Bibliography
[Jones 2004] Harry Jones, Paul H Frings, Michael von Ortenberg, Alex Lagutin,Luc Van Bockstal, Oliver Portugall and Fritz Herlach. First experimentsin fields above 75 T in the European "coilin-coilex" magnet. Physica B:Condensed Matter, vol. 346347, pages 553 – 560, 2004. Proceedings of the7th International Symposium on Research in High Magnetic Fields. (Citedon page 27.)
[Kalt 2013] H. Kalt and M. Hetterich. Optics of semiconductors and their nanos-tructures. Springer Series in Solid-State Sciences. Springer Berlin Heidelberg,2013. and otherreferences cited there. (Cited on page 6.)
[Kane 1978] E.O. Kane. Pollmann-Büttner variational method for excitonic po-larons. Phys. Rev. B, vol. 18, pages 6849–6855, 1978. (Cited on page 65.)
[Kawabata 1977] T. Kawabata, K. Muro and S. Narita. Observation of cyclotronresonance absorptions due to excitonic ion and excitonic molecule ion insilicon. Solid State Communications, vol. 23, no. 4, pages 267–270, jul 1977.(Cited on page 6.)
[Kheng 1993] K. Kheng, R. T. Cox, Merle Y. d’ Aubigné, Franck Bassani, K. Sam-inadayar and S. Tatarenko. Observation of negatively charged excitons X−
in semiconductor quantum wells. Phys. Rev. Lett., vol. 71, pages 1752–1755,Sep 1993. (Cited on page 6.)
[Kieslich 2015] Gregor Kieslich, Shijing Sun and Anthony K. Cheetham. An ex-tended Tolerance Factor approach for organic-inorganic perovskites. Chem.Sci., vol. 6, pages 3430–3433, 2015. (Cited on pages 7 and 8.)
[Kim 2012] Hui-Seon Kim, Chang-Ryul Lee, Jeong-Hyeok Im, Ki-Beom Lee,Thomas Moehl, Arianna Marchioro, Soo-Jin Moon, Robin Humphry-Baker,Jun-Ho Yum, Jacques E. Moser, Michael Grätzel and Nam-Gyu Park. LeadIodide Perovskite Sensitized All-Solid-State Submicron Thin Film MesoscopicSolar Cell with Efficiency Exceeding 9%. Sci. Rep., vol. 2, aug 2012. (Citedon page 14.)
[Kim 2014] Minsung Kim, Jino Im, Arthur J. Freeman, Jisoon Ihm and Hosub Jin.Switchable S = 1/2 and J = 1/2 Rashba bands in ferroelectric halide per-ovskites. Proceedings of the National Academy of Sciences, vol. 111, no. 19,pages 6900–6904, 2014. (Cited on page 59.)
[Koh 2014] Teck Ming Koh, Kunwu Fu, Yanan Fang, Shi Chen, T. C. Sum, Nri-pan Mathews, Subodh G. Mhaisalkar, Pablo P. Boix and Tom Baikie.Formamidinium-Containing Metal-Halide: An Alternative Material forNear-IR Absorption Perovskite Solar Cells. J. Phys. Chem. C, vol. 118,no. 30, pages 16458–16462, jul 2014. (Cited on pages 21 and 22.)
[Kojima 2009] Akihiro Kojima, Kenjiro Teshima, Yasuo Shirai and TsutomuMiyasaka. Organometal Halide Perovskites as Visible-Light Sensitizers for
Bibliography 121
Photovoltaic Cells. J. Am. Chem. Soc., vol. 131, no. 17, pages 6050–6051,may 2009. (Cited on pages 9 and 13.)
[Kong 2015] Weiguang Kong, Zhenyu Ye, Zhen Qi, Bingpo Zhang, Miao Wang,Arash Rahimi-Iman and Huizhen Wu. Characterization of an abnor-mal photoluminescence behavior upon crystal-phase transition of perovskiteCH3NH3PbI3. Phys. Chem. Chem. Phys., vol. 17, pages 16405–16411, 2015.(Cited on pages 12, 68 and 69.)
[Kossacki 2000] P Kossacki, V Ciulin, J Cibert, Y Merle d’Aubigné, A Arnoult,C Bourgognon, A Wasiela, S Tatarenko, J.-L Staehli, J.D Ganière, B De-veaud and J.A Gaj. Oscillator strengths of charged excitons: combiningmagnetoabsorption and photoluminescence dynamics in semimagnetic quan-tum wells. Journal of Crystal Growth, vol. 214-215, pages 837–841, jun 2000.(Cited on page 6.)
[Kroeze 2003] Jessica E. Kroeze, * Tom J. Savenije, Martien J. W. Vermeulen, andJohn M. Warman. Contactless Determination of the Photoconductivity Ac-tion Spectrum, Exciton Diffusion Length, and Charge Separation Efficiencyin Polythiophene-Sensitized TiO2 Bilayers. The Journal of Physical Chem-istry B, vol. 107, no. 31, pages 7696–7705, 2003. (Cited on page 19.)
[Kulbak 2015] Michael Kulbak, David Cahen and Gary Hodes. How Important Isthe Organic Part of Lead Halide Perovskite Photovoltaic Cells? EfficientCsPbBr3 Cells. J. Phys. Chem. Lett., vol. 6, no. 13, pages 2452–2456, jul2015. (Cited on pages 81 and 82.)
[Kulbak 2016] Michael Kulbak, Satyajit Gupta, Nir Kedem, Igal Levine, TatyanaBendikov, Gary Hodes and David Cahen. Cesium Enhances Long-Term Sta-bility of Lead Bromide Perovskite-Based Solar Cells. J. Phys. Chem. Lett.,vol. 7, no. 1, pages 167–172, jan 2016. (Cited on page 81.)
[Kulkarni 2014] Sneha A. Kulkarni, Tom Baikie, Pablo P. Boix, Natalia Yantara,Nripan Mathews and Subodh Mhaisalkar. Band-gap tuning of lead halideperovskites using a sequential deposition process. J. Mater. Chem. A, vol. 2,pages 9221–9225, 2014. (Cited on page 9.)
[Kunugita 2015] Hideyuki Kunugita, Tsubasa Hashimoto, Yuki Kiyota, YosukeUdagawa, Yuko Takeoka, Yuiga Nakamura, Junro Sano, Tomonori Mat-sushita, Takashi Kondo, Tsutomu Miyasaka and Kazuhiro Ema. ExcitonicFeature in Hybrid Perovskite CH3NH3PbBr3 Single Crystals. Chemistry Let-ters, vol. 44, no. 6, pages 852–854, 2015. (Cited on page 77.)
[Lampert 1958] Murray A. Lampert. Mobile and Immobile Effective-Mass-ParticleComplexes in Nonmetallic Solids. Phys. Rev. Lett., vol. 1, pages 450–453,Dec 1958. (Cited on page 6.)

122 Bibliography
[Landau 1977] L. D. Landau and E. M. Lifschitz. Quantum mechanics: Non-relativistic theory. course of theoretical physics. vol.3. Pergamon Press, Lon-don, 1977. (Cited on page 47.)
[Lee 2015] Jin-Wook Lee, Deok-Hwan Kim, Hui-Seon Kim, Seung-Woo Seo,Sung Min Cho and Nam-Gyu Park. Formamidinium and Cesium Hybridiza-tion for Photo- and Moisture-Stable Perovskite Solar Cell. Advanced EnergyMaterials, vol. 5, no. 20, pages 1501310–n/a, 2015. 1501310. (Cited onpage 23.)
[Leguy 2015] Aurélien M. A. Leguy, Yinghong Hu, Mariano Campoy-Quiles, M. Is-abel Alonso, Oliver J. Weber, Pooya Azarhoosh, Mark van Schilfgaarde,Mark T. Weller, Thomas Bein, Jenny Nelson, Pablo Docampo and PiersR. F. Barnes. Reversible Hydration of CH3NH3PbI3 in Films, Single Crys-tals, and Solar Cells. Chemistry of Materials, vol. 27, no. 9, pages 3397–3407,may 2015. (Cited on pages 13 and 14.)
[Leijtens 2015] Tomas Leijtens, Giles E. Eperon, Nakita K. Noel, Severin N. Habis-reutinger, Annamaria Petrozza and Henry J. Snaith. Stability of Metal HalidePerovskite Solar Cells. Advanced Energy Materials, vol. 5, no. 20, page1500963, 2015. and other cited there. (Cited on pages 13, 14 and 21.)
[Li 2016] Dehui Li, Gongming Wang, Hung-Chieh Cheng, Chih-Yen Chen, Hao Wu,Yuan Liu, Yu Huang and Xiangfeng Duan. Size-dependent phase transitionin methylammonium lead iodide perovskite microplate crystals. Nature Com-munications, vol. 7, page 11330, apr 2016. (Cited on page 12.)
[Liang 1970] W Y Liang. Excitons. Physics Education, vol. 5, no. 4, page 226, 1970.(Cited on page 4.)
[Lidzey 2000] David G. Lidzey, Donal D. C. Bradley, Adam Armitage, Steve Walkerand Maurice S. Skolnick. Photon-Mediated Hybridization of Frenkel Excitonsin Organic Semiconductor Microcavities. Science, vol. 288, no. 5471, pages1620–1623, 2000. (Cited on page 4.)
[Lin 015] Q. Lin, Ardalan Armin, Ravi Chandra Raju Nagiri, PL. Burn andP. Meredith. Electro-optics of perovskite solar cells. Nature Photonics, vol. 9,no. 2, pages 106–112, FEB 2015. (Cited on pages 5 and 45.)
[Liu 2013] Mingzhen Liu, Michael B. Johnston and Henry J. Snaith. Efficient planarheterojunction perovskite solar cells by vapour deposition. Nature, vol. 501,pages 395–398, 2013. (Cited on page 37.)
[Liu 2015] Jiewei Liu, Sandeep Pathak, Thomas Stergiopoulos, Tomas Leijtens,Konrad Wojciechowski, Stefan Schumann, Nina Kausch-Busies and Henry J.Snaith. Employing PEDOT as the p-Type Charge Collection Layer in Regu-lar Organic–Inorganic Perovskite Solar Cells. J. Phys. Chem. Lett., vol. 6,no. 9, pages 1666–1673, may 2015. (Cited on page 13.)

Bibliography 123
[LNCMP-team 2004] The LNCMP-team. The LNCMP: a pulsed-field user-facilityin Toulouse. Physica B: Condensed Matter, vol. 346347, pages 668 – 672,2004. Proceedings of the 7th International Symposium on Research in HighMagnetic Fields. (Cited on page 26.)
[Mak 2012] Kin Fai Mak, Keliang He, Changgu Lee, Gwan Hyoung Lee, JamesHone, Tony F. Heinz and Jie Shan. Tightly bound trions in monolayer MoS2.Nature Materials, vol. 12, no. 3, pages 207–211, dec 2012. (Cited on page 6.)
[Makado 1986] P C Makado and N C McGill. Energy levels of a neutral hydrogen-like system in a constant magnetic field of arbitrary strength. Journal ofPhysics C: Solid State Physics, vol. 19, no. 6, page 873, 1986. (Cited onpages 49 and 50.)
[Marco 2016] Nicholas De Marco, Huanping Zhou, Qi Chen, Pengyu Sun, ZonghaoLiu, Lei Meng, En-Ping Yao, Yongsheng Liu, Andy Schiffer and Yang Yang.Guanidinium: A Route to Enhanced Carrier Lifetime and Open-Circuit Volt-age in Hybrid Perovskite Solar Cells. Nano Letters, vol. 16, no. 2, pages1009–1016, 2016. PMID: 26790037. (Cited on page 68.)
[Matteocci 2014] F. Matteocci, S. Razza, F. Di Giacomo, S. Casaluci, G. Mincuzzi,T. M. Brown, A. D’Epifanio, S. Licoccia and A. Di Carlo. Solid-state solarmodules based on mesoscopic organometal halide perovskite: a route towardsthe up-scaling process. Phys. Chem. Chem. Phys., vol. 16, pages 3918–3923,2014. (Cited on page 14.)
[McMeekin 2016] D. P. McMeekin, G. Sadoughi, W. Rehman, G. E. Eperon, M. Sal-iba, M. T. Horantner, A. Haghighirad, N. Sakai, L. Korte, B. Rech, M. B.Johnston, L. M. Herz and H. J. Snaith. A mixed-cation lead mixed-halideperovskite absorber for tandem solar cells. Science, vol. 351, no. 6269, pages151–155, jan 2016. (Cited on pages 20 and 23.)
[Menéndez-Proupin 2014] E. Menéndez-Proupin, P. Palacios, P. Wahnón and J. C.Conesa. Self-consistent relativistic band structure of the CH3NH3PbI3 per-ovskite. Phys. Rev. B, vol. 90, page 045207, Jul 2014. (Cited on pages 63and 64.)
[Mitioglu 2013] A. A. Mitioglu, P. Plochocka, J. N. Jadczak, W. Escoffier, G. L.J. A. Rikken, L. Kulyuk and D. K. Maude. Optical manipulation of theexciton charge state in single-layer tungsten disulfide. Phys. Rev. B, vol. 88,page 245403, Dec 2013. (Cited on page 6.)
[Miyata 2015] Atsuhiko Miyata, Anatolie Mitioglu, Paulina Plochocka, Oliver Por-tugall, Jacob Tse-Wei Wang, Samuel D. Stranks, Henry J. Snaith andRobin J. Nicholas. Direct measurement of the exciton binding energy and ef-fective masses for charge carriers in organic-inorganic tri-halide perovskites.
124 Bibliography
Nature Physics, vol. 11, pages 582–587, 2015. (Cited on pages 5, 46, 56, 61,62, 66 and 96.)
[Mizusaki 1983] J. Mizusaki, K. Arai and K. Fueki. Ionic conduction of theperovskite-type halides. Solid State Ionics, vol. 11, no. 3, pages 203–211,nov 1983. (Cited on page 14.)
[Møller 1958] C. K. Møller. Crystal Structure and Photoconductivity of CæsiumPlumbohalides. Nature, vol. 182, no. 4647, pages 1436–1436, nov 1958. (Citedon pages 81 and 82.)
[Motta 2015] Carlo Motta, Fedwa El-Mellouhi, Sabre Kais, Nouar Tabet, FahhadAlharbi and Stefano Sanvito. Revealing the role of organic cations in hybridhalide perovskite CH3NH3PbI3. Nature Communications, vol. 6, page 7026,apr 2015. (Cited on page 11.)
[Muto 1958] Toshinosuke Muto, Seiichi Oyama and Hiroshi Okuno. ElectronicStructure of the Exciton in Ionic Crystal. Progress of Theoretical Physics,vol. 20, no. 6, pages 804–821, dec 1958. (Cited on page 4.)
[Noel 2014] Nakita K. Noel, Samuel D. Stranks, Antonio Abate, Christian Wehren-fennig, Simone Guarnera, Amir-Abbas Haghighirad, Aditya Sadhanala,Giles E. Eperon, Sandeep K. Pathak, Michael B. Johnston, AnnamariaPetrozza, Laura M. Herz and Henry J. Snaith. Lead-free organic-inorganictin halide perovskites for photovoltaic applications. Energy Environ. Sci.,vol. 7, pages 3061–3068, 2014. (Cited on pages 9 and 14.)
[Noh 2013] Jun Hong Noh, Sang Hyuk Im, Jin Hyuck Heo, Tarak N. Mandal andSang Il Seok. Chemical Management for Colorful, Efficient, and StableInorganic-Organic Hybrid Nanostructured Solar Cells. Nano Letters, vol. 13,no. 4, pages 1764–1769, 2013. PMID: 23517331. (Cited on pages 9 and 22.)
[Oku 2015] Takeo Oku. Crystal Structures of CH3NH3PbI3 and Related PerovskiteCompounds Used for Solar Cells. In Solar Cells - New Approaches andReviews. InTech, oct 2015. , and other references cited there. (Cited onpages 11 and 12.)
[Ong 2015] Khuong P. Ong, Teck Wee Goh, Qiang Xu and Alfred Huan. MechanicalOrigin of the Structural Phase Transition in Methylammonium Lead IodideCH3NH3PbI3. The Journal of Physical Chemistry Letters, vol. 6, no. 4, pages681–685, 2015. PMID: 26262485. (Cited on pages 11 and 12.)
[Onida 2002] Giovanni Onida, Lucia Reining and Angel Rubio. Electronic exci-tations: density-functional versus many-body Green’s-function approaches.Rev. Mod. Phys., vol. 74, pages 601–659, Jun 2002. (Cited on page 15.)
[Onoda-Yamamuro 1990] Noriko Onoda-Yamamuro, Takasuke Matsuo and HiroshiSuga. Calorimetric and IR spectroscopic studies of phase transitions in

Bibliography 125
methylammonium trihalogenoplumbates (II)†. Journal of Physics and Chem-istry of Solids, vol. 51, no. 12, pages 1383–1395, jan 1990. (Cited on page 13.)
[Osherov 2016] Anna Osherov, Eline M. Hutter, Krzysztof Galkowski, RobertoBrenes, Duncan K. Maude, Robin J. Nicholas, Paulina Plochocka, VladimirBulović, Tom J. Savenije and Samuel D. Stranks. The Impact of PhaseRetention on the Structural and Optoelectronic Properties of Metal HalidePerovskites. Advanced Materials, oct 2016. (Cited on page 13.)
[Pang 2014] Shuping Pang, Hao Hu, Jiliang Zhang, Siliu Lv, Yaming Yu, Feng Wei,Tianshi Qin, Hongxia Xu, Zhihong Liu and Guanglei Cui. NH2CH2NH2PbI3 :An Alternative Organolead Iodide Perovskite Sensitizer for Mesoscopic SolarCells. Chemistry of Materials, vol. 26, no. 3, pages 1485–1491, feb 2014.(Cited on page 10.)
[Peierls 1932] R. Peierls. Zur Theorie der Absorptionsspektren fester Körper. An-nalen der Physik, vol. 405, no. 8, pages 905–952, 1932. (Cited on page 3.)
[Pelant 2012] Ivan Pelant and Jan Valenta. Luminescence of excitons, chapitre 7,pages 180–182. John Wiley & Sons, Inc., 2012. (Cited on page 6.)
[Pellet 2014] Norman Pellet, Peng Gao, Giuliano Gregori, Tae-Youl Yang, Moham-mad K. Nazeeruddin, Joachim Maier and Michael Grätzel. Mixed-Organic-Cation Perovskite Photovoltaics for Enhanced Solar-Light Harvesting. Ange-wandte Chemie International Edition, vol. 53, no. 12, pages 3151–3157, feb2014. (Cited on page 22.)
[Poglitsch 1987] A. Poglitsch and D. Weber. Dynamic disorder in methylammoni-umtrihalogenoplumbates (II) observed by millimeter wave spectroscopy. TheJournal of Chemical Physics, vol. 87, no. 11, pages 6373–6378, 1987. (Citedon pages 65 and 103.)
[Pollman 1975] J. Pollman and H. Büttner. Upper bounds for the ground-state en-ergy of the exciton-phonon system. Solid State Communications, vol. 17,pages 1171–1174, 1975. (Cited on page 65.)
[Rehman 2015] Waqaas Rehman, Rebecca L. Milot, Giles E. Eperon, ChristianWehrenfennig, Jessica L. Boland, Henry J. Snaith, Michael B. Johnston andLaura M. Herz. Charge-Carrier Dynamics and Mobilities in FormamidiniumLead Mixed-Halide Perovskites. Advanced Materials, vol. 27, no. 48, pages7938–7944, sep 2015. (Cited on page 23.)
[Sakata 1979] Makoto Sakata, Takashi Nishiwaki and Jimpei Harada. NeutronDiffraction Study of the Structure of Cubic CsPbBr3. Journal of the PhysicalSociety of Japan, vol. 47, no. 1, pages 232–233, jul 1979. (Cited on page 82.)
[Saliba 2014] Michael Saliba, Kwan Wee Tan, Hiroaki Sai, David T. Moore, TrentScott, Wei Zhang, Lara A. Estroff, Ulrich Wiesner and Henry J. Snaith.

126 Bibliography
Influence of Thermal Processing Protocol upon the Crystallization and Pho-tovoltaic Performance of Organic-Inorganic Lead Trihalide Perovskites. TheJournal of Physical Chemistry C, vol. 118, no. 30, pages 17171–17177, 2014.(Cited on page 36.)
[Saliba 2016a] Michael Saliba, Taisuke Matsui, Konrad Domanski, Ji-Youn Seo,Amita Ummadisingu, Shaik M. Zakeeruddin, Juan-Pablo Correa-Baena,Wolfgang R. Tress, Antonio Abate, Anders Hagfeldt and Michael Grätzel.Incorporation of rubidium cations into perovskite solar cells improves photo-voltaic performance. Science, 2016. (Cited on page 23.)
[Saliba 2016b] Michael Saliba, Taisuke Matsui, Ji-Youn Seo, Konrad Domanski,Juan-Pablo Correa-Baena, Mohammad Khaja Nazeeruddin, Shaik M. Za-keeruddin, Wolfgang Tress, Antonio Abate, Anders Hagfeldt and MichaelGratzel. Cesium-containing triple cation perovskite solar cells: improved sta-bility, reproducibility and high efficiency. Energy Environ. Sci., vol. 9, pages1989–1997, 2016. (Cited on pages 19, 22 and 23.)
[Saliba 2016c] Michael Saliba, Simonetta Orlandi, Taisuke Matsui, Sadig Aghazada,Marco Cavazzini, Juan-Pablo Correa-Baena, Peng Gao, Rosario Scopelliti,Edoardo Mosconi, Klaus-Hermann Dahmen, Filippo De Angelis, AntonioAbate, Anders Hagfeldt, Gianluca Pozzi, Michael Graetzel and Moham-mad Khaja Nazeeruddin. A molecularly engineered hole-transporting ma-terial for efficient perovskite solar cells. Nature Energy, vol. 1, no. 2, page15017, jan 2016. (Cited on page 22.)
[Selinsky 2013] Rachel S. Selinsky, Qi Ding, Matthew S. Faber, John C. Wright andSong Jin. Quantum dot nanoscale heterostructures for solar energy conver-sion. Chem. Soc. Rev., vol. 42, pages 2963–2985, 2013. (Cited on page 19.)
[Shah 1999] A. Shah, P. Torres, R. Tscharner, N. Wyrsch and H. Keppner. Photo-voltaic Technology: The Case for Thin-Film Solar Cells. Science, vol. 285,no. 5428, pages 692–698, 1999. (Cited on page 20.)
[Shaw 2008] Paul Edward Shaw, Arvydas Ruseckas and Ifor David William Samuel.Exciton diffusion measurements in poly(3-hexylthiophene). Advanced Mate-rials, vol. 20, no. 18, pages 3516–3520, 9 2008. (Cited on page 19.)
[Shi 2015] Dong Shi, Valerio Adinolfi, Riccardo Comin, Mingjian Yuan, ErkkiAlarousu, Andrei Buin, Yin Chen, Sjoerd Hoogland, Alexander Rothen-berger, Khabiboulakh Katsiev, Yaroslav Losovyj, Xin Zhang, Peter A. Dow-ben, Omar F. Mohammed, Edward H. Sargent and Osman M. Bakr. Lowtrap-state density and long carrier diffusion in organolead trihalide perovskitesingle crystals. Science, vol. 347, no. 6221, pages 519–522, 2015. (Cited onpages 18 and 20.)

Bibliography 127
[Shkrob 2014] Ilya A. Shkrob and Timothy W. Marin. Charge Trapping in Pho-tovoltaically Active Perovskites and Related Halogenoplumbate Compounds.J. Phys. Chem. Lett., vol. 5, no. 7, pages 1066–1071, apr 2014. (Cited onpage 20.)
[Shockley 1961] William Shockley and Hans J. Queisser. Detailed Balance Limit ofEfficiency of "p-n" Junction Solar Cells. Journal of Applied Physics, vol. 32,no. 3, pages 510–519, 1961. (Cited on page 20.)
[Singh 2016] Shivam Singh, Cheng Li, Fabian Panzer, K. L. Narasimhan, AnnaGraeser, Tanaji P. Gujar, Anna Köhler, Mukundan Thelakkat, Sven Huet-tner and Dinesh Kabra. Effect of Thermal and Structural Disorder on theElectronic Structure of Hybrid Perovskite Semiconductor CH3NH3PbI3. J.Phys. Chem. Lett., vol. 7, no. 15, pages 3014–3021, aug 2016. (Cited onpage 16.)
[Sivaram 2015] Varun Sivaram, Samuel D. Stranks and Henry J. Snaith. OutshiningSilicon. Sci Am, vol. 313, no. 1, pages 54–59, jun 2015. (Cited on page 20.)
[Soufiani 2015] Arman Mahboubi Soufiani, Fuzhi Huang, Peter Reece, Rui Sheng,Anita Ho-Baillie and Martin A. Green. Polaronic exciton binding energy iniodide and bromide organic-inorganic lead halide perovskites. Applied PhysicsLetters, vol. 107, no. 23, 2015. (Cited on page 66.)
[Spencer 2004] K. Spencer, F. Lecouturier, L. Thilly and J.D. Embury. Establishedand Emerging Materials for use as High-Field Magnet Conductors. AdvancedEngineering Materials, vol. 6, no. 5, pages 290–297, 2004. (Cited on page 28.)
[Stoumpos 2013] Constantinos C. Stoumpos, Christos D. Malliakas and Mercouri G.Kanatzidis. Semiconducting Tin and Lead Iodide Perovskites with OrganicCations: Phase Transitions, High Mobilities, and Near-Infrared Photolumi-nescent Properties. Inorganic Chemistry, vol. 52, no. 15, pages 9019–9038,2013. PMID: 23834108. (Cited on pages 13 and 18.)
[Stranks 2013] Samuel D. Stranks, Giles E. Eperon, Giulia Grancini, ChristopherMenelaou, Marcelo J. P. Alcocer, Tomas Leijtens, Laura M. Herz, AnnamariaPetrozza and Henry J. Snaith. Electron-Hole Diffusion Lengths Exceeding1 Micrometer in an Organometal Trihalide Perovskite Absorber. Science,vol. 342, no. 6156, pages 341–344, 2013. (Cited on pages 17, 18, 19, 35, 36,74 and 94.)
[Stranks 2015] Samuel D. Stranks, Pabitra K. Nayak, Wei Zhang, Thomas Ster-giopoulos and Henry J. Snaith. Formation of Thin Films of OrganicInor-ganic Perovskites for High-Efficiency Solar Cells. Angewandte Chemie Inter-national Edition, vol. 54, no. 11, pages 3240–3248, 2015. (Cited on page 37.)
[Suarez 2014] Belen Suarez, Victoria Gonzalez-Pedro, Teresa S. Ripolles, Rafael S.Sanchez, Luis Otero and Ivan Mora-Sero. Recombination Study of Combined

128 Bibliography
Halides (Cl, Br, I) Perovskite Solar Cells. The Journal of Physical ChemistryLetters, vol. 5, no. 10, pages 1628–1635, 2014. PMID: 26270357. (Cited onpage 9.)
[Swainson 2003] I.P. Swainson, R.P. Hammond, C. Soullière, O. Knop andW. Massa. Phase transitions in the perovskite methylammonium lead bro-mide, CH3ND3PbBr3. Journal of Solid State Chemistry, vol. 176, no. 1,pages 97–104, nov 2003. (Cited on page 13.)
[Tanaka 2003] Kenichiro Tanaka, Takayuki Takahashi, Takuma Ban, TakashiKondo, Kazuhito Uchida and Noboru Miura. Comparative study onthe excitons in lead-halide-based perovskite-type crystals CH3NH3PbBr3,CH3NH3PbI3. Solid State Communications, vol. 127, no. 910, pages 619– 623, 2003. (Cited on pages 46, 59 and 64.)
[Thomas 1977] G.A. Thomas and T.M. Rice. Trions, molecules and excitons abovethe Mott density in Ge. Solid State Communications, vol. 23, no. 6, pages359–363, aug 1977. (Cited on page 6.)
[Trots 2008] D.M. Trots and S.V. Myagkota. High-temperature structural evolutionof caesium and rubidium triiodoplumbates. Journal of Physics and Chemistryof Solids, vol. 69, no. 10, pages 2520–2526, oct 2008. (Cited on page 81.)
[Uchino 2015] Kenji Uchino. Glory of piezoelectric perovskites. Science and Tech-nology of Advanced Materials, vol. 16, no. 4, page 046001, jul 2015. andother references cided there. (Cited on page 6.)
[Umari 2014] Paolo Umari, Edoardo Mosconi and Filippo De Angelis. Relativis-tic GW calculations on CH3NH3PbI3 and CH3NH3SnI3 Perovskites for So-lar Cell Applications. Scientific Reports, vol. 4, no. 4467, 2014. (Cited onpages 15, 63, 64, 65 and 103.)
[Umebayashi 2003] T. Umebayashi, K. Asai, T. Kondo and A. Nakao. Electronicstructures of lead iodide based low-dimensional crystals. Physical Review B,vol. 67, no. 15, apr 2003. (Cited on pages 9 and 15.)
[Valverde-Chavez 2015] David A. Valverde-Chavez, Carlito S. Ponseca, Constanti-nos C. Stoumpos, Arkady Yartsev, Mercouri G. Kanatzidis, Villy Sundstromand David G. Cooke. Intrinsic femtosecond charge generation dynamics insingle crystal CH3NH3PbI3. Energy Environ. Sci., vol. 8, pages 3700–3707,2015. (Cited on page 20.)
[Vidyasagar 1985] Kanamaluru Vidyasagar, Armin Reller, Jagannatha Gopalakr-ishnan and C. N. Ramachandra Rao. Oxygen vacancy ordering in superlativesof the two novel oxides, La2Ni2O5 and La2Co2O5, prepared by low temper-ature reduction of the parent perovskites. J. Chem. Soc., Chem. Commun.,pages 7–8, 1985. (Cited on page 8.)

Bibliography 129
[Wang 2015a] He Wang, Luisa Whittaker-Brooks and Graham R. Fleming. Excitonand Free Charge Dynamics of Methylammonium Lead Iodide Perovskites AreDifferent in the Tetragonal and Orthorhombic Phases. J. Phys. Chem. C,vol. 119, no. 34, pages 19590–19595, aug 2015. (Cited on pages 12 and 69.)
[Wang 2015b] Qiong Wang, Miaoqiang Lyu, Meng Zhang, Jung-Ho Yun, HongjunChen and Lianzhou Wang. Transition from the Tetragonal to Cubic Phaseof Organohalide Perovskite: The Role of Chlorine in Crystal Formation ofCH3NH3PbI3 on TiO2 Substrates. J. Phys. Chem. Lett., vol. 6, no. 21, pages4379–4384, nov 2015. (Cited on page 13.)
[Wang 2015c] Youwei Wang, Yubo Zhang, Peihong Zhang and Wenqing Zhang.High intrinsic carrier mobility and photon absorption in the perovskiteCH3NH3PbI3. Phys. Chem. Chem. Phys., vol. 17, pages 11516–11520, 2015.(Cited on page 19.)
[Wang 2016] Jacob Tse-Wei Wang, Zhiping Wang, Sandeep Pathak, Wei Zhang,Dane W. deQuilettes, Florencia Wisnivesky-Rocca-Rivarola, Jian Huang,Pabitra K. Nayak, Jay B. Patel, Hanis A. Mohd Yusof, Yana Vaynzof, RuiZhu, Ivan Ramirez, Jin Zhang, Caterina Ducati, Chris Grovenor, Michael B.Johnston, David S. Ginger, Robin J. Nicholas and Henry J. Snaith. Efficientperovskite solar cells by metal ion doping. Energy Environ. Sci., vol. 9, no. 9,pages 2892–2901, 2016. (Cited on page 21.)
[Wannier 1937] Gregory H. Wannier. The Structure of Electronic Excitation Levelsin Insulating Crystals. Phys. Rev., vol. 52, pages 191–197, Aug 1937. (Citedon page 3.)
[Wehrenfennig 2014a] C. Wehrenfennig, M. Liu, H.J. Snaith, M.B. Johnston andL.M. Herz. Charge carrier dynamics in vapour-deposited films of theorganolead halide perovskite CH3NH3PbI3−xClx. Energ. Environ. Sci.,vol. 7, pages 2269–2275, 2014. (Cited on pages 65 and 103.)
[Wehrenfennig 2014b] Christian Wehrenfennig, Mingzhen Liu, Henry J. Snaith,Michael B. Johnston and Laura M. Herz. Charge carrier recombination chan-nels in the low-temperature phase of organic-inorganic lead halide perovskitethin films. APL Mater., vol. 2, no. 8, 2014. (Cited on page 74.)
[Weller 2015] Mark T. Weller, Oliver J. Weber, Paul F. Henry, Antonietta M.Di Pumpo and Thomas C. Hansen. Complete structure and cation orien-tation in the perovskite photovoltaic methylammonium lead iodide between100 and 352 K. Chem. Commun., vol. 51, pages 4180–4183, 2015. (Cited onpages 12 and 13.)
[wook Park 2015] Byung wook Park, Bertrand Philippe, Sagar M. Jain, Xiao-liang Zhang, Tomas Edvinsson, Håkan Rensmo, Burkhard Zietz and GerritBoschloo. Chemical engineering of methylammonium lead iodide/bromide

130 Bibliography
perovskites: tuning of opto-electronic properties and photovoltaic perfor-mance. J. Mater. Chem. A, vol. 3, no. 43, pages 21760–21771, 2015. (Citedon page 21.)
[Xiao 2014] Zhengguo Xiao, Cheng Bi, Yuchuan Shao, Qingfeng Dong, Qi Wang,Yongbo Yuan, Chenggong Wang, Yongli Gao and Jinsong Huang. Efficient,high yield perovskite photovoltaic devices grown by interdiffusion of solution-processed precursor stacking layers. Energy Environ. Sci., vol. 7, pages 2619–2623, 2014. (Cited on pages 14 and 37.)
[Xing 2013] Guichuan Xing, Nripan Mathews, Shuangyong Sun, Swee Sien Lim,Yeng Ming Lam, Michael Grätzel, Subodh Mhaisalkar and Tze Chien Sum.Long-Range Balanced Electron- and Hole-Transport Lengths in Organic-Inorganic CH3NH3PbI3. Science, vol. 342, no. 6156, pages 344–347, 2013.(Cited on pages 18 and 74.)
[Yamada 2015] Y. Yamada, T. Nakamura, M. Endo, M. Endo, A. Wakamiya andY. Kanemitsu. Photoelectronic Responses in Solution-Processed PerovskiteCH3NH3PbI3 Solar Cells Studied by Photoluminescence and PhotoabsorptionSpectroscopy. Photovoltaics, IEEE Journal of, vol. 5, no. 1, pages 401–405,Jan 2015. (Cited on pages 65 and 69.)
[Yang 2003] Gai Ying Yang, Elizabeth C. Dickey and Clive A. Randall. Insights intoDegradation Mechanisms and Vacancy Ordering in BaTiO3. Microscopy andMicroanalysis, vol. 9, pages 850–851, 8 2003. (Cited on page 8.)
[Yang 2015] Jinli Yang, Braden D. Siempelkamp, Dianyi Liu and Timothy L. Kelly.Investigation of CH3NH3PbI3 Degradation Rates and Mechanisms in Con-trolled Humidity Environments Using in Situ Techniques. ACS Nano, vol. 9,no. 2, pages 1955–1963, feb 2015. (Cited on page 13.)
[yi Huang 2016] Ling yi Huang and Walter R. L. Lambrecht. Electronic band struc-ture trends of perovskite halides: Beyond Pb and Sn to Ge and Si. Phys.Rev. B, vol. 93, no. 19, may 2016. (Cited on page 9.)
[Yu 2010] M. Yu Peter Y. & Cardona. Fundamentals of semiconductors: Physicsand materials properties. Graduate Texts in Physics. Springer Berlin Hei-delberg, 2010. (Cited on pages 3, 4, 5 and 6.)
[Yuan 2015] Yongbo Yuan, Jungseok Chae, Yuchuan Shao, Qi Wang, ZhengguoXiao, Andrea Centrone and Jinsong Huang. Photovoltaic Switching Mecha-nism in Lateral Structure Hybrid Perovskite Solar Cells. Advanced EnergyMaterials, vol. 5, no. 15, page 1500615, jun 2015. (Cited on page 14.)
[Zhang 2015] Huimin Zhang, Chunjun Liang, Yong Zhao, Mengjie Sun, Hong Liu,Jingjing Liang, Dan Li, Fujun Zhang and Zhiqun He. Dynamic interfacecharge governing the current–voltage hysteresis in perovskite solar cells. Phys.

Bibliography 131
Chem. Chem. Phys., vol. 17, no. 15, pages 9613–9618, 2015. (Cited onpage 14.)
[Zhao 2015] Yong Zhao, Chunjun Liang, Huimin Zhang, Dan Li, Ding Tian, GuobaoLi, Xiping Jing, Wenguan Zhang, Weikang Xiao, Qian Liu, Fujun Zhangand Zhiqun He. Anomalously large interface charge in polarity-switchablephotovoltaic devices: an indication of mobile ions in organic–inorganic halideperovskites. Energy Environ. Sci., vol. 8, no. 4, pages 1256–1260, 2015. (Citedon page 14.)
[Zheng 2016] Xiaojia Zheng, Bo Chen, Mengjin Yang, Congcong Wu, Bruce Orler,Robert B. Moore, Kai Zhu and Shashank Priya. The Controlling Mechanismfor Potential Loss in CH3NH3PbBr3 Hybrid Solar Cells. ACS Energy Lett.,vol. 1, no. 2, pages 424–430, aug 2016. (Cited on page 22.)
[Zhou 2014] Huanping Zhou, Qi Chen, Gang Li, Song Luo, Tze-bing Song, Hsin-Sheng Duan, Ziruo Hong, Jingbi You, Yongsheng Liu and Yang Yang. In-terface engineering of highly efficient perovskite solar cells. Science, vol. 345,no. 6196, pages 542–546, 2014. (Cited on pages 15, 64, 67 and 104.)


Copyright © 2022 FDOKUMEN