RADIOTHERAPY VERSUS STENTING IN MANAGEMENT OF ...
573
9 Benha M. J. Vol. 29 No 2 May 2012 Introduction Introduction Esophageal cancer is diagnosed in about 400,000 patients each year worldwide, and its incidence is increasing [1] , it is the sixth leading cause of death from can- cer [2] . In Europe, while incidence of SCC has remained stable or de- clined during the past few dec- ades, the incidence of esophageal adenocarcinoma has been rising. This increase has been more prominent in Northern Europe, notably in the United Kingdom and Ireland [3,4] . The majority of the patients suffering from a cancer of the esophagus presents with symp- toms of dysphagia and weight loss because of an obstructive tumor [5] . RADIOTHERAPY VERSUS STENTING IN RADIOTHERAPY VERSUS STENTING IN MANAGEMENT OF MALIGNANT DYSPHAGIA MANAGEMENT OF MALIGNANT DYSPHAGIA Hany Eldeeb MD, Hend A. El-Hadaad MD**, Hany Eldeeb MD, Hend A. El-Hadaad MD**, and David Hunter MD* and David Hunter MD* Oncology Centre, Department of Surgery*, Northampton General Hospital, United Kingdom. Department of Clinical Oncology** and Nuclear Medicine, Mansoura University, Egypt. Abstract Abstract Background: Background: The majority of patients with cancer esophagus present with locally advanced disease and suffering from dysphagia. Stenting and radiotherapy (RT) provide survival benefits along with im- provement of dysphagia. Patients and methods: A prospective data of 91 patients with locally advanced or metastatic esophageal cancer who has been treated with either palliative RT, stent or both. Group I had RT only, Group II had stent only and group III had both RT and stent. Re- sults: The median overall survival (OAS) was 169 days in GI, 119 days in GII and 237 days in GIII. The difference between GI & III was statisti- cally significant (p=0.01). Conclusion: Combinations of stent and RT in patients provide survival benefit in patients with malignant dysphagia. Key words: Key words: Malignant dysphagia; esophageal cancer, radiotherapy; stent.
-
Upload
khangminh22 -
Category
Documents
-
view
0 -
download
0
Transcript of RADIOTHERAPY VERSUS STENTING IN MANAGEMENT OF ...

9
Benha M. J.
Vol. 29 No 2 May 2012
IntroductionIntroductionEsophageal cancer is diagnosed
in about 400,000 patients each
year worldwide, and its incidence
is increasing [1], it is the sixth
leading cause of death from can-
cer [2]. In Europe, while incidence
of SCC has remained stable or de-
clined during the past few dec-
ades, the incidence of esophageal
adenocarcinoma has been rising.
This increase has been more
prominent in Northern Europe,
notably in the United Kingdom
and Ireland [3,4].
The majority of the patients
suffering from a cancer of the
esophagus presents with symp-
toms of dysphagia and weight
loss because of an obstructive
tumor [5].
RADIOTHERAPY VERSUS STENTING INRADIOTHERAPY VERSUS STENTING INMANAGEMENT OF MALIGNANT DYSPHAGIAMANAGEMENT OF MALIGNANT DYSPHAGIA
Hany Eldeeb MD, Hend A. El-Hadaad MD**,Hany Eldeeb MD, Hend A. El-Hadaad MD**, and David Hunter MD* and David Hunter MD*
Oncology Centre, Department of Surgery*, Northampton General Hospital,
United Kingdom. Department of Clinical Oncology**
and Nuclear Medicine, Mansoura University, Egypt.
AbstractAbstractBackground: Background: The majority of patients with cancer esophagus
present with locally advanced disease and suffering from dysphagia.Stenting and radiotherapy (RT) provide survival benefits along with im-provement of dysphagia. Patients and methods: A prospective data of 91patients with locally advanced or metastatic esophageal cancer who hasbeen treated with either palliative RT, stent or both. Group I had RTonly, Group II had stent only and group III had both RT and stent. Re-sults: The median overall survival (OAS) was 169 days in GI, 119 daysin GII and 237 days in GIII. The difference between GI & III was statisti-cally significant (p=0.01). Conclusion: Combinations of stent and RT inpatients provide survival benefit in patients with malignant dysphagia.
Key words: Key words: Malignant dysphagia; esophageal cancer, radiotherapy;stent.

1010
Hany Eldeeb, et al...
Several management options
have been developed to palliate
malignant dysphagia. These in-
clude endoluminal stenting or
surgery and external beam radi-
ation, brachytherapy, chemo-
therapy, chemoradiotherapy, laser
treatment, photodynamic therapy
or ablation using injection of
alcohol or chemotherapeutic
agents [6,7,8].
Placement of self-expanding
metallic stents (SEMS) made up of
an alloy, usually nitinol or stain-
less steel, and deployed using en-
doscopic or fluoroscopic tech-
niques, is a newer method for
relief of dysphagia in these pa-
tients [9].
External beam radiotherapy
(EBRT) is known to provide dura-
ble and effective relief of dyspha-
gia. However, there is a time lag
before symptomatic relief occurs,
and up to 6 weeks are required for
maximum benefit [8].
Survival advantage of combined
stenting and radiotherapy was
first suggested by Ogilvie et al.[10],
other studies [11,12] have also in-
vestigated the effect of combined
stenting and radiotherapy on sur-
vival of patients with advanced
esophageal cancer and reported
superior results with regard to
both relief of dysphagia and survi-
val for stenting followed by radio-
therapy in those patients.
In view of promising results of
stenting and radiotherapy, we
conducted this study to compare
stenting alone and radiotherapy
with or without stenting in pa-
tients of locally advanced cancer
esophagus regarding overall survi-
val.
Materials and MethodsMaterials and MethodsThis is a prospective data of
ninety-one patients with locally
advanced or metastatic esopha-
geal cancer who were treated at
Northamptonshire Oncology Cen-
tre from 1/1/99 till 1/1/2007. El-
igibility criteria included patients
with locally advanced or metastat-
ic (T3, T4, any N, any M) previous-
ly untreated cancer esophagus
with Eastern Cooperative Oncolo-
gy Group [ECCOG] performance
status ≤ 3, age greater than 18
years, adequate bone marrow
function, renal and hepatic func-
tions. Patients are not eligible to

1111
Benha M. J.
Vol. 29 No 2 May 2012
any radical treatment. Patients in-
cluded in this study were divided
into three groups, group I (GI) 30
Patients received radiotherapy
only, 35 patients underwent stent-
ing only (GII) and 26 patients un-
derwent radiotherapy followed by
stenting (GIII).
Pretreatment and follow-upPretreatment and follow-up
evaluation:evaluation:
Pretreatment evaluation includ-
ed a detailed history taking,
physical examination, and routine
laboratory examinations. All pa-
tients underwent a baseline CT of
the neck, chest and abdomen ex-
amination, barium swallow, endo-
scopic ultrasound, upper gastroin-
testinal endoscopy and biopsy. All
these studies were repeated after
one month of end of treatment.
Treatment:Treatment:
Radiotherapy Radiotherapy
Patients were treated by 2 D
conventional EBR, which was de-
livered with linear accelerator
6MV energy, conventional simula-
tion planning two parallel oppos-
ing filed was used. The target vol-
ume included the initial lesion
with a margin of 3cm to 5cm at
both proximal and distal ends of
the esophagus. The total radiation
dose ranged from 20Gy in 5 frac-
tions over one week to 30 Gy in 10
fractions over two weeks.
Stenting Stenting
The stent of proper length was
selected, placed and released
along the site of stenosis by endo-
esophageal stent introducer. Stent
should extend about 2cm proxi-
mal and distal to the tumor. After
placement, patients were advised
to drink adequate warm water,
making the stent expand properly.
One week after examination was
carried out through upper diges-
tive tract fluoroscopy with barium.
Radiotherapy and stentRadiotherapy and stent
EBRT was used first and after
progression of their dysphagia pa-
tients were offered stent place-
ment, radiotherapy dose ranged
from 20Gy in 5 fractions to 30 Gy
in 10 fractions. Only two patients
received 40Gy in 20 fractions over
4 weeks.
Statistical methods:Statistical methods: The study
endpoint was overall survival and
it was calculated from the day of
the start of treatment to the day of
death or of lost follow-up. The

1212
Hany Eldeeb, et al...
data were coded and entered into
a computer using Statistical Pack-
age for Social Sciences (SPSS) ver-
sion 15.0. Results were expressed
as number, percentiles and medi-
ans. Categorical variables were
compared using chi-square tests.
Survival functions (OAS) were esti-
mated using Kaplan Meier test,
comparison between survival
curves was achieved by the Log
Rank test. P value of <0.05 taken
to indicate statistical signifi-
cance.
ResultsResultsPatient's characteristicsPatient's characteristics
The characteristics of the 91
patients of groups I, II and III are
shown in Table 1. The three pa-
tient groups were balanced; the
most common pathological type
was squmous cell carcinoma 60%
in GI, 48.6% in GII and 53.8% in
GIII, followed by adenocarcinoma,
all patients had dysphagia, 14.3%
had metastasis and the most com-
mon sites of metastasis were lung
and liver.
There was no significance dif-
ference between the median radia-
tion dose given for GI and GIII, it
was 24.66 and 26.29 in G1and
GIII respectively, stent migration
occurred in 3 patients of GII and
in 1patient of GIII. All patients un-
derwent stent had complications
included transient chest pain after
stent placement and gastroesoph-
ageal reflux.
The median overall survival
(OAS) was 169 days (95% CI
96.53-241.46) in GI, 119 days
(95% CI 106.48-131.51) in GII and
237 days (95% CI 107.07-366.92)
in GIII. The difference between GI
&II was statistically insignificant
(p=0.86) while the difference be-
tween GI &III was significant
(p=0.01) (fig 1&2).

1313
Benha M. J.
Vol. 29 No 2 May 2012

1414
Hany Eldeeb, et al...

1515
Benha M. J.
Vol. 29 No 2 May 2012
DiscussionDiscussionEsophageal cancer is increas-
ing in last few years, unfortunate-
ly the majority of patients will
present with locally advanced or
metastatic disease which is diffi-
cult to control. Considering this
fact, it is important to offer treat-
ment providing adequate and rap-
id palliation of symptoms especial-
ly the obstructive symptoms
which reflect on the quality of life.
Radiotherapy for esophageal can-
cer is a relatively effective treat-
ment and provides survival bene-
fits.
In the present study 91 pa-
tients enrolled 30 patients re-
ceived radiotherapy, 35 patients
underwent stent and 26 patients
underwent stent and received ra-
diotherapy, relief of dysphagia oc-
curs rapidly in stent groups than
in radiotherapy alone group [8]
and was more standing in stent
plus radiotherapy group, recur-
rence of dysphagia occurs in
8.5% in GII and 3.8% in GIII this
is due to tumor over growth on the
stent in GII. The median overall
survival time was 169 days for pa-
tients receiving radiotherapy and
this comparable to reported by
Slabber et al.[13], who reported
144 days median over all survival,
the median radiation dose was
24.66 ± 5.07 in GI and 26.29 ±
6.17 GIII, doses more than 40Gy
increase toxicity. Median overall
survival for stent only patients
was 119 days and this results
similar to that reported by Homs
et al.[14], and Conio et al.[15],
however, Han et al.[12] reported
312 days median overall survival
in stent alone patients. The
present study shows survival ben-
efits for addition of radiotherapy
to stent patients of locally ad-
vanced disease, its median overall
survival time was 237d days, Han
et al.[12] reported 499 days, while
Song et al.[16] reported 161 days,
this advantage may be due to tu-
mor local control by radiotherapy.
Yu et al. in a their trail of offering
radiotherapy 4-7 days after stent
replacement has reported mean
survival of 510 days but this was
a very small series[17]. In the fu-
ture, it can be expected that re-
movable stents will be used as a
bridge to surgery or radiotherapy
to maintain luminal patency dur-
ing neoadjuvant treatment. How-
ever it is difficult to assess the
survival benefit in these approach-

1616
Hany Eldeeb, et al...
es for each treatment modalities
as some patients underwent sur-
gery or radical chemoradiotherapy
thereafter [18,19].
ConclusionConclusionCombination of stent and radi-
otherapy in patients with locally
advanced esophageal cancer pro-
vide survival benefits along with
improvement of obstructive symp-
toms with acceptable complica-
tions.
ReferencesReferences1.1. Siersema P. D. (2008):Siersema P. D. (2008):
Esophageal cancer. Gastroenterol
Clin North Am; 37: 943-64.
2.2. Falk J., Carstens H., Falk J., Carstens H.,
Lundell L. and Albertsson M.Lundell L. and Albertsson M.
(2007):(2007): Incidence of carcinoma of
the oesophegus and gastric Car-
dia-Changes over time and geo-
graphical differences. Acta Oncol.;
46: 1070-4.
3.3. Karim-Kos H. E., de VriesKarim-Kos H. E., de Vries
E., Soerjomataram I., LemmensE., Soerjomataram I., Lemmens
V., Siesling S. and Coebergh J.V., Siesling S. and Coebergh J.
W. (2008): W. (2008): Recent trends of can-
cer in Europe: a combined ap-
proach of incidence, survival and
mortality for 17 cancer sites since
the 1990s. Eur J Cancer; 44:
1345-89.
4.4. Steevens J., BotterweckSteevens J., Botterweck
A. A., Dirx M. J., van denA. A., Dirx M. J., van den
Brandt P. A. and Schouten L. J.Brandt P. A. and Schouten L. J.
(2010):(2010): Trends in incidence of
esophageal and stomach cancer
subtypes in Europe. Eur J Gas-
troenterol Hepatol ;22: 669-78.
5.5. Watt E. and Whyte F.Watt E. and Whyte F.
(2003):(2003): The experience of dyspha-
gia and its effect on the quality of
life of patients with esophageal
cancer. Eur J Cancer Care; 12(2):
183-93.
6.6. Weigel T. L., Frumiento C.Weigel T. L., Frumiento C.
and Gaumintz E. (2002): and Gaumintz E. (2002): Endolu-
minal palliation for dysphagia sec-
ondary to esophageal carcinoma.
Surg Clin North Am; 82: 747-761.
7.7. Allum W. H., Griffin S.Allum W. H., Griffin S.
M., Watson A. and Colin-JonesM., Watson A. and Colin-Jones
D. (2002): D. (2002): Guidelines for the
management of oesophageal and
gastric cancer. Gut; 50 Suppl 5:
v1-v23.
8.8. Bown S. G. (1991): Bown S. G. (1991): Pallia-
tion of malignant dysphagia: sur-
gery, radiotherapy, laser, intuba-

1717
Benha M. J.
Vol. 29 No 2 May 2012
tion alone or in combination? Gut;
32: 841-844.
9.9. O’Donnel C. A., FullartonO’Donnel C. A., Fullarton
G. M., Watt E, Lennon K, Mur-G. M., Watt E, Lennon K, Mur-
ray G. D. and Moss J. G. (2002):ray G. D. and Moss J. G. (2002):
Randomised clinical trial compar-
ing self- expanding metallic stents
with plastic endoprosthesis in the
palliation of oesophageal cancer.
Br J Surg; 89:985-92.
10.10. Ogilvie A. L., Dronfield Ogilvie A. L., Dronfield
M. W., Ferguson R. and Atkin-M. W., Ferguson R. and Atkin-
son M. (1982):son M. (1982): Palliative intuba-
tion of oesophagogastric neo-
plasms at fibreoptic endoscopy.
Gut.; 23(12): 1060-7.
11.11. Zhong J., Wu Y., Xu Z., Zhong J., Wu Y., Xu Z.,
Liu X., Xu B. and Zhai Z. (2003):Liu X., Xu B. and Zhai Z. (2003):
Treatment of medium and late
stage esophageal carcinoma with
combined endoscopic metal stent-
ing and radiotherapy. Chin Med
J.; 116(1): 24-8.
12.12. Han Y. T., Peng L., Han Y. T., Peng L.,
Fang Q. and Li Q. (2004):Fang Q. and Li Q. (2004): Value
of radiotherapy and chemotherapy
after SEMS implantation opera-
tion in patients with malignant
esophageal stricture. Ai Zheng.;
23(6): 682-4.
13.13. Slabber C. F., Nel J. S., Slabber C. F., Nel J. S.,
Schoeman L., et al. (1998):Schoeman L., et al. (1998): A
randomized study of radiotherapy
alone versus radiotherapy plus 5-
fluorouracil and platinum in pa-
tients with inoperable, locally ad-
vanced squamous cancer of the
esophagus. Am J Clin Oncol.; 21
(5):462-5.
14.14. Homs M. Y., Steyerberg Homs M. Y., Steyerberg
E. W., Eijkenboom W. M., et al.E. W., Eijkenboom W. M., et al.
(2004):(2004): Single-dose brachytherapy
versus metal stent placement for
the palliation of dysphagia from
esophageal cancer: multicentre
randomized trial. Lancet.; 364:
1497–504.
15.15. Conio M., Repici A., Conio M., Repici A.,
Battaglia G., et al. (2007): Battaglia G., et al. (2007): A ran-
domized prospective comparison
of self-expanding plastic stents
and partially covered self-
expanding metal stents in the pal-
liation of malignant esophageal
dysphagia. Am J Gastroenterol.;
102(12): 2667-77.
16.16. Song H. Y., Lee D. H., Song H. Y., Lee D. H.,
Seo T. S., et al. (2002): Seo T. S., et al. (2002): Retrieva-
ble covered nitinol stents: experi-
ences in 108 patients with malig-
nant esophageal strictures. J Vasc

1818
Hany Eldeeb, et al...
Interv Radiol.; 13(3): 285-93.
17.17. You-Tao Yu, Guang You-Tao Yu, Guang
Yang, Yan Liu. and Bao-ZhongYang, Yan Liu. and Bao-Zhong
Shen. (2004): Shen. (2004): Clinical evaluation
of radiotherapy for advanced
esophageal cancer after metallic
stent placement. World J Gas-
troenterol; 10(14): 2145-6.
18.18. Hirdes M. M., Vleggaar Hirdes M. M., Vleggaar
F. P. and Siersema P. D. (2011):F. P. and Siersema P. D. (2011):
Stent placement for esophageal
strictures: an update. Expert Rev
Med Devices.; 8(6): 733-55..
19.19. Langer F. B., Schopp- Langer F. B., Schopp-
mann S. F., Prager G., et al.mann S. F., Prager G., et al.
(2010):(2010): Temporary placement of
self-expanding oesophageal stents
as bridging for neo-adjuvant ther-
apy. Ann Surg Oncol.;17(2):470-5.

1919
Benha M. J.
Vol. 29 No 2 May 2012
RADIOTHERAPY VERSUS STENTINGRADIOTHERAPY VERSUS STENTINGIN MANAGEMENT OF MALIGNANTIN MANAGEMENT OF MALIGNANT
DYSPHAGIADYSPHAGIA
Hany Eldeeb MD, Hend A. El-Hadaad MDHany Eldeeb MD, Hend A. El-Hadaad MDand David Hunter MDand David Hunter MD
BENHAMEDICALJOURNAL
REPRINT
Published byPublished by
Benha Faculty of MedicineBenha Faculty of Medicine Volume 29 Number 2May 2012

1919
Benha M. J.
Vol. 29 No 2 May 2012
IntroductionIntroductionEvoked potentials are a well es-
tablished method of investigating
neural projections to the cerebral
cortex and can be applied to any
situation in which it is possible to
evoke a synchronous volley of af-
ferent activity. This is difficult,
however, for vestibular afferents
using their natural stimulus - ro-
tational and linear movement - be-
cause synchronous activation is
hard to achieve using imposed
movements and the results are
prone to stimulus artifact. Recent-
ly, Todd et al. demonstrated that
vestibular evoked potentials could
be produced by an acoustic stimu-
OCULAR VESTIBULAR EVOKEDOCULAR VESTIBULAR EVOKEDMYOGENIC POTENTIALS IN PATIENTS WITHMYOGENIC POTENTIALS IN PATIENTS WITH
PERIPHERAL VESTIBULAR DISORDERSPERIPHERAL VESTIBULAR DISORDERS
Ashraf E. Morgan M.Sc, Ayman E. El-Sharabasy MD,Ashraf E. Morgan M.Sc, Ayman E. El-Sharabasy MD,Hesham S. Zaghloul MD and Elsaeid M. Thabet MDHesham S. Zaghloul MD and Elsaeid M. Thabet MD
Department of Audiology unit, ENT, Faculty of Medicine,
Mansoura university, Egypt.
AbstractAbstractOne hundred and fifty one subjects classified into five different
groups was included in this study. Twenty volunteer was served in thecontrol group, thirty patients with vestibular neuritis, thirty patientswith typical BPPV, thirty two patients with Meniere’s disease with andthirty nine patients with undiagnosed dizziness. All subjects was sub-jected to history taking, otological examination, basic audiological eval-uation and vestibular testing in the form of bedside examination, VNG,cVEMP and oVEMP recordings. oVEMP and cVEMP parameters in thecontrol and the other four groups was analyzed. Correlation betweencVEMP and oVEMP results between different study group reflecting var-iable degrees of significance suggesting that cVEMP and oVEMP re-sponses may produce characteristic profile in each of theses groups aid-ing in the diagnosis and differential diagnosis of different peripheralvestibular diseases.

2020
Ashraf E. Morgan, et al...
lus capable of activating the ves-
tibular apparatus (1). An alternate
method for synchronously activat-
ing the vestibular system is by
means of acoustic stimulation, in
conjunction with the use of suita-
ble auditory controls. This tech-
nique exploits a conserved vestib-
ular sensitivity to sound and has
been developed and validated us-
ing vestibular evoked myogenic
potentials (VEMPs).
Since Colebatch et al. reported
surface potentials from the ster-
nocleidomastoid muscles in re-
sponse to loud clicks i.e., cervical
VEMP (cVEMPs), the cVEMP test
evoked by air-conducted clicks,
galvanic stimulation, and bone-
conducted stimuli has become a
well-established clinical test of
vestibular function(2). Recently,
cVEMP is widely used to assess
the sacculocollic pathway in vari-
ous diseases such as Meniere’s
disease, vestibular neuritis, ves-
tibular schwannoma, and superior
canal dehiscence syndrome(3,4).
Another vestibular evoked re-
sponses from the eye muscles
produced by bone-conducted
sound were also reported(5)
namely, ocular vestibular evoked
myogenic potentials (oVEMPs).
oVEMPs are short latency
mainly negative evoked potentials
thought to represent consequent-
ly, excitation and inhibition of
extraocular muscles. Recently, Ro-
sengren et al reported oVEMPs
produced by bone-conducted
sound stimulation(5). The surface
potentials recorded in his study
group were not consistent with
electro-retinal potentials generat-
ed by ocular movement. On the
basis of circumstantial evidence,
they concluded that oVEMPs are
likely produced by synchronous
activity in the extraocular muscles
(i.e. myogenic potentials). The
oVEMPs, and the associated eye
movements, are distinct morpho-
logically for air-conducted (AC)
and bone-conducted (BC) sound,
consistent with differing profiles of
vestibular afferents being recruit-
ed by these stimuli. Todd et al.
proposed that AC-evoked oVEMPs
were most likely a manifestation
of pathways originating from
the sacculus, whereas BC-evoked
oVEMPs were likely to be due to
the excitation of both saccular
and utricular afferents(6). This
study was conducted to determine

2121
Benha M. J.
Vol. 29 No 2 May 2012
the usefulness of oVEMPs in dizzy
patients.
Methodology:Methodology:
I- Subjects:I- Subjects:
This study was conducted on
151 subjects classified in to 5 dif-
ferent groups:
1) Control group: twenty nor-
mal subjects (age ranged between
29 to 42 years) with normal hear-
ing and vestibular functions.
2) Vestibular neuritis group:
thirty patients with age range be-
tween 34 and 50 years. The crite-
ria for selecting the patients with
vestibular neuritis were: (1) typical
history of vestibular neuritis, (2)
nausea and vomiting, (3) absent
or markedly reduced horizontal
canal function and (4) positive
bedside examination.
3) BPPV group: thirty patients
with age range between 30 and 45
years with positive Dix-Hallpike
testing for posterior canal BPPV.
4) Meniere’s disease group:
thirty-two patients with age range
between 32 and 43 years. They
were selected according to the
classification of Committee on
Hearing and Equilibrium, Ameri-
can Academy of Otolaryngology-
Head and Neck surgery criteria for
definite Meniere’s disease (1995).
5) Undiagnosed group: thirty-
nine patients with age range be-
tween 30 and 49 years. To exclude
vascular arteriosclerotic changes
and systemic aging, patients older
than 50 years were not included
in the study. Undiagnosed dizzi-
ness was based on the following
criteria: patients suffering from
vertigo or disequilibrium with nor-
mal audiometric, bedside vestibu-
lar examination and videonystag-
mography. All of the study
subjects had no history of neuro-
logical disorders, external, middle
ear problems, noise exposure or
ototoxicity.
II- Methods:II- Methods:
All participants were submitted
to the following:
1- History taking. 2- Otologi-
cal examination. 3- Basic audio-
logical evaluation in the form of
pure tone and speech audiometry
using a Madsen two channed pure
tone and speech audiometer mod-
el Orbiter 922. Tympanometry and
acoustic reflex threshold measure-

2222
Ashraf E. Morgan, et al...
ments using a GSI immittanceme-
ter TympStar, Version 2 Middle
Ear Analyzer. 4- VNG: Computer-
ized 4 channel VNG recording sys-
tem from Micromedical Inc. Visual
eyes using spectrum software ver-
sion 6.1. 5- Vestibular evoked po-
tentials testing: using a Biologic
two channel evoked potential re-
cording system version 4.5.
A) cVEMP testing: EMG activi-
ty was ipsilaterally recorded from
the upper half of the sterncleimas-
toid (SCM) muscle using surface
electrode, with a reference elec-
trode on the upper edge of the
sternum and a ground electrode
on the forehead. During each re-
cording session, the subject was
instructed to rotate the head to-
wards the contralateral side of the
tested ear to keep the SCM muscle
under tension. Subjects were in-
structed to tense the SCM muscle
during acoustic stimulation and
relax it in between the recording
sessions. Tone bursts of 500 Hz
with a two-cycle rise/fall time and
plateau were used. They were pre-
sented at a rate of 3 cycles per
seconds (through TDH 39 head-
phones) at 116 dBnHL and down
to threshold. The EMG signal was
amplified (10000 times), bandpass
filtered (30 to 1500 Hz) and was
averaged after 300 sweeps. The
analysis window was 50 ms wide.
Measurements made on the VEMP
response were the threshold
(threshold was defined as the low-
est value of the stimulus intensity
capable of eliciting a visually de-
tectable response), latency of the
first positive peak (P1), latency of
the next negative peak (N1), and
the amplitude difference (N1P1)
between the P1 and the N1 ampli-
tudes. The left-right difference in
the P1-N1 amplitude was evaluat-
ed using the P1-N1 amplitude ra-
tio defined as [(AR-AL)/(AR+
AL)]100, where AR is the P1-N1
amplitude on the right side and
AL is the P1-N1 amplitude on the
left side.
B) oVEMP testing: EMG activi-
ty was contralaterally recorded by
inferior electrode below the eye
glob using surface electrode, with
a reference electrode 2 cm below
the primary electrode and a
ground electrode on the forehead.
During each recording session,
the subject was instructed to gaze
upward superomedially on a tar-
get placed on the roof of the sound

2323
Benha M. J.
Vol. 29 No 2 May 2012
treated room in order to contract
the inferior oblique muscle. In the
control group, in addition to the
previous electrode montage, the
EMG was recorded also ipsilateral-
ly, using superior electrode placed
on the upper eye lid and the pa-
tient was instructed to gaze con-
tralateral. This was done to char-
acterize the best montage for the
oVEMP. Tone bursts of 500 Hz
with a two cycle rise/fall time and
plateau were used. They were pre-
sented at a rate of 5 cycles per
seconds (through a TDH 39 head-
phones) at 116 dBnHL and down
to threshold. The EMG signal was
amplified (10000 times), bandpass
filtered (10 to 1500 Hz) and was
averaged after 300 sweeps. The
analysis window was 50 ms wide.
Measurements made on the
oVEMP response were the thresh-
old (threshold was defined as the
lowest value of the stimulus inten-
sity capable of eliciting a visually
detectable response), latency of
the first negative peak (n10), and
the n10 base line to peak ampli-
tude. The left-right difference in
the n10 amplitude was evaluated
using the n10 amplitude ratio de-
fined as [(AR-AL)/(AR+ AL)]100,
where AR is the n10 amplitude on
the right side and AL is the n10
amplitude on the left side.
ResultsResults151 subjects classified into five
different groups was included in
this study. 20 volunteer was
served in the control group with a
mean age of 37 years, 30 patients
with vestibular neuritis with a
mean age of 43 years, 30 patients
with typical BPPV with a mean
age of 43 years, 32 patients with
Meniere’s disease with a mean age
of 43 years and 39 patients with
undiagnosed dizziness and a
mean age of 39 years. The study
groups with age and sex matched.

2424
Ashraf E. Morgan, et al...

2525
Benha M. J.
Vol. 29 No 2 May 2012

2626
Ashraf E. Morgan, et al...

2727
Benha M. J.
Vol. 29 No 2 May 2012
DiscussionDiscussionThe oVEMP test generated no
sex-based difference in this study
- n10 latency, threshold and am-
plitude did not differ significantly
between male and female adults
and this may agree with sung et
al.(7). There is no significant differ-
ence regarding the age between
control and the other study
groups.
oVEMP responses in the con-oVEMP responses in the con-
trol group:trol group:
Incidence of oVEMP responses: Incidence of oVEMP responses:
In all subjects in the control
group, there was clear cVEMP and
oVEMP responses in the 40 ears
using AC 500 Hz tone burst at
maximum acoustic stimulation
(116 dBnHL) with 1 ms rise and
fall times and 2 ms plateau down
to threshold. Recently, it has been
reported that normal cVEMP re-
sponses show frequency tuning,
with the lowest threshold for 500-
Hz tone-burst stimuli(8). Using the
maximal acoustic stimulation,
oVEMP were elicited in all ears at
500 Hz, however, using other fre-
quencies, not in all ears produced
oVEMP response (80% at 250 Hz,
95% at 1000 Hz, 83% at 2000 Hz).
cVEMP were elicited in 100% at
250, 500, and 1000 Hz and 98%
at 2000Hz. It is important to get
consistently positive responses
from all normal subjects for a test
to be used as a screening test. In
that sense, cVEMP is a more relia-
ble measure than oVEMP and
oVEMP responses at 500 Hz are
more reliable than those at other
frequencies (9).
Thresholds of oVEMP:Thresholds of oVEMP:
The cVEMP and oVEMP re-
sponses can be obtained at similar
threshold and oVEMP can even be
obtained at slightly higher thresh-
old possibly this may be related to
the structural differences in the
muscles used to record these dif-
ferent responses and to the am-
plitude of the response, cVEMP
response has larger amplitude
and can be easily detected at
threshold lower than the oVEMP
response. Park et al. reported
that oVEMP thresholds were high-
er by about 10 dB than cVEMP
thresholds throughout the fre-
quencies(9). A tone-burst stimula-
tion of 500 Hz also had lower
thresholds compared to those at
other frequencies in oVEMP and
seems to be clinically most appro-
priate(10).

2828
Ashraf E. Morgan, et al...
Amplitudes and latencies ofAmplitudes and latencies of
oVEMP:oVEMP:
The amplitudes and latencies of
oVEMP were similar to those pre-
viously reported and it was report-
ed that the amplitude of cVEMP
responses scaled in proportion to
the level of tonic activation of the
muscles(2,11,12). In this study,
cVEMP P13-N23 peak to peak am-
plitudes were higher by about 15
times than oVEMP N10 ampli-
tudes at 500 Hz. In this study, the
first peak (n1) latency of oVEMP
was shorter than the first peak
(P1) latency of cVEMP. The differ-
ence of the first peak latencies
between oVEMP and cVEMP may
be due to the different length of
neural pathways or different num-
ber of synapses between the excit-
atory and the inhibitory connec-
tions (13).
oVEMP in vestibular neuritisoVEMP in vestibular neuritis
group: group:
In vestibular neuritis group, 13
out of 30 patients (43%) did not
give cVEMP response and 6 pa-
tients in addition to the 13 that
did not give cVEMP(19) out of 30
patients (63%) did not give oVEMP
response. The group of patient
that produced responses, both
cVEMP and oVEMP response am-
plitude ratios were significantly
higher than that of the control
group.
AC cVEMP, which are likely
due to excitation of saccular affer-
ents in the inferior vestibular
nerve, are abolished in only about
20-30% of acute vestibular neuri-
tis ears(5). Kim et al. reported that
abnormal cVEMP results were ob-
served in 25 out of 51 patient
(49%) in his study in the form of
decreased amplitude or absent
cVEMP on the ipsi-lesional side
were found in 14 and 11 patients,
respectively(6).
oVEMP in BPPV group: oVEMP in BPPV group:
In BPPV group, all patient
produced a response, this con-
firms the hypothesis of the patho-
logical basis of BPPV disease.
BPPV arises from damage of the
utricular macula and release of
the otoconia in the SSCs and thus
mainly affects the superior vestib-
ular nerve function and spared
the inferior vestibular nerve func-
tion. In the present study, there
was a significant threshold and
latency difference in both cVEMP
and oVEMP and significant dif-

2929
Benha M. J.
Vol. 29 No 2 May 2012
ference in the amplitude ratio of
oVEMP between BPPV and control
group. This can be explained on
the basis of not only BPPV arises
from damage of the utricle but
may be associated by saccular
damage in addition there may be
significant difference in the recov-
ery of cVEMP pathway before
oVEMP pathway as the later is as-
sumed to be multi-synaptic path-
way and may be delayed in recov-
ery. Benign paroxysmal positional
vertigo is thought to arise from the
detachment of otolith from the
macula of the utricle; this degen-
erative process may also affect the
macula of the saccule which can
be detected by cVEMP and oVEMP
testing (7,13).
oVEMP in Meniere’s diseaseoVEMP in Meniere’s disease
group: group:
In Meniere’s disease group,
23 out of 32 patient (71%) pro-
duced no cVEMP responses.
None of the patient in the
study group produced oVEMP
response when the affected ear is
stimulated.
In Meniere’s disease, de Waele
et al. stated that AC cVEMP is ab-
sent in 55% of affected ears and
its absence correlates with low-
frequency hearing loss(14). In the
present study, the higher overall
prevalence of AC-cVEMP abnor-
malities in definite MD is likely
to reflect saccular involvement. It
was expected that AC cVEMP, a
predominantly saccular test to
yield a significantly larger num-
ber of abnormalities than the
AC oVEMP, (which is likely to
have additional utricular repre-
sentation). Yet, it was found a
higher prevalence of oVEMP than
cVEMP abnormalities in our
study, with a significantly higher
proportion of absent reflexes for
AC cVEMP. AC stimulus was near-
er threshold for cVEMP thus more
likely to yield an absent reflex.
oVEMP when compared with the
cVEMP is a low-amplitude reflex
and thus more likely to fall below
the limits of detection. An addi-
tional point may be related to the
disease duration, in advanced Me-
niere’s disease, there may be more
than saccular involvement (re-
sponsible for cVEMP generation),
the utricle may be also involved
(sharing in oVEMP generation)
and thus increasing the propor-
tion of oVEMP reflex abnormali-
ties.

3030
Ashraf E. Morgan, et al...
oVEMP in undiagnosed group: oVEMP in undiagnosed group:
In undiagnosed group, 14 out
of 39 patients did not give cVEMP
response and 6 patients in addi-
tion to the previous 14(20) out of
39 patients did not give oVEMP re-
sponse. The remainder of patient
showed responses that do not dif-
fer significantly between both ears
except in oVEMP latency. The ab-
sence of cVEMP and oVEMP re-
sponses can be explained on the
basis that this group of patient
may have saccular dysfunction re-
sponsible for the generation of
cVEMP and share considerably
in the generation of oVEMP re-
sponse(15). Some investigators
have reported that the symp-
toms of unilateral otolith dys-
function are compensatory, like
those of semicircular canal dys-
function(16). Thus, patients with
complete compensation for a pre-
vious saccular disorder may ex-
hibit abnormal cVEMP.
oVEMP provides a new method
for examining otolith-ocular path-
ways. It is a manifestation of the
short-latency, phasic VOR. In con-
trast, oVEMP may remain abnor-
mal, making them a useful new
test of otolith function. It has been
shown oVEMP can be effective in
detecting lesions of central vestib-
ular pathways. Patients with MS
who have clinical lesions of inter-
nuclear pathways have a high rate
of oVEMP abnormalities, with rel-
atively spared cVEMPs. Comple-
menting other evoked potentials
used for detecting abnormalities
in MS, oVEMP may be valuable for
detecting and confirming lesions
of otolith–ocular pathways.
Correlation between cVEMP
and oVEMP results between differ-
ent study group reflecting variable
degrees of significance suggesting
that cVEMP and oVEMP respons-
es may produce characteristic pro-
file in each of theses groups and
aid in the diagnosis and differen-
tial diagnosis of many vestibular
disorders.
References References 1-1- Todd N. P. M., RosengrenTodd N. P. M., Rosengren
S. M. and Colebatch J. G.S. M. and Colebatch J. G.
(2003) : (2003) : A short latency vestibular
evoked potential produced by
bone-conducted acoustic stimula-
tion. J Acoust Soc Am 114 : 3264-
72.
2-2- Colebatch J. G. and Hal-Colebatch J. G. and Hal-

3131
Benha M. J.
Vol. 29 No 2 May 2012
magyi G. M. (1992) : magyi G. M. (1992) : Vestibular
evoked potentials in human neck
muscles before and after unilater-
al vestibular deafferentation. Neu-
rology 42:1635-6.
3-3- Welgampola M. S. andWelgampola M. S. and
Colebatch J. G. (2005) : Colebatch J. G. (2005) : Charac-
teristics and clinical applications
of vestibular-evoked myogenic po-
tentials. Neurology 64:1682-8.
4-4- Zaghloul H. and ThabetZaghloul H. and Thabet
E. (2005) :E. (2005) : Frusemide loaded-
VEMP in diagnosing Meniere’s
disease. Paper presented in the
American Academy of Audiolo-
gy.
5-5- Rosengren S. M., Todd N.Rosengren S. M., Todd N.
P. M. and Colebatch J. G.P. M. and Colebatch J. G.
(2005) : (2005) : Vestibular-evoked extra-
ocular potentials produced by
stimulation with bone-conducted
sound. Clin Neurophysiol 2005;
116:1938-48.
6-6- Todd N. P., Rosengren S.Todd N. P., Rosengren S.
M. and Colebatch J. G. (2007) :M. and Colebatch J. G. (2007) :
Ocular vestibular evoked myogen-
ic potentials (OVEMPs) produced
by air- and bone conducted
sound. Clin Neurophysiol 118 :
381-90.
7-7- Sung P., Po-Wen ChengSung P., Po-Wen Cheng
P. and Young Y. (2011) : P. and Young Y. (2011) : Effect of
gender on ocular vestibular-
evoked myogenic potentials via
various stimulation modes. Clini-
cal Neurophysiology.
8-8- Todd P., Rosengren M.Todd P., Rosengren M.
and Colebatch G. (2009) : and Colebatch G. (2009) : A
utricular origin of frequency tun-
ing to low frequency vibration in
the human vestibular system.
Neurosci Lett, 451(27):175-80.
9-9- Kim A., Hong H. and LeeKim A., Hong H. and Lee
H., et al., (2008) :H., et al., (2008) : Otolith dys-
function in vestibular neuritis: re-
covery pattern and a predictor of
symptom recovery. Neurology, 70
(6):449-53.
10-10- Park H., Lee and ShinPark H., Lee and Shin
J., et al. (2010) :J., et al. (2010) : Frequency-
tuning characteristics of cervical
and ocular vestibular evoked myo-
genic potentials induced by air-
conducted tone bursts. Clinical
Neurophysiology.
11-11- Ochi K., Ohashi T. andOchi K., Ohashi T. and
Nishino H. (2001) :Nishino H. (2001) : Variance of
vestibular evoked myogenic po-
tential. Laryngoscope, 111 : 522-
7.

3232
Ashraf E. Morgan, et al...
12-12- Seo T., Miyamoto A. andSeo T., Miyamoto A. and
Saka N., et al., (2008): Saka N., et al., (2008): Vestibu-
lar evoked myogenic potential in-
duced by bone-conducted stimuli
in patients with conductive hear-
ing loss. Acta Otolaryngol, 128
(6):639-43.
13-13- Angelaki D. E. (2004) :Angelaki D. E. (2004) :
Eyes on target, what neurons
must do for the vestibuloocular re-
flex during linear motion. J Neuro-
physiol 92:20-35.
14-14- de Waele C., Huy T.de Waele C., Huy T.
and Diard P ., et al., (1999) :and Diard P ., et al., (1999) :
Saccular dysfunction in Meniere’s
disease. Am J Otol, 20(2):223-
32.
15-15- Chihara Y., Iwasaki S.Chihara Y., Iwasaki S.
and Ushio M., et al., (2007) :and Ushio M., et al., (2007) :
Vestibular-evoked extraocular po-
tentials by air-conducted sound:
another clinical test for vestibular
function. Clin Neurophysiol,
118:2745-51.
16-16- Welgampola S., Migliac-Welgampola S., Migliac-
cio A. and Myrie A., et al.,cio A. and Myrie A., et al.,
(2009): T(2009): The human soundevoked
vestibulo-ocular reflex and its
electromyographic correlate. Clin
Neurophysiol, 120(1):158-66.

3333
Benha M. J.
Vol. 29 No 2 May 2012
OCULAR VESTIBULAROCULAR VESTIBULAREVOKED MYOGENIC POTENTIALS INEVOKED MYOGENIC POTENTIALS IN
PATIENTS WITH PERIPHERALPATIENTS WITH PERIPHERALVESTIBULAR DISORDERSVESTIBULAR DISORDERS
Ashraf E. Morgan M.Sc, Ayman E. El-Sharabasy MD,Ashraf E. Morgan M.Sc, Ayman E. El-Sharabasy MD,Hesham S. Zaghloul MD and Elsaeid M. Thabet MDHesham S. Zaghloul MD and Elsaeid M. Thabet MD
BENHAMEDICALJOURNAL
REPRINT
Published byPublished by
Benha Faculty of MedicineBenha Faculty of Medicine Volume 29 Number 2May 2012

3333
Benha M. J.
Vol. 29 No 2 May 2012
CORONARY ANGIOGRAPHIC PATTERNS OFCORONARY ANGIOGRAPHIC PATTERNS OFPATIENTS WITH METABOLIC SYNDROMEPATIENTS WITH METABOLIC SYNDROME
Abdel-Razek A. Maaty MD, Helmi M. Abo-Bakr MD,Abdel-Razek A. Maaty MD, Helmi M. Abo-Bakr MD,Ahmed A. Wafa MD and Hoda M. Sobh MSc.Ahmed A. Wafa MD and Hoda M. Sobh MSc.
Department of Cardiology, Mansoura University, Egypt.
AbstractAbstractObjectives : Objectives : We sought to study the relation between the metabolic
syndrome (MS) and the coronary artery disease (CAD) to identify the ex-tension, severity and morphologic patterns of coronary lesions associat-ed with MS.
Background :Background : Evidences from cross-sectional and prospective stud-ies demonstrate that MS is associated with an increased risk for coro-nary atherosclerosis. However the relation between the MS and the mor-phologic pattern of coronary lesions has not been studied extensively.
Methods : Methods : The study group consisted of 155 patients, in whom therewere indications for coronary angiography for clinically suspected CAD.Coronary angiographic findings including the extent, severity and mor-phologic patterns of the lesions were compared between both MS groupand non MS (NMS) group.
Results : Results : Significant increase in the number of diseased vessels,number of diseased segments and Gensini score in patients with MSwhen compared to those without MS (P=.000, .000, .001; respectively).Significant increase in the number of lesions in LAD (left anterior de-scending), LCX (left circumflex) and RCA (right coronary artery) in pa-tients with MS when compared to those without MS (.026, .000, .027;respectively). Significant increase in the LAD, LCX and RCA scores inpatients with MS when compared to those without MS (P= .028, .000,.006; respectively). Significant increase in the number of complex andsimple lesions in patients with MS when compared to those without MS(P.011, .001; respectively).
Conclusions :Conclusions : MS is associated with more extensive, severe andcomplex coronary lesions.
Key words: Key words: Metabolic syndrome, coronary artery disease, morpho-logic patterns.

3434
Abdel-Razek A. Maaty, et al...
IntroductionIntroductionIn the last years, MS has
caused an authentic revolution in
vascular risk stratification and
has become one of the most widely
used concepts within the health
sciences. It describes the accu-
mulation of several risk factors
for cardiovascular disease and di-
abetes within an individual pa-
tient (1).
The two underlying mecha-
nisms of MS are abdominal adi-
posity and insulin resistance. It is
exacerbated by age, genetic condi-
tioning, and an inappropriate life-
style which includes physical in-
activity and the consumption of
high calorie, high-fat foods, con-
centrated carbohydrates, and salt.
These metabolic alterations occur
simultaneously more frequently
than would be expected by chance
and the concurrence of several
factors increases cardiovascular
risk over and above the risk asso-
ciated with the individual factors
alone (1).
Several previous studies proved
that patients with MS are at in-
creased risk of cardiovascular ath-
erosclerosis. Nathan et al. stated
that individuals with MS and DM
have a greater incidence and abso-
lute progression of coronary artery
calcium compared with individu-
als without these conditions, with
progression also predicting coro-
nary heart disease events in those
with MS and DM (16). However lit-
tle was studied about the relation
between the MS and the character
of the coronary lesions. The
present study aimed at, first to
identify the relation between the
MS and the CAD. Second to iden-
tify the angiographic and mor-
phological pattern, extension and
severity of coronary lesions asso-
ciated with MS.
MethodsMethods
Study population:Study population:
We examined 155 patients (83
males, 72 females), admitted to
cardiology department at Mansou-
ra Specialized Hospital with sus-
pected CAD for elective coronary
angiography. Patients with con-
genital and valvular heart diseas-
es were excluded. Informed con-
sent was obtained from all
patients after detailed description
of the procedure.

3535
Benha M. J.
Vol. 29 No 2 May 2012
Study design:Study design:
Careful and comprehensive
medical history was taken. Cardi-
ovascular risk factors such as
smoking and hyperlipidemia were
defined according to previous pub-
lications (2,3). All patients under-
went a clinical examination with
special stress on the cardiovascu-
lar system, ECG and echocardiog-
raphy.
Measurements for the waist cir-
cumference, hip circumference,
height and weight were obtained
from each patient. Blood samples
were withdrawn from fasting pa-
tients for assay of blood sugar,
serum creatinine, lipid profile, by
standard laboratory methods.
Coronary angiography:Coronary angiography:
It was performed in the cathet-
erization laboratory at Mansoura
Specialised Hospital by means of
COROSCOP (Siemens AG, Mu-
nich, Germany), equipped with
Quantcor QCA version 2.0 quanti-
tative coronary analysis software.
All angiographies were performed
by the modified Seldinger tech-
nique through femoral artery ac-
cess. Angiographic scoring was
performed by observers who were
blinded to the MS state of the pa-
tients. Coronary angiograms were
interpreted qualitatively and were
analyzed in two orthogonal views.
Patients were classified as having
CAD when their coronary angio-
grams show any diameter lumen
stenosis at any of the coronary ar-
teries. The observers identified the
coronary atherosclerotic lesions,
ectasia and irregularities of the
wall of the coronaries denoting
atherosclerosis and they estimat-
ed the following:
• Lesions distribution.
• Mean % diameter stenosis.
• Extent; determined by the
number occluded segments (from
1 to 27) and the number of oc-
cluded vessels.
• Morphology of the lesion be-
ing simple or complex; with the
complex plaque defined as coro-
nary intraluminal filling defect
suggestive or intraluminal throm-
bus and/or coronary asymmetric
narrowing with irregular borders
and/or multiple irregularities
and/or overhanging edges or with
abrupt proximal face or a rough or
sawtooth component suggestive of
ulcers.
• All abnormal angiographies
were assessed by the modified

3636
Abdel-Razek A. Maaty, et al...
Gensini score (4); briefly, location
and degree of stenosis (severity),
were evaluated. Every lesion was
given a score; which is the prod-
uct of its weighted severity by its
weighted location. Weighted loca-
tion: coronary vasculature was di-
vided into 27 segments and each
involved segment was weighted by
a value from 0.5 (least important)
to 5 (critical location) as follow: le-
sions in the LM (Left main), 5; le-
sions in the proximal LAD, 2.5; le-
sions in the mid LAD, 1.5; lesions
in the distal LAD, 1; lesions in the
proximal LCX, 2.5; lesions in the
obtuse marginal, 1; lesions in the
RCA, 1; others, 0.5. Weighted se-
verity: the severity (percentage of
stenosis) was weighted as follows:
<25%, 1; 26-50%, 2; 51-75%, 4;
76-90%, 8; 91-99%, 16; 100%, 32.
The sum of all lesions scores is
the Gensini score.
Grouping of patients accord-Grouping of patients accord-
ing to MS:ing to MS: Patients were grouped
according to the current adult
treatment panel III (ATP III) defini-
tion of MS: Presence of any 3 of
the following 5 traits: Abdominal
obesity, defined as waist circum-
ference in men > 102 cm and in
women > 88 cm. Serum triglyce-
rides ≥ 150 mg/dl or drug treat-
ment for elevated triglycerides.
High density lipoprotein choleste-
rol (HDL-C) < 40 mg/dl in men
and <50 mg/dl in women or drug
treatment for HDL-C. Blood pres-
sure ≥ 130/85 mm Hg or drug
treatment for elevated blood pres-
sure. Fasting blood sugar
≥100mg/dl or drug treatment for
elevated blood sugar (5). Accord-
ing to this definition patients were
divided into 2 major groups:
Group 1 for patients with MS and
Group 2 for patients without MS.
Statistical methods:Statistical methods:
Frequency, mean and stan-
dard deviation were used to de-
scribe data. Chi-square test was
used to test for association be-
tween different risk factors and
abnormal coronary arteries. Stu-
dent t-test was used to test for
significance of difference in
quantitative variables between
each two groups. Pearson prod-
uct moment correlation was
used to test for linear relation-
ships between different quantita-
tive variables. Discriminant analy-
sis was used to select variables
affecting coronary arteries. P value
was considered significant if less

3737
Benha M. J.
Vol. 29 No 2 May 2012
than 0.05. These tests were run
on an IBM compatible personal
computer using the Statistical
Package for Social scientists
(SPSS) for windows 7.5 (SPSS Inc.,
Chicago, IL,USA).
ResultsResults

3838
Abdel-Razek A. Maaty, et al...

3939
Benha M. J.
Vol. 29 No 2 May 2012

4040
Abdel-Razek A. Maaty, et al...
DiscussionDiscussionMS, a common clinical problem
with high prevalence, has been
associated with adverse cardiovas-
cular risk and mortality, where
acute coronary syndrome signifi-
cantly affects mortality, morbidity
and quality of life in these pa-
tients (6,7).
Compared to patients without
MS, our patients with MS had
more extensive coronary disease.
The group of patients with MS
showed significant increase in the
number of affected coronary ves-
sels and segments. Also they had
significantly higher Gensini score.
These results are similar to those
of other previous studies; Lanz et
al. studied the gender specific ef-
fect on the relation between MS
and coronaries, they reported that
both severity and extension scores
showed significantly higher values
in the MS group, compared with
the NMS group. These differences
were important in both males and

4141
Benha M. J.
Vol. 29 No 2 May 2012
females. In their work they have
found higher scores for the exten-
sion and severity of lesions in the
MS than NMS group. Interesting-
ly, the impact of MS in CAD
scores was more pronounced in
females than in males (8).
Butler et al. studied the rela-
tion of the MS to quantity of coro-
nary atherosclerotic plaque, they
found that patients with MS were
more likely to have more plaques
and a greater extent of plaque dis-
tribution compared to patients
without MS. They also concluded
that MS was significantly associat-
ed with the presence and extent of
both calcified and noncalcified
coronary atherosclerotic plaque
detected using multi-detector
computed tomography scan
(MDCT). Furthermore, they
showed that this association was
independent of the presence of in-
dividual traditional risk factors
and of the Framingham risk score.
Their data showed that MS was
associated with both higher likeli-
hood of having coronary artery
disease detected using coronary
MDCT and, if present, more exten-
sive disease compared with pa-
tients without MS. This associa-
tion remained positive even after
adjusting for age; gender; smok-
ing; body mass index; history of
hypertension, hyperlipidemia, cor-
onary disease, and diabetes; and
Framingham risk score (10).
On studying each coronary ar-
tery separately; we found that
while the LM did not show any
significant difference of the num-
ber of lesions or the vessel score,
the other coronary vessels (LAD,
LCX and the RCA) showed signifi-
cant increase in both number of
lesions and score among the MS
group. Non significant difference
between the two groups regarding
the LM could be explained by its
wider diameter that needs more
amplification of risk factors such
as older age (mean age of MS
group in our patients was 54.27)
or longer duration of risk factors
to be present. Actually we found
significant positive correlation be-
tween the duration of diabetes
and the LM affection.
Regarding the morphology of
the coronary lesions, our study
showed that patients with MS
have significant increase in the
number of complex lesions com-

4242
Abdel-Razek A. Maaty, et al...
pared to patients without MS. Ac-
cording to our knowledge the rela-
tion between MS and the morphol-
ogy of coronary angiographic
lesion was not studied before.
However Amano et al. studied the
impact of MS on tissue character-
istics of angiographically mild to
moderate coronary lesions. They
reported that patients with more
than three clustering risks had
significantly increased lipid-rich
plaque rates, which is consistent
with a previous report showing the
synergistic effects of risk factors
on atherosclerosis. In keeping
with the building evidence on the
role of inflammation in cardiovas-
cular disease, inflammatory fac-
tors have been shown as signifi-
cant predictors of atherosclerotic
plaques (13).
Kawasaki et al. have developed
an integrated backscatter intra-
vascular ultrasound (IB-IVUS),
which allows analyzing tissue
components of coronary plaque in
vivo and shows that vulnerable
plaques caused by acute coronary
syndrome are relevant to increase
in plaque burden, including great-
er lipid pool (14,15). Regarding the
association of MS with vessel ath-
erosclerosis, several studies have
shown that the individual compo-
nents of MS are related to meas-
urements of subclinical athero-
sclerosis such as carotid intima-
media thickness (16). Few studies,
however, have examined the rele-
vance of MS as an entity with cor-
onary plaque, especially with its
tissue components. To assess the
relevant detail of MS and coronary
plaque morphology is more impor-
tant from a prevention perspec-
tive (17).
Amano et al. studied the im-
pact of MS on coronary plaque
characteristics. In their study, sig-
nificant differences in the refer-
ence diameter and the percentage
diameter stenoses measured by
QCA were not recognized between
patients with and without MS.
However, vessel volume and
plaque volume in the conventional
IVUS analysis showed a tendency
to increase in patients with MS
compared with patients without
MS. These results suggest that
vessels in patients with MS might
be compensatorily enlarged to pre-
vent building atheroma from en-
croaching in lumen, thereby con-
cealing the presence of a lesion

4343
Benha M. J.
Vol. 29 No 2 May 2012
when angiography is performed.
In the IB-IVUS analysis, vessels in
patients with MS significantly in-
creased in the percentage of lipid
volume (%LV) and significantly de-
creased in the percentage of fi-
brous volume (%FV). This finding
suggests the incidence of lipid-
rich plaque. Furthermore, on lo-
gistic regression, their study
showed that the prevalence of MS
was independently associated with
lipid-rich plaque. It has been re-
ported that greater plaque volume,
including lipid-rich components,
is relevant to plaque vulnerability,
resulting in increasing coronary
events. Taken together, these find-
ings might explain the mecha-
nisms of MS contributing to the
increasing risk of cardiovascular
events (13).
These findings may contribute
to our understanding of the in-
creased cardiovascular event risk
in patients with MS and may ex-
plain that this risk was increased
above the sum of all individual
risk factors. The interaction be-
tween clinical components of MS
and its biologic phenotype, for ex-
ample, insulin resistance and dys-
lipidemia, is known to contribute
to the development of a vascular
proinflammatory state, including
increased lipoprotein peroxidation,
smooth muscle cell proliferation,
accumulation of lipid-laden mate-
rial, extracellular matrix deposi-
tion, and activation of platelets
and thrombotic pathways; in sum-
mary, all the aspects of athero-
sclerosis development and pro-
gression and its culmination into
adverse clinical events (10).
Our results may also have ther-
apeutic implications. Optimally,
information about the presence
and extent of coronary artery dis-
ease may identify patients at low
and high cardiovascular event risk
in patients with MS. Considering
the high prevalence of MS and the
obesity epidemic, only targeted
therapies to high-risk patients
may be safe and cost-effective.
ConclusionConclusionPatients with MS have more ex-
tensive, severe and complex coro-
nary lesions compared to those
without MS.
Study limitation :Study limitation :
In this study we used coronary
angiography to assess the coro-

4444
Abdel-Razek A. Maaty, et al...
nary lesions. Coronary angiogra-
phy is a lumen gram that may not
detect early lesions. Other tools
like IVUS would be better to dem-
onstrate earlier lesions and would
give a better idea about the com-
ponents and characters of these
lesions.
ReferencesReferences1. Reilly M. P. and Rader1. Reilly M. P. and Rader
D. J. (2003) : D. J. (2003) : The metabolic
syndrome: more than the sum of
its parts? Circulation; 108 : 1546-
51.
2. Espinola-Klein C., Rup-2. Espinola-Klein C., Rup-
precht H. J., Blankenberg S. C.,precht H. J., Blankenberg S. C.,
Kopp H., Rippin G., Victor A.,Kopp H., Rippin G., Victor A.,
Hafner G., Schlumberger W. andHafner G., Schlumberger W. and
Meyer J. (2002) : Meyer J. (2002) : Impact of infec-
tious burden on extent and long-
term prognosis of atherosclerosis.
Circulation;105:15-21.
3. Rupprecht H. J., Blanker-3. Rupprecht H. J., Blanker-
berg S., Bickel C., Rippin G.,berg S., Bickel C., Rippin G.,
Hafner G., Prellwitz W., Schlum-Hafner G., Prellwitz W., Schlum-
berger W. and Meyer J. (2001) :berger W. and Meyer J. (2001) :
Impact of viral and bacterial infec-
tious burden on long-term progno-
sis in patients with coronary ar-
tery disease. Circulation; 104:25-
31.
4. Gensini, GG A more mean-
ingful scoring system for deter-
mining the severity of coronary
heart disease. Am J Cardiol
1983;51,606-607.
5. Alberti K. G., Zimmet P.5. Alberti K. G., Zimmet P.
and Shaw J. (2005) : and Shaw J. (2005) : The meta-
bolic syndrome-a new worldwide
definition. Lancet; 366:1059-62.
6. Lakka H. M., Laaksonen D.6. Lakka H. M., Laaksonen D.
E., Lakka T. A., et al. (2002) :E., Lakka T. A., et al. (2002) :
The metabolic syndrome and total
and cardiovascular disease mor-
tality in middle aged men. JAMA;
288:2709 -16.
7. Butler J., Rodondi N., Zhu7. Butler J., Rodondi N., Zhu
Y., et al. (2006) : Y., et al. (2006) : Metabolic syn-
drome and the risk of cardiovas-
cular disease in older adults. J
Am Coll Cardiol; 47: 1595-602.
8. Lanz J. and Alexandre C.8. Lanz J. and Alexandre C.
(2006) : (2006) : Pereira, Eulogio Martinez
Metabolic syndrome and coronary
artery disease: Is there a gender
specific effect? International Jour-
nal of Cardiology.;107:317-321.
9.9. Kasai T., Miyauchi K.,Kasai T., Miyauchi K.,
Kubota N., et al. (2008) : Kubota N., et al. (2008) : The re-
lationship between the metabolic

4545
Benha M. J.
Vol. 29 No 2 May 2012
syndrome defined by various crite-
ria and the extent of coronary ar-
tery disease Atherosclerosis.; 179:
944-950.
10.0. Butler J., MD, MPHa,b, Butler J., MD, MPHa,b,
Eline A. Q. Mooyaart, MSa, NinaEline A. Q. Mooyaart, MSa, Nina
Dannemann et al. (2008) :Dannemann et al. (2008) : Rela-
tion of the Metabolic Syndrome to
Quantity of Coronary Atheroscle-
rotic Plaque. Am J Cardi-
ol;101:1127-1130.
11.11. Amano T., MD, PHD, Amano T., MD, PHD,
and Matsubara T. (2007) : and Matsubara T. (2007) : Im-
pact of Metabolic Syndrome on
Tissue Characteristics of Angio-
graphically Mild to Moderate Coro-
nary Lesions Integrated Backscat-
ter Intravascular Ultrasound
Study J Am Coll Cardiol.; 49 :
1149-56.
12.12. Kawasaki M., Takatsu Kawasaki M., Takatsu
H., Noda T., et al. (2002) : H., Noda T., et al. (2002) : In
vivo quantitative tissue characteri-
zation of human coronary artery
plaques by use of integrated back-
scatter intravascular ultrasound
and comparison with angioscopic
findings. Circulation;105:2487-92.
13.13. Sano K., Kawasaki M., Sano K., Kawasaki M.,
Ishihara Y., et al. (2006) : As-Ishihara Y., et al. (2006) : As-
sessment of vulnerable plaques
causing acute coronary syndrome
using integrated backscatter intra-
vascular ultrasound. J Am Coll
Cardiol; 47:734-41.
14.14. Goldman S. H., Folsom Goldman S. H., Folsom
A. R., Coresh J., et al. (2002) :A. R., Coresh J., et al. (2002) :
Risk factor groupings related to
insulin resistance and their syner-
gistic effects on subclinical athero-
sclerosis. Diabetes; 51:3069-76.
15.15. Ahluwalia N., Drouet L., Ahluwalia N., Drouet L.,
Ruidavets J. B., et al. (2006) :Ruidavets J. B., et al. (2006) :
Metabolic syndrome is associated
with markers of subclinical ath-
erosclerosis in a French popula-
tion-based sample. Atherosclero-
sis; 186:345-53.
16. Nathan D., Jennifer C.,16. Nathan D., Jennifer C.,
Tanya G., et al. (2012) : Tanya G., et al. (2012) : Meta-
bolic Syndrome, Diabetes, and
Incidence and Progression of
Coronary Calcium. The Multieth-
nic Study of Atherosclerosis
Study. J Am Coll Cardiol Img,; 5 :
358-366.

4646
Abdel-Razek A. Maaty, et al...
CORONARY ANGIOGRAPHICCORONARY ANGIOGRAPHICPATTERNS OF PATIENTS WITHPATTERNS OF PATIENTS WITH
METABOLIC SYNDROMEMETABOLIC SYNDROME
Abdel-Razek A. Maaty MD, Helmi M. Abo-Bakr MD,Abdel-Razek A. Maaty MD, Helmi M. Abo-Bakr MD,Ahmed A. Wafa MD and Hoda M. Sobh MSc.Ahmed A. Wafa MD and Hoda M. Sobh MSc.
BENHAMEDICALJOURNAL
REPRINT
Published byPublished by
Benha Faculty of MedicineBenha Faculty of Medicine Volume 29 Number 2May 2012

4747
Benha M. J.
Vol. 29 No 2 May 2012
ROLE OF COLLAGEN CROSS-LINKING USINGROLE OF COLLAGEN CROSS-LINKING USINGRIBOFLAVIN/ULTRAVIOLET-A INRIBOFLAVIN/ULTRAVIOLET-A IN
KERATOCONUSKERATOCONUS
Amani E. Badawi MS, Amr M. El-Kannishy MD,Amani E. Badawi MS, Amr M. El-Kannishy MD,Tarek A. Mohssen MD, Hany Abdel-Rahman MDTarek A. Mohssen MD, Hany Abdel-Rahman MD
and Mohammad M. El-Dessouky MDand Mohammad M. El-Dessouky MDDepartment of ophthalmology, Faculty of Medicine,
Mansoura University, Egypt.
AbstractAbstractAim : Aim : The aim of this study is to evaluate the safety and effectiveness
of riboflavin-ultraviolet type A (UV-A) light rays induced cross-linking ofcorneal collagen in improving visual acuity and in stabilizing the pro-gression of keratoconic eyes.
Subjects and Methods :Subjects and Methods : This is a prospective study of patients at-tending the outpatient clinic of Mansoura Ophthalmic Center and diag-nosed as keratoconus during the period from March 2010 to February2011 with maximum keratometric (K) reading less than 54 D and mini-mal corneal thickness greater than 400 microns. The corneal epitheliumwas removed manually within the central 8 mm diameter area and thecornea was soaked with riboflavin eye drops (0.1% in 20% dextran) for30 minutes followed by exposure to UVA radiation (370 nm, 3 mW/cm2)for 30 minutes. During the follow-up period, uncorrected visual acuity(UCVA), best corrected visual acuity (BCVA), slit lamp examination, re-fraction, and topographic changes, pachymetry, and endothelial cellcount were recorded at 3, 6, 12 months.
Results : Results : Fifty one eyes of 31 patients with mild to moderate keratoc-onus were included in the study. All patients completed one year followup. Fourteen (45%) patients were males and seventeen (55%) were fe-males. The mean age was 24.4 years (range: 17-30 years). Keratoconuswas bilateral in 20 patients (65%) and unilateral in 11 patients (35%).There was statistically significant improvement of UCVA from a preoper-ative mean 0.7 ± 0.07 to 0.48 ± 0.03 at one year (P < 0.05). None of the

4848
Amani E. Badawi, et al...
IntroductionIntroductionKeratoconus is characterized
by the development of a non-
inflammatory ectasia of the axial
or peri-axial region of the cornea
and is usually bilateral. Its inci-
dence in the general population
is reported to be about one in
2000.[1] Incidences of one in 600
to one in 420 seem more in keep-
ing with the current diagnostic ca-
pacity.[2] The thinning and the
protrusion in keratoconus induces
irregular astigmatism, myopia and
scarring resulting in visual loss
and mild to marked impairment in
the quality of vision. Among the
risk factors of this condition is ge-
netics, usually inherited in an au-
tosomal dominant fashion.[3]
As the disease advances, high
corneal astigmatism and stromal
opacities develop to the point
where contact lenses can no long-
er provide useful vision and pene-
trating keratoplasty (PKP) be-
comes necessary to restore visual
function. Penetrating keratoplasty
is the most commonly performed
surgical procedure for keratoco-
nus, but is associated with com-
eyes lost lines of preoperative UCVA or BCVA. The cylinder values at 1-year examination were statistically significantly (mean 3.7 ± 0 .3 D) lessthan the preoperative values (mean 4.02 ± 0 .3 D). There was a statisti-cally significant decrease in the mean K value at the apex from the pre-operative values and one year values (P < 0.05).The preoperative meanapex K value was (48.27 ± 0.45 D) and changed to (47.65 ± 0.46 D) atone year. Pachymetric reading was reduced from 467.98 ± 5.1 µm pre-operatively to 455.27 ± 4.8 µm at 3 months. One-year evaluationshowed the pachymetric values increased gradually to 455.68 ± 4.68µm. Collagen cross-linking did not induce endothelial damage duringfollow-up. All eyes developed minimal faint stromal haze that cleared in50 eyes within 1 month. In only 1 eye, this haze resolved within 6weeks. Other sight threatening complications were not encountered inthis series.
Conclusion : Conclusion : The results show a stabilization and improvement inkeratoconus after collagen cross-linking. This suggests that it is an ef-fective and promising method for keratoconus treatment.

4949
Benha M. J.
Vol. 29 No 2 May 2012
plications including graft rejec-
tion.[4] It is estimated that eventu-
ally 21% of the keratoconus pa-
tients require surgical intervention
(PKP) to restore corneal anatomy
and eyesight.[5]
Changes in corneal collagen
structure,[6] and extracellular ma-
trix, apoptosis and necrosis of ker-
atocytes, exclusively involving the
central anterior stroma, and Bow-
man's membrane are documented
in the structurally weakened cor-
neal tissue in keratoconus. [7]
A new treatment, Ultraviolet
corneal collagen cross-linking
(CXL), has been recently intro-
duced to reduce the progression of
noninflammatory corneal degener-
ation such as keratoconus, pellu-
cid marginal degeneration, and ec-
tatic corneal disorders after
corneal refractive procedures. [8]
Since the early 1990s, basic la-
boratory studies have demonstrat-
ed that CXL caused a long-term
increase in corneal biomechanical
rigidity by stiffening the human
cornea by more than 300%,[9] in-
creasing the collagen fiber diame-
ter by 12.2%,[10] and inducing the
formation of high-molecular-
weight collagen polymers, with a
remarkable chemical stability. [11]
The technique of corneal colla-
gen cross-linking consists of pho-
topolymerization of stromal fibers
by the combined action of a photo-
sensitizing substance (riboflavin
or vitamin B2) and ultraviolet A
rays (UVA) from a solid-state UVA
source.[8] Photopolymerization in-
creases the rigidity of corneal col-
lagen and its resistance to kera-
tectasia.[9] The cross-linking effect
is not distributed homogenously
over the corneal depth. The stiff-
ening effect is concentrated in the
anterior 200 to 300 microns of the
cornea due to the high absorption
of UV light in this area.[9]
Riboflavin has a dual function
of acting as a photosensitizer for
the production of oxygen free radi-
cals, which induce physical cross
linking of collagen, and it gives a
“shielding effect” by absorbing the
UV-A irradiation (90%), thereby
preventing damage to deeper ocu-
lar structures. UV-A light of 370
nm wavelength at 3 mW/cm2 al-
lows approximately 95% of the UV
light to be absorbed into the

5050
Amani E. Badawi, et al...
cornea; thus there is no risk for
damage to the lens or retina. Col-
lagen cross-linking is the only
treatment that deals with not only
the refractive effects of the condi-
tion but the underlying patholo-
gy. [12]
The aim of this study is to eval-
uate the safety and effectiveness
of riboflavin UV-A light-induced
cross-linking of corneal collagen
in improving visual acuity and in
stabilizing the progression of ke-
ratoconic eyes.
Subjects and MethodsSubjects and MethodsThis is a prospective study of
patients attending the outpatient
clinic of Mansoura Ophthalmic
Center and diagnosed as keratoco-
nus during the period from March
2010 to February 2011.
Inclusion criteria: Inclusion criteria:
- Completely clear cornea with
maximum keratometric (K) read-
ing less than 54 D and minimal
corneal thickness more than 400
micron with the absence of any
other ocular or systemic disease.
Preoperative examination :Preoperative examination :
- Slit lamp examination, uncor-
rected visual acuity (UCVA), best
corrected visual acuity (BCVA)
measurement, corneal topography
(Wavelight -ALLEGRO Topolyzer
1075, Germany), corneal thick-
ness measurement and endothe-
lial cell count using a noncontact
specular microscope (Tomy EM-
3000) and dilated fundus exami-
nation using non- contact Volk
90 lens, and indirect ophthalmos-
copy.
Surgical technique :Surgical technique :
The procedure was conducted
under sterile conditions in the op-
erating room of Al-Nokhba oph-
thalmic center at Mansoura.After
topical anesthetic eye drops (be-
noxinate hydrochloride 0.4%) eve-
ry 5 minuet for 30 minutes, the
epithelium was mechanically re-
moved within the central 8 mm di-
ameter area using a Beaver blade.
Next, riboflavin (0.1% solution, 10
mg riboflavin-5-phosphate in 10
ml dextran 20% solution) (Ricro-
lin, Sooft Italia, Montegiorgio, Ita-
ly) was applied every 3 minutes for
30 minutes until the stroma was
completely saturated and aqueous
stained yellow. Ultraviolet, A irra-
diation, was accomplished using
a commercially available UVA

5151
Benha M. J.
Vol. 29 No 2 May 2012
system (UV EMITTER Mod. VEGA
C.S.O. srl Via degli Stagnacci, 12/
E 50010 SCANDICCI (FIRENZE) -
ITALY). Before treatment, the in-
tended 3 mW/cm2 surface irradi-
ance (5.4 J/cm2 surface dosage
after 30 minutes) was calibrated
using a UVA meter (LaserMate-Q,
LASER 2000, Wessling, Germany).
During treatment, riboflavin solu-
tion was applied every 5 minutes
to ensure saturation and balanced
salt solution (BSS®) was applied
every 5 minutes to moisten the
cornea.
A drop of moxifloxacin hydro-
chloride eye drops and a bandage
contact lens were applied at the
end of the surgery.
Postoperative care :Postoperative care :
Patients received moxifloxacin
hydrochloride eye drops 5 times
daily for 1 week. A bandage soft
contact lens was applied until re-
epithelialization was complete.
Then, patient received topical ster-
oid-antibiotic drops (Tobramycin
and Dexamethasone) 4 times daily
for a week and then tapered over
the next 3 weeks; and, Carboxy-
methylcellulose Sodium (CMC)
(0.5%) eye Lubricant 6 times daily
for 1 month.
Follow-up was first done after
one day, 3 days for contact lens
removal, then after one week for
prescription of steroid-antibiotic
drops (Tobramycin and Dexameth-
asone) and one month for assess-
ment of corneal haze. Uncorrected
visual acuity, BCVA, refractive,
topographic changes, pachymet-
ery, and endothelial count were
recorded at 3,6,12 months.
• Informed consent was ob-
tained from each patient after the
nature of the procedure and its
known risks were explained.
Data analysisData analysis
The statistical analysis was
carried out using the SPSS (Statis-
tical Package for Social Science)
program, version 15, utilizing
paired's t test for paired data was
used to compare preoperative and
postoperative data.
ResultsResultsFifty one keratoconic eyes of 31
patients were included in the
study. All patients completed one
year follow up. Fourteen (45%) pa-
tients were males and seventeen

5252
Amani E. Badawi, et al...
(55%) were females. The mean age
was 24.4 years (range : 17-30
years). Keratoconus was bilateral
in 20 patients (65%) and unilater-
al in 11 patients (35%).
•Uncorrected visual acuity :•Uncorrected visual acuity :
Visual acuity was measured
using the Snellen Metric chart and
transformed into logarithm of the
Minimum Angle of Resolution (log-
MAR) for further statistical analy-
sis as recommended by Holladay
[13]. There was a statistically sig-
nificant improvement from the
preoperative values (P < 0.05). The
preoperative mean UCVA was 0.7
± 0.07 which changed to 0.6 ±
0.06 at 3 month, 0.49 ± 0.03 at 6
month and to 0.48 ± 0.03 at one
year. Eight eyes (15.5%) main-
tained the preoperative UCVA;
twenty seven eyes (53%) gained
one line, ten eyes (19.5%) gained
two lines and six (12%) eyes
gained three to four lines. None of
the eyes lost lines of the preopera-
tive UCVA.
•Best corrected visual acuity:•Best corrected visual acuity:
There was a statistically signifi-
cant (P < 0.05) improvement in
BCVA between the preoperative
and 1-year evaluations. Of the 51
eyes evaluated at 1 year, 43 eyes
(84%) experienced at least a
gained of 1-4 lines of BCVA.
Eight of the 51 eyes (16%) experi-
enced no change in BCVA. There
was no statistically significant
change from the 6 months exami-
nation values and one year values
(P > 0.05). The preoperative mean
BCVA was 0.49 ± 0.03 and
changed to 0.42 ± 0.04 at 3
month, 0.27 ± 0.03 at 6 months
and 0.26 ± 0.02 at one year.
•Cylindrical refractive error:•Cylindrical refractive error:
The cylinder values at 1-year
examination were statistically sig-
nificant (mean 3.7 ±0 .3 D) less
than the preoperative values
(mean 4.02 ±0 .3 D). While, there
was no statistically significant
change from the preoperative val-
ues and 3 month values (P >
0.05).
•Keratometry :•Keratometry :
There was a statistically signifi-
cant decrease in the mean K value
at the apex from the preoperative
values and one year values (P <
0.05). The preoperative mean
apex K value was (48.27 ± 0.45 D)
and changed to (47.65 ± 0.46 D)
at one year. The K value at the

5353
Benha M. J.
Vol. 29 No 2 May 2012
apex decreased by a mean of 0.62
D from preoperative values. Eight-
een eyes (35.3%) maintained the
preoperative apex K values, and
thirty three eyes (64.7%) showed
decrease in K value with range
(0.4-2.3 D).Reduction in K value
was less than one diopter (< 1D)
in eighteen eyes (35.3%) and up to
2.3D (1-2.3D) in fifteen eyes
(29.4%). In the one year, there
were no statistically significant
changes in K readings, compared
to six months records, denoting
the short term stability of the top-
ographic changes. Progression of
corneal steepening from the pre-
operative value was not observed
in any of the treated eyes.
•Uncorrected visual acuity :•Uncorrected visual acuity :
Visual acuity was measured
using the Snellen Metric chart
and transformed into logarithm of
the Minimum Angle of Resolution
(logMAR) for further statistical
analysis as recommended by Hol-
laday[13]. There was a statistically
significant improvement from the
preoperative values (P < 0.05). The
preoperative mean UCVA was 0.7
± 0.07 which changed to 0.6 ±
0.06 at 3 month, 0.49 ± 0.03 at 6
month and to 0.48 ± 0.03 at one
year. Eight eyes (15.5%) main-
tained the preoperative UCVA;
twenty seven eyes (53%) gained
one line, ten eyes (19.5%) gained
two lines and six (12%) eyes
gained three to four lines. None of
the eyes lost lines of the preopera-
tive UCVA.
•Best corrected visual acuity:•Best corrected visual acuity:
There was a statistically signifi-
cant (P < 0.05) improvement in
BCVA between the preoperative
and 1-year evaluations. Of the 51
eyes evaluated at 1 year, 43 eyes
(84%) experienced at least a
gained of 1-4 lines of BCVA.
Eight of the 51 eyes (16%) experi-
enced no change in BCVA. There
was no statistically significant
change from the 6 months exami-
nation values and one year values
(P > 0.05). The preoperative mean
BCVA was 0.49 ± 0.03 and
changed to 0.42 ± 0.04 at 3
month, 0.27 ± 0.03 at 6 months
and 0.26 ± 0.02 at one year.
•Cylindrical refractive error:•Cylindrical refractive error:
The cylinder values at 1-year
examination were statistically sig-
nificant (mean 3.7 ±0 .3 D) less
than the preoperative values
(mean 4.02 ±0 .3 D). While, there

5454
Amani E. Badawi, et al...
was no statistically significant
change from the preoperative val-
ues and 3 month values (P >
0.05).
• Keratometry :Keratometry :
There was a statistically sig-
nificant decrease in the mean K
value at the apex from the pre-
operative values and one year
values (P < 0.05). The preopera-
tive mean apex K value was
(48.27 ± 0.45 D) and changed to
(47.65 ± 0.46 D) at one year. The
K value at the apex decreased by a
mean of 0.62 D from preoperative
values. Eighteen eyes (35.3%)
maintained the preoperative apex
K values, and thirty three eyes
(64.7%) showed decrease in K val-
ue with range (0.4-2.3 D). Reduc-
tion in K value was less than one
diopter (< 1D) in eighteen eyes
(35.3%) and up to 2.3D (1-2.3D) in
fifteen eyes (29.4%). In the one
year, there were no statistically
significant changes in K readings,
compared to six months records,
denoting the short term stability
of the topographic changes. Pro-
gression of corneal steepening
from the preoperative value was
not observed in any of the treated
eyes.
• PachymetryPachymetry
At 3-months post-operative ex-
amination, there was a significant
reduction in pachymetry (P <
0.05). Pachymetry reduced from
467.98 ± 5.1 µm pre-operatively to
455.27 ± 4.8 µm at 3 months.
One-year evaluation showed the
pachymetry to increase gradually
to 455.68±4.68 µm but still there
was a significant reduction in pa-
chymetry than preoperative values
(P < 0.05).
http://www.ncbi.nlm.nih.gov/
pmc/articles/PMC3018104/
figure/F0004/
• Endothelial cell count:Endothelial cell count:
The mean baseline endothelial
cell count was 2624.02 ± 37.3/
mm2. Three months after the pro-
cedure, it was 2463.78 ± 32.91/
mm2; 6 months after, 2587.74 ±
33.89/ mm2; 12 months after,
2620.27 ± 37.58/ mm2. The dif-
ference between the baseline and
one year after the procedure was
not statistically significant (P >
0.05)http://
www.ncbi.nlm.nih.gov/pmc/
articles/PMC3018104/figure/
F0004/, indicating that CXL did
not induce endothelial damage
during follow-up. One-year evalu-

5555
Benha M. J.
Vol. 29 No 2 May 2012
ation showed the endothelial
cell count to increase gradually
to nearly preoperative values Fig-
ure (2).
• ComplicationsComplications
All eyes developed faint diffuse
stromal haze (stromal edema)
that cleared in 50 eyes (98 %)
within 1 month Figure (3). In
only one eye (2 %) the haze
cleared within 6 weeks. No oth-
er complications were not record-
ed .

5656
Amani E. Badawi, et al...
Discussion Discussion The idea of using corneal colla-
gen cross-linking for corneal stiff-
ening was conceived in Germany
in the 1990s. The impressive clini-
cal results initially achieved in
Germany have prompted world-
wide use of CXL. Currently, there
are over 300 centers performing
corneal collagen cross-linking in
Europe, and the technique has
also been used in Canada since
2008. The United States Food and
Drug Administration (FDA) recent-
ly approved the start of three clini-
cal trials in the United States.[14]
Collagen cross-linking (CXL) is
a relatively new method to in-
crease stability of the cornea by
inducing additional cross-links be-
tween or within collagen fibers us-
ing UVA light and riboflavin as
photomediators.[15] The efficacy
and safety of this new, minimally
invasive method for correcting cor-
neal ectasia has been the focus of
recent studies. Most work has fo-
cused around keratoconus pa-
tients, while more recent reports
have been published on iatrogenic
corneal ectasia as following laser-
assisted in situ keratomileusis
(LASIK). [16]
In the present study there was
statistically significant improve-
ment of UCVA. None of the eyes
lost lines of the preoperative
UCVA. Eight eyes (15.5%) main-
tained the preoperative UCVA;
(84.5%) gained one to four lines,
comparable to that of Arbelaez et
al.[12] Also there was significant
improvement in BCVA, (84%) ex-
perienced at least a gained of 1-4
lines of BCVA and (16%) showed
no change in BCVA. There was no
statistically significant change
from the 6 months examination

5757
Benha M. J.
Vol. 29 No 2 May 2012
values and one year values.
In contrast, El-Raggal[17] found
(6.67%) lost 1 line of preoperative
value and Hersh et al. [18] found
(1.4%) lost 2 or more Snellen lines
of BCVA. The cause of UCVA loss
in these patients is unclear and
did not appear directly related to
refractive error or change in cor-
neal topography.
Mean cylinder refraction in this
study showed a statistically signif-
icant decrease with a significant
improvement in uncorrected and
best corrected visual acuity 12
months postoperatively. Several
studies supported this significant
reduction in mean cylindrical
power.[8],[19],[12]and[20] In a study
done by El-Raggal[17] there was
no statistically significant change
in mean cylindrical refractive val-
ues from the preoperative values
(P>0.05). However there was a sig-
nificant improvement in UCVA
and BCVA.
A prospective study published
in 2003 reported the earliest clini-
cal experiences in a series of 23
eyes with moderate or advanced
progressive keratoconus. During
follow-up, which lasted for be-
tween 3 months and 4 years, not
only disease progression was at
least halted, but, in 70% cases,
there was also a statistically sig-
nificant improvement in BCVA,
correlating with a reduction of the
maximal keratometry readings by
2 diopters. [8]
In the present study, there was
a statistically significant decrease
in the mean apex K reading be-
tween preoperative value (48.27 ±
0.45 D) and 3 months value
(48.01 ± 0.46 D) and 3months
(48.01 ± 0.46 D) and 6 months
(47.67 ± 0.46 D). There was no
significant change between 6
months and one year (P > 0.05).
This result is comparable to sever-
al studies [12],[17]and[18], and con-
trasts with the findings of others[21] and [22] who reported a con-
tinued decrease in maximum K
values after the one year follow
up.
In the present study, there was
a significant reduction in pachym-
etry at 3 months than the preop-
erative values (P < 0.05). It re-
duced from 467.98 ± 5.1 µm pre-
operatively to 455.27 ± 4.8 µm at

5858
Amani E. Badawi, et al...
3 months. One-year evaluation
showed the pachymetry to in-
crease gradually (455.68±4.68
µm) but still there was a signifi-
cant reduction in pachymetry
than preoperative values. This cor-
responds to the findings of other
studies [12] and [23].
This reduction in corneal thick-
ness could correspond to the
apoptosis that occurs after the
treatment (2 to 3 months) and the
repopulation that occurs thereaf-
ter. Based on this finding, the au-
thors strongly suggest that when
the cross-linking treatment is
combined with an additional treat-
ment, a healing interval of approx-
imately 2 to 3 months should be
respected to avoid complications
caused by the additional damage
of the added procedure.[12]
Regarding endothelial cell
count, there were not statisti-
cally significant changes at the
end of one year indicating that
CXL did not induce endothelial
damage. These findings were sup-
ported by several previous stud-
ies[19],[23] and[20].
The lack of evidence of endo-
thelial cell loss is an important
safety consideration in assessing
this new procedure. Follow-up in
this patient was not long enough
to assess the long-term effective-
ness of Collagen cross-linking.
However, the results appear prom-
ising. [23]
Sight threatening complications
were not found in this study de-
noting the safety of this proce-
dure. The main complication was
faint diffuse stromal haze which
cleared in 50 eyes within 4 weeks
and within 6 weeks in one eye. El-
Raggal,[17] reported results simi-
lar to the current study.
In conclusion, riboflavin-UVA
corneal cross-linking is a safe
measure to increase stability of
the cornea and may arrest or even
reverse the progression of keratoc-
onus at least in the short term as
demonstrated by this study. It is
technically simpler, cheaper and
less invasive than other treatment
modalities for keratoconus. It
could be performed in many pa-
tients with non advanced keratoc-
onus (K reading less than 54 D).
In addition, surgeons must be

5959
Benha M. J.
Vol. 29 No 2 May 2012
aware of potential complications of
the procedure reported above. It
would be preferable to treat earlier
stages of progressive keratoconus
in an effort to better preserve visu-
al acuity.
Some limitations of this study
include the limited follow-up
and a relatively small number of
patients. Further studies with
more patients and longer fol-
low-up to evaluate the duration of
the stiffening effect are recom-
mended. No analysis of the fellow
eye was done in this study; such
analysis is also indicated in the
future.
ReferencesReferences1.1. Rabinowitz Y. S. (1998) :Rabinowitz Y. S. (1998) :
Keratoconus. Surv Ophthalmol.;
42 : 297-319.
2.2. Caporossi A., Biaocchi S.,Caporossi A., Biaocchi S.,
Mazzota C., Traversi C. andMazzota C., Traversi C. and
Caporossi T. (2006) : Caporossi T. (2006) : Parasurgi-
cal therapy for keratoconus by
riboflavin-ultraviolet type A rays
induced cross-linking of corneal
collagen : Preliminary refractive
results in an Italian Study. J
Cataract Refract Surg.; 32 : 837-
45.
3.3. Rabinowittz Y. S. (2003) :Rabinowittz Y. S. (2003) :
The genetics of keratoconus. Op-
thalmol Clin North Am.;16:607-
20.
4.4. Thompson R. W., Jr.,Thompson R. W., Jr.,
Price M. O., Bowers P. J. andPrice M. O., Bowers P. J. and
Price F. W., Jr. (2003) : Price F. W., Jr. (2003) : Long
term graft survival after penetrat-
ing keratoplasty. Ophthalmolo-
gy.;110:1396-402.
5.5. Waller S. G., Steinert R.Waller S. G., Steinert R.
F. and Wagoner M. D. (1995) :F. and Wagoner M. D. (1995) :
Long term results of epikerato-
plasty for keratoplasty for keratoc-
onus. Cornea.;14:84-8.
6.6. Cheng E. L., MaruyamaCheng E. L., Maruyama
I., SundarRaj N., Sugar J., Fed-I., SundarRaj N., Sugar J., Fed-
er R. S. and Yue B. Y. (2001) :er R. S. and Yue B. Y. (2001) :
Expression of type XII collagen
and hemidesmosome-associated
proteins in keratoconus corneas.
Curr Eye Res.; 22:333-40.
7. Scroggs M. W. and Proia A.7. Scroggs M. W. and Proia A.
D. (1992) : D. (1992) : Histopathological
variation in keratoconus. Cornea.;
11:553-9.
8.8. Wollensak G., Spoerl E.Wollensak G., Spoerl E.
and Seiler T. (2003) : and Seiler T. (2003) : Riboflavin/
ultraviolet - A - induced collagen

6060
Amani E. Badawi, et al...
crosslinking for the treatment of
keratoconus. Am J Ophthalmol.
135(5):620-627.
9.9. Wollensak G., Spoerl E.Wollensak G., Spoerl E.
and Seiler T. (and Seiler T. (2003) : 2003) : Stress-
strain measurements of human
and porcine corneas after ribofla-
vin-ultraviolet-A-induced cross-
linking. J Cataract Refract Surg.;
29(9):1780-1785.
10.10. Wollensak G., Wilsch M.,Wollensak G., Wilsch M.,
Spoerl E. and Seiler T. (2004) :Spoerl E. and Seiler T. (2004) :
Collagen fiber diameter in the rab-
bit cornea after collagen crosslink-
ing by riboflavin/UVA. Cornea.;23
(5):503-507.
11.11. Wollensak G. and Iomdi-Wollensak G. and Iomdi-
na E. (2009) : na E. (2009) : Long-term biome-
chanical properties of rabbit cor-
nea after photodynamic collagen
crosslinking. Acta Ophthalmol.;
87(1):48-51.
12.12. Arbelaez M. C., Sekito Arbelaez M. C., Sekito
M. B., Vidal C. and ChoudhuryM. B., Vidal C. and Choudhury
S. R. (2009) :S. R. (2009) : Collagen cross-
linking with riboflavin and ul-
traviolet - A light in keratoconus:
One - year results. Oman J Oph-
thalmol. Jan-Apr; 2 (1) : 33 -
38.
13.13. Holladay J. T. (2004) :Holladay J. T. (2004) :
Visual acuity measurements .J
Cataract Refract Surgery. Feb;30
(2):287-290.
14.14. Hovakimyan M., GuthoffHovakimyan M., Guthoff
R. F. and Stachs O. (2012) :R. F. and Stachs O. (2012) :
Collagen Cross-Linking: Current
Status and Future Directions.J
Ophthalmol.; 2012: 406850.
15.15. Spoerl E. and Seiler T.Spoerl E. and Seiler T.
(1999) :(1999) : Techniques for stiffening
the cornea. J Refract Surg.; 15 :
711-3.
16.16. Hafezi F., KanellopoulosHafezi F., Kanellopoulos
J., Wiltfang R. and Seiler T.J., Wiltfang R. and Seiler T.
(2007) : (2007) : Corneal collagen cross-
linking with riboflavin and ul-
traviolet A to treat induced kera-
tectasia after laser in situ
keratomileusis. J Cataract Refract
Surg. Dec; 33(12):2035-40.
17.17. El-Raggal T. M. (2009) :El-Raggal T. M. (2009) :
Riboflavin-Ultraviolet A Corneal
Cross-linking for Keratoconus..
Middle East Afr J Ophthalmol.
Oct; 16(4):256-9.
18.18. Hersh P. S., GreensteinHersh P. S., Greenstein
S. A. and Fry K. L. (2011) :S. A. and Fry K. L. (2011) :
Corneal collagen crosslinking for

6161
Benha M. J.
Vol. 29 No 2 May 2012
keratoconus and corneal ectasia :
One - year results. J Cataract
Refract Surg. Jan; 37 (1) : 149-
60.
19.19. Caporossi A., BaiocchiCaporossi A., Baiocchi
S., Mazzotta C., Traversi C. andS., Mazzotta C., Traversi C. and
Caporossi T. (Caporossi T. (2006) : 2006) : Parasurgi-
cal therapy for keratoconus by ri-
boflavin-ultraviolet type A rays in-
duced cross-linking of corneal
collagen; preliminary refractive re-
sults in an Italian study. J Cata-
ract Refract Surg.; 32:837-45.
20.20. Kanellopoulos A J.Kanellopoulos A J.
(2012) : (2012) : Long term results of a
prospective randomized bilateral
eye comparison trial of higher
fluence, shorter duration ultravio-
let A radiation, and riboflavin col-
lagen cross linking for progressive
keratoconus.Clin Ophthalmol.; 6:
97-101.
21.21. Raiskup-Wolf F., HoyerRaiskup-Wolf F., Hoyer
A., Spoerl E. and Pillunat L. E.A., Spoerl E. and Pillunat L. E.
(2008) :(2008) : Collagen crosslinking
with riboflavin and ultraviolet-A
light in keratoconus: long-term re-
sults. Journal of Cataract and Re-
fractive Surgery.; 34(5):796-801.
22.22. Caporossi A., MazzottaCaporossi A., Mazzotta
C., Baiocchi S. and Caporossi T.C., Baiocchi S. and Caporossi T.
(2010) : 2010) : Long-term results of ribo-
flavin ultraviolet a corneal colla-
gen cross-linking for keratoconus
in Italy: the siena eye cross study.
American Journal of Ophthalmol-
ogy.;149(4):585-593.
23.23. Vinciguerra P., Albè E.,Vinciguerra P., Albè E.,
Trazza S., Seiler T. and EpsteinTrazza S., Seiler T. and Epstein
D. (2009) : D. (2009) : Intraoperative and
Postoperative Effects of Corneal
Collagen Cross-linking on Progres-
sive Keratoconus.Arch Ophthal-
mol.; 127(10):1258-1265.

6262
Amani E. Badawi, et al...
ROLE OF COLLAGENROLE OF COLLAGENCROSS-LINKING USINGCROSS-LINKING USING
RIBOFLAVIN/ULTRAVIOLET-ARIBOFLAVIN/ULTRAVIOLET-AIN KERATOCONUSIN KERATOCONUS
Amani E. Badawi MS, Amr M. El-Kannishy MD,Amani E. Badawi MS, Amr M. El-Kannishy MD,Tarek A. Mohssen MD, Hany Abdel-Rahman MDTarek A. Mohssen MD, Hany Abdel-Rahman MD
and Mohammad M. El-Dessouky MDand Mohammad M. El-Dessouky MD
BENHAMEDICALJOURNAL
REPRINT
Published byPublished by
Benha Faculty of MedicineBenha Faculty of Medicine Volume 29 Number 2May 2012

6363
Benha M. J.
Vol. 29 No 2 May 2012
IntroductionIntroductionBreast cancer is the most com-
mon cancer and the second lead-
ing cause of cancer deaths in
women in North America(1).
Breast cancer is not a single
entity; it is a multifactorial disor-
der(2-4). Prognostic factors for
breast cancer are in part derived
from the tumor and in part from
the host .Host factors include age
at diagnosis, race, genetic and fa-
milial factors. Tumor factors in-
clude tumor size, histological
CLINICO-PATHOLOGICAL CORRELLATIONCLINICO-PATHOLOGICAL CORRELLATIONBETWEEN EXPRESSION OF CONNEXINBETWEEN EXPRESSION OF CONNEXIN
26 AND BREAST CANCER26 AND BREAST CANCER
Abu Zeid M. A. MD, Amin M. A. MD, Moatamed A. MD,Abu Zeid M. A. MD, Amin M. A. MD, Moatamed A. MD,Abu Hashem M. M. MD* and Abo El Hoda M. F. MDAbu Hashem M. M. MD* and Abo El Hoda M. F. MD
Department of ophthalmology, Faculty of Medicine,
Mansoura University, Egypt.
AbstractAbstractHypothesis:Hypothesis: The role played by CX26 in breast cancer is controver-
sial. Some studies had described CX26 as a tumor suppressor con-versely, others as a tumor promoting protein thus, the exact role ofCX26 is yet to be precisely resolved, as it may embrace prognostic, pre-dictive and therapeutic significance.
Methods: Methods: Our study examined 144 patients, 2 patients with bilateralsynchronous breast cancers, so we had 146 tumor specimens. We had70 patients (with72 tumors) presented a Cx26 positive status, while, theremaining 74 patients (with 74 tumors) presented a Cx26 negative stat-us. We compare between the results of the two groups.
Results: Results: Cx26 positivity was associated with large sized tumors, clin-ically palpable axillary lymph nodes, infiltration of more axillary lymphnodes after their pathological examination, advanced tumor stage, hightumor grade and positive lymho-vascular invasion.
Conclusions: Conclusions: These results suggest that Cx26 positivity was asso-ciated with poor prognosis of patients of breast cancer.

6464
Abu Zeid M. A. et al...
grade, histological type, lymphatic
spread, vascular spread, nodal in-
volvement status and other fac-
tors(5).
Connexins are transmembrane
proteins form intercellular com-
municating channels termed gap
junctions (GJ), ensuring electrical
and chemical coupling between
cells playing a major role in devel-
opment, growth and differentia-
tion of cells (6-10).
The function of gap junctions
affects the development of tumors
according to the stage of tumori-
genesis. Gap junctions act as tu-
mor suppressors, while , the re-
expression of connexins in migrat-
ing tumor cells may help these
cells to invade surrounding tissue,
and intra- and extravasate (7).
The role played by CX26 in
breast cancer is controversial.
Many studies described CX26 as
a tumor suppressor, others as a
tumor promoting protein. Thus,
the exact role of CX26 is not
yet precisely determined, as it
may embrace prognostic, predic-
tive as well as therapeutic signifi-
cance (11-14).
Patients & MethodsPatients & Methods(A) Patients :-(A) Patients :-
This study included 144 female
patients with breast cancer admit-
ted at Mansoura University Hospi-
tal and Oncology Center Mansou-
ra University over 48 months
between January 2008 and Janu-
ary 2012. Their age ranged from
34-80 years with the mean age of
50 years.
Evaluation of the patients:Evaluation of the patients:
Preoperative assessment: Preoperative assessment: All
patients were subjected to the fol-
lowing: Detailed history taking,
Clinical examination, laboratory
investigation, radiology includ-
ing: Sonomammography, Abdomi-
nal sonography and bone scan.
Surgical technique: Surgical technique: Conserva-
tive Breast Surgery (CBS): for pa-
tients had primary tumor less
than 5cm (T2), not multicentric,
axillary lymph node (N1) without
distant metastasis (M0). Patients
did not fulfill these criteria under-
went Modified radical mastectomy.
Postoperative management:Postoperative management:
Post operative care: wound care,
follow up and discharge was on
the second postoperative day,

6565
Benha M. J.
Vol. 29 No 2 May 2012
patients advised to follow up in
our OPD, sutures and drains were
removed 14 days postoperative
unless there was any wound com-
plication.
Adjuvant therapy:Adjuvant therapy: 129 pa-
tients (88.6%) received adjuvant
radiotherapy, 141 patients
(97.9%) received adjuvant chemo-
therapy in the form of 6 cycles of
5-flurouracil, Adriamycin, cyclo-
phosphamid (FAC) and 117 pa-
tients (81.2%) were treated with
hormonal therapy in the form of
Tamoxifen 20mg/day.
Postoperative follow up in-Postoperative follow up in-
cluded: cluded: clinical examination every
3 months, sonomamography for
the patients who were treated with
conservative breast surgery every
3 months, chest X-ray, pelviabdo-
moinal sonography and bone scan
every 6 months. The mean follow-
up period of these patients was 31
months, ranging from 14 to 40
months.
Pathological assessment ofPathological assessment of
the tumor specimen: the tumor specimen: Each tu-
mor specimen was assessed as re-
gard: tumor size, lymph node stat-
us, histological type, grade,
lympho-vascular invasion, ER, PR
and Cx26 status (negative or posi-
tive and the degree of positivity).
(B)- Immunohistochemistry :(B)- Immunohistochemistry :
Estimation of Cx26 in breast tis-
sue by immunohistochemical
method (13): Breast tissue sam-
ples were fixed in10% neutral
buffered formalin, then pro-
cessed to paraffin blocks which
were cut into 3 µm thick tissue
sections. Prepared sections were
cut on charged slides. Each pre-
pared slide was subjected to the
following steps: deparaffiniztion,
rehydration in alcohol, washing in
Phosphate Buffer Saline PBS (Ph
7.2), blocking of endogenous per-
oxidase then, it was washed in
(PBS) buffer solution, antigen re-
trieval was performed, cooling of
the slides then washing with PBS
buffer, each slide was covered by
protein blocking solution. Connex-
ins were investigated using poly-
clonal goat Cx26 antibody (1:500
dilution; Santa Cruz Biotechnolo-
gy, Santa Cruz, USA), and then
washed in PBS three times; we ap-
plied the streptavidin biotin perox-
idase complex technique to visual-
ize the complexes of connexins
and their specific antibodies

6666
Abu Zeid M. A. et al...
(LSAB kit; Dako, Glostrup, Den-
mark), and then washed in PBS,
covered by a film of avidin enzyme
conjugate then washed in PBS, Di-
aminobenzidine (DAB) chromogen
was applied to each slide then
washed in PBS, Haematoxylin
was then added as counter stain
and then slides were washed in
water until the blue color ap-
peared, Dehydration of the slides,
followed by addition of xylene, Fi-
nally, each slide was covered by
the mounting media to preserve
them, in negative controls (slides
which did not stained by the anti-
body to be used as a control), the
primary specific antibody was
omitted for the immunohisto-
chemical staining, expression of
Cx26 was analyzed in 10 different
tumor fields and its presence was
assessed according to a 3 point
scale (0 = <10% positive cells; 1+ =
10-50% positive cells; 2+ = >50%
positive cells) this assessment was
a quantitative one. The specimens
were then divided into connexin
positive (levels 1+ or 2+) and con-
nexin negative (level 0) tumors
based on this grading, also, the
intensity of staining was assessed
as mild, moderate and severe, this
assessment was a qualitative one.
(C)-Statistical Analysis: (C)-Statistical Analysis: Data
was analyzed using SPSS (Sta-
tistical Package for Social Scienc-
es) version 14. Qualitative data
was presented as number and
percent. Comparison between
groups was done by Chi-Square
test. Quantitative data were test-
ed for normality by Kolmogrov-
Smirnov test. Normally distrib-
uted data were presented as
mean ± SD. Student t-test was
used to compare between two
groups. P < 0.05 was considered
to be statistically significant. The
Kaplan-Meier method was used to
perform survival analysis. Statisti-
cal significance between survival
curves was assessed by the log-
rank test.
ResultsResultsTable 1 shows that : Table 1 shows that : The rela-
tionship between Cx26 expression
and
- Clinical size of the tumor (T),
showed that there was a statisti-
cally significant difference (p-
value=0.006), in the meaning of,
Cx26 expression was positive in
T3 (55.6%, 40/72), while, Cx26
was negative in T2 and T1{(56.8%,
42/74) and (8.1%, 6/74) respec-
tively}. Also in T3 tumors most of

6767
Benha M. J.
Vol. 29 No 2 May 2012
these tumors 40 of 66 (60.6%)
were Cx26 positive.
- Clinical lymph node status
(N), showed that there was a sta-
tistically significant difference (p-
value=0.001), in the meaning of,
Cx26 expression was positive in
N1 (86.1%, 62/72), while, Cx26
was negative in N0 (37.8%, 28/
74). Also in tumors with N1 status
most of these tumors 62 of 108
(57.4%) were Cx26 positive.
- Clinical stage, showed that
there was a highly significant sta-
tistical difference (p-value=0.000),
in the meaning of, Cx26 expres-
sion was positive in stage IIIA
(36.1%, 26/72), while, Cx26 was
negative in stage IIA and stage I
{(27%, 20/74) and (10.8%, 8/74)
respectively} as shown in figure 1.
Also in patients with stage IIIA
most of their tumors 26 of 34
(76.5%) were Cx26 positive.
- Overall recurrence and me-
tastasis, showed that overall re-
currence and metastasis were
higher in patients with Cx26 posi-
tive tumors (28.6%, 20/70) than
in patients with Cx26 negative tu-
mors (27%, 20/74) though not
statistically significant (p-value=
0.836).
- Mortality due to disease re-
lated causes, showed that the oc-
currence of mortality due to dis-
ease related causes was higher in
patients with Cx26 positive tu-
mors (8.6%, 6/70) than in pa-
tients with Cx26 negative tumors
(5.4%, 4/74) though not statisti-
cally significant (p-value=0.080).
Also in patients died due to dis-
ease related causes most of their
tumors 6 of 10 (60%) were Cx26
positive. Survival curves of breast
cancer patients according to the
expression levels of Cx26 are
shown in figure 2.
Figure 2 shows that:Figure 2 shows that: 6 pa-
tients with Cx26 positive tumors
(red line curve) died due to dis-
ease related causes, the first
patient died after 14 months of
follow up and the last patient
died after 33 months of follow
up. 4 patients with Cx26 nega-
tive tumors (blue line curve) died
due to disease related causes,
the first patient died after 14
months of follow up and the last
patient died after 31 months of
follow up.

6868
Abu Zeid M. A. et al...
Table 2 shows that: Table 2 shows that: The rela-
tionship between Cx26 expression
and:
- Histological grade of the tu-
mor, showed that there was a sta-
tistically significant difference (p-
value=0.018), in the meaning of,
tumors with grade II represented
mainly a negative Cx26 status
(73%, 54/74), while, tumors with
grade III represented mainly a
Cx26 positive status (22.2%, 16/
72) .Also in tumors with histologi-
cal grade III, most of these tumors
16 of 26 (61.5%) were Cx26 posi-
tive.
- Lympho-vascular invasion,
showed that there was a highly
significant statistical difference (p-
value=0.000), in the meaning of,
Cx26 expression was positive in
case of positive lympho-vasculr in-
vasion (88.9%, 64/72), while,
Cx26 was negative in case of nega-
tive lympho-vascular invasion
(75.7%, 56/74) as shown in figure
3.Also in tumors with positive
lymph vascular invasion, most of
these tumors 64 of 82 (78%) were
Cx26 positive.
- Pathological LN status,
showed that there was a highly
significant statistical difference (p-
value=0.000), in the meaning of,
Cx26 expression was positive in
case of PN2 and PN3 {(41.7%, 30/
72) and (27.8%, 20/72) respective-
ly}, while, Cx26 was negative in
case of PN1 and PN0 { (35.1%, 26/
74) and (29.7%, 22/74) respective-
ly}.Also in tumors with pathologi-
cal lymph node status PN3, most
of these tumors 20 of 28 (71.4%)
were Cx26 positive.
- (ER and PR), showed that
there was a significant statistical
difference (p-value=0.001) in the
meaning of tumors with posi-
tive Cx26 presented mainly a
(positive both ER and PR) stat-
us (83.4%, 60/72), while tumors
with negative Cx26 presented
mainly a (negative both ER and
PR) status (29.7%, 22/74) .Also
most of the tumors with positive
both ER and PR (60%, 60/100)
were Cx26 positive, while tumors
with negative both ER and PR
(81.5%, 22/27) were Cx26 nega-
tive.

6969
Benha M. J.
Vol. 29 No 2 May 2012

7070
Abu Zeid M. A. et al...

7171
Benha M. J.
Vol. 29 No 2 May 2012

7272
Abu Zeid M. A. et al...
DiscussionDiscussionOur study demonstrated that
Cx26 expression was positive in
clinically and pathologically large
sized tumors (T3) while, Cx26 was
negative in clinically and patholog-
ically small sized tumors (T1 and
T2). This means that Cx26 positiv-
ity is associated with tumors of
large size. The previous results
were in agreement with Naoi et al
(2007) who found that there was a
statistically significant association
between Cx26 expression and
large tumor size (P = 0.013)(15). In
contrast to our results, Qin et al
(2002) found that Cx26 over ex-
pression was associated with inhi-
bition of tumor growth, possibly
via altered interaction between fi-
broblastic growth factor and its re-
ceptor (16). This difference may be
attributed to the difference be-
tween the methodology of our
study and theirs. Conklin et al
(2007) found that there was no
statistically significant value be-
tween Cx26 expression and tumor
size (p-value = 0.980)(17). Cx26 ex-
pression was positive in clinically
palpable axillary lymph node (N1),
while, Cx26 was negative in clini-
cally non palpable axillary lymph
node (N0).After pathological as-
sessment of the removed axillary
lymph node, we found that Cx26
positive tumors were associated
with PN3 andPN2, while Cx26
negative tumors were associated
with PN1and PN0. This means
that Cx26 positivity is associated
with clinically palpable axillary
lymph nodes and infiltration of
more axillary lymph nodes after
their pathological examination.
Our results are in accordance
with those of Kamibayashi et al
(1995) who suggested that con-
nexins may play an important
role in the extravasation of
cancerous cells into lymphoid tis-
sues by formation of gap junc-
tions between tumour cells and
endothelial cells in lymph node
vessel(18). In contrast to our re-
sults, Naoi et al (2007) found that
no statistically significant associa-
tion between Cx26 expression and
lymph node metastasis (p-value=
0.862)(15). Conklin et al (2007)
found that there was no statisti-
cally significant value between
Cx26 expression and lymph node
status (p-value = 0.807)(17). Over-
all recurrence and metastasis
were higher in patients with Cx26
positive tumors than in patients
with Cx26 negative tumors though

7373
Benha M. J.
Vol. 29 No 2 May 2012
not statistically significant. This
means that Cx26 positivity may be
associated with increase in overall
recurrence and metastasis. Such
an increased metastatic potential
of tumor cells with a high expres-
sion of Cx26 may be attributable
to the formation of a heterologous
(Cx26-Cx43) gap junction between
the CX26-expressing tumor cells
and Cx43-expressing vascular en-
dothelial cells(19,20) resulting in
the increased invasion of tumor
cells into the blood vessels (21,22).
Our study showed that, grade III
tumors were mainly Cx26 positive
tumors, while, grade II tumors
were mainly Cx26 negative. This
means that Cx26 positivity was
associated with tumors with high
histological grade. This result was
in agreement with Naoi et al
(2007) who found that there was
statistically significant association
between Cx26 and histological
grade of the tumor (p-value=
0.043), most of tumors with histo-
logical grade III were Cx26 positive
(72.2%, 16/22)(15). Jamieson et al
(1998) found that greater portion
of grade III tumors were Cx26 pos-
itive (73.3%, 11/15) compared to
grade II tumors (33.3%, 4/12)
(23). In contrast to our results,
Conklin et al (2007) found that no
statistically significant association
between Cx26 expression and
histological grade of the tumor
(p-value = 0.364)(17), this differ-
ence may be due to the difference
in sample size, they worked on
346 tumor specimens. Cx26 ex-
pression was positive in case of
positive lympho-vasculr invasion,
while, Cx26 was negative in case
of negative lympho-vascular inva-
sion. This means that Cx26 posi-
tivity is associated with lympho-
vascular invasion.This result was
in agreement with Naoi et al
(2007) who found that blood ves-
sel invasion was higher in Cx26-
positive tumors (5.1%, 4/78) than
in Cx26-negative tumors (1.4%,
1/74), though there was no statis-
tical significance (p-value=0.214).
Lymphatic vessel invasion was
significantly (p-value=0.001) more
frequently observed in Cx26-
positive tumors (39.7%, 31/78)
than in Cx26-negative tumors
(14.9%, 11/74)(15). Over expres-
sion of connexins facilitate tran-
sendothelial migration through
the formation of heterocellular
GJIC between breast cancer cells
and the endothelium(24). Cx26-
positive tumor cells are mostly

7474
Abu Zeid M. A. et al...
localized in the periphery (inva-
sion front) of a tumor, where
blood and lymphatic vessels are
also most frequently seen. Thus, it
is speculated that Cx26-positive
tumor cells localizing in the inva-
sion front, even if the number of
such tumor cells is small, seem to
have a good chance of invading
the adjacently existing lymphatic
vessels(15). The frequency of ER or
PR negativity was higher among
the Cx26 negative tumors than
Cx26 positive tumors and most of
ER or PR negative tumors were
Cx26 negative though not statisti-
cally significant. In contrast to our
study, Naoi et al (2007) found that
frequency of ER negativity was
higher among the Cx26 positive
tumors (29.5%, 23/78) than Cx26
negative tumors (27%, 20/74)
though not statistically significant
(p-value = 0.906). Most of ER neg-
ative tumors were Cx26 positive
(53.5%, 23/43), while frequency of
PR negativity was higher among
the Cx26 positive tumors (42.3%,
33/78) than Cx26 negative tu-
mors (24.3%, 18/74) with statisti-
cally significant value (p-value =
0.008). Most of PR negative tu-
mors were Cx26 positive (64.7%,
33/51)(15). This difference may be
attributed to difference between
our results and theirs regarding
Cx26 expression. In their study
positive patients were more than
negative patients, while, in our
study positive patients were less
than negative. Also it may be due
to ER+ and PR + breast cancer
was higher in developed coun-
tries(25,26). Conklin et al (2007)
found that there was a statistical-
ly significant association between
Cx26 expression and ER+ status
(p-value= 0.030). The relation be-
tween Cx26 expression and PR +
status showed that there was no
statistically significant association
(p-value=0.637)(17). This differ-
ence may be due to the difference
in sample size, they worked on
283 tumor specimens in case of
ER and 307 tumor specimens in
case of PR.
ConclusionConclusionCx26 positivity was associated
with large sized tumors, clinically
palpable axillary lymph nodes, in-
filtration of more axillary lymph
nodes after their pathological ex-
amination, advanced tumor stage,
high tumor grade and positive
lymho-vascular invasion. Also
Cx26 positivity might be associat-

7575
Benha M. J.
Vol. 29 No 2 May 2012
ed with increase in the overall re-
currence and metastasis (bone,
brain, liver) except lung metasta-
sis but without statistically signifi-
cant value. From the previous
points we concluded that Cx26 ex-
pression might be associated with
more aggressive tumors and bad
prognosis of patients with breast
cancer so it could be used as a
useful prognostic factor for breast
cancer but this conclusion needs
further study. We recommend to
do further studies with large sam-
ple size in multicentre, with evalu-
ation of Cx26 in primary tumors,
axillary lymph nodes and metasta-
sis to get more accurate results.
ReferencesReferences1- Jemal A., Siegel R., Ward1- Jemal A., Siegel R., Ward
E., Hao Y., Xu J., Murray T., etE., Hao Y., Xu J., Murray T., et
al (2008) :al (2008) : Cancer statistics, CA
cancer J Clin 58:71-96.
2- Zhu H. H., Hu C. H. and2- Zhu H. H., Hu C. H. and
Strickland P. (2011): Strickland P. (2011): Perspec-
tives of breast cancer etiology:
synergistic interaction between
smoking and exogenous hormone
use. Chin J Cancer 30 (7): 433-
441.
3- Garcia-Patiño E., Gomen-3- Garcia-Patiño E., Gomen-
dio B., Provencio M., Garcia J.dio B., Provencio M., Garcia J.
M., España P. and Bonilla F.M., España P. and Bonilla F.
(1998) :(1998) : Germ-like BRCA 1 Muta-
tions in Women with Sporadic
Breast Cancer, Clinical Correla-
tion. Journal of Clinical Oncology
16(1): 115 - 120.
4- Ahmad M. (2003) :4- Ahmad M. (2003) : Risk fac-
tors for breast cancer among
women attending breast clinic in
University Malaya Medical Centre
Kuala Lumpur NCD Malaysia 2(4):
23-31.
5- Wahl R. L., Siegel B. A.,5- Wahl R. L., Siegel B. A.,
Coleman R. E. and Gatsonis C.Coleman R. E. and Gatsonis C.
G. (2004) :G. (2004) : Prospective multicen-
ter study of axillary nodal staging
by positron emission tomography
in breast cancer: a report of the
staging breast cancer with PET
Study Group. J Clin Oncol 22(2):
277-285.
6- Evans W. H. and Martin P.6- Evans W. H. and Martin P.
E. (2002) :E. (2002) : Gap junctions: struc-
ture and function (Review). Mol.
Membr. Biol 19:121-136.
7- Kardami E., Dang X., Ia-7- Kardami E., Dang X., Ia-
cobas D. A., Nickel B. E., Jeya-cobas D. A., Nickel B. E., Jeya-
raman M., Srisakuldee W., et alraman M., Srisakuldee W., et al
(2007) : (2007) : The role of connexins in

7676
Abu Zeid M. A. et al...
controlling cell growth and gene
expression Progress in Biophysics
and Molecular Biology 94:245-
264.
8- Goldberg G. S., Lampe P.8- Goldberg G. S., Lampe P.
D. and Nicholson B. J. (1999):D. and Nicholson B. J. (1999):
Selective transfer of endogenous
metabolites through gap junctions
composed of different connexins.
Nat. Cell Biol 1: 457-459.
9- Laird D. W. (2005) : 9- Laird D. W. (2005) : Con-
nexin phosphorylation as a regu-
latory event linked to gap junction
internalization and degradation.
Biochim. Biophys. Acta 1711 :
172-182.
10- Solan J. L. and Lampe P.10- Solan J. L. and Lampe P.
D. (2005) :D. (2005) : Connexin phosphory-
lation as a regulatory event linked
to gap junction channel assembly.
Biochim. Biophys. Acta 1711 :
154-163.
11- Kanczuga-KodaL, Sul-11- Kanczuga-KodaL, Sul-
kowska M., Koda M., Rutkowskikowska M., Koda M., Rutkowski
R. and Sulkowski S. (2007) : R. and Sulkowski S. (2007) : In-
creased expression of gap junction
protein - connexin 32 in lymph
node metastases of human ductal
breast cancer.Folia Histochem Cy-
tobiol 45 (1): 175-180.
12- Cairns R. A., Khokha R.12- Cairns R. A., Khokha R.
and Hill R. P. (2003) : and Hill R. P. (2003) : Molecular
mechanisms of tumor invasion
and metastasis: an integrated
view. Curr Mol Med 3:659-671.
13- Kanczuga-Koda L., Sul-13- Kanczuga-Koda L., Sul-
kowski S., Koda M., Sobaniec-kowski S., Koda M., Sobaniec-
Lotowska M. and Sulkowska M.Lotowska M. and Sulkowska M.
(2004): (2004): Expression of connexins
26, 32 and 43 in the human co-
lon-an immunohistochemical
study. Folia Histochem Cytobiol
42(4):203-207.
14- Thomas F., Renaud F.,14- Thomas F., Renaud F.,
Benefice E., Meeus T. and Gue-Benefice E., Meeus T. and Gue-
gan J. F. (2001) :gan J. F. (2001) : International
Variability of Ages at Menarche
and Menopause: Patterns and
Main Determinants. Human Biolo-
gy 73 (2): 271-290.
15- Naoi Y., Miyoshi Y., Tagu-15- Naoi Y., Miyoshi Y., Tagu-
chi T., Kim S. J., Arai T., Tama-chi T., Kim S. J., Arai T., Tama-
ki Y., et al., (2007): ki Y., et al., (2007): Connexin26
expression is associated with lym-
phatic vessel invasion and poor
prognosis in human breast can-
cer. Breast Cancer Res Treat 106 :
11-17.
16- Qin H., Shao Q., Curtis16- Qin H., Shao Q., Curtis
H., Galipeau J., Belliveau D. J.,H., Galipeau J., Belliveau D. J.,

7777
Benha M. J.
Vol. 29 No 2 May 2012
Wang T., et al., (2002) :Wang T., et al., (2002) : Retrovi-
ral delivery of connexin genes to
human breast tumor cells inhibit
in vivo tumor growth by a mecha-
nism that is independent of signif-
icant gap junctional intercellular
communication. The journal of Bi-
ological Chemistry 277 (32) :
29132-29138.
17- Conklin C., Huntsman17- Conklin C., Huntsman
D., Yorida E., Makretsov N.,D., Yorida E., Makretsov N.,
Turbin D., Bechberger J. F., etTurbin D., Bechberger J. F., et
al., (2007) : Tal., (2007) : Tissue microarray
analysis of connexin expression
and its prognostic significance in
human breast cancer. Cancer Let-
ters 255: 284-294.
18- Kamibayashi Y., Oyama-18- Kamibayashi Y., Oyama-
da Y., Mori M. and Oyamada M.da Y., Mori M. and Oyamada M.
(1995) :(1995) : Aberrant expression of
gap junction proteins (connexins)
is associated with tumor progres-
sion during multistage mouse
skin carcinogenesis in vivo. Car-
cinogenesis 16: 1287-1297.
19- Xie H., Laird D. W.,19- Xie H., Laird D. W.,
Chang T. H. and Hu V. W.Chang T. H. and Hu V. W.
(1997) : (1997) : A mitosis-specific phos-
phorylation of the gap junction
protein connexin 43 in human
vascular cells : biochemical char-
acterization and localization. J
Cell Biol 137:203-210.
20- Krenacs T. and Rosendaal20- Krenacs T. and Rosendaal
M. (1995) :M. (1995) : Immunohistological
detection of gap junctions in hu-
man lymphoid tissue: connexin43
in follicular dendritic and lym-
phoendothelial cells. J Histochem
Cytochem 43:1125-1137.
21- Koval M. (2006) : 21- Koval M. (2006) : Path-
ways and control of connexin olig-
omerization. Trends Cell Biol
16:159-166.
22- Ito A., Katoh F., Kataoka22- Ito A., Katoh F., Kataoka
T. R., Okada M., Tsubota N.,T. R., Okada M., Tsubota N.,
Asada H., et al., (2000) :Asada H., et al., (2000) : A role
for heterologous gap junctions be-
tween melanoma and endothelial
cells in metastasis. J Clin Invest
105:1189-1197.
23- Jamieson S., Going J. J.,23- Jamieson S., Going J. J.,
D'Arcy R. and George W. D.D'Arcy R. and George W. D.
(1998) :(1998) : Expression of gap junc-
tion proteins connexin 26 and
connexin 43 in normal human
breast and in breast tumours. J
Pathol 184(1): 37-43.
24- Pollmann M. A., Shao Q.,24- Pollmann M. A., Shao Q.,
Laird D. W. and Sandig M.Laird D. W. and Sandig M.

7878
Abu Zeid M. A. et al...
(2005) :(2005) : Connexin 43 mediated
gap junctional communication en-
hances breast tumor cell diapede-
sis in culture. Breast Cancer Res
7 (4): 522-534.
25- Li C. I., Daling J. R. and25- Li C. I., Daling J. R. and
Malone K. E. (2003) : Malone K. E. (2003) : Incidence
of invasive breast cancer by hor-
mone receptor status from 1992
to 1998. J Clinical Oncol 21(1):28-
34.
26- Desai S. B., Moonim M.26- Desai S. B., Moonim M.
T., Gill A. K., Punia R. S., Na-T., Gill A. K., Punia R. S., Na-
resh K. N. and Chinoy R. F.resh K. N. and Chinoy R. F.
(2000) : (2000) : Hormone receptor status
of breast cancer in India : a
study of 798 tumors. Breast 9:
267-270.

7979
Benha M. J.
Vol. 29 No 2 May 2012
CLINICO-PATHOLOGICALCLINICO-PATHOLOGICALCORRELLATION BETWEENCORRELLATION BETWEEN
EXPRESSION OF CONNEXINEXPRESSION OF CONNEXIN26 AND BREAST CANCER26 AND BREAST CANCER
Abu Zeid M. A. MD, Amin M. A. MD, Moatamed A. MD,Abu Zeid M. A. MD, Amin M. A. MD, Moatamed A. MD,Abu Hashem M. M. MD and Abo El Hoda M. F. MDAbu Hashem M. M. MD and Abo El Hoda M. F. MD
BENHAMEDICALJOURNAL
REPRINT
Published byPublished by
Benha Faculty of MedicineBenha Faculty of Medicine Volume 29 Number 2May 2012

7979
Benha M. J.
Vol. 29 No 2 May 2012
IntroductionIntroductionHepatitis C virus is a member
of Hepacivirus genus of the Flavi-
viridae family. To date, six major
HCV genotypes with a large num-
ber of subtypes within each geno-
EFFECTS OF HEPATITIS C VIRUS VIRAL LOADEFFECTS OF HEPATITIS C VIRUS VIRAL LOADIN SERUM AND SEMEN ON COMPUTERIZEDIN SERUM AND SEMEN ON COMPUTERIZED
SEMEN ANALYSIS PARAMETERSSEMEN ANALYSIS PARAMETERS
Ahmed F. Ismael MSc., Ashraf H. Hassan MD,Ahmed F. Ismael MSc., Ashraf H. Hassan MD,Ahmed Kh. Ahmed MD, Hosam Z. Abdel-Hafez MD*Ahmed Kh. Ahmed MD, Hosam Z. Abdel-Hafez MD*
and Waleed A. El-Sherbeny MD**and Waleed A. El-Sherbeny MD**Department of Dermatology, Andrology and STDs, * Clinical Pathology and of
**Tropical Medicine, Mansoura Faculty of Medicine.
Mansoura University, Egypt.
AbstractAbstractBackground:Background: It was reported that viral infections contribute to male
infertility either by direct toxic effects on cells in the male reproductivetract, and/or indirectly by causing a local inflammatory, or immunologi-cal, reaction. Methods: Methods: 30 patients matching our inclusion and exclu-sion criteria were evaluated with computerized semen analysis (CASA).15 of the patients were fertile and 15 were infertile, in the same time 30fertile healthy controls were also evaluated by CASA. Results: Results: 2.35% ofthe HCV infected patients were infertile. There were non significant dif-ferences between CASA parameters of patients with positive and nega-tive HCV in semen. A significant positive correlation was found betweenthe viral loads in blood and teratozoospermic index. A strong significantnegative correlation was found between HCV RNA viral load in semenand sperm deformity index. Significant differences were also seen whencomparing infertile HCV infected patients and controls regardingstraight line velocity, percentage of straightness and normal morphologypercentage. Conclusions: Conclusions: HCV affects male fertility mainly throughsperm motility and morphology. No significant differences in CASA werefound between fertile and infertile HCV infected patients.

8080
Ahmed F. Ismael, et al...
type are known(1). Hepatitis C vi-
rus is a major cause of chronic liv-
er disease worldwide. > 200 mil-
lion people are infected with HCV,
with ≥ 70% of acute infections pro-
gressing to chronic active hepati-
tis(2). The prevalence of HCV in-
fection in Egypt approximates
12%(3). Though HCV infection is a
serious public health problem,
some aspects of its biology are still
not well understood, such as its
transmission through seminal
fluid and sexual transmission(4).
It was reported that viral infec-
tions contribute to male infertility
either by direct toxic effects on
cells in the male reproductive
tract, and/or indirectly by causing
a local inflammatory, or immuno-
logical, reaction(5). The effect, if
any, of HCV infection on male fer-
tility is still being debated(6).
Patients & MethodsPatients & MethodsThis study was conducted on
60 males. 30 of them were suffer-
ing from HCV infection (with posi-
tive HCV RNA Real time PCR in
serum) & the other 30 were
healthy fertile controls.
The 30 HCV infected patients
(proved by HCV RNA RT PCR test
in serum) were included in the
study after a survey on 637 ran-
domly selected HCV positive (by
ELISA test for HCV antibodies in
serum) patients in the reproduc-
tive age attending the tropical
medicine outpatient clinic and in-
patient department beside the an-
drology clinic of the Mansoura
University Hospitals during the
period between August 2010 and
February 2012.
Our 30 patients as well as the
30 controls were in the repro-
ductive age. Patients in both
groups A and B were subjected
to thorough history taking, gen-
eral and genital examination,
quantitative Real time PCR test for
HCV in blood, quantitative Real
time PCR test for HCV in semen
and computerized semen analysis
(CASA) according to WHO criteria
in 2010.
Controls Group was subjected
to thorough history taking, physi-
cal and genital examination and
computerized semen analysis
(CASA) according to WHO criteria
in 2010 through the same ma-
chine, soft ware and operator used
for the other 2 groups.

8181
Benha M. J.
Vol. 29 No 2 May 2012
ResultsResultsWe found that 15 of the HCV
infected patients (Group B) were
infertile among the 637 HCV
infected patients we examined
and we found that the preva-
lence of infertility among HCV in-
fected males matching our inclu-
sion and exclusion criteria was
2.35% (15 in 637). HCV RNA was
detected in four patients out of
thirty HCV infected patients
(Groups A and B) and the load
ranged from 161 IU ⁄ ml to 178000
IU ⁄ ml.
Rest of patients (26) gave nega-
tive results and the load if present
was below the detection limit (<12
IU ⁄ ml). So we estimated that the
percentage of HCV infected pa-
tients (Groups A and B) that
found to be able to pass the virus
in semen in a detectable level was
13.33%. 3 out of the 4 patients
with positive test were fertile
(Group A) and only one patient
was infertile (Group B). So HCV
was detected more in semen of fer-
tile HCV infected patients (75% of
these patients are fertile). Median
level of HCV RNA viral load in ser-
um showed no significant differ-
ence in both groups of infected pa-
tients (Groups A and B) as shown
in table 1.
Also the median level of HCV
RNA viral load in serum showed
no significant difference between
patients with positive and negative
tests for detection of HCV RNA in
semen.
Different CASA parameters
were studied in patients with posi-
tive HCV RNA RT PCR test in se-
men in comparison to patients
with negative HCV RNA RT PCR
test in semen where non signifi-
cant comparison was found (see
tables 2 and 3).
On the other hand, when we
correlated between HCV RNA viral
load in serum of HCV infected pa-
tients and CASA parameters a sig-
nificant positive correlation was
found between the viral load in
blood and teratozoospermic index.
Non significant positive correla-
tion was demonstrated between vi-
ral load in blood and percentage of
progressive motility, percentage of
non progressive motility, percent-
age of total motility, mean angular
degree of movement, amplitude of

8282
Ahmed F. Ismael, et al...
lateral head displacement, per-
centage of straightness, normal
morphology percentage, sperm de-
formity index and multiple anoma-
lies index. While Non significant
negative correlation was demon-
strated between viral load in blood
and semen volume, semen PH,
sperm concentration, sperm
Count, percentage of immotile
sperms, curvilinear velocity,
straight line velocity, average path
velocity, beat cross frequency, per-
centage of linearity and percent-
age of wobble. Then we repeated
this correlation on each group (A
and B) and nonsignificant correla-
tion was found. To study the effect
of HCV RNA viral load in semen
on CASA parameters in patients
found to be RT PCR positive for
the virus another correlation was
done where a strong significant
negative correlation was found
only between HCV RNA viral load
in semen and sperm deformity in-
dex. On comparing the 3 groups
(A, B and Control) regarding CASA
parameters a significant differenc-
es between the 3 groups were seen
regarding percentage of straight-
ness and normal morphology per-
centage. We then compared be-
tween every 2 of the 3 groups.
Nonsignificant differences re-
garding the CASA parameters
were found on comparing Group A
with Group B. But when we com-
pared between Group A and con-
trols we found significant differ-
ences between the 2 groups
regarding percentage of progres-
sive motility, percentage of total
motility and percentage of immo-
tile sperms. Significant differences
were also seen when comparing
Group B and Controls regarding
straight line velocity, percentage of
straightness and normal morphol-
ogy percentage.
Further studies were applied
on group B patients (infertile HCV
positive patients). Firstly we corre-
lated between HCV RNA viral load
in serum and duration of infertili-
ty. A significant positive correla-
tion was discovered. Secondly we
compared between HCV RNA viral
load in sera of patients with pri-
mary and secondary infertility.
Nonsignificant difference was
found between patients. Then we
correlated between duration of in-
fertility and semen parameters.
Non significant positive correlation
was discovered between duration
of infertility and percentage of pro-

8383
Benha M. J.
Vol. 29 No 2 May 2012
gressive motility, percentage of to-
tal motility, curvilinear velocity,
straight line velocity, average path
velocity, amplitude of lateral head
displacement, percentage of line-
arity, percentage of wobble, per-
centage of straightness, teratozoo-
spermic index, sperm deformity
index and multiple anomalies in-
dex.
While Non significant negative
correlation was demonstrated be-
tween duration of infertility and
semen volume, semen PH, sperm
concentration, sperm count, per-
centage of non progressive motili-
ty, percentage of immotile sperms,
mean angular degree of move-
ment, beat cross frequency and
normal morphology percentage.
Finally no significant differences
were found comparing semen pa-
rameters between patients pre-
sented with primary and secon-
dary infertility.

8484
Ahmed F. Ismael, et al...

8585
Benha M. J.
Vol. 29 No 2 May 2012
DiscussionDiscussionMale infertility affects 15%
of reproductive age men world-
wide (7). Male factor infertility ac-
counts for up to half of all cases of
infertility and affects one man in
20 in the general population (8). It
is estimated that 15% of couples
attempting to conceive are not
able to do so within 1 year(9). In
our study in order to include 15
infertile HCV infected patients
matching our inclusion and exclu-
sion criteria (Group B) we exam-
ined 637 HCV infected patients
and we found that the prevalence
of infertility among HCV infected
males matching our inclusion and
exclusion criteria was 2.35%.
So the prevalence of infertility
among HCV infected males when
other factors that may contribute
to the problem of infertility are to
some degree excluded as in our
study was only 2.35%. This is
much lower than the prevalence of
infertility in general population
(15%).
Lower prevalence of infertility
detected in our study may be
due to the strict inclusion and
exclusion criteria applied during
selection of our patients. This
low prevalence may allow us to
suggest that the role of HCV infec-
tion as a causative factor of male
infertility is present but minimal.
Few studies assisting the effect of
HCV infection on male fertility
were done one study was a retro-
spective analysis by Chu et al in
2006 (10) that concluded that men
co-infected with HCV and HIV-1
does reasonably well undergoing
ART and that the transmission
risk of viruses to their partners
and children is absent. This coin-
cides with our suggestion that the
role of HCV as a causative agent
of male infertility is minimal. No
significant differences in CASA pa-
rameters were found in our study
when we compared between infer-
tile HCV infected patients and fer-
tile HCV negative controls apart
from that regarding straight line
velocity, percentage of straight-
ness and normal morphology per-
centage.
The differences in the percent-
age of normal sperm morphology
as well as in 2 of the parameters
measuring sperm motility could
suggest that the effect of HCV in-
fection on male fertility may be

8686
Ahmed F. Ismael, et al...
through the effect on sperm mor-
phology and/or motility.
Also on comparing the 3 groups
(A, B and Control) regarding se-
men parameters significant differ-
ence between the 3 groups was
seen regarding the percentage of
straightness and normal morphol-
ogy.
This suggestion can be sup-
ported by our findings when we
compared CASA parameters be-
tween Group A (Fertile HCV infect-
ed patients) and fertile HCV nega-
tive controls of significant
differences between the 2 groups
regarding percentage of progres-
sive motility, percentage of total
motility and percentage of immo-
tile sperms. When comparing
Group A with Group B we found
no significant differences between
the 2 groups regarding CASA pa-
rameters.
Moretti et al in 2008 (11) stud-
ied the effect of chronic hepatitis
B and hepatitis C on sperm quali-
ty. They analyzed sperm quality
from selected patients with chron-
ic HBV or HCV infections. Semen
samples were examined by light
and transmission electron micros-
copy (TEM). Despite normal sperm
concentration, they observed re-
duced motility. TEM analysis
highlighted that 35.7% of patients
showed generally good semen
quality. However, significantly
higher values of apoptosis and ne-
crosis, compared with controls,
were observed, demonstrating
spermatogenetic alterations. They
concluded that the fertility index
was significantly lower in HCV-
and HBV-infected patients versus
controls. This study agrees with
our suggestion of an effect of HCV
on sperm motility.
In Saudi Arabia Mansoor et al
in 2011 (6) tried to determine the
prevalence of HBV, HCV and HIV
in a group of infertile couples at-
tending a tertiary care unit. They
performed a retrospective cross-
sectional observational study. All
patients were screened for HBV
markers, anti-HCV, anti-HIV types
I and II using enzyme linked im-
munoassay technique. They found
that the overall HCV prevalence in
this group was 0.5%. All females
were negative for HCV. This study
supports our suggestion that the
role of HCV as a causative agent

8787
Benha M. J.
Vol. 29 No 2 May 2012
of male infertility is minimal.
Garrido et al in 2005 (12) evalu-
ated semen characteristics in 136
samples provided from 125 males.
They also included a control group
of 125 males matched by age and
length of sexual abstinence. At the
time of semen retrieval, 70 of
them were infected with HIV (45
also with HCV), and 55 of them
with HCV alone.
Semen analysis, according to
the WHO criteria, of HIV- and
HCV-affected patients showed no
differences from that of non-
infected males. Semen analysis
performed in this study was rou-
tine analysis and same results
were found in our study when we
assessed count, motility and mor-
phology. But significance differ-
ences between cases and controls
were seen using CASA parame-
ters.
Safarinejad et al in 2009 (12)
evaluated reproductive endocrine
profile, sperm chromosomal ab-
normalities, and semen quality in
patients with chronic hepatitis C.
In patients with chronic hepatitis
C, the mean total sperm count,
motility and normal morphology
was significantly lower than in
controls. In this study unlike ours
patients with liver failure were not
excluded and CASA was not done.
This may explain the difference in
results regarding sperm count.
Hofny et al in 2011 (13) studied
57 male patients with chronic
hepatitis C virus (HCV) infection
and found a statistically signifi-
cant decrease in semen volume,
sperm count, and progressive
sperm motility and a statistically
significant increase in abnormal
sperm morphology compared with
healthy controls.
Vicari et al in 2006 (14) evaluat-
ed the sperm abnormalities in
young infertile patients with hepa-
titis B or C virus infection beside
evaluation of the additional nega-
tive influence of varicocele on
sperm parameters in these pa-
tients. Forty-two infertile patients
with HBV (n=23) or HCV (n=19)
infection were studied.
Sperm parameters were com-
pared to those of a group of 30 pa-
tients with primary infertility due
to causes different from liver dis-

8888
Ahmed F. Ismael, et al...
eases and/or varicocele. HBV pa-
tients showed median sperm para-
meters (sperm density, total num-
ber, viability, forward motility and
morphology) significantly worse
than those found in patients with
HCV. In our study we excluded
patients with HBV infection.
Researchers concluded that pa-
tients with HBV infection show
worse sperm parameters com-
pared with HCV patients. The ad-
ditional presence of varicocele fur-
ther impairs sperm output in HBV
patients. This may explain the rel-
atively lower prevalence of infertili-
ty in our patients reminding that
we excluded cases of HBV and va-
ricocele from our study.
In our study in order to avoid
the effect of liver failure on male
fertility we included only HCV
infected patients with compensat-
ed liver functions. To our knowl-
edge no other study evaluating ef-
fect of HCV on male fertility
included only compensated pa-
tients.
ReferencesReferences(1) Simmonds P., Bukh J.,(1) Simmonds P., Bukh J.,
Combet C., et al., (2005): Combet C., et al., (2005): Con-
sensus proposals for a unified sys-
tem of nomenclature of hepatitis C
virus genotypes. Hepatology; 42 :
962-973.
(2) Leone N. and Rizzetto M.(2) Leone N. and Rizzetto M.
(2005) :(2005) : Natural history of hepati-
tis C virus infection: from chronic
hepatitis to cirrhosis, to hepato-
cellular carcinoma. Minerva Gas-
troenterol Dietol. 31:46- 51.
(3) El-Guinaidy M., Abdel-(3) El-Guinaidy M., Abdel-
latif M., Amin H. and Ahmedlatif M., Amin H. and Ahmed
S. (2003) :S. (2003) : A Study of the pres-
ence of HCV RNA in semen of
patients with chronic HCV infec-
tion. Journal of Hepatology. 38
(2): 137.
(4) Cavalheiro N. P., Santos A.(4) Cavalheiro N. P., Santos A.
C., Melo C. E., Morimitsu S. R.C., Melo C. E., Morimitsu S. R.
and Barone A. A. (2008) :and Barone A. A. (2008) : Hepati-
tis C virus detection in the semen
of infected patients. Braz J Infect
Dis. 12(5): 358-361.
(5) Englert Y., Lesage B., Van(5) Englert Y., Lesage B., Van
Vooren J., Liesnard C., Place I.,Vooren J., Liesnard C., Place I.,
Vannin A., Emiliani S. and Del-Vannin A., Emiliani S. and Del-
baere A. (2004): baere A. (2004): Medically assist-
ed reproduction in the presence of
chronic viral diseases. Hum. Re-
prod. Update. 10:149-162.

8989
Benha M. J.
Vol. 29 No 2 May 2012
(6) Mansoor A. A., Salih A. I.(6) Mansoor A. A., Salih A. I.
and Al-Jaroudi D. H. (2001) :and Al-Jaroudi D. H. (2001) :
Screening of hepatitis B and C
and human immunodeficiency vi-
rus in infertile couples in Saudi
Arabia. Saudi Med J. 32(3):260-
264.
(7) Jarow J. P., Sharlip I. D.,(7) Jarow J. P., Sharlip I. D.,
Belker A. M., et al. (2002): Belker A. M., et al. (2002): Male
infertility best practice policy com-
mittee of the American Urological
Association Inc. J Urol. 167 :
2138-2144.
(8) McLachlan R. and de(8) McLachlan R. and de
Krester D. (2001):Krester D. (2001): Male infertility:
The case for continued research.
MJA. 174:116-117.
(9) Sigman M. and Jarow J.(9) Sigman M. and Jarow J.
(2002) :(2002) : Male infertility. Camp-
bell’s Urology. 8: 1475-1531.
(10) Chu M. C., Pena J. E.,(10) Chu M. C., Pena J. E.,
Nakhuda G. S., Thornton M. H.Nakhuda G. S., Thornton M. H.
and Sauer M. V. (2006) : and Sauer M. V. (2006) : Assess-
ing the reproductive performance
of men co-infected with HIV-1 and
hepatitis C undergoing assisted
reproduction. Arch Gynecol Ob-
stet. 274(3):155-159.
(11) Moretti E., Federico M.(11) Moretti E., Federico M.
G., Giannerini V. and CollodelG., Giannerini V. and Collodel
G. (2008) :G. (2008) : Sperm ultrastructure
and meiotic segregation in a group
of patients with chronic hepatitis
B and C. Andrologia. 40(5): 286-
291.
(12) Safarinejad M. R., Kolahi(12) Safarinejad M. R., Kolahi
A. A. and Iravani S. (2009) :A. A. and Iravani S. (2009) :
Evaluation of semen variables,
sperm chromosomal abnormalities
and reproductive endocrine profile
in patients with chronic hepatitis
C. BJU Int. 105(1):79- 86.
(13) Hofny E. R., Ali M. E.,(13) Hofny E. R., Ali M. E.,
Taha E. A., et al. (2011) :Taha E. A., et al. (2011) : Semen
and hormonal parameters in
men with chronic hepatitis C in-
fection. Fertil Steril. 95(8):2557-
2559.
(14) Vicari E., Arcoria D.,(14) Vicari E., Arcoria D.,
Di Mauro C., Noto R., Noto Z.Di Mauro C., Noto R., Noto Z.
and La Vignera S. (2006) :and La Vignera S. (2006) :
Sperm output in patients with
primary infertility and hepatitis B
or C virus; negative influence of
HBV infection during concomitant
varicocele. Minerva Med. 97(1),
65-77.

9090
Ahmed F. Ismael, et al...
EFFECTS OF HEPATITIS CEFFECTS OF HEPATITIS CVIRUS VIRAL LOAD IN SERUMVIRUS VIRAL LOAD IN SERUM
AND SEMEN ON COMPUTERIZEDAND SEMEN ON COMPUTERIZEDSEMEN ANALYSIS PARAMETERSSEMEN ANALYSIS PARAMETERS
Ahmed F. Ismael MSc., Ashraf H. Hassan MD,Ahmed F. Ismael MSc., Ashraf H. Hassan MD,Ahmed Kh. Ahmed MD, Hosam Z. Abdel-Hafez MDAhmed Kh. Ahmed MD, Hosam Z. Abdel-Hafez MD
and Waleed A. El-Sherbeny MDand Waleed A. El-Sherbeny MD
BENHAMEDICALJOURNAL
REPRINT
Published byPublished by
Benha Faculty of MedicineBenha Faculty of Medicine Volume 29 Number 2May 2012
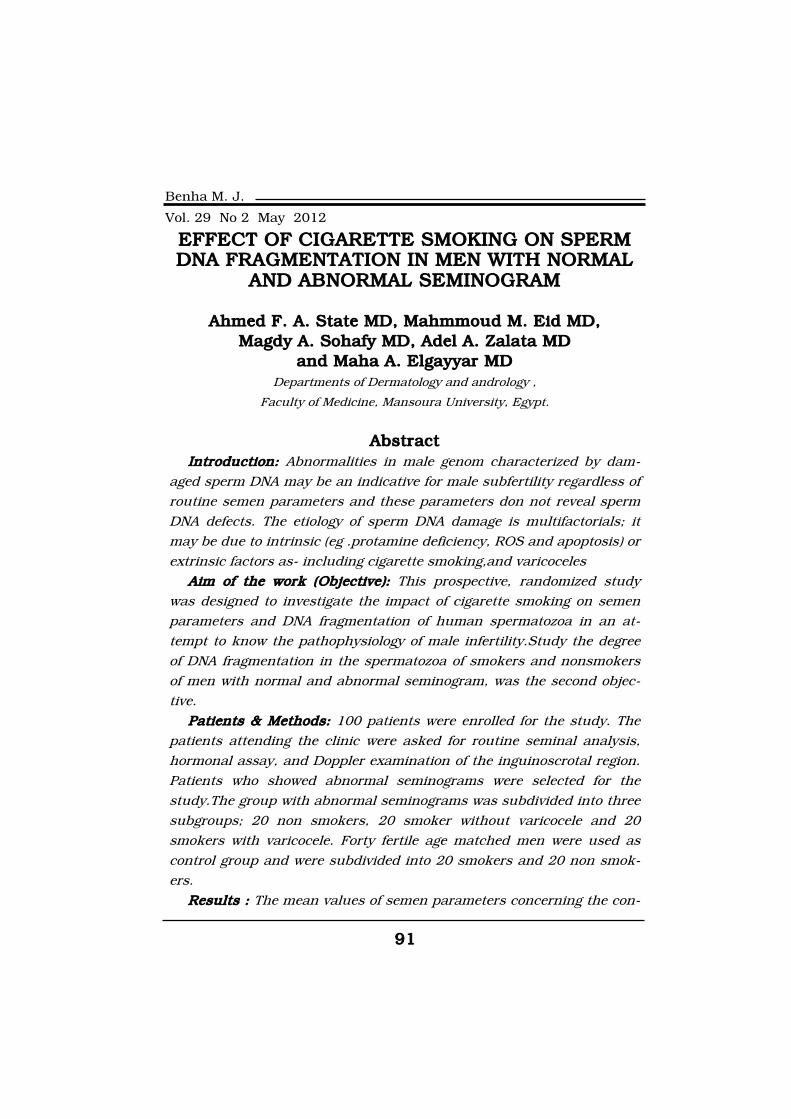
9191
Benha M. J.
Vol. 29 No 2 May 2012
EFFECT OF CIGARETTE SMOKING ON SPERMEFFECT OF CIGARETTE SMOKING ON SPERMDNA FRAGMENTATION IN MEN WITH NORMALDNA FRAGMENTATION IN MEN WITH NORMAL
AND ABNORMAL SEMINOGRAMAND ABNORMAL SEMINOGRAM
Ahmed F. A. State MD, Mahmmoud M. Eid MD,Ahmed F. A. State MD, Mahmmoud M. Eid MD,Magdy A. Sohafy MD, Adel A. Zalata MDMagdy A. Sohafy MD, Adel A. Zalata MD
and Maha A. Elgayyar MDand Maha A. Elgayyar MDDepartments of Dermatology and andrology ,
Faculty of Medicine, Mansoura University, Egypt.
AbstractAbstractIntroduction: Introduction: Abnormalities in male genom characterized by dam-
aged sperm DNA may be an indicative for male subfertility regardless ofroutine semen parameters and these parameters don not reveal spermDNA defects. The etiology of sperm DNA damage is multifactorials; itmay be due to intrinsic (eg .protamine deficiency, ROS and apoptosis) orextrinsic factors as- including cigarette smoking,and varicoceles
Aim of the work (Objective): Aim of the work (Objective): This prospective, randomized studywas designed to investigate the impact of cigarette smoking on semenparameters and DNA fragmentation of human spermatozoa in an at-tempt to know the pathophysiology of male infertility.Study the degreeof DNA fragmentation in the spermatozoa of smokers and nonsmokersof men with normal and abnormal seminogram, was the second objec-tive.
Patients & Methods: Patients & Methods: 100 patients were enrolled for the study. Thepatients attending the clinic were asked for routine seminal analysis,hormonal assay, and Doppler examination of the inguinoscrotal region.Patients who showed abnormal seminograms were selected for thestudy.The group with abnormal seminograms was subdivided into threesubgroups; 20 non smokers, 20 smoker without varicocele and 20smokers with varicocele. Forty fertile age matched men were used ascontrol group and were subdivided into 20 smokers and 20 non smok-ers.
Results : Results : The mean values of semen parameters concerning the con-

9292
Ahmed F. A. State, et al...
IntroductionIntroductionOver the past two decades,
there has been an increasing
body of evidence that several
environmental toxicants may im-
pair semen quality and thus
male fertility in animals as well as
in human. Even exposure to epi-
sodic seasonal air pollution can
have deleterious effects on hu-
man sperms(1). Among different
air pollutant, cigarette smoke
contains toxic chemicals, muta-
genic and carcinogenic com-
pounds, which can adversely af-
fect male fertility too (2) Cigar-
ette smoke contains more than
4000 different chemical com-
pounds, such as nicotine, nitrosa-
mine, polycyclic aromatic hydro-
carbons, cadmium and carbon
monoxide. Some of these sub-
stances were found in seminal
plasma at concentrations propor-
tional to those in the serum, sug-
gesting their crossing of the blood
- testis barrier(3). Thus, the semi-
nal plasma of smokers can be con-
sidered as a toxic environment for
spermatozoa.
centration, motility, morphology and linear velocity were significantlylower in smokers than non smokers in the groups with normal and ab-normal seminograms. Moreover, the differences were also significantlylower if the smokers in the two groups with abnormal and normal semi-nograms were compared. The Comet assay in the groups with normaland abnormal seminograms showed a significantly higher percentage ofDNA fragmentation in smokers than non smokers. Moreover, the differ-ence in sperm DNA fragmentation in group with abnormal was signifi-cantly higher in smokers with varicocele than smokers without varico-cele (p=0,000)
Conclusion: Conclusion: The conventional semen parameters such as spermdensity, motility, morphology and PH in the semen samples are not suf-ficient for evaluation of reproductive activity. Sperm DNA integrity mustbe evaluated in addition to routine sperm parameters. This will indicatethe quality of the spermatozoa and could have better diagnostic andprognostic values if compared with routine seminal analysis alone.Smokers have statistically significant lower semen volume, sperm countand sperm motility compared with non-smokers.

9393
Benha M. J.
Vol. 29 No 2 May 2012
Several studies showed a corre-
lation between the consumption of
tobacco and an alternation of se-
men quality(4) and nuclear integri-
ty(5). Cigarette smoking is linked
to significantly increase levels of
seminal reactive oxygen species
(ROS) which is responsible for oxi-
dative stress(6). This is why smok-
ing may induce alterations of
sperm plasma membrane and
high degree of DNA fragmenta-
tion(7).
Abnormalities in male genom
characterized by damaged sperm
DNA may be indicative for male
subfertility regardless of routine
semen parameters(8). and these
parameters don not reveal sperm
DNA defects.. There appears to be
threshold of sperm DNA damage
beyond which embryo develop-
ment and subsequent pregnancy
outcome are impaired. Clinical ev-
idences suggest that damage to
human sperm DNA might adverse-
ly affect reproductive outcomes
and that spermatozoa of infertile
men possess substantially more
sperm DNA damage than do sper-
matozoa of fertile men(9). The
present work was therefore carried
out to study the impact of smok-
ing on the nuclear DNA damage in
human spermatozoa.
Patients and MethodsPatients and MethodsThe study was carried out upon
adult males attending the outpa-
tient clinic of andrology depart-
ment in Mansoura University Hos-
pital during the period from
December 2008 to January 2010.
All patients were subjectedAll patients were subjected
to:to:
1.1. Thorough history taking: Thorough history taking:
Personal history: Personal history: including
Name, age, job, and address and
special habits mainly cigarette
Smoking (duration of smoking,
number of cigarettes /day). The
smokers included in the study
were those who smoked cigar-
ettes on a regular basis for at least
1 year. The men who never smoke
or stopped smoking one year prior
to examination were considered
nonsmokers(10).
Smoking index (SI) is calculat-
ed (number of cigarettes/day x
years of smoking) and classified as
mild < 2000 moderate 200-600
and heavy > 600(11).
Fertility history: Fertility history: Infertile de-

9494
Ahmed F. A. State, et al...
fined as failure to conceive within
one year of regular unprotected
intercourse. The duration, type,
previous investigation and treat-
ment of infertility were reported.
Then the female partner was eval-
uated (age and history of infertility
in previous marriage).
Medical history of diseases with
possible adverse effect on fertility
(systemic diseases, fever, drug
abuse,…..etc).
Sexual history: Libido:Sexual history: Libido:
(present- diminished-absent).
Erection: Adequate or inadequate.
Ejaculation: (normal-premature-
painful-absent).Timing and fre-
quency.
2.2. Thorough clinical exami-Thorough clinical exami-
nation of the patient:nation of the patient:
Physical examination: as regard
height, weight, and spans, signs of
hypogonadism, galactorrhea, as
well as signs of kartagner or Kall-
man syndrome. Signs of systemic
or endocrinal disease were taken
in consideration.
Genital examination:Genital examination:
• Penis:Penis: position of urethral
meatus, penile curvature, scars,
plaque, and urethral discharge
• Scrotal Content:Scrotal Content: testes
(site, volume and consisten-
cy).Scrotal swelling. Epididymis:
head, body and tail, thickened,
tender or cystic.
• Examination of spermaticExamination of spermatic
cord: cord: Vas deferens (palpable or
non-palpable, beaded or thick-
ened). Examination for varicocele
in both erect and supine postures,
during both quiet respiration and
Valsalva's maneuver to detect ab-
normal visible or palpable veins
within the spermatic cord and
around the tests with comparing
both sides.
• Per rectal (P/R) examination
of the "prostate" and "seminal ves-
icle.
3.3. Investigations:Investigations:
A. Semen analysis.
B. Hormonal assay: (testoste-
ron, FSH, LH, prolactin, es-
tradiol).
C. Doppler examination of the
inguinoscrotal region.
Our patients were divided in to
two main groups:
Group I: Group I: Sixty infertile men

9595
Benha M. J.
Vol. 29 No 2 May 2012
with abnormal seminogram and
normal sex hormone level were
taken and categorized into three
subgroups.
a) Smokers without varicocele
(n=20).
b) Smokers with varicocele
(n=20).
c) Non smokers without va-
ricocele (n=20).
Group II:Group II: Forty fertile men with
normal seminogram and normal
sex hormone level were used as
control groups which categorized
into two subgroups:
a) Smokers without varicocele
(n=20)
b) Non smokers without varic-
ocele (n=20).
Fertile men were those who had
no history of fertility problem and
those whose partners become
pregnant spontaneously within
one year of regular unprotected
intercourse.
Exclusion criteria :Exclusion criteria :
Patient with history of diseases
or factors with possible adverse ef-
fect on fertility such:
• Systemic diseases: D.M.,
T.B., chronic respiratory tract
diseases, others.
• Fever in past 6 months.
• Surgery: orchiectomy, vasec-
tomy.
• Urinary tract infection.
• Sexually transmitted diseas-
es.
• Epididymitis.
• Pathology possibly causing
testicular damage (orchitis;
mumps or others, and testicu-
lar injury or torsion).
• Testicular maldescent and its
treatment; either surgical or
medical and age of treatment.
• Environmental and/or occu-
pational factors.
• Excessive consumption of al-
cohol.
• Drug abuse.
• Patients with azoospermi.
Both group with abnormal sem-
inogram and control group were
subjected to the Sperm nuclear
DNA fragmentation test using
COMET Assay (single cell gel elec-
trophoresis assay).
Semen analysis:Semen analysis:
The samples were collected af-
ter a minimum of 48 hours and
not longer than 7 days of sexual
abstinence.

9696
Ahmed F. A. State, et al...
The semen samples were analyzed
according to World Health Organi-
zatio (12) using computer-assisted
method of semen analysis.
Doppler examination of theDoppler examination of the
inguinoscrotal region :inguinoscrotal region :
A portable ultrasonic blood flow
detector was used with built in
printer, 10 Mhz frequency probe
and speaker for detection of
changes in the blood flow sonic
waves. (Hadeco, Smartdap 20Ex,
Hayashi Denki Co., LTD.).
Sperm nuclear DNA fragmenta-
tion test using COMET Assay (sin-
gle cell gel electrophoresis assay).
Procedure:Procedure:
Sperm cells were prepared and
washed with HEPES-bufferd EBSS
(Earles balanced salt solution)
rapidly at room temperature, spa-
ret into miniature agarose gels on
microscope slides and lysed in
situ to remove DNA associated
proteins and allow the compacted
DNA in the sperm to relax. Lysis
buffer (Tris 10mmol/l, 0.5mol/l
EDTA and 2.5 mol/l NaCI, pH 10)
contained 1% Triton X-100, 40
mmol/l dithiothreitol and protei-
nase K, 100 µg/ml). Microgels
were then electrophoresed (20
min at 25V). The comet assay
conducted in alkaline (pH>12)
buffer (Tris 10 mmol/l containing
0.08 mol/l boric acid and 0.5
mol/l EDTA)(13). The slides
stained with a DNA-specific fluo-
rescent stain (SYBR Green I) and
examined using a microscope at-
tached to a digital camera. This
is followed by visual analysis of
the staining DNA and calculating
fluorescence by manual scoring to
determine the extent of DNA dam-
age (14).
Comet image analysis: The
head region of a comet represents
unfragmented DNA that does not
migrate outside the region of the
nucleus while tail represents DNA
which migrates due to fragmenta-
tion and loss of structure.
Statistical Analysis :Statistical Analysis :
The statistical analysis of data
was done by using excel program
and SPSS program statistical
package for social science version
10. The description of the data
was done in form of mean (+/-)
standard deviation (SD) for quan-
titative data and frequency & pro-
portion for qualitative data. The

9797
Benha M. J.
Vol. 29 No 2 May 2012
analysis of the data was done to
test statistical significant differ-
ence between groups(15) Munor et
al., 2002).
ResultsResultsTables (1, 2) showed Semen pa-
rameters of groups with abnormal
seminogram and control groups.
In groups with abnormal semino-
gram the mean values of semen
parameters concerning concentra-
tion, motility, the percentage of
normal morphology and liner ve-
locity of smokers were signifi-
cantly lower than those of non
smokers. Moreover, the semen pa-
rameters were significantly lower
regarding the mean of concentra-
tion, motility, velocity, and normal
morphology in smoker with varico-
cele compared with smokers with-
out varicocele (table 1). In control
groups the mean values of semen
parameters concerning motility,
normal morphology and liner ve-
locity of smokers were significant-
ly less than those of nonsmokers
(Table 2).
Table (3) showed comparison
between smokers without varico-
cele in the studied groups regard-
ing Semen parameters. The mean
values of most of semen pa-
rameters concerning concentra-
tion, motility, normal morpholo-
gy and velocity in smokers with
abnormal seminogram were sig-
nificantly poor compared to those
of smokers with normal semino-
gram.
Table (4, 5) showed Comet as-
say in groups with abnormal semi-
nogram and control groups. The
mean value of DNA fragmentation
in the spermatozoa of groups with
abnormal seminogram was in-
creased significantly in both
smokers with varicocele and
smokers without varicocele com-
pared with those of nonsmokers.
Moreover the difference in sperm
DNA fragmentation was signifi-
cantly higher in smokers with va-
ricocele than smokers without va-
ricocele (table 4). Also, the mean
values of DNA fragmentation of
smokers with normal seminogram
were significantly higher than
those of nonsmokers (table 5).
Table (6) showed Effect of
smoking index on sperm DNA
fragmentation in studied groups.
The mean percentage of DNA frag-
mentation of smokers with abnor-

9898
Ahmed F. A. State, et al...
mal seminogram was significantly
higher than those of smokers with
normal seminogram for all grade
of smoking index.
Table (7) showed the higher
percentage of more than 30% of
the spermatozoa with DNA frag-
mentation assessed by comet was
detected only in the group with
abnormal seminogram in smokers
with varicocele .

9999
Benha M. J.
Vol. 29 No 2 May 2012

100100
Ahmed F. A. State, et al...

101101
Benha M. J.
Vol. 29 No 2 May 2012
DISCUSSIONDISCUSSIONDiagnosis of male infertility has
mainly been based on the semen
parameters; sperm concentration,
motility and morphology. It has
become apparent that none of
these parameters are reliable
markers for evaluation of the fer-
tility potential of a couple(16). A
search for better markers has led
to an increased focus on sperm
chromatin integrity testing in fer-
tility work-up and assisted repro-
ductive techniques. During the
last couple of decades, numerous
sperm DNA integrity tests have
been developed(17).
The quality of sperm DNA is
very important in maintaining the
reproductive potential of men.
Sperm DNA is being recognized
as an independent measure of
sperm quality that may have bet-
ter diagnostic and prognostic ca-
pabilities than standard sperm pa-
rameters(9).
There are several causes of
DNA damage; mainly smoking, va-
ricocele, oxidative stress, histone-
protamine ratio, radiation and
high temperature (18).
Cigarette smoking is a widely
recognized health hazard, yet
despite worldwide antismoking
campaigns, some people continue
to consume cigarettes on a regular
basis, and the highest prevalence
of smoking is observed in young
adult males during their reproduc-

102102
Ahmed F. A. State, et al...
tive period(19). It has been sug-
gested that cigarette smoking af-
fect every system involved in the
reproductive process.(20).
It was observed in the present
study that smoker had lower
sperm count, motility and mor-
phology in both fertile and infertile
groups.
Concerning the sperm count, it
was lower in smoker versus the
non-smokers. The difference was
statistically significant in infertile
groups. This is more or less in
agreement with findings of Kun-
zel et al.(21) and Reina Bouvet et
al.(22) who reported that smokers
had significantly lower sperm
count versus nonsmokers in infer-
tile men. Our result was also in
agreement with finding that heavy
smokers show statistically signifi-
cant lower sperm concentration
compared to mild and non smok-
er’s(19).
Concerning the motility it was
reported in the present work that
there was very high statistically
significant drop in the percentage
of motile sperm with in smokers if
compared with non-smokers. In
agreement with our finding Hassa
et al.(23) had reported that cigar-
ette smoking was associated
with statistically significant de-
crease in the total number of mo-
tile sperms.
As regard the effect of smoking
on sperm morphology, it was ob-
served in the present work that
smokers had high statistically sig-
nificant elevated percentage of
sperm with abnormal forms. Our
results support the works of Re-
ina Bouvet et al.(22) and Niu et
al.(24) who concluded that smok-
ers had statistically significant
higher number of abnormal sperm
morphology versus nonsmokers.
Chi et al.(25) reported that smok-
ers had high percent of head-piece
sperm defects versus non smok-
ers. Gaur et al.(26) mentioned
that heavy smoking produces te-
ratozoospermia.
Nicotine and its metabolites
have been implicated to mediate
the harmful effects of smoking on
sperm parameters. Also, increased
copper and lead loading in smok-
ing subjects’ mediat oxidation in
seminal plasma have been impli-
cated(27).

103103
Benha M. J.
Vol. 29 No 2 May 2012
Oxidative stress produced by
some cigarette smoking compo-
nents could be one of the mecha-
nisms involved in the change of
standard sperm parameters and
spermatozoon nuclear quality(28).
The functions of accessory sex
glands were reduced significantly
in smokers. Detached ciliary tufts
(DCTs) were observed in the se-
men of men associated with a high
incidence of smoking. It has been
postulated that DCTs originate
from the epididymal epithelium,
possibly shed as part of epididy-
mal involvement as a result of tes-
ticular pathology caused by sever-
al agents. In addition, seminal
mast cells were detected at higher
frequency among smokers(20).
On the other hand our results
regarding semen paramerers con-
tradict with those of Oldereid et
al.,(29) and Trummer et al.,(30)
who reported no statistically sig-
nificant difference in sperm con-
centration, morphology and motili-
ty between non-smokers, ex-
smokers and smokers. This differ-
ence may be due to the difference
in type, duration, number of cig-
arette smoking and method used
for semen analysis between our
study and the above mentioned
works.
In the present study the Comet
assay in the groups with normal
and abnormal seminograms
showed that the mean values of
sperm DNA fragmentation were
significantly higher in smokers
than non smokers. Also the mean
percentage of DNA fragmentation
of smokers with abnormal semino-
gram was significantly higher than
those of smokers with normal
seminograms at all degrees of
smoking index light, moderate or
severe.
Many studies reported that ex-
posure to smoking; environmental
industrial toxins, genetics and oxi-
dative stress are known to cause
sperm DNA fragmentation and in-
fertility(31-32).
Belcheva et al.(7) reported a sig-
nificant increase of population of
apoptotic spermatozoa in ejacu-
lates of smokers. They also report-
ed some degree of DNA damages
with high frequencies of double-
and single- stranded breaks in the
spermatozoa of smokers compared

104104
Ahmed F. A. State, et al...
with non smokers. However, this
difference is not statistically sig-
nificant. Sperm DNA integrity of
healthy smokers remains in the
normal range.
Ereinpeiss et al.(33) also report-
ed a significant proportion of men
with otherwise normal semen pa-
rameters but with high sperm
DNA damage.
Moreover, in agreement with
our result, Niu et al. (24) who ob-
served that smokers have a signif-
icantly higher percentage of sper-
matozoa with DNA fragmentation
than non smokers These findings
support the suggestion that smok-
ing could have impact in male re-
production that is not apparent in
the usual parameters of semen
analysis (31).
On other hand Sergerie et
al.,(34) using TUNL technique for
detection of DNA fragmentation,
they had reported that the per-
centage of DNA fragmentation was
not statistically different in heavy,
light and non smokers. Their re-
sults concluded no association be-
tween smoking and DNA fragmen-
tation of spermatozoa of healthy
men. This controversy to our re-
sults may be due to different tech-
niques used for detection of DNA
fragmentation. In present study,
comet assay was used which is
sensitive, simple and can detect
non uniform responses within a
mixed population (35).
It was observed in the present
study that the mean values of
DNA fragmentation in the sper-
matozoa of the groups with abnor-
mal seminogram were increased
significantly in both smokers with
varicocele and smokers without
varicocele compared with non
smokers. Moreover, the difference
in sperm DNA fragmentation was
statistically significant higher in
smokers with varicocele than
smokers without varicocele.
Similar to our results, Smith et
al. (36) found sperm DNA fragmen-
tation in patients with varicoceles.
They concluded that the presence
of varicocele is associated with
high levels of DNA fragmentation
even in the presence of normal se-
men profile. Moreover, Blumer et
al.(37) reported that men with va-
ricocele show highly significant
sperm DNA fragmentation. Also,

105105
Benha M. J.
Vol. 29 No 2 May 2012
significantly decreased percentag-
es of spermatozoa with abnormal
chromatin and spermatozoa with
DNA fragmentation after varicoce-
lectomy were reported by La vigne-
ra et al.(38).
Oxidative stress can occur
when there is an imbalance be-
tween the production of ROS and
the scavenging ability of antioxi-
dants in the seminal plasma (39).
The presence of oxidative stress in
infertile men suggests its role in
the pathophysiology via several
mechanisms acting in synergisms
which impair the sperm character-
istics and functional capacity(40).
In the present study, a higher per-
centage of more than 30% of the
spermatozoa with DNA fragmenta-
tion assessed by Comet was de-
tected only in the infertile groups
with abnormal seminogram in
smokers with varicocele.
Sperm DNA damage is clearly
associated with male infertility
and abnormal spermatogenesis,
but small percentage of spermato-
zoa from fertile men also pos-
sess a detectable levels of DNA
damage(41). The etiology of sperm
DNA damage is multifactorials; it
may be due to intrinsic (eg
.protamine defficiency ROS and
apoptosis) or extrinsic factors
which include, cigarette smoking,
genital tract inflammation, tes-
ticular hyperthermia and varico-
celes(42). About 40% of idiopathic
infertility had high levels of sperm
DNA fragmentation (43).
Mostafa et al., (44) who report-
ed that recent studies at molecu-
lar levels have demonstrated that
varicocele can cause testicular
DNA damage, apoptosis and
raised levels of reactive oxygen
species.
ReferencesReferences1)1) Rubes J., Selevan S.,Rubes J., Selevan S.,
Evenson D., Zudova D., Vozdo-Evenson D., Zudova D., Vozdo-
va M., Zudova Z., Robbins W.va M., Zudova Z., Robbins W.
and Perreault S. (2005) : and Perreault S. (2005) : Episod-
ic air pollution is associated with
increased DNA fragmentation in
human sperm without other
changes in semen quality. Hum.
Reprod., 20 : 2776-2783.
2)2) Zenzes M. (2000) : Zenzes M. (2000) : Smok-
ing and reproduction: gene dam-
age to human gametes and em-
bryos. Human. Repord., 6 : 122-
131.

106106
Ahmed F. A. State, et al...
3)3) Zimamman J., Brown, C.,Zimamman J., Brown, C.,
Silvan G. and Clegg D. (2000) :Silvan G. and Clegg D. (2000) :
Semen quality and human fertili-
ty: a retrospective study with
healthy couples. J. Androl.; 21 :
145-153.
4)4) Hosseinzadeh, Colagar,Hosseinzadeh, Colagar,
A., Jorsaraee G. and Tahmasb-A., Jorsaraee G. and Tahmasb-
pour Marzony E. (2007) : pour Marzony E. (2007) : Cigar-
ette smoking and the risk of male
infertility. Pak. J. Biol. Sci.; 10 :
3870-3874.
5)5) Pang M., Hoegerman S.,Pang M., Hoegerman S.,
Cuticchia A., Moon S., DoncelCuticchia A., Moon S., Doncel
G., Acosta A. and Kearns W.G., Acosta A. and Kearns W.
(1999) :(1999) : Detection of aneuploidy
for chromosomes 4, 6, 7, 8, 9, 10,
11, 12, 13, 17, 18, 21, X and Y by
fluorescence in situ hybridization
in spermatozoa form nine pa-
tients with oligoasthenoteratozoos-
permia undergoing intracyto-
plasmic sperm injection. Human.
Reprod., 14 : 1266-1273.
6)6) Saleh R., Agarwal A.,Saleh R., Agarwal A.,
Kandirali E., Sharma R., Thom-Kandirali E., Sharma R., Thom-
as A. and Nada E. (2002) : as A. and Nada E. (2002) : Leu-
kocytospermia is associated with
increased reactive oxygen species
production by human spermato-
zoa. Fertil. Steril. 78:1215-1224.
7)7) Belcheva A., Ivanova Ki-Belcheva A., Ivanova Ki-
cheva, M., Tzvetkova P. andcheva, M., Tzvetkova P. and
Marinov M. (2004) : Marinov M. (2004) : Effects of
cigarette smoking on sperm plas-
ma membrane integrity and DNA
fragmentation. Int. J. Androl.; 27 :
296-300.
8)8) Weinstein S., Mermel-Weinstein S., Mermel-
stein R., Shiffman S. and Flaystein R., Shiffman S. and Flay
B. (2008) : B. (2008) : Mood variability and
cigarette smoking escalation
among adolescents. Psychol. Ad-
dict. Behav., 22 : 504-513.
9)9) Zini A. and Libman J.Zini A. and Libman J.
(2006) :(2006) : Sperm DNA damge: clini-
cal significance in the era of as-
sisted reproduction. G.M.J., 175 :
495-500.
10)10) Ramadan A., Saleh M.,Ramadan A., Saleh M.,
Ashok Agarwal P., Rakesh K.,Ashok Agarwal P., Rakesh K.,
Sharma P., David R., Nelson M.Sharma P., David R., Nelson M.
and Anthony J. (2002) : and Anthony J. (2002) : Effect of
cigarette smoking on levels of
seminal oxidative stress in infer-
tile men: Fertil. Steril., 78 : 491-
499.
11)11) Mehrannia T. (2007) :Mehrannia T. (2007) :
The effect of cigarette smoking on
semen quality of infertile men.
Pak. J. Med. Sci., 23:717-719.

107107
Benha M. J.
Vol. 29 No 2 May 2012
12)12) World Health Organiza-World Health Organiza-
tion (1999) :tion (1999) : WHO Laboratory
Manual for the Examination of
Human Semen and Sperm-
Cervical Mucus Interaction. Cam-
bridge, United Kingdom.
13)13) Morris L., Ilott S., DixonMorris L., Ilott S., Dixon
L. and Brison, D. (2002) : L. and Brison, D. (2002) : The
spectrum of DNA damage in hu-
man sperm assessed by the single
cell gel electrophoresis. Hum. Re-
prod., 17: 990-998.
14)14) Rojas E., Lopez M. andRojas E., Lopez M. and
Valverde M. (1999) : Valverde M. (1999) : Single cell
gel electrophoresis assay : metho-
dology and applications. Journal
of Chromatography., 722 : 225-
254.
15)15) Munor B., Jacobsen B.,Munor B., Jacobsen B.,
Duffy M. and Bratmar L.Duffy M. and Bratmar L.
(2002) :(2002) : Statistical methods for
health care research. 4th ed. Uni-
versity of Pennsylvania, Boston
Collage. Lipincott, U.S.A. 1-412.
16)16) WHO (2010) : WHO (2010) : WHO. La-
boratory Manual for the Examina-
tion and Processing of Human Se-
men.
17)17) Bungum M., Bungum L. Bungum M., Bungum L.
and Giwercman A. (2011) :and Giwercman A. (2011) :
Sperm chromatin structure assay
(SCSA) : a tool in diagnosis and
treatment of infertility. Asian, 13 :
69-75.
18)18) Shamsi M., Imam S. andShamsi M., Imam S. and
Dada R. (2011) :Dada R. (2011) : Sperm DNA in-
tegrity assays: diagnostic and
prognostic challenges and implica-
tions in management. J Assist.
Reprod. Genet., 28: 1073-1085.
19)19) Collodel G., Capitani S.,Collodel G., Capitani S.,
Pammolli A., Gglannerini V., Ge-Pammolli A., Gglannerini V., Ge-
miniani M. and Moretti E.miniani M. and Moretti E.
(2010) : (2010) : Semen Quality of Male Id-
iopathic Infertile Smokers and
Nonsmokers: J Androl., 13 : 108-
113.
20)20) Mostafa T. (2010) :Mostafa T. (2010) : Cig-
arette smoking and male infertili-
ty. J. Adv. Res., 10 : 1016.
21)21) Kunzle R., Mueller M.,Kunzle R., Mueller M.,
Hanggi W., Birkhauser M., Dres-Hanggi W., Birkhauser M., Dres-
cher H. and Bersinger N. (2003):cher H. and Bersinger N. (2003):
Semen quality of male smokers
and nonsmokers in infertile cou-
ples. Fertile Steril., 79:287-291.
22)22) Reina Bouvet B., VicentaReina Bouvet B., Vicenta
Paparella C. and Nestor Feld-Paparella C. and Nestor Feld-

108108
Ahmed F. A. State, et al...
man R. (2007) : man R. (2007) : Effect of tobacco
consumption on the spermatogen-
esis in males with idiopathic infer-
tility. Arch. Esp. Urol., 60 : 273-
277.
23)23) Hassa H., Yildirim A.,Hassa H., Yildirim A.,
Can C., Turgut M., Senses T.Can C., Turgut M., Senses T.
and Sahin - Mutlo F. (2006) :and Sahin - Mutlo F. (2006) :
Effects of cigarette smoking on
semen parameters of men at-
tending an infertility clinic, clin.
Exp. Obstet. Gyencol., 33 : 19-
22.
24)24) Niu Z., Liu J., Shi T.,Niu Z., Liu J., Shi T.,
Yuan Y. and Shi H. (2010) : Yuan Y. and Shi H. (2010) : Im-
pact of cigarette smoking on hu-
man sperm DNA integrity. nation-
al journal of andrology.,4 : 300-
304.
25)25) Chia S., Xu B., Ong C.,Chia S., Xu B., Ong C.,
Tsakok F. and Lee S. (1994) :Tsakok F. and Lee S. (1994) :
Effect of cadmium and cigarette
smoking on human semen quality.
Int J Fertil. Menopausal Stud.,
39 : 292-298.
26)26) Gaur D., Taleka M. andGaur D., Taleka M. and
Pathak V. (2007) :Pathak V. (2007) : Effect of cigar-
ette smoking on semen quality of
infertile men. Singapore Med. J.,
48:119-123.
27)27) EL-Sohfy M. and ZalataEL-Sohfy M. and Zalata
A. (2004) : A. (2004) : Impact of cigarette
smoking and varicocelle on sper-
matozoal oxidative Stress, Seminal
parameters and acrosomal reac-
tion. Pan-Arab. League of Derma-
tol., 15:187.
28)28) SépaniakSépaniak S., Forges T. S., Forges T.
and Monnier-Barbarino P.and Monnier-Barbarino P.
(2006) :(2006) : Cigarette smoking and
fertility in women and men. Gyne-
col. Obstet. Fertil., 34: 945- 949.
29)29) Oldereid N., Rui H.,Oldereid N., Rui H.,
Clausen O. and Purvis K.Clausen O. and Purvis K.
(1989) :(1989) : Cigarette smoking and
human sperm quality assessed by
laser-Doppler spectroscopy and
DNA flow cytometry. J. Reprod.
fertil., 86 : 731-736.
30)30) Trummer H., Haber-Trummer H., Haber-
mann H., Haas J. and Pummermann H., Haas J. and Pummer
K. (2002) : K. (2002) : The impact of cigarette
smoking on human semen param-
eters and hormones. Human Re-
prod., 17 : 1554-155.
31)31) Potts R., Newbury C.,Potts R., Newbury C.,
Smith G., Notarianni L. and Jef-Smith G., Notarianni L. and Jef-
feries T. (1999) : feries T. (1999) : Sperm chroma-
tin damage associated with male
smoking.Mutat.Res.,423:103-111.

109109
Benha M. J.
Vol. 29 No 2 May 2012
32)32) Erenpreiss J., Spano, J.,Erenpreiss J., Spano, J.,
Bunjum M. and Giwerceman A.Bunjum M. and Giwerceman A.
(2006) :(2006) : Sperm chromatin struc-
ture and male fertility: Biological
and clinical aspects. Asian J. An-
drol., 8:11-29.
33)33) Erenpreiss J., ElzanatyErenpreiss J., Elzanaty
S. and Giwercman A. (2008) :S. and Giwercman A. (2008) :
Sperm DNA damage in men from
infertile couples. Asian Journal of
Andrology., 10:786-790.
34)34) Sergerie M., Ouhilal S.,Sergerie M., Ouhilal S.,
Bissonnette F. and Brodeur J.Bissonnette F. and Brodeur J.
(2000) :(2000) : Lack of association be-
tween smoking and DNA fragmen-
tation in the spermatozoa. Hu-
man. Reproduction., 15 : 1314-
1321.
35)35) Frazer L. (2005) : Frazer L. (2005) : Struc-
tural damage to nuclear DNA in
mammalian spermatozoa: its eval-
uation technique and relationship
with male infertility. Pol. J. Vet.
Sci., 7: 311-21.
36)36) Smith R., Kaun K., Pa-Smith R., Kaun K., Pa-
rodi D. and Madariage M.rodi D. and Madariage M.
(2006) : (2006) : Increased sperm DNA
damage in patients with va-
ricocele : relationship with semi-
nal oxidative stress. Human.
Reprod., 21:986-993.
37)37) Blumer C., Restelli A.,Blumer C., Restelli A.,
Giudice P., Soler T., Fraietta,Giudice P., Soler T., Fraietta,
R.; Nichi, M.; Bertolla, R.; Ce-R.; Nichi, M.; Bertolla, R.; Ce-
denho A. (2011) : denho A. (2011) : Effect of varico-
cele on sperm function and semen
oxidative stress. BJU. Int., 109:
259-265.
38)38) La Vignera S., CondorelliLa Vignera S., Condorelli
R., Vicari E., D’Agata R. andR., Vicari E., D’Agata R. and
Calogero A. (2011) :Calogero A. (2011) : Effects of
varicocelectomy on sperm DNA
fragmentation, mitochondrial
function, chromatin condensation,
and apoptosis. Journal of Androlo-
gy.,
39)39) Fujii J., Iuchi Y., Matsu-Fujii J., Iuchi Y., Matsu-
ki S. and Ishii T. (2003) : ki S. and Ishii T. (2003) : Coop-
erative function of antioxidant and
redox systems against oxidative
stress in male reproductive tis-
sues. Asian. J. Androl.,5:231-242.
40)40) Pasqualotto F., SharmaPasqualotto F., Sharma
R., Nelson D., Thomas A. andR., Nelson D., Thomas A. and
Agarwal A. (2000) : Agarwal A. (2000) : Relationship
between oxidative stress, semen
characteristics, and clinical diag-
nosis in men undergoing infertility
investigation. Fertil. Steril., 73 :
459-464.

110110
Ahmed F. A. State, et al...
41)41) Spano M., Bonde J.,Spano M., Bonde J.,
Hjollund H., Kolstad H., CordelliHjollund H., Kolstad H., Cordelli
E. and Leter G. (2000) :E. and Leter G. (2000) : Sperm
chromatin damge impairs human
fertility. The Danish First Preg-
nancy Planner Study Team. Fer-
tile. Steril., 73: 43-50.
42)42) Zini A. and Sigman M.Zini A. and Sigman M.
(2009) :(2009) : Are Tests of Sperm DNA
Damage Clinically Useful?. J. of
Androl., 30: 219-229.
43)43) Shamsi M., Kumar R.Shamsi M., Kumar R.
and Dada R. (2008) :and Dada R. (2008) : Evaluation
of nuclear DNA damage in hu-
man spermatozoa in men opt-
ing for assisted reproduction.
Indian. J. Med. Res., 127 : 115-
123.
44)44) Moustafa M., Sharma R.,Moustafa M., Sharma R.,
Thornton J., Mascha E., Abdel-Thornton J., Mascha E., Abdel-
Hafez M. Thomas A. and Agar-Hafez M. Thomas A. and Agar-
wal A. (2004) :wal A. (2004) : Relationship be-
tween ROS production, apoptosis
and DNA denaturation in sper-
matozoa from patients examined
for infertility. Hum. Reprod., 19 :
129-138.

111111
Benha M. J.
Vol. 29 No 2 May 2012
EFFECT OF CIGARETTE SMOKINGEFFECT OF CIGARETTE SMOKINGON SPERM DNA FRAGMENTATIONON SPERM DNA FRAGMENTATION
IN MEN WITH NORMAL ANDIN MEN WITH NORMAL ANDABNORMAL SEMINOGRAMABNORMAL SEMINOGRAM
Ahmed F. A. State MD, Mahmmoud M. Eid MD,Ahmed F. A. State MD, Mahmmoud M. Eid MD,Magdy A. Sohafy MD, Adel A. Zalata MDMagdy A. Sohafy MD, Adel A. Zalata MD
and Maha A. Elgayyar MDand Maha A. Elgayyar MD
BENHAMEDICALJOURNAL
REPRINT
Published byPublished by
Benha Faculty of MedicineBenha Faculty of Medicine Volume 29 Number 2May 2012

111111
Benha M. J.
Vol. 29 No 2 May 2012
INTERNAL ILIAC ARTERY LIGATION FORINTERNAL ILIAC ARTERY LIGATION FORINTRACTABLE POSTPARTUM HEMORRHAGE.INTRACTABLE POSTPARTUM HEMORRHAGE.
IS IT A LIFE SAVING PROCEDURE?IS IT A LIFE SAVING PROCEDURE?
Mohamed Hasan MD*, Hosam Roshdy MD,Mohamed Hasan MD*, Hosam Roshdy MD,Mohamed Gad MD and Khaled El-Alfy MDMohamed Gad MD and Khaled El-Alfy MD
Departments of General & Vascular Surgery, *Obesraric & Gyaencolical,
Faculty of Medicine, Mansoura University, Egypt
AbstractAbstractBackground:Background: Postpartum hemorrhage (PPH) is a major cause of
worldwide maternal mortality ranging from 13% in developed countriesto 34% in developing countries. Uterine atony is the commonest causeof life threatening obstetric hemorrhage. In women not responding tomedical treatment. The traditional surgical treatment to perform anemergency hysterectomy. Bilateral ligation of internal iliac (hypo-gastric) arteries (BIL) is an alternative life-saving operation.
Patients and Methods: atients and Methods: This study was conducted in MansouraUniversity hospital from 2008 to 2012. Thirty women presented by post-partum Hemorrhage where included in the study during this period. Alloperative procedures were performed by the same consultant team ofobstetrician and surgeon. All patients had bilateral ligation of internaliliac artery, if bleeding does not stopped & continued unabated decisionfor hysterectomy was taken.
Results: esults: Seventeen patients (57%) had vaginal delivery and 13 pa-tients (43%) had caesarean section. All patients had sings of hypovo-laemic shock. Twenty patients are multipara and ten patients are pri-miparous. Their age rage from (19-40 years) Mean 27+4.5 years. Threewere three maternal deaths in out study. Hysterectomies were done de-spite Bilateral IIAL in nine patients. There were liver impairment innine patients and renal impairment in four patients.
Conclusion: onclusion: Bilateral internal iliac artery ligation is safe and effec-tive procedure in treatment of post partum hemorrhage, prevent hyster-

112112
Mohamed Hasan et al...
IntroductionIntroductionPostpartum hemorrhage (PPH)
is a major cause of worldwide ma-
ternal mortality ranging from 13%
in developed countries to 34% in
developing countries(1). It is re-
ported to be responsible for over
125 000 maternal deaths each
year and is associated with mor-
bidity in 20 million women per
year(2).
Classically. PPH has been de-
fined as a blood loss greater than
500 ml after a vaginal delivery and
greater than 1000 ml. after a ce-
sarean section(3).
A more useful and accepted
definition of PPH is defined as
blood loss sufficient to cause hy-
povolemia, a 10% drop in the
hematocrit or requiting transfu-
sion of blood products (regardless
the route of delivery)(4). PPH of
this nature may occur in 4% of
vaginal deliveries and up to 6% of
cesarean deliveries in developed
countries(5).
Uterine atony accounts for 80%
of cases of PPH. Other causes in-
clude retained placental frag-
ments, Lower genital tract lacera-
tions and uterine rupture(6).
When PPH continues despite
aggressive medical treatment.
Early consideration should be giv-
en to surgical intervention. The
choice of procedure will depend on
the parity of the women and her
desire for childbearing. The extent
of hemorrhage and, most impor-
tantly, the experience and judg-
ment of the surgeon (7).
Uterine atony is the commonest
cause of life threatening obstetric
hemorrhage. In women not re-
sponding to medical treatment.
the traditional surgical treatment
to perform an emergency hysterec-
tomy eliminating any possibility of
future fertility. Bilateral ligation of
internal iliac (hypogastric) arteries
(BIL) is an alternative life-saving
operation, which preserves repro-
ductive capacity (8).
ectomy in women with uterine atony and facilitates repair or hysterecto-my when indicated in traumatic PPH.
Key words:Key words: internal iliac artery ligation, postpartum hemorrhage,Hysterectomy.

113113
Benha M. J.
Vol. 29 No 2 May 2012
Internal iliac artery ligation
does not produce pelvic ischemia,
it merely converts the high pres-
sure arterial flow in the pelvic ar-
teries into a sluggish venous-like
flow, allowing clotting and hae-
mostasis; and successful pregnan-
cies have been reported after the
procedure(9).
Following ligation of internal
iliac artery, there is a reduction
of 85% in pulse pressure and
48% in the blood flow in the
arteries distal to the ligation.
Thereby the arterial pressure ap-
proaches the venous pressure and
is rendered more amenable to he-
mostasis by a simple clot forma-
tion(10).
The aim of this study is to de-
scribe the effectiveness of internal
iliac artery ligation for control of
life threatening post partum hem-
orrhage.
Patients and MethodsPatients and MethodsThis study was conducted in
Mansoura University hospital
from 2008 to 2012.
Thirty women presented by
postpartum Hemorrhage where
included in the study during this
period.
All operative procedures were
performed by the same consultant
team of obstetrician and surgeon
Women with atonic PPH at vag-
inal delivery or caesarean section
were initially treated with massage
and uterotonics such as oxytocin
infusion and carboprost injections
250 mg at appropriate intervals.
Failure to restore the uterine tone
and arrest the blood loss despite
these measured led to the deci-
sion to do BIIAL ligation.
All the patients in the study
had BIIAL by transpertioneal ap-
proach.
The women were placed in
the semi-lithotomy position as it
permitted assessment of vaginal
bleeding. When quick access was
required in high-risk situations
like rupture Uterus or shock, a
midline infraumbilical incision
was preferred. Otherwise, a Pfan-
nenstiel incision was used. The
uterus was pulled out of the ab-
dominal incision and bowels were
packed away. After identifying

114114
Mohamed Hasan et al...
the ureter at the pelvic brim, the
peritoneum was incised starting
from a point just proximal to the
bifurcation of the common iliac ar-
tery proceeding caudally along the
external iliac artery for a length of
about 8-cm. Using gentle finger
dissection, the ureter was retract-
ed medially exposing the retroperi-
toneal anatomy. Using a long hae-
mostat, the fascia around the
internal iliac artery was dissected
completely to free the artery from
its adjacent structures and to
clarify the anatomical relationship
of the internal iliac artery with the
iliac veins. A right-angled clamp
was passed beneath the internal
iliac artery from lateral to medial
side about four cm distal to its ori-
gin. Using a nonabsorbable No-O
silk suture the internal iliac artery
was double ligated without divi-
sion.
The procedure is repeated on
the other side. All patients had bi-
lateral ligation of internal iliac ar-
tery, if bleeding does not stopped
& continued unabated decision for
hysterectomy was taken.
ResultsResultsSeventeen patients (57%) had
vaginal delivery and 13 patients
(43%) had caesarean section. All
patients had sings of hypovolaem-
ic shock. Twenty patients are mul-
tipara and ten patients are primip-
arous. Their age rage from (19 -
40 years) Mean 27 + 4.5 years.
Hysterectomies were done in
our study despite Bilateral IIAL in
nine patients. There were liver im-
pai-rment in nine patients and re-
nal impairment in four patients.
There were three maternal deaths
in out study.

115115
Benha M. J.
Vol. 29 No 2 May 2012

116116
Mohamed Hasan et al...

117117
Benha M. J.
Vol. 29 No 2 May 2012
DiscussioniscussionThere is extensive collateral cir-
culation in the pelvis both be-
tween branches of the two-
hypogastric trunks, and from the
systemic circulation. In the ab-
sence of severe local or systemic
vascular disease. Serious pelvic is-
chemia is unlikely to be produced
by internal iliac ligation, even with
the ligature above the point of di-
vision into the two trunks(11).
Kelly(12) first performed ligation
of internal iliac artery with a suc-
cess rate 95% and without any
major complication. Mukherjee et
al (13) performed 36 cases of inter-
nal artery ligation with a success
rate of 83.3% in 6 years.
Burchell and Olson(14) showed
that within seconds of ligation,
blood enters the iliolumbar. Later-
al sacral and middle haemorrhoid-
al arteries in a retrograde fashion.
From the lumbar, middle sacral
and superior haemorrhoidal ves-
sels. The internal iliac artery im-
mediately below the ligation will
still contain blood, but the pres-
sure is markedly diminished ow-
ing to the small caliber of the con-
tributing vessels, and clots can
form and remain in the bleeding
vessel.
When uterus is preserved liga-
tion of these arteries does not
hamper future reproductive func-
tion (10). Wagarrachchi and Fer-
nando (15) observed future preg-
nancy in 50% of the cases
following bilateral ligation of inter-
nal iliac artery.
There were three maternal
deaths in our study one due to
Rupture uterus, one due to atony
& one due to cervical and vaginal
tears all of these patients dies due
to delayed interference because
they referred late to Mansoura
University hospital.

118118
Mohamed Hasan et al...
In our study, there were nine hys-
terectomies despite of BIIAL due
to massive and unstopped bleed-
ing
IIAL not only contributes to the
prevention of hysterectomy but
also in cases where hysterectomy
cannot be prevented, it facilitates
hysterectomy as in cases of ute-
rine trauma (16). IIAL Performed at
the outset decreases the bleeding,
clears the operative field and thus
enables the surgeon to avoid
blindly clamping and ligating tis-
sues submerged in a pool of blood.
This is particularly helpful in re-
ducing the risk of ureteric injury.
IIAL also facilitates repair of vagi-
nal lacerations that bleed profuse-
ly with each suture through the
vaginal wall(17).
In our study, nine patients
(30%) had Caesarean hysterec-
tomy after internal iliac artery li-
gation. This is less than Evans
and Mc Shane experience where 8
out of 14(57%) of their patients re-
quired a hysterectomy after inter-
nal iliac artery ligation(18). The
immediate formation of collateral
circulation on the pelvic wall con-
tributes to failure of control of the
bleeding and equal to Elsheikh
and Elfadul (19)study where they
reported 29% hysterectomies after
IIAL (4 patients out of 14).
Of the 17 patients we were able
to follow up ten patients had preg-
nancy and seven patients did not
desire any more children and us-
ing contraception.
ConclusionsConclusionsBilateral internal iliac artery li-
gation is safe and effective proce-
dure in treatment of post partum
hemorrhage, prevent hysterectomy
in women with uterine atony and
facilitates repair or hysterectomy
when indicated in traumatic PPH.
RefferancesRefferances1-1- Khan K. S., Wojdyla D.,Khan K. S., Wojdyla D.,
Say L., Gulmezoglu A. M. andSay L., Gulmezoglu A. M. and
Van Look P. F. (2006) : Van Look P. F. (2006) : WHO
analysis of causes of maternal
death: a syetmatic review. Lancet;
367 : 1066 - 74.
2-2- Selo-Ojente D. O. (2002) :Selo-Ojente D. O. (2002) :
Primary post portion hemorrhage.
J Obstet Gynecol; 22:463-9.
3-3- Weisbrod A., SheppardWeisbrod A., Sheppard
F., Chernofiky M. BlankenshipF., Chernofiky M. Blankenship

119119
Benha M. J.
Vol. 29 No 2 May 2012
C., Gage F., Wind G., Elster E.C., Gage F., Wind G., Elster E.
and Liston W. (2009) : and Liston W. (2009) : Emergent
management of postpartum hem-
orrhage for the general and acute
care surgeon. World journal of
emergency surgery; 4: 43.
4-4- American college of Ob-American college of Ob-
stetrics Gynecology practice Bul-stetrics Gynecology practice Bul-
letin (2006) :letin (2006) : Clinical manage-
ment Guidelines for Obstetricians
- Gynecologist number 76, Octo-
ber : Postpartum Hemorrhage.
5-5- Combs C. A., MurphyCombs C. A., Murphy
Elm Laros R. K. (1991) : Elm Laros R. K. (1991) : Factors
Associated with postpartum Hem-
orrhage with Vaginal Birth. Ob-
stetrics & Gynecology, 77 : 77 -
82.
6-6- Arulkumuran S. and DeArulkumuran S. and De
Cruze B. (1999) :Cruze B. (1999) : Surgical man-
agement of severe postpartum
hemorrhage .Curr Obstet Gyne-
col; 8:101-5.
7-7- Joshi V, Otivs S, Majum-Joshi V, Otivs S, Majum-
der R. Nikam Y and Shrivastavader R. Nikam Y and Shrivastava
M. (2007) :M. (2007) : Internal iliac artery li-
gation for arresting postpartum
hemorrhage. An international
journal of obstetrics and Gynae-
cology, 114 : 356 - 361.
8-8- Prasertcharoensuk W.,Prasertcharoensuk W.,
Swadpanich U. and LumbiganonSwadpanich U. and Lumbiganon
P. (2000) :P. (2000) : Accuracy of the blood
loss estimation in the third stage
of labor. Internal journal of Gy-
naecology & Obsterrics;71: 96-70.
9- Papp Z. and Sztany K. L.9- Papp Z. and Sztany K. L.
(1996) : (1996) : Szabo invoay. Successful
pregnancy after bilateral internal
ilic artery ligation monitored by
coloured Doppler imaging. Ultra-
sound obstet Gynaecol; 7 : 211 -
212.
10- Mukhopadhyay P., Nask-10- Mukhopadhyay P., Nask-
ar T., Hazra S. and Bhattachar-ar T., Hazra S. and Bhattachar-
ya D. (2005) : ya D. (2005) : Emergency internal
iliac artery ligation - still a life sav-
ing procedure. J obstet Gynecol
India; 55 : 144 - 145.
11- Johnston. T. B. and11- Johnston. T. B. and
whillis, J. eds (1954) :whillis, J. eds (1954) : Gray’s
Anatomy; 31st ed. P. 796. London:
Longmans, Green.
12-12- Kelly HA. (1849) : Kelly HA. (1849) : Liga-
tion of internal iliac arteries for
hemorrhage in hysterectomy for
carcinoma uteri. Bull Johns Hop-
kins Hosp; 5:53.
13-13- Mukherjee P., Das C.Mukherjee P., Das C.

120120
Mohamed Hasan et al...
and Mukherjee G. (2002) : and Mukherjee G. (2002) : Emer-
gency internal iliac artery ligation
for obstetrical and gynecological
hemorrhage. J obstet Gynaecol.
Ind; 52:147 - 9.
14- Burchell R. C. and Men-14- Burchell R. C. and Men-
ger W. F. (1969) : ger W. F. (1969) : Int. J. Gynaec.
Obstet;7,85.
15- Wagarrachchi and Fer-15- Wagarrachchi and Fer-
nando L. (2000) :nando L. (2000) : Fertility follow-
ing ligation of internal iliac arter-
ies for life-threatening obstetric
haemorrhage:case report. Hum
Reprod; 15:1311-3.
16- Crutshunk S. H. (1986) :16- Crutshunk S. H. (1986) :
management of postpartum and
pelvic hemorrhage. Clin Obestet
Gynecol; 2:213-19.
17-17- Romans H. Sentilhes L.Romans H. Sentilhes L.
and Cingotti M. (2005) : and Cingotti M. (2005) : Uterine
devascularization and subsequent
major intrauterine synechiae and
ovarian failure. Fertil Steril;
83:755-7.
18- Evans S. and McShane P.18- Evans S. and McShane P.
(1985) : (1985) : The efficacy of internal ili-
ac artery ligation in obstetric hem-
orrhage. surg Gynecol obstet; 166:
253.
19- El-Sheikh M. and El-19- El-Sheikh M. and El-
Fadual B. (2000) :Fadual B. (2000) : Bilateral inter-
nal iliac artery ligation in obstetric
hemorrhage Yemen Medical Jour-
nal; 3: 106 - 114.

121121
Benha M. J.
Vol. 29 No 2 May 2012
INTERNAL ILIAC ARTERYINTERNAL ILIAC ARTERYLIGATION FOR INTRACTABLELIGATION FOR INTRACTABLEPOSTPARTUM HEMORRHAGE.POSTPARTUM HEMORRHAGE.
IS IT A LIFE SAVING PROCEDURE?IS IT A LIFE SAVING PROCEDURE?
Mohamed Hasan MD, Hosam Roshdy MD,Mohamed Hasan MD, Hosam Roshdy MD,Mohamed Gad MD and Khaled El-Alfy MDMohamed Gad MD and Khaled El-Alfy MD
BENHAMEDICALJOURNAL
REPRINT
Published byPublished by
Benha Faculty of MedicineBenha Faculty of Medicine Volume 29 Number 2May 2012

121121
Benha M. J.
Vol. 29 No 2 May 2012
ROLE OF SUPPRESSOR GENES ANDROLE OF SUPPRESSOR GENES ANDANGIOGENIC FACTORS IN HEPATOCELLULARANGIOGENIC FACTORS IN HEPATOCELLULAR
CARCINOMA IN CIRRHOTIC PATIENTSCARCINOMA IN CIRRHOTIC PATIENTS
Aml M. E. Ismaiel M.Sc, Eman Y. Al-Ttanaihy Ph.D,Aml M. E. Ismaiel M.Sc, Eman Y. Al-Ttanaihy Ph.D,Azmi A. Awad Ph.D, Soheir M. A. Sirag Ph.DAzmi A. Awad Ph.D, Soheir M. A. Sirag Ph.D
and Ibrahim El-Dosoky Ph.Dand Ibrahim El-Dosoky Ph.DDepartment of ophthalmology, Faculty of Medicine,
Mansoura University, Egypt.
AbstractAbstractObjective:Objective: Hepatocellular carcinoma (HCC) is the most common pri-
mary hepatic malignancy and the third cause of cancer related deathsin the world. Genetic and epigenetic alterations accumulate under theeffect of risk factors (viral infections, aflatoxin exposure.etc). Mutation ofp53 gene and overexpression of VEGF are among these important alter-ations. The aim of this work is to correlate expression of p53 and VEGFin HCC tissue arising in cirrhotic patients with clinicopathological pa-rameters. Materials and Methods: Materials and Methods: This study was conducted on 70cases of HCC arising on top of cirrhosis and selected from surgical pa-thology files of gastroenterology center in Mansoura University duringthe period from 2008 to 2011. Immunohistochemistry for P53 andVEGF was performed. Nuclear staining for P53 and cytoplasmic stainingfor VEGF was considered positive. Results: Results: 40% of cases were P53 posi-tive. There was statistically positive correlation between age, size andgrades of p53 staining (p=0.001). There was significant positive correla-tion between tumor grade and degree of P53 staining (p=0.000). All cas-es show negative staining in surrounding cirrhotic tissue. 91.4% of cas-es were VEGF positive. There was positive correlation between size andVEGF positivity (p=0.355).There was statistical significance between dif-ferent grades of the tumor and grades of VEGF staining (p=0.003). Con-Con-clusions:clusions: There was positive correlation between p53 expression andVEGF expression and age of patient, size of the tumor and grade. Thisshould be included in the strategies of target therapy. Absence of p53

122122
Aml M. E. Ismaiel, et al...
IntroductionIntroductionHepatocellular carcinoma is the
most common primary hepatic
malignancy of adults and the third
most common cause of cancer-
related deaths(1). It is a tumor of
interest to investigators in many
fields, especially to those interest-
ed in the pathogenesis of human
cancer(2). There is a wide differ-
ence in geographical distribution
of HCC with the highest incidence
in Asia and sub-Saharan Africa
and lowest in USA and Western
Europe(3). The incidence has been
doubled in recent years attributed
to the rising incidence of hepatitis
infection and fatty liver disease re-
lated cirrhosis (2).
Hepatocellular tumorigenesis is
a DNA disease due to the accumu-
lation of alterations in the genes
that control the cell cycle and cell
proliferation, as well as, a large
number of genetic and epigenetic
alterations accumulate during this
process. Classically, in the initia-
tion of carcinogenesis, the differ-
ent risk factors (viral infections,
cirrhotic lesions, obesity, aflatoxin
exposure, haemochromatosis,…..)
contribute to promoting the occur-
rence of gene alteration in hepa-
tocytes. Then, tumor development
process will select the altered he-
patocyte with the highest capacity
to survive and proliferate. These
alterations together with other
pathways, such as angiogenesis,
are the bases for the carcinogenic
process (4).
P53 gene is an important tu-
mor suppressor gene that plays
important roles in controlling the
cell cycle, cell growth, division and
apoptosis by acting as a transcrip-
tion factor or by forming complex-
es with other proteins. P53 muta-
tion is frequently detected in HCC.
It is associated with lower cellu-
lar differentiation and poor prog-
nosis (5). Abnormalities of p53 are
also considered a predisposing
factor for hepatocarcinogenesis.
expression in surrounding cirrhotic tissue make it useless as a surveil-lance marker of high risk cirrhotic patients while high expression ofVEGF in surrounding cirrhotic tissue makes it good candidate for sur-veillance for high risk group patients.
Key Words: Key Words: HCC- P53- VEGF- Immunohistochemistry.

123123
Benha M. J.
Vol. 29 No 2 May 2012
Hence, restoration of a wild-type
p53 gene is an attractive approach
to the treatment of HCC (6).
Angiogenesis is critical for the
growth and progression of various
human solid tumors because it
enables delivery of oxygen and nu-
trients (7). Angiogenesis is regulat-
ed by angiogenic factors, such as
vascular endothelial growth factor
(VEGF) and angiopoietins, which
can be secreted by tumor cells.
VEGF has emerged as the central
regulator of the angiogenic pro-
cess in physiological and patho-
logical conditions. VEGF, also
known as vascular permeability
factor, stimulates the proliferation
of endothelial cells (8).
Hepatocellular carcinoma is
one of the most vascular solid
tumors, in which angiogenesis
plays an important role in its
development, progression, and
metastasis(9). Significant HCC
growth is dependent on angiogen-
esis, and an increase in tumor di-
mension beyond 0.5 mm will in-
duce the proliferation of vascular
endothelial cells. It has been
shown that VEGF expression sig-
nificantly increases during the
course of liver fibrosis through cir-
rhosis till HCC development(10).
Antiangiogenic strategies that tar-
get angiogenic molecules and in-
hibit activation of various types of
cells that participate in the angio-
genic processes become potential
therapies for HCC (11).
The aim of this work is to study
the expression of P53 and VEGF
in HCC tissue and surrounding
cirrhotic tissue using immunohis-
tochemistry on liver resection
specimens and correlation be-
tween these molecular markers
and clinicopathological parame-
ters.
Materials and MethodsMaterials and MethodsThe study was conducted on 70
cases received in the Mansoura
Gastroenterology Center pathology
lab. 57 cases were retrospective
from 2008 to 2009 and the re-
maining 13 were collected during
the period of the study from 2010
to 2011. All the cases were HCC
on background of cirrhosis. Cases
arising in normal livers, asso-
ciated with bilharizial fibrosis
only with no evident cirrhosis, or
received previous adjuvant thera-
py or chemo-embolization were

124124
Aml M. E. Ismaiel, et al...
excluded. Resection specimens, as
well as total hepatectomy speci-
mens from the patients underwent
liver transplant surgery, were
used in the study. No Tru cut bi-
opsy material was used. The path-
ologic diagnosis and classification
of variables were based on the cri-
teria recommended in the General
Rules for Clinical and Pathological
Study of Primary Liver Cancer(12)
and included age, gender, liver pa-
thology (cirrhosis), tumor size (<5
cm vs ≥ 5cm), tumor grade, vascu-
lar invasion, and multiplicity(10).
Sixty patients were males and
ten patients were females with
age ranging from 44 to 69 years
(mean =55.06 years). All patients
were HCV positive confirmed by
PCR.
Immunohistochemical staining: Immunohistochemical staining:
Formalin-fixed, paraffin-embe-
dded sections of tumor tissue and
surrounding cirrhotic tissue ob-
tained from the resected liver
specimens were cut into 4 mi-
crons thick sections. Antigen re-
trieval was performed by using
0.01 M citrate buffer in case of
P53 for 10m, and by EDTA in case
of VEGF for 10m. The slides were
then incubated overnight with
monoclonal anti- p53 (1:150 dilu-
tion, Invitrogen; code No.18-7251),
and for 1 hour for mouse polyclo-
nal anti VEGF antibody (1: 100 di-
lution, Invitrogen code No.
726127A). This was followed by bi-
otin-conjugated goat anti-mouse
immunoglobulin and horseradish
peroxidase-conjugated streptavi-
din (UltraVision Detection system)
DAP was used as chromogenic
substrate. The brown precipitate
was identified as positive staining.
Positive staining of p53 with nu-
clear localization were graded by
counting the number of positive
nuclei in 8- 10 randomly chosen
medium power (20 x magnifica-
tion) fields; (-) no positive cells, (+)
< 30 %, (++) = 31%- 70% and (+++)
> 71% (13). For VEGF cytoplasmic
staining of more than 10% of the
tumor cells were defined as posi-
tive, the intensity of immunoreac-
tivity was graded as weak (+) mod-
erate(++) and marked(+++)(8). The
expression of both markers was
correlated with positive, (cancer
breast for P53 and cancer colon
for VEGF), and negative controls.
The expression of both markers
was correlated with clinicopatho-
logical data collected. For this
purpose the patients were divided

125125
Benha M. J.
Vol. 29 No 2 May 2012
into two age groups (< 60 years &≥
60 years), size (< 5cm & ≥ 5cm),
and tumors were graded according
to Edmonson and Steiner four
tiered grading system (14, 2).
Statistical analysis of data
was done by using Excel pro-
gram and SPSS program (statisti-
cal package of social science). De-
scriptive data are in the form of
mean ±standard deviation and fre-
quency of cases. Analytic data
was done by comparing groups
using Chi- square test and Pear-
son test for correlation. P is sig-
nificant if <0.05.
ResultsResultsImmuno histochemical ex-Immuno histochemical ex-
pression of p53:pression of p53:
There were forty two (60%)
P53 negative cases that showed
no evidence of staining or staining
of cell nuclei less than 10% (Fig-
ure: 1) . Twenty eight cases (40%)
were positive. Eight cases (8.6%)
were (+) (Figure: 2) four (5.7%)
were (++) = (Figure: 3) while eight-
een cases (18) (25.7%) were (+++)
(Figure: 4). There was negative
staining of p53 in the surrounding
cirrhotic tissue in all seventy cas-
es (Figure: 5).
As shown in table 1; seventy
one per cent of patients 60 years
or more show positive staining of
p53 and 57.1% of them show high
degree of the stain (+++), in con-
trast to 32.1% of patients under
60 years who were positive and
only 17.9% of them show high
grade of staining (+++). The differ-
ence in p53 positivity between two
age groups was statistically signif-
icant (p=0.007) and there was sta-
tistically positive correlation be-
tween age and grades of p53
staining (p=0.001). As regard to
gender most of positive P53 cases
(22.9%) are male. Of these, four-
teen (23.3%) are more than 70%
positive (+++). There was no differ-
ence between male and female
positivity for p53 (p=1.00). In rela-
tion to size, most positive p53 cas-
es are 5cm or more in size with
fourteen cases (63.6%) of them
more than 70% (+++) positivity,
however in tumors less than 5cm
in size there are four cases (4)
(18.2%) also show positivity more
than 70% (+++). The difference in
p53 positivity in two size groups
was statistically insignificant
(p=0.67). There was non statisti-
cally significant positive correla-
tion between tumor size and grade

126126
Aml M. E. Ismaiel, et al...
of p53 staining (p=0.29). Most of
positive cases of p53 were GIII tu-
mors. Fourteen (53.8%) of them
are (+++) while four (15.4%) are (+)
and only two (7.7%) are (++). GIV
tumors showed six positive cases,
four of them (66.7%) are (+++).
Only two cases (5.6%) of GII tu-
mors are positive with positivity
from 10 - 30% of tumor cells (+).
No cases of GI were positive for
p53 staining. There was signifi-
cant positive correlation between
Tumor grade and degree of P53
staining (p=0.000).
Immunhistochemical expres-Immunhistochemical expres-
sion of VEGF:sion of VEGF:
Immunohistochemical staining
of the 70 cases for VEGF shows
expression of the biomarker in
both tumor tissue and the sur-
rounding cirrhotic tissue and the
endothelial cells lining the blood
vessels in the tumor area mainly
and in the nearby periphery of the
tumor. There were six (8.6%) cas-
es negative for VEGF (Figure: 6).
Sixty four (91.4%) of cases were
positive for VEGF; eight (11.5%)
showed weak staining (+) (Figure:
7), thirty two (45.7%) were of mod-
erate staining (++) (Figure: 8),
twenty four (34.3%) showed
marked staining (+++) (Figure: 9).
In twenty two cases the stain was
more intense at the periphery of
the tumor than in the centre and
in fourteen cases the stain was
more intense in the surrounding
cirrhotic tissue than the tumor it-
self (Figure:10).
Table 2 shows that, of patients
under the age of 60 years, twenty
six cases (46.4%) were moderately
positive for VEGF (++), twenty
case (35.7%) were markedly posi-
tive (+++) and four cases (7.1%)
were weak (+). While in patients
60 years or more, six cases
(42.9%) were moderately positive
(++), four cases (28.6%) in both
mild (+) and marked (+++) staining
category. None statistically signifi-
cant positive correlation between
age and VEGF positivity was
found (p=0.206). The difference
between two age groups was sta-
tistically insignificant (p=0.2).
Twenty six (43.3%) of male cases
showed moderate intensity of
staining (++) while twenty two cas-
es (36.7%) showed marked inten-
sity (+++). Six (60%), out of the ten
(14.3%) female cases, showed
moderate intensity (++). The differ-
ence between male and female

127127
Benha M. J.
Vol. 29 No 2 May 2012
positivity of VEGF was statistically
insignificant (p=0.296). As regard
the size of the tumor, ten tumors
less than 5cm (45.5%) showed
moderate staining (++). Twenty
two tumors (31.4%) of 5cm or
more size showed (++) degree of
staining, eighteen (25.7%) cases
showed (+++) degree of staining
while four (4) (5.7%) cases were
weak (+). The VEGF positivity dif-
ference between two size groups
was statistically insignificant
(p=0.916). There was positive cor-
relation between size and VEGF
positivity (p=0.355).
Two GI tumors (100%) show
marked degree of positivity for
VEGF (+++). Twenty two cases
(61.1%) of GII tumors, showed
moderate degree of staining (++),
while in GIII tumors, the largest
number of cases (10) (38.5%)
showed marked degree of staining
(+++). Four cases (4) (66.7%) of
GIV tumors showed marked de-
gree of staining (+++). There was
statistical significance between
different grades of the tumor
and grades of VEGF staining
(p=0.003). There were increased
number of cases of vascular inva-
sion with increased intensity of
VEGF expression and twelve
(17.1%) cases showed marked de-
gree of staining (+++). There was
positive correlation between VEGF
degrees of staining and vascular
emboli (p=0.000).

128128
Aml M. E. Ismaiel, et al...
Fig. 1 :Fig. 1 : Showing negative staining
of p53 in the tumor tis-
sue.
Fig. 2 :Fig. 2 : Showing mild staining of
p53 10 - 30% of nuclei
show positive stain.

129129
Benha M. J.
Vol. 29 No 2 May 2012
Fig. 4 :Fig. 4 : Showing negative cirrhotic
tissue for p53.
Fig. 6 :Fig. 6 : show the the intensity of
VEGF stain is weak (+).
Fig. 3 :Fig. 3 : The stain of p53 is
marked > 70 % 0f cells
are positive.
Fig. 5 :Fig. 5 : Showing negative VEGF in
tumor tissue.

130130
Aml M. E. Ismaiel, et al...
Fig. 8 :Fig. 8 : The Stain of VEGF is of
marked intensity (+++).
Fig. 10 :Fig. 10 : Showing intense VEGF
stain in the surrounding
cirrhotic tissue that HCC
tumor tissue.
Fig. 7 :Fig. 7 : The stain of VEGF is mod-
erate (++).
Fig. 9 :Fig. 9 : Showing increased inten-
sity of theh VEGF stain at
the periphery of the tu-
mor more than the center
area.

131131
Benha M. J.
Vol. 29 No 2 May 2012
DiscussionDiscussionP53 is an important member of
apoptosis network; the mutant
protein can be detected by immu-
nohistochemical staining. Gener-
ally speaking, mutations of p53
were considered relatively late
events in HCC development and
correlated with tumor recurrence
and prognosis (15).
Zhang et al,(16) reported that,
several IHC-based studies have
shown the proportion of p53-
positive HCC cases to vary in the
range of 24-69%. In this study,
twenty eight cases (40%) were
positive. This percentage lies
within most of the reported
percentages including that of
Stroescu et al,(13) and Zhang et
al,(16) and others. The cause for
the variation in p53 expression
may be partially due to the lack of
a consistent way of measuring
p53 positivity among different
studies. Another cause of the dis-
crepancy in the reported percent-
age of p53-positive tumors is the
differences in the p53 mutation
and expression according to the
relevance of carcinogenic factors
and certain unknown molecular
mechanisms.
Goodman et al,(2) reported
that, there is a direct correlation
between Aflatoxin exposure and
mutation of P53 especially G to T
mutation. In addition, Sanyal et
al,(17) mentioned the role of HCV
NS2-5 proteins that cause seques-
tration of P53, inhibition of P21
WAF and induction of oxidative
stress. In addition to direct inter-
action of HCV core protein with
P53. In this study all the patients
were HCV positive confirmed by
PCR as well as there is high inci-
dence of Aflatoxin exposure in the
locality which explains the results
of P53 positivity which is more to-
ward the higher levels.
Ng et al,(18) reported that the
presence of p53 mutations did not
show a significant association
with tumor size, gender, age, tu-
mor invasiveness, microsatellites
and venous permeation, cirrhosis
and encapsulation. However,
Stroescu et al, (13) mentioned oth-
er studies show strong association
between p53 overexpresion and
large tumors as well as post- re-
section recurrence.
In our study there was positive
correlation between age and p53

132132
Aml M. E. Ismaiel, et al...
positivity grades (p=0.001). On
other hand, there was no signifi-
cant difference between male and
female positivity for p53 (p=1.00).
There was positive correlation be-
tween tumor size and p53 degrees
of staining (p=0.29).
Different studies the frequency
of mutation of p53 tumor suppres-
sor gene of HCC increased with
the increased grading of the tu-
mor(19). In this study, There was
significant positive correlation be-
tween the expression of p53 and
the grade of the tumor (p=0.000)
which is coincident with Tanaka
et al, (19).
Different researches were per-
formed to study the expression of
biomarkers as p53 in the HCC
carcinoma tissue and surrounding
liver tissue in order to examine
the ability to use these biomarkers
for early detection of high risk cas-
es(10). In correlation with the sur-
rounding cirrhotic tissue, in this
study all seventy cases show neg-
ative surrounding cirrhotic tissue
to p53 stain even with cases of
high degree of positivity. This was
also reported by Alves et al,(20)
while studying expression of p53
in both HCC and surrounding
cirrhosis in Brazilian patients
which also considered of high inci-
dence area. On contrary, Zhang et
al,(16) reported the positivity of
P53 in surrounding normal, not
cirrhotic, liver tissue in their
study but with lesser degree than
HCC.
Deli et al,(10) reported that
VEGF plays an important role in
the angiogenesis of HCC. Studies
have demonstrated that increas-
ing expression of VEGF is correlat-
ed with aggressive behaviors and
a poor prognosis of various hu-
man cancers including breast,
gastric, esophageal and colorectal
cancer. It is reported that expres-
sion of VEGF in HCC is correlated
with cirrhotic liver.
There is increased level of
VEGF in HCV- related HCC as a
result of VEGF gene amplifica-
tion(21,22). As our cases are all
HCV positive, so explain the high
expression level of VEGF by
91.4%.
Moon et al,(8) stated that VEGF
in HCC is correlated with tumor
size. In this study, as regard the

133133
Benha M. J.
Vol. 29 No 2 May 2012
size of the tumor, there was corre-
lation between the size of the tu-
mor and expression of VEGF keep-
ing with Moon et al statement.
There was positive correlation be-
tween the size and grade of stain-
ing with VEGF (P=0.355).
VEGF expression has a signifi-
cant correlation with vascular
invasion, and intrahepatic me-
tastasis. Also positive VEGF ex-
pressions in HCC correlate with
shortened survival rates (10). In
our study, there was correlation
between the VEGF expression and
vascular invasion, as there were
increased number of cases of vas-
cular invasion with increased in-
tensity of VEGF expression as
twelve (46.2%) cases showed
marked degree of staining (+++).
There was positive correlation be-
tween VEGF degree of staining
and vascular emboli (0.000).
Yoo et al,(23) reported signifi-
cant correlation between expres-
sion of VEGF and grades of HCC
as increased expression in poorly
differentiated tumors and de-
creased in well differentiated ones.
There was also positive correlation
between grades of the tumor and
degree of VEGF expression in this
study (p=0.003).
In this study, in twenty two
cases (31, 4%), the stain was more
intense at the marginal area of the
tumor than in the centre. This
was also reported by Deli et al,
(10). This is explained by the fact
that Rapid cell proliferation in the
center of a tumor can lead to in-
creased interstitial fluid pressure,
which may result in compression
closure of capillaries and consecu-
tive tissue necrosis. Central necro-
sis areas cause a suppression of
VEGF protein synthesis.
It was reported that, there was
significant higher expression of
VEGF in the surrounding cirrhotic
liver tissue than in HCC (10), a
finding detected in our cases. This
is as a result of sustained me-
chanically- reduced blood flow
that affects the hepatocytes at the
cirrhotic area. This leads to de-
creased oxygen pressure and
strongly up- regulates VEGF tran-
scription and protein synthesis in
the cirrhotic area.
ConclusionConclusionThere was positive correlation

134134
Aml M. E. Ismaiel, et al...
between p53 expression and
VEGF expression and clinicopath-
ological markers such as age of
patient, size of the tumor and
grade. Absence of p53 in sur-
rounding cirrhotic tissue makes it
unavailable for surveillance for
high risk patients. VEGF show
combined expression in both tu-
mor tissue and surrounding cir-
rhotic tissue with intense stain in
surrounding tissue in some cases.
It can be used as marker for sur-
veillance of high risk patients.
RefrenceesRefrencees1- Kaseb A. O., Hanbali A.,1- Kaseb A. O., Hanbali A.,
Cotant M., Hassan M. M., et al.Cotant M., Hassan M. M., et al.
(2009) ;(2009) ; Vascular Endothelial
Growth Factor in the Management
of Hepatocellular Carcinoma A Re-
view of Literature. Cancer;115:
4895- 906.
2- Goodman Z. D., Terraccia-2- Goodman Z. D., Terraccia-
no L. M. and Wee A. (2012) : no L. M. and Wee A. (2012) : Tu-
mors and tumor- like lesions of
the liver in: Burt AD, portmann
BC, Ferrell LD ed. MacSween's Pa-
thology of the liver 6th edn. Vol. 2
Churchill Livingstone Elsevier;
761- 829.
3- El-Sarag H. B. and Ru-3- El-Sarag H. B. and Ru-
dolph K. L. (2007) :dolph K. L. (2007) : Hepatocellu-
lar carcinoma epidemiology and
molecular carcinogenesis. Gas-
troenterology; 132: 2557- 76.
4- Rossi J. Z. (2010) : 4- Rossi J. Z. (2010) : Molecu-
lar classification of hepatocellular
carcinoma. Digestive and Liver
Disease; 42S: S235- S241.
5- Gamal El-Din H., Abdel5- Gamal El-Din H., Abdel
Ghafar N., Saad N. E., Aziz M.,Ghafar N., Saad N. E., Aziz M.,
et al. (2010) : et al. (2010) : Relationship be-
tween codon 249 mutation in exon
7 of p53 gene and diagnosis of he-
patocellular carcinoma. Arch Med
Sci; 6, 3: 348-355.
6- Guan Y. S., La Z., Yang L.,6- Guan Y. S., La Z., Yang L.,
He Q. and Li P. (2007) : He Q. and Li P. (2007) : p53 gene
in treatment of hepatic carcinoma:
Status quo. World J Gastroente-
rol; 13: 985-92.
7- Aucejo F., Kim R., Zein N.,7- Aucejo F., Kim R., Zein N.,
Quintini C., et al. (2009) : Quintini C., et al. (2009) : Vas-
cular Endothelial Growth Factor
Receptor 2 Expression in Non-
tumorous Cirrhotic Liver Is Higher
When Hepatoma Is Beyond Milan
Criteria. Liver Transplantation;
15:169-176.
8- Moon W. S., Rhyu Kh.,8- Moon W. S., Rhyu Kh.,

135135
Benha M. J.
Vol. 29 No 2 May 2012
kang M. J., et al. (2003) : kang M. J., et al. (2003) : Over-
expression of VEGF and angio-
poietin 2: a key to high vascularity
of hepatocellular carcinoma?. Mod
Pathol; 16:552- 7.
9- Yang Z. F. and Poon R. T.9- Yang Z. F. and Poon R. T.
P. (2008) : P. (2008) : Vascular Changes in
Hepatocellular Carcinoma. The
Anatomical Record 291:721-734.
10- Deli G., Jin C. H., Mu R.,10- Deli G., Jin C. H., Mu R.,
Yang S., et al. (2005) : Yang S., et al. (2005) : Immuno-
histochemical assessment of an-
giogenesis in hepatocellular carci-
noma and surrounding cirrhotic
liver tissues World J Gastroente-
rol; 11(7):960-963.
11- Jain S., Singhal S., Lee P.11- Jain S., Singhal S., Lee P.
and Xu R. (2010) : and Xu R. (2010) : Molecular ge-
netics of hepatocellular neoplasia
Review Article. Am J Transl Res;
2(1):105-118.
12- Liver Cancer Study12- Liver Cancer Study
Group of Japan. (2000) : Group of Japan. (2000) : Gen-
eral rules for the clinical and
pathological study of primry liver
cancer, 2nd edn. Kaanehara, To-
kyo. Lozano G, Montes de Oca
Luna R. (1998). MDM2 function.
Biochim Biophys Acta. 17;1377
(2):55-9.
13- Stroescu C., Dragnea A,13- Stroescu C., Dragnea A,
Ivanov B., Pechianu C., et al.,Ivanov B., Pechianu C., et al.,
(2008).(2008). Expression of p53, cBcl-2,
VEGF, Ki67 and PCNA and Prog-
nostic Significance in hepatocellu-
lar Carcinoma. J Gastrointestin
Liver Dis;17 (4): 411-417.
14- Edmondson H. and Stein-14- Edmondson H. and Stein-
er P. E. (1954) :er P. E. (1954) : Primary carcino-
ma of the liver: a study of 100 cas-
es among 48,900 necropsies.
Cancer; 7: 462- 503.
15- Guo R. P., Shi C. Z. M.,15- Guo R. P., Shi C. Z. M.,
Zhang C. Q., Wei W., et al.Zhang C. Q., Wei W., et al.
(2006) : (2006) : Clinical value of apopto-
sis and angiogenesis factors in es-
timating the prognosis of hepato-
cellular carcinoma. J Cancer Res
Clin Oncol; 132:547-555.
16- Zhang M. F., Zhang Z. Y.,16- Zhang M. F., Zhang Z. Y.,
Fu1 J., Yang Y. F., et al. (2009) :Fu1 J., Yang Y. F., et al. (2009) :
Correlation between expression of
p53, p21/WAF1, and MDM2 pro-
teins and their prognostic signifi-
cance in primary hepatocellular. J
Transl Med. 22;7:110.
17- Sanyal A. J., Yoon S. K.17- Sanyal A. J., Yoon S. K.
and Lencionir R. (2010) : and Lencionir R. (2010) : The
Etiology of Hepatocellular Carci-
noma and Consequences for

136136
Aml M. E. Ismaiel, et al...
Treatment. The Oncologist;15
(4):14-22.
18- Ng I. O., Chung L. P.,18- Ng I. O., Chung L. P.,
Tsang S. W., et al. (1994) :Tsang S. W., et al. (1994) : P53
gene mutation spectrum in hepat-
ocellular carcinomas in Hong
Kong Chinese. Oncogene 1994; 9:
985-990.
19- Tanaka S., Toh Y., Adachi19- Tanaka S., Toh Y., Adachi
E., Matsumata T., et al. (1993) :E., Matsumata T., et al. (1993) :
TTumor Progression in Hepatocellu-
lar Carcinoma May Be Mediated
by p53 Mutation. Cancer Re-
search; 53: 2XS4- 2KX7.
20- Alves V. A. F., Nita M. E.,20- Alves V. A. F., Nita M. E.,
Carrilho F. J., Ono-Nita S. K., etCarrilho F. J., Ono-Nita S. K., et
al. (2004).al. (2004). P53 Immunostaning
pattern in Brazilian patients
with hepatocellular carcinoma.
Rev Inst Med trop S Paulo; 46 :
25-31.
21- Shimamura T., Saito S.,21- Shimamura T., Saito S.,
Morita K., et al. (2000) : Morita K., et al. (2000) : Detec-
tion of vascular endothelial growth
factor and its receptor expression
in human hepatocellular carcino-
ma biopsy specimens. J Gastroen-
terol Hepatol.; 15(6):640-6.
22- Hassan M., Selimovic D.,22- Hassan M., Selimovic D.,
Ghozlan H. and Abdel- Kader O.Ghozlan H. and Abdel- Kader O.
(2009) :(2009) : Hepatitis C virus protein
triggers hepatic angiogenesis by a
mechanism including multiple
pathway. Hepatology; 49(5): 1469-
82.
23- Yoo Y. G., Oh S. H., Park23- Yoo Y. G., Oh S. H., Park
E. S., Cho H. N., et al. (2003) :E. S., Cho H. N., et al. (2003) :
Hepatitis B virus X protein en-
hances transcriptional activity of
hypoxia-inducible factor 1alpha
through activation of mitogen- ac-
tivated protein kinase pathway. J.
Biol. Chem. 278:39076-39084.

137137
Benha M. J.
Vol. 29 No 2 May 2012
ROLE OF SUPPRESSOR GENESROLE OF SUPPRESSOR GENESAND ANGIOGENIC FACTORS INAND ANGIOGENIC FACTORS IN
HEPATOCELLULAR CARCINOMA INHEPATOCELLULAR CARCINOMA INCIRRHOTIC PATIENTSCIRRHOTIC PATIENTS
Aml M. E. Ismaiel M.Sc, Eman Y. Al-Ttanaihy Ph.D, AzmiAml M. E. Ismaiel M.Sc, Eman Y. Al-Ttanaihy Ph.D, AzmiA. Awad Ph.D, Soheir M. A. Sirag Ph.DA. Awad Ph.D, Soheir M. A. Sirag Ph.D
and Ibrahim El-Dosoky Ph.Dand Ibrahim El-Dosoky Ph.D
BENHAMEDICALJOURNAL
REPRINT
Published byPublished by
Benha Faculty of MedicineBenha Faculty of Medicine Volume 29 Number 2May 2012

137137
Benha M. J.
Vol. 29 No 2 May 2012
INTESTINAL PARASITES AMONG SCHOOLINTESTINAL PARASITES AMONG SCHOOLCHILDREN IN DAKAHLIACHILDREN IN DAKAHLIA
GOVERNORATEGOVERNORATE
Abeer El-Henawy MD and Mohamed El-Malky MDAbeer El-Henawy MD and Mohamed El-Malky MDDepartment of Medical Parasitology, Faculty of Medicine,
Mansoura University, Mansoura, Egypt.
AbstractAbstractThis study was conducted to determine the prevalence of intestinal
parasites in children attending schools in Dakahlia governorate alongthe period from October 2011 to January 2012. A total of 201 samplesfrom children of 4 governmental schools (2 urban and 2 rural) were col-lected. Prevalence of intestinal protozoa by microscopic examination ofstools were in order of frequency: Entamoeba histolytica (26.9%), Giar-dia (cyst & trophozoite) (17.9%), Giardia cyst (15.4%), E. coli cyst(7.5%), B. homimnis (4.5%), Giardia trophozoite (2.5%), and finally E.histolytica trophozoite (1.5%). There was no statistically significant dif-ferences between urban and rural areas except for E. coli cyst (14%,0.99%) in rural and urban areas respectively (p<0.001), and Giardia tro-phozoite which was absent in urban areas while in rural areas, it was5% (p=0.023). Regarding prevalence of intestinal helminthes in schools.Hymenolepis nana and S. mansoni were the highest (8.5%) each, fol-lowed by A. lumbricoides (6.5%), E. vermicularis (4.5%), and finally H.heterophyes (2.5%). There was a statistically significant difference be-tween urban and rural areas regarding prevalence of H. nana be-ing higher in rural children (14% versus 2.97%), also S. mansoni(15%, versus 1.98%) in rural and urban children respectively. While H.heterophyes was (4.95%) in urban children and absent in rural chil-dren. A. lumbricoides was 9% in rural and 3.96% in urban children. Im-pact of negative Giardia infection on children was proven as weight,height, and BMI of infected children with Giardia trophozoite were lowercompared to controls. Height residual was significantly lower in patientsinfected with Giardia trophozoite (p=0.003). Also, height residual had a

138138
Abeer El-Henawy and Mohamed El-Malky
IntroductionIntroductionParasitic intestinal infections
continue to be an important cause
of morbidity and mortality in the
developing world. Intestinal para-
sites are among the most common
infections of school age children in
developing countries. As a result
of this morbidity, they are at risk
of detrimental effects like poor
cognitive performance and physi-
cal growth (1). The purpose of this
study was to find out the preva-
lence of intestinal parasitic infec-
tion in school children of Dakahlia
as well as the impact of such in-
fections on affected children.
Material and MethodsMaterial and MethodsThis study was conducted from
October 2011 to January 2012
and included 201 schoolchildren
attending 4 governmental schools
(2 urban and 2 rural schools). A
complete clinical sheet was taken
from participants including symp-
toms suggestive of parasitic infec-
tion. General and abdominal ex-
amination was performed and
stool samples were collected in
screw capped, labelled plastic con-
tainers, which were distributed to
patients one day prior to the day
of collection. Stool samples were
subjected for complete examina-
tion - gross and direct microscopic
examination (saline and iodine
preparation) within 1 to 2 h of its
collection. Negative samples were
re-examined after formal ether
concentration method (5) and by
special stains as Trichrome stain-
ing technique and modified Ziehl-
Neelsen stain. Also Kato-Katz
technique (8) was performed and
cellophane tape was done for cas-
es with a history of perianal itch-
ing.
significant regression in presence of S. mansoni infection. This meansthat patients with S. mansoni have a lower height for their ages. Whileweight residual had a significant regression in presence of undigestedfood, E. coli cyst, S. mansoni, and B. hominis. These results contributeto the growing evidence on the association between intestinal parasiticinfection and growth retardation as intestinal parasitic infections con-tribute significantly to poor growth and malnutrition in children and in-dicate the need to implement control measures in form of regular de-worming, health education and provision of safe water supply.

139139
Benha M. J.
Vol. 29 No 2 May 2012
Statistical MethodsStatistical MethodsNon-parametric statistical
methods were used. Frequency,
mean, standard deviation and
standard error of mean were used
to describe data. Chi-square test
was used to test for association
between parasitic infections and
different risk factors. Regression
analysis was used to calculate
predicted height, weight and BMI
for each child and residual of each
variable was calculated (Residual
= actual value/predicted value).
This residual was compared in
children with and without para-
sitic infections using Mann-
Whitney µ test. Also, multiple lin-
ear regressions were used to test
the contribution of different para-
sitic infections on these residuals.
P value was considered significant
if less than 0.05. These tests were
run on an IBM compatible person-
al computer using the Statistical
Package for Social scientists
(SPSS) for windows Ver. 13 (SPSS
Inc., Chicago, IL, USA).
ResultsResults

140140
Abeer El-Henawy and Mohamed El-Malky

141141
Benha M. J.
Vol. 29 No 2 May 2012
DiscussionDiscussionIn Egypt, parasitic diseases
constitute a common health prob-
lem especially in children that
leads to malnourishment and im-
pairment in physical and mental
development (16).
Community based studies of
parasitic diseases often focus on
pediatric population. Previous
studies found a consistent correla-
tion between rates of infection in
children and its rates in adult
population thus; it reflects the
burden of such infections on
the community(7). In the present
study, 201 children from 4
schools (2 urban and 2 rural
schools) were chosen. Eighty eight
of them were females and 113
were males. Number of urban stu-
dents was 101, (48 females and
53 males). Number of rural stu-
dents was 100 (40 females and 60
males). Regarding symptoms in
schools, abdominal pain was the
commonest complaint, it was
present in 39 cases (19.4%) fol-
lowed by diarrhea in 37 cases
(18.4%), perianal itching in 15
cases (7.5%), pallor in 3 cases
(1.5%) and finally vomiting in one
case only (0.5%). Symptoms were

142142
Abeer El-Henawy and Mohamed El-Malky
found to be most common in stool
positive cases according to stool
analysis and this is logic as pres-
ence of parasitic infection leads to
the appearance of symptoms ac-
cording to the parasite found. Ab-
dominal pain was the commonest
in positive cases, followed by diar-
rhea. In comparison between ur-
ban and rural schools, as shown
in table (2), E. histolytica tropho-
zoite was found in (2%) of urban,
and (1%) of rural children with a
total of 1.5%. Entamoeba histolyti-ca cyst was found in 27.8% of ur-
ban and 26.0% of rural children
with a total of 26.9% (54 out of
201). Entamoeba coli cyst was
found in 1% only of urban and
14% of rural students (p<0.001)
with a total of 7.5% (15 out of
201). This could be explained by
the fact that urban students re-
ceive exclusively treated water
which leads to decrease preva-
lence of hydro-transmission para-
sites as E. coli in agreement with
Giraldi et al. (2001). An explana-
tion for higher rates of intestinal
parasites among urban students
is that high concentrations of peo-
ple and wastes in urban areas
create more opportunities for ex-
posure to pathogens and a corre-
spondingly greater need for the
levels of hygiene that adequate
water and sanitation make possi-
ble. In general, the overall distri-
bution of protozoa prevalence is
consistent with that found in oth-
er countries where E. histolyticaand G. lamblia are the most com-
mon protozoa. However, the per-
centages do not coincide. This
may be due to a variety of factors
such as employment of different
diagnosing techniques, geographi-
cal differences, morphologic, and
socioeconomic patterns of popula-
tions studied (age, urban versus
rural areas)(11). In general, among
school children in our study, there
was a higher prevalence of proto-
zoa than helminthes in agreement
with (6).
Regarding helminthes in our
results: Hymenolepis nana and S.mansoni were the highest (8.5%)
each, followed by A. lumbricoides(6.5%), E. vermicularis (4.5%),
and finally H. heterophyes (2.5%).
Heterophyes heterophyes was sig-
nificantly higher in urban schools
(4.95%) than rural schools (0.0%)
with a total of (2.5%; p=0.024).
Schistosoma mansoni was found
in 2 students from urban and 15

143143
Benha M. J.
Vol. 29 No 2 May 2012
students from rural schools with a
total of 17 students (8.5%;
p=0.001). A comparison between
urban and rural areas in similar
studies revealed that for example
in Chennai, A. lumbricoides was
the most common helminthic par-
asite detected in rural areas
(52.8%) followed by T. trichura(45.6%), A. duodenale (37.6%), S.stercoralis (3.2%) and H. nana(1.6%). Under urban settings, in-
testinal parasites such as T. tri-chura (2.01%), H. nana (1.01%)
and A. lumbricoides (0.50%) were
found to have much lower preva-
lence in comparison to the rural
area tested (4). Presence of S.mansoni in 15 student from rural
areas and only 2 urban students
could be explained by the habit of
playing in ponds or river among
them, while urban students have
little exposure to infection due to
absence of this habit and by feed-
back from those urban students
infected with S. mansoni, we
found both of them were resident
in countryside and just moved to
Mansoura city. Ascaris lumbri-coides was found in 13 students
9% of rural and 3.96% of urban
children with a total of (6.5%). In
Ethiopia, Legesse and Erko(9)
found prevalence of S. mansoniamong schoolchildren of (21.2%)
which was much higher than ours
(8.5%). This could be explained by
the presence of high number of
snail intermediate host making
new transmission foci in this
country.
Our results of multiple linear
regressions showed the relation
between parasitic infections and
anthropometric measures of chil-
dren especially weight and height
for age. There was only a negative
impact on weight of children in-
fected with S. mansoni (p=0.012),
E. coli cyst (p=0.007), B. hominis(p=0.033), and on those found
with undigested food in their stool
(p=0.015) leading to a decrease in
their weight for age as shown in
table. As regard effect of parasites
on height, height residual showed
a marked regression on presence
of S. mansoni; (p<0.001) and Giar-
dia trophozoite; (p=0.003) which
means that patients with S. man-soni and Giardia trophozoite have
a lower height for their ages. Our
results were in agreement with
Cooper,(2) who stated that all
forms of chronic intestinal inflam-
mation lead to growth failure

144144
Abeer El-Henawy and Mohamed El-Malky
whether by secondary effects on
nutrient balance or by more direct
effects on metabolism and also in
agreement with Parraga et al.,(13)
who reported on the effects of
treatment for S. mansoni on
growth and development in Brazil-
ian schoolchildren and concluded
that light or moderate intensity in-
fection with S. mansoni contribute
to growth deficits as evidenced
by anthropometric measurements
taken from S. mansoni-infected
children who exhibited chronic
malnutrition, with growth retarda-
tion in height and were signifi-
cantly smaller in height and
weight compared to their controls.
Similarly, in Sao Paulo, Brazil, a
study conducted among school
children found a weak but signifi-
cant association between helminth
infection and height. However, no
significant relationship between
parasitic infection and children’s
weight was detected (10). In a vil-
lage in Cote d’ivoire, a study
among schoolchildren found that
the heaviest intestinal parasitism
especially A. lumbricoides could
have a negative impact on anthro-
pometric measures, nutritional
development, and pubertal growth
of children(3). In Mexico, intestinal
parasitic infections are regarded
as main risk factors associated
with poor nutritional status in
Mexican schoolchildren according
to a study carried by(14) who
found a significantly higher weight
and height in non-infected versus
infected children. In Colombia, a
study to establish the associations
between intestinal parasitism and
undernourishment was undertak-
en in a village in the Colombian
Amazon region. Anthropometric
indices were calculated based on
height and weight for age. Indi-
ces were inversely related to age
and number of parasites (12).
Also, in rural Ecuador, children
with intestinal parasitic infections
were twice as likely as non-
infected children to suffer from
growth stunting or chronic malnu-
trition (16).
ConclusionConclusionBased on results from this
study, regular screening of chil-
dren in schools for parasitic infec-
tions is required and anthropo-
metric measures should be taken
as indicators of malnutrition and
growth suppression Also, the wide
adoption of school-based helminth
control programs will likely re-

145145
Benha M. J.
Vol. 29 No 2 May 2012
quire the active participation of
Education Ministry. Finally, we
emphasize the importance of nu-
trition education as well as health
education for children and their
parents.
ReferencesReferences1.1. Aher A. and Kulkarni S.Aher A. and Kulkarni S.
(2011): (2011): Prevalence of intestinal
parasites in school going students
of rural community. IJBR, 2(12):
605-607.
2.2. Cooper E. (1991) : Cooper E. (1991) : Intesti-
nal parasitoses and the modern
description of diseases of poverty.
Transactions of The Royal Society
of Tropical Medicine and Hygiene,
85: 168-170.
3.3. Dancesco P., Akakpo C.,Dancesco P., Akakpo C.,
Iamandi I., Abeu J., Tshipeta M.Iamandi I., Abeu J., Tshipeta M.
and Kacou E. (2005) : and Kacou E. (2005) : Intestinal
parasitoses in a village of Cote
d'Ivoire. II : Relationship between
intestinal parasitoses, physical
and physiological development
and child nutrition. Sante. Jan-
Mar; 15 (1): 11-16.
4.4. Fernandez M. C., Ver-Fernandez M. C., Ver-
ghese S., Bhuvaneswari, R.,ghese S., Bhuvaneswari, R.,
Elizabeth S. J., Mathew T., Ani-Elizabeth S. J., Mathew T., Ani-
tha A. and Chitra A. K. (2002) :tha A. and Chitra A. K. (2002) :
A comparative study of the intesti-
nal parasites prevalent among
children living in rural and urban
settings in and around Chennai.
J. Commun. Dis. Mar;34(1):35-39.
5.5. Garacia L. S. and Bruck-Garacia L. S. and Bruck-
ner D. A. (1997) : ner D. A. (1997) : Diagnostic
Medical Parasitology, 3rd ed., ASM
Press, Washington DC, USA.
6.6. Giraldi N., Vidotto O., Na-Giraldi N., Vidotto O., Na-
varro T. I. and Garcia L. J.varro T. I. and Garcia L. J.
(2001) :(2001) : Enteroparasites preva-
lence among daycare and elemen-
tary schoolchildren of municipal
schools, Rolandia, PR, Brazil Rev.
Soc. Bras. Med. Trop., July/Aug,
34 (4).
7.7. Guyatt H. L., Brooker S.Guyatt H. L., Brooker S.
and Donnelly C. A. (1999) : and Donnelly C. A. (1999) : Can
prevalence of infection in school-
aged children be used as an index
for assessing community preva-
lence Parasitology,118(3):257-268.
8.8. Katz N. Z., Coelho P. M.Katz N. Z., Coelho P. M.
Z. and Pellegrino J. (1970) :Z. and Pellegrino J. (1970) :
Evaluation of Kato quantitative
method through the recovery of
Schistosoma mansoni eggs added
to human faeces. J. Parasitol., 56:
1032-1041.

146146
Abeer El-Henawy and Mohamed El-Malky
9.9. Legesse M. and Erko B.Legesse M. and Erko B.
(2004) :(2004) : Prevalence of intestinal
parasites among schoolchildren in
a rural area close to the southeast
of Lake Langano, Ethiopia. Ethiop.
J. Health Dev.; 18 (2): 116-120.
10.10. Muniz P. T., Ferreira M.Muniz P. T., Ferreira M.
U., Ferreira C. S., Conde W. L.U., Ferreira C. S., Conde W. L.
and Monteiro C. A. (2002) : and Monteiro C. A. (2002) : In-
testinal parasitic infections in
young children in Sao Paulo, Bra-
zil: Prevalences, temporal trends
and associations with physical
growth. Ann. Trop. Med. Parasit-
ol., 96 (5): 503-512.
11.11. Navarrette-Espinoza J.,Navarrette-Espinoza J.,
Navarrette-Cadena E., Escan-Navarrette-Cadena E., Escan-
don-Romero C. and Esacobedo-don-Romero C. and Esacobedo-
de la Pena J. (1993) : de la Pena J. (1993) : Prevelencia
de Parasitosis intestinal en la po-
blacion infantil de Santiago Jamil-
tepec, Oaxaca. Rev. Med. Inst.
Mex. Seguro. Soc.; 31: 157. Eng-
lish abstract.
12.12. Ordonez L. E. and Angu-Ordonez L. E. and Angu-
lo E. S. (2002) : lo E. S. (2002) : Malnutrition and
its association with intestinal par-
asitism among children from a vil-
lage in the Colombian Amazonian
region. Biomedica. Dec; 22 (4):
486-498.
13.13. Parraga I. M., Assis A.Parraga I. M., Assis A.
M., Prado M. S., Barreto M. L.,M., Prado M. S., Barreto M. L.,
Reis M. G., King C. H. and Blan-Reis M. G., King C. H. and Blan-
ton R. E. (1996) : ton R. E. (1996) : Gender differ-
ences in growth of school-aged
children with schistosomiasis and
geohelminth infection. Am. J.
Trop. Med. Hyg., Aug; 55 (2):150-
156.
14.14. Quihui-Cota L., ValenciaQuihui-Cota L., Valencia
M. E, Crompton D. W., PhillipsM. E, Crompton D. W., Phillips
S., Hagan P., Diaz-Camacho S.S., Hagan P., Diaz-Camacho S.
P. and Triana Tejas A. (2004):P. and Triana Tejas A. (2004):
Prevalence and intensity of intesti-
nal parasitic infections in relation
to nutritional status in Mexican
schoolchildren. Trans R. Soc.
Trop. Med. Hyg., Nov; 98 (11):
653-659.
15.15. Sabry A. A. (1991) :Sabry A. A. (1991) : Par-
asitic infection in Sennores pri-
mary school, El-Fayum Governo-
rate, Egypt. J. Egypt. Soc.
Parasitol., 21 (2): 571-574.
16.16. Sackey M. E., Weigel, M.Sackey M. E., Weigel, M.
M. and Armijos R. X. (2003) :M. and Armijos R. X. (2003) :
Predictors and nutritional conse-
quences of intestinal parasitic in-
fections in rural Equadorian chil-
dren. J. Trop. Pedatr.; Feb.,49 (1):
17-23.

147147
Benha M. J.
Vol. 29 No 2 May 2012
INTESTINAL PARASITESINTESTINAL PARASITESAMONG SCHOOL CHILDREN INAMONG SCHOOL CHILDREN IN
DAKAHLIA GOVERNORATEDAKAHLIA GOVERNORATE
Abeer El-Henawy MD and Mohamed El-Malky MDAbeer El-Henawy MD and Mohamed El-Malky MD
BENHAMEDICALJOURNAL
REPRINT
Published byPublished by
Benha Faculty of MedicineBenha Faculty of Medicine Volume 29 Number 2May 2012

147147
Benha M. J.
Vol. 29 No 2 May 2012
HISTOCHEMICAL AND ULTRASTRUCTURALHISTOCHEMICAL AND ULTRASTRUCTURALSTUDY OF THE RENAL CORTEX OFSTUDY OF THE RENAL CORTEX OF
THE ADULT MALE ALBINO RAT AFTERTHE ADULT MALE ALBINO RAT AFTERADMINISTRATION OF GENTAMICIN WITHADMINISTRATION OF GENTAMICIN WITH
OR WITHOUT ADMINISTRATION OFOR WITHOUT ADMINISTRATION OFVITAMIN E OR EPOIETINVITAMIN E OR EPOIETIN
Zeinab A. Sakara Ph.D, Husseiny I. Dessouki Ph.D,Zeinab A. Sakara Ph.D, Husseiny I. Dessouki Ph.D,Shireen A. Mazroa Ph.D and Hanaa A. H. Khalaf M.Sc.Shireen A. Mazroa Ph.D and Hanaa A. H. Khalaf M.Sc.
Department of Histology & Cell biology,
Faculty of Medicine, Mansoura University, Egypt
AbstractAbstractBackground:Background: Gentamicin is the most common cause of drug induced
renal failure. When the drug accumulates in the proximal convolutedtubules, it cause acute tubular necrosis. These effects impair renalfunction.
Aim of the work: Aim of the work: This work was carried out to study the histochemi-cal and ultrastuctural changes that occurred in the renal cortex of adultmale albino rats after administration of therapeutic doses of gentamicinand the effect of vitamin E or epoietin or both on these changes.
Materials & Methods: Materials & Methods: 95 adult male albino rats were divided intothree groups. Group I: a control group. Group II: experimental groupwere divided into four equal subgroups: Subgroup IIa: were injectedwith gentamicin for 2 weeks. Subgroup IIb: received gentamicin andepoietin for 2 weeks. Subgroup IIc: received gentamicin and vitamin Efor 2 weeks. Subgroup IId: received gentamicin and both epoietin andvitamin E for 2 weeks. The kidneys from each rat used for light andelectron microscopic examination to study the renal cortex.
Result:Result: After two weeks of gentamicin administration in subgroupIIa, the lesion was mainly in the proximal convoluted tubules. The celllining showed vacuolated cytoplasm, pyknotic nuclei and there were ar-eas of cellular infiltration. The lumen of affected tubules contained epi-thelial remnants. There was a decrease in the activity of succinic dehy-

148148
Zeinab A. Sakara, et al...
IntroductionIntroductionGentamicin (GM) is an effective
aminoglycoside antibiotic, it is
widely used as a bactericidal
agent against life threatening
gram-negative bacterial infec-
tions (1).
However, its clinical use is lim-
ited, as 30% of patients treated
with gentamicin for more than 7
days show signs of nephrotoxici-
ty (2).
Nephrotoxicity is more likely to
be encountered when therapy is
continued for more than five days
as well as with higher doses or in
elderly patients (1). The recom-
mended dose of gentamicin is 3-
5mg\kg\day divided into 3 doses
or once daily in a dose of 5-7
mg\kg (for no more than 7 days in
both) (3).
The signs of tubular damage in-
cluding loss of brush borders, tu-
bular debris, cellular vacuolations
with inflammatory cellular infiltra-
tion (4). With electron microscopy
the cytoplasm of the cells of the
proximal convoluted tubules re-
vealed various intensity (5).
It was mentioned that, amino-
glycosides generate many types of
free radicals which play an impor-
tant role in aminoglycoside in-
duced toxicity. These free radicals
or cell oxidizers cause cell de-
struction through breaking down
the cell membrane and pericellu-
lar protective barrier (6).
The antioxidant at low concen-
trations delay or prevent oxidation
of the free radicals. These antioxi-
dant are either endogenous anti-
oxidant (naturally) as glutathione
drogenase enzyme activity. Electron microscopic examination revealedloss of the basal infoldings of the basement membrane of cells of PCTwith only few scattered mitochondria in the cytoplasm. Some of the nu-clei were heterochromatic with irregular outline. The histological archi-tecture of the renal cortex of the subgroups IIb,c,d were not differentthan in control group I rats.
Conclusion:Conclusion: The function and the structure of the renal cortex wasaffected by gentamicin adminstration for more than one week. Combi-nation of gentamicin with epoietin or vitamin E or both can be used toprevent the occurrence of its nephrotoxic effects.

149149
Benha M. J.
Vol. 29 No 2 May 2012
peroxidase and vitamin C or exog-
enous antioxidant as vitamin E
and selenium (7).
A number of studies have
demonstrated the ability of vita-
min E in the protection against
the nephrotoxicity induced by gen-
tamicin (4,8 &9).
Erythropoietin (Epo) is a glyco-
protein produced by the peritu-
bular interstitial cells in the mid-
dle region of renal cortex (10). It
stimulates erythroid proliferation
and differentiation by interlacing
with specific erythropoietin recep-
tors on red cell progenitors(11&12).
Epo has an important cytopro-
tective effects on various cell lines
and inhibition of apoptotic death-
related pathways has been re-
ported in renal tissue, brain and
heart (13).
Erythropoietin is a growth fac-
tor, it support the growth not only
of red cell progenitors but also
other cell types (14).
Materials and MethodsMaterials and MethodsA) Materials :A) Materials :
I- Experimental animals : I- Experimental animals :
95 adult male albino rats
(weighing about 150-200gm) were
used throughout this study. 15
rats were considered as a control
group. The rest of rats (80) re-
ceived different protocols of medi-
cations.
Groups of the animals:Groups of the animals:
I-I- Control group (group I):Control group (group I):
Animals of this group (15 rats)
were divided into 3 subgroups (5
rats each):
a) Subgroup Ia control non
medicated rats.
b) Subgroup Ib control rats
were injected intraperitonea-
ly (IP) with 1ml normal sa-
line for two week.
c) Subgroup Ic control rats
were received 1ml oil via
gastric tube for two
weeks.
II.II. Experimental groupExperimental group
(group II):(group II):
Animals of the 2nd group (80
rats) were divided into (4) sub-
groups (20 rats each):
i.i. Subgroup IIa :Subgroup IIa :
This subgroup were injected IP
with therapeutic dose (6 mg/Kg
bw/day) gentamicin sulfate (3),
(Epigent, obtained from the

150150
Zeinab A. Sakara, et al...
E.I.P.I.C.O. Company-Egypt) for 2
weeks.
ii.ii. Subgroup IIb:Subgroup IIb:
This subgroup as subgroup IIa,
received gentamicin in addition si-
multaneous IP injection of (100
IU\Kg bw\day) epoietin(14) (Re-
combinant human erythropoietin)
for 2 weeks. Epoietin was obtained
from the E.I.P.I.C.O. Company-
Egypt.
iii. Subgroup IIc:iii. Subgroup IIc:
This subgroup as subgroup
IIa received gentamicin in addi-
tion to simultaneous administra-
tion of 100mg vitamin E (4),
(Pharco Company- Egypt) dis-
solved in oil, via gastric tube, for 2
weeks.
iv. Subgroup IId :iv. Subgroup IId :
This subgroup as subgroup
IIa received gentamicin in addi-
tion to injection of epoietin and
administration of vitamin E for 2
weeks.
At the end of the experiment,
the rats were sacrificed.
The animals were fed on labor-
atory food and water ad-libitum.
At the time of sacrifice, the rats
were anaesthetized by IP injection
of 50 mg/kg pentobarbital. In
each rat, right and left kidneys
were dissected, The right kidney
was used for light microscopic ex-
amination, while the left kidney
was used for electron microscopic
examination to study the renal
cortex.
II- Staining techniques: II- Staining techniques:
1. Paraffin sections were pre-
pared and stained with Hae-
matoxylin and eosin.
2. Frozen sections were pre-
pared and treated histo-
chemically for the study of
succinic dehydrogenase en-
zyme activity (15).
3. Ultrathin sections were pre-
pared (16) and stained for
examination with transmis-
sion electron microscopic
study.
The sections were examined by
the transmission electron micro-
scope in:
• Electron Microscopic Unite
in Tanta University using Zeiss
EM 100 S transmission electron
microscope at 60 KV.

151151
Benha M. J.
Vol. 29 No 2 May 2012
ResultsResultsI) Histological Structure of the
Renal Cortex in Control group I
Rats:
Light microscopic examination:
a) Haematoxylin and eosin-:
The renal cortex of adult con-
trol rats group I contains renal
corpuscles, proximal convoluted
tubules, distal convoluted tubules
and collecting tubules. The renal
corpuscles were formed from glo-
merulus surrounded by Bowman's
capsule. Each glomerulus was
formed of numerous tortuous
blood capillary loops (Fig. 1). The
proximal convoluted tubules occu-
pied the majority of the cortex.
The cells lining of these tubules
were cuboidal with indistinct
boundaries between the cells. The
free borders of these cells had stri-
ated brush border. The cytoplasm
was acidophilic and granular. The
nuclei were rounded, basal and
vesicular. (Fig. 1).
b)- Succinic dehydrogenase en-
zyme activity:
Examination of fresh frozen
sections in the control renal cortex
treated for the activity of succinic
dehydrogenase enzyme revealed
strong reaction in the proximal
convoluted tubules, and distal
convoluted tubules. While the
glomeruli exhibited a negative re-
action (Fig. 2).
Electron microscope:Electron microscope:
Examination of The renal cor-
puscles under the electron micro-
scope revealed the presence of the
glomerular capillaries that were
surrounded by podocytes which
exhibited major and minor pro-
cesses. (Fig. 3).
The proximal convoluted tu-
bules with E/ M revealed that the
cell lining rest on a basement
membrane. The cytoplasm con-
tained lysosomes and mitochon-
dria. The mitochondria were tubu-
lar and longitudinally oriented
inside basal infoldings of the cell
membrane. The nucleus was cen-
tral, rounded and euchromatic.
(Fig 4).
The distal convoluted tubule
cells showed numerous, tubular
and longitudinally oriented mito-
chondria inside the basal infold-
ings. The nuclei were rounded and
euchromatic. The upper luminal
border exhibited few and short
microvilli. Compared with the

152152
Zeinab A. Sakara, et al...
proximal convoluted tubules, the
lumen of DCT appeared wide
(Fig. 5).
II) Histological Structure of the
Renal Cortex in Experimental
Rats:
Light microscopic picture:
a) Haematoxylin and eosin:
* Subgroup IIa:
After two weeks of gentami-
cin administration, morphologi-
cal changes were observed in the
renal cortex. The lesion was main-
ly in some of the proximal convo-
luted tubules while the renal
corpuscles, DCT were nearly
similar to those of the control
group I rats. The cell lining of af-
fected PCT showed vacuolated cy-
toplasm and pyknotic nuclei. The
lumen of affected tubules con-
tained epithelial remnants. There
were focal areas of cellular infiltra-
tion in the cortical interstitial tis-
sues (fig. 6).
* Subgroup IIb,c,d:
The histological architecture
of the renal cortex of these
subgroups was not different
than in control group I rats. (Fig
7, 8, 9).
c) Succinic dehydrogenase en-
zyme activity:
* Subgroup IIa:
Examination of a fresh frozen
section of the renal cortex for the
activity of succinic dehydroge-
nase enzyme (SDH) revealed that
there was a decrease in the ac-
tivity of SDH enzyme in this
subgroup in some PCT while oth-
ers still showed a strong reaction
(Fig. 10).
*Subgroup IIb, Subgroup IIc,
Subgroup IId:
Examination of a fresh frozen
section of the renal cortex treated
for the activity of SDH enzyme re-
vealed that the staining enzymatic
activity was not different in these
subgroups, (Fig 11,12, 13 respec-
tively) compared to control group I
rats.
Electron microscopic picture:
*Subgroup IIa:
Electron microscopic examina-
tion of the renal cortex of rat-
receiving gentamicin for two weeks
revealed many inflammatory cel-
lular infiltrations in the renal in-
terstitium. The cells of PCT
showed loss of the basal infold-

153153
Benha M. J.
Vol. 29 No 2 May 2012
ings of the basement membrane
with only few scattered mitochon-
dria in the cytoplasm. Some of the
nuclei were heterochromatic with
irregular outline (Fig. 14).
*Subgroup IIb,IIc and IId:
The ultrastructure of the re-
nal cortex of rats of these sub-
groups was similar to the control
(Fig. 15,16,17).
Fig. (1):Fig. (1): A photomicrograph of a par-affin section in the renal cor-tex of control rat of group (I)showing the proximal convo-luted tubules (P), it had nar-row lumen, acidophilic granu-lar cytoplasm, apical brushborder (arrows heads) androunded vesicular nuclei. Therenal corpuscles show glomer-ulus (G), it's Bowman's cap-sule had two layers separatedby the Bowman's space (S).The Parietal layer lined bysimple squamous epithelium(arrows). (Hx&E x 1000)
Fig. (2):Fig. (2): A photomicrograph of a fro-zen section in the renal cortexof control rat of group (I)showing a strong reaction inthe renal tubules (arrows) andthe negative reaction detectedin the glomeruli (G).
(Succinic dehydrogenase x 100)
Fig. (3): Fig. (3): An electron micrograph of therenal cortex of adult controlrat of group (I) showing the re-nal corpuscle containing theglomerular capillary (G) sur-rounded by podocyte (P) withmajor (ma) and minor (arrows)processes. (TEM x 4000)

154154
Zeinab A. Sakara, et al...
Fig. (4):Fig. (4): An electron micrograph of therenal cortex of control rat ofgroup (I) showing the cells ofproximal convoluted tubuleresting on a basement mem-brane (B), containing roundedand euchromatic nuclei (N)and lysosomes (crossed ar-rows). Note the numerous, tu-bular longitudinally orientedmitochondria (M) inside basalinfoldings of the cell mem-brane (arrows) are detected.
(TEM x 6000)
Fig. (5): Fig. (5): An electron micrograph of therenal cortex of control rat ofgroup (I) showing the cells ofdistal convoluted tubule withnumerous tubular mitochon-dria (M) arranged among thebasal infoldings of the cellmembrane. Note, the roundedeuchromatic nuclei (N) andthe few short microvilli (arrow)projecting in a wide lumen (E)of the tubule. (TEM x 1000)
Fig. (7):Fig. (7): A photomicrograph of a sec-tion in the renal cortex of asubgroup IIb treated rat for 2weeks show intact histologicalarchitecture of renal corpuscle(RC), PCT (P), DCT (D) and col-lecting tubule (C).
(H&E x 400)
Fig. (6):Fig. (6): A photomicrograph of a sec-tion in the renal cortex of asubgroup IIa treated rat for 2weeks showing some of PCTwith vacuolated cytoplasm (ar-row) and pyknotic nuclei (ar-rows heads), degenerated des-quamated cells in their lumen(crossed arrows). Note the fo-cal cellular infiltration in theinterstitial tissue (asterisk).
(H&E x 400)

155155
Benha M. J.
Vol. 29 No 2 May 2012
Fig. (8):Fig. (8): A photomicrograph of a sec-tion in the renal cortex of asubgroup IIc treated rat for 2weeks showing intact histolog-ical architecture of renal cor-puscle (RC), PCT (P), DCT (D)and collecting tubule (C).
(H&Ex 400)
Fig. (9): Fig. (9): A photomicrograph of a sec-tion in the renal cortex of asubgroup IId treated rat for 2weeks showing intact renalcorpuscle (RC), PCT (P), DCT(D) and collecting tubule (C).
(H&Ex 400)
Fig. (11):Fig. (11): A photomicrograph of a fro-zen section of the renal cortexof a subgroup IIb treated ratfor two week showing positivestaining in the renal tubules(arrows) and negative stainingin glomeruli (G).
(Succinic dehydrogenase x 100)
Fig. (10):Fig. (10): A photomicrograph of a fro-zen section of the renal cortexof a subgroup IIa treated ratfor two week showing a strongreaction (crossed arrows) insome PCT and a weak reactionin others (arrows). Note thenegative staining of the renalglomeruli (G).
(Succinic dehydrogenase x 100)
156156
Zeinab A. Sakara, et al...
Fig. (12):Fig. (12): A photomicrograph of a frozensection of the renal cortex of asubgroup IIc treated rat for twoweek showing positive staining inthe renal tubules (arrows) andnegative staining in glomeruli (G).
(Succinic dehydrogenase x 100)
Fig. (13): Fig. (13): A photomicrograph of a frozensection of the renal cortex of asubgroup IId treated rat for twoweek showing positive staining inthe renal tubules (arrows) andnegative staining in glomeruli (G).
(Succinic dehydrogenase x 100)
Fig. (15):Fig. (15): An electron micrograph of the re-nal cortex of subgroup IIb treatedrats for two week showing twocells of proximal convoluted tu-bule with the regular basal infold-ings of basement membrane(crossed arrows) enclosing the mi-tochondria (M). Note the presenceof euchromatic nuclei (N) withlong apical microvilli (MV).
(TEM x 2000)
Fig. (14):Fig. (14): An electron micrograph of the re-nal cortex of subgroup IIa treatedrats for two week showing cells ofproximal convoluted tubule withan area of partial loss of basal in-foldings of basement membranewith few scattered mitochondriadistributed in the cytoplasm(crossed arrow). Note the nuclearirregularities with condensed nu-clear chromatin (N) and the in-flammatory cells in the peritubu-lar interstitial tissue (arrows).
(TEM x 1000)

157157
Benha M. J.
Vol. 29 No 2 May 2012
DiscussionDiscussionIn the present work, the histo-
logical structure of the renal cor-
tex of adult control albino rats
were examined with light and elec-
tron microscopes, revealed similar
structures as those mentioned by
many authors(17&18).
Examination of frozen sections
of the control renal cortex
treated for the demonstration of
the activity of SDH enzyme re-
vealed negative reaction in the
glomeruli, while the renal tubules
(proximal & distal) revealed a
strong enzymatic activity specially
at their basal parts. The same
finding was reported by many re-
searchers(19&20).
After two weeks of gentamicin
treatment in the current study,
there was a toxic morphological
change in the renal cortex detect-
ed by haematoxylin and eosin-
stained paraffin sections of treated
subgroup IIa rats. The lesion was
mainly in the proximal convoluted
tubules while the renal corpuscles
and DCT were nearly similar to
those of the control group. The
cells lining the affected PCT
showed vacuolated cytoplasm and
pyknotic nuclei. The lumen of af-
fected tubule contained degenerat-
Fig. (17):Fig. (17): An electron micrograph of the re-nal cortex of subgroup IId treatedrats for two week showing cells ofproximal convoluted tubule withregular basal infoldings of base-ment membrane (arrows) enclos-ing mitochondria (M), euchromaticnuclei (N) and long apical microvil-li (MV). (TEM x 1000)
Fig. (16):Fig. (16): An electron micrograph of the re-nal cortex of subgroup IIc withregular basal infoldings of base-ment membrane (arrows) enclos-ing the mitochondria (M), euchro-matic nuclei (N) and long apicalmicrovilli (MV). (TEM x 1000)

158158
Zeinab A. Sakara, et al...
ed epithelial cells.There were some
areas of focal cellular infiltration
in the cortical interstitial tissues.
The result of the present study
was in agreement with(21&22).
They stated that there was no evi-
dence of any morphological chang-
es in the glomeruli after gentami-
cin administration in both human
and rats. They also noticed some
morphological changes in the PCT
in the form of vacuolated cyto-
plasm. Some tubular cells showed
rupture of the cytoplasm followed
by desquamation of the epithelial
residues into the lumina of the
PCT and extrusion and karyor-
rhexis of the nuclei.
5% of filtered aminoglycosides
is actively reabsorbed by the prox-
imal tubular cells. Acidic phos-
pholipids were considered the
binding site of aminoglycosides in
brush-border membrane of proxi-
mal tubular cells. Once attached,
these agents undergo pinocytosis
and enter the cell setting off com-
plex biochemical events that re-
sult in tubular destruction(23&24).
As regard the focal mononucle-
ar cellular infiltration that seen in
the cortical interstitial tissue (25)
explained this finding as kidney
injury that caused by gentamicin
stimulate an inflammatory re-
sponse in which chemokines, are
secreted to attract leukocytes to
damaged areas.
On the contrary,(26) examined
the kidney after aminoglycosides
administration and noticed that
DCT occasionally showed vacuoli-
zation and disruption of the basal
cell architecture.
The present work showed a de-
crease in the activity of SDH en-
zyme at the examination of a fresh
frozen section of the renal cortex
of rats treated by gentamicin for
two weeks. We attributed this de-
crease in the activity to the effect
of gentamicin on the mitochondria
as detected by electron microscop-
ic examination of the renal cortex.
This finding was agreed with that
of(20&27) they found that there
was a gradual depletion of SDH
enzyme activity in the renal cortex
after gentamicin treatment.
Electron microscopic examina-
tion of the renal cortex of rat-
received therapeutic dose of gen-
tamicin for two weeks in the
present work revealed many in-

159159
Benha M. J.
Vol. 29 No 2 May 2012
flammatory cellular infiltrations in
the renal interstitium, some cells
of PCT showed partial or complete
loss of the basal infoldings of the
B.M. with only few scattered mi-
tochondria in the cytoplasm.
Some of the nuclei were hetero-
chromatic with irregular outline.
The result of this study was
consistent with that of(28). They
reported that the cytoplasmic vac-
uoles that have been described in
the PCT resulted from pinocytotic
activity at the luminal membrane.
A pinocytotic vacuoles in the
cytoplasm of the affected PCT cells
as well as swollen and distorted
mitochondria which became freely
scattered in the cytoplasm as a re-
sult of loss of the normal basal in-
foldings of the basement mem-
brane were detected in the altered
PCT(29).
In addition,(30) reported that
when tubular cells die, they
slough off into the tubule lumen
and contribute to cast formation.
Treatment of experimental ani-
mals with gentamicin results in
apoptosis as well as necrosis of
tubular epithelial cells mainly in
the proximal tubule in which the
drug accumulates(31).
The present work demonstrat-
ed that the renal cortex of the tre-
ated rats with gentamicin for two
weeks with simultaneous adminis-
tration of Epo didn't develop any
histological changes as those ob-
served in the renal cortex of treat-
ed rats with gentamicin alone.
The result of this study was
similar to those of(32&33). They
mentioned that erythropoietin me-
diates anti-apoptotic effects in the
bone marrow, facilitating matura-
tion and differentiation of eryth-
roid progenitors, also exerts anti-
apoptotic effects in the brain,
heart and in the kidney, which
can limit the degree of organ dam-
age.
Many researches done by
(34,35&36), suggest that Epo pro-
vides cytoprotection by ameliorat-
ing oxidative stress. Epo may ex-
ert its antioxidative effects directly
by exploiting intracellular antioxi-
dative mechanisms and indirectly
by inhibiting iron-dependent oxi-
dative injury.

160160
Zeinab A. Sakara, et al...
The present work demonstrated
that the renal cortex of subgroup
IIc treated rats with gentamicin for
two weeks with simultaneous ad-
ministration of vitamin E didn't
develop any histological changes
as those observed in the renal cor-
tex of treated rats with gentamicin
alone.
The role of vitamin E in ame-
liorating the toxic changes in-
duced by gentamicin was investi-
gated by(37), stated that vitamin E
can prevent the tubular altera-
tions induced by gentamicin. This
is possibly due to prevention of
lipid peroxidation and the preser-
vation of superoxide dismutase
(SOD) and glutathione peroxidase
activities.(38) reported that the
use of antioxidant like vitamin E
improved the renovascular func-
tion as well as the histopathologi-
cal changes caused by aminogly-
coside.
The present work demonstrated
that the renal cortex of subgroup
IId treated rats with gentamicin
for two weeks with epoietin and vi-
tamin E, didn't develop any histo-
logical changes as those observed
in the renal cortex of treated rats
with gentamicin alone.
Few studies investigated the ef-
fect of both epoietin and vitamin
E on the changes that caused by
gentamicin administration,(34),
found that co-supplementation of
epoietin, vitamin E and iron im-
prove the changes caused by gen-
tamicin administration.
ConclusionConclusionand recommendationand recommendation
1. It could be concluded from
the present study that, the func-
tion and the structure of the renal
cortex was affected by gentamicin
adminstration.
2. Also, it was proved that
epoietin, vitamin E or both mark-
edly reduce these changes. How-
ever combination of epoietin and
vitamin E were more effective in
the prevention of these changes.
ReferencesReferences1.1. Chambers H. F. (2001) :Chambers H. F. (2001) :
Chemotherapy of microbial dis-
ease. In : Goodman & Gilman’s.
The pharmacological Basis of
Therapeutics, 10th ed., By, Idard-
man JG, Limbrid LE and Gilman
AG (eds), McGraw-Hill, New York
(46): 1219-1232.
2.2. Martinez-Salgado C., Lo-Martinez-Salgado C., Lo-
pez-Hernandez F. J. and Lopezpez-Hernandez F. J. and Lopez-

161161
Benha M. J.
Vol. 29 No 2 May 2012
Novoa J. M. (2007) :Novoa J. M. (2007) : Glomerularnephrotoxicity of aminoglycosides.Toxicol Appl Pharmacol 223(1):86-98.
3.3. Henry F. C. (2006) : Henry F. C. (2006) : Ami-noglycoside. In : Goodman & Gil-man, The pharmacological Basisof Therapeutics. 11th ed., by Lau-rance L.B., John S.L. and KeithL.P. (eds), Mc Graw Hill, USA.
4.4. Mehri K., Hossein K.,Mehri K., Hossein K.,Mahdieh F., Rana G. and Mar-Mahdieh F., Rana G. and Mar-yam Z. (2005) : yam Z. (2005) : Effects of co-supplementation of vitamins Eand C on gentamicin-inducednephrotoxicity in rat. The Physio-logical Society.
5.5. Kifer-Wysocka E., Roma-Kifer-Wysocka E., Roma-nowska-Sarlej J., Karwan A.,nowska-Sarlej J., Karwan A.,Matysiak W. and Lis-SochockaMatysiak W. and Lis-SochockaM. (2004) : M. (2004) : The proximal convo-luted tubule of rats' nephron afterexperimental administration ofgentamicin. Ann Univ Mariae Cu-rie Sklodowska Med.,59(2):86-90.
6.6. Abdel-Reheem I. T., Ab-Abdel-Reheem I. T., Ab-del-Ghany A. A. and Mohameddel-Ghany A. A. and MohamedG. A. (2009) :G. A. (2009) : Protective effect ofquercetin against gentamicin- in-duced nephrotoxicity in rats. Biol.Pharm. Bull., Jan,32(1):61-7.
7.7. Halliwell B. (1991) :Halliwell B. (1991) : Reac-
tive oxygen species in living sys-tem: source, biochemistry and rolein human disease. Am J Med., 91(3c):145.
8.8. Pattabiraman T. N.Pattabiraman T. N.(2005):(2005): Text Book of Biochemis-try. 2nd edition. All India publish-ers and distributor, New Delhi, P:370-371.
9.9. Varzi H. N., EsmailzadehVarzi H. N., EsmailzadehS., Morovvati H., Avizeh R.,S., Morovvati H., Avizeh R.,Shahriari A. and Givi M. E.Shahriari A. and Givi M. E.(2007) : (2007) : Effect of silymarin andvitamin E on gentamicin-inducednephrotoxicity in dogs. J. VetPharmacol. Ther. 30(50): 477-481.
10.10. Yamaguchi-Yamada M.,Yamaguchi-Yamada M.,Manabe N., Kiso M., Goto Y.,Manabe N., Kiso M., Goto Y.,Mori T., Sakata C., Anan S., Na-Mori T., Sakata C., Anan S., Na-gao M., Yamamoto Y. and Oguragao M., Yamamoto Y. and OguraA. (2005) :A. (2005) : Dysfunction of eryth-ropoietin-producing interstitialcells in the kidneys of ICR-derivedglomerulonephritis (ICGN) mice. JVet Med Sci. Sep,67(9):891-9.
11.11. Hillman R. S. (2001) :Hillman R. S. (2001) :Erythropoietin. In Goodman &Gillman. The pharmacological Ba-sis of therapeutics. 10th ed byHardman J.G., Limbrird L.E. andGilman A.G. (eds), Mc Graw Hill,USA 1489-1491.

162162
Zeinab A. Sakara, et al...
12.12. Santi D. V. and Ries C.Santi D. V. and Ries C.A. (2001) :A. (2001) : Erythropoietin. In Ba-sic and Clinical Pharmacology 8thed. By Katzung BG (edr) LangMedical books, Mc Graw Hill, NewYork, 558-559.
13.13. Danilo F., Carsten H.Danilo F., Carsten H.and Thomas B. (2009) : and Thomas B. (2009) : Erythro-poietin (Epo) and Ischemia-Reperfusion After Kidney Trans-plantation. Germany: Federal In-stitute for Drugs and Medical De-vicesVerified by Hannover MedicalSchool.
14.14. Bagnis C., Beaufils H.,Bagnis C., Beaufils H.,Jacquiaus C., Adabra Y. andJacquiaus C., Adabra Y. andJouanneau C. (2001) : Jouanneau C. (2001) : Erythro-poietin enhances recovery aftercisplatin-induced acute renal fail-ure in the rat. Nephrol Dial Trans-plant, (16): 932-938.
15.15. Nestor S. L. and Ban-Nestor S. L. and Ban-croft J. D. (2008) : croft J. D. (2008) : Enzyme histo-chemistry and its diagnostic appli-cations. In Theory and Practice ofhistological techniques. Ed. ByBancroft J.D. and Gamble M. 6thed., PP:420-424. Churchill Living-stone, New York, London.
16.16. Woods A. E. and StirlingWoods A. E. and StirlingW. J. (2008) :W. J. (2008) : Electron microsco-py: the preoperative techniques. InTheory and Practice of Histological
Techniques. Ed. By Bancroft J.D.and Gamble M. 5th ed., PP:679-700. Churchill Livingstone, NewYork, London.
17.17. Mescher A. L. (2010) :Mescher A. L. (2010) :The urinary system. In : Junquei-ra’s Basic Histology Text & Atlas,12th edition Mc Graw-Hill Comp.P: 332-347.
18.18. Gartner P. L. and HiattGartner P. L. and HiattL. J. (2011) : L. J. (2011) : Urinary system. In:Concise Histology. By Gartner P.L.and Hiatt L.J. PP 260-271. Saun-ders an imprint of Elsevier Inc.
19.19. Bertelli R., Ginevri F.,Bertelli R., Ginevri F.,Candiano G., Giardi M. R. andCandiano G., Giardi M. R. andSessa A. (1990) : Sessa A. (1990) : Tubular epithe-lium culture from nephronophthi-sis affected kidneys: a new ap-proach to molecular disorders oftubular cells. Am. J. Neph, 10 (6),PP:463-469.
20.20. Soliman K. M., Abdul-Soliman K. M., Abdul-Hamid M. and Othman A. I.Hamid M. and Othman A. I.(2007) : (2007) : Effect of carnosine ongentamicin-induced nephrotoxici-ty. Med Sci Monit., 13(3):BR73-83.
21.21. Begum N. A., Dewan F.Begum N. A., Dewan F.Z., Nahar N. and Mamun R.Z., Nahar N. and Mamun R.(2006) :(2006) : Effect of n-Hexane extractof Nigella sativa on gentamicin-induced nephrotoxicity in rats.

163163
Benha M. J.
Vol. 29 No 2 May 2012Bangladesh J Pharmacol, 1:16-20.
22.22. Ajami M., Eghtesadi S.,Ajami M., Eghtesadi S.,Pazoki-Toroudi H., Habibey R.Pazoki-Toroudi H., Habibey R.and Ebrahimi S. A. (2010): and Ebrahimi S. A. (2010): Ef-fect of crocus sativus on gentami-cin induced nephrotoxicity. Biol.Res. 43: 83-90.
23.23. Nagai J. and Takano M.Nagai J. and Takano M.(2004) : (2004) : Molecular aspects of re-nal handling of aminoglycosidesand strategies for preventing thenephrotoxicity. Drug Metab. Phar-macokinet. 19:159-170.
24.24. Nagai J. (2006) :Nagai J. (2006) : Molecu-lar mechanisms underlying renalaccumulation of aminoglycosideantibiotics and mechanism-basedapproach for developing nonnephrotoxic aminoglycoside thera-py. Yakugaku Zasshi 126, 327-35.
25.25. Abdel-Reheem I. T., EL-Abdel-Reheem I. T., EL-SHerbiny G. A. and Taye A.SHerbiny G. A. and Taye A.(2010) :(2010) : Green tea ameliorates re-nal oxidative damage induced bygentamicin in rats. Pak. J. Pharm.Sci., Vol.23, No.1, pp.21-28.
26.26. Toubeau G., Laurent G.,Toubeau G., Laurent G.,Carlier M. B., Abid S., MaldagueCarlier M. B., Abid S., MaldagueP., Heuson-Stiennon J. A. andP., Heuson-Stiennon J. A. andTulkens P. M. (1986) : Tulkens P. M. (1986) : Tissue re-pair in rat kidney cortex aftershort treatment with aminoglyco-
sides at low doses: a comparativebiochemical and morphometricstudy. Lab. Invest. 54:385-393.
27.27. Banday A. A., Farooq N.,Banday A. A., Farooq N.,Priyamvada S., Yusufi A. N. andPriyamvada S., Yusufi A. N. andKhan F. (2008) :Khan F. (2008) : Time dependenteffects of gentamicin on the en-zymes of carbohydrate metabo-lism, brush border membrane andoxidative stress in rat kidney tis-sues.Life Sci.Feb27,82(9-10):450-9.
28.28. Gilbert D. N., Wood C.Gilbert D. N., Wood C.A., Kohlhepp S. J., Kohnen P.A., Kohlhepp S. J., Kohnen P.W., Houghton D. C., FinkbeinerW., Houghton D. C., FinkbeinerH. C. and Lindsl J. (1989) : H. C. and Lindsl J. (1989) : Poly-aspartic Acid Prevents Experimen-tal Aminoglycoside NephrotoxicityThe Journal of Infectious Diseas-es, Vol. 159, No. 5 :pp. 945-953.
29.29. Houghton D. C., Hart-Houghton D. C., Hart-nett M., Boswell M. C. and Ben-nett M., Boswell M. C. and Ben-nett W. M. (1976) :nett W. M. (1976) : A light andelectron microscopic analysis ofgentamicin nephrotoxicity in rats.Am. J. Path., 82:589-599.
30.30. Comstock T. J. (2001) :Comstock T. J. (2001) :Renal disorder. In applied thera-peutic. The clinical use of drugsby Koda Kimple M.A. and YoungL.Y. 7th ed., Lippencott Williams&Wilkins, Philadelphia: 23-29.
31.31. Lopez-Novoa J. M., Qui-Lopez-Novoa J. M., Qui-

164164
Zeinab A. Sakara, et al...
ros Y., Vicente L., Morales A andros Y., Vicente L., Morales A andLopez-Hernandez J. F. (2011):Lopez-Hernandez J. F. (2011):New insights into the mechanismof aminoglycoside nephrotoxicity:an integrative point of view KidneyInternational 79, 33-45.
32.32. Spandou E., Tsouchni-Spandou E., Tsouchni-kas I., Karkavelas G., Evangeliakas I., Karkavelas G., EvangeliaD., Constantina S., Olympia G.D., Constantina S., Olympia G.and Dimitrios T. (2006): and Dimitrios T. (2006): Erythro-poietin attenuates renal injury inexperimental acute renal failureischaemic / reperfusion modelNephrology Dialysis Transplanta-tion 2006 21(2):330-336.
33.33. Rjiba-Touati K., Ayed-Rjiba-Touati K., Ayed-Boussema I., Bouaziz C., Belar-Boussema I., Bouaziz C., Belar-bia A., Azzabi A., Achour A.,bia A., Azzabi A., Achour A.,Hassen W. and Bacha H. (2012):Hassen W. and Bacha H. (2012):Protective effect of erythropoietinagainst cisplatin-induced nephro-toxicity in rats: antigenotoxic andantiapoptotic effect. Drug ChemToxicol. Jan,35(1):89-95.
34.34. Thongchai P., Chaiya-Thongchai P., Chaiya-butr P. and Buranakar C.butr P. and Buranakar C.(2008) :(2008) : Renal Function and Oxi-dative Stress following Gentamicininduced Renal Injury in RatsTreated with Erythropoietin, Ironand Vitamin E. TJVM 38(2):19-27.
35.35. Rjiba-Touati K., Bousse-Rjiba-Touati K., Bousse-ma I. A., Belarbia A., Achour A.ma I. A., Belarbia A., Achour A.and Bacha H. (2011) : and Bacha H. (2011) : Protectiveeffect of recombinant humanerythropoietin against cisplatin-induced oxidative stress andnephrotoxicity in rat kidney. Int JToxicol. Oct,30(5):510-7.
36.36. Kaynar K., AliyaziogluKaynar K., AliyaziogluR., Ersoz S., Ulusoy S., Al S.,R., Ersoz S., Ulusoy S., Al S.,Ozkan G. and Cansiz M.Ozkan G. and Cansiz M.(2012) : (2012) : Role of erythropoietinin prevention of amikacin-induced nephropathy. J Nephrol.Feb 8.
37.37. Cuzzocrea S., MazzonCuzzocrea S., MazzonE., Dugo L., Serraino I., DiE., Dugo L., Serraino I., DiPaola R., Britti D., De Sarro A.,Paola R., Britti D., De Sarro A.,Pierpaoli S., Caputi A, MasiniPierpaoli S., Caputi A, MasiniE. and Salvemini D. (2002):E. and Salvemini D. (2002): Arole for superoxide in gentami-cin-mediated nephropathy inrats. Eur. J. Pharmacol., 450 : 67-76.
38.38. Derakhshanfar A., Bi-Derakhshanfar A., Bi-dadkosh A. and Kazeminia S.dadkosh A. and Kazeminia S.(2007):(2007): Vitamin E protectionagainst gentamicin induced neph-rotoxicity in rats : abiochemicaland histopathologic study. J. Vet-erinary. (8):20.

165165
Benha M. J.
Vol. 29 No 2 May 2012
HISTOCHEMICAL ANDHISTOCHEMICAL ANDULTRASTRUCTURAL STUDYULTRASTRUCTURAL STUDYOF THE RENAL CORTEX OFOF THE RENAL CORTEX OF
THE ADULT MALE ALBINO RATTHE ADULT MALE ALBINO RATAFTER ADMINISTRATION OFAFTER ADMINISTRATION OF
GENTAMICIN WITH OR WITHOUTGENTAMICIN WITH OR WITHOUTADMINISTRATION OFADMINISTRATION OF
VITAMIN E OR EPOIETINVITAMIN E OR EPOIETIN
Zeinab A. Sakara Ph.D, Husseiny I. Dessouki Ph.D,Zeinab A. Sakara Ph.D, Husseiny I. Dessouki Ph.D,Shireen A. Mazroa Ph.D and Hanaa A. H. Khalaf M.Sc.Shireen A. Mazroa Ph.D and Hanaa A. H. Khalaf M.Sc.
BENHAMEDICALJOURNAL
REPRINT
Published byPublished by
Benha Faculty of MedicineBenha Faculty of Medicine Volume 29 Number 2May 2012

165165
Benha M. J.
Vol. 29 No 2 May 2012
ERYTHROPOIETIN MEASUREMENTS INERYTHROPOIETIN MEASUREMENTS INPATIENTS WITH RENAL CYSTSPATIENTS WITH RENAL CYSTS
Gadri A. Buahdela MD, Ahmed El-Komati MD*Gadri A. Buahdela MD, Ahmed El-Komati MD*and Farag Bensauod MD**and Farag Bensauod MD**
Urologic Department of Alwahda Hospital, Derna - Libya.
*Surgery Department, Faculty of Medicine, Elmergeb University, Libya
**Cardiologist, High Institute of Medical Technology, Derna-Libya.
AbstractAbstractBackground: Background: Erythropoietin (EPO) is a sialoglycoprotein hormone
secreted primarily by the mature kidneys in response to tissue hypoxia
and/or red cell mass decrease. It stimulates erythrocyte production
from the blood marrow. Objectives: To estimate hemoglobin and EPO in
blood and cystic fluid in patients with renal cysts.
Methodology: Methodology: This case control study included 60 subjects, 30 pa-
tients (30 - 60 years of age) with renal cysts, attended urology depart-
ment at Alwahda Hospital, Derna-Libya, during 2007. In addition, 30
healthy subjects, matched with age and sex were chosen as controls
(29-58 years of age). Blood hemoglobin, urea and creatinine were meas-
ured. EPO were estimated in serum and cystic fluid by ELISA.
Results: Results: Mean values of serum EPO and urea in patients with renal
cysts were (29.7±7 mU/ml and 7.2±1.3 mmole/1, respectively), which
was significantly higher than the control group (6.2±4.3 mU/ml and
4.4±1.1 mmole/1, respectively, P < 0.05). Hemoglobin levels in patients
with renal cysts were significantly lower than the control group
(11.2±0.6 and 13.2±1.3 gm/dl, respectively, P < 0.05). EPO in cystic
fluid showed a 15 times higher level than serum EPO.
Conclusion: Conclusion: This study suggests that in patients with renal cysts,
there is no erythropoietin penetration from cystic fluid into blood and
the level of erythropoietin in cystic fluid needs more research.
Keywords: Keywords: Chronic Kidney Diseases; Renal Cyst; erythropoietin; re-
nal anemia; Cystic fluid.

166166
Gadri A. Buahdela, et al....
IntroductionIntroductionA number of underlying dis-
eases, such as diabetes mellitus
and hypertension, can contrib-
ute to the incidence of chronic
kidney disease (CKD), which in
1996 accounted for 43% and 23%
of incident cases of end-stage re-
nal disease (ESRD), respectively(1,2).
Simultaneous with the proac-
tive management of these underly-
ing diseases, these patients
should also undergo comprehen-
sive preparatory treatment for en-
try into ESRD. According to The
National Kidney Foundation's Kid-
ney Disease Outcomes Quality Ini-
tiative Guidelines (NKF-K/DOQI)
recently released for CKD, the
evaluation and treatment of pa-
tients with CKD requires under-
standing of separate but related
concepts of diagnosis, comorbid
conditions, severity of disease,
complications of disease, and
risks for loss of kidney function
and cardiovascular disease.
Among CKD patients, the disease
stages are defined based on the
level of kidney function, thus the
rate at which patients approach
ESRD varies. Defining the stages
of CKD is crucial to the effective
management of these patients
and requires "categorization" of
continuous measures of kidney
function (3).
A hypothesis that EPO may be
produced in renal cyst (RC) was
put forward during an observation
of patients with renal cysts coex-
isting renal failure (4).
The aim of the present study is
to estimate hemoglobin and EPO
in blood and cystic fluid in pa-
tients with renal cysts.
Subjects and MethodsSubjects and MethodsThis case control study in-
cluded 60 subjects, 30 patients
(30 - 60 years of age) with renal
cysts, attended urology depart-
ment at Alwahda Hospital, Der-
na-Libya, during 2007. In addi-
tion, 30 healthy subjects, matched
with age and sex were chosen
as controls (29 - 58 years of
age).
Hematological parameters by
hematology analyzer H-l Techni-
con. Blood urea and creatinine
were determined by biochemical
analyzer RA-XT Technicon, rea-

167167
Benha M. J.
Vol. 29 No 2 May 2012
gents from Technicon (5).
Cyst fluid from patients with
renal cysts was obtained by either
in vivo aspiration or immediately
after nephrectomy. EPO in serum
and cystic fluid were determined
using Anthos Labtec ht II microti-
tracic platelets counter and rea-
gents from Boehringer Mannheim
(immuno-enzymatic method, ELI-
SA technique (6). Statistical analy-
sis were done using SPSS software
ver. 12. All results were presented
as mean ± standard deviation
(SD). Student "t" test were used to
compare between means. The level
of significance was set at P value
<0.05 (7).
ResultsResultsTable (1) shows that the mean
values of serum EPO and urea in
patients with renal cysts were
(29.7±7 mil/ml and 7.2±1.3
mmole/1, respectively), which was
significantly higher than the con-
trol group (6.2±4.3 mil/ml and
4.4±1.1 mmole/1, respectively, P <
0.05). Hemoglobin levels in pa-
tients with renal cysts were signif-
icantly lower than the control
group (11.2±0.6 and 13.2±1.3
grn/dl, respectively, P < 0.05).
Table (2) shows that EPO in
cystic fluid was 15 times higher
level than serum EPO in patients
with renal cysts.

168168
Gadri A. Buahdela, et al....
DiscussionDiscussionPerhaps the most common cys-
tic change of all is the appearance
of one or more "simple renal cysts"
in adults. These cysts may be only
a few millimeters in size, or may
reach 10 cm or more. They are
rarely numerous enough so that
intervening normal parenchyma is
not recognizable, and they are
very unlikely to be the cause for
renal failure. These cysts are lined
by a flattened cuboidal epithelium
and filled with a clear fluid. On oc-
casion, there may be hemorrhage
into a larger cyst, and it may ap-
pear as a mass lesion that can be
difficult to differentiate from a re-
nal cell carcinoma. Endocrine ab-
normalities.in patients with
chronic renal failure are well doc-
umented. In some articles ac-
quired cystic kidney disease has
been related to improvement of
anemia in dialysis patients. It has
been suggested that this could be
due to erythropoietin production
by the cysts (8).
Anemia is a common complica-
tion of CKD, mainly due to the in-
ability of the kidneys to secrete
enough erythropoietin to stimulate
adequate hematopoiesis. Addition-
al factors that may cause or con-
tribute to CKD-related anemia in-
clude iron deficiency, severe
hyperparathyroidism, acute and
chronic inflammatory conditions,
aluminum toxicity, folate deficien-
cy, shortened red blood cell survi-
val, hypothyroidism, and hemo-
globinopathies such as a-
thalassemia (9).
It is recently proposed a nomo-
gram allowing an easy interpreta-
tion of serum erythropoietin val-

169169
Benha M. J.
Vol. 29 No 2 May 2012
ues (EPO) by plotting them
against hemoglobin using percen-
tiles. They found that EPO corre-
lated inversely with hemoglobin
and patients with chronic kid-
ney disease (CKD) of various eti-
ologies preserved the feedback
loop although at a lower level,
with most patients below the 25th
percentile(l0).
Although serum EPO concen-
trations can easily be measured
with radioimmunoassay (RIA) or
enzyme-linked assay (ELISA), rou-
tine measurement of serum EPO
concentrations is not practiced
widely. K/DOQI guidelines do not
recommend EPO measurements to
establish the diagnosis of renal
anemia in patients with creatinine
concentrations >2 mg/dl. The low
utilization of measuring serum
EPO concentrations can partly be
explained by the difficult interpre-
tation since EPO concentrations
have to be assessed in relation to
the severity of anemia and to the
renal function. Relative EPO defi-
ciency may be easily overlooked
without correction for these fac-
tors since reference values given
by the manufacturer are mainly
derived from healthy non-anemic
subjects. Expression of EPO con-
centrations in percentiles im-
proves the diagnostic value of
measuring EPO concentrations for
diagnosing relative EPO deficiency
and renal anemia (11,12).
The EPO level is generally in-
creased in patients with acquired
cystic kidney disease and renal
cancer. This is currently attribut-
ed to either production of EPO in
the cyst or tumor tissue or to the
hypoxic enhancement of EPO pro-
duction secondary to vascular
compression by a renal mass.
However, it seemed unlikely that
such factors were responsible for
the elevated EPO level in our heart
failure group, because no cysts or
renal tumors were detected by ab-
dominal computed tomography.
The erythrokinetic rates in the
anemic uremic patients were
about one-half the rate in normal
hematological stable individuals
even though the serum EPO titers
were the same or higher in the
anemic uremic patients (13).
Serum erythropoietin may be
increased in patients on chronic
hemodialysis secondary to ac-
quired polycystic disease of the

170170
Gadri A. Buahdela, et al....
kidneys. The development of RCC
in ADPKD is rare and the associa-
tion of RCC and ADPKD is contro-
versial. The majority of reported
cases have been shown to be an
incidental finding either on surgi-
cal exploration or at autopsy. The
serum EPO level is usually low in
long-term hemodialysis patients
with anemia. However, increased
levels of serum EPO and hemoglo-
bin have been observed in hemo-
dialysis patients because the renal
proximal tubule cells produce
EPO into the fluid of cysts. Thus,
the diagnosis of EPO-producing
RCC in such cases is difficult due
to overlapping clinical features
and marked distortion of architec-
ture (14).
In the present study, the mean
values of serum EPO and urea in
patients with renal cysts were
(29.7±7 mU/ml and 7.2±1.3
mmole/1, respectively), which was
significantly higher than the con-
trol group (6.2±4.3 mU/ml and
4.4±1.1 mmole/1, respectively, P <
0.05). Hemoglobin levels in pa-
tients with renal cysts were signif-
icantly lower than the control
group (11.2±0.6 and 13.2±1.3 gm/
dl, respectively, P < 0.05).
Hemoglobin and erythropoietin
were significantly higher in pa-
tients with polycystic kidney dis-
ease. Patients without cysts had
the lowest levels of hemoglobin
and erythropoietin, although no
significant difference was found in
those with multiple bilateral cysts
or in those with 1 - 3 isolated
cysts (8).
In another study, serum
erythropoietin levels were ran-
domly collected and measured
by a sensitive radioimmunoassay
in a hemodialysis population. Pa-
tients were divided into two
groups: those with polycystic kid-
ney disease and those with other
kidney diseases. It was demon-
strated that polycystic kidney dis-
ease patients manifested higher
hematocrit, reticulocyte counts,
and serum erythropoietin levels
when compared to other kidney
disease patients. Authors sug-
gested an inappropriately low ser-
um erythropoietin level for the se-
verity of anemia in uremic
hemodialysis patients and that
greater availability of erythropoie-
tin results in more effective eryth-
ropoiesis, even in the uremia envi-
ronment(15).

171171
Benha M. J.
Vol. 29 No 2 May 2012
In the present study, EPO in
cystic fluid showed a 15 times
higher level than serum EPO.
It has been demonstrated that
cystic fluid and interstitial cells
produce erythropoietin indepen-
dent to the oxygen content, and
this has been the main argument
for the opinion that PKD patients
produce more EPO than others.
Although this may be true in early
stages of CKD with volume expan-
sion, this effect may be offset in
the later stages as a result of ure-
mia. Therefore as PKD progresses,
more cysts produce more EPO and
may contribute to higher hemoglo-
bin in stages 3 and 4. In stage 5,
the inhibitory effect of uremia may
block the response of bone mar-
row to EPO. Our data are limited
because the number of patients in
the control group is small. Besides
this limitation, our results show
the utility of the nomogram in a
clinical setting and that PKD pa-
tients have higher hemoglobin
only in early stages (16). A pro-
nounced enrichment of EPO was
observed in cysts with sodium
concentrations greater than 100
mmol/liter, suggesting an associa-
tion with proximal tubular malfor-
mations. Findings suggest that
single interstitial cells juxtaposed
to proximal tubular cysts may
produce EPO independent of the
oxygen pressure inside the cysts,
which ameliorates the anemia
during end-stage polycystic kidney
disease (17).
The role of EPO in the cystic
fluid cannot be unambiguously
explained. No evidence of fluid
EPO penetration to the serum is
provided. A new question arises,
whether fluid EPO could be a
growth factor for renal cysts, simi-
larly to inflammation mediators or
the interleukins which are present
in the cystic fluid (18).
ConclusionConclusionThis study suggests that in pa-
tients with renal cysts, there is no
erythropoietin penetration from
cystic fluid into blood and the lev-
el of erythropoietin in cystic fluid
needs more research.
ReferencesReferences1. U. S. Renal Data Set1. U. S. Renal Data Set
(USRDS). (1999) :(USRDS). (1999) : ADR. Bethes-
da, MD: National Institutes of
Health, National Institute of Dia-
betes and Digestive and Kidney

172172
Gadri A. Buahdela, et al....
Diseases (NIDDK); April 1999. Ap-
pendix, Table A-l.
2. U. S. Renal Data Set2. U. S. Renal Data Set
(USRDS). (1999) : (USRDS). (1999) : ADR. Bethes-
da, MD: NIH, NIDDK; April 1999.
Appendix, Table A-15.
3. National Kidney Founda-3. National Kidney Founda-
tion. (2002) :tion. (2002) : NKF-K/DOQI Clini-
cal Practice Guidelines; update
2002.
4. Westenfelder C. (2002) :4. Westenfelder C. (2002) :
Unexpected renal actions of eryth-
ropoietin. Exp Nephrol 2002;
10:294-8.
5. Coresh J. and Stevens L.5. Coresh J. and Stevens L.
A. (2006) : A. (2006) : Kidney function esti-
mating equations: where do we
stand? Curr Opin Nephrol Hyper-
tension, 15:276-284.
6. Fisher J. W. (2003) : 6. Fisher J. W. (2003) : Eryth-
ropoietin; physiology and pharma-
cology update. Exp Biol Med,
228:1-14.
7. Armitage P. (1974) : 7. Armitage P. (1974) : Statis-
tical methods in medical re-
search, 1st Edition. PP 116-120.
Blackwell Scientific Publications,
New York.
8. Fernandez A., Mortal L.,8. Fernandez A., Mortal L.,
Rodriguez J. C., Vega N., PlazaRodriguez J. C., Vega N., Plaza
C., et al. (1991) : C., et al. (1991) : Anemia in dial-
ysis: its relation to acquired kid-
ney disease and serum levels of
erythropoietin. Am J Nephrol; 11:
12-5.
9. Pavlovic-Kentera V., de-9. Pavlovic-Kentera V., de-
mons G. K., Djukanovic L. andmons G. K., Djukanovic L. and
Bilianovic-Paunovic L. (1987) :Bilianovic-Paunovic L. (1987) :
Erythropoietin and anemia in
chronic renal failure. Exp Hema-
tol; 15 : 785-9. 9. 10. de Almeida
E,
Alho I., Marques F., ThiranAlho I., Marques F., Thiran
C., Bicho M. and Praia M.C., Bicho M. and Praia M.
(2008) : (2008) : Hemoglobin and erythro-
poietin levels in polycystic kid-
ney disease. Nephrology Dialysis
Transplantation, 23(1): 4J2-413.
11. Artunc F. and Risler T.11. Artunc F. and Risler T.
(2007) : (2007) : Serum erythropoietin
concentrations and responses to
anemia in patients with or -
without chronic kidney disease.
Nephrol Dial Transpl 22:2900-
2908.
12. Sakamoto S., Igarashi T.,12. Sakamoto S., Igarashi T.,
Osumi N., Imamoto T., Tobe T.,Osumi N., Imamoto T., Tobe T.,
Kamiya M., et al. (2003) : Kamiya M., et al. (2003) : Eryth-

173173
Benha M. J.
Vol. 29 No 2 May 2012
ropoietin-producing renal cell car-
cinoma in chronic hemodialysis
patients: a report of two cases. Int
J Urol; 10:49-51.
13. Fehr T., Ammann P., Gar-13. Fehr T., Ammann P., Gar-
zoni D., et al. (2004) : zoni D., et al. (2004) : Interpreta-
tion of erythropoietin levels in pa-
tients -with various degrees of
renal insufficiency and anemia.
Kidney Int. 66:1206-1211.
14. Chandra M., Miller M. E.,14. Chandra M., Miller M. E.,
Garcia J. F., Mossey R. T. andGarcia J. F., Mossey R. T. and
McVicar M. (1985) :McVicar M. (1985) : Serum im-
muno-reactive erythropoietin lev-
els in patients with polycystic
kidney disease as compared with
other hemodialysis patients.
Nephron; 39: 26-9.
15. Tarantino G., D'Elia F.,15. Tarantino G., D'Elia F.,
Brusasco S., Giancaspro V., delBrusasco S., Giancaspro V., del
Rosso D., et al (2000) :Rosso D., et al (2000) : Acquired
cystic kidney disease (ACKD): ex-
perience of a dialysis center. Arch
Ital UrolAndrol; 72: 221-4,
16. Abbott K. C. and Agodoa16. Abbott K. C. and Agodoa
L. Y. (2002) :L. Y. (2002) : Polycystic kidney
disease at end-stage renal disease
in the United States: patient char-
acteristics and survival. Clin
Nephrol; 57: 208-14.
17. Grantham J. J., Torres V.17. Grantham J. J., Torres V.
E., Chapman A. B., et al.E., Chapman A. B., et al.
(2006) : (2006) : Volume progression in
polycystic kidney disease. NEnglJ-
Med, 354:2122-2130.
18. Gardner Jr. K. D., Burn-18. Gardner Jr. K. D., Burn-
side J. S., Elzinga L. W., Lock-side J. S., Elzinga L. W., Lock-
sley R. M. (1991) : sley R. M. (1991) : Inflammatory
mediators in the progression of re-
nal cystic disease. Nephrology; 2:
1532.

174174
Gadri A. Buahdela, et al....
ERYTHROPOIETINERYTHROPOIETINMEASUREMENTS INMEASUREMENTS IN
PATIENTS WITH RENAL CYSTSPATIENTS WITH RENAL CYSTS
Gadri A. Buahdela MD, Ahmed El-Komati MDGadri A. Buahdela MD, Ahmed El-Komati MDand Farag Bensauod MDand Farag Bensauod MD
BENHAMEDICALJOURNAL
REPRINT
Published byPublished by
Benha Faculty of MedicineBenha Faculty of Medicine Volume 29 Number 2May 2012

175175
Benha M. J.
Vol. 29 No 2 May 2012
ACUTE APPENDICITIS :ACUTE APPENDICITIS :THE RELIABILITY OF DIAGNOSIS ATTHE RELIABILITY OF DIAGNOSIS AT
EL-MERGIB REGION TEACHING HOSPITALSEL-MERGIB REGION TEACHING HOSPITALS
Ahmed El-GomatiAhmed El-Gomati MD MDDepartment of Consultant Surgeon
at El-Khoms Teaching Hospital, Egypt
AbstractAbstractThe aim of the present study was to spotlight different risk and asso-
ciated factors amenable for incidence of acute appendicitis (A.Ap) and to
clarify the validity of procedures done to provisionally diagnosed A.Ap.
All cases admitted to surgery department at AL-Khoms teaching hospi-
tal and Zeliten teaching hospital, with query appendicitis were taken
during period from 1-10-2009 to 31-12-2009. All cases subjected to a
well formed questionnaire involved all variables and all cases were fol-
lowed during period of observation and investigations till open appen-
dectomy were done. Results showed a more predominance of A. Ap.
among males than females (ratio of 1.28:1) at all age groups with the
commonest age at 10-19 years. Also, it emphasized that the most sensi-
tive and specific symptoms were pain at first (98.9%), then vomiting
(67.8%) and anorexia (35.6%), Lavardo score as a diagnostic tool has
high sensitively 93.9%, a high positive predictive value (75.6%) if an ul-
tra investigations as C.T. and c-reactive protein were done, because still
ultimate diagnosis of A. Ap. in our teaching hospitals depends upon leu-
cocytosis and ultrasonography whose have a low sensitivity (59%,
56.1%) and specificity (58.3%, 75%) respectively, the study recommend-
ed that these ultra investigation (C.T and c-reactive protein)Must be
done to all patients before appendectomy, furthermore the study opened
new challenges in educational career of our students in diagnosis of
acute appendicitis.
Keywords:Keywords: Risk factors, acute appendicitis, Lavardo score, c-reactive
protein.

176176
Ahmed El-Gomati
IntroductionIntroductionAppendicitis is the most com-
mon acute surgical condition of
abdomen; approximately 7% of the
population will have appendicitis
in their life time, with the peak in-
cidence occurring between the
ages of 10 and 30 years. The white
blood cell (W.B.C) count is elevat-
ed (greater than 10.000 per mm in
80 percent of all cases of a cute
appendicitis, unfortunately, the
W.B.Cs is elevated in up to 70 per-
cent of patients with other causes
of right lower quadrant pain, thus
elevated W.B.Cs has a lower pre-
dictive value, but serial W.B.Cs
measurement (over 4-8 hours) in
suspected cases may increase the
specificity as the W.B.Cs count of-
ten increases in acute appendici-
tis(ref-l). ultrasonography specific-
ity is 92% but sensitivity does not
exceed 85% while C.T. scan sensi-
tivity reaches to 90% to 100% and
specificity reaches 95 to 97% (1).
During the period from April
2003 to April 2004, 247 pa-
tients underwent appendectomy
in Colorado University hospital,
the normal appendix in these
patients reached 10 cases (4.05%)
while actually inflamed cases
were (184) with a percent of
(75,5%) while those with perfora-
tion reached (53) cases with a per-
cent (21.45%) (2).
In U.S.A, the highest incidence
of primary positive appendectomy
was found in persons aged 10-19
years, males had higher rate of
appendicitis than female for all
groups (overall rate ratio, 1.4: 1).
But the incidence of appendicitis
decreased from 1970 to 1984 by
about 14.6% the reasons for this
decline are unknown (3-4).
Appendicitis remains one of the
most common acute surgical dis-
ease, its peak incidence occurs
more frequently in early adult-
hood, appendicitis occurs more
frequently in males especially at
time of puberty. A review of more
than (2000) patients with appendi-
citis demonstrated an overall 1.3:
1 male predominance. A decline in
incidence of acute appendicitis
from 100 cases per 100.000 popu-
lation to 52 cases per 100.000
population was demonstrated
over a study period (1975-1991)
from changes does not seem to
be explained by improved diagno-
sis and the explanation for this

177177
Benha M. J.
Vol. 29 No 2 May 2012
phenomenon remains elusive.
Currently 84 percent of all appen-
dectomies are performed for acute
pathology, the rate of normal ap-
pendectomy average was 16 % of
patients, with females comprising
68 % of these patients found to
have a normal appendix at explo-
ration (5).
Among British there has been a
decline in the incidence of appen-
dicitis over the last 20 years, but
the reason for this is unknown.
There is an equal incidence in
males and females. Appendicitis is
uncommon in patients below age
of 2 year and above the age of 65
years with a peak incidence be-
tween 8 and 14 years in western
countries, it is seen more fre-
quently in cities than in rural are-
as. Only 50% of patients give a
typical history. Abdominal pain re-
mains the prime symptom of
acute appendicitis. Vomiting oc-
curs in 75 percent of patients, but
not prolonged and most patients
vomit only once or twice. Most pa-
tients give a history of constipa-
tion before onset of pain, diarrhea
may occur in some patients par-
ticularly children, in 95% of pa-
tients with acute appendicitis fol-
lowed with acute appendicitis an-
orexia is the first symptom fol-
lowed by abdominal pain which is
followed in turn by vomiting, if
vomiting precedes pain the diag-
nosis should be questioned. Tem-
perature is rarely more than 1°C
rise (5-6).
Despite newer imaging tech-
niques, acute appendicitis can be
very difficult to diagnose. 1/2 to
2/3 of patients have the classical
presentation pain begins in the
epigastrium then shifted to RLQ
typically occurs, RLQ pain was
81% sensitive and 53% specific for
diagnosis, Anorexia is the most
common associated symptoms.
Vomiting is more variable, occur-
ring in about 1/2 of patients. The
white blood cell count (W.B.C) rise
is of limited value in diagnosis of
acute appendicitis where sensitivi-
ty of WBC is 70-90% but specifici-
ty is very low. But, a positive pre-
dictive value of high W.B.C is 92%
and negative predictive value is
50%. Graded compression ultraso-
nography to diagnose acute ap-
pendicitis reported 94.7% sensitiv-
ity and 88.9% specificity. But
there are limitations of US where
retrocecal appendix may not be

178178
Ahmed El-Gomati
visualized perforations may be
missed due to return to normal di-
ameter. C,T. (computed tomogra-
phy) is best choice in diagnosis of
acute appendicitis. In one study,
CT had greater sensitivity, accura-
cy, negative predictive value than
US (ultrasonography) (7).
More recently suggested labora-
tory evaluation is the determina-
tion of the C-reactive protein level.
An elevated C-reactive protein lev-
el (greater than 0.8 mg per dl) is
common in appendicitis, but some
studies disagree on its sensitivity
and specificity. An elevated C-
reactive protein level in combina-
tion with an elevated WBC count
and neutrophilia are highly sensi-
tive (97 to 100 percent), if one of
these three findings is absent the
chance of appendicitis is low (8).
The aim of the study were:The aim of the study were:
1. To clarify the major risk fac-
tors associated with occur-
rence of acute appendicitis.
2. To spotlight the validity of
different procedures done on
acute appendicitis patients
starting from provisional di-
agnosis in outpatient depart-
ment (O.P.D), to observation-
al period in the internal sec-
tion where lab. Investiga-
tions were done till surgery
done where the removed ap-
pendix may be normal or in-
flamed.
Subjects and MethodsSubjects and MethodsThis study was carried out dur-
ing the period from October
2009 till end of December 2009
where all provisionally diagnosed
acute appendicitis patients in
O.P.D at El-Khoms teaching hos-
pital (group I) and at Zeiiten
teaching hospital (group II) were
taken in the study. A well de-
signed questionnaire involved all
risk factors and confounding asso-
ciated.
With acute appendicitis was
applied to study groups. All sub-
ject were followed up during ob-
servation and investigations done
(C.B.Cs, Hb%, and urine analysis)
and ultrasonography. Number of
study subjected relieved during
observation and remaining sub-
jects were followed in operation
room to see whether the re-
moved appendix was normal or in-
flamed.

179179
Benha M. J.
Vol. 29 No 2 May 2012
All data were collected, present-
ed and analyzed using Alvarado
score in detection of acute appen-
dicitis (1). This score gives one
point for following [Migratory pain
in RLQ, Anorexia, Nausea and
vomiting, rebound tenderness, fe-
ver, shifting of leucocytosis to left
(segmented neutrophils)] and gives
two points to [Both RLQ tender-
ness and leucocytosis]. A score be-
low 5 is strongly against a diagno-
sis of appendicitis, while a score of
7 or more is strongly predictive of
acute appendicitis, in patients
with an equivocal score of 5-6, CT
scan is used in U.S.A to further
reduce the rate of negative appen-
dectomy (1). Data are analyzed us-
ing basic statistical methods ac-
cording to Armitage 1987.
Results and DiscussionResults and DiscussionOver all positive predictive val-
ue of provisional diagnosis is 62.
9% while highest predictive values
80%, 75% were at age group 50-
60, 40-50 years old respectively
while, lowest +ve predictive values
53.8%, 58.10%, 58.3% were at age
group 30-40, 20-30 and less than
10 years old respectively.
Provisional diagnosis predictive
values is statistically higher
(PO.01) among males 74.58% than
among females 52.22%.
9.1% of inflamed appendix pa-
tients show negative lavordo score
33.3% (one third of cases) lavordo
score gave and doubt result which
needs further investigation espe-
cially C.T. to confirm it 57.5% of
cases confined by lavando scales.
Acute appendicitis is one of the
most important surgical emergen-
cies to which certain percent
(reached to 7%) of human popula-
tion are exposed, but our study is
not a community based study, so
incidence rate can be deduced,
but it resulted that the common-
est ages of incidence are 10-19
years (about 35.2%) of studied
subjects fall in this age group, and
20-29 years (about 29.5%) of se-
lected subjects occurred within
age group, with a male predomi-
nance where male to female ratio
scored (1.28: 1). This coincided
with many studies which reported
that primary positive appendicec-
tomy was found in persons aged
10-19 years, male had higher rate
of appendicitis than females for all
age group (over all rate ratio is

180180
Ahmed El-Gomati
1.4: 1). Other study reported that
appendicitis occurs more fre-
quently in male especially at
time of puberty (overall rate ratio
is 1.3: 1).
Furthermore, the study showed
that the provisional diagnosis of
acute appendicitis had a more
positive predictive value (74.58%)
among males than among females
(74.83%) with a highly significant
difference (PO.001) as shown in
tabs (3, 4). Where 61.5% of nor-
mal appendix found on open ap-
pendectomy were females and
only 38.5% were males it was also
found that out of 90 appendecto-
mized patients only 54 were in-
flamed (60%), about 12 (13.3%)
were perforated and the normal
appendix removed from 24 ones
(24.7%) However, these results are
nearly consisted with the results
of a study carried out at Colorado
University hospital (2003-2004)
where number of inflamed appen-
dix were 184 (75.5%) and the
number of perforated appendix
were 23 patients (21.45%), but the
normal appendix were 10 cases
(4.05%).
Only contradiction to this study
were percent of normal which
were in our study (26.7%). This
may be difference in teaching of
diagnosis, large sample size taken
in this hospital, but fortunately,
other study reported that the per-
cent of normal appendectomy
reached to 16 percent with fe-
males comprising 68% percent of
these patients found to have a
normal appendix at exploration
and this agrees with our founda-
tions as in table (4) where percent
of normality in female reached
61.5% out of the normal.
As regard residual, our study
resulted that actually inflamed ap-
pendix were statistically higher
(p<0.05) among Rural patients
(63.6%) than among urban ones
(36.4%) this was in contrast to
findings in western countries,
James et al. (2007) reported that
acute appendicitis occurs more
frequently in cities than is rural
areas, our explanation for that
controvers is that our region AL-
Margib province is considered
from demographic point of view, a
rural region and urbanization
status can't be applied on it.
Lavardo score as a diagnostic
tool showed a fairly good results
in our study where only (9.1%) of

181181
Benha M. J.
Vol. 29 No 2 May 2012
actually inflamed appendix gave a
negative score (less than 5) but al-
ready positive score (more than or
equal 7) showed in only 57.5% of
actually inflamed (sensitivity
57.8% and specificity 66.7%) as
shown in tables (7-10), this was
due to a high number of doubtful
diagnosis (33.3%) cases by Alvara-
do score which needs further in-
vestigations as C,T.,and c-reactive
protein if these investigations
were applied as in table (10), this
will elevate the sensitivity of Alva-
rado- score to 93.9% these results
are consistent with many studies
1, 8, 9.
Classical clinical presentation
occurs in 60% of patient under-
went appendectomy and this
agrees with other studies 5, 6, 7
who reported that 1/2 to 2/3 of
patients have the classical presen-
tation, pain was the imminent
symptom (98.9%) with 100% sen-
sitivity & very low specificity and
with 74.2% positive predictive val-
ue (Table 11) after pain, vomiting
was more common among those
submitted to surgery (67.8%), oth-
er studies (5, 6) reported that
vomiting occurs in (75%) of pat-
ents while another study (7) re-
ported that vomiting occurring in
about 1/2 of patients only, vomit-
ing sensitivity in our study was
69.7% and specificity 37.5% was
the third common symptom with
40.9% sensitivity and 79.2% spec-
ificity with the highest positive
predictive value of all symptoms
(84.4%) as shown in Table (11B),
Table (12) B- showed that leucocy-
tosis > 9000 was evident in 54.4%
of appendectomized patients with
a sensitivity 59.1% and specifity
58.3% and 79.6% positive predic-
tive value, as regards ultrasonog-
raphy its sensitivity was 56.1%
and specificity 75% and a higher
positive predictive value (86.1%)
than leucocytosis. This was in
agreement as the other studies
but our finding is highly lower
than these studies, because other
studies used computed tomogra-
phy (C.T.) and c-reactive protein
as a more meticulous investiga-
tions for diagnosis of acute appen-
dicitis.
It could be concluded that
computed tomography (C. T.) and
C-reactive protein must be
done for all provisionally diag-
nosed patients as acute appen-
dicitis.

182182
Ahmed El-Gomati

183183
Benha M. J.
Vol. 29 No 2 May 2012

184184
Ahmed El-Gomati

185185
Benha M. J.
Vol. 29 No 2 May 2012

186186
Ahmed El-Gomati
ReferencesReferences1. Ozguner I. F., Buyukaya-1. Ozguner I. F., Buyukaya-
vuz B. I. and Savas M. C.vuz B. I. and Savas M. C.
(2004) : (2004) : The influence of delay on
perforation in childhood appendi-
citis. A retrospective analysis of 58
cases. Saudi Med J; 25: 1232-6.
2. Balthazar E. J. (1991) : 2. Balthazar E. J. (1991) : Ap-
pendicitis: Prospective evaluation
with high resolution CT. Radiolo-
gy;180:21-4.
3. Gough I. R., Morris M. I.,3. Gough I. R., Morris M. I.,
Pertnikovs E. I., Murray M. R.,Pertnikovs E. I., Murray M. R.,
Smith M. B. and Bestmann M.Smith M. B. and Bestmann M.
S. (1983) : S. (1983) : Consequences of re-
moval of a "normal" appendix.
Med J Aust;16:370-2.
4. Wright J. E. and Rowley M.4. Wright J. E. and Rowley M.
(l987) : (l987) : Appendicectomy in child-
hood:pathology found. Aust N
Z J Surg; 57:381-5.
5 Rothrock S. G., Skeoch5 Rothrock S. G., Skeoch
G., Rush J. J. and Johnson N.G., Rush J. J. and Johnson N.
E. (1991) : E. (1991) : Clinical features of

187187
Benha M. J.
Vol. 29 No 2 May 2012
misdiagnosed appendicitis in chil-
dren. Ann Emerg Med; 20 : 45-
50.
6. Surana R., O'Donnell B.6. Surana R., O'Donnell B.
and Puri P. (1995) : and Puri P. (1995) : Appendicitis
diagnosed following active obser-
vation does not increase morbidity
in children. Pediatr Surg Int;
10:76-8.
7. Pearl R. H., Hale D. A.,7. Pearl R. H., Hale D. A.,
Molloy M., Schutt D. C. andMolloy M., Schutt D. C. and
Jaques D. P. (1995) : Jaques D. P. (1995) : Pediatric
appendectomy. J Pediatr Surg;
30:173-81.
8. Douglas C. D., Macpher-8. Douglas C. D., Macpher-
son N. E., Davidson P. M. and-son N. E., Davidson P. M. and-
Gani J. S. (2000) : Gani J. S. (2000) : Randomised
controlled trial of ultrasonography
in diagnosis of acute appendicitis,
incorporating the Alvarado score.
Br Med J; 321:9l9-22.
9. Chang A. R. (1981) : 9. Chang A. R. (1981) : An
analysis of the pathology of 3003
appendices. Aust NZ Surg ;
51:163-78.
10. Boerema W. J. and Bur-10. Boerema W. J. and Bur-
nand K. G, (1981) :nand K. G, (1981) : Fitzpatrick.
Acute appendicitis. Aust N. Z
Surg; 51:163-78.
11. Goh B. K., Chui C. H.,11. Goh B. K., Chui C. H.,
Yap T. L., Low Y., Lama T. K.,Yap T. L., Low Y., Lama T. K.,
Alkouder G., et al. (2005) : Alkouder G., et al. (2005) : Is
early laparoscopic appendectomy
feasible in children with acute ap-
pendicitis presenting with an ap-
pendiceal mass? A prospective
study. J Pediatr Surg; 40:1134-7.
12. Blanco J. A., Casasa J.12. Blanco J. A., Casasa J.
M., Castellvi A., Isnard R. M.M., Castellvi A., Isnard R. M.
and Lopez P. (2005) : and Lopez P. (2005) : [Laparosco-
py in chronic abdominal pain in
children] [Article in Spanish] Cir
Pediatr;18:61-4.
13. Al-Bassam A. A. (2005) :13. Al-Bassam A. A. (2005) :
Laparoscopic appendectomy in
children. Saudi Med J;26:556-9.
14. Kaneko K. and Tsuda M.14. Kaneko K. and Tsuda M.
(2004) : (2004) : Ultrasound-based deci-
sion making in the treatment of
acute appendicitis in children. Pe-
diatr Surg Int;3 9:1316-20.
15. Rhea J. T., Halpem E. F.,15. Rhea J. T., Halpem E. F.,
Ptak T., Lawrason J. N., Sack-Ptak T., Lawrason J. N., Sack-
noff R. and Novelline R. A.noff R. and Novelline R. A.
(2005) : (2005) : The status of appendiceal
CT in an urban medical center 5
years after its introduction: expe-
rience with 753 patients. AJR Am
J Roentgenol; 184:1802-8.

188188
Ahmed El-Gomati
16. Samuel M. (2002) : 16. Samuel M. (2002) : Pediat-
ric Appendicitis Score. J Pediatr
Surg; 37; 877-81.
17. Kharbanda A. B., Taylor17. Kharbanda A. B., Taylor
G. A., Fishman S. J. and BachurG. A., Fishman S. J. and Bachur
R. G. (2005) : R. G. (2005) : A clinical decision
rule identify children at low risk
for appendicitis. Pediatrics; 16 :
709-16.
18. Geryk B., Kubikova E.18. Geryk B., Kubikova E.
and Jakubovsky J. (2000) :and Jakubovsky J. (2000) :
(Abstract) Clinical and histopatho-
logic picture of acute appendici-
tis in children. Rozhl Chir; 79 :
211-4.
19. abekir A. R. and Devi N.19. abekir A. R. and Devi N.
(1990) : (1990) : Analysis of the pathology
of 405 appendices. East Afr
Med J; 67:599-602.
20. Ludtke F. E., Muller B.20. Ludtke F. E., Muller B.
and Peiper H. J. (1987) :and Peiper H. J. (1987) : (Ab-
stract) Indications for appendicec-
tomy: A retrospective analysis.
Zentralbl Chir; 12:1545-51.

189189
Benha M. J.
Vol. 29 No 2 May 2012
ACUTE APPENDICITIS :ACUTE APPENDICITIS :THE RELIABILITY OFTHE RELIABILITY OF
DIAGNOSIS AT EL-MERGIBDIAGNOSIS AT EL-MERGIBREGION TEACHING HOSPITALSREGION TEACHING HOSPITALS
Ahmed El-GomatiAhmed El-Gomati MD MD
BENHAMEDICALJOURNAL
REPRINT
Published byPublished by
Benha Faculty of MedicineBenha Faculty of Medicine Volume 29 Number 2May 2012

189189
Benha M. J.
Vol. 29 No 2 May 2012
IntroductionIntroductionThere is no more dramatical
but sometimes even tragical situa-
tion among critical conditions of
surgical practice than severe early
postoperative complications that
STANDARDIZED COMPREHENSIVE DYNAMICSTANDARDIZED COMPREHENSIVE DYNAMICDIAGNOSTICS AND TREATMENT OFDIAGNOSTICS AND TREATMENT OF
POSTOPERATIVE PERITONITISPOSTOPERATIVE PERITONITIS
Nazirov F. Gavurovich MD, Devyatov A. Vasilovich MD,Nazirov F. Gavurovich MD, Devyatov A. Vasilovich MD,
Hodjiev D. Shamuratovich MD, Babadjanov A. Hasanovich MDHodjiev D. Shamuratovich MD, Babadjanov A. Hasanovich MD
and Sadikov R. Yusupovich MDand Sadikov R. Yusupovich MD
Department of Portal Hypertension, Republican Specialized Centre of Surgery
named after acad. V Vahidov, Tashkent, Uzbekistan.
AbstractAbstractStructural issues of primary interventions, development frequency,
mortality and treatment tactics of postoperative peritonitis after emer-gency and selective abdominal operations were ana-lyzed on huge clini-cal material. The assessment and opportunity of prognostic integralscale appli-cation, summery of results, which was standardize by proto-cols of treatment of patients with post-operative peritonitis, adequatelyestimate risk and selection of optimal tactics of reoperation.
Considering obtained analysis results it is possible to establish a factthat the use of prognostic scales allow not only to adequately assess theseverity of main pathology and its complications but also with high de-gree of accuracy to verify the extent demonstration of polyorgan dis-function and accordingly to identify the group prognosis for mortalityrisk. Based on above mentioned infor-mation we suggest to use two in-tegral systems to identify the tactics of managing patients with postsur-gical peritonitis. To assess the probability of reintervention it is possibleto use specifications of PIR and to use the system SOFA (Sepsis-RelatedOrgan Failure Assessment, Vincent J., 1996) for dynamic assessment ofthe severity of polyorgan disfunction and efficacy of medical activities.
Key Words: Key Words: postoperative peritonitis, protocol of treatment, prognos-tic integral scale.

190190
Nazirov F. Gavurovich et al...
require secondary surgical in-
tervention. Early relaparotomy re-
mains to be the main mean of sav-
ing patient under development of
serious postoperative complica-
tions as peritonitis, abdominal
bleeding, mechanical obstruction,
destructive pancreatitis and oth-
ers[1,5,7]. Postoperative peritonitis
belongs to one of the most compli-
cated and adverse complica-
tions[2,3,4,5,8]. Lack of unified
standardized tactics of managing
of this category of patients is de-
termined by empirical approach to
the choice of appropriateness, du-
ration and method of surgical re-
intervention. AIM :AIM : the main aim
of current analysis is to try
the implementation of standard-
ized guidelines of managing of
postoperative peritonitis based on
different prognostic criteria by
adapting them to the individual
possibilities of different chains of
surgical service of Uzbekistan
Health System.
Subjects and MethodsSubjects and MethodsTo conduct multicentral analy-
sis we included into research the
treatment results of 317 patients
with postoperative peritonitis (PP)
treated at 17 inpatient facilities
that were divided into 3 groups.
In group 1 (Republican level) were
included 191 patients (79 pa-
tients after primary emergency
surgery and 112 patients after
elective surgical interventions)
that were under observation at
Republican Specialized Center of
Surgery named after academician
V.Vakhidov in all abdominal de-
partmetns for the period from
1976 up to 2008 including. In
group 2 (city and regional level)
were included 96 patients (77 pa-
tients after primary emergency
surgery and 19 patients after
elective surgical interventions)
that were under observation at
different clinics of city and re-
gional level of surgical service
for 2000 - 2008 : Nukus branch of
Republican Scientific Center of
Emergency Care; Tashkent city
hospitals #1 and #7; Tashkent
regional multidisciplinary medical
center; City clinic of Samar-
kand; Clinic of Samarkand State
Medical Institute. In group 3
(district clinics) were included 30
patients after primary emergency
surgery that were observed at
district clinics of the Republic
of Karakalpakstan for 2000 -
2008.

191191
Benha M. J.
Vol. 29 No 2 May 2012
Female patients - 72 (22.7%),
male patients - 245 (77.3%), aver-
age age of patients in group 1 was
- 47.15±12.09 years, in group 2 -
48.12±13.28 years and group 3 -
35.29±11.47 years. It should be
note that in group 3 the average
age of patients was (P<0.05) less
than in groups 1 and 2.
All conducted primary surger-
ies according to the category of
complexity were divided into the
following types:
1. General surgical opera-1. General surgical opera-
tions:tions: appendectomy, traditional
cholecystectomy, palliative treat-
ment of complications of ulcer dis-
ease (suture ligation of perfora-
tions and discontinue of bleeding),
treatment of intestinal obstruction
(excision of adhesions, to tunnel a
stoma, bypass), rupture of small
pyogenic abscesses of abdominal
cavity, urgent operation in con-
nection with trauma of ab-
dominal cavity organs without re-
section technologies, suturing of
veins of stomach cardia in order to
stop bleeding from varix of oe-
sophagus and stomach under por-
tal hypertension (Patsiora's opera-
tion), uncomplicated forms of
echinococcosis of abdominal cavi-
ty organs, traditional hernioplasty.
Put the other way round these are
interventions that don't require
specific surgical tools, expansion
of the capacity of proposed inter-
vention, prolonged reanimation
and accordingly experts in special-
ized fields. This type of operations
is conducted at all levels of surgi-
cal service and at the same time
as a main intervention that is
used at district clinics, against of
republican and regional clinics.
2. High technological opera-2. High technological opera-
tions:tions: radical treatment of compli-
cations of ulcer disease (resection
of stomach), calculous cholecysti-
tis complicated by mechanical
jaundice laparoscopic chole-
cystectomy and appendoctomy,
collateral choledochoduodenoana-
tomosis and cholecystoentero-
anastomosis, total separation of
gastroesophageal collector (meth-
od of Nazirov FG), external drain-
ing of gall ducts under postchole-
cystectomic syndrome, operations
under acute pancreatitis and hia-
tal hernia. Performance of these
types of surgeries depends on two
components; from one side it is a
surgical, diagnostical, resuscita-
tion and anestisia equipment of

192192
Nazirov F. Gavurovich et al...
the clinics and from the other side
is the professional skills of a sur-
geon.
3. Surgeries are mainly being3. Surgeries are mainly being
performed in Republican spe-performed in Republican spe-
cialized centers are:cialized centers are: radical treat-
ment of tumors of gas-
trointestinal tract (gastrectomy,
hemicolectomy, pancreatoduoden-
al resections), reconstructive-
rehabilitative surgeries on gall
ducts, reconstructive surgeries on
stomach under diseases of operat-
ed stomach, radical correction of
syndrome portal hypertension
(portosystem shunting), peritoneo-
atrial shunting under diuretic re-
sistant forms of ascites, surgeries
on esophagus. This type of sur-
gery is mainly typical for republi-
can chain of surgical service, ap-
plies to the category of severe
patients and directly depends on
particular speciality and profes-
sional skills of a surgeon, appro-
priate equipping of diagnostical,
special surgical equipment and in-
struments, possibilities for dinam-
ycal monitoring by qualiffied spe-
cialists of resuscitation and
anestesia services.
Certainly we understand the
conditional character of this divi-
sion especially for urgent surgery
but for objective analysis of the
quality of surgical assistance this
gradation is necessary especially
due to the fact that the main task
for surgical service is a develop-
ment of tactics-diagnostical and
accordingly treatment standards
for this severe category of inter-
ventions as relaparotomy. Charac-
ter of primary surgeries is shown
in table 1.
Period of developing of postop-
erational peritonitis is approxi-
mately similar in the groups with
maximum frequency of 3-5 days -
64.6-70.1% and 6-9 days - 15.2-
18.8% of patients.
Prevalence of peritonitis and
character of peritoneal exudate
have an important role especially
in details of treatment and disease
prognosis. It was noted that maily
by intraoperative way were detect-
ed diffusive forms of peritonitis
with the most frequency after pri-
mary emergency interventions (ta-
ble 2).
Depending on the specifics of
performed surgeries we can note

193193
Benha M. J.
Vol. 29 No 2 May 2012
that in group 1 in 40.5% of cases
after emergency operations and in
20.5% after elective interventions,
peritonitis was of bilious etiology,
in group 2 these indicators were
6.5% and 42.1% respectively. The
serous-fibrinosis and purulent
character of exudate prevailed in
all groups under general postsur-
gical peritonitis.
The diagnostics of postsurgical
peritonitis is a critical problem
under unclear clinical picture. Di-
agnostical monitoring, or putting
it more precisely, its quality de-
pends on the level of surgical ser-
vice.
Considering different applied
methods of diagnostics, their
comprehension regarding verifica-
tion of postsurgical peritonitis,
depends not only on the level
of inpatient facility and respec-
tively diagnostical potential but
as well as from the use rate i.e.
qualitative dynamic monitoring.
Thus based on clinical and la-
boratory data, postsurgical perito-
nitis is verified in 63.4% patients
of group 1 and only 42.7% in
group 2 and 40.0% in group 3 (ta-
ble 3).
Ultrasound scanning is the
simplest method to evaluate the
condition of abdominal cavity or-
gans but the comprehension of
this method depends on the abili-
ties of the equipment and profes-
sional skills of a researcher and at
the same time at Republican Spe-
cialized Center of Surgery the effi-
cacy of ultrasound scanning was
60.8%, in group 2 - 45.5% and in
group 3 only 20.0%. Com-puter
tomography is an expensive meth-
od and difficult to perform at
those conditions however its com-
prehension is 66.7-67.9%. The
most diagnostic value was re-
ceived by performing laparoscopic
diagnostic - 85.7% (in 12 out of 14
patients in group 1).
In table 4 we showed a charac-
ter of reinterventions in patients
with postoperative peritonitis. De-
pending on ethiology of peritonitis
we divided operations according to
the following complications: incon-
sistency of suture after close per-
foration or applied anastomosis;
biliary peritonitis (in-consistency
of stump of cystic duct, iatrogenic
damage of choledoch, inconsisten-
cy of suture of biliodegestive anas-
tomosis of a different ethiology -

194194
Nazirov F. Gavurovich et al...
cases when peritonitis was devel-
oping after pri-mary surgery with-
out verifying provoking factor, was
progressing after primary emer-
gency surgery or situations with
not verifyied main diagnosis - di-
verticulitis (Mekkel) with perfora-
tion (group 3 - 2 patients that had
appendectomy), development of
appendicitis with general peritoni-
tis in a patient of group 3 after su-
turing of perforative ulcer, devel-
opment duodenal ulcer (group1 -
in 2 patients after hemicolonecto-
my and echinococcectomy) as well
as ascetic-peritonitis in a patient
with liver cirrhosis after splenecto-
my that resulted in eventration.
ResultsResultsFor the last ten years the main
direction in development of surgi-
cal service for patients with differ-
ent postsurgery complications be-
came a development and
implementaiton of different prog-
nostic system concerning as eval-
uation of severity of patient's con-
dition so as a possible identica-
tion of potential risk of death from
this complication. All leading
world-wide clinics are working in
this direction and by present time
the developed prognostic scales
were acknowledged by many spe-
cialists and their diagnostic value
allowed standardizing the evalua-
tion of patients' condition in many
countries. Objective evaluation of
severity of patient's condition in
peritonitis and identifica-tion of
the possibility of failure represent
certain difficulties. At the moment
there are several ap-proaches in
solving this task. First, the use of
widespread integral scales to eval-
uate the severity of patients' con-
dition (APACHE, APACHE II,
APACHE III, SAPS, SAPS II, SOFA,
MODS and some others); second-
ly, the use of specific scales that
had been developed considering
particular qualities of peritonitis
(the most famous scale - Man-
game index of peritonitis, prognos-
tic index re-laparotomy); thirdly,
the use of some individual indica-
tors of homeostasis as an inde-
pendant predic-tor of failure [8].
But this kind of variety of evaluat-
ing scales can also be evidence of
weakness of the latter. Due to
that, after a thorough analysis of
literature, we decided on the most
optimal options of prognosis esti-
mation and retrospectively identi-
fied their diagnostic value for the
different level clinics of surgical

195195
Benha M. J.
Vol. 29 No 2 May 2012
service. An analysis on evaluating
the probability of reintervention
was conducted on identifying
prognostic index of relaparotomy
suggested as prognostic criteria of
surgical reinterventions. The sys-
tem includes score system accord-
ing to 8 criteria (performance of
first surgery according to emer-
gency indicators; respiratory in-
sufficiency; renal failure; intesti-
nal paresis after 72 hours of
postsurgery; abdominal pain after
48 hours of postsurgery; infec-
tious complications at the area of
surgery; consciousness disorders;
pathological symptoms occuring
after 96 hours of postsurgery) at
the same time prognostic index of
relaparotomy more than 20 points
- absolute indicator to relaparoto-
my. After retrospective analysis it
is possible to establish a fact that
having the simple use of this in-
dex we were able to divide patients
according to prognostic index of
relaparotomy only in groups 1 and
2. It was not possible to classify
medical files of a 3 group as there
was no data regarding conscious-
ness dynamic condition or some
laboratory indicators were not
mentioned. Due to the same rea-
son it was possible to systematize
medical files in group 1 only in
164 patients out of 191; in group
2 in 44 patients out of 96 pa-
tients. Average value of prognostic
index of relaparotomy in analysis
groups as well as division of pa-
tients according to its indicator is
shown in table 5.
Distribution of mortality rate
depending on PIR showed that
mortality rate was minimum when
PIR was less than 20 points and it
was 9.7% in group 1 and 14.3% -
in group 2. Under PIR 20-22
points the mortality rate had in-
creased sharply and reached -
43.5% and 53.8% respectively;
under PIR 23-24 points - 80.9%
and 88.9% (figure 1).
Objective integral and quantita-
tive assessment of the severity of
patient's condition in a critical
condition including abdominal
sepsis can not be performed with-
out using objective scale-system of
assessing functional disorders
(APACHE II, SAPS) and the extent
of organ disorders (MODS, SOFA).
Between those systems regardless
of the fact that they have the same
methodological approach there is
a principal or strictly speaking

196196
Nazirov F. Gavurovich et al...
ideological difference. Particularly,
the main purpose of objective sys-
tems of assessing the severity of
patients' condition is prognosis
and risk assessment for the lethal
outcome. At the same time
PACHE II and SAPS are higly spe-
cific (90%) regarding success prog-
nosis but less sensitive (50-70%)
regarding lethal outcome progno-
sis. Furthermore these systems
are accepted for outcome progno-
sis and comparative analysis of
groups of patients but not for the
assessment of individual patients
[2]. Exactly for this reason they
are not recommended for prognos-
tic assessment of a particular pa-
tient and can not be basis for tak-
ing a decision in a clinical practice
that had been noted at the confer-
ence of European society of inten-
sive medicine (1998). Therefore it
has to be considered that scales
MODS and SOFA are clinically sig-
nificant instrument for objective
assessment of severity of patients'
condition and for prognosing out-
come of critical condition in ab-
dominal sepsis.
The system of assessment
SOFA (Sepsis-Related Organ Fail-
ure Assessment, Vincent J., 1996)
intended for dynamic assessment
of severity of polyorgan disfunc-
tion and efficacy of medical activi-
ties is the most comfortable and
simple for use. Distinctive quality
of this scale is its high sensitivity
for patients with peritonitis as it is
intended especisally for the as-
sessment of septic demonstrations
and polyorgan disfunction, on the
other hand dynamic indicators
reflrect efficacy of current con-
ducting treatment that is also
important for managing this diffi-
cult category of patients. Accord-
ing to data of distribution, the in-
dicator SOFA of 1-4 points is
obtained in 25.3% of patients of
group 1 and 26.1% in group 2. In-
dicator SOFA of 5-8 points in
51.6% and 43.5%, more than 9
points in 23.2% and 30.4% re-
spectively (table 6).
According to distribution as of
severity of indicator SOFA the
mortality rate in group 1 with
SOFA of 1-4 points was - 8.3%, 5-
8 points - 40.8% and more than 9
points - 100%, in group 2 - 16.7%,
50.0% and 100% accordingly (fig-
ure 2).

197197
Benha M. J.
Vol. 29 No 2 May 2012

198198
Nazirov F. Gavurovich et al...

199199
Benha M. J.
Vol. 29 No 2 May 2012

200200
Nazirov F. Gavurovich et al...
DiscussionDiscussionAccording to suggested algo-
rithm while suspecting a develop-
ment of postsurgical peritonitis
first of all PIR has to be identified.
In case of PIR is less than 20
points it is possible to have a dy-
namic observation conducting
full-scale conservative therapy
that includes specific antibacterial
therapy, decontamination of gas-
trointestinal tract, correction of
Fluid Electrolite Balance and oth-
er disorders. Main value in identi-
fying the efficacy of a therapy is
given to a dynamic Ultrasound
scanning (dynamic of focal mass,
exudate, intestinal peristalsis and
etc) as well as for score system of
SOFA where regress indicator is
an evidence of a positive efficacy
of conductig conservative ac-
tivities. In case of failure of a ther-
apy there will be increase of dy-
namic indicator of SOFA scale as
well as PIR increase. Respectively
in case the value of PIR exceeds
20 points than this is an absolute
indicator for relaparotomy.
At this stage the following qual-
ity should be paid attention. For
the last years laparoscopic sur-
gery took a special place and there
is progressive increase of the pos-
sibilities of this small inva-sive in-
tervention. Despite of small clini-
cal experience of Republican
specialized center of surgery in
performing reinterventions by la-
paroscopic method, this method
can be reffered to the category of

201201
Benha M. J.
Vol. 29 No 2 May 2012
choice surgery especially because
mini-invasive effect in adequately
performed operation decreases the
risk of developing or progressing
of different complications. Of
course, the probability of per-
forming laparoscopy depends on
many factors but in the view of di-
agnostic guideline the indications
for its use don't not differ from
standard indications for this type
of intervention in emergency ab-
dominal surgery. Thus we took
the possibility of laparoscopic di-
agnostics into separate direction.
According to a suggested algo-
rithm while having a possibility for
performing laparoscopic di-
agnostics, the reintervetion espe-
cially in unclear clinical situations
is more advisable to start from
this method of surgery. While re-
vising it has to be assessed the ex-
tent of peritonitis and its charac-
ter, and that the source of this
complication is verified. In limited
or general peritonitis with serous
exudate or of enzyme ethiology,
lack of inconsistency of sutures or
perforation i.e. the factors of caus-
es of peritonitis, the laparoscopic
diagnostics can be transferred to a
medical laparascopy that consid-
ers sanation of abdominal cavity,
adequate draining. In laparoscopy
verified factor of causes of perito-
nitis (inconsistency, perforation
and etc) or isolated fibrinosis-
purulent peritonitis to adequately
perform intervention it is advisa-
ble to transfer to relaparotomy.
But in case of severe Poly-organ
insufficiency (PI) with the value of
SOFA more than 9 points and ex-
tremely high risk of mortality, it is
possible to perform medical lapa-
roscopy with a thorough sanation,
tamponing the source and ade-
quate draining of abdominal cavi-
ty. In relaparotomy the choice of
surgical tactics also depends on
the severity of PI. If in case of revi-
sion serous-fibrinous or enzyme
peritonitis were identified and the
value of assessment system SOFA
is 1-4 points than it is possible to
extend interven-tion up to high
technological level. For example,
complications of undiagnozed ul-
cer disease (perforation) after con-
ducting intervention concerning
different emergency abdominal pa-
thology (cholesistitis, intestinal
obstruction, appendectomy and
etc) when SOFA is 1-4 points, it is
possible to propose performing of
stomach resection or vagotomy

202202
Nazirov F. Gavurovich et al...
with draining operation (picture
3). An exception regarding choice
of complexity of the surgery for
patients with PI when SOFA is 1-
4 points for Republican clinics or
regional and city level with availa-
bility of specialized departments
can be peritonitis of biliary ethiol-
ogy (under inconsistency of su-
tures of choledoch or BDA, incon-
sistency of cystic duct after chole-
cystectomy of residual multiple
choledocholiasis, iatrogenic dam-
ages of hepaticocholedoch and etc)
when it is possible to perform re-
constructive-rehabilitative sur-
geries using precision technolo-
gies.
Conclusions Conclusions Postoperative peritonitis is one
of the severest and prognostically
adverse complications in the
structure of those its frequency
can reach 31.1-43.8%. Depending
on the level of surgical service and
accordingly the categories of com-
plexity of performing surgeries,
the summary frequency of the
mortality after interventions re-
garding to this complication
reaches 51.3% at Republican spe-
cialized center of surgery, 63.5%
in the inpatient facilities of city
and regional level and 36.7% in
district clinics. In 81.1 - 90.9% of
cases a main reason of mortality
outcome is polyorgan insufficien-
cy.
Main predisposing factor for de-
veloping or progressing of postsur-
gical peritonitis is unjustified ex-
pansion of operation capacity, not
following of compulsory principles
of surgical treatment of peritonitis
and underestimation of patients'
condition.
Available diagnostic potential in
patients with postsurgical perito-
nitis determines their different
verified descriptiveness that is
only 14.3-50.0% at district clinics,
18.5-66.7% at inpatient facilities
of city and regional level and 26.7-
90.0% at Republican clinic.
Optimal option of standardizing
guidelines on managing this type
of patients is the use of prognostic
integral scales, combined results
of the latter allow to adequately
assess the risk of surgical reinter-
vention and accordingly to opti-
mize a choice of treatment tactics
at all levels of surgical service of
Health system.

203203
Benha M. J.
Vol. 29 No 2 May 2012
ReferencesReferences1.1. Holzheimer R. G. andHolzheimer R. G. and
Gathof B. (2003) : Gathof B. (2003) : Re-operation
for complicated secondary perito-
nitis - how to identify patients at
risk for persistent sepsis. Eur J
Med Res.; 8:125-34.
2.2. Gelfund B. R., GolorodskyGelfund B. R., Golorodsky
V. A., Burnevich S. Z. and Gel-V. A., Burnevich S. Z. and Gel-
fund E. B. (2000) :fund E. B. (2000) : Antibacterial
therapy of surgical abdominal in-
fection and abdominal sepsis.
Consilium medicum.; 9:374-379.
3.3. Koperna T. and Schulz F.Koperna T. and Schulz F.
(2000) :(2000) : Relaparotomy in peritoni-
tis : prognosis and treatment of
patients with persisting intra-
abdominal infection. World J
Surg.; 24:32-7.
4.4. Makarova N. P. and Kir-Makarova N. P. and Kir-
shina O. V. (2000) : shina O. V. (2000) : Laparosto-
my in treatment of extended
peritonitis. Surgery; 3:30-32.
5.5. Maloman E., Lep-atu C.,Maloman E., Lep-atu C.,
Sainsus N., Ungureanu S. andSainsus N., Ungureanu S. and
Balica I. (2005) :Balica I. (2005) : Enhahcement of
antibiotic ac-tivity with proteolitic
enzymes. Intra-abdomunal sepsis
unresolved issues. Proceeding of
The First international Humboldt
Workshop on Surgical Research.
Bucharest,; 107-112.
6.6. Mamchich V. I. (1992) :Mamchich V. I. (1992) :
Intrabdominal bleeding after sur-
gery on organs of abdominal cavi-
ty that re-quires performance.
Clincal surgery; 8:31-34.
7.7. Nazirov F. G. and Devya-Nazirov F. G. and Devya-
tov V. Ya. (2005) : tov V. Ya. (2005) : Drama and
tradegies in a surgery. Monogra-
phy M: Geotar, - 305 page.
8.8. Peritonitis : PracticalPeritonitis : Practical
guideline. (2006) : guideline. (2006) : Edited by VS,
Saveliev BR, Gelfund MI, Filimo-
nov MI M.; 208. (Practical guide-
line).

204204
Nazirov F. Gavurovich et al...
STANDARDIZED COMPREHENSIVESTANDARDIZED COMPREHENSIVEDYNAMIC DIAGNOSTICS ANDDYNAMIC DIAGNOSTICS AND
TREATMENT OF POSTOPERATIVETREATMENT OF POSTOPERATIVEPERITONITISPERITONITIS
Nazirov F. Gavurovich MD, Devyatov A. Vasilovich MD,Nazirov F. Gavurovich MD, Devyatov A. Vasilovich MD,
Hodjiev D. Shamuratovich MD, Babadjanov A. Hasanovich MDHodjiev D. Shamuratovich MD, Babadjanov A. Hasanovich MD
and Sadikov R. Yusupovich MDand Sadikov R. Yusupovich MD
BENHAMEDICALJOURNAL
REPRINT
Published byPublished by
Benha Faculty of MedicineBenha Faculty of Medicine Volume 29 Number 2May 2012

205205
Benha M. J.
Vol. 29 No 2 May 2012
THE POTENTIAL BENEFICIAL EFFECTS OFTHE POTENTIAL BENEFICIAL EFFECTS OFPERINDOPRIL OVER CLONIDINE ON DIABETICPERINDOPRIL OVER CLONIDINE ON DIABETIC
NEPHROPATHY IN RATSNEPHROPATHY IN RATS
Hanan T. Emam MD, Ghada A. Abd El Fattah MD* Hanan T. Emam MD, Ghada A. Abd El Fattah MD* and Noha I. Hussien MD** and Noha I. Hussien MD**
Departments of Pharmacology, Therapeutics, Pathology* and Physiology**
Faculty of Medicine, Benha University, Egypt
AbstractAbstractDiabetic nephropathy has become a worldwide epidemic, accounting
for approximately one third of all cases of end- stage renal disease.
About 30-50% of patients with long-standing diabetes will develop dia-
betic nephropathy.
Improved management of diabetes aimed at improved glycemic con-
trol, to avoid initiation of diabetic nephropathy, and antihypertensive
treatment blocking the renin-angiotensin system, to avoid its progres-
sion and need to be implemented, particularly in high-risk patients.
This study was designed to evaluate and compare the reno protective
effects of clonidine and perindopril on rats with diabetic nephropathy.
Diabetic nephropathy was induced in rats by streptozotocin (STZ)
100mg/Kg/single I.P) administration. Diabetic nephropathy rats were
randomly divided into one of 3 groups. Diabetic nephropathy group,
clonidine (0.03mg/kg/day) treated group and perindopril (1.5mg/kg/
day) treated group. Each given orally for 4 weeks starting 4 weeks after
STZ injection. Systolic and mean arterial blood pressure (SBP & MBP),
were measured by rat tail method. Renal blood flow (RBF) were estimat-
ed by flowmeter. Fasting blood glucose (FBG) and 24 hours urine albu-
min were measured by colorimetric methods. Renal tissue specimens
were histopatholgically examined by hematoxylin & eosin staining.
Both drugs significantly reduced SBP, MBP, fasting blood glucose
(FBG) and urine albumin (mg/24hours). There was insignificant differ-

206206
Hanan T. Emam, et al...
IntroductionIntroductionFrequently Hypertension and
diabetes mellitus are closely relat-
ed conditions, their deleterious ef-
fects being additive. In type 1 dia-
betes, hypertension often develops
late, whereas in the type 2 dia-
betes, hypertension diagnosis fre-
quently precedes that of diabetes
itself (1).
Overall, 50% to 60% of dia-
betics over the age of 60 years
are hypertensive (2). Hypertension
prevalence reaches 40% in type
1 diabetes and 70% in type 2 dia-
betics, with a female predomi-
nance (3).
Diabetic nephropathy is char-
acterized by persistent protei-
nuria, decreasing glomerular
filtration rate (GFR) and in-
creasing blood pressure (4).
Diabetic nephropathy is an im-
portant complication of diabetes
for a number of reasons. Firstly, it
is a relatively common complica-
tion affecting about one of three of
patients with IDDM.- secondly,
the proteinuria which is the hall-
mark of widespread damage to
small and large blood vessels and
a marker for cardiovascular dis-
ease which is a common cause of
death in these patients. Thirdly,
there is increasingly convincing
and optimistic evidence that the
progression of nephropathy and
its associated mortality can be
ameliorated by antihypertensive
and other treatments if started at
an early stage (5).
Beside glycemic control, the
systolic blood pressure could be
identified as the pre-eminent fac-
tor influencing the development of
ence between hypotensive effects of clonidine and preindopril. Effects of
preindopril on RBF, FBG and urine albumin were more significant than
that of clonidine. Moreover, histopathological examination of kidney tis-
sues showed improvement of nephropathy in the form of reduction of
basement membrane, thickening and infiltration of the inflammatory
cells.
From this study we can conclude that, both drugs significantly re-
duced blood pressure, urine albumin, FBG and RBF with superior ef-
fect of perindopril over clonidine.

207207
Benha M. J.
Vol. 29 No 2 May 2012nephropathy. Hypertension is a
crucial determent not only for the
loss of kidney function but also for
the prospects of survival of diabet-
ics with nephropathy (6).
The lowering diastolic blood
pressure below the traditional tar-
get blood pressure of 90 mmHg is
safe in diabetic patient and should
indeed be recommended. This pol-
icy results in a reduction of mor-
tality and morbidity superior to
that seen with the conventional
treatment goal of a reduction be-
low 90 mmHg (7).
The Modification of Diet in
Renal Disease (MDRD) study
demonstrated that tight blood
pressure control to a level of 92
mmHg mean blood pressure
(corresponding to a blood pres-
sure of 125/75 mmHg) signifi-
cantly slowed the deterioration
of renal function relative to a
less tight blood pressure reduction
to 107 mmHg mean arterial pres-
sure (corresponding to 140/90
mmHg) (8).
The renin angiotensin aldoste-
rone system plays a central role in
the development of hypertension
and progression of end organ
damage (9).
Evidence has accumulated
during the last few years that
ACE inhibitors convey a specific
nephroprotective effect in addition
to the beneficial effects of blood
pressure reduction and therefore
are even superior to the beneficial
effects of conventional antihyper-
tensives. Comparable studies
showed that ACE inhibitors were
superior to (β-blockers, diuretics
and calcium antagonists in reduc-
ing albuminuria (10).
The sympathetic nervous sys-
tem plays an important role in the
pathogenesis and maintenance of
essential hypertension. Sympa-
thetic overactivity and excess cate-
cholamines may contribute to the
development of other pathological
processes associated with elevated
blood pressure(11).
Furthermore, sympathetic over-
activity can lead to underperfu-
sion of the kidney(12) and several
metabolic abnormalities, including
changes in glucose metabolism,
insulin resistance, a rise in low-
density lipoprotein (LDL) and a fall

208208
Hanan T. Emam, et al...
in high- density lipoprotein
(HDL)(13).
Therefore, inhibition of sympa-
thetic nervous system activity may
ameliorate not only hypertension
but may also of the chronic dis-
eases associated with it (14).
Perindopril erbumine is a
once-daily angiotensin-converting
enzyme (ACE) inhibitor that effec-
tively lowers systolic and diastolic
blood pressure (BP) in patients
with mild-to-moderate hyperten-
sion (15).
Clonidine (catapress) is a cen-
trally acting antihypertensive
agent characterized by its wide
therapeutic range. Clonidine is an
imidazoline derivative, was origi-
nally developed as a nasal decon-
gestant and vasoconstrictor(16).
Clonidine decreases plasma re-
nin activity, presumably as a re-
sult of the decrease in sympa-
thetic activity. However, it may
directly inhibit the renal release
of renin (17). The inhibition of re-
nin release contributes to the
antihypertensive effect of cloni-
dine(18).
The aim of this work is to in-
vestigate and compare the poten-
tial reno-protective effects of cloni-
dine and prenidopril on (STZ)
induced diabetic nephropathy in
rats.
Material and MethodsMaterial and MethodsAnimals :Animals :
Twenty four male adult albino
rats of locally breaded strain
weighing between 150-250g at the
beginning of the study were used.
They have acclimatized for one
week in groups (6/cage) in fully
ventilated room at ordinary room
temperature. Rats were allowed to
ad libitum, access to water and
balanced diet.
At the beginning of the ex-
periment they were divided into
4 groups each contained 6
rats:
Group I:Group I: Control normal rats.
They receive no drugs; they only
receive drug vehicles (methyl cel-
lulose).
Group II:Group II: was served to induce
nephropathy by administration of
a single dose of streptozotocin
(STZ) (100mg/kg I.P.), then exam-
ined after 1 month.

209209
Benha M. J.
Vol. 29 No 2 May 2012Group III:Group III: was served to study
the renoprotective effect of cloni-
dine (0.03 mg/kg/orally) on dia-
betic nephropathy rat. The drug
was administered daily for one
month after induction of nephrop-
athy.
Group IV: Group IV: was served to study
the renoprotective effect of perin-
dopril (1.5 mg/kg/orally) on dia-
betic nephropathy rat. The drug
was administered for one month
after induction of nephropathy.
Drugs: Drugs:
- Clonidine hydrochloride (ca-
tapress) [Boehringer Ingel-
heim pharma KG-Germany].
It was supplied as tablet
150µg.
- Perindopril tetra butyllamine
(coversyl 10) [Servier Egypt
Industries limited]. It was
supplied as tablet 10mg.
- Heparin (Novo Industry,
Denmark).
- Hematoxylin and eosin: (E.
Merk, Darmastadt.,) [U.S.A.].
- Formaline (neutral 10% for-
maline): El-Gomhoria Phar-
maceutical Chemical Co,
ARE.
- Streptozotocin (STZ) powder
(Sigma chemicals Co., U.S.A).
- Urethane (Ethyl carbamate):
(Prolabo, Paris) white crystals
0.6ml/100g 25% freshly pre-
pared solution (19).
All drugs were dissolved in
methyle cellulose and all drugs
and chemicals were freshly pre-
pared before each experiment.
Clonidine and perindopril were
administered orally using a curved
gag reaching up to the pharynx for
4 weeks after induction of diabetic
nephropathy by (STZ) which was
administrated IP.
All groups were subjected toAll groups were subjected to
the following investigation: the following investigation:
- Systolic and mean arterial
blood pressure (SAP, MAP).
- Renal blood flow (RBF).
- Fasting blood glucose (FBG).
- 24 hour urine albumin.
- Histopathological examina-
tion.
• N.B.N.B. it should be taken in
consideration that doses of
clonidine and perindopril
chosen in this study are
based mainly on researches
done by other investigators

210210
Hanan T. Emam, et al...
(20,21), on pilot experiments
performed in our study, and
also by calculating the thera-
peutic doses for experimental
animals by (22).
• Systolic blood pressure
(SBP) was measured by
rat tail plethysmography (23).
• Renal blood flow (RBF) was
measured by Doppler flow
meter (24).
• Fasting blood glucose levels
(FBG) : only one drop of blood
of the adult rat was obtained
by a puncture of the retrobul-
bar sinus, the capillary end of
the glass tube was inserted
into the medial canthus of
the eye. The sinus was punc-
tured and blood entered the
tube by its own pressure
forming a free flow of blood.
The blood was biochemically
investigated for FBG accord-
ing to (25).
• Urine albumin g/24 h.
• After functional studies
were completed, both kidneys
were removed and the upper
1/3 of each kidney was put
into a buffered 4% formaline
fixation solution and pro-
cessed with paraffin wax for
histopathological examina-
tion. Sections (5 µm) were
stained with hematoxylin and
eosin (26).
Statistical Analysis:Statistical Analysis:
All data were expressed as
mean ± S.D, data were evaluated
by the one way analysis of vari-
ance. Difference between groups
were compared by Student's t-test
with P < 0.05 selected as the level
of statistical significance.
ResultsResultsAdministration of STZ (100
mg/kg/ single I.P) resulted in sig-
nificant (P < 0.001) elevation of
both SBP and MBP from means of
(122.2 ± 5.3) & (92.3 ± 3.5) in con-
trol group to means of (210.6 ±
9.7) & (165 ± 7.2) mmHg with a
percentage increase of ( 72.3%)
& ( 78.8%) respectively. RBF was
significantly reduced (P<0.001)
from a mean of (10 ± 0.4) cm/s to
a mean of (4.7 ± 0.2) cm/s with
percentage change (53% ). FBG
was increased from a mean of
(93.4±3.4) to a mean of (240.5 ±
10.6) mg/dl which is significant at

211211
Benha M. J.
Vol. 29 No 2 May 2012(P < 0.001) compared with the
control group with a percentage
increase of ( 157.4%). The results
showed also that STZ induced dia-
betic nephropathy produced sig-
nificant (P < 0.001) increase of
urine albumin from (1.05 ±0.08) to
(3.9 ±0.13) mg/dl with a percent-
age increase of ( 271.4%) com-
pared to control group, Table (1),
Fig. (2,6).
Histopathological examination
of renal tissues revealed diffuse di-
abetic glomerular sclerotic lesion
which is characterized by diffuse
thickening of glomerular capillary
wall and generalized increase in
mesengial matrix in all mesengial
regions of all golmeruli fig. (10).
Administration of clonidine
(0.03 mg/kg/orally) resulted in
significant (P < 0.01) reduction
of SBP and MBP with a per-
centage reduction of ( 38.2%) and
( 37.9%) from a mean of (210.6 ±
9.7) and (165±7.2) mmHg in dia-
betic nephropathy non-treated
group to (130 ± 4.6) and (102.4 ±
4.2) mmHg respectively in cloni-
dine treated group. There was sig-
nificant (P < 0.01) increase of RBF
from a mean of (4.7±0.2) to a
mean of (6.1 ± 0.24) with percent-
age increase ( 29.8%). Regarding
FBG in clonidine treated group,
results of the present work dem-
onstrated significant (P < 0.05) re-
duction of FBG from (240.5 ±
10.6) in diabetic nephropathy non
treated rats to a mean of
(205.5±7.6) mg/dl in clonidine
treated group with a percentage
reduction of ( 14.5%). Concerning
urine albumin the data revealed,
significant (P < 0.01) reduction
from a mean of (3.9± 0.13) mg/
24h in the diabetic nephropathy
non treated group to a mean of
(2.1±0.12) mg/24h in the cloni-
dine treated group with a percent-
age reduction of ( 46.1%) (Table
2), Fig. (3,7).
Histopathological examination
of renal tissues in clonidine
treated rats showed mild thicken-
ing of glmoerular capillary wall
and mild changes in mesengial
matrix Fig. (11).
Administration of perindopril
(1.5mg/kg/orally) resulted in sig-
nificant (P < 0.01) reduction of
SBP and MBP from means of
(210.6±9.7) & (165±7.2) mmHg in
diabetic nephropathy non-treated

212212
Hanan T. Emam, et al...
group to (125±4.2) & (95.2±3.7)
mmHg in perindopril treated
group with a percentage reduction
of ( 40.6%) and ( 42.3%) respec-
tively. RBF was significantly (P <
0.001) increased from a mean of
(4.7 ± 0.2) cm/s in diabetic neph-
ropathy non treated rats to a
mean of (9.8± 0.5) cm/s in perin-
dopril treated group with percent-
age increase of ( 108.5%).
Also there was significant (P <
0.01) reduction of FBG from a
mean of (240.5 ± 10.6) mg/dl in
diabetic nephropathy non treated
rats to (165.7±8.2) mg/dl in
perindopril treated group with a
percentage decrease of ( 31.1%)
compared with diabetic non treat-
ed group. Also there was with a
percentage reduction of ( 71.7%)
in urine albumin from (3.9±0.13)
mg/dl to (1.1±0.05) mg/dl in
perindopril treated group which
is significant at (P < 0.001). (Ta-
ble 3 ), Fig. (4,8).
Histopathological examination
of kidney tissues removed from
perindopril treated rats revealed
minimal changes in glomerular
capillary wall and mesengial ma-
trix Fig. (12).
Statistical analysis revealed no
significant differences between the
effects of clonidine and perindo-
pril on SBP, MBP compared with
the diabetic nephropathy group,
Table (4).
On the other hand, statistical
analysis showed significant (P <
0.05) difference between clonidine
and perindopril in improving FBG
level of STZ-induced diabetic
nephropathy in rats, table (4).
Our study also revealed a sig-
nificant (P< 0.001) difference be-
tween clonidine and perindopril in
improving RBF and 24 hour col-
lected urine albumin in experi-
mentally- induced diabetic neph-
ropathy in rats, table (4).

213213
Benha M. J.
Vol. 29 No 2 May 2012

214214
Hanan T. Emam, et al...

215215
Benha M. J.
Vol. 29 No 2 May 2012

216216
Hanan T. Emam, et al...

217217
Benha M. J.
Vol. 29 No 2 May 2012
Fig. (9): Fig. (9): Cut section of renal tissues ofcontrol normal rats showingno remarkable pathologicchanges (H&E x 40).
Fig. (10): Fig. (10): Cut section of renal tissuesof diabetic nephropathyrats (H&E x 40).

218218
Hanan T. Emam, et al...
DiscussionDiscussionHypertension aggravates both
decline in renal function and mor-
tality rates in diabetic patients,
and the importance of treating hy-
pertension in diabetics is no long-
er in question. The United King-
dom Prospective Diabetes Study
Group (UKPDS) showed that con-
trolling blood pressure in the
type 2 diabetic provides morbidity
- mortality benefits at least equal
to, possibly greater than, tight dia-
betic control (1). The need for ef-
fective and reliable antihyperten-
sive`agents is therefore
underlined.
In the present study, we in-
duced diabetic nephropathy in
adult male albino rats by single
(I.P.) injection of streptozotocin
(STZ) and rats were examined
after one month (27).
STZ induced significant in-
crease of SBP, MBP, RBF FBG and
24-hour collected urine albumin
in rats. Histopathological exami-
nation of renal tissues of diabetic
nephropathy rats by light micro-
scop revealed diffuse glomerular
sclerotic lesion.
Our study revealed that chron-
ic clonidine administration in dia-
betic nephropathy rats for 4 weeks
produced significant decrease of
SBP, MBP, FBG and 24-hour col-
lected albumin with significant
increase in RBF in diabetic neph-
ropathy rats. Histopathological ex-
amination of renal tissues from
clonidine treated diabetic neph-
Fig. (11): Fig. (11): Cut section of renal tissuesof clonidine treated diabeticnephropathy (H&E x 40).
Fig. (12): Fig. (12): Cut section of renal tissuesof perindopril treated dia-betic nephropathy (H&E x40).

219219
Benha M. J.
Vol. 29 No 2 May 2012ropathy rats revealed mild thick-
ening of glomerular capillary wall
and mild changes in mesengial
matrix.
These results were in agree-
ment with (1). Acute injection of
clonidine (centrally acting sym-
patholytic drug) in type 1 diabetes
(insulin-dependent) with incipient
nephropathy reduced arterial
blood pressure(28). The preven-
tion of elevation of blood pressure
by clonidine in diabetic nephropa-
thy could be explained by its bind-
ing to imidazoline receptors and
hence reducing the sympathetic
tone and prevention of excess so-
dium and water reabsorption (1).
Some selective α2 antagonist
appeared to have weak or no
blocking effects on the peripheral
hypotensive action of clonidine or
its related compounds. This sug-
gests the functional dominance of
the imidazoline receptors (29).
Chloroethylclonidine caused at-
tenuation of the renal vasocon-
strictor responses elicited by the
adrenergic stimuli(30).
(31)Studied the effect of prophy-
lactic clonidine administration in
STZ-induced diabetes in rats and
concluded that clonidine prevent-
ed glucose intolerance.
In agreement with these re-
sults are that of(32) who had been
studied the metabolic effects of ril-
mendine (Imidazolines structural-
ly-related derivative) in hyperten-
sive patients with metabolic
syndrome. They found that both
fasting and post-prandial plasma
glucose levels were significantly
lowered in rilmendine- treated pa-
tients.
These data are in agreement
with(33) who suggested that cen-
tral inhibition of sympathetic drive
by rilmendine in hypertensive pa-
tients could have favourable ef-
fects on glucose and lipid metabo-
lism.
Moreover, the results run in
consistence with(34) who demon-
strated that imidazolines and
structurally- related derivatives
are able to stimulate insulin re-
lease from pancreatic β-cells
through inhibition of ATP- sensi-
tive K+ channels.
Reduction of FBG by clonidine

220220
Hanan T. Emam, et al...
could be explained by its capacity
to increase the concentration of
an intracellular factor essential for
insulin-mediated activation of glu-
cose disposal, as shown by mox-
onidine (another selective imidazo-
line binding drug) and/or
reduction of the sympathetic ac-
tivity with result of improvement
of insulin resistance (35).
Our results were disagreed with
that of (28) who reported that slow
clonidine injection to 12 patients
with type 1 (IDDM) with incipient
nephropathy did not significantly
affect blood glucose concentration.
(36)Reported that increased al-
bumin excretion rate not only in-
dicated renal disease, but also re-
flected universal vascular damage
affecting large and small renal
vessels.
The results regarding 24-hour
collecting urine are in agreement
with(28) who reported that acute
clonidine injection in hypertensive
type 1 diabetics significantly re-
duced urinary albumin excretion
and functional clearance of albu-
min in all patients.
Thus the results of the present
study may provide an evidence for
the beneficial effects of clonidine
in the hypertensive diabetic pa-
tients by reducing blood pressure,
FBC and urine albumin with in-
creasing RBF.
This study also revealed that
chronic perindopril administration
in STZ- induced diabetic nephrop-
athy rats produced significant de-
crease of SBP, MBP, FBG and al-
bumin excretion in urine with
significant increase of RBF. Our
data also demonstrated a renopro-
tective effect of perindopril in the
form of improvement of glomerular
and vascular sclerotic lesions in
kidneys of diabetic nephropathy
rats.
These results run in agreement
with that of (37) who studied the
effect of renal and metabolic disor-
ders that depend on the renin-
angiotensin system in Lyon hyper-
tensive rats associated with dia-
betes. He reported that perindopril
normalized the BP, reduced the
plasma lipids, and lowered the
proteinuria.
Renal medullary protection is
conferred in spontaneous hyper-

221221
Benha M. J.
Vol. 29 No 2 May 2012tensive rats by ACE inhibition,
an effect that, is not obtained
with other antihypertensive treat-
ments (21).
Late inhibition of RAS halts the
progression of glomerulosclerosis
in obese Zucker rat (OZR), revers-
es mesangiolysis and prevents the
decline in glomerular endothelial
cell and podocyte numbers (38).
Our results are also in consis-
tence with(39) who suggestes
that the intrarenal renin-
angiotensin system (RAS) may
play an important role in the de-
velopment of glomerular changes
associated with diabetic nephrop-
athy. In their study, they induced
diabetic nephropathy in male rats
by STZ. They found that, in glo-
merular extracts of diabetic rats,
angiotensinogen and angiotensin
II were significantly increased by
2.2 and 1.9 fold respectively.
Analysis of glomerular extracts of
diabetic rats demonstrated that
exogenous angiotensin I was sig-
nificantly converted into various
angiotensin peptides including an-
giotensin II. Pre-incubation of glo-
merular extracts with captopril re-
sulted in a 20%-30% decrease in
the angiotensin II conversion from
exogenous angiotensin I in diabet-
ic and control rats.
Concerning the results about
renoprotective effects of perindo-
pril (40) reported that perindopril
suppresses the apoptosis induced
by endoplasmic reticulum stress
in renal tubular in experimental
diabetic rats.
Also (41) reported that perindo-
pril attenuates renal tubulointer-
stitium injury by inhibiting scav-
enger receptor A (SR-A) over -
expression in diabetic rats.
Finally, we can conclude that
the use of drugs that inhibit the
renin-angiotensin system is an ef-
fective way to intervene in the
pathogenesis of cardiovascular
and renal disorders. Some studies
have shown that ACE inhibitors
can delay or prevent the deteriora-
tion of renal function in chronic
renal disease, independently of
their antihypertensive effects (42).
The present work revealed a
more significant effect of perindo-
pril over clonidine in lowering
FBG and 24-hour collected albu-

222222
Hanan T. Emam, et al...
min with increasing of RBF in
STZ-induced diabetic nephropathy
rats. On the other hand, we re-
vealed no significant difference be-
tween perindopril and clonidine in
normalizing SBP & MBP of STZ-
induced diabetic nephropathy
rats.
ReferencesReferences1- Dupuy O., Bauduceau B.1- Dupuy O., Bauduceau B.
and Mayaudon H. (2000) :and Mayaudon H. (2000) : Effica-
cy of rilmenidine, a selectivel 1 im-
idazoline receptor binding agent in
diabetic hypertensive patients.
Am. J. Hypertens. June, 13 (6 Pt
2): 1235: 1265.
2- Simonson D. C. (1988) :2- Simonson D. C. (1988) :
Etiology and prevalence of hyper-
tension in diabetic patients. Dia-
betes Care, 11: 821-827.
3- Tarnow L., Rossing P., Gall3- Tarnow L., Rossing P., Gall
M. A., Nielsen F. S. and ParvingM. A., Nielsen F. S. and Parving
H. H. (1994) : H. H. (1994) : Prevalence of arte-
rial hypertension in diabetic pa-
tients after the JNC- V. Diabetes
Care, 17: 1247-1251.
4- Parving H. H., Andersen A.4- Parving H. H., Andersen A.
R., Smidt U. M., Honumel E.,R., Smidt U. M., Honumel E.,
Mathiesen E. R. and SvendsenMathiesen E. R. and Svendsen
P. A. (1987) : P. A. (1987) : Effect of anti- hy-
pertensive treatment on kidney
function in diabetic nephropathy.
Br. Med. J. 294:1443-7.
5- Deckert T., Feldt-5- Deckert T., Feldt-
Rasmussen B., Borch-JohnsenRasmussen B., Borch-Johnsen
K., et al., (1986) : K., et al., (1986) : Clinical assess-
ment and prognosis of complica-
tions of diabetes. Transplantation
Proc. 18:1636-8.
6- Amazonas R. B. and Lopes6- Amazonas R. B. and Lopes
de faria J. B. (2006) :de faria J. B. (2006) : Effect of
tight blood pressure control on
glomerular hypertrophy in a mod-
el of genetic hypertension and ex-
perimental diabetes mellitus. Life
Sci., Oct.; 79 (22): 2135-43.
7- Hansson L., Zanchetti A.,7- Hansson L., Zanchetti A.,
Carruthers S. G., et al., (1998) :Carruthers S. G., et al., (1998) :
Effects of intensive blood pressure
lowering and low- dose aspirin in
patients with hypertension: princi-
pal results of the hypertension op-
timal treatment (HOT) randomized
trial. Lancet, 351: 1755-62.
8- Klahr S., Levey A. S., Beck8- Klahr S., Levey A. S., Beck
G. J., et al., (1994): G. J., et al., (1994): Effects of
dietary protein restriction and
blood pressure control on the pro-
gression of chronic renal disease.
N. Engl. J. Med., 330:877-84.

223223
Benha M. J.
Vol. 29 No 2 May 20129- Stier C. T. Jr., Chander P.9- Stier C. T. Jr., Chander P.
N. and Rocha R. (2002) :N. and Rocha R. (2002) : Aldoste-
rone as a mediator in cardiovascu-
lar injury. Cardiol. Rev., Mar.-
Apr.; 10 (2): 97-107.
10- Cao Z., Bonnet F. Davis10- Cao Z., Bonnet F. Davis
B., Allen T. J. and Cooper M. E.B., Allen T. J. and Cooper M. E.
(2001):(2001): Additive hypotensive and
anti- albuminuric effects of angio-
tensin-converting enzyme inhibi-
tion and angiotensin receptor
antagonism in diabetic spontane-
ously hypertensive rats. Clin. Sci.
(lond). Jun.; 100 (6): 595-9.
11- Nowak L., Adamczak M.11- Nowak L., Adamczak M.
and Wiecek A. (2005) :and Wiecek A. (2005) : Block-
ade of sympathetic nervous sys-
tem activity by rilmenidine in-
creases plasma adiponection
concentration in patients with
essential hypertension. Am. J,
Hypertens., Nov.; 18 (11): 1470-5.
12- Benno M. D., Stegmann12- Benno M. D., Stegmann
J., Morton H. B., Nadja R., Erd-J., Morton H. B., Nadja R., Erd-
mann S., Ingolf S., Ingolf S.,mann S., Ingolf S., Ingolf S.,
Wolfgane H. R. and Pontus B. P.Wolfgane H. R. and Pontus B. P.
(2000): (2000): Antihypertensive effect of
0.1-Hz blood pressure oscillations
to kidney. Circulation, 101:553.
13- Richard J. K., Rodney A.13- Richard J. K., Rodney A.
V. and Paul E. (2003) :V. and Paul E. (2003) : The role
of I1-imidazoline receptors and al-
pha2-adrenergic receptors in the
modulation of glucose and lipid
metabolism in the SHROB model
of metabolic syndrome x. Ann.
N.Y. Acad. Sci. 1009: 251-261.
14- Ernsberger P., Freidman14- Ernsberger P., Freidman
J. E. L. and Koletsky R. J.J. E. L. and Koletsky R. J.
(1998) :(1998) : The I1- receptor: from
binding site to therapeutic target
in cardiodvascular disease. J. Hy-
pertens., 15 (Suppl.1): S9-S23.
15- Oprail S. (2001) : 15- Oprail S. (2001) : Efficacy
of perindopril in the treatment of
system hypertension. Am j Cardiol
4, 88 (7 Suppl): 31-121.
16- Timmermans P. B. M. and16- Timmermans P. B. M. and
Van Zwieten P. A. (1982): Van Zwieten P. A. (1982): α2-
adrenoceptors: Classification, lo-
calization, mechanisms, and tar-
gets for drugs. J. Med. Chem., 25
(12): 1389-1401.
17- Ritz E., Amann K. and17- Ritz E., Amann K. and
Fliser D. (1998) : Fliser D. (1998) : The Sympathet-
ic nervous system and the kidney:
its importance in renal diseases.
Blood Press., (Suppl.3):9-14.
18- Smyth D. D., Pirant D.18- Smyth D. D., Pirant D.

224224
Hanan T. Emam, et al...
and Frozley B. (2003) : and Frozley B. (2003) : Apparent
absence of direct renal effect of
imidazoline receptor agonists.
Ann. N.Y. Ascad. Sci., Dec, 1009 P
288-95.
19- Iwamouto K.. Chein C.19- Iwamouto K.. Chein C.
and Kato L. (1987) :and Kato L. (1987) : Effects of
urethane anesthesia and age on
organ blood flow in rats measured
by hydrogen gas clearance meth-
od. J. Pharmacobiodyn. 10 (6):
280.
20- VanZwieten P. A. (2000) :20- VanZwieten P. A. (2000) :
Renewed interest in centrally act-
ing antihypertensive drugs. Cardi-
ovasc. J.S. Afr. 11 (4): 225-229.
21- Issiakhem M., Liu K. L.21- Issiakhem M., Liu K. L.
and Benzoni D. (2008) : and Benzoni D. (2008) : Effect of
perindopril on renal medullary
blood flow: comparison with other
antihypertensive treatments. From
the Department de Physiologie et
Pharmacologie Clinique, Univer-
site de Lyon, Universite Lyon,
France. Mar; 51 (3): 280-5.
22- Pagets G. T. and Barnet I.22- Pagets G. T. and Barnet I.
M. (1964) :M. (1964) : In evaluation of drug
activates pharmacometries Eds.
Laurence, D.R. and Bacharach,
A.L.; 1-135. Academic press, Lon-
don and New York.
23- Ullian M. E., Islam M. M.,23- Ullian M. E., Islam M. M.,
Robinson C. J., Fitzgibbon W.Robinson C. J., Fitzgibbon W.
R., Tobin E. T. and Poul R. V.R., Tobin E. T. and Poul R. V.
(1997):(1997): Resistance to mineralocor-
ticodis in wistarats. Am. J. Physi-
ol., 272: 111545-111461.
24- Haywood J. R., Shaffer A.24- Haywood J. R., Shaffer A.
A. and Fastenow C. (1981) : A. and Fastenow C. (1981) : Re-
gional blood flow measurements
with pulsed Doppler flowmeter in
conscious rats. Am. J. Physiol.,
241: H273-H278.
25- Fossatip S. (1982) : 25- Fossatip S. (1982) : Prin-
ciple Clin. Chemistry 28: 2077-80.
Quoted from Boehringer Mann-
heim GMBH Diagnostic Manual.
26- Drury R. A. B. and Wall-26- Drury R. A. B. and Wall-
ington E. A. (1967) : ington E. A. (1967) : Carlton's
Histological technique, 4th ed. Ox-
ford University Press, Oxford, P.
129.
27- Katoh M., Ohmachi Y.,27- Katoh M., Ohmachi Y.,
Kurosawa Y., Yoneda H., TanakaKurosawa Y., Yoneda H., Tanaka
N. and Narita H. (2000) : N. and Narita H. (2000) : Effects
of imidapril and captopril on
streptozotocin-induced diabetic
nephropathy in mice. Eur. J.
Pharmacol. Jun. 23;398(3):381-7.
225225
Benha M. J.
Vol. 29 No 2 May 201228- Hommel E., Mathiesen E.,28- Hommel E., Mathiesen E.,
Edsberg B., Bahnsen M. andEdsberg B., Bahnsen M. and
Parving H. H. (1986) :Parving H. H. (1986) : Acute re-
duction of arterial blood pressure
reduces urinary albumin excretion
in type 1 (insulin- dependent) dia-
betic patients with incipient neph-
ropathy. Diabetologia,29:211-215.
29- Yamazato M., Sakima A.,29- Yamazato M., Sakima A.,
Nakazato J., Sesoko S., Murata-Nakazato J., Sesoko S., Murata-
ni H. and Fukiyama K. (2001):ni H. and Fukiyama K. (2001):
Hypotensive and sedative effects
of clonidine injected into the ros-
tral ventrolateral medulla of con-
scious rats. Am. J. Physiol. Regul.
Integr. Comp. Physiol. 281 (6): R
1868-76.
30- Khan M. A., Sattar M. A.,30- Khan M. A., Sattar M. A.,
Abdullah N. A. and Johns E. J.Abdullah N. A. and Johns E. J.
(2008) : (2008) : Alpha 1 B-adrenoceptors
mediate adrenergically-induced re-
nal vasoconstrictions in rats with
renal impairement, Feb; 29 (2):
193-203.
31- Goyal R. K. (1999) : 31- Goyal R. K. (1999) : Hy-
perinsulinemia and insulin in hy-
pertension: differencial effects of
antihypertensive agents. Clin.
Exp. Hyperten., 21 (1-2): 167-79.
32- De Luca, Raffaele Izzo,32- De Luca, Raffaele Izzo,
Dario Fontana, Gianluigi Lovino,Dario Fontana, Gianluigi Lovino,
Luigi Argenziano, Carmine Vec-Luigi Argenziano, Carmine Vec-
chione and Bruno Trimarcochione and Bruno Trimarco
(2000): (2000): Haemodynamic and meta-
bolic effects of rilmenidine in hy-
pertensive patients with metabolic
syndrome X. A double- blind par-
allel study versus amlodipine.
Journal of Hypertension, 18 :
1515-1522.
33- Konrady A. O., Kasherini-33- Konrady A. O., Kasherini-
ov Y. R., Shavarov A. A., Shava-ov Y. R., Shavarov A. A., Shava-
rova E. K., Vachrameeva N. V.,rova E. K., Vachrameeva N. V.,
Krutikov A. N., Stnironova E. V.Krutikov A. N., Stnironova E. V.
and Shlyakhto E. V. (2006) :and Shlyakhto E. V. (2006) :
How can we block sympathetic
overactivity? Effects of rilmenidine
and atenolol in overweight hyper-
tensive patients. J. Hum. Hyper-
tens., Jun.; 20 (6). 398-406.
34- Jonas, J.C.; Plant, T.D.34- Jonas, J.C.; Plant, T.D.
and Henquin J. C. (1992) :and Henquin J. C. (1992) : Imi-
dazoline antagonists of alph-2
adrenoceptors increase insulin re-
lease in vitro by inhibiting ATP-
sensitive potassium channels in
pancreatic beta-cells. Br. J. Phar-
macol., 107: 8-14.
35- Friedman J. E., Ishizuka,35- Friedman J. E., Ishizuka,
T., Liu S., Farret C. J., KoletskyT., Liu S., Farret C. J., Koletsky
R. J., Bedol D., et al., (1998):R. J., Bedol D., et al., (1998):

226226
Hanan T. Emam, et al...
Antihyperglycemic activity of mox-
onidine: metabolic and molecular
effects in obese spontaneously hy-
pertensive rats. Blood Press, 7
(suppl. 3): 32-39.
36- Bos H., Andersen S.,36- Bos H., Andersen S.,
Rossing P., Zeeuw D., PavrvingRossing P., Zeeuw D., Pavrving
H. H., Jong P. E. and Navis G.H. H., Jong P. E. and Navis G.
(2000) : (2000) : Role of patient factors in
therapy of resistance to antiprotei-
nuric intervention in non-diabetic
and diabetic nephropathy.
37- Emonnot L., Cohen R.37- Emonnot L., Cohen R.
and Lo M. (2008) : Rand Lo M. (2008) : Renal and
metabolic disorders depend on the
rennin- angiotensin system in
Lyon hypertensive rats associated
with diabetes. Centre National de
la Recherche Scientifique FRE
3075, Interactions Neurjovascu-
laires, Universite de Lyon 1, uni-
versite de Lyon, Lyon, France.
Jun; 21 (6): 657-62. Epub, Apr 3.
38- Sebekova K., Lill M., Boor38- Sebekova K., Lill M., Boor
P., Heidland A. and Amann K.P., Heidland A. and Amann K.
(2009) :(2009) : Functional and partial
morphological regression of estab-
lished renal injury in the obese
zucker rat by blockade of the re-
nin-angiotensin system. 29 (3):
164-70.
39- Singh R., Singh A. K. and39- Singh R., Singh A. K. and
Leehey D. J. (2005) : Leehey D. J. (2005) : A novel
mechanism for angiotensin II for-
mation in STZ-diabetic rat glome-
ruli. Am. J. Physiol. Renal Pyhsiol.
40- Sun H. L., Sun L., Li, Y.40- Sun H. L., Sun L., Li, Y.
Y., Shao M. M., Cheng X. Y., GeY., Shao M. M., Cheng X. Y., Ge
N., Lu J. D. and Li S. M. (2009) :N., Lu J. D. and Li S. M. (2009) :
ACE-inhibitor suppresses the
apoptosis induced by endoplasmic
reticulum stress in renal tubular
in experimental diabetic rats. Jul;
117 (7): 336-44.
41- Sun L., Wen J. H., Sun H.41- Sun L., Wen J. H., Sun H.
L., Shu X. C., Hu F., Yin D. C.,L., Shu X. C., Hu F., Yin D. C.,
Yang Q., Zeng Y. J., Sun Y. andYang Q., Zeng Y. J., Sun Y. and
Liu L. (2011) : Liu L. (2011) : Perindopril attenu-
ates renal tubulointerstitium inju-
ry by inhibiting scavenger receptor
a over-expression in diabetic rats.
Department of Endocrinology, the
Fifth Affiliated Hospital, Sun Yat-
sen University, Ahuhai 51900,
Guangdong Province, China. Jul
3.
42- Giatras I., Lau J. and Le-42- Giatras I., Lau J. and Le-
vey A. S. (1997) :vey A. S. (1997) : Effect of angio-
tensin converting enzyme inhibi-
tors on the progression of non-
diabetic renal disease. Ann. Inter.
Med., 127: 337-345.

227227
Benha M. J.
Vol. 29 No 2 May 2012
THE POTENTIAL BENEFICIALTHE POTENTIAL BENEFICIALEFFECTS OF PERINDOPRIL OVEREFFECTS OF PERINDOPRIL OVER
CLONIDINE ON DIABETICCLONIDINE ON DIABETICNEPHROPATHY IN RATSNEPHROPATHY IN RATS
Hanan T. Emam MD, Ghada A. Abd El Fattah MDHanan T. Emam MD, Ghada A. Abd El Fattah MD and Noha I. Hussien MD and Noha I. Hussien MD
BENHAMEDICALJOURNAL
REPRINT
Published byPublished by
Benha Faculty of MedicineBenha Faculty of Medicine Volume 29 Number 2May 2012

227227
Benha M. J.
Vol. 29 No 2 May 2012
BONE MARROW INVOLVEMENT BY NONBONE MARROW INVOLVEMENT BY NONHODGKIN’S LYMPHOMAS IN MANSOURAHODGKIN’S LYMPHOMAS IN MANSOURA
ONCOLOGY MEDICAL CENTER,ONCOLOGY MEDICAL CENTER,A PROSPECTIVE STUDYA PROSPECTIVE STUDY
Entsar I. I. Aladl M.Sc, Khalid R. Zalata Ph.D.,Entsar I. I. Aladl M.Sc, Khalid R. Zalata Ph.D.,Mahmoud A. B. Elbaz Ph.D,Mahmoud A. B. Elbaz Ph.D,
Sameh S. A. Shamaa MD*and Nadia I. Atwan Ph.DSameh S. A. Shamaa MD*and Nadia I. Atwan Ph.DDepartments of Pathology and Internal Medicine*,
Faculty of Medicine, Mansoura University, Egypt.
AbstractAbstractLymphoma is a relatively common malignancy in Egypt, contribut-
ing to 12% of all cancer patients, ranking as 4th of all malignant tu-
mors. The presence or absence of bone marrow infiltration by lympho-
ma has a significant impact on prognosis and treatment options in a
variety of NHL. Antrograde 287 bone marrow biopsies were taken for
staging patients who were already diagnosed as NHL Lymphomas from
nodal or extranodal sites. The trephine biopsies were routinely stained
by H&E, Geimsa, reticulin and Masson trichrome stains. Immunohisto-
chemical staining was done using CD20, CD3, CD5, CD23, CD30,
CD10 and CD99 monoclones for confirmation and establishing the mar-
row infiltration.
Positive marrow infiltration was seen in 38.7% of cases by BMB and
8% by BMA. The highest rates of infiltration were noticed in SLL (100%)
and HCL (100%) cases, while the lowest rates were in TCL (16,7%) and
ALCL (12.5%). The use of IHC staining increased the diagnostic accura-
cy of bone marrow biopsies in 12.6% (14 cases) of total positive cases.
The most commonly seen secondary changes in BMB were myelofibrosis
and reduced haematopoiesis.
Key words:Key words: Bone marrow biopsy, NHL, Staging

228228
Entsar I. I. Aladl, et al....
IntroductionIntroductionLymphoma is a relatively com-
mon malignancy in Egypt, contrib-
uting to 12% of all cancer pa-
tients, ranking as 4th of all
malignant tumors after breast,
leukemias and bladder cancer (1).
The presence or absence of bone
marrow infiltration by lymphoma
has a significant impact on prog-
nosis and treatment options in a
variety of Non Hodgkin lympho-
mas (NHL) (2).
Bone marrow involvement by
lymphoma is more often apparent
on trephine specimens than bone
marrow aspirates (BMA), the bone
marrow biopsy (BMB) renders im-
portant diagnostic information
which cannot be obtained from
BMA; as architectural features of
the infiltrate and its topographic
distribution as well as the amount
of marrow space occupied by a
malignant infiltrate. The negative
results on aspirate samples are
due to the presence of bone mar-
row fibrosis which is a frequent
finding in lymphomatous infil-
trates (3).
Staging bone marrow is gener-
ally done using routine bone mar-
row histology, with ancillary stud-
ies as immunophenotyping being
performed in some cases to con-
firm or establish lymphomatous
involvement (4).
Aim of workAim of workThe aim of this study is to as-
sess the frequency of bone marrow
involvement by both BMA and
BMB procedures in established
cases of lymphomas, and to study
the relative frequency, patterns of
infiltration in different subtypes
and the secondary associated
changes.
Material and MethodMaterial and MethodAntrograde 287 BMB together
with their aspirates were taken for
patients who were previously diag-
nosed as NHL lymphoma in On-
cology Medical center, Mansoura
Univerisity during the period from
January 2010 to January 2012.
Their H&E, immunohistochemical
(IHC) stained slides were retrieved
and reviewed. The primary lym-
phoma cases were 199 diffuse
large B cell lymphoma (DLBCL),
30 cases were small lymphocytic
lymphoma (SLL), 28 cases were
follicular lymphoma (FL), 10 cases
were T cell rich B cell lymphoma

229229
Benha M. J.
Vol. 29 No 2 May 2012
(TCRBCL), 8 cases were anaplastic
large cell lymphoma (ALCL), 6
cases were T cell lymphoma (TCL),
4 cases were T cell lymphoblastic
lymphoma (LL) and two cases
were Hairy cell leukemia (HCL),
The trephine cores for these pa-
tients were fixed in neutral buf-
fered formalin 10% and decalcified
in formic acid 8%. Then the tre-
phine cores were processed and
stained routinely for H&E, Geim-
sa, reticulin and Masson tri-
chrome stains. The IHC staining
were done using the following
monoclones:
1- CD20: monoclonal mouse
antibodies, Dako., Catalog
No: M 0755, 1ml concen-
trate.
2- CD 3: monoclonal mouse an-
tibody, Dako. Catalog No: M
7254, 1ml concentrate.
3- CD5: monoclonal mouse an-
tibody, Dako. Catalog No:
M7194, 1ml concentrate.
4- CD10: monoclonal mouse
antibody, Dako. Catalog No:
110 M -16, 1ml concentrate.
5- CD 23: monoclonal mouse
antibody, Lab Vision, Cata-
log No: 729-s, 1ml concen-
trate.
6- CD30: monoclonal mouse
antibody, Dako. Catalog No:
M 7254, 1ml concentrate.
7- CD99: monoclonal mouse
antibody, Lab Vision, Cata-
log No: Ms 294p, 2 ml con-
centrate.
- Dilution of these monoclones
was done as follows; for CD3,
CD20, CD5 the dilution was 1/50,
for CD23 and CD30 the dilution
was 1/25, for CD10 was 1/10 and
for CD99 was 1/100
Detection system: Dako LSAB/
HRP kit code No k 0679 and Dako
En Vision /HRP kit code No k
4004 and k 4006.
The procedure of immunostain
was conducted according to the
methods described by Kiernan (5).
Interpretation of immunohisto-
chemical staining:
The results were interpreted in
light of the appropriate staining of
all positive and negative controls.
CD20, CD3, CD5, CD10, CD 99
and CD23: membranous staining
CD30: Perinuclear and membra-
nous staining.

230230
Entsar I. I. Aladl, et al....
Statistical analysis of data was
done by using SPSS program
(statistical package of social sci-
ence Version 16). Descriptive
data are in the form of mean
±standard deviation and frequency
of cases. Analytic data was done
by comparing groups using Chi-
square test. P is significant if
<0.05.
ResultsResultsOut of 287 cases of lympho-
ma for staging, 152 were males
and 135 were females with age
range from 10 to 77 years and
mean age 50.08 years ± 1.42 SD.
Positive marrow infiltration was
found in 111 cases (38.7%) by
BMB (table 1) and in 8% by BMA
with significant differences be-
tween BMB and BMA (P value
<0.001).
Regarding the pattern of infil-
tration, mixed pattern of infiltra-
tion was the commonest of all pat-
terns and in cases of DLBCL.
while diffuse pattern was the com-
monest in SLL, HCL, ALCL, and
TCL. The paratrabecular pattern
was the commonest in FL cases,
while the nodular pattern predom-
inant in T cell LL, There was sig-
nificant association between the
patterns and subtypes of lympho-
ma (P value = 0.01)(table 2).
Secondary changes in BMB
were myelofibrosis in 107 cases,
reduced hematopoiesis in 49 cas-
es, reactive T cells in 15 cases,
morphologic dysplasia in 7 cases,
and ALIP in 4 cases. There was
significant association between
these secondary changes and sub-
types of lymphoma (P value =
0.01) (table 3).

231231
Benha M. J.
Vol. 29 No 2 May 2012

232232
Entsar I. I. Aladl, et al....

233233
Benha M. J.
Vol. 29 No 2 May 2012

234234
Entsar I. I. Aladl, et al....

235235
Benha M. J.
Vol. 29 No 2 May 2012
DiscussionDiscussionThe current study included 287
BMB for staging NHL patients,
bone marrow was infiltrated in
111 cases (38.7%). Lower frequen-
cy of bone marrow infiltration
(12.4%-30%) was reported by(6,7),
while higher frequency of bone
marrow infiltration (44-69%) was
detected by others(8,9,10). The dif-
ferences between previous studies
and the present one could be at-
tributed to inclusion of unequal
proportions of patients with early
and advanced disease, in addition
to different proportions of various
histological sub-types of lympho-
mas which already have variable
frequencies of bone marrow infil-
tration(8).
Bone marrow aspirate in the
present study showed positivity in
8% of total cases, especially in B
cell lymphomas. Significantly
higher rate of positivity (30%) was
reported(9). The lower results of
bone marrow aspirate may be re-
lated to marrow fibrosis.
In the current study, higher
rate of bone marrow infiltration
was identified in BCL (39.4%)
than TCL (27.8%). Lower rate;
24.4% and 18.9% in BCL and
TCL, respectively with predomi-
nant BCL was reported(20), while
higher rate of infiltration in TCL
(16.7% ) than BCL (11.4%) was re-
ported(7).
The predominant histological
pattern of bone marrow infiltra-
tion by lymphoma in this study
was the mixed one, which was
observed in (28.1%). Similar re-
sults were reported in another
study(10). However, this was dif-
ferent from the results of El Bol-
kainy et al.,who found the pre-
dominant pattern of marrow
infiltration to be the paratrabecu-
lar in 30% of cases(9).
In cases of DLBCL positive
bone marrow infiltration was
found in 28.1%, other studies
showed wide range of marrow in-
filtration in 8-35%(11,12). Regard-
ing the pattern of infiltration in
DLBCL in the current study mixed
and nodular patterns were the
most common, while in other
studies nodular pattern was the
commonest(11,12).
In SLL, 100% of the staged cas-
es showed marrow infiltration, in

236236
Entsar I. I. Aladl, et al....
other studies similar results;
100% of cases were positive(13,14). Although the predominant
patterns in present study were
the diffuse and mixed patterns,
in other studies the nodular
and interstitial patterns were the
commonest(13,14). This may be re-
lated to late stage of SLL and leu-
kemic transformation especially
that 13 cases in this work pre-
sented with absolute lymphocyto-
sis.
Regarding FL cases, it showed
positive marrow infiltration in
57.1 % of cases, and the paratra-
becular pattern was predomi-
nate. These results were consist-
ant with other studies in which
50–60% of cases were positive and
also paratrabecular pattern was
the most common (15,16).
Among cases of TCRBCL mar-
row infiltration was detected in
20% of cases. A higher rate of in-
filtration was reported in another
study which showed marrow infil-
tration in 33% of cases(17). The
pattern of infiltration in this study
was interstitial, while in another
study, the pattern was often para-
trabecular(17).
Regarding HCL (2 cases), in the
current and other studies, bone
marrow infiltration was detected
in 100% of cases, with diffuse pat-
tern of infiltration (18,9).
In cases of LL, marrow infiltra-
tion was found in 75%. In other
studies constant marrow infiltra-
tion (100%) was seen.(19,9). The
pattern of infiltration in the
present study was nodular. In oth-
er studies, the pattern of infiltra-
tion was ranging from interstitial
to diffuse (18,9).
In anaplastic large cell lym-
phoma, only one case showed
marrow infiltration (12.5%) with
diffuse pattern of infiltration.
Other studies showed marrow
involvement in 10 - 30% of cas-
es and the involvement was
subtle and undetectable without
IHC(19,20).
Regarding T cell lymphoma
in this study one case showed
BM infiltration (16.7%). Higher
rate of bone marrow infiltra-
tion (27.8%) was reported in an-
other study(21). The infiltration
pattern was diffuse in this
study, while in another study the

237237
Benha M. J.
Vol. 29 No 2 May 2012
infiltration varies from subtle to
diffuse and widespread (22).
Importantly in the current
study all the positive cases were
concordant, similar results were
reported by another study (9),
however in other studies discor-
dant morphology between the pri-
mary and marrow infiltrate was
encountered in 29.63% in cases of
follicular lymphomas and diffuse
large B-cell lymphomas (10,8).
In the present study, myelofib-
rosis was found in 107 cases
(37.2%). The remaining 4 cases
were negative for fibrosis, prob-
ably may be due to early intersti-
tial infiltrate. This results indi-
cates that immunohistochemistry
is more sensitive in detecting
marrow infiltration than reticulin
and H & E stains, and can aid in
increasing the diagnostic accuracy
of bone marrow biopsy in detec-
tion of occult lymphomas(12).
These results of reticulin stains
were different from Kumar et al.,
who found that reticulin stain
helped in detection of scanty focal
or interstitial infiltrate, which may
not be apparent in routine H and
E stains (11).
In this study marrow morpho-
logic dysplasia was found in 7 cas-
es (2.6%), theses reactive changes
maintained relative topographic
distribution of all series. Inspite of
these changes secondary myelo-
dysplasia was not implicated as
the blast cells did not exceed 5%
of marrow cells. Higher rate of
morphologic dysplasia 6.3% was
reported by Elbokainy et al (9).
Abnormal localization of imma-
ture precursors (ALIP) was found
in 4 cases (2.5%) in the current
study, and also it was not asso-
ciated with increase in the marrow
blasts. Higher rate of ALIP was
found by other authors(23,9). Re-
active T cells were found in 15
cases of FL and DLBCL (5.6%).
Similar to Kremer who found a
high number of reactive T cells in
neoplastic infiltrates of bone mar-
row in BCL especially FL (24).
Eventually using IHC staining
was a valuable tool for staging
lymphoma in bone marrow biopsy
as it confirmed the diagnosis of
positive cases by H&E in 92/106
cases (86.8%) and established the
diagnosis of bone marrow infiltra-
tion in 14/106 cases (13.2%) with

238238
Entsar I. I. Aladl, et al....interstitial pattern of infiltration,
which were suspicious by H&E.
Similar results were reported by
Talaulikar et al., as they found
that using IHC techniques in-
creased the diagnostic accuracy of
BMB in staging lymphoma in 11%
of cases when compared to histol-
ogy alone (12).
ConcConclulusion sion This study highlights the inci-
dence and different patterns of in-
volvement of 287 cases lymphoma
in the bone marrow, without dis-
cordance between BM morphology
and primary site histology.
Bone marrow trephine biopsy
showed involvement by lymphoma
in 38.7% of cases. The incidence
of involvement was higher in B-
cell lymphomas when compared
with T-cell lymphomas and the
predominant pattern of involve-
ment was mixed. The highest rate
of infiltration was seen in small
lymphocytic lymphoma, and hairy
cell leukemia, while T cell lympho-
ma and T cell rich B cell lympho-
ma showed the lowest rate of bone
marrow infiltration. The use of
IHC, increased the diagnostic ac-
curacy by unmasking obscured
patterns and morphology.
Bone marrow aspirates had
lower diagnostic value in staging
NHL than bone marrow biopsy.
ReferencesReferences1.1. Mokhtar N., Gouda I. andMokhtar N., Gouda I. and
Adel I. (2007): Adel I. (2007): Lympho-hemato-
poietic system tumors. In Cancer
pathology registry 2003-2004 and
time trend analysis (Egypt).
2.2. Bain B. J. (2001) : Bain B. J. (2001) : Bone
marrow trephine biopsy. J Clin
Pathol 54: 737-742.
3.3. Kremer M., Quintanilla-Kremer M., Quintanilla-
Martinez L., Nahrig J., et al.,Martinez L., Nahrig J., et al.,
(2005) :(2005) : Immunohistochemistry in
bone marrow pathology: a useful
adjunct for morphologic diagnosis.
Virchows Arch; 447 : 920-937.
4.4. Foucar K. (2001) :Foucar K. (2001) : Bone
Marrow Pathology. Chicago, ASCP
Press.
5.5. Kiernan J. A. (ed.)(1999) :Kiernan J. A. (ed.)(1999) :
Histological and Histopathological
methods: Theory & practice, 3rd
edition: p 390-430.
6.6. Merli M., Arcaini L., Bove-Merli M., Arcaini L., Bove-
ri E., et al., (2010) : ri E., et al., (2010) : Assessment
of bone marrow involvement in
non-Hodgkin's lymphomas: com-

239239
Benha M. J.
Vol. 29 No 2 May 2012
parison between histology andflow cytometry. Eur J Haematol.Nov;85(5):405-15.
7.7. Jeong S. Y., Chang Y. H.,Jeong S. Y., Chang Y. H.,Lee J. K., et al., (2007): Lee J. K., et al., (2007): Inci-dence and histologic patterns ofbone marrow involvement ofmalignant lymphoma based onthe World Health Organizationclassification-a single institutionstudy. Korean J Lab Med; 27 :383-7.
8.8. Kumar S., Rau A. R., NaikKumar S., Rau A. R., NaikR.. et al., (2009) : R.. et al., (2009) : Bone marrowbiopsy in non-Hodgkin lymphoma:a morphological study. Indian JPathol Microbiol.;52(3):332-8.
9.9. EL-Bolkainy T. M., AboEL-Bolkainy T. M., AboDeif W. S., Gouda H. M., et al.,Deif W. S., Gouda H. M., et al.,(2008) :(2008) : Evaluation of Bone Mar-row in 143 Lymphomas : TheRelative Frequency and Pattern ofInvolvement, Secondary Myelopa-thies, Pitfalls and Diagnostic Va-lidity; J. Egypt.Nat. Cancer Inst.,20, 1:17-30.
10.10. Arber D. A. and GeorgeArber D. A. and GeorgeT. I. (2005) :T. I. (2005) : Bone marrow biopsyinvolvement by non- Hodgkin'slymphoma: frequency of lympho-ma types, patterns, blood involve-ment, and discordance with other
sites in 450 specimens. Am J SurgPathol;29:1549-57.
11.11. Campbell J., Seymour J.Campbell J., Seymour J.F., Matthews J., et al., (2006) :F., Matthews J., et al., (2006) :The prognostic impact of bonemarrow involvement in patientswith diffuse large cell lymphomavaries according to the degree ofinfiltration and presence of discor-dant marrow involvement. Eur JHaematol; 76: 473-80.
12.12. Talaulikar D., ShadboltTalaulikar D., ShadboltB., Bell J., et al., (2008) : B., Bell J., et al., (2008) : Clini-cal role of flow cytometry in rede-fining bone marrow involvement indiffuse large B-cell lymphoma(DLBCL): a new perspective. His-topathology 52:340-347.
13.13. Oscier D., Fegan, C.,Oscier D., Fegan, C.,Hillmen P., et al., (2004) : Hillmen P., et al., (2004) : Guide-lines on the diagnosis and man-agement of chronic lymphocyticleukaemia. Brit. J. Haemato., 125,294-317.
14.14. Schade U., Bock O.,Schade U., Bock O.,Vornhusen S., et al., (2006) :Vornhusen S., et al., (2006) :Bone marrow infiltration patternin B-cell chronic lymphocytic leu-kemia is related to immunoglobu-lin heavy-chain variable regionmutation status and expression of70-kDa zeta associated protein

240240
Entsar I. I. Aladl, et al....
(ZAP-70). Hum Pathol; 37:1153-1161.
15.15. Henrique R., Achten R.,Henrique R., Achten R.,Maes B., et al., (1999) :Maes B., et al., (1999) : Guide-lines for subtyping small B-celllymphomas in bone marrow biop-sies. Virchows Arch; 435 : 549-558.
16.16. Torlakovic E., TorlakovicTorlakovic E., TorlakovicG. and Brunning R. D. (2002) :G. and Brunning R. D. (2002) :Follicular pattern of bone marrowinvolvement by follicular lympho-ma. Am J Clin Pathol;118:780-786.
17.17. Aki H., Tuzuner N., On-Aki H., Tuzuner N., On-goren S., et al., (2004) : goren S., et al., (2004) : T-cell-rich B-cell lymphoma: a clinico-pathologic study of 21 cases andcomparison with 43 cases of dif-fuse large B-cell lymphoma. LeukRes;28:229-236.
18.18. Fend F. and Kremer M.Fend F. and Kremer M.(2007) :(2007) : Diagnosis and Classifica-tion of Malignant Lymphoma andRelated Entities in the Bone Mar-row Trephine Biopsy. Pathobiolo-gy;74:133-143.
19.19. Falini, B. (2001) : Falini, B. (2001) : Ana-plastic large cell lymphoma: path-ological, molecular and clinicalfeatures. Brit. J Haematol, 114,741-760.
20.20. Pillon M., Gregucci F.,Pillon M., Gregucci F.,Lombardi A., et al., (2012) : Lombardi A., et al., (2012) : Re-sults of AIEOP LNH-97 protocolfor the treatment of anaplasticlarge cell lymphoma of childhood.Pediatr Blood Cancer. 2. [Epubahead of print].
21.Kittivorapart J. and Chin-21.Kittivorapart J. and Chin-thammitr Y. (2011) : thammitr Y. (2011) : Incidenceand risk factors of bone marrowinvolvement by non-Hodgkin lym-phoma. J Med Assoc Thai. 2011Feb;94 Suppl 1:S239-45. abstr.
22.22. Asano N., Suzuki R., Ka-Asano N., Suzuki R., Ka-gami Y., et al., (2005) : gami Y., et al., (2005) : Clinico-pathologic and prognostic signifi-cance of cytotoxic molecule expre-ssion in nodal peripheral T-celllymphoma, unspecified. The Am JSurg Patholo; 29, 1284-1293.
23.23. Fenaux P. (2001) :Fenaux P. (2001) : Chro-mosome and molecular abnormal-ities in myelodysplastic syn-dromes. Int J Hematol.;73:429-437.
24.24. Kremer M., Spitzer M.,Kremer M., Spitzer M.,Mandl-Weber S., et al., (2003) :Mandl-Weber S., et al., (2003) :Discordant bone marrow involve-ment in diffuse large B-cell lym-phoma: comparative molecularanalysis reveals a heterogeneousgroup of disorders. Lab Invest; 83:107-114.

241241
Benha M. J.
Vol. 29 No 2 May 2012
BONE MARROW INVOLVEMENTBONE MARROW INVOLVEMENTBY NON HODGKIN’S LYMPHOMASBY NON HODGKIN’S LYMPHOMAS
IN MANSOURA IN MANSOURA ONCOLOGYONCOLOGYMEDICAL CENTER,MEDICAL CENTER,
A PROSPECTIVE STUDYA PROSPECTIVE STUDY
Entsar I.I. Aladl M.Sc, Khalid R. Zalata Ph.D.,Entsar I.I. Aladl M.Sc, Khalid R. Zalata Ph.D.,Mahmoud A.B. Elbaz Ph.D, Sameh S.A. Shamaa MDMahmoud A.B. Elbaz Ph.D, Sameh S.A. Shamaa MD
and Nadia I. Atwan Ph.Dand Nadia I. Atwan Ph.D
BENHAMEDICALJOURNAL
REPRINT
Published byPublished by
Benha Faculty of MedicineBenha Faculty of Medicine Volume 29 Number 2May 2012

241241
Benha M. J.
Vol. 29 No 2 May 2012
LEFT VENTRICULAR SYSTOLIC DYSFUNCTIONLEFT VENTRICULAR SYSTOLIC DYSFUNCTIONIN CIRRHOTIC PATIENTS ASSOCIATEDIN CIRRHOTIC PATIENTS ASSOCIATED
WITH HCV INFECTIONWITH HCV INFECTION
Ahmed Bahy El-Dien M.Sc; Hassan M. El-Askalany MD,Ahmed Bahy El-Dien M.Sc; Hassan M. El-Askalany MD,Talal Amer MD*, Mohamed M. Hamouda MD,Talal Amer MD*, Mohamed M. Hamouda MD,
Mohamed Atwa MD** and Afaf Abdel-Hafez MDMohamed Atwa MD** and Afaf Abdel-Hafez MDDepartments. of Internal Medicine, Radiodiagnosis*, Clinical Pathology**,
Mansoura University, Egypt
AbstractAbstractIntroduction: Introduction: Hepatitis C virus (HCV) becomes chronic in 55 - 85%
of the person infected with HCV. Immunological studies demonstrated
the presence of HCV in extrahepatic organs, including the heart. HCV
infection has been largely considered as an important cause of myocar-
ditis and heart failure, however, fewer studies investigated systolic func-
tion abnormalities in HCV positive cirrhotics without clinical, evidence
of cardiac problem.
Aim of study: Aim of study: The study was designed to study systolic function of
HCV positive cirrhotics without clinical evidence of cardiac problems.
Subject and Methods: Subject and Methods: The study comprised of 63 HCV +ve cirrhot-
ics & 34 HCV negative cirrhotics and 22 control subjects. Control sub-
jects were clinically free with no regular medications. Exclusion criteria
included very obese, elderly subjects, patients with ischemic heart dis-
ease or organic heart disease, autoimmune disorders including autoim-
mune liver disease, endocrinal disorders and history of medication af-
fecting the heart. All subjects had history taking, clinical examination,
routine laboratory and radiologic investigations, anti HCV antibodies,
HCV PCR and complete echo Doppler study.
Results:Results: there was no statistically significant difference between the
three main patient and control groups regarding age, sex, body mass in-
dex, systolic and diastolic blood pressure. However, HCV +ve cirrhotics

242242
Ahmed Bahy El-Dien, et al....
IntrodIntroductiouctionHepatitis C virus (HCV) causes
not only liver disease but also a
broad clinical spectrum of extra-
hepatic manifestation. Immuno-
logical studies demonstrated the
presence of HCV in extrahepatic
organs including the heart (1,2).
HCV infection becomes
chronic in 55-85% of the per-
sons infected with HCV. HCV in-
fection is generally asymptomatic.
It is known that chronic HCV in-
fection triggers autoimmune disor-
ders. A strong relationship has
been found with essential mixed
cryoglobulinemia, glomeruloneph-
ritis and porphyria tarda. Addi-
tionally HCV infection has been
associated with extrahepatic in-
volvement such as Sjogren’s syn-
drome, lichen planus and Hashi-
moto thyroiditis (3).
It is known that, the hyperdy-
namic circulation in portal hyper-
tension begins in the portal ve-
nous bed. As liver disease
progresses and liver function dete-
riorates. The systemic hyperdy-
namic circulation becomes more
manifest with activation of the re-
nin-angiotensin-aldosterone sys-
tem (RAAS) (4).
It has been widely reported
that HCV antibodies were more
prevalent in patients with myocar-
ditis and heart failure, also, HCV
infection has been largely consid-
ered as an important cause of
myocarditis and heart failure (5).
However, fewer studies investigat-
ed systolic function abnormali-
ties in cirrhotic patients with HCV
revealed significant lower ejection fraction and fractional shortening
than the other groups. Also they revealed higher myocardial perfor-
mance index (MPI). Moreover, HCV +ve cirrhotic showed significant pos-
itive correlation of HCV viraemia with interventricular septal thickness
during diastole as well as near positive correlation with MPI of left ven-
tricle.
Conclusion: Conclusion: HCV infection could be an additional factor to portal hy-
pertension in the pathogenesis of left ventricular systolic dysfunction in
cirrhotics.

243243
Benha M. J.
Vol. 29 No 2 May 2012infection without clinical evidence
of heart failure.
This study was designed to in-
vestigate systolic function abnor-
malities in a group of Egyptian pa-
tients with liver cirrhosis without
clinical evidence of myocarditis or
cardiomyopathy as well as heart
failure.
Subjects and MethodsSubjects and MethodsThe present study comprisedThe present study comprised
3 main groups:3 main groups:
• Sixty three cirrhotic patients
(based on clinical and ultra-
sound data) with positive
anti-HCV and HCV RNA by
PCR.
• Thirty four cirrhotic patients
(based on clinical and ultra-
sound data) with negative
HCV and HCV RNA.
• Twenty two control subjects
who were non-cirrhotic with
no clinical or laboratory or ul-
trasonographic evidence of
liver disease, kidney disease,
cardiac disease as well as en-
docrinal disease.
Patients and control were se-
lected and evaluated at Mansoura
University Hospitals (MUH), from
January 2010 to December 2011.
The two patient groups and the
control group were matched re-
garding age, sex and systolic blood
pressure (SBP).
Patients and controls exclu-Patients and controls exclu-
sion criteria included:sion criteria included:
Very obese and old ages more
65 years, ages less than 39
years, technically difficult cases
for echo Doppler study ischemic
heart disease (IHD), rheumatic
heart disease, atherosclerotic
heart disease, moderate or severe
hypertensives or subjects on anti-
hypertensive medications, endo-
crinal diseases including diabetes
mellitus, renal failure or dialysis,
autoimmune liver disease, alcohol
intake, patients with history of
sclerotherapy, pregnant and lac-
tating women and subjects refus-
ing enrollment to the study. Pa-
tients with positive HBSAg were
also excluded.
All subjects were subjected to: All subjects were subjected to:
• Thorough history taking, full
clinical examination, routine
laboratory investigation to ex-
clude considerable renal dis-
ease, endocrinal disorders as

244244
Ahmed Bahy El-Dien, et al....
well as autoimmune liver dis-
ease.
• Liver function tests, hepati-
tis C virus antibody, hepatitis
B surface antigen, Quantita-
tive PCR for hepatitis C virus
infection.
• Electrocardiography (stan-
dard resting 12 leads ECG),
all of the patients were in si-
nus rhythm and none of
them were on cardioactive
medications.
• Abdominal ultrasound ex-
amination of the abdomen
using 3.5 MHz transducer
connected to the Aloka SSD
680 device portal hyperten-
sion was diagnosed taking
the criteria reported previous-
ly by Yong (6) as a guide.
Echocardiographic examination
was performed using general elec-
tric vivid 5, equipped with 3.5MHz
transducer. All examinations were
performed with the subject in left
lateral decubitus in accordance to
the recommendation of American
Society of Echoardiography (7).
During echocardiography, a
one lead electrocardiogram was re-
corded continuously internal left
ventricular end systolic (LVES),
left ventricular end diastolic
(LVED), left ventricular interven-
tricular septum during diastole
(IVSD) and posterior wall thick-
ness during diastole were all
measured, standard methods were
used to calculate LV ejection frac-
tion (LVEF) and left ventricular
fractional shortening (LVFS).
Pulsed-wave mitral flow velocities
were measured from the apical
four-chamber view. Mitral early
and late diastolic velocities were
recorded. Mitral Early (E) deceler-
ation time and isovolumetric re-
laxation time (IRT, ms) were re-
corded as well isovolumic
contraction time (IRT, ms) and left
ventricular ejection time (ET, ms).
Lt ventricular myocardial per-
formance index (MPI) was calcu-
lated using (ICT + IRT) / ET for-
mula(8). Each representative value
was obtained from the average of
the three consecutive measure-
ments.
Statistical analysis:Statistical analysis:
Statistics were run on an IBM
compatible computer system us-
ing the statistical package for So-
cial Scientists (SPSS) for windows

245245
Benha M. J.
Vol. 29 No 2 May 201215 (SPSS Inc, Chicago, IL, USA).
Qualitative data was presented as
number and percent. Comparison
between groups was done by Chi-
Square test. Mean and standard
deviations were used to describe
data. Student t-test was used to
compare between two groups. F-
test (One Way Anova) was used to
compare between more than two
groups. P value was considered
significant if less than 0.05.
ResultsResultsThere was no statistically sig-
nificant difference between anti-
HCV positive, anti-HCV negative
and control groups regarding age,
body mass index, SBP, DBP, dysp-
nea and palpitation by one way
Anova (Table 1).
Cirrhotics with +ve anti-HCV
showed statistically significant
higher LVED, LVES diameters as
well as significant higher IVST and
LVPWT. They also showed statisti-
cally significant lower LVEF and
LVFS as compared with cirrhotics
with -ve anti-HCV. Statistically
significant higher MPI of left ven-
tricle is found in cirrhotics with
positive HCV infection than other
groups, (Table 2).
Portal vein diameter (PVD), su-
perior mesenteric vein diameter
(SMV) and splenic vein (SV) diam-
eters were statistically higher in
patient groups than the control
group (Table 3).
Also, P and SMV and SV maxi-
mum flow rates were statistically
significant lower in patient groups
than the control group (table 3).
HCV +ve cirrhotic showed sig-
nificant positive correlation of
HCV viraemia with interventricu-
lar septal thickness during diasto-
le as well as near positive correla-
tion with MPI of left ventricle
(table 4).

246246
Ahmed Bahy El-Dien, et al....

247247
Benha M. J.
Vol. 29 No 2 May 2012

248248
Ahmed Bahy El-Dien, et al....
DiscussionDiscussionHeart in patients with cirrhosis
presents with structural and func-
tional abnormalities that have
been termed cirrhotic cardiomyo-
pathy (9).
The cause of these cardiac al-
teration in portal hypertension is
not clear and probably both con-
tinuous mechanical stress and
neurohumoral factors play a role
in the condition (10,11).
Many studies reported dia-
stolic dysfunction that worsen
with the presence of ascites and
physical stress, less numerous
studies reported abnormal sys-
tolic response to stress (12). Some
authors reported that their cir-
rhotic patients, in response to
stress were unable to adequate-
ly increase their heart rate,
stroke volume index and cardiac
index. In addition, their LVEF
showed a mean negative in-
crease compared to controls. As
a consequence, cirrhotic patients
presents a reduced exercise ca-
pacity and lower maximal work-
load. Other data suggested that
cirrhotic patients have reduced
maximal oxygen consumption

249249
Benha M. J.
Vol. 29 No 2 May 2012
with an early anaerobic thresh-
old supporting the hypothesis of
impaired cardiac response to
stress as an important contrib-
utor to the reduced exercise ca-
pacity (13).
Links between hepatitis C virus
and dilated cardiomyopathy were
previously reported (14,15). Moreo-
ver, findings and new diagnostic
tests resulted in increased interest
in inflammatory cardiomyopathies
and a better understanding of its
pathophysiology (16).
Impaired autonomic function is
caused by chronic HCV infection
(17). It was reported that neither
cryoglobulinaemia, nor the serum
HCV RNA level correlated with
impaired autonomic function.
They also reported that cardiova-
gal autonomic dysfunction in pa-
tients with chronic HCV infection
independently correlates with ALT
level.
Because HCV infection/
replication itself is not cytopathic,
both liver and neurological pathol-
ogies in chronic HCV infection are
considered by many authors to be
immune mediated (18,19).
In this study, it was found that
HCV +ve cirrhotics had signifi-
cantly higher LVED, LVES and
IVST than HCV -ve cirrhotics
and control. Moreover, they ex-
hibited significantly lower ejection
fraction, these findings were
more or less similar to previous
reports documented by Demir et
al.; Kawai et al. and Demir &
Demir (20- 22).
Moreover, this study also re-
vealed that HCV +ve cirrhotic
showed significant positive corre-
lation of HCV viraemia with inter-
ventricular septal thickness dur-
ing diastole as well as near
positive correlation with MPI of left
ventricle.
However, it has been hypothe-
sized previously that portal hy-
pertension itself can be added
to the list as one of the impor-
tant factors in the pathogenesis
of the cardiac diastolic dysfunc-
tion, and other factors like al-
dosterone may play some role
particularly as the liver dys-
function progresses (23). They
also reported a significant in-
crease in aldosterone levels
among the cirrhotics and they

250250
Ahmed Bahy El-Dien, et al....
suggested a role of activated RAAS
in the pathogenesis of cardiac
contractile dysfunction.
In addition, Torregrosa et al.
reported that cardiac alterations
in cirrhosis are mild and inde-
pendent of the etiology of cir-
rhosis, and consist of increased
ventricular wall thickness, a dia-
stolic dysfunction that worsens
with the presence of ascites and
physical stress, and a basal hy-
perdynamic systolic function with
abnormal systolic response to
stress conditioning limited exer-
cise capacity (12).
It is not exactly known which
mechanisms were involved in car-
diac damage due to HCV infection,
however, that HCV-RNA was dem-
onstrated in the myocardium sug-
gests that the virus may have a di-
rect cytopathic effect on the
myocardium and may induce cell
growth (1,24).
Also, inflammatory cytokines
as interleukin-1, -6 or TNF re-
leased secondary to HCV infection
could account for cardiac involve-
ment in patients infected with
HCV.
It has been reported that an as-
sociation between HCV infection
and left ventricle hypertrophy in
terms of left ventricle systolic dys-
function could exist (20,21).
ConclusionConclusionHCV infection could be addi-
tional factor in the pathogenesis of
left ventricular systolic dysfunc-
tion in cirrhotics. Cardiac involve-
ment should be considered during
follow up of a patient with HCV in-
fection.
RecommendationsRecommendations• Further studies including
large number of cirrhotic pa-
tients and controls for accu-
racy of results.
• Determination of plasma al-
dosterone levels as well as
RAAS and serum levels of
cryoglobulins should be add-
ed to variables investigated in
such studies.
• HLA typing inspite of its
higher cost should be done
as not all the HCV infected
patients exhibited abnormal
cardiac findings.
• Autonomic dysfunction
should be evaluated in fur-
ther similar studies.

251251
Benha M. J.
Vol. 29 No 2 May 2012ReferencesReferences
(1) Takeda A., Sakata A. and(1) Takeda A., Sakata A. and
Tadea N. (1999) : Tadea N. (1999) : Detection of
hepatitis C virus RNA in the
hearts of patients with hepatogen-
ic cardiomyopathy. Mol Cell Bio-
chem; 195: 257-261.
(2) Shichi D., Matsumori A.,(2) Shichi D., Matsumori A.,
Naruse T. K., Inoko H. and Ki-Naruse T. K., Inoko H. and Ki-
mura A. (2008) : mura A. (2008) : HLA-DPB chain
may confer the susceptibility to
hepatitis C virus-associated hy-
pertrophic cardiomyopathy. Int J
Immunogenet.; 35(1): 37-43.
(3) Kadiroglu A. K., Göral V.,(3) Kadiroglu A. K., Göral V.,
Sit D., et al. (2005) :Sit D., et al. (2005) : The evalua-
tion of the prevalence of extrahe-
patic findings in chronic hepatitis
C virus. Turkiye Klin J Med Sci;
25 : 621-626.
(4) Blendis L. and Wong F.(4) Blendis L. and Wong F.
(2001) : (2001) : The hyperdynamic circu-
lation in cirrhosis: an overview.
Pharmacology & Therapeutics; 89:
221-231.
(5) Matsumori A, Shimada T,
Chapman NM, Tracy SM, Mason
JW. Myocarditis and heart failure
associated with hepatitis C virus
infection. Journal of Cardiac Fail-
ure 2006; 12(4).
(6) Yong H. (2004) :(6) Yong H. (2004) :
Hahn.portal hypertension.(Edi-
tor)Division of Gastroentrology
and Hepatology.Internal medi-
cine,Milton Shershey Medical Cen-
ter,Pennsylvania State University.
(7) Sahn K. J., DeMacro A.,(7) Sahn K. J., DeMacro A.,
Kisslo J., et al. (1978) :Kisslo J., et al. (1978) : Recom-
mendation regarding quantitation
in M-mode echocardiography: re-
sults of a survey of echocardio-
graphic measurements. Circula-
tion; 58: 1072-83.
(8) Tei C., Ling L. A., Hodge(8) Tei C., Ling L. A., Hodge
D. O., et al. (1995) : D. O., et al. (1995) : New index of
combined systolic and diastolic
myocardial performance: a simple
and reproducible measure of car-
diac function - a study in nor-
mals and dilated cardiomyopathy.
J Cardiol; 26 : 357-366.
(9) Moller S. and Henriksen J.(9) Moller S. and Henriksen J.
H. (2002) : H. (2002) : Cirrhotic cardiomyo-
pathy: a pathophysiological review
of circulatory dysfunction in liver
disease. Heart; 87: 9-15.
(10) Ma Z. and Lee S. S.(10) Ma Z. and Lee S. S.
(1996) : (1996) : Cirrhotic cardiomyopa-

252252
Ahmed Bahy El-Dien, et al....
thy: getting to the heart of the
matter. Hepatology; 24 : 451-
459.
(11) Myers R. P. and Lee S. S.(11) Myers R. P. and Lee S. S.
(2000) : (2000) : Cirrhotic cardiomyopathy
and liver transplantation. Liver
Transpl; 6 : S44-S52.
(12) Torregrosa M., Aguade(12) Torregrosa M., Aguade
S., Dos L., Segura R., GonzalezS., Dos L., Segura R., Gonzalez
A., Evangelista A., Castell J.,A., Evangelista A., Castell J.,
Margarit C., Esteban R., Guar-Margarit C., Esteban R., Guar-
dia J. and Genesca J. (2005) :dia J. and Genesca J. (2005) :
Cardiac alterations in cirrhosis:
reversibility after liver transplan-
tation. Journal of Hepatology; 42:
68-74.
(13) Wong F., Girgrah N.,(13) Wong F., Girgrah N.,
Graba J., Allidina Y., Liu P. andGraba J., Allidina Y., Liu P. and
Blendis L. (2001) : Blendis L. (2001) : The cardiac
response to exercise in cirrhosis.
Gut; 49: 268-275.
(14) Matsumori A., Matoba Y.(14) Matsumori A., Matoba Y.
and Sasayama S. (1995) : and Sasayama S. (1995) : Dilat-
ed cardiomyopathy associated
with hepatitis C virus infection.
Circulation; 92: 2519-25.
(15) Shonian U., Crombach(15) Shonian U., Crombach
M., Master S. and Maisch B.M., Master S. and Maisch B.
(1995) : (1995) : Cytomegalovirus asso-
ciated heart muscle disease. Eur
Heart J; 16(Suppl 0): 46-9.
(16) Dennert R., Crijns J. H.(16) Dennert R., Crijns J. H.
and Heymans S. (2008) : and Heymans S. (2008) : Acute
viral myocarditis European Heart
Journal; 29: 2073-2082.
(17) Osztovits J., Horvath T.,(17) Osztovits J., Horvath T.,
Aonyi M., Toth T., Visneyei Z.,Aonyi M., Toth T., Visneyei Z.,
Beko F., Csak T., Lakatos P. L.,Beko F., Csak T., Lakatos P. L.,
Littvay L., Feher J., Kempler P.,Littvay L., Feher J., Kempler P.,
Kollai M. and Szalay Ference.Kollai M. and Szalay Ference.
(2009) : (2009) : Chronic hepatitis C virus
infection associated with auto-
nomic dysfunction. Liver interna-
tional; 29(10): 1473-1478.
(18) Brass V., Moradpour D.(18) Brass V., Moradpour D.
and Blum H. E. (2007) : and Blum H. E. (2007) : Hepati-
tis C virus infection: in vivo and in
vitro models. J Viral Hepat; 14
(suppl 1): 64-7.
(19) Spengler U. and Natter-(19) Spengler U. and Natter-
mann J. (2007) : mann J. (2007) : Immunopatho-
genesis in hepatitis C virus cirrho-
sis. Clin Sci; 112 : 141-55.
(20) Kawai K., Hata K.,(20) Kawai K., Hata K.,
Kawai et al. (2005) : Kawai et al. (2005) : Pathophy-
siological characteristics and re-
sponsiveness to neurohormonal
antagonism in idiopathic dilated

253253
Benha M. J.
Vol. 29 No 2 May 2012cardiomyopathy patients with
antihepatitis C virus antibody. Int
Heart J; 46: 407-417.
(21) Demir M., Demir C. and(21) Demir M., Demir C. and
Ulcay A. (2009) : Ulcay A. (2009) : Effect of hepati-
tis C virus infection on the left
ventricular hypertrophy. Turkiye
Klin J Cardiovasc Sci; 21 : 315-
319.
(22) Demir M. and Demir C.(22) Demir M. and Demir C.
(2011) : (2011) : Effect of hepatitis C vi-
rus infection on the left ventric-
ular systolic and diastolic func-
tion. Southern Medical Journal;
104(8).
(23) De B. K., Majumdar D.,(23) De B. K., Majumdar D.,
Das D., Biswas P. K., Mandal S.Das D., Biswas P. K., Mandal S.
K., Ray S., Bandopadhyay K.,K., Ray S., Bandopadhyay K.,
Das T., Dasgupta S. and GuruDas T., Dasgupta S. and Guru
S. (2003) : S. (2003) : Cardiac dysfunction in
portal hypertension among pa-
tients with cirrhosis and non-
cirrhotic portal fibrosis. Journal of
Hepatology; 39: 315-319.
(24) Tsuchihara K., Hijikata(24) Tsuchihara K., Hijikata
M., Fukuda K., et al. (1999) :M., Fukuda K., et al. (1999) :
Hepatitis C virus core protein reg-
ulates cell growth and signal
transduction pathway transmit-
ting growth stimuli. Virology; 258:
100-107.

254254
Ahmed Bahy El-Dien, et al....
LEFT VENTRICULAR SYSTOLICLEFT VENTRICULAR SYSTOLICDYSFUNCTION IN CIRRHOTICDYSFUNCTION IN CIRRHOTIC
PATIENTS ASSOCIATEDPATIENTS ASSOCIATEDWITH HCV INFECTIONWITH HCV INFECTION
Ahmed Bahy El-Dien M.Sc; Hassan M. El-Askalany MD,Ahmed Bahy El-Dien M.Sc; Hassan M. El-Askalany MD,Talal Amer MD, Mohamed M. Hamouda MD,Talal Amer MD, Mohamed M. Hamouda MD,Mohamed Atwa MD and Afaf Abdel-Hafez MDMohamed Atwa MD and Afaf Abdel-Hafez MD
BENHAMEDICALJOURNAL
REPRINT
Published byPublished by
Benha Faculty of MedicineBenha Faculty of Medicine Volume 29 Number 2May 2012

255255
Benha M. J.
Vol. 29 No 2 May 2012
COMBINED THERAPY OF TRANSARTERIALCOMBINED THERAPY OF TRANSARTERIALCHEMOEMBOLIZATION AND THREECHEMOEMBOLIZATION AND THREE
DIMENSIONAL CONFORMAL RADIOTHERAPYDIMENSIONAL CONFORMAL RADIOTHERAPYFOR HEPATOCELLULAR CARCINOMAFOR HEPATOCELLULAR CARCINOMA
Nawal M. El-Kholi MD, Hanem A Sakr MD,Nawal M. El-Kholi MD, Hanem A Sakr MD,Talal A. Amer MD*, Saleh M. Taema MDTalal A. Amer MD*, Saleh M. Taema MD
and Shymaa A. Taher M.Sc.and Shymaa A. Taher M.Sc.Departments of Clinical Oncology & Nuclear medicine and of Radiology*,
Faculty of Medicine, Mansoura University, Egypt.
AbstractAbstractIntroduction: Introduction: Hepatocellular carcinoma is the most severe complica-
tion of chronic liver disease. The overall incidence remains alarminglyhigh in the developing world especially in Egypt. Combined treatment ofTACE with 3D-CRT has some advantages. Tumor shrinkage after TACEmakes the radiation field smaller, lipiodol uptake of the tumor aids indelineating the target and chemotherapy retained act as a radiosensitiz-ing effect.
Aim to work Aim to work is to evaluate the efficacy and toxicity of combined ther-apy of three-dimensional conformal radiotherapy (3DCRT) and trans-arterial Chemoembolization (TACE) for unresectable hepatocellular car-cinoma (HCC).
Methods:Methods: Between August 2009 and August 2011, 15 patients withlocally advanced unresectable HCC were enrolled prospectively in thisstudy. TACE was performed first by using mixture of 50mgAdriamycin,750mg 5-Fluorouracil, 50mg cisplatin, and lipiodol with a median oftwo courses, followed by 3DCRT (30-50 GY, 1.8GY/day, 5days/week) af-ter 8-10 weeks. Tumor response was evaluated by the European Asso-ciation for the Study of Liver disease (EASL) recommendation to accounttumor necrosis recognized by non enhanced areas on serial computedtomography scans and toxicity was evaluated by the Common Terminol-ogy Criteria for Adverse Events Version 4 (CTCAE 4).
Results:Results: An objective response was achieved in 5 patients (33.4%),with a complete response in 2 patients (13.3%) and partial response in

256256
Nawal M. El-Kholi, et al....
IntrodIntroductiouctionHepatocellular carcinoma is the
most severe complication of
chronic liver disease. The overall
incidence remains alarmingly high
in the developing world especially
in Egypt where it is considered the
second most frequent cancer site
for males and number one cause
of death (1).
Although early diagnosis and
curative surgical resection can
achieve the best prognosis, the
number of patients who could un-
dergo resection is still limited,
even for those with small tumors
because of the unique characteris-
tics of this tumor, such as multi-
focality, early vascular invasion,
and concurrent liver cirrhosis (2).
Most of the patients with HCC
are frequently diagnosed at the
intermediate or advanced stages.
For these patients, the prognosis
has been assumed to be poor,
with median survival of less
than 1 year. TACE has long been
used as a palliative treatment for
patients with technically unresect-
able or medically inoperable HCC
with unsatisfactory results (3).
Historically, HCC has been con-
sidered a radioresistant tumor;
however, this view was likely relat-
ed to the fact that only low doses
3 patients (20.1%). The overall survival rates were 60%, 20%, at 1 year,and 2 year respectively, with median survival time was 18 months. Theprogression-free rate at the end of study was 86.7% at the end of study,with median progression free survival (PFS) 18 months. T stage, child-Pugh grade, ECOG performance status, portal vein thrombosis (PVT),number of TACE session and radiotherapy dose were identified as inde-pendent predictors for survival by univariate analysis. All are still signif-icant by multivariate analysis except radiotherapy dose. Regardingacute toxicities, most toxicity were mild to moderate, transient andmost patients recovered within 1-2week. Radiation induced liver disease(RILD) was developed in13.3%.
Conclusion:Conclusion: The combined modality is tolerable, effective therapeu-tic strategy in carefully selected patients and need further trials to con-firm the efficacy of this combined therapy.
Key words: Key words: hepatocellular carcinoma, conformal radiotherapy,trans-arterial chemoembolization.

257257
Benha M. J.
Vol. 29 No 2 May 2012were used originally to treat HCC
to avoid toxicity. Three-
dimensional conformal radiothera-
py (3D-CRT), however, makes it
possible to deliver higher doses to
the tumor where as minimizing
the irradiation of normal liver tis-
sue. Recent studies using 3D-CRT
for HCC showed a significant re-
sponse of 60% to 70% with ac-
ceptable toxicities and dose-
response relationships(4).
Combined treatment of TACE
with 3D-CRT has some advantag-
es. Tumor shrinkage after TACE
makes the radiation field smaller,
lipiodol uptake of the tumor aids
in delineating the target volume,
and anticancer drugs retained in
the tumor after TACE may have a
radiosensitizing effect. Local RT
can also eliminate residual tumor
cells after TACE. This approach
has been applied and several re-
ports have showed that TACE
plus RT was more effective than
either of these therapies alone(5).
Patients and methodsPatients and methodsThis study was performed on
15 with inoperable hepatocellular
carcinoma, referred to Gastroente-
rology Center, Internal Medicine
hospital, and Clinical Oncology
and Nuclear Medicine Depart-
ment, Faculty of Medicine, Man-
soura University dated from Au-
gust 2009 to August 2011
inclusive. All the following eligibili-
ty criteria were satisfied: HCC
confirmed by radiological criteria;
Inoperable due to liver cirrhosis or
cardiovascular diseases, or techni-
cally unresectable because of
bulky tumor, partial invasion of
the main portal vein or its branch-
es; Single HCC nodules at any site
or a few adjacent small nodules
closely located within a restricted
volume of the liver parenchyma.
Single HCC nodules can be divid-
ed in large (>5cm) or small size
(≤5cm) tumors; Good general con-
dition with ECOG performance
status ≤ 2; Liver cirrhosis of
Child-Pugh A or B7; Adequate he-
matological, hepatic and kidney
functions.
Pretreatment evaluation :Pretreatment evaluation :
Pretreatment evaluation includ-
ed complete history, physical ex-
amination, and laboratory studies
including viral serology and tumor
marker. Pre and post-treatment
imaging including multiphasic CT
scan of the abdomen.

258258
Nawal M. El-Kholi, et al....
Treatment:Treatment:
TACE :TACE :
TACE was performed using the
Seldinger technique with a mix-
ture of 50 mg of doxorubicin hy-
drochloride (Adriamycin), 5-
Fluorouracil (750 mg), and cispla-
tin (50 mg) as a total dose were
perfused slowly into hepatic arter-
ies, followed by a mixture of io-
dized oil (10-30 ml; Lipiodol). The
total volume of emulsion was
judged by the tumor size and
achievement of stagnant arterial
flow. For the entire group, 1 to 3
courses of TACE were adminis-
tered with interval range 6–8
weeks.
Radiation therapy :Radiation therapy :
Patients were treated with ex-
ternal beam irradiation. The pre-
scription dose is the ICRU-50 ref-
erence point within the planning
target volume, at or near the cen-
ter of target. With total dose
ranged from 30 Gy to 50 GY, 1.8
Gy / fraction once daily and 5
days / week. Gross target volume
(GTV) was delineated on CT scan
aided by iodine injected by TACE,
and the margin of GTV was about
0.5 cm beyond the iodine deposit.
CTV = gross tumor + 1cm safety
margin in all directions. PTV =
CTV + 0.5 cm. 0.5-2.5 cm was
added for respiratory motion of
the liver. This addition was deter-
mined individually using fluoros-
copy.
CT scan was given at 5 mm
cuts in treatment position with
use of intravenous contrast and
oral contrast. Cuts were taken
from 2 cm above the dome of the
diaphragm to the bottom of the
kidneys. The target volumes and
dose-limiting structures, including
the stomach and duodenum, bilat-
eral kidneys, spinal cord, normal
liver were delineated. Isodose dis-
tribution, multileaf collimators,
beam’s eye view and dose volume
histogram (DVH) were done and
treatment plans and DVHs were
compared for the plan optimiza-
tion.
Adjuvant therapy:-Adjuvant therapy:-
During the treatment, adjuvant
therapy consisted of vitamins, liv-
er supportive drugs, and H2-
Blockers to relieve side effects and
toxicity of treatment.
Toxicity:Toxicity:
Irradiation toxicities were

259259
Benha M. J.
Vol. 29 No 2 May 2012scored by Radiation Therapy On-
cology Group (RTOG) criteria, in-
cluding acute (within the first 90
days of treatment) and late (more
than 90 days post-treatment).
Acute toxicity was graded accord-
ing to Common Terminology Crite-
ria for Adverse Events (CTCAE)
Version 4.0. Late toxicity was fo-
cused on radiation induced liver
disease (RILD) (6).
Patient evaluation :Patient evaluation :
Response was defined accord-
ing to the European Association
for the Study of Liver disease
(EASL)recommendation to account
tumor necrosis recognized by non-
enhanced areas (EASL Necrosis
Criteria). Complete response (CR)
was defined as the absence of en-
hanced tumor areas, reflecting
complete tissue necrosis; Partial
response (PR) was defined a de-
crease ≥50% of enhanced areas,
reflecting partial tissue necrosis;
Progressive disease (PD) was de-
fined as an increase >25% in the
size of ≥1 measurable lesion(s) or
the appearance of new lesions;
and Stable disease (SD) was de-
fined as a tumor response be-
tween PR and PD or <50% de-
crease in enhancing tissue.
Statistical methodsStatistical methods
Statistical calculations were
performed using SPSS, version 16
for Windows (SPSS Inc. Chicago,
IL, U.S.A). Overall survival was
estimated using the Kaplan-Meier
method. Univariate and multivari-
ate analyses by Cox proportional
regression model were performed
to identify the prognostic factors
for survival. Statistical signifi-
cance was calculated at the 95%
confidence level (P< 0.05).
ResultsResultsFOLLOW-UP :FOLLOW-UP :
Patients were seen on a weekly
basis during their RT to monitor
symptoms and toxicity. Follow-Up
was performed with multiphasic
CT. CT scans were obtained with-
in 1 month after 3D-CRT, and
then every 3 months. The median
follow up period was 18 months
(range: 7-24 months). All the pa-
tients had been followed up until
death or end of the study. The last
follow up was performed in Au-
gust 2011.
At the time of the last follow-up
7 patients were alive with disease,
one patient still free from disease
and the other 7 patients died with

260260
Nawal M. El-Kholi, et al....
disease; one patient died from
lung metastases, two patient died
from RILD, two patient died from
liver cell failure, one patient died
due to complication of diabetes
mellitus, and one patient died
from irrelevant psychic disorder.
Tumor Response: Tumor Response:
At the last follow up, two pa-
tients (13.3%) had complete re-
sponse (Figure1) and 3 patients
(20.1%) had partial response,
eight patients (53.3%) have sta-
tionary disease and 2 patients
(13.3%) had disease progression
with response rate 33.4 %.
Survival, local progression-Survival, local progression-
free rate and distant metastasis free rate and distant metastasis
The overall survival rates (from
the date of first session of TACE)
were 60%, and 20% at 1 year, and
2 year respectively, with the medi-
an survival time (MST) 18 months
(figure 2). The progression-free
rate was 86.7%, while median pro-
gression free survival (PFS) was 18
months.
Prognostic factors affectingPrognostic factors affecting
overall survivaloverall survival
By applying univariate analysis
to identify the importance of prog-
nostic factors for survival, child-
Pugh grade, T stage, PVT, ECOG
performance status, number of
TACE sessions and tumor radia-
tion dose was statistically signifi-
cant with P value < 0.05 (P =
0.020, 0.003, 0.020, 0.001,
0.003, 0.048 respectively), in fa-
vor of T2 stage, small tumor diam-
eter, ECOG < 2, no thrombosis in
portal vein, and Child-Pugh Grade
A, large number of TACE and high
radiotherapy dose as shown in
Figure 3, 4, 5, 6, 7, 8 and table 1.
From Cox regression analysis
only T-stage, child-Pugh grade,
PVT, ECOG score and number of
TACE session remained statisti-
cally significant prognostic factors
(P=0.016, 0.044, 0.044, 0.015 and
0.016 respectively) but radiothera-
py dose became statistically non
significant (P=0.127) as shown in
table 2.
Tolerance and toxicities:Tolerance and toxicities:
Four patients were not able to
tolerate treatments due to acute
hepatic toxicity in one case, and
general condition worsened in
three cases during irradiation.
Acute hepatic toxicity was notable
in the form of G1 elevation of total

261261
Benha M. J.
Vol. 29 No 2 May 2012
bilirubin in 20 %, elevation of liver
enzymes in 14 patients with 80%
CTCAE G1 in 12 patients and G3
in two patients. Elevations of alka-
line phosphatase were found in 2
patients (G1) during the early time
after 3D-CRT but all recovered
eventually. Hematological toxicity
not exceeds G2 except in two pa-
tients who develop G3 thrombocy-
topenia. Also, Acute gastrointesti-
nal complication was mild not
exceed G2.
Late toxicities were evaluated 3
months after completion of RT.
two patients (13.3%) have radia-
tion induced liver disease (RILD).
One RILD patients was positive for
HBV and the other was positive
for HCV. Both were associated
with cirrhosis of Child-Pugh B of 7
scoring. Both were treated by
supportive hepatic medications to
retain their hepatic function, and
died of hepatic failure soon after
the onset of RILD.

262262
Nawal M. El-Kholi, et al....

263263
Benha M. J.
Vol. 29 No 2 May 2012

264264
Nawal M. El-Kholi, et al....
DiscussionDiscussionMany authors have reported on
the results of treatments combin-
ing TACE with RT. The methods
used for combining TACE and RT
are heterogeneous, but 2 strate-
gies can be conceptually de-
scribed. The first strategy is to use
RT as a salvage treatment for un-
responsive tumors despite repeat-
ed TACE. Seong et al(7) used RT
with patients who eventually failed
2 to 10 sessions of TACE. The sec-
ond strategy is to use RT as a
planned consolidation treatment
to target residual tumors after
TACE. In a study of Li et al(8), RT
was planned after 2 cycles of
TACE for patients with stage III
HCC. Two further cycles of TACE
were administered after comple-
tion of RT.
The present study is a prospec-
tive clinical trial, which is de-
signed to evaluate the efficacy and

265265
Benha M. J.
Vol. 29 No 2 May 2012toxicity of 3DCRT combined with
transcatheter arterial chemoem-
bolization (TACE) in management
of unresectable hepatocellular car-
cinoma. In the present study, our
regimen was to deliver RT immedi-
ately after 1 - 3 sessions of TACE.
This is a planned consolidation
treatment to target residual tu-
mors after TACE. This regimen
has advantages of reducing liver
atrophy resulting from repeated
TACE, and so it can be more toler-
able to deliver RT. Combined
treatment can produce synergistic
effects such as the elimination of
residual viable tumor cells around
the capsule after TACE could be
eradicated by RT, especially in
large-sized HCC. Also, for some
small-sized HCC are resistant to
TACE because of low vascularity.
In the present study conven-
tional fractionated RT, i.e. 1.8 Gy
per fraction, five fractions a week
based on the fact that, liver was
considered a late responding nor-
mal organ with a low ratio of α/β.
The α/β ratio in HCC cells and
normal hepatocytes is 11.2Gy and
1-2 Gy, respectively. So, conven-
tional radiotherapy is better than
hypofractionated radiotherapy
based on calculated biologically ef-
fective dose (BED) using the line-
ar-quadratic equation with lower
reported morbidity and mortality
from RILD in patients receiving
3 DCRT with conventional frac-
tions (9).
In our results, the response
rates was 33.4 % (13.3% complete
response and 20.1% partial re-
sponse), 53.3% stationary disease
and 13.3% disease progression
which is nearly similar to results
of Shim et al (10) where, the re-
sponse rate was 36.8%. In 2005
Zeng et al (11) had reported higher
results than ours with objective
responses 76%.
The overall survival rates were
60%, and 20% at 1 year, and 2
year respectively which is compar-
able to previous studies results of
Zhou et al.,(12) where the overall
survival rates at 1 year, and 2
years were 60%, and 38% respec-
tively.
The median survival time in
our study was 18 month which is
similar to result of Xu et al.,(13)
who reported 18 month median
survival but less than results of

266266
Nawal M. El-Kholi, et al....
Oh et al.,(14) where the median
survival were 23.5 month. Also,
this results higher than results re-
ported by Seong et al.(15) where
median survival (12 month).
Analysis of pattern of treatment
failure of studied cases showed 2
failures (13.3%). Intra-hepatic me-
tastasis manifested by appearance
of new lesions out of the RT field
in one patient (6.7%) and extra-
hepatic metastasis (lung metasta-
sis) was found in one patient
(6.7%). These results are superior
to result of Oh et al.,(14) where
40.0% developed intra-hepatic me-
tastasis or new lesions out of the
RT field developed and 32.5% ex-
tra-hepatic metastasis. On con-
trary Zhou et al.,(12) showed lower
rates of treatment failure 8%.
In our study from univariate
analysis, we found that child-
Pugh grade, T stage, PVT, ECOG
performance status, number of
TACE session, and radiotherapy
dose significantly impacted on
overall survival in favor of T2
stage, small tumor diameter, no
thrombosis in portal vein, Child-
Pugh grade A, large number of
TACE and higher dose. This result
similar to study of Zhou et al.,(12)
in that T stage, PVT, irradiation
dose and liver cirrhosis signifi-
cantly impacted on overall survi-
val.
From Cox regression analysis
only T-stage, Child-Pugh grade,
maximum diameter, PVT, and
number of TACE session remained
statistically significant prognostic
factors which consistent with re-
sult of Zhou et al.,(12) in that T
stage and hepatic cirrhosis grade
(Child-Pugh grade) were demon-
strated as independent predictors
for overall survival. Also, our re-
sult consistent with result of Wu
et al.,(16) as tumor size was a sig-
nificant prognostic factor.
On the other hand in terms of
radiotherapy complications as the
primary end point in our trial, the
most common acute treatment-
related toxicities include haemato-
poietic, hepatic, and gastrointesti-
nal such as leukocyte count de-
cline, total bilirubin, alanine
amino transferase level increase,
and nausea/ vomiting. Most toxic-
ity was mild to moderate accord-
ing CTCAE 4. These effects were
transient and most patients recov-

267267
Benha M. J.
Vol. 29 No 2 May 2012ered within 1-2 weeks. No grade 4
toxicities had occurred, except in
two patients (13.3%). These pa-
tients develop grade 4 thrombocy-
topenia which was manageable
without severe sequelae. These re-
sult consistent with result of Oh
et al., (14).
As regard late toxicities in our
study, the most serious late com-
plication was RILD, which oc-
curred in two patients (13.3%)
have radiation-induced liver dis-
ease (RILD).which is consistent
with result reported by Dawson et
al.,(17) where the incidence of
RILD has been reported from 4%
to 20%. Also, consistent with re-
sult of Mornex et al., (18) where
more patients develop RILD in
Child-Pugh class B.
ReferencesReferences1.1. Lehman E. M., Soliman A.Lehman E. M., Soliman A.
S., Ismail K., et al., (2008) : S., Ismail K., et al., (2008) : Pat-
terns of hepatocellular carcinoma
incidence in Egypt from a popula-
tion-based cancer registry: Hepa-
tology Research; 38:465-473.
2.2. Nathan H., Schulick R.Nathan H., Schulick R.
D., Choti M. A., et al (2009) :D., Choti M. A., et al (2009) :
Predictors of survival after resec-
tion of early hepatocellular carci-
noma. Ann Surg; 249:799–805.
3.3. Shi M., Chen J. A., Lin X.Shi M., Chen J. A., Lin X.
J., et al., (2010) : J., et al., (2010) : Transarterial
chemoembolization as initial treat-
ment for unresectable hepatocel-
lular carcinoma in southern Chi-
na. World J Gastroenterol; 14; 16
(2):264-9.
4. Tse R. V., Guha C. and4. Tse R. V., Guha C. and
Dawson L. A. (2008) : Dawson L. A. (2008) : Conformal
radiotherapy for hepatocellular
carcinoma. Crit Rev Oncol Hema-
tol; 67:113-123.
5.5. Guo W. J., Yu E. X., LiuGuo W. J., Yu E. X., Liu
L. M., et al., (2003) : L. M., et al., (2003) : Comparison
between chemoembolization com-
bined with radiotherapy and
chemoembolization alone for large
hepatocellular carcinoma. World J
Gastroenterol; 9: 1697-1701.
6.6. National Cancer InstituteNational Cancer Institute
(2010) :(2010) : Common Terminology
Criteria for Adverse Events
(CTCAE) Version 4.02; pp1 -194.
7.7. Seong J., Park H. C., HanSeong J., Park H. C., Han
K. H., et al., (2000) : K. H., et al., (2000) : Local radio-
therapy for unresectable hepato-
cellular carcinoma patients who

268268
Nawal M. El-Kholi, et al....
failed with transcatheter arterial
chemoembolization. Int J Radiat
Oncol Biol Phys; 47: 1331-1335.
8.8. Li B., Yu J., Wang L., etLi B., Yu J., Wang L., et
al., (2003) : al., (2003) : Study of local three-
dimensional conformal radiothera-
py combined with transcatheter
arterial chemoembolization for pa-
tients with stage III hepatocellular
carcinoma. Am J Clin Oncol; 26:
e92-e99.
9.9. Zeng Z. C. (2008) : Zeng Z. C. (2008) : Confor-
mal radiation therapy for patients
with unresectable primary liver
cancer 3D-CRT is now a realistic
option. Austral-Asian J Can-
cer7:5-14.
10.10. Shim S. J., Seong J.,Shim S. J., Seong J.,
Han K. H., et al., (2005) :Han K. H., et al., (2005) : Local
radiotherapy as a complement to
incomplete transcatheter arterial
chemoembolization in locally ad-
vanced hepatocellular carcinoma.
Liver Int; 25: 1189-1196.
11.11. Zeng Z. C., Fan J., TangZeng Z. C., Fan J., Tang
Z. Y., et al., (2005) :Z. Y., et al., (2005) : A compari-
son of treatment combinations
with and without radiotherapy for
hepatocellular carcinoma with
portal vein and/or inferior vena
cava tumor thrombus. Int J Radi-
at Oncol Biol Phys; 61 (2):432-43.
12.12. Zhou Z. H., Liu L. M., Zhou Z. H., Liu L. M.,
Chen W. W., et al., (2007) :Chen W. W., et al., (2007) : Com-
bined therapy of transcatheter ar-
terial chemoembolization and
three-dimensional conformal radi-
otherapy for hepatocellular carci-
noma. Br J Radiol; 80: 194-201.
13.13. Xu L. T., Zhou Z. H., LinXu L. T., Zhou Z. H., Lin
J. H., et al., (2011) : J. H., et al., (2011) : Clinical
study of transarterial chemoem-
bolization combined with 3-
dimensional conformal radiothera-
py for hepatocellular carcinoma.
Eur J Surg Oncol; 37:245-251.
14.14. Oh D., Lim do H., ParkOh D., Lim do H., Park
H. C., et al., (2010) :H. C., et al., (2010) : Early three-
dimensional conformal radiothera-
py for patients with unresectable
hepatocellular carcinoma after in-
complete transcatheter arterial
chemoembolization: a prospective
evaluation of efficacy and toxicity.
Am J Clin Oncol; 33 (4):370-5.
15.15. Seong J., Lee I. J., ShimSeong J., Lee I. J., Shim
S. J., et al., (2009) : S. J., et al., (2009) : A multicen-
ter retrospective cohort study of
practice patterns and clinical out-
come on radiotherapy for hepato-

269269
Benha M. J.
Vol. 29 No 2 May 2012cellular carcinoma in Korea. Liver
Int; 29 (2):147-52.
16.16. Wu D. H., Liu L. andWu D. H., Liu L. and
Chen L. H. (2004) :Chen L. H. (2004) : Therapeutic
effects and prognostic factors in
three-dimensional conformal radi-
otherapy combined with trans-
catheter arterial chemoemboliza-
tion for hepatocellular carcinoma.
World J Gastroenterol: 1; 10 (15):
2184-9.
17.17. Dawson L. A., NormolleDawson L. A., Normolle
D., Balter J. M., et al., (2002) :D., Balter J. M., et al., (2002) :
Analysis of radiation-induced liver
disease using the Lyman NTCP
model. Int J Radiat Oncol Biol
Phys;53: 810-21.
18.18. Mornex F., Girard N.,Mornex F., Girard N.,
Beziat C., et al., (2006) :Beziat C., et al., (2006) : Feasi-
bility and efficacy of high-dose
three-dimensional-conformal radi-
otherapy in cirrhotic patients with
small-size hepatocellular carcino-
ma non-eligible for curative thera-
pies-mature results of the French
Phase II RTF-1 trial. Int J Radiat
Oncol Biol Phys; 66:1152-8.

270270
Nawal M. El-Kholi, et al....
COMBINED THERAPY OF TRANSARTERIALCOMBINED THERAPY OF TRANSARTERIALCHEMOEMBOLIZATION AND THREECHEMOEMBOLIZATION AND THREE
DIMENSIONAL CONFORMALDIMENSIONAL CONFORMALRADIOTHERAPY FORRADIOTHERAPY FOR
HEPATOCELLULAR CARCINOMAHEPATOCELLULAR CARCINOMA
Nawal M. El-Kholi MD, Hanem A Sakr MD,Nawal M. El-Kholi MD, Hanem A Sakr MD,Talal A. Amer MD, Saleh M. Taema MDTalal A. Amer MD, Saleh M. Taema MD
and Shymaa A. Taher M.Sc.and Shymaa A. Taher M.Sc.
BENHAMEDICALJOURNAL
REPRINT
Published byPublished by
Benha Faculty of MedicineBenha Faculty of Medicine Volume 29 Number 2May 2012

271271
Benha M. J.
Vol. 29 No 2 May 2012
EVALUATION OF LONG-AXIS MYOCARDIALEVALUATION OF LONG-AXIS MYOCARDIALFUNCTION WITH 2D STRAINFUNCTION WITH 2D STRAIN
ECHOCARDIOGRAPHY IN PATIENTS WITHECHOCARDIOGRAPHY IN PATIENTS WITHSIGNIFICANT CORONARY ARTERY STENOSISSIGNIFICANT CORONARY ARTERY STENOSIS
Hesham Rashid MD, Neama El-Melegy MD,Hesham Rashid MD, Neama El-Melegy MD,Ali Attia MD, Hesham Abou El-Eineen MD,Ali Attia MD, Hesham Abou El-Eineen MD,
Mahmoud Awad M.B.B.ChMahmoud Awad M.B.B.ChCardiology department, Benha University, Egypt
AbstractAbstractBackground:Background: myocardial ischemia or infarction is usually assessed
with 2-D echocardiography by detecting the segmental wall motion ab-normalities.
With the introduction of color Doppler myocardial imaging (CDMI), itis currently possible to noninvasively quantify in-plane myocardial def-ormation (regional strain).
Objective:Objective: To assess and validate 2 Dimensional long axis myocar-dial strains for detection of myocardial ischemia.
Patients and methods: Patients and methods: This study included 40 patients categorizedinto two groups, Group A that included 30 patients with significant cor-onary artery disease and no visual segmental wall motion abnormali-ties, who underwent coronary angiography within 6 months before in-clusion in the study, their age ranged between 40-60 years, and GroupB that included 10 patients with chest pain and normal coronary angio-graphy, age matched with group A as a control group. All of these pa-tients were subjected to full history taking, physical examination, rest-ing 12 leads ECG, coronary angiography and trans-thoracicechocardiography (conventional 2D echo. and 2D myocardial strain).
Results: Results: There is significant reduction in 2D long axis myocardialstrains in mid anterior septal, mid inferior septal, mid inferior, apicalanterior, apical septal and apex in patients have significant LAD diseasein compare with control group (Group B)(p value <0.01), while in pa-tients with significant right coronary artery disease, there is significantreduction on 2D myocardial strains at basal anterior, basal inferior sep-tal, basal inferior, mid inferior septal, mid inferior & apical lateral seg-

272272
Hesham Rashid, et al....
IntrodIntroductiouctionThe early identification of
acutely ischemic myocardium has
both important therapeutic and
prognostic implications (1).
Myocardial ischemia or infarc-
tion is usually assessed with 2-D
echocardiography by detecting the
segmental wall motion abnormali-
ties (2).
With the introduction of color
Doppler myocardial imaging
(CDMI), it is currently possible to
non invasively quantify in-plane
myocardial deformation (regional
strain). (3)(4)
The accuracy of such ultrason-
ic strain measurements has been
recently validated in a comparison
with son micrometry in an experi-
mental ischemia model (5).
Aim of the workAim of the workTo assess and validate 2 Di-
mensional long axis myocardial
strain for the detection of myocar-
dial ischemia in patients with sig-
nificant coronary artery stenosis
without visual wall motion abnor-
malities at rest.
Patients and methodsPatients and methodsThis study included 40 patients
and was conducted at cardiology
department, Benha University
Hospital.
Exclusion criteria:Exclusion criteria:
1. Patients with previous myo-
cardial infarction.
2. Heart failure.
3. Arrhythmia mainly (AF)
4. Conduction abnormality
(LBBB)
5. Significant Valvular lesion.
6. Previous cardiac surgery.
ments compared to Group B(p<0.01). In patients with both significantLAD & RCA, there is significant reduction on 2D strains at basal anteri-or, basal anterior septal, basal inferior septal, basal inferior, basal pos-terior lateral, mid anterior, mid anterior septal, mid inferior septal, midinferior, mid anterior lateral, apical anterior, apical septal and apicallateral segments compared to control group.
The sensitivity of 2D myocardial strains for detection of coronary ar-tery disease was 89.6% and specifity 63.6%.
Conclusions:Conclusions: long axis 2D myocardial strain is a good diagnostictool for diagnosis of coronary artery disease in compared to usual diag-nostic wall motion scoring.

273273
Benha M. J.
Vol. 29 No 2 May 2012All patients were subjectedAll patients were subjected
to:to:1- Full history taking:1- Full history taking:
a- History of coronary artery
disease risk factors, including dia-
betes mellitus, smoking, family
history of CAD, hypertension and
dyslipidemia.
b- History of angina pectoris,
myocardial infarction and dysp-
nea.
c- History of previous coronary
revascularization, PCI, or valve re-
placement.
2- Full clinical examination:2- Full clinical examination:
Thorough physical examination
including vital signs (pulse and
blood pressure), general examina-
tion and local cardiac examination
were performed for every patient.
3- Resting 12 leads ECG: 3- Resting 12 leads ECG: for
detection of ischemic heart dis-
ease.
4- Diagnostic Coronary angio-4- Diagnostic Coronary angio-
graphy.graphy.
All patients underwent coro-
nary angiography within 6 months
before inclusion in this study; the
right common femoral artery was
punctured by using Seldinger?s
technique. Selective coronary an-
giography was performed using
left and right Judkin?s coronary
catheters.
5- Trans-thoracic echocardi-5- Trans-thoracic echocardi-
ography examinatioography examinatio
A- Conventional 2 D echocar-A- Conventional 2 D echocar-
diographydiography
It was done using two-
dimensional mode from classic
windows of apical 4-chamber, api-
cal 2-chamber, apical long axis,
left parasternal long and short
axes, the following measures were
done:
* Left ventricular end diastolic
and end systolic diameters were
measured by M mode.
* Left ventricular ejection frac-
tion (EF) was measured by M
mode.
According to (American Society
of Echocardiography's Guidelines)(6)
* Left ventricular wall motions
were assessed by 2D mode to ex-
clude patients with resting motion
abnormalities from the study.

274274
Hesham Rashid, et al....
* Valvular assessment was
done by color flow and Doppler
studies, to exclude any patients
with valvular heart disease.
B-2D longitudinal strainB-2D longitudinal strain
Echocardiography was per-
formed to all patients within 6
months from coronary angiogra-
phy, with a commercially available
ultrasound equipment and trans-
ducer (Vivid 7 dimension, M3S
probe, GE Vingmed).
Two-dimensional grayscale im-
ages have been acquired in apical
four-chamber, apical two-
chamber, apical long-axis and
three short-axis of the left ventri-
cle at the levels of mitral valve,
mid-ventricle and apex using
frame rates from 50–70 frames/s.
All images have been digitally
stored on the hard disk in the ma-
chine for off-line analysis. The off-
line analysis has been performed
independently to the clinical and
coronary angiographic results.
The left ventricle has been ana-
lyzed using a 17 segment model(7).
The endocardial borders have
been traced at the end-systolic
frame from the three apical views
and three short-axis views, and an
automated tracking algorithm out-
lined the myocardium in succes-
sive frames throughout the cardi-
ac cycle. After the tracking quality
was verified for each segment
(with subsequent manual adjust-
ment of the region-of-interest if
necessary), myocardial motion
was analyzed by speckle-tracking
within the region-of-interest
bound by endocardial and epicar-
dial borders.
Myocardial longitudinal, strain
profiles were obtained and peak
systolic strain values were meas-
ured. The location of myocardial
segments was correlated with cor-
onary artery distribution by using
a scheme modified from that pro-
posed by Segar et al. (8).
Anteroseptal, anterior and mid-
and apical posteroseptal segments
were considered to be a part of the
left anterior descending coronary
artery (LAD) distribution; lateral
and posterior segments were con-
sidered to be a part of the left cir-
cumflex coronary artery (CX) dis-
tribution and the basal-
posteroseptal; and inferior seg-
ments were considered to be a

275275
Benha M. J.
Vol. 29 No 2 May 2012part of the right coronary artery
(RCA) distribution (8).
The patients according to coro-
nary angiography were divided
into two groups:
• Group (A):• Group (A): Diseased patients
group:
Included thirty patients with
significant coronary artery disease
and no visual segmental wall mo-
tion abnormalities by 2D echocar-
diography, and underwent for cor-
onary angiography within 6
months before inclusion in these
study, and their age ranged be-
tween 40-60 years.
All patients had more than
70%coronary artery diameter
stenosis in at least one major cor-
onary artery.
• Group (B): Control group:• Group (B): Control group:
Ten patients with chest pain
and normal coronary angiography
and their age matched with group
A.
STATISTICAL ANALYSISSTATISTICAL ANALYSISThe collected data were orga-
nized, tabulated and statistically
analyzed using SPSS software sta-
tistical computer package version
12.The results were analyzed by
the suitable statistical methods,
which included:
• Mean.
• Standard deviation (SD).
• Student's T-test:
• Paired student t-test to ana-
lyze data within a group.
• Unpaired student t-test to an-
alyze data in different groups.
Data were considered signifi-
cant at p value <0.05. (9)
ResultsResultsForty patients were included in
this study and divided into 2
groups according to the angio-
graphic findings as follows:
1- Group A: 1- Group A: included 30 pa-
tients with significant coronary ar-
tery lesion ( ≥ 70% stenosis), 8 of
them have LAD lesion, 7 patients
with RCA lesion, 13 patients with
LAD & RCA lesions, while only 2
patients have both LAD & LCX le-
sions.
The mean age of this group was
( 52.8±5), 19 of them (63.3%)were
males and 11 (36.7%) were fe-
males, 22 patients(73.3%) were
hypertensive , 70% (21/30) were
diabetics, 46.7% (14/30) were

276276
Hesham Rashid, et al....
smokers, 43.3% (13/30) were dys-
lipidemics and 53.3% (16/30) with
positive family history of coronary
artery disease.
2- Group B: 2- Group B: Included 10 sub-
jects, and age matched with group
A with normal coronary angiogra-
phy, their mean age was (51±4),
40% of them (4/10)were males
and 60% (6/10)were females, 60%
(6/10) were hypertensive, 50% (5/
10) were diabetics, 30% (3/10)
were smokers, 40% (4/10) were
dyslipidemic and 20% (2/10) have
positive family history of coronary
artery disease, there is no statisti-
cally significant difference be-
tween the diseased patients group
as compared to the control group
in demographic data (P>0.05). Ta-
ble (1)
Table (2): show, there is statis-
tically significant difference be-
tween patients having significant
LAD lesion and control group in
mean long axis myocardial strain
at (mid anterior septal, mid inferi-
or septal, mid inferior, apical ante-
rior, apical septal and apex) that
show significant decrease in pa-
tients with significant LAD steno-
sis. (P value<0.01).
Table (3) show there is statisti-
cally significant decrease in the
mean long axis myocardial strain
between patients having signifi-
cant RCA lesion and control group
at (basal anterior, basal inferior
septal, basal inferior, mid inferior
septal, mid inferior and apical.
(P<0.01).
In table (4) there was statisti-
cally significant difference be-
tween patients having significant
2 vessels disease(LAD& RCA) and
control group in mean long axis
myocardial strain ( P value<0.01)
at (basal anterior, basal anterior
septal, basal inferior septal, basal
inferior, basal posterior lateral,
mid anterior, mid anterior septal,
mid inferior septal, mid inferior,
mid anterior lateral, apical
anterior, apical septal and apical
lateral) that show significant
decrease in patients with
significant stenosis in the 2
vessels LAD & RCA.
As regards from table (5) there
was statistically significant differ-
ence between patients having sig-
nificant 2 vessels disease (LAD&
CX) and control group in mean
long axis myocardial strain (P val-

277277
Benha M. J.
Vol. 29 No 2 May 2012ue<0.05) at (basal anterior, basal
inferior septal, basal inferior, mid
anterior, mid inferior septal, mid
inferior, apical septal and apical
lateral) that show significant de-
crease in patients with significant
stenosis in the 2 vessels LAD &
CX.
Table (6): show the sensitivity
and specificity of 2D echocardiog-
raphy strain for detection of CAD,
the sensitivity was 89.6% and
specificity was 63.6%.

278278
Hesham Rashid, et al....

279279
Benha M. J.
Vol. 29 No 2 May 2012

280280
Hesham Rashid, et al....
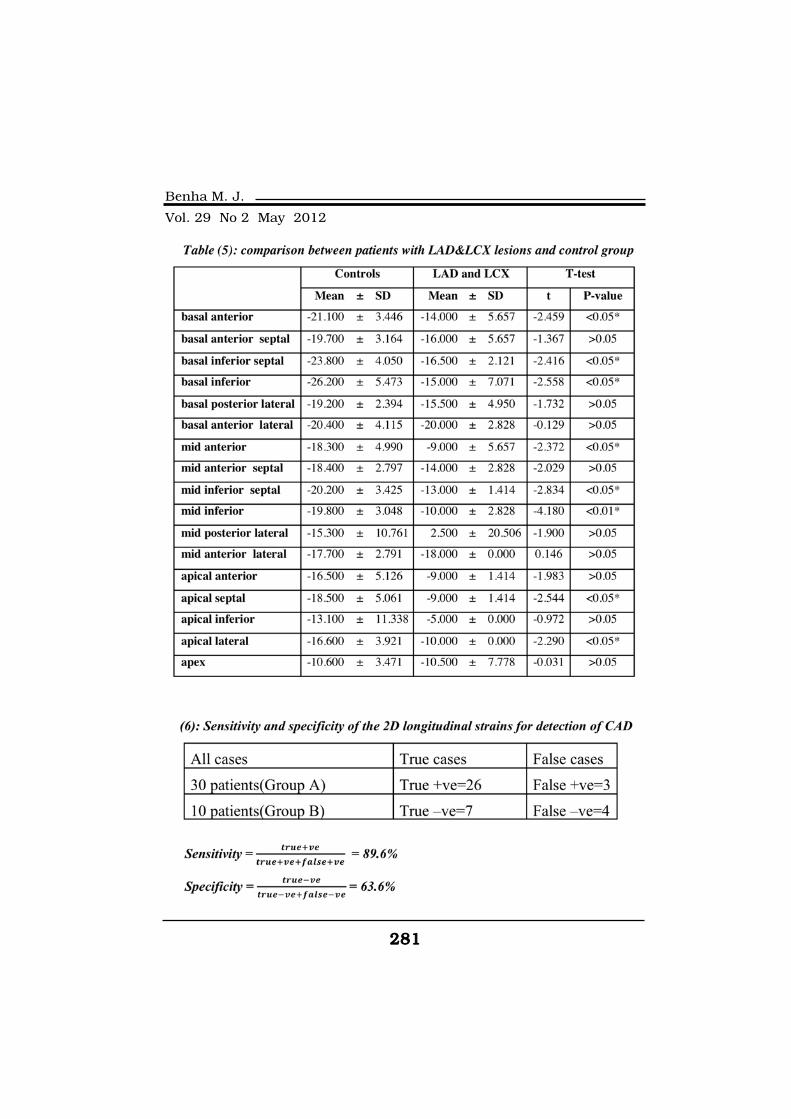
281281
Benha M. J.
Vol. 29 No 2 May 2012

282282
Hesham Rashid, et al....
DiscussionDiscussionTissue Doppler imaging (TDI)
has been introduced as a new
method to quantify regional myo-
cardial function. It provides an
analysis of myocardial velocities
and regional myocardial displace-
ment, deformation and rate of def-
ormation. (10).
Nevertheless to improve speed,
pertinence and efficiency of the di-
agnosis in many patients, a sub-
jective interpretation of myocar-
dial regional motion and thickness
is frequently performed in the in-
tensive care unit (ICU), therefore
not necessarily in the best condi-
tions. (11)
The wall motion score
assessing regional contractility
has been validated. Reproducibili-
ty of this method is high for expert
observer but it requires dedicated
training and remains subjective.(5)
Thus, TDI may offer an alterna-
tive quantitative technique that
can be used in routine practice.
Several parameters have been de-
scribed in experimental settings.(12)
The aim of this study to assess
and validate 2 Dimensional long
axis myocardial strain for the de-
tection of myocardial ischemia in
patients with significant coronary
artery stenosis without visual wall
motion abnormalities at rest.
As shown from our results as
regards clinical characteristics of
patients, there were no statistical-
ly significant difference between
the diseased patients as regards
age ,sex, hypertension , cigarette
smoking, diabetes mellitus, dyslip-
idemia and positive family histo-
ry of coronary artery disease as
compared to the control group
(P>0.05) as, these results were
similar to those reported by Erwan
et al who compared tissue Dop-
pler echocardiography and coro-
nary angiography results in coro-
nary artery disease patients. (13)
Coronary angiography of group
(A) in this study, revealed that
there were (8) patients have single
(LAD) significant stenosis, (7) pa-
tients have single (RCA) significant
lesion, (13) patients have signifi-
cant 2 vessels (LAD & RCA) le-
sions and only (2) patients have
significant 2vessls (LAD &CX) le-

283283
Benha M. J.
Vol. 29 No 2 May 2012sions.
Long axis myocardial strainLong axis myocardial strain
Myocardial fibers consisted of
three different anatomical layers.(14) The innermost sub-
endocardial layer of fibers has an
oblique clockwise orientation in
the longitudinal direction. Recent
studies have demonstrated that
sub-endocardial layer of fibers
mainly contributes to cardiac
long-axis function (15). Zhang et
al. (2005) reported that the peak
systolic longitudinal velocity and
strain rate obtained with tissue
Doppler-derived strain rate imag-
ing declined significantly in sub-
endocardial infarction segments
and acute coronary syndrome
when compared with those in con-
trols. (16)
In our study, we found that al-
though there was no visual seg-
mental wall motion abnormalities
could be detected in patients with
coronary artery stenosis at rest on
conventional 2-D echocardiogra-
phy, the peak systolic longitudinal
strain was significantly reduced at
(mid anterior septal, apex, apical
anterior, apical septal, mid inferi-
or septal and mid inferior) seg-
ments in patients having single
LAD with >70% Stenosis Group
when compared with those in con-
trol group as regarded at table (2).
The peak systolic longitudinal
strain was significantly reduced at
(basal anterior, basal inferior sep-
tal, basal inferior, apical inferior,
mid inferior, mid inferior septal)
segments in patients having single
RCA with >70% Stenosis Group
when compared with those in con-
trol group as regarded at table (3).
The peak longitudinal strain
was significantly reduced at (basal
anterior, basal anterior septal, ba-
sal inferior septal, basal inferior,
basal posterior lateral, apical lat-
eral, apical septal, mid anterior,
mid anterior septal, mid inferior
septal and mid inferior) segments
in patients having 2 vessels
(LAD&RCA) with >70% Stenosis
Group when compared with those
in control group as observed at ta-
ble (4).
It is also found that the peak
longitudinal strain was signifi-
cantly reduced at (basal anterior,
basal inferior septal, basal inferi-
or, mid anterior, mid inferior sep-

284284
Hesham Rashid, et al....
tal, apical lateral, Apical septal
and mid inferior) segments in pa-
tients having 2 vessels (LAD&CX)
with >70% Stenosis Group when
compared with those in control
group as regarded at table (5).
Similarly, Zhang et al. (2005)
also showed that peak systolic
longitudinal strain measured with
2-D strain echocardiography tech-
nique reduced significantly in
sub-endocardial infarction seg-
ments when compared with those
in controls. Our study further
extended those observations by
demonstrating that decrease in
myocardial long-axis function
exists at rest in the myocardial
segments subtended by the
coronary arteries with >70%
stenosis. (16)
Our findings are in accordance
with the previous studies, Yip et
al. (2002) reported a decreased
longitudinal systolic velocity as
measured by myocardial tissue
Doppler in patients with left ven-
tricular hypertrophy and normal
left ventricular ejection fraction.
Similarly, a decreased longitudinal
systolic strain as measured by tis-
sue tracking was reported recently
in patients with diastolic heart
failure. (17)
Liang et al. (2006) revealed a
reduction in longitudinal peak
systolic strain rate in myocardial
segments subtended by >70% cor-
onary stenosis compared with
control group. It has been report-
ed that when the coronary artery
flow reduced, sub-endocardial
myocardium would be the first to
suffer and sub-endocardium is
more vulnerable to ischemic dam-
age than the mid myocardium or
sub-epicardium.(18). When coro-
nary arteries are constricted to re-
duce total coronary artery flow to
approximately 40% of control, en-
docardial to epicardial flow ratio
falls from 1.16 at baseline to 0.37.(19)
Tissue Doppler velocities can
detect an ischemic myocardium
effectively but strain rate imaging
is superior in detection of ischem-
ic myocardium than tissue Dop-
pler velocities alone. (5, 12)
Yao et al. (2008) demonstrated
that sub-endocardial flow begins
to reduce after 75% stenosis of the
left anterior descending coronary

285285
Benha M. J.
Vol. 29 No 2 May 2012artery by using myocardial con-
trast echocardiography, whereas
the sub-epicardial flow remains
unchanged. This pattern of redis-
tribution of flow away from the en-
docardium may, in part, explain
the findings observed in our
study. (20), that is sub-
endocardial layer of fibers mainly
contributes to cardiac long-axis
function which was significantly
reduced in segments supplied by
coronary arteries having >70%
Stenosis.
Sensitivity and specificity were
89.6% and 63.6%, respectively
for peak systolic longitudinal
strain to predict segments sub-
tended by coronary arteries with
significant coronary artery steno-
sis. Table (6)
Tongji Medical College 2010
also reported the same result in
study conducted on department of
medical ultrasound, Tongji Hospi-
tal at 2009, which revealed that
Sensitivity and specificity were
74% and 72%, respectively, for
peak systolic longitudinal strain to
predict segments subtended by
coronary arteries with greater
than 75% stenosis. (21)
ReferencesReferences1- Rawles J. M., (1997):1- Rawles J. M., (1997):
Quantification of the benefit of
earlier thrombolytic therapy: five-
year results of the Grampian Re-
gion Early Anistreplase Trial
(GREAT). J Am Coll Cardiol 30,
pp. 1181–1186.
2-2- Kern M. J. (2005):Kern M. J. (2005): Coro-
nary flow and myocardial ische-
mia. In: Zipes DP, Libby P, Bonow
RO, Braunwald E, (eds). Braun-
wald’s Heart Disease: A Textbook
of Cardiovascular Medicine. 7th
ed. Philadelphia: Saunders; p.
1103–1127.
3- Heimdal, A. Stoylen, H.3- Heimdal, A. Stoylen, H.
Torp and T. Skjaerpe, (1998):Torp and T. Skjaerpe, (1998):
Real-time strain rate imaging of
the left ventricle by ultrasound. J
Am Soc Echocardiogr 11, pp.
1013–1019.
4-4- Voigt J. U., Arnold M. F., Voigt J. U., Arnold M. F.,
and Karlsson M., et al., (2000):and Karlsson M., et al., (2000):
Assessment of regional
longitudinal myocardial strain
rate derived from Doppler
myocardial imaging indices in nor-
mal and infarcted myocardium. J
Am Soc Echocardiogr 13, pp.
588–598.

286286
Hesham Rashid, et al....
5-5- Urheim S., Edvardsen T.,Urheim S., Edvardsen T.,
Torp H., Angelsen B. and Smis-Torp H., Angelsen B. and Smis-
eth O. (2000):eth O. (2000): Myocardial strain
by Doppler echocardiography: val-
idation of a new method to quanti-
fy regional myocardial function.
Circulation 102, pp. 1158–1164.
6-6- Lang R. M., Bierig M. andLang R. M., Bierig M. and
Devereux R. B., et al., 2005):Devereux R. B., et al., 2005):
Chamber Quantification Writing
Group; American Society of Echo-
cardiography's Guidelines and
Standards Committee; European
Association of Echocardiography:
Recommendations for chamber
quantification: A report from the
American Society of Echocardiog-
raphy's Guidelines and Standards
Committee and the Chamber
Quantification Writing Group, de-
veloped in conjunction with the
European Association of Echocar-
diography, a branch of the Euro-
pean Society of Cardiology. J Am
Soc Echocardiogr; 18:1440.
7-7- Wasmeier G. H., Asmus-Wasmeier G. H., Asmus-
sen S., Voigt J. U., Flachskampfsen S., Voigt J. U., Flachskampf
F. A., Daniel W. G. and NixdorffF. A., Daniel W. G. and Nixdorff
U. (2008):U. (2008): Real-time myocardial
contrast stress echocardiography
using bolus application. Ultra-
sound Med Biol; 34: 1724–1731.
8-8- Segar D. S., Brown S. E.,Segar D. S., Brown S. E.,
Sawada S. G., Ryan T. and Fei-Sawada S. G., Ryan T. and Fei-
genbaum H. (1992):genbaum H. (1992): Dobutamine
stress echocardiography: correla-
tion with coronary lesion severity
as determined by quantitative an-
giography. J Am Coll Cardiol; 19:
1197–1202.
9- Petrie A. and Sabin C.9- Petrie A. and Sabin C.
(2005):(2005): Medical Statistics at a
Glance. 2nd ed., Blackwell Pub-
lishing.
10-10- Fang Z. Y., Yuda S. andFang Z. Y., Yuda S. and
Anderson V., et al (2003): Anderson V., et al (2003): Echo-
cardiography detection of early di-
abetic myocardial disease .J AMm
.Coll cardiol, 41: p611-7.
11-11- Naqvi T. Z., Neyman G.Naqvi T. Z., Neyman G.
and Broyde A. et al., (2001):and Broyde A. et al., (2001):
Myocardial Doppler tissue imag-
ing: findings in inferior myocardial
infarction and left ventricular hy-
pertrophy--wall motion assess-
ment.. J Am Soc Echocardiogr.
14(9): p867-73.
12-12- Kukulski T., Jamal F.,Kukulski T., Jamal F.,
and D’hooge J. et al., (2002):and D’hooge J. et al., (2002):
Acute ischemic changes in systolic
and diastolic events during clini-
cal coronary angioplasty: a com-

287287
Benha M. J.
Vol. 29 No 2 May 2012parison of regional velocity, strain
rate and strain measurement. J
Am Soc Echocardiogr: 15, pp.
1–12.
13-13- Erwan D., Pascal R. R.Erwan D., Pascal R. R.
and Damien C., et al., (2005):and Damien C., et al., (2005):
TTissue Doppler echocardiography
quantification comparison to coro-
nary angiography results in acute
coronary syndrome patients,
p1186- 1476.
14-14- Waldman L. K., Fung Y.Waldman L. K., Fung Y.
C. and Covell J. W. (1985):C. and Covell J. W. (1985):
Transmural myocardial deforma-
tion in the canine left ventricle.
Normal in vivo three-dimensional
finite strains. Circ Res;57:
pp152–163.
15-15- Chan J., Hanekom L.,Chan J., Hanekom L.,
Wong C., Leano R., Cho G. Y.Wong C., Leano R., Cho G. Y.
and Marwick T. H. (2006): and Marwick T. H. (2006): Diffe-
rentiation of sub-endocardial and
transmural infarction using two-
dimensional strain rate imaging to
assess short-axis and long axis
myocardial function. J Am Coll
Cardiol ; 48: pp2026–2033.
16-16- Zhang Y., Chan A. K.,Zhang Y., Chan A. K.,
Yu C. M., Yip G. W., Fung J. W.,Yu C. M., Yip G. W., Fung J. W.,
Lam W. W., So N. M.,Wang M.,Lam W. W., So N. M.,Wang M.,
Wu E. B., Wong J. T. and San-Wu E. B., Wong J. T. and San-
derson J. E. (2005): derson J. E. (2005): Strain rate
imaging differentiates transmural
from non-transmural myocardial
infarction a validation study using
delayed-enhancement magnetic
resonance imaging. J Am Coll Car-
diol; 46: p864–871.
17-17- Yip G., Wang M., ZhangYip G., Wang M., Zhang
Y., Fung J. W., Ho P. Y. andY., Fung J. W., Ho P. Y. and
Sanderson J. E. (2002): Sanderson J. E. (2002): Left ven-
tricular long axis function in dia-
stolic heart failure is reduced in
both diastole and systole: time for
a redefinition? Heart ; 87:
p121–125.
18-18- Liang H. Y., Cauduro S.,Liang H. Y., Cauduro S.,
Pellikka P., Wang J., Urheim S.,Pellikka P., Wang J., Urheim S.,
Yang E. H., Rihal C., BelohlavekYang E. H., Rihal C., Belohlavek
M., Khandheria B., Miller F. A.M., Khandheria B., Miller F. A.
and Abraham T. P. (2006): and Abraham T. P. (2006): Use-
fulness of two-dimensional speck-
le strain for evaluation of left ven-
tricular diastolic deformation in
patients with coronary artery dis-
ease. Am J Cardiol ; 98:
p1581–1586.
19-19- Bache R. J., McHale P.Bache R. J., McHale P.
A. and Greenfield J. C. Jr.A. and Greenfield J. C. Jr.
(1977): (1977): Trans-mural myocardial
perfusion during restricted coro-

288288
Hesham Rashid, et al....
nary inflow in the awake dog.AmJ
Physiol ; 232: pp 645–651.
20-20- Yao G. H., Zhang C.,Yao G. H., Zhang C.,
Sun F. R., Zhang M., Zhao Y. X.,Sun F. R., Zhang M., Zhao Y. X.,
Zhang P. F., Zhong L., Ding S.Zhang P. F., Zhong L., Ding S.
F., Chen W. Q., Li X. N. andF., Chen W. Q., Li X. N. and
Zhang Y., (2008):Zhang Y., (2008): Quantification
of transmural gradient of blood
flow in myocardial ischemia with
real-time myocardial contrast ech-
ocardiography and dipyridamole
stress test. Ultrasound Med Biol ;
34: pp22–30.
21-21- Tongji Medical CollegeTongji Medical College
(2010):(2010): Huazhong University of
Science and Technology, Wuhan,
PR China, Ultrasound in Med. &
Biol., Vol. 36, No. 2, pp. 227–233.

289289
Benha M. J.
Vol. 29 No 2 May 2012
EVALUATION OF LONG-AXISEVALUATION OF LONG-AXISMYOCARDIAL FUNCTION WITH 2D STRAINMYOCARDIAL FUNCTION WITH 2D STRAINECHOCARDIOGRAPHY IN PATIENTS WITHECHOCARDIOGRAPHY IN PATIENTS WITH
SIGNIFICANT CORONARYSIGNIFICANT CORONARYARTERY STENOSISARTERY STENOSIS
Hesham Rashid (MD), Neama El-Melegy (MD),Hesham Rashid (MD), Neama El-Melegy (MD),Ali Attia (MD), Hesham Abou El-Eineen (MD),Ali Attia (MD), Hesham Abou El-Eineen (MD),
Mahmoud Awad (M.B.B.CH)Mahmoud Awad (M.B.B.CH)
BENHAMEDICALJOURNAL
REPRINT
Published byPublished by
Benha Faculty of MedicineBenha Faculty of Medicine Volume 29 Number 2May 2012

289289
Benha M. J.
Vol. 29 No 2 May 2012
POPULATION BASED EVALUATION OFPOPULATION BASED EVALUATION OFANTITHROMBOTIC THERAPY IN PATIENTSANTITHROMBOTIC THERAPY IN PATIENTS
WITH ATRIAL FIBRILLATIONWITH ATRIAL FIBRILLATION
Neama El-Meligy MD, Hesham Rashid MD,Neama El-Meligy MD, Hesham Rashid MD,Khaled Erabat MD, Hyam Abdrahman M.B.B.CHKhaled Erabat MD, Hyam Abdrahman M.B.B.CH
Cardiology Department, Benha Faculty of Medicine, Benha University, Egypt
AbstractAbstractBackground:Background: Atrial fibrillation (AF) is the most frequent arrhythmia
in clinical practice and is the strongest independent risk factor forstroke. Approximately 50% of all cardiac and systemic emboli occur inindividuals with AF.
Objective:Objective: The aim of this work is to determine the use of oral anti-thrombotic therapy for treatment of patient with atrial fibrillation in Ka-lubia government, Egypt.
Patients and methods:Patients and methods: These present cross sectional analytic studywas conducted on 200 AF patients and were eligible for antithrombotictherapy. All patients were subjected to full history taken with emphasison admission details, thromboembolic and hemorrhagic complications,risk factors, also clinical examinations, investigations including pro-thrombin time, INR ,resting ECG, and trans- thoracic echocardiographydata were collected. The patients were divided into two groups, GroupA: patients received oral anticoagulation regularly, and Group B: pa-tients not received oral anticoagulation. Group A subdivided into sub-group A1 {controlled patients with normal INR level (2-3)}, and subgroupA2 (patients with uncontrolled INR).
Results:Results: The present study included 200 patients, 83 (41.5%) fe-males and 117 (58.5%) males, their age range from 20 to 87 years old.One hundred and eighty six (93%)of patients with chronic (permanent)AF, 14(7%) with paroxysmal recurrent AF, Forty nine (24.5%) patientspresented by rapid AF, and only 4 patients (2.5%) presented by slow AF.The commonest causes of AF in our study was IHD included117patients (58.5%) ; hypertension found in 80 patients (40%), whilerheumatic heart disease presented in 78 (39%) of cases, and finally

290290
Neama El-Meligy, et al....
IntrodIntroductiouctionAtrial fibrillation (AF) is the
most frequent arrhythmia in clini-
cal practice and is the strongest
independent risk factor for stroke.
Approximately 50% of all cardio-
genic and systemic emboli occur
in individuals with AF.(1)
There are three potential thera-
peutic goals of treatment for pa-
tients with AF; these include res-
toration and maintenance of sinus
rhythm, rate control during AF
and prevention of thromboembo-
lism(2). In patients with atrial fib-
rillation, warfarin prevents 62% of
strokes .Thus; warfarin has be-
come the recommended treatment
for candidates who have atrial fib-
rillation and at least one addition-
al risk factor for stroke.(3)
Despite clear and consistent
recommendations warfarin is sub-
optimal prescribed. Several factors
contribute to suboptimal use of
warfarin therapy.(4)
Aim of the workAim of the workAim of this study is to deter-
mine the use of antithrombotic
therapy for the treatment of pa-
tient with atrial fibrillation and to
survey the knowledge of anti-
thrombotic therapy for atrial fibril-
lation in Kalubia government.
Patients and methodsPatients and methodsThis present cross sectional an-
alytic study was conducted on 200
AF patients in Kalubia govern-
ment and eligible for antithrom-
botic therapy during the period
from March to October 2009.
54patients (27%) with heart failure. Seventy six patients (38%) receivedoral anticoagulant, 36.8% of them with controlled INR, and most ofthem with prosthetic valves (92 %).Thromboembolic complications weredeveloped in 9 patients(11.7% )all of them in group A2 versus 39 pa-tients(31.4%)in group B. The estimated bleeding complications in pa-tients taking warfarin developed in 10 patients (13.9%),2 patients(3.1%) of them had intracranial hemorrhage.
Conclusion:Conclusion: Only 38% of patients receive oral anticoagulation regu-larly, 36.8% of them were properly anticoagulated. Prosthetic valves,rheumatic heart disease, associated with high rate of warfarin use inour study. Intracranial hemorrhages developed in 3.1% with anticoagu-lated patients, and thromboembolic complications in patients not anti-coagulated were 31.4%.
291291
Benha M. J.
Vol. 29 No 2 May 2012Patient with lone AF (no heart
diseases or risk factors) were ex-
cluded from this study.
The following data was collect-
ed:-
1- Full history data was collect-
ed with to determined risk factors
as DM, HTN, rheumatic heart dis-
ease, prosthetic valve, and throm-
boembolic, hemorrhagic complica-
tions.
2- Clinical examinations data.
3- Investigations data was col-
lected included routine laboratory
investigations and prothrombin
time, prothrombin concentration,
and INR.
4- Resting 12 lead surfaces
ECG.
5- Trans-Thoracic Echocardiog-
raphy (TTE) data was collected to
determined valvular heart diseas-
es LA & LV size, LV EF.
These patients were divided
into two groups:-
(i) Group A: (i) Group A: included 76 pa-
tients received oral anticoagula-
tion regularly.
They divided into 2 sub groups:
A1:A1: 28 Controlled patients,
where INR within the therapeutic
range.
A2:A2: 48 uncontrolled patients.
(ii) Group B: (ii) Group B: included 124 pa-
tients not received oral anticoagu-
lation.
Statistical analysisStatistical analysisData were collected from total
patients (group A and B), and
expressed as the mean value,
standard deviation and
percentages.
Kruskal – Wallis test was used
to compare different parameters
between groups. When inter-group
differences were found, Mann-
Whitney test was performed to de-
termine which groups were signifi-
cantly different.
Categorical variables were ana-
lyzed with the Chi square test.
Paired student’s t-test was used to
compare different parameters of
studied groups.
A value of P < 0.05 was consid-
ered statistically significant.(5)

292292
Neama El-Meligy, et al....
ResultsResultsThe present study included 200
patients, 83 (41.5%) females and
117 (58.5%) males, their age range
from 20 to 87 years. One hundred
and eighty six (93%) patients have
chronic (permanent) AF and 14
(7%) patients have paroxysmal re-
current AF, Forty nine (24.5%) pa-
tients presented by rapid AF, 4
(2.5%) presented by slow AF and
146 (73%) patients have controlled
AF.
The commonest risk factors of
AF in our study were IHD, includ-
ed 117 patients(58.5%) 27 of them
in group A and 90 patients in
group B; hypertension found in 80
(40%) of cases 15 of them in group
A and 65 patients in group B,
while RHD presented in 78 (39%)
of cases 59 of them in group A
and 19 patients in group B, and fi-
nally heart failure found in 54
(27%) of cases, 21 of them in
group A and 33 patients in group
B. Table (1).
Only 76 (38%) patients received
oral anticoagulant (group A),
(36.8%) of them (14% from the to-
tal study) have controlled INR
(group A1), while (62%) of patients
not received oral anticoagulant
(Group B). Fig. (1).
Married patients were used oral
anticoagulant more in group A,
65patients (84.5%) versus 90 pa-
tients(71.6%) in group B, and
these statistically significant (p
value < 0.05), while widow pa-
tients were more in group B, 23
patients(18.5%) versus 3 patients
(4.8%) in group A with statistical
significant (P value < 0.05).
Forty four(57.8%) of patients in
group A were living in urban area
versus 33 patients (28.2%) in
group B, also large number of pa-
tients in group B, 91patients
(71.8%) were living in rural area
versus 32 patients (42.2%) in
group A, and these result high
statistical significant (p value <
0.001). Table (2).
Table (3) show significant in-
crease in the mean value of both
left atrium (LA) and left ventricle
(LV) dimensions in patients with
group A, it was (5±0.71, 6.5±1.07
respectively) versus (4.4±0.61,
6±1.03) in group B (p value
<0.05), also the mean value of
LVEF was significantly lower in

293293
Benha M. J.
Vol. 29 No 2 May 2012group A, it was (48±13%) versus
(53.4±14%) in group B (P val-
ue<0.05)
Thromboembolic complications
in patients who received oral anti-
coagulation were 9 patients
(11.7%) all of them in group A2
versus 39 patients (31.4%) in pa-
tients who not received oral
anticoagulation (group B), the
difference was statistically
significant (p value<0.01), while
bleeding complications in patients
taking warfarin (group A) were 10
patients (13.9%) all of them were
in group A1 and 2 patients of
them (3.1%) developed intracrani-
al hemorrhage (p value <0.05).
Table (4)

294294
Neama El-Meligy, et al....

295295
Benha M. J.
Vol. 29 No 2 May 2012DiscussionDiscussion
Approximately 50% of all cardi-
ogenic and systemic emboli occur
in individuals with AF.(1) Trials of
anticoagulant and antiplatelet
medications to prevent stroke in
AF were conducted to interrupt
the presumed cardioembolic
mechanism of stroke in AF. De-
spite clear and consistent recom-
mendations, several factors con-
tribute to suboptimal use of
warfarin therapy.(4)
The aim of this work is to eval-
uate the use of antithrombotic
therapy for the treatment of pa-
tient with atrial fibrillation and to
survey the awareness of anti-
thrombotic therapy for atrial fibril-
lation in Kalubia government,
Egypt.
The commonest underlying
causes of AF in our study were
IHD found in 117 (58.5%) of cases
This discordance with Salah , et
al., (2007) who, reported that the
commonest underlying cause of
AF was RHD (70%) while IHD was
present in 8.8% of cases.(6) Ac-
cording to current guidelines' rec-
ommendations for anticoagula-
tion, all patients of our study were
eligible for oral anticoagulation.
Unfortunately, only 76 (38%)
patients received oral anticoagu-
lants in our study while, 23
(11.5%) patients received oral an-
ticoagulation and ASA, 91(45.5%)
patients received ASA alone in Sa-
lah, et al study.(6)
In Taiwan, Lin et al., (2008) re-
ported that only 24.7% of the
overall population received appro-
priate antithrombotic therapy,
when patients with risk for bleed-
ing were excluded, the rate of
compliance increased to 26.2%, so
most of patients with AF in Tai-
wan did not receive appropriate
antithrombotic therapy over the
period studied which is in concor-
dance with the current study.(7)
Glazer et al., (2007) found
that 59% used warfarin, 28% used
aspirin, and 24% neither used
warfarin nor aspirin, so many at
high risk of stroke did not receive
warfarin.(8) In USA Lieva et al.,
(2009) reported that 79% were be-
ing treated with warfarin (to main-
tain an International Normalized
Ratio between 2.0 and 3.0), 17%
were being treated with aspirin

296296
Neama El-Meligy, et al....
325 mg daily and 4%were not be-
ing treated with warfarin or aspi-
rin.(9)
We found that only 28 patients
with controlled INR, they were
36.8% from patients who received
oral anticoagulation (14% from the
total study), This is consistent
with Salah Atta et al., (2007) re-
ported that only 25 (19%) were
properly anticoagulated But Fust-
er, et al., (2001) reported that only
36.8% of their patients were con-
trolled. (6,10)
In our study patients whose
lives in urban areas, married,
prosthetic heart valves and rheu-
matic heart disease were more use
of oral anticoagulation than pa-
tient’s lives in rural areas, widow,
patients with hypertension, coro-
nary artery disease, diabetes mel-
litus, and heart failure.
Lin et al (2008) found that hy-
pertension, coronary artery dis-
ease, older age, and bleeding risk
factors were associated with low
rates of warfarin use.(7)
In our study we found that,
high incidence of thromboembolic
complications (31.4%) in patients
who not received oral anticoagula-
tion versus (11.7%) in patients un-
der anticoagulant therapy and un-
controlled INR.
GO et al., (2003) found that
among 11,526 patients, 397 of
them developed thromboembolic
events (372 ischemic strokes, 25
peripheral embolisms) during fol-
low-up, and warfarin therapy was
associated with a 51% lower risk
of thromboembolism compared
with no warfarin therapy (either
no antithrombotic therapy or aspi-
rin).(11)
A nested case-control analysis
estimated a 64% reduction of
thromboembolism with warfarin
compared with no antithrombotic
therapy. Warfarin was also asso-
ciated with a reduced risk of all-
cause mortality. Intracranial hem-
orrhage was uncommon, but the
rate was moderately higher among
those taking vs those not taking
warfarin, however, warfarin thera-
py was not associated with an in-
creased adjusted risk of non intra-
cranial major hemorrhage.
In our study lack of patients

297297
Benha M. J.
Vol. 29 No 2 May 2012compliance and withdrawal of
warfarin after a period of intake
were due to either the high cost of
follow-up of INR and being in vil-
lages far-away from hospitals or
the occurrence of bleeding compli-
cations or social problems oc-
curred in 11.5% of patients, but
contraindications to warfarin due
to high risk of bleeding was ob-
served in only 6% of our cases.
ConclusionsConclusionsUnfortunately, 76 (38%) pa-
tients receive oral anticoagulation
regularly, 28 (36.8%) of them (14%
of total study) were properly anti-
coagulated but 124 (62%) patients
not receive oral anticoagulation,
Prosthetic heart valves, rheumatic
heart disease, married were asso-
ciated with high frequency of war-
farin use in our study but
hypertension, coronary artery
disease, diabetes mellitus, older
ages and living in villages were
associated with low rates of
warfarin use.
Intracranial hemorrhages in
patients taking warfarin was 3.1%
and thromboembolic complica-
tions of AF in our study were 39%
in patients not taking warfarin
and 11.7% in patients that use
oral anticoagulant but INR under
controlled level.
ReferencesReferences1- Manning W. J., Silverman1- Manning W. J., Silverman
D. I., Keighley C. S., et al(1995):D. I., Keighley C. S., et al(1995):
Trans-esophageal echocardiogra-
phy facilitated early cardio-version
from atrial fibrillation using
short-term anticoagulation: final
results of a prospective 4.5-year
study. J Am Coll Cardiol ; 25:
1354–61.
2-2- Prystowsky E. N. (2000):Prystowsky E. N. (2000):
Management of atrial fibrillation:
therapeutic options and clinical
decisions. Am J Cardiol ; 85:3D-
11D.
3-3- Hart R. G., Benavente O.,Hart R. G., Benavente O.,
McBride R., et al (1999): AMcBride R., et al (1999): Anti-
thrombotic therapy to prevent
stroke in patients with atrial fibril-
lation: a meta-analysis. Ann In-
tern Med.; 131: 492–501.
4- Birman-Deych E., Radford4- Birman-Deych E., Radford
M. J., Nilasena D. S., et alM. J., Nilasena D. S., et al
(2006):(2006): Use and effectiveness of
warfarin in Medicare beneficiaries
with atrial fibrillation. Stroke ;
37:1070-1074.

298298
Neama El-Meligy, et al....
5- Raymond, and Bayarri,5- Raymond, and Bayarri,
(2003):(2003): P Values are not Error
Probabilities. A working paper
that explains the difference be-
tween Fisher's evidential p-value
and the Neyman–Pearson Type I
error rate ∝.
6- Salah Atta, Sherin Abdel-6- Salah Atta, Sherin Abdel-
Salam, Yehia Kishek et alSalam, Yehia Kishek et al
(2007):(2007): Current Care Gap of Prop-
er Anticoagulation in Patients with
Atrial Fibrillation Patients of
Upper Egypt, Egypt Heart; J 59
(3): 301-306.
7-7- Lin L. J., Cheng M. H.,Lin L. J., Cheng M. H.,
Lee C. H., et al (2008):Lee C. H., et al (2008): Compli-
ance with antithrombotic prescrib-
ing guidelines for patients with
atrial fibrillation--a nationwide de-
scriptive study in Taiwan. Clin
Ther. Sep; 30(9):1726-36.
8-8- Glazer N. L., Dublin S,.Glazer N. L., Dublin S,.
Smith N. L., et al (2007): Smith N. L., et al (2007): Newly
detected atrial fibrillation and
compliance with antithrombotic
guidelines. Arch Intern Med. Feb
12; 167(3):246-52. Cardiovascular
Health Research Unit and Depart-
ment of Epidemiology, University
of Washington, 1730 Minor Ave-
nue, Seattle, WA 98101, USA.
9-9- Lieva P., Aronow W. S.,Lieva P., Aronow W. S.,
Gutwein AH et al (2009): Gutwein AH et al (2009): Preva-
lence of inappropriate use of di-
goxin in 136 patients on digoxin
and prevalence of use of warfarin
or aspirin in 89 patients with per-
sistent or paroxysmal atrial fibril-
lation. Am J Ther. Nov-Dec; 16
(6):e41-3.
10- Fuster V., Ryden L. E.,10- Fuster V., Ryden L. E.,
Asinger R.W., et al (2001): Asinger R.W., et al (2001): ACC/
AHA/ESC guidelines for the man-
agement of patients with atrial fib-
rillation. A report of the American
College of Cardiology/American
Heart Association Task Force on
Practice Guidelines and the Euro-
pean Society of Cardiology Com-
mittee for Practice Guidelines and
Policy Conferences (Committee to
Develop Guidelines for the Man-
agement of Patients With Atrial
Fibrillation) developed in collabo-
ration with the North American
Society of Pacing and Electrophys-
iology. Eur Heart J; 22: 1852–923.
11- Go A.S., Hylek E.M., Chang11- Go A.S., Hylek E.M., Chang
Y., et al (2003): Y., et al (2003): Anticoagulation
therapy for stroke prevention in
atrial fibrillation: how well do ran-
domized trials translate into clini-
cal practice? JAMA; 290: 2685–92.

299299
Benha M. J.
Vol. 29 No 2 May 2012
POPULATION BASED EVALUATION OFPOPULATION BASED EVALUATION OFANTITHROMBOTIC THERAPY IN PATIENTSANTITHROMBOTIC THERAPY IN PATIENTS
WITH ATRIAL FIBRILLATIONWITH ATRIAL FIBRILLATION
Neama El-Meligy MD, Hesham Rashid MD,Neama El-Meligy MD, Hesham Rashid MD,Khaled Erabat MD, Hyam Abdrahman M.B.B.CHKhaled Erabat MD, Hyam Abdrahman M.B.B.CH
BENHAMEDICALJOURNAL
REPRINT
Published byPublished by
Benha Faculty of MedicineBenha Faculty of Medicine Volume 29 Number 2May 2012

299299
Benha M. J.
Vol. 29 No 2 May 2012
EFFECT OF TAMOXIFEN VERSUSEFFECT OF TAMOXIFEN VERSUS17 BETA-ESTRADIOL ON SKELETAL17 BETA-ESTRADIOL ON SKELETAL
MUSCLE PERFORMANCE INMUSCLE PERFORMANCE INOVARIECTOMIZED RATSOVARIECTOMIZED RATS
Hesham A. D. Abdel-Razek MDHesham A. D. Abdel-Razek MDDepartment of Medical Physiology, Faculty of Medicine,
Menoufiya University, Egypt
AbstractAbstractBackground: Background: Estrogen replacement therapy is used to relief post-
menopausal symptoms and to improve the physical dysfunction asso-
ciated with the deficiency of the female sex hormones. The present
study was designed to investigate a possible beneficial effect of tamoxi-
fen administration versus estradiol replacement on skeletal muscle con-
traction (SMC) and its glucose uptake (GU) in ovariectomized rats.
MaMaterial and Methods: terial and Methods: Thirty adult female Sprague-Dawley rats were
assigned randomly into five equal groups (n=6): (1) Non-ovariectomized
(control) group; (2) Sham-operated (sham) group, in which animals were
surgically manipulated without removal of ovaries; (3) Non-treated ova-
riectomized (OVX) group, in which surgical ovariectomy was done; (4) 17
β-estradiol-treated ovariectomized (OVX+E2) group, in which ovariecto-
mized rats were subcutaneously (s.c.) injected with 17 β-estradiol ben-
zoate (30 µg/kg b.w.), daily for 4 weeks; (5) Tamoxifen-treated ovariecto-
mized (OVX+T) group, in which ovariectomized rats were s.c. injected
with tamoxifen (1 mg/kg b.w), daily for 4 weeks. At the end of experi-
ment, phrenic nerve-hemidiaphragm preparation was dissected and
used for measurement of the strength of SMC at the onset and after 30
min activity (obtained by both indirect and direct stimulation) and of
GU by the muscle during 30 min activity and recovery times. Results:Results:
OVX group showed a significant reduction in strength of SMC, and in
its GU, when compared with those in control and sham groups. Both

300300
Hesham A. D. Abdel-Razek
IntrodIntroductiouctionElderly women have lower func-
tional capacity compared with
men [1], including a clear deterio-
ration in muscle performance
from early menopause [2]. Given
the wide range of activities of en-
dogenous estrogens during the
reproductive years and the signif-
icantly increased risk of cardiovas-
cular, immune, and skeletal disor-
ders after menopause [3,4], a
major effort has been made to de-
velop hormone replacement thera-
pies aimed at providing aging
women with the same biological
advantages observed before cessa-
tion of ovarian functions [5].
Estrogen replacement therapy
after menopause improves the
health and quality of life for wom-
en; estrogen helps to relieve many
post-menopausal symptoms, as
well as to influence emotional
state [6]. There are two isoforms of
the estrogen receptors (ER), ER∝
and ERβ [7], whose distribution
and density vary depending on the
target site. In many tissues, ER∝
has proliferative effects, whereas
ERβ has anti-proliferative ones [8].
OVX+E2 and OVX+T groups showed a significant improvement in the
strength of SMC and GU versus OVX group. After 30 min activity, the
percentage decrease of SMC from the initial level was significantly in-
creased in OVX group compared to control and sham groups indicating
more muscle fatigability; values were reduced to normal levels of control
and sham rats. In all groups, indirect to direct contraction ratio was in-
significantly changed, which excludes the involvement of neuromuscu-
lar junction in the observed muscle dysfunction. Conclusion:Conclusion: tamoxi-
fen could improve the strength of SMC and delays its fatigue and
increase its GU during activity and recovery times in a rat model of sur-
gical ovariectomy. Therefore, tamoxifen could be considered as a poten-
tial alternative line of treatment to estradiol replacement therapy in
post-menopausal skeletal muscle disturbances in adult humans.
Keywords:Keywords: tamoxifen, 17 β-estradiol, estrogen replacement, ovariec-
tomy, phrenic nerve-hemidiaphragm preparation, skeletal muscle func-
tion.

301301
Benha M. J.
Vol. 29 No 2 May 2012The continuous administration
of female sex hormones was asso-
ciated with the risk of undesired
hyperproliferation in the reproduc-
tive tissues[9]. Long-term estrogen
replacement therapy in postmeno-
pausal women, who have a uter-
us, might has the disadvantage of
being tissue agonists for endome-
trium, which increases the inci-
dence of endometrial cancer[10].
Although adding progestin to es-
trogen can be used to prevent the
development of endometrial can-
cer, this combination may cause
some unwanted side effects, as
breast cancer, venous throm-
boembolism, stroke and coronary
heart disease[10]. Thus, estrogen
replacement therapy is no longer
recommended because of its se-
vere side effects[11], and alterna-
tive therapies may offer attractive
options because they may protect
against breast or endometrial can-
cer, have fewer side effects and
still provide health benefits[12],
Therefore, an attempt was made
to develop compounds agonists in
non-reproductive tissues[13].
Selective estrogen receptor
modulators (SERMs) are synthetic
non-steroidal agents that bind to
the ER and produce a change in
the biologic activity of the receptor
depending on the tissue type[14].
Once a SERM binds to the ER, it
causes a change in the shape of
the ER that allows recruitment of
co-activators, if it is destined to
elicit an estrogenic response or co-
repressors if its response is anti-
estrogenic[15].
Tamoxifen is an example of
SERMs, which was originally de-
veloped for the treatment of breast
cancer[16]. Although tamoxifen is
primarily an estrogen receptor an-
tagonist by competing with estro-
gen in binding to ER[17], it has
some actions as an agonist de-
pending on tissue[18]. Tamoxifen
binds both ER∝ and ERβ with
equivalent affinity[19], however,
the ratio of ER∝ to ERβ at a target
site may play a role in determining
the overall action of a SERM on
that tissue [15]. Tamoxifen is easi-
ly absorbed by the gut without
modification and 98% is bound to
albumin after entering the circula-
tion. 4-Hydroxy tamoxifen, and
endoxifen are metabolites of ta-
moxifen formed in the liver and
have the same affinity for the ER
as estrogen[20]. However, tamoxi-

302302
Hesham A. D. Abdel-Razek
fen has side effects including hot
flushes and vaginal discharges.
Thrombo-embolic disorders, as a
possible side effect, have also been
reported in association with ta-
moxifen treatment[21].
The present study aimed at
investigating the possible benefi-
cial effects of 17 β-estradiol (E2)
replacement and, alternatively,
treatment with tamoxifen on post-
menopausal muscle weakness by
an ovariectomized animal model.
Material and MethodsMaterial and MethodsExperimental groups: Experimental groups: This
study followed a randomized con-
trolled animal experiment design.
Thirty adult cycling female
Sprague-Dawley rats, weighed be-
tween 150-200 g, were obtained
from the National Research Cen-
ter, Cairo, Egypt. Animals were
housed in the animal house of Me-
noufiya Faculty of Medicine with a
12:12-hrs dark/light cycle, and
were fed a standard rat chow diet
and had free access to tap water
ad libitum. Rats were randomly
divided into five equal groups (n=6
per group): (1) Non-ovariectomized
(control) group, in which animals
were left to rest for 1 week, and
then they were injected subcuta-
neously (s.c.) with 1ml/kg of 10%
ethanol/90% saline vehicle, daily
for 4 weeks; (2) Sham-operated
(sham) group, in which animals
were exposed to sham operation
as described below, got 1 week
rest, and then were s.c. injected
with 10% ethanol/90% saline ve-
hicle as in control group; (3) Non-
treated ovariectomized (OVX)
group, in which animals were sub-
jected to surgical ovariectomy ac-
cording to the method described
below, got 1 week rest, and then
were injected with 10% ethanol/
90% saline vehicle as in the above
groups; (4) E2-treated ovariecto-
mized (OVX+E2) group, in which
animals, after ovariectomy and 1
week rest, were s.c. injected with
50 µg/kg b.w. of 17β-estradiol
benzoate, (Misr Co. Pharm. Ind.,
Egypt) dissolved in 1ml/kg of 10%
ethanol/90% saline vehicle[22],
daily for 4 weeks; (5) Tamoxifen-
treated ovariectomized (OVX+T)
group, in which animals, after ov-
ariectomy and 1 week rest, were
s.c. injected with 1mg/kg b.w. of
tamoxifen (Nolvadex, Sedico
Pharma, Egypt) dissolved in 1ml/
kg of 10% ethanol/90% saline ve-
hicle[22], daily for 4 weeks. The

303303
Benha M. J.
Vol. 29 No 2 May 2012experiment was conducted in ac-
cordance with the ethical guide-
lines for investigations in laborato-
ry animals and was approved by
the Ethical Committee of the Fa-
culty of Medicine, Menoufiya Uni-
versity.
Ovariectomy and sham opera-Ovariectomy and sham opera-
tion:tion: Ovariectomy was performed
by the method described by Rog-
ers and Sheriff[23]. Briefly, each
rat was laid under light ether an-
esthesia in supine position and
upper and lower limbs were fixed.
Lower abdominal region was ster-
ilized and a midline abdominal in-
cision (2 cm) was made, where ab-
dominal viscera were manipulated
gently to locate the uterus, fallopi-
an tubes and ovaries. In both
sides, the junction between the
uterus and each ovary, including
oviduct and blood vessels, was cir-
cumferentially ligated, followed by
an incision just distal to the su-
ture, and ovaries were excised.
The muscle wall, subcutaneous
tissue and skin were then su-
tured, and topical sterilization and
gentamicin ointment (garamycin,
Memphis, Egypt) were applied im-
mediately, and daily for 1 week af-
ter operation to help wound heal-
ing. Sham-operated rats under-
went the same operative proce-
dures, but without ligation or exci-
sion of the ovaries. Closure
proceeded as above.
At the end of the experiment (5
weeks after ovariectomy), retro-
orbital blood samples were ob-
tained from animals, after over-
night fasting, through heparinized
capillary tubes. Samples were
added to EDTA and were centri-
fuged at 1000 rpm for 15 min for
separation of plasma and were
stored at 4oC to assay plasma es-
tradiol level, as a marker of suc-
cessful ovarian hormone depletion
and replacement [24], by estradiol
ELISA (KA0234, Abnova Corpora-
tion, Taiwan) according to the
manufacturer specifications. The
effectiveness of ovariectomy and
E2 replacement in this study were
proved as plasma E2 levels
showed a marked significant drop
(P<0.001) in OVX (6.9±1.1 pg/ml)
and OVX+T (6.3±0.9 pg/ml) rats
compared to those of control
(59.7±11.2 pg/ml), sham
(58.3±10.9 pg/ml) and OVX+E2
(65.8±18.7 pg/ml) animals. The
presence of a measurable low
amount of E2 in OVX and OVX+T

304304
Hesham A. D. Abdel-Razek
rats is explained by the capa-
bility of the peripheral tissues
of converting adrenal-synthesized
androgen precursors into estro-
gen [25].
Phrenic nerve-hemidiaphragmPhrenic nerve-hemidiaphragm
preparation:preparation: At the end of the ex-
perimental protocol period, ani-
mals of all groups were sacrificed
by cervical dislocation, and the
phrenic nerve-hemidiaphragm
preparation was dissected and
used for measuring of the strength
of skeletal muscle contraction
(SMC) and glucose uptake (GU) by
the muscle according to a method
modified from Bulbring [26]. Brief-
ly, the skin over the chest was
opened along the right border of
the sternum and the frontal part
of the right thoracic wall was re-
moved. The mediastinum behind
the sternum was incised and a cut
was made just above the frontal
insertion of the diaphragm. The
frontal part of the left thoracic
wall was then removed and the
phrenic nerve was exposed. The
left abdominal muscles were cut
along the costal margin and the
last rib was hold with a pair of for-
ceps. A strip of diaphragm was cut
out towards the tendinous part of
the diaphragm with about 2.5 cm
of phrenic nerve attached to it.
The preparation had a fanlike
shape being 3 mm wide at the ten-
dinous end, while at the costal
margin it was about 12 mm wide.
The preparation was attached to a
standard plastic diaphragm elec-
trode by the costal margin and im-
mersed in a 35 mm diameter and
50 ml capacity organ bath con-
taining Krebs' solution that con-
sists of (in mmol/L) NaCl 118, KCl
4.8, CaCl.2H2O 2.5, MgSO4.7H2O
1.6, KH2PO4 1.3, NaHCO3 35 and
glucose 5.5, with pH 7.4. The
Krebs solution was pre-warmed to
37oC and aerated with carbogen
(95% oxygen and 5% carbon diox-
ide). The gas bubbles were made
to impinge on the tissue to insure
adequate oxygenation. The central
tendon of the diaphragm was con-
nected by a thread to an isometric
transducer (Dynamometer UFI, Pi-
oden Controls), then to 4 channel
oscillograph (MK III-S; Narco Bio-
System, USA). The nerve was laid
over a pair of platinum, and the
plastic holder was suitably wired
to allow independent direct stimu-
lation of the muscle through plati-
num electrodes. Each preparation
was left in Krebs' solution for 30

305305
Benha M. J.
Vol. 29 No 2 May 2012min before stimulation to insure
stability.
Electrical stimulation: Electrical stimulation: Both
direct stimulation of the dia-
phragm and indirect stimulation
through phrenic nerve were done
using Dual Impedance Research
Stimulator (Harvard, England).
The preparation was stimulated
with a train of supramaximal te-
tanic repetitive electrical impulses
stimulation (25 volts, 100 Hz) with
a frequency of 90/min, and the
duration of each train-stimulation
was set at 0.1 sec in indirect stim-
ulation and at 0.2 sec in direct
stimulation [27]. Initially, the mus-
cle was stimulated directly for half
a minute, and then indirectly for
30 min, followed by a direct stim-
ulation again for half a minute.
The isometric muscle contraction,
in g tension, was recorded at the
onset and the end of indirect stim-
ulation as well as during the two
short direct stimulations of the
muscle. The percentage changes
of both direct and indirect con-
traction after 30 min stimulation
from the initial values at the onset
of contraction were calculated.
The ratio of strength of SMC due
to indirect to direct electrical stim-
ulation at the onset of contraction
and at its end after 30 min activity
time was also calculated.
Estimation of glucose uptakeEstimation of glucose uptake
by the muscle: by the muscle: Three samples
were collected from the Krebs' so-
lution bathing the phrenic nerve-
hemidiaphragm preparation: at
the start of experiment, at the end
of contraction (after 30 min activi-
ty time) and 30 min after the end
of contraction (after 30 min recov-
ery time). The glucose level in
samples was determined using
the enzymatic method of glucose
oxidase kits described by Trind-
er [28], and glucose uptake by the
muscle during contraction and re-
covery periods was calculated in
mg/g wet weight.
Statistical analysis: Statistical analysis: Data were
expressed as means ± standard
deviation (SD). One-way analysis
of variance (ANOVA), followed by
Fisher multiple comparisons were
used to detect level of significance
among individual means of all
groups. Statistically significant
difference was set at P<0.05 [29].
ResultsResultsDiaphragmatic muscle con-Diaphragmatic muscle con-

306306
Hesham A. D. Abdel-Razek
traction:traction: An insignificant change
of the strength of SMC, at the on-
set and after 30 min activity time,
was observed in sham group com-
pared to control animals, whether
contraction was induced by indi-
rect or direct electrical stimulation
(table 1). The percentage decrease
of the strength of SMC at the end
of 30 min contraction, obtained by
both indirect and direct stimula-
tions, from the corresponding ini-
tial value at the onset of contrac-
tion, was also insignificantly
changed in sham group versus
control animals (fig 1).
OVX group showed a signifi-
cant reduction in the strength of
SMC, induced by both indirect
and direct electrical stimulations,
at the onset of contraction
(P<0.001) and after 30 min activity
time (P<0.001), when compared
with the corresponding values in
control and sham groups. In
OVX+E2 group, average values of
the strength of SMC, caused by
both indirect and direct electrical
stimulations, were significantly in-
creased at the onset of contraction
(P<0.001) and after 30 min activity
time (P<0.001), when compared
with the corresponding values in
OVX group; an insignificant varia-
tion was observed when values of
OVX+E2 group were compared
with those in control and sham
groups. OVX+T group had values
of the strength of SMC, induced
by both indirect and direct electri-
cal stimulation, which were signif-
icantly elevated both at the onset
of contraction (P<0.001) and after
30 min activity time (P<0.001),
when compared with the corre-
sponding values in OVX group,
but were still significantly lower
than those of control (P< 0.05) and
sham (P<0.05) groups; an insignif-
icant variation between values of
the strength of SMC in OVX+T
and OVX+E2 groups was observed
(table 1).
The percentage decrease of the
strength of SMC, obtained by both
indirect or direct stimulation, at
the end of 30 min activity from
that at the onset of contraction
was significantly elevated in OVX
group (P<0.001) versus control
and sham groups. In OVX+E2 and
OVX+T groups, the percentage de-
crease was significantly minimized
(P<0.001), when compared with
that of OVX group; a non-
significant change in the percent-

307307
Benha M. J.
Vol. 29 No 2 May 2012age decrease was observed be-
tween control, sham, OVX+E2 and
OVX+T groups (fig.1).
In all the experimental groups,
the ratio of the strength of SMC
induced by indirect electrical stim-
ulation to direct one showed an
insignificant variation, whether at
the onset of contraction or after
30 min activity time (table 2).
Glucose uptake by the dia-Glucose uptake by the dia-
phragmatic muscle: phragmatic muscle: A non-
significant variation in GU by the
diaphragmatic muscle of animals
of control and sham groups was
observed during 30 min contrac-
tion and 30 min recovery periods.
In OVX group, the average values
of GU by the contracting muscles
during 30 min activity, as well as
by the recovering muscle during
the next 30 min, were significantly
reduced (P<0.001), when com-
pared with the corresponding val-
ues in control and sham groups.
Both OVX+E2 and OVX+T groups
showed a significant increase of
GU by the muscle during 30 min
contraction and 30 min recovery
times (P<0.001), when compared
with the corresponding values in
OVX group, but when compared
with each other and with control
and sham groups, both OVX+E2
and OVX+T groups showed an in-
significant change (fig. 2).

308308
Hesham A. D. Abdel-Razek
Fig. 1. Fig. 1. Percentage decrease of muscle contraction after 30 min activity from the initialvalue. Percentage decrease obtained by [A] indirect and [B] direct repetitive elec-trical stimulations (90 impulses/min). control: control group, sham: sham-operated group, OVX: non-treated-ovariectomized group, OVX+E2: 17 β-estradiol-treated ovariectomized group, OVX+T: tamoxifen-treated ovariecto-mized group. Results are expressed as mean±SD (n=6). The group which carrythe mark "*" is significantly different from all other groups at P<0.001.
Fig. 2.Fig. 2. Glucose uptake by the diaphragmatic muscle. Glucose uptake [A] during 30 minactivity time, and [B] during 30 min recovery one. control: control group, sham:sham-operated group, OVX: non-treated-ovariectomized group, OVX+E2: 17 b-estradiol-treated ovariectomized group, OVX+T: tamoxifen-treated ovariecto-mized group. Results are expressed as mean±SD (n=6). The group which carrythe mark "*" is significantly different from all other groups at P<0.001.

309309
Benha M. J.
Vol. 29 No 2 May 2012
DiscussionDiscussionDecreased serum E2 may occur
naturally as a part of the female
life process at menopause, or by
surgical removal of the ovaries in
rat models[30]. The present study
showed that ovariectomy in rats
resulted in a significant reduction
of the strength of the isometric
contraction of the diaphragmatic
muscle in response to both indi-
rect and direct electrical stimula-
tions, when compared with the
corresponding values in normal
and sham-operated rats. The per-
centage decrease in muscle con-
traction from the initial values,
after 30 min activity, was signifi-
cantly more in ovariectomized rats
than in normal and sham-
operated ones, which indicates a
condition of more muscle fatigabil-
ity than normal as a consequence
of ovariectomy. The data present-
ed here would suggest that ova-
riectomy may result in adverse
consequences on the physiological
function of the skeletal muscle.
Many studies demonstrated a
decrement in force generation
and myosin function in muscles
that occurs as a result of E2 defi-
ciency in both women and ro-
dents[31-33]. It has been shown
that ovariectomy induces a shift
from fast to slow myosin heavy
chain isoforms in rat skeletal
muscles, which results in altera-
tions in their contractile proper-
ties[34]. Furthermore, Sitnick et
al.[35] reported that ovariectomy
resulted in a failed recovery of
atrophied muscle mass, and ex-
plained that by the need of the
presence of ovarian hormones for
its regrowth in mature female ani-
mals. The changes in hormonal
status may be the contributor of
the decline in the skeletal muscle
function after ovariectomy. It has
been reported that the lowered
plasma level of E2 in ovariecto-
mized rats with a subsequent his-
topathological changes in the con-
tractile elements and their
properties may be the cause of the
observed reduction in the force of
muscle contraction [36].
Estradiol replacement to ova-
riectomized rats resulted in a sig-
nificant improvement in the
strength of the diaphragmatic iso-
metric muscle contractions in-
duced by both indirect and direct
electrical stimulations, when com-
pared with the animals subjected
to ovariectomy without treatment.

310310
Hesham A. D. Abdel-Razek
The percentage decrease of the
strength of diaphragmatic muscle
contraction from the initial value,
after 30 min activity, was signifi-
cantly less in ovariectomized rats
treated with E2 than that in non-
treated ovariectomized rats; which
indicates a less fatigability of skel-
etal muscles in rats subjected to
ovariectomy and received E2 re-
placement than that in non-
treated ovariectomized animals. In
consistency with our finding, Mo-
ran et al.[31] showed a reduction
of about 20% of muscle and myo-
sin functions in ovariectomized
mice, and that the losses in force
generation at both the whole mus-
cle and molecular levels were com-
pletely restored when mice were
administered E2 [33]. A meta-
analysis on data from about
10,000 postmenopausal women
showed that those taking an estro-
gen-based hormone therapy were
stronger than those not taking the
treatment[37]. Baltgalvis et al.[38]
demonstrated a significantly
greater strength in post-
menopausal women who were tak-
ing estrogen replacement therapy.
Moreover, Hertrampf et al. [39] no-
ticed that E2 treatment signifi-
cantly increased the movement ac-
tivity of ovariectomized rats. Inter-
estingly, Sotiriadou et al.[40]
showed that E2 replacement in ov-
ariectomized rats partially protect-
ed the soleus muscle from the in-
jury normally induced by downhill
running, and explained their find-
ings by a possible estrogen-
induced attenuation of the excita-
tion-contraction coupling failure,
a mechanism which may, in part,
contribute to the E2 replacement-
less muscle fatigability observed
in this study. In a trial to explain
the mechanism behind the E2-
induced improvement of skeletal
muscle performance after ovariec-
tomy, Baltgalvis et al.[38] said that
ER∝ and ERβ are expressed in
skeletal muscle, and only ER∝ is
responsive to both acute and
chronic changes in circulating E2.
Evans et al.[41] explained the ef-
fect of estrogen on skeletal mus-
cles by anabolic effects of E2 re-
placement, mediated by ER
present in skeletal muscle. Sipila
and Poutamo [1] observed that E2
induces expression of transcrip-
tion factors in proliferating
myoblasts. In fact, the mecha-
nisms of estrogen action are di-
verse, and include not only ac-
tions at ER[42], but also

311311
Benha M. J.
Vol. 29 No 2 May 2012antioxidant activity[43]. Estrogens
have only a weak radical scaveng-
ing activity [44], but are able to in-
hibit oxidative stress markers
such as lipid peroxidation[45], and
as such, it is possible that E2 it-
self has a direct effect on the oxi-
dative status of muscle fibers. In
addition, Sotiriadou et al.[46] re-
ported that estrogen may have a
protective effect on muscle tissue
possibly due to its antioxidant and
membrane stabilizing properties.
Lowe et al. [32] speculated that im-
proving the reduction-oxidation
state in muscle fibers by E2, and
thus keeping muscle proteins
such as myosin free from post-
translational oxidative modifica-
tions, could contribute to the
maintenance of protein structure-
function and ultimately strength,
based on findings that antioxidant
proteins, such as superoxide dis-
mutase and glutathione peroxi-
dase, are regulated through ER by
E2 [32].
The main finding of this study
is that tamoxifen administration
to ovariectomized rats improves
the strength of diaphragmatic con-
traction in response to both indi-
rect and direct electrical stimula-
tion compared to those with no
treatment. Treatment of rats with
tamoxifen after ovariectomy re-
sulted in a significantly lower per-
centage decrease in the strength
of muscle contraction from the
corresponding initial value, after
30 min activity, when compared
with the non-treated ovariecto-
mized animals, which reflects less
fatigability. Notably, the average
values of percentage decrease in
tamoxifen-treated ovariectomized
animals were statistically insignifi-
cant when compared with those of
the normal and sham-operated
rats, as well as those of ovariecto-
mized rats with E2 replacement
therapy. In consistency, Gorzek et
al.[47] observed that ovariecto-
mized mice treated with tamoxifen
ran distances comparable to those
of ovariectomized mice replaced
with E2. Although tamoxifen is
primarily an ER antagonist by
blocking estrogen binding to the
ER [48], it has some action as an
agonist in certain physiological
conditions depending on tissue
and tamoxifen concentration [49].
This diverse effect of some SERMs
is determined by a complex inter-
action between factors including
ER subtypes, adaptor protein ex-

312312
Hesham A. D. Abdel-Razek
pression, ligand identity and tran-
scription target sites, which vary
with cell type [49]. Tamoxifen has
not only an action at ER[42], but
also a potential action of scaveng-
ing of reactive oxygen species
(ROS) and reactive nitrogen spe-
cies (RNS) in vivo[50]. Tamoxifen
and its immediate metabolite, 4-
hydroxytamoxifen, are effective
antioxidants, and they protect
smooth muscle cell membrane
phospholipids against peroxida-
tion[51]. The benefit of the antioxi-
dant action of tamoxifen in ische-
mia animal models was
highlighted by Wakade et al. [52].
In fact, a balancing oxidative
stress in skeletal muscle was
found to be crucial for myosin
function[53] and overall muscle
contractility[54].
In all groups of animals of this
study, the ratio of the strength of
muscle contraction obtained by
indirect electrical stimulation to
direct one was insignificantly
changed after 30 min of activity
from the corresponding initial ra-
tio at the onset of contraction.
This finding excludes the neuro-
muscular junction as the site of
the partial muscle fatigue ob-
served in this experiment. It
seems that the major contributor
to fatigue is the muscle fiber itself
and not the nervous system or the
neuromuscular junction. Interest-
ingly, the ratios of the strength of
muscle contraction induced by in-
direct stimulation to direct one ob-
tained in non-treated ovariecto-
mized rats and the ovariectomized
rats treated with either E2 or ta-
moxifen were insignificantly
changed from those of the control
and sham-operated animals,
whether at the onset of contrac-
tion or after 30 min activity time.
The unaltered ratio in the non-
treated ovariectomized rats and
those treated with E2 or tamoxi-
fen, from control and sham-
operated ones, directs the atten-
tion to the skeletal muscle, and
not the neuromuscular junction,
as the primary site of the early
dysfunction in post-menopause.
In fact, the concept of neuropro-
tective effects of estrogen remains
controversial; while no reports
have shown a role of estrogen in
the acetylcholine release from
neuromuscular junction, an obvi-
ous one was demonstrated in
nerve fibers to detrusor muscle of
urinary bladder [55]. Centrally, es-

313313
Benha M. J.
Vol. 29 No 2 May 2012trogens play a definite role in the
neuroprotection of hippocampus
and amygdala of the limbic sys-
tem, an effect which was linked to
their ability to protect mitochon-
dria [56].
In the present work, the glu-
cose uptake by the diaphragmatic
muscle during 30 min contraction
time and 30 min recovery one was
determined. Ovariectomized rats
showed a significant reduction in
the glucose uptake by the dia-
phragmatic muscle during both
30 min-contraction and 30 min-
recovery times compared to those
of normal and sham-operated ani-
mals. The decrease in glucose up-
take by skeletal muscle after ova-
riectomy could, at least in part, be
explained by estrogen deficiency.
Similar result has been reported
by D'Eon et al.[57], who observed
that glucose uptake during mus-
cle contractions was impaired in
ovariectomized rats compared
with intact animals.
A marked increase of glucose
uptake by the diaphragmatic mus-
cle of ovariectomized rats subject-
ed to E2 replacement versus non-
treated ovariectomized animals
was observed during both the 30
min muscle activity time and the
30 min recovery one. This finding
might be attributed to the estro-
gen replacement that may improve
insulin action brought about by
ovarian hormone deficiency [36].
Campbell and Febbraio[58] demon-
strated that treatment with E2
can completely restore glucose up-
take in skeletal muscle of ovariec-
tomized rats to the control levels.
In fact, plasma concentration of
E2 may be a determinant factor
for insulin activity [59]. In ovariec-
tomized streptozotocin-induced di-
abetic rats, Ordonez et al.[60] ob-
served that E2 increased basal
skeletal muscle glucose uptake by
influencing signaling molecules
and/or glucose transporter-4 con-
tent. Even in the blood-brain bar-
rier, estrogens were found to in-
crease expression of glucose
transporter subunits and increase
glucose transport[61].
Data of this experiment re-
vealed that tamoxifen improved
glucose uptake by the diaphrag-
matic muscle of ovariectomized
rats during both the 30 min activi-
ty and 30 min recovery times,
when compared with the corre-

314314
Hesham A. D. Abdel-Razek
sponding values of ovariectomized
rats which did not receive any
treatment; an effect which could
be explained by the ability of ta-
moxifen to stimulate the ER in tis-
sues, with a subsequent ERβ- and
ERβ-mediated signaling pathways,
which participate in glucose ho-
meostasis by modulating the ex-
pression of genes involved in insu-
lin sensitivity and glucose uptake[62]. In fact, treatment of ovariec-
tomized rats with tamoxifen in
this investigation could restore the
normal levels of glucose uptake by
the diaphragmatic muscle, wheth-
er during 30 min contraction time
or during 30 min recovery one, an
effect on substrate utilization
which was definitely reflected on
the performance of the muscle of
rats.
In conclusion, the present
study demonstrates that surgical
ovariectomy in rats causes impair-
ment of the skeletal muscle per-
formance, and not of the neuro-
transmission at the motor end
plate. Tamoxifen administration
caused an improvement in the
strength of skeletal muscle con-
traction and glucose uptake by
the muscle similar to that induced
by estradiol replacement therapy,
possibly through its ER stimulato-
ry action and antioxidant effects.
Putting in mind that tamoxifen
has a preventive action on breast
cancer [63], and that it is extreme-
ly cheap in comparison to estro-
gen replacement therapy which is
an issue in undeveloped countries
or in countries with under-funded
managed healthcare systems, the
results strongly suggest that ta-
moxifen might be considered as
an alternative line of treatment for
the management of postmenopau-
sal muscle weakness caused by
estrogen deficiency in humans.
Further studies are needed to fur-
ther support these effects, to de-
termine the possible side effects of
tamoxifen, and to allow more ra-
tional design of any proposed clin-
ical trials.
ReferencesReferences1.1. Sipila S. and Poutamo J.Sipila S. and Poutamo J.
(2003): (2003): Muscle performance, sex
hormones and training in peri-
menopausal and post-menopausal
women. Scand J Med Sci Sports,
13(1):19-25.
2.2. Sipila S., Taaffe D. R.,Sipila S., Taaffe D. R.,
Cheng S., Puolakka J., ToivanenCheng S., Puolakka J., Toivanen
J. and Suominen H. (2001) : J. and Suominen H. (2001) : Ef-
fects of hormone replacement

315315
Benha M. J.
Vol. 29 No 2 May 2012therapy and high-impact physical
exercise on skeletal muscle in
post-menopausal women: a ran-
domized placebo-controlled study.
Clin Sci (Lond), 101(2):147-157.
3.3. Bolego C., Vegeto E., Pin-Bolego C., Vegeto E., Pin-
na C., Maggi A. and Cignarellana C., Maggi A. and Cignarella
A. (2006) :A. (2006) : Selective agonists of
estrogen receptor isoforms: new
perspectives for cardiovascular
disease. Arterioscler Thromb Vasc
Biol, 26:2192-2199.
4.4. Straub R. H. (2007) : Straub R. H. (2007) : The
complex role of estrogens in in-
flammation. Endocr Rev, 28:521-
574.
5.5. Komm B. S. (2008) : Komm B. S. (2008) : A
new approach to menopausal
therapy: the tissue selective estro-
gen complex. Reprod Sci, 15:984-
992.
6.6. Schneider H. P. G. (2003):Schneider H. P. G. (2003):
Menopause: The state of the art in
research and management. The
Parthenon Publishing, New York.
7.7. Kuiper G. G., Enmark E.,Kuiper G. G., Enmark E.,
Pelto-Huikko M., Nilsson S. andPelto-Huikko M., Nilsson S. and
Gustafsson J. A. (1996) : Gustafsson J. A. (1996) : Cloning
of a novel receptor expressed in
rat prostate and ovary. Proc Natl
Acad Sci USA, 93:5925-5930.
8.8. Koehler K. F., Helguero L.Koehler K. F., Helguero L.
A., Haldosen L. A., Warner M.A., Haldosen L. A., Warner M.
and Gustafsson J. A. (2005) :and Gustafsson J. A. (2005) :
Reflections on the discovery and
significance of estrogen receptor
beta. Endocr Rev, 26:465-478.
9.9. Rando G., Horner D., Bi-Rando G., Horner D., Bi-
serni A., Ramachandran B., Ca-serni A., Ramachandran B., Ca-
ruso D, Ciana P, Komm B andruso D, Ciana P, Komm B and
Maggi A (2010): Maggi A (2010): An Innovative
Method to Classify SERMs Based
on the Dynamics of Estrogen Re-
ceptor Transcriptional Activity in
Living Animals. Mol Endocrinol,
24(4):735-744.
10.10. Warren M. P. (2004) :Warren M. P. (2004) : A
comparative review of the risks
and benefits of hormone replace-
ment therapy regimens. Am J Ob-
stet Gynecol, 190:1141-1167.
11.11. Song T., Barua K., Buse-Song T., Barua K., Buse-
man G. and Murphy P. A.man G. and Murphy P. A.
(1998) :(1998) : Soy isoflavone analysis:
quality control and a new internal
standard. Am J Clin Nutr,
68:1474-1479.
12.12. Warren M. P., Shortle B.Warren M. P., Shortle B.

316316
Hesham A. D. Abdel-Razek
and Dominguez J. E. (2002) :and Dominguez J. E. (2002) :
Use of alternative therapies in
menopause. Best Pract Res Clin
Obstet Gynecol, 16:411-448.
13.13. Jordan V. C. (2004) :Jordan V. C. (2004) :
Selective estrogen receptor modu-
lation: concept and consequences
in cancer. Cancer Cell, 5:207-213.
14.14. Oseni T., Patel R., PyleOseni T., Patel R., Pyle
J. and Jordan V. C. (2008) :J. and Jordan V. C. (2008) : Se-
lective Estrogen Receptor Modula-
tors and Phytoestrogens. Planta
Med, 74(13):1656-1665.
15.15. Jordan V. C. (2007) :Jordan V. C. (2007) :
Chemoprevention of breast cancer
with selective oestrogen-receptor
modulators. Nat Rev Cancer, 7:46-
53.
16.16. Cox D. A. and HelveringCox D. A. and Helvering
L. M. (2006) :L. M. (2006) : Extracellular ma-
trix integrity : a possible mecha-
nism for differential clinical effects
among selective estrogen receptor
modulators and estrogens? Mol
Cell Endocrinol, 247:53-59.
17.17. Brzozowski A. M., PikeBrzozowski A. M., Pike
A. C., Dauter Z., Hubbard R. E.,A. C., Dauter Z., Hubbard R. E.,
Bonn T., et al. (1997) : Bonn T., et al. (1997) : Molecular
basis of agonism and antagonism
in the oestrogen receptor. Nature,
389:753-758.
18.18. MacGregor J. L. and Jor-MacGregor J. L. and Jor-
dan V. C. (1998) : dan V. C. (1998) : Basic guide to
the mechanisms of antiestrogen
action. Pharmacol Rev, 50 : 151-
196.
19.19. Kuiper G. G., CarlssonKuiper G. G., Carlsson
B., Grandien K., Enmark E.,B., Grandien K., Enmark E.,
Haggblad J., Nilsson S., et al.,Haggblad J., Nilsson S., et al.,
(1997) : C(1997) : Comparison of the ligand
binding specificity and transcript
tissue distribution of estrogen re-
ceptors alpha and beta. Endocri-
nology, 138:863-870.
20.20. Borgna J. L. and Roche-Borgna J. L. and Roche-
fort H. (1981) : fort H. (1981) : Hydroxylated me-
tabolites of tamoxifen are formed
in vivo and bound to estrogen re-
ceptor in target tissues. J Biol
Chem, 256:859-868.
21.21. Meier C. R. and Jick H.Meier C. R. and Jick H.
(1998) :(1998) : Tamoxifen and risk of idi-
opathic venous thromboembolism.
Br J Clin Pharmacol, 45(6):608-
612.
22.22. Fudge M. A., KavaliersFudge M. A., Kavaliers
M., Baird J. P. and OssenkoppM., Baird J. P. and Ossenkopp
K. P. (2009) :K. P. (2009) : Tamoxifen produces

317317
Benha M. J.
Vol. 29 No 2 May 2012conditioned taste avoidance in
male rats: An analysis of micro-
structural licking patterns and
taste reactivity. Horm Behav, 56
(3):322-331.
23.23. Rogers J. and Sheriff D.Rogers J. and Sheriff D.
D. (2004) :D. (2004) : Role of estrogen in ni-
tric oxide- and prostaglandin-
dependent modulation of vascular
conductance during treadmill lo-
comotion in rats. J Appl Physiol,
97(2):756-763.
24.24. Greising S. M., Baltgal-Greising S. M., Baltgal-
vis K. A., Kosir A. M., Moran A.vis K. A., Kosir A. M., Moran A.
L., Warren G. L. and Lowe D. A.L., Warren G. L. and Lowe D. A.
(2011) : (2011) : Estradiol's beneficial ef-
fect on murine muscle function is
independent of muscle activity. J
Appl Physiol, 110(1):109-115.
25.25. Brodie A. (1991) : Brodie A. (1991) : Arom-
atase and its inhibitors-an over-
view. J Steroid Biochem Mol Biol,
40:255-261.
26.26. Bulbring E. (1946) :Bulbring E. (1946) : Ob-
servation on the isolated phrenic
nerve diaphragm preparation of
the rat. Br J Pharmacol, 1:38-61.
27.27. Osman O. H., Ismail M.Osman O. H., Ismail M.
and Hamadein H. A. (1974) :and Hamadein H. A. (1974) :
Neuromuscular blocking activity
of snake (naja melanoleuca, Hal-
lowel). venom. Toxicon, 12(5):501-
508.
28.28. Trinder P. (1969) : Trinder P. (1969) : Enzy-
matic colorimetric method for de-
termination of glucose, cholesterol
and triglycerides. Ann Clin Bio-
chem, 6:24-27.
29.29. Smoller S. W. (2004) :Smoller S. W. (2004) :
From A primer for health and bio-
medical professionals. In Biosta-
tistics and Epidemiology, 3rd edi-
tion. Springer-Verlag Inc New
York, USA; p:69-77.
30.30. Cirpan T., Iscan O., Te-Cirpan T., Iscan O., Te-
rek M. C., Ozsener S., Kanit L.,rek M. C., Ozsener S., Kanit L.,
Pogun S., Zekioglu O. and Yuce-Pogun S., Zekioglu O. and Yuce-
bilgin S. (2006) :bilgin S. (2006) : Proliferative ef-
fects of different hormone regi-
mens on mammary glands in
ovariectomized rats. Eur J Gynae-
col Oncol, 27(3):256-261.
31.31. Moran A. L., Warren G.Moran A. L., Warren G.
L. and Lowe D. A. (2006) : L. and Lowe D. A. (2006) : Re-
moval of ovarian hormones from
mature mice detrimentally affects
muscle contractile function and
myosin structural distribution. J
Appl Physiol, 100:548-559.
318318
Hesham A. D. Abdel-Razek
32.32. Lowe D. A., Baltgalvis K.Lowe D. A., Baltgalvis K.
A. and Greising S. M. (2010) :A. and Greising S. M. (2010) :
Mechanisms behind estrogen's
beneficial effect on muscle
strength in females. Exerc Sport
Sci Rev, 38:61-67.
33.33. Moran A. L., Nelson S.Moran A. L., Nelson S.
A., Landisch R. M., Warren G. L.A., Landisch R. M., Warren G. L.
and Lowe D. A. (2007) :and Lowe D. A. (2007) : Estradiol
replacement reverses ovariectomy-
induced muscle contractile and
myosin dysfunction in mature fe-
male mice. J Appl Physiol,
102:1387-1393.
34.34. Kadi F., Karlsson C.,Kadi F., Karlsson C.,
Larsson B., Eriksson J., LarvalLarsson B., Eriksson J., Larval
M., Billig H. and Jonsdottir I. H.M., Billig H. and Jonsdottir I. H.
(2002): (2002): The effects of physical ac-
tivity and estrogen treatment on
rat fast and slow skeletal muscles
following ovariectomy. J Muscle
Res Cell Motil, 23(4):335-339.
35.35. Sitnick M., Foley A. M.,Sitnick M., Foley A. M.,
Brown M. and Espen E. (2006):Brown M. and Espen E. (2006):
Spangenburg Ovariectomy pre-
vents the recovery of atrophied
gastrocnemius skeletal muscle
mass. J of Appl Physiol, 100
(1):286-293.
36.36. Latour M. G., ShinodaLatour M. G., Shinoda
M. and Lavoie J. M. (2001) :M. and Lavoie J. M. (2001) :
Metabolic effects of physical train-
ing in ovariectomized and hyper-
estrogenic rats. J Appl Physiol, 90
(1):235-241.
37.37. Greising S. M., Baltgal-Greising S. M., Baltgal-
vis K. A., Lowe D. A. and Warrenvis K. A., Lowe D. A. and Warren
G. L. (2009) : G. L. (2009) : Hormone therapy
and skeletal muscle strength: a
meta-analysis. J Gerontol A Biol
Sci Med Sci, 64:1071-1081.
38.38. Baltgalvis K. A., GreisingBaltgalvis K. A., Greising
S. M., Warren G. L. and Lowe D.S. M., Warren G. L. and Lowe D.
A. (2010) :A. (2010) : Estrogen Regulates
Estrogen Receptors and Antioxi-
dant Gene Expression in Mouse
Skeletal Muscle. PLoS One, 5
(4):e10164.
39.39. Hertrampf T., Gruca M.Hertrampf T., Gruca M.
J., Seibel J., Laudenbach U.,J., Seibel J., Laudenbach U.,
Fritzemeier K. H. and Diel P.Fritzemeier K. H. and Diel P.
(2007) : (2007) : The bone-protective effect
of the phytoestrogen genistein is
mediated via ER alpha-dependent
mechanisms and strongly en-
hanced by physical activity. Bone,
40(6):1529-1535.
40.40. Sotiriadou S., KyparosSotiriadou S., Kyparos
A., Albani M., Arsos G., ClarkeA., Albani M., Arsos G., Clarke
M. S., Sidiras G., AngelopoulouM. S., Sidiras G., Angelopoulou

319319
Benha M. J.
Vol. 29 No 2 May 2012N. and Matziari C. (2006) : N. and Matziari C. (2006) : Sole-
us muscle force following downhill
running in ovariectomized rats
treated with estrogen. Appl Physi-
ol Nutr Metab, 31(4):449-459.
41.41. Evans E. M., Van PeltEvans E. M., Van Pelt
R. E., Binder E. F., Williams D.R. E., Binder E. F., Williams D.
B., Ehsani A. A. and Kohrt W.B., Ehsani A. A. and Kohrt W.
M. (2001) : M. (2001) : Effects of HRT and ex-
ercise training on insulin action,
glucose tolerance, and body com-
position in older women. J Appl
Physiol, 90(6):2033-2040.
42.42. Dhandapani K. M. andDhandapani K. M. and
Brann D. W. (2002) : Brann D. W. (2002) : Protective
effects of estrogen and selective
estrogen receptor modulators in
the brain. Biol Reprod, 67:1379-
1385.
43.43. Green P. S. and Simp-Green P. S. and Simp-
kins J. W. (2000) : kins J. W. (2000) : Neuroprotec-
tive effects of estrogens: potential
mechanisms of action. Int J Dev
Neurosci, 18:347-358.
44.44. Romer W., Oettel M.,Romer W., Oettel M.,
Menzenbach B., Droescher P.Menzenbach B., Droescher P.
and Schwarz S. (1997) : and Schwarz S. (1997) : Novel
estrogens and their radical scav-
enging effects, iron-chelating, and
total antioxidative activities: 17 al-
pha-substituted analogs of delta
9(11)-dehydro-17 beta-estradiol.
Steroids, 62:688-694.
45.45. Ruiz-Larrea M. B., LealRuiz-Larrea M. B., Leal
A. M., Liza M., Lacort M. and deA. M., Liza M., Lacort M. and de
Groot H. (1994) :Groot H. (1994) : Antioxidant ef-
fects of estradiol and 2-
hydroxyestradiol on iron-induced
lipid peroxidation of rat liver mi-
crosomes. Steroids, 59:383-388.
46.46. Sotiriadou S., KyparosSotiriadou S., Kyparos
A., Mougios V., Trontzos C., Si-A., Mougios V., Trontzos C., Si-
diras G. and Matziari C. (2003):diras G. and Matziari C. (2003):
Estrogen effect on some enzymes
in female rats after downhill run-
ning. Physiol Res, 52(6):743-748.
47.47. Gorzek J. F., Hendrick-Gorzek J. F., Hendrick-
son K. C., Forstner J. P., Rixenson K. C., Forstner J. P., Rixen
J. L., Moran A. L. and Lowe D.J. L., Moran A. L. and Lowe D.
A. (2007) : A. (2007) : Estradiol and tamoxi-
fen reverse ovariectomy-induced
physical inactivity in mice. Med
Sci Sports Exerc, 39:248-256.
48.48. Jordan V. Jordan V. C. and DowseC. and Dowse
L. J. (1976) :L. J. (1976) : Tamoxifen as an
anti-tumour agent: effect on oes-
trogen binding. J Endocrinol, 68
(02):297-303.
49.49. McDonnell D. P. (2000) :McDonnell D. P. (2000) :

320320
Hesham A. D. Abdel-Razek
Selective estrogen receptor modu-
lators (SERMs): a first step in the
development of perfect hormone
replacement therapy regimen. J
Soc Gynecol Investig, 7(Suppl):
S10-S5.
50.50. Obata T. and Kubota S.Obata T. and Kubota S.
(2001) :(2001) : Protective effect of ta-
moxifen on 1-methyl-4-pheny-
lpyridine-induced hydroxyl radical
generation in the rat striatum.
Neurosci Lett, 308:87-90.
51.51. Dubey R. K., Tyurina Y.Dubey R. K., Tyurina Y.
Y., Tyurin V. A., Gillespie D. G.,Y., Tyurin V. A., Gillespie D. G.,
Branch R. A., Jackson E. K. andBranch R. A., Jackson E. K. and
Kagan V. E. (1999) :Kagan V. E. (1999) : Estrogen
and tamoxifen metabolites protect
smooth muscle cell membrane
phospholipids against peroxida-
tion and inhibit cell growth. Circ
Res, 84:229-239.
52.52. Wakade C., Khan M. M.,Wakade C., Khan M. M.,
De Sevilla L. M., Zhang Q. G.,De Sevilla L. M., Zhang Q. G.,
Mahesh V. B. and Brann D. W.Mahesh V. B. and Brann D. W.
(2008) : (2008) : Tamoxifen neuroprotec-
tion in cerebral ischemia involves
attenuation of kinase activation
and superoxide production and
potentiation of mitochondrial su-
peroxide dismutase. Endocrinolo-
gy, 149:367-379.
53.53. Prochniewicz E., LoweProchniewicz E., Lowe
D. A., Spakowicz D. J., HigginsD. A., Spakowicz D. J., Higgins
L., O'Conor K., et al., (2008):L., O'Conor K., et al., (2008):
Functional, structural, and chemi-
cal changes in myosin associated
with hydrogen peroxide treatment
of skeletal muscle fibers. Am J
Physiol Cell Physiol, 294:C613-
C626.
54.54. Thompson L. V. (2008) :Thompson L. V. (2008) :
Age-related muscle dysfunction.
Exp Gerontol, 44:106-111.
55.55. Yoshida J., Aikawa K.,Yoshida J., Aikawa K.,
Yoshimura Y., Shishido K., Ya-Yoshimura Y., Shishido K., Ya-
nagida T. and Yamaguchi O.nagida T. and Yamaguchi O.
(2007) : (2007) : The effects of ovariectomy
and estrogen replacement on ace-
tylcholine release from nerve fi-
bres and passive stretch-induced
acetylcholine release in female rat
bladder. Neurourology and Urody-
namics, 26(7):1050-1055.
56.56. Simpkins J. W., Yi K. D.Simpkins J. W., Yi K. D.
and Yang S. H. (2009) : and Yang S. H. (2009) : Role of
protein phosphatases and mito-
chondria in the neuroprotective ef-
fects of estrogens. Front Neuroen-
docrinol, 30(2):93-105.
57.57. D'Eon T. M., Sharoff C.,D'Eon T. M., Sharoff C.,
Chipkin S. R., Grow D., RubyChipkin S. R., Grow D., Ruby

321321
Benha M. J.
Vol. 29 No 2 May 2012
B. C. and Braun B. (2002) : B. C. and Braun B. (2002) : Reg-
ulation of exercise carbohydrate
metabolism by estrogen and pro-
gesterone in women. Am J Physiol
Endocrinol Metab, 283(5):E1046-
E1055.
58.58. Campbell S. E. and Feb-Campbell S. E. and Feb-
braio M, A, (2002) : braio M, A, (2002) : Effect of the
ovarian hormones on GLUT4 ex-
pression and contraction-
stimulated glucose uptake. Am J
Physiol Endocrinol Metab, 282
(5):E1139-E1146.
59.59. Gonzalez C., Alonso A.,Gonzalez C., Alonso A.,
Grueso N. A., Esteban M. M.,Grueso N. A., Esteban M. M.,
Fernandez S. and Patterson A.Fernandez S. and Patterson A.
M. (2002) :M. (2002) : Effect of treatment
with different doses of 17-beta-
estradiol on the insulin receptor.
Life Sci, 70:1621-1630.
60.60. Ordonez P., Moreno M.,Ordonez P., Moreno M.,
Alonso A., Fernandez R., Diaz F.Alonso A., Fernandez R., Diaz F.
and Gonzalez C. (2007) :and Gonzalez C. (2007) : Insulin
sensitivity in streptozotocin-
induced diabetic rats treated with
different doses of 17 beta-
oestradiol or progesterone. Exp
Physiol, 92(1):241-249.
61.61. Shi J. and Simpkins J.Shi J. and Simpkins J.
W. (1997) : W. (1997) : 17 beta-Estradiol
modulation of glucose transporter
1 expression in blood-brain barri-
er. Am J Physiol, 272:E1016-
E1022.
62.62. Nilsson S., Mäkelä S.,Nilsson S., Mäkelä S.,
Treuter E., Tujague M., Thom-Treuter E., Tujague M., Thom-
sen J., Andersson G., Enmarksen J., Andersson G., Enmark
E., Pettersson K., Warner M.E., Pettersson K., Warner M.
and Gustafsson J. A. (2001):and Gustafsson J. A. (2001):
Mechanisms of estrogen action.
Physiol Rev, 81:1535-1565.
63.63. Powles T. J., Ashley S.,Powles T. J., Ashley S.,
Tidy A., Smith I. E. and DowsettTidy A., Smith I. E. and Dowsett
M. (2007) : M. (2007) : Twenty-year follow-up
of the Royal Marsden randomized,
double-blinded tamoxifen breast
cancer prevention trial. J Natl
Cancer Inst, 99(4):283-290.

322322
Hesham A. D. Abdel-Razek
EFFECT OF TAMOXIFEN VERSUSEFFECT OF TAMOXIFEN VERSUS17 BETA-ESTRADIOL ON SKELETAL17 BETA-ESTRADIOL ON SKELETAL
MUSCLE PERFORMANCE INMUSCLE PERFORMANCE INOVARIECTOMIZED RATSOVARIECTOMIZED RATS
Hesham A. D. Abdel-Razek MDHesham A. D. Abdel-Razek MD
BENHAMEDICALJOURNAL
REPRINT
Published byPublished by
Benha Faculty of MedicineBenha Faculty of Medicine Volume 29 Number 2May 2012
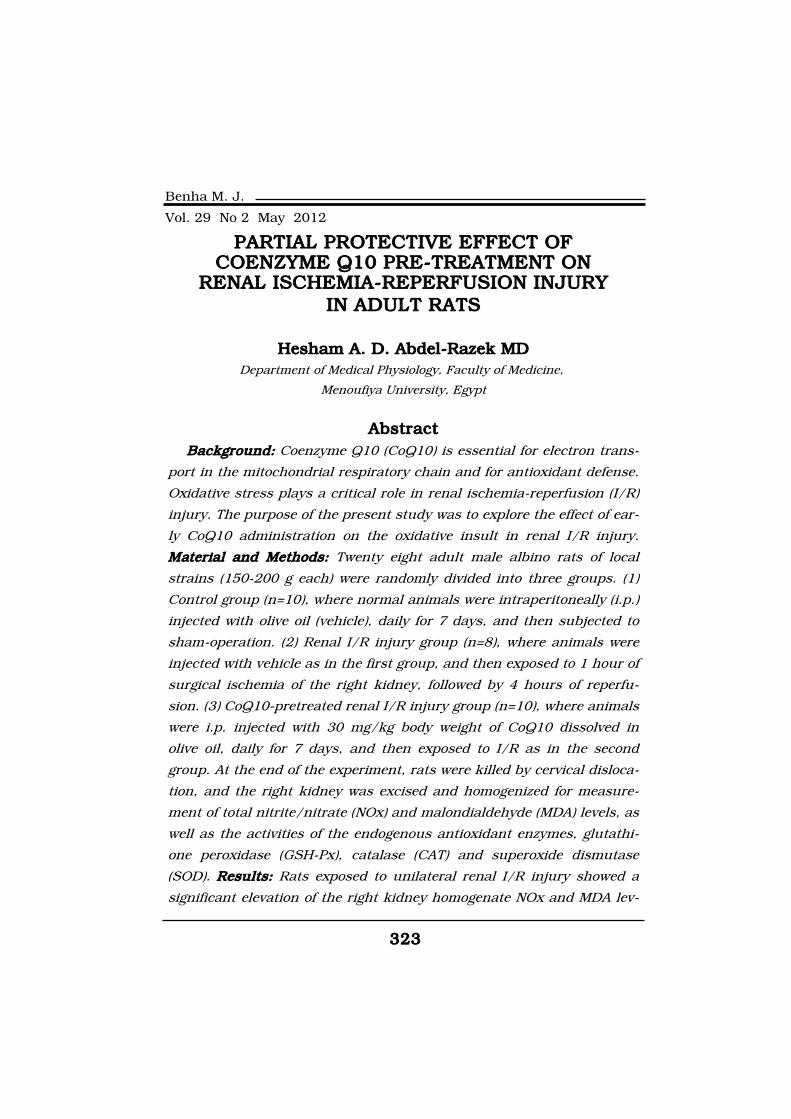
323323
Benha M. J.
Vol. 29 No 2 May 2012
PARTIAL PROTECTIVE EFFECT OFPARTIAL PROTECTIVE EFFECT OFCOENZYME Q10 PRE-TREATMENT ONCOENZYME Q10 PRE-TREATMENT ON
RENAL ISCHEMIA-REPERFUSION INJURYRENAL ISCHEMIA-REPERFUSION INJURYIN ADULT RATSIN ADULT RATS
Hesham A. D. Abdel-Razek MDHesham A. D. Abdel-Razek MDDepartment of Medical Physiology, Faculty of Medicine,
Menoufiya University, Egypt
AbstractAbstractBackground:Background: Coenzyme Q10 (CoQ10) is essential for electron trans-
port in the mitochondrial respiratory chain and for antioxidant defense.
Oxidative stress plays a critical role in renal ischemia-reperfusion (I/R)
injury. The purpose of the present study was to explore the effect of ear-
ly CoQ10 administration on the oxidative insult in renal I/R injury.
MaMaterial and Methods:terial and Methods: Twenty eight adult male albino rats of local
strains (150-200 g each) were randomly divided into three groups. (1)
Control group (n=10), where normal animals were intraperitoneally (i.p.)
injected with olive oil (vehicle), daily for 7 days, and then subjected to
sham-operation. (2) Renal I/R injury group (n=8), where animals were
injected with vehicle as in the first group, and then exposed to 1 hour of
surgical ischemia of the right kidney, followed by 4 hours of reperfu-
sion. (3) CoQ10-pretreated renal I/R injury group (n=10), where animals
were i.p. injected with 30 mg/kg body weight of CoQ10 dissolved in
olive oil, daily for 7 days, and then exposed to I/R as in the second
group. At the end of the experiment, rats were killed by cervical disloca-
tion, and the right kidney was excised and homogenized for measure-
ment of total nitrite/nitrate (NOx) and malondialdehyde (MDA) levels, as
well as the activities of the endogenous antioxidant enzymes, glutathi-
one peroxidase (GSH-Px), catalase (CAT) and superoxide dismutase
(SOD). Results:Results: Rats exposed to unilateral renal I/R injury showed a
significant elevation of the right kidney homogenate NOx and MDA lev-

324324
Hesham A. D. Abdel-Razek
IntrodIntroductiouctionRenal ischemia - reperfusion
(I/R) injury is the leading cause
of acute renal injury with high
mortality and morbidity, and it
is commonly encountered in clini-
cal situations such as trauma,
aortic bypass surgery, hemorrhag-
ic shock, and renal transplanta-
tion [1]. In fact, I/R injury leads to
the production of excess reactive
oxygen species (ROS) that are po-
tentially very reactive molecules
and, at high enough concentra-
tions, they cause damage to criti-
cal cellular constituents, such as
proteins, nucleic acids, carbohy-
drates, and lipids, resulting in cell
necrosis [2]. Therefore, the need
for therapeutic modalities to pre-
vent the sequelae of renal I/R in-
jury is quite urgent in order to
reduce these hazardous metabo-
lites and to improve the patient's
outcome and achieve a good prog-
nosis. Many studies have exam-
ined a variety of free radical oxy-
gen scavengers, including the
effects of external supplementa-
tion of antioxidants [3] and the
activities of endogenous enzy-
matic antioxidant defense system
in a kidney I/R injury [4]. Antioxi-
dants have been defined as sub-
stances that are able to prevent,
delay or remove oxidative damage
els, and a significant decrease of the GSH-Px, CAT and SOD enzymatic
activities, when compared with those of the control group. CoQ10 pre-
treatment of the renal I/R rats resulted in an improvement of the oxida-
tive state of the right kidney, as demonstrated by a significant decrease
of the NOx and MDA levels, and a significant increase of the GSH-Px,
CAT and SOD activities compared to those of rats exposed to renal I/R
and did not receive any treatment; however, values of the previously
measured parameters in I/R injured rats pretreated with CoQ10 did not
return to the normal ones. Conclusion:Conclusion: CoQ10 pre-treatment has a
partial protective effect against the kidney oxidative stress induced by I/
R injury in adult rats.
Keywords:Keywords: Coenzyme Q10, renal ischemia-reperfusion injury, reac-
tive oxygen species, nitrite/nitrate, malondialdehyde, antioxidant en-
zymes.

325325
Benha M. J.
Vol. 29 No 2 May 2012to a molecule [5]. Humans have
evolved a highly sophisticated and
complex antioxidant protection
system. It involves a variety of
components, both endogenous
and exogenous in origin, which
function interactively and syner-
gistically to neutralize free radi-
cals. These include endogenous
antioxidant enzymes that act as a
primary defense mechanism by
catalyzing free radical quenching
reactions, antioxidant coenzymes
as coenzyme Q10 (CoQ10), nutri-
ent-derived antioxidants as L-
ascorbic acid, α-tocopherol, β-
carotene and polyphenols, metal-
binding proteins that sequester
free iron and copper ions capable
of catalyzing oxidative reactions as
ceruloplasmin, ferritin and myo-
globin, and numerous other anti-
oxidant phytonutrients present in
a wide variety of plant foods [6].
CoQ10, also known as ubiqui-
none (2,3-dimethoxy-5-methyl-6-
multiprenyl-1,4-benzoquinone), is
a naturally occurring quinone that
is found in most aerobic organ-
isms from bacteria to mammals,
and is located in the hydrophobic
domain of the phospholipid bilay-
er of cellular membranes [7].
CoQ10 can be endogenously syn-
thesized from phenylalanine, ace-
tyl coenzyme A, tyrosine and by
seven vitamins (B2, B3, B5, B6,
B9, B12 and C); however, food can
also supply CoQ10. Primary die-
tary sources of CoQ10 include oily
fish, organ meats and whole
grains [8]. Most individuals obtain
sufficient amounts of CoQ10
through a balanced diet, but sup-
plementation may be useful for in-
dividuals with particular health
conditions. The primary biochemi-
cal action of CoQ10 is as a cofac-
tor in the electron-transport chain
that is involved in the synthesis of
adenosine triphosphate (ATP),
where it functions as an energy
transfer molecule; therefore, the
level of CoQ10 is the highest in or-
gans with high rates of metabo-
lism, such as the heart, kidney
and liver [9]. Later studies demon-
strated the presence of CoQ10 in
subcellular fractions other than
mitochondria and in plasma [10].
Saini et al. [6] stated that CoQ10
can neutralize free radicals and
may reduce or even help to pre-
vent some of the damage they
cause. Therefore, the potential use
of CoQ10 supplements may help
prevent or treat oxidative stress.

326326
Hesham A. D. Abdel-Razek
The present experimental study
was designed, using a rat model of
unilateral renal I/R injury, to in-
vestigate the potential protective
effect of CoQ10 pre-treatment
against the associated kidney oxi-
dative stress.
Material and MethodsMaterial and MethodsExperimental animals andExperimental animals and
groups: groups: This study followed a ran-
domized controlled animal experi-
ment design. Twenty eight adult
male albino rats of local strains,
each weighed between 100-150 g,
were housed with a 12:12-hrs
dark/light cycle, and were fed a
standard rat chow diet and had
free access to tap water ad libit-
um. Rats were randomly divided
into three groups. (1) Normal
sham-operated group (control
group, n=10), in which animals
were injected intraperitoneally
(i.p.) with 0.1 ml of olive oil (vehi-
cle), daily for 7 days, and then
subjected to sham-operation de-
scribed below. (2) Renal I/R injury
group (I/R group, n=8), in which
animals were i.p. injected with the
vehicle as in the control group,
and then exposed to renal I/R in-
jury according to the method de-
scribed below. (3) CoQ10-
pretreated renal I/R injury group
(Q+I/R group, n=10), in which an-
imals were i.p. injected with 30
mg/kg body weight (b.w.) of
CoQ10 (MEPACO, Egypt), dis-
solved in 0.1 ml of olive oil, daily
for 7 days[11], and then exposed
to renal I/R injury as in I/R
group.
Unilateral renal ischemia-Unilateral renal ischemia-
reperfusion injury and sham-reperfusion injury and sham-
operation:operation:
Animals of I/R and Q+I/R
groups were exposed to unilateral
renal ischemia for 1 hour, followed
by reperfusion for 4 hours. The
model of the renal I/R injury used
in this experiment was similar to
that described previously by Fo-
glieni et al.[12]. Briefly, rats were
initially anesthetized with intra-
muscular injection of 50 mg/kg
b.w. of ketamine hydrochloride
(EIPICO, Egypt) followed by a half
dose as required during the proce-
dure. The animals did not receive
ventilatory support. Body temper-
ature was monitored by a rectal
probe inserted into the rectum
and was maintained between 37°C
and 38°C by a thermal pad and a
heating lamp. After a midline lapa-
rotomy, the right kidney was iden-

327327
Benha M. J.
Vol. 29 No 2 May 2012tified and both the right renal ar-
tery and vein were clamped with a
microsurgical clamp. Ischemia
was confirmed by blanching of the
kidneys. The incision was tempo-
rarily closed during ischemia. Af-
ter 60 minutes of interruption of
the renal blood flow, the incision
was re-opened, the clamp was re-
moved and reperfusion was visu-
ally verified upon the removal of
the clamp. The wound was then
closed in two layers with a 4-0 silk
suture, and animals were i.p. in-
jected with 0.5 ml of 0.9% NaCl
upon completion of the surgery for
resuscitation. The animals were
allowed to recover with free access
to food and water. Reperfusion
was performed for 4 hours.
Sham-operated control rats
were anesthetized and underwent
identical surgical procedures as in
animals of the I/R group, but
without clamping of the right re-
nal artery and vein.
Preparation of kidney homog-Preparation of kidney homog-
enates:enates:
After 4 hours of the reperfusion
of the ischemic right kidney or of
the end of sham-operation, ani-
mals of all groups were killed by
cervical dislocation, and the right
kidney was dissected out, cut into
small pieces and homogenized in
ice-cold 50 mM Tris, 1.0 mM
EDTA, pH 8.0, with 10 mM 4-(2
aminoethyl) benzenesulfonyl fluo-
ride (AEBSF), 2 mM dithiothreitol,
5 mM leupeptin and 2 mM pepsta-
tin, using an Omni tissue homog-
enizer (Omni international,
Gainesville, VA). The extracts were
centrifuged at 14,000 rpm for 30
min at 4°C. The supernatant was
stored at -80°C for various assays.
Protein concentration was meas-
ured by the bicinchoninic acid
(BCA) method to correct for differ-
ences between preparations [13].
Biochemical Assays:Biochemical Assays:
1. Total Nitrite/nitrate level.1. Total Nitrite/nitrate level.
The method for estimation of
the total nitrite/nitrate (NOx)
amount in right kidney homogen-
ates was done using a commercial
assay kit (Oxford Biomed Re-
search, Inc), based on the Griess
reaction [14]. NOx level was meas-
ured after enzymatic conversion of
nitrate to nitrite by nitrate reduc-
tase in the presence of NADPH.
The oxidation of the coenzyme was
monitored by the decrease in ab-
sorbance at 340 nm [15]. Results

328328
Hesham A. D. Abdel-Razek
are expressed in nmol/mg protein.
2. Malondialdehyde level.2. Malondialdehyde level.
Malondialdehyde (MDA) con-
centration was measured in right
kidney tissue homogenates after
precipitation of protein with tri-
chloroacetic acid. Thiobarbituric
acid (TBA) reacts with MDA to
form TBA reactive product, which
was measured at 532 nm spectro-
photometrically. An MDA solution
freshly made by the hydrolysis of
1,1,3,3-tetramethoxy propane was
used as standard [16]. The results
were expressed as nmol of MDA
per mg protein.
3. Glutathione peroxidase en-3. Glutathione peroxidase en-
zymatic activity.zymatic activity.
The enzymatic activity of glu-
tathione peroxidase (GSH-Px) in
the right kidney homogenates was
assayed as described by Paglia
and Valentine[17], using H2O2and NADPH as substrates. The
conversion of NADPH to NADP+
was followed by recording the
changes in absorption intensity at
340 nm (Ransel kit, Randox, UK).
Results were expressed in U/mg
protein, where one unit (U) of
GSH-Px activity is defined as the
amount of the enzyme required to
consume 1 nmol of NADPH per
minute per mg protein [17].
4. Catalse enzymatic activity.4. Catalse enzymatic activity.
The calatase (CAT) enzymatic
activity was measured in the right
kidney homogenates by the meth-
od of Bonaventura et al. [18]. Five
µg of proteins from the homogen-
ate were mixed with 2 ml of 7.5
mmol H2O2, and a time scan was
performed for 10 min at 240 nm
at 25°C. Results were expressed in
U/g protein, where one unit of
CAT activity is defined as the
amount of enzyme decomposing 1
µmol of H2O2 per minute per mg
protein [18].
5. Superoxide dismutase en-5. Superoxide dismutase en-
zymatic activity.zymatic activity.
The enzymatic activity of the
superoxide dismutase (SOD) in
kidney homogenates was assayed
following the method developed by
Nishikimi et al. [19] and modified
by Kakkar et al. [20]. Five µg of
protein were mixed with sodium
pyrophosphate buffer, phenazine
methosulphate (PMT) and nitro
blue tetrazolium (NBT). The reac-
tion was started by the addition of
NADH. The reaction mixture was
incubated for 90 seconds at 30°C.

329329
Benha M. J.
Vol. 29 No 2 May 2012The reaction was then stopped by
the addition of 1 ml of glacial ace-
tic acid. The absorbance of the
chromogen formed was measured
at 560 nm. Results were ex-
pressed in U/mg protein, where
one unit of SOD activity is defined
as the enzyme concentration re-
quired to inhibit chromogen pro-
duction by 50% in one minute un-
der the assay conditions [20].
Statistical analysis: Statistical analysis:
Data were expressed as means
± standard deviation (SD). One-
way analysis of variance (ANO-
VA) followed by Fisher multiple
comparisons were used to detect
significant differences among indi-
vidual means of all groups. Differ-
ences with P<0.05 were consid-
ered statistically significant [21].
ResultsResultsFig. (1) demonstrates the
changes in the NOx and MDA
levels in the right kidney ho-
mogenates after induction of is-
chemia for 1 hour and reperfusion
for 4 hours, and the effect of
pretreatment with CoQ10 before
I/R injury. A significant elevation
(P<0.001) of the NOx and MDA
levels was observed in kidney ho-
mogenates of I/R group, when
compared with the corresponding
values in homogenates of control
group. Q+I/R group showed a
significant decrease (P<0.001) of
the kidney homogenates NOx
and MDA levels, when compared
with those of the control group.
However, mean values of NOx and
MDA levels in Q+I/R group did
not return to the normal values,
with significant differences
(P<0.001) from those of the control
group.
Fig. (2) demonstrates the effect
of 1 hour-ischemia followed by 4
hours-reperfusion of the right kid-
ney on the GSH-Px, CAT and SOD
enzymatic activity in its homogen-
ate, as well as the effect of the
CoQ10 pre-treatment on the previ-
ously mentioned enzymatic activi-
ties. I/R group showed a signifi-
cant reduction (P<0.001) in the
enzymatic activities of GSH-Px,
CAT and SOD, when compared
with those of the control group.
Q+I/R group showed a significant
increase (P<0.001) in the GSH-Px,
CAT and SOD activities compared
to those of I/R group. However,
the activities of the antioxidant
enzymes mentioned above were

330330
Hesham A. D. Abdel-Razek
still significantly lower (P<0.001)
in CoQ10-pretreated I/R injured
rats than those of the control
group.
Kid
ney
NO
x (m
mol
/m
g pro
tein
)K
idn
ey S
OD
(U
/m
g pro
tein
)K
idn
ey G
SH
-Px
(U/m
g pro
tein
)
Kid
ney
CA
T (U
/g
pro
tein
)K
idn
ey M
DA
(m
mol
/m
g pro
tein
)
10
8
6
4
2
0

331331
Benha M. J.
Vol. 29 No 2 May 2012DiscussionDiscussion
The data of the present study
demonstrate that ischemia of the
right kidney of rats for 1 hour, fol-
lowed by reperfusion for 4 hours
caused an elevation of the lev-
els of NOx and MDA, as well as
a reduction in the antioxidant en-
zymatic activities of GSH-Px, CAT
and SOD in kidney homogenates,
when compared with those of the
normal sham-operated animals.
Previous studies have demon-
strated similar results. Post-
ischemic nitrosative damage has
been demonstrated in the kid-
ney during the reperfusion
phase following ischemia, where
superoxide is produced, and it
rapidly reacts with NO- and
forms NOx [22]. The same obser-
vation has been shown in the
heart [23], liver [24], brain [25] and
lung [26]. Lipid peroxidation acts
as one of the most important
sources of oxidative stress, and
previous works have already
demonstrated evidence indicating
its implication in renal I/R inju-
ry [27]. MDA content, the index of
lipid peroxidation [28], was pre-
viously found to increase in I/R
injury of the heart [29] and the
brain [30].
Our results have shown a de-
crease of the intracellular antioxi-
dant enzymatic activities in kidney
homogenates after I/R injury. The
reduction in the activities of the
antioxidant enzymes measured in
this study is in agreement with
many research workers. An earlier
study has shown that myocardial
mitochondrial Mn-SOD activity
was decreased after ischemia [31].
Kizilgun et al. [32] observed that
renal I/R resulted in decreased
SOD and GSH-Px activities. Tes-
ticular damage precipitated by
temporary ischemia was associat-
ed with oxidative stress with a
sudden induction of lipid peroxi-
dation and a concomitant sup-
pression of endogenous antioxi-
dant activities, including those of
GSH-Px, catalase and SOD [33].
Moreover, unilateral testicular tor-
sion with subsequent ischemia
and excessive ROS generation
resulted in depletion of antioxi-
dant enzymes in the contralateral
testis [34]. Ischiropoulos et al. [35]
observed that NOx reacts with a
number of metal-containing en-
zymes, and can inactivate certain
types of the endogenous SOD by
nitration of critical residues. On
the other hand, Portakal and

332332
Hesham A. D. Abdel-Razek
Inal-Erden [36] found that GSH-
Px, catalase and SOD activities in-
creased during I/R of the liver, as
compared with controls. These
contradictory results may be ex-
plained by different techniques of
I/R injury with a resultant differ-
ent rates of production of ROS,
where in the present study, the
extent of the possible compensato-
ry mechanisms of the enzymes
syntheses to face the oxidative in-
sult was less than the degree of
their depletion, with a subsequent
final decrease in their activities in
kidney homogenates.
The present experiment demon-
strates a protective antioxidant ef-
fect of CoQ10 administration be-
fore induction of renal I/R in rats.
CoQ10 pretreatment of rats ex-
posed to I/R injury resulted in an
amelioration of the associated oxi-
dative stress in the kidney, as
demonstrated by a decrease of
NOx and MDA levels, and an in-
crease in the activities of the en-
dogenous antioxidant enzymes
GSH-Px, CAT and SOD in kidney
homogenates, when compared
with those in kidney homogenates
of I/R rats that did not receive any
treatment. However, the improve-
ment of the oxidative stress was
not complete, as the levels of NOx
and MDA, and the activities of the
antioxidant enzymes measured in
kidney homogenates of CoQ10-
pretreated rats exposed to renal I/
R injury, in this work, did not re-
turn to the normal values of the
control rats. In fact, as early as
1961, Kaufmann and Garloff [37]
suggested that CoQ10, which is a
part of the respiratory chains of
mitochondria, exerts yet another
function in biology by acting as a
membrane antioxidant. CoQ10
therapy has also been shown to be
protective against kidney I/R-
mediated oxidative damage in
rats [38]. Moreover, Quinzii et al.[39] showed that partial CoQ10 de-
ficiency causes oxidative stress.
The results of Takenaka et al. [40]
indicate that CoQ10 administra-
tion was accompanied by an in-
crease in the survival rate of is-
chemic rats, presumably by a
protective effect on warm ischemic
damage to the rat kidney. In vitro,
CoQ10 has been shown to inhibit
lipid peroxidation in mitochondrial
membranes that have been deplet-
ed of α-tocopherol [41]. Further-
more, the reduced form of CoQ10,
ubiquinol, was found to be one of

333333
Benha M. J.
Vol. 29 No 2 May 2012the most potent lipophilic antioxi-
dants in all cell membranes [42].
Ubiquinol inhibits the peroxida-
tion of cell membrane lipids and
also that of lipoprotein lipids
present in the circulation when
they are exposed to oxidizing con-
ditions [10]. Booth et al. [43] sug-
gested that, in the inner mito-
chondrial membrane, ubiquinol is
at least as active as α-tocopherol
in removing free radicals because
of its similar antioxidant efficien-
cy. In the present work, the in-
creased enzymatic activities of
GSH-Px, CAT and SOD in the kid-
ney homogenates of renal I/R in-
jured rats after early CoQ10 ad-
ministration, compared to non-
treated renal I/R injured animals,
is in agreement with the observa-
tion of Lee et al. [44], and is prob-
ably explained by a possible de-
crease in their depletion as a
result of scavenging ROS.
Indeed, CoQ10 therapy has
been shown to be protective
against many different experi-
mental models of I/R injury.
CoQ10 pretreatment protects
the myocardium from I/R injury
via both antioxidant and bioener-
getic pathways[45]. Administered
CoQ10 has been shown to protect
against acute post-ischemic he-
patic injury in experimental ani-
mals [46]. The results of Marubay-
ashi et al. [46] are compatible with
the assumption that cellular dam-
age caused by hepatic ischemia
can be explained by free radical
reaction processes during ische-
mia and, especially, reperfusion
and suggest that exogenous
CoQ10 functions as an antioxi-
dant with endogenous CoQ10 in
lipid peroxidation during reperfu-
sion. A protective effect of CoQ10
against warm ischemia damage in
rat pancreatic transplantation has
also been observed by Ikeda et
al. [47]. Ostrowski [48] detected a
beneficial neuroprotective effect of
CoQ10 in the cerebral ischemia
via a potent antioxidant and free
radicals scavenging effects, with
a resultant decrease of free radi-
cals concentration. Yokoyama et
al. [49] observed that CoQ10 scav-
enged ROS that was produced in
replanted limbs as a result of I/R
injury. There is some evidence for
antioxidant activity of CoQ10 also
in humans. For example, it has
been shown that preoperative ad-
ministration of CoQ10 to patients
can increase the tolerance of the

334334
Hesham A. D. Abdel-Razek
heart to ischemia [50]. In human
lenses, CoQ10 was found to ameli-
orate the oxidative stress, the
most common damaging factor re-
sponsible for the development of
cataract [51].
The mechanisms involved in
the antioxidant action of CoQ10
are not completely understood.
However, the CoQ10 helps to
fight against the free radicals
released later during reperfusion
probably by two mechanisms,
directly by scavenging free rad-
icals produced [52], and indirectly
by regenerating the active forms
of other antioxidant molecules[53]. In fact, CoQ10 in its re-
duced form, ubiquinol, is capable
of recycling and regenerating oth-
er antioxidants such as α-
tocopherol and ascorbate [54]. α-
tocopherol seems to act as a direct
scavenger forming tocopheroxyl
radical, whereas ubiquinol reacts
with tocopheroxyl radical to regen-
erate α-tocopherol. Sohal [55] con-
firmed the sparing/regenerative
effect of CoQ10 on α-tocopherol
in vivo. In young adult mice,
CoQ10 intake effectively augment-
ed the α-tocopherol concentration
in tissue homogenates and mito-
chondria [56]. The sparing effect of
the reduced form CoQ10, ubiqui-
nol, on α-tocopherol was also ob-
served by Frei et al. [57], who ex-
plained that by a site-specific
antioxidant action within the
membrane of the two antioxi-
dants.
In conclusion, the present
study shows that prophylactic
CoQ10 administration appears to
attenuate renal I/R injury in rats,
as demonstrated by decreasing
the levels of the NOx and MDA,
and by increasing the activities of
the antioxidant enzymes GSH-Px,
CAT and SOD. Further studies to
explore the possible mechanisms
of action behind the partial pro-
tective effect of CoQ10 against the
oxidative and nitrosative insults
associated with I/R injury are still
needed.
Acknowledgement:Acknowledgement:
Thanks to all staff members
and technicians of Physiology-Lab,
Faculty of Medicine, Menoufiya
University for their kind support
to complete this work. Deep grati-
tude to Dr. Mohammed Rizk, De-
partment of Biochemistry, Faculty
of Medicine, Menoufiya University

335335
Benha M. J.
Vol. 29 No 2 May 2012for his great help and performing
the biochemical assays in this
work.
ReferencesReferences1.1. Thadhani R., Pascual M.Thadhani R., Pascual M.
and Bonventre J. V. (1996):and Bonventre J. V. (1996):
Acute renal failure. N Engl J Med,
334 : 1448-1460.
2.2. Sies H. (1997) : Sies H. (1997) : Oxidative
stress: oxidants and antioxidants.
Experimental Physiol, 82(2):291-
295.
3.3. Bosco P. J. and SchweizerBosco P. J. and Schweizer
R. T. (1988) : R. T. (1988) : Use of oxygen radi-
cal scavengers on autografted pig
kidneys after warm ischemia and
48-hour perfusion preservation.
Arch Surg, 123:601-604.
4.4. Barnard M. L., Snyder S.Barnard M. L., Snyder S.
J., Engerson T. D. and TurrensJ., Engerson T. D. and Turrens
J. F. (1993) : J. F. (1993) : Antioxidant enzyme
status of ischemic and postis-
chemic liver and ischemic kidney
in rats. Free Radic Biol Med, 15 :
227-232.
5.5. Harwell B. (2007) :Harwell B. (2007) : Bio-
chemistry of oxidative stress. Bio-
chemical Society Transactions, 35
(5):1147-1150.
6.6. Saini R., Saini S. andSaini R., Saini S. and
Sharma S. (2010) : Sharma S. (2010) : Antioxidants
accelerates cellular health. Int J
Green Pharm, 3:212.
7.7. Lenaz G., Fato R., Di Ber-Lenaz G., Fato R., Di Ber-
nardo S., Jarreta D., Costa A.,nardo S., Jarreta D., Costa A.,
Genova M. L. and Parenti Cas-Genova M. L. and Parenti Cas-
telli G. (1999) :telli G. (1999) : Localization and
mobility of coenzyme Q in lipid bi-
layers and membranes. Biofac-
tors, 9:87-93.
8.8. Kubo H., Fuj K., II., Kaw-Kubo H., Fuj K., II., Kaw-
abe T., Matsumoto S., Kishidaabe T., Matsumoto S., Kishida
H. and Hosoe K. (2008) : H. and Hosoe K. (2008) : Food
content of ubiquinol-10 and ubi-
quinone-10 in the Japanese diet.
J Food Composit Analy, 21(3):199-
210.
9.9. Battino M., Ferreiro M.Battino M., Ferreiro M.
S., Bomparde S., Leone L., Mos-S., Bomparde S., Leone L., Mos-
ca F. and Bullon P. (2001) : ca F. and Bullon P. (2001) : Ele-
vated hydroperoxide levels and an-
tioxidant patterns in Papillon-
Lefevre syndrome. J Periodontol,
72:1760-1766.
10.10. Littarru G. P. and TianoLittarru G. P. and Tiano
L. (2007) 0: L. (2007) 0: Bioenergetic and an-
tioxidant properties of coenzyme
Q10: recent developments. Mol Bi-
otechnol, 37(1):31-37.

336336
Hesham A. D. Abdel-Razek
11.11. Tominaga R., Kouda Y.,Tominaga R., Kouda Y.,
Tanaka J., Nakano E., Ando H.,Tanaka J., Nakano E., Ando H.,
Ueno Y. and Tokunaga K.Ueno Y. and Tokunaga K.
(1983): (1983): Effects of pretreatment
with coenzyme Q10 on myocardial
preservation during aortic cross
clamping. J Surg Res, 34(2):111-
117.
12.12. Foglieni C., Fulgenzi A.,Foglieni C., Fulgenzi A.,
Ticozzi P., Pellegatta F., ScioratiTicozzi P., Pellegatta F., Sciorati
C., Belloni D., Ferrero E. andC., Belloni D., Ferrero E. and
Ferrero M. E. (2006) :Ferrero M. E. (2006) : Protective
effect of EDTA preadministration
on renal ischemia. BMC Nephrol,
7:5.
13.13. Smith P. K., Krohn R. I.,Smith P. K., Krohn R. I.,
Hermanson G. T., Mallia A. K.,Hermanson G. T., Mallia A. K.,
Gartner F. H., Provenzano M.Gartner F. H., Provenzano M.
D., Fujimoto E. K., Goeke N. M.,D., Fujimoto E. K., Goeke N. M.,
Olson B. J. and Klenk D. C.Olson B. J. and Klenk D. C.
(1987) :(1987) : Measurement of protein
using bicinchoninic acid. Anal Bi-
ochem, 163:279-282.
14.14. Sun J., Zhang X., Borde-Sun J., Zhang X., Borde-
rick M. and Fein H. (2003) :rick M. and Fein H. (2003) :
Measurement of nitric oxide pro-
duction in biological systems by
using Griess reaction assay. Sen-
sors, 3:276-284.
15.15. Moshage H., Kok B., Hu-Moshage H., Kok B., Hu-
izenga J. R. and Jansen P. L.izenga J. R. and Jansen P. L.
(1995):(1995): Nitrite and nitrate deter-
minations in plasma: a critical
evaluation. Clin Chem, 41
(6Pt1):892-896.
16.16. Ohkawa H., Ohishi N.Ohkawa H., Ohishi N.
and Yagi K. (1979) : and Yagi K. (1979) : Assay for lip-
id peroxides in animal tissues by
thiobarbituric acid reaction. Anal
Biochem, 95:351-358.
17.17. Pagalia D. E. and Val-Pagalia D. E. and Val-
entine W. N. (1967) : entine W. N. (1967) : Studies
on quantitative and qualitative
characterization of erythrocyte
GPx. J Lab Clin Med, 70 :
158.
18.18. Bonaventura J., Schroe-Bonaventura J., Schroe-
der W. A. and Fang S. (1972) :der W. A. and Fang S. (1972) :
Human erythrocyte catalase: an
improved method of isolation and
revaluation of reported properties.
Arch Biochem Biophys, 150:606-
617.
19.19. Nishikimi M., Rao N. A.Nishikimi M., Rao N. A.
and Yagi K. (1972) : and Yagi K. (1972) : The occur-
rence of superoxide anion in the
reaction of reduced phenazine me-
thosulfate and molecular oxygen.
Biochem Biophys Res Commun,
46:849-854.
20.20. Kakkar P., Das B. andKakkar P., Das B. and

337337
Benha M. J.
Vol. 29 No 2 May 2012Viswanathan P. N. (1984) : Viswanathan P. N. (1984) : A
modified spectrophotometric assay
of superoxide dismutase. Indian J
Biochem Biophys, 21:130-132.
21.21. Smoller S. W. (2004) :Smoller S. W. (2004) :
Biostatistics and Epidemiology: A
primer for health and biomedical
professionals, 3rd edition. Spring-
er-Verlag Inc., New York, USA, p:
69-77.
22.22. Yu L., Gengaro P. E.,Yu L., Gengaro P. E.,
Niederberger M., Burke T. J.Niederberger M., Burke T. J.
and Schrier R. W. (1994) : and Schrier R. W. (1994) : Ni-
tric oxide : A mediator in rat tu-
bular hypoxial reoxygenation inju-
ry. Proc Natl Acad Sci, 91:1691-
1695.
23.23. Naseem S. A., Kontos M.Naseem S. A., Kontos M.
C., Rao P. S., Jesse R. L., HessC., Rao P. S., Jesse R. L., Hess
M. L. and Kukreja R. C. (1995):M. L. and Kukreja R. C. (1995):
Sustained inhibition of nitric oxide
by Na-nitro-L-arginine improves
myocardial function following is-
chemia/reperfusion in isolated
perfused rat heart. J Mol Cell Car-
diol, 27:419-426.
24.24. Ma T. T., IschiropoulosMa T. T., Ischiropoulos
H. and Brass C. A. (1995): H. and Brass C. A. (1995): Endo-
toxin-stimulated nitric oxide pro-
duction increases injury and re-
duces rat liver chemiluminescence
during reperfusion. Gastroenterol-
ogy, 108:463-469.
25.25. Gunasekar P. G., Kanta-Gunasekar P. G., Kanta-
samy A. G., Borowitz I. L. andsamy A. G., Borowitz I. L. and
Isorn C. E. (1995) :Isorn C. E. (1995) : WDA receptor
activation produces concurrent
generation of nitric oxide and re-
active oxygen species: Implication
for cell death. J Neurochem, 65:
2016-2021.
26.26. Kooy N. W., Royall J. A.,Kooy N. W., Royall J. A.,
Ye Y. Z., Kelly D. R. and Beck-Ye Y. Z., Kelly D. R. and Beck-
man J. S. (1995) : man J. S. (1995) : Evidence for in
vivo peroxynitrite production in
human acute lung injury. Am J
Respir Crit Care Med, 15:1250-
1254.
27.27. Eschwege P., Paradis V.,Eschwege P., Paradis V.,
Conti M., Holstege A., Richet F.,Conti M., Holstege A., Richet F.,
et al., (1999) : et al., (1999) : In situ detection of
lipid peroxidation by-products as
markers of renal ischemia injuries
in rat kidneys. J Urol, 162:553-
557.
28.28. Kohen R. and Nyska A.Kohen R. and Nyska A.
(2002) :(2002) : Oxidation of biological
systems : oxidative stress phe-
nomena, antioxidants, redox reac-
tions and methods for their quan-
tification. Toxicol Pathol, 30:620-
650.

338338
Hesham A. D. Abdel-Razek
29.29. Dhalla N.S., Golfman L.,Dhalla N.S., Golfman L.,
Takeda S., Takeda N. and Naga-Takeda S., Takeda N. and Naga-
no M. (1999) : no M. (1999) : Evidence for the
role of oxidative stress in acute is-
chemic heart disease: a brief re-
view. Can J Cardiol, 15:587-593.
30.30. Beckman J. S. (1991) :Beckman J. S. (1991) :
The double-edged role of nitric ox-
ide in brain function and superox-
ide-mediated injury. J Dev Physi-
ol, 15:53-59.
31.31. Turrens JF, Thornton J,Turrens JF, Thornton J,
Barnard ML, Snyder S, Liu GBarnard ML, Snyder S, Liu G
and Downey JM (1992): and Downey JM (1992): Protec-
tion from reperfusion injury by
preconditioning hearts does not
involve increased antioxidant de-
fenses. Am J Physiol, 262:H585-
H589.
32.32. Kizilgun M., PoyrazogluKizilgun M., Poyrazoglu
Y., Oztas Y., Yaman H., CakirY., Oztas Y., Yaman H., Cakir
E., Cayci T., Akgul O. E., KurtE., Cayci T., Akgul O. E., Kurt
Y. G., Yaren H., Kunak Z. I.,Y. G., Yaren H., Kunak Z. I.,
Macit E., Ozkan E., TaslipinarMacit E., Ozkan E., Taslipinar
M. Y., Turker T. and Ozcan A.M. Y., Turker T. and Ozcan A.
(2011) :(2011) : Beneficial effects of N-
acetylcysteine and ebselen on re-
nal ischemia/reperfusion injury.
Ren Fail, 33(5):512-7.
33.33. Unsal A., Eroglu M.,Unsal A., Eroglu M.,
Avci A., et al. (2006) :Avci A., et al. (2006) : Protective
role of natural antioxidant supple-
mentation on testicular tissue af-
ter testicular torsion and detor-
sion. Scand J Urol Nephrol,
40:17-22.
34.34. Sarica K., Kupeli B., Bu-Sarica K., Kupeli B., Bu-
dak M., et al. (1997) :dak M., et al. (1997) : Influ-
ence of experimental spermatic
cord torsion on the contralateral
testis in rats : Evaluation of tissue
free oxygen radical scavenger en-
zyme levels. Urol Int, 58:208-212.
35.35. Ischiropoulos H., Zhu L.,Ischiropoulos H., Zhu L.,
Chen J., Tsai M., Martin J. C.,Chen J., Tsai M., Martin J. C.,
Smith C. D. and Beckman J. S.Smith C. D. and Beckman J. S.
(1992) : (1992) : Peroxynitrite-mediated ty-
rosine nitration catalyzed by su-
peroxide dismutase. Arch Bio-
chem Biophys, 298:431.
36.36. Portakal O. and Inal-Portakal O. and Inal-
Erden M. (1999) : Erden M. (1999) : Effects of pen-
toxifylline and coenzyme Q10 in
hepatic ischemia/reperfusion in-
jury. Clin Biochem,32(6):461-466.
37.37. Kaufmann H. P. andKaufmann H. P. and
Garloff H. (1961) : Garloff H. (1961) : Fette Seifen
Anstrichmittel, 63:331-344.
38.38. Aragno M., Cutrin J. C.,Aragno M., Cutrin J. C.,
Mastrocola R., Perrelli M. G.,Mastrocola R., Perrelli M. G.,
Restivo F., et al. (2003) : Restivo F., et al. (2003) : Oxida-
tive stress and kidney dysfunction
due to ischemia/reperfusion in

339339
Benha M. J.
Vol. 29 No 2 May 2012rat: attenuation by dehydroepian-
drosterone.Kidney Int,64:836-843.
39.39. Quinzii C. M., López L.Quinzii C. M., López L.
C., Gilkerson R. W., Dorado B.,C., Gilkerson R. W., Dorado B.,
Coku J., Naini A. B., Lagier-Coku J., Naini A. B., Lagier-
Tourenne C., Schuelke M., Salvi-Tourenne C., Schuelke M., Salvi-
ati L., Carrozzo R., Santorelli F.,ati L., Carrozzo R., Santorelli F.,
Rahman S., Tazir M., Koenig M.,Rahman S., Tazir M., Koenig M.,
DiMauro S. and Hirano M.DiMauro S. and Hirano M.
(2010): (2010): Reactive oxygen species,
oxidative stress, and cell death
correlate with level of CoQ10 defi-
ciency. FASEB J, 24(10):3733-
3743.
40.40. Takenaka M., Tatsu-Takenaka M., Tatsu-
kawa Y., Dohi K., Ezaki H., Mat-kawa Y., Dohi K., Ezaki H., Mat-
sukawa K. and Kawasaki T.sukawa K. and Kawasaki T.
(1981) :(1981) : Protective effects of al-
pha-tocopherol and coenzyme
Q10 on warm ischemic damages
of the rat kidney. Transplantation,
32(2):137-141.
41.41. Ernster L. and DallnerErnster L. and Dallner
G. (1995) : G. (1995) : Biochemical, physio-
logical and medical aspects of ubi-
quinone function. Biochim Bio-
phys Acta, 1271:195-204.
42.42. Bentinger M., BrismarBentinger M., Brismar
K. and Dallner G. (2007) :K. and Dallner G. (2007) : The
antioxidant role of coenzyme Q.
Mitochondrion,7(Suppl.):S41-S50.
43.43. Booth R. F. G., Galano-Booth R. F. G., Galano-
poulou D. G. and Quinn P. J.poulou D. G. and Quinn P. J.
(1982):(1982): Biochem Int, 5:151-156.
44.44. Lee J., Son H. Y. andLee J., Son H. Y. and
Kim M. C. (2006).: Kim M. C. (2006).: Attenuation of
ischemia-reperfusion injury by as-
corbic acid in the canine renal
transplantation. J Vet Sci, 7(4):
375-379.
45.45. Yokoyama H., Lingle D.Yokoyama H., Lingle D.
M., Crestanello J. A., et al.M., Crestanello J. A., et al.
(1996) : (1996) : Coenzyme Q10 protects
coronary endothelial function from
ischemia reperfusion injury via an
antioxidant effect. Surgery, 120
(2):189-196.
46.46. Marubayashi S., DohiMarubayashi S., Dohi
K., Yamada K. and Kawasaki T.K., Yamada K. and Kawasaki T.
(1984) :(1984) : Changes in the levels of
endogenous coenzyme Q homo-
logs, alpha-tocopherol, and glu-
tathione in rat liver after hepatic
ischemia and reperfusion, and the
effect of pretreatment with coen-
zyme Q10. Biochim Biophys Acta,
797:1-9.
47.47. Ikeda M., Fukuda Y.,Ikeda M., Fukuda Y.,
Sumimoto K., Urushihara T.,Sumimoto K., Urushihara T.,
Sakimoto H., Nishihara M., Ok-Sakimoto H., Nishihara M., Ok-
ugawa K., Yamanaka K. andugawa K., Yamanaka K. and
Dohi K. (1996) : Dohi K. (1996) : Protective effect

340340
Hesham A. D. Abdel-Razek
of coenzyme Q10 against warm is-
chemia damage in rat pancreatic
transplantation. Transplant Proc,
28(3):1807.
48.48. Ostrowski R. P. (1999) :Ostrowski R. P. (1999) :
Effect of coenzyme Q10 (CoQ10)
on superoxide dismutase activity
in ET-1 and ET-3 experimental
models of cerebral ischemia in the
rat. Folia Neuropathol, 37(4):247-
251.
49.49. Yokoyama K., NakamuraYokoyama K., Nakamura
K., Nakamura K., Kimura M.,K., Nakamura K., Kimura M.,
Nomoto K. and Itoman M.Nomoto K. and Itoman M.
(1999) : (1999) : Effect of coenzyme Q10
on superoxide production in rats
with reperfusion injuries. Scand J
Plast Reconstr Surg Hand Surg,
33(1):1-5.
50.50. Tanaka J., Tominaga R.,Tanaka J., Tominaga R.,
Yoshitoshi M., Matsui K., Komo-Yoshitoshi M., Matsui K., Komo-
ri M., Sese A., Yasui H. and Tok-ri M., Sese A., Yasui H. and Tok-
unaga K. (1982) : unaga K. (1982) : Ann Thor Surg,
33:145-151.
51.51. Wang S., Zhang J., Ji-Wang S., Zhang J., Ji-
ang T., et al. (2011) : ang T., et al. (2011) : Protective
effect of Coenzyme Q10 against
oxidative damage in human lens
epithelial cells by novel ocular
drug carriers. IN J Pharmaceut,
403(1-2):219-229.
52.52. Joo J. S. (2005) : Joo J. S. (2005) : Coen-
zyme Q10 and cardiovascular
health: to take or not to take, that
is the question. Nutrition Bytes,
10:p.4.
53.53. Quinn P. J., Fabisiak J.Quinn P. J., Fabisiak J.
P. and Kagan V. E. (1999) : P. and Kagan V. E. (1999) : Ex-
pansion of antioxidant function of
vitamin E by coenzyme Q. BioFac-
tors, 9(2-4):149-154.
54.54. Crane F. L. (2001) : Crane F. L. (2001) : Bio-
chemical functions of coenzyme
Q10. J Am Col Nutr, 20(6):591-
598.
55.55. Sohal R. S. (2004) : Sohal R. S. (2004) : Co-
enzyme Q and vitamin E inter-
actions. Methods Enzymol, 378:
146-151.
56.56. Kamzalov S., Sumien N.,Kamzalov S., Sumien N.,
Forster M. J. and Sohal R. S.Forster M. J. and Sohal R. S.
(2003) :(2003) : Coenzyme Q intake ele-
vates the mitochondrial and tissue
levels of coenzyme Q and α-
tocopherol in young mice. J Nutr,
133:3175-3180.
57.57. Frei B., Kim M. C. andFrei B., Kim M. C. and
Ames B. N. (1990) : Ames B. N. (1990) : Ubiquinol-10
is an effective lipid-soluble antioxi-
dant at physiological concentra-
tions. Proc Nati Acad Sci, 87:
4879-4883.

341341
Benha M. J.
Vol. 29 No 2 May 2012
PARTIAL PROTECTIVE EFFECT OFPARTIAL PROTECTIVE EFFECT OFCOENZYME Q10 PRE-TREATMENTCOENZYME Q10 PRE-TREATMENT
ON RENAL ISCHEMIA-REPERFUSIONON RENAL ISCHEMIA-REPERFUSIONINJURY IN ADULT RATSINJURY IN ADULT RATS
Hesham A. D. Abdel-Razek MDHesham A. D. Abdel-Razek MD
BENHAMEDICALJOURNAL
REPRINT
Published byPublished by
Benha Faculty of MedicineBenha Faculty of Medicine Volume 29 Number 2May 2012

341341
Benha M. J.
Vol. 29 No 2 May 2012
IntrodIntroductiouctionObesity is a major public
health problem all over the
world,with nearly one-third of
ROLE OF VITAMIN D AND ADIPOKINESROLE OF VITAMIN D AND ADIPOKINESIN OBESITY RELATED TYPE 2IN OBESITY RELATED TYPE 2
DIABETES MELLITUSDIABETES MELLITUS
Refka Kh. Messiha MD, Hanaa Shata MD,Refka Kh. Messiha MD, Hanaa Shata MD,Nisreen Abo El-Maaty PhD, Lashin Saad M.ScNisreen Abo El-Maaty PhD, Lashin Saad M.Sc
and Nabeel Laimoon MD*and Nabeel Laimoon MD*Department of physiology and Internal Medicine*,
Mansoura Faculty of Medicine, Mansoura University, Egypt.
AbstractAbstractVit.D has been recently found to be associated with many metabolic
disorders as obesity and diabetes.The present work aims to study vit.D
and adipokines status in type 2 diabetic females with different body
weights and to investigate the probable correlation between serum vit.D
level and two of adipokines namely adiponectin and resistin.The study
involved 72 females, 36 non diabetic and 36 diabetic, divided into 3
groups according to their body mass index.Biochemical assays for vit.D,
resistin, adiponectin, lipid profile and insulin sensitivity markers were
done. Vit.D replacement therapy was given to those proven to be vit. D
defcient and biochemical assay was repeated. Results: vit. D was defi-
cient in morbid obese non diabetic and morbid obese diabetic fe-
males.Adiponectin was significantly reduced in obese and morbid obese
non diabetic females and in normal weight diabetic females.Resistin
was significantly increased in obese and morbid obese diabetic and non
diabetic females and in obese diabetic females.Vit.D replacement thera-
py improved insulin sensitivity in diabetic females but didn’t affect adip-
okine dysregulation. Conclusion: vit. D deficiency is correlated to mor-
bid obesity and type 2 DM suggesting a possible protective effect for
vitamin D in these conditions.

342342
Refka Kh. Messiha, et al....
adults are obese.Obesity is a ma-
jor risk factor for many diseases,
mainly cardiovascular disease,
cancer and diabetes mellitus (1).
Vit. D has long been known for
its effects on calcium metabo-
lism,gut and kidney. However, the
discovery of the wide spread dis-
tribution of vit. D receptors in
pancreas, immune cells, musles,
cardiovascular system, nervous
system, breast tissue, thyroid
gland, parathyroid gland, pros-
tate, endothelial cells and many
other tissues revealed the fact that
vit. D has a much broader range
of actions in the human body(2).
Evidence from recent studies has
indicated a role vit. D in mediating
many physiologic actions as insu-
lin secretion from β cells of the
pancreas and insulin actions on
target tissues(3). A number of pos-
sible “novel” pathologic conse-
quences of vit. D deficiency have
been identified in recent years,
mostly on the basis of associa-
tions that have yet to be examined
for causation by appropriate inter-
vention studies in humans. These
include possible increases in the
risk of cancer, ischemic heart dis-
ease, chronic kidney dis-
ease,autoimmune disease, eleva-
tion in blood pressure and dia-
betes mellitus(4). Moreover,recent
studies suggested a possible role
for vit. D in the metabolic dysreg-
ulation associated with metabolic
syndrome in that vit. D deficien-
cy is suggested to be a cause of
common obesity, dyslipidae-
mia,insulin resistance and hyper-
tension (5). However, little is
known about the correlation be-
tween vit. D and adipokines.
Therefore, the aim of the present
work is to study vit. D and adipo-
kines status in type 2 diabetic fe-
males with different body weights
and to investigate the probable
correlation between serum vit. D
level and two of adipokines name-
ly adiponectin and resistin.
Subjects and methodsSubjects and methodsThe study involved 72 Egyp-
tian females aged 30-50 years,
the diabetic and obese patients
were recruited from those treated
in Mansoura university outpatient
clinics while the healthy control
were recruited from Mansoura
university employees and others.
Exclusion criteria included inges-
tion of vit. D or multi-vitamin sup-
plements, anticonvulsants or sys-

343343
Benha M. J.
Vol. 29 No 2 May 2012temic glucocorticoids, presence of
hepatic or renal disease, malab-
sorptive disorders (Crohn’s dis-
ease, cystic fibrosis, and celiac
disease) and cancer.
The 72 females were divided ac-
cording to their body mass index
(BMI) being types 2 diabetic or
not, into 3 main groups as follows,
group I included 12 normal weight
non diabetic females and 12 nor-
mal weight diabetic females, group
II included 12 obese non diabetic
females and 12 obese diabetic fe-
males, group III included 12 mor-
bid obese non diabetic females
and 12 morbid obese diabetic fe-
males. At the start of the study
serum level of vit. D, adiponectin,
resistin, insulin, calcium, fasting
glucose, lipid profile, creatinine
and HBA1C were assayed as de-
scribed in the commercially used
kits for each female. Also insulin
resistance was assessed by HOMA
(the homeostatic model assess-
ment), according to the equation:
Vit. D deficient females received
vit. D replacement therapy in the
form of one oral daily tablet con-
taining 1000 IU vit. D for 2
months. Blood samples were col-
lected by the end of this period
and the previous parameters were
measured again. 25-hydroxy vit. D
(25-OH Vit. D) portrays the biolog-
ical active form of vit. D, which is
synthesized in the kidney.It is
widely accepted that the measure-
ment of circulating 25-OH vit. D
provides better information with
respect to patients vit. D status
because it is easily measured, has
the longest half-life in circulation
(approximately 2 or 3 weeks), and
the levels of 25- OH vit D correlate
with vit. D stores and clinical dis-
ease states. According to Immun-
diagnostik Enzyme - Immuno-
Assay kits vit. D is considered suf-
ficiently applied when its serum
levels are above 30 n.mol/l and
deficiency is considered when its
levels are below 30 n.mol/l (6).
Statistical analysis:Statistical analysis:
Data are expressed as mean
value ± SD. Comparisons were
carried out using analysis of vari-
ance (ANOVA) followed by Tukey’s
test, using SPSS for Windows Z
(15.0 Version). Differences were
considered statistically significant
when P < 0.05. Pearson correla-

344344
Refka Kh. Messiha, et al....
tion was used to assess relations
between variables.
ResultsResultsTable (1) shows that in non dia-
betic females, TG, fasting insulin,
HOMA-IR and resistin were signifi-
cantly higher in obese non diabet-
ic females compared to normal
weight non diabetic females while
HDL and adiponectin were signifi-
cantly low.In morbid obese non di-
abetic females, cholestrol, TG,
LDL, fasting insulin, HOMA-IR,
HBA1c and resistin were signifi-
cantly higher when compared to
normal weight non diabetic fe-
males, HDL, vit. D and adiponec-
tin were significantly low. Serum
levels of cholestrol, TG, LDL,
HBA1C and resistin were signifi-
cantly higher in morbid obese non
diabetic females compared to
obese non diabetic females but
adiponectin was significantly low.
In diabetic females, TG, fasting
insulin, HOMA-IR and resistin
were significantly higher in obese
compared to normal weight fe-
males while HDL was significantly
low.In morbid obese subgroup,
cholestrol, TG, LDL, fasting insu-
lin, HOMA-IR and resistin were
significantly higher when com-
pared to normal weight diabetic
females while HDL and vit. D were
significantly low. Vit. D was signif-
icantly low in morbid obese dia-
betic females compared to obese
diabetic females.
Table (2) shows that cholesterol
and TG were significantly higher
in normal weight and obese dia-
betic females compared to non di-
abetic females. However, HDL was
significantly low in normal weight,
obese and morbid obese diabetic
females compared to non diabetic
females.
Table (3) shows that fasting
glucose, HOMA-IR and HBA1C are
significantly higher in normal
weight, obese and morbid obese
diabetic females compared to non
diabetic females. As shown in ta-
ble (4), adiponectin was signifi-
cantly lower in normal weight dia-
betic females compared to normal
weight non diabetic females. Vit.
D was significantly lower in mor-
bid obese diabetic females than
morbid obese non diabetic fe-
males. By contrast, resistin was
significantly higher in obese dia-
betic females compared to obese

345345
Benha M. J.
Vol. 29 No 2 May 2012non diabetic females. Table (5)
shows that vit. D was higher after
vit. D replacement therapy in both
morbid obese diabetic and morbid
obese non diabetic females. Fast-
ing glucose, fasting insulin and
HOMA-IR were significantly lower
after vit. D replacement therapy.
Testing whether vit. D level was
correlated or not with different pa-
rameters, vit. D was negatively
correlated to HOMA-IR in both
non diabetic females (figure 1-
a) and diabetic females (figure
1-b). Moreover, vit. D was posi-
tively correlated to adiponectin
in non diabetic females (figure 2-
a) and in diabetic females (2-b)
but negatively correlated to resis-
tin in diabetic females (figure
2-c).

346346
Refka Kh. Messiha, et al....

347347
Benha M. J.
Vol. 29 No 2 May 2012

348348
Refka Kh. Messiha, et al....

349349
Benha M. J.
Vol. 29 No 2 May 2012
DiscussionDiscussionIn the present study, serum
level of vit. D was found to be low
in both morbid obese non diabetic
and morbid obese diabetic females
when compared to normal weight
or obese females in each group
(table 1). Indeed, there is a contro-
versy whether decreased vit. D lev-
el in obese persons is a cause or a
consequence of obesity. A hypoth-
esis proposed that reduced serum
vit. D level is a cause of obesity in
that common obesity results from
an anomalous adaptation to a cold
climate which is induced by a fall
in vit. D (5). A pivotal assumption
is that vit. D acts as an ultraviolet
(UV) radiation-sensitive sensor
which serves to signal changes in
sunlight intensity. A fall in UV ra-
diation in the autumn and winter
is proposed to be the environmen-
tal cue for an acclimatory or adap-
tive response which enhances
winter endurance. The winter re-
sponse entails an increase in body
size by the accumulation of fat
mass(5). According to this hypoth-
esis vit. D deficiency is a potential-
ly significant reason, not only for
obesity, but also for hyperten-
sion,insulin metabolism and dys-
lipidemia. On the other hand an-
other study concluded that vit. D
deficiency is a consequence of
obesity based on the fact that vit.
D is fat soluble and thus seques-
trated in the larger body pool of
fat of obese individuals specially
the subcutaneous adipose tissue
decreasing its serum levels (7).
Further, vit. D level was found
to be greatly reduced in morbid
obese diabetic females compared
with morbid obese non diabetic fe-
males (table 4).Additionally,serum
vit.D was negatively correlated
with HOMA-IR in diabetic fe-
males.Taken together,these re-
sults suggest a link between vit.D
deficiency and reduced insulin
sensitivity, the main hallmark in
type 2 DM.
The finding that vit.D was defi-
cient not only in morbid obese dia-
betic females but also in morbid
obese non diabetic raises a ques-
tion whether the deficiency is
linked more to which parameter;
morbid obesity or diabetes? In-
deed, the small number of pa-
tients represents a limitation
that should be addressed,as
bigger number would determine
more precisely the link between

350350
Refka Kh. Messiha, et al....
different parameters studied.
Previous studies examined
vit.D deficiency-induced insulin
resistance suggested that vit.D
may have a beneficial effect on in-
sulin action either directly,by
stimulating the expression of in-
sulin receptor and thereby en-
hancing insulin responsiveness
for glucose transport, or indi-
rectly via its role in regulating
extracellular calcium and ensur-
ing normal calcium influx
through cell membranes and ade-
quate intracellular cytosolic cal-
cium pool(8).
The present experiments
showed that adiponectin serum
level was significantly reduced in
obese and morbidly obese non dia-
betic women women compared to
normal weight non diabetic wom-
en (Table 1).This negative correla-
tion between adiponectin and
obesity has been reported before
(9).The mechanism behind con-
comitant reductions in plasma
adiponectin levels with increased
visceral fat remains to be clari-
fied.However, one probable mech-
anism is that decreased adiponec-
tin level is secondary to elevated
levels of detrimental adipokines
secreted in states of increased adi-
posity such as TNF- α which in-
hibits adiponectin secretion(10).
On the other hand, the present
study has shown that serum re-
sistin level was increased in
obese and morbidly obese wom-
en (tables 1), a finding that is in
line with previous studies pub-
lished about the relation between
resistin and obesity.Earlier stud-
ies showed that increased serum
resistin levels and gene expression
levels in abdominal depots in
states of increased adiposity (11).
The present finding that adipo-
nectin serum level was signifi-
cantly low in diabetic females
while resistin level was elevated
is consistent with previous stud-
ies(12,13). The mechanisms by
which adiponectin may ameliorate
insulin resistance have not been
fully elucidated.One proposed
mechanism is that adiponectin
decreases circulating FFA by
increasing fatty acid oxidation
by skeletal muscle. This results
in decreased triglyceride content
in muscle that has been associat-
ed with improved insulin sensi-
tivity (14). On the other hand,

351351
Benha M. J.
Vol. 29 No 2 May 2012proposed mechanisms for the re-
duced insulin sensitivity by resis-
tin include reduction in adeno-
sine 5-monophosphate activated
protein kinase activity in skeletal
muscle,adipose tissue,and liver.In
addition,insulin receptor sub-
strate-1 (IRS-1) and IRS-2 protein
levels and phosphorylation
states,as well as protein kinase B
activity, were decreased in hyper-
resistinemic animal tissues.These
alterations decrease tissue insulin
sensitivity that results in glucose
intolerance, hyperinsulinemia, ele-
vated free fatty acid levels, and hy-
pertriglyceridemia (15).
In the present study, vit.D is
positively correlated to adiponec-
tin in both diabetic and non dia-
betic females and negatively corre-
lated to resistin in diabetic but not
in diabetic ones (Figure 2). This
supports further the assumption
of the relation between vit.D defi-
ciency and the pathogenesis of
type 2 DM. These results are
consistent with a recent study
which indicated a positive corre-
lation between vit.D and adipo-
nectin but with no relation be-
tween vit.D and resistin(16).
However, a negative correlation
between vit.D and adiponectin has
been reported (17).
As indicated in the results sec-
tion,vit.D was measured in the 72
females included in the study : the
percentage of cases with vit.D defi-
ciency was 36% of the total num-
ber. However, this ratio increased
to be 44% among the diabetic fe-
males. Replacement therapy of
vit.D continued for 2 months (18)
and succeeded to raise serum
vit.D levels in the treated females
to normal levels (table 5). Vit.D re-
placement therapy achieved signif-
icant reduction in HOMA-IR, insu-
lin levels and blood glucose in
morbid obese diabetic females but
there was no change in serum in-
sulin, HOMA-IR which remain ele-
vated in morbid obese non diabet-
ic females (table 5). Further,
serum level of all other studied
variables,namely lipid profile,
ABP, calcium, adiponectin and re-
sistin didn’t change after vit.D re-
placement therapy either in mor-
bid obese non diabetic or in
morbid obese diabetic females.
Absence of an effect of vit.D on
these parameters again high-
lights the need for special design
of a study that could follow these

352352
Refka Kh. Messiha, et al....
parameters for a longer period of
time,specially in light of the fact
that patients are recruited from
outpatient clinics that makes their
compliance to treatment is ques-
tionable.An interesting question
here is why vit.D replacement
therapy improved serum fasting
insulin and HOMA-IR in diabetic
morbid obese but not in non dia-
betic morbid obese? further re-
search is needed to clarify this.
ConclusionConclusionThere is a possible link be-
tween vit.D deficiency and patho-
genesis of obesity and type 2 DM.
Vit.D level is positively correlated
to adiponectin level in diabetic
and non diabetic females but neg-
atively correlated to resis-
tin.Measuring serum level of vit.D
can be recommended to be done
as a routine for morbid obese per-
sons either diabetic or not and
vit.D adjuvant therapy can be
used in cases of vit.D deficiency.
More comprehensive studies are
needed to fully clarify the link be-
tween vit.D deficiency and dyslipi-
daemia in morbid obese persons.
ReferencesReferences(1) McTiernan A. (2005) :(1) McTiernan A. (2005) :
Obesity and cancer : the risks, sci-
ence, and potential management
strategies. Oncology; 19 (7) : 871-
81:81-2, 85-6.
(2) Bijlsma M. F., Spek C. A.,(2) Bijlsma M. F., Spek C. A.,
Zivkovic D., Van De Water S.,Zivkovic D., Van De Water S.,
Rezaee F. and Peppelenbosch M.Rezaee F. and Peppelenbosch M.
P.(2006) :P.(2006) : "Repression of smooth-
ened by patched-dependent (pro-
)vitamin D3 secretion". PLoS biolo-
gy 4 (8): e232.
(3) Chiu K. C., Chu A., Go(3) Chiu K. C., Chu A., Go
VLW, et al. (2004) :VLW, et al. (2004) : Hypovitamin-
osis D is associated with insulin
resistance and b cell dysfunction.
Am J Clin Nutr; 79: 820-825.
(4) Major G. C., Alarie F.,(4) Major G. C., Alarie F.,
Dore J. and Phouttama S,Dore J. and Phouttama S,
(2007) :(2007) : Tremblay. Supplementa-
tion with calcium and VIT.D en-
hances the beneficial effect of
weight loss on plasma lipid and
lipoprotein concentrations. Am J
Clin Nutr; 85:54 -9.
(5) Foss Y. J. (2009) : (5) Foss Y. J. (2009) : VIT.D
deficiency is the cause of common
obesity. Med Hypotheses;72:314-
21.
(6) Hollis B. W. (2005) : (6) Hollis B. W. (2005) : Circu-

353353
Benha M. J.
Vol. 29 No 2 May 2012lating 25-hydroxyvitamin D levels
indicative of VIT.D sufficiency: im-
plications for establishing a new
effective dietary intake recommen-
dation for VIT.D. J Nutr; 135:317-
22.
(7) Ybarra J., S. Gnchez-Hern(7) Ybarra J., S. Gnchez-Hern
Gndez J., Pérez A. (2007) : Gndez J., Pérez A. (2007) : Hypo-
vitaminosis D and morbid obesity.
Nurs Clin N Am; 42:19-27.
(8) Wang Y., Lam K. S., Chan(8) Wang Y., Lam K. S., Chan
L., Chan K. W., Lam J. B., LamL., Chan K. W., Lam J. B., Lam
M. C., Hoo R. C., Mak W. W.,M. C., Hoo R. C., Mak W. W.,
Cooper G. J. and Xu A. (2006) :Cooper G. J. and Xu A. (2006) :
Post-translational modifications of
the four conserved lysine residues
within the collagenous domain of
adiponectin are required for the
formation of its high molecular
weight oligomeric complex. J Biol
Chem 281:16391-16400.
(9) Gil-Campos M., Canete R.(9) Gil-Campos M., Canete R.
and Gil A. (2004) :and Gil A. (2004) : Adiponectin,
the missing link in insulin resis-
tance and obesity. Clin Nutr 23 :
963-974.
(10) Bedi D., Clarke K. J.,(10) Bedi D., Clarke K. J.,
Dennis J. C., Zhong Q., Brun-Dennis J. C., Zhong Q., Brun-
son B. L., Morrison E. E. andson B. L., Morrison E. E. and
Judd R. L. (2006) : Judd R. L. (2006) : Endothelin-1
inhibits adiponectin secretion
through a phosphatidylinositol 4,
5-bisphosphate / actin-dependent
mechanism. Biochem Biophys Res
Commun 345: 332-339.
(11) McTernan P. G., McTer-(11) McTernan P. G., McTer-
nan C. L. and Chetty R. (2002) :nan C. L. and Chetty R. (2002) :
Increased resistin gene and pro-
tein expression in human abdomi-
nal adipose tissue. J Clin Endo-
crinol Metab; 87:2407.
(12) Trujillo M. E. and Scher-(12) Trujillo M. E. and Scher-
er P. E. (2005) : er P. E. (2005) : Adiponec-
tin:journey from an adipocyte se-
cretory protein to biomarker of the
metabolic syndrome. J Intern Med
257:167-175.
(13) Rajala M. W., Obici S.,(13) Rajala M. W., Obici S.,
Scherer P. E. and Rossetti L.Scherer P. E. and Rossetti L.
(2003) : (2003) : Adipose-derived resistin
and gut-derived resistin-like mole-
cule-_ selectively impair insulin
action on glucose production. J
Clin Invest 111:225-230.
(14) Boden G. and Shulman(14) Boden G. and Shulman
G. I. (2002) : G. I. (2002) : Free fatty acids in
obesity and type 2 diabetes :
defining their role in the devel-
opment of insulin resistance
and β-cell dysfunction. Eur J

354354
Refka Kh. Messiha, et al....
Clin Invest 32(Suppl 3):14-23.
(15) Rae C., Robertson S. A.,(15) Rae C., Robertson S. A.,
Taylor J. M. and Graham A.Taylor J. M. and Graham A.
(2007) : (2007) : Resistin induces lipolysis
and reesterification of triacylglyce-
rol stores, and increases choleste-
ryl ester deposition, in human
macrophages. FEBS. Lett., 581 :
4877-4883.
(16) Nasser Al-Daghri, Omar(16) Nasser Al-Daghri, Omar
Al-Attas, Majed Alokail1, KhalidAl-Attas, Majed Alokail1, Khalid
Alkharfy, Hossam Draz & MarioAlkharfy, Hossam Draz & Mario
clerici. (2011) :clerici. (2011) : Serum 25-
hydroxy-vitamin D is associated
with adiponectin and insulin
resistance in diabetic Saudi
adults. Endocrine Abstracts 25
P124.
(17) Nunlee-Bland G., Gamb-(17) Nunlee-Bland G., Gamb-
hir K., Abrams C., Abdul M., Va-hir K., Abrams C., Abdul M., Va-
hedi M. and Odonkor W. (2011) :hedi M. and Odonkor W. (2011) :
VIT.D deficiency and insulin resis-
tance in obese african-american
adolescents. J Pediatr Endocrinol
Metab; 24:29-33.
(18) Roux C., Bischoff-Ferrari(18) Roux C., Bischoff-Ferrari
H. A., Papapoulos S. E., et al.H. A., Papapoulos S. E., et al.
(2008) : (2008) : New insights into the role
of VIT.D and calcium in osteoporo-
sis management : an expert
roundtable discussion. Curr Med
Res Opin; 24(5):1363-70.

355355
Benha M. J.
Vol. 29 No 2 May 2012
ROLE OF VITAMIN D ANDROLE OF VITAMIN D ANDADIPOKINES IN OBESITY RELATEDADIPOKINES IN OBESITY RELATED
TYPE 2 DIABETES MELLITUSTYPE 2 DIABETES MELLITUS
Refka Kh. Messiha MD, Hanaa Shata MD,Refka Kh. Messiha MD, Hanaa Shata MD,Nisreen Abo El-Maaty PhD, Lashin Saad M.ScNisreen Abo El-Maaty PhD, Lashin Saad M.Sc
and Nabeel Laimoon MDand Nabeel Laimoon MD
BENHAMEDICALJOURNAL
REPRINT
Published byPublished by
Benha Faculty of MedicineBenha Faculty of Medicine Volume 29 Number 2May 2012

355355
Benha M. J.
Vol. 29 No 2 May 2012
INFLAMMATORY MARKERS AND MEANINFLAMMATORY MARKERS AND MEANPLATELET VOLUME IN PATIENTS WITH SLOWPLATELET VOLUME IN PATIENTS WITH SLOW
CORONARY FLOW AND ITS RELATIONSHIPCORONARY FLOW AND ITS RELATIONSHIPWITH CLINICAL PRESENTATIONWITH CLINICAL PRESENTATION
Ahmed K. Motawea MD, Magdy Z. El-Ghannam MD*,Ahmed K. Motawea MD, Magdy Z. El-Ghannam MD*,Khaled I. Nageuib MD**, Mohammed A. Ateia MD**,Khaled I. Nageuib MD**, Mohammed A. Ateia MD**, Mohamed Aleraki MD* and Tarek Ahmad M.Sc.** Mohamed Aleraki MD* and Tarek Ahmad M.Sc.**
The Departments of Cardiology and Clinical Pathology
Al-Azhar Faculty of Medicine, Cairo, Damietta*,**
AbstractAbstractPlatelets play an important role in the pathogenesis of atherosclerotic
complications by contributing to thrombus formation or plaque rupture.Platelet volume is a marker of platelet activation and function, and ismeasured using mean platelet volume (MPV). A large amount of data in-dicated that C-reactive protein (CRP) is a sensitive marker of underlyingsystemic inflammation. CRP increases among men and women at riskfor future cardiovascular events, and the addition of CRP testing tostandard lipid screening seems to provide an improved method to deter-mine vascular risk.
Between January 2010 and May 2011 this study was established ,included thirty patients with coronary slow flow detected by coronaryangiography via Thrombosis In Myocardial Infarction (TIMI) frame countmethod and fifteen patients with normal coronary arteries were selectedas control group.They were attended to cardiology department of Al-hussein , Sayed-Galal and new dameitta university hospitals for cardi-ac consultation. All patients controls underwent the following: legalconsent, Complete history taking, Resting 12 leads ECG, CBC ,fastingblood glucose level, serum triglycerides, LDL, HDL, Mean platelet vol-ume, c-reactive protein(CRP), ESR, interleukin 6 (IL6).at admission andafter 6 months of treatment with antiplatelet and antidyslipidem-ic,Transthoracic Echocardiography and Coronary angiography to diag-nose slow coronary flow by TIMI frame count.
Results of this study found that: Results of this study found that: interleukin-6 and c-reactive pro-

356356
Ahmed K. Motawea, et al....
IntrodIntroductiouctionPlatelets play a role in the path-
ogenesis of atherosclerotic com-
plications by contributing to
thrombus formation or plaque
rupture(1). Larger platelets are he-
mostatically more active and are a
risk factor for developing coronary
thrombosis, leading to unstable
coronary syndromes(2). Platelet
volume is a marker of platelet acti-
vation and function, and is meas-
ured using mean platelet volume
(MPV). The slow coronary flow
(SCF) phenomenon is an angio-
graphic observation characterized
by angiographically normal or
near-normal coronary arteries
with delayed opacification of the
distal vasculature(3).
tein were increased in patients with coronary slow flow in comparison tocontrol group; mean platelet volume was increased in patients with cor-onary slow flow in comparison to control group; interleukin 6 and c-reactive protein were decreased after six months of antidyslipidemicdrugs(20mg atorvastatin) in comparison to their values at the start;mean platelet volume decreased after six months of antiplatelet(aspirin150mg) in comparison to their values at the start.
Conclusion:Conclusion: the results of the present study proved that, 1) in-creased plasma inflammatory markers including CRP and IL-6 existedin patients with SCF. This suggesting that an inflammation may be acontributor for the development of SCF. In other words, increased con-centrations of inflammatory markers in patients with SCF may be an in-dicator of endothelial activation and inflammation and are likely to be inthe causal pathway involving in SCF. Despite the relative good progno-sis of patients with SCF, the chronic, frequent nature of the persistentchest uncomfortable can significantly impair quality of life. Therefore,an attention should be paid to this unique phenomenon. However,whether increased inflammatory markers are related to the pathogene-sis of SCF in these patients deserved further investigation; 2)-Our find-ings showed also that MPV is increased in patients with SCF, and SCFpatients presenting with USA exhibit significantly increased MPV val-ues, suggesting an altered platelet reactivity and aggregation which re-quire effective anti-platelet therapy in this patient subgroup.
Keywords:Keywords: slow coronary flow, mean platelet volume, inflammatorymarkers.

357357
Benha M. J.
Vol. 29 No 2 May 2012It has been reported that coro-
nary endothelial dysfunction play
an important pathogenetic role in
patients with SCF. However, the
precise mechanisms responsible
for this microvascular endothelial
dysfunction in patients with SCF
are still unknown (4).
Although atherosclerosis has
been considered to be multifacto-
rial disease in which genetic, envi-
ronmental, metabolic factors have
been implicated, the gaps remain
in our knowledge of the etiopatho-
genesis of atherosclerosis. There is
mounting evidence that inflamma-
tion plays an important role in the
initiation, development as well as
evolution of atherosclerosis, sug-
gesting that atherosclerosis is an
inflammatory disease(5). In addi-
tion, a large amount of data indi-
cated that C-reactive protein (CRP)
is a sensitive marker of underlying
systemic inflammation. CRP in-
creases among men and women at
risk for future cardiovascular
events, and the addition of CRP
testing to standard lipid screening
seems to provide an improved
method to determine vascular
risk. These data, as well as accu-
mulating evidence that CRP may
have direct inflammatory effects at
the endothelial levels. Besides,
among pro-inflammatory cyto-
kines, interleukin-6 (IL-6) is one of
the most important factors and
has multiple important effects in
human pathphysiology(6). In other
studies, the data showed that an
enhanced production of IL-6 by
monocytes in response to CRP in
patients with unstable angina(7).
Moreover, IL-6 is a powerful stim-
ulus for CRP production(8). Based
on those observations, Jian-Jun
Li, hypothesis that an inflammato-
ry process may be associated with
the development of SCF(9).
Aim of the workAim of the workThe aim of this study is to eval-
uate mean platelet volume and
some inflammatory markers in pa-
tients with slow coronary flow
(SCF) and its possible relationship
with clinical presentation.
Patients and methodsPatients and methodsThis study included thirty con-
secutive patients with coronary
slow flow detected by coronary an-
giography via the Thrombosis in
Myocardial Infarction (TIMI) frame
count and fifteen patients with
normal coronary angiography (as

358358
Ahmed K. Motawea, et al....
control group) who were attending
the cardiology department of Al
Hussein and Elsayed Galal univer-
sity hospital.
Inclusion criteria:Inclusion criteria: Patients did
not receive any medication; pa-
tients with coronary artery diseas-
es (lesions<30%) are included in
this study.
Exclusion criteria:Exclusion criteria: the follow-
ing patients were excluded from
the study; patients with evidence
of obstructive coronary artery dis-
eases (lesions >30%); patients
with valvular heart disease; pa-
tients with congestive heart fail-
ure; patients with echocardio-
graphically proven left ventricular
hypertrophy; patients with un-
treated thyroid disease; patients
with sinus node dysfunction or
conduction disturbance; patients
with estrogen replacement thera-
py; patients with uncontrolled hy-
pertension; patients with recent
major operation ( less than 3
months) and finally patients with
coronary artery ectesia.
All patients underwent the fol-
lowing: complete history taking;
resting 12 leads ECG; CBC, fast-
ing blood glucose level, serum tri-
glycerides, LDL, HDL; mean plate-
let volume, c-reactive protein
(CRP), ESR, interleukin 6 (IL6) be-
fore and after 6 months of anti-
platelet therapy; transthoracic
Echocardiography and finally, cor-
onary angiography to diagnose
slow coronary flow by TIMI frame
count. All electrocardiograms were
performed by the same machine.
The papers speed at 25mm/S at
standard 10mm/mv. Coronary an-
giography was performed using
the standard Judkin's techniques,
and the results were analyzed by
at least 2 interventional physi-
cians. Contrast used in angiogra-
phy of this study is Iopromide (Ul-
travist-370, and teleberex).
Coronary flow rates of all subjects
were determined by Thrombosis In
Myocardial Infarction frame count
(TIMI frame count) because the
method is a simple, reproducible,
objective and quantitative index of
coronary flow velocity .TIMI frame
count was determined for each
major coronary artery in each pa-
tient and control subject accord-
ing to the method first described
by Gibson et al.(10).
EDTA-anticoagulated peripher-

359359
Benha M. J.
Vol. 29 No 2 May 2012al blood sample were taken after
12-h overnight fast at baseline
(before coronary angiography). The
plasma was obtained after a cen-
trifugation of 3000 rpm at 4°C for
15 min. The concentrations of
CRP were determined using im-
muno-turbidometry (Beckmann
Assay 360). IL-6 was measured
with a commercial assay kit (hu-
man IL-6, ELISA kit). The assay
employs an antibody specific for
human interleukin-6 coated on a
96-well plate. Standards, samples
and biotinylated anti-human IL-6
are pipetted into the wells and IL-
6 present in a sample is captured
by the antibody immobilized to the
wells and by the biotinylated IL-6
specific detection antibody; after
washing away unbound biotinylat-
ed antibody, HRP-conjugated
streptavidin is pipetted to the
wells. The wells are again washed.
Following this second step, TMB
substrate solution is added to the
wells, resulting in color develop-
ment proportional to the amount
of IL-6 bound. The stop solution
changes the color from blue to yel-
low, and the intensity of the color
is measured 450nm. For laborato-
ry tests, blood samples were col-
lected from the patients after a
12-hr overnight fasting. All rou-
tine biochemical tests were carried
out on an autoanalyser CBC, fast-
ing blood glucose level, serum tri-
glycerides, LDL, HDL and mean
platelet volume.
Statistical analysis of data: The
collected data was organized, tab-
ulated and statistically analyzed
using statistical package of social
science (SPSS) version 16 (SPSS
Inc, USA). For qualitative data,
frequency and percent distribu-
tion were calculated and for com-
parison between groups, chi
square (X2) test was used. For
quantitative data, mean, mini-
mum, maximum and standard de-
viation were calculated and for
comparison between two groups,
the independent sample (t) test
was calculated. For comparison
between the same group at two
different points of time, paired
samples (t) test was calculated.
For correlation between two pa-
rameters, the spearman’s correla-
tion coefficient (r) was calculated;
it was mild if r < 0.3; moderate if r
≥ 0.3 and ≤0.7, powerful if r > 7.
For interpretation of results p val-
ue ≤ 0.05 was considered signifi-
cant.

360360
Ahmed K. Motawea, et al....
ResultsResultsThe present study included 45
subjects, 28 of them (62.2%) were
males and 17 (37.8%) were fe-
males with male to female ratio of
1.65 and there was statistically in-
significant difference between
study and control groups as re-
gard sex distribution (males repre-
sent 63.3% of the study group
compared to 60.0% of the control
group). As regard age, it ranged
from 37 to 65 with a mean of
52.84±7.36 and there was statisti-
cally insignificant increase in age
of control group in comparison to
study group (53.00±8.07 vs
52.76±7.12 age respectively). As
regard risk factors, diabetes was
reported in 26 cases (57.8%), hy-
pertension reported in 29 cases
(64.4%), obesity reported in 15
cases (33.3%) and smoking report-
ed in 21 cases (46.7%) and there
was statistically insignificant dif-
ference between study and control
group as regard risk factors (table
1).
As regard clinical presentation,
it was in form of stable angina in
14 cases (31.1%); atypical in 14
cases (31.1%); unstable angina in
15 cases (33.3%) and non ST seg-
ment in 2 cases (4.4%) and there
was statistically insignificant dif-
ference between study and control
groups as regard clinical presenta-
tion (data not presented). As re-
gard LDL, it ranged from 83 to
170 with a mean of 123.98±23.05
and there was statistically signifi-
cant increase in study group in
comparison to control group
(132.43±21.00 vs 107.07±17.24
respectively). In addition, total
cholesterol ranged from 73 to 270
with a mean of 189.89±36.39 and
there was statistically significant
increase in study in comparison to
control group (204.13±30.28 vs
161.40±30.95 respectively). On
the other hand, there was statisti-
cally insignificant difference be-
tween study and control groups as
regard LDL and triglycerides. As
regard fasting blood sugar, it
ranged from 70 to 157 with a
mean of 108.11±26.98 and there
was statistically significant in-
crease in the study in comparison
to control group (112.80±27.20 vs
98.73±24.76mg/dl respectively).
As regard ESR, it ranged from 7 to
45 with a mean of 20.26±9.0 and
there was statistically insignificant
increase in the study in compari-
son to control group (21.86±9.28

361361
Benha M. J.
Vol. 29 No 2 May 2012
vs 17.06±7.74 respectively). On
the other hand, CRP ranged from
2.10 to 6.30 with a mean of
4.43±1.16 and there was statisti-
cally significant increase of CRP in
study group in comparison to con-
trol group (4.91±0.93 vs 3.48±1.00
respectively) (table 2).
As regard ECG findings, it was
normal in 11 cases (24.4%), flat T
wave in 2 cases (4.4%), T wave in-
version in 16 cases (35.6%) and
ST depression in 16 cases (35.6%)
and there was statistically insig-
nificant difference between study
and control group as regard ECG
findings. As regard echocardio-
gram findings, it was normal in 17
cases (37.8%); DD grade I in 18
cases (40.0%), DD grade III in 6
cases (13.3%) and RWMA in 4 cas-
es (8.9%), and there was statisti-
cally insignificant difference be-
tween study and control group as
regard Echocardiogram findings
(data not presented).
As regard MPV, it ranged from
7.30 from 15.20 with a mean of
11.32±2.13 with statistically sig-
nificant increase in study group in
comparison to control (12.26±1.69
vs 9.44±1.64 respectively). As re-
gard interleukin 6, it ranged from
3.40 to 1000.0 with a mean
114.19±222.7 and there was sta-
tistically significant increase in
study group in comparison to con-
trol group (164.29±259.71 vs
13.98±6.55 respectively) (table 2).
In the present study, it was dem-
onstrates that there was statisti-
cally significant decrease in MPV,
CRP and IL-6 after 6 months in
comparison to their values at the
start (table 3). In addition, there
was statistically significant vari-
ance between different clinical
presentations as regard LDL and
HDL. On the other hand, there
was statistically insignificant vari-
ance between different clinical
presentations as regard TC, TG,
fasting blood sugar and ESR (table
4).
In the present work, there was
statistically insignificant differ-
ence between different clinical
presentations as regard ECG find-
ings or Echocardiographic find-
ings. In addition, there was statis-
tically insignificant difference
between different clinical presen-
tations as regard MPV at the start,
while at 6 months; there was sta-
tistically significant variance be-

362362
Ahmed K. Motawea, et al....
tween different clinical presenta-
tions as regard MPV at 6 months.
Furthermore, there was statisti-
cally insignificant variance be-
tween different clinical presenta-
tions as regard CRP at the start
and at 6 months. Finally, there
was statistically insignificant vari-
ance between different clinical
presentations as regard IL-6 at the
start and at 6 months (data not
presented). In the present study,
there was proportional (positive),
statistically significant correlation
between MPV and fasting blood
sugar at the start and after 6
months. The same correlation was
found between CRP and MPV at
the start and at 6 months. The
correlation between CRP at 6
months and MPV at 6 months was
powerful (table 5)

363363
Benha M. J.
Vol. 29 No 2 May 2012

364364
Ahmed K. Motawea, et al....
DiscussionDiscussionThe aim of this study is to eval-
uate mean platelet volume and
some inflammatory markers in pa-
tients with slow coronary flow
(SCF) and its possible relationship
with clinical presentation. In this
study interleukin-6 and c-reactive
protein were increased in patients
with coronary slow flow in com-
parison to control group, P value=
(0.031 and0.001 respectively),this
was in agreement with the study
done by Li et al. (9) which included
Forty-two patients with SCF de-
tected by coronary angiography
via the Thrombosis In Myocardial
Infarction (TIMI) frame count
method and 30 control subjects
with angiographically normal cor-
onary flow The data showed that
plasma CRP and IL-6 concentra-
tions were higher in patients with
SCF compared with normal con-
trol subject P value=0.01
Consistent with this, previous
study by Turhan et al.(11) Per-
formed a study to evaluating plas-
ma soluble adhesion molecules;
intercellular adhesion molecule-1
(ICAM-1), vascular cell adhesion
molecule-1 (VCAM-1) and E-
selectin as possible indicators of
endothelial activation or inflam-
mation in patients with SCF, but
with angiographically proven nor-
mal coronary arteries in all three
coronary vessels ,Coronary flow
rate of all patients and control
subjects were documented by TIMI
frame count. The results showed
that serum ICAM-1, VCAM-1, and
E-selectin concentrations of pa-
Figure (1): Correlation between MPVat 6 months and CRP at 6months.
Figure (2): Correlation between MPV atthe start and CRP at thestart.

365365
Benha M. J.
Vol. 29 No 2 May 2012tients with SCF were found to be
significantly higher than those of
control subjects with normal coro-
nary flow.
In this study we found that
mean platelet volume was in-
creased in patients with coronary
slow flow in comparison to control
group,P value=0.001. This was in
agreement with the study done by
Nurkalemet al.(12) who included
50 patients with SCF and other-
wise normal coronary arteries
were selected for the study group,
and 22 patients with normal coro-
nary arteries were selected for the
control group, this study proved
that MPV is increased in patients
with SCF, and SCF patients pre-
senting with USA exhibit signifi-
cantly increased MPV values, sug-
gesting an altered platelet
reactivity and aggregation which
may require effective anti-platelet
therapy in this patient subgroup.
P value= 0.007.
In previous studies, increased
MPV was demonstrated in acute
myocardial infarction(13), unstable
angina pectoris(1) congestive heart
failure (14) and coronary artery ec-
tasia(15).
In the present study interleu-
kin 6 and c-reactive protein were
decreased after six months of an-
tidyslipidemic drugs (20mg ator-
vastatin) in comparison to their
values at the startup value=0.015.
The study done by Li et al.(16)
proved that Alternate-day dosing
of rosuvastatin could be effective
comparable with once-daily dosing
of rosuvastatin in Chinese pa-
tients in improving not only lipid
profile but also inflammatory
markers, (interleukin 6 and C - re-
active protein). There was another
study done by Ye et al.(17) found
that short-term (3-12 weeks) treat-
ment with fenofibrate is an effec-
tive strategy in the management of
elevated CRP concentrations.
There was another study done by
Li et al. (7) found that statistically
significant reduction in CRP after
statin treatment in patients with
coronary heart disease (CHD) or
hyperlipidemia.
In present work, mean platelet
volume decreased after six months
of antiplatelet in comparison to
their values at admission. In ad-
dition, there was no significant
difference in mean platelet vol-
ume as regard clinical presenta-

366366
Ahmed K. Motawea, et al....
tion. This results disagreement
with the study done by Nurkalem
et al. (12) in which there was sig-
nificant increase in MPV in pa-
tients with SCF presenting with
unstable angina.In this study we
found that there was no signifi-
cant difference between patients
group and control group as regard
clinical presentation P value=0.34
this result was in agreement with
the study done by Li et al. (9).
In the present study, we found
that there was no significant dif-
ference in patient group with coro-
nary slow flow and control group
as regard systolic function of the
left ventricle measured by conven-
tional echocardiography, P val-
ue=0.18. But there was significant
difference in diastolic function of
the left ventricle which were sig-
nificantly impaired in patients
with coronary slow flow compared
to the control group by pulsed
wave Doppler P value =0.001, this
was in agreement with the study
done by Seviml et al. (18) which
included 22 patients (12 males
and 10 females) with coronary
slow flow and 22 patients (14
males and 8 females) with normal
coronary angiography as control
group, which found that no signif-
icant difference in systolic func-
tion of left ventricle measured by
conventional echocardiography
between patients group and con-
trol group, P value=0.3 ,but that
study also found that there was
difference in systolic function of
the left ventricle measured by tis-
sue Doppler imaging between pa-
tients group and control group P
value=0.001, this may be due to
Tissue Doppler echocardiography
is less influenced by several fac-
tors such as load condition and
PW Doppler mitral inflow veloci-
ties. In addition, Seviml et al. (18)
found that there were significant
difference in diastolic function of
the left ventricle by pulsed
Doppler and tissue Doppler
between patients group and
control group.
In the present work, we found
that there was no significant dif-
ference between patients group
and control group as regard rest-
ing electrocardiogram, P val-
ue=0.23. This was disagreement
with the study done by Güne_ et
al. (19) this study included 30 pa-
tients with coronary slow flow and
30 patients with normal coronary

367367
Benha M. J.
Vol. 29 No 2 May 2012angiography they found that there
were significant changes in resting
electrocardiogram in the form of
increased P wave duration and P
wave dispersion, in patients group
which improved after the use of
nebivelol for about 3 months.
Results of the present study
found that there was no signifi-
cant difference between patients
group and control group as regard
ESR P value=0.092 ,This was in
agreement with study done by
Madak et al.(20) which included
82 patients with angiographically
proven normal coronary arteries
and slow coronary flow in all three
coronary vessels (45 males and 37
females, mean age 59±11 years)
and 34 patients with normal coro-
nary arteries and normal coronary
flow (19 males and 15 females,
mean age 56±10 years) with simi-
lar risk profiles they found that
Hs-CRP and proBNP are signifi-
cantly higher in patients with cor-
onary slow flow compared with
normal control group but no
significant difference in ESR
between patients group and
control group.
As regard LDL and fasting
blood glucose levels, In this study
we found that there was signifi-
cant increase in patients group in
comparison to control group P val-
ue=0.001. Previous studies (9, 12,
20) proved that, there were no sig-
nificant differences between pa-
tients with coronary slow flow and
control group with normal coro-
nary angiography as regard lipid
profile, fasting glucose levels,
white blood cell and platelet
counts.
In short, the results of the
present study proved that, 1) in-
creased plasma inflammatory
markers including CRP and IL-6
existed in patients with SCF. This
suggesting that an inflammation
may be a contributor for the devel-
opment of SCF. In other word, in-
creased concentrations of inflam-
matory markers in patients with
SCF may be an indicator of endo-
thelial activation and inflamma-
tion and are likely to be in the
causal pathway involving in SCF.
Despite the relative good progno-
sis of patients with SCF, the
chronic, frequent nature of the
persistent chest uncomfortable
can significantly impair quality of
life. Therefore, an attention should

368368
Ahmed K. Motawea, et al....
be paid to this unique phenome-
non. However, whether increased
inflammatory markers are related
to the pathogenesis of SCF in
these patients deserved further in-
vestigation; 2)-Our findings
showed also that MPV is increased
in patients with SCF, and SCF pa-
tients presenting with USA exhibit
significantly increased MPV val-
ues, suggesting an altered platelet
reactivity and aggregation which
require effective anti-platelet ther-
apy in this patient subgroup.
ReferencesReferences1- Martin J. F., Plumb J., Kil-1- Martin J. F., Plumb J., Kil-
bey R. S. and Kishk Y. T. (1983):bey R. S. and Kishk Y. T. (1983):
Changes in volume and density of
platelets in myocardial infarction.
BMJ; 287: 456-9.
2- Yilmaz M. B., Cihan G.,2- Yilmaz M. B., Cihan G.,
Guray Y., Guray U., Kisacik H.Guray Y., Guray U., Kisacik H.
L. and Sasmaz H. (2008):L. and Sasmaz H. (2008): Role of
mean platelet volume in triagging
acute coronary syndromes. J
Thromb Thrombolysis; 26(1):49-
54.
3- Goel P. K., Gupta S. K.,3- Goel P. K., Gupta S. K.,
Agarwal Aa nd Kapoor A. (2001):Agarwal Aa nd Kapoor A. (2001):
Slow coronary flow: a distinct an-
giographic subgroup in syndrome
X. Angiology;52(8):507-14.; 52:
507-14.
4- Mosseri M., R. Yarom, M.S4- Mosseri M., R. Yarom, M.S
Gotsman and Y. Hasin (1986):Gotsman and Y. Hasin (1986):
Histologic evidence for small-
vessel coronary artery disease in
patients with angina and patent
large coronary arteries, Circula-
tion; 74:964-972.
5- Li J. J. (2005):5- Li J. J. (2005): Inflamma-
tion: an important mechanism for
different clinical entities of coro-
nary artery disease. Chin Med J;
118(21):1817-26.
6- Fang C. H. (2004): 6- Fang C. H. (2004): C-
reactive protein is not only an in-
flammatory marker but also a di-
rect cause of cardiovascular dis-
ease. Med Hypotheses; 62(4):499-
506.
7- Li J. J., Wang H. R.,7- Li J. J., Wang H. R.,
Huang C. X., Xue J. L. and Li G.Huang C. X., Xue J. L. and Li G.
S. (2005): S. (2005): Enhanced response of
blood monocytes to C-reactive pro-
tein in patients with unstable an-
gina. Clin Chim Acta;352(1-2):
127-33.
8- Li J. J., Chen X. J. (2003):8- Li J. J., Chen X. J. (2003):
Simvastatin inhibits interleukin-6

369369
Benha M. J.
Vol. 29 No 2 May 2012release in human monocytes stim-
ulated by C-reactive protein and
lipopolysaccharide. Coron Artery
Dis; 14(4):329-34.
9- Li J. J., Xu B., Li Z. C.,9- Li J. J., Xu B., Li Z. C.,
Qian J., Wei B. Q. (2006): Qian J., Wei B. Q. (2006): Is
slow coronary flow associated with
inflammation. Med Hypotheses;
66(3):504-8.
10- Gibson C. M., Ryan K. A.10- Gibson C. M., Ryan K. A.
and Kelley M. (1999):and Kelley M. (1999): Methodo-
logic drift in the assessment of
TIMI grade 3 flow and its implica-
tions with respect to the reporting
of angiographic trial results. The
TIMI Study Group, Am Heart J;
137 (6): 1179-84.
11- Turhan H., Saydam G. S.,11- Turhan H., Saydam G. S.,
Erbay A. R., Ayaz S., Yasar A. S.Erbay A. R., Ayaz S., Yasar A. S.
and Aksoy Y. (2006): and Aksoy Y. (2006): Increased
plasma soluble adhesion mole-
cules: ICAM-1, VCAM-1, and E-
selectin concentrations in patients
with slow coronary flow. Int J Car-
diol; 108: 224-30.
12- Nurkalem Z., Alper A. T.,12- Nurkalem Z., Alper A. T.,
Orhan A. L., Zencirci A. E., SariOrhan A. L., Zencirci A. E., Sari
I., Erer B., Aksu H. U., Ergün D.I., Erer B., Aksu H. U., Ergün D.
S., Yilmaz H. Y. and Eren M.S., Yilmaz H. Y. and Eren M.
(2008): (2008): Mean platelet volume in
patients with slow coronary flow
and its relationship with clinical
presentation. Turk Kardiyol Dern
Ars;36(6):363-7.
13- Endler G., Klimesch A.,13- Endler G., Klimesch A.,
Sunder-Plassmann H., Schilling-Sunder-Plassmann H., Schilling-
er M., Exner M. and Mannhalterer M., Exner M. and Mannhalter
C. (2002):C. (2002): Mean platelet volume is
an independent risk factor for
myocardial infarction but not for
coronary artery disease. Br J Hae-
matol; 117:399-404.
14- Erne P., Wardle J., Sand-14- Erne P., Wardle J., Sand-
ers K., Lewis S. M. and Maseriers K., Lewis S. M. and Maseri
A. (1988):A. (1988): Mean platelet volume
and size distribution and their
sensitivity to agonists in patients
with coronary artery disease and
congestive heart failure. Thromb
Haemost;59:259-63.
15- Bitigen A., Tanalp A. C.,15- Bitigen A., Tanalp A. C.,
Elonu O. H., Karavelioglu Y. andElonu O. H., Karavelioglu Y. and
Ozdemir N. (2007): Ozdemir N. (2007): Mean platelet
volume in patients with isolated
coronary artery ectasia. J Thromb
Thrombolysis; 24:99-103.
16- Li J. J., Yang P., Liu J.,16- Li J. J., Yang P., Liu J.,
Jia Y. J., Li Z. C., Guo Y. L., WuJia Y. J., Li Z. C., Guo Y. L., Wu
N. Q., Tang Y. D., Jiang L. X.N. Q., Tang Y. D., Jiang L. X.
(2012): (2012): Impact of 10mg rosuvas-
370370
Ahmed K. Motawea, et al....
tatin daily or alternate-day on lip-
id profile and inflammatory mark-
ers. Clin Chim Acta; 18; 413(1-
2):139-42.
17- Ye J., Kiage J. N., Arnett17- Ye J., Kiage J. N., Arnett
D. K., Bartolucci A. A., Kaba-D. K., Bartolucci A. A., Kaba-
gambe E. K. (2011):gambe E. K. (2011): Short-term
effect of fenofibrate on C-reactive
protein: A meta-analysis of ran-
domized controlled trials. Diabetol
Metab Syndr; 22;3:24.
18- Sevimli S., Büyükkaya E.,18- Sevimli S., Büyükkaya E.,
Gündogdu F., Arslan S. and Ak-Gündogdu F., Arslan S. and Ak-
sakal E. (2007): sakal E. (2007): Left ventricular
function in patients with coronary
slow flow: a tissue Doppler study.
Arch Turk Soc Cardiol; 35:360-
365.
19- Günes Y., Tuncer M.,19- Günes Y., Tuncer M.,
Güntekin U., Ceylan Y. (2009):Güntekin U., Ceylan Y. (2009):
The effects of nebivolol on P wave
duration and dispersion in pa-
tients with coronary slow flow -
Original Investigation. Anadolu
Kardiyol Derg; 9(4): 290-5.
20- Madak N., Nazlı Y., Mer-20- Madak N., Nazlı Y., Mer-
gen H., Aysel S., Kandaz M.,gen H., Aysel S., Kandaz M.,
Yanık E., Cekdemir D. and TavlıYanık E., Cekdemir D. and Tavlı
T. (2010):T. (2010): Acute phase reactants
in patients with coronary slow
flow phenomenon. Anadolu Kar-
diyol Derg; 10(5): 416-20.

371371
Benha M. J.
Vol. 29 No 2 May 2012
INFLAMMATORY MARKERS AND MEANINFLAMMATORY MARKERS AND MEANPLATELET VOLUME IN PATIENTS WITHPLATELET VOLUME IN PATIENTS WITH
SLOW CORONARY FLOW AND ITSSLOW CORONARY FLOW AND ITSRELATIONSHIP WITH CLINICALRELATIONSHIP WITH CLINICAL
PRESENTATIONPRESENTATION
Ahmed K. Motawea MD, Magdy Z. El-Ghannam MD,Ahmed K. Motawea MD, Magdy Z. El-Ghannam MD,Khaled I. Nageuib MD, Mohammed A. Ateia MD,Khaled I. Nageuib MD, Mohammed A. Ateia MD, Mohamed Aleraki MD and Tarek Ahmad M.Sc. Mohamed Aleraki MD and Tarek Ahmad M.Sc.
BENHAMEDICALJOURNAL
REPRINT
Published byPublished by
Benha Faculty of MedicineBenha Faculty of Medicine Volume 29 Number 2May 2012

371371
Benha M. J.
Vol. 29 No 2 May 2012
IntrodIntroductiouctionSacrococcygeal teratomas (SCT)
originate from Hensen's node
(primitive knot), which is an area
of the primitive streak. As the
mesoderm proliferates, the
primitive streaks may persist
moves further caudally where the
remnant of Hensen's node
descends to the tip of the coccyx
or its anterior surface gives rise to
a SCT. >90% of SCT is benign1.
Although generally a rare
condition, it is said to be the most
common tumor in the newborn
period, with a reported incidence
of approximately 1 in
35,000-40,000 live births 2-4. It is
a more common tumor in
SACROCOCCYGEAL TERATOMA A RARESACROCOCCYGEAL TERATOMA A RAREDISEASE: CASE REPORTDISEASE: CASE REPORT
Mona A. Almushait, JBOGMona A. Almushait, JBOGDepartment of Obstetrics and Gynecology, College of Medicine
King Khalid University, Abha, Saudi Arabia
AbstractAbstractSacroccocygeal teratomas are rare congenital tumors that develop
early in fetal life. Fetuses with this malformation are at risk ofsignificant perinatal morbidity and mortality. This case reportdemonstrates the benefits of the early diagnosis and intervention ofsacrococcygeal teratoma.
In this case study a fetus was identified with sacrococcygealteratoma during 33 weeks antenatal scan of the of 11.48x10.97x9.02cm size. The mother opted for elective caesarean section followingcounseling but due to pre-term labour at 36 weeks of gestation, themother underwent emergency caesarean section without anycomplications. A newborn healthy female was delivered without anyfetal complications. The baby was scheduled for enbloc surgicalresection of the tumor on the 3rd day of life. Histopathological report didnot reveal any malignancy. Neonate had an uneventful recovery.Neonate was followed up with regular follow-ups.
Keywords: Keywords: fetal sacroccocygeal teratoma, ultrasonography.

372372
Mona A. Almushait
newborn females,4 with a male:
female ratio of about 1: 3-45,6.
The tumors are divided and
classified according to their
location, type and tumor
components according to
American Academy of Pediatrics,
Surgical Section Classification
(table 1)5.
Case ReportCase Report
A 31-year-old nulliparous
woman Gravida 2 Para 0 Abortion
1, her last menstrual period (LMP)
was on 20.02.2011 and the
expected date of delivery (EDD)
was on 27.11.2011. She presented
herself to the antenatal outpatient
clinic for regular antenatal
checkup at 33 weeks gestation. A
year ago, the patient had a
missed abortion at 8 weeks of
gestation which was followed by
dilatation and curettage. Medical
and family history was
insignificant. There was no family
history of birth defects. Relevant
hematological and biochemical
investigations were all within
normal limits. Three dimensional
ultrasonography (USG) revealed a
single viable fetus with anterior
fundal placenta with estimated
gestational age of 33 weeks. The
measurements were as follow at
33weeks -BPD 8.74cm, OFD
11.51, HC 32.52 cm, AC 30.46 cm
and FL 6.38 cm.
USG revealed a mass at the
sacrococcygeal region of the fetus.
The tumor contained considerable
part of solid component and
showed vascularity. The fetus was
diagnosed to have type II SCT
composed of cystic components as
well as calcific foci with the
11.48x10.97x9.02 cm size and
there was a pre-sacral extension
of the cystic component (Figure 1
& 2). The condition was not
associated with hydrops or
polyhydraminios. The spine,
abdomen and pelvic appeared
normal. There was no extension of
the tumor to the bladder. The
fetus did not present any other
congenital anomaly. There was no
evidence of intrapelvic extension
of the mass.
Following the diagnosis, the
patient was referred to the
pediatric consultant and surgeon.
The pregnancy was allowed to
continue until fetal viability with
regular antenatal checkups. The

373373
Benha M. J.
Vol. 29 No 2 May 2012patient was closely monitored with
USG to determine the size of the
mass, amount of liquoramni,
placentomegaly, fetal hydrops and
fetal wellbeing (lung maturity).
Serial scans at weeks 34 and 35
revealed no increase in the size of
the mass. By week 36, the patient
was advised about the risk of
continuing the state of pregnancy
following a family counseling for
elective caesarean section, but the
patient presented to the
emergency with pre-term labor
and an emergency caesarean was
performed without any
complications. It was a newborn
female of 3.1kg, apgar score of 5
and 8 in 1st and 5th minutes
respectively after birth. Placental
size and weight were within
normal limits (Figure 3).
After that, the baby was
transferred to the neonatal
intensive care unit and referred to
the pediatric surgery department.
On observation, the baby was
active and healthy looking with a
mass in the sacrococcygeal region.
The baby passed meconium. On
clinical examination the mass
showed dilated veins over its
surface and a variable
consistency. The systemic
examinations were normal. There
was no intrapelvic extension of the
mass.
The newborn was scheduled for
surgery on the 3rd day of life. The
tumor was sub totally removed by
enbloc surgical resection via
sacral approach and sent for
biopsy and was shown to be
benign. The baby had an
uneventful postoperative recovery.
A follow-up of biochemical profile
and physical examination was
recommended to determine the
developmental milestones of the
baby.
Table 1 : Table 1 : American Academy of Pediatrics, Surgical Section
Classification5.

374374
Mona A. Almushait
DiscussionDiscussionThis is a typical case report of a
newborn with SCT diagnosed at
week 33 during a routine
antenatal scan. Early prenatal
USG detection of SCT allows
optimal perinatal obstetric and
surgical management. Since the
presented patient did not have
fetal hydrops or cardiac failure
signs, the amniotic fluid was
within normal ranges, and tumor
growing rate was slow. The
sacrococcygeal area is the most
common extragonadal site for
teratoma. They are the rare
tumors that develop at the base of
the spine by the tailbone(coccyx)
although most of these tumors are
benign, they grow large, and

375375
Benha M. J.
Vol. 29 No 2 May 2012surgical intervention is essential.
Embryologically, they originate
from pluripotent cells and contain
three embryologic layers of
endoderm, ectoderm and
mesoderm. The distribution of
these three layers is explained by
cessation and disorder in the
migration of primordial germ cells.
Generally these mature cells do
not belong in these places and
frequently originate from
neurons7.
In most centers, diagnosis of
SCT is made during antenatal
period8. Early diagnosis will
enhance coordinated and well
planned management of the
patient. A study reported a large
series in multiple centers, that the
average determination time of SCT
is 26 gestational weeks9. Usually
diagnosis is made with USG.10
Three-dimensional ultrasound
may better define the degree of
involvement of the sacrum and
pelvic structures for prognostic
importance11.
Sonography can reveal mass at
the sacrococcygeal region of the
fetus. The tumor contains
considerable part of solid
component and vascularity.
Diagnosis can determine the type
of SCT composition and can show
the cystic components as well as
calcific foci with the size. USG
must be followed to observe for
further enlargement of SCT and
any signs of fetal complications.
Prenatal detection can be done by
using ultrasound, computed
tomography, or MRI in the
postnatal period allowing better
surgical planning.
Prenatal definition of SCT is
important for prenatal
management and surgical
planning. During vaginal labor,
severe dystocia and extremely
vascular tumors can cause fetal
death due to hemorrhage,
caesarean section is
recommended for tumors larger
than 5 cm12. In addition to labor
dystocia, tumor rupture can cause
massive hemorrhage. Large
tumors can cause difficulties even
with caesarean sections13.
Neonates with SCT after
excision require long-term
follow-up for functional
impairment. Surgical trauma,
tumor compression or invasion of

376376
Mona A. Almushait
nerves contribute to this
condition. It is reported that
incidence of SCT is approximately
1 in 35,000-40,000 live births2-4.
Tumor recurrence occurs in 7.5%
to 22% of cases14. A report
suggested that the recurrence
rate of SCT in 173 children was
11% within 3 years and was
associated with immature and
malignant histology and
incomplete resection.
Postoperative monitoring of serum
AFP levels is also essential to
detect early tumor recurrence15.
Early diagnosis of fetal SCT,
with routine USG monitoring,
is important for prenatal
management and surgical
planning of SCT16. While planning
delivery of the fetus, the least
traumatic method must be
selected and the fetus must be
referred to pediatric surgeon as
early as possible. During the
postoperative period, long-term
follow-up is mandatory. Fetal SCT
needs to be managed by
cooperation and team efforts of
the obstetrician, pediatrician and
pediatric surgeon.
ConclusionConclusionSCT are relatively uncommon
tumors in the neonatal period.
With advancement in the less
invasive diagnosis and therapeutic
techniques, many clinical
obstetrician screen for SCT during
antenatal period. Early surgical
management is mandatory to
prevent the spread in case of
malignancy. A minimum of three
post-operative follow-up is advised
to detect the reoccurrence of the
case.
References References 1.1. http://www.
fetalultrasound.com/online/text/
30-160. HTM.
2.2. Backer D., Erpicum P.,Backer D., Erpicum P.,
Philippe P., Demarche M., OttePhilippe P., Demarche M., Otte
J. B., Schwagten K., et al.J. B., Schwagten K., et al.
(2001):(2001): Sacrococcygeal teratoma:
Results of a retrospective multi
centric study in Belgium and
Luxembourg. Eur J Pediatr Surg.;
11:182-185. [PubMed].
3. Flake A. W. (1993):3. Flake A. W. (1993):
Foetalsacrococcygealteratoma.
SeminPediatrSurg.; 2:113-120.
[PubMed].

377377
Benha M. J.
Vol. 29 No 2 May 20124. Pantanowitz L., Jamieson4. Pantanowitz L., Jamieson
T., Beavon I. (2001):T., Beavon I. (2001): Pathology of
sacrococcygeal teratomas. S Afr J
Surg.; 39:56-62. [PubMed].
5.5. Altman R. P., Randolph J.Altman R. P., Randolph J.
G., Lilly J. R.. (1974):G., Lilly J. R.. (1974):
Sacrococcygeal teratoma:
American Academy of Pediatrics
Surgical Section Survey - 1973. J
Pediatr Surg.; 9 : 389-398.
[PubMed].
6. Keslar P. J., Buck J. L.,6. Keslar P. J., Buck J. L.,
Suarez E. S. (1994):Suarez E. S. (1994): Germ cell
tumours of the sacrococcygeal
region: radiologic-pathologic
correlation. Radiographic.;
14:607-620. [PubMed].
7. Kazandı M., Akman L.,7. Kazandı M., Akman L.,
Sahin C. (2011): Sahin C. (2011): Huge fetal
sacrococcygeal teratoma:
Antenatal and postnatal
management. Journal of Medicine
50 (3) : 213-216.
8. Chuileannain F. N.,8. Chuileannain F. N.,
Woodrow N., de-Crespingy L.Woodrow N., de-Crespingy L.
Prenatal (1999):Prenatal (1999): diagnosis and
management of sacrococcygeal
teratoma. Aust NZ J Obstetrics
Gynecol Nov; 39 (4) : 497 -
501.
9. Tongsong T., Wanapirak9. Tongsong T., Wanapirak
C., Piyamongkol W., SudasanaC., Piyamongkol W., Sudasana
J. (1999):J. (1999): Prenatal sonographic
features of sacrococcygeal
teratoma. Int J Gynecol Nov; 67
(2) : 95-101.
10. Bond S. J., Harrison M.10. Bond S. J., Harrison M.
R., Schmidt K. G., et al. (1990):R., Schmidt K. G., et al. (1990):
Death due to high output cardiac
failure in fetal sacrococcygeal
teratoma. J Pediatr Surg;
25:1287-1291.
11.11. Adzick N. S.,Adzick N. S.,
Crombleholme T. M., Morgan M.Crombleholme T. M., Morgan M.
A., et al. (1997): A., et al. (1997): A rapidly
growing fetal Teratoma. Lancet;
349:538.
12.12. Sherer D. M., FrombergSherer D. M., Fromberg
R. A., Rindfusz D. W., et al.R. A., Rindfusz D. W., et al.
(1997): (1997): Color Doppleraided
prenatal diagnosis of a type I
cystic sacrococcygeal teratoma
simulating a meningomyelocele.
Am J Perinatol; 4:5-13.
13.13. Gross S. J., Benzie R. J.,Gross S. J., Benzie R. J.,
Server M., Skidmore M. B. et al.Server M., Skidmore M. B. et al.
(1987):(1987): Sacrococcygeal teratoma
prenatal diagnosis and
management. Am Obstet Gynecol;
156:393-6.

378378
Mona A. Almushait
14.14. Hedrick H. L., Flake A.Hedrick H. L., Flake A.
W., Crombleholme T. M., et al.W., Crombleholme T. M., et al.
(2004):(2004): Sacrococcygeal teratoma:
prenatal assessment, fetal
intervention and outcome. J
Pediatr Surg; 39:430-438.
15.15. Bilik R., Shandling B.,Bilik R., Shandling B.,
Pope M., et al. (1993):Pope M., et al. (1993): Malignant
benign neonatal sacrococcygeal
teratoma. J Pediatr Surg.;
28:1158-1160.
16.16. Derikx J. P., De BackerDerikx J. P., De Backer
A., van de Schoot L., et al.A., van de Schoot L., et al.
(2006):(2006): Factors associated with
recurrence and metastasis in
sacrococcygeal teratoma. Br J
Surg.; 93:1543-1548.

379379
Benha M. J.
Vol. 29 No 2 May 2012
SACROCOCCYGEAL TERATOMA A RARESACROCOCCYGEAL TERATOMA A RAREDISEASE: CASE REPORTDISEASE: CASE REPORT
Mona A. Almushait, JBOGMona A. Almushait, JBOG
BENHAMEDICALJOURNAL
REPRINT
Published byPublished by
Benha Faculty of MedicineBenha Faculty of Medicine Volume 29 Number 2May 2012

379379
Benha M. J.
Vol. 29 No 2 May 2012
CORRELATION BETWEEN P WAVE DISPERSIONCORRELATION BETWEEN P WAVE DISPERSIONAND MYOCARDIAL FUNCTION IN PATIENTSAND MYOCARDIAL FUNCTION IN PATIENTS
WITH ACUTE MYOCARDIAL INFARCTIONWITH ACUTE MYOCARDIAL INFARCTION
Hesham Rashid MDHesham Rashid MDCardiology department, Benha University, Egypt
AbstractAbstractBackground: Background: P wave dispersion because of its relation to the non-
homogenous and interrupted conduction of sinus impulses both Intraand inter atrial is a non-invasive indicator that enables the calculationof Atrial fibrillation (AF) risk on the 12 - lead surface ECG and corre-lates to LV end diastolic pressure.
Aim: Aim: to study the relationship between P wave dispersion and leftventricular function was investigated in patients presenting with acuteanterior myocardial infarction.
Patients and Methods:Patients and Methods: The present study included 50 patients diag-nosed as acute anterior myocardial infarction and admitted at coronarycare unit of Benha university hospital from January 2011 to September2011; there mean age was 57±9.4, 88% were male and only 12% werefemales. All patients were subjected for full history taken included age,sex, risk factors for coronary artery disease (CAD) as diabetes smoking,hypertension. ECG was done for every patients with analysis of P waveto determine maximum P wave dispersion (P max.), minimum P wavedispersion (P min.), and the difference in between P max. and P min.called PWD. Echocardiography was done for all patients to determineLA and LV dimensions, LVEF, and also tissue Doppler performed to de-termine Em/Am ratio and systolic S wave by pulsed wave tissue Dop-pler at lateral wall of mitral valve on apical four chamber view.
Results:Results: We found that, positive correlation between P wave disper-sion and age, LA size, LVEF, tissue Doppler Em/Am ratio, and P waveduration on ECG (p < 0.001); also there was increase in only P max. inpatients with systolic dysfunction (P <0.05). There is no effect of throm-bolytic therapy, Beta Blocker, and ACE inhibitor on P wave dispersion

380380
Hesham Rashid
IntrodIntroductiouctionDiastolic function usually de-
clines before systolic function, and
this precedes clinical signs, there-
fore, diagnosis of diastolic dys-
function is very important for ear-
ly diagnosis, follow up and
treatment (1).
Mitral annulus systolic and
diastolic velocities determined
by pulsed wave tissue Doppler
are relatively preload-independent
and reliable variables in evaluat-
ing systolic and diastolic left ven-
tricular function (2).
P wave dispersion is related to
the non-homogenous and inter-
rupted conduction of sinus im-
pulses intra- and inter atrial; PD
is described as a noninvasive indi-
cator of atrial fibrillation risk,
which can be calculated easily on
a 12-lead surface ECG (3)
Aim of the workAim of the workTo study the relationship be-
tween P wave dispersion and left
ventricular systolic and diastolic
function in patients with acute an-
terior myocardial infarction.
Patients and MethodsPatients and MethodsThe study included 50 patients
with acute anterior myocardial in-
farction. Patients were selected
from patients attending to coro-
nary care unit of Benha uni-
versity hospital during the period
from January 2011 to September
2011.
Acute anterior myocardial in-
farction was diagnosed when two
or more of the following criteria
were present: (according to Euro-
pean society and American col-
lege of cardiology committee of
definition of myocardial infarction
2000) : Chest pain lasting >30
minutes or ST segment elevation >
2 millimeters in two anterior chest
leads or significant elevation in
cardiac enzymes.
Patients with arrhythmias or
with conduction abnormalities,
or cardiogenic shock were exclud-
ed.
and duration (P > 0.05).Conclusion:Conclusion: P wave dispersion is simple noninvasive ECG test can
used as predictors of occurrence of arrhythmia in patients with AMI.

381381
Benha M. J.
Vol. 29 No 2 May 2012
Methods:Methods:
All patients included in the
study were subjected to the follow-
ing:
1- Careful history analysis
which include data about age, sex,
smoking, hypertension and dia-
betes.
2- Complete general and local
examination of the heart, chest
and abdomen.
3- Electrocardiogram:
The P-wave onset was defined
as the first atrial deflection from
the isoelectric line , and the offset
was the return of the atrial signal
to baseline(4). Patients whose
measurements could be performed
in at least 8 derivations were in-
cluded in the study. In all pa-
tients, derivations were excluded
if the beginning or the ending
of the P wave could not be
clearly identified. Maximum P
wave duration (P max) is defined
as the longest and minimum P
wave duration (P min) is defined
as the shortest P wave dura-
tion. Leads that showed P min
and P max were observed. PWD
defined as difference between P
max and P min. All the meas-
urements were repeated three
times and average values were cal-
culated for each of electrocardio-
graphic parameter. All of the
measurements were performed us-
ing the same experienced investi-
gators blind to the subject’s clini-
cal status.
The 12-lead surface electrocar-
diogram will be calculated manu-
ally, with paper speed at 25 mm/s
and 10mv/cm standardization,
the measurements are performed
manually in all 12 leads by using
a 0.5 mm scale precision ruler,
and magnifying lens. This method
has been found to be more precise
than the standard caliper method
for QT interval (3).
4- Echocardiogram:
All patients will be evaluated
by two-dimensional, M-mode,
pulsed wave Doppler and
pulsed wave tissue Doppler with-
in hours of myocardial infarc-
tion. EF% will be calculated from
apical two and apical four cham-
ber views using modified Simp-
son’s method, LA size, FS% will be
determined (5).
Trans mitral Doppler parame-

382382
Hesham Rashid
ters will be analyzed; peak early
(E) and late (A) trans-mitral filling
velocities, the ratio of early to late
peak velocities (E/A), deceleration
time of (E) will be determined (6).
Pulsed wave tissue Doppler
echocardiography will be per-
formed with a 2 mm sample vol-
ume placed at the lateral corner of
the mitral annulus from the apical
four chamber view, Early (Em)
and late diastolic (Am), and peak
systolic (Sm) mitral annular veloc-
ities will be recorded. the ratio of
(Em) to (Am) (Em/Am) and E/Em,
which is an index for predicting el-
evated left ventricular filling pres-
sure will be calculated (7).
Statistical AnalysisStatistical AnalysisData was analyzed using SPSS
(Statistical Package for Social Sci-
ences) version 15. Qualitative data
was presented as number and
percent. Quantitative data was
tested for normality by Kolmogrov-
Smirnov test. Normally distributed
data was presented as mean ± SD.
Student t-test was used to com-
pare between two groups. Regres-
sion curve was done. P < 0.05
was considered to be statistically
significant.(8)
ResultsResultsThe present study included 50
patients with acute anterior myo-
cardial infarction, their mean age
was 57.5 ± 9.4 years, 88% are
males and 12% are females, fifty
percent were diabetic, 58% were
hypertensive, 36% were smokers
and 50% had abnormal lipid pro-
file.
Systolic dysfunction (EF<50%)
was present in 27 (54%) of pa-
tients, one patient had sever (2%),
16 (32%) with moderate systolic
dysfunction and 10 (20%) had
mild systolic dysfunction.
Diastolic dysfunction was
present in 39 (78%) of patients, 15
patients (30%) had grade I, 18 pa-
tients (36%) had grade II and 6
patients (12%) had grade III dia-
stolic dysfunction.
Thirty-nine patients (78%) re-
ceived streptokinase, 32 patients
(64%) received beta blocker and
46 patients (92%) received ACE in-
hibitor.
Fig. (1): shows that, age is the
only parameter that correlates
positively and significantly with

383383
Benha M. J.
Vol. 29 No 2 May 2012P wave dispersion.
Table (1),(2),(3) shows no signif-
icant effect of thrombolytic thera-
py, patients received Beta blocker
or ACE inhibitor on P wave dura-
tion and dispersion.
There is insignificant increase
in P wave duration and dispersion
with increase in severity of systolic
dysfunction (P > 0.05). Table (4)
Table (5): shows, there is in-
significant increase in P wave
duration and dispersion in pa-
tients with diastolic dysfunction
compared to those without (P >
0.05).
In comparing p wave dispersion
and different echocardiography
parameters, we found that signifi-
cant increase in p wave dispersion
parameters with impaired LVEF,
increased LA size (p value < 0.01,
and <0.001 respectively) {Table (6),
Fig.(2), (3)}, also there is signifi-
cant increase in p wave dispersion
in correlation with increased left
ventricular filling pressure (Am/
Em ratio and E/Em indices) (p
value <0.001, <0.05). Table (6) Fig.
(5), (6).

384384
Hesham Rashid

385385
Benha M. J.
Vol. 29 No 2 May 2012

386386
Hesham Rashid

387387
Benha M. J.
Vol. 29 No 2 May 2012

388388
Hesham Rashid

389389
Benha M. J.
Vol. 29 No 2 May 2012DiscussionDiscussion
Patients with acute myocardial
infarction, frequently have both
left ventricular (LV) systolic and
diastolic dysfunction, although
both isolated systolic and dia-
stolic LV dysfunction can be iden-
tified (1).
There is a growing recognition
that LV dysfunction is associated
with marked alternation in the
electro physiologic properties of
the myocardium which is the pre-
cursor of the cardiac conduction
and rhythm abnormalities (9).
Several non-invasive electrocar-
diographic (ECG) indicators have
been investigated to predict the
occurrence of arrhythmia in pa-
tients with left ventricular dys-
function.(10)
In the present study, the rela-
tionship between P wave disper-
sion and left ventricular function
was investigated in patients pre-
senting with acute myocardial in-
farction.
In the present study, there is
increase in the mean values of P
wave maximum (119.63msc vs
112.52msc) and P wave dispersion
(61.41 msc vs 56.09msc) in pa-
tients with systolic dysfunction
compared to patients without LV
systolic dysfunction.
In addition, the present study
shows that the P wave duration
and P wave dispersion increase
along with the severity of LV sys-
tolic dysfunction.
Correlation studies in the cur-
rent study have demonstrated sig-
nificant positive correlation be-
tween LV ejection fraction and
P wave dispersion (r =0.30, p
=0.03).
These results demonstrate the
close association of P wave disper-
sion and left ventricular systolic
dysfunction and are in agreement
with the results of other previous
studies such as that of.(11)
Yilmaz et al (2004). study is the
first study in literature to demon-
strate a direct correlation between
P wave dispersion and tissue Dop-
pler echocardiographic parameters
of systolic LV function in patients
with acute myocardial infarction.(10)

390390
Hesham Rashid
Additionally, Yilmaz et al. study
demonstrated that worsening of
LV systolic function parameters
was related to the increase of P
wave dispersion.(10)
Huseyin (2005) reported that
there is a significant relationship
between P wave dispersion and LV
ejection fraction.(11)
In the current study, there is
insignificant increase in P wave
dispersion in patients with com-
pared to patients without LV dia-
stolic dysfunction (60.3
+_15.5msc vs. 54.4 _+16.6 msc, p
>0.05).
In the present study, there is a
strong positive correlation of P
wave dispersion and different pa-
rameters of left ventricular diastol-
ic dysfunction: E/A ratio (r=-
0.714, p <0.001), and E/Em
(r=0.3, p<0.05).
As the ratio between E and Em
has shown to be a reliable index of
left ventricular filling pressure , it
can concluded from these results
that the increase in left ventricu-
lar filling pressure may be reflect-
ed on the surface ECG as an in-
crease in P wave dispersion.(7)
Ilknur et al. (2010) studied the
relationship between P wave dis-
persion and diastolic dysfunction
in patients with significant and in-
significant coronary artery disease
and reported similar results as the
present study.(12)
They concluded that P wave
dispersion is a non-invasive mark-
er for left ventricular end diastolic
pressure; they stated that P wave
dispersion is another alternative
for assessment of left ventricular
diastolic dysfunction in coronary
artery disease. They failed to show
any significant change in P wave
dispersion with the three different
stages of diastolic dysfunction and
related this failure to the small
studies groups.
kato (2003) compared hyper-
tensive patients with LV diastolic
dysfunction with hypertensive pa-
tients without LV diastolic dys-
function and found P wave disper-
sion to be higher in LV diastolic
dysfunction patients.(13)
Yilmaz et al. (2005) reported
that there was a statistically sig-

391391
Benha M. J.
Vol. 29 No 2 May 2012nificant positive correlation be-
tween the E/Em and P wave dis-
persion suggesting that the in-
crease of LV filling pressure is
associated with increase in P wave
dispersion, they concluded that
the E/Em ratio early after acute
myocardial infarction can be used
for predicting elevated LV end dia-
stolic pressure and occurrence of
atrial fibrillation.(10)
In the present work, there is
significant strong positive correla-
tion between left atrial dimension
and P wave dispersion (r= 0.677,
p<0.001).
Similarly, Ilknur et al. (2010)
showed that P wave dispersion is
significantly correlated to left atri-
al volume and dimension in all
studied population whether hav-
ing significant or non-significant
coronary artery disease.(12)
However Dilaveris et al (2000),
has been stated that left atrial di-
ameter is not an important predic-
tor for atrial fibrillation and that P
wave duration is unrelated to left
atrial diameter.(3)
The cause of difference between
the present study and previous
studies may be due to small sam-
ple size (in the present study), dif-
ferent population studied, differ-
ent clinical sitting (hypertension
vs, acute myocardial infarction vs.
coronary artery disease) and the
different methods used to calcu-
late P wave dispersion.
In the current study, among
the different clinical variables
(age, sex, coronary risk factors,
heart rate and blood pressure),
only the age was found to be
strongly correlated with P wave
dispersion (r =0.689, p<0.001).
In contrary, Huseyin et al.
(2005) found that, there is insig-
nificant relationship between P
wave dispersion and these vari-
ables including age.(11)
ReferencesReferences1-1- Marino P., Little W. C.,Marino P., Little W. C.,
Rossi A., et al., (2002):Rossi A., et al., (2002): Can left
ventricular diastolic stiffness be
measured non-invasively ? J Am
Soc Echocardiogr.; 15: 935-43.
2-2- Burgess M. I., Jenkins C.,Burgess M. I., Jenkins C.,
Shaman J. E., et al., (2006):Shaman J. E., et al., (2006): Dia-
stolic stress echocardiography: he-

392392
Hesham Rashid
modynamic validation and clinical
significant of estimation of
ventricular filling pressure with
exercise. J Am Coll Cardiol.; 47:
1891-900.
3-3- Dilaveris P. E., GialafosDilaveris P. E., Gialafos
J. E. P. wave dispersion (2001):J. E. P. wave dispersion (2001):
a novel predictor of paroxysmal
atrial fibrillation. Ann Noninvasive
Electrocardiol; 6: 159-165.
4-4- Steine K., Stugeard M.,Steine K., Stugeard M.,
Smiseth O. A. (2000):Smiseth O. A. (2000): Mecha-
nisms of retarded apical filling in
acute ischemic left ventricular fail-
ure. Circulation; 99: 2048.
5-5- Schiller N. B., Shah P.Schiller N. B., Shah P.
M., Crowford M., et al., (1998):M., Crowford M., et al., (1998):
Quantitation recommendation of
left ventricle by Two –dimension
echocardiography, American soci-
ety of echocardiography committee
on stand. Am Soc Echocardigr; 2;
358-67.
6-6- Nishimura R. A., Abel M.Nishimura R. A., Abel M.
D., Hatle L. K., et al., (1990):D., Hatle L. K., et al., (1990): Re-
lation of pulmonary vein to mitral
flow velocities by trans esophageal
Doppler echocardiography effect of
different loading conditions. Cir-
culation.; 81: 1988-97.
7-7- Min P. K., Ha J. W., JungMin P. K., Ha J. W., Jung
J. H., et al., (2007):J. H., et al., (2007): Incremental
value of measuring the time differ-
ence between the onsets of mitral
inflow: the onset of early diastolic
pressure in patients with normal
systolic function and an indeter-
minate E/É. Am J Cardiol.; 100:
326-30.
8-8- Raymond and Bayarri.Raymond and Bayarri.
(2003):(2003): P Values are not Error
Probabilities. A working paper
that explains the difference be-
tween Fisher's evidential p-value
and the Neyman–Pearson Type I
error rate ?.
9-9- Burgess M. I., Jenkins C.,Burgess M. I., Jenkins C.,
Shaman J. E., et al., (2006):Shaman J. E., et al., (2006): Dia-
stolic stress echocardiography: he-
modynamic validation and clinical
significant of estimation of ventric-
ular filling pressure with exercise.
J Am Coll Cardiol.; 47: 1891-900
10-10- Yilmaz R., Demirbag R.Yilmaz R., Demirbag R.
(2005):(2005): P-wave dispersion in pa-
tients with stable coronary artery
disease and its relationship with
severity of the disease. J Electro-
cardiol 2005; 38: 279-284
11-11- Huseyin Gunduz, EmrahHuseyin Gunduz, Emrah

393393
Benha M. J.
Vol. 29 No 2 May 2012Binak, Emrah Binak, et al.,Binak, Emrah Binak, et al.,
(2005):(2005): The Relationship between
P Wave Dispersion and Diastolic
Dysfunction. Texas Heart Institute
Journal; 32: 163-7.
12-12- Ilknur Can, Kudret Ayt-Ilknur Can, Kudret Ayt-
mir, Ahmet Ugur Demir et al.,mir, Ahmet Ugur Demir et al.,
(2010):(2010): P wave dispersion and du-
ration in patients with obstructive
acute myocardial infarction, Indi-
an pacing electrophysiol J.; 10
(1)10-20.
13-13- Kato T., Noda A., IzawaKato T., Noda A., Izawa
H. et al., (2003):H. et al., (2003): Myocardial ve-
locity grading as a noninvasive de-
termind index of left ventricular
diastolic dysfunction in patients
with hypertrophic cardiomyopa-
thy. J Am Coll Cardiol.; 42: 278-
85.

394394
Hesham Rashid
CORRELATION BETWEEN P WAVECORRELATION BETWEEN P WAVEDISPERSION AND MYOCARDIALDISPERSION AND MYOCARDIAL
FUNCTION IN PATIENTS WITH ACUTEFUNCTION IN PATIENTS WITH ACUTEMYOCARDIAL INFARCTIONMYOCARDIAL INFARCTION
Hesham Rashid Hesham Rashid MDMD
BENHAMEDICALJOURNAL
REPRINT
Published byPublished by
Benha Faculty of MedicineBenha Faculty of Medicine Volume 29 Number 2May 2012

395395
Benha M. J.
Vol. 29 No 2 May 2012
OUTBREAKS OF FOOD POISONING DUEOUTBREAKS OF FOOD POISONING DUETO BACTERIAL CONTAMINATION AT FASTTO BACTERIAL CONTAMINATION AT FASTFOOD RESTAURANTS AROUND AL HARAMFOOD RESTAURANTS AROUND AL HARAM
AL NABAWI - AL MADINAH AL MONOWARAHAL NABAWI - AL MADINAH AL MONOWARAH
Ahmed R. Ragab MD, Rania H. Abdel Rahman MD,Ahmed R. Ragab MD, Rania H. Abdel Rahman MD,Basem Sheik MD*, Hassan Abdel-Salam MD**,Basem Sheik MD*, Hassan Abdel-Salam MD**,
Quadi M. Al Hakk MD*** and Mohamed Abd Al-Samad MD***Quadi M. Al Hakk MD*** and Mohamed Abd Al-Samad MD***Departments of Clinical Toxicology and Forensic Medicine, Mansoura University, Egypt.
Medical Education* & Microbiology***, Faculty of Medicine
and Bacteriology, Faculty of Pharmacy**, Taibah University, Saudi Arabia
AbstractAbstractFood poisoning represents a widespread international health prob-
lem. It can be attributed to contamination of food and drinking water bybacteria, parasites, viruses, toxins or chemicals. The massive prolifera-tion of fast food restaurants in Saudi Arabia, serving people at Haj andUmrah have resulted in a corresponding increase in fast food consump-tion. Thus, the aim of this study was to assess the incidence of food poi-soning outbreaks and to determine the types of bacterial contaminationin fast food restaurants in Al-Madina Al-Monowarah. Several food sam-ples were collected from 30 fast food restaurants around Al Haram AlNabawi in Al Madinah Al Monowarah. Culture methods were used fordetection of S. aureus, Salmonella, E. coli, etc. The results revealed twolarge outbreaks of food poisoning in Al Madina Al-Monowarah. It wasfound that the majority of the fast food samples and their wrappingswere contaminated by 9 different types of bacteria. The most commonorganisms detected were staphylococcus aureus (44.7%) followed by co-agulase negative staphylococci (36%). Levels of bacterial contaminationwere unacceptable for human consumption and should be avoided toprevent outbreaks of food poisoning. Food handling with bare handsand poor hygiene during catering represent risk factors for food contam-ination. Cleanliness and safe hygienic environment are recommended toreduce the risk of food borne illness.
Keywords: Keywords: food poisoning, bacterial contamination, fast food.

396396
Ahmed R. Ragab, et al...
IntrodIntroductiouctionFood-borne illness or its synon-
ymous food poisoning represents
a widespread international health
problem and a significant source
of human morbidity and mortality
in addition to economic losses.[1]
The global incidence of food-
borne illnesses is difficult to esti-
mate, but it has been reported
that about 1.8 million people died
from diarrheal diseases in 2005. A
great proportion of these cases
can be attributed to contamina-
tion of food and drinking water by
a wide variety of bacteria, para-
sites, viruses, toxins or chemicals.
Food poisoning is characterized
by short incubation period,
acute illness and clinical symp-
toms of gastro-intestinal distur-
bances.[2-4]
It has been reported that
there are five primary factors
contributing to food poisoning.
They include improper cooking
procedures; temperature abuse
during storage; lack of hygiene
and sanitation by food han-
dlers; cross-contamination be-
tween raw and fresh ready-to-eat
foods; and acquiring food from
unsafe sources.[5] On the other
hand, food poisoning outbreaks
are defined as the occurrence
of two or more cases of a simi-
lar illness resulting from the in-
gestion of a common food[6]. They
are common in many countries
despite the dramatic improve-
ment of food safety, educational
efforts and exploratory microbi-
ology.[1,2]
The massive proliferation of
fast food restaurants in Saudi
Arabia, serving people at Haj and
Umrah have resulted in a corre-
sponding increase in fast food
consumption. Thus, the aim of
this study was to assess the prev-
alence of food-borne illnesses,
the incidence of outbreaks of food
poisoning and types of bacterial
food contamination in fast food
restaurants in Al-Madina Al-
Monowarah.
Material and MethodsMaterial and Methods1) A retrospective investiga-1) A retrospective investiga-
tional study:tional study:
This was done to identify the
incidence of food borne illness and
to determine the extent of food
poisoning outbreaks in Saudi Ara-
bia.

397397
Benha M. J.
Vol. 29 No 2 May 20122) Questionnaire:2) Questionnaire:
It was issued by the investiga-
tor towards the degree of sanitary
care of the restaurant concerning
cleanliness of the floor and food
containers. Special emphasis was
directed towards the safety meas-
ures taken by food handlers dur-
ing food handling as regards wear-
ing gloves, masks, overall and
overheads. This was done after
taking approval from Ministry of
Health.
3) Sampling :3) Sampling :
• Collection of outer wrap-
pings of food, outer surface of the
sandwiches and food they con-
tained was done in 30 fast food
restaurants around Al Haram Al
Nabawi in Al Madinah Al Monowa-
rah. Different types of food were
included such as shawarma, eggs,
shashqua, bean tamiah, salad and
potatoes.
• The whole sandwiches were in-
serted into a sterile polyethy-
lene bag. The samples were
transported within 1 hour to
the laboratory in a cool-box.
• After taking informed consent,
fingernail and hand swabs were
collected from food handlers
and put into an ethylene oxide
sterilized bag. Aseptic tech-
niques were maintained during
media preparation, collection,
transportation and analysis of
samples. Examination was car-
ried out on the same day of
samples collection. [7]
4) Bacteriological cultures: 4) Bacteriological cultures:
Culture methods were used for
detection of S. aureus, Coagulase
negative staphylococci, Salmonel-
la, Coliforms, E. coli, Shigella shi-
ga, Enterococcus feaccalis, Bacil-
lus spp., Bacillus cereus and
Pseudomonous aeuroginosa.[8] All
foodstuff samples were diluted ten
folds in sterile saline and peptone
water media. Then, they were in-
cubated aerobically at 35º C for
24-48 hours to clarify the colonies
then they were plated and sub-
cultured onto the following media:
1. Blood Agar: for selective
isolation of haemolytic mi-
cro-organisms.
2. MacConkey Agar (Mac): se-
lective isolation of S. aureus.
3. Mannitol salt Agar (MSA) :
selective isolation of S. aure-
us.
4. Salmonella Shigella Agar
(S.S Agar).
5. Xylose lysine deoxycholate

398398
Ahmed R. Ragab, et al...
(XLD) Agar: for isolation of
salmonella and shigella.
6. Thiosulphate citrate bile
salt sucrose Agar (TCBS): se-
lective isolation of vibrio
cholera.
7. Cysteine Lactose electrolyte
deficient (CLED) Agar: for
isolation of urinary tract or-
ganisms.
8. Nutrient Agar: for growth of
non-fastidious organisms.
9. Malt Agar: for the cultiva-
tion of fungi Aspergillus ni-
ger, Candida ablicans, Pen-
cillium roquefortii and
Trichophyton mentagraphy-
tes.
10. Diagnostic sensitivity test
(DST) Agar : used as an anti-
biotic sensitivity testing me-
dium.
Representative colonies were
Gram stained to differentiate be-
tween Gram-positive and Gram-
negative bacteria by using the
standard techniques and Analyti-
cal Profile Index (API) system (Bio
Merieux, France). [9]
5) Statistical analysis: 5) Statistical analysis:
It was carried out with Micro-
soft Excel program. Descriptive
statistics regarding all the vari-
ables were given as mean ± SD.
Differences between groups were
analyzed by “comparing more
than two proportions” test. Differ-
ences between the values were an-
alyzed by Chi-Square test. P value
≤ 0.05 was considered statistically
significant.
ResultsResultsTable (1) illustrated the socio-
demographic data and overall in-
cidence of food borne illness in
Saudi Arabia during the period
from 1990-2001. It was found that
the total number is 10.173 cas-
es. In Al Madina Al Monowarah,
928 cases of food-borne illness
were detected. All the recorded
cases were sporadic and not con-
sidered as an outbreak of food poi-
soning.
More recent reports (in the last
ten years) demonstrated that there
are only two large outbreaks of
food poisoning related to mass ca-
tering occurred in 2003 and 2011
in Al-Madina Al-Monowarah.
Table (2) demonstrated abun-
dance of bacterial loads in the col-
lected samples.

399399
Benha M. J.
Vol. 29 No 2 May 2012Frequency and percentages of
positive samples contaminated by
different bacterial species in food
substances and their wrappings
are shown in table 3.
Figure (1) shows the frequency
of using protective overalls,
overheads and masks among
food handlers in fast food restau-
rants.
The differences between bacte-
rial isolate percentages in food
handlers in relation to wearing
masks and gloves were found sta-
tistically significant as seen in fig-
ures 2 and 3 respectively.

400400
Ahmed R. Ragab, et al...

401401
Benha M. J.
Vol. 29 No 2 May 2012
DiscussionDiscussionFood-borne disease outbreaks
and acute infectious diseases of
the gastrointestinal tract are prob-
lems of great importance in haj
and Umrah due to large numbers
of populations consuming food at
fast food restaurants widely
spreading around El-Haram El-
Nabawi. Hence, the aim of this
study was to assess the incidence
of food borne illness in Saudi Ara-
bia and to determine the causes
and types of bacterial food con-
tamination in fast food restau-
rants in Al-Madina Al-Monowarah.
In the present work, an overall
statistical report indicated an in-
creased incidence of food-borne
illnesses in many areas of Saudi
Arabia during the period from
1990-2001. In the last ten years,
two large outbreaks of food poi-
soning were reported in Al Madina
Al-Monowarah. The first outbreak
was in 2003 where 492 Iranian
pilgrims were complaining of
vomiting (95%), abdominal pain
(78.7%), nausea (75.4%) and diar-
rhea (27%) after mass catering.
Most of the patients were treated
at the emergency departments
and recovered from symptoms
within 24 hours while thirteen
cases (6.3%) were admitted to the
hospital. Four food items were eat-
en: rice, chicken, bread and yo-
ghurt. Staphylococcus aureus was
isolated from the stool cultures of
13 workers and from the nasal
and throat swabs of two responsi-
ble for food preparation. It was
also isolated from the vomitus of

402402
Ahmed R. Ragab, et al...
10 cases and food remnant speci-
mens. [10]
Asao et al.[11] stated that
staphylococcal food poisoning is
one of the most common food-
borne diseases in the world. It is
caused by ingestion of staphylo-
coccal enterotoxin (SE) produced
in food by certain strains of staph-
ylococcus aureus.[12,13] The in-
toxication is characterized by sud-
den onset of nausea, vomiting,
abdominal cramps and diarrhea
which usually appear within 1
to 6 hours. The symptoms gener-
ally last from 24 to 48 hours and
the mortality rate is very low or
nil. [14].
A 2nd outbreak happened in
2011 where a total of 81 Bangla-
deshi pilgrims were taken to sev-
eral hospitals in Al-Madina Al-
Monowarah suffering from mani-
festations of food poisoning after
eating a meal at an unlicensed
caterer. They received their
medical treatment and recovered
from symptoms within 24 hours.
The occurrence of these out-
breaks urged the Ministry of
Health (MOH) to recommend the
investigations of the causes of
food poisoning and assessment
of bacterial contamination in dif-
ferent food stuffs with the ne-
cessity of more awareness and
strict control measures on food
safety. [15]
The results of the present work
indicated that 44.7% of the fast
food samples and their wrappings
were contaminated by 9 different
types of bacteria and each sample
was harboring 1-4 bacterial spe-
cies. The most common organisms
detected were staphylococcus au-
reus (44.7%) followed by coagu-
lase negative staphylococci (36%).
In addition, bacillus spp. (9.3%),
bacillus cereus (8.7%) and salmo-
nella (2%) were isolated from the
food samples. However, no cases
of human infection of salmonella
were reported in the area at the
time of the study.
Likewise, Isara et al.[4] reported
a high prevalence of food contami-
nation in the fast food restaurants
in Nigeria (37.5%) with staphylo-
coccus aureus and bacillus cereus
the most commonly detected bac-
teria. Mensah et al. [16] found
nearly similar results in Ghana
where street foods were heavily

403403
Benha M. J.
Vol. 29 No 2 May 2012contaminated with micro-
organisms. Unacceptable levels of
bacterial contamination were de-
tected in 356 (69.7%) specimens
“salads, macaroni, fufu, omo tuo
and red pepper”: 172 had Entero-
bacteriaceae (33.7%), 163 con-
tained Staphylococcus aureus
(31.9%) and Bacillus cereus was
detected in 28 samples (5.5%).
Shigella sonnei and Escherichia
coli were isolated from macaroni,
rice, and tomato stew.
In contrast to the present find-
ings, a lower prevalence of bacteri-
al contamination was reported by
Oh et al.[17] in Korea where S. au-
reus was detected in just 8.6% of
ready-to-eat tested food samples
(n = 3332). Moreover, in Thailand,
S. aureus concentration >102
CFU/g was detected among 10.8%
of food samples[18] which may be
attributed to more strict safety
measures on food handling.
The present work revealed the
presence of Escherichia coli and
Enterococcus faecalis (8% and
4.7% respectively) in food samples
and their wrappings. Soomro et
al. [19] stated that Escherichia coli
can cause severe diarrhea and
vomiting. Furthermore, the detec-
tion of these pathogens is a relia-
ble indicator of faecal contamina-
tion of water and food and points
to the high bacterial contamina-
tion of the hands of food handlers
during work periods with lack of
enough hygiene and improper
glove use. [20]
The present study revealed that
all the examined foodstuffs con-
tained different bacterial loads
ranging from 102 to more than
105 colony forming units (CFU) /
ml. Hence, the analyzed food
items have unacceptable microbio-
logical quality according to the
published microbiological guide-
lines. These foodstuffs have poten-
tial risk for human consumption
as there are chances for bacteri-
um’s multiplication during the
time of food poisoning particularly
if these foods are kept at room
temperature for a long time in
tropical climate. [21]
According to the US Food and
Drug Administration, 105 CFU/g
S. aureus is capable of causing
staphylococcal intoxication[22].
The present results showed that
the number of S. aureus popula-

404404
Ahmed R. Ragab, et al...
tion is within the required dose to
cause food poisoning and may be
responsible for the detected out-
breaks.
Additionally, all the examined
food samples (shawarma, eggs,
shashqua, bean tamiah, salad and
potatoes) whether fresh, heated or
stored were contaminated. More
or less similar, Schmid et al. [23]
reported that outbreaks of staphy-
lococcal food poisoning are usual-
ly associated with protein-rich
foods. Food contamination usually
occurs during catering with exten-
sive manual handling, often in
combination with inadequate
heating and/or inappropriate stor-
age of food. [24]
Regarding the analysis of hand
swabs, a high bacterial isolate
percentage was detected in sam-
ples from bare hands (61%) while
it was 16% in those samples from
gloved hands. A highly significant
difference was found between bare
and gloved hands (p < 0.05). The
present findings showed that all
the studied food items were con-
taminated which may be ex-
plained by the fact that these
foods require direct hand contact
and thus could be contaminated
during preparation by the bare
hands of the food handlers.
Asao et al. [11] reported that
57.5% of food handlers harbored
S. aureus and they are the most
frequent source of contamination
of food in staphylococcal food poi-
soning mainly due to lack of prop-
er hygienic measures during food
preparation. The rather high isola-
tion rates of S. aureus and coagu-
lase-negative staphylococci from
the hand swabs in this study
could be explained by the fact that
these organisms are found in the
permanent flora of the skin. More-
over, S. aureus primarily inhabits
the nasopharyngeal region and
hair of humans. [25, 26] Loeto et
al. stated that food can be easily
contaminated if food handlers
sneeze or cough during food prep-
aration, and if they do not wash
their hands properly after making
contact with their nose or after us-
ing the rest room. [27]
ConclusionsConclusionsThis study has shown that the
majority of fast food in the Al-
Madina Al Monawarrha was con-
taminated with several pathogenic

405405
Benha M. J.
Vol. 29 No 2 May 2012bacteria with unacceptable and
unsafe levels for human consump-
tion as they could lead to out-
breaks of food-borne illnesses.
They also indicate poor hygiene
level and lack of cleanliness in
food preparation practices.
Recommendations: Recommendations:
It is recommended to apply
good food hygiene as it greatly re-
duces the risk of transmission of
food-borne disease via infected
food handlers or through cross-
contamination. Training on proper
hand washing and wearing gloves
in both hands with adequate
mask during food handling in the
fast food restaurants should be
improved.
ReferencesReferences1.1. Jacob C., Mathiasen L.Jacob C., Mathiasen L.
and Powell D. (2010) : and Powell D. (2010) : “Designing
effective messages for microbial
food safety hazards”. Food Con-
trol, 21(1): 1-6.
2.2. WHO (2007) :WHO (2007) : Food safety
& food-borne illness. Fact sheet
no. 237,pp.1-2 (reviewed in March
2007): WHO, Geneva: http://
www.who.int/mediacentre/
factsheets/fs237/en/.
3.3. Sharif L. and Al-Malki T.Sharif L. and Al-Malki T.
(2010) :(2010) : “Knowledge, attitude and
practice of Taif University stu-
dents on food poisoning”. Food
Control, 21: 55-60.
4.4. Isara A. R., Isah E. C., Lo-Isara A. R., Isah E. C., Lo-
for P. V. O. and Ojide C. K.for P. V. O. and Ojide C. K.
(2010) :(2010) : “Food contamination in
fast food restaurants in Benin
City, Edo State, Nigeria: Implica-
tions for food hygiene and safe-
ty”. Public health, 124 : 467e-
471.
5.5. WHO (2006) : WHO (2006) : Five keys to
safer food manual. Published by
the WHO Department of Food
Safety, Zoonoses and Foodborne
Diseases. Avenue Appia 20, CH-
1211 Geneva, 27-Switzerland, Re-
trieved from: http://www.who.int/
entity/foodsafety/publications/
consumer/manual_keys.pdf.
6.6. Olsen S., Mckinnon L.,Olsen S., Mckinnon L.,
Goulding J., Bean N. and Sluts-Goulding J., Bean N. and Sluts-
ker L. (2000) : ker L. (2000) : Surveillance for
foodborne disease outbreaks-
United States, 1993-1997. Mor-
tality and Morbidity Weekly Re-
port, 1-51. <http://www.cdc.gov/
mmwr/preview/mmwrhtml/
ss4901a1.htm>.

406406
Ahmed R. Ragab, et al...
7.7. Larson E. L., Strom M. S.Larson E. L., Strom M. S.
and Evans C. A. (1980) :and Evans C. A. (1980) : “Analy-
sis of three variables in sampling
solutions used to assay bacteria of
hands: type of solution, use of an-
tiseptic neutralizers, and solution
temperature”. Journal of Clinical
Microbiology, 12: 255-260.
8.8. Ayçiçek H., Aydogan H.,Ayçiçek H., Aydogan H.,
Küçükkaraaslan A., BaysallarKüçükkaraaslan A., Baysallar
M. and Basustaoglu A. C.M. and Basustaoglu A. C.
(2004): (2004): “Assessment of the bacte-
rial contamination on hands of
hospital food handlers”. Food Con-
trol, 15:253-259.
9.9. Koneman E. W., Allen S.Koneman E. W., Allen S.
D., Janda W. M., Schreckenber-D., Janda W. M., Schreckenber-
ger P. C. and Winn Jr. W. C.ger P. C. and Winn Jr. W. C.
(1992) :(1992) : Diagnostic Microbiology,
J.B. Lippincott Company, Phila-
delphia, PA., 4th ed., pp. 1-
1113.
10.10. Ministry of HealthMinistry of Health
“MOH” (2003) :“MOH” (2003) : Staphylococcus
aureus Food Poisoning Outbreak
in Al-Madinah Al-monwarah.
March Saudi Epidemiology Bulle-
tin; Department of preventive
Medicine and field of epidemiology
training program, ISSN: 1319-
3965, Riyadh, Vol. 10, Number 2.
11.11. Asao T., Kumeda T.,Asao T., Kumeda T.,
Kawai T., Shibata H., Oda H.,Kawai T., Shibata H., Oda H.,
Haruki K., et al. (2003) :Haruki K., et al. (2003) : “An ex-
tensive outbreak of staphylococ-
cal food poisoning due to low-fat
milk in Japan: estimation of enter-
otoxin A in the incriminated milk
and powdered skim milk”. Epi-
demiology and Infection, 130: 30-
40.
12.12. Hu D. L., Omoe K., In-Hu D. L., Omoe K., In-
oue F., Kasai T., Yasujima M.,oue F., Kasai T., Yasujima M.,
Shinagawa K. and Nakane A.Shinagawa K. and Nakane A.
(2008) :(2008) : “Comparative prevalence
of superantigenic toxin genes in
meticillin-resistant and meticillin-
susceptible Staphylococcus aure-
us isolates”. J. Med. Microbiol.,
57: 1106-1112.
13.13. Larkin E. A., Carman R.Larkin E. A., Carman R.
J., Krakauer T. and Stiles B. G.J., Krakauer T. and Stiles B. G.
(2009) : (2009) : “Staphylococcus aure-
us: the toxic presence of a
pathogen extraordinaire”. Curr.
Med. Chem., 16:4003-4019.
14.14. Hu D. L., Zhu G., MoriHu D. L., Zhu G., Mori
F., Omoe K., Okada M., Waka-F., Omoe K., Okada M., Waka-
bayashi K., et al. (2007) :bayashi K., et al. (2007) :
“Staphylococcal enterotoxin in-
duces emesis through increasing
serotonin release in intestine and

407407
Benha M. J.
Vol. 29 No 2 May 2012it is downregulated by cannabi-
noid receptor 1”. Cell. Microbiol.,
9: 2267-2277.
15.15. Ministry of healthMinistry of health
“MOH” (2012) : “MOH” (2012) : Food poisoning
accidents during the years 1431-
1432. Annual Report. Riyadh
(KSA): Food Poisoning Depart-
ment.
16.16. Mensah P., Yeboah-Mensah P., Yeboah-
Manu D., Owusu-Darko K. andManu D., Owusu-Darko K. and
Alblordey A. (2002) : Alblordey A. (2002) : “Street
foods in Accra, Ghana; how safe
are they?” Bull World Health Or-
gan, 80:546-654.
17.17. Oh S. K., Lee N., Cho, Y.Oh S. K., Lee N., Cho, Y.
S., Shin D. B., Choi S. Y. andS., Shin D. B., Choi S. Y. and
Koo M. (2007) : Koo M. (2007) : “Occurrence of
toxigenic Staphylococcus aureus
in ready-to-eat food in Korea”.
J. Food Prot.,70:1153-1158.
18.18. Chomvarin C., Chantar-Chomvarin C., Chantar-
asuk Y., Srigulbutr S., Chareon-asuk Y., Srigulbutr S., Chareon-
sudjai S. and Chaicumpar K.sudjai S. and Chaicumpar K.
(2006) :(2006) : “Enteropathogenic bacte-
ria and enterotoxin-producing
Staphylococcus aureus isolated
from ready-to-eat foods in Khon
Kaen, Thailand”. The South east
Asian Journal of Tropical Medi-
cine and Public Health, 37 : 983-
990.
19.19. Soomro A. H., Arain M.Soomro A. H., Arain M.
A., Khaskheli M. and Bhutto B.A., Khaskheli M. and Bhutto B.
(2002) : (2002) : “Isolation of Escherichia
coli from raw and processed milk
in relation to public health sold
under market conditions at Tan-
dojam”. Pakistan Journal of Nutri-
tion, 1 (3): 151-152.
20.20. Kawano K., Okada M.,Kawano K., Okada M.,
Haga T., Maeda K. and Goto Y.Haga T., Maeda K. and Goto Y.
(2008) :(2008) : “Relationship between pa-
thogenicity for humans and the
stx genotype in Shiga toxin-
producing Escherichia coli sero-
type O157”. European Journal of
Clinical Microbiology and Infec-
tious Diseases, 27: 227-232.
21.21. Gilbert R. J., de LouvoisGilbert R. J., de Louvois
J., Donovan T., Little C., Nye K.,J., Donovan T., Little C., Nye K.,
Ribeiro C. D., et al. (2000) :Ribeiro C. D., et al. (2000) :
“Guidelines for the microbiological
quality of some ready-to-eat foods
sampled at the point of sale”.
Commun. Dis. Pub. Health,
3:163-167.
22.22. Rho M. J. and SchaffnerRho M. J. and Schaffner
D. W. (2007) : D. W. (2007) : “Microbial risk as-
sessment of staphylococcal food

408408
Ahmed R. Ragab, et al...
poisoning in Korean kebab”. Inter-
national Journal of Food Microbi-
ology, 116: 332-338.
23.23. Schmid D., Gschiel E.,Schmid D., Gschiel E.,
Mann M., Huhulescu S., Rup-Mann M., Huhulescu S., Rup-
pitsch W., Böhm G., et al.pitsch W., Böhm G., et al.
(2007) :(2007) : Outbreak of acute gas-
troenteritis in an Austrian
boarding school, September,
2006. Euro Surveill., 12: 224.
Available online: www. eurosur-
veillance. org/ em/v12n03/1203-
1224.asp
24.24. Smyth C. J., Smyth D.Smyth C. J., Smyth D.
S., Kennedy J., Twohig J. andS., Kennedy J., Twohig J. and
Bolton D. J. (2004) : Bolton D. J. (2004) : Staphylo-
coccus aureus: from man or ani-
mal-an enterotoxin iceberg? In:
Maunsell, B., Sheridan, J., Bolton,
D.J. (Eds.), EU-RAIN. Teagasc.
The National Food Centre, Padua,
Italy.
25.25. Stewart C. M., Cole M.Stewart C. M., Cole M.
B., Legan J. D., Slade L., Vande-B., Legan J. D., Slade L., Vande-
ven M. H. and Schaffner D. W.ven M. H. and Schaffner D. W.
(2002) : (2002) : “Staphylococcus aureus
growth boundaries: moving to-
wards mechanistic predictive
models based on solute-specific ef-
fects”. Applied and Environmental
Microbiology, 68: 1864-1871.
26.26. Le Loir Y., Baron F. andLe Loir Y., Baron F. and
Gautier M. (2003) :Gautier M. (2003) : “Staphylococ-
cus aureus and food poisoning”.
Genetics and Molecular Research,
2: 63-76.
27.27. Loeto D., Matsheka M. I.Loeto D., Matsheka M. I.
and Gashe B. A. (2007) : and Gashe B. A. (2007) : “Enter-
otoxigenic and antibiotic resis-
tance determination of Staphylo-
coccus aureus strains isolated
from food handlers in Gaborone,
Botswana”. Journal of Food Pro-
tection, 70: 2764-2768.

409409
Benha M. J.
Vol. 29 No 2 May 2012
OUTBREAKS OF FOOD POISONINGOUTBREAKS OF FOOD POISONINGDUE TO BACTERIAL CONTAMINATIONDUE TO BACTERIAL CONTAMINATION
AT FAST FOOD RESTAURANTSAT FAST FOOD RESTAURANTSAROUND AL HARAM AL NABAWI - AROUND AL HARAM AL NABAWI -
AL MADINAH AL MONOWARAHAL MADINAH AL MONOWARAH
Ahmed R. Ragab MD, Rania H. Abdel Rahman MD,Ahmed R. Ragab MD, Rania H. Abdel Rahman MD,Basem Sheik MD, Hassan Abdel-Salam MD,Basem Sheik MD, Hassan Abdel-Salam MD,
Quadi M. Al Hakk MD and Mohamed Abd Al-Samad MDQuadi M. Al Hakk MD and Mohamed Abd Al-Samad MD
BENHAMEDICALJOURNAL
REPRINT
Published byPublished by
Benha Faculty of MedicineBenha Faculty of Medicine Volume 29 Number 2May 2012

409409
Benha M. J.
Vol. 29 No 2 May 2012
PROSPECTIVE COMPARISON OF TRANSIENTPROSPECTIVE COMPARISON OF TRANSIENTELASTOGRAPHY AND LIVER BIOPSY FOR THEELASTOGRAPHY AND LIVER BIOPSY FOR THE
ASSESSMENT OF FIBROSIS IN CHRONICASSESSMENT OF FIBROSIS IN CHRONICHEPATITIS C BEFORE AND AFTERHEPATITIS C BEFORE AND AFTER
INTERFERON THERAPYINTERFERON THERAPY
Magdy H. Abd El-Fattah MD, Ayman N. Menessy MD,Magdy H. Abd El-Fattah MD, Ayman N. Menessy MD,Khaled R. Zalata MD*, Seham M. Seif MDKhaled R. Zalata MD*, Seham M. Seif MD
and Mohammed E. Essa M.Sc.and Mohammed E. Essa M.Sc.Departments Internal Medicine and Pathology*, Faculty of Medicine, Mansoura University, Egypt.
AbstractAbstractBackground:Background: Transient elastography (fibroscan) is a rapid, non inva-
sive and reproducible method allowing liver stiffness measurements(LSM) to evaluate liver fibrosis. The aim of this study: to evaluate the ac-curacy of fibroscan in assessment of liver fibrosis in patients withchronic hepatitis C in comparison with liver biopsy (LB). Also, to assessthe impact of treatment with pegylated interferon and ribavirin on theliver histology.
Methods: Methods: This prospective study enrolled 134 patients with chronichepatitis C (genotype 4). All patients underwent LB, LSM (Fibrsocan,Echosens, Paris, France) and routine laboratory investigations. Liver fi-brosis was assessed by Metavir scoring system with scale range from 0to 4 by 2 experienced pathologists. Also steatosis and necroinflammato-ry activity were reported. The accuracy of fibroscan was assessed bymeasurement of the areas under the receiver operating characteristics(ROC) curve, sensitivity and specificity. After treatment with combina-tion therapy of pegylated interferon alpha 2a weekly and ribavirin for 48weeks. Twenty patients achieved sustained virological response (SVR)were reassessed by post-treatment liver biopsy after 1 year of discontin-uation of treatment.
Results:Results: Fibroscan values ranged from 2.4 to 75.4 kilopascals. For F≥ 2, the cut off was 7.8 kpa with AUROC of 0.82, sensitivity of 67% andspecificity of 91%. For F ≥ 3, the cutoff was 11.9 kpa with AUROC of

410410
Magdy H. Abd El-Fattah, et al...
IntrodIntroductiouctionHepatic fibrosis is a wound
healing response characterized by
accumulation of extracellular ma-
trix (ECM) that follows chronic liv-
er disease. The ECM components
in fibrotic liver are similar regard-
less of the underlying cause. Acti-
vation of hepatic stellate cells is
the central event in hepatic fibro-
sis these persiniusoidal cells or-
chestrate an array of changes in-
cluding degradation of the normal
ECM of liver, deposition of scar
molecules, vascular and organ
contraction and release of cyto-
kines (1).
The prognosis and manage-
ment of chronic liver diseases
after depend strongly on the de-
gree of liver fibrosis. This is partic-
ularly true of chronic hepatitis C
virus infection(2). Until recently,
liver biopsy (LB) examination was
the only way of evaluating liver
fibrosis(3). However, LB examina-
tion is invasive and painful and
can have life threatening LB ex-
amination can lead to treatment
delays, and LB examination is
difficult to repeat in poorly,
symptomatic subjects. The accu-
racy of LB examination for as-
sessing fibrosis also has been
questioned because of sampling
errors and intra- and interob-
server variability that may lead
0.91, sensitivity of 86% and specificity of 85%. For F = 4, the cut off was19.3 kpa with AUROC of 0.96 sensitivity of 95% and specificity of 92%.Liver stiffness measurement by fibroscan was correlated significantlywith Metavir fiborsis stages (P = 0.000) but not with the degree of necro-inflammatory activity or steatosis (P = 0.311, P = 0.384 respectively).Twenty patients achieved SVR, reassessed after interferon therapy andthere was progression in fibrosis score in 3 patients (15%), stationarycourse in 7 patients (35%) and improvement in 10 patients (50%) butthis didn’t reach statistical significance (P = 0.334) while significant de-crease in the degree of necroinflammatory activity was reported (P =0.000).
Conclusion: Conclusion: Fibroscan is a simple, non invasive and acceptablemethod for assessing liver fibrosis. Combination of pegylated interferonand ribavirin could improve histological activity grade after one year ofthe end of treatment in chronic hepatitis C patients.

411411
Benha M. J.
Vol. 29 No 2 May 2012to over or understaging of fibro-
sis (4).
So, there is a need for accurate
noninvasive methods of measur-
ing the degree of liver fibrosis
proposed approaches include
physical examination, routine bio-
chemical and hematological tests
such as aspartate transaminase to
platelets ratio index (APRI) (5) and
more recently transient elastogra-
phy (fibroscan) (6).
Transient elastography (fibro-
scan) is a novel, rapid, noninva-
sive and reproducible method
for measuring liver stiffness.
Briefly, an ultrasound transducer
probe is mounted on the axis
of a vibrator; vibrations of mild
amplitude and low frequency are
transmitted by the transducer,
inducing an elastic shear wave
that propagates through the un-
derlying tissue. Pulse-echo ultra-
sound acquisitions are used to
follow the propagation of the
shear wave and to measure its
velocity, which is related direct-
ly to tissue stiffness. The stiffer
the tissue, the faster the shear
wave propagates. Preliminary re-
ports suggest that fibroscan accu-
rately predicts hepatic fibrosis
in patients with chronic hepatitis
C (7).
Aim of the study:Aim of the study:
The aim of this study to com-
pare the diagnostic performance of
fibroscan with that of liver biopsy
and routine biochemical and he-
matological test (the aspartate
transaminase to platelets ratio in-
dex APRI) in the assessment of fi-
brosis in chronic hepatitis C. Also
we aimed to estimate the degree of
improvement in fibrosis scores af-
ter successful antiviral treatment
of chronic hepatitis C.
Patients and MethodsPatients and MethodsThe study was conducted on
134 chronic HCV patients diag-
nosed by seropositivite HCV anti-
bodies and HCV RNA by PCR. Pa-
tients were selected from
Mansoura International Hospital
for assessment prior to interferon
therapy as a part of the national
program for combating viral hepa-
titis (HCV). All patients were sub-
jected to full history taking, clini-
cal examination and investigation
in the form of liver biopsy (ultra-
sound guided), liver stiffness
measurement using fibroscan and

412412
Magdy H. Abd El-Fattah, et al...
other laboratory tests. Nine pa-
tients were excluded because bi-
opsy specimens length < 1.5 cm or
contain < 10 portal tracts.
The patients were included ac-
cording to the following criteria:
Inclusion criteria:Inclusion criteria:
1) Age > 18 years and < 60
years.
2) Compensated liver disease
(total serum bilirubin < 1.5
mg/dl, INR < 1.5, serum al-
bumin > 3.5 gm/dl).
3) Acceptable hematological
indices (hemoglobin ≥12 g/
dl, White blood cell count
(WBC) ≥4,000/mm3, Neu-
trophil count ≥2,000/mm3,
Platelets count ≥100,000/
mm3).
4) Signed written informed
consent for this study and
willing to be treated and to
adhere to treatment require-
ments.
Exclusion criteria:Exclusion criteria:
• Liver biopsy contraindica-
tions: [international normal-
ized ratio INR > 1.6, platelets
< 100,000/mm3].
• Liver diseases other than
HCV (as metabolic, storage,
immune liver diseases).
• Decompensated liver dis-
ease.
• Pregnancy or breast feeding.
• Active seizures which re-
quire medication.
• Immunologically mediated
diseases (ulcerative colitis,
Crohn’s disease, ITP, SLE,
autoimmune hemolytic ane-
mia, scleroderma, severe pso-
riasis, rheumatoid arthritis).
• Organ transplants.
• Substance abuse.
• Patients with BMI > 30.
• Severe pre-existing psychiat-
ric conditions.
• HBsAg positive.
Patients were subjected to thePatients were subjected to the
following:following:
1- History taking and full clin-
ical assessment.
2- Complete blood picture es-
pecially (HB, RBCs, plate-
lets, absolute neutrophilic
count).
3- Liver function tests such as
(AST, ALT, Total serum bilir-
ubin [direct and indirect bi-
lirubin], serum albumin,
serum alkaline phosphatase,
prothrombin time and inter-

413413
Benha M. J.
Vol. 29 No 2 May 2012national normalized ratio
[INR]).
4- Renal function tests such as
(S.creatinine, Bl. urea).
5- B-HCG for all females in the
child bearing period.
6- HBsAg was routinely
checked for diagnosis of
chronic HBV infection.
7- Antischistosomal antibodies
were tested.
8- Alpha-fetoprotein.
9- TSH.
10- ANA (antinuclear antibod-
ies).
11- ECG, fundus examination.
12- Abdominal ultrasound was
performed to evaluate liver
condition including (size,
surface, texture).
13- Liver stiffness measure-
ment using the transient
elastography (fibroscan) (8).
• It was performed on the
same day of liver biopsy us-
ing the fibroscan device
(Echosense, Paris, France)
which consist of 5MHz ultra-
sound transducer probe
mounted on the axis of a vi-
brator.
• Vibration of mild ampli-
tude and low frequency are
transmitted by the transduc-
er, inducing an elastic shear
wave that propagates
through the underlying tis-
sues.
• Velocity is directly related
to tissue stiffness, the stiffer
the tissue, the faster the
shear wave propagates.
• The patient was lying in
the dorsal decubitus with
the right arm in maximal ab-
duction. The tip of the trans-
ducer was covered with a
drop of gel and placed on the
skin, between the rib bones
at the level of right lobe of
the liver.
• Under the control of TM
and A-mode, the operator lo-
cated a liver portion at least
6 cm thick and free of large
vascular structures, when
the target area had been lo-
cated, the operator pressed
the probe button to com-
merce. Stiffness is measured
on a cylinder of hepatic tis-
sue of 1 am diameter and 2
to 4 cm of length.
• The median value of ten
successful acquisitions ex-
pressed in kilopascal (kpa)
and was kept as representa-
tive of liver stiffness meas-

414414
Magdy H. Abd El-Fattah, et al...
urement. Only procedures
with 10 validated measure-
ments and a success rate of
at least 60% are considered
reliable.
14- Ultrasound guided liver
biopsy: liver biopsy was performed
using a semi-automatic true cut
needle (16G). All biopsy specimens
were analyzed independently by 2
experienced pathologists blinded
to the results of fibroscan and
APRI. Liver biopsy specimens were
fixed in formalin and embedded in
paraffin. Liver biopsies than con-
tain less than 10 portal tracts (ex-
cept for cirrhosis) were excluded
from histological analysis. Liver fi-
brosis and necro inflammatory ac-
tivity evaluated semiquantitatively
according to the METAVIR scoring
system. Also, steatosis, hemosid-
rosis and bilharzial ova were as-
sessed.
Fibrosis was staged on a 0-4Fibrosis was staged on a 0-4
scale as follows (METAVIRscale as follows (METAVIR
Score):Score):
F0, No fibrosis.
F1, Portal fibrosis without sep-
ta.
F2, Portal fibrosis with rare
septa.
F3, Numerous septa without
cirrhosis.
F4, Cirrhosis.
Activity (A) was graded as fol-Activity (A) was graded as fol-
lows (METAVIR Score):lows (METAVIR Score):
A0, No histologic necroinflam-
matory activity.
A1, Mild activity.
A2, Moderate activity.
A3, Severe activity.
Patients eligible to interferon
based therapy were received a
pegylated interferon alpha 2a
180 microgram or pegylated in-
terferon alpha 2b 1.5 mcg/kg
weekly and an average dose of
ribavirin about 15 mg/kg/d for
48 weeks. Follow up of those
patients were done by quantita-
tive PCR for HCV RNA at 12th
week and qualitative PCR for
HCV RNA at 24th, 48th, 72nd
weeks. Patients who achieved
sustained virological response
(negative PCR for HCV RNA af-
ter 6 month of discontinuation
of treatment) followed up for
another 6 months. Re biopsy
was done to these patients who
achieved SVR and agreed to as-
sess liver fibrosis after treat-
ment.

415415
Benha M. J.
Vol. 29 No 2 May 2012ResultsResults
Table (1) shows that according
to metavir scoring system, 53.6%
of patients represent F0, F1
group, 26.4% of patients represent
F2 group, 11.2% of patients repre-
sent F3 group and 8.8% of pa-
tients represent F4 group.
Table (2) shows that according
to metavir scoring system, 33.6%
of patients were A1, 58.4% of pa-
tients were A2 and 8% of patients
were A3.
Table (5) shows APRI and fibro-
scan values in the studied pa-
tients, the mean APRI was 0.34
and mean of fibroscan was
11.16.
Table (6) shows the mean val-
ues of fibroscan for F0, F1, F2, F3,
F4 stages were 3.7, 6.4, 9.1, 14.3,
43.7 respectively and there was
statistical significance between
different stages.
Table (7) shows that the mean
values of fibroscan for A1, A2, A3
grade were 9.4, 12, 11.9 respec-
tively and there was no statistical
significance between different
grades.
Table (8) shows that the mean
values of fibroscan for patients
with steatosis and patients with-
out steatosis were 10.6 and 11.8
respectively and there was no sta-
tistical significance between the
two groups.
Table (10) and Figure (5) show
that our new fibroscan cut off
level for detection of significant
fibrosis F ≥2 was 7.85 (kPa) with
sensitivity 67%, specificity 91%,
positive predictive value (PPV)
88% and negative predictive value
73%.
Table (11) and Figure (6) show
that our new fibroscan cut off lev-
el for detection of F ≥3 groups was
11.9 (kPa) with sensitivity 86%,
specificity 85%, positive predictive
value (PPV) 85% and negative pre-
dictive value (NPV) 86%.
Table (12) and Figure (7) show
that our new fibroscan cut off lev-
el for detection of cirrhosis F = 4
was 21.3 kPa with sensitivity 95%,
specificity 92%, positive predictive
value (PPV) 92% and negative pre-
dictive value 95%.
Table (13) shows that the mean

416416
Magdy H. Abd El-Fattah, et al...
values of APRI for F0, F1, F2, F3,
F4 stages were 0.20, 0.30, 0.34,
0.43 and 0.51 respectively and
there was statistical significance
between different stages.
Table (14) shows that the mean
values of APRI for A1, A2, A3
grades were 0.36, 0.33, 0.35 re-
spectively and there were no sta-
tistical significance between differ-
ent grades.
Table (15) shows that there was
regression in fibrosis stages in
some cases after interferon thera-
py but this does not reach statisti-
cal significance.
Table (16) shows that there
was significant decrease in activi-
ty grades after interferon thera-
py.
Table (17) shows significant dif-
ference between age groups as re-
gard SVR which was higher in 30-
39y group and no significant dif-
ference between hemosedrosis and
steatosis as regard SVR.

417417
Benha M. J.
Vol. 29 No 2 May 2012

418418
Magdy H. Abd El-Fattah, et al...

419419
Benha M. J.
Vol. 29 No 2 May 2012

420420
Magdy H. Abd El-Fattah, et al...

421421
Benha M. J.
Vol. 29 No 2 May 2012
DiscussionDiscussionThe development of liver fibro-
sis is the underlying pathogenic
phenomenon that leads to most
clinical complications in patients
with chronic hepatitis C virus
(HCV) infection (9).
Liver biopsy is currently “The
gold standard” for assessing he-
patic fibrosis. It is an invasive and
painful procedure, however, with
rare but potentially life threaten-
ing complications. In addition, the
accuracy of liver biopsy in assess-
ing fibrosis may be questioned be-
cause of sampling error and inter-
observer variability. Thus, there is
a need to develop and validate non
invasive tests that can accurately
reflect the full spectrum of hepatic
fibrosis (10).
Ideally, a non invasive marker
of liver fibrosis should be liver
specific, easy to perform, reliable
and inexpensive. It should in addi-
tion to be accurate not only for the
staging of fibrosis, but also for the
monitoring of disease progression
and antiviral therapy efficacy. A
variety of methods including the
measurement of liver stiffness us-
ing transient elastography (TE)
and serum markers as APRI (the
aspartate transaminase to plate-
lets ratio index), have been pro-
posed for the non invasive assess-
ment of hepatic fibrosis (8).
In the present study and as re-
garding the results of pathology 9
patients were F0, 58 patients were
F1, 33 patients were F2, 14 pa-
tients were F3 and 11 patients

422422
Magdy H. Abd El-Fattah, et al...
were F4 as assessed by Metavir
score and the mean of liver stiff-
ness measurements were 3.7, 6.4,
9.1, 14.3 and 43.7 kpa respective-
ly.
We found a significant positive
correlation between liver stiffness
measurement (Fibroscan) and fi-
brosis stages in patients with
chronic hepatitis C (r = 0.77, P =
0.000). This observation is consis-
tent because stiffness of tissues
largely depends on their molecular
building blocks (collagen) and on
the microscopic structural organi-
zation of these blocks (septa) (11).
But there was no significant corre-
lation between liver stiffness
measurement (Fibroscan) and the
degree of necroinflammatory activ-
ity or steatosis (P = 0.311, P =
0.384 respectively). These results
agreed with Foucher et al. (12)
who found that correlation of liver
stiffness was not affected by stea-
tosis or activity grade but there
was significant correlation be-
tween liver stiffness measure-
ments and fibrosis stages as-
sessed by liver biopsy.
The current study concluded
that the cut off level of significant
fibrosis F ≥ 2 assessed by the Met-
avir score as regard fibroscan
was (7.85) kpa with AUROC of
(82%). Sensitivity of (67%) and
specificity of (91%). Castera et al.(8) reported cut off level of 7.1 kpa
for detection of significant fibrosis.
This small difference may be at-
tributed to the number of patients
in this group (134 versus 183 pa-
tients in Castera study) and fat
distribution in patients. Also our
study was done on Egyptian pa-
tients where HCV genotype 4 is
prevalent but Castera studied oth-
er types.
In this study, the cut off was
11.9 kpa with AUROC of (91%)
sensitivity of (86%) and specificity
of (85%) for patients group F ≥ 3.
Also, we reported a cut off level of
19.3 kpa for detection of cirrhosis
with AUROC of (96%), sensitivity
of (95%) and specificity of (92%).
But, Castera et al.(8) reported a
cut off level of 12.5 kpa for detec-
tion of cirrhosis. So the increase
in our cut off value for F4 may be
due to schistosmal coinfection in
our patients. Also the prevalence
of cirrhosis varied in both studies
(11% versus 25% in Castera
study).

423423
Benha M. J.
Vol. 29 No 2 May 2012Gomez-Domingues et al. (13) re-
ported that the cut off for F4 is
15.6 kpa in patients with primary
biliary cirrhosis while Marcellin et
al. (14) said that the cut off for F4
is 18.2 kpa in patient with hepati-
tis B virus. Many studies reported
different cut off values of liver
stiffness measurement for the di-
agnosis of cirrhosis. This differ-
ence may be explained as the ae-
tiologies of liver diseases in these
studies were different.
This study showed that the re-
sults of detection of F0, F1 group
and F4 group is better than F2, F3
group and this agreed with Fouch-
er et al.(12). They reported that the
best results of transient elastogra-
phy at differentiating cirrhosis ver-
sus non cirrhosis. So fibroscan
can be used for diagnosis or ex-
clusion of liver cirrhosis.
Our study reported that there
was significant positive correlation
between APRI and both fibroscan
values and different fibrosis stages
in liver biopsy according to Meta-
vir scoring system (P = 0.004, P =
0.002 respectively). Also this
study concluded that APRI has a
high positive predictive value to
identify patients with significant
fibrosis and a high negative pre-
dictive value to Rule out cirrhosis
and this agreed with Wai et al.(5)
who showed that it is possible to
predict the presence or absence of
significant fibrosis in 51% of pa-
tients and to predict the presence
or absence of cirrhosis in 81% of
patients, but not agreed with Lie-
ber et al.(15) and Shiha(16). It may
be attributed to that their studies
or patients with alcoholic liver dis-
ease and chronic hepatitis B virus
respectively.
In this study, 20 patients were
assessed to study the impact of
treatment and histological out-
come after interferon therapy. We
found that there was significant
decrease in activity grades accord-
ing to Metavir scoring system after
interferon therapy. Also there was
regression in fibrosis stages in
some cases after interferon thera-
py but this does not reach statisti-
cal significance and this may be
due to the number of patients and
short term follow up of those pa-
tients. The decrease in fibrosis
stages in those patients support
the idea about reversibility of he-
patic fibrosis.

424424
Magdy H. Abd El-Fattah, et al...
This is supported by Issa et
al.(17) who showed that in clinical
circumstances where an effective
treatment for the underlying in-
sult is available, remodeling of the
scar tissue can occur and a return
towards architectural normality
has been documented even in ad-
vanced fibrosis. This has been
most clearly documented in auto-
immune liver disease. Also, in
haemochromatotic patients after
vensection and in patients with
hepatitis B and C after successful
interferon therapy.
Regression of fibrosis studied
by Bateller and Brenners(18)
which showed that the hepatic
mRNA content of TIMPS dropped
greatly in livers which concided
with the most rapid phase of colla-
gen degradation by collagenase.
Another important observation
was that there was prominent
apoptosis of activated HSC during
recovery.
ConclusionConclusionNon invasive methods such as
transient elastography (Fibroscan)
and APRI are easy and quick clini-
cal non invasive methods for as-
sessment of fibrosis. Results are
available immediately and they
are accurate methods for predic-
tion of significant fibrosis, detec-
tion of cirrhosis and in the follow
up of patients during and after re-
ceiving antiviral treatment. Also
non invasive methods can be help-
ful in patients refuse biopsy and
in patients with relative contrain-
dication to liver biopsy (such as
hemophilia or anticoagulation
therapy in patients who are at
high risk of developing thrombotic
events if treatment is interrupted).
But this non invasive methods
have limitations. First, these tests
generally have not been applied to
the evaluation of other potentially
contributing disease processes
such as non alcoholic steatohepa-
titis. Second, the degree of hepatic
inflammation is not assessed by
these tests. Third, the utility of
these tests has not been evaluated
in selected populations such as di-
alysis patients, HIV patients per-
sons and liver transplant recip-
ients. Fourth, fibroscan is not
helpful in obese patients as the
fatty thoracic belt attenuates elas-
tic waves making liver stiffness
measurement impossible. Combi-
nation of pegylated interferon and
ribavirin could improve histologi-

425425
Benha M. J.
Vol. 29 No 2 May 2012cal activity grade but not fibrotic
stage after treatment.
ReferencesReferences1. Cassiman D. and Roskmas1. Cassiman D. and Roskmas
T. (2002) :T. (2002) : Beuty is in the eye of
the beholder: emerging concepts
and pitfalls in hepatic stallate cell
research. J Hepatop; 37 : 527-
535.
2. Poynard T., Mathurin, P.,2. Poynard T., Mathurin, P.,
Lai C. L., et al., (2003): Lai C. L., et al., (2003): A com-
parison of fibrosis progression in
chronic liver diseases. J Hepatol;
38: 257-265.
3. Dienstag J. L. (2002) :3. Dienstag J. L. (2002) : The
role of liver biopsy in chronic hep-
atitis C. Hepatol; 36(1): 152-160.
4. Rockey D. C., Stephen H.,4. Rockey D. C., Stephen H.,
Caldwell, et al., (2009) :Caldwell, et al., (2009) : Liver Bi-
opsy. Hepatology; 49: 3.
5.Wai C. T., Greenson J. K.,5.Wai C. T., Greenson J. K.,
Fontana R. J., et al., (2003) : Fontana R. J., et al., (2003) : A
simple noninvasive index can pre-
dict both signifcant fbrosis and
cirrhosis in patients with chronic
hepatitis C. Hepatology; 38 : 518-
526.
6. Sandrin L., Fourquet B.,6. Sandrin L., Fourquet B.,
Hasquenoph J. M., et al.,Hasquenoph J. M., et al.,
(2003): T(2003): Transient elastography: a
new noninvasive method for as-
sessment of hepatic fibrosis. Ul-
trasound Med Biol; 29 : 1705-
1713.
7. Saito H., Tada S., Nakamo-7. Saito H., Tada S., Nakamo-
to N., Kitamura K., Horikawa H.,to N., Kitamura K., Horikawa H.,
Kurita S., et al., (2004) :Kurita S., et al., (2004) : Efficacy
of non-invasive elastometry on
staging of hepatic fibrosis. Hepatol
Res; 29: 97-103.
8. Castera L., Vergniol J.,8. Castera L., Vergniol J.,
Foucher J., et al. (2005) : PFoucher J., et al. (2005) : Pros-
pective comparison of transient
elastography, Fibrotest, APRI, and
liver biopsy for the assessment of
fibrosis in chronic hepatitis C.
World J Gastroenterol; 128 : 343-
50.
9. Ryder S. (2004) : 9. Ryder S. (2004) : Progres-
sion of hepatic fibrosis in patients
with hepatitis C: a prospective re-
peat liver biopsy study. Gut; 53:
451-5.
10. Bedossa P., Dargère D.10. Bedossa P., Dargère D.
and Paradis V. (2003) : and Paradis V. (2003) : Sampling
variability of liver fibrosis in
chronic hepatitis C. Hepatology;
38 : 1449-1457.

426426
Magdy H. Abd El-Fattah, et al...
11. Fung Y. C. (2003) : 11. Fung Y. C. (2003) : Biome-
chanical properities of living tis-
sues. New York: Springer Verlag.
12. Foucher J., Chanteloup12. Foucher J., Chanteloup
E., Vergniol J., et al. (2006): E., Vergniol J., et al. (2006): Di-
agnosis of cirrhosis by transient
elastography (FibroScan): a pros-
pective study. Gut; 55: 403-408.
13. Gomez-Dominguez E.,13. Gomez-Dominguez E.,
Mendoza J., Garcia-Buey L., etMendoza J., Garcia-Buey L., et
al. (2008) : al. (2008) : Transient elastogra-
phy to assess hepatic fibrosis in
primary biliary cirrhosis. Aliment
Pharmacol Ther; 27: 441-447.
14. Marcellin P., Ziol M., Be-14. Marcellin P., Ziol M., Be-
dossa P., et al. (2008) : dossa P., et al. (2008) : Non-
invasive assessment of liver
fibrosis by stiffness measurement
in patients with chronic hepatitis
B. Liver Intern; 29(2): 242-274.
15. Lieber C. S., Weiss D. G.,15. Lieber C. S., Weiss D. G.,
Morgan T. R., et al. (2006) :Morgan T. R., et al. (2006) :
Aspartate aminotransferase to
platelet ratio index in patients
with alcoholic liver fibrosis. Am J
Gastroenterol; 101: 1500-1508.
16. Shiha G., Sarin S. K., Ib-16. Shiha G., Sarin S. K., Ib-
rahim A. E., et al. (2009) : rahim A. E., et al. (2009) : Liver
fibrosis: consensus recommenda-
tions of the Asian Pacific Asso-
ciation for the Study of the Liv-
er (APASL). Hepatol Int: 3; 323-
333.
17. Issa R., Zhou X., Con-17. Issa R., Zhou X., Con-
standinou C. M., et al. (2004) :standinou C. M., et al. (2004) :
Spontaneous recovery from micro-
nodular cirrhosis: evidence for in-
complete resolution associated
with matrix cross-linking. Gas-
troenterology; 126: 1795-1808.
18. Bataller R. and Brenner18. Bataller R. and Brenner
D. (2005) : D. (2005) : Liver fibrosis. J Clin
Invest.; 115: 209-218.

427427
Benha M. J.
Vol. 29 No 2 May 2012
PROSPECTIVE COMPARISON OFPROSPECTIVE COMPARISON OFTRANSIENT ELASTOGRAPHY ANDTRANSIENT ELASTOGRAPHY AND
LIVER BIOPSY FOR THE ASSESSMENTLIVER BIOPSY FOR THE ASSESSMENTOF FIBROSIS IN CHRONICOF FIBROSIS IN CHRONIC
HEPATITIS C BEFORE AND AFTERHEPATITIS C BEFORE AND AFTERINTERFERON THERAPYINTERFERON THERAPY
Magdy H. Abd El-Fattah MD, Ayman N. Menessy MD,Magdy H. Abd El-Fattah MD, Ayman N. Menessy MD,Khaled R. Zalata MD, Seham M. Seif MDKhaled R. Zalata MD, Seham M. Seif MD
and Mohammed E. Essa M.Sc.and Mohammed E. Essa M.Sc.
BENHAMEDICALJOURNAL
REPRINT
Published byPublished by
Benha Faculty of MedicineBenha Faculty of Medicine Volume 29 Number 2May 2012

427427
Benha M. J.
Vol. 29 No 2 May 2012
EXPRESSION OF TENASCIN DURINGEXPRESSION OF TENASCIN DURINGPRENATAL DEVELOPMENT OF THE CENTRALPRENATAL DEVELOPMENT OF THE CENTRAL
NERVOUS SYSTEM IN ALBINO RATSNERVOUS SYSTEM IN ALBINO RATS
Huda M. El-Tahry MD, Adel A. Bondok MD,Huda M. El-Tahry MD, Adel A. Bondok MD, Adel A. El-Hawary MD, Hamdino M. Attia MD*, Adel A. El-Hawary MD, Hamdino M. Attia MD*,
and Ehab K. Ali MD**and Ehab K. Ali MD**Departments of Anatomy, Mansura Faculty of Medicine; *Al-Azhar Faculty of
Medicine; ** Master Degree of Anatomy, Al-Azhar University, Egypt
AbstractAbstractBackground: Background: Tenascin is an extracellular matrix (ECM) glycoprotein
abundantly expressed in neural and non-neural tissues. In the develop-ing central nervous system (CNS) of rodents, Tenascin is expressed inspecific spatial and temporal patterns in different brain regions. Thisexpression must be of importance during major developmental process-es such as cell proliferation, cell migration and axonal guidance, as wellas synaptic plasticity.
Aim of the work: Aim of the work: The present study was designed to detect the ex-pression of tenascin in CNS of the rat embryos to study its possiblerole in the development of CNS.
Material and Methods: Material and Methods: Seventy (70) Albino rat embryos (obtainedfrom twenty (20) albino rat females) were included in the present study.Matting of male and female rats were allowed and Females werechecked for the presence of vaginal plugs each morning; which repre-sents the day 0 of pregnancy (E0). The embryos of pregnant female ratswere obtained after scarifying female rats at different periods of preg-nancy as the following: Group1: Group1: at E8; Group 2: Group 2: at E10; Group 3: Group 3: atE12; Group 4: Group 4: at E14; Group 5:Group 5: at E16; Group 6: Group 6: at E18; Group 7:Group 7: atE20. Each group consisted of 10 embryos. All rats were taken as awhole mount, then they were put into paraffin blocks to be sectioned forimmunohistochemical staining. Longitudinal sections were incubatedwith primary antibody; tenascin antibody. These sections were incubat-ed with biotinylated anti-mouse secondary antibody followed by the avi-din-biotin complex (ABC) method. Finally, the sections were visualized

428428
Huda M. El-Tahry, et al...
IntrodIntroductiouctionMost cells do not float freely in
the body but are linked to each
other and to the surrounding envi-
ronment, extracellular matrix
(ECM). The ECM is secreted by the
resident cells and is composed of
supporting molecules (collagens
and protoglycans) as well as extra-
cellular linkage molecules. The
shape of cell, their capacity for
motility and their polarity are de-
termined by how the cell interacts
with its neighboring cells and ex-
tracellular matrix. These interac-
tions are known as cell to cell and
cell to matrix interaction [1].
Maris et al.[2] mentioned that
the extracellular matrix plays a
number of central roles in many
biological processes, such as pro-
liferation, angiogenesis and migra-
tion which all are achieved
through its principal elements,
tenascin and thrombospondin.
Tenascin is an extracellular ma-
trix glycoprotein abundantly ex-
pressed in neural and non-neural
tissues. In the developing central
with 3, 3-diaminobenzidine (DAB). The slides were studied using lightmicroscopy and subjected to morphometric and Statistical analysis.
Results of the present study revealed the following: Results of the present study revealed the following: Tenascin wasrecognized in ventricular zones with the age of E10, 12, and 14 days;the maximal increase was in E14. In subventricular zone, tenascin ex-pressed only in E14 and E16 days with the level increased in E16 morethan E14; In cerebral cortex, tenascin was expressed at E16, 18 and 20days. The maximal increase was in E20 . In corpus striatum, it was ex-pressed in E14 and increased in E16. In hippocampus, it was ex-pressed in E18 and increased in E20 ; In spinal cord, tenascin wasrecognized in E16, 18 and 20 days. The maximal expression was inE20 .
Conclusion: Conclusion: The present study revealed that, the expression of te-nascin in the development of CNS of albino rat embryos. The expressionof tenascin was different in different areas of CNS and increased withthe increase of age due to proliferation and migration of cells during de-velopment.
Keywords: Keywords: tenascin expression, prenatal development, central ner-vous system

429429
Benha M. J.
Vol. 29 No 2 May 2012nervous system (CNS) of rodents,
tenascin is expressed in specific
spatial and temporal patterns in
different brain regions. This ex-
pression must be of importance
during major developmental pro-
cesses such as cell proliferation,
cell migration and axonal guid-
ance, as well as synaptic plas-
ticity [3].
Jones and Jones [4] mentioned
that the extracellular matrix pro-
teins, tenascin (TN) family of gly-
coproteins (TN-C, TN-R, TN-W,
TN-X, and TN-Y) display highly re-
stricted and dynamic patterns of
expression in the embryo, particu-
larly during neural development,
skeletogenesis, and vasculogene-
sis. These molecules are reex-
pressed in the adult during nor-
mal processes such as wound
healing, nerve regeneration, and
tissue involution, and in patholog-
ical states including vascular dis-
ease, tumorigenesis, and metasta-
sis.
Tenascin R (TN-R), a member of
the tenascin gene family, is highly
expressed in perineuronal nets of
inhibitory interneurons. Tenascin
R expression is being started by
corpus striatum, at late embryonic
stages. TNR is also expressed by
oligodendrocytes, immature astro-
cytes in the somatosensory cortex
and at nodes of Ranvier in the
central nervous system [1].
Tenascin is believed to be im-
portant for several cellular pro-
cesses including adhesion, migra-
tion, and proliferation of cells at
different regions. Tenascin may
play its important roles in nervous
tissue histogenesis, possibly by
modulating signal transduction
across the plasma membrane.
Also, tenascin is able to play a
number of morphoregulatory roles
during the processes of develop-
ment and tissue remodeling as
well as in disease [2].
The objective of this study is to
study the expression of tenascin
in the development of central ner-
vous system of the albino rat em-
bryos at different ages.
Materials and MethodsMaterials and MethodsThirty (30) adult albino rats (20
females and 10 males) were
brought from animal house, Cairo
Faculty of Medicine. Rats were
housed in standard individual

430430
Huda M. El-Tahry, et al...
maternity cages under controlled
temperature and humidity with
free access to water and food.
Matting of male and female rats
were allowed and females were
checked for the presence of vagi-
nal plugs each morning; which
represents the day 0 of pregnancy
(E0). Seventy embryos of preg-
nant female rats were obtained af-
ter scarifying female rats at differ-
ent periods of pregnancy and were
divided into 7 groups. Group1: Group1: at
E8; Group 2: Group 2: at E10; Group 3: Group 3: at
E12; Group 4: Group 4: at E14; Group 5:Group 5:
at E16; Group 6:Group 6: at E18; Group
7: at E20. Each group consisted of
10 embryos, the embryos are tak-
en as a whole mount after extra-
version of the internal organs of
abdomen and thorax and then
they were put into paraffin blocks
to be sectioned for immunohisto-
chemical staining. Longitudinal
sections were incubated with pri-
mary tenascin antibody. These
sections were incubated with bio-
tinylated anti-mouse secondary
antibody followed by the avidin-
biotin complex (ABC) method. Fi-
nally, the sections were visualized
with 3, 3-diaminobenzidine (DAB).
The slides were studied using light
microscopy and subjected to mor-
phometrical and Statistical analy-
sis. Anesthesia and sectioning
were done according to method
described by[5]. Sections were
stained with hematoxylin and Eo-
sin[6] and immunostained by the
indirect immunohistochemistry
using avidin-biotin complex
(ABC)[7].
Statistical analysis: Statistical analysis: The densi-
ties of tenascin expression in dif-
ferent parts of the central nervous
system in all studied age groups
were organized, tabulated and sta-
tistically analyzed using Statistical
Package for Social Sciences (SPSS)
version 16, running on IBM com-
patible computer with Windows 7
operating system. For quantitative
data, mean and standard devia-
tion (SD) were calculated and for
comparison between two means,
the student (t) test was used. For
comparison between more than
two means, the one way analysis
of variance (ANOVA) tests was
used. For interpretation of results,
the p value ≤0.05 was considered
significant.
ResultsResultsHematoxylin and eosinHematoxylin and eosin
stained sections:stained sections: Light micro-
scopic examination of parasagittal

431431
Benha M. J.
Vol. 29 No 2 May 2012sections of albino rat embryo aged
(E18 day ), showed cerebral cor-
tex (CC), thalamus (TH), corpus
striatum (CS), midbrain (MB),
pons (PO), medulla (M) cerebellum
and spinal cord (SC) (figure 1).
Immunostained sections: Immunostained sections: Ex-
tracellular matrix tenascin expres-
sion was assessed morphologically
in different parts of central ner-
vous system, ventricular zone,
sub-ventricular zone, sub-plate
zone, preplate zone, cortical plate
zone, marginal zone ,corpus stria-
tum, hippocampus and spinal
cord. The intensity differed from
one age group to another.
i- Brain: i- Brain: in the present study,
tenascin expression could not be
detected before E10. The expres-
sion, started at E10 and gradually
increased with the age. Expres-
sion of tenascin at E10 was limit-
ed to the ventricular zone (fig. 2).
At E12, expression of tenascin
was increased (fig.3) and started
to invade subventricular zone at
E14 (fig. 4). Then, it gradually in-
creased till it completely covered
the subventricular zone at E16
(fig. 5). Regarding the cerebral cor-
tex, tenascin started to appear at
E16 by limited expression at the
preplate zone (fig. 6). At E18, the
cortex appeared divided into 3
zones: sub-plate, cortical plate
and marginal zones, with unequal
expression at the three zones, be-
ing most expressed in cortical
plate more than subplate than
marginal zones (fig. 7). Finally at
E20, the cortex appeared as single
zone (cortical zone) and it showed
intense expression of tenascin
(Fig.8). Regarding subcortical re-
gion, tenascin expression could be
detected in corpus striatum at
E14, and increased in intensity in
E16 (figs.9, 10). In addition, te-
nascin expression could be detect-
ed in hippocampus at E18, which
increased in intensity till E20
(Figs. 11, 12).
ii- Spinal Cord: ii- Spinal Cord: tenascin ex-
pression could be detected at the
dorsal plate of the spinal cord at
E16 (Fig. 13), and started to ap-
pear in the ventral plate of spinal
cord at E18. At E20, tenascin was
equally expressed in both plates
(Fig. 14).
Morphometric assessment ofMorphometric assessment of
tenascin expression in studiedtenascin expression in studied
age groups:age groups: The densities of te-
nascin expression were assessed

432432
Huda M. El-Tahry, et al...
in different parts of the central
nervous system in all studied age
groups. The mean values of tenas-
cin densities were calculated and
compared with each other. The
mean percentage values of density
of tenascin in the ventricular zone
were 5.30±1.16; 7.20±1.14;
9.50±1.08 in groups 2, 3 and 4 in
sucdcession. In subventricular
zone, the mean values were
15.20±1.32, 19.30±1.77 in groups
4 and 5 respectively. In cerebral
cortex, it was 34.10±2.60,
38.80±3.49 and 53.90±10.26 in
groups 5, 6 and 7 in succession.
The mean values of density of te-
nascin in corpus striatum were
16.100±1.79, 20.80±2.74 in
groups 4 and 5 respectively. In
hippocampus, the mean values of
density of tenascin were
23.60±3.60, 28.10±4.07 in groups
6 and 7 respectively. In spinal
cord, the mean values of density
of tenascin were 5.40±0.96,
7.40±0.96 and 9.60±1.43 in
groups 5, 6 and 7 in succession.
In the ventral root of spinal cord
the mean values were 5.30±0.95,
2.80±1.14 and 4.70±1.25 in
groups 5, 6 and 7 in succession
and in the dorsal root of spinal
cord the mean values were
4.60±0.97, 4.90±1.37 in groups 6
and 7 respectively. In ventricular
zone, there was statistically signif-
icant increase of tenascin density
in group 4 (E14) when compared
to groups 3 (E12) and group 2
(E10) .In sub ventricular zone and
corpus striatum, there was signifi-
cant increase of tenascin density
in group 5 (E16) in comparison to
group 4 (E14). In cerebral cortex,
there was significant increase of
tenascin density in group 7 (E20)
in comparison to groups 6 (E18)
and group 5 (E16)(table1).In hip-
pocampus, there was significant
increase of tenascin density in
group 7 (E20) in comparison to
group 6 (E18) (table 1).
In group 4 (E14), there was sig-
nificant increase of tenascin den-
sity in corpus striatum in compar-
ison to sub ventricular and
ventricular zones. On the other
hand, there was significant in-
crease of tenascin density in sub
ventricular zone in comparison to
ventricular zone. In group 5 (E16),
there was significant increase of
tenascin density in cerebral cortex
when compared to subventricular
zone, corpus striatum and spinal
cord. In addition, there was signif-

433433
Benha M. J.
Vol. 29 No 2 May 2012icant increase of tenascin density
in subventricular zone and corpus
striatum when each compared to
the spinal cord. In group 6 (E18),
there was significant increase of
tenascin density in cerebral cortex
when compared to either spinal
cord or hippocampus. In addition,
there was significant increase in
hippocampus when compared to
spinal cord. In group 7 (E20),
there was significant increase in
cerebral cortex when compared to
spinal cord and hippocampus. In
addition, there was significant in-
crease in hippocampus when com-
pared to the spinal cord. In spinal
cord, there was significant in-
crease of tenascin density in
group 7 (E20) in comparison to
groups 6 (E18) and 5 (E16). Also,
there was statistically significant
increase of tenascin density in the
dorsal plate of spinal cord in
group 5 (E16) in comparison to
group 6 (E18) and no significant
difference in the dorsal plate be-
tween group 5 (E16) and group 7
(E20). In the ventral plate of spi-
nal cord there was significant in-
crease of tenascin density in
group 6 ( E16) in comparison to
groups 5 (E16) and 7(E20) in addi-
tion there was significant in-
crease of tenascin density In the
ventral plate in group 7 (E20) in
comparison to group 5 (E16).
When compared tenascin density
of dorsal plate with ventral plate
in group 5 (E16), there was signifi-
cant increase of tenascin density
in dorsal plate, while in group 6
(E18), there was significant in-
crease of tenascin density in ven-
tral plate. In group 7 (E20), there
was no significant difference be-
tween dorsal and ventral plates
(table 2).

434434
Huda M. El-Tahry, et al...

435435
Benha M. J.
Vol. 29 No 2 May 2012

436436
Huda M. El-Tahry, et al...
DiscussionDiscussionTenascins are a family of gly-
coproteins found in the ECM of
many tissues. In vertebrates, the
tenascin family consists of only
four members named tenascin-C,
tenascin-X, tenascin-R and te-
nascin-W [8]. The first member of
the tenascin family, known as te-
nascin-C (TN-C), was discovered
independently almost 30 years ago
by several groups which simulta-
neously investigated different as-
pects of cell, developmental, and
tumor biology [9]. This new pro-
tein, tenascin attracted interest
because of its selective expression
in developing and pathological tis-
sues. The expression of Tenascin
showed oncofetal predominance at
epithelial-mesenchymal interac-
tion with prominent expression
seen during embryogenesis and
tumorigenesis [10].
In the present study, tenas-
cin upregulated in ventricular
zones with the age of E10, E12,
and E14; the maximal increase
was in E14. These results agreed
with[11] who reported that, tenas-
cin is prominently expressed dur-
ing forebrain development in the
ventricular and subventricular
zone where neural stem cells re-
side. In accordance with these re-
sults, Tucker et al.[12] reported
that, restricted expression of TN
has been reported in the develop-
ing chicken central nervous sys-
tem. They suggested that TN is a
component of the Reissner's fibre,
a thread-like strand of extracellu-
lar matrix that is produced by
floor plate cells and extends the
length of brain ventricles into the

437437
Benha M. J.
Vol. 29 No 2 May 2012central canal of the spinal cord.
In the present work, tenascin
expressed in the subventricular
zone only at the age of E14 and
E16 and the level of expression
was increased in E16 more than
E14. In agreement with this
study, Garcion et al. [13] reported
that, tenascin is highly expressed
in the subventricular zone as, a
result of migration of cells from
ventricular zone.
The present study showed lim-
ited tenascin expression in the
preplate zone at E16. Then at E18
the cortex appeared divided into
three zones, sub-plate, cortical
plate and marginal zones, being
most expressed in cortical plate
zone. Then the cortex appeared as
single zone at E20. The maximal
increase of tenascin expression
was in (E20). In agreement with
this study, Allan et al. [14] found
that, during embryonic period te-
nascin expression appeared first
in preplate zone, then, sub-plate,
cortical plate and marginal zone
then distributed through the
whole cortex. Tenascin is ex-
pressed from the onset of cortical
development in radial glial cells
which not only provide scaffolding
for migrating neurons but also
participate in the generation of
both neuronal and glial cells [15].
As corticogenesis proceeds, TN
appears in the subplate and mar-
ginal zones and becomes widely
expressed in the cortex, from
where it gradually disappears by
the end of the second week. The
temporal pattern of protein ex-
pression coincides with periods of
generation and migration of di-
verse cortical cells, establishment
of synaptic connections, myelina-
tion and rapid functional tissue
maturation [3].
On the other hand, Yuasa [16]
reported that, expression of tenas-
cin is particularly prominent dur-
ing neuronal differentiation and
migration in the cerebral cortex.
These results agreed with that of
the present study.
In contradiction to results of
the present study, Derr et al. [17]
reported that, during early brain
development, when cortical neu-
rons migrate, no expression has
been reported so far. In addition,
it was reported that, in the cere-

438438
Huda M. El-Tahry, et al...
bral cortex, TN may not be in-
volved in neuronal migration or
axonal growth, since it does not
appear until after cortical layers
and axonal pathways are estab-
lished [18].
In this study, tenascin was ex-
pressed in corpus striatum at the
age of E14 and E16, and in-
creased in E16 more than E14. In
many cases, tenascin, immuno-
reactivity is located in a discrete
fashion, and one remarkable fea-
ture of the resulting patterns is
the development of a boundary
like appearance, which correlates
with the functional subdivision of
neuroanatomical systems. Thus,
tenascin has been found in the so-
called barrel boundaries of the so-
mato-sensory cortex and at the in-
terface between compartments in
the developing nigro-striatal path-
way [19].
In agreement with this
work, Gunnar et al. [1] reported
that, tenascin is highly expressed
in perineuronal nets of inhibitory
interneurons, including those in
the striatum, which start to ex-
press tenascin at late embryonic
stages.
In the present research, tenas-
cin was expressed in hippocam-
pus at the age of E18 and E20,
and increased in E20 more than
E18. In accordance with the
present results, Alison et al. [20]
reported that, the expression of te-
nascin by oligodendrocytes and
small interneurons in the hippo-
campus and cerebellum is highly
regulated during development of
these regions. Erickson and Bour-
don [21] added that this complex
glycoprotein displays both adhe-
sive and anti-adhesive properties
that contribute to the formation
and maintenance of synapse. In
addition, the extracellular matrix
(ECM) molecule tenascin has at-
tracted interest due to its restrict-
ed and rapidly changing pattern of
expression during embryogenesis.
Tenascin is found especially at
sites of mesenchyme-epithelium
interaction in many developing or-
gans.
In the study of spinal cord, te-
nascin expression was appeared
at E16, E18 and E20. The
maximal expression was in E20.
Tenascin expression started at the
dorsal plate of spinal cord then
ventral plate after that the expres-

439439
Benha M. J.
Vol. 29 No 2 May 2012sion was equal in the two plates.
In agreement with the present re-
sult Bartsch et al. [22] stated that,
tenascin is an oligodendrocyte-
derived molecule; it is maximally
expressed during the time of ac-
tive myelination, and it has been
found to be associated with the
surface of myelinating oligoden-
drocytes, neurons, and type 2 as-
trocytes, it appeared at the
dorsal part where proliferation
of precursor cells occur then mi-
grated with the cell to other parts
of cord. Jones and Jones [4] re-
ported that, this expression must
be of importance during major de-
velopmental processes such as
cell proliferation, cell migration
and axonal guidance, as well as
synaptic plasticity in the adult or-
ganism.
The main findings of the
present study showed that, tenas-
cin were upregulated with age ac-
cording temporal and spatial ex-
pression. These results indicate
that, tenascin may play a pivotal
role in CNS development. These
results are in accordance with
several previous reports, as it was
reported that, TN- has so far been
found exclusively expressed in the
developing and adult CNS by olig-
odendrocytes and small subsets of
neurons (mainly interneurons and
motoneurons), such as the small
inhibitory inter- neurons of the
cerebellar cortex (stellate and bas-
ket cells), motoneurons in the spi-
nal cord and the brain, and the
horizontal cells of the retina [23].
In agreement with results of the
present work, Pesheva and Probst-
meier [24] reported that, TN-R
protein and mRNA are amply
present in the presumptive white
matter within the pathways of
oligodendrocyte precursor migra-
tion and during the phase of ac-
tive myelination when the protein
becomes abundant in the white
matter of different CNS regions.
After myelination have ceased,
both mRNA and proteins levels are
downregulated to lower adult val-
ues when TN-R appears predomi-
nantly associated with the surface
of oligodendrocytes, myelinated
axons and the nodes of Ranvier.
With neuronal maturation (i.e.
during the first two to three post-
natal weeks in mammals), TN-R
has been shown to accumulate in
perineuronal nets of interneurons
and motoneurons, often in a colo-
calization with TN-C.

440440
Huda M. El-Tahry, et al...
ConclusionConclusionThe present study revealed
that, the expression of tenascin in
the development of CNS of albino
rat embryos. The expression of te-
nascin was different in different
areas of CNS and increased with
the increase of age due to prolife-
ration and migration of cells dur-
ing development.
ReferencesReferences1- Gunnar H., Yifang C. and1- Gunnar H., Yifang C. and
Janinne-Sylvie S., et al. (2008) :Janinne-Sylvie S., et al. (2008) :
Tenascin-R promotes neuronal dif-
ferentiation of embryonic stem
cells and recruitment of host-
derived neural precursor cells af-
ter excitotoxic lesion of the mouse
striatum. Stem cells (Dayton,
Ohio) ; 26(8):1973-84.
2- Maris C., Rorive S. and2- Maris C., Rorive S. and
Sandras F., et al. (2008) : Sandras F., et al. (2008) : Tenas-
cin-C expression relates to clinico-
pathological features in pilocytic
and diffuse astrocytomas. Neuro-
pathology and Applied Neurobiolo-
gy; 34; pp: 316-329.
3- Andrey I., Astrid R. and3- Andrey I., Astrid R. and
Edgardo T., et al. (2005): Edgardo T., et al. (2005): Struc-
tural and Functional Aberrations
in the Cerebral Cortex of Tenas-
cin-C Deficient Mice. Cerebral
Cortex; 15:950-962.
4- Jones F. S. and Jones P. L.4- Jones F. S. and Jones P. L.
(2000) :(2000) : The tenascin family of
ECM glycoproteins: structure,
function, and regulation during
embry. Dev Dyn; Pp: 218: 235-59.
5 - Carson F. L., Martin J. H.5 - Carson F. L., Martin J. H.
and Lynn J. A. (1973) : and Lynn J. A. (1973) : Formalin
fixation for electron microscopy: a
re-evaluation. American Journal
of Clinical Pathology; 59: 365-373.
6- Richard W. H. and Ban-6- Richard W. H. and Ban-
croft J. D. (1998) :croft J. D. (1998) : Trouble shoot-
ing histology stain. Churchill Le-
vinginston, New York, Edinburgh,
London, pp: 88- 93.
7- Volsen S. G. (1984) : 7- Volsen S. G. (1984) : A bio-
tin-avidin technique for the locali-
sation of membrane-bound mono-
clonal antibodies by low power
transmission electron microscopy.
Journal of Immunological Meth-
ods; Volume 72(1) Pp: 119-126.
8- Tucker R. P., Ferralli J.,8- Tucker R. P., Ferralli J.,
Chiquet-Ehrismann R., et al.Chiquet-Ehrismann R., et al.
(2006) :(2006) : Phylogenetic analysis of
the tenasin gene family: evidence
of origin early in the chordate line-

441441
Benha M. J.
Vol. 29 No 2 May 2012age. BMC Evol Biol: 6: 60.
9- Chiquet-Ehrismann R. and9- Chiquet-Ehrismann R. and
Tucker R. P. (2011) :Tucker R. P. (2011) : Tenascins
and the importance of adhesion
modulation. Cold Spring Harb Per-
spect Biol; 3(5), pii: a004960.
10- Daniel R. M., Bing C., Jo-10- Daniel R. M., Bing C., Jo-
seph R., et al. (1998) : seph R., et al. (1998) : Tenascin-
C matrix assembly in oral squa-
mous cell carcinoma. Int J Can-
cer; 75:680-7.
11- von Holst A., Egbers U.,11- von Holst A., Egbers U.,
Prochiantz A., et al. (2007): Prochiantz A., et al. (2007): Neu-
ral stem/progenitor cells express
20 tenascin C isoforms that are
differentially regulated by Pax6. J
Biol Chem; 282(12):9172-81.
12- Tucker R. P., Hagios C.12- Tucker R. P., Hagios C.
and Chiquet-Ehrismann R.and Chiquet-Ehrismann R.
(1999): (1999): Tenascin-Y in the develop-
ing and adult avian nervous sys-
tem. Dev Neurosci:21:126-133.
13- Garcion E., Dobbertin A.13- Garcion E., Dobbertin A.
and Faissner A. (2004) : and Faissner A. (2004) : The ex-
tracellular matrix glycoprotein Te-
nascin-C is expressed by oligoden-
drocyte precursor cells and
required for the regulation of
maturation rate, survival and
14- Allan M., Sheppard and14- Allan M., Sheppard and
Sarah K., et al. (1991) : Sarah K., et al. (1991) : Changes
in the Distribution of Extracellular
Matrix Components Accompany
Early Morphogenetic Events of
Mammalian Cortical Development.
The Journal of Neuroscience, De-
cember, f 7 (12): 3928-3942.
15- Doetsch F. (2003) : 15- Doetsch F. (2003) : The
glial identity of neural stem cells.
Nat Neurosi. Nov; 6 (11) : 1127-
34.
16- Yuasa S. (1996) : 16- Yuasa S. (1996) : Berg-
mann glial development in the
mouse cerebellum as revealed by
tenascin expression. Anat Em-
bryol (Berl) 194:223-234.
17- Derr L. B., McKae L. A.17- Derr L. B., McKae L. A.
and Tucker R. P. (1998) : and Tucker R. P. (1998) : The
distribution of tenascin-R in the
developing avian nervous system.
J Exp Zool: 280: 152-164.
18- Sheppard A. M., Hamilton18- Sheppard A. M., Hamilton
S. K. and Pearlman A. L. (1991):S. K. and Pearlman A. L. (1991):
Changes in the distribution of ex-
tracellular matrix components ac-
company early morphogenetic
events of mammalian cortical de-
velopment. J Neurosci; 11 (12):
3928-42.

442442
Huda M. El-Tahry, et al...
19- O'Brien T. F., Faissner A.19- O'Brien T. F., Faissner A.
and Steindler D. A. (1992) : and Steindler D. A. (1992) : Af-
ferent-boundary interactions in
the developing neostriatal mosaic.
Brain Res Dev Brain Res. 1992;
65(2):259-67.
20- Alison W., Dorothy F. and20- Alison W., Dorothy F. and
Jacques U. B. (2002) :Jacques U. B. (2002) : Spatial
and Temporal Regulation of Te-
nascin-R Glycosylation in the Cer-
ebellum. J Biol Chem; 277 (52):
50941-50947.
21- Erickson H. P. and Bour-21- Erickson H. P. and Bour-
don M. A. (1989) :don M. A. (1989) : Tenascin: an
extracellular matrix protein promi-
nent in specialized embryonic tis-
sues and tumors. Annu Rev Cell
Biol 5:71-92.
22- Bartsch U., Pesheva P.22- Bartsch U., Pesheva P.
and Raff M., et al. (1993) : and Raff M., et al. (1993) : Ex-
pression of janusin (J1-160/180)
in the retina and optic nerve of the
developing and adult mouse. Glia
9:57-69.
23- Wintergerst E. S., Fuss23- Wintergerst E. S., Fuss
B. and Bartsch U. (1993) :B. and Bartsch U. (1993) :
Localization of janusin mRNA
in the central nervous system
of the developing and adult
mouse. Eur J Neurosci: 5 : 299-
310.
24- Pesheva P. and Probst-24- Pesheva P. and Probst-
meier R. (2000) :meier R. (2000) : The yin and
yang of tenascin- R in CNS devel-
opment and pathology. Prog Neu-
robiol 61:465-493.

443443
Benha M. J.
Vol. 29 No 2 May 2012
EXPRESSION OF TENASCIN DURINGEXPRESSION OF TENASCIN DURINGPRENATAL DEVELOPMENT OF THEPRENATAL DEVELOPMENT OF THE
CENTRAL NERVOUS SYSTEMCENTRAL NERVOUS SYSTEMIN ALBINO RATSIN ALBINO RATS
Huda M. El-Tahry MD, Adel A. Bondok MD,Huda M. El-Tahry MD, Adel A. Bondok MD, Adel A. El-Hawary MD, Hamdino M. Attia MD, Adel A. El-Hawary MD, Hamdino M. Attia MD,
and Ehab K. Ali MDand Ehab K. Ali MD
BENHAMEDICALJOURNAL
REPRINT
Published byPublished by
Benha Faculty of MedicineBenha Faculty of Medicine Volume 29 Number 2May 2012

443443
Benha M. J.
Vol. 29 No 2 May 2012
PROPHYLACTIC IMPACT OF CURCUMIN ONPROPHYLACTIC IMPACT OF CURCUMIN ONADRIAMYCIN-INDUCED NEPHROTOXICITY : ADRIAMYCIN-INDUCED NEPHROTOXICITY :
HISTOLOGICAL AND IMMUNOHISTOCHEMICALHISTOLOGICAL AND IMMUNOHISTOCHEMICALSTUDY ON ALBINO RATSTUDY ON ALBINO RAT
Saleh A. Al-Marashi Ph.D, Mohamed Saeed Ph.DSaleh A. Al-Marashi Ph.D, Mohamed Saeed Ph.Dand Chhaya T.Sawant MD*and Chhaya T.Sawant MD*
Departments of Anatomy, Faculty of Medicine, Sana” a University and Internal Medicine, Kuwait University Hospital Sana”a*
AbstractAbstractObjectives: Objectives: The present experimental study was designed to evaluate
the impact of prophylactic curcumin (CUR) on chronic adriamycin(ADR) exposure-induced structural renal alterations.
Materials & Methods: Materials & Methods: The study comprised 30 normal healthy grow-ing male albino rats divided into 3 groups: Control group given distilledwater, ADR group injected once intraperitoneally by ADR in a dose of 50mg/kg, 5 rats were sacrificed every 2 weeks after injection (ADR-2,ADR-4 & ADR-6) and CUR group included 15 rats received 200 mg/kgbody weight of curcumin in 1% gum acacia, orally for 7 days before in-traperitoneal injection of ADR in dose of 50 mg/kg and daily thereafterthroughout the study and 5 rats were sacrificed every 2 weeks after in-jection (CUR-2, CUR-4 & CUR-6). Kidney tissue was obtained for histo-logical studies using hematoxylin and eosin (Hx & E) and Masson’s tri-chrome stains. Immunohistochemical and morphometric study todetermine golmerular area cortical and medullary connective tissue per-centage and the count of PCNA +ve endothelial, mesangial and intersti-tial nuclei.
Results: Results: There was time-course progression of harmful effect of ADRon renal structure manifested as minimal congested renal glomeruliand interstitial congestion in ADR-2 specimens progressed in ADR-4specimens to congested glomeruli with narrowing extending to partialobliteration of Bowman's space but in ADR-6 group, there were multipleshrunken and congested renal glomeruli with vacuolation of cytoplasmof the lining cells of the proximal tubules and intense mononuclear cel-lular infiltration. Minimal glomerular and interstitial congestion with

444444
Saleh A. Al-Marashi, et al...
IntrodIntroductiouctionAdriamycin (ADR), a quinone-
containing anthracycline cytotoxic
antineoplastic drug, is used in the
treatment of various solid tumors.
It works by interfering with the
function of DNA in rapidly divid-
ing cells. Cancer cells divide par-
ticularly rapidly, and doxorubicin
can cause them to die. However,
preserved Bowman's space and no obvious cellular infiltration was re-ported in CUR-2 and CUR-4 groups, and CUR-6 rats showed picturecomparable to control animals apart from mild congestion and occa-sional shrunken glomeruli with preserved Bowman's space and minimalcellular infiltration. In Masson's Trichrome stained sections, ADR-4specimens showed focal dense fibrous bands that become dense inADR-6 group, while few thin bands between the proximal tubules weredetected in CUR-6 specimen. Multiple PCNA +ve rounded nuclei of me-sangial cells were detected among the +ve flattened endothelial nuclei inglomeruli recruiting obliterated Bowman's space in ADR-4 group and inthe shrunken glomeruli of ADR-6 specimens, while were occasional inCUR-6 group. Areas of PCNA +ve nuclei were detected between the prox-imal tubules were detected in ADR-4 groups and detected in wider are-as in ADR-6 group, while group CUR-6 showed smaller areas of +ve flat-tened nuclei than in ADR-6. Mean glomerular area was significantlylarger and smaller in groups ADR-4 and ADR-6 compared to groupsCUR-4 and CUR-6, respectively. Both cortical and medullary connectivetissue percentage were significantly higher in ADR-4 and ADR-6 groupscompared to control group and compared to CUR-4 group both corticaland medullary connective tissue areas were significantly higher in ADR-4 group. Compared to control, mean PCNA positive nuclei of endothelialcells was significantly lower in ADR-6 animals, but mean PCNA positivenuclei of mesangial cells was significantly higher in ADR-4 and ADR-6.Mean positive PCNA count in nuclei of interstitial cells of ADR-6 ani-mals was significantly higher compared to ADR-4 and CUR-6 animals,no positive PCNA nuclei were detected in interstitial cells in othergroups.
Conclusion:Conclusion: It could be concluded that prophylactic administrationof curcumin could ameliorate the nephrotoxic effects of chronic treat-ment with adriamycin and was recommended in the tried dose for pa-tients assigned to adriamycin treatment.

445445
Benha M. J.
Vol. 29 No 2 May 2012
certain types of normal body cells
also divide rapidly; doxorubicin
damages them as well. This leads
to a variety of possible side ef-
fects, including hair loss, digestive
problems, reduced immunity, ex-
cessive bruising or bleeding, ane-
mia, mouth sores and male infer-
tility. The efficacy of adriamycin
continues to be challenged by sig-
nificant toxicities including neph-
rotoxicity(1).
In human renal disease, sus-
tained heavy proteinuria is usual-
ly accompanied by rapid loss of re-
nal function. Rats that are given
adriamycin provide an experimen-
tal model of the association be-
tween proteinuria and loss of
function, as described by Bertani
et al.,(2). These animals develop
heavy proteinuria within a few
weeks after adriamycin adminis-
tration. Protein excretion rates re-
main high thereafter, and the GFR
declines gradually,(3). Various
studies showed that the appear-
ance of proteinuria is associated
with injury to the glomerular vis-
ceral epithelial cells and that the
subsequent decline in GFR is as-
sociated with both glomerular
sclerosis and widespread tubu-
lointerstitial injury(4).
Adriamycin associated nephrot-
ic syndrome is characterized by
heavy proteinuria, albuminuria,
hypoalbuminaemia and hyperlipi-
daemia, (5). Several lines of evi-
dence suggest reactive oxygen spe-
cies (ROS) as the principal
mediator in the development of
nephrosis caused by ADR. The hy-
pothesis was proposed, that if
ADR nephrotoxicity is related to
free radical formation and lipid
peroxidation then antioxidant
therapy may protect ADR toxicity
in kidney(6).
Agapito et al., (7) rreported a
significant increase in lipid peroxi-
dation products in brain, heart,
and kidney tissues after a single
administration of adriamycin,
which was attenuated by pre- and
post-treatment with a low phar-
macological dose of melatonin and
concluded that oxidative damage
induced by adriamycin can be re-
duced by low pharmacological
doses of melatonin. Sayed et al.,
(8) found Propionyl-l-carnitine, a
naturally occurring compound
that has been considered for the
treatment of many forms of cardi-

446446
Saleh A. Al-Marashi, et al...
omyopathies completely protects
against ADR-induced inhibition of
mitochondrial beta-oxidation of
long-chain fatty acids; induces a
powerful antioxidant defense
mechanism against ADR-induced
lipid peroxidation of cardiac mem-
branes without effect on the anti-
tumour activity of ADR.
Curcumin, the yellow curry pig-
ment isolated from turmeric (Cur-
cuma longa) is its active principle.
Curcumin represents a class of
anti-inflammatory antioxidants re-
ported to be a potent inhibitor of
reactive oxygen species formation
and modulates hydrogen perox-
ide-induced peroxidation of micro-
somal membrane lipids and DNA
damage,(9). Curcumin has been
also shown to provide protection
against oxidative stress in a renal
cell line,(10) and has been report-
ed to reduce ischaemic renal inju-
ry,(11). Therefore, the present
study was undertaken to evaluate
the protective effects of curcumin
against ADR nephrotoxicity.
The present experimental study
was designed to evaluate the im-
pact of prophylactic curcumin on
chronic adriamycin exposure-
induced structural renal altera-
tions.
Materials & MethodsMaterials & MethodsThe study comprised 30 normal
healthy growing male albino rats,
weighing 200-400 gm. Rats were
purchased from the laboratories of
Ministry of Agriculture, and kept
under standard conditions, tem-
perature 20oC, humidity 60% and
12-hs day/night cycle, and main-
tained on standard diet and free
water supply till the start of study
regimens. The animals were divid-
ed into 3 groups, each in a separ-
ate cage:
1. Control group included 6 rats
given distilled water. One rat
was sacrificed at the same time
with rats of each experimental.
2. ADR group included 15 rats
injected once intraperitoneally
by ADR in a dose of 50 mg/kg,
(2). Five rats were sacrificed
every 2 weeks after injection
(ADR-2, ADR-4 & ADR-6).
3. Curcumin (CUR) group includ-
ed 15 rats received 200 mg/kg
body weight of curcumin in 1%
gum acacia, orally for 7 days
before intraperitoneal injection
of ADR in dose of 50 mg/kg
and daily thereafter throughout

447447
Benha M. J.
Vol. 29 No 2 May 2012the study. Five rats were sacri-
ficed every 2 weeks after injec-
tion (CUR-2, CUR-4 & CUR-6).
Rats were sacrificed by decapi-
tation and kidney tissue was cut
into 2 pieces, one fixed in 85%
cold alcohol for histological stud-
ies and the other in 10% buffered
formalin for immunohistochemical
study:
a. Histological studies: included
Hx & E and Masson’s trichrome
stain, (12).
b. Immunohistochemical stu-dy:
using streptavidin-biotin perox-
idase method, monoclonal anti-
body against proliferating cell
nuclear antigen (PCNA) (DACO
Cooperation) was performed.
Tonsil sections served as posi-
tive control, (13).
c. Morphometric study: using Le-
ica Qwin 500 LTD image analy-
sis system, the area of renal
glomeruli in Hx & E stained
sections, the count of PCNA +ve
endothelial and mesangial nu-
clei were measured in 10 low
power fields (LPF) using inter-
active measurements menu.
The area% of connective tissue
fibres in cortex and medulla
and the area of PCNA +ve inter-
stitial nuclei were measured in
10 LPF using binary mode,(14).
Statistical analysis Statistical analysis
Morphometric results were pre-
sented as mean±SD, ranges and
ratios. Statistical analysis was
conducted using Wilcoxon (Z-test)
test for unrelated data using SPSS
(Version 10, 2002). P value of
<0.05 was considered significant.
ResultsResultsA) Histological resultsA) Histological results
Histological examination of the
kidney specimens of the control
group showed normal architecture
of renal glomeruli, and proximal
and distal tubules were detected
in the renal cortex, (Fig. 1). High
magnification of renal glomeruli
showed normal endothelial cells,
mesangial cells Bowman's space
and glomerular blood capillaries,
(Fig. 2).
In ADR group, there was time-
course progression of harmful ef-
fect of ADR on renal structure
manifested as the presence of
minimal congested renal glomeruli
and interstitial congestion in ADR-
2 specimens progressed in ADR-4
specimens to congested glomeruli

448448
Saleh A. Al-Marashi, et al...
with narrowing extending to par-
tial obliteration of Bowman's
space, (Fig. 3) with some mononu-
clear cellular infiltration, (Fig. 4).
High magnification examination
showed Malpighian corpuscles
surrounded by proximal tubules
with proliferated mesangial cells
in addition to some infiltrating
mononuclear cells between the
proximal convoluted tubules, (Fig.
5). In ADR-6 group, there were
multiple shrunken and congested
renal glomeruli with vacuolation of
cytoplasm of the lining cells of the
proximal tubules, (Fig. 6) and in-
tense mononuclear cellular infil-
tration, (Fig. 7).
Prophylactic curcumin highly
ameliorated the renal toxic effect
of ADR manifested as minimal glo-
merular and interstitial congestion
in groups CUR-2 and CUR-4, (Fig.
8) groups with preserved Bow-
man's space and no obvious cellu-
lar infiltration. Such protective ef-
fect continued till 6-weeks, renal
specimens obtained from CUR-6
rats showed picture comparable to
control animals apart from mild
congestion and occasional shru-
nken glomeruli but still with pre-
served Bowman's space and mini-
mal cellular infiltration (Fig. 9).
Control specimens showed nor-
mal structure of the collecting tu-
bules and no obvious changes
were reported in ADR-2 and CUR-
2 specimens from control speci-
mens. However, obvious conges-
tion with fibrotic infiltration was
recorded in ADR-4 specimens and
became dense in ADR-6 speci-
mens, (Fig. 10) with vacuolated cy-
toplasm of some of the lining cells
of some collecting tubules and
completely vacuolated cytoplasm
with flattening of nuclei of oth-
er tubules, (Fig. 11). Only mini-
mal congestion was recorded in
CUR-4 specimens and in CUR-6
specimens few fibroblasts were de-
tected between the collecting tu-
bules with minimal vacuolation of
some lining cells of some tubules
(Fig. 12).
In Masson's Trichrome stained
sections; minimal connective tis-
sue fibres were detected between
the proximal convoluted tubules
of the renal cortex in control, (Fig.
13) ADR-2, CUR-2 and CUR-4
groups. ADR-4 specimens showed
focal dense fibrous bands that be-
come dense in ADR-6 group, (Figs.

449449
Benha M. J.
Vol. 29 No 2 May 201214). On contrary, few thin bands
between the proximal tubules
were detected in CUR-6 specimen,
(Fig. 15). The renal medulla re-
vealed minimal fibers between the
collecting tubules in control, ADR-
2, CUR-2 and CUR-4 groups.
ADR-6 group showed multiple re-
ticula of dense fibrous bands be-
sides scattered connective tissue
fibres among the collecting tu-
bules, (Figs. 16). On the other
hand, in CUR-6 group a single re-
ticulum of fibrous bands was ob-
served in the different fields exam-
ined, (Fig. 17).
B)Immunohistochemical results:B)Immunohistochemical results:
Few PCNA +ve rounded nuclei
of mesangial cells appeared
among more numerous +ve flat-
tened nuclei of endothelial cells of
glomerular capillaries in control,
(Fig. 18), ADR-2, CUR-2 and CUR-
4 groups, (Fig. 19), while in CUR-6
group occasional +ve rounded nu-
clei and some +ve flattened nuclei
were detected, (Fig. 20). In group
ADR-4 multiple PCNA +ve round-
ed nuclei of mesangial cells were
detected among the +ve flattened
endothelial nuclei in glomeruli re-
cruiting obliterated Bowman's
space, (Fig. 21), while in ADR-6
group multiple +ve rounded and
few +ve flattened nuclei in the
shrunken glomeruli, (Fig. 22).
Similarly, PCNA +ve immunos-
taining of few nuclei lining some of
the proximal and distal tubule in
the renal cortex and some of the
collecting tubules in the renal me-
dulla of control rats, (Fig. 23). In
ADR-4 group, areas of PCNA +ve
nuclei were detected between the
proximal tubules, (Fig. 24) and
ADR-6 group showed wider areas
of PCNA +ve flattened nuclei be-
tween the renal tubules, (Fig. 25),
while group CUR-6, (Fig. 26)
showed smaller areas of +ve flat-
tened nuclei than in ADR-6.
C) Morphometric results :C) Morphometric results :
Compared to control group,
mean glomerular area was signifi-
cantly larger in groups ADR-2 and
ADR-4 (Fig. 27) and CUR-4 and
non-significantly in group CUR-2,
while was significantly smaller in
group ADR-6 and non-signifi-
cantly smaller in group CUR-6.
Mean glomerular area was signifi-
cantly larger and smaller in
groups ADR-4 and ADR-6 com-
pared to groups CUR-4 and CUR-
6, respectively, with non-signifi-

450450
Saleh A. Al-Marashi, et al...
cant difference between groups
ADR-2 and CUR-2, (Fig. 28).
Both cortical (Fig. 29) and me-
dullary (Fig. 30) connective tissue
areas were significantly higher in
ADR-4 and ADR-6 groups, but
non-significantly higher in other
groups compared to control group.
Compared to CUR-4 group both
cortical and medullary connective
tissue areas were significantly
higher in ADR-4 group, while the
difference was significant in corti-
cal but was non-significant in me-
dullary area in ADR-6 compared
to CUR-6 group,(Table 1, Fig. 31 &
32).
Mean PCNA positive nuclei of
endothelial cells was significantly
lower in ADR-6 animals compared
to control and other studied
groups with non-significant differ-
ence between other studied
groups compared to control and
in-between, (Fig. 33). On contrary,
mean PCNA positive nuclei of me-
sangial cells was significantly
higher in ADR-4 and ADR-6 ani-
mals compared to control and oth-
er studied groups with significant-
ly higher number in ADR-6
animals compared to ADR-4 ani-
mals. Also, the mean number of
PCNA positive nuclei of mesangial
cells was significantly higher in
CUR-4 animals compared to con-
trol and CUR-2 and CUR-6
groups, with non-significantly dif-
ferent number between other
groups, (Fig. 34). No positive
PCNA nuclei were detected in in-
terstitial cells in control, ADR-2,
CUR-2 and CUR-4 groups; howev-
er, mean positive PCNA count in
nuclei of interstitial cells of ADR-6
animals (Fig. 35) was significantly
higher compared to number re-
corded in ADR-4 and CUR-6 ani-
mals, (Table 2 Fig. 36).

451451
Benha M. J.
Vol. 29 No 2 May 2012
Fig. 1 : Fig. 1 : Control group specimen show-ing Malpighian renal corpus-cles (m), proximal tubules (P)and distal tubules (d) (Hx & E;X 200).
Fig. 2 : Fig. 2 : High magnification of a Malpi-ghian corpuscle in controlgroup showing Bowman’sspace (arrow), mesangial cells(MC) and glomerular bloodcapillaries (C) (Hx & E; X 400).
Fig. 3 : Fig. 3 : ADR-4 group specimen show-ing congested renal glomeruli(g) and interstitial congestion(C) with partial narrowing andobliteration of Bowman’sspace (Hx & E; X 200).
Fig. 4 : Fig. 4 : ADR-4 group specimen show-ing some infiltrating mononu-clear cells (arrows) (X 200).

452452
Saleh A. Al-Marashi, et al...
Fig. 5 : Fig. 5 : ADR-4 group specimen show-ing high magnification of aMalpighian corpuscle sur-rounded by proximal tubules(P) with proliferated mesangialcells (arrows) (Hx & E; X400).
Fig. 6 : Fig. 6 : ADR-6 group specimen show-ing multiple shrunken andcongested glomeruli (s) andvacuolated cells lining theproximal tubules (arrows), (Hx& E; x200).
Fig. 8 : Fig. 8 : CUR-4 group specimen show-ing minimally congested glom-eruli (g) and minimal intersti-tial congestion (C) areobserved, (Hx & E; x200).
Fig. 9 : Fig. 9 : CUR-6 group specimen show-ing glomeruli (g) comparableto control with mild conges-tion with preserved Bowman’sspace and less infiltration (ar-rows), (Hx & E; x200).
Fig. 7 : Fig. 7 : ADR-6 group specimen show-ing intense mononuclear infil-tration (arrows)(Hx & E;x200).
Fig.10 : Fig.10 : ADR-6 group specimen show-ing obvious congestion (C) andmultiple fibroblasts (F) be-tween the collecting tubules,(Hx & E; x200).

453453
Benha M. J.
Vol. 29 No 2 May 2012
Fig.11: Fig.11: ADR-6 group specimen show-ing vacuoles in the cytoplasm(V) of lining cells of some col-lecting tubules. Other tubulesshow total vacuolations of cy-toplasm and flattening of nu-clei (r). (Hx & E; x200).
Fig.12: Fig.12: CUR-6 group specimen show-ing some collecting tubuleswith minimal vacuolations (V)of the cytoplasm (Hx&E;x200).
Fig.14 : Fig.14 : ADR-6 group specimen show-ing few thin fibrous bands (B)between proximal tubules(Masson’s Trichrome, x100).
Fig. 15: Fig. 15: CUR-6 group specimen show-ing few thin fibrous bands (B)between proximal tubules(Masson’s Trichrome, x100).
Fig.13: Fig.13: Control group showing mini-mal connective tissue fibres (f)between proximal tubules(Masson’s Trichrome, x100).
Fig.16 : Fig.16 : ADR-6 group specimen show-ing multiple reticula of densefibrous bands (B) among thecollecting tubules (Masson’sTrichrome, x100).

454454
Saleh A. Al-Marashi, et al...
Fig.17: Fig.17: CUR-6 group specimen show-ing a reticulum of less densefibrous bands (B) and minimalfibres (f) (Masson’s Trichrome,x100).
Fig.18: Fig.18: PNCA immunostaining of con-trol group specimen showingsome + ve flattened nuclei (t)of endothelial cells liningblood capillaries and two + verounded nuclei (r) of mesan-gial cells.
Fig. 20 : Fig. 20 : PNCA immunostaining ofCUR-6 group specimen show-ing some +ve flattened nuclei(t) and three + ve rounded nu-clei (r), (x200).
Fig. 21: Fig. 21: PNCA immunostaining ofADR-4 group specimen show-ing some +ve flattened nuclei(t) and multiple + ve roundednuclei (r), (x200).
Fig.19:Fig.19:PNCA immunostaining of CUR-4 group specimen showing few+ve flattened nuclei (t) and one+ ve rounded nuclei (r), (x200).
Fig.22:Fig.22:PNCA immunostaining of ADR-6 group specimen showing two+ve flattened nuclei (t) andmultiple +ve rounded nuclei (r)in a shrunken glomerulus,(x200).

455455
Benha M. J.
Vol. 29 No 2 May 2012
Fig.23: Fig.23: PNCA immunostaining of con-trol group specimen showing a+ve nucleus (arrows) lining acollecting tubule (C) (x200).
Fig.24: Fig.24: High magnification of PNCAimmunostaining of ADR-4group specimen showing mul-tiple +ve flattened nuclei (ar-rows) between the proximal (P)and distal (d) tubules (x400).
Fig. 26 : Fig. 26 : High magnification of PNCAimmunostaining of CUR-6group specimen showing mul-tiple +ve flattened nuclei (ar-rows) between the proximaltubules (x400).
Fig.25: Fig.25: High magnification of PNCAimmunostaining of ADR-6group specimen showing mul-tiple +ve flattened nuclei (ar-rows) between the proximal (P)and distal (d) tubules (x400).
Fig. 27 : Fig. 27 : Showing glomerular area in ADR-4 group.

456456
Saleh A. Al-Marashi, et al...
Fig. 27 : Fig. 27 : Showing area percentage of connective tissue fibers in renal cortex inADR-6 group .
Fig. 30 : Fig. 30 : Showing area percentage of connective tissue fibers in renal medullain ADR-6 group.

457457
Benha M. J.
Vol. 29 No 2 May 2012
Fig. 35 : Fig. 35 : Showing count of PNCA positive interstitial nuclei in ADR-6 group.

458458
Saleh A. Al-Marashi, et al...
DiscussionDiscussionAnti-cancer agent adriamycin
has demonstrated high anti-tumor
efficacy. However, its use in chem-
otherapy has been limited largely
due to its diverse toxicities, in-
cluding renal toxicity, such as
nephrotic syndrome with protei-
nuria. Podocyte injury leads to
glomeruli proteinuria, (15). Moreo-
ver, adriamycin exposure affect
vascular function in a distinct
fashion in adriamycin-induced
nephrotic syndrome, (16).
The obtained results of the
present study illustrated the dele-
terious toxic effect of ADR on re-
nal tissue that was manifested as
glomerular congestion, prolifera-
tion of mesangial cells resulting in
partial to total obliteration of Bow-
man's space, multiple congested
shrunken glomeruli, mononuclear
cellular infiltration and vacuola-
tion of the cytoplasm of the lining
cells of proximal and collecting tu-
bules and in addition, some of the
collecting tubules revealed total
vacuolation of the cytoplasm of
the lining cells with flattening of
the nuclei. These findings agreed
with Kelly et al.,(17) stated that in-
terstitial infiltration with a variety
of inflammatory cell subtypes is a
prominent feature of human and
experimental focal segmental glo-
merulosclerosis and correlates
well with the degree of renal insuf-
ficiency. Bricio et al., (18) reported

459459
Benha M. J.
Vol. 29 No 2 May 2012that CD4 + and CD8+cells are
prominent components of intersti-
tial inflammation in murine ADR
nephropathy. Amore et al., (19) hy-
pothesized that CD4 + cells do not
mediate renal injury, but have a
protective effect and CD4+ cell de-
pletion aggravated histologic and
functional damage in ADR neph-
ropathy. Rangan et al., (20) re-
corded an increase in CD8 cells in
the renal interstitium associating
CD4+ cell depletion and lysis of
native cells by cytotoxic CD8 +
T-cells appears to be an impor-
tant cause of organ dysfunction
in many situations. Gorgun et
al.,(21), observed vacuoles in the
cytoplasm of renal tubular cells
between the nuclei and the cellu-
lar membranes, on electron mi-
croscopic examination. Wang et
al.,(22) attributed the pathogenesis
of ADR nephrosis to cellular infil-
tration and in their experimental
animal study, reported that partial
macrophage depletion starting be-
fore but not after ADR exposure
protected against the initiation of
renal injury as regards both renal
function and structure.
These Structural changes
showed time-dependency and
were minimal within 2-weeks of
exposure and progressed to severe
after 6-weeks of exposure. Glo-
merular affection, started at 2-
weeks, preceded tubular affection
that was evident in 6-weeks speci-
mens. These findings suggest that
tubular affection may be secon-
dary to glomerular affection and
go in hand with previously re-
ported in literature; Bertani et al.,(2,23) found tubule injury in adri-
amycin nephrosis is considered to
be secondary to glomerular injury
and proteinuria and obstruction
by casts is one mechanism by
which proteinuria could injure tu-
bules, these casts have been local-
ized mostly to the distal nephron.
Various studies tried to explore
the mechanisms of such sequence
of injury; Okada et al.,(24) found
that reducing urine concentration
with a V2 receptor antagonist
would limit cast formation, less-
ened proteinuria and consequent
tubule injury in adriamycin neph-
rotic rats. On the other hand, Su-
giura et al.,(25) found that a forced
increase in water intake reduces
both glomerular and tubulointer-
stitial injury in rats subjected to
renal ablation. Javaid et al.,(3),
found increased water intake and

460460
Saleh A. Al-Marashi, et al...
urine excretion of approximately
the same magnitude induced by
V2 blockade in nephrotic rats
had no beneficial effect. Haas et
al.,(26) suggested that adriamycin
associated proteinuria is toxic for
the tubular cells and antiprotei-
nuric therapy protects the remain-
ing tubular cells by decreasing hy-
percatabolism.
In Masson's trichrome sections
focal cortical fibrous bands ap-
peared in ADR-4 and became dif-
fuse in ADR-6 groups, in addition
to fibrous reticula in the renal me-
dulla that appeared multiple in
ADR-6 group. These findings indi-
cated intiation and continuation of
nephron sclerosing changes in-
duced by continued exposure to
ADR. In support of these findings,
the reported multiple shrunken
and congested renal glomeruli in
Hx & Eosin section and the signif-
icantly reduced glomurluar area
and significantly higher mean area
percentage of cortical and medul-
lary connective tissue fibres ob-
served in ADR-6 group.
These results agreed with that
reported by Nakayama et al., (27)
who reported a greater fibronectin
score in the cortical tubulo-
interstitium in animals treated
with ADR. Jovanovic et al., (28) re-
ported that chronic experimental
exposure to ADR induced syn-
drome nephroticum with glomeru-
lar sclerosis, tubular dilatation
and interstitial fibrosis developed
which led to chronic renal failure.
Tamaki et al., (29) attributed these
sclerotic changes to increased
CD8 + cells infiltration which
secrete transforming growth fac-
tor-β; one of the most potent stim-
ulator of collagen and fibronetin
production in fibroblasts such at-
tribution could be supported by
the progressively increased cellu-
lar infiltration reported in exam-
ined specimens in the current
study and such cellular infiltra-
tion preceded appearance of scler-
osis manifested as the reported
shrunken glomeruli in ADR-6
specimens. Wang et al.,(30) re-
ferred the term glomerulosclero-
sis to increase in the percentage
of relative mesangial area; this
definition goes in hand with the
reported significant increase of
the mean glomerular area ADR-
4 group versus other groups.
Deman et al.,(31) stated that me-
sangial cells injury stimulates

461461
Benha M. J.
Vol. 29 No 2 May 2012cytokines production by macro-
phages that induce proliferation
such explaination is supported by
the significant increase in the
mean count of PCNA +ve mesan-
gial nuclei in ADR-4 group com-
pared to other group.
The ameliorating effect of pro-
phylactic curcumin was evident
and illustrated in non-significant
histological and immunohisto-
chemical alterations observed in
CUR-2 and CUR-4 specimens
compared to control specimens
and the significant decrease of
such alterations in CUR-6 speci-
mens compared to ADR-6 speci-
mens. In support of such protec-
tive effect, morphometeric studies
showed non-significant changes in
mean glomerular area, mean per-
centage of cortical and medullary
connective tissue in CUR groups
compared to control group.
These findings could be attrib-
uted to the potent anti-oxidative
and anti-proliferative effects of
CUR and go in hand with that pre-
viously reported in literature; Gae-
deke et al.,(32) tried to determine
the antifibrotic properties of CUR
in glomerular fibrosis and report-
ed that CUR potently induced me-
sangial cell heme oxygenase-1 ex-
pression in vitro and up-regulated
glomerular heme oxygenase-1 ex-
pression in nephritic animals in
vivo and CUR treatment led to a
significant, dose-dependent reduc-
tion of markers of fibrosis particu-
larly plasminogen activator inhibi-
tor-1, transforming growth factor-
beta, fibronectin, periodic acid-
Schiff staining and concluded that
CUR has antifibrotic effects in glo-
merular disease, which are medi-
ated through an induction of
heme oxygenase-1.
Sharma et al., (33) examined
the effect of curcumin on renal
function and oxidative stress in
streptozotocin-induced diabetic
rats and found chronic treatment
with curcumin significantly atten-
uated both renal dysfunction and
oxidative stress in diabetic rats.
Farombi & Ekor, (34) investigated
the effect of curcumin on gentami-
cin-induced-renal oxidative dam-
age in rats and found CUR signifi-
cantly attenuated the gentamicin-
induced increases in both plas-
ma and kidney malondialde-
hyde and lipid hydroperoxide for-
mation and normalized renal

462462
Saleh A. Al-Marashi, et al...
function parameters. Eybl et
al., (35) examined the antioxidative
effect of curcumin pre-treatment
on cadmium-induced oxidative
damage and cadmium distribution
in an experimental model in mice
and found CUR oral pre-treatment
completely prevented the cadmi-
um-induced lipid peroxidation and
inhibition of glutathione peroxi-
dase activity but did not affect
cadmium distribution in the tis-
sues.
Kuhad et al., (36) evaluated the
protective effect of CUR on cispla-
tin-induced acute renal failure
and found CUR treatment signifi-
cantly and dose-dependently re-
stored renal function, reduced lip-
id peroxidation, and enhanced the
levels of reduced glutathione and
activities of superoxide dismutase
and catalase and attributed this
protective effect of CUR on cispla-
tin-induced experimental nephro-
toxicity to its direct anti-
inflammatory and strong antioxi-
dant profile.
It could be concluded that pro-
phylactic administration of curcu-
min could ameliorate the nephro-
toxic effects of chronic treatment
with adriamycin and was recom-
mended in the tried dose for pa-
tients assigned to adriamycin
treatment.
ReferencesReferences1.1. Kalaiselvi P., PragasamKalaiselvi P., Pragasam
V., Chinnikrishnan S., Veena C.V., Chinnikrishnan S., Veena C.
K., Sundarapandiyan R. & Vara-K., Sundarapandiyan R. & Vara-
lakshmi P. (2005) : lakshmi P. (2005) : Counteract-
ing adriamycin-induced oxidative
stress by administration of N-
acetyl cysteine and vitamin E. Clin
Chem Lab Med.; 43(8):834-40.
2.2. Bertani T., Rocchi G.,Bertani T., Rocchi G.,
Sacchi G., Mecca G. & RemuzziSacchi G., Mecca G. & Remuzzi
G. (1986):G. (1986): Adriamycin induced
glomerulosclerosis in the rat. Am
J Kidney Dis; 7 : 12-9.
3.3. Javaid B., Olson J. L. &Javaid B., Olson J. L. &
Meyer T. W. (2001): Meyer T. W. (2001): Glomerular
injury and tubular loss in adriam-
ycin nephrosis. J Am Soc Neph-
rol.; 12(7):1391-400.
4.4. Shu Y., Hoshi S., TomariShu Y., Hoshi S., Tomari
S., Watanabe T. & Nagata M.S., Watanabe T. & Nagata M.
(2002) :(2002) : Phenotypic changes and
cell cycle activation in early tubu-
lointerstitial injury of rat adriamy-
cin nephrosis. Pathol Int.; 52
(3):214-23.

463463
Benha M. J.
Vol. 29 No 2 May 20125.5. Milner L. S., Wei S. H. &Milner L. S., Wei S. H. &
Houser M. T. (1991) : Houser M. T. (1991) : Amelioration
of glomerular injury in doxorubi-
cin hydrochloride nephrosis by
dimethylthiourea. J Lab Clin
Med.;118(5):427-34.
6.6. Oteki T., Nagase S., Yo-Oteki T., Nagase S., Yo-
koyama H., Ohya H., Akatsukakoyama H., Ohya H., Akatsuka
T., Tada M., Ueda A., HirayamaT., Tada M., Ueda A., Hirayama
A. & Koyama A. (2005) : A. & Koyama A. (2005) : Normal-
izing renal reducing ability pre-
vents adriamycin-induced protei-
nuria. Biochem Biophys Res
Commun.; 337(1):48-51.
7.7. Agapito M. T., Antolín Y.,Agapito M. T., Antolín Y.,
del Brio M. T., López-Burillo S.,del Brio M. T., López-Burillo S.,
Pablos M. I. & Recio J. M.Pablos M. I. & Recio J. M.
(2001): (2001): Protective effect of melato-
nin against adriamycin toxicity in
the rat. J Pineal Res.;31(1):23-30.
8.8. Sayed-Ahmed M. M., Sal-Sayed-Ahmed M. M., Sal-
man T. M., Gaballah H. E., Abouman T. M., Gaballah H. E., Abou
El-Naga S. A., Nicolai R. & Cal-El-Naga S. A., Nicolai R. & Cal-
vani M. (2001) :vani M. (2001) : Propionyl-L-
carnitine as protector against ad-
riamycin-induced cardiomyopa-
thy. Pharmacol Res.;43(6):513-20.
9.9. Iqbal M., Okazaki Y. &Iqbal M., Okazaki Y. &
Okada S. (2003) : Okada S. (2003) : In vitro curcu-
min modulates ferric nitrilotriace-
tate (Fe-NTA) and hydrogen perox-
ide (H2O2)-induced peroxidation
of microsomal membrane lipids
and DNA damage. Teratog Carci-
nog Mutagen.; Suppl 1:151-60.
10.10. Cohly H. H. P., TaylorCohly H. H. P., Taylor
A., Angel M. F. & Salahudeen A.A., Angel M. F. & Salahudeen A.
K. (1998) :K. (1998) : Effect of turmeric, tur-
merin and curcumin on H2O2-
induced renal epithelial (LLC-PK1)
cell injury. Free Radic Biol Med
24: 49-54.
11.11. Shoskes D. A. (1998) :Shoskes D. A. (1998) :
Effect of bioflavanoids quercetin
and curcumin on ischemic renal
injury: a new class of renoprotec-
tive agents. Transplantation; 66:
147-52.
12.12. Drury R. A. & Walling-Drury R. A. & Walling-
ton E. A. (1980) : ton E. A. (1980) : Carleton's His-
tological Techniques, 5th ed., Ox-
ford Univ. press, London.
13.13. Geleilete T. J., Costa R.Geleilete T. J., Costa R.
S., Dantas M. & Coimbra T. M.S., Dantas M. & Coimbra T. M.
(2001) :(2001) : Alpha-smooth muscle ac-
tin and proliferating cell nuclear
antigen expression in focal seg-
mental glomerulosclerosis; func-
tional and structural parameters
of renal disease progression. Braz.

464464
Saleh A. Al-Marashi, et al...
J. Med. Biol. Res.; 34(8):985.
14.14. Wells S. J., De Rose P.Wells S. J., De Rose P.
B. & Cohen C. (1996) : B. & Cohen C. (1996) : Image cy-
tometric comparison of proliferat-
ing cell nuclear antigen and MIB-1
staining in hepatocellular carcino-
ma and adjacent liver tissue. Cy-
tometry; 26(3):198.
15.15. He L., Rong X., Jiang J.He L., Rong X., Jiang J.
M., Liu P. Q. and Li Y. (2008) :M., Liu P. Q. and Li Y. (2008) :
Amelioration of anti-cancer agent
adriamycin-induced nephrotic
syndrome in rats by Wulingsan
(Gorei-San), a blended traditional
Chinese herbal medicine. Food
Chem Toxicol.;46(5):1452-60.
16.16. Ulu N., Buikema H.,Ulu N., Buikema H.,
van Gilst W. H. and Navis G.van Gilst W. H. and Navis G.
(2008) : (2008) : Vascular dysfunction in
adriamycin nephrosis: different ef-
fects of adriamycin exposure and
nephrosis. Nephrol Dial Trans-
plant.; 23:1854-60.
17.17. Kelly C. J., Roth D. A. &Kelly C. J., Roth D. A. &
Meyers C. M. (1991) : Meyers C. M. (1991) : Immune
recognition and response to the
renal interstitium. Kidney Int.;
39:518.
18.18. Bricio T., Molina A. &Bricio T., Molina A. &
Egido J. (1992) : Egido J. (1992) : IL- 1 like pro-
duction in adriamycin induced
nephritic syndrome in the rat.
Clin Exp. Immunol.; 87:117.
19.19. Amore A., Mazzucco G.Amore A., Mazzucco G.
& Cavallo F. (1996) : & Cavallo F. (1996) : Adriamycin
induced proteinuria in mice An
immune system nediated toxic ef-
fect. Nephrol. Dial. Transplant.;
11:1012.
20.20. Rangan G. K., Wang Y.Rangan G. K., Wang Y.
& Tay Y. C. (1999) :& Tay Y. C. (1999) : Inhibition of
nuclear factor kappa B activation
reduces cortical tubulointerstitial
injury in proteinuric rats. Kidney
Int.; 56:118.
21.21. Gorgun M., Erdogan D.,Gorgun M., Erdogan D.,
Abban G., Turkozkan N. & ElbegAbban G., Turkozkan N. & Elbeg
S. (1999) : S. (1999) : Effect of vitamin E on
adriamycin induced nephrotoxici-
ty at the ultrastructural level in
guinea pigs. Nephron; 82:155.
22.22. Wang Y., Mahajan D.,Wang Y., Mahajan D.,
Tay Y. C., Bao S., Spicer T., Kai-Tay Y. C., Bao S., Spicer T., Kai-
raitis L., Rangan G. K. & Harrisraitis L., Rangan G. K. & Harris
D. C. (2005) :D. C. (2005) : Partial depletion of
macrophages by ED7 reduces re-
nal injury in Adriamycin nephrop-
athy. Nephrology (Carlton); 10 (5):
470-7.

465465
Benha M. J.
Vol. 29 No 2 May 201223.23. Bertani T., Cutillo F.,Bertani T., Cutillo F.,
Zoja C., Broggini M. & RemuzziZoja C., Broggini M. & Remuzzi
G. (1986) : G. (1986) : Tubulo-interstitial le-
sions mediate renal damage in ad-
riamycin glomerulopathy. Kidney
Int 30: 488-96.
24.24. Okada H., Suzuki H.,Okada H., Suzuki H.,
Kanno Y. & Saruta T. (1996) :Kanno Y. & Saruta T. (1996) :
Evidence for the involvement of
vasopressin in the pathophysiolo-
gy of adriamycin-induced neph-
ropathy in rats. Nephron 72:667-
72.
25.25. Sugiura T., YamauchiSugiura T., Yamauchi
A., Kitamura H., Matsuoka Y.,A., Kitamura H., Matsuoka Y.,
Horio M., Imai E. & Hori M.Horio M., Imai E. & Hori M.
(1999) : (1999) : High water intake amelio-
rates tubulointerstitial injury in
rats with subtotal nephrectomy:
Possible role of TGF-beta. Kidney
Int 55:1800-10.
26.26. Haas M., Boer E. & JangHaas M., Boer E. & Jang
P. E. (2003) :P. E. (2003) : Effects of antiprotei-
nuric therapy with angiotensin
converting enzyme inhibition on
renal protein catabolism in the ad-
riamycin induced nephritic rat.
Clin Sci., 105(1):51.
27.27. Nakayama M., Okuda S.Nakayama M., Okuda S.
& Tamaki K. (1996) : & Tamaki K. (1996) : Short or
long term effects of a low peotein
diet on fibronectin and transform-
ing growth factor beta synthesis in
adriamycin induced nephropathy.
J. Lab. Clin. Med.; 127:29.
28.28. Jovanovic D. B., JovovicJovanovic D. B., Jovovic
D. J., Varagic J., Dimitrijevic J,D. J., Varagic J., Dimitrijevic J,
Dragojlovic Z. & Djukanovic L.Dragojlovic Z. & Djukanovic L.
(2002) :(2002) : Slowing the progression
of chronic renal insufficiency with
captopril in rats with spontaneous
arterial hypertension and adriam-
ycin nephropathy. Srp Arh Celok
Lek.; 130(3-4):73-80.
29.29. Tamaki K., Okuda S. &Tamaki K., Okuda S. &
Miyazono K. (1995) :Miyazono K. (1995) : Matrix asso-
ciated latent TGF- beta with latent
TGF- beta binding protein in the
progressive process in adriamycin
induced nephropathy. Lab. In-
vest.; 73:81.
30.30. Wang Y., Wang Y. P. &Wang Y., Wang Y. P. &
Tay S. (2000) : Tay S. (2000) : Progressive adri-
amycin nephropathy in mice: Se-
quence of histological and immu-
nohistochemical events. Kidney
Int.; 58:1797.
31.31. Deman A., Ceyssens B.Deman A., Ceyssens B.
& Pauwels M. (2001) : & Pauwels M. (2001) : Altered
antioxidant defence in a mouse

466466
Saleh A. Al-Marashi, et al...
adriamycin model of glomerulos-
clerosis. Nephrol. Dial. Trans-
plant.; 16:147.
32.32. Gaedeke J., Noble N. A.Gaedeke J., Noble N. A.
& Border W. A. (2005): & Border W. A. (2005): Curcu-
min blocks fibrosis in anti-Thy 1
glomerulonephritis through up-
regulation of heme oxygenase 1.
Kidney Int.; 68(5):2042-9.
33.33. Sharma S., Kulkarni S.Sharma S., Kulkarni S.
K. & Chopra K. (2006) : K. & Chopra K. (2006) : Curcu-
min, the active principle of tur-
meric (Curcuma longa), amelio-
rates diabetic nephropathy in rats.
Clin Exp Pharmacol Physiol.; 33
(10):940-5.
34.34. Farombi E. O. & Ekor M.Farombi E. O. & Ekor M.
(2006) :(2006) : Curcumin attenuates
gentamicin-induced renal oxida-
tive damage in rats. Food Chem
Toxicol.;44(9):1443-8.
35.35. Eybl V., Kotyzova D. &Eybl V., Kotyzova D. &
Koutensky J. (2006) : Koutensky J. (2006) : Compara-
tive study of natural antioxidants
- curcumin, resveratrol and melat-
onin - in cadmium-induced oxida-
tive damage in mice. Toxicology;
225(2-3):150-6.
36.36. Kuhad A., Pilkhwal S.,Kuhad A., Pilkhwal S.,
Sharma S., Tirkey N. & ChopraSharma S., Tirkey N. & Chopra
K. (2007) : K. (2007) : Effect of curcumin on
inflammation and oxidative stress
in cisplatin-induced experimental
nephrotoxicity. J Agric Food
Chem.; 55(25):10150-5.

467467
Benha M. J.
Vol. 29 No 2 May 2012
PROPHYLACTIC IMPACT OF CURCUMINPROPHYLACTIC IMPACT OF CURCUMINON ON ADRIAMYCIN-INDUCEDADRIAMYCIN-INDUCED
NEPHROTOXICITY : HISTOLOGICALNEPHROTOXICITY : HISTOLOGICALAND IMMUNOHISTOCHEMICALAND IMMUNOHISTOCHEMICAL
STUDY ON ALBINO RATSTUDY ON ALBINO RAT
Saleh A. Al-Marashi Ph.D, Mohamed Saeed Ph.DSaleh A. Al-Marashi Ph.D, Mohamed Saeed Ph.Dand Chhaya T.Sawant MDand Chhaya T.Sawant MD
BENHAMEDICALJOURNAL
REPRINT
Published byPublished by
Benha Faculty of MedicineBenha Faculty of Medicine Volume 29 Number 2May 2012

467467
Benha M. J.
Vol. 29 No 2 May 2012
SINGLE INCISION TRANSPERINEAL REPAIRSINGLE INCISION TRANSPERINEAL REPAIROF SIMPLE AND RECURRENT RECTOVAGINALOF SIMPLE AND RECURRENT RECTOVAGINAL
FISTULA WITH VITAL BULBOCAVERNOSUSFISTULA WITH VITAL BULBOCAVERNOSUSMUSCLE FLAPMUSCLE FLAP
Waleed Thabet MD, Mohamed Youssef MD,Waleed Thabet MD, Mohamed Youssef MD,Tamer Youssef MD, Adham Elsaied MD, Alaa Magdy MD,Tamer Youssef MD, Adham Elsaied MD, Alaa Magdy MD,
Mohamed Farid MDMohamed Farid MD and Rafeek Barakat MD*nd Rafeek Barakat MD*Departments of General Surgery, Obstetrics and Gynecology*
Faculyu of Medicine, Mansoura University, Mansoura, Egypt.
AbstractAbstractBackground : Background : Rectovaginal fistulas (RVFs) are abnormal epithelial-
lined connections between the rectum and vagina. RVFs may be simpleor complex. Current study analyzed the outcome of single incisiontransperineal repair of simple rectovaginal fistula with vital bulbocaver-nosus muscle flap.
Methods: Methods: A total of 11 consecutive patients with simple and recur-rent RVFs were included and assigned to single incision transperinealrepair with vital bulbocavernosus muscle flap. Postoperatively, patientswere followed up by outpatient clinic or telephone interviews with spe-cific questionnaires to collect the information about status of fecal con-trol, flatus or fecal leakage from vagina, and quality of personal and so-cial life for sex months. Functional results were evaluated after 6months by anal manometry and a questionnaire reflecting the sympto-matic results, WIS and the FSFI.
Results: Results: Mean hospital stay was 10.37±1.12 days. Mean follow upperiod was 8.81±2.56 months. The results of mean anal pressure meas-urements postoperatively showed no significant differences comparedwith preoperative measurements. The results of pre- and postoperativeWexner incontinence scores and female sexual function indices showedhigh significant postoperative improvements in all patients (P =0.001).By the time of the last follow-up, there was no recurrence of RVF, andall patients reported normal fecal continence and returned to a normallife.

468468
Waleed Thabet, et al...
IntrodIntroductiouctionRectovaginal fistulas (RVFs) are
abnormal epithelial-lined connec-
tions between the rectum and va-
gina, being uncommon accounting
for 5% of anal rectal fistulas (1).
They can be quite bothersome to
both the patient and the surgeon
due to their irritating and embar-
rassing symptoms and high fail-
ure rate after repair. RVFs can be
the result of congenital malforma-
tions or acquired etiologies. Ac-
quired Rectovaginal fistulas may
be caused by prolonged labor with
necrosis of the rectovaginal sep-
tum, obstetric injury with a third-
or fourth-degree perineal tear or
episiotomy(2). Cryptoglandular an-
orectal abscesses and Bartholin
gland infections may spontane-
ously drain causing a low recto-
vaginal fistula(3). Inflammatory
bowel disease, diverticular dis-
ease, tuberculosis, lymphogranu-
loma venereum, radiation therapy
and malignancy have also been re-
ported(4).
RVFs are classified on the basis
of location, size, and etiology into
simple and complex fistulas,
which affects the treatment plan
and prognosis (5, 6). Simple RVFs
consist of small or medium, low or
mid-zonal fistulas secondary to in-
fection or trauma(7). RVFs are
considered complex if they are
large, high, recurrent or caused by
inflammatory bowel disease.
Small-sized fistulas are less than
0.5 cm in diameter, medium-sized
fistulas are 0.5-2.5 cm, and large-
sized fistulas exceed 2.5 cm. Low
and mid-zonal RVFs are located
between the lower third of the rec-
tum and the lower half of the vagi-
na while high fistulas occur be-
tween the middle third of the
rectum and the posterior vaginal
fornix (8, 9). Low fistulas generally
have healthy, well-vascularized
surrounding tissue, which can be
repaired with local perianal tech-
niques (7).
To provide the best chance
of successful repair, healthy,
well-vascularized tissue needs to
be introduced after resection of
diseased tissue(8,9). In simple
RVFs, rectal advancement flaps
Conclusion:Conclusion: Though the rectovaginal fistula is troublesome to thesurgeons, it could be cured by using our procedure. It seems that thistechnique is both simple and effective, giving excellent anatomical andfunctional results without the need for a protecting stoma.

469469
Benha M. J.
Vol. 29 No 2 May 2012
are the most popular transanal
procedure among colorectal sur-
geons(10,11). Two newer approach-
es are introduced, one approach
involves the use of a bio- pros-
thetic fistula plug made from
porcine intestinal submucosa
(Anal Fistula Plug, Cook Surgical
Inc., Bloomington, IN)(12), the
second recently popularized surgi-
cal treatment is coined LIFT (liga-
tion of intersphincteric fistula
tract)(13). Bulbocavernosus flap is
a versatile flap for repair of simple
vaginal fistulae. Anteriorly based
flap is good for urogenital fistulae
and posteriorly based flap for
RVFs (10).
In complex rectovaginal fistu-
las, abdominal resection proce-
dures or tissue interposition
techniques are used. Tissue inter-
position using a perineal approach
include a labial fat pad, bulboca-
vernous muscle, and pedicled
muscle flaps (rectus, sartorius,
and gluteal muscles), as well as
bioprosthetic materials (14).
In our research, a single inci-
sion transperineal repair with left
posteriorly based bulbocavernosus
muscle flap, through the same in-
cision, is applied on 11 cases of
simple rectovaginal fistula.
Patients and MethodsPatients and MethodsThe potential study population
comprised 16 patients with recto-
vaginal fistulae referred to our
General and Colorectal Surgery
Unit, Mansoura University Hospi-
tal in the period from January
2010 to January 2012 with one or
more of the following symptoms:
passage of flatus, liquid or solid
stool per vagina, a malodorous
vaginal discharge, recurrent vag-
initis and or dyspareunia. Patients
with Cohn’s disease with active
proctitis, malignant or radiation-
related fistula, stricture of the an-
orectum or an external sphincter
defect were excluded from the
study. A total of 11 patients ful-
filled the study criteria. A detailed
informed consent was obtained
from all patients after approval
from local ethics committee.
All patients were evaluated pre-
operatively by clinical interview in-
cluding Wexner Incontinence
Score (WIS) (15) and Female Sexu-
al Fuctional Index (FSFI)(16). Ano-
rectal manometry using perfusion
catheter systems (Synectics,

470470
Waleed Thabet, et al...
Stockholm, Sweden) was done for
all patients with evaluation of
mean anal resting pressure
(MARP), mean anal squeezing
pressure (MASP) and recto-anal
inhibitory reflex (RAIR).
Patients were given a me-
chanical bowel preparation the
day before surgery and an enema
of sorbitol was administrated on
the morning of the operation. The
patient was placed in the lithoto-
my position under general anes-
thesia. Antibiotics in the form of
third generation cephalosporin
and 500 mg of Metronidazole
(Baxter, Deerfield, IL, USA) were
given.
Submucosal lidocain 5% in ad-
renalized saline 1:200,000 was in-
jected around the fistula at the
vaginal and rectal sides. Surgical
excision of the fistula, without the
use of diathermy, using scalpel
number 15 was done. Biopsies of
rectal mucosa and the fistula mar-
gin were also obtained for patho-
logical evaluation to exclude an
underlying active IBD or malig-
nancy. A transverse perineal inci-
sion was done with elevation of
the posterior vaginal wall till the
cervix uteri. Dissection of the in-
ternal sphincter fibers away from
the external sphincter fibers was
done allowing a tension-free rec-
tal closure at the fistulous site
(Fig. 1). Closure of the fistulous
opening at the rectal side was
done using Vicryl 3/0 sutures (Vi-
cryl; Ethicon, Somerville, NJ,
USA). This is followed by suturing
the rectovaginal septum to the in-
ternal sphincteric fibers using Vi-
cryl 3/0 sutures (Fig. 2). The bul-
bocavernous muscle flap was
harvested from the left side in all
patients at its anterior part, pre-
serving the postero-external vas-
cular pedicle (Fig. 3), through the
same incision and sutured across
the rectum to its fellow on the oth-
er side (Fig. 4), using 2/0 Vicryl
sutures. Advancement of the vagi-
nal flap at the fistula site and su-
tured to the perineal skin using
Vicryl 3/0 sutures (Fig. 5). No
suction drain was used. No cover-
ing stoma was done. Postopera-
tively, oral intake was restricted
with intravenous fluids for five
days followed by clear oral fluids
for other five days with gradual re-
turn to food intake. Meanwhile,
patients abstained from vaginal
intercourse for three months.

471471
Benha M. J.
Vol. 29 No 2 May 2012Postoperatively, patients were
followed up by outpatient clinic
or telephone interview with specif-
ic questionnaires to collect the in-
formation about status of fecal
control, flatus or fecal leakage
from vagina, and quality of per-
sonal and social life. The interview
was scheduled twice a month for
the first 3 months, followed by
once a month for 6 months.
Functional results were evaluated
after 6 months by anal manome-
try and a questionnaire reflecting
the symptomatic results, WIS and
the FSFI.
Success was defined clinically
by the absence of any vaginal pas-
sage of feces, flatus or mucous
discharge.
Statistical analysis: Statistical analysis:
The statistical analysis of the
data in this study was performed
using the SPSS version 10 under
windows XP. The tests used were
the arithmetic mean value (aver-
age) and standard deviation, Stu-
dent’s t test (a P value <0.05 was
considered significant).
ResultsResultsThe mean age of the patients
was 31.26 ± 3.927 years (range
26-40). The etiologies of RVFs are
shown in Table 1. Two of the elev-
en patients underwent two trials
for RVF surgical repair. All pa-
tients had symptoms of passage of
flatus, liquid or solid stool
through the vagina and or signs of
vaginitis. Openings of the fistula
were all located above the anal
sphincter and varied between 5
and 25 mm in diameter. The pre-
operative MARP, MASP and rec-
toanal inhibitory reflex were nor-
mal in all patients.
Symptoms occurred after the
surgery included discomfort in
the anus in all patients, tenes-
mus without diarrhea in three
patients, and feeling of incom-
plete defecation in two patients.
Mean hospital stay was 10.36 ±
1.12 days (range 9-12). All the
symptoms spontaneously disap-
peared in 2 weeks after surgery.
Wound swollenness was seen in
three patients on the third postop-
erative day, which was caused by
hematoma in one patient and in-
fection in two patients. However,
there was no incision disruption
and all surgical wounds were
healed in 21 days after surgery.

472472
Waleed Thabet, et al...
No postoperative mortality was
seen.
Mean follow up was 8.81 ± 2.56
months (range 6-14). Patients
were followed up by clinic or tele-
phone interview with specific
questionnaires to collect the in-
formation about status of fecal
control, flatus or fecal leakage
from vagina, and quality of per-
sonal and social life. The inter-
view was scheduled twice a
month for the first 3 months, fol-
lowed by once a month for 6
months. Functional results were
evaluated after 6 months by anal
manometry and a questionnaire
reflecting the symptomatic re-
sults involving both the WIS
and FSFI. Two patients com-
plained of mild dyspareunia,
which requires no further surgical
management.
The results of mean anal pres-
sure measurements postoperative-
ly showed no significant differenc-
es compared with preoperative
measurements (Tables 2). The re-
sults of pre- and postoperative
Wexner incontinence scores
showed high significant postoper-
ative improvements in all patients
(p=0.001) (Table 3). The results of
pre- and postoperative female sex-
ual function indices showed high
significant postoperative improve-
ments in all patients (p =0.001)
(Table 3). By the time of the last
follow-up, there was no recurrence
of RVF, and all patients reported
normal fecal continence and re-
turned to a normal life.

473473
Benha M. J.
Vol. 29 No 2 May 2012

474474
Waleed Thabet, et al...
Fig.1: Fig.1: Dissection of internal sphi-
ncter fibres from external
sphincter fibres.
Fig.2: Fig.2: Suturing of internal sphinc-
ter fibres to rectovaginal
septum.
Fig.3: Fig.3: Bulbocavernosus flap pre-
paring.
Fig.4: Fig.4: Bulbocavernosus flap su-
turing to its fellow.

475475
Benha M. J.
Vol. 29 No 2 May 2012
DiscussionDiscussionFistulas between the rectum
and vagina are generally debili-
tating and often resistant to re-
peated repair procedures. The
management of rectovaginal fistu-
las depends on the size, loca-
tion and cause of the fistula,
anal sphincter function, overall
health of the patient, as well as
the skill and judgment of the
surgeon (2,5,6).
Various surgical procedures
have been suggested for the re-
pair of these fistulas, including fe-
cal diversion, primary repair, en-
dorectal advancement flap,
transvaginal repair, coloanal
sleeve anastomosis, and transpo-
sition flaps (17, 18). The relative
rarity of this type of fistula makes
prospective studies and random-
ized controlled trials difficult to
carry out.
Careful preoperative assess-
ment of the fistula, surrounding
tissue, anal sphincter and exclu-
sion of associated disease are es-
sential. Timing of repair is also of
importance. The chances of suc-
cess are increased if the sur-
rounding tissue is in optimal con-
dition, i.e. not inflamed or
infected. A rest period of three to 6
months is suggested by some au-
thors (19).
More importantly, the underly-
ing disorders such as IBD or tu-
mor should also be diagnosed at
the same time because these
conditions can lead to repeated
failure of a correct surgical pro-
cedure. Therefore, biopsy of the
mucosa from the rectum or the
margin of the fistula, pelvic CT,
and colonoscopy should be con-
sidered mandatory prior to surgi-
cal repair (2, 3).
Fig.5: Fig.5: Vaginal advancement flap.

476476
Waleed Thabet, et al...
Noble first described the use of
a sliding flap for repair of a RVF in
1902 and in 1983, Farkas and
Gingold described the first case of
rectal advancement flap (RAF) for
RVF in Crohn’s disease (20). The
advantages of the flap procedure
are: absence of a perineal wound
and of keyhole deformity, no wors-
ening of incontinence, no aggrava-
tion of patients’ symptoms in case
of failure and the presence of a
stoma is not mandatory (21).
The reported success rate for
RAF technique to repair rectovagi-
nal fistulas in different series
ranges between 29 percent in a
mixed group of patients with both
simple and complex fistulas after
varying numbers of previous re-
pair attempts to as high as 88 per-
cent in patients with simple fistu-
las who had an advancement flap
as their primary procedure(18).
The success rate decreases with
repeated attempts at repair. Suc-
cessful repair correlates with the
number of previous repairs, i.e.
none, 88% success; one, 85% suc-
cess; two, 55% success (22).
A RAF is preferred whenever
easily feasible because the flap is
created on the high-pressure ano-
rectal side of the fistula rather
than from the low-pressure vagi-
nal side (23).
In our study, transperineal
combined rectal and vaginal ad-
vancement flaps with intervening
vital bulbocavernosus muscle
flap was accomplished. Its use
is based on the hypothesis that
the interposition of tissue be-
tween the sutures lines will
result in enhanced blood sup-
ply to the devascularized epi-
thelium, obliteration of dead
space and the interruption of
sutures lines along the length
of the multilayer closure. Fur-
thermore the flap interposition
prevents vaginal stenosis.
Certain basic principles should
be followed, including excision of
the epithelialized tract, complete
closure of the rectal opening, in-
version of the rectal edges, ade-
quate tissue mobilization, hemo-
stasis, and tension free multilayer
closure.
As the described fistulas were
located in the lower-half of the va-
gina, we decided together with the
477477
Benha M. J.
Vol. 29 No 2 May 2012patients at their request, not to
perform a protecting stoma. If the
fistula is located in the upper-
third of the vagina it may be pru-
dent or even essential, to divert
the fecal contents by means of a
temporary ileostomy or colostomy.
Rates of healing reported
after other procedures appear
to be lower. The Musset tech-
nique obtained good initial re-
sults in 87-100% of patients but
with the risk of anal inconti-
nence, owing to sphincte-
rotomy required for this proce-
dure(8). Rectal advancement flap
alone, which avoids direct anal
sphincter damage, resulted in a
healing rate in 80% of pa-
tients(12). Repairing fistulas in pa-
tients with Crohn’s disease has a
lower success rate ranging from
50% to 70(13). We have success-
fully cured all of nine patients
without any significant morbidity.
Neither fecal incontinence nor re-
currence was found during the
time of follow-up. Two patients ex-
perienced mild dyspareunia, for
whom further treatment was not
needed.
Some reasons contributed to
this success. The etiology of fistu-
las in our patients was relatively
simple, which may contribute to
the excellent outcome in these pa-
tients. Interposing a health and
well-vascularized tissue avoids di-
rect apposition of two suture lines
and introduces well-vascularized
tissue to the area. Other reasons
are the surgeons’ understanding
about the anatomy of rectum,
anus, and pelvic floor, and the op-
erators’ skill in meticulous dissec-
tions, without diathermy, for pro-
tecting the blood vessel of the
pedicle.
ConclusionConclusionThough the rectovaginal fistula
is troublesome to the surgeons, it
could be cured by using our pro-
cedure. Despite the small patients'
cohort in this series, it seems that
this technique is both simple and
effective, giving excellent anatomi-
cal and functional results without
the need for a protecting stoma.
ReferrencesReferrences1- Cui L., Chen D., Chen W.,1- Cui L., Chen D., Chen W.,
et al. (2009) : et al. (2009) : Interposition of vi-
tal bulbocavernosus graft in the
treatment of both simple and re-
current rectovaginal fistulas. Int J

478478
Waleed Thabet, et al...
Colorectal Dis; 24: 1255-1259.
2- Corman M. L. (2004) :2- Corman M. L. (2004) : Rec-
tovaginal and rectourethral fistu-
las. In Corman ML, ed. Colon and
Rectal surgery, 5th ed. Philadel-
phia: Lippincott Williams and Wil-
kins, pp 333-346.
3- Ruffolo C., Scarpa M., Bas-3- Ruffolo C., Scarpa M., Bas-
si N., et al. (2010) :si N., et al. (2010) : A systemat-
ic review on advancement flaps
for rectovaginal fistula in Crohn’s
disease: transrectal versus trans-
vaginal approach. Colorectal Dis;
12: 1183-1191.
4- Gordon P. H. (1992) : 4- Gordon P. H. (1992) : Rec-
tovaginal fistula. In : Gordon PH,
Nivatvongs S, eds. Principles and
Practice of Surgery for the Colon,
Rectum and Anus, 3rd ed. New-
York and London: Informa Health-
Care, pp 333-352.
5- Teresa H. and Jaime L.5- Teresa H. and Jaime L.
(2010) :(2010) : Rectovaginal fistula. In :
Clinics in colon and rectal sur-
gery, NewYork: Thieme Virlag, 23
(2): 99-103.
6- Reisenauer C., Huebner6- Reisenauer C., Huebner
M. and Wallwiener D. (2009) :M. and Wallwiener D. (2009) :
The repair of rectovaginal fstulas
using a bulbocavernosus muscle-
fat flap. Arch Gynecol Obstet; 279:
919-922.
7- Mc Nevin M. S., Lee P. Y.7- Mc Nevin M. S., Lee P. Y.
and Bax T. W. (2007) : and Bax T. W. (2007) : Martius
flap: an adjunct for repair of com-
plex, low rectovaginal fistula. Am
J Surg; 193(5): 597-599.
8- Lefevre J. H., Bretagnol F.,8- Lefevre J. H., Bretagnol F.,
Maggiori L., et al. (2009) : Maggiori L., et al. (2009) : Opera-
tive results and quality of life after
gracilis muscle transposition for
recurrent rectovaginal fistula. Dis
Colon Rectum; 52: 1290-1295.
9- Hannaway C. D. and Hull9- Hannaway C. D. and Hull
T. L. (2008) : T. L. (2008) : Current Considera-
tions in the Management of Recto-
vaginal Fistula from Crohn’s Dis-
ease. Colorectal Dis; 10: 747-755.
10- Songne K., Scotte M., Lu-10- Songne K., Scotte M., Lu-
brano J., et al. (2007) : brano J., et al. (2007) : Treat-
ment of anovaginal or rectovaginal
fistulas with modified Martius
graft. Colorectal Dis; 9: 653-656.
11- Sonoda T., Hull T., Pied-11- Sonoda T., Hull T., Pied-
monte M. R., et al. (2002) : monte M. R., et al. (2002) : Out-
comes of primary repair of anorec-
tal and rectovaginal fistulas using
the endorectal advancement flap.

479479
Benha M. J.
Vol. 29 No 2 May 2012Dis Colon Rectum; 45:1622-1628.
12- Champagne B. J., O'Con-12- Champagne B. J., O'Con-
nor L. M., Ferguson M., et al.nor L. M., Ferguson M., et al.
(2006) : (2006) : Efficacy of anal fistula
plug in closure of cryptoglandular
fistulas: long-term. Dis Colon Rec-
tum; 49(12): 1817-1821.
13- Bleier J. I., Moloo H. and13- Bleier J. I., Moloo H. and
Goldberg S. M. (2010) : Goldberg S. M. (2010) : Ligation
of intersphincteric fistula tract: an
effective technique for complex fis-
tulae. Dis Colon Rectum; 53(1):43-
46.
14- Palanivelu C., Rangarajan14- Palanivelu C., Rangarajan
M., Sethilkumar R., et al.M., Sethilkumar R., et al.
(2007) :(2007) : Laparoscopic manage-
ment of iatrogenic high rectovagi-
nal fistulas( type IV). Singapore
Med J; 48:96-98.
15- Rockwood T. H., Church15- Rockwood T. H., Church
J. M., Fleshman J. W. et al.J. M., Fleshman J. W. et al.
(2000) : (2000) : Fecal Incontinence Quali-
ty of Life Scale: quality of life in-
strument for patients with fecal
incontinence. Dis Colon Rectum;
43: 9-16.
16- Wiegel M., Meston C. and16- Wiegel M., Meston C. and
Rosen R. (2005) : Rosen R. (2005) : The female sex-
ual function index (FSFI): cross-
validation and development of
clinical cutoff scores. J Sex Mari-
tal Ther; 31: 1-20.
17- Rothenberger D. A. and17- Rothenberger D. A. and
Goldberg S. M. (1983) : Goldberg S. M. (1983) : The man-
agement of rectovaginal fistulae.
Surg Clin North Am; 63(1):61-79.
18- MacRae H. M., McLeod R.18- MacRae H. M., McLeod R.
S., Cohen Z., et al. (1995) :S., Cohen Z., et al. (1995) :
Treatment of rectovaginal fistulas
that has failed previous repair at-
tempts. Dis Colon Rectum;
38:921-925.
19- Halverson A. L., Hull T.19- Halverson A. L., Hull T.
L., Fazio V. W., et al. (2001) :L., Fazio V. W., et al. (2001) :
Repair of recurrent rectovaginal
fistulas. Surgery; 130 : 753 -
758.
20- Farkas A. M. and Gingold20- Farkas A. M. and Gingold
B. S. (1983) : B. S. (1983) : Repair of rectovagi-
nal fistula in Crohn’s disease by
rectal mucosal advancement flap.
Mt Sinai J Med; 50: 420-423.
21- Kodner I. J., Mazor A.,21- Kodner I. J., Mazor A.,
Shemesh E. I., et al. (1993) : Shemesh E. I., et al. (1993) : En-
dorectal advancement flap repair
of rectovaginal and other compli-
cated anorectal fistulae. Surgery;
114: 682-690.

480480
Waleed Thabet, et al...
22-. Lowry A. C., Thorson A.22-. Lowry A. C., Thorson A.
G., Rothenberger D. A., et al.G., Rothenberger D. A., et al.
(1988) : (1988) : Repair of simple rectovag-
inal fstulas. Infuence of previous
repairs. Dis Colon Rectum; 31
(9):676-678.
23- Penninckx F., D’Hoore A.23- Penninckx F., D’Hoore A.
and Filez L. (2001) :and Filez L. (2001) : Advance-
ment flap plasty for the closure of
anal and recto-vaginal fistulae in
Crohn’s disease. Acta Gastroente-
rol Belg; 64: 223-226.

481481
Benha M. J.
Vol. 29 No 2 May 2012
SINGLE INCISION TRANSPERINEALSINGLE INCISION TRANSPERINEALREPAIR OF SIMPLE AND RECURRENTREPAIR OF SIMPLE AND RECURRENTRECTOVAGINAL FISTULA WITH VITALRECTOVAGINAL FISTULA WITH VITALBULBOCAVERNOSUS MUSCLE FLAPBULBOCAVERNOSUS MUSCLE FLAP
Waleed Thabet MD, Mohamed Youssef MD,Waleed Thabet MD, Mohamed Youssef MD,Tamer Youssef MD, Adham Elsaied MD,Tamer Youssef MD, Adham Elsaied MD,
Alaa Magdy MD, Alaa Magdy MD, Mohamed Farid MDMohamed Farid MDand Rafeek Barakat MDnd Rafeek Barakat MD
BENHAMEDICALJOURNAL
REPRINT
Published byPublished by
Benha Faculty of MedicineBenha Faculty of Medicine Volume 29 Number 2May 2012

481481
Benha M. J.
Vol. 29 No 2 May 2012
IntrodIntroductiouctionMyelination has evolved in
vertebrates to electrically insu-
late axons to promote rapid, ener-
gy efficient action potential propa-
gation which facilitates rapid
saltatory conduction along their
length(1), ensures their long-term
viability(15) and contributes to
functional regulation of nervous
system plasticity(7). In the central
nervous system (CNS), the pro-
duction of multilamellar myelin
sheaths is performed by oligoden-
GLIOGENESIS OF THE OPTIC NERVE IN THEGLIOGENESIS OF THE OPTIC NERVE IN THERAT DURING EARLY POSTNATAL PERIODRAT DURING EARLY POSTNATAL PERIOD
Hamdino M. Attia MDHamdino M. Attia MD Department of Anatomy, Faculty of Medicine,
Al-Azhar University (Dumiatte), Egypt.
AbstractAbstractOligodendrocytes are the end product of a cell lineage which has to
undergo a complex and precisely timed program of proliferation, migra-tion, differentiation to finally produce the insulating sheath of axons,myelin. The present study is designed to trace the changes in densitiesand distribution of oligodendrocytes in both chiasmal and retinal endsof the optic nerve during the period of brain growth spurt which is thefirst two postnatal weeks in rats, corresponding to the third trimester inhuman. To achieve this goal, immunohistochemical staining of the opticnerves from rats at 4 age groups at postnatal days 2, 5, 10 and 15 eachgroup contained 10 rats. The antibody used in the present study is di-rected against myelin basic protein to detect oligodendrocyte. And bycomparing olgodendrocytes densities in both chiasmal and retinal endswe could trace the path of migration. The present study could detectsignificant increase in the density of oligodendrocytes with aging withconsiderable difference in density between both ends up to the end ofsecond week of postnatal life denoting persistence of active gliogenesisduring that period of life with an active migration toward the retinalend.
Key words:Key words: Optic nerve, oligodendrocyte, myelin basic protein, Gliogenesis.

482482
Hamdino M. Attia
drocytes (OLs)(6). Oligodendrocy-
tes are the end product of a cell
lineage which has to undergo a
complex and precisely timed pro-
gram of proliferation, migration,
differentiation to finally produce
the insulating sheath of axons,
myelin(23). Oligodendrocytes pre-
cursor cells (OPCs) migrate out of
germinal zones in the brain and
spinal cord. When the cells reach
their final destination, they be-
come postmitotic, extend process-
es, and begin to synthesize the
components of myelin as exten-
sions of their plasma membrane.
In most mammals this occurs rel-
atively late in CNS development
during late embryonic and early
postnatal life, after neurons and
astrocytes are formed(11). Regard-
ing rat optic nerve, precursor
cells enter the nerve before birth
and colonize the nerve in a chi-
asmal-to-retinal gradient during
the first postnatal week(21). Dif-
ferentiated oligodendrocytes are
first detected 4 days after birth
(P4) in the chiasmal end of the
optic nerve, and populate the
nerve in a chiasmal-to-retinal gra-
dient between P4and P7(4). Myeli-
nation is first detected around P6
and myelination progresses in a
retinal-to-chiasmal gradient(20).
The present study is designed
to trace the process of migra-
tion of OPCs in an "in vivo" man-
ner by applying the antibody
myelin basic protien (MBP) as a
marker for mature (myelinating)
oligodendrocytes during the early
postnatal period. And comparing
their densities in chiasmal and
retinal ends at four postnatal days
during the brain growth spurt, a
period characterized by cellular
proliferation and differentiation,
neuronal and glial migration, axo-
nal growth, and synaptogenesis,
occurs during the third trimester
of pregnancy in humans and in
the first two weeks after birth in
rats(13).
Material and MethodsMaterial and MethodsAnimals:Animals:
All experiments were performed
in accordance with the guide for
the care and use of laboratory ani-
mals(16).
Ten pregnant Wistar rats de-
rived from Animal Care Center
Mansoura University, Mansoura,
Egypt, kept in sanitary cages with
free access to chow and water.

483483
Benha M. J.
Vol. 29 No 2 May 2012Pregnant rats were checked at
9:00 and 18:00 h daily for delivery
of pups. Day of delivery was
counted as postnatal day 0 (P0).
Four Groups of pups at ages of
postnatal days 2, 5, and 10 and
15 (P2, P5, P10 and P15) were
used each group contained 10
pups chosen from different moth-
ers in a random manner. The first
two postnatal weeks was selected
because it has already demon-
strated that this is the time when
the phase of rapid postnatal devel-
opment of the optic nerve is com-
pleted(5).
Fixation and sectioning:Fixation and sectioning:
Under deep phenobarbital an-
esthesia (100mg/Kg b. wt), Wistar
rat pups were perfused transcar-
dially with saline containing hep-
arin (2 U/ml), and subsequently
with a fixative consisting of 4%
paraformaldehyde in phosphate
buffered saline (PBS).
The whole length of the optic
nerves from pups was carefully
dissected out, avoiding traction
on the nerves. Immediately put
into the same fixative over night
at 4˚C. After overnight cryopro-
tection in 20% sucrose in PBS
each optic nerve was mounted in
OCT compound. Transverse sec-
tions of ~ 10 µm from optic nerves
at chiasmal and retinal ends were
obtained using cryostat (Lieka co.
Tokyo Japan)
Immunohistochemistry:Immunohistochemistry:
The method of immunostaining
applied in this study is the indi-
rect immunohistochemistry using
avidin-biotin complex (ABC)(14).
Briefly; antigen retrieval was done
using enzymatic proteolysis via
0.1% Trypsin in Tris buffer at pH
7.6. Endogenous perioxidase ac-
tivity was quenched by incubat-
ing the specimens in 3% H2O2 in
PBS at room temperature for 10
minutes. Permiabelization was
achieved using 0.25% of triton
X100 diluted in PBS (PBS-T) for
10 minutes at room temperature.
Further, it was used in dilution of
antibodies and wash.
Sections were then incubat-
ed with primary antibody. The
sections were then incubated
with biotinylated anti-mouse sec-
ondary antibody followed by
the avidin-biotin complex (ABC)
method (Vector, CA, USA). Final-
ly, the sections were visualized

484484
Hamdino M. Attia
with 3, 3-diaminobenzidine (DAB)
(Dojin, Japan).
Primary antibodies:Primary antibodies:
Anti-MBP (SMI 94), Mouse
monoclonal antibody against mye-
lin basic protein (MBP) recognizing
mature oligodendrocyte and mye-
lin sheath (Sternberger Monoclo-
nals inc., Maryland, USA).
The optimal concentrations of
the antibody were determined by
trying different concentrations
and choosing the optimum one
with least background staining.
The following concentration was
used (1: 2000).
The specimens were incubated
with the primary antibody in a
well-sealed humid chamber over-
night at 4˚C.
Quantification of oligoden-Quantification of oligoden-
drogyes Densitiesdrogyes Densities
Oligodendrocyte cell density
was quantified by counting MBP-
labeled cell bodies in optic nerves
at the chiasmal and retinal ends
from test and control rats using a
40 x objective lens, a rectile (10 x
10 grid), and Zeiss Axiophot mi-
croscope. The number of MBP-
labeled cells per grid area was de-
termined and the total area ana-
lyzed in each section was calculat-
ed. For each portion, total areas
and MBP+cells numbers were cal-
culated and expressed as cells/
mm2 of tissue.
Statistical analysis:Statistical analysis:
The data were expressed as
mean ± standard error of mean
(SEM). The significance of differ-
ences between results was deter-
mined by using Student t-test
and one-way analysis of variance
(ANOVA). In case of significant F
ratio Post Hook Turkey test for
multiple comparisons was done at
p<0.01 level of significance.
Statistical studies were done
using SPSS software package “ver-
sion 16”.
ResultsResultsAssessment of the densityAssessment of the density
and morphology of mylinatingand morphology of mylinating
oligodendrocye:oligodendrocye:
Mature oligodendrocytes were
labeled by antibodies detecting the
myelin basic protein (MBP) which
produced by the myelinating oligo-
dendrocutes and constitute 35%
of the total myelin sheath protein.

485485
Benha M. J.
Vol. 29 No 2 May 2012MBP+ cells were counted at
postnatal day 2, 5, 10 and 15 in
both the chiasmal and retinal
ends. The number was significant-
ly reduced in retinal end at all ex-
amined age groups (p value <0.01)
except at age of P15 where the dif-
ference in densities between both
ends was insignificant Table (1)
and Fig. (5).
The morphology of the MBP+
cells was changed with aging dur-
ing the first two post natal weeks
as it appeared polygonal with
short non branching processes in
P2 rats (Fig. 1). At P5 the cells ac-
quired longer processes which
were more abundant and more
branched at the chiasmal ends
more than in retinal ends (Fig. 2).
At P10 myelinated axons started
to appear especially at the retinal
end (Fig. 3). At P15 rats the fields
appeared to be fully occupied by
myelinated axons, in the chiasmal
end transverse and longitudinal
oriented myelinated fibers and
rows of MBP+cells seen in be-
tween them (Fig. 4).

486486
Hamdino M. Attia

487487
Benha M. J.
Vol. 29 No 2 May 2012

488488
Hamdino M. Attia
DiscussionDiscussionThe present study is designed
to trace the migration and diffe-
rentiation of OPCs "in vivo" by ap-
plying specific antibody directed
against the final stage in the
course of OPCs differentiation into
mature oligodendrocytes. And
compare the densities at the reti-
nal end of optic nerve with that at
the chiasmal end. In this respect,
the optic nerve was chosen as it
offers several advantages. First, it
is one of the simplest parts the
CNS, it contains only two main
cell types-astrocytes and oligoden-
drocytes in addition to the axons
of the retinal ganglion cells(3); sec-
ond, the majority of precursor ex-
pansion and all of oligodendrocyte
differentiation and myelination oc-
cur postnatally and can be easily
assayed(22).
The study of the oligodendro-
cyte lineage was facilitated by the
identification of the oligodendro-
cyte precursor using the A2B5 an-
tibody that recognizes a surface
ganglioside(18). Although this anti-
body was first used to label neu-
rons and is notoriously difficult to
use in vivo, when used in vitro, it
clearly identifies a small, round,
process-bearing cell that will be-
come an oligodendrocyte under
most conditions. These cells were
originally identified in cultures de-
rived from optic nerve but are
present throughout the CNS and
spinal cord(10). Initial studies of
the oligodendrocyte precursor
cells (OPCs) in vitro found that in
serum-free medium, the OP will
quickly differentiate and express
myelin-associated proteins. When
gown in 10% - 20% serum or
when treated with growth factors,
such as bone morphogenetic pro-
tein (BMP), the OP will continue to
express A2B5 and also express
glial fibrillary acidic protein
(GFAP), a major internal filament
associated astrocytes. Raff and
coworkers termed these novel cells
“type 2 astrocytes” to distinguish
them from the classic type of as-
trocytes (“type 1 astrocytes”). They
called the OP cells “O-2A” to credit
their bipotential nature(18). Sever-
al other antibodies are now known
to identify the OPCs; one detects
the alpha subunit of the re-
ceptor for platelet-derived growth
factor (PDGFRα) a potent mitogen,
survival and differentiation factor
for oligodendrocytes(12). Another
OPC antibody detects chondroitin

489489
Benha M. J.
Vol. 29 No 2 May 2012sulphate proteoglycan NG2 and
appears slightly after PDGFR?.
Both antibodies co-localize both
in vitro and in vivo and disap-
pear at differentiation(11). As
OPCs begin to differentiate, they
express a sulfated surface anti-
gen known as POA (pro-
oligodendroblast antigen) that is
recognized by the antibodies O4.
Expression of these antigens coin-
cides with the extension of numer-
ous branching processes and a
cessation of migration(2). The pro-
olgodendroblast is known to repre-
sent a transition stage that is
characterized by continued prolife-
ration but altered response to mi-
togens when compared to A2B5
+/O4-(9). As oligodendrocytes dif-
ferentiate, they begin to synthesize
the structural proteins of myelin.
Each of these is expressed at
specific time in the development
of the cell on both the RNA
and protein level. The first to ap-
pear is 2’,3’-cyclic nucleotide 3’-
phosphohydrolase, a basic myelin
protein that form 4% of all mye-
lin(19). More abundant myelin pro-
teins, proteolipid protein (PLP),
constitutes with its alternatively
spliced form, DM20 about 50% of
the protein mass of myelin and
myelin basic protein (MBP), con-
stitute 30%-40% of CNS myelin
protein, appear several days after
galactocerebrocide in cultured
cells(11). Several other minor com-
ponents of myelin have begun
to be characterized. For exam-
ple, myelin-associated glycopro-
tein (MAG) constitutes 1% of mye-
lin protein and is involved in
neuron-glial interaction(8).
In the present work, MBP anti-
body was used to label mature
oligodendrocytes which could be
detected at the chiasmal end of
the optic nerves derived from P2
rats while no positive cells could
be detected at the retinal ends of
that age. This finding is inconsis-
tent with earlier reports of Small
et al. (1987) who could not trace
MBP+cells at ages earlier than P4
rat in an "in vitro" study(21). Other
reports identified MBP+cells at the
chiasmal end at earlier ages(11)
who could detect MBP+ cells at
the chiasmal end as early as the
first day of postnatal life (P1).
With further aging MBP+ve cells
could be identified in both ends of
the optic nerve but with signifi-
cant difference in density being
much reduced in the retinal ends

490490
Hamdino M. Attia
compared with that in the chias-
mal ends up to age of P15 where
no significant difference could be
elicited, a finding which was con-
firmed by earlier reports(21,20&4).
Regarding the morphology, the
MBP+ve cells appeared less ma-
ture in early postnatal ages, being
less ramified with shorter process-
es at P2 and P5 ages compared to
more extensively ramified with
longer branching processes in
more mature cells at later ages
(P10 and P15). Maturation of olig-
odendrocytes is accompanied with
morphological changes. As they
begin to extend a complex mesh-
work of processes with the goal of
contacting multiple axons. Once
axoglial contact has been estab-
lished, oligodendrocytes produce
large amounts of specialized mem-
brane (myelin) that form multiple
wraps around the contacted ax-
ons. The final stages of myelina-
tion involve the expulsion of cyto-
plasm from the membrane wraps
to form compact myelin. In the
current study, the number of
myelinated axons at the retinal
end increased compared with
that in the chiasmal end at P10
and P15. This finding is consis-
tent with previous reports using
electron microscopic morphomet-
ric analysis(20&4). The molecular
events underlying oligodendrocyte
proliferation, survival, and matu-
ration are poorly understood, yet
knowledge of these processes is of
great value for the development of
therapeutics for demyelinating
diseases like MS(17).
ReferencesReferences1.1. Bakiri Y., Karadottir R.,Bakiri Y., Karadottir R.,
Cossell L. and Attwell D.Cossell L. and Attwell D.
(2011) :(2011) : Morphological and electri-
cal properties of oligodendrocytes
in the white matter of corpus cal-
losum and cerebellum. Journal of
Physiology; 589(3):559-73.
2.2. Bansal R., Stefansson K.Bansal R., Stefansson K.
and Pfeiffer S. E. (1992): and Pfeiffer S. E. (1992): Proligo-
dendroblast antigen (POA), a de-
velopmental antigen expressed by
A007/P4+ oligodendrocyte progen-
itors prior to the appearance o
sulfatide and galactocerebroside.
Journal of Neurochemistry; 58:
2221-29.
3.3. Barres B. and Raff M.Barres B. and Raff M.
(1994) : (1994) : Control of oligodendro-
cyte number in the developing
rat optic nerve. Neuron; 12 : 935-
942.

491491
Benha M. J.
Vol. 29 No 2 May 20124.4. Colello R., Devey L., Im-Colello R., Devey L., Im-
perato E. and Pott U. (1995) :perato E. and Pott U. (1995) :
Chronology of oligodendrocyte dif-
ferentiation in the rat optic nerve:
evidence for a ignaling step initiat-
ing myelination in the CNS. Jour-
nal of Neuroscince; 15 : 7665-
7672.
5.5. Dangata Y., Findlater G.Dangata Y., Findlater G.
and Kaufman M. (1996) :and Kaufman M. (1996) : Postna-
tal development of the optic nerve
in (C57BL * CBA) F1 hyprid mice:
general changes in morphometric
parameters. Journal of Anatomy;
189: 117-125.
6.6. Dugas J. C., Cuellar T. L.,Dugas J. C., Cuellar T. L.,
Scholze A., Ason B., Ibrahim A.,Scholze A., Ason B., Ibrahim A.,
Emery B., Zamanian J. L., FooEmery B., Zamanian J. L., Foo
L. C., McManus M. T. andL. C., McManus M. T. and
Barres B. A. (2010) : Barres B. A. (2010) : Dicer1 and
miR-219 Are required for nor-
mal oligodendrocyte differentiation
and myelination. Neuron; 65: 597-
611.
7.7. Fields R. D. (2010) :Fields R. D. (2010) :
Change in the brain's white mat-
ter. Science; 330 (6005): 768-9.
8.8. Filbin M. (1996) : Filbin M. (1996) : The
muddle with MAG. Molecular Cell
Neuroscience; 8: 84-92.
9.9. Gard A. L. and Pfeiffer S.Gard A. L. and Pfeiffer S.
E. (1990) :E. (1990) : Two proliferative stage
of oligodendrocyte lineage (A2B5-
O4+ and O4+GalC-) under differ-
ent mitogenic control. Neuron; 5:
615-25.
10.10. Grinspan J. B., Stern J.Grinspan J. B., Stern J.
L. and Pustilnik S. M. (1990) :L. and Pustilnik S. M. (1990) :
Cerebral white matter contains
PDGF-responsive precursors to
O2A cells. Journal of Neuroscince;
10 : 1861-73.
11.11. Grispan J. (2002) :Grispan J. (2002) : Cells
and signaling in oligodendrocyte
development. Journal of Neuropa-
thology and Experimental Neurol-
ogy; 61: 297-306.
12.12. Hart I., Richardson W.Hart I., Richardson W.
and Bolsover S. (1989) : and Bolsover S. (1989) : PDGF
and intracellular signaling in the
timing of oligodendrocye differenti-
ation. Journal of Cell Biology; 109:
3411-17.
13.13. Helfer J. L., Calizo H. L.,Helfer J. L., Calizo H. L.,
Dong W. K., Goodlett C. R.,Dong W. K., Goodlett C. R.,
Greenough W. T. and Klits A. K.Greenough W. T. and Klits A. K.
(2009) : (2009) : Bing-like postnatal al-
cohol exposure triggers cortical
gliogenesis in adulscent rats.
Journal of comparative neurology;

492492
Hamdino M. Attia
514(3): 259-271.
14.14. Hsu S., Raine L. andHsu S., Raine L. and
Fanger H. (1981) : Fanger H. (1981) : Use of avidin-
biotin-peroxidase complex (ABC)
in immunoperoxidase techniques:
A comparison between ABC and
unlabeled antibody (PAP) proce-
dures. Journal Histochemistryand
Cytochemistry; 29: 577-580.
15.15. Nave K. A. (2010) :Nave K. A. (2010) :
Myelination and support of axonal
integrity by glia. Nature; 468
(7321): 244-52.
16.16. N. I. H. publicationsN. I. H. publications
(1995) :(1995) : No. 96: 3926.
17.17. O’Meara R. W., MichalsjiO’Meara R. W., Michalsji
J. P. and Kothary R. (2011) : J. P. and Kothary R. (2011) : In-
tegrin signaling in oligodendrocy-
tes and its importance in CNS
myelination. Journal of Signal
Transduction; 10: 1155-1166.
18.18. Raff M. C. (1989) : Raff M. C. (1989) : Glial
cell diversification in the rat optic
nerve. Science; 243: 1450-1455.
19.19. Scherer S., Braun P. andScherer S., Braun P. and
Grinspan J. (1994) : Grinspan J. (1994) : Differen-
tial regulation of the 2’3’-cyclic
nucleotide 3’ - phosphodiastease
gene in oligodendrocyte develop-
ment. Neuron; 12: 1363-75.
20.20. Skoff R. (1990) : Skoff R. (1990) : Gliogen-
esis in rat optic nerve : astro-
cytes are generated in a single
wave before oligodendrocytes. De-
velopmental Biology; 139 : 149-
168.
21.21. Small R., Riddle P. andSmall R., Riddle P. and
Noble M. (1987) : Noble M. (1987) : Evidence for
migration of oligodendrocyte-type-
2 astrocyte progenitor cells into
the developing rat optic nerve. Na-
ture; 328: 155-157.
22.22. Ueda H., Levine J., Mill-Ueda H., Levine J., Mill-
er R. and Trapp B. (1999) : er R. and Trapp B. (1999) : Rat
optic nerve oligodendrocytes devel-
op in the absence of viable retinal
ganglion cell axons. Journal of
Cell Biology; 146: 1365-1374.
23.23. Yang Y., Lewis R. andYang Y., Lewis R. and
Miller R. H. (2011) : Miller R. H. (2011) : Interactions
between oligodendrocyte precur-
sors control the onset of CNS
myelination. Developmental biolo-
gy ; 350(1): 127 -138

493493
Benha M. J.
Vol. 29 No 2 May 2012
GLIOGENESIS OF THE OPTIC NERVEGLIOGENESIS OF THE OPTIC NERVEIN THE RAT DURING EARLYIN THE RAT DURING EARLY
POSTNATAL PERIODPOSTNATAL PERIOD
Hamdino M. Attia MDHamdino M. Attia MD
BENHAMEDICALJOURNAL
REPRINT
Published byPublished by
Benha Faculty of MedicineBenha Faculty of Medicine Volume 29 Number 2May 2012

493493
Benha M. J.
Vol. 29 No 2 May 2012
IntrodIntroductiouctionThe role of inadequate calcium
intake on acceleration of osteopor-
osis is well Known. The daily re-
quirement of calcium remains un-
der debate some authors suggest
EFFECT OF INTERACTION BETWEENEFFECT OF INTERACTION BETWEENNUTRITIONAL ELEMENTS CALCIUMNUTRITIONAL ELEMENTS CALCIUM
AND MANGANESE ON BONEAND MANGANESE ON BONEMINERAL DENSITY (BMD)MINERAL DENSITY (BMD)
Reham M. Shaat MD, Rehan M. S. El Baz A.Reham M. Shaat MD, Rehan M. S. El Baz A.and El-Defrawy M. M. MDand El-Defrawy M. M. MD
Departments of Rheumatology Rehabilitation and BiochemistryFaculty of Medicine, Analytical Chemistry Faculty of Science
Mansoura, University Hospital, Egypt
AbstractAbstractThe material for the present study included 24 patients with post –
menopausal osteoporosis selected from Rheumatology and Rehabilita-tion out patient clinic Mansoura university hospital with age range (40 –68 years) Bone mineral density (BMD) was determined using Dual ener-gy X-ray absorptiometry technique (DEXA). T score (hip) was (-2.5). 8healthy volunteers with matched age and sex served as (control group).Serum calcium, manganese, alkaline phosphatase and 24 hours uri-nary excretion of both calcium and phosphorous were determined for allpatients and volumteers. Both serum calcium and manganese concen-trations were found to be significantly decreased (P< 0.05) among pa-tients with post. Menopausal osteoporosis mean while serum alkalinephosphatase and 24 hours urinary excretion of both calcium and phos-phorous were significaully increased (P= < 0.05). Our results were dis-cussed in light of previous literature and we concluded that manganesedeficiency may lead to osteoporosis, probably through diminished bonecalcium fixation, decreased intestinal calcium, absorption, and in-creased urinary clearance of both calcium and phosphorous. Manga-nese and calcium dietary supplements are recommended particularlyfor elderly post-menopausal women.

494494
Reham M. Shaat, et al...
value of 1200 mg for peri-
menopausal women aged 35-50
years, and 1500 mg for post men-
opausal women(1) also manganese
is one of several trace elements,
that are necessary for bone
health, taking a combination of
Ca, Zinc copper and manganese
(Mn) reduce bone loss in post
menopausal women(2) in one set
of studies concerning interaction
between nutritional elements sup-
plemental calcium was found to
decrease slightly manganese bio-
availability(3) Mean while calcium
deficiency increased manganese
absorption(4) Recent studies have
led researchers(5)(6) to suggest
that it may be time to change the
hypothesis of osteoporosis as be-
ing a result of calcium deficien-
cy. The researchers suggest that
manganese which has a role in
fixation of calcium in bones could
be the real culprit(6) lack of man-
ganese was almost as if the glue
that sticks calcium to bones is
missing, the bones can’t absorp
and fix calcium and the body ex-
cretes excess of Ca in urine. The
primary aim of the present study
was to investigate, the effect of
interaction between nutritional
elements calcium and manga-
nese on bone mineral density
(BMD) a second objective was to
validate the new hypothesis sug-
gesting that manganese deficiency
may be the primary cause of oste-
oporosis.
Material and MethodsMaterial and MethodsThe material for the present
study included 24 patients with
post menopausal osteoporosis se-
lected from Rheumatology and Re-
habilitation,out patient clinic,
Mansoura University Hospital
with age range (40 - 68 years)
bone mineral density (BMD) was
determined using dual energy x-
ray obsorptiometry (DEXA) value
of T score(hip) was(-2.5). 8 healthy
volunteers with matched age and
sex served as (control group).
All patients and volunteersAll patients and volunteers
(control group) were subjected to(control group) were subjected to
the following study :the following study :
1) Determination of both ser-
um calcium and serum alka-
line phosphatase according
to the methods desribed by
Tietz NW (7)
2) Serum manganese concen-
tration was determined us-
ing Perkin Elmer atomic
absorption spectrophotome-
try (8)
3) 24 hours urine calcium

495495
Benha M. J.
Vol. 29 No 2 May 2012
and phosphorous excretion
were determined according
to the methods described by
Rockwell(9) Chernecky and
Berger (10)
ResultsResults1- Both serum calcium and
manganese concentrations were
found to be significantly decreased
(P = < 0.05) among patients with
post Menopausal osteoporosis (ta-
ble I , II).
2- serum alkaline phospha-
tase was found to be signifi-
cantly increased (P = < 0.05)
among patients with post meno-
pausal osteoporosis ompared with
healthy volunteers (control group)
table III.
3- 24 hours urinary excretion
of both calcium and phosphorous
were found to be significantly in-
creased (P = < 0.05) among post.
Menopausal osteoporotic patients
compared with control group (ta-
ble (IV).
4- Serum manganese concen-
tration was found to be signifi-
cantly lower (P = < 0.05) among
elderly post menopausal osteopo-
rotic patients with age > 60 years
compared with middle aged pa-
tients < 50 years table (V).

496496
Reham M. Shaat, et al...
DiscussionDiscussionIn the present study serum
manganese (Mn) concentration
was found to be significantly de-
creased among patients with
post - menopausal osteoporosis
similar finding was previously re-
ported in several studies(11)(12).
Women with osteoporosis have
been found to have not only de-
creased plasma or serum level of
Mn but also an enhanced plasma
response to an oral dose of Mn,
suggesting they have lower Mn
status, than women without oste-
oporosis(3). Manganese is one of
several trace elements, including
vanadium and boron, that are
necessary for bone health, taking
a combination of Ca, Zinc, Cop-
per and Mn reduce bone loss in
post - menopausal women, also
low levels of manganese in the
body can contribute to bone mal
formation and weakness (2) Mn
deficiency may also decrease plas-
ma oestrogen level(14) and aggre-
vate osteoprosis.
In the present study serum Mn

497497
Benha M. J.
Vol. 29 No 2 May 2012
concentration was found to be sig-
nificantly lower among elderly
post- menopausal osteoporotic
women with age > 60 years com-
pared with middle aged pa-
tients < 50 years. Elderly osteopo-
rotic women commonly absorps
less Mn due to both lost appetite
and inadequate dietary intake also
consumption of Mn is increased in
elderly, since manganese is com-
ponent of antioxidant enzyme su-
per - oxide dismutase which
helps to fight against free radicals
which damage cell membrane and
DNA and contribute to ageing(13).
Also brain consumption of Mn
is increased with age which ex-
haust manganese reserves since
brain function decline with age
and Mn helps to sustain brain
work, which uses (25%) of our en-
ergy intake when at rest (6).
In the present study serum
calcium concentration was found
to be significantly decreased
among patients with post - men-
opausal osteoporosis. the role of
prolonged inadequate calcium in-
take on the acceleration of osteo-
porosis is well known. One of the
most important uses of calcium is
to prevent and treat osteoporosis.
Hypocalcaemia observed in our
patients was assocciated with con-
comitant increase in 24 hours
urinary execration of both Ca and
phosphorous. Hypocalcaemia in
our patients may also be related
to possible multiple interactions
between (Ca) and (Mn). Calcium,
phosphorous and manganese
work closely together in the body
for this reason you may need more
manganese if you are getting more
calcium, calcium was reported to
accelerate the uptake of manga-
nese, and manganese retard the
uptake of Ca by brain Mitochon-
dria (13).
Recently researchers(5)(6) sug-
gest that manganese is neces-
sary for ca absorption and fix-
ation in bones, manganese
deficiency means not only de-
creased intestinal absorption of
Ca, but also Ca dose not stick
to bones, easyly released from
bones, and excreted in urine. Hy-
pocalcaemia in our patients was
associated with concomitant ele-
vation of serum alkaline phospha-
tase. Hypocalcaemia trigger para-
thyroid hormone release, which
increases urinary phosphate

498498
Reham M. Shaat, et al...
clearance, mobilize Ca from bone,
decrease bone mineral density
activate osteoblasic activity and
increase release of serum alka-
line phosphatase our results
were discussed in light of pre-
vious literature and we con-
cluded that manganese deficiency
may lead to osteoporosis probably
through diminished bone calcium
fixation and increased urinary
clearance of both calcium and
phosphate. Mn and Ca dietary
supplements are recommended
particularly for elderly post - men-
opausal women.
ReferencesReferences1.1. Heany R. P., Recker R. R.Heany R. P., Recker R. R.
and saville P. (1978) :and saville P. (1978) : Menopau-
sal changes in calcium balance
performance : j Lab clin Med 92 :
953.
2.2. Whelan A. M., jurgine T.Whelan A. M., jurgine T.
M. and Bowles S. K. (2006) :M. and Bowles S. K. (2006) :
Natural health products in the
prevention and treatment of osteo-
porosis : Ann pharmacother 40 (5)
836 - 49.
3.3. Jane Higdon (2001) : Jane Higdon (2001) : Mi-
cronutrient research for optimal
health (Ed) linus pauling insti-
tute of micronutrient information
Oregon state University.
4.4. Murphy V. A., et al.,Murphy V. A., et al.,
(1991) :(1991) : Elevation of brain manga-
nese in calcium deficient rate :
Neurotoxicology 265.
5.5. Broken deer AntlersBroken deer Antlers
(2012) : (2012) : Jan- Manganese deficien-
cy may lead to osteoporosis : The
Indian express 20 : 19.
6.6. Tomas Landete Castille-Tomas Landete Castille-
jos (2012) : jos (2012) : Alternative hypoth-
esis for the origin of osteoporo-
sis : Frontiers in Bio science 4
(1).
7.7. Tietz N. W. (1995) :Tietz N. W. (1995) : Clini-
cal guide to laboratory test 3ed
edition W.B saunders, philadel-
phia P. A.
8.8. Stock Well. P. B. andStock Well. P. B. and
corns W. T. (1993) : corns W. T. (1993) : The role of
atomic absorption fluorescence
environmental monitoring trace
element analysis : J automatic
chemistry : 15 (79 - 84).
9.9. RockWell G. F., MorganRockWell G. F., Morgan
M. G. and Broden G. (2008) :M. G. and Broden G. (2008) :
preliminary observations of

499499
Benha M. J.
Vol. 29 No 2 May 2012urinary calcium excretion in pre-
mature infants and adults Neona-
tology 93(4) 241 - 245.
10. Chernecky CC, Berger B,
(2008) Labortaory test and diag-
nostic procedures 5th edition St
Louis : saunders.
11.11. Reginster J. Y., StrauseReginster J. Y., Strause
L. G., Saltman P. and Franchi-L. G., Saltman P. and Franchi-
mont P. (1988) : mont P. (1988) : Trace elements
and post - menopause osteoporo-
sis, a preliminary study of de-
creased serum manganese : Med
Sci Res 16 337 - 338.
12.12. Freeland Gravis and Li-Freeland Gravis and Li-
anes C. (1994) : anes C. (1994) : Models to study
manganese deficiency in : Klimis -
Tavantzis DL, (Ed) manganese in
health and disease Boca Raton
CRC : press INC.
13.13. Kanji V., Montag A.,Kanji V., Montag A.,
Sandri G., Nordenbrand K. andSandri G., Nordenbrand K. and
Ernester L. (1985) : Ernester L. (1985) : Transport of
calcium and manganese by mito-
chondria from rat liver , heart and
brain : Biochimie vol 67 P 1241 -
1250.
14.14. Cao Shengfeng andCao Shengfeng and
Chen Lujiang (1987) : Chen Lujiang (1987) : Effect of
manganese on plasma concentra-
tion of oestrogen and progeste-
rone: J of Shanghai Jiatong Uni-
versity (1987 - O2).

500500
Reham M. Shaat, et al...
EFFECT OF INTERACTION BETWEENEFFECT OF INTERACTION BETWEENNUTRITIONAL ELEMENTS CALCIUMNUTRITIONAL ELEMENTS CALCIUM
AND MANGANESE ON BONEAND MANGANESE ON BONEMINERAL DENSITY (BMD)MINERAL DENSITY (BMD)
Reham M. Shaat MD, Rehan M. S. El Baz A.Reham M. Shaat MD, Rehan M. S. El Baz A.and El-Defrawy M. M. MDand El-Defrawy M. M. MD
BENHAMEDICALJOURNAL
REPRINT
Published byPublished by
Benha Faculty of MedicineBenha Faculty of Medicine Volume 29 Number 2May 2012

501501
Benha M. J.
Vol. 29 No 2 May 2012
ROLE OF EXERCISE REHABILITATION INROLE OF EXERCISE REHABILITATION INRHEUMATOID ARTHRITIS PATIENTSRHEUMATOID ARTHRITIS PATIENTS
Sahar S. Ganeb MD, Yasser A. Abd-El-Hamid MD,Sahar S. Ganeb MD, Yasser A. Abd-El-Hamid MD,Neama M. Mahmood MD*, Howyda M. Kamal MD**,Neama M. Mahmood MD*, Howyda M. Kamal MD**,
Hany A. Nowara MD***Hany A. Nowara MD***and Mohammad A. Ibrahim MD****and Mohammad A. Ibrahim MD****
Departments of Rheumatology, Physical Medicine & Rehabilitation, Cardiology*,Clinical & Chemical Pathology**, Physiology***, Faculty of Medicine
and Faculty of Physical Education****, Benha University, Egypt
AbstractAbstractObjective: Objective: The aim of the present work was to evaluate the effect of
exercise rehabilitation on general health, Pain, fatigue, disease activityscore (DAS-28) and quality of life in patients with rheumatoid arthritis(RA).
Subjects and Methods: Subjects and Methods: forty RA patients were divided into twogroups: group A: 20 patients who introduced into exercise rehabilitationprogram and group B: 20 patients who are not introduced into the exer-cise rehabilitation program and served as a control group. All patientswere subjected to full history taking, thorough clinical examination withevaluation at both the beginning and after twenty weeks of the trainingprogram. Assessment included general health, Pain, fatigue, assess-ment of disease activity using Disease Activity Score (DAS-28), quadri-ceps strength, grip strength and assessment of quality of life using theEuro health-related quality of life (QoL) questionnaire.
Results:Results: there were no statistical significant differences in all itemsof QoL between both groups at the entrance to the study. Statistical sig-nificant difference between both groups was observed at the end of thestudy as regards morning stiffness, general health, pain, fatigue, gripstrength, quadriceps strength, disease activity and all items of QoL.
Conclusions: Conclusions: This study supports the role of exercise rehabilitationin the management of patients with RA. We have found significant im-provement in general health, pain, fatigue, DAS-28 and quality of life in

502502
Sahar S. Ganeb, et al...
IntrodIntroductiouctionRheumatoid arthritis is a
chronic, systemic, autoimmune,
inflammatory condition that is as-
sociated with a reduced life expec-
tancy, patients with RA have re-
stricted range of motion of joints,
joints pain, reduced physical
functioning and higher mortality
rate(1). In addition to the direct ef-
fects of RA on joints, this disease
is characterized by a loss of mus-
cle mass(2).
RA is most prevalent in individ-
uals aged 40 years or older(3). Al-
though outcomes of the disease
have improved with modern ap-
proaches to drug treatment, the
disease is still a progressive one
with long-term joint damage and
disability(4).
Low physical activity is an im-
portant and reversible characteris-
tic of RA, it has been demonstrat-
ed that RA patients do less
exercise than the healthy popula-
tion; more than 80% of RA pa-
tients are physically inactive in
some countries, whilst in the UK it
is believed that approximately
68% of RA patients are physically
inactive(5). The extreme physical
inactivity of RA patients’ becomes
a vicious circle in terms of health
and disease progression, thus it
has become apparent that encour-
aging physical activity is an im-
portant and essential part of the
overall treatment of RA(4).
Habitual physical activity is de-
creased in RA patients due to joint
pain, restricted mobility, fatigue,
reduced muscle mass, strength,
and endurance, and these will
result in decreased physical
function and quality of life(6)
Low physical activity increases
the risk for RA patients to devel-
op cardiovascular disease, osteo-
porosis, insulin resistance, and
obesity(7).
patients with rheumatoid arthritis. Beneficial effects of exercise trainingwere evident in RA patients who introduced into exercise rehabilitationprogram compared with patients who were not introduced into exerciserehabilitation program.
Keywords: Keywords: Rheumatoid arthritis; Pain; Exercise; Fatigue; Health-related quality of life; Disease activity.

503503
Benha M. J.
Vol. 29 No 2 May 2012
Patients with RA have pain and
stiffness as the most limiting fac-
tors of their illness(8) and report
lower health-related quality of life
(QOL) than healthy individuals (9),
a relationship that is even more
pronounced for RA patients who
do not participate in regular phys-
ical activity (10). In the last few
decades, research illustrating the
importance of physical activity for
patients with RA has begun to ac-
cumulate. Several treatment trials
have demonstrated that physical
activity has positive impacts upon
pain, disease activity, and func-
tional status (11).
The aim of the present work
was to evaluate the effect of exer-
cise rehabilitation on general
health, Pain, fatigue, DAS-28 and
quality of life in patients with RA.
Subjects and MethodsSubjects and MethodsThe present study included for-
ty RA patients diagnosed accord-
ing to the American College of
Rheumatology/European League
Against Rheumatism Collaborative
Initiative(12), who were attending
the outpatients clinic of the Rheu-
matology and Rehabilitation De-
partment of Benha University
Hospitals, they were divided into
two groups:
Group A :Group A : 20 patients who in-
troduced into exercise rehabilita-
tion program, their mean ages
were 45.74±9.23 years and the
mean disease duration was
11.46±5.67 years.
Group B:Group B: 20 patients who are
not introduced into the exercise
rehabilitation program and served
as a control group. Their mean
ages was 43.76±8.23 years and
the mean disease duration was
10.56±6.39 years.
Eclusion Criteria: treatment
with >10 mg glucocorticoid per
day, noncompliance to disease
modifying anti-rheumatic drugs
(DMARD) treatment, disease activ-
ity score 28 (DAS-28) more than
5.1 in the past 3 months and/or
global functional status in RA
class III or IV(13), cardiovascular
events, i.e. transitory ischemic at-
tack, myocardial infarction, hyper-
tension, congestive heart failure,
stroke, major diseases which may
prevent exercise (cardiac failure or
late phase renal or pulmonary dis-
eases), high-grade mechanical or
degenerative disorders, other

504504
Sahar S. Ganeb, et al...
rheumatological diseases or ortho-
pedic or neurological disorder of
walking were excluded from the
study.
Informed written consents were
obtained from all participants and
the study was approved by the lo-
cal Ethical Committee.
All Patients Were Subjected toAll Patients Were Subjected to
the Following:the Following:
- Full history taking and thor-
ough clinical examination
with stress on:
- Body mass index (BMI) calcu-
lated by dividing body weight
in kilograms by the square of
body height in meters.
- Evaluation at both the be-
ginning and at the end of
the study (i.e. after twenty
weeks of the training pro-
gram).
Assessment:Assessment:
- Echocardiography: - Echocardiography: to ex-
clude RA organ manifesta-
tions, each patient had an
echocardiography assessment
before and at the end of the
study.
- Blood pressure tested before
and after each session.
- General health perception
rated on a 10cm visual an-
alogue scale (VAS) from ‘To-
tally fine’ (=0) to ‘Worst imag-
inable health’ (=10)(14).
- Perceived pain rated on a 10
cm VAS from ‘No pain’ (= 0) to
’Maximal pain’ (=10)(15).
- Fatigue rated on a 10 cm VAS
from ’No fatigue’ (=0) to
’Maximal fatigue’ (=10)(16-17).
- Disease Activity Score (DAS-
28) measures disease activity
based on erythrocyte sedi-
mentation rate, number of
swollen and tender joints and
self-reported general health
perception (VAS 0-10 cm
scale)(18). The DAS28 is
scored 0-10 with scores below
3.2 indicating low disease ac-
tivity and those up to 5.1 as
moderate disease activity.
- Quadriceps strength (QdS):- Quadriceps strength (QdS):
The force of the maximum volun-
tary contraction of the knee exten-
sors was measured. The subject

505505
Benha M. J.
Vol. 29 No 2 May 2012
sat upright in an adjustable
straight-backed chair with the
lower leg dependent and the knee
flexed to 90. A cuff was placed
round the leg just proximal to the
malleolus and attached horizon-
tally to an electrical strain gauge
with a digital readout. Quadriceps
strength was recorded from the
mean of three voluntary contrac-
tions separated by 1 minute inter-
val and expressed in Newton-
meter.
- Grip strength: - Grip strength: The force of
the maximum voluntary contrac-
tion of the hand was measured
using handheld dynamometer.
The test was done three times and
the mean was calculated.
- Assessment of quality of life:- Assessment of quality of life:
For assessing quality of life
the EuroQoL questionnaire was
used(19). The QoL questionnaire is
a standardized and valuing health
related quality of life. The QoL in-
strument measures five domains.
For each modality there are three
options. Each of the five domains
measured had points from 1 to 3,
hence the best performance of the
QOL is 15 degrees and the worst
performance of the QoL is 5 pints.
The score of each patient was re-
corded and the mean score of
each group was calculated for
both groups at initial presentation
and at the end of the study pro-
grams.
- Laboratory investigations:- Laboratory investigations:
serum concentrations of the fol-
lowing parameters were meas-
ured: complete blood count, ESR,
CRP, RF, serum glutamic oxaloa-
cetic transaminase (SGOT), serum
glutamate pyruvate transaminase
(SGPT), creatinine, and ALP.
Training programTraining program (20)
Combined strength and endu-
rance training program: The train-
ing programme was designed to
improve muscle strength, flexibili-
ty, endurance and balance. Twen-
ty subjects participated in a 20
weeks combined strength training
and endurance training program
undertaken in two sessions, on
non-consecutive days of the week.
A brief warm-up period required
10 min of stretching exercises be-
fore each training session began.
Strength training (ST)-During
the first 2 weeks of the training
program, patients began with

506506
Sahar S. Ganeb, et al...
resistance levels they could do
easily and increased gradually,
the weight was kept to a minimal
level so that the patients could
learn the exercise techniques and
allow muscles to adapt to the
training, as well as to prevent
muscle soreness and joint pain.
From the third week, the objective
of the training was to achieve
strengthening, so two sets of exer-
cises per muscle group were un-
dertaken each week.
The ST program consisted of a
series of exercises for major mus-
cle groups. Resistance and inten-
sity of exercise were designed after
individual evaluation of each pa-
tient and modified according to
pain, the available range of move-
ment and fatigue. Regular breaks
and relaxation sessions were al-
lowed. Each session was preceded
by a ‘warm-up’ and followed by a
‘cool-down’.
Endurance training (ET)-
Systematic ET was performed on a
cycle ergometer. During the first 4
weeks, ET participants trained for
15 min per session, two times per
week. From the fifth week, exer-
cise sessions were increased by 5
min every 4 weeks. Heart rate
(HR) was monitored continuously
throughout the training period.
Control groupControl group
The patients in the control
group were instructed to perform
stretching exercises twice a week,
without using additional resis-
tance, to maintain their joint mo-
bility. They were free to continue
their recreational physical activity
with the exception of ST or ET.
Statistical analysis:tatistical analysis:
The collected data were pre-
sented and analyzed using SPSS
version 17 soft was used. Suitable
statistical techniques were calcu-
lated as mean and standard devia-
tion. Student “t” test, was used as
a test of significance. P< 0.05 was
considered significant.
ResultsResults- Baseline characteristics of the
studied groups were repre-
sented in (table 1).
- There were no statistical
significant differences in all
items of QoL between both
groups at the entrance to
the study (table 2).

507507
Benha M. J.
Vol. 29 No 2 May 2012
- Statistical significant differ-
ence between both groups
was observed at the end of
the study as regards morning
stiffness, general health,
pain, fatigue, grip strength,
quadriceps strength and dis-
ease activity (table 3).
- Comparison of QoL between
both groups showed statisti-
cal significant improvement
in all items of QoL at the end
the study period (table 4).

508508
Sahar S. Ganeb, et al...
Discussion Discussion Rheumatoid arthritis (RA) is a
chronic inflammatory autoim-
mune disease, causing progressive
damage to the musculoskeletal
system and loss of function (21).
Joints pain is typically caused by
inflammation and in advanced
cases can relate to joint destruc-
tion, further limiting the patients’
physical activities(22). Conse-
quently, patients with RA suffer
from muscle loss and reduced
muscle strength(23), these factors
contribute to the loss of physical
function and quality of life(6).
The aim of the present work
was to evaluate the effect of exer-
cise rehabilitation on general
health, Pain, fatigue, DAS-28 and
quality of life in patients with
rheumatoid arthritis.
Cooney et al. 2011(4), reported
that exercise is fundamentally

509509
Benha M. J.
Vol. 29 No 2 May 2012
beneficial for RA patients, it re-
sults in improved cardiorespirato-
ry fitness and cardiovascular
health, increased muscle mass,
reduced adiposity (including at-
tenuated trunk fat), improved
strength, and physical function-
ing, all achieved without exac-
erbation of disease activity or
joint damage. Exercise training
in stable RA is effective in increas-
ing aerobic capacity, muscle
strength, joint mobility, and phys-
ical function with no detrimental
effect on disease activity in pa-
tients with controlled (24) or active
RA(25).
Exercise is an effective treat-
ment for various chronic muscu-
loskeletal pain disorders(26). Sev-
eral mechanisms are suggested to
play a role in exercise-induced en-
dogenous analgesia (EA), includ-
ing release of endogenous opioids
and growth factors(27), and activa-
tion of (supra) spinal nociceptive
inhibitory mechanisms orchestrat-
ed by the brain(28). These mecha-
nisms are related to cardiovascu-
lar changes (i.e. increase in heart
rate and blood pressure) during
exercise, patients with hyperten-
sion show reduced pain sensitivi-
ty(29). The interaction can be ex-
plained by similar brain stem
nuclei, neurotransmitters (e.g.
monoamines) and peptides (e.g.
opioids)(30). The exercise-induced
blood pressure activates arterial
baroreceptors, resulting in in-
creased supraspinal inhibition
sensitivity(29) and stimulation of
brain centers involved in pain
modulation(31).
Patients with RA usually suffer
from disability, severe pain, joint
stiffness, and fatigue which im-
pair physical function(32). Howev-
er, exercise has been shown to
significantly improve some or all
of these symptoms, especially
function as well as psychological
well-being(24, 33,34).
In the present study there were
statistical significant differences
between RA patients who intro-
duced into the rehabilitation pro-
gram and those who were not in-
troduced into the rehabilitation
program after the study period as
regards pain and disease activity.
This finding was in accordance
with those of Strasser and his col-
legues 2011(35), who found that
disease activity, the number of

510510
Sahar S. Ganeb, et al...
clinically active joints and pain
were found to be reduced after 6
months of combined strength and
endurance training in RA patients
and they reported that the typical
patient with RA is non-trained as
regards fitness and strength and
no negative outcomes for function
and disease activity was observed
with dynamic exercise training.
They also found improvement in
general health and functional abil-
ity in those patients after exercise
training.
Previous studies that assessed
exercise and the radiologic pro-
gression of the small joints found
that exercise, even long-term ST,
is safe for the joints of hands and
feet (36-39).
Fatigue limits overall function
in RA patients, it is frequently ex-
perienced in RA with 42% of RA
patients experiencing severe fa-
tigue(40). Often patients report fa-
tigue as one of the most annoying
symptoms(41). Fatigue can be de-
scribed as a subjective experience,
a feeling of “extreme, persistent
tiredness, weakness or exhaustion
which can be both mental and
physical” (42).
In the present study there was
statistical significant difference as
regards fatigue between RA pa-
tients and controls after the study
period. This finding was also con-
cluded by Neill et al 2006(34), who
reported that both aerobic and re-
sistance exercise interventions re-
duce RA fatigue in their review on
fatigue in RA patients.
Physical activity improves QOL
among patients with RA, this may
be explained, at least in part, by
improvements in patients’ per-
ceived control over their disease,
where the achievement of treat-
ment goals was shown to predict
increased feelings of control over
illness and increased QOL(43).
In the present study there was
statistical significant difference in
all items of QoL between RA pa-
tients who introduced into the re-
habilitation program and those
who does not introduced into the
rehabilitation program after the
study period. This result was in
accordance with those of Baillet et
al. 2009(44), who found improve-
ment in disease activity and QoL
in RA patients after 4-weeks of dy-
namic exercise programme.

511511
Benha M. J.
Vol. 29 No 2 May 2012Cooney et al. 2011, reported
that the importance for inclusion
of exercise training in the treat-
ment of RA is now clear and prov-
en, exercise in general seems to
improve overall function in RA
without any proven detrimental ef-
fects to disease activity, thus all
RA patients should be encouraged
to include some form of exercise
training as part of their routine
care.
ConclusionConclusionThis study supports the role of
exercise rehabilitation in the man-
agement of patients with RA. We
have found significant improve-
ment in general health, pain, fa-
tigue, DAS-28 and quality of life in
patients with rheumatoid arthri-
tis. Beneficial effects of exercise
training were evident in RA pa-
tients who introduced into exer-
cise rehabilitation program com-
pared with patients who were not
introduced into exercise rehabili-
tation program. More research is
required for the optimal period
and types of exercises.
ReferencesReferences1- Elkan A. C., Engvall I. L.,1- Elkan A. C., Engvall I. L.,
Cederholm T. and Hafström I.Cederholm T. and Hafström I.
(2009) : (2009) : Rheumatoid cachexia,
central obesity and malnutrition
in patients with low-active rheu-
matoid arthritis: feasibility of an-
thropometry, Mini Nutritional As-
sessment and body composition
techniques. European Journal of
Nutrition. 48(5):315-322.
2- Ekdahl C. and Broman G2- Ekdahl C. and Broman G
(1992) : (1992) : Muscle strength, endu-
rance and aerobic capacity in
rheumatoid arthritis: a compara-
tive study with healthy subjects.
Ann Rheum Dis 51:35-40.
3- Brosseau L., Wells G. A.,3- Brosseau L., Wells G. A.,
Tugwell P., et al. (2004) : Tugwell P., et al. (2004) : Ottawa
panel evidence-based clinical
practice guidelines for therapeutic
exercises in the management of
rheumatoid arthritis in adults.
Physical Therapy. 84 (10) 934-72.
4- Cooney J., Law R. J.,4- Cooney J., Law R. J.,
Matschke V., et al. (2011) :Matschke V., et al. (2011) : Ben-
efits of Exercise in Rheumatoid
Arthritis. Journal of Aging Re-
search. Volume 2011, Article ID
681640, 14 pages.
5- Sokka T. and Häkkinen A.5- Sokka T. and Häkkinen A.
(2008) :(2008) : Poor physical fitness
and performance as predictors of

512512
Sahar S. Ganeb, et al...
mortality in normal populations
and patients with rheumatic and
other diseases. Clinical and Ex-
perimental Rheumatology, vol. 26,
no. 5, pp. S14-S20.
6- Plasqui G. (2008) :6- Plasqui G. (2008) : The role
of physical activity in rheumatoid
arthritis. Physiol Behav 94:270-
275.
7- Summers G. D., Deighton7- Summers G. D., Deighton
C. M., Rennie M. J. and BoothC. M., Rennie M. J. and Booth
A. H. (2008) :A. H. (2008) : Rheumatoid ca-
chexia : a clinical perspective.
Rheumatology; 47(8):1124-1131.
8- Stenstrom C. H., Lindell8- Stenstrom C. H., Lindell
B., Swanberg E., et al. (1990):B., Swanberg E., et al. (1990):
Functional and psychosocial con-
sequences of disease and experi-
ence of pain and exertion in a
group of rheumatic patients con-
sidered for active training. Scand
J Rheumatol;19:374-82.
9- Uhlig T., Loge J. H., Kris-9- Uhlig T., Loge J. H., Kris-
tiansen I. S. and Kvien T. K.tiansen I. S. and Kvien T. K.
(2007) : (2007) : Quantification of reduced
health - related quality of life in
patients with rheumatoid arthri-
tis compared to the general
population. J Rheumatol. 34 :
1241-7.
10- Abell J. E., Hootman J.10- Abell J. E., Hootman J.
M., Zack M. M., et al. (2005):M., Zack M. M., et al. (2005):
PPhysical activity and health relat-
ed quality of life among people
with arthritis. J Epidemiol Com-
munity Health. 59:380-5.
11- Hakkinen K., Alen M.,11- Hakkinen K., Alen M.,
Kraemer W. J., et al. (2003) :Kraemer W. J., et al. (2003) :
Neuromuscular adaptations dur-
ing concurrent strength and endu-
rance training versus strength
training. Eur J Appl Physiol; 89 :
42-52.
12- Daniel Aletaha D., Tuhina12- Daniel Aletaha D., Tuhina
Neogi T., Alan J., et al. (2010):Neogi T., Alan J., et al. (2010):
An American College of Rheuma-
tology/European League Against
Rheumatism Collaborative Initia-
tive. ARTHRITIS & RHEUMATISM.
62(9) 2569-81.
13- Hochberg MC, Chang RW,13- Hochberg MC, Chang RW,
Dwosh I, et al. (1992): Dwosh I, et al. (1992): The Amer-
ican College of Rheumatology
1991 revised criteria for the classi-
fication of global functional status
in rheumatoid arthritis. Arthritis
Rheum;35:498-502.
14- Felson D. T., Anderson J.14- Felson D. T., Anderson J.
J., Boers M., et al. (1993) : J., Boers M., et al. (1993) : The
American College of Rheumatology

513513
Benha M. J.
Vol. 29 No 2 May 2012preliminary core set of disease ac-
tivity measures for rheumatoid ar-
thritis clinical trials. The Commit-
tee on Outcome Measures in
Rheumatoid Arthritis Clinical
Trials. Arthritis Rheum, 36 (6):
729-740.
15- Huskisson E. C. (1982) :15- Huskisson E. C. (1982) :
Measurement of pain. J Rheuma-
tol; 9(5):768-769.
16- Tack B. B. (1990) : 16- Tack B. B. (1990) : Self-
reported fatigue in rheumatoid ar-
thritis. A pilot study. Arthritis
Care Res; 3(3):154-157.
17- Wolfe F. (2004) :17- Wolfe F. (2004) : Fatigue
assessments in rheumatoid arthri-
tis: comparative performance of
visual analog scales and longer fa-
tigue questionnaires in 7760 pa-
tients. J Rheumatol. 31(10):1896-
1902.
18- Prevoo M. L., vant M. A.,18- Prevoo M. L., vant M. A.,
Kuper H. H., et al. (1995) :Kuper H. H., et al. (1995) :
Modified disease activity scores
that include twenty - eight - joint
counts. Development and valida-
tion in a prospective longitudinal
study of patients with rheuma-
toid arthritis. Arthritis Rheum;
38 (1) : 44 48.
19- Hurst N. P., Kind P., Ruta19- Hurst N. P., Kind P., Ruta
D., et al. (1997) : D., et al. (1997) : Measuring
health-related quality of life in
rheumatoid arthritis: validity, re-
sponsiveness and reliability of Eu-
roQol (EQ-5D). Br J Rheumatol;
36(5): 551-559.
20- Williams M. A., Haskell20- Williams M. A., Haskell
W. L., Ades P. A., et al. (2007) :W. L., Ades P. A., et al. (2007) :
Resistance training in individuals
with and without cardiovascular
disease: 2007 update. A scientific
statement from the American
heart association council on clini-
cal cardiology and council on nu-
trition, physical activity, and me-
tabolism. Circulation 116:572-584
21- Gough A., Lilley J., Ayre21- Gough A., Lilley J., Ayre
S., et al. (1994) : S., et al. (1994) : Generalized
bone loss patients with early rheu-
matoid arthritis. Lancet 344:23-
27.
22- Hicks E. J. (1990) : 22- Hicks E. J. (1990) : Exer-
cise in patients with inflammatory
arthritis and connective tissue
disease. Rheum Dis Clin North
Am 16:845-870.
23- Roubenoff R. (2003) :23- Roubenoff R. (2003) : Ex-
ercise and inflammatory disease.
Arthritis Rheum 49:263-266.

514514
Sahar S. Ganeb, et al...
24- Lemmey A. B., Marcora S.24- Lemmey A. B., Marcora S.
M., Chester K., et al. (2009) : M., Chester K., et al. (2009) : Ef-
fects of high-intensity resistance
training in patients with rheuma-
toid arthritis: a randomized con-
trolled trial,” Arthritis Care and
Research, vol. 61, no. 12, pp.
1726-1734.
25- Van Den Ende C. M.,25- Van Den Ende C. M.,
Breedveld F. C., Cessie S., et al.Breedveld F. C., Cessie S., et al.
(2000) : (2000) : Effect of intensive exer-
cise on patients with active rheu-
matoid arthritis: a randomised
clinical trial. Annals of the Rheu-
matic Diseases, vol. 59, no. 8, pp.
615-621.
26- Van Middelkoop M., Ru-26- Van Middelkoop M., Ru-
binstein S. M., Ver hagen A. P.,binstein S. M., Ver hagen A. P.,
et al. (2010) :et al. (2010) : Exercise therapy
for chronic nonspecific low-back
pain. Best Pract Res Clin Rheuma-
tol; 24:193-204.
27-Koltyn K. F. (2000) : 27-Koltyn K. F. (2000) : Anal-
gesia following exercise: a review.
Sports Med; 29:85-98.
28- Ray C. A. and Carter J. R.28- Ray C. A. and Carter J. R.
(2007) :(2007) : Central modulation of
exercise-induced muscle pain in
humans. J Physiol; 585 : 287-
294.
29- Koltyn K. F. and Umeda29- Koltyn K. F. and Umeda
M. (2006) : M. (2006) : Exercise, hypoalgesia
and blood pressure. Sports Med;
36: 207-214.
30- Ghione S. (1996) : 30- Ghione S. (1996) : Hyper-
tension-associated hypalgesia. Ev-
idence in experimental animals
and humans, pathophysiological
mechanisms, and potential clini-
cal consequences. Hypertension;
28 : 494-504.
31-Dworkin B. R., Elbert T.,31-Dworkin B. R., Elbert T.,
Rau H., et al. (1994) : Rau H., et al. (1994) : Central ef-
fects of baroreceptor activation in
humans: Attenuation of skeletal
reflexes and pain perception. Proc
Natl Acad Sci U S A. 91:6329-
6333.
32- Young A., Stokes M. and32- Young A., Stokes M. and
Iles J. F. (1987) :Iles J. F. (1987) : Effects of joint
pathology on muscle. Clinical Or-
thopaedics and Related Research,
vol. 219, pp. 21-27.
33- Brorsson S., Hilliges M.,33- Brorsson S., Hilliges M.,
Sollerman C. and Nilsdotter A.Sollerman C. and Nilsdotter A.
(2009) :(2009) : A six-week hand exer-
cise programme improves strength
and hand function in patients
with rheumatoid arthritis. Jour-
nal of Rehabilitation Medicine,

515515
Benha M. J.
Vol. 29 No 2 May 2012vol. 41, no. 5, pp. 338-342.
34- Neill J., Belan I. and Ried34- Neill J., Belan I. and Ried
K. (2006) :K. (2006) : Effectiveness of non-
pharmacological interventions for
fatigue in adults with multiple
sclerosis, rheumatoid arthritis, or
systemic lupus erythematosus: a
systematic review. Journal of Ad-
vanced Nursing, vol. 56, no. 6, pp.
617-635.
35- Strasser B., Leeb G.,35- Strasser B., Leeb G.,
Strehblow C., et al. (2011) : Strehblow C., et al. (2011) : The
effects of strength and endurance
training in patients with rheuma-
toid arthritis. Clin Rheumatol.
May; 30(5):623-32.
36- Häkkinen A., Sokka T.,36- Häkkinen A., Sokka T.,
Kautiainen H., et al (2004-a):Kautiainen H., et al (2004-a):
Sustained maintenance of exercise
included muscle strength gains
and normal bone mineral density
in patients with early rheumatoid
arthritis: a 5 year follow up. Ann
Rheum Dis 63:910-916.
37- de Jong Z., Munneke M.,37- de Jong Z., Munneke M.,
Zwinderman A., et al (2004) :Zwinderman A., et al (2004) :
Long term high intensity exercise
and damage of small joints in
rheumatoid arthritis. Ann Rheum
Dis 63:1399-1405.
38- de Jong Z., Munneke M.,38- de Jong Z., Munneke M.,
Zwinderman A. H., et al. (2003) :Zwinderman A. H., et al. (2003) :
Is a long term high-intensity exer-
cise program effective and safe in
patients with rheumatoid arthri-
tis? Results of a randomized con-
trolled trial. Arthritis Rheum
48:2415-2424.
39- Häkkinen A,. Sokka T.39- Häkkinen A,. Sokka T.
and, Hannonen P. (2004-b) : and, Hannonen P. (2004-b) : A
home-based two year strength
training period in early rheuma-
toid arthritis led to good long-term
compliance: a five-year follow-up.
Arthritis Rheum 51:56-62.
40- Van Hoogmoed D., Fran-40- Van Hoogmoed D., Fran-
sen J., Bleijenberg G. and vansen J., Bleijenberg G. and van
Riel P. (2010) :Riel P. (2010) : Physical and psy-
chosocial correlates of severe fa-
tigue in rheumatoid arthritis.
Rheumatology, vol. 49, no. 7, pp.
1294-1302.
41- Hewlett S., Carr M., Ryan41- Hewlett S., Carr M., Ryan
S., et al. (2005) :S., et al. (2005) : Outcomes gen-
erated by patients with rheuma-
toid arthritis: how important are
they?; Musculoskeletal Care, vol.
3, pp. 131-142.
42- Dittner A. J., Wessely S.42- Dittner A. J., Wessely S.
C. and Brown R. G. (2004) : C. and Brown R. G. (2004) : The

516516
Sahar S. Ganeb, et al...
assessment of fatigue: a practical
guide for clinicians and research-
ers. Journal of Psychosomatic Re-
search, vol. 56, no. 2, pp. 157-
170.
43- Fischer M., Scharloo M.,43- Fischer M., Scharloo M.,
Abbink J., et al. (2010) : Abbink J., et al. (2010) : The dy-
namics of illness perceptions: test-
ing assumptions of Leventhal’s
common-sense model in a pulmo-
nary rehabilitation setting. Br J
Health Psychol; 15:887-903.
44- Baillet A., Payraud E.,44- Baillet A., Payraud E.,
Niderprim V., et al. (2009) : Niderprim V., et al. (2009) : A
dynamic exercise programme to
improve patients’ disability in
rheumatoid arthritis : a prospec-
tive randomized controlled
trial. Rheumatology. 48 : 410 -
415.

517517
Benha M. J.
Vol. 29 No 2 May 2012
ROLE OF EXERCISEROLE OF EXERCISEREHABILITATION IN RHEUMATOIDREHABILITATION IN RHEUMATOID
ARTHRITIS PATIENTSARTHRITIS PATIENTS
Sahar S. Ganeb MD, Yasser A. Abd-El-Hamid MD,Sahar S. Ganeb MD, Yasser A. Abd-El-Hamid MD,Neama M. Mahmood MD, Howyda M. Kamal MD,Neama M. Mahmood MD, Howyda M. Kamal MD,
Hany A. Nowara MD and Mohammad A. Ibrahim MD Hany A. Nowara MD and Mohammad A. Ibrahim MD
BENHAMEDICALJOURNAL
REPRINT
Published byPublished by
Benha Faculty of MedicineBenha Faculty of Medicine Volume 29 Number 2May 2012

517517
Benha M. J.
Vol. 29 No 2 May 2012
EFFECT OF PEGYLATED INTERFERON ANDEFFECT OF PEGYLATED INTERFERON ANDRIBAVIRIN THERAPY IN HCV RELATEDRIBAVIRIN THERAPY IN HCV RELATED
NEPHROPATHYNEPHROPATHY
Tarek A El-Shazly MD and Mohamed Mosaad MD*Tarek A El-Shazly MD and Mohamed Mosaad MD*Departments of internal medicine, Mansoura University, and endemic
& infectious diseases*, Suez Canal University, Egypt.
AbstractAbstractBackground: Background: chronic hepatitis C infection is a major health prob-
lem, where it causes a major burden of illness for the patients and com-munity, however nephropathy is a common extra hepatic manifestationfor this diseases whether associated with cryoglobinemia or not; moreo-ver, the standard treatment of chronic HCV infection now is the com-bined peg-interferon and ribavirin.
Aim of the work: Aim of the work: This study was conducted to estimate the preva-lence of HCV-related nephropathy and cryoglobinemia in our settingand its response to the standard treatment of chronic hepatitis C name-ly (pegylated interferon and ribavirin).
Patient and method: Patient and method: eighty-four patients with chronic hepatitis Cgenotype 4 who were eligible for therapy with pegylated interferon andribavirin were tested for nephropathy (presence of proteinuria and/orheamaturia) and presence of cryoglobinemia before treatment, after 12weeks, at end of treatment(48 weeks), and 6 months after end of treat-ment.
Data analysis: Data analysis: The collected data was statistically managed by SPSSsoftware version 17. Chi-square (?2) was used to test statistically signif-icant difference among the qualitative variables and student t test inquantitative variables. The significance level was accepted if the p value≤ 0.05
Results:Results: the prevalence of nephropathy before treatment was 38.1%and prevalence of cryoglobinemia was 34.5% where both decreased seg-nifecantly to 16.7%. However nephropathy with cryoglobinemia moresignificantly responded to treatment while those with nephropathy and

518518
Tarek A El-Shazly and Mohamed Mosaad
IntrodIntroductiouctionHepatitis C virus (HCV) infec-
tion is a major public health prob-
lem with an estimated number
between 130 and 170 million peo-
ple infected worldwide and ac-
counts for over 1 million deaths as
a result of cirrhosis and liver
cancer[1,3]. Hepatitis C virus gen-
otype 4 (HCV-G4) is prevalent in
the Middle East and Africa and
has spread to several regions in
Europe [4]. Membranoproliferative
glomerulonephritis is thought to
be the most common extra he-
patic HCV infection, either cryog-
lobulinemic or noncryoglobuli-
nemic[5,6]. An association between
HCV infection and focal segmental
glomerulosclerosis (FSGS) and
membranous nephropathy has
also been reported[7,8]. Other
forms of kidney disease have been
previously linked to chronic HCV
infection, including acute exuda-
tive and proliferative glomerulo-
nephritis and immunoglobulin M
nephropathy [9]. Although in pa-
tients with HCV infection and
liver disease, renal involvement
may be mild or clinically silent[10], a study showed that patients
with HCV and age < 70 years have
a two folds increase in risk for de-
veloping end-stage renal disease
(ESRD) when compared with pa-
tients without HCV infection[11].
The principal clinical manifesta-
tions of glomerular disease in
HCV-infected patients are the
presence of proteinuria and mi-
croscopic hematuria with or with-
out impaired kidney function[12].
While the standard treatment of
HCV now is the combined peg-
ylated-interferon and ribavirin,
Of relevance is the fact that both
interferon (IFN)[13,14] and ribavi-
rin (RBV) [15,16] are excreted by
the kidney and their clearances
are impaired in patients with
kidney failure[17,18]. Consequent-
ly, both drugs should have their
doses adjusted according to the
degree of kidney function. How-
ever No dose adjustment is
no cryoglobinema showed insignificant decrease from 7.1% to only 6%.As regard the virological response EVR was 67.8%, but SVR was 47.6%.
Conclusion: Conclusion: HCV-related nephropathy associated with cryoglobine-mia responds significantly to standard therapy for HCV genotype 4 withpegylated interferon and ribavirin.

519519
Benha M. J.
Vol. 29 No 2 May 2012needed for patients with GFR > 60
ml/min [19].
Aim of the workAim of the workThis study was conducted to
estimate the prevalence of HCV-
related nephropathy and cryoglob-
inemia in our setting and its re-
sponse to the standard treatment
of chronic hepatitis C (namely
pegylated-interferon and ribavi-
rin).
Subjects:Subjects:
This was a prospective study
conducted in King Fahd hospital
in AlMadina Almonawara - KSA
between July 2008 and December
2011; our subjects were 84 con-
secutive eligible patients who at-
tended the gastroenterology and
hepatology clinic with chronic
hepatitis C genotype 4 and ful-
filled the criteria for interferon
therapy. Exclusion criteria were
the presence of diabetes, hyper-
tension, concurrent hepatitis B or
human immunodeficiency virus
infections, autoimmune hepatitis,
hemochromatosis, or Wilson’s dis-
ease; active alcohol consumption;
antiviral or corticosteroid treat-
ment; chronic renal disease or
history of dialysis; collagen vas-
cular disease, kidney calculus,
chronic pyelonephritis, and reflux
nephropathy, or any confounding
factor for proteinuria (such as fe-
ver, exercise, and dehydration).
Methods:Methods:
Before starting the standard
therapy for the patients, Blood
samples were collected after an
overnight fast. Serum creatinine
was measured by means of the
modified kinetic rate Jaffe meth-
od; and a random spot urine sam-
ple was obtained from each partic-
ipant using a clean-catch
technique and sterile containers,
and the sample was analyzed on
frozen nonhematuric specimens.
Urine protein was measured in a
24-hour urine sample, and protei-
nuria was defined as a urine pro-
tein level higher than 500 mg
(Dipstick, Biosystem, Germany).
Urine also was tested microscopi-
cally for detection of haematuria
where clinical nephropathy was
defined as proteinuria and/ or mi-
croscopic haematuria; finally
Cryogluobbenemia was measured
in all patients and all these tests
were repeated at the time of inves-
tigations for the early virological
response (EVR) after 3 monthhs,

520520
Tarek A El-Shazly and Mohamed Mosaad
at the end of treatment after 48
weeks and after 6 months of the
end of treatment at the time of
detecting the sustained virological
response (SVR). Our 84 patients
received 180 αg of peginterferon
α-2a (Pegasys®; Hoffmann-
LaRoche, Basel, Switzerland) sub-
cutaneously once weekly and ri-
bavirin (Copegus®; Hoffmann-La
Roche, Basel, Switzerland) at a
daily oral dose of 1000 mg (body
weight < 75 kg) or 1200 mg (body
weight > 75 mg) for 48 wk. and all
the patient had the standard
protocol for interferon therapy
follow up.
ResultsResultsOut of 84 patients with chronic
hepatitis C, who were fulfilled the
criteria for the standard therapy
with peginterferon α-2a and ribav-
irin, 56 (61.9%) were females
while 32 (38.1%) were males. The
mean age for the patients were
41.2 (ranging 21-48 years). Blood
urea, serum creatinin and glomer-
ular filtration rate were normal in
all patients (table 1), however,
clinical nephropathy was evident
in 32 patients (38.1%), out of
them 26 patients (81.3%) had
cryoglobulinemia and only 6 pa-
tients (18.7%) have nephropathy
without cryoglobulinemia (table
2). After 3 months of starting the
therapy EVR was achieved in 57
patients out of 84 (67.8%), while
cure of nephropathy was achieved
in 2 patients out of 32 (6.3%)
both of them had cryoglobinemia
and showed EVR while there was
no improvement for those with
nephropathy without cryoglobine-
mia. at the end of treatment the
virological response was achieved
in 43 patients (51.2%), and neph-
ropathy cured in 21 out of 32 pa-
tients with nephropathy (65.6%),
after 6 months of treatment SVR
achieved in 40 patients (47.6%),
while cure of nephropathy persist
in 18 patients (56.2%) (Figures
2, 3). Cryoglobinemia was found
in 29 patients out of 84 (34.5%)
before treatment, however the
prevalence were 33.3% (28 pa-
tients), 14.3% (12 patients), and
16.7% (14 patients) after 3
months of treatment, end of treat-
ment and 6 months after treat-
ment respectively.
Patients with nephropathy
and cryoglobinemia decline sig-
nificantly from 31% (26 patients)
before treatment to 28.6% (24

521521
Benha M. J.
Vol. 29 No 2 May 2012
patients) after 3 months of thera-
py and finally became 10.7% (9
patients) after 6 month of end
of treatment, while those with
nephropathy without cryoglobine-
mia changed from 7.1% (6 pa-
tients) before treatment to only
5.9% (5 patients) at end of
treatment and persists the same
6 months after treatment which
was statistically insignificant (fig-
ure 1).

522522
Tarek A El-Shazly and Mohamed Mosaad

523523
Benha M. J.
Vol. 29 No 2 May 2012
DiscussionDiscussionThere is no doubt that chronic
hepatitis C, nephropathy and
cryoglobinemia are interrelated
subjects. Although the mecha-
nisms that cause renal damage
are not fully elucidated[20], it
seems that the formation of im-
mune complexes [HCVantigens,
anti-HCV IgG antibody and rheu-
matoid factor (RF) IgM] contribute
to the insitu tissue destruction
owing to the deposition of virus
nuclear protein and immunoglob-
ulins in the glomerular capillary
wall, renal interstitium and tu-
bules[21]. While Cryoglobulins are
cold-insoluble immune complexes
containing IgM rheumatoid fac-
tor, polyclonal IgG, HCV RNA
and complement. Deposition of
cryoglobulins on the vascular en-
dothelium of organs such as
skin, nerves and kidneys can in-
duce a vasculitis that clinically
manifests as palpable purpura,
arthritis, neuropathy or glomeru-
lonephritis[22].
However the prevalence of
nephropathy and cryoglobinemia
in patients with chronic hepatitis
C showed significant variations
between studies; in our study
nephropathy was found to be
38.1% which is matched with a

524524
Tarek A El-Shazly and Mohamed Mosaad
study by Derball et al, who report-
ed a prevalence of 39.7% in all his
study sample with chronic hepati-
tis C being higher in diabetics
compared to non diabetics (49.6%
versus 37.6%) [23]; nevertheless
other studies shows variations be-
tween 4% up to 50%[24,27]. The
same discrepancy can be applied
to the prevalence of cryoglobine-
mia; while in our study it was
34.5% which is not far from the
study by Diana et al where it was
37.5% [24], and an important mis-
analysis which reported a mean
prevalence of cryoglobinemia to be
44% [28]; however other studies
shows variations from 25% up to
100%. These variations can be ex-
plained on the bases of the differ-
ences for the study sample as
regard viral genotype, the dura-
tion of illness, the type and de-
gree of renal pathology, pres-
ence of other co-morbid condition
specially diabetes and the sample
size[24,26,28,29]. More over the
prevalence of nephropathy with
cryoglobinema in our study was
more than those with nephrop-
athy without cryoglobinemia
[81.3% versus 18.7%], and this
obvious relationship was reported
in many other studies[30,32], as
most of HCV-related nephropathy
is due to cryoglobinemia while
20% to 30% of positive HCV cryo-
globinemic patients have clinically
renal diseases. As regard the
treatment and according to the
guidelines Treatment regimens
and their doses will vary with the
severity of the kidney disease. No
dose adjustment is needed for pa-
tients with GFR > 60 ml/min [19].
This recommendation is based on
the results of three large random-
ized trials that were completed in
IFN-naive patients with normal
kidney function [33,35]. The effica-
cy and safety of combined IFN and
RBV therapy is not affected in pa-
tients with a GFR > 50 ml/min/
1.73 m2. As such, the results re-
ported in patients with normal
kidney function treated with peg-
IFN and RBV should apply to kid-
ney disease stages 1 and 2. So we
apply these recommendations for
our patients as all of them having
normal renal functions. SVR was
achieved in 47.6% of our patients
which is reasonable in genotype 4,
normal kidney function with or
without cryoglobinemia and using
the standard therapy and go with
other studies [36,37]. Moreover,
we get a significant improvement

525525
Benha M. J.
Vol. 29 No 2 May 2012in nephropathy after completion of
the treatment and 6 months after
treatment, and this was more
marked in those with cryoglobene-
mia more than those without cryo-
globinemia; and when looking to
cure curves through treatment
course, both of nephropathy and
cryoglobinemia were positively
correlated and always preceded by
a significant viremic cure; and
though other studies showed a
significant improvement in protei-
nuria and other kidney diseases
due to HCV infection, better
outcomes have been achieved
by combined use of IFN with
RBV[38-41], and peg-IFN with
RBV[42-46]. For instance, Sabry et
al.[41] treated 20 patients with IFN
for 3 months, and in case of no-
response addition of RBV 15 mg/
kg for 12 months, Proteinuria was
markedly reduced while serum
creatinine was unchanged. Simi-
larly, Bruchfeld et al.[38] treated 7
patients with IFN- 2 b 3 MU (n =
4) or 1.5 MU (n = 1) 3times weekly
or peg-IFN- 2 b 50 g once a week
(n = 2) + RBV 200-800 mg daily
for 24 weeks to 15 months and
showed SVR in 71.4% (5 patients).
Proteinuria was markedly re-
duced, hematuria resolved in 6 of
7 patients and GFR improved in 3
patients and was stable in others.
Results were stable at 24 months
of follow- up. While, Alric et al.
[43] treated 18 patients with IFN-
2b (3 MU 3 times weekly, (n = 14)
or peg-IFN- 2 b (1.5 g/kg per
week, n = 4) and RBV 600-1,000
mg/day for 6-24 months. SVR
occurred in 66.7% of the patients,
and only patients with SVR
showed reduction of proteinuria.
These differences can be explained
as a result of different kidney pa-
thology and the renal function, as
most of these studies showed sig-
nificant glomerulonephritis in re-
nal biopsy. Nevertheless, those pa-
tients with nephropathy without
cryoglobinemia in our study, did
not show a reliable improvement
which may reflect a persistent and
irreversible direct pathological ef-
fect of HCV, or presence of other
intrinsic renal cause which need
renal biopsy for better diagnosis.
ConclusionConclusionHCV-related nephropathy and
cryoglobinemia are prevalent con-
ditions and significantly improved
in response to peg-interferon and
ribavirin in patients with normal
renal functions, on the contrary,

526526
Tarek A El-Shazly and Mohamed Mosaad
nephropathy without cryoglobine-
mia poorly respond to this stan-
dard therapy and need further
studies.
ReferencesReferences1- Williams R. (2006) : 1- Williams R. (2006) : Global
challenges in liver disease. Hepa-
tology; 44: 521-526.
2- Poynard T., Yuen M. F.,2- Poynard T., Yuen M. F.,
Ratziu V. and Lai C. L. (2003) :Ratziu V. and Lai C. L. (2003) :
Viral hepatitis C. Lancet; 362:
2095-2100.
3- Alter M. J. (2007) : 3- Alter M. J. (2007) : Epidem-
iology of hepatitis C virus infec-
tion. World J Gastroenterol; 13 :
2436-2441.
4- Kamal S. M. (2009) : 4- Kamal S. M. (2009) : Hepa-
titis C genotype 4 therapy: in-
creasing options and improving
outcomes. Liver Int; 29 Suppl 1:
39-48.
5- Johnson R. J., Gretch D.5- Johnson R. J., Gretch D.
R., Couser W. G., et al. (1994) :R., Couser W. G., et al. (1994) :
Hepatitis C virus-associated glom-
erulonephritis. Effect of alpha in-
terferon therapy. Kidney Int.;
46:1700-4.
6- Ohsawa I., Ohi H., Endo6- Ohsawa I., Ohi H., Endo
M., Fujita T., Seki M. and Wata-M., Fujita T., Seki M. and Wata-
nabe S. (1999) : nabe S. (1999) : High prevalence
of hepatitis C virus antibodies
in older patients with membra-
noproliferative glomerulonephritis.
Nephron.; 82:366-.
7- Altraif IH. , Abdulla AS, al7- Altraif IH. , Abdulla AS, al
Sebayel MI, Said RA, al Suhai-Sebayel MI, Said RA, al Suhai-
bani MO, Jones AA. (1995) :bani MO, Jones AA. (1995) :
Hepatitis C associated glomerulo-
nephritis. Am J Nephrol.;15:407-
10.
8- Stehman-Breen C., Alpers8- Stehman-Breen C., Alpers
C. E., Couser W. G., Willson R.C. E., Couser W. G., Willson R.
and Johnson R. J. (1995) : and Johnson R. J. (1995) : Hep-
atitis C virus associated mem-
branous glomerulonephritis. Clin
Nephrol.; 44:141-7.
9-Kamatsoda A., Imai H., Wa-9-Kamatsoda A., Imai H., Wa-
hui H., et al. (1996) :hui H., et al. (1996) : Clinico-
pathological analysis and therapy
in HCV associated nephropathy.
Intern Med.; 35:529-33.
10- Radhakrishnan J., Uppot10- Radhakrishnan J., Uppot
R. N. and Colvin R. B. (2010) :R. N. and Colvin R. B. (2010) :
Case records of the Massachusetts
General Hospital. Case 5-2010. A
51-year-old man with HIV infec-
tion, proteinuria, and edema. N
Engl J Med; 362: 636-646.

527527
Benha M. J.
Vol. 29 No 2 May 201211- Tsui J. I., Vittinghoff E.,11- Tsui J. I., Vittinghoff E.,
Shlipak M. G., et al. (2007) : Shlipak M. G., et al. (2007) : As-
sociation of hepatitis C seroposi-
tivity with increased risk for devel-
oping end-stage renal disease.
Arch Intern Med; 167: 1271-1276.
12- Sabry A., E-Agroudy A.,12- Sabry A., E-Agroudy A.,
Sheashaa H., El-Husseini A.,Sheashaa H., El-Husseini A.,
Mohamed Taha N., Elbaz M.Mohamed Taha N., Elbaz M.
and Sobh M. (2005) : and Sobh M. (2005) : HCV asso-
ciated glomerulopathy in Egyptian
patients: clinicopathological analy-
sis. Virology; 334: 10-16.
13- Bino T., Madar Z., Gertler13- Bino T., Madar Z., Gertler
A. and Rosenberg H. (1982) :A. and Rosenberg H. (1982) :
The kidney is the main site of in-
terferon degradation. J Interferon
Res 2 : 301-308.
14- Bocci V., Pacini A., Mus-14- Bocci V., Pacini A., Mus-
cettola M., Paulesu L., et al.cettola M., Paulesu L., et al.
(1981) :(1981) : Renal filtration, absorp-
tion and catabolism of human-
interferon. J Interferon Res; 1 :
347-352.
15- Glue P. (1999) : 15- Glue P. (1999) : The clini-
cal pharmacology of ribavirin.
Semin Liver Dis; 19(suppl 1):17-
24.
16- Kramer T. H., Gaar G. G.,16- Kramer T. H., Gaar G. G.,
Ray C. G., et al. (1990) : Ray C. G., et al. (1990) : Hemodi-
alysis clearance of intravenously
administered ribavirin. Antimicrob
Agents Chemother; 34: 489-490.
17- Rostaing L., Chatelut E.,17- Rostaing L., Chatelut E.,
Payen J. L., et al. (1998) : Payen J. L., et al. (1998) : Phar-
macokinetics of IFN-2b in chronic
hepatitis C virus patients under-
going chronic hemodialysis or
with normal renal function: clini-
cal implications. J Am Soc Neph-
rol; 9: 2344-2348.
18- Uchihara M., Izumi N.,18- Uchihara M., Izumi N.,
Sakai Y., et al. (1998) : Sakai Y., et al. (1998) : Interfer-
on therapy for chronic hepatitis C
in hemodialysis patients: in-
creased serum levels of interferon.
Nephron; 80: 51-56.
19- KDIGO. (2008) : 19- KDIGO. (2008) : Clinical
practice guidelines for the preven-
tion, diagnosis, evaluation, and
treatment of hepatitis C in chronic
kidney disease. Kidney Int Suppl:
S69-S77.
20- Kamar N., Rostaing L., Al-20- Kamar N., Rostaing L., Al-
ric L. (2006) : ric L. (2006) : Treatment of hepa-
titis C virus-related glomerulo-
nephritis. Kidney Int; 69 : 436-9.
21- Fabrizi F., Lunghi G.,21- Fabrizi F., Lunghi G.,

528528
Tarek A El-Shazly and Mohamed Mosaad
Messa P. and Martin P. (2008) :Messa P. and Martin P. (2008) :
Therapy of hepatitis C virus asso-
ciated glomerulonephritis: current
approaches. J Nephrol; 21 : 813-
25.
22- Perico N., Cattaneo D.,22- Perico N., Cattaneo D.,
Bikbov B. and Remuzzi G.Bikbov B. and Remuzzi G.
(2009) : (2009) : Hepatitis C infection and
chronic renal diseases. Clin J Am
Soc Nephrol; 4 : 207- 220.
23 - Moutaz Derbala, Fatma23 - Moutaz Derbala, Fatma
M Shebl, Awad Rashid, AliaaM Shebl, Awad Rashid, Aliaa
Amer, Abdulbari Bener (2010) :Amer, Abdulbari Bener (2010) :
Microalbuminuria in hepatitis C-
genotype 4: Effect of pegylated in-
terferon and ribavirin World J
Gastroenterol March 14; 16(10):
1226-1231.
24- Diana V., Stefanova, et al,24- Diana V., Stefanova, et al,
(2007) : (2007) : Chronic hepatitis C vi-
rus infection : Prevalence of extra
hepatic manifestations and associ-
ation with cryoglobulinemia in
Bulgarian patients: World J Gas-
troenterol December 28;13(48):
6518-6528.
25- Saddadi F., Attari F., Na-25- Saddadi F., Attari F., Na-
jafi I., Gangi M. R., Hakemi M.jafi I., Gangi M. R., Hakemi M.
and Amini M. (2010) :and Amini M. (2010) : Renal in-
volvement in patients with hepati-
tis C virus infection. Iran J Kidney
Dis. Apr; 4(2):123-7.
26- Morcos N. Y., Hassanein26- Morcos N. Y., Hassanein
M. H., Eliase N. Y., BayoumiM. H., Eliase N. Y., Bayoumi
Eel D. and Mustafa I. M.Eel D. and Mustafa I. M.
(2010) : (2010) : Chronic hepatitis C virus
infection : prevalence of cryoglo-
bulinemia and renal affection in
the Egyptian patients. J Egypt Soc
Parasitol. Aug;40(2):539-50.
27- Liangpunsakul S. and27- Liangpunsakul S. and
Chalasani N. (2005) : Chalasani N. (2005) : Relation-
ship between hepatitis C and mi-
croalbuminuria: results from the
NHANES III.Kidney Int; 67 : 285-
290.
28-Kayali Z., Buckwold V. E.,28-Kayali Z., Buckwold V. E.,
Zimmerman B. and Schmidt W.Zimmerman B. and Schmidt W.
N. (2002) :N. (2002) : Hepatitis C, cryoglobu-
linemia, and cirrhosis : a meta-
analysis. Hepatology; 36 : 978-
985.
29- Lapinski TW, Parfieniuk29- Lapinski TW, Parfieniuk
A, Rogalska-Plonska M, Czaj-A, Rogalska-Plonska M, Czaj-
kowska J, Flisiak R. (kowska J, Flisiak R. (2009) :2009) :Prevalence of cryoglobulinaemia in
hepatitis C virus- and hepatitis C
virus/human immunodeficiency
virus-infected individuals: implica-
tions for renal function. Liver Int.

529529
Benha M. J.
Vol. 29 No 2 May 2012Sep; 29(8):1158-61. Epub 2009
Jul 7
30- Ferri C., Sebastiani M.,30- Ferri C., Sebastiani M.,
Giuggioli D., Cazzato M., Lon-Giuggioli D., Cazzato M., Lon-
gombardo G., Antonelli A., Puc-gombardo G., Antonelli A., Puc-
cini R., Michelassi C. andcini R., Michelassi C. and
Zignego A. L. (2004) : Zignego A. L. (2004) : Mixed
cryoglobulinemia : demographic,
clinical, and serologic features
and survival in 231 patients.
Semin Arthritis Rheum ; 33 : 355-
374.
31- Cacoub P., Poynard T.,31- Cacoub P., Poynard T.,
Ghillani P., Charlotte F., OliviGhillani P., Charlotte F., Olivi
M., Piette J. C. and Opolon P.M., Piette J. C. and Opolon P.
(1999) :(1999) : Extrahepatic manifesta-
tions of chronic hepatitis C.
MULTIVIRC Group. Multidepart-
ment Virus C. Arthritis Rheum;
42: 2204-2212.
32- Daghestani L. and Pome-32- Daghestani L. and Pome-
roy C. (1999) :roy C. (1999) : Renal manifesta-
tions of hepatitis C infection. Am J
Med; 106: 347-354.
33- Fried M. W., Shiffman M.33- Fried M. W., Shiffman M.
L., Reddy K. R., et al. (2002) :L., Reddy K. R., et al. (2002) :
Peginterferon alfa-2a plus ribavi-
rin for chronic hepatitis C virus
infection. N Engl J Med; 347: 975-
982.
34- Manns M. P., McHutchi-34- Manns M. P., McHutchi-
son J. G., Gordon S. C., et al.son J. G., Gordon S. C., et al.
(2001) :(2001) : Peginterferon alfa-2b plus
ribavirin compared with interferon
alfa-2b plus ribavirin for initial
treatment of chronic hepatitis C :
a randomised trial. Lancet; 358 :
958-965.
35- Hadziyannis S. J., Sette35- Hadziyannis S. J., Sette
H. Jr., Morgan T. R., et al.H. Jr., Morgan T. R., et al.
(2004) : (2004) : Peginterferon- 2 alfa and
ribavirin combination therapy in
chronic hepatitis C: a randomized
study of treatment duration and
ribavirin dose. Ann Intern Med;
140: 346-355.
36 - Ghany M. G., Strader D.36 - Ghany M. G., Strader D.
B., Thomas D. L. and Seeff L. B.B., Thomas D. L. and Seeff L. B.
(2009) : (2009) : Diagnosis, management,
and treatment of hepatitis C: an
update. Hepatology; 49: 1335-
1374.
37- Dore M. P., Fattovich G.,37- Dore M. P., Fattovich G.,
Sepulveda A. R. and Realdi G.Sepulveda A. R. and Realdi G.
(2007) : (2007) : Cryoglobulinemia related
to hepatitis C virus infection. Dig
Dis Sci; 52: 897-907.
38- Bruchfeld A., Lindahl K.,38- Bruchfeld A., Lindahl K.,
Stahle L., et al. (2003) : Stahle L., et al. (2003) : Interfer-
on and ribavirin treatment in

530530
Tarek A El-Shazly and Mohamed Mosaad
patients with hepatitis C-
associated renal disease and renal
insufficiency. Nephrol Dial Trans-
plant; 18 : 1573-1580.
39- Garini G., Allegri L., Car-39- Garini G., Allegri L., Car-
nevali L., et al. (2001) :nevali L., et al. (2001) : Interfer-
on- in combination with ribavirin
as initial treatment for hepatitis C
virus-associated cryoglobulinemic
membranoproliferative glomerulo-
nephritis. Am J Kidney Dis;
38:E35.
40- Rossi P., Bertani T.,40- Rossi P., Bertani T.,
Baio P., et al. (2003) : Baio P., et al. (2003) : Hepatitis
C virus-related cryoglobulinemic
glomerulonephritis: long-term re-
mission after antiviral therapy.
Kidney Int; 63: 2236-2241.
41- Sabry A. A., Sobh M. A.,41- Sabry A. A., Sobh M. A.,
Sheaashaa H. A., et al. (2002) :Sheaashaa H. A., et al. (2002) :
Effect of combination therapy (ri-
bavirin and interferon) in HCV-
related glomerulopathy. Nephrol
Dial Transplant; 17: 1924-1930.
42- Garini G., Allegri L., Lan-42- Garini G., Allegri L., Lan-
nuzzella F., et al. (2007) : nuzzella F., et al. (2007) : HCV-
related cryoglobulinemic glomeru-
lonephritis: implications of antivi-
ral and immunosuppressive thera-
pies. Acta Biomed; 78: 51-59.
43- Alric L., Plaisier E., The-43- Alric L., Plaisier E., The-
bault S., et al. (2004) : bault S., et al. (2004) : Influence
of antiviral therapy in hepatitis C
virus-associated cryoglobulinemic
MPGN. Am J Kidney Dis; 43: 617-
623.
44- Cacoub P., Saadoun D.,44- Cacoub P., Saadoun D.,
Limal N., et al. (2005) : Limal N., et al. (2005) : Pegylated
interferon alfa-2b and ribavirin
treatment in patients with hepati-
tis C virus-related systemic vascu-
litis. Arthritis Rheum;52:911-915.
45- Mazzaro C., Zorat F.,45- Mazzaro C., Zorat F.,
Caizzi M., et al. (2005) : Caizzi M., et al. (2005) : Treat-
ment with peg-interferon alfa-2b
and ribavirin of hepatitis C virus-
associated mixed cryoglobuline-
mia: a pilot study. J Hepatol; 42 :
632-638.
46- Saadoun D., Resche-46- Saadoun D., Resche-
Rigon M., Thibault V., et al.Rigon M., Thibault V., et al.
(2006) : (2006) : Antiviral therapy for hep-
atitis C virus associated mixed
cryoglobulinemia vasculitis: a
long-term follow-up study. Arthri-
tis Rheum; 54: 3696-3706.

531531
Benha M. J.
Vol. 29 No 2 May 2012
EFFECT OF PEGYLATEDEFFECT OF PEGYLATEDINTERFERON AND RIBAVIRIN THERAPYINTERFERON AND RIBAVIRIN THERAPY
IN HCV RELATED NEPHROPATHYIN HCV RELATED NEPHROPATHY
Tarek A El-Shazly MD and Mohamed Mosaad MDTarek A El-Shazly MD and Mohamed Mosaad MD
BENHAMEDICALJOURNAL
REPRINT
Published byPublished by
Benha Faculty of MedicineBenha Faculty of Medicine Volume 29 Number 2May 2012

531531
Benha M. J.
Vol. 29 No 2 May 2012
CONCOMITANT THREE- DIMENSIONALCONCOMITANT THREE- DIMENSIONALCONFORMAL BOOST TO GROSS TUMORCONFORMAL BOOST TO GROSS TUMOR
VOLUME IN CONCURRENT CHEMORADIATIONVOLUME IN CONCURRENT CHEMORADIATIONFOR PATIENTS WITH UNRESECTABLE STAGEFOR PATIENTS WITH UNRESECTABLE STAGE
III NON- SMALL CELL LUNG CANCERIII NON- SMALL CELL LUNG CANCER
Khaled A. Mansour MD, Muhammad A. Badawy MDKhaled A. Mansour MD, Muhammad A. Badawy MDand Maher Abdul Hameid MDand Maher Abdul Hameid MD
Department of Clinical Oncology & Nuclear Medicine,Faculty of Medicine, Zagazig University, Egypt
AbstractAbstractPurpose: Purpose: We evaluated the efficacy and toxicity of synchronous
three- dimensional conformal boost to the gross tumor volume (GTV)versus conventional fractionation in concurrent chemoradiation for pa-tients with locally advanced non- small cell lung cancer (LA-NSCLC).Patients and Methods: Patients and Methods: Thirty patients (25 males and 5 females, medi-an age 61 years) with stage IIIA and IIIB NSCLC (no pleural effu-sion and no supraclavicular nodal involvement), Eastern CooperativeOncology Group performance score of 0-2, were assigned to the twotreatment arms; in the concomitant boost arm (group A): included 15patients (13 males and 2 females, median age 62 years, range 26-76years), who have received a dose of 1.8 Gy to the planning target volume(PTV) with concomitant boost of 0.6 Gy to the GTV, with a total dose of60 Gy to the GTV and 45 Gy to PTV in 25 fractions during 5 weeks byusing 3-D conformal radiotherapy, the conventional arm (group B): in-cluded 15 patients (12 males and 3 females, median age 60 years, range28-74 years), who have received, a dose of 1.8 Gy in 25 fractions to PTVthen another 10 Fractions to GTV with a total dose of 63 Gy during 7weeks. Both arms received concurrent chemotherapy consisted of cis-platin 50 mg/m2 days 1, 8, 29, 36 with gemcitabine 1000 mg/m2 days1, 8, 29, 36, a total of 6 cycles were given during and after irradiation.All patients were monitored for hematological, esophageal and lung tox-icities. Results: Results: The tumor response was evaluated 4 weeks afterthe end of radiotherapy where the overall response (OR) was seen in

532532
Khaled A. Mansour, et al...
IntrodIntroductiouctionNon small cell lung cancer
(NSCLC) is the most frequent type
of primary lung malignancy. More
than one- third of patients are
stage III at presentation who is not
candidate for surgical resection
with very low cure rate[1]. But
during the last two decades, the
use of chemoradiotherapy (CRT)
has improved the outcomes for
those patients with locally ad-
vanced non-small cell lung cancer
(LA-NSCLC)[2].
The concurrent chemoradio-
therapy (cCRT) improved median
survival time and 5-year survival
rate compared with sequential
chemotherapy and radiotherapy
as improvement in loco-regional
control can still play a role in
prolonging patient survival [3].
The NSCLC is a rapidly growing
tumor and its potential doubling
time is estimated to be 5-7 days[4]. Cancer cells can proliferate
even more rapidly during the later
stage of RT, which is known as
‘‘accelerated repopulation’’ and is
a cause of radiation failure [5].
Short course of radiation which
still retains a high dose would pro-
duce a much stronger effect in
killing tumor cells, because it will
provide less chance for tumor cells
to proliferate[6]. Therefore, an ac-
celerated fractionation schedule
using synchronous 3-D conformal
boost to the GTV in the setting of
concurrent chemoradiation (cCRT)
for patients with LA-NSCLC was
12 patients (80%) in group A versus 8 patients (53.3%) in group B; com-plete response (CR) was achieved in (13% vs. 7%), (P- value 0.08).The only significance was recorded in relation to TNM staging as ORin patients with stage IIIA was 90% in group A vs. 50% in group B (P-value < 0.05). Overall toxicity was acceptable as two patients (13%) ingroup A vs. one (7%) in group B had grade 3 esophagitis (P- value>0.05). Conclusion:Conclusion: The addition of daily 3- D conformal concomitantboost in concurrent chemoradiation is feasible and well tolerated in pa-tients with LA -NSCLC as compared to concurrent conventional chemo-radiation.
Key words: Key words: Locally advanced Non- small cell lung cancer, Chemora-diation, Three- dimensional conformal radiotherapy, concomitant boost.

533533
Benha M. J.
Vol. 29 No 2 May 2012
designed; which delivers a slightly
greater daily dose to the GTV than
in conventional fractionation to
shorten overall treatment time
and overcome accelerated repopu-
lation [7].
Based on this knowledge, we
designed this study is to evaluate
the efficacy and toxicity of concur-
rent chemoradiation with addition
of daily 3-D conformal boost as
compared to conventional frac-
tionation for patients with LA-
NSCLC.
Patients and MethodsPatients and MethodsEligibility:Eligibility:
We entered 30 patients who
met the following eligible crite-
ria: informed consent; histological-
ly or cytologically proven stage IIIA
and IIIB NSCLC according to
AJCC[21] excluding patients with
pleural effusion and supraclavicu-
lar nodal involvement; age of 18
years or older; No prior chemo-
therapy, thoracic radiotherapy or
thoracic surgery; Eastern Cooper-
ative Oncology Group (ECOG) per-
formance score (PS) of 0 to 2; Ade-
quate bone marrow (absolute
neutrophil count 1,500/µL, plate-
lets 100,000/µL, and hemoglobin
10 g/dL at least), renal function
(serum creatinine 2 mg/dL or cal-
culated creatinine clearance 60
mL/min at least), and hepatic
function (bilirubin less than 1.5
mg/dL and AST/ALT less than
twice the upper limit of normal.
Patient assessment:Patient assessment:
All patients had pretreatment
evaluation, including complete
medical history and physical ex-
amination; assessment of perfor-
mance status; complete blood
count (CBC), liver functions test
(LFT) and kidney function test
(KFT). Adequate pulmonary func-
tion test. Radiological studies were
routinely done including chest
roentgenography, thoracic and
upper abdomen computed tomog-
raphy scan (CT), pelvi-abdominal
ultrasonography, a brain magnetic
resonance imaging (MRI) and a
bone scan.
Treatment Schedule:Treatment Schedule:
All patients in the study were
treated definitively using concur-
rent chemoradiation. Patients
were randomly stratified into two
groups; Group A: fifteen patients
who received concurrent chemora-
diation using 3-D conformal RT

534534
Khaled A. Mansour, et al...
with addition of daily 3-D confor-
mal boost to the gross tumor vol-
ume (GTV). Group B: Other fifteen
patients who treated with concur-
rent chemoradiation using con-
ventionally fractionated radiation
using 3-D conformal RT without
conformal boost.
Radiotherapy plan:Radiotherapy plan:
Patients were treated in the su-
pine position and immobilized, ly-
ing comfortably with arms above
the head using an arm pole or
with hands behind the head and
with the head on a low sponge,
patients set up was done by refer-
ence to tattoos on the skin and
bony landmarks, usually the ster-
num and mid-axillary lines. CT
based planning was performed
and the patient was CT scanned
at 5 mm intervals in the treatment
position, the radiotherapy targets
were defined in accordance with
International Commission on Ra-
diation Units and Measurements
(ICRU 2001). Pulmonary lesions
were delineated with the "lung
window" setting and lymph nodes
were outlined using "mediastinal
window" settings.
The GTV encompassed all
detectable tumors and lymph
nodes 1 cm or greater in short-
axis diameter observed on CT. The
clinical target volume (CTV) in-
cluded the GTV plus a 1 cm
margin to account for microscop-
ic tumor extension. Ipsilateral hi-
lum was commonly included in
the CTV. The planning target vol-
ume (PTV) included the CTV plus
a 5-15 mm margin.
Contouring of normal organs at
risk (OARs; esophagus, spinal
cord, lung and heart) was carried
out.
The 3D conformal RT was used
for all patients involving a mini-
mum of three coplanar isocentric
fields designed to adequately cover
target volumes and minimize dos-
es to the OAR. At least one of
these fields was designed to spare
spinal cord to avoid radiation
myelitis. Treatments were deliv-
ered by using linear accelerators
with a 6-15 MeV; Large-field tho-
racic irradiation was used encom-
passing the gross and microscopic
regions of spread which includes
all abnormal regions on radiology
as well as mediastinum, hilum
and ipsilateral supraclavicular

535535
Benha M. J.
Vol. 29 No 2 May 2012
fossae (only for upper lobe le-
sions).
The radiotherapy dose and
fractionation for group (A) was 1.8
Gy daily to the PTV with a syn-
chronous boost of 0.6 Gy to the
GTV to bring its daily dose to 2.4
Gy/fraction. Total cumulative dos-
es were 60 Gy to the GTV and 45
Gy to the PTV in 25 fractions over
5 weeks.
For group (B); a dose of 1.8 Gy
was delivered daily to the PTV in
25 fractions over 5 weeks reaching
45 Gy followed by a boost of 18 Gy
to the GTV in 10 fractions over 2
weeks.
The total dose to spinal cord
should not exceed 45 Gy with a
daily dose of 1.8 Gy or less, the
volume of both lungs that receive
more than 20 Gy should not ex-
ceed 35% of total lung, the volume
of esophagus that receives more
than 55 Gy should not exceed
30%, and total dose to the whole
heart should not exceed 36 Gy.
ChemotherapyChemotherapy
Began on day 1 concurrently
with initiation of radiation and
was given as follows; Vigorous in-
travenous hydration was given im-
mediately before and during each
infusion (at least 0.5 L of saline
with 125 mg of mannitol). Premed-
ication with antiemetics was used
including combination of steroid,
serotonin 5-HT3 receptor antago-
nist (Ondansetron), and dopamine
antagonists (Domperidone and
Metoclopramide).
Concurrent chemotherapy regi-
men was the same in both groups
and consisted of Cisplatin 50 mg/
m2 days 1, 8, 29, and 36 with
gemcitabine 1000 mg/m2 days 1,
8, 29 and 36. A total of 6 cycles of
chemotherapy were given, during
and after the course of irradiation,
with 3 weeks interval between the
cycles provided full clinical and
hematological recovery.
Post-irradiation chemotherapy
consisted of Cisplatin 75 mg/m2
day 1 with gemcitabine 1000 mg/
m2 day 1and 8 every 3 weeks up
to another four cycles. During the
course of irradiation, complete
blood count was performed twice
weekly, electrolytes; kidney and
liver profiles were performed be-
fore each cycle of chemotherapy.

536536
Khaled A. Mansour, et al...
Dose modifications of chemothera-
py, blood transfusions or blood
products, antibiotics, antiemetic,
and GM-CSF were allowed when
needed.
Response and toxicity criteriaResponse and toxicity criteria
CT chest was done 2 weeks
after completion of the third cy-
cle of chemotherapy to evaluate
the response and those showing
complete or partial response or
stable disease proceeded to com-
plete the 6 cycles of chemothera-
py.
Response and toxicity were
evaluated according to WHO crite-
ria [8]. A complete response (CR)
was defined as the disappearance
of all known disease as deter-
mined by two observations not
less than 4 weeks apart. A partial
response (PR) was defined as more
than 50% decrease in total tumor
size of the lesions that have been
measured. There should be no ap-
pearance of new lesions or pro-
gression of any lesions. A stable
disease (SD) was defined as 50%
decrease in total tumor size can-
not be established. A progressive
disease (PD) was defined as at
least 25% increase in the size of
measurable lesions or the appear-
ance of new lesions.
Acute toxicity was defined as
occurring within 90 days from
starting treatment; so assess-
ment was done weekly during
treatment and thereafter includ-
ing complete blood count, kidney
and liver functions; chest x- ray.
Chest CT was done if the lesion
was not measurable on the chest
x- ray; Esophagitis less than grade
II-III, a neutrophil count of 1500/
mm3 or more, a platelet count
100,000/mm3 or more, a hemo-
globin of 10 gm. /dl or more and
no signs of organ toxicity were re-
quired for continuing treatment;
otherwise, chemotherapy and ra-
diotherapy were postponed until
recovery.
Statistical methodsStatistical methods
Data were checked, entered
and analyzed by using SPSS ver-
sion 15. Data were expressed as
mean ± standard deviation for
quantitative variables; number
and percentage for qualitative var-
iables. T-test or chi-square (X2)
was used when appropriate. P val-
ue < 0.05 was considered statisti-
cally significant.

537537
Benha M. J.
Vol. 29 No 2 May 2012
ResultsResultsPatient characteristics:Patient characteristics:
A total of thirty patients were
enrolled in this study between
January 2008 and December
2009.
Their characteristics are listed
in table (1). Median age was 61
years (range, 26-76 years), and 25
patients (83%) were men. Twenty
one patients (70%) had stage IIIA,
nine patients (30%) had stage IIIB,
Twenty three patients (77%) had
weight loss less than 10%, twenty
three patients (77%) had Eastern
Cooperative Oncology Group per-
formance score of 0 or 1, nineteen
patients (64%) had histological
type of squamous cell carcinoma
and nine (30%) had adenocarcino-
ma. Primary tumor was localized
to: left upper lobe in (13%), left
lower lobe in (24%), right upper
lobe in (13%), right middle lobe in
(27%), and right lower lobe in
(23%). Nodal stages of the patients
were as follow: N1 (33%), N2
(47%), and N3 (20%).
Response :Response :
All patients completed their
course of concurrent conformal
chemoradiation either with con-
comitant boost in period of 5
weeks as in group A or without
concomitant boost in period of 7
weeks as in group B.
Initial tumor response was
evaluated 4 weeks after the end of
radiotherapy where overall re-
sponse (OR) was seen in 12 pa-
tients (80%) in group A versus 8
patients (53.3%) in group B but
with no significant difference (P-
value; 0.08). Tow cases (13%) had
complete response (CR) versus
only one (7%), ten (67%) had par-
tial response (PR) versus 7 (47%),
2 (13%) had stable disease (SD)
versus 5 (33%) and one patient
(7%) had progressive disease (PD)
versus two patients (13%), in
group A and B respectively (p- val-
ue; 0.08). (Table 2).
The only significance was re-
corded in relation to TNM staging
as OR in patients with stage IIIA
was 90% in group A versus 50%
in group B (P- value; < 0.05).
Treatment related toxicity:Treatment related toxicity:
The hematological toxicities
after concurrent chemoirradia-
tion were mild in both groups,
as ten patients (67%) in each

538538
Khaled A. Mansour, et al...
group had grade I-2 anemia
and thrombocytopenia and 9 pa-
tients (60%) had grade 1-2 neu-
tropenia in each group, and 3 pa-
tients in both groups needed
whole blood transfusion and 6
patients in each group needed
GM-CSF injections until hemato-
logical recovery, with insignifi-
cant difference between the two
groups (P > 0.05), as regard
esophageal toxicity thirteen pa-
tients (87%) had grade 1-2 esoph-
agitis in group A versus 12 (80%)
in group B, and no one had grade
4 esophagitis in both groups,
meanwhile the lung toxicity grade
1-2 was recorded in thirteen pa-
tients (87%) in group A versus
fourteen (93%) in group B (P >
0.05). So the treatment schedule
was tolerable by most of our pa-
tients with insignificant morbidity.
(Table 3).

539539
Benha M. J.
Vol. 29 No 2 May 2012
DiscussionDiscussionChemoradiotherapy is consid-
ered the standard of care for many
subsets of stage III disease, which
conceptually can be considered a
two-compartment model, locore-
gional compartment in the chest
and a distant compartment har-
boring potential micrometastasis.
So we must eradicate the disease
from both compartments to
achieve cure [9].
Tumor cell proliferation during
conventionally fractionated radio-
therapy can negatively influence
the treatment outcome in patients
with unresectable NSCLC.
Accelerated and hyperfraction-
ated radiotherapy may therefore
have an advantage over conven-
tionally fractionated radiothera-
py. Moreover, earlier studies sug-
gested improved survival with

540540
Khaled A. Mansour, et al...
addition of cisplatin-based chemo-
therapy [10].
In our study, the age range for
both groups was between 26 - 76
years with a mean age of 61 years
which was similar to that reported
in the study by Stupp et al[11],
but slightly lower than the mean
age of 66 years reported by Uitte-
rhoever et al [12]. The male to fe-
male ratio was 4.7:1 in our study
which was close to that stated by
Semrau et al [13] that had a male
to female ratio of 4.5:1. Perfor-
mance status is one of the most
important prognostic factors re-
garding selection of treatment mo-
dality and expected response rate.
Available evidence suggested that
patients with poorer performance
status have higher rates of serious
adverse effects[14], our study in-
cluded patients with performance
status of 0 to 1 similar to that re-
ported by Kwan et al [7] to stand
concomitant chemoradiotherapy.
Fifty percent of patients in our
study were presented with squa-
mous cell carcinoma, 30% with
adenocarcinoma and 20% with
large cell carcinoma, while 69% of
patients were presented with
squamous cell carcinoma, 12%
with adenocarcinoma and 19%
with undifferentiated carcinoma in
the study reported by Mustafa et
al[15]. Seventy percent of our pa-
tients had stage IIIA and 30% had
stage IIIB at presentation, that
nearly similar to patients included
in the study carried out by Mey-
dan et al[16].
Weight loss <10% was present
in 23% of patients which was
close to what reported by Kwan et
al [7] (27%) but lower than report-
ed by Meydan et al [16] (58%). The
primary tumor, in our study, was
localized to the right middle lobe
in 27%, right lower lobe in 23%
and left lower lobe in 20%, while
the site of the primary tumor, re-
ported by Mustafa et al[15], was
42% in left upper lobe, 38% in
right upper lobe, and 12.5% in left
lower lobe.
The overall response was 80%
in patients received concurrent
conformal chemoradiation with
concomitant boost as the dose per
fraction increased to 2.4 Gy in 25
fractions to GTV reaching for total
dose of 60 Gy versus 53.3% in
group (B) that received 63 Gy, 1.8
Gy per fraction in 35 fractions

541541
Benha M. J.
Vol. 29 No 2 May 2012with insignificant difference be-
tween both groups. The overall re-
sponse in group (A) was compara-
ble to those found in the study
underwent by Meydan et al[16] in
which the overall response was
75% and also comparable to the
results of Sureyya et al[17] in
which the overall response was
73%. The overall response in
group (A) was lower than that re-
ported by Kwan et al[7] in which
the overall response was 93%. The
overall response in group (B) was
also slightly lower to than that re-
ported by Mustafa et al[15] in
which the overall response was
58%.
The hematological toxicity pro-
file in group (A) was mild and sim-
ilar to that of group (B). 60% of
patients developed grade I-II neu-
tropenia and 40% of patients
needed GM-CSF injections until
hematological recovery, 20% of pa-
tients in both groups needed
whole blood transfusion.
The toxicity profile of both
groups were better than those
stated by Hirose et al.[18] who
treated patients with locally ad-
vanced NSCLC with conventional-
ly fractionated radiotherapy in
combination with cisplatin plus
vinorelbine where 84.6% had
grade III to IV neutropenia, 3.8%
of patients had grade III to IV
thrombocytopenia and 61.5% of
patients had grade III to IV ane-
mia. As regards to the incidence
of treatment related esophagitis,
most of the patients in both
groups experienced moderate
esophagitis within the fourth and
fifth weeks of radiation and re-
solved spontaneously two to four
weeks after ending the course of
radiotherapy. The results were
similar to that reported by Kaplan
et al[19] where moderate esophagi-
tis was noted in 89.4% of patients.
Although there are limits to
draw conclusions from this study
with small sample size, several
explanations for the favorable
outcome of our study are possi-
ble, as follows. First, exclusion
of patients with supraclavicular
nodal involvement who have poor
outcomes because they tend to
develop distant metastases and it
is common site of local failure,
and also the prognostic signifi-
cance of stage IIIB with involved
supraclavicular LN was similar to

542542
Khaled A. Mansour, et al...
that of stage IV[20]. Second, there
was relatively larger squamous
cell population than none- squa-
mous cell population (64% vs.
36%) as squamous carcinoma
tend to respond better to acceler-
ated radiotherapy but related
OR had insignificant difference.
Third, the chemotherapy protocol
of cisplatin and gemcitabine was
effective and tolerable by most of
patients. Last, the use of synchro-
nous GTV boost achieved better
local control.
ConclusionConclusionIn conclusion, our results re-
vealed that concurrent chemora-
diation with addition of daily 3-D
conformal boost are feasible and
well tolerated by patients with lo-
cally advanced NSCLC giving sat-
isfactory results. In addition to the
potential radiobiological gain other
advantages were gained as single
daily treatment was convenient
for patients despite multiple dai-
ly treatments, shorter course; 5
weeks than conventional; 7 weeks
consuming time and cost.
ReferencesReferences1-1- World Health Organiza-World Health Organiza-
tion (WHO) (2009) : tion (WHO) (2009) : Facts about
cancer.
2-2- Pfister D., Johnson D.,Pfister D., Johnson D.,
Azzoli C., et al. (2004) :Azzoli C., et al. (2004) : American
Society of Clinical Oncology treat-
ment of unresectable non-small
cell lung cancer guideline: update
2003. J Clin Oncol; 22: 330-53.
3-3- Fournel P., Robinet G.,Fournel P., Robinet G.,
Thomas P., et al. (2005) :Thomas P., et al. (2005) : Ran-
domized phase III trial of se-
quential chemoradiotherapy com-
pared with concurrent chemo-
radiotherapy in locally advanced
non–small cell lung cancer:
Groupe Lyon-Saint-Etienne d'On-
cologie Thoracique-Group Fran-
cais de Pneumo-Cancerologie NPC
95-01 study. J Clin Oncol; 23:
5910-17.
4-4- Wilson G., Mcnally N.,Wilson G., Mcnally N.,
Dische S., et al. (1988) : Dische S., et al. (1988) : Meas-
urement of cell kinetics in human
tumors in vivo using bromodeox-
yuridine incorporation and flow
cytometry.Br J Cancer;58:423-
431.
5-5- Withers H., Taylor J., Ma-Withers H., Taylor J., Ma-
ciewjewski B., et al. (1988) : ciewjewski B., et al. (1988) : The
hazard of accelerated tumor clono-
gen repopulation during radiother-
apy. Acta Oncol; 27: 131-146.
6-6- Chen M., Jiang G. L., FuChen M., Jiang G. L., Fu

543543
Benha M. J.
Vol. 29 No 2 May 2012xl. et al. (2000) : xl. et al. (2000) : The impact of
overall treatment time on out-
comes in radiation therapy for
non- small cell lung cancer. Lung
Cancer; 28: 11-19.
7-7- Kwan H., Sung J., HongKwan H., Sung J., Hong
R., et al. (2009) : R., et al. (2009) : A phase II study
of synchronous three-dimensional
conformal boost to the gross tu-
mor volume for patients with un-
resectable stage III non small cell
lung cancer: Results of Korean Ra-
diation Oncology Group 0301
Study. Int J Radiat Oncol Biol
Phys; 74(5): 1397-404.
8-8- World Health Organiza-World Health Organiza-
tion (1979) :tion (1979) : WHO Handbook for
Reporting Results of Cancer Treat-
ment. Geneva, Switzerland, WHO
offset publication no. 48.
9-9- Gandara D., Naryan S.,Gandara D., Naryan S.,
Lana P., et al. (2005) : Lana P., et al. (2005) : Integra-
tion of novel therapeutics into
combined modality therapy of
locally advanced non-small cell
lung cancer. Clin Cancer Res.; 11
(13 suppl): 5057-62.
10-10- Nyman J., Bergman B.,Nyman J., Bergman B.,
Mercke C., et al. (1998) : Mercke C., et al. (1998) : Acceler-
ated hyperfractionated radiothera-
py combined with induction and
concomitant chemotherapy for in-
operable NSCLC-- impact of total
treatment time. Acta Oncol; 37(6):
539-45.
11-11- Stupp R., Mayer M.,Stupp R., Mayer M.,
Kann R., et al. (2009) :Kann R., et al. (2009) : Neoadju-
vant chemotherapy and radiother-
apy followed by surgery in selected
patients with stage IIIB non-small
cell lung cancer: a multicentre
phase II trial. Lancet Oncol; 10:
785-93.
12-12- Uitterhoeve A., KoolenUitterhoeve A., Koolen
M., van Os R., et al. (2007) : M., van Os R., et al. (2007) : Ac-
celerated high-dose radiotherapy
alone or combined with either con-
comitant or sequential chemother-
apy; treatments of choice in pa-
tients with Non-Small Cell Lung
Cancer Radiation Oncology; 2: 27-
37.
13-13- Semrau S., Bier A.,Semrau S., Bier A.,
Thierbach U., et al. (2003) :Thierbach U., et al. (2003) : Con-
current radiochemotherapy with
vinorelbine plus cisplatin or car-
boplatin in patients with locally
advanced NSCLC and an in-
creased risk of treatment compli-
cations. Preliminary results. Stra-
hlenther Onkol; 179(12): 823-31.

544544
Khaled A. Mansour, et al...
14-14- Vincent T., Theodore S.Vincent T., Theodore S.
& Steven A. (2008) : & Steven A. (2008) : Devita, Hell-
man & Rosenberg's Cancer: Prin-
ciples & Practice of Oncology, 8th
Edition: Cancer of the Lung; 896-
945.
15-15- Mustafa I., Fuat Y., M.Mustafa I., Fuat Y., M.
Y., et al. (2005) : Y., et al. (2005) : An accelerated
radiotherapy scheme using a
concomitant boost technique for
the treatment of unresectable
stage III non small cell lung can-
cer. Jpn J Clin Oncol; 35(5): 239-
44.
16-16- Meydan D, Cakir F, Oz-Meydan D, Cakir F, Oz-
bek N, et al. (2006) :bek N, et al. (2006) : Neoadju-
vant chemotherapy and concomi-
tant boost radiotherapy in locally
advanced non-small cell lung can-
cer. Turkish Journal of Cancer;
36(4):162-8.
17-17- Sureyya S., Emin D.,Sureyya S., Emin D.,
Ahmet K., et al. (1998) :Ahmet K., et al. (1998) : A phase
II trial, feasibility of combination
of daily cisplatinum and accelerat-
ed radiotherapy via concomitant
boost in stage III non-small cell
lung cancer. Lung Cancer; 20: 37-
46.
18-18- Hirose T., Mizutani Y.,Hirose T., Mizutani Y.,
Ohmori T., et al. (2006) :Ohmori T., et al. (2006) : The
combination of cisplatin and vino-
relbine with concurrent thoracic
radiation therapy for locally ad-
vanced stage IIIA or IIIB NSCLC.
Cancer Chemother Pharmacol; 58
(3): 361-7.
19-19- Kaplan B., Altynbas M.,Kaplan B., Altynbas M.,
Eroglu C., et al. (2004) :Eroglu C., et al. (2004) : Prelimi-
nary results of a phase II study of
weekly paclitaxel (PTX) and car-
boplatin (CBDCA) administered
concurrently with thoracic radia-
tion therapy (TRT) followed by
consolidation chemotherapy with
PTX/CBDCA for stage III unre-
sectable NSCLC. Am J Clin Oncol;
27(6): 603-10.
20-20- Kiricuta IC. I. (1999) :Kiricuta IC. I. (1999) :
prolonged survival possible for pa-
tients with supraclavicular node
metastases in NSCLC treated with
chemoradiotherapy? Int J Radiat
Oncol Biol Phys; 44:847-853.
21-21- Greene F. L. (2002) :Greene F. L. (2002) :
American Joint Committee on
Cancer, American Cancer Society.
AJCC Cancer Staging Manual. 6th
Ed. New York: Springer- Verlag.

545545
Benha M. J.
Vol. 29 No 2 May 2012
CONCOMITANT THREE-DIMENSIONALCONCOMITANT THREE-DIMENSIONALCONFORMAL BOOST TO GROSS TUMORCONFORMAL BOOST TO GROSS TUMOR
VOLUME IN CONCURRENTVOLUME IN CONCURRENTCHEMORADIATION FOR PATIENTS WITHCHEMORADIATION FOR PATIENTS WITH
UNRESECTABLE STAGE IIIUNRESECTABLE STAGE IIINON-SMALL CELL LUNG CANCERNON-SMALL CELL LUNG CANCER
Khaled A. Mansour MD, Muhammad A. Badawy MDKhaled A. Mansour MD, Muhammad A. Badawy MDand Maher Abdul Hameid MDand Maher Abdul Hameid MD
BENHAMEDICALJOURNAL
REPRINT
Published byPublished by
Benha Faculty of MedicineBenha Faculty of Medicine Volume 29 Number 2May 2012

BENHA
MEDICAL
JOURNAL
VOLUME 29 NO. 2
May 2012
RADIOTHERAPY VERSUS STENTING IN MANAGEMENT OF MA-LIGNANT DYSPHAGIAHany Eldeeb MD, Hend A. El-Hadaad MD and David Hunter MD
OCULAR VESTIBULAR EVOKED MYOGENIC POTENTIALS IN PA-TIENTS WITH PERIPHERAL VESTIBULAR DISORDERSAshraf E. Morgan M.Sc, Ayman E. El-Sharabasy MD, Hesham S.Zaghloul MD and Elsaeid M. Thabet MD
CORONARY ANGIOGRAPHIC PATTERNS OF PATIENTS WITHMETABOLIC SYNDROMEAbdel-Razek A. Maaty MD, Helmi M. Abo-Bakr MD, Ahmed A. WafaMD and Hoda M. Sobh MSc.
ROLE OF COLLAGEN CROSS-LINKING USING RIBOFLAVIN/ULTRAVIOLET-A IN KERATOCONUSAmani E. Badawi MS, Amr M. El-Kannishy MD, Tarek A. MohssenMD, Hany Abdel-Rahman MD and Mohammad M. El-Dessouky MD
CLINICO-PATHOLOGICAL CORRELLATION BETWEEN EXPRES-SION OF CONNEXIN 26 AND BREAST CANCERAbu Zeid M. A. MD, Amin M. A. MD, Moatamed A. MD, Abu Ha-shem M. M. MD* and Abo El Hoda M. F. MD
EFFECTS OF HEPATITIS C VIRUS VIRAL LOAD IN SERUM ANDSEMEN ON COMPUTERIZED SEMEN ANALYSIS PARAMETERSAhmed F. Ismael MSc., Ashraf H. Hassan MD, Ahmed Kh. AhmedMD, Hosam Z. Abdel-Hafez MD and Waleed A. El-Sherbeny MD
EFFECT OF CIGARETTE SMOKING ON SPERM DNA FRAGMENTA-TION IN MEN WITH NORMAL AND ABNORMAL SEMINOGRAMAhmed F. A. State MD, Mahmmoud M. Eid MD, Magdy A. SohafyMD, Adel A. Zalata MD and Maha A. Elgayyar MD
INTERNAL ILIAC ARTERY LIGATION FOR INTRACTABLE POST-PARTUM HEMORRHAGE. IS IT A LIFE SAVING PROCEDURE?Mohamed Hasan MD, Hosam Roshdy MD, Mohamed Gad MD andKhaled El-Alfy MD
ROLE OF SUPPRESSOR GENES AND ANGIOGENIC FACTORS INHEPATOCELLULAR CARCINOMA IN CIRRHOTIC PATIENTSAml M. E. Ismaiel M.Sc, Eman Y. Al-Ttanaihy Ph.D, Azmi A. AwadPh.D, Soheir M. A. Sirag Ph.D and Ibrahim El-Dosoky Ph.D
INTESTINAL PARASITES AMONG SCHOOL CHILDREN IN DAKAH-LIA GOVERNORATEAbeer El-Henawy MD and Mohamed El-Malky MD
1
2
3
4
5
6
7
8
9
10
9
19
33
47
63
79
91
111
121
137
CONTENTS

HISTOCHEMICAL AND ULTRASTRUCTURAL STUDY OF THE RE-NAL CORTEX OF THE ADULT MALE ALBINO RAT AFTER ADMIN-ISTRATION OF GENTAMICIN WITH OR WITHOUT ADMINISTRA-TION OF VITAMIN E OR EPOIETINZeinab A. Sakara Ph.D, Husseiny I. Dessouki Ph.D, Shireen A.Mazroa Ph.D and Hanaa A. H. Khalaf M.Sc.
ERYTHROPOIETIN MEASUREMENTS IN PATIENTS WITH RENALCYSTSGadri A. Buahdela MD, Ahmed E l-Komati MD and Farag Ben-sauod MD
ACUTE APPENDICITIS : THE RELIABILITY OF DIAGNOSIS ATEL-MERGIB REGION TEACHING HOSPITALS Ahmed El-Gomati MD
STANDARDIZED COMPREHENSIVE DYNAMIC DIAGNOSTICS ANDTREATMENT OF POSTOPERATIVE PERITONITISNazirov F. Gavurovich MD, Devyatov A. Vasilovich MD, Hodjiev D.Shamuratovich MD, Babadjanov A. Hasanovich MD and SadikovR. Yusupovich MD
THE POTENTIAL BENEFICIAL EFFECTS OF PERINDOPRIL OVERCLONIDINE ON DIABETIC NEPHROPATHY IN RATSHanan T. Emam MD, Ghada A. Abd El Fattah MD and Noha I.Hussien MD
BONE MARROW INVOLVEMENT BY NON HODGKIN’S LYMPHO-MAS IN MANSOURA ONCOLOGY MEDICAL CENTER, A PROSPEC-TIVE STUDYEntsar I. I. Aladl M.Sc, Khalid R. Zalata Ph.D., Mahmoud A. B. El-baz Ph.D, Sameh S. A. Shamaa MD and Nadia I. Atwan Ph.D
LEFT VENTRICULAR SYSTOLIC DYSFUNCTION IN CIRRHOTIC PA-TIENTS ASSOCIATED WITH HCV INFECTIONAhmed Bahy El-Dien M.Sc; Hassan M. El-Askalany MD, TalalAmer MD, Mohamed M. Hamouda MD, Mohamed Atwa MD andAfaf Abdel-Hafez MD
COMBINED THERAPY OF TRANSARTERIAL CHEMOEMBOLIZA-TION AND THREE DIMENSIONAL CONFORMAL RADIOTHERAPYFOR HEPATOCELLULAR CARCINOMANawal M. El-Kholi MD, Hanem A Sakr MD, Talal A. Amer MD, Sa-leh M. Taema MD and Shymaa A. Taher M.Sc.
EVALUATION OF LONG-AXIS MYOCARDIAL FUNCTION WITH 2DSTRAIN ECHOCARDIOGRAPHY IN PATIENTS WITH SIGNIFICANTCORONARY ARTERY STENOSISHesham Rashid MD, Neama El-Melegy MD, Ali Attia MD, HeshamAbou El-Eineen MD, Mahmoud Awad M.B.B.Ch
POPULATION BASED EVALUATION OF ANTITHROMBOTIC THER-APY IN PATIENTS WITH ATRIAL FIBRILLATIONNeama El-Meligy MD, Hesham Rashid MD, Khaled Erabat MD,Hyam Abdrahman M.B.B.Ch
EFFECT OF TAMOXIFEN VERSUS 17 BETA-ESTRADIOL ONSKELETAL MUSCLE PERFORMANCE IN OVARIECTOMIZED RATSHesham A. D. Abdel-Razek MD
11
12
13
14
15
16
17
18
19
20
21
147
165
175
189
205
227
241
255
271
289
299

PARTIAL PROTECTIVE EFFECT OF COENZYME Q10 PRE-TREATMENT ON RENAL ISCHEMIA-REPERFUSION INJURY INADULT RATSHesham A. D. Abdel-Razek MD
ROLE OF VITAMIN D AND ADIPOKINES IN OBESITY RELATEDTYPE 2 DIABETES MELLITUSRefka Kh. Messiha MD, Hanaa Shata MD, Nisreen Abo El-MaatyPhD, Lashin Saad M.Sc and Nabeel Laimoon MD
INFLAMMATORY MARKERS AND MEAN PLATELET VOLUME INPATIENTS WITH SLOW CORONARY FLOW AND ITS RELATION-SHIP WITH CLINICAL PRESENTATIONAhmed K. Motawea MD, Magdy Z. El-Ghannam MD, Khaled I. Na-geuib MD, Mohammed A. Ateia MD, Mohamed Aleraki MD and Ta-rek Ahmad M.Sc.
SACROCOCCYGEAL TERATOMA A RARE DISEASE : CASE RE-PORTMona A. Almushait, JBOG
CORRELATION BETWEEN P WAVE DISPERSION AND MYOCAR-DIAL FUNCTION IN PATIENTS WITH ACUTE MYOCARDIAL IN-FARCTIONHesham Rashid MD
OUTBREAKS OF FOOD POISONING DUE TO BACTERIAL CON-TAMINATION AT FAST FOOD RESTAURANTS AROUND AL HARAMAL NABAWI - AL MADINAH AL MONOWARAHAhmed R. Ragab MD, Rania H. Abdel Rahman MD, Basem SheikMD, Hassan Abdel-Salam MD, Quadi M. Al Hakk MD and Mo-hamed Abd Al-Samad MD
PROSPECTIVE COMPARISON OF TRANSIENT ELASTOGRAPHYAND LIVER BIOPSY FOR THE ASSESSMENT OF FIBROSIS INCHRONIC HEPATITIS C BEFORE AND AFTER INTERFERONTHERAPYMagdy H. Abd El-Fattah MD, Ayman N. Menessy MD, Khaled R.Zalata MD, Seham M. Seif MD and Mohammed E. Essa M.Sc.
EXPRESSION OF TENASCIN DURING PRENATAL DEVELOPMENTOF THE CENTRAL NERVOUS SYSTEM IN ALBINO RATSHuda M. El-Tahry MD, Adel A. Bondok MD, Adel A. El-Hawary MD,Hamdino M. Attia MD, and Ehab K. Ali MD
PROPHYLACTIC IMPACT OF CURCUMIN ON ADRIAMYCIN-INDUCED NEPHROTOXICITY : HISTOLOGICAL AND IMMUNO-HISTOCHEMICAL STUDY ON ALBINO RATSaleh A. Al-Marashi Ph.D, Mohamed Saeed Ph.D and ChhayaT.Sawant MD
SINGLE INCISION TRANSPERINEAL REPAIR OF SIMPLE AND RE-CURRENT RECTOVAGINAL FISTULA WITH VITAL BULBOCAVER-NOSUS MUSCLE FLAPWaleed Thabet MD, Mohamed Youssef MD, Tamer Youssef MD, Ad-ham Elsaied MD, Alaa Magdy MD, Mohamed Farid MD and RafeekBarakat MD
22
23
24
25
26
27
28
29
30
31
323
341
355
379
379
395
409
427
443
467

GLIOGENESIS OF THE OPTIC NERVE IN THE RAT DURING EAR-LY POSTNATAL PERIODHamdino M. Attia MD
EFFECT OF INTERACTION BETWEEN NUTRITIONAL ELEMENTSCALCIUM AND MANGANESE ON BONE MINERAL DENSITY (BMD)Reham M. Shaat MD, Rehan M. S. El Baz A. and El-Defrawy M.M. MD
ROLE OF EXERCISE REHABILITATION IN RHEUMATOID ARTHRI-TIS PATIENTSSahar S. Ganeb MD, Yasser A. Abd-El-Hamid MD, Neama M. Mah-mood MD, Howyda M. Kamal MD, Hany A. Nowara MD and Mo-hammad A. Ibrahim MD
EFFECT OF PEGYLATED INTERFERON AND RIBAVIRIN THERAPYIN HCV RELATED NEPHROPATHYTarek A El-Shazly MD and Mohamed Mosaad MD
CONCOMITANT THREE- DIMENSIONAL CONFORMAL BOOST TOGROSS TUMOR VOLUME IN CONCURRENT CHEMORADIATIONFOR PATIENTS WITH UNRESECTABLE STAGE III NON- SMALLCELL LUNG CANCERKhaled A. Mansour MD, Muhammad A. Badawy MD and MaherAbdul Hameid MD
32
33
34
35
36
481
493
501
517
36

BENHABENHAMEDICALMEDICALJOURNALJOURNAL
Benha Medical Journal is published four monthly(January, May and September) by Benha Faculty ofMedicine.
Cheif EditorCheif EditorProf. Dr. Tawheed Mohamed MowafyProf. Dr. Tawheed Mohamed Mowafy
Editor in ChargeEditor in ChargeProf. Dr. Mohamed Samy El-HamadyProf. Dr. Mohamed Samy El-Hamady
Correspondence to be sent to editors Benha Faculty ofMedicine, Qalubia Egypt.

سورة فاطراآلية : ٢٨

Prof. Dr. Mohamed S. El-HamadyProf. Dr. Mohamed S. El-Hamady
Prof. Dr. Mahmoud F. El-GendyProf. Dr. Mahmoud F. El-Gendy
Prof. Dr. Mohsen MashhourProf. Dr. Mohsen Mashhour
Prof. Dr. Yousry A. FekryProf. Dr. Yousry A. Fekry
Editorial Board Editorial Board

Prof. Dr. Tawheed M. HowafyProf. Dr. Tawheed M. Howafy
Prof. Dr. Ahmed M. Kottb El-GazzarProf. Dr. Ahmed M. Kottb El-Gazzar
Prof. Dr. Adel Shebl El-SayedProf. Dr. Adel Shebl El-Sayed
Prof. Dr. Mohamed El-ShafaeProf. Dr. Mohamed El-Shafae
Prof. Dr. Mohamed S. El-HamadyProf. Dr. Mohamed S. El-Hamady
Prof. Dr. Abd El-Rahman M. El-SaadnyProf. Dr. Abd El-Rahman M. El-Saadny
Prof. Dr. Samia Ahmed YossefProf. Dr. Samia Ahmed Yossef
Prof. Dr. Osama M. HigazyProf. Dr. Osama M. Higazy
Prof. Dr. Abd El-Shafy TabllProf. Dr. Abd El-Shafy Tabll
Prof. Dr. Mostafa RiskProf. Dr. Mostafa Risk
Prof. Dr. Yousry A. FekryProf. Dr. Yousry A. Fekry
Administrative CommitteeAdministrative Committee

Benha medical journal is publishedfour monthy and will publish leadingand original articles in all medical ac-ademic and clinical branches.
All papers to be sent to chief editor,Benha Faculty of Medicine, QalubiaEgypt. Papers received are assumed tohave been sudmitted exclusively tothe Journal. The Editor will decide onthe time of publication and retains theusual right to modify the style andlength of a contribution; major chang-es will be agreed with the author (s).
Statements and opinions expressedin the articles and communicationsherein are those of the author (s) andnot necessarily those of the Editor(s)or Pulisher and the Editor (s) andPublisher disclaim any responsibilityof liability for such material. Neitherthe Editor(s) nor the Publisher guar-antees, warrants, or endorses anyproduct or service advertised in thispublication, nor do they guaranteeany claim made by the manufacturerof such product or service.
Presentation of manuscriptsPresentation of manuscriptsTwo copies of the manuscript and il-
lustrations should be sent. Manu-scripts should be typed double spacedon one side of the paper, with widemargins. The names of author (s) andtheir appointment (s) and addressesat the time of preparation of the man-uscript should appear at the head ofthe paper; present addresses, if differ-ent, will be given as a footnote.
Auhours are advised to keep a copyof all manuscripts, as no responsibili-ty can be accepted for loss.
Reports of original work should usu-ally be arranged in the conventionalorder of abstract, introduction, mate-rial and methods, results, discussion,and references.
Results may be presented in thetext, in tables and/or figures but thetext should, in general, comment on
rather than repeat information in ta-bles.
The abstract should contain a factu-al account of the methods and resultsin not more than 200 words, ratherthan a description of the subject ofthe paper and the opinions of the au-thor(s).
Tables should be typed on separatesheets of paper, not in the text, withone table to a page. They should benumbered in sequence and each mustbe referred to at an appropriate pointin the text. Captions of the tablesshould be brief yet indicate clearly thepurpose or content of each table.Rows and columns in the table shouldprecisely define the nature of the datain each. Abbreviations should be ex-plained in a footnote to the table.
Figures should be marked on theback (light pencil) with the name(s) ofthe author (s), the figure number, andthe top indicated. Each should have adescriptive legend typed on a sheetseparate from the figure. Photographsshould be glossy prints of good con-trast.
Figures consist of all material whichcannot be set in type, such as photo-graphs, Iine drawings. etc. Tables arenot included in this classification.Original X-ray films should not besent, glossy prints must be submitted.Line drawings should be on whiteboard, drawn with black India ink.
Typewritten lettering should not beused on illustrations and explanationsshould appear in the legend not onthe figure itself.
The identity of patients in illustra-tions should be concealed by maskingthe face or eyes: or written permissionfor publication from the patient orthe parent or guardian must be sup-plied.
Units and abbrevialtionsUnits and abbrevialtionsAbbreviations are used sparingly
Directions to ContributorsDirections to Contributors

and only if a lengthy namy or expres-sion is repeated frequently throughoutthe manuscript. Words must appearin full on first appearance in bothsummary and text, followed by the ab-breviation in parenthesis.
Drugs are described by their offcialnames but trade names should be in-dicated in brackets the first time adrug is quoted in the main text.
Measurements should be expressedin SI units with the exception of hae-moglobin (g/dl) and blood pressure(mmHg).
The accepted abbreviations forThe accepted abbreviations forunitsunitsKilogram (s) kg Hour (s) h
gram (s) g minute (s) min
milligram (s) mg second (s) S
microgram (s) ug centimeter (s) cm
nanogram (s) ng cubic millimeter cmm
micrometer um millilitre (s) ml
millicurie(s) mCi milliequivalent mEq
molar mol/l millimole mmol
StatisticesStatisticesAuthors should describc the plan of
their investigation indicating the num-ber of expcrimental units (e. g. sub-jects; blood samples). For repeated ob-servations, their numbers and timingshould be specified. Control subjectsshould be described as completely asthe experimental subjects .
Measures of location (e.g. mean, me-dian) should be accompanied by anappropriate measure of variability,e.g. standard deviation (SD) or stan-dard error of the mean (SEM). Meth-ods of statistical analysis should beindicated, but details are not requiredunless relevant to the discussion. Inmultivariate analysis, an indication ofthe goodness of fit of the modelshould be given (e.g.multiple correla-tion coefficient). When a result isclaimed to be statistically significantthe test used and the level of probabil-ity should be specified (e.g. paired t-test p<0.01) When only one type ofstatistical test is used in the paper, it
should be stated in the scction formethods to avoid repetition. Tablesshould be self explanatory.
ReferenceseferencesIn the text, use the number of the
reference.Arrange the list of authors quoted at
the end of the text, in numericl order.Opposite their number, the name ofthe author(s) followed by their date ofpublication: Where there are morethan two authors use Robinson et al.(1979).
Name (s), and initials of all author(s) year of publication (in brackets), ti-tle of the article, name of the journal(abbreviated according to Index Medi-cus), voulme number, first page num-ber. In the case of books the order is:Name(s) and initials of author(s), yearof publication (in brackets), full title,edition, publisher and place of pub-lisher, page numbers. Where appro-priate, the chapter title and the namesof the editors should be given.
References to personal communica-tions and 'unpublished work' may bequoted in the text but should not beincluded in the references.
Examples of the style to be used aregiven below:
Trudiner B.J., Lewis p.j. & petit, B.(2000); fetal breathing in intrauterinegrowth retardation. Br J Obstet Gy-naecol, 86:432.
Hytten, F.F & Leitch I. (2000): Thephysiology of Human pragnancy 2ndedn, Blackwell Scientific publications,Oxford, p.26.
It must be noted that :-It must be noted that :-Publication will not be done and the
letter of acceptance will not be givenexcept after the approval for publica-tion by referees and payment of thepublication fees.
Off Prints for contributorsOff Prints for contributorsFifty off prints of each paper are
supplied free, but additional copiesmay be rdered on the printed cardsent with the proofs.