Prostate Cancer Death After Radiotherapy or Radical ...
10
Platinum Priority – Prostate Cancer Prostate Cancer Death After Radiotherapy or Radical Prostatectomy: A Nationwide Population-based Observational Study David Robinson a, *, Hans Garmo b,c , Ingela Franck Lissbrant d , Anders Widmark e , Andreas Pettersson f , Adalsteinn Gunnlaugsson g , Jan Adolfsson h , Ola Bratt i,j , Per Nilsson g , Pa ¨r Stattin k a Department of Urology, Ryhov Hospital, Jönköping, Sweden; b Regional Cancer Centre Uppsala Örebro, Uppsala University Hospital, Uppsala, Sweden; c Cancer Epidemiology Group, Division of Cancer Studies, School of Medicine, King's College London, London, UK; d Department of Oncology, Institute of Clinical Sciences, The Sahlgrenska Academy, University of Gothenburg, Sweden; e Department of Radiation Sciences, Oncology, Umeå University, Umeå, Sweden; f Department of Medicine Solna, Clinical Epidemiology Unit, Karolinska Institutet, Stockholm, Sweden; g Department of Oncology and Radiation Physics, Skåne University Hospital, Lund University, Lund, Sweden; h Department of Clinical Science, Intervention and Technology (CLINTEC), Karolinska Institutet, Stockholm, Sweden; i Division of Urological Cancers, Department of Translational Medicine, Lund University, Lund, Sweden; j Department of Urology/CamPARI Clinic, Cambridge University Hospitals, Cambridge, UK; k Department of Surgical Sciences, Uppsala University, Uppsala, Sweden EUROPEAN UROLOGY 73 (2018) 502 – 511 available at www.sciencedirect.com journal homepage: www.europeanurology.com Article info Article history: Accepted November 28, 2017 Associate Editor: Giacomo Novara Statistical Editor: Andrew Vickers Keywords: Prostate cancer Radiotherapy Radical prostatectomy Abstract Background: There are no conclusive results from randomized trials on radiotherapy (RT) versus radical prostatectomy (RP) for prostate cancer. Numerous observational studies have suggested that RP is associated with a lower risk of prostate cancer death, but whether results have been biased due to limited adjustments for confounding factors is unknown. Objective: To compare the risk of prostate cancer death after RT versus RP. Design, setting, and participants: Nationwide population-based observational study of men in the Prostate Cancer data Base Sweden 3.0 who had undergone RT or RP between 1998 and 2012. Outcome measurements and statistical analysis: Prostate cancer deaths were com- pared. Hazard ratios (HRs) were calculated in Cox regression models, including clinical T stage, M stage, Gleason grade group, serum levels of prostate-specific antigen, proportion of biopsy cores with cancer, mode of detection, comorbidity, age, educational level, and civil status. Period analysis with left truncation was performed. Results and limitations: Primary treatment was RT or RP for 41 503 men. Treatment effect was associated with disease severity. In univariate analysis of RT versus RP, risk of prostate cancer death was higher after RT—low- and intermediate-risk cancer, HR 1.82 (95% confidence interval [CI]: 1.53–2.16), and high-risk cancer, HR 1.57 (95% CI: 1.33– 1.85). After full adjustment in period analysis, this difference between the treatments was attenuated—low- and intermediate-risk cancer, HR 1.24 (95% CI: 0.97–1.58), and high-risk cancer, HR 1.03 (95% CI: 0.81–1.31). Confounding remained due to nonrandom allocation to treatment. Conclusions: In comparison with previous studies, the difference in prostate cancer mortality after RT and RP was much smaller. * Corresponding author. Ho ¨ glandssjukhuset Eksjo ¨ , 57581 Eksjo ¨ , Sweden. Tel. +46703443082; Fax: +4638135339. E-mail address: [email protected] (D. Robinson). https://doi.org/10.1016/j.eururo.2017.11.039 0302-2838/© 2017 European Association of Urology. Published by Elsevier B.V. This is an open access article under the CC BY-NC-ND license (http://creativecommons.org/licenses/by-nc-nd/4.0/).
-
Upload
khangminh22 -
Category
Documents
-
view
0 -
download
0
Transcript of Prostate Cancer Death After Radiotherapy or Radical ...

E U RO P E AN URO LOGY 73 ( 2 018 ) 5 0 2 – 511
avai lable at www.sciencedirect .com
journal homepage: www.europeanurology.com
Platinum Priority – Prostate Cancer
Prostate Cancer Death After Radiotherapy or RadicalProstatectomy: A Nationwide Population-basedObservational Study
David Robinson a,*, Hans Garmo b,c, Ingela Franck Lissbrant d, Anders Widmark e,Andreas Pettersson f, Adalsteinn Gunnlaugsson g, Jan Adolfsson h, Ola Bratt i,j, Per Nilsson g,Par Stattin k
aDepartment of Urology, Ryhov Hospital, Jönköping, Sweden; bRegional Cancer Centre Uppsala Örebro, Uppsala University Hospital, Uppsala, Sweden;cCancer Epidemiology Group, Division of Cancer Studies, School of Medicine, King's College London, London, UK; dDepartment of Oncology, Institute of
Clinical Sciences, The Sahlgrenska Academy, University of Gothenburg, Sweden; eDepartment of Radiation Sciences, Oncology, Umeå University, Umeå,
Sweden; fDepartment of Medicine Solna, Clinical Epidemiology Unit, Karolinska Institutet, Stockholm, Sweden; gDepartment of Oncology and Radiation
Physics, Skåne University Hospital, Lund University, Lund, Sweden; hDepartment of Clinical Science, Intervention and Technology (CLINTEC), Karolinska
Institutet, Stockholm, Sweden; iDivision of Urological Cancers, Department of Translational Medicine, Lund University, Lund, Sweden; jDepartment of
Urology/CamPARI Clinic, Cambridge University Hospitals, Cambridge, UK; kDepartment of Surgical Sciences, Uppsala University, Uppsala, Sweden
Article info
Article history:Accepted November 28, 2017
Associate Editor:
Giacomo Novara
Statistical Editor:
Andrew Vickers
Keywords:
Prostate cancerRadiotherapyRadical prostatectomy
Abstract
Background: There are no conclusive results from randomized trials on radiotherapy(RT) versus radical prostatectomy (RP) for prostate cancer. Numerous observationalstudies have suggested that RP is associated with a lower risk of prostate cancer death,but whether results have been biased due to limited adjustments for confoundingfactors is unknown.Objective: To compare the risk of prostate cancer death after RT versus RP.Design, setting, and participants: Nationwide population-based observational study ofmen in the Prostate Cancer data Base Sweden 3.0 who had undergone RT or RP between1998 and 2012.Outcome measurements and statistical analysis: Prostate cancer deaths were com-pared. Hazard ratios (HRs) were calculated in Cox regression models, including clinicalT stage, M stage, Gleason grade group, serum levels of prostate-specific antigen,proportion of biopsy coreswith cancer, mode of detection, comorbidity, age, educationallevel, and civil status. Period analysis with left truncation was performed.Results and limitations: Primary treatment was RT or RP for 41 503 men. Treatmenteffect was associated with disease severity. In univariate analysis of RT versus RP, risk ofprostate cancer death was higher after RT—low- and intermediate-risk cancer, HR 1.82(95% confidence interval [CI]: 1.53–2.16), and high-risk cancer, HR 1.57 (95% CI: 1.33–1.85). After full adjustment in period analysis, this difference between the treatmentswas attenuated—low- and intermediate-risk cancer, HR 1.24 (95% CI: 0.97–1.58), andhigh-risk cancer, HR 1.03 (95% CI: 0.81–1.31). Confounding remained due to nonrandomallocation to treatment.Conclusions: In comparison with previous studies, the difference in prostate cancermortality after RT and RP was much smaller.
* Corresponding author. HoFax: +4638135339.E-mail address: drobinson@
https://doi.org/10.1016/j.eururo.2017.11.0390302-2838/©2017EuropeanAssociation ofUrology. Published byElsevier B.V. Tlicense (http://creativecommons.org/licenses/by-nc-nd/4.0/).
¨ glandssjukhuset Eksjo, 57581 Eksjo, Sweden. Tel. +46703443082;
telia.com (D. Robinson).
his is anopen access article under the CCBY-NC-ND
Patient summary: The difference in prostate cancer mortality after contemporaryradiotherapy and radical prostatectomy was small in contrast to previous studies,indicating that potential side effects should be more emphasized when selectingtreatment.© 2017 European Association of Urology. Published by Elsevier B.V. This is an open accessarticle under the CC BY-NC-ND license (http://creativecommons.org/licenses/by-nc-nd/
4.0/).
E U RO P E AN URO LOGY 73 ( 2 018 ) 5 0 2 – 511 503
1. Introduction
Radiotherapy (RT) and radical prostatectomy (RP) are bothevidence-based treatments for nonmetastatic prostatecancer (Pca) that decreased Pca mortality compared withnoncurative treatment in randomized clinical trials [1,2]. Re-cently, results from Prostate Testing for Cancer andTreatment, the first randomized clinical trial comparingRT, RP, and active monitoring, were reported [3]. After 10 yrof follow-up, therewas no statistically significant differencein cancer-specific survival after RP versus RT, but therewereonly four deaths from Pca after RT and five after RP. In ameta-analysis of previous observational studies, the ad-justed risk for Pca death was twice as high after RTcompared with RP [4].
Men treated with RT generally have worse cancercharacteristics than those treated with RP, and they arealso generally older and have more comorbidities, whichmay affect the probability of receipt of secondary cancertreatment if disease recurrence occurs [5]. Despite adjust-ment for covariates to decrease confounding, there remainsconcern for residual confounding in these previousobservational studies comparing RT with RP.
The aim of this study was to provide risk estimates toinform contemporary treatment decision for men withnonmetastatic prostate cancer. We used data in a nationalpopulation-based prostate cancer registry combined withdata from other health care registries and demographicdatabases that are almost complete. To obtain the most up-to-date risk estimates, we used period analyses to overcomeissues regarding incomplete data, misclassification of bonemetastasis, and subpar treatment that were present in theearly study period.
2. Patients and methods
The study cohort included men in the National Prostate Cancer Register(NPCR) of Sweden diagnosed between January 1, 1998 and December 31,2012 with Pca in clinical local stage T1c-T3 or Tx, any Gleason gradegroup (GGG), serum levels of prostate-specific antigen (PSA)<l00 ng/ml,no verified lymph node metastases (N0 or Nx), and no verified bonemetastases (M0 or Mx), and treated with primary RT or RP [6].
NPCR captures 98% of all Pca cases in the Swedish Cancer Registry, towhich registration is mandated by law [7]. The registration to NPCR hasrecently been described in detail [7,8]. In brief, NPCR containsinformation on the date of diagnosis, tumor stage, biopsy Gleasongrading, serum PSA level, mode of detection, and executed or plannedprimary treatment. For men diagnosed before 2008, an audit (Retro-spective collection of data on Radiotherapy; RetroRad) collected datafrom RT dose verification systems at oncological departments through-out Sweden [9]. RPs registered in NPCRwere verified by data obtained by
linkage to the National Patient Registry. Since 2007, prostate volume,total number of cores obtained at the diagnostic biopsy session, numberof cores containing cancer, and extent of cancer inmillimeters in all corescombined are registered. For men diagnosed during 1998–2007, data onproportion of cores containing cancer were retrieved from histopathol-ogy reports for 14 609 men (74% capture rate).
As previously described, NPCR has been linked to other nationwidepopulation-based health care registries and demographic databases in theProstate Cancer data Base Sweden (PCBaSe) [7,9]. The National PatientRegistry contains information on in-patient care including surgicalprocedures and discharge diagnoses, coded according to InternationalClassification of Diseases system (ICD-9 or ICD-10) since 1987. Using dataondischarge diagnoses for the 10 yr preceding the Pcadiagnosis,menwereclassified into four comorbidity categories according to the Charlsoncomorbidity index (CCI) [10]. For assessment of socioeconomic status, weused data on civil status and educational level, categorized as low (�9 yr ofschool), middle (10–12 yr), and high (�13 yr).
2.1. Statistical analyses
Inclusion started on January 1, 1998, and follow-up started on the date ofsurgery for RP and date of start of RT and ended at the date of emigration,date of death, or December 31, 2014, whichever event came first. Coxproportional hazardmodelswith age as time scalewere used to calculatehazard ratios (HRs) with 95% confidence intervals (CIs) [11,12].
Analyses was stratified by two different risk score assessments,National Comprehensive Cancer Network (NCCN) and Cancer of theProstate Risk Assessment (CAPRA) [13,14]. AWald test for the interactionbetween risk category and treatment was performed [15].
Definitions of themodified version of NCCN risk categorization are asfollows: for low risk: clinical local stage T1–T2, PSA<10 ng/ml andGGG 1[16]; intermediate risk: T1–T2 with PSA level 10–20 ng/ml and/or GGG2 or 3; and high risk: T3 and/or PSA level 20–99 ng/ml and/or GGG 4 or5. We combined the low- and intermediate-risk categories because weanticipated that therewould be very few events in the low-risk category.
CAPRA is a prognostic model with scores from 0 to 10, based on age,PSA, GGG, clinical stage, and percent of biopsy cores with cancer.
To diminish influence from earlier time periods when data qualitywas poor and to obtain the most representative estimates for theoutcome of contemporary RT and RP, period analysis was performed[17]. Period analysis is based on the results from left truncation. Weapplied left truncation on January 1, 2011. Therefore, depending on dateof treatment, our period analysis includes different 4 yr of follow-up foreach man. For example, men treated in 2012 contribute with person-years and events to years 0–3, men treated in 2011 contribute to years 1–4, men treated in 2010 contribute to years 2–5, and so on back until mentreated in 1998, who contributed to years 13–16 of the total person time.
The models were built stepwise including clinical T stage (T1c, T2,T3), M stage (M0, Mx), GGG (1–5), serum PSA (using linear spline withknots at PSA 3, 10, 20, and 50 ng/ml), interaction between PSA and GGG[18], proportion of biopsy cores with cancer (continuous), mode ofdetection (screening, lower urinary tract symptoms, other symptoms),CCI (0, 1, 2, 3+), educational level (low, middle, high), and civil status(married, not married). N stage was not included as a covariate, since N

E U RO P E AN URO L OGY 73 ( 2 018 ) 5 0 2 – 511504
stage is affected by differentialmisclassification [19]. Potential sources ofbias were handled as described by Sterne et al [20].
Absolute 10-yr risk of Pca death after RT and RP was calculatedassuming a direct relation between the relative risk and absolute 10-yrrisk estimates. First, the 10-yr risk of Pca death in menwho had receivedeither RT or RP treatments was estimated. By use of this estimate, theproportion of RT, and the observed relative risk, an absolute 10-yr riskdifference was calculated.
Potential changes in misclassification of bone metastases during thestudy period were investigated using logistic regression on risk of Pcadeath within 3 yr from diagnoses. To assess the potential differentialmisclassification of comorbidity between men who received RT andthose who received RP, differences in the change in CCI during follow-upbetween cases treated with RT or RP compared with their respectivematched Pca-free men were calculated in three separate time-to-eventanalyses [21]. The significance levelwas set to p < 0.05, and all tests weretwo sided. Missing data were handled by chained equations with fiveimputation data sets for each missing value [22,23]. Statistical analysiswas performed with R, version 3.0.2 [24].
3. Results
The final study cohort included 15 054 men treated with RTand 26 449 men treated with RP (Fig. 1). In 1998–1999, fineneedle aspiration was used in more than one-third of thecases with no information on GGG and cancer extent. From2000 onward, the completeness of data improved drasti-cally (Supplementary Fig. 1). Men treated with RT hadhigher T stage, GGG, PSA level, and proportion of biopsieswith cancer than men who underwent RP (Table 1). Mentreated with RT were also older, had a lower educationallevel, and higher comorbidity than those who underwentRP. In the full study group, 893/15 054 (6%) men who hadreceived RT and 499/26 449 (2%) who had received RP diedof Pca. There was a significant interaction between riskcategories and treatment (p < 0.01 for NCCN risk categories[lowand intermediate vs high risk] and p < 0.001 for CAPRAscores), and therefore only results from stratified analysesare presented [15]. In men with low- and intermediate-riskcancer according to NCCN, the unadjusted risk of Pca deathwas substantially higher after RT than after RP (HR 1.82 [95%CI: 1.53–2.16]; Table 2). The difference in risk decreasedwith each added covariate down to HR 1.35 (95% CI: 1.13–1.61) in the fully adjusted model, and further decreased inthe period analysis (HR 1.24 [95% CI: 0.97–1.58]).
For menwith NCCN high-risk cancer, the unadjusted riskwas also higher after RT than RP (HR 1.57 [95% CI: 1.33–1.85]; Table 3). This difference decreased in the fullyadjusted model (HR 1.14 [95% CI: 0.96–1.36]), and in theperiod analysis with full adjustment, no differenceremained (HR 1.03 [95% CI: 0.81–1.31]).
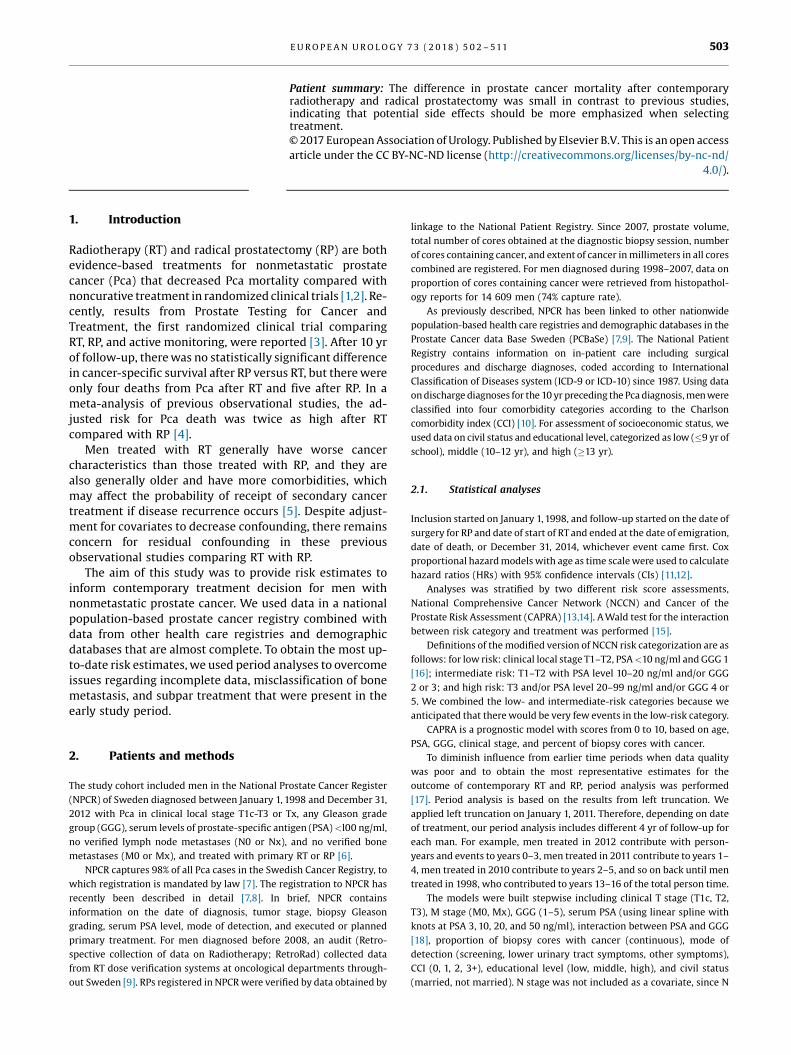
The results stratified on CAPRA score showed a similarsteady decrease in the difference between RT and RP withincreasinglyaggressivecancer:CAPRAscores0–4,HR1.52(95%CI: 1.16–2.01); CAPRA scores 2–6, HR 1.14 (95% CI: 0.93–1.40);CAPRA scores 4–8, HR 1.09 (95% CI: 0.89–1.33); and CAPRAscores 6–10,HR0.97 (95%CI: 0.75–1.25) (Fig. 2). Tenyears aftertreatment, 1% of menwith CAPRA scores 0–4 and 13% of menwith CAPRA scores 6–10 had died from Pca. The absolutedifference inPcadeathat 10yrbetweenmenwhohad received
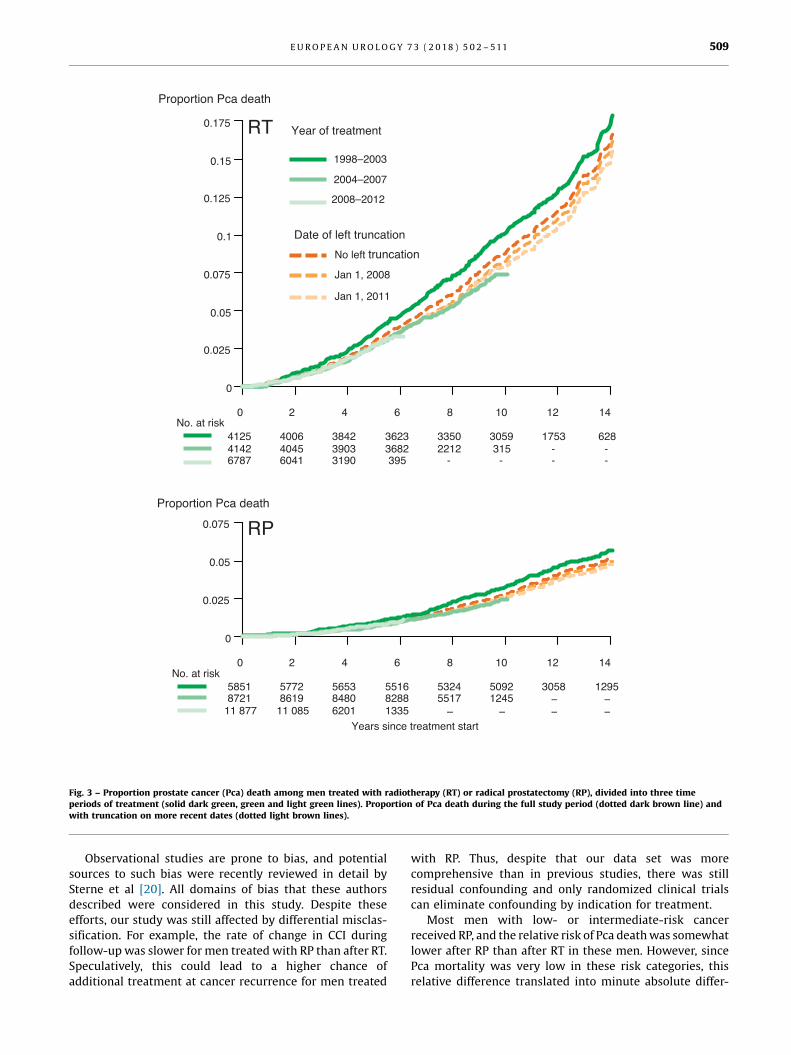
RT or RP was <1% for all CAPRA scores. The improvement inoutcome by year of treatment was more pronounced in mentreated with RT than in men treated with RP (Fig. 3).
Menwho were planned for RT according to data in NPCRbut ultimately did not receive RT were almost three timesmore likely to die fromPca than thosewhowere planned forbut did not receive RP (Pca mortality rate 17 vs 6 per1000 person-years; Fig. 1). During the study period, the RTdoses increased substantially, and robotic-assisted RPbecame the most commonly used surgical technique(Supplementary Table 1). There are no data on adjuvantandrogen deprivation therapy (ADT) in PCBaSe for theearliest time periods, but use of neoadjuvant or adjuvantADT could be assessed from 2006. Use of ADT together withRT decreased in men with low-risk Pca, down from 31% in2006 to 16% in 2012, and inmenwith intermediate-risk Pca,down from 62% in 2006 to 43% in 2012. In contrast, use ofADT with RT for locally advanced Pca remained high at 90%both in 2006 and in 2012. There was a temporal trend ofdecreased risk in misclassification of bone metastases(ptrend = 0.02). The rate of change in CCI during follow-upwas slower for men treated with RP than for RT(Supplementary Fig. 2 and Supplementary Table 2).
4. Discussion
In this nationwide population-based cohort study, thedifference in Pca mortality after RT and RP for potentiallycurable disease was much smaller than that in previousstudies.
A small difference in favor of RP persisted inmenwith low-and intermediate-risk Pca,[5_TD$DIFF] for high-risk Pca there was nodifference. However, the absolute difference in the risk of Pcadeath within 10 yr was <1% across all CAPRA risk categories.
The risk of death from Pca after RT and RP has previouslybeen compared in 15 observational studies (SupplementaryTable 3). In comparison with these studies, the presentstudy showed smaller differences in outcomes after RTcompared with RP, including one study based on an earlierversion of PCBaSe [5].
There are several reasons why the risk estimates in thisstudy differ from those of the previous studies. The previousPCBaSe study used the registered treatment in NPCR,whereas we only included men for whom the receipt of [6_TD$DIFF]RT and RP were verified. Our study was stratified on diseaseseverity, which was done in only three of the other studies(Supplementary Table 3). RT doses may have beensuboptimal in previous studies, as doses were unknownin nine of the previous studies (Supplementary Table 3). Incontrast, we had data from an audit on exact RT doses for97% of the men (Supplementary Table 1)[7_TD$DIFF]. Further strengthsare the comprehensive, nationwide population-based datafrom NPCR and other health care registers[16_TD$DIFF] [19,25,26]. Ourstudy included more confounders and the data had highergranularity than any previous study. For example, we hadseparately collected data on the proportion of biopsy corespositive for cancer, and such datawere available in only fourof the previous studies; Gleason grading was applied with

[(Fig._1)TD$FIG]
Men in NPCR
diagnosed 1998–2012
(n = 129 391)
Curative treatment
according to NPCR
(n = 45 026)
Noncurative
treatment
(n = 84 365)
RP according to NPCR
(n = 27 507)
RT according to NPCR
(n = 16 022)
M1/PSA > 100 or N1
according to NPCR
(n = 717)
Curatively treated men
with M0/MX, N0/NX,
and T1c, T2-3, Tx
disease according to
NPCR (n = 43 529)
Curative RT
(n = 174)
Pca discovered during
cystectomy (n = 288)
Lymph node removal only
(n = 40)
No verified RP
(n = 521)
Verified RP
(n = 26 449)
Radical prostatectomy
(n = 39)
Lymph node removal only
(n = 276)
No verified curative RT
(n = 554)
Verified curative RT
(n = 15 054)
Matched men free of Pca from PCBaSe
(n = 132 038)
Matched men free of Pca from
PCBaSe (n = 74 863)
To study
(n = 248 404)
No follow-up a
(n = 13) Date mismatch
(n = 39)
Ta/T1b/T4 according to
NPCR
(n = 780, 345/386/49)
Curatively treated M0
according to NPCR
(n = 44 309)
Late treatment start b
(n = 56)
Late treatment start b
(n = 22)
Pca discovered during
cystectomy (n = 4)
Fig. 1 – Flow chart of selection of study participants from Prostate Cancer data Base Sweden (PCBaSe) 3.0. Pca = prostate cancer; NPCR = NationalProstate Cancer Register of Sweden; RP = radical prostatectomy; RT = radiotherapy. a Due to emigration (n = 1), death from myocardial infarction at dateof surgery (n = 1), and date mismatch (n = 11). b Later than 2 yr from the date of diagnosis.
E U RO P E AN URO LOGY 73 ( 2 018 ) 5 0 2 – 511 505

Table 1 – Baseline characteristics of study participants in Prostate Cancer data Base Sweden 3.0
Radical prostatectomy Radiotherapy
n (%) n (%)
Number of treated men 26 449 15 504Follow-up time, mean (standard deviation) 7.3 (3.7) 6.9 (3.7)Age (yr), mean (SD) 63.1 (5.8) 67 (5.8)Age (yr)�55 2519 (10) 442 (3)56–60 4942 (19) 1433 (10)61–65 8302 (31) 3344 (22)66–70 7881 (30) 4812 (32)70+ 2805 (10) 5023 (33)
Treatment year1998–2001 2635 (10) 1841 (12)2002–2005 6969 (26) 3871 (25)2006–2009 8833 (33) 4358 (29)2010–2013 8012 (30) 4984 (33)
Charlson comorbidity index0 18 538 (70) 8154 (54)1 3933 (15) 3085 (20)2 2275 (9) 1851 (12)3+ 1703 (6) 1964 (13)
Educational level a
Low 7325 (28) 5350 (36)Middle 10 841 (41) 5993 (40)High 8156 (31) 3623 (24)Missing 127 (0.5) 88 (0.6)
Civil statusNot married 6989 (26) 4436 (30)Married 19 460 (74) 10 618 (70)
Clinical T stageT1c 16 441 (62) 6020 (40)T2 9042 (34) 5794 (38)T3 745 (3) 3101 (21)Missing 221 (1) 139 (1)
N stageN0 5545 (21) 4498 (30)Nx 20 778 (79) 10 470 (70)Missing 126 (0) 86 (1)
M stage b
M0 10 370 (39) 9090 (60)Mx 15 968 (60) 5885 (39)Missing 111 (0) 79 (1)
Gleason grade groups c
GGG 1 14 886 (56) 5749 (38)GGG 2 6067 (23) 3669 (24)GGG 3 2330 (9) 2214 (15)GGG 4 1342 (5) 1530 (10)GGG 5 428 (2) 957 (6)Missing d 1396 (5) 935 (6)
PSA (ng/ml)Median (Q1–Q3) 6.9 (4.9–10) 10 (6.4–18)Missing 155 (0.6) 40 (0.3)
Proportion biopsies with cancer per patient e
Median (Q1–Q3) 0.33 (0.20–0.50) 0.50 (0.30–0.70)Missing 3776 (14) 2551 (17)
Mode of detectionScreening 13 396 (51) 6257 (42)LUTS 6049 (23) 3887 (26)Other symptoms 5149 (19) 3705 (25)Missing information 1855 (7) 1205 (8)
Risk category f
Low risk 11 080 (42) 3071 (21)Intermediate risk 10 306 (39) 4839 (32)High risk 3321 (13) 6041 (40)Missing data 1742 (6) 1103 (7)
CAPRA score g
0–2 8241 (31) 2180 (14)3–4 7737 (29) 3625 (24)5–7 3975 (15) 4338 (29)8–10 339 (1) 1579 (10)Missing data 6157 (23) 3332 (22)
E U RO P E AN URO L OGY 73 ( 2 018 ) 5 0 2 – 511506

Table 1 (Continued )
Radical prostatectomy Radiotherapy
n (%) n (%)
Time to treatment start from diagnosis<3 mo 9585 (36) 652 (4)3–6 mo 12 798 (48) 6147 (41)6–12 mo 3759 (14) 7291 (48)1–2 yr 307 (1) 964 (6)
GGG = Gleason grade group; LUTS = lower urinary tract symptoms; Pca = prostate cancer; PSA = prostate-specific antigen; RP = radical prostatectomy;RT = radiotherapy.Using chi-square -test for categorical variables and Wilcoxon rank-sum test for continuous variables, all p values for test of equality between RP and RT were<0.001.Within 1 yr after RP, postoperative RT with curative intent was given to 4% of menwith low-risk Pca, 6% of menwith intermediate-risk Pca, and 14% of menwithhigh-risk Pca. We have no data on salvage prostatectomy after radiation, but this was an extremely unusual treatment in Sweden during the study period.a Educational level: low (�9 yr, elementary school), middle (10–12 yr, high school), and high (�13 yr, college or university).b M stage according to UICC 6th edition, 2006.c Gleason grade groups according to International Society of Urological Pathology; GGG 1 = Gleason score (GS) 6, GGG 2 = GS 7 (3 + 4), GGG 3 = GS 7 (4 + 3), GGG4 = GS 8, and GGG 5 = GS 9–10 [16].d GGG was 2 or 3, that is, unknown primary and secondary Gleason grade in 1190/2331 (51%) of men with missing GGG. World Health Organization grade wasknown in 946/1141 (83%) of the remaining men.e Proportion of biopsies with cancer: number of cores with cancer/all cores obtained in biopsy session.f According to a modified version of the National Comprehensive Cancer Network risk classification.g Cancer of the Prostate Risk Assessment (CAPRA) score. Scoring system from 0 to 10 points based on age, serum PSA, Gleason score, clinical stage, and percent ofbiopsy cores involved with cancer. A high CAPRA score is associated with a poor prognosis.
E U RO P E AN URO LOGY 73 ( 2 018 ) 5 0 2 – 511 507
five categories in the current study, whereas 14 of the15 previous studies applied fewer grade categories [27].
Limitations of our study included incomplete data,misclassification of bone metastases, and subpar RT inthe early calendar time. To address this issue, we usedperiod analysis, an analytical approach that increases theinfluence of data from more recent calendar time. Periodanalysis is arguably the best analysis to inform current
Table 2 – Hazard ratios (HRs) with 95% confidence intervals (95% CIs) ofcancer treated with radiotherapy (RT) versus radical prostatectomy (R
Complete f
RT
Number of men who received treatment 8503Number of Pca deaths 276Risk of Pca deaths by 10 yr (%) 5.0
HR
AdjustmentUnadjusted using age as time scale 1.82+ M stage 1.67+ T stage 1.60+ Gleason score 1.53+ PSA #
[15_TD$DIFF] 1.46+ Interaction between PSA and Gleason
grade group1.46
+ Proportion of biopsy cores with cancer 1.38+ Mode of detection 1.37+ CCI 1.36+ Educational level 1.35+ Civil status 1.35
CCI = Charlson comorbidity index; PSA = prostate-specific antigen.a RT—median 6.4 yr (Q1 = 3.9 yr, Q3 = 9.7 yr) and RP—median 7.0 yr (Q1 = 4.3 yr, Q3
that is, date of surgery for prostatectomy and first dose of radiation. Adjustments wspline with knots# in PSA = 3, PSA = 10, interaction between PSA and Gleason graeducational level, and civil status. A higher HR denotes a higher risk of Pca death
treatment decisions [17]. Themethodwas not developed forcomparative studies, but we argue that to provide accurateinformation on the results of contemporary treatmentsmoreweightmust be put on data frommore recent calendartime. Further limitations of our study were lack of data onPSA density and total cancer extent in biopsies inmillimeters, both of which have been related to theoutcome [28,29].
prostate cancer (Pca) death for men with low- and intermediate-riskP)
ollow-up a Period analysisLeft truncationJanuary 1, 2011
RP RT RP
22 913 7893 22 116298 143 165
1.9 4.1 1.7
(95% CI) HR (95% CI)
(1.53–2.16) 1.71 (1.35–2.17)(1.41–1.99) 1.62 (1.28–2.05)(1.34–1.90) 1.54 (1.22–1.95)(1.28–1.82) 1.47 (1.16–1.87)(1.22–1.74) 1.40 (1.10–1.78)(1.22–1.74) 1.41 (1.11–1.79)
(1.16–1.65) 1.31 (1.03–1.67)(1.15–1.64) 1.31 (1.03–1.67)(1.14–1.62) 1.25 (0.98–1.59)(1.13–1.61) 1.24 (0.97–1.58)(1.13–1.61) 1.24 (0.97–1.58)
= 9.9 yr). Age was used as time scale. Start of follow-up was at treatment start,ere done for M stage, T stage, Gleason grade groups, PSAmodeled using a linearde group, proportion biopsy cores with cancer, mode of detection, CCI,for men treated with RT.
Table 3 – Hazard ratios (HRs) with 95% confidence intervals (95% CIs) of prostate cancer (Pca) death for men with high-risk cancer treatedwith radiotherapy (RT) versus radical prostatectomy (RP)
Complete follow-up a Period analysisleft truncation2011-01-01
RT RP RT RP
Number of men who received treatment 6551 3536 5900 3331Number of Pca deaths 617 201 318 110Risk of Pca deaths by 10 yr (%) 13.7 8.9 13.1 9.2
HR (95% CI) HR (95% CI)
AdjustmentUnadjusted using age as time scale 1.57 (1.33–1.85) 1.55 (1.24–1.94)+ M stage 1.53 (1.29–1.80) 1.52 (1.21–1.89)+ T stage 1.36 (1.15–1.61) 1.32 (1.05–1.66)+ Gleason grade group 1.39 (1.17–1.65) 1.30 (1.03–1.63)+ PSA # 1.31 (1.10–1.56) 1.21 (0.96–1.54)+ Interaction between PSA and Gleason score 1.31 (1.10–1.56) 1.21 (0.96–1.53)+ Proportion biopsy cores with cancer 1.19 (1.00–1.42) 1.09 (0.86–1.38)+ Mode of detection 1.16 (0.97–1.38) 1.07 (0.84–1.36)+ CCI 1.15 (0.97–1.37) 1.04 (0.82–1.32)+ Educational level 1.14 (0.96–1.36) 1.03 (0.81–1.31)+ Civil status 1.14 (0.96–1.36) 1.03 (0.81–1.31)
CCI = Charlson comorbidity index; PSA = prostate-specific antigen.a RT—median 5.9 yr (Q1 = 3.7 yr, Q3 = 9.6 yr) and RP—median 6.3 yr (Q1 = 3.8 yr, Q3 = 9.5 yr). Age was used as time scale. Start of follow-up was at treatment start,that is, date of surgery for prostatectomy and first dose of radiation. Adjustments were done for M stage, T stage, Gleason grade group, PSA modeled using a linearspline with knots# in PSA = 3, PSA = 10, PSA = 20, PSA = 50, interaction between PSA and Gleason grade group, proportion biopsy cores with cancer, mode ofdetection, CCI, educational level, and civil status. A higher HR denotes a higher risk of Pca death for men treated with radiotherapy.
[(Fig._2)TD$FIG]
Fig. 2 – Hazard ratios for prostate cancer (Pca) death shown for Cancer of the Prostate Risk Assessment (CAPRA) scores, with 95% confidence intervals.CAPRA is a scoring system from 0 to 10 based on age, PSA, Gleason score, clinical stage, and percent of biopsy cores involved with cancer. A highCAPRA score is associated with a poor prognosis [14]. Left truncation of data on January 1, 2011. PSA = prostate-specific antigen; RP = radicalprostatectomy; RT = radiotherapy. a [8_TD$DIFF] An assumption was made that the absolute 10-yr risk of Pca death for RT and RP is directly corresponding to therelative risk estimates. Then by considering the proportion of RT and the absolute 10-yr risk of Pca death for RT and RP combined in each CAPRA scorecategory, an absolute 10-yr risk difference was calculated combining this with the relative risks.
E U RO P E AN URO L OGY 73 ( 2 018 ) 5 0 2 – 511508
[(Fig._3)TD$FIG]
20 64 1412108
0
0.025
0.05
0.075
0.1
0.125
0.15
0.175
Proportion Pca death
412541426787
400640456041
384239033190
36233682395
33502212
-
3059315
-
1753--
628--
20 64 1412108
Years since treatment start
0
0.025
0.05
0.075
Proportion Pca death
58518721
11 877
57728619
11 085
565384806201
551682881335
53245517
–
50921245
–
3058––
1295––
No. at risk
No. at risk
RT
RP
Year of treatment
Date of left truncation
No left truncation
Jan 1, 2008
Jan 1, 2011
1998–2003
2004–2007
2008–2012
Fig. 3 – Proportion[1_TD$DIFF] prostate cancer (Pca) death among [2_TD$DIFF] men treated with radiotherapy (RT) or radical prostatectomy (RP [3_TD$DIFF]),[4_TD$DIFF] divided into three timeperiods of treatment (solid [9_TD$DIFF]dark green, green and [10_TD$DIFF]light green lines) [11_TD$DIFF]. [12_TD$DIFF]Proportion of Pca death during the full study period ([13_TD$DIFF]dotted dark brown line)[14_TD$DIFF] andwith truncation on more recent dates (dotted light brown lines).
E U RO P E AN URO LOGY 73 ( 2 018 ) 5 0 2 – 511 509
Observational studies are prone to bias, and potentialsources to such bias were recently reviewed in detail bySterne et al [20]. All domains of bias that these authorsdescribed were considered in this study. Despite theseefforts, our study was still affected by differential misclas-sification. For example, the rate of change in CCI duringfollow-upwas slower for men treated with RP than after RT.Speculatively, this could lead to a higher chance ofadditional treatment at cancer recurrence for men treated
with RP. Thus, despite that our data set was morecomprehensive than in previous studies, there was stillresidual confounding and only randomized clinical trialscan eliminate confounding by indication for treatment.
Most men with low- or intermediate-risk cancerreceived RP, and the relative risk of Pca deathwas somewhatlower after RP than after RT in these men. However, sincePca mortality was very low in these risk categories, thisrelative difference translated into minute absolute differ-

E U RO P E AN URO L OGY 73 ( 2 018 ) 5 0 2 – 511510
ences in the risk of Pca death. In contrast, most men withhigh-risk cancer received RT, and in this risk category therewas a substantially higher absolute risk of Pca deathwith nodifference between RT and RP.
5. Conclusions
In comparison with previous studies, the difference in Pcamortality after RT and RPwasmuch smaller in this study thanin previous studies and very small in absolute terms. Thus, thechoice between these two treatments should be guided by therisk of side effects and patient preference rather than by theriskofPcadeath.Strongselectionmechanismsaffect treatmentselection in comparative observational studies, and withoutdetailed information on disease severity, comorbidity, andtreatment, results from such studies will be biased.
Author contributions: [17_TD$DIFF]Hans [18_TD$DIFF]Garmo had full access to all the data in thestudy and takes responsibility for the integrity of the data and theaccuracy of the data analysis.
Study concept and design: Robinson, Garmo, Widmark, Nilsson, Stattin.Acquisition of data: All authors.Analysis and interpretation of data: Robinson, Garmo, Widmark, Nilsson,Stattin.Drafting of the manuscript: Robinson, Garmo, Nilsson, Stattin.Critical revision of the manuscript for important intellectual content: Allauthors.Statistical analysis: Garmo.Obtaining funding: Robinson, Stattin.Administrative, technical, or material support: Stattin.Supervision: Stattin, Nilsson.Other: None.
Financial disclosures: David Robinson certifies that all conflicts ofinterest, including specific financial interests and relationships andaffiliations relevant to the subject matter or materials discussed in themanuscript (eg, employment/affiliation, grants or funding, consultan-cies, honoraria, stock ownership or options, expert testimony, royalties,or patents filed, received, or pending), are the following: None.
Funding/Support and role of the sponsor: This work was supported byThe Swedish Research Council 825-2012-5047, The Swedish CancerSociety 16-0700, Uppsala County Council, Clinical Cancer ResearchFoundation in Jönköping, and The Prostate Cancer Association. None ofthese funders had any part in the collection, management, analysis,interpretation of the data and not in preparation, review, or approval ofthe manuscript, and decision to submit the manuscript for publication.
Acknowledgments: This project was made possible by the continuouswork of the National Prostate Cancer Register of Sweden (NPCR) steeringgroup: Pär Stattin (chairman), Anders Widmark, Camilla Thellenberg,OveAndrén, Eva Johansson, Ann-Sofi Fransson,Magnus Törnblom, StefanCarlsson, Marie Hjälm Eriksson, David Robinson, Mats Andén, JohanStranne, Jonas Hugosson, Ingela Franck Lissbrant, Maria Nyberg, CalleWalller, Per Fransson, Fredrik Sandin, and Karin Hellström.
Appendix A. Supplementary data
Supplementary data associated with this article can befound, in the online version, at https://doi.org/10.1016/j.eururo.2017.11.039.
References
[1] Holmberg L, Bill-Axelson A, Helgesen F, et al. A randomized trialcomparing radical prostatectomy with watchful waiting in earlyprostate cancer. N Engl J Med 2002;347:781–9.
[2] Widmark A, Klepp O, Solberg A, et al. Endocrine treatment, with orwithout radiotherapy, in locally advanced prostate cancer (SPCG-7/SFUO-3): an open randomised phase III trial. Lancet 2009;373:301–8.
[3] Hamdy FC, Donovan JL, Lane JA, et al. 10-Year outcomes aftermonitoring, surgery, or radiotherapy for localized prostate cancer.N Engl J Med 2016;375:1415–24.
[4] Wallis CJ, Saskin R, Choo R, et al. Surgery versus radiotherapy forclinically-localized prostate cancer: a systematic review and meta-analysis. Eur Urol 2016;70:21–30.
[5] Sooriakumaran P, Nyberg T, Akre O, et al. Comparative effectivenessof radical prostatectomy and radiotherapy in prostate cancer: ob-servational study of mortality outcomes. BMJ 2014;348:g1502.
[6] Sobin LH, Wittekind C. TNM classification of malignant tumours.ed. 6 Hooken, NJ: John Wiley and Sons; 2002.
[7] Van Hemelrijck M, Wigertz A, Sandin F, et al. Cohort profile: theNational Prostate Cancer Register of Sweden and Prostate Cancerdata Base Sweden 2.0. Int J Epidemiol 2013;42:956–67.
[8] NPCR. The National Prostate Cancer Register of Sweden. www.npcr.se [accessed 01.11.17].
[9] Van Hemelrijck M, Garmo H, Wigertz A, Nilsson P, Stattin P. Cohortprofile update: the National Prostate Cancer Register of Sweden andProstate Cancer data Base—a refined prostate cancer trajectory. Int JEpidemiol 2016;45:73–82.
[10] Charlson ME, Pompei P, Ales KL, MacKenzie CR. A new method ofclassifying prognostic comorbidity in longitudinal studies: devel-opment and validation. J Chronic Dis 1987;40:373–83.
[11] Cox D, Oakes D. Analysis of survival data. London, New York:Chapman & Hall/CRC; 1984.
[12] Thiebaut AC, Benichou J. Choice of time-scale in Cox's modelanalysis of epidemiologic cohort data: a simulation study. StatMed 2004;23:3803–20.
[13] NCCN. Guidelines for prostate cancer. 2016.[14] CooperbergMR, Pasta DJ, Elkin EP, et al. The University of California,
San Francisco Cancer of the Prostate Risk Assessment score: astraightforward and reliable preoperative predictor of disease re-currence after radical prostatectomy. J Urol 2005;173:1938–42.
[15] Wang R, Lagakos SW, Ware JH, Hunter DJ, Drazen JM. Statistics inmedicine—reporting of subgroup analyses in clinical trials. N Engl JMed 2007;357:2189–94.
[16] Epstein JI, Egevad L, Amin MB, et al. The 2014 International Society ofUrological Pathology (ISUP) consensus conference on Gleason gradingof prostatic carcinoma: definitionof gradingpatterns andproposal for anew grading system. Am J Surg Pathol 2016;40:244–52.
[17] Brenner H, Soderman B, Hakulinen T. Use of period analysis forproviding more up-to-date estimates of long-term survival rates:empirical evaluation among 370,000 cancer patients in Finland. Int JEpidemiol 2002;31:456–62.
[18] Mahal BA, Aizer AA, Efstathiou JA, Nguyen PL. Association of verylow prostate-specific antigen levels with increased cancer-specificdeath in men with high-grade prostate cancer. Cancer2016;122:78–83.
[19] Tomic K, Sandin F, Wigertz A, Robinson D, Lambe M, Stattin P.Evaluation of data quality in the National Prostate Cancer Registerof Sweden. Eur J Cancer 2015;51:101–11.
[20] Sterne JA, Hernan MA, Reeves BC, et al. ROBINS-I: a tool for asses-sing risk of bias in non-randomised studies of interventions. BMJ2016;355:i4919.
[21] Lindhagen L, Van Hemelrijck M, Robinson D, Stattin P, Garmo H.How to model temporal changes in comorbidity for cancer patients

E U RO P E AN URO LOGY 73 ( 2 018 ) 5 0 2 – 511 511
using prospective cohort data. BMC Med Inform Decis Mak2015;15:96.
[22] White IR, Carlin JB. Bias and efficiency of multiple imputationcomparedwith complete-case analysis formissing covariate values.Stat Med 2010;29:2920–31.
[23] Buuren SV. Flexible imputation of missing data. Boca Raton, FL: CRCPress; 2012.
[24] Team RC. R: a language and environment for statistical computing.Vienna: R Foundation for Statistical Computing; 2013.
[25] Fall K, Stromberg F, Rosell J, Andren O, Varenhorst E, South-EastRegion Prostate Cancer G. Reliability of death certificates in prostatecancer patients. Scand J Urol Nephrol 2008;42:352–7.
[26] Tomic K, Berglund A, Robinson D, et al. Capture rate and represen-tativity of the National Prostate Cancer Register of Sweden. ActaOncol 2015;54:158–63.
[27] Albertsen PC, Hanley JA, Penson DF, Barrows G, Fine J. 13-Yearoutcomes following treatment for clinically localized prostate can-cer in a population based cohort. J Urol 2007;177:932–6.
[28] Vellekoop A, Loeb S, Folkvaljon Y, Stattin P. Population based studyof predictors of adverse pathology among candidates for activesurveillance with Gleason 6 prostate cancer. J Urol 2014;191:350–7.
[29] Huang J, Vicini FA, Williams SG, et al. Percentage of positive biopsycores: a better risk stratification model for prostate cancer? Int JRadiat Oncol Biol Phys 2012;83:1141–8.
![Prostate cancer: 1HMRS-DCEMR at 3 T versus [(18)F]choline PET/CT in the detection of local prostate cancer recurrence in men with biochemical progression after radical retropubic prostatectomy](https://static.fdokumen.com/doc/165x107/63221f91807dc363600a4aa0/prostate-cancer-1hmrs-dcemr-at-3-t-versus-18fcholine-petct-in-the-detection.jpg)