Acute toxicity during external-beam radiotherapy for localized prostate cancer: Comparison of...
13
Ini J Rodumon Oncology Bml. Phys Vol. 25. PP. 359-371 0360-3016/93 $6.00 + .I0 Printed in the U.S.A. All rights resewed. Copyright Q 1993 Pergamon Press Ltd. ?? Special Feature ACUTE TOXICITY DURING EXTERNAL-BEAM RADIOTHERAPY FOR LOCALIZED PROSTATE CANCER: COMPARISON OF DIFFERENT TECHNIQUES S. VIJAYAKUMAR, M.B., B.S., DMRT,* A. AWAN, M.D., T. KARRISON, PH.D.,+ H. CULBERT, PH.D.,* S. CHAN, M.S.,* J. KOLKER, M.D.,* N. Low, M.D.,* H. HALPERN, M.D., PH.D.,* S. RUBIN, M.D.,* G. T. Y. CHEN, PH.D.* AND R. R. WEICHSELBAUM, M.D.* University of Chicago, Center for Radiation Therapy, Chicago, IL Purpose: The chronic and acute toxicities associated with conventional radiotherapy of localized prostate cancer are well documented. However, the degree and incidence of toxicities with conformal techniques are not known. Studying side effects associated with modern radiotherapeutic techniques is more important now since there has been a general trend to use computerized tomography-based techniques in recent years; beam’ s eye view-based conformal techniques are also becoming more commonplace. It is possible that the local disease control can be improved with the delivery of higher doses than currently used. Conformation of the treatment volume to the target volume may facilitate such dose-escalation. However, prior to such dose-escalation, it is important to know the toxicities associated with such techniques with conventional doses. Methods and Materials: We have compared week-by-week acute toxicities associated with conventional (Group A, 16 patients), computerized tomography-based, manual (Group B, 57 patients) and beam’ s eye view-based (Group C, 43 patients) techniques during 7 weeks of radiotherapy. Group B and C patients were treated contemporaneously (1988-1990). Results: Acute side effects gradually increased from week 1 through weeks 4-5 and generally declined or plateaued after that. The incidence of acute toxicities was significantly less with the beam’ s eye view/based technique than with the other two methods. For instance, the percentages of Grade 2 acute genitourinary toxicities for Groups A, B, and C were as follows: Week l-0, 0, 0; Week 2-6,0,0; Week 3-6, 9, 2; Week 4-12, 14, 9; Week 5-35, 14, 9; Week 6-31, 16, 7; Week 7-33, 8, 8, respectively. The p values associated with differences in acute genitourinary toxicities for Weeks l-7 using chi-square test were 0.072,0.627,0.389,0.538,0.123,0.06, and 0.012; the p values for acute gastrointestinal toxicities were 0.512,0.09,0.031,0.031,0.003, < 0.0001, and 0.004, respectively. Pairwise comparison (Wilcoxon rank-sum test) showed statistically significant lower acute toxicity in Group C than Group B (e.g., p values, Weeks l-7 for gastrointestinal toxicity: 0.633, 0.056, 0.010, 0.014, < 0.0001, < 0.0001, and < 0.0001, respectively) in the latter part of the treatment course. No correlation was found between the extent of toxicity and the patient age or the overall treatment time. Also, no correlation was found between the degree of toxicity and the radiation dose and fraction size, within the narrow ranges used (65-70 Gy and 180-200 cGy, respectively). A trend suggesting increased severity of toxicity with increase in the volume of treatment was seen. Conclusion: The findings in this retrospective study need to be confirmed by other prospective studies. Prostate cancer, Acute toxicity, Side-effects, Conformal therapy, Beam’ s eye view, Techniques. INTRODUCIION Prostate cancer (PC) is a major health problem among American men (6). Radiotherapy (RT) is one of two major curative treatment modalities for PC. The acute toxicity (1, 4, 5, 7, 8, 9, 10, 12, 13, 21, 23, 25, 31, 32, 33, 34, 38, 39) and late toxicity ( 1, 8, 10, 13, 14, 16, 20, 24, 26-29, 31, 33, 34, 35) associated with RT with conventional techniques are well documented. In the majority of these reports, the whole pelvis was treated to a dose of 40-50 Presented in the 33rd ASTRO Annual Meeting, 4-8 Novem- ber 199 1, Washington, DC * Department of Radiation and Cellular Oncology. + Department of Medicine. * Department of Statistics. Reprint requests to: Srinivasan Vijayakumar, M.B., B.S., DMRT, Humana Hospital, Michael Reese, Department of Ra- diation Oncology, 2929 So. Ellis Ave., Room 148 MR, Chicago, IL 60616. Acknowledgements-The authors thank Evelyn Davison for typing the manuscript, Elizabeth Lanzl for editorial help, and Alan Houghton for his help in data analysis. We are also indebted to Judy Mitchell, Clarissa Trinidad, and Lani Ignacio for data collection and Susan Kohlstedt for the graphics. Accepted for publication 13 August 1992. 359
-
Upload
independent -
Category
Documents
-
view
0 -
download
0
Transcript of Acute toxicity during external-beam radiotherapy for localized prostate cancer: Comparison of...

Ini J Rodumon Oncology Bml. Phys Vol. 25. PP. 359-371 0360-3016/93 $6.00 + .I0 Printed in the U.S.A. All rights resewed. Copyright Q 1993 Pergamon Press Ltd.
??Special Feature
ACUTE TOXICITY DURING EXTERNAL-BEAM RADIOTHERAPY FOR LOCALIZED PROSTATE CANCER: COMPARISON OF DIFFERENT TECHNIQUES
S. VIJAYAKUMAR, M.B., B.S., DMRT,* A. AWAN, M.D., T. KARRISON, PH.D.,+ H. CULBERT, PH.D.,* S. CHAN, M.S.,* J. KOLKER, M.D.,* N. Low, M.D.,*
H. HALPERN, M.D., PH.D.,* S. RUBIN, M.D.,* G. T. Y. CHEN, PH.D.*
AND R. R. WEICHSELBAUM, M.D.*
University of Chicago, Center for Radiation Therapy, Chicago, IL
Purpose: The chronic and acute toxicities associated with conventional radiotherapy of localized prostate cancer are well documented. However, the degree and incidence of toxicities with conformal techniques are not known. Studying side effects associated with modern radiotherapeutic techniques is more important now since there has been a general trend to use computerized tomography-based techniques in recent years; beam’s eye view-based conformal techniques are also becoming more commonplace. It is possible that the local disease control can be improved with the delivery of higher doses than currently used. Conformation of the treatment volume to the target volume may facilitate such dose-escalation. However, prior to such dose-escalation, it is important to know the toxicities associated with such techniques with conventional doses. Methods and Materials: We have compared week-by-week acute toxicities associated with conventional (Group A, 16 patients), computerized tomography-based, manual (Group B, 57 patients) and beam’s eye view-based (Group C, 43 patients) techniques during 7 weeks of radiotherapy. Group B and C patients were treated contemporaneously (1988-1990). Results: Acute side effects gradually increased from week 1 through weeks 4-5 and generally declined or plateaued after that. The incidence of acute toxicities was significantly less with the beam’s eye view/based technique than with the other two methods. For instance, the percentages of Grade 2 acute genitourinary toxicities for Groups A, B, and C were as follows: Week l-0, 0, 0; Week 2-6,0,0; Week 3-6, 9, 2; Week 4-12, 14, 9; Week 5-35, 14, 9; Week 6-31, 16, 7; Week 7-33, 8, 8, respectively. The p values associated with differences in acute genitourinary toxicities for Weeks l-7 using chi-square test were 0.072,0.627,0.389,0.538,0.123,0.06, and 0.012; the p values for acute gastrointestinal toxicities were 0.512,0.09,0.031,0.031,0.003, < 0.0001, and 0.004, respectively. Pairwise comparison (Wilcoxon rank-sum test) showed statistically significant lower acute toxicity in Group C than Group B (e.g., p values, Weeks l-7 for gastrointestinal toxicity: 0.633, 0.056, 0.010, 0.014, < 0.0001, < 0.0001, and < 0.0001, respectively) in the latter part of the treatment course. No correlation was found between the extent of toxicity and the patient age or the overall treatment time. Also, no correlation was found between the degree of toxicity and the radiation dose and fraction size, within the narrow ranges used (65-70 Gy and 180-200 cGy, respectively). A trend suggesting increased severity of toxicity with increase in the volume of treatment was seen. Conclusion: The findings in this retrospective study need to be confirmed by other prospective studies.
Prostate cancer, Acute toxicity, Side-effects, Conformal therapy, Beam’s eye view, Techniques.
INTRODUCIION
Prostate cancer (PC) is a major health problem among American men (6). Radiotherapy (RT) is one of two major curative treatment modalities for PC. The acute toxicity
(1, 4, 5, 7, 8, 9, 10, 12, 13, 21, 23, 25, 31, 32, 33, 34, 38, 39) and late toxicity ( 1, 8, 10, 13, 14, 16, 20, 24, 26-29, 31, 33, 34, 35) associated with RT with conventional techniques are well documented. In the majority of these reports, the whole pelvis was treated to a dose of 40-50
Presented in the 33rd ASTRO Annual Meeting, 4-8 Novem- ber 199 1, Washington, DC
* Department of Radiation and Cellular Oncology. + Department of Medicine. * Department of Statistics. Reprint requests to: Srinivasan Vijayakumar, M.B., B.S.,
DMRT, Humana Hospital, Michael Reese, Department of Ra- diation Oncology, 2929 So. Ellis Ave., Room 148 MR, Chicago, IL 60616.
Acknowledgements-The authors thank Evelyn Davison for typing the manuscript, Elizabeth Lanzl for editorial help, and Alan Houghton for his help in data analysis. We are also indebted to Judy Mitchell, Clarissa Trinidad, and Lani Ignacio for data collection and Susan Kohlstedt for the graphics.
Accepted for publication 13 August 1992.
359
360 I. J. Radiation Oncology 0 Biology 0 Physics Volume 25, Number 2. 1993
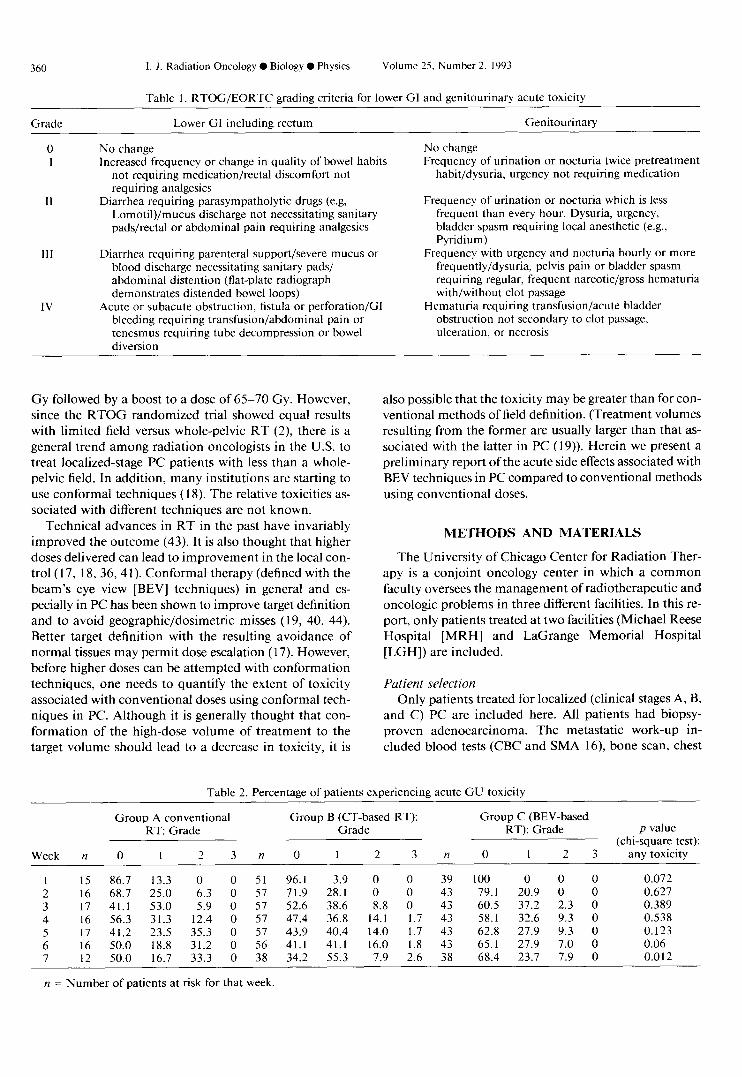
Table 1. RTOG/EORTC grading criteria for lower GI and genitourinary acute toxicity
Grade Lower GI including rectum Genitourinary
No change Increased frequency or change in quality of bowel habits
not requiring medication/rectal discomfort not requiring analgesics
Diarrhea requiring parasympatholytic drugs (e.g, LomotiI)/mucus discharge not necessitating sanitary pads/rectal or abdominal pain requiring analgesics
III
IV
Diarrhea requiring parenteral support/severe mucus or blood discharge necessitating sanitary pads/ abdominal distention (flat-plate radiograph demonstrates distended bowel loops)
Acute or subacute obstruction, fistula or perforation/G1 bleeding requiring transfusion/abdominal pain or tenesmus requiring tube decompression or bowel diversion
No change Frequency of urination or nocturia twice pretreatment
habit/dysuria, urgency not requiring medication
Frequency of urination or nocturia which is less frequent than every hour. Dysuria, urgency, bladder spasm requiring local anesthetic (e.g., Pyridium)
Frequency with urgency and nocturia hourly or more frequently/dysuria, pelvis pain or bladder spasm requiring regular, frequent narcotic/gross hematuria with/without clot passage
Hematuria requiring transfusion/acute bladder obstruction not secondary to clot passage, ulceration. or necrosis
Gy followed by a boost to a dose of 65-70 Gy. However, since the RTOG randomized trial showed equal results with limited field versus whole-pelvic RT (2) there is a general trend among radiation oncologists in the U.S. to treat localized-stage PC patients with less than a whole- pelvic field. In addition, many institutions are starting to use conformal techniques ( 18). The relative toxicities as- sociated with different techniques are not known.
Technical advances in RT in the past have invariably improved the outcome (43). It is also thought that higher doses delivered can lead to improvement in the local con- trol (17, 18, 36,4 1). Conformal therapy (defined with the beam’s eye view [BEV] techniques) in general and es- pecially in PC has been shown to improve target definition and to avoid geographic/dosimetric misses (19, 40, 44). Better target definition with the resulting avoidance of normal tissues may permit dose escalation ( 17). However, before higher doses can be attempted with conformation techniques, one needs to quantify the extent of toxicity associated with conventional doses using conformal tech- niques in PC. Although it is generally thought that con- formation of the high-dose volume of treatment to the target volume should lead to a decrease in toxicity, it is
also possible that the toxicity may be greater than for con- ventional methods of field definition. (Treatment volumes resulting from the former are usually larger than that as- sociated with the latter in PC (19)). Herein we present a preliminary report of the acute side effects associated with BEV techniques in PC compared to conventional methods using conventional doses.
METHODS AND MATERIALS
The University of Chicago Center for Radiation Ther- apy is a conjoint oncology center in which a common faculty oversees the management of radiotherapeutic and oncologic problems in three different facilities. In this re- port, only patients treated at two facilities (Michael Reese Hospital [MRH] and LaGrange Memorial Hospital [LGH]) are included.
Patient selection Only patients treated for localized (clinical stages A, B,
and C) PC are included here. All patients had biopsy- proven adenocarcinoma. The metastatic work-up in- cluded blood tests (CBC and SMA 16), bone scan, chest
Table 2. Percentage of patients experiencing acute CU toxicity
Week n
1 15 2 16 3 17 4 16 5 17 6 16 7 12
Group A conventional Group B (CT-based RT): Group C (BEV-based RT: Grade Grade RT): Grade
0 1 2 3
86.7 13.3 0 0 68.7 25.0 6.3 0 41.1 53.0 5.9 0 56.3 31.3 12.4 0 41.2 23.5 35.3 0 50.0 18.8 31.2 0 50.0 16.7 33.3 0
n
51 57 57 57 57 56 38
0 1 2 3
96.1 3.9 0 0 71.9 28.1 0 0 52.6 38.6 8.8 0 47.4 36.8 14.1 1.7 43.9 40.4 14.0 1.7 41.1 41.1 16.0 1.8 34.2 55.3 7.9 2.6
n 0 1 2 3
39 100 0 0 0 0.072 43 79.1 20.9 0 0 0.627 43 60.5 37.2 2.3 0 0.389 43 58.1 32.6 9.3 0 0.538 43 62.8 27.9 9.3 0 0.123 43 65.1 27.9 7.0 0 0.06 38 68.4 23.7 7.9 0 0.012
p value (chi-square test):
any toxicity
n = Number of patients at risk for that week.

Acute toxicity 0 S. VIJAYAKUMAR et al. 361
Week n
Table 3. Percentage of patients experiencing acute GI toxicity
Group A conventional RT: Group B (CT-based RT): Group C (BEV-based RT): Grade Grade Grade
0 1 2 3n 0 1 2 3 n 0 1 2 3
p value (chi-square test):
any toxicity
1 15 100 0 0 0 51 92.2 7.8 0 0 38 94.7 5.3 0 0 0.512 2 16 81.3 12.5 6.2 0 57 63.2 35.1 1.8 0 43 81.4 16.3 2.3 0 0.090 3 17 52.9 35.3 11.8 0 57 38.6 42.1 19.3 0 43 65.1 25.6 9.3 0 0.03 1 4 16 37.5 37.5 25.0 0 56 26.8 42.9 30.3 0 43 55.8 23.3 20.9 0 0.013 5 16 43.75 31.3 25.0 0 56 26.8 37.5 33.9 1.8 43 60.5 27.9 11.6 0 0.003 6 16 62.5 18.8 18.8 0 56 25.0 35.7 37.5 1.8 42 61.9 26.2 11.9 0 < 0.001 7 12 58.3 25.0 16.7 0 38 21.1 42.1 36.8 0 38 55.3 39.5 5.2 0 0.004
n = Number of patients at risk for that week.
roentgenogram, and CT of the pelvis. Our policy since 1986 is to treat with localized fields (prostate + seminal vesicles and peri-prostatic tissues) only. The doses used for the various stages are: 65-66 Gy for Stage A, 66 Gy for Stage B 1, 68 Gy for Stage B2, and 70 Gy for Stage C. Doses are target minimum doses.
Treatment technique All patients except three were treated with the 4-field
“box” (anterior-posterior, posterior-anterior, and two lat- erals) technique. The three exceptional (LGH) patients were treated with a combination of techniques (usually 4-field + bilateral arc) because of prosthetic hip replace- ments. Megavoltage x-rays (6, 10, or 18 MV) were used: all fields were treated every day, 5 days a week. The frac- tion sizes used were 180-200 cGy with very few excep- tions.
Included in this report are three groups of patients: Group A- 17 patients treated with limited fields between 1986 and 1988 with conventional techniques (i.e., treat- ment fields were based on bladder and rectal contrast studies, with beam plans and monitor unit calculations based on a wire contour taken at the central-axis level). Corner field blocks were used, designed by clinical judg- ment. Group B-57 patients treated at LGH since 1988, whose treatment planning was computerized tomography (CT)-based. Computerized tomography was done prior
to simulation in the majority of patients and after simu- lation in the remaining patients. The targets were recon- structed on the simulation films from CT-scan hard-copy findings. Beam plans and monitor unit calculations were performed from the central-axis wire contours. Blocks were drawn after target reconstruction on the simulation films. Group C-43 patients treated since 1988 with the BEV-based technique at MRH. The technique has been detailed previously ( 19,44). In brief, targets were outlined on multiple (appropriate) CT slices, and the blocks were individually tailored to each patient’s BEV-generated tar- gets. Monitor units were calculated on the central axis slice. Only a coplanar, 4-field technique was used.
Definition of targets The targets were defined as follows: For Stage A and B
patients, the prostate and seminal vesicles with 1 cm mar- gin around them constituted the primary target, with an additional 1 cm margin to the block (“planning target”); this volume received 46-50 Gy, followed by a boost to a secondary planning target of prostate only with a 2 cm margin to the blocked field edge. Stage C patients’ primary and boost targets included the prostate and seminal ves- icles with 1 cm and 2 cm margin around it defining the primary and planning targets, respectively. No deliberate defining of targets was done for the conventional group. The aim was to treat the prostate, periprostatic tissues,
Table 4. Pairwise comparison of GU and GI toxicities: Wilcoxon rank-sum test (“p” values)
GU toxicitv GI toxicity
Week Group A vs. B Group A vs. C Group B vs. C Group A vs. B Group A vs. C Group B vs. C
(Conven. vs. CT) (Conven. vs. BEV) (CT vs. BEV) (Conven. vs. CT) (Conven. vs. BEV) (CT vs. BEV)
1 0.183 0.022 0.214 0.267 0.370 0.633 2 0.703 0.356 0.417 0.232 0.940 0.056 3 0.528 0.162 0.321 0.275 0.408 0.010 4 0.530 0.839 0.232 0.46 1 0.297 0.014 5 0.399 0.049 0.062 0.218 0.188 < 0.000 1 6 > 0.999 0.128 0.014 0.014 0.888 < 0.000 1 7 > 0.999 0.129 0.007 0.030 0.898 < 0.000 1
All 7 weeks 0.526 0.077 0.056 0.036 0.400 < 0.000 1

362 I. J. Radiation Oncology 0 Biology 0 Physics
and base of the seminal vesicles. Dose prescription was always to the 100% isodose line, which always surrounded the primary target on the central axis.
Definition of acute toxicity Acute toxicities were graded based on RTOG/EORTC
criteria (Table 1). All of our patients were seen at least once a week during the course of RT. The notes for each patient’s weekly evaluations were reviewed retrospectively, and a grade was assigned by one oncologist and confirmed by another. If sufficient information was not available, no grading was assigned for that week.
Volume calculations Two measures of treatment volumes were determined,
and an attempt was made to correlate these measures with toxicity. The first r, sure was “boxed volume” (BV), in which we used the i.,Lual field sizes of AP-PA and lateral fields to obtain the treatment volume. The effects of blocks are not represented in these BVs. The second measure was the volume of treatment. To obtain the true volume (TV) of treatment, a computer program was written which calculated this volume from AP-PA and lateral simulation films. The treated fields (omitting blocked portions) were digitized from simulation films in a subset of patients, and TVs were calculated. The second measure was ob- tained only in groups B and C.
Statistical methods Toxicities in the three groups were compared by two
methods: (a) Obtaining the percentage of patients with
Mean Toxicity of Bladder over 7 weeks
~ Conventional ct
_/.
,’ . I’
. ,’ ,I
I 1 I I I I
1 2 3 4 5 6 7
Week
Fig. 1. The weekly mean GU toxicity (? 1 SD) for each group is plotted over the course of RT. Group C (BEV, ----) patients experienced less toxicity than did Group A (conventional )- ) orB(CT, .+..).
Volume 25, Number 2. 1993
i
i
i
Fig. 2. Mean GI toxicity for the 3 groups. Group C (BEV, ----) had the least toxicity; however, Group B (CT, - - . . ) experienced more GI toxicity than did Group A (conventional, -).
any toxicity (Grades O-3) (no grade 4 toxicity was ob- served) for a specific week and applying a chi-square test, and (b) pairwise comparison of toxicity scores among the three groups using the Wilcoxon rank-sum test (22). Scores were compared on a week-by-week basis as well as ob- taining a cumulative sum over the entire 7 weeks. Com- parisons of other parameters in the different groups were carried out by ANOVA (analysis of variance) with allow- ance for multiple comparisons.
To study the correlation between toxicity and age, dose, fraction size, and treatment duration, we summarized and plotted these parameters (e.g., mean toxicity over the en- tire 7 weeks of treatment vs. age) and calculated corre- lation coefficients. In addition, because the initial volumes (46-50 Gy) and’ final boost volumes (20-30 Gy) differed, we assessed the,correlation with a week-by-week plotting of individual patient toxicity versus the initial volume of treatment for the first 5 weeks; similarly, the boost vol- umes were plotted against the grade of toxicity for the last 2 weeks of treatment. These results are represented in “box plots” in which the boxes show the median value (central, horizontal line), the upper (75%) quartile (upper border of the box), and lower (25%) quartile (lower border of the box). The upper and lower extents of the vertical dashed lines extending from the box represent the largest (smallest) value falling within 1.5 times the interquartile range from the upper (lower) quartile. Asterisks represent outliers falling beyond this range.
RESULTS
The percentages of patients who developed any toxicity are shown in Tables 2 and 3 for GU and GI side effects,

Acute toxicity 0 S. VIJAYAKUMAR et al.
Table 5. Comparison of relevant parameters between groups
363
Parameter
Pairwise group comparisons
P Mean value values+ p values+ p values+
GrpA GrpB GrpC p value* A vs. B A vs. C B vs. C
(Conventional) 6655
(19) 195.2 (19) 49.4 (17)
1126 (18)
675 (19) -
(CT) WV) 6745 6674
(57) (43) 196.4 194.2 (43) (43) 49.1 49.2 (54) (43)
1264 1601 (54) (43)
1109 1337 (55) (43)
974 1036 (44) (35)
869 718 (44) (35) 75.9 99.1 (44) (35)
6.43 6.79
Dose (cGy) 0.042
0.373
0.915
0.005
< 0.00 1
0.53
0.04 1
0.004
0.004
0.005
NS NS
NS NS
NS NS
NS p < 0.005
p < 0.05 p < 0.05
- -
NS
NS
NS
p < 0.05
p < 0.05
NS
0.041
0.004
NS
NS
Fraction size (cGy)
Treatment time (days)
BVs--Initial (cc)
BVs-Boost (cc)
TVs--Initial (cc)
TVs-Boost (cc) - - -
Prostate volume (cc) -
NS
NS
-
p < 0.05
p < 0.005
No. of weekly evaluations (OTV’s) for GU
No. of weekly evaluations (OTV’s) for Gl
5.74
5.68 6.40 6.74
NS = Not significant: OTV = On-treatment visits. ** Numbers in parentheses indicate the number of patients at risk. * From ANOVA F-statistic on 2 d.f. + Tukey’s allowance for multiple comparison.
Table 6. Acute toxicities reuorted in the literature
Acute toxicity* (%)
Reference
Grades 1 + Grades 3 + 2 4 Total
dose Split No. of pts. Gl GU Gl GU (GY) Technique Pelvis treated course
112
107
310
136
50 121
84
105
597
30”
- -
37.5 -
24 25
62 32
62 24 21 23.3
71.4 54.8
44 62
68 40.2
43.3 46.6
10
-
5.5
1.5
- -
0
-
0.5
3
70 AP-PA + AP for the boost Yes No
No No
Yes No
Perez et at.+
(25) McGowan+
(21) Bagshaw+ et al.
(4, 5, 33, 34)
Ploysongsang et al. (32)
Nacey (23) Shipley et al.
(38) Pino Y Torres
et al. (31) Davies et al. (8)
Douchez et al.
(10) Ang and Van
Der Schueren (1)
60 5 fields
10 70-75 Bilat. arc or rotation (360”) [4-field (50 Gy) + (boost) arcs (20 Gy)]
4-field 0 66-70
55-74 - 64-70
0 60-70
Yes
in 14 pts. Yes
Yes
No
No No
Yes
AP-PA or 4-field 4-field
? + arc for the boost
- 51- 60*
0.5 64.7-66
AP + 2 post. obliq. No
0 60 4 or 3-fields
Yes (in 555 pts.)
Yes
See text
Yes
* Approximate conversion to RTOG/EORTC grading system. + Reviewed by Dewit et al. (8). $300 cGy fractions. g Included were 8 bladder cancer patients; 200 cGy, 3 fractions X 5 days --, 4 weeks split --) 3 fractions X 5 days.

364 1. J. Radiation Oncology 0 Biology 0 Physics Volume 25, Number 2, 1993
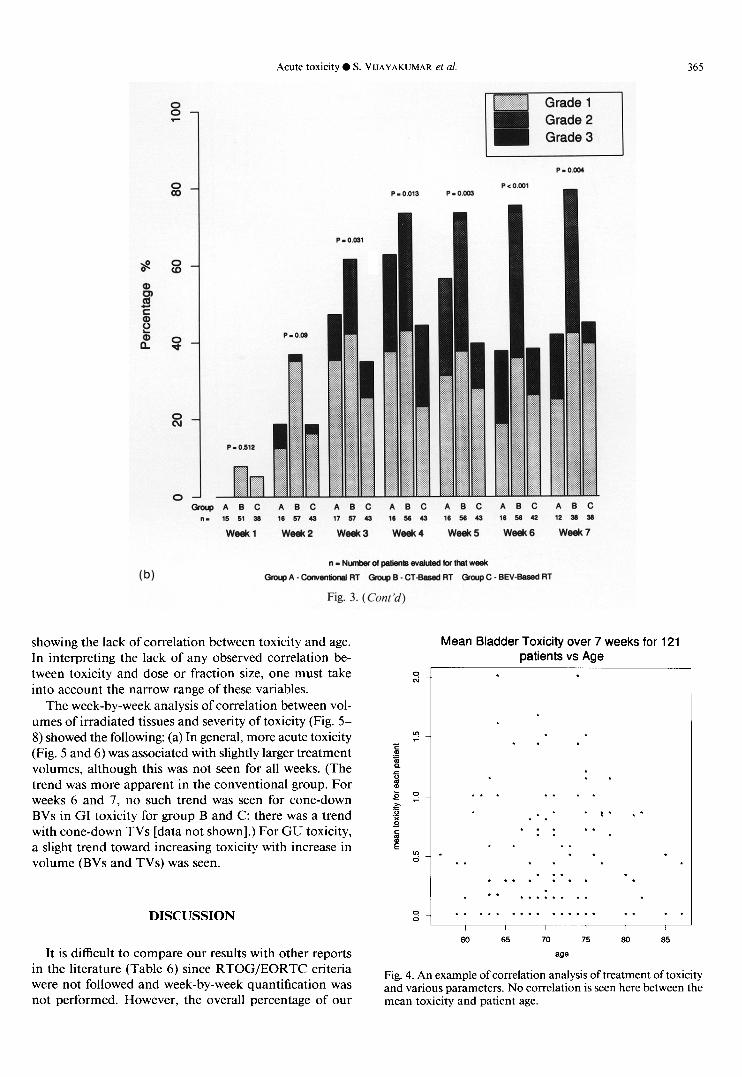
” - Ntdzes ol @ienls evebled for Mel week
(a) Group A - ‘.ktwenlioml RT Gmup B - CT-Bawd RT Group C - BEV-Based RT
Fig. 3. Percentage of patients experiencing acute toxicity for each group. RTOG grades and chi square test p values are also indicated. (a) acute GU toxicity. (b) acute GI toxicity.
respectively. In Table 4, the “p” values resulting from the pairwise comparisons of GU and GI toxicities from the Wilcoxon test are reported. Figures 1 and 2 depict the mean weekly toxicity for each group over the 7-week course of RT. The acute GI/GU toxicity gradually in- creased from the beginning of RT to week 4-5; after the 5th week, the toxicity declined or plateaued except in the CT group (Fig. 1 and 2). GU toxicity was lower in the BEV group than in the CT or conventional groups (Fig. 1 and 3a; Table 2), although a statistically significant dif- ference between the BEV and CT groups was observed only in weeks 6-7 (Tables 2 and 4). For all 7 weeks, the BEV technique resulted in the lowest toxicity (Table 4). GI toxicity was lower in the BEV group than in the other two groups after week 3 (Fig. 2 and 3b; Tables 3 and 4). GI toxicity was less in the conventional group than in the CT group throughout (Fig. 2 and 3b), but was significantly so only during the last 2 weeks of RT (Table 4).
We also looked for differences among the three groups in various other parameters which may alter the toxicity: we compared these parameters among Groups A, B, and C and the results are shown in Table 5. The CT group
received a higher mean dose (about 100 cGy) than did the other two groups. However, the fraction size and total duration of treatment did not differ significantly among the three groups. The initial mean BV was significantly (p < 0.05) higher in the BEV group (1601 cc) than in the other two groups (1126 cc and 1264 cc in group A and B, respectively). The mean boost BVs were significantly (Q < 0.05) higher in the CT ( 1109 cc) and BEV ( 1337 cc) groups than in the conventional group (675 cc); they were also higher in the BEV group than in the CT group 0) < 0.05). Although the mean initial TVs were not different (p = 0.53) between the CT (974 cc) and BEV (1036 cc) groups, they were significantly 01 = 0.041) higher in the CT group (869 cc) for the mean boost TVs, although the mean prostate volumes were significantly (p = 0.004) lower in the CT group (Table 5). This is true even though the boost BVs were higher in the BEV group than in the CT group.
There was no significant correlation between age, dose, fraction size, or treatment duration and the mean degree of toxicity over 7 weeks for all three groups taken together, or within any one group. Figure 4 is a typical scatter plot
Acute toxicity 0 S. VIJAYAKUMAR et al.
0 A B C A 0 C A B C A B C A 0 C A 0 C A 0 C 15 51 38 16 37 43 17 57 43 16 50 43 18 SB 43 I(1 s 42 (2 38 50
week1 week2 week3 week4 weeks Week6 weak7
ll-NunbsrdpIltht3Wtlluted(or~lweek
GrapA-Conv~lionsl~~ ~;rwp~-C~-~ssed~~ GKUJ~C-BEV-B~~~~RT
Fig. 3. ( Cant ‘d)
(b)
showing the lack of correlation between toxicity and age. In interpreting the lack of any observed correlation be- tween toxicity and dose or fraction size, one must take into account the narrow range of these variables.
The week-by-week analysis of correlation between vol- umes of irradiated tissues and severity of toxicity (Fig. 5- 8) showed the following: (a) In general, more acute toxicity (Fig. 5 and 6) was associated with slightly larger treatment volumes, although this was not seen for all weeks. (The trend was more apparent in the conventional group. For weeks 6 and 7, no such trend was seen for cone-down BVs in GI toxicity for group B and C; there was a trend with cone-down TVs [data not shown].) For GU toxicity, a slight trend toward increasing toxicity with increase in volume (BVs and TVs) was seen.
Mean Bladder Toxicity over 7 weeks for 121 patients vs Age
- 7
. .
. * . . .
(I
. (I 0
* . * . * .:. f * . . . *. * * .
f * . . f . .
60 65 70 75 60 65
age
DISCUSSION
It is difficult to compare our results with other reports in the literature (Table 6) since RTOG/EORTC criteria were not followed and week-by-week quantification was not performed. However, the overall percentage of our
Fig. 4. An example of correlation analysis of treatment of toxicity and various parameters. No correlation is seen here between the mean toxicity and patient age.

366 I. J. Radiation Oncology 0 Biology 0 Physics Volume 25, Number 2, 1993
Week 4
Week5 Week6
Fig. 5. Degree of GI toxicity for “boxed volumes” (Vl or V2, Y axis). VI represents the initial “boxed volume” (i.e., volume derived from field sizes) and V2, the boost “boxed volume.” Since some patients started boost treatment after 4600 cGy and others after 5000 cGy, for week 5, comparison is made with both Vl and V2. This figure includes all patients (i.e., groups A, B, and C).
patients experiencing acute toxicity in any given week from weeks 4-7 falls within the range of many reports in Table 6.
There are many reports which attest to the benefits of CT-based treatment planning in prostate cancer (3, 11, 15, 30). More recently, it has been shown that the target coverage is significantly improved with individualized CT- based conformal treatment planning (19, 42, 44) and therefore it should be preferred, especially if it causes equal or lesser toxicity. In our study, a trend toward decreased
acute toxicity is seen with BEV-based planning compared to conventional or manual CT-based planning.
A decrease in acute toxicity may result in a decrease in late complications. Ray et al. noted a higher rate of persistent complications among patients in whom acute symptoms developed (33). In this respect, it should be noted that H. Sandler, C. Perez-Tamayo, and A. Lichter have found no significant late toxicity in a limited number of patients in a dose escalation study (doses > 70 Gy) in which conformal techniques were used (36). However,

Acute toxicity 0 S. VIJAYAKUMAR et al. 367
Week 4 Week5
, I I
Fig. 6. Relationship of acute GI toxicity to “true volumes” of treatment. “True volumes” represent the actual volumes of treatment excluding the blocked portions. “IgV” indicates the initial “true volumes”; cdV represents the “true” cone-down volumes. For weeks 2-7, the median volume for grade 2 toxicity is higher than those for grades 0 and 1 toxicity. IgV/cdV values were not available for Group A.
acute and chronic toxicity may not necessarily be related, and further studies are needed before any definite con- clusion can be drawn.
Many authors note that late complications are tech- nique and volume-related (16, 20, 24, 28, 29). The de- creased acute toxicity with the BEV technique probably reflects a lesser volume of normal tissues being irradiated because of conformation of the high-dose treatment vol- ume to the target. Although CT-based manual recon- struction should theoretically also “conform” the treat- ment volume to the targets, in a preliminary report of acute toxicity we previously noted a tendency to give a
larger safety margin around the target with manual re- construction than with computerized, BEV-based target reconstruction (44). Perhaps, with the latter technique, the physician’s confidence in target definition is greater (44). This is probably true, because Group B patients’ mean TVs were higher than those for Group C (p = 0.04 I), although the mean prostate volumes were smaller (Group B = 75.9 cc; Group C = 99.1 cc.; p = 0.004).
The lower GI toxicity in the conventional group com- pared to the CT group is probably due to two factors: (a) the posterior border of the lateral fields bisected the rectum in the conventional technique, whereas with CT-based

368 1. J. Radiation Oncology 0 Biology 0 Physics Volume 25, Number 2, 1993
Week 4
Week 5 Week6
Fig. 7. Relationship of acute GI and C) are included here.
toxicity to “boxed volumes.” Symbols as in Figure 4. All patients (Groups A, B,
planning, the blocks were tailored to the individual pa- tient’s target size and volume and therefore, in some cases, more rectum was treated; (b) the boost volumes were smaller in the conventional group (Groups A vs. B = 675 cc. vs. 1109 cc.; p = < 0.05). The plateauing/decreasing toxicity curves for Groups A and C for GI toxicity (Fig. 1) probably are due to smaller boost volumes than initial treatment volumes (Group A: initial vs. boost volume = 1126 vs. 675 cc.; Group C: 1601 vs. 1337 cc.); however, for the CT group, the volumes did not change much (ini- tial vs. boost volume = 1264 vs. 1109 cc., respectively), thus accounting for absence of a decrease in acute toxicity after week 4. We are currently analyzing the relationship of the degree of toxicity to dose-volume-histograms for
the rectum and bladder. Our finding that the BVs (field sizes) tended to be larger in the BEV than in the CT group, and in the CT and BEV groups than in the conventional group (Table 5; significant p values), further confirms our previous observation that, with conventional treatment planning, there was a significant chance of geographic/ dosimetric miss (19, 44).
Patients were not randomized in our study, although patients in Groups B and C were treated contempora- neously. Possible physician differences might account for inaccurate documentation of acute toxicity. To test this, we compared the mean number of weekly patient eval- uations (i.e., number of interviews during the RT course) for each patient within Groups A, B, and C. If this bias

Acute toxicity 0 S. VIJAYAKLJMAR et al 369
Week 1 week2 Week3
r I I .
Week 4 Week 5
Week 5 Week 6 Week 7
Fig. 8. Acute GU toxicity: correlation with “true volumes” of treatment. Legend as in Figure 6. “True volumes” shown here are for Groups B and C only.
exists, then the mean number of weekly patient evaluation group received approximately 100 cGy (total dose) more should be lower in the BEV group. However, there were than the other two groups (Table 5). This is likely to in- more weekly evaluations in Group C (Table 5) (statistically fluence the acute toxicity only in week 7. However, the significant). The number of observations from week to differences in acute toxicities between groups are not re- week remained relatively constant across all groups except stricted to week 7. Differences in socioeconomic and as- week 7 (Tables 2 and 3). This was because, in the BEV sociated disease status between different groups lead to group, the treatment completion summaries more con- systematic differences in toxicity. We are currently con- sistently included the 7th-week toxicity, whereas in ducting a prospective, randomized trial comparing CT- Groups A and B, it was not always indicated. The CT based and BEV-based treatments.
REFERENCES
1. Ang, K. D.; Van der Schueren E. The tolerance to multiple daily fractionated radiotherapy for the treatment of prostatic
and bladder carcinoma: A feasibility study. Int. J. Radiat. Oncol. Biol. Phys. 8: 166% 1670; 1982.

370 I. J. Radiation Oncology 0 Biology ??Physics Volume 25, Number 2, 1993
2. Asbell, S. 0.; Krall, J. M.; Pilepich, M. V.; Baerwald, H.; Sause, W. T.; Hanks, G. E.; Perez, C. A. Elective pelvic irradiation in stage A2, B carcinoma of the prostate: Analysis of RTOG 77-06. Int. J. Radiat. Oncol. Biol. Phys. 15: 1307;1988.
3. Asbell, S. 0.; Schlager, M. D.; Baker, A. S. Revision oftreat- ment planning for carcinoma of the prostate. Int. J. Radiat. Oncol. Biol. Phys. 686 l-865; 1980.
4. Bagshaw, M. A. Definitive megavoltage radiation therapy in carcinoma of the prostate. In: Fletcher, G. H., ed. Text- book of radiotherapy. Philadelphia, PA: Lea & Febiger; 19731752-767.
5. Bagshaw, M. A.; Ray, G. R. Carcinoma of the prostate: The role of radiotherapy. Proceedings of the XIII International Congress of Radiology, Madrid. Amsterdam: Excerpta Med; 1973.
6. Boring, C. C.; Squires, T. S.; Tong, T. Cancer statistics, 1991. Ca 41:19;1991.
7. Culbert, H.; Vijayakumar, S.; Awan, A.; Low, N.; Chen, G. T. Y. Acute toxicity and volumetric comparison of dif- ferent techniques in patients treated with radical radiother- apy in prostate cancer (Abstract). Proceedings of the Amer- ican Society for Therapeutic Radiology and Oncology, 33rd Annual Meeting, 2 1 (S 1):230; 199 1.
8. Davies, A. H.; Davis, H. L.; Ramarakha, P.; Durrant, K. D.; Fellows, G. J. External-beam radiation for carcinoma of the prostate. J. Urol. 18: I 17-I 19; 1990.
9. Dewit, L.; Ang, K. K.; Van der Schueren, E. Acute side effects and late complications after radiotherapy of localized carcinoma of the prostate. Cancer Treat. Rev. 10:79- 89; 1983.
10. Douchez, J.; Allain, Y. M.; Cellier P. Prostatic cancer: In- tolerance and morbidity of external radiotherapy. Bull. Cancer (Paris) 72:573-577;1985.
1 I. Forman, J. D.; Zinreich, E.; Lee, D.; Wharam, M. D.; Blaumgardner, R. A.; Order, S. E. Improving the therapeutic ratio of external beam irradiation for carcinoma of the pros- tate. Int. J. Radiat. Oncol. Biol. Phys. I 1:2073-2080;1985.
12. Hanks, G. E.; Soffen, E. F.; Chu, J. C. H.; Stafford, P. M. Conformal static field radiation therapy treatment of low volume low grade prostate cancer: Immobilization, dose volume histograms and acute morbidity. Proceedings of the European Society for Therapeutic Radiology & Oncology, 9th Annual Meeting, Montecatini Terme, Italy, September 12-15, 1990; 52.
13. Knufermann, H.; Wannenmacher, M. Prostate carcinoma: curative radiotherapy. Bull. Cancer (Paris) 72:568-572; 1985.
14. Lai, P. P.; Perez, C. A.; Shapiro, S. J.; Lockett, M. A. Car- cinoma of the prostate Stage B and C: Lack of influence of duration of radiotherapy on tumor control and treatment morbidity. Int. J. Radiat. Oncol. Biol. Phys. 19:561- 568; 1990.
15. Lee, D. J.; Leibel, S.; Shiels, R.; Sanders, R.; Siegelman, S.; Order, S. The value of ultrasonic imaging and CT scanning in planning the radiotherapy for prostatic carcinoma. Cancer 45:724-727;1980.
16. Leibel, S. A.; Hanks, G. E.; Kramer, S. Patterns of care outcome studies: Results of the national practice in ade- nocarcinoma of the prostate. Int. J. Radiat. Oncol. Biol. Phys. lo:40 l-409; 1984.
17. Leibel, S. A.; Ling, C. C.; Kutcher, G. J. The biological basis for conformal three-dimensional radiation therapy. Int. J. Radiat. Oncol. Biol. Phys. 2 1:805-8 11; 199 1.
18. Lichter, A. S. Three-dimensional conformal radiation ther- apy: A testable hypothesis. Int. J. Radiat. Oncol. Biol. Phys. 21:853-855;1991.
19. Low, N. N.; Vijayakumar, S.; Rosenberg, I.; Rubin, S.; Vi- rudachalam, R.; Spelbring, D. R.; Chen, G. T. Y. Beam’s
eye view based prostate treatment planning: Is it useful? Int. J. Radiat. Oncol. Biol. Phys. 19:759-768;1990.
20. Mameghan, H.; Fisher, R.; Mameghan, J.; Watt, W. H.; Tynan A. Bowel complications after radiotherapy for car- cinoma of the prostate: The volume effect. Int. J. Radiat. Oncol. Biol. Phys. 18:3 15-320; 1990.
2 1. McGowan, D. G. Radiation therapy in the management of localized carcinoma of the prostate: A preliminary report. Cancer 39:98-103;1977.
22. Moses, L. E.; Emerson, J. D.; Hosseini, H. Analyzing data from ordered categories. New Eng. J. Med. 311:442- 448;1984.
23. Nacey, J. N. Radical radiotherapy for carcinoma of the prostate: Localised and extended field treatment. Aust. N. Z. J. Surg. 53:561-565;1983.
24. Neglia, W. J.; Hussey, D. H.; Johnson, D. E. Megavoltage radiation therapy for carcinoma of the prostate. Int. J. Ra- diat. Oncol. Biol. Phys. 2:873-882; 1977.
25. Perez, C. A.; Ackerman, L. V.; Silber, I.; Royce, R. K. Ra- diation therapy in the treatment of localized carcinoma of the prostate. Cancer 34: 1059- 1068; 1974.
26. Pilepich, M. V.; Perez, C. A.; Walz, B. J.; Aivnuska, F. R. Complications of definitive radiotherapy for carcinoma of the prostate. Int. J. Radiat. Oncol. Biol. Phys. 7: 1341- 1348; 198 I.
27. Pilepich, M. V.: Asbell, S. 0.; Krall, J. M.; Baerwald, W. H.; Sause, W. T.; Rubin, P.; Emami, B. N.; Pidcock, G. M. Correlation of radiotherapeutic parameters and treatment related morbidity-Analysis of RTOG study 77- 06. Int. J. Radiat. Oncol. Biol. Phys. 13:1007-1012;1987.
28. Pilepich, M. V.; Krall, J.; George, F. W. Treatment-related morbidity in phase III RTOG studies of extended-field ir- radiation for carcinoma ofthe prostate. Int. J. Radiat. Oncol. Biol. Phys. 10:1861-1867;1984.
29. Pilepich, M. V.; Krall, J. M.; Sause, W. T.; Johnson, R. J.; Russ, H. H.: Hanks, G. E.; Perez, C. A.; Zinninger, M.; Martz. K. L.; Gardner, P. Correlation of radiotherapeutic parameters and treatment related morbidity in carcinoma ofthe prostate-Analysis of RTOG study 75-06. Int. J. Ra- diat. Oncol. Biol. Phys. 13:351-357;1987.
30. Pilepich, M. V.; Prasad, S. C.; Perez, C. Z. Computed to- mography in definitive radiotherapy of prostatic carcinoma, part 2: Definition of target volume. Int. J. Radiat. Oncol. Biol. Phys. 8:235-240; 1982.
31. Pino Y Torres, J. L.; Lee, D. J.; Leibel, S. A.; Wharam, M.; Cantrell, B.; Bross, D.; Order, S. Local control and reduced complications in split course irradiation of prostatic cancer. Int. J. Radiat. Oncol. Biol. Phys. 7:43-47;1981.
32. Ploysongsang, S.; Aron, B. S.; Shehata, W. M.; Jazy, F. K.; Scott, R. M.; Ho, P. Y.; Morand, T. M. Comparison of whole pelvis versus small field radiation therapy for carci- noma of the prostate. J. Urol. 27: lo- 16; 1986.
33. Ray, G. R.; Bagshaw, M. A. The role of radiation therapy in the definitive treatment of adenocarcinoma of the pros- tate. Ann. Rev. Med. 26:567-588;1975.
34. Ray, G. R.; Cassady, J. R.; Bagshaw, M. A. Definitive ra- diation therapy of carcinoma of the prostate. A report on 15 years experience. Radiology 106:407- 18; 1973.
35. Rounsaville, M. C.; Green, J. P.; Vaeth, J. M.; Purdon, R. P.; Heltzel, M. M. Prostatic carcinoma: Limited field irradiation. Int. J. Radiat. Oncol. Biol. Phys. 13:1013- 1020;1987.
36. Sandler, H.; Perez-Tamayo, C.; Lichter, A. Dose escalation in the treatment of stage C (T3) prostate cancer: report on the rectal toxicity observed in a prospective series using a conformational external beam technique. European Society for Therapeutic Radiology and Oncology, Italy, 9th Annual Meeting, September 12-15, 1990; 329.

Acute toxicity 0 S. VIJAYAKUMAR et al. 371
37. Sandier, H. M.; Perez-Tamayo, C.; Ten Haken, R. K.; Lich- prostate cancer with rigid immobilization. Int. J. Radiat. ter, A. S. Dose escalation for stage C (T3) prostate cancer: Oncol. Biol. Phys. 20:141-146;1991. Minimal rectal toxicity observed using conformal therapy. 41. Suit, H. D. Editor’s note. Int. J. Radiat. Oncol. Biol. Phys. Radiother. Oncol. 23:53-54;1992. 221223-234; 199 1.
38. Shipley, W. U.; Prout, G. R. Jr.; Coachman, N. M.; McManus, P. L.; Healey, E. A.; Althausen, A. F.; Heney, N. M.; Parkhurst, E. C.; Young, H. H. II; Shipley, J. W.; Kaufman, S. D. Radiation therapy for localized prostate carcinoma: Experience at the Massachusetts General Hos- pital (1973-1981). NC1 Monog. 7:67-73;1988.
42. Ten Haken, R. K.; Perez-Tamayo, C.; Tesser, R. J. Boost treatment of the prostate using shaped fixed fields. Int. J. Radiat. Oncol. Biol. Phys. 16: 193-200; 1989.
39. Soffen, E. M.; Epstein, B. E.; Hunt, M. A.; Hanks, G. E. Decreased acute morbidity with conformal static field ra- diation therapy treatment of early prostate cancer as com- pared to non-conformal techniques. Int. J. Radiat. Oncol. Biol. Phys. 21(S1):152;1991.
43. Urtasun, R. C. Does improved depth dose characteristics and treatment planning correlate with a gain in therapeutic results? Evidence from past clinical experience using con- ventional radiation sources. Int. J. Radiat. Oncol. Biol. Phys. 22:235-239;1992.
40. Soffen, E. M.; Hanks, G. E.; Hwang, C. C.; Chu, J. C. H. Conformal static field therapy for low volume low grade
44. Vijayakumar, S.; Low, N.; Chen, G. T. Y.; Myrianthopoulos, L.; Culbert, H.; Chiru, P.; Spelbring, D.; Awan, A.; Rosen- berg, I.; Halpern, H.; Weichselbaum, R. R. Beam’s eye- view based photon radiotherapy I. Int. J. Radiat. Oncol. Biol. Phys. 21:1575-1586;1991.