Incidence of late rectal bleeding in high-dose conformal radiotherapy of prostate cancer using...
16
The Incidence of Late Rectal Bleeding in High-Dose Conformal Radiotherapy of Prostate Cancer using EUD- and Dose-Volume Based NTCP Models Söhn M, Dipl.Phys. 1 , Di Yan, D.Sc. 2 , Jian Liang, Ph.D. 2 , Elisa Meldolesi, M.D. 2 , Carlos Vargas, M.D. 3 , and Markus Alber, Ph.D. 1 1Section for Biomedical Physics, University Hospital for Radiation Oncology, Hoppe-Seyler-Str. 3, 72076 Tübingen, Germany 2Department of Radiation Oncology, William Beaumont Hospital, Royal Oak, Michigan 48073, USA 3Radiation Oncology, University of Florida, Gainesville, Florida 32611, USA Abstract Purpose—Accurate modelling of rectal complications based on DVH data is necessary to allow safe dose escalation in radiotherapy of prostate cancer. We applied different EUD- and dose-volume based NTCP models to rectal wall DVHs and follow-up data of 319 prostate cancer patients in order to identify the dosimetric factors most predictive for grade 2 or higher rectal bleeding. Materials and Methods—Data of 319 patients, treated at the William Beaumont Hospital with 3D-CRT under an adaptive radiotherapy protocol, were used for this study. The following models were considered: (1) Lyman model and (2) logit-formula with DVH reduced to generalized EUD, (3) serial reconstruction unit (RU) model, (4) Poisson-EUD-model, (5) mean dose- and (6) cutoff dose-logistic regression model. The parameters and their confidence intervals were determined using maximum likelihood estimation. Results—51 patients (16.0%) showed grade 2 or higher bleeding. As assessed qualitatively and quantitatively, the Lyman- and Logit-EUD, serial RU and Poisson-EUD model fitted the data very well. Rectal wall mean dose did not correlate to grade 2 or higher bleeding. For the cutoff dose model, the volume receiving more than 73.7 Gy showed most significant correlation to bleeding. However, this model fitted the data worse than the EUD-based models. Conclusions—Our study clearly confirms a volume effect for late rectal bleeding. This can be described very well by the EUD-like models, where the serial RU- and Poisson-EUD model can describe the data with only two parameters. Dose-volume based cutoff-dose models performed worse. Keywords Prostate cancer; Rectal toxicity; NTCP; Volume effects; Dose-volume histograms; EUD Corresponding author: Matthias Söhn, Section for Biomedical Physics, University Hospital for Radiation Oncology, Hoppe-Seyler-Str. 3, 72076 Tübingen, Germany; Tel: ++49/(0)7071/2986061; Fax: ++49/(0)7071/295920; E-mail: [email protected] This work will be presented in part at the 48th Annual ASTRO Meeting, Philadelphia, Pennsylvania, November 5–9, 2006. Conflict of Interest Notification No conflicts of interest. Publisher's Disclaimer: This is a PDF file of an unedited manuscript that has been accepted for publication. As a service to our customers we are providing this early version of the manuscript. The manuscript will undergo copyediting, typesetting, and review of the resulting proof before it is published in its final citable form. Please note that during the production process errors may be discovered which could affect the content, and all legal disclaimers that apply to the journal pertain. NIH Public Access Author Manuscript Int J Radiat Oncol Biol Phys. Author manuscript; available in PMC 2008 March 15. Published in final edited form as: Int J Radiat Oncol Biol Phys. 2007 March 15; 67(4): 1066–1073. NIH-PA Author Manuscript NIH-PA Author Manuscript NIH-PA Author Manuscript
Transcript of Incidence of late rectal bleeding in high-dose conformal radiotherapy of prostate cancer using...
The Incidence of Late Rectal Bleeding in High-Dose ConformalRadiotherapy of Prostate Cancer using EUD- and Dose-VolumeBased NTCP Models
Söhn M, Dipl.Phys.1, Di Yan, D.Sc.2, Jian Liang, Ph.D.2, Elisa Meldolesi, M.D.2, CarlosVargas, M.D.3, and Markus Alber, Ph.D.11Section for Biomedical Physics, University Hospital for Radiation Oncology, Hoppe-Seyler-Str. 3, 72076Tübingen, Germany
2Department of Radiation Oncology, William Beaumont Hospital, Royal Oak, Michigan 48073, USA
3Radiation Oncology, University of Florida, Gainesville, Florida 32611, USA
AbstractPurpose—Accurate modelling of rectal complications based on DVH data is necessary to allowsafe dose escalation in radiotherapy of prostate cancer. We applied different EUD- and dose-volumebased NTCP models to rectal wall DVHs and follow-up data of 319 prostate cancer patients in orderto identify the dosimetric factors most predictive for grade 2 or higher rectal bleeding.
Materials and Methods—Data of 319 patients, treated at the William Beaumont Hospital with3D-CRT under an adaptive radiotherapy protocol, were used for this study. The following modelswere considered: (1) Lyman model and (2) logit-formula with DVH reduced to generalized EUD,(3) serial reconstruction unit (RU) model, (4) Poisson-EUD-model, (5) mean dose- and (6) cutoffdose-logistic regression model. The parameters and their confidence intervals were determined usingmaximum likelihood estimation.
Results—51 patients (16.0%) showed grade 2 or higher bleeding. As assessed qualitatively andquantitatively, the Lyman- and Logit-EUD, serial RU and Poisson-EUD model fitted the data verywell. Rectal wall mean dose did not correlate to grade 2 or higher bleeding. For the cutoff dose model,the volume receiving more than 73.7 Gy showed most significant correlation to bleeding. However,this model fitted the data worse than the EUD-based models.
Conclusions—Our study clearly confirms a volume effect for late rectal bleeding. This can bedescribed very well by the EUD-like models, where the serial RU- and Poisson-EUD model candescribe the data with only two parameters. Dose-volume based cutoff-dose models performedworse.
KeywordsProstate cancer; Rectal toxicity; NTCP; Volume effects; Dose-volume histograms; EUD
Corresponding author: Matthias Söhn, Section for Biomedical Physics, University Hospital for Radiation Oncology, Hoppe-Seyler-Str.3, 72076 Tübingen, Germany; Tel: ++49/(0)7071/2986061; Fax: ++49/(0)7071/295920; E-mail: [email protected] work will be presented in part at the 48th Annual ASTRO Meeting, Philadelphia, Pennsylvania, November 5–9, 2006.Conflict of Interest NotificationNo conflicts of interest.Publisher's Disclaimer: This is a PDF file of an unedited manuscript that has been accepted for publication. As a service to our customerswe are providing this early version of the manuscript. The manuscript will undergo copyediting, typesetting, and review of the resultingproof before it is published in its final citable form. Please note that during the production process errors may be discovered which couldaffect the content, and all legal disclaimers that apply to the journal pertain.
NIH Public AccessAuthor ManuscriptInt J Radiat Oncol Biol Phys. Author manuscript; available in PMC 2008 March 15.
Published in final edited form as:Int J Radiat Oncol Biol Phys. 2007 March 15; 67(4): 1066–1073.
NIH
-PA Author Manuscript
NIH
-PA Author Manuscript
NIH
-PA Author Manuscript

1 IntroductionThe essential dose-limiting organs in prostate radiotherapy are bladder and rectum. Here, oneof the most relevant side effects, which can significantly compromise a patient's quality of life,is chronic rectal bleeding.
Conventional external beam radiotherapy (RT) treatment typically does not allow prostatedoses beyond 65–70 Gy without unacceptably high risk of rectal toxicity, while higher tumourdoses are favourable for improved tumour control. The possibility of dose escalation beyond70 Gy to the prostate is based on the volume-effect of rectum, i.e. the observation of increasedtolerance to high doses if the high dose region is confined to a small volume. Technically, thisbecomes feasible thanks to conformal techniques like three-dimensional conformalradiotherapy (3D-CRT) or intensity modulated RT (IMRT), especially when aided by image-guided adaptive approaches.
Safe dose escalation necessitates accurate quantitative modelling of the volume effect basedon the detailed dose-volume information provided by modern treatment planning systems.Numerous studies have established evidence of a significant correlation between parametersderived from rectal dose-volume histograms (DVHs) and toxicity, see e.g. (1–4) and referencestherein. However, only a few publications have quantified the risk of rectal complications interms of normal tissue complication probability (NTCP) models (5–9). Such empiric or semi-empiric models parametrize the vast information about inhomogeneous dose distributions andcorresponding outcome data from large patient populations into few-parametric models thatassign a single probability value to an individual treatment plan. This enables evidence basedranking of alternative plans in the planning process according to their predicted complicationrisk. Two important types of NTCP-models can be distinguished: Dose-volume based modelswhich use a single DVH-parameter (e.g. the volume VD irradiated to a certain dose-level D)for ranking plans according to their complication probability. In contrast, EUD-like modelsdefine an equivalent uniform dose, EUD = f −1(Σi vi f (Di)), as surrogate parameter calculatedusing all bins (vi,Di
) of a DVH, where the form of the (monotonic) function f depends on themodel. Besides possible differences in the quality of fit as investigated in this study, it shouldbe mentioned that the choice between dose-volume based vs. EUD-like models when used fortreatment planning, esp. IMRT, affects the process of plan optimization (10–12)
In this study we apply one dose-volume based and five EUD-like NTCP models for chronicrectal bleeding of grade ≥ 2 to a population of 319 prostate cancer patients treated with a 3D-CRT adaptive radiotherapy (ART) technique to doses between 70.2 and 79.2 Gy at the WilliamBeaumont Hospital. This is so far the largest published single-institution patient populationused for fitting of rectal NTCP-models. Thus this study not only provides valuable informationfor identification of the superior modelling approach(es), but also statistically, well basedestimates of the corresponding model parameters.
2 Methods and Materials2.1 Patient data
Data of 319 prostate cancer patients treated between 1999-2002 at the William BeaumontHospital were used for this study. The characteristics of this patient population have beendescribed in previous studies (3,13). The patients were part of a Phase II dose-escalation studyand underwent 3D conformal radiotherapy with image-guided off-line correction under anadaptive radiotherapy (ART) protocol.
All patients had one pre-treatment planning CT scan, daily portal images to determine andcorrect for setup errors, additional four CT scans during the first week of the treatment used
M et al. Page 2
Int J Radiat Oncol Biol Phys. Author manuscript; available in PMC 2008 March 15.
NIH
-PA Author Manuscript
NIH
-PA Author Manuscript
NIH
-PA Author Manuscript

for individual adaptation of the treatment plan and weekly CT scans in the following to precludeundetected drifts. The (solid) rectum was contoured on the initial CT scan from the anal vergeor ischial tuberosities (whichever was higher) to the sacroiliac joints or rectosigmoid junction(whichever was lower). Rectal wall was defined based on the solid rectum contours with 3–4mm wall thickness.
The ART scheme used has been described elsewhere (14,15). In short, a four-field boxtechnique with 18 MV photons was used both for the initial treatment plan of the first weekand the following adapted plan. In the first week the patients were treated for a dose of 9 Gyto the target, where the PTV was generated based on the CTV of the initial CT (prostate orprostate+sem. vesicles) with a population based margin of 1 cm. For the adapted plan,information from daily portal imaging and the five CT scans available after the first week oftreatment were used to estimate setup error and individual prostate mobility, which allowed todefine a (generally smaller) patient-specific PTV.
The final dose to the PTV was limited by dose-volume constraints of rectal wall and bladderbased on the geometry of the initial planning CT image. For rectal wall these were: (1) D30%= 75.6 Gy and (2) D5% = 82 Gy. The possible dose levels (minimal prostate dose) were chosenunder the requirement to meet rectum (and bladder) constraints and were as follows: 70.2, 72,73.8, 75.6, 77.4 and 79.2 Gy.
For each patient the dose distributions of the initial and adapted plan were calculated usingPinnacle 6.2b (ADAC Laboratories, Milpitas, CA). An in-house developed software was usedto calculate DVHs of rectal wall. This software used the contours from the initial (planning)CT and calculated the overall dose as sum of initial and adapted (physical) dose distributions.The DVH-dose bin size was 0.1 Gy, with volume defined as relative (percentage) volumeirradiated.
The rectal toxicity variable regarded in this analysis is chronic rectal bleeding. The follow-upscheme defined examinations at 3-month intervals during the first 2 years, and every 6 monthsfrom the second to the fifth year. As mentioned above, this study is based on the patientpopulation analysed in Vargas et al. (3,13). However, for the current study, all patient fileswere reexamined to improve follow-up time. Complications were graded based on theCommon Terminology Criteria for Adverse Events (CTCAE) v3.0 (see Tab. 1). Twelve of the331 patient datasets used in Vargas et al. could not be used due to technical problems inrestoring dose-distributions or lost, incomplete or inconsistent follow-up information. Themedian clinical follow-up for the remaining 319 patients was 2.8 years (range: 0.1–6.4), witha inter-quartile range of 1.5–4.0 years (25th–75th percentile).
2.2 NTCP modelsA NTCP model assigns a complication probability for an organ at risk to a generallyinhomogeneous dose-distribution. The functional form of such a model can be based on amechanistic description of biological processes, or might be designed to result in aphenomenological ‘fit of the data’.
The models regarded in this work are of the following general from:• First, a summary measure μ, such as the mean dose, an equivalent uniform dose (EUD)
or similar, is calculated from the dose distribution. The quantity μ serves as a rankingfunction by imposing an order among individual plans according to their complicationrisk.
• Then, a function, NTCP(μ), which assigns complication probabilities to the values ofthe summary measure is defined. Such a function is required to (1) continuously map
M et al. Page 3
Int J Radiat Oncol Biol Phys. Author manuscript; available in PMC 2008 March 15.
NIH
-PA Author Manuscript
NIH
-PA Author Manuscript
NIH
-PA Author Manuscript
μ to the interval [0, 1], while (2) preserving the ranking imposed by the numericalvalues of the summary measure. This leads to the class of sigmoid-type (S-shaped)functions, where in the following the probit-, logit-, Poissonian- and logistic formulaeare used.
We applied six different models to our data, where the endpoint was chosen to be chronic rectalbleeding of grade ≥ 2. These models differ in the summary measure used and/or the functionalform of the NTCP function as described in the following.
2.2.1 Lyman-EUD model—The most widely used phenomenological approach is the familyof Lyman models (16–20) which uses the probit function
NTCPprobit(μ) = 12π ∫−∞
s⋅(μ−μ50)exp ( − x 2 / 2)dx (1)
to map the summary measure μ to the interval [0, 1] of complication probabilities. This integralessentially yields the error function, where the parameter s is the slope of the sigmoid responsecurve at the steepest point μ=μ50, for which the NTCP function predicts 50% complicationprobability. Usually the slope parameter s is replaced by its inverse m according to s=1/(m·μ50
).
Different DVH reduction schemes have been used for defining the summary measure μ, suchas an effective volume (LKB model, (18)) or an effective dose (21). In the following thegeneralized equivalent uniform dose (22) is used, which defines EUD as Lebesque a-norm ofthe dose, i.e. in terms of the following power-law relationship:
μ : = EUDPL = (Σi viDia)1/a (2)
The sum is calculated over all bins (vi,Di
) of the differential DVH, and a is a parameterassociated with the strength of the volume effect for the organ under consideration (range a∈[1…∞]): For a→∞ the EUD is the maximum dose (i.e. no volume effect), while for a=1 Eq.(2) gives the mean dose (large volume effect).
Summarizing, the Lyman-EUD model as used in our study is described by three parameters:a, m and EUD50 (usually termed D50
).
2.2.2 Logit-EUD model—This model also uses the generalized EUD (Eq. 2) as summarymeasure μ, while it differs from the Lyman-EUD model in the choice of the NTCP function.Here the logit function
NTCPlogit(μ) = 11 + (μ50 /μ)k (3)
is chosen as sigmoid shape function (6,10). Its two parameters μ50 (i.e. D50) and k are
determined by the EUD, which causes a complication rate of 50%, and the slope of the NTCPcurve here. Thus, together with the parameter a of the EUD, this model has three parameters.
2.2.3 Serial reconstruction-unit model—In contrast to the two previousphenomenological NTCP models, the serial reconstruction unit model, which has beenproposed recently by Alber and Belka (23), arises from certain general assumptions about thebiological processes causing normal tissue complications.
M et al. Page 4
Int J Radiat Oncol Biol Phys. Author manuscript; available in PMC 2008 March 15.
NIH
-PA Author Manuscript
NIH
-PA Author Manuscript
NIH
-PA Author Manuscript
The model regards radiation induced complications as the consequence of local failure ofdynamic repair processes. As an assumption, the latter is attributed to the finite range of therepair mechanisms, which finds its correlate in the model by the description of finite-sizedreconstruction units and their microscopic dose-response. Borrowing analogies fromthermodynamics and statistical physics, the authors derive the following expression to describethe macroscopic dose response in terms of the NTCP for homogeneous irradiation of the partialvolume V of an organ with the dose D:
NTCPSRU(V , D) = 1 − exp ( − V exp(σ(D−D0))) (4)
where σ is an organ specific sensitivity parameter and D0 is a reference dose.
For inhomogeneous dose distributions an equivalent uniform dose, which would give the samemacroscopic dose-response when applied homogeneously to the whole organ (V=1), can bedefined as
EUDSRU = 1σ log (Σi vi exp (σDi)) (5)
Consequently, the NTCP function then reads:
NTCPSRU (EUDSRU) = 1 − exp( − exp(σ(EUDSRU − D0))) (6)
Summarizing, the serial reconstruction unit model has the two parameters σ and D0 to be fitted.Note that in contrast to the previously described models, which have the volume effectparameter a of the power-law EUD as a third parameter, here the sensitivity parameter σ isinherently coupled to the same value in the EUD and NTCP function.
2.2.4 Poisson-EUD model—Similarly to the serial reconstruction unit model, this modelutilizes mechanistic concepts to describe predominantly serial tissue dose-response. Assumingthat complication is a consequence of local dose-response of non-interacting subunits, thefollowing NTCP-function can be derived based on Poissonian statistics (24):
NTCPpoisson(EUD) = 1 − exp − ( EUDD0 )a
= 1 − exp − ln2 ⋅ ( EUDD50 )a (7)
with a reference dose D0 (or a dose D50 causing 50% complication probability) and a volume-effect (steepness) parameter a. The EUD is given by Eq. (2), where according to this modelthe exponent of EUD and the steepness parameter of the NTCP function have the same value.Thus, unlike the Lyman- and Logit-EUD models, the Poisson-EUD model has only twoparameters.
2.2.5 Mean dose logistic regression model—An association of the rectal mean dosewith chronic rectal bleeding has been reported by some authors (7,8). To test for such anassociation based on our data, we used logistic regression as a standard method from statisticsfor this purpose. In terms of the general NTCP model scheme presented above, here the NTCPfunction is given by the two-parametric logistic function
NTCPlogistic(μ) = 11 + exp( − β0 − β1μ) (8)
M et al. Page 5
Int J Radiat Oncol Biol Phys. Author manuscript; available in PMC 2008 March 15.
NIH
-PA Author Manuscript
NIH
-PA Author Manuscript
NIH
-PA Author Manuscript
with the mean doseDmean = Σi viDias summary measure μ. Note that Dmean is a special caseof the EUD, Eq. (2), for fixed parameter a=1. Thus this model only has the two parametersβ0 and β1.
2.2.6 Cutoff dose logistic regression model—In classical, i.e. non-biological treatmentplanning approaches, dose limitation to organs at risk (OAR) is usually implemented in termsof dose-volume constraints. For a given treatment-technique, the most relevant dose level(s)predictive for toxicity can be determined by retrospectively fitting a sigmoid type NTCPfunction to outcome data of a patient population. In this phenomenological approach thesummary measure μ is given by the proportion VDc of the OAR receiving doses equal to orabove a (cutoff) dose level Dc In the present study VDc is regarded as relative volume, formally:VDc
= Σi|(Di≥Dc) viwhere vi is the discretized form of the differential DVH, and only dose
bins i with Di ≥ Dc are used in the sum.
For given value Dc we used logistic regression (Eq. 8) to test for correlation of VDc and chronicrectal bleeding, resulting in two fit parameters β0 and β1. This was systematically repeated forall possible Dc up to 85 Gy in increments of 0.1 Gy to assess the significance of such an logisticregression model for different cutoff doses. Thus altogether the model has the three parametersDc, β0 and β1.
2.3 Fitting procedureThe method of choice for fitting such models to sparse, dichotomous response data (‘0’/‘1’, ifpatient shows bleeding of grade < 2 or ≥ 2, respectively) is maximum likelihood estimation(Jackson et al. (25) and references therein; see also (6)). In this method the optimal modelparameters are determined such as to maximize the probability of occurrence of the observeddata, which is given by the so-called likelihood function L. Due to its smallness, numericallythis is usually implemented as maximization of the natural logarithm ln(L), the LogLikelihoodLL. In our implementation, the software package Mathematica version 5.0 (Wolfram ResearchInc., Champaign, IL) was used for this. To reduce calculation time, the DVH discretizationwas changed to 0.5 Gy when fitting the Lyman-, Logit-, Poisson-EUD and serial reconstructionunit models.
Uncertainties of the model parameters were assessed using the variance-covariance matrix ofthe parameters calculated around the maximum of LL as described in (25): The 68% confidenceintervals for the parameters can be estimated by the square root of the diagonal elements.
The goodness of fit of each individual model has been quantified in two ways. The first methodfollows Jackson et al. (25): If the actual (maximized) value of the LogLikelihood for the NTCPmodel fitted to the observed patient population is denoted by LLobs, the probability P ofobtaining a value smaller than LLobs (i.e. a worse fitting model) purely by chance can beassessed based on the statistical distribution of LL. This can be obtained from analyticalformulae for the mean <LL> and variance SLL (see Eq. (A3) and (A4) in Jackson et al.) underthe assumption of a normally distributed LL. If this probability turns out to be too large, themodel ‘overfits’ the data; if it is too small, the model does not fit the data well. According toRancati et al. (6) values between 30% and 70% indicate a satisfactory fit.
Additionally, a chi-square goodness-of-fit test was performed for each model: A histogram ofthe observed patient data was calculated, and the resulting group complication rates fi(obs) werecompared to the corresponding rates fi(fit) predicted by the respective NTCP model bydeterminingx 2 = ΣN ( f i
(obs) − f i( fit))2 / f i
( fit), which approximately follows a chi-square
M et al. Page 6
Int J Radiat Oncol Biol Phys. Author manuscript; available in PMC 2008 March 15.
NIH
-PA Author Manuscript
NIH
-PA Author Manuscript
NIH
-PA Author Manuscript
distribution with N-1-n degrees of freedom (N: number of histogram bins; n: number of modelparameters).
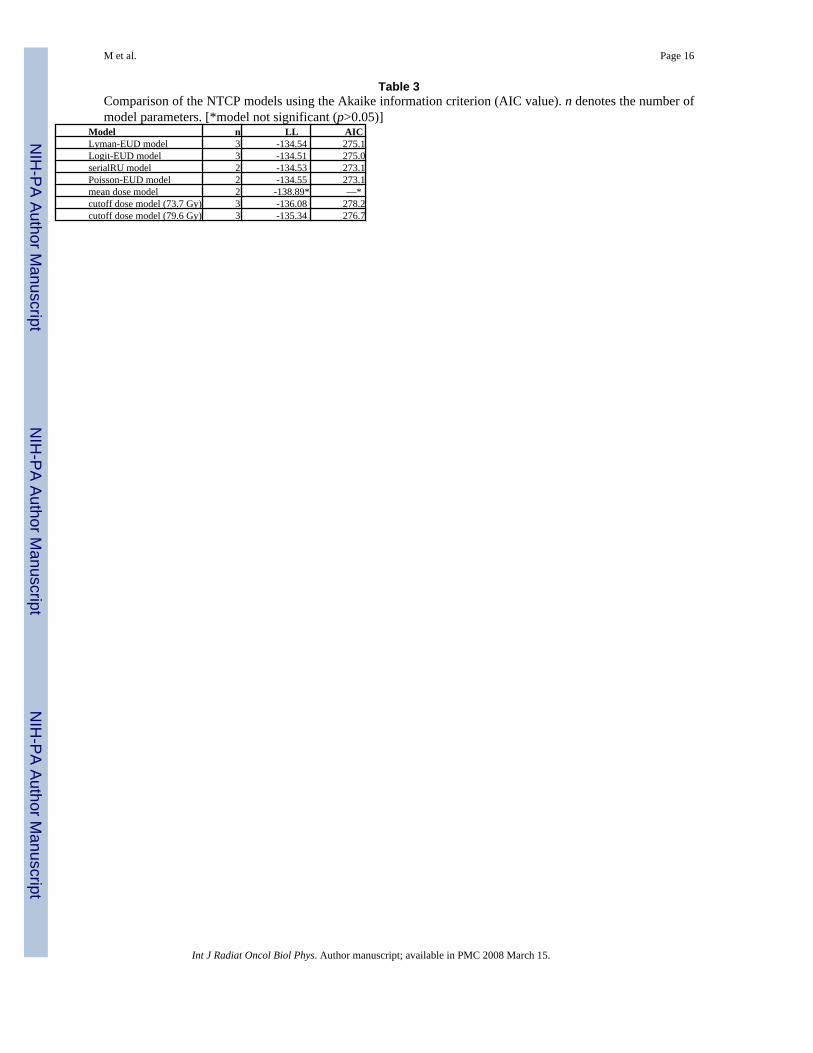
2.4 Inter-model comparison: Akaike information criterionA widely used measure allowing to compare competing models is the Akaike informationcriterion (AIC (26,27); see also (7)). Generally, for fits of different models to a given dataseta larger likelihood value indicates a better fit to the data. The AIC quantifies the tradeoffbetween the a model's quality of fit (associated with the likelihood value) and its complexity(expressed by the number of model parameters n), and is defined as AIC = −2LL + 2n. Modelswith smaller AIC values are considered to provide a better (in the sense of more efficient) fitto the data than models with larger AIC.
3 ResultsOf the 319 patients, 45/5/1 (14.1/1.6/0.3%) showed chronic rectal bleeding of grade 2/3/4. Thusaltogether 51 patients (16.0%) showed chronic rectal bleeding of grade ≥ 2}, which is theendpoint for the following model fits.
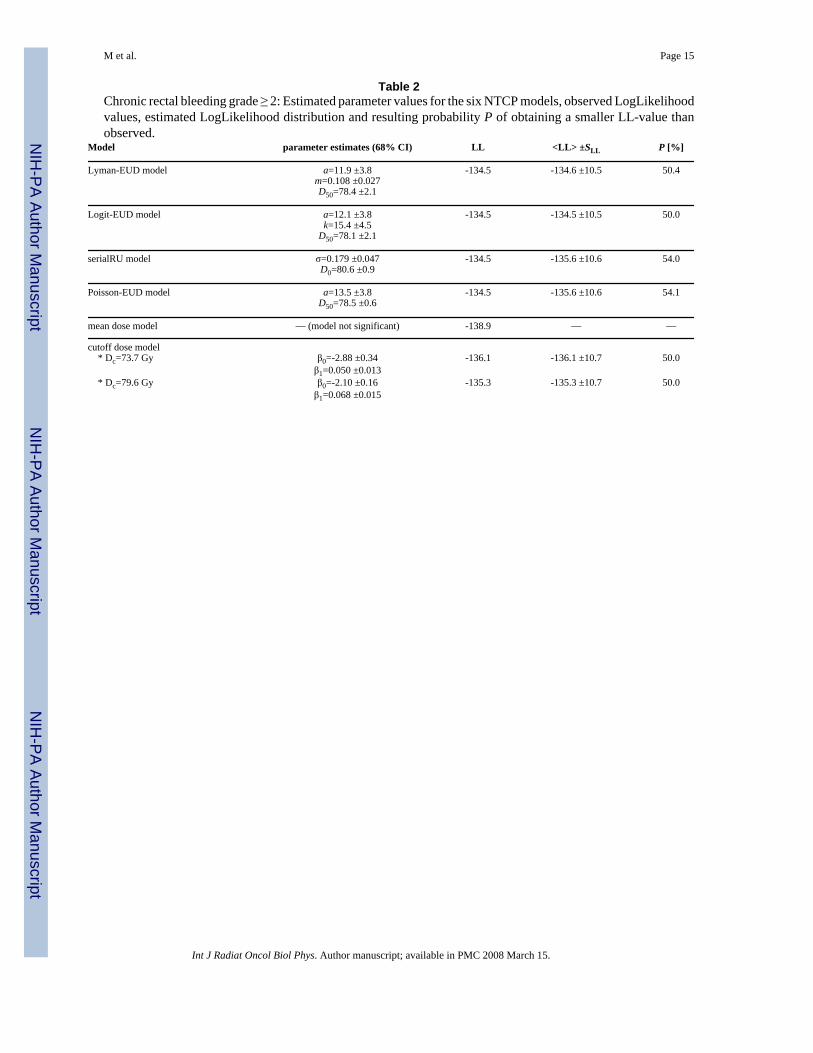
3.1 EUD-based models, mean dose modelParameter estimates and their 68% CIs for the Lyman-, Logit-, Poisson-EUD and serialreconstrunction unit model are given in Tab. 2. The plots of the corresponding NTCP-curvesare shown in Fig. 1a-d. As obvious in these plots by comparison with the observed complicationrates, all four models fit the data very well. Quantitatively, this is manifest by the small valuesof x2: As example, the fit of the serial reconstruction unit model (Fig. 1c) resulted in a x2 of0.03, where the upper limit of x2 for an acceptable fit is 5.99 according to chi-square statistics(2 degrees of freedom; α=0.05). As described in section 2.3, the goodness of fit was alsodetermined based on the LogLikelihood LL, <LL> and SLL. These values together with theresulting probability P of obtaining a smaller LL are given in Tab. 2. Again, for all four modelsP indicates acceptable fits.
Concerning the mean dose logistic regression model, it turns out that Dmean does notsignificantly correlate to chronic rectal bleeding of grade ≥ 2 (p=0.11). The worse fit qualityof this model in comparison with the four above mentioned EUD-based models is alsoexpressed by its significantly lower LogLikelihood value (Tab. 2). Thus this model is notconsidered further in the following.
3.2 cutoff dose modelFig. 2a shows the LogLikelihood values of different logistic regression model fits when varyingthe cutoff dose Dc. For all dose levels in the range Dc ∼ 50–80 Gy a significant correlation(α<0.05) of the relative volume irradiated with doses ≥ Dc and chronic rectal bleeding of grade≥ 2 was found for our patient population. The curve has maxima at Dc =73.7 Gy and 79.6 Gy.Fig. 2b depicts the model fit for Dc = 73.7 Gy: As obvious, the fit quality is slightly worse thanfor the EUD-models. However, both the value of P in Tab. 2 and a x2 of 1.06 (upper limitaccording to chi-square statistics (1 degree of freedom, α=0.05): 3.84) show that the fit isacceptable. Formally, this is also the case for the model with Dc = 79.6 Gy (plot not shown;x2=2.24 < 3.84). However, as only a part of our patient population receives doses above 79.6Gy to non-vanishing volumes of rectal wall, the distribution of the summary measureV79.6Gy itself is strongly shifted to small values, thereby compromising the statistical strengthof the patient dataset in the region of larger V79.6Gy.
M et al. Page 7
Int J Radiat Oncol Biol Phys. Author manuscript; available in PMC 2008 March 15.
NIH
-PA Author Manuscript
NIH
-PA Author Manuscript
NIH
-PA Author Manuscript

3.3 Comparison of the modelsBoth visually from Fig. 1 and according to the LogLikelihood values in Tab. 3 the four EUD-based NTCP models fit the data of chronic rectal bleeding of grade ≥ 2 equally well. However,as the Akaike information criterion shows, both 2-parametric NTCP models (serialreconstruction unit model and Poisson-EUD model) have the lowest AIC-values ( Tab. 3) andthus can be considered to fit the data most efficiently.
Compared to these models, the AIC-values of the two cutoff-dose models (Dc = 73.7 Gy and79.6 Gy) are considerably larger, which is both due to the smaller LogLikelihood values(indicating worse fit quality itself) and the larger number of model parameters. Thus the EUD-based models provide a quantitatively better and more efficient description of our dataset.
4 Discussion and conclusionsIn this study six dose-volume based or EUD-like NTCP models were fitted to late rectalbleeding data of a large, consistently treated patient population (319 patients), thereby aimingto identify the most accurate approach for quantifying the risk of chronic rectal bleeding basedon planned dose distributions of rectum and allowing statistically robust estimation of thecorresponding model parameters.
Our results clearly confirm the volume effect for chronic rectal bleeding of grade 2 or worse.Quantitatively, this can be described very well with the four EUD-like models, where the serialreconstruction unit and the Poisson-EUD model fitted the data most efficiently according tothe Akaike information criterion (smallest AIC values), as they need only two parameters todescribe the dataset. Thus according to our data, these two models can be considered to providethe most concise approach to quantifying the risk of chronic rectal bleeding of grade 2 or worse.The cutoff-dose model, a directly dose-volume based model, generally fitted the data worse,but still found significant correlation of rectal wall relative volume above single cutoff-doselevels Dc in the range ∼ 50–80 Gy (most significant for Dc =73.7 and 79.6 Gy) for our patientpopulation. Mean dose did not correlate to late rectal bleeding of grade ≥ 2.
For the three models incorporating the power-law EUD (Eq. 2), i.e. the Lyman-, Logit- andPoisson-EUD model, the parameter describing the volume effect was found to be in the orderof a ≈ 12, see Tab. 2. Accounting for uncertainties in parameter estimation this is consistentto Burman et al. (5), who found n ≈ 0.12 (different definition of volume effect parameter: a =1/n, i.e. a = 8.3). It is also in agreement with the data published by Skwarchuk et al. (28) whichyield a = 10.3 (fit based on Fig. 3 of the cited paper). However, it is in contradiction to findingsof Rancati et al. (6) (a = 4.3, 68% CI ∼ 3.6–5.6) and Tucker et al. (7) (a = 0.3, with largeuncertainty a ∼ 0–32.3 (95% CI)).
Due to the ART-protocol used, which defined different prescription dose levels depending onindividual organ geometry and mobility, the patient population shows a wide range of DVHshapes and thus large variability of dose/volume combinations, which is advantageous forrobust fitting of NTCP models. However, possible statistical biases are introduced by thetreatment technique and specific characteristics of the patient population itself.
This is indeed the case as becomes most evident for the results of the cutoff-dose model, Fig.2a: The (local) maxima of the LogLikelihood at Dc = 73.7 and 79.6 Gy are strongly influencedby the different prescription dose levels defined by the ART protocol (70.2, 72, 73.8, 75.6,77.4 and 79.2 Gy), while the finding that all models with Dc in the range ∼ 50–80 Gy areformally significant can be traced back to the 4-field box treatment technique used, whichinduces correlations of all DVH dose-bins in this range. Quantitatively, such correlations canbe assessed by principal component analysis (PCA, (29,30)); a detailed investigation of the
M et al. Page 8
Int J Radiat Oncol Biol Phys. Author manuscript; available in PMC 2008 March 15.
NIH
-PA Author Manuscript
NIH
-PA Author Manuscript
NIH
-PA Author Manuscript

use of DVH-PCA in the context of NTCP-modelling will be presented in a subsequentpublication.
In this context a comparison with results from other publications is elucidating: Both Jacksonet al. (2) and Tucker et al. (7) found significant correlations of intermediate doses ∼ 40–45Gy with toxicity in contradiction to our findings. This is likely due to differences in thetreatment technique (6-field 3D-CRT versus 4-field box in combination with 6-field 3D-CRTboost), which induces specific correlations between dose-bins. Thus an important conclusionis that results of DVH-based models like the cutoff-dose model are superimposed bycharacteristics of the treatment technique and patient population, which compromisesinferences about radiobiological effects and extrapolability of results gained from a certaintreatment technique to others.
Concerning the mean dose model, our results are in contrast to the studies of Zapatero et al.(8), Tucker et al. (7), who found a correlation of mean dose and chronic rectal bleeding ofgrade ≥ 2. Again, this might be due to differences in the treatment technique or the gradingscheme used (to mention, grade ≥ 3 bleeding correlated to mean dose for our population(p=0.045; data not shown))
Concerning the magnitude of the volume effect for rectum, our results can be compared tovalues published for other organs (5): Lung (a ≈ 1.1) and liver (a ≈ 3.1) are typical organs witha large volume effect, while e.g. spinal cord shows only a small volume effect (a ≈ 20.0). Thusfor our data, the EUD-like models suggest a rather small volume effect of rectal bleeding (a ≈13.5 for the Poisson-EUD model, see Tab. 2). As illustration of this, a plan should not havemore than 2.4% (1.7%) of rectal volume irradiated with 80 Gy (82 Gy) to have the same EUD(and thus same NTCP) as an otherwise identical plan with 72 Gy to 10% of the volume.
If the presented EUD-based models are used for dose optimisation, e.g. for IMRT doseescalation, it is always preferrable to err towards smaller volume effects. In consequence, aEUD-based optimisation of prostate radiotherapy with the parameters derived here willseverely penalize high dose regions in the rectum, perhaps for some patients to an extent thatprevents satisfying PTV coverage. Hence, the data suggest that safe dose escalation to theprostate can only be achieved by image guided and adaptive strategies to reduce the extent ofthe PTV.
Acknowledgements
This work was supported in part by Deutsche Krebshilfe e.V. grand No. 106280 and NIH grand No. RO1 CA091020.
References1. Boersma LJ, van den Brink M, Bruce AM, et al. Estimation of the incidence of late bladder and rectum
complications after high-dose (70–78 Gy) conformal radiotherapy for prostate cancer, using dose-volume histograms. Int J Radiat Oncol Biol Phys 1998;41(1):83–92. [PubMed: 9588921]
2. Jackson A, Skwarchuk MW, Zelefsky MJ, et al. Late rectal bleeding after conformal radiotherapy ofprostate cancer (II): volume effects and dose-volume histograms. Int J Radiat Oncol Biol Phys 2001;49(3):685–698. [PubMed: 11172950]
3. Vargas C, Martinez A, Kestin LL, et al. Dose-volume analysis of predictors for chronic rectal toxicityafter treatment of prostate cancer with adaptive image-guided radiotherapy. Int J Radiat Oncol BiolPhys 2005;62(5):1297–1308. [PubMed: 16029785]
4. Peeters STH, Lebesque JV, Heemsbergen WD, et al. Localized volume effects for late rectal and analtoxicity after radiotherapy for prostate cancer. Int J Radiat Oncol Biol Phys 2006;64(4):1151–1161.[PubMed: 16414208]
5. Burman C, Kutcher GJ, Emami B. Fitting of normal tissue tolerance data to an analytic function. IntJ Radiat Oncol Biol Phys 1991;21(1):123–135. [PubMed: 2032883]
M et al. Page 9
Int J Radiat Oncol Biol Phys. Author manuscript; available in PMC 2008 March 15.
NIH
-PA Author Manuscript
NIH
-PA Author Manuscript
NIH
-PA Author Manuscript
6. Rancati T, Fiorino C, Gagliardi G, et al. Fitting late rectal bleeding data using different NTCP models:results from an Italian multi-centric study (AIROPROS0101). Radiother Oncol 2004;73(1):21–32.[PubMed: 15465142]
7. Tucker SL, Cheung R, Dong L, et al. Dose-Volume Response analysis of late rectal bleeding afterradiotherapy for prostate cancer. Int J Radiat Oncol Biol Phys 2004;59(2):353–365. [PubMed:15145148]
8. Zapatero A, García-Vicente F, Modolell I, et al. Impact of mean rectal dose on late rectal bleedingafter conformal radiotherapy for prostate cancer: Dose-volume effect. Int J Radiat Oncol Biol Phys2004;59(5):1343–1351. [PubMed: 15275719]
9. Peeters STH, Hoogeman MS, Heemsbergen WD, et al. Rectal bleeding, fecal incontinence, and highstool frequency after conformal radiotherapy for prostate cancer: Normal tissue complicationprobability modeling. Int J Radiat Oncol Biol Phys 2006;66(1):11–19. [PubMed: 16757129]
10. Wu Q, Mohan R, Niemierko A, et al. Optimization of intensity-modulated radiotherapy plans basedon the equivalent uniform dose. Int J Radiat Oncol Biol Phys 2002;52(1):224–235. [PubMed:11777642]
11. Bär W, Schwarz M, Alber M, et al. A comparison of forward and inverse treatment planning forintensity-modulated radiotherapy of head and neck cancer. Radiother Oncol 2003;69(3):251–258.[PubMed: 14644484]
12. Bos LJ, Schwarz M, Bär W, et al. Comparison between manual and automatic segment generationin step-and-shoot IMRT of prostate cancer. Med Phys 2004;31(1):122–130. [PubMed: 14761028]
13. Vargas C, Yan D, Kestin LL, et al. Phase II dose escalation study of image-guided adaptiveradiotherapy for prostate cancer: Use of dose-volume constraints to achieve rectal isotoxicity. Int JRadiat Oncol Biol Phys 2005;63(1):141–149. [PubMed: 16111582]
14. Martinez AA, Yan D, Lockman D, et al. Improvement in dose escalation using the process of adaptiveradiotherapy combined with three-dimensional conformal or intensity-modulated beams for prostatecancer. Int J Radiat Oncol Biol Phys 2001;50(5):1226–1234. [PubMed: 11483333]
15. Yan D, Lockman D, Brabbins D, et al. An off-line strategy for constructing a patient-specific planningtarget volume in adaptive treatment process for prostate cancer. Int J Radiat Oncol Biol Phys 2000;48(1):289–302. [PubMed: 10925000]
16. Lyman JT. Complication probability as assessed from dose-volume histograms. Radiat Res1985;104:S13–S19.
17. Kutcher GJ, Burman C. Calculation of complication probability factors for non-uniform normal tissueirradiation: the effective volume method. Int J Radiat Oncol Biol Phys 1989;16(6):1623–1630.[PubMed: 2722599]
18. Kutcher GJ, Burman C, Brewster L, et al. Histogram reduction method for calculating complicationprobabilities for three-dimensional treatment planning evaluations. Int J Radiat Oncol Biol Phys1991;21(1):137–146. [PubMed: 2032884]
19. Lyman JT, Wolbarst AB. Optimization of radiation therapy, III: A method of assessing complicationprobabilities from dose-volume histograms. Int J Radiat Oncol Biol Phys 1987;13(1):103–109.[PubMed: 3804804]
20. Lyman JT, Wolbarst AB. Optimization of radiation therapy, IV: A dose-volume histogram reductionalgorithm. Int J Radiat Oncol Biol Phys 1989;17(2):433–436. [PubMed: 2753766]
21. Niemierko A. A generalized concept of Equivalent Uniform Dose [Abstract]. Med Phys 1999;26(6):1100.
22. Mohan R, Mageras GS, Baldwin B, et al. Clinically relevant optimization of 3-D conformaltreatments. Med Phys 1992;19(4):933–944. [PubMed: 1518482]
23. Alber M, Belka C. A normal tissue dose response model of dynamic repair processes. Phys Med Biol2006;51(1):153–172. [PubMed: 16357438]
24. Alber M, Nüsslin F. A representation of an NTCP function for local complication mechanisms. PhysMed Biol 2001;46(2):439–447. [PubMed: 11229724]
25. Jackson A, Haken RKT, Robertson JM, et al. Analysis of clinical complication data for radiationhepatitis using a parallel architecture model. Int J Radiat Oncol Biol Phys 1995;31(4):883–891.[PubMed: 7860402]
M et al. Page 10
Int J Radiat Oncol Biol Phys. Author manuscript; available in PMC 2008 March 15.
NIH
-PA Author Manuscript
NIH
-PA Author Manuscript
NIH
-PA Author Manuscript
26. Akaike, H. Information theory and an extension of the maximum likelihood principle. In: Petrov,BN.; Csaki, F., editors. Second international symposium on information theory. Budapest: AcademiaiKaido; 1973. p. 267-281.
27. Akaike H. A new look at statistical model identification. IEEE Transactions on Automatic Control1974;19(6):716–723.
28. Skwarchuk MW, Jackson A, Zelefsky MJ, et al. Late rectal toxicity after conformal radiotherapy ofprostate cancer (I): multivariate analysis and dose-response. Int J Radiat Oncol Biol Phys 2000;47(1):103–113. [PubMed: 10758311]
29. Dawson LA, Biersack M, Lockwood G, et al. Use of principal component analysis to evaluate thepartial organ tolerance of normal tissues to radiation. Int J Radiat Oncol Biol Phys 2005;62(3):829–837. [PubMed: 15936567]
30. Söhn M, Yan D, Liang J, et al. Influence of Dose Volume Histogram (DVH) Pattern on Rectal Toxicity[Abstract]. Int J Radiat Oncol Biol Phys 2005;63:S58–S59.
M et al. Page 11
Int J Radiat Oncol Biol Phys. Author manuscript; available in PMC 2008 March 15.
NIH
-PA Author Manuscript
NIH
-PA Author Manuscript
NIH
-PA Author Manuscript
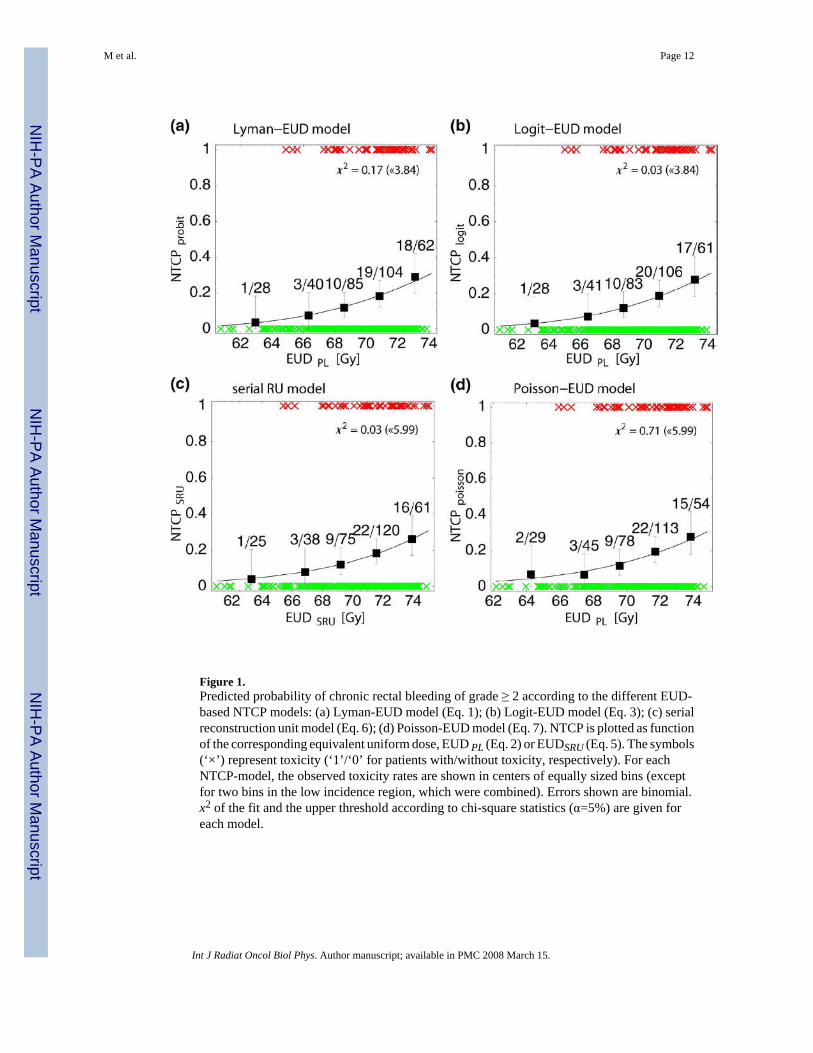
Figure 1.Predicted probability of chronic rectal bleeding of grade ≥ 2 according to the different EUD-based NTCP models: (a) Lyman-EUD model (Eq. 1); (b) Logit-EUD model (Eq. 3); (c) serialreconstruction unit model (Eq. 6); (d) Poisson-EUD model (Eq. 7). NTCP is plotted as functionof the corresponding equivalent uniform dose, EUD PL (Eq. 2) or EUDSRU (Eq. 5). The symbols(‘×’) represent toxicity (‘1’/‘0’ for patients with/without toxicity, respectively). For eachNTCP-model, the observed toxicity rates are shown in centers of equally sized bins (exceptfor two bins in the low incidence region, which were combined). Errors shown are binomial.x2 of the fit and the upper threshold according to chi-square statistics (α=5%) are given foreach model.
M et al. Page 12
Int J Radiat Oncol Biol Phys. Author manuscript; available in PMC 2008 March 15.
NIH
-PA Author Manuscript
NIH
-PA Author Manuscript
NIH
-PA Author Manuscript
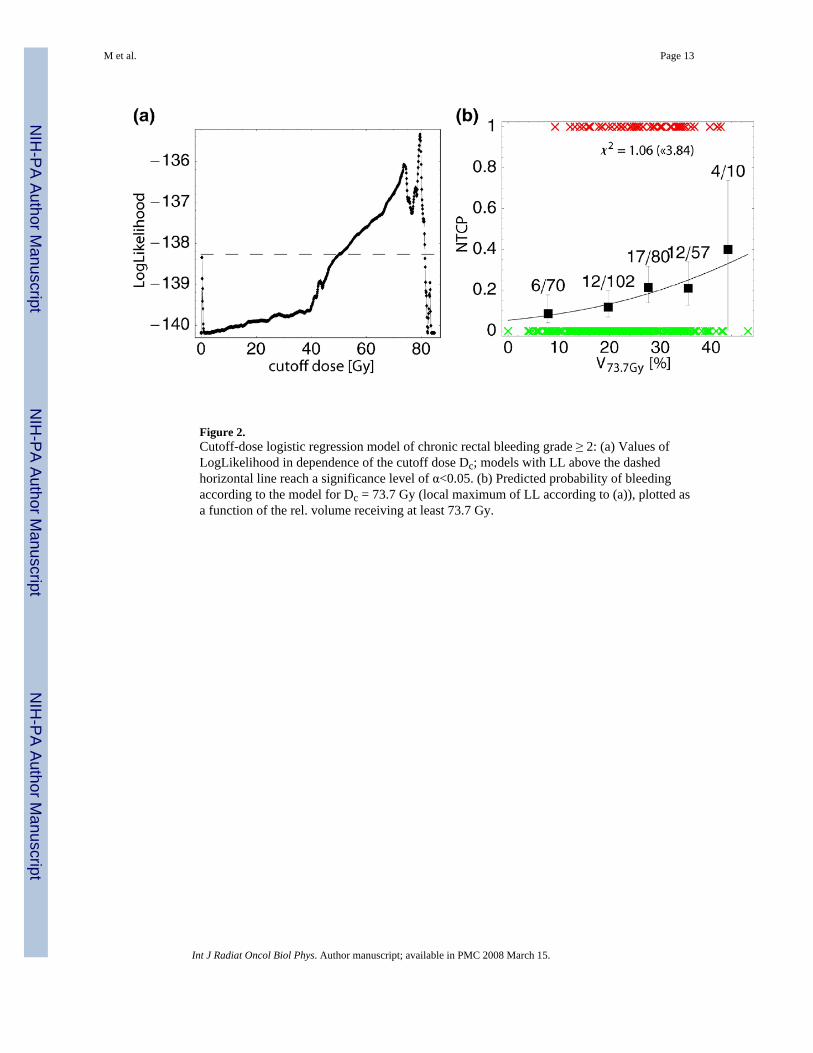
Figure 2.Cutoff-dose logistic regression model of chronic rectal bleeding grade ≥ 2: (a) Values ofLogLikelihood in dependence of the cutoff dose Dc; models with LL above the dashedhorizontal line reach a significance level of α<0.05. (b) Predicted probability of bleedingaccording to the model for Dc = 73.7 Gy (local maximum of LL according to (a)), plotted asa function of the rel. volume receiving at least 73.7 Gy.
M et al. Page 13
Int J Radiat Oncol Biol Phys. Author manuscript; available in PMC 2008 March 15.
NIH
-PA Author Manuscript
NIH
-PA Author Manuscript
NIH
-PA Author Manuscript

NIH
-PA Author Manuscript
NIH
-PA Author Manuscript
NIH
-PA Author Manuscript
M et al. Page 14
Table 1Toxicity score for chronic rectal bleeding based on CTCAE 3.0.
Grade Description1 mild hemorrhage/bleeding; intervention (other than iron supplements) not indicated2 symptomatic and medical intervention or minor cauterization indicated3 transfusion, interventional radiology, endoscopic or operative intervention indicated4 life-threatening consequences; perforation/dysfunction requiring urgent intervention
Int J Radiat Oncol Biol Phys. Author manuscript; available in PMC 2008 March 15.
NIH
-PA Author Manuscript
NIH
-PA Author Manuscript
NIH
-PA Author Manuscript
M et al. Page 15
Table 2Chronic rectal bleeding grade ≥ 2: Estimated parameter values for the six NTCP models, observed LogLikelihoodvalues, estimated LogLikelihood distribution and resulting probability P of obtaining a smaller LL-value thanobserved.
Model parameter estimates (68% CI) LL <LL> ±SLL P [%]
Lyman-EUD model a=11.9 ±3.8 -134.5 -134.6 ±10.5 50.4m=0.108 ±0.027D50=78.4 ±2.1
Logit-EUD model a=12.1 ±3.8 -134.5 -134.5 ±10.5 50.0k=15.4 ±4.5
D50=78.1 ±2.1
serialRU model σ=0.179 ±0.047 -134.5 -135.6 ±10.6 54.0D0=80.6 ±0.9
Poisson-EUD model a=13.5 ±3.8 -134.5 -135.6 ±10.6 54.1D50=78.5 ±0.6
mean dose model — (model not significant) -138.9 — —
cutoff dose model * Dc=73.7 Gy β0=-2.88 ±0.34 -136.1 -136.1 ±10.7 50.0
β1=0.050 ±0.013 * Dc=79.6 Gy β0=-2.10 ±0.16 -135.3 -135.3 ±10.7 50.0
β1=0.068 ±0.015
Int J Radiat Oncol Biol Phys. Author manuscript; available in PMC 2008 March 15.
NIH
-PA Author Manuscript
NIH
-PA Author Manuscript
NIH
-PA Author Manuscript
M et al. Page 16
Table 3Comparison of the NTCP models using the Akaike information criterion (AIC value). n denotes the number ofmodel parameters. [*model not significant (p>0.05)]
Model n LL AICLyman-EUD model 3 -134.54 275.1Logit-EUD model 3 -134.51 275.0serialRU model 2 -134.53 273.1Poisson-EUD model 2 -134.55 273.1mean dose model 2 -138.89* —*cutoff dose model (73.7 Gy) 3 -136.08 278.2cutoff dose model (79.6 Gy) 3 -135.34 276.7
Int J Radiat Oncol Biol Phys. Author manuscript; available in PMC 2008 March 15.