DAILY VARIATIONS IN DELIVERED DOSES IN PATIENTS TREATED WITH RADIOTHERAPY FOR LOCALIZED PROSTATE...
7
doi:10.1016/j.ijrobp.2006.06.011 PHYSICS CONTRIBUTION DAILY VARIATIONS IN DELIVERED DOSES IN PATIENTS TREATED WITH RADIOTHERAPY FOR LOCALIZED PROSTATE CANCER PATRICK A. KUPELIAN, M.D.,* KATJA M. LANGEN,PH.D.,* OMAR A. ZEIDAN,PH.D.,* SANFORD L. MEEKS,PH.D.,* TWYLA R. WILLOUGHBY, M.S.,* THOMAS H. WAGNER,PH.D.,* SAM JESWANI,PH.D., † KENNETH J. RUCHALA,PH.D., † JASON HAIMERL,PH.D., † AND GUSTAVO H. OLIVERA,PH.D. †‡ *Department of Radiation Oncology, The M. D. Anderson Cancer Center Orlando, Orlando, FL; † TomoTherapy Inc., Madison, WI; ‡ University of Wisconsin-Madison, Madison, WI Purpose: The aim of this work was to study the variations in delivered doses to the prostate, rectum, and bladder during a full course of image-guided external beam radiotherapy. Methods and Materials: Ten patients with localized prostate cancer were treated with helical tomotherapy to 78 Gy at 2 Gy per fraction in 39 fractions. Daily target localization was performed using intraprostatic fiducials and daily megavoltage pelvic computed tomography (CT) scans, resulting in a total of 390 CT scans. The prostate, rectum, and bladder were manually contoured on each CT by a single physician. Daily dosimetric analysis was performed with dose recalculation. The study endpoints were D95 (dose to 95% of the prostate), rV2 (absolute rectal volume receiving 2 Gy), and bV2 (absolute bladder volume receiving 2 Gy). Results: For the entire cohort, the average D95 (SD) was 2.02 0.04 Gy (range, 1.79 –2.20 Gy). The average rV2 (SD) was 7.0 8.1 cc (range, 0.1– 67.3 cc). The average bV2 (SD) was 8.7 6.8 cc (range, 0.3–36.8 cc). Unlike doses for the prostate, there was significant daily variation in rectal and bladder doses, mostly because of variations in volume and shape of these organs. Conclusion: Large variations in delivered doses to the rectum and bladder can be documented with daily megavoltage CT scans. Image guidance for the targeting of the prostate, even with intraprostatic fiducials, does not take into account the variation in actual rectal and bladder doses. The clinical impact of techniques that take into account such dosimetric parameters in daily patient set-ups should be investigated. © 2006 Elsevier Inc. Prostate, External Irradiation, Daily dose recalculation. INTRODUCTION The need for accurate daily targeting during a course of external beam radiotherapy in the treatment of localized malignancies has led to the entire field of image-guided radiotherapy. Specifically, in the treatment of localized prostate cancers, the daily positional variation of the pros- tate gland has been extensively studied (1–14). In addition, multiple daily targeting solutions mostly concentrated on daily positional variations, and corrections of the prostate gland have been developed and implemented (14 –19). A few studies have addressed the potential ensuing variations in delivered doses within the pelvis, specifically to the rectum and the bladder (20). Such evaluations have to be based on soft tissues images. Typically, such dosimetric evaluations have been done on computed tomography (CT) scans obtained occasionally throughout the treatment course. Currently, with technologies enabling daily soft tissue imaging, daily evaluation of delivered doses becomes reality. The current study includes the analysis of delivered doses in the prostate gland, rectum, and bladder in 10 patients for the entire course of treatment. To our knowl- edge, this is the only series of patients who have had the entire course of external beam radiotherapy analyzed with daily dose recalculations performed on daily CT studies. METHODS AND MATERIALS Ten patients receiving radiotherapy to the prostate with a helical tomotherapy unit (TomoTherapy Hi*ART II; Tomotherapy Inc., Madison, WI) constituted the study sample. All patients were Reprint requests to: Patrick Kupelian, M.D., Department of Radiation Oncology, M.D. Anderson Cancer Center Orlando, 1400 South Orange Avenue, Orlando, FL 32806; Tel: (407) 841-8666; Fax: (407) 649-6895; E-mail: [email protected] The M. D. Anderson Cancer Center Orlando has received research funding from TomoTherapy, Inc. The following authors are employ- ees of Tomotherapy Inc.: Gustavo H. Olivera, Kenneth J. Ruchala, Sam Jeswani, and Jason Haimerl. Acknowledgment—This work was supported by a grant from Women Playing For T.I.M.E. We are grateful for all the encour- agement and inspiration from Mrs. Elaine Lustig and her col- leagues at Women Playing For T.I.M.E. Received April 25, 2006, and in revised form June 5, 2006. Accepted for publication June 6, 2006. Int. J. Radiation Oncology Biol. Phys., Vol. 66, No. 3, pp. 876 – 882, 2006 Copyright © 2006 Elsevier Inc. Printed in the USA. All rights reserved 0360-3016/06/$–see front matter 876
-
Upload
independent -
Category
Documents
-
view
1 -
download
0
Transcript of DAILY VARIATIONS IN DELIVERED DOSES IN PATIENTS TREATED WITH RADIOTHERAPY FOR LOCALIZED PROSTATE...
P
Temrptmdgfirbe
RSF
fe
Int. J. Radiation Oncology Biol. Phys., Vol. 66, No. 3, pp. 876–882, 2006Copyright © 2006 Elsevier Inc.
Printed in the USA. All rights reserved0360-3016/06/$–see front matter
doi:10.1016/j.ijrobp.2006.06.011
HYSICS CONTRIBUTION
DAILY VARIATIONS IN DELIVERED DOSES IN PATIENTS TREATED WITHRADIOTHERAPY FOR LOCALIZED PROSTATE CANCER
PATRICK A. KUPELIAN, M.D.,* KATJA M. LANGEN, PH.D.,* OMAR A. ZEIDAN, PH.D.,*SANFORD L. MEEKS, PH.D.,* TWYLA R. WILLOUGHBY, M.S.,* THOMAS H. WAGNER, PH.D.,*
SAM JESWANI, PH.D.,† KENNETH J. RUCHALA, PH.D.,† JASON HAIMERL, PH.D.,† AND
GUSTAVO H. OLIVERA, PH.D.†‡
*Department of Radiation Oncology, The M. D. Anderson Cancer Center Orlando, Orlando, FL; †TomoTherapy Inc., Madison, WI;‡University of Wisconsin-Madison, Madison, WI
Purpose: The aim of this work was to study the variations in delivered doses to the prostate, rectum, and bladderduring a full course of image-guided external beam radiotherapy.Methods and Materials: Ten patients with localized prostate cancer were treated with helical tomotherapy to 78Gy at 2 Gy per fraction in 39 fractions. Daily target localization was performed using intraprostatic fiducials anddaily megavoltage pelvic computed tomography (CT) scans, resulting in a total of 390 CT scans. The prostate,rectum, and bladder were manually contoured on each CT by a single physician. Daily dosimetric analysis wasperformed with dose recalculation. The study endpoints were D95 (dose to 95% of the prostate), rV2 (absoluterectal volume receiving 2 Gy), and bV2 (absolute bladder volume receiving 2 Gy).Results: For the entire cohort, the average D95 (�SD) was 2.02 � 0.04 Gy (range, 1.79–2.20 Gy). The averagerV2 (�SD) was 7.0 � 8.1 cc (range, 0.1–67.3 cc). The average bV2 (�SD) was 8.7 � 6.8 cc (range, 0.3–36.8 cc).Unlike doses for the prostate, there was significant daily variation in rectal and bladder doses, mostly because ofvariations in volume and shape of these organs.Conclusion: Large variations in delivered doses to the rectum and bladder can be documented with dailymegavoltage CT scans. Image guidance for the targeting of the prostate, even with intraprostatic fiducials, doesnot take into account the variation in actual rectal and bladder doses. The clinical impact of techniques that takeinto account such dosimetric parameters in daily patient set-ups should be investigated. © 2006 Elsevier Inc.
Prostate, External Irradiation, Daily dose recalculation.
sctrdpeed
tM
SAWal
INTRODUCTION
he need for accurate daily targeting during a course ofxternal beam radiotherapy in the treatment of localizedalignancies has led to the entire field of image-guided
adiotherapy. Specifically, in the treatment of localizedrostate cancers, the daily positional variation of the pros-ate gland has been extensively studied (1–14). In addition,ultiple daily targeting solutions mostly concentrated on
aily positional variations, and corrections of the prostateland have been developed and implemented (14–19). Aew studies have addressed the potential ensuing variationsn delivered doses within the pelvis, specifically to theectum and the bladder (20). Such evaluations have to beased on soft tissues images. Typically, such dosimetricvaluations have been done on computed tomography (CT)
Reprint requests to: Patrick Kupelian, M.D., Department ofadiation Oncology, M.D. Anderson Cancer Center Orlando, 1400outh Orange Avenue, Orlando, FL 32806; Tel: (407) 841-8666;ax: (407) 649-6895; E-mail: [email protected] M. D. Anderson Cancer Center Orlando has received research
unding from TomoTherapy, Inc. The following authors are employ-
es of Tomotherapy Inc.: Gustavo H. Olivera, Kenneth J. Ruchala, A876
cans obtained occasionally throughout the treatmentourse. Currently, with technologies enabling daily softissue imaging, daily evaluation of delivered doses becomeseality. The current study includes the analysis of deliveredoses in the prostate gland, rectum, and bladder in 10atients for the entire course of treatment. To our knowl-dge, this is the only series of patients who have had thentire course of external beam radiotherapy analyzed withaily dose recalculations performed on daily CT studies.
METHODS AND MATERIALS
Ten patients receiving radiotherapy to the prostate with a helicalomotherapy unit (TomoTherapy Hi*ART II; Tomotherapy Inc.,
adison, WI) constituted the study sample. All patients were
am Jeswani, and Jason Haimerl.cknowledgment—This work was supported by a grant fromomen Playing For T.I.M.E. We are grateful for all the encour-
gement and inspiration from Mrs. Elaine Lustig and her col-eagues at Women Playing For T.I.M.E.
Received April 25, 2006, and in revised form June 5, 2006.
ccepted for publication June 6, 2006.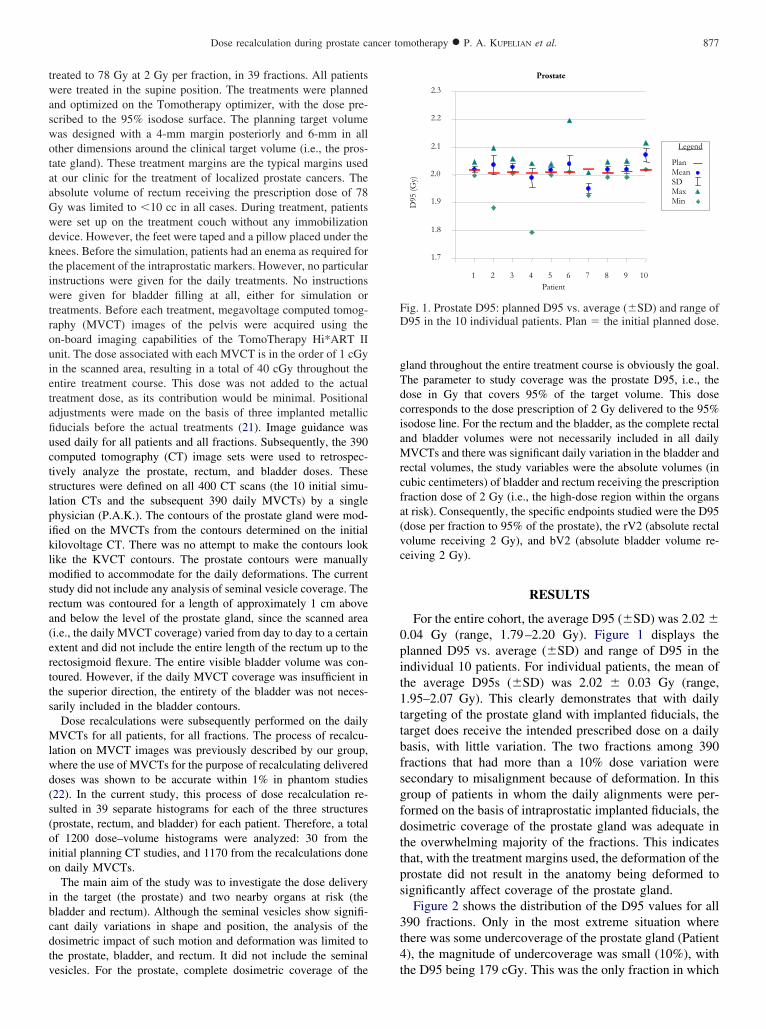
twaswotaaGwdktiwtrouietafiuctslpiklmsra(ertts
Mlwd(s(oio
ibcdtv
gTdciaMrcfa(vc
0pit1ttbfsgfdttps
3t4
FD
877Dose recalculation during prostate cancer tomotherapy ● P. A. KUPELIAN et al.
reated to 78 Gy at 2 Gy per fraction, in 39 fractions. All patientsere treated in the supine position. The treatments were planned
nd optimized on the Tomotherapy optimizer, with the dose pre-cribed to the 95% isodose surface. The planning target volumeas designed with a 4-mm margin posteriorly and 6-mm in allther dimensions around the clinical target volume (i.e., the pros-ate gland). These treatment margins are the typical margins usedt our clinic for the treatment of localized prostate cancers. Thebsolute volume of rectum receiving the prescription dose of 78y was limited to �10 cc in all cases. During treatment, patientsere set up on the treatment couch without any immobilizationevice. However, the feet were taped and a pillow placed under thenees. Before the simulation, patients had an enema as required forhe placement of the intraprostatic markers. However, no particularnstructions were given for the daily treatments. No instructionsere given for bladder filling at all, either for simulation or
reatments. Before each treatment, megavoltage computed tomog-aphy (MVCT) images of the pelvis were acquired using then-board imaging capabilities of the TomoTherapy Hi*ART IInit. The dose associated with each MVCT is in the order of 1 cGyn the scanned area, resulting in a total of 40 cGy throughout thentire treatment course. This dose was not added to the actualreatment dose, as its contribution would be minimal. Positionaldjustments were made on the basis of three implanted metallicducials before the actual treatments (21). Image guidance wassed daily for all patients and all fractions. Subsequently, the 390omputed tomography (CT) image sets were used to retrospec-ively analyze the prostate, rectum, and bladder doses. Thesetructures were defined on all 400 CT scans (the 10 initial simu-ation CTs and the subsequent 390 daily MVCTs) by a singlehysician (P.A.K.). The contours of the prostate gland were mod-fied on the MVCTs from the contours determined on the initialilovoltage CT. There was no attempt to make the contours lookike the KVCT contours. The prostate contours were manuallyodified to accommodate for the daily deformations. The current
tudy did not include any analysis of seminal vesicle coverage. Theectum was contoured for a length of approximately 1 cm abovend below the level of the prostate gland, since the scanned areai.e., the daily MVCT coverage) varied from day to day to a certainxtent and did not include the entire length of the rectum up to theectosigmoid flexure. The entire visible bladder volume was con-oured. However, if the daily MVCT coverage was insufficient inhe superior direction, the entirety of the bladder was not neces-arily included in the bladder contours.
Dose recalculations were subsequently performed on the dailyVCTs for all patients, for all fractions. The process of recalcu-
ation on MVCT images was previously described by our group,here the use of MVCTs for the purpose of recalculating deliveredoses was shown to be accurate within 1% in phantom studies22). In the current study, this process of dose recalculation re-ulted in 39 separate histograms for each of the three structuresprostate, rectum, and bladder) for each patient. Therefore, a totalf 1200 dose–volume histograms were analyzed: 30 from thenitial planning CT studies, and 1170 from the recalculations donen daily MVCTs.The main aim of the study was to investigate the dose delivery
n the target (the prostate) and two nearby organs at risk (theladder and rectum). Although the seminal vesicles show signifi-ant daily variations in shape and position, the analysis of theosimetric impact of such motion and deformation was limited tohe prostate, bladder, and rectum. It did not include the seminal
esicles. For the prostate, complete dosimetric coverage of the tland throughout the entire treatment course is obviously the goal.he parameter to study coverage was the prostate D95, i.e., theose in Gy that covers 95% of the target volume. This doseorresponds to the dose prescription of 2 Gy delivered to the 95%sodose line. For the rectum and the bladder, as the complete rectalnd bladder volumes were not necessarily included in all dailyVCTs and there was significant daily variation in the bladder and
ectal volumes, the study variables were the absolute volumes (inubic centimeters) of bladder and rectum receiving the prescriptionraction dose of 2 Gy (i.e., the high-dose region within the organst risk). Consequently, the specific endpoints studied were the D95dose per fraction to 95% of the prostate), the rV2 (absolute rectalolume receiving 2 Gy), and bV2 (absolute bladder volume re-eiving 2 Gy).
RESULTS
For the entire cohort, the average D95 (�SD) was 2.02 �.04 Gy (range, 1.79–2.20 Gy). Figure 1 displays thelanned D95 vs. average (�SD) and range of D95 in thendividual 10 patients. For individual patients, the mean ofhe average D95s (�SD) was 2.02 � 0.03 Gy (range,.95–2.07 Gy). This clearly demonstrates that with dailyargeting of the prostate gland with implanted fiducials, thearget does receive the intended prescribed dose on a dailyasis, with little variation. The two fractions among 390ractions that had more than a 10% dose variation wereecondary to misalignment because of deformation. In thisroup of patients in whom the daily alignments were per-ormed on the basis of intraprostatic implanted fiducials, theosimetric coverage of the prostate gland was adequate inhe overwhelming majority of the fractions. This indicateshat, with the treatment margins used, the deformation of therostate did not result in the anatomy being deformed toignificantly affect coverage of the prostate gland.
Figure 2 shows the distribution of the D95 values for all90 fractions. Only in the most extreme situation wherehere was some undercoverage of the prostate gland (Patient), the magnitude of undercoverage was small (10%), with
Prostate
1.7
1.8
1.9
2.0
2.1
2.2
2.3
1 2 3 4 5 6 7 8 9 10Patient
D95
(Gy)
Legend
PlanMeanSDMaxMin
ig. 1. Prostate D95: planned D95 vs. average (�SD) and range of95 in the 10 individual patients. Plan � the initial planned dose.
he D95 being 179 cGy. This was the only fraction in which
tEtIcwmw
8r1mecihaDeptt
dmtfraottuutdvsu
6Frtibc
awdWtmtds
mt
for all
Fpi
878 I. J. Radiation Oncology ● Biology ● Physics Volume 66, Number 3, 2006
he D95 decreased by 10% or more in all 390 fractions.ven in this patient who had the D95 at 179 cGy on 1 day,
he average D95 (�SD) over all fractions was 199 � 4 cGy.nterestingly, the D95 was higher than planned in someases, although to a relatively small extent. The magnitudeas small enough (all within 10% and the overwhelmingajority within 5%) that no appreciable clinical differenceould be expected to be observed (Fig. 2).For the entire cohort, the average rV2 (�SD) was 7.0 �
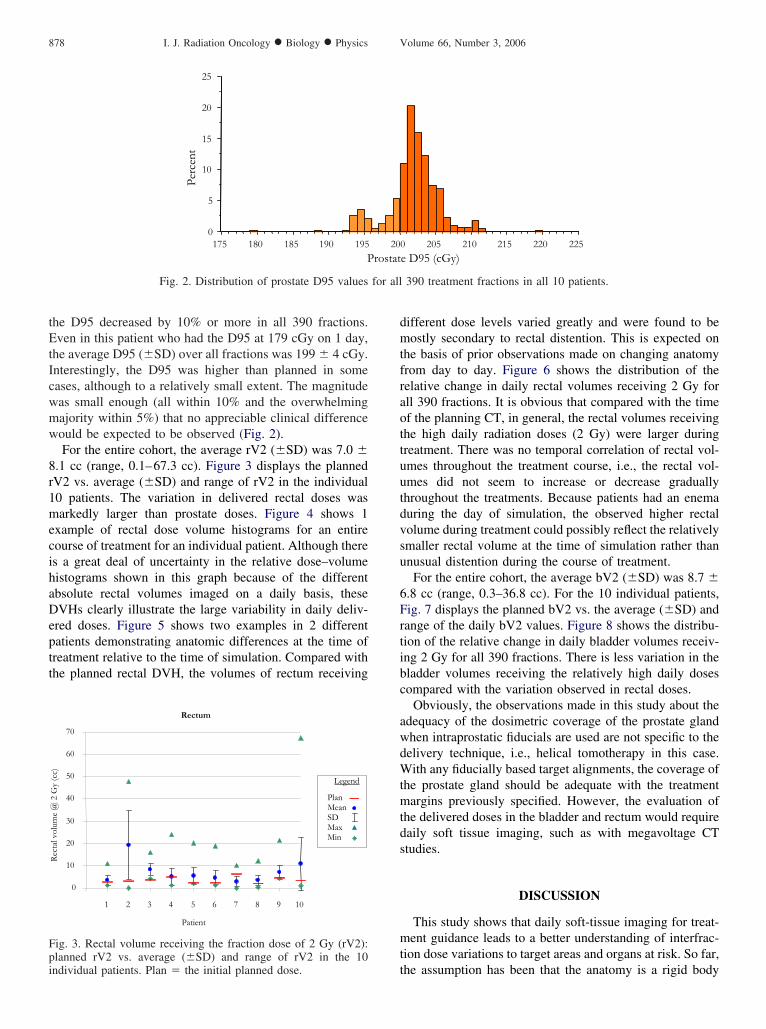
.1 cc (range, 0.1–67.3 cc). Figure 3 displays the plannedV2 vs. average (�SD) and range of rV2 in the individual0 patients. The variation in delivered rectal doses wasarkedly larger than prostate doses. Figure 4 shows 1
xample of rectal dose volume histograms for an entireourse of treatment for an individual patient. Although theres a great deal of uncertainty in the relative dose–volumeistograms shown in this graph because of the differentbsolute rectal volumes imaged on a daily basis, theseVHs clearly illustrate the large variability in daily deliv-
red doses. Figure 5 shows two examples in 2 differentatients demonstrating anatomic differences at the time ofreatment relative to the time of simulation. Compared withhe planned rectal DVH, the volumes of rectum receiving
0
5
10
15
20
25
Perc
ent
175 180 185 190 195P
Fig. 2. Distribution of prostate D95 values
Rectum
0
10
20
30
40
50
60
70
1 2 3 4 5 6 7 8 9 10
Patient
Rec
tal v
olum
e @
2 G
y (c
c)
Legend
PlanMeanSDMaxMin
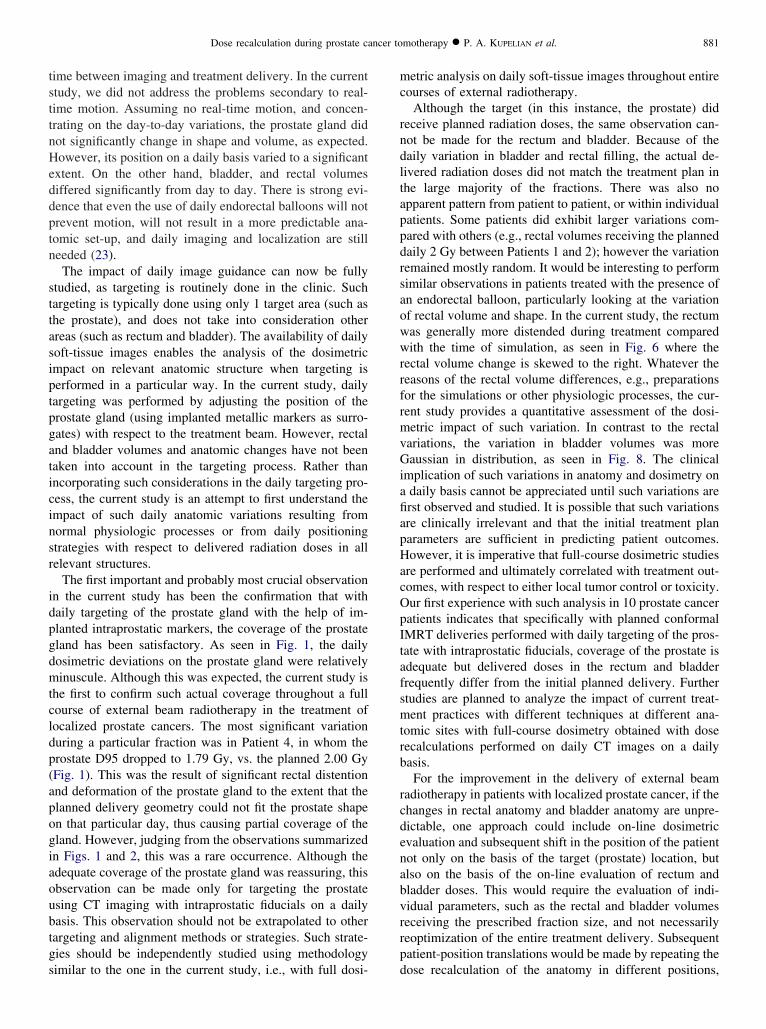
ig. 3. Rectal volume receiving the fraction dose of 2 Gy (rV2):lanned rV2 vs. average (�SD) and range of rV2 in the 10
tndividual patients. Plan � the initial planned dose.
ifferent dose levels varied greatly and were found to beostly secondary to rectal distention. This is expected on
he basis of prior observations made on changing anatomyrom day to day. Figure 6 shows the distribution of theelative change in daily rectal volumes receiving 2 Gy forll 390 fractions. It is obvious that compared with the timef the planning CT, in general, the rectal volumes receivinghe high daily radiation doses (2 Gy) were larger duringreatment. There was no temporal correlation of rectal vol-mes throughout the treatment course, i.e., the rectal vol-mes did not seem to increase or decrease graduallyhroughout the treatments. Because patients had an enemauring the day of simulation, the observed higher rectalolume during treatment could possibly reflect the relativelymaller rectal volume at the time of simulation rather thannusual distention during the course of treatment.For the entire cohort, the average bV2 (�SD) was 8.7 �
.8 cc (range, 0.3–36.8 cc). For the 10 individual patients,ig. 7 displays the planned bV2 vs. the average (�SD) andange of the daily bV2 values. Figure 8 shows the distribu-ion of the relative change in daily bladder volumes receiv-ng 2 Gy for all 390 fractions. There is less variation in theladder volumes receiving the relatively high daily dosesompared with the variation observed in rectal doses.
Obviously, the observations made in this study about thedequacy of the dosimetric coverage of the prostate glandhen intraprostatic fiducials are used are not specific to theelivery technique, i.e., helical tomotherapy in this case.ith any fiducially based target alignments, the coverage of
he prostate gland should be adequate with the treatmentargins previously specified. However, the evaluation of
he delivered doses in the bladder and rectum would requireaily soft tissue imaging, such as with megavoltage CTtudies.
DISCUSSION
This study shows that daily soft-tissue imaging for treat-ent guidance leads to a better understanding of interfrac-
ion dose variations to target areas and organs at risk. So far,
0 205 210 215 220 225e D95 (cGy)
390 treatment fractions in all 10 patients.
20rostat
he assumption has been that the anatomy is a rigid body

879Dose recalculation during prostate cancer tomotherapy ● P. A. KUPELIAN et al.
Fig. 4. Rectal dose–volume histogram (DVH) for all 39 treatment fractions in 1 patient. Red line represents the planning
computed tomography DVH; thinner blue lines represent daily DVHs.Fig. 5. Comparison of pelvic anatomy in two separate patients between the simulation day (kilovoltage computedtomogram [CT]) and the treatment day (megavoltage CT [MVCT]). These CT scans show the deformation of the
prostate, rectum, and bladder that would result in variation in delivered doses.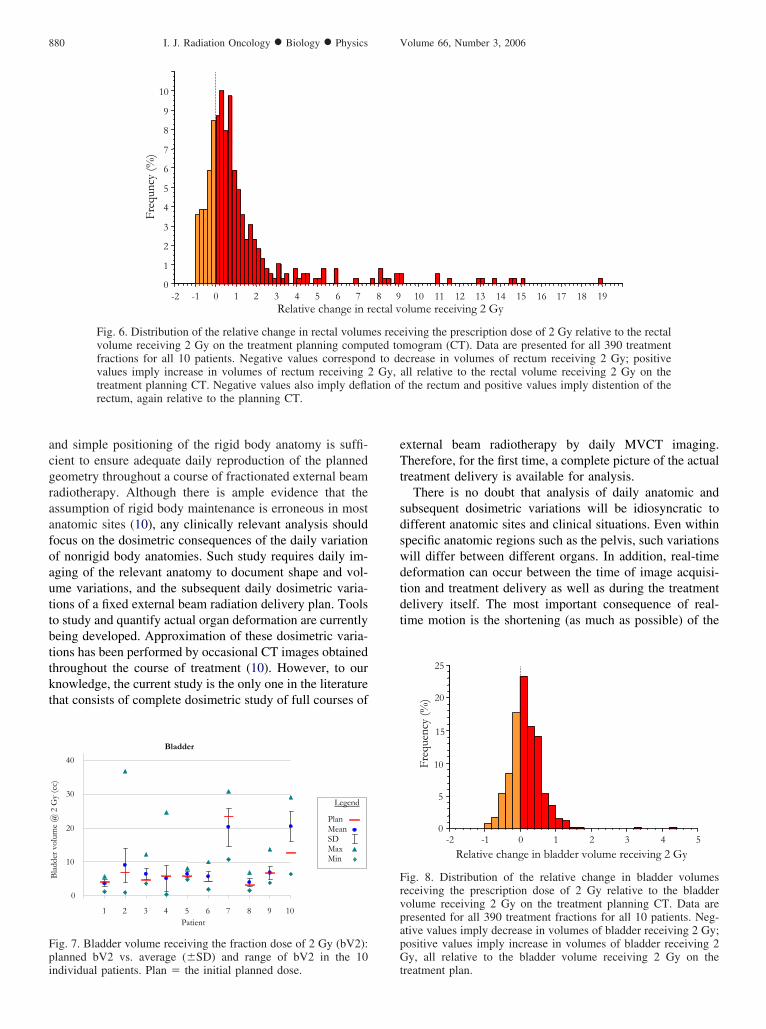
acgraafoauttbttkt
eTt
sdswdtdt
Fpi
FrvpapG
880 I. J. Radiation Oncology ● Biology ● Physics Volume 66, Number 3, 2006
nd simple positioning of the rigid body anatomy is suffi-ient to ensure adequate daily reproduction of the plannedeometry throughout a course of fractionated external beamadiotherapy. Although there is ample evidence that thessumption of rigid body maintenance is erroneous in mostnatomic sites (10), any clinically relevant analysis shouldocus on the dosimetric consequences of the daily variationf nonrigid body anatomies. Such study requires daily im-ging of the relevant anatomy to document shape and vol-me variations, and the subsequent daily dosimetric varia-ions of a fixed external beam radiation delivery plan. Toolso study and quantify actual organ deformation are currentlyeing developed. Approximation of these dosimetric varia-ions has been performed by occasional CT images obtainedhroughout the course of treatment (10). However, to ournowledge, the current study is the only one in the literaturehat consists of complete dosimetric study of full courses of
Freq
uncy
(%)
0
1
2
3
4
5
6
7
8
9
10
-2 -1 0 1 2 3 4 5 6 7Relative change in r
Fig. 6. Distribution of the relative change in rectal volumvolume receiving 2 Gy on the treatment planning compfractions for all 10 patients. Negative values corresponvalues imply increase in volumes of rectum receiving 2treatment planning CT. Negative values also imply deflarectum, again relative to the planning CT.
Bladder
0
10
20
30
40
1 2 3 4 5 6 7 8 9 10Patient
Bla
dder
vol
ume
@ 2
Gy
(cc)
Legend
PlanMeanSDMaxMin
ig. 7. Bladder volume receiving the fraction dose of 2 Gy (bV2):lanned bV2 vs. average (�SD) and range of bV2 in the 10
ndividual patients. Plan � the initial planned dose. txternal beam radiotherapy by daily MVCT imaging.herefore, for the first time, a complete picture of the actual
reatment delivery is available for analysis.There is no doubt that analysis of daily anatomic and
ubsequent dosimetric variations will be idiosyncratic toifferent anatomic sites and clinical situations. Even withinpecific anatomic regions such as the pelvis, such variationsill differ between different organs. In addition, real-timeeformation can occur between the time of image acquisi-ion and treatment delivery as well as during the treatmentelivery itself. The most important consequence of real-ime motion is the shortening (as much as possible) of the
10 11 12 13 14 15 16 17 18 19olume receiving 2 Gy
iving the prescription dose of 2 Gy relative to the rectalmogram (CT). Data are presented for all 390 treatmentcrease in volumes of rectum receiving 2 Gy; positive
all relative to the rectal volume receiving 2 Gy on thef the rectum and positive values imply distention of the
25
Freq
uenc
y (%
)
0
5
10
15
20
-2 -1 0 1 2 3 4 5
Relative change in bladder volume receiving 2 Gy
ig. 8. Distribution of the relative change in bladder volumeseceiving the prescription dose of 2 Gy relative to the bladderolume receiving 2 Gy on the treatment planning CT. Data areresented for all 390 treatment fractions for all 10 patients. Neg-tive values imply decrease in volumes of bladder receiving 2 Gy;ositive values imply increase in volumes of bladder receiving 2y, all relative to the bladder volume receiving 2 Gy on the
8 9ectal v
es receuted tod to de
Gy,tion o
reatment plan.
tsttnHeddptn
sttasiptpgaticinsr
idpgdmtcldp(apogiaoubtgs
mc
rndltappdrsaowwrrfrmvGiafiapHacOpItafsmtrb
rcdenabvrrp
881Dose recalculation during prostate cancer tomotherapy ● P. A. KUPELIAN et al.
ime between imaging and treatment delivery. In the currenttudy, we did not address the problems secondary to real-ime motion. Assuming no real-time motion, and concen-rating on the day-to-day variations, the prostate gland didot significantly change in shape and volume, as expected.owever, its position on a daily basis varied to a significant
xtent. On the other hand, bladder, and rectal volumesiffered significantly from day to day. There is strong evi-ence that even the use of daily endorectal balloons will notrevent motion, will not result in a more predictable ana-omic set-up, and daily imaging and localization are stilleeded (23).The impact of daily image guidance can now be fully
tudied, as targeting is routinely done in the clinic. Suchargeting is typically done using only 1 target area (such ashe prostate), and does not take into consideration otherreas (such as rectum and bladder). The availability of dailyoft-tissue images enables the analysis of the dosimetricmpact on relevant anatomic structure when targeting iserformed in a particular way. In the current study, dailyargeting was performed by adjusting the position of therostate gland (using implanted metallic markers as surro-ates) with respect to the treatment beam. However, rectalnd bladder volumes and anatomic changes have not beenaken into account in the targeting process. Rather thanncorporating such considerations in the daily targeting pro-ess, the current study is an attempt to first understand thempact of such daily anatomic variations resulting fromormal physiologic processes or from daily positioningtrategies with respect to delivered radiation doses in allelevant structures.
The first important and probably most crucial observationn the current study has been the confirmation that withaily targeting of the prostate gland with the help of im-lanted intraprostatic markers, the coverage of the prostateland has been satisfactory. As seen in Fig. 1, the dailyosimetric deviations on the prostate gland were relativelyinuscule. Although this was expected, the current study is
he first to confirm such actual coverage throughout a fullourse of external beam radiotherapy in the treatment ofocalized prostate cancers. The most significant variationuring a particular fraction was in Patient 4, in whom therostate D95 dropped to 1.79 Gy, vs. the planned 2.00 GyFig. 1). This was the result of significant rectal distentionnd deformation of the prostate gland to the extent that thelanned delivery geometry could not fit the prostate shapen that particular day, thus causing partial coverage of theland. However, judging from the observations summarizedn Figs. 1 and 2, this was a rare occurrence. Although thedequate coverage of the prostate gland was reassuring, thisbservation can be made only for targeting the prostatesing CT imaging with intraprostatic fiducials on a dailyasis. This observation should not be extrapolated to otherargeting and alignment methods or strategies. Such strate-ies should be independently studied using methodology
imilar to the one in the current study, i.e., with full dosi- detric analysis on daily soft-tissue images throughout entireourses of external radiotherapy.
Although the target (in this instance, the prostate) dideceive planned radiation doses, the same observation can-ot be made for the rectum and bladder. Because of theaily variation in bladder and rectal filling, the actual de-ivered radiation doses did not match the treatment plan inhe large majority of the fractions. There was also nopparent pattern from patient to patient, or within individualatients. Some patients did exhibit larger variations com-ared with others (e.g., rectal volumes receiving the plannedaily 2 Gy between Patients 1 and 2); however the variationemained mostly random. It would be interesting to performimilar observations in patients treated with the presence ofn endorectal balloon, particularly looking at the variationf rectal volume and shape. In the current study, the rectumas generally more distended during treatment comparedith the time of simulation, as seen in Fig. 6 where the
ectal volume change is skewed to the right. Whatever theeasons of the rectal volume differences, e.g., preparationsor the simulations or other physiologic processes, the cur-ent study provides a quantitative assessment of the dosi-etric impact of such variation. In contrast to the rectal
ariations, the variation in bladder volumes was moreaussian in distribution, as seen in Fig. 8. The clinical
mplication of such variations in anatomy and dosimetry ondaily basis cannot be appreciated until such variations arerst observed and studied. It is possible that such variationsre clinically irrelevant and that the initial treatment planarameters are sufficient in predicting patient outcomes.owever, it is imperative that full-course dosimetric studies
re performed and ultimately correlated with treatment out-omes, with respect to either local tumor control or toxicity.ur first experience with such analysis in 10 prostate canceratients indicates that specifically with planned conformalMRT deliveries performed with daily targeting of the pros-ate with intraprostatic fiducials, coverage of the prostate isdequate but delivered doses in the rectum and bladderrequently differ from the initial planned delivery. Furthertudies are planned to analyze the impact of current treat-ent practices with different techniques at different ana-
omic sites with full-course dosimetry obtained with doseecalculations performed on daily CT images on a dailyasis.For the improvement in the delivery of external beam
adiotherapy in patients with localized prostate cancer, if thehanges in rectal anatomy and bladder anatomy are unpre-ictable, one approach could include on-line dosimetricvaluation and subsequent shift in the position of the patientot only on the basis of the target (prostate) location, butlso on the basis of the on-line evaluation of rectum andladder doses. This would require the evaluation of indi-idual parameters, such as the rectal and bladder volumeseceiving the prescribed fraction size, and not necessarilyeoptimization of the entire treatment delivery. Subsequentatient-position translations would be made by repeating the
ose recalculation of the anatomy in different positions,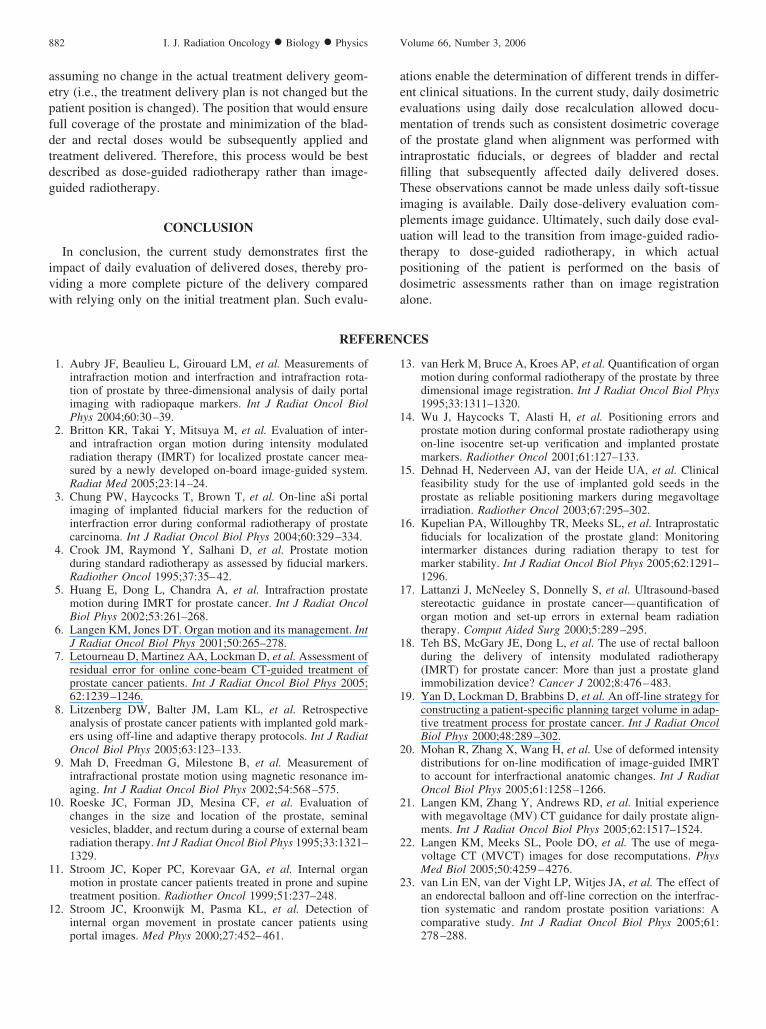
aepfdtdg
ivw
aeemoifiTiputpd
1
1
1
882 I. J. Radiation Oncology ● Biology ● Physics Volume 66, Number 3, 2006
ssuming no change in the actual treatment delivery geom-try (i.e., the treatment delivery plan is not changed but theatient position is changed). The position that would ensureull coverage of the prostate and minimization of the blad-er and rectal doses would be subsequently applied andreatment delivered. Therefore, this process would be bestescribed as dose-guided radiotherapy rather than image-uided radiotherapy.
CONCLUSION
In conclusion, the current study demonstrates first thempact of daily evaluation of delivered doses, thereby pro-iding a more complete picture of the delivery compared
ith relying only on the initial treatment plan. Such evalu- aREFEREN
portal images. Med Phys 2000;27:452–461.
1
1
1
1
1
1
1
2
2
2
2
tions enable the determination of different trends in differ-nt clinical situations. In the current study, daily dosimetricvaluations using daily dose recalculation allowed docu-entation of trends such as consistent dosimetric coverage
f the prostate gland when alignment was performed withntraprostatic fiducials, or degrees of bladder and rectallling that subsequently affected daily delivered doses.hese observations cannot be made unless daily soft-tissue
maging is available. Daily dose-delivery evaluation com-lements image guidance. Ultimately, such daily dose eval-ation will lead to the transition from image-guided radio-herapy to dose-guided radiotherapy, in which actualositioning of the patient is performed on the basis ofosimetric assessments rather than on image registration
lone.CES
1. Aubry JF, Beaulieu L, Girouard LM, et al. Measurements ofintrafraction motion and interfraction and intrafraction rota-tion of prostate by three-dimensional analysis of daily portalimaging with radiopaque markers. Int J Radiat Oncol BiolPhys 2004;60:30–39.
2. Britton KR, Takai Y, Mitsuya M, et al. Evaluation of inter-and intrafraction organ motion during intensity modulatedradiation therapy (IMRT) for localized prostate cancer mea-sured by a newly developed on-board image-guided system.Radiat Med 2005;23:14–24.
3. Chung PW, Haycocks T, Brown T, et al. On-line aSi portalimaging of implanted fiducial markers for the reduction ofinterfraction error during conformal radiotherapy of prostatecarcinoma. Int J Radiat Oncol Biol Phys 2004;60:329–334.
4. Crook JM, Raymond Y, Salhani D, et al. Prostate motionduring standard radiotherapy as assessed by fiducial markers.Radiother Oncol 1995;37:35–42.
5. Huang E, Dong L, Chandra A, et al. Intrafraction prostatemotion during IMRT for prostate cancer. Int J Radiat OncolBiol Phys 2002;53:261–268.
6. Langen KM, Jones DT. Organ motion and its management. IntJ Radiat Oncol Biol Phys 2001;50:265–278.
7. Letourneau D, Martinez AA, Lockman D, et al. Assessment ofresidual error for online cone-beam CT-guided treatment ofprostate cancer patients. Int J Radiat Oncol Biol Phys 2005;62:1239–1246.
8. Litzenberg DW, Balter JM, Lam KL, et al. Retrospectiveanalysis of prostate cancer patients with implanted gold mark-ers using off-line and adaptive therapy protocols. Int J RadiatOncol Biol Phys 2005;63:123–133.
9. Mah D, Freedman G, Milestone B, et al. Measurement ofintrafractional prostate motion using magnetic resonance im-aging. Int J Radiat Oncol Biol Phys 2002;54:568–575.
0. Roeske JC, Forman JD, Mesina CF, et al. Evaluation ofchanges in the size and location of the prostate, seminalvesicles, bladder, and rectum during a course of external beamradiation therapy. Int J Radiat Oncol Biol Phys 1995;33:1321–1329.
1. Stroom JC, Koper PC, Korevaar GA, et al. Internal organmotion in prostate cancer patients treated in prone and supinetreatment position. Radiother Oncol 1999;51:237–248.
2. Stroom JC, Kroonwijk M, Pasma KL, et al. Detection ofinternal organ movement in prostate cancer patients using
3. van Herk M, Bruce A, Kroes AP, et al. Quantification of organmotion during conformal radiotherapy of the prostate by threedimensional image registration. Int J Radiat Oncol Biol Phys1995;33:1311–1320.
4. Wu J, Haycocks T, Alasti H, et al. Positioning errors andprostate motion during conformal prostate radiotherapy usingon-line isocentre set-up verification and implanted prostatemarkers. Radiother Oncol 2001;61:127–133.
5. Dehnad H, Nederveen AJ, van der Heide UA, et al. Clinicalfeasibility study for the use of implanted gold seeds in theprostate as reliable positioning markers during megavoltageirradiation. Radiother Oncol 2003;67:295–302.
6. Kupelian PA, Willoughby TR, Meeks SL, et al. Intraprostaticfiducials for localization of the prostate gland: Monitoringintermarker distances during radiation therapy to test formarker stability. Int J Radiat Oncol Biol Phys 2005;62:1291–1296.
7. Lattanzi J, McNeeley S, Donnelly S, et al. Ultrasound-basedstereotactic guidance in prostate cancer—quantification oforgan motion and set-up errors in external beam radiationtherapy. Comput Aided Surg 2000;5:289–295.
8. Teh BS, McGary JE, Dong L, et al. The use of rectal balloonduring the delivery of intensity modulated radiotherapy(IMRT) for prostate cancer: More than just a prostate glandimmobilization device? Cancer J 2002;8:476–483.
9. Yan D, Lockman D, Brabbins D, et al. An off-line strategy forconstructing a patient-specific planning target volume in adap-tive treatment process for prostate cancer. Int J Radiat OncolBiol Phys 2000;48:289–302.
0. Mohan R, Zhang X, Wang H, et al. Use of deformed intensitydistributions for on-line modification of image-guided IMRTto account for interfractional anatomic changes. Int J RadiatOncol Biol Phys 2005;61:1258–1266.
1. Langen KM, Zhang Y, Andrews RD, et al. Initial experiencewith megavoltage (MV) CT guidance for daily prostate align-ments. Int J Radiat Oncol Biol Phys 2005;62:1517–1524.
2. Langen KM, Meeks SL, Poole DO, et al. The use of mega-voltage CT (MVCT) images for dose recomputations. PhysMed Biol 2005;50:4259–4276.
3. van Lin EN, van der Vight LP, Witjes JA, et al. The effect ofan endorectal balloon and off-line correction on the interfrac-tion systematic and random prostate position variations: Acomparative study. Int J Radiat Oncol Biol Phys 2005;61:
278–288.