
Variability of single event slip and recurrence intervals for ...
Upload
independentCategory
view
0download
0
Integration of Gene Expression Profiling and Clinical Variables toPredict Prostate Carcinoma Recurrence after RadicalProstatectomy
Andrew J. Stephenson, M.D.1, Alex Smith, M.S.2, Michael W. Kattan, Ph.D.1,2, JayaSatagopan, Ph.D.2, Victor E. Reuter, M.D.3, Peter T. Scardino, M.D.1, and William L. Gerald,M.D., Ph.D.31 Department of Urology, Sidney Kimmel Center for Prostate and Urologic Cancers, Memorial Sloan-Kettering Cancer Center, New York, New York
2 Department of Epidemiology and Biostatistics, Memorial Sloan-Kettering Cancer Center, New York, NewYork
3 Department of Pathology, Memorial Sloan-Kettering Cancer Center, New York, New York
AbstractBACKGROUND— Gene expression profiling of prostate carcinoma offers an alternative means todistinguish aggressive tumor biology and may improve the accuracy of outcome prediction forpatients with prostate carcinoma treated by radical prostatectomy.
METHODS— Gene expression differences between 37 recurrent and 42 nonrecurrent primaryprostate tumor specimens were analyzed by oligonucleotide microarrays. Two logistic regressionmodeling approaches were used to predict prostate carcinoma recurrence after radical prostatectomy.One approach was based exclusively on gene expression differences between the two classes. Thesecond approach integrated prognostic gene variables with a validated postoperative predictive modelbased on standard variables (nomogram). The predictive accuracy of these modeling approaches wasevaluated by leave-one-out cross-validation (LOOCV) and compared with the nomogram.
RESULTS— The modeling approach using gene variables alone accurately classified 59 (75%)tissue samples in LOOCV, a classification rate substantially higher than expected by chance.However, this predictive accuracy was inferior to the nomogram (concordance index, 0.75 vs. 0.84,P = 0.01). Models combining clinical and gene variables accurately classified 70 (89%) tissuesamples and the predictive accuracy using this approach (concordance index, 0.89) was superior tothe nomogram (P = 0.009) and models based on gene variables alone (P < 0.001). Importantly, thecombined approach provided a marked improvement for patients whose nomogram-predictedlikelihood of disease recurrence was in the indeterminate range (7-year disease progression-freeprobability, 30–70%; concordance index, 0.83 vs. 0.59, P = 0.01).
CONCLUSIONS— Integration of gene expression signatures and clinical variables producedpredictive models for prostate carcinoma recurrence that perform significantly better than those basedon either clinical variables or gene expression information alone.
Address for reprints: William L. Gerald, M.D., Ph.D., Department of Pathology, Memorial Sloan-Kettering Cancer Center, 1275 YorkAvenue, New York, NY 10021; Fax: (212) 639-4559; E-mail: [email protected] primarily by the P50-CA92629 Specialized Programs in Research Excellence (SPORE) in Prostate Cancer grant from theNational Cancer Institute (NCI) and, in part, by a gift from the Leon Lowenstein Foundation. A. J. S. is supported, in part, by the AmericanFoundation for Urologic Disease and by a National Institutes of Health T32 training grant (CA82088). W. L. G. is supported, in part, bya Director’s Challenge grant (U01-CA84999) from the NCI. J. S. is supported, in part, by grant R01-CA098438 from the NCI.
NIH Public AccessAuthor ManuscriptCancer. Author manuscript; available in PMC 2007 April 17.
Published in final edited form as:Cancer. 2005 July 15; 104(2): 290–298.
NIH
-PA Author Manuscript
NIH
-PA Author Manuscript
NIH
-PA Author Manuscript
Keywordsprostatic neoplasms/pathology/surgery; prostatectomy; gene expression profiling; treatmentoutcome; logistic models
Of the patients who undergo radical prostatectomy (RP) for the treatment of clinically localizedprostate carcinoma, 25–40% will experience disease recurrence, manifested initially as anincreasing level of prostate-specific antigen (PSA).1,2 An estimated 65% of these men willdevelop clinical metastases within 10 years in the absence of salvage therapy.3 There iscurrently no evidence that patients who develop metastatic prostate carcinoma can be curedwith existing systemic therapies. However, adjuvant systemic or local therapy after RP maypotentially benefit patients at risk for meta-static disease progression.
Rational application of adjuvant therapy requires accurate risk stratification models for diseaserecurrence. Several models have been developed based on pathologic stage, tumor grade, andPSA level to predict biochemical recurrence after RP.4–6 A postoperative nomogram wasdeveloped on 996 men treated by RP at Baylor College of Medicine (Houston, TX) between1983 and 1997.4 It predicts the 7-year disease progression-free probability (PFP) after RP (ona continuous scale from 1% to 99%) based on serum PSA level, Gleason grade, margin status,and pathologic stage and was validated on an international cohort of 2465 patients with aconcordance index (c-index) of 0.8.7 Although the nomogram is well calibrated anddiscriminating, the anticipated outcome for patients with predictions in the middle range (7-year PFP, 30–70%) is uncertain as the prediction is no more accurate than a coin toss.Furthermore, the c-index of the nomogram (0.8) indicates that it performs slightly better thanmid-way between a model with perfect discrimination (1.0) and one with no discriminatingability (0.5).
Molecular markers offer an alternative means to determine tumor aggressiveness and mayenhance the ability to predict biochemical recurrence. Several biomarkers have beendemonstrated to be statistically significant predictors of prostate carcinoma progression inmultivariable models that have included standard clinicopathologic variables.8–11 However,no biomarker has yet been shown to outperform or enhance the predictive accuracy of validatedprognostic models based on clinical variables.
High-throughput gene expression profiling of prostate carcinoma has the potential to identifyprognostic genes in an unbiased manner and several studies have identified profiles associatedwith a neoplastic and metastatic phenotype.8,12–16 We used oligonucleotide microarrays toidentify expression profiles of prostate carcinoma associated with disease recurrence after RPand to determine if these molecular signatures can improve the accuracy of outcome prediction.
MATERIALS AND METHODSTissue Samples
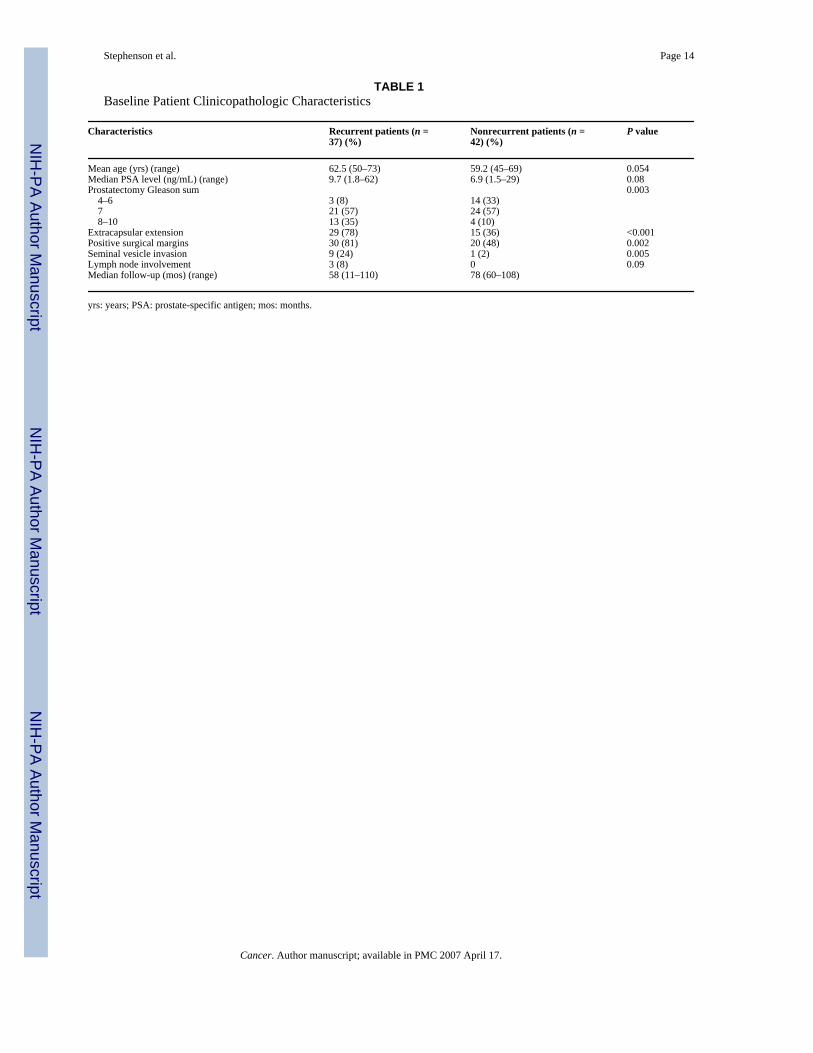
Tissue samples were obtained from 79 patients with clinically localized prostate carcinomatreated by RP alone at Memorial Sloan-Kettering Cancer Center (MSKCC; New York, NY)between 1993 and 1999 (Table 1). Thirty-seven tissue samples from patients with 3 consecutivePSA increases > 0.1 ng/mL were classified as recurrent disease. Two of these patients havesubsequently died of prostate carcinoma, 4 others developed clinical metastases, 4 progressedafter salvage radiotherapy, 3 received long-term androgen-deprivation therapy, and 13 had apostrecurrence PSA doubling time < 10 months. Forty-two tissue samples from patients withan undetectable PSA level for ≥ 5 years (range, 60–108 months) were classified as non-
Stephenson et al. Page 2
Cancer. Author manuscript; available in PMC 2007 April 17.
NIH
-PA Author Manuscript
NIH
-PA Author Manuscript
NIH
-PA Author Manuscript
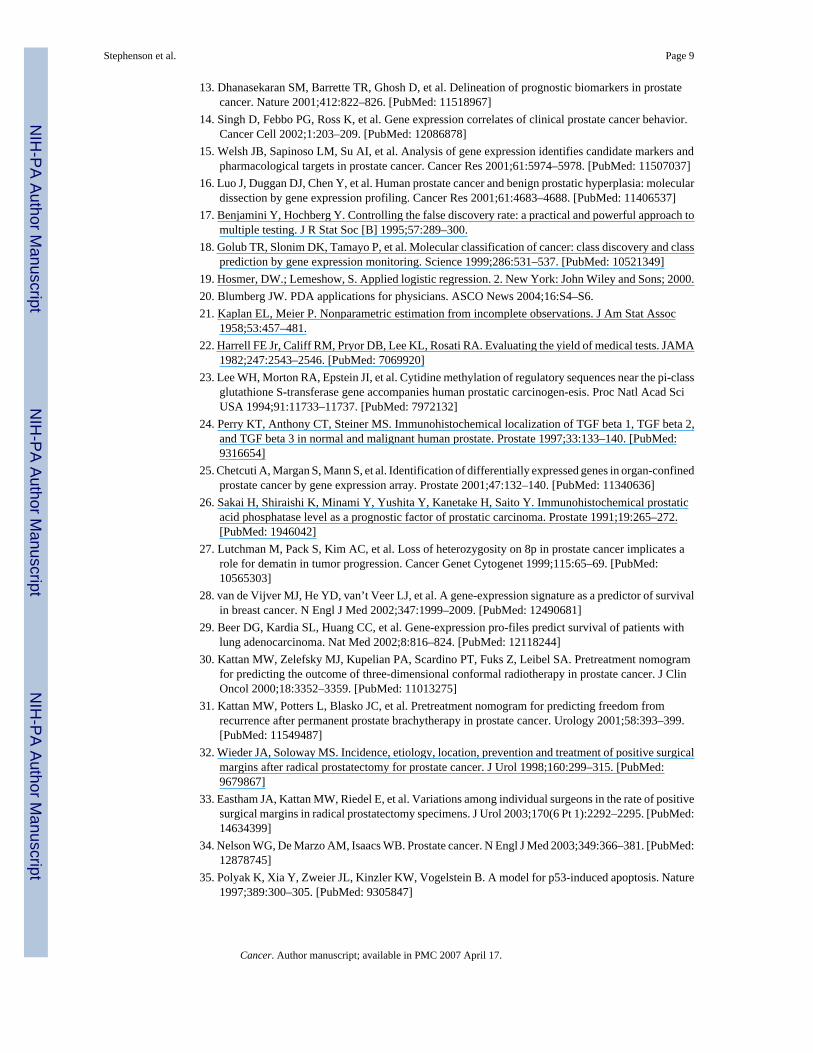
recurrent controls. As determined by the range of postoperative nomogram predictions, thepatients in our cohort represented a broad spectrum of disease severity (Fig. 1).
Tissue samples were snap frozen in liquid nitrogen and stored at −80 °C. Each tissue samplewas examined histologically using hematoxylin and eosin-stained cryostat sections. The frozenblocks were manually dissected, trimming away unwanted tissue sections to ensure thatsamples were enriched for neoplastic epithelium with minimal contamination from benignepithelial and stromal elements. All studies were performed under institutional review board-approved protocols.
Gene Expression AnalysisRNA extraction, RNA target synthesis, and sample labeling were performed as previouslydescribed.12 Gene expression analysis was carried out using the Affymetrix U133A humangene array, which has 22,283 features for individual gene/expressed sequence tag (EST)clusters, using instruments and protocols recommended by the manufacturer. For each geneon every tissue sample, we extracted 2 response measures, the average difference and absolutecall, as determined by the default settings of Affymetrix Microarray Suite 5.0. Expressionvalues on each array were multiplicatively scaled to have an average expression of 500 acrossthe central 96% of all genes on the array. Supervised analysis was performed to identify geneexpression differences between recurrent and nonrecurrent prostate carcinoma by consideringdifferential expression and fold change for each gene. Differential expression was evaluatedby calculating the 2-sample t statistic between the disease recurrent and nonrecurrent tissuesamples (after log2 transformation of expression values) and the P value was subsequentlycorrected for a false discovery rate of 0.05 (adjusted P value).17
Outcome Prediction Model Based on Gene Expression ProfilingTo predict biochemical recurrence using molecular profiling, logistic regression models weredeveloped. Although Cox proportional hazards regression is more appropriate to use withcensored data, logistic regression is preferable in our study, which is a two-class problem.Cases and controls were selected with respect to their clinical follow-up.
Logistic regression models were developed and internally validated using leave-one-out cross-validation (LOOCV).18 In LOOCV, each of the 79 tissue samples served as an independenttest case and 79 unique models were developed. At each iteration of the LOOCV, prognosticgenes were selected for inclusion in the model based on their association with recurrent prostatecarcinoma among the 78 tissue samples in the training set only and the performance of eachmodel was assessed when it was applied to the “left-out” sample that was withheld from allphases of the model development.
Within the training set of each iteration of the LOOCV, a step-wise logistic procedure wasused to incorporate gene variables into the model, a penalization term (the Akaike InformationCriteria) was used to reduce “overfit,” and the addition of new genes to the model ceased whenoptimal classification was achieved within the training set.19 Genes selected for these modelshad to pass a 3-part filter that included a significant expression difference between the 2 classes(uncorrected P < 0.001), a fold change > 1.3, and a “present” call in > 80% of the tissue samplesin either class. To reduce the potential for bias in the selection of genes, the filter was appliedusing only the 78 tissue samples within each training set. The gene filter was used to ensurethat classifying genes were sufficiently associated with disease recurrence and that theirexpression levels would be reproduced in independent sample sets. This modeling method isdepicted graphically in Figure 2.
Stephenson et al. Page 3
Cancer. Author manuscript; available in PMC 2007 April 17.
NIH
-PA Author Manuscript
NIH
-PA Author Manuscript
NIH
-PA Author Manuscript
Two logistic regression modeling approaches were used to predict biochemical recurrence.One approach was based exclusively on gene expression differences between the tumor classes(gene models). A second approach combined the prognostic information of clinical variablesand genes associated with disease recurrence (combined models). For the clinical informationincluded in these models, the prediction of the postoperative nomogram was chosen given thatit has been extensively validated and is currently the most widely used, disease-specific Palmsoftware (palmOne; Milpitas, CA) prediction tool in oncology.4,20 The nomogram was chosenwithout a priori knowledge of its performance within our sample set. The logit transformationof the patient’s 7-year PFP calculated from the nomogram was imposed as the first variable inthe stepwise logistic regression procedure of the combined models and gene variables wereadded until optimal classification was achieved within the training set. The performance ofmodels developed using this combined approach was assessed by LOOCV.
PFP was estimated for each left-out sample classified as recurrent and nonrecurrent by eachof the models using the Kaplan–Meier method.21 The ability of the models to discriminateamong patients was quantified by measuring the c-index which can range from 0.5 (nodiscrimination) to 1.0 (perfectly discriminating).22 The predictive accuracy of the models wascompared using a Z test based on the difference in the c-index and the standard error of thedifference.
We attempted to obtain equal numbers of recurrent and nonrecurrent tumors to identify geneexpression differences between the two classes. As such, our cohort is not a random samplingof the 1227 patients treated by RP during this time period at MSKCC. The 5-year PFP for allpatients treated at MSKCC between 1993 and 1999 was 88% (95% confidence interval [CI],87–90%) compared with 59% (95% CI, 49–70%) for the 79 patients in the current study.Correcting this sampling bias amounts to adjusting the constant term in the logistic regressionmodel. The predictions were based on the adjusted model.
RESULTSGene Expression Analysis
Comparison of gene expression between recurrent and nonrecurrent tumors revealed 153 probesets that exhibited significant expression differences (adjusted P < 0.05). Fifty-seven of thesegenes were overexpressed in recurrent tumors. An association with prostate carcinoma hasbeen identified for several of these genes, including glutathione S-transferase classes pi(GSTP1) and M1 (GSTM1), erythrocyte membrane protein band 4.9 (EPB49), FAT tumorsuppressor homolog 1 (FAT), transforming growth factor, beta 3 (TGFB3), and prostatic acidphosphatase (ACPP),13,23–27 but the majority have not been implicated in prostatecarcinoma.
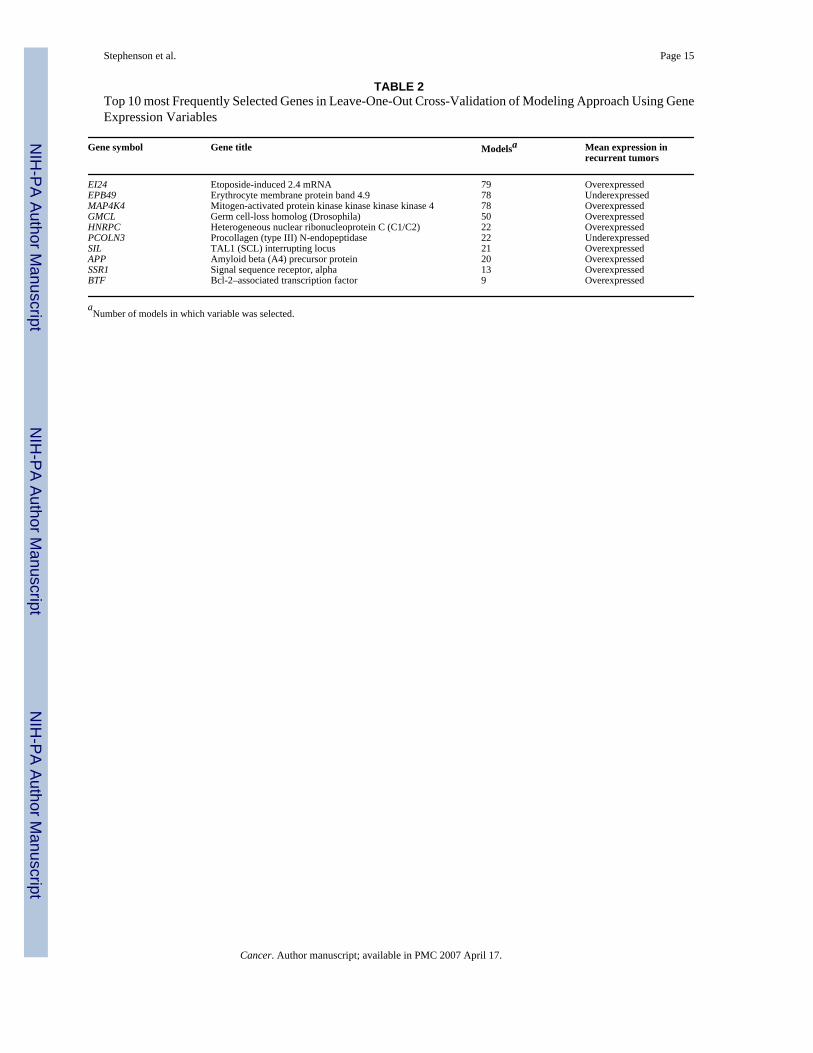
Gene Expression-Based Predictive Model DevelopmentA logistic regression modeling approach based solely on gene expression differences betweenthe two classes was used to predict biochemical recurrence. In LOOCV, a 5, 6, 7, and 8-genemodel was developed in 2, 64, 12, and 1 case(s), respectively, and 46 different genes wereselected. Etoposide-induced 2.4 mRNA (EI24) was chosen as the first variable in all models,EBP49 and mitogen-activated protein kinase kinase kinase kinase 4 (MAP4K4) were selectedas the second and third variables in 99% of the models, and heterogeneous nuclearribonucleoprotein C (C1/C2) (HNRPC) was the fourth variable selected in 28% of the models(Table 2). EI24 and MAP4K4 were the most highly overexpressed genes and EPB49 was themost highly underexpressed gene in recurrent tumors (based on adjusted P values).
Stephenson et al. Page 4
Cancer. Author manuscript; available in PMC 2007 April 17.
NIH
-PA Author Manuscript
NIH
-PA Author Manuscript
NIH
-PA Author Manuscript
In LOOCV, 59 tissue samples (75%) were correctly classified by the gene expression modelingapproach, including 33 nonrecurrent and 26 recurrent tumors. The 5-year PFPs for patientsclassified as disease recurrent and nonrecurrent by the gene models in LOOCV were 37% (95%CI, 21–53%) and 77% (95% CI, 65–90%), respectively (P < 0.001) (Fig. 3A). However, thec-index of the gene models was inferior to the nomogram (0.75 vs. 0.84, P = 0.01). Thelikelihood of achieving 75% classification accuracy in LOOCV by chance using gene variablesalone was evaluated by calculating the classification rate derived from a LOOCV approachwhereby the class labels (disease recurrence and nonrecurrence designation) were randomlypermuted among all 79 patients. The median classification accuracy of the LOOCV modelingapproaches derived from 20 random permutations was 53% (range, 45–61%). Thus, theclassification accuracy of our model based on gene expression variables is unlikely due torandom variation between tissue samples.
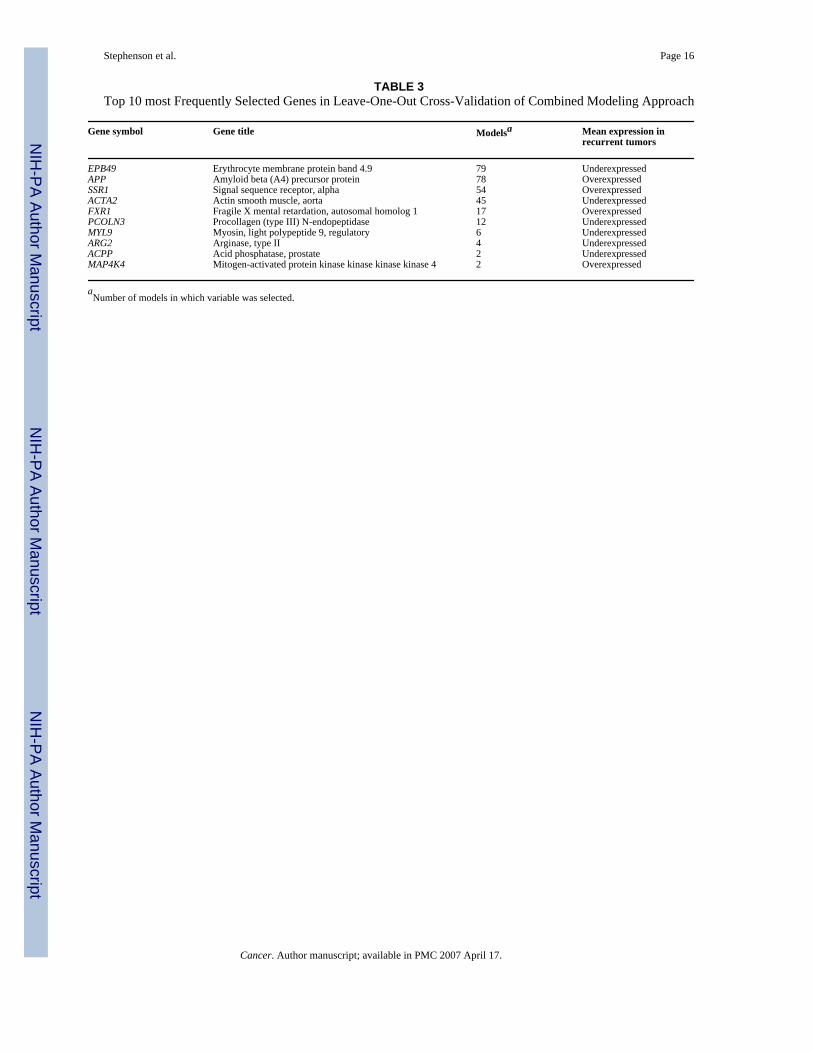
Combined Model for Outcome PredictionAlthough the predictive accuracy of the gene models was inferior to the nomogram, thisapproach accurately predicted outcomes in a subset of patients that was misclassified by thenomogram, suggesting that the models were behaving in a complementary manner. In thecombined models, the nomogram prediction was the first variable and then 3, 4, and 5 geneswere selected in LOOCV in 2, 75, and 2 cases, respectively. A total of 24 different genes wereselected for these 79 combined models and 13 (54%) were also used in the gene models. It isnoteworthy that EI24 was not selected in any of the combined models. EPB49 and APP wereselected as the first and second genes in 96% of the models and signal sequence receptor, alpha(SSR1) was the third gene in 66% of the models (Table 3).
In LOOCV, 70 tissue samples (89%) were correctly classified using the combined modelingapproach, including 38 nonrecurrent and 32 recurrent tumors. For patients classified as diseaserecurrent and nonrecurrent by the combined models in LOOCV, the observed 5-year PFPswere 25% (95% CI, 11–39%) and 88% (95% CI, 79–98%), respectively (P < 0.001) (Fig. 3B).The c-index of models developed using the combined model (0.89) was significantly betterthan the nomogram (P = 0.009) and the modeling approach using gene variables alone (P <0.001).
It is important to note that the improved classification accuracy of the combined modelingapproach was particularly evident for the 27 patients with nomogram predictions in theindeterminate range (7-year PFP, 30–70%). Overall, 23 patients (85%) were correctlyclassified by the combined models in LOOCV, i.e., all 10 nonrecurrent patients and 13 of 17disease recurrent patients. The c-index of the combined modeling approach for this subset ofpatients was markedly better than the nomogram (c-index 0.83 vs. 0.59, P = 0.01). Theimprovement in classification accuracy for this subset using the combined modeling approachis not solely driven by the contribution of gene variables as the c-index by the modelingapproach using gene variables alone for these patients was 0.77. Thus, there is a substantialbenefit to combining gene expression variables with the nomogram to enhance the accuracyof outcome prediction for patients within this range.
DISCUSSIONGene expression profiling using oligonucleotide microarrays enables a genome-wide analysisof transcriptional profiles that are associated with specific clinical phenotypes of humanmalignancies. Several recent studies have identified gene expression profiles that discriminatebetween benign prostate epithelium and prostate carcinoma, Gleason grade, as well as primaryand metastatic prostate carcinoma.8,12,13,15,16 High-throughput techniques such asoligonucleotide microarrays are potentially powerful tools to identify, in a relatively unbiasedmanner, molecular signatures associated with progressive prostate carcinoma after definitive
Stephenson et al. Page 5
Cancer. Author manuscript; available in PMC 2007 April 17.
NIH
-PA Author Manuscript
NIH
-PA Author Manuscript
NIH
-PA Author Manuscript
local therapy. These prognostic molecular signatures may more accurately reflect tumorbiology than clinicopathologic parameters and may enhance the ability to predict the outcomeof patients treated by RP. However, few studies have analyzed gene expression profiles amongprimary tumors associated with prostate carcinoma progression.14 In a gene expressionanalysis of primary tumors, we used molecular signatures of 5–8 genes associated withrecurrent prostate carcinoma and accurately predicted disease recurrence in 75% of tissuesamples using this approach. However, the predictive accuracy of the gene models was inferiorto a validated model based on standard variables currently used in clinical practice. Predictiveaccuracy was significantly enhanced when prognostic genes identified by molecular profilingwere combined with the postoperative nomogram prediction. Validation of these modelingapproaches in an independent expression data set is required to evaluate their potential clinicalapplicability. This novel approach of integrating clinical and molecular variables to predictcancer progression, however, may provide a new paradigm for the use of expression profilingto predict clinical outcome for all malignancies.
To identify prognostic genes for incorporation into our gene and combined models, the LOOCVprocedure was used. The LOOCV reduces the likelihood of developing an overly optimisticpredictive model (i.e., overfitted to the tissue samples within our cohort) by selecting genesassociated with disease recurrence only within the 78 tissue samples of the training set. Thevalidation set consists of one tissue sample that is excluded at each step of model development.Although the LOOCV procedure likely represents the optimal use of the data given therelatively small sample in our study, it is no substitute for external validation on an independentsample set. Independent validation of these models is required to more accurately assess theirperformance relative to the nomogram and to determine if they are suitable for incorporationinto clinical practice. However, due to the difficulty in obtaining sufficient quantities ofcancerous tissue from frozen prostatectomy specimens and the long-term follow-up requiredto determine recurrent cases, it is difficult to obtain an appropriate validation set of sufficientsize and with sufficient clinical follow-up. To our knowledge, there are no publicly availableprostate carcinoma gene expression data sets with the required size, clinical information, andfollow-up for independent testing.
We identified 153 genes that exhibited significant expression differences between recurrentand nonrecurrent primary tumors. These expression differences are relatively few comparedwith the results of our previous analysis of nonrecurrent primary and meta-static tumor samples.12 In a recent study, Singh et al.14 were unable to identify any genes that exhibited significantdifferential expression between recurrent and nonrecurrent tumors, although their sample wasconsiderably smaller than the sample in the current study.14
We used the differences in gene expression between the two classes to develop models thatpredict disease recurrence after RP with 75% accuracy in LOOCV. A final model willeventually be tested on an independent validation set. However, that EI24, EPB49, andMAP4K4 were chosen as the first 3 variables in 78 of 79 models suggests that the final modelmay have similar classification accuracy when applied to a validation set. It is noteworthy that3 of the 4 most commonly selected genes in these models (EI24, MAP4K4, HNRPC) have notbeen previously implicated in prostate carcinoma, whereas EPB49 may have a role as a tumorsuppressor gene in prostate carcinoma.27 Singh et al.14 developed a similar model for diseaserecurrence after RP using a supervised machine learning algorithm based on 5 genes thatclassified 19 of 21 tissue samples (90%) correctly in LOOCV. Although this model performedwell relative to clinical variables, it was not compared with a validated multivariable modelsuch as the nomogram. Nonetheless, these two examples illustrate that prostate carcinoma canbe accurately classified with respect to outcome based exclusively on gene expressiondifferences.
Stephenson et al. Page 6
Cancer. Author manuscript; available in PMC 2007 April 17.
NIH
-PA Author Manuscript
NIH
-PA Author Manuscript
NIH
-PA Author Manuscript
Recently, outcome prediction models have been developed for breast and lung carcinoma usingmolecular profiling and have been shown to perform well, independent of clinical variables.28,29 These molecular models are promising for integration into clinical practice as accurateclinical models for these cancers are lacking. Fortunately, accurate prediction models basedon standard variables exist for prostate carcinoma recurrence after RP, external-beamradiotherapy, and brachytherapy.4,30,31 As we observed with our modeling approach usinggene expression differences alone, outcome prediction based on molecular profiling may notsignificantly improve on models that are based on the optimal combination of clinical variables.Although we were able to predict outcome at a high level of accuracy using molecular profiling,this approach did not generate models that outperformed the nomogram.
To our knowledge, no previous study has attempted to integrate prognostic genes identified bymolecular profiling with validated models based on clinical variables. The diverse informationof clinical and molecular variables is likely to provide a broader assessment of factors that areassociated with cancer progression. Based on LOOCV, the predictive accuracy of the combinedmodeling approach, measured by the c-index (0.89), was superior to the postoperativenomogram (0.84) and the approach using gene variables alone (0.75). This suggests that modelsincorporating both clinical variables and gene expression information provide greaterpredictive accuracy than models based on either set of variables alone.
Overall, the integration of gene expression profiling and clinical variables produced a modelthat had a significant but modest improvement in predictive accuracy over the nomogram.However, a substantial improvement in the classification of patients whose nomogrampredictions were in the middle range (7-year PFP, 30–70%) was achieved with the combinedmodeling approach. The combined models accurately classified 85% of these patients (c-index0.85) and performed significantly better than the nomogram (c-index 0.59). The nomogram isuseful for discriminating among patients at the extremes of predictions, but the anticipatedoutcome is indeterminate for patients whose probability of disease recurrence is in this middlerange. A potential clinical application of a combined model is to distinguish disease recurrentfrom nonrecurrent patients when the nomogram prediction is in this middle range, whichrepresents approximately 30% of patients who undergo RP for clinically localized prostatecarcinoma.
Pending the independent validation of a final combined model, the approach we have taken tointegrate gene expression information with clinical variables may provide a new paradigm forthe use of molecular profiling to predict clinical outcome for all malignancies. For prostatecarcinoma, we believe that the optimal predictive model must be based, in part, on clinicalvariables. A patient’s prognosis after RP is dependent on technical factors in addition to theinherent biologic properties of his cancer (reflected by serum PSA level, Gleason grade, andpathologic stage). Surgical margins have been reported to be positive in 5–53% of patients andincrease the risk of disease recurrence by up to 4-fold in multivariable analysis. Margin statusis included in the postoperative nomogram.1,2,4,32 The risk of positive surgical margins inprostatectomy specimens is associated with the clinical features of prostate carcinoma as wellas the technique used by individual surgeons.33 The prognostic information of molecularprofiling may reflect the biologic potential of prostate carcinoma better than tumor grade, stage,and PSA level, but it does not capture the prognostic importance of technical factors.
Few of the genes that exhibited significant differences in expression in our microarray analysisof recurrent and nonrecurrent primary tumors have been previously implicated in prostatecarcinoma. Nonetheless, their proposed functional properties are intriguing. Accumulatingevidence suggests that oxidative genomic DNA damage is responsible for the molecular eventsthat lead to the development and progression of prostate carcinoma.34 GSTP1 and GSTM1 areimportant carcinogen detoxification enzymes and both were significantly underexpressed in
Stephenson et al. Page 7
Cancer. Author manuscript; available in PMC 2007 April 17.
NIH
-PA Author Manuscript
NIH
-PA Author Manuscript
NIH
-PA Author Manuscript
our recurrent tumor specimens. EI24, the most highly overexpressed gene in recurrent tumors,is believed to be a direct target of TP53 transcriptional activation and is responsible for theformation of reactive oxygen species leading to apoptosis.35,36 Uncoordinated activity ofEI24 may be a potential mechanism contributing to genomic instability and prostate carcinomaprogression via oxidative DNA damage or it may be a sign of uncoordinated apoptoticpathways that have been described in a number of malignancies.37 EPB49, the most highlyunderexpressed gene in recurrent tumors, was the most frequently selected gene in thecombined models. The EPB49 gene has been localized to chromosome 8p21.1 (a regionfrequently deleted in prostate carcinoma) and is an actin-binding/bundling protein involved inthe regulation of cell shape.27 MAP4K4 was the second most highly overexpressed gene inour recurrent tumor specimens. MAP4K4 is overexpressed in tumor cell lines and may be anupstream activator of the c-jun N-terminal kinase pathway responsible for activation of severaltranscription factors.38 These initial observations deserve further investigation to clarify thepotential roles of these genes in prostate carcinoma progression.
Acknowledgements
The authors thank Lishi Chen, Sandra Levcovici, Muzaffar Akram, Faye Taylor, Michelle Pappas, Paul Fearn, Hee-Song Seo, and members of the Pathology and Genomics Core Facilities for technical and database assistance.
References1. Hull GW, Rabbani F, Abbas F, Wheeler TM, Kattan MW, Scardino PT. Cancer control with radical
prostatectomy alone in 1,000 consecutive patients. J Urol 2002;167(2 Pt 1):528–534. [PubMed:11792912]
2. Han M, Partin AW, Pound CR, Epstein JI, Walsh PC. Long-term biochemical disease-free and cancer-specific survival following anatomic radical retropubic prostatectomy. The 15-year Johns Hopkinsexperience. Urol Clin North Am 2001;28:555–565. [PubMed: 11590814]
3. Pound CR, Partin AW, Eisenberger MA, Chan DW, Pearson JD, Walsh PC. Natural history ofprogression after PSA elevation following radical prostatectomy. JAMA 1999;281:1591–1597.[PubMed: 10235151]
4. Kattan MW, Wheeler TM, Scardino PT. Postoperative nomogram for disease recurrence after radicalprostatectomy for prostate cancer. J Clin Oncol 1999;17:1499–1507. [PubMed: 10334537]
5. Blute ML, Bergstralh EJ, Iocca A, Scherer B, Zincke H. Use of Gleason score, prostate specific antigen,seminal vesicle and margin status to predict biochemical failure after radical prostatectomy. J Urol2001;165:119–125. [PubMed: 11125379]
6. Partin AW, Piantadosi S, Sanda MG, et al. Selection of men at high risk for disease recurrence forexperimental adjuvant therapy following radical prostatectomy. Urology 1995;45:831–838. [PubMed:7538245]
7. Graefen M, Karakiewicz PI, Cagiannos I, et al. Validation study of the accuracy of a postoperativenomogram for recurrence after radical prostatectomy for localized prostate cancer. J Clin Oncol2002;20:951–956. [PubMed: 11844816]
8. Varambally S, Dhanasekaran SM, Zhou M, et al. The poly-comb group protein EZH2 is involved inprogression of prostate cancer. Nature 2002;419:624–629. [PubMed: 12374981]
9. Yang G, Truong LD, Wheeler TM, Thompson TC. Caveolin-1 expression in clinically confined humanprostate cancer: a novel prognostic marker. Cancer Res 1999;59:5719–5723. [PubMed: 10582690]
10. Rhodes DR, Sanda MG, Otte AP, Chinnaiyan AM, Rubin MA. Multiplex biomarker approach fordetermining risk of prostate-specific antigen-defined recurrence of prostate cancer. J Natl CancerInst 2003;95:661–668. [PubMed: 12734317]
11. Cote RJ, Shi Y, Groshen S, et al. Association of p27Kip1 levels with recurrence and survival inpatients with stage C prostate carcinoma. J Natl Cancer Inst 1998;90:916–920. [PubMed: 9637141]
12. LaTulippe E, Satagopan J, Smith A, et al. Comprehensive gene expression analysis of prostate cancerreveals distinct transcriptional programs associated with metastatic disease. Cancer Res2002;62:4499–4506. [PubMed: 12154061]
Stephenson et al. Page 8
Cancer. Author manuscript; available in PMC 2007 April 17.
NIH
-PA Author Manuscript
NIH
-PA Author Manuscript
NIH
-PA Author Manuscript
13. Dhanasekaran SM, Barrette TR, Ghosh D, et al. Delineation of prognostic biomarkers in prostatecancer. Nature 2001;412:822–826. [PubMed: 11518967]
14. Singh D, Febbo PG, Ross K, et al. Gene expression correlates of clinical prostate cancer behavior.Cancer Cell 2002;1:203–209. [PubMed: 12086878]
15. Welsh JB, Sapinoso LM, Su AI, et al. Analysis of gene expression identifies candidate markers andpharmacological targets in prostate cancer. Cancer Res 2001;61:5974–5978. [PubMed: 11507037]
16. Luo J, Duggan DJ, Chen Y, et al. Human prostate cancer and benign prostatic hyperplasia: moleculardissection by gene expression profiling. Cancer Res 2001;61:4683–4688. [PubMed: 11406537]
17. Benjamini Y, Hochberg Y. Controlling the false discovery rate: a practical and powerful approach tomultiple testing. J R Stat Soc [B] 1995;57:289–300.
18. Golub TR, Slonim DK, Tamayo P, et al. Molecular classification of cancer: class discovery and classprediction by gene expression monitoring. Science 1999;286:531–537. [PubMed: 10521349]
19. Hosmer, DW.; Lemeshow, S. Applied logistic regression. 2. New York: John Wiley and Sons; 2000.20. Blumberg JW. PDA applications for physicians. ASCO News 2004;16:S4–S6.21. Kaplan EL, Meier P. Nonparametric estimation from incomplete observations. J Am Stat Assoc
1958;53:457–481.22. Harrell FE Jr, Califf RM, Pryor DB, Lee KL, Rosati RA. Evaluating the yield of medical tests. JAMA
1982;247:2543–2546. [PubMed: 7069920]23. Lee WH, Morton RA, Epstein JI, et al. Cytidine methylation of regulatory sequences near the pi-class
glutathione S-transferase gene accompanies human prostatic carcinogen-esis. Proc Natl Acad SciUSA 1994;91:11733–11737. [PubMed: 7972132]
24. Perry KT, Anthony CT, Steiner MS. Immunohistochemical localization of TGF beta 1, TGF beta 2,and TGF beta 3 in normal and malignant human prostate. Prostate 1997;33:133–140. [PubMed:9316654]
25. Chetcuti A, Margan S, Mann S, et al. Identification of differentially expressed genes in organ-confinedprostate cancer by gene expression array. Prostate 2001;47:132–140. [PubMed: 11340636]
26. Sakai H, Shiraishi K, Minami Y, Yushita Y, Kanetake H, Saito Y. Immunohistochemical prostaticacid phosphatase level as a prognostic factor of prostatic carcinoma. Prostate 1991;19:265–272.[PubMed: 1946042]
27. Lutchman M, Pack S, Kim AC, et al. Loss of heterozygosity on 8p in prostate cancer implicates arole for dematin in tumor progression. Cancer Genet Cytogenet 1999;115:65–69. [PubMed:10565303]
28. van de Vijver MJ, He YD, van’t Veer LJ, et al. A gene-expression signature as a predictor of survivalin breast cancer. N Engl J Med 2002;347:1999–2009. [PubMed: 12490681]
29. Beer DG, Kardia SL, Huang CC, et al. Gene-expression pro-files predict survival of patients withlung adenocarcinoma. Nat Med 2002;8:816–824. [PubMed: 12118244]
30. Kattan MW, Zelefsky MJ, Kupelian PA, Scardino PT, Fuks Z, Leibel SA. Pretreatment nomogramfor predicting the outcome of three-dimensional conformal radiotherapy in prostate cancer. J ClinOncol 2000;18:3352–3359. [PubMed: 11013275]
31. Kattan MW, Potters L, Blasko JC, et al. Pretreatment nomogram for predicting freedom fromrecurrence after permanent prostate brachytherapy in prostate cancer. Urology 2001;58:393–399.[PubMed: 11549487]
32. Wieder JA, Soloway MS. Incidence, etiology, location, prevention and treatment of positive surgicalmargins after radical prostatectomy for prostate cancer. J Urol 1998;160:299–315. [PubMed:9679867]
33. Eastham JA, Kattan MW, Riedel E, et al. Variations among individual surgeons in the rate of positivesurgical margins in radical prostatectomy specimens. J Urol 2003;170(6 Pt 1):2292–2295. [PubMed:14634399]
34. Nelson WG, De Marzo AM, Isaacs WB. Prostate cancer. N Engl J Med 2003;349:366–381. [PubMed:12878745]
35. Polyak K, Xia Y, Zweier JL, Kinzler KW, Vogelstein B. A model for p53-induced apoptosis. Nature1997;389:300–305. [PubMed: 9305847]
Stephenson et al. Page 9
Cancer. Author manuscript; available in PMC 2007 April 17.
NIH
-PA Author Manuscript
NIH
-PA Author Manuscript
NIH
-PA Author Manuscript

36. Gu Z, Flemington C, Chittenden T, Zambetti GP. ei24, a p53 response gene involved in growthsuppression and apoptosis. Mol Cell Biol 2000;20:233–241. [PubMed: 10594026]
37. Kaufmann SH, Vaux DL. Alterations in the apoptotic machinery and their potential role in anticancerdrug resistance. Oncogene 2003;22:7414–7430. [PubMed: 14576849]
38. Wright JH, Wang X, Manning G, et al. The STE20 kinase HGK is broadly expressed in human tumorcells and can modulate cellular transformation, invasion, and adhesion. Mol Cell Biol 2003;23:2068–2082. [PubMed: 12612079]
Stephenson et al. Page 10
Cancer. Author manuscript; available in PMC 2007 April 17.
NIH
-PA Author Manuscript
NIH
-PA Author Manuscript
NIH
-PA Author Manuscript
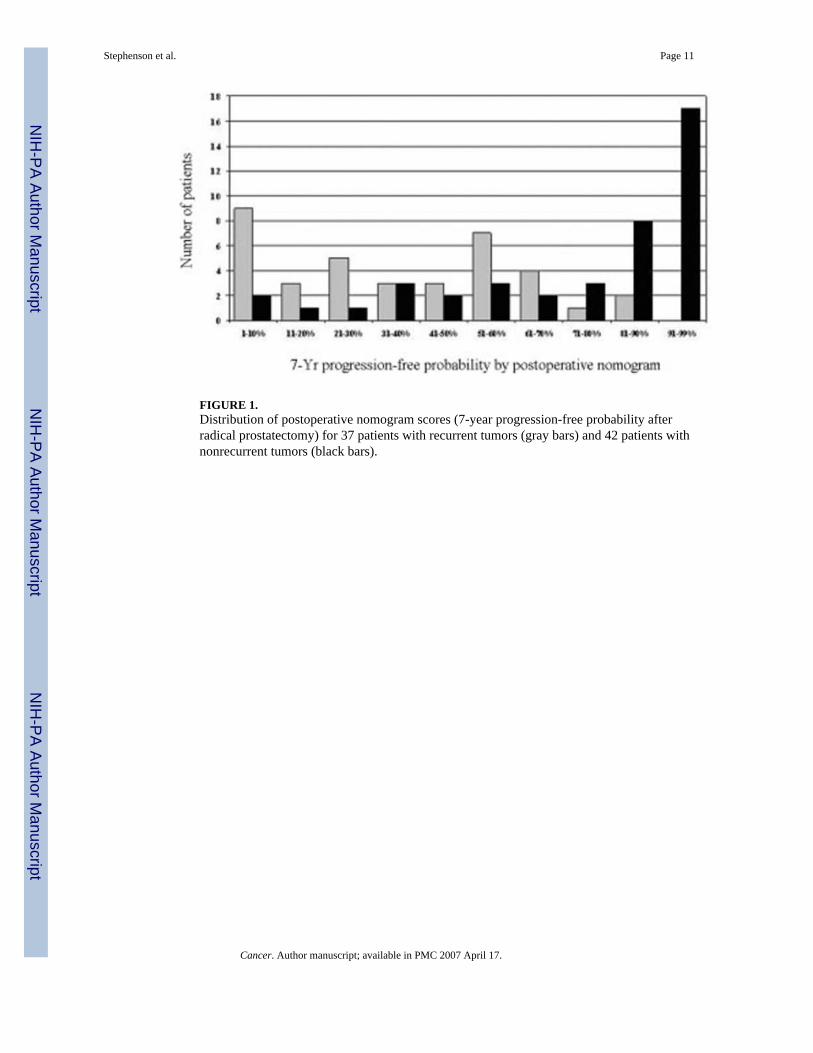
FIGURE 1.Distribution of postoperative nomogram scores (7-year progression-free probability afterradical prostatectomy) for 37 patients with recurrent tumors (gray bars) and 42 patients withnonrecurrent tumors (black bars).
Stephenson et al. Page 11
Cancer. Author manuscript; available in PMC 2007 April 17.
NIH
-PA Author Manuscript
NIH
-PA Author Manuscript
NIH
-PA Author Manuscript
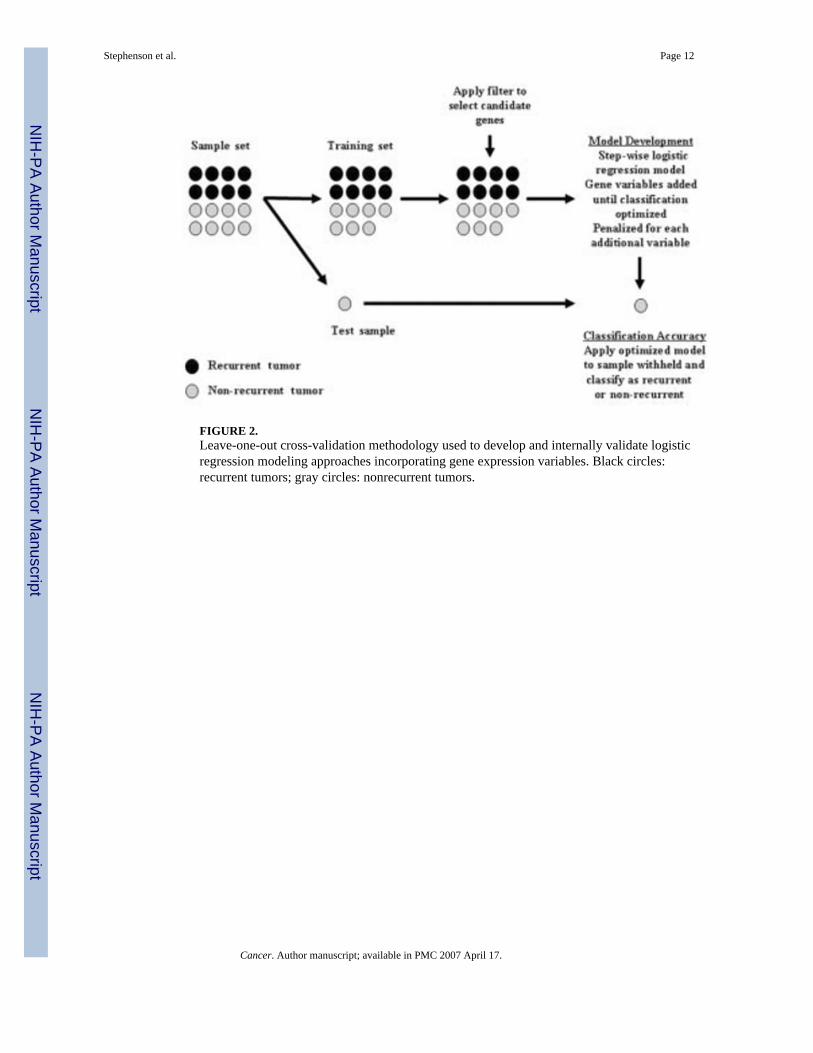
FIGURE 2.Leave-one-out cross-validation methodology used to develop and internally validate logisticregression modeling approaches incorporating gene expression variables. Black circles:recurrent tumors; gray circles: nonrecurrent tumors.
Stephenson et al. Page 12
Cancer. Author manuscript; available in PMC 2007 April 17.
NIH
-PA Author Manuscript
NIH
-PA Author Manuscript
NIH
-PA Author Manuscript
FIGURE 3.Kaplan–Meier estimates of the probability of disease recurrence for patients classified asnonrecurrent and recurrent by gene expression model (A) and combined model (B).
Stephenson et al. Page 13
Cancer. Author manuscript; available in PMC 2007 April 17.
NIH
-PA Author Manuscript
NIH
-PA Author Manuscript
NIH
-PA Author Manuscript
NIH
-PA Author Manuscript
NIH
-PA Author Manuscript
NIH
-PA Author Manuscript
Stephenson et al. Page 14
TABLE 1Baseline Patient Clinicopathologic Characteristics
Characteristics Recurrent patients (n =37) (%)
Nonrecurrent patients (n =42) (%)
P value
Mean age (yrs) (range) 62.5 (50–73) 59.2 (45–69) 0.054Median PSA level (ng/mL) (range) 9.7 (1.8–62) 6.9 (1.5–29) 0.08Prostatectomy Gleason sum 0.003 4–6 3 (8) 14 (33) 7 21 (57) 24 (57) 8–10 13 (35) 4 (10)Extracapsular extension 29 (78) 15 (36) <0.001Positive surgical margins 30 (81) 20 (48) 0.002Seminal vesicle invasion 9 (24) 1 (2) 0.005Lymph node involvement 3 (8) 0 0.09Median follow-up (mos) (range) 58 (11–110) 78 (60–108)
yrs: years; PSA: prostate-specific antigen; mos: months.
Cancer. Author manuscript; available in PMC 2007 April 17.
NIH
-PA Author Manuscript
NIH
-PA Author Manuscript
NIH
-PA Author Manuscript
Stephenson et al. Page 15
TABLE 2Top 10 most Frequently Selected Genes in Leave-One-Out Cross-Validation of Modeling Approach Using GeneExpression Variables
Gene symbol Gene title Modelsa Mean expression inrecurrent tumors
EI24 Etoposide-induced 2.4 mRNA 79 OverexpressedEPB49 Erythrocyte membrane protein band 4.9 78 UnderexpressedMAP4K4 Mitogen-activated protein kinase kinase kinase kinase 4 78 OverexpressedGMCL Germ cell-loss homolog (Drosophila) 50 OverexpressedHNRPC Heterogeneous nuclear ribonucleoprotein C (C1/C2) 22 OverexpressedPCOLN3 Procollagen (type III) N-endopeptidase 22 UnderexpressedSIL TAL1 (SCL) interrupting locus 21 OverexpressedAPP Amyloid beta (A4) precursor protein 20 OverexpressedSSR1 Signal sequence receptor, alpha 13 OverexpressedBTF Bcl-2–associated transcription factor 9 Overexpressed
aNumber of models in which variable was selected.
Cancer. Author manuscript; available in PMC 2007 April 17.
NIH
-PA Author Manuscript
NIH
-PA Author Manuscript
NIH
-PA Author Manuscript
Stephenson et al. Page 16
TABLE 3Top 10 most Frequently Selected Genes in Leave-One-Out Cross-Validation of Combined Modeling Approach
Gene symbol Gene title Modelsa Mean expression inrecurrent tumors
EPB49 Erythrocyte membrane protein band 4.9 79 UnderexpressedAPP Amyloid beta (A4) precursor protein 78 OverexpressedSSR1 Signal sequence receptor, alpha 54 OverexpressedACTA2 Actin smooth muscle, aorta 45 UnderexpressedFXR1 Fragile X mental retardation, autosomal homolog 1 17 OverexpressedPCOLN3 Procollagen (type III) N-endopeptidase 12 UnderexpressedMYL9 Myosin, light polypeptide 9, regulatory 6 UnderexpressedARG2 Arginase, type II 4 UnderexpressedACPP Acid phosphatase, prostate 2 UnderexpressedMAP4K4 Mitogen-activated protein kinase kinase kinase kinase 4 2 Overexpressed
aNumber of models in which variable was selected.
Cancer. Author manuscript; available in PMC 2007 April 17.
Copyright © 2022 FDOKUMEN


![Prostate cancer: 1HMRS-DCEMR at 3 T versus [(18)F]choline PET/CT in the detection of local prostate cancer recurrence in men with biochemical progression after radical retropubic prostatectomy](https://static.fdokumen.com/doc/165x107/63221f91807dc363600a4aa0/prostate-cancer-1hmrs-dcemr-at-3-t-versus-18fcholine-petct-in-the-detection.jpg)