Using Ultrasound to Enhance Targeted Radiotherapy
233
Using Ultrasound to Enhance Targeted Radiotherapy Jonathan Vince St. Catherine’s College Supervisors Professor Eleanor Stride Professor Andrew Lewis A thesis submitted to the Department of Engineering Science towards the degree of Doctor of Philosophy September 2021
-
Upload
khangminh22 -
Category
Documents
-
view
2 -
download
0
Transcript of Using Ultrasound to Enhance Targeted Radiotherapy

Using Ultrasound to Enhance
Targeted Radiotherapy
Jonathan Vince
St. Catherine’s College
Supervisors
Professor Eleanor Stride
Professor Andrew Lewis
A thesis submitted to the Department of Engineering Science
towards the degree of Doctor of Philosophy
September 2021

J. Vince DPhil Thesis
2 | P a g e Using Ultrasound to Enhance Targeted Radiotherapy

J. Vince DPhil Thesis
3 | P a g e Using Ultrasound to Enhance Targeted Radiotherapy
Statement of Originality
I hereby declare that this submission is my own work and, to the best of my knowledge, it
contains no materials previously published or written by another person, or substantial
proportions of material which have been accepted for the award of any other degree or
diploma at the University of Oxford or any other educational institution, except where due
acknowledgement is made in the thesis.
Any contribution made to the research by others, with whom I have worked at the University
of Oxford or elsewhere, is explicitly acknowledged in the thesis.
I also declare that the intellectual content of this thesis is the product of my own work, except
to the extent that assistance from others in the project’s design and conception or in style,
presentation and linguistic expression is acknowledged.
Jonathan Vince
September 2021

J. Vince DPhil Thesis
4 | P a g e Using Ultrasound to Enhance Targeted Radiotherapy

J. Vince DPhil Thesis
5 | P a g e Using Ultrasound to Enhance Targeted Radiotherapy
Acknowledgements
Years ago, the prospect of reaching higher education appeared almost impossible to me. To
now be concluding my graduate studies at Oxford University, feels incredibly surreal to both
my family and myself. There are numerous people to thank for my experience at Oxford and
whom without, this thesis would not have been possible.
Firstly, I would like to thank Professor Andrew Lewis for his mentorship, support and guidance
over the past few years. For nurturing both my professional and academic careers,
encouraging me to pursue further education and the opportunities it presents thereafter. I
definitely owe you more than a beer, or two.
I am forever grateful to Eleanor Stride, for her continued support and assistance in my
research. For making me feel a welcome and valued part of the BUBBL group; despite my initial
hesitations and concerns about joining such a prestigious group and university. Imparting me
with the self-belief that I was capable to complete my studies, despite the numerous obstacles
that I encountered throughout it. I hope we’ll continue to stay in touch however you may now
need to find a new penguin, to do all your heavy lifting.
I would like to express my sincerest gratitude to the Royal Commission of 1851 for awarding
me my industrial fellowship and sponsorship of this research. In particular, I would like to
thank Amahl Smith for being so accommodating of my situation post redundancy and enabling
me to complete my studies despite the withdrawal of my industrial sponsor. The charity and
support given to me, has comforted me on countless sleepless nights.
I acknowledge the generous support of the Kennedy Trust for Rheumatology Research for the
microscopy facilities used in this research. Honourable mentions to Emma Carter-Biggs for her
aid in facilitating my return to the Kennedy during the relaxation of the pandemic restrictions.

J. Vince DPhil Thesis
6 | P a g e Using Ultrasound to Enhance Targeted Radiotherapy
I would like to thank Mr Puneet Plaha, associate professor and consultant neurooncology
surgeon of the John Radcliffe Hospital Oxford, for his collaboration in this research and the
unique opportunity to witness a surgical resection in person; an experience I will treasure and
never forget.
All of this would not have been possible without the staff of St.Catherine’s college, Oxford
University and Oxford University Innovation; particularly the help of Dinalia de Silva in helping
us navigate the complex and sometimes convoluted structure of patent language and aiding in
our successful patent submission.
My work would have been impossible without the incredible facilities and staff of the Institute
of Biomedical Engineering. My sincerest thanks to Dr. Michael Gray, for his knowledge and
teachings on transducer characterisation; and to Jim Fisk of the IBME workshop, for his
constructive criticism and fabrication of my engineering schematics.
I owe a great deal to Dr. Catherine Paverd, Dr. Bernard Shieh and Cameron Smith for their help
in pursuit of this DPhil. All of whom have been incredibly patient with me and taken it upon
themselves to educate me on numerous areas of acoustics of which I am incredibly grateful. To
Alex Martin, Tamsyn Clarke and Dr. Laura Spiers for their comradery, moral support and
uplifting spirits during the long nights into the early hours. Friends I won’t soon forget. I wish
them all the best of luck in their new careers moving forward.

J. Vince DPhil Thesis
7 | P a g e Using Ultrasound to Enhance Targeted Radiotherapy
Abstract
The use of radiation as a selective modality for the treatment of cancer and various other
diseases is a fundamental principle in modern medicine. However, despite decades of research
and development, selective internal radiation therapy (SIRT), the arterial delivery of
radioactive particles for the treatment of hepatic tumours, remains a poorly utilised
technology outside of the liver. A major challenge for SIRT is the current lack of control over
the distribution of particles in the affected tissue. Achieving a uniform distribution throughout
the tumour mass is critical for ensuring a therapeutically relevant dose of radiation and hence
successful treatment. Cavitation of microbubbles has been successfully employed to facilitate
the extravasation of various nanoparticles and therapeutic agents in tissue. It is hypothesised
that ultrasound induced cavitation has the potential to move larger micron sized particles used
within SIRT, to increase the distribution of the therapeutic microspheres. The primary goal of
this doctoral thesis is to investigate the potential use of ultrasound-induced cavitation to
enhance SIRT by facilitating transport of radioactive microspheres in tissue.
A secondary goal of the thesis is to explore its use in the treatment of other types of cancer, in
particular Glioblastoma Multiforme; a particularly grave cancer of high incidence. First, a tissue
phantom and experimental protocol are designed to enable observation of the transport of
microspheres induced by ultrasound exposure using high resolution X-ray computed
tomography (µCT) imaging. Proof of concept results are obtained to confirm the feasibility of
the approach. An analysis framework and image processing software are then employed to
enable quantification of microsphere transport in three dimensions and the corresponding
radiation exposure that could be achieved. A detailed investigation of the parameter space is
then made using a statistical Design-of-Experiments methodology to identify the conditions
under which a suitable microsphere distribution can be achieved; peak negative pressure

J. Vince DPhil Thesis
8 | P a g e Using Ultrasound to Enhance Targeted Radiotherapy
correlated non-linearly with post focal projection depth and could be used to make predictions
with 88.4% confidence for 95% of the observations used in the model. Finally, ultra-high speed
imaging (0.1-2Mfps) is used to explore the mechanisms by which cavitation promotes
microsphere transport; producing novel brightfield images of microbubble cloud activity and
mass transport of dense glass microspheres. Overall, the results presented in the thesis
demonstrate the feasibility of using ultrasound induced cavitation to enhance SIRT within
target tissues not readily treated by an arterial route. Further work to understand the impact
of tissue heterogeneity and the design of a bespoke ultrasound transducer will be required to
enable clinical translation.

J. Vince DPhil Thesis
9 | P a g e Using Ultrasound to Enhance Targeted Radiotherapy
Contents
1. Introduction and Literature Review ............................................................................ 16
1.1. Glioblastoma Multiforme ........................................................................................... 16
1.1.1. Adjuvant Chemotherapy ..................................................................................... 17
1.1.2. Adjuvant Whole Brain Radiotherapy .................................................................. 18
1.1.3. Effects of radiation on tumour cells .................................................................... 19
1.2. TheraSphere® and SIRT .............................................................................................. 20
1.2.1. Microsphere Distribution and Relative Density ................................................... 22
1.2.2. TheraSphere® Procedure ..................................................................................... 23
1.3. Limitations of SIRT ...................................................................................................... 26
1.4. Ultrasound .................................................................................................................. 27
1.4.1. Thermal Ablation ................................................................................................ 27
1.4.2. Mechanical Effects .............................................................................................. 28
1.4.3. Acoustic Cavitation ............................................................................................. 29
1.5. Cavitation Nuclei ........................................................................................................ 30
1.5.1. Microbubbles and Nanobubbles ......................................................................... 30
1.5.2. Nanocups ............................................................................................................ 31
1.5.3. Nanodroplets ...................................................................................................... 34
1.6. Cavitation Enhanced Extravasation of Particles.......................................................... 34
1.6.1. Microjetting ........................................................................................................ 35
1.6.2. Microstreaming .................................................................................................. 36
1.6.3. Microbubble Tunnelling ...................................................................................... 36
1.6.4. Microbubble Cloud Formation ............................................................................ 37
1.7. Novelty and Thesis Objectives .................................................................................... 40
2. In Vitro Extravasation of Glass Microspheres in Hydrogel Cavities ............................... 55
Summary ................................................................................................................................ 55
2.1. Introduction................................................................................................................ 55
2.1.1. Ultrasonic Aspiration for Tumour Resection ....................................................... 56
2.1.2. Ultrasound Induced Cavitation as a Treatment Modality for Glioblastoma
Multiforme ......................................................................................................................... 57

J. Vince DPhil Thesis
10 | P a g e Using Ultrasound to Enhance Targeted Radiotherapy
2.2. Methods ..................................................................................................................... 58
2.2.1. Phantom Development ....................................................................................... 58
2.2.1. Malignancies of the Brain and Ex Vivo Surrogates.............................................. 58
2.2.4. Tissue Phantom Mould ....................................................................................... 64
2.2.5. Fabrication of Bespoke Ultrasound Tank and Movement Stages ........................ 65
2.2.6. Ultrasound Transducer Setup and Calibration .................................................... 66
2.2.7. Ultrasound Transducer Alignment ...................................................................... 70
2.3. Experimental Procedure and Analysis Techniques ..................................................... 71
2.3.1. Micro Computed Tomography (µCT)................................................................... 72
2.3.2. µCT Image Analysis ............................................................................................. 73
2.4. Characterisation of Microsphere Extravasation ......................................................... 74
2.4.1. Phantom Well ..................................................................................................... 75
2.4.2. Microsphere Projection ....................................................................................... 75
2.4.3. Projection Channels ............................................................................................ 76
2.4.4. Projection Bulbs .................................................................................................. 77
2.5. Discussion ................................................................................................................... 78
2.6. Conclusion .................................................................................................................. 79
2.6.1. Limitations .......................................................................................................... 80
3. In Silico Analysis and Interpretation of Cavitation Induced Projections of Glass
Microspheres .................................................................................................................... 87
3.1. Introduction................................................................................................................ 87
3.2. Methods ..................................................................................................................... 88
3.2.1. Minimum-volume enclosed ellipsoid (MVEE) ...................................................... 89
3.3. Single Well Elimination Microsphere Projection Interpretation ................................. 89
3.3.1. Predicting 90Yttrium β Radiation Emission from Glass Microspheres .................. 94
3.3.2. Factorial Design – Response Surface................................................................... 95
3.3.3. Parameters Investigated ..................................................................................... 97
3.3.4. Post Focal Projection Depth Surface Design........................................................ 99
3.4. Results ...................................................................................................................... 105
3.4.1. 0.5 MHz Non-linear Regression......................................................................... 105
3.5. Discussion ................................................................................................................. 109
3.5.1. Experimental Order........................................................................................... 109
3.5.2. Primary Factor Responses Using Linear Regression .......................................... 110
3.5.3. Factor Interaction Responses Using Linear Regression ..................................... 113

J. Vince DPhil Thesis
11 | P a g e Using Ultrasound to Enhance Targeted Radiotherapy
3.5.4. Comparison of Predictive Outputs for Regression Models ................................ 114
3.6. Conclusion ................................................................................................................ 115
3.6.1. Limitations ........................................................................................................ 117
3.6.2. Future Work ...................................................................................................... 118
4. High-speed Imaging of Cavitation Enhanced Projection Events .................................. 123
4.1. Introduction.............................................................................................................. 123
4.2. Methods ................................................................................................................... 123
4.2.1. Mould Design .................................................................................................... 123
4.2.2. Ultrasound Tank and Movement Stages ........................................................... 125
4.2.3. Shimadzu Hypervision HPV-X2 High-speed Camera .......................................... 127
4.2.4. High Speed Camera Triggering ......................................................................... 128
4.2.5. Ultrasound Exposure Conditions to Facilitate High-speed Imaging .................. 130
4.3. Results ...................................................................................................................... 131
4.3.1. Extravasation of Glass Microspheres through Agar Phantoms ......................... 131
4.3.2. Microsphere Bolus Speed Measurements ......................................................... 135
4.3.3. Rippling of the Edge of the Well ....................................................................... 137
4.3.4. Observations of Bubble Cloud and Microsphere Interactions ........................... 139
4.3.5. Microsphere Bolus Movement .......................................................................... 151
4.4. Discussion ................................................................................................................. 156
4.4.1. Order of Events Leading to Microsphere Extravasation .................................... 156
4.4.2. Microsphere Imaging Capability and Clarity ..................................................... 157
4.4.3. Microbubble Cloud Erosion of the Agar Medium .............................................. 159
4.4.4. Microsphere Projection Wake Banding ............................................................. 161
4.5. Conclusion ................................................................................................................ 164
4.5.1. Limitations ........................................................................................................ 167
4.5.2. Future Work ...................................................................................................... 168
5. Conclusions .............................................................................................................. 174
5.1. Publications .............................................................................................................. 177
5.2. Limitations ................................................................................................................ 177
5.3. Future Projects ......................................................................................................... 178
5.3.1. Tumour Inhomogeneity .................................................................................... 179
5.3.2. Prototype Optimisation .................................................................................... 182

J. Vince DPhil Thesis
12 | P a g e Using Ultrasound to Enhance Targeted Radiotherapy
Appendices
1. Khachiyan Algorithm - Minimum Volume Enclosed Ellipse Code ................................ 188
2. Single Well Elimination Microsphere Projection Interpretation Code ......................... 190
3. Interaction Plot for Post Focal Projection Depth (mm) ............................................... 197
4. HPV-X2 Image Calibration and Objective Limitations ................................................. 198
5. HPV-X2 External Trigger Methods ............................................................................. 201
5.1. Manual Gated Timing ............................................................................................... 201
5.2. Light Responsive Trigger Method ............................................................................. 205
6. Microsphere Banding within Projection Channels...................................................... 210
7. Design and Fabrication of a Novel Ultrasound Horn for Intraoperative adjuvant use in
Glioblastoma Multiforme Resections ............................................................................... 215
7.1. Proof of Principle ...................................................................................................... 215
7.2. Methods ................................................................................................................... 217
7.2.1. Design Parameters ........................................................................................... 217
7.2.2. Horn Prototypes x1c & x3c ................................................................................ 218
7.3. Results ...................................................................................................................... 220
7.3.1. Acoustic Field (x1c) ........................................................................................... 220
7.3.2. Pressure Output (x1c) ....................................................................................... 224
7.3.3. Acoustic Field (x3c) ........................................................................................... 225
7.3.4. Pressure Output (x3c) ....................................................................................... 227
7.3.5. LDV Measurements x3c .................................................................................... 228
7.3.6. Initial In Vitro Phantom Testing ........................................................................ 230
7.4. Discussion ................................................................................................................. 231
7.4.1. Variable Impedance of the x1c and x3c Horn Prototypes ................................. 231
7.4.2. Design Improvements ....................................................................................... 232
7.5. Conclusion ................................................................................................................ 233

J. Vince DPhil Thesis
13 | P a g e Using Ultrasound to Enhance Targeted Radiotherapy
Acronyms and Abbreviations
µCT Micro Computed Tomography
5-ALA 5-aminolevulinic dye
ARF Acoustic Radiation Force
BBB Blood Brain Barrier
BTIC Brain Tumour Initiating Cells
CBD Cannabinoids
CSF Cerebrospinal Fluid
CT Computer Tomography
CTE Chronic Traumatic Encephalopathy
DICOM Digital Imaging and Communications in Medicine
DoE Design of Experiment
DSB Double strand breaks
Duty Cycle DC
EBRT external Beam Radiotherapy
EOR Extent of Resection
FOV Field of View
GBM Glioblastoma Multiforme
HA Hyaluronic acid
HCC Hepatocellular Carcinoma
HeNe Helium Neon
HIFU High Intensity Focussed Ultrasound
HPS Hepatopulmonary Shunting
IBME Institute of Biomedical Engineering
IORT intraoperative radiation therapy
kVp Peak Kilovoltage
LED Light Emitting Diode
LRT localised radiotherapy
LS Lung Shunting
MB Microbubble
MGMT O6-methylguanine-DNA-methyltransferase
MIP Maximum Intensity Projections
MRI Magnetic Resonance Imaging
MTIC 3-methyl-(triazen-1-yl)imidazole-4-carboxamide

J. Vince DPhil Thesis
14 | P a g e Using Ultrasound to Enhance Targeted Radiotherapy
MVEE Minimum-volume Enclosed Ellipsoid
Mw Molecular Weight
NO Nitric Oxide
OV Oncolytic Viruses
PET Photon Emission Tomography
PMMA Polymethyl Methacrylate
PNP Peak Negative Pressure
PRF Pulse Repetition Frequency
PVA Polyvinyl alcohol
RBC Red Blood Cell
ROBs Radiopaque Beads
ROS Reactive Oxygen Species
SIRT Selective Internal radiotherapy
SPECT Single Photon Emission Computed Tomography
SRT Stereotactic Radiation Therapies
SSB Single Strand Breaks
SWL Shockwave Lithotripsy
TAE Trans arterial embolisation
TBI Traumatic Brain Injuries
Tc99m-MAA Technetium99 labelled Macro Aggregated Albumin
TMZ Temozolomide
VGEF Vascular Endothelial Growth Factor
WBRT Whole Brain Radiotherapy
YAS Yttrium-Aluminium-Silicon

J. Vince DPhil Thesis
15 | P a g e Using Ultrasound to Enhance Targeted Radiotherapy
CHAPTER 1
Introduction
J. Vince DPhil Thesis
16 | P a g e Using Ultrasound to Enhance Targeted Radiotherapy
1. Introduction and Literature Review
1.1. Glioblastoma Multiforme
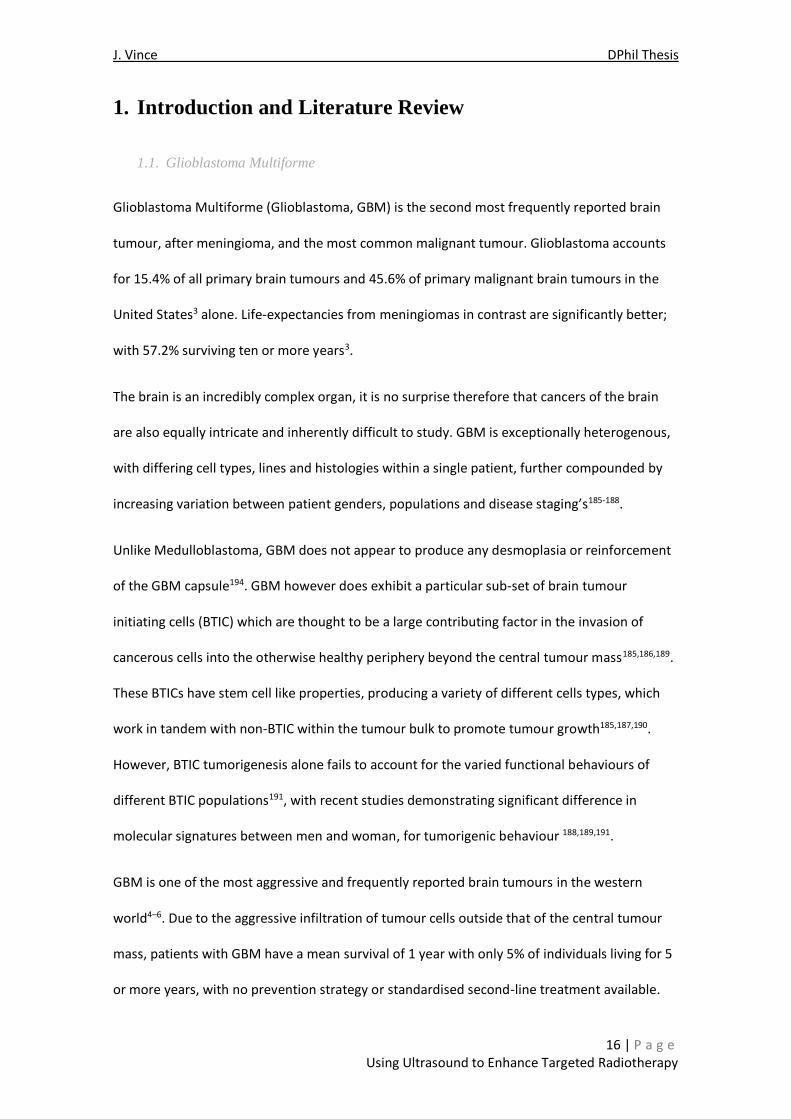
Glioblastoma Multiforme (Glioblastoma, GBM) is the second most frequently reported brain
tumour, after meningioma, and the most common malignant tumour. Glioblastoma accounts
for 15.4% of all primary brain tumours and 45.6% of primary malignant brain tumours in the
United States3 alone. Life-expectancies from meningiomas in contrast are significantly better;
with 57.2% surviving ten or more years3.
The brain is an incredibly complex organ, it is no surprise therefore that cancers of the brain
are also equally intricate and inherently difficult to study. GBM is exceptionally heterogenous,
with differing cell types, lines and histologies within a single patient, further compounded by
increasing variation between patient genders, populations and disease staging’s185-188.
Unlike Medulloblastoma, GBM does not appear to produce any desmoplasia or reinforcement
of the GBM capsule194. GBM however does exhibit a particular sub-set of brain tumour
initiating cells (BTIC) which are thought to be a large contributing factor in the invasion of
cancerous cells into the otherwise healthy periphery beyond the central tumour mass185,186,189.
These BTICs have stem cell like properties, producing a variety of different cells types, which
work in tandem with non-BTIC within the tumour bulk to promote tumour growth185,187,190.
However, BTIC tumorigenesis alone fails to account for the varied functional behaviours of
different BTIC populations191, with recent studies demonstrating significant difference in
molecular signatures between men and woman, for tumorigenic behaviour 188,189,191.
GBM is one of the most aggressive and frequently reported brain tumours in the western
world4–6. Due to the aggressive infiltration of tumour cells outside that of the central tumour
mass, patients with GBM have a mean survival of 1 year with only 5% of individuals living for 5
or more years, with no prevention strategy or standardised second-line treatment available.

J. Vince DPhil Thesis
17 | P a g e Using Ultrasound to Enhance Targeted Radiotherapy
These distressing figures are reflective of the limited treatments available, with most
procedures failing to prevent reoccurrence and disease progression occurring within 10 to 30
weeks7. Current approaches for the treatment of glioblastoma combine surgical resection with
adjuvant radiotherapy and chemotherapy; a particularly aggressive and demanding protocol
particularly considering incidence of the disease is highest in patients aged 75 years and
above3,7; with patients rarely reaching the 2 year survival period4.
1.1.1. Adjuvant Chemotherapy
Treatment with chemotherapeutic drugs has limited efficacy and a high risk of side-effects,
most drugs being non-selective and having limited access to the brain due to the blood brain
barrier (BBB). Temozolomide (TMZ) is a prodrug with some limited selectivity, having 100%
oral bioavailability and is capable of crossing the blood brain barrier. TMZ is metabolised in the
gut, into 3-methyl-(triazen-1-yl)imidazole-4-carboxamide (MTIC); MTIC and its subsequent
derivatives are thought to be primarily responsible for its effect though the methylation of
DNA base nucleotides at the N-7 or O-6 positions8. During replication this methylation causes
mutation which can induce intrinsic apoptosis9–11. However, the effects of methylation can be
repaired by the cancerous cells, despite TMZs ubiquitous bioavailability.
As a result TMZ’s efficacy in GBM is significantly better than other dacarbazine derivatives,
offering improvements in 6- month progression free and overall survival for brain cancers12.
Efforts continue investigating a combination of chemotherapy agents and therapies, to bolster
the effects of TMZ in this indication5,13–15.
Carmustine mustard gas is an alternative, non-selective agent used in chemotherapy. Infused
into biodegradable wafers and implanted into resection cavities, it has shown some limited
efficacy in increasing time to progression for patients who have already received a ‘complete’
resection and remain suitable for further surgical intervention16,17. However the use of

J. Vince DPhil Thesis
18 | P a g e Using Ultrasound to Enhance Targeted Radiotherapy
carmustine wafers has declined due to the threat of potential secondary infections and the
need for costly repeated surgical intervention18–20.
1.1.2. Adjuvant Whole Brain Radiotherapy
Glioblastomas are particularly aggressive in nature, with patients frequently having recurrence
at the surgical site or development of new lesion(s) elsewhere in the brain21. Whole brain
radiation therapy (WBRT) is an invaluable tool for slowing the reoccurrence of gliomas, and is a
proven method for localised tumour control. Necrosis of tissue surrounding the surgical
wound, however, prolongs the healing process22.
A common approach for adjuvant WBRT consists of a total of 37.5Gy of radiation in 15
fractions or 30 Gy in 10 fractions over six weeks, to treat one or multiple locations of
intracranial lesions; with the optimal timing for postoperative radiotherapy being at least one
week after surgical invention21,23. This is to allow for sufficient time for immediate recovery
from the invasive surgery, minimising the likelihood of post-operative complications.
Compared to chemotherapy treatment WBRT offers better prevention against progression of
GBM when used as adjunctive therapy, particularly in the formation of new lesions elsewhere
in the brain. Successive treatments of WBRT, however, are not possible due to memory loss,
leukoencephalopathy and subsequent neurocognitive decline21,12. Combining WBRT with other
more selective radiotherapies also increase the risk of developing leukoencephalopathy12.
Whilst the brain remains fairly resilient to non-selective external beam radiation, repeated
dosing as with any organ leads to a swift decline in patient health; there is a finite number of
times a patient can be beneficially exposed to radiation6,23–25.
Improvements in patient welfare have arisen more recently16 as a result of from moving away
from WBRT and towards localised radiotherapy (LRT) such as stereotactic radiation therapies

J. Vince DPhil Thesis
19 | P a g e Using Ultrasound to Enhance Targeted Radiotherapy
(SRT) or intraoperative radiation therapy (IORT) for cancerous lesions21. Improving local control
can enhance procedural outcomes and in some cases overall survival of patients compared to
WBRT for patients with a limited number of lesions or metastases 26,16. Using this approach,
not only is the damage to nearby critical structures reduced, but subsequent retreatments of
secondary malignancies are possible; depending on previous dose exposure and proximity to
the original lesion 17,16. Using SRT as initial adjuvant radiotherapy, reserves the use of WBRT for
further disease reoccurrences and as terminal treatment for palliative care21.
As the majority of gliomas relapse adjacent to previously treated areas, localised reirradiation
of the initial tumour volume either via external beam or stereotactic radiotherapy is an
attractive approach for adjuvant therapy27. Intercranial brachytherapy has been investigated
with the use of low dose rate 125Iodine crystals, however efficacy of the stereotactic
brachytherapy is dependent upon the number of large iodine crystals deposited28 and the
subsequent volume of tissue irradiated.
1.1.3. Effects of radiation on tumour cells
Ionizing radiation can be an incredibly powerful tool in treatment of cancerous lesions,
inducing single (SSB) and double strand breaks (DSB) and base damage of cellular DNA. DSB,
whilst the most toxic, occur less frequently than SSB which are produced in far higher yields.
DSB or several SSB occurring within close proximity to one another, are resistant to repair and
impair or completely inhibit, the cell replication via mitosis29,30,31. Radiation induced SSB breaks
and base DNA damage lead to DSB upon subsequent DNA replication31 therefore cancerous
cells which undergo increased rates of replication, have less opportunity for repair and are
more susceptible to apoptosis. Radiotherapy of cancerous lesions is therefore more selective
of malignant cells, than that of healthy tissue29–32 but may still result in undesired mutations in
surviving healthy tissue30.

J. Vince DPhil Thesis
20 | P a g e Using Ultrasound to Enhance Targeted Radiotherapy
1.2. TheraSphere® and SIRT
Selective internal radiotherapy (SIRT) is a modern evolution of surgical brachytherapy. Current
approaches to SIRT, use isotopes of far higher purity and of known grade to localise radiation
using non-biodegradable biocompatible microspheres, with calculated emission energies and
treatment durations for specific indications.
As with brachytherapy, SIRT allows for precise, controlled radiotherapy to radiosensitive
organs and tissues, which otherwise would not tolerate a large dose of unfocused, diffuse
radiation. Treatment is minimally invasive, via femoral or radial access to the arterial supply,
enabling delivery through out-patient care and making it an attractive alternative to external
beam radiotherapy (EBRT). Despite the initial concept of treatment being developed in the
1950’s, adoption and practice of SIRT as a palliative technique did not become widespread
until the approval of current SIRT products in the 2000’s33. SIRT remains a non-curative
treatment, recommended by several health agencies across the globe for the treatment of
hepatocellular carcinoma and colorectal metastasis in the liver.
TheraSphere® is a radioembolic glass microsphere, produced by BTG plc (recently acquired by
Boston Scientific Corp.) and recommended by the European Society for Medical Oncology for
SIRT in the treatment of colorectal liver metastasis and inoperable hepatic
cholangiocarcinoma34,35,36. The spheres are a combination of three high purity metal oxides,
yttrium, aluminium and silicon which are blended and melted together at extreme
temperatures to produce a solid (YAS) glass. The glass is shattered, powdered and spherodised
over a naked flame to form the YAS microspheres37,38. The exact composition of the YAS glass
is key to the melting characteristics of the glass and obtaining a spherical radioembolic
product.

J. Vince DPhil Thesis
21 | P a g e Using Ultrasound to Enhance Targeted Radiotherapy
Once sieved to generate a size range of 25-35 µm, the microspheres are subjected to neutron
bombardment in a nuclear reactor, producing Yttrium 90 as the sole radioactive component.
Other isotopes formed, as the result of the neutron bombardment, of silicon or aluminium are
deemed stable or insignificant by composition38,39. The enriched 90Y isotope undergoes β-
decay to 90Zr with a half-life of 64.1h40 and a mean decay energy of 0.93 MeV. Emissions of
electrons from the unstable 90Y atoms are decelerated by neighbouring atoms electrostatic
repulsions; this deceleration and loss of kinetic energy is emitted as ‘braking’ gamma radiation
to the surrounding cells (Bremsstrahlung or Cerenkov radiation) and can be detected
externally for imaging41,42,43. The energy emitted into neighbouring cells causes DNA DSB, with
downstream signalling of this DNA damage inducing cellular necrosis.
The depth of irradiation is dependent upon the permeability of the material and hence its
density, atomic arrangement and the energy of the electrons emitted; all of which contribute
to the frequency of the secondary irradiation produced43. The maximum observed depth of
penetration for patients undergoing TheraSphere® treatment in a clinical environment is
2.5mm mean tissue penetration43. Variance in necrosis surrounding the radioembolic
microsphere is associated with inter-sphere clustering. Where YAS spheres are closely packed,
the gradient of energy release is larger, resulting in a slightly larger penetration distance45.
TheraSphere®’s energy per microsphere is significantly higher than that of other competitor
microspheres46,47, resulting in a product that delivers a significantly larger radiation dose (205.7
±19.7 vs. 128.9 ± 10.6 Gy, for TheraSphere versus SIR-Sphere®, p<0.001)46 to the tumour.
Deposition of a high activity based microsphere like TheraSphere leads to excessive irradiation
of the surrounding tissue, which varies based upon the cellular heterogeneity, perfusion and
volume of the tumour treated182. Despite its higher activity per sphere and the deposition of
surplus radiation, the use of TheraSphere is deemed safe and approved for use in
radioembolisation.

J. Vince DPhil Thesis
22 | P a g e Using Ultrasound to Enhance Targeted Radiotherapy
Despite being classed as a radioembolic, TheraSphere®’s primary mode of action is irradiation
and not an embolic effect48. As it is incompressible in vivo and with a relative density of 3.6
gml-1, its terminal placement is in the fine vasculature adjacent to the capillary beds supporting
organ parenchyma. TheraSphere® is unable to pass through the capillary beds (5-10µm) due to
its size and incompressibility, preventing it from passing into the venous system45.
TheraSphere® is not currently promoted as a direct micro-embolic primarily because of the
near-stasis flow surrounding the capillary beds, where any reduction of flow is negligible in
necrotic tissue. Secondly, as the area of necrosis exceeds that of any micro-embolic effect, it is
challenging to distinguish the physiological properties of TheraSphere® from its radiological
ones49; of which the depth of radiation penetration predominates for individual microspheres.
In contrast, a resin based radioembolic product SIR-sphere® by SIRTex Medical Ltd., is
significantly larger (20-60µm), less dense (1.1gml-1) and has a higher embolic effect. The
spheres become embedded within the arterioles feeding the tumour, more distal from the
tumour than its smaller glass counterpart7 reducing blood flow to a larger volume of tissue. It
has been suggested however that in instances of accumulation in larger tumour feeding
arteries TheraSphere® may also have a larger embolic effect49.
1.2.1. Microsphere Distribution and Relative Density
The distribution of the β radiation and hence successful treatment of the intended malignancy,
is largely governed by the terminal placement of the radioembolic microsphere. Treatment of
larger surface areas or lobes of the liver, requires either a larger number of microspheres or a
greater distribution of the same number of spheres; with a decreased intensity of radiation.
Delivering the spheres from an arterial branch more distal from the tumour site, offers less
control over targeted or super-selective delivery, an approach frequently used for lobectomy
or segmentectomy in treatment of HCC50.

J. Vince DPhil Thesis
23 | P a g e Using Ultrasound to Enhance Targeted Radiotherapy
Caine et al. simulated the effect of relative density, fluid viscosity, injection velocity, injection
solution viscosity and injection flow rate on microsphere distribution; concluding that relative
microsphere density had minimal influence on distribution, even in reduced flow conditions33.
Flow behaviour is instead dominated by the fluid viscosity, flow rate and vascular geometry.
The density of the microsphere does however play a more important role in controlling
sedimentation of the radioembolic as the flow rate approaches stasis33.
The distribution of the microspheres is ultimately limited by the placement of the catheter
delivering them. In hypoxic solid tumours large areas of the tumour may remain untreated due
to the vasculature of the cancer primarily being present on the periphery of the solid lesion, its
poor vascular density preventing delivery of radioactive microspheres to the centre of the solid
mass; in addition to any interstitial tumour pressure. Thus the energy of irradiation and its
subsequent depth of irradiation, are vital to the viability of the procedure. If the depth of
penetration of the radiation were to be extended, to enable treatment of a greater proportion
of the tumour, it is expected that patient prognosis would also improve.
1.2.2. TheraSphere® Procedure
Once a patient has been assessed as eligible for TheraSphere® SIRT, the extent of the disease
will be mapped and staged, in accordance with the Barcelona Clinic Liver Cancer (BCLC) staging
crietria183. Mapping of the region of interest enables the pre-planning and visceral
angiography, using radiopaque contrast agent to enhance the resolution of the arterial
vasculature feeding the lesion and its periphery51. Once the route of administration has been
determined (via the radial or femoral artery), the physician will perform a lung shunting
assessment using Technetium99 labelled macro aggregated albumin (Tc99m-MAA)51. This
colloidal suspension of protein encapsulated radioactive metal isotope tracer, with greater
than 90% of the particles between 10-90 µm, is used to assess the percentage of material

J. Vince DPhil Thesis
24 | P a g e Using Ultrasound to Enhance Targeted Radiotherapy
delivered off-target either as extrahepatic shunting within the abdomen, hepatopulmonary
shunting (HPS) more commonly known as lung shunting (LS), or reflux towards the
gastrointestinal region51. If the percentage of off-target delivery is deemed hazardous, a
preliminary trans arterial embolisation (TAE) procedure or coil placement may be performed.
TAE procedures are used in two distinct cases, either for reducing the off-target delivery of
microspheres outside the target region (preventing extra-hepatic leakage) or to minimise any
observed hepatic vein shunting, where beads ultimately reside in the vasculature of the heart
and lungs, a toxicity concern39.
99m Technetium is a meta stable gamma emitting isotope, with a short half-life of 6.00 hours
and energy of 140keV40. The visualisation of the isotope and its distribution, is achieved via
single photon emission computed tomography (SPECT). This is due to the photon emission
having a much shorter (gamma) wavelength to that of conventional diagnostic x-ray
equipment40. With such a brief radioactive period, 93.7% of the isotope is completely stable
(as 99Tc) within 24 hours, thus reducing potential side effects of radiation during the
metabolism and excretion of the macro aggregated albumin41.
The combination of the angiography data, mapping of the peripheral vasculature and
administration route, scintigraphy and the particle distribution assessment data, culminates in
a more consistently accurate prediction of the required radiation dose, for the treatment in
relation to the grade of the disease38,52.
Delivery of the glass YAS spheres is performed with sterile 0.9% saline, flushing the spheres out
of their v-glass vial residing within a secondary acrylic holder, into the arterial vasculature via
microcatheter. The placement of the tip and the internal diameter of the microcatheter is
determined by the operator, availability and territory preferences. Completion of the
irradiation treatment occurs within 2 weeks, with patient follow-up occurring after 6 weeks;
consisting of further imaging of the parenchyma and necrotic tissue, potentially with further

J. Vince DPhil Thesis
25 | P a g e Using Ultrasound to Enhance Targeted Radiotherapy
histology to assess procedural performance44,48,3. The increased dose rate, total radiation dose
in combination with a smaller seed size and larger volume of irradiation compared to iodine-
125 crystals, places SIRT as a potentially effective adjuvant for stereotactic radiotherapy of
glioblastoma and other gliomas.

J. Vince DPhil Thesis
26 | P a g e Using Ultrasound to Enhance Targeted Radiotherapy
Figure 1: Fig. 2.3 reproduced from Image-Guided Interventions in Oncology, pp 15-27 Physics and
Physiology of 90Y Radioembolization for Liver Tumors40, with permission from Springer Nature.
Copyright © 2020, Springer Nature Switzerland AG. (a) The TheraSphere administration box. The dose
vial within the lead pig is positioned within the box, and the needle assembly has been snapped in place.
Saline flushed through the “B” line suspends the microspheres which then flow from the dose vial into the
exit tubing and microcatheter. (b) Close up image of the TheraSphere administration box shows the
radiation dosimeter near the dose vial. The reading should drop to zero during administration. The
overflow vial is seen below “A”. This serves to limit the rate of injection. If there is excess pressure
during administration, excess saline will flow into this vial rather than over-pressurize the needle
assembly. (c) The SIR-Spheres administration box. Dextrose solution injected in line and needle “D”
agitates and suspends the microspheres, which then exit the vial through the outlet needle toward the
three-way stopcock mounted on the interior of the box, connected to the external black knob. The distal
outlet line “A” is connected to the microcatheter, and can be cleared by turning the black knob toward
“Flush/Contrast” and injecting into line “B”. The external stopcock attached to line “B” allows
injection of contrast medium to perform interval angiography between aliquots of microspheres to assess
arterial flow for stasis. A radiation dosimeter has been placed inside the administration box to monitor
completeness of administration (not recommended by manufacturer). (d) Interior of the SIR-Spheres
administration box showing the administration needles positioned within the v-bottom dose vial. The inlet
needle is positioned just above the microsphere pellet and is used to suspend the particles, and the outlet
needle is positioned near the top of the meniscus where dilute suspended microspheres exit the proximal
outlet line toward the three-way stopcock mounted on the interior of the box. The stopcock can be turned
remotely by the external knob and allows alternating between microsphere aliquot administration and
distal outlet line flushing or contrast medium injection.
1.3. Limitations of SIRT
SIRT remains an underutilised technology because of the restrictions imposed by the current
intra-arterial catheter delivery method. Tumour vasculature is substantially different from that
of healthy tissue, with vessels having a chaotic structure with blind ends, shunts and a
tendency to collapse53 . This is primarily due to the unchecked, rapid growth of vessels
generated by increased expression levels of the vascular endothelial growth factor (VEGF)
signalling protein at the periphery of solid tumours. The vessels themselves are also typically
more porous or “leaky” than in healthy tissue vasculature54. The irregular distribution of
vessels leads to oxygen levels (O2%) being as low as 0.3 – 4.2% in some areas of solid tumours,
compared with normal tissue oxygen levels ‘normoxia’ being 20-21%. The sparse and/or
chaotic vessel structure reduces the number of radioactive microspheres that can be
distributed in the tumour region. It also introduces high variability into the mean distance
between microspheres which prevents a uniform dose of radiation from being delivered. For
SIRT to be used effectively, a means of improving the distribution of microspheres is required

J. Vince DPhil Thesis
27 | P a g e Using Ultrasound to Enhance Targeted Radiotherapy
so that a uniform and sufficient dose of radiation can be delivered to the malignant tissue. This
thesis explores the use of ultrasound induced cavitation in this context.
1.4. Ultrasound
Ultrasound is broadly defined as pressure perturbations having a frequency above the audible
range of humans (20 kHz). The medical applications of ultrasound as a diagnostic imaging
modality (sonography) are well established55. Medical sonography uses very low intensities,
resulting in a safe and non-invasive methodology suitable for imaging sensitive tissues and
organs56. At higher intensities, ultrasound can produce significant and destructive effects in
tissue which can be exploited in therapeutic applications.
1.4.1. Thermal Ablation
High intensity focussed ultrasound (HIFU) is primarily used for non-invasive thermal ablation in
current clinical practice. Absorption of the energy from the HIFU, can produce significant local
elevation in temperature (hyperthermia) within the target tissue 57. The heating or ‘ablation’ of
the tissue is achieved either via continuous wave application over several seconds or repetitive
pulses of HIFU over several minutes. Tissue coagulation, the combination of protein
denaturation and permanent cell damage, is induced from 39oC with the relationship between
temperature and permanent cellular damage standardised in minutes at 43oC in vivo 58, 59, 60,
denoted as the thermal isoeffect dose (TID). TIDs allow for comparisons between treatment
regimens independent of the exact parameters and time domains used, according to CEMo43
thermal does thresholding184.
Pre-focal tissue, despite receiving ultrasound of lower intensity compared to the focal region,
does experience pre-focal energy deposition and heating61. Pre-focal heating is an important
concern for in vivo therapies involving the use of HIFU, where undesired collateral damage can

J. Vince DPhil Thesis
28 | P a g e Using Ultrasound to Enhance Targeted Radiotherapy
cause thermal ablation prior to the focal point, resulting in skin burns due to the pre-focal
tissue being continuously exposed to converging HIFU wavefronts61. The problem is
particularly acute in the brain which has a very low thermotolerance and where different
regions have different thresholds for damage62.
1.4.2. Mechanical Effects
Ultrasound can also produce a range of mechanical effects that can be exploited
therapeutically 58,63,64. For example, very high pressure acoustic waves can be used to break
apart large solid masses, frequently used in shockwave lithotripsy (SWL) for minimally invasive
treatment of small kidney stones65. Mechanical effects can enhance drug delivery and
apoptosis66,67, with the most extreme (high intensity histotripsy) leading to complete
disintegration or homogenisation of tissue68,63,64. There are three key phenomena
underpinning the mechanical effects of ultrasound:
Acoustic Radiation Force
As a result of focusing the ultrasound wave into a small focal region, a significant pressure
gradient is produced compared to that of outside the focal region. When a particle is subject to
this pressure field it experiences a force, the primary Bjerknes or primary acoustic radiation
force (ARF)69–71 .
F = −(𝑉𝑡∆𝑃𝑟,𝑡).
Equation 1: Time averaged acoustic radiation force on an object. Volume (V) Pressure gradient (ΔP)72.

J. Vince DPhil Thesis
29 | P a g e Using Ultrasound to Enhance Targeted Radiotherapy
Acoustic Streaming
Eckart or ‘bulk’ streaming occurs in fluids as the result of momentum transfer from the
propagating wave to the surrounding medium73,74 which creates a velocity gradient and
consequently net flow within the bulk fluid75. The timescales associated with bulk streaming
are far larger than those produced by the primary acoustic radiation force.
When the flow of fluid is not in free space and is bound, a velocity gradient is established
adjacent to the boundary interface. This creates a thin layer of fluid with increased streaming
as a result of the no slip condition. The thickness of this boundary layer is given by:
𝑑 = √𝜇
𝜌𝜔
Equation 2: Thickness of boundary layer driven streaming (d), frequency (ω), pressure (ρ) and dynamic
viscosity (µ)76.
1.4.3. Acoustic Cavitation
Cavitation, the formation of gas bubbles, can occur when a liquid is exposed to ultrasound. To
produce a bubble from within a completely pure liquid, the energy absorbed from the
ultrasound wave must overcome the intermolecular bonding present, to allow for the
collection of gas molecules as a bubble77.
In practice lysis of the intermolecular bonds in a bulk fluid is not accomplished, as the energies
required are very significant and even purified liquids contain pre-existing discontinuities
which trap gases that act as nucleation sites for bubble formation78–80. When ultrasound is
applied, these pre-existing pockets of gas are supplied with enough energy to overcome the
liquid’s surface tension and grow in size, producing a bubble. Free non-stabilised bubbles are
swiftly eliminated from the bulk fluid by their buoyancy or will rapidly dissolve into the bulk
medium if it is not super saturated with gas79.

J. Vince DPhil Thesis
30 | P a g e Using Ultrasound to Enhance Targeted Radiotherapy
In liquids the use of surfactants can bring about fluctuations in the intermolecular bonding
which produces discontinuities of lower surface tension81–84 which promote the entrapment
and coalescence of gases. Gas can also be entrapped within crevices and voids in the surface of
the liquid container or on solid particles suspended within the bulk liquid, reducing the
external pressure on the gas bubble and promoting their stability85,85–87. Exploiting the
presence of cavitation nucleation sites can be beneficial in therapeutic67,85,92,93 ultrasound.
1.5. Cavitation Nuclei
Cavitation nuclei can be described as any particle that under exposure to ultrasound, produces
an expanding bubble of gas and/or vapour 54,85,94–98. They may be endogenous (i.e. naturally
occurring in tissue) as described above, or exogenous (i.e. deliberately added to promote
cavitation). Unless otherwise specified the use of the term cavitation nuclei hereafter relates
to exogenous nuclei.
1.5.1. Microbubbles and Nanobubbles
Microbubbles (MB) have been confirmed as occurring naturally in vivo, in swine kidneys and
porcine liver99,100 and the incidence of MBs is linearly proportional to the concentration of
human red blood cells (RBC) in vitro101.
When exposed to an external ultrasound field, gas-filled MBs will expand and contract with an
amplitude dependent upon the amplitude and frequency of the field102. At low amplitudes the
oscillations of bubbles are largely linear but as the amplitude increases the behaviour of the
bubble is increasingly non-linear, whereby the ratio of radial expansion and contraction may
vary significantly with the maximum volume of the MB dependent upon the wave pressure103.
As the inertia of the surrounding liquid, primarily associated with temperature and pressure,

J. Vince DPhil Thesis
31 | P a g e Using Ultrasound to Enhance Targeted Radiotherapy
overcomes the internal pressure of the MB, the bubble collapses102 with the loss of the
periodic oscillation denoted as inertial, unstable or transient cavitation104. The onset of inertial
cavitation can be denoted as the bubble expanding beyond a certain limit, the interior
temperature exceeding a certain value or by the rate of collapse exceeding the speed of sound
in the liquid. This unstable cavitation event can also produce new smaller MBs which have
different critical excitation pressures and resonance frequencies.
Synthetic MBs primarily consist of a gas core, often perfluorocarbon, stabilised by a lipid or
protein shell98,105–108 to prevent the dissolution of gas from larger bubbles (>1µm) into the
surrounding solution; with stabilised bubbles less than 1µm termed ‘Nanobubbles’95,110 . The
core-shell chemistry can influence the stability and cavitation threshold of the MB population,
often with substrates of interest (cytotoxins, metal particles, proteins, viruses) bound to the
surface67,93,110–114. Excipients may be used with MB formulations to alter the surface tension
and induce effects such as cell permeability, sonoporation, reduction of oscillation amplitude
and increases in resonance frequency115,66,116.
Synthetic MBs have been used in vivo as a contrast agent and a delivery vector for various
applications including cytotoxic drugs for the treatment of solid tumours117, ultrasound-
accelerated fibrinolysis118, magnetic nanoparticles for MRI imaging67 and siRNA for gene
therapy67.
1.5.2. Nanocups
The presence of cavitation nuclei in combination with focused ultrasound can promote effects
such as the transport of cytotoxic drugs or particles; e.g. improving oncolytic viruses (OV)
delivery by up to fifty times compared to passive diffusion alone119. One of the largest
drawbacks of MBs is their inability to cross tissue membranes; they are also cleared quickly in
vivo due to their relative size (>1 µm) compared to that of: cellular endothelial pores (100-

J. Vince DPhil Thesis
32 | P a g e Using Ultrasound to Enhance Targeted Radiotherapy
800nm) and eukaryotic cells typically being in the range of 5-10 µm56, 85. In addition to this,
under ultrasound exposure MBs are rapidly destroyed and so the concentration of nuclei
within the circulation and associated cavitation activity cannot be sustained over long periods
of time (1-2 minutes)119.
As an alternative, sub-micrometre hollow polymer spheres can be prepared via seeded
thermally initiated emulsion polymerisation. As the organic monomers react together, a
polymer shell or lens is produced on the surface of the suspended droplets. Due to the
osmotic pressure on the unsupported polymer film, the surface shell collapses inwards,
producing a polymer disc or ‘nanocup’. Changing the monomer composition changes the film
viscosity generated on the particle during polymerisation and the subsequent size of the cavity
produced within the nanocup120.
The small cavity of the concave polymer nanocup, can entrap gases as nucleation sites for
cavitation events85. Under exposure to ultrasound the associated gas nanobubble will expand
radially and outside of the cavity in which it is situated. As the nanobubble grows in size, it will
fill the cavity of the cup and at a critical size, where the contact angle between the bubble and
the nanocup approaches its maxima, the bubble will dissociate itself from the nanocup;
allowing the MBs to continue to expand in size85 . The maximum radius the detached MB
reaches, is independent of the size of the nanocup cavity or acoustic pressure but is directly
related to frequency of the focused ultrasound wave85. Kwan et al. reported a fourfold
increase in the duration of sustained cavitation when using nanocups (2 minutes) over
commercial MBs (<30 seconds), a phenomena which produced a subsequent increase in
extravasation of drugs, in an agarose hydrogel phantom54.

J. Vince DPhil Thesis
33 | P a g e Using Ultrasound to Enhance Targeted Radiotherapy
Figure 2: Reprinted Figure with permission from the American Physical Society. Copyright 2016 by the
American Physical Society. https://doi.org/10.1103/PhysRevApplied.6.044004 .FIG. 3. Ultrahigh-Speed
Dynamics of Micrometer-Scale Inertial Cavitation from Nanoparticles85. Comparison of hypothesized
mechanism and experimental observation. (a) An illustration of a surface-trapped nanobubble
undergoing inertial collapse. (b) Evidence for a (1) nanocup likely with a trapped nanobubble, (2)
nucleation, and (3) detachment from a single large nanocup is shown. Dashed lines indicate the initial
position of the nanocup. Scale bars represent 100 μm. The arrow points to the 600-nm-diameter nanocup.
The time stamps on the images are based on the onset of cavitation. The color bar is the difference in
pixel intensity (of arbitrary units) in each frame of the video compared to the same frame number of the
no-ultrasound control video.
Nanocups can be fabricated in a variety of size distributions (174 ± 2, 425 ± 6, and 609 ± 8 nm)
their relative size compared to perfluorocarbon MBs and endothelial pores allows nanocups to
passively extravasate through tissue and out of the circulatory system after initial intravenous
injection. The entrapped nanobubble grows under ultrasound exposure, becomes detached
and is subsequently depleted whereas the polymer nanocup is not destroyed and has the
potential to continue to nucleate cavitation activity despite their increased nuclei
concentration54,85,97.

J. Vince DPhil Thesis
34 | P a g e Using Ultrasound to Enhance Targeted Radiotherapy
1.5.3. Nanodroplets
Unlike MBs which have a stabilised gas core, nanodroplets have a liquid (e.g.
perfluoropentane, perfluorohexane) perfluorocabon core which is stabilised by similar lipid or
phospholipid molecules on the surface. Nanodroplets offer advantages over both MBs and
nanocups. Unlike cups they can directly encapsulate drugs and at a much higher dose per unit
volume due to their liquid core compared to the surface of MBs, requiring a much smaller dose
to be injected. Secondly, nanodroplets have increased stability, particularly in circulation in
vivo121,122, compared to that of their microscale gas counterparts. Upon exposure to
ultrasound, the highly volatile liquid is vaporised into a gas, breaking the shell coating and
releasing the contents into its surrounding; a property frequently utilised for drug delivery
applications123–125. The energy required for this phase transformation however is far higher
compared to that of gas core cavitation agents, but still remains a viable option even for
sensitive therapeutic delivery applications e.g. DNA, RNA, virus transfection124.
1.6. Cavitation Enhanced Extravasation of Particles
Molecular delivery of therapeutic drugs can be enhanced by ultrasound, normally by the action
of a cavitation agent. This in turn has led to the intentional design of MBs and other cavitation
nuclei containing various therapeutic agents (chemotherapeutics123,126,127,128, antibodies129,
metal complexes124,130,131) within them for simultaneous collapse of the cavitation agent and
delivery of the therapeutic payload.
The majority of work within the field of ultrasound enhanced delivery focuses on molecular or
nanometre sized objects 103,114,132,133(siRNA124, viruses119,134 etc.) . Producing extravasation of
micro or larger scale particles has not been intensively investigated135–137. Moreover, to date
MBs are only marketed as contrast agents, and not for enhancing the delivery of therapeutics,
with or without ultrasound61,81,112,138,139.

J. Vince DPhil Thesis
35 | P a g e Using Ultrasound to Enhance Targeted Radiotherapy
The inertial collapse of bubbles can produce a range of effects in addition to shock waves, light
emission and bubble fragmentation that help to enhance the transport of therapeutic material
out of the vasculature into surrounding tissues54,109,140,141. These effects are discussed below.
1.6.1. Microjetting
Non-spherical oscillations occur when bubbles are in close proximity with one another or when
a single bubble approaches a boundary. The presence of the nearby surface causes a non-
symmetrical pressure field around the bubble resulting in non-spherical motion and secondary
(Bjerknes) radiation forces that can amplify the effect by drawing the bubble closer to the
surface 116,142,143. If a bubble is oscillating with sufficient amplitude then during its collapse the
asymmetry can cause it to adopt a concave disc shape and eventually fully involute so that a
jet of liquid pierces its centre143. The subsequent impact of this microjet on the proximal
surface can be sufficient to erode metal surfaces144 and theorised to be the possible
mechanism for contrecoup damage in traumatic brain injuries (TBI) resulting from high
explosive shock waves145. It has been demonstrated in vitro that this phenomenon can
puncture cell membranes, hypothesised to be a mechanism of sonoporation and the cause of
the increased uptake of drugs or nanoparticles146, 126; experiments in vivo however are less
definitive due to the relatively soft boundary layers provided by tissues or tissue mimics which
vary in architecture and stiffness147–150. The microjet impact could permanently damage cells
and surrounding tissue which is not currently observed; it is more likely therefore that the non-
inertial cavitation phenomena, including microstreaming, temporarily disrupt the cell
membrane particularly when the pressure amplitude is low116.

J. Vince DPhil Thesis
36 | P a g e Using Ultrasound to Enhance Targeted Radiotherapy
1.6.2. Microstreaming
As above, absorption of momentum from a propagating acoustic wave can generate a velocity
gradient in the surrounding fluid that results in its motion, i.e. streaming96,116,151,152.
Oscillating MBs can produce streaming on a far smaller scale, termed microstreaming, and
hence shear stresses on nearby boundaries. If the boundary is the membrane of a biological
cell, the microstreaming may aid in the transport of drugs and nanoparticles through both
convection and membrane permeabilisation74, 153, 151. If the amplitudes of oscillation are too
large however, cellular disruption can occur, resulting in internal haemorrhaging if the cells are
endothelial cells lining a blood vessel 154, 155.
1.6.3. Microbubble Tunnelling
Oscillating MBs confined within a small channel or capillary156 can “tunnel” into the
surrounding medium, leaving an approximately cylindrical void in their wake. During the
positive pressure phase of each ultrasound cycle, the bubble shrinks dramatically, becoming
invisible under high speed light microscopy157, enabling it to travel through the pores of the
adjacent medium, in the direction of the propagating wave. When the MB undergoes
expansion, during the negative pressure phase, the bubble remerges at a distance from its
origin, producing a tunnel equivalent in diameter to the maximum diameter at peak expansion
of the oscillating MBs157. Extended tunnels can hence be generated by long ultrasonic pulses as
an accumulation of several individual MB tunnelling events. It should be noted that tunnelling
is most likely produced by a combination of effects, including direct impingement due to the
bubble oscillation, microjetting and ARF. For example, Caskey et al. demonstrated that
increasing the ultrasound frequency increased the tunnel width. For pulses having equivalent
time-averaged acoustic intensity, decreasing the pulse duration increased the pressure
amplitude required to disrupt gel mediums157. Consideration should be made therefore of MB

J. Vince DPhil Thesis
37 | P a g e Using Ultrasound to Enhance Targeted Radiotherapy
concentration, centre frequency, acoustic pressure, and pulse duration when analysing the
mechanisms of tunnel formation in vitro or in vivo.
Figure 3: This figure is reproduced from The Journal of the Acoustic Society of America 125, EL183
(2009);https://doi.org/10.1121/1.3097679. Copyright 2009 by AIP Publishing LLC. Fig. 1. Tunnel
images and high-speed microscopy157. Optical evidence of tunnel formation using a microbubble
concentration of ~2.5 x 10⁷ bubbles/ml and pulse duration of 10 ms. Tunnels created from insonation at
(a) 1-MHz, (b) 2.25-MHz, and (c) 5-MHz ultrasonic pulses at matched MI of 1.5. Scale bar indicates 250
µm. Sequential high-speed images (d)–(g)show a microbubble oscillating during a 1-MHz pulse creating
a 45µm-diameter tunnel. The frame rate is 10 kHz and the first image is acquired at 0.1 ms after the onset
of insonation. Subsequent images were selected to show compressional and rarefactional half-cycles. The
microbubble forms in (d) from the fusion of multiple microbubble fragments and then oscillates
asymmetrically as it moves through the gel. Scale bar indicates 50 µm. High-speed images (h)-(k) show
multi-bubble interactions and fluid jets during the formation of a 50µm tunnel. The frame rate is 10 kHz
and the images are selected for clear jet visualization. Scale bar indicates 50 µm’. 0.75% (w/v) OmniPur
agarose gel.
1.6.4. Microbubble Cloud Formation
When the concentration of cavitation nuclei and the peak negative pressure is high enough,
the formation of MB clouds can be observed (Figures 3-7). These clouds exhibit behaviour
similar to that of a bubble having a volume equivalent to the sum of the individual bubble

J. Vince DPhil Thesis
38 | P a g e Using Ultrasound to Enhance Targeted Radiotherapy
volumes. They can continue to oscillate for far longer than a single bubble158, and induce
significantly different effects on the surroundings.
Figure 4: This figure is reproduced from Fig. 5. Bubble Cloud Behavior and Ablation Capacity for
Histotripsy Generated from Intrinsic or Artificial Cavitation Nuclei 159
https://doi.org/10.1016/j.ultrasmedbio.2020.10.020. https://creativecommons.org/licenses/by-nc-nd/4.0.
Histotripsy bubble cloud images. Optical images of cavitation bubble clouds generated inside agarose
phantoms containing microbubbles, nanocones, or intrinsic nuclei captured by a high-speed camera.
Ultrasound propagating left to right.. Peak negative Pressure (p-)bubble clouds generated at p- ranging
from 0.15 to 45 MPa at a 0.5 Hz PRF inside agarose tissue phantoms containing gas-filled
decafluorobutane-microbubbles or fluid-filled perfluorocarbon hexane-nanocones, or control phantoms
without artificial nuclei. Ultrasound 0.5 MHz, 0.5 Hz PR. Tissue phantom contains 1% (w/v) agarose.
Figure 5: This figure is reproduced from Fig. 7. For Whom the Bubble Grows: Physical Principles of
Bubble Nucleation and Dynamics in Histotripsy Ultrasound Therapy77.
https://doi.org/10.1016/j.ultrasmedbio.2018.10.035. https://creativecommons.org/licenses/by-nc-nd/4.0/.
Left: Initiation of a bubble cloud via shock scattering captured by shadowography. Ultrasound
propagation is from left to right. The scattering bubble (dark cone, t = 0 frame) has been distorted
because of the asymmetric incident shock wave (dark line). The large size of the scattering bubble

J. Vince DPhil Thesis
39 | P a g e Using Ultrasound to Enhance Targeted Radiotherapy
compared with the shock thickness and the flattened surface allow strong scattering of the incident shock
wave. Furthermore, the pressure release boundary condition of the bubble/ gel interface inverts the
shock. The scattered, inverted wave nucleates cavitation proximal to the bubble. Right: A shadowgraph
sequence revealing formation of a bubble cloud over a 15-cycle pulse. The acoustic propagation is from
left to right, but cloud growth forms in the opposite direction during passage of the pulse. 0.5 MHz
fundamental frequency. 1% Agar tissue phantom.
Figure 6: This figure is reproduced from Phys. Rev. Applied 15, 034033. Copyright 2021 by the American
Physical Society. https://doi.org/10.1103/PhysRevApplied.15.034033. FIG. 5. Dynamics of cavitation
clouds within a high-intensity focused ultrasonic beam160. A close-up view of the inner structure of a
bubble cloud; pf = 1.44 MPa. This picture is generated by collapsing a series of reconstructed holograms
from different depths onto a single plane.’ 500kHz fundamental frequency, 1 million cycles per pulse.
Single burst in quiescent water with particles ~10µm in diameter.
Figure 7:’ This figure is reproduced from The Journal of the Acoustic Society of America 122, 1191
(2007); https://doi.org/10.1121/1.2747204. Copyright 2007 by AIP Publishing LLC. FIG. 5.
Microbubble fusion. Two sequences of images indexed according to description in Fig. 2 obtained with a
transmission center frequency of 1 MHz and peak rarefactional pressure of 0.8 MPa as multiple
microbubbles approach and fuse. The vessel diameter in both sequences is approximately 12 µm. Scale
bar indicates 10 µm.’. 2 Cycle wave burst. 161

J. Vince DPhil Thesis
40 | P a g e Using Ultrasound to Enhance Targeted Radiotherapy
Figure 8: This figure is reproduced from Fig. 5 Bifurcation of ensemble oscillations and acoustic
emissions from early stage cavitation clouds in focused ultrasound162. doi:10.1088/1367-
2630/15/3/033044.https://creativecommons.org/licenses/by-nc-nd/4.0/. Sequential frames extracted from
80μs after the nucleation event, in HIFU of PNP = 1.29MPa, rich in jetting activity from bubbles
peripheral to the cloud (examples arrowed white). Scale bar bottom right: 50μm. Acoustic cavitation is
nucleated via a 6–8 ns 532nm laser-pulse. A total of 160 HIFU acoustic cycles are generated, with the
laser-pulse incident after 80µs, to allow for transducer ‘ring-up’ to the required pressure amplitude.
High-speed camera operation is triggered to capture a few frames prior to nucleation of cavitation
activity, such that cloud development is observed from inception through ∼50 HIFU cycles.’
Fundamental frequency 0.521 MHz.
1.7. Novelty and Thesis Objectives
SIRT as a technology and as an extension of historical brachytherapy, is currently limited to
indications within the liver44,46,170–172,48,163–169. Whilst research into other diseases in other
organs continues, including the brain173, colon46,174 and pancreas175, to date no individual or
group has published any work on improving the delivery of radioactive microscale particles in
either animal models or humans. The majority of parallel research in the field is aimed not at
improving the efficacy of the therapy itself, but at improving the planning and diagnostic
capabilities45,47,176. Investigations into the immune-stimulatory potential of SIRT177–180
compared to EBRT are also underway but with limited results having been published to date.
The propulsion of nanometre sized objects using ultrasound with or without
cavitation119,128,133,141 is well established and has been achieved in various models. With the
exception of blood clot dissolution118,181, no attempts have been made to extravasate
micrometre-sized particles with or without radioactive isotopes.

J. Vince DPhil Thesis
41 | P a g e Using Ultrasound to Enhance Targeted Radiotherapy
GBM remains an unsolved challenging indication because of the lack of access to the central
tumour and the cellular infiltration beyond it. Defining the extent of the disease infiltration by
existing diagnostic methods (MRI, CT) does not provide sufficient information to improve
existing external beam radiotherapies, whilst existing chemotherapeutic agents have proven
insufficient for extending patient overall survival. Localised therapies continuously fail because
of the extent of the ‘invisible disease’, the cellular infiltration of the cancerous cells beyond the
central tumour mass, frequently referred to as GBM ‘tendrils’. Whilst less precise than gamma
knife surgery, it is hoped that using high activity radioactive microspheres to irradiate the
margins surrounding the tumour mass will be selective towards the cancerous cells, reducing
the collateral damage to the surrounding healthy tissue. As in the case of resection, the use of
high-dose stereotactic radiotherapy is not used in the pursuit of a cure for the disease but
focussed on improving the palliative care and quality of life for those who are already
undergoing resection surgery. Improving upon the current standard of care for the disease and
hopefully the dire 2-year survival statistic.
In order to improve the current standard of care for GBM patients eligible for resection,
TheraSphere® is proposed as a hypothetical solution for the stereotactic radiotherapy of the
surrounding tumour margins, during current resection procedures. To be successful, the
biocompatible glass microspheres must be deposited and then propelled into the surrounding
soft tissue of the resection cavity. This propulsion is intended to be achieved by intraoperative
ultrasound induced inertial cavitation (Figure 9).

J. Vince DPhil Thesis
42 | P a g e Using Ultrasound to Enhance Targeted Radiotherapy
Figure 9: Diagram of envisioned adjuvant therapy. Radioactive microspheres are distributed within the tissue
margins of the resection cavity. Image is not to scale. Margins may be up to a further 30-40mm outside of the central
mass. Sonopet aspiration device image courtesy of Stryker®.
After removal of the central tumour mass, a slurry of radioactive microspheres and cavitation
nuclei will be deposited in the resection cavity. An ultrasonic device, commercially available or
specifically designed for this application, is then to be placed within the resection cavity. The
acoustic field emitted from the device will cause the exogenous nuclei to cavitate and
distribute the surrounding microspheres into the tissue margins. The distributions of the
microspheres will need to be examined, quantified and modelled to isolate the ultrasound
exposure parameters required. The field of radiation is to be estimated from the mean tissue
penetration data of the radioactive microspheres.
Whilst there are other modalities (gels, resins, crystals) that could be used instead of the
radioactive microspheres, the relative radioactivity and therefore therapeutic treatment, is
directly proportional to the mass of the radioactive element. In order to deliver a high
therapeutic dose, as seen with TheraSphere™, a high mass content is required. Using resin
spheres, gels or specifically designed radioactive cavitation agents (utilising a porphyrin ring to
encapsulate the radioactive metal) will ultimately produce a low therapeutic dose, undesirable

J. Vince DPhil Thesis
43 | P a g e Using Ultrasound to Enhance Targeted Radiotherapy
for this application. However, tailoring the size and distribution of the microspheres to the
proposed procedure, is a foreseeable optimisation for translation of the technology. It could
be argued that the optimal distribution of microspheres would have a separation distance
equal to the or slightly less than the mean depth of beta irradiation from the TheraSphere™
microspheres (2.5mm). However, this assumption is based upon the microspheres being
deposited in a ballistic fashion, which may not occur using cavitation activity as the mechanism
for the microsphere extravasation. Further work is required to define what constitutes the
optimum distribution of microspheres, particularly as the intended cellular target is ‘invisible’.
Producing micro-channels using cavitation tunnelling phenomena, whilst destructive, removes
significantly less tissue than extending the physical or mechanical extent of resection (EoR)
during the surgery. The anticipated microsphere channels produced are necessary collateral
damage, to enable the delivery of the more-selective radiotherapeutic. The volume of tissue
irradiated by the microspheres is expected to be orders of magnitude larger than that of any
additional tissue removed during the process of embedding the radioactive microspheres.
Inertial cavitation activity and associated phenomena have been demonstrated eroding
hydrogel tissue phantoms several times stiffer than that of human brain parenchyma.
Producing extravasation of various therapeutic agents, within a large ultrasound parameter
space. The literature therefore suggests that cavitation should be a feasible mechanism to
facilitate the transport of radioactive glass microspheres, such as those used in TheraSphere™ ,
towards the intra-operative adjuvant treatment of glioblastoma resection margins.
The aims of the thesis are therefore:
• To investigate the feasibility of producing microsphere extravasation in tissue
mimicking material using ultrasound induced cavitation.
• To develop methods for imaging and quantifying the resulting distribution of
microspheres in tissue/tissue phantoms.

J. Vince DPhil Thesis
44 | P a g e Using Ultrasound to Enhance Targeted Radiotherapy
• To identify the ultrasound exposure parameters critical to producing microsphere
extravasation.
• To investigate the mechanisms responsible for the mass transport of microspheres.
• To evaluate whether ultrasound enhanced internal radiation therapy via the
extravasation of radioactive glass microspheres is a plausible treatment modality for
glioblastoma multiforme.

J. Vince DPhil Thesis
45 | P a g e Using Ultrasound to Enhance Targeted Radiotherapy
References
1. Helmberger, T. Overview of selective internal radiation therapy: From work-up to follow-up. Eur. J. Cancer, Suppl. 10, 48–50 (2012).
2. Pasciak, A. S. et al. The number of microspheres in Y90 radioembolization directly affects normal tissue radiation exposure. Eur. J. Nucl. Med. Mol. Imaging 47, 816–827 (2020).
3. Ostrom, Q. T. et al. CBTRUS statistical report: Primary brain and other central nervous system tumors diagnosed in the United States in 2009-2013. Neuro. Oncol. 18, v1–v75 (2016).
4. Gulati, S., Jakola, A. S., Johannesen, T. B. & Solheim, O. Survival and treatment patterns of glioblastoma in the elderly: A population-based study. World Neurosurg. 78, 518–526 (2012).
5. Woehrer, A., Bauchet, L. & Barnholtz-Sloan, J. S. Glioblastoma survival: Has it improved? Evidence from population-based studies. Curr. Opin. Neurol. 27, 666–674 (2014).
6. Weller, M., Cloughesy, T., Perry, J. R. & Wick, W. Standards of care for treatment of recurrent glioblastoma-are we there yet? Neuro. Oncol. 15, 4–27 (2013).
7. Gallego, O. Nonsurgical treatment of recurrent glioblastoma. Curr. Oncol. 22, e273–e281 (2015).
8. Hvizdos, K. M. & Goa, K. L. Temozolomide. 12, 237–243 (1999).
9. Kou, Y., Koag, M. C. & Lee, S. N7 Methylation Alters Hydrogen-Bonding Patterns of Guanine in Duplex DNA. J. Am. Chem. Soc. 137, 14067–14070 (2015).
10. Mao, X. & Shuman, S. Vaccinia virus mRNA (guanine-7-)methyltransferase: Mutational effects on cap methylation and AdoHcy-dependent photo-cross-linking of the cap to the methyl acceptor site. Biochemistry 35, 6900–6910 (1996).
11. Villani, G. Effect of Methylation on the Properties of the H-Bridges in DNA. A Systematic Theoretical Study on the Couples of Base Pairs. J. Phys. Chem. B 119, 7931–7943 (2015).
12. Trifiletti, D. M. et al. Leukoencephalopathy after stereotactic radiosurgery for brain metastases. Int. J. Radiat. Oncol. Biol. Phys. 93, 870–878 (2015).
13. Koncar, R. F. et al. PLK1 inhibition enhances temozolomide efficacy in IDH1 mutant gliomas. Oncotarget 8, 15827–15837 (2017).
14. Thanasupawat, T. et al. Dovitinib enhances temozolomide efficacy in glioblastoma cells. Mol. Oncol. 11, 1078–1098 (2017).
15. Hicks, J. et al. Intratumoral temozolomide in spontaneous canine gliomas: feasibility of a novel therapy using implanted microcylinders. Vet. Med. Sci. 5, 5–18 (2019).
16. Erwin G. Van Meir, PhD, Costas G. Hadjipanayis, MD, PhD, Andrew D. Norden, MD, MPH, Hui-Kuo Shu, MD, Patrick Y. Wen, MD, and Jeffrey J. Olson, M. Exciting New Advances in Neuro-Oncology: The Avenue to a Cure for Malignant Glioma. CA Cancer J Clin. 60, 166–193 (2010).
17. Larson, D. A. et al. Phase II study of high central dose Gamma Knife radiosurgery and marimastat in patients with recurrent malignant glioma. Int. J. Radiat. Oncol. Biol. Phys. 54, 1397–404 (2002).
18. Chaichana, K. L. et al. Risk of surgical site infection in 401 consecutive patients with glioblastoma with and without carmustine wafer implantation. Neurol. Res. 37, 717–726 (2015).
19. Goerig, N. et al. Klinisch relevante CMV-(Re-)Aktivierung während bzw. nach Bestrahlung/Chemotherapie des Gehirns: Korrelation mit neurologischer Verschlechterung und Besserung unter antiviraler Therapie. Strahlentherapie und Onkol. 192, 489–497 (2016).

J. Vince DPhil Thesis
46 | P a g e Using Ultrasound to Enhance Targeted Radiotherapy
20. Ene, C. et al. Safety and efficacy of carmustine (BCNU) wafers for metastatic brain tumors. Surg. Neurol. Int. 7, S295–S299 (2016).
21. Hsieh, J. et al. Tumor progression in patients receiving adjuvant whole-brain radiotherapy vs localized radiotherapy after surgical resection of brain metastases. Neurosurgery 76, 411–420 (2015).
22. LAURA M. KULIK, BASSEL ATASSI, LODEWIJK VAN HOLSBEECK, TAMEEM SOUMAN, ROBERT J. LEWANDOWSKI, MARY F. MULCAHY, RUSSELL D. HUNTER, ALBERT A. NEMCEK JR., MICHAEL M. ABECASSIS, KENNETH G. HAINES III, R. S. Yttrium-90 Microspheres (TheraSphere1) Treatment of Unresectable Hepatocellular Carcinoma: Downstaging to Resection, RFA and Bridge to Transplantation. J. Surg. Oncol. 94, 572–586 (2006).
23. Patel, D. M., Agarwal, N., Tomei, K. L., Hansberry, D. R. & Goldstein, I. M. Optimal Timing of Whole-Brain Radiation Therapy Following Craniotomy for Cerebral Malignancies. World Neurosurg. 84, 412–419 (2015).
24. Tian, Z. M. Stereotactic intracavitary irradiation of huge cystic craniopharyngiomas. Zhonghua Wai Ke Za Zhi 30, 102-103,125 (1992).
25. Idbaih, A. et al. Safety and feasibility of repeated and transient blood-brain barrier disruption by pulsed ultrasound in patients with recurrent glioblastoma. Clin. Cancer Res. 25, 3793–3801 (2019).
26. Nikfarjam, M., Muralidharan, V., Malcontenti-Wilson, C. & Christophi, C. Scanning electron microscopy study of the blood supply of human colorectal liver metastases. Eur. J. Surg. Oncol. 29, 856–861 (2003).
27. Kickingereder, P. et al. Low-dose rate stereotactic iodine-125 brachytherapy for the treatment of inoperable primary and recurrent glioblastoma: single-center experience with 201 cases. J. Neurooncol. 120, 615–623 (2014).
28. Hadi, I. et al. Radiation necrosis after a combination of external beam radiotherapy and iodine-125 brachytherapy in gliomas. Radiat. Oncol. 16, 1–9 (2021).
29. Parplys, A. C., Petermann, E., Petersen, C., Dikomey, E. & Borgmann, K. DNA damage by X-rays and their impact on replication processes. Radiother. Oncol. 102, 466–471 (2012).
30. Lomax, M. E., Folkes, L. K. & O’Neill, P. Biological consequences of radiation-induced DNA damage: Relevance to radiotherapy. Clin. Oncol. 25, 578–585 (2013).
31. Harper, J. V., Anderson, J. A. & O’Neill, P. Radiation induced DNA DSBs: Contribution from stalled replication forks? DNA Repair (Amst). 9, 907–913 (2010).
32. Thompson, L. H. Recognition, signaling, and repair of DNA double-strand breaks produced by ionizing radiation in mammalian cells: The molecular choreography. Mutat. Res. - Rev. Mutat. Res. 751, 158–246 (2012).
33. Caine, M. et al. Impact of Yttrium-90 Microsphere Density, Flow Dynamics, and Administration Technique on Spatial Distribution: Analysis Using an In Vitro Model. J. Vasc. Interv. Radiol. 28, 260-268.e2 (2017).
34. Gomaa, A. I., Khan, S. A., Toledano, M. B., Waked, I. & Taylor-Robinson, S. D. Hepatocellular carcinoma: Epidemiology, risk factors and pathogenesis. World J. Gastroenterol. 14, 4300–4308 (2008).
35. Eisenhauer, E. A. et al. New response evaluation criteria in solid tumours: Revised RECIST guideline (version 1.1). Eur. J. Cancer 45, 228–247 (2009).
36. Eisenbrey, J. R. et al. Sensitization of Hypoxic Tumors to Radiation Therapy Using Ultrasound-Sensitive Oxygen Microbubbles. Int. J. Radiat. Oncol. Biol. Phys. 101, 88–96 (2018).
37. Savage, A. E. O. United States Patent 5011677. vol. 19 (1985).
38. Hawkins, C. M., Kukreja, K., Geller, J. I., Schatzman, C. & Ristagno, R. Radioembolisation for treatment of pediatric hepatocellular carcinoma. Pediatr. Radiol. 43, 876–881 (2013).
39. Pei, X. Q. et al. Contrast-enhanced ultrasonography of hepatocellular carcinoma: Correlation between quantitative parameters and histological grading. Br. J. Radiol. 85, (2012).
40. Rossi, P. et al. X-rays Compton detectors for Biomedical application. AIP Conf. Proc. 1336, 356–360 (2011).
41. Mazaki, H., Nagatomo, T. & Shimizu, S. Effect of pressure on the decay constant of Tc99m. Phys. Rev. C 5, 1718–1724 (1972).

J. Vince DPhil Thesis
47 | P a g e Using Ultrasound to Enhance Targeted Radiotherapy
42. Abeles, R. D. et al. Multiple organ dysfunction syndrome (MODS), rather than the need for renal replacement therapy per se, dictates poor prognosis in patients with cirrhosis admitted to ICU. J Hepatol 56, S263–S264 (2012).
43. Kennedy, A. S., Nutting, C., Coldwell, D., Gaiser, J. & Drachenberg, C. Pathologic response and microdosimetry of 90Y microspheres in man: Review of four explanted whole livers. Int. J. Radiat. Oncol. 60, 1552–1563 (2004).
44. Sofocleous, C. T. et al. Phase i trial of selective internal radiation therapy for chemorefractory colorectal cancer liver metastases progressing after hepatic arterial pump and systemic chemotherapy. Clin. Colorectal Cancer 13, 27–36 (2014).
45. Gordon, A. C. Tuning Your RADIOembolization : Imaging-guidance of Yttrium-90 Radioembolization. (Evanson, Illinois, 2016).
46. Nezami, N. et al. Y90 radioembolization dosimetry using a simple semi-quantitative method in intrahepatic cholangiocarcinoma: Glass versus resin microspheres. Nucl. Med. Biol. 59, 22–28 (2018).
47. Attarwala, A. A. et al. Quantitative and qualitative assessment of yttrium-90 pet/ct imaging. J. Am. Ceram. Soc. 61, 247–249 (1978).
48. Wang, L. M., Jani, A. R., Hill, E. J. & Sharma, R. A. Anatomical basis and histopathological changes resulting from selective internal radiotherapy for liver metastases. J. Clin. Pathol. 66, 205–211 (2013).
49. Pellerin, O., Lin, M., Bhagat, N., Shao, W. & Geschwind, J.-F. Can C-Arm Cone-Beam CT Detect a Micro-Embolic Effect After TheraSphere Radioembolization of Neuroendocrine and Carcinoid Liver Metastasis? Cancer Biother. Radiopharm. 28, 459–465 (2013).
50. Vouche, M. et al. Unresectable solitary hepatocellular carcinoma not amenable to radiofrequency ablation: Multicenter radiology-pathology correlation and survival of radiation segmentectomy. Hepatology 60, 192–201 (2014).
51. Refaat, R. & Hassan, M. S. The relationship between the percentage of lung shunting on Tc-99m macroaggregated albumin (Tc-99m MAA) scan and the grade of hepatocellular carcinoma vascularity. Egypt. J. Radiol. Nucl. Med. 45, 333–342 (2014).
52. Dai, S. K., Wu, Y. C., Jan, Y. J. & Lin, S. C. The histological grading of HCC using fusion images. 2009 IEEE Int. Conf. Comput. Intell. Meas. Syst. Appl. CIMSA 2009 1, 186–189 (2009).
53. McKeown, S. R. Defining normoxia, physoxia and hypoxia in tumours—implications for treatment response. Br. J. Radiol. 87, 20130676 (2014).
54. Kwan, J. J. et al. Ultrasound-Propelled Nanocups for Drug Delivery. Small 11, 5305–5314 (2015).
55. William D. Callister, J. with special contributions by D. G. R. Materials science and engineering: an introduction. (New York: John Wiley & Sons, 2007).
56. Wells, P. N. T. & Liang, H. Medical Ultrasound - imaging of soft tissue strain and elasticity. J. R. Soc. Interface 8, 1521–1549 (2011).
57. Hoogenboom, M. et al. Mechanical High-Intensity Focused Ultrasound Destruction of Soft Tissue: Working Mechanisms and Physiologic Effects. Ultrasound Med. Biol. 41, 1500–1517 (2015).
58. Hsiao, Y. S., Kumon, R. E. & Deng, C. X. Characterization of lesion formation and bubble activities during high-intensity focused ultrasound ablation using temperature-derived parameters. Infrared Phys. Technol. 60, 108–117 (2013).
59. Dewhirst, M. W., Viglianti, B. L., Lora-Michiels, M., Hanson, M. & Hoopes, P. J. Basic principles of thermal dosimetry and thermal thresholds for tissue damage from hyperthermia. Int. J. Hyperthermia 19, 267–94 (2003).
60. Dewey, W. C., Hopwood, L. E., Sapareto, S. A. & Gerweck, L. E. Cellular responses to combinations of hyperthermia and radiation. Radiology 123, 463–74 (1977).
61. Moyer, L. C. et al. High-intensity focused ultrasound ablation enhancement in vivo via phase-shift nanodroplets compared to microbubbles. J. Ther. Ultrasound 3, 1–9 (2015).
62. Yarmolenko, P. S. et al. Thresholds for thermal damage to normal tissues: An update. Int. J. Hyperth. 27,

J. Vince DPhil Thesis
48 | P a g e Using Ultrasound to Enhance Targeted Radiotherapy
320–343 (2011).
63. Canney, M. S., Khokhlova, V. A., Bessonova, O. V., Bailey, M. R. & Crum, L. A. Shock-Induced Heating and Millisecond Boiling in Gels and Tissue Due to High Intensity Focused Ultrasound. Ultrasound Med. Biol. 36, 250–267 (2010).
64. Parsons, J. E., Cain, C. A., Abrams, G. D. & Fowlkes, J. B. Pulsed cavitational ultrasound therapy for controlled tissue homogenization. Ultrasound Med. Biol. 32, 115–129 (2006).
65. Engle, K. M.; Mei, T-S.; Wasa, M.; Yu, J.-Q. Development and Translation of Histotripsy: Current Status and Future Directions. Curr Opin Urol. 24, 104–110 (2014).
66. Roos, S. T. et al. Unexpected High Incidence of Coronary Vasoconstriction in the Reduction of Microvascular Injury Using Sonolysis (ROMIUS) Trial. Ultrasound Med. Biol. 42, 1919–1928 (2016).
67. Sheng, Y. et al. Magnetically responsive microbubbles as delivery vehicles for targeted sonodynamic and antimetabolite therapy of pancreatic cancer. J. Control. Release 262, 192–200 (2017).
68. Lake, A. M. et al. Histotripsy: Minimally Invasive Technology for Prostatic Tissue Ablation in an In vivo Canine Model. Urology 72, 682–686 (2008).
69. Shi, J., Zhang, X., Chen, R. & Zhang, G. Acoustic radiation force of a solid elastic sphere immersed in a cylindrical cavity filled with ideal fluid. Wave Motion 80, 37–46 (2018).
70. Sadeghi, S., Lin, C. Y. & Cortes, D. H. Narrowband Shear Wave Generation Using Sinusoidally-Modulated Acoustic Radiation Force. IEEE Trans. Ultrason. Ferroelectr. Freq. Control 66, 264–272 (2018).
71. Dadakova, T., Krafft, A. J., Özen, A. C. & Bock, M. Optimization of acoustic radiation force imaging: Influence of timing parameters on sensitivity. Magn. Reson. Med. 79, 981–986 (2018).
72. Leighton, T. G., Walton, A. J. & Pickworth, M. J. W. Primary Bjerknes forces. Eur. J. Phys. 11, 47–50 (1990).
73. Marin, A. et al. Three-Dimensional Phenomena in Microbubble Acoustic Streaming. Phys. Rev. Appl. 3, 1–5 (2015).
74. El Ghamrawy, A. et al. Acoustic Streaming in a Soft Porous Material. Ultrasound Med. Biol. 00, 1–10 (2018).
75. Khelif, A., Vasseur, J. O., Lambin, P., Djafari-Rouhani, B. & Deymier, P. A. Theory of acoustic scattering by supported ridges at a solid-liquid interface. Phys. Rev. E - Stat. Physics, Plasmas, Fluids, Relat. Interdiscip. Top. 65, 1–7 (2002).
76. Nyborg, W. L. M. Acoustic Streaming. Physical Acoustics vol. 2 (ACADEMIC PRESS INC., 1965).
77. Bader, K. B., Vlaisavljevich, E. & Maxwell, A. D. For Whom the Bubble Grows: Physical Principles of Bubble Nucleation and Dynamics in Histotripsy Ultrasound Therapy. Ultrasound Med. Biol. 45, 1056–1080 (2019).
78. Borkent, B. M., Gekle, S., Prosperetti, A. & Lohse, D. Nucleation threshold and deactivation mechanisms of nanoscopic cavitation nuclei. Phys. Fluids 21, (2009).
79. Atchley, A. A. & Prosperetti, A. The crevice model of bubble nucleation. J. Acoust. Soc. Am. 86, 1065–1084 (1989).
80. Jones, S. F., Evans, G. M. & Galvin, K. P. Bubble nucleation from gas cavities - A review. Adv. Colloid Interface Sci. 80, 27–50 (1999).
81. Versluis, M. Nonlinear behavior of ultrasound contrast agent microbubbles and why shell buckling matters. Proc. 20th Int. Congr. Acoust. 1–6 (2010).
82. Samarasinghe, S. Increasing the nonlinear character of microbubble oscillations at low acoustic pressures. 807–811 (2008) doi:10.1098/rsif.2008.0005.
83. Paul, S. et al. Material characterization of the encapsulation of an ultrasound contrast microbubble and its subharmonic response: Strain-softening interfacial elasticity model. J. Acoust. Soc. Am. 127, 3846–3857 (2010).
84. Abou-Saleh, R. H. et al. The influence of intercalating perfluorohexane into lipid shells on nano and microbubble stability. Soft Matter 12, 7223–7230 (2016).
85. Kwan, J. J. et al. Ultrahigh-Speed Dynamics of Micrometer-Scale Inertial Cavitation from Nanoparticles.

J. Vince DPhil Thesis
49 | P a g e Using Ultrasound to Enhance Targeted Radiotherapy
Phys. Rev. Appl. 6, 1–8 (2016).
86. Leighton, T. G. The Forced Bubble. Acoust. Bubble 287–438 (1994) doi:10.1016/b978-0-12-441920-9.50009-2.
87. Leighton, T. G. Cavitation Inception and Fluid Dynamics. Acoust. Bubble 67–128 (1994) doi:10.1016/b978-0-12-441920-9.50007-9.
88. Meng, Y. et al. Safety and efficacy of focused ultrasound induced blood-brain barrier opening, an integrative review of animal and human studies. J. Control. Release 309, 25–36 (2019).
89. Scott, D. J. et al. Development of an In vivo Tumor-Mimic Model for Learning Radiofrequency Ablation. J. Gastrointest. Surg. 4, 620–625 (2000).
90. MAuri, G. A. et al. Focused ultrasound: tumour ablation and its potential to enhance immunological therapy to cancer. Br. J. Radiol. 91, (2018).
91. Cha, G. D. et al. Advances in drug delivery technology for the treatment of glioblastoma multiforme. J. Control. Release 328, 350–367 (2020).
92. Tran, B. C. et al. Microbubble-Enhanced Cavitation for Noninvasive Ultrasound Surgery. IEEE Trans. Ultrason. Ferroelectr. Freq. Control 50, 1296–1304 (2003).
93. Eisenbrey, J. R. et al. Development of an ultrasound sensitive oxygen carrier for oxygen delivery to hypoxic tissue. Int. J. Pharm. 478, 361–367 (2015).
94. Song, J. H., Moldovan, A. & Prentice, P. Non-linear Acoustic Emissions from Therapeutically Driven Contrast Agent Microbubbles. Ultrasound Med. Biol. (2019) doi:10.1016/j.ultrasmedbio.2019.04.005.
95. Gu, Y. et al. Harmonic responses and cavitation activity of encapsulated microbubbles coupled with magnetic nanoparticles. Ultrason. Sonochem. 29, 309–316 (2016).
96. Mannaris, C. et al. Microbubbles, Nanodroplets and Gas-Stabilizing Solid Particles for Ultrasound-Mediated Extravasation of Unencapsulated Drugs: An Exposure Parameter Optimization Study. Ultrasound Med. Biol. 00, 1–14 (2019).
97. Kwan, J. J. et al. Ultrasound-induced inertial cavitation from gas-stabilizing nanoparticles. Phys. Rev. E - Stat. Nonlinear, Soft Matter Phys. 92, 1–5 (2015).
98. Borrelli, M. J. et al. Production of uniformly sized serum albumin and dextrose microbubbles. Ultrason. Sonochem. 19, 198–208 (2012).
99. Bailey, M. R. et al. Cavitation detection during shock-wave lithotripsy. Ultrasound Med. Biol. 31, 1245–1256 (2005).
100. Kyriakou, Z., Corral-Baques, M. I., Amat, A. & Coussios, C. C. HIFU-Induced Cavitation and Heating in Ex Vivo Porcine Subcutaneous Fat. Ultrasound Med. Biol. 37, 568–579 (2011).
101. Xu, Q., Holland, C. K. & Apfel, R. E. Measurement of cavitation thresholds for human blood. J. Acoust. Soc. Am. 91, 2432–2432 (1992).
102. Brujan, E. A. The role of cavitation microjets in the therapeutic applications of ultrasound. Ultrasound Med. Biol. 30, 381–387 (2004).
103. T. G. LEIGHTON. The Acoustic Bubble. J. Fluid Mech. 272, 407–409 (1994).
104. Loglio, G., Pandolfini, P., Liggieri, L., Makievski, A. & Ravera, F. Determination of Interfacial Properties by the Pendant Drop Tensiometry: Optimisation of Experimental and Calculation Procedure. Bubble Drop Interfaces 7 (2011).
105. Swanson, E. J., Mohan, V., Kheir, J. & Borden, M. A. Phospholipid-stabilized microbubble foam for injectable oxygen delivery. Langmuir 26, 15726–15729 (2010).
106. Needham, D. & Kim, D. H. PEG-covered lipid surfaces: Bilayers and monolayers. Colloids Surfaces B Biointerfaces 18, 183–195 (2000).
107. Kwan, J. J. & Borden, M. A. Lipid monolayer collapse and microbubble stability. Adv. Colloid Interface Sci. 183–184, 82–99 (2012).

J. Vince DPhil Thesis
50 | P a g e Using Ultrasound to Enhance Targeted Radiotherapy
108. van Rooij, T. et al. Non-linear Response and Viscoelastic Properties of Lipid-Coated Microbubbles: DSPC versus DPPC. Ultrasound Med. Biol. 41, 1432–1445 (2015).
109. Nittayacharn, P. et al. Enhancing Tumor Drug Distribution With Ultrasound-Triggered Nanobubbles. J. Pharm. Sci. (2019) doi:10.1016/j.xphs.2019.05.004.
110. Garg, S., Thomas, A. A. & Borden, M. A. The effect of lipid monolayer in-plane rigidity on invivo microbubble circulation persistence. Biomaterials 34, 6862–6870 (2013).
111. Sheng, Y. et al. Magnetically responsive microbubbles as delivery vehicles for targeted sonodynamic and antimetabolite therapy of pancreatic cancer. J. Control. Release 262, 192–200 (2017).
112. Guo, X., Li, Q., Zhang, Z., Zhang, D. & Tu, J. Investigation on the inertial cavitation threshold and shell properties of commercialized ultrasound contrast agent microbubbles. J. Acoust. Soc. Am. 134, 1622–1631 (2013).
113. Owen, J. et al. Understanding the Structure and Mechanism of Formation of a New Magnetic Microbubble Formulation. Theranostics 2, 1127–1139 (2012).
114. Mulvana, H., Stride, E., Tang, M. X., Hajnal, J. V. & Eckersley, R. J. The Influence of Gas Saturation on Microbubble Stability. Ultrasound Med. Biol. 38, 1097–1100 (2012).
115. Kratskin, I. L., Yu, X. & Doty, R. L. “Stable” Inertial Cavitation Charles. Ultrasound Med. Biol. 44, 199–203 (1997).
116. Wu, J. & Nyborg, W. L. Ultrasound, cavitation bubbles and their interaction with cells. Adv. Drug Deliv. Rev. 60, 1103–1116 (2008).
117. Bian, S., Seth, A., Daly, D., Carlisle, R. & Stride, E. A multimodal instrument for real-time in situ study of ultrasound and cavitation mediated drug delivery. Rev. Sci. Instrum. 88, (2017).
118. Prokop, A. F., Soltani, A. & Roy, R. A. Cavitational Mechanisms in Ultrasound-Accelerated Fibrinolysis. Ultrasound Med. Biol. 33, 924–933 (2007).
119. Bazan-Peregrino, M. et al. Cavitation-enhanced delivery of a replicating oncolytic adenovirus to tumors using focused ultrasound. J. Control. Release 169, 40–47 (2013).
120. Lv, H. et al. Facile Fabrication of Monodisperse Polymer Hollow Spheres. Langmuir 24, 13736–13741 (2008).
121. Vlaisavljevich, E., Durmaz, Y. Y., Maxwell, A., ElSayed, M. & Xu, Z. Nanodroplet-mediated histotripsy for image-guided targeted ultrasound cell ablation. Theranostics 3, 851–864 (2013).
122. Hannah, A. S., Luke, G. P. & Emelianov, S. Y. Blinking phase-change nanocapsules enable background-free ultrasound imaging. Theranostics 6, 1866–1876 (2016).
123. Lee, J. Y. et al. Nanoparticle-Loaded Protein-Polymer Nanodroplets for Improved Stability and Conversion Efficiency in Ultrasound Imaging and Drug Delivery. Adv. Mater. 27, 5484–5492 (2015).
124. Lee, J. Y. et al. Ultrasound-Enhanced siRNA Delivery Using Magnetic Nanoparticle-Loaded Chitosan-Deoxycholic Acid Nanodroplets. Adv. Healthc. Mater. 6, (2017).
125. Kasoji, S. K. et al. Cavitation enhancing nanodroplets mediate efficient DNA fragmentation in a bench top ultrasonic water bath. PLoS One 10, (2015).
126. Lee, J. Y. et al. Nanoparticle-Loaded Protein-Polymer Nanodroplets for Improved Stability and Conversion Efficiency in Ultrasound Imaging and Drug Delivery. Adv. Mater. 27, 5484–5492 (2015).
127. Paris, J. L. et al. Ultrasound-mediated cavitation-enhanced extravasation of mesoporous silica nanoparticles for controlled-release drug delivery. Chem. Eng. J. 340, 2–8 (2018).
128. Kaur, S., Prasad, C., Balakrishnan, B. & Banerjee, R. Trigger responsive polymeric nanocarriers for cancer therapy. Biomater. Sci. 3, 955–987 (2015).
129. Mo, S. et al. Increasing the density of nanomedicines improves their ultrasound-mediated delivery to tumours. J. Control. Release 210, (2015).
130. McLaughlan, J. R., Cowell, D. M. J. & Freear, S. Gold nanoparticle nucleated cavitation for enhanced high intensity focused ultrasound therapy. Phys. Med. Biol. 63, (2018).

J. Vince DPhil Thesis
51 | P a g e Using Ultrasound to Enhance Targeted Radiotherapy
131. Yoon, Y. Il, Pang, X., Jung, S., Zhang, G. & Kong, M. Smart gold nanoparticle-stabilized ultrasound microbubbles as cancer theranostics. 3235–3239 (2018) doi:10.1039/c8tb00368h.
132. Crum, L. A. Acoustic Cavitation Series: Part Five Rectified diffusion. Ultrasonics 22, 215–223 (1984).
133. Choi, J. J. & Coussios, C.-C. Spatiotemporal evolution of cavitation dynamics exhibited by flowing microbubbles during ultrasound exposure. J. Acoust. Soc. Am. 132, 3538–3549 (2012).
134. Myers, R. et al. Polymeric cups for cavitation-mediated delivery of oncolytic vaccinia virus. Mol. Ther. 24, (2016).
135. Park, K. Targeted delivery nano/micro particles to inflamed intestinal mucosa in human. J. Control. Release 165, 162 (2013).
136. Meng, J., Mei, D., Jia, K., Fan, Z. & Yang, K. Contactless and non-invasive delivery of micro-particles lying on a non-customized rigid surface by using acoustic radiation force. Ultrasonics 54, 1350–1357 (2014).
137. Yu, F. et al. Enteric-coated capsules filled with mono-disperse micro-particles containing PLGA-lipid-PEG nanoparticles for oral delivery of insulin. Int. J. Pharm. 484, 181–191 (2015).
138. Guiot, C. et al. Temperature monitoring using ultrasound contrast agents: In vitro investigation on thermal stability. Ultrasonics 42, 927–930 (2004).
139. Stride, E. P. & Coussios, C. C. Cavitation and contrast: The use of bubbles in ultrasound imaging and therapy. Proc. Inst. Mech. Eng. Part H J. Eng. Med. 224, 171–191 (2010).
140. Shevchenko, S. N. et al. Antimicrobial Effect of Biocompatible Silicon Nanoparticles Activated Using Therapeutic Ultrasound. Langmuir 33, 2603–2609 (2017).
141. Chu, X. et al. Exploration of TiO 2 nanoparticle mediated microdynamic therapy on cancer treatment. Nanomedicine Nanotechnology, Biol. Med. 18, 272–281 (2019).
142. Beranek, L. L. Handbook of Acoustics. American Journal of Physics vol. 77 (Business Media, New York, 2009).
143. Benjamin, T. B. ; Ellis, A. T. The Collapse of Cavitation Bubbles and the Pressures thereby Produced against Solid Boundaries. Philos. Trans. R. Soc. London. Ser. A, Math. Phys. Sci. 260, 221–240 (1966).
144. Shao, J. L., Wang, P. & He, A. M. Influence of shock pressure and profile on the microjetting from a grooved Pb surface. Model. Simul. Mater. Sci. Eng. 25, 1–19 (2017).
145. Goeller, J., Wardlaw, A., Treichler, D., O’Bruba, J. & Weiss, G. Investigation of Cavitation as a Possible Damage Mechanism in Blast-Induced Traumatic Brain Injury. J. Neurotrauma 29, 1970–1981 (2012).
146. Labbaf, S. et al. An encapsulated drug delivery system for recalcitrant urinary tract infection. J. R. Soc. Interface 10, (2013).
147. Culjat, M. O., Goldenberg, D., Tewari, P. & Singh, R. S. A review of tissue substitutes for ultrasound imaging. Ultrasound Med. Biol. 36, 861–873 (2010).
148. Mano, J. F. Designing biomaterials for tissue engineering based on the deconstruction of the native cellular environment. Mater. Lett. 141, 198–202 (2015).
149. Chanda, A., Callaway, C., Clifton, C. & Unnikrishnan, V. Biofidelic human brain tissue surrogates. Mech. Adv. Mater. Struct. 0, 1–7 (2016).
150. Yoon, H. J. et al. Cold water fish gelatin methacryloyl hydrogel for tissue engineering application. PLoS One 11, (2016).
151. Lea-Banks, H., Stride, E. & Coussios, C. C. Ultrasound-mediated transport of nanoparticles and the influence of particle density. University of Oxford (2016). doi:10.1121/1.4950210.
152. Li, T. et al. Pulsed high-intensity focused ultrasound enhances delivery of doxorubicin in a preclinical model of pancreatic cancer. Cancer Res. 75, 3738–3746 (2015).
153. Beguin, E. & Stride, E. SONODYNAMIC THERAPY OF HYPOXIC TUMOURS PRS Transfer Report. (2016).
154. Miller, D. L. & Quddus, J. Diagnostic ultrasound activation of contrast agent gas bodies induces capillary rupture in mice. Proc. Natl. Acad. Sci. U. S. A. 97, 10179–84 (2000).

J. Vince DPhil Thesis
52 | P a g e Using Ultrasound to Enhance Targeted Radiotherapy
155. Price, R. J., Skyba, D. M., Kaul, S. & Skalak, T. C. Delivery of colloidal particles and red blood cells to tissue through microvessel ruptures created by targeted microbubble destruction with ultrasound. Circulation 98, 1264–7 (1998).
156. Stieger, S. M. et al. Enhancement of vascular permeability with low-frequency contrast-enhanced ultrasound in the chorioallantoic membrane model. Radiology 243, 112–21 (2007).
157. Caskey, C. F., Qin, S., Dayton, P. A. & Ferrara, K. W. Microbubble tunneling in gel phantoms. J. Acoust. Soc. Am. 125, EL183 (2009).
158. Sukovich, J. R. et al. Temporally and spatially resolved imaging of laser-nucleated bubble cloud sonoluminescence. Phys. Rev. E - Stat. Nonlinear, Soft Matter Phys. 85, 3–6 (2012).
159. Edsall, C. et al. Bubble Cloud Behavior and Ablation Capacity for Histotripsy Generated from Intrinsic or Artificial Cavitation Nuclei. Ultrasound Med. Biol. 47, 620–639 (2021).
160. Lu, Y., Katz, J. & Prosperetti, A. Dynamics of cavitation clouds within a high-intensity focused ultrasonic beam. Phys. Fluids 25, (2013).
161. Caskey, C. F., Stieger, S. M., Qin, S., Dayton, P. A. & Ferrara, K. W. Direct observations of ultrasound microbubble contrast agent interaction with the microvessel wall. J. Acoust. Soc. Am. 122, 1191–1200 (2007).
162. Gerold, B., Rachmilevitch, I. & Prentice, P. Bifurcation of ensemble oscillations and acoustic emissions from early stage cavitation clouds in focused ultrasound. New J. Phys. 15, (2013).
163. Kallini, J. R. et al. Comparison of the Adverse Event Profile of TheraSphere ® with SIR-Spheres ® for the Treatment of Unresectable Hepatocellular Carcinoma: A Systematic Review. Cardiovasc. Intervent. Radiol. 40, 1033–1043 (2017).
164. Carlos, J., Vega, D. La, Esquinas, P. L., Rodríguez-rodríguez, C. & Bokharaei, M. Radioembolization of Hepatocellular Carcinoma with Built-In Dosimetry : First in vivo Results with Uniformly-Sized , Biodegradable Microspheres Labeled with 188 Re. Theranostics 9, 868–883 (2019).
165. Jakobs, T. Selective internal radiation therapy for other liver metastases. Eur. J. Cancer, Suppl. 10, 72–74 (2012).
166. Tchelebi, L. & Sharma, N. K. Selective Internal Radiation Therapy in the Multidisciplinary Management of Liver Metastases From Colorectal Carcinoma. Seminars in Nuclear Medicine (2019) doi:10.1053/j.semnuclmed.2019.01.002.
167. Pereira, P. L. FRI-03 Intraarterial therapies: SIRT or TACE. Dig. Liver Dis. 45, S241–S242 (2013).
168. Tchelebi, L. & Sharma, N. K. Selective Internal Radiation Therapy in the Multidisciplinary Management of Liver Metastases From Colorectal Carcinoma. Semin. Nucl. Med. doi:S000129981930008X.
169. Grabowski, S. F. et al. The Efficacy of Selective Internal Radiation Therapy (SIRT) With Yttrium-90 (Y90) is Enhanced When Given in Low Volume Disease and in Conjunction With Other Liver-Directed Therapies. Int. J. Radiat. Oncol. 81, S353–S354 (2011).
170. Kloeckner, R. et al. Selective internal radiotherapy (SIRT) versus transarterial chemoembolization (TACE) for the treatment of intrahepatic cholangiocellular carcinoma (CCC): Study protocol for a randomized controlled trial. Trials 15, 1–7 (2014).
171. Wright, G. P. et al. Liver Resection After Selective Internal Radiation Therapy with Yttrium-90 is Safe and Feasible: A Bi-institutional Analysis. Ann. Surg. Oncol. 24, 906–913 (2017).
172. Lyon, P. C. et al. Long-term radiological and histological outcomes following selective internal radiation therapy to liver metastases from breast cancer. Radiol. Case Reports 13, 1259–1266 (2018).
173. Quadri, S. M. et al. Preclinical evaluation of intravenously administered 111in- and 90y-labeled b72.3 immunoconjugate (GYK-DTPA) in beagle dogs. Nucl. Med. Biol. 20, 559–570 (1993).
174. Plöckinger, U. & Wiedenmann, B. Management of metastatic endocrine tumours. Best Pract. Res. Clin. Gastroenterol. 19, 553–576 (2005).
175. Krug, S. et al. Successful selective internal radiotherapy (SIRT) in a patient with a malignant solid pseudopapillary pancreatic neoplasm (SPN). Pancreatology 12, 423–427 (2012).

J. Vince DPhil Thesis
53 | P a g e Using Ultrasound to Enhance Targeted Radiotherapy
176. Attarwala, A. A. et al. Quantitative and qualitative assessment of yttrium-90 pet/ct imaging. PLoS One 9, 1–7 (2014).
177. Formenti, S. C. & Demaria, S. Combining radiotherapy and cancer immunotherapy: A paradigm shift. J. Natl. Cancer Inst. 105, 256–265 (2013).
178. Burnette, B., Fu, Y.-X. & Weichselbaum, R. R. The confluence of radiotherapy and immunotherapy. Front. Oncol. 2, 1–8 (2012).
179. Dillehay, L. E. et al. Use of bremsstrahlung radiation to monitor y‐90 tumor and whole body activities during experimental radioimmunotherapy in mice. Cancer 73, 945–950 (1994).
180. Schäffer, M. et al. Differential expression of inflammatory mediators in radiation-impaired wound healing. J. Surg. Res. 107, 93–100 (2002).
181. Ter Haar, G. Therapeutic ultrasound. in European Journal of Ultrasound vol. 9 3–9 (1999).
182. Crezee, H. et al. Thermoradiotherapy planning: Integration in routine clinical practice. Int. J. Hyperth. 32, 41–49 (2016).
183. Tsilimigras, D. I. et al. Prognosis After Resection of Barcelona Clinic Liver Cancer (BCLC) Stage 0, A, and B Hepatocellular Carcinoma: A Comprehensive Assessment of the Current BCLC Classification. Ann. Surg. Oncol. 26, 3693–3700 (2019).
184. Van Rhoon, G. C. et al. CEM43°C thermal dose thresholds: A potential guide for magnetic resonance radiofrequency exposure levels? Eur. Radiol. 23, 2215–2227 (2013).
185. Singh, S. K. et al. Identification of human brain tumour initiating cells. Nature 432, 396–401 (2004).
186. Gimple, R. C., Bhargava, S., Dixit, D. & Rich, J. N. Glioblastoma stem cells: Lessons from the tumor hierarchy in a lethal cancer. Genes Dev. 33, 591–609 (2019).
187. Xie, Y. et al. The Human Glioblastoma Cell Culture Resource: Validated Cell Models Representing All Molecular Subtypes. EBioMedicine 2, 1351–1363 (2015).
188. Yang, W. et al. Sex differences in GBM revealed by analysis of patient imaging, transcriptome, and survival data. Sci. Transl. Med. 11, 1–15 (2019).
189. Galli, R. et al. Erratum: Isolation and characterization of tumorigenic, stem-like neural precursors from human glioblastoma (Cancer Research (October 2004) 64 (7011-7021). Cancer Res. 64, 8130 (2004).
190. Reifenberger, G., Wirsching, H. G., Knobbe-Thomsen, C. B. & Weller, M. Advances in the molecular genetics of gliomas-implications for classification and therapy. Nat. Rev. Clin. Oncol. 14, 434–452 (2017).
191. Garcia, C. A. et al. Functional characterization of brain tumor-initiating cells and establishment of GBM preclinical models that incorporate heterogeneity, therapy, and sex differences. Mol. Cancer Ther. 20, 2585–2597 (2021).
192. Trifiletti, D. M. et al. Prognostic Implications of Extent of Resection in Glioblastoma: Analysis from a Large Database. World Neurosurg. 103, 330–340 (2017).
193. Sun, T. et al. Sexually dimorphic RB inactivation underlies mesenchymal glioblastoma prevalence in males. J. Clin. Invest. 124, 4123–4133 (2014).
194. Hiraki, T. et al. Application of Genome-Wide DNA Methylation Analysis to Differentiate a Case of Radiation-Induced Glioblastoma From Late-Relapsed Medulloblastoma. J. Neuropathol. Exp. Neurol. 80, 552–557 (2021)

J. Vince DPhil Thesis
54 | P a g e Using Ultrasound to Enhance Targeted Radiotherapy
CHAPTER 2
In Vitro Extravasation of Glass Microspheres in
Hydrogel Cavities

J. Vince DPhil Thesis
55 | P a g e Using Ultrasound to Enhance Targeted Radiotherapy
2. In Vitro Extravasation of Glass Microspheres in Hydrogel
Cavities
Summary
Whilst it has been demonstrated that the extravasation of particles with diameters in the 50-
500nm range can be enhanced using focused ultrasound, this has not been shown for particles
in the micrometre range. The aim of this chapter is therefore to investigate the feasibility of
ultrasound-induced extravasation of microspheres, with diameters of 5-100 µm for SIRT
applications. Focussing on microspheres within this size range would be comparable to that of
the commercially available TheraSphere® product, enabling faster technological translation
should the technology platform be suitable. The design and fabrication of the required
apparatus and development of the analytical methods used are described. The results are then
presented and discussed.
2.1. Introduction
As described in Chapter 1, GBM is a particularly aggressive and persistent form of cancer which
manifests as primary and secondary lower grade gliomas1. GBM cells are highly invasive and
migrate quickly, producing metachronous lesions with the rapid growth of the disease, with
undetectable individual cancerous cells extending into within otherwise healthy parenchyma2.
Current treatments are palliative and aimed at minimising loss of brain function, and
maintaining patient quality of life as the disease progresses3–7. Single tumour volumes can vary
widely due to location and rate of disease progression, medium size tumours (30-40 cm3) are
common8 but cases of particularly large tumours (>100 cm3) are not infrequent9.

J. Vince DPhil Thesis
56 | P a g e Using Ultrasound to Enhance Targeted Radiotherapy
2.1.1. Ultrasonic Aspiration for Tumour Resection
Complete removal of the rapidly growing tumour via resection, is technically challenging; with
an improved survival rate only observed above a 98% extent of resection (EOR)25. Current
medical devices include that of ultrasonic aspirators which use the displacement of the
ultrasonic horns tip to erode the tissue directly in front of the tip, analogues to that of a
pneumatic burr but with less mechanical feedback to the surgeon26. Tips are interchangeable,
with different burr designs suited to different tissue stiffness, from bone through to brain with
irrigation to aid in the removal of the homogenised debris.
Whilst the removal of soft tissue is straightforward, determining which tissue to remove
remains a diagnostic challenge for most indications. Whilst cancerous tissue is stiffer than
healthy parenchyma, tissue densities vary more between different tissue and organs than
between healthy or diseased tissue. Fortunately in the case of GBM, 5-aminolevulinic dye (5-
ALA) offers real-time visualisation of distinction between the two adjacent tissues27–29. Whilst
delivered systemically, 5-ALA metabolism results in the accumulation of fluorescent
protporphyrin IX molecule, solely within cancerous tumour cells causing the cancerous brain
cells to selectively fluoresce under external excitation27. This enables the surgeon to
confidently extend the resection intraoperatively, beyond what is currently visible in
preoperative planning via MRI and CT5,28. All existing feeding vasculature is cauterised prior to
mechanical erosion, to prevent further blood loss to the patient during the procedure. The
cavity produced by ultrasonic erosion is then thoroughly irrigated with saline and aspirated
repeatedly to clear the resection cavity of any emulsified tissue remaining. Despite this
extensive protocol, true comprehensive resection remains unlikely due to the extreme level of
cellular infiltration by the disease, at a low enough concentration as not to be detectable
under selective fluorescence during the resection.

J. Vince DPhil Thesis
57 | P a g e Using Ultrasound to Enhance Targeted Radiotherapy
Adjuvant or follow up treatment with radio and/or chemo-therapy is frequently employed,
particularly using treatment with Temozolomide (TMZ), but is rarely successful1,5,9,30,31. This
may be in the form of a Rickham/Ommaya reservoir, a balloon containing the desired radio or
chemotherapeutic agent situated beneath the scalp, used to locally deliver chemotherapy into
the resection cavity32,33.
Pseudoprogression of the disease is common in post-operative imaging of the patient every 2-
3 months, brought about by blood-brain barrier disruption, oedema, and mass effect
mimicking progression34. Despite the increased use of TMZ, only 6% of patients reach the 5
years survival mark despite early intervention35. Treatment failure and ultimately reoccurrence
is largely due to the repair of TMZ DNA damage by protein O6-methylguanine-DNA-
methyltransferase (MGMT), facilitating resistance to TMZ and recurrence of the GBM within
the cavity3,8,36,37.
2.1.2. Ultrasound Induced Cavitation as a Treatment Modality for Glioblastoma
Multiforme
Stereotactic radiotherapy, although theoretically offering better targeting, is generally not
used for GBM due to the risk of collateral damage resulting from the challenges involved in
accurately defining the tumour volume in pre-operative imaging34. Multiple irradiations at
lower doses are sometimes used as a palliative option, providing patient welfare is not
compromised; but repeated treatment commonly lead to radioresistance5,30. A potential
advantage of radioembolic microspheres is that they could offer a means of delivering an
equivalent dose of radiation with a much lower risk of side effects and/or radioresistance.
Distinct from the use of microspheres in embolic procedures, in this case they could be
injected directly into the cavity created by the tumour resection without the need for any
further surgical intervention.

J. Vince DPhil Thesis
58 | P a g e Using Ultrasound to Enhance Targeted Radiotherapy
Despite this, stereotactic radiation in the form of SIRT as initial adjuvant radiotherapy, holds
the largest promise for increasing survival for GBM patients; reserving the use of WBRT for
combatting further progression reoccurrences. The cavity produced by the intra cranial
aspiration of the GBM central tumour mass, provides an opportunity for adjuvant therapy with
a stereotactic radioactive product such as TheraSphere®. As the exact depth of the aggressive
infiltration of cancerous cells into the healthy tumour margins is unknown, the 2.5 mm mean
depth of irradiation from the glass microspheres may be insufficient; the microspheres
themselves must therefore be placed within the tumour margins, to enlarge the volume of
tissue irradiated. Ultrasound induced cavitation may prove to be the translational mechanism
required for the mass transport of the radioactive glass microspheres.
The aim of the work described in this chapter was to design an experimental setup and
associated data analysis, to test the feasibility of using ultrasound induced cavitation to
extravasate glass SIRT microspheres from a cavity in a tissue mimicking phantom
2.2. Methods
2.2.1. Phantom Development
The first step was to design the phantom. The ideal tissue mimicking phantom would have a
high water content, mechanical and acoustic properties close to those of the relevant tissue
and be generated by a simple but robust fabrication process.
2.2.1. Malignancies of the Brain and Ex Vivo Surrogates
Malignant tissue is frequently stiffer than healthy surrounding tissue, with a higher
corresponding Young’s Modulus, an important differentiating criterion for pathology and
tumour localisation using various methods10; including Vibro-Acoustography, Magnetic

J. Vince DPhil Thesis
59 | P a g e Using Ultrasound to Enhance Targeted Radiotherapy
Resonance Imaging (MRI) and x-ray computed tomography (CT)11,12. Therefore gel surrogates
which mimic tumour tissue, must be chosen with a modulus as close to that of human tissue to
accurately model factors effecting the dispersion of any radioembolic particle.
Brain matter is relatively soft13,15, compared with other tissue, prone to permanent
deformation and long lasting and damage as a result of acute injuries18 or repeated stresses by
the breakdown of the tau-microtubule complex e.g. chronic traumatic encephalopathy
(CTE)19,20 . The primary reason for this degree of damage is due to the low solid content of the
parenchyma. Liquids will oppose applied stress in volume but not in shape21, whereas solids
will tend to oppose stress in both volume and shape. Liquids therefore only have a bulk
whereas solids also have elastic (Young’s) and shear moduli.
Young’s modulus describes the relationship between the stress (unit of force per area) and the
strain (degree of proportional deformation as a result of the force) on a solid object, in a linear
elastic model from a single axis22. Human brain tissue has reported Young’s modulus of 0.17-
16.06 kPa for various pathologies with Human glioma (2.75 ± 1.40 kPa) and metastatic
lymphoma (2.10 ± 0.57 kPa) marginally stiffer but similar to isolated mouse brain (3.97 ± 3.66
kPa)13; including a non-linear elastic component due to the presence of cerebrospinal fluid
(CSF)14. The low modulus of brain tissue, is independent of the displacement of CSF by the
tissue, which occurs before deformation of the cerebral matter15.
Several surrogates have been previously investigated, primarily for modelling drug-distribution
within the brain. They include Agarose gelatine, Alginates, Sylgard 527 Silicone gel, Hyaluronic
acid (HA) and Polyvinyl alcohol (PVA) 16. Readily available inexpensive animal surrogates for
brain tissue include chicken liver (0.44 ± 0.13 kPa) which has similar mechanical properties to
normal brain tissue and chicken gizzard tissue (3.00 ±0.65 kPa) with a similar Young’s Modulus
to that of varying gliomas13. The use of domestic animal tissue allows for the observation of
potential radiation damage on glioma surrogates with a similar stiffness. Ex vivo tissue does

J. Vince DPhil Thesis
60 | P a g e Using Ultrasound to Enhance Targeted Radiotherapy
not offer the same mechanism for decay as necrosis or apoptosis in vivo17, however it does
offer a more suitable medium for observing the depth of radiation penetration compared to in
vitro hydrogel models.
Tissue mimics which are too stiff may inhibit the intended delivery of the surrogate
microspheres, reducing the feasibility of the ultrasound initiated cavitation as an effective
method for facilitating the mass transport of the radioactive microspheres. Whilst selecting a
material which is too soft may incorrectly increase the penetration depth, invalidating any
successful results. A literature survey indicated that hydrogels were most likely to meet the
requirements for this work14,38–42. Hydrogels e.g. Salt crossed alginate hydrogels43–45, which had
reported moduli larger than that of healthy brain tissue13,14,46–48,48 were initially excluded and
were not considered. PVA and Agar-agar hydrogels were investigated in detail.
2.2.2. Poly Vinyl Alcohol Freeze-Thaw Hydrogels
PVA-based tissue substitutes have the advantages of indefinite longevity and particularly low
cost for the volume of gel produced. As a biocompatible polymer, PVA has been used in
various medical device applications for years49,50 as well as tissue phantoms14,24,46,51–53 for
academic research. PVA solutions are liquid at room temperature, but can be turned into
physically cross-linked PVA hydrogels by heat cycling the solution between ambient and <0oC,
known as freeze-thaw24,50,52,54. As the water within the polymer solution begins to crystallise,
PVA is concentrated in supercooled microdomains between growing ice crystals. The increase
in relative concentration as well as the growing surrounding pressure causes the repeating
units within the polymer to adopt a more repetitive, crystalline lattice. The degree of
crystallinity increases with the degree of symmetry (hydrolysis) and length (molecular weight)
of the polymer used.50 As the solution is brought back to ambient temperature and the ice
crystals melt, the increased degree of crystallinity and concentration of the PVA remains,

J. Vince DPhil Thesis
61 | P a g e Using Ultrasound to Enhance Targeted Radiotherapy
physically crosslinking the semi-crystalline PVA chains together producing a hydrogel network.
The PVA’s degree of hydrolysis, its molecular weight and the number of thermal cycles all act
to increase the degree of crystallinity and hydrogel network strength. After one freeze-thaw
cycle the ultrasound attenuation coefficient of the PVA hydrogel is 0.075 dB/cm-MHz and
increases to 0.28 dB/cm-MHz after 4 cycles55.
As PVA freeze-thaw hydrogels can be tuned in various ways, PVA seemed ideally suited as
tissue mimic for healthy brain parenchyma, a particularly soft and deformable tissue13–15,47,48.
The fabrication time for production of freeze-thawed PVA gels is long due to the high
temperatures and long periods of time required to dissolve the polymer granules, and the
hours needed to freeze and thaw large volumes of water. In order to minimise variation
between phantoms, it is important to closely control the ambient temperature and
subsequently the rate of cooling and thawing of the PVA gels, as the crystallinity of the PVA
chains and therefore the material properties of the gel, is directly proportional to the duration
of the freeze-thaw cycles and temperatures used24,52,54 as well as its molecular weight (Mw).
Solutions containing PVA of increasing polymer chain length have higher elastic moduli and
tensile strength, due to the increase in crystallinity in each polymer chain as well as the
increased physical crosslinking of the gel by the longer chains.
PVA gels were produced using a previously reported method14 by dissolving PVA (146-186 kDa
Mw, Sigma Aldrich) in deionised water (Millipore-Q Type 1) to produce a 10% weight/volume
concentration of the PVA after microwave irradiation (1200W, 600s) with intermittent
agitation. The solutions were poured into the desired mould (See Section 2.2.4) cooled to 4oC
for 12h before freezing at -20oC for 18h and thawing at 4oC for a further 6 hours. PVA
hydrogels produced in this manner were stored at 4oC until required. It was impossible to
degas the solution of PVA (required to prevent cavitation within the hydrogel under ultrasound
exposure) due to the polymer acting as a foaming agent under reduced pressure. Only a single

J. Vince DPhil Thesis
62 | P a g e Using Ultrasound to Enhance Targeted Radiotherapy
freeze-thaw cycle was required to form each gel. The gels produced were far stiffer than
expected from the literature, especially when compared to mammalian brain tissue and
undesirably opaque and radiopaque in addition to the lengthy fabrication time, preventing any
µCT analysis (See Section Micro Computed Tomography (µCT). The opacity of the gel also hid
signs of unwanted cavitation within the gel, stemming from gas bubbles which remained
trapped within the gel after completion of the heat cycles. As the degassing of the hydrogel
medium was critical for ultrasound experimentation, PVA was deemed to be unsuitable as a
tissue mimic for brain parenchyma and the use of PVA freeze-thaw gels was abandoned.
Figure 10: Freeze-thaw PVA opaque hydrogel in serial phantom mould with stainless steel screws.
2.2.3. Agar-Agar
Agar based phantoms have been widely used as tissue mimics, primarily due to their ease of
production, optical clarity and having an acoustic impedance akin to that of mammalian tissue
(2%, 1490 m/s )23,56–61. Agar gels are comprised of two compounds, agarose and agaropectin
which adopt a threefold double helix confirmation once in a gel state62, achieved by van der
Waals forces, hydrogen bonding and electrostatic interactions between the agar polymer and
entrapped water molecules. To create a gel, agar is dissolved in hot water, which upon cooling
undergoes a sol-gel transition. The intermolecular forces of the polymer act to entrap water
within the polymer network forming a hydrogel at room temperature.

J. Vince DPhil Thesis
63 | P a g e Using Ultrasound to Enhance Targeted Radiotherapy
Agar phantoms have been shown to be suitable for studying bubble “tunnelling”58,
nanoparticle projections and extravasations60,63,64 produced by ultrasound and cavitation,
whilst remaining stiff enough to simulate arterial or venous vessels for flow simulations23,42,58.
They can be generated with much better reproducibility than PVA phantoms and modification
of the gel stiffness is easily achieved by varying the concentration and molecular weight of the
agar. Unfortunately, even at concentrations as low as 1 or 0.5% agar w/v, the resulting
hydrogels are significantly stiffer than brain tissue14,15,40,48,56,57; whilst very low concentration
solutions (< 0.5% w/v agar) do not form a gel matrix upon cooling.
Material Mean Elastic Modulus (kPa)
PVA (14%) Freeze Thaw Hydrogel 14 2.73
PVA (7%) Freeze Thaw Hydrogel 14 0.34
0.2% agarose 13 2.35 ± 0.39
0.4% agarose 13 6.31 ± 0.96
0.6% agarose 13 12.93 ± 2.99
Human Brain Parenchyma 46 0.58
Human glioma 13 2.75 ± 1.40
Human meningiomas 13 3.97 ± 3.66
Fresh Mouse Brain 13 1.56 ± 0.75
Mouse Tumours 13 7.64 ± 4.73
Table 1: Mechanical stiffness values for tissue mimicking phantom candidates, healthy and cancerous
human and mouse tissues.
Nevertheless, despite the reported values for the freeze-thaw PVA hydrogels, in the interest of
time and as the use of ex vivo tissues was foreseen, agar was chosen as the material for the
initial in vitro investigations.

J. Vince DPhil Thesis
64 | P a g e Using Ultrasound to Enhance Targeted Radiotherapy
2.2.4. Tissue Phantom Mould
It was important that the experimental setup and protocol would enable both consistency and
high throughput to quantify microsphere extravasation over a large range of ultrasound
exposure parameters.
An 8 well rectangular mould (internal volume 225 x 60 x 10 x 40mm) was designed and
fabricated from 10mm polymethyl methacrylate (PMMA, Perspex®) with Mylar (polyethylene
terephthalate) sheet ‘windows’ at the front and rear of the mould (Figure 11). The thin mylar
‘windows’ in the mould allow for propagation of ultrasound waves through the window and
into the tissue phantom (speed of 2400ms-1)65. The phantom mould was assembled using
nylon screws to reduce the need for high density materials in the construction, critical for x-ray
analysis post exposure. Wells were cast in the moulds using suspended stainless steel rods
with modified tips, in a range of diameters (4mm, 2mm, and 1mm) in order to simulate the
effect of varying the excised cavity dimensions. The wells were offset from the front of the
mould to allow extravasating microspheres to pass into the bulk of the phantom, with minimal
interference from adjacent wells or boundaries.
Figure 11: Tissue phantom mould. Internal volume 225 x 60 x 10 x 40m using 10mm thick PMMA acrylic.
A suspension of agar (0.5% w/v, Sigma Aldrich, w201201, Mw 500-1500 Da) in deionised water
(Millipore-Q Type 1) was degassed under reduced pressure for 90 minutes. After which it was
microwave irradiated for 390s to dissolve the agar with minimal agitation in order to avoid

J. Vince DPhil Thesis
65 | P a g e Using Ultrasound to Enhance Targeted Radiotherapy
boiling of the aqueous solution. Moulds were filled with hot (>85oC) agar liquid and set at 4oC
for a minimum of 12 hours before use. The stainless steel rods were removed once the
hydrogel had formed, leaving cavity wells with volumes corresponding to those of the rods.
2.2.5. Fabrication of Bespoke Ultrasound Tank and Movement Stages
In collaboration with the IBME Engineering workshop, an ultrasound tank of medium size (310
x 365 x 150mm, 16L capacity) was designed and built from PMMA. The joining faces of the
tank were sealed with a clear silicone gel and screwed togetehr with stainless steel screws to
prevent leaks. A aluminum bread board (3 x 12, 2.5mm pitch, M4 screw thread) was screwed
into the walls on top of one end of the tank, and fitted with three individual multidirectional
Newport® (MKS Instruments) modular movement stages, capable of mm adjustments in all
three axes. Suspended from the modular stage was a poloxomethylene (Delrin®) holder
designed to hold a range of therapeutic ultrasound transducers (See Figure 13).
An aluminium cross member was used to suspend the mould within the tank, aligning the
focus of the transducer with the bottom (45mm ±0.5mm from the top of the mould) of each
well. Once filled with 10µm filtered, deionised water (Type 1, MilliQ®) the ultrasound
apparatus and gel phantom were immmersed in the tank, avoiding the entrapment of any air
bubbles, submerging the face of the transducer completely whilst not allowing the water level
to rise above that of the front mould face and into the wells.
Securing the positioning stage and the gel phantom into the tank walls, allowed for a reduction
in setup time between well exposures, whilst improving reproducibility between runs. Aligning
the increments of the breadboard to that of the gel phantom, allowed for increased
throughput with minimal adjustments between runs.

J. Vince DPhil Thesis
66 | P a g e Using Ultrasound to Enhance Targeted Radiotherapy
Figure 12: Electronic diagram for the ultrasound setup used to produce microsphere projections
Figure 13: Diagram of the physical setup of the ultrasound transducer, linear array and agar mould with
well cavities within the water tank. Not to scale. The wells are exposed in order 1,2,3 moving across from
left to right (black arrows) in the mould. The ultrasound field is not on during relocation of the
ultrasound transducer.
2.2.6. Ultrasound Transducer Setup and Calibration
The suspended circular Delrin® holder accommodated a series of high intensity focused
ultrasound (HIFU) transducers (H107/B02 series, Sonic Concepts Bothell, WA, USA), all with an
outer diameter of 64mm, a central rectangular cut out measuring 48 x 17mm for a coaxially
aligned linear array (128 elements, 0.3mm pitch, 18mm elevation focus, L11-4v Verasonics®).

J. Vince DPhil Thesis
67 | P a g e Using Ultrasound to Enhance Targeted Radiotherapy
The HIFU transducers had fundamental frequencies of 0.55 or 1.10 MHz with corresponding
third harmonic outputs (1.65 and 3.30 MHz) and individual impedance matching networks.
A large (600 x 630 x 370 mm) thoroughly degassed water tank with motorised stages (±0.1mm,
UMS3, Precision Acoustics) was used for the calibration of the transducers. The rectangular
cut-out transducers (H107 and 102BB series) were calibrated as follows. The centre of the
transducer focus was found by pressure scans in the XY and XZ axis using a 1.2 mm tip
diameter needle hydrophone (100-100-1, Muller-Platte) for the 0.5/1.5MHz pressure
calibrations. A 31-step voltage ramp from 10 to 610mV was used in combination with a 55dB
gain amplifier (E&I, 1140LA, 1000W) to produce and record pressure and voltage traces over
two consecutive tests, for each transducer at its centre frequency and third harmonic.
For the 1.1 and 3.3 MHz pressure calibrations (102BB-022 transducer) a hydrophobic fibre
optic hydrophone (FOH, Precision acoustics 250 kHz – 50 MHz, 10kPa to 15MPa, 10 µm
tapered tip) was used over the needle hydrophone to perform the planar focus (Figures 14 and
15) and pressure scans (Figure 16), reducing the likelihood of cavitation on the surface of the
hydrophone.

J. Vince DPhil Thesis
68 | P a g e Using Ultrasound to Enhance Targeted Radiotherapy
Figure 14: XY planar scan at the focus of H107-045 (0.500 MHz at a resolution of 0.2mm per pixel,
showing the side lobes above and below the focus of the transducer in the y plane using a needle
hydrophone.

J. Vince DPhil Thesis
69 | P a g e Using Ultrasound to Enhance Targeted Radiotherapy
Figure 15: ZY plane scan for H107-045 (0.500 MHz) at a resolution of 0.2mm per pixel, showing the side
lobes above and below the focus of the transducer in the z plane using a needle hydrophone.
Figure 16: Calibration data for H107027, H107-045 and 102BB-022. A third order polynomial was fitted
to each data series, which fitted the recorded data best. The polynomial for the 3.3 MHz data series
should plateau at higher pressures and does not fit a 2nd or 3rd order polynomial correctly.
Monitoring of acoustic emissions was achieved with passive acoustic mapping using signals
recorded on a L11-4 linear array (centre frequency 6.25 MHz, bandwidth 4-11MHz, 128
elements, pitch 0.298-0.302mm, Verasonics Inc., Redmond, WA), aligned coaxially with the
FUS transducer. The linear array was connected to a Verasonics Vantage 256 channel
ultrasound research system (Verasonics Inc., Redmond, WA) on which signals received by each
element were recorded for offline processing.

J. Vince DPhil Thesis
70 | P a g e Using Ultrasound to Enhance Targeted Radiotherapy
2.2.7. Ultrasound Transducer Alignment
Alignment of the transducer and coaxially aligned linear array proceeded by first aligning the
focus of the transducer with a 1mm stainless steel tipped rod, which was inserted into the well
to be tested (See Figure 11). A pulser-receiver (JSR Ultrasonics, DPR300) was used initially to
send a short, low energy pulse to the transducer, so that the soft hydrogel was not
unnecessarily exposed to HIFU. The transducer position was adjusted in sub millimetre
increments until the maximum amplitude of the received signal was observed on the
oscilloscope. Next, a B-mode image was captured (using the Verasonics® system) of the
alignment rod. This was used as a reference point for alignment when manually moving the
transducer and array to adjacent wells within the same agar phantom. Alignment of the next
well in the same mould, could then be checked using the x,y coordinates of the B-mode image,
visually confirmed before proceeding with ultrasound exposure.
Figure 17: B-mode images of the stainless steel 1mm alignment rod within a 4mm diameter well (green,
plastic mould (red), mylar sheet (purple) and the same 4mm well with deposited microspheres (blue) and
microsphere extravasation (yellow).
After initial alignment, the pulser-receiver was replaced with an arbitrary waveform generator.
All of the ultrasound exposure parameters were manually controlled using the waveform
generator, the signal output from the Verasonics dictated the pulse repetition frequency and

J. Vince DPhil Thesis
71 | P a g e Using Ultrasound to Enhance Targeted Radiotherapy
was coded at 0.33s (3.3 Hz PRF). A wide variety of ultrasound parameter combinations were
tested (See Appendix 1, Section 3.2.3.2) which included a range of fundamental frequency,
peak negative pressure and duty cycle. The parameter space investigated was defined from
previously reported literature values for the ultrasound induced extravasation of
nanoparticles58,60,66, microbubble tunnelling67,68 and inertial cavitation of various cavitation
agents63,69–72.
2.3. Experimental Procedure and Analysis Techniques
Once the mould and transducer were successfully aligned, the experimental procedure was as
follows. 250μL suspension of cavitation agent (See section 3.2.3.2), of known concentration
was added to a glass vial containing a known mass of glass YAS microspheres in one of three
diameter distributions (<20, 15-35, >32 µm). A ‘cold’ non-radioactive glass microsphere of
equivalent density and size was used as a surrogate in this body of work to mitigate any
associated unnecessary exposure to radioactive isotopes.
The glass microspheres and cavitation agent were swirled and withdrawn as a single aliquot to
avoid sedimentation of the microspheres. The aliquot was pipetted directly into the well
aligned to the ultrasound transducer and linear array. The well was exposed to ultrasound and
acoustic emissions monitored over the exposure period. A second B-mode image was captured
post exposure and the ultrasound transducer and array relocated by 25mm. This was repeated
for wells 2 through 8 on each iterative mould, with well 1 used as an exposure control between
moulds. After all exposures had been completed, the mould and its cross-member were
disconnected from the tank and the mould stored at 4oC awaiting further analysis.

J. Vince DPhil Thesis
72 | P a g e Using Ultrasound to Enhance Targeted Radiotherapy
2.3.1. Micro Computed Tomography (µCT)
Analysis of the phantoms and any bead extravasation produced, was performed via X-ray
computed tomography (CT). CT generates a map of X-ray absorption with objects of high
density and hence X-ray absorbance appearing brighter than those of lower absorbance. µCT is
capable of imaging objects to micrometre resolution and enables visualisation of incredibly
fine and detailed structures such as bone remodelling and calcification73–75.
The YAS glass microspheres have a relative density of 3.6 gmL-1 making them easily
distinguishable from the surrounding hydrogel matrix, acrylic mould and any entrapped gas
remaining within the cast wells, but not from other metal objects e.g. steel screws. A Perkin
Elmer Quantum FX µCT system, located within the Kennedy Institute of Rheumatology was
used. A bespoke acrylic sample holder, with a recessed bed was used to fix the position of the
sequential mould within the chamber and reduce variation between moulds analysed. The
mould bed could be moved incrementally in any direction using the integrated electrical
movement stage of the Quantum FX µCT.
The µCT system bore can hold one of three acrylic cylinder inserts, which protect the x-ray
detector from the adjustable sample tray. The bore of the acrylic insert determines the
proximity of the detector to the sample bed and therefore the maximum spatial resolution of
the image, by increasing the field of view (FOV).
The FOV of the Quantum FX machine is defined by a square at the centre of the image, the
dimensions of which dictate the size of the sample imaged and the subsequent resolution of
the image obtained. At 73 and 10 mm FOV, the pixel resolution of the square in focus is 148
and 20µm respectively. Therefore, for the majority of experiments studied (30 mm FOV), an
individual bright pixel or voxel is not representative of one, but rather a cluster of
microspheres either adjacent or in close proximity, so as to increase the average density and
provide sufficient contrast for the given volume.

J. Vince DPhil Thesis
73 | P a g e Using Ultrasound to Enhance Targeted Radiotherapy
For all µCT scans obtained, the maximum available voltage and current (90 kV and 160 µA)
were used to produce the largest exposure and resulting contrast in the images produced. The
only parameter that was changed in the acquisition parameters was that of the FOV. Individual
wells were imaged at 30mm FOV as standard, unless otherwise stated.
2.3.2. µCT Image Analysis
The Quantum FX µCT uses DICOM (Digital Imaging and Communications in Medicine) files to
export the X-ray exposure images for interpretation. Two free open source programs (RadiAnt
and InVersalius) were used as DICOM viewers, for initial experiments to gauge approximately
the effect of the different parameters investigated. Both software packages allowed for basic
3D reconstruction of the 512x512 pixel by 512 image stacks obtained from the Quantum FX
machine, allowing for simple contrasting and image manipulation to observe the bright
contrasting microspheres from the dark background of the agar hydrogel phantom and acrylic
holder. Images can be filtered by brightness, falsely coloured to highlight areas of interest and
manipulated to orientate the exposures to the same viewpoint in either software. Initial
images reported were created using maximum intensity projections (MIP), highlighting the
voxels in the desired plane of observation and overlaying them to produce an image with
substantially greater contrast than the corresponding spatially correct 3D images75–77; for the
analysis of the glass YAS microspheres MIPs were found to be useful for characterising
microsphere extravasation.
Figure 18: 3D image reconstructions using radiant DICOM viewer (left) and MIPs of the same 3D
reconstruction (middle and right).

J. Vince DPhil Thesis
74 | P a g e Using Ultrasound to Enhance Targeted Radiotherapy
Figure 19: Image reconstruction using InVersalius showing items of high radiopacity highlighted in each
image slice in each plane, with a 3D reconstruction of the total image (bottom right).
2.4. Characterisation of Microsphere Extravasation
There were several common features of the patterns produced by the extravasating
microspheres. These are illustrated in Figure 20 together with the nomenclature that will be
used in the remainder of the thesis.
Figure 20: Schematic for the labelling of microsphere extravasation from a vertical cavity (well).
Ultrasound is applied from left to right in the image above. The projection bulb is thought to be brought
about by pre-focal turbulence of the glass microspheres eroding the soft pre-focal agar.

J. Vince DPhil Thesis
75 | P a g e Using Ultrasound to Enhance Targeted Radiotherapy
2.4.1. Phantom Well
This is the void or cavity created by the removal of the stepped cylindrical stainless steel rod
from the fixed hydrogel phantom (See Section 2.2.4), simulating the cavity created during
tumour resection. Upon injection into the well, the microspheres settle to the bottom due to
their weight and the vertical orientation of the well.
Figure 21: Microspheres sedimented at the bottom of a vertically orientated 4mm well, appearing bright
white after MIP of a 3D reconstruction acquired via µCT analysis. MIP from a 3D reconstruction, FOV
30mm.The rounded bottom edge is as a result of the agar boundary flexing under the additional weight of
the microspheres and cavitation nuclei.
2.4.2. Microsphere Projection
“Projection” in this context describes the movement of a microsphere or cluster of
microspheres outside of the original well, and includes both the pre-focal and post-focal
extravasation of microspheres. Both linear and planar projections were observed. Linear
projections extend at a fixed angle and in a single direction away from the well; appearing as
lines or streaks away from their original position in the CT images (Figure 22 a). Planar
projections extend in a singular plane at a random angle away from a fixed point, not
necessarily at the well or boundary interface. These appear as flat elliptical shapes, with

J. Vince DPhil Thesis
76 | P a g e Using Ultrasound to Enhance Targeted Radiotherapy
radiopaque microspheres distributed towards the outermost edge of the projection (Figure 22
b).
Figure 22: Cavitation enhanced microsphere projection examples, linear (a) and planar (b). Ultrasound
field is from left to right of the image. MIPs from 3D reconstructions, FOV’s 30mm.
2.4.3. Projection Channels
Within the post-focal extravasation region distinct lines can be seen. These lines are glass
microspheres which have been propelled though the agar and now reside within agar tunnels
or ‘projection channels’ which have been formed (Figure 23). The channels are of various
lengths, originate from various independent positions on the well edge. Projection channels
may intersect and combine to form a single channel as the projection progresses. Projection
channels always start at the well edge and extend solely into the post-focal region. Uneven
microsphere distribution within the channel produced, causes some sections of the channel
lumen to be invisible under µCT due to lack of radiopaque material. The ‘tip’ of the projection
channel is the furthermost point away from the well boundary edge for any single projection
channel and is often highlighted by concentrated microsphere packing, appearing as bright
objects under µCT.
(a) (b)

J. Vince DPhil Thesis
77 | P a g e Using Ultrasound to Enhance Targeted Radiotherapy
Figure 23: Numerous post-focal projection channels within a single microsphere projection. Individual
channels are seen as straight white lines. In places where the channel has not been completely filled with
radiopaque microspheres section of a channel appears black due to a lack of radiopaque material.
2.4.4. Projection Bulbs
Projection bulbs consist of a large void within the agar gel, with microspheres embedded at
the edge of the void, which appear as large teardrop or spherical shapes within the pre-focal
region (Figure 24). The size of the void created can be larger in diameter than the terminal
diameter of the well cavity and may be accompanied by post-focal projections of various
shapes and sizes. Projection bulbs are most frequently seen in combination with planar
projections. The mechanisms by which the different features are formed are discussed in
Chapter 4.

J. Vince DPhil Thesis
78 | P a g e Using Ultrasound to Enhance Targeted Radiotherapy
Figure 24: Large pre-focal projection bulb with single post projection channel. Relative density of the
glass microspheres under µCT limits the view beneath the surface of the microsphere embedded
projection bulb.
2.5. Discussion
Despite the limited resolution and FOV trade-off, the imaging and resolution of the projections
produced has been shown to be sufficient for quantifying microsphere distribution. The
interpretation of the images produced however still poses a significant challenge. Without un-
biased, repeatable and preferably automated interpretations of the projections, it is
impossible to determine the impact of different ultrasound exposure conditions. The next
chapter will therefore focus on the development of method for analysing and quantifying the
microsphere projections.
It should also be noted that the simple uniform hydrogel, whilst analogous in terms of its
mechanical acoustic properties, does also not accurately represent the target organ
architecture. There are no voids, folds, feeding vessels, inter cranial fluid or irrigation fluids in
the wells currently used. Whilst a range of well diameters was investigated to simulate the
effect on microsphere extravasation, the cavities used are far smaller than that of a GBM
resection cavity. It is expected that adjustments to the current practise will therefore need to

J. Vince DPhil Thesis
79 | P a g e Using Ultrasound to Enhance Targeted Radiotherapy
be made; to produce a cavity of the intended size within the target area, allowing the
ultrasound enhanced distribution of the radioembolic microspheres. With the removal and
aspiration of the remaining malignant tissue and subsequent aspiration of the final resection
cavity, occurring after the radioactive microspheres have been adequately distributed.
The pre-focal projection bulbs are an undesirable phenomenon which should be avoided and
removed where possible. This is because the tear-drop shape of the bulb is an example of poor
microsphere distribution within a given volume and dramatically increases the amount of
collateral tissue removed from the patient; this approach is mechanically destructive, non-
selective and not the intended, more selective radiotherapy approach.
Nonetheless, the results presented do confirm that ultrasound induced cavitation can be used
to promote extravasation of microspheres using commercially available microbubbles and
ultrasound exposure parameters comparable to those used in current therapeutic
applications.
2.6. Conclusion
Two potential tissue mimicking phantoms were investigated, with agar found be the most
consistent, reliable and suitable hydrogel for this application. Apparatus for creating phantoms
containing cavities to simulate a post-resection tumour cavity and exposing them to
ultrasound was designed and built. Ultrasound parameters were identified under which
microsphere extravasation could be observed and a method for imaging the resulting spatial
distribution of microspheres using µCT was developed. Descriptive nomenclature for the
observed microsphere extravasation was also defined. In the next chapter a method for
analysing the µCT images of the projections and quantifying microsphere transport and the
anticipated radiation field is proposed. Statistical models are produced for the attributes
measured, allowing separation and weighting of the key factors which contribute to the

J. Vince DPhil Thesis
80 | P a g e Using Ultrasound to Enhance Targeted Radiotherapy
extravasation of the microspheres. Parameter trends are discussed for translation towards the
intra-cranial deposition of radioembolic microspheres, for the treatment of GBM.
2.6.1. Limitations
Whilst the work within this chapter is largely positive, there are a few key limitations to the
work produced. Firstly, the use of an agar-agar hydrogel does not fully imitate the intended
tissue architecture and is an oversimplification only of the elastic modulus. There are no
elements of the tissue phantom design which address the tissue vascularity, the supporting
structures (cerebral fluid and skull) or the innate homogeneity of the brain tissue.
The phantom wells are an order of magnitude smaller, than the average resection cavity
produced (approximately 40 mm) and exploit the directionality of the focussed ultrasound
transducer. Whereas the envisioned therapy is expected to use an un-focussed ultrasonic
device, which may also reduce the occurrence of the unwanted pre-focal extravasation. It is
foreseeable however that the order of the resection procedure could be altered, so that
channels or wells could be produced if needed in the malignant tissue via ultrasonic erosion
and aspiration. Creating voids akin to that of the wells used in the tissue phantom. Changing
the size of the cavity however will influence the settling of the microspheres and may impact
the resultant projections formed.
Finally, images of the microsphere distributions are unlikely to be visible in vivo using CT.
SPECT imaging of the 0.01% gamma ray emissions from the glass microspheres is possible,
although the subsequent image quality obtained is likely to be insufficient due to the low
gamma energy output of the radioactive microspheres. Alternative intra-cranial imaging
techniques may have to be investigated in order to be able to map the distribution of the glass
microspheres post-operation.

J. Vince DPhil Thesis
81 | P a g e Using Ultrasound to Enhance Targeted Radiotherapy

J. Vince DPhil Thesis
82 | P a g e Using Ultrasound to Enhance Targeted Radiotherapy
References
1. Vellayappan, B. et al. Re-Irradiation for Recurrent Glioblastoma Multiforme (GBM) : Systematic Review
and Meta-Analysis. Int. J. Radiat. Oncol. 99, E114 (2017).
2. Dumitru, C. A., Sandalcioglu, I. E. & Karsak, M. Cannabinoids in glioblastoma therapy: New applications
for old drugs. Front. Mol. Neurosci. 11, 1–7 (2018).
3. Gallego, O. Nonsurgical treatment of recurrent glioblastoma. Curr. Oncol. 22, e273–e281 (2015).
4. Gulati, S., Jakola, A. S., Johannesen, T. B. & Solheim, O. Survival and treatment patterns of glioblastoma in
the elderly: A population-based study. World Neurosurg. 78, 518–526 (2012).
5. Cha, G. D. et al. Advances in drug delivery technology for the treatment of glioblastoma multiforme. J.
Control. Release 328, 350–367 (2020).
6. Krieg, S. M. et al. Surgery of highly eloquent gliomas primarily assessed as non-resectable: Risks and
benefits in a cohort study. BMC Cancer 13, 1 (2013).
7. Thanasupawat, T. et al. Dovitinib enhances temozolomide efficacy in glioblastoma cells. Mol. Oncol. 11,
1078–1098 (2017).
8. Chaichana, K. L. et al. Risk of surgical site infection in 401 consecutive patients with glioblastoma with and
without carmustine wafer implantation. Neurol. Res. 37, 717–726 (2015).
9. Grabowski, M. M. et al. Residual tumor volume versus extent of resection: predictors of survival after
surgery for glioblastoma. J. Neurosurg. 121, 1115–1123 (2014).
10. Maccabi, A. et al. An examination of the elastic properties of tissue-mimicking phantoms using vibro-
acoustography and a muscle motor system. Rev. Sci. Instrum. 87, 1–7 (2016).
11. Wolbarst, Anthony B., et al. Sketches of the Standard Imaing Modalities. in Medical Imaging: Essentials
for Physi 1–36 (2013).
12. Vinet, L. & Zhedanov, A. A ‘missing’ family of classical orthogonal polynomials. J. Phys. A Math. Theor.
44, 085201 (2011).
13. Stewart, D. C., Rubiano, A., Dyson, K. & Simmons, C. S. Mechanical characterization of human brain
tumors from patients and comparison to potential surgical phantoms. PLoS One 12, 1–19 (2017).
14. Forte, A. E., Galvan, S., Manieri, F., Rodriguez y Baena, F. & Dini, D. A composite hydrogel for brain
tissue phantoms. Mater. Des. 112, 227–238 (2016).
15. Franceschini, G., Bigoni, D., Regitnig, P. & Holzapfel, G. A. Brain tissue deforms similarly to filled
elastomers and follows consolidation theory. J. Mech. Phys. Solids 54, 2592–2620 (2006).
16. Goeller, J., Wardlaw, A., Treichler, D., O’Bruba, J. & Weiss, G. Investigation of Cavitation as a Possible
Damage Mechanism in Blast-Induced Traumatic Brain Injury. J. Neurotrauma 29, 1970–1981 (2012).
17. Opitz, A., Falchier, A., Linn, G. S., Milham, M. P. & Schroeder, C. E. Limitations of ex vivo measurements
for in vivo neuroscience. Proc. Natl. Acad. Sci. 114, 5243–5246 (2017).
18. Goldstein, L. E. et al. Chronic traumatic encephalopathy in blast-exposed military veterans and a blast
neurotrauma mouse model. Sci. Transl. Med. 4, (2012).
19. Grashow, R. et al. Premortem Chronic Traumatic Encephalopathy Diagnoses in Professional Football. Ann.
Neurol. 88, 106–112 (2020).
20. van den Bedem, H. & Kuhl, E. Molecular mechanisms of chronic traumatic encephalopathy. Curr. Opin.
Biomed. Eng. 1, 23–30 (2017).
21. Reintjes, M. A Note on Incompressibility of Relativistic Fluids and the Instantaneity of their Pressures.
Reports Math. Phys. 82, 113–120 (2018).
22. William D. Callister, J. with special contributions by D. G. R. Materials science and engineering: an
introduction. (New York: John Wiley & Sons, 2007).

J. Vince DPhil Thesis
83 | P a g e Using Ultrasound to Enhance Targeted Radiotherapy
23. Wells, P. N. T. & Liang, H. Medical Ultrasound - imaging of soft tissue strain and elasticity. J. R. Soc.
Interface 8, 1521–1549 (2011).
24. Jiang, S., Liu, S. & Feng, W. PVA hydrogel properties for biomedical application. J. Mech. Behav. Biomed.
Mater. 4, 1228–1233 (2011).
25. Patel, D. M., Agarwal, N., Tomei, K. L., Hansberry, D. R. & Goldstein, I. M. Optimal Timing of Whole-Brain Radiation Therapy Following Craniotomy for Cerebral Malignancies. World Neurosurg. 84, 412–419
(2015).
26. Fatemi, P., Zhang, M., Miller, K. J., Robe, P. & Li, G. How Intraoperative Tools and Techniques Have
Changed the Approach to Brain Tumor Surgery. Curr. Oncol. Rep. 20, (2018).
27. Smith, S. J. et al. The invasive region of glioblastoma defined by 5ALA guided surgery has an altered cancer
stem cell marker profile compared to central Tumour. Int. J. Mol. Sci. 18, 1–13 (2017).
28. Roessler, K., Becherer, A., Donat, M., Cejna, M. & Zachenhofer, I. Intraoperative tissue fluorescence using
5- aminolevolinic acid (5-ALA) is more sensitive than contrast MRI or amino acid positron emission
tomography ( 18F-FET PET) in glioblastoma surgery. Neurol. Res. 34, 314–317 (2012).
29. and Claudins (. 2018 (2018).
30. Cho, D. Y. et al. The role of cancer stem cells (CD133+) in malignant gliomas. Cell Transplant. 20, 121–
125 (2011).
31. Tang, Z. et al. Deep Learning of Imaging Phenotype and Genotype for Predicting Overall Survival Time of
Glioblastoma Patients. IEEE Trans. Med. Imaging 39, 2100–2109 (2020).
32. Boiardi, A. et al. Treatment of recurrent glioblastoma: Can local delivery of mitoxantrone improve survival?
J. Neurooncol. 88, 105–113 (2008).
33. Frosina, G. Advances in drug delivery to high grade gliomas. Brain Pathol. 26, 689–700 (2016).
34. Weller, M., Cloughesy, T., Perry, J. R. & Wick, W. Standards of care for treatment of recurrent
glioblastoma-are we there yet? Neuro. Oncol. 15, 4–27 (2013).
35. Hegi, M. E. et al. MGMT Gene Silencing and Benefit from Temozolomide in Glioblastoma . N. Engl. J.
Med. 352, 997–1003 (2005).
36. Hicks, J. et al. Intratumoral temozolomide in spontaneous canine gliomas: feasibility of a novel therapy
using implanted microcylinders. Vet. Med. Sci. 5, 5–18 (2019).
37. Hvizdos, K. M. & Goa, K. L. Temozolomide. 12, 237–243 (1999).
38. Yoon, H. J. et al. Cold water fish gelatin methacryloyl hydrogel for tissue engineering application. PLoS
One 11, (2016).
39. Markert, C. D. et al. Characterizing the micro-scale elastic modulus of hydrogels for use in regenerative
medicine. J. Mech. Behav. Biomed. Mater. 27, 115–127 (2013).
40. Huang, D. et al. Viscoelasticity in natural tissues and engineered scaffolds for tissue reconstruction. Acta
Biomater. doi:10.1016/j.actbio.2019.08.013.
41. Liu Tsang, V. & Bhatia, S. N. Three-dimensional tissue fabrication. Adv. Drug Deliv. Rev. 56, 1635–1647
(2004).
42. Long, R. & Hui, C. Y. Fracture toughness of hydrogels: Measurement and interpretation. Soft Matter 12,
8069–8086 (2016).
43. Ouwerx, C., Velings, N., Mestdagh, M. M. & Axelos, M. A. V. Physico-chemical properties and rheology of
alginate gel beads formed with various divalent cations. Polym. Gels Networks 6, 393–408 (1998).
44. Chan, E. S. et al. Effect of formulation of alginate beads on their mechanical behavior and stiffness.
Particuology 9, 228–234 (2011).
45. Cendon, F. V., Salomão, B. B., Jorge, R. M. M. & Mathias, A. L. Mechanical and optical evaluation of
alginate hydrospheres produced with different cross-linking salts for industrial application. Colloid Polym.
Sci. 299, 693–703 (2021).
46. McGarry, C. K. et al. Tissue mimicking materials for imaging and therapy phantoms: a review. Phys. Med.
Biol. (2020) doi:10.1088/1361-6560/abbd17.

J. Vince DPhil Thesis
84 | P a g e Using Ultrasound to Enhance Targeted Radiotherapy
47. Wang, C., Tong, X. & Yang, F. Bioengineered 3D brain tumor model to elucidate the effects of matrix
stiffness on glioblastoma cell behavior using peg-based hydrogels. Mol. Pharm. 11, 2115–2125 (2014).
48. Chanda, A., Callaway, C., Clifton, C. & Unnikrishnan, V. Biofidelic human brain tissue surrogates. Mech.
Adv. Mater. Struct. 0, 1–7 (2016).
49. Kumar, A. & Han, S. S. PVA-based hydrogels for tissue engineering: A review. Int. J. Polym. Mater. Polym.
Biomater. 66, 159–182 (2017).
50. Daza Agudelo, J. I., Badano, J. M. & Rintoul, I. Kinetics and thermodynamics of swelling and dissolution of
PVA gels obtained by freeze-thaw technique. Mater. Chem. Phys. 216, 14–21 (2018).
51. Meirza, B. Development of Vessel Phantoms for Ultrasound Methods. Thesis Lund Univ. 73 (2017).
52. Ye, M., Mohanty, P. & Ghosh, G. Morphology and properties of poly vinyl alcohol (PVA) scaffolds: Impact
of process variables. Mater. Sci. Eng. C 42, 289–294 (2014).
53. Culjat, M. O., Goldenberg, D., Tewari, P. & Singh, R. S. A review of tissue substitutes for ultrasound
imaging. Ultrasound Med. Biol. 36, 861–873 (2010).
54. Fukumori, T. & Nakaoki, T. High-tensile-strength polyvinyl alcohol films prepared from freeze/thaw cycled
gels. J. Appl. Polym. Sci. 131, n/a-n/a (2014).
55. Drakos, T., Giannakou, M., Menikou, G., Constantinides, G. & Damianou, C. Characterization of a soft
tissue-mimicking agar/wood powder material for MRgFUS applications. Ultrasonics 113, (2021).
56. Maccabi, A. et al. Quantitative characterization of viscoelastic behavior in tissue-mimicking phantoms and
ex vivo animal tissues. PLoS One 13, 1–18 (2018).
57. Cafarelli, A. et al. Tuning acoustic and mechanical properties of materials for ultrasound phantoms and
smart substrates for cell cultures. Acta Biomater. 49, 368–378 (2017).
58. Lea-Banks, H., Stride, E. & Coussios, C. C. Ultrasound-mediated transport of nanoparticles and the
influence of particle density. University of Oxford (2016). doi:10.1121/1.4950210.
59. Suomi, V., Edwards, D. & Cleveland, R. Optical Quantification of Harmonic Acoustic Radiation Force
Excitation in a Tissue-Mimicking Phantom. Ultrasound Med. Biol. 41, 3216–3232 (2015).
60. Paris, J. L. et al. Ultrasound-mediated cavitation-enhanced extravasation of mesoporous silica nanoparticles
for controlled-release drug delivery. Chem. Eng. J. 340, 2–8 (2018).
61. Hall, L. M. Bassel Rifai Cavitation-Enhanced Delivery of Therapeutics to Solid Tumors. (2011).
62. Boral, S., Saxena, A. & Bohidar, H. B. Universal growth of microdomains and gelation transition in agar
hydrogels. J. Phys. Chem. B 112, 3625–3632 (2008).
63. Mannaris, C. et al. Microbubbles, Nanodroplets and Gas-Stabilizing Solid Particles for Ultrasound-Mediated
Extravasation of Unencapsulated Drugs: An Exposure Parameter Optimization Study. Ultrasound Med. Biol.
00, 1–14 (2019).
64. Yemane, P. T. et al. Effect of Ultrasound on the Vasculature and Extravasation of Nanoscale Particles
Imaged in Real Time. Ultrasound Med. Biol. 45, 3028–3041 (2019).
65. Rajagopal, S., Sadhoo, N. & Zeqiri, B. Reference Characterisation of Sound Speed and Attenuation of the
IEC Agar-Based Tissue-Mimicking Material Up to a Frequency of 60MHz. Ultrasound Med. Biol. 41, 317–
333 (2015).
66. Yao, L. et al. Facilitated brain delivery of poly (ethylene glycol)-poly (lactic acid) nanoparticles by
microbubble-enhanced unfocused ultrasound. Biomaterials 35, 3384–3395 (2014).
67. Caskey, C. F., Qin, S., Dayton, P. A. & Ferrara, K. W. Microbubble tunneling in gel phantoms. J. Acoust.
Soc. Am. 125, EL183 (2009).
68. Acconcia, C., Leung, B. Y. C., Manjunath, A. & Goertz, D. E. Interactions between Individual Ultrasound-
Stimulated Microbubbles and Fibrin Clots. Ultrasound Med. Biol. 40, 2134–2150 (2014).
69. Yamakoshi, Y. & Miwa, T. Observation of microhollows produced by bubble cloud cavitation. Jpn. J. Appl.
Phys. 51, (2012).
70. Song, J. H., Moldovan, A. & Prentice, P. Non-linear Acoustic Emissions from Therapeutically Driven
Contrast Agent Microbubbles. Ultrasound Med. Biol. 45, 2188–2204 (2019).

J. Vince DPhil Thesis
85 | P a g e Using Ultrasound to Enhance Targeted Radiotherapy
71. Lin, Y. et al. Effect of acoustic parameters on the cavitation behavior of SonoVue microbubbles induced by
pulsed ultrasound. Ultrason. Sonochem. 35, 176–184 (2017).
72. Song, J. H., Moldovan, A. & Prentice, P. Non-linear Acoustic Emissions from Therapeutically Driven
Contrast Agent Microbubbles. Ultrasound Med. Biol. (2019) doi:10.1016/j.ultrasmedbio.2019.04.005.
73. Althomali, M. A. M., Wille, M. L., Shortell, M. P. & Langton, C. M. Estimation of mechanical stiffness by finite element analysis of ultrasound computed tomography (UCT-FEA); a comparison with X-ray µCT
based FEA in cancellous bone replica models. Appl. Acoust. 133, 8–15 (2018).
74. Hagenmüller, H. et al. Non-invasive time-lapsed monitoring and quantification of engineered bone-like
tissue. Ann. Biomed. Eng. 35, 1657–1667 (2007).
75. Spin-Neto, R., Marcantonio, E., Gotfredsen, E. & Wenzel, A. Exploring CBCT-based DICOM files. A
systematic review on the properties of images used to evaluate maxillofacial bone grafts. J. Digit. Imaging
24, 959–966 (2011).
76. Garea-Rodríguez, E. et al. Visualizing dopamine transporter integrity with iodine-123-FP-CIT SPECT in combination with high resolution MRI in the brain of the common marmoset monkey. J. Neurosci. Methods
210, 195–201 (2012).
77. Ackerly, T., Geso, M., O’Keefe, G. & Smith, R. Stereotactic radiosurgery planning with ictal SPECT
images. Australas. Phys. Eng. Sci. Med. 27, 136–147 (2004).

J. Vince DPhil Thesis
86 | P a g e Using Ultrasound to Enhance Targeted Radiotherapy
CHAPTER 3
In Silico Analysis and Interpretation of Cavitation
Induced Projections of Glass Microspheres

J. Vince DPhil Thesis
87 | P a g e Using Ultrasound to Enhance Targeted Radiotherapy
3. In Silico Analysis and Interpretation of Cavitation Induced
Projections of Glass Microspheres
3.1. Introduction
Current guidelines do not recommend the post-delivery imaging of YAS microspheres, due to
the risk of legal action if off target delivery is identified. As previously mentioned, only
preliminary arterial mapping using macro-aggregated albumin (99mTc-MAA) is used to plan the
delivery procedure and predict what fraction of the spheres may be lost via lung shunting.
Moreover, at the spatial resolution available in typical clinical scanners it is not possible to
visualise individual glass YAS microspheres, only clusters of microspheres in close proximity to
one another. In order to quantify the distribution of any microsphere extravasation, whether
in vitro or in vivo, a suitable imaging modality is required. In a research context, various
analytical methods (CT1–6, SPECT2,7–10, PET1,2,5–8,11,12, Fluoroscopy13,14)have been employed with
the aim of imaging YAS microspheres, but to date no single technique has been capable of
resolving individual YAS beads within patients to an acceptable level. Whilst x-ray computed
tomography has the potential to image objects smaller than a micrometre, the technique’s
resolution is limited by the need for a relatively wide field of view (FOV). Decreasing the FOV
dramatically increases the scan time as well as the post-imaging processing required to ‘stitch’
multiple acquisitions together for analysis.
In the previous chapter, the feasibility of producing projections of glass microspheres using
ultrasound enhanced cavitation events and imaging them using microcomputed tomography
(µCT), was demonstrated. The interpretation and thresholding of these images was however
found to be heavily biased by the user.
The work within this chapter therefore focusses on the production of a method and associated
MATLAB code, to automate the interpretation of 3D reconstructed images obtained using the

J. Vince DPhil Thesis
88 | P a g e Using Ultrasound to Enhance Targeted Radiotherapy
DICOM file stacks produced from the Quantum FX µCT instrument. The data generated are
then used to determine which experimental parameters are key to producing microsphere
extravasation.
A debt of gratitude is given to Cameron Smith (BUBBL group, IBME, Oxford University, UK), for
his considerable patience with the author and continued support regarding the interpretation
automation. Areas of collaborative work with are highlighted where appropriate.
3.2. Methods
As tumour volumes are approximated in size by physicians 15,16 due to the margins of the
tumour mass, it is important to be confident in the coverage of radiation dose encompassing
the tumour margins beyond the anticipated resection cavity. The diameter of the individual
microspheres is 15-32 µm and the depth of irradiation from each sphere is ~2.5 mm.
Whilst initial experiments in Chapter 2 using the Quantum FX µCT machine produced images
suitable for qualitative analysis of the microsphere extravasation, current commercially
available software for medical imaging is largely orientated towards the image filtering and
measurements of a single large object within a given volume (e.g. tumour mass). Here,
however, it is necessary to use multiple image points and measurements to estimate a given
volume, i.e. the therapeutically relevant levels of radiation emitted from the YAS glass
microspheres. The limitations of the measurement systems available in the commercial
software (e.g. RadiAnt, Inversalius) meant that a bespoke MATLAB script needed to be written
to import, interpret and measure the image stacks obtained from the µCT to produce un-
biased quantitative measurement data of the microsphere distributions produced from each
experimental run.

J. Vince DPhil Thesis
89 | P a g e Using Ultrasound to Enhance Targeted Radiotherapy
3.2.1. Minimum-volume enclosed ellipsoid (MVEE)
Previous work by Thompson et al17 compared the use of in vivo cone beam CT under various
peak kilovoltages (kVp) against excised tissue samples for µCT images of radiopaque beads
(ROBs) after hepatic embolization in a swine model. Due to the natural variation of anatomy
within the study, the authors coined a novel term to describe the volume which encompassed
the total distribution of the static radiopaque microspheres, the minimum-volume enclosed
ellipsoid (MVEE). The use of MVEE as a metric was initially used to compare the total volume
of tissue which contained ROBs via differing imaging techniques and not to produce
quantitative measurements of objects within the volume encompassed. The Khachiyan
algorithm script was kindly provided by the authors (Nima Moshtagh, University of
Pennsylvania, Appendix 1).
Whilst the cold surrogate spheres used previously (See Chapter 2) do not occupy a particularly
large volume within the agar hydrogel, their high relative density and subsequent radiopacity
produce images with particularly high contrast. Using the MVEE metric, we can simulate
volume distribution of the encompassed microspheres and the subsequent radiation coverage.
This differs to current approach used for TheraSphere® of inter-arterial delivery of the
radioembolic spheres which rely on extensive pre-planning and mapping of the vasculature
using MAA.
3.3. Single Well Elimination Microsphere Projection Interpretation
The majority of the images obtained from the Quantum FX µCT machine correspond to a
circular field of view (FOV) 30 mm in diameter chosen by the operator. Each image capture
produces 512 image slices of 512x512 pixels slices along a 30 mm long cylinder. As the X-ray
detector moves around the centrally fixed object in a circular fashion, the 3D reconstruction is
therefore a cylinder, 30mm in diameter and 30mm in length, not a perfect 30mm cuboid. A 30

J. Vince DPhil Thesis
90 | P a g e Using Ultrasound to Enhance Targeted Radiotherapy
mm FOV was sufficient to capture a single well and the majority of projections observed,
including the pre and post focal extravasation, whilst maximising resolution of the images
obtained. Projections which were particularly large and which required an increased FOV, used
the same method for interpretation but with adjustments made for the change in relative
distance observed.
With help a MATLAB algorithm was produced to identify the microspheres distributed within
the projections produced using the in vitro setup (Section 2.2.4) and quantify their distances
from one another. Measurements of the microspheres are split into pre and post focal
extravasation, with both quantified in terms of their respective height, width and length (See
Section 2.4, Figure 20). The angle of extravasation through the tissue phantom, perpendicular
to the acrylic mould, would be generated in addition to the MVEE of the entire projection (pre
and post focal). The MVEE volume would be used to extrapolate the anticipated beta radiation
field over the anticipated tumour margins.
Using a script in MATLAB (See Appendix 2), each DICOM image series, corresponding to a
single well and projection, is imported as a 3D array. The values within the array correspond to
the intensity (brightness) of the voxels and are thresholded between 1521 (226 HU) and 4366
(3071 HU), using a 11586 scale (-1295 to 10290, including zero, defined by the Quantum FX
µCT). This creates a binary array, with 1 corresponding to the presence of beads; segregating
the voxels containing any radiopaque dense material (YAS glass microspheres) from the
surrounding soft hydrogel.
To remove artefacts caused by the presence of screws or distant leaks in the gel, which caused
microsphere pooling on the base of the mould, voxels that are more than 6 mm away from the
bulk microsphere extravasation from the well were excluded. To identify these artefact voxels,
each binary voxel is increased in size by 3 mm, whilst keeping its original central position,
voxels which are close to one another overlap. The overlapping voxels produce a single large

J. Vince DPhil Thesis
91 | P a g e Using Ultrasound to Enhance Targeted Radiotherapy
connected object, all other unconnected points are reduced to a value of zero, removing them
from the reconstruction.
The stainless steel rods used for the formation of well cavities (See Section 2.2.4), have a
terminal section with diameters of either 1 or 2mm (the diameter at the end of the well) which
changes to 4 mm after 10 mm of height. This abrupt diameter step produces a ledge in the
agar, which microspheres frequently stick to (Figure 25). Additionally, microspheres
occasionally stick to the vertical well walls during deposition; both observations cause imaging
artefacts during the reconstruction, as they are not a part of the intended microsphere
extravasation and distort quantification measurements. To remove the voxels corresponding
to the volume of the well, the code searches for a 4 mm cylindrical object (corresponding to
the stainless steel rods maximum diameter) at the top of the image using a circular shape
detection algorithm. As all the images are acquired in a vertical orientation, this corresponds
to the widest point of the stainless steel rod used to form the well.

J. Vince DPhil Thesis
92 | P a g e Using Ultrasound to Enhance Targeted Radiotherapy
Figure 25: Mould 26 well 3 voxel reconstruction. Area highlighted in red show deposition artefacts, not
part of the main projection at the bottom of the well, which need removal for projection processing and
quantification.
This identification is done by summing the 3D binary space to produce a 2D intensity map
showing the axial and lateral positions of the beads. This is then convolved with a circular
shape where 3.5 to 4.5 mm diameter = 1 (to account for slight discrepancies in the rod
manufacture), 3.2 to 3.5 mm diameter = -1, and 4.5 to 4.8 mm = -1. This convolved image will
have a maximum at the centre of the well. Microspheres within the 4mm cylindrical well are
removed throughout the entire 3D image, along with any microspheres in the top half of the
image.
As the exact placement of the well within the image changes, due to manual operation of the
Quantum FX machine, the centre of the 4mm well is used as a point of reference for further
measurements.

J. Vince DPhil Thesis
93 | P a g e Using Ultrasound to Enhance Targeted Radiotherapy
Figure 26: Removal of the 4mm cylindrical well from mould 26, well 3.
A surface mesh of the 3D matrix was found to reduce computation time and memory
requirements for the later parts of this procedure. The reconstructed image skin is split using
the central point of the well, into the pre and post microsphere extravasations. With the width
and height measured by the distance from the fifth greatest (max-5) to the fifth smallest
(min+5) voxels containing microspheres, in both planes. This is achieved by summing the 3D
binary matrix in the direction of the ultrasound propagation, to produce a 2D matrix with
values greater than one, representing the number of voxels which contained microspheres. For
the depth measurement the same method was used, but the fifth greatest voxel was
compared to the centre point of the well. The fifth value was chosen for all axes to improve
the robustness of the algorithm’s measurements, by initially manually counting the number of
spheres that were frequently disconnected from the end of the largest surface mesh object.

J. Vince DPhil Thesis
94 | P a g e Using Ultrasound to Enhance Targeted Radiotherapy
3.3.1. Predicting 90Yttrium β Radiation Emission from Glass Microspheres
To estimate the area of radiation exposure or ‘kill zone’ the voxels of the image were dilated
by 2 mm, a conservative beta radiation penetration depth in human tissue18. Following which
the Khachiyan algorithm is used to place a MVEE around the voxels containing microspheres in
the projection image, with a 5% tolerance. The voxel location furthest from the centre of the
ellipse is found, a straight line is fitted between this point and the centre of the ellipse,
providing the dominant angle for the bulk of the microsphere projection.
Figure 27: MVEE fitted to mould 26 well 3 after removal of the 4 mm well cylinder. Angle of the bulk
microsphere projection can be seen more clearly on the bottom image. Colours are a visual aid for the
reader only.
The killzone % is defined as the percentage of the MVEE volume, which is covered by the kill
zone volume, the field of the radiation emitted from the microspheres contained within the
enclosed ellipsoid. The values are then saved as an output MATLAB file for manual transfer to
an Excel spreadsheet, for import into MiniTab (See Section 3.3.1).

J. Vince DPhil Thesis
95 | P a g e Using Ultrasound to Enhance Targeted Radiotherapy
3.3.2. Factorial Design – Response Surface
Producing ultrasound induced microsphere projection uses a number of both physical and
acoustic parameters as experimental variables, the majority of which are continuous as
numerical values e.g. fundamental frequency, peak negative pressure, in order to model the
effects of how each parameter responds over a variety of input conditions. To produce a full
factorial of all of the potential parameter combinations an immense number of experimental
runs would be required. This is calculated as the number of levels to the power of the number
of factors i.e. investigating 3 factors each with 2 levels would be 23 = 8 to cover all
combinations, ignoring required run iterations19.
Statistical design of experiments (DoE)20,21 can be used to evaluate parameter interactions
whilst reducing the total number of experimental runs required, by estimating the remaining
replicate data required using the data gathered based upon the observed variance. The
variation of the data and model is statistically analysed to highlight key areas of interest or
change within the input design space, typically as a factorial design22 or reduced factorial
design23; this enables order analysis of the response (linear, exponential, cubic etc).
A linear factorial design can be explained as the total of all possible first order products arising
from a series of manually defined input arguments, with two levels (high and low), producing a
long polynomial defining the relationships (factors) between the input arguments and the
observed outputs19. The model tests all possible combinations of both the high and low levels,
with the model (block) replicated, normally for a minimum of 40 samples, to test variability at
each of the cubic points measured. In a simple linear model (Plackett-Burman24), the
polynomial can be used to predict untested input arguments to accurately predict outcomes of
interactions where the variation in the model is small, normally within the input ranges
experimentally tested. This orientates the design towards optimisation of a known set of
conditions, ideal for process improvement.

J. Vince DPhil Thesis
96 | P a g e Using Ultrasound to Enhance Targeted Radiotherapy
Figure 28: Cubic Factorial Design with high and low values, for three input variables. Red lines indicate
primary interactions.
Traditional linear investigations varying a single parameter e.g. ultrasound duty cycle (DC)
while fixing all other parameters, are unsuitable for investigating a wide number of parameters
within a short space of time particularly when multiple parameters are collinear with each
other. Collinearity changes the response of a single parameter based upon parameters that it
is dependent upon, so data obtained under one given set of conditions will not be
representative if the co-linear factor is also changed. Multi-collinearity produces highly
complex parameter spaces with highly entangled factors and interactions making analysis of
single parameters extremely difficult.
A surface response design25 is a second order design which can be employed where there is
less knowledge about the parameter space or interactions within it, frequently using
parameters with more than two levels for each factor. It can be used to locate areas of interest
with subsequently tighter parameter spaces, for further stringent investigation. Frequently this
is in the form of a central composite design26, which uses data points outside that of the
desired ranges in combination with central points, to map the rate of change of a factor within
the desired investigation parameter space. This utilises input arguments with more than two
levels to each output argument.

J. Vince DPhil Thesis
97 | P a g e Using Ultrasound to Enhance Targeted Radiotherapy
Figure 29: A single face of a central composite design. Values outside of the high low range are used to
enable multiple levels within the high low range. Red indicates the centre point, used to assess non-linear
factor response over the surface area.
3.3.3. Parameters Investigated
A variety of input parameters was investigated to generate the design space for investigation,
these can be separated into two categories: physical and acoustic parameters. The acoustic
parameters investigated were: fundamental frequency, peak negative pressure, duty cycle and
the total number of cycles each phantom well was exposed to. The pulse repetition frequency
(PRF) for all exposures was fixed at 3.3 Hz for all tests, as this was controlled independently
from the waveform generator by the Verasonics® software and associated coding (See Fig. 3,
Section 2.2.3).
The physical parameters investigated included: Microsphere size (within a given distribution),
mass of microspheres deposited, cavitation agent, cavitation agent concentration and terminal
well diameter (See section 2.2.2).
Outputs for the modelling were the variables generated by the code in Section 3.2.2. The
height, width and length of the pre and post focal projections were analysed independently.

J. Vince DPhil Thesis
98 | P a g e Using Ultrasound to Enhance Targeted Radiotherapy
The total microsphere volume and expected irradiation volume of the projection as a whole
were also measured.
Initial discussions with Professor Plaha, a consultant neuro-oncology surgeon in the John
Radcliffe Hospital, Oxford, stressed the importance of penetration depth as a key deliverable
for the new technology if it were to be used intra-operatively as an adjuvant to the existing
GBM resection practice. For example, previous investigations using intra-operative iodine-125
crystals for brachytherapy were unsuccessful, due to the low dose of irradiation (35 keV vs
2.28 MeV for 90Y) to the surrounding area from the inserted crystals27,28. To improve the
likelihood of success, the microspheres would need to be lodged within the brain tissue several
millimetres or more beyond the original cavity generated by the aspiration of the tumour mass
and with higher radiation emission.
This chapter therefore focusses primarily on how the variation of the input parameters affects
the measured post-focal penetration depth, and the subsequent volume of tissue irradiated by
the microspheres.
Some variables could not be estimated and are highlighted as such. This normally occurs for
two cases; either a lack of data or repetitions for correct estimate of a sub population within
each category (i.e. n is too low) or multicollinearity of the terms, where the independent terms
themselves are dependent upon each other and cannot be separated, e.g. the driving
frequency and cavitation agent, where a nanodroplet requires a different peak negative
pressure to vaporise and then cavitate compared to a microbubble. As a large number of
factors within the model, particularly the ultrasound parameters, are multicollinear (as
indicated by the reported Variance Inflation Factor (VIF) value) this is a known limitation of the
linear regression model and an oversimplification of the reported data, which is to be
expected. Values above 5 for VIF are deemed multicollinear29, some of the values in this model
which could be calculated were in the thousands, indicating extreme co-dependency.

J. Vince DPhil Thesis
99 | P a g e Using Ultrasound to Enhance Targeted Radiotherapy
3.3.4. Post Focal Projection Depth Surface Design
Measurements obtained via the MATLAB algorithm in Section 3.2.2. were imported into
MiniTab as a worksheet (Figure 30). A total of 9 primary factors, 7 of which were continuous
(Frequency (A), peak negative pressure MPa (B), duty cycle % (C), total number of cycles (D),
mass input g (F), cavitation concentration (H), terminal well diameter mm (J) and 2 categorical
(YAS microsphere size distribution µm (E) and Cavitation agent (G)).
Figure 30: Post focal projection depths recorded over all parameter inputs (N = 338). N* denotes the
number of cells which did not have a numerical value in them, in this case n/a.
Whilst it would have been preferable to use the microsphere diameter as a continuous
variable, no supporting information were provided by the Supplier (MoSci) on each of the
microsphere batches provided (chemical composition, relative density, surface finish,
population distribution etc.) and so this would have only further increased the already large
number of variables. Each batch was therefore deemed ‘unique’ and categorised as such to

J. Vince DPhil Thesis
100 | P a g e Using Ultrasound to Enhance Targeted Radiotherapy
minimise further unneeded complexity in the already heavily congested design space. Mould
number was used to block the recorded data against the standard and run order. Blocking or
grouping of certain experimental runs together is a useful tool for evaluating change over time
where it is not possible to perform the entire DoE at a given time. Particularly useful for
monitoring changes in equipment, operators or in this case variability in the agar used for each
phantom mould.
Data entries with a standard residual larger than 3 were removed over 3 iterations, to remove
extreme outliers from the data set, which could produce misleading results by changing the
weighting of the model’s coefficients. This can result in otherwise significant terms or
interactions becoming insignificant due to extreme outliers. This resulted in the data set being
reduced from N=338 down to N=325. No further reductions to the data set were made
thereafter during the linear regression model analysis.
Figure 31: Frequency data for post focal projection depth after removal of large (>3) residuals over 3
iterations.

J. Vince DPhil Thesis
101 | P a g e Using Ultrasound to Enhance Targeted Radiotherapy
The recorded data are exponential, as indicated by the Anderson-Darling value being large
(Figure 31, A-squared 22.08, p-value <0.005), with the mode (0) of the sample set being
skewed away from the mean value (5.7737). Whilst removing all 0.000 values generated by the
code would improve the normality of the data (AD 16.00, p<0.005) the data set would still
appear exponential but would be subsequently suitable for transformations e.g. BOX-COX or
Johnson transformations30. As the data can be fit to a second order polynomial, they are
suitable for surface response linear regression but this is not the optimal approach. The non-
linearity is caused by the multicollinearity of the input factors (variables). Isolating the factor
with the highest weight was therefore used for further non-linear regression methods to
generate a more accurate model of the post focal projection depth.
A response surface model was used to define the design of experiment (DOE) using the data
set in Figure 31, initially using all primary factors and possible square and secondary terms (S
4.06, R-sq 76.6%, R-sq(adj) 66.3%, R-sq(pred) 44.2%). Secondary terms, either as cross
products or squares, were removed in order of largest p-value to improve the surface response
model (S 4.1, R-sq 76.6%, R-sq(adj) 66.0%, R-sq(pred) 56.0%) with all remaining terms being
significant (p<0.05). Whilst driving frequency, cavitation agent concentration and YAS
microsphere size could not be estimated in the model, these terms were kept in to maintain a
hierarchical model for their respective secondary interactions.

J. Vince DPhil Thesis
102 | P a g e Using Ultrasound to Enhance Targeted Radiotherapy
Figure 32: Analysis of variance for parameters in the optimised surface response linear regression model
for post focal projection depth (mm). Degrees of freedom (DF), adjusted sum of squares (Adj SS) and
adjusted mean of squares (Adj MS).
A Pareto chart (α = 0.05) was generated for the standardised effects, for comparing the
influence of the various factors in our model, critical to using a non-linear regression method
with a single variable for predicting the post focal penetration depth afterwards.

J. Vince DPhil Thesis
103 | P a g e Using Ultrasound to Enhance Targeted Radiotherapy
Figure 33: Pareto chart for standardised effects of the optimal linear regression model for post focal
projection depth (mm).
Whilst Frequency (A) as a factor cannot be estimated in the linear model, the interaction
between frequency (A) and the total number of cycles (D) is the highest absolute value
contributing factor to the model with a coefficient of -37.53, pressure has the largest and
second largest absolute coefficient at 33.43.
Unfortunately, as the linear model failed to estimate the coefficient for fundamental
frequency (MHz) due to multicollinearity, we cannot calculate values for Frequency*Total
number of cycles for use in a non-linear model (AD). Frequency remains a parameter critical to
the future efforts in designing a device for the intended therapy (See Chapter 5, Appendix 7). A
boxplot of the penetration depths over fundamental frequency displays the undulating non-
linear response of post focal projection depth to the applied ultrasound frequency (Figure 34).

J. Vince DPhil Thesis
104 | P a g e Using Ultrasound to Enhance Targeted Radiotherapy
Figure 34: Post-focal projection penetration depth (mm). Mean values are notated by each box plot.
0.5MHz (n= 218), 1.1MHz (n=40), 1.5 MHz (n= 32), 3.3MHz (n=48). Outliers are indicated with an
asterisk. The mean of each frequency is highlighted in the box plot.
Plotting the same data as histograms for post focal projection penetration depth (mm) over
frequency (MHz) in Figure 35 highlights this further. The overlapping population curves are
indicative of a minimum of two different response distributions within the same output data
series. In this instance 0.5 and 3.3MHz appear to have a different population distribution
compared to 1.1/1.5MHz, although this may be skewed due to a low sample number above 0.5
MHz.

J. Vince DPhil Thesis
105 | P a g e Using Ultrasound to Enhance Targeted Radiotherapy
Figure 35: Histogram of post focal penetration depth (mm) for 0.5, 1.1, 1.5 and 3.3 MHz.
Separating data sets based on the apparent difference in data populations for further analysis
did not yield an improvement in the linear model. Combining 0.5 and 3.3 MHz drastically
reduced the predictive power of the unreduced model from 44.21 to 29.8% whilst increasing
the standard deviation (S) from 4.06 to 4.27, indicating a broadening of the data set to the
parameters, not tightening the spread as the distributions may suggest. It was not possible to
isolate the 1.1/1.5 MHz data for independent evaluation due to a poor sample population
(N=72) for the number of variables investigated.
3.4. Results
3.4.1. 0.5 MHz Non-linear Regression
Using linear regression, peak negative pressure (MPa) was highlighted as the most influential
primary input parameter which could be estimated. Frequency however seemed to have the
most significant effect (non-linearly) within the design space, producing bi-modal distributions

J. Vince DPhil Thesis
106 | P a g e Using Ultrasound to Enhance Targeted Radiotherapy
of data within the larger output data set. It therefore seemed appropriate to standardise the
non-linear regression using peak negative pressure to a single frequency, to see if pressure
alone could be used as the sole predictor for post focal projection depth. 0.5MHz contained
the largest number of data points, largest recorded penetration depth as well as the broadest
distribution of data and so was selected as the frequency of choice.
Fitting a cubic line plot to the entire 0.5 MHz data set for post focal penetration depth (mm),
we see that the majority of the data (95%, p=0.05) fall within the predictive interval (PI) or
twice that of the confidence interval (CI). Importantly the S value, the % average distance of
the data from the fitted line is relatively small at 6.5% (Figure 36), indicating a good
agreement.
Figure 36: Cubic polynomial line plot for post focal penetration depth (mm) for 0.5MHz. The regression
equation is:
Post Focal Depth (mm) = 17.70 - 28.56 Pressure (MPa) + 13.98 Pressure (MPa)^2 - 1.729 Pressure
(MPa)^3.

J. Vince DPhil Thesis
107 | P a g e Using Ultrasound to Enhance Targeted Radiotherapy
Whilst the cubic model is a crude assumption, the data more closely resemble an asymmetrical
Bragg peak. This highlights the apparent optimum pressure for extravasation at 0.5MHz
between 3.7 and 5 MPa peak negative pressure before the additional increase in peak negative
pressure becomes counterproductive, leading to a reduction in post focal penetration depth
(Figures 36). Theta values based on the initial cubic analysis (Figure 36) were selected as initial
inputs for identifying a Bragg peak with a Gauss-Newton convergence algorithm to find the
final parameter estimates by minimising the sum of the squared function values31.
Figure 37: Starting theta values for the gauss-newton convergence algorithm (left) and the position of the
theta levels within an example Bragg peak (right).

J. Vince DPhil Thesis
108 | P a g e Using Ultrasound to Enhance Targeted Radiotherapy
Figure 38: Gauss-Newton non-linear regression of post focal penetration depth for 0.5MHz after 10
iterations. S 5.78629. Equation: Post Focal Depth (mm) = 2.79384 + (24.9075 - 2.79384) * exp(-1.33648
* ('Pressure (MPa)' - 3.86696) ^ 2).
The improvement in the S value from 6.5 to 5. 8 reflects the improved regression line fit to the
data set. More importantly it provides a far simpler equation for prediction of post focal
penetration depth (88.4% to a 95% PI) at 0.5MHz using a single variable parameter compared
to that of the linear regression, which had far poorer predictive capabilities for all fundamental
frequencies (40.8%) and (0% for 0.5MHz, due to non-linearity). All without removing extreme
standard residuals (>3) and reducing the dataset (n=214 for 0.5MHz). Removal of outliers (R>2)
over three iterations, reducing the spread of data into the non-linear regression using the
Gauss-Newton Algorithm, did also tighten the S value to 5.0 (n=151) but was deemed an
insignificant improvement for a loss of 30% of the sample data set.

J. Vince DPhil Thesis
109 | P a g e Using Ultrasound to Enhance Targeted Radiotherapy
Figure 39: Parameter estimate outputs and intervals for Figure 38, generated by the Gauss-Newton
algorithm for a Bragg peak.
3.5. Discussion
3.5.1. Experimental Order
As with any new in vitro experiment, benchmarking of results is important for making future
improvements to the system and its design, to remove both type I and type II errors32. Whilst
the MATLAB code despite its large memory requirements minimised human error and bias in
the quantification measurements, it did not improve human error associated with the
experimental ultrasound exposure. A run order versus the standard error of each observation
(Figure 40) shows the reproducibility error of the operator.

J. Vince DPhil Thesis
110 | P a g e Using Ultrasound to Enhance Targeted Radiotherapy
Figure 40: Run order versus residual for post focal projection depth (mm) across all frequencies.
As experience with the system grows as does the operator’s competence. This is particularly
relevant for transducer alignment. As the transducer is manually moved across the breadboard
for further exposures in each mould (See Section 2.2.2 and 2.2.3), the transducer has to be
manually repositioned so that the face of the transducer remains parallel with the mould. This
certainly contributed to the observed error and variation of early experiments (observations
<150). The reduction variation seen in later experiments (>150) is due to the use of a metal pin
used to measure the distance from the face of the transducer to the gel mould, reducing
operator error by minimising misalignment.
3.5.2. Primary Factor Responses Using Linear Regression
Running a Plackett-Burman factorial may have helped identify exactly which factors were
critical to producing post focal extravasation. Running these screening tests prior to the
surface response design would have been futile however due to the multicollinearity of a

J. Vince DPhil Thesis
111 | P a g e Using Ultrasound to Enhance Targeted Radiotherapy
number of the primary factors, leading to the screening tests being approximately the same
size as the final response surface design. The surface response also allowed for a much higher
degree of flexibility regarding levels and parameter combinations without producing needless
or redundant data, which would have been the case in a Plackett-Burman design, allowing for
initial screening and feasibility tests runs to contribute to the design reported.
Whilst the frequency component of the surface response could not be estimated, we can see
that from figures 34 and 35 previously, that the post projection length is non-linearly related to
frequency. The remaining primary factors that were deemed significant in the linear regression
model are highlighted below (Figure 41).
Figure 41: Primary factor effects on the significant remaining factors for post focal projection depth
(mm) using the optimised surface response linear regression method.
It is unsurprising that peak negative pressure correlates to a significant increase in post focal
extravasation, as the peak negative pressure and frequency of the acoustic field primarily
dictate the likelihood of inertial cavitation of a microbubble via the intensity of the acoustic
wave and its acoustic radiation force33–40. Whilst cavitation agent and cavitation concentration
could not be estimated, due to multicollinearity, it is interesting to see that the total number
of cycles or duty cycle negatively affect the post focal projection depth. Whilst theoretically
maintaining a higher cavitation agent concentration leads to a higher chance of inertial
cavitation and post focal microsphere movement, practically we realise that to produce

J. Vince DPhil Thesis
112 | P a g e Using Ultrasound to Enhance Targeted Radiotherapy
projections particularly those of longer lengths require time (total number of cycles) and a
minimum duty cycle (5%) to form. Runs with less than 5% DC were not observed to produce
any significant post focal microsphere extravasation. None the less, it highlights the temporal
significance of the mechanism at play; smaller infrequent but intense pulses seem to provide
the best conditions for producing projections of varying lengths.
The positive influence of mass input, whilst minor is not surprising as increasing the mass and
therefore number of microspheres of a given distribution within the agar well, is required for
x-ray detection of the larger projections. This is because of the associated measure error with
the µCT instrument (see section 2.3.1) requiring ~30µm of material at a 30mm FOV for
sufficient x-ray absorption and is therefore detecting clusters of microspheres rather than
individual microspheres for some tested distributions. This in combination with mass loss via
the manual deposition of the cavitation agent and microsphere slurry (see section 3.3.2)
during the experimentation, means that the addition of more material is unlikely to directly
contribute to the microsphere extravasation mechanism and is more likely to be a false
positive as a result of the methods and analysis used to generate the data.
Increasing well diameter negatively affects the post focal length of the projections produced.
For all well diameters, particularly at the lower (0.5MHz) frequencies used, the majority of the
diameter of the well is encompassed by the focal region of the transducer. The detrimental
effect of well diameter can therefore be explained by reducing the free space between the
boundary edges, brought about by decreasing diameter of the well, reducing the degrees of
freedom for the microspheres to travel from within the agar well. This phenomenon can be
observed during the ultrasound exposure particularly with a combination of large
microspheres, high pressures, low frequencies and a large well diameter; as a pulsing vortex of
microspheres causing turbulence within the well cavity. Each subsequent pulse causes

J. Vince DPhil Thesis
113 | P a g e Using Ultrasound to Enhance Targeted Radiotherapy
agitation within the well and the otherwise sedimented microspheres to ‘jump’ upon
exposure.
3.5.3. Factor Interaction Responses Using Linear Regression
A full interaction plot can be found in Appendix 3. Whilst the majority of secondary
interactions follow the dominant primary factor, there are some secondary interactions which
offer insight into the formation of the microsphere projections.
The positive interaction between frequency and pressure diminishes as frequency increases.
Increasing duty cycle or the total number of cycles a well is exposed to both produce
detrimental effects with increasing frequency.
Whilst the effect of cavitation agent concentration could not be independently assessed, its
interactions with pressure, duty cycle, total number of cycles, mass input and well diameter
are all positive.
For YAS microsphere Size*Total number of cycles, the top two largest distributions (200-400
and 106µm) have the largest negative effects on post focal microsphere extravasation depth.
The data also suggests that different microsphere populations respond differently to the
number of cycles each sample is exposed to. As the remaining distributions are relatively even
this suggests that not only does the diameter of each individual microsphere contribute to the
post focal projection depth, but other uncharacterised attributes e.g. range of distribution
relative to the mean size, surface finish and exact chemical composition, may also have a small
but limited interaction with the applied ultrasound field.

J. Vince DPhil Thesis
114 | P a g e Using Ultrasound to Enhance Targeted Radiotherapy
3.5.4. Comparison of Predictive Outputs for Regression Models
The linear model can be used to optimise the parameter inputs to maximise the measured
output (Figure 42). The linear model indicates that within the defined design space, a 110 mm
post focal penetration depth would be possible using a fundamental frequency of 0.5MHz and
8.7 MPa. The linear model predicts a completely non-sensical solution of -16.2 mm using 3.85
MPa at 0.5 MHz. The non-linear modelling suggests that there is an optimum peak negative
pressure around 3.85 MPa and exceeding this is not optimal, most likely due to consumption
of the cavitation agent nuclei at a rate faster than the extension of the microsphere projection.
Figure 42: Maximal prediction optimising all parameters within the design space for 0.5MHz.
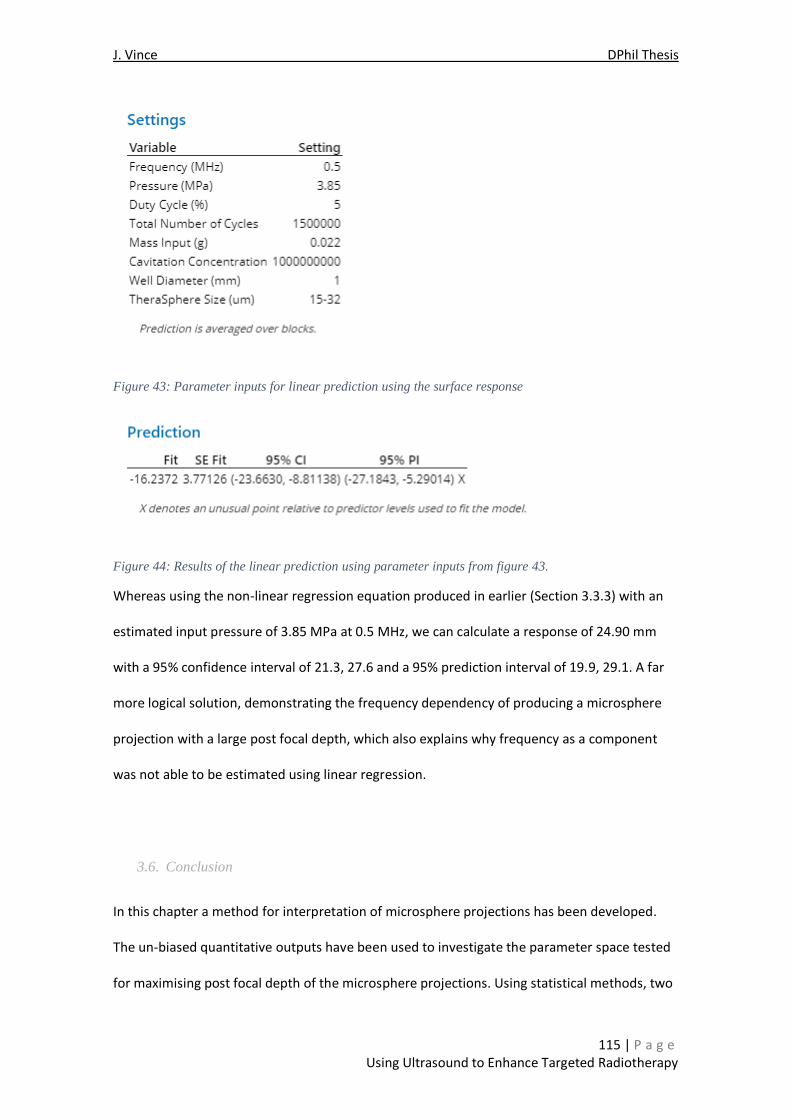
J. Vince DPhil Thesis
115 | P a g e Using Ultrasound to Enhance Targeted Radiotherapy
Figure 43: Parameter inputs for linear prediction using the surface response
Figure 44: Results of the linear prediction using parameter inputs from figure 43.
Whereas using the non-linear regression equation produced in earlier (Section 3.3.3) with an
estimated input pressure of 3.85 MPa at 0.5 MHz, we can calculate a response of 24.90 mm
with a 95% confidence interval of 21.3, 27.6 and a 95% prediction interval of 19.9, 29.1. A far
more logical solution, demonstrating the frequency dependency of producing a microsphere
projection with a large post focal depth, which also explains why frequency as a component
was not able to be estimated using linear regression.
3.6. Conclusion
In this chapter a method for interpretation of microsphere projections has been developed.
The un-biased quantitative outputs have been used to investigate the parameter space tested
for maximising post focal depth of the microsphere projections. Using statistical methods, two

J. Vince DPhil Thesis
116 | P a g e Using Ultrasound to Enhance Targeted Radiotherapy
methods (linear and non-linear) have been used to identify the parameters and their
interactions critical to maximising post focal projection depth. The linear regression analysis
provided more insight into the secondary interactions and nuances within the model, whereas
the simpler non-linear method had increased predictive capabilities. Both models suggest both
peak negative pressure and fundamental frequency as key criteria for maximising post-focal
projection depth, with an optimal peak negative pressure at a given frequency, highlighting
their collinearity. Drastically increasing the peak negative focal pressure, may cause cauterised
vessels within the resection cavity to be reopened. Although this is highly unlikely this could
inadvertently force spheres into the circulatory system, causing downstream health and
toxicity concerns. This failure mode needs to be considered during further in vivo
experimentation, when evaluating the peak negative pressure offset for mammalian tissue
compared to that of the over-simplified agar-agar hydrogel.
For clinical translation the post focal penetration depth of the microspheres can be tailored by
varying the applied peak negative pressure. Whilst the radius of the irradiation field produced
largely static at ~2.5 mm, based upon the mean depth of beta irradiation. It appears that
smaller infrequent but intense pulses seem to provide the best conditions for producing
projections of varying lengths, not too dissimilar to conditions used in ultrasound histotripsy40–
47. Smaller microspheres not only offer increased coverage but also appear to travel the
furthest, with the largest post focal projection lengths. In order to treat the margins of a
particularly large resection, the ultrasound focus must be able to move to encompass the
interior surface of the resection cavity or the aspiration of the tumour mass performed in
stages. Performing the adjuvant therapy in stages would allow for improved localised
dosimetry via increased directional control of the microsphere projection under ultrasound
exposure; using the cavities produced by the ultrasonic aspiration as ‘wells’ for microsphere
and cavitation agent deposition.

J. Vince DPhil Thesis
117 | P a g e Using Ultrasound to Enhance Targeted Radiotherapy
As the work to date has used only focussed ultrasound transducers for producing microsphere
extravasation, the largest directional component measured has always been in the same
direction as the applied ultrasound filed or acoustic radiation force. Therefore, using post focal
projection depth (mm) as the key measurable output does indeed maximise any minimum-
volume enclosed ellipsoid produced and also therefore maximises and volume of irradiation
around the microspheres extravasated into the anticipated tumour margins. However, as the
well does not reflect the size or shape of the cavity produced during the resection procedure,
nor the potential use of an un-focussed ultrasonic horn rather than focussed transducer;
Considerations need to be made for the relative thickness of the in vivo slurry produced
compared to the size and shape of the ultrasound field used during translation, a noticeable
change in geometries from those used within the agar-agar phantom.
3.6.1. Limitations
Whilst there are other µCT machines commercially available, we could only gain access to the
Perkin Elmer Quantum FX machine for this project. As a result, the resolution of the images
produced are 59 and 140 µm, for the 30 and 72 mm FOV’s respectively. Ultimately the images
used for quantifying the microsphere distributions using the 15-32 µm microspheres, rely on
clustering of the microspheres to be detected for a given pixel. It is assumed therefore that
there are some microspheres which are delivered beyond that of the mapped projections and
may be cause for concern in future translation of the technology. The exact number of
microspheres delivered beyond the imaged projects will need quantifying, via histology during
ex vivo experiments.
Additionally, it has not been possible to investigate the potential effects of the ultrasound
focus size independent of the applied ultrasound frequency. This is because the focus region is
dictated by the physical curvature of the transducer and the applied fundamental frequency,

J. Vince DPhil Thesis
118 | P a g e Using Ultrasound to Enhance Targeted Radiotherapy
which cannot be manipulated on each device. The use of a smaller focal region particularly at
higher pressures, appears to produce less controllable projections compared to that of larger
focal regions (See Chapter 1) and is therefore largely undesirable towards translation of the
technology. Preference is given to the use of larger focal regions e.g 0.5 MHz.
3.6.2. Future Work
As shown in both this and the preceding chapter, extravasation of microspheres into agar at
various depths can be achieved using a variety of parameters from focussed ultrasound
transducers. This new method for distributing microspheres using cavitation activity however
is very sensitive to frequency. Further work is needed to more accurately identify the non-
linear relationships and corresponding sensitivities between the fundamental frequency and
the peak negative pressure required to achieve the required degree of extravasation.
Future work is also needed to design of a device to produce the intended microsphere
projections within an intra-operative setting. Fundamental frequency and peak negative
pressure will be key elements moving forward however other considerations including the
physical use, ergonomics and safety concerns of the device must also be considered. This will
be discussed further in Chapter 5. Investigation of the mechanism(s) by which cavitation
produces extravasation is also required and this will be the subject of Chapter 4.
Further feedback from physicians will be required to establish key output criteria of the device
e.g. focussed or unfocussed acoustic field, time allocation for the intervention, availability of
cavitation agents and radioembolic material.

J. Vince DPhil Thesis
119 | P a g e Using Ultrasound to Enhance Targeted Radiotherapy
References
1. Ng, S. C. et al. Patient dosimetry for 90Y selective internal radiation treatment based on 90Y PET imaging. J. Appl. Clin. Med. Phys. 14, 212–221 (2013).
2. Kafrouni, M. et al. Analysis of differences between 99mTc-MAA SPECT- and 90Y-microsphere PET-based dosimetry for hepatocellular carcinoma selective internal radiation therapy. EJNMMI Res. 9, (2019).
3. Gordon, A. C. Tuning Your RADIOembolization : Imaging-guidance of Yttrium-90 Radioembolization. (Evanson, Illinois, 2016).
4. Attarwala, A. A. et al. Quantitative and qualitative assessment of yttrium-90 pet/ct imaging. PLoS One 9, 1–7 (2014).
5. Knešaurek, K., Tuli, A., Pasik, S. D., Heiba, S. & Kostakoglu, L. Quantitative comparison of pre-therapy 99mTc-macroaggregated albumin SPECT/CT and post-therapy PET/MR studies of patients who have received intra-arterial radioembolization therapy with 90Y microspheres. Eur. J. Radiol. 109, 57–61 (2018).
6. Auditore, L. et al. Monte Carlo 90 Y PET/CT dosimetry of unexpected focal radiation-induced lung damage after hepatic radioembolisation . Phys. Med. Biol. 65, 235014 (2020).
7. Kafrouni, M. et al. Analysis of differences between 99mTc-MAA SPECT- and 90Y-microsphere PET-based dosimetry for hepatocellular carcinoma selective internal radiation therapy. EJNMMI Res. (2019) doi:10.1186/s13550-019-0533-6.
8. Elschot, M. et al. Quantitative Comparison of PET and Bremsstrahlung SPECT for Imaging the In vivo Yttrium-90 Microsphere Distribution after Liver Radioembolization. PLoS One 8, (2013).
9. Wang, X. D., Yang, R. J., Cao, X. C., Tan, J. & Li, B. Dose delivery estimated by bremsstrahlung imaging and partition model correlated with response following intra-arterial radioembolization with 32p-glass microspheres for the treatment of hepatocellular carcinoma. J. Gastrointest. Surg. 14, 858–866 (2010).
10. Wondergem, M. et al. 99mTc-macroaggregated albumin poorly predicts the intrahepatic distribution of 90Y resin microspheres in hepatic radioembolization. J. Nucl. Med. 54, 1294–1301 (2013).
11. Walrand, S., Hesse, M., Chiesa, C., Lhommel, R. & Jamar, F. The low hepatic toxicity per gray of 90Y glass microspheres is linked to their transport in the arterial tree favoring a nonuniform trapping as observed in posttherapy PET imaging. J. Nucl. Med. 55, 135–140 (2014).
12. Maughan, N. M. et al. Phantom study to determine optimal PET reconstruction parameters for PET/MR imaging of 90Y microspheres following radioembolization. Biomed. Phys. Eng. Express 2, 15009 (2016).
13. Pasciak, A. S. et al. The number of microspheres in Y90 radioembolization directly affects normal tissue radiation exposure. Eur. J. Nucl. Med. Mol. Imaging 47, 816–827 (2020).
14. Pasciak, A. S. et al. The number of microspheres in Y90 radioembolization directly affects normal tissue radiation exposure. Eur. J. Nucl. Med. Mol. Imaging 47, 816–827 (2020).
15. Gallego, O. Nonsurgical treatment of recurrent glioblastoma. Curr. Oncol. 22, e273–e281 (2015).
16. Erwin G. Van Meir, PhD, Costas G. Hadjipanayis, MD, PhD, Andrew D. Norden, MD, MPH, Hui-Kuo Shu, MD, Patrick Y. Wen, MD, and Jeffrey J. Olson, M. Exciting New Advances in Neuro-Oncology: The Avenue to a Cure for Malignant Glioma. CA Cancer J Clin. 60, 166–193 (2010).
17. Thompson, J. G. et al. Distribution and Detection of Radiopaque Beads after Hepatic Transarterial Embolization in Swine: Cone-Beam CT versus MicroCT. J. Vasc. Interv. Radiol. 29, 568–574 (2018).
18. Westcott, M. A., Coldwell, D. M., Liu, D. M. & Zikria, J. F. The development, commercialization, and clinical context of yttrium-90 radiolabeled resin and glass microspheres. Adv. Radiat. Oncol. 1, 351–364 (2016).
19. Statistics, B. & Improvement, C. <3-s2.0-B9780750647090500077-main.pdf>.
20. Collins, L. M., Dziak, J. J. & Li, R. Design of Experiments With Multiple Independent Variables: A Resource Management Perspective on Complete and Reduced Factorial Designs. Psychol. Methods 14, 202–224

J. Vince DPhil Thesis
120 | P a g e Using Ultrasound to Enhance Targeted Radiotherapy
(2009).
21. Montgomery, D. C. Design and analysis of experiments. (2013).
22. Antony, J. Fundamentals of Design of Experiments. Des. Exp. Eng. Sci. 7–17 (2014) doi:10.1016/b978-0-08-099417-8.00002-x.
23. Federer, W. T. & Raktoe, B. L. Fractional Factorial Designs. Wiley StatsRef Stat. Ref. Online 2, (2014).
24. Briefs, A. M. C. T. Experimental design and optimisation (4): Plackett-Burman designs. Anal. Methods 5, 1901–1903 (2013).
25. Bhatra Charyulu, N. C. & Ameen Saheb, S. Note on reduction of dimensionality for second-order response surface design model. Commun. Stat. - Theory Methods 46, 3520–3525 (2017).
26. Sukriti et al. Surface response methodology-central composite design screening for the fabrication of a Gx-psy-: G -polyacrylicacid adsorbent and sequestration of auramine-O dye from a textile effluent. RSC Adv. 6, 74300–74313 (2016).
27. Hadi, I. et al. Radiation necrosis after a combination of external beam radiotherapy and iodine-125 brachytherapy in gliomas. Radiat. Oncol. 16, 1–9 (2021).
28. Kickingereder, P. et al. Low-dose rate stereotactic iodine-125 brachytherapy for the treatment of inoperable primary and recurrent glioblastoma: single-center experience with 201 cases. J. Neurooncol. 120, 615–623 (2014).
29. Craney, T. A. & Surles, J. G. Model-dependent variance inflation factor cutoff values. Qual. Eng. 14, 391–403 (2002).
30. Transformations, B. Box-Cox Transformations. (1964).
31. Argyros, I. K. Iterative Methods and Their Dynamics with Applications. (CRC Press, 2017).
32. Greenland, S. et al. Statistical tests, P values, confidence intervals, and power: a guide to misinterpretations. Eur. J. Epidemiol. 31, 337–350 (2016).
33. Kratskin, I. L., Yu, X. & Doty, R. L. “Stable” Inertial Cavitation Charles. Ultrasound Med. Biol. 44, 199–203 (1997).
34. Guo, X., Li, Q., Zhang, Z., Zhang, D. & Tu, J. Investigation on the inertial cavitation threshold and shell properties of commercialized ultrasound contrast agent microbubbles. J. Acoust. Soc. Am. 134, 1622–1631 (2013).
35. Lauterborn, W. & Kurz, T. Physics of bubble oscillations. Reports Prog. Phys. 73, (2010).
36. Versluis, M. Nonlinear behavior of ultrasound contrast agent microbubbles and why shell buckling matters. Proc. 20th Int. Congr. Acoust. 1–6 (2010).
37. Prosperetti, A. Bubble phenomena in sould fields: part two. Ultrasonics 22, 115–124 (1984).
38. Samarasinghe, S. Increasing the nonlinear character of microbubble oscillations at low acoustic pressures. 807–811 (2008) doi:10.1098/rsif.2008.0005.
39. Lauterborn, W., Kurz, T., Geisler, R., Schanz, D. & Lindau, O. Acoustic cavitation, bubble dynamics and sonoluminescence. Ultrason. Sonochem. 14, 484–491 (2007).
40. Bader, K. B., Vlaisavljevich, E. & Maxwell, A. D. For Whom the Bubble Grows: Physical Principles of Bubble Nucleation and Dynamics in Histotripsy Ultrasound Therapy. Ultrasound Med. Biol. 45, 1056–1080 (2019).
41. Edsall, C. et al. Bubble Cloud Behavior and Ablation Capacity for Histotripsy Generated from Intrinsic or Artificial Cavitation Nuclei. Ultrasound Med. Biol. 47, 620–639 (2021).
42. Engle, K. M.; Mei, T-S.; Wasa, M.; Yu, J.-Q. Development and Translation of Histotripsy: Current Status and Future Directions. Curr Opin Urol. 24, 104–110 (2014).
43. Lake, A. M. et al. Histotripsy: Minimally Invasive Technology for Prostatic Tissue Ablation in an In vivo Canine Model. Urology 72, 682–686 (2008).
44. Vlaisavljevich, E. et al. Effects of tissue stiffness, ultrasound frequency, and pressure on histotripsy-induced cavitation bubble behavior. Phys. Med. Biol. 60, 2271–2292 (2015).

J. Vince DPhil Thesis
121 | P a g e Using Ultrasound to Enhance Targeted Radiotherapy
45. Hendley, S. A., Bollen, V., Anthony, G. J., Paul, J. D. & Bader, K. B. In vitro assessment of stiffness-dependent histotripsy bubble cloud activity in gel phantoms and blood clots. Phys. Med. Biol. 64, ab25a6 (2019).
46. Hendley, S. A., Bollen, V., Anthony, G. J., Paul, J. D. & Bader, K. B. In vitro assessment of stiffness-dependent histotripsy bubble cloud activity in gel phantoms and blood clots. Phys. Med. Biol. 64, (2019).
47. Hoogenboom, M. et al. Mechanical High-Intensity Focused Ultrasound Destruction of Soft Tissue: Working Mechanisms and Physiologic Effects. Ultrasound Med. Biol. 41, 1500–1517 (2015).

J. Vince DPhil Thesis
122 | P a g e Using Ultrasound to Enhance Targeted Radiotherapy
CHAPTER 4
High-speed Imaging of Cavitation Enhanced
Projection Events

J. Vince DPhil Thesis
123 | P a g e Using Ultrasound to Enhance Targeted Radiotherapy
4. High-speed Imaging of Cavitation Enhanced Projection
Events
4.1. Introduction
Several studies have shown that ultrasound induced cavitation can promote convection of
small molecule drugs1,2 and nanoparticles3–6 both in tissue mimicking phantoms and in vivo4,6,7.
It was established in Chapters 2 and 3 that enhanced extravasation could also be achieved with
glass microspheres having diameters in the range 10 - 100µm in agar phantoms. Interestingly,
despite the ultrasound exposure conditions being comparable in terms of frequency, peak
negative pressure, duty cycle and pulse repetition frequency, the distances travelled by the
microspheres were found to be significantly larger than those reported for nanoparticles5,8 .
This could potentially be explained by the fact that the larger particles will have greater inertia
and/or that they will be subject to larger acoustic radiation forces and/or that the
microspheres may themselves promote cavitation activity. The aim of the work described in
this chapter was to attempt to gain insight into the mechanisms by which microsphere
transport is facilitated, by using a high-speed camera to directly observe the process.
4.2. Methods
4.2.1. Mould Design
For this series of experiments, an acrylic mould for an agar gel block measuring 80 x 40 x
40mm was fabricated, with a wall thickness of 10mm in all directions. A blind M4 thread was
tapped into the top surface of the mould to allow for a metal supporting rod to be attached so
that the mould could be suspended in the water tank. Nylon screws were used to hold the gel
mould together during alignment and experimentation, to avoid unwanted B-mode imaging
artefacts. A 4mm hole was drilled through the acrylic lid near the front right corner of the

J. Vince DPhil Thesis
124 | P a g e Using Ultrasound to Enhance Targeted Radiotherapy
mould, 4mm from the right edge of the mould to the centre and 10mm from the front of the
mould to the centre of the hole. This allowed for a 4mm stainless-steel modified rod to be
inserted, in a similar fashion to previous experiments (See Section 2.2.4) to produce a blind
ended channel or well within the gel. An initial pilot study showed that the optimum terminal
dimensions of the rod were 1x10mm in size for this set of experiments.
The gel was comprised of 0.5% agar and was fabricated in the same manner as previously
reported (Section 2.2.3). The moulds were set on a slight incline whilst cooling, to prevent
ingress of air into the cavity near the stainless-steel rod. Initial experiments included an acrylic
supporting column with a partial relief on the front right of the mould; this was removed to
increase the gel thickness around the well and reduce the frequency of tears in the mould
when removing the stainless-steel rod insert.
Once the gel had solidified, two faces of the mould were removed, the front face and the right
edge, to enable access for the high magnification objectives. With the stainless-steel rod
carefully removed to produce the gel cavity, a mixture of undiluted Sonovue® (310µL, Bracco)
and black glass microspheres (15-35µm, 106µm, 200-400µm) were injected into the well,
which was the sealed with a rubber bung to prevent water ingress. The glass microspheres
were manufactured by MoSci (TheraSphere® manufacturer) and were produced in that the
same way as TheraSphere™ giving them identical surface properties and density but increased
brightfield contrast.

J. Vince DPhil Thesis
125 | P a g e Using Ultrasound to Enhance Targeted Radiotherapy
Figure 45: Acrylic gel mould used for high-speed imaging experiments before (left), after (right).
Ultrasound exposure from left (front) to right (back). Extravasation of black microspheres (outlined in
red). Gel block measures 80 x 40 x 40mm, with 10mm thick acrylic walls, excluding the front and back
faces (left and right faces of the images above) which were 5mm acrylic brackets with mylar sheet in the
middle.
4.2.2. Ultrasound Tank and Movement Stages
A transparent acrylic water tank measuring 445mm x 445mm x 175mm mounted on an
aluminium breadboard with two rows of M6 thread holes pitched 25mm apart on its edges,
was used for this series of experiments (Figure 46 below).

J. Vince DPhil Thesis
126 | P a g e Using Ultrasound to Enhance Targeted Radiotherapy
Figure 46: Equipment setup for high-speed camera experiments. Diagram (not to scale, above) actual
(below). For details of the electronics, please see Figure 47.
Two sets of xyz movement stages were constructed from crossed-roller bearing aluminium
manual linear movement stages (Newport®, MKS Instruments) allowing for fine adjustment
±0.01mm within a 50 mm range of travel. One assembly was used to suspend the rotated gel
mould in the water tank, using the holding rod to avoid entrapment of gas bubbles on the
surface as the mould passed through the air-water interface. Each experimental test run used
a new gel mould, warmed to room temperature (~ 20oC) before exposure.
A second assembly was used to support the single element transducer (64mm, 0.50MHz, H107
Series, Sonic Concepts, Bothell, WA) with a rectangular cutout measuring 48 x 17mm in the
centre for a coaxially aligned linear array (centre frequency 6.25 MHz, bandwidth 4-11MHz,
128 elements, 0.3mm pitch, 18mm elevation focus, L11-4v Verasonics®, Redmond, WA).
Pressure calibrations for this transducer are as previously reported (Section 2.2.6). The tank
was filled each day with degassed deionised water (Millipore-Q Type 1).

J. Vince DPhil Thesis
127 | P a g e Using Ultrasound to Enhance Targeted Radiotherapy
4.2.3. Shimadzu Hypervision HPV-X2 High-speed Camera
A Solis® High-Power LED (445 nm Royal Blue, 48.3mm clear aperture, 5.4 W Min, Thor Labs,
UK) with a Plug-and-Play Solis® LED driver (Thor Labs, UK) was placed beneath the tank to
provide illumination. The driver automatically detects and sets the current limit to the value
stored in each LED's internal memory to protect it from being overdriven; maintaining a
constant level of light emission throughout each experiment.
To capture cavitation events at a sufficient rate for driving frequencies 0.5 - 3.3 MHz, a
Hypervision HPV-X2 (Shimadzu, Tokyo, Japan) high-speed camera was chosen based on its
capability and availability. The HPV-X2 is capable of recording from 60 to 10 million frames per
second, with variable exposure times, and can record a maximum of 256 frames within a single
capture
To the front of the camera was attached a 25mm ID lens tube with a 552 nm edge LaserMUX™
single-edge laser dichroic beam splitter lens (LM01-552-25, Semrock®, Rochester, NY) placed
175mm from the HPV-X2 detector. At a distance of 200mm from the face of the high-speed
camera was placed a 30 mm Cage-Compatible, Kinematic Fluorescence Filter Cube (DFM1T1,
Thor Labs, UK) allowing for a 90-degree reflection to be transmitted to the HPV-X2. In the
direct path of light was placed an aspheric condenser lens with diffuser surface (ACL2520U,
600 Grit, Ø25 mm) followed by a light detector (PDA36A2 Si Switchable gain detector, 400 -
1000 nm, Thor Labs, UK) which produced an output voltage trace for monitoring of the
transmitted light, this was later used to develop a light responsive trigger signal for the
Shimadzu camera. The diffuser lens was required to reduce the intensity of the received light
to the diode as not to damage the oscilloscope input and reduce the detector’s fidelity, a
reduction which could be compensated for by the internal gain of the detector.
At the base of the cube, an adaptor ring for attachment of two NIKON (Tokyo, Japan) CFI Plan
Fluor series air objectives; a 4x (0.13 NA, 17.2mm WD) and a 10x (0.30 NA, 16.00mm WD).

J. Vince DPhil Thesis
128 | P a g e Using Ultrasound to Enhance Targeted Radiotherapy
Over which was placed a 100ml borosilicate glass beaker with a polystyrene insert between
the edge of the glass wall and outermost edge of the objective, to prevent water ingress into
the two objectives and to centre the objective in the middle of the protective glass beaker.
Whilst the base of the beaker was not perfectly flat, nor designed for this application; a water
immersible objective of the correct magnification and working distance could not be sourced.
Ingress of water either as droplets or vapour causes a hazing of the objective surface and a
subsequent reduction in clarity, contrast and resolution as well as being potentially damaging
to the objective.
4.2.4. High Speed Camera Triggering
Cavitation events occurring on the nanosecond to microsecond time scale have been studied
extensively using high-speed cameras9–16. The cavitation induced microsphere transport
observed in this study, however, were found to occur after a variable multi-second delay. This
posed a considerable challenge for triggering the high-speed camera. The size and optical
contrast of the microspheres enabled them to be observed by the naked human eye.
Unfortunately attempts to manually trigger the high-speed camera in time with the projection
events were only successful with imaging frame rates up to 10,000 fps. In order to capture
events at 100,000 fps and above, an electronic trigger signal was required.
Initial attempts used a photo-detector to convert the received transmitted light into an output
voltage (Figure 46) to produce a voltage trace over the exposure time, used to monitor the
change in image contrast during the formation of a microsphere projection (See Appendix 4).
An average of the corresponding voltage-time trace was then used to set a manual delay onto
the second waveform generator, so that the input trigger signal to the high-speed camera
would coincide with the microsphere projection. Due to the variable nature of the delay,
however, this approach was of limited success, with the delay frequently being either

J. Vince DPhil Thesis
129 | P a g e Using Ultrasound to Enhance Targeted Radiotherapy
insufficient (i.e. only capturing the very beginning of the projection event) or too long (only
capturing the end of the event or mid-way through a projection).
Figure 47: Electronic setup for manually gated delay of the HPV-X2 high-speed Camera
A second more responsive electronic setup was therefore devised. The voltage trace
generated from the output of the light detector was split between oscilloscopes, one for
monitoring of the voltage signal (overlaid on the Verasonics™ trigger and waveform out of the
RF amplifier) with a second to produce another output signal independent of the ultrasound
trigger, when the oscilloscope detected a drop in the observed voltage from the detector
trace. This allowed any electronic delay, caused by processing or transmission, to be removed
by setting the trigger frame (from 1-256) to later within the capture sequence, allowing more
frames to be recorded before the delayed trigger signal was received. The second trigger
output signal was triggered by exceeding a voltage window (positive or negative) or by using a
falling edge (negative only) manually set by the operator for each ultrasound exposure from
the mean resting voltage prior to ultrasound exposure. Each exposure required manual editing

J. Vince DPhil Thesis
130 | P a g e Using Ultrasound to Enhance Targeted Radiotherapy
of the mean voltage required for the trigger, even for subsequent exposures. Further
information on development of the triggering methods can be found in Appendix 2.
Figure 48: Light detector voltage gated trigger electronic setup for use with dual oscilloscopes.
4.2.5. Ultrasound Exposure Conditions to Facilitate High-speed Imaging
The exposure conditions investigated were based on the work described in the previous
chapter (See section 3.2.6) and the limitations imposed by the maximum imaging frame rate
and the optical field of view and depth of focus. During initial testing with pressures up to 3.9
MPa it was found that the well shook violently, moving in and out of the field of view, and thus
capturing consecutive frames at these pressures was particularly difficult. All of the
subsequent experiments therefore used the same ultrasound exposure conditions unless
otherwise stated; 0.50 MHz, 1.9 MPa, 5% DC, 3.3Hz PRF at a room temperature ~20oC. It was
hoped that the smaller peak negative pressure, despite producing shorter projections overall
in the direction of US transmission, would provide clearer images to help elucidate the
mechanism by which the projections are formed. Constant exposure to the HLED even at
maximum light output, did not appear to have any effect on microbubble stability, i.e., no
destruction of microbubbles or coalescence/foaming was observed.

J. Vince DPhil Thesis
131 | P a g e Using Ultrasound to Enhance Targeted Radiotherapy
The elasticity of the 0.5% agar, despite its low material strain17–23, is not overcome by a single
flux of pressure, does not tear and retains the integrity of the well. The applied ultrasound
field is therefore not directly responsible for the perforation of the gel boundary and
extravasation of microspheres, validating agar as a suitable choice of body tissue mimic.
4.3. Results
As the majority of results within this chapter are recorded as video files, an unlisted YouTube
channel (https://youtube.com/playlist?list=PL2ZKtYn85C-Qd5WOQkOu7OdbEONlxrU1S) has
been created for the reader(s) to help visualise the dynamic movements of the microbubbles,
microspheres and cavitation activity. Hyperlinks to videos discussed are embedded throughout
the text and Figures for convenience.
4.3.1. Extravasation of Glass Microspheres through Agar Phantoms
Figure 49 shows an example of a typical glass microsphere projection caused by ultrasound
mediated cavitation observed using low magnification (4x). The series of images demonstrates
the various events which occur to produce the numerous channels which contribute to
entirety of the single microsphere projection. The 4x NIKON objective was primarily used to
visualise the macroscopic appearance of the multi-channel cavitation induced projections. Low
magnification videos were captured at relatively low frame rates (2-10,000 fps) to enable
observations of microsphere extravasation, projection channel formation and growth across
the image frames; with the microsphere filled channels appearing as large black streaks against
a white-grey background. Please note that for ease of viewing, all images are shown in the
same orientation with the upper edge corresponding to the edge of the well closest to the
transducer, i.e. the direction of ultrasound propagation is from top to bottom; gravity acts

J. Vince DPhil Thesis
132 | P a g e Using Ultrasound to Enhance Targeted Radiotherapy
perpendicular to the plane of the image, preventing microspheres from sinking into the
projection channels.

J. Vince DPhil Thesis
133 | P a g e Using Ultrasound to Enhance Targeted Radiotherapy
Figure 49: Series of images (a-p) captured during HIFU exposure for Mould 86. Each image is frame
number 256 of 256 of each individual video capture, taken manually approximately 5 seconds apart.
0.500 MHz fundamental frequency, 1.9 MPa peak negative focal pressure, 5% Duty Cycle, 3.3 Hz PRF,
20 mg of 15-32 black glass microspheres with 310 µL of reconstituted SonoVue® microbubbles (3 x 10⁸).

J. Vince DPhil Thesis
134 | P a g e Using Ultrasound to Enhance Targeted Radiotherapy
For this series, each image is the last frame captured from each video recorded, in
chronological order over the whole course of the exposure. The videos were captured at 2,000
fps, for a total of 128ms per video over ~ 80 seconds, with each video being ~5s apart from one
another (corresponding to the save time of the HPV-X2) using the 4x NIKON objective. Please
note that at 4x magnification, the microbubbles themselves are not visible and Figure 49 is
therefore only representative of the extravasation of microspheres through the agar medium
and not of the microbubble movements within the ultrasound field.
Figure 49 shows the start of the projection in more detail. Each projection starts with a
disruption to the packing of the microspheres, presumably brought about by the ultrasound
induced motion of the intermingled microbubbles (although this cannot be resolved at 2000
fps). A ‘bolus’ of microspheres, highlighted in red, can be seen forming within the well at the
centre of the frame (Figure 49, b, YouTube). With each new pulse, a group of microspheres is
seen to collide with the well boundary, distributing other microspheres along it and initiating
projection channels (Figure 49, c, YouTube). As the ultrasound exposure continues and further
microsphere collisions occur, these channels extend in the direction of the applied ultrasound
field and more channels form (Figure 49, b:p), A single tightly packed bolus of microspheres
can be seen at the tip of each channel with a varying number of microspheres along the rest
of its length. With each successive pulse the channels are increasingly filled with further
microspheres (Figure 490, e:h).
As might be expected, those channels most closely aligned with the central axis of ultrasound
propagation appear to grow the fastest, regardless of the order in which the channels are
initially formed. As the channels grow in length, the number of microspheres available in the
well diminishes and the previously obvious boundary edge is no longer visible, only the
microspheres behind the central channel of the projection (Figure 49, i:p) are discernible. This
channel is the broadest and most densely packed with microspheres. In channels with a lower

J. Vince DPhil Thesis
135 | P a g e Using Ultrasound to Enhance Targeted Radiotherapy
density of microspheres, a loose banding is now observable after the bolus at the tip of each
projection (Figure 49, i:p, See Appendix 5 for further detail).
In the example shown in Figure 49, the central projection continues to progress beyond the
edge of the image frame (the height of the frame is 2.2 mm) and continues linearly with the
direction of the applied ultrasound field for several mm. The longer the ultrasound is applied
for, the greater the length of the channels, increasing the overall length of the projection
formed (See Chapter 3.2.6).
4.3.2. Microsphere Bolus Speed Measurements
By comparing distances within the frame and knowing the frame rate, estimates can be made
of the speed at which a bolus of microspheres is propelled through the agar phantom. It is not
possible to track individual microspheres in frame, due to the spatial resolution at this
magnification (4x, 8.93 µm pixel-1).

J. Vince DPhil Thesis
136 | P a g e Using Ultrasound to Enhance Targeted Radiotherapy
Figure 50: Frames 238-242 of mould 86 (YouTube) used to calculate the speed at which the bolus of
microspheres travels through the agar to produce the most central channel. 5,000 fps, 200µs a frame).
0.500 MHz fundamental frequency, 1.9 MPa peak negative focal pressure, 5% Duty Cycle, 3.3 Hz PRF,
20 mg of 15-32 black glass microspheres with 310 µL of reconstituted SonoVue® microbubbles (3 x 10⁸).
Figure 50 illustrates the extension of a projection channel. The projection in the middle of the
image, shown by the red rectangle, measures 474 µm. As the channel grows over the next 4
frames it extends it to a length of 816 µm via the collision of the microsphere bolus with the
end of the channel. In the fifth frame (Figure 50e), however, the ultrasound is off and the agar
at the tip of the channel compressed by the impingement of the microspheres recovers,
reducing the total length of the channel produced to 753 µm (i.e. an elastic relaxation of 63
µm). The average speed of the microsphere bolus in this case is therefore ~ 0.4275 m/s (427.5
mm/s). The width of the channel is also observed to increase (Figure 50, b:d), from 146 to 291

J. Vince DPhil Thesis
137 | P a g e Using Ultrasound to Enhance Targeted Radiotherapy
µm, with the widest point being at the most proximal end to the ultrasound or ‘mouth’ of the
channel. This reduces to a width of 208µm after the ultrasound is switched off.
Measurements were taken for the pitch of multi-channel projections, to ascertain if there was
any consistency in their spacing. As might be expected for a cavitation related process, there
was no consistency in the spacing over multiple experimental runs, despite identical
ultrasound parameters, phantom composition and geometry, microbubble and microsphere
concentration.
Figure 51: Examples of multi-channel microsphere projections using a 4x objective. Achieved using
identical ultrasound parameters (See Section 4.1.8) Min 123.00, Max 739.00, Mean 365.459, STD
164.43; 26 measurements, 6 projections total. 0.500 MHz fundamental frequency, 1.9 MPa peak negative
focal pressure, 5% Duty Cycle, 3.3 Hz PRF, 20 mg of 15-32 black glass microspheres with 310 µL of
reconstituted SonoVue® microbubbles (3 x 10⁸).
4.3.3. Rippling of the Edge of the Well
Prior to the extravasation of microspheres and the formation of projection channels, an
oscillation or ‘rippling’ can be seen of the agar water interface at the edge of the well (Figure
52).
Figure 52: Rippling of the well edge under first ultrasound pulse at 2,000 fps. Frames 141, 142 and 143
of mould 86 (YouTube). Time between frames is 0.5ms. 0.500 MHz fundamental frequency, 1.9 MPa peak
negative focal pressure, 5% Duty Cycle, 3.3 Hz PRF, 20 mg of 15-32 black glass microspheres with 310
µL of reconstituted SonoVue® microbubbles (3 x 10⁸).

J. Vince DPhil Thesis
138 | P a g e Using Ultrasound to Enhance Targeted Radiotherapy
The timescale of this rippling phenomenon does not appear to correspond directly to the
ultrasound exposure as the duration of the event is in the order of milliseconds, orders of
magnitude longer than the period of the ultrasound (2 μs) and shorter than that of the PRF
(3.3 Hz, 300 ms). Increasing the magnification (10x) and imaging frame rate (100,000 fps)
indicated that this movement was in fact due to the formation and motion of a microbubble
cloud (Figure 53, YouTube).

J. Vince DPhil Thesis
139 | P a g e Using Ultrasound to Enhance Targeted Radiotherapy
Figure 53: Rippling of the boundary edge as a result of a microbubble cloud. 10x objective, 100,000 fps,
15-32µm microspheres. Frames 132, 201, 240, 244, 248, 252 and 256 of 256 frame capture. Image
frames within the figure are therefore 250ns apart, total time recorded 2560 µs. The increased packing
density of the microspheres within the well cavity and loss of resolution at higher magnification when
using <15 µm microspheres, inhibits resolving any further activity within the agar well. YouTube
During an ultrasound pulse the microbubble cloud moves throughout the frame within the
voids created by the phantom well or projection channels. Whilst the microbubble cloud does
not move across the frame between pulses, cavitation activity within the cloud and associated
bead movements around the microbubble cloud continue; presumably sustained by
scavenging of other microbubble in close proximity to the microbubble cloud which prolongs
cloud cavitation between pulses (invisible at this magnification).
4.3.4. Observations of Bubble Cloud and Microsphere Interactions
Observing movement within the intermingled microbubbles and microspheres was particularly
difficult with the smaller microspheres using the higher magnification objective. Using a lower
magnification (4x) and much larger microspheres (106µm), which move more slowly due to
their increased inertia, made it possible to track their individual movements within a

J. Vince DPhil Thesis
140 | P a g e Using Ultrasound to Enhance Targeted Radiotherapy
projection. Increasing the relative mass of each particle by an order of magnitude, requires an
increase in focal pressure to induce movement for the same driving frequency (Figure 41,
Section 3.5.4). Therefore, all images produced using the larger (106µm) microspheres used a
focal pressure of 2.8 MPa. In addition to the increased focal pressure and microsphere
diameter, it was necessary to increase the frame rate of video capture (to-200,000 fps) with
the aim of observing microbubble cavitation effects rather than large-scale microsphere
movements. In Figure 54. the smaller circular objects are cavitating microbubbles, expanding
and contracting in response to the applied ultrasound field and consequently changing in
appearance between frames. Bubbles in close proximity to each other can be seen forming a
‘cloud’. In Figure 54, this bubble cloud has a maximum diameter of 329 µm (shown by the red
rectangle), several times larger than that of the microspheres surrounding it; with its exact size
depending on the phase of the ultrasound.
Figure 54: Movements of a cavitating bubble cloud, which attracts and gathers nearby microspheres
(106µm). Microspheres can be seen gravitating towards the clouds (red) and travel with the cloud,
rebounding off the surface. Mould 188, 2.8MPa focal pressure. YouTube

J. Vince DPhil Thesis
141 | P a g e Using Ultrasound to Enhance Targeted Radiotherapy
In the video of Figure 54, the microbubble cloud can be seen travelling to the forefront of the
boundary edge from outside of the frame, propelled by the primary acoustic radiation force
from the applied ultrasound. Despite their close proximity to the boundary edge, the
microspheres appear unable to cross the boundary threshold without assistance from the
cloud cavitation and remain dotted along the edge of the agar well.
The projection bolus, previously identified as a single dark amorphous mass, is now clearly
identifiable as the combination of microbubble cloud and associated microspheres (Figure 54,
red). Microspheres can be seen being drawn towards the cloud and rebounding off its surface.
Due to the increased separation between the larger microspheres, individual microbubbles
within the cloud can be seen oscillating, in and out of phase with one another sustaining the
cloud activity and microsphere movements.
At 2.8MPa peak negative pressure, multiple clouds were observed (Figure 55, circled in blue),
which travel to the front of the well simultaneously extending the length of the microsphere
projection, across the image series (YouTube). Resulting in the formation of a large broad
singular channel, approximately equal in width to the transducer focus (1mm for 0.5 MHz, See
section 2.2.4). It is difficult to ascertain with absolute certainty how many clouds are formed,
expire, coalesce or are sustained throughout the time captured; as at these frame rates
(100,000-200,000 fps) and magnification, it is not possible to temporally or spatially resolve
oscillations of individual microbubbles within the cloud; nor is it possible to record the activity
of the microbubble cloud over the entire pulse length at this capture rate, due to the
maximum number of frames allowed using the HPV-X2.

J. Vince DPhil Thesis
142 | P a g e Using Ultrasound to Enhance Targeted Radiotherapy

J. Vince DPhil Thesis
143 | P a g e Using Ultrasound to Enhance Targeted Radiotherapy
Figure 55: Frames 001, 026, 051, 076, 101, 126, 151, 176, 201, 226 and 251 of mould 188. 100,000 fps
using a 4x objective, 106µm microspheres. Propulsion of multiple cavitating microbubble clouds (blue)
being drawn to the front of the well cavity as a ‘wave’ which extends the microsphere projection. With
further microbubble clouds joining the channel progression over time. YouTube
Between Figures 54 and 55, it is clear that the microbubble clouds which travel from within the
well to the boundary edge of the agar, are directly responsible for the erosion of the agar and
the formation of the projection channel(s). As the ultrasound pulse is applied to the well
behind, the acoustic radiation force acting upon the bubble cloud drives the cavitating bubble
cloud further into the agar (Figure 54) as seen by the extension of the boundary interface,
eroding more of the agar and forming the beginnings of a channel, with the microspheres
back-filling the voids created by the cavitating microbubble clouds.
Between ultrasound pulses the cavitation within individual microbubble clouds wanes, some
clouds coalesce and bring together microspheres to a single focal point of increased density
(Figure 56, h). As the activity within the microbubble cloud wave ceases, and the majority of
the microbubble clouds disappear, a large single bolus of microspheres is now visible at the tip

J. Vince DPhil Thesis
144 | P a g e Using Ultrasound to Enhance Targeted Radiotherapy
of the projection channel (Figure 56, h:k), with a lower concentration of microspheres in its
wake (as previously seen in sections 4.3.2 and 4.3.4).

J. Vince DPhil Thesis
145 | P a g e Using Ultrasound to Enhance Targeted Radiotherapy
Figure 56: Frames 001, 026, 076, 101, 126, 151, 126, 151, 176, 201, 226 and 256 of mould 189.
Captured at 50,000 fps using a 4x objective and 106 µm microspheres. Example images of how the
multiple cavitating microbubble clouds group together to form a single microsphere bolus at the tip of the
projection. YouTube
With the increased microsphere diameter (106 µm, 15-32 µm previously) and interstitial
spacing of the microspheres, there are fewer physical restrictions to prevent bubble clouds to
traversing between microspheres and coalescing with one another to form larger microbubble
clouds (Figure 57).

J. Vince DPhil Thesis
146 | P a g e Using Ultrasound to Enhance Targeted Radiotherapy

J. Vince DPhil Thesis
147 | P a g e Using Ultrasound to Enhance Targeted Radiotherapy
Figure 57: Frames 125, 127, 129, 131, 133, 135, 137, 139 and 141 of mould 191. Captured at 50,000 fps
using s 4x objective and 106µm microspheres. Coalescence of individual bubble clouds is highlighted in
red. YouTube
Both coalescence of microbubble clouds and cloud formation were observed. The latter
appears have been promoted by the collision of the glass microspheres, potentially because
the contact between the two curved surfaces, creates a nucleation site between the two
microspheres24,25 (Figure 58).

J. Vince DPhil Thesis
148 | P a g e Using Ultrasound to Enhance Targeted Radiotherapy
Figure 58: Frames 033, 037, 043, 045, 047, 049, 051 and 053 from mould 190. Captured at 50,000 fps
using a 4x objective and 106µm microspheres. Collision of microspheres results in the formation of a new
bubble cloud and subsequent microsphere-cloud cluster (circled in red). YouTube
Once formed, the new clouds appear to grow and drive the microspheres apart, freeing the
cloud to travel in the direction of ultrasound propagation towards the tip of the projection
(Figure 59) and further assisting the movement of the microspheres in this direction.
Figure 59: Close up images of microbubble cloud dissociation, from mould 190 (Figure 14). Frames
049, 050 and 051 of 256. Microspheres are 106 µm for reference. The formed microbubble cloud can
clearly be seen forming between the microspheres and separating from the nucleation site between them.

J. Vince DPhil Thesis
149 | P a g e Using Ultrasound to Enhance Targeted Radiotherapy
Figure 60: Frames 191 to 196 of mould 191. Captured at 50,000 fps using a 4x objective and 106µm
microspheres. Images show the collision of microspheres acting as a nucleation site for microbubble
cloud formation (red), which in turn moves to join the bolus of other microsphere cloud clusters within it
(blue). YouTube

J. Vince DPhil Thesis
150 | P a g e Using Ultrasound to Enhance Targeted Radiotherapy
The creation of microbubble clouds via the collision of microsphere, is not limited to
microspheres outside the projection bolus at the tip of the projection channel. Indeed, it
seems to have been promoted by the increased packing density of microspheres at the
projection tip. Each microbubble cloud which joins the bolus at the tip of the projection
disrupts the packing density of the resting microspheres causing further collisions, and
formation of microbubble clouds. In Figure 61 microbubble clouds (blue and orange) join the
bolus from the agar well out of frame in the direction of the primary acoustic radiation force.
The microbubble cloud highlighted in blue, causes a microsphere collision and formation of
another microbubble cloud. The newly formed cloud (blue) connects with pre-existing
microbubble clouds (red) sustaining the cavitation activity. The cavitation activity within the
bolus is sustained in this way until either the ultrasound is tuned off or the cavitation nuclei
are depleted.

J. Vince DPhil Thesis
151 | P a g e Using Ultrasound to Enhance Targeted Radiotherapy
Figure 61: Frames 155-161 of mould 191. 50,000 fps using a 4x objective 106 µm microspheres.
Collision of microspheres produces a cavitating microbubble cloud (blue) which under the influence of
primary acoustic radiation force, joins the collection of other microbubble clouds within the bolus of
microspheres, seeding further cloud cavitation. The formation of another microbubble cloud is seen
(orange) repeating the cycle of growth. YouTube
4.3.5. Microsphere Bolus Movement
Whether or not a bolus enters a pre-existing channel appears to be entirely random with
boluses that are initially not in frame suddenly appearing and travelling past visible boluses to
entering a channel (Figure 62) 26.

J. Vince DPhil Thesis
152 | P a g e Using Ultrasound to Enhance Targeted Radiotherapy
Figure 62: Frames 125, 135, 240, 242, 244, 246 and 253 of mould 155 (YouTube). Captured at 10,000
fps. Images show the movement of a single bolus (red) which comes to a halt near the opening of a pre-
existing channel, only for another faster moving bolus out of frame (blue) to pass by in close proximity
travelling down the channel’s lumen and out of the image frame. It is unclear if the cloud cavitation in the
first bolus continues for the entire length of the recording. Another channel of the microsphere projection
at a different depth can be seen forming out of focus in the middle of the frame, causing the blurring in
the centre of the image.

J. Vince DPhil Thesis
153 | P a g e Using Ultrasound to Enhance Targeted Radiotherapy
As a bolus travels down a channel, the channel widens in diameter to accommodate it (as
previously seen in Section 4.3.2) contracting back to its original size after the bolus has passed.
The elasticity of the agar acts as a one-way valve, trapping the bolus and preventing it from
returning to the bulk of the well cavity. The microspheres in the wake of the bolus’s movement
appear to be more densely.
Whilst the microbubble clouds are sustained by the applied ultrasound field, boluses traversing
the well or channel lumen act as single entities, although there is some exchange between
microspheres in bolus and those in the surrounding medium. Unfortunately, it is not possible
to discernible whether the exchange of microspheres enables the microbubble cloud to pass
down the channel, displacing the solid medium in its path.
In between ultrasound pulses, the bubble clouds do not immediately disappear and the bolus
continues to move along the channel. Eventually this movement ceases, and the microspheres
gently settle usually at the furthermost tip of the channel. Channels which are constantly
supplied with fresh boluses increase the most in length, with each new aggregate of
microspheres and microbubbles destroying more agar at the tip of each channel, increasing
the channels total length (Figure 63). Boluses continue to erode the agar boundary interface
until the energy provided by the cloud cavitation ceases, at which point the channel ceases to
increase in size. The same bubble cloud activity is also responsible for each projection channel
formation but requires additional energy to overcome the elastic interface of the agar and
sufficiently allow for a cavitating cloud to fit with its lumen.

J. Vince DPhil Thesis
154 | P a g e Using Ultrasound to Enhance Targeted Radiotherapy
Figure 63: Frames 001, 163, 175 and 245 of mould 167 (YouTube) captured at 100,000 fps, 15-32 µm
microspheres. Cluster cloud cavitation extends a smaller channel (blue), whilst a cluster travels down the
longest, central channel to continue eroding agar at the channels furthest most point (red). Both channels
are formed by the same mechanism of action, but in different time scales, determined via the number of
clusters delivered and energy used to destroy the hydrogel.

J. Vince DPhil Thesis
155 | P a g e Using Ultrasound to Enhance Targeted Radiotherapy
Figure 64: Frames 002, 161, 249 and 256 of Mould 167 (YouTube). Captured at 100,000 fps, 15-32 µm
microspheres, approximately 10s after figure 63. The immature projection channel (top right in images)
has now extended disproportionately to that of the central projection, which is now long enough to
continue out of frame (>782µm).

J. Vince DPhil Thesis
156 | P a g e Using Ultrasound to Enhance Targeted Radiotherapy
4.4. Discussion
4.4.1. Order of Events Leading to Microsphere Extravasation
Figure 65: Events occurring within the well of a hydrogel mould to produce microsphere extravasation.
Microsphere collision (a) brought about by ultrasound exposure, promotes formation of (b) a cloud of
oscillating SonoVue® bubbles which in turn generate microstreaming(c). The primary ARF dissociates
the microbubble cloud (c, d) from the microspheres and presses it into the agar boundary interface (e).
The oscillating microbubble cloud causes mechanical erosion of the agar (e, erosion highlighted in
yellow), producing a channel within it (f), the void created is filled with microspheres and additional
cavitation nuclei via a combination of microstreaming and radiation force (g). Further microsphere
collisions occur, producing additional bubble clouds and extending the channel. These events occur at
multiple locations throughout the well cavity, producing a multitude of microbubble clouds and a number
of projection channels (h). The primary acoustic radiation force from the applied ultrasound acts from
top to bottom in all image panes. Objects are not to scale. The approximate magnification corresponding

J. Vince DPhil Thesis
157 | P a g e Using Ultrasound to Enhance Targeted Radiotherapy
to the high speed videos is indicated in the lower left hand corner of all image panes. Red arrows denote
the direction of microsphere and/or microbubble movement. Dotted lines indicate microstreaming.
4.4.2. Microsphere Imaging Capability and Clarity
It was serendipitous that the existing TheraSphere™ size distribution of 15-32 µm was well
suited to this setup, producing clear images of microsphere distribution under various
magnifications. The use of larger microspheres (106 µm) and a lower magnification objective
(4x), however, ultimately proved to be the most useful for observing cavitation activity and the
interactions with microspheres leading to projection formation. This was because the glass
cover used in the equipment setup (Section 4.4.2), scattered the transmissible light, resulting
in increasingly less focused images at higher magnifications (See Appendix 4, for further
details).
Irrespective of whether or not smaller microspheres would be more favourable for extending
the post-focal projection length, it would not have been possible to image microbubble cloud
activity with smaller (<106 µm) microspheres using the currently proposed setup. This is
because microspheres smaller than 106 µm, had an increased packing density, reducing the
light transmitted between microspheres, making resolving cavitation activity and microsphere
movements difficult, reducing overall image quality and the image resolution of within the
channels of the projections produced. Using microspheres greater in size (>35µm) also
reduced image quality at increased magnification as only a fraction of the microsphere’s depth
could be in focus at any given point using the 10x objective, with the remaining proportion of
the microsphere out of focus which obscured finer details in front or behind the larger
microspheres e.g. gel edges, cloud oscillations or reverberations within the gel channel(s). This
shadowing effect of the larger microspheres under the 10x objective (Figure 66, b) was
mitigated by switching to the 4x objective (See Section 4.3.1) enabling capture of the
microbubble cloud directly.

J. Vince DPhil Thesis
158 | P a g e Using Ultrasound to Enhance Targeted Radiotherapy
Figure 66: Poor focusing of microspheres due to casting of shadows by large microspheres at higher
magnification (a and b). A reduction in image sharpness due to focussing and resolution on small
microspheres (<15um, c).
Changing the total mass of microspheres added to the well (5 – 100 mg), had no effect on the
relative distribution of microspheres within any projections produced. It was hoped that
lowering the mass, would increase visibility of the bubble cloud dynamics behind the spheres
at within the channels produced but this was not the case, irrespective of the mass added the
packing density of the microspheres remained the same. Only the number of microspheres
visible within the well (top of each image frame) changed. It is unclear whether the reduction
in microsphere mass, reduced the number of projection channels formed. The only noticeable
difference was an increase in the minimum pressure required for the formation of the
projections, for the 106 µm microspheres (See Section 4.3.2).
Despite the slight loss of image quality from the glass objective cover, the combination of
increased microsphere diameter (106µm) and spacing between the individual microspheres
meant that bubble-cloud activity was easily visible and distinguishable from the microsphere
movements under low magnification (4x). The obvious difference in size between the larger
microspheres, microbubbles and clouds thereof, allowed for improved identification of effects
and movements which the smaller microspheres obscured. The use of the higher magnification
objective (10x) and the combination of smaller microspheres (<106µm) decreased the image
quality to such an extent as to prevent clear imaging of the microbubble cloud at lower peak
negative pressures (1.9 MPa), it is therefore assumed that the bolus movements at the lower
peak negative pressure are the result of a single microbubble cloud rather than a ‘wave’ of
(a) (b) (c)

J. Vince DPhil Thesis
159 | P a g e Using Ultrasound to Enhance Targeted Radiotherapy
clouds, despite it not being possible to image individual oscillations of the microbubbles within
the cloud. This is because multiple channels with a reduced lumen diameter were produced
using a lower peak negative pressure (1.9 MPa) rather than a single oversized channel
observed at high pressures (2.9MPa) with multiple microbubble clouds interacting with the
agar interface as a ‘wave’ (See Section 4.3.2).
It is unclear whether the increase in diameter of the microspheres and subsequent increase in
peak negative pressure (2.9 MPa) used, increased the overall projection length compared with
smaller (<106µm) microspheres with equivalent pressure, as the number and activity of the
microbubble clouds also increases with the increased peak negative pressure used. As shown
in Chapter 3 (Section 3.2.6) increasing the total mass of microspheres added to the injection
site does increase the total post focal projection length, presumably increasing the total
number of microspheres also increases the number of collisions and microbubble clouds
produced, sustaining the cavitation activity between pulses. It remains unclear whether it is
favourable to use a fewer number of larger microspheres with a higher individual mass or a
greater number of smaller microspheres with a smaller individual microsphere mass.
4.4.3. Microbubble Cloud Erosion of the Agar Medium
The images produced in this chapter show microsphere extravasation occurring as the result of
a microbubble cloud activity rather than of individual microbubbles. It appears from the
images shown in the previous section (4.3.2), that the microbubble clouds erode the agar
interface, with the dense glass microspheres back filling the void produced a combination of
microstreaming and primary and secondary acoustic radiation forces.
Whilst for smaller microspheres and lower pressures (1.9MPa) the number and size of the
channels produced appear to resemble tunnelling phenomena15 of individual microbubbles,
there appears to be no loss in activity of the microbubble cloud at a boundary interface

J. Vince DPhil Thesis
160 | P a g e Using Ultrasound to Enhance Targeted Radiotherapy
(Section 4.3.3). Microbubble cloud boluses can ‘rest’ on the agar boundary surface, whilst the
microbubble population of the cloud continues to cavitate; implying no penetration and
subsequent erosion of the agar hydrogel by microbubbles within the microbubble cloud.
Prentice reports jetting of the surface of the cavitation cloud, with microbubbles collapsing
from the periphery towards the centre of the cloud27. Micro-jetting has been observed
eroding various hard rigid boundaries28–30 and may explain why erosion of the agar boundary is
observed without a dramatic decrease in cloud cavitation activity, which would be obvious in
tunnelling phenomena where the cavitation nuclei are expended to produce the gel
channels15. In practice microjets are preferentially formed towards the most rigid boundary
and away from the pressure relief surface; which in this case would be the glass microspheres.
The surface of the microspheres however is convex, resulting in two opposing jetting forces,
the jet and counter jet, drastically diminishing the impact force on the microspheres31. This
may explain why despite significant cavitation activity, no microsphere fragmentation is
observed in any of the microsphere distributions tested. It is more likely therefore that the
microbubble cloud must dissociate from surrounding microspheres, to enable erosion of the
soft agar boundary. In theory this would enabling micro-jetting to take place and suggests that
the primary acoustic radiation force plays a key role in dissociation of the microbubble cloud
from the microspheres.
Increasing the minimum required peak negative pressure (2.8 MPa from 1.9 MPa) and
therefore the primary acoustic radiation force applied upon a microbubble cloud,
demonstrated this dissociation by the formation of a ‘wave’ of microbubble clouds travelling
together towards the boundary edge (See Section 4.3.2) which was not apparent at the lower
pressure (1.9 MPa) used; where microbubble clouds were encased by numerous smaller
microspheres preventing dissociation of the cloud from the solid particles. This reduction in

J. Vince DPhil Thesis
161 | P a g e Using Ultrasound to Enhance Targeted Radiotherapy
dissociation resulted in shorter more discrete projection channels at the lower pressures
tested (1.9 MPa) akin to microbubble tunneling15.
The increased frequency of microsphere collisions and microbubble cloud nucleation at higher
peak negative pressures certainly plays a role in initiating and sustaining the cavitation activity
of the agar erosion but the inclusion of the microspheres further complicates an already
complex mechanistic model. Irrespective of the exact mechanism of agar erosion, increasing
the number of clouds cavitating at the boundary edge produces more channels which can
subsequently overlap, to produce one large channel at higher pressures.
To directly observe the mechanism responsible for the erosion of the agar, modifications
would have to be made to the current setup to improve the level of transmitted light to enable
a higher rate of image capture (See section 4.5.1). However, it is most likely a combination of
effects including microbubble jetting27,32,33, embedding34–36 and tunnelling 15 of the hydrogel
surrounding the cavitation microbubble cloud34,36 that causes the erosion. It is clear however
that the erosion is not caused by the microspheres physically eroding the surface of the agar
gel, as it is preceded by the microbubble cloud (Figures 54 & 56).
4.4.4. Microsphere Projection Wake Banding
Several experimental exposures produced projection channels which showed distinctive
“banding” of the microspheres. This banding was only observed after several seconds of
ultrasound exposure and was not visible in all projections produced. It is unclear if the banding
is a result of interstitial packing of microspheres, supply of microspheres to the projection
produced or standing wave phenomena from the acrylic mould or the enclosing water tank.
Banding was disrupted by further delivery of boluses to the projection channel (See Figure 67)
which increased the number of microspheres present in the channel; banding could however
be restored after the bolus had travelled further down the lumen.

J. Vince DPhil Thesis
162 | P a g e Using Ultrasound to Enhance Targeted Radiotherapy
Figure 67: Frames from four sequential videos taken from mould 167. Distinctive microsphere banding
can be observed in the lumen of the projection channels produced, where the microspheres have settled.
Taken using a 10x objective and 15-32µm microspheres. Bolus of microspheres (red) can be seen passing
down the projection channels with distinctive microsphere banding left in its wake.
Banding pitch measurements were taken from three individual gel moulds (Table 2).
Measurements were taken over the entire frame, to maximise the number of measurements
and reduce experimental uncertainty due to blurring and distortion in the images, although
this was problematic with the 10x objective.
Mould
Number
Mean
Banding
Distance
(µm)
Standard
Deviation
(µm)
Minimum
Banding
Distance
(µm)
Maximum
Banding
Distance
(µm)
Count
Number (n)
167 48 12 28 81 55
176 47 11 25 90 155
178 54 14 38 106 33
Table 2:Banding measurements for moulds 167, 176 and 178 which displayed significant banding
throughout the image frames captured.

J. Vince DPhil Thesis
163 | P a g e Using Ultrasound to Enhance Targeted Radiotherapy
The banding observed within the channels (circa 50 µm) is far too tight in pitch to be related to
the fundamental driving frequency (0.500MHz, λ 686 µm, λ/2 353µm) or any of its detectable
harmonics up to the 8th harmonic at 4.00MHz .
Figure 68: Example spectra of unfiltered Fast-Fourier Transformation (fft) of the frequency data received
by the L11-4v linear array for mould 175, which has minimal banding. Unfiltered (left) and hi-pass
filtered (right).
It is unlikely therefore that the microsphere banding is formed via standing waves, within the
mould or ultrasound tank, as there was no notable emission beyond that of the broadband
signal, of which the peaks at 4.498 MHz (λ 76.3µm) and 6.494 MHz (λ 52.83µm) predominate
for this example (Figure 68).
Whilst the fundamental signal and the first harmonic encompass the majority of the data,
applying a hi-pass filter (Stop at 4.00MHZ, Pass at 4.5MHz, no upper limit, Figure 68) reveals
the comparatively small amount of broadband noise produced by the cavitation phenomena
observed. To produce the banding pitch via a standing wave, a standing wave to be formed at
6.86 MHz for the ~50µm distance (edge to edge) to be accurate.

J. Vince DPhil Thesis
164 | P a g e Using Ultrasound to Enhance Targeted Radiotherapy
Figure 69: Filtered Frequency content of experimental moulds 167, 176, 178 with significant microsphere
banding throughout. Primarily broadband noise associated with inertial cavitation of microbubbles inside
or outside of bubble clouds. Signal strength is higher in mould 178 due to the length of exposure being
significantly more.
Whilst there is a peak of 6.494 MHz in Figure 68 this is not seen in further examples (Figure
69). If a standing wave was being setup, a consistent frequency component should be visible in
all spectra for samples with significant banding.
A simulation (Appendix 6) of the standing waves produced near the 0.500 MHz fundamental
frequency, by Dr. Bernard Shieh (BUBBL, IBME, Oxford University, UK) also corroborated these
findings. Dr. Shieh found no evidence of any excited modes near the fundamental could be
responsible for the pitch distance associated with the microsphere banding observed;
confirmed by the unfiltered fft of the frequency content recorded.
4.5. Conclusion
This chapter reports the design, fabrication and optimisation of a bespoke high-speed
brightfield imaging setup for the observation of the movement of glass microspheres and
microbubbles under focussed ultrasound exposure. Two methods of triggering the camera
capture were developed, which led to preliminary projection timings and tracking of
microsphere extravasation over time via the change in transmitted light. Multiple cavitation
phenomena were imaged at various frame rates, the findings of which correlated well with
similar findings in the literature.

J. Vince DPhil Thesis
165 | P a g e Using Ultrasound to Enhance Targeted Radiotherapy
The order of events leading to the extravasation of microspheres through agar as the result of
ultrasound induced cavitation is now clear. Microbubble clouds are produced initially by the
insonation of microbubbles which undergo inertial cavitation, under sufficient peak negative
pressure. The primary acoustic radiation force from the applied ultrasound presses active
microbubble clouds into the agar boundary surface, where they erode the agar phantom. The
oscillations of each microbubble cloud produce a region of microstreaming around the
microbubble cloud, drawing in nearby microspheres and additional cavitation nuclei which
sustain the activity of the microbubble clouds. Microsphere are pulled into the channels in the
agar behind the active microbubble clouds, backfilling the channel lumen. The collection of
numerous microspheres in close proximity to one another, causes microspheres to collide.
These microsphere collisions act as transient nucleation sites, increasing the number of
microbubble clouds produced, the coalescence of which sustains cavitation activity in between
external ultrasound pulses. It is unclear if the collision of microspheres, initially by the primary
radiation force of the applied ultrasound, initiates the cavitation cascade microbubble clouds.
The acoustic radiation force of the applied ultrasound aids the formation of the projection
channels by forcing the microbubble clouds, and microspheres, down the lumen of pre-existing
channels further elongating them over time. The total length of the projection, is influenced by
the total time under of which the gel mould and its contents, are exposed to the applied
ultrasound field which is consistent with earlier work (Total Number of Cycles, Figure 33, See
Section 3.3.4). However, it has not been possible to determine exactly how the microbubble
cloud erodes the surface of the hydrogel material at the boundary interface.
From the images captured, it is now apparent why increasing the focal pressure produces
projections of increased length and width. The formation of additional microbubble clouds
determines the number and size of the channels produced. This observation was not
discernible from the statistical modelling performed earlier (Chapter 3) as the computational

J. Vince DPhil Thesis
166 | P a g e Using Ultrasound to Enhance Targeted Radiotherapy
interpretation of the projection images used a surface interpretation or ‘skin’ of the projection.
As a result, the volumetric analysis could not definitively separate individual channels from
within the same projection.
The change in well orientation did not initially appear to influence the formation of projections
provided. Using a horizontal arrangement for this set of experiments, appears to have been
detrimental to the length of the projections produced; however, it was not possible to image
the projections produced from the high-speed setup using µCT due to restrictions during the
COVID-19 pandemic, prohibiting access the required equipment and associated quantification
required for comparisons to earlier work.
In a vertical setup, the well acts as a silo for the microspheres which are gravity fed to the
projection channels as the microbubble clouds erode the agar hydrogel, backfilling the voids
with microspheres. Increasing the packing density of the microspheres presumably increases
the chances of collision and therefore nucleation for microbubble clouds. Assisted by the
primary acoustic radiation, the increased number of clouds travel to the tip of the projection
channel thus extending its length. This agrees with previous findings on the effect of
microsphere mass and total projection length (See Section 3.3.4).
Whilst isolated cloud activity and cavitation induced extravasation have been independently
observed; neither of these has been documented in combination with one another, nor have
they been reported with the co-delivery of relatively large dense glass microspheres. The
findings in this chapter differ from those previously reported in the context thrombolysis34–36
and micro-tunnelling5,8,15 which relate to the activity single microbubbles and not that of a
microbubble cloud or multiple microbubble cloud ‘waves’.
The back-filling of the channels produced by the cavitation cloud activity are uniformly filled
with microspheres, with channels evenly distributed from the acoustic focus, producing an
even anticipated radiation field beyond the channels produced; ideal for future translation. As

J. Vince DPhil Thesis
167 | P a g e Using Ultrasound to Enhance Targeted Radiotherapy
the cavitation cloud activity and subsequently the post focal depth of the channels is directly
related to the post focal pressure applied (See Chapter 3), the delivery approach is suitable for
the envisioned intra-operative adjuvant therapy, unlike that of co-administered arterial
delivery. As is evident by the order of events leading to the production of projection channels,
a proximity relationship between the microbubble clouds and microspheres is evident. This
relationship not only back-fills the cavities produced using the secondary acoustic radiation
forces but also increases the number of cavitation clouds, brought about by collisions of
microspheres. This proximity dependency means that for arterial delivery approaches, where
the cavitation nuclei and microspheres are distant from one another, there will be diminished
cavitation cloud activity, reduced backfilling of microspheres and a dramatic increase of off
target delivery within the circulatory system.
4.5.1. Limitations
The largest limitation to the work within this chapter relates to the objective and glass cover
used (See Appendix 4). The use of the glass beaker cover, to prevent water ingress into the air
objective, which resulted in distortion of the images at even relatively low magnification (x10).
This meant that it was impossible to independently track small bead movements at high
magnification, very high capture rates (e.g. 1 million fps) or see fine cavitation phenomena, key
to understanding the exact mechanism of agar erosion by the bubble cloud. Some of this was
mitigated by the use of larger microspheres which bias the results and conclusions, i.e the
exact cavitation phenomena may change based on the size of glass microspheres used,
particularly regarding the observed microsphere collisions which produced additional
cavitation clouds upon impact.
The work within this chapter also only uses one particular cavitation agent, microbubbles.
Whilst the majority of cavitation nuclei behave very similarly there are some subtle differences

J. Vince DPhil Thesis
168 | P a g e Using Ultrasound to Enhance Targeted Radiotherapy
which may influence the exact cavitation phenomena, e.g. the use of nanocups rather than
microbubbles may enhance the activity or duration of microbubble clouds observed by
reducing the rate of cavitation nuclei depletion. Whilst use of a commercially available
cavitation agent may enable faster translation of the technology, but it may be preferable to
design a cavitation agent suited to the operating parameters of the ultrasound device or
produce a radioactively labelled microbubble which would eliminate the impact of
microsphere size.
4.5.2. Future Work
Overall, the experimental setup performed well and facilitated the planned experimental
work. Future bright field imaging of bubble cloud activity could be improved however by
increasing the clarity of the images produced, by the design and development of either a new
bespoke long distance, water immersible, high magnification objective or the development of
an optically flat glass case to cover commercially available air objectives. Neither of these
options was available during the current project due to the ongoing COVID-19 pandemic and
associated disruption. To date there are no long distance, water immersible, high
magnification objectives available off-the-shelf from major commercial sources (Olympus,
NIKON, Thor, Mitutoyo etc.).
Individual microsphere movements were near impossible to track due to the positional
exchange of microspheres within the projection channels with the existing setup but may be
possible in future with a bespoke objective discussed earlier (Section 4.4.2). This could be
improved using fluorescently tagged microspheres mixed within the microsphere population,
to enable tracking of individual sphere movements. It remains to be seen if this contrast
enhancement under excitation, would be sufficient for video capture using the HPV-X2, as the
camera is only capable of greyscale image capture. It may be possible to exploit the

J. Vince DPhil Thesis
169 | P a g e Using Ultrasound to Enhance Targeted Radiotherapy
sonoluminescence of the bubble cloud37–42 or use high speed ultrasound imaging43–45 to
provide the necessary image contrast to that of the surrounding microspheres to help
elucidate exactly how the microbubble cloud erodes the agar interface.
The extravasation of surrogate glass microspheres through agar gel, as a tissue mimicking
phantom for soft grey matter, has now been demonstrated; and the processes leading to
extravasation elucidated. The next project aim is to utilise the findings thus far towards
producing a device capable of extravasating the YAS microspheres for the envisaged GBM
therapy; and in an ex vivo tissue model with a more clinically representative architecture.

J. Vince DPhil Thesis
170 | P a g e Using Ultrasound to Enhance Targeted Radiotherapy
References
1. Li, T. et al. Pulsed high-intensity focused ultrasound enhances delivery of doxorubicin in a preclinical model of pancreatic cancer. Cancer Res. 75, 3738–3746 (2015).
2. Bian, S., Seth, A., Daly, D., Carlisle, R. & Stride, E. A multimodal instrument for real-time in situ study of ultrasound and cavitation mediated drug delivery. Rev. Sci. Instrum. 88, (2017).
3. Yemane, P. T. et al. Effect of Ultrasound on the Vasculature and Extravasation of Nanoscale Particles Imaged in Real Time. Ultrasound Med. Biol. 45, 3028–3041 (2019).
4. Paris, J. L. et al. Ultrasound-mediated cavitation-enhanced extravasation of mesoporous silica nanoparticles for controlled-release drug delivery. Chem. Eng. J. 340, 2–8 (2018).
5. Lea-Banks, H., Stride, E. & Coussios, C. C. Ultrasound-mediated transport of nanoparticles and the influence of particle density. University of Oxford (2016). doi:10.1121/1.4950210.
6. Yao, L. et al. Facilitated brain delivery of poly (ethylene glycol)-poly (lactic acid) nanoparticles by microbubble-enhanced unfocused ultrasound. Biomaterials 35, 3384–3395 (2014).
7. Park, K. Targeted delivery nano/micro particles to inflamed intestinal mucosa in human. J. Control. Release 165, 162 (2013).
8. Mannaris, C. et al. Microbubbles, Nanodroplets and Gas-Stabilizing Solid Particles for Ultrasound-Mediated Extravasation of Unencapsulated Drugs: An Exposure Parameter Optimization Study. Ultrasound Med. Biol. 00, 1–14 (2019).
9. Prokop, A. F., Soltani, A. & Roy, R. A. Cavitational Mechanisms in Ultrasound-Accelerated Fibrinolysis. Ultrasound Med. Biol. 33, 924–933 (2007).
10. Bezer, J. H., Koruk, H., Rowlands, C. J. & Choi, J. J. Elastic Deformation of Soft Tissue-Mimicking Materials Using a Single Microbubble and Acoustic Radiation Force. Ultrasound Med. Biol. 46, 3327–3338 (2020).
11. Yamakoshi, Y. & Miwa, T. Observation of microhollows produced by bubble cloud cavitation. Jpn. J. Appl. Phys. 51, (2012).
12. Keller, S., Bruce, M. & Averkiou, M. A. Ultrasound Imaging of Microbubble Activity during Sonoporation Pulse Sequences. Ultrasound Med. Biol. 45, 833–845 (2019).
13. Choi, J. J. & Coussios, C.-C. Spatiotemporal evolution of cavitation dynamics exhibited by flowing microbubbles during ultrasound exposure. J. Acoust. Soc. Am. 132, 3538–3549 (2012).
14. Song, J. H., Moldovan, A. & Prentice, P. Non-linear Acoustic Emissions from Therapeutically Driven Contrast Agent Microbubbles. Ultrasound Med. Biol. (2019) doi:10.1016/j.ultrasmedbio.2019.04.005.
15. Caskey, C. F., Qin, S., Dayton, P. A. & Ferrara, K. W. Microbubble tunneling in gel phantoms. J. Acoust. Soc. Am. 125, EL183 (2009).
16. Lin, Y. et al. Effect of acoustic parameters on the cavitation behavior of SonoVue microbubbles induced by pulsed ultrasound. Ultrason. Sonochem. 35, 176–184 (2017).
17. Valery Normand, Didier L. Lootens, Eleonora Amici, Kevin P. Plucknett, Aymard, P. New Insight into Agarose Gel Mechanical Properties. Biomacromolecules 1, 730–738 (2000).
18. Ramzi, M., Rochas, C. & Guenet, J. M. Structure-properties relation for agarose thermoreversible gels in binary solvents. Macromolecules 31, 6106–6111 (1998).
19. Brewin, M. P. et al. Characterisation of Elastic and Acoustic Properties of an Agar-Based Tissue Mimicking Material. Ann. Biomed. Eng. 43, 2587–2596 (2015).
20. Schiavi, A., Cuccaro, R. & Troia, A. Strain-rate and temperature dependent material properties of Agar and Gellan Gum used in biomedical applications. J. Mech. Behav. Biomed. Mater. 53, 119–130 (2016).
21. Ross, K. A., Pyrak-Nolte, L. J. & Campanella, O. H. The effect of mixing conditions on the material properties

J. Vince DPhil Thesis
171 | P a g e Using Ultrasound to Enhance Targeted Radiotherapy
of an agar gel - Microstructural and macrostructural considerations. Food Hydrocoll. 20, 79–87 (2006).
22. Cafarelli, A. et al. Tuning acoustic and mechanical properties of materials for ultrasound phantoms and smart substrates for cell cultures. Acta Biomater. 49, 368–378 (2017).
23. Culjat, M. O., Goldenberg, D., Tewari, P. & Singh, R. S. A review of tissue substitutes for ultrasound imaging. Ultrasound Med. Biol. 36, 861–873 (2010).
24. Borkent, B. M., Gekle, S., Prosperetti, A. & Lohse, D. Nucleation threshold and deactivation mechanisms of nanoscopic cavitation nuclei. Phys. Fluids 21, (2009).
25. Atchley, A. A. & Prosperetti, A. The crevice model of bubble nucleation. J. Acoust. Soc. Am. 86, 1065–1084 (1989).
26. Leighton, T. G. The Sound Field. Acoust. Bubble 1–66 (1994) doi:10.1016/b978-0-12-441920-9.50006-7.
27. Gerold, B., Rachmilevitch, I. & Prentice, P. Bifurcation of ensemble oscillations and acoustic emissions from early stage cavitation clouds in focused ultrasound. New J. Phys. 15, (2013).
28. Brujan, E. A. The role of cavitation microjets in the therapeutic applications of ultrasound. Ultrasound Med. Biol. 30, 381–387 (2004).
29. Shao, J. L., Wang, P. & He, A. M. Influence of shock pressure and profile on the microjetting from a grooved Pb surface. Model. Simul. Mater. Sci. Eng. 25, 1–19 (2017).
30. Lechner, C., Koch, M., Lauterborn, W. & Mettin, R. Pressure and tension waves from bubble collapse near a solid boundary: A numerical approach. J. Acoust. Soc. Am. 142, 3649–3659 (2017).
31. Tomita, Y., Robinson, P. B., Tong, R. P. & Blake, J. R. Growth and collapse of cavitation bubbles near a curved rigid boundary. J. Fluid Mech. 466, 259–283 (2002).
32. Karri, B. et al. High-speed jetting and spray formation from bubble collapse. Phys. Rev. E - Stat. Nonlinear, Soft Matter Phys. 85, 1–5 (2012).
33. Prabowo, F. & Ohl, C. D. Surface oscillation and jetting from surface attached acoustic driven bubbles. Ultrason. Sonochem. 18, 431–435 (2011).
34. Hendley, S. A., Bollen, V., Anthony, G. J., Paul, J. D. & Bader, K. B. In vitro assessment of stiffness-dependent histotripsy bubble cloud activity in gel phantoms and blood clots. Phys. Med. Biol. 64, ab25a6 (2019).
35. Kelsey C. Martin Mhatre V. Ho, J.-A. L. 基因的改变NIH Public Access. Bone 23, 1–7 (2012).
36. Acconcia, C., Leung, B. Y. C., Manjunath, A. & Goertz, D. E. Interactions between Individual Ultrasound-Stimulated Microbubbles and Fibrin Clots. Ultrasound Med. Biol. 40, 2134–2150 (2014).
37. Levinsen, M. T. Concomitance in single bubble sonoluminescence of period doubling in emission and shape distortion. Ultrasonics 54, 637–643 (2014).
38. Didenko, Y. T., McNamara, W. B. & Suslick, K. S. Molecular emission from single-bubble sonoluminescence. Nature 407, 877–879 (2000).
39. Xu, H. & Suslick, K. S. Molecular emission and temperature measurements from single-bubble sonoluminescence. Phys. Rev. Lett. 104, 1–4 (2010).
40. Lauterborn, W., Kurz, T., Geisler, R., Schanz, D. & Lindau, O. Acoustic cavitation, bubble dynamics and sonoluminescence. Ultrason. Sonochem. 14, 484–491 (2007).
41. Sukovich, J. R. et al. Temporally and spatially resolved imaging of laser-nucleated bubble cloud sonoluminescence. Phys. Rev. E - Stat. Nonlinear, Soft Matter Phys. 85, 3–6 (2012).
42. Didenko, Y. T. & Suslick, K. S. The energy efficiency of formation of photons, radicals and ions during single-bubble cavitation. Nature 418, 394–397 (2002).
43. Kauer, M., Belova-Magri, V., Cairós, C., Linka, G. & Mettin, R. High-speed imaging of ultrasound driven cavitation bubbles in blind and through holes. Ultrason. Sonochem. 48, 39–50 (2018).
44. Mulvana, H., Stride, E., Tang, M., Hajnal, J. V. & Eckersley, R. Temperature-Dependent Differences in the Nonlinear Acoustic Behavior of Ultrasound Contrast Agents Revealed by High-Speed Imaging and Bulk Acoustics. Ultrasound Med. Biol. 37, 1509–1517 (2011).

J. Vince DPhil Thesis
172 | P a g e Using Ultrasound to Enhance Targeted Radiotherapy
45. Ketterling, J. A. et al. High-speed, high-frequency ultrasound, in utero vector-flow imaging of mouse embryos. Sci. Rep. 7, 1–9 (2017).

J. Vince DPhil Thesis
173 | P a g e Using Ultrasound to Enhance Targeted Radiotherapy
CHAPTER 5
Conclusions & Future Projects

J. Vince DPhil Thesis
174 | P a g e Using Ultrasound to Enhance Targeted Radiotherapy
5. Conclusions
Glioblastoma Multiforme remains the most aggressive primary central nervous system
cancer1,1,2 with disheartening mortality rates (<5% 5-year survival) despite significant advances
in surgical intervention and combination therapies1,1,3. New approaches are required to
transform patient survival in the future.
Current external beam therapies lack the supporting accuracy from imaging techniques (MRI,
18F-FET PET4) compared to pre-operative 5-ALA and selective tumour fluorescence currently
employed during surgical intervention5. Current adjuvant treatment using external beam
radiotherapy6–10 or chemotherapy (Temozolomide11–13, Carmustine14,15) struggles to control the
aggressive progression of the disease and frequently lowers quality of life for patients in
advanced stages of the disease6,16. Whilst proton beam radiotherapy offers significant benefits
over EBR by minimising exit doses, the treatment remains largely inaccessible due to its high
cost per patient17.
Selective internal radiotherapy (SIRT) remains an under-utilised and under-investigated
approach as an intra-operative adjuvant for glioblastoma surgical resection. SIRT offers
localised radiotherapy via biocompatible radioactive glass18–22 or resin23–25 microspheres
currently approved for use in hepatocellular carcinoma (HCC) and metastases from colorectal
carcinoma25–30.
The main objective of this research was to investigate whether ultrasound induced cavitation
of various cavitation agents (microbubble, nanocups, nanodroplets) has the capability to
propel surrogate glass microspheres through a soft tissue phantom; and hence assess its
potential for translation as an adjuvant therapy for glioblastoma resection surgery. In Chapter
1, the indication of glioblastoma multiforme and its therapeutic regimens was described, with
emphasis on the patient’s welfare and quality of life. The concept of selective internal

J. Vince DPhil Thesis
175 | P a g e Using Ultrasound to Enhance Targeted Radiotherapy
radiation therapy, radioembolic products and existing practices were presented as were their
potential benefits over more commonplace external beam therapies25,26,31–33. Ultrasound as a
non-invasive therapy, including the use of cavitation nuclei was explored as means of
delivering various adjuvants and solid particles suitable for the mass transport of radioembolic
products.
Chapter 2 focussed primarily on the design and fabrication of an experimental setup and
analysis method to investigate the feasibility of ultrasound enhanced cavitation as a potential
means of delivering radioactive microspheres within the margins of a tumour resection cavity.
Suitable soft tissue phantoms were investigated as surrogates for human brain tissue with
0.5% agar selected as the most suitable and robust candidate. The mould, tank and equipment
setup proved to be suitable and initial findings were promising demonstrating the formation of
microsphere projections over a wide range of parameters which warranted further, deeper
investigation. Nomenclature for describing different aspects of the projections was produced
to standardise the analysis. The x-ray imaging performed via µCT enabled visualisation of the
projections, as well as the limitations of the mould design and bias within the image analysis.
Chapter 3 focussed on exploring the parameter space under which ultrasound induced
cavitation produced microsphere projections. Nine different parameters were highlighted for
investigation, over a multitude of levels and combinations. In order to remove the inherent
operator bias from the results, a bespoke MATLAB algorithm was used to identify, filter and
measure the projections formed in manner previously reported for radioembolic products34.
The quantitative result was then analysed using DoE methods, specifically surface response
linear regression to produce a Pareto chart of weighted factor contributions to the model for
post focal projection depth. Primary and secondary interactions were discussed to assess their
role in the formation of microsphere projections, using the setup designed in Chapter 2.
Pressure was identified as the most significant parameter that could be estimated by the

J. Vince DPhil Thesis
176 | P a g e Using Ultrasound to Enhance Targeted Radiotherapy
model and was used to perform non-linear regression, using a Bragg Peak model and a Gauss-
Newton least sum squares algorithm to find the coefficient values from initial estimates. Post
focal projection depth (mm) was significantly correlated to Peak Negative Pressure (PNP) to
such an extent that predications for post focal projection depth could be made within 88.4% of
the input pressure value for 95% of predictions made.
Chapter 4 reported the design of an experimental set up to use a high-speed camera (>1
million fps) to observe cavitation activity and its role in microsphere extravasation. A high
powered LED was used to illuminate the samples, whilst the microsphere movements and
cavitation activity were recorded by the high-speed camera. A light responsive trigger system
was designed to capture microbubble activity up to 200,000 frames per second. The videos
obtained indicated that the agar channels produced were the result of the microbubble cloud
cavitation activity eroding the agar boundary and not the propulsion of microspheres as
projectiles through the soft tissue phantom.
The physical mechanisms by which microsphere projections were initiated and extended were
captured for the first time, demonstrating that the presence of the microspheres themselves
plays a key role in sustaining acoustically initiated microbubble cloud activity and transport..
Other interesting phenomena were observed and recorded using the high-speed setup. For
example, microbubble cloud activity was observed between ultrasound pulses, an original
finding which is key to explaining why projections of microspheres can be produced an order
of size greater than cavitation agents alone. Limitations of the setup prevented observation of
small scale cavitation activity and thus the exact mechanism for the agar erosion and
microsphere projection channel formation still require elucidation.
The body of work within this thesis demonstrates that ultrasound enhanced selective internal
radiotherapy is feasible. Proof of concept work has produced findings which are not only
repeatable but can be controlled via various acoustic and physical parameters.

J. Vince DPhil Thesis
177 | P a g e Using Ultrasound to Enhance Targeted Radiotherapy
Microbubble cloud cavitation activity has been observed as primarily responsible for the
erosion of the agar boundary surface and draws, rather than pushes, microspheres behind it in
its wake. Back filling the agar channels with the microspheres from within the bulk well cavity.
The erosion of the agar hydrogel by the microbubble cloud cavitation activity, raises questions
as to whether the same unobserved mechanism will occur in vivo and whether this will cause
collateral mechanical damage to the healthy parenchyma within the resection margins;
especially crucial as brain tissue is softer than the 0.5% agar hydrogel used in the tissue
phantom.
5.1. Publications
Due to the Coronavirus pandemic and travel restrictions, no formal presentations of the work
have been produced to date. A priority patent submission has been completed and submitted
to the British Patent office titled ‘DISTRIBUTING MICROPARTICLESDISTRIBUTING
MICROPARTICLES’, GB GB2106412.6. Filed May 11, 2021.
Two papers are currently in writing aimed at Radiology and Physics in Medicine and Biology or
Ultrasound in Medicine and Biology. The first paper will be orientated towards the technology
findings, translation potential and indication obstacles; the second paper will primarily focus
on the work within Chapter 4. Discussing the cavitation phenomena findings, the associated
methods and implications for cavitation nuclei when co-delivered with microparticles.
5.2. Limitations
Overall the body of work has some key limitations. The agar-agar hydrogel used for the
majority of the work does not accurately reflect the target tissue architecture and it is unclear
how transitioning from a focussed to an unfocussed ultrasound device will impact the

J. Vince DPhil Thesis
178 | P a g e Using Ultrasound to Enhance Targeted Radiotherapy
cavitation mechanisms and transport of the radioactive microspheres. The hypothesis is an
oversimplification of a dynamic and multi domain disease. It is unclear what impact changing
the type or material of the microspheres will have on the subsequent projections and
distributions. Whilst the gravitational effects on the microspheres and slurry composition are
mitigated by the applied ultrasound field, microspheres which are not embedded within the
tissues margins and remain within the cavity, are mobile and will continue to irradiate the
cavity in which they are deposited; a potential safety concern to be considered. Although these
could be removed via irrigation and aspiration, using the same equipment already used within
theatre; particularly Stryker’s Sonopet device, which offers both ultrasonication and aspiration
within a single handheld device.
Mapping the distribution of the microspheres in vivo, will need further work evaluating other
imaging techniques. The safety profile of the envisioned therapy also needs further
consideration, primarily around the erosion of soft tissue, the impact of ultrasound and
cavitation phenomena within the brain; in addition to impact of the high radioactivity of the
TheraSphere™ microspheres within the targeted organ.
The indication also provides some future challenges to address, primarily how to map the
invasion of the cancerous cells within the healthy tissue and ultimately decide what constitutes
a reasonable volume of irradiation outside that of the resection cavity. This is further
compounded by GBM tendrils which exist as extensions of the central tumour mass, currently
invisible by current imaging techniques.
5.3. Future Projects
Review and critique of the work to date is overdue as a result of limited faculty contact in wake
of the Coronavirus-19 pandemic. As surgical consultant Mr. Plaha has not been updated in the
last 18 months, there is a large body of information to digest and assess as to whether or not

J. Vince DPhil Thesis
179 | P a g e Using Ultrasound to Enhance Targeted Radiotherapy
the emerging new technology has real-world implications. Should there be sufficient interest,
funding and personnel available there are numerous avenues to be explored all of which may
be fruitful in further developing the efficacy of the envisioned therapy.
5.3.1. Tumour Inhomogeneity
Future testing must now move towards a more representative tissue model than that of agar,
particularly the use of ovine and porcine brain tissue which is commonly available. Whilst
some initial testing was performed using these tissue substitutes, microsphere projections
formed via cavitation activity could not be recreated at low pressures (<3.0 MPa). It expected
that the tissue architecture as well as the supporting microvasculature plays an important part
in supporting and solidifying the otherwise incredibly soft ‘pockets’ of gelatinous brain cells.
Whilst there is expected to be differences in the delivery of the microspheres in vivo, which
require further parameter optimisation, the underlying physics is unlikely to change. The work
contained within this thesis therefore is designed to be a foundation for further optimisation
and translation to build upon for use within ex vivo and in vivo research.
The heterogenous nature of GBM means even with sufficient even distribution of the high
activity radioactive microspheres, there is no guarantee that the proposed approach will result
in an increase in overall survival. Radiation success is linked with the availability of radical
carriers (primarily O2) which are limited in hypoxic regions of the central tumour mass.
Assuming the surrounding parenchyma is healthy, there should be sufficient availability of
oxygen for radical propagation within the tumour margins. Producing projections channels
may also increase the availability of oxygen to the irradiated volume but is unlikely to be a key
contributor. Exposing a patient to particularly high acoustic peak negative pressures using a
focussed ultrasound transducer is highly likely to be damaging to the immediate cellular
environment, invoking cellular stress, short term inflammation and swelling as well as

J. Vince DPhil Thesis
180 | P a g e Using Ultrasound to Enhance Targeted Radiotherapy
promoting a variety of cellular cascades and immune responses. By transitioning from a
focussed to an unfocussed (radial) ultrasonic device, the majority of these concerns are
drastically reduced. This is primarily achieved by designing a bespoke unfocussed ultrasonic
device, better suited to the application (See sections 5.3.2 and Appendix 7). An unfocussed
device can be designed to operate at much lower frequencies and subsequently far lower
pressures than a focussed transducer whilst also removing issues surrounding pre-focal
extravasation. As a result there is expected to be a trade-off between a lack of directional
control when using an unfocussed horn device and the safety concerns of using a precise
focussed transducer; which will eventually have to be investigated in a pre-clinical small
mammal model to be evaluated properly.
GBM tumours are incredibly heterogeneous; with pockets of varying densities, vascular
networks, shapes of the central tumour mass and associated tendrils which make modelling
the indication very challenging. It means that the distributions observed within the agar-agar
tissue phantoms may not be representative of those in vivo and will require further gap
analysis work to identify the root cause of the projection variability in vivo. This may result in
either under delivery of microspheres leading to disease progression or over-delivery of
radioactive microspheres into otherwise healthy areas of the brain, off-target delivery with
dire consequences as a result of the varying tissues densities outside the initial cavity. This is
further compounded by heterogeneity within the patient pool, disease staging, disease
progression between planning and intervention as well as previous treatment regimes.
Off-target downstream delivery of microspheres may occur due to extravasation of the
microparticles into nearby vasculature, brought about by the applied ultrasound field and
associated cavitation activity. This may result in unwanted downstream embolisation and is a
design concern particularly with larger more compressible resin based microspheres however
as the arterial and venous walls are far stiffer than the surrounding tissue, it is unlikely that the

J. Vince DPhil Thesis
181 | P a g e Using Ultrasound to Enhance Targeted Radiotherapy
microspheres (glass or resin) will pass through into the circulatory system. It is more likely that
the microspheres which encounter any feeding vessels, will most likely deposit themselves
adjacent to stiffer structures, as they are impenetrable to the cavitation activity. This is
because of the microspheres being ‘pulled not pushed’ by the cavitation cloud activity as
highlighted in Chapter 4.
It is assumed that the use of selective stereotactic radiation within the tumour margins will be
sufficient to eradicate the remaining cancerous cells surrounding the central tumour mass
however success is not guaranteed. Whilst the proposed approach may reduce local
reoccurrence it does not address progression of the disease elsewhere in the brain, potential
long term radio-resistance or complications arising from combination therapy. This work is
therefore only suitable for extending the short term (<2 year) survival and should not be
considered a curative approach. However the mechanical damage caused by the microbubble
clouds may illicit expression of cancerous material and in combination with the localised
irradiation and up-signalling, set off various immunotherapeutic cascades and could result in
treatment of malignant tissue elsewhere in the organ via the Abscopal effect. Whilst unlikely
this modality should be considered in the technology’s translation and future potential
combination therapies.
The efficacy of Y-90 is already being investigated for glioblastoma but via an intra-arterial route
of administration in a canine model58, the results which demonstrate the technical feasibility
and safety of 90Y in canines, whereby treatment of individual hemispheres showed promising
results despite poor localisation of microspheres, radiation doses were tolerated very well
leading to increased overall survival. Developments of in this area will be of particular interest
to those who intend to build upon the work within this thesis. Whether or not arterial
administration of SIRT products for indications within the brain is a suitable choice, remains to
be seen.

J. Vince DPhil Thesis
182 | P a g e Using Ultrasound to Enhance Targeted Radiotherapy
5.3.2. Prototype Optimisation
As the concept of ultrasound enhanced microsphere delivery appears promising, a series of
lightweight ultrasonic horn prototypes were designed and developed for intraoperative use;
this work is captured in Appendix 7. Due to delays brought about by the global pandemic, the
prototype device remains unoptimised. Therefore, work to optimise the pressure output of the
current x3c prototype needs to be completed and the issues surrounding the variable
impedances of the prototype devices resolved. Review of the current prototypes and critical
analysis is required to evaluate if the prototypes are remotely suitable for the envisioned
therapy or whether a complete redesign, focussed on critical parameters not investigated (e.g.
safety concerns, useability, ergonomics) have not been addressed adequately. Particularly as
there is no insulation of the high voltage, ultrasonic vibrations or noise of the device from the
intended user, apart from standard PPE.
Should these prototypes gather significant interest as to warrant further research, initial work
should focus on eliminating or at a minimum reducing the impedance issues experiences by
designing a circular clamp for the horn prototypes; in hope that exerting equal pressure upon
the ultrasonic driver, would allow for a more accurate pressure calibrations and potentially an
increase in peak negative pressure of the x3c device. This may lead to the current prototypes
being useable, in a limited fashion, as to orientate a second design iteration with user
orientated specific improvements.
In the medium to long term, a large body of work akin to that performed in Chapter 3 (In Silico
Analysis and Interpretation of Cavitation Induced Projections of Glass Microspheres) is
required for ultrasonic horns and frequencies from 20-500 kHz. As from previous work (Section
3.4.4) it is understood that the cavitation and therefore microsphere projection depth is highly
responsive to frequency. Identifying a narrower range, in the 10’s of kHz rather than ± 0.5
MHz, will help further prototype designs elicit an improved response. This is particularly key as

J. Vince DPhil Thesis
183 | P a g e Using Ultrasound to Enhance Targeted Radiotherapy
it appears that focussed transducers operating at high frequencies (3.3 MHz) appear to
produce the same 2d planar projections (See Section 2.4.2) as very low frequency (20 kHz)
ultrasonic horns, implying that there is more than one mechanism involved in the production
of microsphere projections, not observed in Chapter 4.
This large body of work may lead to the device prototypes needing a complete overhaul or
redesign as the data and knowledge supporting the ultrasound enhanced distribution of
microspheres grows. This will most likely require further dedicated personnel and significant
funding in order to be suitable for a clinical setting.

J. Vince DPhil Thesis
184 | P a g e Using Ultrasound to Enhance Targeted Radiotherapy
References
1. Grabowski, M. M. et al. Residual tumor volume versus extent of resection: predictors of survival after surgery for glioblastoma. J. Neurosurg. 121, 1115–1123 (2014).
2. Gallego, O. Nonsurgical treatment of recurrent glioblastoma. Curr. Oncol. 22, e273–e281 (2015).
3. Carpentier, A. et al. Clinical trial of blood-brain barrier disruption by pulsed ultrasound. Sci. Transl. Med. 8, (2016).
4. Roessler, K., Becherer, A., Donat, M., Cejna, M. & Zachenhofer, I. Intraoperative tissue fluorescence using 5- aminolevolinic acid (5-ALA) is more sensitive than contrast MRI or amino acid positron emission tomography ( 18F-FET PET) in glioblastoma surgery. Neurol. Res. 34, 314–317 (2012).
5. Smith, S. J. et al. The invasive region of glioblastoma defined by 5ALA guided surgery has an altered cancer stem cell marker profile compared to central Tumour. Int. J. Mol. Sci. 18, 1–13 (2017).
6. Patel, D. M., Agarwal, N., Tomei, K. L., Hansberry, D. R. & Goldstein, I. M. Optimal Timing of Whole-Brain Radiation Therapy Following Craniotomy for Cerebral Malignancies. World Neurosurg. 84, 412–419 (2015).
7. Hsieh, J. et al. Tumor progression in patients receiving adjuvant whole-brain radiotherapy vs localized radiotherapy after surgical resection of brain metastases. Neurosurgery 76, 411–420 (2015).
8. Montay-Gruel, P. et al. Long-term neurocognitive benefits of FLASH radiotherapy driven by reduced reactive oxygen species. Proc. Natl. Acad. Sci. 116, 10943–10951 (2019).
9. Welzel, G. et al. Memory Function Before and After Whole Brain Radiotherapy in Patients With and Without Brain Metastases. Int. J. Radiat. Oncol. Biol. Phys. 72, 1311–1318 (2008).
10. Erwin G. Van Meir, PhD, Costas G. Hadjipanayis, MD, PhD, Andrew D. Norden, MD, MPH, Hui-Kuo Shu, MD, Patrick Y. Wen, MD, and Jeffrey J. Olson, M. Exciting New Advances in Neuro-Oncology: The Avenue to a Cure for Malignant Glioma. CA Cancer J Clin. 60, 166–193 (2010).
11. Koncar, R. F. et al. PLK1 inhibition enhances temozolomide efficacy in IDH1 mutant gliomas. Oncotarget 8, 15827–15837 (2017).
12. Hvizdos, K. M. & Goa, K. L. Temozolomide. 12, 237–243 (1999).
13. Hegi, M. E. et al. MGMT Gene Silencing and Benefit from Temozolomide in Glioblastoma . N. Engl. J. Med. 352, 997–1003 (2005).
14. Ene, C. et al. Safety and efficacy of carmustine (BCNU) wafers for metastatic brain tumors. Surg. Neurol. Int. 7, S295–S299 (2016).
15. Chaichana, K. L. et al. Risk of surgical site infection in 401 consecutive patients with glioblastoma with and without carmustine wafer implantation. Neurol. Res. 37, 717–726 (2015).
16. Andrews, D. W. et al. Whole brain radiation therapy with or without stereotactic radiosurgery boost for patients with one to three brain metastases: phase III results of the RTOG 9508 randomised trial. Lancet (London, England) 363, 1665–72 (2004).
17. Levin, W. P., Kooy, H., Loeffler, J. S. & DeLaney, T. F. Proton beam therapy. Br. J. Cancer 93, 849–854 (2005).
18. LAURA M. KULIK, BASSEL ATASSI, LODEWIJK VAN HOLSBEECK, TAMEEM SOUMAN, ROBERT J. LEWANDOWSKI, MARY F. MULCAHY, RUSSELL D. HUNTER, ALBERT A. NEMCEK JR., MICHAEL M. ABECASSIS, KENNETH G. HAINES III, R. S. Yttrium-90 Microspheres (TheraSphere1) Treatment of Unresectable Hepatocellular Carcinoma: Downstaging to Resection, RFA and Bridge to Transplantation. J. Surg. Oncol. 94, 572–586 (2006).
19. Kallini, J. R. et al. Comparison of the Adverse Event Profile of TheraSphere ® with SIR-Spheres ® for the Treatment of Unresectable Hepatocellular Carcinoma: A Systematic Review. Cardiovasc. Intervent. Radiol. 40, 1033–1043 (2017).
20. Kulik, L. M. et al. Yttrium-90 microspheres (TheraSphere) treatment of unresectable hepatocellular

J. Vince DPhil Thesis
185 | P a g e Using Ultrasound to Enhance Targeted Radiotherapy
carcinoma: downstaging to resection, RFA and bridge to transplantation. J. Surg. Oncol. 94, 572–86 (2006).
21. Pellerin, O., Lin, M., Bhagat, N., Shao, W. & Geschwind, J.-F. Can C-Arm Cone-Beam CT Detect a Micro-Embolic Effect After TheraSphere Radioembolization of Neuroendocrine and Carcinoid Liver Metastasis? Cancer Biother. Radiopharm. 28, 459–465 (2013).
22. Schilling, W. R., Hammond, P. Y. & Snyder, G. H. The “New Look” of 1953. Strateg. Polit. Def. Budgets 43, 379–524 (2019).
23. Attarwala, A. A. et al. Quantitative and qualitative assessment of yttrium-90 pet/ct imaging. J. Am. Ceram. Soc. 61, 247–249 (1978).
24. Attarwala, A. A. et al. Quantitative and qualitative assessment of yttrium-90 pet/ct imaging. PLoS One 9, 1–7 (2014).
25. Pardo, F. et al. The Post-SIR-Spheres Surgery Study (P4S): Retrospective Analysis of Safety Following Hepatic Resection or Transplantation in Patients Previously Treated with Selective Internal Radiation Therapy with Yttrium-90 Resin Microspheres. Ann. Surg. Oncol. 24, 2465–2473 (2017).
26. Pereira, P. L. FRI-03 Intraarterial therapies: SIRT or TACE. Dig. Liver Dis. 45, S241–S242 (2013).
27. Tchelebi, L. & Sharma, N. K. Selective Internal Radiation Therapy in the Multidisciplinary Management of Liver Metastases From Colorectal Carcinoma. Semin. Nucl. Med. doi:S000129981930008X.
28. Lee, B. Q. et al. Radiosensitivity of colorectal cancer to 90Y and the radiobiological implications for radioembolisation therapy. Phys. Med. Biol. 64, (2019).
29. Sofocleous, C. T. et al. Phase i trial of selective internal radiation therapy for chemorefractory colorectal cancer liver metastases progressing after hepatic arterial pump and systemic chemotherapy. Clin. Colorectal Cancer 13, 27–36 (2014).
30. Lyon, P. C. et al. Long-term radiological and histological outcomes following selective internal radiation therapy to liver metastases from breast cancer. Radiol. Case Reports 13, 1259–1266 (2018).
31. Jakobs, T. Selective internal radiation therapy for other liver metastases. Eur. J. Cancer, Suppl. 10, 72–74 (2012).
32. Krug, S. et al. Successful selective internal radiotherapy (SIRT) in a patient with a malignant solid pseudopapillary pancreatic neoplasm (SPN). Pancreatology 12, 423–427 (2012).
33. Garrean, S., Hering, J., Helton, W. S. & Espat, N. J. A primer on transarterial, chemical, and thermal ablative therapies for hepatic tumors. Am. J. Surg. 194, 79–88 (2007).
34. Thompson, J. G. et al. Distribution and Detection of Radiopaque Beads after Hepatic Transarterial Embolization in Swine: Cone-Beam CT versus MicroCT. J. Vasc. Interv. Radiol. 29, 568–574 (2018).
35. Pellow, C. et al. Simultaneous Intravital Optical and Acoustic Monitoring of Ultrasound-Triggered Nanobubble Generation and Extravasation. Nano Lett. 20, 4512–4519 (2020).
36. Lea-Banks, H., Mannaris, C., Grundy, M., Stride, E. P. & Coussios, C. Enhanced delivery of a density-modified therapeutic using ultrasound: Comparing the influence of micro- and nano-scale cavitation nuclei. J. Acoust. Soc. Am. 141, 4011–4011 (2017).
37. Paverd, C., Lyka, E., Elbes, D. & Coussios, C. Passive acoustic mapping of extravasation following ultrasound-enhanced drug delivery. Phys. Med. Biol. 64, (2019).
38. Yildirim, A., Blum, N. T. & Goodwin, A. P. Colloids, nanoparticles, and materials for imaging, delivery, ablation, and theranostics by focused ultrasound (FUS). Theranostics (2019) doi:10.7150/thno.32424.
39. Nittayacharn, P. et al. Enhancing Tumor Drug Distribution With Ultrasound-Triggered Nanobubbles. J. Pharm. Sci. (2019) doi:10.1016/j.xphs.2019.05.004.
40. Pasciak, A. S. et al. Correction to: Yttrium-90 radioembolization as a possible new treatment for brain cancer: proof of concept and safety analysis in a canine model (EJNMMI Research, (2020), 10, 1, (96), 10.1186/s13550-020-00679-1). EJNMMI Res. 10, 1–16 (2020).
41. Gordon, A. C. Tuning Your RADIOembolization : Imaging-guidance of Yttrium-90 Radioembolization. (Evanson, Illinois, 2016).

J. Vince DPhil Thesis
186 | P a g e Using Ultrasound to Enhance Targeted Radiotherapy
42. Auditore, L. et al. Monte Carlo 90 Y PET/CT dosimetry of unexpected focal radiation-induced lung damage after hepatic radioembolisation . Phys. Med. Biol. 65, 235014 (2020).
43. Hickey, R., Lewandowski, R. & Salem, R. Yttrium-90 Radioembolization is a Viable Treatment Option for Unresectable, Chemorefractory Colorectal Cancer Liver Metastases: Further Evidence in Support of a New Treatment Paradigm. Ann. Surg. Oncol. 22, 706–707 (2015).
44. Knešaurek, K., Tuli, A., Pasik, S. D., Heiba, S. & Kostakoglu, L. Quantitative comparison of pre-therapy 99mTc-macroaggregated albumin SPECT/CT and post-therapy PET/MR studies of patients who have received intra-arterial radioembolization therapy with 90Y microspheres. Eur. J. Radiol. 109, 57–61 (2018).
45. Hawkins, C. M., Kukreja, K., Geller, J. I., Schatzman, C. & Ristagno, R. Radioembolisation for treatment of pediatric hepatocellular carcinoma. Pediatr. Radiol. 43, 876–881 (2013).
46. Paladini, A. et al. Delivery of selective internal radiation therapy complicated by variant hepatic vascular anatomy. Radiol. Case Reports 14, 662–672 (2019).
47. Liu, T. I. et al. Radiotherapy-Controllable Chemotherapy from Reactive Oxygen Species-Responsive Polymeric Nanoparticles for Effective Local Dual Modality Treatment of Malignant Tumors. Biomacromolecules 19, 3825–3839 (2018).
48. F., B. & Sonveaux, P. Targeting Tumor Perfusion and Oxygenation Modulates Hypoxia and Cancer Sensitivity to Radiotherapy and Systemic Therapies. Adv. Cancer Ther. (2012) doi:10.5772/23332.
49. Chu, X. et al. Exploration of TiO 2 nanoparticle mediated microdynamic therapy on cancer treatment. Nanomedicine Nanotechnology, Biol. Med. 18, 272–281 (2019).
50. Hou, H. et al. Effect of a Topical Vasodilator on Tumor Hypoxia and Tumor Oxygen Guided Radiotherapy using EPR Oximetry. Radiat. Res. 173, 651–658 (2010).
51. Fraisl, P., Mazzone, M., Schmidt, T. & Carmeliet, P. Regulation of Angiogenesis by Oxygen and Metabolism. Dev. Cell 16, 167–179 (2009).
52. Dumitru, C. A., Sandalcioglu, I. E. & Karsak, M. Cannabinoids in glioblastoma therapy: New applications for old drugs. Front. Mol. Neurosci. 11, 1–7 (2018).

J. Vince DPhil Thesis
187 | P a g e Using Ultrasound to Enhance Targeted Radiotherapy
APPENDIX

J. Vince DPhil Thesis
188 | P a g e Using Ultrasound to Enhance Targeted Radiotherapy
1. Khachiyan Algorithm - Minimum Volume Enclosed Ellipse
Code
function [A , c] = MinVolEllipse(P, tolerance) % [A , c] = MinVolEllipse(P, tolerance) % Finds the minimum volume enclsing ellipsoid (MVEE) of a set of data % points stored in matrix P. The following optimization problem is
solved: % % minimize log(det(A)) % subject to (P_i - c)' * A * (P_i - c) <= 1 % % in variables A and c, where P_i is the i-th column of the matrix P. % The solver is based on Khachiyan Algorithm, and the final solution % is different from the optimal value by the pre-spesified amount of
'tolerance'. % % inputs: %--------- % P : (d x N) dimnesional matrix containing N points in R^d. % tolerance : error in the solution with respect to the optimal value. % % outputs: %--------- % A : (d x d) matrix of the ellipse equation in the 'center form': % (x-c)' * A * (x-c) = 1 % c : 'd' dimensional vector as the center of the ellipse. % % example: % -------- % P = rand(5,100); % [A, c] = MinVolEllipse(P, .01) % % To reduce the computation time, work with the boundary points
only: % % K = convhulln(P'); % K = unique(K(:)); % Q = P(:,K); % [A, c] = MinVolEllipse(Q, .01) % % % Nima Moshtagh ([email protected]) % University of Pennsylvania % % December 2005 % UPDATE: Jan 2009
%%%%%%%%%%%%%%%%%%%%% Solving the Dual
problem%%%%%%%%%%%%%%%%%%%%%%%%%%%5 % --------------------------------- % data points % ----------------------------------- [d N] = size(P);

J. Vince DPhil Thesis
189 | P a g e Using Ultrasound to Enhance Targeted Radiotherapy
Q = zeros(d+1,N); Q(1:d,:) = P(1:d,1:N); Q(d+1,:) = ones(1,N);
% initializations % ----------------------------------- count = 1; err = 1; u = (1/N) * ones(N,1); % 1st iteration
% Khachiyan Algorithm % ----------------------------------- while err > tolerance, X = Q * diag(u) * Q'; % X = \sum_i ( u_i * q_i * q_i') is a
(d+1)x(d+1) matrix M = diag(Q' * inv(X) * Q); % M the diagonal vector of an NxN
matrix [maximum j] = max(M); step_size = (maximum - d -1)/((d+1)*(maximum-1)); new_u = (1 - step_size)*u ; new_u(j) = new_u(j) + step_size; count = count + 1; err = norm(new_u - u); u = new_u; end
%%%%%%%%%%%%%%%%%%% Computing the Ellipse
parameters%%%%%%%%%%%%%%%%%%%%%% % Finds the ellipse equation in the 'center form': % (x-c)' * A * (x-c) = 1 % It computes a dxd matrix 'A' and a d dimensional vector 'c' as the
center % of the ellipse.
U = diag(u);
% the A matrix for the ellipse % -------------------------------------------- A = (1/d) * inv(P * U * P' - (P * u)*(P*u)' );
% center of the ellipse % -------------------------------------------- c = P * u;

J. Vince DPhil Thesis
190 | P a g e Using Ultrasound to Enhance Targeted Radiotherapy
2. Single Well Elimination Microsphere Projection
Interpretation Code
clear variables;close all;clc; folList = dir; whichFols = []; for i = 3:size(folList,1) if folList(i).isdir == 1 whichFols = [whichFols; i]; end end
for n = 1:length(whichFols) tic folName = folList(whichFols(n)).name; rRadius = 2.5; %Rod Radius mm whichHighest = 5;
addpath(folName);
fol = dir([folName '/*.dcm']); temp = dicomread(fol(1).name); dinfo = dicominfo(fol(1).name); pmm = dinfo.SliceThickness; KillRp = round(2/pmm); rData =
ones(size(temp,1)+KillRp*2,size(temp,2)+KillRp*2,length(fol)+KillRp*2)
*4000;
for i = (KillRp+1):(size(rData,3)-KillRp) rData((KillRp+1):(size(rData,1)-KillRp),(KillRp+1):(size(rData,2)-
KillRp),i) = dicomread(fol(i-KillRp).name); end rmpath(folName);
%1521 to 4366 (bone) thresholded = (rData>=(1521+min(rData(:))-
1))&(rData<=(4366+min(rData(:))-1)); thresholded(1:10,:,:) = 0; if sum(thresholded(:)) > 0 Sphere = strel('sphere',round(KillRp*1.5)); dThresholded = imdilate(thresholded,Sphere); CC = bwconncomp(dThresholded); numPixels = cellfun(@numel,CC.PixelIdxList); [~,idx] = max(numPixels); filtered_vol = false(size(dThresholded)); filtered_vol(CC.PixelIdxList{idx}) = true; thresholded = thresholded.*filtered_vol;
%P = zeros(3,sum(thresholded(:))); clear P count = 1; for i = 2:(size(rData,1)-1) for j = 2:(size(rData,2)-1) for k = 2:(size(rData,3)-1)

J. Vince DPhil Thesis
191 | P a g e Using Ultrasound to Enhance Targeted Radiotherapy
if (thresholded(i,j,k) == 1)&&((thresholded(i-
1,j,k)==0)||(thresholded(i+1,j,k)==0)||(thresholded(i,j-
1,k)==0)||(thresholded(i,j+1,k)==0)||(thresholded(i,j,k-
1)==0)||(thresholded(i,j,k+1)==0)) P(:,count) = [i,j,k]; count = count + 1; end end end end
% tThresholded = zeros(size(thresholded)); % tThresholded(min(P(1,:)):round((max(P(1,:))-
min(P(1,:)))/2+min(P(1,:))),:,:) =
thresholded(min(P(1,:)):round((max(P(1,:))-
min(P(1,:)))/2+min(P(1,:))),:,:); tThresholded = thresholded; stThresholded = squeeze(sum(tThresholded)); short = ((max(P(1,:))-min(P(1,:)))*pmm)<10;
circ = zeros(101,101); for i = 1:size(circ,1) for j = 1:size(circ,2) if (((i-size(circ,1)/2)^2+(j-size(circ,2)/2)^2) >=
(3.5/pmm/2)^2) && (((i-size(circ,1)/2)^2+(j-size(circ,2)/2)^2) <=
(4.5/pmm/2)^2) circ(i,j) = 1; elseif (((i-size(circ,1)/2)^2+(j-size(circ,2)/2)^2) >
(4.5/pmm/2)^2) && (((i-size(circ,1)/2)^2+(j-size(circ,2)/2)^2) <=
(4.8/pmm/2)^2) circ(i,j) = -1; elseif (((i-size(circ,1)/2)^2+(j-size(circ,2)/2)^2) <
(3.5/pmm/2)^2) && (((i-size(circ,1)/2)^2+(j-size(circ,2)/2)^2) >=
(3.2/pmm/2)^2) circ(i,j) = -1; end end end
circFit = conv2(stThresholded,circ,'same'); [circx, circy] = find(ismember(circFit, max(circFit(:))));
circx = round(mean(circx)); circy = round(mean(circy));
count = 1; countPre = 1; countPost = 1; PreVol = 0; PostVol = 0; clear PsPre clear PsPost clear Ps for i = 2:(size(rData,1)-1) for j = 2:(size(rData,2)-1) for k = 2:(size(rData,3)-1) if (thresholded(i,j,k) == 1)&&((thresholded(i-
1,j,k)==0)||(thresholded(i+1,j,k)==0)||(thresholded(i,j-
1,k)==0)||(thresholded(i,j+1,k)==0)||(thresholded(i,j,k-
1)==0)||(thresholded(i,j,k+1)==0))&&((((j-circx)*pmm)^2+((k-

J. Vince DPhil Thesis
192 | P a g e Using Ultrasound to Enhance Targeted Radiotherapy
circy)*pmm)^2)>((rRadius)^2))&&((i>((max(P(1,:))-
min(P(1,:)))/2+min(P(1,:))))||short) Ps(:,count) = [i,j,k]; count = count + 1; end if (thresholded(i,j,k) == 1)&&((((j-circx)*pmm)^2+((k-
circy)*pmm)^2)>((rRadius)^2))&&((i>((max(P(1,:))-
min(P(1,:)))/2+min(P(1,:))))||short)&&((j-circx)>=0) PsPre(:,countPre) = [i,j,k]; PreVol = PreVol + 1; countPre = countPre + 1; elseif (thresholded(i,j,k) == 1)&&((((j-circx)*pmm)^2+((k-
circy)*pmm)^2)>((rRadius)^2))&&((i>((max(P(1,:))-
min(P(1,:)))/2+min(P(1,:))))||short)&&((j-circx)<0) PsPost(:,countPost) = [i,j,k]; PostVol = PostVol + 1; countPost = countPost + 1; end end end end
% count = 1; % for i = 2:(size(rData,1)-1) % for j = 2:(size(rData,2)-1) % for k = 2:(size(rData,3)-1) % if ((((j-circx)*pmm)^2+((k-circy)*pmm)^2)<((2.5)^2)) % Ps2(:,count) = [i,j,k]; % count = count + 1; % end % end % end % end if count > whichHighest sPsx = sortrows(Ps',2); PreDistxcirc = sPsx((size(sPsx,1)-whichHighest+1),2); PostDistxcirc = sPsx(whichHighest,2); PreDistxcirc = (PreDistxcirc-circx)*((PreDistxcirc-circx)>0)*pmm; PostDistxcirc = (circx-PostDistxcirc)*((circx-PostDistxcirc)>0)*pmm;
if countPre > whichHighest sPsPrex = sortrows(PsPre',3); sPsPrey = sortrows(PsPre',1); sPsPrez = sortrows(PsPre',2); MWidthPre = (sPsPrex((size(sPsPrex,1)-whichHighest+1),3)-
sPsPrex(whichHighest,3))*pmm; MHeightPre = (sPsPrey((size(sPsPrey,1)-whichHighest+1),1)-
sPsPrey(whichHighest,1))*pmm; MDepthPre = (sPsPrez((size(sPsPrez,1)-whichHighest+1),2)-
circx)*pmm; else MWidthPre = 0; MHeightPre = 0; MDepthPre = 0; end
if countPost > whichHighest sPsPostx = sortrows(PsPost',3); sPsPosty = sortrows(PsPost',1); sPsPostz = sortrows(PsPost',2);

J. Vince DPhil Thesis
193 | P a g e Using Ultrasound to Enhance Targeted Radiotherapy
MWidthPost = (sPsPostx((size(sPsPostx,1)-whichHighest+1),3)-
sPsPostx(whichHighest,3))*pmm; MHeightPost = (sPsPosty((size(sPsPosty,1)-whichHighest+1),1)-
sPsPosty(whichHighest,1))*pmm; MDepthPost = (circx-sPsPostz(whichHighest,2))*pmm; else MWidthPost = 0; MHeightPost = 0; MDepthPost = 0; end
PreProj = zeros(size(thresholded,1),size(thresholded,2)); PostProj = zeros(size(thresholded,1),size(thresholded,2)); Ps3D = zeros(size(thresholded));
countPre = 1; countPost = 1; clear PrPre clear PrPost for i = 1:size(Ps,2) if (Ps(2,i)-circx)>=0 PrPre(1:3,countPre) = Ps(:,i); PrPre(4,countPre) = sqrt((Ps(2,i)-circx)^2+(Ps(3,i)-circy)^2); PreProj(Ps(1,i),Ps(3,i)) = PreProj(Ps(1,i),Ps(3,i))+1; countPre = countPre + 1; else PrPost(1:3,countPre) = Ps(:,i); PrPost(4,countPost) = sqrt((Ps(2,i)-circx)^2+(Ps(3,i)-
circy)^2); PostProj(Ps(1,i),Ps(3,i)) = PostProj(Ps(1,i),Ps(3,i))+1; countPost = countPost + 1; end Ps3D(Ps(1,i),Ps(2,i),Ps(3,i)) = 1; end % if countPost > 1 % sPrPost = sortrows(PrPost(4,:)',1); % PostDistR = sPrPost(size(sPrPost,1)-whichHighest+1)*pmm; % else % PostDistR = 0; % end % if countPre > 1 % sPrPre = sortrows(PrPre(4,:)',1); % PreDistR = sPrPre(size(sPrPre,1)-whichHighest+1)*pmm; % else % PreDistR = 0; % end
Ps3DKill = zeros(size(Ps3D)); for i = 1:size(Ps3D,1) for j = 1:size(Ps3D,2) for k = 1:size(Ps3D,3) if Ps3D(i,j,k) == 1 Ps3DKill((i-KillRp):(i+KillRp),(j-
KillRp):(j+KillRp),(k-KillRp):(k+KillRp)) = 1; end end end end % count = 1; % for i = KillRp:(size(Ps3D,1)-KillRp) % for j = KillRp:(size(Ps3D,2)-KillRp)

J. Vince DPhil Thesis
194 | P a g e Using Ultrasound to Enhance Targeted Radiotherapy
% for k = KillRp:(size(Ps3D,3)-KillRp) % if Ps3DKill(i,j,k) == 1 % PKill(:,count) = [i,j,k]; % count = count + 1; % end % end % end % end
[A , C] = MinVolEllipse(Ps, 0.05); figure; plot3(Ps(1,:),Ps(2,:),Ps(3,:),'.'); daspect([1 1 1]); hold on Ellipse_plot(A,C);
Ellipse3D = zeros(size(thresholded)); count = 1; MaxR = 0; MaxRC = [0;0;0]; NMaxR = 1; clear PE for i = 1:size(Ellipse3D,1) for j = 1:size(Ellipse3D,2) for k = 1:size(Ellipse3D,3) if ([i;j;k]-C)'*A*([i;j;k]-C)<=1 Ellipse3D(i,j,k) = 1; PE(:,count) = [i,j,k]; count = count+1; if (sqrt((i-C(1))^2+(j-C(2))^2+(k-C(3))^2))>=MaxR if (sqrt((i-C(1))^2+(j-C(2))^2+(k-C(3))^2))==MaxR MaxR = (sqrt((i-C(1))^2+(j-C(2))^2+(k-
C(3))^2)); MaxRC = MaxRC + [i;j;k]; NMaxR = NMaxR + 1; else MaxR = (sqrt((i-C(1))^2+(j-C(2))^2+(k-
C(3))^2)); MaxRC = [i;j;k]; NMaxR = 1; end end end end end end MaxRC = round(MaxRC/NMaxR); MVEE = sum(Ellipse3D(:))*pmm^3/1e3; % count = 1; % clear PEs % for i = 2:(size(rData,1)-1) % for j = 2:(size(rData,2)-1) % for k = 2:(size(rData,3)-1) % if (Ellipse3D(i,j,k) == 1)&&((Ellipse3D(i-
1,j,k)==0)||(Ellipse3D(i+1,j,k)==0)||(Ellipse3D(i,j-
1,k)==0)||(Ellipse3D(i,j+1,k)==0)||(Ellipse3D(i,j,k-
1)==0)||(Ellipse3D(i,j,k+1)==0)) % PEs(:,count) = [i,j,k]; % count = count + 1; % end % end

J. Vince DPhil Thesis
195 | P a g e Using Ultrasound to Enhance Targeted Radiotherapy
% end % end % Epolyfit0 = mean(PEs,2); % EA = zeros(3,size(PEs,2)); % EA(1,:) = PEs(1,:)-Epolyfit0(1); % EA(2,:) = PEs(2,:)-Epolyfit0(2); % EA(3,:) = PEs(3,:)-Epolyfit0(3); % [EU,ES,~] = svd(EA); % d = EU(:,1); % t = d'*EA; % t1 = min(t); % t2 = max(t); % temp = ([t1,t2]'*d')'; % Epolyfitl(:,1) = Epolyfit0 + temp(:,1); % Epolyfitl(:,2) = Epolyfit0 + temp(:,2); Epolyfitl(:,1) = MaxRC; Epolyfitl(:,2) = (C-MaxRC)+C; plot3(Epolyfitl(1,:),Epolyfitl(2,:),Epolyfitl(3,:),'r'); % Epolyfitr = Epolyfitl(:,1)-Epolyfitl(:,2); Epolyfitr = MaxRC-C; Eangle =
acos(sum([0;1;0].*Epolyfitr)/sqrt(sumsqr(Epolyfitr)))/pi()*180;
KZ = (1-(sum(Ellipse3D(:))-
sum(sum(sum(Ellipse3D.*Ps3DKill))))/sum(Ellipse3D(:)))*100; KV = sum(sum(sum(sum(Ps3DKill))))*pmm^3/1e3;
figure; plot3(P(1,:),P(2,:),P(3,:),'.'); daspect([1 1 1]);
figure; imagesc(PostProj); daspect([1 1 1]);
% figure; % plot3(PE(1,:),PE(2,:),PE(3,:),'.','color','r'); % daspect([1 1 1]); % hold on % plot3(PKill(1,:),PKill(2,:),PKill(3,:),'.','color','b');
Output(n).Name = folName; Output(n).MVEE = MVEE; Output(n).Angle = Eangle; Output(n).PreProj = PreProj; Output(n).PostProj = PostProj; Output(n).Killzone = KZ; Output(n).KillVolume = KV; Output(n).PreVol = PreVol*pmm^3/1e3; Output(n).PostVol = PostVol*pmm^3/1e3; Output(n).MWidthPre = MWidthPre; Output(n).MHeightPre = MHeightPre; Output(n).MDepthPre = MDepthPre; Output(n).MWidthPost = MWidthPost; Output(n).MHeightPost = MHeightPost; Output(n).MDepthPost = MDepthPost;
else
Output(n).Name = folName;

J. Vince DPhil Thesis
196 | P a g e Using Ultrasound to Enhance Targeted Radiotherapy
Output(n).MVEE = 0; Output(n).Angle = 0; Output(n).PreProj = zeros(size(thresholded,1),size(thresholded,2)); Output(n).PostProj = zeros(size(thresholded,1),size(thresholded,2)); Output(n).Killzone = 0; Output(n).KillVolume = 0; Output(n).PreVol = 0; Output(n).PostVol = 0; Output(n).MWidthPre = 0; Output(n).MHeightPre = 0; Output(n).MDepthPre = 0; Output(n).MWidthPost = 0; Output(n).MHeightPost = 0; Output(n).MDepthPost = 0;
end end toc end
save('Output.mat','Output'); disp('Code Finished');

J. Vince DPhil Thesis
197 | P a g e Using Ultrasound to Enhance Targeted Radiotherapy
3. Interaction Plot for Post Focal Projection Depth (mm)

J. Vince DPhil Thesis
198 | P a g e Using Ultrasound to Enhance Targeted Radiotherapy
4. HPV-X2 Image Calibration and Objective Limitations
As the HPV-X2 camera was initially designed for long distance high magnification observations
of explosive materials at a resolution of 200x450 pixels, it does not have internal
programmable scaling of the objectives in use. Manual calibration was therefore required for
both objectives (4x and 10x). A 20x objective (CFI Plan Fluor, NIKON, Tokyo, Japan) was
investigated initially, but the glass cover obscured the image quality to such a degree as to
make individual beads indistinguishable from one another, only general positioning of bead
clusters within the frame, making measurements using the haemocytometer and image
calibration impossible (Figure lxx). Images captured at 20x were therefore not calibrated.
Figure lxx: 20x objective view of 15-32um black glass microspheres within a channel of a newly formed
projection. Individual spheres are indiscernible (a) at 20x and discernible (b) at 10x magnification.
For the 4x objective, a clear transparent plastic ruler was used to capture the 1mm intervals
for calculation of the image size at the focus. For the 10x objective a haemocytometer (Bright
Line, Hausser Scientific, Horsham, PA) was used to measure a 200µm square etched at the
centre of the glass slide. Measurements were taken with both objectives with and without the
covering glass beaker to calculate the difference the change in the light path had on the
accuracy of the images, particularly noticeable at 10x magnification.
(a) (b)

J. Vince DPhil Thesis
199 | P a g e Using Ultrasound to Enhance Targeted Radiotherapy
Images were thresholded in black and white to produce contrasting images using ImageJ (NIH,
Bethesda, MA). This provided clean cut edges from which to consistently take a series of 6
measurements using the gradations on either measuring apparatus (Figure ii).
Figure lxxi: 4x calibration images original (left), thresholded (right). 1mm increments. Where the red
arrow indicates the lengths measured.
For the 4x objective measurements were made of a 1mm increment from the furthest right to
furthest right edge of the next gradation of the ruler, perpendicular to the gradations, with the
height and increment selected chosen at random. The first measurement of the known
distance was used to scale the image. A further 5 measurements of the known distance were
taken (total n=6) and the mean distance divided by the number of pixels used in the first
measurement. The scale value in pixelsmm-1 or pixelsµm-1 was used thereafter for all 4x images
acquired.
The same procedure was used for the 10x objective but with the measurements using a
calibrated haemocytometer with a known distance of 200µm, one large square or four smaller
squares (See Figure iii). Measurements were consistently taken at -0.9 degrees to match the
manual positioning error of the haemocytometer, to keep the measured distance parallel to
the known distance in the image.
(b) (a)

J. Vince DPhil Thesis
200 | P a g e Using Ultrasound to Enhance Targeted Radiotherapy
Figure lxxii: 10x calibration images, original (left) thresholded (right). Arrow depicting area of square
which was measured.
Measurement
4x objective w/o cover Distance
(mm)
4x objective
with cover Distance
(mm)
10x objective
w/o cover Angle
(degrees)
10x objective w/o cover Distance
(µm)
10x objective
with cover Angle
(degrees)
10x objective
with cover Distance
(µm)
1 1.000 1.217 -0.955 200.000 -0.909 200.000
2 0.983 1.000 0.000 204.404 -0.909 198.347
3 1.036 1.002 -0.939 201.105 -0.924 196.722
4 0.992 1.027 -0.939 201.105 -0.924 196.722
5 1.008 0.962 -0.939 201.089 -0.924 196.713
6 1.008 1.053 -0.955 200.000 -0.939 194.275
Mean 1.005 1.043 -0.788 201.284 -0.922 197.130 SD 0.018 0.090 0.386 1.621 0.011 1.917
Min 0.983 0.962 -0.955 200.000 -0.939 194.275 Max 1.036 1.217 0.000 204.404 -0.909 200.000
Pixel Count 121.333 116.796 NA 60.342 NA 63.000
Mean Distance/Pixel
(µm/pixel) 8.283 8.930 3.336 3.129
SD Distance/Pixel
(µm/pixel) 0.148 0.771 0.0269 0.030
Table iii: Calibration measurements for NIKON objectives used with the HPV-X2 Hi-Speed camera
Therefore, each 400x250 pixel image (frame) captured whilst using the glass cover over the
objective is 3572.04 x 2232.53 ± 308.24 x 192.65 µm for the 4x objective and 1251.6 x 782.25 ±
12.6 x 7.6 µm when using the 10x objective. Scale bars in each picture are either 1mm for the
4x images or 250 µm for the 10x images.

J. Vince DPhil Thesis
201 | P a g e Using Ultrasound to Enhance Targeted Radiotherapy
5. HPV-X2 External Trigger Methods
5.1. Manual Gated Timing
Increasing the contrast under illumination, projections containing the microsphere
/microbubble mixture were significantly darker than that of the surrounding agarose gel and
acrylic; which was largely optically transparent even at a thickness of 60mm (acrylic walls
included). This contrast combined with a light detector produced a sufficient change in output
voltage from the detector to enable time resolved monitoring of the projection events.
With the Solis LED at maximum light output for maximum image contrast at low exposure
levels, the voltage output from the light detector was lower than expected due to the
protective diffuser lens in the light path and the natural aperture of the lens. As a result the
switchable gain was increased to 30dB for 10x objective use. This produced an output voltage
of approximately 1.9V, but not so high as to exceed the recommended output voltage of the
detector (5V) or the recommended channel input for either of the two oscilloscopes (2V). At a
gain of 30dB (2.38 x 10⁴ V/A ±2%, 260kHz Bandwidth3, 211µV noise) each data point is
produced at intervals of every 3.9µs a considerable drop off from the 12MHz bandwidth3 at 0
gain, or a sampling every 83.3ns.
The two oscilloscopes available for use were the Le Croy (HDO4024, Teledyne, CA) and the
WaveSurfer (2014z, Teledyne, CA). Both models have incredibly high sampling frequencies
capable of detecting up to a maximum 10 and 4GS/s respectively however this is only at a
relatively short time period, as irrespective of the time interval, both oscilloscopes can only
record 10,001 data points to memory at any given time. A trade-off between total time
captured and resolution of the data exported by the oscilloscope was therefore required,
particularly given the .csv file export time being significantly longer than that of the trace time
captured.

J. Vince DPhil Thesis
202 | P a g e Using Ultrasound to Enhance Targeted Radiotherapy
To ascertain the timescale of the delay between the exposure to ultrasound and the first
projections being formed, a time trace of the detector output was produced using the manual
time gated experimental setup (See section 4.2.4). Each experiment was run between 2-3
minutes of exposure, with 200us of time captured every second with a resolution of 2ns; our
temporal resolution therefore was not that of the oscilloscope but the output from the light
detector at 30dB gain. The mean of each output file (200us), was plotted against the indices
file number in time producing a plot of mean voltage over the exposure time (below).
Figure lxxiii: Example of light detector output voltage trace against time for mould 135.
In figure iv there is an initial drop in light intensity in the first few seconds of time, as the dark
contrast of the filled well is pressed forward by the acoustic radiation force, decreasing the
output voltage. There appeared to be no immediate recovery of the output voltage once the
ultrasound was turned off, thought to be as a result of the microspheres being compacted

J. Vince DPhil Thesis
203 | P a g e Using Ultrasound to Enhance Targeted Radiotherapy
against the well edge by the acoustic radiation force, decreasing the transmission of light at
the top of the image frame (See Figure v).
Figure lxxiv: 4x Objective. Slight compression of the gel well, at rest (left) under US exposure (right). The
slight angle of the well in this image is caused by the variation in the gel fabrication process, only
noticeable under increased magnification.
Within the first 10 seconds, a second far steeper decline in voltage is observed; this is the
beginning of a successful projection event (confirmed via image capture) and cavitation. The
voltage trace does not indicate, however, at the time at which the projection begins, only that
under the applied ultrasound, black beads crossing the image frame provide a measurable
decrease in transmitted light.
Figure lxxv: 4x objective. Beginning of a single microsphere projection (left), multiple projections (right).
Diagonal lines across the image are a crinkling artefact of the mylar sheet on the surface of the mould.

J. Vince DPhil Thesis
204 | P a g e Using Ultrasound to Enhance Targeted Radiotherapy
To increase the temporal resolution of the detector trace during the first 10 seconds of
exposure, a single 10,001 timepoint file output was recorded over the initial 10s period from
the first Verasonics™ trigger. The corresponding voltage trace had a temporal resolution of
0.1ms. This trace showed that the output from the PDA36A2 Si Switchable gain detector
oscillated frequently between two points even at ‘steady’ light levels and was associated with
the noise of the detector (Figure vii).
Figure lxxvi: Detector output voltage traces for the first 10s of ultrasound exposure. Single files 0.1ms
resolution. 16.6mV noise band (left) and 33.3mV noise band (right).
Even at a ‘steady’ light input the noise band of the detector at 30dB gain can be seen
oscillating over increments of 16.7mV or 33.3mV, despite the same gain level, light and
exposure conditions on the same day. The reason for the change in noise band in each
experiment is not precisely known but does not appear to correlate to any purposeful in
change in experimental or parameter setup.
Despite the apparent step-wise decrease in voltage, there appears to be no consistent voltage
drop consistent with the initiation of a projection event, most likely the result of improper and
inconsistent focussing between each experimental run.
Reducing the time window for the manual delay therefore did not improve the likelihood of
capturing the stochastic events concurrently. Visual confirmation from stationary images

J. Vince DPhil Thesis
205 | P a g e Using Ultrasound to Enhance Targeted Radiotherapy
between pulses, was the only evidence that the timing of the microsphere projections was
loosely grouped, around 5.000 ± 0.250 seconds after initiation of ultrasound exposure.
Figure lxxvii: Example image of an immature projection captured by manual delay. The capture event
has taken place after the initial projection formation and between any subsequent elogation of the
projection channel. The manual delay timing was therefore too long for this particular example.
5.2. Light Responsive Trigger Method
Whilst reducing the size of the delay window was beneficial for the manual input; it did not
improve the chance of the cavitation events coinciding with the trigger of Hi-speed camera.
For example; within a delay window of 500ms (5.000 +/- 0.250s) there is the potential for the
camera to capture 19 distinct events at 10,000 fps (25.6ms per recording) or 195 distinct
events at 100,000 fps (2.56 ms per recording) within the same time interval, with the chances
of serendipitous overlap between the two being incredibly unlikely. In practise it was only
possible to record a few videos recordings manually at 10,000 fps of a single mould over the
entire ultrasound duration. Manually capturing any microsphere movements over a single run
was incredibly difficult and sporadic.
As the save time of the HPV-X2 is of the order of seconds for a single capture, only one
attempt per experimental mould could be performed using the manual delay electronic setup

J. Vince DPhil Thesis
206 | P a g e Using Ultrasound to Enhance Targeted Radiotherapy
(See Chapter 4, Figure 3) before resorting to manual triggering of the HPV-X2, it was decided
that a light-responsive trigger was required to increase the chance of capturing cavitation
events above that of 10,000 fps.
Figure lxxviii: Manually gated timing window for stochastic formation of ultrasound induced cavitation
projections. Image is to scale.
The light responsive electronic setup (Chapter 4, Figure 4) was primarily used with the 10x
objective and did eliminate the difficulty experienced with timing the capture of a stochastic
event but it could not be effectively standardised due to the variable exposure of the gel
mould. Voltage outputs at t0 were variable between moulds and objectives used, resulting in
each mould requiring manual editing of the initial voltage, trigger method (window or negative
edge) and trigger voltage for each hi speed recording.
Whilst the changes in ambient light surrounding the gel were not seen to impact the image
quality, compared to the intensity of light transmitted by the H-LED; issues created by the glass
beaker cover reduced the focus of the objective and image quality sufficiently for the blurring
to affect the received light by the detector (See Appendix 4). Whilst the agar hydrogel protocol
was standardised, the inherent variation in hydrogels did produce a variation in the optical
clarity of the gels used, this in combination with suspended bodies in the water tank (from the
laboratory ventilation and manual manipulation) also diminished the final image quality.

J. Vince DPhil Thesis
207 | P a g e Using Ultrasound to Enhance Targeted Radiotherapy
The variation in the image quality observed resulted in variable intensities of light transmitted
and thus the output voltages associated with each mould had inconsistent maximum values.
The noise band associated with the detector however remained relatively constant with the
gain setting, with a maximum noise band of 33.3mV.
Figure lxxix: Cavitation activity corresponding to diode voltage changes and subsequent triggering of the
HPV-X2 high speed camera. Voltage trace is indicative of the scale of cavitation activity below (1:4).
Individual microbubble oscillations (1), microbubble cloud oscillations (2), numerous cloud activity (3)
leading to extension of projection channels via microsphere extravasation (4).
Irrespective of the trigger method (falling edge vs window) it was found that even relatively
small changes in voltage, below the noise band were sufficient to trigger the hi-speed
recordings, independent of the mean voltage at t=0. As expected changing the delta value of
the trigger setting was related to the size of the cavitation activity and the respective change in
image contrast. Setting the delta trigger value, below that of 60ms resulted in immediate
capture, due to the contrast produced by oscillating bubbles on mass in and out of focus
(Figure x, 1). 80-100mV corresponded to the oscillations of a single microbubble cloud (Figure
x, 2) with increasing levels of activity (Figure x, 3) as the delta value increased (100-200 mV).

J. Vince DPhil Thesis
208 | P a g e Using Ultrasound to Enhance Targeted Radiotherapy
Setting of the delta voltage value too high (>200mV) resulted in capturing only gross changes
to the well in frame i.e formation of a new microsphere projection or drastic changes in size to
an existing microsphere projection within the frame (Figure x, 4); trigger sensitivity ignored at
this level ignored any microbubble cloud or projection bolus phenomena.
Images which were not in focus, where there was no clear edge to the microspheres in frame
either due to shadowing or optical resolution of the setup, resulted in microsphere
movements not being recorded due to a lack of camera triggering. The blurring and distortion
of the image averaged the light intensity transmitted to such an extent that even multiple
channel microsphere projections could not be detectable. In these instances, when using a
voltage trigger window, only removing the mould or turning off the light source would cause a
sufficient change in light intensity to trigger the camera capture.
For each mould in sufficient focus, the first capture was achieved using a negative falling edge
rather than a voltage window. This was chosen because during the first few seconds of
ultrasound exposure the gel channel could move in global position, assumed to be slight
compression of the gel within the mould. This movement of the entire well could pull the
contrasting edge of the well out of focus, causing the transmitted light to increase, exceeding
the voltage window threshold and causing a false positive trigger for recording. This
undesirable false-triggering resulted in recording only dead space of the undisturbed gel as
white frames.
Thus, choosing a negative falling edge, whereby the light transmitted decreased due to the
black microspheres increasing in number across the screen, minimised the occurrence of false
positive triggers but did not eliminate them entirely. Multiple falling edge captures were
therefore used until it was observed that a projection channel had been initiated; after which a
voltage gated window trigger was found to be more consistent. Window voltages were double
that of single negative edge triggers. The applied ultrasound was turned off after each trigger

J. Vince DPhil Thesis
209 | P a g e Using Ultrasound to Enhance Targeted Radiotherapy
event of the HPV-X2, to account for the save time of the video files. This start-stop approach
whilst tedious, allowed for multiple sequential video captures of the same microsphere
projection without a large expanse of time between each capture; critical to tracing the
movements of microspheres and microbubble cloud within the projection channels.
Initially a larger voltage decrease was required to begin a projection, a decrease of 60-100mV
was sufficient to capture initial movements of beads crossing the boundary edge. After which
using a window of 60-100mV, resulted in far more consistent capture of channel progression
after crossing the initial boundary edge. Once outside the initial gel well, bead and bubble
movements were more identifiable due to the lack of overlapping layers of microspheres in
and out of focus, contributing to the overall image.

J. Vince DPhil Thesis
210 | P a g e Using Ultrasound to Enhance Targeted Radiotherapy
6. Microsphere Banding within Projection Channels
Figure lxxx: Simulation performed by Bernard Shieh (BUBBL, IBME, Oxford University) modelling the
ratio of the longitudinal wavelength to the bulk wavelength, for modes of a rectangular cavity near the
driving frequency. The longitudinal wavelength is always greater than the bulk wavelength.
Removal of the glass microspheres from the well cavity shows that a similar albeit fainter
banding is observed within the bulk of the well cavity with Sonovue® microbubbles (Figure xii).

J. Vince DPhil Thesis
211 | P a g e Using Ultrasound to Enhance Targeted Radiotherapy
Figure lxxxi: Image banding from applied ultrasound on neat Sonovue®. Mould 184 using a 10x
objective. Mean 46.510, SD 16.002, Min 22.222, max 95.244, n= 51. All values are in microns (µm).
After initially placing the mould within the experimental setup, a faint band of microbubbles
and microbubble foam can be seen gathering at the highest point of the cylindrical well before
ultrasound exposure. Once the ultrasound field is applied the microbubbles and foam can be
seen cavitating producing the pronounced banding, which travels downwards, presumably due
to the acoustic radiation force 26,28,50.

J. Vince DPhil Thesis
212 | P a g e Using Ultrasound to Enhance Targeted Radiotherapy
Figure lxxxii: Frames 001, 150, 175, 200, 225 and 250 of a 256 frame Sonovue® only using a 10x
objective at 500,000 fps under 1.9Mpa of focal pressure, 0.50 MHz, 5% DC, 3.3Hz PRF (Section 4.2.5).
In Figure xiii the initial dispersion of the cloud foam and entrapped microbubbles which have
floated to the surface of the well cavity can be seen (a). Coalescence of the microbubbles leads
to larger macro-bubbles (c) and clouds which continue to cavitate, producing spherical blurred
objects which have significant contrast (e), which slowly move forward and down in elevation
as they traverse the boundary edge of the well cavity (f). These striations across the image (h)
are similar to that of the banding observed. The number and size of the bubble clouds
produced as well as the visible banding increases with increased focal pressure (2.8 MPa) as
seen in Figure xiv; the explanation of which remains unclear.

J. Vince DPhil Thesis
213 | P a g e Using Ultrasound to Enhance Targeted Radiotherapy
Figure lxxxiii: Frames 001, 125, 175, 200, 225 and 250 of a 256 frame sequence of ultrasound exposure
to Sonovue® using a 10x objective at 500,000 fps. Ultrasound parameters are identical to that of Fig 28
(Section 4.2.5) except the focal pressure which is increased to 2.8 MPa. Microbubble foam edge is placed
at the top of frame for allow for visualisation of movement. Visible pitched banding (red) increases in
density (blue) with increased duration of applied ultrasound and finally to concentrated circular objects
(orange). Banding (red) is restored after cessation of the applied ultrasound.
The cause of the microsphere banding which occurs in the channel lumen of some projections
remains to be explained. The frequency spectra from individual experimental runs, show no
components with sufficient magnitude which correlate to the pitch distance of the
microsphere striations observed. Standing wave phenomena within the tank, was also not
found to be responsible for the pitch distance measured from the images gathered.

J. Vince DPhil Thesis
214 | P a g e Using Ultrasound to Enhance Targeted Radiotherapy
Sonovue® only experiments indicated that the banding phenomena witnessed may be because
of microbubble cloud activity emerging from the grouped microbubble foam and entrapped
microbubbles prior to initial ultrasound exposure; suggesting a mechanical rather than an
acoustic rationale for the banding formation. Further work is required to fully elucidate these
findings.
It remains unclear as to the exact mechanism which causes the observed banding pitch
distance of the black glass microspheres, it seems unlikely however to be related to a
frequency component. Physical interactions and settling or separation of microspheres from
microbubbles or bubble clouds have not been ruled out but further work into the area is
required. The acoustic attenuation and scattering of the acoustic signal by the incompressible
glass microspheres must predominate in this setup as there are no signs of a standing wave
being present, unlike that of witnessed in highly compressible cellular cultures using
continuous wave ultrasound at elevated frequencies51–53. Where cells will migrate in bands of
λ/2, corresponding to the nodes of the wavelength acting upon them.
Which suggests that the foaming and redistribution of microbubbles within the concentrated
bolus pockets causes the channel microsphere banding, as there is no frequency detected
which the observed banding distance. Exactly what causes this phenomenon remains
unknown, particularly as it is not observed in earlier work (See Chapter 2) which uses a vertical
orientation of the well for the microbubble and microsphere slurry.

J. Vince DPhil Thesis
215 | P a g e Using Ultrasound to Enhance Targeted Radiotherapy
7. Design and Fabrication of a Novel Ultrasound Horn for
Intraoperative adjuvant use in Glioblastoma Multiforme
Resections
7.1. Proof of Principle
An unoptimized commercially available sonicator horn (Q125, QSonica, Connecticut, USA)
normally used for cell disruption, DNA/RNA shearing and homogenisation was used for initial
benchmark testing for proof of principle experimentation. The Q125 is a programmable
ultrasonic processor which operates at a maximum of 125W @20 kHz and a 1/8 inch (3.175
mm) cylindrical tip (#4422) with a tip displacement of 30-180µm. The horn has limited cycle
control and can only be run in continuous phase with the duration of each pulse controllable
to a 1s resolution.
Each distribution of black glass microspheres, analogous to that of the commercially available
TheraSphere™ (15-32µm, See Section 4.2.1), was tested in combination with 200 µL neat
Sonovue (mean 2.5 µm, 1-5 x 10⁸ bubbles mL-1, Bracco Diagnostics, USA) using ~0.020g of
microspheres. The slurry of microspheres and microbubbles were added to 4mm agar gel
cavities (See Section 2.2.2) and the sonicator tip immersed in the liquid within the well until it
approached the bottom (distance from the agar floor to the sonicator tip <5 mm, See Figure
xv).

J. Vince DPhil Thesis
216 | P a g e Using Ultrasound to Enhance Targeted Radiotherapy
Figure lxxxiv: Placement of the sonicator tip within the 4mm agar wells filled with neat Sonovue and
black glass microspheres analogous to TheraSphere™.
The sonicator was run at maximum output (125W) for 1s followed by 19s of rest for a total of
60s (3s total on time) to achieve a 5% duty cycle, for each microsphere distribution (see Figure
xvi).
Figure lxxxv: Initial testing using the sonicator horn with neat Sonovue and black glass microspheres of
various diameters. Microsphere sizes <15 µm (1&2), 15-32 µm (3&4), 106µm (5&6), 200-400 µm (7&8).
Initial results using the unoptimized sonicator are shown in Figure xvi. No two projections
formed by the sonicator were identical, the majority of the projections produced by the
sonicator occupied a single 2D plane of microspheres fixed within the agar gel with
microspheres of larger distributions travelling shorter distances (Figure xvi, 7&8) compared to
the smaller microspheres (Figure xvi, 1 & 2). None the less the concept of using an unfocussed
ultrasonic horn, rather than a focussed transducer appeared promising and feasible.
1 2 3 4 5 6 7 8

J. Vince DPhil Thesis
217 | P a g e Using Ultrasound to Enhance Targeted Radiotherapy
7.2. Methods
The parameter findings from Chapters 3 in addition to the observations of microbubble cloud
activity in Chapter 4 were used to design an ultrasonic horn device that would be suitable for
use intraoperative within the skull. With help from Dr. Bernard Shieh, two prototype horns
were designed and constructed from 304 grade stainless steel using the Engineering Workshop
within the Institute of Biomedical Engineering (IBME) and attached to a commercially bought
driver. The fields produced by both devices were mapped and their pressure outputs recorded,
albeit to a limited degree. Both prototypes suffered from variable impedance issues, the root
cause of which is still unknown but is believed to be related to the clamping force exerted onto
the driver and between the driver and the metal horn. Despite the limited PNP outputs of the
two prototypes it was possible to embed 15-32 µm microspheres within the agar cavity,
simulating the resection cavity however significant improvement on the depth of penetration
is needed if the prototype devices are to be eligible for further translation towards a surgical
application.
7.2.1. Design Parameters
The findings in Chapter 3 demonstrated that producing post-focal microsphere projections of
increasing length was dependent upon two key acoustic attributes: frequency and pressure for
applications using a focussed transducer. 0.5 MHz proved to be the most useful and versatile
frequency tested, but the H107 series transducers (64mm, Section 2.2.4) used for the
parameter screening are far too large to be inserted with the skull cavity within a typical
procedure41,42,44,46 even if sufficient coupling was available. Using an unfocussed acoustic horn,
whilst less efficient at producing large peak negative pressures, would be more suitable for a
therapeutic device than a large focussed decoupled transducer. In order to be usable within
the skull, the prototype device would ideally be handheld and similar in dimensions to the

J. Vince DPhil Thesis
218 | P a g e Using Ultrasound to Enhance Targeted Radiotherapy
Sonopet device. Using an unfocussed horn with a terminal tip diameter of 3-4mm would
provide the operator with the required fidelity and dexterity to carry out the procedure,
successfully delivering the radioactive material to the desired location(s) for treatment.
A trade-off between driver size, weight, power and frequency would also be required in order
to make the device portable to use, whilst being powerful enough to generate the cloud
cavitation observed to be the main vehicle for driving the post focal projection depth in
Chapter 4.
7.2.2. Horn Prototypes x1c & x3c
A commercially available unfocussed ultrasonic driver operating at 0.5 MHz could not be
sourced. An aluminium bolt-clamped transducer (Langevin, Part# SMBLTF120W60) using a
SM111 piezo electric material, was chosen based on availability, price and compromise
between the desired attributes. The driver was capable of maximum output power of 60 W, at
a 122 ±2.5 kHz resonant frequency, 800 ±25% Mechanical Q, <25 Ω resonant impedance to a
40mm contact surface tapped with a M10 x 1.0mm thread, for attachment of the bespoke
horn designs: the x1c (Figure xvii) and the x3c (Figure xviii).

J. Vince DPhil Thesis
219 | P a g e Using Ultrasound to Enhance Targeted Radiotherapy
Figure lxxxvi: x1c final design iteration drawing for production.
Figure lxxxvii: x3c final design iteration drawing for production.

J. Vince DPhil Thesis
220 | P a g e Using Ultrasound to Enhance Targeted Radiotherapy
Each horn was manually screwed into the driver using the 12mm relief cut out until the end
range of motion, careful not to overtighten and damage the aluminium threads on the
Langevin driver. Both horn designs take advantage of acoustic focussing using a 76.72o cone
element; once in the x1c and three times in the x3c design. The acoustic focussing was
simulated to provide a PNP of 0.41 MPa at 5mm and 0.21 MPa at 10mm for the x1c horn. With
the x3c horn PNP was simulated to be 1.3 MPa at 5mm and 0.7 MPa at 10mm distance from
the horn tip. A 38mm 59.25o cone was added to each horn design after initial versions
demonstrated a reduction in acoustic output when using a small contact surface with the
driver.
The electrical impedance of each horn was measured using a vector network analyser (SDR-
Kits, DG8SAQ) sweeping from 110-140 kHz. Individual matching networks were also fabricated
by Bernard Shieh from L-networks made from passive components (inductor in series and
parallel) where the inductance and capacitance were selected based on the measured
impedance. The final operating frequencies of the horns with appropriate matching networks
was 103.10 and 129.49 kHz for the x1c and x3c horns respectively. Each horn weighed <390g
with the driver attached.
7.3. Results
7.3.1. Acoustic Field (x1c)
The two horns were pressure calibrated using a 10 – 800 kHz needle hydrophone (Reason,
TC4038, Teledyne) in an analogous manner to that previously (Section 2.2.4) using a waveform
generator to control the ultrasound parameters of the horns. Each horn was tested using a
8000 cycle burst with a 100ms PRF (10Hz), this was because the maximum input of each horn
took several thousand cycles to meet maximum output and displacement at their respective
operating frequencies. The horn was mounted in place using a 3 prong rubber insulated clamp

J. Vince DPhil Thesis
221 | P a g e Using Ultrasound to Enhance Targeted Radiotherapy
attached to a 3-axi movement stage. Field scans were performed in the XY, YZ and XZ planes to
establish the acoustic field emitted from the 4mm stainless steel cylindrical tips, at a depth of
<1 mm from the tip surface.
Figure lxxxviii: Root mean squared (RMS) and peak rarefactional pressure of the XY field of the x1c
horn, 0.2mm resolution. Using the Reson TC4038 needle hydrophone.

J. Vince DPhil Thesis
222 | P a g e Using Ultrasound to Enhance Targeted Radiotherapy
Figure lxxxix: RMS and peak rarefaction pressures for YZ field of the x1c horn, 0.2mm resolution. Using
the Reson TC4038 needle hydrophone

J. Vince DPhil Thesis
223 | P a g e Using Ultrasound to Enhance Targeted Radiotherapy
Figure xc: RMS and peak rarefaction pressure XZ acoustic field for the x1c horn, slight asymmetry in the
lower left corner of the field. 0.2mm resolution. Using the Reson TC4038 needle hydrophone

J. Vince DPhil Thesis
224 | P a g e Using Ultrasound to Enhance Targeted Radiotherapy
7.3.2. Pressure Output (x1c)
Figure xci: x1c with matching network, peak rarefaction pressure (kPa) to power input (W) measured
using the Reson TC4038 needle hydrophone.
Figure xcii: x1c pressure (kPa) loss over distance (mm) calibration using the Reson TC4038 needle
hydrophone.

J. Vince DPhil Thesis
225 | P a g e Using Ultrasound to Enhance Targeted Radiotherapy
7.3.3. Acoustic Field (x3c)
Figure xciii: RMS and peak rarefaction pressure XZ acoustic field for the x3c horn, 0.2mm resolution.
Using the Reson TC4038 needle hydrophone. 0.2mm Resolution.

J. Vince DPhil Thesis
226 | P a g e Using Ultrasound to Enhance Targeted Radiotherapy
Figure xciv: RMS and peak rarefaction pressure XY acoustic field for the x3c horn. 0.5mm resolution.
Using the Reson TC4038 needle hydrophone. 0.5mm Resolution.

J. Vince DPhil Thesis
227 | P a g e Using Ultrasound to Enhance Targeted Radiotherapy
Figure xcv: RMS and peak rarefaction pressure YZ acoustic field for the x3c horn.0.5mm resolution.
Using the Reson TC4038 needle hydrophone. 0.2mm Resolution.
7.3.4. Pressure Output (x3c)

J. Vince DPhil Thesis
228 | P a g e Using Ultrasound to Enhance Targeted Radiotherapy
Figure xcvi: Pressure ramp for x3c horn without a matching network, using the Reson TC4038
hydrophone. Maximum power rating of the driver is 60W.
7.3.5. LDV Measurements x3c
As the TC4038 hydrophone was only capable of operating under pressures equivalent to
~3.5W of power using the x3c, from a potential maximum 60W of power input from the driver
(5.8%), another method was required to calibrate the maximum output pressures from the
x3c. Using either a fibre optic hydrophone or a TC4013 needle hydrophone (Reson, Teledyne) it
was not possible to accurately measure the x3c pressure output. The fibre optic system (See
section 2.2.4) did not have the frequency bandwidth required to measure the horns in the 129-
130 kHz range. Whilst the TC4013 was sensitive down to 10 kHz, it was not suitable for
operation under sufficient pressures to calibrate the maximum input of the 60W driver.
Laser doppler velocimetry (Polytec, NLV-2500), was employed to accurate measure the tip
displacement of the x3c horn and theoretically calculate the RMS and PNP pressures
achievable by the prototype device running at maximum power (60W). The NLV-2500 is a class

J. Vince DPhil Thesis
229 | P a g e Using Ultrasound to Enhance Targeted Radiotherapy
2, <1 mW, Helium Neon (HeNe) laser operating at 633 nm wavelength (visible red). With a
variable working distance and a frequency bandwidth from 100 – 3000 kHz47.
The LDV was mounted to a 3-axis movement stage pointing upwards, similar to that used
previously (Section 2.2.2) and the horn placed in a vertical orientation above the LDV, pointing
down attached to a second 3-axis movement stage using a clamp stand. Measurements were
obtained in air. The variable impedance of the horn and poor network matching resulted in the
maximum input voltage to the amplifier being reached before the maximum 60W power rating
of the driver.
Figure xcvii: Measurements of the x3c tip velocity at the surface, 5mm and 10mm of depth.

J. Vince DPhil Thesis
230 | P a g e Using Ultrasound to Enhance Targeted Radiotherapy
Figure xcviii: Estimated pressure outputs from the x3c in air at the tip surface, 5mm and 10mm of depth.
Second order polynomial used to estimate pressures above 15W power.
7.3.6. Initial In Vitro Phantom Testing
Repeating the initial experiments with either the x1c or the x3c did not produce any sufficeint
formation of projections or extravasation of the microspheres into the agar gel; even when
running in continuous mode at maximum output. The horns were also tested in a more case
representative fashion, using a crude hemi-sphere void carved out of a solid agar block by
hand and filled with the slurry of micropsheres and Sonovue®. Repeating the testing at
maximum output and in coninous wave did sufficeintly cavitate the microbubbles within the
liquid, seen as an improvement in clarity of the liquid within the cavity. Turbulance of the
desposited slurry was also evident within the cavity, as initially sedimented microspheres were
aggitated and suspended within the saline from the Sonovue® addition. After the inertial
cavitation of the microbubbles a focussing and pusling of microspheres could be seen infront

J. Vince DPhil Thesis
231 | P a g e Using Ultrasound to Enhance Targeted Radiotherapy
of the horn tip. No apparent projections were seen during the ultrasound exposure however
upon flushing the cavity with deionised water, to remove any free microspheres and
phospholipid foam, microspheres could be seen to be embedded within the boundary edges
(Figure xxx),demonstrating projection of the microspheres in a limited capacity.
Figure xcix: Hemi-sphere agar voids with 15-32 µm black glass microspheres embedded in the boundary
surface.
7.4. Discussion
7.4.1. Variable Impedance of the x1c and x3c Horn Prototypes
The most significant problem with the current prototype designs is the variance of the
impedance when in use. The impedance varied to such a degree for the x3c that a standard
‘fixed’ matching network was not suitable and a variable matching network (T1K-7A, T&C
Power Conversion Inc.) had to be used to increase the 50 Ω impedance of the amplifier
(Setting 6 1:4.2, Setting 7 1:2.5) to an impedance more closely matching the x3c prototype.
The variable matching network was therefore used for the LDV measurements and initial
testing. Impedance measurements for the x3c were 55.41 Ω (54.53 + 9.86i) prior to use and
62.43 Ω (25.24 +57.10i) afterwards. This continually mismatched impedance meant that the
driver was reflecting a large proportion of the voltage supplied back towards the amplifier,

J. Vince DPhil Thesis
232 | P a g e Using Ultrasound to Enhance Targeted Radiotherapy
resulting in a significantly reduced pressure output. We could not find a matching network that
would adapt to changes of impedance during use.
The underlying reason as to why the x3c experienced a change in impedance during use is
unknown. It is thought to stem from the unequal manual clamping of the driver via the 3 prong
clamp, which slowly loosens over the number of cycles the driver experiences. The clamping
force is known48,49 to alter the power output of other ultrasound devices.
7.4.2. Design Improvements
Whilst the Langevin 60W driver appeared to be suitable for our needs, our choice of driver
may have been the limiting factor in the success of this application. Although we don’t have
accurate maximum pressure outputs for either the sonicator or the x3c prototype, the
sonicator does user a driver with twice the power maximum power rating compared to the
x3c. Particularly given the conclusions from Chapter 3, that PNP is the largest most significant
factor contributing to post focal microsphere projection depth, it seems unlikely that the
estimated PNP of ~840 kPa would be sufficient to reproduce the chaotic projections observed
with the sonicator horn (Figure xvi). Using a driver with double the power (120W) however
should be capable to produce a PNP of 1.5 MPa, assuming some loss due to non-linearity (See
Section 2.2.4). Values of which more closely match the initial estimates (1.3 MPa at 5mm and
0.7 MPa at 10mm distance) produced from the horn simulations by Bernard Shieh (Section
5.2.3).
Commercially available ultrasonic transducer (drivers) for non-HIFU applications, such as the
one purchased for the prototype designs, are orientated towards biodiesel mixing50,51, plastic
welding52,53, ground sonar54,55, ultrasonic cleaning and biofouling applications56,57; none of
which require power inputs to illicit inertial cavitation and microbubble clouds. These designs
utilise very few layers of piezo-electric material to minimise complexity and production costs,

J. Vince DPhil Thesis
233 | P a g e Using Ultrasound to Enhance Targeted Radiotherapy
which can be drastically improved on given sufficient time, funding and expertise. This also
extends to the power supply used in the case of the sonicator and Sonopet, a small power unit
(combination of waveform generator and amplifier) is provided to allow control over the
device output, amplify the voltage for the ultrasonic driver and potentially regulate the devices
impedance during use.
Whilst the crude use of a sonicator demonstrated that very low frequency unfocussed horns
are capable of producing large chaotic projections; the optimised surgical device needs to form
predictable, repeatable projections which are dimensionally similar to one another in order for
it to be useful in pre-operative planning. Despite the reduction in power experienced with both
prototypes, the acoustic fields generated by both prototypes look suitable for the intended
microsphere deposition. The microsphere projections formed using the sonicator, with an
analogous unfocussed acoustic field, demonstrate an even distribution of microspheres (and
therefore uniform radiation dose) within the projection produced; particularly with
microspheres of smaller distributions (<15 and 15-32 µm).
7.5. Conclusion
Using the unoptimised Q125 ultrasonic horn demonstrated proof of principle for the use of an
unfocussed horn for intraoperative use. The current x1c and x3c prototypes however are not
capable of producing microsphere projection of the desired depth to be suitable for
intraoperative adjuvant use for glioblastoma resections. This is expected to be due to
insufficient peak negative pressure being generated via the mismatched electrical
components. Improvements in the matching network and an increase in the driver power
rating will drastically improve the performance and utility of both prototypes. Significant
further work is required for translation of the x1c and x3c prototypes into a surgical setting.