Limited-data image registration for radiotherapy positioning and verification
Upload
khangminh22Category
view
0download
0
IAEA-TECDOC-799
Atomic and molecular datafor radiotherapy and
radiation researchFinal report of a co-ordinated research programme
INTERNATIONAL ATOMIC ENERGY AGENCY mULT^
May 1995

The IAEA does not normally maintain stocks of reports in this series.However, microfiche copies of these reports can be obtained from
ÎNIS ClearinghouseInternationa! Atomic Energy AgencyWagramerstrasse 5PO Box 100A 1400 Vienna, Austria
Orders should be accompanied by prepayment of Austrian Schillings 100,-m the form of a cheque or in the form of IAEA microfiche service couponswhich may be ordered separately from the INiS Clearinghouse.

The originating Section of this pubucation in the IAEA was:
Nuclear Data SectionInternational Atomic Energy Agency
Wagramerstrasse 5P.O. Box 100
A-1400 Vienna, Austria
ATOMIC AND MOLECULAR DATA FOR RADIOTHERAPYAND RADIATION RESEARCH
IAEA VIENNA, 1995IAEA-TECDOC-799
ISSN 1011-4289
© IAEA, 1995
Printed by the IAEA in AustriaMay 1995

FOREWORD
The advent of cancer therapy with the use of varous particle beams requires fullunderstanding of radiation interactions with tumours and other materials for its optimalperfomance. Relevant knowledge in this respect comes from physics, chemistry, biology,medicine, and related technologies. A basic item of required Knowledge are the physical datathat characterize the earliest phase of radiation interactions on the molecular level, which setsa stage for subsequent chemical and biological effects including the control of cancer. Inview of the necessity of an interdisciplinary approach to full understanding, it is desirable tocompile the physical data, to evaluate them for reliability, and to present them in acomprehensive form for use by radiation scientists in genera!.
Recognizing this need, the Nuclear Data Section of the International Atomic EnergyAgency launched the Co-ordinated Research Programme (CRP) on Atomic and MolecularData for Radiotherapy and Radiation Research. The present volume is a comprehensive reportof the programme.
The germ of ideas for the CRP was born at a meeting at Rijswijk, Netherlands, in 1985.The ideas were fully discussed and the scope of the CRI* was established at a follow-upmeeting held in Vienna in 1988. The CRP, which held three meetings altogether, wascommissioned to survey the current status of atomic and molecular data needed forradiotherapy and related research, to identify outstanding problems suitable for study in thenear future, and to present findings in the form of a comprehensive report for the benefit ofdata users and producers. Although the relevance of certain atomic and molecular data toradiation interactions with matter is generally understood, it is appropriate to discuss brieflythe needs and availability of specific kinds of atomic and molecular data that are required forspecial purposes.
In radiotherapy, the clinician must design methods and instruments to assure that adesired dose will be delivered to a specified region of treatment, with a minimal dosedelivered elsewhere in the human body. A central problem here is accurate dosimetry, whichoften rests on the knowledge of certain data. Examples of such data are stopping powers(discussed in Chapter 7) and ionization yields of human tissue substances and of materialsused in dosimetry, for various charged particles (discussed in Chapter 8). Needs for data ofimproved quality and quantity in this context are especially notable for high-energy ions andfor low-energy recoii ions resulting from the interactional neutrons with tissue substances, asfully described in Chapter 1.
More generally, in radiation research one addresses a fundamental question: What arethe physical and chemical mechanisms that lead to eventual changes in matter caused byionizing radiation? This question is important in many contexts including dosimetry, probingand diagnosis in medicine or materials science, as well as industrial processing of materials.It is also crucial to the estimation of the risk of health effects of all radiations present in ourenvironment. Some of these radiations come from natural sources such as cosmic rays andterrestrial radioactivity, and others from human activities such as nuclear energy technologyand the use of radiation in medicine and industry. !n most applications radiation dosesrelevant to the assessment of risk estimate are low. Biological effects of such low doses areminute and therefore difficult to determine through direct measurements. For this reason, thestudy of the underlying mechanisms of radiation action is important. When it is fullydeveloped, the knowledge of these mechanisms should permit us to predict the low-doseeffects reliably.

EDITORIAL NOTE
In preparing this publication for press, staff of the IAEA have made up the pages from theoriginal manuscripts as submitted by the authors. The views expressed do not necessarily reflect thoseof the governments of the nominating Member States or of the nominating organizations.
Throughout the text names of Member States are retained as they were when the text wascompiled.
The use of particular designations of countries or territories does >:ot imply any judgement bythe publisher, the IAEA, as to the legal status of such countries or territories, of their authorities andinstitutions or of the delimitation of their boundaries.
The mention of names of specific companies or products (whether or not indicated as registered)does not imply any intention to infringe proprietary rights, nor should it be construed as anendorsement or recommendation on the part of the IAEA.
The authors are responsible for having obtained the necessary permission for the IAEA toreproduce, translate or use material from sources already protected by copyrights.

CONTENTS
1. DEVELOPMENT OF PARTICLE THERAPY IN CANCER MANAGEMENT.EXPECTATIONS AND JUSTIFICATION OF THE HEAVY-IONTHERAPY PROGRAMS . . . . . . . . . . . . . . . . . . . . . . . . . . . . . . . . . . 7A. Wambersie
1.1. Introduction. Present status of cancer management . . . . . . . . . . . . . . . . 91.2. Improvement of the physical selectivity with proton beams (or helium
i on beams) . . . . . . . . . . . . . . . . . . . . . . . . . . . . . . . . . . . . . . . . 111.3. Improvement of the differential effect with fast neutrons . . . . . . . . . . . . 181.4. Therapeutic applications of heavy ion beams . . . . . . . . . . . . . . . . . . . . 321.5. Summary and conclusions . . . . . . . . . . . . . . . . . . . . . . . . . . . . . . . 37
2. IONIZATION BY FAST CHARGED PARTICLES . . . . . . . . . . . . . . . . . . 47L.H. Toburen2.1. Introduction . . . . . . . . . . . . . . . . . . . . . . . . . . . . . . . . . . . . . . . 5 12.2. Double differential ionization cross sections . . . . . . . . . . . . . . . . . . . . 522.3. Single differential ionization cross sections . . . . . . . . . . . . . . . . . . . . . 1022.4. Total ionization cross sections . . . . . . . . . . . . . . . . . . . . . . . . . . . . 1262.5. Charge transfer cross sections . . . . . . . . . . . . . . . . . . . . . . . . . . . . 1302.6. Multiple ionization . . . . . . . . . . . . . . . . . . . . . . . . . . . . . . . . . . . 1322.7. Effective charge . . . . . . . . . . . . . . . . . . . . . . . . . . . . . . . . . . . . . 1342.8. Inner shell ionization . . . . . . . . . . . . . . . . . . . . . . . . . . . . . . . . . . 141
3. ELECTRON COLLISION CROSS SECTIONS . . . . . . . . . . . . . . . . . . . . . 163T.D. Mark, Y. Halano, F. Linder3.1. Introduction . . . . . . . . . . . . . . . . . . . . . . . . . . . . . . . . . . . . . . . 1653.2. Electron impact ionization mechanism and definitions . . . . . . . . . . . . . . 1653.3. Total electron impact ionization cross sections of atoms and molecules . . . . 1703.4. Partial electron impact ionization cross sections of atoms and molecules ... 1803.5. Electron impact ionization of cluster . . . . . . . . . . . . . . . . . . . . . . . . 1973.6. Electron attachment . . . . . . . . . . . . . . . . . . . . . . . . . . . . . . . . . . . 2083.7. Electron impact dissociation of molecules . . . . . . . . . . . . . . . . . . . . . 2 1 33.8. Elastic and inelastic scattering of electrons . . . . . . . . . . . . . . . . . . . . . 2 1 8
4. LOW ENERGY ELECTRON INTERACTION WITH CONDENSEDMATTER . . . . . . . . . . . . . . . . . . . . . . . . . . . . . . . . . . . . . . . . . . . . 2 7 7L. Sanche, T.D. Mark, Y. Hatano4.1. Introduction . . . . . . . . . . . . . . . . . . . . . . . . . . . . . . . . . . . . . . . 2 7 94.2. Interaction of low-energy electrons with atoms and molecules . . . . . . . . . 2814.3. Electrons in dense gases and liquids . . . . . . . . . . . . . . . . . . . . . . . . . 2844.4. Electron attachment to Van der Waals clusters . . . . . . . . . . . . . . . . . . 2924.5. Electrons in solids . . . . . . . . . . . . . . . . . . . . . . . . . . . . . . . . . . . 3034.6. Conclusion . . . . . . . . . . . . . . . . . . . . . . . . . . . . . . . . . . . . . . . . 3 2 3
5. PHOTOABSORPTION, PHOTOIONIZATION, AND PHOTODISSOCIATIONCROSS SECTIONS . . . . . . . . . . . . . . . . . . . . . . . . . . . . . . . . . . . . . . 331Y. Hatano, M. Inokuli
5.1. Introduction . . . . . . . . . . . . . . . . . . . . . . . . . . . . . . . . . . . . . . . 3 3 35.2. VUV-Optical oscillator strength distributions of polyatomic molecules . . . . 3355.3. Photoionization quantum yields . . . . . . . . . . . . . . . . . . . . . . . . . . . . 342

PLEASE BE AWARE THATALL OF THE MISSING PAGES IN THIS DOCUMENT
WERE ORIGINALLY BLANK

5.4. Comparative studies of ionization quantum yields with excitation spectra ofoptical emission from dissociation fragments . . . . . . . . . . . . . . . . . . . 347
5.5. Basic ideas for treating condensed matter . . . . . . . . . . . . . . . . . . . . . . 3555.6. Concluding remarks . . . . . . . . . . . . . . . . . . . . . . . . . . . . . . . . . . 366
6. COLLISION PROCESSES BETWEEN IONS AND EXCITED NEUTRALSAND SURROUNDING MOLECULES . . . . . . . . . . . . . . . . . . . . . . . . . . 371Z. Herman, T.D. Mark, L. Sanche6.1. Introduction . . . . . . . . . . . . . . . . . . . . . . . . . . . . . . . . . . . . . . . 3 7 36.2. Elementary processes . . . . . . . . . . . . . . . . . . . . . . . . . . . . . . . . . . 3746.3. Reactions in and of cluster ions . . . . . . . . . . . . . . . . . . . . . . . . . . . 3826.4. Processes in condensed phase . . . . . . . . . . . . . . . . . . . . . . . . . . . . . 392
7. STOPPING POWERS, RANGES, AND STRAGGLING . . . . . . . . . . . . . . . 415M.J. Berger, H. Paul7.1. Introduction . . . . . . . . . . . . . . . . . . . . . . . . . . . . . . . . . . . . . . . 4 1 97.2. Electrons . . . . . . . . . . . . . . . . . . . . . . . . . . . . . . . . . . . . . . . . . 4 2 27.3. Hydrogen ions . . . . . . . . . . . . . . . . . . . . . . . . . . . . . . . . . . . . . . 4597.4. Aipha particles . . . . . . . . . . . . . . . . . . . . . . . . . . . . . . . . . . . . . 4977.5. Heavy ions . . . . . . . . . . . . . . . . . . . . . . . . . . . . . . . . . . . . . . . 5 0 8
8. YIELDS OF IONIZATION AND EXCITATION IN IRRADIATEDMATTER . . . . . . . . . . . . . . . . . . . . . . . . . . . . . . . . . . . . . . . . . . . . 5 4 7D. Srdoc, M. Inokuti, I. Krajcar-Bronic8.1. Introduction . . . . . . . . . . . . . . . . . . . . . . . . . . . . . . . . . . . . . . 5508.2. Elements of theory . . . . . . . . . . . . . . . . . . . . . . . . . . . . . . . . . . . 5518.3. The W value . . . . . . . . . . . . . . . . . . . . . . . . . . . . . . . . . . . . . . . 5608.4. Statistical fluctuations . . . . . . . . . . . . . . . . . . . . . . . . . . . . . . . . . 5998.5. Yields of excited states . . . . . . . . . . . . . . . . . . . . . . . . . . . . . . . . . 6068.6. Yields of ionization and excitation in condensed matter . . . . . . . . . . . . . 609
9. TRACK STRUCTURE QUANTITIES . . . . . . . . . . . . . . . . . . . . . . . . . . 633H. G. Paretzke, D. T. Goodhead, I. G. Kaplan, M. Terrissol9.1. Introduction . . . . . . . . . . . . . . . . . . . . . . . . . . . . . . . . . . . . . . . 6359.2. Interactions in tracks of indirectly and directly ionizing particles . . . . . . . . 6379.3. Spatial aspects of track structures . . . . . . . . . . . . . . . . . . . . . . . . . . 6579.4. Classification of tracks . . . . . . . . . . . . . . . . . . . . . . . . . . . . . . . . . 6669.5. Phase effects . . . . . . . . . . . . . . . . . . . . . . . . . . . . . . . . . . . . . . . 6899.6. Recent track structure approaches . . . . . . . . . . . . . . . . . . . . . . . . . . 6929.7. Intercomparison of track structure codes . . . . . . . . . . . . . . . . . . . . . . 702
APPENDIX A: ESTAR, PSTAR, AND ASTAR: COMPUTER PROGRAMS FORCALCULATING STOPPING POWERS AND RANGES FORELECTRONS, PROTONS, AND HELIUM IONS . . . . . . . . . . . 723M.J. Berger
SUBJECT INDEX . . . . . . . . . . . . . . . . . . . . . . . . . . . . . . . . . . . . . . . . . 741
LIST OF CRP MEMBERS AND CONSULTANTS . . . . . . . . . . . . . . . . . . . . . 753
X A f S 3
Chapter l
DEVELOPMENT OF PARTICLE THERAPYIN CANCER MANAGEMENT.
EXPECTATIONS AND JUSTIFICATION OF THEHEAVY-ION THERAPY PROGRAMMES
A. WamfoersieService de Radiothérapie, Neutron- et Curietherapie,
Cliniques Universitaires St-Luc, Université Catholique de Louvain,Brussels, Belgium

1.1. I N T R O D U C T I O N . P R E S E N T STATUS OF C A N C E RM A N A G E M E N T
Today about 45 % of all cancer patients can be cured ( an average for all cancer types)[ 1 ] [ 2 ].
At the moment of the first admittance, around 65 % of the patients are presenting withlocalized tumours. About 2/3 of them are cured either by surgery (22 % of the totalnumber of patients), radiotherapy (12 %) or a combination of both treatment modalities (6%) (Table 1.1 ). In this group of patients, with localized tumours, with probable butunproved subclinical metastatic disease, chemotherapy or immunotherapy, used as anadjuvant treatment, may prolong life and maybe cure some additional patients.
Among the 35 % other patients presenting , at the first consultation, with eitherinoperable or metastatic disease, only 5 % will be cured by combined treatment includingradiotherapy, chemotherapy and/or immunotherapy.
The most prominent progress in this field has been made by the medical treatment ofsolid pédiatrie tumours, leukemias and lymphomas, and testicular tumours. Thesetumours represent about 5 % of all cancers seen in a general population.
TABLE 1.1
Summary of the present situation concerning cancer cure rate
Cure rate
Patients presenting with localized tumour:
cured by surgerycured by radiotherapycured by combination of surgery andradiotherapy
Patients presenting with inoperable ormetastatic disease :
cured by combined treatmentincluding e.g. chemo-and immunotherapy
Total :
65%
22%12%
6%
35%
5%
100 % 45 %
After Devita [1]

In any case, a strong effort is needed to improve local control of the tumours if we want to
see a reduction in the present cancer mortality rate, which is not declining as fast as onemay have hoped [ 2 ] [ 3 ] [ 4 ]. Following Devita, it is "axiomatic that you must control
local disease if you are ultimately to cure any cancer patient". In fact, it has been shownthat 1/3 of the patients dying with cancer had uncontrolled local disease. If local failurecould be reduced by 50 %, one could expect a 10 to 15 % improvement in cure rate [ 5 ].
The techniques of surgery have already reached a very high level of efficiency. Furtherimprovement will be seen in a reduction of the mutilating procedures (limb sparing
operation, breast conserving treatment, reduction of colostomies and urinary diversions).On the other hand wider excisions are still foreseeable in relation with saferanesthesiology, intensive care support and improvement in reconstructive surgery. Theassociation of surgery with irradiation on a wider scale will help to increase the !ocalcontrol rate.
Radiotherapy is still open to new developments. In the field of radiobiology (differentialeffect), future improvement can be expected from the use of better fractionation schedulesor new radiosensitizers. But it is through the development of the irradiation techniquesthat the most promising progress can be expected. The increase in dose to the tumour,
without exceeding the tolerance dose of the surrounding normal tissues, has always beenthe key to better clinical results. Many new techniques like stereotactie radiosurgery,intra-operative radiotherapy, high dose-rate brachytherapy, conformation therapy offeralready encouraging results.
However, in this paper, will shall concentrate on the application of new types of radiationqualities : proton beams, fast neutrons and heavy ions.
When discussing the potential value of non-conventional types of radiations, one has todistinguish :
- particle beams which only improve the physical selectivity of the irradiation, i.e. the dosedistribution (e.g. proton beams or helium ion beams);
- high-LET radiations which produce different types of biological effects, and which aimat improving the differential effect between tumour and normal tissues (e.g. : fastneutrons);
- the two approaches can be combined and one could seek after a high physical selectivitywith high-LET radiation. This can be achieved with heavy ions.
A large number of patients could benefit from progress in cancer management. Indeed,the two following evaluations have to be kept in mind. In the year 1980, there were 730 000
10

deaths attributed to cancer in the European Community countries, and there were 1 186 000new (incident) cases in that year alone [ 6 ]. if the current prevention programmes are noteffective, these numbers will further increase. These estimates exclude non-melanoma skin
cancers which, although a rare cause of death, nevertheless demand adequate medical care.
1.2. I M P R O V E M E N T O F T H E P H Y S I C A L S E L E C T I V I T Y W I T H
PROTON B E A M S ( O R H E L I U M ! O N B E A M S )
1.2.1 R A T I O N A L E
Historically, the major improvement in the efficiency of radiation therapy was thereplacement of conventional X-rays (200 kV X-rays) by high-energy photons or electrons [7].The clinical benefit was rapidly evident for all, or for the majority, of the patients (Table
1.2). This illustrates the importance of the physical selectivity in radiation therapy.
TABLE 1.2
Improved survival of several types of cancer when treated withmegavoltage radiotherapy
Localization /Type of cancer
Survival rate (%)with kilovoltage with megavoltage
X-rays X-rays(1955) (1970)
Hodgkin's diseaseCancer of the cervixCancer of the ovary
Cancer of the bladderCancer of the prostateSeminoma of the testisEmbryonal cancer of the testis
30-3535-4515-20
0-55-15
65-7020-25
70-7555-6550-60
25-3555-6090-9555-70
Cancer of the nasopharynxCancer of the tonsilRetinoblastoma
20-2525-3030-40
45-5040-5080-85
From Conquest of Cancer, Report of the National Panel of Consultants, prepared for theCommittee on Labour and Public Welfare of the United States Senate, November 1970, p.51. [7].
11

We are now close to making a further step : the introduction of proton beams. Thecharacteristics of the proton beams make them superior to high-energy photons from thepoint of view of the physical selectivity. No advantage can be expected from theradiobiological point of view : for the high-energies required to the protons in external beamtherapy we stay in the field of iow-i ,ET radiations. On the other hand, at known doses, no
unexpected radiobiological effects could be feared [ 8 ]. For the present discussion, we canassume that helium-ion beams are similar to proton beams from the radiobiological point ofview.
It is logical to expect that, as in the past with the replacement of 200 kV X-rays by high-energy X-rays, a further improvement of the physical selectivity will result in a furtherimprovement in the clinical results. Indeed, the available clinical data indicate a clinicalbenefit for the selected rumour types for which proton beams have been already applied.
In principle, the best indications for proton beams are radioresistant tumours, relativelysmall in size, located close (or adjacent to) radiosensitive critical normal structures.
1.2.2 PROTON B E A M S FOR UVEAÎ, M E L A N O M A
Among the tumours for which the excellent physical selectivity of the proton beams couid be
mostly exploited, u veal melanoma is probably one of the best examples. Between 1961 and
CORNEA
LENS
OPTICAL NERVE
Figure 1.1
Frotontherapy of uveal melanoma. Dose distribution for a 60 MeV proton beam; the Braggpeak has been spread out by modulating the energy from 0 to 46 MeV. The tumour (hatchedarea), as well as some normal structures (cornea, lens, optic nerve) are indicated. The thickarrow corresponds to the beam axis and the 90 %, 50 % and 20 % isodoses are drawn. Protonbeams allow achieving a homogeneous irradiation of the target volume with an efficientsparing of the normal tissues. However, an accurate patient positioning is required.[Courtesy Ch. Ferret, PSI-Villigen, 1986]
12

T A B L E 1.3
T H E P R O T O N T H E R A P Y F A C I L I T I E S W O R L D W I D E(Uanuary 1994)
Location - Country
USA California Berkeley- 184Massachusetts Harvard
California Loma LindaIndiana University
JAPAN ChibaTsukuba
SOUTH AFRICA NAC-Faure
EUROPE Sweden Uppsala
UppaaiaRussia Dubna
MoscowSt PetersburgDubna
U K. ClatterbridgeSwitzerland PSî-VilhgenFrance Nice
OrsayBelgium Louvam-la-Neuve
Date offirst
treatment
1954196119901993
19791983
1993
19571989196719691975198719891984199119911991
Date of *last
treatment
1957->— »
— »
-4
— >
-»
1976— »1974— >— »
->— >
->->-»->
Totainumber
of patients
306 010
682j
86354
6
734184
2 550719
24463
1.600337334
24
Date ofevaluation
Dec. 1993Dec 1993Dec. 1993
June 1993Sept. 1993
Nov 1993
U)Dec 1993 (2)
(3)Oct 1992«June 1991Aug. 1992 (4)Jan 1994March 1994Dec 1993Dec 1993Dec. 1993
* If the facility was closed.(1) first proton therapy programme in Uppsala(2) new proton therapy programme in Uppsala(3) first proton therapy programme in Dubna(4) new proton therapy programme m Dubna.
March 1994, 2004 patients suffering from uveal melanoma were treated at the Harvard
University Cyclotron in the USA. A local control rate of 96 % and a survival rate of 80 %were reported [ 9 j. Similar results were obtained with helium ion beams at Berkeley, where
the local control rate was 96 % [ 10 ].
As a result of these promising observations, several other centres initiated a proton therapyprogram. Among them the OPT1S program was started at PSI-Villigen in Switzerland in
1984 and more that 1,600 patients with uveal melanoma were treated with protons from 1984
to March Î994 (Fig. 1.1) [11] [12].
13

In addition, 3 other centres in Europe are treating uveal melanoma with proton beams :Clatterbridge in UK, Nice and Orsay in France. The numbers of patients treated up toDecember 1993 in these 3 centres reached 463, 337 and 334 respectively [13].
1.2.3 PROTON B E A M S FOR T U M O U R S OF THE CNS AND S K U L L
Besides uveal melanoma, there are other localizations where the high physical selectivityof the proton beams can be fully exploited, e.g. chordomas or chondrosarcomas of the base ofthe skull, and paraspinai tumours. At the Harvard cyclotron, local control rates of 82 % and63 % were reported at 5 and 10 years respectively [ 14 ] ). A local control rate (actuarial at 3years) of 70 % for chordomas, chondrosarcomas and meningiomas was reported from Berkeleyafter helium ion treatment [ 15} [ 16 j.
The potential benefit of proton beams compared to X-ray beams for the treatment of Drainlesions especially in children has been evaluated (Figures 1.2, 1.3, 1.4) [ 17 ]. A significantreduction in late sequellae (mental retardation) can be expected.
1.2.4 OTHER C L I N I C A L I N D I C A T I O N S
There is an increasing number of programmes and new projects which aim at treating withprotons many other tumour types, and larger proportions of patients. As a matter of fact, since
an improved physical selectivity is, in itself, always a benefit, all photon patients could be,
in principle, potential candidates for proton treatment.
Prostatic adenocarcinomas, soft tissue sarcomas, some head and neck and rectal tumours aretreated with protons at the Harvard cyclotron [ 14 ]. In Japan, 250 MeV protons are used atthe University of Tsukuba for different localizations, including deep seated tumours [18]. TheRussian proton therapy programmes have been reviewed [ 19] [ 20].
A new proton therapy programme has been initiated at the Svedberg Laboratory in Uppsala-
Sweden. From April 1989 to December 1993, 20 patients have been treated with a 72 MeV
proton beam for uveal melanoma (54.5 Gy in 4 fractions using a single field). From April 1991,21 patients with inoperable AVM's have been treated with modified 100 and 180 MeV protonbeams (20-25 Gy in 2-4 fractions, using 2-3 fields). Treatments of pituitary tumours, brainmétastases, malignant gliomas, as well as meningiomas of the base of the skull are plannedfor 1994. In addition, a 200 MeV scanned beam with rotational gantry is in preparation [ 21 ].
At the National Accelerator Centre (NAC) in Faure - South Africa, the first patients were
treated with 250 MeV protons in 1993. An ambitious therapy programme using 250 MeVprotons is in preparation at the PSI in Villigen. At the Orsay-synchrocyclotron, besides thetherapy programme for eye rumours, a 250 MeV proton beam is in preparation [ 13 ]. In Jülich
- Germany, there is also a high-energy proton therapy project for deep seated tumours. The
Gröningen project, in the Netherlands, is making further progress (200 MeV protons).
14

8MV X.rays
5.5cm x 5cm
95 MeV Protonsspread over 4cm
5.5cm x 5cmr0 5cm
Figure 1.2
Tumour boost for a cerebeilar medulloblastoma in a 2 year old child. Comparison of typicalplanning sections for photon (a) and proton (b) irradiations. For 8 MV photons, the targetvolume (hatched area) was boosted with 2 opposed lateral fields. For protons, the targetvolume was treated with a direct posterior field. The Bragg peak of the 95 MeV proton beamwas spread over 4 cm. A bolus was needed to shape the treatment volume to the boost targetvolume. In figures 1.2, 1.3 and 1.4, the indicated proton energies correspond to the incidentenergies [17].
15

Co-60
Beam 2
53cm x 5 c rn
5cm
85 MeV Protonsspread over 4 cm
5.5cm x 5cm
ro 5cm
Figure 1.3
Typical planning sections (boost) for an astrocytoma of the right cerebral hemispheretreated by cobalt-60 y-rays (a) or 85 MeV protons spread over 4 cm (b). For cobalt-60, 2perpendicular equally weighted, wedged beams were used; the normalization point waschosen at the intersection of the beam axes. For protons, the target volume (hatched area)was treated with a direct beam; a bolus was added to better shape the treatment volume[17].
16

8MV X rjysBeam
W - 1
Beam & 2W _ 1
55cm x 5cm
5 5crn * 5cm A
5cm
!30MeV Protonsspread over 4cm
B
110 MeV Protonsspread over 4cm
BeamW = 1
5cm x 5cm
130 MeV Protonsspread over 4cm
!!0 MeV Protonsspread over 4cm
Beam # 2W = 15crn x 5cm
Figure \ 4
Typical planning sections for a large suprasellar craniophary ngioma in a 3 year old childtreated with photons (a) or protons (b) The target \olume is indicated by the hatched areaFor photons and protons, four equally weighted beams were used and the normalization pomtwas chose at the intersection of the beams axes For the 4 proton beams, the Bragg peak \A,asspread over 4 cm [17]
17

1.2.5 TWO D E D I C A T E D H O S P I T A L - B A S E D PROTON TH E R A P Y F A C I L I T I E S
One of the most impressive proton therapy programme has been developed at the LomaLinda University Medical Centre in California. A variable energy synchrotron (70-250
MeV), and 3 treatment rooms with isocentric rotating gantry, are the "core" of a large
oncology department. Two additional rooms with horizontal fixed beams are reserved for
eye and brain irradiation and research respectively. Once all treatment rooms will be fullyoperational, the centre is expected to have a capacity of treating 1 000 patients per year withprotons.
The first patients were treated in 1990, and 682 patients had been treated by December 1993.The Loma Linda group is acting as a pioneer in the field to the extent that, based on asuperior physical selectivity, the proton facility is really aiming at systematicallysubstituting proton beams to conventional photon beams. However, the complexity andmainly the cost of the existing equipment will probably limit the spreading of this type ofapproach.
The approach followed at the Massachusetts General Hospital (MGH) in Boston is ratherdifferent. Taking into account the results obtained with the Harvard University Cyclotron,
the US National Cancer Institute has decided to support the installation within the walls ofthe MGH of a new dedicated proton therapy facility (about $ 17 Millions).
A 235 MeV cyclotron, two treatment rooms with isocentric gantry and a third room with afixed horizontal beam are planned. The beam penetration should be 32 cm in tissues. The
facility will be designed and constructed by the Ion Beam Applications Company (IBA ) from
Louvain-la-Neuve in Be?gium. Conventional cyclotron technology has been selected, as wellas passive scattering to achieve beam homogeneity. However, further addition of a wobblersystem and of a scanning beam should be possible. The aim of the engineers is to provide a
rather simple, compact, safe, reliable, low-cost facility, easy to use and cheap to maintain.
In the long term, it is only in these conditions that proton beam therapy can really expandclinically, and gain its place among the other radiotherapy techniques.
1 . 3 I M P R O V E M E N T O F T H E D I F F E R E N T I A L E F F E C T W I T H
F A S T N E U T R O N S
After the first studies of Stone [ 22 j, neutron therapy programmes were initiated at theHammermith Hospital in London in 1970, and a few years later in several other centres.They were based on radiobiological arguments. It is thus logical to discuss first theseradiobiological arguments before reviewing the clinical data as well as the technical
developments.
18

1.3.1 R A D I O B I O L O G I C A L DATA
1.3.1.1. The hypoxic ce l ls
Historically, the rationale for introducing fast neutrons was the existence of hypoxic cells inall (or in most of) the malignant tumours and a specific resistance of these hypoxic cells to X-rays. The Oxygen Enhancement Ratio (OER) is approximately 3. With fast neutrons, theOER is reduced from 3 to 1.6 and, to the extent that the tumour radioresistance is due to thehypoxic cells, a therapeutic gain of about 1.9 (3 : 1.6) should be achieved.
Two points should be stressed: according to this rationale, the potential gain factor of 1.9 ishigh and. it applies to all (or most of the) tumours since all (or most of them) are assumed tocontain hypoxic cells. In the seventies, when neutron therapy was started, it was expectedthat the radiobiologicat therapeutic gain would be high enough to overcome the technicaldifficulties which nevertheless were recognized.
1 6-
08 -
r He~ions
22QRV X-rays
"1
Ne-ionsl l
C-ions Ar-ionsn * i T
i 04o^ 02-
0 l -
005-
A Mitotic Cellsn G | - Phase Cells
Stationary Phase Cells
10
Median LET ( keV
100 1000
Figure 1.5
The differences in cell radiosensitivity related to the position in the mitotic cycle decreasewith increasing LET. On the ordinate, the cell radiosensitivity is expressed by theparameter a (single-hit inactivation coefficient). Synchronized populations of Chinessehamster cells were irradiated in mitosis (closed triangles), Gj phase (open squares) andstationary phase (closed circles), with 220 kV X-rays and various beams of charged particles.The a coefficients arc plotted as a function of the median LET (in keV.um'1 ).
After Chapman J23].
19

Today it can still be assumed that hypoxic cells do play a major role in the radioresistance of
sjDjoiE tumours, but certainly not in all of them because of the reoxygenation phenomenon,
which can be more or less efficient This raises the problem of the identification of the
tumours in which the hypoxic cells are relevant The importance of patient selection will bestressed again in the next séchons
1.3.1.2 A reduction of the di f ferences in ra diosensiti vi f ry
When comparing the effects produced by neutrons and X-rays, other differences than simplya reduction in OER are observed
With neutrons there is in genera! a reduction in the differences of radiosensitivity betweencell populations For example, Figure 1 5 illustrates the reduction in the radiosensitivity
0 5
Simulated diamete1* 2 /< rn
0 4_
0 3_
0 2_
neutrons-0(14).» Be
gamma raysGO« -~a*.Co n e u t r o n s
p | 65 j + Be "
V"\
0 1-I
0
id2 10y / keV /( m' •1
10 10 10
Figure I 6
Comparison of energy depositions after irradiation with fast neutrons and f-rays The curvesindicate thp dis tr ibut ions of ind iv idua l energy-deposition events in a simulated volume oftissue 2 /jrn in diameter The parameter y (hneal energy) represents the energy deposited bya single charged particle traversing the sphere, divided by the mean cord length The peakwith y rays is at 0-3 keV ßm 1 and with d(14)+Be neutrons at 20 keV jjm ^ The spectrum forp(65)+Be neutrons shows 4 peaks the f irst is at 8 keV fjm *• and corresponds to high energyprotons, the second at 1(X) keV m ^ corresponds to low energy protons, the third at 300keV fjm * is due to a particles and the last at 700 keV /jm * is due to recoil nuclei
After Menzei et a! [ 25]
20

differences of the celis related to their position in the mitotic cycîe [ 23 ]. Cell populations,synchronized in vitro, are irradiated in different phases of the mitotic cycle. The largedifferences, which are observed with X-rays (Jow-LET radiation), are progressively but
markedly reduced with increasing LET.
A reduction in the difference of intrinsic radiosensitivity between cell lines has also beenobserved, although other data suggest that the ranking of radiosensitivity of some cell linescould be a'tered when X-rays are replaced by fast neutrons [24|.
Finally, with increasing LET there is a reduction in the importance of the sublethaî lesions.
Differences in the capacity of accumulating and repairing sublethal lesions are then of lessimportance, in practice, this implies that the dose per fraction also becomes less critical.
It could thus be concluded that al! cell populations in all conditions tend to respond in a moresimilar way to neutrons than to X-rays. This can be logically related to the increase, by a
factor of about 100, in the sizes of the individual energy deposits as can be derived frommicrodosimetric measurements (Fig. 1.6) [25J.
Î .3 .1 .3 .Pract ica l conclusions for rad iat ion therapy
Two practical conclusions can be derived from the available radiobiologica! data.
Need for propjgr patient selection
A reduction in the differences of radiosensitivity related to the position of the cells in themitotic cycle, cell line or repair capacity can be an advantage or a disadvantage dependingon the characteristics of the tumours and of the normal tissues at risk [26].
This stresses the importance of patient selection : an incorrect choice of the radiation qualitycan worsen the clinical results. More generally, if a subgroup suitable for high-LET radiation
cannot be identified, and if the whole group is treated with neutrons, the advantage gainedin the subgroup will be diluted or counterbalanced by the worse results obtained in the othersubgroups which would have been better treated with photons. In practice this could lead toerroneous clinical conclusions.
The importance of physical selectivity.
As a result of the reduction in the (radiobiological) differential effect with increasing LET,the therapeutic efficiency of the treatment wil! depend to a larger extent on the physical
selectivity (dose distribution). Thus, physical selectivity is at least as important with
high-LET as with low-LET radiations This is the second important practical conclusion
which can be derived from the radiobiologicai data [27].
21

1.3.2 R E V I E W AND D I S C U S S I O N OF THE C L I N I C A L DATA
1.3.2.1 Introduction
The clinical data should be reviewed and interpreted bearing in mind the two main
conclusions of the radiobiological analysis : the need for patient selection and the importanceof physical selectivity for high-LET radiations. The initial groups of patients were treatedin far from optimal technical conditions. This has resulted in complications which in turnhave influenced patient recruitment and have impaired the development of neutron therapy.
The clinical indications for fast neutrons are summarized in Table 1.4. They represent morethan 15 % of the patients currently referred to the radiation therapy departments. Inaddition, the tumour types for which neutrons were shown to bring a benefit correspond to alarge extent to those predicted by the radiobiological data. Indeed, the most striking results
TABLE 1.4
Clinical Indications for Neutron Therapy(Summary)
1. SALIVARY GLAND TUMOURSlocally extended, inoperable or recurrent / well differentiated
2. PARANASAL SINUSESadenocarcinomas, adenoid cystic carcinomas, other histology (?)
3. SOME TUMOURS OF THE HEAD AND NECK AREAlocally extended, metastatic adenopathies
4. SOFT TISSUE SARCOMAS, OSTEOSARCOMAS, CHONDROSARCOMASslowly growing/well differentiated
5. PROSTATIC ADENOCARCINOMASlocally extended/ well differentiated
6 RECTUM CARCINOMASInoperable or recurrent
7 SOME NON-SMALL-CELL BRONCHUS CARCINOMAS
8 MELANOMASinoperable/recurrent (palliative treatment).
22

were obtained for well differentiated, slowly growing tumours, often resistant to X-rays as
weil as to chemotherapy. The clinical results are reviewed in more detail elsewhere [28 j.Only three important localizations are discussed here.
1.3.2.2. S a l i v a r y gland tumours
The conclusions of the National Cancer Institute (NCI) can be summarized as follows :The results of the non-random clinical studies and of the prospective randomized trialoverwhelmingly support the contention that fast neutrons offer a significant advance in thetreatment of inoperable and unresectable primary or recurrent malignant salivary glandtumours. Fast neutron therapy alone should be the treatment of choice for advanced stagesalivary gland tumours, and surgery should be limited to cases where there is a high
likelihood of achieving a negative surgical margin and where the risk of facial nervedamage is small [ 29j.
1.3.2.3. Soft tissue sarcomas
Slowly growing, well differentiated soft tissue sarcomas have been treated in most of theneutron therapy centres, mainly because they are often resistant to X-rays and also because ofthe excellent results reported from Hammersmith [30]. When evaluating the results of
neutron therapy, comparison with historical series should be made very carefully, since the
series may differ by histology, degree of differentiation, localization, local extent, etc....Furthermore, patient recruitment, in a given centre, is influenced by the general treatmentpolicy (i.e.the relative place of surgery and/or chemotherapy). Therefore, ideallyrandomized trials are required, but so far have been difficult to achieve for practical
reasons.
A review of the results reported from the different centres (Table 1.5) indicates an overalllocal control rate after neutron therapy of 53 % for inoperable soft tissue sarcomas. This valueis higher than the value of 38 % currently observed after low-LET radiation for similar
patients series [31]. High complication rates were reported in some series. They have to berelated mainly to the poor technical conditions of the irradiation (e.g. skin necrosis) or to thepatient recruitment (e.g. late fibrosis when large fields had to be used to cover extended
target volumes) [15] [28].
The proposed indications of neutron therapy (and/or photon therapy), for low grade soft
tissue sarcomas, are presented in Table 1.6, after Pötter et al. [32].
1.3.2.4. Prostatic adenocarcinomas
Prostatic adenocarcinomas, having in general a long doubling time, should be a good
indication for neutron therapy taking into account the available radiobiological data [33 J. In
23

TABLE 1.5
REVIEW OF THE LOCAL CONTROL RATES FOR SOFT-TISSUE SARCOMASTREATED DEFINITIVELY WITH RADIATION THERAPY
NEUTRONS
Institutions
Essen + Heidelberg, 1983Hammersmith, 1987Harnburg, 1987TAMVEC, 1980FermiSaboratory, 1984Seattle, 1989Louvain-la-Neuve, 1982Amsterdam, 1981MRS, 1979Edinburgh, 1986MANTA, 1980
Overall
Number of patients *
6050452926211913121210
297
Local control (%)
31262718131548754
158
(52 %)(52 %)(60 %)(62 %}(50 %)(71 %) **(21 %)(61 %)(58 %)(42 %)(40 %)
(53 %)
PHOTONS/ELECTRONS
Institutions
Tepper & Suit, 1985Duncan & Dewar, 1985McNeer et al., 1968Windeyer et al., 1966Leibel et al., 1983
Overall
Number of patients *
512525225
128
Local
175
14130
49
control
(33 %)(20 %)(56 %)(59 %)
(38 %)
* Patients treated de noxo or for gross disease after surgery are included but not patientstreated postoperatively for microscopic residual disease or for limited macroscopicresidua! disease.
** Two-year actuarial data
Modified from Lararnore et al., [31 ]

TABLE 1.6
I n d i
Type of surgery
întracapsular
Marginal
Wide
Radical
ça t i ons of n e u t r o n
Plane of dissection
Within lesion
Within reactive zone- extracapsular
Beyond reactive zonethrough normal tissuewithin compartment
Normal tissueextracompartmental
( a n d / o r p h o t o n ) r a d i
Microscopic appearance
Tumour at margin
Reactive tissuemicrosateîlite tumeur
Normal tissue
Normal tissue
o t h e r a p y f o r l o w
Local control aftersurgery
0%
10 - 20 %
50 - 60 %
80 - 90 %
g r a d e s o f t t i s s u e
Indication forradiotherapy
Neutrons(+photons ?)
Neutrons(+photons ?)
Photons
Photons (rare)
sa r coma s
Local control aftercombined
30 - 50 %
> 50 %
90%
> 90 %
modality
(Modified after Pötter et al. [32]).
K)

fact, the benefit of neutron therapy was rapidly recognized in several centres, e.g. inHamburg by Franke [34], in Chiba by Tsunemoto et al. [35 ], and in Louvain-la-Neuve byRichard et al. [36].
However, the most convincing data are the results of two randomized trials, initiated by theRadiation Therapy Oncology Group (RTOG), on locally advanced adenocarcinoma of theprostatic gland (Stages C and Dl).
In the first trial, between June 1977 and April 1983, the patients were randomized betweenphoton and mixed beam (neutron-!-photon) therapy. Neutrons were delivered using physics-laboratory-based machines. A total of 91 analyzabSe patients were entered into the study,
and the two patient groups were balanced with respect to the major prognostic variables.Ten-year results for clinically assessed local control are 70 % for the mixed beam group vs. 58% for the photon group (p=0.03). The ten-year survival rates were 46 % for mixed beams vs.29 % for photons (p=0.04); and ten-year disease-specific survival rates were 58 % for mixed
beams vs. 43 % for photons (p=0.05) [37].
This study suggested that a regional method of treatment can influence both local tumour
control and survival in patient with locally advanced adenocarcinoma of the prostatic gland.
While these results were impressive, a confirmatory study was designed comparing neutronsonly and photons, and using state-of-the art, hospital-based cyclotrons.
From April 1986 to October 1990, 178 patients were randomized on this follow-up studycomparing 20.4 Gy of neutrons delivered in 12 fractions over 4 weeks with 70 Gy of photonsdelivered in 35 fractions over 7 weeks. Four institutions participated in the study : theUniversity of Washington in Seattle, the University of California in Los Angeles (UCLA),
the M.D. Anderson Hospital in Houston and the Great Lakes Neutron Treatment Association(GLANTA). The depth-dose properties and isocentric delivery capabilities of the highenergy neutron beams allowed treatment with neutrons alone to this deep-seated tumour [38].
Patients eligible for the study were those with stages T3-4, NO-1, MO rumours with anyhistologicai grade, as well as patients with high-grade T2 tumours. After stratification forstage, Gleason grade, and me presence or absence of surgical nodal staging, 89 patients wererandomized to each treatment arm. The two treatment arms were balanced for all known
prognostic factors.
With a foliow-up time ranging from 40 to 86 months (68 months median foilow-up) the 5-year actuarial clinical local-regional failure rate for patients treated with neutrons was 11%, vs. 32 % for photons (p <0.01) . Incorporating the results of routine post-treatment prostate
biopsies, the resulting "histologicai" local-regional rumour failure rates were 13 % for
neutrons vs. 32 % for photons (p =0.01) (Table 1.7).
26

T A B L E 1 .7
Neutrons vs.
First failure
Local onlyLocal-regionalLocal -distantRegional-distantDistant only
photons for loca l ly advanced prostat ic adenocarcinoma
Site of f i r s t fa
NeutronsNo (%)
7 (8%)0 (0%)1 (1%)1 (1%)
24 (28%)
ilure
Assigned treatment
PhotonsNo {%)
20 (24%)1 (1%)0 (0%)0 (0%)
22 (26%)
TotalNo (%)
27 (16%)1 (1%)1 (1%)1 (1%)
46 (27%)
After Russell et a». [38].
TABLE 1.8
Neutronthera py of prostatic adenocarcinoma :bowel morbidity by institution
Institution Colostomies
University of Washington - Seattle- p(50)+Be neutrons- multileaf collimator
UCLA - Los Angeles- p(45)+Be neutrons- movable jaw collimator
M.D. Anderson - Houston- p(42)+Be neutrons- fixed cone collimator
0/49 (0 %)
2/25 (8 %)
4/10(40 %)
After NCI, Report 1991 [29].
27

To date, ac tuar ia l survival and cause-specific survival rates are statistically
indistinguishable for the two patient cohorts, with 32 % of the neutron-treated patient
deaths and 41 % of the photon-treated patient deaths caused by prostate cancer (p - n.s.).Prostate specific antigen (PSA) values were elevated in 17 % of neutron-treated patients and45 % of photon-treated patients at 5 years (p < 0.001) .
Severe late complications of treatment were higher for the neutron-treated patients (11 % vs.3%), and were inversely correlated with the degree of neutron beam shaping available at the
participating institutions.
The differences in major complication rates are primarily due to differences in large boweltoxicities resulting in surgical intervention and colostomies. The colostomy rates for neutron-
treated patients are facility dependent (Table 1.8) and the differences in rates observed
between the Cyclotron Corporation machines ai M.D. Anderson and UCLA, and the
Scanditronix machine at the University of Washington are statistically significant vp=0.01).
Differences in these major complication rates are probably due to differences in beam
collirnation capabilities among the neutron facilities, but may also be due to differences in
beam energy spectra [27] [39]. The muitileaf coliimator allows the radiotherapist to better
match the size and shape of the neutron beam with the size and shape of the target volumeand thus to reduce the volumes of normal tissues unnecessarily exposed.
It can be concluded from this study that high-energy fast neutron radiotherapy is safe andeffective when adequate beam delivery systems and collimations are available, and it issignificantly superior to external beam photon radiotherapy in the local-regional treatment
of large prostatic rumours.
Of course, account must be taken of the slow natural history of prostatic adenocarcinoma andcaution is necessary before deriving definitive conclusions. However, the clinical data at
present available indicate a significant benefit for fast neutrons (used alone or in mixedschedule ?} compared to the current photon irradiation modalities for locally advancedcases. They confirm the selective efficiency of neutrons against slowly growing, welldifferentiated rumours, as well as the importance of the physical selectivity when high-LET radiations are used, as could be expected from the radiobioiogical data. The role of thecollirnation system on the complication rate is especially illustrative.
1.3.3. T E C H N I C A L D E V E L O P M E N T S
The technical conditions, in which fast neutron therapy is applied, have progressively been
improved during the two last decades.
As far as neutron energy is concerned, many of the first patient series were treated with low-
energy cyclotrons (16 MeV deuterons). Today, neutron beams produced by protons of 45 MeV
28

I igure 1 " (a)
V a r ' a b l e m i i l t i leaf c o l l i m a t o r i n n e u t r o n t h e r i p \
Piagram of a v a r i a b l e n m l t i leaf co lh iTator shov \ ing the Kmer en 1 o* the l e m ^ and theu i l l i m a t i )n sur face^ w h i c h a re a l l al igned w i t h the proton 'at ge t ( s \ m h n l i / t d b \ the * - 1Fach leaf has i t ^ own motor dn\ e ai.d posit i m readout ( i f t» r Br<ihme c i ted m i t t [27])
for more) are available at several facilities and m 4 centres neutrons are produced by 60 MeV
protons, i e Clatterbrldge, Faure, Fermiiab and Louvam-la-Neuve The depth doses and
skin sparing are similar to that of a 8-10 MV photon linear accelerator
A fixed horizontal beam was often A practical limitation for patient set up when ph\sics
Iaboratory-ba-ed cyclotrons were used Today, a relational pantry is avai lable in several
centres such as Clatterbndge, Detroit, Houston, Faure, Seoul, Seattle UCLA, etc
Variable collirnators (movable jaws) are used in Clatterbndge, Faure, UCLA, and mul t i leaf
colhmators are used in Chiba, Detroit, Lou\am-la-Neuve, Nice and Seattle 'Fig 1 7 )
The neutron therapy facilit ies operational today ate fisted in Table 1 V w i th their mam
characteristics Of course, the technical problems raised by the beam colhmation and the
i^ocentric gantry are far more complex and thus more expensn e for neutrons tfvn for photons
Dosimetnc data about neutron beam1- and protocols for neutron theiapv, accepted at the
internationai !e\el, h^e been published [4O ] in addition, several intercompansons were
performed between the different neutron therapy centres These companions implied
dosimetnc, microdosimetric and radiobioiogical determination » [41 j [42]
29

0 10 20 30 40 50cm
Figure 1.7 (b)
Variable multi-leaf collimator in neutron therapy.
Diagram of one of the leaves of the variable multi-leaf collimator recently installed at thecyclotron of Louvain-la-Neuve. The collimator, which has been installed on a verticalneutron beam line, consists of 2 sets of 22 leaves made of steel and borated polyethylene discs(10 cm in 0). The leaves, calculated for p(65)+Be neutrons, are 92 cm thick. Their width isabout 1 cm [28].
30

T A B L E 1 . 9 .
T H
Centre
E N E U T R O N TH E R A P Y F A C I L I T I E S1s t J a n u a r y 1994
Neutron ProducingReaction
W O R L D W I D E
Comments
E U R O P E
U K
Prance
Belgium
Germany
MRC-C!atterbndge
Orléans
Nice
UCL- Louvam-la-Neuve
HamburgHeidelbergMunsterEssen
Garching -T.U. Munich
p(62HBe
p(34HBe
p(60)-<-Be
p(65)+Be
(d + T)(d + T)(d + T)
d(14)+Be
reactor neutrons(av.energy 2 MeV)
Rotational gantryVariable coUimator
Vertical beam(horizontal beam plpnned)
vertical beammultileaf coihmator
Vertical beamMultileaf collimator
(horizontal beam in preparation)
Rotational gantry
Rotational gantry
Mixed beam
U N I T E D S T A T E S
Texas
California
Washington
Illinois
Michigan
M. D. Anderson- Houston p(42)4-Be
UCLA - Los Angeles
Seattle
Fermilab
Detroit
p(46)+Be
p(50)+Be
p(66)+Be
d(48)+Be
Rotational gantry
Rotational gantryVanable collimator
Rotational gantryMuitileaf coihmator
Horizontal beam
îsocentnc mountingMulti-rod collunator
A S I A
Japan
Korea
China
SaudiArabia
National Institute ofRadiological Sciences(NffiS) - Chiba
Institute for MedicalSciences (IMS) - Tokyo
Korea Cancer CenterHospital (KCCH) - Seoul
Institute of High EnergyPhysics - Beijing
King Faisal Hospital-Riyadh
d(30)+Be
d(14)+Be
p(50 5)+Be
p(35)+Be
p(26HBe
Vertical beamMultileaf coîlimator
Horizontal beam
Rotational gantry
Proton Linac
Rotational gantry
A F R I C A
South Africa National AcceleratorCentre (NAC).Faure
p(66)+Be Rotational gantryVanable collimator
31

1.4. T H E R A P E U T I C A P P L I C A T I O N S O F H E A V Y I O N S B E A M S
ï.4.1 R A T I O N A L E F O R H E A V Y - I O N T H E R A P Y
Heavy ions combine the advantage of a high physical selectivity with high-LET
characteristics (Fig. 1.8). Their physical selectivity is similar to that of proton or helium
ion beams. They even have a smaller penumbra, but it is questionable whether this factor
could be of clinical relevance.
More important is the fact that, with heavy ions, the higher RBE at the level of the spread-out Bragg peak compared to the initia! plateau enhances the advantage of the dosedistribution. A further advantage can be obtained through fractionation due to differences in
repair possibility between, on the one hand, tissues located at the level of the initial
plateau (repair possible for these normal tissues) arid, on the other hand, tissues located at
the level of the spread out Bragg peak (the target volume) where high-LET does not allow
for repair.
The LET depends on the type and energy of the particles as well as on the width of the
spread out Bragg peak. This implies that the parameters which depend on LET, such as RBE,OER and repair capacity, have to be determined for each type of treatment.
Heavy ion therapy programmes are justified by three sets of arguments :
1) the importance of a high physical selectivity which has been clearly demonstrated with
low-LET radiations. The benefit of replacing 200 kV X-rays by high-energy photons was
obvious, and the benefit of further improving the physical selectivity by the introduction
of proton beams has been proven for some selected rumour sites.
As stressed above (see section 1.3.1.3), the available radiobiological data indicate that a
high physical selectivity is even more important with high- than with iow-LET radiationsdue to a general reduction in the differences in radiosensitivity between cell populations.
2) the radiobioiogicai and clinical data indicating that for the treatment of some tumoursites. higlvLET radiations do bring a benefit compared to iow-LET radiations.
Radiobiology indicates some mechanims through which high-LET radiations could bring a
benefit in the treatment of some tumour types.
Review of the clinical results of fast neutron therapy indicates that indeed neutrons are
superior to photons for some tumour types as summarized in Table IV.
3) the encouraging clinicai results available witbJiea^yjQiiis, although it is recognized thatthey were obtained only from one centre, i.e. Berkeley, and on limited and selected groups
of patients.
32

oLUj
LUC/3
O(n
Q.QUJ>OccQ.
HEAVY - IONBEAMSPROTONS BEAMS
WHAT PROPORTION ?
HIGH - ENERGYPHOTONS/ELECTRONS
HIGH-ENERGYCYCLOTRONS 65 MeV
LOW- ENERGYCYCLOTRONS 16 MeV
200 kVX - R A Y S
RADIOBIOLOGICALDIFFERENTIAL EFFECT
LOW OR HIGH LET?WHAT PROPORTION? / CRITERIA?
TUMOUR CHARACTERISTICS
Figure 1.8
Technical development has improved the physical selectivity of the treatments for high-,as well as for low-LET radiations. In both groups of radiations, 3 steps are schematicallyidentified. For low-LET radiations, the 200 kV X-rays have now been completely replacedby high-energy photons (or electrons), which tend, in turn, to be replaced for well selectedtumour types/sites by proton beams. The proportion of patients deserving proton beamtherapy needs to be assessed. Three steps in technological development are alsoschematically identified for high-LET radiations : low-energy cyclotrons, high-energycyclotrons, and heavy ions. The proportion of high-LET patients which deserves heavy ionsalso needs to be assessed (similar question as for the low-LET proton beams). The mainquestion which remains is the proportion of patients which could be better treated withhigh-LET than with low-LET radiations. It is a radiobiological problem related only to thecharacteristics of the tumour and not to the machines. The clinical value of high-LETradiat ions has been assessed main ly in the past by comparing high-energy l inearaccelerators and low-energy cyclotrons (arrow 1). The right comparison (arrow 2) startedlater on, and all the f ina l reports are not yet available. Some limited patient series werealso treated at the Berkeley heavy-ion fac i l i t y .From [15]
1.4.2 THE C L I N I C A L D ATA F R O M B E R K E L E Y
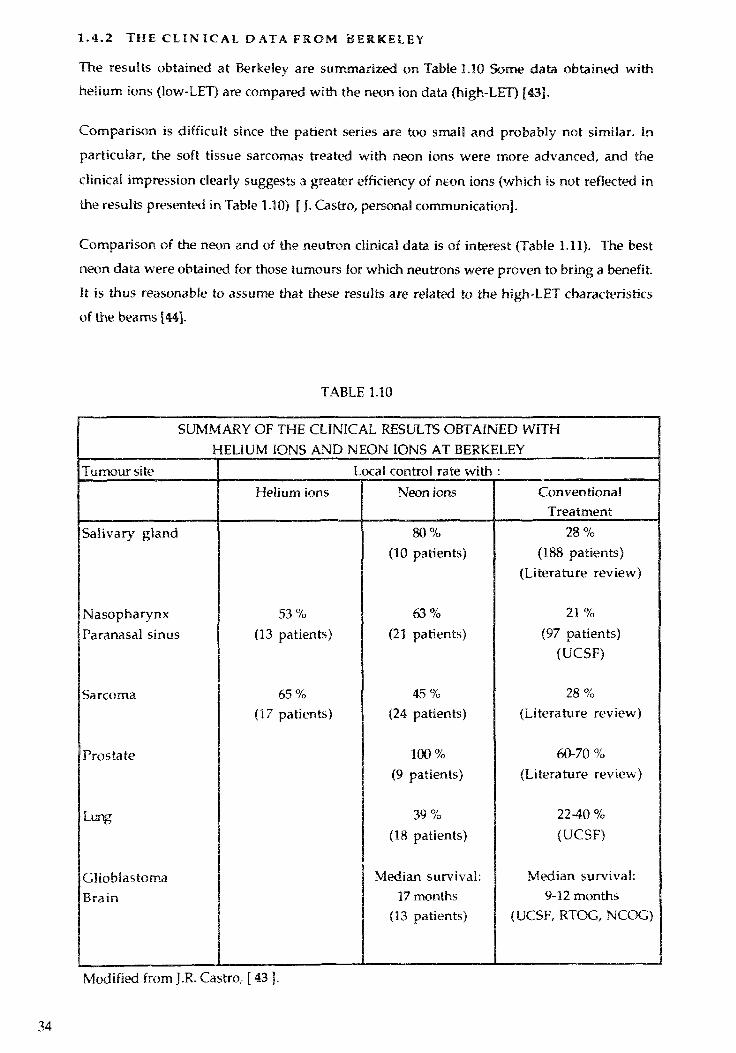
The results obtained at Berkeley are summarized on Table 1.10 Some data obtained withhelium ions (low-LET) are compared with the neon ion data (high-LET) [43].
Comparison is diff icul t since the patient series are too small and probably not similar. In
particular, the soft tissue sarcomas treated with neon ions were more advanced, and theclinical impression clearly suggests a greater efficiency of neon ions {which is not reflected inthe results presented in Table 1.10) [ J. Castro, personal communication].
Comparison of the neon and of the neutron clinical data is of interest (Table 1.11). The best
neon data were obtained for those rumours for which neutrons were proven to bring a benefit.It is thus reasonable to assume that these results are related to the high-LET characteristicsof the beams [44].
TABLE 1.10
SUMMARY OF THE CLINICAL RESULTS OBTAINED WITHHELIUM IONS AND NEON IONS AT BERKELEY
Tumour site
Salivary gland
NasopharynxParanasal sinus
Sarcoma
Prostate
Lung
GlioblastomaBrain
Local control rate with :Helium ions
53%(13 patients)
65%(17 patients)
Neon ions
80%(10 patients)
63%(21 patients)
45%(24 patients)
100%(9 patients)
39%(18 patients)
Median survival:17 months
(13 patients)
ConventionalTreatment
28 %(188 patients)
(Literature review)
21%(97 patients)
(UCSF)
28%(Literature review)
60-70 %(Literature review)
22-40 %(UCSF)
Median survival:9-12 months
(UCSF, RTOG, NCOG)
Modified from J.R. Castro, [ 43 ].
34

TABLE 1.11
SUMMARY OF THE CLINICAL RESULTS OBTAINED WITH HIGH-LET RADIATIONS(FAST NEUTRONS AND NEON IONS)
Tumour site (or type) Local control rates after :
Fast neutrons Neon ions
• salivary gland rumours 67 % (24 %) 80 % (28 %)• paranasal sinuses 67 % 63 % (21 %)• fixed lymph nodes 69 % (55 %)• sarcomas 53 % (38 %) 45 % (28 %)• prostatic adenocarcinomas 77 % (31 %) 100% (60-70%)
( ) for comparison, the local control rates currently obtained with conventional low-LETradiations for patient series as similar as possible.
From A. Wambersie [44]
1.4.3 PATIENT SELECTION FOR H E A V Y ION B E A M T H E R A P YThe general principles of patient selection for heavy-ion beam therapy are presented onTable 1.12. Two main groups of indications can be identified depending whether thebiological effects of high-LET radiations or the high physical selectivity of the beams is
thought to be the most important factor. In addition, more specific indications can beproposed (G.R.H. Sealy, in [15]).
Concerning the first group of indications (for which the high-LET is considered to be mostimportant), it is possible to make a tentative prediction of the clinical benefit which could beexpected from heavy ion beams by considering both the conclusions of the neutron studies andthe heavy ion results from Berkeley (Tables 1.10 and 1,11).
It should be stressed again that neutron data were, in many centres, not obtained in optimaltechnical conditions. A similar remark also applies, but for other reasons, to the neon resultsfor which in addition there was a severe (often negative) patient selection.
Concerning the second group of indications for heavy ions (for which the physical selectivity
is considered to be the most important factor), one can normally expect the same results as
35

TABLE 1.12
GENERAL PRINCIPLES OF PATIENT SELECTIONFOR HEAVY-ION BEAM THERAPY
To take advantage of the biological AND physical characteristics of the beams
A - The radiobiological advantage (high-LET) is thought to be the most important factor,followed by the physical selectivity of the beams
a. where high-LET radiation already demonstrated to be useful
- salivary gland tumours- paranasai sinuses- fixed lymph nodes- prostatic adenocarcinomas- sarcomas, etc.
b. where additional information is needed
- pelvic rumours : bladder, rectum, cervix, etc.- other tumours : stomach, biliary duct, etc.
B. - The physical selectivity (dose distribution) of the beams is thought to be the mostimportant factor followed by the radiobiological advantage of high-LET
Tumours in technically difficult situations, but where high-LET radiation may be betterthan low-LET radiation (e.g. slowly growing rumours)
- adjacent to CNS : meningioma, pharyngioma, chordoma, optic nerve,guoma, AVM, paraspinai cord tumour, paraaortic lymph node, etc.
- root of neck disease : upper oesophagus, post cricoid carcinoma, etc- thoracic disease : tumour of the lung with mediastinal disease after
resection of primary, mesothelioma, etc.
C.- Additional indications
- where possible later surgery should not be prejudiced :tongue, avoiding mandible, etc.
- very poor prognosis disease : unresectable hepatoma, pancreas,retroperitoneal sarcoma, recurrent after previous radiotherapy, etc. .
Modified after G.R.H. Sealy in [ 1 5 ] .
with protons, but with the additional advantage of high-LET radiations for slowly growing
tumours. Heavy ions could extend the field of the ir aicarions of radiation therapy by
allowing the oncologists to envisage irradiation of groups of tumours "traditionally"
considered to be radioresistant {e.g. adenocarcinomas).
36

1.4.4 THE HEAVY ION THERAPY F AC I LIT! ES W ORLDW IDE
Since the Berkeley facility was closed in 1993, there is unfortunately no further heavy-iontherapy facility anywhere in the world. However, the follow-up studies on the patientstreated at Berkeley are still going on.
Another heavy ion therapy program wiîl start, in 1994, in Chiba-Japan, at the National
Institute for Radiological Sciences (MRS). Clinical protocols are now being designed and the
facility is prepared to accept patients from all parts of the world to be treated according tothese protocols.
Tie Chiba HIMAC (Heavy Ion Medical Accelerator) facility consists of an injector linac, two
synchrotron rings and the beam delivery systems. Three treatment rooms are constructed : one
with a vertical beam, the second one with a horizontal beam, the third one with a verticaland horizontal beams. In the last one, the patient can be irradiated simultaneously with thevertical and the horizontal beams (at different energies if needed). This is possible because
of the two synchroton rings. The dose rate (> 5 Gy/min) is sufficient to permit completion ofthe treatments in much less than one minute.
Ion types from He to Ar can be accelerated at a maximum energy of 800 MeV/amu and at a
minimum energy of 100 MeV/amu. A these energies, any tumour even deep seated (30 cm) can
be reached [45] [46].
In Europe, the Commission of the European Communities initiated a feasibility study for the
project EULIMA (European Light Ion Medical Accelerators), but, at the end, was not able tosupport such a complex and expensive project [15].
At the GSI-Darmstadt, in Germany, a heavy ion therapy program is in preparation in
collaboration with the University of Heidelberg Cancer Centre. In France, the possibility oftreating patients at the Accelerator Saturne in Saclay is now under examination.
1 . 5 S U M M A R Y A N D C O N C L U S I O N S
More than any other medical discipline, radiation therapy is dependent on technologicaldevelopments. Historically, this has been clearly illustrated when 200 kV X-rays werereplaced by modern high-energy linear accelerators. In addition, it is recognized that
radiation therapy has taken advantage of the progress made in other technical disciplinessuch as medical imaging, dosimetry, computerized treatment planning.
Today, one of the most promizing approaches to improve the efficiency of radiotherapy (and
thus the local control rate of malignant tumours) is the replacement of X-rays by other
radiation qualities (i.e. particle beam therapy). The importance of technological
developments in the field of particle therapy is particularly evident as shown below.
37

Proton beams aim at improving the physical selectivity of the irradiation while fast
neutrons aim at improving the (radiobiological) differential effect. Proton beams can beexpected to be especially useful for patients when physical selectivity is important, i.e.when a radioresistant tumour is located ciose a radiosensitive critical normal structure. Thepotential benefit of protons can be, to some extent, evaluated from the critical comparison of
the "dose distributions", since at equal dose, the biological effects produced by protons and X--rays are similar.
Identification of the patients (or of trie groups of patients) who could benefit from neutrontherapy is a more difficult problem since it involves radiobiological arguments. In principle,the indications for neutron therapy could be derived from several already available data :
- when hypoxic cells are shown to be the cause of tumour resistance to X-rays (cf. the clinical
studies with hyperbaric oxygen, with hypoxic eel! radiosensitizers, etc) [26] [28];
- slowly growing, well differentiated rumours [23];
- cell strains intrinsically resistant to X-rays;
- rapidly proliferating rumours for which a short overall time could be of interest. Since thedose per fraction is less critical with neutrons, shorter overall times can be applied moreeasily than whith X-rays.
This last argument may seem in contradiction with some of the previous ones and the clinicaldata only will allow deriving the right conclusion. Clinical data are accumulating
continuously and more than 20 000 patients have been treated so far with neutrons worldwide.
However, today, for a given patient, the choice of the appropriate radiation quality (low- orhigh-LET) remains so far a difficult problem, and much hope is placed in the development of
predictive tests.
When evaluating the clinical results of proton and neutron therapy, the technical conditionsin which they were applied should be kept in rnind. Most of the first patient series were
treated in "sub-optimal" technical conditions, with laboratory machines designed initiallyfor physics experiments and later on adapted for clinical applications. These machines wereoften cumbersome, complex to run and expensive to maintain, not fully available for therapy,located outside the hospital, and the fixed radiation beams raised difficult problems forpatient positioning.
In neutron therapy, there was, with some machines, an additional difficulty due to the poorbeam penetration, as well as a lack of appropriate collimation system. These poor technicalconditions resulted in complications (mainly late complications) which in turn impaired thedevelopment of neutron therapy for several years.
The situation has today considerably improved, and progress has been made in 2 quiteindependent directions due to technicalogical developments. Firstly, hospital-based
38

accelerators were installed, fully available for therapy and with technical characteristicssuitable for routine clinical applications : for example, for neutron therapy, in Seattle (USA),Clatterbridge (UK), Seoul (Korea) and, for proton beam therapy, a pioneer centre is Loma-Linda in the USA.
Secondly, some physics machines were adapted to meet the clinical requirements. For
example, for neutron therapy, the beams used in Louvain-la-Neuve, Faure and Ferrnilabfully meet the therapy requirements. The same is true for the proton beams used for uvealmelanoma in different centres such as Harvard, PSI-Viîligen, Orsay, etc.
As a result of these different developments and improvements, patients can be treated todayin safe conditions with neutrons or protons at different facilities worldwide. However, thereis only a limited number of such facilities, and thus only a small proportion of me patientswho need them can benefit today from these new therapeutic modalities. This is partlyrelated to the fact that the existing facilities are expensive, cumbersome, complex andexpensive to run and to maintain, although it is recognized that the available clinical datajustify a further development of neutron and proton therapy.
Finally, one has to stress that recent technological developments have significantly changedthe situation. Using super-conducting magnets or even conventional technology, the engineersare now able to offer compact, reliable machines, easy to use and to maintain, at reasonableprice, which aliow the therapist to irradiate with neutrons and protons as safely and as
accurately as with the modern electron linacs. The first example for neutron therapy is a
super-conducting cyclotron installed in Detroit which is as compact as a modern electron linacand can also rotate around the patient (Table 1.9). For proton therapy, the first example of
the new generation of compact, simple, reliable, proton therapy machine is the 235 MeVcyclotron planned for the Massachusetts General Hospital (MGH) for which conventionalcyclotron technology has been chosen.
These two examples will probably be the first ones of a larger series, and it is only with mistype of machine that nautron therapy and proton therapy could clinically expand and gain areal place, in cancer treatment, among the other radiotherapy techniques.
The problems raised by heavy ion beam therapy are quite different due to the high cost andtechnical complexity of the equipment [15]. [47]. At present, only a few facilities could beplanned worldwide.
An international cooperation is necessary in order to ensure a rapid exchange or informationand an appropriate patient recruitment. Sufficient patient recruitment is needed for se-selecting tumour types or sites for which there is evidence that better results could be
expected with heavy ions than with conventional treatments. From a more scientific point
39

of view, appropriate recruitment is needed for initiating randomized trials designed toanswer specific questions of great relevance in radiobiology and/or radiation therapy.
In photon therapy, an accuracy on dose delivery as high as 3.5 % (i.e., one standarddeviation on the absorbed dose at the specification point) is required. This requirement is due
to the steepness of the dose-effect relations for local tumour control and normal tissuecomplications. For high-LET radiations, the available clinical and radiobiological dataindicate that the dose-effect relations are as steep as those observed for photons, andconsequently the same degree of accuracy must to be achieved. Furthermore, as discussed
above, at least the same physical selectivity (dose distribution) is required due to a reduceddifferentia! effect with high-LET radiations [48].
Therefore, in order to obtain the maximum benefit of the application of these new beams(neutrons, protons, heavy ions), and to use them in optimal conditions, research in dosimetryis necessary as well as development of quality assurance programmes. In addition, further
research on atomic and molecular data is justified for the different components of human(and biologicai) tissues and detectors, as wel! as for materials used for the beam coliirnationand shielding. Acquisition of data should be extended to the types of particles and energy
ranges considered in this report.
R E F E R E N C E S
1 DEVITA V.T.Progress in Cancer ManagementCancer , 51: 2401-2409,1983
2 DEVITA V.T., KORN D.Progress against cancerNew Engl. J. Med., 315 :964,1986
3 DAVIS D.L., HOEL D., FOX J., LOPEZ A.International trends in cancer mortality in France, West Germany, Italy, Japan,England and Wales, and the USAThe Lancet, 336, 474- 481,1990,
4 DOLL R.Are we winning the fight against cancer ? An epidemiological assessmentEACR - Mühlbock Memorial LectureEur. J.Cancer, 26,500-508,1990.
40

SUIT H. D.Potential for improving survival rates for the cancer patient by increasing the efficacyof treatment of the primary lesionCancer, 50, 1227-1234, 1982.
6 MUIR C.S., BOYLE P.The Burden of Cancer in EuropeEur. .(.Cancer, 26,1111-1113,1990
(Report of the) NATIONAL PANEL OF CONSULTANTS ON THE CONQUEST OFCANCER, prepared for the Committee on Labor and Public Welfare United StatesSenate, Novembrer 1970, U.S. Government Printing Office Washington, 1970, Part 2, p.51.
WAMBERS1E A.Les faisceaux de protons dans Se traitement des cancers. Espoirs et Réalités. LouvainMéd. 110: 13-33, 1991.
SUIT H.D., GOITEN M., MUZENRIDER ]., VERHEY L., URIE M., GRAGOUDAS E.,KOEHLER A., GOTTSCHALK B., SISTERSON, ]., TATSUZAKI H, MIRALBELL R.,Increased efficacy of radiation therapy by use of proton beamStrahlentrier. Onkol. 1990; 166: 40-44.
10 J.R. CASTRO, G. GADEMANN, J.M. COLLIER, D. LÏNSTAD, S.PITLUCK, K.WOODRUFF, G.GAUGER, D. CHAR, Ph. GUTIN, Th L. PHILLIPS, W. CHU, Sh.HENDERSONStrahlentherapie mit schweren Teilchen am Lawrence Berkeley Laboratory derUniversität von Kalifornien; Strahlentherapie und Onkologie 1&3_, 1987, 9-16.
11 ZOGRAFOS L., UFFER S., GAILLOUD C, BERCHER L.Les mélanomes de la conjonctive et leur traitement.Klin Monatsbl. Augemheilkd. 1990; 196:285-289.
12 BERCHER L., ZOGRAFOS L., EGGER E., CHAMOT L., UFFER S., GAILLOUD C.,DUCREY N.Le traitement des mélanomes extériorisés de la choroïde par faisceau de protonsaccélérés.Klin Monatsbl. Augemheilkd. 1992; 200 : 440-443.
13 MAZAL AL A.Centre de Protonthérapie d'Orsay, Rapport Technique, Décembre Ï993, CentreUniversitaire, Bât. 101, F-91400 - Orsay-France.
41

14 M. AUSTIN-SEYMOUR, M.URIE, J. MUZENRIDER, C. WILLETT, M. GOITEIN, L.VERHEY, R. GENTRY, P.McNULTY, A. KOEHLER, H.SUIT Considerations inFractionated Proton Radiation Therapy Clinical Potential and Results.Radiotherapy and Oncology, 1990,17. 29-35.
15 CHAUVEL P., WAMBERS1E A. (Editors),EUL1MA Workshop on the Potential Value of Light Ion Beam Therapy.Publication EUR 12165 EN of the Commission of the European Communities,c ECSC-EEC-EAEC, Brussels-Luxembourg and CAL Edition, 1989 .
16 J.R. CASTRO, NOWAKOWSKI V., LINSTADT D., COLLIER J.M., PETTI P.L.,LYMAN )., PHILLIPS T.L., CHAR D., GAUGER G.E., WOODRUFF K., CHU W.,LUDEWIGT B;, RENNER T., SINGH R.P., PITLUCK, S; WHITCOMB T.Heavy charged particle therapy at the Lawrence Berkely Laboratory, pp. 219-232, In:Ref. 15.
17 A. WAMBERSIE, V. GREGOIRE, J.M. BRUCHERPotential Clinical Gain of Proton (and Heavy Ion) Beams for Brain Tumors in Children,Int. J. Radiation Oncology Biol. Phys., 1991, 22, 275-286.
18 KÎTAGAWA T.Proton beam therapy at the Tsukuba University, pp. 191-196. In: Ref. 15.
19 LARSSON B.Use of Medium Energy Particles in Radiobiology and Radiotherapy. Journal Européende Radiothérapie, 2, 223-234, 1984.
20 LARSSON B.Proton therapy : review of the clinical results, pp. 139-164. In: Ref. 15.
21 BLOOMQUISTE. etal.Medical projects at the Svedberg Laboratory, pp. 68-69. In: The Svedberg Laboratoryprogress report, 1992-1993, Uppsala, Sweden.
22 STONE R.S.Neutron therapy and specific ionization. Am. J. RoentgenoL, 59 : 771-785, 1948.
23 CHAPMAN J.D.Biophysical models of mammalian cell inactivation by radiation, in : Radiationbiology in cancer research (R.E. Meyn, H.R. Withers, eds), pp 21-32. Raven Press,New York, 1988.
42

24 FERTIL B., DESCHAVANNE P.J., GUEULETTE J., POSSOZ A., WÂMBERSIE A.,MALAISE E.P.. In vitro radiosensitivity of six human cell lines. Relation to the RBEof 50-MeV neutrons. Radiât, fies., 90: 526-537,1982.
25 MENZELH.G., PIHET P, WAMBERSIE A.Microdosimetric specification of radiation quality in neutron radiation therapy.International Journal of Radiation Biology, 57, 865-883,1990.
26 TUBIANAM., DUTREEKJ., WAMBERSIE A.Introduction to Radiobiology, Taylor & Francis, London, (371 pages), 1990.
27 A. WAMBERSIENeutron therapy : from radiobiological expectation to clinical reality. RadiationProtection Dosimetry (Nuclear Technology Publishing), 44, 379-395, 1992.
28 WAMBERSIE A., RICHARD F., BRETEAU N.Development of Fast-Neutron Therapy Worldwide. Radiobiological, Clinical andTechnical Aspects, Acta Oncologica, 1994 (in press).
29 NATIONAL CANCER INSTITUTE (NCI)Fast Neutron Radiation Therapy in the United States : A Twenty-Year NCISponsored Research Program (NTCWG Annual Report, 1991), National CancerInstitute, Bethesda, MD 20892, USA, 1991.
30 CATTERALL M., BEWLEY D.K.Fast neutrons in the treatment of cancer. London, Academic Press., 1979.
31 LARAMORE G.E., GRIFFITH J.T., BOESPFLUG M., PELTON J.G., GRIFFIN T.,GRIFFIN B.R., RUSSELL K.J., KOH W., PARKER R.G., DAVIS L.W.Fast neutron radiotherapy for sarcomas of soft tissue, bone, and cartilage. Am. J.Clin. Oncol. (CCT) 12: 320-326,1989.
32 PÖTTER R., KNOCKE T.H., HAVERKAMP U., AL-DANDASHI CHR.Treatment planning and delivery in neutron radiotherapy of soft tissue sarcomas,Strahlentherapie und Onkologie, 166, 102-106, 1990.
33 BATTERMANN JJ.Clinical application of fast neutrons, the Amsterdam experience. Thesis, University ofAmsterdam (The Netherlands), 1981.
43

34 FRANKE H.D., LANGENDORFF G., HESS A.Die Strahlenbehandlung des Prostata-Carcinoms in Stadium C mit schnellenNeutronen. VerhandSungsberächt der Deutschen Gesellschaft für Urologie, 32 Tagung1980, Berlin, Heidelberg, New-York Springer-Verlag, 1981, 175-180.
35 TSUNEMOTO, H., MOR1TA, S., SATHO, S., UNO, Y., YUL YOO, S.Present status of fast neutron therapy in Asian countries. Strahlentherapie undOnkologie, 165,330-336, 1989.
36 F. RICHARD, P. j. VAN CANGH, A. WAMBERSIEIntérêt de la neutronthérapie des adénocarcinomes localement étendus de !a prostate(stade C). Résultats obtenus au cyclotron de Louvain-la-Neuve. Acta UrologicaBelgica, 59, 35-52, 1991.
37 LARAMORE G.E., KRALL J.M., THOMAS F.J., RUSSELL K.J., MAOR M.H.,HENDRICKSON F.R., MARTZ, K.L. GRIFFIN T.W. DAVIS L.W.: Fast neutronradiotherapy for locally advanced prostate cancer : Final report of a RadiationTherapy Oncology Group randomized clinical trial. Am j Clin Oncol (CCT) 16: 164-167,1993
38 RUSSELL, K.J., CAPLAN R.J., LARAMORE G.E., BURNISON C.M., MAOR M.H.,TAYLOR M.E., ZINK S., DAVIS L.W., GRIFFIN T.W.Photon versus fast neutron external beam radiotherapy in the treatment of locallyadvanced prostate cancer: results of a randomized prospective trial. Int. J. Radiât.Oncol. Biol. Phys. , 28,47-54,1993
39 V. GREGOIRE, M. BEAUDUIN, J. GUEULETTE, B.M. DE COSTER, M. OCTAVE-PRIGNOT, S.VYNCKIER, A. WAMBERSIERadiobiological intercomparisen of p(45)+Be and p(65)+Be neutron beams for lungtolerance in mice after single and fractionated irradiationRadiation Research, 133, 27-32,1993
40 INTERNATIONAL COMMISSION ON RADIATION UNITS ANDMEASUREMENTS.Clinical Neutron Dosimetry. Part I: Determination of Absorbed Dose in a PatientTreated by External Beams of Fast Neutrons. ICRLT Report 45, 85 pages (1989)ICRU Publications 7910 Woodmont avenue, Suite 1016, BETHESDA, Maryland 20814,USA.
41 PIHET P., MENZEL H. G., SCHMIDT R., BEAUDUIN M.AND WAMBERSIE A.Evaluation of a microdosimetric intercomparison of european neutron therapy centres,in Radiation Protection Dosimetry, Microdosimetry , 31, 437-442 ,1990.
42 WAMBERSIE A.Fast neutron therapy at the end of 1988 - a survey of the clinical data.Strahlentherapie und Onkologie, 166, 52-60, 1990.
44

43 J.R. CASTROHeavy ion radiotherapy In G- Kraft and U. Grundinger (Ed.). Third workshop onheavy charged particles in biology and medicine, GSI - Darmstadt Report 87-11, ISSN0171-4546, 1987, KO 1-5.
44 WAMBERS1E A.The future of high-LET radiation in cancer therapy. Justification of the Heavy-ionTherapy Programs, pp. XIX- LUI, in : Ref. [15].
45 SATO K.HIMAC Project Status I - Accelerator Complex, pp.23-35. In: Akifuni ITANO andTatsuaki KANAI (Eds). Proceedings of the N1RS International Workshop on HeavyCharged Particle Theiapy and Related Subjects , July-4-5, 1991, NIRS-M-81. NationalInstitute of Radiological Sciences, 9-1, Anagawa 4-Chome, Chiba 260, Japan.
46 SOGA F.HIMACProject Status II - Irradiation Facility, pp.36-42. In: Akifuni ITANO andTatsuaki KANAI (Eds). Proceedings of the NÎRS International Workshop on HeavyCharged Particle Therapy and Related Subjects , July-4-5, 1991, NIRS-M81, NationalInstitute of Radiological Sciences, 9-1, Anagawa 4-Chome, Chiba 260, Japan.
47 WAMBERSIE A.Radiobiological and clinical bases of particle therapy (review), pp. S1-S3. In P.
Chauvel, A. Wambersie, P. Mandriilon (Eds). EPÂC 90, Medical Satellite Meeting,Acropolis, Nice-France, June 14-16, 1990. Editions Frontières, B.P. 33, F-91192 Gif -sur-Yvette, France
48 MIJNHEER B.J., BATTERMANN J.J., WAMBERSIE A.What degree of accuracy is required and can be delivered in photon and neutrontherapy ? Radiotherapy and Oncology, 8, 237-252, 1987.
45

£51
Chapter 2
IÖNIZATION BY FAST CHARGED PARTICLES*
L.H. Toburen**Pacific Northwest Laboratory,
Richland, Washington,United States of America
The author acknowledges valuable contributions to this chapter by R.D. Dubois, PacificNorthwest Laboratory, Richland, WÂ 99352, USA, H. Paul, Institut für Experimentalphysik derUniversität Linz, Austria, M.E. Rudd, University of Nebraska, Lincoln, NB 68588, USA andW.E. Wilson, Pacific Northwest Laboratory, Richland WA 99352, USA.
* This research was supported in part by the US Department of Energy, Office of Health andEnvironmental Research, Contract no. DE-AC06-76RLO-1830.** Present address: National Academy of Sciences, 2101 Constitution Ave. N.W., Washington,D.C. 20418, USA.
47

Glossary of commonly used terras and symbols in chapter II(Because this review encompasses several subfields of physics
symbols may, in some cases, be redefined in the text)
CCTCDW-EIS
CTMCDDCS
dQ
dQdO€
EeVfI
keVLETm
MeV
PWBA
RBESDCS
a or <7T
< 7 ( £ )
0(0)
0(6,0)
Bohr radius (5.29 X 10"11 m)
RT
binding energy of the ith electronic shell of an atom or moleculecharge transfer to the ionization continuum of the projectilecontinuum distorted wave-eikonal initial state; atomic wave functionmodelclassical trajectory Monte Carlo computational modeldoubly differential ionization cross section, differential inelected electron energy and solid angle of emissionsingly differential ionization cross section, differential in energyloss Qdoubly differential ionization cross section, differential inenergy loss Q and solid angle Q of electron emissionejected electron energyenergy of the incident particle (projectile)electron voltsdipole oscillator strengthionization potential on the outermost bound electron in the targetatom or moleculethousand electron voltslinear energy transferelectron mass (also designated as me)rest mass of the electronmillion electron voltsnumber of electrons in the ifch subshell of the targetplane wave Born approximationpi = 3.1416net charge of the incident particle (for bare ions q=z)energy loss, i.e., normally Q = « + I, however, for considerationof atomic or molecular electronic subshells, Qj = « + Bx
relative biological effectivenesssingly differential ionization cross section; in this chapter,refers to electron emission cross sections differential with respectto ejected electron energytotal cross section; in this chapter, commonly refers to the totalionization cross sectionsingly differential ionization cross section, differential withrespect to ejected electron energy «; experimentally determined,and, therefore, averaged over the energy resolution of thedetection system.singly differential ionization cross section, differential withrespect to the solid angle of detection for ejected electrons at anemission angle 0 ; experimentally determined, and, therefore,averaged over the angular resolution of the detection system.doubly differential ionization cross section, differential withrespect to the ejected electron energy e and the solid angle fordetection of an electron at an emission angle d; experimentallydetermined, and, therefore, averaged over the energy and angularacceptance of the detection system.Rydberg unit of energy (R = 13.6 eV)energy of the incident particle in units of the energy of anelectron of equal velocity, T=^mevp2, where me is the rest mass ofthe electron and vp is the projectile velocity.
49

TOF time-of-flight; refers to an electron energy analysis technique& ejected electron emission angle measured with respect to the
forward direction the incident projectile.Y(Q,T) ratio of the measured SDCS, for energy loss Q and projectile scaled
energy T, to the corresponding values derived from the Rutherfordformula
v incident particle velocityw e/I; or, for atomic or molecular aubshells WA = e/B^2 or Z2 target nuclear chargez or Zx projectile nuclear chargeZ(Q,T,#) ratio of the measured DDCS, for energy loss Q from an incident
particle of scaled energy T to an electron ejected at an angle 9, tothe corresponding SDCS obtained from the Rutherford formula
50

2.1. INTRODUCTION
Understanding the biological consequences of the interaction of radiationwith matter, whether for developing protocol for radiation therapy or for thepractice of radiation protection, relies on an accurate knowledge of a broadrange of atomic and molecular data. A common feature of energy deposition byall ionizing radiation is the production and degradation of secondaryelectrons in the absorbing medium. The relative biological effectiveness(RBE) of different radiations must, therefore, be related to the detailedcharacteristics of these events and how they influence the subsequent chemicaland biological processes. For radiation of high-linear-energy-transfer (high-LET) the interactions contributing to energy loss may lead to the release offast secondary electrons and energetic recoil ions that, in turn, may producefurther ionization, as well as lead to excited states of the atomic andmolecular constituents of the medium. These interactions result in locallydense regions of energy deposition that spawn highly inhomogeneous chemicalreactions, the products of which must subsequently be confronted by thebiological system.
Considerable progress has been made in understanding the effects ofradiation quality on biological effectiveness through the study ofmicrodosimetry, charged particle track structure, and biochemically basedbiophysical models of the damage initiated by ionizing radiation. Common toall these studies is the application of a detailed data base of excitation andionization cross sections for the interaction of charged particles withatomic, molecular and condensed phase targets. Inokuti [1] has emphasizedthat to be useful for radiological applications this data base must be "right,absolute, and comprehensive". In this chapter we review the present status ofdata base contributing to our understanding of ionization for interactions ofcharged particles with biologically important material and explore techniquesto assess the accuracy of the available data. This review will be limitedprimarily to those ionization cross sections that have been presented asabsolute values or that can be placed on an absolute scale in an unambiguousmanner. Some departure from this condition is allowed where the systematicsof cross sections, such as their energy dependence, is explored.
This chapter focuses on review of differential and total ionization crosssections for charged particle impact, with a more limited discussion of chargetransfer, inner-shell ionization, and the use of effective charge inradiobiology. Total ionization cross sections are useful in radiobiology fordetermination of ion mean-free-paths and they provide useful information forassessing the accuracy of differential ionization cross sections. Crosssections differential in ejected electron energy (SDCS) provide detailedinformation on the energy loss process and doubly differential cross sections(DDCS), differential in ejected electron energy and emission angle, providedata necessary for determining the spatial patterns of energy deposition. Wedo not treat triply differential cross sections, differential in the angle ofthe scattered primary as well as in ejected electron energy and emissionangle, in this report; the availability of such data is limited in extent andhas limited application to radiation biology. Singly and doubly differentialcross sections are discussed for electron impact, proton impact, and heavy ionimpact; in this context heavy ions are considered to be those ions heavierthan protons, including neutral hydrogen.
A serious attempt was made in preparing this chapter to be consistentwith notation commonly used in the field of radiation physics. Being areview, however, we have selected data from many sources and in numerousoccasions the notation used in those sources is different from the "standard"adopted for this chapter. In cases where the work of referenced authorsdiffers from our style, either their notation is changed to conform to ours,or their notation is retained with proper definition of the symbols used. The
51

notation we have used in reference to measured doubly differential crosssections is that the quantity a(e,0) represents the differential cross sectionin units of area, per unit energy (eV) and per unit solid angle (averaged overthe energy and angular acceptance of the detector), for ejection of anelectron of energy « at an emission angle of 0 with respect to the outgoingionizing particle; the energy of the incident ion is not explicitly shown.For singly differential cross sections, a(e) represents the cross section, perunit energy, for emission of an electron of energy e, and 0(6) is the crosssection per unit solid angle for emission of an electron at an angle 8. Thetotal cross section for electron production is given simply by a, or in somecases the more explicit notation aT is used. The use of a, a{e), and a(t,B )are limited for reference to measured quantities; differential cross sectionsobtained from theoretical calculations are designated by da/dQ (differentialwith respect to energy loss) and d2a/dQdß (differential with respect to bothenergy loss of the projectile and solid angle of the ejected electron) toexplicitly indicate the true differential character of these quantities.Charge transfer cross section commonly use the notation alf to refer tocollisions in which the incident particle has charge i and the final chargestate of the ion is given by f.
The review of total ionization cross sections in this chapter is limitedto ion impact; total ionization cross sections for electron impact will bediscussed in chapter 3. All ionization cross section measurements that arereviewed in this chapter were obtained in experiments under single collisionconditions using gas phase targets with the exception of some of themeaseruments of innershell ionization cross section, and stopping power,where, in some instances, solid targets were used. Portions of this chapterwere also included in a recent review of Atomic and Molecular Physics in theGas Phase presented by Toburen [2] at a Symposium sponsored by the U. S.Department of Energy.
2.2. DOUBLY DIFFERENTIAL IONIZATION CROSS SECTIONS2.2.1. Electros Impact
Ionizing radiation, by definition, results in the deposition of energythrough the release of free electrons and, thereby, the generation of ions inmatter. The chemical and biological response of the medium to the absorptionof energy from the radiation field is largely determined by the fate of theseelectrons as they undergo subsequent interactions with the constitutents ofthe stopping medium and ultimately thermalize. Energy transport by theslowing down of electrons leads to the spatial pattern of energy depositionthat, on a microscopic scale, is uniquely, albeit stochastically, defined bythe parameters of the radiation fie^d. This initial pattern of energydeposition sets the stage for subsequent chemical reactions that ultimatelylead to the response of the biological system. It is, therefore, importantthat one have a detailed knowledge of the cross sections for interactions ofelectrons with the stopping medium of interest if an assessment of the effectsof radiation quality on biological effectiveness is to be possible. Ofparticular importance to radiation biology is the energy and angulardistribution of secondary electrons ejected in collisions between movingelectrons and the bound electrons of the absorbing media. These crosssections determine the transport of energy via secondary electrons and definethe spatial characteristics of the absorbed energy. Singly differential andtotal ionization cross sections play a role, not only in determining thepattern of energy deposition, but also in assessing the reliability of thedoubly differential cross sections.
An excellent review of the doubly differential cross sections forelectron impact ionization has been published by McDaniel et al. [3] and a
52

TABLE 2.lPUBLISHED DOUBLY DIFFERENTIAL CROSS SECTIONS
ELECTRON IMPACT
Incident Electron Uiected ElectronTargetHeHeHe
He
He
He
He
He
NeNe
ArAr
ArKr
Energy Energy{ eV ) ( eV )
50 - 300 1-1/2(E-I)100, 200 3-(E-I)50 - 2000 4 - 2000
200 - 2000 2 - E
100 - 600 2 - 4 0
100 1 - (E-I)
50 - 500 4 - (E-I)
500, 1000 25 - 45
100 - 500 4-(E-I)500 4 - 200
100 - 500 4-(E-I)500 4 - 200
1000 4 - 500500 4 - 200
Angle{Deareea)6 -1030
30
18 •
2.5
10
10
1030
1030
9030
156- 150- 150
- 150
- 150
- 164
-150
- 130
- 150- 150
- 150- 150
- 150
InvestiqatorsShyn and Sharp [ 5 3Rudd and DuBois [6]Opal, Beaty, andPeterson [7,8]
Goruganthu and Bonham[9]
Muller-Fiedler, Jung, andEhrhardt [10]
Goodrich [11]
Sethuraman, Rees, andGibson [12]
Oda, Nishimura, andTahira [13]
DuBois and Rudd [14]Opal, Beaty, andPeterson [7,8]
DuBois and Rudd [14]Opal, Beaty, andPeterson [7,8]
Mathis and Vroom [15]Opal, Beaty, and
Kr
Xe
H2HZ
HZ
N,
N,
1000
500
100 - 500500
25 - 250
100 - 50050 - 2000
200 - 2000
500 - 1000
21 - 52
4 - 200
4 - 200
4 - 200
2-E
5 - 500
Peterson [7,8]10 - 130 Oda, Nishimura, and
Tahira [13]30 - 150 Opal, Beaty, arid
Peterson [7,8]10 - 150 DuBois and Rudd [14]30 - 150 Opal, Beaty, and
Peterson [7,8]
12 - 156 Shyn, Sharp, anü Xim[16]
10 - 150 DuBois and Rudd [14]30 - 150 Opal, Beaty, and
Peterson [7,8]30 - 150 Goruganthu, Wilson, and
Bonham [17]40 - 115 Tisone [18]
53

TABLE 2.1 (cont'd)PUBLISHED DOUBLY DIFFERENTIAL CROSS SECTIONS
ELECTRON IMPACT
Incident ElectronEnergy
Target (eV)Ejected ElectronEnergy
N2
N202
02CH4
CH4NH3
H2O
H7O
1000 4 - 500
50 - 400 1-1/2 (E-I)
50 - 2000 4 - 200
25 - 250 1-1/2{E-I)200 4 - 200
500, 1000 5 - 1000
200 4 - 200
50 - 2000 2-(E-I)
1500 2 - 1500
90
12 -
30 -
12 -
30 -
15 -
30 -
15 -
15 -
156
150
156
150
148150
150
150
Angle(Degrees) Investigators
H2O 500
H2O 1000
H,O 1000
H2O 500, 1000
C,H, 500
CO
CO
NO
CO2
CO2
CO,
4 - 200
800
50O
500
500
50 - 400
500, 1000
4
4
5
4
.9
4
- 500
- 500
- 1000
- 200
- 393
- 200
4 - 200
4 - 200
1-1/2(E-I
5 - 1000
30 - 150
90
90
15 - 148
30 - 150
30 - 150
30 - 15O
30 - 150
30 - 150
12 - 156
15 - 148
Mathis and Vroom [15]
Shyn [19]Opal, Beaty, and
Peterson [7,8]Shyn and Sharp [20]Opal, Beaty, and
Peterson [7,8]Oda [21]Opal, Beaty, and
Peterson [7,8]Bolorizadeh and Rudd [22]
Hollman, Kerby, Rudd, Miller,and Manson [23]
Opal, Beaty, andPeterson [7,8]
Mathis and Vroom [15]Mathis and Vroom [15]
(clusters)Oda [21]
Opal, Beaty, andPeterson [7,8]
Ma and Bonham [24]
Opal, Beaty, andPeterson [7,8]
Opal, Beaty, andPeterson [7,8]
Opal, Beaty, andPeterson [7,8]
Shyn and Sharp [25]Oda [21]
more recent review by Paretzke [4] provides an excellent guide to theliterature of electron interactions of interest to radiobiology and toradiation chemistry. Table 2.1 of this chapter provides a listing of themeasured doubly-differential electron emission cross sections, differentialwith respect to "ejected" electron energy and emission angle, that has beenobtained from a search of the literature through 1990. Since electrons areindistinguishable, the slower of the two electrons leaving a collision isdefined as the secondary "ejected" electron. To completely define the
54

collision for electron impact one would need to measure triply-differentialcross section, i.e., also detect the scattering angle of the primary electron.A limited number of triply-differential cross sections have been measured forsimple gas targets such as helium and argon; see, for example, Ehrhardt et al.[26,27], Beaty et al.(28], and Hong and Beaty [29], As indicated above, thesedata are considered out of the scope of the present review as they have beenof little practical use in microdoaimetry and track structure calculations.However, they have been excellent tools for the detailed testing of collisiontheory.
Although Table 2.1 illustrates that there is a relatively large amount ofdata available regarding the DOCS's for ionization of atomic and moleculartargets by incident electrons, only a limited subset of this data isappropriate to targets of direct interest to radiation therapy or radiationbiology. In addition, where data have been obtained by different groups, suchas the cross sections for ionization of water vapor shown in FIG. 2.1, thereis, in certain regions of the spectra, considerable scatter among the datasets. For the data shown in FIG. 2.1, general agreement is observed among thedata of Opal et al. [7], Oda [21], and Bolorizadeh and Rudd [22] for electrons
W
0)
Eü<ETtJ
10
10 -21
30 60 90 1200(degrees)
150 180
FIG. 2.1. Angular distributions of electrons ejected from water vapor bySOOeV electron impact. The data are from (O) Opal et al. [7], (M) Oda [21],and (o) Bolorizadeh and Rudd [22],
55

emitted at intermediate angles , however, at both large and small emissionangles the cross sections of Opal et al. tend to be smaller than the other twomeasurements. These differences are attributed to instrumental effects andthe manner by which the authors use different methods to account for thefinite size of the target as it is viewed from different angles. The truecross sections are probably somewhere between the extremes represented by thedata of Opal et al. [7] and of Bolorizadeh and Rudd [22] .
The increase in the cross section for small emission angles has been aconsistent feature in the data of the University of Nebraska [6, 14, 22] andhas also been observed by Oda [21] and Ehrhardt et al. [30]. However, a peakat small emission angles was not observed in more recent measurements ofGorunganthu et al. [17] that focussed on the ionization of molecular nitrogenby electrons of comparable impact energy. This latter data is particularlysignificant in that Gorunganthu et al. used an entirely different experimentaltechnique in their study. They used a time-of-flight system to measure theenergy spectrum of ejected electrons and determined the absolute scale bymatching the experimental elastic differential cross sections to the absolutemeasurements at each primary energy. Gorunganthu et al. found no evidence ofa peak at small angles at any of the electron energies they investigated. Inaddition, in his analysis of doubly differential cross sections for ionizationof helium by electrons (discussed below) Kim [31] concluded there was notheoretical justification for such a peak at small emission angles. Inaddition, more recent work at the University of Nebz'aska, with improvedmethods of spurious electron suppression [23] has resulted in only a slightindication of a forward peak. These latter results cast doubt on the validityof the data for small emission angles presented by Rudd and DuBois [6], Oda[21], Bolorizadeh and Rudd [22], and Ehrhardt et al. [30].
Because of the lack of a comprehensive set of electron impact data andthe scatter among experimental data from different research groups, a gooddeal of effort has gone into theoretical techniques to evaluate the accuracyof measured cross sections and to provide a means to extrapolate data toregions where data are nonexistent. Following the lead of Platzman, Kirn hasexplored the consistency of experimental data for electron and protoncollisions using well established theory [31-36]. In the study of DDCS forionization of helium by electron impact Kim [31] described six majorrequirements that the data must exhibit; if they are to be considered correct.These requirements are 1} proper threshold behavior, 2) appropriate asymptotic(high-energy) behavior, 3) angular symmetry in the slope of the Fano plot, 4)correct integrated cross sections, 5) correct energy-loss cross sections, and6} proper kinetics of the binary peak. As Kim points out, the firstrequirement is trivial; this requires that the cross sections must vanish atthe appropriate thresholds. The second requirement implies that, when theDDCS for a specific ejected electron energy e and emission angle 6 are plottedas a function of ln(T/R) the limiting slopes must be proportional to theoscillator strengths for photoionization; here T is the kinetic energy of theincident electron and R is the Rydberg unit of energy. The third requirementindicates that the slopes observed in plots of the form described inrequirement 2 should be similar for comparison of doubly differential crosssections at complementary angles, i.e., for $1+$2=180; this results from thenature of the angular distributions of photoelectrons. Requirement 4 is thatthe integrated cross sections must yield the proper single differential andtotal ionization cross sections and that they must exhibit the proper slopeswhen plotted as a Fano plot, i.e., the slope as determined from thecorresponding oscillator strengths for photoionization. Requirement 5provides no direct information on the DDCS, but insures consistency withenergy loss measurements following integration of the DDCS. The lastrequirement, number 6 above, is that the scattering kinematics for collisions
56

resulting in large energy loss must reflect a classical description of thescattering process; i.e., electron-electron or ion-electron scattering shouldobey classical scattering relationships when the energy transfer is largecompared to the electron binding energy.
Because of the effects of electron binding ,the kinematic requirement,the last of Kirn's requirements listed above, becomes more a qualitativeguideline than a definitive test. For electron collisions, assuming a freetarget electron, classical kinematics give the relationship T = Troaxcos2$ ,where T is the energy transferred to the free electron, Tmax is the initialkinetic energy of the incident electron, and 8 is the angle between thedirection of the extended path of the incident electron and that of theejected electron. Except for the lowest ejected electron energy data ofBolorizadeh and Rudd the angular distributions shown in FIG. 2.1 peak near thekinematic prediction. The widths of the angular distributions reflect theeffect of the initial momentum distributions of the bound electrons.
Another direct test of the DDCS described by the consistency requirementsof Kirn is provided by a Fano plot as stated in condition 3, The Fano plot ofthe DDCS plotted for supplementary angles (but for the same ejected electronenergy) should have the same slope. This condition results from relationshipbetween the differential oscillator strengths, photoionization cross sections,and the angular distribution of electrons ejected by unpolarized photons. Toillustrate these relationships it is convenient to follow the conventionintroduced by Kirn and first scale the DDCS in units of the correspondingRutherford cross section. By scaling the DDCS in this way it is possible toreduce the wide dynamic range of the DDCS and exhibit them on linear, ratherthan logarithmic, scales. This enables one to see features in theexperimental cross sections that may otherwise go unnoticed in a logarithmicdisplay. The Rutherford cross section for an energy loss Q in a collisionbetween a bare charged particle of charge z and a bound electron is given by
doR 7r0 R
" —— — '
where a0 is the Bohr radius, R is the Rydberg energy (13.6 eV) , T=^mv2 (m isthe electron mass and v is the incident particle velocity), and Q=e+I (e isthe ejected electron energy and I is the ionization potential of the targetatom or molecule). Equation 2.1 gives the cross section per target electron;the total cross section would be a sum over all bound electrons, and theionization potential I required to evaluate Eg. 2.1 refers to each respectiveelectron in that sum. Unfortunately the experiments can not normallydistinguish in which electronic shell the electron was initially bound.Therefore for scaling purposes the Rutherford cross section per electron isused and, for an atom with more than one electronic shell, the ionizationpotential is taken as that for the outermost, most loosely bound, electron.
The Rutherford cross section can be used to scale either the DDCS or thesingly differential cross sections (SDCS) that are obtained by integration ofthe DDCS with respect to the solid angle of emission. Conventionally thescaled SDCS 's for electron impact (z = 1) are defined as
(2-2)
and the scaled DDCS's are defined as
Z(Q,T,9) --
57

©
\
0.8
0.6
0.4
0.2
e = 20 e V
0 = 6 0 °
0= 120°
O"
OO
D. O
D
K „
D
-X
D
0 1 2 3 4 5 6
In(T/R)
FIG. 2.2. Fano plot of the DDCS for secondary electron emission by electronimpact ionization of helium. Cross sections are plotted for a secondaryelectron energy of 20 eV at the supplementary angles of 60 and 120 degrees.Experimental data are from (o,D ) Opal et al. [8] and (0,x) Shyn and Sharp[5]. The dashed and solid lines are the asymptotic slopes derived fromphotoionization data by Kirn [31].
One of the tests of the reliability and consistency of experimental crosssections {the Fano plot) takes advantage of the asymptotic (high-T) behaviorof the Born approximation [37,38]. One can express the Born cross section forionization by electrons as
[A ln(T/R) + B] (2.4)
where A and B, known as the Bethe parameters, are constants that depend on theproperties of the target atom, but not on the projectile properties or itsenergy. In addition, the parameter A is directly related to the dipoleoscillator strength f through the relationship
A =Q/R
(2.5)
By using Eqs. 2.4 and 2.5 in either Eq. 2.2 or 2.3 one can show that bothY(Q,T) and Z{T,Q,0) are proportional to f in(T/R) at sufficiently highprojectile energy T. Therefore, if one is to plot Y(Q,T) or Z(Q,T,0) versusln(T/R) at a fixed electron emission angle 6, and/or ejected electron energye, at sufficiently large T the slope of the curve should be proportional tothe dipole oscillator strength. This plot, known as the Fano plot, providesan estimate of the reliability of the cross sections in that data sets that do
58
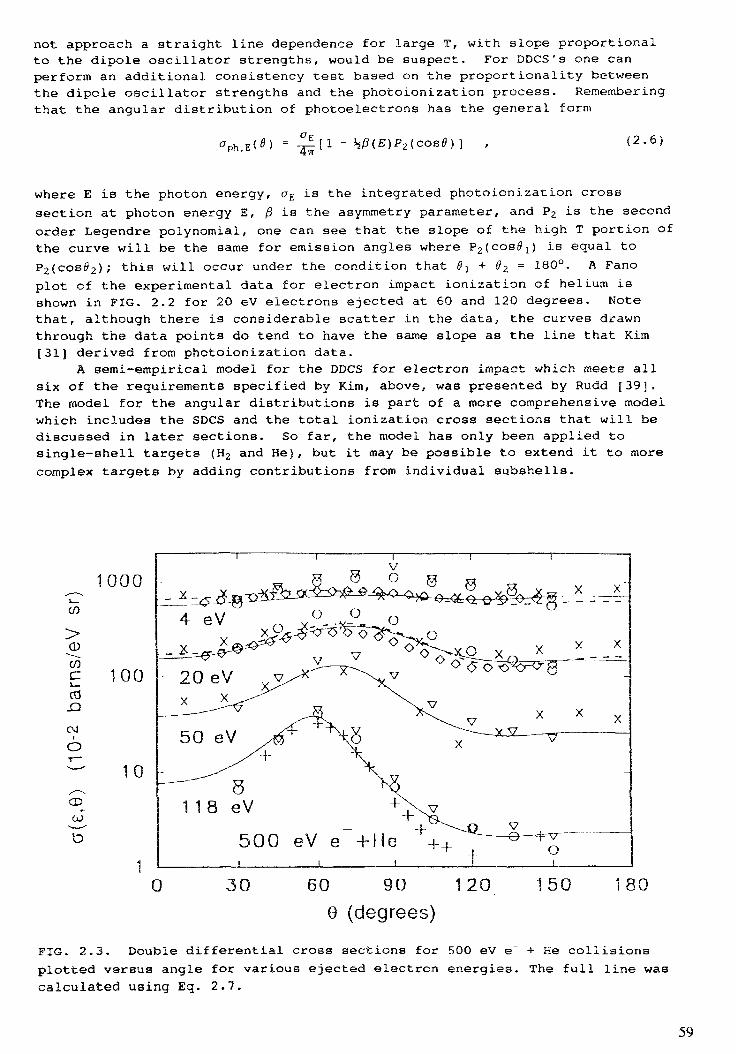
not approach a straight line dependence for large T, with slope proportionalto the dipole oscillator strengths, would be suspect. For DDCS's one canperform an additional consistency test based on the proportionality betweenthe dipole oscillator strengths and the photoionization process. Rememberingthat the angular distribution of photoelectrons has the general form
1 , (2-6)
where E is the photon energy, CTE is the integrated photoionization crosssection at photon energy E, ß is the asymmetry parameter, and P2 is the secondorder Legendre polynomial, one can see that the slope of the high T portion ofthe curve will be the same for emission angles where P2(cos01) is equal toP2(cos02); this will occur under the condition that 6l + 02 = 180°. A Fanoplot of the experimental data for electron impact ionization of helium isshown in FIG. 2.2 for 20 eV electrons ejected at 60 and 120 degrees. Notethat, although there is considerable scatter in the data, the curves drawnthrough the data points do tend to have the same slope as the line that Kirn[31] derived from photoionization data.
A semi-empirical model for the DDCS for electron impact which meets allsix of the requirements specified by Kirn, above, was presented by Rudd [39].The model for the angular distributions is part of a more comprehensive modelwhich includes the SDCS and the total ionization cross sections that will bediscussed in later sections. So far, the model has only been applied tosingle-shell targets (H2 and He), but it may be possible to extend it to morecomplex targets by adding contributions from individual subshells.
CO
CD
cd_Q
OJI
O
CDCO
D
1000
100
10
500 eV e +He___________l___________!
0 60 90 120
0 (degrees)150 180
FIG. 2.3. Double differential cross sections for 500 eV e~ + He collisionsplotted versus angle for various ejected electron energies. The full line wascalculated using Eq. 2.7.
59

He
He
TABLE 2.2PUBLISHED DOUBLY DIFFERENTIAL CROSS
PROTON IMPACT
SECTIONS
Elected ElectronIon Energy
Target Range (keV)H2 50 - 100H2 50 - 100H2 100 - 300H2 300
H2 300 - 1500
H2 1000H2 5 - 100
He 75 - 150He 50 - 150He 100 - 300
He 2 - 100He 2000He 300He 300 - 5000
EnergyRange (eV)4 - 3001 -2 -2 -O „
1001.51 -1 -2 -
K _
30 -1 -™
1 -
50010008003500- 1000- 3005505001000
1001500
10308577
Angle( Degrees!23 - 15210 -10 -20 -
20 -20 -10 -10 -10 -10 -
0 -20 -20 -15 -
160160130130130160160160160
100130150160
InvestigatorsKuyatt and Jorgensen [46]Rudd and Jorgensen [47]Rudd, Sautter and Bailey [48]Toburen [49]Toburen and Wilson [50]Toburen [51]Rudd [52]Cheng, Rudd, and Hsu [53]Rudd and Jorgensen [47]Rudd, Sautter, and
Bailey [48]Gibson and Reid [54]Toburen [51]Stolterfoht [55]Manson, Toburen, Madison and
5 - 5000
5 - 100
1 - 8577
10 - 200
10 - 160
10 - 160
HeHeHeHe
He
NeNeNeNeAr
300 - 15005 - 100
100 - 300
50, 100
1000
7.5 - 15050 - 3001000300 - 150050 - 300
110
40
5
2.
11.111.
- 3500- 200
- 180
- 300
5 - 2500
- 5505 - 1057- 2000- 35005 - 1057
1510
0
0
20
10101515
10
- 125- 160
- 90
- 160
- 160- 160- 125- 125- 160
Stolterfoht [56]Rudd, Toburen and Stolterfoht
[57]
Rudd, Webster, Blocker, andMadison [58]
Toburen, Manson, and Kim [59]Rudd and Madison [60]Crooks and Rudd [61]Bernardi, Suarez, Fainstein,Garibotti, Meckbach, Focke[62]
Pedersen, Hvelplund, Petersenand Fainstein [63]
Cheng, Rudd, and Hsu [53]Crooks and Rudd [64]Toburen and Manson [65]Toburen, Manson, and Kim [59]Crooks and Rudd [64]
60

TABLE 2.2 (cont'd)PUBLISHED DOUBLY DIFFERENTIAL CROSS SECTIONS
PROTON IMPACT
Ion EnergyTarget Range ( keV )
Ar 5 - 1500
ArAr
ArArAr
Ar
Ar
KrKrKrXeN2
N2N2
N2
°2
02H2O
H20
CH4CH4GH,
300 - 50005 - 2000
1000300 - 1500100
5 - 2 0
5 - 5000
7.5 - 15010001000 - 4200300 - 2000300 - 1700
50 - 3005 - 7 0
200 - 500
50 - 300
300 - 150015 - 150300 - 1500200 - 400300 - 1000250 - 2000
ElectedEnergy
Range (eV)
1 - 3500
1.11 -
1 -1 -3 -
1 -
1 -
1 -1 -30,2 -2 -1.5
1.5
1 -
1.5
1 -1 -
1 -
1 -
4 -
1 -
- 100003500
3603500250
26
10000
550300013646204000
- 1057
- 300
1300
- 1057
35003000
3500
1270
5000
5000
ElectronAngle
(Degrees) Investigators
15 - 160
25 -15 -
15 -15 -160
30 -
10 -
10 -15 &15 -20 -20 -
10 -10 -
20 -10 -15 -10 -15 -
20 -20 -20 -
150125
125125
140
160
16019090130130160160
150
160
125160
125150130130
Criswell, Toburen, andRudd [66]
Gabler [67]Criswell, Wilson, andToburen [68]
Manson and Toburen [69]Toburen, Manson, and Kim [59]Rudd, Jorgensen, andVolz [70]
Sataka, Okuno, Urakawa andOda [71]
Rudd, Toburen, andStolterfoht [72]
Cheng, Rudd, and Hsu [53]Manson and Toburen [73]Toburen and Manson [74]Toburen [75]Toburen [49]Crooks and Rudd [64]Rudd [52]Stolterfoht [55]Crooks and Rudd [64]Toburen and Wilson [76]Bolorizadeh and Rudd [77]Toburen and Wilson [76]Stolterfoht [78]Wilson and Toburen [79]Lynch, Toburen, and
CH2 6
300 - 1000 4 - 5000 20 - 130300 - 1000 4 - 5000 20 - 130
300 - 1000 4 - 5000 20 - 130
Wilson [80]Wilson and Toburen [79]Wilson and Toburen [79]Wilson and Toburen [79]
61

Target
TABLE 2.2 (cont'd)PUBLISHED DOUBLY DIFFERENTIAL CROSS SECTIONS
PROTON IMPACT
Ion EnergyRange (keV)
Elected ElectronEnergy Angle
Ranqe (eV> (Deqrees) Investiqators
C6H6 300 - 2000 4 - 5000NH3 250 - 2000 1 - 5000
CH3NH2 250 - 2000 1 - 5000
{CH3)2NH 250 - 2000 1 - 5000
300 - 1800 1 - 5000
300 - 1800 1 - 5000
20 - 130 Wilson and Toburen [79]20 - 130 Lynch, Toburen, and Wilson
[80]20 - 130 Lynch, Toburen, and Wilson
[80]20 - 130 Lynch, Toburen, and Wilson
[80]20 - 130 Toburen, Wilson, and Porter
[81]20 - 130 Toburen, Wilson, and Porter
[81]
In the model of Rudd the angular distribution of ejected electrons,whether true secondary electrons from the target or scattered primaries, canbe represented by two Lorentzian peaks; the binary peak centered at an anglewhich depends on the primary and secondary electron energies, and a backwardpeak centered at 180°. The doubly differential cross section, in terms of thedimensionless variables w=e/I and t=T/I, at(w,0), where £ is the detectedelectron energy, T the primary energy, and I the target electron bindingenergy, is given by
cosfl (2.7)
The quantities Glf ...G5 are the fitting parameters which, in general arefunctions of w and t. The center of the binary peak, G2, is obtainable frommomentum and energy considerations and is given by G2=[(w+1)/t]1/2. G3 is thewidth of the binary peak which is given by G3=0.60[(l-G^)/w]1/2. The relativesize of the backward peak is given by GA=10( 1-w/t)3/[t (w+1) ] . The value ofG5, the width of the backward peak, can be taken to be a constant equal to0.33. GI is determined by equating the integral over angle of Eq. 2.7 to thesingly differential cross sections at(w) (to be discussed later). This yields
at(w)/27ri f i - G 2 i i fi+G2Ïi man-1 _i UtarT1 L_5 ko^tan'1 L£
[ G3 J [ G3 JJ |G5
(2.8)
The DDCS calculated from the model are compared to experimental values for 500eV e"+He in FIG. 2.3.
62

TABLE 2.3PUBLISHED DOUBLY DIFFERENTIAL CROSS SECTIONS
STRUCTURED-ION IMPACT
ReactionH2+ + H2Ne+ + NeNen++ Ne(n=l-4)
Ar* + ArAr"1" + Ar
On+ = 02(n=4-8)
H2+ H2
Elected ElectronIon Energy Energy AngleRanqe (keV) Ranqe (eV} (Decrees) Investiqators600 - 1500 2 - 2000 20 - 125 Wilson and Toburen [82]50 - 300 1.5 - 1000 10 - 160 Cacak and Jorgensen [83]25 - 800 1.6 - 1100 45 - 135 Woerlee, Gordeev, de Waard,
and Saris [84]; andWoerlee [85]
50 - 300 1.5 - 1000 10 - 160 Cacak and Jorgensen [83]100 3 - 250 160 Rudd, Jorgensen, and Volz
[70]30000 10 - 4000 25 - 90 Stolterfoht, et al. [86]
1000, 2000 20 - 1000He* He
30 - 140 Oda and Nishimura [87]
ArHe0
5-20 1 - 2 6 30 - 140 Sataka, Okuno, Urakawa, andOda [71]
H° + He
3He° + He''He0 + He
15 - 150 1.5 - 300 10 - 160 Fryar, Rudd, and Risley[88]
H° + He
He2+ + He
He* He
15 - 150
50, 100
+ Ne 1200He2"1" Ar
1.5 - 300 15 - 150 Rudd, Risley, Friar, andRolf es [89]
5 - 300 0-90 Bernardi, Suarez, Fainstein,Garibotti, Meckbach, Focke[62]
1 - 3500 15 - 125 Toburen and Wilson [90]
He+
HeHe
2++ Ar 300 - 2000 l - 4000
+ H?0He2+
300 - 2000 1 - 4000
15 - 125 Toburen and Wilson [91]
15 - 125 Toburen, Wilson, andPopowich [92]
63

TABLE 2.3 (conf d)PUBLISHED DOUBLY DIFFERENTIAL CROSS SECTIONS
STRUCTURED-ION IMPACT
ReactionIon EnergyRange (keV)
Ejected ElectronEnergyRange feV)
Angle(Degrees) Investigators
H° + H2O 20 - 150 1 - 300 10 - 160 Bolorizadeh and Rudd[93]
+ He 5 - 2 0 2 - 5 0 30 - 120 Urakawa, Tokoro, andOda [94]
H2+ + Ar
He+5-20 2 - 2 6 30, 90 Sataka, Urakawa, and
Oda [95]
2+He
C6+ + He-.8+
1000/u 2 - 2500 20 - 160 Pedersen, Hvelplund,Petersen, andFainstein [63]
C+HeNeAr 1200 1 - 800 30, 90 Toburen [96]
+ He
Cr'+ + Ar(n=l-3)
800 - 4200
1300 - 3000
10 - 1500
1 - 4000
15 - 130 Reinhold, Schultz, Oison,Toburen, and DuBois[97]; and Toburen,DuBois,Reinhold,Schultz, and Oison[98]
15 - 130 Toburen [99]
0++ Ar 50 - 500 5 - 500 16 - 160 Stolterfoht and Schneider
[100]
Kr(n=2-5)
Krn+ + Kr(n=2-5)
50 - 1000 80 - 1000 45 - 135 Gordeev, Woerlee, deWaardand Saris [101]; andWoerlee [85]
25 - 800 16 - 1100 45 - 135 Gordeev, Woerlee, DeWaard,and Saris [102]; andWoerlee [85]
64

TABLE 2.3 (cont'd)PUBLISHED DOUBLY DIFFERENTIAL CROSS SECTIONS
STRUCTURED-ION IMPACT
ReactionIon EnergyRange (keV)
Elected ElectronEnergy Angle
Ranqe (eV) (Degrees) Investigators
Fe17 +
.22++ He, Ar 3500/u 5 - 8000 27 - 155 Schneider, DeWitt, Bauer,Mowat, Graham,Schlachter, Skogvall,Fainstein, andRivarola [103]
He 2500/u 2 - 5000 20 - 160 Stolterfoht et al. [104;
U33+ + Ar 1400/u 1 - 4000 20 - 90 Kelbch, Olson, Schmidt,Schmidt-Böcking, andHagmann [105]
U33+ + Ne 1400/u 1 - 4000 20 - 90 Kelbch, Olson, Schmidt,Schinidt-Böcking, andHagmann [105]
U33+ + Ar
U38+ + He
Th38*+ Ar
1400/u
6000/u
1 - 4000
5 - 5000
20 - 90 Schmidt-Böcking, Ramm,Kraft, Ullrich,Berg,Kelbch, Olson, DuBois,Hagmann, and Jiazhen[106]
20 - 150 Schneider et al. [107;
2.2.2. Pro-ton Impact
There has been a wide range of experimental and theoretical studies of doubly-differential cross sections for proton impact ionization of atomic andmolecular targets and, to a much lesser extent, data are available for muchheavier bare, or nearly bare, ions. Several reviews of doubly-differentialcross sections for ion impact have been published including those by Toburen[1, 40-42], Rudd and Macek [43], Rudd [44] and Stolterfoht [45]. An updatedlisting, first published by Toburen [41], of the publications that reportmeasured doubly differential cross sections for proton impact is presented inTable 2.2 of this chapter and a listing of publications concerned with datafor heavier ions and neutral particles is given in Table 2.3. These listingsfocus on studies that report absolute cross sections and that cover a broadspectrum of ejected electron energies and angles. We have not included inthis review studies of special features of the emission spectra such as"convoy electrons" (see, for example, Breinig, et al., [108] or studies thatfocus on a narrow angular range, eg. publications that focus on electronsejected at zero degrees; such studies are not considered highly relevant toRadiation Therapy, or to Radiological Physics in general.
65

2.2.2.1 Available experimental data;
From a survey of the proton impact data presented in Table 2.2, doublydifferential cross sections are observed to be available that span the regionsof low (5-50 keV), intermediate (50-300 keV), and high (greater than about 300keV) proton energies; these energy ranges reflect regions requiring differenttheoretical approaches to describe the collision process. Only a fewmolecular targets, eg., hydrogen, nitrogen, oxygen, and water vapor, have beenstudied throughout these energy ranges. Those molecules, however, provide agood representation of the constituents of tissue. The majority of the database that has been used to investigate effects of molecular bonding onelectron emission cross sections has been developed in the region of high-energy proton collisions.
An indication of the precision of the various measurements that have beenreported can be addressed by an evaluation of the uncertainties contributingto the individual measurements and by comparison of measurements of differentinvestigators. A comparison of DDCS for ejection of electrons from nitrogen
10-17
10-18
19
10-20
CMGo
CD 10
"b10
10
-21
-22
-230.1
0.3 MeV H+ ON N2
5(T
— T-O-F• STOLTERFOHTo CROOKS AND RUDDx TOBUREN
_i—\ i 11 » 111"<&«
1.0 10 100ELECTRON ENERGY (eV)
1000
FIG. 2.4. Comparison of absolute doubly differential cross sections a(f,6)plotted as a function of ejected electron energy e for ionization of N2 by 0.3MeV protons measured by (®) Stolterfoht [55], (O) Crooks and Rudd [64], and(x) Toburen [49]. The solid lines represent cross sections obtained for low-energy ejected electrons measured by time-of-flight techniques by Toburen andWilson [109].
66

by 0.3 Mev protons measured by three different research groups is shown inFIG. 2.4. For ejected electron energies greater than about 15 eV theagreement is well within the estimated uncertainties in the individualmeasurements of approximately 20%. For low-energy ejected electrons the dataof Toburen [49], Stolterfoht [55], and Crooks and Rudd [64], obtained usingelectrostatic energy analysis of the ejected electrons, diverge. Thesedisagreements are attributed to several possible experimental difficulties,including scattering of the low-energy electrons in the target and residualgas, uncertainties in detection efficiencies for low-energy electrons, and/oreffects of stray electrostatic and magnetic fields on the transmission ofelectrons through the electrostatic energy analyzers. In an effort to resolvesome of these uncertainties in the cross sections for low energy electronemission a time-of-flight (TOF) technique was developed by Toburen and Wilson[109] that was optimized to measure relative cross sections for ejectedelectron energies in the range from 1 to 200 eV. This system used a short TOFpath (about 7.5 cm) from the collision region to the detector to minimizeeffects of stray electric and magnetic fields on the transmission of low-energy electrons, had no analyzing fields that might be distorted by surfaceaffects or fringing, and employed a gas jet as the target to minimize thescattering of low-energy electrons during their transit from the target to thedetector. The solid lines shown in FIG. 2.4 were derived from TOFmeasurements of the relative electron yields converted to absolute crosssections by normalization to the electrostatic results of Toburen [49] at 100eV. The combination of electrostatic and TOF measurements provides reliablecross sections for the ejected energy range from approximately 1 to 5000 eV,thus providing a wide range of data for analysis of cross section systematicsand for development of theoretical models. Cross sections measured using thiscombination of experimental techniques have been published for proton impactionization of a number of carbon containing molecules [79], and nitrogencontaining molecules [80], as well as noble gas atoms [66,110].
2.2.2.2. Theoretical studies;
Coincident with the proliferation of experimental results for the energyand angular distributions of electrons ejected in proton collisions withatomic and molecular targets was a similar activity in the theoreticaldescription of these collisions. Although confined to "fast" collisions,where fast refers to collisions in which the projectile velocity is muchgreater than the bound electron velocity, both quantum mechanical andclassical methods were exploited (See the reviews by Rudd and Macek [43],Stolterfoht [45], and Rudd and Grégoire [111]). The simplest of thesetheories to apply in practice is the classical binary encounter theory firstadvanced for differential ionization cross sections by Vriens [112] andexploited by Rudd and Grégoire [111], Bonsen and Vriens [113], and numerousothers. This method is essentially a classical description of the collisionbetween an incoming bare charged particle and a free electron. The majorcontribution of these authors beyond earlier classical methods was theinclusion of techniques to account for the effects of electronic binding oftarget, electrons to an atom or molecule. This was accomplished by consideringthe target electron to have an initial non-zero velocity distribution owing tothe fact that it is bound. Various means of estimating this initial velocitydistribution for bound electrons were devised; these ranged from the simpleprocedure of setting the kinetic energy of the bound electron equal to itsbinding energy, to the more elaborate scheme of calculating the velocitydistribution from a Hartree-Fock description of the electrons in the atom.
67
The most common method is to assume the velocity distribution to be isotropicwith a quantum-mechanical speed distribution deduced from a Fock distribution(see, for example, Rudd and Macek [43], Rudd and Grégoire [111], and Toburenet al. [114,115]. The primary effect of different assumptions of the initialvelocity distribution of the target electron is observed in the energydistributions of ejected electrons and will be discussed in a later section ofthis chapter that deals with the singly differential electron emission crosssections.
In general, the angular distributions of ejected electrons obtained bybinary encounter calculations are somewhat more sharply peaked at theclassically predicted angles than are measured values. This is illustrated inFIG. 2.5 where calculated angular distributions of electrons ejected atselected energies are compared with measurements for ionization of helium by2-MeV protons. Although there is excellent agreement between the measured andcalculated cross sections near the peak in each distribution there arediscrepancies as large as an order of magnitude at both the largest andsmallest emission angles.
Considerable effort has also been given to quantum mechanicalcalculations of the energy and angular distributions of electrons ejected inproton-atom collisions. The Born approximation has been applied to the studyof proton ionization of helium in a number of studies {see, for example,Manson et al., [56], Madison [116], and Oldham [117]}. The use of the Bornapproximation with hydrogenic wave functions to describe initial discrete andfinal continuum states leads to angular distributions similar to thoseobtained with binary encounter theory. However, with the use of morerealistic wave functions to describe both the bound and continuum states ofthe target the Born approximation provides a notable improvement over thesemi-classical treatments. The calculations of Madison [116], shown in FIG.2.5, are based on a Born approximation with Hartree-Fock initial discrete andfinal continuum wave functions. This calculation is observed to provide muchimproved agreement with experimental cross sections compared to the crosssections obtained from binary encounter theory. There are, however, stillsizeable discrepancies between the Born calculations and measurements forelectrons ejected into small emission angles with velocity comparable to theoutgoing proton. These discrepancies are attributed to an enhancement of themeasured cross sections by the process of continuum-charge-transfer [44]. Asfirst suggested by Oldham [117], this process is due to an interaction betweenthe ejected electron and the scattered proton in which the projectile isconsidered to "pull" a bound target electron from its orbit as though tocapture it, but rather than be captured into a bound projectile state theelectron is "captured" into a continuum projectile state. This ionizationmechanism exhibits its primary influence for electron emission into smallangles for ejected electron velocities near that of the projectile velocity.Continuum-charge-transfer (CCT), also referred to as electron capture to thecontinuum (ECC) or charge transfer to the continuum (CTC), can lead tosizeable differences between calculated and measured cross sections, as areobserved in FIG. 2.5, because the final state interaction between theprojectile and the ejected electron is not usually included as a part of thetheoretical calculation; i.e., it is not included in the the plane wave Borncalculation of FIG. 2.5. The theory for the CCT process was first explored bySalin [118] using the Born distorted wave approximation and by Macek [119]using the Neuman expansion of Faddeev's equation for the final state of theelectron-proton-residual ion system. The Faddeev results of Macek [119,120]are compared in FIG. 2.6 to a hydrogenic Born calculation that includes nocontribution from CCT and to measurements for electrons ejected with
68

10 =
10 ="
CU
10;
10:
10:
T
BEA, Bonsen and Vriens• — - Madison
_«__«_. Experiment, Toburen
eV
30 60 900 (Degrees)
120 150 180
FIG. 2.5. Doubly differential cross sections for ionization of helium by 2MeV protons. The binary encounter theory calculation (BEA) is from Bonson andVriens [113] and the plane wave Born calculation is from the work of Madison[116].
69

.SEo-Sî
<D
iSiS"oj0
I.QMeVf-PonHe
O 2.0MeVD*onHe
Theory
— Faddeev Theory
Born Theory
Electron Energy
500 eV(X10)
909 (Degrees)
120 150 180
FIG. 2.6. Doubly differential cross sections for emission of electrons ofvelocity comparable to the projectile [51] compared to the Faddeev and PlaneWave Born calculations of Macek [120].
70

-SOJ~
EooCMlO
OJ
0.25
a 20
a 15
HÎO
0.05
0.00
-,———,
aso
0.25 -
(a)0.1 MeV
0.5
0.4
0.3
0.2
0.1
0.0
0.25
a 20 -
Q15
(b)0.3 MeV
0.00 0.00
0 30 60 90 120 Î50 Î80 0 30
6 (degrees)60 90 Î20 Î5Q 180
FIG. 2.7. Angular distributions of 81.6 eV electrons ejected from helium byprotons of a) 100 keV, b) 300 keV, c) 1000 keV, and d) 5000 keV. The solidline is a plane wave Born calculation? the calculation and experimental pointsare from Manson et al. [56J.
71

velocities near that of the incident proton (the equivalent electron velocityfor a 1 MeV proton is 544 eV) where the maximum contribution from CCT isexpected. The Faddeev calculation of Macek is shown to be in excellentagreement with the measurements. These comparisons between theory andexperiment illustrate the important role DDCS's can play in investigating thebasic interaction mechanism and testing our theoretical understanding.
Although there have been Born calculations of doubly differential crosssections for proton impact ionization of a number of atomic targets includingneon [65], argon [69], and krypton [73,74], the only comprehensiveexperimental and theoretical studies have been for helium targets [56,60,116].In general the agreement between theory and experiment has been quite good forhigh energy proton impact, i.e., for proton energies greater than about 500keV. There are, of course, discrepancies in the region of the spectra wherecontinuum-charge transfer is important since it is not included in the planewave Born approximation. As the proton energy increases the agreement betweenBorn calculations and experiment improves because the CCT process falls offmuch more rapidly with proton velocity than does direct ionization. This isillustrated in FIG. 2.7, where the angular distribution of 81.6 eV electronsejected by protons with energies of 100-, 300-, 1000-, and 5000-keV arecompared with Born calculations. The Born calculations by Manson et al. [56jare based on the use of Hartree-Slater wave functions for the initial discreteand final continuum states; these wave functions are only slightly differentfrom the Hartree-Fock wavefunctions used by Madison [116]. At the highestproton energy excellent agreement is obtained between the measured andcalculated cross sections. It should also be noted that cross sectionscalculated for electron impact at comparable velocities to the highest energyprotons shown in FIG. 2.7 are in equally good agreement with experiment [56].This comparison leads one to the conclusion that the plane wave Bornapproximation is very good at describing the direct ionization of helium byfast protons and electrons and that the differences observed between theoryand experiment at the lower energies, but still within the expected range ofvalidity of the Born approximation, are a measure of the importance of the CCTmechanism of target ionization. Using this reasoning, Manson et al. [56]looked at the relative contribution of CCT to the doubly differential crosssections for electron energies where this mechanism was expected to bemaximum. The results of their analysis are shown in FIG. 2.8 as a function ofejected electron emission angle and incident proton energy. The CCTcontribution is observed to peak for proton energies somewhere between 300 and500 keV which is approximately where the velocity of the bound electron andthe incident proton coincide. It should be noted that, although the maximumcontribution of the CCT process to the doubly differential cross sections maybe quite large, its influence is over a relatively small region of ejectedelectron energy and emission angle and therefore does not contributesignificantly to the total yield of ejected electrons. This will be apparentin the discussion of singly differential and total electron production crosssections that is presented later in this chapter.
The phenomenon of post-collision electron-projectile interactions hasreceived a good deal of attention in the last few years. Interest wasrekindled by the studies of Meckbach et al. [121] who noted that CCT is only aspecial case of the full three-body final state in which all three particlesinteract equally. In their work the similarities of this interaction to thatof the escape of two electrons from a positive core as treated within theWannier theory was exploited. They were able to show that the ridge in thedoubly differential cross section surface along the 0 degree axis was producedby electrons that were ejected in the combined field of the projectile and the

CM
O)
2 4
/o
o_0
O 2»sW
-4U)
0.5 1.0 1.5 2.0 2.5 3.0PROTON ENERGY (MeV)
3.5 4.0 4.5 5.0
FIG. 2.8. Ratio of experimental to theoretical doubly differential crosssections for proton impact ionization of helium for equal velocity ejectedelectrons and incident protons shown as a function of proton energy andejected electron angle. The solid lines are only a guide to the eye throughthe data points that are then extrapolated to higher energy proton energiesbased on the shape of the curves measured at the larger angles where there aresufficient data points to define the curve shape.

1 0
ob'oo
0.1
-r-r-r-j——
20°®
150° \
10 100 1000
FIG. 2.9. Ratio of doubly differential cross sections for electron emissionfrom Helium by 25 MeV/u Mo*0+ and H+ impact. The Mo<l0+ data were divided by H+results from a Born approximation (PWBA). The long dashed lines are from aCDW-EIS calculation for both H+ and Mo40+ impact. Both experimental andtheoretical data are from Stolterfoht et al. [104].
residual target ion. These "saddle-point" electrons were also successfullytreated using the Classical Trajectory Monte Carlo Theory {CTMC) of Oison etal. [122]. The CTMC theory treats the classical motion of the electron in thecombined coulomb field of the collision partners. In their CTMC calculationthe saddle-point electrons were shown to be produced by a classicallyunderstandable mechanism and observed at non-zero scattering angles.
Both the CTMC and the Wannier calculations mentioned above had focussedon understanding that portion of the electron spectra between the CCT peak andthe low energy peak resulting from electrons escaping with low energies fromthe target. In measurements of the secondary electrons emitted in collisionsof projectiles with higher charge states [63,104,107] the effect of the twocharge centers could be seen over a broad range of the ejected electronspectra. In these studies the emission cross sections are enhanced in theforward direction and reduced for angles greater than 90°; results from thework of Stolterfoht are shown in FIG. 2.9. Variations from the expectedcharge scaling are observed to occur for ejected electron energies well beyondthe equal velocity considerations of CCT. In these collisions first orderBorn calculations are found to give an incomplete representation of theprocess and appear to be inadequate to describe the doubly differential crosssections even for what might be considered "high enough" collision velocities.These two-center effects have been quite successfully described by Fainsteinet al. [123] using the continuum-distorted-wave eikonal-initial-state (CDW-EIS) model (see also, Pedersen et al., [63] and Stolterfoht et al. [104]).
74

The Coulombic behavior due to the active electron-projectile interaction isincluded in the entry channel by choosing a distorted initial wavefunctionwhere the initial bound state is multiplied by an eikonal phase associatedwith that interaction. In the exit channel, the active electron is assumed tofeel simultaneously the fields of the projectile and of the residual target.
2.2.2.3. Consistency teats;
In principle, the DDCS for electron emission in collisions of protons, orother ions, with atomic or molecular targets are subject to the sameconsistency tests described above for electron impact. Ions are in some wayssimpler to deal with than electrons, since, owing to their large mass, theyhave nominally straight line trajectories and one does not have to considerexchange processes as is necessary for ionization by electrons. On the otherhand, positive ions present additional ionization channels not found forincident electrons. For example, positive ions can produce ionization bycapturing electrons from the target atom or molecule into either bound orcontinuum states of the ion. Once an ion has captured an electron into abound state it can release that electron in a subsequent collision. In thissection of this chapter we are considering only bare projectiles, thereforeonly capture into continuum states is of concern here. With that condition,the consistency test developed above for electron impact become valuable toolsfor examining the reliability of proton impact data so long as we take care toapply them to only the regions of the emission spectra that are relativelyunaffected by CCT. For comparing ion and electron cross sections it is alsoconvenient to express the ion energy in units of the equivalent electronenergy. For example the proton energy is expressed as T = ^mvp2, where m isthe electron mass and vp is the proton velocity (or T = Eptn/M, where Ep ia theproton energy and M is the proton mass). This notation can also begeneralized to any ion impact by simply using the ion velocity (or ion energyand mass) in place of the proton value in the relationship given for T.
One of the consistency requirements discussed by Kirn [31] was that theobserved kinematics of the cross sections must be consistent with wellestablished classical scattering relationships for ion-electron collisions.For collisions of a proton of energy T (as defined above) with a free electronthe kinematic collision conditions are only slightly different from therelationship discussed in the previous section for electron impact. For anincident proton of energy T the ejected electron energy e and emission angle 8must satisfy the condition e = 4Tcos20. This relationship is valid for allions of sufficiently high velocity that the incident ion is not significantlydeflected during the collision. Figure 2.10 shows the angular distributionsof ejected electrons of a number of energies resulting from ionization ofxenon by 2 MeV protons. The dashed line indicates the position of the peak ofthe angular distribution determined from the kinematics of a proton collisionwith a free electron. This peak is often referred to as the binary encounterpeak because it reflects the kinematics of a two-body (or binary) collisionbetween the incident proton (or ion) and the target electron. For the lowestenergy electrons the measured angular distribution shows only a vagueindication of a peak at the position predicted for free electrons. Thisabsence of a peak results because the ejected electron has an initial velocitydistribution, owing to its being bound, that dominates the observed angulardistribution at low energies. At higher ejected electron energies the peak inthe observed angular distribution is more pronounced and the width of thatpeak reflects the initial velocity distribution of the bound electrons. Ingeneral the maximum in the peak in the angular distribution occurs at the
75

10-18
10-19
Eo10-20
o>JEo
CD
UÎ
D
10-21
10
10-23
10-24
l l i i I T T
ELECTRONENERGY
(eV)
1080
12503000
J___JL l !..
1500J———!———L
-l
COS 9
FIG. 2.10. Angular distribution of electrons of several energies ejected fromxenon by 2-MeV protons as measured by Toburen [75], The dashed line indicatesthe expected peak in the angular distribution as given by classical kinematicsfor a free electron.
76

10 18
io19L-
10 20
03\
tNJ
£ -,/>o 10 -21
10 22
10 23
1O24
OPAL et aï.5OO eV ELECTRON IMPACT
— TOBUREN AND WILSON1 MeV PROTON IMPACT
EJECTED ELECTRON ENERGY
10 eV _
5O eV -
100 eV
200 eV
(CTx 10 1
A_LO 30 60 90 120
^(DEGREES)150 180
FIG. 2.11. Doubly differential cross sections for ionization of molecularhydrogen by electrons and protons of equal velocity illustrating the effect ofprojectile mass on the scattering kinematics. Electron impact data are fromOpal et al. [7] and the proton data are from Toburen and Wilson [50] .
77

0
50 eV
i i i !___I I
50 eV
_r
..——/rI___I !
55°,- 1251
Q:CNJ
ora
0
24 eV 24 eV
8
0
16 eV
70U
110',o
*£?
--.-A"'
16 eV
---£"
55U
125C
2(T/R)
FIG. 2.12, Comparison of the ratio of measured doubly differential electronemission cross sections to the Rutherford scattering cross section as afunction of ln{T/R) for low-energy electrons ejected in fast proton-SF6collisions. The existence of parallel slopes for data plotted atsupplementary angles is evidence of data consistency. The data are fromToburen et al.[81].
78

angle that is expected from the classical prediction. The angulardistributions for the three highest energies exhibited in FIG. 2.10 seem topeak at somewhat smaller angles than is expected based on the classicalprediction. The shift of the peak to smaller angles may be an indication ofexperimental difficulties in these measurements or it may reflect a breakdownin the classical description of the collision process. In a study of thebinary encounter peak for electrons ejected from helium by 1 Mev protonsconducted by Pedersen et al. [63] it was found that the peak energies wereshifted by about 4% to lower energies than predicted by classical theory. Inthat work this shift was attributed to the interaction of the outgoingelectron with the combined charge of the residual target and the projectile.Such an interaction would also be expected to affect the position of the peakin the angular distribution and may contribute to the shift observed in FIG.2.10.
It is interesting to consider the difference in the position of thebinary encounter electron peak with respect to the angular distributions ofelectrons ejected by electron and proton impact. The observed differencereflects the influence of the mass of the incident particle on the kinematicsof the collision; recall that for electrons 0 is given by cos"1 ( e/T)*, whereasfor ions 6 is given by cos"3 e/4T)\ Data for electron ejection by equalvelocity proton and electron impact are shown in FIG. 2.11. These data showexplicitly the difficulty of directly scaling doubly differential crosssections from proton to electron impact.
The second consistency test advocated by Kirn [31] to test the reliabilityof doubly differential cross sections was the use of the Fano plot. Asdiscussed above for electron impact, a plot of Z(T,e,0) versus ln(T/R) forelectrons ejected at supplementary angles should produce straight lines withsimilar slopes. Data from ionization of SF6 by protons [81] are plotted inthis manner in FIG. 2.12. The slopes of the curves for supplementary anglesare found to be parallel indicating that the proton energy dependence of thedoubly differential cross sections is consistent with theoreticalexpectations. As indicated above, however, one must be careful not to choosedata that are dominated by CCT if this test is to be considered valid. SinceCCT is more important in the spectra of electrons ejected into small anglesand has an ion energy dependence different from direct ionization it maycontribute to supplementary angles having different slopes within the Fanoplot. This must be taken into consideration when using the Fano plot toevaluate the consistency of doubly differential cross sections for positiveions.
2.2.2.4. Cross section systematics:
To this point the discussion of doubly differential cross sections for protonimpact has been limited predominantly to atomic targets; with the majority ofthe work, experimental and theoretical, being for the target helium. Heliumis the simplest target amenable to experiments and provides a good test casefor theoretical developments. For applications to radiological physics, orradiation therapy, cross sections are needed for molecular targets and, morespecifically, there is a need to know the emission cross sections forheterogenous condensed phase targets. Such targets are not amenable tomeasurements of secondary electron cross sections, however, because theelectrons are absorbed in the targets before they can be detected, i.e., theranges of electrons for the energies of interest are shorter than the thinnestpractical targets. The challenge for the physicist is then to develop anunderstanding of the systematics of the emission cross sections that will
79

c
.3?CD
-S"~^oTtu0
10
FIG. 2.13. Doubly-differential cross sections measured for ionization of anumber of molecules by 1.5 MeV protons [H2 - Toburen and Wilson [50] N2 -Toburen [49]; H2O, O2 - Toburen and Wilson [76]; and CO, CO2, N2O - Toburen,unpublished]. The data have all been scaled by dividing the measured crosssections by the number of loosely bound electrons in the respective molecule.In this work the number of weakly bound electrons is defined as all electronsexcept the K-shell electrons of carbon, nitrogen, and oxygen.
80

10-19
10-20
I lo-a"55i»>J~~ECD
10-23
10-24
1.0 MeV H+ON ~HYDROCARBOMSH20
ELECTRONENERGY
lev)
30 I
200
550
0cos e
-i
FIG. 2.14, Doubly-differential cross sections for ionization of a number ofmolecules by 1 MeV protons scaled by the number of weakly bound targetelectrons. The hydrocarbon data are from the work of Wilcon and Toburen [79],H2O and O2 data are from Toburen and WilsonToburen [49 J.
;76] and the N2 data are from
81

enable him to scale the gas phase cross sections for application in condensedphase material.
A great deal of effort has gone into studies of the effects of electronicbinding and molecular structure on interaction cross sections. For moleculartargets, there is considerable similarity in the angular distributions ofelectrons ejected by protons for all of the molecules that have been studied,with the exception of molecular hydrogen. Data for a number of simplemolecular targets are shown in FIG. 2.13 for 1.5 MeV proton impact. Forcomparing cross sections for different molecules we have scaled the crosssections by dividing each by the number of weakly bound electrons in therespective molecule. For this purpose we define weakly bound electrons to beall electrons except the K-shell electrons of carbon, oxygen, and nitrogen.The K~shell electrons of these atoms are excluded because, at the protonenergy shown, they contribute little to the total yield of electrons. Scaledin this way, data for all molecules, except hydrogen, agree withinexperimental uncertainties. Similar results were obtained for cross sectionsmeasured for hydrocarbon molecules; this is illustrated in FIG. 2.14. In thiscomparison, the cross-hatched area of the curves represent data from a numberof simple hydrocarbon molecules [79] including CHA, C2H2, C2H4, C2H6, and C6H8.The data for hydrocarbon molecules show slightly higher values at the peaks inthe angular distributions, i.e., they exhibit a somewhat more hydrogen-likecharacter in the binary-encounter peaks, than the non-hydrogen containingmolecular targets. When scaled in this manner all of these molecular targetsprovide cross sections that agree well at both, large and small emissionangles. If cross sections for higher ejected electron energies were plottedthe peaks in the angular distributions would move to smaller angles inagreement with classical kinematics; i.e., proportional to cos26. Evidence ofionization via the CCT mechanism is also seen in figs. 2.13 and 2.14; thisionization mechanism contributes to the increase in the cross sections for thesmallest angles of ejection with the largest contribution at the highestenergy electrons shown. We would expect enhancement due to CCT to be mostevident in distributions for ejected electron energies near 817 eV in FIG.2.13 and 544 eV in FIG. 2.14; these electrons are of equivalent velocity tothe incident 1.5- and 1.0-MeV protons, respectively, shown in these figures.
The most dramatic differences observed among the data for the differentmolecules shown in Figs. 2.13 and 2.14 are between the scaled molecularhydrogen cross sections and those of all the other molecules. Differences ofmore than an order of magnitude occur at both, small and large emission angle.These differences carry an even more important meaning when we recall thatserai-classical and hydrogenic Born calculations yield results that mimic thehydrogen measurements. It is only when realistic wave functions are used forboth bound and continuum states that the Born approximation gives adequateagreement with measured doubly differential cross sections [56]. Unfortunatelytechniques have not been developed for application of Born theory to moleculartargets owing primarily to the unavailability of adequate target wavefunctions.
The general trends of the angular distributions shown in Figs. 2.13 and2.14 are representative of what we may call "fast" collisions; collisions inwhich the incident proton is fast relative to the speed of the boundelectrons. These conditions lead to the appearance of the binary encounterpeak in the angular distribution of ejected electrons; this is particularlyevident for ejected electrons with energies significantly greater than theinitial binding energy of the ejected electron. An examination of the angulardistributions of electrons ejected by much lower energy proton impact, shownin FIG. 2.15, illustrates that these have a quite different distribution. For
82

0.010 30 60 90 120 150 180
6(deg)FIG. 2.15. Angular distributions of electrons of several energies ejectedfrom krypton by low energy protons; this figure was reproduced from Cheng etal. [53].
such low-energy protons the ejected electron distributions peak at zerodegrees for all ejected electron energies [53].
As can be seen, there have been a wide range of measurements of doublydifferential cross sections for proton impact and these results provide aclear indication of the cross section systematics. However, no theoreticalmodels have been developed for the DOCS's for molecular targets and there hasbeen little work published with regard to phenomenological models of thesecross sections that can be used in radiobiological modeling. One model of thedoubly differential cross sections for electron emission from moleculartargets presently in use for Monte Carlo track structure calculations is thatof Wilson [124, 125]. Wilson bases his semi-theoretical model on Bethe-Borntheory (Eq. 2.4) where the doubly differential cross section for electronemission is given by Kirn [32] as
T/R(2.9)
83

where z is the charge of the incident particle and A and B are defined below.The first term in the brackets of Eq. 2.9 describes the distant interactionsinvolving small momentum transfers, glancing collisions. The second term isthe "hard" collision component, representing close interactions that transfersignificant momentum to the target particle. In Wilson's current model thehigher order terms, O(1/T), are considered negligible and ignored.
The angular dependent part of the glancing collisions term, A(e,0), isrepresented in the optical approximation by
where R/(e+Ij) dfj/de is the dipole optical oscillator strength for shell j .In Eq. 2.10, j3j is the photoelectron asymmetry parameter, P2 is the Legendrepolynomial of second order and Ij is the ionization threshold for shell j.For the oscillator strengths, Wilson uses a piece-wise polynomialrepresentation of the Berkowitz tabulation [126] of the total oscillatorstrength and branching ratios of Tan et al. [127] and of Blake and Carter[128]. The asymmetry parameter ß^ is theoretically equal to 2 for S states,(the 2al orbital of water); for other states ßj is energy dependent and aphenomenological fit to experimental DDCS data [76] is used.
The fast collisions component, B(e,ff), of the experimental angulardistributions is well represented by a (Gaussian) normal distribution [124,125 j. Therefore, this component in Eq. 2.9 is approximated by a product ofthree functions; ge ( 6 ) , Sbea(e), and fb(£). The angular dependence, ge(o), isdescribed by a normalized Gaussian function
g t ( 9 ) - --exp- , (2.11)V27T rwhere $bar is the mean value of the angle at which the binary encounter peakoccurs in the angular distribution and T .s the width of the Gaussian fit tothat peak. The coefficients, F and cos 6, contained in Eq. 2.11 areparameterized as a function of proton energy and energy loss by least squaresfitting to the experimental angular distributions. The amplitude of the hardcollisions term is determined primarily by the second function, Sbea(e). Forit, Wilson uses a simple singly differential binary-encounter treatment [43].Finally, the function fb is introduced to force the hard collisions componentto tend to zero as £ -> 0, in order to achieve better agreement withexperiment (e in eV) ,
fb(e) = max ••• — «———— > (2-12)
This scheme has been used by Wilson for representing water vapor crosssections and the results of his calculations plotted as differential partialstopping cross sections [eo(e,8)], i.e., that part of the stopping crosssection arising from energy loss to kinetic energy of electrons ejected atspecific angles, are reproduced for 1 MeV proton impact in FIG. 2.16. Thepartial stopping cross section for ionization can be obtained from themeasured doubly differential cross sections by carrying out the integration inthe expression Jd£ JdO(I+£)a(e,8), where I is the initial binding energy ofthe ejected electron.

1.0 MeV FT ON HoO
FIG. 2.16. Doubly differential energy loss cross sections for energydeposited as kinetic energy of ejected electrons [eo(e,8), in units of cm2/srmolecule] calculated using the model of Wilson [124,125] with parametersobtained from fitting the data of Toburen and Wilson [76] for proton impactionization of water vapor.
From a review of the doubly differential cross sections for electronemission by protons it would appear that the mechanisms responsible forionization are well understood; this is particularly true for fast ions wherethe Born approximation in expected to be valid. Theoretical techniques topredict doubly differential cross sections in the high energy region (energiesgreater than a few hundred keV) have been successful based on the Bornapproximation. Binary encounter theory and hydrogenic Born calculations bothunderestimate the cross sections for emission of electrons into large andsmall angles. The similarity of angular distributions for a wide range ofmolecular targets, however, is conducive to the development of molecularmodels for use in track structure calculations. Charge-transfer-to-continuumstates contribute to an enhancement of the cross sections for small emissionangles, but do not contribute significantly to the total yield of electrons.
85

Before moving on to the discussion of doubly differential electronemission cross sections for heavier ions it is appropriate to comment on thegeneral features of the angular distributions of electrons ejected in protoncollisions and the relationship of what is observed to that assumed in commonradiological calculations for high LET radiation. The angular distributionsof ejected electrons have been shown to have a broad angular distributionthat, in the intermediate- and high-energy range, varies from nearly isotropicfor the lowest energy ejected electrons to narrow distributions peaked at theclassical emission angles for high-energy ejected electrons. This issummarized here to emphasize that not all electrons are ejected at 90 degreesto the ion path as has been assumed in traditional track structurecalculations (see, for example, Butts and Katz [129] and Chatterjee andShaeffer, [130]).
2.2.3. Heavy Ion Impact
2.2.3.1. Bare Ions:
Protons represent, by far, the most comprehensive data base of doublydifferential cross sections for bare ions. The second largest data set for abare ion is that available for alpha particles, He2'1". There have also beensome measurements of doubly differential cross sections for heavier ions, suchas C5+, and O8+ [63], O8+ [86], and the nearly bare Mo40* ion [104], Thesedata, for somewhat isolated collision systems, serve to examine methods forion charge-state scaling of cross sections and provide tests of evolvingtheory, eg., these data were mentioned briefly above in the context oftheoretical techniques that include the effects of the two charge centers,projectile and target, on the ejected electron spectra. It suffices to repeathere that, for projectiles of sufficiently high charge states, z2 scaling maybe modified somewhat compared to that expected on the basis of first orderclassical and quantum calculations.
The doubly differential cross sections for ejection of electrons into a"large" emission angle (125 degrees) from argon by 1.2 and 2.0 MeV alphaparticles are shown in FIG. 2.17 where they are compared to cross sections forelectron emission by equal velocity protons. Here the cross sections forproton impact were multiplied by a factor of 4 to scale them according to z2scaling, as predicted by classical (Eq. 2.1) and quantum mechanical (Eq. 2.8)theory, for comparison to the alpha particle results. Note that there isexcellent agreement between the scaled proton data and the equal velocityalpha particle cross sections. The only difference observed among the datafor the two projectiles is the somewhat broader Auger electron spectrasuperimposed on the continuum spectra at approximately 200 eV for the alphaparticle impact. The extra width of the alpha particle induced Auger spectraresults from increased multiple ionization of the target by alpha particles,thus resulting in Auger transitions with a broader energy range [131]. Asimilar comparison of doubly differential cross sections is shown in FIG. 2.18for electron emission into a forward angle. Here we see that the z2 scalingprovides excellent agreement among the data for the two projectiles at thelargest and smallest ejected electron energies. Discrepancies are observed,however, at the intermediate electron energies. These discrepancies areattributed to the influence of the CCT ionization mechanism. CCT is expectedto scale as z3 [132] compared to the z2 scaling of direct ionization; thiswould lead to larger cross sections for the alpha particles in the region ofthe spectra where CCT contributes. This mechanism should have a maximumeffect at ejected electron energies such that the outgoing projectile andelectron have comparable velocity; equal velocities occur at ejected electron
86

VU
He ION ifVIPACT lOIMIZATIOfu OF ARGONELECTRON EMISSION AT 125°
10 13
10-14
10-15
_ 10Eo+«»m« 10Oîà-
10
-16
-17
18
10-19
10-20
10-21
-22
_<e~"~ —~ A
2.0 M&V\ (X 104)
1.2 MQ\/102)
-—— 4x H+ GABLER
——— 4 K H*TOBUREIM
i .._ i——i—!—i—i .1 l
10° 102 103
FIG. 2.17. Doubly differential cross sections for ejection of electron into125° from argon by protons and alpha particles. The proton data weremultiplied by 4, scaled by z2, for comparison to the alpha particle results.The data are from ( for », —) Toburen and Wilaon [91] and (——} Gabler [67J.
87

He ION IIVIPACT lOWfZATlOIM OF ARGONELECTRON EMISSION AT 30°
10 -13
10-15
Eo4-»«5l_to>QJ
10-IT-
-19
10 -21
10o
i——i—i—rr~rÎ ' ' ' ' j 1————I——I——l—TTTT-
2 MeV(x 104)
1.2 MeV(x 102)
He
4 x H+ GABLER
4 x H*TOBUREN
i l l l l i l l !_______!————I——!——I—L_J_Li_ i i l l i l l
10' 10'
6(eV)
FIG. 2.18. Doubly differential cross sections for ejection of electron into30o from argon by protons and alpha particles. The data were scaled asdiscussed in FIG. 2.17. The data are from («, —) Toburen and Wilson [91] and(——) Gabler [67].

energies of 272 eV and 163 eV for alpha particle (proton) energies of 2 MeV(0.5 MeV) and 1.2 MeV (0.3 MeV), respectively. These data would suggest thatthe CCT lonization mechanism is an important contribution to the ionizedelectron spectra over a broad range of electron energies and emission angles.
2.2.3.2. Structured Ions:
Studies of lonization of atomic and molecular targets by structured ions,i.e., ions that carry bound electrons and are sometimes referred to as clothedor dressed ions, have been underway for more than 20 years (see for example,Rudd et al. [70], Cacak and Jorgensen, [83], Wilson and Toburen, [82], andhave been discussed in reviews by Toburen [1, 41, 42], Rudd and Macek [43],Rudd [44] e and Stolterfoht [45]. Publications addressing doubly-differentialcross sections for a broad range of collision partners are reviewed in table2.3; in preparing this table the publications were limited to those thatpresent measurements of absolute cross sections and that cover a reasonablywide range of ejected electron energies and ancles.
The primary differences in the spectra of electrons ejected by fast ionsthat carry bound electrons from those ejected by bare ions can be seen in FIG.2.19, where spectra are shown for ejection of electrons from water vapor oy0.3 MeV/u H+, He++, and He* ions [92]; the proton data are shown both, asunsealed cross sections for low-energy electron emission, and as full spectramultiplied by a factor of 4 to account for z2 scaling for comparison to thehelium ion data. Note that the scaled proton data are in excellent agreementwith the He++ results over most of the energy and angular range. The greatestdifferences between the scaled proton and bare helium ion cross sections occurat the smallest angles and for electron energies near 160 eV; the latter isthe electron energy at which the electron and ion have comparable velocity.These differences are attributed, as discussed above, to the CCT mechanism oflonization which scales as a higher power of z than direct lonization.
In contrast to the excellent agreement observed between scaled H+ andHe++ cross sections the emission cross sections for He* impact exhibit markeddifferences from the bare ion results. Most evident is the reduction in crosssection for ejection of low-energy electrons; at the smallest ejected electronenergies the cross sections more nearly reflect the unsealed proton results.Low-energy electrons are ejected in distant "soft" collisions in which thebound projectile electron provides an effective electrostatic shield of thehelium ion nucleus [114] such that the strength of the electrostaticinteraction is greatly reduced. Higher energy electrons, on the other hand,are ejected with increasingly close collisions that penetrate the shieldingradius of the He* bound electron and are subject to the Coulomb potential ofthe full nuclear charge of the projectile. Thus, cross sections for high-energy electrons ejected in He+ collisions are similar to those for He**impact, whereas the low-energy data are more nearly equal to those of unsealedproton cross sections. More explicitly, one finds a gradual change in thenature of the cross sections, from lo^-energy electrons that are ejected inlarge-impact parameter collisions by what would appear to be a proton ("heavy"particle) of charge +1, to fast electrons ejected in close collisions by aneffectively bare alpha particle of charge +2. Unfortunately the functionalrelationship that allows one to scale the charge as a function of energy loss,or impact parameter, has not been determined for different ion species anddifferent molecular targets. The most obvious implication of the energydependence of the "effective" nuclear charge is that the effective charge ofstopping power theory, i.e., an effective charge that is only a function ofthe nuclear charge and particle velocity, is totally inadequate for use in anytheory of differential energy loss by dressed ions. On the other hand, thedependence of effective cnarge on energy loss determined from measured
89

10'
03
OSo
03<v
o.£ö
10U
10 15
10 l«
10'
10'
101
10*°
10 22
1.2 MeV He** on H21.2 MeV He+ on H2O0 3 MeV H+ on H2O (X4)
10 100 1000e(eV)
FIG. 2.19. Doubly differential cross sections for electron emission fromwater vapor by 0.3 MeV/u protons and helium ions. Proton data are shownmultiplied by 4 (as implied by z2 scaling) and unsealed for the low energyportion of the spectra for comparison to the helium ion results; the data arefrom Toburen et al. [92].
90

He ION IMPACT IONIZATION OF ARGONELECTRON EMISSION AT 125°
10 13
10 -14
10-15
_ 10Eoro
» 1003
-16
-17
EÄ 10-18
10 •19
10-20
10 21
10 22
-T—————I———I——I——I—I I IJj
»x 2.0 MeV; \ (X 104)
v ®«
4 x H* GABLER4x H+ TOBUREN
11
Xy.V- < t » i i
10° 102 10-€ (eV)
FIG. 2.20. Representative electron spectra for electron emission from argonat 125 degrees by eg jal velocity H"*", He+, and He2"1" ion impact. The scaledproton data are from Gabler [67], Criswell et al. [66], and Toburen et al.[110].
91

differential ionization cross sections can provide insights into the originsof the effective charge of stopping power theory; if the contribution tostopping power from target excitation is small the effective charge ofstopping power theory can be obtained from an integral over the energy-lossdependent effective charge derived from ionization data such as those shown inFIG. 2.19 when averaged over the population of charge states in a chargeequilibrated beam. The concept of effective charge will be treated in greaterdetail in a later section of this chapter and again in Chapter 7.5.
The second feature observed in the electron spectra measured forstructured ion impact that is different from bare ions is the presence of abroad peak in the spectra originating from electrons that are stripped fromthe incident ion. These electrons are found predominantly in the forwarddirections, small emission angles in the laboratory reference frame, and atelectron energies that correspond to electrons of the same velocity as theion. Such a peak is visible in FIG. 2.19 in the 15- and 30-degree spectra atapproximately 160 eV. In the 15-degree spectrum the contribution fromprojectile electron loss actually enhances the cross sections in the He*spectrum to the point that it is larger than that of the He1"1" spectrum. Atthe larger emission angles the contribution to the spectra from projectileelectron loss is less obvious and the primary difference between the spectrafor the different ions is the strong influence of the bound He+ electron inscreening the projectile nucleus. The contribution to the electron emissionspectra from projectile-electron loss is also strongly dependent upon theprojectile energy in this intermediate energy range. The cross sections forelectron emission into an angle of 125 degrees from ionization of argon by He1"ions is shown in FIG. 2.20 for ion energies from 0.3 MeV to 2 MeV, i.e., 75 to500 keV/u. Here the contribution from electron loss is seen to disappear asthe ion energy is decreased. This reflects the well known tendency of theelectron stripping cross sections to decrease as the ion energy decreases.
Theoretical studies of doubly differential cross sections for He* impacthave been limited primarily to the Born approximation (see, for example,Manson and Toburen, [133], and McGuire, et al., [134]), although efforts havealso been made to apply the binary encounter approximation [114]. Acomparison of the doubly-differential cross sections calculated with the Bornapproximation for the He^-He collision system to spectra measured at 15 and 60degrees with respect to the outgoing He+ ion is shown in FIG. 2.21, this isreprinted from the work of Manson and Toburen [133]. Excellent agreementbetween theory and experiment is observed for electrons ejected at 60 degrees,but differences of approximately a factor of 2 are found for the 15 degreespectra. Since electrons are indistinguishable in these measurement it couldnot be determined whether the discrepancy were with the calculation of targetor projectile ionization. More recently measurements were made in whichelectrons were detected in coincidence with either the transmitted He+ orstripped He1"" ion [135]. Those measurements demonstrated the inadequacy ofthe theoretical treatment to address simultaneous ionization processes, eg.,ionization of both the projectile and target in a single collision. It wasnot clear from this work, however, whether discrepancies were the result ofthe use of inadequate wave functions or if they were a result of a breakdownin the Born approximation itself. More recently measurements have beenundertaken for the H°-He collision system [136] that now indicate that theBorn approximation is sufficient to describe these few electron systems ifadequate wave functions are used for both, discrete and continuum states.
An example of the spectrum of electrons ejected in He+ collisions withwater vapor in which electrons are detected in coincidence with the strippedHe2* ion is shown in FIG. 2.22. These measurements were conducted at thePacific Northwest Laboratory by R. D. DuBois using experimental techniques
92

10'
10 19
in
5 1020
CD
-ÎÎto
10;
10:
« Experiment— Born Calculation
. • f ' .
10 15 20 25 30 35E(R)
FIG. 2.21. Comparison of the measured doubly-differential cross sections forionization of helium by 2 MeV He+ to calculations based on the Born approxima-tion [133].
described by DuBois and Manson [135]. One would expect the coincidencespectrum to be dominated by electrons lost by the projectile; a spectrum thatpeaks at approximately 400 eV for the ion energy considered here. Theexpected spectrum of electrons stripped from the projectiles, based on thetransformation of an ejected electron spectrum from the projectile frame ofreference to the laboratory frame is shown as the dashed line in FIG. 2.22.The large contribution of electrons ejected with energies less than 400 eV inthe coincidence spectrum is attributed to simultaneous projectile and targetionization. This simultaneous ionization implies there will be a significantamount of correlation between the two ejected electrons as they slow down in abiological medium. Such correlation may influence the subsequent chemicalreactions and lead to biologically active chemical species that are differentfrom those following non-correlated energy deposition events.
Only a limited amount of data are available for structured ions heavierthan helium (see Table 2.3 for details). At the low-energy end of theprojectile energy spectrum these studies range from the pioneering work ofJorgensen and his colleagues at the University of Nebraska for symmetric Ar+ -Ar and Ne"1" - Ne collisions [70,83] to the more recent work of Woerlee et al.[84,85] for Nen+ - Ne, n=l-3, Stolterfoht and Schneider [100] for O+ and N"1"
93

collisions with Ar, and Toburen et al. [98] for ionization of He by C+. High-energy projectile studies range from the early studies of Stolterfoht et al.[86] for fast oxygen ions to the very fast, very heavy ion work of Schneideret al. [103] for Fe17+ and Fe22+ ions, Stolterfoht et al. [104] for Mo40'1' ions,Kelbch et al. [105] for U33+ ions, Schmidt-Bocking et al. [106]) for U33+ ions,and Schneider et al. [107] for Th38+ and U38+ ions. For the most part, thesedata for heavy ions are limited in scope; by this we mean they do not cover abroad enough range in projectile energy or charge state to gain a detailedunderstanding of the collision systematics. They do, however, provideexcellent tests of collision theory. Such tests were discussed above for bareions and will be examined further later in this section.
In our studies at the Pacific Northwest Laboratory we have investigatedthe cross section systematics for intermediate-energy "light" heavy ions, eg.,carbon and oxygen ions. The general features of the ejected electron spectrafor these intermediate-energy clothed ions are illustrated in FIG. 2.23 forionization of water vapor by oxygen ions. For an ion of the relatively smallvelocity shown in FIG. 2.23, we see only a small contribution to the ejected
io-18
OT 10-20<B
- J O - 2 2 __
I Ï ! ! 1 Ï Ï
750 keV/smu He» - H2O —
• Total Electron Emission— ®— Electrons In Coincidence with
Stripped Proiactila(--—— Expactad Sliapsl
_LUU103 10"
t leV)
FIG. 2.22. Comparison of the spectrum of electrons detected in coincidencewith ionization of the He+ projectile to that of all electrons ejected at 20degrees with respect to the exiting ion. These unpublished data were measuredby R. D. DuBois at the Pacific Northwest Laboratory using the techniquedescribed by DuBois and Manson [135],
94

10
10 "
<DOJEo
10 19
10:
10:10 100e(eV)
1000
FIG. 2.23. Cross sections for emission of electrons at 15 degrees forionization of water vapor by oxygen ions. The position in the spectrum atwhich the ejected electron velovity is equal to the ion velocity is noted byve = vx; the binary encounter peak is designated as BEP and the high energypeak is attributed to the KL1L2s Auger electron emitted from the oxygen ionexcited and decaying in flight. These are unpublished data from the author'sstudies at the Pacific Northwest Laboratory.
electron spectra resulting from electron loss from the projectile (exhibitedas a small peak where the ejected electron velocity Ve is nearly equal to theion velocity vx). The contribution is largest for the singly charged ion andthen decreases as the projectile charge state increases. The binary encounterpeak (BEP) for "fast" electrons ejected in these collisions is observed as ashoulder on the high energy portion of the spectra and this contribution isobserved to increase slightly with increased projectile charge state. Abovethe BEP the cross sections decrease rapidly; the "width" of the binary peakreflects the initial velocity distribution of the bound target electrons. Itis interesting to note the somewhat faster fall-off of the cross sections forthe higher projectile charge states. This may be the effect of the electronsfeeling the potential of the two charge centers which tends to decrease thecross sections for electrons that exit the collision with velocities greaterthan the projectile [63,104,123]. The peak observed in the spectra atapproximately 1000 eV results from Auger electrons emitted from the oxygenprojectile following collision induced K-shell vacancy production. The Augerspectra are observed in the laboratory frame-of-reference at the Dopplershifted energy (For a review of the kinematics of projectile emitted Augerprocesses, see Stolterfoht [45]). The effect of projectile electron screening
95

10 -18
10-19-
CM
0 10-20
CD
10 -21
10 -22
He+ + He-\C+ + He
X /
0.3 SVIeV/amu incident ionsElectron Emission 1 5°
10 100
c (eV)
1000
FIG. 2.24. Secondary electron emission are shown for electron emission at 15degrees with respect to the out going projectile by equal velocity Hf, He"*",and C+ ions colliding with a helium target. The proton data are from thecompilation of Rudd et al. [72], the He+ data are from Toburen and Wilson[90], and the C+ data are from Toburen et al. [98].
on the collision cross sections is seen in the decreasing cross section forlow-energy electron emission as the charge state of the ion decreases. Forthe lowest energy electrons ejected, those resulting from the most distantcollisions, one would expect the cross sections to be representative of aprojectile point charge equal to the net ion charge. Thus the results for O+may be expected to approach the cross sections obtained for equal velocityprotons. Likewise cross sections for O2+ and OJ+ may be expected to be factorsof 4 and 9 larger than O+ results, reflecting "z2" scaling, at sufficiently
96

10.-17
10„-18
10.-19
o
<n-Ü 10
10.-22
10
10'
.-23
0.3 MeV H+ on Argon
1.2 MeV He* on Argona/4
3.6 MeV C* on Argon0/36
10 100 £(eV) 1000 10,000
FIG. 2.25. Single differential cross sections for ionization of argon byequal velocity H+, He+, and C+ ions. The data for He+ and C* ion impact havebeen divided by 4 and 36, respectively, in accord with z2 scaling for compari-son to the proton résulta.
low ejected electron energies. The fact that the cross sections at the lowestenergies shown do not exhibit these ratios is either because we have not yetmeasured low enough ejected electron energies, or that the basic scalingassumption is invalid.
Cross sections for emission of electrons into an angle of 15 degrees forionization of He by equal velocity 300 keV/u H+, He+, and c+ ions are shown inFIG. 2.24. The cross sections for low-energy electron emission by C+ ionsapproach the same values as those for the other two singly charged ionsillustrating the screening efficiency of projectile electrons. For higherelectron energies, those ejected in small impact parameter collisions, thecarbon cross sections are approximately 36 times greater than the protonresults; this reflect interactions between the incident ion and bound electronthat occur with an essentially unscreened carbon nucleus. This dramaticeffect of nuclear screening by the projectile electrons is perhaps moreclearly seen in the data for singly differential cross sections, obtained frommeasured doubly differential cross sections by integration with respect toemission angle, shown in FIG. 2.25. Here it is reasonably clear that thehigh-energy electrons scale as the square of the projectile nuclear charge,
97

whereas the low-energy electrons ejected in soft, or distant, collisions arerepresentative of interactions with a highly screened projectile nuclearcharge. Although the comparison of secondary electron spectra to proton dataclearly shows that the effective charge of heavier, clothed ions is a functionof the energy loss, there is no theory available, nor is there adequate ex-perimental data at this time, to accurately define the functional relation-ships of this "effective charge" with ion energy, ion opecies, and energyloss.
The interpretation of the cross sections in terms of theory for electronemission in collisions involving structured ions depends strongly on theenergy range of the incident ions. At the highest energies of the incidentions one can expect calculations based on the Born approximation to bereasonably successful. At high projectile energies the ions have anequilibrium charge that is representative of nearly bare nuclei andtheoretical calculations for collisions with such ions are in good agreementwith measurements [63,104,123].
For low-energy dressed ions the ejected electron energy spectra have anearly exponential shape. This is illustrated in FIG. 2.26 where the data ofWoerlee [84,85] are compared with the somewhat higher energy results from theauthor's work at the Pacific Northwest Laboratory. The observation by Woerlee[85] that the differential cross sections exhibit an exponential dependence onejected electron energy and, for given ion energy, decrease with increasingprojectile charge has lead to the use of quasi-molecular theory to describethese collisions [43,84,85]. In that theory the electron emission isconsidered as a result of direct coupling of the discrete and continuumelectronic states via a rotational or radial coupling. This leads to thefunctional form of the cross section given by
f. \(2.13)
where the electrons are assumed to be emitted isotropically and, in theirnotation, R0, a, and 5 are parameters that can be determined from theexperimental data [84]. The physical interpretation of these parameters isthat a is the width of the region where the coupling to the continuum takesplace, 5 is the energy of the discrete state, and R0 is the internucleardistance where the coupling is strongest. In the fitting of theirexperimental Ne+ - Ne data, Woerlee et al. found valves of R0 = 1.32 au, a =0.42 au, and 6 = 10 eV which are reasonable values within the assumedmechanism. It should be noted, however, that the angular distributions arenot found experimentally to be isotropic as assumed in arriving at Eq. 2.13.Woerlee et al. [84] find the angular distributions of ejected electrons to beapproximately cosö in shape in the center-of-mass reference frame with the 90degree minimum to be about 30% of the values at 50 and 140 degrees.
Although the direct coupling theory is expected to be valid only at theextreme low-energy end of the range of ion-atoms collision energies we havetaken the liberty to add our unpublished carbon ion data obtained at somewhathigher ion energy to the Woerlee et al. data for comparison in FIG. 2.26. Thegood agreement in shape and magnitude between the C+ and Ne2+ ion data isquite interesting. It would seem to imply that the details of the projectile-target electronic structure is not very important in this ion energy range.This conclusion could also be drawn from the similarity of cross sectionsfound for different neon ion charge states by Woerlee et al. [84]. If thisconclusion is valid and not simply a coincidence of the particular data setsbeing compared, then the direct coupling theory may provide a good method forparameterizing data for use in radiological modeling. For example, Eq. 2.13would suggest that if the logarithm of the doubly differential cross sections
98
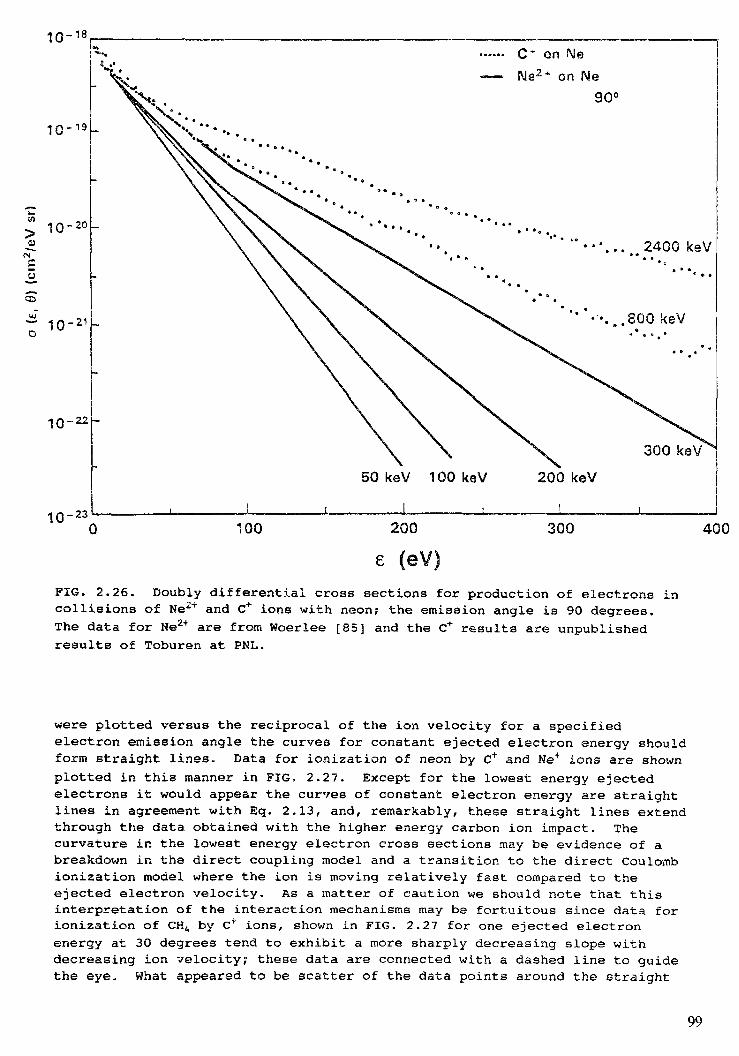
10-18
10-19-
CD
10-20-
10-22
io-23 100 200£ (eV)
300 400
FIG. 2.26. Doubly differential cross sections for production of electrons incollisions of Ne2"1" and C+ ions with neon; the emission angle is 90 degrees.The data for Ne2+ are from Woerlee [85] and the C+ results are unpublishedresults of Toburen at PNL.
were plotted versus the reciprocal of the ion velocity for a specifiedelectron emission angle the curves for constant ejected electron energy shouldform straight lines. Data for ionization of neon by C"1" and Ne+ ions are shownplotted in this manner in FIG. 2.27. Except for the lowest energy ejectedelectrons it would appear the curves of constant electron energy are straightlines in agreement with Eq. 2.13, and, remarkably, these straight lines extendthrough the data obtained with the higher energy carbon ion impact. Thecurvature in the lowest energy electron cross sections may be evidence of abreakdown in the direct coupling model and a transition to the direct Coulombionization model where the ion is moving relatively fast compared to theejected electron velocity. As a matter of caution we should note that thisinterpretation of the interaction mechanisms may be fortuitous since data forionization of CH4 by C+ ions, shown in FIG. 2.27 for one ejected electronenergy at 30 degrees tend to exhibit a more sharply decreasing slope withdecreasing ion velocity; these data are connected with a dashed line to guidethe eye. What appeared to be scatter of the data points around the straight
99

Son Energy (keV)Me +
!on Energy (keV)C
ooo o oo o in00 CM t~—f———j———————!30° Neon Target
£ = 25 eV
10-23
O O OO O IDCO CM
50° IMeon Target
0 0.2 0.4 0.6 0.8 1.0 1.2
v-1 (10-8 sec cm-1)
0 0.2 0.4 0.6 0.8 1.0 1.2 1.4
v-1 (10-8 sec cm-1)
FIG. 2.27. Cross sections for ionization of neon by C+ and Ne+ ions plottedas recommended by the theory of direct coupling between discrete and continuumstates. The Ne ion data are from the work of Cacak and Jorgensen [83] and thecarbon ion data are unpublished data from the Pacific Northwest Laboratoryusing the techniques discussed by Toburen [96B, 99B].
line in the neon target data is accurately reproduced in the CH<, data. Onemust ask whether the high energy C+ data do indeed exhibit a different slopethan the solid lines suggests, or are we justified in connecting the highenergy C+ data with the lower energy Ne+ ion data? Resolving this questionwill require more study.
Although the direct coupling theory seems to describe the generalfeatures of the ejected electron spectra for low and intermediate energycollisions of structured ions with atomic targets this theory is of limitedapplication as it does not provide ab initio absolute cross sections. Onlywith the recent developments of the Classical Trajectory Monte Carlo (CTMC)theory [97,98,105] does it appear that one may be able to address the problemof calculating absolute cross sections for collisions involving intermediate-energy structured ions. Doubly differential cross sections for ionization ofhelium by 200 keV/u C+ ions are compared at an emission angle of 5C degreeswith CTMC results in FIG. 2.28. In this illustration the experimental results
ÎOO
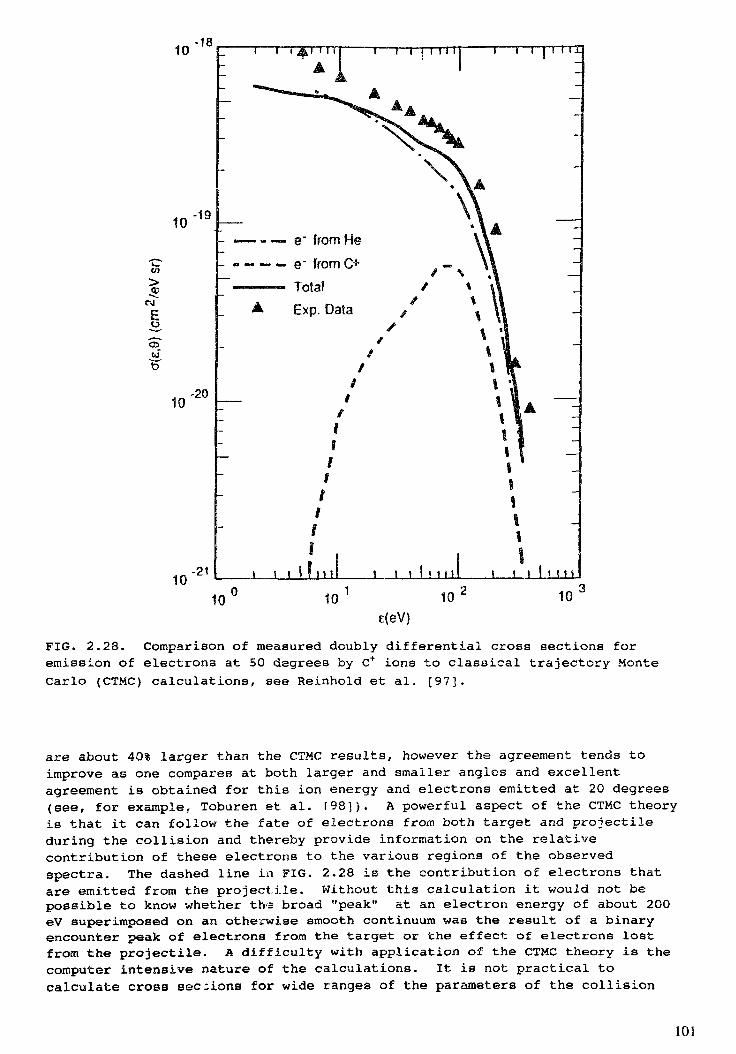
10 -18
10 -19
CM
10 -20
10 -21
T — r i i i irn——i—r i i i n
, „ — e~ from He-» — e~ from O—— Totalà Exp. Data
1 ,l i i f n i i
ÎÎl!I
_J_l M i l
10 10 10 10E(eV)
FIG. 2.28. Comparison of measured doubly differential cross sections foremission of electrons at 50 degrees by C+ ions to classical trajectory MonteCarlo (CTMC) calculations, see Reinhold et al. [97].
are about 40% larger than the CTMC results, however the agreement tends toimprove as one compares at both larger and smaller angles and excellentagreement is obtained for this ion energy and electrons emitted at 20 degrees(see, for example, Toburen et al. T98]). A powerful aspect of the CTMC theoryis that it can follow the fate of electrons from both target and projectileduring the collision and thereby provide information on the relativecontribution of these electrons to the various regions of the observedspectra. The dashed line in FIG. 2.28 is the contribution of electrons thatare emitted from the projectile. Without this calculation it would not bepossible to know whether th-a broad "peak" at an electron energy of about 200eV superimposed on an otherwise smooth continuum was the result of a binaryencounter peak of electrons from the target or the effect of electrons lostfrom the projectile. A difficulty with application of the CTMC theory is thecomputer intensive nature of the calculations. It is not practical tocalculate cross sections for wide ranges of the parameters of the collision
101

- Î 7IO
CD-^ -teC\J (0
Eo
CO10
-19
,020
iOO \
!——FT Ï U I j—————I———T~
PRIMARY ENERGY (eV)
• . • / . • • .' • - . •.•;. •• . . . 100
;:•....200
. • ;* .*• . .300
'•."•> 500"• '"1000
2000°'. -H i l J-Ul
IO 100
e (eV)FIG. 2.29. Single differential cross sections for ionization of molecularnitrogen by 500 eV electron impact. The data are from the work of Opal, etal. [7J.
systems of interest to radiobiology and radiation therapy. However it may bepossible to use this technique to gain a better understanding of the collisionprocess that will enable the development of phenomenological models that canstill reproduce the features of the ejected electron spectra with more simplecomputational forms.
2.3. SINGLY DIFFERENTIAL IONIZATION CROSS SECTIONS
2.3.1 Electron Impact
Although singly differential cross sections (SDCS) for electron emissionin ion atom/molecule collisions are in concept simpler than doublydifferential cross sections there have been essentially1 no experimentsdesigned that measure them directly. Singly differential cross sections arenormally obtained by integration of the doubly differential cross sectionswith respect to either ejected electron energy or emission angle. The SDCS
xThe electron spectrometer developed by Mathis and Vroom [15j could, inprinciple measure singly differential cross sections directly by electricallyconnecting the angular electron detectors together. In practice, however, *-*-spectrometer was not used in that fashion. the
102

are somewhat less sensitive to the details of the collision physics becausethe act of integration over one collision variable tends to average subtlefeatures of the ejected electron spectra. However, for many applications inradiological physics the SDCS provide an adequate description of thecollisions, eg., the SDCS, a(«), obtained from integration of DDCS overemission angle is an accurate indicator of the probability of energy loss by aprojectile in an encounter with the target electron. The SDCS obtained byintegration of DDCS 's also provide additional tests of the accuracy andreliability of experimental data.
Singly differential cross sections, a ( € ) , for the ionization of molecularnitrogen are shown in FIG. 2.29. These data from the work of Opal et al. [7]illustrate the general shape of the secondary electron spectra; for electronimpact, secondary electrons are defined as electrons detected with less thenone half of the incident electron energy. From collision kinematics it isknown that for each secondary electron detected with energy « , the primaryelectron will be observed in the spectrum with an energy given by Ee - e - Ie,where Ee is the incident electron energy, and Ie is the initial binding energyof the ejected electron. The contribution to the spectra from degradedprimaries is observed as the tendency of the cross sections to increase at thehigh energy end of the spectra for the four lowest energy incident electronsshown in FIG. 2.29. If each of the spectra had been continued out to theprimary energy the high-energy half of the spectra would mirror that of thelow-energy half, however shifted slightly to lower energies to account for theloss of energy in overcoming electron binding, and at £ = Ee the elasticscattering peak would be seen. A full electron spectrum for ionization ofmethane by 500 eV electrons is shown in FIG. 2.30. This comparison from thework of Oda [21] also demonstrates the good agreement between his results andthe measurements of Opal et al. [7]. The Mott cross sections given in thework of Oda agree well with the experimental data through the center of thespectrum, but fall below the experimental values for low-energy ejectedelectrons and overestimate the cross sections at the upper end of thespectrum. The steps, or discontinuities, seen in the Mott cross sections aredue to the effects of inner-shell contributions to the electron spectrum.
The data for ionization of atomic and molecular targets by electronimpact are available for only a limited range of incident energies and targetspecies; see the publications cited in Table 2.1. Because of this limitedrange of the availability of experimental data, and the scatter in the datafrom different sources, a good deal of effort has gone into the development oftheoretical techniques to test and extend the existing data. As indicatedabove in the discussion of doubly differential cross section, Kim and hiscolleagues [32-36] have developed methods based on established theory to testthe reliability and to extend the range of electron emission cross sections.For the analysis of singly differential electron emission cross sections it isconvenient to present the SDCS 's as their ratio to the Rutherford or, in thecase of electron impact, the Mott cross sections; this reduces the widedynamic range of the energy loss spectra enabling their display on a linearscale and helps to illustrate established theoretical constraints on the crosssections. To determine this ratio, presented explicitly for the Rutherfordcross sections in Eq. 2.2, above, to targets with more than one electronicshell it is necessary to sum over all contributing electronic levels. In thatcase Eq. 2.2 should be rewritten as
(e + IJ2 au), , (2.14)47ra0.R'iz i
where i refers to the electronic level from which the ejected electronoriginated, IA is the electron binding energy of the ith level, and a(f.)l
103

CDCMo
03
CO
0 2OO 300 400 500
£ (eV)FIG. 2.30. Single differential cross sections for ionization of methane gasby 500 eV electron impact. The data are from Opal et al. [8] and Oda [21].The Mott calculation was presented by Oda [21].
the differential cross section for ejection of an electron from the i level.Unfortunately the experiments do not normally determine the shell or subshellfrom which the detected electron was ejected. Therefore the valence shej.1binding energy Ix is used for all ejected electrons reducing Eq. 2,14 to
(e a(e) (2.15)
This approximation is considered appropriate based on the fact that, at theelectron energies we are considering, the valence electrons provide themajority of the contribution to the energy loss cross section. Thesimplification afforded by Eq. 2.15 is equivalent to dividing the experimentalcross sections by the Rutherford cross section per target valence electron.For electron impact it is instructive to plot the experimental data in theform of Y(Q,T) defined in Eq. 2.15 against the reciprocal of the energy loss.As was pointed out by Kirn and Noguchi [36], the area under the curve in a plotof Y(Q,t) versus R/Q can be shown to be proportional to the total ionizationcross section
(2.16)
104

20 304050 100 500
KLL AugerPeaks ExpectedHere
00.9 08 07 06 0.5 04 03 02 0.1 0
H/Q
FIG. 2.31. Secondary electron spectra for electron impact ionization of N2.The areas under the curves have been normalized to the respective totalionization cross sections. The area between the shaded lines corresponds tothe fraction of the electrons ejected with insufficient energies to producefurther ionization in the target medium. These data are from Kirn [33].
where I is the electron binding energy and E0 is the incident electron energy.Such a plot is useful for testing absolute normalization of the differentialcross sections and for determining the importance of specific features of thespectra as contributors to the overall yield of ionization. Total ionizationcross sections are available with accuracies of 5% to 10% for a wide range ofatoms and molecules (Total ionization cross sections for electron impactionization are reviewed in Chapter 3 of this report.). The functional form ofthe differential cross sections can be determined for specified energy regionsby the use of appropriate theory. For example, the Mott cross section shouldbe accurate for providing the magnitude of the SDCS for fast electrons ejectedin collisions involving sufficiently high-energy incident electrons. Forelectrons ejected with low energies the Bethe-Born theory provides aconvenient framework to investigate the features of the singly differentialcross sections and their dependence upon projectile parameters. The Bethe-Born formula can be written [137] as
(2.17)
105

where df/dQ is the differential optical oscillator atrength distribution. Thefirst term in the brackets includes a dependence on the logarithm of theincident electron energy, thus leading to its dominance as the incidentparticle energy increases. That combined with the 1/Q dependence leads to thelow-energy ejected electron spectral shape that is determined by the dipoleoscillator strength at sufficiently high energies of the incident electrons{or any charged particle); the spectra should become increasingly optical innature as the ion energy increases. The second term in the brackets of Eq.2.17 is independent of the incident particle energy except for the kinematicrestrictions in the maximum energy loss that can occur ir a collision.Although B(Q} contributes at all Q it is expected to dorrr.iate at high Q wherethe first term has become negligible. An estimate of B{Q) can be obtainedfrom use of the Matt formalism at sufficiently high values jf the energy loss.The last term in the expression includes all contributions from terms ofhigher order in 1/T; these are normally negligible in the energy range ofvalidity of the Bethe-Born approximation. An example of the utility of thismethod of data analysis taken from Kirn [32] is shown in FIG. 2.31, where theratios of the experimental cross sections to the corresponding Rutherfordcross sections are plotted as a function of the reciprocal of the energy loss.Plotted in this way the area under the curve is proportional to the totalionization cross section and the shape of the low-energy portion of the curveis representative of the dipole oscillator strength. The fraction of theelectrons ejected with energies between the shaded vertical lines, thatcorrespond to «=o and e=15.6 eV with Q=15.6 eV, represents those electronsthat are unable to produce further ionization as they slow down in the targetmedium. In the example shown in FIG. 2.31, the only experimental differentialcross sections used to establish the family of curves were those for electronemission by 500 eV incident electrons. Those data were used, along with thedipole oscillator strengths, to define the overall shape of the curve for 500eV primaries. The magnitude of the cross sections was then established bynormalization of the a^rea under the curve to the total ionization crosssection. Curves for other primary energies were then drawn by extrapolationbased on maintaining 1) a curve shape consistent with the optical oscillatorstrengths, 2) the proper integrated area consistent with total ionizationcross sections, and 3) the proper kinematic limit to the secondary electronenergy consistent with the maximum energy transfer. Models of this typeprovide means to evaluate experimental consistency, to extrapolate data toregions where data are unavailable, and provide convenient methods ofintroducing data into computer codes for track structure calculations. Thistechnique of data analysis and extrapolation takes advantage of theavailability of a wide range of experimental data on total ionization crosssections (see, for example, reviews by Schräm et al.,[138] and Shiraamura,[139]) and oscillator strengths [126,140]. In addition, the use of spectrabased on oscillator strength distributions has the potential for application
Table 2.4Values of fitting parameters
Parameter Hydrogen HeliumA! 0.74 0.85A2 0.87 0.36A3 -0.60 -0.10n 2.4 2.4
106

6
5
X
0
o 200 eV e + He
o 40 80
w (eV)120 160
FIG. 2.32. Single differential cross sections for 200-eV e' + He collisionsplotted as X versus w, where X is the ratio of the experimental cross sectionto the Mott cross section and w is the ejected electron energy. The dataplotted are; solid lines - calculated from Eq. 2.18, dashed line is from therecommended values of Kirn [31], squares - Shyn and Sharp [5], circles are fromthe data of Opal et al. [B], x's are the data of Goruganthu and Bonham [9],trianglas are data of Rudd and DuBois [6], and diamonds are the data ofMueller-Fiedler [10].
to both gas and condensed phase targets by simply using the proper oscillatorstrengths. These techniques will be described in more detail in the followingsections with regard to their application to proton-induced ionization. Forgreater detail in the application of this method to electron-impact ionizationthe interested reader is directed to the work of Kirn referenced above, as wellas to his review [33], and to studies by Miller et al. [137] and Miller andManson [141].
The semi-empirical model of Rudd [39], described earlier for DDCS,Eqs. 2.7 and 2.8, is part of a comprehensive model that includes the followingexpression for the SDCS, at(w), for ejection of an electron of scaled energy w(w=e/I) by impact on an incident electron of scaled energy t (t=T/I):
(2.18)
where S=47raoN(R/I)2, N is the number of electrons of binding energy I, R isthe Rydberg unit of energy (13.6 eV), a0 is the Bohr radius, and n is an
107

adjustable parameter evaluated by fitting to experimental electron spectra,and
F(t) = (Alin(t) + A2 + A3/t)/£ . (2.19)
The values of Alf A2, and A3 are obtained either by fitting to experimentalSDCSs or, more accurately, by fitting the integral of the SDCS expression tothe experimental total cross sections. The expression for the total crosssection given by this model will be given in a later section. The values ofthese fitting parameters and of n for hydrogen and helium targets are given inTable 2.4. A sample plot of the ratio of the results of Eg. 2.18 to thecorresponding Mott cross section is shown in FIG. 2.32 as the quantity Xplotted versus the reduced electron energy w.
One of the major gaps in our knowledge of differential cross sections forinteractions of electrons with biologically relevant targets is the lack ofdirect -measurements of these processes for the condensed phase. Presently thebasis of condensed phase electron transport used in track structure simulationis deduced from the theory of charged particle interactions in condensedphase, and from oscillator strengths for photoabsorption [126,140]. Duringthe past few years, however, there have been significant advances in ourunderstanding of electron interactions in the condensed phase brought about bythe pioneering work of Leon Sanche and his coworkers [142-145]. Measurementsthat they have conducted, and continue to conduct, on the scattering of low-energy electrons in thin films are providing detailed information on theenergy-loss mechanisms associated with the slowing down of low-energyelectrons. A particularly interesting feature in the preliminary studies hasbeen the similarity of elastic and inelastic electron scattering processes inthe solid to those observed in the gas phase, eg., resonant processes, such astransient negative-ion formation [143], are strong features in the energy-lossspectra for very low-energy electrons. A detailed discussion of electrontransport in the condensed phase is presented in chapter 4 of this report.
2.3.2. Pioton Impact
Singly differential cross sections for proton impact ionization of atomicand molecular targets are normally obtained, as discussed above for electronimpact, by integration of measured doubly differential cross sections withrespect to either the electron ejection energy or the emission angle. Ingeneral the integration is performed with respect to emission angle and theSDCS, a(e), differential in ejected electron energy is presented. Thisspectrum gives the probability of a given energy loss occurring in an ionizingcollision and is therefore of relatively high interest in RadiologicalPhysics. An excellent review of the energy distributions of electrons emittedin collisions of protons with atomic and molecular targets has recently beenpublished by Rudd et al. [146].
As with electron impact, discussed above, it is convenient to display theSDCS for proton impact as the ratio of the measured cross sections to therespective Rutherford cross sections. For fast proton impact ionization thehigh energy extremes of the ejected electron spectra are expected to bereliably given by the Rutherford cross section. Therefore, if we plot Y(Q,T),as defined by Eq. 2.15, against the energy loss Q, the ratio Y(Q,T) shouldapproach a constant value for large ejected electron energies. Owing to thefact that the Rutherford formula incorporated in Eq. 2.15 gives the crosssection per target electron, the magnitude of that constant should be equal tothe number of electrons in the atomic or molecular target. In FIG. 2.33, thisratio, Y(Q,T), is plotted versus Q for an atomic helium target. In thisillustration the ratios approach a value of approximately 2.2 which is
108

protons on Helium
1.0 MeV V 2.0 MeV
50 100 150 200 250 300Q (R)
FIG. 2.33. The ratio of the measured singly-differential cross sectic i forproton ionization of helium [110] to the Rutherford cross section plottedversus collisional energy loss.
indicative that the measured cross sections may be systematically 10% toolarge; that is, if the Rutherford cross section can be expected to be valid.Similar ratios are plotted in FIG. 2.34 for a wider range of proton energiesand an atomic neon target; note that, at the two largest proton energies, thehigh-energy cutoff of these spectra is due to spectrometer limitations, not alack of high-energy electrons. In principle, for an atom such as neon, wherethe electron can be ejected from inner shells or sub-shells, the ionizationpotential used in the Rutherford formula should reflect the origin of theelectron. However, the experiments are not able to determine the origin ofthe detected electron, therefore, the ratio is calculated assuming that allelectrons originate from the valence shell [110]. For neon the ratio Y(Q,T)approaches a value of approximately 10, indicative of the number of boundelectrons in the atom; the peak observed at approximately 800 eV results fromAuger electron emission following K-shell vacancy production that occurs in asmall fraction of the collisions. For the highest energy protons Y(Q,T)approaches a value somewhat greater than 10, the total number of electrons inneon; this is, as for the helium data shown in FIG. 2.33, again indicativethat the experimental values may be systematically about 10% higher than wouldbe expected. It should be noted, however, that the ratio Y(Q,T) observed for1.5 MeV protons reaches a plateau at approximately 8 which is in goodagreement with the Rutherford prediction if only the outer, n = 2, shell
109

electrons participate; the inner-shell electrons are tightly bound andcontribute little to the Rutherford cross section at this proton energy.
An increased scatter in the Y(Q,T) data is observed for the higher energyejected electrons shown in FIG. 2.34. This scatter occurs because the crosssections are becoming significantly smaller and statistical uncertainties aregreater; the 1/Q2 factor in the Rutherford cross section masks the absolutevalue, and therefore the rapid decrease of these cross sections. TheRutherford analysis generally confirms that the differential cross sectionsobtained in the work at the Pacific Northwest Laboratory (PNL) are accurate towithin the stated absolute uncertainties, approximately 20%, derived from theexperimental parameters; data for proton impact from other laboratories aregenerally at lower proton energies and not amenable to this theoretical test,but where data from different laboratories overlap there is good agreement.
Data have been obtained for proton impact ionization of a wide range ofmolecular targets for investigating the effects of molecular structure onelectron emission cross sections. In FIG. 2.35 are displayed the singledifferential electron emission cross sections, a ( (. ) , for a number of carboncontaining molecules plotted as the ratio to the respective Rutherford crosssections against the energy loss. The horizontal lines with the number to theright give the Rutherford estimate of the asymptotic value those cross
Protons on neon40
35
30
25
4.2 MeV3.7 MeV3.0 MeV2.0 MeV1.5 MeVÎ.O MeV0.3 MeV
10 A5 I
o L0
\ \ \V xw i * • * . _ . _ _100 200
Q (R)
XA \». i
300
iI I
11<•• — „.•
400
FIG. 2.34. The ratio of the measured singly-differential cross section to theRutherford cross sections for ionization of neon by protons (data of Toburenet al., [110]).
HO

CH NH \\\tO«. ^_O_ A fa- \ \ >
100 200Q (R)
300
FIG. 2.35. The ratio of the measured to Rutherford singly-differential crosssections for ionization of a number of molecules by protons; data are fromLynch et al., [80].
sections should attain; i.e., the number of electrons actively contributing tothe cross section. This agreement between experimental data and thepredictions is simply a confirmation of the Bragg rule for scaling crosssections for emission of fast electrons or, alternatively, a statement of theindependent particle model for ionization. One must be careful at this pointto stress that this independent electron model is a scaling feature ofcollisions involving large energy loss and it does not apply to softcollisions; this will be discussed in detail later. It does, however, providejustification for application of simplified theory and scaling techniques thatare very useful in track structure calculations.
The limits of applicability and reliability of various theoreticalcalculations can be assessed by comparison of their predictions toexperimental data. In FIG, 2.36 the results of binary encounter theory, theBorn approximation, and Rutherford theory are plotted as the ratio to thecorresponding Rutherford cross section for ionization of the outermostelectron of neon and compared with measured cross sections. The primaryreason for comparing results by dividing by the Rutherford cross section isthat the principal dependence on energy loss, 1/Q2, is removed and one cancompare data on a linear, rather than a logarithmic scale, thus accentuatingspectral features. The gradual increase with energy loss of the Rutherfordcross sections, in this case calculated for each bound electron, summed and
Hi

then divided by the Rutherford cross section for an outer shell electron, thatis plotted as the solid occurs because of the contribution of electronsejected from inner shells [33]; at larger values of the energy loss the moretightly bound electrons contribute more to the total.
Rutherford theory for ionization of a free electron by a 1 MeV protonwould predict an abrupt decrease in the SDCS at approximately 160 R as that isthe kinematic maximum energy that can be transferred in classical proton-electron collision. The measured cross sections, on the other hand, show agradual decrease in magnitude between approximately 100 R and 160 R reflectingthe initial momentum distribution of the bound electrons. The increasingRutherford cross section, owing to inner shell contributions, combined withthe decrease in the experimental values near the maximum energy transfer,owing to binding effects, renders Rutherford theory inappropriate as adefinitive test of the accuracy of measured cross sections in this protonenergy range for target atoms or molecules with tightly bound inner-shellelectrons. At higher proton energies, as shown in FIG. 2.34, a plateau valueof 10 can be expected over a broader ejected electron energy range.
Binary encounter theory (reviewed by Rudd and Macek [43] and Rudd [44])extends the classical Rutherford-like approach to collisions of chargedparticles with electrons that have an initial velocity distribution owing tothe fact that they are bound to the atom. By integrating the classicalcollision spectrum over a quantum mechanical distribution of bound electronvelocities the high energy portion of the ejected electron spectra is wellrepresented. The only parameter that is not well defined in thiscomputational technique is the mean value of the initial distribution of
P 20O 16
20 40 60 80 100 120Q/R
140 160 180 200 220
FIG. 2.36. Comparison of measured and calculated singly-differential crosssections for ionization of neon by 1.0 MeV protons; cross sections arepresented as the ratio to the Rutherford cross section for outer-shellionization of neon. The measured single differential cross sections {xj arefrom Toburen et al. [110]. The cross section for zero energy ejected electrons(D) is from Grissom [147]. The binary encounter calculations are from aprogram of Rudd [44] and includes results assuming the average kinetic energyof the bound electron is equal to the binding energy (BEj) or given bySlater's rules (BES) . The Rutherford cross section is calculated includinginner-shell contributions [34] and the Plane wave Born Calculation (A) isdescribed by Toburen et al-, [110].
112

10 18 _
10
co•4—"
l
<M
Eo
D
1.0-MeVH* lonizationofi» _
100 1000e (eV)
10,000
FIG. 2.37. Singly-differential cross sections for ionization of severalmolecules by 1 MeV protons.
kinetic energies exhibited by the orbital electrons. Calculations that assumethe initial kinetic energy is equal to the binding energy, BEI? and that usethe kinetic energy derived from Slater's rules (see Robinson, [148]), BES, areshown in FIG. 2.36; the use of Slater's rules seems to provide a slightlybetter agreement at high energies than the binding energy approach. For low-energy electron emission neither approach is very good, although the use ofSlater's rules extends the agreement with experimental data to somewhat lowerenergies.
The results of calculations based on the plane wave Born approximation[110] are also shown in FIG. 2.36. This calculation is in good agreement withthe measured differential cross sections for ejection of low-energy electronsand with the independent measurement of Grissom et al. [147] for electronsejected with near zero kinetic energy; the Born calculation was not carriedout to ejected electron energies greater than 64 R because it is based on apartial wave analysis and the number of partial waves necessary to describethe higher energy processes makes the calculation unwieldy. Similar Borncalculations are in good agreement for helium targets [56]. The use of thistechnique for molecules has not been attempted, however, due to a lack ofadequate wave functions to describe the molecular systems.
113
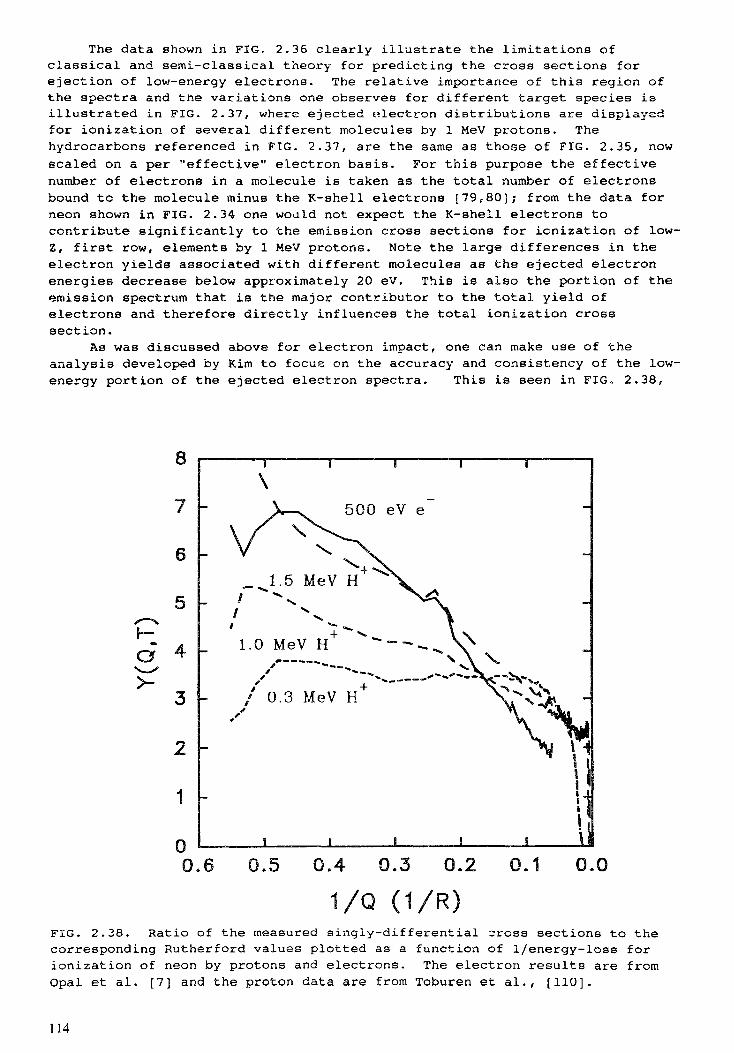
The data shown in FIG. 2.36 clearly illustrate the limitations ofclassical and semi-classical theory for predicting the cross sections forejection of low-energy electrons. The relative importance of this region ofthe spectra and the variations one observes for different target species isillustrated in FIG. 2.37, where ejected electron distributions are displayedfor ionization of several different molecules by 1 MeV protons. Thehydrocarbons referenced in FIG. 2.37, are the same as those of FIG. 2.35, nowscaled on a per "effective" electron basis. For this purpose the effectivenumber of electrons in a molecule is taken as the total number of electronsbound to the molecule minus the K-shell electrons [79,80]; from the data forneon shown in FIG. 2.34 one would not expect the K-shell electrons tocontribute significantly to the emission cross sections for ionization of low-Z, first row, elements by 1 MeV protons. Note the large differences in theelectron yields associated with different molecules as the ejected electronenergies decrease below approximately 20 eV. This is also the portion of theemission spectrum that is the major contributor to the total yield ofelectrons and therefore directly influences the total ionization crosssection.
As was discussed above for electron impact, one can make use of theanalysis developed by Kirn to focue on the accuracy and consistency of the low-energy portion of the ejected electron spectra. This is seen in FIG. 2.38,
8
7
6
5P"S 4>^ 3
2
1
0
\500 eV e
0.6 0.5 0.4 0.3 0.2 1.1 0,1/Q (1/R)
FIG. 2.38. Ratio of the measured singly-differential cross sections to thecorresponding Rutherford values plotted as a function of I/energy-loss forionization of neon by protons and electrons. The electron results are fromOpal et al. [7] and the proton data are from Toburen et al., [110].
114

where data for ionization of helium by protons of different energies are shownplotted as Y(Q,T) versus 1/Q; also shown for comparison are data of Opal et al[7] for 500 eV electrons; 500 eV electrons are of comparable velocity to 1 MeVprotons. The shape of the spectra for low-energy electron ejection aresimilar in shape for electron and proton impact reflecting the dependence onthe optical oscillator strengths. Recall from the discussion for electronimpact that equal areas under the cross section curves contribute equally tothe total ionization cross section; the total area is proportional to thetotal ionization cross section. The data displayed in FIG. 2.38 illustratethe importance of knowing the shape of the low-energy portion of the spectraif one is to be able to gain an accurate knowledge of the total yield ofelectrons; a major fraction of the electrons have energies less than 25 eV(R/Oj=0.27). The need for accurate low-energy electron ejection cross sectionspresents no difficulties where cross section have been measured using both,electrostatic and TOF techniques, such as was done for the proton impact datain FIG. 2.38. However, where TOF is not available there may be largeuncertainties in the low-energy portion of the spectra; see, for example thedata in fig. 2.4 at the beginning of this chapter.
An accurate knowledge of the total yield of electrons produced incollisions of charged particles with biological material can be important inthe analysis of such radiologically important quantities as W-values, meanfree paths, stopping power, etc. The importance of the low-energy portion ofthe spectra to determination of the total yield of electrons, total ionizationcross sections, was demonstrated in Figs. 2.37 and 2.38. To overcome thepotential experimental uncertainties in low-energy electron emission dataMiller et al. [149] applied the Bethe-Born approximation, as originallyadvocated by Kim and Inokuti [35], to develop a method to combine experimentaldata on SDCS's and dipole oscillator strengths to obtain reliable low-energyelectron yields. Inspection of Eq. 2.17 indicates that if we haveexperimental data at any proton energy for which the Born approximation isvalid those data can be used with optical oscillator strengths to evaluatewhat has been called the hard collision component of the interaction B(Q);some authors have expressed this quantity in ejected electron energy B(e)rather than in energy loss Q, Q=e-H, because the experimental data are formeasured electron energy, not energy loss (see Wilson et al. [150]).Evaluation of B(Q), or B(e), using experimental data assumes that terms ofhigher order in Q/'.? are negligible. Since B(Q) is independent of the incidentproton energy, once determined that spectrum can be used to obtain crosssections at other energies. In principle B(Q) could be calculated, howeverthis is impractical for most atomic and molecular targets because of the lackof adequate wave functions to accurately describe the system.
In practice experimental data for oscillator strengths and SDCS's areused to obtain B(Q) for low-energy ejected electrons and the results are thenmerged with binary encounter theory to obtain an estimate of B{Q)+O(Q/T) forhigh energy ejected electrons in order to obtain the full spectrum; binaryencounter has been shown to describe fast ejected electrons reasonably well.The hard collisions contribution, B(e), for ionization of water vapor byprotons, as determined by Wilson et al. [150] using this technique, is shownin FIG, 2.39. Although B(e) is theoretically independent of ion energy therewas considerable scatter among the data for B(e) derived from different protonenergies. To determine the spectrum of B(e) for use in calculating emissioncross sections these authors used a simple average of the experimental valuesat different ion energies (the solid line in FIG. 2.39). Cross sectionsderived from this determination of B(e) are shown in FIG. 2.40. This model ofthe differential cross sections provides values in good agreement with the0.5- and 1.5-MeV data, as it must be because these data were used in thedetermination of B(e), and there is good agreement for electron energies
115

10
-O
-5
-10
o 0.3 MeVx 0.5 MeVa 1,0 MeVA 1.5 MeV
-§-
Binary-EncounterExpérimental Fit
10 20 30e (eV)
40 50
FIG. 2.39. The hard collision component of the Bethe-Born cross section,B(Q), for ionization of water vapor by protons as determined by Wilson et al.[150].
greater than about 20 eV with the measurements for 3.0- and 4.2-MeV protons;these high energy data were obtained with a different experimental system andwere not included in the fitting process. The measured low-energy crosssections e < 25-eV have large uncertainties owing to the effects of residualelectric and magnetic fields in the analyzing field of the electronspectrometer; no TOF measurements are available for this target system. Animportant attribute of the modeling technique is that a high degree ofaccuracy can be obtained for the determination of the low-energy portion ofthe ejected electron spectra owing to the use of optical oscillator strengthsthat dominate in this region.
Models of the ejected electron spectra based on Eq. 2.17 rely on twoprimary sources of experimental data; differential electron emission crosssections, for at least one ion energy, and a source of optical oscillatorstrengths. We have discussed the electron spectra at length, but have saidlittle regarding the availability of oscillator strengths. For the watervapor data discussed above, oscillator strengths were derived from thephotoabsorption cross sections compiled by Berkowitz [126] using theexpression
R df = (2.205
116

where aph/Mb is the photo absorption cross section in units of megabarns (Mb)and R=13.6. A good review of photoabsorption cross sections is also given byGallagher et <al. [140]. Oscillator strengths are also available for a numberof molecules of biological interest, such as DNA [151,152] and DNA bases[153,154]. We can also expect considerable progress to be made in themeasurement of photoabsorption cross sections in the near future assynchrotron light sources become more widely used. A more thorough review ofoptical oscillator strength can be found in Chapter 5 of this report.
One of the shortcomings of modeJ.s of secondary electron emission crosssections based on Bethe-Born theory, as expressed in Eq. 2.17, is that theapplication is limited to ion energies that are sufficiently large for theBorn approximation to be valid. A model developed by Rudd [155] overcomesthis difficulty by incorporating aspects of molecular promotion theory toenable extensions of the model to low-energy ions. Rudd's model is not asversatile as the Bethe-Born, however, with respect to changing target
10
o05MeV(x1000) Voi.5MeV(x1-)0)A30MeV(x10)4 2 MeV \Model
10 100E(eV)
1000
FIG. 2.40. Singly-differential cross sections for ionization of water vaporby protons as presented by Wilson et al [150], The solid lines are derivedfrom the model of Miller et al. [149] with the hard collisions componentevaluated by fitting the low-energy proton data of Toburen and Wilson [76].This comparison illustrates the value of the model in providing reliable crosssections for low-energy ejected electrons where the experimental crosssections scattered owing to experimental difficulties. The 0.5- and 1.5-MeVcross sections are from the work of Toburen and Wilson [76] and the higherenergy proton data are unpublished data of Toburen.
117

parameters and it requires a much more extensive set of data to determine thefull range of model parameters. Rudd's model is based on the molecularpromotion model at low proton energies and on the classical binary encounterapproximation, modified to agree with Bethe-Born theory, at higher energies.
The expression for the singly differential cross sections given by Rudd'smodel is as follows:
(2.21)<w+l ) 3 { l+exp[a (w-w c ) / v ]}
where w=e/I, v=(T/I)%, T=AEp, Ais the ratio of the electron to proton mass, Epis the incident proton energy, S=4^aoN(R/I)2, wc=4v2-2v-R/4I, N is the numberof electrons in the target atom or molecule, and where
H (2.22)
andFz(v) = L2HZ/[LZ + H2] (2.23)
with
v2]/[v (2.24)
(2.25)
H2 = R2/v2 (2.26)
andL2 = (2.27)
The ten basic parameters, A^.-Ej, A2...D2 and a are given for various targetsin Table 2.5.
Table 2.5Parameters for fitting singly differential cross sections
to the model of Rudd
He Ne Ar Kr N, H,0 CO, GH/, inner shells
AIBICiDIEI&2B2C2D2a
1.022.40.701.150.700.846.00.700.500.86
0.58650.230.550.161.400.00.721.350.57
1.208.00.860.000.800.902.70.750.800.71
1.465.70.65-.551.001.30220.95-1.00.78
0.962.60.380.232.21.045.91.150.200.87
1.0512.00.74-.390.800.9F1.201.001.300.70
1.02500.400.120.301.005.00.550.00.59
0.97820.40-.300.381.0417.30.760.040.64
1.09250.750.750.650.783.00.700.850.53
1.15140.350.503.00.603.81.200.450.61
1.250.501.001.003.01.101.31.000.00.66
118

10,000
FIG. 2.41. The calculated singly-differential cross sections for ionizationof N2 by protons from the model of Rudd [155] (solid lines) compared to theexperimental data of (o) Rudd [52], (*) Crooks and Rudd [64], (x) Toburen[49], and (O) stolterfoht [55]. The arrows indicate the position in thespectra where one may expect an enhancement on the cross sections from thecontinuum charge transfer (CCT) ionization mechanism; this mechanism is notexplicitly included in the model calculations.
In total, Rudd's model requires 10 basic fitting parameters for eachelectronic shell of each target. These parameters have been published forproton impact ionization of H2, He, and Ar by Rudd [155] and He, Ne, Ar, andKr by Cheng et al. [53]. Model parameters for N2, CO2, H2O, and O2 areavailable from Rudd by private communication. An example of the results ofRudd's model fit to molecular nitrogen data and divided by the correspondingRutherford cross sections for an outer shell electron is shown in FIG. 2.41for proton ionization of molecular nitrogen. This example illustrates thewide range in proton energy attainable by this model. The experimental datashown in FIG. 2.41 also illustrates the excellent agreement among thedifferent experimental groups; Toburen [49], Rudd [52], Stolterfoht [55], andCrooks and Rudd [64]. The arrows in the figure point to the electron energywhere one would expect to see enhancement of the cross sections by the processof continuum-charge-transfer (CCT). This mechanism can be described as anelectron being "dragged" out of the collision by the proton owing to thecoulomb attraction, but failing to be captured into a bound state of theprojectile [44]. This mechanism should enhance the crocs section for electronenergies where the velocity of the out-going electron and proton arecomparable; the arrows in FIG. 2.41 are placed at those electron energies.
IÎ9

The lack of observable enhancement in the singly differential cross sectionsat the appropriate energy is evidence that this mechanism does not contributemarkedly to the total electron yield; the model of Rudd does not include anytheoretical mechanism for this process.
2.3.3. Heavy Ion Impact
The singly differential cross sections for electron emission incollisions of structured ions with atomic and molecular targets provide aconvenient means to access the effects of electrons bound to the projectile onthe energy loss process. Using Eq. 2.15 and plotting Y(Q,T) versus R/Q theeffect of the bound projectile electron on the yield of electrons ejected bydifferent ions can be easily seen. Data for ionization of helium by H+, He+,and He2+ are shown plotted in this manner in FIG. 2.42. Excellent agreementis observed between the H"1" and He++ induced cross sections illustrating theaccuracy of z-squared scaling of bare ions in this energy range; the onlydifferences observed are at electron energies less than about 18 eV (R/Q=0.3).At ejected electron energies less than 10 to 20 eV one can expect largeruncertainties in the helium ion cross sections because only electrostaticanalysis was used in these measurements, no TOP data are available. For small
00.6 0.5 0.4 0.3 0.2 0.1 0.0
1/Q (1/R)FIG. 2.42. Ratio of the measured singly-differential cross sections forionization of helium by 0.3 MeV/u protons and helium ions to the correspondingRutherford cross sections plotted against the reciprocal of the collinionalenergy loss; data are from Toburen and Wilson [90]. The area under the curvein this plot is proportional to the total ionization cross section.
120

O
0
Helium Target0.3MeV/amu
•" ' --^^ 4. \ l
0.6 0.5 0.4 0.3 0.2 0.1 0.0
1/Q (1/R)FIG. 2.43. Comparison of the singly differential cross sections forionization of helium by 0.3 MeV/u H+, He+, and C+ ions plotted as the ratio tothe corresponding Rutherford cross sections versus the reciprocal of theenergy loss. The H+ and He"1" data are the same as plotted in FIG. 2.42.
values of energy loss the spectrum for He+ impact is considerably smaller thanfor the bare ions. This reflects the screening of the He nuclear charge bythe He* bound electron, thus reducing the strength of the interactionsinvolving the large impact parameter collisions contributing to small energylosses. In FIG. 2.42 the effect of electron loss from the projectile isclearly seen in the He+ data; it enhances the cross sections for He* impactwell over those for bare ions in the region near electron energies of 160 eV(R/Q=.Q7); this corresponds to emission of electrons with velocity comparableto the ion velocity. The actual contribution of electron loss to the totalelectron production cross section is, however, hard to determine accuratelybecause the effects of projectile screening make identification of the portionof the curve due to target ionization alone difficult. One can see from thisillustration, recalling that equal areas under the curve contribute equally tothe total ionization cross section, that the mean energy of the ejectedelectrons will certainly be greater for He+ ions than for bare ions, i.e., theelectron spectrum is biased toward higher electron energies in the case of theHe+ ion impact.
The relative importance of interactions leading to energy loss by clothedions is further explored in FIG. 2.43 where the ratio Y(Q,T) for ionization ofhelium is plotted versus R/Q for singly charged carbon, helium, and hydrogen
121

ions. The effect of screening by projectile electrons is clearly seen in thisillustration in that the z-squared scaling implicit in the definition ofY(Q,T) has reduced the cross sections for carbon ion impact by approximatelyan order of magnitude below the proton values for the collisions involvingsmall energy loss. Recall that data for electron energies less than about 15eV ( R/Q > .35 ) are subject to large uncertainties and should not be takenseriously. They are plotted here, where the area under the curves areproportional to the total ionization cross sections, to show that theseuncertainties have very little influence on the total, yield of electrons thatwould be obtained from integration of the SDCS's for carbon ion impact. Thatis an important fact to keep in mind when using Integrated cross sections toteat absolute calibration of the cross section scale by comparison to measuredtotal ionization cross sections. In particular, this uncertainty contributedby low-energy electron cross sections becomes increasingly small as the atomicnumber of the ion increases for ions that possess a large fraction of theirbound electrona. As the degree of ionization of the projectile increases, theimportance of low-energy electrons as contributors to the total energy lossprocess increases until, for a bare projectile, it should approach the shapeof the proton curve given in Figs. 2.42 and 2.43.
Helium Target
Carbon ion impact
o
0
- 0.8 MeV- — 1.2 MeV--- 2.4 MeV...... 3.6 MeV..... 4_2 MeV
0.6 0.5 0.4 0.3 0.21/Q (1/R)
0.1 0.0
FIG. 2.44. The ratio of measured and Rutherford cross sections for ionizationof helium by singly-charged carbon ions of several energies plotted as afunction of the inverse of the energy loss.
122

2
o
Q
—— 0.8 MeV- — 1.2 MeV-- 2.4 MeV 1
——• 3.6 MeV
"-—• .
0 20 40 60 80 100 120
Q (R)FIG. 2.45. The ratio of measured and Rutherford cross sections for ionizationof helium by singly charged carbon ions plotted as a function of the energyloss.
The spectra for the clothed ions in Figs. 2.42 and 2.43 are all scaledaccording to Rutherford theory by simply the square of the bare projectilecharge, therefore only the highest energy cross sections, produced by veryclose collisions, may be expected to scale to the same values; low-energyejected electron cross sections reflect the extent of screening by the boundelectrons.
There is evidence of a peak in the ejected electron spectra of Figs. 2.42and 2.43 at the equal velocity condition, ve=vt {this occurs for R/Q=0.07),for both the He+ and C+ ions; this indicates contributions to the spectraarising predominantly from electron loss from the projectile; charge transferto the continuum is expected to be a relatively small contribution. It isinteresting to note that, although the carbon ion has a greater number ofbound electrons and they are more loosely bound than in the helium ion, therelative strength of the electron loss contribution from the carbon ion ismuch smaller. The mechanistic implications of this observation on theionization process are not clear at this point in time.
A comparison of spectra for different C+ ion energies is shown in FIG.2.44. This illustration shows that the electron loss contribution grows asthe ion velocity increases reflecting the increasing cross section forelectron loss. The most obvious characteristic of energy loss in collisionsof C+ ions with atomic targets seen in Figs. 2.43 and 2.44 is the much lowerfraction of low-energy electrons resulting from dressed ion collisions
123

compared to bare ions. This leads to a much higher mean energy of the ejectedelectron in such collisions. Also note that it is not possible to scaleproton cross sections to structured ion impact in any simple manner.
In the relatively low energy range where we have studied differencialcross sections for carbon and oxygen ion impact, the analysis advocated byKirn, where the electron spectra are tested against the plateau valuedetermined from Rutherford theory, does not enable a test of the absolutecroBS sections; there is no high energy plateau in the plot of Y(Q,T) versus Qfor carbon ions in this energy range. This lack of high energy plateau, incontrast to the plateau observed in Figs. 2.33-2.36 for higher velocity protonimpact, is illustrated in FIG. 2.45. Absolute cross sections must, thereforebe evaluated from parameters of the experiment and/or from measured totalionization cross sections [97,98],
Because of the combination of effects of screening by projectileelectrons; and electron loss from the projectile, the origin of the spectralfeatures observed in FIG. 2.45 are more difficult to identify than for bareions. The peak, or what appears as a shoulder on the spectra for lower energyions, at the low-energy end of the spectra (10 < Q/R < 20, for ion energiesfrom 0.3 to 4.2 MeV, respectively) is a result of electron loss from theprojectile; the maximum contribution from this process for 4.2 MeV ions shouldoccur at about 190 eV (Q/R=16). The electron loss peaks appear at a somewhathigher energy than predicted by kinematics because these peaks are on arapidly increasing background of electrons from target ionization. The binaryencounter peak should occur with about 4 times higher energy, or atapproximately 58 Rydbergs for the 4.2 MeV spectrum. For even the largestparticle velocity shown here one cannot expect a well defined binary encounterpeak, see for example the proton impact data of FIG. 2.31.
The small peaks observed superimposed on the spectra for the two highestenergy ions in FIG. 2.45, result from Auger transitions following inner-shellvacancy production in the carbon projectile. These transitions are observedat Doppler shifted energies in the laboratory reference frame as determined bythe kinematics of the collision (for a discussion of the kinematics ofprojectile electron emission, see Stolterfoht [45]). Since the spectra shownin FIG. 2.45 were obtained from integration of doubly-differential electronenergy distributions measured at discrete angles, these peaks carry forward asdiscrete peaks in the integral spectrum. The intensity of these transitionsin the double differential cross sections also provides a means to determinethe consistency of the magnitude of the measured absolute cross sections andthe energy scales by comparison to other measurements on inner-shellionization. That was exploited in a recent study of the doubly differentialcross sections for ionization of helium by carbon ions [98].
AS discussed above with regard to doubly differential cross sections,there has been very little collision theory developed for application to thestudy of ionization by structured ions. The most promising theory ispresently the classical trajectory monte carlo (CTMC) technique [97,156].This technique is attractive in that it provides ab initio absolute crosssections and includes continuum charge transfer and multiple ionisationprocesses, as well as being appropriate to the intermediate ion energy range.The primary disadvantage of this technique is the extraordinarily longcomputer times required for the computation. In FIG. 2.46 are shown recentcalculations by Reinhold et al. [97] (also presented in a more detailedcomparison to experiment by Toburen et al. [98]) of the singly differentialcross sections for ejection of electrons in C+ + He collisions at 200 keV/u.There is good agreement between theory and experiment for the high energyportion of the spectra with the experimental data being about 50% larger thantheory at the low energies. A strength of theory, as contrast to experiments,is that one is able to estimate the contribution, and the spectral shape, of
124

10 -17
10-18
l io-19o
10-20
10 -2110 10 10 10
e(eV)FIG. 2.46. Comparison of measured singly differential cross sections (SDCS)to those calculated using classical trajectory Monte Carlo (CTMC) theory. Thesolid line is the CTMC calculation of the sum of electrons ejected from thetarget and projectile; CTMC calculations of electrons originating for thetarget are given by the light stippled line and those originating from theprojectile are given by the heavy stippled line. The result were taken fromthe work of Toburen et al. [98].
electrons coming from either the target or the projectile. The dashed line inFIG. 2.46 is the calculated contribution of electrons ejected from theprojectile. Although there are discrepancies between the CTMC calculationsand experiment, the agreement is comparable to, or better than, that seenearlier for Born calculations for simple collision systems. This, plus thefact that the CTMC calculations can be applied to essentially any system, asit does not rely on special system wave functions, make this theory highlyattractive for complex collision systems.
One could summarize our knowledge of differential ionization crosssections for structured ions as fragmentary. We have a reasonableunderstanding of collisions for light projectiles such as H° and He+, althoughthere is no theoretical means of calculating doubly-differential crosssections for molecular targets at the present time; neither have models been
125

developed for fitting or extrapolating such cross sections. Data presently inexistence, however, show dramatically that scaling from bare ions to dressedions is not possible with a single parameter, such as the effective charge ofstopping power theory, and that the mean energy of electrons emitted incollisions involving structured ions is much higher than that for bare ions.There is a long way to go before cross sections for structured ions will beunderstood with the same detail as bare ions, but recent advances in thedevelopment of theory and in experimental techniques give optimism to a vastlyimproved understanding in the near future.
2.4. TOTAL IONIZATION CROSS SECTIONS
2.4.1. Proton Impact
Total ionization cross sections for collisions of protons with atomic andmolecular targets have been the subject of a large number of experimental andtheoretical investigation. Perhaps the most comprehensive experimental studyhas been that of Rudd et al. [157], where targets of He, Ne, Ar, Kr, H2, N2,CO, O2, CH4, and CO2 were investigated over the proton energy range from 5 to4000 keV. A comprehensive review of all proton impact total ionization crosssections has been prepared by Rudd et al. [158], In that report over 130references are reviewed, data are compiled, fitted, and recommended crosssections presented. For the most part, data from different experiments forproton energies of greater than a few hundred keV are in good agreement,however a considerable amount of scatter exists among data at low protonenergies and there is often disagreement between experimental data sets thatoverlap only at the extremes of the proton energy ranges covered by eachexperiment.
Before discussing the recommended cross sections of Rudd et al. [158] itis necessary to define precisely what is meant by an ionization cross section.When a positively charged particle collides with a neutral atom or molecule,free electrons may be produced and/or electrons may be captured from thetarget by the projectile. The total cross sections for production ofelectrons and positive [target] ions are commonly defined as a_ and a±,respectively. If ale is defined as the cross section for the production of ielectrons and <jjc is the cross section for the capture of j electrons by theincident ion, then in the notation of Rudd et al. [158]
+ 2^aJc ( 2 . 2 8 )i j
and
O s > ÏOi „ « /9 9 Q \- Z-f le (j£ . ^y )i
Using this definition, aie includes all processes that produce i electronsincluding those in which excitation or charge transfer occur simultaneously;similarly for £7jc. From these definitions it is clear that
CT* " a- = UC^Jc • (2.30)j
For protons where only single and double capture processes are observed. Theno+ - o_ = olc + 202c . (2.31)
For application of total ionization cross sections to testing the accuracy ofdifferential electron emission cross sections, the quantity of interest is the
126

electron production cross section; that is the quantity to which theintegrated doubly differential electron emission cross sections should becompared. This comparison then provides a stringent test of the doublydifferential cross sections in that the total cross sections can be measuredwith a much higher degree of accuracy. The recommended cross sections of Ruddet al. [158] are considered to be accurate to better than 10%, with those fora wide range of incident energy and target species considered accurate to afew percent .
In providing recommended ionization cross sections, Rudd et al. [158] fiteach set of data for a given target to an empirical equation. This providedcross sections as a continuous function of energy whereas a simple average ofthe available data would have resulted in discontinuities in energy regionswhere different data sets meet. The criteria he used for deriving the fittingequation were as follows.
(1) The equation should have the correct high-energy dependence; thatbehavior was assumed to be predicted by the Bethe-Bornapprox imat ion .
(2) It should have a power-law dependence on proton energy at the lowenergies.
(3) The equation should be relatively simple.(4) There should be a small number of adjustable parameters.(5) The same form of the equation should be appropriate to all targets.(6) It should fit the energy dependence of the data within experimental
uncertainty.The empirical equation chosen is a simple combination of the cross sectionsappropriate to the low- and high-energy regions;
a- = ("I1 hV1 - <2'32>
whereCTL = 47ra0
2CxD ( 2 . 3 3 )
and
+ x) + B]/x . ( 2 .34 )
In Eqs. 2.33 and 2.34, x=T/R= Ep/1836R, a0 = 0.529 A, and R = 13.6 eV and A,B, C, and D are the adjustable fitting parameters. Values of the fittingparameters obtained by Rudd et al. [158] are presented in Table 2.6. Thesefitting parameters lead to recommended cross sections that are in agreementwith the measured values to within 10% to 25%; agreement is best, commonlybetter than 10%f for higher energy protons with the largest discrepancies, 25%or more, occurring for low-energy protons.
By careful analysis of the published data, and fitting the model to thatdata, Rudd has been able to provide recommended total cross sections forionization of a number of atomic and molecular targets by protons [158]. Anexample of their fit to the data is shown in FIG. 2.47 for ionization ofmolecular oxygen. Here the recommended values from the model are in excellentagreement with published results of Crooks and Rudd [64], Hooper et al. [159],De Heer et al. [160], McNeal and Birely [161], and with the high energyportion of Rudd et al. [157]. The data of Dufay et al. [162] appear to bemuch too large and the results of Park et al. [163] much too small. Data usedto fit the model to molecular oxygen data, as well as a number of other gastargets, are given in Table 2.6. For molecular targets where data are notavailable one may provide estimates of the total cross sections from simple
127

o
O
Table 2.6Values of the fitting parameters for Eqs. 2.22 and 2.23.
Target AH 0.28He 0.49Ne 1.63Ar 3.85Kr 5.67Xe 7.33H2 0.71N2 3.8302 4.77CO 3.67CO2 6.55NH3 4.01CH4 4.55
B
1.150.620.731.985.511.11.632.780.002.790.000.002.07
C
0.440.130.311.892.424.120.511.801.762.083.741.732.54
D
.9071.521.140.890.650.411.240.700.931.051.161.021.08
1 0
0.1 1 0 100Ep (keV)
1000
FIG. 2.47. Cross sections for production of electrons in the ionization ofmolecular oxygen by protons. The solid line is the recommended fit of Rudd etal. [158]. Experimental data are: (A), Crooks and Rudd [64]; (*) Rudd et al.[157]; (+) Hooper et al. [159]; (38) De Heer et al. [160]; (O) McNeal andBirely [161]; (0) Dufay et al. [162]; and (D) Park et al. [163].
128

scaling techniques. Scaling by the number of outer shell electrons was foundto be reasonably successful in studies of ionization of hydrocarbons andamines for relatively high-energy protons [79,80].
2.4.2. Heavy Ion Impact
The largest amount of information on total ionisation cross sections forheavy, or dressed, ions and neutral particles has been obtained for thesimplest collision systems. There has been a considerable number of studiesinvolving collisions of helium ions with different targets. Total crosssection measurements for collisions of H, H2, He and Li atoms and ions withatoms and molecules have been reviewed by Barnett, et al. [164] in the ORNL"Redbooks", Vol. I of the 6086 series. Since this review focusses only ondata for the light targets of helium, hydrogen, and lithium of interest tofusion studies it is of limited value for radiological applications, butprovides a data base to help estimate cross sections for some applications. tnumber of total cross sections for helium ion impact have been obtained forrare gas and alkali targets (see for example, DuBois and Toburen, [165], andDuBois, [166-170] and other ions on simple targets such as molecular hydrogen[171,172], rare gases [173,174], and helium [98]. A review of cross sectionsfor collisions of and with H, H2, and He has been published by Gilbodyet al. [175]. Total ionization cross sections can also be obtained fromdoubly differential cross sections for the collision systems listed in Table2.3 where sufficiently broad ranges of ejected electron energies and angleswere measured for reliable integration to be performed.
1 0-1 4
1 0'- t 5
Eocrt>
1 0-1 6
1 0- 1 7
D
0.01 0.1E/q (MeV/u)p
FIG. 2.48. Total cross sections for ionization of neon by carbon ions. Thedata for highly charged states of carbon are from the work of Schlachter etal. [173] and the singly charged carbon ion data are unpublished data ofToburen from the Pacific Northwest Laboratory.
129

By far the largest quantity of data concerning ionization by heavy ions(mass greater than helium) has come from the Berkeley group of Schlachter andhis co-workers, In their studies with fast multiply charged ions they wereable to define a scaling relationship for the ionization cross sections. Whenthe ionization cross section divided by the projectile charge was plotted as afunction of the energy per nucléon of the incident ion the data for highlycharged ions tend to form a common line. This scaling breaks down at lowercharge states as is shown in FIG. 2.48 where the highly charged ion data ofSchlachter et al. [173] for ionization of neon by carbon ions are compared tounpublished results for singly charged carbon ions from our laboratory. Thescaled data for singly charged ions are somewhat larger than the multiplycharged ion cross sections and exhibit a considerably different energydependence. Unfortunately there is not sufficient experimental or theoreticalwork available for ionization by heavy ions to provide any significant guideto cross section systematics covering other than a narrow range ofexperimental parameters.
2.5. CHARGE TRANSFER CROSS SECTIONS
The process of charge transfer between a moving ion, or neutral particle, andthe atomic constituents of the stopping material becomes increasinglyimportant as the velocity of the moving particle decreases, i.e., for ionenergies less than approximately 1 MeV/u. Processes of electron capture andloss contribute to the energy loss process in several different ways. Theactual process of electron transfer may lead to either an energy loss or anenergy gain by the projectile depending on the initial and final electronicbinding energies. This direct contribution of charge transfer processes tothe total energy transfer that occurs between the projectile and the mediummay be quite small, if not negligible. However, the transfer of electrons mayhave important consequences on the subsequent interaction probabilities andthereby have profound effects on energy transfer, eg. see the discussionearlier in this chapter regarding the effects of electronic screening by boundprojectile electrons on the ejected electron energy distributions observed inionization of atomic and molecular targets by dressed ions. A knowledge ofthe charge state of an ion is also necessary when evaluating experimentalstudies of interactions involving charged particles since such experimentsusually depend on measurements of beam current as a measure of beam fluence.In the study of charged particle track structure and its influence on therelative biological effectiveness of high-LET radiation the processes ofcharge transfer are particularly important near the ends of the tracks. It ishere (ion energies less than about 0.5 to 1 MeV/u) that charge transfer playsan important role in mean free paths between ionizing events and in therelative amount or energy loss that occurs in each interaction.
By far the largest body of data describing charge transfer collisions hasbeen generated by experiments directed towards reactions of interest to fusionenergy. These studies have focussed on reactions of plasma components such asH+, H°, He+, etc. with plasma impurity atoms and molecules such as H2, N2, O2,H2O, etc. Some studies with heavier ions have been conducted for themolecules H, H2, and He for application as plasma diagnostics. These data arevery important as data sources for radiological physics as well, but many ofthe important interactions, such as interactions with biological constituents(water, hydrocarbons, etc.) or interactions involving ions representative ofrecoiling tissue constituents (carbon, nitrogen, oxygen, etc.) have not beenmeasured and there is no reliable theory that can predict charge transfercross sections for intermediate energy ions of most interest to radiologicalissues.
130

As noted above, there has been an extensive data base established forcharged particle interactions of interest to controlled fusion research. Thefusion community has also had a dedicated effort to the review of that dataand to the presentation of recommended cross sections. In 1977, a two volumecompilation of atomic data relevant to fusion research was published as ORNLreports ORNL-5206 and ORNL-5207. Since that time a good deal of new data waspublished and that is included in the most recent update of that compilation.The most recent reviews have been issued as ORNL report 6086 which consiste ofa six volume set of data compilations: Vol. 1, "Collisions of H, H2, He, andLi Atoms and Ions with Atoms and Molecules" [164]; Vol.0, "Collisions ofElectrons with Atoms and Molecules" [176]; Vol. 3, "Particle Interactions withSurfaces" [177]? Vol. 4, "Spectroscopic Data for Iron" [178]; Vol. 5,"Collisions of Carbon and Oxygen Ions with Electrons, H, H2, and He" [179];and Vol. 6., "Spectroscopic Data for Titanium,, Chromium, and Nickel" [180]. Ofparticular interest to work in Radiological Physics and Radiation Therapy areVolumes 1 and 2.
In addition to the ORNL compilations an excellent source of data oncharge transfer and ionization is found in a data compilation published byMcDaniel et al. [3]. These authors review data for a wide range of collisionprocesses and collision partners. Volume 1 of this compilation [3] includescross sections for electron capture and loss in collisions of noble gas ionswith noble gas atoms with collision energies less than about 100 keV. Theyalso include cross sections for excitation occurring in charge transfercollisions. Data for heavy ion collisions involving electron capture arid lossby the projectile, as well as target excitation and dissociation are reviewedin Vol. IV of the review of McDaniel et al. They include such reactions asHe0 collisions with CH4 leading to products H+, CH^+, CH3+, CH2+, CH+, C+, H/,etc.
Perhaps the most thorough review of charge changing cross sections forfast heavy ions is that of Betz [181]. This review focuses on ions withatomic numbers in the range 16<z<92 and includes ion energies up to 400 MeV.Charge transfer in both gaseous and solid targets is discussed.
There are only limited data available involving ions heavier than heliumin collision with molecular targets of interest to radiobiology, i.e., targetssuch as H2O, CH/, etc. Fleischmann et al. [182] have reviewed a broad base ofdata on electron stripping collisions involving such targets as helium, neon,argon, krypton, xenon, molecular hydrogen, molecular nitrogen, and molecularnitrogen. Their review included ions and neutral particles of hydrogen, noblegases, lithium, barium, boron, and nitrogen with energies in the range of afew keV to several MeV/u. They also compared the data to Firsov theory.Cross sections for charge exchange between high charge states of C, N, and Oand hydrogen gas have been reported by Crandall et al. [183] and in helium byCrandall [184] for ion energies of from 25 to about 75 keV. Somewhat higherenergies were covered for these same ions in collisions with atomic andmolecular hydrogen by Phaneuf et al. [185]. Olsen and Hvelplund [186] havemeasured electron capture and loss for oxygen ions of 100 to 500 keV inmolecular hydrogen. Lockwood [187] studied charge transfer in F+ collisionswith H2, N2, He, Ne, and Ar in the energy range 14 to 100 keV. Collisions ofmultiply charged ions of nitrogen and neon have been studied by Dmitriev etal. [188] as they interact with helium, nitrogen, neon, and argon with ionvelocities of 2.7, 4.0, and 8 X 108cm/sec. Electron capture by 60 to 200 keVNe2"*" on He. Ne, Ar, Kr, and Xe has been measured by Suk et al. [189] andelectron loss has been measured by Hird and Suk [190] for 35 to 140 keV N+ions in Ne, Ar, and Kr. These references illustrate that, although there hasbeen a good deal of work performed in the study of charge transfer, there isstill a lack of data relevant to radiobiology and radiation therapy.
131

2.6. MULTIPLE IONISATION
Cross sections for electron emission from energy loss collisions ofcharged particles with atomic and molecular targets are of primary importancefor the development of track structure descriptions of the spatial pattern ofenergy deposition by high-LET radiation. However, the traditional studies ofelectron production do not provide any information regarding the fate of theprojectile or target following electron emission nor do they includeinformation on ionization (positive ion production) produced by chargetransfer. In addition, such meaouremînts do not provide information on thenumber of electrons that may be emitted in a single collision when multipleelectron capture and loss evonte occur. The latter may be biologicallysignificant because the multiply emitted electrons would slow clown Ln aspatially and temporally correlated way. To fully describe the interactionsappropriate to charged particles one must have information on the chargetransfer cross sections, the spectrum of electrons emitted (if any) duringcharge transfer events, the number of electrons emitted per interaction and
.001 10 100E/M (keV/u)
1000
FIG. 2.49. Comparison of the relative importance of the principal mechanismsfor production of free electrons in collisions of protons and helium ions withneon. fe is the fraction of the total number of electrons that are emitted asa consequence of the indicated ionization mechanism; direct ionization of thetarget, electron loss from the projectile, and electron capture by theprojectile. For electron capture to result in electron production requiressimultaneous electron ejection from the target; double ionization of thetarget.
132

.01
,001 _L10 100
E/M jkeV/u)1000
FIG. 2,50. Comparison of the fractions of free electrons produced frommultiple ionisation events for protons and helium ions colliding with neonatome. fe is the fraction of the total electron ejected that result fromcollisions that leave the target multiply ionized.
their individual energy and angular distributions, and the excitation anddissociation states of the target molecules. To have detailed information onall of these processes, and the effect of target structure on them, is a tallorder. AB a first step, an assessment of the relative importance of thedifferent processes can be very useful. For the past few years studies havebeen ongoing in our laboratory at PNL, as elsewhere, to measure the spectrumof charge states of atomic and molecular products following ionizingcollisions with light ions. Such studies enable one to gain insight into therelative importance of different ionization channels appropriate to energyloss by ions and neutrals (see for example, DuBois and Toburen [165], DuBois[166-169,191], DuBois and Kover, [192], and DuBois et al., [193j.
The principal interaction mechanisms leading to the release of freeelectrons following collisions of H+ and He+ ions with a neon target areillustrated in FIG. 2.49 for ion energies from a few keV/u to a few hundredkeV/u. As expected, direct ionization of the target is the primary source ofelectrons for proton collisions throughout the proton energy range shown.Electron capture, which requires simultaneous target ionization to release afree electron, is at most a 5% contribution to free electron production. Forhelium ion impact, however, electron capture and loss can make a sizeablecontribution to the free electron production. In the case of electron capturethis implies a high probability of simultaneous capture-plus-target ionization
133

leaving the target multiply ionized. It is also found that target ionizationis produced with a high probability in collisions resulting in projectileionization, although it is not obvious from this illustration. The message tobe derived from this analysis is that, as energy loss by projectiles heavierthan protons are considered, processes other than direct ionization of thetarget must by considered xf electron production along the charged particletrack ia to be fully described.
In addition to the process of electron capture-plus-target ionizationthat leaves the target atom doubly ionized it is also possible to produce adoubly ionized target simply by direct ionization. The fraction of freeelectrons that result from multiple ionization of neon by protons and heliumions is shown in FIG. 2.50. This fraction never goes above 10% for protonimpact, however, for alpha particles the fraction approaches 100% at very lowenergies and is nearly 40% for He+ ions over a rather broad energy range.These data should serve as a reminder that one cannot simply scale data fromprotons to heavier ions. It should also encourage the investigation of thebiological consequences of multiple ionization, ie., what are the affects of atransient build-up of localized Coulomb charge on biological damage. It is nodoubt true that multiple ionizatic'' is less frequent in molecular andcondensed phase targets than the examples displayed for atomic targets,however, the difference in multiple ionization cross sections for differentions may be manifest as different molecular fragmentation patterns and yieldsthat may be important in leading to biologically important damage. With thepresent emphasis on fundamental studies in molecular science we should see, inthe near future, an enhanced understanding of the relationship between theinitial products of radiation and the subsequent chemistry and biology that isinitiated. With advances that are taking place in molecular biology amolecular description of radiation damage that fo}lows events from energydeposition to the expression of biological damage is within our grasp.
2.7. EFFECTIVE CHARGE
The concept of average effective ionic charge was first introduced byBohr [194,195] to describe effects of the capture and loss of electrons on theslowing down of fission fragments in cloud chambers. With decreasing ionvelocity he noted that the fragment-charge that was effective in electronicinteractions would rapidly decrease owing to the capture of target electronsinto bound states of the projectile. He observed that the direct transfer ofmomentum from the fragment to the gas atoms of the media through nuclearcollisions would gradually become of increasing importance as the projectileslowed. In that work he assumed that the fragment, to a first approximation,would possess an average effective charge equal to the ratio of its velocity vto the orbital velocity of the least tightly bound electron in the atom. Thusall electrons carried by the ion would have velocities greater than, or equalto, the ion velocity v and the rest of the electrons would have been strippedfrom the moving ion. Bohr [195] introduced his concept of an averageeffective charge into the formulation of energy loss in order to provide aquantitative description of the velocity-range relationships observed forfission fragments. Since that time, the concept of average effective chargehas been firmly established in studies of stopping power (see, for example,Kreussler et al., [196], Anthony and Lanford, [197], and Bichsel, [198]). Theeffective charge is usually determined experimentally from the ratio of thestopping power for the ion of interest to that for a bare charged ion, such asa proton.
The spectra of energy loss measured for collisions of projectiles withwell characterized charge states provide a new perspective from which toassess the influence of bound projectile electrons on energy loss and on which
134

to base concepts of effective charge. Whereas stopping power provides onlyaverage quantities, averages over all charge states of the ion and allprocesses leading to energy loss, the ejected electron spectra measured insingle collisions of ions with atomic and molecular targets provides detail onthe effective charge responsible for a specified quantity of energy loss as afunction of projectile charge. Examples of the influence of projectileelectrons on the yield of secondary electrons, or energy loss, were shownabove in Figs. 2.19-2.25 and 2.42-2.46 in the discussion of cross sections forelectron emission for structured ions. Those data clearly illustrated that,within the concepts of high energy theories such as the plane wave Bornapproximation or binary encounter theory, the effective charge of the ion is astrong function of the energy loss; for small values of energy loss that occurpredominately in large impact parameter collisions the bound electrons serveas an effective screen of the projectile nucleus, whereas collisions involvinglarge energy loss occur at small impact parameters where the bound projectileelectrons provide essentially no screening of the projectile nucleus, at leastat the energies of ions considered in this chapter.
The relationship between the ejected electron spectra and stopping powercan be easily shown. In the study of ionization of water vapor by helium ionsToburen et al. [92] examined the mean electrons energies, total ionizationcross sections and partial stopping cross sections for He+, He2+, and equalvelocity H+ ions. In that work the total ionization cross sections werederived from measured doubly differential electron emission cross sectionsusing the expression
(2.35)
where o(e,6) are the measured doubly differential cross sections forionization by a particle of reduced energy T. The major fraction of the totalstopping power can also be derived from doubly differential cross sections andthe density of the medium. Projectile energy loss that is transferred tokinetic energy of ejected electrons plus the energy lost in overcoming thebinding energy to eject electrons account for as much as 90% of the totalstopping power for 0.5 MeV/u ions [199]; additional energy may be lost throughcharge transfer processes and excitation of the target. The partial stoppingcross section owing to energy loss to ionization can be calculated from theexpression
>18° , „ r««» , r1800(e,0)sin8dQ -*• 2n\ ectefIQ JQ Jo Jo
= 2jilfe°"d£f18°0(e,0)sin8d8 + 2n f ecte f18°o (e,6) sinödö , (2.36)Jo Jo Jo Jo
where a(c,d) are the measured doubly differential cross sections (DDCS) forelectron emission. Similarly, one can obtain the mean energy of ejectedelectron from the measured DDCS using the following expression
/"*"*€*f o(e,6)sinod9Jo_____J_o_____________
231 f*"•"<&f18°0 (8, e)sinod0Jo Jo
T = J0 __________ . (2.37)-ISO * '
These derived quantities CTT, £, and eaT (the partial stopping cross sectionfor energy deposited as kinetic energy of ionized electrons) for collisions ofprotons and helium ions with water vapor are reproduced from Toburen et al.[92] in Table 2.7. In this energy range the total ionization cross section isdecreasing with increasing ion energy. The mean energy of the electronsejected by the bare ions is, however, nearly constant over this energy range.The most dramatic change in these quantities in this energy range is the
135

TABLE 2.7
Energy loss as kinetic energy of free electrons in water vapor
Ion Energy(MeV/u)
0.0750.200.300.400.50
1.230.900.950.77
He2+
€
45524951
He + H +
~€aT
55.647.146.739.5
't0.8380.6610.5570.4760.362
€
39637892112
»T -T -< »,33.041.643.3 0.257 45 11.644.140.5 0.170 56 9.6
-15 2CTT in units of 10 cm
e in units of eV_ — 1 5 2ea_ in units of 10 eVcm
(total ionization cross section)
(mean energy of ejected electrons)
(partial energy loss cross sectionfor energy loss as kinetic energy offree electrons)
TABLE 2.8Partial and Total Stopping Cross Sections for water
Partial Stopping Cross Sections Stopping Cross SectionsIon Energy(MeV/u)
0.0750.2000.3000.4000.500
He+
vapor43.550505045
He2 +
vapor71585949
charge stateaverage
vapor60.5565849
Mattesonet air
liquid63.272.966.658.752.1
Palmer and .Akhavan-Rezayat
liquid68645651
vapor77625651
a) Partial stopping cross sections including contributions from bindingenergy and kinetic energy of electrons released in ionizing collisions;cross sections in units of 10~15 eV cmz/molecule.
b) Stopping cross sections in units of 10~15 eV cm2/molecule.c) Data from Matteson et al., [200].d) Data from Palmer and Akhavan-Rezayat, [201]
136
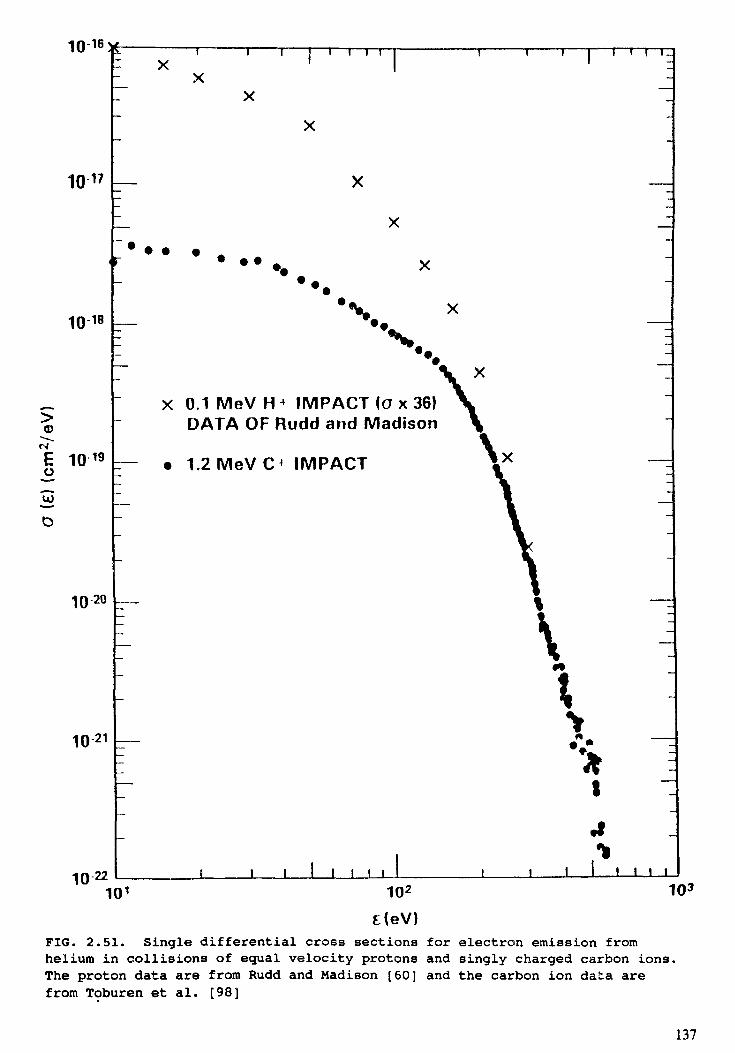
1016
1017
1018
<D
1= 1019
1020
1021
1022
Xi —— i
X
i — i — rr
X
X 0.1 MeV H * IMPACT (a x 36)DATA OF Rudd and Madison
• 1.2 MeV C^ IMPACT
\
>S
I . . . . I i i i102
£(eV)
TO3
FIG. 2.51. Single differential cross sections for electron emission fromhelium in collisions of equal velocity protons and singly charged carbon ions.The proton data are from Rudd and Madison [60] and the carbon ion data arefrom Toburen et al. [98]
137

increase in the mean energy of electrons ejected by the He* ions as theirenergy increases. The partial stopping cross sections for the transfer ofenergy to ejected electron kinetic energy for He"*" and He2"1" ions are verysimilar and, within experimental uncertainties, equal to four times thecomparable partial stopping cross sections for protons as would be expectedfrom z2 scaling. It is interesting that the total ionization cross sectionfor He+ tends to decrease at about the same rate as the mean energy of theejected electron energy increases such that the partial stopping cross sectionremains nearly constant for He+ and equal to that of He2"1".
In order to compare the stopping cross sections obtained fromdifferential cross sections for electron emission to measured stopping crosssections it is necessary to include the contributions from electron binding tothat contributing to electron kinetic energy given in Table 2.7 as prescribedin Eq. 2.36, and one must sum over the fractions of the beam in differentcharge states; stopping cross section and stopping power measurements are madefor particles in charge state equilibrium. For the energy range of themeasurements shown in Table 2.7 only the singly and doubly charged ions aresignificant components of the equilibrated beam. Also, one should note thatEq. 2.36 does not include contributions from production of excited states ofenergy transfer in charge transfer collisions. The charge state averagestopping cross sections obtained by using Eq. 2.36 are shown in Table 2.8along with measured values. The partial cross sections obtained from thedifferential cross sections are smaller than the measurements [200,201] byabout 20% at the lowest ion energy and 5-10% at the higher energies. Thesedifferences are consistent with the expected contributions for excitation[199] that need to be added to the partial cross sections based solely onionization. Note also the partial cross sections are for water vapor.Stopping cross sections for the vapor are found to be somewhat smaller thanfor liquid or solid as indicated from the work of Palmer and Akhavan-Rezayat[201].
When we examine the partial stopping cross sections of ions of aspecified charge state in single collisions with atomic or molecular targetsthe normal concepts of effective charge become difficult to visualize. Forexample, in stopping power theory, as indicated above, it is common to relatethe effective charge to the number of electrons that are effectively strippedoff the swift ion by the medium [194-197]. This seems inappropriate when wecompare the spectra of energy that is lost to ionization electrons by equalvelocity H+ and C* ions shown in FIG. 2.51. If the effective charge for C"1" isdetermined from the differential ionization cross sections, namely that zeffis given by
[(I + e)<7T][(I + e)<7T]
(2.38)
then the effective charge for the singly charged 1.2 MeV carbon ion, asdetermined from the data shown in FIG. 2.51, is approximately 2.7 and it isfound to increase with increasing ion energy. This would imply that theeffective charge for energy loss must be somewhat larger than the actualcharge on a moving ion because screening by the bound projectile is not 100%efficient. This has also been noted in the work of Brandt and Kitagawa [202]in their analysis of stopping power data. Some of the ionization thatcontributes to the energy loss of the ion occurs with impact parameters withinthe screening radius of the bound projectile electrons. If one were to takethe assumption literally, that the effective charge on a moving ion is equal
138

1.0
0.8
0.6
Z*^
0.4
0.2
Yarlagadda et al.V
D
Barkas
q (H2Target)
/
0 1.0 2.0v,/v0
3.0 4.0
FIG. 2.52. Comparison of the empirical effective proton charge obtained inthe work of Yarlagadda et al. [203] using stopping power and theory to theaverage ion charge obtained from charge transfer cross sections for proton-hydrogen collisions tabulated by HcDaniel et al. [3]. The solid line is drawnthrough the data points to guide the eye. Also shown is the effective chargegiven by the empirical formula of Barkas [204].
to the mean charge on the ion, (as some authors still maintain) then a slowion that has become neutralized by electron capture would not be expected tointeract in any way with the electrons of the media it was traversing. Thisis certainly not true and is clearly demonstrated in studies of ionization ofatoms and molecules by the passage of neutral hydrogen particles (see forexample, Rudd et al. [89]; ionization remains a dominant mechanism for energyloss even at H° velocities slower that that of the bound projectile electronin contradiction to the assumptions of Bohr [194].
A comparison of the average effective charge obtained from stopping powermeasurements and the mean ion charge obtained from charge transfermeasurements is shown in FIG. 2.52 as a function of ion velocity for protonimpact. For relative velocities greater than about V!/v0=2.5 the two methodsof arriving at an effective charge are equivalent; at those high velocities
139

the moving ion is effectively bare. At lower proton energies, however, thereis a considerable difference between these two methods of arriving at aneffective charge. As discussed above, the effective charge for energy loss islarger than that obtained based on equilibrium charge transfer cross sections.Also shown in FIG. 2.52 is the effective charge derived from the empiricalformula of Barkas [204]. The Barkas formula is in relatively good agreementwith the effective charge from stopping power data; to be expected as it wasoriginally derived from stopping power data. The data of FIG. 2.52 wouldsuggest that the equilibrium charge measurements may not be a good indicationof the effective charge for energy loss at low velocities of the incidentparticle where the equilibrium charge is relatively small due to capture ofelectrons.
Anthony and Lanford measured stopping power for a wide range of heavyions with energies near the peak in the stopping power and for several
1.0
0.9
0.8
0.7
0.6
Anthony and Lanford
_q (solid)Z = 35
Barkas (Z = 35)
FIG. 2.53. Values of the effective charge, divided by the ion atomic number,obtained from stopping power and from equilibrium charge measurements. Thesolid line is from a fit to the effective charge determined by Anthony andLansford [197] from experimental stopping power for a number of ions includinghigher order z corrections. The dotted lines are the average charge ofbromine ions measured as they exit gases and solida by Betz [181], Also shownis the effective charge of bromine ions obtained from the empirical formula ofBarkas [204].
140

targets. From these data they derived the projectile effective charge from aratio to proton stopping power and compared the results to equilibrium chargemeasurements compiled by Betz [181]. A comparison of their results to Betzand to the Barkas formula is shown in FIG. 2.53. In general stopping powermeasurements lead to an effective projectile charge that is independent of thetarget material (see, for example, J. F. Ziegler, [205] and Ziegler et al.,[206]), whereas the equilibrium charge measured in different material isobserved to be larger for targets of higher atomic number. Anthony andLanford took this difference in target dependence for the different methods ofmeasurements to be an artifact of the means by which the stopping power datawere analyzed, ie, that a z2 dependence on stopping power was used implicitlyin the analysis. By invoking higher order z contributions in the theory ofstopping power they were able to demonstrate a target dependence that was inagreement with equilibrium charge measurements. Still, their results, shownin FIG. 2.53, mimicked the gas phase equilibrium charge measurements, ie.,they were considerably smaller than the solid state measurements. Thisoccurred in spite of the fact that their stopping power measurements were madein solid targets. The use of higher order terms in projectile charge in theanalysis of stopping power data does tend to result in effective charges thatagree with the average equilibrium charge of the beam. However, one mayquestion whether this agreement is forced by the assumptions inherent in theconstraint applied by Anthony and Lansford in their analysis, i.e. that theeffective charge must have the same target dependence as that of theequilibrium charge. Recognize that the lack of target dependence observedwhen stopping power data are analyzed in terms of a z2 dependence onprojectile charge is more in agreement with the studies of differentialionization cross sections.
To explore the effect of target structure on stopping power one canexamine the relative contributions of the energy loos spectra to stoppingpower and compare that with the effect of target structure on energy loss.From the spectra of energy loss in charged particle collisions with differentatomic and molecular targets (see, for example, the data of FIG. 2.37) oneobserves that the effects of target electronic structure is evident only forthe very low-energy portion of the ejected electron spectrum, i.e., ejectedelectron energies less than about 20 eV. This has an important effect on theyield of electrons ejected in ionizing collisions because cross sections forlow-energy electrons are very large. The cross section for energy loss,however, entails the product of ejected electron energy, plus the bindingenergy, times the respective cross section for electron ejection, ie.,probability of energy loss is given by (e+I)a(e). This shifts the influenceof the spectral shape on stopping power to higher electron energies. Theresult is that one would expect a greatly reduced effect of target structureon stopping power relative to its effect on ionization. Thus, one wouldexpect the stopping power to be a function of target electron density, but noton the detailed electronic structure of the target. On the other hand,equilibrium charge states depend on the probability of electron capture andloss processes that are more characteristic of low-energy ionizationprocesses. This echoes the sentiment expressed by Yarlagadda et al. [203]that "a model useful and adequate for stopping power need not apply to otherphenomena".
2.8. INNER SHELL IONIZATION
Most of the results discussed to this point in this chapter refer to theionization of the outer electronic shells of atomic or molecular targets. Butwhen the energy of the projectile is large enough, inner atomic shells mayalso be ionized, although with smaller probability. The total ionization
141

40
30CM
(SIÊu 20CSII
10
10 20 50 100
FIG. 2.54. Comparison between experimental and theoretical cross sections forK-shell ionization of light atoms (Z2 = 6 to 18) by electron impact. crKxI2 isplotted versus T/I. Curves and symbols are defined as follows:__PWBAcalculation for 6 = 0.70 [209], —— Born-Ochkur calculation for 8 = 0.70[209]; Experimental data for O-carbon [210], v-nitrogen [210], A-neon [210],•-neon [211], o-aluminum [212], B-argon [213]. The x-ray data of Tawara etal. [214], for A-carbon, are normalized to Glupe and Mehlhorn's data [210].The data for T-argon, have been converted to ionization cross sections using afluorescence yield w = 0.118 [207].
cross section for an inner shell, for example the K shell, CTK, can be obtainedeither from the x-ray production cross section crK.x ray or from the Auger-electron production cross section <7K_Auger if the fluorescence yield o> is known(see, for example, Krause, [207]. The total K-shell ionization cross sectionis obtained from the x-ray cross sections by crK = a -* ray/w« or from the K-Auger cross sections using a = K-Auger/(1-w )• For targets involving lightatoms, w is small and we have aK = c7K_Auger. The data in FIG. 2.54, taken fromthe very useful review by R. Hippler [208], illustrate experimental andtheoretical cross sections for K-shell ionization of light atoms by electron
142

impact; here the total cross section CTK is multiplied by I2, where I is the K-shell ionization energy, and plotted versus T/I. All the data shown in FIG.2.54 are well represented by the Born-Ochkur calculation [209] for 6 = 0.7.In this calculation, B = I/(Z2-0.3)2R measures the effect of screening byouter electrons, the constant 0.3 corrects for the screening by the second K-shell electron, and R is the Rydberg energy. The cross section rises fromthreshold (at T = I) to a maximum at about 41 and then decreases again.
The experimental total K-shell ionization cross sections for excitationby light ions have been reviewed by Paul and Muhr [215] and specifically for Hand He ions by G. Lapicki [216]. The data are fairly well described by theECPSSR theory [217] which is based on the PWBA and contains severalcorrections for higher order effects. At a certain normalized projectileenergy T/I, the cross section is approximately proportional to Z21/Z42, tofirst order.
104 r
O
E.fMeV1FIG. 2.55. K-shell ionization cross section for protons on aluminum in unitsof 10"28m2, versus proton energy. The curve is the ECPSSR theory [217]; theletters signify measured points compiled from various publications by Paul andSacher [218] including; A, Ogier et al. [219]; B, Khan et al. [220]; C, Khanet al. [221]; D, Shima et al. [222]; E, Basbas et al. [223]; F, Tawara et al.[224J; G, Basbas et al. [225]; H, Sera et al. [226]; I, Bonani et al. [227];and K, Geretschläger, M., Benka, O., [228].
143
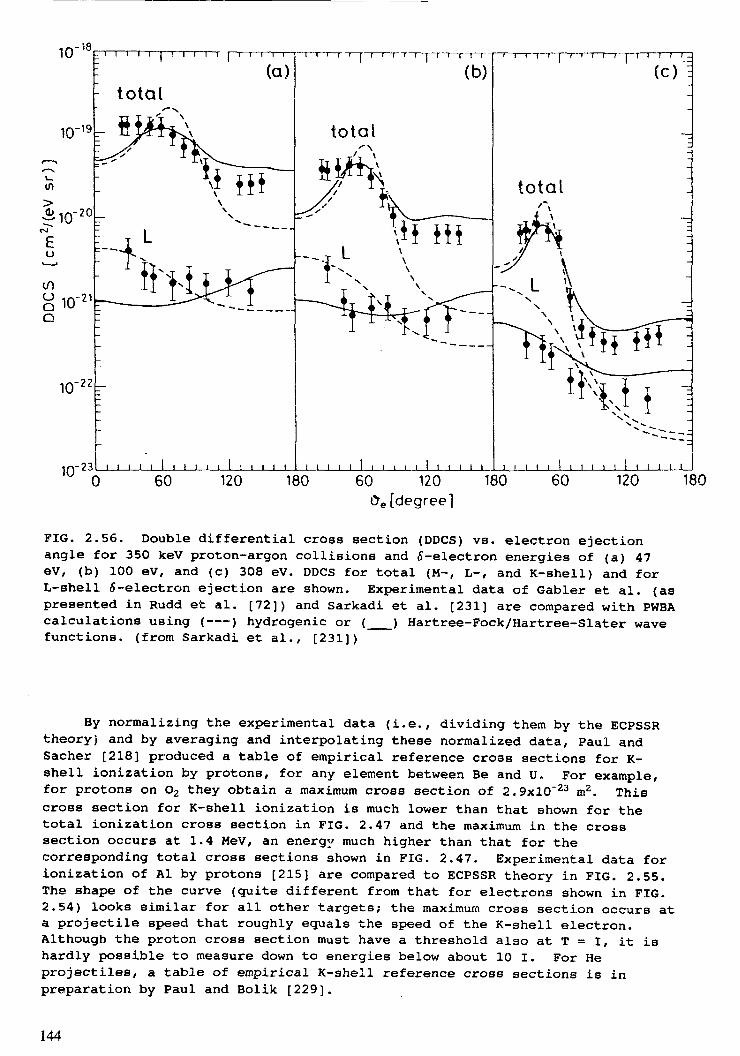
t i I ( i < ( i i l J i r
(C)
irr 23 l i i l l l i l i i i l i i i i i i i i i i l i i i i i l i i i i i i i i i i l i i i i i l i i i i i0 60 120 180 60 120 180 60 120 180
i>e [degree]
FIG. 2.56. Double differential cross section (DDCS) vs. electron ejectionangle for 350 keV proton-argon collisions and 6-electron energies of (a) 47eV, (b) 100 eV, and (c) 308 eV. DDCS for total (M-, L-, and K-shell) and forL-shell 5-electron ejection are shown. Experimental data of Gabler et al. (aspresented in Rudd et al. [72]) and Sarkadi et al. [231] are compared with PWBAcalculations using (——) hydrogenic or (__) Hartree-Fock/Hartree-Slater wavefunctions, (from Sarkadi et al., [231])
By normalizing the experimental data (i.e., dividing them by the ECPSSRtheory) and by averaging and interpolating these normalized data, Paul andSacher [218] produced a table of empirical reference cross sections for K-shell ionization by protons, for any element between Be and U. For example,for protons on O2 they obtain a maximum cross section of 2.9xlO~23 m2. Thiscross section for K-shell ionization is much lower than that shown for thetotal ionization cross section in FIG. 2.47 and the maximum in the crosssection occurs at 1.4 MeV, an energy much higher than that for thecorresponding total cross sections shown in FIG. 2.47. Experimental data forionization of Al by protons [215] are compared to ECPSSR theory in FIG. 2.55.The shape of the curve (quite different from that for electrons shown in FIG.2.54) looks similar for all other targets; the maximum cross section occurs ata projectile speed that roughly equals the speed of the K-shell electron.Although the proton cross section must have a threshold also at T = I, it ishardly possible to measure down to energies below about 10 I. For Heprojectiles, a table of empirical K-shell reference cross sections is inpreparation by Paul and Bolik [229].
144

«ro l .G
JD(LÜ.8
0,0i .2
»n00. B
jp
0.0
0.707 MeV H on Cu
0.0
1.0 2.0
2.000 MeV H on Cu
3.0
3.0
FIG. 2.57. Impact parameter dependence of K-shell ionization probability inproton-copper collisions. Experimental data (+) due to Andersen et al [232]are compared to the semi-classical approximation (SCA) including variouscorrections. The solid curve includes corrections for Coulomb repulsion,energy loss, increased binding, and relativistic electron motion [232].
145

Concerning L-shell ionization, a compilation of experimental x-rayproduction and ionization cross sections has been produced by Sokhi andCrumpton [230], For the L-shell, the curve of the cross section versus energylooks similar to that for the K-shell, but the maximum occurs at lower ionimpact energies (since the L-shell electrons are slower, i.e., smaller bindingenergy) and the cross section at the maximum is larger. The cross sectionscorresponding to the three L~subshells differ; the one for the L3 subshellbeing largest.
At low projectile energies, there is, in addition to direct ionization,the possibility of ionizing the inner shell by charge transfer (or electroncapture by the projectile, as it is often called). This process contributesabout 6% to the total K-shell ionization cross sections of N2 by protons, andless for heavier targets [216]. Since the reference cross sections [218] arebased on empirical ionization data, they include this contribution.
Doubly differential cross sections (differential in ejected electronenergy and angle) can also be measured for electrons ejected from inner shellsby requiring a coincidence between Auger electrons or characteristic x-raysthat signal the decay of an inner shell hole and the ejected electron.Measurements of electron spectra from argon are shown in FIG. 2.56 [231]. Thecurves marked "L" refer to the L-shell; the "total" is essentially M-shell.Another type of differential cross section can be measured by requiring acoincidence between the projectile scattered at a certain angle and thecharacteristic x-ray (or Auger alectron). Since the scattering angle dependson the impact parameter b of the projectile with respect to the targetnucleus, this effectively measures the probability P(b) of inner-shellionization for a particle incident at an impact parameter b. A typical impactparameter dependent measurement is shown in FIG. 2.57 for ionization of copperby 0.7- and 2-MeV protons [232].
ACKNOWLEDGEMENTS
The authors of this chapter would like to thank Professor M. E. Rudd,University of Nebraska, and W. E. Wilson, Pacific Northwest Laboratory, fortheir contributions on cross section modeling that were presented in thischapter and R. D. DuBois for many fruitful discussion on the variousinteraction cross section that lead to energy loss by fast charged particles.The author also wishes to thank members of this report committee and the IAEAfor their comments, support, and encouragement. This work was supported inpart by the Office of Health and Environmental Research (OHER), U. S.Department of Energy under Contract DE-AC06-76RLO 1830.
REFERENCES[1] INOKUTI, M. "Introductory Remarks", (TECDOC-506, 1989) IAEA, Vienna
(1989) 7.
[2] L. H. TOBUREN, 1991, "Atomic and Molecular Physics in the Gas Phase",Physical and Chemical Mechanisms in Molecular Radiation Biology, (Glass,W.A., Varma, N.M., Eds) Plenum Press, New York (1991) 51.
[3] MCDANIEL, E.W. FLANNERY, M.R., THOMAS, E.W., ELLIS, H.W., McCANN, K.J.,MANSON, S.T., GALLAGHER, J.W., RUMBLE, J.R., BEATY, E.G., ROBERTS, T.G.,Compilation of Data Relevant to Nuclear Pumped Lasers,(Technical ReportH-78-1) Vol. V, US Army Missile Research and Development Command,Redstone Arsenal, Alabama (1979) 1917.
146

[4] PARETZKE, H.G., "Radiation Track Structure Theory", Kinetics ofNonhomogeneous Processes (G. R. Freeman, G.R., Ed), John Wiley & Sons,New York, (1987) 89.
[5] SHYN T.W., SHARP, W.E., Doubly differential cross sections of secondaryelectrons ejected from gases by electron impact: 50-300 eV on helium,Phys. Rev. A 19 (1979) 557.
[6] RÜDD, M.E., DUBOIS, R.D., Absolute doubly differential cross sectionsfor ejection of secondary electrons from gases by electron impact. I.100 and 200 eV electrons on helium, Phys. Rev. A 16 (1977) 26.
[7] OPAL, C.B., BEATY, E.G., PETERSON, W.K., Tables of energy and angulardistributions of electrons ejected from simple gases by electron impact,joint institute for laboratory astrophysics (JILA) Report No. 108(1971).
[8] OPAL, C.B., BEATY, B.C., PETERSON, W.K., Tables of secondary electronproduction cross sections, Atomic Data 4 (1972) 209.
[9] GORUGANTHU, R.R., BONHAM, R.A., Secondary-electron-production crosssections for electron impact ionization of helium, Phys. Rev. A 34(1986) 103.
[10] MULLER-FIEDLER, R., JUNG, K., EHRHARDT, H., Double differential crosssections for electron impact ionization of helium, J. Phys. B 19 (1986)1211.
[11] GOODRICH, M., Electron scattering in helium, Phys. Rev. 52 (1937) 259.
[12] SETHURAMAN, S.K., REES, J.A., GIBSON, J.R., Report of the University ofLiverpool, Dept. of Electrical Engineering and Electronics (1972).
[13] ODA, N., NISHIMURA, F., TAHIRA, S., Energy and angular distributions ofsecondary electrons resulting from ionizing collisions of electrons withhelium and krypton, J. Phys. Soc. Japan 33 (1972) 462.
[14] DuBOIS, R.D., M. E. RUDD, M.E., Absolute doubly differential crosssections for ejection of secondary electrons from gases by electronimpact. II. 100-500 eV electrons on neon, argon, molecular hydrogen andmolecular nitrogen, Phys. Rev. A 17 (1978) 843.
[15] MATHIS, R.E., VROOM, D.A., The Energy distributions of secondaryelectrons from Ar, N2f H2O and H2O with clusters present, J. Chem. Phys.64 (1976) 1146.
[16] SHYN, T.W., SHARP, W.E., KIM, Y.-K., Doubly Differential cross sectionsof secondary electrons ejected from gases by electron impact: 25-250 eVon H2, Phys. Rev. A 24 (1981) 79.
[17] GORUGANTHU, R.R., WILSON, W.G., BONHAM, R.A., Secondary electronproduction cross sections for electron impact ionization of molecularnitrogen, Phys. Rev. A 35 (1987) 540.
[18] TISONE, G.C., Energy and angular distributions of electrons ejected fromN2 by electron impact, Sandia Laboratory Report SC-RR-710051, SandiaLaboratories, Albuquerque, New Mexico (1971) 1.
147

[19] SHYN, T.W., Doubly differential cross sections of secondary electronsejected from gases by electron impact: 50-400 eV on N2, Phys. Rev. A 27(1983) 2388.
[20] SHYN, T.W., SHARP, W.E., Doubly differential cross sections of secondaryelectrons ejected from molecular oxygen by electron impact, Phys. Rev. A43 (1991) 2300.
[21] ODA, N., Energy and angular distributions of electrons from atoms andmolecules by electron impact, Radiât. Res. 64 (1975) 80.
[22] BOLORIZADEH, H.A., RUDD, M.E., Angular and energy dependence of crosssections for ejection of electrons from water vapor. I. 50-2000 eVelectron impact, Phys. Rev A 33 (1986) 882.
[23] HOLLMAN, K.W., KERBY III, G.W., RUDD,M.E., MILLER, J.H., MANSON, S.T.,Differential cross sections for secondary electron production by 1.5-keVelectrons in water vapor, Phys. Rev. A 38 (1988) 3299.
[24] MA, C., BONHAH, R.A., Secondary electron production cross sections for800 ev electron-impact ionization of carbon monoxide, Phys. Rev. A 38(1988) 2160.
[25] SHYN, T.W., SHARP, W.E., Doubly differential cross sections of secondaryelectrons ejected from gases by electron impact: 50-400 eV on CO2, Phys.Rev. A 20 (1979) 2332.
[26] EHRHARDT, H., HASSELBACHER, J.H., JUNG, K., SCHULZ, M., WILLMANN, K.,Collisional ionization of helium by 250 eV electrons: experiments withcompletely determined kinematics. J. Phys. B 5 (1972) 2107.
[27] EHRHARDT, H., HASSELBACHER, K.H., JUNG, K., SCHUBERT, E., WILLMANN, K.,Electron impact ionization of argon: measurements of triple differentialcross sections, J. Phys. B 7 (1974) 69.
[28] BEATY, E.G., HESSELBACHER, K.H., HONG, S.P., MOORE, J.H., Measurementsof the triple-differential cross sections for low-energy electron-impactIonization of Helium, Phys. Rev. A 17 (1978)1592.
[29] HONG, S.P., BEATY, E.G., Measurements of the triple-differential crosssection for low-energy electron-impact ionization of argon, Phys. Rev. A17 (1978) 1829.
[30] EHRHARDT, H., HASSELBACHER, K.H., JUNG, K., SCHULZ, M., TAKAAT, T.,WILLMANN, K., Z. Phys. 244 (1971) 254.
[31] KIM, Y.-K., Angular and energy distributions of secondary electrons fromhelium: Slow electrons ejected by electron impact. Phys. Rev. A 28(1983)656.
[32] KIM, Y.-K., Angular distribution of secondary electrons in the dipoleapproximation, Phya. Rev. A 6 (1972) 666.
[33] KIM, Y.-K., "Secondary electron spectra", Radiation Research,Biomédical, Chemical, and Physical Prospectives, Academic Press, Inc.,New York (1975. 219,
148

[34] KIM, Y.-K., Energy distributions of secondary electrons I. Consistencyof experimental data, Radiât. Res, 61 (1975) 21.
[35] KIM, Y.-K., INOKUTI, M., Slow electrons ejected by fast chargedparticles, Phys. Rev. A 7 (1973) 1257.
[36] KIM Y.-K., NOGUCHI, T., Secondary electrons ejected from he by protonsand electrons, Int. J. Radiât. Phys. Chem. 7 (1975) 77.
[37] INOKUTI, M., Inelastic collisions of fast charged particles with atomsand molecules - the Bethe theory revisited, Rev. Mod. Phys. 43 (1971)297.
[38] INOKUTI, M., ITIKAWA, Y., TURNER, T.E., Addenda: Inelastic collisions offast charged particles with atoms and molecules - the Bethe theoryrevisited, Rev. Mod. Phys. 50 (1978) 23.
[39] RUDD, M.E., Differential and total cross sections for ionization ofhelium and hydrogen by electrons, Phys. Rev. A 44 (1991) 1644.
[40] TOBUREN, L.H., Angular distributions of electrons emitted from gases andthin foils during light ion bombardment, Scanning Microscopy Supplement4 (1990) 239.
[41] TOBUREN, L.H., 1982, "Continuum electron emission in heavy-ioncollisions", Nuclear Methods 2; High-Energy Ion-Atom Collisions {BRENYI,D., HOCK, G., Eds), Elsever, New York, (1982) 53.
[42] TOBUREN, L.H., "Atomic and Molecular Processes of Energy Loss byEnergetic Charged Particles", (TECDOC-506, 1989) IAEA, Vienna (1989)160.
[43] RUDO, M.E., MACEK, J., Mechanisms of electron production in ion-atomcollisions, Case Studies At. Phys. 3 (1972) 47.
[44] RUDD, M.E., Mechanisms of electron production in ion-atom collisions,Radiât. Res. 64 (1975) 153.
[45] STOLTERFOHT, N., "Excitation in energetic ion-atom collisionsaccompanied by electron emission", Topics in Current Physics V.:Structure and Collisions of Ions and Atoms, (SELLIN, I.A., Ed.)Springer-Verlag, Berlin (1978) 155.
[46] KUYATT, C.E., JORGENSEN, Jr., T., Energy and angular dependence of thedifferential cross section for production of electrons by 50-100 keVprotons in hydrogen gas, Phys. Rev. 130 (1963) 1444.
[47] RUDD, M.E., JORGENSEN, Jr., T., Energy and angular distributions ofelectrons ejected from hydrogen and helium gas by protons, Phys. Rev.131 (1963) 666.
[48] RUDD, M.E., SAUTTER, C.A., BAILEY, C.L., Energy and angulardistributions of electrons ejected from hydrogen and helium by 100 to300 keV protons, Phys. Rev. 151 (1966) 20.
[49] TOBUREN, L.H., Distributions in energy and angle of electrons ejectedfrom molecular nitrogen by 0.3-1.7 Mev protons, Phys. Rev. A 3(1971)216.
149

[50] TOBUREN, L.H., WILSON, W.E., Distributions in energy and angle byelectrons ejected from molecular hydrogen by 0.3-1.5 MeV protons, Phys.Rev. A 5 (1972) 247.
[51] TOBUREN, L.H., "Angular distributions of electrons ejected by fastprotons", VII International Conference on the Physics of Electronic andAtomic Collisions, Abstracts of Papers, North Holland, Amsterdam (1971)1120.
[52] RUDD, M.E., Energy and angular distributions of secondary electrons from5-100 keV proton collisions with hydrogen and nitrogen molecules, Phys.Rev. A 20 (1979) 787.
[53] CHENG, W.-Q., RUDD, M.E., HSU, Y.-Y., Differential cross sections forejection of electrons from rare gases by 7.5-150 keV protons, Phys. Rev.A 39 (1989) 2359.
[54] GIBSON, O.K., REID, I.D., Double differential cross sections forelectron ejection from helium by fast protons, J. Phys. B 19 (1986)3265.
[55] STOLTERFOHT, N., Angular and energy distributions of electrons producedby 200-500 keV protons in gases II. Results for nitrogen, Z. Physik 248(1971) 92; and STOLTERFOHT, N., "Energy and angular distribution ofelectrons ejected from atoms ionized by protons", VII InternationalConference on the Physics of Electronic and Atomic Collisions, Abstractsof Papers, North Holland, Amsterdam, (1971) 1123.
[56] MANSON, S.T., TOBUREN, L.H., MADISON, D.H., STOLTERFOHT, N., Energy andangular distribution of electrons ejected by fast protons and electrons:Theory and experiment, Phys. Rev. A 12 (1975) 60.
[57] RUDD, M.E., TOBUREN, L.H., STOLTERFOHT, N., Differential cross sectionsfor ejection of electrons from helium by protons, Atomic Data andNuclear Data Tables 18 (1976) 413.
[58] RUDD, M.E., WEBSTER, G.L., BLOCKER, C.A., MADISON, D.A., "Ejection ofelectrons from helium by protons from 5-100 keV", IX InternationalConference on the Physics of Electronic and Atomic Collisions, Abstractsof Papers, University of Washington Press, Seattle (1975) 745.
[59] TOBUREN, L.H., MANSON, S.T., KIM Y.-K., Energy distributions ofsecondary electrons III. Projectile energy dependence for ionization ofHe, Ne, and Ar by protons, Phys. Rev.A 17 (1978) 148.
[60] RUDD, M.E., MADISON, D.H., Comparison of experimental and theoreticalelectron ejection cross sections in helium by proton impact from 5 to100 keV, Phys. Rev. A 14 (1976) 128.
[61] CROOKS, G.B., RUDD, M.E., Experimental evidence for the mechanism ofcharge transfer to continuum states, Phys. Rev. Lett. 25 (1970) 1599.
[62] BERNARDI, G.G., SUAREZ, S., FAINSTEIN, P.D., GARBOTTI, C.R., MECKBACH,W., KOCKE, P., Two-center effects in electron emission in 3He2+ - He andH* - He collisions at intermediate energies, Phys. Rev. A 40 (1989) 6863.
150

[63] PEDERSEN, J.O., HVELPLUND, P., PETERSEN, A.G., FAINSTEIN, P.D., Two-center effects in electron emission from the impact of fast multiplycharged projectiles on helium, J. Phys. B 23 (1990) L597.
[64] CROOKS, J.B., RUDD, M.E., Angular and energy distributions of crosssections for electron production by 50-300 keV proton impact on N2, O2,Ne, and Ar, Phys. Rev. A 3 (1971) 1628.
[65] TOBUREN, L,H. MANSON, S.T., "On the unreliability of the hydrogenicapproximation for inelastic collision of fast charged particles withatoms: lonization of neon by protons", VIII International Conferenceon the Physics of Electronic and Atomic Collisions, Abstracts of Papers,Institute of Physics, Belgrad (1973) 695.
[66] CRISWELL, T.L., TOBUREN, L.H., RUDD, M.E., Energy and angulardistributions of electrons ejected from argon by 5 keV to 1.5 MeVprotons, Phys. Rev. A 16 (1977) 508.
[67] GABLER, H., "Emission von elektronen beim stoss hochenergetischerprotonen mit argon", Ph.D. Thesis, Free University, Berlin (1974).
[68] CRISWELL, T.L., WILSON, W.E., TOBUREN, L.H., "Energy and angulardistribution of electrons ejected from argon by 5-2000 keV H2* impact",IX International Conference on the Physics of Electronic and AtomicCollisions, Abstracts of Papers, University of Washington Press, Seattle(1975) 749.
[69] MANSON, S.T., TOBUREN, L.H., "Energy and angular distribution ofelectrons ejected from ar by 1-MeV proton impact ionization: Theory andexperiment", IX International Conference on the Physics of Electronicand Atomic Collisions, Abstracts of Papers, University of WashingtonPress, Seattle (1975) 751.
[70] RUDD, M.E., JORGENSEN, JR., T., VOLZ, D.J., Electron energy spectrumfrom Ar* - Ar and H+ - Ar collisions, Phys. Rev. 151 (1966) 28.
[71] SATAKA, M., OKUNO, K., URAKAWA, J., ODA, N., "Doubly differential crosssections of electron ejection from argon by 5-20 keV H"*", H2+, and He"1"",International Conference on the Physics of Electronic and AtomicCollisions, Abstracts of Papers, The Society of Atomic CollisionResearch, Kyoto, (1979) 620.
[72] RUDD, M.E., TOBUREN, L.H., STOLTERFOHT, N., Differential cross sectionsfor ejection of electrons from argon by protons, Atomic Data and NuclearData Tables 23 (1979) 405.
[73] MANSON, S.T., TOBUREN, L.H., "Energy and angular distribution ofelectrons ejected from Kr by 1 MeV proton impact ionization: Theory andexperiment", X International Conference on the Physics of Electronicand Atomic Collisions, Abstracts of Papers, Commissariat A L'EnergieAtomique, Paris (1977) 990.
[74] TOBUREN, L.H., MANSON, S.T., "Differential cross sections for ionizationof krypton by fast protons: Theory and experiment", XI InternationalConference on the Physics of Electronic and Atomic Collisions, Abstractsof Papers, The Society for Atomic Collision Research, Kyoto, (1979) 628.
151

[75] TOBUREN, L.H., Distributions in energy and angle of electrons ejectedfrom xenon by 0.3 to 2.0 Mev protons, Phys. Rev. A 9 (1974) 2505.
[76] TOBUREN, L.H., WILSON, W.E., Energy and angular distributions ofelectrons ejected from water vapor by 0.3 - 1.5 MeV protons, J. Chem.Phys. 66 (1977) 5202.
[77] BOLORIZADEH, H.A., RUDD, M.E., Angular and energy dependence of crosssections for ejection of electrons from water vapor. II. 15-150 keVproton impact, Phys. Rev. A 33 (1986) 888.
[78] STOLTERFOHT, N., Angular and energy distribution of electrons producedby 200-500 keV protons in gases: I. Experimental Arrangement, Z. Physik248 (1971) 81.
[79] WILSON, W.E, TOBUREN, L.H., Electron emission from proton-hydrocarbons-molecule collisions at 0.3 to 2 MeV, Phys. Rev. A 11 (1975) 1303.
[80] LYNCH, D,J., TOBUREN, L.H., WILSON, W.E., Electron emission frommethane, ammonia, monomethylamine and dimethylamine by 0.25 to 2.0 MeVprotons, J. Chem. Phys. 64 (1976) 2616.
[81] TOBUREN, L.H., WILSON, W.E., PORTER, L.E., Energy and angulardistributions of electrons ejected in ionization of SF6 and TeF6 by fastprotons, J. Chem. Phys. 67 (1977) 4212.
[82] WILSON, W.E., TOBUREN, L.H., Electron emission in H2+ - H2 collisionsfrom 0.6 to 1.5 MeV, Phys. Rev. A 7 (1973) 1535.
[83] CACAK, R.K., JORGENSEN, Jr., T., Absolute doubly differential crosssections for production of electrons in He^-Ne and Ar+-Ar collisions,Phys. Rev. A 2 (1970) 1322.
[84] WOERLEE, P.H., GORDEEV, Yu. S., DE WAARD, H., SARIS, F.W.,1981, Theproduction of continuous electron spectra in collisions of heavy ionsand atoms. B: direct coupling with the continuum, J. Phys. B 14 (1981)527.
[85] WOERLEE, P.H., Electron and x-ray emission in collisions of multiplycharged ions and atoms, Thesis, University of Amsterdam, (1979)Unpublished.
[86] STOLTERFOHT, N., SCHNEIDER, D., BURCH, D., WIEMAN, H., RISLEY, J.S.,Mechanisms for electron production in 30-MeV On+ + O2 collisions, Phys.Rev. Lett. 33 (1974) 59.
[87] N. ODA, N., NISHIMURA, F., "Energy and angular distributions ofelectrons ejected from He and H2 bombarded by equal velocity H2+ and He+ions", XI International Conference on the Physics of Electronics andAtomic Collisions, Abstracts of Papers, The Society for Atomic CollisionResearch, Kyoto, (1979) 622.
[88] FRYAR, J., RUDD, M.E., and J. S. Risley, Doubly differential crosssections for electron production by impact of H°, H2°, 3He°, and AHe° onhelium, XI International Conference on the Physics of Electronic andAtomic Collisions, Abstracts of Papers, Commissariat A L'EnergieAtomique, Paris (1977) 984.
152
[89] RUDD, M.E., RISLEY, J.S., FRYAR, J., ROLFES, R.G., Angular and energydistribution of electrons form 15-to 150-keV H° + He Collisions, Phys.Rev. A 21 (1980) 506; and RUDD, M.E., RISLEY, J.S., FRYAR, J., "Doubledifferential cross sections for electron production by neutral hydrogenon helium", XI International Conference on the Physics of Electronicand Atomic Collisions, Abstracts of Papers, Commissariat A L'EnergieAtomique, Paris(1977) 986.
[90] TOBUREN, L.H., WILSON, W.E., lonization of noble gases by equal velocityHe"1", He"1"1", and H+ ions, X International Conference on the Physics ofElectronic and Atomic Collisions, Abstracts of Papers (Commissariat AL'Energie Atomique, Paris (1977) 1006.
[91] TOBUREN, L.H., WILSON, W.E., Differential cross sections for ionizationof argon by .3-2 MeV He2+ and He* ions, Phys. Rev. A 19 (1979) 2214.
[92] TOBUREN, L.H., WILSON, W.E., POPOWICH, R.J., Secondary electron emissionfrom ionization of water vapor by 0.3- to 2.0-MeV He"1" and He2* ions,Radiât. Res. 82 (1980) 27.
[93] BOLORIZADEH, H.A., RUDD, M.E., Angular and energy dependence of crosssections for ejection of electrons from water vapor. III. 20-150 keVNeutral Hydrogen Impact, Phys. Rev A 33 (1986) 893.
[94] URAKAWA, J., TOKORO, N., ODA, N., Differential cross sections forejection of electrons and dissociative ionization cross sections for 5-20 keV H2+ and H3+ impacts on helium, J. Phys. B 14 (1981) L431.
[95] ÔATAKA, M., URAKAWA, J., ODA, N., Measurements of double differentialcross sections for electrons ejected from 5-20 keV H+, H2+, and He+impacts on argon, J. Phys. B 12 (1979) L729-L734.
[96] TOBUREN, L.H., "Secondary electron emission in collisions of 1.2 MeV C+ions with He, Ne, Ar, and CH4", XI International Conference on thePhysics of Electronic and Atomic Collisions, Abstracts of Papers, TheSociety for Atomic Collisions Research, Kyoto (1979) 630.
[97] REINHOLD, C.O., SCHULTZ, D.R., OLSON, R.E., TOBUREN, L.H., DUBOIS,R.D.,1990, Electron emission from both target and projectile in C+ +• Hecollisions, J. Phys. B 23 (1990) L297.
[98] TOBUREN, L.H., DUBOIS, R.D., REINHOLD, C.O., SCHULTZ, D.R., OLSON, R.E.,Experimental and theoretical study of the electron spectra in 66.7-350-keV/u C"1" + He collisions, Phys. Rev. A 42 (1990) 5338.
[99] TOBUREN, L.H., "Differential cross sections for electron emission inheavy ion-atom collisions", Proceedings of the Fifth Conference on theuse of Small Accelerators, IEEE Transactions on Nuclear Science NS-26(1979) 1056.
[100] STOLTERFOHT, N., SCHNEIDER, D., "Double differential cross sections forelectron emission from argon by 50-500-keV N+ and O+ impact", Proceedingsof the Fifth Conference on the Use of Small Accelerators, IEEETransactions on Nuclear Science NS-26 (1979) 135.
153
[101] GORDEEV, Yu.S., WOERLEE, P.H., DE WAARD, H., SARIS, F.W., "Continuouselectron spectra produced in Krn+ - Kr collisions", XI InternationalConference on the Physics of Electronic and Atomic Collisions,Abstracts of Papers, The Society for Atomic Collision Research, Japan,(1979) 746.
{102] GORDEEV, Yu.S., WOERLEE, P.H., DE WAARD, H., SARIS, F.W., The productionof continuous electron apectra in collisions of heavy ions and atoms. A.Molecular autoionization, J. Phys. B 14 (1981) 513.
[103] SCHNEIDER, D.H., DEWITT, D.R., BAUER, R.W., MOWAT, J.R., GRAHAM, W.G.,SCHLACHTER, A.S., SKOGVALL, B., FAINSTEIN, P., RIVAROLA, R.D., Absolutedoubly differential cross sections for electron emission in collisionsof 3.5-MeV/u Fe17+ and Fe22+ ions with he and ar gas targets, Phys. Rev. A46 (1992) 1296.
[104] STOLTERFOHT, N., SCHNEIDER, D., TANIS, J., ALTEVOGT, H., SALIN, A.,FAINSTEIN, P.D., RIVAROLA, R., GRANDIN, J.P., SCHEURER, J.N,,ANDRIAMONJE, S., BERTAULT, D., CHEMIN, J.F., Evidence for two-centereffects in the electron emission from 25 MeV/u Mo40+ + He collisions:Theory and experiment, Europhysics Lett. 4 (1987) 899.
[105] KELBCH, C., OLSON, R.E., SCHMIDT, S., SCHMIDT-BÖCKING, H., HAGMANN, S.,Unexpected angular distribution of the S-electron emission in 1.4 MeV/uU33+ - rare gas collisions, J. Phys. B 22 (1989) 2171.
[106] SCHMIDT-BÖCKING, H., RAMM, U., KRAFT, G., ULLRICH, J. , BERG, H., KELBCH,C., OLSON, R.E., HAGMANN, S., JAIZHEN, F., 5-electron emission in fastheavy ion atom collisions, Adv. Space Res. 12 (1992) 7.
[107] SCHNEIDER, D.H., DEWITT, D.R., SCHLACHTER, A.S., OLSON, R.E., GRAHAM,W.G., MOWAT, J.R., DUBOIS, R.D., LLOYD, D.H., NONTEMAYOR, V., SCHIWIETZ,G., Strong continuum-continuum couplings in the direct ionization of Arand He atoms by 6-MeV/u U38"1" and Th38"1" Projectiles, Phys. Rev. A 40 (1989)2971.
[108] BREINIG, M., ELSTON, S.B.,HULDT, S., LILJEBY, L., VANE, C.R., BERRY,S.D., GLASS, G.A., SCHAUER, M., SELLIN, I.A., ALTON, G.D., DATZ, S.,OVERBURY,S., LAUBERT, R,, SUTER,M., Experiments concerning electroncapture and loss to the continuum and convey electron electronproduction by highly ionized projectiles in the 0.7-8.5 MeV/u rangetraversing the rare gases, polycrystalline solids, and axial channels ingold, Phys.Rev A 25 (1982) 3015.
[109] TOBUREN, L.H., WILSON, W.E.,1975, Time-of-flight measurements of low-energy electron energy distributions from ion-atom collisions, Rev. Sei.Instrum. 46 (1975) 851.
[110] TOBUREN, L.H., MANSON, S. T., KIM, Y.-K., Energy distributions ofsecondary electrons. Ill: Projectile energy dependence for ionization ofHe, Ne, and Ar by protons, Phys. Rev. A 17 (1978) 148.
[Ill] RUDD, M.E., GREGOIRE, D.,1969, "Energy distribution of electrons fromionization of helium and hydrogen by proton collisions: Comparison ofclassical theories and experiment", Physics of the One- and Two-ElectronAtoms, (BOPP, F., KLEINPOPPEN, H., Eds) North Holland, Amsterdam, (1969)795.
154

[112] VRIENS, L., Binary-encounter proton-atom collision theory, Proc. Phys.Soc. 90 (1967) 935.
[113] BONSEN, T.F.M, VRIENS, L., Angular distribution of electrons ejected bycharged particles I. lonization of He and H2 by protons, Physica 47(1970) 307,
[114] TOBUREN, L.H., STOLTERFOHT, N.,2IEM, P., SCHNEIDER, D., ElectronicScreeening in heavy-ion-atom collisions, Phys. Rev. 24 (1981) 1741.
[115] TOBUREN, L.H., ZIEM, P., STOLTERFOHT, N., SCHNEIDER,D., PROST, M.,Dynamic screening by projectile electrons in heavy ion collisions, IEEETransactions on Nuclear Science, NS-28 (1981) 1131.
[116] MADISON, D.H., Angular distribution of electrons ejected from helium byproton impact, Phys. Rev. A 8 (1973) 2449.
[117] OLDHAM, Jr., W.J,B., Calculations of the energy and angulardistributions of electrons ejected from helium by protons, Phys. Rev.161 (1967) 1.
[118] SALIN, A., lonization of atomic hydrogen by proton impact, J. Phys. B 2(1969) 631.
[119] MACEK, J., Theory of the forward peak in the angular distribution ofelectrons ejected by fast protons, Phys. Rev. A 1 (1970) 235,
[120] MACEK, J., private communication, (1971).
[121] MECKBACH, W., KOCKE, P.J., GONI, A.R., SUAREZ, S., Effects of theWannier ridge on secondary-electron spectra in proton-helium collisions,Phys. Rev. Lett. 57 (1986) 1587.
[122] OLSON, R.E., GAY, T.J., BERRY, H.G., HALE, E.B., IRBY, V.D., Saddle-point electrons in ionizing ion-atom collisions, Phys. Rev. Lett. 59(1987) 36.
[123] FAINSTEIN, P.D., PONCE, V.H., RIVAROLA, D., Electron emission frommultielectron atoms by ion impact at intermediate and high energies, J.Phys. B 22 (1989) 1207.
[124] WILSON, W.E., "Analytical expression for cross section data", PacificNorthwest Laboratory Annual Report for 1976, Part 4, BNWL-2100 PT4/UC-48, (1977), 40.
[125] WILSON, W.E., "Analytical expression for cross section data", PacificNorthwest Laboratory Annual Report for 1977, Part 4, PNL-2500 PT4/UC-48,(1978) 2.7.
[126] BERKOWITZ, J., Photoabsorption, Photoionization and PhotoelectronSpectroscopy, Academic Press, New York, (1979).
[127] TAN, K.H., BRION, C.E., VAN DER LEEUW, PH.E., VAN DER WIEL, M.J., 1978,Absolute oscillator strengths (10 - 60 eV) for the photoabsorption,photoionization, and photofragmentation of H2O, Chem. Phys. 29 (1978)299.
155

[128] BLAKE, A.J., CARVER, J.H.,1967, Determination of partial photoionizationcross sections by photoelectron spectroscopy, J. Chem. Phys. 47 (1967)1038.
[129] BUTTS, J.J., KATZ, R., Theory of RBE for heavy ion bombardment of dryenzymes and viruses, Radiât. Res. 30 (1967) 855.
[130] CHATTERJEE, A., SHAEFER, H.J., Microdosimetric structure of heavy iontracks in tissue, Rad. and Environm. Biophys. 13 (1976) 215.
[131] WATSON, R.L., TOBUREN, L.H., Auger spectra of carbon and argon followingionization by equal-velocity a particles and deuterons, Phys. Rev. A 7(1973) 1853.
[132] DETTMAN, K., HARRISOK, K.G., LUCAS, M.W., Charge exchange to thecontinuum for light ions in solids, J. Phys. B 7 (1974) 269.
[133] MANSON, S.T., TOBUREN, L.H., Energy and angular distributions ofelectrons from fast He* + He collisions, Phys. Rev. Lett. 46 (1981) 529.
[134] McGUIRE, J.H., STOLTERFOHT, N., SIMONY, P.R., Screening and anti-screening by projectile electrons in high-velocity atomic collisions,Phys. Rev. A 24 (1981) 97.
[135] DUBOIS, R.D., MANSON, S. T., Coincidence study of doubly differentialcross sections: projectile ionization in He*-He collisions, Phys. Rev.Lett. 57 (1986) 1130.
[136] HEIL, O., MAIER, R., HUZEL, M., GROENEVELD, K.-O., DUBOIS, R.D., Asystematic investigation of ionization occurring in few electronsystems, Phys. Rev. Lett., in press.
[137] MILLER, J.H., WILSON, W.E., MANSON, S.T., RUDD, M.E., Differential crosssections for ionization of water vapor by high-velocity bare ions andelectrons, J. Chem. Phys. 86 (1987) 157.
[138] SCHRÄM, B.L., DE HEER, F.J., VAN DER WIEL, M/J., KISTEMAKER, J.,Ionization cross sections for electrons (0.6 - 20 keV) in noble anddiatomic gases, Physica 31 (1965) 94.
[139] SHIMAMURA, I., Cross sections for collisions of electrons with atoms andmolecules, Scientific Papers of the Institute of Physical and ChemicalResearch (Japan) 82 (1989) 1.
[140] GALLAGHER, J.W., BRION, C.E., SAMSON, J.A.R., LANGHOFF, P.W., Absolutecross sections for molecular photoabsorption, partial photoionization,and ionic photofragmentation processes, J. Phys. Chem. Réf. Data 17(1988) 9.
[141] MILLER J.H., MANSON, S.T. Differential cross sections for ionization ofhelium, neon, and argon by fast electrons, Phys. Rev. A 29 (1984) 2435.
[142] MICHAUD, M., SANCHE, L., Total cross sections for slow-electron (1-20eV) scattering in solid H2O, Phys. Rev. A 36 (1987) 4672.
[143] SANCHE, L., Investigation of ultra-fast events in radiation chemistrywith low-energy electrons, Radiât. Phys. Chem. 34 (1989) 15.
156

[144] CLOUTIER, P., SANCHE, L., A trochoidal spectrometer for the analysis oflow-energy inelaatically backscattered electrons, Rev. Sei. Instrum. 60(1989) 1054.
[145] MARSOLAIS, R.M., SANCHE, L., Mechanisms producing inelastic structuresin low-energy electron transmission spectra, Phys. Rev. B 38 (1988) 11118.
[146] RUDD, M.E., KIM, Y.-K., MADISON, D.H.,GAY, T.J., Electron production inproton collisions with atoms and molecules: energy distributions, Rev.Mod. Phys. 64 (1992) 441.
[147] GRISSOM, J.T., COMPTON, R.N., GARRETT, W.R., Slow electrons fromelectron impact ionization of He, Ne, and Ar, Phys Rev. A 6 (1972) 977.
[148] ROBINSON, B.B., Modifications of the impulse approximation forionization and detachment cross sections, Phys. Rev. 140 (1965) A764.
[149] MILLER, J.H., TOBUREN, L.H., MANSON, S.T., Differential cross sectionsfor ionization of helium, neon, and argon by high-velocity ions, Phys.Rev. A 27 (1983) 1337.
[150] WILSON, W.E., MILLER, J.H., TOBUREN, L.H., MANSON, S.T., Differentialcross sections for ionization of methane, ammonia, and water vapor byhigh velocity ions, J. Chem Phys. 80 (1984) 5631.
[151] INAGAKI, T., HAMM, R.N., ARAKAWA, E.T., Optical and dielectricproperties of DNA in the extreme ultraviolet, J. Chem. Phys. 61 (1974)4246.
[152] SONTAG, W., WEIBEZAHN, F., Absorption of DNA in the region of vacuum-UV,Rad. and Environm. Biophys. 12 (1975) 169.
[153] PUJII, M., TAMURA, T., MIKAMI, N., ITO, M., Electronic spectra of uracilin a supersonic jet, Chem. Phys. Lett. 126 (1986) 583.
[154] DILLON, M., Private communication (1990).
[155] RUDD, M.E., Differential cross sections for secondary electronproduction by proton impact, Phys. Rev. A 38 (1988) 6129.
[156] SCHMIDT, S., EULER, J., KELBCH, C., KELBCH, S., KOCH, R., KRAFT, G.,OLSON, R.E., RAMM, U., ULLRICH, J., SCHMIDT-BÖCKING, H., Doublydifferential stopping powers of 1.4 Mev/u U33+ in Ne and Ar derived fromelectron production and multiple ionization cross sections, GSI-89-19,Gesellschaft fur Schwerionenforschung mbH, D-6100 Darmstadt, W. Germany(1989).
[157] RUDD, M.E., DUBOIS, R.D., TOBUREN, L.H., RATCLIFFE, C.A., GOFFE, T.V.,Cross sections for ionization of gases by 5-4000 keV protons and forelectron capture by 5-150 keV protons, Phys. Rev. A 28 (1983) 3244.
[158] RUDD, M.E., KIM, Y.-K., MADISON, D.H., GALLAHER, J.W., Electronproduction in proton collisions: total cross sections. Rev. Mod. Phys.57 (1985) 965.
157

[159] HOOPER, J.W., McDANIEL, E.W., MARTIN, D.W., HARMER, D.S., lonizationcross sections for protons and hydrogen ions in the energy range 0.15 to1.10 MeV, Phys. Rev. 121 (1961) 1123.
[160] De HEER, F. J., SCHÜTTEN, J., MOUSTAFA, H., lonization and électroncapture cross sections for protons incident on noble and diatomic gasesbetween 10 and 140 keV, Physica 32 (1966) 1766.
[161] McNEAL, R.J., BIRELY, J.H., Laboratory studies of collisions ofenergetic H"1" and hydrogen with atmospheric constituents, Rev. Geophys.Space Phys. 11 (1973) 633.
[162] DUFAY, M., DESESQUELLES, J., DRUETTA, M., EIDELSBERG, M., Study ofnitrogen and oxygen excitation by proton shocks, Ann. Geophys. 22 (1966)614.
[163] PARK, J.T., SCHOWENGERDT, F.D., SCHOONOVWE, D.R., Collision crosssections for the excitation of the shumann-runge dissociation continuumin molecular oxygen by 20-110 keV protons, Phys. Rev. A 3 (1971) 679.
[164] BARNETT, C.F., HUNTER, H.T., KIRKPATRICK, M.I., ALVAREZ, I., CISNEROS,C., PHANEUF, R.A., "Collisions of H, H2, He, and Li Atoms and Ions withAtoms and Molecules" ORNL-6086, Vol. 1, Oak Ridge National Laboratory,Oak Ridge, TN, (1990); see also the earlier review of BARNETT, C.F.,RAY, J.A., RICCI, E., WILKER, M.I., McDANIEL, W.W., THOMAS, E.W.,GILBODY, H.B.,1977, "Atomic data for controlled fusion research" ORNL-5206, Vols. I and II, Oak Ridge National Laboratory, Oak Ridge, TN,(1977).
[165] DUBOIS, R.D., TOBUREN, L.H., Single and double ionization of helium byneutral-particle to fully stripped ion impact, Phys. Rev. A 38 (1988)3960.
[166] DUBOIS, R.D., lonization and charge transfer in He2+-rare gascollisions, Phys. Rev. A 33 (1986) 1595.
[167] DUBOIS, R.D., Charge transfer leading to multiple ionization of neon,sodium, and magnesium, Phys. Rev. A 34 (1986) 2738.
[168] DUBOIS, R.D., lonization and charge transfer in He2+-rare-gascollisions. II, Phys. Rev. A 36 (1987) 2585.
[169] DUBOIS, R.D., Recent studies of simultaneous ionization and chargetransfer in helium ion-atom collisions, Nucl. Instrum. Meth. B24/25(1987) 209.
[170] DUBOIS, R.D., Multiple ionization of He^-rare-gas collisions, Phys. Rev.A 39 (1989) 4440.
[171] BERKNER, K.H., GRAHAM, W.G., PYLE, R.V., SCHLACHTER, A.S., STERNS, J.W.,Electron-capture, electron-loss, and impact-ionization cross sectionsfor 103- to 3400-keV/u multicharged iron ions colliding with molecularhydrogen, Phys. Rev. A 23 (1981) 2891.
[172] SCHLACHTER, A.S., BERKNER, K.H., GRAHAM, W.G., PYLE, P.V., STERNS, J.W.,TANIS, J.A., Collisions of fast, highly stripped carbon, niobium, andlead ions with molecular hydrogen, Phys. Rev. A 24 (1981) 1110.
158

[173] SCHLACHTER, A.S., Collisions of highly stripped ions at MeV energies ingas targets: charge transfer and ionization, IEEE Transactions onNuclear Science NS-28 (1981) 1039.
[174] SCHLACHTER, A.S., BERKNER, K.H., GRAHAM, W.G., PYLE, R.V., SCHNEIDER,P.J., STADER, K.R., STERNS, J.W., TANIS, J.A., Ionization of rare-gastargets by fast highly charged projectiles, Phys. Rev. A 23 (1981) 2331.
[175] GILBODY, H.B., SALIN, A., AUMAYR, R., BARANY, A., BELKIC, D.S., DE HEER,F.J., HOEKSTRA, R., JANEV, R.K., NAKAI, Y., RIVAROLA, R.D., TAWARA, H.,WATANABE, T., Reviews of the data base for collisions of C"1* and O*1* ionswith H, H2, and He, Physica Scripta T28 (1989) 8.
[176] GALLAGHER, J.W., "Collisions of Electrons with Atoms and Molecules",ORNL, Oak Ridge National Laboratory, Oak Ridge, TN, In preparation.
[177] THOMAS, E.W., "Particle interactions with surfaces", ORNL-6088, Vol. 3of ORNL-6086, Oak Ridge National Laboratory, Oak Ridge, TN, (1985).
[178] WEISE, W.L., Spectroscopic Data for Iron, ORNL-6089, Vol. 4 of ORNL-6086, Oak Ridge National Laboratory, Oak Ridge, TN, (1985).
[179] PHANEUF, R.A., JANEV, P.K., PINDZOLA, M.S. Collisions of carbon andoxygen ions with electrons, H, H2, and He, ORNL-6090, vol. 5 of ORNL-6086, Oak Ridge National Laboratory, Oak Ridge, TN, (1987).
[180] WEISE, W.L., MUSGROVE, A., Spectroscopic Data for Titanium, Chromium,and Nickel, ORNL-6551, Vol. 6 of ORNL-6086, Oak Ridge NationalLaboratory, Oak Ridge, TN, (1989).
[181] BETZ, H., Charge states and charge-changing cross sections of fast heavyions penetrating through gaseous and solid media, Rev. Mod. Phys. 44(1972) 465.
[182] FLEISCHMANN, H.H., DERMAL, R.C., LEE, S.K., Direct-transition featuresin stripping collisions of heavy neutral atoms and ions, Phys. Rev. A 5(1973) 1784.
[183] CRANDALL, D.H., MALLORY, M.L., KOCHER, D.C., Charge exchange betweenmulticharged ions of C, N, and O and molecular hydrogen, Phys. Rev. A 15(1977) 61.
[184] CRANDALL, D.H., Electron transfer between He-like ions and He, Phys.Rev. A 16 (1977) 958.
[185] PHANEAF, R.A., MEYER, F.W., MCKNIGHT, R.H., Single electron capture bymultiply charged ions of carbon, nitrogen, and oxygen in atomic andmolecular hydrogen, Phys. Rev. A 17 (1978) 534.
[186] OLSEN J.O., HVELPLUND, P., Electron capture and loss in collisions of100- to 500-keV oxygen in molecular hydrogen, J. Phys. B 7 (1974) 1331.
[187] LOCKWOOD, G.J., Total cross sections for charge transfer for F+ in H2,N2/ He, Ne, and Ar, Phys. Rev. A 9 (1974) 1916.
159

[188] DMITRIEV, I.S., TASHAEV, Yu.A., NIKOIAEV, V.S., TEPLOVA, Ya.A., POPOV,B.M., Experimental study of the loss and capture of electrons by fastmultiply charged nitrogen and neon ions in various gases, Sov. Phys.JETP 46 (1977) 884.
[189] SUK, H.C., GUILBAUD, A., H1RD, B., Cross sections for electron captureby Ne2"1" in He, Ne, Ar, Kr, and Xe between 60 and 200 keV, J. Phys. B 11(1978) 1463.
[190] HIRD B., SUK, H.C., Single-electron stripping cross sections of N+ inNe, Ar, and Kr between 35 and 140 keV, Phys Rev A 14 (1976) 928.
[191] DUBOIS, R.D., Electron production in collisions between light ions andrare gases: The Importance of the Charge-Transfer and Direct-IonizationChannels, Phys. Rev. Lett. 52 (1984) 2348.
[192] DUBOIS, R.D., KOVER, A., Single and double ionization of helium byhydrogen-atom impact, Phys. Rev. A 40 (1989) 3605.
[193] DUBOIS, R.D., TOBUREN, L.H., RUDD, M.E., Multiple ionization of raregases by H+ and He+ impact, Phys. Rev. A 29 (1984) 70.
[194] BOHR, N., Scattering and stopping of fission fragments, Phys. Rev. 58(1940) 654.
[195] BOHR, N., Velocity-range relation for fission fragments, Phys. Rev. 59(1941) 270.
[196] KREUSSLER, S., VARELAS, C., BRANDT, W., Target dependence of effectivecharge in stopping power, Phys. Rev. B 23 (1981) 82.
[197] ANTHONY J.M., LANFORD, W.A., Stopping power and effective charge ofheavy ions in solids, Phys. Rev. A 25 (1982) 1868.
[198] BICHSEL, H., Barkas effect and effective charge in the theory ofstopping power, Phys. Rev. A 41 (1990) 3642.
[199] MILLER, J.H., GREEN, A.E.S., Proton energy degradation in water vapor,Radiât. Res. 54 (1973) 343.
[200] MATTESON, S., POWER, D., CHAU, E.K.L., Physical state effect in thestopping cross section of H2O ice and vapor for 0.3-2.0 MeV alphaparticles, Phys. Rev. A 15(1977) 856.
[201] PALMER, R.B.J., AKHAVAN-REZAYAT, A., Range-energy relation in stoppingpower of water, water vapor, and tissue equivalent lig_uids for alphaparticles over the energy range 0.5-8 MeV, Proceedings of the SixthSymposium on Microdosimetry (BOOZ J., EBERT, H.G., Eds) HarwoodPublishers, Amsterdam, (1978) 739.
[202] BRANDT, W., KITAGAWA, M., Effective stopping-power charges of swift ionsin condensed matter, Phys. Rev. B 25 (1982) 5631.
[203] YARLAGADDA, B.S., ROBINSON, J.E., BRANDT, W., Effective-charge theoryand the electronic stopping power of solids, Phys. Rev. B 17 (1978)3173.
160

[204] BARKAS, W.H., Nuclear Research Emulsions-I. Techniques and Theory,Academic Press, New York, (1963).
[205] ZIEGLER, J.F., Handbook of stopping cross sections of energetic ions inall elements, Vol. 5, Pergamon Press, New York, (1980).
[206] ZIEGLER, J.F., BIERSACK, J.T., LITTMARK, U., The Stopping and range ofions in solids, Vol. 1, Pergamon Press, New York, (1985).
[207] KRAUSE, M.O., Atomic radiative and radiationless yields for K and Lshells, J. Phys. Chem. Réf. Data 8 (1979) 307.
[208] HIPPLER, R., "Impact ionization by fast projectiles", Progress in AtomicSpectroscopy, Part C, (BEYER, H.J., KLEINPOPPEN, H., Eds) Plenum Press,New York, (1984) 511.
[209] HIPPLER, R., JITSCHIN, W., Plane wave born cross sections includingexchange for K-shell ionization of light atoms, Z. Physik A 307 (1982)287.
[210] GLUPE, G., MEHLHORN, W., A new method for measuring electron impactionization cross sections for inner shells, Phys. Lett. 25A (1967) 274.
[211] HINK, W., LEES, L., SCHMITT, H.-P., WOLF, A., "Near K-ionizationthreshold Auger electron measurements for neon under electron impact",Inner-Shell and X-ray Physics of Atoms and Solids (FABIAN, D.,KLEINPOPPEN, H., WATSON, L.M., Eds) Plenum Press, New York, (1981) 327.
[212] W. HINK, W., ZIEGLER, A., Der Werkungsquerschnitt für die Ionisierungder K-Schale von Aluminium Durch Electronenstoss (3-30keV), Z. Physik226 (1969) 222.
[213] HIPPLER, R., SAEED, K., MCGREGOR, I., KLEINPOPPEN, H., Energy Dependenceof characteristic and bremsstrahlung cross sections of argon induced byelectron bombardment at low energies, Z. Physik A 307 (1982) 83.
[214] TAWARA, H., HARRISON, K.G., DE HEER, F.J., X-ray emission cross sectionsand flourescence yields for light atoms and molecules by electronimpact, Physica 63 (1973) 351.
[215] PAUL H., MUHR, J., Review of experimental cross sections for K-shellionization by light ions, Phys. Reports 135 (1986) 47.
[216] LAPICKI, G., Cross sections for K-shell X-ray production by hydrogen andhelium ions in elements from beryllium to uranium, J. Phys. Chem. Ref.Data 18 (1989) 111.
[217] BRANDT, W., LAPICKI, G., Energy-loss effect in inner-shell coulombionization by heavy charged particles, Phys. Rev. A 23 (1981) 1717.
[218] PAUL, H., SACHER, J., Fitted empirical reference cross sections for k-shell ionization by protons, Atomic Data and Nuclear Data Tables 42(1989) 105.
[219] OGIER, W.T., LUCUS, G.J., MURRY, J.S., HOLZER, T..E., Soft X-rayproduction by 1.5-MeV protons, Phys. Rev. 134A (1964) 1070.
161

[220] KHAN, J.M., POTTER, D.L., WORLEY, R.D., Studies in X-ray production nyproton bombardment of Cr, Mg, AI, Nd, Sm, Gd, Tb, Dy, and Ho, Phys.Rev.139A (1965) 1735.
[221] KHAN, J.M., POTTER, D.L., WORLEY, R.D., Characteristic K-shell X-rayproduction in magnesium, aluminum, and copper by 60- to 500-keV protons,Phys. Rev. 133A (1964) 890.
[222] SHIMA, K., MARINO, I., SAKISAKA, M., Isotope dependence in K-, L-, andM-shell ionization cross sections by protons and deuterons, J. Phys.Soc. Japan 30 (1971) 611.
[223] BASBAS, G., BRANDT, W., LAUBERT, R., Universal cross sections for K-shell ionization by heavy charged particles. I. Low particle velocities,Phys. Rev. A 7 (1973) 983.
[224] TAWARA, H., HASHIYA, Y., ISHII, K., MORITA, S., K-shell ionization oflight elements by protons and helium-3 ion impact, Phys. Rev. A 13(1976) 572.
[225] BASBAS, G., BRANDT, W., LAUBERT, R., Universal cross sections for K-shell ionization by heavy charged particles. II. Intermediate particlevelocities, Phys. Rev. A 17 (1978) 1655.
[226] SERA, K., ISHII, K., KEMIYA, M., KUWAKO, A., MORITA, S., K-shellionization of Al and Cu for 0.5- to 40-MeV proton impact, Phys. Rev. A21 (1980) 1412.
[227] BONANI, G., STROLLER, Ch., STOECKLI, M., SUTER, M. , WOELFLI, W.,Quantitative spurenanalyse mit ioneninduzierter Röntgenstrahlung, HelvPhys. Acta 51 (1978) 272.
[228] GERETSCHLÄGER, M., BENKA, O., K-shell ionization cross sections for Al,Ti, V, Cr, Fe, Ni, Cu, and Mg by protons and oxygen ions in the energyrange 0.3-6.4 MeV, Phys. Rev. A 34 (1986) 866.
[229] PAUL, H.. BOLIK, O., Fitted empirical reference cross sections for K-shell ionisation by alpha particles, in preparation
[230] SOKHI, R.S., CRUMPTON, D., Experimental L-shell X-ray production andionization cross sections for proton impact, Atomic Data and NuclearData Tables 30 (1984) 49.
[231] SARKADI, L., BOSSLER, J., HIPPLER, R., LUTZ, H.O., Angular distributionof electrons ejected from the argon L-Shell by 350 keV proton impact, J.Phys. B 16 (1982) 71.
[232] ANDERSEN, J.U., LAEGSGAARD, E., LUND, M., Impact parameter dependence ofK-shell ionization, Nuclear Instruments and Methods 192 (1982) 79.
162

Chapter 3
ELECTRON COLLISION CROSS SECTIONS
T.D. MarkInstitut für lonenphysik, Leopold Franzens Universität,
Innsbruck, AustriaY. Hatano
Department of Chemistry, Tokyo Institute of Technology,Tokyo, Japan
F. LinderFachbereich Physik, Universität Kaiserslautern,
Kaiserslautern, Germany
163

3.1. Introduction
The major mechanism for energy loss of fast charged particles (electrons, protons,heavier ions) and photons is the ionization of atomic and molecular constituents (i.e.production of electron-ion pairs) of the irradiated materials (in their gaseous, liquid and solidstate). Therefore a large fraction of the primary energy is converted to kinetic energy ofsecondary electrons, including electrons with energies ranging from thermal up to very highenergies. The interaction of these secondary electrons as well as that of the primaryelectrons with matter is of utmost importance in assessing radiation damage occurring inradiation therapy.
In order to carry out these calculations, cross section fonctions (cross sections versuselectron energy) must be known for inelastic and elastic electron collisions for targets andmaterials used in dosimetry and radiotherapy (i.e., in particular key substances such as Ne,Ar, Ü2, N2, C>2, H2Û, CÛ2, CtLj and C3Hg gases; see also chapter 1), i.e. including totaland differential elastic scattering cross sections; total, partial, and differential ionizationcross sections for parent and fragment ions; partial electronic, vibrational and rotationalexcitation cross sections; total and partial attachment cross sections, and cross sections forthe dissociation of molecules into neutral fragments.
Differential cross sections have been discussed in chapter 1. Here, experimental dataand theoretical formulae for partial and total cross sections will be presented and discussedcritically. The chapter will start with a short introduction and definition of the concept ofionization cross sections.
3.2. Electron impact ionization mechanism and definitions
Electrons accelerated through a potential of several tens of volts have a de Brogliewavelength of ~ 0.1 nm. This wavelength and the molecular dimensions are similar andmutual quantum effects (distortions) occur; that is, an electron may be promoted from alower to a higher orbital (excitation) or-if the electron energy is greater than a critical value(the ionization energy or appearance energy) - an electron may be ejected from the target,thus producing a positive ion (cation).
Conversely, direct attachment of the incident electron to an atomic target to give astable anion is less likely. The reason for this is that the translational energy of the attachingelectron and the binding energy (electron affinity) must be taken up (accommodated) in theemerging product (anion). Usually, the excess energy leads to either fragmentation (in thecase of a molecular target) of the anion or shake-off (détachement) of the electron.
165

As the electron energy is increased, the variety and abundance of the cationsproduced from a specific molecular target will increase, because the electron ionizationprocess may proceed via different reaction channels, each of which gives rise tocharacteristic ionized and neutral products. These include the following types of ions [1,2]:parent ion, fragment ion, multiply charged ion, excited ion, metastable ion, rearrangemention, and ion pair. For the simple case of a diatomic molecule AB these reaction channels are(including excitation and dissociation):
AB + e-»AB+ + es + ee (single ionization) (3.1)AB2+ + es + 2ee (double ionization) (3.2)ABz+ + es + zee (multiple ionization) (3.3)ABK+ + es + ee (K-shell ionization) (3.4)AB** + es -» AB+ + es + ee (autoionization) (3.5)AB+* + es + ee -» A+ + B + es + ee (fragmentation) (3.6)
AB2+ + es + 2ee (autoionization) (3.7)AB+ + es + ee + hv (radiative ionization) (3.8)
A+ + B + es + ee (dissociative ionization) (3.9)A+ + B" + es (ion pair formation) (310)AB* + es (excitation) (3.11)AB'* (attachment) (3.12)A"+B (dissociative attachment) (3.13)A + B +e (dissociation into neutrals) (3.14)A* + B + e (dissociation into excited neutrals)
(3.15)
where es is a "scattered" electron and ee an "ejected" electron. Other products may beobtained, especially when one is using complex atomic targets (i.e., polyatomic molecules[1] or clusters [3,4,5]).
Most of the ionization reactions summarized above (e.g., process (3.1) through(3.4), (3.9), and (3.10)) can be classified as direct ionization events, in which the ejected andthe scattered electron leave the ion within 10' sec. Conversely, there exist alternativeionization channels (competing with direct ionization) in which the electrons are ejected oneafter the other (see Fig. 3.1 for a schematic representation of possible ionization mechanism[6]). For instance, autoionization (e.g., process (3.5) and (3.7)) can be described as a two-step reaction: First, a neutral molecule (or atom) is raised to a superexcited state, which canexist for some finite time. Then, radiationless transition into the continuum occurs. Formolecules, the upper autoionization rate (and hence the ionization cross section) is limited
166

o to'16 io"13 ,-S10"° 10- secdissociative captureresonance capturefluorescenceion pair productionautoionizalionpredissociation
parent ionfragment ionmetastable ion
double ionizationCoulomb explosionmetastable ion
Fig. 3.1 Schematic time chart of possible electron impact ionization processes after Mark[6].
M+«H
_
(M-r-
_
i i•A- + B !M j
LM%. ^ASB-4e\* M+4 2ei A 4 B 4 6
» M++2e^ ——— , —————iN* 4-
1
»M?*, Tr '\f1. '3 C I
A +B *3eIi
' *
\
\
4 1' D T"*6
*i...
<
<
1
—'c
mcoou>
V)
2oco73Nco
(0aO)
roa>tr
Electron energy (eV)
Fig. 3.2 Partial ionization cross section function for Ar + e —» Ar+ + 2e after Crowe et al.[7]. Middle curves illustrate the variation of the strengths of the 3d and 4pautoionization features (see text). Bottom curve shows the efficiency of production ofAr+ via direct ionization processes. Top curve is the sum of the two middle curvesand the bottom curve.
167

Electron energy (eV)
Fig. 3.3 Partial electron impact ionization cross section function for the reaction N2 + e+ 3e after Halas and Adamczyk [8].
Gas target Nt Electrontrap.. •-* i. : .. ..'•• • -—JZ
Electronbeam
X-0 X=L
Fig. 3.4 Schematic view of an electron impact ionization experiment after Mark [6].
by the characteristic energy-storage mode frequency. In addition, if predissociation (into twoneutrals) is faster than autoionization, the latter will not occur at an appreciable rate.
Moreover, autoionization is a resonance process and this will complicate therespective ionization cross-section dependence (i) at low electron energy (e.g., deviationfrom the threshold law; e.g., see Ref.[l]), but also (ii) at higher energies (e.g., see the partialionization cross-section function for the production of Ar+ shown in Fig. 3.2 [7]). The topcurve in Fig. 3.2 shows the variation of the cross-section function obtained by summing overall possible ionization mechanisms. The two curves in the middle illustrate the variation ofthe strengths of the 3d and 4p autoionization processes (e.g., Ar + e —» Ar*(3s3p^3d) + e-> Ar+ (3s^3p^) + 2e). The bottom curve shows the behavior of the direct ionizationmechanism (see reaction (3.1)).
Quite similarly, multiply charged ions can be formed in a two-step autoionizationprocess. First, a singly charged ion is produced by the ejection of an electron from an innershell (inner-shell ionization process (3.4)). This internally ionized atom (or molecule) maythen be transformed (see reaction (3.7)) into a multiply charged ion by a series of
168

radiationless transitions (Auger effect). Figure 3.3 shows as an example the ionization crosssection curve for the production of N2^+, which demonstrates the occurrence and effect ofthis Auger autoionization process at ~ 430 eV [8].
Because of ambiguities in the nomenclature in the literature some definitions will begiven here concerning various ionization cross section terms used:Consider, as shown in Fig. 3.4, a parallel, homogeneous, and monoenergetic beam ofelectrons crossing a semiinfinite medium containing N^ target particles per cubic centimeterat rest. If n(0)e represents the incident electron current, i.e., the number of electrons per unittime, the unscattered electron current at depth x (taking into account only the ionizingcollisions) is given by the exponential absorption law
n(x)e = n(0)e exp(-Nta x) (3.16)
If Nt ax « 1 (single-collision condition*), the number of ions, n(L)f, generated per secondalong the collision interaction path x = L (over which the ions collected and analyzed) is
n(L)j = n(0)eNtacL, (3.17)
where ac is the counting ionization cross section in square centimeters. The total positive-ion current, if produced in this interaction volume is given by
it - n(0)e eNtatL, (3.18)
where Of is the total ionization cross section and e the elemental charge. In the measurementof Of no information is obtained in general about individual partial cross sections. If theproduced ions are analyzed with a mass spectrometer according to their mass, m, to chargez ratio, however, the respective individual ion currents, ims, are given by
where ozj is the partial ionization cross section for the production of a specific ion i withcharge ze.
This condition my be achieved by using low enough number densities Nt and thiscondition is necessary in order to avoid multiple electron collisions and secondary ionmolecule reactions, both of which would lead to erroneous cross section results. If thiscondition is fullfilled, equ. (3.16) may be linearized allowing to derive the relationshipgiven in equ. (3.17).
169

Total and counting ionization cross sections of a specific target system are theweighted and the simple sum of the various single and multiple partial cross sections,respectively, i.e.
°t = ^azi • z and °c ~ °zi (3.20)
Under certain circumstances single ionization is dominant (e.g., for atoms at electronenergies below the double ionization threshold and for many molecules in the entire energyregime) and then
°t = ac (321)
Sometimes the macroscopic cross section s - O|Nt which represents the total effectivecross-sectional area for ionization of all target molecules in 1 cm^ of the target medium, isused. This quantity is numerically equal to the ionization efficiency, usually defined as thenumber of charges (or ion pairs) produced per centimeter of path at l Torr and 0°C.
For more information and details on the ionization mechanisms and processes seeRef. [1,2,6, 9-12].
3.3. Total electron impact ionization cross sections of atoms and molecules3.3.1. Experimental
According to equ. (3.18) the determination of the total ionization cross section o^requires the measurement of four quantities, i.e., ij, n(0)e, Nj and L. Kieffer and Dunn [13]have extensively discussed the problems encountered when trying to measure accurateexperimental CTJ values (see also a more recent review [14]).
One of the earliest and widest used experimental methods to determine totalionization cross sections is the condenser plate method of Täte and Smith [15]. This methodwas later used very successfully by Rapp et al. [16] to produce their benchmark totalionization cross section functions for the rare gases and several small molecules. In short(see Fig. 3.5), in this method a magnetically collimated electron beam is directed through atarget gas of known density N^. All ions which are produced in a well defined region arecompletely removed and collected. The main limitation of this method is the absolutemeasurement of the gas density, a difficult matter for many gases. Djuric et al. [17,18] haverecently overcome some of the difficulties by using a capacitance manometer to determinethe gas pressure in their parallel plate ionization chamber. De Heer and Inokuti [14], in theirdefinitive 1985 review on total electron impact ionization cross sections, discussed and
170

IllIIIs
•l
Fig 3 5 Schematic view of the parallel plate condenser apparatus after Täte and Smith [15]C cathode, S collimator slits, Pj and 1?2 condenser plates and F Faraday cage
'
EINZEL
DC DISCHARGEION SOURCE
fC£LiL_l tGAS
INLET
SOLID
LENS
DEFLECTIONPLATES
V ]jVELDCITY|-- i FILTER! j — j__m ' _" ~"\ \ __ |
(EnBll A
CHARGETRANSFER
CELL
IONDEF
MBKMI
BELE(
...,,™ ... .
^^N
*** CEM __ _ HEMISPHERICAL•70R -. V/1 " ^ ENERGY
jr ———— ^ >v ANALYZERRYDBERG / /^J v
x \/QUENCH BEAM TRAJECTORY LJ ->. \ \PLATES CORRECTION n \ \
/ MAGNETS \ \J \y EINZEL LENS [j 1 j
:-. it" """_"T"____^Z^- |p.r. __^^
91 151 n^ r T™~ IELECTRON VERTICAL HORIZONTAL \
\ GUN DEFLECTION DEFLECTIONBEAM PLATES PLATES ICHOPPER MOVABLE
HORIZONTALa VERTICAL „_.
J NEUTRAL1 P C'A U/ DC.AM
f MONITOR
... .
™%™ ST°PW1RES PYROÉTECTRICCOLLECTOR DETECTOR
Fig 3 6 Schematic view of the fast neutral beam apparatus after Freund et al [39]
summarized experiments and results up to this year, including also the Lozier tube [19], thesummation method [20], gas-filled counters [21] and crossed beam methods [22]
Excellent data on total (and partial, see below) ionization cross sections have beenobtained recently by Freund and coworkers [23] using a modified crossed-beam methodwhere an electron beam is crossed with a fast neutral beam, prepared by charge transferneutralization of a mass selected ion beam. This approach was first used for atomicionization cross-section measurements by Peterson et al [24]; it has since been used byZiegler et al [25] and has been refined by Harrison and coworkers [26-29]. Extensions byFreund and coworkers [30-39] have made it a powerful method (see also Decker andcoworkers [40]).
171

In the fast neutral beam apparatus of Freund et al. (Fig. 3.6), atomic or molecularions are (i) extracted from a dc discharge, (ii) accelerated to 3 kV, and (iii) mass-separatedby a Wien filter. The ion beam is then neutralized by charge transfer with a gas selected tohave an ionization energy resonant with that of the ions. The pressure is adjusted toneutralize several percent of the ions, with the remainder being deflected to a collector.According to Freund [23] the resulting neutral beam in general has a flux of 1010s~V Itsrelative intensity is measured by kinetic electron ejection from a metal surface. For accurateflux measurements, a pyroelectric crystal is used to calibrate the electron ejection coefficient.Ionization is produced by crossing the fast neutral beam with a well-characterized electronbeam. The resulting ions are steered and focussed with magnetic and electrostratic fields to ahemispherical energy analyzer. This analyzer separates ions of different charge or mass,since all ions retain essentially the same velocity of the 3 keV parent neutral beam. Formolecular species, 100% collection of fragments is possible. Ions are finally detected by achannel electron multiplier. The biggest advantage of this method is that it permitspreparation of a pure beam even of unstable species, and that the high beam velocity permitsaccurate flux measurements.
3.3.2. Theoretical
The theoretical treatment of the basic electron impact ionization process (i.e., in theexit channel a full three body problem) has received a great deal of attention. Quantummechanical (approximation) calculations are difficult, few and some of them not as accurateas necessary [41]. Therefore, other methods have been developed, with the goal to obtainreasonably accurate cross sections. Three different approaches have been used, i.e., (i)empirical and semiempirical formulae, (ii) classical theories, and (iii) semiclassical collisiontheories. Theoretical methods have been reviewed several times in great detail[1,2,6,9,11,41-50], in particular the accuracy and reliability of the most widely usedformulae [1,47,50]. Most of these treatments apply only to single ionization. Neverthelessthese formulae (for a compilation of these fomulae see Ref. [47,50]) are used in general alsofor the estimation of total ionization cross sections (e.g., see equ. (3.21)). In the following,very recent theoretical developments will be presented which allow the easy calculation ofelectron impact (single) ionization cross sections as a function of electron energy for(ground state and excited) atoms, radicals, molecules and clusters [51-57].
Using classical mechanics, Thomson [58] was the first to derive a formula for theelectron impact ionization cross section (for single ionization), i.e.,
a = I 4mn En o E.m
u-1u2 (3.22)
172

with ao the Bohr radius, £n the number of electrons in the n-th subshell, Ejn the ionizationenergy in the n-th subshell, E^ ionization energy of H, u = E/Em, and E energy of incidentelectron. This classical treatment has been modified by several authors (e.g. see Ref.[47,50]) using different initial conditions. None of these formulae, however, representsaccording to Rudge [41] a substantial improvement over the Thomson formula, because allof them suffer from the same large deviations at high and low energies as does the Thomsontreatment. A definitive improvement introduced by Gryzinski [59] is the assumption of acontinuous velocity distribution for atomic electrons, leading to an expression for the crosssection
o<E*_~Ë7~
v m y
2,3/2
u Vu + 3 2u
(3.23)
Burgess [60] and Vriens [61] also suggested further means to improve the classical theoryby incorporating certain quantal features, e.g. exchange effects. Although all these formulaeconstitute a significant improvement, they still fail in case of rather simple atoms such as forinstance neon, nitrogen and fluorine in predicting the correct magnitude of ionization crosssection functions (e.g. see Ref. [51,52]). Moreover, while in certain cases empirical formulas(such as the Lotz formula [62]) are helpful, many of them are of limited usefulness [41](they are providing good fits to certain classes of known data (see also the approximateanalytic formula given by Bell et al. [63]), but will not allow reliable predictions for otherunknown systems) and have been superseeded by later formulas which we discuss in thefollowing.
Based on a comparison between these classical formulae and the Born-Bethe formula[64] (which is only accurate at higher energies due to the use of the Born approximation),
2Z4,rao ^ — -ln u (3.24)
with Mfj dipole matrix element and Cjj collisional parameter (to be determined by Fano plotanalyses, see Ref. [14,43]), Deutsch and Mark [52] recently suggested to replace the Bohrradius in the classical formulae (3.23) by the radius of the corresponding electron subshell.This step is in line (i) with a result of Bethe's calculation that the ionization cross section ofan atomic electron with quantum numbers (n,l) is approximately proportional to the meansquare radius <r^>ni of the electron shell (n,l) [65] and (ii) with the experimentalobservation of a correlation between the maximum of the atomic cross section and the sum
173

UO
enc
o>
3.0-
2.5-
2.0-
1.5.
1.0-
0.5-
0.0
l = 0.
l - 1l - 2
2 3 4 5
Quantum number n
Fig. 3.7 Weighting factors gjj as a function of quantum numbers n and i after Margreiter etal. [53,54].
of the mean square radii of all outer electrons [65-67], Following up this suggestion,Margreiter et al. [53,68] successfully applied this DM approach to a large number of groundstate and excited state atoms using
1+ 2 fi . -L l In (2.7 + (u-l)1/2
(3.25)
with Tni2 the mean square radius of the nl shell, and gnj weighting factors (following theoriginal approach of Bethe [64], who calculated these "lonisierungsfaktoren" as a functionof the quantum numbers n and 1 using hydrogenic wave functions; see also considerations byMann [66]). Margreiter et al. [53,54] determined via a fitting procedure these generalizedweighting factors gjj (see Fig. 3.7) using accurate experimental data of the rare gases anduranium as test cases. It was demonstrated that formula (3.25) leads in general to animproved agreement with the experimental results not only in case of ground state atoms,but also in case of excited state atoms [53]. Recently, these authors derived relationships forthe product gni. Ejn yielding with its use even better agreement with the experimental data[68,69], allowing also the calculation of inner-shell ionization cross sections [55] (e.g. seecorresponding data for Ne and Ar in Figs 3.8 and 3.9) and outer-shell ionization crosssections [80]. For more information on inner-shell ionization cross sections and then-possible applications see Ref. [55,81].
174

CSI
CNIo
0.5-
0-10 20 50 100 200 500 1000
Elect ron energy ( e V )Fig. 3.8 Lj-shell ionization cross section versus electron energy for neon: x experimental
results of Luyken et al. [70], — Bora approximation by Peach [71], o Bornapproximation by Omidvar and Kyle [72], -.-.- binary encounter calculation by Vriens[73], — •• — semi-empirical calculation by Lotz [62], --.-- Bom approximation by MeGuire [74], - - - semiclassical calculation (after Gryzinski [50]) using equ. (3.23), and—— DM approach [52] using modified equ. (3.25), see Ref. [55], It is interesting tonote the failure of the semiclassical concept (equ (3.23)) and, moreover, it is importantto note that recently de Heer and coworkers [75] revised their experimental data [70]downwards by a factor of 3.7.
175
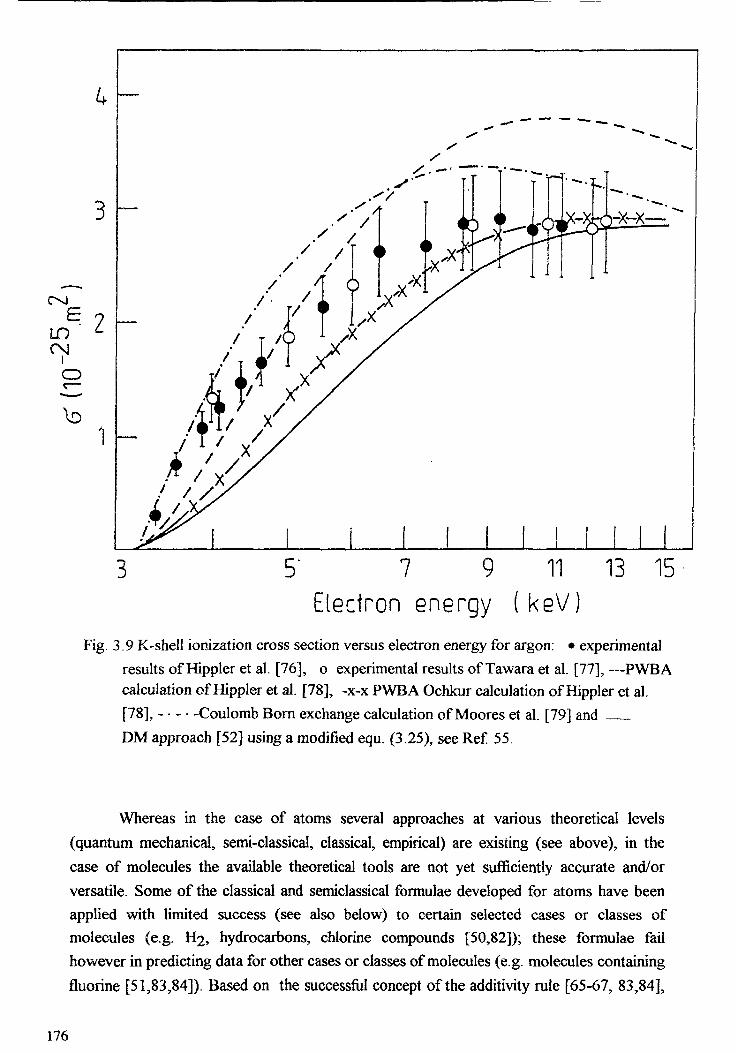
3
LDCN
=• 2O
\0
5' 7 9 11Electron gnergy (
13 15
Fig. 3.9 K-shell ionization cross section versus electron energy for argon: • experimentalresults of Hippler et al. [76], o experimental results of Tawara et al. [77], — PWBAcalculation of Hippler et al. [78], -x-x PWBA Ochkur calculation of Hippler et al.[78], - - - • -Coulomb Born exchange calculation of Moores et al. [79] and __DM approach [52] using a modified equ. (3.25), see Ref. 55.
Whereas in the case of atoms several approaches at various theoretical levels(quantum mechanical, semi-classical, classical, empirical) are existing (see above), in thecase of molecules the available theoretical tools are not yet sufficiently accurate and/orversatile. Some of the classical and semiclassical formulae developed for atoms have beenapplied with limited success (see also below) to certain selected cases or classes ofmolecules (e.g. H2, hydrocarbons, chlorine compounds [50,82]); these formulae failhowever in predicting data for other cases or classes of molecules (e.g. molecules containingfluorine [51,83,84]). Based on the successful concept of the additivity rule [65-67, 83,84],
176

Deutsch et al. [51] introduced recently an empirical correction factor which allows the useof these previous classical and semiclassical theories to calculate ionization cross sectionfunctions of molecules containing fluorine and related atoms.
Conversely, Khare and associates [85,86] were among the first to suggest a formulaspecifically designed to allow the calculation of total (and recently also partial [87,88])ionization cross sections of molecules. This Jain-Khare formula is based on a semi-empirical
1 U
<
_ _." —
CN|
E
.- 5CN
1O
*—
^O
1
i . , , i . i . i . , , i j . i
• x "~ ** .•• / ^• if • *\• /* o i V" v 0 « \
S^ ° *"** >^/O P 0 1 S s
° •" ^"^ W O ^ »
- * ° I -. 'A 57 • • ^*
A ° • • ** ^-N.9 * < > • • ; • - - . ." ^ ' o • •
f * '- ff
"t-jt• • i . i . i . i , , i . r . i . i . i .
0 0.1 0.5 1Electron energy (keV)
Fig. 3.10 Total electron impact ionization cross section function for neon. • Smith [101], DAsundi and Kurepa [102], • Rapp and Englander-Golden [16], V Schräm et al. [103,104], o Gaudin and Hagemann [105], A Fletcher and Cowling [106], — Krishnakumarand Srivastava [107]. The recent results of Wetzel et. al. [33] (not shown for the sakeof clarity) are in good agreement with those of Rapp and Englander-Golden [16]. Thedata of Schräm et al. [104] extend up to an electron energy of 20 keV. Me Clure[108] summarizes data in the MeV region. For more details on the accuracy andreliability see discussion in Ref. [l 1,13,14,23,107].
177

CN
O(NIO
Electron energy ( k e V )Fig. 3.11 Total electron impact ionization cross section function for argon. • Rapp and
Englander-Golden [16], V Schräm et al. [103,104], o Gaudin and Hagemann [105],Kurepa et al. [109], x Wetzel et al. [33], - - - Krishnakumar and Srivastava [107]. Thedata of Schräm et al. [104] extend up to an electron energy of 20 keV (see also arecent study by Me Callion et al. [110] extending up to 5.3 keV). Me Clure [108]summarizes data in the MeV region (see also Rieke and Prepejchal [111]). For moredetails on the accuracy and reliability see disscusions in Ref. [l 1,13,14,23,107].
combination of the Born-Bethe (equ. (3.24)) and the Mott differential cross sections.Besides other atomic properties it is necessary to know the differential optical oscillatorstrengths and the collisional parameter of the molecule under study. This, unfortunately,limits the approach of Khare and coworkers to those molecules which have been studiedalready by photon or electron collisions.
Recently, Margreiter et al. [54] have extended the above mentioned DM approach tomolecules using the additivity rule according to which the ionization cross section of amolecule is the sum of the cross sections of the constituent atoms [65-67]. In order tocalculate molecular ionization cross sections with the DM equ. (3.25) it is essential toidentify the corresponding atomic orbitals of the molecular electrons (using availableMulliken population analyses of the respective molecules). The main advantage of this DMtreatment is that ionization cross sections can be described by a simple analytical formula
178

(depending only on basic atomic properties), which yields results in better agreement withexperimental data than classical, setniclassical or empirical formulae [54]. Very recentlyformula (3.25) has also been shown to be applicable to radicals [56] and clusters [57,69](see 3.5.).
3.3.3. Recommended total cross sections
As mentioned above, there exists a number of comprehensive reviews onexperimental and theoretical cross section determinations [1,2,6,11,13,14,23,39-50,89,90]including also compilations of recommended data [91-100]. It is outside the scope of this
oCM
O
1.0
0.9
0.8
0.7
0.6
0.5
0.4
0.3
0.2
0.1
0.0
%V »AV •
V AV •V A
A»
V
0.0 0.5 1.0 1.5 2.0
Electron energy (keV)Fig. 3.12 Total electron impact ionization cross section function for H2 • Rapp and
Englander-Golden [16], V Schräm et al. [103,104] (these data extend up to anelectron energy of 20 keV), A Cowling and Fletcher [112]. Data reported in the MeVrange are summarized by Me Clure [108] and de Heer [92] (see also Rieke andPrepejchal [111]) For more details on the accuracy and reliability see discussions inRef. [11,13,14,92].
179

CN
OCN
o
4.0
3.0
2-°
1.0
0.0
A
. AAAAA
A •
0.0
• A• A
0.2 0.4 0.6 0.8
Electron energy (keV)1.0
Fig. 3.13 Total electron impact ionization cross section function forN2 (designated •), andCH4 (designated A ) after Rapp and Englander-Golden [16], whose total ionizationcross sections are regarded to be the most reliable data sets available. The results (notshown) of Schräm et al. [103,104] for N2 and of Schräm et al. [113] for CH4 extendup to an electron energy of 20 keV and 12 keV, respectively (MeV data see Ref.[111]). The recent results on CÜ4 of Chatham et al. [114] (not shown) are in goodagreement with those of Rapp and Englander-Golden [16].
review to give a detailed account of all available results. Nevertheless, total ionization crosssection functions for the most important targets related to radiotherapy (i.e., Ne, Ar, FT?,N2, 02, H/^O, CÛ2, CH4, C3Hg) have been assessed and reviewed here and the best datasets available at the time (see discussion in figure headings) are presented in graphical formin Figs. 3.10-3.17.
3.4. Partial electron impact ionization cross sections3.4.1. Experimental
According to relation (3.19) the determination of partial electron impact ionizationcross sections o^ not only requires the measurement of n(0)e, Nt, L and ij (as in the case of
180

total cross section measurements), but in addition an accurate analysis of i^ in terms ofindividual ion currents, ims, produced. In order to measure individual ion currents, ims, massspectrometers must be used in the respective experimental set up. Because of the greatdifficulty in achieving a known and reliable transmission and collection efficiency(independent from the m/z value of the ion to be analyzed) in those instruments, theirprimary value has been for a long time the identification of different ions produced and themeasurement of approximate partial cross section ratios.
The first mass spectrometric determination of partial electron impact ionization crosssection functions have been made in the 30's. Some of these studies were repeated later on,however, up to recently large differences (as an example see a comparison of the crosssection ratio between singly and doubly charged Ar ions shown in Fig. 3.18) existed in both,magnitude and shape, of partial electron impact ionization cross section functions
OJ
E 2OCM
ICD
0
14
z *- %
i 1 1 1 1
0.1 0.5
Elec-lron energy ( keV)Fig. 3.14 Total electron impact ionization cross section function for C>2 o Täte and Smith
[15], V Rapp and Englander-Golden [16], A Schräm et al. [103,104], Peresse andTuffin [115],--- Krishnakumar and Srivastava [116]. The data of Schräm et al. [104]extend up to an electron energy of 20 keV (MeV data see Ref. [Ill]) For moredetails on the accuracy and reliability see discussions in Ref [11,13,14,112].
181

6
CNECDCN
ICD
/
« • « * * « * *
20 40 60 80 100 120 140 160 180 200
E l e c t r o n ene rgy (eV )
Fig. 3.15 Total electron impact ionization cross section function for CC>2 after Rapp andEnglander-Golden [16] (designated *). Also shown for comparison calculated crosssections using the Jain Khare method [85,86] (designated •), the DM formulation[54], equ. (3.25), (designated __) and the Gryzinski formula [59], equ (3.23),(designated - - - -) As described in the text the Gryzinski formula gives erroneousresults for molecular targets.
[1,2,6,11,13,23,47,89,90,126,127]. As pointed out by many workers [1,2,13,126] this is dueto large discrimination effects occurring at the ion source exit and at the mass spectrometerslits (discussed in more detail below). Moreover, a common problem (never solvedsatisfactorily) is the absolute calibration. Closely related to this is the fact that discriminationmay also occur at the ion detector (see [124,128] and references therein).
There exist, however, some recent experimental studies using new and sophisticatedapproaches in order to overcome these difficulties. Some of these new studies come veryclose to meet the main prerequisites for measuring accurate partial ionization cross sectionfunctions, i.e. a constant (known) or complete ion source-mass spectrometer collection
182

10r19
Iff:20
CME
1CT21
101-2210' 103
ELECTRON ENERGY ( eV)
Fig. 3.16 Total electron impact ionization cross section function for H2Û. + Schütten et al.[117], o Bolorizadeh and Rudd [118], and D Djuric et al. [17]. Also shown forcomparison calculated cross sections using the Jain Khare method [85,86] designatedas füll line. For more details on the accuracy and reliability see Ref. 17 (MeV data seeRef. [111]).
183

CM
OCMIO
4
200 400 600 800 1000Electron energy (eV)
Fig. 3.17 Total électron impact ionization cross section for C3Hg. o Schräm et al. [113](extending up to an electron energy of 12keV, MeV data see Ref. [Ill]),» Djuric etal. [18] and — Grill et al. [l 19]. For more details on the accuracy and reliability seeRef [119].

efficiency independent (i) of the mass to charge ratio of the ion under study, independent (ii)of the incident electron energy, and in some cases independent (iii) of the initial kinetic ionenergy. These studies include:1. Improved crossed thermal beam methods [ 124, 129-133]2. Crossed fast atom beam techniques [23-40,90,134,135]3. Improved metastable ion detection [136-139,134]4. Trapped ion mass spectrometry [140]5. Improved ion extraction and transmission techniques (also in
combination with molecular beam techniques), i.e.5.1. Cycloidal mass spectrometry [8,117,141-147]5.2. Fourier transform mass spectrometry [148]5.3. Large acceptance sector field mass spectrometry [149]5.4. Fieldfree diffusive extraction [7,150]5.5. Pulsed electron beam and ion extraction technique
[107,110,116,124,125,151-165] or coincidences technique [165,166]5.6. Penetrating-field-extraction and ion beam deflection method
[47,89,119,120,123,167-180]The last of these methods (developed and constantly improved over the past 10 years in theInnsbruck laboratory) employing a Nier type ion source in combination with a sector fieldmass spectrometer system (e.g. see Fig. 3.19), will be discussed as an example in detail inthe following paragraph, because (i) of the widespread use of this instrumentation in massspectrometer laboratories and (ii) its recent success in the determination of accurate partialionization cross section functions for atoms and molecules. For a detailed and criticaldiscussion of the other rather successful very recent approaches (applied to a series of targetsystems), including the groups of Freund and Becker and coworkers, Srivastava andcoworkers, Gilbody and coworkers, Syage, and Bonham and coworkers, see Ref. 90.
The extraction of ions from the ionization region in a Nier type ion source dependsunder usual experimental conditions on various parameters, i.e. the initial energy of the ions,the mass to charge ratio, m/z, the guiding magnetic field, the electron beam space chargeand the applied extraction field. Usually, ions are extracted from the ionization region (inwhich there is a crossed electric and magnetic field) by a weak electric field applied betweenthe collision chamber exit slit and an electrode opposite to the exit slit,.i.e., the pusher. Thisextraction, however, is not complete and results in discrimination for ions with different m/z(e.g., see detailed discussions in Ref. [1,2,13,47,126]). In an alternative approach apenetrating field from external electrodes may be used, i.e. all electrodes confining thecollision chamber are kept at the same potential (e.g. ion acceleration voltage of 3 kV), andions are drawn out of the collision chamber through the ion source exit slit under the actionof an electric field applied to the external electrodes (Fig. 3.19). It has been shown that thispenetrating field extraction assures saturation of the parent ion current [123,167]. Ions
185

0.1
0.05
io 0
• 0--ö
l i1930 40 50 60 70 80 90
Year of publicationFig. 3.18 Measured partial ionization cross section ratio a(Ar2+/Ar)/ o (Ar4"/Ar) at 100 eV
electron energy versus year of publication of these results (original data referencesgiven in Ref. [89] and [120]). Cross section ratios designated with open circles aremeasured with improved and controlled experimental conditions (see text) and agreequite well with each other within the experimental error bars, i.e. including the resultsof Crowe et al. 1972 [7], Drewitz 1976 [121,122], Stephan et al. 1980 [123], Wetzelet al. 19S7 [33], Syage 1991 [124], Bruce and Bonham 1992 [128], Tarnovsky andBecker 1992 [40] and Me Callion et al. 1992 [110].
extracted in this manner are then centered and focussed by various elements and reach theend of the acceleration region at the so called earth slit. Stephan et al. [123] additionallyintroduced in front of the mass spectrometer entrance slit Sj pairs of deflection plates (seeLg-Lg in Fig. 3.19), which serve to sweep the ion beam across the mass spectrometerentrance slit Sj in the y direction (perpendicular to Si) and z direction (parallel to Sj). Thisallows the recording and integration of the ion beam profile, and hence discrimination at Sjcan be avoided.
It is of special interest to note that this technique has been recently extended to thequantitative detection of fragment ions. Stephan et al. [175] have shown for CF4 that the
186

IS
pump -si •60.2-
\T5 /pur**pr \pump x
//,/ electron
beam'capillary leak
pushe:
\
Cso oven"-
,L»
. \
iL? SI
£Llon_gi^'beam^^s
^ skimmer^ nozzle
\ stagnationchamber
clusterbeam
\
\\
^
gas inlet
temperature / pp^bath / EL
,/ FF2/ PA
on sourcefirst field free regioneinzel lenssecond field free regionpost acceleration
SEM ... secondary electron multiplierDA, SI, S3, S3 ... slits
Fig. 3.19 View (to scale, numbers given in cm) of the electron impact ion source and of thedouble focussing mass spectrometer system after Ref. [119]. L}, collision chamberexit slit electrodes; L2 penetrating field electrodes, L3 and Lq, focussing electrodes,L5, ground slit; Lg, Lj, Lg and Lg, ion beam deflection electrodes; Sj massspectrometer entrance slit; z-direction: perpendicular to the x-y plane (right-handaxes).
overall ion beam shapes are essentially a product of the profiles in either direction. Thus, inorder to account for the overall discrimination at Sj Stephan et al. have demonstrated that itis sufficient to determine separately the profile in the z direction at one particular y value(e.g., Uy = 0 V) and the profile in the y direction at one particular z value (e.g., Uz = 0 V)and then integrate with help of these two data sets over the whole beam shape. Thisintegration method was improved [178] by operating a 1 kHz sweep generator on the y-deflection plates during the z scan. It is then sufficient to integrate over this y-integrated z-ion-beam profile in order to obtain a representative measure of the total ion current of theion under study.
187

_^çCT*
-l— JC
O £_-t— ' t—0 Do o
1.1
DU
10
5
10.5
~ ""^^** -im
^ "*™
-^
~ ~^"^^
^_^ "*
^"*--..-.___ ___ _ —*"•
~ •.
z.
~ I I I I I
' o/ „^2 t5
55 c
o10 -o20 c
e. — .um
0.1 0.5 1 5 10 ' oKinetic ion energy ( eV )
Fig. 3.20 Calculated extracted ion fraction and discrimination factor (see text) as a functionof initial kinetic ion energy for the Nier type ion source used in combination with adouble focussing mass spectrometer (see Fig. 3.19) after Poll et al. [ 179].
Moreover, Margreiter et al. [120] recently introduced an additional correctionprocedure to account for an non-permissible discrimination of energetic fragment ions at theion source exit slits. It was demonstrated in the case of SFß that the smaller fragment ions(which have larger excess kinetic energies than the larger fragment ions) are not extractedout of the ion source with the same efficiency as the large fragment ions despite theexperimental improvements employed previously [175,178]. This new correction procedureis based on a study of the discrimination in the ion source and mass spectrometer by meansof computer simulations [179]. Ion trajectories were calculated in this study as a function ofinitial kinetic energy, starting position and starting angle in the ion source. Fig.3.20 showsthe calculated extracted ion fraction as a function of initial kinetic energy. This relationshipmay be used to correct measured (total) fragment ion currents or in the case of earliermeasurements unconnected partial ionization cross sections. The discrimination factor isdefined, according to Fig. 3.20 and Ref. [179], as the ratio between the calculated extractedion fraction of an ion with initial thermal kinetic energy and of the ion under study (having ahigher kinetic energy), respectively. A representative measure for the kinetic energies hasbeen obtained in these studies [119,120,179,180] by measuring the z-deflection curves of allfragment ions in comparison to Ar+ and Ar^+ (using a relationship between the kineticenergy and the deflection voltage derived by Franklin and coworkers [181]).
In order to complete this survey on recent experimental studies a number of otherstudies -mostly using quadrupole mass filters or time of flight mass spectrometers - shouldbe mentioned, e.g., see reference [114, 182-188].
188

CM
"l1
CM
b
2Û
15
1D
05
18 20 22 24Electron energy (eV)
Fig. 3.21 Partial ionization cross section ratio o(H+/H2) / o(H2+/H2> for the electronimpact ionization of H2 as a function of electron energy given by Hippie (see Ref.[190]) designated •, by Adamczyk et al. [141] designated • and by Crowe and MeConkey [191] designated __ Also shown (designated -.-.-.) for comparison arepredictions by Browning and Fryar [192] using Franck Condon factors (see text).
3.4.2. Theoretical
In contrast to the situation for total ionization cross sections almost no theoreticaltreatments are available for the determination of absolute partial ionization cross sections(except for those cases with atomic targets where the total cross section is about equal tothe single ionization cross section, see above). Besides a few quantum and classicalapproximations for the production of doubly charged rare gase atoms (see Figs. 16 to 19 inRef. [47]) which are disagreeing strongly with the accepted experimental results, the onlyapproach to calculate absolute partial ionization cross section functions is the semiempiricalformulation by Khare and coworkers [87,88]. In this approach Khaire et al. utilized amodified Jain-Khare formula (see 3.3.2.) in order to predict the dissociative ionization ofsmall molecules such as NH3, H2O and F^S. Whereas the cross sections for the dominantions are in good agreement with the experimental results, for the minor ions the theoryunderestimates the cross sections.
Another possibility to predict in the case of diatomic or pseudo-diatomic moleculesat least cross section ratios is the use of the Franck-Condon principle. If the correspondingpotential energy curves of the neutral and ionized diatomic molecule are known, theresulting fragmentation ratios between atomic and diatomic ion may be derived from the
189

ISLuO
OÛ<Lü
Lü
A A---- A _ ,\ — A A A _ A
14 16 18 20 22 24 26 28 30
ELECTRON ENERGY (eV)Fig. 3.22 Relative partial electron impact ionization cross sections for C3Hg after Grill et al.
[l 19], designated by open triangles. Also shown for comparison are QET calculationsby Vestal [195] designated by full dots .
190
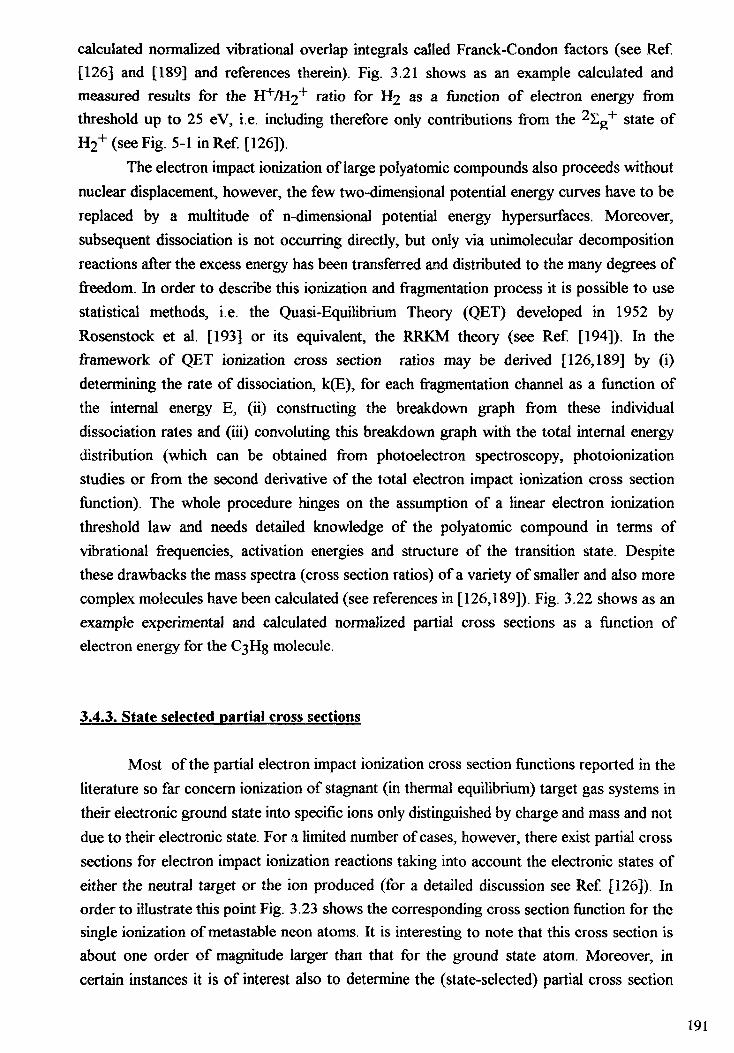
calculated normalized vibrational overlap integrals called Franck-Condon factors (see Ref.[126] and [189] and references therein). Fig. 3.21 shows as an example calculated andmeasured results for the H~i7H2+ ratio for H/? as a function of electron energy fromthreshold up to 25 eV, i.e. including therefore only contributions from the ^Ig+ state ofH2
+(seeFig. 5-1 in Ref. [126]).The electron impact ionization of large polyatomic compounds also proceeds without
nuclear displacement, however, the few two-dimensional potential energy curves have to bereplaced by a multitude of n-dimensional potential energy hypersurfaces. Moreover,subsequent dissociation is not occurring directly, but only via unimolecular decompositionreactions after the excess energy has been transferred and distributed to the many degrees offreedom. In order to describe this ionization and fragmentation process it is possible to usestatistical methods, i.e. the Quasi-Equilibrium Theory (QET) developed in 1952 byRosenstock et al. [193] or its equivalent, the RRKM theory (see Ref. [194]). In theframework of QET ionization cross section ratios may be derived [126,189] by (i)determining the rate of dissociation, k(E), for each fragmentation channel as a fonction ofthe internal energy E, (ii) constructing the breakdown graph from these individualdissociation rates and (iii) convoluting this breakdown graph with the total internal energydistribution (which can be obtained from photoelectron spectroscopy, photoionizationstudies or from the second derivative of the total electron impact ionization cross sectionfunction). The whole procedure hinges on the assumption of a linear electron ionizationthreshold law and needs detailed knowledge of the polyatomic compound in terms ofvibrational frequencies, activation energies and structure of the transition state. Despitethese drawbacks the mass spectra (cross section ratios) of a variety of smaller and also morecomplex molecules have been calculated (see references in [126,189]). Fig. 3.22 shows as anexample experimental and calculated normalized partial cross sections as a function ofelectron energy for the C3Hg molecule.
3.4.3. State selected partial cross sections
Most of the partial electron impact ionization cross section functions reported in theliterature so far concern ionization of stagnant (in thermal equilibrium) target gas systems intheir electronic ground state into specific ions only distinguished by charge and mass and notdue to their electronic state. For a limited number of cases, however, there exist partial crosssections for electron impact ionization reactions taking into account the electronic states ofeither the neutral target or the ion produced (for a detailed discussion see Ref. [126]). Inorder to illustrate this point Fig. 3.23 shows the corresponding cross section function for thesingle ionization of metastable neon atoms. It is interesting to note that this cross section isabout one order of magnitude larger than that for the ground state atom. Moreover, incertain instances it is of interest also to determine the (state-selected) partial cross section
191
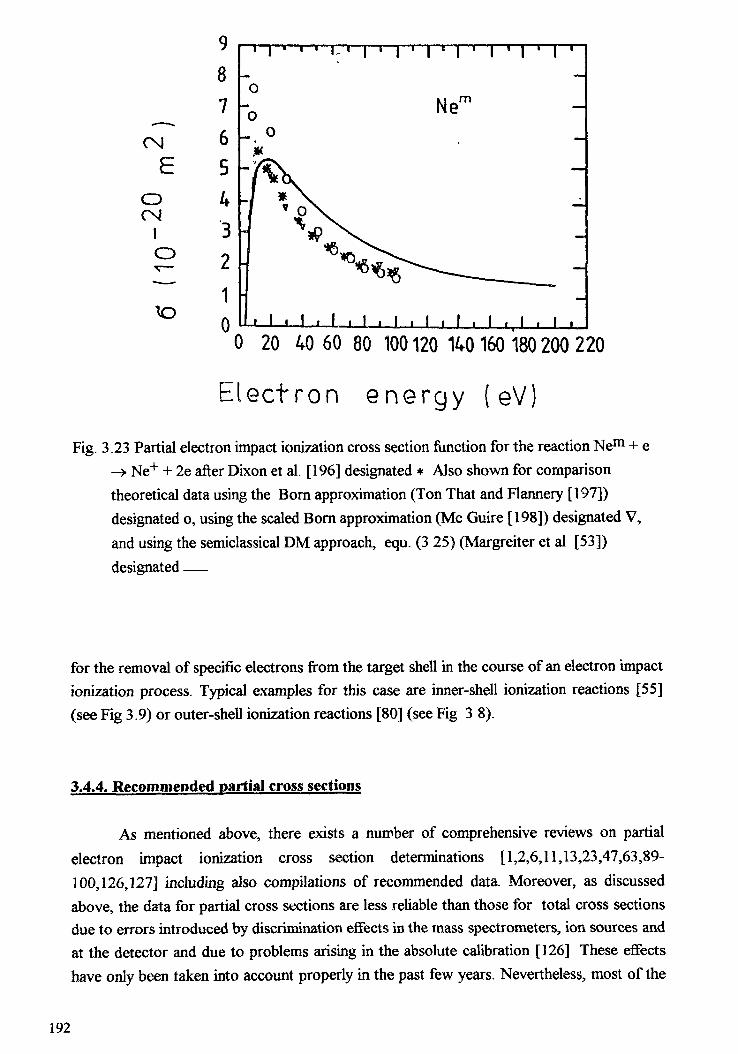
C\l
oCN
O
9
8
765U3210
-[-T- i ' i • i • i • i ' i • i •
Nem
» . l • i . i • . •0 20 40 60 80 100120 140 160 180 200 220
Electron energy ( eV)
Fig. 3.23 Partial électron impact ionization cross section function for the reaction Ne"1 + e—» Ne+ + 2e after Dixon et al. [196] designated * Also shown for comparisontheoretical data using the Bom approximation (Ton That and Flannery [197])designated o, using the scaled Born approximation (Me Guire [198]) designated V,and using the semiclassical DM approach, equ. (3 25) (Margreiter et al [53])designated ——
for the removal of specific electrons from the target shell in the course of an electron impactionization process. Typical examples for this case are inner-shell ionization reactions [55](see Fig 3.9) or outer-shell ionization reactions [80] (see Fig 3 8).
3.4.4. Recommended partial cross sections
As mentioned above, there exists a number of comprehensive reviews on partialelectron impact ionization cross section determinations [1,2,6,11,13,23,47,63,89-100,126,127] including also compilations of recommended data. Moreover, as discussedabove, the data for partial cross sections are less reliable than those for total cross sectionsdue to errors introduced by discrimination effects in the mass spectrometers, ion sources andat the detector and due to problems arising in the absolute calibration [126] These effectshave only been taken into account properly in the past few years. Nevertheless, most of the
192

5. — .»
— > i(N
e^_(N
1CD
,XO 1
0
-
3' — -
CN£
OJC^Ji
° 1-— «••
*o
0
jPX
_ r ° o x
*A **
- tT O **
1 ' ~~-- f s ---.. -' , -? 1.fi-L __i . , i , i , / . i . i . , , i . ,
• o o sv
e> o ^
' o s
' l"f." ° o 'S -
^ ' * s
' o s ^| h.
1 4 O1'
c' ^ —— -. 4 4
** ' ~ - ~ ~ A
l ' ' o ~^"~'^--' o ° o ""•• — , .i /o O " ~ - — .h /-/° ° °; </ ~^ 4 • - ! 1
.fl -fr 1 . 1 . 1 , 1 . 1 . 1 , 1 . 1 .
0.1 Q5 1
10.2
Electron energy ( k e V )
Fig. 3.24 Partial electron impact ionization cross section function for the reactions Ne + e —>Ne+ + 2e (upper part), Ne + e -» Ne2+ + 3e (lower part, left scale) and Ne + e ->Ne3+ + 4e (lower part, right scale). A Schräm et al. [199], o Gaudin and Hagemann[105], D Nagy et al. [149], • Stephan et al. [123], x Wetzel et al. [33] and - - -Krishnakumar and Srivastava [107]. The data of Nagy et al. extend up to 5 keV and ofSchräm et al. up to 18 keV (including up to fivefold charged ions). For more details onthe accuracy and reliability see discussions in Ref. [l 1,23,47,107 and 126].
193

0,1
0.01
1 r
oCsllCD
0.1
0,01
o_0
Jo o
ai 1 10Electron energy (keV)
Fig. 3.25 Partial electron impact ionization cross section function for the reactions Ar + e —»Ar+ + 2e (designated 1), Ar + e -> Ar2+ + 3e (designated 2), Ar + e -» Ar3+ + 4e(designated 3), Ar + e -> Ar^+ + 5e (designated 4) and Ar + e -> Ar^+ + 6e(designated 5). D Schräm [200], A Nagy et al. [149], V Stephan et al. [123], xWetzel et al. [33], • Krishnakumar and Srivastava [107], + Ma et al. [161] and o MCCallion et al. [l 10]. The data of Schräm extend up to 18 keV including up tosevenfold charged ions. For more details on the accuracy and reliability see discussionsin Ref. [11, 23, 47, 107, 110 and 126] (see also Fig. 3.18 and the correspondingdiscussion in the text).
194

CM
CN
O
00.01 "Q1
Electron energy ( keV)Fig. 3.26 Partial electron impact ionization cross section function for the reaction H2 + e ->
H+ (with kinetic energies > 0.25 eV) + H + 2e after Rapp et al. [201]. For furtherpartial cross sections and ratios see Fig. 3.21 and Table 3.1. For more details see Ref.[92 and 99]. Double ionization of Ü2 has been recently studied by Edwards et al.[154].
Table 1. Partial electron impact ionization cross sections (in 10~22 m^) for the reaction H2+ e-»H+ + H + 2e and H^ + e ->H2+ + 2e, respectively, as a function of electron energy Eafter Adamczyk et al. [141].
E(eV)203050701001502003004005006007008009001000
H+0.1180.711.682.12.01.761.561.080.910.750.670.620.550.520.49
H2+245881868071624841332926242321
195

z.
1
CM nE °
0 1CNl l
o
0.6
0.2
0C
/"V
K\<0 0 * Xs
biA \ -r """•-•---«JO
•
X l ! l l
- -"•;,"* L s
\L N
\
' *A A A\L \l Xv
- f A A \ *1 A sx
- 1 A ^^
--«.,_
/*' "^ v/ v __ _
1 " ~~ — -4 / -- —— ~* ^ 1 1 1 1 1
) 0.1 0.5 0.9
0.020.010
Electron energy (keV)
Fig. 3.27 Partial electron impact ionization cross section fonction for the reactions (>2 + e —>C>2+ + 2e (upper part) and C>2 + e -> O2+ (lower part, right hand scale) and theproduction of O22+ plus O+ (lower part, left hand scale). • Rapp et al. [201], 0 Mark[202], A Evans et al. [203] and - - - Krishnakumar and Srivastava [116]. The data ofRapp et al. relate to cross sections for the production of ions with kinetic energieslarger than 0.25 eV and can be best compared with the results of other authors for O+
production. Double ionization of (>2 has been studied and discussed by Mark [202](see Table 3.2). Triple ionization has been estimated to amount at 1 keV to appr. 7.lx10"4 of the total ionization cross section [166]. For more details on the accuracy andreliability see discussions in Ref. [l l, 116, 126 and 202].
196

Table 2 Partial electron impact ionization cross sections for thé reactions C>2 + e —» C>22+ +3e and N2 + e —> N22+ + 3e, respectively, as a function of electron energy E after Mark[202].
E(eV) O22+(10-22m2) E(eV) N22+(10-22m2)
42 0.011 44.5 0.00644 0.023 46.5 0.02848 0.045 50 0.11
51.5 0.080 53.5 0.2853 0.10 57 0.4962 0.24 60.5 0.7673 0.41 68.5 1.30
94.5 0.87 78.5 2.17109 1.02 98.5 2.95126 1.04 118.5 3.32139 1.07 124.5 3.35156 1.04 145.5 3.22167 1.00 165.5 2.59
cross sections for the most important targets related to radiotherapy (i.e. Ne, Ar, Ü2, N2,C>25 H2Û, C(>2, CH4, C3Hg) have been measured recently. The data on these targets havebeen assessed and reviewed here and the best data sets available (partial cross sectionfunctions and/or ratios) at the present time are presented in graphical form in Figs. 3.24-3.32.
3.5. Electron impact ionization of clusters
In recent years, there has been a growing interest in a new category of molecules, i.e.the clusters (see also the discussion in other chapters of this report). Neutral atomic ormolecular clusters (bound by weak forces such as dispersion forces) are produced in free jetnozzle expansion, and most of these experiments on so called van der Waals clusters (seeRef. [4]) use electron impact ionization in combination with mass spectrometry for thedetection of these species. However, very little quantitative information is known yet interms of ionization cross sections. This is mainly due to the fact that it is not possible toproduce beams of neutral clusters of known density and defined size [3-5].
197

0.5
a v
fc m• •
•
CNJ£ 0
oCNJ
1CD11 0.5
0.1n
« — / ^ a!tf h! \
H • • *
" . \\
* *•>SQ
- 1 ^
{ " "^Q^*~ *~*i^^ — — Q_ __
1 / • — - _
• f ——— ——— ——— _.„__
,1.. !., !.. ....... 1......... 1. ........ I.........I....... ..l.........!.........!.,.......!.........
0.02
0.01
0 0.1 0.5 1
Electron energy ( keV)
Fig. 3.28 Partial electron impact ionization cross section function for the reactions 2 + e ~*N2+ + 2e (upper part) and N2 + e -> N2+ (lower part, right hand scale) and theproduction of N22+ plus N+ (lower part, left hand scale). • Crowe and Me Conkey[191], D Rapp and Englander-Golden [16] and Rapp et al. [201], • Mark [202], and -- - Krishnakumar and Srivastava [159]. The data of Rapp et al. [201] (lower part)relate to cross sections for the production of ions with kinetic energies larger than 0.25eV and can be best compared with the results of other authors for N4" production.Double ionization of N2 has been studied and discussed by Mark [202] (see Table3.2). Triple ionization has been estimated to amount at 1 keV to appr. 7 Ax 10"4 ofthe total ionization cross section [166]. For more details on the accuracy and reliabilitysee discussions in Ref. [11, 126,159 and 202].
198

oCM
1.5
1.0
0.5
0
0.3
0.2
0.10
OH*
Q01 0.1 1 10
Electron ervergy (keV)
Fig. 3.29 Partial electron impact ionization cross section functions for the reactions H2Û + e-» H2O+ + 2e, H2O + e -> OH+ + H + 2e, H2O + e ~» H4" + products, and H2<3 + e-> O+ + products after Schütten et al. [117], designated o, (for the much smallerproduction channels concerning the O2+ and H2+ fragments see [117]). Also shownfor comparison the experimental data of Mark and Egger [205] for the case of H2O+,designated •, and theoretical estimates of Khare and Meath [87], designated —(curve A without and curve B with transfer of a certain percentage of the oscillatorstrengths corresponding to t^O4" and Off1" to those of O+).
199

o
— 2CN
Eo7 1o
10 o
• *- •*•••»..
*/ o >^' o *-^«y o -*^/ • « • o ""*^4-!. ./ • • • o -i • .
- / » ^ • . * " — -
' / / •
• j't' A
r
- L* < t i i \ i i i < \ t i i i \ i t i i \ t i i i
0 0.1 0.2 0.3 OA 0.
E l e c t r o n energy ( k e V )Fig. 3.30 Partial electron impact ionization cross section function for the reaction CC>2 + e
--> CC>2+ + 2e: • Adamcyzk et al, [143], o Crowe and Me Conkey [205], A Mark andHille [206], • Orient and Srivastava [185] and - - - Krishnakumar [158]. Doubleionization of C(>2 has been studied by Mark and Hille [206] and other partial crosssections have been reported by Adamczyk et al. [143]. Moreover, Jackson et al. [207]have reported on the influence of the temperature on the dissociative ionization ofC02
No absolute total, counting or partial ionization cross sections for a specific clustersize (except for dimers, see Fig. 3.33 and Table 3.3 [4,126]) have been reported up to date.Conversely, total, counting and partial ionization cross sections have been measured forcluster distributions of H2 and CC>2 (for more detail see references given in Ref. [4]). Fig.3.34 and 3.35 show the total ionization cross section functions divided by the averagednumber of cluster constituents ("effective" cross section) for various H2 and CÛ2 clusterdistributions, respectively. The position of the maximum of the cross section shifts to higherelectron energies with larger averaged cluster size m and the magnitude of the effectivecross section decreases for larger m. Also shown in Figs. 3.34 and 35 are theoreticalestimates from Deutsch et al. [69] using a modified DM approach.
200

According to theoretical considerations [210,211] supported by a limited number ofexperiments, the total ionization cross section O| m for a cluster of size m may be envisionedto be the product of three terms times the total cross section of the monomer, a^ j , i.e ,
T2-T3) (3-26)
The first term TI involves the probability that an electron strikes the cluster. This dependsou the geometric cross-sectional area of the cluster and is proportional to m2/3 for aspherical (or cubic) cluster of m constituents if the density of the cluster is assumed to beindependent of cluster size. One must also assume that the cross-section of a moleculewithin the cluster is the same as that of the free molecule. The next term, T2, corresponds tothe probability that a colliding electron can cause an ionizing event within the cluster This
o«N
iO
o 400 800 1200 1600
Electron energy (eV)20C
Fig. 3.31 Partial electron impact ionization cross section functions for the reactions CIfy + e-> CH4+ , CH4 + e -> CH3
+, CH4 + e -> CH2+ , CH4 + e -» CH+ , CR^ + e -> C+
, CH4 + e -» H2+ ,and CÜ4 + e -> H+ after Adamczyk et al [141] (Neutral productsalso produced in these reactions are not considered in this context). Similar resultshave been obtained recently by Chatham et al. [l 14].
201

0 100 200 300 400 500 600 700 800 900 1000Electron energy (eV)
Fig. 3.32 Partial electron impact ionization cross section fonctions for the production ofC3H8
+, C3H7+ C3H6+, C3H5+, C3H4+, C3H3+ C3H2+, C3H+ C3+; C2H5+,C2H4+C2H3+, C2H2+ C , C2+; CH3+, CH2
+, CH , C+; C3H52+ C3H^-+,C3H3
2+ and C3H22+ ions via electron impact ionization of C3Hg after Grill et al.
[l 19]. See also relative partial cross sections given in Fig. 3.22 and correspondingdiscussion in the text.
202

0.5
0.000 100 200 300 400 500 600 700•Electron energy (eV)
800 900 100C
Fig 3.32 (cont.)
203

C\J
E 2oCsl
lO,___ *A
00 40 80 120 160
Electron energy ( e V )
Fig 3.33 Partial electron impact ionization cross sections for the reaction Ar + e -» Ar+ +2e and Arç + e -> Ar2+ + 2e, respectively, as a function of electron energy after Mark[4]
term can be expressed as 1 - e~ where d is the mean distance traveled inside the clusterby the incident electron and A is the mean free path for ionization within the cluster Themean free path A, depends only on the energy of the incident electron, whereas d depends onthe radial dimension of the cluster which is proportional to m^ Thus, for a small cluster (d« A.), 1 - e~^ is proportional to m^ and for a large cluster (d » >.), the term is unityThe last term, T3, considers the probability that the ensuing secondary electron escapes thecluster This probability is given by 1 - e-D/A. where D is the mean distance that asecondary electron can travel in the cluster and still have sufficient energy to escape thecluster. In this case, for a small cluster (d « D), the probability is unity, whereas for a largecluster the probability is proportional to rn'1/3 Therefore, the total ionization probability fora small cluster (d « A, or D) is directly proportional to the cluster size m. For a largercluster (d » A. or D) the probability becomes proportional to m2/3 The dimension D isexpected to be smaller than A,, so the expected criterion for this proportionality is d » D. If
204

Table 3. Estimated absolute partial ionization cross sections for the production of parentions in Arç, ArKr, Kr2, KrXe and Xe2 after Mark [126]. Electron energy in eV and crosssections in 10~20m2.
Electron a(Ar2V a(ArKrV a(Kr2 + / a(KrXeV a(Xe2V
energy Ar 2 ) ArKr) Kr 2 ) KrXe) Xe 2 )
12.5152025303540455060708090100110120130140150160170180
--1.2.3.3.3.3.3.3.3.3.3.3.3.3.3.3.3.3.3.3.
4966174046433841433833283032322925171002
~0.1.2.3.3.3.4.4.4.4.4.3.3.3.4.4.4.3.3.3.3.
244354448298100308150899978907090599989071
-0.2.3.4.4.5.5.5.5.5.5.4.4.4.4.4.4.4.4.3.3.
512159739611322958572393679690694931107162
0.1.4.5.6.6.6.6.5.6.6.6.5.5.5.5.5.5.5.4.4.4.
21530374173615099205132471616471522801774106
0.2.6.7.7.7.7.7.7.7.7.7.6.6.6.6.6.6.6.5.5.4.
25911449694027431843582784545663510906481168
the cluster is very large (d » K and D), the proportionality should fall to m^. Bottiglioniet al. [210] point out that electrons of about 80 eV incident energy can be captured only byclusters exceeding 10^ molecules.
From the dependence of the total charge production cross section on cluster size (seeFig. 3.34,3.35), Henkes and coworkers determined the ionization shell thickness D to beabout three molecular layers for CÛ2 clusters [209] and five and one-half for the H2 clusters
205

CN
CNIO
0,4-
400
Electron energy (eV)Fig. 3.34 EiFective total electron impact ionization cross section functions for various
cluster distributions with an averaged cluster size m after Henkes and Mikosch [208]designated Exp. Also shown for comparison are calculated values using a modifiedDM approach after Deutsch el al. [69], designated -.-.- (a = 0.47) and -*-*- (a =0.48). In this case r^, and gjj in equ. (3.25) have been replaced by ma r^and gnl/m , respectively [69].
[208]. In the case of the H2 clusters, however, the cross-sections to be used in therelationship (3.26) were found to be about half of the cross-section for the free molecule.
A few relative partial ionization cross section functions have been reported (the mostextensive study concerns Ar clusters [212]; others are summarized in Ref. [4,126]). For thereasons given above no absolute values are available. Owing to this deficiency of data, theadditivity rule [63-65,83,84] (despite being only valid for total cross sections) has been used
206

CNE
oCN
lO
60 80 100
Electron energy ( e V )
200
Fig. 3.35 Effective total electron impact ionization cross section functions for various(CO2)m cluster distributions with an averaged cluster size m after Hagena and Henkes[209] designated Exp. Also shown for comparison are calculated values using amodified DM approach after Deutsch et al. [69], designated -.-.- (a = 0.41; see Fig.3.34).
Table 4 Fragmentation ratio f^^ for electron ionization of Arç and Arç. This ratio isdefined as fmn = Xm
+/I Xm+ for reaction Xn + e -> Xm
+ + 2e (n-m)X.
Ar3
0.33 [216]0.40 [217]
0.30 [217]
0.67 [216]0.60 [217]
0.70 [217] < 10-4 [217]
207

occasionally to calibrate cluster ion signals detected by mass spectrometry, i.e. assuming forinstance that the dimer ion signal is twice the monomer ion signal and so forth. Thisprocedure, however, is at variance with the results presented above (Fig.3.33). It neglectspossible fragmentation of the neutral under study and possible cascading from larger neutralclusters present in the distributions. Using a modified additivity rule taking into accountdissociative channels, it is possible to deduce at least for rare gas dimers absolute partialionization cross sections [4,47] (e.g., see Fig. 3.33 and Table 3.3). Moreover, in a few casesaccurate partial ionization cross section ratios have been determined for small clusters usingeither spectroscopic methods [213] or the method of producing size selected neutral clustersby momentum transfer via scattering [214]. As expected from the mass spectrometry ofordinary molecules [1,2] appreciable fragmentation is occurring for some of the clustersstudied [4,215], Fragmentation ratios deduced for Ar2 and Arç are given in Table 3.4 i.e.,40% of the ions produced (including prompt and metastable dissociation) from Ar 2 are Ar+
fragment ions, and in the case of Ar3 almost 100% of the ions are ending up as Ar2+ or Ar+
fragment ions.
For more details and information on the electron impact ionization of clusters seeRef. [3-5, 126,21 land 215].
3.6. Electron Attachment
Electron attachment is a process in which electrons are captured by atoms ormolecules to form negative ions and classified into two types; dissociative and non-dissociative processes as shown in the following reaction scheme,
A + X- (3.27)cror k *
e" + AX <^> AX" =>\!T
AX" + energy . (3.28)
Interaction of low-energy electrons with molecules, AX, produces unstable negative ions,AX'*, with a cross section a or a rate constant k. The autodetachment of electrons fromAX~* with a lifetime t may compete with the dissociation of AX" or with the formation ofstable molecular negative ions, AX", which requires the release of the excess energy fromAX'*. The lifetime T is related to the electron-energy width of the attachment resonance.The value of 1/t is a rate constant for the autodetachment process. In the presence of third-body molecules, AX~* is collisionally stabilized to form stable AX". The branching ratiosamong the unimolecular processes of decaying AX~* depend on the interrelationship of thepotential energy curves between AX and AX", and also on electron energies. The relative
208

importance of the collisional stabilization process in the overall decaying processes ofelectrons depends largely on these unimolecular processes particularly the lifetime T and onthe number density and character of third-body molecules, in which one may expect someenvironmental effects on the over-all scheme of electron attachment processes. In additionto the determination of cross sections or rate constants for electron attachment or negative-ion formation and their electron energy dependences, it has been of prime importance inelectron attachment studies to clarify the attachment mechanism, not only the two-bodymechanism but also the overall mechanism and how environmental conditions affect themechanism.
Electron attachment processes have been extensively studied theoretically andexperimentally, and these are comprehensively summarized in recent review papers [218-229]. A brief survey is given here of only the experimental studies.Low-energy electron attachment to molecules has been studied using,
1) Beam methods1.1. Electron scattering spectroscopy1.2. Electron impact mass spectroscopy of negative ions1.3. Photo-electron spectroscopy of negative ions1.4. Collision of Rydberg atoms with molecules1.5. Collision of alkali metal atoms with molecules
2) Swarm methods2.1. Electron-swarm (or drift-tube) techniques2.2. Microwave techniques combined with flowing or static afterglow methods
(or with electrical discharges)2.3. Microwave technique combined with pulse radiolysis methods2.4. Electron cyclotron resonance spectroscopy2.5. Pulse sampling technique2.6. Electron density sampling method (the Cavalleri method)
Various types of electron scattering experiments at low energies less than several eVhave given cross sections of electron attachment and information on the initial interactionpotential between electron and molecule, and thus provided an efficient knowledge of thestructure of formed negative ions or the interrelationship of the potential curves between AXand AX". Since it has been difficult, in general, to make electron attachment experimentsusing beam methods at extremely low energies particularly near thermal energies [230,231],heavy particle collisions such as those using Rydberg atoms [232,233] or alkali metal atoms[234,235] as low energy electron sources have been a good substitute giving an importantinformation on electron attachment processes. Electron scattering experiments using beam
209

methods at such low energies including even thermal energies are certainly one of theimportant subjects not only in collision physics itself but also as a bridge between beamexperiments and swarm experiments.
Instead of beam methods, electron-swarm or drift tube techniques have played amajor role in those investigations and accumulated data on attachment rate constants, theirelectron energy dependences, formed negative ions, etc. Most electron swarm studiesmonitor the rate of removal of electrons in the swarm drifting in a tube, usually under DCelectric field in the presence of a buffer gas. In addition to usual swarm techniques aninteresting approach of measuring cyclotron resonance signals due to free electrons in gaseshas been carried out for the study of electron attachment to various molecules as a functionof electron energy in the range of 1 to 10 kT. Another interesting approach to electronattachment studies is highly sensitive monitoring of electron density in the swarm by theCavalleri method. The pulse sampling technique is simple but capable of yielding precisedata particularly on energetics of negative-ion formation. A microwave technique formonitoring the rate of removal of electrons in the swarm has been combined with static orflowing afterglows produced by electrical discharges. This technique has been combined alsowith the pulse radiolysis method in order to eliminate essential limitations inherent to theabove-mentioned microwave technique. The response time of the detection system forelectrons has been highly improved and the effect of the presence of various species inafterglows on electron attachment processes has been eliminated. This combination hasshown, therefore, a distinct advantage in studying thermal electron attachment to molecules,making possible to perform time-resolved observation of decaying electrons with very fastresponse in a wide range of the pressure of an environmental gas which is chosen withvirtually no limitation (see 4.2). Thus, the mechanism of low-energy electron attachment tomolecules has been discussed primarily in terms of the interaction of electrons withmolecules even in a multiple collision system. Recent studies of thermal electron attachmentto C>2, N2O and other molecules using this technique have revealed interesting features ofthe electron attachment to van der Waals molecules, i.e., the effect of the van der Waalspotential on the electron attachment resonance (see 4.2.). This experiment has triggered arecent development in beam experiments of electron-van der Waals molecule collisions[4,5,236,237].
Experimental data on electron attachment processes have been recently surveyed byShimamori [218] and classified into two-body and three-body attachment processes. Thetwo-body processes consist mainly of dissociative attachment and additionally ofnondissociative attachment. In the latter attachment the overall mechanism is essentially athree-body process, but looks like a two-body process because of a long lifetime of AX"* in
Jç ____
comparison with the collision frequency between AX~ and M. The three-body processes
210

6 8 K) 12ELECTRON ENERGY (eV)
Fig. 3.36 Dissociative attachment cross sections as a function of electron energy incomparison with the theoretical maximum cross section TrX^ after [221].
consist totally of the non-dissociative attachment which needs the stabilization of AX"* incollision with M to form stable AX".
Christophorou et al. [221] summarized, as shown in Fig 3.36, dissociativeattachment processes in terms of their cross section values as a function of electron energyand demonstrated an interesting comparison between nté, i.e., the theoretical maximumattachment cross section, where A, is the electron de Broglie wave length, and the observedma,umum ones. The difference in the cross section value between the two, which increaseswith increasing the electron energy, is ascribed to the decrease in the survival probabilitywith increasing the electron energy. The magnitude of extremely large cross sections atrelatively lower electron energies is of great interest when such attachment occurs in thecondensed phase, because the electron de Broglie wavelength in this case is much largerthan an average distance between molecules in the medium.
211

The hydrogen isotope effect of the cross section for dissociative electron attachment,in which a heavier molecule has a smaller cross section in comparison with that for a lightermolecule, is well known and explained in terms of the effect of the difference in the reducedmass of the dissociation fragments, A and X", also on the survival probability. Anotherinteresting isotope effect has been recently observed also in a nondissociative attachmentprocess. Three-body attachment rate constants have been measured for 16O2 and 18Q2? inwhich the difference in the attachment resonance energy between the two is expected[238,239]. In some attachment processes, the effect of the temperature of gases on the crosssection or rate constant has been observed. The effect has been ascribed, in most cases, tothe vibrational excitation of a molecule AX. As described in section 4.2., another type of thetemperature effect has been recently observed. This is the effect of the temperature of gaseson the density of a van der Waals molecule, which has an attachment rate constant to bemuch larger than an isolated molecule.
Oxygen is cited here as a good . example of AX in both dissociative andnondissociative electron attachment processes because this molecule is probably the mostextensively studied molecule in the investigation of low-energy electron attachment[219,222,240], mainly because this is one of the simplest molecules and is also the mainconstituent of atmospheric gases. The dissociative attachment has been investigated by manypeople and general agreement on the cross section has been reached. The cross section has abroad peak with its maximum at about 6.7 eV. This peak is interpreted as a resonanceprocess
) -> 02-(2nu) -> 0-(2P) + 0(3P) . (3.29)
The nondissociative process has been also extensively studied with an electron beamor swarm technique. From those experimental studies, together with theoretical ones, theattachment process for thermal electrons is understood to proceed in the following way.First the electron of ~ 80 meV is resonantly captured by O2:
e- + 02(x3Zg-, v = 0) -> 02-* (2ng, v' = 4) (3.30)
The lifetime of the resonant state O2~* in terms of the autodetachment of electrons:
02-* (2ng, v1 = 4) -> 02(X3Ig-, v=0) + e- (3.31)
212

is known to be ~ 100 ps, which gives a resonance width of ~ 10 ueV. In the presence of athird-body molecule M, O2~ is collisionally stabilized in competing with the process (3.31)to form stable O2~:
°2"*(2ng, V = 4) + M -> O2-(2n„, v' < 3) + M (3.32)
The processes (3.30)-(3.32) are reduced to the overall three-body attachment,
(3.33)
The rate constants of the process (3.33) have been measured for a variety of third bodies Mranging from rare gas atoms and diatomic molecules to complex molecules such ashydrocarbons and alcohols. The difference in the obtained rate constant values areinterpreted in terms of the vibrational energy transfer from O2~ to M. By changing widelythe pressure of M, the electron attachment to van der Waals molecules (O2.M) or (O2)2 hasbeen observed (see 4.2.).
3.7. Electron Impact Dissociation of Molecules
Electron impact dissociation of molecules has been extensively studied by measuringeither the excitation spectra of dissociation, i.e., dissociation cross sections vs. electron-impact energy [241,242], or the translational energy of dissociation fragments [243] (Thissection is concerned with the dissociation into neutral fragments because the dissociationinto ionic fragments is described in Section 3.4.). The former measurements have beenlimited mostly to the dissociation into optically emissive fragments and in some cases intooptically non-emitting but excited fragments, e.g., H(2s) and high Rydberg atoms, becauseof experimental difficulties in the measurement of non-emissive fragments at the groundstate, although the cross sections to form ground state fragments are generally much largerthan those to form excited ones. The latter measurements have been also carried outexclusively with excited fragments and divided further to the following two types dependingon measurement techniques [243]:
213

1. Time of flight measurements
2. Doppler profile measurements.
Electron impact dissociation of molecules has been investigated most extensively byfocussing on optically emitting dissociation fragments. In this section, therefore, a briefsurvey is given by referring some typical results of the excitation spectrum measurementsand translational spectroscopy, and brief comments are added on the measurements of non-emissive fragments in the ground state formed in the electron impact dissociation ofmolecules.
Excitation spectrum measurements:
Optical emission from excited atoms or free radicals has been observed in electronimpact dissociative excitation of a variety of molecules [241,242]. Good examples arechosen and briefly described in the following.
8-
<rCMO
LÜ*O*0
4-
2-
00.05 0.1 0.5 1
Electron energy ( keV )Fig. 3.37 Emission cross sections for Lyman-a radiation presented in the form of a Fano
plot (see Ref. [14,43]) for electron impact on H2 and Ü2 after [244].
214

Absolute emission cross sections for production of hydrogen atoms in the n=2-6excited states, where n is the principal quantum number, have been determined fordissociative excitation of molecular hydrogen and deuterium by electron impact in theenergy range from 0.05 to 6 keV [244]. The excited atoms have been observed by opticaldetection of their fluorescence, Lyman-a radiation in the case of n = 2 and Balmer-a, ß,y,and 0 radiation in the case of the higher states. The Fano plot (see Ref. [14,43]) of H(2p)formation is shown in Fig. 3.37, from which the dipole matrix element for its formation isobtained (see Chapter 5). Figure 3.37 clearly shows that H(2p) is produced from opticallyallowed excitation of H/^. A strong isotope effect is observed for the production of excitedatoms from molecular hydrogen and deuterium and ascribed to a competition in the decay ofsuperexcited states between dissociation and autoionization.
De Heer and his coworkers extended this experiment to other molecules, HF, HC1,H/2O and hydrocarbons [245-248]. The results of hydrocarbons showed a marked contrast inthe Fano plot for the production of excited hydrogen atoms as compared with the result ofH2, HF, HC1 and Ü2O. Figure 3.38 shows the Fano plot for the Balmer ß radiation
0.02-•
tr 0.01 -<NtO«J 0.02-
0.01 -W 0.02^
0.01 -]
Û2H4
D n
CH4r> On
"O O O
0.1 0.5
Electron energy ( keV)Fig. 3.38 Emission cross sections for Balmer ß radiation presented in the form of a Fano
plot (see Ref. [14,43]) for electron impact on acetylene, methane and ethylene after[247].
215

0.2-
ÛC«MO
Co1 -
LU
0
C^H'
CH4
C^H^
0.1-I—I I I I 11
0.5 1
Electron energy ( keV)Fig. 3.39 Emission cross sections for CH(A2 A -> X2I1) radiation in the form of a Fano plot
(see Ref. [14,43]) for electron impact on acetylene, methane and ethylene after [247].
produced from the electron impact on simple hydrocarbons. The slopes of the straight linesat higher electron energies are almost horizontal, which shows that the production of excitedhydrogen atoms is due to optically forbidden excitation of a hydrocarbon molecule.
In Fig. 3.39, however, the Fano plot for the CH(A2A —» X^FI) emission showsclearly the positive slope of the straight line for each hydrocarbon molecule, indicating thatCH(A2A) is produced by optically allowed transitions in the excitation which may involvesuperexcited states of the parent hydrocarbon molecules. De Heer and his coworkersattempted to compare results on excited fragments produced by optically allowed orforbidden transitions with the results of photoexcitation experiments. However, it was verydifficult for them at that time to make such comparison because of relatively very few resultsof photoexcitation experiments in the energy range above the first ionization potential.Since, however, photodissociation experiments of molecules excited into that energy rangeare recently available, as described in Chapter 5, using synchrotron radiation, it is necessaryto make systematic comparison of the experimental results of molecular dissociationbetween electron impact and photon impact.
216

Translational spectroscopy of dissociation fragments:
The broadening of an atomic line spectrum is generally ascribed to several wellknown factors: natural, Doppler, pressure, Stark and Zeeman broadenings [249]. Recently,
Doppler profiles which are ascribed to molecular dissocation have been observed inelectron-molecule collision experiments, from which direct information has been obtained onthe energy and electronic-structure of molecular-dissociation potential-curves [243].
In the electron impact dissociation of H2 the translational energy of H(n), i.e.,excited hydrogen atoms with principal quantum number n, formed from doubly excitedstates (2pou)(nlA.) as well as from vibrationaliy excited states (lsOg)(nlA.), has been obtainedfrom Doppler profiles of Balmer emission lines. The hydrogen isotope effect has been alsoexamined by measuring D(n) formed from 02- These are typical evidence for the Platzman'sprediction of the dissociation of superexcited states of molecules. In the case of molecularhydrogen, therefore, excess energies beyond the ionization threshold of a molecule resultfrom vibrational or double excitation. For other molecules one can estimate another type ofexcess energy resulting from inner-valence excitation. This experimental technique has beenfurther applied to H2Û, HF, NH3, Cffy and other more complex molecules, giving directevidence for the dissociation potential of inner-valence excited states as well as doublyexcited states [243,250].
In a series of these investigations the internal energies of these highly excited stateshave been found to be in good agreement with the energies of corresponding molecular ionsobtained from photoelectron or ESCA (electron spectroscopy for chemical analysis) spectraand from (e,2e) experiments. This agreement shows that superexcited states are molecularhigh-Rydberg states converging to corresponding ionic states, and supports the core-ionmodel proposed for high-Rydberg atomic dissociation fragments [243].
Optically non-emitting fragments at the ground state formed in the electron impactdissociation of molecules:
To measure non-emitting fragments at the ground state formed in the electron impactdissociation of molecules, there have been the following three types of experiments:
1. Measurements of the decay rate of a target-gas pressure due to electronimpact
2. Measurements of laser induced fluorescence from non-emittingfragments
3. Threshold-ionization mass-spectrometry of non-emitting fragments
217

These experiments are still in a preliminary stage of investigations to substantiate thedissociation dynamics into non-emitting fragments. In the experiment (1), the absolute valuefor the total dissociation cross section is obtained from the decay rate of a target-gaspressure due to electron impact [251]. This experiment is conceptually simple, but it ispractically difficult to obtain real cross section values. The experiment (2) is alsoconceptually easy, but it is practically difficult to get enough fluorescence intensity under asingle-collision condition and limited in terms of detected fragments. In the experiment (3),the increase in the yield of fragment ions due to electron impact ionization of neutraldissociation fragments is observed and ascribed to the field of neutral dissociation fragmentsinitially formed [252]. This experiment is useful to understand quantitatively the dissociationinto non-emitting fragments.
It is greatly needed to investigate systematically the dissociation into non-emittingfragments in electron impact experiments as well as in photon impact experiments (seeChapter 5).
3.8. Elastic and inelastic scattering of electrons3.8.1. Scope of presentation
When an electron collides with an atom or molecule, the processes can be dividedinto two general categories: (1) elastic collisions in which no energy is transferred into theinternal degrees of freedom of the target system and (2) inelastic collisions in which suchenergy transfer takes place. The following processes are considered here: (i) elasticscattering; (ii) rotational excitation; (iii) vibrational excitation; (iv) electronic excitation. Theother inelastic processes, i.e., electron impact ionization and dissociation as well as electronattachment, are discussed in previous paragraphs of this chapter.
In both elastic and inelastic scattering, the electron loses some energy due tomomentum transfer. While this energy loss is small in a single collision, it has to be takeninto account because of the multitude of collisions experienced by the electron along itspath. The cross section for momentum transfer is therefore included here.
The discussion will be confined to selected target species (i.e. Ne, Ar, H2, N2, C>2,H2O, CC>2, CÜ4, C3Hg) which play a key role in radiation dosimetry and therapy andrelated instrumentation. The energy range covered is from 10~2 eV to 103 eV. Onlycollisions in the gas phase, i.e. with free atoms and molecules, are considered here.
In an ideal scattering experiment, one would like to measure the cross section for atransition between two completely defined quantum states. Although this may be desirablefrom a basic point of view, it is not always necessary. In practice, it is often also not
218

possible; in most cases, one measures cross sections which are averaged over a number ofexperimentally unresolved quantum states. For example, processes involving individualhyperfine levels or magnetic sublevels of electronic states are not of primary concern here.Such processes are measured in specially designed scattering experiments (e.g.,using laserexcitation or electron-photon coincidence techniques). These measurements are outside thescope of the present survey. Similarly, electron spin polarization effects are not consideredhere, i.e., reported cross sections represent an average over electron spin orientations beforeand after the collision.
In electron-molecule collisions, the rotational and vibrational degrees of freedomoften play an important role. With the presently available energy resolution in electronscattering experiments (typically 10-30 meV), individual rotational transitions can only beresolved for H2- For other molecules, rotationally inelastic scattering is usually notseparated from pure elastic scattering, so that in these cases the reported cross sections for'elastic' scattering should be interpreted as Vibrationally elastic' cross sections. It should benoted that there are some experiments in which information on rotational excitation isextracted by deconvolution methods [253-259].
As regards vibrational excitation, individual state-to-state transitions (starting from v= 0) are usually resolved in the case of diatomic molecules, whereas for polyatomicmolecules the different excitation processes can only be partially separated. In many cases,even the fundamental modes are not clearly separable in the energy loss spectra of thescattered electrons. Additional complications arise for the excitation of higher harmonics andcombination modes. A way of treating this problem usually consists in presenting electronimpact excitation cross sections for certain composites of vibrational modes.
Some remarks may be added concerning the initial target states involved in theprocesses for which cross section data are reported here. First, we note that only collisionswith atoms and molecules in their electronic ground state have been taken into account.Studies of electron collisions with atoms and molecules in electronically excited states, eithermetastable or short-lived, are still rather sparse. For the species considered here, only veryfew examples are found in the literature [260-264]. The subject of electron collisions withmolecules in excited states has recently been reviewed by Christophorou [265].
At room temperature (kT = 25 meV), molecular targets are predominantly in theirvibrational ground state. Only low-frequency modes of polyatomic molecules are excited toan appreciable degree (e.g., the bending mode vibration of CC>2 is populated with about 7 %at room temperature). As in the case of electronic states, we consider only collisions withmolecules in their vibrational ground state. It is worth mentioning, however, that certain
219

processes, e.g. dissociative electron attachment, can show a strong dependence on the initialvibrational state of the target molecule. For the present species, there exist studies onelectron collisions with vibrationally excited molecules for H2, N2 and CC>2 [265-290].
Under the same conditions as above (room temperature, kT = 25 meV), freemolecules are populated in many rotational states, the population distribution depending onthe rotational constant of the molecule. In the adiabatic approximation (i.e., molecularrotation slow compared to electron collision time), the cross section for any rotationaltransition jj -»• jf can be related to those for transitions from the rotational ground state(jj = 0). This relation is given by
°rotjf ) = S fC(jiUf -HI • %t(0 -> J) (3-34)
where C(j. jj,.;000) is the Clebsch-Gordan coefficient. The range of validity of this formula
is discussed in more detail in [291,292].
If rotational excitation is not resolved, an average cross section is given by
avfl>,d (E,T) = I f. (T) I % t(jj-Mf) (3.35)Ji l jf
is measured, which may be called 'vibrationally elastic' in the case of A v = 0 transitions. HereT is the gas temperature and fj (T) is the fractional population of the rotational state j j at
this temperature. Within the framework of the adiabatic approximation mentioned above, itcan be shown that
rot <3J6>
which means that the resulting cross section for 'vibrationally elastic' scattering isindependent of the gas temperature T.
Each of the processes discussed above is characterized by a differential cross sectionda/dn (E,0) which determines the intensity of scattered electrons going into a solid angleelement dQ as a function of collision energy E and scattering angle 9 (for more details see3.8.2.). The angular distribution of scattered electrons can be very different, both for agiven process at different collision energies as well as for different processes at a given
220

energy. In many cases, such detailed data are available. However, for reasons of space thefull set of differential cross section data cannot be presented here. This survey will beconfined to the presentation of angle-integrated cross sections as a function of collisionenergy E. Fine details such as narrow resonances are usually omitted, except in a few cases(e.g., N2,02) where the resonance structure plays a dominant role.
3.8.2. Definition of cross sections
When an electron beam of current density j (in units of electrons per cm2 and persecond) impinges on a gas target consisting of N atoms or molecules, then the current Is ofscattered electrons (in units of electrons per second) going into a solid angle element dQ.under polar angle 6 and azimuthal angle <J> is given by
(3.37)
Here, E denotes the kinetic energy of the incident electrons and dQ = sin0d9d<f>. Thequantity da/dQ is called the differential cross section (DCS) and has the dimension of areaper unit solid angle, i.e. cm^/sr. For atoms and for randomly oriented molecules, the DCS isindependent of the azimuthal angle $. Thus, the DCS may be written as (do/dQ)n (E,6)where we have now specified by the index n an individual elastic or inelastic scatteringprocess. It is assumed that only transitions between discrete states are considered.Otherwise, a double differential cross section (DDCS) of the form (d2a/dQdEf)n (Ej,Ef,6)has to be introduced, where Ej and Ef denote the initial and final electron energy,respectively, and dEf is an energy element of the continuous energy distribution of thescattered electrons. This occurs, for example, in the case of excitation of molecules todissociative states. In practice, it may also be relevant in the case of close-lying,experimentally unresolved discrete states such as vibrational excitation of polyatomicmolecules or excitation to high-lying electronic states. In order to arrive again at theordinary DCS as defined by equation 3.37, the DDCS must be integrated over anappropriate energy interval AEf of the final energy distribution.
In general, the measured DCS represents an average over unresolved initial statesand a sum over unresolved final states, i.e.,
221

where Nj is the fractional population of the initial state |i>. An example has been given inequation 3.35 above. In comparing theoretical and experimental results, care must beexercised concerning the question to which extent such averaging has been performed ornot. Furthermore, it must be recognized that any measured cross section (state-resolved ornot) represents an average over the finite energy and angular resolution of the apparatus. Inpresent beam experiments, the energy resolution is typically in the range of 10-30 meV,whereas the angular resolution may vary between a few tenths of a degree in experiments athigher collision energies and about 5° in experiments at very low energies.
The integral cross section on(E) for each process is obtained by integrating the DCSover all scattering angles.
(E) = 2 K (E,0) sine?d0 (3.39)
In the following, angle-integrated cross sections as a function of electron energy E arepresented which are denoted as follows. OQ for elastic scattering, orot for rotationalexcitation, 0^ or ov for vibrational excitation, and oe for electronic excitation. Otherprocesses are treated in previous paragraphs of this chapter.
The grand total cross section aj(E) is given by
o-T(E) = I C7n(E) , (3.40)n
where the summation includes the elastic and all inelastic processes, i.e., the processesmentioned above as well as dissociation, ionization and attachment.
The momentum transfer cross section, which is important in relation to electrontransport in gases, is defined by
l —S- cos6M smM0. (3.41)ko j
Here, ftko and Äkn are the magnitudes of the initial and final momentum of the electron,respectively. The total momentum transfer cross section OM(E) is again the sum over allcontributing processes. In many cases, o\j(E) is dominated by the contribution from elasticscattering. Under these conditions, a good approximation may be obtained from the relation
222

- l (E,0) (1-COS0) sinötiÖ, (3.42)
which is often used in practice. Here, (da/dQ)o(E,0) denotes the DCS for elastic scattering.
3.8.3. Experimental methods
Here we give only a brief survey of the main experimental methods. More details canbe found in the general literature given below as well as in the original literature citedtogether with the presentation of the data.
Total scattering cross sections CTJ are measured in transmission experiments in whichthe attenuation of an electron beam is measured as a function of the target gas density in ascattering cell. Three different types of experiments may be distinguished: Ramsauer-typeexperiments, linear transmission experiments, and transmission experiments using time-of-flight (TOP) techniques. In the latter type of experiment, the TOP distribution of an electronpulse traversing the gas cell is measured and then converted to an energy distribution. Theenergy dependence of the cross section can be determined over a wide energy range bysplicing many data sets, each obtained in a smaller energy interval. The realm of the TOPmethod lies at low energies where the resolution is the highest and where the other methodsbecome increasingly difficult.
These transmission/attenuation experiments are simple by principle and thereforeallow measurements of high accuracy. The main error sources are due to the pressuremeasurement, the effective path length determination, and contributions from forwardscattering which cannot be completely suppressed because of the finite angular resolution ofthe set-up. An overall accuracy of 2-5 % is typically obtained in modern experiments andthe cross section data reported by various investigators generally agree with each otherwithin these error limits.
More detailed information on the collision processes is obtained from differentialscattering experiments. Firstly, these experiments allow one to separate the total crosssection into the contributions from the individual elastic and inelastic processes. Secondly,DCS data are obtained which give information on the angular dependence of the scatteringprocess. This type of data is needed for the modelling of electron transport in gases.Furthermore, the DCS can be integrated over angles to yield integral cross sections on(E)for the individual processes as well as momentum transfer cross sections
223

In the past, two types of target configurations have been used in these experiments.One is a static gas target which may either be represented by the gas-filled vacuum chamberitself or which may consist of a small gas cell separately mounted in the vacuum. The otherconfiguration, which is most widely employed in current experiments, uses an atomic ormolecular beam as the target. In this type of experiment, a monochromatized electron beam(say of 10-20 meV energy width) is crossed at right angles with the gas beam. The latter isusually an effusive beam simply formed by a needle of 0.5 - 1 mm diameter or by amulticapillary array. Supersonic nozzle beams are seldom used in electron scatteringexperiments. The scattered electrons are detected as a function of energy and angle by adetector system whose main components are an energy analyzer and an electron multiplier.Usually, the electron gun is fixed in position and the detector is rotated around the scatteringcentre. The data are taken in different modes of operation: (i) energy loss spectra in whichthe detector energy is varied, while the primary energy Eo and the scattering angle 0 arefixed; (ii) excitation functions for a certain energy loss process in which the primary energyand the detector energy are varied simultaneously at fixed energy loss AE and scatteringangle 9, (iii) angular distributions in which for a certain process (with Eo and AE fixed) theangular dependence of the DCS is measured.
It is evident that this type of experiment gives both very detailed and nearly completeinformation on the scattering process. However, we also point out some problems whicharise in these measurements. The first problem to be mentioned is the finite energy resolution(typically 10-30 meV in present-day experiments). Particularly for molecules, the energy lossspectra of the scattered electrons are very complex, since many rotational and vibrationallevels are involved. It is generally a difficult task to decompose the complex overlappingstructures of molecular energy loss spectra into the contributions from the individualprocesses. As already mentioned, rotational excitation is usually not resolved (except forH2). The process termed 'elastic' scattering must therefore be interpreted as Vibrationallyelastic' scattering. The problems arising in vibrational excitation of polyatomic moleculeshave also been mentioned before. Regarding electronic excitation, the lower states of atomsand simple (diatomic) molecules are usually well resolved in the energy loss spectra of thescattered electrons. For higher excitations and in the presence of dissociative excitations, itbecomes much more difficult to separate the individual contributions. In the case ofpolyatomic molecules, the energy loss spectra for electronic excitation usually appear asbroad and unresolved structures. This is due to the manifold of excited states, the complexrovibrational structure and the strong participation of dissociative states. In spite of thesedifficulties it should be kept in mind, however, that the data obtained in differentialscattering experiments give the most detailed information on the scattering processes. Thesedata are extremely useful in situations where results obtained by other experimentalmethods, which are more global and more indirect in character (e.g., optical emission,metastable production, swarm type experiments), have to be evaluated and interpreted.
224

Another problem is the determination of the DCS in absolute units, i.e. theconversion of the measured scattering intensities into absolute values of the cross section.This problem has been treated in detail in a series of articles by Trajmar and coworkers[293-296]. Direct determination of absolute DCS based on the defining relation 3.37 isgenerally difficult, since it is not easy to obtain an accurate measure for the effectivescattering volume as viewed by the detector. In order to make absolute measurements, oneneeds to know absolute beam densities including their spatial distribution, the overlapintegral of the two beams, the effective acceptance angle of the detector and other factors.This is hardly possible without large errors. Therefore, one has to rely on other methods.There are several methods which are used in practice. At high energies and small angles, theexperimental DCS can be normalized to theory by utilizing a Born or Born-typeapproximation. Another method, which is most favourably used at low energies where nottoo many channels are open, is based on normalization to measured total cross sections.First, all DCS are measured in relative units, then the data are integrated over angles,summed over all contributing channels and finally normalized to an absolute total crosssection which is known from transmission experiments. In this way, the whole set of DCSvalues can be put on an absolute scale. A third method, which is probably the most practicalone, is the relative flow technique. This method was originally developed in Trajmar's group[293] and is now widely used in many laboratories around the world. Absolute DCS valuesare determined by comparing the scattering intensities for the gas under study with thoseobtained under the same conditions for another gas whose elastic DCS values are wellknown. More precisely, the measurements are performed under such conditions that bothgases satisfy the same molecular flow condition (see also Ref. [202]). The reference gas isusually helium for which the elastic DCS values are known with an accuracy in the order of1%.
In DCS measurements, it is generally impossible to cover the full angular range from0° to 180° because of instrumental limitations. At small scattering angles, the primaryelectron beam begins to interfere with the elastic scattering signal, the critical angledepending on the energy of the primary beam. In low energy experiments, the limit is alreadyreached at about 10° typically. At large angles, the accessible angular range is limited by thefact that the rotatable detector and the electron gun collide with each other. A typical valuefor the maximum angle reached in DCS measurements is 130-140°. In order to obtainintegral cross sections an(E) and <T |(n)(E) from the measured DCS data, it is necessary toextrapolate into the experimentally inaccessible regions. This introduces additional errorsinto the determination of integral cross sections by this method. It should be noted,however, that these errors can be minimized if the extrapolation is based on a phase-shiftanalysis of the experimental data. Nevertheless, the problem of extrapolation is especiallyimportant for O]y[, because backward scattering is heavily weighted in this cross section.
225

A useful cross-check of the data thus obtained can be made by using the relation
CTT = a0 + oexc + <*att + <*t , (3 43)
where GO is the elastic cross section, oexc is the cross section sum for all inelastic processesincluding dissociation, oa^ is the cross section for electron attachment, and c^ is the totalionization cross section (see equ. 3.18 and 3.20). The quantities, which are usually wellknown with an accuracy of 5% or better, are aj and o^. The attachment cross section oatt
often plays only a minor role (except for strongly electronegative gases such as halogens).The cross sections, which usually have the largest uncertainty, are GQ and aexc. Whereas theerrors of OQ are typically in the range of 10-30 % depending on the system and the collisionenergy, no general statement can be made concerning the errors involved in thedetermination of the inelastic collision cross sections. These errors strongly depend on theprocess and the energy range considered. They may be in the order of 10% in favourablecases and may go up to a factor of two in situations where special difficulties exist in themeasurements (e.g. threshold region). In some cases, the presently available inelastic crosssections represent only order-of-magnitude estimates. More specific comments will be giventogether with the presentation of the data.
Integral electron-impact excitation cross sections can also be obtained by measuringoptical excitation functions, i.e. light emission at a particular wavelength induced by electronimpact is measured as a function of impact energy. An optical excitation function (or opticalemission cross section) measured in this way can only be regarded as an "apparent"excitation cross section for the state from which photoemission is observed. Variouscorrections are necessary to obtain the "true" excitation cross section, the most important ofwhich being the correction for cascading from higher states. A further difficulty consists inmaking absolute measurements of the photon yield. Altogether, the experimentaldetermination of electron-impact excitation cross sections by this method is difficult and notvery accurate. On the other hand, the optical emission cross section may be compared withdirectly (i.e., cascade-free) measured excitation cross sections, if the latter are properlysummed over all contributing states. In many cases, the agreement is satisfactory.
Similar considerations apply to the measurement of the total metastable productionby electron impact. This cross section also contains contributions from cascades. Besides theusual difficulties inherent in all of these measurements (beam densities, effective scatteringvolume, collection efficiency, etc.), a special problem in the present case lies in the accuratedetermination of the detection efficiency of the metastables. In most experiments, themetastables are detected by secondary electron emission from a metal surface. Theconversion efficiency for this process is generally not accurately known and often a matter of
226

debate. As in the case of the optical emission cross section, the total metastable productioncross section may be compared with directly measured excitation cross sections summedover all contributing states. Again, reasonable agreement has been found in those caseswhere this comparison could be carried out.
An important contribution to the determination of electron collision cross sectionscomes from electron swarm experiments. We briefly comment on the principle of themethod. Extensive reviews can be found in the literature [297,298]. In the first step,transport and reaction coefficients of an electron swarm drifting in a gas under the influenceof an electric field are measured. Various experimental techniques are used for this purpose.Among the swarm parameters commonly measured are the drift velocity w, the transverseand longitudinal diffusion coefficient D j and DL, respectively, the characteristic energyEK = eOT/u (with \i = electron mobility) which is closely related to the mean energy <e> ofthe electron swarm, the ionization coefficient a, the excitation coefficient ß, and theattachment coefficient TJ. The quantities, which can be measured with the highest accuracy(about 1-2%), are the drift velocity w and the ionization coefficient a. The other quantitieshave typical errors of 5-10%, except the excitation coefficient ß for which the experimentaluncertainty is usually largest (about 20-30%).
The second step consists in deriving cross sections from the measured swarm data.The theoretical analysis is based on numerical solutions of the Boltzmann equation or onMonte Carlo simulation of the electron swarm. This provides the connection between themicroscopic cross sections of the electron-atom and electron-molecule collision processesand the macroscopic transport and reaction coefficients. The actual determination of crosssections from the swarm data is usually accomplished by assuming a set of energy-dependentinput cross sections based on any available information, solving the Boltzmann equation andthe transport integrals with this set, comparing the calculated transport and reactioncoefficients with experiment, and adjusting the input cross sections to improve the fit. Thisprocedure is repeated iteratively until an optimum fit is obtained. The result is a set of elasticand inelastic cross sections which reproduces the measured swarm parameters within theirrespective error bars.
An important and well recognized regime of the electron swarm technique lies at lowelectron energies (say below 1 eV), where beam experiments have always been difficult toperform. If the energy is low enough, all electron-atom and virtually all electron-moleculecollisions are elastic, and it is possible to obtain very accurate values for the momentumtransfer cross section cvjyj from measurements of the transport properties of the electronswarm Such cross sections have been determined for a large variety of gases. At higherenergies, rotational and vibrational excitation begins to play a role in the case of molecular
227

gases. If the energy is still further increased, also electronic excitation and ionization becomeimportant processes for both atomic and molecular species. In these situations, it becomesdifficult to derive a unique set of cross sections from swarm data alone. In general,complementary information from beam experiments or from theory has to be used to solvethis problem. On the other hand, it must be noted that also under these conditions, whereseveral inelastic channels are open, swarm experiments can give important contributions tothe determination of the cross sections. As a particular example, we mention the thresholdregions of rotational and vibrational excitation, where results from beam experiments eitherare not available or have large uncertainties. Another example is the determination of crosssections for electronic excitation, for which in many cases the data are incomplete or non-existent. In swarm experiments, lumped cross sections for electronic excitation (oe) can bederived from measurements of the Townsend ionization coefficient a, if sufficiently accuratedata for the ionization cross section o^ are known. The values of a are particularly sensitiveto the values of cre in the low energy regime.
As a final remark, we mention that there is now a good overlap of the energy rangesof beam and swarm experiments, since beam experiments can now be performed down tocollision energies in the order of 0.1 eV. The two kinds of experiments thus givecomplementary information which can be used to cross-check the accuracy of the data. Inmany cases, the data are consistent with each other, but there are also some cases where thedata are still controversial. Recent developments in both beam and swarm experiments, withspecial emphasis on the relationship of the two techniques, are discussed in some conferencebooks [299,300]. We especially mention the work of Hayashi [301, 302] who hasdetermined comprehensive cross section sets for a large number of atoms and molecules bycombining the information from both types of experiments.
3.8.4. General literature
More general accounts of the present subject can be found in a number of booksdealing with atomic collision physics in general or with electron-molecule collisions inparticular. These books are well known to the experts in the field; they are mentioned hereas reference for those who are not immediately involved in this field. Needless to say thatthis list is by no means exhaustive.
A comprehensive review of the earlier developments of the field (up to late sixties)has been given by Massey et aï. [303] in the classic volumes on "Electronic and Ionic ImpactPhenomena'. The applied aspects of atomic collision physics have been emphasized in aseries of volumes entitled 'Applied Atomic Collision Physics' edited by Massey, McDaniel
228
and Bederson [304]. Two excellent books on electron-molecule collisions, both of themcomprising experimental as well as theoretical aspects, have been published byChnstophorou [305] and by Shimamura and Takayanagi [306]. Very recently, some veryfine books covering the whole field of atomic collision physics have been published byMcDaniel et al. [307,308].
In addition to these books, there is a large number of review articles, each dealingwith a specific aspect of the field. We mention a few of them here [309-334], partly becausethey contain information which is of immediate interest for the present purpose and partlybecause they may be of general interest to the readers of this chapter.
Like in every field, the current developments are documented by conferenceproceedings. Two such books originating from a conference have already been mentioned inthe preceding paragraph [299,300]. The main international conference in this field is the'International Conference on the Physics of Electronic and Atomic Collisions' (ICPEAC),which is held every two years. The invited papers of the conference and the abstracts ofcontributed papers are published in separate volumes. In order to give access to this work,we quote here the conference proceedings (book of invited papers) of the last sixconferences covering a period of about 12 years [335-340].
3.8.5. Cross section data
In figures 3.40-3.46, we present elastic, inelastic and total cross sections for theindividual gases. For the sake of clarity, the momentum transfer cross sections are presentedin separate figures (Figs. 3.47-3.50).
The level of accuracy of the different data can be summarized as follows (see discussion insection 3.8.3). The data for oj should generally be accurate to 5% or better. The errors ofao are in the order of 10-30%. No general statement can be made concerning the accuracyof the inelastic cross section data. The quality of the data varies from 10% accuracy infavourable cases to only order-of-magnitude estimates in other cases. Specific commentswill be made where appropriate. Equation 3.43 has been used to check the consistency ofthe data. Agreement is generally found within the given error limits. The data for OM havean accuracy of 5% or better at low energies, whereas at intermediate and higher energies theerrors are about 10-20%.
Cross section data for Ne and Ar are shown in Figs. 3.40 and 3.41, respectively.Besides the total cross section aj and the integral elastic cross section oo, a selection of
229

es
O
O• i— i•»_ >O
Cflc«2u
n i 111 ;———i—i—i i 111
0.01 0.1 l 10 100Electron energy [eV]
1000
Fig. 3.40 Elastic and inelastic collision cross sections for Ne . oj: grand total cross section;o0: integral elastic cross section. The other cross sections are explained in the text.
inelastic cross sections is shown. In the case of Ne, aej represents the cross section sum forexcitation of the two lowest metastable states 2p53s(3P2) and 2p53s(3Po), whereas oe2gives the cross section sum for excitation of the two lowest optically allowed states2p^3s(3Pi) and 2p53s(1Pi). The data for Ar are presented in the same way: oej is the crosssection sum for excitation of the two lowest metastable states 3p^4s(^P2) and 3p54s(3Po);oe2 is the cross section sum for excitation of the two lowest optically allowed states3p54s(3Pi) and 3p54s(1Pi). In both cases, Ecre represents the cross section sum forelectronic excitation including higher states (see discussion further below).
230

Data on aj are found in many papers [341-355]. Apart from some minordiscrepancies which existed in some of the measurements and which have been resolved inthe meantime, the data are consistent with each other. References to earlier work can befound in these papers. Reliable measurements reach down to about 0.1 eV. The extension tolower energies is accomplished by means of MERT analysis [356]. For energies above 1 eV,the present data are in good agreement with the data given by Shimamura [318]. Below 1eV, the present data slightly deviate from the data given in [318].
CN
So
cO• i—i+-»O<DC/3C/5C/3
2u
0.01 0.1 1 10Electron energy [eV]
1000
Fig. 3.41 Elastic and inelastic collision cross sections for Ar. aj: grand total cross section; ao: integral elastic cross section. The other cross sections are explained in the text.
231

(N
So
4— iO
C/3C/5O5-H
U
JL vl - i Tli i i 111
101
10L
10,-2
10,-3
0.01
H
0-»2i i i i i i i iJ____i i i i i i 111____i i i .i.._i_t..i 11____i i i i i i i 11
0.1 1 10Electron energy [eV]
100 1000
Fig. 3.42 Elastic and inelastic collision cross sections for H2. aj: grand total cross section;ao: integral elastic cross section. The other cross sections are explained in the text.
The determination of ao uses information from two sides: (i) DCS measurements[357-376]; (ii) theoretical calculations [377-403]. In the case of Ne and Ar, the wholeenergy range relevant to the present purpose is well covered both by experiment and theory.We further mention the papers by de Heer et al. [346] and Stauffer et al. [404], which givecomprehensive data on Ne and Ar. The final data derived from these sources are shown inFigs. 3.40 and 3.41; they are in good agreement with the data given in Shimamura's article[318]. Note that ao and oj are identical for energies below the threshold of electronicexcitation. The consistency check based on equation 3.43 is very satisfactory for Ne and Ar.
232

The inelastic collision cross section data shown for Ne (see Fig. 3.40) are primarilybased on the work of Register et al. [405]. Additional information is obtained from the workof deHeer et al. [346], who used a semi-empirical approach to determine the total crosssection for electron-impact excitation of Ne and the other rare gases. Comparison with otherwork (e.g., optical emission studies, metastable production, theoretical calculationsincluding respective references) can be found in these papers. More recent studies of totalmetastable production in Ne have been reported by Zavilopulo et al. [406], Teubner et al.[407] and Mason and Newell [408].
Bo
GO
C/3C0au
10J
102
101
10-1
10,-2
i i i i i 1 i i i i t i i 1 1 i i i n 11 r i i i i i 111 i i i 11
H20
0.01 0.1 1 10Electron energy [eV]
100 1000
Fig. 3.43 Elastic and inelastic collision cross sections for H^O. oj: grand total cross section;a0: integral elastic cross section. The other cross sections are explained in the text.
233

oop*4
b
GO•äo<DVI5/5C/5
U
0.01 l 10Electron energy [eV]
100 1000
Fig. 3.44 Elastic and inelastic collision cross sections for CC»2. oj: grand total cross section;oo: integral elastic cross section. The other cross sections are explained in the text.
The first-mentioned authors [405] performed absolute DCS measurements forelectron-impact excitation of the lowest forty electronic levels in Ne. The inelastic collisioncross sections which are derived from the energy-loss spectra of the scattered electrons,could be grouped into fifteen features, six of which correspond to excitation of individuallyresolved electronic levels and the remaining nine are composed of unresolved contributionsfrom two or more electronic levels each. The DCS data are extrapolated to 0° and 180° andthen integrated over angles to yield absolute integral cross sections as a function of impactenergy. The estimated errors are typically in the range 20-40 %. The four lowest excitedstates, for which cross section data are shown in Fig. 3.40, are folly resolved in the originalmeasurements. Here, we give cross sections suitably combined for clarity of presentation.The curve Zoe includes all excited states observed in the measurements.
234

These cross sections are confirmed by swarm-type experiments. Tachibana andPhelps [409] measured excitation coefficients in Ne by using a drift-tube techniquecombined with laser absorption and laser-induced fluorescence techniques. A Boltzmannanalysis is performed to derive a set of elastic and inelastic collision cross sections whichreproduces the measured excitation coefficients as well as published transport and ionizationcoefficients within their respective uncertainties. These cross sections are in good agreementwith the data of Register et al. [405], but in less satisfactory agreement with other data[410].
oo
ö
0O•0O<u«302on8u
0.01 0.1 l 10Electron energy [eV]
1000
Fig. 3.45 Elastic and inelastic collision cross sections for CH.4. aj: grand total cross section;oo: integral elastic cross section. The other cross sections are explained in the text.
235
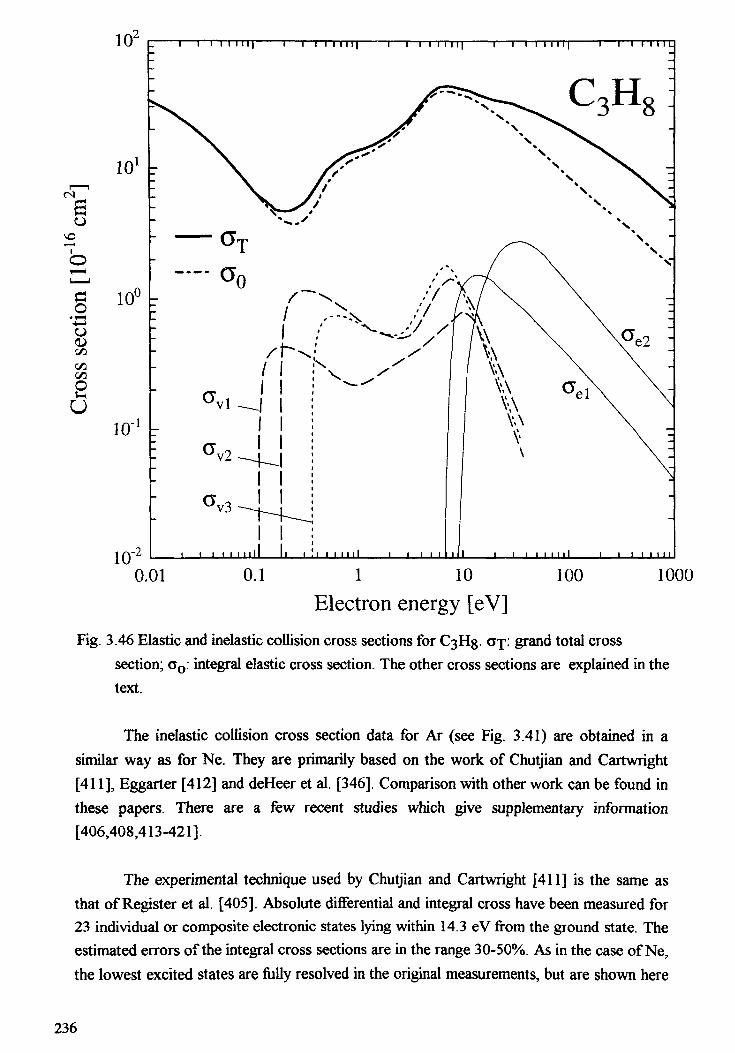
102r
101
CN
6O
co•öo0>
«5
2u10-l
10-2 I I I I I I ill I__[_ I I I I I
0.01 0.1 l 10 100Electron energy [eV]
1000
Fig. 3.46 Elastic and inelastic collision cross sections for C3Hg. err;: grand total crosssection; o0: integral elastic cross section. The other cross sections are explained in thetext.
The inelastic collision cross section data for Ar (see Fig. 3.41) are obtained in asimilar way as for Ne. They are primarily based on the work of Chutjian and Cartwright[411], Eggarter [412] and deHeer et al. [346]. Comparison with other work can be found inthese papers. There are a few recent studies which give supplementary information[406,408,413-421].
The experimental technique used by Chutjian and Cartwright [411] is the same asthat of Register et al. [405]. Absolute differential and integral cross have been measured for23 individual or composite electronic states lying within 14.3 eV from the ground state. Theestimated errors of the integral cross sections are in the range 30-50%. As in the case of Ne,the lowest excited states are fully resolved in the original measurements, but are shown here
236

in combined form for the sake of clarity. The curve Eoe includes (i) all excited statesobserved in the measurements of [411] and (ii) additional contributions from higherelectronic states for which semi-empirical cross sections are given by Eggarter [412].
Again, these cross sections can be checked by swarm-type experiments as describedin the case of Ne. Such work has been performed by Tachibana [422], for example. Themeasured reaction and transport coefficients of the drift-tube experiments are wellrepoduced by this set of cross sections. Work of similar kind is described in many papers[e.g., 423-426]. In general, the beam data are slightly adjusted (keeping within the statederror limits, if possible) in order to fit the swarm results.
oo
Ö
eo• »—l-t—>O<D«3CflC/5au
101
10-l
10,-2
10-3
NeAr
1 1 1 1o.oi 0.1 l 10
Electron energy [eV]100 1000
Fig. 3.47 Momentum transfer cross section for Ne and Ar.
237

IGT C———, , , MM,
ao
Ga•do<DC/500«5au
0.01 0.1 1 10 100Electron energy [eV]
Fig. 3.48 Momentum transfer cross section for H2, 2 an<^ ^2-
1000
As already mentioned before, studies of electron collisions with atoms and moleculesin electronically excited states are extremely scarce. We quote here a few of such studies forthe rare gases [427-435].
In Fig. 3.42, we present cross section data for the H2 molecule. Besides oj and ao,representative cross sections for the main inelastic processes are shown: for rotationalexcitation j = 0 -> 2 and j = 1 -» 3, for vibrational excitation v = 0 -> 1 and v = 0 -» 2, andthree cross sections for electronic excitation. The latter are grouped in the following way:aej gives the cross section for excitation of the b3Iu
+ state, oe2 is the cross section sumfor excitation of other triplet states (c3nu, a3£g
+, e3! "1", d3nu), and oe3 is the crosssection sum for excitation of several singlet states (B1! , E1^4", C1UU 3'1 V*"> D
238

Cross sections for the individual states can be found in the literature (see below). The dataare given in combined form here for clarity of presentation.
An excellent summary report on cross sections and related data for electroncollisions with hydrogen molecules and molecular ions has been given by Tawara et al.[436]. The main sources, on which the present data compilation is based, are found in thisarticle. We further refer to articles by Gerhart [437], Douthat [438], deHeer [439],Buckman and Phelps [440,441] and McConkey et al. [442], which give comprehensiveaccounts of electron collisions with H2- Extensive references to original work and otherreview articles can be found in these papers.
cO
•T—t4—>O<uC««}C/3O!-Hu
10J
r," 10'
101
10e
10'1
10,-2
H20
I I 111
0.01 0.1 1 10 100Electron energy [eV]
Fig. 3.49 Momentum transfer cross section for H2O and CÜ2
1000
239

(N
6o
GO
•ÖO<L>C/Î
au
0.01 0.1 l 10Electron energy [eV]
Fig. 3.50 Momentum transfer cross section for CH4 and
1000
Recent measurements of the total cross section for H2 are reported in [443-450]. Forthe individual elastic and inelastic processes, we mainly refer to the above-mentioned articlesand references therein. Some further studies on H2, both experimental and theoretical, havebeen reported more recently [275-280, 451-456].
An important contribution to the determination of electron collision cross sectionscomes again from electron swarm experiments, in particular for the range of low collisionenergies [457-465]. For H2, there is a remarkable and long-standing controversy betweenbeam and swarm results for near-threshold vibrational excitation [466-468]. Highlyelaborate calculations have been performed to resolve this discrepancy ([469] and theoreticalcontributions in [466-468]). At present, the discrepancy remains unresolved - a fact which is
240

particularly troublesome because for a prototype system like e-FTj one would expect swarmanalysis, beam experiments and theory to arrive at the same result. The reader is referred tothe quoted papers for further study of this interesting problem.
For N2 and C>2, there are comprehensive data reports available [470-473] in whichall information relevant to the present purpose can be found. These data are not reproducedhere, and the reader is referred to the quoted reports. Very recently, an updating of the stateof knowledge has been given by Itikawa [474]. Some further references to recent work onN2 and Ö2 may be added here [475-482].
Fig. 3.43 gives our cross section data for F^O. As usual, the total cross section 0jand the integral elastic cross section OQ presented. Vibrational excitation has beenseparated into three parts: av\ is the cross section for excitation of the bending mode 010(threshold energy 0.198 eV); av2 is the summed cross section for excitation of the twostretching modes, the symmetric stretch 100 with threshold energy 0.453 eV and theasymmetric stretch 001 with threshold energy 0.466 eV. The latter two modes are notresolved in current scattering experiments and their excitation behaviour can only bedescribed in summed form. The third cross section ov3 represents a lump-sum cross sectionfor other kinds of vibrational excitation (higher harmonics., combination modes); a thresholdenergy of 1.0 eV has been assigned to this cross section. Finally, aej and 0e2 are tentativecross sections for electronic excitation, the origin of which will be discussed later. Theassigned threshold energies are 7.5 eV and 13.3. eV, respectively.
Recent summary reports on electron collision cross section data for F^O and thebehaviour of low energy electrons in water vapour have been given by Hayashi [483], Nessand Robson [484] and Elford [485]. A survey of experimental data can also be found in[313].
Measurements of the total cross section oj for F^O are reported in [486-494]covering the energy range from 0.01 eV up to 3000 eV. For energies above 10 eV, themeasurements are in good agreement, except the data of [489], which are generally too low.In the energy range 1-10 eV, there are discrepancies of up to 30% between the variousmeasurements. Here, we have adopted the data of [487]. For very low energies, we havescaled down the data of [488] by a factor of 0.6 (which is still within the stated error bars ofthese measurements) in order to match the data of [487] in the 0.5-1 eV energy range. Weconsider it important to mention the work of Okamoto et al. [495] at this point. Theseauthors have recently performed a thorough theoretical study of electron scattering fromH2O molecules. They point out that the measured values of aj for F^O (and any otherpolar molecules) may generally be too small because of insufficient correction for small-
241

angle scattering. For these molecules, the DCS increases very steeply in the forwarddirection. This makes it very difficult to estimate the small-angle contribution by which themeasured data have to be corrected in order to obtain the true cross section. It is likely thatall experiments on a j reported so far suffer from this difficulty.
The integral elastic cross section GQ is obtained in the same way as described for Neand Ar. The principal data sources are DCS measurements [487,496-500] and theoreticalcalculations [501-508]. On the whole, the present data are in good agreement with thosereported in [483], except for the energy range 20-300 eV, where the present data are slightlylower. The consistency of the data is checked by means of equation 3.43; the result issatisfactory. It should be noted, however, that for GO the same difficulty exists as for ojregarding the strong forward-scattering component.
Rotational excitation of E^O has been studied by Jung et al. [257] experimentallyand by Itikawa [509] and Jain and Thompson [510] theoretically. Under normal conditions,a multitude of rotational excitation and deexcitation processes takes place. Representativecross sections for the most important processes have been summarized by Ness and Robson[484].
Vibrational excitation of H^O has been studied by several workers [511-518].However, only a few of these studies represent absolute measurements [514,517,518]. Thedata presented here (Fig. 3.43) are based mainly on the measurements of Seng and Linder[514] and Shyn et al. [517]. The data beyond 20 eV are simple extrapolations and shouldnot be regarded as very certain. From the swarm side, a need is sometimes claimed for anup-scaling of these cross sections by a factor of 2 or so in order to obtain a better fit tomeasured swarm parameters [483]. We have not made use of such a re-scaling of theoriginal data, because the results of independent beam measurements [514,517] are in goodagreement with each other. The cross sections GV\ and av2 have estimated errors of about20-30% in the energy range 1-20 eV. In the threshold region, the errors are definitely larger.A higher uncertainty must also be assigned to the cross section
Experimental information on electronic excitation of H^O by electron impact is veryscarce. Some energy-loss spectra of scattered electrons, which were taken under differentconditions of impact energy and scattering angle, can be found in [519,520], for example.These measurements were intended to determine generalized oscillator strengths of opticallyallowed transitions on the one hand and energetic positions and configurational assignmentsof triplet states on the other hand. Cross section data for electronic excitation are onlyavailable from indirect methods. Such data can be derived from measurements of theTownsend ionization coefficient a, provided that the ionization cross section o^ and other
242

cross section data are sufficiently well known In particular, the threshold region of o~e isquite sensitive to the values of a at low electric field strengths In the present case, we havetaken the values from Hayashi [483], which are obtained by this method The cross sectionae has been divided into two parts, aei and oe2, with threshold energies of 7 5 eV and 13 3eV, respectively. Another set of cross sections, which has been divided into four parts, isreported by Ness and Robson [484]
In Fig 3.44, we present cross section data for CC>2 The cross sections oj and OQhave their usual meaning Vibrational excitation is described by five separate cross sections°vl> °V2 an<^ av3 are tne cross sections for excitation of the fundamental modes of CO2,the bending mode 010 (threshold energy 0 083 eV), the symmetric stretch mode 100(threshold energy 0 172 eV) and the asymmetric stretch mode 001 (threshold energy 0 291eV), respectively ov2 contains some contribution from 020 excitation (threshold energy0 159 eV) which cannot be separated experimentally The cross sections av4 and oV5 aresummed cross sections which represent excitation of higher modes (higher harmonics andcombination modes) These cross sections have assigned threshold energies of 0 36 eV and2 50 eV, respectively Similar to the case of F^O, only tentative cross sections can be givenfor electronic excitation The three cross sections oej, oe2 and oe3 shown in Fig 3 44 haveassigned threshold energies of 5 7 eV, 9 0 eV and 11 0 eV, respectively The origin of thevarious cross sections is discussed further below
Electron scattering by CC>2 is markedly influenced by a strong resonance in the 3-5eV energy range This resonance is responsible for the enhanced vibrational excitationobserved in that energy range Furthermore, all cross sections show a pronounced finestructure in the resonance region which strongly depends on the process observed, the typeof cross section measured and the scattering angle under which the electrons are detected inDCS measurements No attempt is made here to reproduce the details of this structure, thecross sections shown in Fig 3 44 rather represent an average over the fine structure of theresonance
Recent measurements of the total cross section <TJ for CÛ2 are reported in [521-525, 286,287] These measurements cover the energy range from 0 07 eV up to 3000 eVWith a few exceptions, the data are in good agreement with each other We have adoptedthe data of [521,286,287] for energies up to 9 0 eV (see discussion below) and the data of[525] for higher energies
Recently, it has been observed [286,287] that the total cross section for e-CO2scattering shows a significant dependence on the gas temperature The cross sectionincreases when the temperature is increased from 250 K to 520 K [287] This is attributed to
243

the presence of molecules thermally excited to vibrational states, principally the first bendingmode 010, which increases with the gas temperature. By making some simplifying, butplausible assumptions, the authors derived from the measured data a cross section aj(OOO)for scattering from ground state molecules and a cross section aj(010) for scattering frommolecules excited to the first bending mode (with some possible admixture of 020population). The following features are observed. The cross section aj(010) is generallylarger than aj(OOO). For the non-resonant part, the excess of Gj(OlO) decreases withenergy from about 60% at 1 eV to 10% at 8 eV. In the resonance region, the peak crosssection for 07(010) is higher by 35%, the width of the rjeak is wider by 8% and - mostnoteworthy - the peak position is shifted towards lower energies by 0.3 eV. The reader isreferred to the original papers for more details. It is evident that these observations are ofgeneral importance for the study of electron interactions with polyatomic molecules wherelow-frequency vibrations are easily excited at elevated temperatures.
The integral elastic cross section oo is again determined from DCS measurements[526-532] and theoretical calculations [533-538, 476]. We briefly comment on some pointswhich are worth noting in this case. For energies below 2 eV, experimental data on GQ arerather scarce and uncertain (see also discussion in [302]). The present data have thereforebeen derived through the relation 09 = oj - Lov in this energy range, since both o-j- and£<jv are relatively well known here. In the resonance region, in particular on the rising slopeof the resonance peak near 2-4 eV, the cross section is expected to be rather sensitive totemperature effects (see discussion above). The data presented in Fig. 3.44 should be validfor room temperature. For energies above 30 eV, the sum of the individual cross sectionsadopted here (right side of equation 3.43) exceeds the experimental values of aj by about30%. This apparent inconsisteny of the data must be attributed to uncertainties in either OQor ae (or both), because oj should be accurate to about 5% in this energy range [525].
Vibrational excitation of CC>2 has been discussed in many papers. The earlier work,which was mainly concerned with the role of resonances in e-CC>2 scattering, is wellsummarized in several review and book articles [305,306,310,313]. We especially mentionthe work of Danner [525] and Register et al. [529], who measured absolute cross sectionsfor the different processes. In most of the other work, the measured scattering intensity isgiven only in arbitrary units. More recently, special attention has been devoted tovibrational excitation in the near-threshold region [539-542, 531]. For all three fundamentalmodes, enhanced threshold excitation has been found. For the bending and the asymmetricstretch modes, this is explained by a direct mechanism and can be described by the Born-dipole approximation [543]. For the symmetric stretch mode, the enhanced thresholdexcitation is attributed to a virtual state mechanism. The cross sections avj, av2 and av3have estimated errors of about 20-30% in the energy range 2-20 eV. The errors are larger in
244

the threshold region and at higher energies. This is also the case for the cross sections <yv4and CTV5 which are generally less certain. We finally mention that important information onvibrational excitation and other inelastic processes in e-CU2 collisions is also obtained fromelectron swarm experiments [544-546].
Some special experiments on e-CO2 scattering may be mentioned here. Antoni et al.[547] carried out a rotational branch analysis of vibrational excitation for all threefundamental modes of CC>2. Johnstone et al. [289, 290] performed differential scatteringexperiments from vibrationally excited CC>2 molecules. Data for elastic, inelastic andsuperelastic scattering are presented. Theoretical studies of rotational excitation in e-CC>2collisions are reported by Morrison and Lane [548] and by Onda and Truhlar [534].
Concerning electronic excitation, the situation is the same as for H2Û. There are nodirect measurements for oe. The data shown in Fig. 3.44 have been determined frommeasurements of the Townsend ionization coefficient a just as described for H2O. For CO2
the cross section oe for electronic excitation has been divided into three parts withthreshold energies of 5.7 eV, 9.0 eV and 11.0 eV, respectively. We have adopted the dataderived by Hayashi [302,549]. Another set of cross sections, which is divided into two parts,has been reported by Lowke et al. [545].
Fig. 3.45 shows our cross section data for CHj. As usual, aj and CQ are the grandtotal cross section and the integral elastic cross section, respectively. Vibrational excitationis divided into two parts: one cross section av] for excitation of the modes 02 and 04(threshold energies 0. 190 eV and 0.162 eV, respectively) and a second cross section ov2 forexcitation of the modes u j and 03 (threshold energies 0.362 eV and 0.374 eV, respectively).In either case, the two vibrational modes are too close in energy to be separated in currentscattering experiments (see however [258]). Their cross sections are therefore given insummed form. Excitation of higher modes is of minor importance in CHj and is notrepresented here. Electronic excitation is described by five cross sections with assignedthreshold values of 7.5 eV, 9.0 eV, 10.5 eV, 12.0 eV, and 13.5 eV, respectively. Thesecross sections are discussed further below.
is often regarded as a prototype system for the study of polyatomic molecules.This also applies to electron-molecule scattering. Hence, there is an extensive literaturedealing with e-CFLj collision processes. Compilations and critical assessments of e-CFLjcross section data can be found in several summary reports and other articles[301,302,313,550-553].
Recent measurements of aj for CFf4 are reported in [554-562]. The measurementscover the energy range from 0.085 eV to 4000 eV. The data are in good agreement with
245

each other, which makes it relatively straightforward to construct a recommeded data set fora-f. The data reported in [563], which are often discussed in the literature, should bediscarded because they are obviously in error. In Fig. 3.45, we have extended the data tolower energies by using a MERT fit based on the parameters given by Ferch et al. [554].
The sources for determining the integral elastic cross section GQ are again DCSmeasurements [564-573, 601] and theoretical calculations [574-587, 331,476]. There hasbeen much activity on this subject in recent years which must be ascribed to the above-mentioned prototype role of Ctfy. Recommended data sets for OQ have been derived fromthese studies [549-551]. The present data set has been constructed with both the originalresults for OQ and the consistency of the data according to equation 3.43 in mind. The
consistency check based on equation 3.43 is satisfactory within the error limits for theenergy range 1-300 eV. Some previous problems, which existed in the energy range 4-20eV (i.e., measured values for arj were too low), have been resolved by new measurements[571]. There are two regions where the consistency check fails. One region is above 300 eV,where the results for ao obtained from DCS measurements [569] seem to be rather high. Itis also possible, of course, that the other inelastic cross sections, in particular 0e, are inerror. The second region is near the Raumsauer-Townsend minimum, where the measureddata for OQ [568] and the difference cross section CTQ = oj-Zcrv obtained from equation 3.43are not consistent with each other. The present data for OQ in the range 0.1-1 eV (as given inFig. 3.45) represent a compromise between the two conflicting data sets. Furthermeasurements in this energy range, including more definite results for vibrational excitationin the near-threshold region, are clearly needed.
Cross sections for vibrational excitation are available from various sources: (i) beammeasurements [564, 566,567,573,588-590,258], (ii) swarm experiments [591-597,552], and(iii) summary reports [301, 550-553]. Extensive measurements by beam experiments havebeen performed for the energy range 3-20 eV [567,589,590]. However, the results fromdifferent experiments agree only within a factor of 2. From the analysis of swarmexperiments, it was found necessary to increase the peak cross section around 7 eV by asignificant amount (nearly a factor of 2 compared to the results reported in [589]) in orderto obtain agreement with the measured swarm parameters [552]. For the near-thresholdregion (below 2 eV), the results of beam experiments are only fragmentary and alsosignificantly different from each other [564,566,573]. A variety of different data sets for av
has been derived from swarm experiments for this energy range [591-597,552]. We have toconclude that the data for av in the energy range below 2 eV are rather uncertain. The sameis certainly true for the data beyond 20 eV. In Fig. 3.45, we have adopted the data setreported by Nakamura [552]. These data are identical with those given by Tawara et al.[550,551]. From the discussion above, it is clear that these data are accurate within a factorof 2 at best.
246

Some information is also available on rotational excitation in e-CFLj scattering. Toour knowledge, there are two experiments [256,258] and several theoretical studies[574,579,585,598-600] on this energy-loss process.
For electronic excitation, direct experimental information is again very scarce. Thedata presented in Fig. 3.45 are mainly based on the work of Vuskovic and Trajmar [601].These authors measured energy-loss spectra of scattered electrons at impact energies in therange 20-200 eV and for scattering angles of 8-130° The energy-loss range 7.5-15.0 eVwas covered in the measurements. Since only broad and unresolved structures areobservable in the otherwise continuous energy-loss spectra (probably because nearly allelectronic excitation leads to dissociative processes in CtLj), the inelastic region of thespectrum between 7.5 eV and 15.0 eV was divided into five equidistant segments, eachcorresponding to a number of unassigned electronic transitions. Differential scatteringintensities were measured for these segments and then converted to absolute DCS values bynormalization to the elastic scattering cross section. After integration over angles, the crosssections crei to ae5 are obtained, each representing one of the five sections of the energy-loss spectrum. The errors of the integral cross sections are estimated to about 40%.
Concerning the data presented in Fig. 3.45, it must be noted that the original data ofVuskovic and Trajmar [601] have been modified in order to fit the swarm results for theTownsend ionization coefficient a [549]. For oej, a new cross section has been constructed,whereas the values for oe2 to oe5 have been increased by 40% (which is still within theerror bars of the original data). The resulting data set ([549]; see also [301]) is shown in Fig.3.45. The cross section £ae represents the sum of <jej to oe5- Other sets of cross sections,which are used to describe electronic excitation in Clfy, can be found in [594,595,552,553].Some recent studies are reported by Nakano et al. [602] and Winstead et al. [603,604].
Fig. 3.46 gives our cross section data for C3Hg (n-propane). Besides the total crosssection GJ and the integral elastic cross section OQ, we present three cross sections forvibrational excitation and two cross sections for electronic excitation. More details of thesecross sections are discussed further below.
Measurements of <JT for C3Hg are reported in [555,605,606]. The measurementscover the energy range from 1 eV to 500 eV. The data are in fair agreement in the regions ofoverlap. We have used these data to construct the present oj cross section in the energyrange 2-500 eV. The extension to 1000 eV is based on a semi-empirical extrapolation. Thedata for energies below 2 eV have been derived from measurements of differential elasticand inelastic e-C3Hg scattering which have recently been performed at the University ofKaiserslautern [607]. The details of the method are discussed in connection with arj and av
247

below. In this context, it should be noted that we have discarded the data of [605] forenergies below 2 eV, because they are obviously too low. This seems to be a generalconclusion for Brüche's data at the low energy end of his range of measurement. The sameobservation has also been made for other gases [607].
Summary reports on cross section data for electron collisions with hydrocarbonmolecules have been given by Tawara et al. [550,551]. Besides the species discussed here,these reports include other hydrocarbon molecules as well. We also mention that severalauthors [555,606,608] have designed semi-empirical formulae based on a few molecularparameters, by which total positron and electron cross sections at intermediate energies(about 100-500 eV) are reasonably well described for a large number of molecules. Suchformulae are extremely useful to obtain an estimate of the total cross section in cases whereexperimental information is not available.
Until very recently, experimental data on differential scattering of electrons fromC3Ug were extremely scarce. The only reported DCS measurements were those ofMatsunaga et al. [609,610] for the energy range 3-20 eV. Hayashi [549] used these data toconstruct a data set for GO over the energy range 1-1000 eV. The extension to higherenergies was accomplished by semi-empirical relations in which use is made of the observedsystematics in electron-hydrocarbon molecule scattering [555,605,606,608]. Data availablefor CH4 and €2^ provided the basis to obtain an estimate for e-C3Hg cross sections.
Recently, the situation has changed significantly. As mentioned above, Merz et al.[607] performed measurements of differential elastic and inelastic e-CßHg scattering in theenergy range 0.5-10 eV. A description of the experimental method can be found in[374,611]. These new experimental data have been used to reconstruct the data set for GOup to 10 eV. Towards higher energies, the data have been smoothly connected to the data ofHayashi [549]. The consistency check for GO based on equation 3.43 is quite satisfactoryfor this energy range. On the low energy side, the data for OQ have been extended to 0.01eV by means of MERT analysis [356,374,611]. Together with estimates of the inelasticcross sections for vibrational excitation (see discussion below), the total cross section GJ forthe energy range 0.01-2 eV is obtained by using the relation GJ = GO + ZGV.
A theoretical study of elastic electron scattering from €31^3 (and from otherpolyatomic molecules) in the energy range 5-30 eV has recently been reported by Winsteadet al. [612]. Since the calculations were carried out on the static-exchange level, they werenot expected to give highly quantitative results. Nevertheless, the comparison withexperimental data shows generally good agreement. Further progress is expected fromcalculations at higher levels of approximation (e.g., with inclusion of target polarization). It
248

is also planned to extend these calculations to vibrationally and electronically inelasticscattering [612]. These theoretical developments are very encouraging, because theypromise the possibility of stimulating feed-back between theory and experiment in the studyof electron-polyatomic molecule scattering for the coming years.
During the writing of this article, we became aware of a paper by Boesten et al.[613] who measured elastic and vibrationally inelastic scattering of electrons from CßHgmolecules in the energy range 2-100 eV. Their data for OQ are in excellent agreement withthe data shown in Fig. 3.46.
The propane molecule has 27 vibrational modes with excitation energies rangingfrom 0.041 eV to 0.368 eV [614]. In an electron scattering experiment with 20-30 meVenergy resolution, one cannot expect that the excitation of all individual modes is resolved inthe energy-loss spectra of the scattered electrons. Like in other polyatomic molecules, onecan hope that excitation cross sections for certain composites of vibrational modes can bederived from the measurements. In the above-mentioned experiments [607], three structuresare discernible in the energy-loss spectra which can be attributed to excitation of C-Cstretching modes, CHX bending modes and CHX stretching modes. Other types of modes(e.g. C-C bending and CHX rocking modes) are not clearly observed in the measurements.Cross sections are therefore evaluated for the three composites of vibrational modes quotedabove. These cross sections are designated avj, ov2, and av3, respectively, in Fig. 3.46.The assigned threshold values are 0.110 eV, 0.180 eV, and 0.360 eV, respectively.
The cross sections ovi to ov3 have been determined experimentally only for theenergy range 1-10 eV. The experimental errors are estimated to about 30% for this energyrange. Beyond 10 eV, the data shown in Fig. 3.46 are simple extrapolations and should not
«-
be regarded as very certain. For energies below 1 eV, a Born-type cross section [543] hasbeen fitted to the experimental data in each case in order to provide a rough estimate for thecontinuation of the cross sections towards low energies Note that only the shape of thecross section is given by the Born-dipole approximation [543], the absolute magnitude isdetermined by the normalization to the experimental data at 1 eV. It is clear that these crosssections can only be regarded as tentative. Some justification may be derived from analogywith CÜ4- The corresponding cross sections in CFLj are fairly well reproduced by thisprocedure, in a formal sense at least. The physical interpretation of the near-thresholdbehaviour of the cross sections certainly requires a more thorough discussion [566]. In anycase, it must be stressed that measurements are needed to clarify the situation. We finallynote that excitation of higher harmonics, like in the case of CFLj, is of minor importance in
and is not considered here.
249

In their recent paper on e~C3Hg, Boesten et al. [613] give cross sections forexcitation of the bending composite (here ov2) and the stretching composite (here av3) ofvibrational modes in the energy range 2-15 eV. Within the error bars, the results are inagreement with the data given in Fig. 3.46.
Only little information is available on electronic excitation of C^H^ by electronimpact. Some energy-loss spectra taken at impact energies of 50 eV and 70 eV, respectively,can be found in [615,616]. The spectra exhibit a continuum of energy losses with only a fewrelatively broad structures. Optical absorption spectra in the VUV show a quite similarappearance [617]. Some cross section measurements for electron-impact dissociation ofC3Hg (and other molecules) leading to the production of high-Rydberg atomic fragmentsare reported in [618]. Otherwise, there are no direct measurements for oe. In this respect,the situation is similar to the cases of J^O and CO2- The data shown in Fig. 3.46 have beenderived from measurements of the Townsend ionization coefficient a [549]. The crosssection oe has been divided into two parts, crei and ae2, with threshold energies of 6.80 eVand 9.10 eV, respectively. It is clear that these data must be regarded as very tentative.Direct beam measurements (such as those reported for Clfy above) would be helpful todetermine more definite cross sections for electronic excitation of
In Fig. 3.47-3.50 we present momentum transfer cross sections OM(E) f°r
species discussed in this article. These cross sections play an important role for the transportproperties of electrons in gases [297]. The definition of CM has been given in section 3.8.2.Momentum transfer cross sections are determined from swarm experiments at low energiesand from DCS measurements at higher energies. In the energy range of overlap (about 0. 1-1eV), MERT analysis (e.g. [356,374]) represents a useful tool to make the connectionbetween results obtained by different methods. As mentioned before, the data for CM areexpected to be accurate to 5 % or better at low energies and to about 10-20 % atintermediate and higher energies.
Results for momentum transfer cross sections are reported in many papers. The datapresented here are generally not collected from the original literature, but are taken fromdata compilations. A recent compilation of CTM data for various atoms and molecules hasbeen given by Shimamura [318]. These data are regularly updated with the advent of newinformation [549]. Here, we have used the most recent data as they were available to us. Inthe following, we briefly mention the sources which have been used in the individual cases.
The data for Ne and Ar (Fig. 3.47) are mainly based on the data compilation given byShimamura ([318] and references therein). In the case of Ar the data have slightly changeddue to a recent updating by Hayashi [549]. In Fig. 3.47 we present the revised data for Ar. It
250

may be interesting to compare the data in Fig. 3.47 with the recent MERT analysis byBuckman and Mitroy [356] for energies below 1 or 2 eV. In the case of Ne the oj^ dataobtained from the MERT parameters of [356] are in excellent agreement with the presentdata up to 2 eV. For Ar the agreement holds up to 0.2 eV, but then the data based on theMERT fit tend to be slightly higher.
For HT? (Fig. 3.48) we have used the data of England et al. [463] for energies up to10 eV. For energies above 30 eV we have taken the data reported by Shhnamura [318]which are based on an analysis of Hayashi [312] and which have recently been updated byHayashi [549]. In the energy range 10-30 eV the two data sets have been smoothlyconnected. The data reported by Buckman and Phelps [441] essentially agree with the dataof England et al. [463] for energies up to 5 eV.
For N2 we have used the data reported by Phelps and Pitchford [472] for energies upto 8 eV and then smoothly connected to the data given by Shimamura [318] for energiesabove 10 eV. For energies below the resonance (i.e., below 1.7 eV) the data reported byShimamura are in almost perfect agreement with the data of Phelps and Pitchford, whereasin the resonance region (i.e., 1.9-3.5 eV) the two data sets are different. For more detailedaccounts of the collision processes in the resonance region the reader is referred to thearticles by Itikawa et al. [470] and Itikawa [474].
For O2 Shimamura [318] presents two data sets, one set based on an analysis byHayashi [312] and another set proposed by Phelps [473]. For energies below 0.5 eV onlydata from [473] are available. In the energy range 0.6-10 eV the two data sets are in fairagreement, though not identical. For energies above 10 eV the data sets are in severedisagreement with each other. Here we have adopted the data of Phelps [473] for energiesup to 8 eV and the data of Hayashi [312] for energies above 20 eV. In the interveningenergy range the data have been smoothly connected, following the maximum indicated bythe data of Hayashi. As in the case of N2 we refer for further details of e-C>2 collisions to thearticles by Itikawa et al. [471] and Itikawa [474].
For H2Ü (Fig. 3.49) the data sets reported by Shimamura [318] and by Hayashi[483] are identical. A recent updating using new DCS values has led to a slight correction ofthe CTM data, mainly in the energy range 20-300 eV [549]. We have used this latest revisedversion of OM data here. The data reported by Ness and Robson [484] are in fair agreementwith the data presented here.
For CC>2 the data presented in Fig. 3.49 are essentially those reported by Shimamura[318] except for the energy range 3-8 eV, where the present data are slightly higher, againdue to a recent revision of the data [549].
251

The momentum transfer cross sections for CH^ and C3Hg are presented in Fig. 3.50.We have chosen the data evaluated by Hayashi [301,302,549]. In the case of CH4 a slightlydifferent cross section has been reported by Tawara et al. [550,551]. For C3Hg a largeportion of the cross section had to be estimated from semi-empirical relations (see discussionof ao above). The new experimental results which are becoming available for C3Hg[607,613] will lead to a redetermination of the momentum transfer cross section for thissystem. However, this will not change the basic structure of the cross section, i.e., theminimum near 0.1 eV and the maximum near 8 eV will remain the dominant features.
As a general conclusion we can state that there is continuous progress in thedetermination of electron collision cross sections. We have tried to review the present stateof cross section data relevant to this field. As far as completeness and quantitative aspectsare concerned the cross section data are subject to continuous development and are neverreally final.
Acknowledgements
One of the authors (F.L.) is greatly indebted to Professor M Hayashi for providing awealth of information on cross section data concerning the gases discussed in this report.His invaluable help in preparing this article is gratefully acknowledged. T.D.M. likes toacknowledge support by the Österreichischer Fonds zur Förderung der WissenschaftlichenForschung, Wien,Austria.
References
[1] MARK, T.D., in Electron Molecule Interactions and their Applications, Vol. 1 (L.G.Christophorou, Ed.), Academic Press, New York (1984) 251-334
[2] MARK, T.D., Int. J. Mass Spectrom. Ion Proc., 45 (1982) 125[3] MARK T.D.and A.W. CASTLEMAN, Jr., Adv. Atom. Molec. Phys., 20 (1985) 65[4] MARK, T.D., Int. J. Mass Spectrom. Ion Proc., 79 (1987) 1[5] MARK, T.D., Int. J. Mass Spectrom. Ion Proc., 107 (1991) 143[6] MARK,T.D., in Gaseous Ion Chemistry and Mass Spectrometry (J.H. Futrell, Ed.),
Wiley, New York (1986) 61-93[7] CROWE, A., PRESTON, J.A, Me CONKEY, J.W., J. Chem. Phys., 57 (1972) 1620[8] HALAS, S., ADAMCZYK, B., Int. J. Mass Spectrom. Ion Proc., 10 (1972/73) 157[9] MASSEY, H.S.W., BURHOP, E.H.S., GILBODY, H.B., Electronic and Ionic Impact
Phenomena, Clarendon Press, Oxford (1969)
252

[10] FIELD, F.H., FRANKLIN, J.L., Electron Impact Phenomena, Academic Press, NewYork (1970)
[11] MARK, T.D., DÜNN, G.H., Electron Impact lonization, Springer, Wien (1985)[12] ILLENBERGER, E., MOMIGNY, J., Gaseous Molecular Ions, Steinkopff,
Darmstadt (1992)[13] KJEFFER, L.J., DÜNN, G.H., Rev. Mod. Phys., 38 (1966) 1[14] De HEER, F.J., INOKUTI, M., Chapter 7 in Ref. 11[15] TÄTE, J.T., SMITH, P.T., Phys. Rev., 39 (1932) 270[16] RAPP, D„ ENGLANDER-GOLDEN, P., J. Chem. Phys., 43 (1965) 1964[17] DJURIC, N.L., CADEZ, I.M., KUREPA, M.V., Int. J. Mass Spectrom. Ion Proc.,
83 (1988) R7; FIZIKA, 21 (1989) 339[18] DJURIC, N.L., CADEZ, I.M., KUREPA, M.V., Int. J. Mass Spectrom. Ion Proc.
108(1991) Rl[19] LOZIER, W.W., Phys. Rev., 46 (1934) 268[20] MARK, T.D., EGGER, F., J. Chem. Phys., 67 (1977) 2629[21] GRAFJ., J. Phys. Radium, 10 (1939) 513[22] FUNK, H., Ann. Physik, 4 (1930) 149[23] FREUND,R.S., in Swarm Studies and Inelastic Electron Molecule Collisions (L.C.
Pitchford, B.V. Me Koy, A. Chutjian, S. Trajmar, Eds.) Springer, New York (1987)329-346
[24] COOK, C.J., PETERSON, J.R., Phys. Rev. Lett., 9 (1976) 164[25] ZIEGLER, D.L., NEWMAN, J.H., SMITH, K.A., STEBBINGS, R.F., Planet. Space
Sei., 30(1982)451[26] DIXON, A.J., Von ENGEL, A., HARRISON, M.F.A., Proc. Roy. Soc. Lond., A 343
(1975)333[27] DIXON, A.J., HARRISON, M.F.A., SMITH, A.C.H., J. Phys., B9 (1976) 2617[28] BROOK, E., HARRISON, M.F.A., SMITH, A.C.H., J. Phys., Bll (1978) 3155[29] MONTAGUE, R.G., HARRISON, M.F.A., SMITH, A.C.H., J. Phys., B17 (1984)
3295[30] ARMENTROUT, P.B., TORR, S.M., DOSI, A., FREUND, R.S., J. Chem. Phys., 75
(1981) 2786[31] BAIOCCffl, F.A., WETZEL, R.C., FREUND, R.S., Phys. Rev. Lett., 55 (1984) 771[32] HAYES, T.R., WETZEL, R.C., FREUND, R.S., Phys. Rev., A35 (1987) 578[33] WETZEL, R.C., BAIOCCffl, F.A., HAYES, T.R., FREUND, R S., Phys. Rev, A35
(1987) 559[34] HAYES,T.R., WETZEL, R.C., BAIOCCffl, F.A., FREUND, R S., J. Chem. Phys.,
8« (1988) 823[35] HAYES, T.R., SHUL, R.J., BAIOCCHI, F.A., WETZEL, R.C., FREUND, R.S, J.
Chem. Phys., 89 (1988) 4035
253

[36] SHUL, R.J., HAYES, T.R., WETZEL, R.C., BAIOCCHI, F.A., FREUND, R S., J.Chem. Phys., 89 (1989) 4042
[37] SHUL, R.J., WETZEL, R.C., FREUND, R.S., Phys. Rev., 39 (1989) 5586[38] SHUL, R.J., FREUND, R.S., WETZEL, R.C., Phys. Rev., 41 (1990) 5856[39] FREUND, R.S., WETZEL, R.C., SHUL, R.J., HAYES, T.R.,Phys. Rev., A41 (1990)
3575[40] TARNOVSKY, V., BECKER, K., Z.Phys., D22 (1992) 603[41] RUDGE, M.R.H., Revs. Mod.Phys. 40 (1968) 564[42] VRIENS, L., Case Studies in Atomic Collisions Physics (E.W. Me Daniel, M.R.C. Me
Dowell, Eds.) North Holland, Amsterdam, 1 (1969) 337[43] INOKUTI, M., Revs. Mod.Phys., 43 (1971) 297[44] VAINSTEIN, L.A., SOBELMAN, I.I, YUKOV, E. A., Electron excitation cross
sections of atoms and ions, NAUKA, Moscow (1973)[45] BELL, K.L., KINGSTON, A.E., Adv. Atom. Molec.Phys., 10 (1974) 53[46] PETERKOP, R.K., Theory of ionization of atoms by electron impact (D.G. Hummel,
Transi.) Colorado Ass. Univ. Press, Boulder (1977)[47] MARK, T.D., Beitr. Plasmaphysik, 22 (1982) 257[48] KIM, Y.K., in Physics of Ion-Ion and Electron-Ion Collisions (F. Brouillard, J.W. MC
Gowan Eds.) Plenum, New York (1983) 101-165[49] YOUNGER, S.M., Chapter l in Ref. 11[50] YOUNGER, S.M., MARK, T.D., Chapter 2 in Ref. 11[51] DEUTSCH, H., SCHEIER, P., MARK, T.D., Int. J. Mass Spectrom. Ion Proc., 74
(1986) 81[52] DEUTSCH, H., MARK, T.D., Int. J. Mass Spectrom. Ion Proc., 79 (1987) Rl[53] MARGREITER, D., DEUTSCH, H., MARK, T.D., Contr. Plasma Phys., 30 (1990)
487[54] MARGREITER, D., DEUTSCH, H., SCHMIDT, M., MARK, T.D., Int. J. Mass
Spectrom. Ion Proc., 100 (1990) 157[55] DEUTSCH, H., MARGREITER, D., MARK, T.D., Z.Phys., D 29 (1994) 31[56] DEUTSCH,H., CORNELISSEN, C, CESPIVA, L , BONACIC-KOUTECKY, V,
MARGREITER, D., MARK, T.D., Int. J. Mass Spectrom. Ion Proc., 129 (1993) 43[57] DEUTSCH, H., CESPIVA, L., BONACIC-KOUTECKY, V., Bonacic-Koutecky,
MARK, T.D., submitted for publication (1994)[58] THOMSON, J.J., Philos. Mag., 23 (1912) 449[59] GRYZINSKI, M.,Phys. Rev., A138 (1965) 305[60] BURGESS, A., In: Atomic Collision Processes (M.R.C. Me Dowell, Ed.) North
Holland, Amsterdam (1963) p. 237[61] VRIENS, L.,Phys. Rev., 141 (1966) 88[62] LOTZ, W., AstroPhys., Suppl. 14 (1967) 207; Z.Phys., 206 (1967) 205, 216 (1968)
241, 232 (1970) 101
254

[63] BELL,K.L., GILBODY, H.B., HUGHES, J.G., KINGSTON, A.E., SMITH, F.J.,J.Phys. Chem. Réf. Data, 12 (1983) 891
[64] BETHE, H. Bethe, Ann. Physik, 5 (1930) 325[65] OTVOS, J.W., STEVENSON, D.P., J.Am.Chem. Soc., 78 (1956) 546[66] MANN, J.B., J. Chem.Phys., 46 (1967) 1646[67] TIWARI, P., RAI, O.K., RUSTGI, M.L., J. Chem.Phys., 50 (1969) 3040[68] MARGREITER, D., DEUTSCH, H., MARK, Proc. Symp. Atomic Surface Physics
(SASP 94), Maria Alm, in print (1994). See also D. Margreiter, Thesis, UniversitätInnsbruck, 1988, 1993
[69] DEUTSCH, H., MARGREITER, D., MARK, T.D., Proc. 1st EPCLP (1991) p. 28-40
[70] LUYKEN, B.F.J., de HEER, F.J., BAAS, R.C., Physica, 61 (1972) 200[71] PEACH, G, J.Phys., B3 (1970) 328 and ibid. B4 (1971) 1670[72] OMIDVAR, K., KYLE, H.L., VTIth ICPEAC, Amsterdam, North Holland
(Amsterdam, 1971) p. 890873] VRIENS, L., Proc.Phys. Soc., 89 (1966) 13[74] McGUIRE, EJ.,Phys. Rev., A3 (1971) 267[75] DIJKAMP, D., de HEER, J.Phys., B14 (1981) 1327[76] HIPPLER, R, SAEED, K., McGREGOR, L, KLEINPOPPEN, J.Phys., A307 (1982)
83[77] TAWARA, H., HARRISON, K.G., De HEER, F.J., Physica, 63 (1973) 351[78] HIPPLER, R.H., JITSCHIN, W., Z.Phys., A307 (1982) 287[79] MOORES, D.L., GOLDEN, L.B., SAMSON, D.H., J.Phys., B13 (1980) 385[80] DEUTSCH, H., MARK, T.D., Contr. Plasma Phys., 34 (1994) 19[81] POWELL, C.J., Chapter 6 in Ref. 11[82] DEUTSCH, H., SCHMIDT, M., Beitr. Plasma Phys., 24 (1984) 475[83] DEUTSCH, H, SCHMIDT, M., Contr. Plasma Phys., 25 (1985) 475[84] DEUTSCH, H, MARGREITER, D., MARK, T.D., Int. J. Mass Spectrom. Ion
Proc., 93 (1989) 259 and references therein[85] JAIN, O.K., KHARE, S.P., J.Phys. B9 (1976) 1429; Ind. J. Pure Appl.Phys., 14
(1976) 201[86] KHARE, S.P., KUMAR, A, J.Phys., BIO (1977) 2239 and 11 (1978) 2403[87] KHARE, S.P., MEATH, W.J., J.Phys., B20 (1987) 2101[88] KHARE, S.P., PRAKASH, S., MEATH, W.J., Int. J. Mass Spectrom. Ion Proc., 88
(1989) 299[89] MARK, T.D., PlasmaPhys. Controlled Fusion, 34 (1992) 2083[90] BECKER, K., Proc. XVTflth ICPEAC, Aarhus (1993)[91] LABORE, P., ROCARD, J.M., REES, J.A., DELCROIX, J.L., CRAGGS, J.D.
Craggs, Electronic Cross Sections and Macroscopic Coefficients, Dunod, Paris (1968)
255

[92] De HEER, F.J.,Phys. Scripta, 23 (1981) 170[93] TAWARA, H., KATO, T., OHNÏSffl, M., Institute of Plasma Physics, IPPJ-AM-37,
Nagoya(1985)[94] TAWARA, H., KATO, T., Atomic Data Nucl. Data Tables, 36 (1987) 167[95] HAYASHI, M., In Swarm Studies and Inelastic Electron Molécule Collisions (L.C.
Pitchford, B. V. Me Koy, A. Chutjian and S. Trajmar, Eds.) Springer, New York(1987) 167-187
[96] LENNON, M.A., BELL, K.L., GILBODY, H.B., HUGHES, J.G., KINGSTON,A.E., MURRAY, M.J., SMITH, F.J., J.Phys. Chem. Réf. Data, 17 (1988) 1285
[97] SFflMAMURA, I., Scient. Papers Inst.Phys. Chem. Research, 82 (1989) 1[98] TAWARA, H., ITEKAWA, Y., NISHJMURA, H., YOSfflNO, M., J.Phys. Chem.
Réf. Data, 19 (1990) 617[99] TAWARA, H., ITIKAWA, Y., NISfflMURA, H., TANAKA, H., NAKAMURA,
Y., Atomic and Plasma-Material Interaction Data for Fusion, Vol. 2 (Suppl. J. Nucî.Fusion), 1992, p.41
[100] TAWARA, H., NTJFS-DATA, in print 1992/93[101] SMITH, P.T.,Phys. Rev., 36 (1930) 1293[102] ASUNDI, P.K., KUREPA, J. Electron. Contr., 15 (1963) 41[103] SCHRÄM, B.L., MOUSTAFA, H.R., SCHÜTTEN, J., de HEER, F.J., Physica, 32
(1966) 734[104] SCHRÄM, B.L., de HEER, F.l, Van der WIEL, M.J., KISTEMAKER, J., Physica,
31(1965)94[105] GAUDIN, A., HAGEMANN, R., J. Chim.Phys., 64 (1967) 1209[106] FLETCHER, J., COWLING, I.R., J.Phys., B6 (1973) L 258[107JKRISHNAKUMAR, E., SRIVASTAVA, S.K., J.Phys., B21 (1988) 1055[108] Me CLURE, G.W.,Phys. Rev., 90 (1953) 796[109] KUREPA, M.V., CADEZ, I.M., PEJCEV, V.M., Fizika, 6 (1974) 185[110] Me CALLION, P., SHAH, M.B., GILBODY, H.B., J.Phys., B25 (1992) 1061[111] RffiCKE, F.F., PREPEJCHAL, W.,Phys. Rev., A6 (1972) 1507[112] COWLING, I.R., FLETCHER, J., J.Phys., B6 (1973) 665[113] SCHRÄM, B.L., Van der WIEL, M.J.,DeHEER, F.J., MOUSTAFA, H.R., J.
Chem.Phys., 44 (1966) 49[114] CHATHAM, H., fflLS, D., ROBERTSON, R., GALLAGHER, A., J. Chem.Phys.,
81 (1984)1770[115] PERESSE, J., TUFFIN, F., Meth.Phys. Anal., 3 (1967)[116] KRISHNAKUMAR, E., SRIVASTAVA, S.K., Int. J. Mass Spectrom. Ion Proc., 113
(1992) 1[117] SCHÜTTEN, J., De HEER, F.J., MOUSTAFA, H.R., BOERBOOM, A.J.H.,
KISTEMAKER, J., J. Chem.Phys., 44 (1966) 3924
256

[118] BOLORIZADEH, M.A., RUDD, M.E.,Phys. Rev., A33 (1986) 822[119] GRILL, V., WALDER, G., MARGREITER, D., RAUTH, T., POLL, H.U.,
SCHEIER, P., MARK, T.D., Z.Phys., D25 (1993) 217[120] MARGREITER, D., WALDER, G., DEUTSCH, H., POLL, H.U., WINKLER, C,
STEPHAN, K., MARK, T.D., Int. J. Mass Spectrom. Ion Proc., 100 (1990) 143[121]DR£WITZ, HJ., Int. J. Mass Spectrom. Ion Phys., 19 (1976) 313[122] DREWITZ, HJ., Int. J. Mass Spectrom. Ion Phys., 21 (1976) 212[123] STEPHAN, K., HELM, H., MARK, T.D., J. Chem.Phys., 73 (1980) 3763[124] SYAGE, J.A., J.Phys., B24 (1991) L 527[125]BRUCE, M.R., BONHAM, R.A., Z.Phys., D24 (1992) 149[126] MARK, T.D., Chapter 5 in Ref. 11[127] MARK, T.D., In: The Physics of Ionized Gases (J. Puric, D. Belie, Eds.) World
Scientific, Singapure (1987) 145-160; IAEA-TECDOC - 506 (1989) 179-192[128] AUMAYR, F., MARK, T.D., WINTER, H., Int. J. Mass Spectrom. Ion Proc., 129
(1993)17[129] KARSTENSEN, F., KÖSTER, H., Astron. AstroPhys., 13 (1971) 116[130] SCHNEIDER, M., J.Phys., D7 (1974) L 83[131]KARSTENSEN, F., SCHNEIDER, M., Z. Phys., A273 (1975) 321, J.Phys. Bll
(1978) 167[132]DEFRANCE,P.,CLAEYS, W., CORNET, A., POULAERT, G, J.Phys., B14
(1981)111[133]DETTMANN, J.M., KARSTENSEN, F., J.Phys., BIS (1982) 287; WENDT, H.H.,
KARSTENSEN, F.,Phys. Rev., A29 (1984) 562[134] FREUND, R.S., WETZEL, R.C.,Phys. Rev., A41 (1990) 5861[135] TARNOVSKY, V., BECKER, K., DEUTSCH, H., MARK, T.D., Bull. Am.Phys.,
(1992) in print[136] ADAMS, N.G., SMITH, D., GRIEF, D., J.Phys., B12 (1979) 791[137] VARGA, P., HOFER, W., WINTER, H., J.Phys., B14 (1981) 1341[138] WIESEMANN, K., PUERTA, J., HUBER, B.A., J.Phys., B20 (1987) 58[139]KOSLOWSKI,H.R.,BINDER, J., HUBER, B.A., WIESEMANN, K., J.Phys., B20
(1987) 5903[140] GEFEN, S., LIFSHJTZ, C., Int. I Mass Spectrom. Ion Proc., 58 (1984) 251 and
references therein[141] ADAMCZYK, B., BOERBOOM, A.J.H., SCHRÄM, B.L., KISTEMAKER, J.
Chem.Phys., 44 (1966) 4640[142] SCHRÄM, B.L., ADAMCZYK, B., BOERBOOM, A.J.H., Rev. Sei. Instrum., 43
(1966)638[143] ADAMCZYK, B., BOERBOOM, A.J.H., LUKASIEWICZ, M., Int. J. Mass
Spectrom. Ion Phys., 9 (1972) 407
257

[144] BEDERSKI, K., WOJCIK, L., ADAMCZYK, B., Int. J. Mass Spectrom. Ion Phys.,35(1980)171
[145] STANSKI, T., ADAMCZYK, B., Int. J. Mass Spectrom. Ion Phys., 46 (1983) 3 i[146] ADAMCZYK, B., BEDERSKI, K., WOJCIK, L., Biomed. Environm. Mass
Spectrom., 16(1988)415[147] MICHALAK,L., ADAMCZYK, B, MARCINKOWSKA, E., Int. Mass Spectrom.
Ion Proc., 107(1991)9[148]HAALAND, P., Chem.Phys. Lett., 170 (1990) 146[149]NAGY, N., SKUTLARTZ, P., SCHMIDT, V., J.Phys., B13 (1980) 1241[150] CROWE, A., Me CONKEY, J.W., Int. J. Mass Spectrom. Ion Phys., 24 (1977) 181
and references therein[151] SHAH, M.B., ELLIOTT, D.S., GILBODY, H.B., J.Phys., B20 (1987) 3501[152]SHAH,M.A.,EILLIOTT, D.S., Me CALLION, P., GILBODY, H.B., J.Phys., B21
(1988)2751[153] Me CALLION, P., SHAH, M.B., GILBODY, H.B., J.Phys., B25 (1992) 1051[154] EDWARDS, A.K., WOOD, R.M., BEARD, A.S.,EZELL, R.L.,Phys Rev, A37
(1988) 3687[155] SYAGE, J.A., Chem.Phys. Lett., 143 (1988) 19[156] SYAGE, J.A.,Phys. Rev., A46 (1992) 5666[i57] WANG, O.P., LEE, L.C., SRIVASTAVA, S.K., Chem.Phys. Lett., 152 (1988) 513[158] KRISHNAKUMAR, E., Int. J. Mass Spectrom. Ion Proc., 97 (1990) 283[159JKRISHNAKUMAR, E., SRTVASTAVA, S.K., J.Phys., B23 (1990) 1893[160]HAYDEN, C.C., PENN, S.M., CARLSON MUYSKENS, K.J., CRIM, F.F., Rev.
Sei. Instr.,61(1990)775[161] MA, C., SPORLEDER, C.R., BONHAM, R.A., Rev. Sei. Instr., 62 (1991) 909[162] MA, C., BRUCE, M.R., BONHAM, R.A.,Phys. Rev., A44 (1991) 2921[163] BONHAM, R.A., BRUCE, M.R., Astr. J.Phys., 45 (1992)[164]MA, C., BRUCE, M.R., BONHAM, R.A.,Phys. Rev., A45 (1992) 6932[165] BRUCE, M. R, MA, C., BONHAM, R.A., Chem.Phys. Lett., 190 (1992) 285[166] SPEKOWIUS, G., BREHM, B., Chem.Phys. Lett., 187 (1991) 442[167] STEPHAN, K., HELM, H., MARK, T.D., Adv. Mass Spectrom., 8A (1980) 122[168] MARK, T.D., CASTLEMAN, A.W., J.Phys., E13 (1980) 1121[169] STEPHAN, K., HELM, H., KIM, Y.B., SEJKORA, G., RAMLER, J., GRÖSSL,
M., MARK, E., MARK, T.D., J. Chem.Phys., 73 (1980) 303[170] MARK, T.D., MARK, E., STEPHAN, K., J. Chem.Phys., 74 (1981) 3633[171]KIM, Y.B., STEPHAN, K., MARK, E., MARK, T.D., J. Chem.Phys., 74 (1981)
6771[l72] MARK, E., MARK, T.D., KJM, Y.B., STEPHAN, K., J. Chem.Phys., 75 (1981)
4446
258

[173] STEPHAN, K., MARK, T.D., J. Chem.Phys., 81 (1984) 3116[174] LEITER, K., STEPHAN, K., MARK, E., MARK, T.D., Plasma Chem. Plasma
Proc.,4(1984)235[175] STEPHAN, K., DEUTSCH, H., MARK, T.D., J. Chem.Phys., 83 (1985) 5712[176] SEEFELDT, R., MÖLLER, W., SCHMIDT, M., Z.Phys. Chemie Leipzig, 226
(1985)4[177]GOROKHOV,L.N.,KHANDAMIROVA, N.E., Proc. 10th Int. Mass Spectrom.
Conf., Swansea (1985)[178] LEITER, K., SCHEŒR, P., WALDER, G., MARK, T.D., Int. J. Mass Spectrom.
Ion Proc., 87 (1989) 209[l79] POLL, H.U., WINKLER, C., MARGREITER, D., GRILL, V., MARK, T.D., Int. J.
Mass Spectrom. Ion Proc., 112 (1992) l[l 80] GRILL, V., WALDER, G, SCHEUER, P., KURDEL, M., MARK, T.D., Int. J.
Mass Spectrom. Ion Proc., 129 (1993) 31[181] SEN SHARMA, O.K., FRANKLIN, J.L., Int. J. Mass Spectrom. Ion Phys., 13 (1974)
139[182] SMITH, O.I., STEVENSON, J.S., J. Chem.Phys., 74 (1981) 6777; SMITH, O.I., Int.
J. Mass Spectrom. Ion Proc., 54 (1983) 55[183] SIEGEL, M.W., Int. J. Mass Spectrom. Ion Phys., 44 (1982) 19[184] WIEGANG, M.J., BOEDECKER, L.R., Appl.Phys. Lett., 40 (1982) 225[185] ORIENT, O.J., SRIVASTAVA, S.K., J. Chem.Phys., 78 (1983) 2949; J. Chem.Phys.,
80 (1984) 140; J.Phys., B20 (1987) 3923[186]MONNOM,G.,GAUCHEREL, P., PAPARODITIS, C., J. Physique, 45 (1984) 77[187] MATHUR, D., BADRINATHAN, D., Int. J. Mass Spectrom. Ion Proc., 57 (1984)
167 and 68 (1986) 9; Phys. Rev., A35 (1987) 1033[188]ARMENANTE,M.,CESARO, R., SANTORO, V., SPINELLI, N., VANOLI, F.,
DelRE, G, PELUSO, A. FILIPPI, S ,Int. J. Mass Spectrom. Ion Proc., 87 (1989) 41and references therein
[189] LEVSEN, K., Fundamental Aspects of Organic Mass Spectrometry, Verlag Chemie,Weinheim (1978)
[190]BLEAKNEY, W., CONDON, E.U., SMITH, L.G., J.Phys., Chem., 41 (1937) 197[191] CROWE, A., MC CONKEY, J.W., J.Phys., B6 (1973) 2108[l92] BROWNING, R., FRYAR, J., J.Phys., B6 (1973) 364[193] ROSENSTOCK, H.M., WALLENSTEIN, M.B., WAHRHAFTIG, A.L., EYRING,
H., Proc. Natl.Acad. Sei., 38 (1952) 667[l94] FORST, W., Theory of Unimolecular Reactions, Academic Press, New York (1973)[195] VESTAL, M.L., J. Chem.Phys., 43 (1965) 1356[196] DIXON, A.J., HARRISON, M.F.A., SMITH, A.C.H., Proc. 8th ICPEAC, Beograd
(1973) p. 405
259

[197] TON-THAT, D., FLANNERY, M.R.,Phys. Rev., A15 (1977) 517[198] Me GUIRE, E.J.,Phys. Rev., A20 (1979) 445[199] SCHRÄM, B.L., BOERBOOM, A.J.H., KISTEMAKER, J., Physica, 32 (1966) 185[200] SCHRÄM, B.L., Physica, 32 (1966) 197[201] RAPP, P., ENGLANDER-GOLDEN, P., BRIGLIA, P.B., J. Chem.Phys., 42 (1965)
4081[202] MARK, T.D., J. Chem.Phys., 63 (1975) 3731[203]EVANS,B.,CHANG, IS., VAN, A.W., N1CHOLLS, R.W., HOBSON,
R.M.,Phys. Rev., A38 (1988) 2782[204] MARK, T.D., EGGER, F., Int. J. Mass Spectrom. Ion Phys., 20 (1976) 89[205] CROWE, A., Me CONKEY, W.J., J.Phys., B7 (1974) 349[206] MARK, T.D., HILLE, E., J. Chem.Phys., 69 (1978) 2492[207] JACKSON, W.M., BRACKMANN, R.T., FITE, W.L., Int. J. Mass Spectrom. Ion
Phys., 13(1974)237[208] HENKES, W., MDCOSCH, F., Int. J. Mass Spectrom. Ion Phys., 13 (1974) 151[209] HAGENA, O.F., HENKES, W., Z Naturforschg., 20a (1965) 1344[210]BOTTIGLIONI, F., COUTANT, J., FOIS, M., Phys. Rev., A6 (1972) 1830[211] KEESEE, R.G., CASTLEMAN, A.W., Jr., MARK, T.D., In: Swarm Studies and
Inelastic Electron Molecule Collisions (L.C. Pitchford, B.V. Me Koy, A. Chutjian andS. Trajmar, Eds.) Springer, New York (1987) 351-366
[212] LEZIUS, M., MARK, T.D., Chem.Phys. Lett., 155 (1989) 496[213] GOUGH, T.E., MILLER, R.E., Chem.Phys. Lett., 87 (1982) 280; GERAEDTS, J.,
STOLTE, S., REUSS, J., Z.Phys., A304 (1982) 167[214] BUCK, U., J.Phys. Chem., 92 (1988) 1023[215] MARK, T.D., ECHT, O., In: Clusters of Atoms and Molecules, Vol. 2 (H.
Haberland, Ed.), Springer, Heidelberg (1994) in print[216] HELM, H., STEPHAN, K., MARK, T.D.,Phys. Rev., A19 (1980) 2154[217] BUCK, U., MEYER, H., J. Chem.Phys., 84 (1986) 4854[218] SHIMAMORI, H., Electron attachment, in: CRC Handbook of Radiation Chemistry,
eds. Y. Tabata, Y. Ito and S. Tagawa (CRC, Boca Raton, 1991)[219] HATANO, Y., Electron attachment to van der Waals molecules, in: Electronic and
Atomic Collisions, eds. D.C. Lorentz, W. E. Meyerhof, and J.R. Peterson (Elsevier,1986), p. 153
[220] COMPTON, R.N., Negative-ion states, in: Photophysics and Photochemistry in theVacuum Ultraviolet, eds. S.P. McGlynn, G.L. Findley and R.H., Huebner (D. ReidelPubl. Co., 1985) p. 261]
[221] CHRISTOPHOROU, L.G., Me CORKLE, D.L., CHRISTODOULIDES, A.A.,Electron attachment processes, in: Electron-Molecule Interactions and TheirApplications, Vol. 1, ed. L.G. Christophorou (Academic Press, 1984) p. 477
260

[222] HATANO, Y., SHIMAMORI, H., Electron attachment in dense gases, in: Electronand Ion Swarms, ed. L.G. Christophorou (Pergamon Press, 1981) p. 103
[223] COMPTON, R.N., Electron attachment to molecules, in: Electronic and AtomicCollisions, eds. N. Oda and K. Takayanagi (North-Holland, 1980) p. 251
[224] MASSEY, H.S.W., Negative Ions (Cambridge Univ. Press, 1976).[225] CALEDONIA, G.E., Chem. Rev., 75 (1975) 333[226] SCHULZ, G.J., Revs. Mod.Phys., 45 (1973) 423[227] CHRISTOPHOROU, L.G., Atomic and Molecular Radiation Physics (Wiley
Interscience, 1971)[228] COMPTON, R.N., HUEBNER, R.H., Adv. Radiât. Chem., 2 (1970) 281[229] BARDSLEY, J.N., HANDL, F., Rept. Prog.Phys., 31 (1968) 471[230] CHUTJIAN, A., ALAJAJIAN, S.H., Phys. Rev., A31 (1985) 2885[231] FIELD, D., ZIESEL, J.P., GUYON, P.M., COVERS, T.R., J.Phys., B17 (1984)
4565[232] MATSUZAWA, M., Theory of thermal collisions between high-Rydberg atoms and
neutral species, in: Electronic and Atomic Collisions, eds, N. Oda and K. Takayanagi(North-Holland, 1980), p. 493
[233] KONDOW, T., Negative ion formation by collision of Rydberg atoms with clusters,in: Electron and Atomic Collisions, eds. D.C. Lorentz, W.E. Meyerhof, and J.R.Peterson (Elsevier, 1986), p. 153
[234] LACMANN, K., Adv. Chem.Phys., 42 (1980) 513[235]QUITEVIS,E.L.,BOWEN, K.H., LIESEGANG, G.W., HERSCHBACH, DR.,
J.Phys. Chem., 87 (1983) 2076[236] MARK, T.D., LEITER, K., RITTER, W., STAMATOVIC, A., Phys. Rev. Lett., 55
(1985)2559[237] STAMATOVIC, A., Electron attachment to van der Waals clusters: The zero energy
resonance, in: Electronic and Atomic Collisions, eds., H.B. Gilbody, W.R. Newell,F.H. Read and A.C.H. Smnith (North-Holland, 1988) p. 729
[238] SHIMAMORI, H., HOTTA, H., J. Chem.Phys., 78 (1983) 1381[239] SHIMAMORI, H., HOTTA, H., J. Chem.Phys., 81 (19884) 1271[240]rrntAWA,Y.,ICHIMURA, A,, ONDA, K., SAKIMOTO, K., TAKAYANAGI,
K., HATANO, Y.,HAYASffl, M., NISHJMURA, H., TSURUBUCffl, S., J.Phys.,Chem. Ref. Data, 18 (1989) 23
[241] De HEER, F.J., Int. J. Radiat.Phys. Chem., 7 (1975) 137[242] De HEER, F.J., Van SPANG, H.A., J. chim.Phys., 77 (1980) 773[243] HATANO, Y., Comments At. Mol.Phys., 13 (1983) 259[244] VROOM, D.A., De HEER, F.J., J. Chem.Phys., 50 (1969) 580[245] VROOM, D.A., De HEER, F.J., J. Chem.Phys., 50 (1969) 573[246] VROOM, D.A., De HEER, F.J., J. Chem.Phys., 50 (1969) 1883
261

[247] De HEER, MOUSTAFA MOUSSA, H.R., INOKUTI, M., Chem.Phys. Lett., 1(1967) 484
[248]BEENAKER, d.M., De HEER, F.J., Chem.Phys., 7 (1975) 130[249] MITCHELL, A.C.G., ZEMANSKY, M.W., "Résonance Radiation and Excited
Atoms", Cambridge Univ. Press, London (1961)[250] KOUCffl, N., OHNO, M., ITO, K., ODA, N., HATANO, Y., Chem.Phys., 67 (1982)
287[251] WINTERS, H., J, Chem.Phys., 63 (1975) 3462[252]NAKANO, T., TOYODA, H., SUGAI, H., Jpn. J. Appl.Phys., 30 (1991), in press[253] COMER, J., HARRISON, M., J.Phys., B6 (1973) L70[254] WONG, S.F., DUB'E, L., Phys. Rev., A 17 (1978) 570[255] TANAKA, H., BOESTEN, L., SfflMAMURA, L, Proc. 7th ICAP, Cambrigde/
Massachusetts (1980) p.43[256] TANAKA, H., ONODERA, N., BOESTEN, L., Proc. 13th ICPEAC, Berlin (1983)
p.245[257] JUNG, K., ANTONI, T., MÜLLER, R., KOCHEM, K.H., EHRHARDT, H., J.Phys.,
B 15(1982)3535[258] MÜLLER, R., JUNG, K., KOCHEM, K.H., SOHN, W., EHRHARDT, H., J.Phys.,
B 18 (1985)3971[259] ANTONI, T., JUNG, K., EHRHARDT, H., CHANG, E.S., J.Phys., B 19 (1986) 1377[260] BURROW, P.D., J. Chem.Phys., 59 (1973) 4922[261] HALL, R.I., TRAJMAR, S., J.Phys., B 8 (1975) L 293[262] BELIC, D.S., HALL, RI., J.Phys., B 14 (1981) 365[263]KHAKOO, M.A., NEWELL, W.R., SMITH, A.C.H., J.Phys., B 16 (1983) L 317[264] BÖTTCHER, C., BUCKLEY, B.D., J.Phys., B 12 (1979) L 497[265] CHRISTOPHOROU, L.G., Invited papers 20th ICPIG, Pisa/Italy (1991) p.3[266] ALLAN, M., WONG, S.F., Phys. Rev. Lett., 41 (1978) 1791[267] WADEHRA, J.M., BARDSLEY, J.N., Phys. Rev. Lett., 41 (1978) 1795[268] BARDSLEY, J.N., WADEHRA, J.M., Phys. Rev., A 20 (1979) 1398[269] WADEHRA, J.M., Phys. Rev., A 29 (1984) 106[270]GAUYACQ, J.P., J.Phys., B 18 (1985) 1859[271] MÜNDEL, C., BERMAN, M., DOMCKE, W., Phys. Rev., A 32 (1985) 181[272] HALL, R.I., CADEZ, L, LANDAU, M., PICHOU, F., SCHERMANN C., Phys. Rev.
Lett., 60 (1988) 337[273] CADEZ, L, HALL, R.I., LANDAU, M., PICHOU, F., SCHERMANN, C., J.Phys., B
21(1988)3271[274] fflCKMAN, A.P., Phys. Rev., A 43 (1991) 3495[275] CELIBERTO, R., CACCIATORE, M , CAPITELLI, M., GORSE, C., Chem.Phys ,
133(1989)355
262

[276] CELIBERTO, M., CACCIATORE, M., CAPJTELLI, M., Chem.Phys., 133 (1989)369
[277] CELIBERTO, R., CAPITELLI, M., CACCIATORE, M., Chem.Phys., 140 (1990)209
[278]HISKES, J.R., J. AppLPhys., 70 (1991) 3409[279] CELIBERTO, R., RESCIGNO, T.N., Phys. Rev., A47 (1993) 1939[280] CELIBERTO, R., Proc. 18th ICPEAC, Aarhus/Denmark (1993) p. 341[281] BURROW, P.D., DAVIDOVITS, Phys. Rev. Lett., 21 (1968) 1789[282] WHITE, M.D., ROSS, K.J., LEWIS, E.W., JONATHAN, N.B.H., J.Phys., B9 (1976)
1035[283] WHITE M.D., ROSS, K.J., J.Phys., B9 (1976) 2147[284] HUETZ, A, GRESTEAU, F., HALL, R.I., MAZEAU, J., J. Chem.Phys., 72 (1980)
5297[285] HADDAD, G.N., ELFORD, M.T., J.Phys., B12 (1979) L 743[286]BUCKMAN, S.J., ELFORD, M.T., NEWMAN, D.S., J.Phys., B20 (1987) 5175[287] FERCH, J., MASCHE, C., RAITH, W., WIEMANN, L., Phys. Rev., A40 (1989)
5407[288] SRIVASTAVA, S.K., ORIENT. O.J., Phys Rev., A27 (1983) 1209[289] JOHNSTONE, W.M., MASON, N.J., NEWELL, W.R., J.Phys., B26 (1993) L 147[290] JOHNSTONE, W.M., AKTHER, P., MASON, N.J., NEWELL, W.R., Proc. 18th
ICPEAC, Aarhus/Denmark (1993) p. 302[291] SHIMAMURA, I., Chem.Phys. Lett., 73 (1980) 328[292] SfflMAMURA, I., in "Electron-Molecule Collisions" (eds. I. Shimamura and K.
Takayanagi), Plenum, New York (1984) 89-190[293] SRIVASTAVA, S.K., CHUTJIAN, A., TRAJMAR, S., J. Chem.Phys., 63 (1975)
2659[294] BRINKMANN, R.T., TRAJMAR, S., J.Phys., E14 (1981) 245[295] TRAJMAR, S„, REGISTER, D.F. in "Electron-Molecule Collisions" (eds. I.
Shimamura and K. Takayanagi), Plenum, New York (1984) 427-494[296] NICKEL, J.C., ZETNER, P.W., SHEN, G., TRAJMAR, S., J.Phys., E22 (1989) 730[297] HUXLEY, L.G.H., CROMPTON, R.W., "The Diffusion and Drift of Electrons in
Gases", Wiley, New York (1974)[298] HUNTER, S.R., CHRISTOPHOROU, L.G. in "Electron-Molecule Interactions and
their Applications", Vol. 2 (ed. L.G. Christophorou), Academic Press, New York(1984)89-220
[299] PITCHFORD, L.C., McKOY, B.V., CHUTJIAN, A., TRAJMAR, S. (eds), "SwarmStudies and Inelastic Electron-Molecule Collisions", Springer, New York (1987)
[300] CROMPTON, R.W., HAYASHI, M., BOYD, D.E., MAKABE, T. (eds), "GaseousElectronics and its Applications", KTK Scientific Publishers, Tokyo (1991)
263

[301] HAYASHI, M., "Electron Collision Cross Sections for Molecules Determined fromBeam and Swarm Data", in reference [299], p. 167-187
[302] HAYASHI, M., "Electron Collision Cross Sections of Atoms and Molecules", inreference [300], p. 9-33
[303] MASSEY, H.S.W., BURHOP, E.H.S., GILBODY, H.B. (eds), "Electronic and IonicImpact Phenomena", Vol. I-V, Clarendon Press, Oxford (1969-1974)
[304] MASSEY, H.S.W., McDANIEL, E.W., BEDERSON, B. (eds.), "Applied AtomicCollision Physics", Vol. 1-5, Academic Press, New York (1982-1984)
[305] CHRISTOPHOROU, L.G. (ed.), "Electron-Molecule Interactions and theirApplications", Vol. 1-2, Academic Press, New York (1984)
[306] SfflMAMURA, I., TAKAYANAGI, K. (eds), "Electron-Molecule Collisions",Plenum Press, New York (1984)
[307] McDANIEL, E.W., "Atomic Collisions: Electron and Photon Projectiles", Wiley, NewYork (1989)
[308] McDANIEL, E.W., MITCHELL, J.B.A., RUDD, M.E., "Atomic Collisions: HeavyParticle Projectiles", Wiley, New York (1993)
[309] SCHULZ, G.J., Revs. Mod.Phys., 45 (1973) 378[310] SCHULZ, G.J., in "Electron-Molecule Scattering" (ed. S.C. Brown), Wiley, New
York (1979)1[311] BRANSDEN, B.H., McDOWELL, M.R.C., Phys. Rep., 46 (1978) 249[312] HAYASHI, M., "Recommended Values of Transport Cross Sections for Elastic
Collisions and Total Collision Cross Sections for Electrons in Atomic and MolecularGases", Rep. IPPJ-AM-19, Institute of Plasma Physics, Nagoya University, Nagoya(1981)
[313] TRAJMAR, S., REGISTER, D.F., CHUTJIAN, A, Phys. Rep., 97 (1983) 219[314] GALLAGHER, J.W., BEATY, EC., DUTTON, J., PITCHFORD, L.C., J Phys.
Chem. Réf. Data, 12 (1983) 109[315] FABRIKANT, I.I., SHPENIK, O.B., SNEGURSKY, AV., ZAVILOPULO, A.N.,
Phys. Rep., 159 (1988) 1[316] HEDDLE, D.W.O., GALLAGHER, J.W., Revs. Mod.Phys., 61 (1989) 221[317] VAN DER BÜRGT, P.J.M., WESTERVELD, W.B., RISLEY, J S., J.Phys. Chem
Ref. Data, 18 (1989) 1757[318] SfflMAMURA, I., Scientific Papers of the Institute of Physical and Chemical
Research, Vol. 82, p. 1-51, Saitama/Japan (1989)[319] ALLAN, M., J. Electron Spectrosc. Relat. Phenom., 48 (1989) 219[320]KAUPPILA, W.E., STEIN, T.S., Adv. At. Mol. Opt.Phys., 26 (1990) 1[321] TAKAYANAGI, K., ITKAWA, Y., Adv. At. Mol.Phys., 6 (1970) 105[322] GOLDEN, D.E., LANE, N.F., TEMKIN, A, GERJUOY, E., Revs. Mod.Phys., 43
(1971)642
264

[323] GARRETT, W.R., Mol.Phys., 24 (1972) 465[324] ITIKAWA, Y., Phys. Rep., 46 (1978) 117[325] BURKE, P.G., Adv. At. Mol.Phys., 15 (1979) 471[326] LANE, N.F., Revs. Mod.Phys., 52 (1980) 29[327]NORCROSS, D.W., COLLINS, L.A., Adv. At. Mol.Phys., 18 (1982) 341[328] MORRISON, M.A., Austr. J.Phys., 36 (1983) 239[329] THOMPSON, D.G., Adv. At. Mol.Phys., 19 (1983) 309[330] KAZANSKII, A.K., FABRIKANT, I.I., Sov.Phys. Usp., 27 (1984) 607[331] GIANTURCO, F.A., JAIN, A., Phys. Rep., 143 (1986) 347[332] MORRISON, M.A., Adv. At. Mol.Phys., 24 (1988) 51[333] KEVIURA, M., SATO, H., Comments At. Mol.Phys., 26 (1991) 333[334] DOMCKE, W., Phys. Rep., 208 (1991) 97[335] EICHLER, J., HERTEL, I.V., STOLTERFOHT, N. (eds), "Electronic and Atomic
Collisions" (Proc. 13th ICPEAC, Berlin 1983), North Holland, Amsterdam (1984)[336] LORENTS, D.C., MEYERHOF, W.E., PETERSON, J.R. (eds.), "Electronic and
Atomic Collisions" (Proc. 14th ICPEAC, Palo Alto/USA 1985), North Holland,Amsterdam (1986)
[337] GILBODY, H.B., NEWELL, W.R., READ, F.H., SMITH, A.C.H., (eds.), "Electronicand Atomic Collisions" (Proc. 15th ICPEAC, Brighton/UK 1987), North Holland,Amsterdam (1988)
[338] DALGARNO, A., FREUND, R.S., KOCH, P.M., LUBELL, M.S., LUCCATORTO,T.B., (eds.). "The Physics of Electronic and Atomic Collisions" (Proc. 16th ICPEAC,New York 1989), American Institute of Physics, New York (1990)
[339] MacGnxrVRAY, W.R., McCARTHY, I.E., STANDAGE, M.C. (eds.), "Electronicand Atomic Collisions" (Proc. 17th ICPEAC, Brisbane /Australia 1991), Adam Hilger,Bristol/UK (1992)
[340] ANDERSEN, T., FASTRUP, B., FOLKMANN, F., KNUDSEN, H. (eds.), "ThePhysics of Electronic and Atomic Collisions" (Proc. 18th ICPEAC, Aarhus/Denmark1993), American Institute of Physics, New York (1993)
[341] KAUPPILA, W.E., STEIN, T.S., JESION, G., DABABNEH, M.S., POL, V,Rev.Sei. Instrum., 48 (1977) 822
[342] STEIN, T.S., KAUPPILA, W.E., POL, V., SMART J.H., JESION, G., Phys. Rev.,A17 (1978) 1600
[343] KAUPPILA, W.E., STEIN, T.S., SMART, J.H., DABABNEH, M.S., HO, Y.K.,DOWNING, J.P., POL, V., Phys. Rev., A24 (1981) 725
[344]CHARLTON, M., GRIFFITH, T.C., HEYLAND, GR., TWOMEY, T.R., J.Phys.,B13 (1980) L 239
[345] CHARLTON, M., LARICCHJA, G., GRIFFITH, T.C., WRIGTH, G.L., HEYLAND,G.R., J.Phys., B17 (1984) 4945
265

[346] DeHEER, F.J., JANSEN, R.H.J., van der KAAY, W., J.Phys., B12 (1979) 979[347] WAGENAAR, R.W., de HEER, F.J., J.Phys., B13 (1980) 3855[348] WAGENAAR, R.W., de HEER, F.J., J.Phys., B18 (1985) 2021[349] NICKEL, J.C., IMRE, K., REGISTER, D.F., TRAJMAR, S., J.Phys., B18 (1985)
125[350] FERCH, J., GRANITZA, B., MASCHE, C, RAITH, W., J.Phys., B18 (1985) 967[351]BUCKMAN S.J., LOHMANN, B., J.Phys., B19 (1986) 2547[352] BUCKMAJSI, S.J., (1989), cited in reference [356][353] ZECCA, A., OSS, S., KARWASZ, G., GRISENTI, R., BRUSA, R.S., J.Phys., B20
(1987)5157[354] SUBRAMANIAN, K.P., KUMAR, V., J.Phys., B20 (1987) 5505[355]NISfflMURA, H., YANO, K., J.Phys. Soc. Japan, 57 (1988) 1951[356]BUCKMAN, S.J., MITROY, J., J.Phys., B22 (1989) 1365[357] BROMBERG, J.P., J. Chem.Phys.,61 (1974) 963[358] LEWIS, B.R., FURNESS, J.B., TEUBNER, P.J.O., WEIGOLD, E., J.Phys., B7
(1974)1083[359] LEWIS, B.R., MCCARTHY, I.E., TEUBNER, P.J.O., WEIGOLD, E., J.Phys., B7
(1974)2549[360] GUPTA, S.C., REES, JA., J.Phys., B8 (1975) 417[361] GUPTA, S.C., REES, J.A., J.Phys., B8 (1975) 1267[362] WILLIAMS, J.F., WILLIS, B.A., J.Phys., B8 (1975) 1670[363] WILLIAMS, J.F., CROWE, A., J.Phys., B8 (1975) 2233[364]DuBOIS, R.D., RUDD, M.E., J.Phys., B8 (1975) 1474[365] JANSEN, R.H.J., de HEER, F.J., LUYKEN, HJ., van WTNGERDEN, B.,
BLAAUW, HJ., J.Phys., B9 (1976) 185[366] VUSKOVIC, L., KUREPA, M.V., J.Phys., B9 (1976) 837[367]DuBOIS, R.D., RUDD, M.E., J.Phys., B9 (1976) 2657[368] WILLIAMS, J.F., J.Phys., B12 (1979) 265[369] SRIVASTAVA, S.K., TANAKA, H., CHUTJIAN, A., TRAJMAR, S., Phys. Rev.,
A23 (1981)2156[370] BREWER, D.F.C., NEWELL, W.R., HARPER, S.F.W., SMITH, A.C.H., J.Phys.,
B14(1981)L749[371] QING, Z , BEERLAGE, M.J.M., van der WIEL, M.J., Physica, 113C (1982) 225[372] REGISTER, D.F., TRAJMAR, S., Phys. Rev., A29 (1984) 1785[373] WAGENAAR, R.W., de BOER, A., van TUBERGEN, T., LOS, J., de HEER, F. J.,
J.Phys., 819(1986)3121[374] WEYHRETER, M., BARZICK, B., MANN, A., LINDER, F., Z.Phys., D7 (1988)
333[375] FÜRST, J.E., GOLDEN, D.E., MAHGEREFTEH, M., ZHOU, J., MUELLER, D.,
Phys. Rev., A40 (1989) 5592
266

[376] SHI, X , BURROW, P D , J Phys , B25, (1992) 4273[377] BYRON, F W , JOACHAIN, C J , Phys Rev , A15 (1977) 128[378] MCCARTHY, i E , NOBLE, c J, PHILLIPS, B A , TURNBULL, A D , Phys Rev,
A15 (1977) 2173[379] JHANWAR, B L , KHARE, S P , KUMAR, A, J Phys , Bll (1978) 887[380] FÖN, W C , BERRINGTON, K A, J Phys , B14 (1981) 323[381] TffiRUMALAI, D , TRUHLAR, D G, Phys Rev , A25 (1982) 3058, Phys Rev,
A26( 1982) 793[382] FÖN, W C , BERRINGTON, K A, BURKE, P G , HTßBERT, A, J Phys , B16
(1983) 307[383] McEACHRAN, R P , STAUFFER, A D , J Phys , B16 (1983) 4023[384] McEACHRAN, R P , STAUFFER, A D , Phys Lett, 107A (1985) 397[385] DASGUPTA, A, BHATIA, A K, Phys Rev, A30 (1984) 1241[386] BELL, K L , SCOTT, N S ,LENNON, M A, J Phys , B17 (1984) 4757[387] KEMPER, F, ROSICKY, F , FEDER, R , J Phys , B17 (1984) 3763, J Phys , B18
(1985) 1223[388] HABERLAND, R, PRITSCHE, L , NOFFKE, J ,Phys Rev, A33 (1986) 2305[389] NAKANISHLH, SCHRADER, D M, Phys Rev, A34 (1986) 1823[390] SIENKIEWICZ, J E , BAYLIS, W E , J Phys, B20 (1987) 5145[391] BARTSCHAT, K, McEACHRAN, R P , STAUFFER, AD , J Phys , B21 (1988)
2789[392] YUAN, J , J Phys , B21 (1988) 3753[393] PLENOEWICZ, B , PLENKIEWICZ, P , JAY-GERIN, J P , Phys Rev , A38 (1988)
4460[394] KARIM, K R, JAIN, A , Physica Scripta, 39 (1989) 238[395] SAHA, H P , Phys Rev , A39 (1989) 5048[396] BARTSCHAT, K, McEACHRAN, R P , STAUFFER, A D , J Phys , B23 (1990)
2349[397] SAHA, H P , Phys Rev Lett , 65 (1990) 2003[398] NAHAR, S N, WADEHRA, J M, Phys Rev, A 43 (1991) 1275[399] SAHA, H P , Phys Rev , A43 (1991) 4712[400] fflRA, W, FRIEDRICH, H, Phys Rev, A45 (1992) 5278[401] FRONGILLO, Y, PLENOEWICZ, B , PLENKTEWICZ, P , JAY-GERIN, IP , Can
J Phys, 70 (1992) 305[402] SAHA, H P , Phys Rev, A 47 (1993) 273[403] GIANTURCO, F A, RODRIGUEZ-RUIZ, J A, Phys Rev , A47 (1993) 1075[404] STAUFFER, A D , DIAS, T H V T , CONDE, C A N , Nucl Instr and Meth , A242
(1986)327[405] REGISTER, D F , TRAJMAR, S , STEFFENSEN, G, CARTWRIGHT, D C , Phys
Rev, A29(l984) 1793
267

[406]ZAVILOPULO, A.N., SNEGURSKJI, A.V., SHPENIK, O.B., J Appl. Spectrosc., 42(1985) 125
[407] TEUBNER, P.J.O, RILEY, J.L., TONKIN, M.C., FÜRST, I.E., BUCKMAN, S.J.,J.Phys., B18 (1985) 3641
[408] MASON, N.J., NEWELL, W.R., J.Phys., B20 (1987) 1357[409] TACHEBANA, K., PHELPS, A. V., Phys. Rev., A36 (1987) 999[410] PHILLIPS, M.H., ANDERSON, L.W., LIN, C.C., Phys. Rev., A32 (1985) 2117[411] CHUTJIAN, A., CARTWRIGHT, D.C., Phys. Rev., A23 (1981) 2178[412] EGGARTER, E , J. Chem.Phys., 62 (1975) 833[413] BUCKMAN. S.J., HAMMOND, P., KING, G.C., READ, F.H., J.Phys., B16 (1983)
4219[414] BRETAGNE, J., CALLEDE, G., LEGENTJL, M., PUECH, V., J.Phys., D19 (1986)
761[415JMITYUREVA, A.A., SMIRNOV, V.V., Opt. Spectrosc., 61 (1986) 413[416]MITYUREVA, A.A., PENKTN, N.P., SMIRNOV, V.V., Proc. 15th ICPEAC,
Brighton/UK (1987) p. 189[417] FORAND, J.L, WANG, S., WOOLSEY, J.M., McCONKEY, J.W., Can J.Phys., 66
(1988) 349[418] LI, G.P., TAKAYANAGI, T., WAKIYA, K., SUZUKI, H., AJIRO, T., YAGI, S.,
KANO, S.S., TAKUMA, H., Phys. Rev., A38 (1988) 1240[419] AJELLO, J.M., JAMES, G.K., FRANKLIN, B., HOWELL, S., J.Phys., B23 (1990)
4355[420] ZUO, T., McEACHRAN, R.P., STAUFFER, A.D., J.Phys., B25 (1992) 3393[421] BLANCO, F., SANCHEZ, J.A., CAMPOS, J., J Phys., B25 (1992) 3531[422] TACJÜBANA, K., Phys. Rev., A34 (1986) 1007[423] FERREIRA, C.M., LOUREIRO, J., J.Phys., D16 (1983) 1611[424] PUECH, V., TORCHJN, L., J.Phys., D19 (1986) 2309[425] VLCEK, J., J.Phys., D22 (1989) 623[426] VLCEK, J., PELIKAN, V., J.Phys., D22 (1989) 632[427] CELOTTA, R., BROWN, H., MOLOF, R., BEDERSON, B., Phys. Rev., A3 (1971)
1622[428] MITYUREVA, A.A., PENKTN, N.P., Opt. Spectrosc., 38 (1975) 229[429] WILSON, W.G., WILLIAMS, W.L., J.Phys., B9 (1976) 423[430] KHAKHAEV, A.D., GOSTEV, V.A., ZAITSEV, Y.V., Proc. 7th ICPEAC, Paris
(1977) p. 1308[431] GOSTEV, V.A., ELAKHOVSKJJ, D.V., ZAITSEV, Y.V., LUIZOVA, L.A.,
KHAKHAEV, A.D., Opt. Spectrosc., 48 (1980) 251[432] MÜLLER-FIEDLER, R., SCHLEMMER, P., JUNG, K., HOTOP, H., EHRHARDT,
H., J.Phys., 817(1984)259
268
[433] TAYLOR, K T , CLARK, C W , FÖN, W C , J Phys , B18 (1985) 2967[434] MITYUREVA, A A, PENKIN, N P , SMIRNOV, V V , Opt Spectrosc , 66 (1989)
140[435] RALL, D L A , SHARPTON, F A, SCHULMAN, M B , ANDERSON, L W ,
LAWLER, J E , LIN, C C , Phys Rev Lett, 62 (1989) 2253[436] TAWARA, H, ITIKAWA, Y, NISHIMURA, H, YOSHINO, M, J Phys, Chem
Ref Data, 19 (1990) 617[437] GERHART, D E , J Chem Phys, 62 (1975) 821[438] DOUTHAT, D A, J Phys, B12 (1979) 663[439] DeHEER, F J , Physica Scripta, 23 (1981) 170[440] BUCKMAN, S J, PHELPS, A V, J Chem Phys, 82 (1985) 4999[441] BUCKMAN, S J, PHELPS, A V, "Tabulations of Collision Cross Sections and
Calculated Transport and Reaction Coefficients for Electrons in H2 and 02", JILAInformation Center Report No 27, University of Colorado, Boulder/Colorado (1985)
[442] McCONKEY, J W , TRAJMAR, S , KING, G C M, Comments At Mol Phys , 22(1988)17
[443] FERCH, J, RAITH, W, SCHRÖDER, K, J Phys, B13 (1980) 1481[444] D ALBA, G, FORNASINI, P , LAZZIZZERA, I, RANIERI, G, ZECCA, A ,
J Phys, 813(1980)2839[445] Van WINGERDEN, B , WAGENAAR, R W, de HEER, F J , J Phys , B13 (1980)
3481[446] HOFFMAN, K R, DABABNEH, M S , HSIEH, Y F , KAUPPILA, W E , POL, V ,
SMART, J H , STEIN, T S , Phys Rev , A25 (1982) 1393[447] DEURING,A , FLOEDER, K , FROMME, D , RAITH, W , SCHWAB, A,
SINAPIUS, G, ZITZEWITZ, P W, KRUG, J, J Phys , B16 (1983) 1633[448] JONES, R K , Phys Rev , A31 (1985) 2898[449] SUBRAMANIAN, K P , KUMAR, V, J Phys , B22 (1989) 2387[450] NICKEL, J C , KANIK, I, TRAJMAR, S , IMRE, K, J Phys, B25 (1992) 2427[451] BRUNGER, M J , BUCKMAN, S J , NEWMAN, D S , Aust J Phys , 43 (1990) 665[452] BRUNGER, M J , BUCKMAN, S J , NEWMAN, D S , ALLE, D T , J Phys , B24
(1991)1435[453] OTTINGER C , ROX, T , Phys Lett, A161 (1991) 135[454] MU-TAO, L , MACHADO, L E , BRESCANSIN, L M , MENESES, G D , J Phys ,
B24 (1991) 509[455] BRANCHETT, S E , TENNYSON, J , MORGAN, L A, J Phys , B24 (1991) 3479[456] GAO, H, Phys Rev, A45 (1992) 6895[457] ENGELHARDT, A G , PHELPS, A V , Phys Rev , 131 (1963) 2115[458] PHELPS, A V , Revs Mod Phys , 40 (1968) 399[459] CROMPTON R W , GIBSON, D K , McINTOSH, AI, Aust J Phys , 22 (1969) 715
269

[460] CROMPTON, R.W., GfflSON, O.K., ROBERTSON, A.G., Phys. Rev., A2 (1970)1386
[461JHADDAD, G.N., CROMPTON, R.W., Aust. J.Phys., 33 (1980) 975[462] PETROVIC, Z.L., CROMPTON, R.W., Aust. J.Phys., 40 (1987) 347[463] ENGLAND, J.P., ELFORD, M.T., CROMPTON, R.W., Aust. J.Phys., 41 (1988) 573[464] RAMANAN, G., FREEMAN, G.R., J. Chem.Phys., 95 (1991) 4195[465] SCHMIDT, B., BERKHAN, K., GÖTZ, B., MÜLLER, M., Physica Scripta, (1994),
in press[466] MORRISON, M.A., CROMPTON, R.W., SAHA, B.C., PETROVIC, Z.L., Aust.
J.Phys., 40 (1987) 239[467] BUCKMAN, S.J., BRUNGER, M.J., NEWMAN, D.S., SNITCHLER, G, ALSTON,
S., NORCROSS, D.W., MORRISON, M.A., SAHA, B.C., DANBY, G., TRAIL,W.K., Phys. Rev. Lett. 65 (1990) 3253
[468] CROMPTON, R.W., MORRISON, M.A., Aust. J.Phys., 46 (1993) 203[469] MORRISON, M.A, TRAU., W.K., Phys. Rev., A48 (1993) 2874[470] ITDCAWA, Y., HAYASffl, M., ICfflMURA, A, ONDA, K., SAKIMOTO, K.,
TAKAYANAGI, K., NAKAMURA, M., NISfflMURA, H., TAKAYANAGI, T.,J.Phys. Chem. Réf. Data, 15 (1986) 985
[471] ITIKAWA, Y., ICHIMURA, A., ONDA, K., SAKIMOTO, K., TAKAYANAGI, K.,HATANO, Y., HAYASffl, M.; NISHIMURA, H., TSURUBUCffl, S., J.Phys. Chem.Réf. Data, 18 (1989) 23
[472] PHELPS, A.V., PITCHFORD, L.C., "Anisotropie Scattering of Electrons by N2 andIts Effects on Electron Transport: Tabulations of Cross Sections and Results", JILAInformation Center Report No. 26, University of Colorado, Boulder/Colorado (1985)
[473] PHELPS, A.V., "Tabulations of Collision Cross Sections and Calculated Transportand Reaction Coefficients for Electron Collisions with 02", JILA Information CenterReport No. 28, University of Colorado, Boulder/Colorado (1985)
[474] ITIKAWA, Y., Adv. At. Mol. Opt.Phys., 33 (1994) 253[475] KHARE, S.P., RAJ, D., J.Phys., B24 (1991) 3045[476] JAIN, A., BALUJA, K.L., Phys. Rev., A45 (1992) 202[477]DaPAIXAO, F.J., LIMA, M.A.P., McKOY, V., Phys. Rev. Lett., 68 (1992) 1698[478]MIDDLETON, A.G., BRUNGER, M.J., TEUBNER, P.J.O, J.Phys., B25 (1992)
3541[479] SHYN, T.W., SWEENEY, C.J., Phys. Rev., A47 (1993) 1006[480] SHYN, T.W., SWEENEY, C.J., Phys. Rev., A48 (1993) 1214[481] ZJJSSEL, J.P., RANDELL, J., FIELD, D., LUNT, S.L., MROTZEK, G, MARTIN,
P., J.Phys., B26 (1993) 527[482] RANDELL, J., LUNT, S.L., MROTZEK, G., ZIESEL, J.P., FIELD, D., J.Phys., B27
(1994) in press[483] HAYASffl, M., IAEA-TECDOC, 506 (1988) 193
270

[484] NESS, K.F., ROBSON, R.E., Phys. Rev., A38 (1988) 1446[485] ELFORD, M.T., "The Behaviour of Low Energy Electrons in Water Vapour", in
reference [300], p. 34-50[486] BRÜCHE, E., Ann.Phys., 1 (1929) 93[487] SENG, G., PhD Thesis (unpublished), University of Kaiserslautern,
Kaiserslautern/Germany (1975)[488] SOKOLOV, V.F., SOKOLOVA, Y.A., Sov. Tech.Phys.Lett, 7 (1981) 268[489] SUEOKA, O., MORI, S., KATAYAMA, Y., J.Phys., B19 (1986) L 373[490] SZMYTKOWSKI, Chem.Phys. Lett., 136 (1987) 363[491] ZECCA, A., KARWASZ, G., OSS, S., GRISENTI, R., BRUSA, R.S., J.Phys., B20
(1987) L133[492]MSfflMURA, H., YANO, K., J.Phys. Soc. Japan, 57 (1988) 1951[493] SAGLAM, Z, AKTEKIN, N., J.Phys., B23 (1990) 1529[494] SAGLAM, Z., AKTEKIN, N., J.Phys., B24 (1991) 3491[495] OKAMOTO, Y., ONDA, K., ITIKAWA, Y., J.Phys., B26 (1993) 745[496] DANJO, A., NISHIMURA, H., J.Phys. Soc. Japan, 54 (1985) 1224[497] KATASE, A, ISfflBASHI, K., MATSUMOTO, Y., SAKAE, T., MAEZONO, S.,
MURAKAMI, E., WATANABE, K., MAKI, H., J.Phys., B19 (1986) 2715[498] SHYN, T.W., CHO, S.Y., Phys. Rev., A36 (1987) 5138[499] JOHNSTONE, W.M., NEWELL, W.R., J.Phys., B24 (1991) 3633[500] SHYN, T.W., GRAFE, A., Phys. Rev., A46 (1992) 4406; Phys. Rev., A47 (1993)
3456 (Erratum)[501] BRESCANSIN, L.M., LIMA, M.A.P., GIBSON, T.L., McKOY, V., HUO, W.M.,
J. Chem.Phys., 85 (1986) 1854[502] GIANTURCO, F.A., SCIALLA, S., J. Chem.Phys., 87 (1987) 6468[503] JAIN, A.K., TRJPATffl, A.N., JAIN, A., Phys. Rev., A37 (1988) 2893[504] JAIN, A., J.Phys., B21 (1988) 905[505] SATO, H., KJMURA, M., FUJJMA, K., Chem.Phys. Lett., 145 (1988) 21[506] GL\NTURCO, F.A., J.Phys., B24 (1991) 3837[507] YUAN, J., ZHANG, Z., Phys. Rev., A45 (1992) 4565[508] RESCIGNO, T.N., LENGoFIELD, B.H., Z.Phys., D24 (1992) 117[509] ITIKAWA, Y., J.Phys. Soc. Japan, 32 (1972) 217[510] JAIN, A., THOMPSON, D.G., J.Phys., B16 (1983) 3077[511] TRAJMAR, S., WILLIAMS, W., KUPPERMANN, A, J. Chem.Phys., 58 (1973)
2521[512] ITIKAWA, Y., J.Phys. Soc. Japan, 36 (1974) 1127[513] SENG, G., LINDER, F., J.Phys., B7 (1974) L 509[514] SENG, G., LINDER, F., J.Phys., B9 (1976) 2539[515] ROHR, K., J.Phys., B10 (1977) L735[516] JAIN, A., THOMPSON, D.G., J.Phys., B16 (1983) L 347
271

[517] SHYN, T.W., CHO, S.Y., CRAVENS, T.E., Phys. Rev., A38 (1988) 678[518] FURLAN, M, HUBIN-FRANSKIN, M.J., DELWICHE, J., COLLIN, I.E., J.
Chem.Phys., 95 (1991) 1671[519] LASSETTRE, E.N., SKERBELE, A, J. Chem.Phys., 60 (1974) 2464[520] CHUTJIAN, A, HALL, R.I., TRAJMAR, S„ J. Chem.Phys., 63 (1975) 892[521] FERCH, J., MASCHE, C, RAITH, W., J.Phys., B14 (1981) L 97[522] HUFFMAN, K.R., DABABNEH, M.S., HSIEH, Y.F., KAUPPILA, W.E , POL, V ,
SMART, J.H., STEIN, T.S., Phys. Rev., A25 (1982) 1393[523] KWAN, C.K., HSIEH, Y.F., KAUPPILA, W.E., SMITH, S.J., STEIN, T.S., UDDIN,
M.N., DABABNEH, M.S., Phys. Rev., A27 (1983) 1328[524] SUEOKA, O., MORI, S., J.Phys. Soc. Japan, 53 (1984) 2491[525] SZMYTKOWSKI, C., ZECCA, A., KARWASZ, G., OSS, S., MACIAG, K,
MARINKOVIC, B., BRUSA, R.S., GRISENTI, R., J.Phys., B20 (1987) 5817[526] DANNER, D., Diploma thesis (unpublished), University of Freiburg,
Freiburg/Germany (1970)[527] BROMBERG, IP., J. Chem.Phys., 60 (1974) 1717[528] SHYN, T.W., SHARP, W.E., CARIGNAN, G.R., Phys. Rev., A17 (1978) 1855[529] REGISTER, D.F., NISFÜMURA, H., TRAJMAR, S., J.Phys., B13 (1980) 1651[530] IGA, I., NOGUEIRA, J.C., MU-TAO, L., J.Phys., B17 (1984) L 185[531] KOCHEM, K.H., SOHN, W., HEBEL, N., JUNG, K., EHRHARDT, H, J.Phys., BIS
(1985) 4455[532] KANIK, L, McCOLLUM, D.C., NICKEL, J.C., J.Phys., B22 (1989) 1225[533] MORRISON, M.A., LANE, N.F., COLLINS, L.A, Phys. Rev., A15 (1977) 2186[534] ONDA, K., TRUHLAR, D.G., J.Phys., B12 (1979) 283[535] LYNCH, M.G., DILL, D., SIEGEL, J., DEHMER, J.L., J. Chem.Phys , 71 (1979)
4249[536] COLLINS, L.A, MORRISON, M.A., Phys Rev., A25 (1982) 1764[537] JAIN, A, TAYAL, S.S., J.Phys., BIS (1982) L 867[538] BOTELHO, L.F., FREIT AS, L.C.G., MU-TAO, L., JAJN, A, TAYAL, S.S., J.Phys.,
B17(1984)L641[539] MORRISON, M.A., LANE, N.F., Chem.Phys. Lett., 66 (1979) 527[540] MORRISON, M.A., Phys. Rev., A25 (1982) 1445[541] WHTTTEN, B.L., LANE, N.F., Phys. Rev., A26 (1982) 3170[542] ESTRAD A, H., DOMCKE, W., J.Phys., BIS (1985) 4469[543] ITIKAWA, Y., J.Phys. Soc. Japan, 36 (1974) 1121[544] HAKE, R.D., PHELPS, A. V., Phys. Rev., 158 (1967) 70[545] LOWKE, J.J., PHELPS, A.V., IRWIN, B.W., J. Appl.Phys., 44 (1973) 4664[546] BULOS, B.R., PHELPS, AV., Phys. Rev., A14 (1976) 615[547] ANTONI, T., JUNG, K., EHRHARDT, H., CHANG, E.S., J.Phys., B19 (1986) 1377
272
[548] MORRISON, M.A., LANE, N.F., Phys. Rev., A16 (1977) 975[549] HAYASffl, M., private communication (1993)[550] TAWARA, H., ITIKAWA, Y., NISfflMURA, H., TANAKA, H., NAKAMURA, Y.,
"Collision Data Involving Hydrocarbon Molecules", Research Report NIFS-DATA-6,National Institute for Fusion Science, Nagoya/Japan (1990)
[551] TAWARA, H., ITIKAWA, Y., NISHJMURA, H., TANAKA, H., NAKAMURA, Y,"Cross Section Data for Collisions of Electrons with Hydrocarbon Molecules", inAtomic and Plasma-Material Interaction Data for Fusion (ed. R.K. Janev), IAEAVienna (1992)
[552] NAKAMURA, Y., "Recent Electron Swarm Studies Using Rare Gas/Molecular GasMixtures", in reference [300], p. 178-200
[553] MORGAN, W.L., "A Critical Evaluation of Low Energy Electron Impact CrossSections for Plasma Processing Modelling: I. Cl2, F2, and HC1; II. CF4, SiH4, andCH4", JILA Data Center Report No. 34, University of Colorado, Boulder/Colorado(1991)
[554] FERCH, I, GRANITZA, B., RAITH, W., J.Phys., B18 (1985) L 445[555] FLOEDER, K., FROMME, D., RAITH, W., SCHWAB, A, SINAPIUS, G., J.Phys.,
B18 (1985) 3347[556] JONES, R.K., J. Chem.Phys., 82 (1985) 5424[557]LOHMANN, B., BUCKMAN, S.J., J.Phys., B19 (1986) 2565[558] SUEOKA, O., MORI, S., J.Phys., B19 (1986) 4035[559] DABABNEH, M.S., HSIEH, Y.F., KAUPPILA, W.E., KWAN, C.K., SMITH, S.J.,
STEIN, T.S., UDDIN, M.N., Phys. Rev., A 38 (1988) 1207[560] NISfflMURA, H, SAKAE, T., Jap. J. Appl.Phys., 29 (1990) 1372[561]ZECCA, A, KARWASZ, G , BRUSA, R.S., SZMYTKOWSKI, C, J.Phys., B24
(1991)2747[562]KANIK, I., TRAJMAR, S., NICKEL, J.C., Chem.Phys. Lett., 193 (1992) 281[563] BARBARITO, E., BASTA, M., CALICCHIO, M., TRESSARI, G., J. Chem.Phys.,
71(1979)54[564] ROHR, K., J.Phys., B13 (1980) 4897[565] TANAKA, H, OKADA, T., BOESTEN, L., SUZUKI, T., YAMAMOTO, T ,
KUBO, M., J.Phys., B15 (1982) 3305[566] SOHN, W., JUNG, K., EHRHARDT, H., J.Phys , B16 (1983) 891[567] CURRY, P.J., NEWELL, W.R., SMITH, A.C.H., J.Phys., B18 (1985) 2303[568] SOHN, W., KOCHEM, K.H., SCHEUERLEIN, K.M., JUNG, K., EHRHARDT, H.,
J.Phys., B19 (1986) 3625[569] SAKAE, T., SUMTYOSffl, S., MURAKAMI, E., MATSUMOTO, Y., ISHIBASHI,
K., KATASE, A, J.Phys., B22 (1989) 1385[570] SHYN, T.W., CRAVENS, T.E., J.Phys., B23 (1990) 293[571] BOESTEN, L., TANAKA, H., J.Phys., B24 (1991) 821
273
[572] MAPSTONE, B., NEWELL, W.R., J.Phys., B25 (1992) 491[573] LUNT, S.L., RANDELL, J., ZffiSEL, J.P., MROTZEK, G., FffiLD, D., J.Phys, 27
(1994)1407[574] ABUSALBI, N., EADES, R.A., NAM, T., THIRUMALAI, D., DIXON, D.A.,
TRUHLAR, D.G., DUPUIS, M., J. Chem.Phys., 78 (1983) 1213[575] JAIN, A., J. Chem.Phys., 78 (1983) 6579[576] JAIN, A., J. Chem.Phys., 81 (1984) 724[577] JAIN, A., Phys. Rev., A 34 (1986) 3707[578]BLOOR, J.E., SHERROD, R.E., J.Phys. Chem., 90 (1986) 5508[579] GIANTURCO, F.A., JAIN, A., PANTANO, L.C., J.Phys., B20 (1987) 571[580] GIANTURCO, F.A., SCIALLA, S., J.Phys., B20 (1987) 3171[581] LIMA, M.A.P., GffiSON, T.L., HUO, W.M., McKOY, V., Phys. Rev., A32 (1985)
2696[582] LIMA, M.A.P., WATARJ, K., McKOY V., Phys. Rev., A39 (1989) 4312[583] YUAN, J., J.Phys., 821(1988)3113[584] JAIN, A., WEATHERFORD, CA., THOMPSON, DG., McNAUGHTEN, P , Phys.
Rev., A40 (1989) 6730[585] McNAUGHTEN, P., THOMPSON, D.G., JAIN, A., J.Phys , B23 (1990) 2405 S[586] McCURDY, C.W., RESCIGNO, T.N., Phys. Rev., A39 (1989) 4487[587] Me CURDY, C.W., Aust. J.Phys., 45 (1992) 337[588] KUBO, M., MATSUNAGA, D., TANAKA, H, Proc. 12th ICPEAC,
Gatlinburg/Tennessee (1981) p. 344[589] TANAKA, H., KUBO, M., ONODERA, N., SUZUKI, A., J.Phys., B16 (1983) 2861[590] SHYN, T.W., J.Phys., B24 (1991) 5169[591] POLLOCK, W.J., Trans. Faraday Soc., 64 (1968) 2919[592] DUNCAN, C.W., WALKER, I.C., J. Chem. Soc. Faraday Trans.II, 68 (1972) 1514[593]HADDAD, G.N., Aust. J.Phys., 38 (1985) 677[594] OHMORI, Y., KITAMORI, K., SHEVIOZUMA, M., TAGASHIRA, H., J.Phys , D19
(1986)437[595]DAVIES, O.K., KLINE, LE., BffiS, W.E., J. Appl.Phys., 65 (1989) 3311[596] SCHMIDT, B., J.Phys., B24 (1991) 4809[597] SCHMIDT, B., Comments At. Mol.Phys., 28 (1993) 379[598] JAIN, A, THOMPSON, D.G., J.Phys., B16 (1983) 3077[599] ABUSALBI, N., SCHWENKE, D.W., MEAD, C.A., TRUHLAR, D.G., Theor.
Chim. Acta, 71 (1987) 359[600] BRESCANSIN, L.M., LIMA, M.A.P., McKOY, V., Phys. Rev., A40 (1989) 5577[601] VUSKOVIC, L., TRAJMAR, S., J. Chem.Phys., 78 (1983) 4947[602]NAKANO, T., TOYODA, H., SUGAI, H., Jap. J. Appl.Phys., 30 (1991) 2908, ibid.,
30(1991)2912
274

[603] WINSTEAD, C , SUN, Q , McKOY, V , da SEL VA LINO, J L , LIMA, M A P ,ZPhys,D24(1992) 141
[604] WINSTEAD, C , SUN Q , McKOY, V , da SILVA LINO, J L , LIMA, M A P ,J ChemPhys, 98(1993) 2132
[605] BRUCHE, E , Ann Phys , 4 (1930) 387[606] NISHIMURA, H , TAWARA, H , J Phys , B24 (1991) L 363[607] MERZ, R , PIRRUNG, K , LINDER, F , to be published (1994)[608] SZMYTKOWSKI, C , Z Phys , D13 (1989) 69[609] MATSUNAGA, D , KUBO, M , TANAKA, H , Proc 12th ICPEAC ,
Gatlinburg/Tennessee(1981)p 358[610] MATSUNAGA, D , KUBO, M , ONODERA, N , TANAKA, H , in "Atomic Collision
Research in Japan", Progress Report No 7 (eds Y Hatano et al ), Tokyo (1981) p 6[611] MANN, A, LINDER, F , J Phys , B25 (1992) 533, ibid , 25 (1992) 545[612] WINSTEAD, C fflPES, P G , LIMA, M A P , McKOY, V , J Chem Phys , 94
(1991)5455[613] BOESTEN, L , DILLON, M A , TANAKA, H , KIMURA, M , SATO, H , J Phys ,
B27(1994) 1845[614] HERZBERG, G, "Molecular Spectra and Molecular Structure II Infrared and
Raman Spectra of Polyatomic Molecules", Van Nostrand, Princeton/New Jersey(1945)
[615] EHRHARDT, H , LINDER, F , MEISTER, G, Z Naturf, 20a (1965) 989[616] LASSETTRE, E N , SKERBELE, A, DILLON, M A , J Chem Phys , 49 (1968)
2382[617] KOCH, E E, SKIBOWSKI, M, Chem Phys Lett, 9 (1971) 429[618] SCfflAVONE, J A, TARR, S M, FREUND, R S , J Chem Phys , 70 (1979) 4468
275
Chapter 4
LOW ENERGY ELECTRON INTERACTIONWITH CONDENSED MATTER
L. SancheMRC Group in the Radiation Sciences, Faculty of Medicine,
Université de Sherbrooke, Sherbrooke, CanadaT.D. Mark
Institut für lonenphysik der Universität Innsbruck,Innsbruck, Austria
Y. HatanoDepartment of Chemistry, Tokyo Institute of Technology,
Tokyo, Japan
277

4.1 INTRODUCTION
The effects of high-energy radiation can be perceived as the result of a sequence of events
or processes which follow the interaction of the initial particle. Many chapters in this book deal
with the interaction of high-energy photons, electrons, protons and ions incident on biological
media and with the subsequent interactions of the fast electrons generated in the initial energy de-
posit. Fast electrons ionize the medium, producing a distribution of excited atoms and molecules,
ions and secondary electrons. These latter are created in large quantities (105/MeV) and carry
most of the energy of the fast primaries. Secondary electrons have low energies with a distribu-
tion lying essentially below 70 eV and a most probable energy around 10 eV [1]. At those ener-
gies electrons have their highest cross section for scattering by atoms and molecules [2]. Hence,
they interact rapidly and within a very short range (-10-100 A) in the irradiated medium, where
they generate highly reactive species which in turn initiate chemical reactions. Any analysis of the
sequence of events leading to chemical modification of an irradiated substance must therefore in-
clude a description of the action of secondary low-energy electrons.
In radiotherapy, the medium of interest is the living cell or more specially components of
the cell which play a vital role in its proliferative capabilities. Thus, the information generated in
the fields of radiation physics and chemistry must be transferable to the actual processes which
take place within the cell if we are to understand, at the microscopic level, doses in radiotherapy
including the combined effects of radiation and drugs. For the problem of interest in this book,
we need to consider if the data obtained from the interaction of an isolated molecular or atomic
target with a single projectile are still valid in the condensed phase where the target is surrounded
by neighbouring atoms and/or molecules. This is usually the case for high energy particles includ-
ing the fast primary electrons whose wavelength is short in comparison with the "diameter" of the
elementary constituents of condensed matter. The short wavelength of these electrons make it
possible to consider that each projectile interact individually with the atoms and/or molecules of
the condensed system. This concept is no longer valid at low energies and more specifically be-
low —30 eV where the electron's wavelength is of the order of the interatomic or intermolecular
distances. In this case, the electron is scattered collectively from many targets and the scattered
279
intensity must be derived from the sum of the interaction potentials between the electron and each
of the atoms and/or molecules present in the liquid or solid. The geometrical arrangement of con-
densed matter must therefore be taken into account in order to describe the interference of the
electron waves arising from multiple scattering. However, for many processes (e.g., those by
which energy localization occurs at specific sites), it may still be possible to describe low-energy
electron scattering in the condensed phase in terms of gas-phase phenomena provided that the
modification to the isolated electron-molecule system are properly taken into account. A number
of experiments have been devised to explore these modifications and investigate the gradual
changes which occur as the density of the scattering medium increases. These may be divided
into three major categories:
(1) high-pressure gas-phase (and liquid-phase) electron scattering experiments, including drift
mobility and pulse radiolysis measurements, where electron motion is investigated as
function of number density, mean energy and gas-pressure up to the liquid state;
(2) cluster experiments, in which a low-energy electron beam crosses a high-density molecular
beam containing clusters of atoms and/or molecules;
(3) solid-film experiments, in which a low-energy electron beam strikes a multilayer film of con-
densed atoms and/or molecules. These experiments are briefly described in this chapter.
We first provide a short description in the following section (i.e., 4.2) of the scattering of a
low-energy electron with an isolated target. In the subsequent sections, we explain how the fun-
damental properties of the isolated scattering phenomena are modified when the density of the
targets is increased up to that of the condensed phase. It is shown that our present knowledge of
electron scattering in high-pressure gases and liquids (sec. 4.3), clusters (sec. 4.4) and condensed
molecular films (sec. 4.5) provides valuable models for excess electrons interactions in liquids
and solids thereby linking gas phase properties to those of the other phases. This transfer of in-
formation is of fundamental importance for our understanding of the action of secondary electrons
in biological structures. A list of the acronyms used in this chapter is given in Table 4.1.
280

Table 4.1. List of acronyms
2-D Two-dimensional
DA Dissociative attachment
DD Dipolar dissociation
DOS Density of states
EA Electron affinity
ESD Electron stimulated desorption
HREEL High resolution electron energy lost
KE Kinetic energy
LEET Low energy electron transmission
PDI Post dissociation interaction
QSE Quantum size effects
TOF Time-of-flight
vdW van der Waals
4.2. INTERACTION OF LOW-ENERGY ELECTRONS WITH ATOMS AND
MOLECULES
The interaction of a low-energy electron with an isolated target may be described, outside
the target itself, by a potential [3] which takes into account the force between the two particles
due to the dipole, quadrupole and higher moments of the target as well as induced polarization
effects. By analysing as function of incident electron energy and scattering angle the various
scattering cross sections, it may be possible in particular cases to sort out which part of the po-
tential is dominant. For example, certain energy losses may be characterized as due to "dipolar
scattering" meaning that interaction with the permanent dipole of the molecule is dominant.
However, if the electron penetrates significantly into the target "region" the interaction becomes
more complex due to the possibility of spin-exchange and constructive interference of the electron
wave within the target. This latter phenomenon gives rise to electron resonances. Thus, reso-
nances occur when the scattered electron resides for a time much longer than the usual scattering
281

time in the neighborhood of the target atom or molecule. From an atomic or molecular orbital
point of view, a resonant state may be considered as a negative ion formed by an electron which
occupies temporarily an orbital of the target [4].
Fig. 4.1 illustrates the possible decay channels of a diatomic transient anion AB . The
departing electron may leave the molecule in a rotationally, vibrationally [reaction (1) in Fig. 4.1]
or electronically (2 in Fig. 4.1) excited state. In the condensed state librational and translational
excitation is also possible. If the resulting electronically excited neutral state is dissociative,
fragments in the ground or excited states can be produced (2). If the lifetime of the resonance is,
at least, of the order of a vibrational period, the AB state is dissociative in the Franck-Condon
region and one of the possible fragments has a positive electron affinity, then the anion may dis-
sociate into a stable anion and a neutral fragment in the ground (3 in Fig. 4.1) or an excited (4)
state. This process is called dissociative attachment (DA). If during its lifetime, the transient
anion transfers energy to another system (e.g., to another molecule by collisional interaction) it
can become stable when the parent molecule has a positive electron affinity (5 in Fig. 4.1). Final-
ly, when the transient anion is formed at energies above the ionization potential, two-electron
AB*(r,v) A- + B
AB*(n,r,v)+e— A + B + e
A" + B A B + + 2 eFig. 4.1 Possible decay channels for a transitory anion AB . r, v and n represent, respectively,
rotational, vibrational and electronic excitation. AB* and B* represent excited electronic
states of molecule AB and fragment B, respectively.
282

emission is possible (6 in Fig. 4.1). Not shown among the reactions of Fig. 4.1, is the
spontaneous emission of a photon by the transitory anion followed by stabilization of the electron
on the molecule (i.e., AB * -* AB + hv), since emission of electromagnetic radiation is rarely
faster than electron emission. In the condensed phase and in high pressure gases, this latter
process can be enhanced with the help of an additional stabilizing interaction with other targets.
Autodetachment lifetimes of transient anions vary from =±10-15 s up to the millisecond time scale
for large polyatomic molecules, where the excess energy of the anion may be accommodated
among its many degrees of freedom, thereby delaying autodetachment.
The amplitudes of the vibrational excitation cross sections are also affected by the lifetime
At of transitory anions. Long-lived resonances (At > 10'14 s) cause a significant displacement of
the nuclei of a molecule when the additional electron occupies a strongly bonding or antibonding
orbital. When the electron leaves the molecule, nuclear motion is initiated toward the initial inter-
nuclear distance, causing strong vibrational excitation including many overtones of the molecule.
On the other hand, when the lifetime is much smaller than a typical vibrational period (At «
10-14 s), the nuclei are not displaced significantly and only the lower vibrational levels become ex-
cited with considerable amplitude.
In the condensed state, we expect not only the single-electron-target potential to be
modified by the proximity of neighbouring atoms or molecules, but also the amplitude, lifetime,
symmetry and energy of the isolated transient anions. Among the "environmental effects" or fac-
tors which may contribute to these modifications we note: (i) the change in the symmetry of the
scattering problem introduced by the presence of other nearby targets; (ii) the polarisation of
these targets by the electron and transient anion; (iii) the fixed orientation of the molecule with
respect to a given frame of reference and (iv) the possible distortion and modification of the tar-
get molecule by the adjacent matter. The change in symmetry may be viewed to arise from mul-
tiple scattering of the electron waves between the molecules of a solid. This condition changes the
partial wave content of a resonant electron which in turn influences the lifetime of the state [5].
By acting on the isolated electron-molecule potential, the polarization force can also modify the
resonance lifetime, by promoting electron transfer to the neighbouring targets and lowering the
283

resonance energy with the introduction of an attractive potential. This perturbation may reduce
the number of decay channels; thus, affecting in a drastic manner certain cross sections and in-
creasing the lifetime or decreasing total decay width of the resonance. Lowering of the resonance
energy may be viewed as a change in the electron affinity (EA) of the target molecule (even from
negative to positive) which in clusters can be monitored as a function of size. In the case of well
ordered solids, the orientation of the molecule is fixed so that the differential cross sections and
angular distributions are greatly modified [6] from those of the gas phase, where they are meas-
ured from randomly oriented molecules.
4.3 ELECTRONS IN DENSE GASES AND LIQUIDS
The behavior of excess electrons as in electron transport and reactions in dense molecular
media both polar and nonpolar has recently attracted great interest [7-19]. Excess electron mo-
bilities ue have been measured extensively in a variety of molecular compounds ranging from
rare gas atoms and diatomic molecules to complex molecules such as hydrocarbons and alcohols
in the liquid phase or in the dense-gas phase (see Fig. 4.2), and several theoretical models have
been proposed for the transport mechanism of excess electrons in these media. Excess-electron
reactivities with solute molecules or positive ions in these media, which are closely related to the
transport phenomena, have been also extensively investigated.
In this section, a survey is given of recent understanding of the behavior of excess elec-
trons in particular electron attachment, recombination, solvation, and localization in dense gases
and liquids.
4.3.1 ELECTRON ATTACHMENT [13,19]
As described in section 3.6 of chapter 3, one may expect some environmental effects on
the overall scheme of electron attachment processes in the presence of third-body molecules or in
bulk media (i.e., channel no 5. in Fig. 4.1). In addition to the determination of cross sections or
rate constants for electron attachment or negative-ion formation and their electron energy de-
pendences, it has been of prime importance to clarify the attachment mechanism, not only the
overall mechanism itself but also the influence of environmental conditions on the mechanism.
284
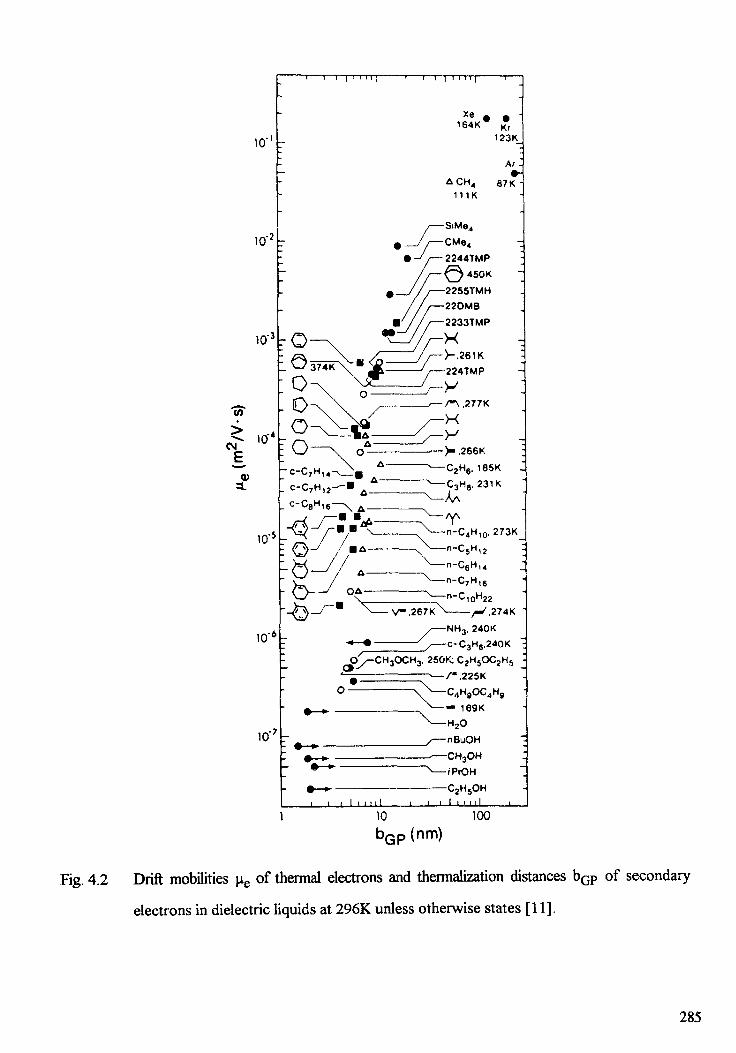
10"
10''
10',-3
)0"4
§:?
10"
10',-7
••—• -
Xe • •164K Kr
123K
Ar»
^CH« 87K111K
——NH3. 240K——c-C3H6.240K
O/^-CH3OCH3, 250K; C2H5O
—r .225K
N— — ,169K
^^——H20
_/—nBuOH--——CH3OH"^—/PrOH———C2H5OH
10
b100
'GP (nm)
Fig. 4.2 Drift mobilities ne of thermal electrons and thermalization distances bGP of secondary
electrons in dielectric liquids at 296K unless otherwise states [11].
285

In the investigation of low energy electron attachment in bulk gases, electron-swarm or
drift-tube techniques have played a major role, accumulating data on attachment rate constants,
their electron energy dependence, formation of negative ions, etc. Christophorou and his co-
workers [20,21] have extensively studied electron attachment in dense gases as quasi-liquids by
using a high-pressure swarm technique. In addition to usual swarm techniques an interesting ap-
proach of measuring cyclotron resonance signals due to free electrons in gases has been carried
out for the study of electron attachment to various molecules as a function of electron energy in
the range of 1 to lOkT [22]. Another interesting approach to electron attachment studies which is
highly sensitive consists of monitoring of electron density in swarms by the Cavalleri method [23].
The pulse sampling technique [24] is simple but capable of yielding precise data particularly on
energetics of negative-ion formation. A microwave technique for monitoring the rate of removal
of electrons in a swarm has been combined with static or flowing afterglows produced by electri-
cal discharges [25]. This technique has been combined also with the pulse radiolysis method in
order to eliminate essential limitations including those in the above-mentioned microwave tech-
niques [13,19,26]. The response time of the detection system for electrons has been greatly im-
proved and the effect of the presence of various species in afterglows on electron attachment
processes has been eliminated. This combination, therefore, has given a reasonably good selec-
tivity for measuring electron attachment processes, even in multiple collision systems.
For the study of electron attachment mechanism ordinary swarm techniques may have
some essential limitations, as they are limited to the use of only a few buffer gases for which the
swarm parameters, electron energy distributions, etc., are well known. Therefore, in cases where
the attachment mechanism is strongly dependent on the particular nature of environmental gases,
the technique may not give enough information to evaluate adequately the mechanism in detail.
Usual beam techniques are evidently not suitable for the study of environmental effects on the at-
tachment mechanism. On the other hand, the microwave technique has been used as an alterna-
tive means for such studies with the main advantage of the technique allowing the observation of
the behavior of thermal electrons, thus excluding any factor dependent on the electron-energy
distribution. For usual swarm and beam techniques, it has been difficult to study electron collision
processes at very low energies such as thermal, whereas the microwave technique combined with
286

Table 4.2
Rate constant, resonance energy, and resonance width for electron attachment to Q2 or (O2-M) [13]
(02-M)
(02-N2)(02'C2H6)(CVCÄ)
02
Rate Constant(10*11 cm3/sec)
30001100380
3
Resonance Energy(meV)
203045
88
Resonance Width(neV)800450270
10
the pulse radiolysis method has shown recently a distinct advantage in studying thermal electron
attachment to molecules [13,19,26]. In the pulse radiolysis method it is possible to time-resolve
the disappearance of decaying electrons over a very wide range of the pressure of a buffer gas
which may be chosen with virtually no limitation. Thus, the mechanism of low-energy electron
attachment to molecules has been discussed primarily in terms of the interaction of electrons with
molecules.
Recent studies of thermal electron attachment to O2, N2O and other molecules have re-
vealed that the electron attachment to pre-existing van der Waals (vdW) molecules or neutral
clusters plays a significant role in the stabilization mechanism [13,19,26]. The rate constants for
the electron attachment to these vdW molecules (e.g., (O2.M) and (N2O.M) where M is O2,
N2O or any other molecule) are much larger than those for the electron attachment to isolated O2
or N2O. This clearly shows that the electron attachment to an ordinary isolated single molecule is
greatly enhanced by the presence of a surrounding guest molecule M as summarized by the values
given in Table 4.2. The modification of the single-electron-molecule potential by the formation
of vdW molecules reflects the departure from the gas-phase characteristics toward those of the
condensed phase. Similar to the electron attachment process in clusters and solid films (Sec. 4.4
and 4.5) the following changes are observed [13]; i.e.,
(1) The lowering of the resonance energy due to a deeper ion-neutral potential in comparison
with neutral-neutral potential of the vdW molecule,
(2) The additional vibrational structures of the vdW molecule,
287

(3) The symmetry breaking due to the vdW interaction which allows the molecule to attach the
electron with additional partial waves,
(4) The deformation of the molecular structure or the change of the vibrational modes due to the
surrounding molecules,
(5) The effective vibrational relaxation of the formed negative ion with excess energies due to
the presence of a built-in third body molecule in vdW molecule.
The distinct features of the electron attachment to vdW molecules as summarized above
may become a substantial clue to understand the fundamental nature of electron attachment not
only in dense gases but also in the condensed phase. It is also apparent that most of the electron
attachment in bulk systems is no longer a simple process consisting of the interaction of electrons
with isolated molecules. From this point of view, interesting phenomena in ionized gases such as
the attachment cooling effect and the response-time of the air-filled fast response ionization
chamber should be analyzed by taking into account the important role of vdW molecules in the
electron attachment mechanism. It should be noted here also that such attachment studies in
dense gases have been complemented by recent beam experiments between electron and van der
Waals clusters [27,28] (See section 4.4).
4.3.3 ELECTRON SOLVATION AND LOCALIZATION IN THE CONDENSED PHASE
This problem has been one of the central subjects in radiation chemistry and it is now rele-
vant to a variety of chemical areas, and even biological or physical areas. Experimental evidence
for the solvated electron has been obtained using the radiolysis-product analysis, photoconducti-
vity and optical or electron spin resonance spectroscopy techniques [43-45]. Solvated electrons
have been observed in a variety of polar solvents including water, alcohols, ammonia, amines, and
ethers, and even in nonpolar solvents such as hydrocarbons [46]. Optical absorption spectra of
the solvated electron in various solvents are characterized by a broad, structureless,
and asymmetric band, and are positioned at wavelength regions from visible to near-infrared de-
pending on the solvent. Formation processes of solvated electrons, i.e., solvation processes of
pre-solvated electrons, have been recently observed using femtosecond laser spectroscopy
288

[47,48]. It is also of great interest that negatively charged clusters formed in sonic nozzle beams
be compared with the theoretical model of solvated electrons (See section 4.4).
Theoretical investigation of the solvated electron has been also extensively carried out to
explain the above-mentioned experimental results and therefore to obtain information on electron
solvent-molecule interaction or the structure of the solvated electron [45]. The stability of nega-
tively charged water clusters has been theoretically investigated in terms of the modelling of the
hydrated electron [49,50].
2.0
1.0
0.5
0.2-
0.10.0!
o Ao
oo oo
o o
O
o
OJ 10 100Electron Mobility (cm / V - s e c )
)000 10000
Fig. 4.3 Plots of kj/kj) vs ue in several fluids; •, solid methane; •, liquid methane; O, gaseous
methane; x, liquid mixtures of neopentane and n-hexane; T, liquid and solid neopentane;
A, liquid and solid tetramethylsilane; +, liquid n-pentane, n-hexane, and tetramethylsilane;
Q, liquid n-hexane and cyclohexane [7],
289

Electrons are also localized or trapped in low temperature glassy or amorphous matrices
of these solvent-molecules and are observable by optical or electron spin resonance spectroscopy
techniques [51,52]. Electron localization and reactivities in various condensed media, particularly
in nonpolar media, have been investigated also by measuring excess-electrons electrical conduc-
tivities [12-15,17,18]. As seen in Fig. 4.2, the measured electron mobilities are strongly depend-
ent on the molecular structure. These values, and their temperature and density dependences have
been measured in a variety of liquids.
(1) A semi empirical treatment by Warman [34] taking both the diffusion-controlled and the
electron-energy-exchange controlled recombination processes into account,
(2) A Monte Carlo simulation by Tachiya [35-37] with the parameter £/a where ( is the mean
free path of electrons and a the reaction radius of recombination,
(3) A molecular dynamics simulation by Morgan [38],
(4) A fractal treatment by Lopez-Quintela et al. [39],
(5) A gas kinetic approach by Kitahara et al [40],
(6) An approach based on the Fokker-Planck equation by Sceats [41], and
(7) A fractal treatment by Mozumder [42].
Warman first proposed a theoretical formula of the recombination rate constant to explain
the result of kr«kd. In spite of many assumptions to derive the formula, the calculated value for
liquid argon is in rather good agreement with the experimental one. For dense gaseous argon,
however, the calculated value is far from the experimental one. Recently, Tachiya pointed out
using a Monte Carlo method that if I/a is not negligible, the rate constant for bulk recombination
deviates from kd. Experimental kr values for liquid methane lie around the theoretical curve of
his simulation which uses (/a only as a parameter. He also explains the effect of the electron field
strength on k,.. The values of kr, in both dense methane and argon, increase roughly in proportion
to the field strength in the lower field strength region and form a peak at around the critical field
strength (e.g., 10"19 V.cm2 in Fig. 4.4); the height of the peak is almost of the same magnitude as
that for ue. These results are explained in terms of the effect of the field strength on the trajec-
tory of electrons to be recombined. In the lower field region, disentangling of random electron
290

10(•—•s
u(fi\£uf 50
X. — s
xT
r\
' i i | l i l l [ i i i [ l l i i | l i i ! i i i
-
A . A . A ° A
f ^\
\
0 0 ' A
\0 0 ^ j
-
t i i 1 i i ^ f 1 i i t l i i i i ! i i i 1 i i i i
1000
O0)CD, j--•>\_
500 °(J
CD=1
n
10',-21 10-20 1Q-19
E/n(V-cm2)10-18
Fig. 4.4 Electric field dependence of ne and kr in liquid methane at 170K (n = 1.2 x 10²²cnr3 ); A,
ue; o, k,. [33].
trajectories caused by the presence of the external electric field should increase the k,. vaiue. In
the field region higher than the critical field strength, the internal energy of an electron-ion pair
(i.e., the energy in excess of the electron's kinetic energy) decreases the kr value.
4.3.3 ELECTRON SOLVATION AND LOCALIZATION IN THE CONDENSED PHASE
This problem has been one of the central subjects in radiation chemistry and it is now rele-
vant to a variety of chemical areas, and even biological or physical areas. Experimental evidence
for the solvated electron has been obtained using the ruliolysis-product analysis, photoconducti-
vity and optical or electron spin resonance spectroscopy techniques [43-45]. Solvated electrons
have been observed in a variety of polar solvents including water, alcohols, ammonia, amines, and
ethers, and even in nonpolar solvents such as hydrocarbons [46]. Optical absorption spectra of
the solvated electron in various solvents are characterized by a broad, structureless,
and asymmetric band, and are positioned at wavelength regions from visible to near-infrared de-
pending on the solvent. Formation processes of solvated electrons, i.e., solvation processes of
291
pre-solvated electrons, have been recently observed using femtosecond laser spectroscopy
[47,48]. It is also of great interest that negatively charged clusters formed in sonic nozzle beams
be compared with the theoretical model of solvated electrons (See section 4.4).
Theoretical investigation of the solvated electron has been also extensively carried out to
explain the above-mentioned experimental results and therefore to obtain information on electron
solvent-molecule interaction or the structure of the solvated electron [45]. The stability of nega-
tively charged water clusters has been theoretically investigated in terms of the modelling of the
hydrated electron [49,50].
Electrons are also localized or trapped in low temperature glassy or amorphous matrices
of these solvent-molecules and are observable by optical or electron spin resonance spectroscopy
techniques [51,52]. Electron localization and reactivities in various condensed media, particularly
in nonpolar media, have been investigated also by measuring excess-electrons electrical conduc-
tivities [12-15,17,18]. As seen in Fig. 4.2, the measured electron mobilities are strongly depend-
ent on the molecular structure. These values, and their temperature and density dependences have
been measured in a variety of liquids.
4.4 ELECTRON ATTACHMENT TO VAN DER WAALS CLUSTERS
It is the purpose of this section to focus on electrons scattering in clusters and in
particular to summarize differences between a negatively charged isolated molecule and its ag-
gregated counterpart. We will develop this theme by first describing the physical properties of
negative cluster ions (electron affinity, electronic states) and then by discussing the kinetics of
electron attachment (attachment cross sections).
4.4.1 LOCALIZED EXCESS ELECTRON STATES IN CLUSTERS
Electrons residing in clusters are corresponding to the following three types of ions and
electron localization:
292

1. Cluster anions consisting of monomers with positive electron affinity (EA)
In this case the electron is bound by a single cluster constituent with a positive EA. The
stable monomer anion is solvated by the surrounding cluster constituents. The excess energy re-
leased during the primary electron attachment process
.!) (4.3)
can either be accommodated within the molecule (in case of large molecules such as SF6) giving
M* , Mn.}, or within the whole cluster, giving (M . Mn.j)*. In general, however, the excess en-
ergy will be subsequently removed by monomer evaporation
M (4.4)
In this way, it is possible to produce completely stable anions (even of the monomer)
without need of other stabilizing processes. In a similar reaction sequence a primary DA process
may end up in a stable non-stoichiometric cluster anion, i.e.
n + e-»(A--Mn_1)* + B (with M = AB)
(4.5)
In both cases subsequent solvation and isomerization reactions (of M~ in Eq. 4.4 and A~
in Eq. 4.5 may lead to further stabilizing evaporations. Systems falling in this category, whose
properties have been studied by free electron attachment, include O2 [27,53,54], N2O [54-57],
SO2 [58], SF6 [56,59], and halogenated hydrocarbons [60,61].
2. Cluster ions consisting of monomers with negative EA
Because the E A of the CO2 monomer (EA = -0.6 eV [62]) is negative (the most stable
configuration of CO2 being a bent structure [63]), attempts to attach free electrons to CO2
monomers have only resulted in transient formation of CO^ which can decay by DA, mainly
forming O~. Conversely, the EA of the CO2 dimer (consisting of a bent CO^, solvated by a linear
CO2) is positive in accordance with theoretical predictions [63] and confirmed by the experimen-
293

tal observation of (CO2)2 and larger homologues [54,64]. Moreover, also CO^ is observable
[55] if electrons are attached to clusters. Its yield exhibits a resonance well below the verticalEA of the monomer, because the precursor of CO~2 is a cluster. As in case of the first class of
cluster anions, the excess energy released by electron attachment is removed by monomer evapo-
ration. Moreover, DA to clusters of this type followed by isomerization and evaporation
again leads to non-stoichiometric cluster anion series, i.e. in case of CO2 to CO^ • (CC^) ions.
The prototypical case of CO2 has been investigated by free electron attachment in detail by several
authors [54-57,64], CF4 has been studied by Illenberger and coworkers [60].
3. Cluster ions consisting of monomers with near-zero EA: The solvated electron
Atoms and molecules with closed shell electronic structure (e.g. the rare gases, H2O,
NH3, hydrogen halides) cannot bind an additional electron, because the EA is exceedingly small if
not zero. Conversely, solids or liquids consisting of these constituents are known to strongly bind
excess electrons (e.g., up to 1.5 eV below the vacuum level for bulk H2O), indicating a positive
EA in the condensed state. These so called solvated (or hydrated) electrons (see Sec.
4.3.3) constitute self-trapped localized electrons in a potential created by the polarization of the
surrounding polar molecules leading to large intermolecular configurational changes [65]. In case
of clusters consisting of these constituents a transition has therefore been observed as a function
of cluster size from an unbound to a bound level for the additional electron. A series of success-
ful experiments to elucidate this transition has been performed by Haberland [66] and by Echt
[56,57] and their coworkers. Fig. 4.5 shows as an example a mass spectrum of D2O clus-
ter anions obtained with electrons of approximately zero energy. It can be seen that the ap-
pearance size of stoichiometric water cluster anions is 12 (n = 11 for ordinary H2O), whereas non-
stoichiometric anions produced via DA (with electrons of higher energy) appear at all cluster
sizes. In case of ammonia the observed appearance size of(NH3)n is n = 36. The existence of
these solvated electron states in clusters has been theoretically attributed to either interior or
surface states depending on the system and size considered [68-70].
In the next paragraph the kinetics of the production by free electron attachment processes
of cluster anions belonging to these categories will be described. It should be mentioned how-
294

CMo
l/)cD
*
JD
O cvj
CCD
DO
CO
i—i o
Ee=7eV (D20)n.1OD'
n=2
rOD'
10 20
\, v Ai
Ee=OeV (D20)n 20
12
(x10)
v u v
5 10 15 20 25 30
Time of f l ight ( p s )35
Fig. 4.5 Mass spectra of water cluster anions obtained with 1 eV (upper part) and appr. 0 eV
(lower part) incident electrons after Knapp et al. [67].
ever, that there exist in addition several studies involving bound electron capture by clusters, in-
cluding charge transfer from fast alkali beams to hydrogen halides, (Cl2)n, (SO2)n, (NO2)n,
(CO2)2 and (H2S)n clusters [71], and capture of bound electrons from high
Rydberg atoms by NO, CO2, N2O, SF6, OCS, CS2, CH3CN, C5H5N clusters [72] including those
studies using Rydberg atoms in well defined nl states [73]. Moreover, during the past ten years
295

photoelectron spectroscopy, photodissociation and reactions of negative ions have proven to be
powerful means of establishing some of the properties of cluster anions including, not
only van der Waals [74,76], but also valence [75,77] and metal [78,79] cluster anions.
4.4.2 ELECTRON ATTACHMENT CROSS SECTIONS
Up to now, five groups (Oak Ridge [54], Innsbruck [53,58,59,64], Konstanz
[55,56,61,67], Novosibirsk [57] and Berlin [60]) have studied the attachment of free electrons to
clusters as a function of electron energy, including O2, CO2, H2O, N2O, SO2, SF6, CF4, C2F4,
C2F6, CF6C1, C2F3C1 and C2F4C12 clusters. In all of these experiments, electrons from an elec-
tron gun are attached to a beam of neutral clusters produced by supersonic expansion
through a nozzle. Due to the statistical nature of the condensing process in such a nozzle expan-
sion a broad distribution of neutral cluster sizes is generated. Therefore it has not been possible -
at least for anions [80] - to determine absolute attachment cross sections for specific clus-
ter sizes. Moreover, relative attachment cross sections reported for a specific cluster anion are
always the result of the interaction of electrons with a distribution of neutral cluster sizes. Never-
theless, mass spectrometric studies concerning the dependence of measured ion abundances on
size and electron energy yield valuable information on (i) ion stability (magic numbers), on (ii)
overall ion production efficiency (mean effective total cross section), and (iii) size dependent
structure in attachment cross section functions (resonances).
1. Ion stability (size distribution, magic numbers, autodetachment)
If vdW clusters are formed by a mild supersonic expansion the measured size distribution
of cations (produced by electron impact ionization) is found to be in general quasi-exponential
[81]. Superimposed on this general trend are local abundance anomalies called magic numbers,
which are attributed to the intrinsic stability of specific cluster ion sizes [80]. Size distributions of
cluster anions are completely different from cation spectra in most cases investigated so far. Fig.
4.6 shows a comparison of mass spectra of (a) (O^)^, produced by electron impact ionization
with 100 eV electrons and (b) (02)^, produced by attachment of electrons with approximately 0
eV. It can be seen that the same neutral distribution leads for instance via electron impact ioni-
zation to a strong signal for (02)24 anc^ ^2)25 anc* v*a electron attachment to strong minima for
296

n•+^"c
_uL_O
Co
T l I
10 20 30 40 50 60 70
Cluster size
Fig. 4.6 (a) Positive mass spectrum of an (O2)n beam (100 eV electrons, (b) Negative mass
spectrum of an (O2)n beam at early times after ion production (appr. 0 eV electrons), (c)
Negative mass spectrum of an (O2)n beam at late times after ion production (appr. 0 eV
electrons) after Walder et al [53].
297

a°d (02)23- Moreover, the two negative-ion spectra recorded at different times after ion
production ((b) and (c) in Fig. 4.6), exhibit completely different overall shapes of distribution.
Whereas the spectrum at early times (b) shows a general decreasing abundance with cluster size,
the spectrum at later times (c) is strongly depleted at small cluster sizes. This depletion is be-
lieved to be due to autodetachment [53]. The strong dependence of the depletion on cluster size
(i.e. increasing depletion with decreasing cluster size) implies shorter lifetimes for smaller clus-
ter ions. This is in accordance with observations in case of polyatomic molecules [20], where the
reported autodetachment lifetimes increase with complexity (i.e., with the number of vibrational
degrees of freedom).
2. Mean effective total attachment cross sections
Vostrikov et al. [57] reported the determination of an absolute effective total attachment
cross sections for H2O clusters of average size 900, N2O clusters of average size 350, and CO2
clusters of average size 1 100. These effective total cross sections (total cross section divided by
cluster size) are shown in Fig. 4.7. From these data (whose accuracy is not known) follows that
the effective attachment cross sections for clusters (in the size of several 100) are much larger
(reaching for very low electron energies values larger than the geometrical cross section) than that
of the monomer, which is in contrast to observations in the case of positive cluster ion production
[82]. These large cross sections reported by Vostrikov et al. [57] are in accordance with quanti-
tative observations by Echt and coworkers [83], who reported that attachment of low energy
electrons to large O2 clusters is at least as efficient as positive electron impact ionization with 30
eV electrons. Moreover, the direct comparison of the total ion yield for anions and cations
for large H2 and N2 clusters at one electron energy (44 eV) shows a strong almost linear depend-
ence of the cross section ratio on averaged cluster [84].
3. Size dependence and structure of relative partial attachment cross section functions
Low energy electron attachment to the O2 monomer yields O as the only observable
product ion via DA
i.e., 02x3Z- + e ^ 0 * 2 n u - ^ 0 - 2 p + o3p (4.6)
298

Fig. 4.7
O
o
T)Q)
o(_o
G;•4—
UJ
1O
1 *
10
10
10
1 » 1 1
= f(x/0*)
900
i t
i i n i i
ffoo r\
I I I 1 I
1100
1 1 1 ) 1to'7
__L__
0 2 4 6 10 14Elec t ron energy ( eV)
Effective total attachment cross section (total cross section divided by the average cluster
size n) versus electron energy after Vostrikov et al. [57] for H2O, N2O and CO2. Also
shown (dashed line) is the total attachment cross section for the respective monomers
(multiplied by a factor given in brackets).
299

The cross section for this process shows a single structureless peak at = 7 eV with an onset at
about 4 eV. The same reaction contributes to dissociative electron attachment to clusters yielding
(O2)n O ions, but in this case the cross section arises from contributions (see Fig. 4.8) of both the2nu and the 2Z^ state of Oj producing essentially a broad single peak at near 7 eV and showing
a slight solvation shift at the onset. The 2!+ is formed in clusters due to a breakdown of the IT
<-» Z+ selection rule [85,86] which is operative in the single-electron-target frame of reference.
Additional structure above the 7 eV peak, not present in the case of the monomer, is attributedessentially to the production of the 2I+ state of O^ which is also forbidden by the symmetry rule.
00 10
Electron energy (eV)
Fig. 4.8 (02)40" anion signal (designated by open squares) produced by electron attachment to 0%
clusters as a function of electron energy after Mark et al. [53]. Also shown is the energy
dependence of the O~ (designated by open circles) produced via dissociative attachment to
O2 (i.e., reaction (5)).
300

ü'E
2
c
oco -1
Electron energy (eV)
Fig. 4.9 Anion signal produced by electron attachment to (>2 clusters as a function of electron
energy after Mark et al. [53] for three different ion sizes. Also shown for comparison theO~ and O J ion yield (see Fig. 8).

In contrast to the monomer, electron attachment to C>2 clusters also yields stoichiometric oxygencluster anions (02)^. The respective attachment cross section function (see Fig. 4.9) not only
shows a peak at approximately 7 eV (involving the anion states 2nu and 2Z+ ), but in addition a
strong resonance peak close to zero energy. This zero energy resonance peak (which becomes
more dominant with increasing cluster size) has been attributed [53] to production via the X2Ilg
state with subsequent stabilization by monomer evaporation, in accordance with observations on
electron attachment in dense gases [13].
Some of the other systems studied (e.g. CO2, H2O, SO2, SF6, C2F3Cl2) show a similar
dependence of the cross section on electron energy and the size of the target. For instance, the
production of (CO2)nO ions is dominated by the same reactions, albeit with significant red shifts
due to solvation effects, as the DA in CO2, i.e. the peak at approximately 4.4 eV due to the first
shape resonance (2nu state) and at about 8.2 eV due to an electron excited Feshbach resonance
(2X+ state) [54-56,64]. The most remarkable feature for the stoichiometric CO2 cluster anions is
again the appearance of an additional resonance at about zero energy, first discovered by Stama-
tovic et al. [64]. Very recently, production of (CO2)nO2 ions and of the other CO2 cluster anion
via the 2<I>g anion state has also been observed [87].
As discussed above, free electrons of almost zero energy can be attached to water clusters
with high efficiency (see Fig. 4.10). The maximum cross section for the formation of (D2O)n at
approximately zero energy is at least one order of magnitude larger than that for the formation of
(D2O)n.1DO at approximately 7 eV (e.g. for n = 20) [67]. The attachment cross section of the
hydroxygenated cluster anions is very similar in shape to that obtained by DA to the monomer
(Fig. 4.10).
Anion yield functions have been recorded for a number of other type of molecular clusters
including those formed with SO2, SF6, C2F3C1, C2F4C12, CF4, C2F4, C2F6, CF6C1 and N2O
[55,56,58-61,88]. The main characteristics of electron attachment in these aggregates has been
found to be similar to those described in this section, although in some instances significant differ-
ences have been observed. For example, in SO2 clusters the first resonance is very effi-
302

10
cD-Û
CQJ
-3O
Co
0 1 2 3 4 5 6 7 8 9 10- 11 12 13 14
Electron energy (eV)Fig. 4.10 Yield of (D2O)~ and (D2O) ,DO* as a fonction of electron energy after Knapp et al.
[67]. The yield being displaced for the solvated hydroxyl anions is the weighted sum over
several cluster sizes between 2 and 9.
ciently quenched in favor of SO2 production [58]. This is in contrast to the findings in O2, CO2
and H2O. Further information on the incident electron energy dependence of anion and cluster-
anion formation from the above-mentioned molecular systems can be found in the recent review
articles by Mark et al and Stamatovic [28] and Oster et al [89].
4.5 ELECTRONS IN SOLIDS
In this section, we describe electron scattering experiments performed with molecular
solid films in the energy range 0-20 eV. Some of the results of these experiments are presented
in order to illustrate the most important processes related to the action of electrons in condensed
media.
303

Molecular solids are of particular interest in the present context because (1) they often
retain many of the properties of their individual component atoms or molecules, making possible
comparisons with gas-phase data and (2) many organic molecules, which are the building blocks
of the more complex biological molecules, form molecular solids in the condensed state.
Furthermore, the description of slow electron scattering processes in terms of intramolecu-
lar resonance mechanisms and potential scattering is an approach which has proven successful to
describe the interaction of low energy electrons with molecular solids [90]. With this approach, it
has often been possible to explain structures in the energy dependence of an inelastic cross section
(or a signal proportional to that cross section) by invoking the formation, at specific energies, of
transient anions within the solid or near its surface. Comparison with gas-phase data has been
most useful in identifying the resonant states and in investigating the modifications to the charac-
teristics of the isolated transient anion induced by the presence of neighboring targets. Other non-
resonant features in the energy dependence of the cross sections could usually be explained by
specifying which part of the interaction potential is dominant.
4.5.1 EXPERIMENTS
The interaction of low-energy electrons with rare-gas and molecular solids can be investi-
gated by allowing monoenergetic electrons to impinge on a thin multilayer film grown in an ultra-
high-vacuum system by the condensation of gases or organic vapors on a clean metal substrate
held at cryogenic temperatures (15-100 K) [90]. The substrate can be either a single crystal or
polycrystalline. Depending on the type of apparatus, it is possible to measure the dependence on
primary electron energy of the current transmitted through [91], trapped [92] in, or reflected from
the film [93,94] or that of the positive ion, [95] negative ion, [96] and neutral species
fluxes [97,98] emanating from its surface. As a general rule, the film thickness must be larger
than the total electron mean free path in order to minimize effects of the metal substrate. Evi-
dence that a given process occurs within the bulk of the material arises from the presence of mul-
tiple scattering effects in the data [99,100]. It can also be provided by specific experiments such
as matrix isolation [93,101].
304

Low-energy electron transmission (LEET) spectra are obtained by measuring, as a func-
tion of incident electron energy, the current It(E) which after traversing a multilayer film arrives
at a metal substrate [91]. In these experiments, It and the beam resolution are of the order of a
few nA and 0.04 eV, respectively. The absolute electron energy scale is calibrated within ±0.15
eV with respect to the vacuum level by measuring the onset of electron transmission through the
films. When the film is charged by the electron beam, this onset is shifted by AV to a higher ac-
celerating potential since the incoming electrons must then possess additional kinetic energy (KE)
to overcome the negative potential barrier caused by accumulated charges. Such measurements
are usually performed in conjunction with LEET and other multilayer-film experiments to make
sure that no significant charge accumulation occurs during the time of the experiment. However,
if the film is purposely allowed to charge by an easily measurable potential AV, this latter can be
related to the trapping cross section by treating the dielectric film as a charged capacitor [92].
Energy losses by electrons scattered within the condensed film can be measured by high
resolution electron energy loss (HREEL) spectroscopy [93]. In these experiments, electrons
leaving a monochromator are focused on the film and those re-emitted from its surface within
narrow cone at another angle are energy analysed by another electron deflector (i.e., the analyser).
Depending on the apparatus, it may be possible to vary the angle of incidence 8, or the analysing
angle 6r (defined from the surface normal) or both. The absolute electron energy scale is calibrated
from LEET spectra. HREEL spectra are recorded by sweeping the energy of either the
monochromator or the analyser. The energy dependence of the magnitude of a given energy loss event
(i.e. the excitation function) is obtained by sweeping the energy of both the monochromator and the
analyser with a potential difference between them corresonding to the probed energy loss. HREEL
spectra are usually recorded at overall resolutions ranging from 6 to 20 meV with corresponding
incident currents lying in the 10'10 - 10-9A range [93,102].
A portion of the positive and negative ions produced by electron impact on condensed
molecules can be measured by placing a mass spectrometer near the film surface [95,103]. In
these electron stimulated desorption (ESD) measurements, ions emerging from the surface are
focused by lenses located in front of the entrance of the mass spectrometer. Grids can be inserted
305

Fig. 4.11 Schematics of the angle-resolved electron stimulated desorption apparatus. The target is
tilted by 15° with respect to the incident electron beam. Grids Gl to G6 are used for
charge and energy discrimination. The electron energy can be varied from 1 to 30 eV.
between the lenses and the mass spectrometer in order to analyse the ion energies by the retarding
potential method. It is also possible to measure the angular distribution of ESD yields of ions and
metastable neutrals by combining position sensitive detection with monochromatic electrons as
shown in Fig. 4.11. In this apparatus, [97] an electron beam, emanating from an electrostatic
monochromator, is incident on a target film. Backscattered electrons and desorbed ions are
energy-analyzed by a set of 4 grids (G1-G4) before they enter a field-free region between G4 and
G5. They are then accelerated onto an imaging device consisting of a stack of two gold-coated
microchannel plates (75 mm diameter detecting area) mounted above a resistive anode. The latter
306

is coupled to a pulse counting position computer The image coordinates are digitized, buffered
distortion-corrected in real-time and stored in a microcomputer. This storage can be time-
discriminated following an incident-electron pulse so as to perform two-dimensional (2-D) time-
of-flight (TOP) analysis. This analysis for metastable species and photons is obtained with large
positive and negative potentials on grids G2 and G3 respectively, in order to repel all charged
particles. With these potentials the space integrated TOP spectra consist of a sharp photon peak
followed by other peaks corresponding to metastable species of different energies and/or masses.
Allowing positive charges to pass through the grids superimposes the contribution of the positive
ions, whereas allowing negatively charged particle to reach the detector superimposes the
contribution from electrons and anions. In the negative-charge counting mode, the 2-D image at
short time corresponds to electrons and those at longer times to anions. On single crystals the
electrons produce sharp diffraction patterns which determine the substrate and film crystalline
structure. In this manner, electrons are also space differentiated from photons, metastables and
anions. From mass spectrometric ESD data, the electron energy can usually be chosen to produce
a unique anion or cation in order to avoid mass ambiguities and determine the ion energies by
TOP.4.5.2 ELASTIC SCATTERING
The structure in the energy dependence of elastically transmitted or reflected currents of
molecular films can be explained by invoking multiple scattering of the electron waves between the
potentials of the individual atoms or molecules. Structures in the elastic cross section due to intermo-
lecular interferences of the electron waves are most prominent in elastic reflectivity experiments, since
in these both the incident and outgoing electron momenta are measured with a HREEL spectrometer.
In well ordered films, the diffraction structure is dominated by long-range order [104] whereas, in
amorphous substances, it is due to short-range order. This effect of this latter can be detected in the
energy dependence of the elastic reflectivity or elastic scattering cross section [100]. The energy
dependence of such a cross section is given by the curve at the top of figure 4.12 (a), obtained from the
analysis of elastic reflectivity data of a 30 monolayer (ML) amorphous H2O film. It exhibits a rise at
low energy and two broad structures whose maxima are located at 6 and 14.5 eV. The relative
position of these features can be calculated from the experimental values [105] for the structure factor
of amorphous ice at 10 K assuming other parameters to be constant.
307

—E
b
Z01-oLU
COCOoceü
4
3
l
1
0
3
2
t
0
2
1
04
3
2
1
0
2
1
°
elastic^ - (a)
K /r\ ,/*"" \ '^ v--* vv;\ , '
t-"10" "7 " • ~°~
' 1 v;X
H - XN ^ . -_^-_-- -T
*
———— 1 ———— t ———— i ———— i ———— i ———— i ———— i ———— | ————
VL
t +' ~~^~- , ,-*-'"""*" ~~~"f".$ T
i' ' X ' ' ' ' •-, / ^
X f__-f---4-- T.
— i —— i —— i —— i — i —— i —— i —— i —
others /!' -/
^*r/
--*-----*-'.'} 2 4 6 B 10 12 14 16 1C
ELECTRON ENERGY(eV)
fs
E,PLT~
Zopo(UCO(00)oerü
4
2
0
10
8
6
4
2
04
2
04
2
0
4
2
(b)_ i •vkv >"''"* •$-——$---'*• *'
— i — i — i — i — i — i — i — i —/ iN
V, 3/ \
J \
/ N
M _ 4_ ixi /i "i T v-N , .
V"*^^JL_ -^^ •i p
'
V)
^ _ __»--•""* ~~-~^,_~~*~î"~ III l~"~~ ~"*~~|— — -• ——— »— l
v. v
~*~—~~^*
2 (V, 3)
*-"'~~^^x v-xi_^s "t- ————— f_^^
-'*** ^^»^
°0 2 4 6 8 10 12 14 16 18
ELECTRON ENERGY(eV)
Fig. 4.12 Energy dependence of the elastic and vibrational electron scattering cross sections per
scatterer in amorphous ice derived from multiple scattering analysis of energy-loss spectra.
The bottom curve in (a) represents the cross section ascribed mainly to the sum of
electronic excitations, dissociative attachment and ionization.
LEET spectroscopy is also sensitive to elastic scattering below the energy threshold for
electronic excitation, in a region where the transmitted current is purely or vibrationally elastic.
However, in transmission only the incident beam has a well defined momentum since electrons which
have been scattered into any angle can be measured at the metal substrate. Furthermore, when the film
is highly disordered, electrons can be scattered in all possible directions near the surface, so that the
308

Ar on Ft
en4-<
cD
£>i_(0
LUcef£Dü
ÛLU
œz<ceh-
I I l l l l l l l l l
5 10E N E R G Y CeV)
15
Fig. 4.13 Electron current transmitted through Ar films as a function of electron energy. The film
thickness is indicated on the right-hand side of each curve. The arrows indicate the
position of structures characteristic of the number of monolayers. The current measured
on the clean Pt substrate is shown at the top.
309

penetrating momentum is also unspecified. So under these conditions, LEET spectra are expected to
represent a directionally averaged band structure [106]. This implies that the elastic portion of the
transmitted current should be related to the electronic conduction band density of states (DOS) of the
condensed material [107,110]. Analysis of the LEET spectra of Ar, Xe, CH4 films according to the
Fermi golden rule has been compared with respective DOS calculations. These comparisons clearly
indicate a relationship between elastic LEET currents and the DOS [107,111-118].
For thin well ordered films where scattering by defects is not sufficiently intense to redistribute
most electrons in random directions and where energy losses to phonons and intra-molecular vibrations
are small, a portion of the penetrating electrons are capable of conserving a specific momentum during
their residence in the film. Then, constructive and destructive interference of the electron wave can
evolve between the film-vacuum and film-substrate boundaries. This phenomenon, called quantum size
effect (QSE), modulates the usual transmission features arising from the bulk DOS [119,120]. This is
shown in Fig. 4.13 by the LEET spectra of 1-3 Ar layers deposited on a polycrystalline platinum
surface having microfacets with the (111) orientation. The drastic differences between these curves is
due to the dominance of QSE features (shown by the arrows in Fig. 4.13) at low coverages. Similar
effects are expected for layered structures located within cells. Coherent scattering of the electron
wave within solids and near their surfaces considerably reduces the gas-phase elastic scattering cross
sections (e.g. by at least an order of magnitude) [100,112] and renders elastic scattering "thickness
dependent" within ordered layers.
4.5.3 INELASTIC SCATTERING
By scattering within molecular solids and at their surfaces low-energy electrons can excite with
considerable cross sections phonon modes of the lattice [93,100,121,122] and individual vibrational
levels of the molecular constituents [93,100,121-131] of the solid. Electronic excitation also occurs
but with a much smaller cross section. All types of energy levels can be populated either by potential
(i.e., direct) or by resonant scattering depending on the mechanism prevailing at specific energies, but
as a general rule resonances have a tendency to dominate the electron-impact vibrational excitation
cross sections in molecular solids. However, for solids composed of molecules having a strong dipole
moment, direct scattering may be sufficiently strong to excite at au energies, with considerable
amplitude, the lowest- energy lattice and molecular vibrational modes [100,131]. Results obtained
310

NORM
ALIZ
ED S
CATT
ERED
INTE
NSI
TY (X
10"3)
1
& S "Ö Ct( "B
a 5 VI O) n» l 8 I *- i s-; o» •8 S
5>w>
O
?
3<D
g
5'
I.s.
sI ?
*"
U
£L
Sïf
s
§•
g.§
O
QS O)
p UJ
O iI
ÊI
«C
B
> a a
roo>
O)
m m
o33
w
O O O)
p o> p 00

with amorphous H20 films provide a good example of the competition between resonance and dipolar
scattering in producing inter- and intra-molecular vibrational excitation [99,100,121,122,131].
HREEL spectra [121] for a 30-ML film of amorphous ice recorded at 6; = 14° and 0r = 45°
and for incident energies of 7.2 and 9.2 eV are shown in Fig. 4,14. These spectra can be compared
with infrared and Raman spectra of ice [132]. The major energy-loss peaks are identified as a transla-
tional mode (VT) at 24 meV, librational modes (VL) at 62 and 95 meV, the bending mode (v2) at 205
meV and the unresolved stretching modes (v^ 3) at 425 meV. The remaining features along with the
background signal are mainly attributed to overlapping and multiple-scattering [132]. In order to
extract scattering cross sections per scatterer from such spectra, HREEL spectra recorded at different
incident electron energies must be fitted to multiple scattering calculations [99,100,133] based on a
Table 4.3
Total effective oTeff and total inelastic, crTi cross section per scatterer (10~16 cm2) with thecorresponding l/aeff and 1/oq MFP values (A) for electron scattering in the low-densityamorphous form of ice.
Electron energy(eV)1.22.23.24.25.26.27.28.29.2
10.211.212.213.214.215.216.217.218.219.2
GT.eff
1.401.030.830.961.021.021.231.180.980.820.830.901.031.181.191.051.170.970.90
>/<*,„22.730.838.233.131.131.125.826.932.438.738.235.330.826.926.730.227.132.735.3
aT.i
1.060.770.610.650.680.700.880.890.750.600.560.590.660.760.800.770.940.820.81
,/a,
30.041.252.048.846.745.336.135.742.352.956.753.848.141.839.741.233.838.739.2
Gasa
0.740.460.460.550.610.660.680.650.57
312

model which takes into account the magnitudes of the relevant cross sections. Such fits [132] are
shown by the continuous curves which pass through the experimental points in Fig. 4.14. From these
and total reflectivity measurements, the absolute cross sections per scatterer given in Table 4.3 were
generated. The cross sections so extracted include intrinsically quantum effects pertaining to a single
site as well as those due to the presence of neighboring similar sites. The fit includes an effective (aeg)
and inelastic (Ojn) coefficient of angular anisotropy which allows to evaluate the contribution of
forward scattering. The energy dependence of the cross sections for the major energy losses is shown
in Fig. 4.12.
The absolute electron scattering cross sections for exciting the translational (v andvj) and
librational (Vj andVj) modes of amorphous ice in the 2-18 eV range are shown in Fig. 4.12 (a). The
bottom curve labeled "others" represents contributions to the inelastic cross section arising from DA,
electronic excitation and ionization. Cross sections for exciting the bending (v2) and stretching (v j and
v3) modes are shown in Fig. 4.12 (b). The latter two are found at two slightly different frequencies
giving rise to the curve labeled v^ 3 which represents the cross section for an unresolved peak con-
taining energy-loss contributions from both the symmetric and asymmetric stretching modes. The 2-
18 eV behavior of the absolute cross section for exciting the strongest combination mode (VL + Vj 3)
and the most intense of the overtones [2(vi 3)] are shown at the bottom of Fig. 4.12 (b). The v andvf
lattice modes are clearly characterized by a peak around 7 eV having =; 2 eV FWHM and a rise at low
energy. The v^ 3 modes exhibit a broader (=; 4 eV FWHM) feature around 8 eV with a smaller rise at
low energy.
In the curves of Fig. 4.12, any increase toward lower energies has been ascribed to direct
scattering (i.e., electron-dipole and electron-polarization interaction) which is present throughout the
spectra and possibly accounts for the constant portion in the magnitude of the cross sections [100].
Note that no constant portion exists in the cross section shown in the bottom curve of Fig. 4.12 (b). In
the absence of a large quadrupole moment, the magnitude of the cross section for overtones can only
arises via resonance scattering since the dipolar interaction, which is dominant, can only impart to the
molecule one quantum of vibrational energy.
313

From comparison of the energies and widths of the features of Fig. 4.12 with those found in the
gas-phase cross sections the strong enhancement of the amplitude of the Vj 3 mode near 8 eV can be
ascribed to the formation of a 2B2 I^O" transient anion state whereas the broad peak near 7 eV in the
Vj excitation fonction correlates to a 2Bj anion state [121]. While the excitation of an intramolecular
vibrational mode by a resonance process can be inferred from gas-phase mechanisms, the excitation of
lattice vibrational modes by the longer-lived 2Bj state requires a new mechanism. Because of the
overlapping of electron-molecule interaction potentials in the condensed phase, a transient anion state
is also coupled with the nuclear and electronic polarization modes of the surrounding medium. When
an electron is localized in the vicinity of an I^O molecule a force is exerted between the E^O" state
and the permanent dipoles of the surrounding molecules which pull these latter toward the anion
initiating translational and rotational motion. Calculations with a classical harmonic oscillator model
[121] indicate that, a resonance whose lifetime is greater than 10'14 sec can transfer a significant
amount of energy to librational motion by this mechanism, which is also effective in producing
translation motion for resonance times of the order or larger than 10~13 sec.
Electronic excitation by low energy electrons in multilayer atomic and molecular films
condensed on metallic substrates has been investigated by LEET [10,91,106,108,109,118,134-139],
HREEL [101,125,130,140] and metastable emission [97] spectroscopy. The inelastic features in
LEET spectroscopy usually appear as broad maxima resulting from a convolution of inelastically
scattered current distributions created by the much reduced energy of electrons having produced
excitons and band-to-band transitions within the film [91,138].
With HREEL spectroscopy sharp energy loss peaks can be observed, when the band-structure
dispersion is small as shown in Fig. 14.5 for 16-eV electrons incident on a 15-ML N2 film [93]. Each
peak can be ascribed to a vibrational progression belonging to the electronic states indicated in the
figure. These results are representative of electronic excitation in molecular solids induced by slow
electrons which has been found to be similar to the gas-phase below the band gap. Above this energy,
Rydberg transitions disappear as well as electron resonances associated with such states. Electronic
transitions have larger widths and slightly different energies than in the gas-phase. As expected from
the strength of the exchange interaction at low energies, spin- forbidden states are prominent below 20
314

*N2s' (a) 3»w AI
2 3 4 5 6 7 3 9 10 11 12
.c:Mm
LU
atuCLIU
OCO
C 3 4 S 5 7 3 9 10 n 121314a' 2. u
i I , l T l i i i i5 6 7 8 9 ion 12131415
0 1 2 3 4 5 6 7 8 3 1 0 ' l ',21314152 3 4 5 6 7 3 9 1 0 1 1
8 9ENERGY LOSS (eV)
11
12 13ENERGY LOSS (eV)
14 15
Fig. 4.15 (a) HREEL spectrum of a 50 A N2 film condensed on Nb in the range 6-11 eV. The
incident energy was 16 eV. (b) HREEL spectrum of N2 on Nb in the range 10-15 eV.
The incident energy was 16 eV. The arrows indicate the position of two weak peaks
whose enhanced visibility at 13.5 eV incident energy (inset) is attributed to a resonance.
315

eV. In fact, below 10.5 eV in Fig. 4.15, the data are qualitatively similar in amplitude and energy to
those recorded in gas-phase N2 at the same primary beam energy. Above 1 1 eV, in a region where an
abundance of Rydberg states appears in the gas phase, we only observe the B^Ily valence state in solid
The curves in Fig. 4.16 give an example of the results obtained from the application of the three
techniques (LEET, HREEL and metastable) to a thick (>100 ML) multilayer Ar film. The top curve
represents the HREEL excitation function for producing the n1 - 1 (j = 1/2) exciton of solid Ar. Some
of these excited states and of the n = 1 (j = 3/2) states, can convert to 3p54s and 3Pj vacuum states
of Ar as seen from the ESD results of the middle curve. This latter exhibits the incident electron
energy dependence of the yield of metastable argon emitted in vacuum with an average energy of 50
meV. Since higher electronically excited states of the solid are much shorter-lived than the TOF in
0 5 10 15 20
INCIDENT ELECTRON ENERGY (eV)Fig. 4.16 (Top) Excitation function of an energy loss of 12.20 eV. (Middle) Function for
metastable Ar production. (Bottom) Electron transmission spectrum. Structures are
correlated via electron density of states for solid Ar. All three curves were recorded with a
multilayer Ar film condensed on Pt.
316

these measurements, the middle tracing is believed to represent the yield function for the production of
the 3p54s states of Ar. The structure above 11 eV in the LEET curve at the bottom of Fig. 4.16
represents the excitation function for exciton creation at incident energies close to that of their
excitation threshold. The similarity in the line shape of the three different spectra reflects the
dependence of exciton production on the joint densities of initial and final states available to the
electron before and after the energy loss event, respectively; these densities intervene in the three
different measurements. The LEET spectrum and metastable yield were recorded with the apparatus
shown in Fig. 4.11; the other curve with a HREEL spectrometer.
4.5.4 MOLECULAR DISSOCIATION
Above a certain energy threshold, electrons impinging on isolated or condensed molecules can
cause disruption of intemuclear bonds which leads to fragmentation. Depending on the intermediate
state involved and charge exchange processes, these fragments can be either neutral, positively, or
negatively charged. In molecular film experiments, dissociation products can be measured by the ESD
techniques of the types described in 4.5.1. Charged particles observed by ESD are those which possess
sufficient KE to overcome the polarization forces they induce in the solid. The other charged particles
which are unable to leave the solid can be monitored by measuring the trapping cross section as
described in the experimental section.
Anion emergence into vacuum from electron bombarded molecular solids [96,103, 141-149]
can proceed via DA and/or dipolar dissociation (DD) (i.e., for a molecule AB, e + AB —» AB* + e —>
A+ + B~ + e). This latter process produces a smooth continuous signal which, beyond threshold,
increases monotonically with electron energy. The threshold energy for dissociation within the solid
corresponds to the dissociation energy of the isolated positive and negative species screened by the
polarization induced by the products in the solid. Below the energy threshold for DD, ESD of negative
ions can only proceed via DA [96]. This process constitutes a particular channel for the decay of
molecular transient anions (Fig. 4.1) formed within molecular solids and near their surfaces and within
clusters as explained in section 4.4. Since a given molecular configuration of a transient anion appears
at a well-defined energy each peak in the electron-energy dependence of the anion ESD yield identifies
the energy of a particular resonant state.
317

I—2LUceenDu2OLU
U
i T T r r i i i i i i T t i i i i i i1 3 5 7 9 11 13 15 17 19
ELECTRON ENERGY (eV)
Fig. 4.17 Energy dependence of H~ signal desorbed by electrons impinging on a 6-ML film of
molecules deposited on a Pt substrate.
Anion ESD by both DA and DD processes is exemplified in Fig. 4.7 by the energy dependence
of H yields recorded with multilayer films of condensed CnH2n+2 (n = 1,2,4,5,6) molecules [146].
All curves exhibit a single peak, whose maximum is located around 10 eV, and a rise which onsets at
higher energy (16-18 eV). This latter is due to DD. The 10-eV peak is caused by the DA reaction
e- + CnH2n+2 -^ (CnH2n+2) -^ H- + CnH2n+1
Similar yield functions are observed for CH3 , CH2 , and CH ions, in order of decreasing intensity
[146]. These anions also arise from the decay of transitory (CnH2n+2)~ states. DA features have also
been observed in the O~, C~, CF and H~ ESD yield functions measured from molecular solids formed
by condensing O2, NO, CO, C12, N2O, H2O and hydrocarbon molecules on a metal substrate
[103,141-147]. More recently, the anion-complexes Ar.O , Ar.Cl were produced by ESD from Ar
matrices containing N2O and C12, respectively [86]. O , Ar.O , Kr.O , Oj (or O2.O~) and O^ were
also produced by ESD from solid rare-gas matrices containing O2 [86,148]. The ESD yield functions
318

cD
-ûD
Oz
0 1 2 3 4 5 6 7 8 9ELECTRON ENERGY (eV)
Fig. 4.18 Anion yields produced by 0-10 eV electron impact on (a and b) gaseous O2 anc^ on (d) a
20-ML Kr film covered with 0,1 ML of O2. The electron energy dependence of the
surface charging coefficient As for 0.1 ML O2 on a 20 ML Kr film is shown in (c).
from O2 isolated on solid rare-gas surfaces have also been reported [142,145]. The O yield function
for submonolayer O2 on a 20 ML Kr film is shown in Fig. 4.18 (d). It results from dissociation of the2nu transitory Or state. Many of the DA reactions in the condensed state and particularly those
observed in ESD from multilayer films, were found to be similar to the processes found in the cluster
experiments described in section 4.4. For example, the ESD results from condensed multilayer O2
films resembles that shown in Fig. 4.9 for the O2.CT and (O^ yields above 6 eV and results from the
same three O ionic states.
Analysis of the electron energy dependence of these anion yields revealed that the gas-phase
DA mechanism was perturbed in the condensed phase by: multiple electron scattering prior to electron
attachment to a molecule; post-dissociation interaction (PDI) of the resulting anion with the solid; and
319

changes in the symmetry of the single-electron-molecule potential introduced by the presence of
neighboring targets. This latter change in symmetry led to the observation of IT <-> Z+ transitions
which are forbidden by electron impact in the gas-phase [85]. In addition, coherent scattering within
solids was found to enhance ESD yields [145], By analyzing the energy distributions of the desorbing
anions as a function of incident electron energy, [103,143,144] it has been possible to distinguish
between the contribution to the total yield arising directly from DA at a molecular site and the other
two portions of the signal which involve multiple scattering and PDI. It was concluded that the lattice
was not involved in the dissociation dynamics and that, therefore, the energy and momentum
conservation laws of the free molecule could be applied to solid state DA reactions [103,144].
Compared to other types of slow electron beam experiments the energy dependence of cation
ESD signals receding from surfaces covered with molecules, does not exhibit appreciable structure
[95,149-155]. In general, the signal rises monotonically from threshold to reach a maximum around 70
eV. The dissociating states are usually not dipole allowed and often involve two electron excitations.
Near threshold, the parent electronic states correspond to excited states of the neutral rather than those
of the ionized configuration. So, dipolar dissociation (DD) is the effective mechanism in this limit.
Predissociation and shake-up contribute to the cation yield at higher energies [151].
ESD of neutrals arising from dissociative states has been recorded primarily from species
chemisorbed on metal surfaces [98,156] and it is only recently that such measurements have been
extended to multilayer molecular films; [97,157] namely, amorphous ice. The 1-30 eV yield function
has been recorded for both molecular and atomic hydrogen. The H2 signal onsets at 6.3 ± 0.3 eV and
exhibits two broad peaks at 15 and 28 eV. The effective cross section for H2 ESD from a 4-ML H2O
film was found to lie within 10*18-10"17 cm2 in the incident energy range 10-30 eV.
4.5.5 CHARGE TRAPPING
As mentioned in section 4.3.1, LEET measurements near the threshold for electron injection
into multilayer films made it possible to obtain absolute values for electron trapping by molecules
condensed at the surface of such films. Measuring the dependence on incident electron energy of the
trapping cross section disclosed fundamental mechanisms for electron stabilization at the surface of
320

dielectrics. In many ways, these mechanisms can be related to those responsible for solvation in liquids
[158,159] discussed in section 4.3.3 and also to those responsible for charge localization within and at
the surface of clusters (sec. 4.4).
The charge trapping measurements are exemplified with the result of Fig. 4.18 (c) for trapping
by 0.1 ML of C>2 molecules condensed onto a 20 ML Kr film [160]. This figure shows the electron
energy dependence of As, a charging coefficient directly proportional to the absolute charge trapping
cross section [161]. The results are comparable to the energy dependence of the anion yields derived
from Û2 in the gas phase (i.e., a and b). No signal has been reported between 1.2 and 4.5 eV in the
gas-phase. The similarity with the gas phase data indicates that the surface charging in the 0-2 eV
range is due to vibrational stabilization via the 2ng Oj resonance, i.e.,
as it also occurs in high pressure gases and clusters. The trapping cross section in the region 4-10
eV is due to DA via the intermediate 2nu state of Oj [160], i.e., Eq. (4.6) sec. 4.4.2.
Since the ESD of O from the surface is also known to proceed through this process, the O
ESD and charging proceed via the same mechanism in this energy region. The small shift in energy
between the peaks for the gas-phase, ESD and charge trapping yields is due to the polarization force of
the Kr film. The maximum in As around 6 eV gives a value of (2.2 ± 0.7) X 10'17 cm2 for the trapping
cross section. This can be compared with the cross section in the gas phase at 6.7 eV of (1.3 ± 0.2) X
10'18 [162]. An enhancement of the DA cross section by at least a factor of 17 occurs on the surface.
The origin of this enhancement has been explained [161] by invoking the reduction of autoionization of
the 2nu C>2 state into the A 3!+, C3AU and C1! states of O2 and into the ground state
configurations due to the lower energy of the resonance at the Kr surface. According to calculations
[161] the change in the internuclear crossing points between the 2I1U and neutral states increases the
dissociation probability into the limit O(3P) + O (2P) by a factor of 21, thus accounting for
observations.
The electron trapping cross section per H2O molecule has recently been measured for
water cluster deposited on a 20 ML Kr film [163]. The incident electron energy dependence of
the cross section follows the trend observed for (D2Û) n and (D2O)n_i OD production from
321

Table 4.4
Charge trapping cross sections per H2O molécule \i (10~17 cm2) in H2O clusters condensed onto aKr surface as a function of initial incident energy Eo (eV) [163]. Also shown are the totalinelastic cross-section per scatterer (u^) and the cross section per scatterer for inelastic processesother than inter- and intra-molecular excitation in amorphous ice fiims (uother) obtained fromMichaud and Sanche [100]. Error on the absolute value of cross section (i ± 47% at 0.5 eVincident energy and ±40% elsewhere.
Electron energy(eV) *in Mother
0.41.01.82.83.33.94.34.64.95.35.96.56.97.47.57.98.48.99.49.69.9
10.110.410.610.9
52.811.8
1.030.440.440.300.740.210.380.230.301.190.941.301.780.801.431.403.094.747.789.634.722.903.77
8.86.56.06.36.66.76.86.86.87.48.39.09.19.18.77.97.16.86.36.15.85.75.6
0.170.120.070.050.090.120.210.360.530.630.650.680.680.680.670.66
Tabulated values for u^ and uother were interpolated using cubic spline from the values given at
other energies [100].
322

cluster containing Kn<10 molecules shown in Fig. 4.10. A sharp rise is observed near 0 eV
indicating strong energy losses to vibrational excitation followed by electron trapping. Similar
to the data in Fig. 4.10, a maximum is observed near 7 eV due to DA. The cross section for this
process is found to be of the order of 10-17 cm2 which is about the same as the gas-phase value.
These electron trapping cross sections per H2O molecule (m) in clusters are listed in Table 4.4 for
incident energies lying between 0.5 and 10.9 eV. Other inelastic cross section in amorphous ice
are also shown in the third and fourth column. The values for u can be compared with those
obtained by Vostrikov et al [57] shown in Fig. 4.7. The high cross sections found by these
authors at the lowest energies are also reproduced in the 0.5-1.0 eV data shown in Table 4.4.
4.6 CONCLUSION
We have shown that recent advances in electron collision experiments make it possible to
obtain reliable information on low-energy electron scattering phenomena in high pressures gases,
clusters and solids. Probing these different forms of the condensation states of matter allows abundant
information on isolated electron-target interactions to be transferred to the liquid and solid phases.
The interaction of a low-energy electron with a molecule is found to be sensitive to the "environment"
in the condensed phase (i.e., the production of excited molecules, radicals, anions and cations by low
energy electron impact is dependent on the nature of the neighbors surrounding the target molecule).
This may render the transfer of information to particular condensed systems more difficult; but on the
other hand, this dependence makes it possible to modify the energy deposited at the molecular level by
changing the "environment" of a specific target (e.g. at a specific bond along the DNA chain). This
control of a relatively large amount of energy within the sequence of energy depositing events offers
extremely promising possibilities in radiotherapy; in particular, in the fabrication of site specific drugs
that could channel part of the energy flow to vital targets within a cell.
ACKNOWLEDGMENTS
L.S. is indebted to Mrs Francine Lussier for her valuable assistance in the preparation of this
chapter. The work was supported by the Medical Research Council of Canada and the IAEA. T.D.M.
acknowledges support by the Österreichischer Fonds zur Förderung der wissenschaftlichen Forschung,
Wien.
323

REFERENCES
[1] PIMBLOTT, S M , LAVERNE, J A, MOZUMDER, A, GREEN, N J B , J Phys Chem 94(1990)488
[2] MOTT, N F, MASSEY, H S W, The Theory of Atomic Collisions, Clarendon, Oxford(1965)
[3] TAKAYANAGI, K, Prog Theor Phys Suppl Japan 40 (1967) 216-48[4] For a review on electron resonances in gases see ALLAN, M, J Electron Spectrosc Relat
Phenom 48(1989)219-351[5] GERBER, A, FJERZENBERG, A, Phys Rev B3I ( 1985) 6219-27[6] DAVENPORT, J W , HO, W , SCHRIEFFER, J R , Phys Rev B 17 (1978) 3115-27[7] SfflNSAKA, K, HATANO, Y, "Non-Equilibrium Effects in Ion and Electron Transport", ed
E E Kunhardt, R Van Brunt, J Gallagher, and D Hudson, Plenum (1990) 275, SHINSAKA,K, HATANO, Y, Nucl Instr Methods, A327 (1993) 7
[8] HOLROYD, R A, SCHMIDT, W F , Annu Rev Phys Chem 40 (1989) 439[9] SCHMIDT, W F , IEEE Trans Electr Insul 19 (1988) 389[10] MARSOLAIS, RM, SANCHE L , Phys. Rev B38 (1988) 1118[l 1] FREEMAN, G R, "Kinetics on Nonhomogeneous Processes", ed G R Freeman,Wiley (1987)
19[12] HOLROYD, R A, "Radiation Chemistry", ed Farhataziz and MAJ Rodgers, VCH Publ
(1987)201[13] HATANO, Y "Electronic and Atomic Collisions", ed D C Lorents, W E Meyerhof, and J R
Peterson, Eisevier (1986) 153[14] JOHNSEN, R, LEE, H S , "Swsarm Studies and Inelastic Electron-Molecule Collisions", ed
LC Pitchford, B V McKoy, A Chutjian, and S Trajmar, Springer-Verlag (1985) 23[ 15] MORGAN, W L , ibid 43[16] CHRISTOPOROU, LG and SIOMOS, K, "Electron-Molecule Interactions and Their
Applications", ed L G Christophorou, Academic Press (1984), Vol 2, 221[17] WARMAN, JM, "The Study of Fast Processes and Transient Species by Electron Pulse
Radiolysis", ed JH Baxendale and F Busi, D ReidelPub Co (1982)433[18] FREEMAN, GR, "Electron and Ion Swarms", ed L G Christophorou, Pergamon Press
(1981)93[19] HATANO,Y,SfflMAMORI,H, ibid 103[20] CHRISTOPHOROU, LG, McCORKLE, DL, CHRISTODOULIDES, A A, "Electron-
Molecule Interactions and Their Applications", ed L G Christophorou, Academic Press(1984), Vol 1,477
[21] CHRISTOPHOROU, L G, HUNTER, S R, "Swarms of Ions and Electrons in Gases", ed WLindmger, T D Mark and F Howorka, Springer-Verlag (1984) 241
[22] MOTHES, K G, SCHUTTES, E , SCHENDLER, R N, J Phys Chem 76 (1972) 3758[23] HEGERBERG, R, CROMPTON, R W , Aust J Phys 36 (1983) 831[24] WENTWORTH, W E , STEELHAMMER, J C , Adv Chem Ser 82 (1968) 75[25] BIONDI, M A , Adv Elect Electron Phys 16 (1963) 67[26] HATANO, Y, Radiât Phys Che-n 34 (1989) 675, HATANO, Y , "Pulse Radiolysis", ed Y
Tabata, CRC Press, Boca Raton (1991) 199[27] MARK, T D , LEITER, K, RITTER, W, STAMATOVIC, A, Phys Rev Lett 55 (1985)
2559[28] MARK, T D , CASTLEMAN, A W Jr, Adv Atom Mol Phys 20 (1983) 65, MARK, T D ,
Int J Mass Spectrom Ion Proc 79 (1987) l, STAMATOVIC, A, "Electronic and AtomicCollisions" ed , H B Gilbody, W R Newell, F H Read and A C H North-Holland (1988) 729
[29] SENNHAUSER, E S , ARMSTRONG, D A, WARMAN, J M , Radiât Phys Chem 15(1980)479
324

[30] TEZUKA, T , NAMBA, H, NAKAMURA, Y, CfflBA, M, SHINSAKA, D , HATANO,Y , Radiât Phys Chem 21 (1983) 197
[31] NAKAMURA, Y , SHINSAKA, K , HATANO, Y , J Chem Phys 78 (1983) 5820[32] SHINSAKA, K , CODAMA, M, SRITHANRATANA, T , YAMAMOTO, M, HATANO,
Y,ibid 88(1988)7529[33] SHINSAKA, K, CODAMA, M, NAKAMURA, Y, SERIZAWA, K , HATANO, Y, Radiât
Phys Chem 34(1989)519[34] WARMAN, J M, J Phys Chem 87 (1983) 4353[35] TACHTYA, M, J Chem Phys 84 (1986) 6178[36] TACHTYA, M, ibid 87(1987)4108[37] TACfflYA, M, ibid 87 (1987) 4622[38] MORGAN, W L, ibid 84 (1986) 2298[39] LOPEZ-QUINTELA, M A, BUJAN-NUNES, M C , PEREZ-MOURE, J C , ibid 88 (1988)
7478[40] KANEKO, K , USAMI, Y, KITAHARA, K, ibid 89 (l 988) 6420[41] SCEATS, M G, ibid 90 (1989) 2666[42] MOZUMDER, A, ibid 92 (1990) 1015[43] Colloque Weyl VI, J Phys Chem 88 (1984) 3699[44] HART, E J, ANBER, M "The Hydrated Electron", Wiley-Interscience (1970)[45] FENG, D, KEVAN, L , Chem Rev 80 (l980) l[46] DORFMAN, L M, JOU, F Y, "Electrons m Fluids", ed J Jortner and N R Kestner, Springer
Verlag (1973) 447[47] MIGUS, A, GAUDUEL, Y, MARTIN, J L, ANTONETTI, A, Phys Rev Lett 58 (1987)
1559[48] LONG, F H, LU, H, SHI, X, EISENTHAL, K B , Chem Phys Lett 169 (1990) 165[49] KESTNER, N R, JORTNER, J, J Phys Chem 88 (1984) 3818[50] RAO, B K, KESTNER, N R, J Chem Phys 80 (1984) 1587[51] FUNABASffl, K, Adv Radiât Chem 4 (1974) 103[52] KEVAN, L , Adv Radiât Chem 4 (1974) 181[53] MARK, T D, LEITER, K, RITTER, W, STAMATOVIC, A, Int J Mass Spectrom Ion
Phys 74 (1986) 265, LEITER, K, RITTER, W , STAMATOVIC, A, MARK, T D , Int JMass Spectrom Ion Proc 68 (1986) 341, WALDER, G, MARGREITER, D , WINKLER,C, STAMATOVIC, A, HERMAN, Z, MARK, T D, J Chem Soc Faraday Trans 86(1990) 2395, WALDER, G, MARGREITER, D, WINKLER, C, STAMATOVIC, A,HERMAN, Z , FOLTIN, M , MA RK, T D , Z Phys D (1990) in print
[54] KLOTS, C E , COMPTON, R N, J Chem Phys 69 (1978) 1636, 1644, Chem Phys Lett 73(1980) 589, KLOTS, C E, Radiât Chem 20 (1982) 51
[55] KNAPP, M, KREISLE, D, ECHT, O, SATTLER, K, RECKNAGEL, E, Surf Science 156(1985) 313, KNAPP, M, ECHT, 0 , KREISLE, D , MARK, T D , RECKNAGEL, E, ChernPhys Lett 126 (1986) 225
[56] KNAPP, M, ECHT, O , KREISLE, D , MARK, T D , RECKNAGEL, E , Phys Chem SmallClusters, ed M Jena, S K Rao, and S N Khanna, Plenum, New York (1987) 693
[57] VOSTRÏÏCOV, A A, DUBOV, DY, PREDTECHENSKIY, MR, Proc 15th ICPEAC,Brighton (1987) 893, REBROV, AK, VOSTRIKOV, A A, DUBOV, DY, PRED-TECHENSKIY, M R, Proc Xlth Int Symp Mol Beams, Edinburgh (1987) and referencestherein
[58] MARK, TD, SCHEIER, P, STAMATOVIC, A, Chem Phys Lett 136 (1987) 177,STAMATOVIC, A, SCHEIER, P , MARK, T D, Z Phys D 6 (1987) 351
[59] MARK, TD, STAMATOVIC, A, SCHEIER, P, Z Phys D12 (1989) 303,STAMATOVIC, A, SCHEIER, P , MARK, T D , J Chem Phys 88 (1988) 6884
325

[60J HASHEMI, R, KOHN, A, ILLENBERGER, E, Int J Mass Spectrom Ion Proc 100(1990) in print, KOHN, A, ILLENBERGER, E , J Chem Phys 93 (1990) 357
[61] SCHWARZ, C, Laborbencht, Universität Konstanz, Fakultät Physik (1987) See AlsoECHT, O, KNA?P, M, SCHWARZ, C, RECKNAGEL, E, Proc 20th Jerusalem SympLarge Finite Systems (1987)
[62] COMPTON, R N, REINHARD!, P W, COOPER, C D , J Chem Phys 63 ( 1975) 3 81[63] ROSSI, A R, JORDAN, K D , J Chem Phys 70 (1979) 4422[64] STAMATOVIC, A, STEPHAN, K, MARK, T D, Int J Mass Spectrom Ion Proc 63
(1985) 37, STAMATOVIC, A, LEITER, K , RITTER, W, STEPHAN, K , MARK, T D , JChem Phys 83(1985)2942
[65] JORTNER, J, Ber Bunsenges, Phys Chem 88 (1984) 188[66] ARMBRUSTER, M, HABERLAND, H, SCfflNDLER, HG, Phys Rev Lett 47 (1981)
323, HABERLAND, H, SCfflNDLER, HG, WORSNOP, DR, Ber Bunsenges PhysChem 88 (1984) 270, HABERLAND, H, RICHTER, T, Z Phys D 10 (1988) 99,HABERLAND, H, KOLAR, T, REINERS, T, Phys Rev Lett 63 (1989) 1219
[67] KNAPP, M, ECHT, O , KREISLE, D , RECKNAGEL, E, J Chem Phys 85 (1986) 636, JPhys Chem 91 (1987)2601
[68] WALLQVIST, A, TfflRUMALAI, D , BERNE, B J, J Chem Phys 86 (1987) 6404[69] BARNETT, R N , LANDMAN, U, CLEVELAND, C L , KESTNER, N R, JORTNER, J,
J Chem Phys 88 (1988) 6670, Chem Phys Lett 148 (1988) 249, BARNETT, RN,LANDMAN, U , CLEVELAND, C L , JORTNER, J, Chem Phys Lett 145 (1988) 382, JChem Phys 88(1988)4421,4429
[70] STAMPFLI, P, BENNEMANN, KH, Phys Rev Lett 58 (1987) 2635, Phys Rev A 38(1988)4431
[71] BOWEN, KH, LIESEGANG, GW, SANDERS, R A, HERSCHBACH, DR, J PhysChem 87 (1983) 557, QUITEVIS, EL, BOWEN, KH, LIESEGANG, GW,HERSCHBACH, D R, J Phys Chem 87 (1983) 2076, ROSS, U , SCHULZE, T, J ChemPhys 85(1986)2664
[72] KONDOW, T , "Electronic and Atomic Collisions", ed D Lorents, W E Meyerhof, and J RPeterson, Eisevier (1986) 517 and references therein
[73] DESFRANCOIS, C , KHELIFA, N, SCHERMANN, JP , J Chem Phys 91 (1989) 5853,KRAFT, T , RUF, M W , HOTOP, H, Z Phys D 14 (1989) 179, D17 (1990) 37
[74] COE, J V, SNODGRASS, J T, TREIDHOFF, C B , McHUGH, K M, BOWEN, K H, JChem Phys 83 (1985) 3169, Chem Phys Lett 124 (1986) 274, COE, JV, LEE, GH,EATON, JG, ARNOLD, ST, SARKAS, HW, BOWEN, KH, LUDEWIGT, C,HABERLAND, H, WORSNOP, D R, J Chem Phys 92 (1990) 3980
[75] ALEXANDER, M L, JOHNSON, M A, LEVINGER, N E , LINEBERGER, W C , PhysRev Lett 57 (1986) 976, POSEY, L A, DE LUCA, M J, JOHNSON, M A, Chem PhysLett 131 (1986) 170, POSEY, LA, JOHNSON, MA, J Chem Phys 88 (1988) 5383,Chem Phys Lett 152 (1988) 67, DE LUC A, MJ, NIU, B, JOHNSON, MA, J ChemPhys 88 (1988) 5857, POSEY, L A, DELUCA, MJ, CAMPAGNOLA, P J, JOHNSON,M A, J Phys Chem 93 (1989) 1178, DE LUCA, M J, HAN, C C , JOHNSON, M A, JChem Phys 93(1990)268
[76] SNODGRASS, J T , ROEHE, C M, KOPPEN, P A M, PALKE, W E , BOWERS, M T , JChem Phys 92 (1990) 5935
[77] BLOOMFJELD, L A, GEUSIC, M G, FREEMAN, R R, BROWN, W L, Chem Phys Lett121(1985)39
[78] FAYET, P , WOSTE, L[79] ZHENG, L S , BRUCAT, P J, PETTffiTTE, C L, YANG, S , SMALLEY, R E , J Chem
Phys 83 (1985) 4273, ZHENG, L S, KARNER, CM, BRUCET, P J,YANG, S H,PETTJETTE, C L, CRAYCRAFT, M J, SMALLEY, R E, J Chem Phys 85 (1986) 1681
326

[80] MARK, T D , ECHT, O , In[81] ECHT, O , KNAPP, M, RECKNAGEL, E , Z Phys B 53 (1983) 71[82] HENKES, W , MDCOSCH, F , Int J Mass Spectrom Ion Phys 13 (1974) 151[83] ECHT, O, In Elemental and Molecular Clusters, ed G Benedek, T P Martin, and G
Pacchioni, Springer, Berlin (1988) 279[84] GSPANN, J, KORTING, K, J Chem Phys 59 (1973) 4726[85] SAMBE, H, RAMAKER, D E, Chem Phys Lett 139 (1987) 386, Phys Rev A 40 (1989)
3651[86] SANCHE, L, PARENTEAU, L , CLOUTIER, P , J Chem Phys 91 (1989) 2664[87] LEZIUS, M, MARK, T D, unpublished results (1990)[88] ILLENBERGER, E, BAUMGARTEL, H, J Electron Spectr Rel Phenom 33 (1984) 123[89] OSTER, T, KÜHN, A, ILLENBERGER, E , Int J Mass Spectrom Ion Proc 89 (1989) l[90] For a review of electron scattering from condensed molecules, see SANCHE, L , J Phys B 23
(1990)1597[91] SANCHE, L, J Chem Phys 71 (1979) 4860, SANCHE, L , BADER, G, CARON, L, J
Chem Phys 76 (1982) 4016[92] MARSOLAIS, R M, DESCHENES, M, SANCHE, L , Rev Sei Instr 60 (1989) 2724[93] SANCHE, L , MICHAUD, M , Phys Rev B 30 (1984) 6078[94] CLOUTIER, P , SANCHE, L , Rev Sei Instr 60 (1989) 1054[95] For a review of the data on ESD of cations and the techniques used for measuring positive ion
formation by electron impact on molecules or atoms adsorbed or chemisorbed on surface, seeTOLK, NH, TRAUM, MM, TULLY, JC, MADEY, TE, In "Desorption Induced byElectronic Transitions", Springer Ser in Chem Phys, Vol 24, Springer-Verlag, New York(1983)
[96] For a review of anions formation by electron impact on condensed molecular solids, seeSANCHE, L, In "Desorption Induced by Electronic Transitions Diet HI", Springer Ser inSurface Sei, Vol 13, ed R H Stulen, and M L Knotek, Springer-Verlag, Berlin (1988) 78
[97] LECLERC, G, BASS, A D, SANCHE, L, J Electron Phys Rel Phenom, 52 (1990) 725[98] ALVEY, M D , DRESSER, M J , YATES, J T , Phys Rev Lett 56 (1986) 367[99] MICHAUD, M, SANCHE, L , Phys Rev A 36 (1987) 4672[100] MICHAUD, M, SANCHE, L, Phys Rev A 36 (1987) 4684[101] SANCHE, L, MICHAUD, M, Chem Phys Lett 80 (1981) 184[102] For a review of surface analysis by high resolution electron energy loss spectroscopy see
IBACH, H, and MILLS, D L, "Electron Energy Loss Spectroscopy and Surface Vibrations",Academic, New York (1982)
[103] AZRIA, R , PARENTEAU, L , SANCHE, L , J Chem Phys 87 (1987) 2292[104] MICHAUD, M , SANCHE, L , GAUBERT, C , BAUDOING, R, Surf Sei 205 (1988)
447[105] NARTEN, A H , VENKATESH, C G, RICE, S A , J Chem Phys 64 (1976) 1106[106] B ADER, G, PERLUZZO, G, CARON, L G, SANCHE, L , Phys Rev B 30 (1984) 78,
CARON, L G, PERLUZZO, G , B ADER, G , SANCHE, L , Phys Rev B 33 (1986)3027
[107] PLENKIEWICZ, B , PLENKIEWICZ, P , PERLUZZO, G, JAY-GERIN, J -P , PhysRev B 32 (1985) 1253, PLENKIEWICZ, B , PLENKIEWICZ, P, JAY-GERTN, J -P ,Phys Rev B 33 (1986) 5744
[108] HARRIGAN, M E, LEE, H J, J Chem Phys 60 (1974) 4909[109] HUANG, J T J, MAGEE, J L , J Chem Phys 61 (1974) 2736[110] CHENG, I Y , FUNABASffl, K , J Chem Phys 59 (1973) 2977[111] UENO, N , SUGITA, K , SEKI, K , INOKUCFH, H , Phys Rev B 34 (1986) 6386[112] BADER, G, PERLUZZO, G, CARON, L G, SANCHE, L, Phys Rev B 26 (1982)
6019
327

[113] JAY-GERIN, J -P , PLENKIEWICZ, B , PLENKIEWICZ, P , PERLUZZO, G, S ANCHE,L, Sol State Comm 55 (1985) 1115, KESZEI, E, JAY-GERIN, J-P, PERLUZZO, G,SANCHE, L,J Chem Phys 85(1986)7396
[114] PLENKIEWICZ, P , JAY-GERIN, J -P , PLENKIEWICZ, B , PERLUZZO, G, Sol StateComm 57(1986)203
[115] PLENKDEWJCZ, P , PLENKIEWICZ, B , JAY-GERIN, J -P , Sol State Comm 65 (1988)1227
[116] HIRAOKA, K , NARA, M , Bull Chem Soc Jpn 57 (1984) 2243, HIRAOKA, K, NARA,M,Chem Phys Lett 94(1983)589
[117] PERLUZZO, G, BADER, G, CARON, L G, SANCHE, L , Phys Rev B 26 (1982) 3976[118] SANCHE, L , PERLUZZO, G, BADER, G, CARON, L G, J Chem Phys 77 (1982) 3285[119] PERLUZZO, G, SANCHE, L, GAUBERT, C , BAUDOING, R, Phys Rev B 30 (1984)
4292[120] PERLUZZO, G, BADER, G, CARON, L G, SANCHE, L, Phys Rev Lett 55 (1985) 545[121] MICHAUD, M, SANCHE, L, Phys Rev Lett 59 (1987) 645[122] THIEL, P A, HOFFMANN, F M, WEINBERG, W H, J Chem Phys 75 (1981) 5556[123] SANCHE, L, MICHAUD, M, J Chem Phys 81 (1984) 257[124] SANCHE, L, MICHAUD, M, Chem Phys Lett 84 (1981) 497[125] SANCHE, L , MICHAUD, M, Phys Rev Lett 47 ( 1981 ) 1008[126] SANCHE, L, MICHAUD, M, In "Resonances in Electron-Molecules Scattering van der
Waals Complexes and Reactive Chemical Dynamics", ed D G Truhlar, ACS Symp Series no263(1984)211
[127] SANCHE, L, MICHAUD, M, Phys Rev B 27 (1983) 3856, MICHAUD, M, SANCHE, L,J Electron Spectr Rel Phenom 51 (1990) 237
[128] SAKURAI, M, OKANO, T , TUZI, Y , J Vac Sd Techno! A 5 (1987) 431[129] HUFFMAN, F M, FELTER, T E , THIEL, P A , WEINBERG, W H, Surf Sei 130 (1983)
173[130] DEMUTH, JE, SCHMEISSER, D, AVOURIS, P, Phys Rev Lett 47 (1981) 1166,
SCHMEISSER, D , DEMUTH, J E , AVOURIS, P , Phys Rev B26 (1982) 4857[131] BADER, G, CfflASSON, J, CARON, L G, MICHAUD, M, PERLUZZO, G, SANCHE,
L, Rad Res 114 (1988) 467[132] HAGEN, W, TffiLENS, A G G M , GREENBERG, JM, Chem Phys 56 (1981) 367,
WONG, P T T , WHALLEY, E, J Chem Phys 64 (1976) 2359[133] MICHAUD, M, SANCHE, L , Phys Rev B 30 (1984) 6067[134] fflRAOKA, K, HAMJJLL, W H, J Chem Phys 57 (1972) 3870, fflRAOKA, K , HAMJJLL,
W H, J Chem Phys 59 (1973) 5749[135] HIRAOKA, K, J Phys Chem 85 (1981) 4008, HIRAOKA, K, NARA, M, Bull Chem Soc
Jpn 54(1981)1589[136] LECLERC, G, GOULET, T, CLOUTIER, P, JAY-GERIN, J -P, SANCHE, L, J Phys
Chem 91(1987)4999[137] ASHBY, C I H , Appl Phys Lett 43 (1983) 609[138] MARSOLAIS, R M, MICHAUD, M, SANCHE, L , Phys Rev A 35 (1987) 607[139] SANCHE, L, Chem Phys Lett 65 (1979) 61, J Phys C 13 (1980) L677[140] MERKEL, P B , HAMILL, W H, J Chem Phys 55 (1971) 1409[141] SANCHE, L , Phys Rev Lett 53 (1984) 1638[142] SAMBE, H, RAMAKER, D E, PARENTEAU, L, SANCHE, L, Phys Rev Lett 59 (1987)
236[143] AZRIA, R, PARENTEAU, L , SANCHE, L , Phys Rev Lett 59 (1987) 638[144] AZRIA, R, PARENTEAU, L , SANCHE, L , J Chem Phys 88 (198«) 5166, AZRIA, R,
SANCHE, L, PARENTEAU, L , Chem Phys Lett 156 (1989) 606
328

[145] SAMBE, H., RAMAKER, D.E., PAREANTEAU, L, SANCHE, L., Phys. Rev. Lett. 59(1987)505.
[146] SANCHE, L., PARENTEAU, L, Phys. Rev. Lett. 59 (1987) 136.[147] SANCHE, L., PARENTEAU, L., J. Vac. Sei. Technol. A 4 (1986) 1240.[148] SANCHE, L., PARENTEAU, L., J. Chem. Phys. 90 (1989) 3402.[149] STOLEN, R.H., KNOTEK, M.L., In "Desorption Induced by Electronic Transitions DIET
III", Springer Ser. in Surface Sei., Vol. 13, Springer-Verlag, Berlin (1988).[150] STOLEN, R.H., THTEL, P.A., Surf. Sei. 157 (1985) 99.[151] NOELL, J.O., MELIUS, C.F., STULEN, R.H., Surf Sei. 157 (1985) 119.[152] STOCKBAUER, R., BERTEL, E., MADEY, T.E., J. Chem. Phys. 76 (1982) 5639.[153] KELBER, J.A., KNOTEK, M.L., Phys. Rev. B 30 (1984) 400.[154] KELBER, J.A., KNOTEK, M.L., Surf. Sei. 121 (1982) L499.[155] ROSENBERG, R.A., REHN, V., KNOTEK, M.L., STULEN, R.H., J. Vac. Sei. Technol. A 5
(1987) 1085.[156] BURNS, A.R., STECHEL, E.B., JENNISON, D.R.; STECHEL, E.B., JENNISON, D.R.,
BURNS, A.R., In "Desorption Induced by Electronic Transitions DIET III", Springer Ser. inSurface Sei, Vol. 13, ed. R.H. Stulen, and M.L. Knotek, Springer-Verlag, Berlin (1988) 67and 136.
[157] VÉZINA, C, SANCHE, L, Proceedings of the "Journées d'Études en Chimie sousRayonnement", JECR, Sherbrooke, QC (1990).
[158] GOULET, T., JAY-GERIN, J.-P., Rad. Res. 118 (1989) 46.[159] GOULET, T, JAY-GERIN, J.-P, J. Phys. Chem. 92 (1988) 6871.[160] SANCHE, L, DESCHÊNES, M, Phys. Rev. Lett. 61 (1988) 2096.[161] SAMBE, H, RAMAKER, D.E., DESCHÊNES, M, BASS, A.D., SANCHE, L, Phys. Rev.
Lett. 64(1990)523.[162] SCHULZ, G.J., Phys. Rev. 128 (1962) 178.[163] BASS, A.D., SANCHE, L, J. Chem. Phys. 95 (1991) 2910.[164] SENG, G., LINDER, F, J. Phys. B 9 (1976) 2539.
329

Chapter 5
PHOTOABSORPTION, PHOTOIONIZATIONAND PHOTODISSOCIATION CROSS SECTIONS
Y. HatanoDepartment of Chemistry, Tokyo Institute of Technology,
Tokyo, JapanM. Inokuti
Argonne National Laboratory,Argonne, Illinois,
United States of America
331
5 . X INTROiOUOTIOlSr
Cross section data on the interaction of photons withmolecules are of great importance in radiotherapy [1]. They mustbe correct, absolute, and comprehensive [2]. Photoabsorptioncross sections are related to the cross sections for impact offast charged particles as discussed in Chapters 2 and 3. Thecross sections for high energy photons, viz., for hard x-rays,are directly pertinent to radiotherapy [3-7].
The interactions of photons with molecules are classifiedinto absorption, scattering, and pair production. In thischapter, photons of moderate energies are discussed, andtherefore only the absorption process is considered. The absorp-tion of a single photon by a molecule changes its electronicstate from the ground state to a final excited or ionized state.Its transition probability is expressed in terms of the opticaloscillator strength, which is proportional to the photoabsorptioncross section.
Oscillator-strength values have long been measured forvarious molecules in the wavelength regions at least longer thanthe near-ultraviolet (UV) region, whereas until recentlymeasurements in the wavelength region shorter than the LiF cutoffat 105 nm (at which the photon energy is 11.8 eV) were relativelyfew because of experimental difficulties in obtaining appropriatephoton sources and because no suitable window materials wereavailable [8]. The cutoff energy of 11.8 eV corresponds, roughlyspeaking, to the ionization potentials of commonly occurringmolecules. The sum of the oscillator strengths below 11.8 eVamounts to only a few percent [8] of the total sum, which isequal to the total number of electrons in a molecule, accordingto the Thomas-Kuhn-Reiche sum rule. The absorption in the vacuumultraviolet and soft x-ray (VUV-SX) region is much stronger thanin all other wavelength regions. (See Table I .) Since there havebeen remarkable advances in synchrotron radiation (SR) researchand related experimental techniques in the VUV-SX region, manymeasurements in this region are now available [8].
333

TABLE 5.1 SUM OF DIPOLE OSCILLATOR STRENGTH DIS-TRIBUTIONS OF C3HB [20]
Photon Energy (eV) Cyclopropane Propylene
Below Ip 0.746 0.507Ip-11.8 0.715 0.66611.8-35.4 11.744 12.176
35.4< 10.251
Total 23.46 23.60Z 24
Ip:the first ionization potential.IP(Cyclopropane)=10.60eVIp(Propylene)=10.03eVZ: the number of electrons in a molecule.
This chapter gives a survey of recent results of measurementof photoabsorption, photoionization, and photodissociation crosssections of molecules in the VUV-SX region, and also a summary ofour understanding in spectroscopy and dynamics of molecules inhighly excited or ionized states. Molecules treated here arechosen from the point of view of basic radiation research. Theyare hydrocarbons, alcohols, ethers, and other organic molecules.Some remarks are presented on molecules in the condensed phase.Problems to be solved are also indicated.
It is well known that the interaction of high energy elec-trons with a medium produces photons, viz., the Cerenkov light,in the spectrum range between infrared and ultraviolet. A possi-bility of photo-excitation processes due to the absorption of theCerenkov light by solute molecules was discussed in the r-radiolysis of aqueous solutions of biological molecules [9-12].Recently, however, it has been concluded in pico-second pulse-radiolysis studies that the contribution of such a photoexcita-tion process to the observed total excitation processes of solute
334

molecules is negligibly small in some hydrocarbon systems [13,14]. Since the magnitude of this contribution seems to dependlargely on the solute molecule, investigations by changing sys-tematically the molecule will be necessary to substantiate thiscontribution.
A list of the acronyms used in this chapter is given inTable II .
TABLE 5.2 LIST OF ACRONYMS
UV UltravioletVUV Vacuum ultravioletEUV Extreme ultravioletSX Soft X-rayHX Hard X-raySR Synchrotron radiationTKR Thomas-Kuhn-Reiche
5.2 VUV — OIPTIOAL OSCILLATORSTRENGTH DIE STRI BUT I ON S OFE»OLYA.TOMIC MOLECULES
Figure 1 shows the wavelengths of electromagnetic radiationfrom the infrared to the r-ray regions and corresponding photonenergies [8]. Characteristic x-rays, e°Co-r rays, and VUV lightfrom discharge lamps are indicated by the arrows. The shadedareas (1-12 eV and above 5 keV) indicate regions for which photonsources, apart from SR, are available. Figure 1 clearly demon-strates that SR bridges the wide gap in the photon energy betweenradiation chemistry and photochemistry, i.e., "electron-collisionchemistry" and "photon-collision chemistry", respectively.
It is important to recognize that a major part of bothphotoabsorption and photoionization intensities lies in the widegap between the two for almost all molecules [8]. The experimen-tal data for cross section values in this wavelength region have
335

— — — — ///
//
/Photochemistry /
^//////////Afarn/I/h*'<$mr
111 !Br H He h
HgXeKrI
\\
V\\\ df/dE Radiation Chemistry
»^-_«K ww///M!m'Mh E(ev)—— I ——— —— YrfWri
101 10P V/ KT1T f*^*f /// / / / / / y /«/ / //l
////// / ///////////J A (nm)
i t t tC AI Cu Mo t t
Ie" 137Cs-v60Co-vSX HX
| EUV
200nm , k
IP
VUV 0.2nm
r
FIG. 5.1 Synchrotron radiation (SR) chemistry as a bridge betweenradiation chemistry and photochemistry [8], The dipole oscillatorstrength df/dE is shown as a function of wavelength A. and photonenergy E. Note the relation E-X=1.24x 10³(eV-nm). The intensityof SR is also shown, as are the energies of photons from severalline sources. VUV, EUV, SX, and HX stand for vacuum ultraviolet,extreme ultraviolet, soft X-ray, and hard X-ray, respectively.
been incomplete in general because of experimental difficultiesrelated to suitable photon sources and window materials. As analternative, electron energy-loss spectroscopy has been used.Even then, cross section data are limited, particularly forchemically important complex molecules such as hydrocarbons andother organic molecules [8].
The absorption of a single photon results in an electronictransition of a molecule from the ground state 0 to a final statej [15]. The transition probability is expressed in terms of theoptical oscillator strength fj. It is in turn expressed in terms
336

of Ej/R, the transition energy measured in units of R=me4/(2nz)=13.6 eV and of Md2, the dipole matrix element squared as measuredin a0z, where a0=^fiz/mez = 0.0529 nm, as
fj(Ej) = (Ej/R) Mj2. (1)
A set of Ej and fj characterizes a discrete spectrum. To discussa continuous spectrum, one expresses the oscillator strength in asmall region of the excitation energy between E and E+dE as(df/dE)dE, and calls df/dE the oscillator-strength distribution,or, more precisely, the spectral density of the oscillatorstrength. The total sum of the oscillator strength includingdiscrete and continuous spectra is equal to the total number Z ofelectrons in the molecule, viz.,
2fj(Ej) + Ij J i (df/dE)dE = Z, (2)
where I represents the (first) ionization potential. Equation (2)is called the Thomas-Kuhn-Reiche (TKR) sum rule.
The oscillator-strength distribution is proportional to thecross section CT for the absorption of a photon of energy E.Explicitly one may write
df= 47r2aa0zR ———dE
df= 8.067 • 10-* ——————— (nm2)d(E/R)
df= 0.01098 ——— (eV-1. nmz), (3)dE
where a = ez/Tic=l/137 . 04 .
A decisive step in the physical and physicochemical stagesof the action of any ionizing radiation on matter is collisionsof secondary electrons in a wide energy range with molecules. Atenergies T higher than about 10Z eV, the total cross sectionQj(T) to excite a molecule to the state j is at least approxi-mately given by the Bethe cross section [16,17]. Using the Bethe
337

cross section and further assumptions, Platzman [18,19] showedthat the number of product species j (e.g., an excited state or adissociation product) formed per 100 eV absorbed is approximatelyproportional to the dipole matrix element squared
f~ R dfMj2 = 0j(E) —— ——— dE, (4)Ja E dE
where 0j(E) is the quantum yield and J is the threshold energy,both for the formation of j. With the use of the W value, viz.,the mean energy, measured in eV, for the production of an ionpair (extensively discussed in Chapter 8), one may write
100_j ~ ~~ W M 2
where Mi2 is the dipole matrix element squared for ionization,i.e.,
= JR dfïj(E) —— ——— dE, (6)E dE
where rj(E) is the quantum yield for ionization. Since
T)(E) - a1(E)/at(E), (7)
where ffi(E) and at(E) are, respectively, the photoionizationcross section and the photoabsorption cross section, Eq. (5)means that the radiation chemical yield Gj is obtained fromoptical cross section data. Equation (5) is therefore called theoptical approximation. Optical cross section data are, thus, offundamental importance in understanding not only the interactionsof photons with molecules, but also the actions of any ionizingradiation with matter.
It is important to obtain photoabsorption and related crosssections for polyatomic molecules such as hydrocarbons and otherorganic molecules and relate them with molecular structure. Withthis idea, photoabsorption and photoionization cross sections formolecules in several stereo-isomer series have been systematical-ly measured and compared with each other [20-23]. The main
338

purpose of these investigations is to reveal how df/dE changeswith changing molecular structures; for this purpose isomers havebeen chosen as examples. Since isomer molecules consist of thesame kind and same number of atoms, the df/dE of isomers areexpected to have the following properties:
1) The sum of df/dE of an isomer over the entire energy regionshould be equal to that of another isomer, and also to thenumber of electrons in the molecule, according to the TKR sumrule.
2) The features of the df/dE of isomers are expected to bealmost identical with each other in the energy region whereinner-core electrons are excited, because the molecularstructure of isomers would have a little influence on inner-core electrons. Moreover, the value of df/dE in such a regionwould be almost equal to the sum of df/dE values of theconstituent atoms.
With these expectations, the photoabsorption cross sectionshave been measured for five series of isomers: CaHe (cyclopropaneand propylene) , C-iHa (1-butene, iso-butène, cis-2-butene, andtrans-2-butene), CeHi2 (cyclohexane, 1-hexene, and tetramethyl-ethylene), CzHeO (ethyl alcohol and dimethyl ether), and C3H80(n-propyl alcohol, i-propyl alcohol, and ethylmethyl ether) inthe wavelength region from about 30 nm (41 eV) to 140 nm (9 eV),and compared with each other [20-23].
Figure 2 shows, as an example, the absorption cross sectionsof C3Hs isomer molecules, cyclopropane and propylene [20]. Simi-lar cross section data have been obtained also for the otherisomer series, giving the common new features of absorption crosssections or oscillator strength distributions summarized asfollows :
1) The values of at show a maximum at 70-80 nm (16-18 eV) foreach molecule.
2) In the high energy side of the maximum the values of crt arealmost the same among the isomer molecules, e.g., cyclopro-pane and propylene, and equal to the sum of the crosssections for the constituent atoms.
339

3) In the low energy side, the cross sections have differentpeaks and shoulders depending on an isomer, i.e., on itsmolecular structure. The sum of the cross sections in thisenergy region is, however, almost equal among the isomermolecules.
These results represent an important contribution to funda-mental physical chemistry particularly as an inducement to a newdevelopment in quantum chemistry, and also a useful contributionto radiation research in enabling estimates of the energydeposition spectra of molecules. These results, e.g., those inFig. 2, are fully consistent with the TKR sum rule. The resultsfor C3HB isomers are shown in Table I . The agreement is goodbetween the sum of the obtained oscillator strength values(partly including semiempirical ones in the higher energy region)
Photon Energy (eV)40 30 20 15 10
100
cg
8 50COCOCOoÜ
V(Cyclopropane)
(Propylene) -\
0 20 40 60 80 100 120 140Wavelength (nm)
FIG. 5.2 Photoabsorption cross sections for cyclopropane and prop-ylene [20]. The wavelength resolution is approximately 0.8 nm.
340

100
Photon Energy (eV)40 30 20 15 10
.a
mooo
COCOCOoÜ
50
Theory-by Platzman
Experiment
0 20 40 60 80 100 120 140Wavelength (nm)
FIG. 5.3 Photoabsorption cross sections for ethyl alcohol vapor[21]. Experimental wavelength-resolution is approximately 0.8 nm.
and the number of electrons, Z. Table I also clearly shows thatthe sum of the oscillator strength in the energy region below thefirst ionization potential amounts to only a few percent of thetotal, and the spectra in the VUV-SX region are of greatimportance in understanding the ionization and excitation ofmolecules. Figure 3 presents comparison of the recently measuredoscillator strength distribution of ethanol vapor and Platzman'sestimate in 1965. The gross features agree well with each other,although the prediction shows several large peaks, which arespurious as discussed in Ref.[21].
341
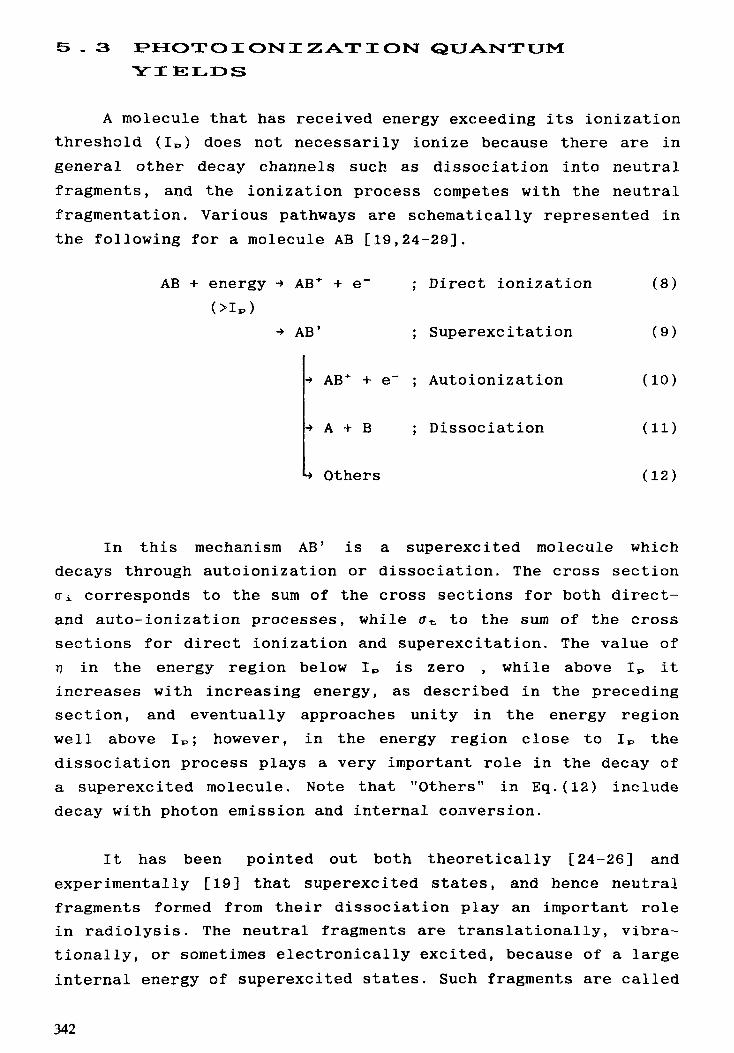
5 . 3 PHOTOIONIZWTION QUANTUMYIELDS
A molecule that has received energy exceeding its ionizationthreshold (I») does not necessarily ionize because there are ingeneral other decay channels such as dissociation into neutralfragments, and the ionization process competes with the neutralfragmentation. Various pathways are schematically represented inthe following for a molecule AB [19,24-29].
AB + energy -» AB* + e" ; Direct ionization (8)
-> AB' ; Superexcitation
•» AB* + e~ ; Autoionization
•» A + B ; Dissociation
Others
(9)
(10)
(11)
(12)
In this mechanism AB' is a superexcited molecule whichdecays through autoionization or dissociation. The cross sectiondi corresponds to the sum of the cross sections for both direct-and auto-ionization processes, while fft to the sum of the crosssections for direct ionization and superexcitation. The value ofrj in the energy region below Ip is zero , while above IP itincreases with increasing energy, as described in the precedingsection, and eventually approaches unity in the energy regionwell above 1^; however, in the energy region close to !„ thedissociation process plays a very important role in the decay ofa superexcited molecule. Note that "Others" in Eq.(12) includedecay with photon emission and internal conversion.
It has been pointed out both theoretically [24-26] andexperimentally [19] that superexcited states, and hence neutralfragments formed from their dissociation play an important rolein radiolysis. The neutral fragments are translationally, vibra-tionally, or sometimes electronically excited, because of a largeinternal energy of superexcited states. Such fragments are called
342

hot atoms or free radicals, and have anomalous chemical reactivi-ties [27].
In order to understand the electronic structure and dissoci-ation dynamics of superexcited states, electron impact spectro-scopy and more recently spectroscopy combined with SR have beenextensively applied [28,29].
In the past two decades electron impact studies, such asmeasurement of the excitation spectrum and the translationalspectroscopy of neutral fragments, photoelectron spectroscopyusing line sources, and (e, 2e) experiments, have uncovered anoutline of the electronic structure and dissociation dynamics ofsuperexcited molecules [28]. A major part of the superexcitedstates of molecules are molecular high Rydberg states convergingto various ionic states and are classified into the followingthree types: 1)vibrationally excited states, 2)doubly excitedstates, and 3) inner-core excited states [28].
Recently SR has been used to obtain more detailed informa-tion about the properties of superexcited molecules [8,29].
In summary, photoionization cross sections and photoioniza-tion quantum yields are of great importance as key features ofsuperexcited states, which characterize the primary processes,(8)-(12), of both photolysis and radiolysis of molecules.
The photoionization quantum yield T? is a quantity ofconsiderable importance, and serves as an index for the degree ofcompetition between direct ionization and excitation to thesuperexcited states opening to autoionization and dissociation.Several experimental efforts have been devoted to the measurementof r). Serious conflicts exist even for simple molecules, not onlybetween photon impact experiments and "simulated" ones by elec-tron impact but also between photon impact experiments themselves[30]. The problems have originated mainly from lack of an intenselight source and a suitable window material in the VUV regionparticularly in the wavelength region shorter than the LiF cutoffat 105 nm. Experiments with differential pumping and without awindow for the entrance of a photon beam into an ionization
343

chamber also present several significant problems, such as aneffusion of sample gases into the beam transportation region or acontribution from a diffracted photon beam in the higher order,making it difficult to determine correct, absolute, and compre-hensive values of 77. in most cases, the rç-values have beenassumed to be unity in the energy region far above the firstionization potential.
Recently systematic measurements have been reported of thephotoionization quantum yields, as well as the photoabsorptioncross sections, of C3He, CUHa, CeH1Z) C2HeO, and C3H80 isomersusing a multiple-staged photoionization chamber and a synchrotronradiation light source in the wavelength region from 105 nm(11.8 eV) up to their respective ionization potentials at about120-140 nm (9-10 eV) [22]. This work has been further extended tothe first attempt of measuring photoionization quantum yields inthe wavelength region of 54-92 nm (13-23 eV) using synchrotronradiation combined with metal thin foil windows [31]. In whatfollows, a survey is given of recent progress in the measurementof 77 values.
T r r1E1 0.5(D3CT
§'•sN'c.2
-
Prop
*
t
'lene
N
'•*** • 'N\\^
»
A ,
1.0
de")" (3er,\ A
oN
o
100 120 140
Wavelength (nm)
Cyclopropane
100 120 140Wavelength (nm)
FIG. 5.4 Photoionization quantum yields for C3HG isomers [23]. Theenergies of ionic states corresponding to molecular orbitals areindicated.
344

The values of TJ have been systematically measured in thewavelength region below the LiF cutoff at 105 nm (11.8 eV) forthe molecules in several isomer series of which, as described inSection 5.2, the photoabsorption cross sections have also beenmeasured. Some of the results are shown in Fig.4 for cyclopropaneand propylene [22]. The n-curves for the same C3He isomermolecules are very different from each other. The rç-curve forcyclopropane rises almost monotonically , and indeed much morerapidly than that for propylene, which has a step or a shoulderat 110-120 nm. The rj-curves for other molecules whose figures arenot given here have shown interesting common features of rç-curvesas a function of photon energy that the energy difference betweenthe first and the second ionization potentials correlates wellwith the shape of the n-curves. A bigger energy differencecorresponds to a longer step-length as seen for propylene inFig. 4. This result means that the Tj-value increases rapidly inthe wavelength or energy region close to the ionization poten-tial, and agrees well with the conclusion that the most importantpart of the superexcited states is high-Rydberg states convergingto each ion state. It is, therefore, concluded that the shape ofthe 77 curves as a function of the energy at least for thesechemically important molecules is determined by the density ofconverging Rydberg states, i.e., superexcited states, whichincreases rapidly with increasing energy in the energy regionclose to the ionization potential.
In the wavelength region shorter than the LiF cutoff at 105nm (11.8 eV), metal foil filters are employed as window materialsfor the incoming SR beam from a VUV monochromator. The filtersprevent sample gas effusion and eliminate higher order radiation.In the wavelength regions of 54-80 nm (16-23 eV) and 74-92 nm(13-17 eV), Sn and In foils respectively, are used. Theirthickness is about 100 nm, with transmittance of about 1%.
Figure 5 shows the ionization quantum yields measured in thewavelength region of 54-92 nm (13-23 eV) together with those inthe wavelength region longer than 105 nm (11.8 eV) . No data areshown in the wavelength region between the two because there isno thin metal window convenient for the measurement of ionization
345

20 18Photon Energy (eV)
16 14 12
1.0
ceOI °-513oo"oQ_
10•CH*
——cyclo-C6Hl2- -CH3OCH3
. —-C2HSOH\ ——n-C3H7OH -
54 60 70 110 12080 90 100
Wavelength (nm)
FIG. 5.5 Photoionization quantum yields for several molecules [31],
quantum yields and because there are large effects of higherorder light.
The present result clearly shows that
1) rj-values in the region close to the first ionization poten-tial are much less than unity, which means that the moleculesshown at least in Fig.5 are not easily ionized even when theyhave received enough energy to ionize.
2) 7]-values do not reach unity even in the energy range morethan about lOeV above the first ionization potential.
3) Tj-values increase with increasing photon energy and reachunity at around 23 eV (or 54 nin).
4) rç-curves show considerable structures.
In summary, non-ionizing processes, such as the neutral fragmen-tation of superexcited molecules, are important among their decaychannels. Neutral fragments thus formed often have excessenergies electronically, vibrationally, rotationally, or transla-tionally, because the photon energies corresponding to thewavelengths in Fig.5 are much larger than the bond dissociationenergies to form the fragments in their ground states. It is,therefore, of great interest to observe optical emissions from
346

excited fragments as a function of wavelength, i.e., to obtainexcitation spectra of optical emission, as compared with thestructures in T?-curves.
5 . 4 COMPARATIVE STUDIES OFIONIZATION QUANTUM YIELDS WITHEXCITATION SPECTRA OF OPTICALEMISSION FROM DISSOCIATIONFRAGMENT S
5.4.1 DIMETHYLETHER [32]
In studies of the oscillator strength distributions andionization quantum yields for isomer molecules, interestingstructures have been observed in the 7]-curve of dimethylether inthe wavelength region of 54-92 nm (13-23 eV). The opticalemission at the wavelength of 115-200 nm, at which one expects tosee Lyman-a emission from fragment H*(n=2), is shown in Fig.6,together with the ionization quantum yield for comparison.
A clear deviation of the rj-value from unity with the threecharacteristic minima shows that a considerable portion of thesuperexcited states in the region decays into dissociation andother nonionizing channels. The minima correspond well to theenergies of ionic states with the vacancies of 7TCH3 and CTCO oranother molecular orbital correlating to the C(2s) orbital, whichare identified from the Hell photoelectron spectra for dimethyl-ether [33]. This correspondence indicates that the superexcitedstates corresponding to the minima are high-Rydberg statesconverging to the ionic states. The large difference from unityof the r?-value, which diminishes with the increase in the photonenergy, is explained by the rate of autoionization in competitionwith dissociation and by the state density of the continuumcorrelating to the superexcited states. The rate of autoioniza-tion decreases with the excess energy above the ionizationpotential. If the photon energy further exceeds other ionizationlimits, new channels correlating to higher ionization continuaincrease the rate.
347

Photon Energy (eV)
20 18 16 14
1.0
COs•- n '-«—; \J.<
o"oo
0
tnCD
<DOCDOV)
§
54 60 70 80Wavelength (nm)
9092
FIG. 5.6 Photoionization quantum yields and the excitation spectrumof Lyman-a emission for dimethylether CH3OCH3 [32].
The excitation spectrum shows also characteristic structuresat around 60, 65, and 77 nm which agree well with the minima inthe n-curve. These results clearly show that the dissociation ofthe superexcited states is followed by fluorescence emission. TheLyman-a emission from dissociated hydrogen atoms is observed inthe excitation spectrum.
348

5.4.2 ACETYLENE [34]
The photoionization quantum yielc? of acetylene measuredusing synchrotron radiation combined with metal thin foil windowsis shown in Fig.7, together with those measured previously usingdischarge lamps or electron beams as virtual photon sources. Inthe energy range between 18-24 eV the yields obtained usingvirtual photon sources are larger than those obtained using SR,
1.0
.
ED+•*CO
OcO
c
0.5
0.010 20
Photon Energy (eV)30
FIG. 5.7 Photoionization quantum yields for acetylene CzH* [34];© : Metzger and Cook (Discharge lamp); if : Person and Nicole(Discharge lamp); +: Cooper et. al. (Electron scattering); and—— : Ukai et al. (Synchrotron radiation).
349

M OO
Cros
s Se
ctio
n (M
b)
§ l !-. O tJ 0) rf,
O ö O O CO CO CO ft) o rt
1 < CD CD 3 CO •-»•
o ü S1
to O (D et ü (& r-1 Cs
Öl
O CT>
O -sf
O CO o o o
ro q OQ
l ro q c i
I
W
'/////,
ro ro ro ro o
§ m D (D (D
Ul oo O ft O to cr en o •3 rt ^
3§ I * s.
to 0
fo 3
o (g
ft
i-h
t-,
3"
o ts —
to O fD rt (b 0 (t) Co 4k.
CJl o O5 O
Cro
ss S
ectio
n (M
b)
g
00 o
r -
W
8TJ
TO** ^
c
8 O)
ro ro ro o ^
13
00
g o
S 510 CO
W
13 "
D» ^
ro

SSto
o
Fluo
resc
ence
Int
ensit
y (a
rb. u
nits)
loni
zatio
n Q
uant
um Y
ield
o -»•
u>

while in the lower energy range agreement is better between theyields obtained using the different methods. The yield functionobtained using SR (solid curve) shows the three minima, whereasthose obtained using either virtual photon sources or dischargelamps do not show them clearly. Obvious deviations from unity inthe ionization quantum yield indicate the neutral dissociation ofa superexcited acetylene molecule strongly competing with auto-ionization. Figure 8 shows the photoabsorption cross sections ofacetylene, the structures of which are assigned to Rydberg seriesconverging to each of the ionic states, (3er,»)-1, (20-u)"1, and(2er«)-1. Combining the photoionization quantum yields and thephotoabsorption cross sections, one obtains the cross sectionsfor non-ionizing decay processes. Results are shown in Fig.9.
Excitation spectra of fluorescence from excited fragmentsproduced in the dissociation of a superexcited acetylene moleculehave been observed using band-pass filters to disperse thefluorescence. The excitation spectra of the dispersed fluores-cence corresponding to the emission spectra of specific fragmentsare summarized in Fig.10 for comparison with the ionizationquantum yields. Comparing the threshold wavelengths of theexcitation spectra with the calculated thresholds of relateddissociation processes, one arrives at the assignment as follows.
1) The measurement of Cz (d •» a) is ascribed toCzH2 -» Cz (d) + Hz (and partly Cz (d) + 2H) ,
2) The measurement of Cz (C -» A) is ascribed toCzHz -» C-z (C) + 2H, and
3) The measurement of CH (A -» X) is ascribed toCzHz -» CH (A) + CH (and partly CH (A) + C + H) .
The three minima in the ionization quantum yields correlate wellwith the structures observed in the excitation spectra.
5.4.3 SILANE [35]
Absolute values have been obtained of the photoabsorptioncross section, photoionization cross section and ionizationquantum yield of SiH4 in the energy range of 13-40 eV (Figs.11and 12) [35] .
352

120
Z -DO 5tzCO ü3£O cofe
80
40
W')V O On-jDJo<pxPo-r0-0°°(c L,1.0
QSh- LUN •*"
7 10 13 16 19 22 25 28 31 34 37PHOTON ENERGY (eV)
FIG. 5.11 Photoabsorption cross sections (at) and photoionizationquantum yields (n) for Sj.H4 [35]. Synchrotron radiation experi-ments by Itoh et al. (a), Suto and Lee (b), and Kameta et al.(d)(d'), and electron scattering experiments by Cooper et al.(c)fc').
Figure 11 shows experimental results for the photoabsorptioncross section of SiH4. There is some discrepancy between theresults obtained from experiments by SR and those by electronscattering [36], in particular, in the energy region of 8-12 eV.One also sees a systematic shift toward a higher energy range ofthe cross section curve obtained in the dipole (e, e) experimentfrom that obtained in the SR experiment in the energy region of13-37 eV. However, the sum of the cross sections in each experi-ment agrees well with the TKR rule.
A broad peak at 14.6 eV is seen in Fig. 12. This is alsoobserved in electron energy loss spectra and assigned to theoptically allowed transition of a 3aa electron to an antibondingcr*(tz) orbital. In the energy region in this broad peak, theionization quantum yield, as clearly shown in Fig.12, deviatesfrom unity, i.e., the cross section for the neutral fragmentationhas a maximum.
353

80 -
.o- 60
§ero
40
20
0
I I I I I I I
L
<ynX2
1.0
P SUz 2
12 14 16 18
PHOTON ENERGY (eV)20 22
FIG. 5.12 Photoabsorption cross sections (G*), photoionizationcross sections (G±), photoionization quantum yields (n), andtotal cross sections for neutral fragmention (an) for SiH4 [35J.
In the energy range just above this range, an interestingstructure is observed in both absorption and ionization crosssections. The cross sections are almost equal with each other,and the ionization quantum yield is unity. This structure isassigned to the (3ax)~x(nptz) Rydberg state, which decays predom-inantly through autoionization as seen in Fig.12. The superexcit-ed states of SiH« in the energy range shown in Fig. 12 arecharacterized as these two types, i.e., the valence excitedstates and the Rydberg states. The former decays predominantlythrough neutral fragmentation while the latter through autoioni-zation. As concluded in Section 5.2 from electron impact experi-ments, an important part of the molecular superexcited states ishigh Rydberg states either vibrationally, doubly, or inner-coreexcited and converging to each ion state. The present SR experi-ment of Sin« has therefore clarified further details of theelectronic states of superexcited molecules.
354

5.4.4 OTHER EXAMPLES [29]
Photoabsorption cross sections have been measured also ofC12) H2S, BF3, BC13, CF«, CF3X (X=H, Cl, Br) , SiF«, GeH4 andCzHsOH in the wavelength region similar to that described in thepreceding sections.
5 . 5 BASIC IDEAS FOR TREATINGCONDENSED MATTER
5.5.1. A SKETCH OF THEORY
The notion of the dielectric-response function, or thefrequency-dependent permeability, is useful for describing thedipole interactions of photons or fast charged particles with anyneutral material including condensed matter. It is the purpose ofthis section to supplement the foregoing discussion on photoab-sorption and related processes in gases and to present a resumeof basic ideas for treating condensed matter. Elementary treat-ments of the topic are found in textbooks, e.g., Landau andLifshitz [37]. Earlier and more technical treatments are seen inNozières and Pines [38], who focused on an electron gas, and inFano [39,40] who dealt with matter in general.
Consider an electromagnetic wave whose intensity is uniformin space and varies harmonically with time, viz., a plane wave ofphotons with a fixed energy ftu. The amplitude of the electricfield is expressed as E(u)exp(-iut) (to be precise, the real partof the amplitude is the strength of the electric field). When theelectric field is present in matter, there will be an electricflux density of the form D((o)exp(-id>t) . The spatial uniformityof the electric field and the electric flux density is a condi-tion for the dipole approximation. The ratio D(fc))/E(o>) = £ (u) isthe dielectric permeability, which is a property of matterindependent of E(a) so long as it is weak enough. The permeabili-ty is a complex-valued function of the frequency u, i.e.,
(w) . (13)
355

The real part £1(0)) describes dispersion, and the imaginary part£2(w) describes absorption of the electromagnetic wave. For anisotropic and homogeneous material, which we shall considerthroughout, e(u) is a scalar; otherwise, it is a tensor.
The two functions, £1 and EZ, are not independent. Indeed,they are related to each other through a set of formulas calledthe Kramers-Kronig relations. Thus, it is useful to express £(<o)in terms of a single real-valued function df(w)/dco, called theoscillator-strength spectrum, asi; df(u')/du)'£(<a) = 1+ ————— du' ——————————— , (14)m Jo « ' 2-6)z-ig« '
where g is a small positive number related to the relaxation ofexcited states of the material. The physical meaning of df(u)/duis as follows. Imagine that there are harmonic oscillators withnatural frequencies u that respond to the electric field E(w)exp(-iut), and suppose that there are df(u) oscillators within thefrequency range between « and w+dw. Historically, this idea camefrom J.J.Thomson before the advent of quantum theory. However,the same idea remains valid in quantum theory, which moreovergives a procedure for calculating df(u)/d(d from first principles.The total number of the imaginary harmonic oscillators is thesame as the total number of electrons in matter, i.e., a general-ization of the TKR sum rule: That is to say,
dw[df (u))/du] = N, (15)o
where N is the total number of electrons per unit volume. Fortreating macroscopic matter, for which N is very large, it isoften convenient to use N-1df(u)/d«, viz., the oscillator-strength spectrum per electron, as Fano [39] does. For a fullerdiscussion of the oscillator-strength spectra, see Fano andCooper [41] and Inokuti [42].
In the limit of weak relaxation, i.e., g -» 0, Eq.(14) leadsto separate expressions for £i(u) and £z(u):
3! du'J o
47rez f- df(u')/du'= 1+ ————— P l du' —————————— , (16)m
356

where P means the Cauchy principal value, and
27T2e2 1 d f ( u )e z ( o i ) = ————— —— ————— . (17)
m u du
Consider a frequency u so high that hw exceeds the bindingenergies of all the electrons in the material. Then, virtuallyall the oscillator strength lies below w, and we may set d>2»u'2
in the denominator of Eq.(16). Using the sum rule, Eq.(15), weobtain an asymptotic expression
£ i ( u ) = l -47re 2 N/(m<o 2 ) . (18)
Let us introduce the nominal plasma frequency UD corresponding tothe total electron density N through
u*.2 = 4ire2N/m. (19)
Then we may write simply
. (20)
For a material with density p(g/cm3), atomic weight A, and atomicnumber Z, the nominal plasma energy may be expressed as
*«„ = 28.816(pZ/A)1'z(eV) . (21)
The ratio Z/A for all ordinary substances is about 1/2. Thus, wesee that tiup ranges from 20 eV to 60 eV for condensed matter withp ranging from unity to 10. Equation (20) holds for "fitj exceedingthe K shell, and shows that £1(0) approaches unity from below.
From Eq. (17) we see that &)£z(6>) is the same as df(u)/d«apart from a universal constant. Therefore, we may rewrite thesum rule as
du o ) e z ( û ) ) = 27T 2 e 2 N/m, ( 2 2 )o
or as
357

(23)
Let us now consider the propagation of an electromagneticplane wave of frequency u in a material with dielectric permea-bility c(u) and magnetic permeability M(U). It is elementary toshow from the Maxwell equations that the electric field E as afunction of the distance x in the line of propagation obeys [37]
d2E/dx2 + (u>/c)2E(&))n(u)E = 0. (24)
This equation has a solution of the form exp(ikx), where the wavenumber
k = (<Ü/C)[E(<O)M((O)]IXZ (25)
is a complex number. It is customary to express
ö), (26)
and call n(u) the refractive index and K (to) the extinctioncoefficient, following the tradition of optics. For nonmagneticmaterials, a(a>) = l, we obtain from Eq. (26) relations
ei(w) = n2(&))-K2(u), (27)
EZ(U)) = 2n(&))K(u)). (28)
The physical meanings of n(«) and «(u) are seen from the behaviorof the electric field given by exp[i(u)/c)n(u)x] exp[-(u/c)K (u)x] .Recalling the presumed time-dependence exp(-iut), we see that thewave propagates at velocity c/n in an ideal case where therefractive index n is independent of u . Otherwise, dispersionoccurs, and a wave packet propagates at the group velocity c/[d&>n(<a)/d<0]. The energy density carried by the wave is proportionalto the square of the electric field, and it decreases withdistance x as exp[-2(<a/c)« (<a)x] . Therefore, we call
A(a) = 2(a/c)K(o) (29)
358

the attenuation coefficient or the absorption coefficient, whichhas the dimension of an inverse length.
Let us now consider a material of low density, e.g., a gasat low pressure. Then £i(«) and n(u) are close to unity.Therefore, K(w)=£z(«)/2 according to Eq.(28), and we may rewriteEq.(29) as
A(w) = (u/c)£z(fc)) = (27T2e2/mc)df (u)/d<a, (30)
mwith the use of Eq.(17). Suppose that the material contains Nmolecules per unit volume, we call p((d)=A(w)/Nm the photoabsorp-tion cross section of the molecule, and dfm(u)/d(i)=[df(u)/du]/Nmthe oscillator-strength spectrum of the molecule. Then, werewrite Eq.(30) as
CT(U) = (27r2e2/mc)dfm(u)/dfe). (31)
Thus we see the relation of the present discussion with theearlier discussion on gaseous molecules.
Finally, we point out the relevance of e(u) to the relativeprobability of different amounts of energy transfer from a fastcharged particle to materials in glancing collisions, whichoccur most often. This topic originates from the famous paper byBethe [43], and has been followed up extensively by many workers[39,40,44]. Here we give only a single point of importance to thetheme of the present Chapter. The probability for the transferof energy ho> in a glancing collision of a fast charged particleis proportional to
n(u) = Im[-l/e(«a)] = £z (a )/[c i 2 (u) + £22 (u) ] . (32)
This result seems to have been first recognized by Fermi [45],and has been derived by many authors at varying levels of rigorand generality, e.g., by Fano [39,40]. An excellent treatment isseen in the textbook of Landau and Lifshitz [37]. Remarks by Fano[46] on Eq.(32) and related topics such as collective excitationare also useful.
359

A few points about Eq.(32) are noteworthy. Recall that thelargest impact parameter effective for the energy transfer hufrom a particle of speed v is about v/w, which corresponds tosome tens of intermolecular distance in ordinary condensed matterfor a relativistic speed v close to c. Then, there are manymolecules within the impact parameter and they screen in part theelectric field of the charged particle. The denominator C:i2(<a) +£22(w) represents the degree of screening of the interactionsbetween the charged particle and electrons that receive energy.The denominator makes n(u)) different from the strength of photo-absorption which is given by EZ(W) according to Eq.(30).
Consider again a low-density material, e.g., a low-pressuregas. Then ei(«) is close to unity, and ez(«) is much smaller thanunity; therefore, the denominator is close to unity, and n(o)) isnearly the same as £Z(G)).
In condensed matter, !!(<•)) may differ from ez(o)) in somefrequency domains. The most drastic difference between n(co) andEZ(U) is seen near u at which ei(b>)=0, if this occurs at all. Inthis event Fl(u) = l/Ez(u) at that u, and has high values in theneighborhood. The vanishing of EI(U) indeed occurs for metals, asis readily expected for the following reason. At low frequencies£x(o) must be negative for a conductor [37], at very highfrequencies £i(a) must be positive for any material according toEq.(18). Therefore, at some frequency O)PC, we must have £i(Ui>c) =0, so long as EI(U)) is a continuous function of u. We call a>vcthe plasma frequency for conduction electrons. If we calculatethe effective density nc of conduction electrons according tocoI,c,= (47re2nc/m):l/'2 the result usually comes out to be sensible. Inmetallic aluminum [47,48], for example, tudDC = 15eV, and hence nc =2.7 per atom. This agrees roughly with the number of valenceelectrons (three) of an aluminum atom.
5.5.2 SELECTED DATA
A comprehensive survey of data on E(U) for various materialsis beyond the scope of the present report. Extensive data onmetals, semiconductors, and inorganic insulators are given in ahandbook edited by Palik [48]. A monograph by Egerton [49] is
360

10-Imr"1 mox = 14.1 AIat 15.0 eV
10" 10' I 10 10 10'PHOTON ENERGY {eV)
10
FIG. 5.13 Dielectric response function for metallic alminum [50].The real part £i(u) is negative and has a large absolute valuebelow 14.9 eV; therefore, -eJ(u)xl03 is plotted. The imaginarypart e.z(u) shows a generally decreasing trend with increasingphoton energy hu. The small peak at about 2 eV arises from intra-band transitions of conduction electrons, the large peak around110 eV from the L-shell excitation, and the peak around 1200 eVfrom the K-shell excitation.
361

also valuable as a source of data. In what follows, we present adiscussion on materials selected for the illustration of a fewnotable points.
As an example of metals, we take aluminum, for which acomprehensive analysis has been given [47,50]. A similar analysisfor silicon has been also given [51]. Figure 13 is a summary ofthe result on aluminum [50]. At low energies hu up to several eV,e(&)) is represented well with a fit according to the Drude model,i.e. ,
E (a) = l-(co*)2/(«2-iro)), (33)
where fi«* = l2.5 eV and fir = 0.0614 eV. This value of "fiw* is close tothe plasma energy of the conduction electrons, ti(i)i,c=14.9 eV, butnot equal to it. This means that a simple model often describesthe behavior of e(u) over a limited range, but cannot be correctover the entire range. At low energies, both -EI(O) and £z(u) arelarge, and n (u) is small. Near the plasma energy of conductionelectrons IT (to) shows a prominent peak. At energies far above
IO'1 10 I02 I03
ENERGY, oj(eV)
FIG. 5.14 Illustration of the sum rules for metallic aluminum [47].
362

h&>üc, £i(ci>) is practically unity and e2(e) is much smaller thanunity. As a result, n(u) is almost the same as £2(u). However,exceptions arise near the L-shell and K-shell thresholds, where£2(0)) and n(u) differ in fine structures (which are undiscerniblein Fig. 13). Figure 14 illustrates the sum rules [47]. The curvelabeled "£2(u)" represents an effective electron number, i.e.,
m d(o'(o'£Z(w' ) . (34)27T 2£ 2 o
According to Eq.(22), nBff((o) should approach 13 as u-*». Thefigure also includes two other quantities defined by replacing£z(u) with Im[-l/£ (&)) ] or K(U) in Eq.(34). The total effectivenumber of electrons is 3.11 for the M-shell, 8.27 for the L-shell.and 1.61 for the K-shell. These values roughly correspondto the electron configuration Is22s22p63s23p of a free atom ofaluminum.
The occurrence of the plasma excitation in metals is mostoften explained by the theory of a free-electron gas with abackground of uniform positive charge, as developed by Bohm andPines [52-54]. More generally, the occurrence is understandablefrom a criterion for collective excitation given by Fano [55].Suppose that a condensed material is formed from structuralunits, e.g., atoms or molecules, which we may call monomers. Letthe oscillator-strength spectrum of the isolated monomer bydfm(u)/d&) . Fano showed that
(35)
is a crucial index, where upv represents the plasma frequency ofthe valence electrons in the condensed matter. Note that thedifferential in Eq.(35) is with respect to &>2 and not u. Thequantity u(u) signifies the density of oscillator strength inspace and energy squared. (A more general interpretation of u(u)has been given recently [56]. If the density is sufficientlyhigh, the condensed-matter spectrum will differ appreciably fromthe monomer spectrum. When this occurs, excited electrons in thecondensed matter will be spatially limited by the presence ofneighbouring monomers, and an associated oscillator strength willbe shifted to higher energies upon going from a monomer to the
363

condensed matter. When u(o>) is much greater than unity in aregion of u, the condensed-matter spectrum differs considerablyfrom the monomer spectrum in that region. When u(&>) is muchsmaller than unity, the two spectra are the same. If we examinedata for an element that form a metal, we find that the lowestvalence excitation in an atom indicates u(u)»l and thus leads tothe plasma excitation, Inokuti [42] showed this in an example oflithium.
Materials of interest to radiation chemistry and biologyinclude water and organic substances. The spectra of many mole-cules of such substances are known, as described earlier in thepresent chapter. With the use of data on those molecules, we findthat u (u) often reaches a maximum of 0.1-0.3 somewhere at excita-tion energies of hu ranging from 10 to 25 eV, as first pointedout by Platzman [18]. The values 0.1-0.3 are tantalizing. Theinfluence of collective effects is not as clear-cut as in metals,but is not negligible. However, in certain cases we have a clearconclusion. In benzene and other aromatic molecules, we find thatU(G))>! in a narrow region around several eV. This indicates theoccurrence of excitons as we know in crystals of those molecules.
Finally, we turn to data on e(u) for materials of this kind.Birkhoff, Painter, and coworkers [57-63] measured reflection ofphotons by liquid water, liquid organics and solid organics, andthereby determine e(&>) up to Tfu^OeV. Another method of study isthe measurements of the electron energy loss spectra, which areclosely related to Il(co). For example, studies by Killat [64,65]on hydrocarbons and by Isaacson [66] on nucleic acid bases are ofparticular interest to radiation chemists and biologists. Morerecently, Dillon et al [67]. measured electron energy-lossspectra of adenine in gas and found them similar to spectra insolid films [66]. More data are seen in many references quoted byEgerton [49] and in a review article by Koch and Otto [68].
Typical data are seen in Fig. 15 for polyethylene [63]. Thefunction n(u) shows a prominent peak around 20 eV. However, thispeak is similar to a peak in the corresponding monomer spectrumand is located only a few eV higher. The real part £i(«) does not
364

.CM T.\Û <J
O
POLYETHYLENE
.25
1.00
„ 0.75-U0.50
0.25
20 40 60PHOTON ENERGY (eV)
i ' iPOLYETHYLENE
20 40 60PHOTON ENERGY (eV)
80
80
FIG. 5.15 Dielectric-response function for polyethylene [63].
365

vanish and merely shows a minimum around 15 eV. In general ei(u)is positive throughout, although at low «, £i(u) shows somestructures. The imaginary part £Z(M) certainly differs from U(u),but the difference is not as dramatic as in metals. This observa-tion is consistent with the result that u(w) is not negligiblecompared with unity but is substantially smaller than unity.Consequently, we may conclude that there are modest effects ofcollective excitation in the materials of this kind.
5 . 6 CONCLUDING
The measurements of photoabsorption, pîiotoionization, andphotodissociation cross sections have advanced rapidly for avariety of polyatomic molecules at least in the gas phase in awide range of energy including the VUV-SX region, and have juststarted to bridge a wide gap existing between radiation chemistryand photochemistry.
Some future problems to need more work are,
1) Cross sections should be measured for more of the chemicallyand biologically important, molecules.
2) Cross sections should be measured for condensed phase systemswhich are of importance in radiation research.
3) The cross sections should be measured also for high pressuregases or cluster systems to provide a basis for understandingthe effect of inter-molecular interactions on the cross sec-tions .
4) For better substantiation of ionization phenomena in the con-densed phase as compared with those in the gas phase, themeasurement has been already made of the ionization thresholdenergy in nonpolar liquids. A key experiment, however, forthis purpose should be the measurement of the absolute ioni-zation quantum yield values in liquids.
366

ACKNOWLEDGEMENTS
Y.H. is indebted to Drs. N.Kouchi, M.Ukai, K.Kameta, and graduatestudents in his group for their excellent collaboration in thesynchrotron radiation research described in this chapter. Thisresearch has been supported scientifically by the staffs of thePF-KEK and financially by the Ministry of Education, Science andCulture, Japan. The M.I.'s work described herein was supported bythe US Department of Energy, Office of Health and EnvironmentalResearch.
REFERENCES[1] Proceedings of the IAEA Advisory Group Meeting on Atomic and
Molecular Data for Radiotherapy, Vienna, June 13-16, 1988,IAEA-TECDOC-506 (1989).
[2] INOKUTI, M., ed., Proceedings of the Workshop on Electronicand Ionic Collision Cross Sections Needed in the Modeling ofRadiation Interactions with Matter, ANL-84-28 (1984).
[3] GERWARD, L., Radiât.Phys.Chem. 41(1993)783.[4] BERGER, M. and HUBBELL, J.H., National Bureau of Standards
Internal Report (1987) 87-3597.[5] CREAGH, D.C. and HUBBELL, J.H., International Tables for
Crystallography, Vol.C, ed. A.J.C. Wilson, Kluwer Academic,Dordrecht (1992) p.189.
[6] HENKE, B.L., LEE, P., TANAKA, T.J., SHIMABUKURO, R.L., andFUJIKAWA, B.K., Atom. Data Nucl. Data Tables, 27(1982)1.
[7] SALOMAN, E.B., HUBBELL, J.H., and SCOTFIELD, J.H., ibid., 38(1988)1.
[8] HATANO, Y., "The Chemistry of Synchrotron Radiation" in"Radiation Research", ed. E.M. Fielden, J.F. Fowler, J.H.Hendry, and D. Scott, Taylor & Francis (1987) p.35.
[9] KAPLAN, I.G., personal communication.[10] MOROSOV, I.I. and MYASNIK, M.N., Radiât.Res. 82(1980)336.[11] REDPATH, J.L., ZABILANSKY, E., MORGAN, T., and WARD, J.F.,
Int.J.Radiât.Biol. 39(1981)569.[12] MICHAEL, B.D., HARROP, H.A., and HELD, K.D., J.Radiât.Biol.
82(1981)580.[13] KATSUMURA, Y., Handbook of Radiation Chemistry, ed. Y.
Tabata, Y. Ito, and S. Tagawa, CRC Press, Boca Raton (1991)p.300.
[14] KATSUMURA, Y., TABATA, Y., and TAGAWA, S., Radiât.Phys.Chem. 24(1985)489.
[15] INOKUTI, M., Photochem.Photobiol. 44(1986)279.[16] INOKUTI, M., Rev.Mod.Phys. 43(1971)297.[17] INOKUTI, M., "Radiation physics as a basis of radiation
chemistry and biology", in: Applied Atomic CollisionPhysics, Vol.4, ed. S. Datz, Academic Press, New York (1983)p.179.
[18] PLATZMAN, R.L., in "Radiation Research", Proceedings of theThird Congress of Radiation Research, Cortina d'Ampezzo.Italy, 1966, ed. G. Silini, North-Holland, Amsterdam (1967)p. 20.
367

[19][20]
[21]
[22]
[23][24][25][26][27][28][29]
[30]
[31][32]
[33][34]
[35]
[36]
[37]
[38][39][40][41][42][43][44][45][46]
[47]
[48]
[49]
[50][51]
Int.J.Radat.Phys.Chem. 8(1976)171.SHINSAKA, K., UKAI, M., MORITA,
Y., YAGISHITA, A., and ITO, K., J.Chem.Phys. 82NAKAZAWA,
YAGISHITA,
K. ARAI, HATANO,K., and
SHIDA, S. and HATANO, Y.KOIZUMI, H., YOSHIMI, T.M., HATANO,(1985)4856.KOIZUMI, H.H., KIMURA,A., ITO, K.KOIZUMI, H.S., UKAI, MY., ITO, Y.TANAKA, K.,KOIZUMI, H.87.PLATZMAN, R.L., Vortex, 23(1962)372.PLATZMAN, R.L., Radiât.Res. 17(1962)419.KAPLAN, I.G. and MITEREV, A.M., Adv.Chem.Phys.HATANO, Y., Radiochim.Acta. 43(1989)119.HATANO, Y., Comm.At.Mol.Phys. 13(1983)259.HATANO, Y., "Dynamics of Superexcited Molecules", in"Dynamics of Excited Molecules", ed. K. Kuchitsu, Eisevier,
, HIRONAKA, K., SHINSAKA, K., ARAI, S.A., HATANO, Y., ITO, Y., ZHANG, Y.W.,
, and TANAKA, K., ibid., 85(1986)4276., SHINSAKA, K., YOSHIMI, T., HIRONAKA,,, MORITA, M., NAKAZAWA, H., KIMURA, A, ZHANG, Y.W., YAGISHITA, A., ITO,Radiât.Phys.Chem. 32(1988)111.
, SHINSAKA, K., and HATANO, Y., ibid., 34(1989)
68(1987)255
Amsterdam,GALLAGHER,
in press.J.W., BRION, C.E,
P.W., J.Phys.Chem.Ref.Data,, SAMSON, J17(1988)9.
A.R., and LANGHOFF,UKAI, M. etKAMETA, K.,N., HATANO,
al., to be published.UKAI, M., KAMOSAKI, T., SHINSAKA, KY., and TANAKA, K.
POTTS, A.W., WILLIAMS, T.A.,Discuss.Chem.Soc. 54(1972)104.UKAI, M., KAMETA, K., CHIBA, R.
J.Chem.Phys.and PRICE,
KOUCHI,96(1992)4911.
FaradayW.C.NAGANO, K., KOUCHI N.
SHINSAKA, K., HATANO, Y., UMEMOTO, H., ITO, Y., and TANAKA,K., J.Chem.Phys. 95(1991)4142.KAMETA,HATANO,COOPER,133.LANDAU,
K., UKAI, M.,Y. and TANAKA,G., IBUKI, T.,
CHIBA, R.K.,and
ibid.,BRION,
, NAGANO, K.,95(1991)1456.C.E., Chem.Phys.
KOUCHI, N.140(1990)
L.D. and LIFSHITZous Media, translated by J
E.M., Electrodynamics of Continu-.B. Sykes and J.S. Bell, Pergamon
Press, Oxford (1960), Chapters 9 and 12.NOZIERES, P. and PINES, D., Nuovo Cimento 2(1958)470.FANO, U.FAND, U.FANO, U.INOKUTI,BETHE, HINOKUTI,FERMI, EFANO, U..Proceedings ofTennessee. 15-18
Phys.Rev. 103(1956)1202,Ann.Rev.Nucl.Sci. 13(1962)1.and COOPER, J.W., Rev.Mod.Phys. 40(1968)441.M., Radiât. Effects Defects Solids 117(1991)143., Ann.Phys. (Leipzig) 5(1930)325.M., Rev.Mod.Phys. 43(1971)297., Phys.Rev. 57(1940)485.in Penetration of Charged Particles in Matter,
an Informal Conference, Gatlinburg,September 1958, ed. A. Edwin Vehling,
Publication 752, National Academy of Sciences NationalResearch Council, Washington, D.C. (1960) p.158.SHILES, E., SASAKI, T., INOKUTI, M., and SMITH, Y.D., Phys.Rev. 622(1980)1612. See also p.369 of Réf.[48].PALIK, E.D., ed., Handbook of Optical ConstantsAcademic Press, Inc., Orlando, Florida (1985).EGERTON, R.F., Electron Energy-Loss SpectroscopyElectron Microscope, Plenum Press, New York (1986)INOKUTI, M. and SMITH, D.Y., Phys.Rev. B25(1982)61.BICHSEL, H., Rev.Mod.Phys. 60(1988)663.
of Solidsin the
368

[52][53][54][55][56][57]
[58]
[59][60]
[61][62]
[63][64][65][66][67][68]
BIRKHOFF, R.D., and
PINES, D. and BOHM, D., Phys.Rev. 85(1952)338.BOHM, D. and PINES, D., ibid., 92(1953)609.PINES, D., ibid., 92(1953)626.FANG, U., ibid., 118(1960)451.FAND, U., Rev.Mod.Phys. 64(1992)314.KERR, G.D., HAMM, R.N., WILLIAMS, M.W.PAINTER, L.A., Phys.Rev. A5(1972)2523.HELLER, J.M.Jr., BIRKHOFF, R.D., WILLIAMS, M.W. and PAINTER,L.R., Radiât.Res. 52(1972)25.HELLER, J.M. Jr., HAMM, R.N., BIRKHOFF, R.D. and PAINTER,L.R., J.Chem.Phys. 60(1974)3483.INAGAKI, T., HAMM, R.N., ARAKAWA, E.T. and PAINTER, L.R.,ibid., 61(1974)4246.WILLIAMS, M.W., HAMM, R.N., ARAKAWA, E.T.Int.J.Radiât.Phys.Chem. 7(1975)95.BIRKHOFF, R.D., PAINTER, L.R. and HELLER,69(1978)4185.PAINTER, L.R., ARAKAWA, E.T., WILLIAMS,J.C., Radiât.Res. 83(1980)l.KILLAT, U., Z.Phys. 263(1973)83.
J.Phys. 07(1974)2396., J.Chem.Phys. 56(1972)1803., TANAKA, H. and SPENCE, D.
and PAINTER, L.R.,J.M., J.Chem.Phys.M.W. and ASHLEY,
KILLAT, U.,ISAACSON, M.DILLON, M.A.(1989)1.KOCH, E. and OTTO, A., Int.J.Radiât.Phys.Chem. 8(1976)113.
Radiât.Res. 117
369
Chapter 6
COLLISION PROCESSES BETWEEN IONS ANDEXCITED NEUTRALS
AND SURROUNDING MOLECULES
Z. HermanJ. Heyrovsky Institute of Physical Chemistry and Electrochemistry,
Prague, Czech RepublicT.D. Mark
Universität Innsbruck,Innsbruck, Austria
L. SancheUniversité de Sherbrooke,
Sherbrooke, Canada
The authors acknowledge the valuable contribution to this chapter by Y. Hatano,Tokyo Instituteof Technology, Tokyo, Japan.
371

6.1. INTRODUCTION
In this chapter we deal with elementary processes in thephysico-chemical stage of radiolysis in which ions and excited neutrals(formed in primary events or secondary electron processes) change theirchemical or energetic nature in collisions with other molecules. Theseprocesses represent an important step in the development of the system whichlinks the physics of the initial processes with the chemistry of subsequentevents (mainly chemical reactions of radicals formed by neutralization ofrelatively stable charged species and/or dissociation of energy rich neutralspecies).
Better understanding of radiation effects related to radiation therapyincludes understanding of basic features of fundamental processes in thisstage of interaction of radiation with matter. Quantitative information,namely, cross section or rate data on various elementary processes areprovided by atomic and molecular physics research. We summarize hereinformation on main elementary processes relevant to the problem.
The elementary processes concern, first of all, a large variety ofencounters between ions and molecules, namely:- chemical reactions of positive and negative ions- charge transfer processes- recombination processes between ions and electrons or between
ions of opposite chargeSecondly, there are elementary processes involving collisions ofelectronically excited neutrals with molecules, in particular- ionization processes- excitation energy transfer leading to neutral species
In the following, first of all the basic characteristics of the abovementioned processes will be given, as obtained from studies in the gaseousphase. Then the fundamental processes involving clusters will be discussed,and - finally - fundamental processes in the condensed phase will beshortly treated. Thereafter, relevant data on the elementary processes willbe summarized in tables. The tables concern data on cross sections or rateconstants of the elementary processes in question. It is important tocomplement the rate data with thermochemical data of the species onquestion. Therefore, the tables contain also data on ionzation potentials,proton and electron affinities of molecules, and heats of formation of ionsand neutfal species.
There have been several reviews on the above mentioned elementaryprocesses over the last twenty years as well as data tabulations. Here we
373

point out some of the useful sources of information. Thermochemical data onthe species in question have been summarized in excellent reviews [1,2],proton affinities in recent tables [3], and general data on properties ofatoms, molecules nad ions are given in the Radzig-Smirnov book [4]. Data onrate constants of ion-molecule reactions and charge transfer processes havebeen summarized in two large reviews [5,6], Penning ionization and relatedprocesses have been treated in [7]. Quite recently, fundamental processes inradiation chemistry have been extensively reviewed [8].
6.2. ELEMENTARY PROCESSES
6.2.1. Chemical Reactions of Positive and Negative Ions
Chemical reactions of ions are elementary collisions processesoccurring between a (positively or negatively) charged particle and aneutral molecule in which a chemical bond rearrangement takes place (usuallyan old bond is broken and a new bond formed). As a result, productschemically different from reactants are formed, one of the products ischarged. Schematically one can write
A+ + BC -> AB+ + C (1)
or, for example,A~ + BC -> AB + C~ (2)
where A, B, C are atoms or groups of atoms.Ion-molecule reactions have been systematically investigated by mass
spectrometric methods as single-collision processes since the early fiftiesand large amount of data was accumulated on reactive cross sections andtheir dependence on energy. Dynamics of the reactions has been ivestigated.From the point of view of reaction data, perhaps the most valuable source ofinformation are results of swarm studies. Flow-tube (FT) andselected-ion-flow-tube (SIFT) investigation of ion-molecule chemicalreactions has provided a wealth of reaction rate constants on a variety ofprocesses in the thermal energy region. An equally important source ofinformation on reaction rate constants are results of ion cyclotronresonance studies.
In this chapter we deal with the collision behaviour of ions andexcited neutrals formed in primary and secondary energy-deposition events.
374

Therefore, we are concerned primarily with collision processes ofenergy-rich particles of thermal translational energies, and we will omitfrom discussion their hyperthermal behaviour.
Rates of chemical reactions of ions are given usually as the reactioncross section, cr(v), for a specific relative velocity v of the reactants,
2 2and measured usually in cm or A . For thermal particles the rate is moreoften expressed as reaction rate constant k(T), at a given temperature T, in
3units of cm /s. The relation between these two important quantities oneobtains, if one realizes that the rate constant is a quantity averaged overthe Boltzmann distribution of the reactant relative velocities at a giventemperature. It holds, therefore,
00k(T) = I f(v,T) <r(v) v dv (3)
0where f(v,T) is the velocity distribution temperature T. One can writecompactly as
k(T) = <v o-(v)> (4)an average of cross section over the Boltzmann distribution of velocities. Afull calculation leads to the expression
oo3/2k(T) = (Ttfi)"1/2 (2/kT)3/2 S dEtr E r(E ) exp(-Etr/kT) (5)
where cr(v) is replaced by <r(E ), cross section in dependence on (relative)translational energy of the reactants (JLI is reduced mass, k - Bcltzmannconstant) .
A basic feature of chemical reactions of ions is -their very high ratein comparison with chemical reactions of neutrals (cross sections of the
-14 2 -9 3order of 10 cm at thermal energies or rate constats of about 10 cm /s).The reason for it is the attractive ion - induced dipole interaction betweenthe colliding particles which results in potential energy surfaces ofbasically attractive type without an activation barrier. (Activationbarriers, if any in ion-molecule processes, result rather from crossing ofpotential energy surfaces in cases of reactions occurring non-adiabaticallythan from a movement of the system on a single potential energy surface).Reaction thus tend to occur at every collision and thermal reaction ratesapproach often the "Langevin collisional limit", k.
kL =27re(o/M)1/2 (6)(e - electron charge, a - neutral partner polarizability) which essentiallydetermines, when a colliding pair ion - induced dipole can still be broughttogether within the orbiting capture radius. A rate constant appreciably
375
smaller than k. means usually that there is a competing (or consecutive)process to the formation of a product in question. Endoergic processes ofground-state species have mostly negligible rates being limited by theexponential factor in the translational energy distribution. Moreover,translational energy is usually not very efficient in overcoming theendoergicity barrier. On the other hand, internal energy (i.e. vibrationalor electronic excitation) of reactants has been shown to be very often quiteefficient in overcoming the endoergicity barrier.
Chemical reactions of ions may be grouped into various classesaccording to which particle is being transferred during the process. A veryimportant class of reactions represent processes in which a proton or aH-atom is transferred and a protonated molecule formed as the ion product:
AH+ + B -> A + BH* (7)
A+ + BH -> AH+ + B (8)
The proton and H-atom transfer processes occur usually in a direct manner,i.e. the chemical change is accomplished during about one vibrationalperiod; in many cases, however, an intermediate, thermodynamically stablespecies may be formed. Thus, e.g., the important reaction between water andwater cation - a basic reaction in water containing systems -
H_0++ HO -> H 0+ + OH (9)<L £• -J
occurs by both direct proton and H-atom transfer, and by the intermediatespecies formation. The formation of the intermediate complex is importantespecially in condensed phases, where it may be stabilized in collisionswith the surrounding molecules to form (HJD..OH) .
Another important reaction type is H (hydride ion) transfer
A+ + BH -> AH + B+ (10)Other reactions concern transfer of functional groups, formation of new C-Cbonds, transfer of other atoms etc. as can be seen in processes listed inthe tables.
6.2.2. Charge Transfer Processes
Charge transfer (charge exchange, electron transfer, electron capture)processes represent another important elementary process in collisions ofions and molecules. They can be symbolized as
A + + BC -> A + BC+ (11)
A+ + BC -> A + B* + C (12)
376

Process (11) is usually referred to as non-dissociative, (12) asdissociative charge transfer. Thus, an electron is exchanged between thecolliding particles, no new bond is formed, a bond may be broken in thedissociative process. Analogous processes occur with negative ions, too.
Positive ions, as electron-deficient species, have very often low-lyingelectonic states. Therefore, several electronic states may be involved intheir collision processes. Charge transfer represents a typicallynon-adiabatic process during which the system passes from one potentialenergy surface, correlating with the reactant pair, to another surface,characterizing the product pair. Charge transfer processes often occur ascompeting processes to chemical reactions of ions.
Cross sections of charge transfer processes are usually comparable insize with cross sections of chemical reactions of ions. For rate processesof charge transfer at thermal energies analogous relations hold as forchemical reactions (see paragraph 2.1,). Rate constats are often usedinstead of velocity dependent reaction cross sections; some of the data aresummarized in the tables of this chapter.
6.2.3. Recombination Processes
A positive ion can recombine either with an electron or with a negativeion.
In a recombination process of a positive ion and an electron, thesurplus energy may be either radiated (radiative recombination (13)),released in a dissociative process (dissociative recombination (14)), ortaken away by a third body (three-body recombination (15)). In all casespart of the energy may be stored as internal excitation of the molecularspecies formed in the process (e.g., M').
AB+ + e -> AB + hv (13)
AB+ -i- e -> A + B (14)
AB* + e + M -> AB + M' (15)
Quantitative data on rates of recombination processes are presented asrecombination coefficients o^(in cm /s) and for two-body recombination they
- 7 3are of the order of 10 cm /s; this corresponds, for thermal velocities, to-12 -11 2average cross sections of the order of 10 to 10 cm .
Recombination processes occurring in collisions of positive andnegative ions may be described in an analogous way as radiative
377

recombination (16), mutual neutralization by electron exchange (17), andthree-body recombination (18)
A+ + B~ -> AB + hv (16)
A+ + B~ -> A' + B' (17)
A+ + B~ + M -> AB + M' (18)
Recombination rate coefficients areeven larger than for theion-electron recombination being of the order of 10 cm /s for most simplegases; this corresponds to the average cross sections at thermal energies of10~10 to 10~9 cm2.
6.2.4. lonization Processes in Collisions of ElectronicallyExcited Neutrals
Elementrary ionization processes in collision of electronically excitedneutral particles with molecules are Penning ionization(19), associativeionization (20), and chemical rearrangement ionization (21).
A* + EC -> A + BC+ + e (19)A* + BC -> ABC+ + e (20)
A* + BC -> AB+ + C + e (21)The necessary conditions for these processes is -that the excitation energyof A , E (A ), is higher than the ionization potenial of BC, IP(BC). Theenergy of the released electron, E , is given by
E . = E (A*) - IP(BC) - AE (22)el ewhere AE =E - E is an energy term which takes into account interactionsbetween the reactant (E ) and product (E ) particles at the internucleardistance where the ionization process occurs.
A collision of an electronically excited neutral particle with a moleculedoes not necessarily result in an ionization process [19,20,21], even if theexcitation energy is higher than ionization energy of the molecule BC. Anexitation energy transfer leading to a superexcited neutral molecule mayoccur, with the excitation energy of the neutral molecule being higher thanits ionization potential. This is the basis of the Jesse effect, discussedin detail elsewhere in this book ( Chapter 5 ) because of its importance inhighly energized systems.
A schematic of potential energy curves for the Penning and associativeionization process X + Y suggest the mechanism [9] (Fig.la): Penning
378

(b)
K.E.(xy+)
x-f y
R
R
FIG. 6.1. Schematics of the mechanism of the Penning and associativeionization (a) and of the chemiionization (b) process (after [9]).
379

ionization occurs in the A-A' transition, associative ionization in B-B" .The latter takes place, if the sum of AE and the relative collision energyof reactants is negative. The Penning, associative, and chemicalrearrangement ionization may occur in competition.
A special case of associative ionization is the chemi ionization processin which the excitation energy of A is lower than the ionization potentialof the target particle CD and ionization occurs on the expenses of forming achemical bond, process (23); potential energy curves for the chemiionizationX + Y are shown in Fig. Ib.
A* + CD -> ACD+ + e (23)and E (A) < IP(CD)e
A chemical rearrangement process (24) may occur in some cases as acompeting process to chemiionization
A* + CD -> AC* + D + e (24)
under the same condition, i.e. E (A) < IP(CD).Penning and associative ionization processes have been investigated
mostly in collisions of metastable rare gas atoms and atoms or molecules. Alarge amount of data on these processes show that thermal rate constants areof the order of 10 to 10 cm /s which corresponds to average crosssections of 10 to 10 cm . General conclusions relating the crosssections to the spatial electron distributions of the outermost orbital ofthe target have been recently formulated [10a]. However, studies have beenby no means limited only to excited noble gas projectiles. Among others,higher lying electonic excited states of other atoms or molecules as well asRydberg states of atoms and molecules have been used as projectiles instudies of Penning, associative, chemical rearrangement and chemiionizationprocesses. Quantitative data are, however, often missing due to inherentdifficulty of determining the excited state concentration, and only relativedata on the competition of various processes may be available. Examples ofsome of the investigated processes are (25) and (26).
He * + H_ -> H * + He + e (25a)m 2 i-> HeH* + H + e (25b)
+ e (25c)
H2* + C2H4 ~> C2H2+ + H2 * e (26a)
-> CH+ + H + e (26b)
380

The extent of fragmentation of polyatomic molecules ionized by metastablenoble gas atoms was investigated with the conclusion that the extent offragmentation was practically the same as that one obtained by impact ofelectrons of the same energy as the excitation energy of the excitedprojectile [10b].
6.2.5. Electronic Excitation Energy Transfer between NeutralParticles
Transfer of electronic excitation energy in gas phase collisions whichresults in excited neutral species belongs to one of the oldest areas ofresearch in atomic and molecular studies. Many specific cases have beenstudied and it is very difficult to review all the possible outcomes ofthese studies. In general, the main elementary processes areelectronic-to-electronic (27) and electronic-to-vibrational energy transfer(28), if we limit our attention to higly-energized particles common toirradiated systems.
A* + BC -> A + BC* (27)
A* + BC -> A + BC' (28)The product excited particle may loose its energy by further energy transferin subsequent collisions, by a radiative process or by dissociation.
Two basic rules apply in description of processes (27) and (28):the Wigner spin conservation rule (total spin of the systems isconserved through the inelastic collision);the energy resonance rule (energy transfer is most efficient when the
*internal energy given up by A is precisely equal to the energy absorbedin the process BC - BC or BC' (i.e. the relative translational energy ofthe colliding pair tends to be conserved).
A very important energy transfer process in irradiated systems is theexcitation transfer (27) under the conditions that the electronic excitationenergy of A is higher than the ionization potential of BC. This process isthen effectively competing with ionization processes and leads to theformation of neutral superexcited molecules which dissociate to formexcitedneutral fragments as discussed more in detail in Chapter 5.
381

6.3. REACTIONS IN AND OF CLUSTER IONS
As already mentioned in chapters 3 and 4, clusters of atoms ormolecules may have rather different properties and show a rather differentreaction behaviour than single monomers consisting of the same atom ormolecule. It has been mentioned in those chapters that clusters presentsystems which bridge the gap between the gaseous and the bulk state.Therefore, knowledge ofcluster properties may help to understand reactionsin the bulk state by extrapolating the evolution from the atomic ormolecular to the bulk properties with increasing cluster size.
In contrast to atomic and molecular ions discussed in chapter 2,cluster ions may not only react with other neutral targets (e.g., see thecase of ion-neutral reactions), but there exists also the possibility ofreactions within the cluster ion, i.e. reactions between clusterconstituents termed internal ion molecule reactions). In this brief reviewwe will discuss first these internal reactions, and then the reactivity ofentire cluster ions. For more information see the specialized literature oncluster ion reactivity given in [11].
6.3.1. Internal Reactions
After initial formation of an excited or ionized cluster (by eitherelectron or photon impact) we can distinguish between four classes ofreactions: associative ionization, Penning ionization, ion moleculereactions, and unimolecular dissociation.
6.3.1.2. Associative Ionization (Chemiionization)In these processes bond formation is involved. Investigations of Dehmer andPoliakoff [12] of Ar„in the VUV using mass spectrometric detection showed
* +that besides autoionization of Ar_ , Ar,, is also formed via theassociative ionization reaction Ar i- Ar -> Ar + e within the excited(Ar .Ar). Ng and coworkers [5] were able to edentify and study the relativereaction probabilities for the formation of various product channels of thechemiionization process CS (v,n).CS -> yielding (CS ) , and variousfragment ions as a function of Rydberg level n.
6.3.1.2. Penning IonizationIn Penning ionization an electron is transferred: In this case initial
energy deposition from the bombarding electron (or photon) into an excitedstate of one cluster constituent (usually a rare gas atom) is followed by
382

Penning energy transfer to a seed cluster constituent leading to itsionization. For instance, Birkhofer et al. [14] have described Penningionization or Ar clusters by metastable He ( a process which has been alsostudied outside of the cluster [15}). Kamke et al. [16] have demonstratedthe energy transfer from excited Ar atoms in clusters leading to theionization of organic seed molecules, and Dao et al. [17] reported thepossibility of Penning transfer of energy from an organic molecule in acluster involving delay times of up to 0.2 P.S. Considering that thisinter-molecular Penning ionization may in principle occur as soon as theadiabatic ionization energy of the cluster as a whole is below theexcitation energy of any of its (solvated) constituents Hertel and coworkers[18] recently suggested that this process is a rather common ionzationchannel, since the ionization energy of molecular clusters is usually muchlower than for any of its constituents.
6.3.2.3. Ion Molecule ReactionsA very common phenomenon, especially in mixed and molecular clusters,
are reactions within the energized ion-neutral complex after the primaryionization event; also referred to as ion-neutral half collision processes.These reactions usually lead to prompt fragmentation of the cluster ion.There exists now a large body of molecular beam photoionization and electronimpact ionization studies of these reactions [9-11]. Information about thesereactions are usually deduced from cluster fragmentation mass spectrameasured as a function of electron (photon) energy and stagnation conditionstaking also into account known properties of the respective reactions in the,gas phase. In these studies the fragmentation pattern is normallyinterrogated at times where not only prompt but also metastabledissociations have already influenced the original pattern.
Recently, the photoion-photoelectron coincidence (PIPECO) techniques[19], which utilize flight time correlation of an ion-electron pair, havebeen used extensively as an ideal approach to incorporate state and energyselection into these studies. For instance, the dissociation of Ar ( P.). CO
+into CO + Ar (produced by photoionization of Ar. CO and studied withPIPECO) is rationalized by Ng and coworkers [20] by a stepwise mechanisminvolving the formation of a vibrationally excited CO (X,v).Ar complex bynear- resonance intermolecular charge transfer and the subsequentunimolecular dissociation of the complex by vibrational predissociation.This is in line with the interpretation of the unimolecular (prompt)dissociation of single ethylene ions in association with large argon
383

clusters (up to Ar.„0), where charge transfer on or close to the surface ismade responsible for the observed fragment abundances [21].
The most common reactions are, however, proton transfer reactions andassociation reactions [22,23]. The production of the protonated ammoniacluster series NH . (NH„) is an example for the occurrence of an exoergic4* «5 nproton exchange reaction, whereas H.O (R.O) for an endoergic reaction. The
J <_. il
ammonia reaction has been studied extensively [24], and Castleman andcoworkers [25], using multiphoton ionization, found that the protonatedpentamer is an unusually prominent species due to a presumed closedsolvation shell. A similar prominent feature is the protonated 21mer in H20clusterspectra, its structure has been ascribed to clathrate formation viaan ion-induced mechanism [26]. It is interesting to note that in both casesionization also leads to the production of stoichiometric cluster ionseries, albeit with much smaller probability than in the protonated cases.Recently, evidence of multiple McLafferty rearrangements in protonatedn-butanoic acid clusters was reported [27]. The fragmentation patterninducedby such ion molecule reactions has been studied for several molecularclusters by Buck and coworkers [28] using size-selected neutral clusters ascollision partners in the primary ionization process. In the case ofethylene clusters, it is assumed that one ethylene unit is ionized, whichleads via an association reaction to a higly excited C H .This complexeither decays to C_H or C H_ ,or, in the case of clusters larger than thedimer, the C.H complex may be stabilized by a third body collision. Theoccurrence of C„H ions is rationalized by the endothermic H-atom transferreaction within the cluster C H . C H -> C H + + C H .
il. T: ^ fi O O ^ O
Another method to follow the ion chemistry has been presented by Brutschy etal. [29], where the neutral precursor of product ions is assigned using theoptical fingerprint in two-color-two-photon ionization spectroscopy.Finally, it is quite noteworthy that similar ion molecule reactions are tobe expected in negative molecular cluster ions [30].
6.3.1.4. Metastable DissociationsAn interesting variation on the theme of unimolecular cluster ion
reactivity is the decomposition in the metastable time regime. Whereasprompt dissociation reactions in the cluster ion (as described above) cannotbe observed directly and identified unambigously from the measuredfragmentation patterns, metastable dissociation reactions may be detecteddirectly in the field-free regions of certain mass spectrometer systems.This offers an opportunity to study in detail energetics, kinetics, anddynamics of selected ion dissociation processes of uniquely selected cluster
384

ion species. The existence of metastable cluster ions after electron (orphoton) ionization of van-der-Waals clusters has been established only inthe last decade [9,10] despite the fact that (i) delayed unimolecular decaywas to be expected and that (ii) a series of cluster ions, differing only insize constitute an ideal testing ground for statistical unimolecular decaytheories. Today, a large number of studies exists [9,10] on the properties
-7of metastable decay reactions of cluster ions (with lifetimes from 10 s[31,32] up to several 100 / s [33-35]) produced by either electron or photonionization of vdW clusters.
Fragmentation of an excited molecular ion usually occurs immediatelyafter the ionization event (prompt dissociative ionization via repulsivehypersurfaces). However, in certain cases such a dissociation cannot takeplace immediately due to obstacles along the possible reaction pathways.Ordinary polyatomic metastable ions can be categorized into three groupscorresponding to three different mechanisms (storage and disposal of excessenergy).1. Electronic (forbidden) predissociation: In this case the radiative decayor the radiationless transition from an excited (bound) state to arepulsive state (leading to instantaneous dissociation) is stronglyforbidden by some selection rules. A typical example is the metastabledecay of Ar^ ( ni/2)u via Ar * [2n1/2) into Ar^ [2p3/2) + Ar with a
lifetime of ~ 90 us [36,37].2. Barrier penetration: A second possible mechanism giving rise tometastable decay of ions is the excitation to bound levels which are abovethe dissociation limit of this ion but below the top of a weak dissociationbarrier. The quantum mechanical tunnel effect is responsible for theobserved metastable decay and the corresponding lifetimes. A particularvariant of this mechanism is tunneling through a centrifugal barrier(rotational predissociation). On the basis of experimental findings [36]and of a model calculation [38], it was suggested that tunneling through arotational barrier is responsible for the slow decay of small Ar clusterions.3. Vibrational predissociation: If a polyatomic ion is complex enough, theLissajous motion of an activated ion on its potential hypesurface will becomplicated enough to increase the lifetime into the metastable timeregime. This process has to be described in the framework of a statisticaltheory where the unimolecular rate constant k (and other properties such asthe release of translational kinetic energy Ç) are assumed to depend onlyon the internal energy of the activated ion. The excitation process is
385

assumed to have no influence on the values of k or T. Vibrationalpredissociation is thought to be the dominant metastable dissociationmechanism for large cluster ions and several variants of statistical theoryhave been applied to this rather new field [39,40]. Moreover, Scharf et al.[41] have recently explored by classical molecular dynamics vibrationalpredissociation induced by exciton trapping in neutral rare gas clusters.It is now well established that under certain conditions following theionization of a cluster, metastable decay not only proceeds according toone of the above mentioned (intramolecular) meachanisms, but also viamechanisms only possible in the complex environment of a cluster. To datetwo intermolecular mechanisms are known to occur:1. Delayed internal ion molecule reaction: One of the first examplesdiscussed in this context was the formation of protonated water clusters by
Klots and Compton [30], where they attributed observed metastable fragmentsto an ion molecule reaction taking place within a water cluster followingits ionization. They also reported observing metastable components in the
+formation of C H^ following the ionization of the ethylene dimer. Otherauthors have made similar observations [42]; for instance Futrell et al.[43] reported that in case of ammonia clusters a rearrangement channel is arelevant factor for metastable dissociation. Morgan et. al. [44] haverecently obtained first evidence for a delayed internal cluster reaction,namely, the metastable loss of H?0 following the ionization. This is incontrast to earlier work, where the product ions detected were also presentas peaks in the direct ionization spectrum.2. Intermolecular energy transfer: In this case vibrational or electronicenergy stored in one moiety of a cluster ion is released with a delay intointermolecular motion leading to the evaporation of specific (magic)mumbers of monomers. In particular, up to four vibrational quanta may bestored in a nitrogen cluster ion [45] leading to a rather peculiarmetastable evaporation pattern. A similar process involving the transfer ofelectronic energy in the metastable time regime has been observed for argoncluster ions resulting in the preferential evaporation of specific magicnumbers of Ar atoms [32]. Furthermore, metastable dissociations have beenalso reported in case of negative cluster ions [46,47].
A particular variant of a delayed decay in these systems is theoccurrence of electron autodetachment in the metastable time regime[46,48]. For more details on the properties of these metastable decayreactions see Ref. [10].
386

6.3.2. Reactivity of Cluster Ions
The field of cluster ion reactions with neutrals comprises a very largesubset of the general subject of ion molecule reactions treated in section 2.Association reactions are the most common variant of cluster ion reactions.The vast majority of association reactions (which are sometimes calledclustering reactions, because they may be seen as production sequence forcluster ions) have been investigated using either flowing afterglow or highpressure pulsed mass spectrometry techniques. This subject has been reviewedseveral times; in particular, the reader is referred to the collected databy Albritton anda recent review by Smith and coworkers [49].
The basic mechanisms of ion/molecule association reactions are wellunderstood. The reactions are visualized to proceed via an intermediatecomplex (AL) which has a lifetime t , against unimolecular decompositionback to the reactants A and L. 'A' may be taken to represent the reactantion, perhaps already containing some cluster subunits, and L the nextassociating molecule. Collision with a third body, M, can either removeexcess energy from the complex and result in the formation of a stableentity, or it can provide collisional energy necessary for dissociation backto the original reactants as follows [9]:
kA + L <---- (AD*
kr k
(AD* + M — --> AL + M (29)k
A + L ----> ALk--AL + M <---- (AD* + Mksk
(AD* — --> A + L (30)
kAL ----> A + L
Taking k to represent the rate of clustering, k (proportional to I/T ),the rate of dissociation of the complex, and k , the rate of stabilizationof the complex by a third body (M), a steady-state treatment for the complex(AD*leads to the following equation for the overall forward rate, k ,Likewise, the overall reverse rate is given by krQ as follows:
387

o o h- •
t—1
H"
V)
M-
O o ri-
O O J3 M ? 3 r»-
t — ,
V r+ fB -1 W O i" fB fB (-t-
(11 >— •
, _ ,
er* ro .. r»-
^f fB a (i) Ü5 £2*
fB a o d -i < fB -i :
fB •o •i fB W fB r-l-
W rt- tr fB < 0) -1 t-1 - W
»-H o' -t r+ tf fB p) o. a H-
r+ M-
O 3 O •-*) o 3 3 O H-« fD 0 d H- ' fD 0 n o r* O n
3.f.
P) W) (« d 3 O n- (->•
O 3 0 M)
^ »-< Q p\ tM < 0> M-
(U r+ M«
O H-
3 <-f tr fB fB *"**> fB O r<-
M-
< er M"
O 3 0 fB O d i— i
pj -i -i r»-
fD O O 3 W ( 3
k/
(cm
^ m
olec
ule
ro
ÖJ
N5
it
O
. tu
— - -
i t
1 1
o
K*
/0
I
h ^
io
1=
h-O
H
0
1+
i —
O-i
1
1 1
I
I
01 CO
o -l o tr H-
OQ
X'
O W
O l p) a t? -i fB W (/) d -i fD
W W fB 3 O D"
fD O fB fB ,Q"i o
-1 fB W •ö fB O rt-
*-••
fD V- '
^
O 3
^*U)
»-j
**.
r+ " ^
-1
S
n r-l-
x-
x--i
-io>
+5
X
1
2
0 tfl n f« 3 er fB
O!» tn
fB -l W H- N
VÛ
U)
W
-l 3 M
U ro
Although the basic mechanisms and kinetics of cluster formation are wellunderstood (e.g. see Fig. 1), the details are still subject to intenseinvestigations [1].
Fig. 2 shows the observed [50] trend in the biomolecular specific rateof the association reaction
Cn+ + C0 -> Cn+/ (35)
as a function of n. The specific rate is seen to increase with n. Similartrends are reen also in other reactions. Theories for association reactionsindicate that the specific rate of association is increasing with theincreasing lifetime of the intermediate association complex (AL) * TThis lifetime is determined by the energy of association and the number ofatoms in the complex. The observed increase in the specific rate ofassociation (Fig.2) is attributed primarily to an increase in T which isexpected from the increase of the number of constituents.
The area which has received by far the greatest attention in this fieldis experimental studies of the thermochemical properties [9, 51 ].' Comparingrelative bond strengths for a variety of ligands about a given positive ionas a function of clustersize n is very instructive in elucidating the roleof the ligand. Data for molecules having a wide range of properties (dipolemoment, polarizability, etc.) clustering around Na are shown in Fig. 3 [9].It is interesting to note that individual AH values seem to approachthe corresponding bulk value AH ° at rather small cluster sizes.
Experimental information in the backward analog of associationreactions, i.e., declustering reaction or collision-induced dissociation, isscarce and limited to a few cluster ions [9]. Kebarle and coworkers [52]demonstrated that cross sections for collision-induced dissociation increaserapidly with the number of ligands, and with the internal energy of thecluster ion, but decreases with the increasing dissociation energy. Ligandswitching reactions in general proceed rapidly (k £ 10 cm /s) whenexothermic [53]. Depending on the energetics of solvation, the successiveexchange may come to a halt at some intermediate stage of mixed solvation[54]. In the following we will only consider reactive (cluster) ion-moleculereactions, including charge transfer, proton transfer, and ion-atominterchange processes [55].
The effect of clustering on the reactivity of ions is important for anunderstanding of ion chemistry in dense gases, as well as solvationchemistry in general. Smith at al. [56] found that, for example, associationof N to N„ does not seriously modify the reactivity of the N except
£, £, <Ct
that it reduces somewhat the energy available for reaction. The most common
389

O.I
NaU)n * L Na*(L}n.,
OMES02"HiCO?3
2,3. 3.4 4,5n,n»i
5,6•&M*V
FIG. 6.3. Values of - AH .vs. cluster reaction n, n+1, for (a) DME,n, n+1(b) NH3, (c) H20, (d) S02> (e) C02> (f) CO, (g) HC1, (h) N2> and (i) CH^clustered to Na (after [9]).
mechanism apparently is direct charge transfer, usually followed byfragmentation with the nitrogen - nitrogen bonds in the reacting ionsremainig intact (see also reactios of (CO ) [57]). Similarly, for ligandexchange (see above), some (non-resonant) charge tranfer processes of0 .(H-0) , and reactions of hydrated hydronium ions, increased hydration of£. nthe reactant ion does not significantly decrease the reaction constant[53,58]. In contrast, for some (resonant) charge transfer processes [58] andin several ion-atom interchange and/or nucleophilic displacement reactions[59], increased solvation of the reactant ion resulted in a significantdecrease in reactivity (see also results obtained by Howard et. al. [60] forassociative detachment of negative ions, in which the reactivities arealsoreduced by clustering with HO). Similary, Bohme et. al. [61] found thatstepwise hydration leads to a decrease of the reaction rate constant forproton transfer from H«0 , e.g., to H S with a concomitant change in AG°
390

10-8
•Sa«Bl
,-/<?
10'
10.-12
IQ-
O OD--(D20)nA CH3O~-(CH3OH)no C2HsO-.(C2H5OH)n
FIG. 6.4. Reaction rate constants for gas phase nucleophilic displacementreactions of solvated anions with metyl chloride as a function of the extentof solvation (after [9]).
(see also [62] for solvated proton transfer reactions). In case ofnucleophilic displacement reactions (e.g. see Fig. 4) these striking resultsmay be interpreted, according to Henchman et al. [59] in terms of thequalitative model developed by Pellerite and Brauman [63].
On the other hand, an enormous reactivity enhancement has been foundby Rowe et. al. [64] for a new class of ion-catalyzed reactions betweenneutrals occurring in cluster ions in which the central ion does not formchemical bonds, e.g , the rate constant for the homologous gas phase
-20 2reaction of N-0,. with NO is smaller than 10 cm /s, whereas the rate forthis reaction on an alkali ion cluster increases at least seven orders of+magnitude in the case of Na as central ion, and in excess of nine orders ofmagnitude in the case of Li (this subject has been recently extended toseveral more reactions yielding rate enhancements up to 30 orders ofmagnitude [65]).
391

6.4. PROCESSES IN CONDENSED PHASE
The recent results obtained on processes of ions and excited neutralsin the condensed phase are of particular interest to radiotherapy since inthis field the medium of interest is the living cell. Information obtainedin the gas-phase must in some way be transferable to the radiation processeswhich take place in the cell; and, in that respect, the condensed phase dataprovide a link between the abundant information found in the gas-phase andthe extremely limited knowledge of initial ultra-rapid ion molecule,radical-molecule and molecule-molecule reactions which may occur in thecondensed phase environment of the cell. We present in the next section theresults of solid-phase ion-molecule reactions in whichthe positive or negative ion reacts with energy of several eV with acondensed molecule. Thus, these processes correspond to those oftheinitialion-molecule reactions in radiolysis.
6.4.1. Chemical Reactions of Ions
The data presently available on initial ion-molecule reactions in thecondensed phase have been obtained from electron stimulated desorption (ESD)experiments. In these studies [66], monoenergetic electrons impinge on atLin film grown in an ultra-high-vacuum system by the condensation of gasesor organic vapors on a clean metal substrate held at cryogenic temperatures(15-100K). The positive and negative ion currents emanating from the filmsurface are measured as a function of primary electron energy. The iondesorption into vacuum is recorded by a quadrupole mass spectrometer havingan input lens located near the film surface. An energy filter can be placedin front of the mass spectometer to discriminate the energies of the ions.The ion yields can be recorded with films whose thickness (10- 2000 A) islimited by charge accumulation. The data are usually obtained attemperatures near 20 K, with incident currents varying between 10 and
_Q10 A depending on the desired resolution (5-200 meV).It has been shown by these experiments [67-69] that anions created by
dissociative attachment could react with surrounding molecules with energies(eV's) defined by the dissociative process. The unique features of thereaction and its pathways could be deduced by monitoring the magnitude of areaction-product signal as a function of incident electron energy andconcetration of one of the reactants [67,68]. For example, the observationof reactions
392

0 + C H„ „ —> OH + C H„ , (36)n 2n+2 n 2n+l(n = 1,2,4,5 and 6) is reported for C H„ molecules condensed on thesurface of a multilayer 0?film deposited on a platinum substrate [67]. Theenergetic 0 ions are generated by the dissociative association reaction
e~ + 02(3Eg") -> °2~C2V ZE+) (37a)
-> 0~(2P) + 0(3P) (37b)This reaction is evidenced by first measuring the 0 ESD yield from a puremultilayer 0? and other molecules as shown in Fig. 5 (a) and (b). Here, the
2 2 +8 eV peak arises from the decay of the IT and E transitory states ofCL whereas the 13 eV peak contains contributions from these and ahigher-energy symmetry-forbidden ( E ) CL states [70] . The features in thecurve representing the electron energy dependence of the 0 yield arereflected into the electron energy dependence od the OH yield and thus serveas a "signature" to detect and identify reaction(36).
Curves (c) to (g) in Fig. 5 represent the energy dependence of the OHyields produced by electron impact on three-layer oxygen film covered by amonolayer of C H_ molecules. At submonolayer coverages, these OHyield functions exhibit the same characteristics but the signal is lower.In fact, in the submonolayer regime the magnitude of the OH signal is foundto be directly proportional to the number of condensed hydrocarbonmolecules. Results similar to those in Fig. 1 were also obtained forsubmonolayer coverages of 0„on three-layer hydrocarbon films [68]. Since nocompound at the film surface contains both hydrogen and oxygen, OH ionscannot be produced by direct electron impact. However, they can result fromreactions between ground state molecules (i.e.,0,, and C H_ ) and anionsproduced directly by the electron beam (i.e., 0 , H and CH , n = 1 to 3).The ion OH can be formed via reaction (36) or the reactions
H~ + 02 -> OH" + 0 (38)
CH ~ + 0_ -> OH~ + CH ,0 (39)n 2 n-1Any OH formed by these latter would bear the "signature" of the yieldfunction for H or CH which exhibits only a single peak at 10 eV [68].Thus, the line shapes in Fig. 1 can only be produced via reaction (1).
Reaction of positive ions with molecules in solid films can also bedetected by monitoring reaction products [69]. In this case, cations aremonitored as a function of electron energy. Fig. 6 shows the result of anexperiment where a 50 A film composed of 20'/. volume 0 and 80% volume N„ isbombarded with 15 to 31 eV electrons. The curve labelled 0 was obtained by
393

c3
.ai«ro
LUCC
o2OLU
K
C3LU2
'—i—'—T7 9 11 13 15
ELECTRON ENERGY (eV)
r19
FIG.6.5. Energy dependence of electron-stimulated desorption (ESD) ofnegative ions in the range 1 - 1 0 eV. Curves a nad b: 0 desorption from athree-layer 00 film; V is a potential retarding the negative ions at theZ Kentrance of the mass spectrometer. Curves c-g: OH desorption from athree-layer 0 film covered with a single layer of C H (n=l,2,3,4,5and 6) molecules; curves c-g recorded with V =0.K
measuring the energy dependence of the 0 signal. Similarly, the curveslabelled N and NO represent the ESD yields of these cations, respectively.The 0 signal can arise from either reactions
+0 - 2e -
°
0 2e
-> 0 +0 + e(40)
(41)
394

17 19 21 23 25 27ELECTRON ENERGY ( eV )
29 31
FIG. 6.6. ESD yields of 0 , N and NO ions produced by electron impact ona multilayer film composed of 20% volume 0_ and 80% volume N .
Near threshold, the 0 signal should arise exclusively from the latterreaction which requires the least energy. The onset of the reaction
) 2e N + 2e~ (42)
lies around 25 eV. The magnitude of the 0 signal is about four times higherthan the N signal and more than an order of magnitude larger than the NOsignal. Below 25 eV, since no N ions can be formed, the NO signal ariesfrom the reaction of energetic 0 with N?. The possible reaction of N with0 or 0„ with N„ yielding NO + NO must be eliminated because anyintermediate NO state in the 17-25 eV range could not lead to NO ionshaving sufficient kinetic energy to overcome the polarization barrier of thefilm. Furthemore, the coincidence of the energy threshold of the 0 andNO signals dictates interpreration involving the reaction
N + -> NO -> N N0 (43)
395

Here, the 0 is created with a few eV of kinetic energy by the dissociationof a repulsive state. The intermediate N„0 state is also repulsive yielding+a NO product with enough kinetic energy to overcome the polarizationattraction (=• 0.5 eV) [71] of the positive charge toward the film. Thereaction occurs during times characteristic of a vibrational period of theN Creation (= 10~14 s).
TABLE 6.1. IQNIZATION POTENTIALS OF ELEMENTS
Element IP(eV) Element IP(eV)
HHeLiBeBCN0FNeNaI
13.59824.5875.3919.3238.2981 1 . 26014.53413.61817.42321.5655.13910.451
-MgAlSiPSClArKÇaBrKrXe
7.4645.9868.15210.48710.36012.96815.7604.3416. 11311.81413.99912.130
396

TABLE 6.2. lONIZATION POTENTIALS OF MOLECULES AND RADICALS AND HEATSOF FORMATION OF THE RESPECTIVE IONS
Molecule
CHC2COC12F2H212CNN2NO
°2OH
CH2co2CS2HCNH2°NH2NZO°3so2
BF3CH3C2H2H2°2NH3cci4CH
IP(eV)
10.6412.1514.01411.5015.68615.4269.399514.0315.5819.26412.05913.18
10.5013.7910.0713.5012.61411.4012.8912.5212.35
15.559.84211.40610.9210. 1511.4712.615
AHf°o(g)[kJ mol'1]
161919921238110915141488.49711794
1503983.611651287
139893510891447978126313301368895
36710951328< >941
10061150
397

Molecule
r~ uC2H4C2H5C* \J
C2H6C3H5O *-)
•J Oc-C H«J Di-CH
+J 1
C3H8•J O
i-C.H-4 8i —C U1 C4H9
4 10A IQ
C6H6C~C6H10C-C6H12
CH CNO s
C H N
HCOHb)CH2OHCH3OHC2H5°H
IP(eV)
10.518.3711.5218.059.7410.067.55
10.959.118.01
10.5510.579.2478.9459,45
12. 199.266
10.888.1410.8510.48
AHf°o(g)tkJ mol"1]
11759171041946960999800953871830887879975858871
12701034
936720856793
a) • j • . - i j v - ipyridin; formaldehyde
398

TABLE 6.3. HEATS OF FORMATION OF SOME NEUTRAL RADICALS
Radical
HBBHCCHCH2CH3C2H5P 14C3H5
i~C3H7n-C3H7
NNHNH2CN
AHf°o[k
216.557.446.711.592.392.145.107.169.73.86.
470.331172431.
:J mol"1]
00364425965966
842
8
Radical
0o3OHCH2OH
FCFCF3
SSHesso
ClBrI
AH ° [kJ mol"1]i o
246.785145.3538.70
-113.4
76.9251.5-467.4
276.6142269.46.3
120.00117.94107.24
399

TABLE 6.4. PROTON AFFINITIES OF ATOMS AND MOLECULES
Atom/Molecule
ArBrClFHHeIKrNNe0SXe
COCNH2HC1HFHSN2NHNO
°2OH
PAleV]
3.845.725.363.512.6501.8456.34.403.42.085.056.95. 14
6.155.14.385.864.097.25.1256. 15.504.386.18
Atom/Molecule
CH2co2HCNHCOH20H02H2SNH2N02N20so2CH3/— TTC2H2H2C°HCOHH2°2NH3CF4CH4C2H4CH3OHC2H6C3H8C6H6
PAleV)
8.555.687.436.67.226.97.48. 106.65.927.0
5.46.77.449.927.228.855.465.727.057.896.226.507.87
400

TABLE 6.5. ELECTRON AFFINITIES OF ATOMS AND MOLECULES
Atom/Molecule
HBC0FNaSClKßrI
Br2C2CFCNesC12F212NHNO
°2OHs2SHSO
C3CF2
EA[eV]
0.75420.281.2631.463.400.54792.0773.620.50153.373.059
2.63.393.33.820.212.442.962.510.380.030.441.8281.662.311.09
2.12.1
Atom/Molecule
C HCH2CNSCOScs2HNOH°2NH2NF2N02N20
°3SCNSH2so2cci3CF3CH3N03S°3
CC1F3CH3°OH.H20C3H3C2H5SF6C2H5°C3H7
EA[eV]
3.730.212.00.50.80.341.190.761.72.280.242.1032.21. 11.06
1.21.921.073.71.7
1. 11.571.952.30.890.60.60.6
401

TABLE 6.6. RATE CONSTANTS OF SELECTED ION-MOLECULE REACTIONS ANDCHARGE TRANSFER PROCESSES
Reactants
HO*.
HO +HO* +OH +OH +OH +
OH +
OH* +OH* +
,OH +
H0„+^ iun
H?*5;H02
CH4
COco2H2H2°H2S
NO
N2N2°
°2
+ Ar+ CH.
*i+ ro+ LL2+ C7 4£_> *±
+ C2H6+ H2
Product (s) Rate Constant, . . - 1 3 - 1 .(molecule cm s
CH5++ 0(13%)H30+ + CH2(87%)CHO + HCH00+ + 04H20 + HH30 + HH3S + 0(40%)H2S + OH (60%)HNO + 0(63%)
jNO + OH (37%)HN * + 0HN20* + 0(72%)N20 + OH (16%)NO + NOH(11%)
.02 + OH (90%)H02 + 0(10%)
ArH* * 0^*
products!_
CH02 + 02productsproductsT, + , pn3 + °2
1.5 (-9)
6.2 (-10)1.44 (-9)l.OH-9)3.4 (-9)2.05C-9)
9.7C-10)
2.2(-9)1.56(-9)
1.9(-10)
1.9 (-11)1 . 0(-9)l.K-9)l.K-9)1.4(-9)3.3(-10)
Method3))
SIFT
SIFTSIFTSIFTICRSIFT
SIFT
SIFTSIFT
SIFT
FDTICRFDTICRICRSIFT
a)EXPERIMENTAL METHODS:DT - drift tube; FA - flowing afterglow; FDT - flow-drift tube;ICR - ion cyclotron resonance; MS - mass spectrometer ion source;SIFT - selected-ion flow tube; SIFDT - selected-ion flow drift tube.
402

Reactants
H02++ NO
H2N* * H2CO
.
H2N + HCOOHH2N; * CH,H2N + CH3OH
H2N++ COH2N C2H4
,H2N * H2H N + HO
+H N + NH4-HZN + NO
HO + HCN
.H20 + CH4HO + COun j. p uH2° C2H2H 0+ + C H2 24+^ iC D
H20+ + H2H?0 + H?0-»•DO + D 02 2
Product (s) Rate Constant, , . - 1 3 - 1(molecule cm s
H4N+ -t- 02 2.0 (-9)HNO+ + 02 7.3(-10)HN + + 0 8.0C-10)i £
CH 0+(80%) 2.8(-10)oH N+(20%)
•*• 4-H4N ,(CH302 ) 2,7(-9)H3N+ -i- CH3 9.2(-10)H3N + CH OH(13%) 3.0(-9)CH50 •»- NH(87%)
H .CO"1" 2.4(-ll)C2H4 ,CH4N (30%); 1.5C-9)C2H .C2H5N (20%);H N t- H 2.7(-10)
•3
HO (95%),H_N (5%) 2. 9 (-9)+H N + H 2.2(-9)
^ j.NO 7.0(-10)
CH2N + OH 2.1 (-9)HO + CN^ j.H30 + CH3 2. 52 (-9)CHU + OH 5. 3 (-9)C H + 1.9(-9)2 2C2H4+ 1.5C-9)H_0 (83%) .C-H. (12%) 1.6 (-9)
4- 4-C.H, (4%),C0HC (1%)26 25HO + H 8.3(-10)OHO •»- OH 1.6 (-9)
* j.D_0 + OD 1.19(-9)•6
Method
FDTFDTFDT
SIFT
FASIFTDT
SIFTSIFT
SIFTSIFTICRSIFT
MS
MSSIFTDTDTSIFT
SIFTMSMS
403

Reactants Product (s) Rate Constant, , . - 1 3 - 1 ,(molecule cm s )
Method
H n+H2°
H 0+
4*»Xu nH2°2H2°2H2°2H2°2TT piH2°2
H3+H +
H3H3+
H3H„
+•3 ,
H3II *3
+3
H3+u +\H3H3+O+\H
o. U C* H2S
+ NO+ 0+ °2
++ co++H20++ H2°2% NH3*+ NO
+ HCN+ CH20+HCOOH
+ CH^+ CO+ CO
*-+ C2H2, f— TT
* C2H4
+ CH COOHo+ H2°j- U C- H2S+ NH3+ NO+ 0+ o0
+ +3 2H30 (3%)N0+ + H20 5.9(-10)02+ + H2 I.S(-IO)°2* + H2° 4.3C-10)
CHO + H02 5. 5 (-11)H30 + H02 1.7 (-9)H302 + HO 6 (-10)H4N + H02 1.8 (-9)N0+ + H202 5.0(-10)
+CH N + H 7.0(-9)
•fCH30 + H2 6.3(-9)CHO + H„0 + H0(70%) 8.03(-9)
£. £
H30 + CO + H (307.)CHC + H0 2.3C-9)
w5 £.
CHO + H 2.CH-9), -
CHO + H 2.0(-9)*- , -
C H + H. 2.9(-9)i— »3 <i.
C H * + 2H (67.) 2. 02 (-9)O O ^
C H + + H (94%)tL. O ^
C2H30 + H20 + H2 6. 8 (-9)HO + H 4.3(-9)
+H3S + H2 3.4(-9)H4N + H2 4.2(-9)HNO + H0 1.1 (-9)/
products S.O(-IO)H00+ + H0 6.7(-10)
SIFT
SIFTSIFTSIFT
FDTFDTFDTFDTFDT
FAFAFA
SIFTSIFTSIFTSIFTFA
FAFAFAFDTSIFTFAFDT
404
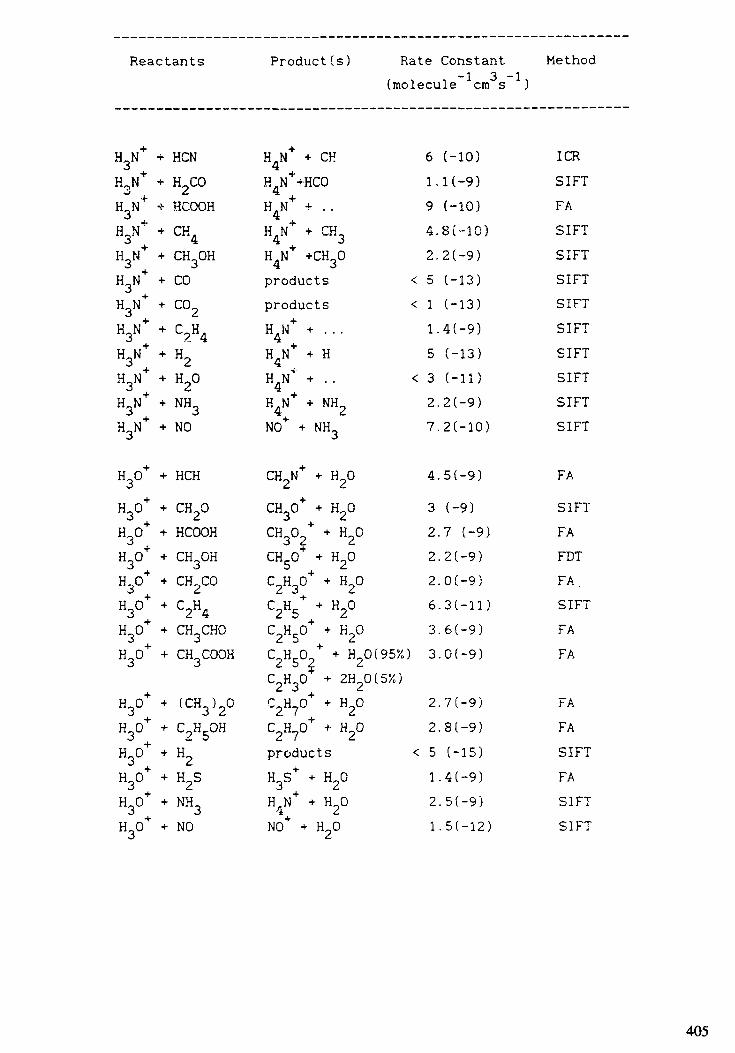
Rea
+^
H3N*H3N*HN +
H3N*H3N*H N*H N*3H3N*H3N*H„N*H3N*
H30*+
«3°*xJ
H30+H30*H O*3H3°;H 03
H 0++
H30+H 0*H O*2
H3°*
ctants
+ HCN+ H2CO+ HCOOH+ CH4+ CH OH
•J
+ CO+ CO+ C H?- 4+ H2+ H2°+ NH3•*• NO
+ HCH4- CH 02+ HCOOH+ CH3OH+ CH2COj. r v+ C2H4+ CH3CHO+ OJ COOH
+ (CH ) 0+ C2H5°H* H2* H2S+ NH3+ NO
Product (s) Rate Constant, . . - 1 3 - 1 ,(molecule cm s J
H.N* + CH 6 (-10)4H4N*+HCO 1.1 (-9)H N* + . . 9 (-10)H.N* + CH_ 4.8C-10)4 3H N* -t-CH30 2. 2 (-9)products < 5 (-13)products < 1 (-13)H.N* + . . . 1.4(-9)4H4N + H 5 (-13)H N"" -•• . . < 3 (-11)H4N* •»- NH2 2. 2 (-9)NO* + NH3 7.2C-10)
CH2N* + H20 4.5(-9)
CH„0 + H 0 3 (-9)•«3 Cm
CH 0 * + H 0 2.7 (-9)J i— ^
CHgO* + H20 2. 2 (-9)C2H30* + H20 2.0 (-9)C H + -»• H 0 6.3(-ll)25 2C2H50 + H20 3.6(-9)C2H502 + H20(95%) 3.0 (-9)C2H30* + 2H20(5%)C2HyO+ + H20 2. 7 (-9)C u n o , u n o ö f a ' i„H_U •*• nJJ e.al-y)
products < 5 (-15)H3S* + H20 1.4 (-9)H.N* + H„0 2.5(-9)4 2NO* -»- H20 1.5(-12)
Method
ICRSIFTFASIFTSIFTSIFTSIFTSIFTSIFTSIFTSIFTSIFT
FA
SIFTFAFDTFA,SIFTFAFA
FAFASIFTFASIFTSIFT
405

Reactants
C* + HCN
C* + HCOOHC* + CH3OH
+c + co„4-f* • I"1 IT
C+ + C2H2r+ 4- H2 4u •*• n_
4-
C+ + NH3C+ + N4
C 4- Q
CH+ + CH 0Œ"1" 4. PU yi
CH+ +CH3OH
CH+ + COCH+ + H2CH+ + H20CH* f NOCH+ + 0.
Product (s) Rate Constanti -, ! -1 3 -1,(molecule cm s )
C/ * HCHO+(20%),CH2"I"(60%)
CHO*CH 0* (33% ) , CH 0* ( 30% )CHO+(8%),CH +(29%)
*jco"1" + coC3H+ + H
C H +(85%),C H +(15%)products <CHO+ ••• HH_N+(22%),CH,,N"t"(75%)•3 ^products <CO* + 00* + CO
CH3+ + CO
+
C2H4+ + H(5%)CH3+ + CH20(50%)CH3o"" + CH2(10%)CHgO* + H(5%)CHO+ + CCH2+ + HCHO+ + H2(main)NO"*" + CHCHO* + O(main)
3.K-9)3.9C-9)
3.3(-9)4.K-9)
l.K-9)2.7(-9)1.82(-9)5 (-13)2.7C-9)2.3(-9)5 (-13)9.9(-10)
3.2(-10)lICR
2.9C-9)
7 (-12)
2.9(-9)7.6(-10)2.9(-9)
Method
SIFTSIFT
SIFTSIFT
SIFTSIFTSIFTSIFTSIFTSIFTSIFTSIFT
SIFT
SIFT
SIFTSIFTSIFTSIFTSIFT
406

Reactants Product(s) Rate Constant, . , -1 3-1,(molecule cm s )
Method
CHO+ 4 HCNCHO + CH,,0CHO + CH.4CHO * CH3OHCHO 4 C02CHO 4 C2H2CHO 4 H 0
j. *~CHO 4 NH3
CH2 4 HCNCH + CH2 4
CH2 4 COCH2 4 H2
CE2* 4 NH3
CH2N * H20CH2N 4 NH3
CH20 + CH20+
++CH 0 + 0
<-. ^
CH3* + HCOOHCH3 + CH4
CH2N+ + COCH30 + COCHC 4 CO <OCH50 + COproducts <C2H3+ 4 COH,0* 4 CO
" ,H4N 4 CO
C2H2N + H
C„H. 4 H (707.)24 2C2H5 4 H (307.)CHO 4 CH <
CH3 + H
CH 0 4 HHO 4 CHoCH4N+ 4 H(557.)H4N 4 CH(45%)
H30+ 4 HCNH.N 4 HCN4
CH30 4 CHOCH30 4 CH30((107JCH50 4 CHO (907.)HO 4 CHO
•3 +CHO 4 HO (707.). ^
H202 4 CO (307.)
j— > TJ , TJC2H5 H2
3.K-9)6.K-10)1 (-13)2.4C-9)2 (-13)1.36C-9)2.5C-9)2.3C-9)
1 . 8 (—9 )1 2 (—9 )
7. (-12)1.6 (-9)2.9(-9)
2.8(-9)
8.8(-13)1.2C-9)
3.2(-9)2.4(-9)
2.6(-9)1.7C-9)
2.K-9)1.2 (-9)
SÏFTICRSIFTSIFTSIFTSIFTSIFTSIFT
ICRSIFT
SIFTSIFTSIFT
SIFT
FAFA
SIFTSIFT
SIFTSIFT
FASIFT
407

Reactants Product(s) Rate Constant Method. . , - 1 3 - 1 ,(molecule cm s )
+3 22
CH„ -»• H„O Cf
CH + H„0O £>
CH„0+ + CH„OHJ oCH30+ * H2CH 0+ + H„0
•J £
CH4 + HCNPH * + PHun . ^ L-ti .4 4CH + CO
4-j TJ , TT
4 2"* C.
4 2CH4+ + 02
CN+ + CH4CN + CO
-i- »CN + H, ^-
CN + H20
CO 4 CH-4
C0+ + H. ^co ••• HZO
CO + 0„
C3H3 + H2-* i *CH. + H4CH2OH -•• . .CH3NH3 (20%)CH4N+ + H2(707.)+
CH 0+ + CH 0O <£productsH.0+ + CH90
•J Cf
CH2N + CH2CH_ + CH„S JCHO + CH, JCH_ + H3
H.O + CH„•«5 s5
°2+ * CH4
CH2N+(607.),CHN+(35%)CO + CN,CHN + H, .
CHN (507J.CHNO (20%)CH2N (15'/.),H20 (10%)
CHO (35%),CH (607.),C H 0*(5X)
CHO + H. j^
HO (667.), CHO (347.)0 * CO
5< 12
1< 43
2j1324
1.21
, 3
1
121
(-13)(-11).2(-9)
-9(-9)(-14)(-11)
.H-9)• 5 ( —9 ). 4(-9).3C-11)-6(-9).41-10)
2C-9).5(-10).OC-9).2(-9)
.36(-9)
.8(-9)-6(-9). 2(-10)
SIFTICRICRSIFT
SIFTSIFTSIFT
ICRSIFTSIFTSIFTSIFTSIFT
ICRSIFTSIFTICR
SIFT
SIFTICRSIFT
CHO"f(407.)>CH00^(60%) 3. 5 (-9) SIFT
408

Reactants Product(s) Rate Constant, . . - 1 3 - 1 ,(molecule cm s J
Method
0 + HCOOHO" + CH40+ + CO0+ -t- C0„
o+ +0
CHO"I"(70%),H02+(30%) 5.0 (-9)CH*(11ÎÎ),CH. + (89Î4) 1.0(-9)
«Ji ftproducts0„ + COH0+ + H
N0+ + 0°2+ * °
< 5 (-13)l (-9)1.7((-9)3.2(-9)1.2C-12)
FASIFTSIFTDTSIFTSIFTSIFTSIFT
0_ + HCOOH
°+ + CH
°
CH3OHC2H4H2°
CHO (10%),CH20 (90%) 2.31-9)CH202+(65°/.),CHO +(35%) 1.8 (-9)CH20*(15i/.),CH302 (70%), 6.3(-12)
CH30't" ( 50% ) , CH40+ ( 50% ) 1 . 0 ( -9 )C2H4+ + °2 6.8C-10)H0* + 0 < 1 (-12)
SIFTSIFTSIFT
SIFTSIDTFDT
409

TABLE 6 . 7 . RATE CONSTANTS OF REACTIONS OF WATER CLUSTER IONS WITH
MOLECULES
H30+.H30*.H30+-H 0+.H30+.+
+ly.+H30+.V*.H30*.H 0*.H30*.«3°;-H3° •H30*.H/.
*J +
V*'H30+.H/.H30+.H/.H3° 'H30+.H30+.H30+-H3o*.
Reactants
H20 + HCNH20 + CH 0H20 + HCOOHHO + CH«£ l±HO + CH OH
<_. tj
HO + CH CHOCf X?
H20 + CH3COOHH n j. p u nu_u T u„n un£ £ ^H20 -i- (CH3)20H20 + (CH3)2COH90 + NH
£. -J
2H20 + CH202H 0 + HCOOH^2H20 + CH3OH2H 0 + CH CHO
<Lf >J
2H20 + CH3COOH2H20 + C2H5OH2H»0 + (CH.)_0
4L- J <-*
2H20 + (CH3)2CO2H20 ••- NH3
3H20 + CH203H20 + HCOOH3H 0 + CH OH
bi ~3
3H20 + CH3CHO3H20 + CH3COOH3H20 + C2H5OH3H20 + (CH3)203H20 + (CH3)2CO.3H.O + NH„
£ *3
Product Ions
CH N+.H20CH30 ,CH30+.H20CH302+,CH302+.H20
H 0*+ +CH50 ,CH50 .HO
C2H5° 'C2H5° 'H2°C2H5°2 >C2H5°2 'H2°C2H7° >C2H7° >H2°+ +C3H7° -sy -H2°N4H ,N4H .H20
,CH 0 . (2-m)H,,Oa;
•J £,
CH 0 * . HO , C H 0+ . 2H70-3 <i <i_^ o £ £CH50. (2-m)H20C2H50 . (2-m)H20C H -0 *. (2-m)H 0
£* O iC. <
C2H?0+. (2-m)H20C2H?0 . (2-m)H20C3H?0 . (2-m)H20N4H . (2-m)H20
CH30+. (3-n)H2Oa)CHO . (3-n)H 0O ^ £.
CH50+. (3-n)H20C2H50+. (3-n)H20C2H502 . (3-n)H20C2H70+. (3-n)H20C2H?0+. (3-n)H20C3H?0+. (3-n)H20H4N+. (3-n)H20
Rate Constantr i i "l 3 -1l[molécule cm s J
l.OC-10)3.0(-9)2.4(-9)5.4C-9)2.4(-9)3.K-9)2.7(-9)2.5C-9)2.2C-9)3.5C-9)2.2C-9)
I.O(-IO)1.5 (-9)2.0 (-9)2.6C-9)2.4C-9)2.01-9)2.0(-9)3.0(-9)1.2C-9)
> I.O(-IO)> l.OC-9)
1.5C-9)2.3C-9)2.21-9)1.7 (-9)1.8C-9)2.9(-9)1.8 (-9)
a)m,n - number of freed water molecules; 0<m<2, 0<n<3.
410

5. REFERENCES
1. FRANKLIN, J.L., DILLARD, J.G., ROSENSTOCK, H.M., HERRON, J.T.,DRAXL, K.: lonization Potentials, Appearance Potentials and Heats ofFormation of Gaseous Positive Ions. Natl. Stand. Ref. Data Syst., NBS 26(1969).
2. ROSENSTOCK, H.M., DRAXL, K., STEINER, B.W.,HERRON, J.T.: Energetics ofGaseous Ions. J. Phys. Chem. Ref. Data, Vol. 6, Suppl. l (1977).
3. LIAS, S.G., LIEBMAN, J.F., LEVIN, R.D.: Proton Affinities and Heats ofFormation of Molecules and Corresponding Protonated Species. J. Phys.Chem. Réf. Data, Vol. 13, Suppl. 3 (1984).
4. RADZIG, A.A., SMIRNOV, B.M.: Refenrence Data on Atoms. Molecules andIons. Springer Ser. Chem. Phys. 31, Springer Verlag (1985).
5. ALBRITTON, D.L.: Ion-Neutral Reaction Rate Constants Measured in flowReactors Through 1977. Atomic Data and Nuclear Tables, Vol. 22,No 1,Academic Press (1978).
6. IKEZOE, Y., MATSUOKA, S., TAKEBE, M., VIGGIANO, A.: Gas PhaseIon-Molecule Reaction Rate Constants Through 1986. Ion Reaction Res.Group, Japan (1987) (Distributed through Maruzen Comp., Tokyo).
7. YENCHA, A.J.: Penning lonization and Related Processes, in ElectronSpectroscopy (BRUNDLE C.R., BAKER A.D., Eds.) Vol. 5, p. 197. AcademicPress, London (1984).UKAI, M..HATANO, Y.: Gaseous Electronics and its Applications ( byCROMPTON, R.W., HAYASHI, M. , BOYD, D.E., MAKABE, T.). KTK Scientific,Tokyo (1991), p.51.SISKA, P.E.: Molecular Beam Studies of Penning lonization. Rev.Mod.Phys.25 (1993) 337.
8. HATANO, Y. in Handbook of Radiation Chemistry (TABATA Y..ITO Y.,TAGAWA S., Eds.) CRS Press (1990).
9. HERMAN, Z., CERMAK, V., Collection Czech. Chem. Commun. 31 (1966) 649.lOa.YOSHIDA, H., KITAJIMA, M., KAWAMURA, H. , HIDAKA, K. , UKAI, M. ,
KOUCHI, N., HATANO, Y. : J.Chem.Phys. 98 (1993) 6190.lOb.CERMAK, V., HERMAN, Z. : Collection Czech. Chem. Commun. 30 (1965) 169.11.MARK, T.D., CASTLEMAN, A.W.,Jr., Adv. Atom. Mol. Phys. 20 (1985) 65.
MARK, T.D., ECHT, 0. , Chapter 5.7. in: Clusters of Atoms and Molecules(H. Haberland, Ed.), Springer (1991); MARK, T.D., Z. Phys. D12 (1989)263; Int. J. Mass Spectrom. Ion Proc. 79 (1987) 11; NG.C.Y., Adv. Chem.Phys., 52 (1983) 263; KEESEE, R.G.,CASTLEMMAN, A.W.,: In Swarm Studiesand Inelastic Electron Molecule Collision (PITCHFORD, L.C. et al)
411

Springer, New York (1987) 351; MEOTNER, M., SPELLER, C.V., J. Phys.Chem., 90 (1986) 6616; COMBIE, J. MC, SCOLES, G. in: The Physics ofElectronic and Atomic Collisions (DALGARNO, A. et al., Eds.) AIP, NewYork (1990) 430.
12.DEHMER.P.M. , POLIAKOFF, E.D., Chem. Phys. Lett., 77 (1981) 326.13.ONO, Y., LINN, S.H., PREST.H.F., GRESS, M.E., NG, C.Y., J. Chem. Phys.
74 (1981) 1125.14.BIRKHOFER, H.P., HABERLAND,H., WINTERER, M., WORSNOP, D., Bunsenges.
Physik, Chem. 88 (1984) 207.15.SIDDIQUI, H.R., BERNFELD D. , SISKA, P.E., J. Chem. Phys., 80 (1984) 567.16.KAMKE, W., KAMKE, B., KIEFL, H.U., HERTEL, I.V., Chem. Phys. Lett.,
122 (1985) 356.17.DAO, P.D., CASTLEMAN, A.W., Jr., J. Chem. Phys., 84 (1986) 1435.18.KAMKE, B., KAMKE, W., HERMANN, R., HERTEL, I.V., Z. Phys. DU (1989) 153.19.POLIAKOFF, E.D., DEHMER, P.M., DEHMERJ.L., STOCKBAUER, R., J. Chem.
Phys., 76 (1982) 5214.20.NORWOOD, K., GUO, J.H., LUO, G., NG, C. Y.,Chem.phys. , in print (1990).21.STACH, A.J., BERNHARD, D.M., Chem. Phys. Lett., 146 (1988) 531 and
earlier references therein.22.KLOTS, C.E., RADIAT, C.E., Phys. Chem., 20 (1982) 51.23.STACE, A.J., SHUKLA, A.K., J. Phys. Chem., 86 (1982) 157;
STEPHAN, K., RUTREL, J.H., PETERSON, K.I., CASTLEMAN, A.W., Jr.,WAGNER, H.E., DJURIC, N., MARK, T.D., Int. J. Mass Spectrom, Ion Phys.,44 (1982) 167; NG, C.Y., TREVOR, D.J., TIEDEMANN, P.W., CEYER, S.T.,KRONEBUSCH, P.L., B.H. MAHAN, B.H., LEE, Y.T., J. Chem. Phys., 67 (1977)4235.
24.COOLBAUGH, M.T., PFEIFFER, W.R., GARVEY, J.F., Chem. Phys. Lett., 156(1986) 19 and references herein.
25.ECHT, 0., S. MORGAN, S., DAO, P.D., STANLEY, R.J., CASTLEMAN, A.W.,Jr.,Ber. Bunsenges. Physik. Chem., 88 (1984) 217.
26.HERMANN, V., KAY, B.D., CASTLEMAN, A.W., Jr., Chem. Phys. 72 (1982) 185.27.BERNARD, D.M., STACE, A.J., Int. J. Mass Spectrom. Ion Proc., 84 (1988)
215.28.BÜCK, U., LAUENSTEIN, C., MEYER, H., SROKA, R., J. Phys. Chem., 92 (1988)
1916.29.BRUTSCHY, B., EGGERT, J., RIEHN, C.R., BAUMAGARTEL, H., Contr. Symp.
Atomic Surface Physics (MARK, T.D., HOWORKA,!., Eds.) Obertraun (1990)pp. 293-298.
412

30.KLOTS, C.E., COMPTON, R.N., J. Chem. Phys., 69 (1978) 1636 and 1644;STAMATOVIC, A., SCHEIER, P.,T.D. MARK, T.D., Z. Phys. D6 (1987) 351;HASHEMI, R., KÜHN, A., ILLENBERGER, E., Int. J. Mass Spectrom. Ion Proc.100 (1990) 753.
31.ECHT, 0., COOK, M.C., CASTLEMAN, A.W., Jr., Chem. Phys. Lett., 135(1987) 229.
32.FOLTIN, M., WALDER, G., MOHR, S.,SCHEIER, P., CASTLEMAN,A.W., Jr.,MARK, T.D., 2. Phys.D, 20 (1991) 157.
33.KREISLE,D., ECHT, 0..KNAPP, M., RECKNAGEL,E., Phys. Rev. A33 (1986) 768.34.LETHBRIDGE, P.C., STAGE, A.J., J. Chem. Phys., 91 (1989) 7685.35.WALDER, G., FOLTIN, M., LEZIUS, M., MOHR, S., SONDEREGGER, M., CLEMOT,
N., SCHEIER, P., MARK, T.D., Contr. Symp. Atomic Surface Physics(MARK, T.D., HOWORKA, F., Eds.) Obertraun (1990) pp. 449-454.
36.STEPHAN, K., STAMATOVIC, A., MARK, T.D., Phys. Rev. A28 (1983) 3105;STEPHAN, K., MARK, T.D., Chem. Phys. Lett., 90 (1982) 51.
37.NORWOOD, K., GUO, J.H., NG, C.Y., J. Chem. Phys., 90 (1989) 2995.38.FERGUSON, E.E., ALBERTONI, C.R., KÜHN, R., CHEN, Z.Y., KEESEE, R.G.,
CASTLEMAN,A.W., Jr., J. Chem. Phys., 88 (1988) 6335.39.'KLOTS, C.E., J. Phys. Chem., 92 (1988) 5864; J.Chem.Phys. 83 (1985) 5854.40.ENGELKING, P.C., J. Chem. Phys., 87 (1987) 936.41.SCHARF, D., JORTNER, J., LANDMANN, U., Chem. Phys. Lett,, 126 (1986) 495.42.STACE, A.J., SHUKLA, A.K., J. Am. Chem. Soc. 104 (1982) 5314.43.FUTRELL, J.H., STEPHAN,K., MARK, T.D., J. Chem. Phys., 76 (1982) 5893.44.MORGAN, S., CASTLEMAN, A.W., Jr., J. Am. Chem. Soc., 109 (1987) 2667.45.MAGNERA, T.F., DAVID, D.E., MICHL, J., Chem. Phys. Lett., 123 (1986)
327; ENGELKING, P.C., Chem. Phys. Lett., 139 (1987) 6;LEISNER, T., ECHT, 0. , KANDLER.O., YAN, X.J., RECKNAGEL, E., Chem. Phys.Lett. 18 (1988) 393; WALDER, G., WINKLER, C., MARK, T.D., Chem. Phys.Lett., 157 (1989) 224.
46.WALDER, G., MARGREITER, D., WINKLER, C., STAMATOVIC, A., HERMAN, Z.,MARK, T.D., J. Chem. Soc. Faraday Trans. 86 (1990) 2395.
47.WALDER, G., MARGREITER, D., WINKLER, C., STAMATOVIC, A., HERMAN, Z.,FOLTIN, M., MARK, T.D., Z. Phys. D. 20 (1991) 201.
48.KNAPP, M., ECHT, 0., KREISLE, D., RECKNATEL, E., J. Phys. Chem., 91(1987) 2601.
49.ALBRITTON, D.L., Atom. DataNucl. Tables, 22« (1978) 1; ADAMS, N.G.,SMITH, S., in: Reactionof Small Transient Species, Kinetics and Energetics(A. FONTIJN, Ed.) Academic Press, New York (1983);SMITH, D., ADAMS,N.G., Top. Curr. Chem., 89 (1980) 1.
413

50.BOHME, D.K., WLODEK, S., WILLIAMS, L, FORTE, L., FOX, A., J. Chem. Phys.,87 (1987) 6934.
51.CASTLEMAN, A.W., KEESEE, R.G., J. Phys. Chem. Ref. Data, 15 (1986) 1011.52.SUNNER, J., KEBARLE, P., J. Phys. Chem., 85 (1981) 327; Y.K. LAU, Y.K.,
KEBARLE, P., Can. J. Chem. 59 (1981) 151.53.BOHME, O.K., NATO Adv. Study Inst. (Viroeiro) 1982.54.SMITH, D., ADAMS, N.G,, ALGE, E., Planet Spase Sei., 29 (1981) 449.55.FERGUSON, E.E., Ann. Conf. Mass Spectrom. Allied Topics, 30th, Honolulu
(1982) 200.56.SMITH, D., ADAMS, N.G., MILLER, T.M., J. Chem. Phys., 69 (1978) 308.57.RAKSHIT, A.B., WARNECK, P., Int. J. Mass Spectrom. Ion Phys., 40 (1981)
135.58.FAHEY, D.W., BÖHRINGER, H., FEHSENFELD, F.C., FERGUSON, E.E.,
J. Chem. Phys., 76 (1982) 1799.59.HENCHMAN, M., PAULSON, J.F, HIERL, P.M., J. Am. Chem. Soc. 105 (1983)
5509.60.HOWARD, C.J., FEHSENFELD, F. C., M. McFARLAND, M. ,J. Chem. Phys., 60
(1974) 5086.61.BOHME, D.K., MACKAY, G.I., TANNER, S.D..J. Am. Chem. Soc., 101 (1978)
3724.62.BOHME, D.,K., RAKSHIT, A.B., MACKAY, G.I., J. Am. Chem. Soc., 104 (1982)
110; A.A. Viggiano, F. Dale and J.F. Paulson, J. Chem. Phys., 88 (1988)2469.
63.PELLERITE, M.J., BRAUMANN, J.I., J. Am. Chem. Soc., 102 (1980) 5993.64.ROWE, B.R., VIGGIANO, A.A., FEHSENFELD, F.C., FAHEY, D.W., FERGUSON, E.E.
J. Chem. Phys., 76 (1982) 742.65.VIGGIANO, A.A., DEAKYNE, C.A., DALE, F., PAULSON, J.F., J. Chem.Phys., 87
(1987) 6544.66.AZRIA, R., PARENTEAU, L., SANCHE, L., J.Chem.Phys. 87 (1987) 2292.67.SANCHE, L., PARENTEAU, L., Phys. Rev. Lett., 59 (1987) 136.68.SANCHE, L., PARENTEAU, L., J. Chem. Phys., (1990)69.SANCHE, L., Radiât. Phys. Chem., 34 (1989) 15.70.SANCHE, L., PARANTEAU,L., Chem. Phys., 91 (1989) 2664.71.SANCHE, L., PERLUZZO, G., MICHAUD, M., J. Chem. Phys., 83 (1985) 3837.
414

Chapter 7
STOPPING POWERS, RANGES AND STRAGGLING
H. PaulJohannes-Kepler-Universität,
Linz, AustriaM.J. Berger
National Institute of Standards and Technology,Gaithersburg, Maryland,United States of America
The authors acknowledge the valuable contribution to this chapter by H. Bichsel, 1211, 22ndAve. East, Seattle, WA 98112, USA.
415

LIST OF SYMBOLS FOR CHAPTER 7
A mass number of projectile (7.3.1.1)A relative atomic mass of natural target element (7.2,1.1, 7.3.1.1)A -A expansion coefficients for stopping power fits (Table 7.10)X 8a angle of emergence with respect to entrance angle (7.5.4)a. half-maximum angle (7.5.4)
a reduced scattering angle (7.5.4)ß = VI/GC/Z shell correction (7.3.1.1)c speed of lightô density effect correction (7.2.1.1, 7.3.1.1)A energy loss for path length s (7.2.4)<A> average energy loss (7.1, 7.2.4)E total relativistic energy (7.1)e = S/n stopping cross section (7.1)$ fraction of energy imparted to medium (7.3.1.5)cI mean excitation energy (7.2.1.1, 7.3.1.1)L(T) Stopping number (7.2.1)L ,L ,L see 7.3.1.10 1 2LFCTR correction factor for screening length (7.5.1.1)A scaled energy loss parameter (7.2.4)A screening length for the projectile (7.5.1.1)m rest mass of electroneM relative atomic mass of projectile (7.3.1.1)M relative atomic mass of target atom (7.3.3)M relative atomic mass of protonp(JL. i moment of a distribution (7.1)n number of atoms or molecules per unit volume (7.1)N number of electrons carried by ion (7.5.1)N Avogadro constantA£2 energy straggling (root-mean-square deviation of energy) (7.3.3)ß Bohr energy straggling (7.3.3)B
Πenergy straggling according to Firsov-Hvelplund (7.5.3)FHn energy straggling due to surface roughness (7.5.3)sn energy straggling for smooth foil (7.5.3)T
p(T) mean free path between inelastic collisions (7.2.5)q = (Z - N)/Z fractional projectile charge (7.5.1.1)r = e / ( 4?re m c )e 0 e
classical electron radius (in SI units) (7.2.1.1, 7.3.1.1)
417

R csda range (7.1)R vector range (average straight-line distance from point of
emission to end of path, 7.1, 7.3.6)R mean projected range (7.1)p density of target (7.1)s path length variable (7.1) (in units of length, except for 7.2.4)s average path length (7.2.5)
dTS = - — linear stopping power (7.1)ds«r range straggling (root-mean-square deviation of R ) (7.1)R xda1 differential cross section for an energy transfer W (7.1)t target thickness (7.5.4)T reduced target thickness (7.5.4)T kinetic energy of projectileT initial kinetic energyT equivalent proton energy (7.3.1.1)eqT kinetic energy of neutron (7.3.1.5)nT = T/M energy per mass unit (7.3.1.1)
12u atomic mass constant, m( C)/12 (7.2.1.1, 7.3.1.1)v Bohr velocity (= c/137; v2- 24.8 keV/u)v projectile speedv Fermi velocity for solid target (7.5.1.1)w. fraction by weight (7.2.1.5)W energy transfer in a single collision (7.1)W cut-off for energy transfer (7.1)cW maximum energy transfer to an electron (7.3.3)mx coordinate axis corresponding to initial beam direction (7.1)Ç energy loss variable (7.2.4)Z atomic number of projectileZ effective charge of projectile (in units of electron charge)1, ef f
(7.4.1.2, 7.5.1)Z atomic number of target atom£
Ç relative effective charge (7.4.1.2, 7.5.1)Ç relative effective charge in the solid (7.5.1.3)
418

7.1. INTRODUCTION
When charged particles traverse a medium, they are scattered and theylose energy; the energy lost is then imparted to the medium (or carriedaway by electromagnetic radiation). In dosimetry and radiology, one needsto understand not only the energy lost by the primary particle, but alsothe energy transfer to the medium through all generations of secondaryparticles [1] . The stopping power only describes the energy lost. This isonly a first step toward a full treatment, but an indispensable step.
The stopping power is defined as the rate at which particles loseenergy along their tracks, averaged over many particles. The linearstopping power, with dimension of energy/length, is therefore expressed asS = -(dT/ds) , where T is the kinetic energy of the projectile, and s isits path length . Here, dT is, of course, identical to dE (where E is thetotal relativistic energy). If the particle path is essentially straightand in the x-direction, one can also write S = -(dE/dx) . If, in aavtransmission measurement of stopping power, the absorber thickness At is sosmall that the energy loss AT is a small fraction of the initial kineticenergy, and if the path length increase due to multiple scattering can beneglected (cf. Sec. 7.5.4), then one has approximately S = -AT /At (Onehas to be careful, however, if the charge of the projectile is notconstant, see below).
It is often useful to consider the mass stopping power S/p (dimensionenergy/areal density) since, to first order, this quantity is independentof the density of the medium. From a theoretical standpoint, one definesthe stopping cross section e = JWdo* (dimension energy/number of atoms (ormolecules) per unit area), where der is the differential cross section foran energy transfer W. Under certain circumstances [2,3,4], e is equal toS/n, where n = pN /A is the number of atoms (or molecules) per unitA 2volume. If S/n is expressed in units of eV/(10 atoms/cm ), it givesapproximately the energy loss per monolayer.
This notation seems to imply that T is a unique, continuous function ofs, but that is only approximately true.
419

One can separate the stopping power into three components whichmust be calculated by different methods:
* the electronic stopping power (sometimes also called collision
stopping power [5]) which is due to the transfer of energy tobound electrons in inelastic Coulomb collisions;
* the radiative stopping power which is due to the emission ofbremsstrahlung quanta in Coulomb collisions with atomic nuclei orbound electrons;
* the nuclear stopping power which is due to the transfer of energy totarget atoms in elastic Coulomb collisions.
For electrons and positrons, the nuclear stopping power is negligiblecompared to the electronic stopping power except at energies below thethreshold for electronic excitations (a few eV). For heavy chargedparticles (mesons, protons and heavier), the radiative stopping power isnegligible compared to the electronic stopping power except at enormouslyhigh energies, and the nuclear stopping power is important only at lowenergies. Electronic stopping leaves the direction of the heavy projectilealmost unchanged, whereas nuclear stopping is accompanied by a change ofdirection.
The restricted collision stopping power [5] often used in radiobiologyis defined as the mean energy loss per unit path length involving energytransfers W smaller than some chosen cut-off energy W . It is also calledc"linear energy transfer" (LET) [6], and describes, approximately, theenergy imparted to the medium in the vicinity of the particle track. Forunrestricted W, it equals the collision stopping power defined above.Results for electrons are given in [5], for several values of W . See alsoTable 7.19 below.
The term "nuclear" is customarily used, even though no nuclear forcesare involved. Janni [7], however, included truly nonelastic nuclearinteractions in his calculations of stopping.
The dependence of nuclear stopping on the solid angle of detection("angle-restricted nuclear stopping") is discussed in Sec. 7.4.2.
420

If a particle has a fixed charge and if the differential cross sectiondo- for an energy transfer W leading to ionisation (Ch.2) or excitation isknown, then the stopping cross section can be determined by integrating Wd<r(see Sec. 7.2.1.7). If only the "partial stopping cross section" (withoutexcitation) is integrated, one obtains a slightly smaller result (see table2.8). Bichsel [4] finds that the integrated energy loss spectrum forvarious projectiles in silicon agrees well with stopping power as given bythe Bethe theory.
A slow heavy particle, when passing through matter, will capture andlose electrons until its charge reaches a dynamic equilibrium state. Inthis case, if one wants to determine the stopping cross section byintegrating Wdo-, one has to include the contribution of charge changingcollisions [8]. In practice, the effect of the charge state upon stoppingpower is normally described by the "effective charge" (see 7.4.1.2 and7.5.1.1, and also chapters 2 and 9). Tabulated stopping power valuesnormally correspond to this equilibrium state. If the thickness of a targetis too small to produce charge equilibrium, then division of energy loss bytarget thickness will not yield the stopping power unless a correction isapplied [9] . To describe the situation of a projectile that changes itscharge state toward equilibrium while entering the surface of somematerial, one speaks of "pre-equilibrium stopping".
The history of particles passing through matter is described bystochastic, i.e., statistically distributed quantities. For many purposes,the description by a simple average is sufficient, but higher moments fi. ofthe energy (or range) distribution may also be needed. For example, theenergy distribution of a particle beam of initial energy T aftertraversing a certain amount of material is completely described by thestraggling function F(A), i.e., the distribution of energy lossesA = T - T. Less completely, the distribution can be described by itsaverage energy <T> or the average energy loss <A> = T - <T> and by its
energy straggling ft = v<(T-<T>) > = v<(A-<A>) >, the root of the secondmoment, p. . For a Gaussian function, the full width at half maximum is2.355xfi. Deviations from Gaussian shape are described by the skewnessfi = <(T-<T>) > (or the dimensionless skewness coefficient pi /ß ) and thekurtosis u. - <(T-<T>) >.4
421

Following in part the suggestions of the Subcommittee on Penetrationof Charged Particles [10, p. iv], we define the following terms:
* The "range" of a group of particles of a given initial energy T istheir mean (rectified) path length from the point of departure to thepoint where they come to rest. This definition is not further usedhere.
T* The "csda range" is defined by the integral R = J — that
0corresponds to the continuous-slowing-down-approximation. Thisquantity is an extremely good approximation [11] to the range definedabove and will be used instead in this chapter (see, however, Sec.7.2.5 for an exception).
* We assume that the particles enter the medium along the x-axis. Thenthe "projected range" <R > is the mean of the path lengths projectedonto the x-axis. The distribution of individual projected ranges isdescribed [12] by this mean and by the root of the second moment of
the distribution <r = v<(R -<R >) >, also called range straggling.R x xClearly, we always have R £ <R >.x
* In cases where the particles are emitted from a point source, it maybe useful to introduce the additional definition "vector range" <R >,i.e., the average straight-line distance from the point of emission tothe point where the particles come to rest (cf. H.H.Andersen [134]).
In the following, the available data will be discussed mainly inregard to the "key substances" that are of interest to radiation therapy(cf. the INTRODUCTION to this book) . Also, we assume the solids to beamorphous (or polycrystalline), i.e., we neglect channeling effects.
7.2. ELECTRONS
7.2.1. Electronic «topping power
7.2.1.1. Stopping Power Formula.
Because of the scarcity of experimental data, all tables [10, 13-15,5] of electronic stopping powers for electrons (also called collision
422

stopping powers, cf. Sec. 7.1) have been based on the use of Bethe's theory[16, 17]. The formula for the mass collision stopping power, — S (T), is:p col
4n r m c l Z(T) = ———t_±_ _i L(T). (7.1)
^ A
L (T) is the stopping number, T is the kinetic energy of the electron, re2is the classical electron radius, me is the electron rest energy, u isethe atomic mass unit, ß is the electron velocity in units of velocity oflight, and Z and A are the atomic number and relative atomic mass of the
2target atom. With r in cm, me in MeV, and u in g, the constant in eq.e e2 2 2(7.1) becomes 4irr m c /u = 0.307075 MeV cm /g, and S /p is given in thee e col
same units. The stopping number is given by
m c/ 2 2L(T) = •£ I log —— — —— — - (2 I - ß - 1 + ß) log 2 +
+ 1 - ß+ £ (1 - •/ 1 - ß' )* - Ô I , ( 7 . 2 )] ,
where J is the mean excitation energy, ô is the density-effect correction,and log means the natural logarithm. The mean excitation energy isapproximately equal to I x Z , with I = 10 eV, and must be determined moreaccurately from experimental data.
7.2.1.2. Absence of Barkas, Bloch and Shell Correction.
Eqs.(7.1,7.2) were derived in the first Born approximation. Whereasfor heavy charged particles higher-order approximations are available inthe form of Barkas and Bloch corrections (proportional to the third,respectively fourth power of the charge of the projectile), similarcorrection terms applicable to electrons have not yet been worked out.
The derivation of the stopping-power formula is based on theassumption that the velocity of the incident electron is large compared tothe velocities of the atomic electrons. For collisions with inner-shellelectrons, especially in high-Z materials, this condition is no longersatisfied for incident electrons with energies below about 100 keV.
423

Corrections are required analogous to the shell corrections which have beenintroduced into stopping power theory for heavy charged particles. However,
3 4 )a theory of such corrections for electrons is not yet available. ' Instopping-power tabulations for electrons it is therefore customary to limitthe use of Eqs. (7.1,7.2) to energies above 10 keV, and to constructstopping powers at lower energies from atomic or molecular cross sections(see Sec. 7.2.1.7).
7.2.1.3. Absence of Binding Corrections for Large Energy Transfers.
In Bethe's derivation of the stopping power formula for electrons,large energy transfers are treated with use of Mailer's [19] cross sectionfor the collision of an electron with a stationary free electron. Noestimates are available for the error incurred by the neglect of thebinding and of the velocity distribution of the atomic electrons.
7.2.1.4. Mean Excitation Energies for Elements.
The mean excitation energy in Eq.(7.2), also denoted as J-value, isthe most important non-trivial parameter that characterizes the stoppingproperties of a material, and must be determined with use of experimentaldata. This involves (a) the analysis of stopping-power and range data forprotons, deuterons or alpha particles, or (b) the use of oscillator-strength distributions for gases, or dielectric response functions formaterials in the condensed phase. Method (a) is the one more widely used.
Bethe and Ashkin [18] point out that the use of the first Bornapproximation down to very low energies in the evaluation of shellcorrections is justified by the fact that an incident heavy particle can betreated as equivalent to a perturbing potential that moves with constantvelocity. This consideration does not apply to electrons.4 ) Inelastic collision cross sections for silicon developed by Bichsel[4] implicitly contain shell corrections. The use of these cross sectionsresults in collision stopping powers for electrons that are 4.6 % lower at10 keV, and 8.3% lower at 1 keV, than those from Eq.(7.1). However, thereliability of these results is uncertain because they were obtained in thefirst Born approximation.
424

However, method (b) has acquired increasing importance in recent years, andmade possible very accurate determinations of J-values for many moleculargases [20], for liquid water [21,22] and for aluminum [23].
The accuracy requirement for J-values is not very stringent. Because Jenters logarithmically into Eq.(7.2), the uncertainties of the collisionstopping powers are several times smaller than the uncertainties of theI-value. This is shown in Table 7.1, which gives the percent decrease ofthe stopping power that would result from a 10-percent increase of the meanexcitation energy.
Numerous evaluations of I-values have been published in the course ofthe years [5, 10, 11, 24-27, 7]. The estimates keep changing as thedatabase of relevant stopping-power data increases. Choices of J-values arealso influenced by unavoidable subjective judgments. In one of the mostrecent compilations [5], experimental data to determine J-values wereavailable for 44 elements, and interpolation with respect to atomic numberwas used for the other elements. For the 44 elements, the uncertainties ofthe adopted J-values were estimated to be smaller than 5% for 36 elements,between 5 and 10% for 5 elements, and between 10 and 15% for 3 elements.
The extraction of J-values from measured stopping-powers and ranges ofprotons, deuterons or alpha particles depends on the use of the Bethestopping power formula with appropriate shell, Barkas and Blochcorrections. The difficulty arises that in general the first two of these
TABLE 7.1. PERCENT DECREASE OF THE COLLISION STOPPING POWER FOR ELECTRONSASSOCIATED WITH A 10 PERCENT INCREASE OF THE MEAN EXCITATION ENERGY.
Energy Percent Decrease of the Collision Stopping Power(MeV)
0.010.11.010.0100.0
Air
2.01.41.00.80.2
Water
21000
.0
.4
.6
.2
.01
Graphite
21000
.0
.4
.7
.3
.01
Aluminum
21100
.4
.6
.1
.3
.04
Copper
21000
.8
.7
.9
.4
.08
Silver
31100
.1
.8
.1
.4
.08
Gold
3.72.01.10.50.12
425

TABLE 7.2. COMPARISON OF MEAN EXCITATION ENERGIES FOR SELECTED ELEMENTS,ADOPTED IN VARIOUS COMPILATIONS, AND OBTAINED IN RECENT EXPERIMENTS.
Compilations: AZ:Janni:ICRU:
B:
Andersen and Ziegler, 1977 [26]Janni, 1982 [7]ICRU Report 37, 1984 [5]Bichsel, 1991 [30]
Experiments; Sak88: Sakamoto et al, 1988 [28]; 6.5-MeV protonsSak91: Sakamoto et al, 1991 [29]; 73-MeV protons
BH: Bichsel and Hiraoka, 1991 [31]; 70-MeV protons
M e a n E x c i t a t i o n E n e r g y , e V
413222629424750737478798292
BeAlTiFeCuMoAgSnTaWPtAuPbU
AZ
62.7162230280322406466487684693759755759847
Janni(a)
65.2160.1228278323423469500738753826807819880
ICRU(a)
63.7166233286322424470488718727790790823890
Sak88 B(b) (a)
63.9167.7232282323413463471674 734
775728 786745 790743 786
836
Sak91 S(b)
169.7247
343466507491753
773799836
ak91(a)
169.4246
341463504488763
786813853
BH(a,c)
[166]242293339440489508736765
816
(a) Based on use of shell corrections calculated according to theprescription of Bichsel [5,30].
(b) Based on use of shell corrections from Bonderup [37].(c) Based on I = 166 eV from ICRU [5]
426

corrections are not known independently with sufficient accuracy, so thatthey must be determined jointly with the mean excitation energy. Thereforethe J-values adopted by various authors depend to a certain extent on theassumptions made in regard to the shell or Barkas corrections. Thesedifficulties are minimized at high energies where the influence of theBarkas and shell corrections is small.
The current situation in regard to J-values for elements is indicatedin Table 7.2, which compares values adopted in several compilations withvalues from recent experiments by Sakamoto et al [28,29], Bichsel [30], andBichsel and Hiraoka [31]. For low-Z elements the agreement issatisfactorily close, but there are discrepancies for high-Z elements whichdeserve further attention.
7.2.1.5. Mean Excitation Energies for Compounds.
It is preferable to use direct experimental J-values for compounds.Such information is often unavailable. However, approximate J-values can beobtained by using Bragg's additivity rule, according to which the masscollision stopping power for compounds is a linear combination of thestopping powers of the constituent elements. From Eqs.(7.1,7.2) it followsthat the corresponding additivity relation for the mean excitation energyis
EW3 (W:j log J3log J = —————————————————— , (7.3)
where w. is the fraction by weight, J. is the mean excitation energy, and(Z /A ) is the ratio of atomic number to atomic weight for the j'th atomic2 2 3constituent of the compound. For improved accuracy, the J. values used inEq.(7.3) should take into account atomic binding effects, and should bedifferent for compounds in the gaseous or condensed phase. Table 7.3 showsthe J-values for atomic constituents in gaseous and condensed compoundsused in ICRU Report 37 [5]. This assignment scheme was justified by showingthat it provides J-values for 13 gaseous, 27 liquid and 14 solids compoundsthat are close to the J-values obtained directly from experimental data.Nevertheless, the scheme is simplistic, and should be replaced by a sounderscheme that takes into account the physics of binding and phase effects,for example, along lines suggested by Thompson [32] and Brandt [33].
427

TABLE 7;3. MEAN EXCITATION ENERGIES ADOPTED IN ICRU REPORT 37 [5] FORATOMIC CONSTITUENTS OF COMPOUNDS, TO BE USED IN THE ADDITIVITY EQ.(7.3).
Constituent
HCN0F
ClOthers
Mean Excitation Energy, eV
Gases Liquids oror Solids
19.2 19.270 8182 8297 106
112180
1.13 x valuefor elements
There are also considerable discrepancies between the experimentalJ-values for graphite, usually obtained by the measurement of the ranges ofhigh-energy protons beams in graphite relative to the ranges in othermaterials. The experimental I-values listed in [5] extend from 91.7 ± 8.6eV to 78.0 ± 4.0 eV. Bichsel and Tschalär (priv. comm. to M. Berger)obtained 78 eV at 19 MeV, and Bichsel and Hiraoka [31] obtained 86.9 eV at70 MeV.
Of particular interest for medical and radiobiological applications isthe mean excitation energy of liquid water. In [5], a value of 75±3 eV wasadopted, based on four experimental results: 75.4±1.9 eV from the analysisof Thompson's [32] measurements of partial ranges of 340-MeV protons;74.6±2.7 eV from the stopping-power measurements of Nordin and Henkelman[34] with 61-MeV pions; 75 eV from Ritchie et al [21], and 75.4 eV fromAshley [22], both obtained from measured optical data. Recently, in anexperiment with 70-MeV protons, Bichsel and Hiraoka [31] determined thestopping powers of water relative to that of aluminum. Assuming foraluminum the accurately known I-value of 166 eV, they determined theJ-value of liquid water to be 79.710.5 eV, which differs significantly fromearlier values.
428

For tissue-equivalent A-150 plastic, Ishiwari and coworkers [36] madestopping-power measurements with 2.5 to 7.5 MeV protons, and estimated anJ-value of 64.7 eV, using shell corrections from Bonderup's theory [37].Re-analysis of their data with shell corrections from [5] leads to J-valuesof 64.4 eV at 2.5 MeV and 62.3 eV at 7.5 MeV. These results aresignificantly lower than the values of 70.210.7 eV to 72.810.7 eV obtainedby Hiraoka and collaborators at 70 MeV with various A-150 targets ofslightly different composition.
Table 7.5 indicates the percent changes of the collision stoppingpowers for water and various organic solids that are caused by thereplacement of I-values from [5] by those from [31,35]. The changes are inmost instances smaller than the uncertainties due to the approximations inthe derivation of the stopping power formula.
TABLE 7.5. PERCENT CHANGE OF COLLISION STOPPING POWERS FOR ELECTRONS THATRESULT WHEN THE J-VALUES ADOPTED IN ICRU REPORT 37 [5] ARE REPLACED BYTHOSE OF BICHSEL AND HIRAOKA [31] FOR WATER, AND BY THOSE OF HIRAOKA ANDCOLLABORATORS [35] FOR THE OTHER MATERIALS.
Electron Energy, MeV0.01 0.1 1 10
Water (liquid)GraphiteA-150 TE plastic
White LuciteClear LucitePolyethylenePolypropyleneNylon 6PolystyrenePolyvinyl chloridePolycarbonateMylarTeflon
-1.21-2.16-1.46-2.00-2.16-0.160.08-1.15-1.60-2.190.300.52-0.950.88
-3.40
-0.84-1.47-1.02-1.40-1.51-0.110.06-0.81-1.12-1.530.210.35-0.660.61
-2.32
-0.37-0.83-0.38-0.52-0.57-0.040.02-0.29-0.41-0.570.080.16-0.260.23
-1.00
-0.11-0.36-0.13a-0.18a-0.19a-0.020.01-0.10-0.14-0.190.030.06-0,090.08
-0.32
a. Three different targets with slightly different composition
430

7.2.1,6. Density-Effect Correction.
This correction takes into account the reduction of the collisionstopping power due to the polarization of the medium by the passage of theincident charged particle. The correction depends on the density and thedielectric response function of the medium. Sternheimer [38,39] developed asimple dielectric model which uses binding energies and occupation numbersfor various atomic shells as input. The key to the success of his model isthe adjustment of the binding energies, which are multiplied by a factorchosen so that the mean excitation energy agrees with the empirical meanexcitation energy adopted used in the stopping power formula.
More accurate calculations of the density effect, based on the use ofexperimental optical data were made by Inokuti and Smith [40] for aluminum,by Ashley [41] for water, and by Bichsel [4] for silicon. The use ofdensity-effect corrections from these authors in place of those from theSternheimer theory changes the collision stopping power by less than 0.4%for electrons with energies between 1 and 10 MeV, and even less at higherenergies.
Difficulties arise in the evaluation of the density effect forinhomogeneous media. An important case is that of graphite, a material thatis widely used for radiation detectors such as ionization chambers andcalorimeters. Graphite is a porous, anisotropic material, consisting ofloosely packed crystallites. The crystallite density is 2.265 g/cm ,whereas the bulk density of graphite can vary from 1.5 to 1.9 g/cm . In[5], a homogeneous medium with a bulk density of 1.7 g/cm was assumed, andthe errors of stopping power incurred thereby might be as large as 1percent.
7.2.1.7. Data below 10 keV.
At energies below 10 keV, where the Bethe theory ceases to beapplicable, stopping cross sections can be constructed as energy-weightedintegrals over the cross sections for electron-impact excitation andionization (see Sec. 7.1). But one must realize that at low enoughenergies, one can no longer use the concept of stopping power to describethe gradual energy loss along the electron track (see Sec. 7.2.5, and [5]).
431

Experimental and theoretical information about electron-impact cross sec-tions is quite limited. Therefore, explicitely or implicitely, the Weiz-säcker-Williams method [41a] is usually employed , which permits the use ofthe more abundant cross section data for photon interactions with matter.
Electron-impact cross sections for soft collisions (that result insmall energy and momentum transfers) are obtained from oscillator-strengthdistributions for gases or dielectric response functions for liquids orsolids. Sum rules for these distributions provide useful constraints thataid the analysis of experimental data. Hard collisions (that result inlarge energy and momentum transfers) , are described by the Mott crosssection, modified by an approximate binding correction. The Mott crosssection also takes into account exchange effects resulting from the factthat the incident electron and atomic electrons are indistinguishable.Collisions of intermediate magnitude, which can be considered neither softnor hard, are treated by heuristic models which interpolate between the twolimiting cases of soft and hard collisions. The model parameters areadjusted to get the best possible agreement with the available experimentaldata on electron-impact ionization. The Weizsäcker-Williams methodimplicitly assumes the validity of the first Born approximation. When thecalculation of stopping powers is extended down to energies of 100 eV oreven 10 eV, as is often the case, the failure of the first Bornapproximation can be expected to result in sizeable errors.
Inelastic scattering cross sections for gases were obtained in thismanner by Gerhart [42] for molecular hydrogen, by Eggarter [43,44] forargon, by Paretzke [45-47], Olivero et al [48], Dayashankar and Green [49],and by Laverne and Mozumder [50] for water vapor, by Jackman et al [51] forvarious atmospheric gases, and by Waibel and Grosswendt [52,53] fornitrogen, carbon dioxide and tissue-equivalent gas. The main purpose ofthese data compilations was to provide input for the calculation ofelectron energy-degradation spectra and yields of excitations andionizations. Stopping powers were obtained as a by-product of this work.
The calculation of stopping powers of solids is usually based onmethods introduced by Lindhard [54] and Ritchie [55] involving the use ofdielectric response functions. The differential inelastic scattering crosssection is proportional to Im [-l/e(w,k)]( where Im indicates the imaginarypart and e(w,k) is the dielectric response function, a complex-valuedfunction of the energy transfer hw and momentum transfer hk to the medium.
432

The stopping power is obtained by integrating the energy-weighteddifferential cross section with respect to u and k.
A variety of procedures has been used to evaluate the requireddielectric response function, involving the combination of experimentalinput (optical data) with the local-plasma approximation (free electronmodel) of Lindhard [54,56]. Ritchie, Ashley, Tung and collaborators at theOak Ridge National Laboratory applied the method to calculate stoppingpowers, and mean free paths for inelastic scattering, for various materials[57-67], They used different dielectric models appropriate for conductors,
10-13
COdo
c«COCOO
buC• *D-CXO-*-iC/3
10-15
10-17
10-19
H Stopping cross sections
• \ " - - _ • • • .^^•/ _ _ \ _ _ ~ ~~
\ metastable
100 1000T(eV)
Fig. 7.1. Stopping cross section of molecular hydrogen gas for electrons.Calculated by M. Kimura (private communication) from cross sectionscompiled by Gerhart [42] and used by Kimura et al [71] for the calculationof energy degradation spectra. The figure shows, in addition to the totalstopping cross section, the contributions from ionizations, from exci-tations resulting in optically allowed transitions and in transitionsleading to metastable states, and contributions from dissociativetransitions.
433

10- 13
10- 14
Eo
Co
0)ooMWOI_ObuC'5,CuO
10- 1 5
10- 16
£ 10- 17
10- 18
Ar Stopping cross sections
total
opt. allowed(4s,5s,6s and 7s)
\ metastable
100 1000
T(eV)
Fig.7.2. Stopping cross section of argon gas for electrons. Calculated byM.Kimura (private communication) from cross sections compiled by Eggarter[43,44], and used by Kimura et al [71] for the calculation of energydegradation spectra. The figure shows, in addition to the total stoppingcross section, the contributions from ionizations and from excitationsinvolving optically allowed and forbidden transitions and transitions tometastable states.
semiconductors and insulators, which take into account single-electronexcitations and collective excitations (plasmons). Measured optical datawere used to determine the dielectric response function in the limit ofzero momentum transfer. The response function was extrapolated into theregion of non-vanishing momentum transfer in such a manner that theresulting cross section for large energy transfers approaches the Mottcross section. The contribution to the stopping power from inner-shellelectrons was evaluated from generalized atomic oscillator strengthdistributions, because the wave functions of inner-shell electrons areinsensitive to the state of aggregation of the medium. Similar calculationswere made by LaVerne and Mozumder [33], Akkerman and Chernov [68], Khlupinand Akkerman [69], and Liljequist [70].
434

Data for Gases. Pig. 7.1 shows the stopping cross section formolecular hydrogen, and Fig.7.2 the stopping cross section for argon. Alsoindicated in these figures are the contributions of ionization and ofvarious excitations to the total cross section. The stopping powers werecalculated by M.Kimura (private communication) with cross section setscompiled by Gerhart [42] for hydrogen and by Eggarter [43,44] for argon.These cross sections were used in recent calculations of energy-degradationspectra [71].
Figs.7.3 and 7.4 show the stopping powers of carbon dioxide and ofmethane-based tissue-equivalent gas (64.5 CH , 32.2% CO and 3.2% N by4 2 I
/
Fig.7.3. Mass stopping power of carbon dioxide gas for electrons,determined by Waibel and Grosswendt [52].
4. : from ionization measurements, with correction for energycarried away by secondary electrons
0 : from ionization measurements, without correction forsecondary electron escape
Q : calculated from inelastic scattering cross sections
: Bethe theory, from [5]
435

910
_ÊIgem
1Q
10
o
10 10 103 eV 104
Fig.7.4. Mass stopping power of methane-based tissue-equivalent gas forelectrons, determined by Waibel and Grosswendt [53].
+ : from ionization measurements, with correction for energycarried away by secondary electrons
• .• from ionization data, without correction for secondary-electron escape
O • calculated from inelastic scattering cross sections
: Bethe theory, from [5]
partial pressure) determined by Waibel and Grosswendt [52,53]. This is oneof the rare instances where stopping powers were calculated as well asmeasured. In the experiments of Waibel and Grosswendt, electron beams wereinjected into a parallel-plate ionization chamber, and the ionizationcurrent of positive charge carriers was measured as a function of gaspressure. The stopping power was obtained as the derivative of the currentwith respect to pressure, extrapolated to zero pressure. A fairlysubstantial correction had to be applied to account for the escape of
436

energy carried by secondary electrons. Figs. 7.3 and 7.4 show stoppingpowers calculated with, and without, this correction. Waibel and Grosswendtestimated the uncertainties of the measured stopping powers to be 10%. Alsoshown in the figures are stopping powers calculated by Waibel andGrosswendt from estimated electron-impact cross sections, which theyestimated to have uncertainties of 15%. Within the limits of error, theagreement between the experimental and theoretical stopping powers is
satisfactory.
The left panel of Fig.7.5 shows stopping powers of water vaporcalculated by Paretzke [45-47] and by Laverne and Mozumder [50]. Paretzke
u>
0>*oQ-or>cCLa.o
280
260
240
220
200
180
160
140
120
100
80
60
40
20
0Wa te r Vapor
Cl
N
U
>«5
<u*oCL
tj>co.Q.O
-*J(/)
280
260
240
220
200
180
160
140
120
100
80
60
40
20 L i q u i d Water0 10 10 10E l e c t r o n K i n e t i c Ene rgy , eV
101 10" 10- 10'E l e c t r o n K i n e t i c Energy, eV
Fig.7.5. Stopping power of water vapor and of liquid water for electrons.
A: Ashley [66]P: Paretzke et al [45-47]L: LaVerne and Mozumder [50].B: Bethe theory, from [5], calculated with mean excitation
energy 71.6 eV for water vapor and 75 eV for liquid water.
437
carried out a critical data analysis for water vapor with the same approachused earlier by Gerhart and Eggarter. Laverne and Mozumder relied on theoscillator-strength distribution for water vapor compiled by Zeiss et al[72] but provided few details of the procedure used. Also shown in Fig. 7.5is the prediction from Bethe's theory (with a mean excitation energy of71.6 eV).
Data for the Condensed Phase. The right panel of Fig.7.5 showsstopping powers for liquid water calculated by Ashley [66], Paretzke et al[45-47], by Laverne and Mozumder [50], and again - for comparison - thestopping power from Bethe's theory (calculated with a mean excitationenergy of 75 eV). In Ashley's work, the dielectric response function wascalculated with an insulator model whose parameters were adjusted to takeinto account the measured optical data up to 26 eV of Heller et al [73] .lonization from the K shell was treated with generalized atomic oscillatorstrength distributions.
The calculation of Laverne and Mozumder was similar to that of Ashley.However, a somewhat different method was used to extrapolate the opticaldata to higher energies, and exchange effects were not explicitly includedin the dielectric model but treated in a more approximate manner by anenergy-loss cut-off.
The cross sections for liquid water used by Paretzke et al wereobtained by modifying their cross sections for water vapor in the followingrespects: The optical data of Heller et al were taken into account; thebinding energies of the outer ionization levels were reduced by 4 eV; theenergy-loss spectrum Im[-l/e(ti>,k) ] was shifted to higher energies;oscillator-strength distributions for discrete transitions were decreasedand broadened.
It can be seen in Fig.7.5, that the three calculations agree closelywith the Bethe theory down to 1 keV, and with each other down to about 300eV. The differences below 300 eV are an indication of the uncertaintiesinherent in the calculation. A comparison of the results in the left andright panels of Fig.7.5 suggests that the phase effect on the stoppingpower of water is small. The stopping powers of LaVerne and Mozumder areslightly larger for vapor than for liquid at the energy where the stoppingpower peaks, which is plausible, and consistent with corresponding results
438

STOPPING POWER (eV/A)
o
ac
cr\
Cofor
eutiontro
ns
li O.? N.)1<Q
ous processes
et al
[57
].to
thestopping
power
of
ELECTR
ON
ENERG
Y ABOVE
TOP
OF
CO
ND
UC
TION
BAND
eV

for protons and alpha particles. A small opposite phase effect indicated bythe results of Paretzke et al is probably a spurious result due to theuncertainties of the calculations.
Fig.7.6, from Tung et al [57] shows the stopping power of aluminum andthe contributions of various modes of energy loss. This calculation, alsodescribed by Ashley et al [60], takes into account separately theinteractions with electrons in the conduction band and with the tightlybound electrons in the ion core.
Table 7.6 shows electron stopping powers calculated by Ashley[65,67a,b] for a few compounds of low atomic number. In these calculationsthe dielectric response function was constructed with the use of
TABLE 7.6. LOW-ENERGY ELECTRON STOPPING POWERS OF COMPOUNDS. THE RESULTSFOR POLYETHYLENE, POLYMETHYL METHACRYLATE (PMMA), WATER AND ALUMINUM WERECALCULATED BY ASHLEY [67a,b], AND THOSE FOR SILICON DIOXIDE BY ASHLEY ANDANDERSON [65]. THE VALUES IN PARENTHESES ARE FROM BETHE'S STOPPING-POWERFORMULA EVALUATED WITH MEAN EXCITATION ENERGIES FROM [5].
S t o p p i n g P o w e r , MeV cm /g
Energy Poly-(eV) ethylene PMMA Water Aluminum
Silicondioxide
406080100150200300400500600800
77.0219290319319296250215189170142
54.1161224253266254220193172156132
56.6159215242258248220194173157133
15716816215313212111110497.892.282.2
55.110512813714113712711710899.687.5
100015002000300040006000800010000
12595.978.757.047.534.927.823.3
(135)(102)(83.3)(61.8)(49.7)(36.4)(29.1)(24.4)
11589.173.355.044.332.325.721.4
(117)(89.6)(73.4)(54.8)(44.3)(32.6)(26.1)(22.0)
11689.273.455.144.632.826.222.0
(120)(91.8)(75.2)(56.2)(45.4)(33.4)(26.8)(22.6)
74.460.050.438.531.824.019.516.5
(73(59(50(38(31(23(19(16
.8)
.5)
.2)
.7)
.8)-9).4).5)
78.162.652.840.833.525.120.417.4
(83.4)(66.3)(55.5)(42.4)(34.7)(25.0)(21.0)(17.8)
440

TABLE 7.7.EXCHANGE CORRECTION FACTORS, FROM ASHLEY [67b], CALCULATED BYTAKING THE RATIO OF THE ELECTRON STOPPING POWER (WITH THE EXCHANGECORRECTION) TO THE POSITRON STOPPING POWER (WITHOUT THE EXCHANGECORRECTION).
E X C H A N G E C O R R E C T I O N F A C T O R
Energy(keV)
0 .040.060.080.100.15
0.200.300.400.500 .60
0.801.001.502.003.00
4 . 0 06.008.00
10.00
C
0.6250.6240.6450.6700.720
0.7510.7860.8050.8170.824
0.8330.8390.8470.8530.864
0.8750.8880.8940.896
Al
0.6480.7030.7260.7370.750
0.7580.7700.7790.7860.793
0.8040.8120.8290.8400.855
0.8640.8740.8810.888
Cu
0.6410.6570.6700.6800.699
0.7120.7310.7450.7560.765
0.7810.7940.8150.8280.839
0.8430.8490.8560.865
Ag
0.6610.6400.6380.6430.665
0.6880.7280.7560.7750.788
0.8030.8110.8180.8230.834
0.8450.8590.8650.864
Au
0.6560.6260.6250.6340 .663
0.6880.7260.7520.7690.781
0.7950.8020.8110.8160.826
0.8350.8470.8520.851
experimental optical data, and exchange effects were taken into account inthe dielectric model. Table 7.6 also shows the corresponding stoppingpowers from Bethe's theory.
Ashley [67b] calculated stopping powers not only for electrons (withthe exchange correction) but also for positrons (without the exchangecorrection, leaving all other aspects of the calculation unchanged). Wehave made a least-squares fit of Ashley's electron/positron stopping-powerratios as functions of the particle energy. These ratios (exchangecorrection factors) are given in Table 7.7 for C, Al, Cu, Ag and Au, andcan be seen to be rather insensitive to the atomic number of the targetmaterial.
441

TABLE 7.8. ELECTRON STOPPING POWERS (in MeV cm /g) OF ELEMENTALCALCULATED BY KHLUPIN AND AKKERMAN [69]. 3.94E2 means 3.94xlQ2, etc.
SOLIDS
Energy(eV)100150200300400600800
100014002000300040006000800010000
Energy(eV)100150200300400600800100014002000300040006000800010000
Energy(eV)100150200300400600800100014002000300040006000800010000
Li
3.94E23.35E22.96E22.43E22.08E21.63E21.35E21.16E29.08E16.96E15.09E14.05E12.93E12.32E11.93E1
Ca
2.09E21.89E21.70E21.41E21.21E29.70E18.29E17.31E16.00E14.81E13.68E13.01E12.25E11.82E11.54E1
Ag
1.11E21.07E29.82E18.24E17.11E15.75E14.96E14.42E13.69E13.02E12.36E11.96E11.50E11.23E11.05E1
3.3.2.2.1.1.1.1.8.6.4.3.2.2.1.
2.1.1.1.1.9.8.7.5.4.3.2.2.1.1.
988765443221111
Be
72E205E265E217E287E248E224E208E259E167E194E196E188E129E191E1
Ti
02E286E269E242E222E270E122E122E189E171E160E195E120E178E151E1
Sn
.59E1
.97E1
.37E1
.32E1
.49E1
.32E1
.59E1
.09E1
.43E1
.82E1-21E1.85E1.42E1. 17E1. OOE1
C
4.30E23.66E23.13E22.43E22.03E21.56E21.29E21.11E28.85E16.88E15.10E14.10E12.99E12.38E11.99E1
Fe
1.51E21.52E21.42E21.21E21.06E28.47E17.11E16.20E15.03E14.01E13.07E12.53E11.90E11.54E11.30E1
Sb
9.95E19.15E18.50E17.43E16.60E15.42E14.67E14.16E13.48E12.85E12.24E11.87E11.43E11.18E11.01E1
Na
2.32E22.26E22.12E21.83E21.60E21.28E21.07E29.24E17.34E15.71E14.25E13.44E12.53E12.03E11.71E1
Ni
1.32E21.50E21.43E21.23E21.08E28.65E17.26E16.30E15.09E14.04E13.09E12.54E11.90E11.54E11.31E1
Ba
7.32E16.76E16.33E15.71E15.23E14.48E13.92E13.51E12.96E12.45E11.95E11.65E11.27E11.06E19. UEO
2.1.1.1.1.1.!..8.7.5.4.3.2.2.1.
1.1.1.1.1.8.6.5.4.3.2.2.1.1.1.
777665433221119
Mg
05E294E283E263E245E219E201E284E109E156E117E139E151E102E170E1
Cu
23E242E234E216E201E212E181E191E175E176E187E135E177E143E121E1
W
.74E1
.93E1
.59E1
.72E1
.02E1
.03E1
.37E1
.89E1
.22E1
. 60E1
. 01E1
. 67E1
.28E1
.06E1
.07EO
Al
2.04E21.82E21.69E21.49E21.34E21.11E29.52E18.35E16.75E15.31E14.00E13.25E12.41E11.94E11.64E1
Zn
1.62E21.65E21.51E21.28E21.11E28.83E17.40E16.41E15.13E14.04E13.07E12.51E11.88E11.52E11.29E1
Au
6.13E16.33E16.14E15.59E15.09E14.35E13.84E13.46E12.91E12.38E11.86E11.55E11.20E19.92EO8.53EO
2.2.1.1.1.1.1.8.7.5.4.3.2.2.1.
1.1.1.1.1.8.7.6.5.4.3.2.1.1.1.
655543332211198
Si
53E211E288E261E243E218E201E286E118E165E125E146E156E106E174E1
Ge
49E239E229E214E202E239E117E128E108E103E107E152E190E154E131E1
Pb
.43E1
.85E1
.49E1
.OOE1
.59E1
.97E1
.54E1
.21E1
.73E1
.25E1
.78E1
. 49E1
. 15E1
. 58EO
.26EO
K
2.13E21.90E21.69E21.38E21.18E29.53E18.15E17.19E15.89E14.71E13.59E12.96E12.19E11.78E11.50E1
Mo
1.09E21.02E29.30E17.91E17.03E15.95E15.25E14.74E13.99E13.27E12.55E12.12E11.62E11.33E11.14E1
Bi
6.81E16.13E15.65E15.08E14.64E13.99E13.54E13.21E12.73E12.25E11.78E11.49E11.15E19.57EO8.26EO
442

Khlupin and Akkerman [69], extending earlier work by Akkerman andChernov [68], calculated electron stopping powers in 24 solids at energiesbetween 0.1 keV and 100 keV. They treated the response of the electrons inthe valence bands with a dielectric response function calculated accordingto Lindhard and Winther [56], and calculated the interactions with inner-shell electrons using the binary-encounter theory of Garcia [74]. Exchangeeffects were not taken into account. Table 7.8 gives stopping powersexcerpted from the more extensive tables of Khlupin and Akkerman. It wouldbe a simple matter to apply Ashley's exchange effect to the Khlupin-Akkerman results, using correction factors obtained by interpolation fromTable 7.7.
Fig.7.7a compares the Khlupin-Akkerman stopping powers of Al, Cu, Agand Au with the corresponding results of Ashley [67b] calculated without
EoVsv*o0.
Q_Q.O•*-•in
Eo
*oo.C"co.Q.Oin
E l e c t r o n K i n e t i c Energy, k e V
E l e c t r o n K i n e t i c Energy, keV
C u -
ï-2 1-110"* 10~' 10°en E l e c t r o n K i n e t i c Energy
65
101, keV
Au'
10~2 10~1 10°El e c t r o n K i n e t i c Energy
101keV
Fig.7.7a. Comparison of stopping powers of Al, Cu, Ag and Au for electrons,calculated without exchange corrections. Solid curves: Ashley [67a,b];Dashed curves: Akkerman and Khlupin [69].
443

the exchange correction. The agreement between the two sets of calculationsis good for Al and Au, and fair for Ag. For Cu, however, Ashley's stoppingpowers are much smaller than those of Khlupin and Akkerman. A somewhatsimilar discrepancy was found by Ashley [67a], who noted that the stoppingpowers obtained with his optical-data model are slightly higher for Ag andAu, but considerably lower for Cu, than the stopping powers obtainedearlier by him with a statistical model [58,61].
Al-Ahmad and Watt measured the stopping powers of Al, Ni, Cu, Ag andAu [69a] and of polyethylene [69b] for electrons with energies from 10 keVto 1 keV. Ref.[69a] also presents comparisons with earlier stopping-powermeasurements by other authors. A calorimetric method was used by Al-Ahmadand Watt to determine the amount of energy lost by electrons in very thinfoils. To interpret these measurements, they had to determine the averagepath lengths of the electrons in the foils, which was done with a simplemultiple-scattering correction. Furthermore the effective energy, i.e. the
350
POLYETHYLENE
1 2 3 4 5 6 7E l e c t r o n K i n e t i c E n e r g y ,
8 9k e V
10
Fig.7.7b. Comparison of stopping powers of polyethylene for electrons.Solid curve: Ashley [67a,b]; short-dashed curve: Bethe's theory; Squaresand circles: experimental results of Al-Ahmad and Watt [69b], obtained withtwo different type of multiple-scattering corrections.
444

Eo
<D
V5OQ_cncu.Q.O
•+->CO
0 2 3 4 5 6 7E l e c t r o n K i n e t i c E n e r g y ,
8keV
Fig.7.7c. Comparison of stopping powers of aluminum for electrons.Solid curve: Ashley [67a,b]; long-dashed curve: Khlupin and Akkerman [69];short-dashed curve: Bethe's theory; circles: experimental results ofAl-Ahmad and Watt [69a].
CMEo
0)
0)5oQ,
cncaQ.o
1501401301201 10100
908070605040302010
0
COPPER
0 1 2 3 4 5 6 7 8 9E l e c t r o n K i n e t i c E n e r g y , k e V
Fig.1.Id. Comparison of stopping powers of copper for electrons,(similar to Fig.7.7c).
10
445

120
en(M
Eo
Q)5O
CLenc
CLCLO
-+-1
en
1 2 3 4 5 6 7 8 9E l e c t r o n K i n e t i c E n e r g y , k e V
1 0
Fig.7.7e. Comparison of stopping powers of silver for electrons,(similar to Fig.7.7c).
CMEo
QJ
<D$OCLcncQ.Q.O-4-<CO
0 2 3 4 5 6 7 8E l e c t r o n K i n e t i c E n e r g y , k e V
Fig.7.7f. Comparison of stopping powers of gold for electrons,(similar to Fig.7.7c).
446

average energy of the electron in the foil, had to be estimatediteratively. For example, for 4-keV electrons incident on the foil thepertinent parameters had the following values:
Material Foil Energy Effective Ratio of average paththickness loss energy length to foil thickness(fig/cm2) (keV) (keV)
Polyethylene 13.24 0.0766 3.61 1.06Al 27.94 0.1334 3.33 1.24Au 55.88 0.3743 2.12 4.97
Except for low-Z materials, the multiple-scattering correction islarge, and somewhat uncertain. Nevertheless the stopping powers extractedby Al-Ahmad and Watt from their data are in fair agreement with calculatedstopping powers. This can be seen in Figs. 7.7b to 7.7f which containcomparisons with the results of Ashley [67a,b] and of Khlupin andAkkerman [69], and with predictions from Bethe's theory. It would beinteresting to analyze the energy-loss data not only with a simplemultiple-scattering correction, but by a complete transport calculation.
7.2.1.8. Uncertainties.
The number of measurements of stopping powers for electrons is verysmall, and the available body of data is not adequate to determine theaccuracy of the stopping power formula. Error estimates must rely on theuncertainties of the parameters in this formula (see Sections 7.2.1.4 to7.2.1.6), and must take into account the absence of various neededcorrections (see Sections 7.2.1.2 and 7.2.1.3). In ICRU Report 37 [5] it isconcluded that the differences between measured and calculated stoppingpowers in the region 2 keV to 100 keV do not form a consistent pattern andprovide little guidance how the Bethe theory should be modified at lowerenergies. In [5] it is estimated that the uncertainties of the collisionstopping powers tabulated with the use of the stopping power formula are1-2% above 100 keV, and 2-3% in low-Z and 5-10% in high-Z materials
jj jj
between 100 keV and 10 keV.
The error estimate for the region 100 keV to 10 keV is consistent withthe differences between the results from the Bethe theory and from otherlow-energy calculations in Table 7.9.
447

TABLE 7.9. PERCENTAGE AMOUNT A BY WHICH THE ELECTRON STOPPING POWERS AT 10keV CALCULATED BY KHLUPIN AND AKKERMAN [69] AND BY ASHLEY AND COLLABORATORS[59,65,66,67] DIFFER FROM THE RESULTS OF THE BETHE THEORY FROM [5].
LiBeCNaMgAl
-2.42.3
-1.51.9
-0.9-0.7
SiKCaTiFeNi
3.0-6.5-6.54.0
-6.3-6.3
CuZnGeMoAgSn
-7.6-2.25.9-2.3-6.4-7.8
SbBaWAuPbBi
-5.212.21.1
-1.6-2.0-2.4
Polyethylene 0.6Polystyrene -1.0Water 0.0Silicon Dioxide 3.3
7.2.2. Radiâtiv« stopping Power
The radiative stopping power, — S , represents the mean energy lossper unit path length due to the emission of bremsstrahlung quanta. Anaccurate evaluation can be accomplished through the combination of severaltheories applicable in different energy regions. Such a combination wasused in ICRU Report 37 [5] . At energies above 50 MeV, the emission ofbremsstrahlung in the screened Coulomb field of the atomic nucleus wascalculated from the analytical theory of Davies, Bethe and Maximon [76];below 2 MeV, the numerical values of the cross sections of Pratt, Tseng andcollaborators [77] were used, obtained by numerical phase-shiftcalculations for a static, screened Coulomb potential. The radiativestopping powers calculated with these cross sections above 50 MeV and below2 MeV were used as input for a cubic-spline, least-squares fitting formula,which was then used for interpolation in the intermediate energy regionfrom 2 to 50 MeV.
A similar interpolation scheme was used subsequently [78,79] for thebremsstrahlung cross sections themselves, and the validity of theinterpolation scheme was confirmed by comparisons with a few directcalculations according the method of Tseng and Pratt at 5 and 10 MeV. The
448

radiative stopping powers in the energy region 2 - 5 0 MeV determined inthis manner differ slightly from the values obtained when interpolation isapplied directly to radiative stopping powers, but the differences aregenerally smaller than 1%.
The contribution to the radiative stopping power from bremsstrahlungin the field of the atomic electrons was calculated in [5] according to thetheory of Haug [80], combined with screening corrections derived fromHartree-Fock incoherent-scattering form factors.
In ICRU Report 37 [5] the uncertainties of the tabulated radiativestopping powers are estimated to be 2% above 50 MeV, 2-5% between 50 MeVand 2 MeV, and 5% below 2 MeV. These estimates are based on comparisonsbetween measured and calculated bremsstrahlung cross sections in [78], andon the inherent uncertainties arising in the combination of variousbremsstrahlung theories.
7.2.3. Computer Program.
A computer program, called ESTAR, has been developed [81] whichcalculates electron stopping powers, ranges and related quantities for anyelement, compound or mixture (see appendix).
ESTAR calculates collision stopping powers for electrons according toEqs.(7.1,7.2), and radiative stopping powers according to the procedureoutlined in Sec. 7.2.2. The output from ESTAR also includes electron rangescalculated in the continuous-slowing-down approximation (CSDA), i.e.,neglecting energy-loss straggling. The CSDA range is a close approximationto the average path length traveled by an electron in the course of slowingdown to rest, and is calculated by integrating the reciprocal of the totalstopping power (collision plus radiative) with respect to energy:
TR= f ———————————————— , (7.4)- I S (T) + S (T)0 col rad
where T is the initial electron energy.
The ESTAR program is accompanied by a database of composition data(J-values and fractions by weight of the atomic constituents) for 278materials. The default values of mean excitation energies are those used in
449

[5] . However, the user of ESTAR has the option of choosing differentJ-values.
7.2.4. Energy LOB« Straggling
The energy loss A which an electron suffers in traversing a given pathlength is the sum of the numerous energy losses in individual inelasticcollisions. For a short path length s such that the average energy loss isonly a small fraction of the initial electron energy, the distribution ofenergy losses, F(A,s), can be calculated according to the theory of Landau[82]:
F(A,s)dA = F (X) dX (7.5)
wherec+ico
F (X) = I exp (u log u + Xu) du (7.6)c-ioo
is a universal function of a scaled energy loss parameter X. The Landaufunction F (X) was accurately tabulated by Börsch-Supan [83]. The relationLibetween the scaled and actual energy loss is
F 2 Ç m c2 ß2 ,A = £ X + log ———————— - ß + 0.4228 - 0 (7.7)
L I2 (1 - ß2 ) J
where J is the mean excitation energy, S the density-effect correction, and
2 22n r m c 1 ZS,-^L---1S. ,7.8,
u ß A
2 2 2with 2irr m c lu - 0.153537 MeVcm /g, and s is expressed in terms of areale edensity. The quantity £ has the significance that in a path length s therewill occur - on the average - only a single collision which results in anenergy loss greater than Ç.
Landau's theory takes into account accurately only the mean value butnot the higher moments of the cross section for small energy losses. Blunckand Leisegang [84] introduced a correction which treats the second momentmore carefully. It involves the convolution of the Landau distribution with
450

a Gaussian distribution. Various prescriptions for the standard deviationof this Gaussian can be found in the literature. Blunck and Westphal [85]recommended the approximation
» - fBW L
•jl/2(10 eV) Z*/3 <A> , (7.9)
where <A> = s — S is the average energy loss in path length s. Seltzerp co 1[86] analyzed many experimental energy-loss distributions in terms of themost probable energy loss and the full width at half maximum. He found thatuse of Eq.(7.9) leads to predictions in fairly good agreement withexperiment.
Due to approximations in its derivation, the Landau distribution (evenwith the Blunck-Leisegang correction) is accurate only if Ç » I, where Iis the mean excitation energy [82,87]. Fair accuracy is obtained whenÇ > 10 J, and very good accuracy when Ç > 100 J. Under these conditions theLandau theory with the Blunck-Leisegang correction has the great advantagethat it requires knowledge only about the mean and mean-squared energyloss, but not about the energy-loss cross section itself, which is oftenhard to obtain.
Landau's theory is approximate in that it admits arbitrarily largeenergy losses in individual inelastic collisions. This has the consequencethat the function F (A) extends to arbitrarily large values of A, and does
Li
not have a finite mean value. When the Landau distribution is used intransport calculations, it must be truncated at a suitable value A , so
Cthat the mean value of the truncated distribution, via eq.(7.7),corresponds to the correct mean energy loss —S . The appropriate cut-offp co 1valuer as functions of energy were determined by Seltzer [86].
Finally we note that Landau's theory takes into account only energylosses due to collisions resulting in the ionization of atoms. Blunck andWestphal [85] developed an approximate theory to include energy-losses dueto the emission of bremsstrahlung. In a more detailed treatment by theMonte Carlo method [86,88], the use of Landau's theory was combined withrandom sampling of all individual bremsstrahlung emission events.
When the Landau theory is not applicable, it is necessary to fall backon more laborious methods involving (a) the evaluation of the energy-loss
451

o>
0.04 -
0.02 -
I I
( b )Water1 MeV74.4 /xm
0.3
Fig.7.8. Energy-loss Distributions for 1-MeV electrons in water (from[90]). The histograms are Monte Carlo results calculated by simulating allindividual excitations and ionizations, using cross sections for watervapor. The smooth curves are from the Landau theory with theBlunck-Leisegang binding correction.
(a)
Path length, Jim 372Avg.number of inelastic collisions 1230
Average energy loss, keV 71. 6
50
(b)
74.4
246
14.3
10
(c)
7.44
24.6
1.43
1
(d)
1.0
3.3
0.19
0.134
cross section, and (b) the development of a suitable mathematical methodfor calculating multiple inelastic scattering. The preparation of thenecessary database of inelastic scattering cross sections has been carriedout only for a small number of materials. Especially thorough evaluationswere done by Bichsel and Saxon [89] for aluminum, and by Bichsel [4] forsilicon. These authors used an efficient numerical convolution methoddevised by Kellerer to calculate the energy-loss distribution from theinelastic cross sections.
452

Energy-loss cross sections for water vapor have been compiled andapplied to the calculation of energy-loss distributions by the Monte Carlomethod [90]. These results, for 1-MeV electrons, are illustrated in Fig. 7. 8for four path lengths, and are compared with the predictions of the Landautheory (with the Blunck-Leisegang correction) . The agreement is excellentfor a path length such that Ç = 50 I, still rather good when £ = 10 I, andpoor when Ç = I. For a path length of 1 fjm (of interest in microdos imetry) ,
is 0.134, and the Landau distribution is inapplicable and is not shown.
7.2.5. Limitations of th« usefulness of Stopping Powers.
Stopping powers are essential ingredients for calculating penetration,diffusion and slowing down of electrons in extended media, but bythemselves they are sufficient only for rough estimates. Transport ofelectrons and energy deposition are strongly influenced by angulardeflections due to multiple elastic scattering, by energy-loss straggling,and by the transport of energy by secondary electrons and photons.Scattering effects are much larger for electrons than for protons, becausethe elastic-scattering cross section depends inversely on the square of theprojectile mass. Energy-loss straggling is more important for electronsthan for protons, because in a single inelastic collision an electron canlose up to half its energy, whereas the energy loss of a proton is limited
22 2 2to the much smaller value 2m c ß /(I - ß ), where me is the electron reste emass and ß the proton velocity divided by the speed of light.
The limited utility of stopping powers for calculations of electrontransport is illustrated in Fig. 7.9, which pertains to the energy-loss perunit depth, dT/dx, in a water medium irradiated by a monoenergetic electronbeam incident along the x-direction. dT/dx is plotted as function of thedepth in units of the CSDA range. Results are given for beam energies of 1MeV (Fig.a) and 20 MeV (Fig.b). The short-dashed curves represent the rateof energy loss per unit depth, calculated with stopping powers only, on theassumption that the electrons travel in a straight line (no multiplescattering) and lose energy at a rate equal to the stopping power (nostraggling). The other curves were obtained with the Monte Carlo transportprogram ETRAN [86,88]. The long-dashed curves take into account the effectsof multiple scattering angular deflections. The solid curves include inaddition the effect of energy loss straggling, and the transport of energyby secondary electrons and bremsstrahlung photons. The solid curves thus
453

4. 0
1-MeV E L E C T R O N SN W A T E R
0 0 .1 0 .2 0 .3 0 .4 0 .5 0 .6 0 .7 0 .8 0 .9 1 . 0
§
3.02.82.62.4
2.22.0
1 .61 .4
1 .21 .0
0.80.60.4
0.20.00.0
20-MeV ELECTRONSIN WATER
0.1 0.2 0.3 0.4 0.5 0.6 0.7 0.8 0.9 1.0X/R
Fig.7.9. Energy loss per unit depth, dT/dx, as function of the depth in awater medium. Depths are expressed in units of the CSDA range, R. Theshort-dashed curves are calculated with neglect of multiple-scatteringdeflections and energy-loss straggling. The long-dashed curves include theeffects of multiple scattering. The solid curves represent the energyimparted to the medium, and take into account energy-loss straggling andthe transport of secondary electrons and photons.
2a. 1 MeV electrons, CSDA range 0.4378 g/cm2
b. 20 MeV electrons, CSDA range 9.295 g/cm
454

actually represent the energy imparted to the medium (depth-dosedistribution) rather than the loss of energy by the primary electron beam.
At 1 MeV, the influence of multiple scattering is large, but that ofenergy-loss straggling is small. The converse is the case at 20 MeV. Atthis energy the depth dose is modified at shallow depths by the transportof energetic secondary electrons. Moreover, at 20 MeV the combined effectof energy-loss straggling and the transport of energy by secondary photonsextends the depth dose curves beyond the CSDA range.
At energies below 10 keV the utility of stopping powers is decreasedbecause the continuous-slowing-down-approximation becomes increasinglyinaccurate. In each inelastic collision, the primary electron must loseenough energy to supply at least the energy needed for the ejection of abound electron from the target atom, or for raising the atom to an excited
70
65>v 60
w 55co°, 50
L.
C
45
40
35
& 30oL- 2 5 f<D
< 20
15
10H20/
10 10' 10' 10'E l e c t r o n Energy, eV
Fig.7.10. Average energy loss per inelastic collision, obtained as theproduct of tabulated mean free path and stopping power. Obtained fromKhlupin and Akkerman [69] for C and Al, and from Ashley [66] for water.
455

Wco00
oüo
o0)c
IQ-
10
><
10
10
-1
-2
L i q u i d w a t e r , CSDAWater V a p o r , CSDAWater V a p o r , Monte C a r l o
10' 1 0'n i t i a l E l e c t r o n E n e r g y , T0, e V
Fig.7.11. Average number of inelastic collisions made by an electron with
initial energy T as it slows down to an energy of 12.6 eV. Results were
obtained either in the CSDA, or by the Monte Carlo method taking into
account fluctuations. The results for liquid water were obtained with the
stopping powers and mean free paths given by Ashley [66] .
state. The average energy loss per collision can be calculated as theproduct p(T)S(T), where p(T) is the mean free path for inelastic collisionsand S(T) the stopping power at energy T. These quantities can be obtainedfrom the various tabulations described in Sec. 7.2.1.7. The resultingaverage energy loss per inelastic collision in water, carbon and aluminumis shown in Fig. 7.10. At 1000 eV, the average fractional energy loss percollision is 4 to 5 percent of the primary electron energy, but at 100 eVit is as large as 20 percent, so that the assumption of a smooth gradualdecrease of the electron energy is no longer realistic.
456

The average number of inelastic collisions, <n>, made by an electronin the course of slowing down from an initial energy T to a final energyT can be calculated, in the continuous-slowing-down approximation, as
•j; dTP(T)S(T) (7.10)
Plots of <n> vs. T from Eq.(7.10) are shown in Fig. 7.11 for electronsslowing down in water vapor or in liquid water to an energy T = 12.6 eV.
1.05
1.0
GC
V)°-95
0.9
0.8510 10' 10"
TO (eV)Fig.7.12. Ratio s /R of the average path length to the CSDA range, for
aV
electrons of initial energy T slowing down in water vapor to an energy of'012.6 eV. From Berger [75].
457

ceLLU
2.0 2.4
Fig.7.13. Distribution of the path lengths traveled in water vapor byelectrons of various initial energies, when they have slowed down to anenergy of 12.6 eV, normalized to unity. Path lengths are expressed in unitsof the CSDA range R.
The values of <n> are « 30 at 1000 eV and « 5 at 100 eV. Also shown in Fig.7.11 are values of <n> from a Monte Carlo calculation (taking into accountstraggling) which - below 100 eV - become significantly smaller than thevalues from Eq.(7.10).
The deterioration of the continuous-slowing-down-approximation withdecreasing energy can be illustrated by the relation between the averagepath length s and the CSDA range R. Fig.7.12 shows the ratio s /R, fromav ava Monte Carlo calculation, for electrons that have slowed down in watervapor to an energy of 12.6 eV. For initial electron energies T above 1keV, s /R is only slightly larger than unity, so that R is a good estimateof the rectified path length (as is usually assumed). Below 1 keV, however,s /R becomes smaller than unity, reaching the value 0.87 at 100 eV.avFurthermore, as shown in Fig.7.13, the shape of the distribution of thepath-length/range ratio s/R changes significantly below 1 keV. For T = 10
458

keV and 1 keV, the distribution is approximately Gaussian. At 100 eV itbecomes much broader and highly skewed, and the most probable value of s/Ris 0.5.
7.3. HYDROGEN IONS
7.3.1. Electronic Stopplag Power
7.3.1.1. .Introduction.
The mean electronic energy loss of protons in elementary substances atenergies >1 MeV is well described by the Bethe-Bloch theory (see, e.g.,[5]) with subsequent improvements:
2 2S 4itr m c l Z_2£i = ——U_ _ J: z2 (L + Z L + Z2L ) . (7.11)
_2 , l 0 11 12P u ß A2
Hère, S /p is the mass electronic (or collision) stopping power (incol-2 2MeV/(gem ), e.g.), r the classical electron radius, m c the rest energye eof the electron, u the atomic mass unit, ß the projectile speed divided bythe speed of light, Z and A are the atomic number and the relative atomicmass of the target element, and Z (=1) is the atomic number of theprojectile. The numerical constant is given in 7.2.1.1, and L is given by
f2m c2ß2\L (ß) = in e - ß2 - In I - — - - (7.12)
1-ß2 Z2 2
where I is the mean excitation energy of the target medium, C/Z is theshell correction of the first order term, and 5/2 the density effectcorrection. The terms L and L in eq.(7.11) extend the treatment beyondthe first Born approximation (see, e.g., P.Bauer's recent review [91]). Fora discussion of I-values, see Sec. 7.2.1.4 and 7.2.1.5.
Evidently, the stopping power depends on the projectile speed but noton the projectile mass, M . Eq.(7.11) therefore applies equally well todeuterons and to tritons. Instead of describing the stopping power as afunction of speed, one conveniently uses T = T/M , the energy per mass
2unit, as an independent variable (which is proportional to ß , for anon-relativistic projectile) . If T is in MeV and if M is the relative
459

atomic mass of the projectile, then T is in units of MeV u . Another,slightly different, choice [92] is the equivalent proton energy, i.e., theenergy of a proton of equal speed,
MT = -£ T (7.13)eq MI
where M is the proton mass, and M may refer to p, d or t.p l
If differences of 1% or so do not matter, one can also use thespecific energy instead, i.e., the energy per nucléon, T/A (in MeV), whereA is the atomic mass number of the projectile. This is common for heavyprojectiles (see Sec.7.5).
Table 7.10 contains a short resume of the various stopping powertables and computer programs presently available. Janni (J82) gives a listof some additional tables. Conversion factors for converting S to S/p or toS/n or vice versa are given, e.g., by AZ77. For a list of reference codeslike AZ77, see table 7.11.
The stopping power according to eq. (7.11) can be convenientlycalculated using program BEST (see Table 7.11). This program is valid aboveabout T = 1 MeV (see ICRU49); it contains the necessary data for allelements and for many additional substances of interest to radiology. Onecan also calculate additional substances it one enters the mean excitationenergy (using, e.g., ICRU37). For a comparison of these I-values withrecent experimental results, see Tables 7.2 and 7.4.
In the region of the maximum (near T = 100 keV) , no reliable theoryhas existed until recently [93,91], but now one may hope that the chargestate approach [94,95] will provide one. Indeed, Penalba et al [95] wereable to reproduce the experimental stopping power of Al for protons (below100 keV) within about 20%, taking the contributions due to H , H , and Hseparately into account. For special cases (light targets), coupled-channelcalculations [96,97] are very promising: see the recent result by Schiwietzand Grande in Fig. 7.17 below. Recently, Kaneko (K93) has produced a tableof theoretical stopping powers for protons from 1 to 10000 keV, for allatomic targets (2SZ S92) , and for many elements also in the solid state.
£i
Examples of his results are shown in Figs. 7.15 and 7.16 below; theyindicate agreement with experiment within 20 to 30%. It is surprising that
460

TABLE 7.10. FITTED CURVES AND TABLES OF ELECTRONIC STOPPING POWER FOR HYDROGEN IONS.
C ... C o e f f i c i e n t s of f i t t e d curve g iven , Tb , . . T a b l eP ... Program, T ... K i n e t i c energy in k e V , T = T/M ,
Andersen- C 92 e l e m e n t sZ i e g l e r Tb( A Z 7 7 )
Janni Tb 92 e l e m e n t s ,(J82) 63 compounds
or m i x t u r e s
B i c h s e l - T b H 2 , H e , N 2 ,Porter _ „„ ,,(BP82) 0 2 , C H 4 , A i r
Z i e g l e r - C 92 e l e m e n t sBier sackL i t t m a r k ( f o r a l l ions)( Z B L 8 5 )
Z89 P 92 e l e m e n t s ,Z90 many m i x -
t u r e s andcompounds
Berger Tb 25 e l e m e n t s ,( I C R U 4 9 ) 48 compounds
or mi x tures
Berger- P 92 e l e m e n t s ,B i c h s e l any compound(BEST) or m i x t u r e s
B i c h s e l Tb 7 e l e m e n t s( B I 9 1 ) (La - U)
o f f i t t e d s topp ing power d a t a ,e * S/n . . . S t o p p i n g c ross s ec t i on
1 - 1 0 keV 10 - 999 keV
wher e
CH . li in [l + £i + A 5 T r ]r L r J
1 - 5 k e V 5 - 2 0 k e V
e a T 0 ' 5 e a: T S
( s var i ab 1 e )
0.4 - 20 MeV
Bethe e q u a t i o n w i t h one
0 - 2 5 k e Ve <* T ° - " 5
r
[but e oc T / ' 2 5
for Z2 < 7]
20 - 1000 keV
F i f t h o r d e r p o l y n o m i a lf i t t o e x p e r i m e n t a l d a
0.6 - 100 MeVAS r K*2] ß? j A
wh e re ß ~ —C
( I n T ^ ' J
1 - 1000 Mev
Bethe e q u a t i o n w i t h a l l necessaryta correct i on s
f r e e p a r a m e t e r ( i n Barkas c o r r e c t i o n t e r m )
0 . 0 2 5 - 100 MeV ( b u t s h o u l d not be used above 10 MeE - 1 _ £ - i + e - i [ C o e f f i c i e n t s A . i n f i l e
H A2 A - As Kw h e r e E L = A 1 T p + A
3T
r ' eH
= ~£7 ln T~ + A8Tr
oSCOEF.DATA]
Program c o n t a i n e d in TRIM89 , T R I M 9 0 . Uses the same f u n c t i o n s as ZBL85 , and an upda tedf i l e , SCOEF.88, o f c o e f f i c i e n t s A ( . Above T f = 1 0 M e V , i tuses e = H + H2x + H x + H 4 / x ( w h e r e x = In T , and the c o e f f i c i e n t s H t are c o n t a i n e di n f i l e H I C O E F . D A T )
T = 1 keV - 10000 MeVBethe e q u a t i o n , w i t h c o r r e c t i o n s , at h i g h energy ( 2: 1 M e V ) , merged to e x p e r i m e n t a lva lues a t low e n e r g i e s . I - v a l u e s f r o m I C R U 3 7 . See a p p e n d i x for p r o g r a m PSTAR .
Program BEST, a v a i l a b l ef r o m about T = 1 to T =
f r o m t h e au thor s , c a l c u l a t e s Be the e q u a t i o n , w i t h co r r ec t i ons ,1000 M e V .
Bethe e q u a t i o n , w i t h c o r r e c t i o n s , f i t t e d t o e x p e r i m e n t a l v a l u e s f r o m 0 . 3 t o 1 0 0 MeV,

TABLE 7.11. DATA REFERENCE CODES
Ab91 ABDESSELAM, M., STOQUERT, J.P., GUILLAUME, G., HAGE-ALI, M., GROB,J.J., SIFFERT, P., Nucl. Instrum. Methods B61,385, and personalcommunication to H. Paul
Ab92a ABDESSELAM, M., STOQUERT, J.P., GUILLAUME, G., HAGE-ALI, M., GROB,J.J., SIFFERT, P., Nucl. Instrum. Methods B72,293.
Ab93 ABDESSELAM, M., STOQUERT, J.P., HAGE-ALI, M., GROB, J.J., SIFFERT,P., Nucl. Instr. Methods B73, 115.
An68 ANDERSEN, H.H., HANKE, C.C., SIMONSEN, H., SÖRENSEN, H., VAJDA, P.,Phys.Rev. 175, 389
And69 ANDREEV, V.N., NEDOPEKIN, V.G., ROGOV, V.l., Soviet Phys. JETP 29,No. 5, 807.
Ar69 ARKHIPOV, E.P.,GOTT, Yu.V., Sov. Phys. JETP 29, 615.Ay82 ANTHONY, J.M., LANFORD, W.A., Phys. Rev. A25, 1868.AZ77 ANDERSEN, H.H., ZIEGLER, J.F., Hydrogen Stopping Powers and Ranges in
all Elements, Pergamon Press, Elmsford, New York.Ba83a BAUMGART, H., ARNOLD, W., BERG, H., HUTTEL, E., CLAUSNITZER, G-,
Nucl. Instr. Meth. 204, 597.Bd56 BADER, M., PIXLEY, R.E., MOZER, F.S., WHALING, W.,
Phys.Rev. 103, 32Be81 BEDNYAKOV, A.A., BULGAKOV, Yu.V., NIKOLAEV, V.S., CHERNOV, V.L.,
Phys. Status Solidi A68, 187.BEST Computer program by BERGER, M.J., BICHSEL, H., available from the
authors for use on personal computer (1990).BG65 BOOTH, W., GRANT, I.S., Nucl.Phys. 63, 481.Bi78 BIMBOT, R., DELLA NEGRA, S., GARDES, D., GAUVIN, H., Nucl. Instr.
Methods 153, 161.Bi89 BIMBOT, R., CABOT, C., GARDES, D., GAUVIN, H-, HINGMANN, R.,
ORLIANGE, I., DE REILHAC, L., HUBERT, F., Nucl. Instr. Methods B44, 1BI91 BICHSEL, H., Nat. Inst. of Standards and Technology, report NIST
IR-4550, and Phys. Rev. A46 (1992) 5761.Bp71 BONDERUP, E., HVELPLUND, P., Phys. Rev. A4, 562.BP82 BICHSEL, H., PORTER, L.E., Phys. Rev. A25, 2499.Br90 BAUER, P., Nucl. Instr. Methods B45, 673.Bs79 BESENBACHER, F., ANDERSEN, H.H., HVELPLUND, P., KNUDSEN, H.,
Kgl. Danske Vid. Selskab Mat.-fys. Medd. 40, No.3.
462

By55 BROLLEY, J.E., RIBE, F.L., Phys. Rev. 98, 1112.Cr42 CRENSHAW, C.M., Phys. Rev. 62, 54.Ct54 CHILTON, A.B., COOPER, J.N., HARRIS, J.C., Phys. Rev. 93, 413.Do75 DOSE, V., SELB, G., Z. Phys. A272, 237.Ef75 EFKEN, B., HAHN, D., HILSCHER, D., WUSTEFELD, G.,
Nucl. Instr. Methods 129, 219.Ep93 EPPACHER, Ch., SEMRAD, D., unpublished dataFu80 FUKUDA, A., Phys. Med. Biol. 25, 877.Ga87 GAUVIN, H., BIMBOT, R., HERAULT, J., Nucl. Instrum. Methods B28, 191.G192a GOLSER, R., EPPACHER, Ch., SEMRAD, D., Nucl. Instrum. Methods B67,
69.Gl92b GOLSER, R., SEMRAD, D., Nucl. Instrum. Methods B69, 18.Go67 GORODETZKY, S., CHEVALIER, A., PAPE, A., SENS, J.Cl., BERGDOLT, A.M.,
BRES, M., ARMBRUSTER, R., Nucl. Phys. A91, 133.He91 HERAULT, J., BIMBOT, R., GAUVIN, H., KUBICA, B., ANNE, R., BASTIN,
G., HUBERT, F., Nucl. Instrum. Methods B61, 156.Hm62 HUBERMAN, M.N., Phys. Rev. 127, 799.Hof76 HOFFMANN, !.. JÄGER, E., MÜLLER-JAHREIS, U., Rad. Effects 31, 57.HU90 HUBERT, F., BIMBOT, R., GAUVIN, H., At. Data Nucl. Data Tables 46, 1.Hv71 HVELPLUND, P., Kgl. Danske Videnskab. Selskab Mat.-fys. Medd. 38, 4.ICRU37 ICRU Report 37: Stopping Power for Electrons and Positrons, Intern.
Commission on Radiation Units and Measurements, Bethesda, MD 20814,USA (1984).
ICRU49 ICRU Report 49 : Stopping Powers and Ranges for Protons and AlphaParticles, Intern. Commission on Radiation Units and Measurements,Bethesda, MD 20814, USA (1993); the tables can also be produced usingthe programs described in the appendix
J82 JANNI, J.F., At. Data Nucl. Data Tabl. 27, 150, 341.Jo71 JOHANSEN, A., STEENSTRUP, S., WOHLENBERG, T., Radiât. Eff. 8, 31.K93 KANEKO, T., Atomic Data Nucl. Data Tabl. 53, 271.Kr82 KREUSSLER, S., VARELAS, C., SIZMANN, R., Phys. Rev. B26, 6099.La75 LANGLEY, R., Phys. Rev. B12, 3575.Ld85 LAND, D.J., SIMONS, D.G., BRENNAN, J.G., GLASS, G.A., Nucl. Instrum.
Methods BIO/11, 234, and pers. communication to H. Paul (1992).Ld92 LAND, D.J., pers. communication to H. Paul, see also:
PRICE, J.L., STERN, S.H., SIMONS, D.G., LAND, D.J., BRENNAN, J.G.,Nucl. Instr. Methods B56/57 (1991) 348.
463

LenSSa LENNARD, W., GEISSEL, H-, JACKSON, D., PHILLIPS, D., Nucl. Instrum.Methods B13, 127.
Len86b LENNARD, W.N., GEISSEL, H., Nucl. Instrujn. Methods B27, 338.Mar62 MARTIN, E.W., NORTHCLIFFE, L.C., Phys. Rev. 128, 1166.Me78 MERTENS, P., Nucl. Instrum. Methods 149, 149.Me80 MERTENS, P., KRIST, Th., Nucl. Instrum. Methods 168, 33.Me82a MERTENS, P., KRIST, Th., Nucl. Instrum. Methods 194, 57.Me82b MERTENS, P., KRIST, Th., J. Appl. Phys. 53, 7343.Mh.65 MOORHEAD, R.D., J. Appl. Phys. 36, 391.Mi90 MITTERSCHIFFTHALER, C., BAUER, P., Nucl. Instrum. Methods B48, 58.Ms66 MASON, D.L., PRIOR, R.M., QUINTON, A.R., Nucl. Instrum. Methods 45,
41.Na68 NAKATA, H., Can. J. Phys. 46, 2765, and Erratum: Can. J. Phys.48
(1970) 1744.Ny78 NYAIESH, A.R., STECKELMACHER, W., LUCAS, M.W., J. Phys.C ,Solid State
Phys. 11, 2917.Op75 OPHEL, T.R., KERR, G.W., Nucl. Instrum. Methods 128, 149.Or63 ORMROD, J.H., DUCKWORTH, H.E., Can. J. Phys. 41, 1424.Or65 ORMROD, J.H., MAC DONALD, J.R., DUCKWORTH, H.E., Can. J. Phys. 43,
275.Or68 ORMROD, J.H., Can. J. Phys. 46, 497.Ov79 OVERBURY, S.H., DITTNER, P.F., DATZ, S., Rad. Eff. 41, 219.Ph53 PHILLIPS, J.A., Phys. Rev. 90, 532.Pi68 PIERCE, T.E., BLANN, M., Phys. Rev. 173, 390.Po59 PORAT, D.I., RAMAVATARAM, K., Proc. R. Soc. Lond. A252, 394.Po60 PORAT, D.I., RAMAVATARAM, K., Proc. Phys. Soc. 77, 97.Po61 PORAT, D.I., RAMAVATARAM, K., Proc. Phys. Soc. 78, 1135.Pr91 PRICE, J.L., STERN, S.H., SIMONS, D.G., LAND, D.J., BRENNAN, J.G.,
Nucl. Instrum. Methods B56/57, 348.PSS PAUL, H., SEMRAD, D., SEILINGER, A., Nucl. Instrum. Methods B61
(1991) 261Rä91 RÄISANEN, J., RAUHALA, E., BJÖRNBERG, M., KISS, A.Z., DOMINGUEZ, J.,
Rad. Eff. and Defects in Solids, 118, 2, 97.RBS Program due to STEINBAUER, E..Re87 REITER, G., BAUMGART, H., KNIEST, N., PFAFF, E., CLAUSNITZER, G.,
Nucl. Instrum. Methods B27, 287.Re90 REITER, G., KNIEST, N., PFAFF, E., CLAUSNITZER, G.,Nucl. Instrum.
Methods B44, 399.
464

R160 ROLL, P.G., STEIGERT, F.E., Nucl. Phys. 17, 54.Rn53 REYNOLDS, H.K., DUNBAR, D.M.F., WENZEL, W.A., WHALING, W., Phys. Rev.
92, 742SaSla SANTRY, D.C., WERNER, R.D., Nucl. Instrun». Methods 188, 211.Sa91 SANTRY, D.C., WERNER, R.D., Nucl. Instrum. Methods B53, 7.Sa92 SANTRY, B.C., WERNER, R.D., Nucl. Instrum. Methods B69, 167.Sc82 SCHULZ, F., BRANDT, W., Phys. Rev. B26, 4864.Sc85 SCHULZ, F., SHCHUCHINSKY, J., Nucl. Instrum. Methods B12, 90.Sf78 SOFIELD, C.J., COWERN, N.E.B., PETTY, R.J., FREEMAN, J.M.,
MASON, J.P., Phys. Rev. A17, 859.SG93 SCHIWIETZ, G., GRANDE, P.L., Radiation Eff. Def. in Solids 27 (1993)Sh84 SHCHUCHINSKY, J., PETERSON, C., Radiât. Eff. 81, 221-229.Sim75 SIMONS, D-, LAND, D., BRENNAN, J., BROWN, M., Phys. Rev. A12, 2383.Sr65 SAUTTER, C.A., ZIMMERMANN, E.J., Phys. Rev. 140, 490.SUG89 SUGIYAMA, H., ELT Technical Report TR-89-13, Electro-technical Lab.,
Ibaraki, JapanSw70 SWINT, J.B., PRIOR, R.M., RAMIREZ, J.J., Nucl. Instrum. Methods 80,
134.Tp62 TEPLOVA, Y.A., NIKOLAEV, V.S., DMITRIEV, I.S., FATEEVA, L.N., Sov.
Phys.-JETP 15, 31.TRIM89 Monte Carlo program describing TRansport of Ions through Matter by
BIERSACK, J.P., ZIEGLER, J.F., based on ZBL85available on diskette from ZIEGLER, J.F..
TRIM90 like TRIM89, but 3-dimensional, and with graphical output.TRIM91 like TRIM90, but with different definition of lateral straggling and
of skewness and kurtosis of range. Also, energy straggling islinearly reduced below the Bohr value for energies below thestopping power maximum. Energy straggling not calculated for Z > 3.
TRIM92 like TRIM91, but flight path within a layer now decreases towardlayer edge (see Sect. 7.3.3) and nuclear stopping for compounds nowcalculated using Bragg additivity.
T2D Two-dimensional TRIM program by BIERSACK, J.P.,can be purchased from the author.
We53 P.K., WEYL, Phys. Rev. 91, 289.Wi62 VAN WIJNGAARDEN, A., DUCKWORTH, H.E., Can. J. Phys. 40, 1749.Wo63 WOLKE, R.L., BISHOP, W.N., EICHLER, E., JOHNSON, N.R.,
O'KELLEY, G.D., Phys. Rev. 129, 2591.
465

Wr79 WARD, D., ANDREWS, H.R., MITCHELL, I.R., LENNARD, W.N., WALKER, R.B.,RUD, N., Can. J. Phys. 57, 645.
Ya83 YALYSHKO, S.V., WEDELL, R., Phys. stat. sol. B116, K47.YonSO KIM, Yong-Ki, CHENG, Kwok-tsang, Phys. Rev. A22, 61.Z77 ZIEGLER, J.F., Helium: Stopping Powers and Ranges in all elemental
Matter, Pergamon Press, Elmsford, New York.Z80 ZIEGLER, J.F., Handbook of Stopping Cross Sections for Energetic Ions
in all Elements, Pergamon Press, Elmsford, New York.(Vol.5 of: The Stopping and Ranges of Ions in Matter)
ZBL85 ZIEGLER, J.F., BIERSACK, J.P., LITTMARK, U.,The Stopping and Ranges of Ions in Matter, Vol. 1, Plenum, New York
Z89 Stopping power programs contained in TRIM89. The changes withrespect to ZBL85 are discussed in chapters 7.3.1.1 and 7.5.1.1
Z90 Stopping power programs contained in TRIM90 (identical to Z89)Z91 Stopping power programs contained in TRIM91 (identical to Z89)
Kaneko reaches this agreement assuming a point charge projectile at allvelocities, whereas Penalba et al [95] need contributions also from H and
For practical purposes, one uses empirical functions fitted to thedata (see table 7.10). To predict the stopping of substances where nomeasurements exist, one interpolates the fitting coefficients, taking intoaccount the empirical fact that *Z -oscillations" exist, i.e., that due toshell structure, S/p is not a smooth function of Z . AZ77 performed thisinterpolation guided by the Z -oscillations already known for He
£
projectiles. ZBL85 first used the dielectric response of an electron plasmain random phase approximation together with the local density approximation(for atoms whose electron distribution corresponds to the solid state) tocalculate the stopping power, and then interpolated the 10-20% differencebetween theory and experiments, both in velocity and in Z .
As an example. Fig. 7.14 shows S/n as a function of Z according toAZ77, J82, Z90 and to ICRU49. At 60 keV, Z -oscillations are quitenoticeable; in particular, the stopping cross section for the noble metalsCu, Ag, and Au is seen to be smaller than that for the neighbor elements.At higher energy, the oscillations are strongly reduced.
466

o0)
S oo
Z2 - Oscillations
„B-° < 1 i 1 i 1 i 1 i 1 1 i 1 i 1 i 1
10 20 30 40 50 60 70
Atomic Number of Target80
Fig.7.14. Electronic stopping cross section of all elemental targetsand 1000 keV protons, according to AZ77 (- — ), J82 (——), Z90 (---ICRU49 (B); (cf. table 7.11).
90
for 60), and
Below about 20 keV, the stopping power is generally assumed to beroughly proportional to velocity [98]. Echenique, Nieminen and Ritchie[99,100], e.g., have calculated velocity proportional stopping in thisenergy region using a non-linear density-functional approach and describingthe solid target by its one-electron radius [101] (see Fig. 7.15). Inaccordance with this assumption of velocity proportionality, the fittingfunctions (cf. table 7.10) usually assume S « T '5 or S « T°'45 at lowenergy. For light targets (Li, Be, C), ZBL85 claim that the stopping power
0 25should be proportional to T . Our Fig.7.15 for H on C shows that thisclaim is rather questionable (see also Sec. 7.3.5). On the other hand, in aspecial case like H on He the stopping cross section depends on a power ofT much higher than 0.5, as found recently by Golser and Semrad [102].
467

The book AZ77 contains the most comprehensive compilation ofexperimental data (S/n versus T/M^ , including graphs and tables, available
to date. This includes all the elements, also those that are normallygaseous (or liquid). The densities given on the graphs for N and Ne, e.g.,
2i
seem to imply the solid state, but the measurements (and hence, the fittedcurves) really refer to the gaseous state. It should be noted [103] thatmedium- and high-energy fits by AZ77 are not continuous at 1 MeV; there is,e.g., a jump by 3.6% for H =» Ag.
The same data (including some new ones, see Z80) were later refittedby Ziegler (ZBL85). This has been an improvement in some cases, e.g., for
H on amorphous Carbon
0.2 0.5 1. 2. 5. 10. 20. 50. 100. 200. 500. 1000.
Equivalent Proton Energy [keV]
Fig.7.15. Electronic stopping cross section of amorphous carbon forhydrogen ions. The curves correspond to the following references:—— AZ77; short dashed: ZBL85 and K93 (solid), as marked; long dashed: Z90(without bonding corr. ) ; •••-••-- J82; -••- ICRU49; -•- Echenique et al [100].The symbols indicate measured points from the following references (seetable 7.11):A Be81; B Kr82; C Me80; D Me82a; E Me82b; G SaSla; H Sc85; I Sh84;J,K,L Br90; M Ov79; N Rn53; 0 Ar69; P Or65; Q WÎ62; R Op75; T Mh65; U Go67;V Sr65; W Jo71; X Ny78; Z,3 G192a; 2 Or63.
468

H on Argon
Mf\ __________[______t 1 I j I J . | 1___________|______j I | ! | ) 1 ]___________\_____| .....J
5 10 20 50 100 200 500 1000 2000 5000Equivalent Proton Energy [keV]
Fig.7.16. Electronic stopping cross section of argon for hydrogen ions. Thecurves correspond to the following references:—— AZ77; short dashed: K93; long dashed: Z9C (identical to ZBL85);•-•--- J82. ICRU49 is identical to AZ77.The symbols indicate measured points from the following references:A Ba83a; B Bs79; C Ct54; D Rn53; E Or68; F Or68; G Wo63; H We53; I Ph53;J Bp71; K Sw70; L Ms66; M By55; N Re90
gold [103], but made agreement worse in others, e.g. for carbon (see Fig.7.15). ZBL85, according to the title of the book, is for solids only.Elements which normally occur as gases are assumed to be at the meltingpoint. For elements in the gaseous state one should therefore use AZ77 (orICRU49), not ZBL85 (see Fig. 7.16 for hydrogen on Ar).
More recent versions of Ziegler's stopping power programs (referred toas Z89, Z90, Z91 or Z92 in the following), written in Quickbasic to be usedon a personal computer, are contained in TRIM89, TRIM90, TRIM91 andTRIM92. Z89, Z90, Z91 and Z92 are identical. These programs contain acorrection for relativistic projectiles (in the ZBL85 version, the stoppingpower keeps decreasing toward high energy rather than going through a
469
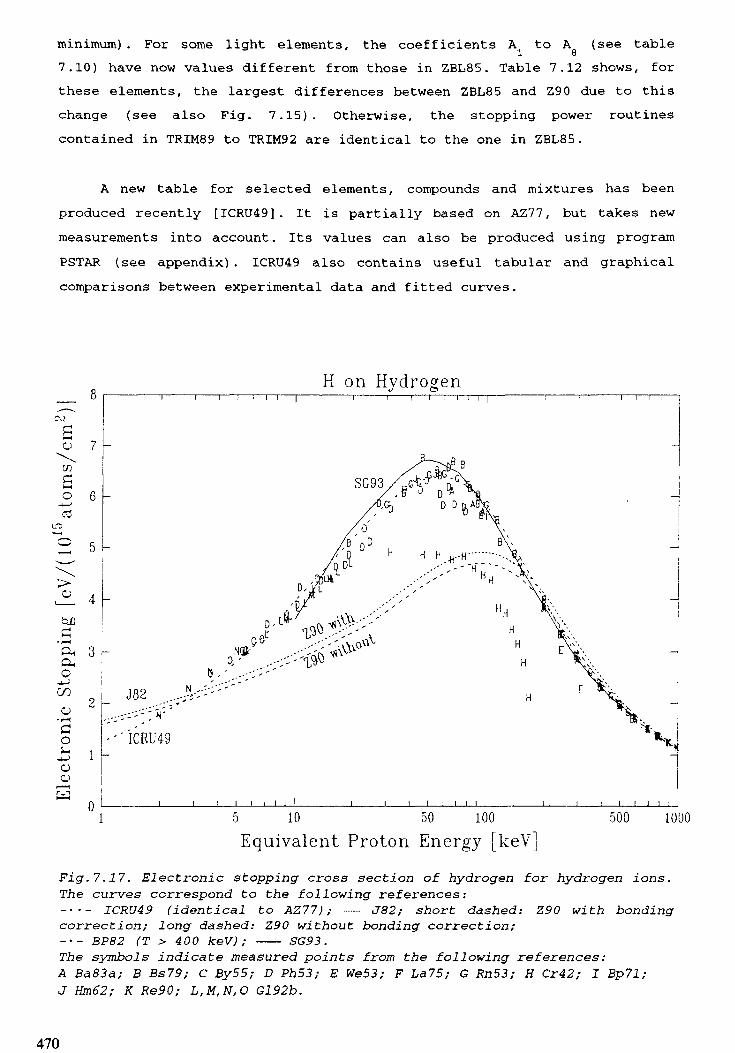
minimum) . For some light elements, the coefficients A to A (see table1 87.10) have now values different from those in ZBL85. Table 7.12 shows, forthese elements, the largest differences between ZBL85 and Z90 due to thischange (see also Fig. 7.15). Otherwise, the stopping power routinescontained in TRIM89 to TRIM92 are identical to the one in ZBL85.
A new table for selected elements, compounds and mixtures has beenproduced recently [ICRU49]. It is partially based on AZ77, but takes newmeasurements into account. Its values can also be produced using programPSTAR (see appendix). ICRU49 also contains useful tabular and graphicalcomparisons between experimental data and fitted curves.
H on Hydrogen
a 7
0 6 -
LTD
~o
SG93
5 I-
oeno
o-»->o
S
1 l-
J82 ...•:--''". H' '
' ICRU49
J______1 ! \ I i I I
5 10 50 100Equivalent Proton Energy [keV]
500 1000
Fig.7.17. Electronic stopping cross section of hydrogen for hydrogen ions.The curves correspond to the following references:-••- ICRU49 (identical to AZ77) ; ••••••- J82; short dashed: Z90 with bondingcorrection; long dashed: Z90 without bonding correction;-•- BP82 (T > 400 keV) ; —— SG93.The symbols indicate measured points from the following references:A Ba83a; B Bs79; C By55; D Ph53; E We53; F La75; G Rn53; H Cr42; I Bp71;J Hm62; K Re90; L,M,N,O Gl92b.
470

TABLE 7.12. STOPPING POWER ACCORDING TO Z89, DIVIDED BY THE VALUE FROMZBL85, AT THE ENERGY WHERE THE CHANGE IS LARGEST:A) below 10 MeV; b) between 10 and 100 MeV. The unusually low value for Sat 10 MeV is due to a discontinuity in the Z89 stopping for S at thisenergy.
TargetH2HeCNOFNeAlSiSKrXe
(aEnergy
£25 keV70
£25
7970
£25
£25
£25
5.6
40£25
£25
)
Ratio1.121.120.941.111.131.030.811.030.931.131.131.08
(b)Energy100 MeV1001001001001001001004410100100
Ratio1.111.211.151.141.131.131.121.100.980.931.051.03
The table by J82 is useful in that it also gives uncertainties for allstopping power values. These uncertainties, based on statistical methodsalone, may however be too small in some cases. In the region of thestopping power maximum for Ni, e.g., J82 gives ± 2.1%, but this fit appears[103] too high by 10%.
A recent reanalysis [103] of all the published data for Au, Ag, Cu, Niand Al targets for T between 10 and 2500 keV shows that the stoppingmaximum is lower than given by AZ77, and (for Cu and Ni) lower also thanZ90 and J82. Only for Al targets, all fits agree (J82 being slightly low).Uncertainties are also given in this paper, hopefully more realistic thanthose by J82.
7.3.1.2. Mixtures and Compounds.
To calculate the stopping power for mixtures, one uses Bragg'sadditivity rule [5]:
S/p = £ w. (S/p)., (7.14)
471

where w. is the fraction by weight and (S/p). is the mass stopping power of1- Vithe j atomic constituent. This is valid provided the condition discussed
by Golser and Semrad [8] does not occur (if some gases have very differentcharge-changing cross sections for a particular low-energy projectile, thenthe addition of only a small amount of one gas will have a large effect onthe population of different projectile charge states and hence on thestopping power).
Eq. (7.14) is approximately valid also for compounds above about 1MeV, but at lower energies and for light targets, where the valenceelectrons contribute significantly to stopping, it becomes more and moreinaccurate due to "chemical binding effects". In the extreme cases of SiOand AI O^, Bauer et al [104] have found the stopping in the compoundreduced by as much as 14 and 27 %, resp., at about 20 keV, with respect tothe Bragg value (eq. 7.14). But it is well known from the high energymeasurements of Tschalär et al [105] that this reduction extends far intothe Bethe region: it amounts to 4% at 1 MeV and to 2% at 10 MeV for AI O ,a 23and it corresponds to an increased I-value for the compound (see also table7.3) .
Z90 offers the possibility to calculate the stopping power of manycompounds using eq. (7.14) and a bonding correction according to Zieglerand Manoyan [106], based on a joint analysis of the large amount ofstopping data measured at Baylor University [107] and at Köln University[108] . Here, the molecule is not decomposed into single atoms as in eq.(7.14) but into atomic cores and different bonds (essentially between lighttarget atoms from H to F) ; phase effects are assumed to be negligible. Thecorrection is a constant factor at low energy, and it converges to unity atabout 1 MeV. (Actually, the correction should differ slightly from unityeven abo'.e that energy, as one can see from the results on AI O justmentioned, and also from fig. 7.19 below). The core-and-bond approach usedby Ziegler and Manoyan describes the input data well, but becomes lessaccurate [109] if used to describe data outside the original input set.
For heavier atoms, no bond corrections are supplied even though theseare necessary at least [104,91] in the case of AI O . The constants
/i J
describing the various mixtures and compounds (including bond structure!)are contained in a file COMPOUND.DAT. The file also contains informationfor many (especially organic) liquids and gases, but this should be used
472

with caution: Big. 7.17 for H on H shows that the stopping power from Z90(with or without bonding correction) is about 30% low at the maximum. It isremarkable that the Z9Q stopping power for He on H seems to agree muchbetter with the data. This may indicate that in Z90, a (bad) H stoppingpower has been combined with a (bad) effective charge for He to give a. goodHe stopping power.
The bond correction contained in Z90 assumes a constant relativedifference at low energy (see, e.g., fig.7.19 below). The results by Baueret al [104] for Al O and SiO , however, indicate that a constant absolute
£• J À
difference at low energy describes the data better.
Thwaites [109] has recently proposed an empirical scheme to calculatecorrections to Bragg additivity for dosimetric materials. This schemerequires knowledge of stopping powers and I values of the constituents, andof a realistic value for the mean excitation energy I of the compound(which can be estimated using eq. 7.3 and Table 7.3); the scheme is said toprovide values accurate to 5% at 100 keV and to 10% at 1 keV.
In Sec. 7.2.1.5, the small changes in electron stopping power ofliquid water and various solids were discussed that result when theI-values from ICRU37 are replaced by recently measured I-values (Table7.5). Similar changes occur of course in the proton stopping power at asimilar projectile velocity. For example, for protons in liquid water,changes of -2.4%, -1.9% or -1.1% could be expected at 0.5, 1 or 10 MeV,respectively, provided the Barkas and shell corrections are left unaltered.
7.3.1.3. Difference between condensed phase and gas.
The interaction of a proton with an electron gas is weaker than thatwith an isolated atom, due to the dynamic screening by the electron gas[100,110]; therefore the stopping cross section for protons in thecondensed phase is generally smaller than in the gas ("phase effect" or"physical state effect"). Indeed, one finds differences up to 10% at thestopping power peak [109]. Recently, P. Bauer et al Till] have found aphase difference for Zn which becomes as large as 60% at 20 keV. Calculatedphase differences can be found in Kaneko's new table (K93) for manyelements. For water, see the discussion in the following section, and alsoCh. 9.

H on Nitrogen
0.001 0.01 0.1 1. 10. 100.
Equivalent Proton Energy [MeV]1000.
Fig.7.18. Electronic stopping cross section of nitrogen for hydrogen ionsfrom various publications, divided by values from Z90 (without bondingcorrection). The curves correspond to the following references:—— AZ77; - J82; -• •- ICRU49; -•- SUG89. ICRU49 is identical to AZ77below 0.3 MeV and identical to BP82 ( —— ) from 0.4 to 20 MeV.The symbols indicate measured points from the following references:A Ba83a; B Bs79; C Fu80; D Re87; E Ph53; F Do75; G Do75; H La75; I Rn53;J 3w70; K Or68; L By55; M Ct54; N Wo63; O Re90.
7.3.1.4. Comparison of stopping power compilations.
We have compared all the recent stopping power fits for key substanceswith each other, from 0.001 to 1000 MeV. For convenience, we normalize allthe curves (where possible) by the Z90 function, since this is easilycalculable. If this is not possible, we use a different normalization.Fig. 7.18 shows an example, for H on nitrogen. Like in the case of H on H ,
£n
Z90 is low with respect to the measurements, below 0.1 MeV (with or withoutbonding correction, which is negligible here). Since AZ77, ICRU49 and J82follow the data better, they appear high in this plot around 40 keV. TheICRU49 curve follows AZ77 at low energy but merges into BP82 above 0.3 MeV.
474

TABLE 7.13. RATIOS OF FITTED CURVESSUBSTANCES, NEAR THE MAXIMUM.NB . .. no bonding correction used; E .
Z90
FOR THE STOPPING OF PROTONS IN KEY
.. bonding correction used.
AZ77 J82 ICRU49 PSSNB B
Gases :H2N202ArH 02CO2AirCH4C H3 8
Solids:
C (am. )C (graph.)MgAISiPCaFeLiFCaF2AI 02 3 *)LucitePolyethyleneNylon
Liquids:
H 02Toluene
404040404040404040
40401006020306060606030404040
4040
keVkeVkeVkeVkeVkeVkeVkeVkeV
keVkeVkeVkeVkeVkeVkeVkeVkeVkeVkeVkeVkeVkeV
keVkeV
0.956 1 1.4521.001 1 1.1240.997 1 1.031
11
10.923 10.937 1
1 1.0980.941 1 1.0331 1.1201 0.9971 0.9961 0.7471 1.2231 0.8391
10.983 10.947 10.968 1
1.098 10.926 1
1111
1111
11001110110111
1
.471
.171
.070
.020
.160
.236
.211
.080
.017
.84
.948
.097
.149
.391
.811
.357
.987
.180
.193
.179
.367
111110111
01
01
0100111
11
.452
.124
.031
.000
.110
.983
.115
.219
.121
.994
.012
.997
.156
.836
.063
.791
.785
.123
.051
.131
.077
.052
1.023
Lucite = Plexiglas = Perspex = Polymethyl methacrylate (see ICRU37)
475

Table 7.13 summarizes the differences between the various fits in thelow energy region. The curves are compared at a single energy value (nearthe maximum) where the discrepancies are fairly big. This table may be usedto estimate the accuracy of the fits (see also Sect. 7.3.1.5); it alsoshows which fits are available for the key substances.
Concerning gases, one can see that the various fits agree within a fewpercent {except for Z90) . Evidently, measurements on gases using protonsare less prone to erroneous results than measurements on solids (compare,e.g.. Figs. 7.15 and 7.16). Clearly, the low Z90 values for H and N carry
£t £•
over into low values for air, water and organic gases; the bondingcorrection is too small to compensate for this effect. For methane, e.g.,ICRU49 shows that its curve agrees with experimental data down to T =20rkeV within 5%; this is in contrast to the 20% deviation of Z90 (table7.13).
1.3Protons on Water
oo
5
O i.l
£o 1.0
0.9
a«3 0.8
o3 0.6
l iquid
Z90 vapor
Z90 liquid
ICRU49 l iquid
10 -3 10 -2 10~' 10° 101
Proton Energy [MeV]102
Fig.7.19. Electronic stopping power of water (liquid or vapor) for protonsfrom various publications, divided by values from Z90 (without bondingcorrection). The -•- curve is from SUG89 (for liquid).
476

H on Calcium~i——i—r
O——>«3oO
OHOHO
—— >
C/2
>— I
Oi-,
M
20 -
10 -
100 500 1000Equivalent Proton Energy [keV]
5000 10000
Fig.7.20. Electronic stopping cross section of calcium for H ions. Thecurves correspond to the following references:—— AZ77; --- Z90; •---•- J82.The symbols indicate measured points from the following references:A An68; B Go67; C Bd56; D Ep93.
Fig. 7.19 shows the various stopping power curves for water normalizedby the Z90 curve for water vapor. Comparison with experimental data (Ph53,Rn53, Mi90) shows that the ICRU49 curve for vapor follows the data forvapor rather well, whereas the Z90 curve is too low, as expected.
Concerning solids, table 7.13 shows that the differences between thevarious fits are generally as large as 20 - 40% at these low energies. Alis an exception: here all the fits (except for J82) agree quite well [103].The discrepancies for Mg and P are not surprising, since here noexperimental data are available at all, but the discrepancies are evenlarger in the case of Ca, where some data do exist (see fig. 7.20) . Therecent measurements by Eppacher and Semrad (Ep93) show that the stoppingmaximum of Ca is higher even than the highest fit curve (J82). The ratherlarge difference between ICRU49 and AZ77 for Si is due to the fact thatICRU49 has taken new measurements into account.
477

Carbon is a special case since there are indications that the stoppingpowers of graphite and evaporated amorphous carbon are different (seeICRU49). Fig. 7.21 shows that indeed, both ICRU49 and Z90 give higherstopping powers for graphite than for amorphous carbon. Actually, one mightexpect the reverse effect since the experimental plasma energy [112] isslightly higher for graphite than for evaporated carbon. Indeed, Necas etal [113] have recently found the stopping power of graphite a few percentsmaller than that of amorphous carbon for hydrogen ions below 50 keV/u (seeFig. 7.21). The computer program PSTAR, described in the Appendix, producesstopping powers for graphite that take into account theamorphous-carbon/graphite stopping power ratios measured by Necas et al. Itshould be noted that there are many more measurements for amorphous C thanfor graphite, hence the fits by AZ77 and by J82 may be assumed to refer toamorphous C, even though J82 calls it "graphite". The steep descent inFig. 7.21 at low energy is due to the unrealistic energy dependence of Z90(see Fig. 7.15 above).
1 2 Protons on Carbonoo-orHN-<o
3 1.1O ,. JCRU49 Graphite
^ n _... Z9.Q .(M9.9I.-1.,
CO 0.9 L
ICRU49 amorphousAZ77
0• r— <
,— <
O^
•+Jo
'— ' n R
^ //: //
' '/1 1 'l Y 1 1 ! l' 1 1 . . . 1 1 1 1 1 1 1 1 1 1 1 1 1 1 1 1 ! 1 1 1 1 1 1 1 1
— 1
:l i i l l i i i ! i ill ii
10" 10" 10'' 10° 10'Proton Energy [MeV]
10' 10s
Fig.7.21. Electronic stopping power of carbon (amorphous or graphite) forprotons from various publications, divided by values from Z90 (withoutbonding correction). N: experimental values for the ratioS /S due to Necas et al [113].
graphite amorphous
478

TABLE 7.14. RATIOS OF FITTED CURVESSUBSTANCES, AT 1 MEV.NB ... no bonding correction used; B .
T90
Gases:
Solids:
Liquids:
FOR THE STOPPING OF PROTONS IN KEY
.. bonding correction used.
AZ77 J82 ICRU49/BEST PSS
H2N2O2ArH O2CO2AirCH4C H3 8
C (am.)C (graph.)MgAISiPCaFeLiFCaF2AI 02 3LucitePolyethyleneNylon
H 02BenzeneCyclohexanen-PentaneTolueneXylene
NB B
0.967 1 0.9841.001 1 1.0190.996 1 0.992
11
10.942 1
0.953 1
1 1.0010.956 11 0.9681 1.0121 1.0031 0.9921 0.9931 0.9811
10.988 10.960 10.976 1
1.070 10.941 10.960 10.955 10.945 10.947 1
0000
1000
0
000010010000
1
.954
.965
.936
.992
.963
.933
.944
.994
.940
.987
.967
.996
.001
.980
.964
.962
.966
.952
.953
.019
0.9741.0200.9981.0050.9891.0651.0220.956C.968
0.9800.9510.9580.9880.9881.0021.0360.9830.9810.9880.9450.9550.9440.968
1.0450.9370.9480.9440.9380.939
0.989
479

Concerning solid compounds, it should be noted that J82 uses Bragg'srule, whereas ICRU49 takes deviations from this rule into account. Hencethe ICRU49 values are always smaller than J82 (indicating that electrons inthe compound are more tightly bound). In the case of AI O , e.g., ICRU49has taken the measured values due to Bauer et al [114,104] into account.Here again, the low Z90 values for hydrogen lead to low Z90 values forlucite, polyethylene and nylon.
Concerning liquids, very little information is available at lowenergies, because of experimental difficulties. Fig. 7.19 shows that Z90and ICRU49 agree in predicting a stopping power for liquid water about 10%lower than that for vapor, at low energy (as expected from Sec. 7.3.1.3).Using the common assumption that the stopping powers of liquid and solidwater are the same, this difference agrees with that found experimentallyby Bauer et al (Mi90). Sugiyama [115] has suggested a slightly smallerdifference (4%). Above 0.5 MeV, the difference between the two curves byICRU49 is due to the difference in I-values (as given, e.g., in ICRU37; seealso table 7.3). For more water stopping powers, see also fig. 7.44.
Table 7.14 shows the differences between the various fits for 1 MeV.Here, the agreement (and hence the expected accuracy) is much better: thediscrepancies amount only to a few percent.
The tissue substitute A-150 TE plastic is not shown in tables 7.13 and7.14 since it is only given in ICRU49 and hence cannot be compared to othertables. A precise measurement of the stopping power of this substance forprotons of 2.5 to 7.5 MeV was carried out recently by Ishiwari et al [36].The result agrees within 0.2% (on the average) with that obtained usingBragg's rule and the element data from AZ77; this is surprisingly goodindeed. Also, if we calculate the stopping using BEST or PSTAR, the resultis, on the average, only 0.5% above Ishiwari's measurements [36], and inagreement with the calculation by Thwaites [116].
Summarizing, it seems advisable to use the ICRU49 table (or programPSTAR) for best accuracy, if possible. This table contains data for most ofthe key substances, and for many additional substances of interest todosimetry. In this table, compounds are treated using either directlyexperimental data, if available, or else Bragg's rule (eq. 7.14); mixturesare treated by applying Bragg's rule to molecular and/or atomicconstituents. Above 1 MeV, program BEST can also be used instead. Program
480

Z90 is convenient in that its stopping subroutine RSTOP can be included inother main programs, but it appears less reliable at least for compoundscontaining hydrogen. J82 is inconvenient in that it exists only in the formof printed tables; below 1 MeV, it can be replaced by the fit function dueto Eppacher and Semrad [117]. J82 has the advantage of containing allelements; for compounds it has the disadvantage of neglecting chemicaleffects.
TABLE 7.15. FRACTION OF THE (NORMALIZED) DOSE D AT DEPTH X THAT ISCONTRIBUTED BY PROTONS WHOSE ENERGY IS SMALLER THAN T .cResults pertain to a 160-MeV proton beam penetrating through a watermedium. R = 17.65 cm is the CSDA range at 160 MeV. The maximum of the Braggcurve is at a depth equal to 0.99 R.
T (keV) 10cx(cm)
16.9417.0317.1217.21
17.3017.3917.4717.56
17.6517.7417.8317.91
18.0018.0918.1818.27
x/R
0.0.0.0.
0.0.0.0.
1.1.1.1.
1.1.1.1.
960965970975
980985990995
000005010015
020025030035
D
0.6060.6500.7070.782
0.8720.9581.0000.953
0.8020.5720.3410.165
0.0650.0200.0050.001
0000
0000
0000
0000
.0
.0
.0
.0
.0
.0
.0
.1
.1
.1
.1
.1
.1
.2
.2
.3
20
0000
0000
0000
0000
F r
.0
.0
.0
.0
.0
.0
.1
.1
.1
.2
.2
.2
.3
.3
.4
.6
50
a
0000
0000
0000
0011
c t
.0
.0
.0
.0
.1
.1
.2
.3
.4
.4
.5
.6
.7
.9
.0
.5
100
i o n
0000
0000
0011
1112
.0
.0
.0
.1
.1
.2
.4
.6
.7
.9
.1
.2
.4
.7
.9
.9
200 500 1000
(percent)
0000
0001
1122
2335
.0
.0
.0
.1
.3
.5
.8
.1
.5
.8
.1
.5
.9
.4
.8
.2
0000
0112
3456
78910
.0
.0
.1
.3
.6
.2
.9
.8
.6
.5
.3
.2
.1
.1
.3
.5
0.00.10.20.6
1.32.43.95.5
7.39.0
10.612.4
14.215.917.919.4
481

7.3.1.5. The influence of stopping power uncertainties upon problems indosimetry.
The tables of proton stopping powers in ICRU49 are estimated to havethe following uncertainties: at energies of a few MeV or higher, 1 to 2percent for elements, and 1 to 4 percent for compounds; at 1000 keV, 2 to 5percent; at 100 keV, 5 to 10 percent; at 10 keV, 10 to 15 percent; and at 1keV, at least 20 to 30 percent (see also Tables 7.13 and 7.14).
In many applications in conventional dosimetry, the proton stoppingpowers at high energies (with their relatively small uncertainties) are allthat matters, because low-energy protons play only small role. A case inpoint is the depth-dose distribution in a water phantom irradiated with ahigh-energy proton beam used for therapy. The proton spectra from suchbeams, as functions of depth, have been calculated [118], and can be usedto estimate the relative contributions to the absorbed dose from protonswith different energies. The results of such a calculation for a 160-MeVproton beam are shown in Table 7.15. This table shows the fraction of theabsorbed dose at various depths that is contributed by protons whoseenergies are less than 10, 20, .... 1000 keV. It can be seen that fordepths up to 96% of the cdsa range, there is no contribution at all fromprotons with energies below 1000 keV. With increasing depth, near andbeyond the Bragg peak, contributions from protons with lower energiesappear, but remain small.
Another example pertains to neutron irradiation, namely, protons setin motion in elastic collisions. The proton spectrum is approximatelyuniform, and extends up to the neutron energy T . Let # denote then cfraction of the proton energy that is imparted to the medium by protonswith energy smaller than T . It can be shown that this fraction isc
i rc T jii . T dT + — . dT
n n T0 c
i T
~ - Sn T dTTn 0
T r- c (2T ^
n
Tc
Tn
(7.15)
For example, for a neutron energy T = 14 MeV, <f> is 13.4%, 1.4%, 0.14% orn c0.014% for T = 1000 keV, 100 keV, 10 keV or 1 keV, respectively. For T = 1c nMeV, 6 is 19.0%, 2.0% or 0.2% at 100 keV, 10 keV or 1 keV, respectively.c
482

The need for proton stopping powers at low energies, where theuncertainties are large, may,, however, arise in the modeling of radiationeffects on small biological structures, at the cellular or sub-cellularlevel. Even for such applications the energy degradation process takesplace largely via secondary electrons. However, if one is concerned withthe penetration of protons through very small targets, one must know thestopping powers down to energies where the residual range is smaller,perhaps by an order of magnitude, than the dimension of the target. In thisconnection, it should be noted that the residual proton range in water is10 fun at 553 keV, 1 im at 62 keV, 100 run at 3.4 keV, and 10 run at 380 eV.
7.3.2. Nuclaar Stopping Powar
Many of the tables and programs mentioned in table 7.10 also giveresults on nuclear stopping. This is in general quite small compared toelectronic stopping. In the worst case (hydrogen projectiles on hydrogentarget) it amounts to 30% at T = 1 keV, to 1.7% at 10 keV (see ICRU49).Actually these values are upper limits, since they include elasticscattering through all angles. If the energy loss of a beam of protons isconsidered, then a large angle scattering would usually remove the protonfrom the beam, so this proton would not contribute to the energy lossmeasured. This effect can be calculated using the TRIM program; a fewexamples have been calculated by ICRU49; see also Sec. 7.4.2.
7.3.3. Energy Loss Straggling. TRIM Programs.
Since charged particles lose their energy statistically in many smallamounts, their energy after penetrating a certain amount of material is astochastic quantity, described by its average, by its variance Î2 (seeSec. 7.1) and possibly by higher moments. Straggling of energetic H and Heions has been reviewed by Besenbacher et al [118a], and a general review ofthe statistics of charged particle penetration has been presented recentlyby P. Sigmund [119].
If the target is thick enough so that individual contributions W tothe energy loss are small compared to the straggling, i.e., if [126]
3 W < 0, (7.:-,6)m
483

but if it is thin enough so that the energy loss in the target isnegligible, the energy distribution of transmitted projectiles is expectedto be Gaussian [118a]. If, in addition, one assumes the target electrons to
2be free and initially at rest, then the variance ß of the energydistribxation is given by Bohr's simple energy-independent expression [2]
ß = 4ir r2 (m c2)2 Z2 Z n s = (2.6056xl(f 13eV2cm2/atom) Z2 Z n s.•B G G 1 2 12(7.17)
Here,
4 mW = -—- T = 2m v2 (7.18)m M U e l
is the maximum possible energy transfer to a free electron (for anon-relativistic projectile), and r is the classical electron radius.<2
Various refinements of the Bohr expression (7.17) are discussed in[118a]; they take into account that the target electrons are not initiallyat rest and that they are spatially correlated. The effect of electronbinding has been discussed by Bichsel [120a]. The Bohr expressionpresupposes that the projectile energy remains constant throughout thetarget; in practice, it is valid up to a 20% loss of the initial energy[121].
It is difficult to obtain agreement between theoretical andexperimental results for straggling in solids, since effects like crystalstructure and non-uniform film thickness can influence the measurements ina way that is hard to control. For gaseous targets, however, these problemsdo not arise, and very careful measurements in 13 different gases andcomparisons with theories have therefore been carried out by Besenbacher etal [120]. At first these authors checked if their measurements yield an
2energy variance ß proportional to target density. Fig. 7.22 shows thatthis is indeed true for 600 keV He ions penetrating nitrogen. According tothe conditions mentioned above, Bohr straggling should be valid from 0.04to 0.7 jjm, i.e., over most of the thickness shown. Actually, theexperimental results exceed the Bohr straggling (because of theintra-molecular correlation of the target electrons).
It is instructive to compare these results to calculations performedusing the program for "TRansport of Ions through Matter" (TRIM) mentioned
484

already above. This Monte Carlo program, originally written by J.P.Biersack[122] and described in ZBL85, has since been updated many times by Ziegler.It calculates every single nuclear collision (leading to deflection andenergy loss), but treats the much more numerous collisions with targetelectrons only in a global way: between any two nuclear collisions, it addsto the csda energy loss a stochastic contribution that corresponds tostraggling. TRIM90 (and its successors TRIM91, TRIM92) computes particlepenetration in 3 dimensions and draws instructive pictures of all relevantprocesses on the screen. Another version of TRIM ("T2D"), available fromJ.P.Biersack, calculates penetration in 2 dimensions; it is faster but doesnot draw pictures. Both versions use tht- same stopping powers (Z90) below10 MeV/nucleon. Above this specific energy, the T2D stopping is theoriginal one from ZBL85 and hence inaccurate.
TRIM results are also shown in Fig.7.22. Except at small thickness,T2D agrees with the Bohr straggling as it should. The TRIM90 result isconsistently lower, possibly due to a different choice of the free flightpath . (Note that for comparing with Bohr straggling, we exclude thoserare large-angle scattering events from the statistical analysis whose
Note that the TRIM programs contain a statement forbidding an energyincrease between two nuclear collisions. This makes the straggling toosmall for small flight paths (where R may exceed the energy loss), and itmakes the straggling too small also for the entire target, if the freeflight path is chosen too small (the flight path can be chosen by the userin T2D). This difficulty can be remedied in T2D by removing the statementthat forbids an energy increase. In TRIM92, the difficulty is enhanced bythe fact that the flight path within a layer is decreased toward the layeredge until it reaches a monolayer thickness (in order to avoid unphysicalpeaks or dips near an edge), and by the fact that straggling isartificially kept below 20% of the csda energy loss (J. Ziegler, pers.comm.). Hence, the TRIM92 straggling is even lower than that of TRIM90 (seeFig. 7.23).
In TRIM91 and TRIM92, the straggling is linearly reduced below theBohr straggling for energies below the stopping power peak. This is areasonable approximation (see, e.g., Fig. 7.25 below).
485

24
22
20
cCT" 18>d)
M 16
Energy straggling of 600 keV Alphas in Nitrogen
0)ü 14 -
. 12s_cö> 10
Ofi
W 6
1 1 1 1 1
-
-
~-
—
~~,''-
' s' s
<" s
~~~ * s' s
' s' s
,' f
~ -''E'_ ' rT^-âr' i , i
i r • i i i i i i i i i ^ , - 1X
s
s ~
.'* ,-lX •» ""
X -•X ^ f *
* *• *** *• "*
G'''','"'--0'
,'' .E-""' x
y x- —" x
' x
p-^ "
r' f,-'* —
-
1 1 1 1 ! 1 1 1 1 1 1 ! 1 1
0.0 0.1 0.2 0.3 0.4 0.5 0.6 0.7
Thickness \ßm]O.É 0.9 i.o
Fig.7.22. Energy straggling of 600 keV alphas penetrating nitrogen. Theenergy variance is plotted versus the target thickness, assuming a
3 1 8 2hypothetical density of 0.8096 g/cm , so that IJLTJI « 3.482x10 atoms/cm .
Experimental results due to Besenbacher (•••) and the Bohr prediction (-•-)
according to eg. (7.17) are indicated by lines. TRIM results are indicated
by open squares (TRIM90, TRIM91) and full squares (T2D), resp.
energy is clearly outside the Gaussian distribution of transmitted
energies)6)
Figures 7.24 to 7.26 show the energy straggling of protons in Ar, Njj
and H , as examples taken from [120]. In Ar (Fig. 7.24), the straggling is
The program TRIM90 produces an output file TRANSMIT.TXT that containsthe final energy and angle of every transmitted projectile. This file canbe analyzed using program TRANSMIT.BAS (also on the TRIM90 disc) thatcalculates energy and angular straggling and produces a histogram of finalangles. We have added a section that produces a histogram of final energiesalso.
486

QJ
o
cöF—— *
OJK
Energy Distribution of 70 MeV Protons after 3.67 cm of Water
l -
10 15 25Energy [MeV]
Fig.7.23. Energy distribution of 70 MeV protons after passing 3.67 cm ofwater (p = 0.997 gem ), as calculated by Bichsel and Hiraoka [130]
(dashed), and by use of TRIM90 (full curve) or TRIM92 (dotted curve). The_2
csda range of these protons is 4.08 gem-2projected range 4.075 gem" (ICRU49), but only 4.00 gem
TRIM90. The TRIM92 curve is too narrow (see text).
(ICRU49, Bichsel); the mean-2 according to
slightly below the Bohr value. This canatomic electron density realistically [123]due to intra-atomic electron correlation7.2,) can be understood by including,correlations. The straggling in H (Fig. 7.
£f
using Fano's [11] asymptotic perturbationelectron speeds as not negligible compared
be understood by treating theand by adding a straggling term[120]. The result for N (Fig.
£*
in addition, intra-molecular26) is explained down to 80 keVformula which treats the targetto the projectile speed.
To see how well these measurements can be reproduced by TRIM, weconsider 500 keV protons on nitrogen, at a thickness corresponding to
487

10
08
>2 06
02
i————r~———r————i————r"
• H-Ar• He-Ar
0 100 200 300 400 500 600
MpE rf (keV)
M,
Fig.7.24 Energy straggling variance [120] of H and He ions in Argon,divided by Eohr variance, eq. (7.17), versus equivalent proton energy.
2 2 -
1.8 r
-10
06
02
l i
BOHR
1 i l l — — 1 — — 1 — L
50 100 200E ( k e V )
500 1000
Fig.7.25 Energy straggling variance [120] of protons in nitrogen, dividedby Bohr variance, eg. (7.17), versus energy.
488

0.4*- — •
0*4
EuCM
5*••..-
CM
C
— -*.
S 0.3"o
_•*•
- 0.2
•z.0.1
n
1 i i 1 1 I I I I T ————— — 'I T t ••• T T ) 1
. '""BOHR
. If* BONDERUP, HVELPLUND (1971!
~" 21 • THIS EXPERIMENT
i i i i i t i 1 i i i i i i i i i50 100 200
E (keV)500 1000
Fig.7.26 Energy straggling variance [120] of protons in hydrogen, dividedby areal density, versus energy, compared to the formulas by Bohr(eq.7.17) and by Fano [11] for molecular (——) and atomic (---) targets.
18 26.96x10 atoms per cm . In this case, the Bohr straggling amounts to1.82x10 eV cm /atom, or 12.7 keV for the given thickness, and the
2measured value is 13.6 keV (cf. Fig.7.25). Using TRIM, we obtainn2 = 12.5 keV2 (TRIM90) and 14.0 keV2 (T2D) , resp., in fair agreement.Since W =1.1 keV (eq. 7), the thickness is just enough (eq. 7.16) formBohr straggling to apply.
Using a local-electron-density model, Kaneko and Yamamura [124] havecalculated the straggling for protons (and He ions) in many solid targets.They use Hartree-Fock wave functions modified to include plasma electrons,and they include collisional as well as charge-changing contributions. Theyfind that the straggling variance is proportional to T for small T, andthat it approaches the Bohr value above 1 MeV/u. Measurements by Matsunamiand Kitoh [125] using 100 keV protons and He ions on C films of about 10 runthickness and high (30 eV) resolution agree with their prediction.
For solid targets, variations of the target thickness due to surfaceroughness produce an important contribution to straggling. Besenbacher etal [118a] have attempted to determine this contribution by comparing theresults from measurements with H, He, and Li ions. See also Sec. 7.5.3.
489

0.18Protons on Aluminum
• 1.955 MeVO 2.875 MeVl»- 4.065 MeV• 4.864 MeVA 5.225 MeVn 6.784 MeV+ 7.215 MeV
0.00 o.o 0.4 0.6 0.8Energy Loss / Initial Energy
Fig.7.27 Energy straggling Q (divided by energy loss in the foil) versusenergy loss (divided by initial energy), for protons from 1.9 to 7.2 MeV inaluminium. Measurements by Bauer et al [128], indicated by symbols, arecompared to the Bohr result (——), eg. (7.17), to Tschalär's [121,137]calculations (short dashed: 1.5 MeV; -••-.- 7.6MeV), and to TRIM90 (longdashed: 2 MeV; -•-: 7.6 MeV).
For thin targets, the energy distribution of transmitted projectilesis asymetrical (see, e.g., the reviews in [119] and in ICRU49) ; it can bedescribed by the Vavilov theory [126] (see Sec. 7.2.4). For very thintargets, this theory does not apply and must be replaced by otherapproaches (see ICRU49).
For thick targets, the Bohr theory cannot be used either. Thestraggling theory developed by Tschalär [121,127] can, however, be used forrelative energy losses up to 80%. In fig.7.27, we compare TRIM90calculations for 1.5 and 7.6 MeV protons on aluminum to Tschalär'scalculations and to measurements by G.H.Bauer et al [128]. Although thestraggling is, of course, no more energy independent, one can see in thistype of representation that the normalized energy straggling becomes
490

approximately energy-independent if plotted versus the normalized energyloss. Evidently, the TRIM calculations (after excluding r-are low-ensrgyevents, as above) agree well with the Tschalär results. Both calculationsappear to be in fair agreement with Bauer's measurements at energiesbetween 4 and 5.3 MeV. The results measured at energies below 3 MeV appearsomewhat high; this could be partly due to non-uniformities in the targetfoils [cf. ICRU49]. Similar results were obtained by Armitage and Trehan[129].
As another example for a thick target, we show the energy spectrumcalculated by Bichsel and Hiraoka [130] for 70 MeV protons in water. Here,the importance of the third moment (skewness) can be seen from the asymetryof the spectrum. Fig. 7.23 shows Bichsel's curve for a thickness of 3.67 cmof H 0, calculated using the moment method by Tschalär [127] and including
Zi
multiple scattering. The figure also shows the result of a Monte Carlocalculation carried out using TRIM90. The latter curve has a lower meanenergy, since the Z90 stopping is slightly higher in this energy region(see Fig. 7.18), but the two curves have the same variance. A curveobtained using TRIM92 is also shown; it is much too narrow .
For a discussion of TRIM calculations of ranges and range straggling,see Sec. 7.3.5 below.
Bichsel [4] has also carefully compared measurements of Q for highenergy (>38 MeV) protons on Si with his calculations carried out by meansof the convolution method; he found agreement within 1%.
7.3.4. Multiple Scattering
Multiple scattering is treated in Sec. 7.5.4, since most of the recentdata refer to heavy ions. But it should be noted that Fig. 7.48 containsalso data measured with H and He ions.
7.3.5. Range« and Range Straggling
Curves for the csda range R (cf. Sec. 7.1) in all elemental targetsheavier than Li are given in AZ77 (called "path length"). In addition,AZ77 show the mean projected range R , calculated according to Schi«tt'sapproximation [131], and the range straggling, or . They say that the
Rresults f.ar R and <r are of limited accuracy,x R
491

Kistemaker and Sanders [132] have given a simple expression for theratio R/R (based on a constant nuclear stopping power) which is a functionof M and M only. Al-Affan [133] has used this function to convert thetrue stopping power to a so-called "effective stopping power" theintegration of which yields the projected range, and he has produced atable of stopping powers and projected ranges in some materials ofdosimetric interest (see [134] for a critical review of this work byH.H.Andersen).
The tables in ICRU49 list the "csda range" R and the "detour factor"(= R /R) . Alternatively, these values and also R can be calculated usingx xprogram PSTAR. The Janni table (J82) separately lists the "proton range"R , the "path length" R, the path length straggling, and, in addition, itgives the probability for the projectile to be lost from the beam due tonuclear interactions.
The computer programs TRIM89 and TRIM90 permit calculation ofprojected ion ranges either by the PRAL algorithm based on an analyticalsolution of the transport equation or by the Monte Carlo code. Bothprograms use the electronic stopping power and a universal scatteringpotential as inputs. They both give results on longitudinal and lateralstraggling; in addition, TRIM90 can produce graphical range and stragglingdistributions (and even a distribution of deposited energy vs. depth). Anewer version, TRIM91, produces generally the same results as TRIM90(within statistics), except for the lateral straggling which has beenredefined. It also calculates dimensionless measures of the higher momentsof projected range, skewness and kurtosis (which appear on the screentogether with the ion range distribution). Fig.7.28 (taken from ZBL85)shows graphical comparisons of experimental and calculated results for R,R and <r for Si and Ni targets. For Si at least, the agreement betweenx Rexperimental and calculated range is impressive. The disagreement in thestraggling results is said to be due to the different straggling definitionused by the experimenters.
Fig.7.29 compares the csda range R for protons on nitrogen fromdifferent tables. At 1 keV, the three curves differ by up to a factor 2;this is in part due to the different low-energy values of S (see Fig.7.18),in part due to different assumptions about the low energy integrationlimit. Toward higher energies, the relative differences become quite small.
492

— Tot»! P»th Length—— Mean Range
———— StrugglingIon - 1H1 <A= DTarget- Si14
(Vf = o 87)
£ §StWB KI
l 1101 <tTl1 »ST ÏTO5 iöJT 1»T1
nKT>T Universal . .Stopping
o;
tifi
101
ToUl Path Length-Mean RangeSLr»jgling
103
Ion - 1H1 (A = s )Target- Ni26
(vf = 1.2)
0) -Q
CO
oo
StW *f •*» 7' M' Z3t un rm- 3 i -t, M3 au UTT; 3 :2»3 unr TTTT; i - -j if< 11*1, UT»" i. a zi.5 »>«, '«77^ V , 2 2»e i4j it« i 3 ï»
101 102 103
ION ENERGY ( keV )
Fig.7.28 Average path length R (• ), mean projected range R (-
range straggling cr (---) for protons in Si and Ni targets, takenR
•), and
from
ZBL85. The letter S indicates experimental straggling data,
symbols indicate experimental data for the projected range.
the other
493

Protons on Nitrogen
iO"5 -''10 -3
Proton Energy [MeV]10U
Fig.7.29 Csda range for protons on nitrogen, according to AZ77 (——), J82(•••), and ICRU49 (-••-).
Fig.7.30 shows the detour factor (= R /R) for protons on nitrogen,X
taken from five different compilations. To obtain the TRIM curve, R wasX
calculated using TRIM90, but the corresponding R was obtained using [135]program RBS with Z90 stopping powers. Evidently, all the calculations(except AZ77) are in pretty fair agreement with each other.
B0rgesen et al [136] have measured the projected range and the rangestraggling of 10-30 keV deuterons implanted into various solids. Fig.7.31shows their result for aluminum, compared to various calculations includingtheir own (which uses the AZ77 stopping power). One can see that the rangemeasurements agree with the TRIM90 curves within about 10%, and that thePRAL curve is slightly below the Monte Carlo result, at low energy. Forthe straggling width, the two Monte Carlo results agree fairly well, butthe experimental result is somewhat higher. The PRAL result appears too
494

high. Note that Ashworth et al 1137] have recently published a revisedversion of PRAL; they find that the first-order PRAL algorithm contained inTRIM90 is poor in predicting longitudinal and lateral straggling, due to amathematical error.
The Bergesen results for carbon [136] (not shown here) indicate thatthe TRIM90 range is about 15% low due to the high stopping power (seeFig.7.15). These range measurements may be qualitatively compared to morerecent measurements by Ross and Terreault [138,139] using H and D ions ofenergies up to 2 keV. Here, the discrepancy with the TRIM90 stopping powerfor carbon is even more striking. If the stopping power of carbon wereproportional to T ' (as assumed in TRIM90, see 7.3.1.1), the csda rangewould be proportional to T . Such an energy dependence is indeed foundapproximately by Ross and Terreault, but of course for the projected range,not for the csda range.
Protons on Nitrogen
10'Proton Energy [MeV]
Fig.7.30 Detour factor for protons on nitrogen, according fco AZ77PRAL/RBS (——), J82 (•••), ICRU49 (-••-), and Al-Affan [133] (-•-)
495

Go
=1
120
100
Deuterons on Aluminum
O Range
V StragglingO
ß(aß
80
in-d 60
öCO
0)iac0 40CO
OJ
~o 20QJ
O
V
v
10 20Deuteron Energy [keV]
30
Fig.7.31 Projected range and range straggling (fwhm) of deuterons inaluminium. Measured points and two theoretical curves (full: range; longdashed: straggling) are from Bergesen et al [136]. The remaining curveswere calculated using TRIM90:
Range: Monte Carlo (-•-); PRAL (•••)Straggling: Monte Carlo (short dashed); PRAL (-••-)
For comparison with the experimental results which are given in terms ofthe full width at half maximum, the theoretical values <r have beenmultiplied by 2.35.
7.3.6. Vector Ranges
To our knowledge, no tables of the vector range R are available[134] . To estimate this quantity, we can calculate the longitudinal rangeand the "radial range" (i.e., the final perpendicular distance of theprojectile from the axis of its original velocity) using TRIM90, and addthem in quadrature. Taking protons on Al as an example, we find that R.vhardly differs from R~~ down to about 50 keV. For 2 keV we get, e.g., axlongitudinal range of 0.034 jfln and a radial range of 0.023 jcn, which add upto R = 0.04l (im. This is an upper limit, since particles that happen tohave a large longitudinal range must have small radial range, and viceversa.
496

H on Calcium
50 100 500 1000Equivalent Proton Energy [keV]
5000 10000
Fig.7.20. Electronic stopping cross section of calcium for H ions. Thecurves correspond to the following references:—— ÄZ77; --- Z90; ••-—- J82.The symbols indicate measured points from the following references:A An68; B Go67; C Bd56; D Ep93.
Fig. 7.19 shows the various stopping power curves for water normalizedby the Z90 curve for water vapor. Comparison with experimental data (Ph53,Rn53, Mi90) shows that the ICRU49 curve for vapor follows the data forvapor rather well, whereas the Z90 curve is too low, as expected.
Concerning solids, table 7.13 shows that the differences between thevarious fits are generally as large as 20 - 40% at these low energies. Alis an exception: here all the fits (except for J82) agree quite well [103].The discrepancies for Mg and P are not surprising, since here noexperimental data are available at all, but the discrepancies are evenlarger in the case of Ca, where some data do exist (see fig. 7.20). Therecent measurements by Eppacher and Semrad (Ep93) show that the stoppingmaximum of Ca is higher even than the highest fit curve (J82) . The ratherlarge difference between ICRU49 and AZ77 for Si is due to the fact thatICRU49 has taken new measurements into account.
477

Carbon is a special case since there are indications that the stoppingpowers of graphite and evaporated amorphous carbon are different (seeICRU49) . Fig. 7.21 shows that indeed, both ICRU49 and Z90 give higherstopping powers for graphite than for amorphous carbon. Actually, one mightexpect the reverse effect since the experimental plasma energy [112] isslightly higher for graphite than for evaporated carbon. Indeed, Necas etal [113] have recently found the stopping power of graphite a few percentsmaller than that of amorphous carbon for hydrogen ions below 50 keV/u (seeFig. 7.21). The computer program PSTAR, described in the Appendix, producesstopping powers for graphite that take into account theamorphous-carbon/graphite stopping power ratios measured by Necas et al. Itshould be noted that there are many more measurements for amorphous C thanfor graphite, hence the fits by AZ77 and by J82 may be assumed to refer toamorphous C, even though J82 calls it "graphite". The steep descent inFig. 7.21 at low energy is due to the unrealistic energy dependence of Z90(see Fig. 7.15 above).
Protons on Carbon
10 10 10'' 10° 10'Proton Energy [MeV]
10'
Fig.7.21. Electronic stopping power of carbon (amorphous or graphite) forprotons from various publications, divided by values from Z90 (withoutbonding correction). N: experimental values for the ratioS /S due to Necas et al [113].graphite amorphous
478

TABLE 7.14. RATIOS OF FITTED CURVESSUBSTANCES, AT 1 MEV.NB ... no bonding correction used; B .
T90
Gases :
Solids:
Liquids:
FOR THE STOPPING OF PROTONS IN KEY
.. bonding correction used.
AZ77 J82 ICRU49/BEST PSS
H2N202ArH 02CO2AirCH4C H3 8
C (am.)C (graph.)MgAISiPCaFeLiFCaF2AI O2 3LucitePolyethyleneNylon
H 02BenzeneCyc lohexanen-PentaneTolueneXylene
NB B
0.967 1 0.9841.001 1 1.0190.996 1 0.992
11
l
0.942 10.953 1
1 1.0010.956 11 0.9681 1.0121 1.0031 0.9921 0.9931 0.9811
10.988 10.960 10.976 1
1.070 10.941 10.960 10.955 10.945 10.947 1
0000
1000
0
000010010000
1
.954
.965
.936
.992
.963
.933
.944
.994
.940
.987
.967
.996
.001
.980
.964
.962
.966
.952
.953
.019
0.9741.0200.9981.0050.9891.0651.0220.9560.968
0.9800.9510.9580.9880.9881.0021.0360.9830.9810.9880.9450.9550.9440.968
1.0450.9370.9480.9440.9380.939
0.989
479

Concerning solid compounds, it should be noted that J82 uses Bragg'srule, whereas ICRU49 takes deviations from this rule into account. Hencethe ICRU49 values are always smaller than J82 (indicating that electrons inthe compound are more tightly bound). In the case of AI O , e.g., ICRU49has taken the measured values due to Bauer et al [114,104] into account.Here again, the low Z90 values for hydrogen lead to low Z90 values forlucite, polyethylene and nylon.
Concerning liquids, very little information is available at lowenergies, because of experimental difficulties. Fig. 7.19 shows that Z90and ICRU49 agree in predicting a stopping power for liquid water about 10%lower than that for vapor, at low energy (as expected from Sec. 7.3.1.3).Using the common assumption that the stopping powers of liquid and solidwater are the same, this difference agrees with that found experimentallyby Bauer et al (Mi90). Sugiyama [115] has suggested a slightly smallerdifference (4%). Above 0.5 MeV, the difference between the two curves byICRU49 is due to the difference in I-values (as given, e.g., in ICRU37; seealso table 7.3). For more water stopping powers, see also fig. 7.44.
Table 7.14 shows the differences between the various fits for 1 MeV.Here, the agreement (and hence the expected accuracy) is much better: thediscrepancies amount only to a few percent.
The tissue substitute A-150 TE plastic is not shown in tables 7.13 and7.14 since it is only given in ICRU49 and hence cannot be compared to othertables. A precise measurement of the stopping power of this substance forprotons of 2.5 to 7.5 MeV was carried out recently by Ishiwari et al [36].The result agrees withi.i 0.2% (on the average) with that obtained usingBragg's rule and the element data from AZ77; this is surprisingly goodindeed. Also, if we calculate the stopping using BEST or PSTAR, the resultis, on the average, only 0.5% above Ishiwari's measurements [36], and inagreement with the calculation by Thwaites [116] .
Summarizing, it seems advisable to use the ICRU49 table (or programPSTAR) for best accuracy, if possible. This table contains data for most ofthe key substances, and for many additional substances of interest todosimetry. In this table, compounds are treated using either directlyexperimental data, if available, or else Bragg's rule (eq. 7.14); mixturesare treated by applying Bragg's rule to molecular and/or atomicconstituents. Above 1 MeV, program BEST can also be used instead. Program
480

Z90 is convenient in that its stopping subroutine RSTOP can be included inother main programs, but it appears less reliable at least for compoundscontaining hydrogen. J82 is inconvenient in that it exists only in the formof printed tables; below 1 MeV, it can be replaced by the fit function dueto Eppacher and Semrad [117]. J82 has the advantage of containing allelements; for compounds it has the disadvantage of neglecting chemicaleffects.
TABLE 7.15. FRACTION OF THE (NORMALIZED) DOSE D AT DEPTH X THAT ISCONTRIBUTED BY PROTONS WHOSE ENERGY IS SMALLER THAN T .cResults pertain to a 160-MeV proton beam penetrating through a watermedium. R = 17.65 cm is the CSDA range at 160 MeV. The maximum of the Braggcurve is at a depth equal to 0.99 R.
T (keV) 10c
x(cm)
16.94
17.03
17.12
17.21
17.30
17.39
17.47
17.56
17.65
17.74
17.83
17.91
18.00
18.09
18.18
18.27
x/R
0
0
0
0
0
0
0
0
1
1
1
1
1
1
1
1
.960
.965
.970
.975
.980
.985
.990
.995
.000
.005
.010
.015
.020
.025
.030
.035
D
0.606
0.650
0.707
0.782
0.872
0.958
1.000
0.953
0.802
0.572
0.341
0.165
0 . 0 6 5
0 . 0 2 0
0 .005
0.001
20
F r
0
0
0
0
0
0
0
0
0
0
0
0
0
0
0
0
.0
.0
.0
.0
.0
.0
.0
.1
.1
.1
.1
.1
.1
.2
.2
.3
0
0
0
0
0
0
0
0
0
0
0
0
0
0
0
0
.0
.0
.0
.0
.0
.0
.1
.1
.1
.2
.2
.2
.3
.3
.4
.6
50
a c t
0
0
0
0
c0
0
0
0
0
0
0
0
0
11
.0
.0
.0
.0
.1
.1
.2
.3
.4
.4
.5
.6
.7
.9
.0
.5
100
i o n
0.0
0 .0
0 .0
0.1
0.1
0.2
0 .4
0 .6
0.7
0 .9
1.1
1.2
1.4
1.7
1.9
2 .9
200 500 1000
(percent)
0
0
0
0
0
0
0
1
1
1
2
2
2
3
3
5
.0
.0
.0
.1
.3
.5
.8
.1
.5
.8
.1
.5
.9
.4
.8
.2
0
0
0
0
0
1
1
2
3
4
5
6
7
8
9
10
.0
.0
.1
.3
.6
.2
.9
.8
.6
.5
.3
.2
.1
.1
.3
.5
0
0
0
0
1
2
3
5
7
9
10
12
14
15
17
19
.0
.1
.2
.6
.3
.4
.9
.5
.3
.0
.6
.4
.2
.9
.9
.4
481

7.3.1.5. The influence of stopping power uncertainties upon problems indosimetry.
The tables of proton stopping powers in ICRU49 are estimated to havethe following uncertainties: at energies of a few MeV or higher, 1 to 2percent for elements, and 1 to 4 percent for compounds; at 1000 keV, 2 to 5percent; at 100 keV, 5 to 10 percent; at 10 keV, 10 to 15 percent; and at 1keV, at least 20 to 30 percent (see also Tables 7.13 and 7.14).
In many applications in conventional dosimetry, the proton stoppingpowers at high energies (with their relatively small uncertainties) are allthat matters, because low-energy protons play only small role. A case inpoint is the depth-dose distribution in a water phantom irradiated with ahigh-energy proton beam used for therapy. The proton spectra from suchbeams, as functions of depth, have been calculated [118], and can be usedto estimate the relative contributions to the absorbed dose from protonswith different energies. The results of such a calculation for a 160-MeVproton beam are shown in Table 7.15. This table shows the fraction of theabsorbed dose at various depths that is contributed by protons whoseenergies are less than 10, 20, .... 1000 keV. It can be seen that fordepths up to 96% of the cdsa range, there is no contribution at all fromprotons with energies below 1000 keV. With increasing depth, near andbeyond the Bragg peak, contributions from protons with lower energiesappear, but remain small.
Another example pertains to neutron irradiation, namely, protons setin motion in elastic collisions. The proton spectrum is approximatelyuniform, and extends up to the neutron energy T . Let à denote then cfraction of the proton energy that is imparted to the medium by protonswith energy smaller than T . It can be shown that this fraction isc
1T
n•r0
T dT + -- . f dT
c
1 T
~ • SU T dTn 0
T
Tn
('T
Tn
(7.15)
For example, for a neutron energy T = 14 MeV, <f> is 13.4%, 1.4%, 0.14% orn c0.014% for T = 1000 keV, 100 keV, 10 keV or 1 keV, respectively. For T = 1c nMeV, 4> is 19.0%, 2.0% or 0.2% at 100 keV, 10 keV or 1 keV, respectively.c
482

The need for proton stopping powers at low energies, where theuncertainties are large, may, however, arise in the modeling of radiationeffects on small biological structures, at the cellular or sub-cellularlevel. Even for such applications the energy degradation process takesplace largely via secondary electrons. However, if one is concerned withthe penetration of protons through very small targets, one must know thestopping powers down to energies where the residual range is smaller:,
perhaps by an order of magnitude, than the dimension of the target. In thisconnection, it should be noted that the residual proton range in water is10 pin at 553 keV, 1 fim at 62 keV, 100 run at 3.4 keV, and 10 run at 380 eV.
7.3.2. Nuclaar Stopping Power
Many of the tables and programs mentioned in table 7.10 also giveresults on nuclear stopping. This is in general quite small compared toelectronic stopping. In the worst case (hydrogen projectiles on hydrogentarget) it amounts to 30% at T = 1 keV, to 1.7% at 10 keV (see ICRU49) .Actually these values are upper limits, since they include elasticscattering through all angles. If the energy loss of a beam of protons isconsidered, then a large angle scattering would usually remove the protonfrom the beam, so this proton would not contribute to the energy lossmeasured. This effect can be calculated using the TRIM program; a fewexamples have been calculated by ÏCRU49; see also Sec. 7.4.2.
7.3.3. Energy Loss Straggling. TRIM Programs.
Since charged particles lose their energy statistically in many smallamounts, their energy after penetrating a certain amount of material is astochastic quantity, described by its average, by its variance SI (seeSec. 7.1) and possibly by higher moments. Straggling of energetic H and Heions has been reviewed by Besenbacher et al [118a], and a general review ofthe statistics of charged particle penetration has been presented recentlyby P. Sigmund [119].
If the target is thick enough so that individual contributions W tothe energy loss are small compared to the straggling, i.e., if [126]
3 W < n, (7.J6)m
483

but if it is thin enough so that the energy loss in the target isnegligible, the energy distribution of transmitted projectiles is expectedto be Gaussian [118a]. If, in addition, one assumes the target electrons to
2be free and initially at rest, then the variance & of the energydistribution is given by Bohr's simple energy-independent expression [2]
fi2 = 4rr r2 (mec2)2 Z2 Z2 n s = (2. S056xlCf 13eV2cm2/atom) Z2 Z^ n s.(7.17)
Here,
4 mW = —— T = 2m v2 (7.18)m M u e l
is the maximum possible energy transfer to a free electron (for anon-relativistic projectile), and r is the classical electron radius.
e
Various refinements of the Bohr expression (7.17) are discussed in[118a]; they take into account that the target electrons are not initiallyat r^st and that they are spatially correlated. The effect of electronbinding has been discussed by Bichsel [120a]. The Bohr expressionpresupposes that the projectile energy remains constant throughout thetarget; in practice, it is valid up to a 20% loss of the initial energy[121] .
It is difficult to obtain agreement between theoretical andexperimental results for straggling in solids, since effects like crystalstructure and non-uniform film thickness can influence the measurements ina way that is hard to control. For gaseous targets, however, these problemsdo not arise, and very careful measurements in 13 different gases andcomparisons with theories have therefore been carried out by Besenbacher etal [120]. At first these authors checked if their measurements yield anenergy variance Cl proportional to target density. Fig. 7.22 shows thatthis is indeed true for 600 keV He ions penetrating nitrogen. According tothe conditions mentioned above, Bohr straggling should be valid from 0.04to 0.7 jjm, i.e., over most of the thickness shown. Actually, theexperimental results exceed the Bohr straggling (because of theintra-molecular correlation of the target electrons).
It is instructive to compare these results to calculations performedusing the program for "TRansport of Ions through Matter" (TRIM) mentioned
484

already above. This Monte Carlo program, originally written by J.P.Biersack[122] and described in ZBL85, has since been updated many times by Ziegler.It calculates every single nuclear collision (leading to deflection andenergy loss), but treats the much more numerous collisions with targetelectrons only in a global way: between any two nuclear collisions, it addsto the csda energy loss a stochastic contribution that corresponds tostraggling. TRIM90 (and its successors TRIM91, TRIM92) computes particlepenetration in 3 dimensions and draws instructive pictures of all relevantprocesses on the screen. Another version of TRIM ("T2D"), available fromJ.P.Biersack, calculates penetration in 2 dimensions; it is faster but doesnot draw pictures. Both versions use the same stopping powers (Z90) below10 MeV/nucleon. Above this specific energy, the T2D stopping is theoriginal one from ZBL85 and hence inaccurate.
TRIM results are also shown in Fig.7.22. Except at small thickness,T2D agrees with the Bohr straggling as it should. The TRIM90 result isconsistently lower, possibly due to a different choice of the free flightpath . (Note that for comparing with Bohr straggling, we exclude thoserare large-angle scattering events from the statistical analysis whose
Mote that the TRIM programs contain a statement forbidding an energyincrease between two nuclear collisions. This makes the straggling toosmall for small flight paths (where Q may exceed the energy loss), and itmakes the straggling too small also for the entire target, if the freeflight path is chosen too small (the flight path ran be chosen by the userin T2D) . This difficulty can be remedied in T2D by removing the statementthat forbids an energy increase. In TRIM92, the difficulty is enhanced bythe fact that the flight path within a layer is decreased toward the layeredge until it reaches a monolayer thickness (in order to avoid unphysicalpeaks or dips near an edge), and by the fact that straggling isartificially kept below 20% of the csda energy loss (J. Ziegler, pers.comm.). Hence, the TRIM92 straggling is even lower than that of TRIM90 (seeFig. 7.23) .
In TRIM91 and TRIM92, the straggling is linearly reduced below theBohr straggling for energies below the stopping power peak. This is areasonable approximation (see, e.g., Fig. 7.25 below).
485

24
2220
18
16
14
12
10
Energy straggling of 600 keV Alphas in Nitrogen
0)
cuo0«5
03
_L _L0.0 0.1 0.2 0.3 0.4 0.5
Thickness0.6 0.7 0.8 0.9 1.0
Fig.7.22. Energy straggling of 600 kéV alphas penetrating nitrogen. The
energy variance is plotted versus the target thickness, assuming a3 1 8 ?hypothetical density of 0.8096 g/cm , so that l\m « 3.482x10 atoms/cm .
Experimental results due to Besenbacher (•••) and the Bohr prediction (-•-)
according to eq. (7.17) are indicated by lines. TRIM results are indicated
by open squares (TRIM90, TRIM91) and full squares (T2D), resp.
energy is clearly outside the Gaussian distribution of transmitted.6)energies)
Figures 7.24 to 7.26 show the energy straggling of protons in Ar, Nand H , as examples taken from [120]. In Ar (Fig. 7.24), the straggling is
£t
6) The program TRIM90 produces an output file TRANSMIT.TXT that containsthe final energy and angle of every transmitted projectile. This file canbe analyzed using program TRANSMIT.BAS (also on the TRIM90 disc) thatcalculates energy and angular straggling and produces a histogram of finalangles. We have added a section that produces a histogram of final energiesalso.
486

J-,tu
o>
'-£&"oK
Energy Distribution of 70 MeV Protons after 3.67 cm of Water
J
10 15 20 25Energy [MeV]
Fig.7.23. Energy distribution of 70 MeV protons after passing 3.67 cm of
water (p = 0.997 gem ), as calculated by Bichsel and Hiraoka [130]
(dashed), and by use of TRIM90 (full curve) or TRIM92 (dotted curve). The
csda range of these protons is 4.08 gem-2projected range 4.075 gem" (ICRU49), but only 4.00 gem
TRIM90. The TRIM92 curve is too narrow (see text).
(ICRU49, Bichsel); the mean-2 according to
slightly below the Bohr value. This can be understood by treating theatomic electron density realistically [123] and by adding a straggling termdue to intra-atomic electron correlation [120] . The result for N (Fig.7.25) can be understood by including, in addition, intra-molecularcorrelations. The straggling in H (Fig. 7.26) is explained down to 80 keV
&
using Fano's [11] asymptotic perturbation formula which treats the targetelectron speeds as not negligible compared to the projectile speed.
To see how well these measurements can be reproduced by TRIM, weconsider 500 keV protons on nitrogen, at a thickness corresponding to
487

1.0
0.8
2 0.6T6 0.4
02
• H- Ar• He-Ar
100 200 300 400 500 600
MpE T (keV)
Fig. 7. 24 Energy straggling variance [120] of H and He ions in Argon,divided by Bohr variance, eg. (7.17), versus equivalent proton energy.
EU
r*
V
22
1.8
I Ua
1.0
0.6
0.2
0
BOHR
i i i i i50 100 200
E(keV)500 1000
Fig.7.25 Energy straggling variance [120] of protons in nitrogen, dividedby Bohr variance, eg. (7.17), versus energy.
488

~"lCM 2
5°fM
"o
CM OHr** *3^Z
0.4
0.3
0.2
0.1
n
1 1 1 • l 1 I J 1 1 | 1 [ ! 1 1 1
T ""*""* •~^T~~-f 1
• ~~~~~-^5r~— - _ _ _ _ _ -
. '"""BOHR
. I( * BONOERUP, HVELPLUND (1971)
~* 2l • THIS EXPERIMENT
1 l l t l i i t I i 1 l i l l t l
E(keV)Fig.7.26 Energy straggling variance [120] of protons in hydrogen, dividedby areal density, versus energy, compared to the formulas by Bohr(eq.7.17) and by Fano [11] for molecular (——) and atomic (---) targets.
18 ?6.96x10 atoms per cm . In this case, the Bohr straggling amounts to- 1 2 2 2 21.82x10 eV cm /atom, or 12.7 keV for the given thickness, and the
2measured value is 13.6 keV (cf. Fig.7.25). Using TRIM, we obtainSI2 = 12.5 keV2 (TRIM90) and 14.0 keV2 (T2D) , resp., in fair agreement.Since W = 1.1 keV (eq. 7), the thickness is just enough (eq. 7.16) formBohr straggling to apply.
Using a local-electron-density model, Kaneko and Yamamura [124] havecalculated the straggling for protons (and He ions) in many solid targets.They use Hartree-Fock wave functions modified to include plasma electrons,and they include collisional as well as charge-changing contributions. Theyfind that the straggling variance is proportional to T for small T, andthat it approaches the Bohr value above 1 MeV/u. Measurements by Matsunamiand Kitoh [125] using 100 keV protons and He ions on C films of about 10 nmthickness and high (30 eV) resolution agree with their prediction.
For solid targets, variations of the target thickness due to surfaceroughness produce an important contribution to straggling. Besenbacher etal [118a] have attempted to determine this contribution by comparing theresults from measurements with H, He, and Li ions. See also Sec. 7.5.3.
489

0.12Protons on Aluminum
1.955 MeVO 2.875 MeV
4.065 MeV• 4.864 MeVA 5.225 MeVG 6.784 MeV4- 7.215 MeV
0.4 0.6Energy Loss / Initial Energy
Fig. 7.27 Energy straggling Q ("divided Jby energy loss in the foil) versusenergy loss (divided by initial energy), for protons from 1.9 to 7.2 MeV inaluminium. Measurements by Bauer et al [128], indicated by symbols, arecompared to the Bohr result (——), eg. (7.17), to Tschalär's [121,137]calculations (short dashed: 1.5 MeV; -••-.- 7. 6MeV), and to TRIM90 (longdashed: 2 MeV; -•-: 7.6 MeV).
For thin targets, the energy distribution of transmitted projectilesis asymetrical (see, e.g., the reviews in [119] and in ICRU49); it can bedescribed by the Vavilov theory [126] (see Sec. 7.2.4). For very thintargets, this theory does not apply and must be replaced by otherapproaches (see ICRU49).
For thick targets, the Bohr theory cannot be used either. Thestraggling theory developed by Tschalär [121,127] can, however, be used forrelative energy losses up to 80%. In fig,7.27, we compare TRIM90calculations for 1.5 and 7.6 MeV protons on aluminum to Tschalär'scalculations and to measurements by G.H.Bauer et al [128]. Although thestraggling is, of course, no more energy independent, one can see in thistype of representation that the normalized energy straggling becomes
490

approximately energy-independent if plotted versus the normalized energyloss. Evidently, the TRIM calculations (after excluding rare low-energyevents, as above) agree well with the Tschalär results. Both calculationsappear to be in fair agreement with Bauer's measurements at energiesbetween 4 and 5.3 MeV. The results measured at energies below 3 MeV appearsomewhat high; this could be partly due to non-uniformities in the targetfoils [cf. ICRU49]. Similar results were obtained by Armitage and Trehan[129] .
As another example for a thick target, we show the energy spectrumcalculated by Bichsel and Hiraoka [130] for 70 MeV protons in water. Here,the importance of the third moment (skewness) can be seen from the asymetryof the spectrum. Fig. 7.23 shows Bichsel's curve for a thickness of 3.67 cmof H 0, calculated using the moment method by Tschalär [127] and includingmultiple scattering. The figure also shows the result of a Monte Carlocalculation carried out using TRIM90. The latter curve has a lower meanenergy, since the Z90 stopping is slightly higher in this energy region(see Fig. 7.18), but the two curves have the same variance. A curveobtained using TRIM92 is also shown; it is much too narrow .
For a discussion of TRIM calculations of ranges and range straggling,see Sec. 7.3.5 below.
Bichsel [4] has also carefully compared measurements of fl for highenergy (>38 MeV) protons on Si with his calculations carried out by meansof the convolution method; he found agreement within 1%.
7.3.4. Multipl« Scattering
Multiple scattering is treated in Sec. 7.5.4, since most of the recentdata refer to heavy ions. But it should be noted that Fig. 7.48 containsalso data measured with H and He ions.
7.3.5. Ranges and Rang« Straggling
Curves for the csda range R (cf. Sec. 7.1) in all elemental targetsheavier than Li are given in AZ77 (called "path length"). In addition,AZ77 show the mean projected range R , calculated according to Schiatt'sapproximation [131], and the range straggling, cr . They say that theRresults for R and <r are of limited accuracy.x R
491

Kistemaker and Sanders [132] have given a. simple expression for theratio R/R (based on a constant nuclear stopping power) which is a functionof M and M only. Al-Affan [133] has used this function to convert thetrue stopping power to a so-called "effective stopping power" theintegration of which yields the projected range, and he has produced atable of stopping powers and projected ranges in some materials ofdosimetric interest (see [134] for a critical review of this work byH.H.Andersen).
The tables in ICRU49 list the "csda range" R and the "detour factor"(= R /R) . Alternatively, these values and also R can be calculated usingx xprogram PSTAR. The Janni table (J82) separately lists the "proton range"R , the "path length" R, the path length straggling, and, in addition, itgives the probability for the projectile to be lost from the beam due tonuclear interactions.
The computer programs TRIM89 and TRIM90 permit calculation ofprojected ion ranges either by the PRAL algorithm based on an analyticalsolution of the transport equation or by the Monte Carlo code. Bothprograms use the electronic stopping power and a. universal scatteringpotential as inputs. They both give results on longitudinal and lateralstraggling; in addition, TRIM90 can produce graphical range and stragglingdistributions (and even a distribution of deposited energy vs. depth). Anewer version, TRIM91, produces generally the same results as TRIM90(within statistics), except for the lateral straggling which has beenredefined. It also calculates dimensionless measures of the higher momentsof projected range, skewness and kurtosis (which appear on the screentogether with the ion range distribution). Fig.7.28 (taken from ZBL85)shows graphical comparisons of experimental and calculated results for R,R and <r for Si and Ni targets. For Si at least, the agreement betweenx Rexperimental and calculated range is impressive. The disagreement in thestraggling results is said to be due to the different straggling definitionused by the experimenters.
Fig.7.29 compares the csda range R for protons on nitrogen fromdifferent tables. At 1 keV, the three curves differ by up to a factor 2;this is in part due to the different low-energy values of S (see Fig.7.18),in part due to different assumptions about the low energy integrationlimit. Toward higher energies, the relative differences become quite small.
492

ToUl Path Length-Mean Range
———— Straggling
CO
Ion — H (A = DTarget- Si14
(Vf = o.»?)5*KB KS ttAH-Z
* 1105 If787 ¥IT ITT»
1037 1177*OI l»7.i_«•» ' V»»«"
oo
o -Q
coH
7 RI Universal , ^stopping
101
— ToUI Path Length— Mean Range— Straggling
102 103
Ion -Target- Ni28
(Vf =
io4
,r» «tr YTJ« zi yi zij 11*1 r«f- j i 1, M ; ; ! J3 au IITT: 3:22». : :3 losr TTTT i - 2 7T ' * ' "i in« , IITS" 2! 4îi ^ ,5 lim H77, U i 2» . 4. . j6 142 1*63 1 J 2f
17137 Universal
10» 102
ION ENERGY103
( keV )
Fig. 7.28 Average path length R ( • • • ) , mean projected range R (——}, and
range straggling <r (---) for protons in Si and Ni targets, taken fromR.
ZBL85. The letter S indicates experimental straggling- data, the other
symbols indicate experimental data for the projected range.
493

Protons on Nitrogen
10-3
OJ
osic
o
K IQ'4
eu-0(/)
CJ
10° -'10 -3 KT
, H10°
Proton Energy [MeV]
Fig. 7.29 Csda range for protons on nitrogen, according to AZ77 (——), J82(•••), and ICRU49 (-••-).
Fig.7.30 shows the detour factor (= R /R) for protons on nitrogen,taken from five different compilations. To obtain the TRIM curve, R was
Xcalculated using TRIM90, but the corresponding R was obtained using [135]program RBS with Z90 stopping powers. Evidently, all the calculations(except AZ77) are in pretty fair agreement with each other.
Bergesen et al [136] have measured the projected range and the rangestraggling of 10-30 keV deuterons implanted into various solids. Fig.7.31shows their result for aluminum, compared to various calculations includingtheir own (which uses the AZ77 stopping power). One can see that the rangemeasurements agree with the TRIM90 curves within about 10%, and that thePRAL curve is slightly below the Monte Carlo result, at low energy. Forthe straggling width, the two Monte Carlo results agree fairly well, butthe experimental result is somewhat higher. The PRAL result appears too
494

high. Note that Ashworth et al [137] have recently published a revisedversion of PRAL; they find that the first-order PRAL algorithm contained inTRIM90 is poor in predicting longitudinal and lateral straggling, due to amathematical error.
The B0rgesen results for carbon [136] (not shown here) indicate thatthe TRIM90 range is about 15% low due to the high stopping power (seeFig.7.15). These range measurements may be qualitatively compared to morerecent measurements by Ross and Terreault [138,139] using H and D ions ofenergies up to 2 keV. Here, the discrepancy with the TRIM90 stopping powerfor carbon is even more striking. If the stopping power of carbon wereproportional to T (as assumed in TRIM90, see 7.3.1.1), the csda rangewould be proportional to T . Such an energy dependence is indeed foundapproximately by Ross and Terreault, but of course for the projected range,not for the csda range.
Protons on Nitrogentao
I °'9«J
0) 0.7euo00-6
•Oo>-*jo
Q_
0.5
0.4
0.3
0.2tc.
'3 o.iO
-fJOJo o.o
-310
Fig. 7. 30PRAL/RBS
1-110"' 10y
Proton Energy [MeV]101
Detour factor for protons on nitrogen, according to AZ77 ( —— ),( —— j , J82 ( • • • ) , ICRU49 (-••-), and Al-Affan [133] (-•-)
495

120c\?ao"^o l°0
Deuterons on Aluminum
feC
feCfeCCO
80
60
feOfi 40cOK
a 20•>—so
0
O Range
V Straggling
O
V
10 20Deuteron Energy [keV]
30
Fig.7.31 Projected range and range straggling (fwhm) of deuterons inaluminium. Measured points and two theoretical curves (full: range; longdashed: straggling) are from Bvrgesen et al [136]. The remaining curveswere calculated using TRIM90:
Range: Monte Carlo (-•-); PRAL (•••)Straggling: Monte Carlo (short dashed); PRAL (-••-)
For comparison with the experimental results which are given in terms ofthe full width at half maximum, the theoretical values <r have beenmultiplied by 2.35.
7.3.6. Vactor Rang«8
To our knowledge, no tables of the vector range R are available[134] . To estimate this quantity, we can calculate the longitudinal rangeand the 'radial range* (i.e., the final perpendicular distance of theprojectile from the axis of its original velocity) using TRIM90, and addthem in quadrature. Taking protons on Al as an example, we find that Rhardly differs from R down to about 50 keV. For 2 keV we get, e.g., axlongitudinal range of 0.034 jjm and a radial range of 0.023 jam, which add upto R = 0.04l (im. This is an upper limit, since particles that happen tohave a large longitudinal range must have small radial range, and viceversa.
496

7.4 ALPHA PARTICLES
7.4.1. Electronic stopping Power
7.4.1.1. Compilation of Ziegler
The first comprehensive compilation of stopping cross sections of allelements for helium ions was published in 1977 by Ziegler [140] . Atenergies from 10 MeV to 100 MeV, Ziegler used Bethe's stopping powerformula with empirical shell corrections (which implicitly also includedBarkas and Bloch corrections). These corrections were based on thecorresponding corrections for protons of the same velocity, from Andersenand Ziegler [26]. At energies from 10 MeV to l keV, Ziegler usedexperimental data represented by the following fitting formula for thestopping cross section:
S/n (S/n) (s/n>v,. ulow high
(7.19)
whereA.
(S/n) = A (1000 T)low 1and
(S/n) = (A / T) log (1 + A / T + AT),high 3 4 5
and T is the kinetic energy in MeV.
The formulas for (S/n) and (S/n) are similar to theoreticallow highexpressions applicable at low and high energies, respectively. Used incombination, they provide a good description of the energy dependence ofthe stopping cross section in the vicinity of the stopping power peak. Forthe determination of the coefficients A ,....A in Eq.(7.19) Ziegler had athis disposal data for 50 elements. For the other elements he interpolatedwith respect to atomic number. The interpolations were also guided byknowledge of stopping cross sections for protons of the same velocity fromthe compilation of Andersen and Ziegler [26].
Table 7.16 lists the elements for which data were available for heliumions, and the lowest energy for each element to which the data extend. Itcan be seen that measurements at energies as low as 10 keV are available
497

TABLE 7.16. LOWEST ENERGIES AT WHICH EXPERIMENTAL STOPPING CROSS SECTIONSOF ELEMENTS FOR ALPHA PARTICLES ARE INCLUDED IN THE COMPILATION OF ZIEGLER[140] .
LowestEnergy, keV
245
10152030405075100150200250300400
2000
476,14,7,5,1,
282425,32,7817,639,4,64,
Atomic Number
297918, 23, 321334, 46, 51, 83
26, 27
8, 10, 36, 54
68, 74
39, 40, 41, 42, 52, 53, 57, 66, 7312, 23, 49, 5072, 77
for only 7 elements, and as low as 100 keV only for additional 26 elements.Clearly the use of the Eq. (7.19) down to 10 keV or 1 keV represents anextrapolation with considerable uncertainty.
7.4.1.2. Method of Ziegler, Biersack and Littmark.
Ziegler, Biersack and Littmark (ZBL)[141] introduced a differentmethod for obtaining empirical stopping powers for helium ions below 10MeV, which involved a scaling from protons to helium ions, in a two-stepprocedure. First, proton stopping cross sections for all elements arefitted by a formula similar to the one used by Andersen and Ziegler (cf.Table 7.10). Second, an effective charge parameter Ç is introduced, such
498

LI"/ H STOPPING RATIOC SOLID TARGETS ONLY ] = CALC. STOPPING RATIOl
oo
ranrfragWIBS»
O•z.l—lCLu_Oh-COI
u>
'Tb B
a 3
rl 44K'o<J
Öl
-i" 8
10 100 1000ION ENERGY C KEY / AMU ]
1E4
Fig.7.32 Z as defined by eg. (7.22), for Li ions in solid elements,
versus energy per mass unit [152]. Every symbol represents an experimental
value; the line is a fit to the points.
that Ç Z is the effective charge of an ion of charge Z (see also Sec.7.5.1) . The ratio of the stopping cross section for a helium ion to thatfor a hydrogen ion of the same velocity is then given by
He zHe He He (7.20)
ZBL assumed that the effective charge parameter for hydrogen ions, Ç ,His equal to unity at all energies. They determined the parameter Ç forhelium ions by analyzing experimental stopping cross sections for hydrogenand helium ions with the same velocity. They found that Ç depends
il 6predominantly on the velocity. Neglecting the residual dependence of Ç onHethe atomic number of the target atom, they fitted Ç by an empiricalformula that depends only on the energy of the helium ion. This formulapredicts an effective charge that decreases monotonically with decreasing
499

velocity (e.g., Ç = 1 at 1 keV/u). However, in a review of stopping powersof light ions near the maximum, Bauer [91] pointed out that for gas targetsas well as solids such as carbon, AI O and SiO , the effective charge of2 3 2helium ions reaches a plateau below 50 keV/u. [Note that the effectivecharge shown in fig. 7.32 for Li ions does reach a plateau below 20 keV/u!]Similar results were obtained by Eppacher and Semrad [142] who alsoemphasize that the effective charge of helium ions is not quite independentof the target.
There is another case where the concept of effective charge is quiteinappropriate: Golser and Semrad [143] have found that the squaredeffective charge for He ions in helium gas at 4 keV/nucleon is 5.8. Thisexceeds even the high-energy limit of 4 that one would naively expectsomewhere above 300 keV/u; it is due to the unusually steep energydependence of S for H ions in He.
A similar scaling procedure was applied by ZBL to all heavy ions (seeSec. 7.5.1.1), and was incorporated into a charged-particle transport codecalled TRIM [141] which car be applied to compounds as well as elements(cf. sections 7.3.3, 7.5.3). The TRIM programs are updated from time totime. From the 1990 version [144] on, they include bonding corrections forcompounds developed by Ziegler and Manoyan [106] (cf. Sec. 7.3.1.2). Eventhough these bonding corrections were derived for solids, the TRIM programalso offers bonding corrections for some gaseous compounds.
7.4.1.3. Compilation in ICRU Report 49.
In ICRU Report 49 [145], stopping powers for helium ions with energiesabove a few MeV are evaluated according to Bathe's theory, with shell,Barkas and Bloch corrections. The mean excitation energies used were thesame as those adopted previously in ICRU Report 37 [5] dealing withelectrons and positrons. The mean excitation energies for compounds wereeither taken directly from experimental data, or were obtained by amodified Bragg rule as described in section 7.2.1.5. The shell correctionsand Barkas corrections were evaluated according to procedures proposed byBichsel [5,30,145] which involve the adjustment of various parameters toobtain close agreement ^ith measured stopping powers for alpha particlesand protons. If the mean excitation energy for liquid water were changedfrom the value of 75 eV used by the ICRU to the value of 79.8 eVrecommended by Bichsel and Hiraoka (see Table 7.4), and if the shell and
500

Barkas corrections were left unchanged, the stopping power for helium ionswould be reduced by 2.4%, 1.8% or 1.5% at 2, S, or 10 MeV, respectively.
At energies below a few MeV, Ziegler's fitting formula, Eq.(7.19), wasuseci. For most elements, the numerical values of the coefficients weretaken from Ziegler [140] . However, for elements with atomic numbers Z = 1,4, 6, 7, 8, and 14, the values were re^vised in order to take into accountnewer experimental data. Coefficients for amorphous carbon were adoptedwhich differ from those for graphite. For 13 compounds for whichexperimental data were available, the stopping powers were evaluated withuse of a different fitting-formula developed by Powers [146], For othercompounds, Bragg additivity was applied to the elemental stopping crosssections.
The tables of ICRU49 can also be calculated using program ASTAR (seeappendix).
7.4.1.4. Comparisons of Electronic Stopping Powers
Table 7.17 contains comparisons of stopping powers of selectedelements and compounds from three sources: the compilation of Ziegler[140], the compilation in ICRU Report 49 [145], and the TRIM program (1990version) . At 1000 keV and 100 keV the differences are moderate, on theorder of a few percent, but occasionally they exceed 10 percent. At 10 keVand 1 keV the differences are large, which is not unexpected because thestopping powers at these energies often depend on rather uncertainextrapolations. The differences between Ziegler's 1977 compilation and ICRUReport 49 on the one hand, and the TRIM program on the other hand, arelargely due to the reliance on experimental alpha-particle data of theformer two, instead of the proton-to-alpha-partiele scaling procedure ofthe TRIM program. See also fig. 7.44 for results on water.
Included in the stopping power tables for heavy charged particlespublished by Hubert et al [HU90; see table 7.11 for reference codes andSec. 7.5.1.1 for a more complete description], are stopping powers forhelium ions with energies from 10 MeV to 2000 MeV. Below 600 MeV, thesestopping powers are from Ziegler [140], and differ by less than 1 percentfrom those from ICRU Report 49 [145]. The stopping powers in HU90 above 600MeV were obtained from Janni's proton stopping power tables [J82], assumingZ -proportionality, and differ by less than 2 percent from those in ICRU
501

TABLE 7.17 . RATIOS OF FITTED CURVES FOR THE STOPPING OF ALPHA PARTICLESIN SELECTED MATERIALS.
T90: TRIM-90 [144]NB: no bonding correction usedB: bonding correction used
277: Ziegler [140]ICRU49: ICRU Report 49 [145]
Gases :
Solids:
1 keV 10 keV
H2N202H 02AirCO2CH4C H3 8BeC (Graphite)AlSiFeCuAgAuPbLiFAl 02 3SiO
2LucitePolyethylenePolystyreneTeflon
WaterToluene
T90NB B
0.956 11.001 10.997 11110.923 10.937 1
1111111111110.983 10.947 10.933 10.961 1
1.098 10.926 1
Z77 ICRU49
0.470 0.4271.367 1.3171.865 1.929
1.2431.4611.2740.8640.975
0.929 0.9221.730 1.5671.130 1.1300.922 0.9692.108 2.1081.637 1.6371.826 1.8261.098 1.2811.557 1.557
1.9361.3761.1340.9030.9190.9531.339
1.0681.162
T90NB B
0.956 11.001 10.996 11110.923 10.923 1
111j_111111110.983 10.947 10.933 10.961 1
1.098 10.926 1
Z77 ICRU49
0.587 0.5531.178 1.1521.391 1.406
1.0511.2211.0640.8000.847
0.880 0.8001.236 1.2351.162 1.1621.004 1.0601.520 1.5201.333 1.3331.376 1.3761.037 1.1891.257 1.257
1.4701.1571.0730.8550.8480.8841.053
0.9730.946
502

----------------- laoj-e / . j. / , concinue
100 keV
Gases ; H2N2O2H O2
AirCO2CH4C H3 8
Solids: BeC (Graphite)AISiFeCuAgAuPbLiFAI 02 3SiOïLucitePolyethylenePolystyreneTeflon
Liquids: WaterToluene
T90NB B
0.956 11.001 10.996 11110.923 10.937 1
1111
111111110.983 10.947 10.933 10.961 1
1.098 10.926 1
Z77 ICRU49
0.364 00.914 00.937 0
00000
0.915 01.049 10.986 00.974 10.993 00.983 00.940 00.892 00.919 0
1000000
00
.847
.303
.329
.897,925.884.893.975
.809
.143
.986
.002
.993
.983
.940
.998
.919
.114
.863
.782
.901
.931
.968
.835
.884
.940
a.
1000 keVT90
NB B
0.956 11.001 10.996 11110.924 10.937 1
1111111111110.983 10.947 10.933 10.961 1
1.098 10.927 1
Z77 ICRU49
0.954 0.9651.008 1.0190.996 1.019
1.0041.0291.0600.9750.914
0.996 0.9980.955 0.9981.032 1.0320.992 0.9481.015 1.0150.990 0.9901.002 1.0021.020 1.0370.991 0.991
1.0360.9350.8870.9440.9610.9190.887
1.0280.893
503

Report 49 or from the computer program BEST. These small differences aredue to the use of different I-values and shell corrections in the variouscompilations.
7.4.2. Kuclaar Stopping Power
Because of the scar-city of experimental data, nuclear stopping powersare usually obtained by calculations involving three steps: (a) thedetermination of an appropriate projectile-target scattering potential; (b)the determination of the elastic-scattering cross section by aclassical-mechanics calculation; and (c) the evaluation of the energytransferred to recoiling target atoms in elastic collisions. Confirmationof the validity of such calculations is usually obtained throughcomparisons between calculated and measured ranges, or with more detailedtransport results.
There is no controversy in regard to steps (b) and (c) , but manydifferent prescriptions can be found in regard to step (a) , thedetermination of the potential which must take into account the Coulombinteractions between the projectile and target, including nuclei andorbital electrons. The most detailed discussed of this problem can befound in the book by Ziegler, Biersack and Littmark [141]. It is customaryto calculate such potentials for a large number of projectile-targetcombinations, and then to adopt a single potential that provides a goodapproximation to the results for all the combinations. Such potentials weredeveloped by various authors including Kalbitzer, Oetzmann, Grahmann andFeuerstein [147], Wilson, Haggmark and Biersack [148], Bister, Hautala andJäntti [149], and Ziegler, Biersack and Littmark [141].
For applications to alpha particles it is not necessarily best to takesuch a universal potential, and it might be better to rely on calculationsinvolving alpha-particle projectiles only. However, the application of theso-called universal potential of ZBL to alpha particles appears to bejustified by the transport calculations by Fink, Biersack, Städele andCheng [150], who were able to get good agreement with measured rangeprofiles of 50 to 1500-keV He ions in 30 solid elemental targets.
Table 7.18 compares nuclear stopping powers of elements from fourcalculations. There are large differences between the results from [147]
504

TABLE 7.18. RATIOS OF NUCLEAR STOPPING POWER FROM VARIOUS PUBLICATIONS.
T90: TRIM-90 [144]ICRU49: ICRU Report 49 [145]BHJ79: Bister, Hautala and Jantti [149]
K76: Kalbitzer et al [147]
l keV 10 keV
HBeCAlAgPb
T90
111111
ICRU49
0.9960.9950.9430.9971.0031.002
BHJ79
1.2591.2121.1951.1370.9620.863
K76
0.7300.7240.7550.8440.9280.859
T90
111111
ICRU49
1.0441.0391.0341.0170.9930.994
BHJ79
1.1701.1491.1411.1021.9700.895
K76
0.8210.7640.7050.6390.6180.656
and [149] on the one hand, and [144] and [145] on the other. Both [144] and[145] use the ZBL universal potential, and the small differences betweenthem are due to the fact that the TRIM program uses an approximationformula for the calculated numerical results, whereas in [145] thenumerical data are used directly.
For nuclear stopping powers of compounds, the results given in [145]are essentially identical to those obtained from the TRIM program, if oneuses TRIM92 (from version 92.05 onward).
The nuclear stopping powers found in compilations are calculatedwithout any restriction on the underlying elastic-scattering deflections.In many experimental situations such restrictions are needed. For example,when stopping powers are measured in a foil-transmission experiment, thelarge deflections associated with large energy transfers to atomic nucleiwould tend to remove the projectiles from the cone of acceptance angles ofthe detector. Therefore the measured stopping power would in effect includeonly the electronic stopping power plus a small fraction of the nuclear
505

stopping power. The exact evaluation would require detailed multipleelastic scattering calculations. However, the magnitude of the effect canbe estimated by calculating angle-restricted nuclear stopping powers whichinclude contributions only from collisions with deflections smaller than aspecified cut-off value. In Table 7.19, ratios of the angle-restricted tounrestricted nuclear stopping powers are given for a few elements, asfunctions of the cut-off angle.
TABLE 7.19. RATIO OF ANGLE-RESTRICTED TO UNRESTRICTED NUCLEAR STOPPINGPOWER FOR ALPHA PARTICLES.
Cut-off angle (in the laboratory system), degrees1 2 5 10 20 50 100 180
Energy(keV)
Be 1 0.0070 0.0188 0.0644 0.1507 0.3163 0.6694 0.9256 1.010 0.0426 0.0926 0.2187 0.3680 0.5550 0.8166 0.9616 1.0100 0.2045 0.3115 0.4742 0.6036 0.7333 0.8933 0.9778 1.0
C 1 0.0047 0.0129 0.0463 0.1141 0.2568 0.6021 0.8946 1.010 0.0282 0.0652 0.1691 0.3052 0.4909 0.7729 0.9452 1.0100 0.1551 0.2539 0.4182 0.5553 0.6951 0.8704 0.9692 1.0
AI l 0.0022 0.0064 0.0250 0.0663 0.1656 0.4714 0.8226 1.010 0.0117 0.0296 0.0913 0.1914 0.3536 0.6657 0.9019 1.0100 0.0795 0.1511 0.2985 0.4433 0.6030 0.8149 0.9480 1.0
Ag 1 0.0008 0.0025 0.0110 0.0327 0.0927 0.3315 0.7254 1.010 0.0031 0.0087 0.0320 0.0810 0.1907 0.4928 0.8228 1.0100 0.0195 0.0467 0.1288 0.2444 0.4132 0.6962 0.9059 1.0
Pb 1 0.0006 0.0018 0.0083 0.0255 0.0760 0.2946 0.6945 1.010 0.0019 0.0055 0.0215 0.0575 0.1451 0.4265 0.7866 1.0100 0.0104 0.0263 0.0822 0.1743 0.3291 0.6305 0.8811 1.0
506

TABLE 7.20. COMPARISON OF ALPHA PARTICLE RANGES: RATIOS OF PROJECTED RANGESFROM ICRU REPORT 49 [145] TO THOSE CALCULATED WITH TRIM-90 [144].
Energy (keV)10 100 1000
BeGraphiteAlFeAgAuU
0.9080.8050.8930.8790.9140.9680.967
1.0480.8010.8690,8190.8900.9540.923
1.2110.8670.9450.9180.9780.9810.889
1.0390.9490.9651.0030.9890.9310.880
Air 0.833 0.813 0.968 0.980Water, liquid 0.969 0.929 1.120 1.118
7.4.3. Projected Ranges
The projected range is defined as the average depth to which particlespenetrate, with the depth measured along the direction in which theparticles start out. In the continuous-slowing-down approximation, theprojected range is given by
<R •r <cos S (T)el (T) dT (7.
where S and S refer to electronic and nuclear stopping power, resp.,el nucand T is the initial particle energy. The quantity <cos X(T =* T)> is tneaverage deflection cosine, due to multiple elastic scattering, that occursas the particle is slowed down from T to energy T. Projected ranges anddetour factors for alpha particles are given in [145] (or can be calculatedusing program ASTAR, see appendix) . Projected ranges are also part of theoutput of the TRIM program. Projected ranges from these two sources arecompared in Table 7.20 for several materials and energies. Differencesranging from a few to 20 percent occur. Since the projectile-targetpotential in both cases is the universal potential of ZBL, the
507

elastic-scattering deflections and nuclear stopping powers in the twocalculations can be presumed to be the same, so that the projected-rangedifferences are probably due to differences in the assumed electronicstopping powers.
7.5. HEAVY IONS
We consider mainly ions from Be to Ar, in elemental targets. Forcompounds, we have, unfortunately, found very few measurement using theseions. Two exceptions are given in Sec. 7.5.1.2.
Instead of describing stopping power as a function of velocity, oneconveniently uses T/A (in MeV/nucleon) or T = T/M (in MeV/u) as energyvariable, as for hydrogen ions (see 7.3.1.1). The difference between thesetwo possibilities usually amounts to about 0.1% of the energy variable inthe range considered (see the list of masses of the most abundant isotopein [25], in ZBL85 or in file SCOEF.88 of TRIM90) . (For the definition ofreference codes like ZBL85, see table 7.11).
7.5.1. Electronic Stopping Power
7.5.1.1. The Effective Charge concept.
At sufficiently high speeds where the projectile is bare and where thefirst Born approximation holds, the electronic stopping power is
2proportional to Z (if one compares different projectiles at equal speeds),i.e., eq.(7.11) holds with L = L = 0. At lower speeds the projectileX ^usually carries some orbital electrons, and this reduces the stoppingpower. If N is the average number of electrons carried, the charge on theprojectile (in units of e) is Z - N, and the fractional projectile chargeis q = (Z - N)/Z . For distant collisions, all the electrons on theprojectile will shield the nuclear charge of the projectile (and hence,reduce the stopping power), but for close collisions, the shielding will bereduced. One therefore introduces an effective projectile charge Zl,ef f(smaller than Z but larger than the true charge, Z - N) to replace Z in
508

the equation mentioned above. If the projectile's charge state is indynamic equilibrium with the target, one can describe the measured stoppingpower S for an arbitrary ion (Z ) by comparing it to the stopping powerS''" for a reference ion (Z ) whose stopping is presumably well known, inthe same target and at the same velocity (see also Sec. 7.4.1.2 and Ch. 9):
s sref - (7.22)
Eg.(7.22) defines Z . Clearly, Z not only contains information1, ef f 1,effabout the projectile charge, but also about deviations from2Z -proportionality. In the following, we assume, unless stated otherwise,
re fthat the proton is used for reference and that Z =1 (note, however, thataccording to [95] the true equilibrium charge of a slow hydrogen ion isless than 1). As an example, Fig. 7.32, taken from Ziegler [152], showsexperimental values for the squared effective charge of Li ions; theyapproach the value 9 at high speeds, as they should. One also introducesthe relative effective charge
<7-23)
The most comprehensive and most practical source of information onstopping, ranges and straggling of all ions of all energies in all solidelements (and in many mixtures and compounds) is the computer program byZBL85 and its more recent versions Z89, Z90, Z91 or Z92 which areidentical to each other and differ from ZBL85 only in some of thecoefficients in file SCOEF, and above 10 MeV/u (see 7.3.1.1, and alsobelow).
7 Shima [151] and Gauvin et al [9] have compared the ionic equilibriumcharges Z - N of fast heavy ions (as measured after exit from the targetfoil) to their effective charges, for many different solid targets. Theyfind, in part, a similar behaviour as a function of Z , but they also findZ - N equal to or even larger than Z , contrary to what was said above.This is presumably because the ionic charge, after exit from the foil,increases as a result of Auger electron emission.
509

0)
U
0)
OJK
1.0
0.9
0.8
0.7
0.6
0.5
0.4
0.3
0.2
0.1
0.010"
1J •> ' l
Ar
10" 10"' 10°Energy per Nucléon [MeV]
1C1 io2
Fig. 7.33. Relative effective charge Ç for Be, C, O and Ar ions in
carbon, calculated using Ziegler's program STOP (contained in TRIM90). The
curves are essentially the same for other targets, except at the low energy-
end (see Fig.7.34).
The semi-empirical program Z90 is based on eq. (7.22) and on theproton as a reference projectile. It uses the Brandt-Kitagawa theory [153]
ef fto calculate Z , as follows: The ions penetrating the solid are assumedto be in charge state equilibrium, and their fractional ionization q isdetermined as a function of the relative velocity between the electrons inthe solid (described by the Fermi velocity v ) and the ion. Then thescreening length A for the ion is calculated as a function of Z and q,including an empirical correction factor LFCTR given in file SCOEF forevery Z . Finally, the fractional effective charge Ç is found from q, vand A. In this procedure then, Ç depends on Z only through v . Fig.7.33
2t r
shows the fractional effective charge according to Z90, for Be, C, O and Arions, as a function of T/A . As expected, the heavier the ion, the moreIspeed is necessary to strip off all electrons.
510

The dependence of Ç on v just mentioned leads to a small2 -dependence of the stopping power additional to the Z -oscillationsalready present in the proton data (see Sec. 7.3.1.1). Fig.7.34 shows thisadditional dependence on 2 for carbon projectiles, according to Z90. Onlyfor the extremely small energy of 12 keV there are sizeable variations; at100 keV/nucleon the oscillations are practically gone, and the effectivecharge becomes target-independent.
In practice, this target-independence of Ç is useful as a firstapproximation, but it cannot be completely correct. Geissel et al [154,155]in their very useful reviews of heavy ion stopping, show that the peaks ofthe Z -oscillations found for H and He projectiles (cf. Sec.7.3.1.1) stay
£4
roughly at the same Z -values but become more pronounced at large Z (e.g.,£• \-
for Pb projectiles). These enhanced oscillations can not be reproduced bythe program Z90 (because here, Ç is essentially independent of Z , as noted
0.6 Effective Charge of Carbon Projectiles
0) 0.5
0.40)a;
0) 0.3 -
0.2
1200 keV
10 20 30 40 50 60 70
Atomic Number of Target80 90
Fig.7.34. Relative effective charge Ç for carbon projectiles, versus targetatomic number Z , according to Ziegler's stopping tables (Z90), for T = 12
keV and T = 1200 keV.
511

Z? - Oscillations for N Projectiles~ n———p
A Ld85 (25 keV/u)
A Ld92 (25 keV/u
10 20 30 40 50 60 70Atomic Number of Target
80 90
Fig.7.35. Electronic stopping power as a function of target atomic number
Z , for nitrogen projectiles. The points shown by symbols were deduced from
experimental range values, assuming a stopping power proportional to v
(full triangles: inert gases; other points: solid targets). Lower full
curve: Z90 for 25 keV/u (v = v ); upper full curve: Z90 for 57 keV/u.
Remaining curves by Northcliffe and Schilling [157] for 25 keV/u:
-.- solids, --- gases.
above). But for nitrogen and argon ions, the measured oscillations arestill fairly well reproduced by Z90, cf. figs.7.35 and 7.36. The well-knownstopping tables by Northcliffe and Schilling [157] that date from 1970 andare sometimes used even today, follow the general trend of the data (fig.
7.35) but do not contain Z -oscillations.2
For specific ion energies less than about 10 - 20 keV/u, Z90 assumesS oc v0.75 for Si and Ge targets (if Z s 19) and for C targets, and S « vfor all other targets (see, e.g., Fig. 7.45 for an Ar target).
512

In going from ZBL85 to Z89, some of the proton stopping coefficientsin file SCOEF were changed, as mentioned in Sec. 7.3.1.1. This producedgenerally the same relative changes in heavy ion as in proton stopping
12powers. In addition, most of the values v were changed for Z < 19. For 'C
on Na, e.g., this change reduced S by 16% (below 13 keV/u) . In addition,the correction factors LFCTR (see above) were changed for Li, B, Si and Pprojectiles. For 31P on Mg, e.g., this reduced S by 19% (below 20 keV/u) .Kuronen [158] found that the difference between these two codes is lessthan 2% for the cases studied by him, but there are evidently largerdifierences in other cases.
7.5.1.2.Solid Targets.
If one plots the measured stopping cross section versus Z , for agiven Z and at a fixed projectile velocity, one also finds oscillations
j
("Z -oscillations"). Ward et al [159] and others have investigated these
- Oscillations for Ar ions (0.5 MeV/u)
aaen>~4
oCo
>o
feOG
• pHCL,ÄO—>
LOO
OO
10 20 30 40 50 60 70Atomic Number of Target
80 90
Fig.7.36. Electronic stopping power for Ar ions (0.5 MeV/u), versus
Z Curve- Z90; symbols: values measured on solid targets [156]2
513

- Oscillations for Carbon Target
10 20Atomic Number of Projectile
30
Fig.7.37. Electronic stopping power of carbon for light projectiles at
v = v , versus Z . The experimental points, measured at various ion speeds
given below, were reduced to v = v , assuming the stopping power to be
proportional to v . Full curve: Z90 for v = v .
Open triangles: Wr79 (0.818 v ) ; full triangles: Wr79 (v =v ) ; open
squares: Len86a (0.8v); full squares: Len86b (0.8v); crosses: Hof76
(0.402 v ); hexagons: Or63, Or65 (0.41 v ). Beyond Z - 30, the discrepancy
between Z90 and Len86a becomes very large.
Dashed curve: empirical correction factor LFCTR (Z90; right scale).
oscillations in several materials . An example for carbon is shown in fig.7.37. Ward et al found that the amplitude and the phase of the oscillationdepends on the material; the amplitude decreases with increasing projectilevelocity. These oscillations have been built into 290 by introducing theempirical correction factor LFCTR mentioned above. Fig.7.37 shows thiscorrection factor; it also shows that Z90 represents the oscillation quitewell (within about 10%), up to Z„= 20. The Z - oscillation for a carbon
À .Ltarget has been calculated by Echenique et al [100] using a non-linear
514

density-functional approach; the result agrees rather well with experiment,except that the calculated depth of the minimum at Z = 12 is too low.
For aluminum, the Z -oscillation is similar to that for carbon; fornickel, the amplitude is considerably smaller [159]. This change cannot bereproduced by Z90 because in this calculation, the variation of therelative effective charge with Z is practically independent of Z (see
1 /!
fig.7.38).
Evidently, it is of interest to compare the ZBL85 and the Z90 stoppingpowers to recent experiments. We discuss such comparisons in the followingfour paragraphs. Sofield [160], e.g., in a recent review of heavy-ionenergy loss, finds that the ZBL85 code provides a sound practical basis forstopping power calculations, but that one may have to resort to experimentif high accuracy is required.
0.6
0.5
03'S °'40)
oo>0)
n „(J.O
0.1 -
Effective Charge in different Targets—————————————————————
\\
0.0 I I I I10 15 20 25
Atomic Number of Projectile30
Fig.7.38. Relative effective charge Ç, according to Z90, for lightprojectiles in various targets: full curve: C; dashed curve: Al; dottedcjrve: Ni. The curves are almost identical.
515

12,
SU)
0)C oC- J
ino*—«p"o
Z2 - Oscillation for 4.56 MeV 1CC Projectiles
10 20 30 40 50 60 70Atomic Number of Target
80 90 100
12Fig.7.39. Electronic stopping power for C ions at 4.56 MeV in various
targets, versus Z . The experimental points are due to Kuronen et al [162],
the curve is from Z90.
The Helsinki group has done many useful comparisons in recent years,for energies of about 1 MeV/nucleon or less. Räisänen and Rauhala [161]find that Z89 gives systematically better fits to experimental data thanZ80 (except for Li ions). Kuronen et al [162] measured the stopping powerfor 12C ions (T/A = 0.4 to 1.4 MeV) in 18 different elemental solids. Theygive correction factors f by which ZBL stopping should be multiplied togive their experimental results. Fig. 7.39 shows their experimentalstopping power for C ions (0.38 MeV/u), compared to the prediction ofZ90. One sees agreement in most cases within the experimental error of 12%.(Note that the Z -oscillation appears much reduced compared to the originalpublication [162] since we have plotted S/p rather than S) . For Li-, B-,C-, N-, and O- projectiles in Au, they also find mostly agreement withZBL85, within the experimental error of 4%.
516

Similarly, Räisänen and Rauhala [163] measured the stopping of "Li-,B-, C-, N-, and O-ions (T/A = 0.2 to 2.1 MeV) in Mylar, Kapton, Havar, andnickel and compared it to Z80, ZBL85, and Z89. For Mylar and Kaptontargets, Z89 (with bonding correction, see Sec. 7.3.1.2) was generallybest, pointing to a positive effect of this correction; the measured valuesfor B-ions were, however, larger than predicted; also, for Li-ions, thespecial values given for Li in Z80 were better. For Nickel and for Havar (afoil consisting mainly of Cr, Fe, Co, and Ni), there was agreement withZBL85 for N- and O-ions, but for B- and C-ions, experimental values werehigher than Z80 and ZBL85 by up to 15%. This result may correspond to thefinding by Anthony and Lanford [164] that experimental stopping for C-ionsin Cu is higher than predicted by Z -scaling,not described by the Ziegler stopping power.in Cu is higher than predicted by Z -scaling; it points to a Z -oscillation
In their paper [165] on the stopping power of bisphenolA-polycarbonate C H O for Li, B, C, N, and O ions, Rauhala and Räisänen16 14 3compare their results to their previous [163] data on Mylar (C H 0 )mentioned above. Since both materials contain the same elements, comparingthem will provide a good test of Bragg's rule. For all ions, the authorsfind that the measured stopping power of polycarbonate exceeds that ofMylar by a few percent, and that this difference is correctly predicted byBragg's rule. (Only for Li, the predicted difference is too small to bemeasurable). The small bonding corrections predicted by Z89 (cf. Sec.7.3.1.2) are, however, obscured by the noticeable Z - oscillation.
Bauer and Rössler [166] have recently made another test of Bragg'srule. They find that, for N ions in AI O and SiO , the stopping crosssection is about 20% higher at 25 keV/u than expected from Bragg's rule.This large effect is in a direction opposite to the effect found for H ionsin the same materials (see 7.3.1.2); evidently the influence of projectilecharge states is of importance here.
For Mg-ions in 17 elemental solids, Arstila et al [167] find fairagreement with ZBL85 stopping for 2v < v < 5v ; their correction factorsf are given in table 7.21 (Note that v = 24.8 keV/u) . For v < 2v ,however, they find the electronic energy loss much higher and its velocitydependence different from that predicted by ZBL85. This is in contrast tothe finding by other members of the same group [168] that for Al- andSi-ions in Ta at 0.4v < v < 4v , the velocity dependence agrees with thatpredicted by ZBL85. Similarly, Land et al [169] found that the electronic
517

TABLE 7.21. LIST OF CORRECTION FACTORS f ACCORDING TO ARSTILA et al [167],cfor Mg ions in the velocity range 2v < v < 5v . f is the ratio of
experimental stopping powers to ZBL85 values. Error of f : 5%.c
TargetTi22V23Fe26Co27Ni28Cu29Ge32Nb4 1Mo42Pd46Ag47 aHf72Ta73W74Re75Pt78Au
fc1.100.900.930.970.991.031.051.051.151.051.081.091.071.051.051.050.9679
14stopping power of Fe, Ni and Zr for N ions is consistent with velocityproportionality from 14 to 140 keV/u.
To arrive at an estimate of the accuracy of stopping powers forrelevant projectiles, we show here a few figures comparing experimentalvalues to Z90. Fortunately, we find that C-, N, and 0-projectiles, whichare relevant for radiotherapy, have also been measured most frequently.Figs. 7.40 and 7.41 show the result for C- and O-ions in aluminum.Evidently, Z90 agrees with the experimental data within about 20% between0.01 and 0.1 MeV/u, and within about 10% above 0.1 MeV/u. The same is truefor C- and O-ions in carbon (not shown) , if one disregards the slightly lowdata by Po60. There is similarly good agreement for C-, N, and O-ions onnickel, and for C- and O-ions on silver. The data for N-ions on aluminumform rather an exception {Fig. 7.42): here, the agreement is only within20% in the range shown.
518

12
0.01
C on Al
0.02 0.05 0.10 0.20 0.50 1.00Energy per Nucléon [MeV]
2.00 5.00
12Fig.7.40. Electronic stopping power of Al for C ions. Full curve: Z90;dashed curve: HU90. The symbols indicate measured points from the followingreferences: A Sa91; B Wr79; C Rä91; D Ay82; E Po60; F Ab91; G Ab93.
It was mentioned above that the effective charge introduced ineq.(7.11) neglects corrections of higher order in Z . Anthony and Lanford[164] did extensive measurements of the stopping power of five solids formany ions near the stopping maximum; they could represent their resultsbetter by using a relative effective charge Ç that decreases withincreasing Z and by including L - and L -corrections, rather than by the2 1 2formalism of Z80. The importance of L - and L -corrections in connection
.L £
with effective charge has also been stressed by Semrad et al [170] and byAbdessalam et al [171].
For higher energies (2.5 < T/AI < 500 MeV), Hubert et al (HU90)produced a new table of stopping powers and ranges for all ions in therange 2 Z s 103 (assuming the most probable mass for the ion) , in 36solids from Be to U, based mainly on the very accurate (1-3%) measurements
519

from their own group (For a recent review of this work, see Bimbot [172]).Their table is based on eq. (7.22). They find that, to represent the dataadequately, one must use a Ç that decreases with increasing Z [173]. They
4 2use the He-projectile (which is fully stripped at these energies) and theHe stopping power table 277 below 150 MeV/u as a reference. Presumably,
4this table represents the He data better than the all-encompassing programZBL85 (cf. Sec. 7.4.1.4). Above 150 MeV/u, HU90 use Janni ' s proton table
4 2(J82) instead, converted to He data by assuming Z -proportionality.
12.As an example, Fig. 7.43 compares HU90 to Z90 for 30 MeV C ions,i.e., at the low energy end of the HU90 table. Evidently, the two agreerather well (average difference 2.6±2%). As seen in Fig. 7.41, the
cOH
D,OHO——>COo'Soacu
1.2
1.1
i.o
0.9
0.8 -
0.7
160 on Al
0.01 0.10 1.00 10.00Energy per Nucléon [MeV]
100.00
Fig. 7.41. Electronic stopping power of Al for O ions, divided by valuesfrom Z90. Dashed curve: HU90; dot-dashed curve: BEST. The symbols indicatemeasured points from the following references: A Po60; B Rä91; C Wr79;D Sa92; E Ab92a; F Ab93; G BG65; H,I,J: Ga87; K BÎ78; L Sf78.The apparent kinks in the measurement by Sa92 at 0.025 MeV/u and in theHU90 and BEST curves at 10 MeV/u are due to the fact that the Z90 curve iscontinuous but not different!able at these points.
520

14 N on Al
0.005 0.010 0.050 0.100 0.500 1.000
Energy per Nuc léon [ M e V ]5.000
14,Fig. 7.42. Electronic stopping power of Al for N ions. Full curve: Z90;
dashed curve: HU90. The symbols indicate measured points from the following
references: A Sa91; B Po61; C Sc82; D Wr79; E Rä91; F Na68; G Tp62; H Po59;,15J Me78; J Ab93 ( N!); K Sh84; L Ya83
agreement improves toward higher energy; the average difference becomes0.6±2% at 120 MeV and 0.4±0.4% at 1200 MeV. For Ar ions, the difference isslightly larger at 2.5 MeV/u (-4.6±5%), but similar at the larger specificenergies.
Hubert et al give Ç as an analytical function for all but the lightesttargets; hence their values can be calculated for all solid targets, aboveabout Z = 11.
At high energy, where the projectiles are fully stripped (Ç > 0.99 forC ions above 8 MeV/u, and for Ar ions above 38 MeV/u, see Fig. 7.33), onecan use the BEST program in place of HU90. BEST has the advantage that itcan be used for all target elements and for many compounds. For 0 on Al,
521

e.g., (Fig. 7.41} the two agree within 1% above 6 MeV/u (see also fig.7.44).
In summary, we estimate that the Z90 program describes the availableempirical stopping power data of key substances for C to Ar ions from 0.01to 0.1 MeV/u within about 20%, and above 0.1 MeV/u, within about 10%. Forenergies above 2.5 MeV/nucleon, HU90 state that the experimental pointsfall near their table values "with deviations typically less than 5%". Theagreement of HU90 with Z90 and (partly) with BEST is evidently better thanthat over most of the energy range above 2.5 MeV/nucleon [Even for anextreme case like uranium ions at T/A = 2.5 MeV in carbon, HU90 and Z90disagree only by 16%].
12C ions at T/AL= 2.5 MeV
10 20 30 40 50 60 70 80 90Atomic Number of Target
12Fig.7.43. Electronic stopping power of various elemental targets for Cions at 2.5 MeV per nucléon. The curve is due to Z90, the symbolscorrespond to HU90.
522

Stopping Power of various Ions in Water~1—I—I I I |————————I————I———i——1—TT T—I—I II |
0.01 0.02 0.05 0.1 0.2 0.5 1. 2. 5. 10.
Energy per Mass Unit [MeV/u]50, 100.
Fig.7.44. Total (electronic plus nuclear) stopping power of water for H,He, C, O, Ne, Ar, and Fe ions. Full line: Z90; dashed line: Stewart [174];short dashed: ICRU49; dash-dotted: BEST. X...Northcliffe and Schilling[157] for H, He and C ions.
7.5.1.3. Liquid Targets: Water.
It was mentioned in Sec. 7.3.1.3 that one assumes the mass stoppingpower of liquid water to agree with that of ice. Figure 7.44 compares thestopping power from various tabulations for H, He, C, O, Ne, Ar and Fe ionsin water. Good overall agreement between the old Stewart program [174] andZ90 can be seen for light ions up to Neon, where Stewart was able to basehis calculations on experimental data. Only for He ions around 0.8 MeV/u,Stewart is about 15% high. For fast Ar and Fe ions, Stewart is about 15%low, as one can see from a comparison with BEST.
Fig. 7.44 also shows a few points from Northcliffe and Schilling[157] . Evidently, this table disagrees by as much as 30% from the otherresults. This is surprising since both the Stewart and the Northcliffe
523

calculations are based on the original work of Northcliffe [157].Incidentallyfig. 7.35).Incidentally, neither calculation contains Z - or 2 -oscillations (see also
Deviations from Bragg additivity cannot easily be seen in fig. 7.44,due to the scale used, but all the curves shown (except for Stewart's) arebased on the existence of such deviations. See also fig. 7.19 and tables7.13, 7.14, and 7.17.
The curves in fig. 7.44 include the contribution of nuclear stopping(see Sec. 7.5.2). This contribution is small except for Fe ions at lowenergy.
7.5.1.4. Gas targets.
In 1982, Geissel et al [176] observed for the first time that the massstopping power for partially stripped very heavy ions (of several MeV/u) isconsiderably less in a gas than in solids of similar Z . This is due to adensity effect as predicted by Bohr and Lindhard [177]: in a gaseous(dilute) medium, an ion excited in a collision with a target atom cande-excite before the second collision; but in a solid (dense) medium, theion, while still excited, has a high probability of undergoing a secondcollision that may lead to ionization. Hence the ionic equilibrium charge,and also the effective charge, is higher in the solid than in the gas[172]. Hérault et al [178] have shown that at very high energies, where theions are fully stripped, the gas-solid difference vanishes, as expected.They also gave a useful curve that shows the gas-solid difference as afunction of the relative effective charge in the solid, Ç . For example, atÇ =0.9 (i.e., for 1.75 MeV/u 12C or 7.8 MeV/u 4°Ar ions, see Fig. 7.33)the difference amounts to 10%.
It is worth noting that the gas-solid difference mentioned here (aprojectile state effect) is opposite to the difference found for protons (atarget effect), which is discussed in Sec. 7.3.1.3.
At lower energies, the gas-solid difference can be seen superimposedon Z -oscillations in the data by Land et al for nitrogen projectiles. Fig.
2i7.35, where Ç » 0.37. Here, Z90 describes the measurements for He and Neswell, but becomes progressively too high for the heavier gas targets.Although Z90 is strictly speaking for solid targets only (according to the
524

title of the book, ZBL85), it is still useful for gas targets, at least asa first approximation.
Hvelplund [179] found that the stopping power of air. He and Ne forlight projectiles is roughly proportional to velocity between 100 and 500keV. Price et al [180] found the stopping power of N ions in Heproportional to velocity from v = v up to 2.25 v ; for N ions in Ar, it islinear in (but not proportional to) v (see Fig. 7.45). Hvelplund [179] hasalso investigated Z -oscillations in He, Ne and air at v = 0.9v ; he founda behaviour similar to that shown in Fig. 7.37.
A tabulation of stopping powers of gas targets for projectiles in therange 2-100 MeV/u, is being prepared by Bimbot et al [181].
14N on Ar
0.20.001
Fig. 7. 45MeasuredA And69;
0.005 0.01 0.05 0.1
Energy per Nucléon [MeV]14.Electronic stopping power of Ar for N ions, versus energy,
points are from the following references:O Or68; T Tp62; W We53; 9 Pr91.
525

Ions Be - Ar on Targets H,N,0,Ne,Ar
W0.001 0.01 0.10 1.00
Energy per Nucléon [MeV]10.00
Fig.7.46. Experimental electronic stopping of light elementary gas targetsfor various light ions, divided by electronic stopping from Z90. Thesymbols have the following meaning (Here, "ion" means the most abundantisotope of the ion):
Symbol Ref.code IonsABE
H
M
0
P
R
T
V
W
Y
9
And69
Bi8 9
Ef75
He91
Mar62
Or68
Pi68
R160
Tp62
Hv71
We53
Y on 80
Pr91
Be, B,
Ne, A:
N, Ne.
O, Ar
C,Ar
B,C,1
S,C1
B,C,l
B, N, l
Be, B,
N, Ne
Ar
N
Be,B, C,N, O, F,Ne,Na,Mg
TargetsAr
H ,N ,Ne,Ar
Ar
Ar
526

Unfortunately, for gas targets, there are hardly any cases where morethan four authors have measured the same projectile/target combination. An
14exceptional example, with data (for N in Ar) from five authors, is shownin Pig. 7.45. To make some comparison possible in spite of the scarcity ofdata, we have plotted all the stopping data measured with Be, B, C,N, O, F,Ne,Na,Mg,A1,S,C1 and Ar ionc in H ,N ,O ,Ne and Ar, divided by the
£* 2t £t
corresponding value from Z90, in Fig. 7.46. Evidently, the agreement withZ90 is worse here than for solid targets: it is within 5% from 10 to 60MeV/u, within 15% from 1 to 10 MeV/u, and within 30% from 0.01 to I MeV/u.Below 0.01 MeV/u, there are even larger discrepancies, especially for theOr68 measurements in Ar (see also Fig. 7.45).
A few measurements on compounds (CH and CO ) have been done by Bi894 2and He91, at specific energies > 2 MeV/u where Bragg's rule should befairly accurate (indeed, Bragg additivity has been assumed for alphaparticles in the course of the evaluation). The only measurements on a gasmixture have been done on air (We53, Tp62, Hv71). Even though these were atlow specific energy, Bragg's rule should be valid here, provided thecondition discussed by Golser and Semrad [Q] does not apply (see 7.3.1.2).
7.5.2. Nuclear Stopping Power
Nuclear stopping and the universal potential due to ZBL85 have beendiscussed in Sec. 7.4.2. The importance of Coulomb scattering and hence, ofnuclear stopping increases with increasing Z and Z , but it is alwaysimportant only at low energies. Within the range 2 < 27, i.e. for key
2i
substances, electronic stopping becomes larger than nuclear stopping for Cions above about 1 keV/u, and for Ar ions above about 10 keV/u. Likeelectronic stopping, nuclear stopping can be calculated using the stoppingroutines contained in the TRIM programs (with respect to nuclear stopping,ZBL85 and Z90 are identical; Bragg's rule for nuclear stopping in compoundsis used correctly only from version 92.05 of TRIM on). As discussed forprotons and for alphas, the numbers thus obtained are based on theassumption that all scattering angles are allowed, an assumption not always
12appropriate (see chapters 7.3.2 and 7.4.2). For C ions of 0.017 MeV/u onAl (the lowest energy experimental points shown in Fig. 7.40), nuclearstopping according to Z90 amounts to only 6% of electronic stopping, andthe actual correction in a forward scattering geometry (e.g., Sa91a) is
527

certainly less than that and hence negligible. For range calculations, thenuclear contribution to stopping can become quite important (e.g., in Fig.7.49) .
For light ions in polycrystalline Ta at very small velocities (« v ) ,oKuronen and his coworkers [158] have found that the nuclear stoppingaccording to ZBL85 should be multiplied by a factor between 0.7 and 0.8(for a geometry where all scattering angles are allowed).
7.5.3. Energy Loss Straggling
Bohr's energy-independent straggling formula was given in Sec. 7.3.3,and it was stated there that crystal structure and non-uniform filmthickness can influence measurements on the straggling of protons in solidsto a great extent. The same holds true for heavy ions, so that here also,measurements on gas targets are preferable fer a comparison with theory[154] .
According to Besenbacher et al [118a], the measured straggling for gastargets consists of the contributions due to statistically independentelectron excitations (corresponding to the Bohr formula), due tointra-atomic electron correlations, due to charge exchange, and (formolecular targets) due to intra-molecular correlations. For low velocity
2/3heavy ions (v/v < Z ) , the intra-atomic contribution should dominate[118a]. This contribution can be approximated by the Firsov-Hvelplund
2formula [179,183] for the straggling variance ß (based on theFHThomas-Fermi atomic model):
H2 = (8xlO~15 eV2cm2/atom) n s (Z + Z )8 /3 (v/v )2 (7 .24)FH X 2i U
Fig. 7.47, taken from Geissel et al [184], compares stragglingmeasurements carried out on gas targets by four groups [179,184-186] to
2eq.(7.24). The experimental results in units of ß are plotted in reduced3energy units so that eq. (7.24) appears as a straight line; the agreementis surprisingly good.
To understand straggling measurements on solid targets, one must takesurface roughness into account. If this roughness is described by a
528
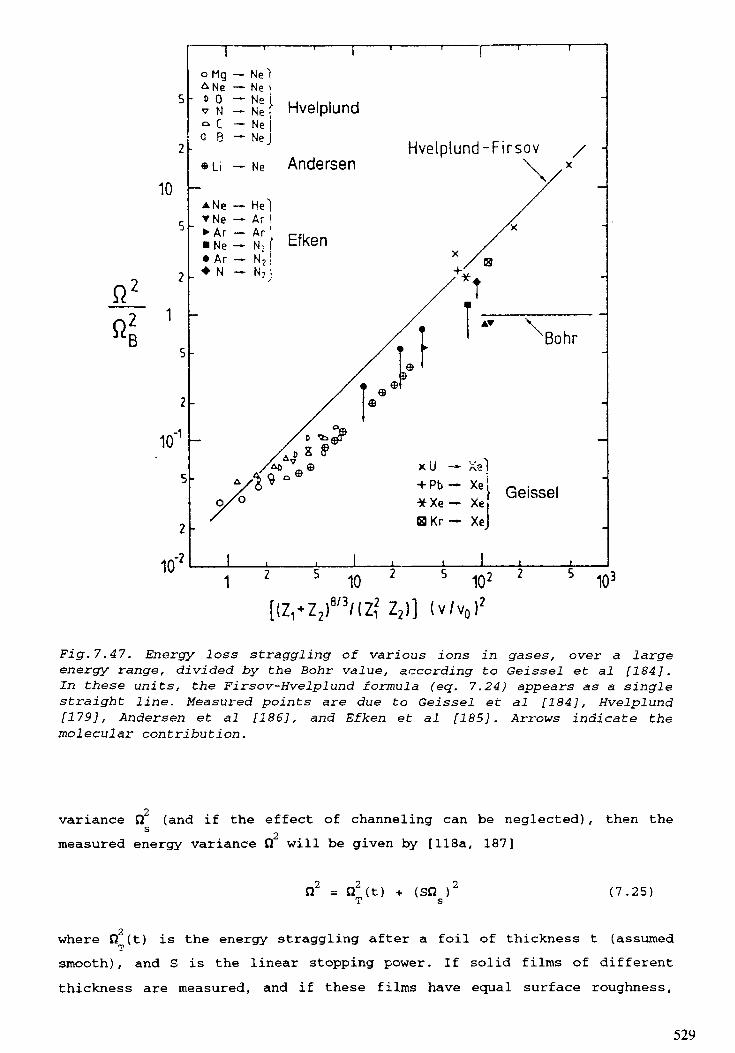
10
2T 1B
10'-1
10,-2
o MgA Ne
t> 0v N« CQ 8
NeNeNeNeNeNe
Hvelplund
®ii — Ne AndersenHvelplund-Firsov /
X
T Ne»>Ar• Ne• Ar+ N
HeiAr lAr l
— N,
Efken
Geissel
2 5 10 2 5 102 2
[(VZ2)8/3/(Z2 Z2)] (v/v0)2103
Fig.7.47. Energy loss straggling of various ions in gases, over a largeenergy range, divided by the Bohr value, according to Geissel et al [184J.In these units, the Firsov-Hvelplund formula (eq. 7.24) appears as a singlestraight line. Measured points are due to Geissel et al [184], Hvelplund[179], Andersen et al [186], and Efken et al [185]. Arrows indicate themolecular contribution.
variance R (and if the effect of channeling can be neglected) , then thes 2measured energy variance Q will be given by [118a, 187]
H2 = £î2(t) + (SQ )2T s (7.25)
where ß (t) is the energy straggling after a foil of thickness t (assumedsmooth), and S is the linear stopping power. If solid films of differentthickness are measured, and if these films have equal surface roughness,
529
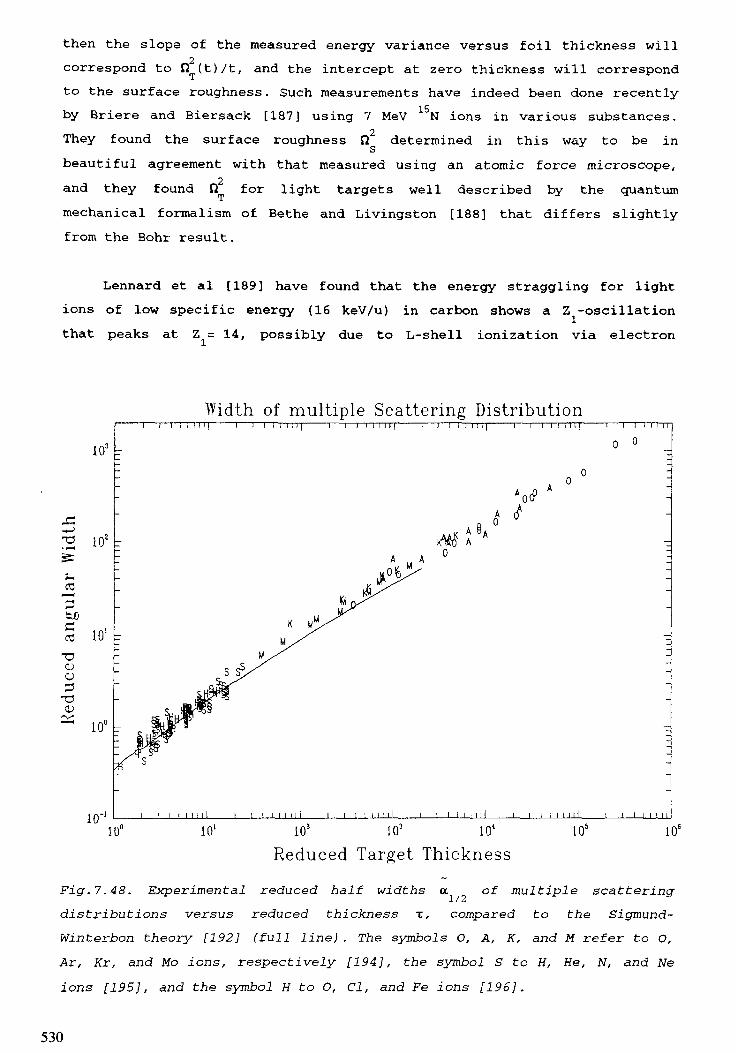
then the slope of the measured energy variance versus foil thickness willcorrespond to ß (t)/t, and the intercept at zero thickness will correspondto the surface roughness. Such measurements have indeed been done recentlyby Briere and Biersack [187] using 7 MeV 15N ions in various substances.They found the surface roughness ß determined in this way to be inbeautiful agreement with that measured using an atomic force microscope,and they found ß for light targets well described by the quantummechanical formalism of Bethe and Livingston [188] that differs slightlyfrom the Bohr result.
Lennard et al [189] have found that the energy straggling for lightions of low specific energy (16 keV/u) in carbon shows a Z -oscillationthat peaks at Z = 14, possibly due to L-shell ionization via electron
10 r
10
Width of multiple Scattering Distribution
,-1 _____I ' 1 i J LJjJ_____l l L ± 1 I I 1 I_____I I 1 l...l_i_l_l_l_____I I l.__.i \ M 1 I_____L 1 il! t_LLJ_____! I ! I 1 1 I
10° 101 102 103 10'
Reduced Target Thickness105 106
Fig.7.48. Experimental reduced half widths a of multiple scattering-
distributions versus reduced thickness T, compared to the Sigmund-
Winterbon theory [192] (full line). The symbols O, A, K, and M refer to O,
Ar, Kr, and Mo ions, respectively [194], the symbol S to H, He, N, and Ne
ions [195], and the symbol H to O, Cl, and Fe ions [196].
530

Range of 120 keV Ions in C
20 30 40 50 60
Atomic Number of Projectile70 80
Fig.7.49. Projected range in carbon of various 120 keV ions, versus Z .
S: experimental points due to Santry et al [201]; full curve: PRAL
(TRIM90).
promotion. This peak is in a place different from where the stopping powerhas a peak (see Fig. 7.37), since the straggling is more sensitive to largeinelastic energy transfers than the stopping power.
The TRIM programs may be used to calculate electronic straggling in anapproximate way, as discussed in Sec. 7.3.3. Note that TRIM91 and TRIM92calculate electronic straggling only for Z < 4 [190].
7.5.4. Multiple Scattering
Sigmund [119] has recently reviawed theoretical descriptions andexperimental results concerning multiple scattering.
531
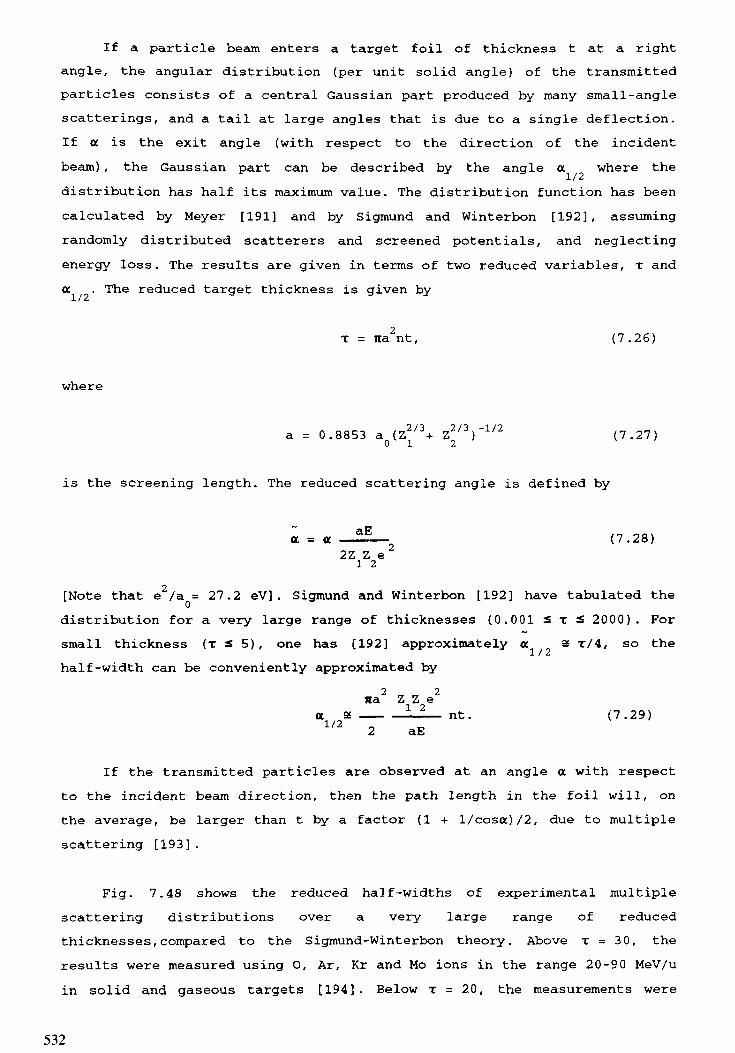
If a particle beam enters a target foil of thickness t at a rightangle, the angular distribution (per unit solid angle) of the transmittedparticles consists of a central Gaussian part produced by many small-anglescatterings, and a tail at large angles that is due to a single deflection.If a is the exit angle (with respect to the direction of the incidentbeam) , the Gaussian part can be described by the angle a where the
\. I Zi
distribution has half its maximum value. The distribution function has beencalculated by Meyer [191] and by Sigmund and Winterbon [192], assumingrandomly distributed scatterers and screened potentials, and neglectingenergy loss. The results are given in terms of two reduced variables, r anda . The reduced target thickness is given by
2T = ira nt, (7 .26)
where
a = 0.8853 a (Z+ Z)" (7.27)
is the screening length. The reduced scattering angle is defined by
a = a — — — (7.28)
[Note that e2/a = 27.2 eV] . Sigmund and Winterbon [192] have tabulated thedistribution for a very large range of thicknesses (0.001 s T 2000). Forsmall thickness (T s 5), one has [192] approximately a 3 T/4, so the
1 / •&
half -width can be conveniently approximated by
na Z Z ea a —— —— —— nt. (7.29)1/2 2 aE
If the transmitted particles are observed at an angle a with respectto the incident beam direction, then the path length in the foil will, onthe average, be larger than t by a factor (1 + l/cosa)/2, due to multiplescattering [193].
Fig. 7.48 shows the reduced half-widths of experimental multiplescattering distributions over a very large range of reducedthicknesses,compared to the Sigmund-Winterbon theory. Above T = 30, theresults were measured using 0, Ar, Kr and Mo ions in the range 20-90 MeV/uin solid and gaseous targets [194]. Below T = 20, the measurements were
532

done using H, He, N, and Ne ions (1-11 MeV) [195] and using O, Cl and Peions (12 - 40 MeV) [196] . One sees that in reduced units, all thesemeasurements lie on a common curve, at least to a first approximation.Above T = 20, the Sigmund-Winterbon curve appears 20% low. Below thisvalue, it appears to represent the data well, within the largeruncertainties. A closer look at the results by Hooton et al [196] showsthat the Fe data tend to lie below the O data.
If the stopping power is measured in a transmission experiment with abeam at normal incidence and a detector of small solid angle, then theresult appears to depend upon the angle a between the incident beam and thedirection to the detector [154, Fig.16], due to multiple scattering. If thetarget thickness is not constant across the target but fluctuates about amean value, then areas of different thickness contribute with differentweight to the energy loss [197]. If a is close to zero, e.g., then the thinparts of the foil contribute more to the measurement than the thick parts,and the measured value S comes out too small (since it is referred to theaverage foil thickness); the opposite holds for large a. Golser et al haveshown [198] that one obtains the correct value S if one measures the energyloss at an angle a such that the counting rate is about 30% of the rate ata = 0, and by dividing this value by the average foil thickness.
The etfects of multiple scattering can, of course, be calculated usingthe TRIM programs. If one uses TRIM91, e.g., multiple scattering can benicely visualized by observing the computer screen during calculation.
7.5.5. Rang«B and Rang* Straggling
Ziegler et al (ZBL85, Ch.7) discuss various methods for measuring themean projected range. Many of these measurements have been done out ofinterest for ion implantation, mostly in silicon. Ziegler et al also showfigures (similar to Fig. 7.28) from which one can estimate the accuracy ofthe results. They state an overall accuracy of 9% for the range of ions insilicon. Fichtner, Biersack et al [199] and Grande et al [200] state thatthe calculated projected ranges and range stragglings of ZBL85 are inoverall good agreement (» 10%) with most of the published data, for a widerange of ion energies and for many ion-target combinations (except [200]for low energy heavy ions which are not of interest here).
533

B on Si
o.oi i. 5. 10. 50. 100. 500. 1000.
Energy [keV]5000. 10000.
10.Fig.7.50. Projected range and range straggling in amorphous silicon of B
and B ions, versus projectile energy.10 11———— : PRAL (TRIM90) for B; -----: PRAL (TRIM90) for B.
-•---: Brice [204]; - • • - ; Monte Carlo (TRIM90).
Experimental points are from the following references:
E: [205]; H: [206]; J: [207]; T: [208]; W: [209]; X: [210]; Z: [211];
0 and +: [203] (10B); 1 and x: [203] (11B) .
The TRIM calculations mentioned can be done using either the MonteCarlo code or using program PRAL (see also Sec. 7.3.5). The two approachesgenerally give the same result for the projected range, but not for rangestraggling (see Ch. 7 of ZBL85, and our Sec. 7.3.5, and Fig. 7.50). PRALshould therefore not be used to determine range straggling, except forpreliminary estimates. The figures in Ch.7 of ZBL85 also permit comparisonsof the projected range with the csda range.
In Fig. 7.49, we show the range of 33 different ions in carbon at 120keV, as measured by Santry et al [201], compared to the PRAL-values from
534

TRIM90. Except for the heaviest ions, the agreement is within a fewpercent, on the average. At Z = 11, the kink in the PRAL curve is anindication of the Z -oscillation also seen in Pig. 7.37.
Santry et al [201] also measured the ranges of these ions in Be, Aland Si targets, with similar results.
Recently, Schule et al [202] have measured the range parameters ofmany different ions implanted at energies from 3 keV to 40 MeV into C, Siand Ge targets made amorphous to prevent channeling. For projectiles withA /A < 1 in Si and Ge, they found that the projected ranges and the rangestraggling agree with TRIM calculations (ZBL85) within 10%. For Si, Ti andCr ions with A /A > 1, the agreement is slightly worse. Since these authorsbased their depth measurements on stopping powers from the same TRIM code,some of these conclusions might be circular.
Behar et al [203] have measured the mean projected range and the rangestraggling for B ions implanted into amorphized silicon at energies from 10keV to 2 MeV, Their results aro shown in Fig. 7.50 together with rangeresults from other authors selected because they are new or because therange of implantation energies is large (see also the corresponding figurein ZBL85, where many ether measurements are shown) . One can see that mostof the range measurements agree within about 10% with the PRAL calculation,and also with the Brice table [204]. For range straggling, the TRIM90 MonteCarlo calculation agrees well with experimental results, while the PRALcalculation appears too large, with respect to Behar's results (thestraggling results due to Wong et al [209] are higher, but the disagreementbetween different results is generally larger for straggling than forranges [203]). The apparent disagreement between Monte Carlo straggling andexperimental results at low energy is due to the finite energy resolutionof the measurements and can be quantitatively understood [203].
Fig. 7.50 also shows that the calculated range of B ions is slightly11smaller (by 4% at BOOkeV) than that of B ions. Considering electronic
10stopping, this is not surprising, since at the same energy, the B ionsare faster and hence, are stopped more efficiently. But Zalm et al [211]have shown that the range of the lighter ions is always smaller, even ifthe additional effect of nuclear stopping is taken into consideration.
535

Abel et al [212] found that the projected range of Ar ions implantedinto C films at energies from 10 to 200 keV, is 20% larger than predictedby ZLB85 (PRAL or Monte Carlo). Since the stopping power of C according toTRIM90 is slightly lower than that of ZBL85 (see Table 7.12), the rangeaccording to TRIM90 is 1% larger, so there is still a 19% differencebetween measurements and TRIM90. This discrepancy resembles the one foundby Grande et al [200] for heavier ions. We note, however, that the range ofAr ions found by Santry at 120 keV agrees with TRIM90 within 4% (see Fig.7.49), and that the experimental range values shown in Fig. 7-13 of ZBL85agree quite well the ZBL85 prediction.
It is obvious that range distributions should reflect the Z - andZ -oscillations found for the electronic stopping power (see figs. 7.35 to7.39). A Z -oscillation was mentioned above; Geissel et al [155] have foundZ -oscillations in the projected ranges and the range straggling observedfor He ions implanted at 35 keV into 14 metallic targets. But Besenbacheret al [213] have found Z -oscillations also where nuclear stoppingdominates the range (using ions with Z a 18 in Si).
ACKNOWLEDGEMENTS
The critical reading of various parts of the manuscript by Dr.P. Bauer, Dr. D. Semrad and Prof R. Ritchie is gratefully acknowledged.
REFERENCES (For data reference codes, see Table 7.11)
[I] INOKUTI, M., BERGER, M.J., Nucl. Instr. Meth. B27 (1987) 249.[2] BOHR, N., Mat. Fys. Medd. Dan. Vid. Selsk. 18, no. 8 (1948)[3] SIGMUND, P., in: Radiation Damage Processes in Materials, ed.
by C.H.S. Dupuy, Noordhoff (Leyden) (1975)[4] BICHSEL, H., Rev. of Modern Physics 60 (1988) 663[5] INTERNATIONAL COMMISSION ON RADIATION UNITS AND MEASUREMENTS, ICRU
Report 37, Stopping Powers for Electrons and Positrons (1984)[6] INTERNATIONAL COMMISSION ON RADIATION UNITS AND MEASUREMENTS, ICRU
Report 16 (1970)[7] JANNI, F.J., At. Data Nucl. Data Tabl. 27 (1982) 150 and 341[8] GOLSER, R., SEMRAD, D., Phys. Rev. A45 (1992) R4222[9] GAUVIN, H., BIMBOT, R., HERAULT, J., KUBICA, B., ANNE, R., BASTIN, G.,
HUBERT, F., Nucl. Instr. Meth. Phys. Res. B47 (1990) 339
536

[10] NAT. ACAD. OF SCIENCES - NAT. RES. COUNCIL, Studies of Penetration ofCharged Particles in Matter, Publication 1133, Washington (1964)
[11] FANO, U.( Ann. Rev. Nucl. Science 13 (1963) 1[12] KUMAKHOV, M.A., KOMAROV, F.F., Energy Loss and Ion Ranges in Solids,
Gordon and Breach, New York, 1981.[13] NELMS, A.T., Nat.Bur.Standards Circular 577 (1956).[14] PAGES, L., BERTEL, E., JOFFRE, H., SKLAVENITIS, L., Atomic Data 4
(1972) 1.[15] BERGER, M.J., SELTZER, S.M., NASA Publication SP-3012 (1964).[16] BETHE, H-, Ann.Phys. 5 (1930) 325.[17] BETHE, H., Z. Phys. 76 (1932) 298.[18] BETHE, H., ASHKIN, J., Experimental Nuclear Physics, Vol 1 (1953)
166.[19] M0LLER, C.,Ann.Phys. 14 (1932) 568.[20] ZEISS, G.D., MEATH, W.J., MCDONALD, J.C.F., DAWSON, C.D.,
Radiât. Res. 70 (1977) 284.[21] RITCHIE, R.H., HAMM, R.N., TURNER, J.E., WRIGHT, H.A., Sixth Symp. on
Microdosimetry, Vol 1 (1978) 345.[22] ASHLEY, J., Radiât.Res. 89 (1982) 25.[23] SHILES, E., SASAKI, T., INOKUTI, M., SMITH, D.Y., Phys.Rev. B22
(1980) 1612.[24] TURNER, J.E., ROECKLEIN, P.D., VORA, R.B., Health Phys. 18, (1970)
159.[25] BICHSEL, H., American Inst.of Physics Handbook, 3d Edition (1972),
sect. 8d[26] ANDERSEN, H.H., ZIEGLER, J.F., Hydrogen: Stopping Powers and Ranges in
all Elements. Vol.3 of The Stopping and Ranges of Ions in Matter,Pergamon Press, Elmsford, New York (1977).
[27] AHLEN, S.P., Rev.Mod.Phys. 52 (1980) 121.[28] SAKAMOTO, N.,SHIOMI-TSUDA, N., OGAWA, H., and ISHIWARI, R. , Nucl.
Instr. Meth. B33 (1988) 158.[29] SAKAMOTO, N. , OGAWA, H., MANAMI, M.,KIMURA, K.,SUSUKI, Y.,HASEGAWA,
M., KATAYAMA, T., NORO, T., and IKEGAMI, H., Radiation Eff. and Def.in Solids 117 (1991) 193
[30] BICHSEL, H., Stopping Power of Fast Charged Particles in HeavyElements, National Inst. of Standards and Technology ReportNISTIR-4550 (1991).
[31] BICHSEL, H., andHIRAOKA, T., Nucl.Instr.Meth. B66 (1992) 345.[32] THOMPSON, T.J., Report UCRL-1910 (1952).
537

[33] BRANDT, W., Phys.Rev. 104 (1956) 691.[34] NORDIN, J.A., and HENKELMAN, R.M., Phys.Med.Biol. 24 (1979) 781.[35] HIRAOKA, T.,KAWASHIMA, K.,HOSHINO, K.,FUKUMURA, A.,and BICHSEL, H.,
Medical Physics 20 (1993) 135[36] ISHIWARI, R., SHIOMI-TSUDA, N., SAKAMOTO, N.,and OGAWA, H.,
Nucl.Instr.Meth. B47 (1990) 111.[37] BONDERUP, E., Kgl.Danske Videnskab. Selskab., Mat-Fys. Medd 35, No.17
(1967).[38] STERNHEIMER, R.M., Phys.Rev. 88 (1952) 851.[39] STERNHEIMER, R.M-, BERGER, M.J., SELTZER, S.M., Phys.Rev.B26 (1982)
6067.[40] INOKUTI, M., and SMITH, D.Y., Phys.Rev. B25 (1982) 61.[41] ASHLEY, J.,Radiât.Res. 89 (1982) 32.[4la]WILLIAMS, E.J., Kgl.Danske Videnskab. Selskab., Mat-Fys. Medd. 13,
No.4 (1935)[42] GERHART, E., J. Chem. Phys. 62 (1975) 821.[43] EGGARTER, J., J. Chem. Phys. 62 (1975) 833.[44] EGGARTER, J., INOKUTI, M., Cross Sections for Electron Inelastic
Collisions with Argon, Argonne National Laboratory Report ANL-50-58(1980) .
[45] PARETZKE, H.G,. Simulation von Elektronenspuren im Energiebereich0.01 - 10 keV, GSF-Bericht 24/88 (1988).
[46] PARETZKE, H.G., TURNER, J.E., HAMM, R.N., WRIGHT, H.A., RITCHIE, R.H.,J. Chem. Phys. 84 (1986) 3182.
[47] PARETZKE, H.G., Kinetics of Nonhomogeneous Processes, (FREEMAN, G.R,Ed.), Wiley, New York (1987) 89.
[48] OLIVERO, J., STAGAT, R. W., GREEN, A.E.S., J. Geophys. Res. 77 (1972)4797.
[49] DAYASHANKAR, GREEN, A.E.S., Radiât. Phys. Chem. 40 (1992) 523.[50] LaVERNE J.A., MOZUMDER, A., J. Phys. Chem. 90 (1986) 3242. See also
MOZUMDER, A., LaVERNE, J.A., J. Phys. Chem. 89 (1985) 930.[51] JACKMAN, C.H., GARVEY, R.H., GREEN, A.E.S., J. Geoph. Res. 82,
(1977) 5081.[52] WAIBEL, E., GROSSWENDT, B., Nucl. Instr. Meth., B5 (1991) 239.[53] WAIBEL, E., GROSSWENDT, B., Phys. Med. Biol. 37 (1992) 1127.[54] LINDHARD, J., K.Danske Vidensk. Selsk. Mat.-Fys. Medd. 28, No.l
(1954) .[55] RITCHIE, R.H., Phys. Rev. 114 (1959) 644.[56] LINDHARD, J., WINTHER, A., K. Danske Vidensk. Selsk. Mat.-Fys. Medd.
34, No.4, (1964) .
538

[57] TUNG, C.J., RITCHIE, R.H., ASHLEY, J.C., ANDERSEN, V.E., "Inelasticinteractions of swift electrons in solids," Rep. ORNL/TM-5188, OakRidge Natl. Lab. (1976).
[58] ASHLEY, J.C., TUNG, C.J., RITCHIE, R.H., ANDERSON, V.E., IEEE Trans.on Nuclear Science, NS-23 (1976) 1833.
[59] ASHLEY, J.C., TUNG, C.J., RITCHIE, R.H., IEEE Trans, on NuclearScience, NS-25 (1978) 1566.
[60] ASHLEY, J.C., TUNG, C.J., RITCHIE, R.H., Surface Science 81 (1979) 409[61] TUNG, C.J., ASHLEY, J.C., RITCHIE, R.H., Surface Science 81 (1979) 427[62] ASHLEY, J.C., COWAN, J.J., RITCHIE, R.H., ANDERSON, V.E., HOELZL, J.,
Thin Solid Films, 60 (1979) 361.[63] ASHLEY, J.C., IEEE Trans, on Nuclear Science, NS-27 (1980) 1454.[64] ASHLEY, J.C., ANDERSON, V.E., IEEE Trans, on Nuclear Science, NS-28
(1981) 4132.[65] ASHLEY, J.C., ANDERSON, V.E., J. of Electron Spectroscopy and Related
Phenomena 24 (1981) 127.[66] ASHLEY, J.C., Radiât. Res. 89 (1982) 25, and priv. comm. to M. Berger[67] ASHLEY, J.C., Radiât. Res. 90 (1982) 433.[67a]ASHLEY, J.C., J. of Electron Spectroscopy and Rel. Phen. 46 (1988) 199[67b]ASHLEY, J.C., J. of Electron Spectroscopy and Rel. Phen. 50 (1990) 323[68] AKKERMAN, A.P., CHERNOV, G.Ya., Phys. Stat. Sol (b) 89 (1978) 320.[69] KHLUPIN, S.I., AKKERMAN, A.F., Academy of Sciences of the Kazakh SSR,
Preprint HEPI-81021 (1985).[69a]AL-AHMAD, K.O., WATT, D.E., J. Phys. D: Appl. Phys. 16 (1983) 2257[69b]AL-AHMAD, K.O., WATT, D.E., J. Phys. D: Appl. Phys. 17 (1984) 1899[70] LILJEQUIST, D., J. Phys. D: Appl. Phys. 16 (1983) 1567.[71] KIMURA, M., KRAJCAR-BRONIC, I., DILLON, M., INOKUTI, M.,
Phys. Rev. A 45 (1992) 7831[72] ZEISS, G., MEATH, W.J., MacDONALD, J.C.F., DAWSON, D,J., Radiât. Res.
63 (1975) 64[73] HELLER, J.M., HAMM, R.N., BIRKHOFF, R.D., PAINTER, L.R., J. Chem.
Phys. 60 (1974) 1483.[74] GARCIA. J.D., Phys. Rev. 177 (1969) 223.[75] BERGER, M.J., Proc. of an Advisory Group Meeting on Nuclear and Atomic
Data, IAEA Vienna (1987) 323.[76] DAVIES, H., BETHE, H.A., MAXIMON, L.C., Phys.Rev. 93 (1954) 788.[77] PRATT, R.H., TSENG, H.K., LEE, C.M.,KISSEL, L., MACCALLUM L., RILEY,
M., Atom.Data and Nucl.Data Tables 20, 175 (1977); errat. 26 (1981)477.
[78] SELTZER, S.M., BERGER, M.J., Nucl.Instr.Meth. B12 (1985) 95.
539

[79] SELTZER, S.M., BERGER, M.J., Atom.Data and Nucl.Data Tables 35 (1986)345.
[80] HAUG, E., Z.f.Naturf. 30a, (1975) 1099.[81] BERGER, M.J., Nat.Inst.of Standards and Technology, Report NISTIR 4999
(1992) .[82] LANDAU, L., J.Phys.USSR 8 (1944) 201.[83] BÖRSCH-SUPAN, W., J.Res.Nat.Bur.Standards 65B (1961) 245.[84] BLUNCK, O., LEISEGANG, S.,Z.Phys.128 (1950) 500.[85] BLUNCK, O., WESTPHAL, K., Z.Phys.130 (1951) 641.[86] SELTZER, S.M., Int.J.Appl.Radiât.Isot. 42 (1991) 917.[87] CHECHIN, V.A., ERMILOVA, V.C., Nucl.Instr.Meth.136 (1976) 551.[88] BERGER, M.J., Methods in Computational Physics, I (1963) 135.[89] BICHSEL, H., SAXON, R.P., Phys.Rev. All (1975) 1286.[90] BERGER, M.J., WANG, R., Monte Carlo Transport of Electrons and
Photons, p. 21, Plenum , New York (1988).[91] BAUER, P., Nucl. Instr. Methods B45 (1990) 673.[92] ANDERSEN, H.H., HANKE, C.C., SOERENSEN, H., VAJDA, P.,Phys. Rev. 153
(1967) 338.[93] SEMRAD, D., BAUER, P., Nucl. Instr. Methods B12 (1985) 24.[94] ARNAU, A., PENALBA, M., ECHENIQUE, P.M., FLORES, F., RITCHIE, R.H.,
Phys. Rev. Lett. 65 (1990) 1024.[95] PENALBA, M., ARNAU, A., ECHENIQUE, P.M., FLORES, F., RITCHIE, R.H.,
Europhys. Lett. 19 (1992) 45.[96] SCHIWIETZ, G., Phys. Rev. A42 (1990) 296.[97] SCHIWIETZ, G., GRANDE, P.L., Nucl. Instr. Methods B69 (1992) 1.[98] FERMI, E., TELLER, E., Phys. Rev. 72 (1947) 399.[99] ECHENIQUE, P.M., NIEMINEN, R.M., R.H. RITCHIE, R.H., Solid State
Commun. 37 (1981) 779.[100] ECHENIQUE, P.M., NIEMINEN, R.M., ASHLEY, J.C., RITCHIE, R.H., Phys.
Rev. A33 (1986) 897.[101] see also MANN, A., BRANDT, W., Phys. Rev. B24 (1981) 4999.[102] GOLSER, R., SEMRAD, D., Phys. Rev. Lett. 66 (1991) 1831.[103] PAUL, H., SEMRAD, D., SEILINGER, A., Nucl. Instr. Methods B61 (1991)
261.[104] BAUER, P., RÖSSLER, W., and MERTENS, P., Nucl. Instr. Methods B69
(1992) 46.[105] TSCHALÄR, C., BICHSEL, H., Phys. Rev. 175 (1968) 476[106] ZIEGLER, J.F., MANOYAN, J.M., Nucl. Instr. Methods B35 (1988) 215.[107] POWERS, D., Nucl. Instr. Methods B40/41 (1989) 324[108] NEUWIRTH, W., Nucl. Instr. Methods B27 (1987) 337
540

[109] THWAITES, D.I., Nucl. Instr. Methods B69 (1992) 53.[110] BAUER, P., KASTNER, F., ARNAU, A., SALIN, A., PONCE, V.H., ECHENIQUE,
P.M., J. Physics: Condensed Matter 5 (1993) A273[111] BAUER, P., KASTNER, F., ARNAU, A., SALIN, A., FAINSTEIN, P.D., PONCE,
V.H., ECHENIQUE, P.M., Phys. Rev. Lett. 59 (1992) 1137.[112] RAETHER, H., Excitations of Plasmons and Interband Transitions by
Electrons, Springer, Berlin (1980).[113] NECAS, V., KÂFERBÔCK, W., RÖSSLER, W., BAUER P., Nucl. Instr. Methods
B 80/81 (1993) 41[114] BAUER, P., MERTENS, P., MITTERSCHIFFTHALER, Ch., PAUL, H.,
IAEA-TECDOC-506 (1989) 151.[115] SUGIYAMA, H., Bull. El. Techn. Lab. 51 (1987) 520.[116] THWAITES, D.I., Radiât. Prot. Dos. 13 (1985) 65.[117] EPPACHER, C., SEMRAD, D., Nucl. Instr. Methods B35 (1988) 109.[118] BERGER, M.J., Penetration of Proton Beams through Water: I. Depth-
dose Distributions, Spectra and LET Distributions, National Instituteof Standards and Technology Report NISTIR 5226 (1993).
[118a] BESENBACHER, F.,ANDERSEN, J.U., BONDERUP, E., Nucl. Instr. Methods168 (1980) 1.
[119] SIGMUND, P., in: Interaction of Charged Particles with Solids andSurfaces (Proc. of a NATO Advanced Study Institute in Alicante, Spain,May, 1990), (GRAS-MARTI, A., URBASSEK, H.M., ARISTA, N.R., FLORES, F.,Eds.), Plenum Press, New York (1991) 73.
[120] BESENBACHER, F., ANDERSEN, H.H., HVELPLUND, P., KNUDSEN, H., Kgl.Danske Videnskab. Selskab Mat. Fys. Medd. 40, No.9 (1981).
[120a] BICHSEL, H., Phys. Rev. Bl (1970) 2854[121] TSCHALAR, C., Nucl. Instr. Methods 64 (1968) 237.[122] BIERSACK, J.P., HAGGMARK, L.G., Nucl. Instr. Methods 174 (1980) 257.[123] BONDERUP, E., HVELPLUND, P., Phys. Rev. A4 (1971) 562.[124] KANEKO, T., YAMAMURA, Y., Phys. Rev. A33 (1986) 1653.[125] MATSUNAMI, N., KITOH, K., Nucl. Instr. Methods B59/60 (1991) 5.[126] VAVILOV, P.V., Zh. Exp. Teor. Fiz. 32 (1957) 920 (Soviet Physics JETP
5 (1957) 749) .[127] TSCHALAR, C., Nucl. Instr. Methods 61 (1968) 141.[128] BAUER, G.H., ANTOLAK, A.J., PONTAU, A.E., MORSE, D.H., HEIKKINEN,
D.W., PROCTOR, I.D., Nucl. Instr. Methods B43 (1989) 497.[129] ARMITAGE, B.H., TREHAN, P.N., Nucl. Instr. Methods 134 (1976) 359.[130] BICHSEL, H., HIRAOKA, T., Int. J. Quantum Chem.: Quantum Chemistry
Symposium 23 (1989) 565.
541

[131] SCHI0TT, H.E., Kgl. Danske Videnskab. Selskab Mat. Fys. Medd. 35,No.9 (1966).
[132] KISTEMAKER, J., SANDERS, J.B., Proc. 2nd L.H. Gray Conf., Inst.Physics, London (1970) 197.
[133] AL-AFFAN, I.A.M-, Calculated effective stopping powers and projectedranges for H, He, C, N and O Projectiles (0.05 - 500 keV) in someElements and Materials of dosimetric interest, South Bank Polytechnic,London (1989) .
[134] ANDERSEN, H.H., Nucl. Instr. Methods B44 (1989) 121.[135] STEINBAUER, E., priv. comm. to H.Paul[136] B0RGESEN, P., B0TTIGER, J., MÖLLER, J., J.Appl.Phys. 49 (1978) 4401.[137] ASHWORTH, D.G-, BOWYER, M.D.J., OVEN, R-, J.Phys.D: Appl.Phys. 24
(1991) 1376.[138] ROSS, G.G., TERREAULT, B., Nucl. Instr. Methods B15 (1986) 61.[139] ROSS, G.G., TERREAULT, B., Nucl. Instr. Methods B45 (1990) 190.[140] ZIEGLER, J.F., Helium: Stopping Powers and Ranges in All
Elemental Matter. Vol.4 of The Stopping and Ranges of Ions in Matter,Pergamon Press, Elmsford, New York (1977) .
[141] ZIEGLER, J.F., BIERSACK, J.P., LITTMARK, U., The Stopping and Rangeof Ions in Solids. Vol.1 of The Stopping and Ranges of Ions inMatter, Pergamon Press, Elmsford, New York (1985) .
[142] EPPACHER, Ch., SEMRAD, D., Nucl. Instr. Methods B69 (1992) 33.[143] GOLSER, R., SEMRAD, D., Nucl. Instr. Methods B69 (1992) 18.[144] ZIEGLER, J.F., TRIM-90, The Transport of Ions in Matter, (1990).[145] INTERNATIONAL COMMISSION ON RADIATION UNITS AND MEASUREMENTS, Report
49, Stopping Powers and Ranges for Protons and Alpha Particles,(1993) .
[146] POWERS, D., Stopping Cross Sections and Ranges of Alpha Particles inMatter, Report prepared for the ICRU Stopping Power Committee, Dept.of Physics, Baylor University, Waco, Texas (1978).
[147] KALBITZER, S., OETZMANN, H., GRAHMAN, H., FEURSTEIN, A., Z.Phys.A278, 223 (1976) .
[148] WILSON, W.D., HAGGMARK, L.G., BIERSACK, J.P., Phys. Rev. B 15, 2458(1977) .
[149] BISTER, M., HAUTALA, M., JÄNTTI, M., Radiât.Eff. 42, 201 (1979).[150] FINK, D., BIERSACK, J.P., STADELE, M., CHENG, V.K., Radiât.Eff. 104,
1 (1987).[151] SHIMA, K., Nucl. Instr. Methods BIO/11 (1985) 45.
542

[152] ZIEGLER, J.F., Handbook of Stopping Cross Sections for energetic Ionsin all Elements Vol.5 of The Stopping and Ranges of Ions in Matter,Pergamon Press, New York (1980).
[153] BRANDT, W., KITAGAWA, M., Phys.Rev. B25 (1982) 5631.[154] GEISSEL, H., in: Semi classical Descriptions of Atomic and Nuclear
Collisions, (BANG, J, DeBOER, J., Ed.) North-Holland (1985) p.431.[155] GEISSEL, H., LENNARD, W.N., ARMBRUSTER, P., Rad. Effects and Def. in
Solids 110 (1989) 7.[156] GEISSEL, H., ARMBRUSTER, P., KITAHARA, T., KRAFT, G., SPIELER, H.,
GÜTTNER, K., Nucl. Instr. Methods 170 (1980) 217.[157] NORTHCLIFFE, L.C., SCHILLING, R.F., Nucl. Data Tables A7 (1970) 233.[158] KURONEN, A., Comm. physico-mathematicae, Finland, 122 (1991).[159] WARD, D.H., ANDREWS, H.R., MITCHELL, I.V., LENNARD, W.N.,
WALKER, R.B., RUD, N., Can. J. Phys. 57 (1979) 645.[160] SOFIELD, C.J., Nucl. Instr. Methods B45 (1990) 684.[161] RÄISÄNEN, J., RAUHALA, E., Radiation Eff. and Def. in Solids 108
(1989) 21.[162] KURONEN, A-, RÄISÄNEN, J., KEIKONEN, J., TIKKANEN, P., RAUHALA, E.,
Nucl. Instr. Methods B35 (1988) 1.[163] RÄISÄNEN, J., RAUHALA, E., Phys. Rev. B41 (1990) 3951, and earlier
publications cited there[164] ANTHONY, M.,LANFORD, W.A,, Phys. Rev. A25 (1982) 1868.[165] RAUHALA, E., RÄISÄNEN, J., Phys. Rev. B42 (1990) 3877.[166] RÖSSLER, W., Diploma Thesis, Univ. of Linz (1992).[167] ARSTILA, K., KEIKONEN, J., TIKKANEN, P., Phys. Rev. B41 (1990) 6117.[168] KEIKONEN, J.,KURONEN, A., HAUTALA, M. , KARTTUNEN, V., LAPPALAINEN,
R., UHRMACHER; M, Phys. Lett. A123 (1987) 307.[169] LAND, D.J.,SIMONS, D.G., BRENNAN, J.G., BROWN, M.D., Phys. Rev. A22
(1980) 68.[170] SEMRAD, D., EPPACHER, Ch., TOBER, R., Nucl. Instr. Methods B48 (1990)
79.[171] ABDESSALAM, A., STOQUERT, J.P., GUILLAUME, G., HAGE-ALI, M.,
GROB, J.J., SIFFERT, P., Nucl. Instr. Methods B56/57 (1991) 355 andB72 (1992) 7 and 293.
[172] BIMBOT, R., Nucl. Instr. Methods B69 (1992) 1.[173] HUBERT, F., BIMBOT, R., GAUVIN, H., Nucl. Instr. Methods B36 (1989)
357[174] STEWARD, P.G., UCRL-18127, Univ. of California Radiation Lab. (1968).[175] NORTHCLIFFE, L.C., Ann. Rev. Nucl. Science 13 (1963) 67.
543
[176] GEISSEL, H., LAICHTER, Y., SCHNEIDER, W.F.W., ARMBRUSTER, P., Nucl.Instr. and Meth. 194 (1982) 21; Phys. Lett. A88 (1982) 26.
[177] BOHR, N., LINDHARD, J., Kgl. Dansk Videnskab. Selsk., Mat. Phys.Medd. 26 (1954) 1.
[178] HÉRAULT, J., BIMBOT, R., GAUVIN, H., KUBICA, B-, ANNE, R.,BASTIN, G., HUBERT, F., Nucl. Instr. Methods B61 (1991) 156.
[179] HVELPLUND, P., Kgl. Danske Vid. Selskab Mat.-fys. Medd. 38 (1971)No. 4.
[180] PRICE, J.J., STERN, S.H., SIMONS, D.G., LAND, D.J., BRENNAN, J.G.,Nucl. Instr. Methods B56/57 (1991) 348.
[181] BIMBOT, R., HUBERT, F.,RIVET, M.F., in preparation (see [172])[183] FIRSOV, O.B., Sov. Phys. JETP 9 (1959) 1076.[184] GEISSEL, H., LAICHTER, Y., SCHNEIDER, W.F.W., ARMBRUSTER, P., Nucl.
Instr. Methods 215 (1983) 329.[185] EFKEN, B., HAHN, D., HILSCHER, L., WÜSTEFELD, G., Nucl. Instr.
Methods 129 (1975) 219.[186] ANDERSEN, H.H., BESENBACHER, F., KNUDSEN, H., Nucl. Instr. Methods
149 (1978) 121.[187] BRIERE, M.A., BIERSACK, J.P., Nucl. Instr. Methods B64 (1992) 693.[188] LIVINGSTON, M.S., BETHE, H.A., Rev. Mod. Phys. 9 (1937) 245.[189] LENNARD, W.N., GEISSEL, H., PHILLIPS, D., JACKSON, O.P., Phys. Rev.
Lett. 57 (1986) 318.[190] ZIEGLER, J.F., pers. coinin. to H. Paul[191] MEYER, L., Phys. Stat. Sol. 44 (1971) 253.[192] SIGMUND, P., WINTERBON, K.B., Nucl. Instr. Methods 119 (1974) 541.[193] BAUER, P., STEINBAUER, E., BIERSACK, J.P., Nucl. Instr. Methods B64
(1992) 711.[194] ANNE, R., HERAULT, J., BIMBOT, R., GAUVIN, H., BASTIN, G.,
HUBERT, F., Nucl. Instr. Methods B34 (1988) 295.[195] SPAHN, G., GROENEVELD, K.O., Nucl. Instr. Methods 123 (1975) 425.[196] HOOTON, B.W., FREEMAN, J.M., KANE, P.P., Nucl. Instr. Methods 124
(1975) 29.[197] MERTENS, P., Nucl. Instr. Methods B27 (1987) 315, 326.[198] GOLSER, R., EPPACHER, Ch. , SEMRAD, D., Nucl. Instr. Methods B67
(1992) 69.[199] FICHTNER, P.F.P., BEHAR, M., ÖLIVIERI, C.A., LIVI, R.P-, DE SOUZA,
J.P., ZAWISLAK, F.C., BIERSACK, J.P., FINK. D., Nucl. Instr. MethodsB61 (1991) 282.
[200] GRANDE, P.L., ZAWISLAK, F.C., FINK, D., BEHAR, M., Nucl. Instr.Methods B61 (1991) 282.
544

[201] SANTRY, D.C., WERNER, R.D., WESTCOTT, O.M., IEEE Trans. Nucl.Se. NS-26 (1979) 1332.
[202] SCHULE, V-, GÜNZLER, R., OBERSCHACHTSIEK, P., WEISER, M.,KALBITZER, S., Nucl.Instr. Methods B62 (1992) 338.
[203] BEHAR, M., WEISER, M., KALBITZER, S., FINK, D., GRANDE, F.L-, Nucl.Instr. Methods B34 (1988) 316.
[204] BRICE, D.K., Ion-Implantation and Energy Deposition Distributions,Vol.1 IFI/Plenum, New York (1975).
[205] ELLMER, K., MERTENS, A., ROCKOFF, A., RÖHRICH, J., VYSEK, W.-M.,Nucl.Instr. Methods B62 (1992) 431.
[206] HOFKE, W.K., OOSTHOEK, O.P., KOLMAN, N.J., DE GREFTE, H.A.M., Radiât.Eff. 24 (1965) 227.
[207] JAHNEL, F., RYSSEL, H., PRINKE, G., HOFFMANN, K., MUELLER, K.,BIERSACK, J.P., HENKELMANN, R., Nucl. Instr. Methods 182/183 (1981)223.
[208] THEVENIN, P., GROB, J.J., STUCK, R., SIFFERT, P., Nucl. Instr.Methods B62 (1992) 346
[209] WONG, H., DENG, E., CHEUNG, N.W., CHU, P.K., STRATHMAN, E.M.,STRATHMAN, M.D., Nucl. Instr. Methods B21 (1987) 447.
[210] XIA, Y., LAU, W.M., LENNARD, W.N., Nucl. Instr. Methods B71 (1992)165.
[211] ZALM, P.C., FONTIJN, G.M., JANSSEN, K.T.F., VRIEZEMA, C.J., Nucl.Instr. Methods B42 (1989) 397.
[212] ABEL, F., BEHAR, M., COHEN, C., Nucl. Instr. Methods B30 (1988) 13.[213] BESENBACHER, F., BOTTIGER, J., LAURSEN, T., LOFTAGER, P., MÖLLER, W.,
Nucl. Instr. Methods 170 (1980) 183.
545

Chapter 8YIELDS OF IONIZATION AND EXCITATION
IN IRRADIATED MATTER
D. SrdocBrookhaven National Laboratory,
Upton, New York,United States of America
M. InokutiArgonne National Laboratory,
Argonne, Illinois,United States of America
I. Krajcar-BronicRudjer Boskovic Institute,
Zagreb, Croatia
The authors acknowledge valuable contributions to this chapter by E. Waibel, Physikalisch-Technische Bundesanstalt, Braunschweig, Germany, Y. Hatano, Tokyo Institute of Technology,Tokyo, Japan and I.G. Kaplan, Karpov Institute of Physical Chemistry, Moscow, Russian Federation.
547
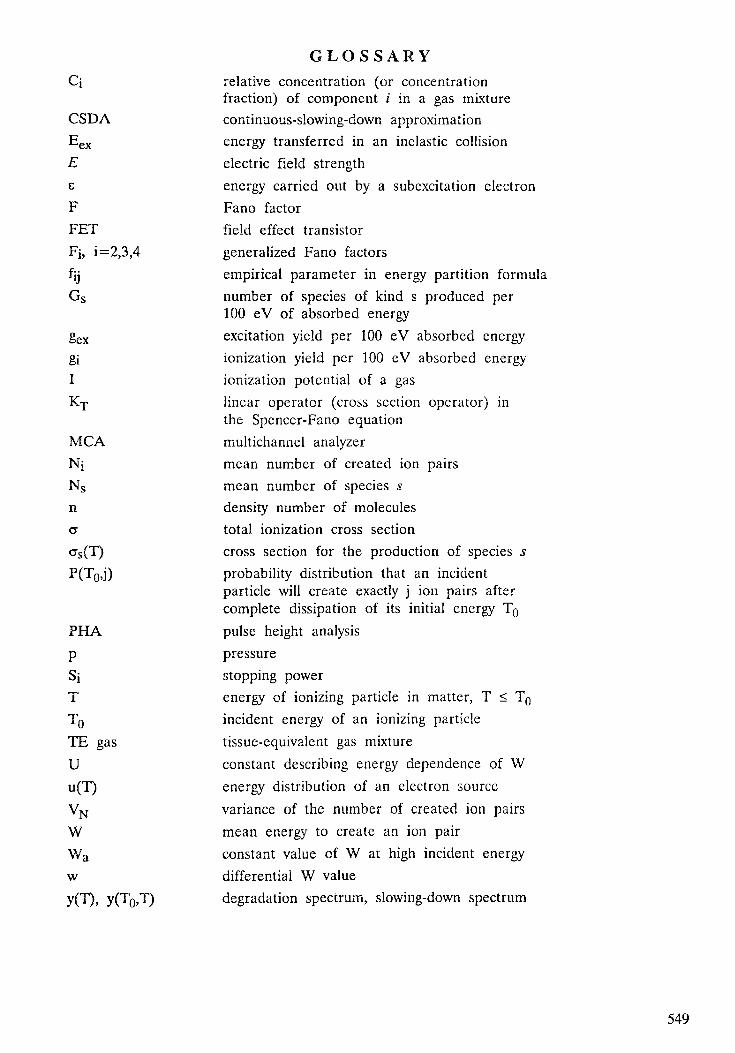
Ci
CSDA
^•exE£
FFETFi, i=2,3,4
êexgiIKT
MCANiNs
n
P(T0j)
PHA
PSiTTOTE gasUu(T)VNwWa
wy(T), y(T0;T)
G L O S S A R Yrelative concentration (or concentrationfraction) of component i in a gas mixturecontinuous-slowing-down approximationenergy transferred in an inelastic collisionelectric field strengthenergy carried out by a subexcitation electronFano factorfield effect transistorgeneralized Fano factorsempirical parameter in energy partition formulanumber of species of kind s produced per100 eV of absorbed energyexcitation yield per 100 eV absorbed energyionization yield per 100 eV absorbed energyionization potential of a gaslinear operator (cross section operator) inthe Spencer-Fano equationmultichannel analyzermean number of created ion pairsmean number of species sdensity number of moleculestotal ionization cross sectioncross section for the production of species sprobability distribution that an incidentparticle will create exactly j ion pairs aftercomplete dissipation of its initial energy T0
pulse height analysispressurestopping powerenergy of ionizing particle in matter, T < T0
incident energy of an ionizing particletissue-equivalent gas mixtureconstant describing energy dependence of Wenergy distribution of an electron sourcevariance of the number of created ion pairsmean energy to create an ion pairconstant value of W at high incident energydifferential W valuedegradation spectrum, slowing-down spectrum
549

8.1. INTRODUCTION
Chapter 8 deals with physical quantities that characterize stochasticprocesses induced in matter exposed to ionizing radiation and related mean values.The term ionizing radiation includes photons and charged particles (e.g., electrons,pions, protons, alpha particles, or heavy ions) with energy sufficient to ionizemolecules. (The term molecules is used to indicate atoms and molecules in gases orappropriate structural units in condensed matter.) These particles collide withmolecules many times and thus dissipate their energy in the absorber. Quantitiestreated below describe major consequences of a multitude of collisions. A review ofrecent progress in theoretical and experimental research on the ionization yield and itsstatistical fluctuations in gases, is presented. Excitation yields in gases are discussed inSection 8.5, and W and G values in the condensed phase arc discussed in Section 8.6.
The ionization and excitation of molecules are the dominant processeswhen particles traverse matter, although non-ionizing processes such as moleculardissociation into neutral fragments also take place. Many secondary electrons ejected inthe primary ionizing events carry sufficient energy to cause further ionizations, and asubstantial fraction of radiation energy is delivered to matter through secondaryelectrons. The molecular entities generated by the interactions of the initial particlesand the secondary electrons are termed initial species. Subsequently, these initial speciesmay form new species during thermalization and in thermal collisions with othermolecules, as discussed in Chapter 6. Evaluation of the initial yield of ions and excitedstates is essential for dosimetry, radiation chemistry, and biology.
A full description of ionization is given by the probability distributionP(T0,j), that is, the probability that a particle of initial energy T0 will give rise toprecisely j ion pairs. Often the description is condensed into two parameters: the meannumber of created ion pairs N; and the variance VN. Statistical fluctuations in theionization yield are usually characterized by the Fano factor F = VN/Nj.
If particles lose all their energy in the absorber the average amount ofenergy used to create an ion pair is termed the W value, W = TQ/NJ. For particleslosing a fraction A of their energy a differential value w = A/Ni is defined. Acomprehensive review of W values in gases, including some data on W in rare gasliquids and solids, was published by the International Commission on Radiation Unitsand Measurements in 1979 [1]. Recent developments in experiment and theorypresented in this Chapter have significantly enlarged our knowledge on the ionizationyield for various kinds of ionizing radiation. In radiation chemistry, in which both ionsand excited states need to be discussed, the yield Ns(Tg) of any initial species s inirradiated matter is expressed in terms of the G value, GS(T0) = (100/To)Ns(T0), i.e.,the number of species produced per 100 eV of absorbed energy.
The knowledge of W-values is crucial to radiation dosimetry using ionizationchambers and to proportional counter spectroscopy. W values are the link between theenergy deposited in the gas by ionizing radiation, and the resulting electric chargemeasured.
More precisely, in radiation dosimetry using a gas chamber, one isdetermining the number of ion pairs produced by either primary particles or secondaryparticles released in the gas, some of which may result from cavity walls. Theknowledge of the W value for the particles involved remains the most fundamental inthe conversion of the ionization to the energy absorbed. Notice also that the
550

knowledge of the stopping power (discussed extensively in Chapter 7) is also requiredin the analysis. For measurements in charged particle beams which traverse a chamber,the differential w value is relevant in calculating the absorbed dose, especially forparallel plate chambers, since only a portion of each track deposits energy in thechamber. lonization chamber measurements, like proportional counter measurementscan make use of W values to correct the energy calibration obtained with a referencesource to that for the radiation being measured.
For electrons the degradation spectrum or the slowing-down spectrumy(T0,T) is fundamental in theoretical calculations of all previously mentioned physicalquantities. Its meaning is as follows: y(T0,T)dT is the summed pathlengths of all theelectrons that are generated from a stationary source of electrons of energy TQ at unitintensity and have kinetic energies between T and T + dT. In theoretical studies, acomplete database is needed of all absolute cross-sections (for ionization, excitation,and dissociation) for the interactions of photons and charged particles, especiallyelectrons, with molecules. Once the degradation spectrum has been determined, theyield of ionization, and other initial species, can be calculated.
Calculations may be tested by comparison with experimentally determinedquantities such as w, W and F, and thus the accuracy and reliability of the basicatomic and molecular data can be inferred. At the same time, values such as w, W,F, and stopping powers, which are derived from the more fundamental atomic andmolecular data, are also directly pertinent to radiation dosimetry, nuclear spcctroscopyand radiation chemistry. In particular they determine the accuracy of absorbed dosedetermination and kerma measurements of direct relevance for radiation therapy usingdifferent kind of radiations.
8.2. ELEMENTS OF THEORY
8.2.1. Introductory Remarks
The calculation of the yield of ions, excited states, or any other initialspecies requires two steps. The first step is to determine the cross-sections for allcollision processes of the incident radiation and of all secondary particles, in particularsecondary electrons, with molecules in the material.
Cross-section data have been discussed in Chapters 2-6. It is crucial touse cross-section values that are reliable and internally consistent. In particular, cross-sections for individual collisions should be consistent with the total cross-sections foral! possible processes and with the stopping cross-section (treated in Chapter 7), bothof which are often better known than individual cross-sections. Calculations of initialyield using unrealistic cross-sections are of little value at best and may be misleading.
The second step is the determination of the consequences of all collisionprocesses to both the particle and the material. This analysis belongs to statisticalphysics [2] or physical kinematics [3] in the language of the Landau school and maybe called particle transport theory. Two kinds of approaches are used. The first kindis the Monte Carlo method, in which one simulates histories of collisions for manyparticles on a computer and draws conclusions from statistics of those histories [4, 5].The advantage of this approach is the relative simplicity of the algorithms and itsresulting applicability to a wide range of problems. Indeed, when questions concerning
551

media with complicated geometry are asked, the Monte Carlo simulation is often theonly practicable method. However, a challenge lies in adopting an informative schemefor statistical analysis of a large volume of numerical data, and also in reliablyassessing the precision of results against the background of numerical noise. Thesecond kind of approach is the analytic transport theory, in which one writes anequation for a quantity of interest, such as the yield of a product itself or the energydistribution of energetic particles. The advantages of this approach are the clearmeaning of the results and the possibility that general consequences may be deduciblewithout numerical solution. However, a transport equation is solvable throughnumerical analysis only in simpler cases. Consequently, the two kinds of approachesare complementary. (It is unwise to regard them as competitive, as unfortunately isoccasionally done.) Perhaps a good approach will be a hybrid of the two kinds, inwhich one treats simpler parts of a problem by means of a transport equation andthe rest by means of Monte Carlo simulation.
In what follows we present a resume of the analytic transport theory as anintroduction to the discussion of data on the yields of ionization and excited states.
8.2.2. Degradation Spectra
Consider a particle of kinetic energy T moving in a material consisting ofn molecules of a single species per unit volume. Let crs(T) be the cross-section forthe formation of product s by a collision of the particle. A method for calculating theyield of products is as follows. The number of products ^ produced in a small trackof length dx is nas(T)dx. Therefore, the cotal number Ns of products s produced ina finite track segment may be written as follows:
N s = n J a s ( T ) d x (8.1)
However, the meaning of the integral is ambiguous unless one specifies howthe track length dx is related to T and determines the limits of integration. Arelation between dx and T may be readily found in a simple case of an ion atsufficiently high speed losing its kinetic energy gradually, i.e., through many collisionsin each of which a small fraction of its kinetic energy is lost to a molecule. Then, thekinetic energy T may be viewed as a smooth function of the track length x, and onemay set dx = dT/(dT/dx), where dT/dx is the energy loss per unit track length, viz.,the stopping power. This idea is now known as the continuoits-slowing-downapproximation (CSDA).
Fano [6] pointed out limitations of this idea and introduced the notion ofthe degradation spectrum, y(T), sometimes called the track length distribution. Accordingto his idea, one rewrites Eq. (8.1) as follows:
N s = n J d T y ( T ) o s ( T ) (8.2)
Here the infinitesimal track length dx has been written as y(T)dT, wherethe function y(T) is determined through methods described in Section 8.2.3. It turnsout that y(T) is the same as the product of the speed VT of the particle at energy Tand the number density of such particles, apart from a constant dependent on thevolume of the material. (In introducing the idea of the degradation spectrum, one
552
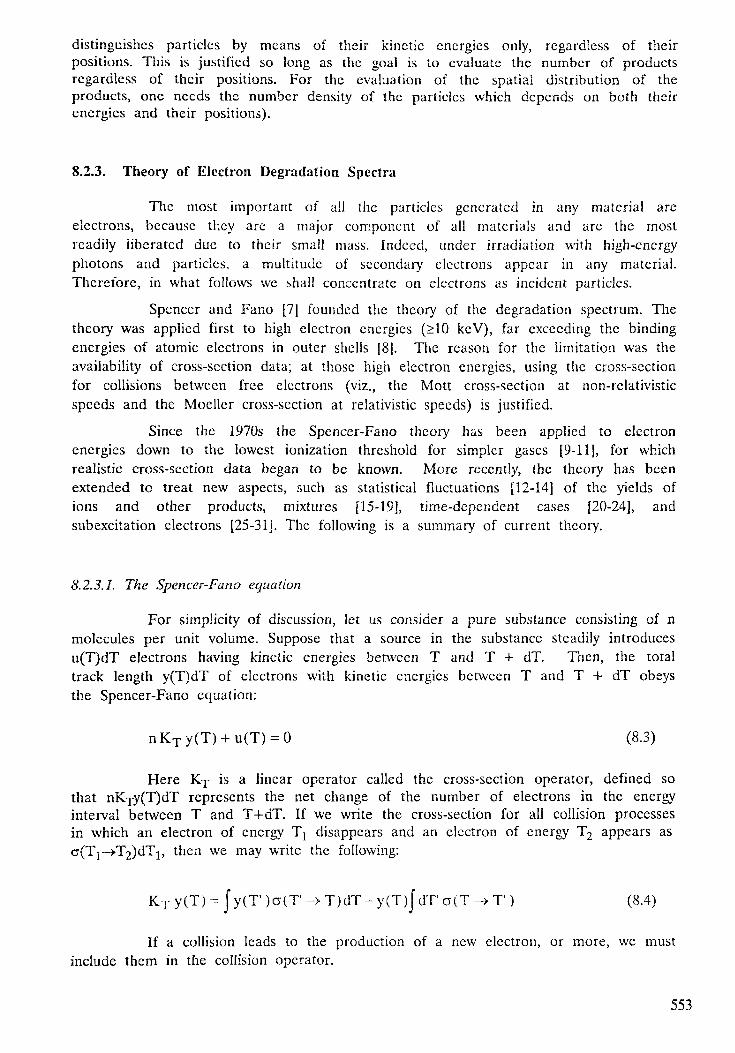
distinguishes particles by means of their kinetic energies only, regardless of theirpositions. This is justified so long as the goal is to evaluate the number of productsregardless of their positions. For the evaluation of the spatial distribution of theproducts, one needs the number density of the particles which depends on both theirenergies and their positions).
8.2.3. Theory of Electron Degradation Spectra
The most important of all the particles generated in any material areelectrons, because they are a major component of all materials and are the mostreadily liberated due to their small mass. Indeed, under irradiation with high-energyphotons and particles, a multitude of secondary electrons appear in any material.Therefore, in what follows we shall concentrate on electrons as incident particles.
Spencer and Fano [7] founded the theory of the degradation spectrum. Thetheory was applied first to high electron energies (>10 keV), far exceeding the bindingenergies of atomic electrons in outer shells [8]. The reason for the limitation was theavailability of cross-section data; at those high electron energies, using the cross-sectionfor collisions between free electrons (viz., the Mott cross-section at non-rclativisticspeeds and the Moeller cross-section at relativistic speeds) is justified.
Since the 1970s the Spencer-Fano theory has been applied to electronenergies down to the lowest ionization threshold for simpler gases [9-11], for whichrealistic cross-section data began to be known. More recently, the theory has beenextended to treat new aspects, such as statistical fluctuations [12-14] of the yields ofions and other products, mixtures [15-19], time-dependent cases [20-24], andsubexcitation electrons [25-31]. The following is a summary of current theory.
8.2.3.1. The Spencer-Fano equation
For simplicity of discussion, let us consider a pure substance consisting of nmolecules per unit volume. Suppose that a source in the substance steadily introducesu(T)dT electrons having kinetic energies between T and T + dT. Then, the totaltrack length y(T)dT of electrons with kinetic energies between T and T + dT obeysthe Spencer-Fano equation:
nK T y(T) + u(T) = 0 (8.3)
Here KT is a linear operator called the cross-section operator, defined sothat nKTy(T)dT represents the net change of the number of electrons in the energyinterval between T and T+dT. If we write the cross-section for all collision processesin which an electron of energy Tj disappears and an electron of energy T2 appears asc(T1->T2)dT1, then we may write the following:
KT y(T) = Jy(T' )a(T -> T)dT - y(T)JdT' a(T -» T ) (8.4)
If a collision leads to the production of a new electron, or more, we mustinclude them in the collision operator.
553

8.2.3.2. The solution for a monoenergetic source
It is useful to consider the solution of Eq. (8.3) for a monoenergeticsource of unit strength, viz., u(T) = o(T - T0). We write this solution as y(T0,T); inother words, y(T0,T) satisfies the equation
nKTy(T 0 ,T) + 5(T-T0) = 0 (8.5)
We call y(T0,T) the fundamental solution. It plays the role of the Greenfunction for our problem, in the language of mathematical physics. The solution ofEq. (8.3) for an arbitrary u(T) is expressed as follows:
y(T) = JdT0u(T0)y(T0 ,T) (8.6)
We may call Eq. (8.6) the superposition theorem.
Another theorem relates three fundamental solutions of different sets ofvariables:
y(T0,T2)=-nKTJdT1y(To,T1)y(T1,T2) (8.7)
Equation (8.7) follows readily from the definition of the fundamental
solution, Eq. (8.5). To verify this, note that the operator nKj acts on y(Tj,T2) underthe integral on the right-hand side of Eq. (8.7). This equation may be called thecombination theorem. The physical meaning is as follows. The unit source at T0causes the electron spectrum y(Tg,Ti) at lower Tj. Each electron at Tj may beviewed as a source for creating the electron spectrum y(Tj,T2) at an even lower T2-The integral over Tj means that contributions from all Tj between T0 and T2 must
be accounted for. Finally, the operator -nKj signifies the effects of collisions at T2
that need to be incorporated to arrive at y(T0,T2). The basis of numerical evaluationof the degradation spectrum is indeed Eq. (8.7), applied to sufficiently small stepsfrom TO to Tj and then to T2. Notice that the degradation spectrum is determinedsuccessively by descending in T.
8.2.3.3. The yield of an initial species
An alternative method exists for evaluating the yield Ns of any product s.Consider the mean number of products s resulting from complete degradation startingwith an electron of energy T0:
TON s(T0)-nJdTy(T0 ,T)a s(T) (8.8)
Es
Here the lower limit of integration is the threshold energy Es for product s.
554

Let us consider the following integral:
TOJdTN s (T)[nKTy(T 0 ,T) + 8(T-T0)] = 0 (8.9)Es
Its value is evidently zero because of Eq. (8.5). Recall the definition of KT,Eq. (8.4), and rewrite the first term in Eq. (8.9) as follows:
JdTN s (T)nK T y(T,T) = nJdTN s(T)|dT'y(T0 ,T')o(T1-»T)
-nJdTN s(T)y(T0 ,T)Jdra(T->T') (8.10)
Here every integral is taken over the interval from Es to T0. We mayinterchange the integration variables T and T' in the first term on the right-handside, but not in the second term. The final result is expressed compactly as follows:
JdTN s (T)nK T y(T 0 ,T) = |dT[nK^N s(T)ly(T0 ,T) (8.11)
Here Kj is a new operator defined as follows:
= JdT'o(T-»T')N s(T')-N(T)JdT'a(T->T') (8.12)
The square bracket in Eq. (8.11) means that Kj operates on NS(T) butnot on y(T0,T). The operator Kj is called the adjoint of KT. The differencebetween Eqs. (8.4) and (8.12) arises in the first term of each equation. Theintegration over T' is taken over the electron energy before the collision in KT, but itis taken over the electron energy after the collision in Ky.
Let us return to Eq. (8.9) and focus on the second term. Obviously, fromthe definition of NS(T0), Eq. (8.8), this term is equal to the following:
JdTN s(T)5(T-T0) = JdTna s(T)y(T0 ,T) (8.13)
Consequently, we insert Eqs. (8.11) and (8.13) into Eq. (8.9) to arrive atthis expression:
nJdT[K£N s(T)+a s(T)]y(T0 ,T) = 0 (8.14)
Therefore, we may conclude that
K+ Ns(T) + as(T) = 0 (8.15)
555
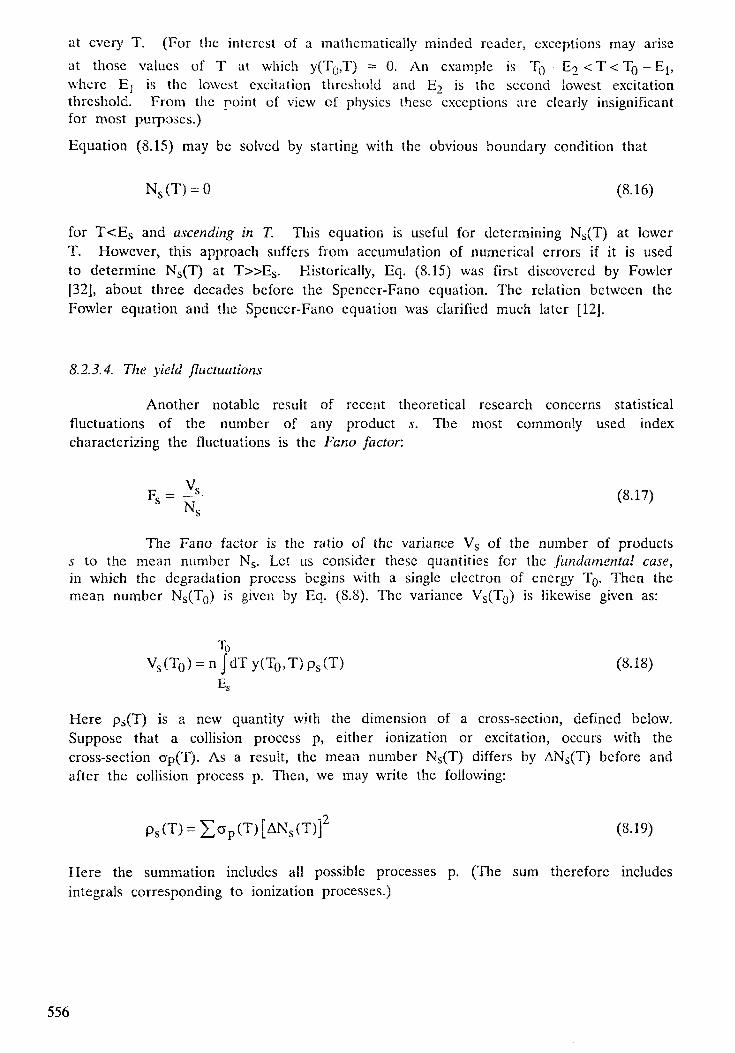
at every T. (For the interest of a mathematically minded reader, exceptions may ariseat those values of T at which y(T0,T) = 0. An example is T0 -E2 < T< T0 -Ej,where Ej is the lowest excitation threshold and E2 is the second lowest excitationthreshold. From the point of view of physics these exceptions are clearly insignificantfor most purposes.)
Equation (8.15) may be solved by starting with the obvious boundary condition that
NS(T) = 0 (8.16)
for T<ES and ascending in T. This equation is useful for determining NS(T) aï lowerT. However, this approach suffers from accumulation of numerical errors if it is usedto determine NS(T) at T»ES. Historically, Eq. (8.15) was first discovered by Fowler[32], about three decades before the Spencer-Fano equation. The relation between theFowler equation and the Spcncer-Fano equation was clarified much later [12].
8.2.3.4. The yield fluctuations
Another notable result of recent theoretical research concerns statisticalfluctuations of the number of any product s. The most commonly used indexcharacterizing the fluctuations is the Fano factor.
Fs = -s- (8.17)S Ns
The Fano factor is the ratio of the variance Vs of the number of productsj> to the mean number Ns. Let us consider these quantities for the fundamental case,in which the degradation process begins with a single electron of energy T0. Then themean number NS(T0) is given by Eq. (8.8). The variance VS(T0) is likewise given as:
ToVS(T0) = n JdT y(T0,T) ps(T) (8.18)
ES
Here ps(T) is a new quantity with the dimension of a cross-section, defined below.Suppose that a collision process p, either ionization or excitation, occurs with thecross-section ap(T). As a result, the mean number NS(T) differs by ANS(T) before andafter the collision process p. Then, we may write the following:
ps(T) = £ap(T)[ANs(T)]2 (8-19)
Here the summation includes al! possible processes p. (The sum therefore includesintegrals corresponding to ionization processes.)
556

8.2.4. Characteristics of Electron Degradation Spectra
The knowledge of electron degradation spectra, obtained from varioustheoretical and experimental studies, is by no means complete. However, it is useful topoint out general characteristics that are understood.
8.2.4.1. Dependence of the Spectrum on Electron Energy
The spectrum varies greatly depending on T. The magnitude of thespectrum is thus often shown on the logarithmic scale, as in Fig. 8.1. The spectrumis generally bimodal; it is peaked near the source energy and is peaked more stronglynear the lowest energy, Ij, i.e., the (first) ionization threshold. The peaking near Ijresults from accumulation of secondary electrons, most of which are produced at lowenergies owing to the general characteristics of the secondary-electron spectra (asdiscussed in Chapter 2).
The fundamental solution y(T0,T) peaks near the source energy TQ, anddeclines with decreasing T. According to the CSDA, y(TQ,T) is close to the reciprocalof the stopping power dT/dx at energy T. This rule holds in the interval To/2<T<T0,where secondary electrons make no contribution. However, notable exceptions arise atdiscrete energies T0 - Ej, T0 - E2, ..., where Ej, E2, ... are thresholds for discreteexcitations; at these energies, the spectrum y(T0,T) has sharp peaks and vanishesbetween peaks. These discrete structures, known as the Lewis effect, arise from a smallnumber of specific collisions that are necessary to bring down electron energies tospecific discrete values. With decreasing energies, these structures diminish andeventually disappear.
20 50 100 200T ( e V )500 iOOO 2000 5000 10,000 20,000
IQ'2 k
10,-3
10
IQ"
-4
6In T (eV)
10
FIG. 8.1. An example of the electron degradation spectrum. The horizontal axis representsthe electron energy T on a logarithmic scale. The vertical axis represents the spectrum y(TQ,T)produced in H2 gas at 0°C at one atmosphere, steadily subjected to incident electrons of initialenergy TO = 10 keV at the rate of one electron per second per cm^. Reproduced withpermission from Douthat [11].
557

20 50 100 200T(eV)500 10002000 5000 10,000 20,000———— — -T
In T (eV)
FIG. 8.2. An example of the yield spectrum. The horizontal axis is the same as in Fig. S.I.The vertical axis represents ny(To,T)Tai(T)/To, where y(To,T) is the spectrum shown inFig. 8.1., and aj(T) is the total ionization cross section of H? for electrons of energy T.
8.2.4.2. Dependence of Yield on Electron Energy
The relative importance of the electrons of different energies T indetermining the yield of ionization or any product is represented by the integrand ofEq. (8.2). Because the T integration runs over many decades, it is best to consider iton the logarithmic scale. Thus, one may rewrite Eq. (8.2) in the following form:
= njd(lnT)y(T)Ta s(T) (8.20)
Then, the product y(T)Tas(T) represents contributions to Ns from any unit interval inInT. We often call the product the yield spectrum. Figure 8.2 shows an example.Note the flatness of the spectrum apart from the rise near the source energy. Inother words, no energy region is of particular importance for determining theionization yield; all energies between T0 and ll make appreciable contributions, andthe energies immediately below T0 are somewhat more notable than others.
8.2.4.3. Scaling of the Spectrum
An example of the relations among y(T0,T) for different T0 is shown inFig. 8.3. The near-invariance of the rescaled spectra shown in Fig. 8.3b with respect toTQ is an explanation of the near-constancy of the W value at high incident energies.Fano and Spencer [33] gave an analytical interpretation of the scaling.
558

i 00T ( e V )
500 2500 10,000 30.000
10 -.5 1
.16
<U
^
~^SpbG
H
H^
J4
.12
JO
.08
.06
£4
.02
0
Tn = 30 keV-
E^ 041-
V 10 keV-
0.0 ai 02 0.3 0.4 0.5 0.6 0.7 0.8 0,9 1.0
FIG. 8.3. The scaling of the degradation spectrum. The spectra y(To,T) are for helium at0CC at one atmosphere, subjected to incident electrons of ini t iai energies TQ = 1.99, 10, and30 keV. In Fig. S.3a, spectra themselves are shown; in the abscissa scale, R = 13.6 eV. InFig. 8.3b, suitably scaled quantities are used for both abscissa and ordinale. The three curvesare very nearly the same. The symbol aj(T) represents the total ionization cross-section of Hefor electrons of energy T, and I represents the (first) ionization threshoid, 24.58 eV, ofhelium. Reproduced with permission from Douthat [9].
559

8.2.5. Monte Carlo Calculations
Electron degradation processes have been studied by using the Monte Carlomethod in various gases (He, Nc, Ar, H2, CO2, CH4, N2, H2O vapor and liquid,mixture ot Ar f 50% CH4, and the methane-based tissue-equivalent gas mixture)[5, 34-53) The electron degradation spectra, the lomzation and excitation yields, themean energy required to form an ion pair, the probability distribution of ion pairsformed, and the statistical fluctuations of the yield were obtained from computersimulation for various incident energies Thus, it was possible to study the probabilitydensity distribution of the number of ion pairs and their moments as a function ofincident electron energy The obtained values were compared to experimentallydetermined values and results of the Monte Carlo calculations arc presented inSections 83 and 84, together wi th experimental data The uncertainty of Monte Cailocalculations is primarily defined by uncertainties in cioss section data needed forcalculation In particular, the data for \\atcr, the pnncipal const i tuent of biologicalcells, are important for ladiation physics, chemistry, and biology However,experimental data on cross-sections and other relevant quantities for liquid water arevery scarce Water in both gaseous and liquid phases was intensively studied byParetzke and Berger [39], Hamm et al [40], Turner et al [41], Parctzke et al[5, 42], Ternssol et a! [43], Malbcrt et al [44], and Kaplan et al [45-49] Results forliquid water are presented m more detail in Section 8 6
83 THE W VALUE
Let N^Tfl) be the mean number of ion pairs (the mean lomzation yield)formed by incident ionizing radiation after complete dissipation of its energy T0 Themean lomzation yield is customarily expressed in terms of the mean energy per ionpair
W(T0) = — — (821)N i (To)At high energies (usually at T0 > 10 keV for electrons), the W value
generally approaches a constant value Wa [1] The W value increases as the incidentparticle energy decreases (below about 1 keV for electrons), because in the low-energyregion, the ratio of the lomzation cross-section to the cross-section lor non-iomzmgprocesses becomes smaller than in the high-energy region The fraction of incidentenergy carried by subiomzation electrons must also be considered Inokuti [54]proposed an analytic approximation N\(TQ) = (T0 - U)/Wa, where U is a constantclose to the mean energy of the subiomzation electrons, and Wd is the asymptoticvalue of W at high energies According to this idea, we may write the following
WW(T) = ———-— (822)
1 - U TO
Measurements on propane |55j, methane [56], and xenon [57] give anenergy dependence consistent wi th this relation do\vn to quite low energy Some oldermeasurements in air and other gases [58-60] give a much stronger energy dependence,
560

1 dw(T) dT
T_ W(T)
but several recent measurements in the same gases [50, 51, 61, 62] are in agreementwith Eq. (8.22). (As a qualification we note that some of these measurements [55-57]were made with the use of photons, which act as a source of electrons having adistribution of initial energies. Therefore, comparison of those measurements withEq. (8.22) is not altogether straightforward).
The W value is defined for complete dissipation of the initial energy T0 tothe matter. However, for high-energy particles in thin media, it is necessary toconsider the differential value, w, of the mean energy necessary to produce an ionpair, defined as follows:
w - —— (8.23)dN
Here dT is the mean energy lost by a charged particle of energy T intraversing an absorber of thickness dx, and dN is the mean number of ion pairsproduced when dT is completely dissipated in the gas. The relationship between w andW is as follows:
(8.24)
If W(T) = W = const at any particular T, then w(T) = const at that T, and itsvalue is W. This rule holds for sufficiently high TO, to a close approximation. (As aqualification, the above discussion presumes that dT in Eq. (8.23) is the energydeposited within the thickness dx. Any energy departing from dx, e.g., by means ofsecondary electrons must be corrected for, in a rigorous treatment).
To explain the magnitude of the W value in pure gases, Platzman [63] gavean elementary treatment based on the idea of energy balance. When the kineticenergy T of any incident particle is completely absorbed in a pure gas, the energy Tmay be apportioned into three parts, a part used in producing discrete excited statesor neutral dissociation fragments, a part used in producing ions, and a part carried bysubexcitation electrons (i.e., electrons that have kinetic energies lower than the firstelectronic-excitation threshold and are therefore incapable of producing excited states orions). Let Nex be the mean number of excited states produced and Eex the meanenergy transfer per excited state. Let N[ be the mean number of ions and E j themean energy transfer per ion pair. Note that the total number of subexcitationelectrons is equal to Ni and suppose that the mean kinetic energy carried by them ise. Then, one may write:
T = N i E i + N e x E e x + N i e (8.25)
By definition the W value is the ratio T/Ni. A natural unit for the W values is the(first) ionization threshold I for the gas; therefore, we consider the ratio W/I. Thisratio may be expressed as follows:
'Ni I I
561

Each term of this equation depends on the particle energy T, but thedependence on T is weak for T»I. For pure helium, Platzman gave the followingestimates of the magnitude of each term for large T values:
1.71 » 1.06 + 0.85 • 0.40 + 0.31
The ratio Ej/I is slightly greater than unity because excited states of He4"ions are produced. The ratio should be greater for other atoms (for which possibilitiesfor excited ion states are more diverse), and even greater for molecules (which leadto molecular ions that may dissociate or may carry some vibrationa! and rotationalenergy). The ratio Ee\/I i-s generally less than unity but is close to unity becauseexcited states lie slightly below I in most cases. Molecules have superexcited states thatare above I and yet produce neutral fragments; therefore, one expects a higher valueof the ratio. The ratio Nex/Ni is hard to evaluate without detailed analysis. It is about0.5 for closed-shell atoms, about 1 for ordinary molecules, and about 2 for freeradicals (molecules containing an odd number of electrons), according to Platzman'sestimates [63], which are basically correct in the light of current knowledge. The ratioe/I should be smaller than unity in general, and it is about 0.3 for rare gases.Consequently, the ratio W/I, for high-energy particles is 1.7 - 1.8 in rare gases and2.1 - 2.5 in molecular gases.
A characteristic feature of rare gases is a relatively small number ofexcitations in comparison with the number of ionizations. This feature is reflected inrelatively small values of W/I and the Fano factor compared to molecular gases. Theionization of molecular gases is more complex, because non-ionizing dissociationprocesses are possible after the transfer of energy T>I [64, 65], and the ionizationprocess competes with the neutral fragmentation. Consequences of the competition tothe ionization yield were pointed out by Platzman [64, 65] and were further discussedby Alkhazov [66]. This topic is closely related to the quantum yield of photoionization,as discussed in Chapter 5. A recent study by Kimura et al. [67] showed that thecompetition between these channels for the de-excitation of superexcited molecularstates is responsible for oscillations in the W value in a series of alkanes.
Extensive knowledge of the W value for different incident particles ofvarious incident energies in gases and liquids is needed for full elucidation of radiationeffects. Measurements of absorbed dose or of kerma by using gas cavity chambersrequire precise knowledge of basic physical data. For radiotherapy it is desirable todetermine doses in soft tissue with an overall absolute uncertainty of 5% [68-70]. Suchan overall accuracy implies that the separate contributions of stopping power ratios, Wvalues, and kerrna ratios in ion chamber materials and tissues should be known withabsolute uncertainties of ±2% or less.
The ICRU Report 31 [1] on W values provides a database of measured Wvalues for different charged particles in various gases, published up to 1978. Most ofthe W values presented in ICRU Report 31 [Ij were obtained at high energies, wheresignificant energy dependence was neither expected nor observed. We will refer to theaverage high-energy W values as ICRU values in the following sections. In this Chapterwe will pay more attention to new data obtained either experimentally or theoreticallysince 1978 and will attempt to critically assess all published data. Recent experimentalW values in various gases are presented as a function of energy. Materials of interestfor dosimetry and radiotherapy are argon, hydrogen, nitrogen, oxygen, methane,
562
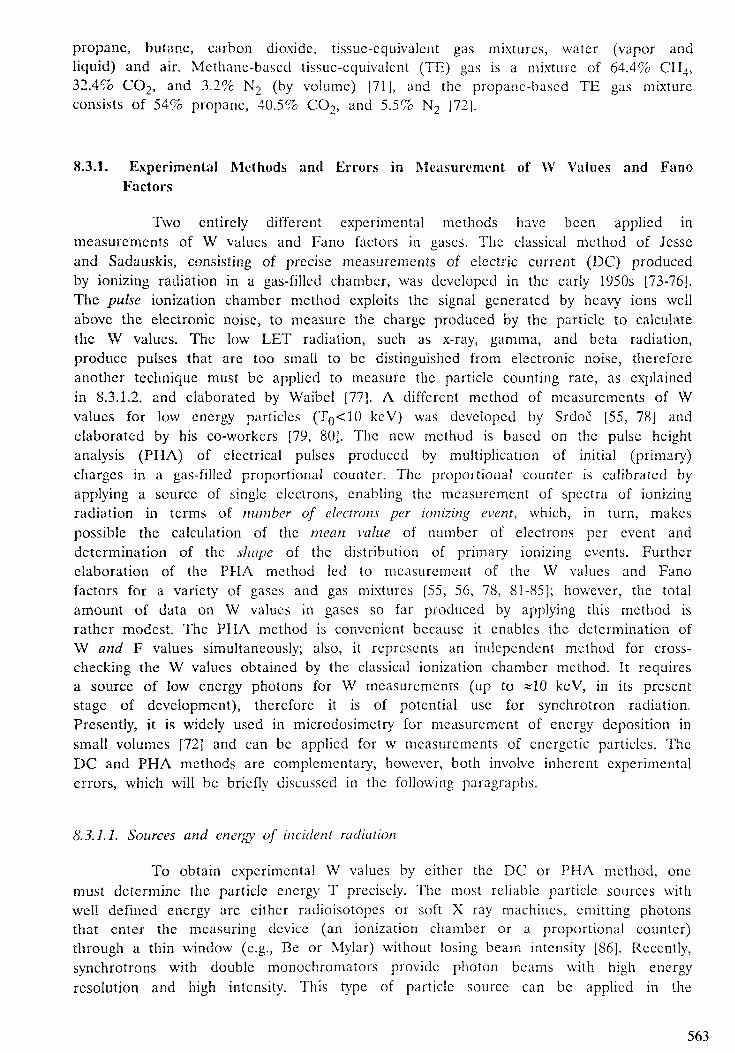
propane, butane, carbon dioxide, tissue-equivalent gas mixtures, water (vapor andliquid) and air. Mcthanc-bascd tissue-equivalent (TE) gas is a mixture of 64.4% CH4,32.4% CO2, and 3.2% N2 (by volume) [71J , and the propane-based TE gas mixtureconsists of 54% propane, 40.5% CO2, and 5.5% N2 [72].
8.3.1. Experimental Methods and Errors in Measurement of W Values and FanoFactors
Two entirely different experimental methods have been applied inmeasurements of W values and Fano factors in gases. The classical method of Jcsseand Sadauskis, consisting of precise measurements of electric current (DC) producedby ionizing radiation in a gas-filled chamber, was developed in the early 1950s [73-76].The pulse ionization chamber method exploits the signal generated by heavy ions wellabove the electronic noise, to measure the charge produced by the particle to calculatethe W values. The low LET radiation, such as x-ray, gamma, and beta radiation,produce pulses that are too small to be distinguished from electronic noise, thereforeanother technique must be applied to measure the particle counting rate, as explainedin 8.3.1.2. and elaborated by Waibel [77]. A different method of measurements of Wvalues for low energy particles (Tg<10 keV) was developed by Srdoc [55, 78] andelaborated by his co-workers [79, 80]. The new method is based on the pulse heightanalysis (PHA) of electrical pulses produced by multiplication of initial (primary)charges in a gas-filled proportional counter. The proportional counter is calibrated byapplying a source of single electrons, enabling the measurement of spectra of ionizingradiation in terms of number of electrons per ionizing event, which, in turn, makespossible the calculation of the mean value of number of electrons per event anddetermination of the shape of the distribution of primary ionizing events. Furtherelaboration of the PHA method led to measurement of the W values and Fanofactors for a variety of gases and gas mixtures [55, 56, 78, 81-85]; however, the totalamount of data on W values in gases so far produced by applying this method israther modest. The PHA method is convenient because it enables the determination ofW and F values simultaneously; also, it represents an independent method for cross-checking the W values obtained by the classical ionization chamber method. It requiresa source of low energy photons for W measurements (up to «10 keV, in its presentstage of development), therefore it is of potential use for synchrotron radiation.Presently, it is widely used in microdosimetry for measurement of energy deposition insmall volumes [72] and can be applied for w measurements of energetic particles. TheDC and PHA methods are complementary, however, both involve inherent experimentalerrors, which will be briefly discussed in the following paragraphs.
8.3.1.1. Sources and energy of incident radiation
To obtain experimental W values by either the DC or PHA method, onemust determine the particle energy T precisely. The most reliable particle sources withwell defined energy are either radioisotopes or soft X ray machines, emitting photonsthat enter the measuring device (an ionization chamber or a proportional counter)through a thin window (e.g., Be or Mylar) without losing beam intensity [86]. Recently,synchrotrons with double monochromators provide photon beams with high energyresolution and high intensity. This type of particle source can be applied in the
563

measurement of W values for photo-electrons ejected from the K shell of gasmolecules in the chamber. Depending on the chamber (or counter) size, gas density,and Z (the atomic number), the created secondary electrons are usually contained inthe active gas volume up to the incident particle energy of several keV. Care must betaken at intermediate and high energies to avoid loss of energy to the chamber wallsinstead of the active gas volume. This may be done by increasing the gas density(pressure). However, limits often exist, beyond which the experimentalist may encountermore troubles than gain, such as an incomplete charge collection due to low E/p nearthe chamber walls, ruptures of fragile windows, or electric breakdowns due to theexcessively high voltage required to operate the proportional counter at high gaspressures.
Sources emitting a and ß particles are usually manufactured in the form offoils or plaques having the active material electrodeposited on the base metal. Veryoften a thin protective layer of gold, for example, is evaporated on the active surface.In such cases one has to take into account the particle energy losses (1) due to self-absorption in the active layer; (2) in the protective layer; (3) in the gap between thesource and the chamber window, if the gap is filled with a gas; and (4) in thechamber window. The energy degradation of the particle due to losses in the sourceand along its path to the gas-filled chamber, is often difficult to calculate precisely. Insome cases, however, all the uncertainties in determining the incident particle energycan be eliminated by using internal gaseous sources, such as ^7Ar. Adding a smallamount of radioactive gas to the working counter gas can eliminate particle energylosses due to passage through various materials outside the active gas volume in thechamber.
When electrons or ions are produced by accelerators (here we are dealingmostly with very low energy accelerators), care must be taken to avoid several sourcesof energy distortion. At low electron energies, up to a few hundred electron volts, thework function of the target material must be considered. The energy spread of theelectron or ion beam must be closely controlled. The electron energy spread and themean energy shift are caused by the space charge at the source and depend on theparticular source parameters [87, 88]. The voltage ripple introduced by power suppliesof ion accelerators must be measured and its effect on the spread of the electronenergy must be evaluated. Loss of energy in the entrance window or in the effluentgas, if an entrance aperture is used, can lead to significant errors. Another source ofenergy shift can be the ion-collecting voltage in the gas chamber. At very low particleenergies approaching the ionization threshold a DC method with alternate non-symmetrical pulsed primary and secondary currents is applied to avoid serious changesof the input particle energy caused by the ion collecting field [61]. In the adjacenthigher energy region the current or charge integrating methods give the best results[51, 52, 62, 89]; in both cases no chamber window foils are acceptable for chargedparticles due to the large loss of energy in the window material. At higher particleenergy the primary particle rate is measured by counting individual particles to avoid alarge difference in DC current, provided that the corresponding pulse heightdistribution of the primary particles can be safely discriminated against noise [90]. Andat very high energies where the ionization chamber dimensions should be very largeand the pressure high to stop the particles it is more convenient to measuredifferential w values [91, 92].
564

8.3.1.2. îonization chamber measurement techniques
Measurements of W values in gases by means of DC ionization chambersrequire a precise determination of the total number of particles entering the chamberwith energy T and the number of ion pairs resulting from interaction of energeticparticles with gas molecules. This setup, called the integration mode, is very oftenreplaced in practice by measuring the particle rate and the corresponding ionizationcurrent, which is the electric current produced by interaction of incident particles withthe investigated gas. Steady source conditions must therefore be provided, because inmost cases there is no way to measure both the primary particle current and thesecondary ionization current simultaneously.
The primary particle rate must be kept low to avoid space charge andrecombination effects caused by high ionization density, especially at higher incidentparticle energies. Hence, only at lower particle energies are current or chargeintegration methods convenient. Particle counting methods are applied by using theionization pulse in the gas of interest with or without gas amplification. Two mainsources of error should be mentioned here: incorrect discrimination against electronicnoise [93], and deadtime losses. Analysis of pulse height distribution and the theory ofcounting losses must be applied. For current or charge measurements, the precisionand stability of the capacitors and resistors of the input preamplifier are of utmostimportance [93]. Charge exchange of accelerated ions with residual gas molecules inthe beam-guiding system leads to errors in particle current measurement; thecorresponding cross-sections are high at low energies.
The number of ion pairs may be determined from each ionization pulse,but in most cases it is derived from the mean ionization current or an integratedcharge. High collection efficiency must be ensured; this depends on the chambergeometry, the type of gas, the pressure, and the ion density. Loss of particles due toscattering in the effluent gas from the entrance aperture must be taken into accountby using the pressure dependence of the ionization current. By extrapolating thepressure-dependent current from the region of complete particle stopping to p->0, theionization and particle losses in front of the entrance aperture can be taken intoaccount [94]. However, an optimum collection of charges can be achieved in manycases only if the collecting voltage is varied with a constant ratio E/p of electric fieldstrength E and pressure p. From the dependence of the ionization current on theratio E/p, the energy shift can easily be determined if a parallel-plate ionizationchamber is used in the region of high collection efficiency [94]. Attention should alsobe given to ionization losses due to the backscattering of primary particles in the gas;this effect is especially important for electrons.
8.3.1.3. Proportional counter measurement technique
Except for alpha particles and heavy ions, most of ionizing particles producea too small an electric charge in a chamber or counter gas to be detected directly bythe coupled electronics. In spite of a significant progress in low-noise techniques [93]the signal produced by beta or gamma rays in an ionization chamber is buried inelectronic noise. Therefore, gas multiplication of the order of 103 is required to raisethe signal above the noise. A proportional counter serving that purpose deliverselectric pulses proportional to the electric charge produced in the counter gas, which
565

is, in turn, proportional to the incident particle energy dissipated in the gas andinversely proportional to the W, i.e., the energy spent to form an ion pair.
The proportional counter technique for measurement of W values and Fanofactors comprises three interconnected systems: (1) the proportional counter and theassociated gas handling manifold, (2) the electronics and high-voltage power supplies,and (3) the data processing system, usually on-line for data acquisition and off-line forsubsequent elaborated data processing. Each of the three steps contains specificproblems and inherent measurement errors that will be discussed briefly.
To obtain by the proportional counter method a reliable and reproducibledistribution of electric charges produced by incident particles in a gas, the followingconditions must be met or precautions taken:
The contamination of the investigated gas in the proportional counterarising from vacuum lines and counter casing leaks should be carefully tested andeliminated. A vast selection of methods for eliminating or reducing outgassing (a slowdiffusion of gases trapped in metal, especially in plastic insulators inside the gas-filledvolume) have been described in high vacuum literature. Essentially, prolonged pumpingand simultaneous baking at an elevated temperature of all parts of the vacuum systemare recommended. A different approach consists of the so-called flow mode, in which aconstant flow of the investigated gas maintains the required gas purity. The flow modehelps to overcome the leakage and outgassing problems, but very often the fluctuationsin gas pressure due to imperfect pressure regulating devices offset all the advantagesof the flow mode. Rubber or plastic gaskets used to seal various metal parts of anassembled proportional counter are prone to leaks over a prolonged period of timebecause of diffusion of atmospheric gases into the counter. The vacuum sealantsbehave similarly. A compromise leading to a good, practical solution was applied bySrdoc and Clark [86]. The procedure consisted of a combination of both techniques,that is a thorough outgassing at an elevated temperature followed by system operationin the gas flow mode. However, to avoid gas pressure fluctuations during datacollection, the proportional counter was sealed off by closing the inlet and outletvalves. The gas purity was controlled by measuring a calibration spectrum before andafter data collection under the closed system mode. Additional good practices arekeeping the air out of the vacuum lines and the counter at all times and soaking thecounter in the gas at working pressure for 24 h before measurement. Theexperimentalist is coping with two entirely different and very distinct phenomena ingaseous physics. A small amount of inadvertently admixed gas, very often of the orderof ppm, causes no substantial change of W values or Fano factors in regular gasmixtures, as explained in Section 8.3.7. However, the admixture of any gas that makesthe gas mixture irregular will drastically change the physical properties of the gasmixture by inducing the Jesse or Penning effects. The W and F values obtained insuch cases are relevant to the (very often unknown) gas mixture, not to the vehiculargas. A totally different phenomenon occurs if the gas impurity contains a componenthaving a high electron attachment coefficient, such as the ubiquitous oxygen [95]. Inthis case, the primary distribution of charges may not be significantly affected by, e.g.,several ppm of O2 in a gas. However, the probability that free electrons formed inthe track (or in a cluster in the case of a low-energy particle) are attached to O2
molecules is relatively high in a period of time much shorter than the average transittime for electrons to reach the gas multiplication zone in a proportional counter.Consequently, a significant fraction of created free electrons is lost for multiplication
566

80
70-
60
50
40
30
20
n
Ar
D
D
102 103 104T(eV)
FIG. 8.4. W value for electrons in argon. The ICRU [1] reference value of 26.4 eV isdenoted by the arrow. +, Smith and Booz [601; D. Combecher (61j ; A, Kowari et al. (14);»,-Eggarter [15]; x, Unnikr i shnan and Prasad [98]. Measured W values [60, 61] are presentedtogether with W values calculated by applying the following methods: Monte Carlo [98], theFowler equation [15], and the Spencer-Fano theory [14]. Monte Carlo calculation byGrosswendt [37] (not shown here) is in good agreement with measured W values [61], exceptat very low energies. The differential w value for 60Q) gamma rays, measured by Hiraokaet al. [99], is 26.0 eV.
because heavy, negatively charged O2 molecules cannot gain enough energy in anelectric field to produce additional charges on collision, and detachment coefficients areusually too low at E/p values encountered in proportional counters to free theelectrons. The net result is a completely distorted spectrum, shifted toward the low-energy side, which is useless for further processing and calculation of W or F values.Low-energy electron attachment to O2 molecules in gas mixtures has been extensivelystudied and summarized in a recent review [96]. The effect of the attachment processon the response-time of an air-filled ionization chamber and the consequences on Wand F value measurements have been discussed in details.
Besides gas pressure and composition, gas multiplication depends strongly onthe counter's high voltage. Care must be taken to provide a high-quality power supply
567

without ripples. Continuous monitoring of the high voltage during measurement isrecommended. The input stage of a preamplifier should be coupled directly to theproportional counter anode at ground potential, to reduce excessive input capacitance,which is a major source of electronic noise. A low-noise FET preamplifier developedby Radeka [93] serves well for signal amplification.
The process of gas multiplication introduces a substantial broadening oflines in the event-frequency spectrum, which is more conspicuous with decreasingparticle energy. Thus, a spectrum of monoenergetic K« lines of AI (Tg « 1.5 keV) orC (Tg « 0.277 keV) consists of a broad, bell-shaped pulse height distribution, and theso-called single electron spectrum in a proportional counter is a curve stretching overtwo decades, which can be fitted by a gamma function. In spite of such extremebroadening of energy lines due to the very nature of electron multiplication in a gasunder the influence of a strong electric field, recent developments in computer-assisteddata processing have eliminated the broadening of spectral lines introduced by gasmultiplication [80, 81].
100
90
80
70
60
50
40
30
H.
10 10' 10' 10'T(eV)
FIG. 8.5. W value for electrons in hydrogen. D, Ü2, Combecher [61]; —, Ü2, [61];A, Eggarter [15]; x, Kimura et al. [100]. The ICRU [1] high-energy value (36.5 ± 0.3 eV) isdenoted by the arrow. W values for keV electrons in H2 were calculated according to theFowler equation [15] and the Spencer-Fano theory [100].
568

3.Z
100
90
80
70
60
50
40
30
D
N
D
à> D
a
13
D0a-
101 102 103 10T(eV)
FIG. 8.6. W value for electrons in N2- The ICRU [1] high-energy value (equal to34.8 ± 0.2 eV) is denoted by the arrow. 0, Smith and Booz [60]; D, Combecher [61];+, Waibel and Grosswendt [51]. The differential w value measured by Hiraoka et al. [99] for60Co gamma rays is 35.1 eV.
The processing of spectra obtained by a proportional counter is described insome detail in [80]. Most spectra are incomplete in their original form; usually thelow-energy part is buried in electronic noise and the high-energy tail is missingbecause of the limited range of most electronic devices (typically two decades). Carefulextrapolation is required, based on the best fit to experimental data or the theoreticalor empirical shape of the pulse height distribution. The deconvolution of experimentallyobtained spectra, properly processed at the low- and high-energy ends, is performed bythe aid of a computer [80, 81]. The final result is a frequency distribution of ionpairs in the investigated gas, irradiated by a chosen ionizing radiation of a well-definedenergy. The W value and the Fano factor are easily calculated from such a frequencydistribution.
569

The accuracy of W values and Fano factors obtained either by theionization chamber or proportional counter method depends on so many experimentalerrors, as described above, that the error margins claimed by the author(s) must betaken cautiously. A laboratory bias is sometimes evident, meaning that a set of datapublished by an author or a group of authors using the same instrument in alaboratory may differ systematically from another set of data or an accepted set ofaverage values. With typical experimental errors in ionization chamber and proportionalcounter techniques, an overall error of ±2% may be considered realistic for W and Fvalues. Departures in both directions are possible. Experimental values deviating morethan 3% from an accepted average value should be shelved until more data areavailable to confirm or definitely reject the values.
DO
60
55
50~A 45^
35
40
30
95
D 1 I
~~ CH4 ~
— D A —
+ 0- D o
am 0 Q
_ a Oo -a.f
_ a° ^ —
^ 0-
\* ' U+ H- t«*
7°» +++i "*101 102 10 104
T(eV)
FIG. 8.7. W value for electrons in Crfy. The ICRU [1] high-energy value (equal to27.3 ± 0.3 eV) is denoted by the arrow. 0, Smith and Booz [60]; D, Combecher [61];+, Waibel and Grosswendt [50]; and A, Krajcar-Bronic et al. [82]. Data in [60] differsignificantly from other data. Monte Carlo calculations by Waibel and Grosswendt [50] (notshown here) are in good agreement with the experimental data of '.he same group and thoseof Combecher [61]. Data of Krajcar-Bronic et al. [82] are electron W values calculated fromphoton W values measured by Srdoc [78]. The differential w value, equal to 26.6 eV withuncertainty of 4.3% and measured by Hiraoka et al. [99] for 60Co gamma rays (1.33 and1.17 MeV), is in good agreement with the ICRU high-energy W value.
570

75
70
65
60
55
50
45
40
35
30
D
C0
A a vo
, o+ o
* ±0
10' 103 104
T{eV)
FIG. 8.8. W value for electrons in CO2 The ICRU [1] high-energy value (equal to33.0 ± 0.7 eV) is denoted by the arrow. 0, Smith and Booz [60]; D, Cambecher [61];+, Waibel and Grosswendt [52]; A, Monte Carlo calculations by Waibel and Grosswendt [52].Data of Combecher [61] above 100 eV and data of Smith and Booz [60] differ from data ofWaibel and Grosswendt [52], which approach the high-energy W value. Monte Carlocalculations [52J closely follow the experimental W value, with a small discrepancy at the low-energy end. The differential w value for 60Qj gamma rays, measured by Hiraoka et al. [99], is33.4 eV.
8.3.2. W Values for Electrons
Combecher [61] has published W values for electrons in air, N2, O2, CO2,TE gases, H2, D2, H2O, D2O, Ar, Kr, Xe, methane, ethane, propane, butane, pentane,hexane, nonane, ethylene, acetylene, ethanol, acetone, C6H6, and C6D6 in the energyrange from 200 eV to 1200 eV. He claimed a total experimental error in W of lessthan 2%. Smith and Booz [60] measured W values for electrons in methane-based TEgas, CH4, CO2, N2, and Ar from 30 eV to 2 keV with quoted uncertainties largerthan 5%. Waibel and Grosswendt published measured W values for air [62], CH4 [50],N2 [51], CO2 [52] and methane-based TE gas [53] in the energy region from 20 eV
571

to 5 keV. The standard deviation of these data is less than 1% for energies between50 eV and 5 keV and less than 2% below 50 eV in most cases. Waibel andGrosswendt gave also fitting parameters to their experimental data, carried out MonteCarlo calculations and obtained W values for CH4 [50J, N2 [51], CO2 [52] andmethane-based TE gas [53] in good agreement with measurements. Tung and Baum[97] calculated W values for electrons of 1-10 keV in several hydrocarbons by usingInokuti's solution of the Fowler equation.
Figures 8.4-8.14 show W values for electrons in various pure gases, intissue equivalent gas mixtures, and in air as a function of electron energy.
W values in argon are presented in Fig. 8.4. The data of Smith and Booz[60] show stronger energy dependence than data of Cornbecher [61] and the calculated
•S-
DO
60
55
50
45
40
35
30
QC:
! 1D
~ 0 TE-CH4
_. ö _D 0+ 0D 0
n *D 0
Ç 0„ D O
tp 0st 0
DSèaî^5r;;+- -i i
101 10' 10T{eV)
FIG. 8.9. W value for electrons in methane-based TE gas. 0, Smith and Booz [60];D, Combecher [61]; +, Waibel and Grosswendt [53]; A, Krajcar-Bronic et al. [82]. Data in[60] significantly differ from those in [6Î] and [53]. Data of Krajcar-Bronic et al. [82] areelectron W values calculated from photon W values measured by Srdoc [78]. The differential wvalue for 60Q) gamma rays, measured by Hiraoka et al. [99], is 29.4 eV. This value may betaken as the high-energy W value.
572

OU
48
46
44
42
40
_ 38
Ä 36
^ 34
32
30
28
26
24
221
! i_ D _
C3H8
~ n ~
~ D ~
_ D _
~~ D ~
D
D- Ifo
D_ D _
D
+^ftßte_ + « _
l l
O1 102 103 10'T(eV)
FIG. 8.10. W value for electrons and photons in CsHg. Electrons: D, Combecher [61];0, Krajcar-Bronic et al. [82]. Photons: +, Srdoc [55j. W values for photons in the keV energyregion in propane, measured by Srdoc [55], are higher than the average high-energy value of(24.0 ± 0.5) eV recommended by the ICRU [1] and denoted by the arrow. Data of Krajcar-Bronic et al. [82] are electron W values calculated from photon W values measured by Srdoc [78].
W values [14, 15, 37, 98]. The ionization is not zero at the atomic ionizationthreshold because of production of the diatomic rare gas ion Ar2
+ by energy transferfrom the excited atoms, Ar* + Ar —> Ar2+ + e".
W values in hydrogen are presented in Fig. 8.5. No significant difference inW values for H2 and D2 was observed [61].
W values in N2, CH4 and CO2, i.e., the constituents of the methane-basedTE gas, are presented in Figs 8.6, 8.7, and 8.8, respectively, while the W values inthe methane-based TE gas are presented in Fig. 8.9. The W values obtained byCombecher [61] agree very well with those of Waibel and Grosswendt (Figs 8.6, 8.7,and 8.9), except for electron energies above 100 eV in CO2 (Fig. 8.8). The data ofSmith and Booz [60] deviate from other measurements and have stronger energydependence (Figs 8.6-8.9).
573

W values for low-energy electrons in propane and propane-based TE gasare presented in Figs 8.10 and 8.11.
The W values for TE gas mixtures are well represented in the energyrange from about 20 eV to several keV, as evident from Figs 8.9 and 8.11, but datafor medium- and high-energy electrons are very scarce [1]. The importance of thesegas mixtures in radiation dosimetry and microdosimetry suggests that more attentionshould be given to measuring W values for electrons above 10 keV in TE gases.
W values in butane are presented in Fig. 8.12. Differences in W forelectrons in chemical isorners n- and i-butane were found by Combecher [61] atenergies between 13 eV and 80 eV.
W values in water vapor are given in Fig. 8.13. Paretzke et al. [42]presented a Monte Carlo calculation for the degradation of 10 keV electrons in watervapor. The W values thus obtained are in good agreement with the experimentalvalues of Combecher [61]. Olko et al. [101] reported W values equal to 30.4 eV for
4846444240383634323028262422
-*-
TE-C3H8
xXX
XxX
x vXX
10 103 10'T(eV)
FIG. 8.11. W value for electrons in propane-based TE gas mixture, x, Combecher [61];V, Krajcar-Bronic et al. [82]. Data in [82] are electron W values calculated from photonW values measured by Srdoc [78].
574

^b
44
42
40
38
36*—'"•.
^ 34£
32
30
28
26
24
2?
- + n-C4H1 0 -
- a+ i-C4H10
~ »
- ^0-
- ft- -q-
_ D —
%.
*È
^eibnÉ+ DD
00 — *
I I102 103
T(eV)10'
FIG. 8.12. W value for électrons in n-butane (G) and i-butane (+) as measured byCombecher [61]. The ICRU [1] high-energy value (23.4 ± 0.4 eV) is denoted by the arrow.Data of Krajcar-Bronic et al. [82] (0) are electron W values calculated from photon W valuesmeasured by Srdoc [78].
12 keV X rays, and Marshall et al. [102] obtained 32.6 eV and 36.4 eV for electronshaving energies 0.76 keV and 0.27 keV, respectively, in water vapor. Combecher [61]reported isotope effects in water vapor and benzene. Significantly lower W values werefound in deuterated water and benzene at low electron energies.
W values in air are presented in Fig. 8.14. Cole [59] quoted uncertaintiesof 15% below 100 eV and 5% above 2 keV, and his data deviate from otherexperimental W values [58, 61, 62]. Data of Gerbes [58] show stronger energydependence below 1 keV than data in [61, 62]. The dependence of W on the partialpressure of water vapor in air was published in ICRU Report 31 [1]. Measurementsof W for electrons produced by 60Co radiation in dry air were presented by Niatelet al. [103]. Taking into account new values for stopping powers, Boutillon andPerroche-Roux [104] re-evaluated all data for dry air (data from ICRU 31 and recent
575

values of Niatel et al. [103] and Kunze and Hecker [105]) and obtained the meanvalue W = 33.97 eV, compared to the former value of W = 33.85 eV given inICRU 31 (Fig. 8.14).
Above 5 keV, and in some cases even above 500 eV, a discrepancy existsin measured W values for electrons in all gases. This problem may be remedied forpractical purposes by smoothly extending the W values from the region between 1 keVand 5 keV, if available, to the high-energy values recommended by the ICRU Report31 [1].
8.3.3. W Values for Photons
Very few data exist on the W value for low-energy photons. The onlymeasurement of the W value for low-energy photons in methane was made by Srdoc
80
70
60
50
40
30
20
H2O
110 10 103
T(eV)10 10
FIG. 8.13. W value for electrons in water vapor. The ICRU [1] high-energy VV value(29.6 ± 0.3 eV) is denoted by the airow. D, H2O Combecher [61]; —, D2Ü [61]; V, Marshallet al. [102]; 0, Paretzke et al. [42]; A, Turner et al. [41]. Monte Carlo calculations byParetzke et al. [42] and Turner et al. [41] agree well with the measured data.
576

Q>
75
70
65
60
55
50
45
40
35
xD
0!— x
a
oq-D
30
AIR
—*^>
10 10 103 10 105 106
T(eV)
FIG. 8.14. W value for electrons in air. The ICRU [1] high-energy value(33.85 ± 0.05 eV) is denoted by the arrow. A, Gerbes [58]; x, Cole [59]; D, Combecher [61];+, Waibel and Grosswendt [62}; 0, Niatel et al. [103]; V, Boutillon and Perroche-Roux [104].Older data of Gerbes [58] and especially of Cole [59] differ from recent data of Combecher[61] and Waibel and Grosswendt [62]. Boutillon and Perroche-Roux [104] re-evaluated theICRU [1] average W value on the basis of recently published stopping power data andobtained W = 33.97 ± 0.05 eV.
and Obeiic [56]. Their results show an increasing W value with decreasing energy.Srdoc [55] measured W values for low-energy photons in propane down to 85 eV andobtained a slow increase of W up to 7% (Fig. 8.8). Srdoc [78] measured the W valuefor low-energy photons in both TE mixtures and compared the results to otherexperimental data. Suzuki and Saito [106, 107] measured W values for photons inmethane and propane by using monochromatic, ultrasoft X rays generated fromsynchrotron radiation through a plane grating monochromator. They were primarilyinterested in the effects of inner-shell excitation on the fine structure of the W valuenear the C-K edge of methane and propane (260-360 eV). Their results werepublished as relative values, and therefore they will not be included in this report.
577

The W values for photons of 0.277, 1.49, and 5.9 keV in a series of alkanes, TEmixtures, and some other polyatomic gases were published by Srdoc et al. [81].Generally, the conversion of photon W values to electron W values is not trivial.However, the procedure reported in [82], based on certain simplifications, offers apossibility to convert the photon W values into the electron W values by assumingthat (1) each 277 eV photon ejects electron from an outer shell and (2) all 1.5 keVand 5.9 keV photons eject electrons from an inner shell, thus creating two electronshaving energies 1.2 (or 5.6) keV and 250 eV [82].
An interesting feature that appears in the data of Srdoc et al. [81] andKrajcar-Bronic et al. [82] is the oscillatory structure of the W values as a function ofthe number of carbon atoms in an alkanc molecule (Fig. 8.15). This behavior wasexplained by Kimura et al. [67] as follows: the oscillations are due to the strong
>CD
33
32
31
30
29
28
27
26
25
24
23
22 I 1 I
2 3 4 5
NUMBER of C ATOMS
FIG. 8.15. W for electrons in alkanes (saturated hydrocarbons, CnH2n+2. n = 1 methane,n = 2 ethane, etc.) as a function of number of carbon atoms in an alkane molecule.V, ICRU-recommenckd high-energy values for electrons; x, 100 eV, Combecher [61]:A, 150 eV [61]: 0, 250 eV [61]: +, 0.26 keV, Krajcar-Bronic et al. [82[; D, 1.2 keV [82].Data in [82] are electron W values calculated from photon \V values measured by Srdoc [78].
578

30
29
28>CD
27
26
25
Ar
0A
V
0
0
00
JD
l l10' 10' 10° 10
T (keV)10V
FIG. 8.16. W value for protons in argon. D, Thomas and Burke [108]; 0, Chemtob et al.[109]; A, Lowry and Miller [110]; •, Larson [111]; V, Phipps et al. [112]. Data by Petti et al[92] (+), Parks et al. [113] (*), Bakker and Segre [91] (©), and Hiraoka et al. [99] (•) aredifferential w values. (—), the ICRU [1] suggested value of 27.0 ± 1.0 eV for the energyrange 10 keV < TO < 4-103 keV. Note the scattered data points and the poorly definedenergy dependence.
oscillations of the branching ratio of ionization and neutral decomposition of molecularsuperexcited states. Similar oscillations can be seen in data of Combecher [61] atelectron energies above 100 eV when plotted as the mean values given by the author(Fig. 8.15). Whereas the 2% error bar renders these osciibtions less certain, thereproducjbility of results presented in [81] and [82] indicated a much smaller relativeerror in W values in a series of alkanes, as opposed to the absolute W value error of±2%.
8.3.4. W Values for Protons
Recommended W values for protons in the energy range from 20 keV to4 MeV were given in the ICRU Report 31 [1] for the following gases: N2, CO2, Ar,
579

and methane-based TE gas, and for protons having energy between 2.5 keV and500 keV in methane. In the following Sections 8.3.4-8.3.6 we will always indicate thekind of an incident particle.
Only three W values for protons in argon have been published since theICRU Report [1]. Petti et al. [92] measured the differential w value for protons at150 MeV, and Thomas and Burke [108] measured W at 2.52 MeV and 3.18 MeV(Fig. 8.16).
The W values for protons in nitrogen, displayed in Fig. 8.17, show a widescattering between 20 keV and 1 MeV. However, the data of Waibel and Willems[89], Huber et al. [114], Boring et al. [115], and Nguyen et al. [116] confirm a
o^
50
48
46
44•^ fc
t 42£
40
38
36
34
3P
i i ! ! SD
N2
T-
__ __
X
— a —* *
~ xa
- x
— * * ^ -
— o ^ ' l * * * * —^ ^jj[x*k 0<>j>
•«^ *1 1 1 ! !
10 102 103
T (keV)105 106
FIG. 8.17. W value for protons in KT2- D, protons, Huber et al. [114]; -l-, Ü2+ ions [114];0, Thomas and Burke [90]; à, Nguyen et al. [116]; V, Boring et al. [115]; *, Schaller et al.[118]; », Siùenius [117]; ©, Lowry and Miller [110]; A, Larson [111]; x, Waibel and Willems[89]; H, Kuehn and Werba [119]. Values of Parks et al. (•) [113] and Petti et al. (•) [92]are differentia! w value«. (—), the ICRU [I] suggested values of 36.5 ± 1.5 eV for theenergy range 20 keV < TQ < 4-103 kev. A minimum in the W(T) plot can be observedaround 20-30 keV.
580

>CD
60
55
50
45
40
35
30
25
CH
~ D
A *
ffl.
0 0 0<3>
10 102T (keV)
103 10'
FIG. 8J8. W value for protons in ŒL}. D, protons, Huber et aï. [114]; +, H2+ ions
0, Thomas and Burke [90]; A, Nguyen et al. [116]; x, Kuehn and Werba [119j; », Sidenius[117]; A, Waibel and Willems [89]. (—) The ICRU [1] suggested values of 30.5 ± 1.0 eV forthe energy range 10 keV < TO < 500 keV on the basis of measurements by McDonald andSidenius [122]. Recent measurements by Sidenius [117], Huber et al. [114J. and Waibel andWillems [89] showed that W is not constant below TO = 100 keV. A differentia] w valuemeasured for 70 MeV protons by Hiraoka et al. [99], 27.9 eV, is comparable to W values forMeV protons measured by Thomas and Burke [90].
minimum around 20-30 keV with a depth of at least 1.5 eV. The minimum was notobserved by Sidenius [117] and Lowry and Miller [110]. At much higher energies, thedifferential w value of Petti et a!. [92] at 150 MeV agrees satisfactorily with the Wdata around 3 MeV, while the w value of Bakker and Segre [91] (33.6 eV) at340 MeV is much lower. Improved data are needed between 0.1 MeV and 2 MeVand at higher energies, while a satisfactory set of W values for practical work may bederived from 1 keV to 100 keV with an overall uncertainty of about 3%, disregardingsome strongly deviating data.
The experimental W values for protons in the main constituents of themethane-based TE gas, CH4 and CO2, as well as in the methane-based TE gas, have
581

been updated considerably since 1978 [1]. The data on W values have been extendedto energies above 1 MeV by Thomas and Burke [90] and below 100 keV by Sidenius[117], Huber et al. [114], and Waibel and Willems [89, 12.0], while Chemtob et al.[109] and Nguyen et al. [116] measured W values for protons having energy between25 and 375 keV.
The W for protons in methane (Fig. 8.18) is a smooth function of energyup to «1 MeV. A step of about 2 eV is then observed between the data at lowerenergies [89, 114, 116, 117, 119] and those of Thomas and Burke [90] and Hiraoka etal. [99] (w value). Bichscl and Inokuti [121] calculated the differential w value
5Z
50
48
46
44
3, 42^
40
38
36
34
39
I I !
CO 2V
V
~~ V ~
— —
V- + -
V
_ _
Vn
~~ v xx J^A0 * A ^ x— v ° ^it* „A A. * -
V D A °Q Wv
102
T (keV)103
FIG. 8.19. W value for protons in CÖ2- ü, protons, Huber et al. [114]; + , H2+ ions [114];0, Thomas and Burke [90], à, Nguyen et al. [116]; x, Kuehn and Werba [119]; *, Sidenius[117]; A, Boring et al. [123]; *, Larson [111]; V, Waibel and Wülems [89]; (—), valuesuggested by ICRU [1] (34.5 ± 1.5 eV) for the energy range 30 keV < TO < 2-1Q3 keV.Recent measurements showed a broad minimum around TO = 20 keV. The W valuesmeasured by Thomas aad Burke [90] are considerably lower than the ICRU value.A differential w value for 70 MeV protons measured by Hiraoka et al. [99] is 34.3 eV, thesame as the W value measured by Larson [111] and given by ICRU [lj.
582

48
46
44
42
40
38
36
34
32
30
28
TE-CH4
D
a
*
v
JU
1 10 102
T (keV)10- 104
FIG. 8.20. W value for protons in methane-based TE gas. (—), the ICRU Jl] suggestedvalues of (31.0 ± 1.5 eV) for the energy range 20 keV < TO < 3-103 key. D, protons,Huber et al. [114]; -f, H2+ ions [114]; •, Larson [111]; 0, Thomas and Burke [90]; V, Kuehnand Werba [119]; A, Nguyen et al. [116]; *, Leonard and Boring [124]; *, Sidenius [117];A, Rohrig and Colvett [125]; x, Waibe! and Willems [120]. The differential w value (30.4 eV)for 70 MeV protons measured by Hiraoka et al. [99] is comparable to values of Rohrig andColvett [125] but higher than values of Thomas and Burke [90].
w=29.4 eV for 1 MeV protons in CH4 from experimental secondary electron spectra,total ionization cross sections and W values for electrons. This value is in goodagreement with the measured W values.
In contrast to the smooth energy dependence in CH^ a flat minimumaround 20 keV in CÛ2 (Fig. 8.19) can be confirmed from the data of Sidenius [117],Nguyen et al. [116] and Waibel and Willems [89]. The W values measured by Thomasand Burke [90] are lower than the ICRU value and the W measured by Larson [111].Further investigations are needed at proton energies above 100 keV.
Figure 8.20 gives W values for protons in methane-based TE gas as afunction of proton energy. The energy dependence of W is very similar to that in
583

methane. However, the scatter of the data between «10 keV and 1 MeV is quitelarge. An apparent maximum around 350 keV suggested by Chemtob et al. [109] andNguyen et al. [116] is questionable because of the large uncertainties quoted. Amonotonie energy dependence seems to be more realistic. Further precisemeasurements are therefore required for this energy region and for energies above3.5 MeV.
Propane-based TE gas is increasinglybut only Posny et al. [126] measured W valuespropane at proton energies from 25 keV touncertainty of W for protons in propane waspropane-based TE gas at about 4%. As for thevalues show a shallow minimum around 175 keV.the whole energy range.
being applied in neutron dosimetry,for protons in this TE gas and in375 keV, (Fig. 8.21). The overallquoted at about 3% and for the
energy dependence, the measured WMore measurements are required for
30
29
28
CD
27
26
25
H8
TE-C3H8
O
D
O
10
FIG. 8.21. W value for protons inby Posny et al. [126].
102
T (keV)103
(D) and propane-based TE gas (+) as measured
584

42
40
38
36
34
32
+A
— A
Air
es
0 A A
1 10 10'T (keV)
FIG. 8.22. W value for protons in air. D, protons, Huber et al. [114]; +, H2+ ions [114];0, Larson [111]; A, Willems et al. [127]. A broad minimum is observed at proton energiesaround TO = 20 keV. A differential w value for 70 MeV protons measured by Hiraoka et al.[99], 35.3 eV, is comparable to the W value measured by Larson [111].
Marshal! et al. [102] reported differential w values in water vapor equal to33.6 ± 2.4, 31.9 ± 2.0, and 30.6 ± 1.9 eV for protons having energies 85 keV,230 keV, and 390 keV, respectively. Olko et al. [101] reported differential w valuesfor protons in water vapor, calculated by the Monte Carlo method, equal to 34.1,33.5, and 33.1 eV for protons having energies 0.3, 1.0, and 3.5 MeV, respectively.These results are much higher than those of Marshall et al. [102].
W values for protons in air (Fig. 8.22) have been measured by Willemset al. [127] at energies from 1 keV to 100 keV and by Huber et al. [114] from5 keV to 50 keV. The uncertainties quoted were about 2%. Waibel and Willems [128]confirmed a flat minimum around 20 keV. A single W value has been published byLarson [111] at 1.826 MeV, while the differential w values were measured by Bakkerand Segre [91] at 340 MeV (w = 33.3 eV) and by Hiraoka et al. [99] at 70 MeV(w = 35.3 eV).
8.3.5. W Values for Alpha Particles
ICRU Report 31 [1] gave average W values for «5.3 MeV alpha particlesin the following gases of radiological interest: Ar, H2, N2, CH4, C3H8, CO2, methane-based TE gas, H2O, and air. The W values for alpha particles in Ar, N2, methane,and methane-based TE gas were also given as a function of energy in the ICRUReport 31.
New measurements of W values for alpha particles in various gases werereported by Krieger et al. [129], Whillock and Edwards [130], Thomas and Burke[131], and Tawara et al. [132]; values for He+ ions were given by Nguyen et al [116],
585

Huber et al. [114], and Posny et al. [126], They measured W in Ar, methane-basedTE gas and its constituents, except that Posny et al. [126] measured W for He+ inpropane and propane-based TE gas. Figures 8.23-8.27 show the W values for alphaparticles and He"1" ions in Ar, N2, CH4, CO2, and methane-based TE gas, respectively.
Although the ICRU Report 31 [1] suggested the same value ofW = 26.5 ± 0.5 eV for both 1 MeV and 10 MeV alpha particles in Ar, recentmeasurements by Tawara et al. [132] showed a slight decrease of the W value withincreasing energy between 1 and 5 MeV (Fig. 8.23).
31
30
29
28
27
26
25
Ar
A A
101 10' 10' 104
T (keV)FIG. 8.23. W value for alpha particles and He+ ions in argon. D, Krieger et al. [129];+, Chemtob et al. [109]; 0, Thomas and Burke [131]; A, Chappell and Sparrow [133];x, Phipps et al. [112]; T, Tawara et al. [132]. The ICRU [1] recommended 26.31 eV fors=5 MeV alpha particles, with an uncertainty of at least 0.7%, and suggested 27.5 ± 1.0,26.5 ± 0.5, and 26.5 ± 0.5 eV for alpha particles at about 0.1, 1, and 10 MeV, respectively.Recent measurements by Tawara et al. [132] showed a slight decrease of the W value withincreasing energy between 1 MeV and 5 MeV. Hiraoka et al. [99] obtained 27.4 eV for thedifferential w value for 99 MeV 3He ions.
586

52
50
48
46
44
42
40
3836
34
a
_ n
— o
N.
D
x x * x *X V
1 10' 103T (keV)
FIG. 8.24. W value for alpha particles and He+ in N2- D, Huber et al. [114]; », Whillockand Edwards {130]; 0, Varma and Baum [134]; A, Thomas and Burke [131]; x, Nguyen et al.[116]; V, Schaller et al. [118]; », Boring et al. [115]; +, Kuehn and Werba [119]; *, Jesse[135J; A, Tawara et al. [132]; *, Chappell and Sparrow [133]. The ICRU [1] recommended36.39 ± 0.23 eV for »5 MeV alpha particles and suggested 42 ± 1, 37.5 ± 1.0, and36 ± 1 eV for alpha particles at approximately 0.1, 1, and 10 MeV, respectively.
More precise data are needed for alpha particle energies from 100 keV to5 MeV in N2 (Fig. 8.24) to confirm the maximum at about 400 keV obtained bySchaller et al. [118], Nguyen et al. [116] and Varma and Baum [134]. Kuehn andWerba [119] reported a monotonie decrease of the W value in the energy range100 keV - 1 MeV.
W for CH4 decreases smoothly with increasing alpha particle energy(Fig. 8.25), but the data of Kuehn and Werba [119] are approximately 2 eV lowerthan other data [116, 132, 134] at the same particle energy. The data points for Wvalues in CO2 (Fig. 8.26) are prohibitively scattered, and more measurements areneeded for ail energies. A weak maximum at 300 keV in methane-based TE gas (Fig.8.27) was reported by Nguyen et al. [116], Varma and Baum [134], and by Rohrig
587

and Colvett [125]. It was not observed by Kuehn and Werba [119], whose data showa monotonie decrease of the W value with increasing energy, and are lower 1-2 eVthan other data [116, 125, 130, 134]. Simmons [137] pointed at discrepancies betweenthe measured W values in TE gas mixture reported by various workers and pointedout that these differences are larger than the uncertainties quoted by authors. Furthercomments by Waker on W value for alpha particles in TE gas can be found in [138].
The data for propane and propane-based TE gas are presented inFig. 8.28. New measurements are needed in both gases to cover a wider energy rangethan that given by Posny et al. [126].
W values for alpha particles in air are presented in Fig 8.29. A gapbetween «60 keV and 1 MeV should be filled by new measurements.
5856 -54-525048464442403836343230
— D
— D
28
CH
10 102 10 10'T (keV)
FIG. 8.25. W value for alpha particles and He-!- ions in CH4- D, Huber et al. [1141];E, Krieger et al. [129]; V, Kuehn and Werba [119]; +, Whillock and Edwards [130]; 0, Varmaand Baum [134]; A, Thomas and Burke [131]; x, Nguyen et al. [116]; », Tawara et al. [132];*, Jesse [136]. The ICRU [1] recommended 29.11 eV for »5 MeV alpha particles, withuncertainty of at least 0.7%, and suggested 36.0 ± 1.5, 30.5 ± 1.0, and 29.0 ± 1.0 eV foralpha particles at approximately 0.1, 1, and 10 MeV, respectively. Hiraoka et al. [99] obtained28.3 eV for the differential w value for 99 MeV 3He ions.
588

48
46
44
42
40
38
36
34
CO2
+ +
A _
3210 102 103 104
T (keV)
FIG. 8.26. W value for alpha particles and He+ ions in CÛ2- D, Kuehn and Werba [119];+, Whillock and Edwards [130]; 0, Varma and Baum [134]; A, Thomas and Burke [131];x, Nguyen et al. [116]. The ICRU [1] recommended 34.21 eV with an uncertainty of at least0.7% for »5 MeV alpha particles. Hiraoka et al. [99] obtained 34.9 eV for the differential wvalue for 99 Mev ^He ions.
8.3.6. W Values for Heavy Ions
Heavy ions combine the advantages, for the treatment of certain tumors, ofradiation with high linear energy transfer and excellent physical selectivity. Heavycharged particles are especially needed in clinical cases where physical sensitivity isessential [70]. High-energy heavy ions used in radiotherapy have a much differentrange of charge, mass, and velocity than do electrons and alpha particles. Heavy ionsare also important recoil particles generated after interaction of neutrons with matter.
ICRU Report 31 [1] summarized data for C+, N+, and O+ ions inmethane-based TE gas; heavy ions in N2; and various ions in other gases. All datashow an energy-dependent W. Two causes of energy dependence of W values forheavy ions are discussed in [1].
589
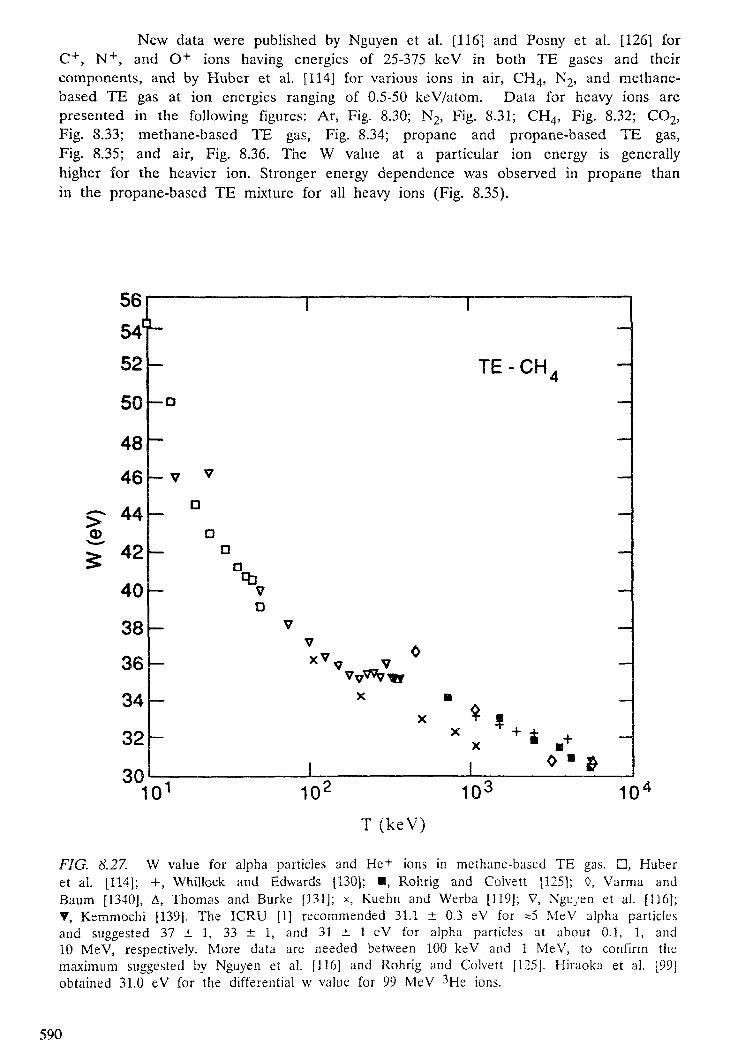
New data were published by Nguyen et al. [116] and Posny et al. [126] forC+, N+, and O+ ions having energies of 25-375 keV in both TE gases and theircomponents, and by Huber et al. [114] for various ions in air, CH4, N2, and methane-based TE gas at ion energies ranging of 0.5-50 keV/atom. Data for heavy ions arepresented in the following figures: Ar, Fig. 8.30; N2, Fig. 8.31; CH4, Fig. 8.32; CO2,Fig. 8.33; methane-based TE gas, Fig. 8.34; propane and propane-based TE gas,Fig. 8.35; and air, Fig. 8.36. The W value at a particular ion energy is generallyhigher for the heavier ion. Stronger energy dependence was observed in propane thanin the propane-based TE mixture for all heavy ions (Fig. 8.35).
t54l52 -50-'484644424038363432
_ w V
3010
TE-CH
D
,
X x + *<>'»
10 103 10'T (keV)
FIG. 8.27. W value for alpha particles and He+ ions in methane-based TE gas. D, Huberet al. [114]; +, Whillock and Edwards [130]; •, Rohrig and Coivett [125]; 0, Varma andBaum [1340], A, Thomas and Burke [131]; x, Kuehn and Werba [119]; V, Ngi:yen et al. [116];V, Kemmochi [139]. The ICRU [1] recommended 31.1 ± 0.3 eV for =5 MeV alpha particlesand suggested 37 ± 1, 33 ± 1, and 31 ± 1 eV for alpha particles at about 0.1, 1, and10 MeV, respectively. More data are needed between 100 keV and 1 MeV, to confirm themaximum suggested by Nguyen et al. [116] and Rohrig and Coivett [125]. Hiraoka et al. [99]obtained 31.0 eV for the differential w value for 99 MeV 3He ions.
590
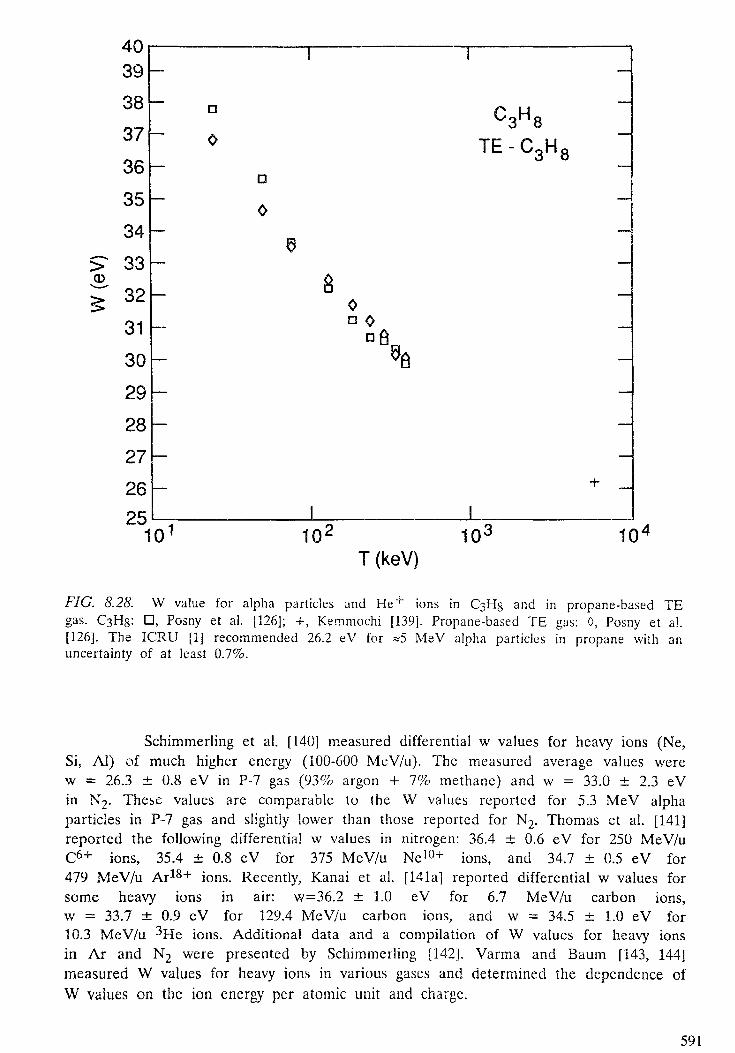
4039383736353433323130292827262510
*
C3H8
o0
a
10 10 10'T (keV)
FIG. 8.28. W value for alpha particles and He+ ions in CßHg and in propane-based TEgas. CßHs: D, Posny et al. [126]; 4-, Kemmochi [139]. Propane-based TE gas: 0, Posny et al.[126]. The ICRU [1] recommended 26.2 eV for «5 MeV alpha particles in propane with anuncertainty of at least 0.7%.
Schimmerling et al, [140] measured differential w values for heavy ions (Ne,Si, Al) of much higher energy (100-600 MeV/u). The measured average values werew = 26.3 ± 0.8 eV in P-7 gas (93% argon + 7% methane) and w = 33.0 ± 2.3 eVin N2- These values are comparable to the W values reported for 5.3 MeV alphaparticles in P-7 gas and slightly lower than those reported for N2. Thomas et al. [141]reported the following differential w values in nitrogen: 36.4 ± 0.6 eV for 250 MeV/uC6+ ions, 35.4 ± 0.8 eV for 375 MeV/u Ne10+ ions, and 34.7 ± 0.5 eV for479 MeV/u Ar18+ ions. Recently, Kanai et al. [141a] reported differential w values forsome heavy ions in air: w=36.2 ± 1.0 eV for 6.7 MeV/u carbon ions,w = 33.7 ± 0.9 eV for 129.4 MeV/u carbon ions, and w = 34.5 ± 1.0 eV for10.3 MeV/u ^He ions. Additional data and a compilation of W values for heavy ionsin Ar and N2 were presented by Schimmerling [1421. Varma and Baum [143, 144]measured W values for heavy ions in various gases and determined the dependence ofW values on the ion energy per atomic unit and charge.
591

Since 5 rays are frequently produced in the collisions of charged particles,it is important to consider their ranges. Whenever a 5 ray enters into the wallsurrounding the gas volume in which the ionization is measured, it only produces ionpairs to the extent that energy is lost in the gas. The residual energy of the particlegiven to the wall will be lost to the ionization process ("wall effect"). If in Eq. (8.23)the energy lost by the particle is calculated from the stopping power, the w value willbe too iargc. Conversely, if the energy loss is calculated from the observed ionizationwith the tabulated value of w, the energy loss will appear to be too small. Theincreases of w measured by Schimmcrling et al. [140] may be due to a wall effect. Aneffect of the order of 20%, increasing with particle energy, was observed by Pfutzneret al. [144a] for 150 to 900 MeV/u Ar, Kr and Xe ions in argon gas passing throughthe center of an ionization chamber with a diameter of 40 cm. A reduction of thewidth of the straggling function by as much as a factor of 2.5 was observed. A MonteCarlo calculation by Bichsel [144b] gave quantitative agreement for the effect.
48
46
44
42
40
38
36
34
32
Air
44
10 10' 10' 10'T (keV)
FIG. 8.29. W value for alpha particles and He+ ions in air. ", Huber et al. [114]; 4, Chappell and Sparrow [133]; *, Kemmochi [139]. The ICRU [1] recommended 35.08 eV withan uncertainty of at least 0.7% for ~5 MeV alpha particles. Hiraoka et al. [99] obtained 35.7eV for the differential w value for 99 MeV 3He ions.
592

Evidently, the wall effect is of great importance for the dosimetry of heavyions with gaseous ionization chambers. Similarly, it must be considered for biologicaleffects. It must be calculated for particular chamber geometry and biological models,as discussed in Chapter 9.
8.3.7. W Values in Gas Mixtures
Two groups of binary gas mixtures can be distinguished: the regular mixtureand the irregular one [145J. In mixtures of molecular gases, the W value of themixture lies between the extreme values for the pure gases arid changes smoothly fromone limit to the other as the composition of the mixture is changed. Such mixturesare called regular mixtures. In irregular mixtures, a small amount of admixture to a raregas causes considerable increase in ionization. Such mixtures will be discussedseparately.
100 r
Q)
90-
80
70
60
50
40
3010
Ar
DA$
D
I102
T (keV / atom)FIG. 8.30. W value for C+, N+, O + , and Ar+ ions in argon. 0, C+ ions; A, N+ ions;x, O+; +, Ar+, Phipps et al. [112]. D, Ar+ ions, Chemtob et al. [109].
593

200
180
160
140
120
100
80
60
40
Q
N
D
y
* *
1 10 103
T(keV/aîom)
FIG. 8.31. W value for C+, N+, O+, and Ar+ ions in N2- C+ ions: D, Huber et al.[114]; +, Boring et al. {115J. N+ ions: •, [114]; ©, [115], *, Nguyen et al. [116]. O+ ions:m, [114]; », [116], 0, [115]. Ar+ ions: D, [114]; *, [115].
8.3.7.1. Regular Mixtures
In regular mixtures the intermolecular energy transfer is considerednegligible, and the W value for the mixture can be related to the W values in purecomponents. Several models for calculating W values in mixtures are described in theliterature. All models are based on the assumption that the presence of gas A doesnot affect the ionization of gas B, and vice versa. In the simplest model, theionization yield in a mixture is obtained by simple addition of the ionizations in purecomponents according to their relative concentrations Q. The corresponding W value isas follows:
w •y vmix T^W;(8.27)
594

Here Q and Wj are the concentration fraction and the W value, respectively, for thepure component i, where i = A,B.
Other models take into account different interaction properties of the gases.The model of Haeberli et al. [146, 147] assumes that the energy T0 of the incidentparticle is dissipated to the components in proportion to their respective stoppingpowers Si.
(8.28)W •vv mix SACA + S B C B
This model was modified by Bortner and Hurst [148] and Strickler [145] byreplacing relative stopping powers in Eq. (8.28) with the empirical parameter f}.
W - W A f A C A + W B f B C Bwrmx ~ f f1 -i-f r (8.29)
<D
220
200
180
160
140
120
100
80
60
40
10°
o
D
a
0+ 0
CH
10T (keV / atom)
103
FIG. 8.32. W value for C+, N+, and O+ ions in CH4- C+ ions: +, Nguyen et al. [116].N+ ions: D, Huber et al. [114]. O+ ions: 0, Nguyen et al. [116].
595

I iJU
140130120110100908070605040
1
IA
CO2— —
— —
_ V _
VV
AD
A— - Y * " ——
0 D X_ '-'n A _
o +o + + + +
IO1 102 103
T (keV)FIG. 8.33. W value for C+, O+, and Ar+ ions in CÖ2- C+ ions: 0, Nguyen et al. [116].O+ ions: D, Huber ei ai [114]; +, [116]; x, Boring et al. [115]. Ar+ ions: A, [116]; T, [115].
Recent considerations by Eggarter [15], Inokuti and Eggarter [16] andSwallow and Inokuti [149] showed that the energy partition is determined by the totalionization cross-sections, a[, evaluated at sufficiently high electron energy. The W valuein a regular mixture is then given by:
(8.30)aACA +aB CB
All these expressions can be easily extended to mixtures with more than twocomponents, such as TE gas mixtures.
The measured W values for electrons, protons, and alpha particles in bothmethane-based and propane-based TE gases have been compared with the calculatedW values according to Eqs (8.27-8.30) [84]. Good agreement between the experimentaland the calculated values for methane-based TE gas has been obtained for all models.
596

This is because the values of energy partition parameters (fi or aj for CO2 and CH4,the main components of the mixture, are almost equal. In contrast, the values of fiand ai for CO2 and C3H8, the main components of the propane-based TE gas, areconsiderably different. The best agreement between the experimental and the calculatedW values for propane-based TE gas was obtained by using Eq. 8.29 over the wholeenergy range and for all kinds of incident particles, and by using Eq. 8.30 forelectrons having energy T0 > 100 eV [84].
8.3.7.2. Mixtures with Irregular Effects
In sharp contrast to the properties of regular mixtures of molecular gases,a significant increase in ionization and a consequent decrease in W values areobserved when small amounts (<1%) of certain gases are mixed with a rare gas, if
180
160-
140
120
100.
80
60
40
TE-CH4
*
**
I
10 102
T (keV)103
FIG. 8.34. W value for C+, N+, O+, and Ar+ ions in methane-based TE gas. C+ ions:•, Huber et al. [114]; x, Chemtob et al. [109]; V, Rohrig and Colvett [125]. N+ ions:*, [114]; A, [109]. O+ ions: D, [114]; +, Nguyen et al [116]; 0, Leonard and Boring [124].Ar+ ions: A, [114].
597

62-60-5856-5452504846444240383610
C3H8
TE-C3H8
0
0v
IP
è4-5
0 ,X 0x
D
a
1 10*T (keV)
103
FIG. 8.35. W value for C+, N+, and O+ ions in CsHg and in propane-based TE gas.Propane: D, C+ ions; +, N+ ions; 0, O+ ions. Propane-based TE gas: A, C+ ions; x, N+
ions; T, O+ ions. All measurements were by Posny et al. [126].
80
70
> 603-£ 50
40
30
AIR
10 T (keV) 10'
FIG. 8.36. W value for N+ and O+ ions in air. •, N+ ions; », O+ ions; Huber et al.[114]. More measurements are needed for heavy ions having energies above 100 keV/atom inair.
598

the ionization potential of the admixture is lower than that of the metastable state ofthe rare gas, as first reported by Jessc and Sadauskis [73-76]. This observation hasbeen referred to as the Jesse effect. Melton et al. 1150] also observed the increasedionization in Ar, even when the admixture had an ionization potential greater thanthat of the Ar metastable level, at higher admixture concentrations of 5% inargon-methane and 3% in argon-ethane. This additional yield was attributed to thenon-metastable Penning processes,
The de-excitation of metastable (and other excited) rare gas atomic statesby collisions with the admixture molecules leads to additional ionizations in the mixtureand to a corresponding decrease in W values. The total ionization yield in suchmixtures is composed of direct ionization of both gases by the incident particle andthe ionization of the admixture by excited atoms of the rare gas through the Penningprocesses. In these mixtures, the simple additivity rule of W values (Eqs 8.27-8.30)cannot be applied.
Processes that involve excited (and metastable) states of rare gas atoms aredependent on the admixture's concentration at a constant total pressure of the mixture,as shown by Melton, et al. [150] and Tawara et al. [151], and are also dependent onthe total pressure of the mixture at constant admixture concentration, as shown byParks et al. [113], Jarvinen and Sipila [152], and Krajcar-Bronic et al. [83]. Thepressure dependence of the W value in argon-butane mixtures is described in somedetail in [83]. These interesting features of W values in mixtures of rare gases withvarious atoms and molecules have been discussed in terms of the collisionalde-excitation of excited rare gas atoms by atoms and molecules. Investigations of suchde-excitation processes have been greatly advanced. Absolute cross section values, aswell as product branching ratios have been measured extensively for a variety ofelectronic excited states in rare gases, both metastable and non-metastable and forvarious quenching atoms and molecules [153].
8.4. STATISTICAL FLUCTUATIONS
The degradation of a charged particle passing through matter occursthrough many collisions of diverse kinds, which result in energy transfer of differentvalues and in different outcomes such as excitation or ionization. Therefore, theprecise history of successive collisions is different for each incident energetic particle.To express this fact compactly, one often states that the degradation process isstochastic.
A stochastic description of the ionization is given by the probability P(T0,j)that an incident particle of energy T0 and all subsequent generations of secondaryelectrons produce a total of exactly j ions after complete dissipation of energy TQ.
The probability is normalized as follows at all T0:
599

The mean number Nj(T0) of ions produced is given by:
) (8.32)
It is related through Eq. (8.21) to the W value, which we have discussed extensively.
The simplest index characterizing statistical fluctuations of the number ofions is the variance defined as follows:
P(T0 , j) (8.33)
Fano [154], the first to discuss the fluctuations, showed that VN(Tg) shouldbe proportional to Nj(T0) for sufficiently high incident energies T0. It is customary towrite the variance as follows and to call F(T0) the Fano factor:
VN(To) = F(T 0 )Nj (T 0 ) (8.34)
Then, F(T0) tends to a constant at high energies T0. Fano [154] alsopointed out that the value of F(T0) should be less than unity. If the ionizationprocess were described by simple Poisson statistics, the Fano factor would be unity.Actually, the ionization yield is subject to limitations due to the partitioning of energyTO into individual inelastic collisions resulting in ionization or excitation, and the cross-sections for these collisions are dependent on the kinetic energy of a particle.Therefore, the Poisson statistics does not apply at all.
The Fano factor represents the limit of ultimate resolution of the particleenergy by ionization measurements and is therefore of interest in dosimetry andparticle-detection technology.
In what follows, we shall review the values of the Fano factor for variousmaterials and particles (in Section 8.4.1) and knowledge of P(T0,j) (in Section 8.4.2).
8.4.1. The Fano Factor
The Fano factor and the W value depend mainly on the properties of theirradiated matter and only weakly on the energy and nature of the incident particles,if they are much faster than the valence electrons in molecules of the medium. Athigher particle energies the Fano factor has a constant value between «0.2 and 0.4 (inpure gases), increasing toward unity as the particle energy decreases toward theionization energy of the gas.
Fano factors have characteristic values for various gases, but usually F islower in gases in which most of the incident energy is spent on ionization. For thesame reason as for W values, the Fano factor in rare gases is smaller (0.13-0.19,according to Alkhazov [155]) than in molecular gases (0.26-0.37) owing to differentenergy partition between ionization and other processes (excitation, dissociation) ingases. In the limiting case of ionization of a complex molecule that has a high
600

TABLE 8.1. FANQ FACTOR IN PURE GASES AND REGULAR MIXTURES
Gas Energy* F Ref.
ElectronsHH2
H2H2
HeHeNcNeArArArAr + 10% CH4C02
02N2
C2H2
CH4CH4H2O vaporH2O vaporTE (CH4)
keVlOkeV
keV
keV>1 keV2.8 keV
keVkeVkeV
keVkeVkeV
100 eVkeV
0.390.300.400.340.210.170.130.170.170.160.150.140.320.370.280.270.220.260.250.320.25
15513
15415566
15715515715715598
15815515515516338
157393936
Electron energy is indicated where specified in cited reference;keV denotes incident electron energy range.
probability for pre-dissociation, so that the ionization yield is low, F should be nearlyequal to unity [155, 156]. Values of the Fano factors in several gases [78,81, 155, 157-168] are presented in Table 8.1.
In certain gas mixtures with a pronounced Penning effect (irregularmixtures), the Fano factor can be as low as 0.05. As discussed in Section 8.3.7.2, anadmixture to the rare gas often converts the excitation energy of the rare gas atomsto additional ionizations, increasing the mean number of ion pairs and decreasingstatistical fluctuations. Some W values and Fano factors for irregular gas mixtures arepresented in Table 8.2.
A recent discovery about the systematics of the Fano factor deservesattention. A linear correlation between the Fano factor and the W value was reportedby Srdoc et al. [81] for 1.49 keV photons in several polyatomic gases. Kimura et al.[100] pointed out that the Fano factor and the W value show notable correlationrevealed in Fig. 8.37, where the Fano factor is plotted against the W value of argon-hydrogen mixtures of various compositions. The best fit to the calculated data points
601

TAB LE 8.1. (cont.)
Gas Energy F Ref.
PhotonsKrKrXeXeXeCH4
CH4
TE (CH4)TE (CH4)TE (CH4)TE (see [164])TE (see [164])C3H8
C3H8
C3H8
TEC3H8
TE C3H8
Ar + 10% CH4
Kr+ 1.3% XQKr + 60% Xe
l .SkeV1.5 keV5.9 keV1.5 keV5.9 keVl.SkeV1.5 keVl .SkeV1.5 keV277 eVl .SkeV277 eV1.5 keV1.5 keV277 eVl .SkeV1.5 keV5.9 keVl.SkeVl.SkeV
<0.23<0.190.17
<0.150.130.290.260.370.310.320.400.250.290.250.270.320.300.210.190.21
1601621611601597881788181
1641647881817881
165160160
Gas
AlphaHeAr
particles
Ar + 10% CH4
Ar + 0. 8 % CH4
Energy
5.3 MeV5.7 MeV5.3 MeV5.7 MeV
F
0.24<0.200.18
<0.19
Ref.
168166167157
was obtained from the linear equation F = 0.0165-W - 0.2865, and the correlationcoefficient was r2 = 0.99. The correlation between the Fano factor and W values forelectrons in various gases and gas mixtures was later generalized by Krajcar-Bronicet al. [170]. They found that W and F tend to increase or decrease together in seriesof comparable gases. In Fig. 8.38 the Fano factor is plotted against the ratio W/I forvarious pure gases [171]. Here the dimensionless ratio W/I is used because it isappropriate for comparison with F. The trend of simultaneous increase or decrease ofW/I and F is easily understandable because a small value of W/I means a highprobability of ionization, which in turn means that a small variety of inelastic collisionsis involved. Hence, the value of F will be small. Conversely, a large value of W/Imeans a low probability of ionization, a large variety of inelastic collisions, and hence
602

TABLE 8.2. FANO FACTOR AND W VALUES INMIXTURES WITH ADDITIONAL IONIZ.ATION
Gas mixture W (eV) F Ref.
ElectronsHe + 0.5% ArHe + Xe (0.5-1%)He + CÜ4 (0.5-1%)Ar + 0.5% C2H2Ne + 0.5% ArNe + 0.5% Ar
29.228.730.320,325.325.3
0.0540.0570.0890.0750.0630.05
155Î.55155Î57155157
PhotonsAr+ 1%C2H2Ar + 0.5% C4HioNe + 0.5% Ar
20.722.325.4
---
152152152
ProtonsAr+ 1%C2H4 23.8 - 113
Alpha particlesHe + 1 % ArAr + 0.5% C2H2Ar + 0.5% C2H2Ar + 0.8%C2H2
28.9-
20.321.2
0.11<0.09
-0.09
168157166169
a large value of F. More significantly, we see that W/I and F are related to eachother virtually linearly:
(8.35)
Here a and b are constants. The best fit given by F = 0.188 W/I - 0.15,j-2 = 0.97, approximates very weli the data for electron energies higher than 50 eV. Inthe low-energy region, where the energy dependence of both quantities is significant,the relation is no more linear, and the Fano factor asymptotically approaches alimiting value equal to 1 for W/I»1 (Fig. 8.38). Although this relation has not beensuccessfully derived theoretically, the relation obtained by Kimura et aï. [100] can beapproximated by a linear relationship within a relatively narrow range of W/I and Fvalues. The linear dependence of F versus W/I, which is certainly remarkable, canserve as a practical guide for gases for which no oata on either F or W areavailable. In most cases the linear approximation may be used to estimate the Fanofactor in gases and gas mixtures for which the W values are known.
603

0.30
0.25
0.20
0.15
0.2
26.0 28.0 30.0 32.0 34.0 36.0
W(eV)FIG. 8.37. The relation between the Fano factor (F) and the W value in Ar-H2 mixtures.D, Calculated values from Kimura et al. [100]; — best fit. The fractional concentration ofargon in the mixture is indicated along with the calculated data points.
W/IFIG. 8.38. The relationship between the Fano factor (F) and the ratio W/I in pure gasesand gas mixtures. D, rare gases; +, molecular gases; +, regular Ar-H2 mixture; A, gasmixtures exhibiting metastable Penning effect; —, best fit. Data are taken from Alkhazov [155],Combecher [61], Grosswendt [35], Kimura et al. [100], Kowari et al. [14], and Srdoc et al. [81].
604

The Monte Carlo method (i.e., the simulation of histories of a largenumber of individual particles in a computer) enables one to calculate W and F, aswell as some other quantities characterizing the energy degradation process. Examplesof Monte Carlo calculations of the Fano factors were given by Unnikrishnan andPrasad [98] in argon; by Grosswendt in H2 [35], in methane-based TE gas [36, 53],and in He, Ne and Ar [37]; by Grosswendt and Waibel in N2 and air [34] and inCH4 and CO2 [38]; and by Turner et al. [41] and Parctzke et a!. [42] in water vaporand liquid.
As we pointed out in Section 8.2.3, the Fano factor can be evaluated fromtransport theory, with the use of Eqs (8.17)-(8.19). Examples of the evaluation of theFano factor for electrons arc shown in Refs [13, J4, 100], while in [172] the Fanofactor is calculated for protons. If proton or alpha particle is an incident particle, thanthe yield and the fluctuations receive contributions from direct ionization by theincident ion and from ionization by secondary electrons. The Fano factor for protonsof energies between 0.1 and 2 MeV in argon is nearly the same as that for electronsat the same speeds, but it is considerably lower than the Fano factor measured withalpha particles [172]. Doke et al. [173] summarized and compared the theoretical andexperimental results on the Fano factor in pure rare gases and their mixtures. Theyfound that the Fano factors for alpha particles are systematically larger than those forelectrons.
8.4.2. Probability Distribution of the Number of Ion Pairs
The probability distribution of the number of ion pairs formed by anincident electron in various gases has been evaluated by the Monte Carlo method[34-38, 42, 53]. The generalized Fano factors, introduced by Inokuti et al. [13], havealso been evaluated as functions of incident electron energy.
Monte Carlo calculations of the probability distribution at various electronenergies in water [42] and in methane-based TE gas [53] have shown a rapid changein the shape of the P(T0,j) curve from a Poisson-like distribution at low energies to aGaussian-like distribution with increasing energy. This behavior is accompanied by avery rapid decrease of the Fano factor with increasing energy and an asymptoticapproach to a constant value at higher energy (~5 keV). Furthermore, Waibel andGrosswendt [53] compared the data characterizing ionization yield for electrons(W value, Fano factor, P(T0,j) distribution) in methane-based TE gas with those inwater vapor [42] and showed the similarity in the ionization behavior of electrons inboth media, what may be important for many purposes in radiation research andapplications.
The probability distribution of the number of ion pairs can also bedetermined experimentally. The pulse height distribution measured with a proportionalcounter is the result of two independent processes: (1) ionization along the primarytrack in the counter gas, producing ion pairs the mean number of which isproportional to the energy spent by incident particles and depends on the gasproperties, (often called the primary ionization distribution), and (2) multiplication of theprimary electrons, which depends on the working voltage, gas properties, and pressure.If the distribution of avalanche sizes triggered by a single electron in the counter isknown, the distribution P(T0,j) can be calculated from the measured pulse height
605

spectrum. An iterative deconvolution method was developed by Gold [174] and testedand modified by Marino and Srdoc [175] and Obelic [80], Obelic [80] described thismethod in detail. By applying this method, Srdoc et al. [81] obtained the primaryionization probability density distribution for incident low-energy photons in severalgases that are frequently used in radiation dosimetry. Moments, central moments, andgeneralized Fano factors were calculated. These values confirmed the supposition thatthe primary distribution approaches a Gaussian distribution at higher energies, whereaspositively asymmetric shapes, more peaked than Gaussian, were obtained for incidentparticle energies below 1.49 keV.
Another method of measuring the probability distribution and its indicessuch as the Fano factor was developed by Hurst and co-workers [165]. Their method,known as rcsonance-ionization spectmscopy, is based on multiphoton ionization by laserlights combined with ingenious use of proportional counters. Unfortunately, this line ofwork does not seem to be pursued as vigorously as its merits warrant.
8.5. YIELDS OF EXCITED STATES
The absorption of radiation produces various electronically excited states, inaddition to ions. The excited states of an isolated molecule eventually decayspontaneously in many ways, including photon emission, dissociation into fragments(which may be also excited), and internal conversion into vibrationally and rotationallyexcited levels of a lower electronic state (which may be the ground state). As wementioned in Section 8.2., the yield of any excited state can be calculated as for anion. Theory also shows that the total yields of excited states are generally appreciable.Recall the discussion (Section 8.3) of the ratio Nf/Nex in the energy balance equationof Platzman, Eq. (8.26). To illustrate the yield of excited states theoretically evaluated,we cite results of Douthat [11] for molecular hydrogen (Table 8.3).
In a gas at any appreciable pressure, an excited state may survive longenough to collide with another molecule in the ground state because of thermalmotion, and thus may cause important consequences. An example is seen in the Jesseeffect in gas mixtures, discussed in Section 8.3.7.2. A full discussion of the rich topicis in Chapter 6. In condensed matter, an electronically excited state is in immediatecontact with neighboring molecules, especially because the orbital of any excitedelectron is spatially more extended than that of an unexcited valence electron.Therefore, the consequences of an excited state in condensed matter are even morespectacular and diverse (as exemplified in the production of excitons and excimers,which are outside the scope of the present volume). Therefore excited states shouldclearly be just as important as ions in the mechanisms leading to chemical andbiological effects.
Experimentally, it has been difficult to obtain absolute yields directly for theformation of excited states in radiolysis. However, qualitative evidence for theirformation has been obtained with the use of the following methods [165, 176-184]:
1. Optical emission from radiative excited states
2. Optical absorption of excited states
3. Laser-induced fluorescence or ionization of excited states
606

4. Electron spin resonance (ESR) absorption
5. Monitoring of other spectroscopic signals attributable to excited states
6. Optical emission or absorption, and in some cases ion formation (ifPenning ionization occurs), due to energy transfer from excited states toan additive quencher molecule
In general, experimental results are explained by the reaction schemesshown in Table 8.4., which are selected from all known fundamental processes ofradiation chemistry for their roles in producing excited states [180, 1S1].
Table 8,4. shows that a molecule AB may be directly ionized, supcrexciiedto form a supercxdtcd state AB' (which may autoionize or dissociate into neutralfragments), or excited to form an excited state AB* below the ionization potentialAB* is also formed bv the recombination of AB+ and e-. An excited molecule AB"
TABLE 8.3. YIELDS OF VARIOUS PRODUCTS GENERATED INMOLECULAR HYDROGEN BY AN ELECTRON OF INITIAL.ENERGY TO = 10 keV, ACCORDING TO DOUTHAT [11]
Transition
LymanWernerH(2P)Slow H(2S)Fast H(2S)H(n = 3)RemainingIonsTripletsSubexcitationélectrons
NS*
96.8112.1
5.629.6
5.33.2
12.2295.6102.6295.6
Total**
ESNS
(eV)
12101457
8445317547
17747591036975
10373
Energy absorbed(% of total)
11.714.00.84.41.70.51.7
45.910.09.4
' The symbol Ns represents the mean number of products s. The G value is given byGs = 100 NS/TQ, where TQ is the initial electron energy in eV; for TQ = 10 keV theyield is given by GS = NS/100. The product ESNS represents the energy used togenerate product s. The terms Lyman and Werner indicate the excited states thatemit luminescence photons associated with the names of the spearoscopists. Theterms H(2P), and Remaining indicate h>drogen atoms in various states result ingfrom dissociation.
The sum of ESNS exceeds the in i t ia l energy of 10 keV by 3.79J because oftruncation and other errors in numerical work. The inconsistency is insignif icant inview of uncertainties in cross-section data used as input .
607

TABLE 8.4 REACTION SCHEMES THAT PRODUCE EXCITED STATES [180, 181]
Reactant(s)
AB
AB'
AB+ + c-
AB*
AB* + S
AB* + AB
Product(s)
-AA> AB+ + e"-AA> AB'
-JVV> AB
—— > AB+ + c-
—— > A -f B
__ > AB*
—— » A + B
—— > A + B*__ > B + A*
vibrational androtational energy
—— > AB -+ hv
—— > AB + S*—— > AB + S+ + e-—— > ABS*
—— > ABS+-i-e-
—— > (AB)2*
Type of reaction
Direct iouizauon
Excitation to superexcited statesExcitation to excited states below theionisation potentialAuto-ionization of superexcited statesDissociation of superexcited statesElectron-ion recombination resulting inexcited statesDissociation of excited states to groundslate fragmentsDissociation to an excited fragmentand a ground state fragment
Internal conversion
Optical emissionEnergy transferPenning ionizationExciplex formationAssociative ionizationExcimer formation
may dissociate into neutral fragments, cascade to lower excited states via eitherinternal conversion or intersystem crossing, isomerize to another excited state AB*',emit a photon, or react with AB to form an excimer (AB)2*. In the presence of anadditive molecule S, AB* is collisionaliy quenched by S in simple energy transfer,Penning ionization, associative ionization, or exciplex formation. Some examples in thegas phase, chosen from recent advances in radiation chemistry to show the importantrole of excited states in radiolysis, are discussed below.
Fundamental processes of radiation chemistry of simple molecules, such asO2, N2, N2O, CO, CO2, H2S, H2O, and NH3 in the gas phase, were surveyed [182]by compiling a large body of data on yields of radiolysis products; cross-sections forelectron-molecule collisions; and information about ion-molecule reactions, electron-ionrecombination, electron attachment, and others obtained up to the early 1970s. In thissurvey, G values were determined for ionization and excitation and also for individualelementary processes that are dependent on electronic states of ions and excitedneutral species. Table 8.5 shows, as an example, the G values for H2O vaporradiolvsis.
608

TABLE 8.5. G VALUES FOR PRIMARY IONIC AND NEUTRALDISSOCIATION AND EXCITATION PROCESSES IN THERADIOLYSIS OF WATER VAPOR, ACCORDING TO WILLISANDBOYD[182].
Reactant Products G(100 eV)-i
Ionic processes
H2O — 'H2O — 'H2O — 'H2O — n
H2O — '
Neutral dissociation
H2O — H2O —r
V-» H2O+ + e-l^> OH+ + H + e-\,v-> H+ + OH + c-L^> H2
+ + O + e-u^-> H2 + O+ + e-
Sum
and excitation processes
/-> H + OH/-> H2 + 0
Sum
1.990.570.670.010.06
3.30
3.580.45
4.03
The understanding of these elementary processes in the gas phase has beengreatly advanced both in theory and experiment, and new data on cross-sections andrate constants have been available since the early 1970s. Thus, it may be worthwhileto re-evaluate the results obtained by Willis and Boyd [182].
8.6. YIELDS OF IONIZAT1ON AND EXCITATION IN CONDENSED MATTER
lonization and related phenomena in condensed matter are rich in physicsand chemistry, and their mechanisms are only partially delineated, as can be seen inrecent books edited by Freeman [185] and by Ferradini and Jay-Ge^in [186].
Therefore, the current understanding of the yield of ionization in condensedmatter is limited in several respects. First, ionization phenomena manifest themselvesdifferently, depending on the nature of the condensed matter (crystals or amorphousmaterials and conductors, semiconductors, or insulators). Second, to devise anexperiment that produces a signal unquestionably representative of the ionization yieldis often difficult. For instance, a current induced by radiation may depend on anapplied electric field in a complicated manner that prevents the determination ofionization yield without a detailed analysis. Even an apparent yield of ionization that isunequivocally determined from measurements may not necessarily correspond to theinitial yield in the sense of our discussion in Section 8.1; thus, to relate measuredresults with theory is not straightforward.
609

Generally speaking, ionization occurs at higher probability in a liquid thanin a vapor consisting of the same molecular species. This difference is chieflyattributable to the lower value of the first ionization threshold in a liquid than in avapor. For instance, the ionization threshold in liquid water is lower than that inwater vapor by as much as 3.8 eV. In addition, the difference in the distributions ofenergy transfer, seen most clearly as the differences in the oscillator strength spectra(discussed in Chapter 6), contributes to the higher probability of ionization in liquid.In a phase change from gas to condensed matter for a single molecular species, theoscillator strength is modified often considerably, as was discussed fully by Inokuti[187]. A general modification is the shift toward higher excitation energies, whichmeans that the spectral intensities corresponding to some of the discrete excitations inthe gas will add to ionization in the liquid. Consequently, the ionization yield isexpected to be higher in liquid than in vapor.
In the following sections, we shall briefly discuss several topics selected fortheir particular relevance to the theme of the present report.
8.6.1. Rare Gas Liquids
The ICRU Report 31 [1] briefly summarized knowledge about the W valuesin rare gas liquids. A review of the physical properties of liquids used in ionizationchambers is presented in [188]. Various physical properties of liquid rare gases andthe possibility of their application in radiation detectors have been recently studiedextensively and presented at the International Conference on Liquid RadiationDetectors [189].
The W values for liquids reported in literature are 23.6 eV for Ar [190],20.5 eV [191] and 18.4 eV [192, 192a] for Kr, and 15.6 eV for Xe [193]. Recently,Seguinot et al. [194] reported W = 9.76 ± 0.70 eV for 1 GeV electrons in liquid Xe.Their value is considerably lower than the value of Takahashi et al. [193] and only alittle higher than the gap energy Eg=9.3 eV. Seguinot et al. [194] also reportedWs = 14.2 eV, i.e., the energy required to produce a scintillation photon in liquidxenon. Reported experimental W values in liquid rare gases depend on the method ofextrapolation to an infinite electric field strength. Several recombination models weretested by Aprile et al. [192a] in the case of liquid krypton, and the authors foundthat the reported values in liquid rare gases obtained by the pulsed ionization chamberare the upper W value limits.
The W values for rare gas liquids are considerably lower than the valuesfor gases (26.3 eV for Ar, 24.1 eV for Kr, and 21.9 eV for Xe). Doke and co-workers [190, 191, 193] interpreted the W values in rare gas liquids by extendingPlatzman's idea of energy balance [64], which we quoted in Section 8.3. In Eq. (8.26)they replaced the ionization threshold I with the gap Eg between the filled band andthe conduction band and wrote the following:
L + e x . « + (8.36)F F N- Fg g i g
610

Dokc and co-workers and Aprilc et al. [192a] estimated each term of this equation byusing various pertinent data. The main conclusions of the treatment are discussedbelow.
The ratio W/Eg is about 1.65, only slightly smaller than the ratioW/Ï = 1.7 - 1.8 in gases. In other words, the primary reason for the low W values inliquids is the decrease in the ionization potential for the liquid relative to the gas.Second, the difference between W/Eg and W/I is chiefly at t r ibutable to very smallvalues of Nex/Nj in liquids (e.g., about 0.2 in Ar, 0.07 in Kr, and 0.05 in Xe). Thesmall values of Nex/Ni also suggest that the Fano factor in liquids should beconsiderably smaller than that in gases of the same element: 0.11 in liquid Ar, 0.06 inliquid krypton, and 0.04 in liquid xenon [195j. This expectation is one of themotivations for the recent development of liquid rare gas ionization counters [189,196-203]. The present state of the art in developing liquid rare gas detectors isreviewed by Doke [204].
An increased charge per event was observed by Doke et al. [205J whenliquid argon is doped with a small amount of organic molecules whose effectiveionization potential is lower than the energies of photons emitted in liquid argon. Inliquid argon-allene mixture the effective W value is 19.5 eV. An effect similar to theJesse effect in gas phase was observed also in a mixture of liquid argon and 1%xenon: both the W value [195, 206, 207] and the Fano factor [195] were lower. Theenhanced ionization was attributed to electronic energy transfer from exciton states ofliquid argon to xenon.
8.6.2. Molecular Liquids
8.6.2.1. Summary of Experimental Knowledge
In liquids composed of polyatomic molecules, especially those with highdielectric constants, a low-energy electron ejected from a molecule may rapidly lose itsenergy through vibrational excitation, phonon generation, and other inelastic collisions(as discussed fully in Chapter 5) and eventually recombine with the remainingmolecular ion. This process is called geminate recombination [183, 185, 208-212].Electrons that are ejected at sufficiently high energies travel far from the ion, to aregion where the potential energy of attraction, partly shielded by the dielectricmedium, is less than the thermal energy. Then we say that a free ion pair is formed.The number of such ion pairs, determined by measurements at the limit of zeroapplied electric field, is expressed by the free ion yield, Gfi, which represents thenumber of free ion pairs produced per 100 eV of absorbed energy. Numerousmeasurements of Gfi have been made, and results have been extensively tabulated[208-212].
In contrast, the total number of ion pairs, including those that undergogeminate recombination, is difficult to measure directly in most of liquids. The totalion yield, Gtj, represents the total number of ion pairs produced per 100 eV ofabsorbed energy and is related to the W value through Gti = 10Q/W. The ratioGfi/Gti, called the probability of escaping gemmate recombination, has been the topic ofmany treatments, as seen in Chapters 2, 5, and 6 of Freeman [185]. With atheoretical estimate of the ratio Gfj/G{j, a measured value of Gfi leads to an estimate
611

of Gtj. The W/I value thus derived is generally close to the value for the gas phaseof the molecular species, within the sizable uncertainty of the estimate.
The measurement of G values of excited states in the condensed phase,which is much more difficult than in the gas phase, was recently summarized byKatsumura [179]. It has been generally accepted that excited states play a significantrole in radiation chemistry. This role is most clearly observed in non-polar media likehydrocarbons. However, in polar media such as water and alcohols, no clearcutevidence is available about the role of excited states. The primary excited states AB'(i.e., H2O') should be formed in the radiolysis of water. Experimentally, however, noevidence has been obtained for AB* or AB'. The generally accepted primary speciesin the radiolysis of water [177] arc, therefore, eaq" (hydrated electron), H, OH, H2,H2Û2, and H^O"*", which correspond to the "primary" species in the physicochemicalstage. This stage should be sharply distinguished from the physical stage or the veryearly stage at a time between 10-18 and 1(H9 sec, just after the ini t ia l interaction ofionizing radiation and water.
In the radiolysis of liquid hydrocarbons, cyclohcxane, a key compound, hasbeen investigated most extensively [213j. Measured G values of excited cyclohexanc,however, still range widely, from 0.3 to 1.7, although physicochemical features of thisspecies (e.g., its optical emission, absorption spectrum, and lifetime) have been greatlyclarified [179]. The roles of excited states and their G values in the radiolysis ofliquid hydrocarbons have been investigated by measuring the effect of the addition ofscavengers for electrons, positive ions, and free radicals [183].
An example is shown in Table 8.6 for liquid cyclohcxane [213], where H,H', and H7 denote thermal hydrogen atoms, hot hydrogen atoms, and hydrogen formed
TABLE 8.6. HYDROGEN FORMATION IN THE RADIOLYSIS OELIQUID CYCLOHEXANE [213]
Reactant(s)
Direct ionisation
CöHi2
Product(s)*
and excitation
—— > H—— > H' and H2
Sum
Yield G(100 eV)-i
0.571.201.77
Neutralization
C 6Hi2+ - fe- — » H— > H' and H2
SumTotal G(H2)
0.893.013.905.67
H, H', and Ho denote thermal hydrogen atoms, hut hydrogen atoms, andhydrogen formed by molecular detachment, respectively.
612
by molecular detachment, respectively. The yields of excited states and ions can beinferred from the measured yields of hydrogen. Product hydrogen is formed bybimolccular processes (hydrogen abstraction from C6H12 by H and H') and byunimolccular processes (molecular detachment of H2 from C6H12
+, C6HP', orC6H12*)- A fraction, 10-20%, of the total G(H2) is attributable to the moleculardetachment as determined in experiments with C6H]2 and C6D12. Furthermore, the C-C bond scission is almost negligible compared with the C-H bond scission in theradiolysis of liquid cyclohcxanc [178j. Consequently, the total hydrogen yield of 5.67given in Table 8.6 corresponds approximately to the sum of the yields of ions andexcited states as precursors of H, H', and H2 1183]. The G value of 1.77 almostexclusively represents the yield of direct excitation, al though it may include a minorcontribution from direct ionization. More precisely, the value 1.77 corresponds to theyields of relatively highly excited states, including superexcited states. The G value of3.90, which represents the yield of electrons that eventually undergo geminaterecombination, is comparable to the ionization yield in gaseous cyclohexane. Excitedstates resulting from geminate recombination are believed to be generally low lying.Analyses of luminescence and related phenomena such as interrnolccular energy transferlead to G values for "excited states" of 0.3 - 1.7. These excited states arc singletstates, the most important of which is the lowest singlet state.
8.6.2.2. Summary of Monte Carlo Calculations for Liquid Water
Several groups of authors have calculated yields of ions and excited statesfor electrons in liquid water by performing Monte Carlo calculations. Collectiveexcitation effects have been included as the current understanding permits. Ritchie andco-workers at Oak Ridge National Laboratory in collaboration with Paretzke [39-42],Terrissol and co-workers at Centre de Physique Atomique, University of Toulouse [43,44], and Kaplan and co-workers at the Karpov Institute of Physical Chemistry [45-49]made significant contributions to the field. Table 8.7 summarizes some salient resultsof the MC calculations. (The symbol gj represents the number of all ions, and thesymbol gex the number of all excited states, produced as initial species per 100 eV ofabsorbed energy). As we stated in Section 8.1, the initial species are productsimmediately resulting from the degradation of electrons and other energetic particles.The yield of initial species is a major result of particle transport calculations, either byMonte Carlo methods or by analytic methods. However, measurements in condensedphases seldom lead to the determination of the yields of initial species, because theinitial species are often rapidly converted into other species, as we indicated in Section8.6.2. To show the distribution between the initial species and measurable products,Platzman [214] proposed to use the symbols gi and gex for the initial species and toreserve the symbol G for measurable products.
Returning to Table 8.7, we see general agreement in the results for watervapor. However, results for liquid water are quite different among the groups.According to Paretzke et al. [42], the ratio gi/gex hardly changes between vapor andliquid water. However, in the calculation by Kaplan et al. [49], the ratio gi/gex in *hecondensed phase is twice that in the gas phase. Similar result is obtained by Tenissolet al. [43]. The main reason for this result is a sizable decrease (3.8 eV) in theionization potential and a shift of the excitation spectrum to higher energies for theliquid phase. Furthermore, for 1Q-Î6 s the collective plasmon-type state decays and
613
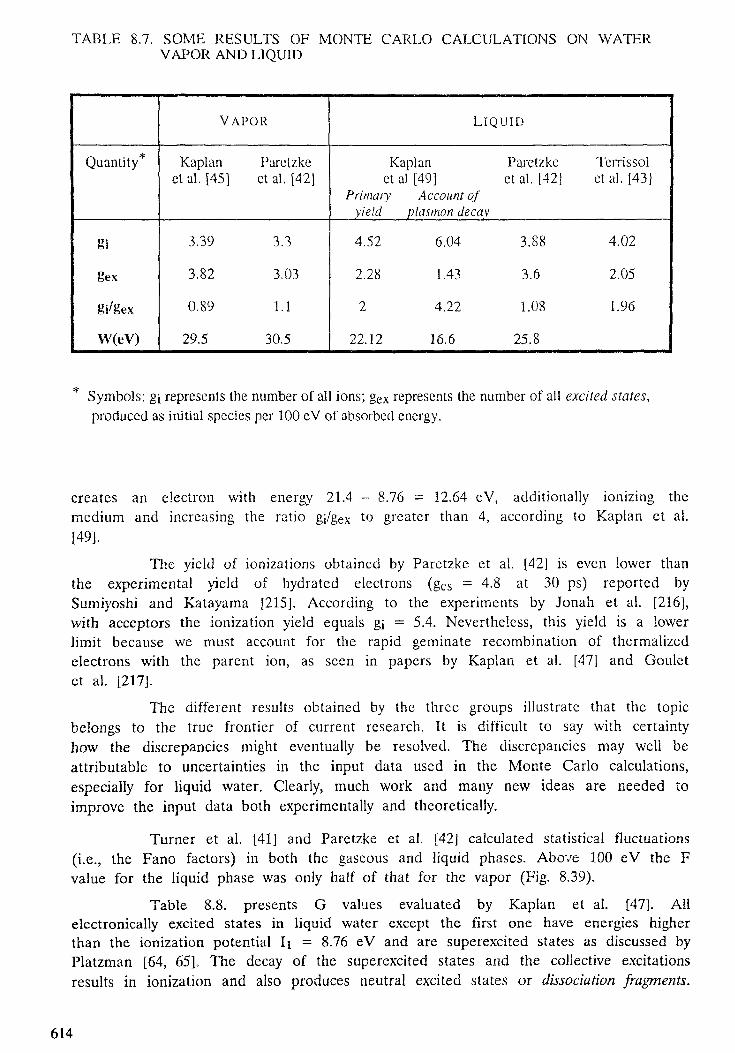
TABLE 8.7. SOME RESULTS OF MONTE CARLO CALCULATIONS ON WATERVAPOR AND LIQUID
Quantity*
gi
gex
gi/gex
W(eV)
VAP
Kaplanet al. [45]
3.39
3.82
0.89
29.5
OR
Paretzkect al. [42 J
3.3
3.03
1.1
30.5
L I Q U I D
Kaplanet al [49]
Primary Account
Paretzkeet al. [42]
of
Terri ssolétal . [43]
yield plasmon decay
4.52 6.04
2.28 1.43
2 4.22
22.12 16.6
3.88
3.6
1.08
25.8
4.02
2.05
1.96
Symbols: g[ represents the number of all ions; gex represents the number of all excited states,produced as initial species per 100 eV of absorbed energy.
creates an electron with energy 21.4 - 8.76 = 12.64 eV, additionally ionizing themedium and increasing the ratio gi/gex to greater than 4, according to Kaplan et al.[49].
The yield of ionizations obtained by Paretzke et al. [42] is even lower thanthe experimental yield of hydrated electrons (ges = 4.8 at 30 ps) reported bySumiyoshi and Katayama [215]. According to the experiments by Jonah et al. [216],with acceptors the ionization yield equals gi = 5.4. Nevertheless, this yield is a lowerlimit because we must account for the rapid geminate recombination of thermalizedelectrons with the parent ion, as seen in papers by Kaplan et al. [47] and Gouletet al. [217].
The different results obtained by the three groups illustrate that the topicbelongs to the true frontier of current research. It is difficult to say with certaintyhow the discrepancies might eventually be resolved. The discrepancies may well beattributable to uncertainties in the input data used in the Monte Carlo calculations,especially for liquid water. Clearly, much work and many new ideas are needed toimprove the input data both experimentally and theoretically.
Turner et al. [41] and Paretzke et al. [42] calculated statistical fluctuations(i.e., the Fano factors) in both the gaseous and liquid phases. Above 100 eV the Fvalue for the liquid phase was only half of that for the vapor (Fig. 8.39).
Table 8.8. presents G values evaluated by Kaplan et al. [47]. Allelectronically excited states in liquid water except the first one have energies higherthan the ionization potential Ii = 8.76 eV and are superexcited states as discussed byPlatzman [64, 65]. The decay of the superexcited states and the collective excitationsresults in ionization and also produces neutral excited states or dissociation fragments.
614

10000
FIG. 8.39. The Fano factor F in water as a function of incident electron energy T. •, watervapor; *, liquid water. Data are from Paretzke et al [42]
The competition between these decay modes is clearly an important item of study.Results so far reported on liquids are largely based on theoretical considerations ratherthan well established experimental data concerning the dynamics of the competition.
Excited states can be produced in another indirect way when fast electronsinteract with medium. Excited water molecules result from the following geminaterecombination:
H9O+ ->H2O" (8.37)
When we account for the energy spent on the reorganization of a medium,we obtain the value for the excited-state energy equal to 6.26 eV, which is lower thanthe energy of the first triplet and singlet electronically excited states of the watermolecule. Thus, the water molecules produced by ion-electron recombination are inhighly vibrationally excited states. The yields of these states are as large as 1.77,according to Kaplan et al. [47]. This value is compatible with the total yield of theexcitations created as a result of direct interaction, gextot = 2.3.
615

In the condensed phase the vibrationally excited molecule has the followingthree possible decay channels:
I 2 H2O
H2Ovib** + H2O -» 1 H2 + 2 OH (8.36)
l H + OH + H2O
The last decay mode produces hot hydrogen atoms with high chemical reactivity.
TABLE 8.8. YIELD PER 100 eV OF ABSORBED ENERGY FOR ELECTRONICALLYEXCITED STATES PRODUCED BY INCIDENT ELECTRON WITH INITIALENERGY TO IN LIQUID WATER, ACCORDING TO KAPLAN et al. [47]*
State Excited Excitation Oscillatornumber state energy (eV) strength
1
1 A l ß l 8.4 0.018 0.0420.535
2 B l A l 10.1 0.039 0.0460.256
3 Ry(A + B) 11.26 0.0089 0.0080.039
4 Ry(C + D) 11.93 0.0536 0.04420.187
5 Diffusion 14.1 0.103 0.0627bands
0.209
6 Collective 21.4 2.03 0.635excitation
1.200
Total excitation yield 2.426
Yield at TO (keV)
5
0.0170.542
0.0230.258
0.0480.038
0.0220.191
0.035
0.202
0366
1.066
2,300
10
0.0130.545
0.0200.256
0.00410.038
0.02180.184
0.033
0.200
0.343
1.060
2.283
The first line is related to the primary electron effect, and the second line includes the effect ofthe spectrum of ejected electrons.
616

8.6.2.3. G Values and Chemical Dosimetry
Chemical dosimetry means the determination of the radiation dose, i.e., theenergy absorbed, through measurements of some chemical change induced in amaterial, most often in condensed matter. The G values for the chemical changemonitored must be known in advance, because it enables one to convert the amountof the chemical change into the energy absorbed. The best known example is theFricke dosimeter, which consists of an aqueous solution of ferrous sulfate and in whichFe2+ ions are converted to Fe3+ ions in a series of reactions that are wellunderstood. The G value for the conversion is about 15.5 (per 100 eV absorbed), fora wide variety of radiations. Other examples are the ccric sulfate dosimeter, thehydrated-electron dosimeter, and the potassium dichromate dosimeter.
Full discussions of this topic can be found in ICRU Report 34 [218] andin Tabata [219].
8.6.3. Silicon, Germanium, and Other Solids
Only for semiconductors have measurements of ionization yields in solidsbeen nearly as unequivocal in their physical meaning as for gases or rare gas liquids.When a semiconductor is subjected to ionizing radiation, one observes a current thatis proportional to the electric field, and thus one attributes the current to chargecarriers generated by radiation. This observation means that the recombination of thecharge carriers takes a long time compared to the time necessary for the chargecarriers to reach electrodes. In other words, measurements are operationally similar tothe measurements of the W value in a gas.
The charge carriers are not free electrons like those found in a gas, butare the conduction electrons and holes discussed in the band theory of crystals [220].
TABLE 8.9. IONIZATION YIELDS IN SEMICONDUCTORS, EXPRESSED IN TERMS OFTHE W VALUES AND RELATED QUANTITIES
Material
Si
Ce
Temp
(K)
77300
7790
300
Eg
(3V)
1.12
0.813
W
(eV)
3.863.62 ±0.023.68 ±0.02
2.97 ± 0.022.95 ±0.02
2.81
W/Eg
3.453.233.28
3.653.633.46
F
<0.1<0.1
0.13*
<0.12<0.12<0. 1 07<0.080.058
Ref
222224
1225224227226222228
* the F value not extrapolated to infinite electric field strength
617

Thus, the band gap Eg, which we mentioned in connection with rare gas liquids inSection 8.6.1 , plays the role of the lonization threshold î m a gas.
Table 8.9 summarizes values of the loruzation yields and the Fano factorfor silicon and geimamum The W values appear to be well established in theliterature [1, 221]. W value m solid state is temperature dependent [1] and it alsodepends on the concentration of crystal imperfections [221]. Theoretical calculations[222, 224] show that the Fano factor should be less than 0.1 in Si, and close to 0.06m Ge. Experimental F values are approaching theoretically calculated values asdetectors and experimental techniques improve [222, 223]. The extrapolation to infiniteelectric field strength can result in large errors in experimental F values.
The mean energy required to form an electron-hole pair in meicunc iodide(HgI2) is 4.2 eV, and the upper limit of the Fano factor determined at T = 253 Kis 0.19 ± 0.03 [223].
R E F E R E N C E S[I] INTERNATIONAL COMMISSION ON RADIATION UNITS AND MEASUREMENTS,
Average Energy Required to Produce an Ion Pan , 1CRU Report 31, Washington, DC(1979)
[2] LANDAU, L D , LIFSH1TZ, EM, S ta t i s t i ca l Phvsics, t rans la ted by SYKES, J B ,KEARSLEY, M J , 2nd edn Peigamon Press, London, (1958)
[3] LIFSHITZ, EM, PITAEVSKII, L P , Physical Kinetics, t rans la ted by SYKES JB,FRANKLIN, RN, Perg imon Piess, London (19S1)
[4] JENKINS, TM, NELSON, WR, RINDI, A (Eds), Monte Cailo Transport of Electrons andPhotons, Plenum Press, New York (1988)
[5] PARETZKE, H G , in Kinet ics ot Nonhomogeneous Processes, (FREEMAN, G R, Ed) JohnWiley & Sons, New York (1984) 89-170
[6] FANO, U , Degradation and tange straggling of high energy radiation, Phys Rev 92 (1953)328-349
[7j SPENCER, LV, FANO, U, Energy spectrum resul t ing from electron slowing do\\n,Phys Re\ 93 (1954) 1172-1181
J8] McGINNES, RT, Enersrv spectrum les i ihmg trom electron slowing down, Nat Bur StandCucular 597 (1959) "
[9] DOUTHAF, DA, Elec t ion degrada t ion s p e c t i a in h e l i u m , Radiâ t Res 61 (1975) 1-20
[10] DOUTHAT, DA, Energy deposi t ion bv e l ec t ions and déglaciat ion spect ia , Radiât Res 64(1975) 141-152
[ I I ] DOUTHAT, DA, Energy deposition and electron energy degradation in molecular hydrogen,J Phys B Atom Motet Phys 12 (1979) 663-678
[12] RAU, A R P , INOKUTI, M, DOUTHAT, DA, Vanationa! t rea tment of electrondegradation and \iekls ot i n i t i a l molecula i species Phvs Rev A 18 (1978) 971-988
[13] INOKUTI, M, DOUIHAT, DA RAU, ARP Statist ical f l u c t u a t i o n s in the lonizationv.ield and the i r re la t ion to the electron degradation spectium, Phys Rev A 22 (1980)445-453
618
[141 KOVvARI K, K I M U R A M, INÜKUTI, M, Election degradation and v ie lds o f i n i t i a lproducts V Degiadat ion spectra, the lonization yield, and the Fano factor for argonunder e l ec t ion n i a d i a t i o n , Pius Rex A. 39 (1989) 5^45-5553
[HJ EGGARFFR, L Ihcon o! i n i t i il \ iekls ot ions g e n e r i t e d bv e l ec t i ons in binary mixtures,J Ou m Pins 84 (1980) 6 1 2 3 - ( > 1 _ 8
|16] 1NOKU ÎI M, FG(j \ R F E R h Theon ot i n i t i a l \ i t l d s ol ion-, geneia ted bv electrons inbin in n m t u i e s I! J C l i t .m Pins 86 (1987) 3S7Ü >,S74
1 1 7 ] K I M U R X M I N O K U I I M, E l e c t i o n deg iad i t i o n aiul \ i c l d s o t i n i t i a l p toduc t s I Excitedspecies g e i i c t a t c d b\ e l e c t i o n s in bin u\ m i x t u t e - , J ( h e m Plus 87 (19S7) 387^-3879
[1S| KÎMURA, M, INOkUTI, M, KO\VARI, K, Electron degiadation and >iekis o i in i t ia lpiodncts VI Eneigv spect i i of subexei t » l i on e l ec t ions in aigon and molecular hydrogen,Pins Re\ \ 40 (198 l>; 2316-2320
[ 1 9 j I N O k U l ! M KOWARl K \ l !ennt i \e t o i m s ot the ^pencer- i ano equa t ion , Phys Re\\ 41 (1990) M64-5467
|20] DILLON, MA, k I M U R A , M, INOkUTI M, Time dependent aspects o t electrondegradation I Subexuta t ion e l ec t rons in he l ium or neon admixed w i t h nitrogen, RadiâtPhys Chem 32 (19SS) O 4S
1 2 1 J INOkUTI, M , K I M U R X M DILLON MA, Time-dependent aspects ot electrondegradation II Geneia l theorv, Pins Rev A 38 (1988) 1217-1224
[22] INOKUTI, M, KIMURA, M, DILLON, MA, Time-dependent aspects o t electrondegradation III High-eneigv electrons inc ident on molecular hydrogen, Radiât PhysChem 34 (1989) 477-4SO
123] KIMURA M, INOkUTI, M, KOWARl K, DILLON, MA., PAGNAMENTA A, Time-dependentaspects ot e lec t ion degradat ion IV Subexcitation electrons in nitrogen and carbondioxide, Radiât Pins Chem 34 (1989) 481-485
(24] KOWARl, K, INOKUTI, M, KIMURA, M , Time-dependent aspects of electrondegradation V Ar-H? mixtmes, Phys Rev A 42 (1990) 795-802
[25\ KOWARl, K, KIMURA, M, INOKUTI, M, Electron degradation and yields of in i t ia lproducts II Subexcitat ion e lect ions in molecular nitrogen, J Chem Phys 89 (1988)7229-7237
[26] PAGNAMENTA, A, KIX1URA M, INOKUTI M, KOWARl, K, Electron degradation andyields ot i n i t i a l products III Di s soe i i tne a t t a c h m e n t in carbon dioxide J Chem Phvs89 (1988) 6220-6225
[21 \ ISHII MA, KIMURA, M INOKUII , M KOWARl, K, Election degradation and yieldsot i n i t i a l p roducts IV Subexc i t a t i on e l ec t ions in molecular oxygen, J Chem Phys 90(1989) 3081-3086
[28] ISHII, MA, KÎMURA, M , INOKUII M, Electron degradation and yields of ini t ia!products VII Subexci ta t ion e lec t ions in gaseous and solid I^O, Phys Rev A 42 (1990)6486-6496
[29] INOKUTI, M, "Subexcitation electrons in gases', Molecular Processes in Space,(WATANABE, T, SHIMAMURA, I , SHIMIZU, M, ITIKAWA, Y , Eds), PlenumPublishing, Neu York (1990) 65-86
[30] KIMURA, M , INOKUTI, M , Subexcitation electrons in molecular gases, Comments AtMol Phys 24 (1990) 269-286
[31] INOKUTI, M, Subexcitation electron An appraisal ot our understanding, AppI RadiâtIsotopes 42 (1991) 979-983
619

|32) FOWLER, RH, Contnhut ions to the theory of the motion of oc-particles through matterPart II Ionisat ions Proc Canih Philos Sot 21 (1923) 531-540
P Ï ] FANO, U S P E N C F R LV Qu I S I - S L i lms of e l ec t ron degrad i t ion spectra Int J Radiâ tPins C h e m 7 (I'PS) t>3-67
J 3 4 ] GROSS\\ENDT B \\A!BEL, E, Transpor t ot low energy e lec t rons in mtrogtn and air ,Nucl I n s t i M c t h 155 (1978) 145-156
[35] GROSSWENDF, B, De te rmina t i on ot s t a t i s t i c a l f l u c t u a t i o n s in the lonization y ie ld ot loweneigetic e lect ions in hvdiogen, Nucl In s t i Meth 198 (1982) 403-409
|36] GROSSVVENDT, B, Déglaciat ion spectra and s t a t i s t i ca l lonization y i e ld f luc tua t ions tor lowenergy elect ions in TE gas, (Pioc Eighth S \mp Microdosimetry, Luxembourg, 1982)(BOOZ, J, EBERT, H G T Eds), EUR 8385 EN Luxembourg (1983) 165-174
[37] GROSS\\ENDI, B St i t i s t i c i! t l u c t u i t i ons of tbc 'oni7at ion yi t ld ot low-energy electrons inHe, Ne, and Ar, J Ph\s B Atom Molec Phvs 17 (1984) 1391-1404
[38] GROSSWENDT, B W \1BEL, E, S t a t i s t i c a l loniza t ion > ie ld f l u c t u a t i o n s and determinat ionot spatial lonizat ion and eneigv absoiption for low energy electrons, Rachat Prot Dosim13 (1985) 95-102
[39] PARETZKE, HG, BERGER, MJ Stopping power and energy degradation for electrons in\ \a ter \apor, (Proc Sixth Svmp Microdosimetry, Brussels, Belgium, 1977) (BOOZ, J,EBERT, H G , Eds) EUR 6064, Hamood, London (1978) 749-758
[40] HAMM, RN, WRIGHT, HA, KATZ, R, TURNER, JE , RITCHIE, RH, Calculatedyields and slovving-down spectra foi e lec t ions in l iquid water Implications for electron andphoton RBE, Phvs Med Biol 23 (1978) 1149-1161
[41] TURNER, JE, PARETZKE, HG, HAMM, RN, WRIGHT, HA, RITCHIE, RH, Comparisonof electron transport calculations tor water in the liquid and vapor phases, (Proc EighthSymp Microdosimetry, Luxembourg, 1983) (BOOZ, J , EBERT, H G , Eds), EUR 8395EN, Luxembourg (1983) 175-185
[42] PARETZKE, HG, TURNER, JE, HAMM, RN, WRIGHT, HA RITCHIE, RH, Calculated yieldsand fluctuations for electron degradation in liquid watei and water vapor, J Chem Phys84 (1986) 3182
[43] TERRISSOL, M, BEAUDRE, A, S imul i t i o n ot space and t ime evo lu t i on of rachol>ticspecies induced bv e l e c t i o n s in l i q u i d w a t e r , Rad iâ t Plot Dosim 31 (1990) 171-175
[44] MALBERT, M, CAREL C, PA TAU JP TERRISSOL, M, Transport des protons debasse ereigie et de leurs e lec t ions secondaries dans l 'eau, (Proc Seven th MicrodosimetrySymp, Oxiord, UK, 1980) (BOOZ, J , EBERT, H G , HART FIEL, HD, Eds),Haruood Academic Publishers, Brussels (1981) 359-374
[45] KAPLAN, IG, MITEREV, AM, SUKHONOSOV, V YA, Comparative study of yields otprimary products in tracks of fast electrons in liquid water and in wa t e r vapor, RachatPhys Chem 27 (1986) 83-90
[46] KAPLAN, IG, MITEREV, AM, Interact ion ot charged particles w i t h molecular mediumand track effects in rad ia t ion chemistry, Adv Chem Phvs 68 (1987) 255-386
[47] KAPLAN, IG, MITEREV, AM, SUKHONOSOV, V YA, Simulation of the primary stageof liquid wa te r radiolysis, Radiât Phvs Chem 36 (1990) 493-498
[48] KAPLAN, IG, 'Computer experiment and radiation data for liquid water and water vaporirradiated by fast electrons', Atomic and Molecular Data for Radiotherapy, IAEA-TECDOC-506, IAEA, Vienna (1989) 80-91
[49] KAPLAN, IG , SUKHONOSOV, V YA, Simulation of the passage ot fast electrons and theearly stage of water radioKsis by the Monte Carlo method, Radiât Res 127 (1991) 1-10
620

|50] WAIBEL, E, GROSSWENDT, B, S p a t i a l eneigv dissip i t ion p ro f i l e s W \a lues , backscatterc o e f f i c i e n t s , .nul langes for lou-eneigv e lec t ions m m e t h a n e , Nuclear J n s t r Meth 211(1983) 4S7-49S
|51] WAIBEL, E, GROSSWENDT, B, S tudv of W \a lues , piactica! ranges, and energydissipation prof i les of low-energy e lec t ions in N-j, (Proc Eighth Symp Microdosimetry,Luxembourg, 1983) (BOOZ, ), EBERT, H G , ~ Eds), Commission ol the EuropeanCommunit ies , Luxembourg, EUR 8395, Luxembourg (1983) 301-310
[52] WAIBEL, E, GROSSWENDT, B, Degradation of low-energy electrons in carbon dioxideEnergy loss and lomzat ion , Nucl Instr Meth B S3 (1991) 239-250
[53] WAIBEL, E, GROSSWENDT, B, W va lues and other t ranspoi t data on low-energyelect ions in t i s s u e - e q u i v a l e n t gas, Ph \ s Med Bio! 37 No 5 (1992) 1127-1145
[54j INOKUTI, M , lom/at ion yields in gases unde i e lec t ion n rad ia t ion , Radiât Res 64 (1975)6-22
[55] SRDOC, D , Dependence ol the energy per ion pair on the photon energy below 6 keV invarious gases, Nucl Instr Meth 108 (1973) 327-332
[56] SRDOC, D, OBELIC, B, Measurement of W at very low photon energy, (Proc FifthSymp Microdosimetry, Veibama Pal lanza , Italy, 1975), (BOOZ, J , EBERT, H G ,SMITH, EG R, eds) EUR 5452 d-e-f, Luxembourg (1976) 1007-1021
[57] SAMSON, J A R , HADDAD, GN, Average eneigy loss, per ion pair formation by photonand electron impact on xenon betueen thieshold and 90 eV, Radiât Res 66 (1976) 1-10
[58] GERBES, W, Über die lonizierungsvvirkung von Kathodenbtrahlen in Lutt, Ann Phys 23(1935) 64S-656
[59] COLE, A, Absorption of 20-eV to 50,000-eV electron beams in air and plabtic,Radiât Res 38 (1969) 7-33
[60] SMITH, B G R , BOOZ, J, Expenmental results on W-values and transmission of low-energyelectrons in gases, (Proc Sixth S \mp Microdosimetry, Brussels, Belgium, 1977)(BOOZ, J, EBERT, H G Eds) EUR 6064 Haraood, London (1978) 759-775
[61] COMBECHER, D, Measu iemen ' s of W v a l u e s of low-energy electrons m several gases,Radiât Res 84 (19M)) l . S 9 2 i c S
[62] WAIBEL, E , GROSSWENDT, B , De te rmina t ion of W values and backscat ter coeff icientsfor slow electrons m air, Radiât Res 76 (1978) 241-249
[63] PLATZMAN, RL, Total lomzation in gases by lugh-eneigy paiticies An appraisal ot ourunderstanding, lut J App! Rachat Isot 10 (1961) 116-127
[64] PLATZMAN, RL, Superexcited states of molecules, Rachat Res 17 (1962) 419-425
[65] PLATZMAN, RL, Probabil i té d ' ionisat ion par t r a n s f e r t d 'énergie d'atomes excites à desmolecules, J Physique Radium 21 (1960) 8*3-858
[66] ALKHAZOV, GD, lomzation cascade m hel ium caused by nonre la t iv is t ic electrons,Zh Tekh Fiz 41 (1972) 2513-2523, Engl Transi Sov Phys - Techn Phys 16 (1972)1995-2002
[67] KIMURA, M, KOWARI, K, INOKUTI, M, KRAJCAR-BRONIC, I, SRDOC, D,OBELIC, B , Theore t i ca l s tudv ot W values m hydiocarbon gases, Radiât Res 125(1991) 237-242
621

|68] I N T E R N A T I O N A L C O M M I S S I O N ON RADIATION U N I T S AND MEASUREMENTS,Deter mm i l i o n of Absoibed Dose in ,i P a t i e n t h i a d i a t e d by Beams ot X or GammaRa\s m R i d i o t l v r a p v Piocedures , 1C RU Repo i t 24 W a s h i n g t o n , DC (1976)
[69] INTERNATIONAL C O M M I S S I O N ON RADIATION UNITS AND MEASUREMENTS,Basic Aspects ot i i i gh Energy Par t i c le I n t e r a c t i o n s and Radia t ion Dosimetry,ICRU Repoit 2,S, Washington , DC (S978)
1701 WAMBERS1E, A, VAN DAM, J , HANKS G, MIJNHEER, BJ , BATTERMAN, JJ ,"Need for i m p r o v i n g the accuracy in close de l i ve ry in tad io - and n e u t i o n therapyImpoitance oi a tomic and molecuk ' i data", Atomic and Molecular Data tor Radiotherapy,IAEA-TECDOC-506, IAEA, Vienna (1989) 51-72
[71] ROSSI, HH, ROSENZWEIG W, A device for the measurement of dose as a func t ion otspecific loii ization, Radiology 64 (19*0) 404-410
[72] SRDOC, D, Expenmenta l t e c h n i q u e ot measurement of microscopic eneigy distr ibution inurad ia ted mal le i using Rossi coun te i s , Radiât Res 43 (1970) 302-319
[73] JESSE, W P, SADAUSKIS, J , u-part icle lomzation in mixtures of noble gases, Phys Rev88 (1952) 417-418
[74] JESSE, W P., SADAUSKIS, J, a-pai t ic le lonizalion in pure gases and average energy tomake ion pair, Phys Rev 90 (19r>3) 1120-1121.
[75] JESSE, WP, SADAUSKIS, J, lori '^atio' i in pu ie gases and average energy to make ionpair tor a and ß lad ia t ion , Phys Rev 97 (1955) 1668-1670
[76] JESSE, \V P., SADAUSKIS, J , lomzation by alpha particles in mix tures of gases,Phys. Rev 100 (1955) 1755-1762
[77] WAIBEL, E , "Experimentally determined W values, stopping powers and ranges of low-energy protons and electrons in gases Methods and problems", Atomic and MolecularData ' for Radiotherapy, IAEA-TECDOC-506, IAEA, Vienna (1989) 136-150
[78] SRDOC, D , The W-value for electrons and photons in tissue-equivalent gas, Annual Reporton Research Pioject COO-4733-2, Columbia Univers i ty , New York (1979) 37-50
[79] BREYER, B , Pulse he igh t d i s t r i b u t i o n in lo\\ ene rgy propor t iona l counter measurements ,NUL! Ins t r Meth 112 (1973) 91-93
[80] OBELIC, B , P iobab i l i t v dens i ty d i s t r i b u t i o n ot p r i m a r y lomzat ion calcula ted by means of ani t e r a t i ve deconvolut ion ptocess, Nucl I n s t r Meth A 241 (1985) 515-518
[81] SRDOC, D, OBELIC, B, KRAJCAR-BRONIC, I , Stat is t ical f luctuat ions in the lomzationyield for low-eneigy photons absorbed in pol> atomic gases, J Phvs B Atom MolecPhys 20 (19cS7) 4473-4484
[82] KRAJCAR-BRONIC, I, SRDOC, D, OBELIC, B, The mean eneigy requued to form anion pair for km-energy photons and electrons in pol\ atomic gases, Radiât Res 115(1988) 213-222
[83] KRAJCAR-BRONIC, I , SRDOC, D , OBELIC, B , The W values tor photons and electronsin mixtures of aigon and alkanes, Rad iâ t Res 125 (1991) 1-5
[84] KRAJCAR-BROMC, I, SRDOC, D, A comparison ot calculated and measured W values intissue equ iva l en t gas mixtures , Radiât Res 137 (1994) 10-24
[85] SRDOC, D, Measu iemen t ot the Fano f ac to r in t i s sue-equ iva len t and other gases, AnnualReport on Research Project COO-47"3-2, Columbia Universi ty, Ne\v Yoik (1979) 58-63
622

J86J SRDOC, D C L X R K , B Genei i t i o n and spectioscopv of u l t r a so t t x- ravs by non-dispersivemethods NuJ I iMs Meth 78 (1970) 305-3 H
(S7 j BOERSCII l i , L\penmental!e Bcs tmimuiu ' der E n e i g i i v e r t e i i u n g m the rmisch ausgelostenEiek t ionens t i i h l en Z Plns ik 139 (1954) MS-146
[88] FORST G , Uhu die E n u g i e v e r t e i l u n g dei Ionen aus einer Hothirequenz-Ionenquelle ,Z Physik 159 (1960) 7-18 ~
[89] W AI BEL, E, WILL EMS, G, W \a lues for low-energy protons in methane-based tissue-eqimjlent gas and its cons t i tuents , Phys Med Bio) 37 (1992) 249-259
[90] THOMAS, DJ, BURKE, M W va lue s measurements for protons in t issue-equivalent gasand its const i tuent gases, Phvs Med Bio! 30 (1985) 1201-1213
|91] BARKER, CJ, SEGRE, E, Stopping po\\er and eneigy loss tor ion pair production for340-MeV piotons, Pli\s Re\ 81 (1951) 189 492
[92] PETTI, PL, VERHEY, L, \\1LSON, R, A measurement of \v tor 150 MeV protons inmtrogui and aigon, Pins Med Biol 31 (1986) 1129-1138
[93] RADEKA, V, Lo\\-noise techniques in deteciois, Ann Re\ Nucl Part Sei 38 (1988) 217-277.
[94] WAIBEL, E, GROSSWEXDT, B, Zur Technik der Bestimmung von W-Werten in Gasen,PTB-Mitteilungen 87 (1977) 13-21
|95] SRDOC, D, SLIEPCEVIC, A, Carbon dioxide propott ional counter, effects of gaseousimpurities and gas pur i f ica t ion method, J Appl Rad 14 (1963) 481-488
[96] HAT AN O, Y, 'Electron a t tachment to van der Waals molecules', Electronic and AtomicCollisions, (LORENTS, DC, MEYERHOF, WE, PETERSON, JR, Eds) Elsevier,Amsterdam (1986), 153-173
[97] TUNG, CJ, BAUM, JW, lomzation v i e ld s in hydrocarbons under e'ectron irradiation,Radiât Res 119 (1989) 413-423
[98] UNNIKRISHNAN, K, PRASAD, MA, Energv deposit ion b> electrons in argon,Radiât Res 80 (1979) 22S-232
[99] HIRAOKA, T, KAWASHIMA, K, HOSHINO, K, F U K U M U R A , A, Est imat ion of vv-valuesfor particle beams in several gases, Jpn Radiol Ph>s 9 (1989) 143-152(in Japanese, w i t h abstract f igure captions, and tables in English, an updated Englishtranslation can be obtained f iom the f u s t author)
[100] KIMURA, M, KR/JCAR-BRONIC, I , DILLON, MA, INOKUTÎ, M , Electrondegradation and )ields of i n i t i a l products X The Fano factor tor mixtures of argon andmolecular hydrogen, Ph>s Rev A 45 No 11 (1992) 7831-7837
[101] OLKO, P, BOOZ, J, PARETZKE, H G , WILSON, WE, 'Eneigv deposition in thenanometer sites based on the track s t r u c t u i e calculations", Atomic and Molecular Datafor Radiotheiapv, IAEA-TECDOC-506, IAEA, Vienna (1989) 105-116
[102] MARSHALL, M, STON'ELL, GP, HOLT, P D lomzation dis t r ibut ions from proton andother tiacks in water vapour, Radiât Piot Dosim 13 (1985) 41-44
[103J NIATEL, MT, PERROCHE-ROUX, AM, BOUTILLON, M, TV.O cleteimmations of Wfor electrons in drv an, Pins Med Biol 30 (19S5) 67-75
[104] BOUTILLON, M, PERROCHE-ROUX AM R e - e v a l u a t i o n of the W v a l u e tor electronsin dry a i r , Phys Med Biol 32 (19S7) 2 1 3 2 1 9
623

Kl'NZt, R, 1 I L C M R Ü, D e t e t m i n a t i o n of the mean expended energy W L for thet o i m a t i o n ot ,in ion pan in ni toi cobal t 60 g n n m a l a d i a t i o n , Isotopenpi axis 16 (1980)i25-327
[106J SUZUKI, IH , SAIIO, N , L t i e c t s o t i n n e i - s l i L l l exc i t a t i on on the \V- \ a lue o t propane,Bull C h e m Soc Jpn 58 (1985) 3210-3214
[1071 SAITO, N, SUZUKI, IH, Fine su .Unie nea, the C-K edge in the photon W va lue otmethane, Chem Phys 108 (1986) 327-333
[108] THOMAS, DJ, BURKE, M, Measuiement of W values tor protons in an A-150 piastic-equivalent gas and in argon, Ph\s Med Biol 32 (1987) 1119-1126
[109] CHEMTOB, M, PARMENFIER, N, NGUYEN, VD, Some experimental results on Wvalues for hcaw part ic les , Phvs Med Biol 23 (1978) 1197-1199
|110j LOWRY, R A, MILLER, GH, Ionisa t ion v i e l d o t protons in nitrogen and aigon,Pins Re\ 109 (19^8) 826-831
[ 1 1 1 ] LARSÜN, II V, Energy loss pei ion pan for p io tons in va r ious gases, Pins Rev 112(1958) 1927-1928
[112] PHIPPS, JA, BORING, J W, LOWRY, R A, Total lomzation in argon by heavy ions ofenergies 8 to 100 keV, Phys Rev 135 (1964) A36-A39
[113J PARKS, JE, HURST, GS, STEWART, TE, WEIDNER, HL, lomzation of the noblegases by protons Jesse e f f e c t s as a f u n c t i o n of pressure, J Chem Phys 57 (1972) 5467-5474
[114] HUBER, R, COMBECHER, D, BURGER, G, Measurement ot average energy requiredto produce an ion pair (W va lue ) for low -energy ions m several gases, Radiât Res 101(1985) 237-251
[115] BORING, JW, STROHL, GE, WOODS, FR, Total lomzation in nitrogen by heavy ionsof energies 25 to 50 keV, Pins Rev 140 (3965) A1065-A1069
[116] NGUYEN, VD, CHEMTOB, M CH'XRY, J , POSNY F, PARMENTIER, N, Recentexpérimentai results on W v ilues toi heaw particles, Phvs Med Biol 25 (1^80) 509-518
[117] SIDENIUS, G, The to ta l lomzation of low energy ions in a tissue equ iva len t gas and itscomponent gases Absolute measurements , Rad Eft 39 (1978) 213-220
[118] SCHALLER, L, HUBER, P, BAUMGARTNER, E, Messung der Arbeit pro lonenpaar mStickstoff für Protonen und He-Ionen im Energiegebiet unterhalb l MeV, Helv PhysActa 36 (1963) 113-131
[119] KUEHN, H, WERBA, T, Measurements ot the energy expenditure tor the production otan ion pair in t issue e q u n a i e n t gas foi heavy particles, (Pioc Third Symp NeutronDosimetrv in Biologv and Medic ine , Neuheibe ig /Munchen , 197"?) EURATOM EUR 5848DE'EN/FR, Luxembomg (1978) 85-95
[120] WAIBEL, E, \ \ ILLEMS G, Ionisa t ion ranges and W va lue s for low energy protons int i s sue -equ iva len t gas, Radiâ t Plot Dosim 13 (1985) 79-81
[121] BICHSEL, H, I N O K U T I , M, Ca lcu la t ion ot the eneigv to torm an son pair tor protons,Radiâ t Res 67 (1976) 613
[122] MacDONALD, JR, SIDEMUS, G, Hie tota l lomzat ion in me thane of ions w i t h 1< Z<22at eneigies f i o m 10 to 120 keV P h v s Lett A 28 (1969) 543
624

1123] BORING JW, \\OODS FR, The lomzation of CO2 C2H4, and C2H2 by low-energyheavy ions, R uliat Res 35 (196S) 472-478
[124] LEON \RD BE, BORING J \V , I b e average energy pei ion pair, W, for hvdrogen andcm gen ions in a tissue equivalent gas, Radiât Res 55 (1973) i-9
[125] ROHRIG, N , COLVETT, RD, Measurements of W for protons, helium-4 ions, andcarbon-12 ions in t issue-equivalent gas, Radiât Res 76 (197S) 225-240
[126] POSNY, F, CHARY, J, NGUYEN, VD, W values for heavy particles in propane and mTE gas, Phys Met! Bio! 32 (1987) 509-515
[127] WILLEMS, G, WAIBEL, E, HUBER, R, Eneigv range re la t ion and W values for low-energy protons in air and m e t h «ne , (Proc Eighth Svmp Mitrodosimetry, Luxembourg1982)' (BOOZ, J EBERT, H G Eds) EUR «395 EN, Commission of the EuropeanCommunit ies I uxemhomg (19S3) 255-263
[128] WAIBEL, E, \ \ ILLEMS, G \S v a l u t s tor lo\\-eneig\ piotons m air , Phys Med Biol 37(1992) 2319-2322
[129] KRIEGER, G L, BAUM, J W , VARMA, M N, BEACH, JL, Relative détermination of Wvalues for alpha particles m tissue-equivalent and other gases, Phys Med Biol 24 (1979)286-298
[130] WHILLOCK, M, EDWARDS, A, Determinat ion of W va lues for t i ssue-equivalent gas andconstituents using alpha part icles in the range 1 1-3 9 MeV, Phvs Med Biol 28 (1983)367-374
[131] THOMAS, DJ, BURKE, M, W v a l u e measurements for 241Am alpha particles in var iousgases, Phvs Mtd Biol 30 (1985) 1215-1223
[132] TAWARA, H, ISHIDA, N, KIKUCHI, J, DOKE, T, Measurements of the W values inargon, nitrogen and methane for 093 to 53 MeV alpha particles, Nucl Instr Meth B29 (1987) 447-455
[133] CHAPPELL, SE, SPARROW, JH, The aveiage eneigy required to produce an ion pair inargon, nitrogen, and air for l-to-5- MeV alpha particles, Rad>at Res 32 (1967) 383-403
[134] VARMA, MM, BAUM, JW, Energy dependence on W tor alpha particlesin N2> CO2, CH.4, Ar, H2 and Rossi-tvpe tissue-equivalent gases, Phys Med Bio! 23(1978) 1162-1172
[135] JESSE, WP, Alpha particle lomzation in polyatomic gases and the energy dependenceof W, Phys Rev 122 (1961) 1195
[136] JESSE, WP, Alpha-particle lomzation in a igon-methane mixture and the energy dependenceof the ion p a n - f o i m a t i o n eneigy, Phvs Rev Î74 (1968) 173-177
[137] SIMMONS, JA Comments on measu iemen t s of W va lues in t i s sue -equ iva len t gas for alphaparticles, Phvs Med Biol 31 (1986) 275-279
[138] WAKER, AJ, W v a l u e s in t i s s u e - e q u i v a l e n t gas for a lpha part icles - 19"?2 revis i ted , PhvsMed Biol 33 (198S) 984-9S7
[139] KEMMOCHI, M , Measurements of W v a l u e s tor alpha part icles in t i ssue-equivalent gases,Health Phvs 30 (19~6) 439-446
625

[140] SCHIMMERL1NG, W, KAPLAN, S , SUBRAMANIAN, T S, McDONALD, W J ,GABOR, G, S \DOFF, \, ALPEN, E, Measurements of W tor high energy heavy ions,(Pioc Eighth Svmp Miuodosimetrv Luxembourg, 1982) (BOOZ, J EBERT, HG, Eds),EUR 8395 EN, Luxembourg (19b3) "511-321
[1411 THOMAS, RH, LYMAN, J F, DE CASTRO, TM, A measurement of the average energyrequited to create an ion pan in nitiogen by high-energy ions, Radiât Res 82 (1980) 1-12
J141aj KANAI, T, KOHNO, T, MINOHARA, S, SUDOU, M, TAKADA, E, SOGA, F,KAWACHI, K, FUKUMURA, A, Dosimetry and measured d i f f e r e n t i a l W values of airfor heavy ions, Radiât Res 135 (1993) 293-301
[142] SCHIMMERLÎNG, W, 'Heavy ion dosimetrv ' , Advances in Radiat ion Protection andDosimetrv in Medicine, (TflOMAS RH, PEREZ-MENDEZ, V, Eds), Plenum Press,New Yoik and London (19S2)
J 1 4 " 5 ) VARMA, NM, BAUM, J W, Dependence of the \V-\alue on the atomic number of heavyions", Na t iona l and I n t e r n a t i o n a l S t a n d a i d i z a t i o n ot Radia t ion Dosimetrv, IAEA-SM-222/02, IAEA, Vienna (1978) OS-71
[144] VARMA MN, BAUM J W , Stopping po\vtr and average energy to form an ion pair for42 MeV oxygen ions, Phvs Med Biol 27 (1982) 1149-1453
[144a]PFUTZNER,M, GEISSEL H, MUNZENBERG, G, NICKEL, F, SCHEIDENBERGER, Ch,SCHMIDT, K - H , SUMMERER, K, BROHM, T, VOSS, B, BICHSEL, H, Energydeposition by re la t ivis t ic heavy ions in thin argon absorbers, Nucl Instr Meth B xx(1993) in press
[144b] BICHSEL, H, unpubl i shed resul ts
[145] STRICKLER, TD, lomzation by alpha particles in binar)' gas mixtures, J Phys Chem 67(1963) 825-830
[146] HAEBERLI, W, HUBER, P, BALDINGER, E, Arbeit pro lonpaar in Gasgemischen fürAlpha-Teilchen, Helv Phvs Acta 23 (1950) 481-484
[147] HAEBERLI, W, HUBER, P, BALDINGER, E, Arbeit pro lonenpaar von Gasen undGasmischungen für Alpha-Teilchen, Helv Phvs Acta 26 (1953) 145-180
[148] BORTNER, TE, HURST, GS, lomzation of pure gases and mixtures of gases by5-MeV alpha paiticle, Phys Rev 93 (1954) 1236-1241
[149] SWALLOW, AJ, INOKUTI, M, Radiation-energy partition among mixture componentsCurrent ideas on an old question, Radiât Phy5 Chem 32 (1988) 185-189
[150] MELTON, CE, HURST, GS, BORTNER, T.E, lomzation produced by 5-MeV alphaparticles in argon mixtures, Phys Rev 96 (1954) 643-645
[151] TAWARA, H, KIKUCHI, J, DOKE, T, Energy dependences of VV values for MeV alphaparticles in Ar-Xe, Ar-N2, and Ai-CH4 mixtures, Nuc! Instr Meth B 29 (1987) 456-460
[ J 5 2 ] JARVINEN, M-L SIPILA H, Avetage lonizat ion energies of gas mixtures for X-rays, NuclInstr Meth 217 (19S3) 282-2S4
J153] UKAI, M, HATANO, Y, Co l l i s i ona l deputat ion ot excited rare gas j toms in metastableand resonant states ' , Gaseous Elec t ionics and I ts Applications, (CROMPTON, RW,HAYASHI, M, BOYD, DE, MAKABE, Eds) Khuvei Academic Publ , Dordrecht (1991),51-72
[154] FANO, U , lomzation viele! ot radia t ions II The f luctuat ions of the number of ions, PhysRev 42 (1947) 26-29
626

ALKHAZOV, G D, lonizat ion t i u c l i i l i i ons in gases, Zh Tekh Fiz 41 (1971),Eng] Trans] So\ Plus - Tech Plus 16 (1972) 1540-1546
ALKHAZOV, G D, VÜROB bV, AA, T o t a l l o m z i t i o n and lon iza t ion f l u c t u a t i o n s inhe l ium, Ph\s Lett 29 A (1969) 25-26
[157] ALKHAZOV, G D, KOMAR, AP, VOROB'EV, A A, lonization f luc tuat ions and resolutionof lonization chambers and semiconductor detectors, Nue! Instr Meth 48 (1967) 1-12
[158[ NEUMANN, W, The u l t i m a t e energy resolution of the proportional counter and theanalvs is of n m e s o K e d !o\v energy spectia, (Proc Seventh Symp Miciodosimetry, Oxford,UK., 1980) (BOOZ, J, EBERT, HG, HARTFIEL, HD, BJs) Hanvood Academic PublishersBiussels (1981) 1067-10S2
[159 ] ANDERSON DF H \\1ILTO N IT, kU \\ H M, NOVICK, B, A large aiea, gas s c i n t i l l a t i o np iopor t ion i l c o u n t e i , Nuc! I n s t i M t l h 163 (1979) 123-134
|160] RIBEIRETE, M M F POL1CARPO A J P L , S \LEHr M, LEITE, S C P ALVFS, M / V F ,DE LIMA EP Fano fac to r s of kr\pton-\ tnon m i x t u r e s , Nucl Insti Meth 214 (1983)561- 563
[161] POLICARPO, A J P L , ALVES, M A P , SALETE, M, LEITE, S C P , DOS SANTOS, M C M ,Detection of soft X-rays \ \ i th a xuion propor t iona l sc in t i l l a t ion countei , Nucl Ins t rMeth 118 (1974) 221-226
[162] DE LIMA, EP, SALETE M, LEITE, S C P , ALVES, M A P , POLICARPO, A J P L,Fano factors of rare gases and then m i x t u r e s , Nucl Instr Meth 192 (1982) 575-581
[161] LUKIRSKII, AP, ERSHOV, OA, BRYTOV I \ , Operat ion of proportional counters inthe u l t rasof t X-ra> region, Bu l l Acad Sei USSR, Pins Ser 27 (1963) 798-807
[164] BUDD, T, MARSHALL, M, K\\OK, CS, Advances in cloud- chamber t echn iques andmeasurements of W va lue in a t i s sue -equ iva l en t gas, Radiât Res 88 (1981) 228-239
1165] HURST, GS, PAYNE, MG, KRAMER, SD, YOUNG, JP, Resonance lonizationspectroscopy and one-atom detect ion, Re\ Mod Phys 51 (1979) 767-819
[166] KASE, M, AKIOKA, T, MAMYODA, H, K1KUCHI, J, DOKE, T, Fano factor in pureargon, Nucl In s t r Meth 227 (1984) 311-317
[166a]MOE, H J, BORTNER, T E, HURST, G S , lonization of acetylene mixtures and othermixtures by Pu-239 alpha-par t ic les , Ph>s Rev 61 (1957) 422-425
[167] KASE, M, KIKUCHI, J, DOKE, T, Fano factor m gas mix tu re of A.r + ICK'c CH4, NuclInstr Meth 163 (1979) 289-291
[168] ISHIDA, N, KIKUCHI, J, DOKE, T, The W Values and Fano Factors in Helium andArgon-Doped Hel ium, Jpn J App! Ph\s 31 (1992) 1465-1469
[169] VOROB'EV, A A, KOMAR, AP, KOROLEV, VA, Decrease of f luc tua t ions of theromzation produced b\ alpha p a r t i c l e s Sovr t t Ph^-JEPP 16 (1962) 306-30"7
[170] KRAJCAR-BROMC I, KIMURA \1 INOKUTI \1 DILLON, M \ Die Fano factor lorelectrons in gas m i x t v n e s , N u c l I n s t r Meth B71 (1992) 366-370
[171] KRAJCAR-BRONIC I , On a r e l a t i o n b e t w e e n the \ \ v a l u e a id the Fauo f a c t o r , J PinsB Atom Mo! Opt Pins 25 (1992) L215-L21«
[172] INOKUTI, M, KOWARI, K, kIMURA, M, Stat is t ical f luctuations in the j r e l d oflonization due to protons or alpha particles, Phvs Rev A 45 (1992) 4499-4506
627

[173] DOKE, T, ISHIDA, N, KÄSE, M, Fano factor in raie gases and their mixtures,Nucl Ins t r Meth Pins Res B63 (1992) 373-376
1174] GOLD, R, An i t e i a t i v e un tok l ing method foi lesponse matrices, Argonne Na t iona lLaboiatory Repor t ANL-69S4, Argonne, IL (1964)
[175] MARINO, SA, SRDOC, D, Frequency d is tnbut ion of number of electrons pioduced bylow energy X-rays (Radiat ion Research Society Meeting, New Orleans, LA, 1980) Radiâ tRes 83 (1980) 492 (abstract).
[176] ARMSTRONG, D A, Radiat ion Chemistry, (FARHATAZIZ, RODGERS, M A J, Eds),VCH Pub l , Ne\\ York (1987) Ch 9
[177] BUXTON, i b i d , Ch 10
1178] SWALLOW, i b i d , Ch 11
1179] KATSUMURA, Y , Exci ted s ta tes m condensed media G-va lues of exci ted states", CRC-Handbook of Radia t ion Chemistry (IABATA Y, ITO, Y, TAGAWA, S, Eds), CRCPress, Boca Raton (1991) Ch IX B
[180] HATANO, Y, "Fundamenta l molecular parameters in the gas phase Fundamenta l processesin the gas-phase l ad ia t ion chemistry ' , CRC-Handbook of Radiat ion Chemistry(TABATA, Y, ITO, Y, TAGAWA, S, Eds), CRC Press, Boca Raton (1991),Ch IV B
[181] HATANO, Y, Fundamen ta l piocesses in radiolysis Collision dynamics data on someeiementarv processes', Atomic and Molecular Data for Radiotherapy, IAEA-TECDOC-506,IAEA, Vienna (1989) 200-214
[182] WILLIS, G, BOYD, AW, Excitation m the radiat ion chemistry of inorganic gases, Int JRadiât Phys Chem 8 (1976) 71-111
[183] HATANO, Y, "Method of studying radiation chemical processes" and 'Hydrogen atom",CRC-Handbook of Radiat ion Chemistry (TABATA, Y, ITO, Y, TAGAWA, S , Eds),CRC Press, Boca Raton (1991), Ch III A and X B
[184] ASMUS, K - D , WARMAN, JM, SCHULER, RH, The effect of electron, positive ion,and hydrogen atom scavengers on the yields of atomic and moleculai hydrogen in theradiolysis of l iquid cvclohexane, J Phys Chem 74 (1970) 246-257
[185] FREEMAN G R (Ed), Kinetics of Nonhomogeneous Processes, John Wiley & Sons,New York (1987)
[186] FERRANDINI, C, JAY-GERIN J-P (Eds), Excess Electrons in Dielectric Media, CRCPress, Boca Raton, Flonda (1991)
[187] INOKUTI, M , How is the r ad i a t i on energy absorption d i f f e r e n t be tween the gas phase andthe condensed phase ' R a d i a i E f f e c t s Defects in Solids 117 (1991) 143-162
[188] GRUHN, CR, LOVEMAN R, A r e v i e w of the plnsical p rope i t i es of l iqu id lomzationchambei medn, IFEE T i m s N u c l Sei NS-26 (1979) 110-119
[189] SIEGBAHN, K, KARLSSON, E, (Eds), Proc I n t e r n a t i o n a l Conference on Liquid RadiationDetectors Their F u n d a m e n t a l Piopert ies and Applications, Tok)o, Japan, 1992, Nucllus t rum Meth A 327 (1992) 1-226
[190] MIYAJIMA, M, TAKAHASHI, T, KONNO, S, HAMADA, T, KUBOTA, S,SHIBAMURA, E, DOKE, T, Average energy expended per ion pair in l iquid argon,Phys Rev A 9 (1974) 1438-1443
628

[191] TAKAHASHI, T, KONNO S, DOKE, T, The aveiage energies, \V, required to form anion pair in hqu ihed lare gases J Phys C 7 (1974) 230-240
[192] APRILE, E BOLOTN1KOV, A, C HEN, D, MUKHERJEE, R, lomzation of l iquidkrypton by elect ions, gamma ra\s and alpha particles, Nucl Ins t r Meth in Pins Res A327 (1993) 25-30
[192a] APRILE, E, BOLOTNIKOV, A, CHEN, D, MUKHERJEE, R, W v a l u e in l iquidkrypton, Phvs Rev A 48 (1993) 1313-1318
[191] TAKAHASHI, T, KONNO, S, HAMADA, T, MIYAJIMA, M, KUBOTA, S,NA.KAMOTO, A H I T A C H I A, SHIBAMURA, E, DOKE, T, Average energyexpended pel ion in l i q u i d \en HI, Pins Rev \ 12 (1975) 1771-1775
1194] SEGUINOT, ! P \SS\RD1, G, TISC »HÄUSER J, YPSILAM1S, T, Liquid xenonioni?ation and s L i n t i l l a t i o n Studies toi a t o t a l K ac t i ve -vec to r e lec t romagnet ic calorimeter ,Nucl l u s t r u m Meth in Pins Re-, A 323 (1992) 5S3-60Ü
[195] DOKE, T, HITACHI, A, KUBOTA, S, NAKAMOTO, A, TAKAHASHI, T, Es t imat ionof Fano factors in l iquid argon, krypton, xenon and xenon-doped liquid argonNucl Instr Meth 134 (1976) 353-357
|196] MIYAJIMA, M, MASUDA, K, HITACHI, A, DOKE, T, TAKAHASHI, T, KONNO, S,HAMADA, T, KUBOFA, S, NAKAMOTO, A, SHIBAMURA, fc, Proportional counter f i l l edwi th highh punfied l iquid xenon, Nucl Instr Meth 134 (1976) 403-405
[197) MIYAJIMA, M, MASUDA, K, HOSHI Y, DOKE, T, TAKAHASHI, T, HARADA, T,KUBOTA, S, N \KAMOTO, A, SHIBAMURA, E, A self-triggered l iquid xenon dr i f tchamber by use of propoit ional lomzation or proport ional sc in t i l l a t ion , Nucl Inb t r Meth160 (1979) 236-246
[198] MASUDA, K, TAKASU, A, DOKE, T, TAKAHASHI, T, NAKAMOTO, A,KUBOTA. S, SHIBAMURA, E, A liquid xenon proportional scintillation counter, NaclInstr Meth 160 (1979) 247-253
[199] BARABASH, AS, GOLUBEV, A A, KAZACHENKO, OV, LOBASHEV, V.M ,OVCHINNIKOV, BM, STERN, BE, A pulsed liquid lonization chamber ti l led with Xe,Ar and CH4, Nucl Instr Meth A 236 (1985) 69-81
[200] APRILE, E , KU, \V H -M , PARK, J , SCHWARTZ, H , Energy resolution studies of liquidargon lonization detectors, Nacl Instr Meth A 261 (1987) 519-526
[201] GIBONI, KL, Limited energy resolution in liquid argon due to 5-ray productionNucl Instr Meth A 269 (1988) 554-559
[202] ICHINOSE, H, DOKE. T, KIKUCHI, J HITACHI, A, MASUDA, K, SHIBAMURA, E,The response of a l iqu id Xe lonization chamber to 5 3 MeV a-particles, Nucl InstrMeth A 305 (1991) 111-115
[203] APRILE, E, MUKHERJEE, R, S U Z U K I , M, Pe i to rmance ot a l i qu id xenon lonizationchamber i r radia ted w i t h e lec t ions and gamma-ra \ s Nuc l Ins t r Meth in Pins Res A302 (1991) 177-185
[204] DOKE, T A historical v i e w on the R&.D tor l iqu id rare gas detectors, Nuc! Instr Methin Phys Res A 327 (1993) 113-1 IS
[205] DOKE, T, CRAWFORD, H J , ENGELAGE, J M, FLORES, T, GREINER, L,KASHIWAGI, T, KIKUCHI J , MASUDA, K, NISHIJIMA, K, SHIBAMURA, E,SYMONS, T J M , Sampling calorimeter tor high energy heavy particles filled withallene-doped liquid argon, Nucl lustrum Meth in Phys Res A 302 (1991) 290-300
629

[206] APR1LE, E, KU, W H-M , PARK, J , Delta electron pioduction and the u l t ima te energyresolution ot l i q u i d argon lomzation detectors, IEEE Trans Nucl Sei NS-35/1 (1988) 37-41
[207] KUBOTA, S, NAKAMOTO, A, TAKAHA.SIII, T, KONNO, S , HAMADA, T,MIYAJIMA, M, HITACHI, A, SHIBAMURA, E, DOKE, T, Evidence oi the existenceof exciton s ta tes in l i q u i d aigon and exc i ton-enhanced lomzation f rom xenon doping,Phys Rev B 13 (1976) 1649-16S3
[208] HUMMEL, A, SCHMIDT, W F, lomzat ion ot d i e l e c t r i c l iqu ids bv high-energy' radia t ionstudied bv means of e lec tnca l c o n d u c t i v i t y method , Rachat Res Rev 5 (1974) 199-297
[209] WARMAN, JM, in The S tudv ot F IM Piocesses and T i a n s i e n t Species by Election PulseRadio lvs i s (BAXANDALE, P H BUSI F, Eds), D Reide l P u b ] , Dordiecht (1982) 433
[210] HOLROYD R A, in Rad.auoi , C h e m i s t i v , (FARHATAZIZ, RODGERS, M A J , Eds), VCHPubl , New York (1987) Ch 7
[211] HOLROYD, R A, SCHMIDT, W F, Tiansport of electrons m nonpolar fluids, Ann RevPhys Chem 40 (1989) 439
[211d] HOLROYD, R A, SH/VM, TK, YANG B - X , FENG, X - H , Free ion yields in l iquidsexposed to s jnchiotron X-iays, J Phys Chem 96 (1992) 7438-7441
[212] KLASSEN, NV, in Radia t ion Chemistry, (FARHATAZIZ, RODGERS, M A J , Eds), VCHPubl , New York (1987) Ch 2
[213] HATANO, Y, Hot h\drogen atoms in radia t ion chemis t ry , Hot Atom Chemistry(MATSUURA, T, Ed) Kodansha, Tokyo (1984) 98-119
[214] PLATZMAN, RL, Energy spectrum ot primary activations in the action of ionizingradiation, in Radiat ion Research 1966, Pioc Third Internat ional Congress of RadiationResearch, Cortina d'Ampezzo, I taly (SILINI G, Ed) North-Holland Publishing Company,Amsterdam (1967) 20-42
[215] SUMIYOSHI, T, KATAYAMA, M, The yield ot h \d i a t ed electrons at 30 picosecond,Chem Lett 12 (1982) 1887-1890
[216] JONAH, CD, MATHESON MS, MILLER, JR, HART, EJ, Yield and decay of thehydrated electron from 100 ps to 3 ns, J Phys Chem 80 (1976) 1267-1270
[217] GOULET, T, PATAU, J - P , JAY-GERIN, J - P , Thermahsation and recombination ofsubexci ta t ion electrons in solid w a t e r , Radiâ t Protect Dosim 31 (1990) 33-36
[218] INTERNATIONAL COMMISSION ON RADIATION UNITS AND MEASUREMENTS,The Dosimetn, of Pulsed Rad ia t ion , ICRU Repoi t 34 Bethesda, Maryland (1982)
[219] TABATA, Y, Rad ia t ion sources and dosimetry Rad ia t ion dos ime t ry ' , CRC Handbook ofRadiat ion Chemistry (FABATA, Y, ITO, Y, TAGAWA, S, Eds), CRC Press, BocaRaton, Florida (1991), Ch II B
[220] KITTEL, C, Quantum Theory of Solids, John Wiley & Sons, New York (1963)
[221] BICHSEL, H , Straggling in thin silicon detectors, Rev Mod Phys 60 (19SS) 663-699
[222] ZULLIGER, H R , AITKEN, D W, Fa no fac tor fact and fallacy, IEEE Trans Nucl SeiNS-17 (1970) 187-195
630
[223] RICKER, GR, VALLERGA, JV , DABROWSKI, AJ , IWANCZYK, JS , ENTINE, G ,New measurement of the Fano facto! of mertunc iodide, Rev Sei lustrum 53 (1982)700-701
|224] KLEIN, CA, Semiconductor part icle detectots A reassessment of the Fano factor s i tua t ion ,IEEE Trans Nucl Sei NS-15/3 (196S) 214-225
[225] STEINBAUER, E BAUER, P, GERETSCH LAGER, M, BORTELS, G, BIERSACK, JP,BURGER, P, Eneigv resolu t ion ot sil icon detectors Approaching the physical l im i t , NuclInstrum Meth B \\ H993) in press
[226] SHER, AH, KEERY, W J , Var ia t ion of the e f f ec t i ve Fano factor in a Ge(Li) detector,IEEE Trans Nucl Sei NS-17/1 (1970) 39-43
[227] DRUMMOND, WE, High purity germanium radiation detectors, IEEE Transaction onNuclear Science, NS-18/2 (1971) 91-100
[228] STROKAN, N, AJDACIC, V, LALOVIC, B , Measurements of the Fano factor ingermanium, Nuc! Inst r Meth 94 (1971) 147-149
631

AA15
Chapter 9
TRACK STRUCTURE QUANTITIES
H.G. ParetzkeGSF-Forschungszentrum für Strahlenschutz und Umweltforschung,
Neuherberg, GermanyD.T. Goodhead
Medical Research Council, Radiobiology Unit,Chilton, United Kingdom
I.G. KaplanIstituti di Fisica, Universidad Nacional Autönoma de Mexico,
Mexico City, MexicoM. Terrissol
Centre de Physique Atomique, Université Paul Sabatier,Toulouse, France
633

9.1. INTRODUCTION
For the analysis of radiation effects in matter, knowledge of radiation track structuresis essential. The spatial distributions of species excited by the interaction of aradiation affects their reaction probabilities, which in turn govern the final changes inthe micro- and macroscopic structures of the material. Examples of radiation trackstructures are shown in Figure 9.1. The species making up a track are ions, electrons,excited molecules, and molecular fragments (free radicals) that have lifetimes longerthan, say, 1O10 s (1-3). These are the species that remain after the decay ofplasmonlike excitations and super-excitations. The new species are the starting pointsof subsequent physical, chemical, and biological processes. They mark the end of thephysical stage of radiation action and the beginning of the chemical stage (Figure9.2). During the latter stage diffusion and reaction of primary species with otherradiogenic species or with molecules of the irradiated object alter the pattern of thephysical track structure. This occurs according to the boundary conditions set in thefirst stage.
Thus, it is the objective of track structure theory to:
(i) Identify the molecular changes of importance for the development of aradiation effect under consideration.
(ii) Predict and explain the spatial distribution of relevant species with a minimumof assumptions regarding preliminary processes (2); this spatial distributionshould be given in terms of the joint probability to find an event of type S} atposition Xj and at the same time an event S2 at position x2 and S3 at x3, and soon, to account for spatial correlations for further reactions.
(iii) Identify (for example by correlation studies or modelling of subsequentprocesses) the parameters of physical track structure that predominantlydetermine the nature and magnitude of a final radiation effect and that mayalso be used to characterize a radiation field with regard to its radiation actionwhen compared to other fields.
The theory that describes the generation of radiation tracks and their structure is stillunder development. Contributions have been made by Spencer (4), Fano (1-3),Berger (5), Boag (6,7), Platzman (8,9), Mozumder and Magee (10,11), Caswell(12,13), Voltz (14), Ritchie (15), Inokuti (16), Lea (17), Katz (18-20), Kaplan (21),Paretzke (22), Zerby (23) and others. Recent progress has been made with newsimulation techniques on fast computers developed by Grosswendt et al (24,25),Hamm et al (26-29), Ito (30), Kaplan (31), Nelson et al (32), Paretzke (33,34),Terrissol (35), Uehara et al (36), Wilson and Toburen (37-40), Zaider and Brenner(41,42).
The importance of radiation track structure in biological effects was demonstratedalready in 1946 (17). Applications of track structure theory include the interpretationof tracks in nuclear emulsions and other solid-state nuclear track detectors (18-20).
The first objective (i) depends on the radiation effect under consideration,lonizations, dissociations, and the resulting ions, electrons, and radicals play a majorrole in further chemical or biological reactions. In this chapter emphasis is given tothe second (ii) and third (iii) objectives, namely, to the prediction of track structuresand their quantitative evaluation.
635

VACUUMIncident
RadiationField
Photon
Neutron
Fast Ion
MATERIAL
TrackStructures
Figure 9.1 Incident radiations are characterized by particle mass, charge, and velocity;the stochastic structure of tracks resulting from interactions of these radiationswith matter are described by track matrices T (S, x, r), where the 5 is the typeof a new chemical species at location \ at time t.
co
ctu
Excitation
Electronic Vibrational Rotational
Dissociation
e~- Thermal isation
0»O) i_o o
.y .r o« TJ *r>» c ^
«•- u0 2Ê•o *- <uc c -cUJ ± O
+ + +-17 -16 -15 -14 -13 -12 -11 -10
Log time in s
Figure 9.2 Time scale of processes occurring during the physical stage of energy transferfrom ionizing radiations to molecules.
636

A survey of processes in which photons and neutrons transfer energy to matter isgiven in Sections 9.2.1 and 9.2.2. From this it is evident that electrons, in particularlow-energy electrons, are the carriers that distribute most of the energy to theindividual molecules in matter and thus create most of the track structures. Theinteractions of electrons are described in Section 9.2.3 and those of heavy chargedparticles in Section 9.2.4. With consistent sets of interaction cross sections, trackstructures can be simulated on a computer. Results of simulations for electrons,protons, a particles, and heavier ions in water vapor are described in Section 9.3.Section 9.4 outlines concepts for the quantitative evaluation of such stochasticstructures for the purpose of characterization and classification.
9.2. INTERACTIONS IN TRACKS OF INDIRECTLY AND DIRECTLY IONIZINGPARTICLES
9.2.1. Interactions of Photons
Photons play an important role in radiation research and in technical and medicalapplications of ionizing radiation. A photon normally imparts a large fraction of itsenergy to a single electron, which then ionizes many other molecules along its path.The track generated by a photon is therefore an electron track.A photon of energy hv might interact inelastically with a molecule in one of threeways (43-47):(i) In a photoelectric process where the photon is completely absorbed and an
electron is ejected with kinetic energy E = hv - U, where U is the bindingenergy of the electron in the molecule. This effect is dominant at low photonenergies, below, say, 40 keV in materials with a small atomic number Z. Itproduces sharp energy spectra of photoelectrons that carry essentially all thephoton energy, since the binding potential in low-Z matter is typically onlyabout 500 eV. In addition, often Auger electrons or fluorescent photons areemitted from the target atom.
(ii) In an incoherent Compton-scattering event where only part of the photon'senergy is transferred to an electron. This Compton electron is emitted from itsparent atom; the scattered photon continues its flight in a new direction andwith reduced energy according to the laws of energy and momentumconservation. In water and other low-Z materials this process is the mostimportant energy loss mechanism for photons in the medium energy rangefrom, say, 0.04 to 10 MeV. It leads to tracks of Compton electrons with awide energy spectrum, from zero up to a substantial fraction of the primaryphoton energy hv.
(iii) In a pair production event, when, in the strong fields of the atomic nucleusand of the orbital electrons, the photon is transformed into an electron-positron pair. This process can only occur at photon energies above 1.02MeV, which is the energy equivalent of the masses of an electron and positronwith zero kinetic energy. The excess energy hv - 1.02 MeV is shared askinetic energy E+ and E~ between the created positive and negative particles.Their energy spectrum is rather flat in the energy range from essentially zeroup to E+, E~ = hv - 1.02 MeV. This interaction process must be taken intoaccount only at high photon energies (above, say, 5 MeV), but it gainsimportance with increasing energy. For conventional X rays, 137Cs y rays(0.66 MeV) and 60Co y rays (1.17 and 1.33 MeV), pair production can beneglected.
637

10
10' 10" 10 10" 10 10Photon Energy ( MeV )
Figure 9.3 Cross sections (in barn/atom: 1 barn = 10"28 m2) for various types ofinteraction of photons with aluminium, a typical low-Z material (48).
-i10
0
OnuT
c•o-4
10
a)100 keV
500 keV
1 MeV
10
O
<uLU -3"o 10
G"O
iö4
b)100 keV
500keV1MeV
500 1000 500 WOOPhoton Energy ( keV ) Electron Energy ( keV )
Figure 9.4 Scattered photon (a) and corresponding recoil electron (b) spectra (inbarn/keV per electron) after Compton scattering of 0.1, 0.4, and 1 MeVincident photons. daK*N/dE is evaluated by the Klein and Nishina formula(43,44).
638

Figure 9.3 shows cross sections for aluminium as an example of low-Z atoms. Thestrong absorption at low energies (say, below 40 keV) due to the photoeffect isevident, as is the importance of the Compton effect at medium to high energies and ofpair production at very high energies.
The photoelectric cross section of an atom, between its resonant absorption edges,varies with the photon energy approximately as (/tv)~2-5 and increases approximatelyas the fourth to fifth power of the atomic number Z (see Chapter 5 for details). TheCompton cross section of an electron, however, is almost independent of the atomicnumber, and it decreases only slightly with increasing photon energy. Thus, inheterogeneous objects made up by atoms of different Z, a variation in photon energycan lead to a significant change in the relative importance of interaction modes and ofthe locations of interactions.
The close correspondence between the photon energy after collision and Comptonelectron kinetic energy is visible in Figure 9.4, which shows the energy spectra of thescattered photons (a) and electrons (b) for photons with incident energy 0.1, 0.5, andIMeV.
10 10' 10"
Start Energy (keV)
Figure 9.5 Mean number of electrons of all generations with initial energies larger than Eproduced by interaction of various radiation fields with water (normalized toan absorbed energy of 1 J); adapted from Ref. 49. Parameters giveacceleration voltages and target materials of X-ray tubes.
639

Electrons set in motion by inelastic photon collisions in turn excite and ionize othermolecules. Thus, the original electron can produce an avalanche of higher ordergenerations of electrons with decreasing initial energies, which all contribute to thetrack formation. The number and energy spectra of the higher generation electronsdepend on electron collision cross sections, which are discussed in Section 9.2.3.
Figure 9.5 shows such spectra for photon fields of widely different energies and forincident fast electrons (49). The interactions of electrons change the shapes of theinitial Compton- and photo-effect start spectra.
Photon track structures, and thus their energy deposition, are mainly characterized bythe start energies of the electrons ejected in inelastic photon collisions and by thedistances between subsequent inelastic photon collisions.
The locations and types of energy transfers in inelastic photon events are determinedby the respective cross sections of the three inelastic processes mentioned above (aswell as inelastic scattering), which are governed by the photon energy and the atomicconstitution of the irradiated medium. The lengths of the corresponding electrontracks are generally small (typically nanometers to millimeters in water), compared tothe distance between subsequent photon collisions (typically centimeters). Thus theanalysis of photon track structures can usually be reduced to the analysis ofappropriate electron track structures.
o~bo"00OCOn
Figure 9.6
1.0
0.8
0.6
0.4
0.2
0.0
^'*'30
E(keV)/
60/
/ 100 /
2750+' '
' '2750
1 1 1 1
7 10 20Radius ( g / cm2 )
30 50
Absorbed fractions in sphères for isotropic point sources (——) of photons ofvarious energies and for uniformly distributed sources (——) as a function ofthe radius (50).
640

The low density of electron tracks in photon-irradiated matter and its dependence onphoton energy can be estimated from Figure 9.6, which shows the fraction of photonenergy absorbed within concentric spheres around photon point sources located in thecenter and for uniformly distributed sources (50). However, this low energy densityin single-photon tracks leads to the complicating situation that, with increasing valuesof energy deposited in finite mass elements, many photons have interacted in thatelement. Thus, the spatial and temporal overlap of track structures of manysecondary electrons and their physical and chemical consequences must beconsidered. They might lead to non-linearities in dose-effect relationships and todifferent effects of the same total dose if it is delivered at different dose rates orfractions.
9.2.2. Interactions of Neutrons
Whereas photons mainly interact with the electrons of molecules, ejecting electrons ascharged secondary particles, neutrons collide with atomic nuclei, leading to recoilatomic ions and products of nuclear reactions as charged secondary particles. Thesereaction processes can be divided into elastic scattering (the most importantinteraction in this context) producing recoil ions, inelastic scattering (leading to anexcitation of the struck nucleus and to a slower neutron), nonelastic scattering(ejecting another particle out of the hit nucleus), neutron capture processes (which areimportant for slow neutrons and lead to their disappearance), and spallation processes(breaking up the hit target nucleus and ejecting significant pieces of it, of importanceat neutron energies above, say, 10 MeV) (44,51,52).
In hydrogen-containing media such as water and biological substances, the mostimportant interaction is elastic scattering with hydrogen nuclei, accounting fortypically more than 90% of the energy transferred. Hydrogen nuclei are protons.Neutron collisions produce a wide spectrum of recoil proton energies from zero to theneutron energy.
The contributions of the various neutron interaction processes to neutron trackstructures depends on the neutron energy and on the relative abundances of theelements in the irradiated object. Cross sections for elements can be found elsewhere(51,53-57). The abundance of hydrogen in an object is of great importance forneutron track structure because the cross sections for hydrogen are relatively high forneutron energies up to about 1 MeV.
As with photons, the kinetic energy of the charged secondary particles produced bythe interactions of neutrons is of main importance in determining the track structure.From energy and momentum conservation in the hard-sphere approximation, it can beshown (43-46) that, to a good approximation, the energy spectrum of elasticallyrecoiled nuclei is a rectangular distribution from zero to the maximum energy £maxthat can be transferred from a neutron of energy En to a nucleus of mass A:
This flat distribution is seen in the initial secondary particle spectra shown in Figure9.7. The proton contribution around 1.5 MeV for 1-MeV neutrons stems from the(n, p) reaction in nitrogen. The structure in the spectra for 14- MeV neutrons is due tocontributions from inelastic and nonelastic processes.
641
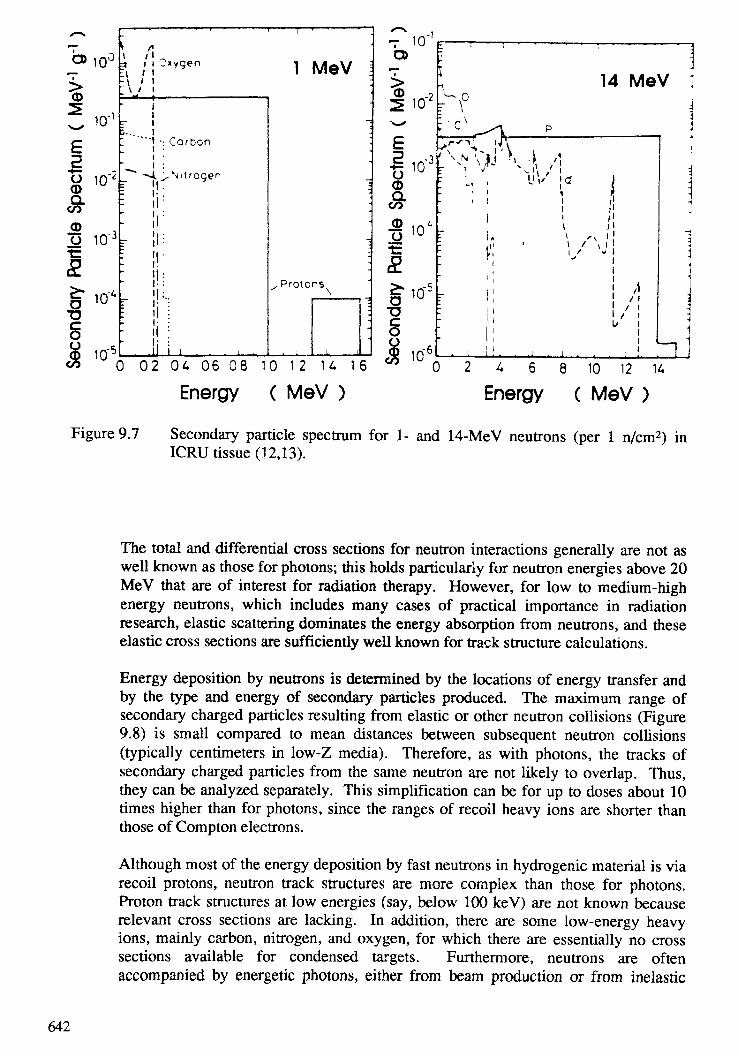
CO
o
Ê
gL
o 10'3saTJ
3 i C»yqen
-\ i" \ /
: "" • Carbon
~~~ ~> . Nitrogen
: J- 1r* l
•• \; i
i .! i" . .!i i . ,
I '
1 MeV \
-
-••;
x Protons
i i . i0 02 04 06 08 10 12 14 16
Energy ( MeV )
• 'uCO
fe -i5 10'^
E|lff3
OCO
f 10'
1^K ./-r50
1
<x in6
E ——— i ——— l — ' —— ' ——— • ——— i ——— • ———
; 14 Mer-\°I . P \
' f~^\ P
']fr~-r^ lJ\
^ I, X'V' IQ; 1
1 11 1\ 1r , \ ,^ i
! y1
1 'j: ' /
:1 . . 1 1 1 , . 1
\Jv
:
-
3
:
1-i1
0 2 4 6 8 10 12
Energy ( MeV )
Figure 9.7 Secondary particle spectrum for 1- and 14-MeV neutrons (per 1 n/cm2)ICRU tissue (12,13).
in
The total and differential cross sections for neutron interactions generally are not aswell known as those for photons; this holds particularly for neutron energies above 20MeV that are of interest for radiation therapy. However, for low to medium-highenergy neutrons, which includes many cases of practical importance in radiationresearch, elastic scattering dominates the energy absorption from neutrons, and theseelastic cross sections are sufficiently well known for track structure calculations.
Energy deposition by neutrons is determined by the locations of energy transfer andby the type and energy of secondary particles produced. The maximum range ofsecondary charged particles resulting from elastic or other neutron collisions (Figure9.8) is small compared to mean distances between subsequent neutron collisions(typically centimeters in low-Z media). Therefore, as with photons, the tracks ofsecondary charged particles from the same neutron are not likely to overlap. Thus,they can be analyzed separately. This simplification can be for up to doses about 10times higher than for photons, since the ranges of recoil heavy ions are shorter thanthose of Compton electrons.
Although most of the energy deposition by fast neutrons in hydrogenic material is viarecoil protons, neutron track structures are more complex than those for photons.Proton track structures at low energies (say, below 100 keV) are not known becauserelevant cross sections are lacking. In addition, there are some low-energy heavyions, mainly carbon, nitrogen, and oxygen, for which there are essentially no crosssections available for condensed targets. Furthermore, neutrons are oftenaccompanied by energetic photons, either from beam production or from inelastic
642

10"
5En.
<D0>0
xE 2
10
5
Figure 9.8
1 2 5 1 0 2 0 5 0 1 0 0Neutron Energy ( MeV )
Maximum range of the most important charged particles released in tissue byneutrons [p = recoil protons, a and 13C from 16O (n, ot)13C, 16O from 16O (n,
(52).
interactions in the irradiated object. The interaction of these photons in the volume ofinterest may also have to be taken into account. This mixture of various heavycharged particles, electrons, and photons and the corresponding mixture of physicalevents makes analysis of neutron radiation effects in terms of track structure theorymore difficult than for photons or monoenergetic, fast charged particles. This may bethe reason why rigorous neutron track structure calculations have not been performedyet. The deficiencies of analytical approximations (12,13,58,59) and of semi-MonteCarlo approaches (60,61) underline the need for more detailed calculations.
643

9.2.3. Interactions of Electrons
Electrons are of prime importance in thé production of track structures. Essentiallyall energy from photons or primary high-energy electrons is transferred to andtransported in irradiated matter by secondary and higher generation electrons. Thesame is true for a large fraction of the energy lost by fast ions and thus also forneutrons. Because of this importance, much has been written on various aspectsof electron interactions with matter. References 3,8,62-69 can be consulted fordetails. For a survey of the general characteristics of interactions of low- to-medium-energy electrons, see Chapter 4.
The starting point for a study of the energy deposition of electrons is their stochastictrack structure (Section 9.3.2). Input data for track structure calculations are crosssections for all relevant processes (see e.g. Chapters 2,3,4,5). Averaged quantitiessuch as stopping power (the rate of energy loss along a particle path; see Chapter 7),range (some expectation value or extrapolated value of the length of a particle track;see Chapter 7), or yields (expectation values of the production of primary,intermediate, or long-lived new species; see Chapters 6,8) are also useful in radiationresearch.
The stopping power dEldx of a medium can be considered as the sum of all singleenergy loss processes:
*°- - (9.2)dx
where N = number density of molecules in the mediumQi = energy transferred to a molecule in process /a,- = cross section for discrete collision process i
= differential cross section foryth transition into the continuum.
Stopping powers known accurately from theory or experiment can be used asconstraints in the estimation of less well known cross sections (in particular ofsecondary electron spectra; see Chapter 7).
It is useful to mention here the so-called electron degradation spectrum Y(EQ, E),which gives the sum of the path segment lengths where the degraded primaryelectron (start energy £0) and all secondary electrons produced during completeslowing down have an energy between E and E + dE (70-72):
Y( E0,E) ~ (9.3)
where N(E, £0) is the absolute number of all secondary and higher order electronscreated by complete slowing down of an electron of incident energy E0, which havekinetic start energy larger than E, plus 1 for the primary electron. The electrondegradation spectrum increases steeply with decreasing electron energy (Figure9.9a), because of the increase in the number of low-energy secondary electrons andthe decrease of the stopping power at energies below 100 eV. As written here,equation 9.3 is only a rough approximation that does not explicitly take into
644

Figure 9.9
10 ** 10J n.Energy E (eV)
105
1.5kV(C)3kV{Al)
5kV(Ag)
103 icr KPEnergy E ( eV )
Degradation spectrum of electrons in water vapour (a) of various low-LETradiation fields (34) and (b) photon and electron fields (adapted from Ref. 49).
account departures from the continuous-slowing-down approximation or adequatelydescribe contributions from secondary electrons. For more detailed discussion ofelectron degradation spectra see Chapter 8.
Figure 9.9b gives degradation spectra for several photon fields and very fastelectrons. It shows the strong distortion of electron energy spectra during slowingdown from their clean Compton- and photo-electron spectra produced by the initialphoton interactions.
645

10.O
1.O
pg
0.1
0.01
0.001
Tolai
tm lonizationExcitation
dbDC 74DC 9 7OH ' Tr Ptflyd C»DLyORyd A3 »83
Ly PHa
Ly yTri 9 81Tri 4.5HpK-Shell
10' 10J
Energy ( MeV )10"
Figure 9.10 Yields of various primary excitations and of ionizations produced by completeslowing down of electrons in water vapor as a function of incident energy.
Degradation spectra are useful for the calculation of the yield G/ of any species /:
Gi(E0) = I Y(EQ, E)Gi(E) dE (9.4)
where Oj(£) is the production cross section of species / by electron of energy E.Yields (for example of ions, electrons, or light-emitting excitations) produced duringthe complete slowing down of a primary particle can be measured to a much higheraccuracy than total or differential cross sections for single collisions. Therefore,yields represent a means to check predictions of track structure calculations againstexperiments and thus to improve iteratively on relevant cross sections. Figure 9.10shows the result of such a calculation for water vapor. The predominance ofionizations at high energies and of excitations below, say, 200 eV is evident. Anaverage of 14 eV is spent here per inelastic event (G/ = 7 events per 100 eV). For amore detailed discussion see Chapter 8.
Yields, as defined in Eq. (9.4), are expectation values averaged over many primaryelectron tracks. In reality, however, each track will produce a somewhat differentnumber of new species than another track. In many cases, because of the correlationbetween energy loss and species production and because of the finite energyavailable, the frequency distributions of the number of new species is narrower than aPoisson distribution (73-76). The ratio of the variance of the observed distribution tothat of a Poisson distribution is often called the Fano factor. Comparison of
646
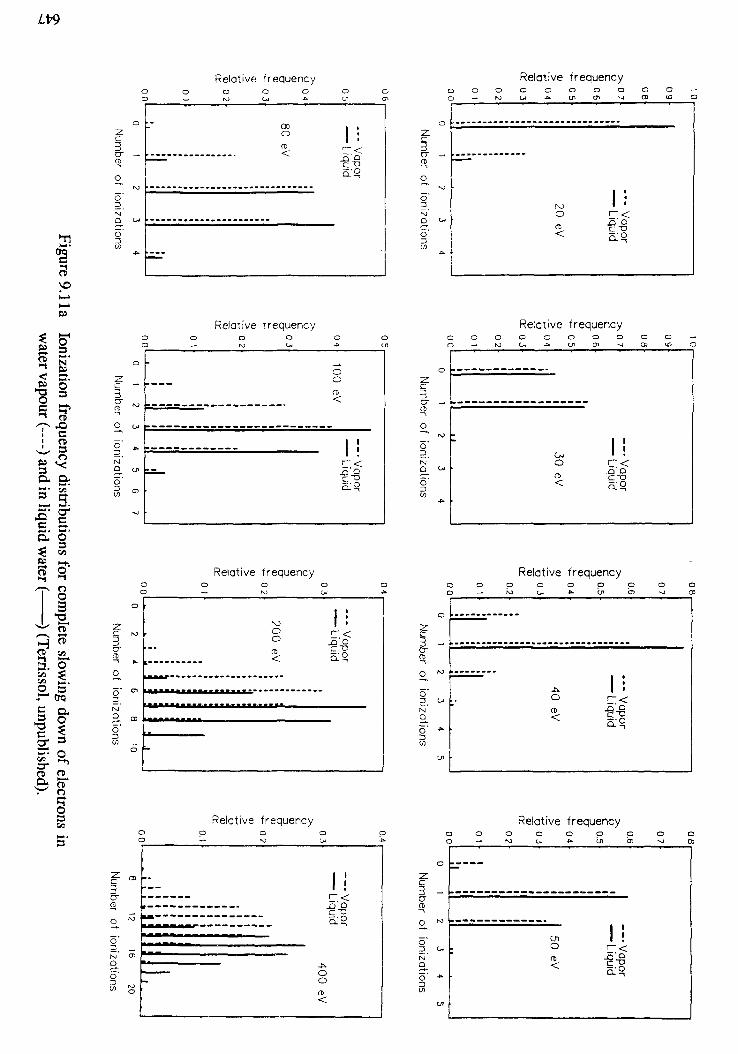
LV)
Relative frequency
crq
§
cc
2C3
o~" N>oNJ
oU)
3 O O O O O C5 — ro Lj J* Ul C
œ i i
0> |— .
"c-oQ-'R
——
3 Cn c
Z
3
o~*' NJ
O
Ni
ODU)
-R.
D O O O O O O O Q O3 — . M L * J - t * a i C J 1 ^ 4 O 3 U 3 C
———
lio r~ <<B- C"0< £0
Relative frequency! O1
» 3
*$< S.a o§ 3
^ jf: ci «1 3
3 ^i. Q.
*— '•*** CX53 9S' g"
ä" °Ç &n
» §*-v O1^Tjf3 csS 2L3- 2" S"
I &? ^r ao ^^?* *
L ^3§3
CC
O
-z.c —3
0 OJ
M"0 en5'3 -
-
CC
0
C fo3cr
2.0- a.DMQ CO
5'
CO —O
cc
3 O O O O C3 -- !*J L^ -ft- c
o0)
[——-—- ———— 1!•_^^ ri' O
U.'O
Relative frequency3 O O O C3 — ro oj J
| :ro I •O r-<
[ ° .ö'o
Relative frequency0 0 0 C— NJ L-J -t
D CJl C
-z.
cr -^
~" N;5'NiQ CJ
5'
CO
3 C» C
22 _.
CB
0 M
O3 CJ
o5' *~w
en
) Cc
3 O O O O O O O O O -3 ~ - M C - A C n a i ^ J C 2 3 t u C
.
1 !o i — <_ J3'O2. CT3< sq
Relative frequency3 O O O O O O O C3 ^ N J L - * - C n C T ) - j a
^ ". ^
1 1
O i— <(ti -Û Û< uO
Relative frequencyo o o o o o o o— N 3 o - - ^ c n o i ^ i c o
Z o,3O30 «
'•
o
5'3 g
lir —————————— . _5'u
c "o",._,.__. CL?
_ _ _ _ _ _ _
._ _
OCD<
O
5'NI'a5'
3 0 0D — N)
IT ——
O 0 0 0 O Co- J* en 01 i a
I!< 11

10 20 30 iO SO 60 70 80 90 100
Number of lonizations
Figure9.lib lonization sum distributions (probability graphs) for complete slowing downof electrons in water vapor (—) and in liquid water (——); adapted from Ref.77. Arrows indicate respective mean values.
calculated and experimental yield distributions can also be a sensitive check ofconsistency of single-collision cross sections (74). Figures 9.11 a and b givedistributions of the number of ionizations produced in the tracks of electrons in liquidwater and in water vapor. The distributions appear essentially Gaussian over a wideparameter range (Fig. 1 Ib). The consequent G-values (Figure 9.12) show that at highelectron energy more ionizations are produced in the liquid and that the outermostelectron orbits contribute most to ionization (contrary to irradiation by photons). Thecalculated total ionization yields for the vapor are in excellent agreement withexperimental data (78). The lower part of Figure 9.12 shows that (a) the frequencydistributions for the total ionization yields are narrower in the liquid (i.e. their Fanofactor is smaller) and (b) the respective distributions for each single shell are muchbroader than that for all ionizations (i.e., their Fano factor is larger).
Finally some spatial aspects of electron energy deposition shall be considered, sincethe spatial correlation of all initial events influences the subsequent physical andchemical reactions. The expectation values of electron energy deposition show anumber of typical features, some of which are depicted in Figure 9.13 (5 keVelectrons vertically incident on a slab of water). The number of transmitted electrons
648

10' K)
Energy ( eV )
10"Energy ( eV )
Figure 9.12 G-values for ionization from different molecular levels and correspondingFano factors for electron impact on water vapor (—) and liquid water (——)(adapted from Ref. 77).
decreases strongly with increasing slab thickness (compared to corresponding plotsfor heavy charged particles, which show almost a step function). However, thekinetic energy per transmitted electron decreases much more slowly. At a thicknessequal to their range (obtained in the continuous-slowing-down-approximation [csda,(79)] about 1% of the incident energy and around 5% of the incident number ofelectrons are still transmitted. With increasing slab thickness electrons are alsoreflected (back-scattered). Their number fraction at medium energies and for verticalincidence on low-Z matter is around 10%, and the mean energy per reflected electronis around 40-50% of the incident energy. The reflected number is independent ofthickness beyond dIR = 0.4 because electrons are not appreciably reflected back to thesurface from greater depths.
649

ooo
Figure 9.13 Calculated fractions of reflected and transmitted electrons and their energiesas a function of slab thickness d (in units of the electron range R) (34).Vertical incidence, pencil beam, and water vapor. See Figure 9.14 for valuesof A.
Electrons in Water
Energy ( eV )
Figure 9.14 Calculated mean track length r0, practical range rp, mean range rm, and totaltrack length r, for electrons of energy E0 in water vapor; data from Refs. 34,49 and 79.
650
The transmission curves indicate that there are many possibilities for definition of anelectron "range" (csda, mean, practical, extrapolated, and so on) (49). The rangebecomes even less well defined at low energies (< 100 eV), where electrons are moreor less in complete diffusion, or at subexcitation energies, where electrons can diffuseover long distances because of the reduced number of energy loss processes. Figure9.14 shows some of these ranges calculated by a Monte Carlo electron track structureprogram in comparison with data from ICRU Report 37 and an empirical range-energy relationship for low-Z matter (p = 1 g/cm3), which gives reasonably accuratevalues up to, say, 20 keV:
R = 40 E( 1 + 0.5 E) (nm) (9.5)
where E = electron energy in keV.
9.2.4. Interactions of Heavy Charged Particles
Energy transfer from fast charged particles to matter occurs primarily throughexcitations and ionizations. For ions with specific energy E per mass in the range0.5-100 MeV/u, around 65-75% of the energy loss is transferred to and thentransported by secondary electrons, 15-25% is needed to overcome their bindingenergy, and the residual 5-10% produces neutral excited species. The large fractiontransferred to secondary electrons emphasizes the importance of electrons also in thiscontext. For 0.8 MeV/u particles around half of all ionizations are produced by thefast ion itself, and the rest by its secondary electrons. With increasing ion energy twoout of three ionizations are ultimately due to secondary electrons and are thus notnecessarily located close to the ion path (see Chapter 2).
Let us consider some characteristics of heavy charged particle (ion) tracks. The maincontribution to energy losses of a fast ion comes from inelastic interactions with theelectrons of a medium. The role of the elastic interactions becomes important only atthe end of the ion's track. The role of charge exchange processes between a movingion and the target molecules increases when the ion slows down, see Chapter 2 of thisreport. The size of regions of the energy localization depends only on speed of acharged particle. Therefore, a fast proton generates a similar track structures as doesa fast electron with the same speed.
But for the whole track picture we must take into account the differences in theinteractions of ions and electrons. This difference in action is based on the differencein charge and in mass.
Interaction cross-sections and stopping power depend only upon charge and speed,they are proportional ~Z2/v2, and do not depend upon mass of a particle. So when anion and an electron have the same speed the ratio of inelastic cross-sections is equal toZ2 (this is also valid for the ratio of stopping powers).
Another difference between the action of an ion and electron is the difference in themaximum energy of the knocked out electron. The ion with the speed v can transferto a free electron in a medium the maximum energy E1^ = 2 mv2, where m is theelectron mass, whereas a fast electron with the same speed can transfer maximumenergy E^ax = mv2/4, so E^/E^ = 8. Consequently, in the case of ions the energyof the knocked out electrons will be distributed partly to regions of the medium farmore remote from the point of initial ionization than in the case of electron collisions.
651

1-21Iw
TO'22
X— N
Ü io-23
Ev — /
C j,0 10'24
ÜOcoin If,g io-25
ÜS io-26c20)t
5 io-27
in-28
, 1 1 1 1 M 1 M ———— 1 —— l 1 1 M 1 1 ——— ] —— f — T ; MM ———— ! —— 1 1 I M ' l
: XN :r ^X\ i
•p* \•„ t \_ • •. c% — o 3 MeV —1 \s. Y !'- \ y °*V 1 0 MeV :
^^P v^<i *
- 2 0 MeV "N 1 ^ -• g *
- ^ -H \
fc*
^ ;ft». «^ "
• Methane i •*. ;« Ethane ^ t^• Ethylene •. j"11 Acetylen | • "i ;• Benzene • \ '-° Hydrogen | \ "_
__ ' i 1 1 1 1 1 1 i i i 1 1 1 1 1 t i 1 1 » 1 1 1 t i i 1 1 1 1 1IU -— -- ——————————————————————————— -m m* m3 in
Secondary Electron Energy ( eV )
Figure 9.15 Secondary electron ejection cross section for proton impact (0.3, 1.0, and 2.0MeV) on various target molecules, divided by the number of weakly boundtarget electrons (37).
There are two new interaction processes for fast ions, compared to electrons. First,heavy charged particles of medium energy (say, 0.1-5 MeV/u) can capture electronsfrom target molecules into their own continuum states [charge transfer to thecontinuum (CCT)], which leads to the ejection of additional secondary electrons.These have essentially the same speed as the ion and travel in essentially the samedirection. Their production cross sections are not well known. Second, heavycharged particles are usually incompletely stripped ions that carry electrons in boundstates (for example He+ and Xe5+) and can successively lose electrons and capturetarget electrons. This complicates the derivation of relevant cross sections for heavycharged particles.
The singly differential ionization cross sections for protons show the same generalshape as those for primary electrons (Figure 9.15). This figure gives experimentaldata for secondary electron ejection cross sections for proton impact on varioushydrocarbons and on hydrogen. The cross section (a) decreases with increasing ion
652

10,-23
o,-Ä
T W
(D
o io-25
"o0)
COCOcoO
,-26U 10
CQ)Q)
5 n»nDOu
»n-28
10
lE(eV)
15
30
50
550
05 0 -0.5
COS 0
-1
Figure 9.16 Angular distribution of secondary electrons with energies E ejected by 1-MeVproton impact on various molecules divided by the number of weakly boundtarget electrons. The range of data for hydrocarbons is indicated by verticalslashed (I), data for hydrogen (O) are connected to guide the eye (37).
energy (^T1) and (b) falls at medium energies of secondary electrons approximatelyas E-2. Also, (c) the maximum electron energy increases linearly with the ion energy(«7). All this is understood from theory and is similar to cross sections for primaryelectrons. The features (a) and (c) are mainly responsible for the fact that therecannot exist one single parameter characterizing the "quality" of any radiation field inproducing a certain radiation action (see also Section 9.4.5). The absolute value ofthese cross sections per weakly bound target electron (i.e., for all electrons except forthe K orbital electrons) is almost independent on the chemical nature of the targetmolecule. The same is true for the angular distribution of the ejected secondaryelectrons (Figure 9.16).
The magnitude of cross sections of charged particles is proportional to the square oftheir electric charge Z. The classical Rutherford cross section is:
653

- (9.6)dE y T Q2
where T = 1A mv2
m = electron massv = ion speedQ = energy transfer (= E + U)
This relationship is approximately correct for bare nuclei or fast ions with tightlybound electrons, but the supposition that this holds also for fast ions with looselybound electrons is not correct. Figure 9.17 shows an example of this failure; the ionsH2
+ and H+ are both singly charged and a constant cross section ratio might be
MeV/amu0.750.5
250 500 750Electron Energy ( eV )
1000
Figure 9.17 Ratio of energy differential cross sections for the production of secondaryelectrons by H2
+ and H+ projectiles of various specific energies impinging onhydrogen gas (81).
654

expected, but over a wide secondary electron energy range the contribution of theejected electron of the H2
+ molecule shows that such a simple scaling from protoncross sections to heavy-ion cross sections is not obtained. Scaling from proton data toheavier ions with a so-called effective charge Zeff (83-88), however, has proven usefulin stopping power analysis (see Chapter 7). The empirical formula derived by Barkasfrom nuclear emulsion work (89) is often adequate. His formula is also in agreementwith experimental data for the charge state distribution after penetration of heavy ionsthrough gases (Figure 9.18). The higher charge states observed after penetrationthrough solids are most probably due to electron ejection from the highly excited fastion after leaving the solid (82). It might be worthwhile to put more effort intounderstanding this apparent discrepancy between the meaningfulness of the conceptof an effective charge in stopping power and the failure of this concept for those crosssections that essentially determine the stopping power.
Tracks of heavy charged particles are often characterized by their mean rate of energyloss and their range. This mean rate, the stopping power, has been the object of manytheoretical and experimental studies (1,90-108), which has led to substantialknowledge about the general underlying principles (see Chapter 7). However, theaccuracy of actual stopping power values for charged particles heavier than aparticles and for all particles at low energies is far from satisfactory. In the context of
Dimitnev and Nikolaev-•• -Northchf fe and Schilling-•- Wilhamson et al- - - Barkaso • exp. data
0.03 0.1 0.3 1.0 3.0
Specific Energy ( MeV / u )Figure 9.18 Effective charge of iodine projectiles after passing through solid, in gaseous
targets, and according to various empirical formulas derived from stoppingpower analysis (84,85,87,89).
655

track structure theory it is sufficient to remember the usefulness of this integralquantity for consistency checks as outlined in the section on electrons, theinsensitivity of stopping power to the physical phase of the target matter (107,108),and the principles of the dependency of material and particle parameters in the basicstopping power formula of Bethe (79,91) (see Eq. (2), Chapter 7).
dE _ Z2 Z2 2mc2ß2 C o) /n _.— = 47tr(2mc2— — - In ——— — -ß2-lnl- — -- (9.7)
dx ° ß 2 A 2 l , 1-ß2 Z2 2)
where C/Z2 represents shell corrections (79) that are discussed in Chapter 7.
The material properties enter essentially only with Z2/A2 (~ 0.5) and In /, and thedependency on the particle parameters is approximately as ß~2 (which is similar to thecase of electrons) and proportional to Zf. Therefore, particles of the same velocityhave different stopping powers according to their Zf, whereas particles with the samestopping power and different Zf have different speeds (with the consequences fortheir secondary electron cross sections mentioned above). Because of the similarityin the Z\ and ß dependences of cross sections and stopping power, an apparentcorrelation over a restricted parameter range of the size of a radiation effect withstopping power could in reality be due to an actual correlation with one or moreimportant basic interactions since the cross sections for these have the samedependency. Data for stopping power of heavy charged particles in water are givenin Chapter 7 (Figure 7.5.13).
Beyond the considerations outlined above, the applicability of stopping power intrack structure research is rather limited for several reasons. First, the molecularchanges in a target material depend on energy deposited in it and not on the energylost by the passing particle; this is an important difference which can be large whenthe site dimensions under consideration are small. Second, the number of collisionsand the energy transferred in them are random variables with certain probabilitydensities. Therefore, the actual energy loss in a small region of interest can varyconsiderably (109,110), and the physical and chemical reactions do not "know" ofaverage values but "feel" only actual values. This variation in actual energy loss isshown in Figure 9.19 (111,112), which shows the variance o2 of energy loss in thinabsorbers divided by the expected energy loss A£ (stopping power times pathlength)for electrons and protons. For thin absorbers this straggling ratio is independent ofabsorber thickness. Third, secondary electrons can acquire rather high energy andform tracks of their own physicochemical consequence. Fourth, a site of interestmight be larger than the finite range of a particle track structure; this makesconsiderations of mean rates of energy loss useless in some cases. The regions ofinfluence of these various aspects are illustrated in Figure 9.19.
Chapter 7 gives data for the csda ranges of heavy charged particles in water, whichcan be used to estimate the longitudinal extensions of their track structures. Theranges of these particles are orders of magnitude shorter than those of electrons of thesame kinetic energy.
656

Electron Energy ( keV )100
01 1 10 100
Proton Energy ( MeV )
10
-£
gb
05 0.10.1 1 10
Energy ( MeV )100
Figure 9.19 (a) Ratio of variance of energy loss spectrum to mean energy loss for protonsand electrons in the free electron model, (b) Regions of site diameters andproton energies where the energy deposition is strongly influenced by theirfinite range (I), straggling (III + IV), and by the range of their delta rays (IV).In region II the energy deposition can be approximated by dE/dx. (111,112).
9.3. SPATIAL ASPECTS OF TRACK STRUCTURES
9.3.1. Characteristics of Tracks from Photons and Neutrons
Photons and neutrons in most cases produce primary events separated by distancesthat are large compared to the ranges of their secondary charged particles. This isillustrated in Figure 9.20 for water and air. It can also be seen by comparing theparticle ranges given in Figures 9.8 and 9.14. Therefore, the track structuresproduced by primary electrons, protons, and heavier ions are similar to thoseproduced by photons and neutrons. However, with the latter two radiations more thanone particle sometimes leaves the same affected atom, for example, because of Augerelectron emission after inner shell ionization, or an (n, 3a) reaction.
657

IU
Iio2
toCo .Î5 10o0)
cg>- inO) !U
CD
f »"n-*—o. IO"3
oCD
i 10""0io'5
W 6 ,10
1 ' ' ' '""\ rr-nrm] — i l mini — l l l mil) — i i mm; — i i i nu
- SL—-^^^ :
r Air / ,
: 1 hv -^:r 1 -" ^ S; / /W^V^~ :r " -•*—--[- :
y / !1 / l
, ,,,,„1 ,/,],/,! , ,,,„„1 , ,,,„„! , ,,,,,„1 , ,,,,„!
io2 io3 10' io5 io6 io7
Energy ( eV )
Figure 9.20 Mean free paths for energy transfer reactions of neutrons and photons in dryair and water (51-57,113).
Figure 9.21 shows another characteristic of photon and neutron track structures (114).The ranges of secondary particles from neutrons (mainly protons and heavier chargedparticles) are much shorter than those from photons (electrons). Therefore, for thesame absorbed dose neutrons have a smaller chance to affect a certain small site ofinterest in the irradiated matter. But if the small site happens to be affected, theamount of energy imparted e to that site in this interaction is much larger (because ofthe higher stopping power of ions compared to that of electrons). This leads to thehigher expectation value of the specific (imparted) energy zn for neutrons than forphotons Zy per energy deposition event, where z is the first moment of the frequencydistribution f(z) of specific energy z (see Section 9.4.3). At a fixed absorbed dose,for the same reason, the standard deviation o of the distribution of z is much broaderfor neutrons than for photons (Figure 9.21). The determination of such distributionsis a main objective of proportional counter microdosimetry. Further discussions ofthe properties of these characteristic functions can be found in the literature (112).
658

Mean Number of Eventsn 0.01 0.1 1 10
Absorbed Dose ( Gy )
Figure 9.21 Range of specific energies (mean values z ± standard deviation o) and meannumber of events as a function of absorbed dose for 14-MeV neutrons (n) and60Co y rays in tissue spheres of 1 \im diameter (112).
9.3.2. Structures of Electron Tracks
The distance an electron travels between two consecutive events of energy transfer iscalled the free path length 4, with respect to inelastic scattering. Its average valueequals l^ - (n a,^)'1, where n is the density of molecules in the medium and <stot is thetotal cross section for inelastic scattering. For fast electrons with E > 10 keV, thevalue of lin exceeds significantly the region of localization of the energy transferredto the medium. For relativistic electrons (E > 100 keV) in water, /,„ is equal to 200-300 nm, while for a 10 keV-electron it is an order of magnitude smaller. At the sametime the size of the energy localization region or a spw (following Samuel and Magee(80)) is several nm. Thus, the track of a fast electron is regarded as a set ofnonoverlapping microregions (isolated spurs) containing excited and ionizedmolecules. In the approach of Samuel and Magee, with decreasing electron energy,the spurs in the track are no longer isolated from each other and at E < 1 keV thetrack structures are described as a continuous region of overlapping spurs.
Electron track structures have been calculated for energies from about 10 eV toseveral MeV, and for gases, liquids, and solids (5,22,24-29,34,35,115-125). Here afew characteristic results are shown, using tracks of keV electrons in water vapor.
659

Electron tracks in water vapor
50 eV
500 «.y —.«
100 «V200 eV —
1 keV— • • •».
2kcV —
conid • — *
• vv»
10 20 30 50 60 |nm) 70
Figure 9.22 Two-dimensional projections of electron tracks in water vapor calculated witha Monte Carlo simulation program (MOCA-8). For graphical reasons the 2-keV e~ track is continued in the last line. For this plot all 20 types ofactivations are divided into two classes: +, excitation; •, ionization.
Electron TracksEnergy (keV)
" ^-_/ s*
Figure 9.23 Ten tracks of 1-, 2-, 5-, and 10-keV electrons each in water, showing thestochastic nature of paths of identical projectiles and the widely differentdegrees of spatial concentrations of energy absorption events.
660

AI - Ka ( 1.S k*V } Photon Absorption
.•*.
i« \
*•.
10 nm
10 nm I-125
Figure 9.24 Simulated electron tracks from the absorption of Al-Ka X rays in water(leading typically to one photoelectron and one Auger electron) and from an125I decay (up to 22 electrons of widely different energies ejected per decay).
Figure 9.22-9.24 (and track structures in later sections) are two-dimensionalprojections of three-dimensional computed tracks, which originally contain fullinformation about the location of each event and its physicochemical nature. Forthe decay mode of initially excited or ionized states, evaluated experimental dataof Tan et al (126) were used. The figures show that (a) the number of eventsincreases with electron energy (69), (b) with increasing electron energy the meandistance between inelastic collisions increases, (c) electrons suffer appreciableangular scattering, and (d) the event density is particularly high in the track endsof the primary and secondary electrons.
The largest number of events with small distances to their neighbors can be found intracks of electrons of around 500 eV; electrons with less energy produce less eventsper energy deposited, and those with higher energies produce them further apart onthe average. This can be seen from the frequency distribution to the next neighbors(Figure 9.25).
661

Nearest NeighbourDistance Distribution
2 3 4Distance ( nm )
Figure 9.25 Frequency distributions of nearest neighbor distances between excitations andionizations in tracks of electrons with starting energies from 0.05 to 20 keV.
For electrons with energies in the keV range the probability to find less than 1, 2, 3,... additional events within a certain distance follows approximately a Gaussianfunction. However, this distribution describes only expected distances averaged overmany events and tracks. Actual reactions of events in a track do not know of theseaverages and react according to their actual distances. If the reaction probabilitiesvary nonlinearly with reactant separation distances, for example, in a second-orderreaction, the distance distributions must also be weighted nonlinearly. This ispossible with Monte Carlo simulations.
9.3.3 Structures of Proton Tracks
Proton track structures have been calculated for comparison with experimental protondata, for neutron track structure studies, and to provide basic data for radiationbiology (127-133). Figure 9.26 gives three tracks each for simulated short segmentsof 0.3-, 1-, and 3-MeV protons in water vapor to demonstrate the similarities anddifferences between fast ion tracks of the same energy compared to those of differentenergy. In general, these tracks are straight because the heavier mass of fast ionsprevents them from being scattered as much as electrons in elastic and inelasticcollisions. With increasing ion energy the relative fraction of all events produceddirectly by the fast ion decreases from more than two-thirds for energies T around 0.3MeV/u to around one-third at 5 MeV/u. The fraction of events on or close to the ionpath also decreases. This is due to the T~l In T behaviour of the secondary electroninelastic cross sections and the "hardening" of the secondary electron spectrum withincreasing ion energy (the secondary electron maximum energy increases with T).
662

0.3 M«V p
1.0 MeV p
3.0 M»V p
10 nm
Figure 9.26 Proton track segments in water (0.3, 1.0, and 3.0 MeV, three tracks perenergy) calculated with a Monte Carlo simulation program (MOCA-14).
The linear density of fast secondary electrons along the ion path, however, is rathersmall, and it decreases with increasing secondary electron energy (°c £-2). Therefore,the usefulness of a "radial dose concept" for classification of heavy-ion tracks(Section 9.4,4), which averages the energy deposited by secondary electrons at certainradial distances from the ion path along the path, is not obvious (at least for protonsand a panicles).
The differences in the three track structures produced by protons of the same energyare completely due to the stochastic nature of all single-collision processes. It is stilla challenging problem to derive a rigorous strategy for the classification of such trackstructures, regarding the similarities of tracks produced by identical particles anddissimilarities between tracks from different particles.
663

Ea (MeV)
..-
-t..
TT " / *^ • • -^ —,1——^———rS ^ -• if : . »
• *j^ • i
tOnm
Figure 9.27 Calculated a particle track segments (1, 2, 4, 6, and 8 MeV) in water(MOCA-14).
9.3.4. Structures of Heavy Charged Particle Tracks
The great difference between the ion mass and electron mass results in the greatdifference in the geometry of ion and electron tracks. While an electron can lose upto half of its energy, the energy lost by an ion in colliding with an electron is less thanone thousandth of its kinetic energy. This leads to the rectilinearly of an iontrajectory, since the energy that an ion loses in each event and the correspondingchange in its momentum amount to only a small fraction of its total energy andmomentum; it is proportional to m/M, where M is the mass of an ion. Therefore,along the whole track except its end part, where elastic collisions are dominating, thetrajectory of an ion can be considered as a straight line.
For protons and a particles experimental cross section data and theory permitestimates of basic input data for track structure calculations with reasonable accuracyfor a few target media (e.g., water vapor) for a restricted energy range (say, 0.3-10MeV/u). Figure 9.27 shows two-dimensional projections of track segments from 1 to8 MeV a particles in water vapor. The higher density of events (all primary and
664

secondary inelastic events are symbolized by a dot, though the full information ontheir chemical nature is available in the computer program) stems from the Z2
dependence of all ion cross sections. The electron transport, however, is independentof the charge of the ejecting ion. Because of the Z2 dependence of the primary crosssection, more higher energy secondary electron tracks are also visible per unit tracklength for a particles than for protons (Figure 9.26).
In these computed a particle tracks one can see the transition from the "grain count"(single, separated events along the ion path) regime at high particle energies to the"track width" (overlapping events on and close to the ion path) regime at lowerenergies. This can lead to different types of radiation action (17) and can actually beseen microscopically in fast heavy-ion tracks registered in nuclear emulsions(18,134).
Presently it is still impossible to perform reliable track structure calculations for ionsheavier than a particles and for condensed targets, because of the lack of reliable orcomprehensive experimental absolute cross sections and the lack of accurate enough
Carbon
*•* * »MeV /u •» • \ i«•«..• Ui .v. Jk
lOnm
Figure 9.28 Track segments of 1- and 3-MeV/u carbon ions in water (MOCA-14) scaledfrom proton tracks of the same velocity by multiplication of primary electronejection cross sections by the effective charge squared.
665

theories. As mentioned above, the existence of loosely bound electrons in theprojectile is the main reason for this problem. However, to give a semiquantitativeexample, track structures of fast carbon ions were derived from proton tracks bymultiplying all primary ion cross sections with the speed-dependent effective chargesquared, as calculated from Barkas's formula (89). Figure 9.28 gives an impressionof such a heavy-ion track. The event density is very high along, and even at somedistance from, the ion path. Quite different chemical reactions and dynamics mightbe expected in the "core" of such tracks than in sparsely ionizing electron tracks, suchas are encountered at larger distances from an ion track or due to photon interactions.
9.4. CLASSIFICATIONS OF TRACK STRUCTURES
9.4.1. Concepts of Classification
As demonstrated in the preceding section, radiation track structures, due to theirstochastic nature and the usually large number of events per track, contain muchdetailed information. This fact introduces the problem of data reduction andclassification (135-137). This is a general problem in science and various approachesto its solution can be found in different fields. It is a common objective in research toidentify the essential parameters in the usually large number of descriptors that can beattached to an object, process, or phenomenon. Such an identification for datareduction is necessary for the derivation of underlying principles. The aim shouldfirst be to establish quantitative criteria for similarities and dissimilarities betweenobjects of study (here track structures) and then to derive strategies for classificationand discrimination.
Classification of incident radiation fields (even of mixed fields) is an easy task. Inmost cases they can conveniently be described at any point in space by their spectraldistributions of particle radiances pf (i identifies the particle type) as a function ofenergy, solid angle, and time (138). These radiances are related to the particlefluence <t>p which is the number of particles per unit area, by
(}> i=/JJp i(E,ß, t)dtdßdE (9.8)EO i
The classification of track structures produced in matter, however, is a difficult taskand presently there is no rigorous solution. A few limited approaches are mentionedbelow, and ways are shown that might lead to improvements.
9.4.2. Macroscopic Dose. Kerma and Fluence
One possibility of classification is by the energy spent to produce all events of tracks,or of that spatial subgroup, which is in a certain site element of interest. Essentiallythis means that tracks are ordered according to the energy needed to produce them.The chemical nature of the events and their spatial arrangement (within a site elementof interest) is ignored. This could be justified if the so-called optical approximationwere valid throughout (8,9), namely, the relative spectrum of physicochemical initialspecies produced by interaction is independent of the parameters of the radiation anddepends only on material properties (for example on its dipole oscillator strengthdistribution). However, this approximation is valid only for fast charged particles andnot for slow electrons, which are very important for track structure formation.
666

Examples of Concepts of Macro- and Microscopic Dosimetry
1 Macroscopic Dose :
2 Microscopic Dose :
3 Linear Energy Transfer
4 Degradation Spectrum
Cl»
10pm
5 Radial DoseLr D(r)
Figure 9.29 Some dosimetric classification concepts for charged particle tracks.
Examples of Concepts of Track Structure AnalysisTrack« jS1,x'1;S2,x2;....Sn,^
Nearest Neighbour Analysis
Activation centeredNeighbourhood .Analysis :
3 Track Entities :
Cluster Formation :
blotV£3
track
• —v-Act.. "% ' wetgbt
s Cluster Association :^Clusterweight
Figure 9.30 Some classification concepts based on locations and types of new chemicalspecies in charged particle tracks.
667

Furthermore, the primary interactions of photons, neutrons, and charged particles arequite different and the direct consequences of these primary collisions can also bequite different. Thus, the energy absorbed to produce a track is not a very goodquantity for classification in radiation research in spite of its wide usage. Its frequentuse, in fact, might be a major reason that insight into radiation action mechanisms isnot more advanced.
For some applications, however, absorbed energy in mass elements might be anacceptable classification quantity, for example, in calorimetry, or if exactly the sameradiation field and irradiation condition is used repeatedly to investigate the dose-effect relationship for this field. Absorbed energy can then be used as an implicitintegral measure of the number of charged particle tracks produced. However, if thedensity in space and time of tracks from different primary particle interactionsbecomes so high that the track structures overlap and interfere with each other, evenin this restricted sense classification by absorbed energy in a mass element can initiatemisleading interpretations of observed radiation actions. For mixed fields or whencomparing radiation effects produced by different irradiation modalities, even use of a"radiation quality" factor (accounting for different actions of different radiations atthe same absorbed dose) cannot overcome the general shortcomings of the quantity"energy absorbed in a mass element" for classification of track structures and theireffects. Therefore, it is doubtful whether dosimetric quantities actually "provide aphysical measure to correlate with actual or potential effects" (138).
It is mainly for historical reasons and because of its usefulness in certain applications(see above) that absorbed dose is mentioned in this context. Absorbed dose D can bedefined (138) as the quotient of the expectation value of the energy e absorbed in aninfinitesimally small element (still containing many molecules) divided by its mass m:
D = —— = limz (9.9)dm
where z = e/m = specific energyz = first moment of /(z)
Figure 9.29 gives a survey of classification schemes based essentially on dosimetry.By contrast, Figure 9.30 shows preliminary concepts for characterization of trackstructures based on the locations and types of events rather than on the total energyneeded to produce them. Some of these concepts are discussed in more detail below.
Closely related to the quantity absorbed dose is the quantity kerma, which is thefcinetic energy released in matter by uncharged particles (photons, neutrons) dividedby the mass of the scattering element (52,139,140).
K = = <})E^ = XF^- (9.10)dm p p
where <]> = particle fluence (particles/m2)*¥ = energy fluence (MeV/m2)E = particle energy
= mass energy transfer coefficient (100)
668

10 c
0^0
8C0)
10" ^
io1 t-_ 2
— in -u. i u r(D
EQJ 10* r
10"10
muscle or water photon
10 10 io6 io710 10 10"
Energy ( eV )Figure 9.31 Kerma per fluence for photons and neutrons in water and tissue (muscle)
(48,139).
301 10
Neutron Energy ( MeV )Figure 9.32 Partitioning of kerma in tissue-equivalent plastic (A 150) into the contributing
charged particles (141).
669

i r
S 0.5(Dû>ö>Oc
LUCD
O(Dû:
0.2
0.1
dosekerma 30MeV
neutrons
dosekerma 20 MV
photons
ij_i i i10 20
Depth (cm)30
Figure 9.33 Kerma and absorbed dose on the central axis as a function of depth for high-energy photons and neutrons in tissue (derived from Refs. 52, 140 and 142and normalized to the dose maximum).
Kerma factors (kerma/fluence) for neutrons and photons in water and tissue are givenin Figure 9.31. Both materials have low Z and thus the cross sections are almostidentical, except for the additional nitrogen content of muscle, which influences thelow energy neutron values through its (n, p) reaction. The partitioning of the kermaof neutrons in tissue in Figure 9.32 shows the dominance of proton recoils in neutrontrack structure, as mentioned in Section 9.2.2. At higher neutron energies nuclear (n,a) and (n, 3a) reactions in carbon and oxygen start to play a significant role.
Whereas absorbed dose is proportional to the energy actually absorbed in a masselement, kerma is the energy lost from a radiation field (into kinetic energy ofsecondary charged particles). The spatial distribution of energy lost by the primaryradiations differs from that of the energy imparted to the medium, because of thetransport of energy (mainly in the forward direction) by secondary radiationsincluding electrons and Bremsstrahlung. This can be seen in Figure 9.33.
For the classification of track structures and their action, the differential particleradiance (138) is recommended to specify the local radiation field by direction,particle type, energy spectrum, time, and so on. At the next higher level of datareduction the fluence or fluence rate can be used [see Eq. 9.8]. These primaryquantities characterize the radiation field, and the corresponding track structurescharacterize its action on matter. A change in the energy spectrum of the radiation
670
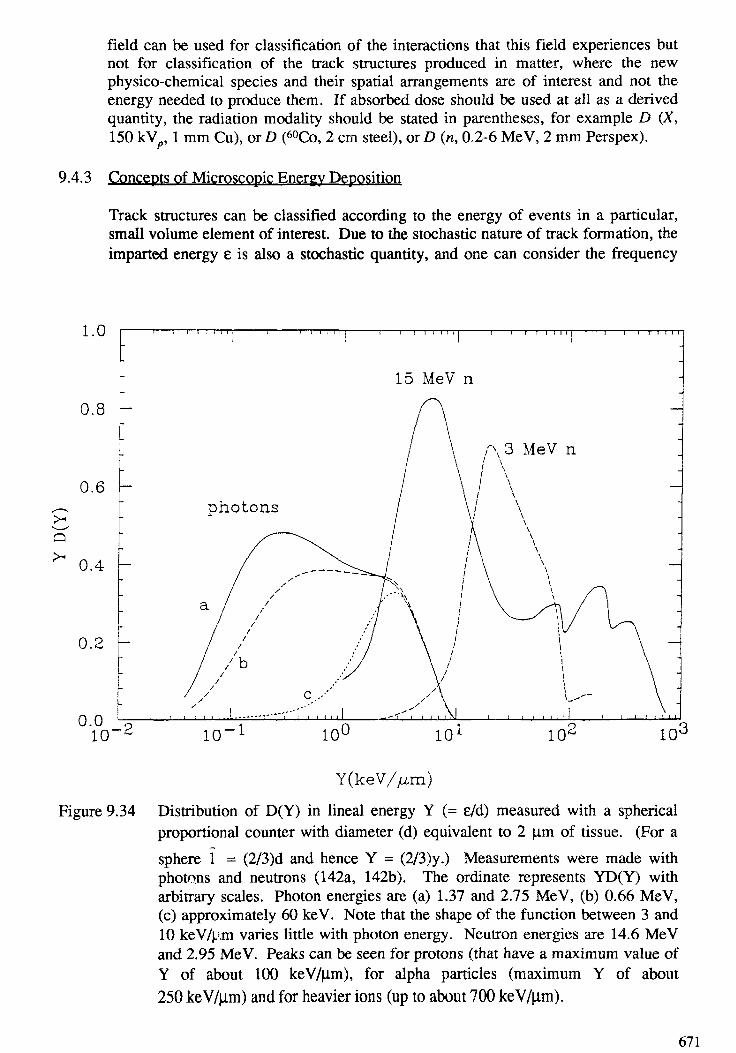
field can be used for classification of the interactions that this field experiences butnot for classification of the track structures produced in matter, where the newphysico-chemical species and their spatial arrangements are of interest and not theenergy needed to produce them. If absorbed dose should be used at ail as a derivedquantity, the radiation modality should be stated in parentheses, for example D (X,150 kVp, I mm Cu), or D (60Co, 2 cm steel), or D (n, 0.2-6 MeV, 2 mm Perspex).
9.4.3 Concepts of Microscopic Energy Deposition
Track structures can be classified according to the energy of events in a particular,small volume element of interest. Due to the stochastic nature of track formation, theimparted energy e is also a stochastic quantity, and one can consider the frequency
1.0
0.8 -
0.6
0.4
0.2 -
0.010-2 10-1 100 10- 10'
Y(keV//xm)
Figure 9.34 Distribution of D(Y) in lineal energy Y (= e/d) measured with a sphericalproportional counter with diameter (d) equivalent to 2 |j.m of tissue. (For asphere 1 = (2/3)d and hence Y = (2/3)y.) Measurements were made withphotons and neutrons (142a, 142b). The ordinale represents YD(Y) witharbitrary scales. Photon energies are (a) 1.37 and 2.75 MeV, (b) 0.66 MeV,(c) approximately 60 keV. Note that the shape of the function between 3 and10 keV/p.m varies little with photon energy. Neutron energies are 14.6 MeVand 2.95 MeV. Peaks can be seen for protons (that have a maximum value ofY of about 100 keV/nm), for alpha particles (maximum Y of about250 keV/jim) and for heavier ions (up to about 700 keV/^m).
671

distribution f(t) and its mean value e. In a major branch of microdosimetry thatdeveloped from experimentally-measurable proportional counter quantities (112,143),the quantity e itself plays only a minor role compared to the two derived quantitieslineal energy y and specific energy z defined as:
z = (9.11)
where 1 = mean chord length of volume element (for convex bodies 1 is four timesthe volume divided by the surface area)
mv = mass of volume element.
07
06
05
S 04TJ>. 03
02
01
0
05
03 -
02 -
01 -
00001
001 01 10 10y ( keV • (jrrr1 )
01 10y ( keV
10
a)
100
b)
100
Figure 9.35 Spectra of lineal energy y for (a) a 1-^im-diamter site and various photonenergies; (b) 60Co y rays and various site diameters (M-m); adapted from Ref.79, data from Ref. 144.
672

Distributions of y and z in a spherical volume element of tissue show large differencesfor sparsely ionizing radiations (photons) and densely ionizing radiations (neutrons)(Figure 9.34) and also differences among photon fields (Figure 9.35). This can beunderstood from the preceding discussion of the respective secondary particles andtheir track structure properties. Thus measured y or z spectra might be used to deriveparticle and energy radiances of the incident radiation and thus provide the basicinformation needed for a more appropriate classification. For tissue-like volumeelements of dimensions greater than about 0.3 Jim, y and z spectra can be measuredexperimentally and also computed from track-structure simulations for comparison(145, 145a-f). For much smaller dimensions the computational methods are essentialbecause experimental measurement is usually not possible (112,146).
The first moment, yF , of the distribution and the second moment divided by the firstmoment, yD , are also characteristics of the energy deposition by radiation in aparticular site (Figure 9.36) and have been used for classification in microdosimetry(112,114,143). However, all these distributions depend on the size and shape of thevolume element of interest, and thus this information must be stated for each y or zspectrum and for their mean values. The frequency mean specific energy z F has wideapplication as a normalizing factor because the event frequency per unit macroscopicdose is 1/Zp (112,146). The dose means, ZD and yD, have application only for verymuch more restricted assumptions (112,146).
10*
I 2
> 10<D
2A.3cm
T i l l I I l I
•;• 20.3cm
ir'mesons neutrons' 0 05 MeV
X).3cm
200kV65kV
photonselectrons
i 1 1 15 1 2 5 1 0 2
7F ( keV /5 10'
Figure 9.36 Second moment divided by first moment, yD , vs. first moment yF of linearenergy spectra in l-|im-diameter sites for various radiation fields (112).
673

100 50 20
XX)Radius ( nm )
Figure 9.37 Comparison of inter- and intratrack contributions to the energy impartedwithin spheres around arbitrary activations in high-energy electron tracks:"electron" indicated the intratrack component, the parameterized lines showthe intratrack part as a function of absorbed dose (112). The curve labelledelectron correspond to the proximity function T(r) for a single high-energyelectron.
Another possibility to classify track structures within the concept of microdosimetryis the integral proximity function T(r). It gives the average energy deposited aroundinitial species as a function of radial distance (112). For one track T(r) increases withincreasing distance. At higher doses it includes a contribution from an "average"single track (intratrack) and a component from track overlaps (intertrack) (Figure9.37). The objections raised against dose and possibly wrong averages also apply tothe above microdosimetric descriptions.
It is sometimes more useful to obtain and present the energy deposition informationas spectra of e directly rather than converting to y or z. In this way, for example,chemical and biological consequences of given events in DNA can be estimatedempirically or on the basis of numbers of ionizations or excitations in the events (seeSection 9.6). Large consistent databases have been generated for many differentradiations, evaluating absolute frequency distributions f(e) particularly in cylindricalvolume elements of dimensions varying from 0.5 to 100 nm or larger (147-152) usingthe MOCA track structure codes for electrons, protons and alpha-particles (34,130).If other track structure codes are used, some differences in f(e) are obtained,particularly for larger values of e in smaller volume elements (153,154). Frequencydistributions have also been evaluated directly in terms of numbers of ionizations inthe volume elements (130,155,156) but these are substantially dependent on the totalionization yield of the medium including its state of condensation (26,77,157).
674

9.4.4. Average Track Characteristics for Different Ions
At high speeds the track of an ion can be considered as consisting of separatetrack structures similar to those of a fast electron. On the other hand an ion withenergy E < 10 Me V/u produces a region of continuous ionizations and excitationsconsisting of overlapping spurs (10). The inner cylindrical part of this region isthen characterized by the increased concentration of ionizations and excitationsand is called a core. The region of track outside the core is called penumbra(Figure 9.38). It is characterized by a "diffuse" concentration of ionizations andexcitations and is formed by electrons with enough energy to leave the core.
Inside the core the density of ionizations and excitations is produced by both theprimarily ion itself and by secondary electrons it has generated. In this model thecore has the shape of a cylindrical column with a radius rcore. The value of rcore isestimated on the basis of the direct action only of the primary ion. There areseveral formulas for rcore. Mozumder (10) defined rcore from qualitativeconsiderations equating the effective time of collision and the average time of thequantum transition on the lowest excited level (transition energy Aco01) as
(9.12)2co01
where v is the speed of the ion. Kaplan and Miterev (21) defined rcore by equatingto zero the distribution function of the probability of exciting a molecule to thelowest excited level. According to Ref. (21),
71 V /O 1 -2\(9.13)CO0!
This expression is 2n times greater than (9.12).
2r core
Figure 9.38 The geometrical picture of heavy ion track; rp is the radius of penumbra whichis equal to maximum range of 0-electrons, Tcore is the radius of a core.
675

Formula (9.13) is valid for nonrelativistic speeds of an ion, when ß^e((u) « 1, where ß= v/c, e(co) is the dielectric permittivity. The formula for rcore for arbitrary velocitiesof an ion taking into account the dielectric properties of condensed medium wasobtained by Miterev (158). It can be transformed to the following form:
rcore = ( V2ît ßc / (001 )/{[!! - ß2El (co01 )l2 + ß4e2 (tu01 )J K + 11 - ß2
£l (co01 )l J (9.14)
where e,(co01), ^(^oi) are real and imaginary components of the dielectricpermittivity. For ß2 e « 1 the formula (9.14) is similar to the formula (9.13). But incontrast to the monotone behaviour of (9.13), rcore according to the formula (9.14)takes a maximum value at ß = [EJ ((u^)]'** For increases of speed above this value,the radius of Tcore decreases (relativistic reduction). In Table 9.1 are presented thedependence Tcore on the speed of charged particle for water (h co01 = 8.4 eV ).
The distribution of excited and ionized molecules produced directly by the primaryion inside the core of the track can be found from the following formula:
Noj(r) = nPoj(r) (9.15)
where n is the concentration of molecules, and P0j (r) is the probability of creation ofthe electronic state j by direct action of the primary ion at radial distance r. In thenonrelativistic case, when ß2 e « 1 a sufficiently good approximation for N0j (r) is
(9.16)goj W = ————J-~r expJ m v2 h o>„: r20j 2v2
where Z is the ion charge and F0j is the oscillator strength; in the condensed phase it isobtained by integrating the continuous distribution of the oscillator strengths (9.19)over the peak width. According to this formula, NOJ decreases very rapidly withincrease of r and this decrease is steeper the smaller the ion speed.
The distribution of excitations and ionizations produced by knocked out secondaryelectrons can be calculated by the Monte Carlo method. In the model of continuousslowing down an analytical expression can be obtained (Butts and Katz (159),Miterev et al (160)), which is more convenient in a number of practical applications.When the range of an electron R (E) ~ E, this analytical expression can be presentedin the following form:
„„.i-Z^Jlf , _ _ £ _ ] (9.17)m v2 r2 1, rmax )
where Nv is the number of valence electrons in the molecule, and r, is the range ofelectrons with maximum energy.
Now let us consider the track characteristics for ions with different charges. In Table9.2 we compare the characteristics of tracks of protons and a-particles with the samestopping power. The difference between them is based on the difference in theircharges. The stopping power is roughly proportional to the factor Z2/v2. So for the
676

Table 9.1.
The dependence of rcore on the velocity of charge particle for water according toformula (9.14).
Velocityß = v/c
0.010.10.250.50.6930.750.90.9350.999
EnergyMeV/u
0.0474.73
30145363480
12141707
20047
coremz
0.747.4
19.052.4
118.096.873.370.868.4
Table 9.2.
Characteristics of tracks of protons and a-particles with the same LET in water*
Track Characteristics
LET, eV/nm
Energy, MeV
Speed, 108 cm/s
Core radius, nm
Maximum energy of 0 electrons, keV
Penumbra radius, nm
Average density of energy absorption in track core,eV/nm3
eV/molecule
Average density of ionizations in track core, nm-3
Average density of ionizations in the track, nm-3
proton a-particle
98 98
0.082
4
1.2
0.18
4.5
15
4.5
2.2
3.74
1.16
1.3-10-1
65.7
19.2 1.565.8-10-1 4.7-10-2
9.4-10-3
4.3-10-4
* Kaplan and Miterev (unpublished).
677

Table 9.3.
Characteristics of tracks of a-particles and multicharged 127I ions with the same speedin water*
Track Characteristics a-particle 127I ion
Speed, 108 cm/s 10 10
Energy, MeV 2 63.5
Effective charge 1.86 10.76
LET, eV/nm 146.8 4920.6
Number of 5 electrons per 1 nm track length 3.2 117
Core radius, nm 2.4 2.4
Penumbra radius, nm 29.3 29.3
Average density of energy absorption in track core,eV/nm3 4.48 150eV/molecule 0.134 4.49
Average density of ionizations in track core, nnv3 2.7-10-' 9.04
Average density of ionizations in the track, nnv3 4.9-10~3 1.6-10'1
* Kaplan and Miterev (unpublished).
same stopping powers the speed of a-particles is almost 4 times greater than thespeed of protons if we neglect a weak dependence of the logarithmic term. This is thereason for different values of E, (for secondary-electrons) and radius of penumbrarp. The Tp is greater for a-particles and as a consequence the average concentration ofionizations created in the tracks of the a-particles is lower than in the proton tracks.
In Table 9.3 we present the characteristics of tracks of a-particles and multiply-charged 127I ions with the same speed. The high value of the effective charge ofiodine results in a very high stopping power. We see that the number of ionizationsand their concentration are extremely high for a multicharged ion. The number ofionizations near the axis of the track of a multicharged ion exceeds the number ofmolecules. We can conclude that each molecule undergoes multiple ionization andwith great probability dissociates into fragments. This fact can be very important forradiation effects.
678

9.4.5. Linear energy transfer
Higher densities of events in charged particle tracks are often more effective thanlower densities in producing certain radiation effects (though sometimes theopposite is true). Therefore, concepts have been put forward to classify radiationtrack structures according to their stopping power or their stopping powerdistribution (161). The average energy locally imparted to the medium is calledLinear Energy Transfer (LET), which is essentially the same quantity as stoppingpower. rr o
Energetic ionizing radiation can lead to the ejection of energetic secondary electrons.These electrons can travel considerable distances away from the path of the primaryparticle and virtually form sparse density tracks of their own. Therefore, modifiedclassifications have been put forward (161) that neglect the energy expended in sparsetracks because it is almost "wasted". This neglect can be introduced either by anenergy cutoff (Lq) in the energy transfer distribution or a radius cutoff (Lr) in theradial distance up to which energy is considered "locally imparted" (161). Figure9.39 demonstrates the effect of extending the integral over the energy transferdistributions (essentially the secondary electron kinetic energy distributions) only upto the cutoff energy q (162-164). Around 50% of the stopping power is contained inenergy transfers below 100 eV and thus remains rather close (say, within a fewnanometers) to the point of interaction.
Whereas Lq can readily be calculated from basic differential cross sections by simpleintegration but not measured directly, Lr, which is the energy absorbed locally at acertain radial distance from the path of a primary particle, has been measured for
1.0
0.8
0.6
0.4
0.2
| I I | I I ! I
Specific Ion Energy:A ' / I ' ' '
0.1/0.2X 0.5
10 2 5 10 2 5 10 2Cut-off Energy q (eV)
10
Figure 9.39 Ratio of the energy restricted stopping power Lq to the unrestricted stoppingpower Lx for various specific ion energies as a function of cutoff energy(162,163).
679

Radius ( nm )
20 40 60Radius ( nm )
Radius ( nm )L 8 '2
40 80 120
Radius ( nm )
10'
10
2 ,
0)is> ,O 101
Q
10'
10'
,2°
Radius ( nm )2 4 6
Radius ( nm )0 2 4
0 10 20 30
Radius ( nm )0 20 40 60
Radius ( nm )
Figure 9.40 Calculated radial dose profiles around photon paths and a particle paths intissue equivalent [csda (heavy line), mixed csda-Monte Carlo (triangles), andfull Monte Carlo (histograms) models, for explanation see Ref. 88] comparedto experimental data (•, Ref. 165), Baum's model (B, Ref. 166), and the modelof Butts and Katz (BK, Ref. 159).
several fast ions and used to check the reliability of track structure calculations(159,165-180) (Figure 9.40). In general, these radial dose profiles decreaseapproximately with 1/r2 up to the range of the maximum energy secondary electrons,which is proportional to the ion energy. They are also proportional to the square ofthe (effective) charge of the incident ion.
These general properties are depicted in Figure 9.4la, which also shows thecontributions of secondary electrons ejected from inner and outer shells of targetmolecules. Based on such radial dose distributions averaged along the ion path, Katzhas put forward an empirical classification scheme (18-20,159) that agrees with manyobservations.
680

—— total.—— 10 *V, na»075- -- 400 »V, n ,=025
LUI
001
1 0
08
0 6
0 4
0 2
10 10
Radius ( nm )
Parameter I iSpecific Ion Energy (MeV/u) I
T rack Core Radius
10 50 10 0 MeV la
10
Radial Distance ( nm )
10
Figure 9.41 (à) Generalized radial dose profiles around heavy-ion tracks in a modelsubstance (outer shell potential 10 eV, electron occupation fraction 0.75; innershell potential 400 eV, electron occupation fraction 0.25). (&) Quotient ofradius restricted stopping power Lr to unrestricted stopping power Lm as afunction of radial distance from the ion path. For comparison the adiabaticlimit for excitations is indicated as track core radius (175) for several specificion energies.
Figure 9.41b shows calculated LJL^ ratios (L„ is the unrestricted linear energytransfer and is thus essentially equal to the stopping power). As mentioned above, alarge fraction of the energy lost by fast ions stays within the first nanometer aroundthe path, but with increasing ion energy a large fraction can be transported byenergetic electrons to large distances from that path. Also shown in this figure is theradius of the so-called track core as introduced by Mozumder and Magee (175), seeSection 9.4.4.
681

20Ne
CM
ff•f-
10 102 103
LET (eV/nm)Figure 9.42 Variation of the differential molecular hydrogen yield G(H2) with ion LET in
benzene for the various ions. (La Verne and Schuler (181)).
16.0 fast electrons
12.0
"a, 8.0
4.0
0.001 1 10
LET in Water (eV/Ä)
100
Figure 9.43 Differential Fe3+ yields in aerated Fricke dosimeter for the various ions as afunction of ion LET (La Verne and Schuler (182)).
682

One of the important questions is the following: can LET be a universalcharacteristic of the quality of radiation? If we consider radiochemical andradiobiological actions the answer is very definite: it cannot be. Experimentalevidences have been demonstrated by La Verne and Schuler (181,182) see Figure9.42 and 9.43. The same value of LET corresponds to different values of G(H2) andG(Fe3+), if we irradiate benzene or Fricke dosimeter by different ions. The reason forsuch behaviour has already been explained above when we discussed Table 9.2. Forequal stopping powers an ion with greater Z has greater speed and can create faster §-electrons which spread their energy over larger distances. As a result for an ion withgreater charge the same energy spreads in a greater volume and as a consequence thevalue of G(H2) in benzene is lower for an ion with greater charge. For these reasonsG(Fe3+) also is lower for the ion with greater charge.
So we conclude that LET should not be used as a sufficient characteristic of radiationeffect when we compare different ions. This conclusion is not surprising becauseLET is a one-dimensional characteristic but all reactions proceed in volume. From allthis follows an important conclusion for chemical dosimetry: each type of radiationmust have its own dosimetric curve. The well known curve of Bibler (183) for aFricke dosimeter cannot be recommended for practical dosimetry.
Thus, LET cannot serve as a universal characteristic of radiation quality. Attemptshave been undertaken to introduce other parameters instead of LET, but they wereunsuccessful. This can be understood because the identical set of track structures canbe obtained only for charged particles with all the three parameters being equal(charge, speed and mass), i.e. only in the case of a particle and its antiparticle. Forparticles differing in at least one parameter the track structures will be different. Thisis obvious for particles that differ in charge or in speed (see Tables 9.2,9.3).
The differences in the track structures are less obvious if the particles differ only inmass. To reveal these differences it should be taken into account that a heavy particleunder other equal conditions (equal Z and v) is more slowly retarded in the matter ascompared with a light one. Therefore, the change of distributions (9.16) and (9.17)along the trajectory of particles of different mass will be different. The track of aparticle with lower mass is more compressed. As a result averaged concentration ofthe primary active particles in this case will be higher.
For example let us consider protons with the energy of Ep = 100 MeV and electronswith Ee = 55 keV. They have almost the same values of \ and the initial LET valuesare also rather close (S^ = 0.75 eV/nm, Se = 0.6 eV/nm). When such electrons passthrough the water layer of 5.10'3 cm thickness their energies decrease down to Ee =7.5 keV, and the LET value increases up to Se = 2.5 eV/nm. By contrast the protonstraverse this same layer of water without any practical change in the energy and LETvalues. Due to such rapid slowing down the electrons will form more dense trackstructures in a layer than the protons.
As was discussed above there is no universal parameter of radiation quality.However, for practical purposes (e.g. simulation or prediction of particular radiationeffects) it is desirable to have at least an approximate parameter by means of which itcould be possible to estimate the radiation effect when we substitute one type ofradiation for another.
683

10
A useful characteristic of the ion track for some purposes can be the average specificenergy absorption in the track core Dc (184):
~ S-SS»<=^r- (9.18)"• core
where S is the energy transferred by the primary ion to the electrons of a medium perunit length of the track; S5 is energy carried by secondary electrons to outside thecore. The track characteristic Dc takes into account the three-dimensional characterof energy absorption in the microvolume of irradiated matter and is mainly dependenton the parameters of the primary ion. Therefore, it can be used as an approximateequivalence parameter.
The correlation of radiation effects of different ions with Dc value were applied to theradiolysis of benzene by La Verne and Schuler (181). In Figure 9.44 we presentedthe differential yields G(Fe3+) in a Fricke dosimeter (182) as a function of Dc,calculated according to formula (9.18). The value of rcore was calculated according to(9.14). We see that beginning with 7Li ions the G(Fe3+) curves as a function of Dc areclose to each other. So the representation of G(Fe3+) as a function of Dc removes theambiguity which exists in the LET dependencies of G(Fe3+), when for one type of anion there are several values of G(Fe3+) corresponding to the same LET value (seeFigure 9.43). Although the representation of differential yields as a function of Dcdoes not allow to exclude completely the dependence of the radiation effect on the iontype, nevertheless, by means of Dc one can make more realistic estimations of thechange of effect under substitution of one type of an ion for another.
\
\ \\\
X
I I 1 i i n! i i i i i i nl i i i i i ml i i i i i nil———\—i i i i n l~4 io~3 io~2 icr1 10 10
DC i eV/molecule
Figure 9.44 The dependence of G(Fe3+) on Dc (eqn. 9.18) for different ions (184).
684

co.Û
"co
"co"üo
1.0
0.5
l__
12 5 10 2 5 100 2 5 103 2 5 10*Electron Energy ( keV )
Figure 9.45 Track structure classification by so-called track entities spurs, blobs, and shorttracks (10).
10,-2 10' XT 10'
Primary Electron Energy ( keV )10
Figure 9.46 Yields in water vapor of secondary electrons in energy intervals relevant totrack entity classification.
685

In conclusion of this section we note that LET concepts and radial dose concepts forthe classification of track structures depend also on the validity of the averagingprocedure. If an effect depends on the types and actual densities of events on amicroscopic scale, averages of the initial energy depositions can lead to doubtfulconclusions. In many radiation effects averages are meaningful only for final yields,after the reactions are complete. Energy density in itself does not contain enoughinformation.
9.4.6. Track Entities
Ninety-five percent of the energy loss events of fast electrons transfer less tban 100eV to matter. Each of the resulting low-energy electrons produces three or Jessadditional ionizations during their own slowing down, which can be seen in thedecrease of the yield curves (per 100 eV) in Figure 9.10. About 60% of them do notproduce any further ionizations. Therefore, in most cases there are only one or a fewevents in such isolated spatial areas, which are called "spurs" (10,11,185-187), andthe subsequent chemical reactions and their dynamics are quite different from thoseencountered in areas of higher ionization density. Areas of higher density areclassified by Mozumder and Magee (10,11) as "blobs" (energy transfers between 100and 500 eV) or "short tracks" (energy transfers between 0.5 and 5 keV). Secondaryelectrons produced in energy transfers above 5 keV are considered as "branch tracks",which are not likely to overlap with the other entities. The fraction of energy spentby fast electrons to form such entities is given in Figure 9.45. Figure 9.46 shows theyields of such entities for fast and slow electrons, depicting the decrease of secondaryblobs and spurs at low electron energies. Similar calculations have been performedfor electrons by Berger (191) and for radiation chemical yields from heavy chargedparticles by Turner et al (192) and Miller and Wilson (193). The high event densityin blobs and short tracks favors recombination of radiogenic species over reactionwith molecules of the material. The low-event density in spurs may favor reactionwith molecules of the material (80,185-190).
The old concept of track entities is still a useful approach for the classification oftrack structures, since it takes into account the spatial arrangements of initial species,which affects their subsequent reactions. Refinement of this concept is needed inparticular for heavy charged particle tracks.
9.4.7. Outlook for Other Clustering Concepts for Track Structures
In 1937 Gray stated that "the most natural unit of radiation dosimetry is the absoluteincrease of energy of the absorbing medium" (194), and dosimetric concepts (forexample, LET) have been used for classification of track structures for many decades.However, dosimetric concepts are inadequate to explain recently observed differencesbetween results obtained with different radiation fields. Track structures are a betterstarting point for classification. This is illustrated in Figure 9.47, which comparesenergy-based evaluation concepts (left panel) with event-based evaluation (rightpanel). Such evaluation or similar approaches can follow the principles outlines inFigure 9.48. First, track structures are measured [for example, in a low-pressurecloud chamber (196-198)] or calculated with an appropriate Monte Carlo program.Then the important distances and their distributions are derived from the structures.Finally, from these distributions of event densities reaction probabilities are computedand evaluated.
686

i——i—i—m*- p(n(r)>N)f
E(keV) / /^ 075t— - - - 0 2 -/-•/-
--0.5 //
Imported Energy !Radius lnm),
075'200 '51
Energy (ev )10
Radius ( nm )
Figure 9.47 (ä) Probability of finding more than a certain imparted energy within a certainradial distance around an excitation or ionization in electron tracks as afunction of electron start energy, (b) Probability of finding more than Nadditional ionizations within a certain distance r around an arbitrary ionizationin water for electrons of 0.2-, 0.5-, and 5-keV start energy (136,195).
a) simulation of particle track
A"V. * . *"•*•
- • / A subexc. electron
b) distance between events
Energy Absorption Ionizationi = const
c) distributions for each event
Ns40
30
20
10
0
s
Rrconst P'
Niconst
0 10 20 30 40 50 60 70r, (nm)
raoo800
600 r
400
200
0
Figure 9.48 Some possibilities of track structure evaluation for the purpose of informationreduction.
687

10
1
M
0-1
C
0UC
' ^-! Û
COoE
<N-J 0
! o)i
fl
Figure 9.49 Dendrogram of 1-keV electron track using the &-means algorithm.
The evaluation can be made by using conventional cluster algorithms (199-203)designed for the analysis of more-dimensional data. Results from such types ofclassification can be displayed in the form of dendrograms (Figures 9.49 and 9.50).Here the merging to clusters of increasing sizes of closely located initial events isshown as a function of their increasing amalgamation distance (for example thesquare root of the sum of the distances of all members of a cluster to its virtual center)until the whole track forms one large cluster. The dendrograms of Figure 9.50 can beused to demonstrate that there are fewer events in electron tracks in water vapor thanin liquid water (scaled for the density), they are further apart on a mass basis in theliquid (because of the assumed delocalization through plasmon diffusion), but thetotal track lengths scaled for the density are very similar (as is also expressed in thephase state insensitivity of stopping power).
688

I^ I<D 10ü
a 10Q
O ,
a
10 J
liquid
10 J
I•V—'
Q) 10'O
O
o '°o?'°
gas c
liquid
Figure 9.50 Dendrograms of single 0.5- and 5.0-keV electron tracks in water vapor andliquid water.
The classification of track structures requires further improvement. There areclassification concepts used in other fields, for example, in fuzzy set theory (204-207), in pattern recognition, and in artificial intelligence (208-210), which should beexplored for usefulness in this context.
9.5. PHASE EFFECTS
All substances of the living organism are in a condensed phase. So for simulation ofpenetration of charged particles through matter we must take into account the specificfeatures of a condensed phase (210a).
One of them is the high density of a condensed phase as compared with gas and as aconsequence the necessity of using such macroscopic characteristic as the dielectricpermittivity e(o>) (see Chapter 5, Section 5.5). The probability of energy losses by acharged particle in a condensed medium is described by the energy loss function,which is equal to the imaginary part of the inverse permittivity: Im [-l/e(co)]. It isthis function that determines the distribution of oscillator strengths in the liquid phase
1
710)^ e(co)(9.19)
689

where Zm is number of electrons in a molecule, copl =(4n Nc e2 /m) is theplasmon frequency, Ne is the number of electrons in a unit volume of the medium, mand e are the mass and charge of an electron.
The distribution of the oscillator strengths of water in the condensed phase strikinglydiffers from that in the gaseous phase (210a). The discrete peaks at low energies thatone observes in the gaseous phase transform into a continuous distribution with awide absorption peak around 21 eV. The latter peak is often attributed to collectiveplasmon-type excitations (for details see review by Kaplan and Miterev (21). Thispeak is independent of the kind of condensed state: liquid or solid (see Figure 9.5lafor ice) and is typical of various condensed materials, (see Figure 9.5 Ib).
o>
_LJE
a) Polycrystalline ice
—— 1
J• ~-
J_J
Ei — i
0.6
0.50.4
0.3
0.2
0,1
.!*"-•.
/ ""\
- / ' tJ ''/
~ ,^/'
-;''
! I I I
10 15 20 25
hiu (eV)
b) Polystyrene film
0.7
0.6
0.5
0.4
0.3
0.2
0,1 \-
0 10 15 20 25 30 35
ha. (eV)Figure 9.51 Spectra of energy losses in condensed phase for polycrystalline ice (184) and
polystyrene film (211).
690

Figure 9.52 Scheme of energy levels in a dielectric. lc is the ionization potential in thecondensed state, E£h is the photoemission threshold, V0 is the bottom energyof the conductivity band (Ec) counted off the vacuum level, Es is the energylevel of a solvated electron.
Another peculiarity of the condensed phase is the lowering of the ionization potential.In the condensed phase ionization takes place when an electron appears on theconductivity band, see Figure 9.52. The ionization potential Ic equals the energyneeded to transfer an electron to the bottom of the conductivity band
I.= + V (9.20)
Ef is the photoemission threshold, V0 is the so-called work function which equalsthe energy the electron has at the bottom of the conductivity band. The ionizationpotential in a condensed phase Ic is connected with the ionization potential Ig in agaseous phase by the following equation
I =1* * (9.21)
where Pt is the energy required for reorganizing the medium after one of themolecules has been replaced by a positive ion (this energy being approximately equalto the polarization energy). Pt and V0 are negative, so the ionization potential in aliquid phase is always lower than in a gaseous phase. The difference is the greatestfor water, AI = Ig - Ic = 3.8 eV.
The comparative simulation and computer experiments on interaction of fast electronswith water in liquid and gaseous phases with regard to the above mentionedspecificity of the liquid phase have been performed by several groups (Turner et al(27); Kaplan et al 31,212-214); Paretzke et al (77); Terrissol and Beaudre (35)). Ifwe are interested only in ranges and stopping powers, then for electrons with E > 200eV the dependence upon phase state is small (77,31). So for calculating thesequantities the model of tissue-equivalent gas is quite satisfactory. But this model failsincreasingly if we are interested in the yields of excitations and ionization for lowerenergy electrons, see Chapter 8, Section 8.6.2.2. Further details regarding phaseeffects are discussed in Chapter 5.
691

9.6. RECENT TRACK STRUCTURE APPROACHES TO BIOLOGICAL DAMAGE
Track simulation methods now make it possible to describe the stochastic tracks ofdifferent radiations down to dimensions of the order of a nanometre, although thereremain significant limitations on resolution due to phase effects and cross sections forparticular media. This development has given wide scope for attempts to describe themechanisms by which the radiations cause damage to DNA and other biologicalmolecules and the consequent cellular effects after the majority of the damage hasbeen repaired. Because of the complexity of the overall process, different modelapproaches tend to concentrate on particular stages and to use experimentalinformation on intermediate damage, such as DNA, to constrain their assumptions.Subsequent combination of the stages should then lead to more complete descriptions.Four recent model approaches are summarized below (215) as non-exhaustiveexamples. These four approaches have many features in common but also notabledifferences in their methods, emphasis, detailed assumptions and some of theirconclusions. By closer comparisons between the models, and close comparison withexperimental data, it should be possible to evolve improved integrated approaches.Other examples can be seen in the proceedings of recent meetings on track structure,biophysical modelling and microdosimetry and other reviews, such as in References216-221.
9.6.1. Energy Deposition Frequencies in Microscopic Targets
The basic philosophy of this approach is that radiation quality effects should be duepredominantly to the spatial properties of the radiation tracks on a microscopic scale,and that comparison of relative biological effectiveness (RBE) with features ofsimulated track structures for different radiations should lead to the identification ofbiologically relevant track properties and hence closer to the biomolecularmechanisms. Although DNA is a likely target of interest, this is not an a prioriassumption of the approach and the dimensions of the targets of interest are soughtfrom the correlations themselves (222-226).
There are still uncertainties about the fine details of track structure simulations at thenanometre and subnanometer levels, even for water. For the analysis of biologicaleffects we would be concerned also with track structures in materials such as DNAand protein (and inhomogeneous combinations), for which track simulation crosssections are not at present available. Hence the approach taken is to seek robustproperties that may serve as a useful guide to evolving studies, without being misleadby possible code or medium differences.
An approach used to date (147-149,224) has been to evaluate the absolute frequenciesof energy depositions in cylindrical targets of dimensions 1 to > 100 nm and hence toseek regions of energy and volume that correlate with RBE and may thereforeprovide focus for more detailed mechanistic studies (227) (Fig. 9.53). Energy hasbeen used rather than numbers of ionizations because it is clear that ionization yieldswould be strongly dependent on the medium chosen, its state of condensation anddetails of assumed cross sections and because there is no a priori reason to exclude apossible role for excitations in the locally-clustered damage that may be more severeand of particular relevance to final biological effects after cellular repair haseliminated the minor damage (228,229).
692

10~6-
ABSOLUTE
FREQUENCY
OF r-7
DEPOSITION
EVENTS OF
ENERGY >E
(a) Energy Deposition in Cylindrical Target ofDimensions Similar to a Segment of DNA —
100
ENERGY, E ( eV )
1000
100
DNA
SEGMENTS
HIT
PER CELL
( Gy"1 )
10
200
lU
ABSOLUTE
FREQUENCY
OF 10.6
DEPOSITION
EVENTS OF
ENERGY >E, _ i . irr7
„.'s (b) Energy Deposition in Cylindrical Target of -x%. Dimensions Similar to a Nucleosome
^\ '- ^ ' ~ ~Tf ~-~- nrn "
\\ i\ " v - 2MeV ~~"^-~-^^_ ]; "cu\ \ «-particles ^~'^^^-^
- ^N^ 'V-f "x^• \0-28 l<eV V-v ''-^ X\ :
photons \ '•,J
i i i i •>- Y i \ i i i
NUCLEOSOME100 HlT
PER CELL
f r "1 1
10
0 500ENERGY, E ( e V )
Figure 9.53 Absolute frequencies of energy deposition events, by various radiations inwater, in randomly positioned cylindrical volumes corresponding to the sizesof DNA structures (146). The right-hand axis shows the correspondingfrequencies of such events in DNA of a typical mammalian cell (224).
It seems likely that detailed results for the smallest dimensions and smallest energydepositions will be the least reliable because they are most dependent on code-specific assumptions regarding individual interactions or small combinations of a fewadjacent interactions. For larger dimensions and numbers of interactions, averagingwithin the target should increase robustness of the results and interpretations.Robustness should be further enhanced by expression of the frequencies of energydeposition as ratios between radiations, for comparison with experimental RBEs.
693

EFFECTIVENESS OF ^-PARTICLES OF VARIOUS ENERGIES[relative to L. MeV)
Figure 9.54
'00 200 300ENERGY E (eV)
£00 500
LETHALEFFECTIVENESS(on humanfibroblasts)
MeV«-^2 MeV^5 MeV
•*—10 MeV
600
Relative effectiveness of track segments of a-particles of selected energies indepositing energy > E in cylindrical targets of diameter 10 nm and length5 nm (similar in size to a nucleosome). Comparison with relativeeffectiveness for cell killing (222) suggests as a relevant property E ~ 340 eVfor these high-LET radiations (215).
L,
3NUMBER
OF
LETHAL
LESIONS
(cell"1 Gy"1)2
(
——— , ——— ! ——— ! ——— ! ——— , ——— | ——— | ——— ! ! , , , ( ! , j-
<i O
• Experiment(HF19 human cells) 0 .,
~ o Monte -Carlo calculation °( 10 nm x 5 nm
cylinderE>3U)eV I
^
: i: j :-
„ 1 0 6 U MeV 2t ° i i :D ' 5° LET l'keV urn"1) 1°° 15°
Figure 9.55 Comparison of observed numbers of lethal lesions (222) (versus a-particleLET) with absolute frequencies of E > 340 eV in nucleosomes, assuming that1/24 of nucleosomes contain information relevant to cell survival (231).
694

J
NUMBEROF 2
LETHALLESIONS(cell"1 Gy"1)
1
n
• Experimentcr (HF19 human fibroblasts)
\ a Monte-Carlo calculation\ ( 2nmx2nm cylinderam E>100 eV ; n = 26)
\
\
: ^^B
0-1 1 10 100PHOTON ENERGY (keV)
Figure 9.56 Comparison of observed numbers of lethal lesions (232) (versus X-rayenergy) with absolute frequencies of E > 100 eV in DNA-segment, assuming1/26 of DNA segments contain information relevant to cell survival (231).
With this philosophy a very large consistent database has now been generated formany radiations (147-154,230), using the Monte Carlo codes MOCASb andMOCA14. This can serve also as a baseline for comparison with other codes(153,154).
Figure 9.54 illustrates how the scored data for a-particles of different LET, whencompared to RBEs for inactivation of human fibroblasts, defines a track property ofpotential interest, namely f(> 340 eV) in a nucleosome-sized target, where f(>E) isthe absolute frequency of deposition of energy >E in the specified target volumeplaced at random in the irradiated medium. This correlation is illustrated further inFig. 9.55.
These and other analyses have suggested that there are different critical properties forthe readily-modifiable and repairable dominant damage from low-LET radiations andthat from slow high-LET ions. Figure 9.56 illustrates a property of potential interestfor X-rays of 0.3 to 100 keV, namely f(> 100 eV) in a target of DNA dimensions.
It should be emphasised that this approach makes no a priori assumptions as to themolecular nature or dimensions of the biologically critical targets. However, whereregions of correlation are obtained, more detailed studies and interpretations ofmechanisms may be assisted by more specific assumptions, such as for example inassessing yields of DNA breaks (224,233) or in assessing the molecular nature of thelarger target volumes apparently involved in the less-repairable high-LET damage(227,228). A number of related approaches have also been taken to identifying, fromtrack structure simulation, the ionization-clustering properties that may bepredominantly responsible for DNA double-strand breaks and for final cellulareffectiveness (156,234-236).
695

track-radius t
Rt
trackFigure 9.57a Schematic representation of the interaction of a track with a single-hit
detector (231).
COV)<Dc<D
Ü0>
JO<D
£E
1.11.00.90.80.70.60.50.40.30.20.10.0
- e__ Rt»
M-8.2 nm0.06
• expariment
7Li
10s 107 10s 10» 10 10
Stopping power (eV.cm"1)
Figure 9.57b Comparison of calculated and experimental data on the relative efficiency of aradiochromic dye film exposed to different types of radiaton (231).
9.6.2. The Radiation Track Segment Model
A track structure model (237) has been developed which provides a description of thespatial distribution of events for both electron and ion tracks. For each ionizingparticle, both primary and all secondary particles, the parameters of stopping power,average energy loss per event and average track radius are calculated over a limitedtrack segment. Using these quantities the complete slowing down process, i.e. thecomplete inventory of all particles generated by the primary particle and theirrespective contribution to dose is calculated in liquid water down to subionizationenergies. The model thus permits calculations of radiation effectiveness to be madetaking into account the three dimensional structure of the target at nanometerdimensions. Only secondary particles with an initial energy greater than 25 eV are
696

nucleotidebase unit
track-radius
DNA-strands
Figure 9.58a. Schematic representation of the interaction of a track with a DNA doublehelix (231).
COCOCDc.CD
OCD
"CDCD
CDÛC
10'
„ _0 *
109
Stopping power (eV.cnrT1)
10 to
Figure 9.58b Comparison of calculated and experimental data on the relative efficiency ofradiaton induced DNA double-strand breaks for different types of radiation(231).
697
treated as separate particles for the calculation of the three parameters, although theircontribution to the radiation effect forms part of the complete slowing downinventory.
This model has been applied to calculate the efficiency of different types of radiationon single hit detectors and for DNA double-strand breaks. The target of a single-hitdetector is represented by a sphere with interaction radius Rj (see Fig. 9.57a). Eachenergy deposition in this sphere is assumed to have a probability f} to cause an effect.
The results of calculations using f j = 0.06 and R^ = 8.2 nm have been compared withdata for radiation effects in the radiochromic dye film (238). Fig.9.57b clearlydemonstrates that a family of curves is predicted for the different radiation types,which indicates that, although different radiation types may have the same stoppingpower their relative effectiveness is not necessarily the same, because there aredifferences in delta ray spectrum and average energy loss per event and thus in trackstructure geometry.
The model has also been applied to calculate the efficiency for the induction of DNAdouble-strand breaks because this lesion has been assumed to be crucial forradiobiological effects. The double stranded DNA helix presents a structuredmolecular target of nanometer dimensions and has been represented by twoassociated cylinders having an interaction radius of Rj and the axes of which areseparated by 2 nm (see Fig. 9.58a). It is assumed that an energy deposition event inthe cylinder with radius Rj has a probability of f\ of causing a strand break. Twoadjacent strand breaks induced by the passage of the same primary particle areassumed to lead to a double-strand break. The initial slope of cell survival curve hasbeen used as a surrogate for the induction of DNA double-strand breaks by thepassage of one particle. In Fig. 9.58b the experimental data for human fibroblasts(239) are compared with two sets of calculations. The humped behaviour withstopping power revealed by the experimental data is closely approximated by thecalculations and arises because the probability that the track intersects the twocylinders causing an event in each cylinder increases as the stopping power and theaverage track radius increase. At high stopping powers excessive energy depositionsin the two cylinders cause a decrease in the relative efficiency of the radiation effect.The initial slopes of survival curves of several other cell lines show a strongerdependence on LET than the factor of about 3 shown in Fig. 9.58b. These other celllines generally have a more pronounced shoulder on their low-LET survival curves,in contrast to the unshouldered curves of the human diploid fibroblasts.
This continuous slowing down track structure model is derived from basic physicalprinciples but is not as advanced as the Monte Carlo based track structure models.However, it also offers the possibility of calculating energy deposition events on ananometer scale which is important when energy deposition events in a geometricallystructured target such as the DNA helix are considered. The results presented in Fig.9.57b and 9.58b demonstrate the importance of the target structure and the usefulnessof the model.
9.6.3. PARTRAC-Model
The Mfinte Carlo track structure simulation codes MOCA8 (for incident electrons upto 100 keV) (88) and MOCA14 (for protons and alpha particles) (240) were
6QR

developed for the model target 'homogeneous water vapour' and are used in manyradiation physical calculations (for a review see Ref. 34). This particle track modelhas been extended into the PARTRAC code (241,242) which in its present status;(a) follows also incident photons (10 eV - 100 MeV) with their photoelectric,coherent and incoherent scattering, and pair production effects; (b) extends theelectron energy range considered up to 100 MeV; (c) considers phase dependentdifferences in ionization cross sections for the condensed state (243,244); (d) permitsthe use of complex geometry algorithms to simulate structured, heterogeneous targets(e.g. 'DNA" in 'chromatin' in a 'nucleus' in a 'cell' in 'tissue'); and (e) follows also thefate of primary or secondary chemical species (e.g. H, OH, hydronium ions, solvatedelectrons, DNA-breaks) produced by radiation action in the target.
The PARTRAC code was used to calculate the induction of single and double strandbreaks for photons of various energy spectra (C- and Al-K-lines, filtered 30 kV and150 kV X-rays)5 to study the importance of indirect (via OH-radical attack) and direct(via energy deposition in the DNA above a certain threshold energy (Et)) radiationaction for these end points, and the sensitivity of the yield of single-strand breaks(SSB) and double-strand breaks (DSB) on model assumptions regarding the directenergy deposition in the sugar phosphate backbone, threshold energy needed toproduce a SSB and the maximum SSB-interaction distance d to form a DSB.
If a minimum energy deposition Et for the production of a single-strand break bydirect action of 17.5 eV in the DNA (245) is assumed, SSB-yields per Dalton and Gyof (4.0 ± 0.5) x 10'10 are calculated for the X-ray photon spectra and of ca. 2.6 x 10"10 for the Al- and C-K-photons. This is somewhat higher than the experimentalvalues of 1.2 to 2.8 x 10'10 reported for high energy photons (246,247). However,this calculated yield decreases with increasing threshold Et, e.g. to ca. 50% at Ettwice the 17.5 eV used here, which might indicate that a somewhat higher value of Etwould lead to more consistency with experimental observations.
Under the assumptions of random diffusion of OH-radicals within ca. 3 nm towards acylindrical DNA target (248) and of 80% probability for a radical interaction with theDNA taking place on the bases (leading only to point mutations but no breaks) and20% with the desoxyribose (249), about one third of the calculated S SB s appear toresult from indirect action and two thirds from direct.
The formation of DSBs was assumed to result from the interaction of two S SB s onopposite strands if their distance was less than d base pairs. Setting d to a plausiblevalue of 10 base pairs the calculated DSB-yield increases from ca. 2.3 x 10'11 perDalton and Gy to ca. 3 x 10"11 with the photon energy decreasing from 150 kV X-rays to C-K-photons which is also somewhat higher than the reported experimentalvalues (typically around 1.5 x 10"11). This calculated yield decreases to ca. 50% itsabove value for d decreasing to ca. 3 base pairs. Again the contribution from indirectaction was found to be smaller than that from the direct action with roughly one thirdof the DSBs resulting apparently from radical plus direct action and ca. one tenthfrom radical only action. The calculated DSB-yield in the low dose regime increasesonly slightly (i.e. by ca. 20%) for d larger than 10 base pairs, since the action is hereessentially by intra-track effects and most of the primary chemical modifications inphoton produced electron tracks are located to each other closer than these 10 basepairs.
699

9.6.4. Modelling of Chemical Stage
The space and time distributions of radicals and molecular products coming from thewater radiolysis between 10'15 and 1 second have been calculated with Monte Carlotype codes (35,31)- This allows the possibility to add various finite volumescontaining solutes like scavengers (Tris, formate ions, ...) which are chemicallyreactive with water radicals, or volumes containing a set of biological molecules(DNA or other) also chemically reactive with water radicals or scavengers. All thechemical reactions between these species can be taken into account. The addition ofa scavenger was necessary as a substitute for incorporation in the model of numerousbiomolecules and chemistry associated with DNA in a cellular environment (250). Itis a step towards the real simulation of what happens in an irradiated cell. Due tocomputer time and relative memory limitation, these finite volumes were limited ininitial studies to about hundreds of cubic nanometers, sufficient to contain a DNAhelix of 14 nm length with 2 nm radius and surrounding media of liquid water with ascavenger concentration not exceeding 2M.
As a first example, an infinite medium of liquid water was considered (see Figure9.59) inside which is placed a small volume Vj of interest supposedly containing aDNA molecule, taken as a cylinder of 2 nm radius and 14 nm length, and a largersecond scavenger volume V2 is drawn (shape unimportant) large enough to containall the species involved around Vj until 10"8s. An electron with 278 eV energy is tobe introduced, as indicated by the small arrow on Figure 9.59, at a distance of 2 nmfrom the axis of Vj.
At early times, say between 10'18 and 10'15s, the slowing down of the electron isalmost complete, elastic and inelastic (ionisations and excitations) collisions havetaken place, and every ionisation localised in the volume of interest is counted as one'direct' product, and removed from the track. Then thermalization and solvation ofelectrons and creation of water radicals are simulated and a data set in a four co-ordinates systems (t, x, y, z) is obtained for each species: e~aq, OH-, H-, H3O+, H2C>2,OH", H2, HÛ2, starting at 10'15s. In V2, molecules of scavenger are added. As afunction of time, all water species and scavengers can diffuse and react together.When OH- or H- radical enters Vj, these are counted as 'indirect' products, andremoved from the species set.
For 278 eV electrons (e.g. CK-Auger electrons), and in the case represented in Figure9.59, the analysis gave a 'direct' product yield of 0.242 per electron and a value of0.192 for the 'indirect' product yield at 10'12s. The variations of 'indirect' yields as afunction of time and concentrations of Tris and Formate ion, are represented inFigure 9.60. At about 10'10s the indirect yield is twice the direct, and then increaseswith time. Wright et al. (251), found comparable results with a ratio indirect/directof 2.1 for 125I Auger electrons (mean energy close to 300 eV), without a scavenger.The Tris effect on cumulated direct yield is small, as mentioned also by Holley andChatterjee (250). The present model has been applied also to take into accountchemical reactions with DNA after the Auger-cascade decay of 125I incorporated intoDNA (252).
Such chemical-stage computer models are powerful tools for biophysicalinvestigations. They are stochastic in nature and it can be improved as moreinformation becomes available.
?nn

Liquid Water
H20+
scavenger
H2O•f
scavenger
• Volume of interest0 = 2nmh = 14 nm
Liquid Water
Figure 9.59 Schema of the model used. Monoenergetic 278 eV electrons are emitted inthe direction of the volume of interest as indicated by e~ and the small arrow(231).
oL.
I 1.0vL-
Q.
32•2 0.5-*-<u
0.0
i i i mii| i mm i r i uni| r T i mm i
0.0 MO no scavenger• 0.02 M Tris* 2.0 M TrisO 0.02 M Form+ 2.0 M Form
O
ô• 0.2 TO 0.2 F
* 2.0 T+ 2.0 F
11 mil i i i min i i i mu! i i i nun i i i iinil i i mini
10- 1 2 IQ' 1 0 10-8
Time (sec)
Figure 9.60 Variations of 'indirect' yield, the number of OH and H radicals entering thevolume of interest per election, as a function of time. 0.0 M represent thecase without scavenger. 0.02 T and 2.0 T are concentrations in mole per litreof Tris and 0.02 F and 2.0 F for Formate ion (231).
701

9.7. INTERCOM?ARISON OF TRACK STRUCTURE CODES
Most of our knowledge on spatial distribution of track structure is based on MonteCarlo calculations. Results of such calculations are often used in modelling thebiological effects of radiation. In the absence of direct experimental checks, someassessment of the confidence one might place in our present theoretical understandingof the physics of track structures can be obtained by comparing specific resultscalculated by using different independently developed, particle transport codes.
9.7.1. Vapour and Liquid Wajejr Çp4gs
The development of Monte Carlo codes (252a) for charged particle transport trackstructure studies arose in 1963 with Berger (5). Since many authors have developedtheir own track structure codes, it is not possible to present here an intercomparisonof all existing codes, but we can focus on ones dealing with water medium, mostoften used as tissue equivalent. Comparisons have been done for electrons in thevapor and liquid phase (27,115,153,154,157). We can see for instance on Figure 9.61the cumulative percentage of interactions at 1 nm intervals plotted against the radialdistance from the starting point of the electron. The codes used MOCA (33) andKURBUC (36) are for water vapor, while OREC (253) and CPA (35,254) are forliquid water. The distributions are very similar for all four electron track codes.Some differences are observed at distances around 20 nm.
O)1_0)c
LUT3
QJJQi_Ovt
Figure 9.61
inen
qen
inc\3
qc\i
in
inö
qd
1 keV electron
KURBUC
OREC
15 30 45Radial Distance (nm)
60 75
Radial distribution of interactions represented as cumulative % of interactions,normalized to total number of interactions, for 100 tracks of 1 keV electron,plotted at 1 nm intervals, for each of the four Monte Carlo track structurecodes.
702

3- g
^_i.
5ÏV
3 P
-
S £
CB
«r£ °
55 ET
*<
CB
|l
3 e.
i-B
2
sr^
C
BO
o
O
o3
S
uCX
CB
CB
sw
l P
O* 3 0
&h> I Q
* d
p
3^c?
a-r1 o o
-l3
l&
C
P
la- £?.
3 w il g.sI* vT
P52
. o
IX!
O il la m g
3 » sa s 3-
O
H
g 8
3 o
n
' g-
CB
ff
OJ
CT
«"3 ^"0 *
~ "
a-
s 1. §
^^s
so
K-~
Ai
^U
"§
n^a
t«
PÙ
2 •*
—^
»-•.
t—
!S
w o
tr
^-^
9
P ^
&^
cw
•&-
2 —
S >
- 3.|-
a&^a
è
to I C/î
' B 3 auid
3<S
O
iS-5
s- l1 11 8-1
S 8
§ ^
3 -
«« 2
•-*> o
-H
-»
O H I & P S Cu c 3 i. o1 3- t—
»• O x a?!|
Sil.
«Il
I'l|
c»
O
3t—
*• r*
r^
3
VI
t«
Iî5'
8 II
p N
. 3c«
3
f&»;O
Q M
§
T
S-
3 P
a«
&
3.
** P
sr°g
&•
RS
O
••*
•CB
3
SS
?" c
ro
^ s;
"^35
^5
SK
-?
OP
S
> ^ &
^ "
e^§
^^
Iß2
i'ii
Û3
M
r*
W
r*2
3- 3
-CL
O
P
<*•
^
av:
3
3^
& 3
tO
G
0
3 C
L 2
3 |3
a- a
p-v;
cr
&•
Kl
C °
10 &
<!
3
O
S.
35
3-
o •>
S3
£A gï §^§OT ^§
3-
&t
II.
sr§ § 2,
B
gV
i K a£ ÇA
-g
L« S
w S
"h- c
Ul
CB
O
3
3-3
-<
« lu Qrq
C^S
O
CB
i-h
fr
3
CB ul
O
O >—^
,. o
n CTP
rt
»_--
* C/5 aï &R
-CD
c«
§§
S s
2Ï era 1 vo o\ to
g.g*
&<Q
. >
CB
g
p
,.-
Q.
G
3 5
CB 6
«S
o 3
3 o
.O
O
P "
„
c"
3
CB
C
B
P
5on
3
>-i
g
Ct
i "%
a»&a
s^
5'
S
CB
O
1^
3^
&
"G.
IgH
? a-
a« w
g:^ ^
^ I
|M«
o3
qg
as3-
3
P
Ocf *
^ a
«»"E
S'
g&
| » §
» S.
g. 59
ï;*t
3
2
O O
to
3
*-<
Se.
& S
" g-
i 9 §
:p
^3
-2^
o p
>•
ff^ï a^é
§"^
1 s-
cTlj
-J*
i w
O .,
<< ~
^^
i-h
P
Abs
olut
e fr
eque
ncy
of
ener
gy d
epos
ition
even
ts o
f en
ergy
>E
(GyH
)
m n o> -i ça «< rn <ô"
<
en o o o ai o w o o r\) en o co o o

uncontested cross sections does not exist. So, depending on the age of the code, themodel of computer used and the results expected, the analysts are makingassumptions and nobody does this exactly the same. It is also possible that veryrecently a few points in the large cross section sets and different assumptions havebeen improved and inserted in the codes, but the results presented here have beenobtained with the described set of cross sections up to 1990.
9.7.2.1. Cross Sections Used
As one can see in Tables 9.4, 9.5 and 9.6, the basic input data are similar butnevertheless different. Such large codes make assumptions and use algorithms thatare similar but designed for specific objectives, so that comparisons cannot be done ina large scale. For elastic cross sections (Table 9.4) in the low energy domain(0-200 eV) agreement is not satisfactory and more data are needed (see Chapter 4).For excitation cross sections there is reasonable agreement, except for subexcitationelectrons.
Table 9.4 - Elastic cross sections used in liquid water Monte Carlo codes
CodeKIPC
OREC
CPA
Energy Range<200eV
>200eV0 - 10 eV
<1000eV>1000eV0 - 8.4 eV
up to 30 keV
Cross Sections Usedexperimental data of Danjo-Nishimura (255)
assuming: liquid = vaporThomas - Fermiexperimental data of Trajmar, Itikawa (256,257)
assuming liquid = 0.6*vaporphase-shift Mott-Dirac formulaThomas - Fermiexperimental data of Sanche-Michaud (258)
assuming liquid = icephase-shift Mott-Dirac formula (254)
Table 9.5 - Excitation Cross Sections Used in Liquid Water Monte Carlo Codes
CodeKIPCORECCPA
OREC
CPA
Excitation StateA'B,B!A,Rydberg (A+B)Rydberg (C+D)Diffuse bandsCollectiveSubexcitationelectronsSubexcitationelectrons
Energy8.4 eV
lO.leV11.26eV11.93eV14.1 eV21.4 eV
< 8.4 eV
< 8.4 eV, ——————
Cross Section UsedIntegration of energy loss functionwithin the limits of each peak width,using differential oscillator strengthsdetermined with dielectric responsefunction derived from experiments
Stopping power calculated with opticaldata and Fermi age theoryExper. cross sections of Sanche-Michaud,assuming liquid = ice
704

Table 9.6 - lonization Cross Sections Used in Liquid Water Monte Carlo Codes
CodeKIPC
OREC
CFA
lonization LevelOxygen K shellFor outer shells:8.76 - 25 eV>25eVOxygen K andIb,,lb2,2a,3a, shellsOxygen K shellFor outer shells:lb,, lb„ 2a,,3a,
Cross Section UsedAsymptotic Bethe cross section
Use of dielectric response function andJain-Khare semi-empirical cross sections (259)Partitioning of the imaginary part of thedielectric function between the five levelswith sum rulesGryzinski cross section (260)Partitioning of the dielectric responsefunction between the four levels
Table 9.7 - Initial Radiation Yield, for 5 keV Electron in Liquid Water
CodeKIPCORECCPA
eicm
4.514.364.02
g,T2.303.092.05
Table 9.8 - Yields at 1O12 s for 5 keV Electrons in Liquid Water
Code OH H H, H9Q9 OH" 1KIPCORECCPA
4.86.34.51
6.88.44.8
4.86.34.5
0.842.11.5
0.620.30.4 0.98 0.01
Table 9.9 - Yields at IQ-7 s for 5 keV Electron in Liquid Water
CodeKIPCORECCPA
H^O*3.782.622.6
OH4.652.21.5
e-M
3.321.632.05
H0.850.920.95
H,0.620.760.9
_H2p2_0.800.921.45
OH- |0.46
0.55
Table 9.10 - Calculated Fricke G values at 0.28 IQ-6 s in Liquid Water
CodeKIPCORECCPA
IkeV
12.113.8
5keV18.712.913.4
705

9.7.2.2. Results
Table 9.7 presents initial ionization and excitation yields (at about 1O15 second),resulting from the physical step. Differences may be due to including or not thedeexcitation scheme and then disappear in Table 9.8, obtained after the physico-chemical step.
Table 9.9 is presented at 1O7 second, which is the beginning of a stationary phase.And for greater times it is then possible to calculate the so-called Fricke G value with:
GFricke = 2<JH202 + GOH +3((-JH
Table 9.10 shows Fricke G values calculated for 1 and 5 keV. The KIPC value iscalculated at 1O7 second, with data of Table 9.9.
9.7.3. Remarks
Studies of this nature are important to allow better understanding, modelling andinterpretation of biophysical mechanisms of action of ionizing radiations in biologicalmedia. Although the different codes are developed from the same initial phenomena,methods by which the subsequent processes involved have been treated producedifferent track parameters. These differences could lead to significant differences inphysical, chemical and then in biological interpretations. Therefore more work isneeded to identify the most realistic description for an electron track.
References
1. FANO, U., Ann. Rev. Nucl. Sei. 13 (1963) 1.
2. FANO, U., in Charged Particle Tracks in Solids and Liquids, (ADAMS, G.E.,BEWLEY, O.K., BOAG, J.W., Eds.), Institute of Physics, Conference Series No. 8,London (1970) p. 1.
3. FANO, U., in Radiation Biology, Vol. 1, (HOLLANDER, A., Ed.), McGraw-Hill,New York, (1954) p. 1.
4. SPENCER, L.V., Phys. Rev. 98 (1955) 1597.
5. BERGER, M.J., in Methods in Computational Physics, Vol. 1, (ALDER, B.,FERNBACH, S., ROTENBERG, M., Eds.), Academic Press, New York (1963)p. 135.
6. BOAG, J.W., in Advances in Radiation Research, Vol. 1, (DUPLAN, J.F., CHAPIROA., Eds.), Gordon and Breach, New York (1973) p.9.
7. BOAG, J.W., in Progress and Problems in Contemporary Radiation Chemistry (Proc.of the 10th Czechoslovac Ann. Meeting on Radiât. Chem., Marianske Lazne,Czechoslovakia, June 22-25, 1970) Vol. 1 (TEPLY, J. et al, Eds.), Academy ofScience, Prague (1971) p.19.
706

8. HART, E.J., PLATZMAN, R.L., in Mechanisms in Radiobiology Vol. l (ERRERA,M., FORSSBERG, A., Eds.), Academic Press, New York (1961) p.93.
9. PLATZMAN, R.L., in Radiation Research: Proceedings of the 3rd InternationalCongress, Cortina d'Ampezzo, Italy (Silini, G., Ed.), Wiley, New York (1967) p.20.
10. MOZUMDER, A., in Advances in Radiation Chemistry Vol. 1 (BURTON, M. andMAGEE, J.L., Eds.), Wiley (1969) p.l.
11. MOZUMDER, A., MAGEE, J.L., Radiât. Res. 28 (1966) 203.
12. CASWELL, R.S., COYNE, J.J., Radiât. Res. 52 (1972) 448.
13. CASWELL, R.S., COYNE, J.J., RANDOLPH, M.L., Radiât. Res. 83 (1980) 217.
14. VOLTZ, R., in Progress and Problems in Contemporary Radiation Chemistry, (Proc.of the 10th Czechoslovac Ann. Meeting on Radiât. Chem., Marianske Lazne,Czechoslovakia, June 22-25, 1970) Vol. 1 (TEPLY, J. et al, Eds.), Academy ofScience, Prague (1971) p.45, 139.
15. BRANDT, W., RITCHIE, R.H., in Physical Mechanisms in Radiation Biology,(COOPER, R.D., WOOD, R.W., Eds.), Technical Information Center, US AtomicEnergy Commission, Oak Ridge, TN (1974) p.20.
16. INOKUTI, M., Applied Atomic Collision Physics, Vol. 4, Academic Press, NewYork (1983) p. 179.
17. LEA, D.E., Actions of Radiations on Living Cells, University Press, Cambridge(1946).
18. KATZ, R., SHARMA, S.C., HOMAYOONFAR, M., in Topics in RadiationDosimetry, Radiation Dosimetry Supplement l, (ATTIX, F.H., Ed.), Academic Press,New York (1972) p.317.
19. KATZ, R., KOBETICH, E.J., Phys. Rev. 186 (1969) 344.
20. KATZ, R., KOBETICH, E.J., in Charged Particle Tracks in Solids and Liquids,(ADAMS, G.E., BEWLEY, O.K., BOAG, J.W., Eds.), Institute of Physics,Conference Series No. 8, London (1970) p. 109.
21. KAPLAN, LG., MITEREV, A.M., Adv. Chem. Phys. 68 (1987) 257.
22. PARETZKE, H.G., in Advances in Radiation Protection and Dosimetry, (THOMAS,R.H., PEREZ-MENDEZ, V., Eds.), Plenum Press, New York (1980) p.51.
23. ZERBY, C.D., in Methods in Computational Physics, Vol. 1, (ALDER, B.,FERNBACH, S., ROTENBERG, M., Eds.), Academic, New York (1963) p.89.
24. GROSSWENDT, B., in Eighth Symposium on Microdosimetry, (BOOZ, J., EBERT,H.G., Eds.), EUR 8395, Commission of the European Communities, Luxembourg(1982) p.79.
25. GROSSWENDT, B., WAIBEL, E., Nucl. Instr. Meth. 155, (1978) 145.
707

26. HAMM, R.N., WRIGHT, H.A., RITCHIE, R.H., TURNER, J.E., TURNER, T.P., inFifth Symposium on Microdosimetry, (BOOZ, J., EBERT, H.G., SMITH, B.G.R.,Eds.), Report EUR 5454, Commission of the European Communities, Luxembourg(1976)p.l037.
27. TURNER, I.E., PARETZKE, H.G., HAMM, R.N., WRIGHT, H.A., RITCHIE, R.H.,Radiât. Res. 92 (1982) 47.
28. WRIGHT, H.A., TURNER, I.E., HAMM, R.N., RITCHIE, R.H., MAGEE, J.L.,CHATTERJEE, A., in Eighth Symposium on Microdosimetry, (BOOZ, J., EBERT,H.G., Eds.), EUR 8395, Commission of the European Communities, Luxembourg(1982)p.l01.
29. RITCHIE, R.H., HAMM, R.N., TURNER, I.E., WRIGHT, H.A., in SixthSymposium on Microdosimetry, (BOOZ, J., EBERT, H.G., Eds.), Report EUR 6064,Harwood Academic Publishers, London (1978) p.345.
30. ITO, A., in Monte Carlo Transport of Electrons and Photons, (JENKINS, T.,NELSON, W., RINDI, A., Eds.), Plenum Press, New York (1988) p.361.
31. KAPLAN, I.G., SUKHONOSOV, V. Ya., Radiât. Res. 127 (1991) 1.
32. NELSON, W.R., HIRAYAMA, H., ROGERS, D.W.O., The EGS4 Code System,Stanford Linear Accelerator Center report, SLAC-265 (1985).
33. PARETZKE, H.G., Simulation von Elektronenspuren im Eneergiebereich 0,01-10keV in wasserdampf, Report GSF 24/88, GSF Neuherberg, Munich (1988).
34. PARETZKE, H.G., in Kinetics on Nonhomogeneous Processes, (FREEMAN, G.R.,Ed.), Wiley, New York (1987) p. 89.
35. TERRISSOL, M., BEAUDRE, A., Radiât. Prot. Dosim., 31 (1990) 175.
36. UEHARA, S., NIKJOO, H., GOODHEAD, D.T., Phys. Med. Biol., 38 (1993) 1841.
37. WILSON, W.E., PARETZKE, H.G., in Fourth Symposium on Microdosimetry,(BOOZ, J., EBERT, H.G., EICKEL, R., WAKER, A., Eds.), Report EUR 5122,Commission of the European Communities, Luxembourg (1974) p.l 13.
38. TOBUREN, L.H., WILSON, W.E., in Radiation Research: Proceeding of the 6th Int.Congress, (OKADA, S., IMANURA, M., TERASHIMA, T., YAMAGUCHI, H.,Eds.), Japan Association of Radiation Research, Tokyo (1979) p.80.
39. TOBUREN, L.H., Phys. Rev. A3 (1971).
40. TOBUREN, L.H., WILSON, W.E., J. Chem. Phys. 60 (1977) 5202.
41. ZAIDER, M., BRENNER, D.J., Radiât. Res. 100 (1984) 213.
42. ZAIDER, M., BRENNER, D.J., Radiât. Res. 100 (1984) 245.
43. EVANS, R.D., in Radiation Dosimetry, Vol. 1 (ATTIX, F.H., ROESCH, W.C.,Eds.), Academic Press, New York (1968) p.93.
708

44. EVANS, R.D., The Atomic Nucleus, McGraw-Hill, New York (1955).
45. DYSON, N.A., X-Rays in Atomic and Nuclear Physics, Longmans Green, New York(1973).
46. ANDERSON, D.A., Absorption of Ionizing Radiation, University Park Press,Baltimore (1984).
47. JOHNS, H.E., CUNNINGHAM, J.R., The Physics of Radiology, Charles ThomasPublisher, Springfield IL (1984).
48. PLECHATY, E.F., CULLEN, D.E., HOWERTON, R.J., Tables and Graphs ofPhoton-Interaction Cross Sections form 0.1 keV to 100 MeV derived from the LLLEvaluated-Nuclear Data Library, Lawrence Livermore National Laboratory, ReportUCRL-50400, Vol. 6, Rev. 3, Livermore, CA (1981).
49. BLOHM, R., Durchgang von Elektronen durch Strahlenempfindliche Bereiche desZellkerns, Dissertation, Universität Göttingen, Federal Republic of Germany (1983).
50. BROWNELL, G.L., ELLETT, W.H., REDDY, A.R., J. Nucl. Med., MIRD 3 (1968)27.
51. BECKURTS, K.H., WIRTZ, K., Neutron Physics, Springer-Verlag, Berlin (1964).
52. INTERNATIONAL COMMISSION ON RADIATION UNITS ANDMEASUREMENTS, Neutron Dosimetry for Biology and Medicine, ICRU-Report 26,ICRU, Bethesda MD (1977).
53. HOWERTON, R.J., CULLEN, D.E., MACGREGOR, M.H., PERKINS, S.T.,PLECHATY, E.F., The LLL Evaluated Nuclear Data Library (ENDL): Graphs ofCross Sections from the Library, UCRL-50400, Vol. 15, Part B, University ofCalifornia, Berkeley (1976).
54. MUGHABGHAB, S.F., GARBER, D. (Eds.), Neutron Cross Sections, Vol. I,Resonance Parameters, BNL-325, Brookhaven National Laboratory, Upton, NY(1973).
55. KINSEY, R.R., GARBER, D.I. (Eds.), Neutron Cross Sections, Vol. II, GraphicalData, BNL-325, Brookhaven National Laboratory, Upton, NY (1979).
56. GOLDBERG, M.D., MUGHABGHAB, S.F., PUROHIT, S.N., MAGURNO, B.A.,MAY, V.M. (Eds.), Neutron Cross Sections, Vol. IIB, Z = 41-60, Report BNL-325,Brookhaven National Laboratory, Upton, NY (1966).
57. GARBER, D.I., STROMBERG, L.E., GOLDBERG, M.D., CULLEN, D.W., MAY,V.M. (Eds.), Angular Distributions in Neutron Induced Reactions, Vol. I: Z = 1-20,Vol. II, Z = 21-94, BNL-400, Brookhaven National Laboratory, Upton, NY (1970).
58. EDWARDS, A.A., DENNIS, J.A., Phys. Med. Biol., 20 (1975) 395.
59. PARETZKE, H.G., GRÜNAUER, F., MAffiR, E., BURGER, G., in FirstSymposium on Neutron Dosimetry in Biology and Medicine, (BURGER, G.,SCHRAUBE, H., EBERT, H.G., Eds.), EUR 4896, Commission of the EuropeanCommunities, Luxembourg (1972) p.73.
709

60. OLDENBURG, U., BOOZ, J., Radiât. Res. 51 (1972) 551.
61. BOOZ, J., COPPOLA, M., in Annual Report of the Joint Research Center, EUR5260, Commission of the European Communities, Luxembourg (1974) p.396.
62. CHRISTOPHOROU, L.G., Atomic and Molecular Radiation Physics, Wiley, NewYork (1971).
63. CHRISTOPHORU, L.G. (Ed.), Electron-Molecule Interactions and theirApplications, 2 vols., Academic Press, New York (1984).
64. SCHNATTERLY, S.E., in Solid State Physics, Vol. 34, (EHRENREICH, H., SEITZ,F., TURNBULL, D., Eds.), Academic Press, New York (1979) p.275.
65. RAETHER, H., Excitations of Plasmons and Interband Transitions in Solids,Springer Tracts in Modern Physics 88, Springer-Verlag, New York (1980) p.l.
66. KLOTS, C.E., in Fundamental Processes in Radiation Chemistry, (AUSLOOS, P.,Ed.), Wiley, New York (1968) p.l.
67. MOTT, N.F. MASSEY, H.S.W., The Theory of Atomic Collisions, Third Edition,Oxford University Press, London (1965).
68. MASSEY, H.S.W., BURHOP, E.H.S., and GILBODY, H. B., Electronic and IonicImpact Phenomena, Second Edition in Five Volumes, Clarendon Press, Oxford(1969-1974).
69. INOKUTI, M., KIM, Y.-K., PLATZMAN, R.L., Phys. Rev. 164 (1967) 55.
70. SPENCER, L.V., FANO, U., Phys. Rev. 93 (1954) 1172.
71. DOUTHAT, D.A., Radiât. Res. 61 (1975) 1.
72. FANO, U., SPENCER, L.V., Int. J. Radiât. Phys. Chem. 7 (1975) 63.
73. FANO, U., Phys. Rev. 72 (1947) 26.
74. INOKUTI, M., DOUTHAT, D.A., RAO, A.R.P., Phys. Rev. A22 (1980) 445.
75. ALKHAZOV, D.G., KOMAR, A.P., VOROB'V, A.A., Nucl. Instr. Meth. 48 (1967)1.
76. NEUMANN, W., in Seventh Symposium on Microdosimetry, (BOOZ, J., EBERT,H.G., HARTFIEL, H.D., Eds.), EUR 7147, Harwood Academic, London (1981)p. 1067.
77. PARETZKE, H.G., TURNER, I.E., HAMM, R.N., WRIGHT, H.A., RITCHIE, R.H.,J. Chem. Phys. 84 (1986) 3182.
78. COMBECHER, D., Radiât. Res. 84 (1980) 189.
79. INTERNATIONAL COMMISSION ON RADIATION UNITS ANDMEASUREMENTS, Stopping Power for Electrons and Positrons, ICRU-Report 37,ICRU, Bethesda MD (1984).
710

80. SAMUEL, A.H., MAGEE, J.L., J. Chem. Phys. 21 (1953) 1080.
81. WILSON, W.E., TOBUREN, L.H., Phys. Rev. A7 (1973) 1535.
82. BETZ, H-D., Rev. Mod. Phys. 44 (1972) 465.
83. BETZ, H-D., WITTKOWER, A.B., Phys. Rev. A 6 (1972) 1485.
84. NORTHCLIFFE, L.C., SCHILLING, R.F., Nucl. Data A 7 (1970) 233.
85. WILLIAMSON, C.F., BOUJOT, J.P., PICARD, J., Tables of Range and StoppingPower of Chemical Elements for Charged Particles of Energy 0.5 to 500 MeV,Rapport CEA-R 3042, Fontenay-aux-Roses (1966).
86. DIMITRIEV, I.S., NIKOLAEV, V.S., Soviet Phys. JETP 20 (1965) 409.
87. NIKOLAEV, V.S., DIMITRIEV, I.S., Phys. Lett. 28A (1968) 277.
88. PARETZKE, H.G., in Fourth Symposium on Microdosimetry, (BOOZ, J., EBERT,H.G., EICKEL, R., WAKER, A., Eds.), Report EUR 5122, Commission of theEuropean Communities, Luxembourg (1974) p. 141.
89. BARKAS, W.F., Nuclear Research Emulsions, Academic Press, New York (1963).
90. BETHE, H.A., Ann. Phys. 5 (1930) 325.
91. BETHE, H.A., in Handbuch der Physik, Vol. 24, Part I, (GEIGER, H., SCHEEL, K.,Eds.), Springer-Verlag, Berlin (1933) p.273.
92. INOKUTI, M., Rev. Mod. Phys. 43 (1971) 297.
93. INOKUTI, M., ITIKAWA, Y., TURNER, J.E., Rev. Mod. Phys. 50 (1978) 23.
94. BICHSEL, H., in American Institute of Physics Handbook, 3rd ed., (GRAY, D.E.,Ed.), McGraw-Hill, New York(1972) p.8.142.
95. BICHSEL, H., in Radiation Dosimetry, Vol. l (ATTIX, F.H., ROESCH, W.C., Ed.),Academic Press, New York (1968) p. 157.
96. NORTHCLIFFE, L.C., Ann. Rev. Nucl. Sei. 13 (1963) 67.
97. SIGMUND, P., in Radiation Damage Processes in Materials, (DUPUY, C.H.S., Ed.),Noordhoff, Leyden (1975) p. 3.
98. LINDHARD, J., SCHARFF, M., DANSKE, K., Vidensk. Selsk. Mat.-Fys. Medd. 34(1953).
99. AHLEN, S.P., Rev. Mod. Phys. 52 (1980) 121.
100. INTERNATIONAL COMMISSION ON RADIATION UNITS ANDMEASUREMENTS, Basic Aspects of High Energy Particle Interactions andRadiation Dosimetry, Report 28, ICRU, Bethesda MD (1978).
101. RITCHIE, R.H., BRANDT, W., Phys. Rev. A 17 (1978) 2102.
711

102. STEWARD, P.G., Stopping Power and Range for any Nucleus in the Specific EnergyInterval 0.01-500 MeV/amu in Any Nongaseous Material, UCRL-18127, Universityof California, Berkeley (1968).
103. ANDERSEN, H.H., The Stopping and Ranges of Ions in Matter, Vol. 2, Bibliographyand Index of Experimental Range and Stopping Power Data, Pergamon Press, NewYork (1977).
104. ANDERSEN, H.H., ZIEGLER, J.F., Ref. 75a, Vol. 3, Hydrogen: Stopping Powersand Ranges in all Elements (1977).
105. ZIEGLER, J.F., Ref. 75a, Vol. 4, Helium: Stopping Powers and Ranges in allElemental Matter (1977).
106. ZIEGLER, J.F., Ref. 75a, Vol. 5, Handbook of Stopping Cross Sections for EnergeticIons in all Elements (1980).
107. DENNIS, J.A., POWERS, D., in Sixth Symposium on Microdosimetry, (BOOZ, J.,EBERT, H.G., Eds.), Report EUR 6064, Harwood Academic Publishers, London(1978) p.661.
108. PALMER, R.B.J., AKHAVAN-REZAYAT, A., in Sixth Symposium onMicrodosimetry, (BOOZ, J., EBERT, H.G., Eds.), Report EUR 6064, HarwoodAcademic Publishers, London (1978) p.739.
109a. VAVILOV, P.V., Sov. Phys. JETP 5 (1957) 749.
109b. BICHSEL, H., Rev. Med. Phys. 60 (1988) 663.
110. TSCHALÄR, C., MACCABEE, H.D., Phys. Rev. B l (1970) 2863.
111. KELLERER, A.M., CHMELEVSKY, D., Radiât. Res. 63 (1975) 226.
112. INTERNATIONAL COMMISSION ON RADIATION UNITS ANDMEASUREMENTS, Microdosimetry, ICRU-Report 36, ICRU, Bethesda, MD(1983).
113. STORM, E., ISRAEL, H.I., Nucl. Data Tabl. A7 (1971) 565.
114. BOOZ, J., in Third Symposium on Neutron Dosimetry in Biology and Medicine,(BURGER, G., EBERT, H.G., Eds.), EUR 5848, Commission of the EuropeanCommunities, Luxembourg, p.499 (1978).
115. PARETZKE, H.G., BERGER, M., in Sixth Symposium on Microdosimetry, (BOOZ,J., EBERT, H.G., Eds.), Report EUR 6064, Harwood Academic Publishers, London(1978) p.749.
115a. COMBECHER, D., KOLLERBAUR, J., LEUTHOLD, G., PARETZKE, H.G.,BURGER, G., in Sixth Symposium on Microdosimetry, (BOOZ, J., EBERT, H.G.,Eds.), Report EUR 6064, Harwood Academic Publishers, London (1978) p.295.
116. BERGER, M.J., in Second Symposium on Microdosimetry, (EBERT, H.G., Ed.),Report EUR 4452, Commission of the European Communities, Brussels (1969)p.541.
712

116a. BERGER, M.J., in Third Symposium on Microdosimetry, (EBERT, H.G., Ed.), EUR4810, Commission of the European Communities, Luxembourg (1972) p. 157.
116b. BERGER, M.J., SELTZER, S.M., MAEDA, K., J. Atmos. Terr. Phys. 32 (1970)1015.
117a. TERRISSOL, M., PATAU, J.P., in Seventh Symposium on Microdosimetry, (BOOZ,J., EBERT, H.G., HARTFIEL, H.D., Eds.), EUR 7147, Harwood Academic, London(1981)p.414.
117b. TERRISSOL, M., PATAU, J.P., EUDALDO, T., in Sixth Symposium onMicrodosimetry, (BOOZ, J., EBERT, H.G., Eds.), Report EUR 6064, HarwoodAcademic Publishers, London (1978) p. 169.
118. SINGHAL, R.P., JACKMAN, C.H., GREEN, A.E.S., J. Geophys. Res. 85 (1980)1246.
119. GREEN, A.E.S., RIO, D.E., in Workshop on the Interface between RadiationChemistry and Radiation Physics, Argonne National Laboratory, Report ANL-82-88(1982) p.65.
120. KYSER, D.F., in Electron Beam Interactions with Solids for Microscopy,Microanalysis and Microlithography, Scanning Electron Microscopy, POB 66507,AME O'Hare, IL (1984) p.l 19.
121. NEWBURY, D.E., MYKLEBUST, R.L., in Electron Beam Interactions with Solidsfor Microscopy, Microanalysis and Microlithography, Scanning Electron Microscopy,POB 66507, AMF O'Hare, IL (1984) p. 153.
122. REIMER, L., Optik 27 (1968) 86.
123. SHIMIZU, R., KATAOKA, Y., IKUTA, T., KOSHIKAWA, T., HASHIMOTO, H.,J. Phys. D 9 (1976) 101.
124. MURATA, K., KYSER, D.F., TING, C.H., J. Appl. Phys. 52 (1981) 4396.
125. LOVE, G., COX, M.G., SCOTT, V.D., J. Phys. D 10 (1977) 7.
126. TAN, K.H., BRION, C.E., VAN DER LEEUW, P.E. VAN DER WTEL, M.J., Chem.Phys. 29 (1978).
127. PARETZKE, H.G., LEUTHOLD, G., BURGER, G., JACOBI, W., in FourthSymposium on Microdosimetry, (BOOZ, J., EBERT, H.G., EICKEL, R., WAKER,A., Eds.), Report EUR 5122, Commission of the European Communities,Luxembourg (1974) p.123.
128. BAUM, J.W., VARMA, M.N., WINGATE, C.L., PARETZKE, H.G., KUEHNER,A.V., in Fourth Symposium on Microdosimetry, (BOOZ, J., EBERT, H.G., EICKEL,R., WAKER, A., Eds.), Report EUR 5122, Commission of the EuropeanCommunities, Luxembourg (1974) p.93.
129. PARETZKE, H.G., SCHINDEL, F., in Seventh Symposium on Microdosimetry,(BOOZ, J., EBERT, H.G., HARTFIEL, H.D., Eds.), EUR 7147, Harwood Academic,London (1981) p.387.
713

130. WILSON, W.E., PARETZKE, H.G., Radiât. Res. 87 (1981) 521.
131. MALBERT, M., CAREL, C, PATAU, J.P., TERRISSOL, M., in SeventhSymposium on Microdosimetry, (BOOZ, J., EBERT, H.G., HARTFIEL, H.D., Eds.),EUR 7147, Harwood Academic, London (1981) p.359.
132. CHARLTON, D.E., GOODHEAD, D.T., WILSON, W.E., PARETZKE, H.G.,Energy Deposition in Cylindrical Volumes: a) Protons, Energy 0.3-4.0 MeV, b)Alpha Particles, Energy 1.2-20.0 MeV, Monograph 85/1, Medical Research Council,Radiobiology Unit, Chilton (1985).
133. ZAIDER, M., BRENNER, D.J., WILSON, W.E., Radiât. Res. 96 (1983) 231.
134. FOWLER, P.H., in Advances in Radiation Research, vol. 1, (DUPLAN, J.F.,CHAPIRO, A., Eds.), Gordon and Breach, New York (1973) p.39.
135. PARETZKE, H.G., in Solid State Nuclear Track Detectors: Proceedings of the llthInternational Conference, Bristol, Pergamon Press, Oxford (1982) p.3.
135a. PARETZKE, H.G., in Eighth Symposium on Microdosimetry, (BOOZ, J., EBERT,H.G., Eds.), EUR 8395, Commission of the European Communities, Luxembourg(1982) p.67.
136. PARETZKE, H.G., in Sixth Symposium on Microdosimetry, (BOOZ, J., EBERT,H.G., Eds.), Report EUR 6064, Harwood Academic Publishers, London (1978)p.925.
137. BURGER, G., COMBECHER, D., KOLLERBAUR, J., LEUTHOLD, G., IBACH,T., PARETZKE, H.G., in Seventh Symposium on Microdosimetry, (BOOZ, J.,EBERT, H.G., HARTFIEL, H.D., Eds.), EUR 7147, Harwood Academic, London(1981)p.537.
138. INTERNATIONAL COMMISSION ON RADIATION UNITS ANDMEASUREMENT, Radiation Quantities and Units, ICRU-Report 33, ICRU,Bethesda MD (1980).
139. INTERNATIONAL COMMISSION ON RADIATION UNITS ANDMEASUREMENTS, Neutron Fluence, Neutron Spectra and Kerma, ICRU-Report 13,ICRU, Washington, DC (1969).
140. NATIONAL COUNCIL ON RADIATION PROTECTION AND MEASUREMENT,Protection against Neutron Radiation, NCRP-Report 38, NCRP-Publications,Washington, DC (1971).
141. COYNE, J.J., in Ion Chambers for Neutron Dosimetry, (BROERSE, J.J., Ed.),Commission of the European Communities, EUR 6782, Harwood AcademicPublishers, London, p. 195 (1980).
142. COHEN, M., JONES, D.E.A., GREENE, D., Br. J. Radiol. Suppl. 11 (1972) 12; 11(1972) 81.
142a. BICHSEL, H. et al., in First Symposium on Neutron Dosimetry in Biology andMedicine, Commission of the European Communities, Luxembourg, EUR 4896(1972)p.93.
714

142b. B1CHSEL, H. et al, in Biomédical Dosimetry, IAEA publ. 401 (1975) p.3.
143. KELLERER, A.M., ROSSI, H.H., Curr. Top. Radiât. Res. Q. 8 (1972) 85.
144. KLIAUGA, P.J., DVORAK, R., Radiât. Res., 73 (1978) 1.
145. BRENNER, D., ZAIDER, M., DICELLO, J.F., BICHSEL, H., in SeventhSymposium on Microdosimetry, (BOOZ, J., EBERT, H.G., HARTFIEL, H.D., Eds.),Report EUR 7147, Harwood Academic Publishers, London (1981) p. 677.
145a. RUBACH, A., BICHSEL, H., Phys. Med. Biol. 27 (1982) 893.
145b. RUBACH, A., BICHSEL, H., Phys. Med. Biol. 27 (1982) 1003.
145c. RUBACH, A., BICHSEL, H., Phys. Med. Biol. 27 (1982) 1231.
145d. RUBACH, A., BICHSEL, H., Phys. Med. Biol. 27 (1982) 1455.
145e. RUBACH, A., BICHSEL, R, Phys. Med. Biol. 28 (1983) 913.
146. GOODHEAD, D.T., in The Dosimetry of Ionizing Radiation, Vol. II, (KÄSE, K.R.,BJÄRNGARD, B.E., ATTIX, F.H., Eds.), Academic Press, Orlando (1987) p.l.
147. CHARLTON, D.E., GOODHEAD, D.T., WILSON, W.E., PARETZKE, H.G.,Radiât. Prot. Dosim. 13 (1985) 123.
148. NIKJOO, H., GOODHEAD, D.T., CHARLTON, D.E., PARETZKE, H.G., Phys.Med. Biol. 34 (1989) 691.
149. NIKJOO, H., GOODHEAD, D.T., CHARLTON, D.E., PARETZKE, H.G., Int. J.Radiât. Biol. 60 (1991) 739.
150. CHARLTON, D.E., GOODHEAD, D.T., WILSON, W.E., PARETZKE, H.G.,Energy Deposition in Cylindrical Volumes: (a) Protons, Energy 0.3 MeV to 4.0 MeV,(b) Alpha Particles 1.2 MeV to 20.0 MeV. MRC Radiobiology Unit Monograph85/1, Medical Research Council Radiobiology Unit, Didcot, U.K. (1985).
151. NIKJOO, H., GOODHEAD, D.T., CHARLTON, D.E., PARETZKE, H.G., EnergyDeposition in Cylindrical Volumes in Water Irradiated with Ultrasoft X-rays ofEnergy 0.28, 1.5, 4.5 and 8.1 keV. MRC Radiobiology Unit Monograph 88/1,Medical Research Council Radiobiology Unit, Didcot, U.K. (1988).
152. NIKJOO, H., GOODHEAD, D.T., CHARLTON, D.E., PARETZKE, H.G., EnergyDeposition in Cylindrical Targets by Monoenergetic Electrons, 100 eV to 100 keV.MRC Radiobiology Unit Monograph, Medical Research Council Radiobiology Unit,Didcot, U.K. (in press).
153. NIKJOO, H., TERRISSOL, M., HAMM, R.N., TURNER, J., UEHARA, S.,PARETZKE, H.G., GOODHEAD, D.T., Radiât. Prot. Dosim. (in press).
154. NIKJOO, H., UEHARA, S., in Proc. DOE Workshop on Monte Carlo Methods inTrack Structure, 27-29 April 1993, Irvine, California (in press).
155. WILSON, W.E., METTING, N.F., Radiât. Res. 115 (1988) 389.
715

156. MICHALIK, V., Phys. Med. Biol. 36 (1991) 1001.
157. PARETZKE, H.G., TURNER, I.E., HAMM, R.N., WRIGHT, H.A., RITCHIE, R.H.,Radiât. Res. 127 (1991) 121.
158. MITEREV, A.M., High Energy Chemistry 21 (1987) 332.
159. BUTTS, J.J., KATZ, R., Radiât. Res. 30 (1967) 855.
160. MTTEREV, A.M., KAPLAN, LG., BORISOV, E.A., High Energy Chemistry 8(1974)461.
161. INTERNATIONAL COMMISSION ON RADIATION UNITS ANDMEASUREMENTS, Linear Energy Transfer, ICRU-Report 16, ICRU, Bethesda MD(1970).
162. PARETZKE, H.G., in Solid State Nuclear Track Detectors: Proceedings of the 9thInternational Conference, Neuherberg/Munich, Pergamon Press, Oxford (1978) p.87.
163. BENTON, E.V., NIX, W., Nucl. Instr. Meth. 67 (1969) 343.
164. ROHRLICH, F., CARLSON, B.C., Phys. Rev. 93 (1954) 38.
165. WINGATE, C.L., BAUM, J.W., Radiât. Res. 65 (1976) 1.
166. BAUM, J.W., in Second Symposium on Microdosimetry, (EBERT, H.G., Ed.),Report EUR 4452, Commission of the European Communities, Brussels (1969)p.653.
167. VARMA, M.N., PARETZKE, H.G., BAUM, J.W., LYMAN, J.T., HOWARD, J., inFifth Symposium on Microdosimetry, (BOOZ, J., EBERT, H.G., SMITH, B.G.R.,Eds.), Report EUR 5454, Commission of the European Communities, Luxembourg(1976) p.75.
168. VARMA, M.N., BAUM, J.W., KUEHNER, A.V., Radiât. Res. 62 (1975) 1.
169. VARMA, M.N., BAUM, J.W., Radiât. Res. 81 (1980) 363.
170. VARMA, M.N., BAUM, J.W., KUEHNER, A.V., Phys. Med. Biol. 25 (1980) 651.
171. VARMA, M.N., BAUM, J.W., KLIAUGA, P., in Sixth Symposium onMicrodosimetry, (BOOZ, J., EBERT, H.G., Eds.), Report EUR 6064, HarwoodAcademic Publishers, London (1978) p.227.
172. KLIAUGA, P., ROSSI, H.H., in Fifth Symposium on Microdosimetry, (BOOZ, J.,EBERT, H.G., SMITH, B.G.R., Eds.), Report EUR 5454, Commission of theEuropean Communities, Luxembourg (1976) p. 127.
173. MENZEL, H.G., BOOZ, J., in Fifth Symposium on Microdosimetry, (BOOZ, J.,EBERT, H.G., SMITH, B.G.R., Eds.), Report EUR 5454, Commission of theEuropean Communities, Luxembourg (1976) p.61.
716

174. m ACH, T., COMBECHER, D., in Seventh Symposium on Microdosimetry, (BOOZ,J., EBERT, H.G., HARTFIEL, H.D., Eds.), EUR 7147, Harwood Academic, London
175. MOZUMDER, A., J. Chem. Phys. 60 (1974) 1 145.
176. CHATTERJEE, A., MACCABEE, H., TOBIAS, C, Radiât. Res. 54 (1973) 479.
177. CHATTERJEE, A., SCHÄFER, HJ., Radiât. Environ, Biophys. 13 (1976) 215.
178. FAIN, J., MONNIN, M., MONTRET, M., in Fourth Symposium on Microdosimetry,(BOOZ, J., EBERT, H.G., EICKEL, R., WAKER, A., Eds.), Report EUR 5122,Commission of the European Communities- Luxembourg (1974) p. 169.
179. MONNIN, M., in International Topical Conference on Nuclear Track Registration inInsulating Solids and Applications, Vol. l, (ISABELLE, D., MONNIN, M., Eds.),Université de Clermont-Ferrand (1969) p. 11-73.
180. HANSEN, J.W., OLSEN, K.J., Radiât. Res. 97 (1984) 1.
181. LA VERNE, J.A., SCHULER, R.H., J. Phys. Chem. 88 (1984) 1200.
182. LA VERNE, J.A., SCHULER, R.H., J. Phys. Chem. 91 (1987) 5770.
183. BIBLER, N.E., J. Phys. Chem. 79 (1975) 1991.
184. MITEREV, A.M., MAMEDJAROV, D.Y., KAPLAN, I.G., High Energy Chem. 26(1992) 20.
185. MAGEE, J.L., J. Chim. Phys. 52 (1955) 528.
186. MOZUMDER, A., MAGEE, J.L, J. Chem. Phys. 45 (1966) 3332.
187. MAGEE, J.L, CHATTERJEE, A., in Radiation Research: Proceeding of the 6thIntern. Congress, (OKADA, S., IMANURA, M., TERASHIMA, T., YAMAGUCHI,H., Eds.), Japan Association of Radiation Research, Tokyo (1979) p. 166.
188. KUPPERMANN, A., in Radiation Research: Proceedings of the 3rd InternationalCongress, Cortina d'Ampezzo, Italy, (SILINI, G., Ed.), Wiley, New York (1967)p.212.
189. FREEMAN, G.R., in Workshop on the Interface between Radiation Chemistry andRadiation Physics, Argonne National Laboratory, Report ANL-82-88 (1982) p.9.
190. BURNS, W.G., in Seventh Symposium on Microdosimetry, (BOOZ, J., EBERT,H.G., HARTFIEL, H.D., Eds.), EUR 7147, Harwood Academic, London (1981)p.471.
191. BERGER, M.J., in Seventh Symposium on Microdosimetry, (BOOZ, J., EBERT,H.G., HARTFIEL, H.D., Eds.), EUR 7147, Harwood Academic, London (1981)p.521.
717

192. TURNER, J.E., MAGEE, J.L., HAMM, R.N., CHATTERJEE, A., WRIGHT, H.A.,RITCHIE, R.H., in Seventh Symposium on Microdosimetry, (BOOZ, J., EBERT,H.G., HARTFIEL, H.D., Eds.), EUR 7147, Harwood Academic, London (1981)p.507.
193. MILLER, J.H., WILSON, W.E., in Workshop on the Interface between RadiationChemistry and Radiation Physics, Argonne National Laboratory, Report ANL-82-88(1982) p.73.
194. GRAY, L.H., Br. J. Radiol, 10 (1937) 600; (1937) 721.
195. PARETZKE, H.G., in Fifth Symposium on Microdosimetry, (BOOZ, J., EBERT,H.G., SMITH, B.G.R., Eds.), Report EUR 5454, Commission of the EuropeanCommunities, Luxembourg (1976) p.41.
196. DELAFIELD, HJ., HOLT, P.D., in Charged Particle Tracks in Solids and Liquids,(ADAMS, G.E., BEWLEY, O.K., BOAG, J.W., Eds.), Institute of Physics,Conference Series No. 8, London (1970) p.35.
197. BUDD, T., MARSHALL, M., Radiât. Res. 93 (1983) 19.
198. BUDD, T., KWOK, C.S., MARSHALL, M., LYTHE, S., Radiât. Res. 95 (1983) 217.
199. SPATH, H., Cluster Analysis Algorithms for Data Reduction and Classification ofObjects, Wiley, New York (1980).
200. SOKAL, R.R., in Classification and Clustering, (VAN RYZIN, J., Ed.), AcademicPress, New York (1977) p.l.
201. SNEATH, P.H.A., SOKAL, R.R., Nature 193 (1962) 855.
202. SOKAL, R.R., ROHLF, F.J., Taxonomy 11 (1962) 33.
203. SNEATH, P.H.A., SOKAL, R.R., Numerical Taxonomy, Freeman, San Francisco(1973).
204. ZADEH, L.A., in Classification and Clustering, (VAN RYZIN, J., Ed.), AcademicPress, New York (1977) p.251.
205. BEZDEK, J.C., J. Math. Biol. 1 (1974) 57.
206. KACPRZYK, J., YAGER, R.R. (Eds.), Management Decision Support SystemsUsing Fuzzy Sets and Possibility Theory, Verlag TÜV Rheinland, Köln (1985).
207. GOGALA, E., Probabilistic Sets in Decision Making and Control, Verlag TÜVRheinland, Köln (1984).
208. HAKEN, H. (Ed.), Pattern Formation by Dynamic Systems and Pattern Recognition,Springer-Verlag, Berlin (1979).
209. FU, K.S., Digital Pattern Recognition, Springer-Verlag, Berlin (1976).
718

210. CHEN, C.H. (Ed.), Pattern Recognition and Artificial Intelligence, Academic Press,New York (1976).
210a. INOKUT1, M., Radiât. Eff. Defects Solids 117 (1991) 143.
211. SWANSON, N., POWELL, C.J., Phys. Rev. 145 (1966) 195.
212. KAPLAN, LG., MITEREV, A.M., SUKHONOSOV, V. Ya, Radiât. Phys. Chem. 27(1986) 83.
213. KAPLAN, LG., IAEA -TECDOC 506 (1989) 80.
214. KAPLAN, LG., MITEREV, A.M., SUKHONOSOV, V. Ya, Radiât. Phys. Chem. 36(1990) 493.
215. GOODHEAD, D.T., LEENHOUTS, H.P., PARETZKE, H.G., TERRISSOL, M.,NIKJOO, H., BLAAUBOER, R., Radiât. Prot. Dosim. (in press).
216. PROC. TENTH SYMP. ON MICRODOSIMETRY, Radiât. Prot. Dosim. 31 (1990)1-4.
217. PROC. ELEVENTH SYMP. ON MICRODOSIMETRY, Gatlinburg, Sept 1992.Radiât. Prot. Dosim. (in press).
218. HOWELL, R.W., NARRA, V.R., SASTRY, K.S.R., RAO, D.V. (Eds.), BiophyiscaïAspects of Auger Processes. American Institute of Physics, Woodbury, USA (1992).
219. CHADWICK, K.H., MOSCHINI, G., VARMA, M.N. (Eds.), Biophysical Modellingof Radiation Effects, Adam Hilger, Bristol (1992).
220. PROC. DOE WORKSHOP ON MONTE CARLO METHODS IN TRACKSTRUCTURE, 27-29 April 1993, Irvine, California (in press).
221. NYGAARD, O.P., SINCLAIR, W.K., LETT, J.T. (Eds.), Effects of Low Dose andLow Dose Rate Radiation, Advances in Radiât. Biol. 16, Academic Press, San Diego(1992).
222. GOODHEAD, D.T., MUNSON, R.J., THACKER, J., COX, R., Int. J. Radiât. Biol.37 (1980)135.
223. GOODHEAD, D.T., BRENNER, D.J., Phys. Med. Biol. 28 (1983) 485.
224. GOODHEAD, D.T., NIKJOO, H., Int. J. Radiât. Biol. 55 (1989) 513.
225. HOWARD-FLANDERS, P., Adv. Biol. Med. Phys. 6 (1958) 553.
226. BARENDSEN, G.W., Int. J. Radiât. Biol. 8 (1964) 453.
227. GOODHEAD, D.T., Int. J. Radiât. Biol. 56 (1989) 623.
228. GOODHEAD, D.T., THACKER, J., COX, R., Int. J. Radiât. Biol. 63 (1993) 543.
719

229. GOODHEAD, D.T., Int. J. Radiât. Biol. 65 (Jan. 1994).
230. CHARLTON, D.E., NIKJOO, H., GOODHEAD, D.T., in Radiation Research, Atwentieth-Century Perspective, (DEWEY, W.C., EDINGTON, M., FRY, R.J.M.,HALL, E.J., WHITMORE, G.F., Eds.) (1992) p. 421.
231. GOODHEAD, D.T., CHARLTON, D.E., WILSON, W.E., PARETZKE, H.G., inRadiation Protection: Fifth Symposium on Neutron Dosimetry, (SCHRAUBE, H.,BURGER, G., BOOZ, J.J., Eds.), Report EUR 9762, Commission of the EuropeanCommunities, Luxembourg (1985) p. 57.
232. GOODHEAD, D.T., THACKER, J., COX, R., Phys. Med. Biol. 26 (1981) 1115.
233. CHARLTON, D.E., NIKJOO, H., HUMM, J.L., Int. J. Radiât. Biol. 56 (1989) 1.
234. MICHALIK, V., Int. J. Radiât. Biol. 62 (1992) 9.
235. MICHALIK, V., Radiât. Environm. Biophys. 32 (1993) 251.
236. BRENNER, D.J., WARD, J.F., Int. J. Radiât. Biol. 61 (1992) 737.
237. PRUPPERS, M.J.M., LEENHOUTS, H.P., CHADWICK, K.H., Radiât. Prot. Dosim.31 (1990) 185.
238. HANSEN, J.W., OLSEN, K.J., Radiât. Res. 97 (1984) 1.
239. COX, R., MASSON, W.K., Int. J. Radiât. Biol. 36 (1979) 149.
240. WILSON, W.E., PARETZKE, H.G., Radiât. Res. 81 (1980) 326.
241. HENSS, S., Biophysikalisches Modell zur Induktion Dizentrischer Chromosomendurch Ionisierende Strahlung, Dissertation, Technische Universität, München (1991).
242. HENSS, S., PARETZKE, H.G., in Biophysical Modelling of Radiation Effects,(CHADWICK, K.H., MOSCHINI, G., VARMA, M.N., Eds.), Adam Hilger, Bristol(1992) p. 69.
243. LONG, K.A., PARETZKE, H.G., MUILLER-PLATHE, F., DIERCKSEN, G.H.F., J.Chem. Phys. 91 (1989) 1569.
244. LONG, K.A., PARETZKE, H.G., J. Chem. Phys. 95 (1991) 1049.
245. CHARLTON, D.E., HUMM, J.L., Int. J. Radiât. Biol. 53 (1988) 353.
246. MILLAR, B.C., SAPORA, O., FIELDEN, E.M., LOVELOCK, P.S., Radiât. Res. 86(1981) 506.
247. BOYE, E., KIRSCH, R.E., Int. J. Radiât. Biol. 37 (1980) 119.
248. MARK, F., BECKER, U., HERAK, J.N., SCHULTE-FROHLINDE, D., Radiât.Environm. Biophys. 28 (1989) 81.
720

249. VON SONNTAG, C., The Chemical Basis of Radiation Biology, Taylor & Francis,London (1981).
250. HOLLEY, W.R., CHATTERJEE, A., in The Early Effects of Radiation on DNA,(FffiLDEN, E.M., O'NEILL, P., Eds.), NATO ASI Series (1991) p. 195.
251. WRIGHT, H.A., HAMM, R.N., TURNER, J.E., HOWELL, R.W., RAO, D.V.,SASTRY, K.S.R., Radiât. Prot. Dosim., 31 (1990) 59.
252. TERRISSOL, M., POMPLUN, E., Radiât. Prot. Dosim. (in press).
252a. KALOS, M.H., WHITLOCK, P.A., Monte Carlo Methods Vol. I: Basics. Wiley andSons, New York (1986).
253. HAMM, R.N., TURNER, J.E., RITCHIE, R.H., WRIGHT, H.A., Radiât. Res. 104(1985) S20.
254. TERRISSOL, M., Méthode de simulation du transport des électrons d'énergiescomprises entre 10 eV et 30 keV. Thesis no 839 UPS Toulouse (1978).
255. DANJO, A., NISHIMURA, H., J. Phys. Soc., Japan, 54 (1985) 1224.
256. ITIKAWA, Y., J. Phys. Soc. Japan, 36 (1974) 1127.
257. TRAJMAR, S., WILLIAMS, W., KUPPERMANN, A., J. Chem. Phys. 58 (1973)2521.
258. MICHAUD, M., SANCHE, L., Phys. Rev. A36 10 (1987) 4672.
259. JAIN, A., KHARE, S.P., J. Phys. B: Atom. Mol. Phys. 15 (1982) L867.
260. GRYZINSKI, M., Phys. Rev. A138 (1965) 305.
721

APPENDIX
ESTAR, PSTAR and ASTAR: Computer Programs for CalculatingStopping Powers and Ranges for Electrons, Protons and Helium Ions
M.J. BergerNational Institute of Standards and Technology,
Gaithersburg, Maryland,United States of America
This Appendix describes three computer programs, ESTAR, PSTAR and ASTAR, whichcalculate stopping-powers and ranges for electrons, protons and alpha particles (helium ions).ESTAR is applicable to any element, compound or mixture. PSTAR and ASTAR are applicableto 74 materials, including many of interest in biomédical dosimetry. A detailed description of themethods used in these programs can be found in ICRU Reports 37 and 49 [1,2].
The original versions of PSTAR and ASTAR [3] are based on calculations with a fixedset of mean excitation energies from [1,2]. In Version 2 presented here, stopping powers andranges can be adjusted so that they correspond to mean excitation energies that differ by up to10 percent from the values used in Version 1. Furthermore, the stopping powers of graphite inversion 2 of PSTAR are modified to take into account recent measurements of the amorphous-carbon/graphite stopping power ratio by Necas et al. [4].
The files for ESTAR, PSTAR and ASTAR are stored in compressed form in threearchive files EST.EXE, PST.EXE and AST.EXE. These archives contain executable code (foruse with IBM-compatible personal computers), data files, and Fortran source code. The lattercan be used to compile the programs on other types of computers. The archive files are self-extracting. When used with an IBM-compatible personal computer, the commands EST, PST orAST will extract and decompress all the files from the archives.
The archive files are stored on two 3.5-inch 1.44-Mb floppy disks. Disk 1 containsEST.EXE and AST.EXE, and Disk 2 contains PST.EXE. The two disks can be obtained fromthe Nuclear Data Section, Division of Physical and Chemical Sciences, International AtomicEnergy Agency, Wagramerstrasse 5, P.O. Box 100, A-1400 Vienna, Austria.
A.I. ESTAR: Stopping Powers and Ranges for Electrons.
A.1.1. Output from ESTAR
ESTAR calculates the following quantities:
a) Electronic mass stopping power — average rate of energy loss per unit path length,due to Coulomb collisions that result in the ionization and excitation of atoms, MeV cm2/g.
b) Radiative mass stopping power — average rate of energy loss per unit path length dueto collisions with atoms and atomic electrons in which bremsstrahlung quanta are emitted,MeV cm2/g.
c) Total mass stopping power - sum of a) and b), MeV cm2/g.
723

d) Density effect correction — correction term in the stopping power formula that takesinto account the reduction of the electronic mass stopping power due to the polarization of themedium by the incident electron.
e) CSDA range - a close approximation to the average path length traveled by a chargedparticle as it slows down to rest, calculated in the continuous-slowing-down approximation,g/cm2. Obtained by integrating the reciprocal of the total stopping power with respect to energy.
f) Radiation yield — fraction of the energy of primary electron converted intobremsstrahlung, calculated in the continuous-slowing-down approximation.
There are two output options:
Option 1 A table is produced that includes all of the quantities a) through f) at astandard set energies between 10 keV and 1000 MeV. The spacing of theenergy grid is approximately logarithmic. The output is a two-page tablewith a format similar to that of the tables in [1].
Option 2 Output quantities a) through d) are tabulated at a user-selected set of energiesbetween 1 keV and 10 GeV.
A. 1.2. Method used for Electrons
Electronic mass stopping powers are calculated from the theory of Bethe [5,6], using Eq.(7.1) of Chapter 7.2, with a density-effect correction evaluated according to Sternheimer [7,8].By default, I-values are used which are identical with those recommended in [1,2]. However, theuser is given the opportunity of choosing different I-values.
The uncertainties of the calculated electronic mass stopping powers for electrons areestimated in [1] to be 1 to 2 percent above 100 keV, and 2 to 3 percent (in low-Z materials) and5 to 10 percent (in high-Z materials) between 100 keV and 10 keV. The increasing uncertaintiesat low energies are mainly due to the lack of shell corrections.
Radiative stopping powers are evaluated in ESTAR with a combination of theoreticalbremsstrahlung cross sections described by Seltzer and Berger [9]. Analytical formulas (usinghigh-energy approximations) are used above 50 MeV, and numerical results of Pratt et al. [10]below 2 MeV. Cross sections in the intermediate energy region from 2 MeV to 50 MeV areobtained by interpolation. The uncertainties of the radiative stopping powers are estimated to be2 percent above 50 MeV, 2 to 5 percent between 50 and 2 MeV, and 5 percent below 2 MeV.
A. 1.3. Required Program Files and Data Files
ESTAR can be run on an IBM-compatible personal computer, using the DOS operatingsystem (Version 2.1 or higher). A mathematical coprocessor is required. The following files areused:
ESTAR.EXE executable code
UEDAT atomic data, in an unformatted direct-access file
724

UCOMP data pertaining to the composition of materials, in a binary direct-accessfile
IDLIST.COM executable code that displays a list of material names included in thedatabase UCOMP
COMPOS.EXE executable code for examining the contents of the database UCOMP
ENG.ELE default energy list (81 values between 0.01 and 1000 MeV).
For the installation of the program on a different type of computer, the followingFortran-77 source-code and data files (in ASCII format) are available:
ESTAR.FOR, COMPOS.FOR, EDCONV.FOR, CONVERT.FOR, FEDAT, and FCOMP.
These files are to be used as follows:
a) ESTAR.FOR, COMPOS.FOR, EDCONV.FOR and CONVERT.FOR must becompiled individually to produce executable codes.
b) EDCONV must be run, using FEDAT as input. The output is the unformatteddirect-access file UEDAT.
c) CONVERT must be run, using FCOMP as input. The output is the unformatteddirect-access file UCOMP.
A. 1.4. Specification of the Properties of the Stopping Medium
ESTAR must be supplied with information about the atomic composition, density, andmean excitation energy (I-value) of the material. There are two ways in which this informationcan be provided:
Option 1 For 279 materials, the required information can be read from the data fileUCOMP.
Option 2 The information for any material can be supplied from the keyboard, inresponse to prompts from ESTAR.
With both options, ESTAR provides a default I-value, which the user can accept, orreplace by another value. Because of the scarcity of experimental data for electrons, such achoice has to be based on a data analysis for protons or alpha particles, or on the determinationof I-values from the analysis of oscillator strengths or dielectric response functions.
The UCOMP file includes data for 279 materials, which are referenced by identification(ID) numbers 1,2,...,278, and 906. Carbon appears twice, as amorphous carbon (ID = 6) andas graphite (ID = 906). ID numbers smaller than 99 pertain to elements, and are identical withatomic numbers. The other ID numbers pertain to compounds or mixtures. Table 1 gives alisting of ID numbers and names of materials. Elements appear in this list in order of increasingatomic number, and are followed by compounds and mixtures arranged alphabetically by name.The command IDLIST can be used to start a program which lists, on the monitor screen, all IDnumbers and material names in UCOMP. This display can be scrolled.

Included in UCOMP are default I-values for 279 materials. The values for 25 elementsand 48 compounds are identical those used in [1,2]. Those for the other compounds in UCOMPare obtained with approximate procedures adopted in [1] for materials for which directexperimental information is lacking. This involved use of a modified Bragg rule using I-valuesfor atomic constituents that in a crude way take into account chemical-binding and phase effects(see Section 7.2.1.5).
The contents of UCOMP for a specified ID number can be examined by running theprogram COMPOS. The program prompts the user to specify the ID number of the material ofinterest, and lists the atomic ambers and weights of the atomic constituents, the density of thematerial, and the I-value.
If the composition data are entered from the keyboard, the user is prompted to supply thefollowing information:
a) Name of the material, to be used in table headings;
b) The density of the material, g/cm3;
c) The classification of the material: element, compound or mixture;
d) The chemical symbol for the element, or the chemical formula for the compound,which must be entered in standard chemical notation, with upper and lower caseletters; subscripts must be written on-line. For example, silicon is to be entered asSi, silicon dioxide as SiO2, and water as H2O.
e) For mixtures, the user must provide the number of constituents (which can beelements or compounds), the fractions by weight of these constituents, and theirchemical symbols or formulas. If data for a constituent are included in the UCOMPfile, it is possible (but not required) to enter the information from the UCOMP fileby using the appropriate ID number. For example, for Pyrex glass (80.7% SiO2,12.9% B2O3, 3.8% Na2O, 2.2% A12O3 and 0.4% K2O by weight) the input forA12O3 and SiO2 can belaken from UCOMP.
ESTAR calculates, and displays on the monitor screen, the fractions by weight of theatomic constituents in a mixture. The user is prompted to inspect these fractions, and can eitheraccept them or enter different composition data. With entry from the keyboard, the compositiondata are used by ESTAR to determine the I-value of the material. For compounds this is done bythe modified Bragg-additivity rule described above. The use of this procedure results in I-valuesthat for elements are the same, and for compounds are either identical with, or very close to,those stored in UCOMP.
ESTAR provides the option of storing the composition data entered from the keyboard ina designated file, which can be merged into the FCOMP file. When an enlarged FCOMP file isused, the data statements KMAX/279/ in CONVERT.FOR and KLST/278/ in COMPOS.FORmust be appropriately changed.
A.1.5. Specification of Electron Energies
With Output Option 2 (see Section A. 1.1) a list of energies must be supplied at whichstopping powers are to be calculated. This can be done in three ways:
726

a) A list of energies can be read a from default file ENG.ELE, containing 81 energiesbetween 1 keV and 1000 MeV.
b) A list of energies can be read from a previously prepared file. The first line of thisfile must contain the number of energies in the list; subsequent lines must contain theenergies (in MeV), separated by blanks.
c) The desired list of energies can be entered from the keyboard, in response to promptsfrom ESTAR.
In cases b) and c), ESTAR issues a warning if at least one of the requested energies issmaller than 10 keV. ESTAR halts if it encounters an energy below 1 keV.
A.2. PSTAR and ASTAR: Stopping Powers and Ranges for Protons and Helium Ions
A.2.1. Output from PSTAR and ASTAR
The following quantities are calculated:
a) Electronic mass stopping power - average rate of energy loss per unit path length,due to Coulomb collisions that result in the ionization and excitation of atoms,MeV cm2/g.
b) Nuclear mass stopping power — average rate of energy loss per unit path length, dueto elastic Coulomb collisions with atomic nuclei, MeV cm2/g.
c) Total mass stopping power - sum of a) and b), MeV cm2/g.
d) CSDA range - an extremely close approximation to the average path length traveledby a charged particle as it slows down to rest, in g/cm2, calculated in the continuous-slowing-down approximation. Obtained by integrating the reciprocal of the totalstopping power with respect to energy.
e) Projected range - average value of the depth to which a charged particle penetratesin the course of slowing down to rest, in MeV cm2/g. This depth is measured alongthe initial direction of the particle.
f) Detour factor - ratio of the projected range to the CSDA range (always smaller thanunity, due to multiple-scattering detours)
A.2.2. Method of Calculation for Protons and Helium Ions
PSTAR and ASTAR rely on interpolation in a database of stopping powers and ranges.A brief description will now be given of the methods used for producing this database.
A.2.2.1. Merger of High-Energy Theory and Low-Energy Data. Electronic massstopping powers are evaluated from Bethe's theory at high energies, and from experimentally-based fitting formulas at low energies. The experimental stopping powers at energies below acut-off energy T1? together with the theoretical values from the Bethe theory at energies above acut-off energy T2, are fitted by a cubic spline. Actually the cubic-spline fit is made for the
727

quantity /32(S/p), where ß is the particle speed in units of the speed of light, and S/p is the massstopping power. The cubic-spline function is used to obtain, by interpolation, stopping powers atenergies between Tj and T2. The values of Tj and T2 are adjusted individually for each materialto obtain a visually pleasing plot of stopping power vs. energy. The adopted values of T1 and T2are given in Table 2 for protons, and in Table 3 for helium ions.
The uncertainties of the electronic mass stopping powers in the high-energy region areestimated to be 1 to 2 percent for elements, and 1 to 4 percent for compounds. The uncertaintiesin the low-energy region are estimated to be 2 to 5 percent at 1000 keV, 5 to 10 percent at100 keV, 10 to 15 percent at 10 keV, and at least 20 to 30 percent at 1 keV.
A.2.2.2 Stopping Power Theory at High Energies. Stopping powers are calculatedaccording to the formulas given in Chapter 7.3.1.1.* The shell corrections for most elementsare based on semi-empirical formulas developed by Bichsel (described in [1]). For mostmaterials the shell corrections, together with the default I-values, are those denoted as "Model 1"in [2].
For elements with atomic numbers Z = 47, 64, 74, 78, 79, 82 and 92 two sets ofcalculations are made, one with shell corrections from Model 1, and another with shellcorrections and I-values from a Model 2 due to Bichsel [11]. The calculations with Model 2 areused up to an energy T3, and those with Model 1 above energy T4, and stopping-power valuesbetween T3 and T4 are obtained by cubic-spline interpolation. The values of T3 and T4 are takento be 25 MeV and 100 MeV for protons, and 100 MeV and 400 MeV for helium ions.
The Barkas correction is calculated according to the method of Ashley et al. [12,13], withparameter values used in [1]. For elements with atomic numbers Z = 47, 64, 74, 78, 79, 82and 92, empirical Barkas correction from [14] are used. The density-effect correction isevaluated according to Sternheimer [7,8], and is significant only for protons with energies ofseveral hundred MeV or higher.
A.2.2.3. Adjustment of Mean Excitation Energy. For each material ESTAR calculatesthe stopping powers in the high-energy region three times, with different I-values: with thedefault value (from [1,2]) and with values that are 10 percent lower, and 10 percent higher, thanthe default value. The results from these three calculations are merged with the same set of fittedlow-energy stopping powers. Stopping powers with intermediate I-values can be accuratelycalculated by interpolation with respect to logl.
For elements with atomic numbers Z = 47, 64,74, 78, 79, 82 and 92, the Bethe formulawith Model-2 shell corrections quite accurately represents a large body of experimental data inthe energy region from 0.3 MeV to 20 MeV [11]. For these elements the changes of thestopping power due to differences of the I-value from the default value are therefore onlyevaluated for protons above 25 MeV and helium ions above 100 MeV.
In view of the differences between the I-values recommended by various authors (see,e.g., the discussion in Chapter 7.2.1), the opportunity of varying the I-values in ESTAR is
*This was done with a program BEST, which combines codes from ESTAR for the calculation of thedensity effect correction with subroutines for the calculation of the Bloch, Barkas and shell correctionsfrom an unpublished program of H. Bichsel. With BEST one can obtain stopping powers for strippedparticles of any mass or charge.
728

useful, but should be used with care. One should keep in mind that many of the default I-valuesadopted in [1,2] are obtained in an analysis of measured stopping powers or ranges that involvedthe simultaneous determination of I-values and of various parameters pertaining to the shellcorrections and Barkas corrections. A change of an I-value may therefore require acorresponding adjustment of these corrections, to ensure that the calculated and experimentalstopping powers remain in adequate agreement. References to the available experimentalliterature for such an analysis can be found in the bibliographies of Andersen [15] and Powers[16].
A.2.2.4 Empirical Stopping Powers at Low Energies. In the low-energy region,stopping powers are calculated from fitting formulas that represent experimental data for manyelements and a limited number of compounds. Extensive use is made of a fitting formula ofVarelas and Biersack [17] with numerical coefficients adopted in [2], which - except for a fewmaterials - are from Andersen and Ziegler [18] for protons, and from Ziegler [19] or Watt [20]for alpha particles. For a few materials use is made of a different fitting formula foralpha-particle stopping powers developed by Powers [21].
For compounds for which no experimental stopping power data are available, the Braggadditivity rule is used, and mass stopping powers are calculated as linear combinations of themass stopping powers of the constituents atoms. When applying the additivity rule to mixtures,these are treated, to the extent possible, as a mixtures of compounds and elements. For example,the stopping power of "muscle" is obtained by as a weighted sum of the stopping power of water(assumed to be 78.6% by weight) and the stopping powers of the other elemental constituants.
A.2.2.5. Nuclear Stopping Powers. Cross sections for the elastic scattering of chargedparticles by atoms are obtained by a classical-mechanics orbit calculation, using the method ofE verhart et al. [22]. For protons the screened potential is assumed to be the Thomas-Fermipotential as parameterized by Molière [23]. For alpha particles, the "universal" ion-atompotential of Ziegler et al. [24] is used. Nuclear stopping powers are calculated using the relationbetween the deflection angles and the energy transfers to the recoiling atom in elastic collisions.In [2] the uncertainties of nuclear stopping powers for alpha particles are estimated to be 5 to10 percent at 100 keV, 10 percent at 10 keV, and 10 to 20 percent at 1 keV.
A.2.2.6 CSDA and Projected Ranges. CSDA ranges are calculated by integrating thereciprocal of the total stopping power (electronic plus nuclear) with respect to energy. Projectedranges are obtained in a transport calculation according to the method of Lewis [25], which usesthe elastic scattering cross sections mentioned above.
A.2.3. Required Program and Data Files
PSTAR and ASTAR can be run on an IBM-compatible personal computer using the DOSoperating system (Version 2.1 or higher). A mathematical coprocessor is required. Thefollowing files are required to run PSTAR:
*The files FCOMP, UCOMP, COMPOS.EXE, COMPOS.FOR and CONVERT.FOR are used in ESTARas well as PSTAR and ASTAR. However, PSTAR and ASTAR use only part of the information storedin FCOMP and UCOM.
729

PSTAR.EXE executable code for generating a stopping-power and range table
UPROTO database that contains stopping power and range data calculated withdefault I-values
UPROTL similar to UPROT, but calculated with I-values 10 percent smaller thanthe default I-values
UPROTH similar to UPROT, but calculated with I-values 10 percent larger thanthe default I-values
NAMES set of names of the 74 materials in the database
ENG. PRO default energy list (133 energies between 1 keV and 10,000 MeV)
UCOMP file that contains material composition data
COMPOS.EXE executable code for examining the contents of UCOMP
IDL.COM executable code that displays a list of material names and correspondingID numbers;
The following files are required to run ASTAR:
ASTAR.EXE executable code for generating a stopping-power and range table
UALPHO database that contains stopping power and range data
UALPHL similar to UPROT, but calculated with I-values 10 percent smaller thanthe default I-values
UALPHH similar to UPROT, but calculated with I-values 10 percent larger thanthe default I-values
NAMES set of names of the 74 materials in the database
ENG.ALF default energy list (122 energies between 1 keV and 1000 MeV)
UCOMP file that contains information about the composition of the materialsincluded in the database;
COMPOS.EXE executable code for examining the contents of UCOMP for a specifiedmaterial;
IDL.COM executable code that displays a list of material names and correspondingID numbers.

For the installation of the program on a different type of computer, the followingFortran-77 source-code and data files (in ASCII format) are available:
For Protons:PSTAR.FORPCONVERT.FORFPROTFPROTLFPROTH
For Helium Ions:
ASTAR.FORACONVERT.FORFALPHFALPHLFALPHH
For Both:
COMPOS. FORCONVERT. FORFCOMP
These files are to be used as follows:
a) PSTAR.FOR, ASTAR.FOR, PCONVERT.FOR , ACONVERT.FOR andCONVERT.FOR must be compiled individually to generate executable code
b) PCONVERT must be run, using formatted files FPROTO, FPROTL or FPROT1 asinput, to generate unformatted direct-access files UPRPOTO, UPROTL or UPROTH
c) ACONVERT must be run, using formatted files FALPHO, FALPHL or FALPHH asinput, to generate unformatted direct-access files UALPHO, UALPHL or UALPHH
d) CONVERT must be run, using formatted file FCOMP as input, to generateunformatted direct-access file UCOMP.
A.2.4. List of Materials
For easy reference in the computer programs, each material is given an identification (ID)number. For elements the ID numbers are identical with atomic numbers (except for graphitewhich has ID number 906, to distinguish it from amorphous carbon with ID number 6).
Table 4 list the names and ID numbers of the 74 materials in the data files. The listincludes 26 elements and 48 compounds and mixtures. A listing of ID numbers and names canalso be displayed, and scrolled, on the monitor screen by running the program IDL. Theinformation in the composition file UCOMP for each material consists of:
a) The atomic numbers and fractions by weight of the constituent atomsb) The density of the materialc) The mean excitation energy of the material
A.2.5. Specification of Energies
A list of energies must be supplied at which stopping powers are to be calculated. Thiscan be done in three ways:
a) A list of energies can be read from a default file ENG.PRO for protons (133 energiesbetween 1 keV and 10,000 MeV) or from a default file ENG.ALF for helium ions(122 energies between 1 keV and 1000 MeV).
731

b) A list of energies can be read from a previously prepared file. The first line of thisfile must contain the number of energies in the list; subsequent lines must contain theenergies (in MeV), separated by blanks.
c) The desired list of energies can be entered from the keyboard, in response to promptsfrom PSTAR or ASTAR.
A.2.6. Choice of Mean Excitation Energy
PSTAR and ASTAR display on the monitor screen the default I-value of the material, andprompt the user to indicate whether this value is acceptable. If the reply is negative, the programdisplays the three I-values for which stopping powers are available for interpolation: the defaultvalue Idef, Ij = Idef/l.l and I2 = 1.1 Idef. The user is then asked to specify the desired I-value,Is. When making this choice, the user should keep in mind the cautionary remarks in SectionA.2.2.4.
If Is lies between Ij and I2, the program uses quadratic polynomial interpolation withrespect to logl to determine the stopping power. If Is is smaller than It or larger than I2, theprogram uses linear extrapolation with respect to logl. Extrapolation should of course be usedwith caution.
732

Table A. 1. List of ID numbers and names of materials for which data are included in file UCOMP.1 HYDROGEN2 HELIUM3 LITHIUM4 BERYLLIUM5 BORON6 AMORPHOUS CARBON (deiuily 2.0 g/cm3)7 NITROGEN8 OXYGEN9 FLUORINE10 NEON11 SODIUM12 MAGNESIUM13 ALUMINUM14 SILICON15 PHOSPHORUS16 SULFUR17 CHLORINE18 ARGON19 POTASSIUM20 CALCIUM21 SCANDIUM22 TITANIUM23 VANADIUM24 CHROMIUM25 MANGANESE26 IRON27 COBALT28 NICKEL29 COPPER30 ZINC31 GALLIUM32 GERMANIUM33 ARSENIC34 SELENIUM35 BROMINE36 KRYPTON37 RUBIDIUM38 STRONTIUM39 YTTRIUM40 ZIRCONIUM41 NIOBIUM42 MOLYBDENUM43 TECHNETIUM44 RUTHENIUM45 RHODIUM46 PALLADIUM47 SILVER48 CADMIUM49 INDIUM50 TIN51 ANTIMONY52 TELLURIUM53 IODINE54 XENON55 CESIUM56 BARIUM57 LANTHANUM58 CERIUM59 PRASEODYMIUM60 NEODYMIUM61 PROMETHIUM62 SAMARIUM63 EUROPIUM64 GADOLINIUM65 TERBIUM66 DYSPROSIUM67 HOLMIUM68 ERBIUM69 THULIUM70 YTTERBIUM
71 LUTETIUM72 HAFNIUM73 TANTALUM74 TUNGSTEN75 RHENIUM76 OSMIUM77 IRIDIUM78 PLATINUM79 GOLD80 MERCURY81 THALLIUM82 LEAD83 BISMUTH84 POLONIUM85 ASTATINE86 RADON87 FRANCIUM88 RADIUM89 ACTINIUM90 THORIUM91 PROTACTINIUM92 URANIUM93 NEPTUNIUM94 PLUTONIUM95 AMERICIUM96 CURIUM97 BERKELIUM98 CALIFORNIUM99 A-150TISSUE-EQUIVALENTFLASTIC100 ACETONE101 ACETYLENE102 ADENINE103 ADIPOSE TISSUE (ICRP)104 AIR, DRY (NEAR SEA LEVEL)105 ALANINE106 ALUMINUM OXIDE107 AMBER108 AMMONIA109 ANILINE110 ANTHRACENE111 B-100 BONE-EQUIVALENT PLASTIC112 BAKELITE113 BARIUM FLUORIDE114 BARIUM SULFATE115 BENZENE116 BERYLLIUM OXIDE117 BISMUTH GERMANIUM OXIDE118 BLOOD (ICRP)119 BONE, COMPACT (ICRU)120 BONE, CORTICAL (ICRP)121 BORON CARBIDE122 BORON OXIDE123 BRAIN (ICRP)124 BUTANE125 N-BUTYL ALCOHOL126 C-552 AIR-EQUIVALENT PLASTIC127 CADMIUM TELLURIDE128 CADMIUM TUNGST ATE129 CALCIUM CARBONATE130 CALCIUM FLUORIDE131 CALCIUM OXIDE132 CALCIUM SULFATE133 CALCIUM TUNGST ATE134 CARBON DIOXIDE135 CARBON TETRACHLORIDE136 CELLULOSE ACETATE, CELLOPHANE137 CELLULOSE ACETATE BUTYRATE138 CELLULOSE NITRATE139 CERIC SULFATE DOSIMETER SOLUTION140 CESIUM FLUORIDE
733

Table A.I. (Continued)141 CESIUM IODIDE142 CHLOROBENZENE143 CHLOROFORM144 CONCRETE, PORTLAND145 CYCLOHEXANE146 1,2-DICHLOROBENZENE147 DICHLORODÎETHYL ETHER148 1,2-DICHLOROETHANE149 DIETHYL ETHER150 N.N-DIMETHYLFORMAMIDE151 DIMETHYL SULFOXIDE152 ETHANE153 ETHYL ALCOHOL154 ETHYL CELLULOSE155 ETHYLENE156 EYE LENS (ICRP)157 FERRIC OXIDE158 FERROBORIDE159 FERROUS OXIDE160 FERROUS SULFATE DOSIMETER SOLUTION161 FREON-12162 FREON-12B2163 FREON-13164 FREON-13B1165 FREON-1311166 GADOLINIUM OXYSULFIDE167 GALLIUM ARSENIDE168 GEL IN PHOTOGRAPHIC EMULSION169 Pyrex Glai»170 GLASS, LEAD171 GLASS, PLATE172 GLUCOSE173 GLUTAMINE174 GLYCEROL175 GUANINE176 GYPSUM, PLASTER OF PARIS177 N-HEPTANE178 N-HEXANE179 KAPTON POLYIMIDE FILM180 LANTHANUM OXYBROMIDE181 LANTHANUM OXYSULFIDE182 LEAD OXIDE183 LITHIUM AMIDE184 LITHIUM CARBONATE185 LfTHIUM FLUORIDE186 LITHIUM HYDRIDE187 LITHIUM IODIDE188 LITHIUM OXIDE189 LITHIUM TETRABORATE190 LUNG (ICRP)191 M3 WAX192 MAGNESIUM CARBONATE193 MAGNESIUM FLUORIDE194 MAGNESIUM OXIDE195 MAGNESIUM TETRABORATE196 MERCURIC IODIDE197 METHANE198 METHANOL199 MIX D WAX200 MS20 TISSUE SUBSTITUTE201 MUSCLE, SKELETAL (ICRP)202 MUSCLE, STRIATED (ICRU)203 MUSCLE-EQUIVALENTLIQUID, WITH SUCROSE204 MUSCLE-EQUIVALENTLIQUID, WITHOUT SUCROSE205 NAPTHALENE206 NITROBENZENE207 NITROUS OXIDE208 NYLON, DU PONT ELY AMIDE 8062209 NYLON, TYPE 6 AND TYPE 6/6210 NYLON, TYPE 6/10
211 NYLON, TYPE ! 1 (RILSAN)212 OCTANE, LIQUID213 PARAFFIN WAX214 N-PENTANE215 PHOTOGRAPHIC EMULSION216 PLASTIC SCINTILLATOR(VINYLTOLUENE BASED)217 PLUTONIUM DIOXIDE218 POLYACRYLONITRILE219 POLYCARBONATE (MAKROLON, LEXAN)220 POLYCHLOROSTYRENE221 POLYETHYLENE222 POLYETHYLENETEREPHTHALATE (MYLAR)223 POLYMETHYL METHACRALATE (LUCFTE, PERSPEX)224 POLYOXYMETHYLENE225 POLYPROPYLENE226 POLYSTYRENE227 POLYTETRAFLUOROETHYLENECTEFLON)228 POLYTRIFLUOROCHLOROETHYLENE229 POLYVINYL ACETATE230 POLYVINYL ALCOHOL231 BUTYRAL232 POLYVINYLCHLORIDE233 POLYVINYLEDENE CHLORIDE, SARAN234 POLYVINYLIDENE FLUORIDE235 POLYVINYL PYRROLEDONE236 POTASSIUM IODIDE237 POTASSIUM OXIDE238 PROPANE239 PROPANE, LIQUID240 N-PROPYL ALCOHOL241 PYRIDINE242 RUBBER, BUT* L243 RUBBER, NATURAL244 RUBBER, NEOPRENE245 SILICON DIOXIDE246 SILVER BROMIDE247 SILVER CHLORIDE248 SILVER HALIDES IN PHOTOGRAPHIC EMULSION249 SILVER IODIDE250 SKIN (ICRP)251 SODIUM CARBONATE252 SODIUM IODIDE253 SODIUM MONOXIDE254 SODIUM NITRATE255 STILBENE256 SUCROSE257 TERPHENYL258 TESTES (ICRP)259 TETRACHLOROETHYLENE260 THALLIUM CHLORIDE261 TISSUE, SOFT (ICRP)262 TISSUE, SOFT (ICRU FOUR-COMPONENT)263 TISSUE-EQUIVALENTGAS (METHANE BASED)264 TISSUE-EQUIVALENT G AS (PROP ANE BASED)265 TITANIUM DIOXIDE266 TOLUENE267 TRICHLOROETHYLENE268 TRŒTHYL PHOSPHATE269 TUNGSTEN HEXAFLUORIDE270 URANIUM DICARBIDE271 URANIUM MONOCARBIDE272 URANIUM OXIDE273 UREA274 VALINE275 VITON FLUOROELASTOMER276 WATER, LIQUID277 WATER VAPOR278 XYLENE906 GRAPHITE (density 1.7 g/cnr)
734

Table A. 2. Cutoff energies Tj and T2 used in combination of low-energy experimental andhigh-energy theoretical stopping powers for protons.
IDNo.12467,810,1314182226,2932,3642,475054,6474,78 79829299101103104,106111,119,120126130
TI(MeV)0.20.250.30.20.250.30.50.50.50.50.50.750.50.50.30.50.250.50.20.30.20.30.20.3
T2(MeV)0.50.50.50.50.51.00.81.01.51.01.52.01.51.00.51.01.01.00.50.50.50.50.50.5
IDNo.134138139141155,160,169179185,189191197200201,202,203,204209,213215216,219,221,222223225,226227,232,238245252255263,264,266276277
TI(MeV)0.20.30.20.80.20.30.20.20.20.30.20.30.80.30.20.30.20.30.80.20.30.150.3
T2(MeV)0.50.50.52.00.50.50.50.50.50.50.50.53.00.50.50.50.50.53.00.50.50.50.5
735

Table A.3. Cutoff energies Tt and T2 used in combination of low-energy experimental andhigh-energy theoretical stopping powers for helium ions.
IDNo.12467,8,1013,141822,26,29,323642,47,50,5464,74,7879,829299101103104,106,111,119,120126,130,134,138,139141155,160,159,179185189191197200,201,202,203,204,209,213215216,219,221,222,223,225,226.227232238,245,252255263.264,266,276,277
TI(MeV)1.01.51.01.01.02.00.82.03.02.01.01.01.01.01.00.81.01.01.01.01.00.81.00.61.00.61.01.01.01.01.0
T2(MeV)2.03.04.03.02.04.03.06.07.05.03.02.04.02.03.02.02.03.05.02.03.02.02.02.02.05.02.04.02.03.02.0
736

Table A.4. List of ID numbers and names of materials for which codes PSTAR and ASTARprovide stopping powers and ranges.
HYDROGENHELIUMBERYLLIUM
ft AMORPHOUS CARBON (deiuity 2.0 g/cm3)7 NITROGEN8 OXYGEN10 NEON13 ALUMINUM14 SILICON18 ARGON22 TITANIUM26 IRON29 COPPER32 GERMANIUM36 KRYPTON42 MOLYBDENUM47 SILVER50 TIN54 XENON64 GADOLINIUM74 TUNGSTEN78 PLATINUM79 GOLD82 LEAD92 URANIUM99 A-150TISSUE-EQUIVALENTPLASTIC101 ACETYLENE103 ADIPOSE TISSUE (ICRP)104 AIR, DRY (NEAR SEA LEVEL)106 ALUMINUM OXIDE111 B-100 BONE-EQUIV ALENT PLASTIC119 BONE, COMPACT (ICRU)120 BONE, CORTICAL (ICRP)126 C-5 52 AIR-EQUIVALENT PLASTIC130 CALCIUM FLUORIDE134 CARBON DIOXIDE138 CELLULOSE NITRATE
139 CERIC SULFATE DOSIMETER SOLUTION141 CESIUM IODIDE155 ETHYLENE160 FERROUS SULFATE DOSIMETER SOLUTION169 Pyrex GU*i179 KAPTON POLYIMIDE FILM185 LITHIUM FLUORIDE189 LITHIUM TETRABORATE191 M3 WAX197 METHANE200 MS20 TISSUE SUBSTITUTE201 MUSCLE, SKELETAL (ICRP)202 MUSCLE, STRIATED (ICRU)203 MUSCLE-EQUIVALENT LIQUID, WITH SUCROSE204 MUSCLE-EQUTVALENTUQUID, WITHOUT SUCROSE209 NYLON, TYPE 6 AND TYPE 6/6213 PARAFFIN WAX215 PHOTOGRAPHIC EMULSION216 PLASTIC SCINTILLATOR (VINYLTOLUENE BASED)219 POLYCARBONATE (MAKROLON, LEXAN)221 POLYETHYLENE222 POLYETHYLENETEREPHTHALATE (MYLAR)223 POLYMETHYL METHACRALATE (LUCTTE, PERSPEX, PLEXIGLAS;225 POLYPROPYLENE226 POLYSTYRENE227 POLYTETRAFLUOROETHYLENE<TEFLON)232 POLYVINYLCHLORIDE238 PROPANE245 SILICON DIOXIDE252 SODIUM IODIDE255 STILBENE263 TISSUE-EQUrVALENTGAS (METHANE BASED)264 TISSUE-EQUIVALENT G AS (PROPANE BASED)266 TOLUENE276 WATER, LIQUID277 WATER VAPOR906 GRAPHITE (density 1.7 g/cm3)
737

REFERENCES
[I] International Commission on Radiation Units and Measurements, ICRU Report 37,Stopping Powers for Electrons and Positrons, 1984.
[2] International Commission on Radiation Units and Measurements, ICRU Report 49,Stopping Powers and Ranges for Protons and Alpha Panicles, 1993.
[3] M. J. Berger, ESTAR, PSTAR and ASTAR: Computer Codes for Calculating StoppingPower and Range Tables for Electrons, Protons and Helium Ions, National Institute ofStandards and Technology Report NISTIR 4999, 1992.
[4] V. Necas, W. Käferbock, W. Rossler and P. Bauer, Nucl. Inst. Meth. B, in press.
[5] H. Bethe, Ann. d. Physik 5, 325, 1930.
[6] H. Bethe, Z. Phys. 76, 293, 1932.
[7] R. M. Sternheimer, Phys.Rev. 88, 851, 1952.
[8] R. M. Sternheimer, S. M. Seltzer, and M. J. Berger, Phys. Rev. B. 26, 6067, 1982.
[9] S. M. Seltzer and M. J. Berger, Nucl. Instr. Meth. B12, 95, 1985.
[10] R. H. Pratt, H. K. Tseng, C. M. Lee, L. Kissel, C. MacCallum, and M. Riley, AtomicData Nucl. Data Tables 20, 175, 1977. Errata in 26, 477, 1981.
[II] H. Bichsel, Phys. Rev. A, 46, 5761, 1992.
[12] J. C. Ashley, R. H. Ritchie and W. Brandt, Phys. Rev. B, 5, 2393, 1972.
[13] J. C. Ashley, R. H. Ritchie and W. Brandt, Phys. Rev. A, 8, 2402, 1973.
[14] H. Bichsel, Phys. Rev. A, 41, 3642, 1990.
[15] H. H. Andersen, Bibliography and Index of Experimental Stopping Power and RangeData, Pergamon Press (Elmsford, N.Y.), 1977.
[16] D. Powers, Topical Survey of the Literature on Experimental and Theoretical StoppingPower Phenomena for Energetic Protons, Helium Ions, and Heavy Ions in Matter for thePeriod 1977-2987, Internal Report, Department of Physics, Baylor University, Waco,Texas, 1988.
[17] C. Varelas and J. Biersack, Nucl. Instr. Meth. 79, 213, 1970.
[18] H. H. Andersen and J. F. Ziegler, Hydrogen: Stopping Powers and Ranges in AllElements, Pergamon Press (Elmsford, N.Y.), 1977.
[19] J. F. Ziegler, Helium: Stopping Powers and Ranges in All Elemental Matter, PergamonPress (Elmsford, N.Y.), 1977.
738

[20] D.E. Watt, Stopping Cross Sections, Mass Stopping Powers and Ranges in 30 Elementsfor Alpha Particles (1 keV to 100 MeV), Internal Report, Department of Physics andAstronomy, University of St. Andrews, Scotland, 1988.
[21] D. Powers, Stopping Cross Sections and Ranges of Alpha Particles in Matter, InternalReport, Department of Physics, Baylor University, Waco, Texas, 1977.
[22] E. Everhart, G. Stone, and R. J. Carbone, Phys. Rev. 99, 1287, 1955.
[23] G. Molière, Z. f. Naturf. 2a, 133, 1947.
[24] J. F. Ziegler, J. P. Biersack and U. Littmark, The Stopping and Range of Ions in Solids,Pergamon Press (Elmsford, N.Y.), 1985.
[25] H. W. Lewis, Phys. Rev. 78, 526, 1950.
739

SUBJECT INDEX
absolute cross sectionsabsorbed doseacetyleneaccuracy (in radiotherapy)adenineadditivity rulealpha (a) particlesaluminumangle of emergenceangle-restricted nuclear stoppinganion(s)appearance energyaromatic molecule(s)association reactions of cluster ionsassociative ionizationassociative ionization in clustersASTARattachmentAuger electronsautodetachmentautoionizationaverage path lengthAVM - arterio-venous malformationBarkas correctionbeam methodbenzeneBESTBethe
Bethe-BornBethe cross sectionbinary encounter theory
binary peakbinding correctionblobsBloch correctionBohr energy stragglingbonding correctionBorn-Bethe approximationBragg peakBragg's additivity rulebranch tracksbreakdown graphbremsstrahlungBurgess-Vriens formulationcancer (cure rate)cationscellcharge transfer
4.5.37.3.1.5, 9.4.25.4.21.55.5.23.3.27.4, 9.15.5.27.5.47.4.24.1.2, 4.4.1, 4.4.2, 4.5.1., 4.5.2, 4.5.4, 4.63.25.5.26.3.1.3, 6.3.26.2.46.3.1.17.4.1.3, 7.4.33.22.2.3, 2.2.3.2, 2.3.2, 2.3.3, 2.8, 9.6.43.63.2, 5.37.2.51.2.47.2.1.1, 7.2.1.4, 7.4.1.1, 7.4.1.33.65.5.27.3.1.1, 7.3.1.4, 7.5.1.27.2.1.1, 7.2.1.4, 7.2.1.7, 7.3.1.1, 7.4.1.1,7.4.1.32.2.2.4, 2.3.1, 2.3.25.22.2.2.2, 2.2.2.3, 2.2.2.4, 2.2.3.2, 2.3.2,2,3.3, 2.7, 7.2.1.72.2.1, 2.2.3.27.2.1.39.4.67.2.1.1, 7.2.1.4, 7.3.1.1, 7.4.1.1, 7.4.1.37.3.3, 7.5.37.3.1.2, 7.3.1.4, 7.4.1.23.3.27.3.1.5, 1.2.2, 1.2.3, 1.4.17.2.1.5, 7.3.1.2, 7.4.1.3, 7.5.1.2, 7.5.29.4.63.4.2see: radiative stopping power3.3.21.14.4.2, 4.69.6.36.2.2
741

charge transfer to the continuumcharge trappingcharging coefficientcharge state approachcharge state equilibriumcharge state populationchemical binding effectchemical dosimetrychemical reactions of cluster ionschemical reactions of ionschemical stagechemiionizationchemiionization in clusterschromatinclassical collision theoryclassical electron radiusclassificationcluster anionscluster(s)
cluster-distribution cross sectioncluster ionscluster system(s)CNS - central nervous system (tumors of the)collection efficiencycollective effectscollective excitationcollective plasmon-type excitationscollimator (Multileaf)collision stopping power
compounds
Compton-scatteringcomputer programscondensed mattercondensed phase
condensor plate methodcontinuous-slowing-down approximationcorecore-and-bond approachcounting ionization cross sectioncoupled-channel calculationCPAcrossed beam methodcrossed beam techniquecross section functioncross section(s)
cross sections of charge transfercross sections of ionization by excited neutralscross sections of reactions of ions
9.2.44.5.54.5.57.3.1.17.1, 7.5.1.17.3.1.2, 7.5.1.17.3.1.29.4.56.3.1, 6.3.2, 6.6.6, 6.6.76.2.1, 6.2.29.16.2.46.3.1.19.6.33.3.27.2.1.1, 7.3.1.19.1, 9.3.34.4.13..5, 4.1, 4.3.1, 4.3.3, 4.4, 4.4.1, 4.4.2,4.5.4, 4.5.53.56.35.61.2.33.4.15.5.25.5.29.51.3.2.4, 1.3.3, 1.57.1, 7.2.1, see also: electronic stoppingpower7.2.1.5, 7.2.1.7, 7.3.1.2, 7.3.1.4, 7.4.1.2,7.4.1.3, 7.5.1.2, 7.5.1.49.2.17.2.3, 7.3.1.1, 7.3.1.45.5.14.1, 4.2, 4.3.3, 4.5.3,4.5.4, 4.6, 7.2.1.7,7.3.1.3, 7.3.1.4, 7.4.1.2, 7.5.1.2, 7.5.1.3,7.5.33.3.1see: csda9.3.4, 9.4.4see: bonding correction3.27.3.1.19.7.13.3.13.4.13.13.6, 4.1, 4.2, 4.3.1, 4.4, 4.4.2, 4.5.1,4.5.2, 4.5.3, 4.5.4, 5.5.5, 9.16.2.2, 6.6.66.2.46.2.1, 6.6.6
742

csda rangecycloidal mass spectrometrycyclopropanecyclotronsdamagedata reference codesdegradation spectrum definition
for electronscharacteristics of
delta raydense mediadensity effectdensity-functional approachdensity of oscillator strengthdensity of statesdetour factorDeutsch-Mark formulationdf/dEdielectric permeabilitydielectric-response functiondifferential cross section for energy transferdiffusiondimethyletherdipolar dissociationdipole approximationdipole (e,e) experimentsdipole matrix elementdipole momentdirect ionizationdischarge lamp(s)discrimination effectdissociation(s)dissociative attachmentdissociative processdissociative recombination of ionsDNADoppler profile methoddosedosimetrydouble-strand breaks (DSB)doubly differential cross sections
doubly excited statesDrude modeleffective chargeeffective charge of projectileeffective cross sectionejection cross sectionselastic scatteringelectromagnetic waveelectronelectron affinityelectron affinity of atoms
7.1, 7.2.3, 7.2.5, 7.3.5, 7.4.3, 7.5.5, 9.2.33.4.15.21.2.5, 1.3.3, 1.59.6Table 7.108.1, 8.2.28.2.38.2.49.6.24.3.27.2.1.1, 7.2.1.6, 7.3.1.1, 7.5.1.47.3.1.1, 7.5.1.25.5.24.5.27.3.5, 7.4.33.3.25.25.5.15.5.1,7.2.1.4, 7.2.1.6, 7.2.1.7, 7.3.1.17.19.2.35.4.14.5.45.5.15.4.35.24.5.33.2, 5.35.4.23.4.12.5, 4.5.4, 4.5.5, 5.3, 9.14.23.66.2.34.6, 9.63.79.4.27.3.1.59.6.2, 9.6.32.1, 2.2.1, 2.2.2, 2.2.2.1, 2.2.2.2, 2.2.2.3,2.2.2.4, 2.2.3.1, 2.2.3.2, 2.3.3, 2.4.1,2.4.2, 2.7, 2.85.35.5.22.1, 2.2.3.2, 2.2.3.2, 2.3.3,2.7, 2.5, 9.2.47.1, 7.4.1.2, 7.5.1.13.59.2.49.2.25.5.13.1. 3.23.2. 4.2, 4.4, 4.5.26.6.5
743

electron affinity of moleculeselectron attachmentelectron capture and losselectron capture to the continuumelectron ejectionelectron energy-loss spectroscopyelectron ionizationelectronic excitationelectronic stateelectronic stopping powerelectron-impact cross sectionelectron interactionelectron ionizationelectron-ion recombinationelectron localizationelectrons
electrons carried by ionelectron solvationelastic differential cross sectionselastic scatteringelectron attachmentelectron impact dissociationelementary processeselementsempirical formulaenergy cutoff (Lq)energy deposition eventenergy imparted to the mediumenergy loss
energy loss functionenergy loss parameterenergy loss per collision, averageenergy loss stragglingenergy per mass unitenergy stragglingenergy transferenergy transfer of electronic excitationenergy variableenvironmental effectsequivalent proton energyerror estimatesESTARethanolevaporation(s)excess electronsexchange effectsexcitation(s)excitation cross sectionexcitation spectra of fluorescenceexciton(s)
6.6.54.3, 4.3.1, 4.4, 4.4.1, 4.4.2, 4.5.42.5, 2.6, 2.7, 2.82.2.2.29.2,45.23.54.5.2, 4.5.33.4.37.1, 7.2.1, 7.3.1, 7.4.17.2.1.73.13.24.3.24.3.3, 4.4.14.1, 4.2, 4.3, 4.3.1, 4.3.2, 4.3.3, 4.1,4.4.1, 4.4.2, 4.5, 4.5.1, 4.5.2, 4.5.3, 4.5.4,7.2, 9.17.5.14.3.32.2.14.5.23.63.76.27.2.1.4, 7.4.1.1, 7.4.1.3, 7.4.23.3.29.4.59.3.17.1, 7.2.5, 7.3.1.52.1, 2.2.1, 2.2.2.4, 2.2.3.2, 2.3.1, 2.3.2,2.3.3, 2.5, 2.6,2.7, Ch.79.57.2.47.2.57.1, 7.2.4, 7.3.3, 7.5.37.3.1.1see: energy loss straggling7.16.2.57.3.1.1, 7.54.2, 4.3.17.3.1.1see: uncertainties7.2.35.24.4.1, 4.4.24,1, 4.3, 4.3.17.2.1.72.1, 2.2.3.2, 2.4.1, 2.5, 2.7, 3.2, 9.13.75.4.24.5.3, 4.5.4, 5.5.2
744

experimental determination of W 8.3.1PHA method 8.3.1, 8.3.1.3ionization chamber method 8.3.1, 8.3.1.2particle sources 8.3.1.1effects of gas contamination 8.3.1.3
experimental method(s) 3.3.1, 3.4.1, 3.6exponential absorption law 3.2extinction coefficient 5.5.1Fano factor definition 8.1, 8.4, 9.2.3
calculation 8.2.3.4in gases 8.4.1in gas mixtures 8.4.1relation with W 8.4.1in semiconductors 8.6.3in liquid water 8.6.2.2in rare gas liquids 8.6.1
fast neutral beam apparatus 3.3.1fast neutrons (see neutrons)Fermi velocity for solid target 7.5.1.1Feshbach resonance 4.4.2fieldfree extraction 3.4.1film(s) 4.1, 4.5.1, 4.5.2, 4.5.3, 4.5.4, 4.5.5Fourier transform mass spectrometry 3.4.1fragmentation 3.5fragment ion 3.4.1Franck-Condon factor 3.4.2free path length ljn 9.3.2frequency-dependent permeability 5.5.1Fricke dosimeter 9.4.5G value(s) definition 8.1, 9.2.3
for cyclohexane 8.6.2.1in liquids 8.6.2in liquid water 8.6.2.2of excited states in gases 8.5
gases 7.2.1.7, 7.3.1.3, 7.3.1.4, 7.4.1.2, 7.5.1.4,7.5.3
gas filled counters 3.3.1gas mixtures in proportional counter 8.3.1.3
irregular mixtures 8.3.7.2regular mixtures 8.3.7.1
gas-solid difference 7.5.1.4glancing collision 5.5.1grain count 9.3.4Gryzinski formula 3.3.2H-atom transfer reactions of ions 6.2.2H2O 4.4.1, 4.4.2, 4.5.2, 4.5.3, 4.5.4, 4.5.5half-maximum angle 7.5.4heavy charged particles 9.2.4heavy ions 7.5, 1.1, 1.4, 1.5heavy ion therapy
rationale 1.4.1clinical data 1.4.2patient selection 1.4.3
745
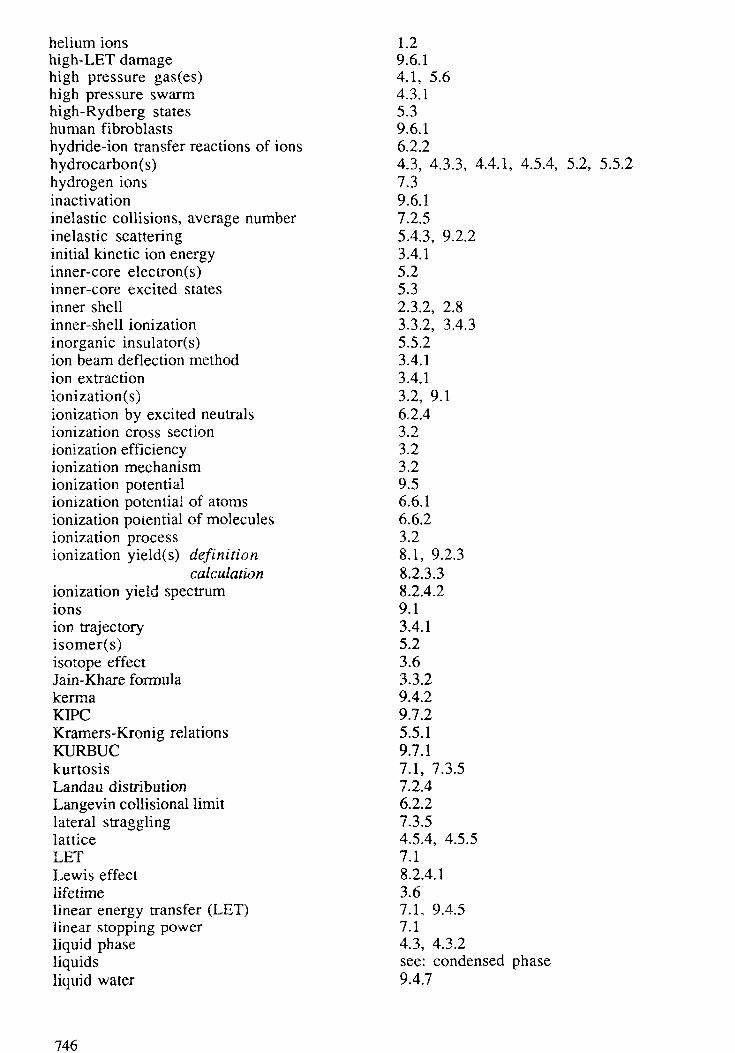
helium ionshigh-LET damagehigh pressure gas(es)high pressure swarmhigh-Rydberg stateshuman fibroblastshydride-ion transfer reactions of ionshydrocarbon(s)hydrogen ionsinactivationinelastic collisions, average numberinelastic scatteringinitial kinetic ion energyinner-core electron(s)inner-core excited statesinner shellinner-shell ionizationinorganic insulator(s)ion beam deflection methodion extractionionization(s)ionization by excited neutralsionization cross sectionionization efficiencyionization mechanismionization potentialionization potential of atomsionization potential of moleculesionization processionization yield(s) definition
calculationionization yield spectrumionsion trajectoryisomer(s)isotope effectJain-Khare formulakermaKIPCKramers-Kronig relationsKURBUCkurtosisLandau distributionLangevin collisional limitlateral stragglinglatticeLETLewis effectlifetimelinear energy transfer (LET)linear stopping powerliquid phaseliquidsliquid water
1.29.6.14.1, 5.64.3.15.39.6.16.2.24.3, 4.3.3, 4.4.1, 4.5.4, 5.2, 5.5.27.39.6.17.2.55.4.3, 9.2.23.4.15.25.32.3.2, 2.83.3.2, 3.4.35.5.23.4.13.4.13.2, 9.16.2.43.23.23.29.56.6.16.6.23.28.1, 9.2.38.2.3.38.2.4.29.13.4.15.23.63.3.29.4.29.7.25.5.19.7.17.1, 7.3.57.2.46.2.27.3.54.5.4, 4.5.57.18.2.4.13.67.1, 9.4.57.14.3, 4.3.2see: condensed phase9.4.7
746

lithiumlocal-density approximationlocally-clustered damageLotz formulalow energylow energy electronslow-pressure cloud chamberLozier tubemagnetic permeabilitymass spectrometermass spectrummass stopping powermaximum energymaximum energy transfermean excitation energy
mean free path between inelastic collisionsmean projected rangemetastablemetastable dissociations of cluster ionsmetastable ion detctionmicrodosimetrymicrowavemixturesMOCA8MOCA14modelsmodified additivity rulemolecular solidsmolecular structuremoleculemoments of distributionmonomersMonte Carlo approachesMonte Carlo calculation of W and FMonte-Carlo methodMonte Carlo simulationsMott cross sectionmultiple ionizationmultiple scatteringneutral dissociationneutral fragmentationneutral fragment(s)neutron beam therapy
radiobiological rationaleclinical datatechnical developments
neutron capture processesneutron irradiationneutronsNier type ion sourcenonpolar liquid(s)non-adiabatic elementary processesnon-dissociative process
5.5.27.3.1.1, 7.3.39.6.13.3.24.3.1, 4.4.2, 4.5, 4.5.2, 4.5.34.1, 4.2, 4.5.1, 4.5.3, 4.69.4.73.3.15.5.13.4.13.4.27.19.2.47.2.5, 7.3.37.2.1.1, 7.2.1.4, 7.2.1.5, 7.3.1.1, 7.3.1.2,7.4.1.37.2.57.14.5.1, 4.5.36.3.1.43.4.19.3.1, 1.3.1.24.3.17.3.1.2, 7.5.1.49.6.39.6.32.3.1, 2.3.2, 2.3.33.54.5, 4.5.1, 4.5.3, 4.5.44.3.1, 4.3.33.77.14.4.1, 4.4.29.2.28.2.1, 8.2.57.2.4, 7.2.5, 7.3.59.3.23.3.2, 7.2.1.72.2.3, 2.3.3, 2.67.2.1.7, 7.2.5, 7.3.4, 7.5.45.4.25.4.35.31.1, 1.3, 1.51.3.1, 1.51.3.21.3.39.2.27.3.1.59.1, 9.2.23.4.15.66.6.23.6
747

nonelastic scatteringnon-emissive fragmentnon-stoichiometricnuclear emulsionnuclear interactionsnuclear stopping powernucleic acid base(s)nucleosomenucleusTj-value(s)OER - oxygen enhancement ratioOH-radicalsoptical approximationoptical dataORECorganic molecule(s)organic substance(s)oscillator strengthoscillator strength distributionoscillator-strength spectrumouter-shell ionizationpair productionparent ionpartial cross sectionpartial cross section ratiopartial ionization cross sectionparticle fluencePARTRACpath lengthpath length increasepenetrating field extractionpenetrationPenning ionizationPenning ionization in clusterspenumbraphase effect
photoabsorptionphotochemistryphotoelectric processphotoemission thresholdphotoionization quantum yield(s)photonsphoton source(s)physical selectivity (of a radiation treatment)physical stagephysical state effectphysico-chemical stage of radiolysisplane waveplasma excitationplasma frequencypolyatomic molecule(s)polyethylenepositrons
9.2.23.74.4.19.2.47.3.57.1, 7.3.2, 7.4.2, 7.5.25.5.29.6.19.6.35.31.3.1.19.6.39.4.27.2.1.5, 7.2.1.6, 7.2.1.79.7.15.25.5.25.1. 5.2, 9.4.45.2. 7.2.1.4, 7.2.1.75.5.13.3.2, 3.4.39.2.13.4.13.13.53.2, 3.4.1, 3.4.29.4.19.6.37.1, 7.2.4, 7.3.57.2.1.7, 7.5.43.4.19.2.46.2.46.3.1.19.4.47.3.1.2, 7.3.1.3, see also: gas-soliddifference2.3.15.29.2.19.55.34.1, 4.5.1, 9.15.21.1, 1.2, 1.3.1.3, 1.4.1, 1.59.1see: phase effect6.15.5.15.5.25.5.1, 5.5.25.65.5.27.2.1.7
748

PRALpredictive tests (in radiation therapy)pre-equilibrium stoppingprobability distribution definition
Monte Carlo calculationexperimental determination
projected rangeprojectile charge, fractional (fractional ionization)proportional counterpropyleneprostatic adenocarcinomaproton affinity of atomsproton affinity of moleculesproton beam therapy
rationaletechnology
proton doseproton impactprotonsproton transfer reactions of ionsproton transfer reactions in cluster ionsPSTARpulse radiolysispulsed electron and ion techniquequantum mechanical calculationquantum yieldquantum yield for ionization, theQuasi-Equilibrium theoryradial dose conceptradiancesradiation biologyradiation chemical yieldradiation chemistryradiation damageradiation effectsradiation qualityradiative recombination of ionsradiative stopping powerradicalsradiochromic dye filmradiotherapyradius cutoff (lr)rangerange stragglingrare gasrate constant(s)rate constants of charge transferrate constants of reactions of ionsratio W/I definition and values
relation with FRBE - relative biological effectivenessreactions of ionsreactions of ions in condensed phasereactions of ions in clusters
7.3.5, 7.5.51.57.18.1, 8.48.4.28.4.2, 8.3.1.37.1, 7.3.5, 7.4.3, 7.5.57.5.1.19.3.15.21.3.2.4, 1.2.4, 1.4.26.6.46.6.4
1.2.11.2.5, 1.5Table 7.149.2.47.3, 9.16.2.2, 6.3.1.36.3.1.37.3.1.1, 7.3.1.4, 7.3.54.1, 4.3.13.4.13.3.25.25.23.4.29.3.39.4.19.3.35.25.23.19.19.4.56.2.37.1, 7.2.2, 9.4.29.19.6.23.3.3, 3.4.4, 4.1, 4.69.4.57.1, 7.3.5, 7.5.2, 7.5.5, 9.2.2, 9.2.37.1, 7.3.5, 7.5.54.4.13.6, 4.3.16.2.2, 6.6.66.2.1, 6.6.68.38.4.11.3.1, 1.3.2.4, 1.4.16.2.1, 6.2.26.4.16.3
749

recoil ionsrecombination coefficientsrecombination of ionsrecommended partial cross sectionrecommended total cross sectionreduced scattering anglereduced target thicknessreference codesreflectionrefractive indexrelative biological effectivenessresonance(s)restricted collision stopping powerRRKM theoryRutherford cross sectionRydberg statessalivary gland tumorsscewnessscreening lengthsecondary electron(s)sector field mass spectrometerselection (of patients for particle therapy)selection rulesemi-classical collision theorysemiconductor(s)shell correctionshort trackssilanesimilaritiessimulationssingle collision conditionsingle-hit detectorsingle ionizationsingle ionization cross sectionsingle-strand breaks (SSB)singly differential cross sectionsskull (tumors of the)slowing downsoft tissue sarcomassoft X-raysolid filmsolidssolid-state nuclear track detectorssolvationspallation processesspecific energyspectroscopySpencer-Fano equationspin conservation rulespread out Bragg peak-SOBP (see Bragg peak)spur(s)state selected partial cross sectionstatistics of penetrationstereo-isomer
9.2.26.2.36.2.33.4.43.3.37.5.47.5.4Table 7.105.5.25.5.19.6.14.2, 4.3.1, 4.3.3, 4.4.1, 4.4.2, 4.5.3, 4.5.57.13.4.29.2.45.4.31.3.2.27.1, 7.3.3, 7.3.57.5.1.1, 7.5.43.1, 4.1, 5.2, 9.2.4, 9.4.43.4.11.3.1.3, 1.3.2.1, 1.4.3, 1.54.4.23.3.25.5.27.2.1.1, 7.2.1.4, 7.3.1.19.4.65.4.39.4.19.13.29.6.23.23.3.29.6.32.1, 2.2.1, 2.2.2, 2.3.1, 2.3.2, 2.3.31.2.39.6.41.2.4, 1.3.2.3, 1.4.25.14.1, 4.3.1, 4.5see: condensed phase9.19.6.49.2.27.3.1.1, 9.3.14.3.3, 4.4.1, 4.5.1, 4.5.2, 4.5.38.2.3.16.2.5
9.3.2,3.4.37.3.35.2
9.4.6
7*50

stimulated desorptionstoichiometricstopping cross sectionstopping numberstopping powerstopping power compilationsstopping power, effectivestopping power fitsstopping power: limitation of the usefulnessstraggling
straggling ratiosubexcitationsummation methodsuperexcited statesuper-conducting cyclotronssurface roughnesssurface statessuperexcitationsuperexcited moleculesuperexcited statesswarm methodsymmetrysymmetry breakingsynchrotron (for therapy)synchrotron radiationtarget thickness, variation oftheoretical methodtherapythermalizationthermodynamic data of ionsthin metal windowThomas-Kuhn-Reiche sum ruleThomson formulathree-body recombination of ionstime-of-flight techniquetotal cross sectiontotal ionization cross sectiontracktrack endstrack entitiestrack structure theorytransient anionstransition probabilitytranslational energytransmissiontransmission measurementtransport equationtrapped ion mass spectrometryTRIMtriply differential cross sectionstwo-step ionizationuncertaintiesuniversal scattering potential
4.5.14.4.1, 4.4.27.1, 7.2.1.7, 7.3.1.1, 7.3.1.3, 7.4.1, 7.5.1.27.2.1.1Ch.7, 9.2.3, 9.4.57.3.1.1, 7.3.1.4, 7.4.1.1, 7.4.1.47.3.57.3.1.1, 7.4.1.1, Table 7.97.2.5see: energy loss straggling, rangestraggling9.2.49.2.33.3.13.71.5see: target thickness, variation of4.4.15.35.35.33.64.2, 4.3.1, 4.4.2, 4.5.44.3.11.2.4, 1.2.5, 1.4.4, 1.55.17.3.3, 7.5.3, 7.5.43.3.2, 3.4.27.3.1.59.6.46.6.25.35.13.3.26.2.33.73.13.2, 3.3.19.2.19.3.29.4.79.14.2, 4.5, 4.5.45.23.74.5.1, 4.5.27.4.2, 7.5.47.3.5, 7.4.23.4.17.3.3, 7.4.1.4, 7.4.3, 7.5.3, 7.5.52.1, 2.2.13.27.2.1.7, 7.2.2, 7.3.1.1, 7.3.1.5, 7.5.1.27.3.5,7.4.2, 7.5.2
751

uveal melanomavalence excited statesVavilov theoryvdW clustersvector rangevibrational excitationvibrationally excited statesvibrational stabilizationvirtual photon source(s)VUV monochromatorVUV-SX regionwaterwater vaporWeizsäcker-Williams methodwork functionW value
definitioncalculationmethods of measurementsionization chamber techniqueproportional counter techniquefor electrons in gasesfor photonsfor protonsfor alpha particlesfor heavy ionsin regular gas mixturesin irregular gas mixturesin liquid rare gasesin molecular liquidsin semiconductors
w value definitionin gases
Z\ -oscillationZ2-oscillationZiegler, Biersack, Littmark (ZBL)
1.2.25.4.37.3.34.4.27.1, 7.3.64.2, 4.5.2, 4.5.45.34.5.55.4.25.35.65.5.29.4.77.2.1.79.55.28.1, 8.38.2.18.3.18.3.1.28.3.1.38.3.28.3.38.3.48.3.58.3.68.3.7.18.3.7.28.6.18.6.2.28.6.38.1, 8.38.3.4 to 8.3.67.5.1.2, 7.5.3, 7.5.57.3.1.1, 7.5.1.1, 7.5.57.3.1.1, 7.3.3, 7.4.1.2, 7.4.2, 7.4.3,7.5.1.1, 7.5.1.2, 7.5.5
752

LIST OF CRP MEMBERS AND CONSULTANTS
Dr. M.J. BergerCenter for Radiation ResearchDiv. 846National Institute of Standardsand Technology (NIST)Gaithersburg, MD 20899, U.S.A.Tel.: 301-975-5551Fax: 301-656-8331
Dr. H. Bichsel (Consultant)1211 22nd A venue EastSeattle, Washington 98112-3534U.S.A.Tel.: 206-329-2792Fax: 206-685-4634E-mail: BICHSEL®
NPL.NPL.WASHINGTON.EDU
Dr. D.T. GoodheadMedical Research CouncilRadiobiology UnitChilton, Didcot OX11ORDUnited KingdomTel.: 44-235-834393Fax: 44-235-834776
Professor Y. HatanoDepartment of ChemistryFaculty of ScienceTokyo Institute of TechnologyOhkayama 2-21-1, Meguro-kuTokyo 152, JapanTel.: 81-3-3726-1111Fax: 81-3-3729-0099E-mail: [email protected]
Dr. Z. HermanJ. Heyrovsky Institute of PhysicalChemistry and ElectrochemistryDolejskova 3, 182 23 PragueThe Czech RepublicTel.: 42-2-858-3751 or 42-2-815-3514Fax: 42-2-858-2307E-mail : HERMAN@CSPGAS 11
Dr. M. InokutiArgonne National Laboratory9700 S. Cass Avenue, Bldg. 203Argonne, IL 60439, U.S.A.Tel: 708-252-4186Fax: 708-252-7415E-mail: B10757@ANLVM
Dr. I.G. KaplanInstitute de FisicaUniversidad National Autönoma
de MexicoApdo. Postal 20-36401000 Mexico, D.F.Tel: 525-622-5014 to 17
Dr. N.P. KocherovNuclear Data SectionInternational Atomic Energy AgencyWagramerstrasse 5, P.O. Box 100A-1400 Vienna, AustriaTel.: 43-1-2360-1718Fax: 43-1-234564E-mail: RNC@IAEAI or
Dr. I. Krajcar-Bronic (Consultant)Rudjer Boskovic InstituteBijenicka 5441001 Zagreb, CroatiaTel.: 38-41-424-239Fax: 38-41-434-467 or 425-497E-mail: [email protected]
Professor T.D. MarkInstitut für lonenphysikder Universität InnsbruckTechnikerstrasse 25A-6020 Innsbruck, AustriaTel.: 43-512-218-5124Fax: 43-512-218-5032E-mail: [email protected]
753

Dr. H.G. ParetzkeGSF-Forschungszentrum fürStrahlenschutz und UmweltforschungIngolstädter Landstrasse lD-85758 OberschleissheimGermanyTel.: 49-89-31870-4006
Home: 49-89-916984Fax: 49-89-3187-3323E-mail: [email protected]
Professor H. PaulInstitut für Experimentalphysikder Universität LinzAbteilung Atom- und KernphysikAltenbergerstrasse 69A-4040 Linz, AustriaTel.: 43-732-2468-508Fax: 43-732-2468-10E-mail: K340570@ALUKU11
Dr. P. Pihet (Consultant)Institut de Protection et Sûreté NucléairesB.P. 6F-92265 Fontenay aux Roses CedexFranceTel.: 33-1-46-54-9121Fax: 33-1-47-46-9777
Professor L. SancheFaculty of MedicineUniversity of SherbrookeStoke RoadSherbrooke, Quebec JIH 5N4CanadaTel.: 819-563-5555 ext. 4678
Home: 819-562-4236Fax: 819-564-5442E-mail: QAAB@UDESVM
Dr. D. SrdoéSafety & Environmental ProtectionBldg. 535ABrookhaven National LaboratoryUpton, N.Y. 11973, U.S.A.Tel.: 516-282-5641
Home: 516-345-6947Fax: 516-282-5773E-mail: [email protected]
Dr. M. TerrissolCentre de Physique AtomiqueUniversité Paul Sabatier118 Route de NarbonneF-31062 Toulouse, FranceTel.: 33-6155-6851Fax: 33-6155-6332E-mail: [email protected]
Dr. L.H. ToburenBoard on Radiation Effects, NAS-342National Academy of Sciences2101 Constitution Avenue, NWWashington, DC 20418, U.S.A.Tel.: 202-334-3163Fax: 202-334-1639E-mail: LTOBUREN@NAS
Professor E. Waibel (Consultant)Physikalisch-Technische BundesanstaltGruppe 6.1, Bundesallee 100D-38116 Braunschweig, GermanyTel.: 49-0531-592-6100
Home: 49-05341-26876Fax: 49-0531-592-4006
Professor A. Wambersie (Consultant)Unité de RadiothérapieNeutron- et CurietherapieCliniques Universitaires St. LucUCL 10/47521200 Brussels, BelgiumTel.: 32-2-764-1111/4726Fax: 32-2-764-3703
O00OOinO)
754

QUESTIONNAIRE ON IAEA-TECDOCs
It would greatly assist the International Atomic Energy Agency in its analysis of the effective-ness of its Technical Document programme if you could kindly answer the following questionsand return the form to the address shown below. Your co-operation is greatly appreciated.
Title: Atomic and molecular data for radiotherapy and radiation researchNumber: IAEA-TECDOC-799
1. How did you obtain this TECDOC?
[ ] From the IAEA:[ ] At own request[ ] Without request[ ] As participant at an IAEA meeting
[ ] From a professional colleague[ ] From library
2. How do you rate the content of the TECDOC?
[ ] Useful, includes information not found elsewhere[ ] Useful as a survey of the subject area[ ] Useful for reference[ ] Useful because of its international character[ ] Useful for training or study purposes[ ] Not very useful. If not, why not?
3. How do you become aware of the TECDOCs available from the IAEA?
[ ] From references in:[ ] IAEA publications[ ] Other publications
[ ] From IAEA meetings[ ] From IAEA newsletters[ ] By other means (please specify)[ ] If you find it difficult to obtain information on TECDOCs please tick this box
4. Do you make use of IAEA-TECDOCs?
[ ] Frequently[ ] Occasionally[ ] Rarely
5. Please state the institute (or country) in which you are working:
Please return to: R.F. KelleherHead, Publishing SectionInternational Atomic Energy AgencyP.O. Box 100Wagramerstrasse 5A-1400 Vienna, Austria

ISSN 1011-4289
Copyright © 2022 FDOKUMEN