
Skúsenosť s prechodom od LMS Moodle ku cloudovému LMS iSmart
Upload
khangminh22Category
view
0download
0
Case 1 : Ostial and diffuse LAD disease with LMS stenting A 64-year-old man with history of recent heart failure and EF 35% was referred for angiogram. Angiogram showed ostial and mid LAD disease. After Multi-Disciplinary Team discussion, he was referred for PCI. The LAD was pre-dilated with a 2.5x20mm balloon and OCT pullback was performed.
Figure 1 A: Diagnostic angiogram
Figure 1 B: OCT pullback after pre-dilatation with 2.5x20mm balloon
The distal reference diameter was measured at 2.15mm in the distal LAD. The proximal diameter was to be decided after studying the lesion further.
*
* *

Figure 2: Distal reference 2.15mm
Analysis of the lesion showed mainly fibrous plaque in the distal LAD with balloon induced dissection. There was fibroatheroma in mid and proximal LAD with only mild calcification. The ostial LAD was severely diseased with MLA of 3mm2 and a mean diameter of 2mm. We therefore decided to place a stent back into the LMS. The proximal reference in the LMS was measured as 4.3mm
*
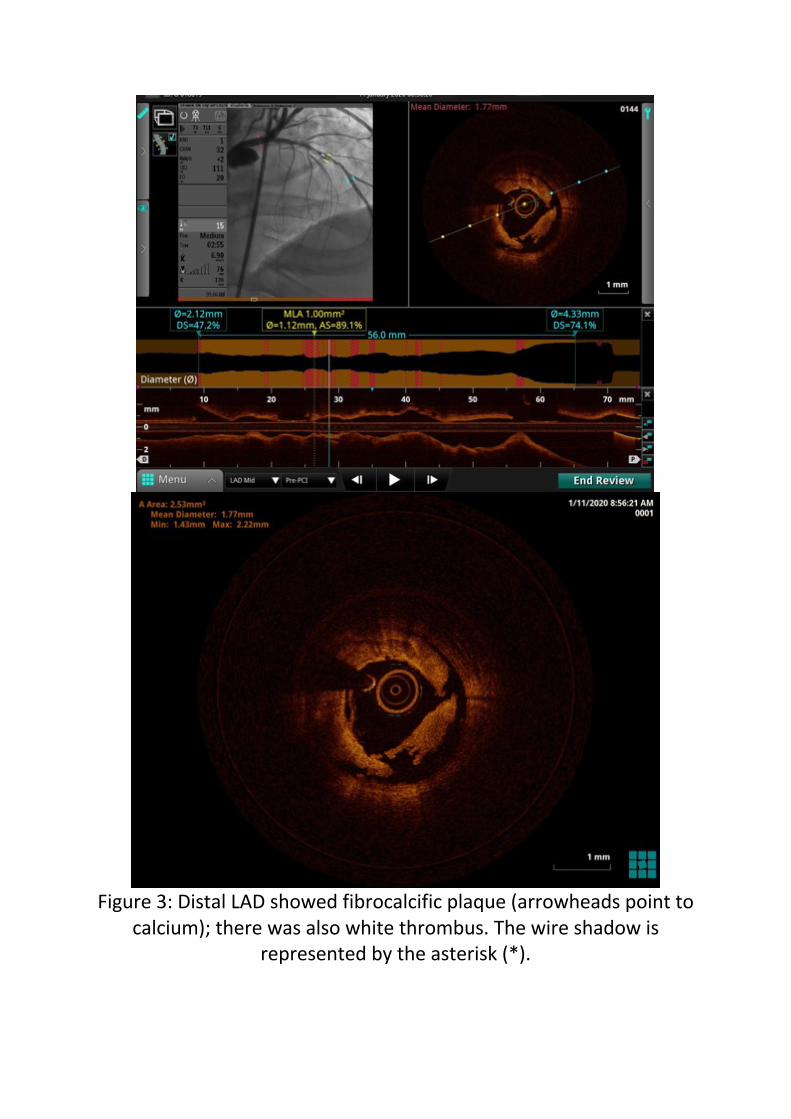
Figure 3: Distal LAD showed fibrocalcific plaque (arrowheads point to
calcium); there was also white thrombus. The wire shadow is represented by the asterisk (*).
*

Figure 4: More proximally in the mid-LAD, the lesion is made of
mixed plaque – fibroatheroma with a large lipid pool (asterisk) and also superficial calcium from 12 to 6 o’clock (arrowheads)
*

Figure 5: Ostial lesion with mean diameter of 2mm and lumen area of 3.2mm2. There is macrophage
accumulation (arrowheads), identified by high backscattering and shadow in the tissue behind

Figure 6: Proximal reference diameter in the LMS – 4.3mm
We decided to place stents from the distal LAD to the LMS, covering the dissection and the proximal stenosis. We chose a 2.5mm stent in distal LAD. Proximally, in view of the large LMS, we decided on a self-expanding stent. Accordingly, he was treated with Xience Sierra 2.5x28mm and 2.75x18mm DES in mid to proximal LAD. A Stentys Xposition S 3-3.5x22mm self-expandable DES was deployed from proximal LAD to LMS at 14 atm. Post-PCI OCT was performed to look at expansion, apposition and any stent edge dissection. Check OCT showed some underexpansion in the mid LAD but good apposition throughout, including the large LMS. There was no stent edge dissection.

Figure 6: Angiogram post-PCI
Figure 7: Co-registered OCT post-PCI. The rendered stent in the L-mode shows the stents are well apposed throughout (white).

Cross-section shows an area of underexpansion in the distal LAD where the 2.5mm stent has only expanded to 2.1mm with an MLA of 3.47mm2, resulting in nonuniform strut distribution.
Figure 8: 3D reconstruction shows ostium of the LCx crossed by
multiple stent struts and connectors. There is no plaque shift and the ostium is wide open. No kissing balloon inflation was
performed in this case.

Figure 9: 3D reconstruction (navigation) is presented on the top left image with Tissue and Lumen excluded. This shows that all 3 stents are well apposed (white) with a gradual tapering in diameter from
LMS to distal LAD. The cross-section image shows the self-expanding Stentys stent expanded to 4.4mm in LMS and is well apposed to the
vessel wall, without the need for any post-dilatation.
The distal LAD stent was post-dilated with a 2.5mm NC balloon. The final result was satisfactory.
Case 2 : Stent deformation leading to ACS A 46-year-old lady presented with ACS. She had undergone PCI to LMS bifurcation previously with a 2.5x18 DES in LCx and a Stentys Xposition S 3–3.5x27mm self-expandable drug-eluting-stent in LMS-LAD using a reverse T technique. The LMS stent had been post-dilated with a 4x8mm NC balloon.

Diagnostic angiogram now revealed an irregular lesion in the roof of the LMS-LAD junction suggestive of thrombus and possible underlying stent problem.
B B

Figure 1. A: Irregular lesion on the roof of LMS-LAD. B: Stentys
Xposition S in LMS-LAD (note dots) and DES in LCx
C D A A A

OCT to LMS-LAD was performed. The stent in the proximal LAD looked healthy, with good signs of endothelial coverage.
Figure 2A and 2B: Proximal LAD: Well expanded stent with good endothelial coverage. Mild neo-intimal hyperplasia at 11 o’clock.
However, in the LAD-LMS junction, there was stent deformation and malapposition. There was protrusion of multiple stent struts into the

lumen. Near the proximal stent edge, there is evidence of white thrombus on the protruding stent struts.

Figure 3A, B: Stent deformation with malapposition in the LMS and ostial LAD. The proximal LAD stent is well apposed (white) while the ostial LAD and LMS portions of the stent are malapposed (red). 3B
shows 3D reconstruction (tissue and lumen) with proximal LAD stent well apposed against the vessel wall (white) and malapposition in the
LMS (red)


Figure 3C,D,E: Serial images in the distal LMS (arrows) showing deformation of previously inserted stent with protrusion of struts into the lumen and white thrombus deposition (arrowheads). 3E
shows proximal stent edge with crowding of the deformed strut and uncovered vessel between 12 to 5 o’clock
It was not possible to pass the OCT catheter or IVUS catheter into the LCx, despite pre-dilatation with a 2mm balloon. This was likely because of the stent deformation at the bifurcation. LMS-LAD stent was dilated with a 3.5mm NC balloon at high pressures. We decided to deploy a regular DES to treat the deformation of the Stentys stent. A Xience Sierra 3.5x18mm DES was deployed from proximal LAD to ostial LMS at 16atm and post-dilated with a 4.5x8mm NC balloon. The LCx was recrossed and dilated with a 2.5mm NC balloon. A final KBI was performed in the LMS bifurcation.

Final angiogram and OCT showed good stent deployment in the LMS and resolution of the stent deformation.
TSD Suspected fibroatheroma

Figure 4 A: Final angiographic result. 4B: Well expanded new stent and resolution of stent deformation. Old and new stent struts seen
together around 7o’clock.

4C: stent rendering showing good apposition. 4D: 3D reconstruction (tissue and lumen) showing good apposition of the stent against the
vessel wall
Case 3: MINOCA with recurrent presentations A 63-year-old lady had presented with epigastric pain and mild troponin leak and was referred for an angiogram. She had a 40% borderline ostial LAD stenosis. iFR was negative and she was managed with medications including dual anti-platelets. She presented 2 weeks later with further chest pain. Repeat angiogram showed similar appearance in the ostial LAD and no significant stenosis elsewhere.
Figure 1: Borderline stenosis in ostial LAD
In view of the repeat presentation with chest pain, we decided to interrogate the LAD lesion with OCT. As expected, there was no
LCx origin Suspected fibroatheroma
fibroatheroma

significant stenosis in the LAD but there was a suspicious appearance in the ostium of the LAD, opposite the origin of the LCx. There was evidence of fibroatheroma but the vessel was not clearly seen. The rest of the LMS was normal, except for a superficial calcium plaque, but no stenosis.
LCx

Figure 2A: First OCT run.
A: OCT at the origin of the LCx, showing fibroatheroma at 3 o’clock. The vessel wall at this area was obscured by the OCT catheter. The
LCx origin LCx LCx LCx
LCx

arrow points at an area of Tangential Signal Drop-out (TSD), an artefact caused by glancing incidence of the OCT light because of the position of the OCT catheter close to the wall, reducing penetration of the infra-red light through the vessel wall. LCx origin at 9 o’clock
We had a high index of suspicion in view of the clinical presentation and the abnormal appearance on OCT, which was partly obscured by the eccentric position of the catheter. We therefore re-inserted the OCT catheter and repeated a pullback, hoping the OCT catheter would be in a slightly different position and reveal any underlying pathology. This time around, the catheter was more central, revealing red thrombus at the same location.

Figure 3. Second OCT run. Red thrombus.
LCx

We tried to avoid a stent in view of the trifurcation location of the lesion (with a large Diagonal branch). We treated the lesion with a 3.5x12mm NC balloon balloon and a 3.5x20mm Magic Touch Drug Coated Balloon.
Figure 4: 3.5x20mm Magic Touch Drug Coated Balloon
Repeat OCT showed that the thrombus had disappeared, now revealing a large ruptured plaque (Figure 6,7). There was intimal dissection which could have been caused or extended by the balloon dilatations, but there was clear evidence of a vessel wall cavity below the intimal flaps. This was consistent with the original clinical presentation of ACS.

Figure 6: OCT after balloon deployment - ruptured plaque with
cavity. The intimal flaps and the cavity are interrupted by the wire shadow.

Based on the OCT appearance of plaque rupture, we decided to treat the lesion with a stent. There was no haemodynamically significant stenosis but the stent was deployed for plaque pacification. On OCT, the distal reference in the LAD was about 3.2mm and the proximal reference in the LMS was 4.4mm.

A Xience Sierra 4x18mm drug-eluting-stent was deployed from the LMS to the LAD at 14atm. The stent in the LMS was post-dilated with a 4.5x8mm NC balloon.

Check OCT showed good result at the site of the ruptured plaque but malapposition in the LMS.
Figure 7A: Good stent expansion and appostion at the LMS
bifurcations. 7B: Malapposition in the LMS

Further post-dilatation was performed with a 5x8mm NC balloon at 16atm. Final angiogram showed good stent deployment and TIMI 3 flow.
Figure 8: Final angiographic result
Case 4: Multivessel disease – assessment of severity and treatment
strategy A 68-year-old lady was referred for angiogram with angina and abnormal treadmill test. She had a history of previous PCI procedures to LMS and LAD. Angiogram showed moderate ISR in the distal end of the LAD stent and borderline de-novo disease in mid-LAD. There was a 70% stenosis in the mid LCx.

Figure 1. Initial angiogram. A: moderate mid-LAD stenosis. B: severe
stenosis in mid-LCx

LAD OCT to the LAD showed plaque disease in the native mid-vessel and mild ISR in the proximal vessel. The MLA was 2.33mm2 in distal LAD. The stents were well endothelialised. The ostium of the LCx was interrupted by stent struts covered by fibrin, forming a neointimal bridge.


Figure 2. OCT images in LAD
A: Distal LAD - moderate de novo stenosis but MLA 2.33mm2 B. Mid-LAD - stent edge well endothelialised, with no neointimal
hyperplasia C. LMS bifurcation - Neointimal bridge across the ostium of the LCx
(arrowhead)
Based on these OCT findings, we decided against any intervention in the LAD. LCx We proceeded to PCI of the LCx. We were unable to pass the OCT catheter. This was possibly related to the struts across the ostium. The LCx ostium and mid-vessel were dilated with a 3.0mm balloon with some difficulty and a Magic Touch 3x25mm DCB was deployed through a Guideliner catheter extension.

Figure 3: Magic Touch 3x25mm DCB in LCx, deployed through a
Guideliner Check angiogram showed a large dissection in the mid-LCx (4A). This was assessed further on OCT. The dissection was almost 270 degrees wide and extended more than 10mm.
* *

Figure 4. Post-DCB. A: suggestion of dissection on angiogram. B:
Extensive intimal dissection on OCT in mid-LCx, extending almost 270 degrees


Figure 5: Serial cross-sectional images of the dissection in the mid LCx – the dissection involves only the intima and not the media. There is calcium seen within the plaque (blue arrowheads). The
longitudinal image shows that the dissection is more than 10mm in length.

Figure 6: Distal reference and proximal reference
We therefore decided to cover the LCx with a stent. The distal reference was 2.4mm and the proximal reference was 2.8mm. A

Synergy 3x20mm DES was deployed, resulting in a good final angiographic appearance.
Figure 7: Final angiographic result
Case 5 : Severe ISR and malapposition A 46-year-old man with End-Stage Renal Disease on Haemodialysis presented with recent onset angina. He had history of previous CABG and PCI to native RCA and LCx. He had a patent LIMA to LAD. The LCx had been treated with a 3.5x22 DES back into the LMS 6 months earlier. Diagnostic angiogram showed severe ISR from LMS to ostial LCx. There was CTO of the distal LCx as noted previously.

Figure 1: severe ISR in LMS-LCx and CTO of distal LCx (arrow)

The CTO was crossed with a PT2 wire. After pre-dilatation with a 2.5x15mm balloon, OCT catheter was passed with Guideliner support and a pullback was performed from mid-LCx to LMS. OCT helped us to understand the pathology of the ISR and decide on a DCB or DES. There was under-sizing and malapposition in the proximal LCx and LMS with severe neointimal hyperplasia. There was dissection in the ostial LMS, possibly caused by the guiding catheter.

Figure 2: OCT pullback from mid LCx to LMS. A: The mid LCx was
heavily calcified but the diameter was 2.8mm with a lumen area of 6.2mm2.
B: There is dissection of the ostial LMS, likely catheter induced


Figure 3: Serial images from mid LCx to LMS.
A. Relatively normal distal LCx stent – well expanded and well endothelialised, with only mild neointimal hyperplasia.
B. Gross malapposition in the ostial LCx
C. Homogenous appearance of neointimal hyperplasia in the LMS, with some disruption caused by the balloon pre-dilatation
Based in the severe neointimal hyperplasia and the proximal dissection, we decided to place another DES. The stent diameter was based on the LCx lumen size at the site of malapposition which was 4mm (Figure 3B). The previous stent was post-dilated with a 4x15mm NC balloon. A Xience Sierra 4x23mm DES was deployed from proximal LCx to ostial LMS at 15atm. The distal LCx occlusion was predilated and treated with Xience Sierra 3x33mm and 3.5x12mm DES from distal to mid LCx (Figure 4).

Figure 4: Xience Sierra 3x33mm DES deployed in distal LCx using a
Guideliner catheter extension
Ostial LMS was post-dilated with a 4.5x12mm NC balloon. Final angiogram showed good stent deployment and TIMI 3 flow. The mid LCx had residual disease but OCT had shown confirmed that the stenosis was not significant, hence it was not treated (see Figure 2).

Figure 5: Final angiographic result
Case 6 : de novo lesion with calcification A 67-year-old man referred for PCI to LAD for persisting angina despite medical management. Angiogram showed mid LAD stenosis.
*

Figure 1: Diagnostic angiogram showing mid LAD stenosis just
proximal to the origin of a Diagonal branch
On OCT, this was found to be severe with MLA 2.7mm2. There was heavy calcification.

Figure 2: Heavy calcification, extending more than 270o in
circumference (interrupted by wire shadow at 3 o’clock). There are also lipid pools (asterisk).
*

Figure 3: Distal reference was 2.88mm and proximal reference was 2.9mm

Given the thickness of the calcium, Rotational Atherectomy could have been considered here (usually indicated when the calcium thickness is more than 500 microns). However we decided to proceed with just balloon predilatation in this case. The vessel was predilated with a 3mm scoring balloon and a 3x38mm Resolute Onyx DES was deployed at 12atm.
Figure 3: OCT pullback after stent deployment
Check OCT showed some under-expansion at the site of the original tight stenosis, as well as malapposition in an ectatic segment just proximal to the stenosis.

Figure 4: OCT showing malapposition in the proximal LAD – indicated by red dots in the picture on the left (with stent rendering). The

corresponding enlarged picture on the right is presented without stent rendering. There is also under-expansion with a diameter of 2.62mm (with a 3mm stent) at the site of MLA (measurements on
the L-mode) The stent was post-dilated with a 3.5x15 NC balloon at high pressures to optimise the final result.
Figure 5: Final angiogram
Case 7 : STEMI – Very Late Stent Thrombosis
A 55-year-old lady presented with an anterior STEMI. She had previously undergone PCI to LAD with a 3.5x23mm DES 5 years earlier. Angiogram showed a critical stenosis in the proximal LAD within the previous stent. There was suggestion of thrombus.

Figure 1: Initial angiogram showing severe ISR and possible thrombus
in the proximal LAD Aspiration thrombectomy was performed with Advance Export catheter. OCT was then performed to better understand the pathology of the stent failure and plan further treatment. No pre-dilatation was performed prior to the OCT.

Figure 2: OCT pullback performed after aspiration
OCT showed normal appearance of the stent in the distal portion and severe ISR in the proximal portion, with suggestion of thrombus (Fig 3). A closer analysis of the images highlighted the pathology of the plaque within the stent including neoatheroma, macrophages and plaque rupture.

Figure 3 A: Normal appearance of the stent in the distal portion with
good endothelialisation and no ISR

Figure 3 B: Severe neo-intimal hyperplasia in mid-portion of the stent (detailed images below)
Figure 3 C: Ruptured plaque within the stent (detailed
images below)

Figure 3D: Ostial LAD with fibroatheroma but to significant stenosis.
MLA was 5.5mm2

Figure 3: Serial images from proximal LAD E. Normal appearance of the stent in the distal portion with good endothelialisation and no ISR F. Severe neo-intimal hyperplasia G. Ruptured plaque within the stent H. Ostial LAD with fibroatheroma but to significant stenosis. MLA was 5.5mm2
Figure 3: Serial images from proximal LAD A. Normal appearance of the stent in the distal portion with good endothelialisation and no ISR B. Severe neo-intimal hyperplasia C. Ruptured plaque within the stent D. Ostial LAD with fibroatheroma but to significant stenosis. MLA was 5.5mm2


F

Figure 4: Progression of neoatheroma in the proximal LAD
A. severe neointimal hyperplasia made up mainly of fibrous tissue
B. Fibroatheroma and Macrophages (arrows)
C. Thinning of the fibrous cap. The underlying stent struts can be seen clearly.
D, E TCFA with necrotic core
F. Plaque rupture The lesion was treated with a 3.5 and 3.75mm NC balloons and an Agent 3.5x20mm DCB was deployed. Final angiogram result was satisfactory.

Figure 5: Final angiogram
Case 8 : CTO of RCA and assessment of recent PPCI in ectatic LAD A 40-year-old gentleman was treated recently for an anterior STEMI with PPCI to an ectatic thrombus laden LAD. He was now brought in for PCI to a chronically occluded RCA. RCA
Figure 1: Initial angiogram: CTO of the RCA
The occlusion was crossed with a PT2 wire and serially pre-dilated with up to 2.5mm balloon. OCT was performed. This showed diffuse fibroatheroma. There was a large burden of chronic thrombus, that had been disrupted by balloon dilatation. The short proximal segment of relatively healthy vessel measured 3.2mm in diameter.
*

Figure 2: OCT pullback after predilatation. Diffuse disease across the
RCA made up of fibroatheroma and chronic organised thrombus. Detailed images below


Figure 3: OCT pullback from distal to proximal RCA
A. Fibroatheroma. Macrophages at 9-10 o’clock

(arrowhead)
B. Red thrombus in the lumen (arrowhead)
C. Well expanded vessel with some red thrombus or possibly blood swirl (arrowhead)
D. Proximal vessel with fibroatheroma, including large lipid pool but no stenosis
In view of the ectatic nature of the vessel, we chose to use Stentys Xposition S self-expanding stents. Since the OCT pullback did not reach the distal RCA, a distal reference of 3mm was decided, based on angiogram. The proximal reference was 3.2-3.5mm, based on OCT (Figure 3C and 3D) We deployed 3.0-3.5x37mm, 3.0-3.5x17mm and 3.5-4.5x37mm stents from distal to proximal RCA respectively.

A check OCT was performed. This showed an area of underexpansion in the distal segment.
Figure 4: OCT pullback after stent deployment

Figure 5. A: Underexpansion in the distal portion of the stent. The rest of the stent looks well expanded and well apposed as seen on
the rendered stent on the L-mode. B: The proximal stent (3.5-4.5mm) expanded to appose
against the walls of the large vessel

The distal stent was post-dilated with a 3.5x15mm NC balloon. The stents were otherwise well expanded and well apposed. Of note, the proximal stent managed to expand to cover the areas of ectasia, reaching diameters of 3.9mm without any malapposition and without any need for post-dilatation with larger balloons.
LAD
After completion of the RCA PCI, OCT assessment of the LAD stent was performed. At index presentation with anterior STEMI more than a month earlier, the LAD was ectatic with high thrombus load. He was treated with aspiration thrombectomy and Stentys Xposition S 3-3.5x17mm stent (Fig 6). Index presentation

Figure 6: Angiograms at index presentation with STEMI 1 month
earlier A. Initial angiogram

B. Final result after primary PCI Staged procedure
OCT now showed that the stent had expanded adequately to cover the ectatic areas, reaching a diameter of over 4mm, with no malapposition. There was layered organised thrombus at the site of the original culprit lesion.

Figure 7: Check OCT of the LAD, one month after PPCI. A. layered
thrombus at site of original culprit lesion. B. Stent well-expanded and well-apposed

No further intervention was required. In view of the ectatic nature of the vessel and residual thrombus, the patient was commenced on NOAC, along with Clopidogrel, instead of DAPT.
Case 9 : Severe mid-LCx stenosis and borderline ostial disease A 51-year-old man had previous PCI to LAD and RCA for stable IHD. He was known to have untreated LCx stenosis. Following an abnormal treadmill stress test, he was brought it for PCI. Angiogram showed progression of the LCx disease with severe stenosis in mid to distal vessel and borderline osteoproximal LCx stenosis.
Figure 1: Diagnostic angiogram showing severe stenosis in mid to
distal LCx and borderline ostial stenosis
* *
*
*

After pre-dilatation with a 2.25x15mm balloon, OCT was performed.
Figure 2: OCT pullback after pre-dilatation
There was good result from balloon dilatation in the mid and distal segment. The proximal LCx was clearly abnormal with evidence fibroatheroma, however the stenosis was only of borderline severity as seen by a MLA of 2.7mm2 and diameter of 1.84mm.

Figure 3: Osteoproximal lesion composed of fibroatheroma (lipid
pools from 6o’clock to 3o’clock) with an MLA of 2.7mm2 and diameter of 1.84mm

The mid and distal LCx were treated with 2.25x38mm and 2.25x8mm stents, post-dilated to 2.5mm with good angiographic result.
Figure 4: Final angiogram after stent in mid-distal LCx
Further assessment of the untreated proximal LCx was performed with QFR, after completion of PCI in the mid LCx

Figure 5: Post-PCI QFR measured 0.98, hence the proximal lesion was
not significant
Figure 4: Final angiogram after dtent in mid-distal LCx

The final QFR was measured 0.89. Based on the OCT and QFR, it was concluded that the proximal lesion was not haemodynamically significant. We opted for conservative management. Case 10 : Healing and Bioresorption of BVS over 5 years
2015 A 52-year-old man was treated with an Absorb 3.5x18 BVS in May 2015 for ACS. The PCI was performed with IVUS guidance.

Figure 1: Index angiogram and PCI with BVS in 2015
2017

He had an angiogram in 2017 following atypical symptoms and a borderline TMT.
Figure 2: Angiogram in 2017, 2 years after BVS implantation
OCT showed almost complete endothelialisation with a few uncovered struts. There scaffold struts appeared to be in different stages of bioresorption. Following BVS implantation, the PLLA is replaced with a proteoglycan-rich matrix, which undergoes subsequent inspissation and is replaced by connective tissue infiltration. The stages have been described as preserved box, open box, dissolved black box and dissolved bright box, based on comparisons of OCT images with histology.

Figure 3: OCT images of the BVS 2 years after implantation. Normal size lumen (MLA 7.4mm2) with good coverage of the scaffold struts
by endothelium. Detailed images below

Figure 4: OCT images of
the BVS 2 years after

implantation – enlarged images
A. Different phases of BVS bioresorption:
Open box (green arrow)
Dissolved bright box (blue arrow)
Uncovered scaffold struts (thin yellow arrows)
B. BVS strut across the ostium of the diagonal branch covered in neointima and possibly fibrin, leading to a neointimal bridge (grey arrow)
No intervention was required. DAPT was continued in view of the uncovered struts.
2020
In 2020, the patient underwent an angiogram and OCT assessment of his BVS. He was asymptomatic. The angiogram showed patent vessel with no stenosis (Fig 5).

Figure 5: Angiogram in 2020, 4.5years after BVS implantation
OCT showed complete endothelial coverage and advanced stage of bioresorption of the scaffold, with only ‘dissolved black-box’ appearance. There was also suggestion of luminal enlargement when compared to the previous study.
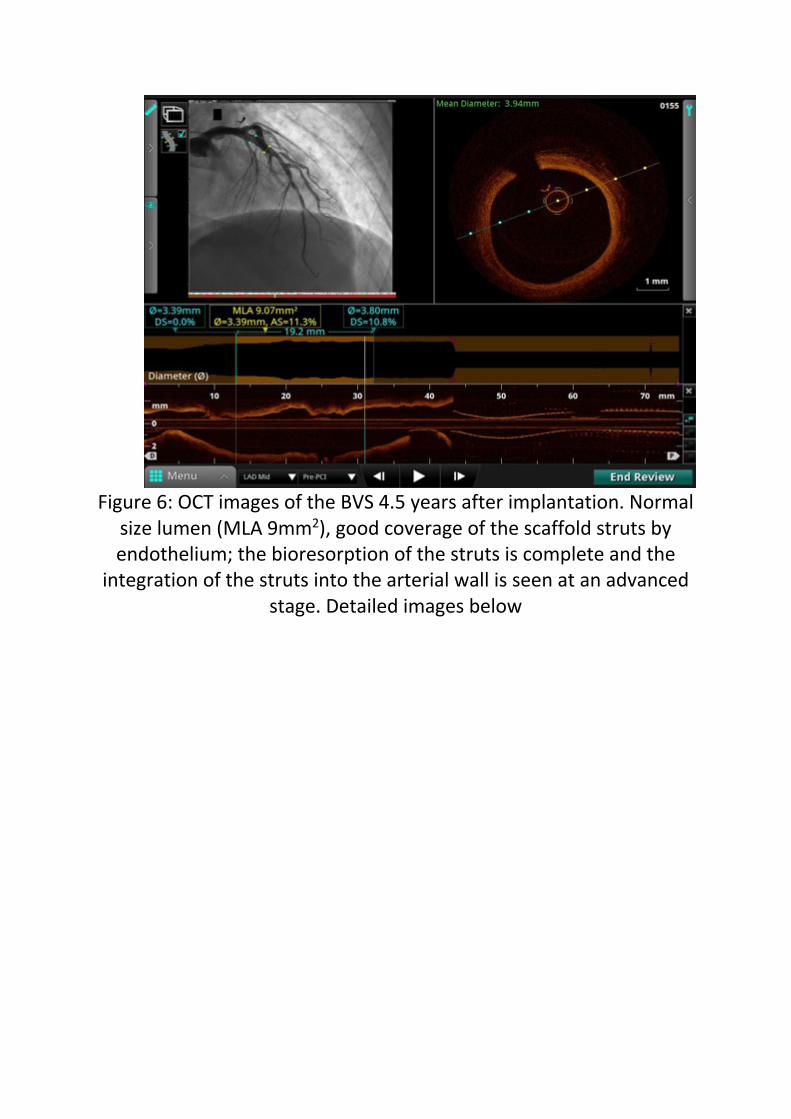
Figure 6: OCT images of the BVS 4.5 years after implantation. Normal
size lumen (MLA 9mm2), good coverage of the scaffold struts by endothelium; the bioresorption of the struts is complete and the
integration of the struts into the arterial wall is seen at an advanced stage. Detailed images below

Figure 7:
OCT images of the BVS 2 years

after implantation.
A. Dissolved black box appearance (arrows)
B. Dissolved black box surrounded by fibrin across the Diagonal origin (arrow)
No intervention was required. DAPT was discontinued.
Case 11 : LM-LAD stenosis and ISR – plaque morphology and
severity A 72-year-old man presented with VT and severe LV impairment. He had previous PCI to LAD in 2008. Angiogram showed LMS, LAD and RCA disease. He refused CABG and was brought is for PCI to LMS-LAD. A review of the angiogram showed severe distal LMS and ostial LAD stenosis. There was severe ISR in the distal portion of the stent, extending beyond the stent edge. TIMI 2 flow was seen in the distal LAD.

Figure 1: Angiogram showing distal LMS stenosis, ostial LAD stenosis
(arrow), ISR in mid-LAD (arrowheads) and TIMI 2 flow in the LAD

OCT was performed to plan the PCI. This showed extensive disease in the native vessel and within the stent.
Figure 2: OCT pullback. Arrow points to the denovo mid-vessel
stenosis

need image
Figure 3: Significant mid-LAD de-novo stenosis

Figure 6: Heterogenous neoatheroma but no flow-limiting stenosis.
Stent struts visible only between 12 – 2 o’clock. The rest of the struts are obscured by the neoatheroma

Figure 7: Stent struts across the origin of a large Diagonal branch
covered with fibrin. This forms a neointimal bridge across the distal

part of the ostium of the diagonal branch (green arrowhead on the longitudinal mode)
Figure 8: Stent struts just proximal to the origin of the Diagonal
branch. The struts are malapposed and not endothelialised

Figure 9: severe ostial LAD stenosis with MLA of 2.06mm2. The plaque is composed of thick cap fibroatheroma – high signal intensity

fibrous plaque with underlying lipid pool from 6 – 12 o’clock . There is intimal vessel seen at 7 o’clock (arrow). Note stitch artefact at 10
o’clock
Figure 10: Ostial LMS eccentric but the MLA was around 5mm2. The plaque was fibroatheroma with large lipid pools and no significant
calcium. The 2 guidewires are seen near 3 and 9o’clock

Figure 11: Reference diameter in the shaft of the LMS, measuring 4.82mm
The OCT showed that the LMS stenosis was not significant. However, since the ostial LAD was severely stenosed, we had the stent back into the LMS. Distal reference for first stent was 2.5mm. Following pre-dilatation, the mid-LAD was treated with a Xience Sierra 2.75x18mm DES, overlapping with the previous stent. Further distal LAD disease was treated with a DCB. For LMS-LAD stent, distal reference was measured close to the ectatic area and proximal to the diagonal origin. Proximal reference was in the LMS. A Xience Sierra 4x23mm DES was deployed in LM-LAD and post-dilated in the LMS with a 5x8mm NC balloon at nominal pressure. Check OCT showed good expansion of the stents but some malapposition in the LMS.

Figure 12: Malappostion in the LMS (red dots)
The LMS stent was post-dilated further with the same 5x8mm NC balloon at high pressures. Final result was satisfactory.

Figure 13: Final angiogram
Case 12 : CTO bifurcation
A 64-year-old lady presented with heart failure. Echo showed severe LV impairment with EF 35%. Diagnostic angiogram showed CTO of LAD. She was referred for PCI. She had a proximal LAD CTO with retrograde collaterals from RCA. There was a diagonal branch at near the distal end of the CTO.

Figure 1: CTO of the LAD with retrograde collaterals from the RCA.
The CTO was initially crossed with a Gaia 3rd wire into a large Diagonal branch. Using a Crusade catheter, the main LAD was wired. Pre-dilatation was performed with 2mm and 2.5mm balloons. OCT was performed with co-registration.

Figure 2: OCT pullback after wiring and predilatation The co-registered OCT images were used to measure the proximal and distal landing zones and the stent size. The LAD ostium showed fibroatheroma but no flow-limiting stenosis.
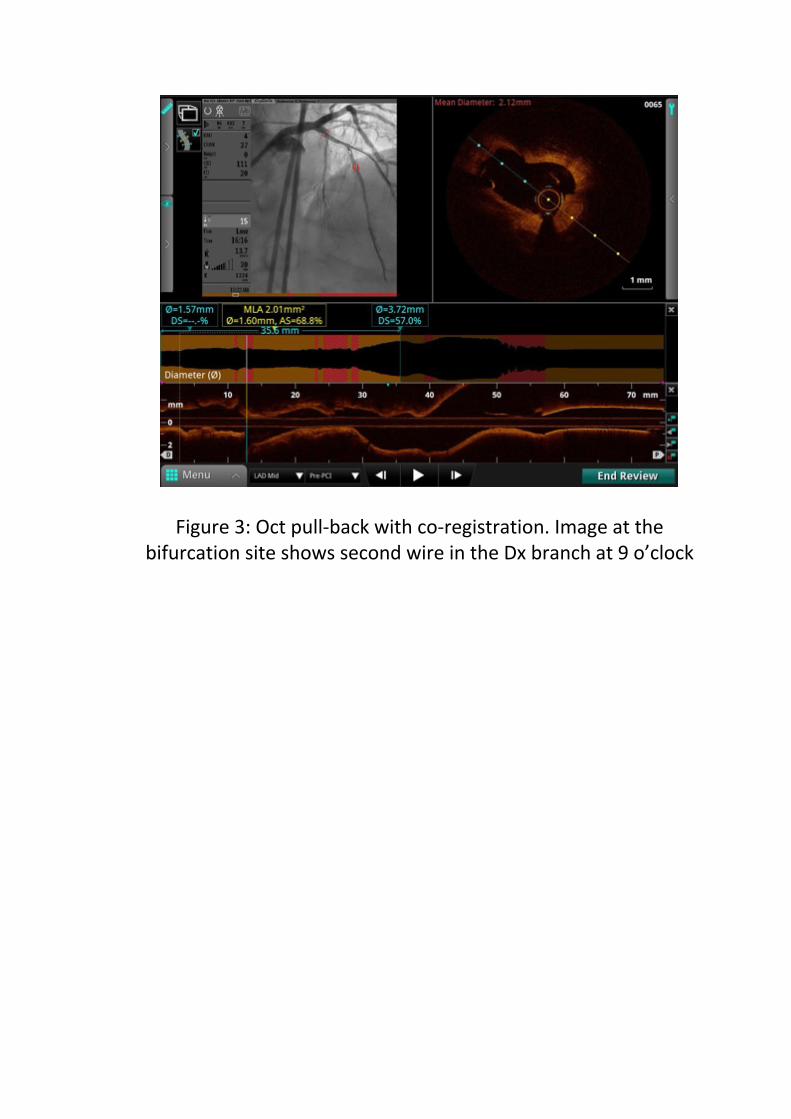
Figure 3: Oct pull-back with co-registration. Image at the bifurcation site shows second wire in the Dx branch at 9 o’clock


Figure 4: Serial
images from distal to ostial LAD
A. Distal LAD with just over 180 degrees of calcification
B. Heterogenous plaque in the occluded segment.
C. Intimal dissection caused by balloon inflation.
D. Osteoproximal LAD with thin-cap fibroatheroma (arrows) but no limiting stenosis

The LAD/D1 bifurcation was treated using a Culotte technique. The distal and proximal reference diameters in the LAD were measured on OCT. Resolute Onyx 2.75x34mm and 2.25x22mm DES were placed in the LAD and D1 respectively. The LAD stent was post-dilated to 3.75mm. Final Kissing Balloon Inflation and POT were performed. A check OCT was done. Repeat OCT showed an excellent result. The ostium of the large Diagonal branch was wide open with no overlying struts.

Figure 5: Post-PCI OCT showing good expansion of the LAD stent and
and open struts across the LCx ostium

Figure 6: Final angiographic result
Case 13 : Calcium nodules
This 72-year-old man underwent an angiogram following 2 recent episodes of angina and an abnormal treadmill test. He had 2 previous PCI procedures to the RCA.
Angiogram showed multiple focal calcified lesions in the proximal RCA.

Figure 1: Focal calcific lesions with borderline stenosis
OCT was done to analyse these lesions further. This showed multiple calcium nodules protruding into the vessel lumen

Figure 2: OCT pullback showing calcium nodules covered with res
thrombus


Figure 3: Serial images showing multiple calcium nodules ‘pushing’
the stent struts away from the vessel wall and into the lumen, leading to malapposition.
Aggressive post-dilatation of the stents was performed with
4.5x12mm NC balloon at 20 atm and 4x10mm OPN NC balloon at 35 atm.
Repeat OCT showed improvement but there was residual malapposition.


Figure 4.A: OPN 4.5x10mm NC balloon at 35atm.
B: Final angiogram. C: Final OCT pullback


Figure 5 : Final OCT showing improvement after the high pressure
balloon dilatations but significant residual protrusion of the calcium nodules and malapposition
Further post-dilatation was performed with the 4.5x12mm balloon. We accepted that we cannot get a perfect result and decided against more aggressive post-dilatation, as there would be a risk of vessel perforation. We decided to try ESWL in the next few months when the technology is available. Until then, he will remain on DAPT.
Case 14 : optimisation of PPCI stent
A 40-year-old man had recent Primary PCI to RCA. The occluded RCA was treated with aspiration thrombectomy (using Eliminate and Guideliner) and IC Aggrastat, followed by implantation of Orsiro 4x18mm DES in proximal RCA at 12 atm. Index procedure

Figure 1: Index presentation with inferior MI. A: Initial angiogram
showing occluded RCA. B; After PCI with 4x18mm DES

Staged procedure He was brought back for functional assessment of bystander disease in LAD. We performed OCT guided optimisation of the RCA stent at the same time.
Figure 2: Check OCT of RCA 2 days later after Primary PCI.
Malapposition is seen as red dots on stent rendering.


Figure 3: Serial images showing malapposition (red dots on stent
rendering), tissue prolapse (arrowhead in B) and thombus (arrows) The stent was post-dilated with 4x15mm and 4.5x8mm NC balloons. Repeat OCT showed good apposition and angiogram showed satisfactory result.

Figure 3: Final result after post-dilatation
Case 15 : Recurrent ACS with thrombus and distal embolisation

Oct 2018 A 66-year-old man was admitted with an NSTEMI and underwent angiogram. The LAD was the culprit vessel.
Figure 1: First presentation. Severe proximal LAD stenosis
After pre-dilatation with a 2.5x15mm balloon, OCT was performed. This showed diffuse atherosclerotic disease in the LAD with heavy thrombus load at the culprit lesion.

Figure 2: OCT pullback. Image shows red thrombus and underlying
fibroatheroma


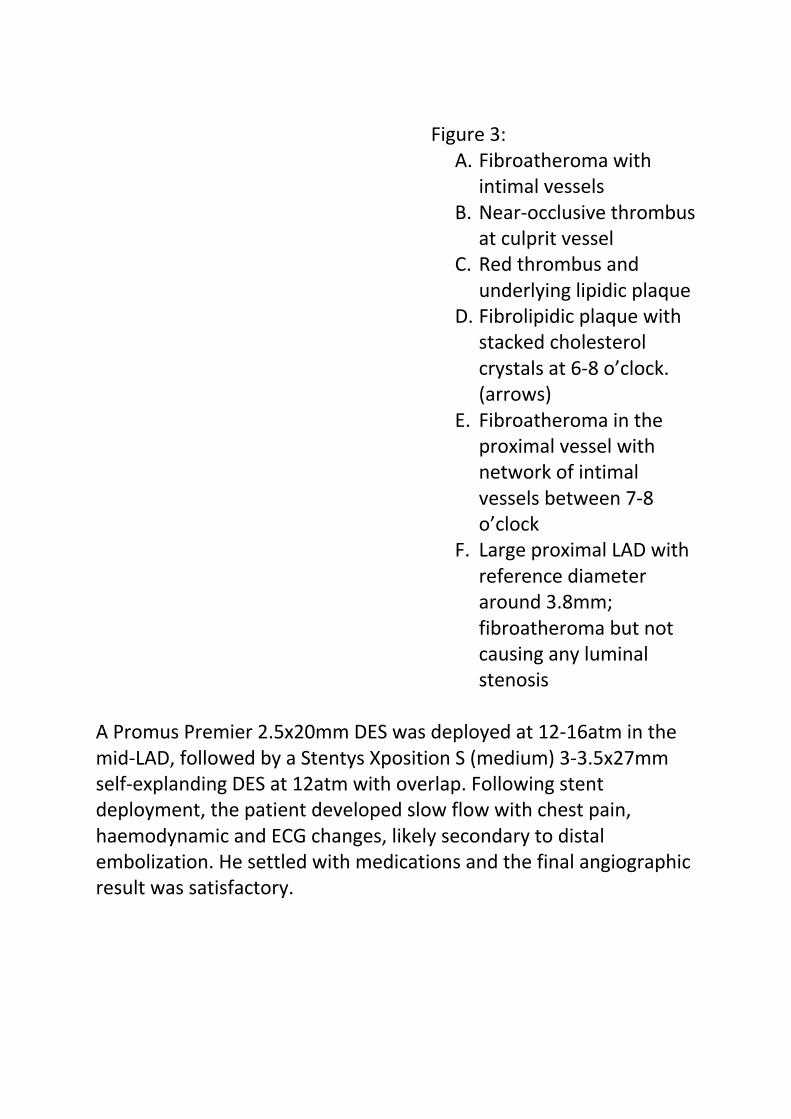
Figure 3:
A. Fibroatheroma with intimal vessels
B. Near-occlusive thrombus at culprit vessel
C. Red thrombus and underlying lipidic plaque
D. Fibrolipidic plaque with stacked cholesterol crystals at 6-8 o’clock. (arrows)
E. Fibroatheroma in the proximal vessel with network of intimal vessels between 7-8 o’clock
F. Large proximal LAD with reference diameter around 3.8mm; fibroatheroma but not causing any luminal stenosis
A Promus Premier 2.5x20mm DES was deployed at 12-16atm in the mid-LAD, followed by a Stentys Xposition S (medium) 3-3.5x27mm self-explanding DES at 12atm with overlap. Following stent deployment, the patient developed slow flow with chest pain, haemodynamic and ECG changes, likely secondary to distal embolization. He settled with medications and the final angiographic result was satisfactory.

Figure 4: First presentation. Final result after PCI
July 2019 Nine months later, he presented with NSTEMI. Angiogram showed severe in-stent restenosis in the LAD, within the Stentys Xposition S.

Figure 5. Second presentation. Severe ISR in LAD
The lesion was dilated with a 2.5x15mm balloon and OCT was performed. This showed late stent thrombosis.

Figure 6. OCT pullback after balloon dilatation


Figure 7: A. Well-
expanded Promus Premier

stent with good endothelialisation
B. Well-expanded Stentys Xposition S but a few uncovered struts from 11 to 2 o’clock
C. Heavy load of red thrombus at the culprit lesion
D. White thrombus more proximally in the culprit lesion
E. Layered ISR more proximally in the Stentys Xposition S (struts visible at about 4

o’clock to 10 o’clock but obscured in the other areas)
F. Proximal stent well expanded with no significant ISR
The stents were treated with 3.5x15mm NC balloon at 14-18atm. Just like in the previous procedure, this was complicated by significant slow-flow which improved with medications. The stents were then treated with Pantera Lux 3.5x25mm DCB at 7atm and post-dilated further with 3.75x15mm NC balloon. Repeat OCT showed significant lumen gain but there was there was residual thrombus.

Figure 8. Angiogram after NC balloon dilatation, intracoronary
GpIIbIIa and DCB
Before


After


Figure 10: Top panel shows images before the balloon dilatation
Bottom panel shows images after balloon dilatation at similar points in the vessel (identified by referencing the proximal edge of the
stent). The images show significant clearance of the thrombus and expansion of the lumen. There is residual red thrombus.
In view of the risk of distal embolization with more aggressive post-dilatation, we decided to stop and treat with medications. He was treated with Rivaroxaban and Plavix and brought back 4 months later for re-look angiogram and OCT. Nov 2019 As planned, a check angiogram and OCT was done 4 months later. This showed no significant stenosis. There was only mild ISR in the proximal vessel and some organised layered thrombus.

Figure 11: Elective angiogram and OCT done 4 months after the last
intervention


Figure 12: OCT pullback significant improvement with only mild ISR No further intervention was required. He was continued on DAPT.
Case 16 : optimisation of PPCI stent A 49-year-old man underwent Primary PCI for inferior STEMI. The RCA was thrombus laden. PCI was performed with thrombus aspiration, intracoronary Aggrastat and a Resolute Onyx 3x18mm DES, post-dilated with a 3.5x15mm balloon. There was residual thrombus and mild disease noticed proximal to the stent.

Figure 1: Index presentation. A: occluded RCA. B: after PPCI

He was treated with overnight Aggrastat and Heparin infusion. He was brought back to the lab 2 days later for staged PCI to LAD and optimisation of the RCA. After completing the staged PCI to LAD, angiogram and OCT of the RCA were performed. This showed multiple areas of tissue prolapse within the stent, malapposition in the mid-portion of the stent and a significant medial dissection proximal to the stent.

Figure 2: Angiogram and OCT in RCA 2 days after Primary PCI


Figure

3: Serial images in RCA
A. Tissue prolapse
B. Malapposit

ion
C. Medial dissection proximal to th

e stent
D. Proximal RCA with fibrocalci

fic plaque disease with MLA 5.49mm2

The proximal reference was 3.5mm. A Resolute Onyx 3.5x26mm DES was deployed in the proximal RCA overlapping with the previous stent. The stent balloon was used to post-dilate the previous stent at 12 atm. The final angiographic result was satisfactory.
Figure 4: Final result
Case 17 : elective PCI of osteoproximal LAD A 64-year-old man underwent PCI to LAD for stable IHD. Angiogram showed severe proximal LAD stenosis extending back to the ostium.

Figure 1. Diagnostic angiogram - proximal LAD stenosis
The proximal LAD was pre-dilated with a 2.5x15mm balloon
and OCT was performed.
D B

Figure 2: OCT pullback after pre-dilatation
OCT was used the measure to distal and proximal reference diameters, assess the need for further vessel preparation and to study the ostium of the LAD to size the stent for LM-LAD.


Figure 3: OCT pullback from distal LAD to LMS
A. Distal reference vessel – 2.3mm diameter
B. Mixed plaque within the lesion – calcific plaque from 9-12 o’clock, with a thin edge extending to 2 o’clock. Lipidic pool with thin fibrous cap from 2-7 o’clock. The plaque has been disrupted by balloon dilatation.
C. Ostium of the LAD shows stenosis with a lumen area of 3.1mm2. There is white thrombus, which likely developed during the course of the intervention. Some blood swirling seen in the LCx.
D. Proximal reference in the body of the LMS – mean diameter of 3.7mm but eccentric with a maximum diameter of 5mm
A C
B
B D

No further vessel preparation was required. The distal reference was 2.3mm and the proximal reference was 3.7mm. (but eccentric LMS). Resolute Onyx 2.5x26mm and 3.5x22mm DES were deployed in distal LAD and proximal LAD-LMS respectively with overlap. The LAD stent was post-dilated with a 3.75x12mm NC balloon and the LMS with a 4.5x8mm balloon OCT was repeated. This showed under-expansion in the proximal LAD and malapposition in the LMS.

Figure 4 A: Underexpansion in the proximal LAD, with the 3.5mm
stent only measuring 2.9mm.


Figure 4 B. Malapposition in the LMS, likely caused by the eccentric shape of the LMS
The LAD was post-dilated with the 3.75mm balloon at higher pressures and the LMS was post-dilated with a 5x8mm balloon. The final result was satisfactory.

Figure 5: Final result after PCI to LM-LAD

Case 18 : STEMI in a young man
A 30-year-old man was admitted with an Anterior MI. He was a smoker with history of using anabolic steroids and protein supplements previously. Angiogram showed occluded LAD. Flow was restored after wire-crossing, revealing a severe mid-LAD stenosis.

Figure 1. A: Initial angiogram showing occluded

LAD. B: Flow restored after wire crossing.
The stenosis was pre-dilated with a 2.5x15mm balloon and OCT was performed. Given his very young age, the OCT aimed to confirm that the underlying pathology was only atherosclerosis. It would also help plan the stenting strategy.
Figure 2: OCT after balloon dilatation showed diffuse fibroatheroma and red thrombus at the site of occlusion (Detailed images below)


Figure 3: OCT pullback after balloon dilatation and restoration of flow
A. Fibroatheroma with macrophages (arrowheads)
B. White (white arrowhead) and Red thrombus (red arrowhead) at the site of occlusion
C. Proximal LAD showing no stenosis but the vessel is diseased, with fibroatheroma
The vessel was treated with a Synergy 2.5x32mm DES, post-dilated to a maximum of 3.5mm proximally.

Figure 4: Final angiogram and OCT showing good flow, stent
expansion and apposition

Case 19 : elective PCI in LAD after old MI
A 61-year-old man awaiting surgery for meningioma was referred for angiogram as part of pre-operative work-up. He had an anterior MI in 2014, treated with thrombolysis. Diagnostic angiogram showed significant LAD stenosis.
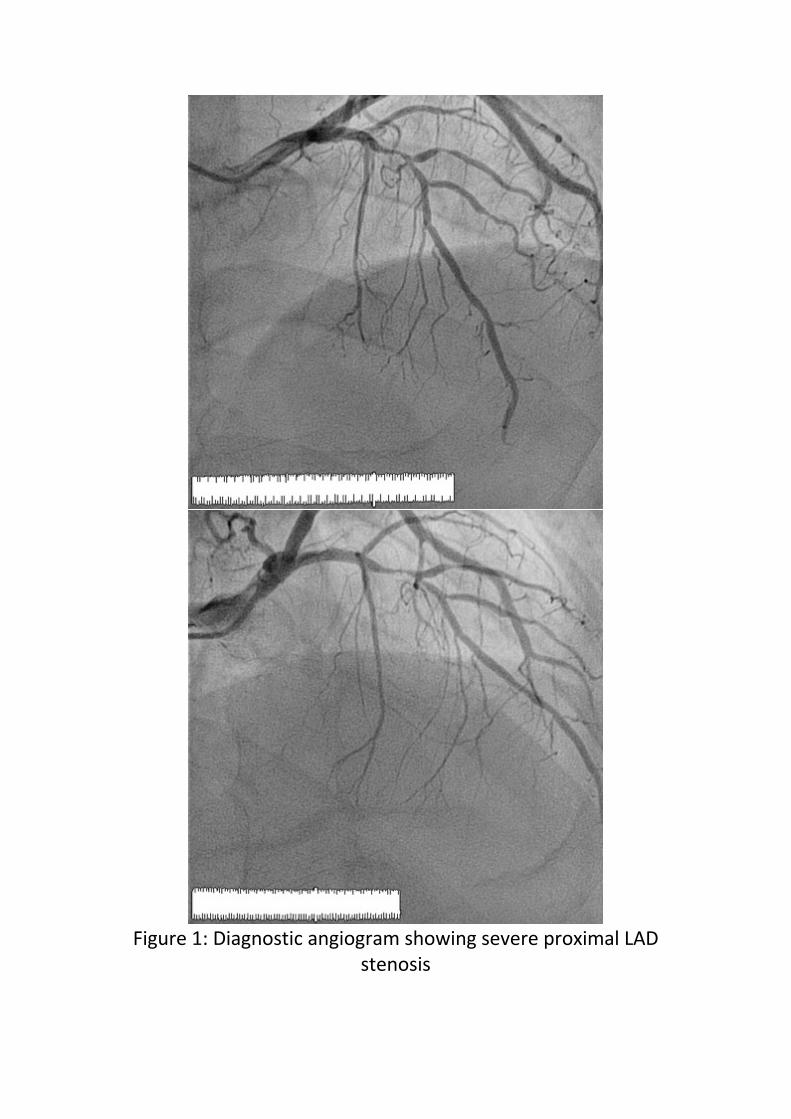
Figure 1: Diagnostic angiogram showing severe proximal LAD
stenosis

The LAD was pre-dilated with a 2.25x15mm balloon and OCT was performed.
Figure 2: OCT pullback after pre-dilatation
Serial pullback images:

Figure 3A: Fibrous plaque in distal vessel

Figure 3B. Balloon-induced dissection of fibro-calcific plaque. It is
interesting to note the large calcium plaque from 10-3 o’clock. This likely allowed the pre-dilatation balloon to only expand in the opposite direction, leading to dissection of the fibrous plaque.

Figure 3C: The plaque turns more heterogenous with a thick fibrous inner layer but lipid pool, macrophages and cholesterol crystals in
the deeper layers

Figure 3D: Necrotic core covered with only a thin layer of intima
(arrows)

Figure 3E: Healed ruptured plaque from previous MI with remnants
of the cavity, but now covered by a thick fibrous plaque. Macrophages at the margins (arrows)

Figure 3F: ‘Stable’ fibrous plaque in proximal LAD with small calcium
plaque but no flow-limiting stenosis

The reference diameters were 2mm distally and 2.5mm proximally. PCI was performed with Synergy 2.5x32mm DES, deployed at 11 atm and post-dilated with a 2.75x15mm NC balloon at up to 20atm. Post-PCI OCT was then performed.
Figure 4: OCT pullback post-PCI

Figure 5 A: Tissue prolapse from 3-6o’clock partly obscured by
wire shadow B: Malapp

osition in proximal edge of the stent (enlarged pictures below)

Figure 6: Malapposition in proximal edge of the stent. Good
apposition from 10-2 o’clock (WHITE), borderline apposition from 3-

5 o’clock (YELLOW) and significant malapposition from 6-8 o’clock (RED)
Further post-dilatation was performed with 3.0x15mm DES at 14atm with good final angiographic result
Figure 7: Final angiogram
Case 20 : Tandem LAD lesions managed with OCT and QFR A 73-year-old man had undergone PCI to LAD 5 months earlier. He now presented with recurrence of angina. Angiogram now showed disease in the proximal and distal LAD.

Figure 1: Diagnostic angiogram showing severe stenosis in mid-LAD
and borderline lesion in osteoproximal LAD
We performed iFR to assess the significance of the tandem lesions. iFR was 0.85 in distal LAD and 0.90 in mid-LAD. This corroborated well with the QFR, which was 0.77 in the distal LAD and 0.84 in mid-LAD.

Figure 2: QFR measured o.77 in the distal LAD (significant) and 0.84
in the mid-LAD (suggesting proximal lesion not significant)

A decision was made to perform PCI to mid-LAD with OCT guidance. OCT showed severe stenosis in the distal LAD as expected (MLA 1.32mm2) but also in the proximal LAD (MLA <3mm2). This was surprising as the QFR and iFR pullbacks suggested that the proximal LAD lesion was not haemodynamically significant. We decided to treat the distal LAD and reassess.

Figure 3 A: Severe distal LAD lesion with MLA 1.32mm2 and arc of calcium less than 180 degrees.

B: Proximal LAD lesion with MLA 2.35mm2
The d-LAD was predilated and treated with a Resolute Onyx 2.5x26mm stent. In view of the OCT appearance of the osteoproximal LAD lesion, iFR was repeated. This was 0.87, confirming that the osteoproximal lesion was significant on its own. This was treated with Resolute Onyx 3.5x22mm stent in LM-LAD, post-dilated with a 4.5x8mm NC balloon in the LMS. Post-PCI OCT showing good expansion but some malappostion in the LMS. The LCx ostium was wide open with no significant carina shift.

Figure 4: Post-PCI OCT
A. Good stent expansion; some malapposition in the LMS B. LCx ostium wide open with no significant carina shift; some
overhanging stent strusts seen

The LMS stent was post-dilated further with a good final result.
Figure 5: Final angiogram
Copyright © 2022 FDOKUMEN