COSIMA calibration for the detection and characterization of ...
25
COSIMA calibration for the detection and characterization of the cometary solid organic matter Léna Le Roy a,b,n , Anais Bardyn b,a , Christelle Briois a , Hervé Cottin b , Nicolas Fray b , Laurent Thirkell a , Martin Hilchenbach c a Laboratoire de Physique et Chimie de l’Environnement et de l’Espace (LPC2E), UMR 7328 CNRS – Université d’Orléans, 3A Avenue de la Recherche Scientifique, 45071 Orléans Cedex 2, France b Laboratoire Interuniversitaire des Systèmes Atmosphériques, LISA, UMR CNRS 7583, Université Paris Est Créteil (UPEC) et Université Paris Diderot (UPD), Institut Pierre Simon Laplace, 61 Avenue du Général De Gaulle, 94010 Créteil Cedex, France c Max Planck Institute for Solar System Research (MPS), Justus-von-Liebig-Weg 3, 37077 Göttingen, Germany article info Article history: Received 29 April 2014 Received in revised form 1 August 2014 Accepted 28 August 2014 Available online 10 September 2014 Keywords: Organic compounds Calibration COSIMA Rosetta TOF SIMS cometary grains Comet abstract On the orbiter of the Rosetta spacecraft, the Cometary Secondary Ion Mass Analyser (COSIMA) will provide new in situ insights about the chemical composition of cometary grains all along 67P/ Churyumov–Gerasimenko (67P/CG) journey until the end of December 2015 nominally. The aim of this paper is to present the pre-calibration which has already been performed as well as the different methods which have been developed in order to facilitate the interpretation of the COSIMA mass spectra and more especially of their organic content. The first step was to establish a mass spectra library in positive and negative ion mode of targeted molecules and to determine the specific features of each compound and chemical family analyzed. As the exact nature of the refractory cometary organic matter is nowadays unknown, this library is obviously not exhaustive. Therefore this library has also been the starting point for the research of indicators, which enable to highlight the presence of compounds containing specific atom or structure. These indicators correspond to the intensity ratio of specific peaks in the mass spectrum. They have allowed us to identify sample containing nitrogen atom, aliphatic chains or those containing polyaromatic hydrocarbons. From these indicators, a preliminary calibration line, from which the N/C ratio could be derived, has also been established. The research of specific mass difference could also be helpful to identify peaks related to quasi-molecular ions in an unknown mass spectrum. The Bayesian Positive Source Separation (BPSS) technique will also be very helpful for data analysis. This work is the starting point for the analysis of the cometary refractory organic matter. Nevertheless, calibration work will continue in order to reach the best possible interpretation of the COSIMA observations. & 2014 Elsevier Ltd. All rights reserved. 1. Introduction The European Space Agency (ESA) Rosetta cometary mission could be a milestone in the exploration of the Solar System for the in situ detection of organic compounds. Previous space probes with instruments enabling direct in situ measurements, i.e. with- out teledetection, of carbonaceous molecules have proven how difficult and challenging is the conception and operation of an instrument tailored to detect them. The global context of the explored environment which is most of the time poorly characterized, if not unknown, when the instrument is conceived, can have unexpected implications jeopardizing its science cap- abilities. It was the case for the NASA Viking landers for which the astrobiology experiments including gas chromatographs (GC) were not able to detect organic compounds (if any) due to the strong oxidizing conditions of the Martian environment (Klein, 1978). More recently, the first results released by the Sample Analysis at Mars (SAM) instrument on-board the NASA Curiosity rover are quite ambiguous regarding the origin of the carbon in the carbo-chlorinated molecules detected: either endogenous to Mars, or with carbon imported from Earth and reacting with oxidizing Martian perchlorates during the analytic process (Leshin et al., 2013; Ming et al., 2014). The in situ search for organic compounds in the atmosphere of Titan, thanks to the coupling of the Aerosol Collector Pyrolyser (ACP) and Gas Chromatograph–Mass Contents lists available at ScienceDirect journal homepage: www.elsevier.com/locate/pss Planetary and Space Science http://dx.doi.org/10.1016/j.pss.2014.08.015 0032-0633/& 2014 Elsevier Ltd. All rights reserved. n Corresponding author. Present address: Center for Space and Habitability, University of Bern, Sidlerstrasse 5, 2012 Bern, Switzerland. Tel.: þ41 31 631 34 43; fax: þ41 31 631 44 05. E-mail address: [email protected] (L. Le Roy). Planetary and Space Science 105 (2015) 1–25
-
Upload
khangminh22 -
Category
Documents
-
view
2 -
download
0
Transcript of COSIMA calibration for the detection and characterization of ...

COSIMA calibration for the detection and characterizationof the cometary solid organic matter
Léna Le Roy a,b,n, Anais Bardyn b,a, Christelle Briois a, Hervé Cottin b,Nicolas Fray b, Laurent Thirkell a, Martin Hilchenbach c
a Laboratoire de Physique et Chimie de l’Environnement et de l’Espace (LPC2E), UMR 7328 CNRS – Université d’Orléans, 3A Avenue de la RechercheScientifique, 45071 Orléans Cedex 2, Franceb Laboratoire Interuniversitaire des Systèmes Atmosphériques, LISA, UMR CNRS 7583, Université Paris Est Créteil (UPEC) et Université Paris Diderot (UPD),Institut Pierre Simon Laplace, 61 Avenue du Général De Gaulle, 94010 Créteil Cedex, Francec Max Planck Institute for Solar System Research (MPS), Justus-von-Liebig-Weg 3, 37077 Göttingen, Germany
a r t i c l e i n f o
Article history:Received 29 April 2014Received in revised form1 August 2014Accepted 28 August 2014Available online 10 September 2014
Keywords:Organic compoundsCalibrationCOSIMARosettaTOF SIMS cometary grainsComet
a b s t r a c t
On the orbiter of the Rosetta spacecraft, the Cometary Secondary Ion Mass Analyser (COSIMA) willprovide new in situ insights about the chemical composition of cometary grains all along 67P/Churyumov–Gerasimenko (67P/CG) journey until the end of December 2015 nominally. The aim of thispaper is to present the pre-calibration which has already been performed as well as the differentmethods which have been developed in order to facilitate the interpretation of the COSIMA mass spectraand more especially of their organic content. The first step was to establish a mass spectra library inpositive and negative ion mode of targeted molecules and to determine the specific features of eachcompound and chemical family analyzed. As the exact nature of the refractory cometary organic matteris nowadays unknown, this library is obviously not exhaustive. Therefore this library has also been thestarting point for the research of indicators, which enable to highlight the presence of compoundscontaining specific atom or structure. These indicators correspond to the intensity ratio of specific peaksin the mass spectrum. They have allowed us to identify sample containing nitrogen atom, aliphaticchains or those containing polyaromatic hydrocarbons. From these indicators, a preliminary calibrationline, from which the N/C ratio could be derived, has also been established. The research of specific massdifference could also be helpful to identify peaks related to quasi-molecular ions in an unknown massspectrum. The Bayesian Positive Source Separation (BPSS) technique will also be very helpful for dataanalysis. This work is the starting point for the analysis of the cometary refractory organic matter.Nevertheless, calibration work will continue in order to reach the best possible interpretation of theCOSIMA observations.
& 2014 Elsevier Ltd. All rights reserved.
1. Introduction
The European Space Agency (ESA) Rosetta cometary missioncould be a milestone in the exploration of the Solar System for thein situ detection of organic compounds. Previous space probeswith instruments enabling direct in situ measurements, i.e. with-out teledetection, of carbonaceous molecules have proven howdifficult and challenging is the conception and operation ofan instrument tailored to detect them. The global context ofthe explored environment which is most of the time poorly
characterized, if not unknown, when the instrument is conceived,can have unexpected implications jeopardizing its science cap-abilities. It was the case for the NASA Viking landers for which theastrobiology experiments including gas chromatographs (GC)were not able to detect organic compounds (if any) due to thestrong oxidizing conditions of the Martian environment (Klein,1978). More recently, the first results released by the SampleAnalysis at Mars (SAM) instrument on-board the NASA Curiosityrover are quite ambiguous regarding the origin of the carbon inthe carbo-chlorinated molecules detected: either endogenous toMars, or with carbon imported from Earth and reacting withoxidizing Martian perchlorates during the analytic process (Leshinet al., 2013; Ming et al., 2014). The in situ search for organiccompounds in the atmosphere of Titan, thanks to the coupling ofthe Aerosol Collector Pyrolyser (ACP) and Gas Chromatograph–Mass
Contents lists available at ScienceDirect
journal homepage: www.elsevier.com/locate/pss
Planetary and Space Science
http://dx.doi.org/10.1016/j.pss.2014.08.0150032-0633/& 2014 Elsevier Ltd. All rights reserved.
n Corresponding author. Present address: Center for Space and Habitability,University of Bern, Sidlerstrasse 5, 2012 Bern, Switzerland. Tel.: þ41 31 631 34 43;fax: þ41 31 631 44 05.
E-mail address: [email protected] (L. Le Roy).
Planetary and Space Science 105 (2015) 1–25

Spectrometer (GCMS) instruments on-board the ESA Huygens probe,has been less rewarding than expected. About 20 organic moleculeshave been detected in the atmosphere of this satellite of Saturn sincethe Voyager missions, and many other compounds were anticipatedaccording to laboratory simulations both in the gaseous and in thesolid phase (Coll et al., 1999). Nonetheless the in situ measurementsduring the probe descent through the atmosphere and landing havenot revealed any new molecule that was not already detected withremote sensing techniques (Niemann et al., 2005; Niemann et al.,2010). This time, the lack of data was not due to any unexpectedpeculiar environmental conditions interfering in the analytic suite,but rather some issue at the ACP/GCMS coupling, which resulted inan extremely limited sample transfer from ACP to GCMS. Never-theless it was shown that Titan aerosol particles include a solidorganic N containing refractory core (Israël et al., 2005). Almostparadoxically, the most rewarding detection of organic compounds inthe atmosphere of Titanwas the utterly unexpected detection of highmolecular weight organics (up to �8000 u/e) in the upper atmo-sphere by direct mass spectrometry thanks to the Ion and NeutralMass Spectrometer (INMS) instrument (Waite et al., 2007).
The exploration of comets has provided so far the mostencouraging results concerning the analysis of organic matterusing in situ techniques. In 1986, comet 1P/Halley has been visitedby five space probes, Sakigake and Suisei, two Japanese probes,Vega 1 and 2, two Soviet probes, and Giotto, a European probe.The Sakigake and Suisei spacecrafts stayed rather far from thenucleus of the comet (7106 and 152,400 km respectively) and hadno in situ capabilities, but the Vega 1 and 2 and Giotto spacecraftswere equipped with a series of mass spectrometers devoted to theanalysis of the gaseous and the solid phase in the coma.
Comets are a key to understand the origin of the Solar System,and maybe the origin of life. Rosetta would be an unparalleledchance to make a real breakthrough into these questions only ifthe instruments analyzing the organic composition of comet67P/Churyumov–Gerasimenko would work properly, but also ifsufficient calibration campaigns (before, during and most probablyafter their operation in the vicinity of the comet) have beenconducted. Indeed, a complex mixture of organic material isanticipated, and the interpretation of results should be extremelychallenging. More than 20 volatile molecules have been detectedin comets by spectroscopic surveys including H2O, CO and CO2
for the most abundant, but also a large range of small organiccompounds such as CH4, CH3OH, HCN, H2CS (Bockelée-Morvanet al., 2004; Mumma and Charnley, 2011). Among them, thedistribution density in the atmosphere of molecules such asH2CO cannot be explained only by its direct release from thenucleus, but rather through a distributed source that could bedue to the degradation of polyoxymethylene (H2CO polymer) inthe solid phase (Cottin et al., 2008). Hence, complex organiccompounds, i.e. with high molecular mass, should be present inthe solid phase. This idea is also supported by measurementsperformed in 1986 with the mass spectrometers on-board theGiotto and Vegas spacecrafts. Spectra showed that both thegaseous (Mitchell et al., 1992) and the solid phase (grains)(Kissel and Krueger, 1987) were containing organic moleculeswith higher masses than those of the molecules detected byremote sensing techniques in the gaseous phase. Some of thegrains analyzed in the atmosphere of comet 1P/Halley seem to beessentially made of a mixture of carbon, hydrogen, oxygen andnitrogen (Fomenkova, 1999). The precise nature of the organiccontent detected is still rather elusive and only tentative assign-ments of spectral features to actual molecules have been proposed(Kissel and Krueger, 1987) because the bulk matter was analyzedwithout any prior separation, and the resolving powers ofthe instruments were too low to avoid an important spectralconfusion.
NASA Stardust mission was another opportunity to probe thecomposition of a comet (81P/Wild 2). A few in situ measurementsby mass spectrometry (Cometary and Interstellar Dust Analyzer(CIDA) instrument) have confirmed an organic component ofgrains collected by this instrument (Kissel et al., 2004) but didnot get our knowledge of the organic content of comets muchbeyond what was known since the post Halley era. On the otherhand greatest expectations were placed in the samples returned toEarth. However, although those samples have been analyzed withthe state-of-the-art ground analytical techniques (among them aresome we cannot currently imagine to adapt for a space probe toperform in situ analyses) FTIR, HPLC, XANES (Sandford et al., 2006),the organic content of the cometary grains has been extremelydifficult to distinguish from carbonaceous contamination in theaerogel (Sandford et al., 2010). To date, only glycine, the simplestamino acid, has been identified as an individual molecule presentin the cometary material, unaltered by the collection process orcontamination (Elsila et al., 2009).
The organic composition of comets can also be inferred fromthe analysis of natural proxies such as carbonaceous meteorites.Some of them, such as the Orgueil class CI meteorite, are suspectedto be of cometary origin (Gounelle et al., 2006), and they haveproven to contain organic material including soluble moleculessuch as amino acids and nucleobases (Botta et al., 2002; Martinset al., 2008, 2007; Sephton, 2002) as well as insoluble organic matter(IOM) which is an organic macromololecular material. Recentanalysis by high resolution mass spectrometry of the Murchisonclass CM meteorite has shown an exceptional diversity of solubleorganic compounds (Schmitt-Kopplin et al., 2010). Hundreds ofthousands molecular formulae were revealed by those analyses,which means that most probably several millions of molecularstructures are present in the meteorite. CI class meteorites are asrich in organic matter than CM (Glavin et al., 2010; Martins andSephton, 2009), and such a complexity is to be expected in comets.The composition of micrometeorites is also seen as a good analogsince some of them are thought to originate from comets. Aminoacids have been detected in some of them (Matrajt et al., 2004)and a variety of them called Ultra Carbonaceous Antarctica Micro-Meterorites (UCAMMs), show very low metamorphism level(Dobrica et al., 2011), and a high content of organic matter (up to70%) (Dartois et al., 2013; Duprat et al., 2010). The extremely lowamount recovered so far prevents to conduct analyses similar tothose performed on meteorites, but their discovery strengthens(if necessary) the interest of the study of comets in the frame ofthe study of organic matter in the Solar System.
Laboratory simulations complete the anticipated portrait of theorganic content of comets that should be revealed by the Rosettamission. They are based on the photolysis, irradiation and/orwarming of icy mixtures made of the most abundant moleculesdetected in the gaseous phase: H2O, NH3, CH3OH… (Cottin et al.,1999; Greenberg, 1982). The processing of these simple mixturesresults in the production of a large amount of organic compoundswhich provides a glance on the anticipated complexity of cometswith several thousands of molecules produced within a few hoursof laboratory work (Danger et al., 2013). Such experiments are alsocrucial to understand how the pristine organic matter from acometary nucleus can be processed when it is ejected on grains inthe coma, and how measurements from the instruments on-boardthe Rosetta spacecraft can be linked to the composition of thenucleus (Briani et al., 2013; Le Roy et al., 2012). Moreover,laboratory simulations can provide essential material for thecalibration of the instruments.
Even though little information is currently known about theexact nature of refractory organic matter present in comet's nuclei,some in situ measurements at 1P/Halley and some laboratoryanalysis of the Stardust samples and of some natural proxies have
L. Le Roy et al. / Planetary and Space Science 105 (2015) 1–252

been able to determine some elemental ratio. These analyses couldgive important clues concerning the origin and evolution ofcometary materials. In particular the comparison of the cometaryelemental ratios with the protosolar ones (Lodders, 2003) couldconstraint the origin and evolution of cometary materials.
The analysis of cometary grains of 1P/Halley by the massspectrometers on board Giotto, Vega-1 and Vega-2 probes haveshown that, in average, 1P/Halley has more or less protosolarabundances for almost all rock-forming elements. Nevertheless, H,C and N are significantly more abundant in 1P/Halley that inCI-chondrites and approach solar abundances (Jessberger, 1999;Jessberger et al., 1988). Moreover, it has also been shown thatelemental ratios, especially the ones related to organic elementssuch as N/C and O/C, present large variations between individualgrains (Jessberger et al., 1991). This point seems to have beenconfirmed thanks to the study of Stardust grains (Cody et al., 2008;Sandford et al., 2006). These analyses reveal that N/C ratio isranging from 0.03 up to 0.2–0.3 in different grains (Cody et al.,2008; de Gregorio et al., 2011). This ratio presents also largevariation in the insoluble organic matter of natural proxies(carbonaceous chondrites, IDPs and chondritic micrometeorites,UCAMM). For the carbonaceous chondrites, the N/C elementalratio ranges from 0.01 to 0.05. The highest values correspond tothe most primitive meteorites. Most IDPs and chondritic micro-meteorites present bulk N/C ratio compatible with carbonaceousmicrometeorites (Matrajt et al., 2003), whereas N/C ratio can spanup to 0.1 or 0.2 in some micrometer sized inclusions. Recently, ithas been shown that the UCAMMs are characterized by highnitrogen concentration with bulk values about 0.1 (Dartois et al.,2013). The highest N/C values could be tentatively associated withthe most primitive and less altered materials. Thus, it is importantto measure in-situ this ratio in comet 67P/CG to compare with theprevious measurements. We could also try to correlate the N/Cvariations from grain to grain with the nature of organic andminerals contained in the grains.
COSIMA is a Time Of Flight-Secondary Ion Mass Spectrometer(TOF-SIMS) on-board the orbiter of the Rosetta spacecraft. Thebasic principle of the instrument can be described as follow. Grainsejected from the nucleus of the comet will be collected on metallictargets exposed outside the spacecraft. At regular time intervals,exposed targets will be replaced by new ones, and brought inside
the instrument to be pictured by a microscope (COSISCOPE) tolocate the coordinates and the shape of any grains larger thanabout 15 μm. Selected locations on the targets can then bebombarded with an indium gun and secondary ions from thesurface of the grains analyzed by time of flight mass spectrometry(Fig. 1). More details about the instrument can be found in Kisselet al. (2007). The resolving power of COSIMA (M/ΔM�1400 at 50%high of the peak at m/z¼100) should enable to distinguishbetween the mineral and the organic components of grains thanksto the mass defect properties of elements. Nevertheless, thisresolving power will not prevent spectral confusion amongorganic compounds. One peak on a mass spectrum measured byCOSIMA can then be produced by several combinations of atoms,as well as several fragments of various compounds with similarmasses can be seen as only one peak on the spectrum. Eventhough COSIMA is of course a wonderful tool with greatercapabilities than an instrument such as PUMA on-board the Vegasspacecrafts (resolving power of �1400 vs. �100, soft ionization vs.high velocity impact), which has analyzed grains in the atmo-sphere of comet 1P/Halley in 1986 (Kissel and Krueger, 1987),we cannot expect an analytical capacity at the scale of the molecularcomplexity we are expecting from comets. As current groundadvanced techniques barely meet the analytical requirements, spaceborne instrumentation conceived in the 90s cannot be moreadvanced. A calibration of the instrument is therefore necessaryto prepare the interpretation of the measurements and retrieve asmuch information as possible from the results. Mass spectrameasured by TOF-SIMS are strongly influenced by the character-istics of the instrument such as the primary ions source, theirenergy and by the sample itself (cleanness and physical state).Therefore we cannot rely on existing databases. Over the last years,we have prepared the cometary rendezvous and characterize theinstrument to learn its response to the analysis of various samples.This paper is focussing on the analysis of organic matter andcalibration of the instrument to meet this goal. Calibration onCOSIMA regarding mineral samples is presented in a separate paper(Krüger et al., in preparation).
Calibration of a mass spectrometer to prepare a cometaryrendezvous is all but a straightforward process. It would beillusionary to pretend to constitute an exhaustive database witha reference spectrum for each organic compound expected to be
Fig. 1. Schematics of the COSIMA instrument on-board the ROSETTA spacecraft. The main instrument features are the dust collection position where metallic targetsextracted from the target storage are exposed to space and should collect grains in the atmosphere of the comets, the microscope (COSISCOPE) in front of which exposedtargets will be placed to detect the location of any grains, and the analysis position where grains will be bombarded with the Primary Ion Beam System (PIBS) and fromwhich secondary ions will be accelerated and focalized into the Reflectron Time Of Flight (RTOF) mass spectrometer. A chemical station can also be used to warm the targetsup to 403 K. This figure is adapted from Kissel et al. (2007).
L. Le Roy et al. / Planetary and Space Science 105 (2015) 1–25 3
present in comets. Such a reference TOF-SIMS library would haveto include tens of thousands of molecules, not mentioning that wealso have to get ready to analyze unexpected compounds. Hence-forth, another strategy has been chosen to prepare the analysisof COSIMA measurements. Our study is focused on a selectednumber of organic compounds representative of various chemicalfamilies. They were selected not only on their likeliness to beactually detected on comets, but to cover a large panel of organicfunctions, (aliphatic and aromatic patterns, N-heterocycles, ethers,carboxylic acids and C, N, O, H ratios). We also have chosen toproceed step by step, from simple and pure compounds to learnhow the instrument is ‘responding’ to organics, before studyingcomplex mixtures of organics, analogs of cometary material, andinteractions between organic and minerals. This paper presentsthe first step of the calibration of COSIMA regarding organicmaterial and the systematic analysis strategy derived from ourresults on pure samples. Of course, we are aware that suchsamples are far from the anticipated nature of the samplesCOSIMA will analyze. But their analysis is the foundation of amore detailed work in progress on more realistic materials.
The purpose of this article is to present the calibrationmeasurement done in order to prepare the data interpretation ofCOSIMA, more especially the organic content of the mass spectra.This work is divided in five sections.
The first one reviews the current knowledge about the come-tary organic composition.
Section 2 presents the TOF-SIMS principle and the Orleansmodel instrument used for this study. The list, structure andchoice of the samples are also given.
Section 3 deals with the fingerprint characterization of eachchemical family analyzed in the positive and negative mode of theinstrument. Mass spectra of 23 organic compounds have beenmeasured. Features related to common contaminants for theseanalyses are also described.
Section 4 is about the different methods found in order tofacilitate the COSIMA data interpretation. Elaborating on our
database, we will show that detection of polymeric structures,distinction between samples poor and rich in nitrogen, saturatedaliphatic and aromatic chains, should be feasible.
Section 5 presents the Bayesian Positive Source Separationapproach and its different utilities to interpret a large amount ofmass spectra.
2. Methods
In the following section, the Time-Of-Flight Secondary Ion MassSpectrometry principle, the description of the instrument usedand its representativeness towards the flight model will bepresented as well as a description of a typical analysis and thelist of the sample.
2.1. TOF-SIMS technique principle
Time-Of-Flight Secondary Ion Mass Spectrometry (TOF-SIMS) isa surface sensitive analytical method used to analyze the veryoutermost surface of a solid sample. The TOF-SIMS techniqueprinciple consists in focusing an ion beam (called primary ion) onthe solid surface of a sample that will gently bombard it in order toextract chemical species (called secondary particles) characteristicof the sample. When striking the solid surface, the primary iontransfers energy and momentum to a first atom that which willalso interact with its surrounding and so on, generating a so-calledcollision cascade. Ions and neutrals (atoms and molecules) are bythen sputtered from the outermost mono-atomic layers of thesample. Only a small fraction (�1%) of these secondary particles ischarged (positively and negatively) when escaping the surface.These sputtered secondary ions are then accelerated to the sameelectrical field into a flight tube (with a well-defined length) tosort them by their mass, and they finally reach the mass analyzerdetector. The time each ion of mass m and charge z takes to reachthe detector is correlated to its mass to charge ratio. Number of
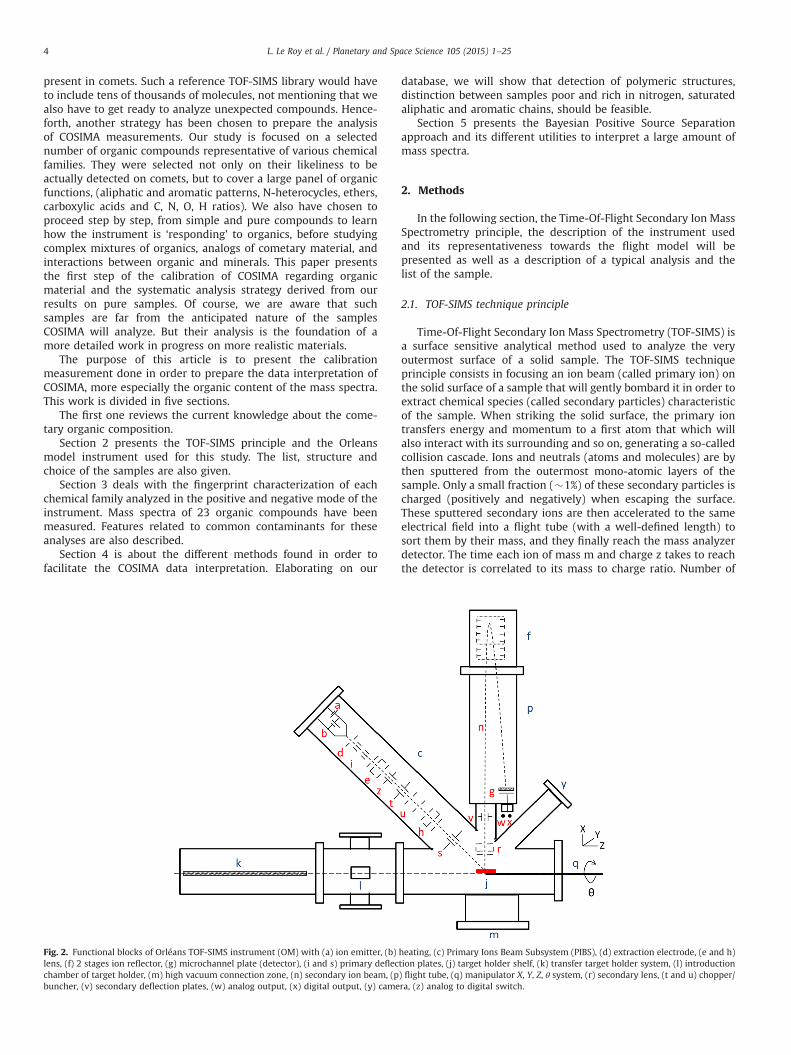
Fig. 2. Functional blocks of Orléans TOF-SIMS instrument (OM) with (a) ion emitter, (b) heating, (c) Primary Ions Beam Subsystem (PIBS), (d) extraction electrode, (e and h)lens, (f) 2 stages ion reflector, (g) microchannel plate (detector), (i and s) primary deflection plates, (j) target holder shelf, (k) transfer target holder system, (l) introductionchamber of target holder, (m) high vacuum connection zone, (n) secondary ion beam, (p) flight tube, (q) manipulator X, Y, Z, θ system, (r) secondary lens, (t and u) chopper/buncher, (v) secondary deflection plates, (w) analog output, (x) digital output, (y) camera, (z) analog to digital switch.
L. Le Roy et al. / Planetary and Space Science 105 (2015) 1–254
counts vs. m/z histogram gives mass spectrum of atoms ormolecules constituent of the surface analyzed. TOF-SIMS leadsalmost exclusively to the formation of singly ionized species.Consequently the mass to charge ratio can almost always be readas the mass of the ion.
2.2. Description of the calibration TOF-SIMS and itsrepresentativeness towards the flight model (COSIMA)
There are two ground models of COSIMA flight model: (i) anexact replica of flight COSIMA instrument, the Reference Model(hereafter RM) located at Max Planck Institute of Göttingen(Germany) and, (ii) a conventional homemade instrument ofTOF-SIMS especially build up to test and to qualify the primaryion beam subsystem (PIBS) of COSIMA experiment, named OM forOrléans Model and located at LPC2E (Orléans, France).
The COSIMA flight model (XM), RM and OM instruments havethe same PIBS system, which is one of the key elements of aTOF-SIMS instrument to determine its mass resolution power.The OM TOF-SIMS has similar instrumental characteristics thanCOSIMA, and therefore can mimic COSIMA flight model andCOSIMA Reference Model. OM instrument is therefore of goodsupport for all the calibration campaigns that RM could perform.
For this study, the measurements have been performed withthe OM.
2.2.1. Description of the Orleans model (OM) TOF-SIMSThe schematic view of the Orléans TOF-SIMS instrument (OM)
functional elements is shown in Fig. 2. Several subunits arenecessary to perform analysis of samples:
� a sample holder to put the sample at the optical axis of thelenses,
� a primary ion (115Inþ) emitter to ionize the sample,� a system to provide a pulsed primary ion beam,� an ion optic to provide a focused primary ion beam on the
sample,� an ion optic to focus secondary ions (sputtered from the
sample) on detector,� a time-of-flight mass analyzer to separate ions by their mass to
charge ratios m/z,� an ion reflector to tune the initial ion energy compensation and
minimize time dispersion of ions of the same mass at thedetector,
� a micro-channel plate as detector of secondary ions.
The OM instrument is composed of two distinct areas: thesample introduction and the analysis area. They are hermeticallydivided, which allows to introduce and remove sample at atmo-spheric pressure without altering the high vacuum condition(Po1.10�8 mbar) highly recommended for the PIBS and detector(located in the analysis area). Moreover, to optimize the time for
0.0
0.2
0.4
0.6
0.8
1.0
1.2
0.0
0.2
0.4
0.6
0.8
1.0
1.2
0 50 100 150 200 250 300 350 400 450 500 550 6000.0
0.2
0.4
0.6
0.8
1.0
1.2 OM - ground Model 2
Nor
mal
ized
Inte
nsity
RM - ground Model 1
XM - Flight Model
Si4O4(CH3)7
+
281.05
Si4O4(CH3)7
+
281.05
Si3O2(CH3)7
+
221.08
Si3O3(CH3)5
+
207.03
Si2O(CH3)5
+
147.07
Na+
Na+
22.99
Si(CH3)3
+
Si(CH3)3
+
73.05
73.05
Si2O(CH3)5
+
Si2O(CH3)5
+
147.07
147.07
In+
In+
114.90
114.90Nor
mal
ized
Inte
nsity
Si2O(CH3)5
+
147.07
Si(CH3)3
+
73.05
In+
114.90
Si4O4(CH3)7
+
281.05
Si3O2(CH3)7
+
221.08
Si3O3(CH3)5
+
207.03147.07
Si2O(CH3)5
+
22.99
Nor
mal
ized
Inte
nsity
m/z
Si3O2(CH3)7
+
221.08
Si2O(CH3)5
+
147.07
207.03207.03Si3O3(CH
3)5
+
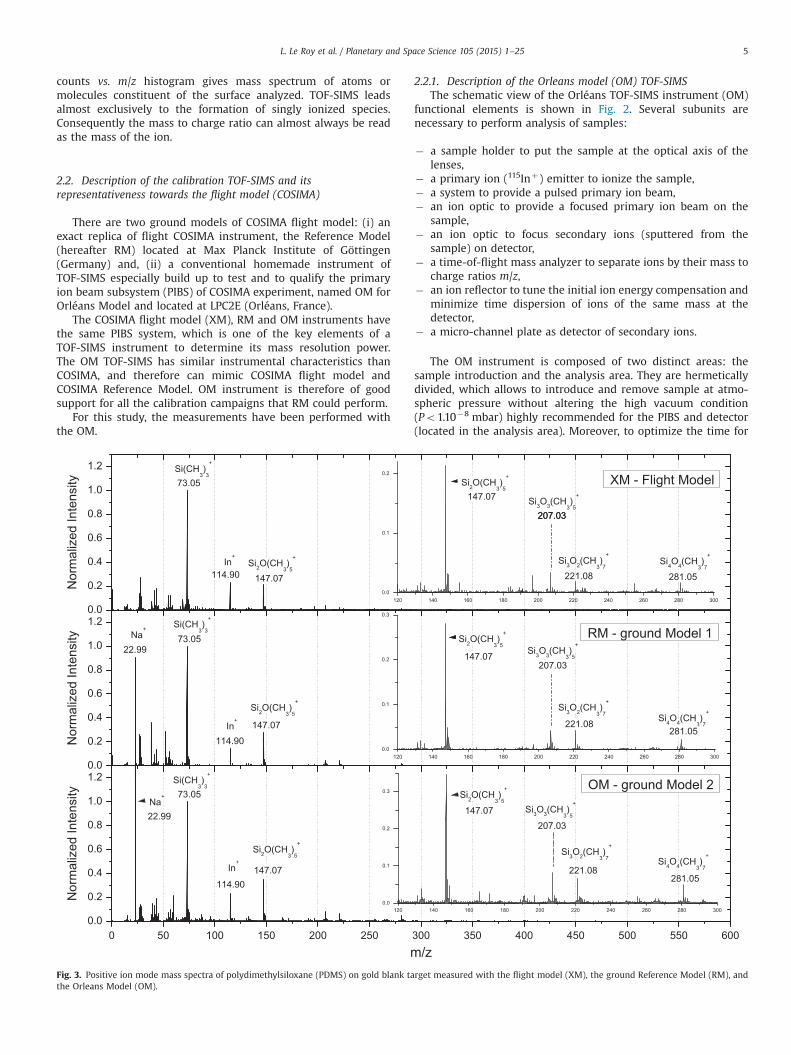
Fig. 3. Positive ion mode mass spectra of polydimethylsiloxane (PDMS) on gold blank target measured with the flight model (XM), the ground Reference Model (RM), andthe Orleans Model (OM).
L. Le Roy et al. / Planetary and Space Science 105 (2015) 1–25 5
the introduction process several vacuum units are used. Theintroduction chamber is connected to a dry primary vacuumpump (Scroll pump, GVSP30) coupled to a turbo vacuum pump(Pfeiffer Vacuum, D35614-Asslar), bringing the pressure fromatmospheric to �10�6 mbar. The analysis chamber is held atpressure around 10�8 to 10�9 mbar by two cryogenic vacuumpumps (CT8, Brooks Automation).
The PIBS is the LPC2E (Orléans, France) hardware contributionto COSIMA/Rosetta experiment, for which its specifications andgeneral concept have been presented in Kissel et al. (2007). Theprimary ion beam is generated by a liquid metal ion source (LMIS)of indium (115Inþ) beam pulsed within 2–3 ns of about 2000 ionsper pulse at a repetition rate of up to 1000 pulses per second. Thefocal spot of the beam on the target is of elliptical shape of around50 mm major axis.
As mentioned above with a TOF mass analyzer there is aproportional relation between the root square of m/z ratio of theparticles and their time of flight. The flight distance is fixed, butparticles of same mass can arrive at slightly different times due totheir initial energy, their temporal and space dispersions, whichcontribute to a degradation of the mass resolving power (m/Δm) ofthe analyzer. A two stages ion reflector device offsets these time-related dispersions. Thanks to this reflectron, the OM TOF-SIMSinstrument has a mass resolving power of 1400 at the full width athalf maximum (FWHM) of peak at m/z¼100 u/e. Reflected sec-ondary particles travel the field-free region before reaching thetwo stages micro-channel plate (Hamamatsu, model F4292-06)detector.
2.2.2. Representativeness of the OM towards the flight model(COSIMA)
The OM and the RM have been built to have similar instru-mental characteristics than the COSIMA flight model (XM) and soto give similar results i.e. similar mass spectrum. In order to checkthe representativeness of the OM data towards those obtained bythe flight model, three mass spectra containing features of a samecompound have been compared (Fig. 3). Actually there is fewcross-linked data between the XM, the RM and the OM but a lotbetween the RM and the OM. The RM and the OM were then usedfor the calibration of the XM. It is not an issue because measure-ment with the RM and the XM leads to the exact same result. Theonly difference comes from their internal own contaminants.Currently the only organic molecule that has been measured withthese three instruments is the polydimethylsiloxane (PDMS).The PDMS, a silicon oil, is a very common contaminant forTOF-SIMS analysis. For more details on COSIMA contaminationsee Hilchenbach et al. (in preparation).
This comparison will only be qualitative and not quantitative.First we do not know the concentration of the PDMS on eachtarget and it is most likely not the same because this contaminanttends to migrate easily and quickly inside the instrument (Leggettet al., 1992). Moreover, even if blank gold target and indium asprimary ion beam have been used for each analysis, the toplayered surface properties of the targets are not controlled forthese experiments. Thus different matrix effects can be expected.
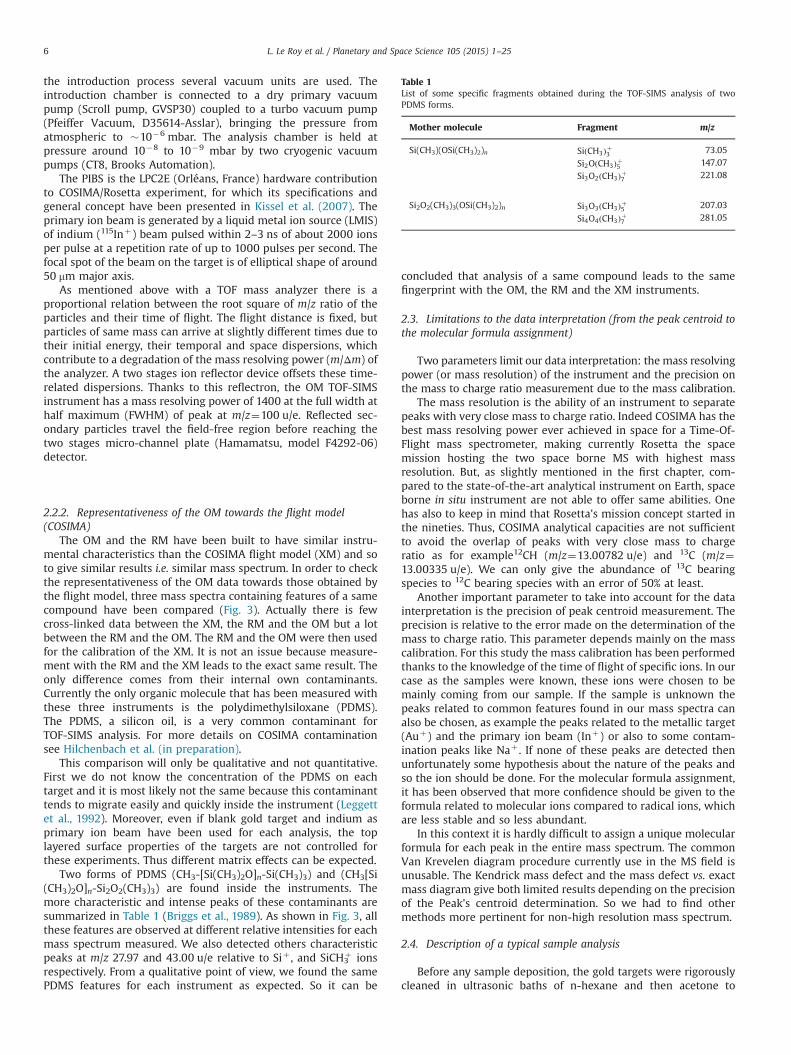
Two forms of PDMS (CH3-[Si(CH3)2O]n-Si(CH3)3) and (CH3[Si(CH3)2O]n-Si2O2(CH3)3) are found inside the instruments. Themore characteristic and intense peaks of these contaminants aresummarized in Table 1 (Briggs et al., 1989). As shown in Fig. 3, allthese features are observed at different relative intensities for eachmass spectrum measured. We also detected others characteristicpeaks at m/z 27.97 and 43.00 u/e relative to Siþ , and SiCH3
þ ionsrespectively. From a qualitative point of view, we found the samePDMS features for each instrument as expected. So it can be
concluded that analysis of a same compound leads to the samefingerprint with the OM, the RM and the XM instruments.
2.3. Limitations to the data interpretation (from the peak centroid tothe molecular formula assignment)
Two parameters limit our data interpretation: the mass resolvingpower (or mass resolution) of the instrument and the precision onthe mass to charge ratio measurement due to the mass calibration.
The mass resolution is the ability of an instrument to separatepeaks with very close mass to charge ratio. Indeed COSIMA has thebest mass resolving power ever achieved in space for a Time-Of-Flight mass spectrometer, making currently Rosetta the spacemission hosting the two space borne MS with highest massresolution. But, as slightly mentioned in the first chapter, com-pared to the state-of-the-art analytical instrument on Earth, spaceborne in situ instrument are not able to offer same abilities. Onehas also to keep in mind that Rosetta's mission concept started inthe nineties. Thus, COSIMA analytical capacities are not sufficientto avoid the overlap of peaks with very close mass to chargeratio as for example12CH (m/z¼13.00782 u/e) and 13C (m/z¼13.00335 u/e). We can only give the abundance of 13C bearingspecies to 12C bearing species with an error of 50% at least.
Another important parameter to take into account for the datainterpretation is the precision of peak centroid measurement. Theprecision is relative to the error made on the determination of themass to charge ratio. This parameter depends mainly on the masscalibration. For this study the mass calibration has been performedthanks to the knowledge of the time of flight of specific ions. In ourcase as the samples were known, these ions were chosen to bemainly coming from our sample. If the sample is unknown thepeaks related to common features found in our mass spectra canalso be chosen, as example the peaks related to the metallic target(Auþ) and the primary ion beam (Inþ) or also to some contam-ination peaks like Naþ . If none of these peaks are detected thenunfortunately some hypothesis about the nature of the peaks andso the ion should be done. For the molecular formula assignment,it has been observed that more confidence should be given to theformula related to molecular ions compared to radical ions, whichare less stable and so less abundant.
In this context it is hardly difficult to assign a unique molecularformula for each peak in the entire mass spectrum. The commonVan Krevelen diagram procedure currently use in the MS field isunusable. The Kendrick mass defect and the mass defect vs. exactmass diagram give both limited results depending on the precisionof the Peak's centroid determination. So we had to find othermethods more pertinent for non-high resolution mass spectrum.
2.4. Description of a typical sample analysis
Before any sample deposition, the gold targets were rigorouslycleaned in ultrasonic baths of n-hexane and then acetone to
Table 1List of some specific fragments obtained during the TOF-SIMS analysis of twoPDMS forms.
Mother molecule Fragment m/z
Si(CH3)(OSi(CH3)2)n SiðCH3Þþ3 73.05
Si2OðCH3Þþ5 147.07
Si3O2ðCH3Þþ7 221.08
Si2O2(CH3)3(OSi(CH3)2)n Si3O3ðCH3Þþ5 207.03
Si4O4ðCH3Þþ7 281.05
L. Le Roy et al. / Planetary and Space Science 105 (2015) 1–256
remove any kind of contamination. For each samples, three sets ofhigh statistics of positive and negative mass spectra were taken inorder to get molecular structure information in the framework ofCOSIMA spectra interpretation database. The first set acquiredbefore sample deposition monitors the level of the surface pollu-tion. For each sample, tiny amount was then gently crushed withagate pestle on the cleaned targets. The second and third series ofmass spectra were then measured: sample spectra and contam-ination control spectra on the gold foil outside the sample area.
2.5. List and choice of samples
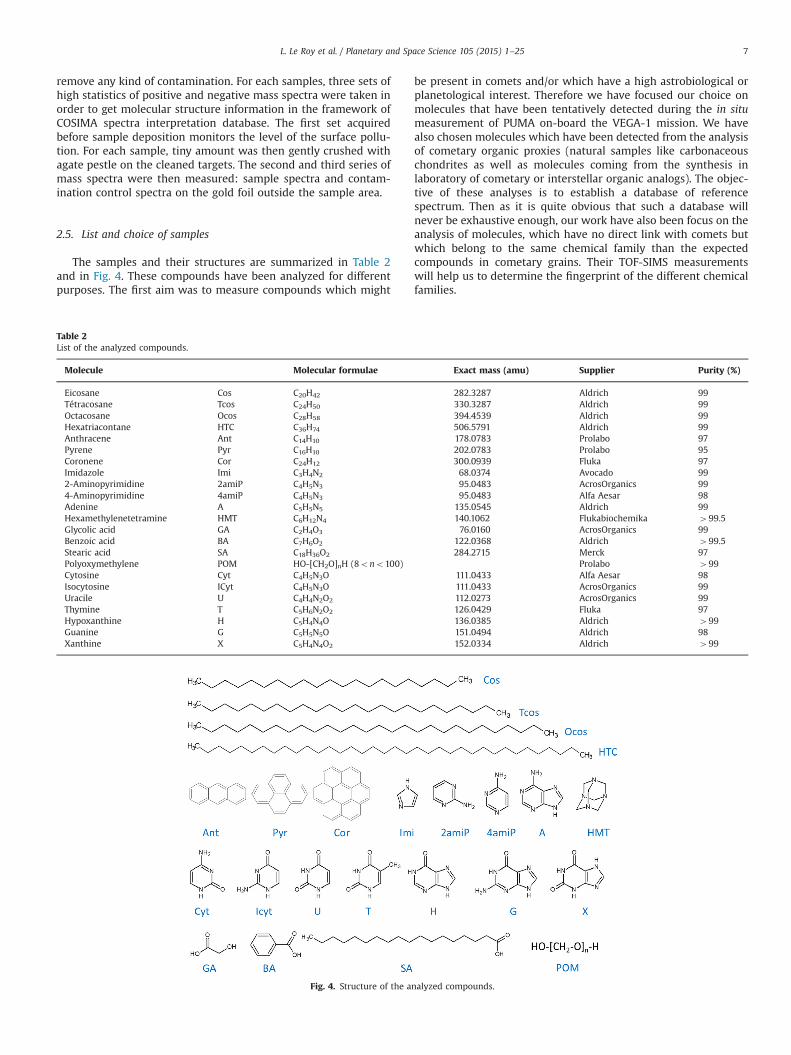
The samples and their structures are summarized in Table 2and in Fig. 4. These compounds have been analyzed for differentpurposes. The first aim was to measure compounds which might
be present in comets and/or which have a high astrobiological orplanetological interest. Therefore we have focused our choice onmolecules that have been tentatively detected during the in situmeasurement of PUMA on-board the VEGA-1 mission. We havealso chosen molecules which have been detected from the analysisof cometary organic proxies (natural samples like carbonaceouschondrites as well as molecules coming from the synthesis inlaboratory of cometary or interstellar organic analogs). The objec-tive of these analyses is to establish a database of referencespectrum. Then as it is quite obvious that such a database willnever be exhaustive enough, our work have also been focus on theanalysis of molecules, which have no direct link with comets butwhich belong to the same chemical family than the expectedcompounds in cometary grains. Their TOF-SIMS measurementswill help us to determine the fingerprint of the different chemicalfamilies.
Table 2List of the analyzed compounds.
Molecule Molecular formulae Exact mass (amu) Supplier Purity (%)
Eicosane Cos C20H42 282.3287 Aldrich 99Tétracosane Tcos C24H50 330.3287 Aldrich 99Octacosane Ocos C28H58 394.4539 Aldrich 99Hexatriacontane HTC C36H74 506.5791 Aldrich 99Anthracene Ant C14H10 178.0783 Prolabo 97Pyrene Pyr C16H10 202.0783 Prolabo 95Coronene Cor C24H12 300.0939 Fluka 97Imidazole Imi C3H4N2 68.0374 Avocado 992-Aminopyrimidine 2amiP C4H5N3 95.0483 AcrosOrganics 994-Aminopyrimidine 4amiP C4H5N3 95.0483 Alfa Aesar 98Adenine A C5H5N5 135.0545 Aldrich 99Hexamethylenetetramine HMT C6H12N4 140.1062 Flukabiochemika 499.5Glycolic acid GA C2H4O3 76.0160 AcrosOrganics 99Benzoic acid BA C7H6O2 122.0368 Aldrich 499.5Stearic acid SA C18H36O2 284.2715 Merck 97Polyoxymethylene POM HO-[CH2O]nH (8ono100) Prolabo 499Cytosine Cyt C4H5N3O 111.0433 Alfa Aesar 98Isocytosine ICyt C4H5N3O 111.0433 AcrosOrganics 99Uracile U C4H4N2O2 112.0273 AcrosOrganics 99Thymine T C5H6N2O2 126.0429 Fluka 97Hypoxanthine H C5H4N4O 136.0385 Aldrich 499Guanine G C5H5N5O 151.0494 Aldrich 98Xanthine X C5H4N4O2 152.0334 Aldrich 499
Fig. 4. Structure of the analyzed compounds.
L. Le Roy et al. / Planetary and Space Science 105 (2015) 1–25 7

This study has been focused on the analysis of alkanes,polyaromatic hydrocarbons (PAHs), carboxylic acids, nucleobasesand other N-heterocyclic compounds. The following paragraphexplains the choice of these families.
Many attempts were made to demonstrate the presence of PAHs incomets. COSIMA may raise the ambiguity of their presence in thegrains ejected by 67P/CG. The first report was made by Baas et al.(1986) with the detection of a weak infrared feature at 3.28 μm in thecoma of 1P/Halley after its perihelion, at heliocentric distances of1.6 AU and 2.0 AU. Three Channel Spectrometer on-board the Vega-2probe took spectra in which Moreels et al. (1994) and later Clairemidiet al. (2004) tentatively attributed respectively specific emissionsbands to the fluorescence of phenanthrene and pyrene. Neverthelesstheir extraterrestrial origin was discussed. The presence of PAHs hasalso been suggested in the cometary grains collected by the Stardustspacecraft. However their extraterrestrial origins have been amatter ofcontroversy (Sandford et al., 2006, 2010; Spencer and Zare, 2007).On the other hand, PAHs with up to 7 rings and their alkyl derivativesare detected in carbonaceous chondrites (Sephton et al., 2004). Theyare also found in extraterrestrial interplanetary dust particles (Clemettet al., 1993) and in carbonaceous Antarctic Micrometeorites (Clemettet al., 1998). Another interesting family is the carboxylic acids family.Indeed numerous analysis of the soluble matter of the carbonaceouschondrites like Murchison, Orgueil or the Tagish lake meteorite havehighlighted that this chemical family is quite abundant in thesemeteorites (Botta and Bada, 2002; Herd et al., 2011; Pizzarello et al.,2001; Sephton, 2002). Moreover some of them are synthesized duringthe photolysis of cometary/interstellar ice analogs (Despois and Cottin,2005). Among the N-heterocyclic compounds, our choice has beenfocused on the nucleobases. These molecules, elementary buildingblock of DNA and RNA, which have obviously a high astrobiologicalinterest, have been detected in the soluble matter of numerouscarbonaceous chondrites since the 60s (Hayatsu, 1964; Hayatsuet al., 1968, 1975; Stoks and Schwartz, 1979, 1981; Van der Veldenand Schwartz, 1977). These analyses have highlighted the presence ofadenine, guanine hypoxanthine, xanthine and uracil. Nonetheless theirextraterrestrial origin was discussed. The13C isotopic analysis onMurchison made by Martins et al. (2008) and the recent experimenton eleven meteorites made by Callahan et al. (2011) have also resultedto the identification of nulceobases and some derivatives, which areconsistent with an extraterrestrial origin. Nitrogen-heterocyclic com-pounds have also been suggested as being part of the Halley grainswith PUMA-1 mass spectrometer on-board Vega 1 spacecraft. Theresults of CIDA on-board also tentatively proposed the presence ofmolecules containing nitrogen (Kissel et al., 2004). The last chemicalfamily is the alkanes. Indeed light alkanes have been detected invarious astrophysical medium: molecular cloud, interstellar medium,comets. Nevertheless the presence of heavy alkanes, which have beendetected in several carbonaceous chondrites, probably come fromterrestrial contamination (Sephton, 2002). The conditions on the earlyearth were not favorable to the accumulation of heavy acyclichydrocarbons. Therefore an exogenous source as the comets has beenconsidered (Marcano et al., 2003).
3. The mass spectra database
The aim of this paper is to facilitate the interpretation ofCOSIMA mass spectra and more especially of their organic part.One of the COSIMA ultimate purposes is to highlight with noambiguity the presence of organic compounds in the cometarygrains collected and to identify them. A prerequisite for theidentification of molecules or family of molecules in a massspectrum of an unknown sample is the knowledge of their specificfeatures. Therefore this work has started with the elaboration of alibrary of mass spectra in order to determine the fingerprint of
these compounds and of their chemical families. The determina-tion of the sensitivity factors (i.e. factors which enables thequantification) will not be addressed in this paper. To perform aquantitative analysis, a perfect knowledge of the surface state ofthe sample is needed. The aim of our measurements was to obtainthe best spectral feature and not to study exhaustively the sampledeposition since we cannot fairly mimic the organics at the surfaceof cometary grains.
The following section presents first the common species, whichare found in the reference mass spectra and then the specificfeatures related to each family (alkanes, PAH, N-heterocycliccompounds, carboxylic acids).
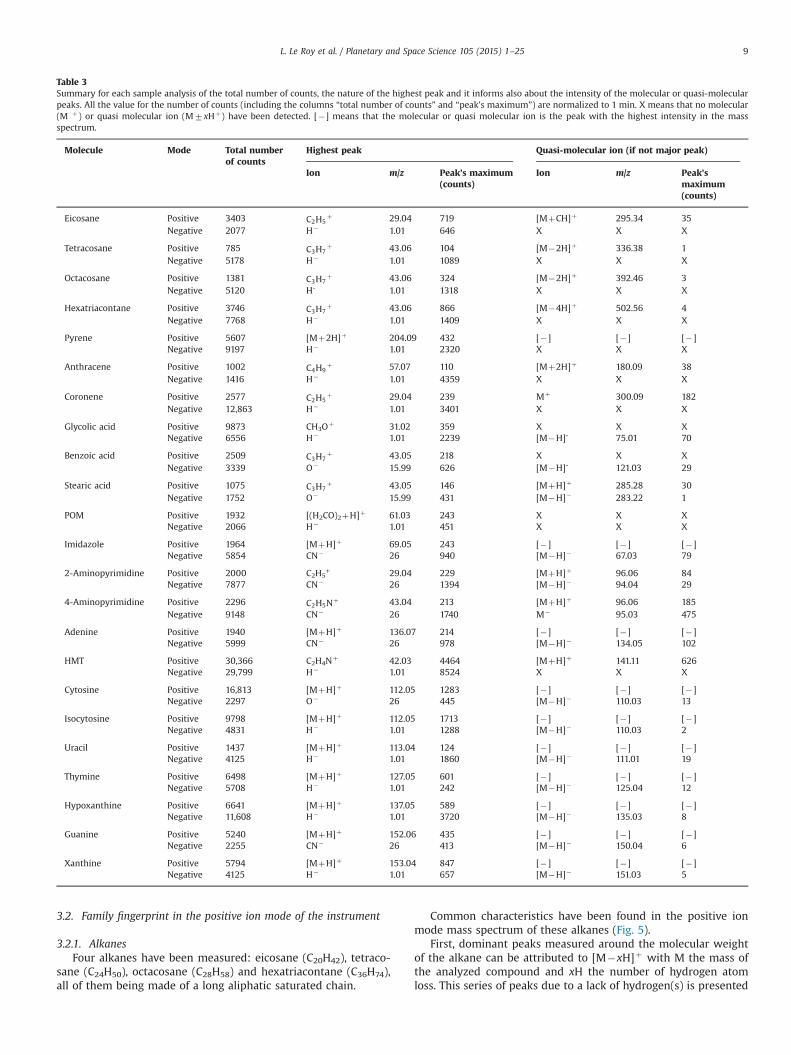
Table 3 summarizes for each analysis the nature of the highestpeak and it also informs about the intensity of the molecular orquasi-molecular peaks. All the values for the number of counts(including the number of count for the peak's maximum) arenormalized to 1 min of TOF-SIMS analysis. During operation withthe XM, TOF SIMS measurement will mainly last around 1 min inorder to localize the grain position (several spectra on the sameposition in order to have better statistics are obviously alsoplanned).
It should be mentioned that as the number of counts dependson the sample deposition, it is very hazardous to derive from thistable and to apply to other analysis any kind of quantitativeinformation.
3.1. Typical features in a reference mass spectrum
As mentioned before, TOF-SIMS is a technique sensitive tosurface contamination. The mass spectra measured for this studyare no exception to that rule. Some contaminants peaks are oftendetected.
This section aims to present these species and some commonfeatures found in our mass spectra in order to that the reader willnot be confused by the presence of these peaks in the followingfigures.
3.1.1. Typical features in the positive ion modeGenerally alkali ions as, Naþ and Kþ ions are often observed
and respectively localized at m/z¼22.99 and 38.96 u/e. Presence ofphthalates and azelates have also been sometimes detected. Theseinternal contaminants of the OM instrument lead to the presenceof small hydrocarbons peaks as C2H3
þ , C2H5þ , C3H5
þ , C3H7þ ,
C4H7þ and C4H9
þ , respectively at m/z¼27.02, 29.04, 41.04, 43.05,55.05 and 57.07 u/e. These peaks can be a source of problemsduring the data interpretation. Indeed numerous organic com-pounds produce also these ions when they are ionized with theindium ion beam. The presence of peaks related to PDMS is alsooften observed. Its characteristic peaks have been described inparagraph 2, Section 2.2. Peaks associated to the indium (from theprimary ion beam) and gold (from the target) ions are alsoobserved.
3.1.2. Typical features in the negative ion modeThe major peak in the negative ion mode is most of the time
related to the presence of H� ion. But other peaks are system-atically detected as O� , OH� , CN� and CNO� ions respectively atm/z¼15.99, 17.00, 26.00 and 42.00 u/e. Their relative intensitiesvary from one reference spectrum to another as a function of thetarget pollution. The C� (m/z¼12.00 u/e), CH� (m/z¼13.01 u/e),C2
� (m/z¼24.00 u/e) and C2H� (m/z¼25.01 u/e) ions, as well as
the chloride isotopes (m/z¼34.97 u/e and m/z¼36.96 u/e)are classically detected. The presence of sulfur ions as SO3
�
(m/z¼79.96 u/e) and HSO4� (m/z¼96.96 u/e) can also be high-
lighted in the majority of the reference mass spectra.
L. Le Roy et al. / Planetary and Space Science 105 (2015) 1–258
3.2. Family fingerprint in the positive ion mode of the instrument
3.2.1. AlkanesFour alkanes have been measured: eicosane (C20H42), tetraco-
sane (C24H50), octacosane (C28H58) and hexatriacontane (C36H74),all of them being made of a long aliphatic saturated chain.
Common characteristics have been found in the positive ionmode mass spectrum of these alkanes (Fig. 5).
First, dominant peaks measured around the molecular weightof the alkane can be attributed to [M�xH]þ with M the mass ofthe analyzed compound and xH the number of hydrogen atomloss. This series of peaks due to a lack of hydrogen(s) is presented
Table 3Summary for each sample analysis of the total number of counts, the nature of the highest peak and it informs also about the intensity of the molecular or quasi-molecularpeaks. All the value for the number of counts (including the columns “total number of counts” and “peak's maximum”) are normalized to 1 min. X means that no molecular(M þ) or quasi molecular ion (M7xHþ) have been detected. [�] means that the molecular or quasi molecular ion is the peak with the highest intensity in the massspectrum.
Molecule Mode Total numberof counts
Highest peak Quasi-molecular ion (if not major peak)
Ion m/z Peak's maximum(counts)
Ion m/z Peak'smaximum(counts)
Eicosane Positive 3403 C2H5þ 29.04 719 [MþCH]þ 295.34 35
Negative 2077 H� 1.01 646 X X X
Tetracosane Positive 785 C3H7þ 43.06 104 [M�2H]þ 336.38 1
Negative 5178 H� 1.01 1089 X X X
Octacosane Positive 1381 C3H7þ 43.06 324 [M�2H]þ 392.46 3
Negative 5120 H- 1.01 1318 X X X
Hexatriacontane Positive 3746 C3H7þ 43.06 866 [M�4H]þ 502.56 4
Negative 7768 H� 1.01 1409 X X X
Pyrene Positive 5607 [Mþ2H]þ 204.09 432 [�] [�] [�]Negative 9197 H� 1.01 2320 X X X
Anthracene Positive 1002 C4H9þ 57.07 110 [Mþ2H]þ 180.09 38
Negative 1416 H� 1.01 4359 X X X
Coronene Positive 2577 C2H5þ 29.04 239 Mþ 300.09 182
Negative 12,863 H� 1.01 3401 X X X
Glycolic acid Positive 9873 CH3Oþ 31.02 359 X X XNegative 6556 H� 1.01 2239 [M�H]- 75.01 70
Benzoic acid Positive 2509 C3H7þ 43.05 218 X X X
Negative 3339 O� 15.99 626 [M�H]- 121.03 29
Stearic acid Positive 1075 C3H7þ 43.05 146 [MþH]þ 285.28 30
Negative 1752 O� 15.99 431 [M�H]� 283.22 1
POM Positive 1932 [(H2CO)2þH]þ 61.03 243 X X XNegative 2066 H� 1.01 451 X X X
Imidazole Positive 1964 [MþH]þ 69.05 243 [�] [�] [�]Negative 5854 CN� 26 940 [M�H]� 67.03 79
2-Aminopyrimidine Positive 2000 C2H5+ 29.04 229 [MþH]þ 96.06 84
Negative 7877 CN� 26 1394 [M�H]� 94.04 29
4-Aminopyrimidine Positive 2296 C2H5Nþ 43.04 213 [MþH]þ 96.06 185
Negative 9148 CN� 26 1740 M� 95.03 475
Adenine Positive 1940 [MþH]þ 136.07 214 [�] [�] [�]Negative 5999 CN� 26 978 [M�H]� 134.05 102
HMT Positive 30,366 C2H4Nþ 42.03 4464 [MþH]þ 141.11 626Negative 29,799 H� 1.01 8524 X X X
Cytosine Positive 16,813 [MþH]þ 112.05 1283 [�] [�] [�]Negative 2297 O� 26 445 [M�H]� 110.03 13
Isocytosine Positive 9798 [MþH]þ 112.05 1713 [�] [�] [�]Negative 4831 H� 1.01 1288 [M�H]� 110.03 2
Uracil Positive 1437 [MþH]þ 113.04 124 [�] [�] [�]Negative 4125 H� 1.01 1860 [M�H]� 111.01 19
Thymine Positive 6498 [MþH]þ 127.05 601 [�] [�] [�]Negative 5708 H� 1.01 242 [M�H]� 125.04 12
Hypoxanthine Positive 6641 [MþH]þ 137.05 589 [�] [�] [�]Negative 11,608 H� 1.01 3720 [M�H]� 135.03 8
Guanine Positive 5240 [MþH]þ 152.06 435 [�] [�] [�]Negative 2255 CN� 26 413 [M�H]� 150.04 6
Xanthine Positive 5794 [MþH]þ 153.04 847 [�] [�] [�]Negative 4125 H� 1.01 657 [M�H]� 151.03 5
L. Le Roy et al. / Planetary and Space Science 105 (2015) 1–25 9

in the spectrum of the hexatriacontane (Formula weight (FW)¼506.58 u/e): [M�H]þ at m/z¼505.51 u/e, [M�2H]þat m/z¼504.62 u/e, [M�3H]þ at m/z¼503.63 u/e and [M�4H]þ at m/z¼502.59 u/e. This hydrogen loss would come from an unimole-cular dissociation in the vacuum because of an internal excess ofenergy (Delcorte and Bertrand, 1998). The peak presenting themajor intensity is either [M�2H]þor [M�4H]þ . Because of itshigh number of carbons, isotopical ratios have been calculated inorder to determine the potential contribution of 13C at highmasses. Nevertheless, 13C isotopes cannot completely explain thepresence of the peaks [M�H]þand [M�3H]þ , meaning that theyare part of the alkane's features.
A second characteristic is found in the low range of the positiveion mode mass spectrum (below 100 u/e), also called the hydro-carbons envelope. This domain is defined by hydrocarbon frag-ments which, in the case of alkane, forms well defined patterndominated by the alternation of [CnH2n�1]þ and [CnH2nþ1]þ ions,as observed in Fig. 5 in red and blue respectively. These peaksresult from the fragmentation of the alkane chain and a maximumis usually observed for n¼3.
The last feature comes from a dominant mass separation of14.02 u/e between the peaks. Because of its long alkane chain, thisrepeated mass separation can easily be attributed to the fragmentCH2 (see Section 4.3.2).
3.2.2. Polyaromatic hydrocarbons (PAHs)Polycyclic aromatic Hydrocarbons (PAHs) are benzene-based multi
rings molecules. Three of them were analyzed for this study: acatacondensed PAH, anthracene (C14H10), and two pericondensedones, pyrene (C16H10) and coronene (C24H12). The positive massspectra of these PAHs exhibit common characteristic features.
For the tree PAHs analyzed, the molecular ion [M]þ (with Mthe mass of the analyzed compound) is detected by TOF-SIMSin the positive ion mode: at m/z¼178.08 u/e for anthracene at
m/z¼202.13 u/e for pyrene and at m/z¼300.08 u/e for coronene.In the high mass range the most intense peak is the [M]þ ion forcoronene, and the secondary ion relative to [Mþ2H]þ , atm/z¼180.08 u/e and m/z¼204.17 u/e respectively for anthraceneand pyrene. Toporski and Steele (2004) have obtained similarresults for pyrene dropped on silicon wafer. For each compound,around their intense peak in the mass range of the intact molecule,a cluster of peaks is also observed relative to successive addition orloss of hydrogen atom on the molecule (series [M7xH]þ). Thisseries of peaks is presented in the positive mass spectrum ofcoronene (FW¼300.35 u) in Fig. 6.
In this figure, it can also be noticed other series of clusterspeaks surrounding the molecular peak series. Similar featureswere observed by Fister et al. (1995) on their studies of benz(a)anthracene and benzopyrene cast on Si wafer. On each massspectrum, these series of cluster peaks can be attributed tosuccessive removal or addition of (CH) group, leading to severalcluster series of [M7xH�(CH)y]þ ions and [M7xHþ(CH)y]þ ionsabove and below the exact mass.
Au-cationised molecules (cluster series [MþxHþAu]þ) areclearly observed for coronene, but are more fainted for anthraceneand for pyrene. It can be noticed by the ratio I(MþAu)þ/I(Auþ ) thatthe signal of the gold-cationised coronene is more intense than thegold signal itself, while this trend is different for anthracene andpyrene. Dimers and/or their metallic cationised homologs areclearly detected for anthracene and pyrene compounds. Forcoronene several cluster peaks of dimer series of [2M�xH�(CH)y]þ ions resulting of successive removal of (CH) group aredimly observed. On the other hand, due to the mass range chosenfor the analysis, no metallic cationised dimers of coronene aredetected in the mass spectrum. For anthracene, It is interesting tonote that the intensity of dimers cationised molecules [2MþAu]þ
is much stronger than the monomer cationised ones [MþAu]þ .Table 4 summarizes the ions observed in the higher mass range forthe 3 PAH analyzed.
5505001005000.0
0.2
0.4
0.6
0.8
1.0
1.2
500 502 504 506 5080.000
0.002
0.004
0.006
0.008
85.10
C H71.09
C H55.05
504.62
502.55
114.90
83.09
69.07
57.07
41.04
InC H
C H
C H
C H
C HC H
[M-2H]
HexatriacontaneCH -(CH ) -CH
M=506,58 g/mol
Nor
mal
ized
inte
nsity
[M-4H]27.02
C H29.04
43.05C H
[M-H]505.51
[M-3H]503.63
504.62
502.55
[M-2H]
Nor
mal
ized
inte
nsity
m/z (u/e)
[M-4H]
Fig. 5. Positive ion mode mass spectrum of hexatriacontane. The alternation of [CnH2n�1]þ and [CnH2nþ1]þ ions within a pattern is represented in red and blue respectively.The intensity is normalized to the major peak (m/z¼43.05 u/e). (For interpretation of the references to color in this figure, the reader is referred to the web version of thisarticle.)
L. Le Roy et al. / Planetary and Space Science 105 (2015) 1–2510

3.2.3. N-heterocyclic compoundsN-heterocyclic compounds are molecules made of a closed
chain of atoms, one of them at least being a nitrogen atom. Thesize of ring typically varies from 3 to 6 atoms. Several rings can be
fused together and they can contain a large variety of substituent.So the N-heterocyclic compounds are a wide class of molecules.
For this study, we have focused the analysis on nucleobases andother N-heterocyclic molecules. We have measured unsaturated
1008060402000
1
2
240 252 264 276 288 300 312 3240.00
0.02
0.04
0.06
0.08
495 496 497 498 795 796 797 798 799
0.001
0.002
0.003
norm
aliz
ed in
tens
ityno
rmal
ized
inte
nsity
norm
aliz
ed in
tens
ity
m/z (u/e)
Fig. 6. Positive ion mode mass spectrum of coronene. The intensity is normalized to the major peak (m/z¼29.04 u/e).
Table 4Organic and organometallic molecular ions observed in the mass spectra of PAH sample deposited on Au substrate.
Samplesdeposition on Au
Major molecular ions (in bold the dominant one of the series) I(MþAu)/I(M)
I(MþAu)/I(Au)
Anthracene [Mþ2H]þ (series [M7xH]þ) 0.05 0.07[Mþ2HþCH]þ (series [M7xHþCH]þ)[M-CH]þ(series [M7xH�CH]þ)[M�(CH)2]þ (or [M�H�(C2H)]þ) (series [M7xH�(CH)2]þ)[MþAu]þ (series [M7xHþAu]þ)[2MþAu]þ (series [MþxHþAu]þ)
Pyrene [Mþ2H]þ (series [M7xH]þ) 0.33 0.28[Mþ3HþCH]þ(series [M7xHþCH]þ)[Mþ4H�CH]þ (series [M7xH�CH]þ)[M�(CH)2]þ (or [M�H�(C2H)]þ) (series [M7xH�(CH)2]þ)[M�(CH)3]þ (or [M�2H�(C3H)]þ) (series [M7xH�(CH)3]þ)[MþHþAu]þ (series [M7xHþAu]þ)[2Mþ2HþAu]þ (series [MþxHþAu]þ)[2M]þ(series [2M7xH]þ)[(2Mþ4H)�CH]þ (series [2M7xHþCH]þ)[(2Mþ4H)þCH]þ (series [2M7xH�CH]þ)
Coronene [M]þ (series [M7xH]þ) 0.10 1.27[MþCH]þ and [Mþ2HþCH]þ (series [M7xHþCH]þ)[M�CH]þ(series [M7xHþCH]þ)[MþAu]þ and [M7HþAu]þ
[Mþ2H�(CH)2]þ (or [MþH�(C2H)]þ) (series [M7xH�(CH)2]þ)[M�(CH)3]þ (or [M�2H�(C3H)]þ) (series [M7xH�(CH)3]þ)[M�(CH)4]þ (or [M�3H�(C4H)]þ) (series [M7xH�(CH)4]þ)[M�(CH)5]þ (or [M�4H�(C5H)]þ) (series [M7xH�(CH)5]þ)[M�2Hþ(CH)2]þ (series [M7xHþ(CH)2]þ)[M�2Hþ(CH)3]þ (or [Mþ(C3H)]þ) (series [M7xHþ(CH)3]þ)It can also be slightly observed some series of dimer molecular peak: series [2M�xH�(CH)5]þ; series [2M�xH�(CH)4]þ;series [2M�xH�(CH)3]þ; series [2M�xH�(CH)2]þ; series [2M�xH�CH]þ; series [2M�xH]þ
L. Le Roy et al. / Planetary and Space Science 105 (2015) 1–25 11

N-heterocyclic compounds: some pyrimidine and purine deri-vatives, the imidazole and one saturated N-heterocyclic com-pound the hexamethylenetetramine (HMT). The general beha-vior of these compounds towards a TOF-SIMS analysis will befirst discussed and then the specificities of some subclasses willbe presented.
A typical positive mass spectrum of the N-heterocyclic com-pounds is presented in Fig. 7. For all analyzed molecule, a quasi-molecular ion, [MþH]þ (the analyzed molecule (M) enriched witha proton (H)) is observed and easily identified. For almost allthe unsaturated compounds, this quasi-molecular ion is themajor peak of the mass spectrum. These high intensities can beexplained by the stability of this peak induced by the resonanceeffect of the ring. For almost all the N-heterocyclic compounds,we can also identified peaks related to dimers [2MþH]þandto organo-metallic clusters [MþAu]þ and or [2MþAu]þ (seeTable 5).
It can be also mentioned that as in Varmuza et al. (1999) somealkali clusters of the quasi-molecular ion ([(MþH)þNa]þ or[(MþH)þK]þ) can be observed.
For the analyzed unsaturated compounds, we can distinguishthree subclasses: the imidazole; the pyrimidine and the purinederivatives
The pyrimidine derivatives (cytosine, isocytosine, uracile, thy-mine, 2- and 4-aminopyrimidine) are six-membered ring com-pounds with two nitrogen atoms. At least one substituent (amino,carbonyl and/or methyl group) is linked to the pyrimidine ring.Some effects on the fragmentation mechanisms related to thepresence of the different functional group substituent areobserved. The fragmentation of the quasi-molecular ion leadsoften to the loss of NH2/NH3, O or HCNO.
The purines derivatives (adenine, guanine, xanthine andhypoxanthine) are made of a pyrimidine derivative fused withan imidazole ring. All the pyrimidine derivatives are part ofthe analyzed purines. Same kind of fragmentation than forthe pyrimidine derivatives can be observed: the loss from thequasi-molecular ion of NH2/NH3, O or HCNO and also of CH2N2.Observations expected because the analyzed pyrimidine deri-vatives are substructures of purines. Moreover, peaks related toeach of the fused rings minus one or two hydrogen have beenobserved.
The case of the unsaturated N-heterocyclic compound, HMT,will be discussed in details in a following paper.
3.2.4. Carboxylic acidThree carboxylic acids have been currently analyzed: a small
hydroxycarboxylic acid (glycolic acid), an aromatic acid (benzoicacid), and a fatty acid (stearic acid). From these measurements, thefatty acid and the two others lighter carboxylic acids seem tobehave completely differently towards the different mode of theinstrument.
The stearic acid, a long aliphatic chain containing a carboxylicfunction, showed a strong quasi-molecular peak and even somedimer peaks on the positive ion mode mass spectrum (Fig. 8). Theloss of a water fragment from the quasi-molecular ion leads also toan important peak. Below 100 u/e, several peaks can be linked tothe presence of hydrocarbon fragments, as its mass spectrumpresents the characteristic peaks of the alkanes CnH2nþ1 andCnH2n�1. These hydrocarbons fragments stem from the scissionof two sp3 carbon atoms between the numerous CH2 functionsthat contain the fatty acid. Spool (2004) has suggested that theinitialization of this carbon cleavage start at the chain end of thestearic acid.
On the other hand, the glycolic and benzoic acid positive ionmode mass spectra show just a few peaks, which are characteristicto the analyzed sample. For the benzoic acid, no quasi-molecularion is observed contrary to Mahoney et al. (2006). At least, thefragment C6H5COþ at mass 105.04 has been identified but atlow intensities yield according to the background (Fig. 9). Forthe glycolic acid, no quasi-molecular ion is observed either.The positive ion mode mass spectrum obtained is very similar tothe control spectrum (spectrum of the target without the sample).Only the peak at m/z¼31.02 u/e could be attributed to the sample.This mass corresponds to the molecular formula H3COþ and canresult from the loss of the HOCHO fragment from the sample.
It appeared that light carboxylic acids would not be easy todetect in the positive ion mode of COSIMA. Further analyses ofother carboxylic acids are required to see if it is a common trend.
3.2.5. PolyoxymethyleneThe positive ion mass spectrum of polyoxymethylene have
already been discussed in Le Roy et al. (2012). In this section abrief summary of these previous results will be presented.
POM is the polymer of formaldehyde (H2CO). As function ofthe terminal group and of monomer's number, POM has differentchemical properties. The sample analyzed in this study is a
0 50 100 150 200 250 300 350 400 450 5000.0
0.2
0.4
0.6
0.8
1.0
1.2
69.05
[M+H]112.05
[2M+H] [M +Au][2M +Au]
norm
aliz
ed in
tens
ity
m/z (u/e)
[(M+H)-NH ]95.03
[(M+H)-CHON]
M= 111.04 g/mol
Cytosine
Fig. 7. Positive ion mode mass spectrum of cytosine. The intensity is normalized tothe major peak (m/z¼112.06 u/e). For graphical purpose, there is a break in thescale between 125 and 126 u/e.
0 50 100 150 200 250 300 550 6000.0
0.2
0.4
0.6
0.8
1.0
1.2
norm
aliz
ed in
tens
ity
Stearic acid
m/z (u/e)
Fig. 8. Positive ion mode mass spectrum of stearic acid. The intensity is normalizedto the major peak (m/z¼43.05 u/e).
L. Le Roy et al. / Planetary and Space Science 105 (2015) 1–2512

paraformaldehyde sample (Molecular formula: HO-[CH2]n-H with8ono100).
Fig. 10 shows a close-up of a positive ion mode mass spectrumfor mass to charge ratio lower than 125. Most of the intense peakscan be attributed to fragments of POM, such as [(H2CO)nþH]þ ,[(H2CO)nþH–H2O]þ , [(H2CO)nþH–O]þ and [(H2CO)nþH–CH2]þ .Such fragmentation pattern is observed up to m/z¼600 but afterm/z¼300 molecular formula attributions are very difficult due tothe limited number of secondary ions and also to the broad shapeof these peaks.
3.3. Family fingerprint in the negative ion mode of the instrument
3.3.1. AlkanesThe negative ion mode spectra of alkane do not show as many
peaks as in the positive ion mode. In particular, no peaks areobservable in the high mass range, especially near the exact massof the alkane, making it impossible to distinguish an alkane fromanother. It is worth to point out that alkanes are difficult to ionize.
Negative ion mode mass spectra can be characterized in thelow mass range by dominance of ions made of hydrogen and/or
carbon such as H� , C� , CH� , CH2� , C2
� and C2H� (Fig. 11). Thesepeaks come clearly from the fragmentation of the aliphaticsaturated chain. Nevertheless some distinctions appear for theseions within the four alkanes. The common feature is that H� , C�
and CH� are the ions for which the intensity increases the mostfrom the blank. On the contrary, the increase of CH2
� , C2� and
C2H� is lower, and seems correlated to the chain length: theseions are faintly present for eicosane (C20H42) although they areclearly present for hextriacontane (C36H74) as figured on itsnegative ion mode mass spectrum (Fig. 11).
3.3.2. Polyaromatic hydrocarbonsFor the three PAHs analyzed, no quasi-molecular peaks relative
to the different molecules have been observed. Consequently itwould be rather difficult to be able to identify a PAH moleculefrom another one in mass spectrum of an unknown sample byusing only the negative ion mode.
Nonetheless characteristic fingerprints of PAHs that resultedfrom the fragmentation of molecular or quasi-molecular ion ofPAHs under the TOF-SIMS primary ion beam are observed in thelower mass range: H� , C� , CH� , C2
� and C2H� . These peaks arethe major peaks of the PAHs negative ion mode mass spectra.It should also be mentioned that series of peaks relative to Cn
�
and CnH� are observed for all the PAHs analyzed (Fig. 12). Foranthracene, these series are detected till n¼6. For the pyrene,these series are not really obvious after n¼4. Further analysesshould be performed to determine if these series are also observedfor other PAHs but they seem to be a very good indicatorto highlight the presence of PAHs in the negative ion mode.
3.3.3. N-heterocyclic compoundsFor the negative ion mode mass spectra of the N-heterocyclic
compounds, the quasi-molecular peak ([M�H]�) is alwaysobserved but at rather low intensity compared to the positiveion mode (Fig. 13). For some compounds it can be 50 times lowerthan the major peak of the spectrum.
The other characteristic peaks of the N-heterocyclic com-pounds are CN� or O� for compounds including oxygen atom atm/z¼26.00 and 15.99 u/e respectively. These ions have among themost important intensities of the negative mass spectrum Fig. 13.The peak related to CNO� at m/z 42.00 u/e can also give animportant contribution to the total amount of counts of the massspectrum. Nevertheless these peaks are not very specific of theanalyzed compounds. Therefore we cannot use only them asindicators in order to identify with no ambiguity the presence of
0 30 60 90 1200.0
0.2
0.4
0.6
0.8
1.0
Nor
mal
ized
inte
nsity
m/z (u/e)
Fig. 10. Positive ion mode mass spectrum of POM. The triangles as well as thevertical gray lines represent the position of the main fragments of POM which canbe attributed to [(H2CO)nþH]þ , [(H2CO)nþH–H2O]þ , [(H2CO)nþH–O]þ and[(H2CO)nþH–CH2]þ .
0 20 40 60 80 100 120 140 160 180 200 220 2400.0
0.2
0.4
0.6
0.8
1.0
1.2
norm
aliz
ed in
tens
ity
M=122.04 g/mol
m/z (u/e)
Benzoic acid
Fig. 9. Positive ion mode mass spectrum of benzoic acid. The intensity is normal-ized to the major peak (m/z¼22.99 u/e).
0 20 40 60 80 1001E-3
0.01
0.1
1Hexatriacontane
Nor
mal
ized
inte
nsity
m/z (u/e)
Fig. 11. Negative ion mode mass spectrum of hexatriacontane. The intensity isnormalized to the major peak (m/z¼1.01 u/e).
L. Le Roy et al. / Planetary and Space Science 105 (2015) 1–25 13
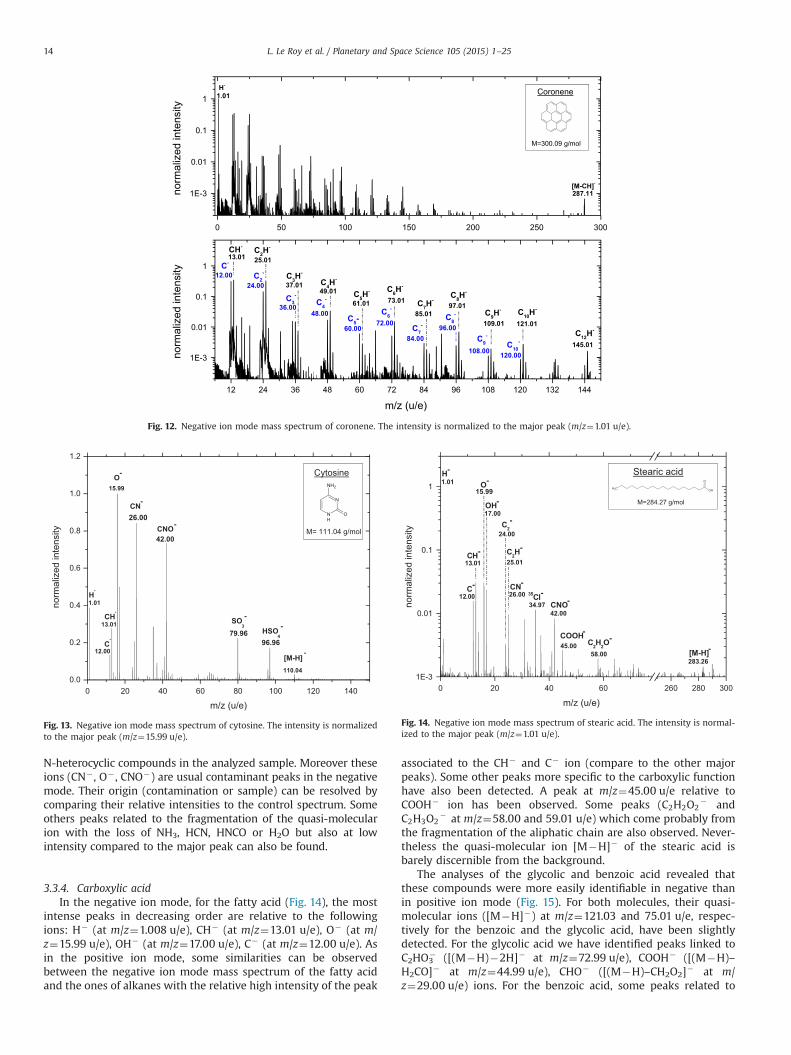
N-heterocyclic compounds in the analyzed sample. Moreover theseions (CN� , O� , CNO�) are usual contaminant peaks in the negativemode. Their origin (contamination or sample) can be resolved bycomparing their relative intensities to the control spectrum. Someothers peaks related to the fragmentation of the quasi-molecularion with the loss of NH3, HCN, HNCO or H2O but also at lowintensity compared to the major peak can also be found.
3.3.4. Carboxylic acidIn the negative ion mode, for the fatty acid (Fig. 14), the most
intense peaks in decreasing order are relative to the followingions: H� (at m/z¼1.008 u/e), CH� (at m/z¼13.01 u/e), O� (at m/z¼15.99 u/e), OH� (at m/z¼17.00 u/e), C� (at m/z¼12.00 u/e). Asin the positive ion mode, some similarities can be observedbetween the negative ion mode mass spectrum of the fatty acidand the ones of alkanes with the relative high intensity of the peak
associated to the CH� and C� ion (compare to the other majorpeaks). Some other peaks more specific to the carboxylic functionhave also been detected. A peak at m/z¼45.00 u/e relative toCOOH� ion has been observed. Some peaks (C2H2O2
� andC2H3O2
� at m/z¼58.00 and 59.01 u/e) which come probably fromthe fragmentation of the aliphatic chain are also observed. Never-theless the quasi-molecular ion [M�H]� of the stearic acid isbarely discernible from the background.
The analyses of the glycolic and benzoic acid revealed thatthese compounds were more easily identifiable in negative thanin positive ion mode (Fig. 15). For both molecules, their quasi-molecular ions ([M�H]�) at m/z¼121.03 and 75.01 u/e, respec-tively for the benzoic and the glycolic acid, have been slightlydetected. For the glycolic acid we have identified peaks linked toC2HO3
� ([(M�H)�2H]� at m/z¼72.99 u/e), COOH� ([(M�H)–H2CO]� at m/z¼44.99 u/e), CHO� ([(M�H)–CH2O2]� at m/z¼29.00 u/e) ions. For the benzoic acid, some peaks related to
0 50 100 150 200 250 300
1E-3
0.01
0.1
1
12 24 36 48 60 72 84 96 108 120 132 144
1E-3
0.01
0.1
1
norm
aliz
ed in
tens
ityno
rmal
ized
inte
nsity
m/z (u/e)
Fig. 12. Negative ion mode mass spectrum of coronene. The intensity is normalized to the major peak (m/z¼1.01 u/e).
0 20 40 60 80 100 120 1400.0
0.2
0.4
0.6
0.8
1.0
1.2
M= 111.04 g/mol
norm
aliz
ed in
tens
ity
m/z (u/e)
Cytosine
Fig. 13. Negative ion mode mass spectrum of cytosine. The intensity is normalizedto the major peak (m/z¼15.99 u/e).
0 20 40 60 260 280 3001E-3
0.01
0.1
1
m/z (u/e)
norm
aliz
ed in
tens
ity
Fig. 14. Negative ion mode mass spectrum of stearic acid. The intensity is normal-ized to the major peak (m/z¼1.01 u/e).
L. Le Roy et al. / Planetary and Space Science 105 (2015) 1–2514
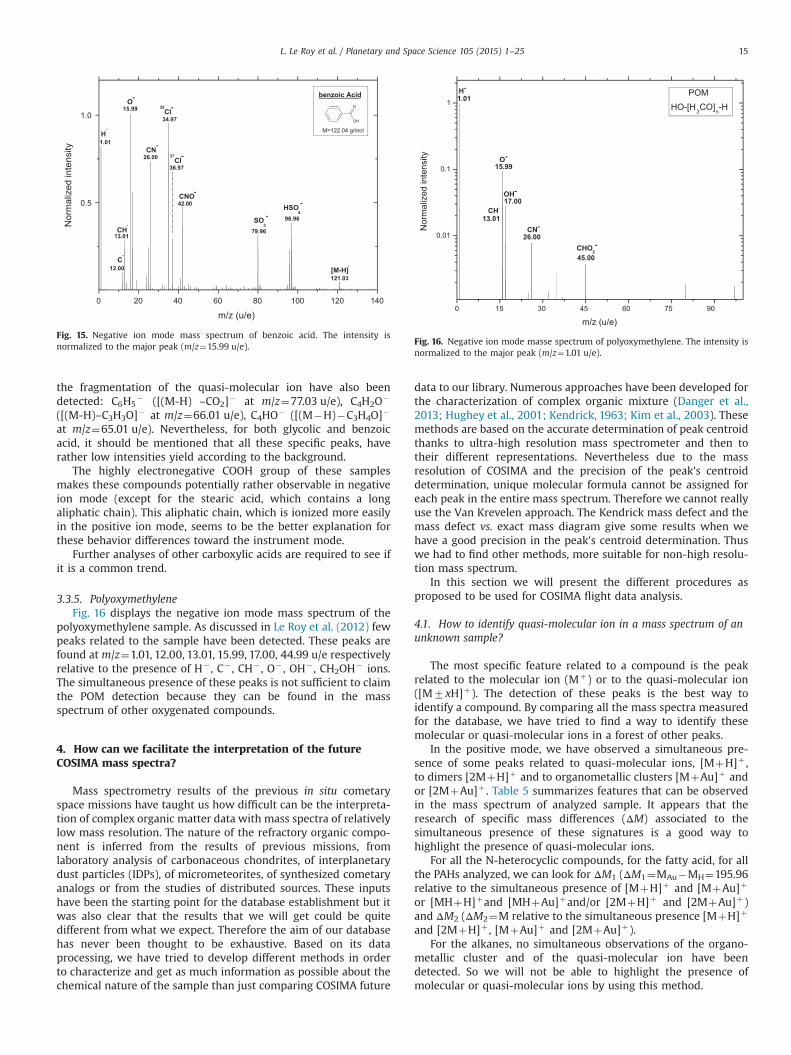
the fragmentation of the quasi-molecular ion have also beendetected: C6H5
� ([(M-H) –CO2]� at m/z¼77.03 u/e), C4H2O�
([(M-H)–C3H3O]� at m/z¼66.01 u/e), C4HO� ([(M�H)�C3H4O]�
at m/z¼65.01 u/e). Nevertheless, for both glycolic and benzoicacid, it should be mentioned that all these specific peaks, haverather low intensities yield according to the background.
The highly electronegative COOH group of these samplesmakes these compounds potentially rather observable in negativeion mode (except for the stearic acid, which contains a longaliphatic chain). This aliphatic chain, which is ionized more easilyin the positive ion mode, seems to be the better explanation forthese behavior differences toward the instrument mode.
Further analyses of other carboxylic acids are required to see ifit is a common trend.
3.3.5. PolyoxymethyleneFig. 16 displays the negative ion mode mass spectrum of the
polyoxymethylene sample. As discussed in Le Roy et al. (2012) fewpeaks related to the sample have been detected. These peaks arefound at m/z¼1.01, 12.00, 13.01, 15.99, 17.00, 44.99 u/e respectivelyrelative to the presence of H� , C� , CH� , O� , OH� , CH2OH� ions.The simultaneous presence of these peaks is not sufficient to claimthe POM detection because they can be found in the massspectrum of other oxygenated compounds.
4. How can we facilitate the interpretation of the futureCOSIMA mass spectra?
Mass spectrometry results of the previous in situ cometaryspace missions have taught us how difficult can be the interpreta-tion of complex organic matter data with mass spectra of relativelylow mass resolution. The nature of the refractory organic compo-nent is inferred from the results of previous missions, fromlaboratory analysis of carbonaceous chondrites, of interplanetarydust particles (IDPs), of micrometeorites, of synthesized cometaryanalogs or from the studies of distributed sources. These inputshave been the starting point for the database establishment but itwas also clear that the results that we will get could be quitedifferent from what we expect. Therefore the aim of our databasehas never been thought to be exhaustive. Based on its dataprocessing, we have tried to develop different methods in orderto characterize and get as much information as possible about thechemical nature of the sample than just comparing COSIMA future
data to our library. Numerous approaches have been developed forthe characterization of complex organic mixture (Danger et al.,2013; Hughey et al., 2001; Kendrick, 1963; Kim et al., 2003). Thesemethods are based on the accurate determination of peak centroidthanks to ultra-high resolution mass spectrometer and then totheir different representations. Nevertheless due to the massresolution of COSIMA and the precision of the peak's centroiddetermination, unique molecular formula cannot be assigned foreach peak in the entire mass spectrum. Therefore we cannot reallyuse the Van Krevelen approach. The Kendrick mass defect and themass defect vs. exact mass diagram give some results when wehave a good precision in the peak's centroid determination. Thuswe had to find other methods, more suitable for non-high resolu-tion mass spectrum.
In this section we will present the different procedures asproposed to be used for COSIMA flight data analysis.
4.1. How to identify quasi-molecular ion in a mass spectrum of anunknown sample?
The most specific feature related to a compound is the peakrelated to the molecular ion (Mþ) or to the quasi-molecular ion([M7xH]þ). The detection of these peaks is the best way toidentify a compound. By comparing all the mass spectra measuredfor the database, we have tried to find a way to identify thesemolecular or quasi-molecular ions in a forest of other peaks.
In the positive mode, we have observed a simultaneous pre-sence of some peaks related to quasi-molecular ions, [MþH]þ ,to dimers [2MþH]þ and to organometallic clusters [MþAu]þ andor [2MþAu]þ . Table 5 summarizes features that can be observedin the mass spectrum of analyzed sample. It appears that theresearch of specific mass differences (ΔM) associated to thesimultaneous presence of these signatures is a good way tohighlight the presence of quasi-molecular ions.
For all the N-heterocyclic compounds, for the fatty acid, for allthe PAHs analyzed, we can look for ΔM1 (ΔM1¼MAu�MH¼195.96relative to the simultaneous presence of [MþH]þ and [MþAu]þ
or [MHþH]þand [MHþAu]þand/or [2MþH]þ and [2MþAu]þ)and ΔM2 (ΔM2¼M relative to the simultaneous presence [MþH]þ
and [2MþH]þ , [MþAu]þ and [2MþAu]þ).For the alkanes, no simultaneous observations of the organo-
metallic cluster and of the quasi-molecular ion have beendetected. So we will not be able to highlight the presence ofmolecular or quasi-molecular ions by using this method.
0 20 40 60 80 100 120 140
0.5
1.0
Nor
mal
ized
inte
nsity
m/z (u/e)
Fig. 15. Negative ion mode mass spectrum of benzoic acid. The intensity isnormalized to the major peak (m/z¼15.99 u/e).
0 15 30 45 60 75 90
0.01
0.1
1
Nor
mal
ized
inte
nsity
m/z (u/e)
POMHO-[H CO] -H
Fig. 16. Negative ion mode masse spectrum of polyoxymethylene. The intensity isnormalized to the major peak (m/z¼1.01 u/e).
L. Le Roy et al. / Planetary and Space Science 105 (2015) 1–25 15
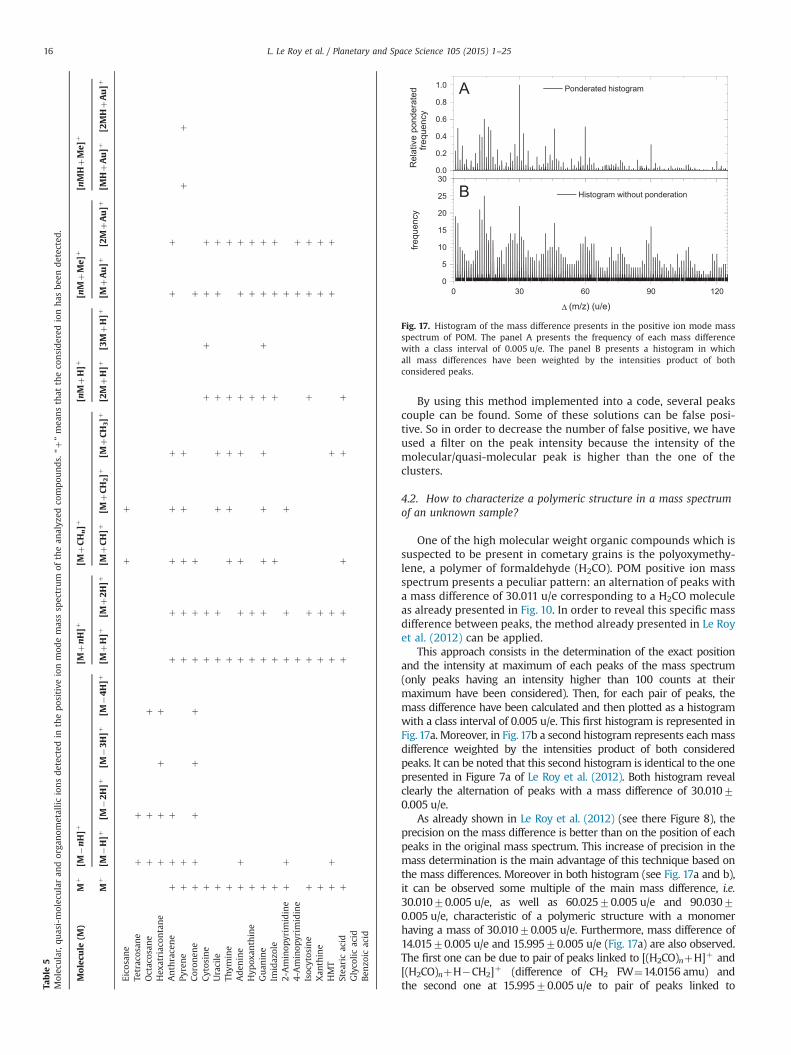
By using this method implemented into a code, several peakscouple can be found. Some of these solutions can be false posi-tive. So in order to decrease the number of false positive, we haveused a filter on the peak intensity because the intensity of themolecular/quasi-molecular peak is higher than the one of theclusters.
4.2. How to characterize a polymeric structure in a mass spectrumof an unknown sample?
One of the high molecular weight organic compounds which issuspected to be present in cometary grains is the polyoxymethy-lene, a polymer of formaldehyde (H2CO). POM positive ion massspectrum presents a peculiar pattern: an alternation of peaks witha mass difference of 30.011 u/e corresponding to a H2CO moleculeas already presented in Fig. 10. In order to reveal this specific massdifference between peaks, the method already presented in Le Royet al. (2012) can be applied.
This approach consists in the determination of the exact positionand the intensity at maximum of each peaks of the mass spectrum(only peaks having an intensity higher than 100 counts at theirmaximum have been considered). Then, for each pair of peaks, themass difference have been calculated and then plotted as a histogramwith a class interval of 0.005 u/e. This first histogram is represented inFig. 17a. Moreover, in Fig. 17b a second histogram represents eachmassdifference weighted by the intensities product of both consideredpeaks. It can be noted that this second histogram is identical to the onepresented in Figure 7a of Le Roy et al. (2012). Both histogram revealclearly the alternation of peaks with a mass difference of 30.01070.005 u/e.
As already shown in Le Roy et al. (2012) (see there Figure 8), theprecision on the mass difference is better than on the position of eachpeaks in the original mass spectrum. This increase of precision in themass determination is the main advantage of this technique based onthe mass differences. Moreover in both histogram (see Fig. 17a and b),it can be observed some multiple of the main mass difference, i.e.30.01070.005 u/e, as well as 60.02570.005 u/e and 90.03070.005 u/e, characteristic of a polymeric structure with a monomerhaving a mass of 30.01070.005 u/e. Furthermore, mass difference of14.01570.005 u/e and 15.99570.005 u/e (Fig. 17a) are also observed.The first one can be due to pair of peaks linked to [(H2CO)nþH]þ and[(H2CO)nþH�CH2]þ (difference of CH2 FW¼14.0156 amu) andthe second one at 15.99570.005 u/e to pair of peaks linked to
0 30 60 90 1200
5
10
15
20
25
30
Histogram without ponderation
frequ
ency
Δ (m/z) (u/e)
0.0
0.2
0.4
0.6
0.8
1.0 Ponderated histogram
Rel
ativ
e po
nder
ated
freq
uenc
y
Fig. 17. Histogram of the mass difference presents in the positive ion mode massspectrum of POM. The panel A presents the frequency of each mass differencewith a class interval of 0.005 u/e. The panel B presents a histogram in whichall mass differences have been weighted by the intensities product of bothconsidered peaks.
Table
5Molecular,qu
asi-molecularan
dorga
nom
etallic
ionsdetectedin
thepositiveionmod
emasssp
ectrum
ofthean
alyz
edco
mpou
nds.
“þ”mea
nsthat
theco
nsidered
ionhas
been
detected.
Molecu
le(M
)M
þ[M
�nH]þ
[MþnH]þ
[MþCH
n]þ
[nM
þH]þ
[nM
þMe]
þ[nMHþMe]
þ
Mþ
[M�H]þ
[M�2H
]þ[M
�3H
]þ[M
�4H
]þ[M
þH]þ
[Mþ2H
]þ[M
þCH
]þ[M
þCH
2]þ
[MþCH
3]þ
[2M
þH]þ
[3M
þH]þ
[MþAu]þ
[2M
þAu]þ
[MHþAu]þ
[2MHþAu]þ
Eico
sane
þþ
Tetracosan
eþ
þOctacosan
eþ
þþ
Hex
atriacon
tane
þþ
þþ
Anthracene
þþ
þþ
þþ
þþ
þþ
Pyrene
þþ
þþ
þþ
þþ
þCoron
ene
þþ
þþ
þþ
þþ
þCytosine
þþ
þþ
þþ
þUracile
þþ
þþ
þþ
þþ
Thym
ine
þþ
þþ
þþ
þAde
nine
þþ
þþ
þþ
þþ
þHyp
oxan
thine
þþ
þþ
þþ
Guan
ine
þþ
þþ
þþ
þþ
þþ
Imidazole
þþ
þþ
þþ
2-Aminop
yrim
idine
þþ
þþ
þþ
4-Aminop
yrim
idine
þþ
þIsoc
ytosine
þþ
þþ
þþ
Xan
thine
þþ
þþ
þHMT
þþ
þþ
þþ
þStea
ricacid
þþ
þþ
þþ
Glyco
licacid
Ben
zoic
acid
L. Le Roy et al. / Planetary and Space Science 105 (2015) 1–2516

[(H2CO)nþH]þ and [(H2CO)nþH�O]þ (difference of O FW¼15.995 amu). The only compound, which can explain all theseobservations, is a H2CO polymer.
The same approach could also be employed for non-polymericcompounds, such as hydrocarbons. Histograms of the mass differ-ences present for the positive ion mode mass spectra of pyrene(C16H10) and hexatriacontane (C36H74) are represented in Fig. 18.In these histograms, major peak is located at 14.01870.005 u/e.This mass difference results from the alternation of [CnH2n�1]þ
and [CnH2nþ1]þ ions in the lowmass spectra and can be attributedto CH2. Multiples are also observed at 28.04870.005 and42.06270.005 supporting the presence of a repetitive unit withinthe mass spectrum. The same characteristics are observed for thefour alkanes, the three PAHs and the stearic acid studied in thispaper. The latter does not belong to the hydrocarbon family, butits long aliphatic saturated chain (CH3(CH2)16CO2H) confers thebehavior of an alkane on it.
4.3. How to distinguish compounds made of different kind of atoms(absence or presence of nitrogen) or made of different structures(aliphatic and aromatic hydrocarbons) in an unknown massspectrum?
4.3.1. Tentative of quantitative measurements of the N/C elementalratio.
This section is focused on the N/C elemental ratio. In order tomeasure it, a study on the intensity of peaks which can be observed
in all the analyzed samples and which are not specific to some ofthem have been achieved: peaks at mass to charge ratio lower than30 u/e for instance. Indeed, at these low masses, few overlappingsoccur and convincing attributions could be performed for mostpeaks. More specifically four peaks have been chosen: peaks atnominal masses 24 and 26 u/e in negative ion mode and peaks atnominal masses 28 and 29 u/e in positive ion mode. These fourpeaks have been adjusted by a Gaussian function to preciselydetermine the exact position of their maximum and to measuretheir intensities, i.e. the number of counts. We have considered thespectra, in negative and positive modes, of the 23 different pureorganic compounds presented in Table 1, as well as “blank” spectrafor each compound and mode, leading to a total of 92 consideredspectra. Fig. 19 presents the ratio of the peak's intensity at nominalmasses 28 and 29 u/e (I(28)/I(29)) as a function of their maximum'sposition. The maximum of the peak at nominal mass 29 u/e isquite stable and is precisely located at m/z¼29.03970.004 u/e (seeFig. 19B), thus this peak can be attributed to C2H5
þ (m/z¼29.039u/e) for all the positive ion mode mass spectra. The exact position ofpeak at the nominal mass 28 range from m/z¼28.017 up to28.033 u/e and it is correlated to the intensity ratio I(28)/I(29)(see Fig. 19A). Thus, an overlap between HCNHþ (m/z¼28.019 u/e)and C2H4
þ (m/z¼28.031 u/e) is observed. When, the maximum ofthis peak is close to 28.031 u/e, the intensity ratio I(28)/I(29) isabout 0.1. In that case, this peak is attributed to C2H4
þ which is aradical ion, thus less stable that C2H5
þ which is a molecular ionexplaining the low intensity ratio (as for alkanes and PAHs). On theother hand, when the maximum of the peak is close to 28.019 u/e,
0 10 20 30 40 50 60 70 800.0
0.2
0.4
0.6
0.8
1.0
1.2
42.062
28.048
42.062
28.048
42.062
28.048
(CH2)2 (CH2)2
(CH2)2
(CH2)3
(CH2)3
(CH2)3
(CH2)3
Ponderated histogram of Pyrene
Rel
ativ
e po
nder
ated
freq
uenc
yCH2
CH2
CH2 CH2
14.018
0 10 20 30 40 50 60 70 800.0
0.2
0.4
0.6
0.8
1.0
1.2
1.4 Ponderated histogram of Hexatriacontane
42.062
28.048
14.018
0 10 20 30 40 50 60 70 800
5
10
15
20
25
14.01814.018
Histogram without ponderation of Pyrene
Freq
uenc
y
Δ (m/z) (u/e)0 10 20 30 40 50 60 70 80
0
5
10
15
Histogram without ponderation of Hexatriacontane
Δ (m/z) (u/e)
Fig. 18. Histograms of the mass differences in the positive ion mode mass spectrum of hexatricontane and pyrene. The top panel presents the frequency of each massdifference with a class interval of 0.005 u/e. The bottom panel presents a histogram in which all mass differences have been weighted by the intensities product of bothconsidered peaks.
L. Le Roy et al. / Planetary and Space Science 105 (2015) 1–25 17

the intensity ratio I(28)/I(29) is about 1. In this second case, thispeak could be attributed to HCNHþ which is a molecular ion asC2H5
þ . Both ions have similar stability and the I(28)/I(29) intensityratio is about 1.
Unfortunately, the correlation between the variation of the I(28)/I(29) intensity ratio and the N/C elemental ratio of the studiedsamples is very low. Thus, this intensity ratio cannot be used forquantitative estimation of the N/C elemental ratio in samples ofunknown nature such as cometary grains. Nevertheless, it can benoted that the exact position of the peak at mass 28 as well as the I(28)/I(29) intensity ratio could give clues to the presence ofnitrogen atoms in a sample of unknown nature.
In negative ion mode, the exact positions of peaks at nominalmasses 24 and 26 u/e are stable and are precisely locatedat 24.00070.003 u/e and 26.00270.003 u/e. They couldbe unambiguously attributed to C2
� (m/z¼24 u/e) and CN�
(m/z¼26.003 u/e). The non-nitrogenated compounds as well asthe blank present a quite large dispersion of the intensity ratio I(26)/I(24) (Fig. 20), due to the presence of nitrogen atom inthe background of the instrument and the weakness of the peaksrelated to the C2
� ions. Nevertheless, the non-nitrogenatedand nitrogenated compounds can be clearly distinguished(Fig. 20).
Considering only the spectra of nitrogenated compounds, acalibration line can be calculated as well as the prediction bands at68% of confidence (Fig. 21). These prediction bands could be usedto estimate the uncertainties on the determined N/C elementalfrom an unknown sample. Whatever the elemental ratio is, theerrors bar is about70.2.
This error bar is high compared to the plausible cometary N/Celemental ratio which ranges from almost zero to 0.25. It is clearthat more work is needed before to perform a rigorous analysis ofthe spectra of cometary grains. The present work could be seen asa guideline for a future calibration based on samples containingmacromolecular carbonaceous compounds such as insolubleorganic matter (IOM) extracted from carbonaceous meteorites,meteorites samples and kerogen which present low N/C elemental
ratio representative of the ones which could be present in thegrains of comet 67P/CG
4.3.2. How to highlight the presence of aliphatic chains or aromaticstructures in a sample of unknown nature?
Alkane and PAH families are both only made of hydrogen andcarbon atoms but through a different structure: a long aliphaticsaturated chain and a polyaromatic structure. Similarly, the hydro-gen content differs, being higher for alkanes than for PAHs.
As mentioned in Section 4.2 alkanes and PAHs are compoundsshowing, in the low mass range of positive mass spectra, asignificant alternation of [CnH2n�1]þ and [CnH2nþ1]þ ions.
28.015 28.020 28.025 28.030 28.035
0.1
1
10
C2H4+
CHONCHNCHOCH
BlankI(2
8) /
I(29)
Position of the peak at 28 u/e
CH2N+
29.030 29.035 29.040 29.045 29.050
0.1
1
10
Position of the peak at 29 u/e
C2H5+
Fig. 19. Intensity, i.e. number of counts, ratio for peaks at nominal masses 28 and 29 u/e as a function of the exact position of peak at m/z 28 (Panel a) and 29 (Panel b) inpositive ion mode. Spectra of molecules for the different molecular families “CHON”, “CHN”, “CHO” and “CH” have been represented in black, blue, green and red respectively,whereas the blank spectra have been represented by open symbols. Vertical dashed lines represents the exact position of HCNHþ , C2H4
þ and C2H5þ ions. (For interpretation of
the references to color in this figure legend, the reader is referred to the web version of this article.)
0 5 10 15 20 25 30-0.2
0.0
0.2
0.4
0.6
0.8
1.0
N/C
I (26) / I (24)
CHONCHNCHOCHBlank
Fig. 20. N to C elemental ratio as a function of the intensity ratio of peaks at masses26 and 24 in negative ion mode. We arbitrary assign a negative N/C ratio from the“blank” spectra represented by open symbols. Spectra of molecules for the differentmolecular families “CHON”, “CHN”, “CHO” and “CH” have been represented inblack, blue, green and red respectively. (For interpretation of the references to colorin this figure legend, the reader is referred to the web version of this article.)
L. Le Roy et al. / Planetary and Space Science 105 (2015) 1–2518

Moreover, in the negative ion mode, low mass fragments arealso found such as H� , C� , CH� , CH2
� , C2� and C2H� . Among them
C2� and C2H� ions belonging to the PAH family have a very high
intensity in regard to the other analyzed compounds. This ten-dency, normalized to the CH2
� ion is pointed out in Fig. 22. Thisfigure can be an attempt to highlight the presence of aliphaticchains and polyaromatic structure in an unknown mass spectrum.It could also be seen as a tentative distinction of low atomichydrogen to carbon ratio and high atomic hydrogen to carbonratio. The organic compounds with a “low” content of hydrogenare the PAHs and those with a higher content of hydrogen atom tocarbon atom are the alkanes. It should be obviously mentionedthat our database is not exhaustive and therefore these resultscan evolve with the analyses of new chemical family. This resultwill obviously come as additional support to the analysis of the
positive mass spectra. Nevertheless it clearly supports the fact thatnegative ion mode will also bring us some information on theinterpretation of the future COSIMA mass spectra.
5. Applying the Blind Source Separation approach to interpretCOSIMA mass spectra
As a first step for COSIMA data handling strategy, methodsimplementing data reduction will be extremely useful. As part ofregular COSIMA operations on board Rosetta, after a preliminaryset of TOF-SIMS analysis on a target holder, the COSIMA team willhave to quickly (within 48 h) optimize the COSIMA commandssequence for more detailed measurements. Processing all thespectra one by one is time-consuming, and not feasible in a shorttime period. A data reduction method will provide clues to choosethe most interesting cometary grains for which long analysesshould be foreseen.
Moreover, COSIMA will provide a relatively high number ofmass spectra as cometary grains found on the target and sometarget area free of visible sample will be analyzed by line or matrixscanning. A dataset of mass spectra can provide a huge amount ofuseful data that may be difficult to understand without a pre-liminary step of reduction. In order to extract useful and likelihoodinformation, our goal is then to study a large number of spectrawithout any assumptions about the samples composition, througha limited data volume that should be representative of the fulldata set.
All these COSIMA data will have to be interpreted for scientificanalyses of the collected cometary matter. It is expected that thedata we may record would be mixtures of pure compounds,including minerals and organics from the grain, as well as acontribution from the target itself (as discussed in Section 2). Thusthe data recorded could be seen as a linear combination of purecomponents spectra. It is then a source separation problem wherethe unknown pure components spectra would be the sources andthe concentrations the mixing coefficients. For the scientific dataanalyses, again, data reduction methods could also provide cluesto identify pure compounds hidden into the expected complexmixtures.
To process multivariate data, many numerical statistical tech-niques are available, such as the most popular one: the PrincipalComponent Analysis (PCA). Blind Source Separation (BSS)approach (Comon and Jutten, 2010) is more constraining and issuitable to reveal hidden factors underlying on sets of measuredsignals. Through the Bayesian Positive Source Separation method(BPSS), it provides a decomposition of multivariate data intopositive sources through positive mixing coefficients.
In this paper, we attempt to address the capability of the BPSStechnique as a valuable method to interpret future COSIMA data.At first for an easier understanding of our work, a description ofthe method is briefly given in Section 5.1 (for more details see forinstance Moussaoui et al. (2006a, 2006b, 2006c)). Section 5.2presents the three significant use features that can bring BPSStechnique to interpret COSIMA dataset. Section 5.3 recalls mainpreliminary results and further perspectives of the use of thistechnique.
5.1. Bayesian Positive Source Separation (BPSS)
A typical separation problem entails to extract individualsources emitting any kind of signal from the overall recording ofa detector. Bayesian Positive Source Separation (BPSS) formalismgenerally assumes N independent sources s(t)¼(s1(t), …, sN(t)) andP independent mixtures x(t)¼(x1(t), …, xP(t)) (x(t) being theobservation vectors or mass spectra in this study). The mixture
0 5 10 15 20 25 300.0
0.2
0.4
0.6
0.8
1.0
N /
C
I(26) / I(24)
CHONCHN Best adjustementPrediction bands at 68%
Fig. 21. N/C elemental ratio for nitrogenated compounds as a function of theintensity ratio at masses 26 and 24 in negative mode. The black line is the bestadjustment and both gray lines are the prediction bands at 68% of confidence.Spectra of molecules for “CHON” and “CHN” molecular families have beenrepresented in black and blue respectively. (For interpretation of the referencesto color in this figure legend, the reader is referred to the web version of thisarticle.)
BlankLong aliphatic saturated chainPAHOther compounds
0 5 10 15 20 25 30
0
5
10
15
C2- /C
H2-
C2H-/CH
2-
Fig. 22. C2� /CH2
� intensity ratio as a function of C2H�/CH2� intensity ratio in
negative mode. Long aliphatic saturated chain compounds in orange refer to thefour alkanes and the stearic acid; PAH compounds are represented in red and blankspectra by open symbols; “Other compounds” in black refer to remaining analyzedmolecules from Table 2. (For interpretation of the references to color in this figurelegend, the reader is referred to the web version of this article.)
L. Le Roy et al. / Planetary and Space Science 105 (2015) 1–25 19
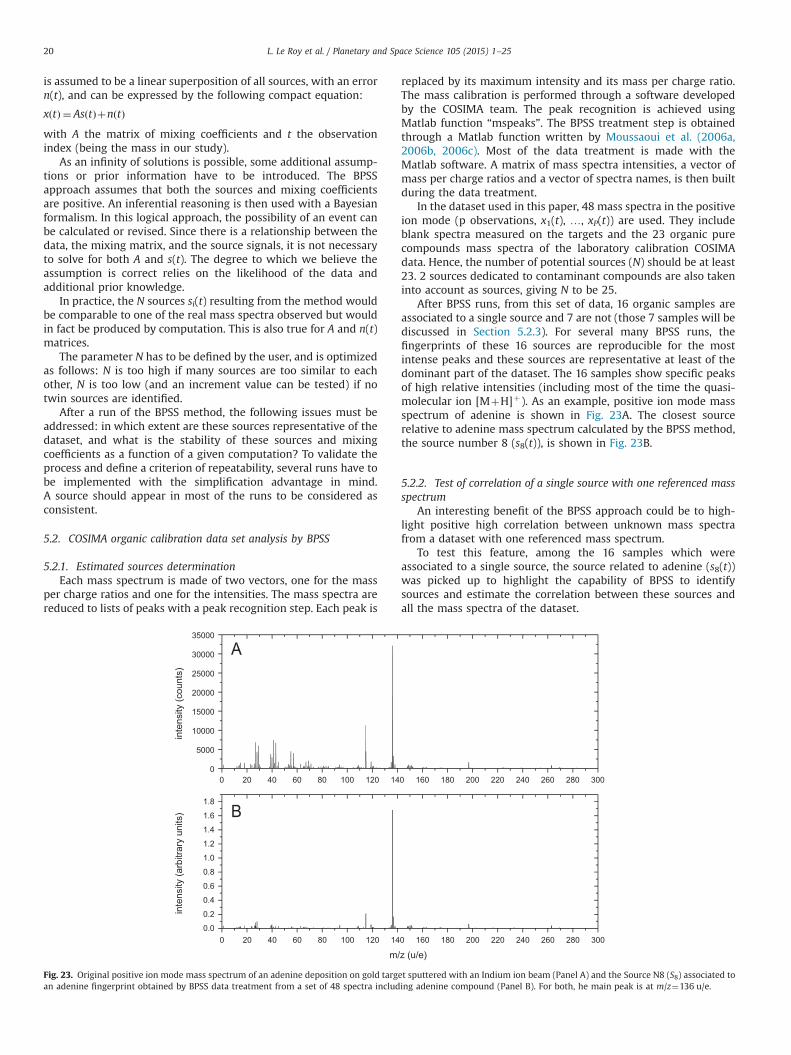
is assumed to be a linear superposition of all sources, with an errorn(t), and can be expressed by the following compact equation:
x tð Þ ¼ As tð Þþn tð Þwith A the matrix of mixing coefficients and t the observationindex (being the mass in our study).
As an infinity of solutions is possible, some additional assump-tions or prior information have to be introduced. The BPSSapproach assumes that both the sources and mixing coefficientsare positive. An inferential reasoning is then used with a Bayesianformalism. In this logical approach, the possibility of an event canbe calculated or revised. Since there is a relationship between thedata, the mixing matrix, and the source signals, it is not necessaryto solve for both A and s(t). The degree to which we believe theassumption is correct relies on the likelihood of the data andadditional prior knowledge.
In practice, the N sources si(t) resulting from the method wouldbe comparable to one of the real mass spectra observed but wouldin fact be produced by computation. This is also true for A and n(t)matrices.
The parameter N has to be defined by the user, and is optimizedas follows: N is too high if many sources are too similar to eachother, N is too low (and an increment value can be tested) if notwin sources are identified.
After a run of the BPSS method, the following issues must beaddressed: in which extent are these sources representative of thedataset, and what is the stability of these sources and mixingcoefficients as a function of a given computation? To validate theprocess and define a criterion of repeatability, several runs have tobe implemented with the simplification advantage in mind.A source should appear in most of the runs to be considered asconsistent.
5.2. COSIMA organic calibration data set analysis by BPSS
5.2.1. Estimated sources determinationEach mass spectrum is made of two vectors, one for the mass
per charge ratios and one for the intensities. The mass spectra arereduced to lists of peaks with a peak recognition step. Each peak is
replaced by its maximum intensity and its mass per charge ratio.The mass calibration is performed through a software developedby the COSIMA team. The peak recognition is achieved usingMatlab function “mspeaks”. The BPSS treatment step is obtainedthrough a Matlab function written by Moussaoui et al. (2006a,2006b, 2006c). Most of the data treatment is made with theMatlab software. A matrix of mass spectra intensities, a vector ofmass per charge ratios and a vector of spectra names, is then builtduring the data treatment.
In the dataset used in this paper, 48 mass spectra in the positiveion mode (p observations, x1(t), …, xP(t)) are used. They includeblank spectra measured on the targets and the 23 organic purecompounds mass spectra of the laboratory calibration COSIMAdata. Hence, the number of potential sources (N) should be at least23. 2 sources dedicated to contaminant compounds are also takeninto account as sources, giving N to be 25.
After BPSS runs, from this set of data, 16 organic samples areassociated to a single source and 7 are not (those 7 samples will bediscussed in Section 5.2.3). For several many BPSS runs, thefingerprints of these 16 sources are reproducible for the mostintense peaks and these sources are representative at least of thedominant part of the dataset. The 16 samples show specific peaksof high relative intensities (including most of the time the quasi-molecular ion [MþH]þ). As an example, positive ion mode massspectrum of adenine is shown in Fig. 23A. The closest sourcerelative to adenine mass spectrum calculated by the BPSS method,the source number 8 (s8(t)), is shown in Fig. 23B.
5.2.2. Test of correlation of a single source with one referenced massspectrum
An interesting benefit of the BPSS approach could be to high-light positive high correlation between unknown mass spectrafrom a dataset with one referenced mass spectrum.
To test this feature, among the 16 samples which wereassociated to a single source, the source related to adenine (s8(t))was picked up to highlight the capability of BPSS to identifysources and estimate the correlation between these sources andall the mass spectra of the dataset.
0 20 40 60 80 100 120 140 160 180 200 220 240 260 280 3000
5000
10000
15000
20000
25000
30000
35000
0 20 40 60 80 100 120 140 160 180 200 220 240 260 280 3000.0
0.2
0.4
0.6
0.8
1.0
1.2
1.4
1.6
1.8
inte
nsity
(cou
nts)
inte
nsity
(arb
itrar
y un
its)
m/z (u/e)
Fig. 23. Original positive ion mode mass spectrum of an adenine deposition on gold target sputtered with an Indium ion beam (Panel A) and the Source N8 (S8) associated toan adenine fingerprint obtained by BPSS data treatment from a set of 48 spectra including adenine compound (Panel B). For both, he main peak is at m/z¼136 u/e.
L. Le Roy et al. / Planetary and Space Science 105 (2015) 1–2520
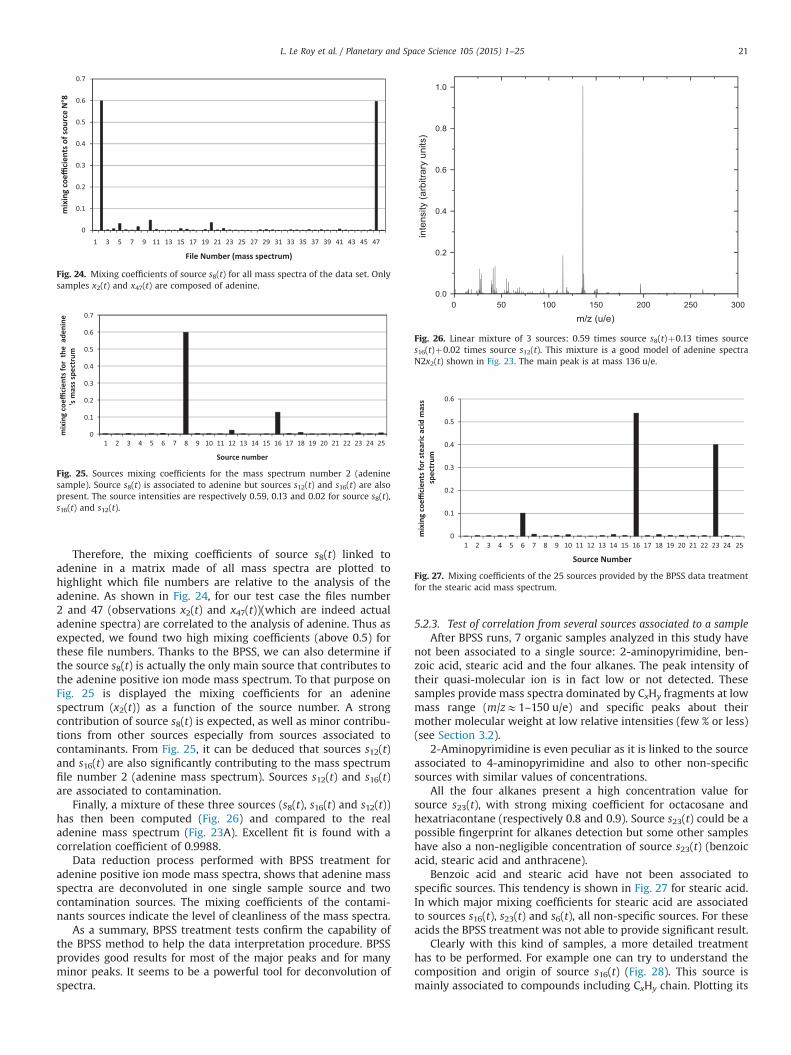
Therefore, the mixing coefficients of source s8(t) linked toadenine in a matrix made of all mass spectra are plotted tohighlight which file numbers are relative to the analysis of theadenine. As shown in Fig. 24, for our test case the files number2 and 47 (observations x2(t) and x47(t))(which are indeed actualadenine spectra) are correlated to the analysis of adenine. Thus asexpected, we found two high mixing coefficients (above 0.5) forthese file numbers. Thanks to the BPSS, we can also determine ifthe source s8(t) is actually the only main source that contributes tothe adenine positive ion mode mass spectrum. To that purpose onFig. 25 is displayed the mixing coefficients for an adeninespectrum (x2(t)) as a function of the source number. A strongcontribution of source s8(t) is expected, as well as minor contribu-tions from other sources especially from sources associated tocontaminants. From Fig. 25, it can be deduced that sources s12(t)and s16(t) are also significantly contributing to the mass spectrumfile number 2 (adenine mass spectrum). Sources s12(t) and s16(t)are associated to contamination.
Finally, a mixture of these three sources (s8(t), s16(t) and s12(t))has then been computed (Fig. 26) and compared to the realadenine mass spectrum (Fig. 23A). Excellent fit is found with acorrelation coefficient of 0.9988.
Data reduction process performed with BPSS treatment foradenine positive ion mode mass spectra, shows that adenine massspectra are deconvoluted in one single sample source and twocontamination sources. The mixing coefficients of the contami-nants sources indicate the level of cleanliness of the mass spectra.
As a summary, BPSS treatment tests confirm the capability ofthe BPSS method to help the data interpretation procedure. BPSSprovides good results for most of the major peaks and for manyminor peaks. It seems to be a powerful tool for deconvolution ofspectra.
5.2.3. Test of correlation from several sources associated to a sampleAfter BPSS runs, 7 organic samples analyzed in this study have
not been associated to a single source: 2-aminopyrimidine, ben-zoic acid, stearic acid and the four alkanes. The peak intensity oftheir quasi-molecular ion is in fact low or not detected. Thesesamples provide mass spectra dominated by CxHy fragments at lowmass range (m/zE1–150 u/e) and specific peaks about theirmother molecular weight at low relative intensities (few % or less)(see Section 3.2).
2-Aminopyrimidine is even peculiar as it is linked to the sourceassociated to 4-aminopyrimidine and also to other non-specificsources with similar values of concentrations.
All the four alkanes present a high concentration value forsource s23(t), with strong mixing coefficient for octacosane andhexatriacontane (respectively 0.8 and 0.9). Source s23(t) could be apossible fingerprint for alkanes detection but some other sampleshave also a non-negligible concentration of source s23(t) (benzoicacid, stearic acid and anthracene).
Benzoic acid and stearic acid have not been associated tospecific sources. This tendency is shown in Fig. 27 for stearic acid.In which major mixing coefficients for stearic acid are associatedto sources s16(t), s23(t) and s6(t), all non-specific sources. For theseacids the BPSS treatment was not able to provide significant result.
Clearly with this kind of samples, a more detailed treatmenthas to be performed. For example one can try to understand thecomposition and origin of source s16(t) (Fig. 28). This source ismainly associated to compounds including CxHy chain. Plotting its
Fig. 24. Mixing coefficients of source s8(t) for all mass spectra of the data set. Onlysamples x2(t) and x47(t) are composed of adenine.
Fig. 25. Sources mixing coefficients for the mass spectrum number 2 (adeninesample). Source s8(t) is associated to adenine but sources s12(t) and s16(t) are alsopresent. The source intensities are respectively 0.59, 0.13 and 0.02 for source s8(t),s16(t) and s12(t).
0 50 100 150 200 250 3000.0
0.2
0.4
0.6
0.8
1.0
inte
nsity
(arb
itrar
y un
its)
m/z (u/e)
Fig. 26. Linear mixture of 3 sources: 0.59 times source s8(t)þ0.13 times sources16(t)þ0.02 times source s12(t). This mixture is a good model of adenine spectraN2x2(t) shown in Fig. 23. The main peak is at mass 136 u/e.
Fig. 27. Mixing coefficients of the 25 sources provided by the BPSS data treatmentfor the stearic acid mass spectrum.
L. Le Roy et al. / Planetary and Space Science 105 (2015) 1–25 21
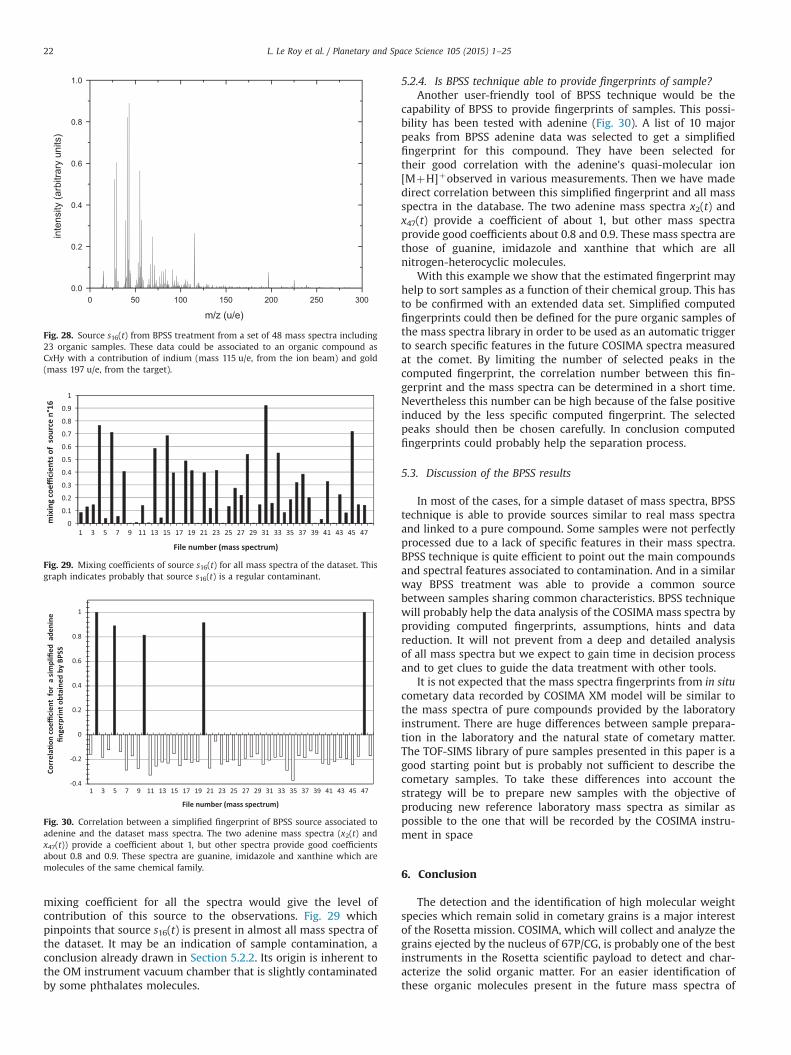
mixing coefficient for all the spectra would give the level ofcontribution of this source to the observations. Fig. 29 whichpinpoints that source s16(t) is present in almost all mass spectra ofthe dataset. It may be an indication of sample contamination, aconclusion already drawn in Section 5.2.2. Its origin is inherent tothe OM instrument vacuum chamber that is slightly contaminatedby some phthalates molecules.
5.2.4. Is BPSS technique able to provide fingerprints of sample?Another user-friendly tool of BPSS technique would be the
capability of BPSS to provide fingerprints of samples. This possi-bility has been tested with adenine (Fig. 30). A list of 10 majorpeaks from BPSS adenine data was selected to get a simplifiedfingerprint for this compound. They have been selected fortheir good correlation with the adenine's quasi-molecular ion[MþH]þobserved in various measurements. Then we have madedirect correlation between this simplified fingerprint and all massspectra in the database. The two adenine mass spectra x2(t) andx47(t) provide a coefficient of about 1, but other mass spectraprovide good coefficients about 0.8 and 0.9. These mass spectra arethose of guanine, imidazole and xanthine that which are allnitrogen-heterocyclic molecules.
With this example we show that the estimated fingerprint mayhelp to sort samples as a function of their chemical group. This hasto be confirmed with an extended data set. Simplified computedfingerprints could then be defined for the pure organic samples ofthe mass spectra library in order to be used as an automatic triggerto search specific features in the future COSIMA spectra measuredat the comet. By limiting the number of selected peaks in thecomputed fingerprint, the correlation number between this fin-gerprint and the mass spectra can be determined in a short time.Nevertheless this number can be high because of the false positiveinduced by the less specific computed fingerprint. The selectedpeaks should then be chosen carefully. In conclusion computedfingerprints could probably help the separation process.
5.3. Discussion of the BPSS results
In most of the cases, for a simple dataset of mass spectra, BPSStechnique is able to provide sources similar to real mass spectraand linked to a pure compound. Some samples were not perfectlyprocessed due to a lack of specific features in their mass spectra.BPSS technique is quite efficient to point out the main compoundsand spectral features associated to contamination. And in a similarway BPSS treatment was able to provide a common sourcebetween samples sharing common characteristics. BPSS techniquewill probably help the data analysis of the COSIMA mass spectra byproviding computed fingerprints, assumptions, hints and datareduction. It will not prevent from a deep and detailed analysisof all mass spectra but we expect to gain time in decision processand to get clues to guide the data treatment with other tools.
It is not expected that the mass spectra fingerprints from in situcometary data recorded by COSIMA XM model will be similar tothe mass spectra of pure compounds provided by the laboratoryinstrument. There are huge differences between sample prepara-tion in the laboratory and the natural state of cometary matter.The TOF-SIMS library of pure samples presented in this paper is agood starting point but is probably not sufficient to describe thecometary samples. To take these differences into account thestrategy will be to prepare new samples with the objective ofproducing new reference laboratory mass spectra as similar aspossible to the one that will be recorded by the COSIMA instru-ment in space
6. Conclusion
The detection and the identification of high molecular weightspecies which remain solid in cometary grains is a major interestof the Rosetta mission. COSIMA, which will collect and analyze thegrains ejected by the nucleus of 67P/CG, is probably one of the bestinstruments in the Rosetta scientific payload to detect and char-acterize the solid organic matter. For an easier identification ofthese organic molecules present in the future mass spectra of
0 50 100 150 200 250 3000.0
0.2
0.4
0.6
0.8
1.0
inte
nsity
(arb
itrar
y un
its)
m/z (u/e)
Fig. 28. Source s16(t) from BPSS treatment from a set of 48 mass spectra including23 organic samples. These data could be associated to an organic compound asCxHy with a contribution of indium (mass 115 u/e, from the ion beam) and gold(mass 197 u/e, from the target).
Fig. 29. Mixing coefficients of source s16(t) for all mass spectra of the dataset. Thisgraph indicates probably that source s16(t) is a regular contaminant.
Fig. 30. Correlation between a simplified fingerprint of BPSS source associated toadenine and the dataset mass spectra. The two adenine mass spectra (x2(t) andx47(t)) provide a coefficient about 1, but other spectra provide good coefficientsabout 0.8 and 0.9. These spectra are guanine, imidazole and xanthine which aremolecules of the same chemical family.
L. Le Roy et al. / Planetary and Space Science 105 (2015) 1–2522
COSIMA, a TOF-SIMS library of targeted molecules was initiated bythe COSIMA team. The analyses of several families of compoundshave started with one of the ground models of COSIMA: theOrleans Model (OM). In general, the interpretation of the positiveion mode mass spectra (except for two carboxylic acids) facilitatesthe identification of the analyzed compounds. Indeed, theseorganic molecules have a larger number of characteristic signa-tures (molecular, quasi-molecular ions, dimer, metal adducts etc.).In this mode, the quasi-molecular ion is most of the time, thepredominant peak of the mass spectrum. However negative ionmode mass spectra provide also important information on thenature of the sample and so will not be neglected. The massspectra of cometary grains collected by COSIMA will be most likelya mixture of different minerals and organic molecules. It could bea challenge to identify a peak related to a molecular or a quasi-molecular ion in the numerous peaks of a mass spectrum. Themethod that has been developed to address this issue is to look forspecific mass differences relative to the simultaneous presence ofsome specific ions (molecular, quasi-molecular ions, dimer, metaladducts). Furthermore we are totally aware that our database isnot exhaustive and that the intensity of the organic moleculescould be very low in the future COSIMA mass spectra, which couldmake very difficult the identification of the samples in cometarygrains. Therefore other procedures have been developed in orderto characterize the nature of the sample: a software dedicated tothe research of polymeric structure has been developed; bymeasuring the intensity ratio of some peaks in the different modeof COSIMA, the presence of compounds with specific atom(molecules containing nitrogen atom or not) or with a specificstructure (aliphatic chains vs. polyaromatic structure) can behighlighted. A first step for the quantification of N/C has also beenpresented by calculating the intensity ratio of peak at nominalmasses 24 and 26 u/e in the negative mode. The Bayesian PositiveSeparation Source seems to be also very valuable to help us tostudy quickly the large amount of data that we will received and inorder to send the most relevant command to the instrumentduring the operational phase. This technique can be also veryuseful for the data interpretation because some correlationbetween simplified fingerprint and all COSIMA mass spectra canbe done in a short time. In any case, this work is just the startingpoint for the COSIMA mass spectra interpretation. The calibrationwork will continue until the end of Rosetta mission. The postcalibration will play an important role for the good evaluation ofthe data.
Acknowledgments
COSIMA was built by a consortium led by the Max-Planck-Institut für Extraterrestrische Physik, Garching, Germany in colla-boration with Laboratoire de Physique et Chimie de l’Environne-ment et de l’Espace, Orléans, France, Institut d’AstrophysiqueSpatiale, CNRS/INSU and Université Paris Sud, Orsay, France,Finnish Meteorological Institute, Helsinki, Finland, UniversitätWuppertal, Wuppertal, Germany, von Hoerner und Sulger GmbH,Schwetzingen, Germany, Universität der Bundeswehr, Neubiberg,Germany, Institut für Physik, Forschungszentrum Seibersdorf,Seibersdorf, Austria, Institut für Weltraumforschung, Österrei-chische Akademie der Wissenschaften, Graz, Austria and isled by the Max-Planck-Institut für Sonnensystemforschung, Göt-tingen, Germany.
The support of the national funding agencies of Germany (DLR),France (CNES), Austria and Finland and the ESA Technical Direc-torate is gratefully acknowledged.
We thank the Rosetta Science Ground Segment at ESAC, theRosetta Mission Operations Centre at ESOC and the Rosetta Project
at ESTEC for their outstanding work enabling the science return ofthe Rosetta Mission.
L.L.R. was the recipient of a CNES/Region Centre Ph.D. fellow-ship, and A.B. is the recipient of a CNES/LABEX ESEP Ph.D. fellow-ship in the frame of the ROSETTA COSIMA project.
The authors would like to thanks S. Moussaoui (Ecole centralede Nantes) to have provided us the BPSS code.
References
Baas, F., Geballe, T.R., Walther, D.M., 1986. Spectroscopy of the 3.4 μm emissionfeature in comet Halley. Astrophys. J. Lett. 311, L97–L101.
Bockelée-Morvan, D., Crovisier, J., Mumma, M.J., Weaver, H.A., 2004. The composi-tion of cometary volatiles. In: Festou, M.C., Keller, H.U., Weaver, H.A. (Eds.),Comets II. University of Arizona Press, Tucson, USA, pp. 391–423.
Botta, O., Bada, J.L., 2002. Extraterrestrial organic compounds in meteorites. Surv.Geophys. 23, 411–467.
Botta, O., Glavin, D.P., Kminek, G., Bada, J.L., 2002. Relative amino acid concentra-tions as a signature for parent body processes of carbonaceous chondrites. Orig.Life Evol. Biosph. 32, 143–163.
Briani, G., Fray, N., Cottin, H., Benilan, Y., Gazeau, M.-C., Perrier, S., 2013. HMTproduction and sublimation during thermal process of cometary organicanalogs. Implications for its detection with the ROSETTA instruments. Icarus226, 541–551.
Briggs, D., Brown, A., Vickerman, J.C., 1989. Handbook of Static Secondary Ion MassSpectrometry. John Wiley & Sons Ltd, Chichester.
Callahan, M.P., Smith, K.E., Cleaves, H.J., Ruzicka, J., Stern, J.C., Glavin, D.P., House, C.H.,Dworkin, J.P., 2011. Carbonaceous meteorites contain a wide range of extra-terrestrial nucleobases. Proc. Natl. Acad. Sci. 108, 13995–13998.
Clairemidi, J., Bréchignac, P., Moreels, G., Pautet, D., 2004. Tentative identification ofpyrene as a polycyclic aromatic molecule in UV spectra of comet P/Halley: anemission from 368 to 384 nm. Planet. Space Sci. 52, 761–772.
Clemett, S.J., Chillier, X.D.F., Gillette, S., Zare, R.N., Maurette, M., Engrand, C., Kurat, G.,1998. Observation of indigenous polycyclic aromatic hydrocarbons in ‘Giant’carbonaceous antarctic micrometeorites. Orig. Life Evol. Biosph. 28, 425–448.
Clemett, S.J., Maechling, C.R., Zare, R.N., Swan, P.D., Walker, R.M., 1993. Identifica-tion of complex aromatic molecules in individual interplanetary dust particles.Science 262, 721–725.
Cody, G.D., Ade, H., O’D Alexander, C.M., Araki, T., Butterworth, A., Fleckenstein, H.,Flynn, G., Gilles, M.K., Jacobsen, C., Kilcoyne, A.L.D., Messenger, K., Sandford, S.A.,Tyliszczak, T., Westphal, A.J., Wirick, S., Yabuta, H., 2008. Quantitative organic andlight-element analysis of comet 81P/Wild 2 particles using C-, N-, and O-μ-XANES. Meteorit. Planet. Sci. 43, 353–365.
Coll, P., Coscia, D., Smith, N., Gazeau, M.-C., Ramirez, S.I., Cernogora, G., Israël, l.G.,Raulin, F., 1999. Experimental laboratory simulation of Titan's atmosphere:aerosols and gas phase. Planet. Space Sci. 47, 1331–1340.
Comon, P., Jutten, C., 2010. Handbook of Blind Source Separation: IndependentComponent Analysis and Independent Component Analysis and Application.Elsevier, Oxford.
Cottin, H., Coll, P., Coscia, D., Fray, N., Guan, Y.Y., Macari, F., Raulin, F., Rivron, C.,Stalport, F., Szopa, C., Chaput, D., Viso, M., Bertrand, M., Chabin, A., Thirkell, L.,Westall, F., Brack, A., 2008. Heterogeneous solid/gas chemistry of organiccompounds related to comets, meteorites, Titan and Mars: in laboratory andin lower Earth orbit experiments. Adv. Space Res. 42, 2019–2035.
Cottin, H., Gazeau, M.C., Raulin, F., 1999. Cometary organic chemistry: a review fromobservations, numerical and experimental simulations. Planet. Space Sci. 47,1141–1162.
Danger, G., Orthous-Daunay, F.R., Marcellus, P.D., Modica, P., Vuitton, V., Duvernay,F., Flandinet, L., d’Hendecourt, L.L.S., Thissen, R., Chiavassa, T., 2013. Character-ization of laboratory analogs of interstellar/cometary organic residues usingvery high resolution mass spectrometry. Geochim. Cosmochim. Acta 118,184–201.
Dartois, E., Engrand, C., Brunetto, R., Duprat, J., Pino, T., Quirico, E., Remusat, L.,Bardin, N., Briani, G., Mostefaoui, S., Morinaud, G., Crane, B., Szwec, N.,Delauche, L., Jamme, F., Ch, S., Dumas, P., 2013. UltraCarbonaceous Antarcticmicrometeorites, probing the Solar System beyond the nitrogen snow-line.Icarus 224, 243–252.
de Gregorio, B.T., Stroud, R.M., Cody, G.D., Nittler, L.R., David Kilcoyne, A.L., Wirick, S.,2011. Correlated microanalysis of cometary organic grains returned by Stardust.Meteorit. Planet. Sci. 46, 1376–1396.
Delcorte, A., Bertrand, P., 1998. Sputtering of parent-like ions from large organicadsorbates on metals under keV ion bombardment. Surf. Sci. 412–413, 97–124.
Despois, D., Cottin, H., 2005. Comets: potential sources of prebiotic molecules forthe early earth. In: Heidelberg, S.B. (Ed.), Lectures in Astrobiology.
Dobrica, E., Engrand, C., Quirico, E., Montagnac, G., Duprat, J., 2011. Ramancharacterization of carbonaceous matter in CONCORDIA Antarctic microme-teorites. Meteorit. Planet. Sci. 46, 1363–1375.
Duprat, J., Dobrică, E., Engrand, C., Aléon, J., Marrocchi, Y., Mostefaoui, S., Meibom, A.,Leroux, H., Rouzaud, J.-N., Gounelle, M., Robert, F., 2010. Extreme deuteriumexcesses in ultracarbonaceous micrometeorites from Central Antarctic snow.Science 328, 742–745.
L. Le Roy et al. / Planetary and Space Science 105 (2015) 1–25 23

Elsila, J.E., Glavin, D.P., Dworkin, J.P., 2009. Cometary glycine detected in samplesreturned by Stardust. Meteorit. Planet. Sci. 44, 1323–1330.
Fister, T.F., Strossman, G.S., Willett, K.L., Odom, R.W., Linton, R.W., 1995. In situanalysis of organic monolayers and their reactivity on single micrometer-sizedparticles by time-of-flight secondary ion mass spectrometry. Int. J. MassSpectrom. Ion Processes 143, 87–111.
Fomenkova, M.N., 1999. On the organic refractory component of cometary dust.Space Sci. Rev. 90, 109–114.
Glavin, D.P., Callahan, M.P., Dworkin, J.P., Elsila, J.E., 2010. The effects of parent bodyprocesses on amino acids in carbonaceous chondrites. Meteorit. Planet. Sci. 45,1948–1972.
Gounelle, M., Spurn, P., Bland, P.A., 2006. The orbit and atmospheric trajectory ofthe Orgueil meteorite from historical records. Meteorit. Planet. Sci. 41, 135–150.
Greenberg, J.M., 1982. What are comets made of? A model based on interstellardust. In: Wilkening, L.L. (Ed.), Comets. University of Arizona Press, Tucson,pp. 131–163.
Hayatsu, R., 1964. Orgueil meteorite: organic nitrogen contents. Science 146,1291–1293.
Hayatsu, R., Studier, M., Oda, A., Fuse, K., Anders, E., 1968. Origin of organic matterin the early solar system-II. Nitrogen compounds. Geochim. Cosmochim. Acta32, 175–190.
Hayatsu, R., Studier, M.H., Moore, L.P., Anders, E., 1975. Purines and triazines in theMurchison meteorite. Geochim. Cosmochim. Acta 39, 471–488.
Herd, C.D.K., Blinova, A., Simkus, D.N., Huang, Y., Tarozo, R., Alexander, C.M.O.D.,Gyngard, F., Nittler, L.R., Cody, G.D., Fogel, M.L., Kebukawa, Y., Kilcoyne, A.L.D.,Hilts, R.W., Slater, G.F., Glavin, D.P., Dworkin, J.P., Callahan, M.P., Elsila, J.E., DeGregorio, B.T., Stroud, R.M., 2011. Origin and evolution of prebiotic organicmatter as inferred from the Tagish Lake Meteorite. Science 332, 1304–1307.
Hilchenbach, M., Fischer, H., Krüger, H., Thirkell, L., Rynö, J., 2014. Compoundsobserved in-flight by secondary ion mass spectrometry with ROSETTA–COSIMAbefore the encounter with comet 67P/Churyumov–Gerasimenko. Nucl. Instrum.Methods Phys. Res. B, (in preparation).
Hughey, C.A., Hendrickson, C.L., Rodgers, R.P., Marshall, A.G., Qian, K., 2001.Kendrick Mass defect spectrum: a compact visual analysis for ultrahigh-resolution broadband mass spectra. Anal. Chem. 73, 4676–4681.
Israël, G., Szopa, C., Raulin, F., Cabane, M., Niemann, H.B., Atreya, S.K., Bauer, S.J., Brun,J.-F., Chassefière, E., Coll, P., Condé, E., Coscia, D., Hauchecorne, A., Millian, P.,Nguyen, M.-J., Owen, T., Riedler, W., Samuelson, R.E., Siguier, J.-M., Steller, M.,Sternberg, R., Vidal-Madjar, C., 2005. Complex organic matter in Titan's atmo-spheric aerosols from in situ pyrolysis and analysis. Nature 438, 796–799.
Jessberger, E.K., 1999. Rocky cometary particulates: their elemental, isotopic andmineralogical ingredients. Space Sci. Rev. 90, 91–97.
Jessberger, E.K., Cristoforidis, A., Kissel, J., 1988. Aspects of the major elementcomposition of Halley's dust. Nature 332, 691–695.
Jessberger, E.K., Kissel, J., Neugebauer, M., Rahe, J., 1991. Chemical properties ofcometary dust and a note on carbon isotopes. In: Newburn, R.L. Jr. (Ed.), IAUColloq. 116: Comets in the post-Halley era, pp. 1075–1092.
Kendrick, E., 1963. A mass scale based on CH2¼14.0000 for high resolution massspectrometry of organic compounds. Anal. Chem. 35, 2146–2154.
Kim, S., Kramer, R.W., Hatcher, P.G., 2003. Graphical method for analysis ofultrahigh-resolution broadband mass spectra of natural organic matter, theVan Krevelen diagram. Anal. Chem. 75, 5336–5344.
Kissel, J., Altwegg, K., Clark, B.C., Colangeli, L., Cottin, H., Czempiel, S., Eibl, J., Engrand, C.,Fehringer, H.M., Feuerbacher, B., Fomenkova, M., Glasmachers, A., Greenberg, J.M.,Grün, E., Haerendel, G., Henkel, H., Hilchenbach, M., von Hoerner, H., Höfner, H.,Hornung, K., Jessberger, E.K., Koch, A., Krüger, H., Langevin, Y., Parigger, P., Raulin, F.,Rüdenauer, F., Rynö, J., Schmid, E.R., Schulz, R., Silén, J., Steiger, W., Stephan, T.,Thirkell, L., Thomas, R., Torkar, K., Utterback, N.G., Varmuza, K., Wanczek, K.P.,Werther, W., Zscheeg, H., 2007. Cosima: high resolution time-of-flight secondary ionmass spectrometer for the analysis of cometary dust particles onboard Rosetta.Space Sci. Rev. 128, 823–867.
Kissel, J., Krueger, F.R., 1987. The organic component in dust from comet Halley asmesured by the PUMA mass spectrometer on board Vega 1. Nature 326, 755–760.
Kissel, J., Krueger, F.R., Silén, J., Clark, B.C., 2004. The cometary and interstellar dustanalyzer at Comet 81P/Wild 2. Science 304, 1774–1776.
Klein, H.P., 1978. The Viking biological experiments on Mars. Icarus 34, 666–674.Krüger, H., Baklouti, D., Briois, C., Engrand, C., Hilchenbach, M., Merouane, S.,
Siljeström, S., Stephan T., Evaluation of inorganic compounds with the labora-tory instrument of COSIMA, this issue, (in preparation).
Le Roy, L., Briani, G., Briois, C., Cottin, H., Fray, N., Thirkell, L., Poulet, G., Hilchenbach, M.,2012. On the prospective detection of polyoxymethylene in comet 67P/Churyu-mov–Gerasimenko with the COSIMA instrument onboard Rosetta. Planet. SpaceSci. 65, 83–92.
Leggett, G.J., Vickerman, J.C., Briggs, D., Hearn, M.J., 1992. Surface studies by staticsecondary ion mass spectrometry: cluster ion formation studied by tandemmass-spectrometric techniques. J. Chem. Soc. Faraday Trans. 88, 297–309.
Leshin, L., Mahaffy, P., Webster, C., Cabane, M., Coll, P., Conrad, P., Archer, P., Atreya, S.,Brunner, A., Buch, A., Eigenbrode, J., Flesch, G., Franz, H., Freissinet, C., Glavin, D.,McAdam, A., Miller, K., Ming, D., Morris, R., Navarro-González, R., Niles, P., Owen,T., Pepin, R., Squyres, S., Steele, A., Stern, J., Summons, R., Sumner, D., Sutter, B.,Szopa, C., Teinturier, S., Trainer, M., Wray, J., Grotzinger, J., Team, M.S.L.S., 2013.Volatile, isotope, and organic analysis of martian fines with the Mars Curiosityrover. Science (N.Y.) 341, 1238937.
Lodders, K., 2003. Solar System abundances and condensation temperatures of theelements. Astrophys. J. 591, 1220–1247.
Mahoney, C.M., Gillen, G., Fahey, A.J., 2006. Characterization of gunpowder samplesusing time-of-flight secondary ion mass spectrometry (TOF-SIMS). Forensic Sci.Int. 158, 39–51.
Marcano, V., Benitez, P., Palacios-Prü, E., 2003. Acyclic hydrocarbon environ-mentsZn-C18 on the early terrestrial planets. Planet. Space Sci. 51, 159–166.
Martins, Z., Botta, O., Fogel, M.L., Sephton, M.A., Glavin, D.P., Watson, J.S., Dworkin, J.P.,Schwartz, A.W., Ehrenfreund, P., 2008. Extraterrestrial nucleobases in the Murch-ison meteorite. Earth Planet. Sci. Lett. 270, 130–136.
Martins, Z., Hofmann, B.A., Gnos, E., Greenwood, R.C., Verchovsky, A., Franchi, I.A.,Jull, A.J.T., Botta, O., Glavin, D.P., Dworkin, J.P., Ehrenfreund, P., 2007. Amino acidcomposition, petrology, geochemistry, 14C terrestrial age and oxygen isotopesof the Shişr 033 CR chondrite. Meteorit. Planet. Sci. 42, 1581–1595.
Martins, Z.M., Sephton, A., 2009. Extraterrestrial amino acids. In: Hughes, A.B. (Ed.),Amino Acids, Peptides and Proteins in Organic Chemistry. Wiley-VCH VerlagGmbH & Co. KGaA, Weinheim, pp. 1–42.
Matrajt, G., Pizzarello, S., Taylor, S., Brownlee, D., 2004. Concentration andvariability of the AIB amino acid in polar micrometeorites: implications forthe exogenous delivery of amino acids to the primitive Earth. Meteorit. Planet.Sci. 39, 1849–1858.
Matrajt, G., Taylor, S., Flynn, G., Brownlee, D., Joswiak, D., 2003. A nuclear microp-robe study of the distribution and concentration of carbon and nitrogen inMurchison and Tagish Lake meteorites, Antarctic micrometeorites, and IDPs:implications for astrobiology. Meteorit. Planet. Sci. 38, 1585–1600.
Ming, D., Archer, P., Glavin, D., Eigenbrode, J., Franz, H., Sutter, B., Brunner, A., Stern, J.,Freissinet, C., McAdam, A., Mahaffy, P., Cabane, M., Coll, P., Campbell, J., Atreya, S.,Niles, P., Bell, J., Bish, D., Brinckerhoff, W., Buch, A., Conrad, P., Des Marais, D.,Ehlmann, B., Fairén, A., Farley, K., Flesch, G., Francois, P., Gellert, R., Grant, J.,Grotzinger, J., Gupta, S., Herkenhoff, K., Hurowitz, J., Leshin, L., Lewis, K.,McLennan, S., Miller, K., Moersch, J., Morris, R., Navarro-González, R., Pavlov, A.,Perrett, G., Pradler, I., Squyres, S., Summons, R., Steele, A., Stolper, E., Sumner, D.,Szopa, C., Teinturier, S., Trainer, M., Treiman, A., Vaniman, D., Vasavada, A.,Webster, C., Wray, J., Yingst, R., Team, M.S.L.S., 2014. Volatile and organiccompositions of sedimentary rocks in Yellowknife Bay, Gale crater, Mars. Science(N.Y.) 343, 1245267.
Mitchell, D.L., Lin, R.P., Carlson, C.W., Korth, A., Rème, H., Mendis, D.A., 1992. Theorigin of complex organic ions in the coma of comet Halley. Icarus 98, 125–133.
Moreels, G., Clairemidi, J., Hermine, P., Brechignac, P., Rousselot, P., 1994. Detectionof a polycyclic aromatic molecule in comet P/Halley. Astron. Astrophys. 282,643–656.
Moussaoui, S., Brie, D., Mohammad-Djafar, A., Carteret, C., 2006a. Separation ofnon-negative mixture of non-negative sources using a Bayesian approach andMCMC sampling. IEEE Trans. Signal Process. 54, 4133–4145.
Moussaoui, S., Carteret, C., Brie, D., Mohammad-Djafari, A., 2006b. Bayesian analysisof spectral mixture data using Markov Chain Monte Carlo methods. Chemom.Intell. Lab. Syst. 181, 137–148.
Moussaoui, S., Carteret, C., Brie, D., Mohammad-Djafari, A., 2006c. Bayesian analysis ofspectral mixture data using MCMCmethods. Chemom. Intell. Lab. Syst. 81, 137–148.
Mumma, M.J., Charnley, S.B., 2011. The chemical composition of Comets – emergingtaxonomies and natal heritage. Annu. Rev. Astron. Astrophys. 49, 471–524.
Niemann, H.B., Atreya, S.K., Bauer, S.J., Carignan, G.R., Demick, J.E., Frost, R.L.,Gautier, D., Haberman, J.A., Harpold, D.N., Hunten, D.M., Israel, G., Lunine, J.I.,Kasprzak, W.T., Owen, T.C., Paulkovich, M., Raulin, F., Raaen, E., Way, S.H., 2005.The abundances of constituents of Titan's atmosphere from the GCMS instru-ment on the Huygens probe. Nature 438, 779–784.
Niemann, H.B., Atreya, S.K., Demick, J.E., Gautier, D., Haberman, J.A., Harpold, D.N.,Kasprzak, W.T., Lunine, J.I., Owen, T.C., Raulin, F., 2010. Composition of Titan'slower atmosphere and simple surface volatiles as measured by the Cassini–Huygens probe gas chromatograph mass spectrometer experiment. J. Geophys.Res. – Planets 115, E12006.
Pizzarello, S., Huang, Y., Becker, L., Poreda, R.J., Nieman, R.A., Cooper, G., Williams, M.,2001. The organic content of the Tagish Lake Meteorite. Science 293, 2236–2239.
Sandford, S.A., Aleon, J., Alexander, C.M.O.D., Araki, T., Bajt, S., Baratta, G.A., Borg, J.,Bradley, J.P., Brownlee, D.E., Brucato, J.R., Burchell, M.J., Busemann, H., Butterworth,A., Clemett, S.J., Cody, G., Colangeli, L., Cooper, G., D’Hendecourt, L., Djouadi, Z.,Dworkin, J.P., Ferrini, G., Fleckenstein, H., Flynn, G.J., Franchi, I.A., Fries, M., Gilles, M.K., Glavin, D.P., Gounelle, M., Grossemy, F., Jacobsen, C., Keller, L.P., Kilcoyne, A.L.D.,Leitner, J., Matrajt, G., Meibom, A., Mennella, V., Mostefaoui, S., Nittler, L.R.,Palumbo, M.E., Papanastassiou, D.A., Robert, F., Rotundi, A., Snead, C.J., Spencer,M.K., Stadermann, F.J., Steele, A., Stephan, T., Tsou, P., Tyliszczak, T., Westphal, A.J.,Wirick, S., Wopenka, B., Yabuta, H., Zare, R.N., Zolensky, M.E., 2006. Organicscaptured from Comet 81P/Wild 2 by the Stardust spacecraft. Science 314,1720–1724.
Sandford, S.A., Bajt, S.A., Clemett, S.J., Cody, G.D., Cooper, G., Degregorio, B.T., de Vera,V., Dworkin, J.P., Elsila, J.E., Flynn, G.J., Glavin, D.P., Lanzirotti, A., Limero, T., Martin,M.P., Snead, C.J., Spencer, M.K., Stephan, T., Westphal, A., Wirick, S., Zare, R.N.,Zolensky, M.E., 2010. Assessment and control of organic and other contaminantsassociated with the Stardust sample return from comet 81P/Wild 2. Meteorit.Planet. Sci. 45, 406–433.
Schmitt-Kopplin, P., Gabelica, Z., Gougeon, R.D., Fekete, A., Kanawati, B., Harir, M.,Gebefuegi, I., Eckel, G., Hertkorn, N., 2010. High molecular diversity of extra-terrestrial organic matter in Murchison meteorite revealed 40 years after itsfall. Proc. Natl. Acad. Sci. 107, 2763–2768.
Sephton, M.A., 2002. Organic compounds in carbonaceous meteorites. Nat. Prod.Rep. 19, 292–311.
Sephton, M.A., Love, G.D., Watson, J.S., Verchovsky, A.B., Wright, I.P., Snape, C.E.,Gilmour, I., 2004. Hydropyrolysis of insoluble carbonaceous matter in the
L. Le Roy et al. / Planetary and Space Science 105 (2015) 1–2524

Murchison meteorite: new insights into its macromolecular structure. Geochi-mica et Cosmochimica Acta 68, 1385–1393.
Spencer, M.K., Zare, R.N., 2007. Comment on “organics captured from Comet 81P/Wild 2 by the Stardust spacecraft”. Science 317, 1680.
Spool, A.M., 2004. Interpretation of static secondary ion spectra. Surf. InterfaceAnal. 36, 264–274.
Stoks, P.G., Schwartz, A.W., 1979. Uracil in carbonaceous meteorites. Nature 282,709–710.
Stoks, P.G., Schwartz, A.W., 1981. Nitrogen-heterocyclic compounds in meteorites:significance andmechanisms of formation. Geochim. Cosmochim. Acta 45, 563–569.
Toporski, J., Steele, A., 2004. Characterization of purified biomarker compoundsusing time of flight-secondary ion mass spectrometry (ToF-SIMS). Org. Geo-chem. 35, 793–811.
Van der Velden, W., Schwartz, A.W., 1977. Search for purines and pyrimidines inMurchison meteorite. Geochim. Cosmochim. Acta 41, 961–968.
Varmuza, K., Werther, W., Krueger, F.R., Kissel, J., Schmid, E.R., 1999. Organicsubstances in cometary grains: comparison of secondary ion mass spectral dataand californium-252 plasma desorption data from reference compounds.Int. J. Mass Spectrom. 189, 79–92.
Waite, J.H., Young, D.T., Cravens, T.E., Coates, A.J., Crary, F.J., Magee, B., Westlake, J.,2007. The process of tholin formation in Titan's upper atmosphere. Science 316,870–875.
L. Le Roy et al. / Planetary and Space Science 105 (2015) 1–25 25