detection and characterization of gene-fusions in breast and ...
184
DETECTION AND CHARACTERIZATION OF GENE-FUSIONS IN BREAST AND OVARIAN CANCER USING HIGH-THROUGHPUT SEQUENCING A Dissertation Presented to The Academic Faculty By Vinay K. Mittal In Partial Fulfillment of the Requirements for the Degree Doctor of Philosophy in Bioinformatics in the School of Biology Georgia Institute of Technology August 2014 Copyright © 2014 by Vinay K. Mittal
-
Upload
khangminh22 -
Category
Documents
-
view
1 -
download
0
Transcript of detection and characterization of gene-fusions in breast and ...

DETECTION AND CHARACTERIZATION OF GENE-FUSIONS IN
BREAST AND OVARIAN CANCER USING HIGH-THROUGHPUT
SEQUENCING
A Dissertation
Presented to
The Academic Faculty
By
Vinay K. Mittal
In Partial Fulfillment
of the Requirements for the Degree
Doctor of Philosophy in Bioinformatics in the
School of Biology
Georgia Institute of Technology
August 2014
Copyright © 2014 by Vinay K. Mittal

DETECTION AND CHARACTERIZATION OF GENE-FUSIONS IN
BREAST AND OVARIAN CANCER USING HIGH-THROUGHPUT
SEQUENCING
Approved by:
Dr. John F. McDonald, Advisor
School of Biology
Georgia Institute of Technology
Dr. Gregory Gibson
School of Biology
Georgia Institute of Technology
Dr. I. King Jordan
School of Biology
Georgia Institute of Technology
Dr. Nathan J. Bowen
Department of Biological Sciences
Clark Atlanta University
Dr. Jung Choi
School of Biology
Georgia Institute of Technology
Date Approved: June 16, 2014

To my parents…

iv
ACKNOWLEDGEMENTS
Firstly, I would like to thank my advisor, Dr. McDonald, who has supported and
supervised my research throughout my Masters and PhD. I wouldn’t have been able to
accomplish my research goals without his advice. I can’t thank him enough for being my
‘guru’ for which I will forever be grateful. I thank my committee members, Drs. Nathan
Bowen, King Jordan, Jung Choi and Greg Gibson who have taken time out of their busy
schedules for committee meetings, to conduct written exams, read and critique my
proposal and guide me throughout this endeavor. I would like to especially thank Nathan
Bowen for being one of my best mentors in the early days in the lab and for teaching me
all the basics of cancer biology and computational genomics; and for his thoughtful
suggestions during my research.
I am also thankful to the members of McDonald lab who have shared with me and
supported me during my time spent at Georgia Tech. I would specifically like to express
my sincere gratitude to Dr. DeEtte Walker and Dr. Lilya Matyunina for their moral
support, kindness and motherly affection. My special thanks to my seniors and fellow
students in the lab without whom everyday work wouldn’t be as much fun and a learning
experience.
On a personal note, I would like to thank my mother for her affection and
confidence in me; my father for his unconditional support, advice and the best guidance
throughout my life. I want to thank my brother, Rahul, and my sister, Aparna, for their
love and best wishes; and for sharing beautiful memories that I will cherish forever. It is
beyond words to express my gratitude for my family for always being there for me and
giving me the purpose of my life. I have always been fortunate to have so many
considerate and trustworthy friends. My life wouldn’t have been the same without them. I
want to thank one of my dearest friends, Harsh Pareek, for sharing the best memories

v
from college days, for always believing in me and encouraging me in all of my endeavors
and efforts.
I would like to take this opportunity to acknowledge all the teachers and mentors,
from my school days to the time that I spent at Georgia Tech, for their teachings and
guidance; and for making me a better person in every aspect of life. I will forever be
indebted to them for their contributions.

vi
TABLE OF CONTENTS
Page
ACKNOWLEDGEMENTS……………………………………………............................iv
LIST OF TABLES……………………………………………………………………….. x
LIST OF FIGURES……………………………………………………………………..xiii
LIST OF SYMBOLS AND ABBREVIATIONS………………………………………..xv
SUMMARY……………………………………………………………………………..xvi
CHAPTERS
1 - INTRODUCTION………………………………………………………………...1
Cancer is a genetic disease…………………………………………………….1
Cancer genomes are characterized by somatic mutations……………………..1
Genomic-rearrangements are a prevalent class of mutations that give rise to
gene-fusions.…………………………………………………………………..3
Genomic rearrangements and gene-fusions are non-random and cancer
specific mutations……………………………………………………………..5
Gene-fusions are employed as biomarkers and therapeutic targets in cancer...6
High-throughput DNA sequencing has accelerated the discovery of gene-
fusions and their global patterns in cancer………………………………….....8
2 - R-SAP: A MULTI-THREADING COMPUTATIONAL PIPELINE FOR THE
TRANSCRIPTOMICS STUDIES USING HIGH-THROUGHPUT RNA-
SEQUENCING…………………………………………………………………..11
Abstract………………………………………………………………………11
Introduction…………………………………………………………………..11
Materials and Methods……………………………………………………….14
Overview of the pipeline…………………………………………………14

vii
Implementation and requirements………………………………………..21
Methods…………………………………………………………………..23
Results and Discussion………………………………………………………24
Demonstration of the applicability of R-SAP using the MAQC dataset...24
R-SAP’s performance compares favorably with currently popular
pipelines………………………………………………………………….37
Evaluation of RNA expression level quantification……………………..41
Evaluation of the chimer-detection module……………………………...44
Evaluation of R-SAP’s run time performance....………………………...44
Summary and Conclusion……………………………………………………46
Acknowledgements…………………………………………………………..48
3 - DE NOVO ASSEMBLY AND CHARACTERIZATION OF BREAST CANCER
TRANSCRIPTOMES IDENTIFIES LARGE NUMBERS OF NOVEL FUSION-
GENE TRANSCRIPTS OF POTENTIAL FUNCTIONAL SIGNIFICANCE….49
Abstract………………………………………………………………………49
Introduction…………………………………………………………………..50
Methods………………………………………………………………………51
Data pre-processing……………………………………………………...52
Transcriptome assembly…………………………………………………53
Chimeric transcript detection and filtering………………………………53
Expression quantification………………………………………………...56
Results………………………………………………………………………..57
An average of 35 chimeric transcripts per sample were detected in
cancerous and normal breast tissue samples……………………………..57
Chimeric transcripts were classified based on structural and functional
criteria……………………………………………………………………60
Some fusion-protein transcripts recur across cancer patient samples……67
viii
Seventy-nine cancer-specific fusions encode protein-coding domains
where the ORFs are maintained………………………………………….68
Fusions that place protein-coding genes under novel regulatory control are
frequent in breast cancer samples………………………………………..72
A number of chimeric transcripts include sequences from gene desert
regions of the genome……………………………………………………76
Comparative analysis of chimeric transcripts in normal and cancer
samples identifies potential pro-neoplastic genes………………………..78
Discussion……………………………………………………………………81
Acknowledgements…………………………………………………………..83
4 - IDENTIFICATION AND EXPRESSION ANALYSIS OF GENE FUSIONS
AND OTHER STRUCTURAL VARIANTS IN OVARIAN CANCER USING
HIGH-THROUGHPUT SEQUENCING………………………………………...84
Abstract………………………………………………………………………84
Introduction…………………………………………………………………..84
Materials and Methods……………………………………………………….86
Sequencing data acquisition ……………………………………………..86
Genomic SV Detection using WGS ……………………………………..87
Fusion transcript detection using RNA-Seq …………………………….91
Gene-expression analysis ………………………………………………..92
Results………………………………………………………………………..92
More than 10,000 structural variants (SVs) identified in six ovarian cancer
patient samples…………………………………………………………...92
Ovarian Cancer SVs can be divided into 3 groups based upon the location
of chromosomal breakpoints …………………………………………….96
Inter-genic SVs encompass multiple classes of fusion-genes ………….100
The breakpoints of most intra-genic SVs map to introns ……………...103
Many of the SVs map to gene desert regions ………………………….103
A minority of gene fusions is transcribed ……………………………...103

ix
Only somatically derived coding sequence gene fusions are expressed..104
Microarray analysis …………………………………………………….109
Chromosomal translocations are most frequently associated with changes
in gene expression ……………………………………………………...109
Discussion…………………………………………………………………..113
Acknowledgements…………………………………………………………115
5 - CONCLUSIONS……………………………………………………………….116
APPENDIX A: SUPPLEMENTARY INFORMATION FOR CHAPTER 2………...121
APPENDIX B: SUPPLEMENTARY INFORMATION FOR CHAPTER 3………...135
APPENDIX C: SUPPLEMENTARY INFORMATION FOR CHAPTER 4………...142
REFERENCES…………………………………………………………………………148

x
LIST OF TABLES
Page
Table 2.1. Results of initial mapping and alignment screening of MAQC Reference
Human RNA-seq data using R-SAP……………………………………………………..24
Table 2.2. Number (%) of high-scoring reads (obtained from MAQC Reference Human
dataset) partitioned by R-SAP into sub-categories………………………………………25
Table 2.3. Number (%) of chimeric transcripts detected by R-SAP from MAQC
Reference Human dataset and represented RefSeq transcripts…………………………..36
Table 2.4. Comparison between R-SAP and Trans-ABySS characterization sub-
categories for the high-scoring reads from MAQC Reference Human dataset………….39
Table 2.5. Comparison between R-SAP characterizations and Cuffcompare’s novel-
isoforms classification from transcripts assembled by Cufflinks using ENCODE
Gm12878 cell line RNA-Seq dataset…………………………………………………….40
Table 3.1. Distribution of breast cancer specific chimeric transcript across multiple
structural and functional classes…………………………………………………………65
Table 4.1. Summary of the number of the various types of SVs detected in the DNA
sequencing analysis and their expression as detected by RNA seq or microarray studies
…………………………………………………………………………………………..108
Table 4.2. Summary of the number of various functional classes of SVs across multiple
structural classes of SVs..………………………………………………………………110
Table A.1. Data sources and types of datasets that were used for the demonstration of
R-SAP’s application as well as its performance assessment and testing……………….128
Table A.2. GenBank accession IDs for the 206 EST and mRNA sequences that were used
as the high confidence test dataset for testing the chimer-detection module of R-SAP..129
Table A.3. Intron-retention events detected in MAQC Reference Human dataset using R-
SAP from high-scoring reads that were also characterized as
internal-exon-extension…………………………………………………………………130
Table A.4. Distribution of “multiple-annotations” reads that were detected in MAQC
Reference Human dataset using R-SAP……………………………………………......130
Table A.5. Distribution of Trans-ABySS characterized reads that were also classified as
“high-scoring” by R-SAP previously using MAQC Human Reference RNA-Seq data.131

xi
Table A.6. Distribution of transcripts that were assembled from ENCODE Gm12878
RNA-Seq data using Cufflinks and then characterized by R-SAP……………………..132
Table A.7. Distribution of transcripts that were assembled from ENCODE Gm12878
RNA-Seq data using Cufflinks and then classified by Cuffcompare into structurally
variant classes of RefSeq transcripts (hg18)……………………………………………133
Table A.8. Comparison between R-SAP’s characterizations and Cuffcompare’s
classification of transcripts that were previously assembled from ENCODE Gm12878
RNA-Seq dataset using Cufflinks………………………………………………………134
Table A.9. Sequencing reads, reference genome alignment and R-SAP characterization
statistics for the ENCODE RNA-seq data for Gm12878 cell line……………………...134
Table A.10. New intronic-exons detected in human RefSeq transcripts (hg18) by R-SAP
from intron-only reads in MAQC Reference Human RNA-Seq dataset……………….134
Table B.1. Summary statistics on raw and processed RNA-Seq data from the 55 breast
samples used in this study………………………………………………………………137
Table B.2. Detailed alignment and annotation information on 1959 filtered chimeric
transcripts from 55 samples analyzed in the study……………………………………..137
Table B.3. Distribution of structural and functional classes for chimers found only in
normal tissue samples………………………………………………………………….138
Table B.4. Distribution of structural and functional classes for chimeras found in both
normal and in cancer tissue samples……………………………………………………138
Table B.5. Recurrence of chimeric transcripts across cancer samples…………………139
Table B.6. Cancer specific in-frame fusions where at least one protein domain from each
(5’ and 3’) of the participating genes is covered by the ORFs involved in the chimera
formation………………………………………………………………………………..139
Table B.7. Cancer specific in-frame fusions where 3’ partner gene is up-regulated by >
2X relative to the intact gene in normal tissue samples………………………………...140
Table B.8. Cancer specific chimeric transcripts with fused 5’ or 3’ UTRs and having the
ORF of the coding gene intact and displaying > 2X change in expression relative to the
intact gene’s expression in normal tissue………………………………………………140
Table B.9. Detailed information for gene-desert-I and gene-desert-II chimeric
transcripts……………………………………………………………………………….141
Table B.10. Chimeric transcripts comprised of in-frame fusion gene transcripts present in
both normal and cancer samples………………………………………………………..141

xii
Table C.1. Summary statistics on processed whole genome sequencing data and detected
structural variants from 12 samples (6 control (whole blood), 6 cancer patient
samples)………………………………………………………………………………...144
Table C.2. Table describing read-groups in the ovarian WGS data and various cutoffs
used for the SV detection ………………………………………………………………144
Table C.3. Summary of the ovarian samples used to perform the microarray gene-
expression by TCGA …………………………………………………………………...145
Table C.4. Detailed alignment and annotation information on 14,719 validated SVs from
12 ovarian samples (6 control (whole blood) and 6 ovarian cancer patient samples)
analyzed in the study …………………………………………………………………...145
Table C.5. Table summarizing the potential functional impacts each class of inter-genic
SV ……………………………………………………………………………………...146
Table C.6. Distribution of somatically and germline derived SVs that were characterized
as intra-genic SVs ……………………………………………………………………...146
Table C.7. Somatically and germline derived inter-genic SVs that were detected by
RNA-Seq or resulted in differential gene-expression as measured by microarray……..147
Table C.8. Detailed distribution of functional classes of inter-genic SVs among various
structural classes of SVs ……………………………………………………………….147

xiii
LIST OF FIGURES
Page
Figure 2.1. Architecture of R-SAP and data flow in the pipeline………………………..14
Figure 2.2. Characterization strategy of R-SAP for high-scoring reads…………………18
Figure 2.3. Schematic diagram of the detection and annotation of chimeric transcripts by
R-SAP using fragmented genomic alignments…………………………………………..20
Figure 2.4. Distribution of the high-scoring reads from MAQC Reference Human dataset
onto RefSeq transcripts......................................................................................................26
Figure 2.5. Frequency of exon skipping in high-scoring reads from MAQC Reference
Human dataset……………………………………………………………………………27
Figure 2.6. Examples of various sub-categories characterized by R-SAP from the test
MAQC Reference Human dataset as they are displayed in the UCSC genome browser
(hg18) snap-shots………………………………………………………………………...35
Figure 2.7. Distribution of RefSeq transcripts detected by R-SAP using MAQC
Reference Human dataset……………………………………………………………......37
Figure 2.8. Comparison of R-SAP estimated RPKM vs. Affymetrix microarray and
TaqMan qRT-PCR expression values……………………………………………………41
Figure 2.9. Correlation plots of RefSeq transcripts (hg18) quantification estimates from
ENCODE Gm12878 RNA-Seq data using three different methods: R-SAP, Cufflinks and
RSEM…………………………………………………………………………………….43
Figure 2.10. Benchmarking of R-SAP’s running time as compared with Cufflinks…….45
Figure 3.1. Computational workflow for chimeric transcript discovery………………...52
Figure 3.2. Chimeric transcript detection and characterization by R-SAP………………54
Figure 3.3. Re-confirmation of chimeric transcripts……………………………………..56
Figure 3.4. Sequencing coverage distribution across samples…………………………...58
Figure 3.5. Chimeric transcript distribution across samples before and after filtering…..59
Figure 3.6. Distribution of chimeric and associated reference transcripts……………….59
Figure 3.7. Hierarchical classification system for chimeric transcripts………………….61

xiv
Figure 3.8. Relative distribution of inter-genic, gene-desert-I and gene desert-II in (A)
cancer samples, (B) in normal tissue samples, and (C) in both cancer and normal tissue
samples…………………………………………………………………………………...63
Figure 3.9. Structure based functional classification of chimeric transcripts……………64
Figure 3.10. Relative distribution of functional classes of chimeric transcripts…………66
Figure 3.11. Recurrence of breast cancer associated chimeric transcripts across patient
samples…………………………………………………………………………………...68
Figure 3.12. Structure of in-frame gene-fusion mutations resulting in gain of signaling
protein domains (trans-membrane and/or signal peptide domains) from another
participating gene………………………………………………………………………...72
Figure 3.13. Gene-expression change due to fusion with heterologous UTRs…………..75
Figure 3.14. Detection of transcription factor binding sites (TFBS) in proximity to gene-
desert regions involved in chimera formation…………………………………………...77
Figure 3.15. Potential pro-neoplastic gene-fusions that are functionally suppressed in
normal breast tissues but activated in cancer tissues…………………………………….80
Figure 4.1. Integrative data analysis workflow for structural variants …………………87
Figure 4.2. Validation and breakpoint detection ………………………………………...91
Figure 4.3. Comparison between germline and cancer SVs …………………………….93
Figure 4.4. Comparison between germline and cancer SVs for individual patient samples
……………………………………………………………………………………………94
Figure 4.5. Distribution of SVs across structural categories ……………………………95
Figure 4.6. Multiplicity of SVs across samples …………………………………………96
Figure 4.7. Structural classification scheme for SVs ……………………………………98
Figure 4.8. Characterization of SVs ……………………………………………………..99
Figure 4.9. Distribution SVs across functional characterization classes ………………..99
Figure 4.10. Distribution SVs across functional characterization classes ……………..102
Figure 4.11. Structure of the six transcribed SVs resulting in in-frame gene-fusions....107
Figure 4.12. Genomic distribution of inter-genic SVs …………………………………112

xv
LIST OF SYMBOLS AND ABBREVIATIONS
Blast Basic local alignment search tool
BLAT Blast like alignment tool
BP Base-pair
BRCA Breast invasive carcinoma
CDS Protein coding sequence
ENCODE Encyclopedia of DNA Elements
Kb Kilobases
lincRNA Large intergenic non-coding RNA
lncRNA Long non-coding RNA
NGS Next-generation sequencing
RNA-Seq RNA-Sequencing
R-SAP RNA-Seq analysis pipeline
SMART Simple molecular architecture analysis tool
SSAHA2 Sequence search and alignment by hashing algorithm
SV Structural variant
TCGA The Cancer Genome Atlas
TFBS Transcription factor binding site
TM Trans Membrane
UTR Untranslated Region
WGS Whole-genome sequencing

xvi
SUMMARY
Gene-fusions are a prevalent class of genetic variants that have been implicated in
the onset and progression of variety of cancer types (Mitelman et al. 2007). Gene-fusions
often lead to oncogenic activation by creating fusion-protein or resulting in
transcriptional deregulation of cancer genes (Rabbitts 1994; Tomlins et al. 2005).
Recurrent gene-fusions, in particular, considered as ‘driving’ or causal mutations that
have often been employed as cancer biomarkers (Mitelman 2000; Laxman et al.
2008)and, in some cases as, potential therapeutic targets (Baselga et al. 1996; Druker et
al. 2001).
In recent years, rapid advances in high-throughput DNA sequencing (also known
as next-generation sequencing, NGS) technologies have enabled the detection of
chromosomal aberrations and fusion-genes at single base-pair resolution (Campbell et al.
2008; Maher et al. 2009a; Stephens et al. 2009). Massively parallel RNA sequencing
(RNA-Seq) of the cellular transcriptome has emerged as a promising approach for the
identification of previously uncharacterized fusion-gene or “chimeric” transcripts of
potential functional significance (Maher et al. 2009a; Ozsolak and Milos 2011; Wang et
al. 2013). Despite these technological advancements, our knowledge about the global
patterns and complete functional consequences of fusion-genes in cancer is still
rudimentary. In recent years, the discovery of novel functional and regulatory elements in
the previously considered ‘gene-desert’ regions of the human genome (Consortium et al.
2007; Cabili et al. 2011; Prensner et al. 2011) poses the question if these regions can also
contribute to the formation of gene-fusions. This dissertation describes studies that
characterize gene-fusions and resulting chimeric transcripts in breast and ovarian cancer
using high-throughput transcriptome and whole genome sequencing. I also address the
bioinformatics challenges associated with the analysis of the massive volumes of

xvii
sequencing data by developing bioinformatics pipelines and more applied integrated
computational workflows.
Research advance 1: Chapter 2 presents the bioinformatics pipeline called R-SAP
(RNA-Seq analysis pipeline) that systematically analyze and characterize cancer
transcriptomes. Multi-threading capability of R-SAP allows rapid analysis. A systematic
hierarchical characterization R-SAP allows accurate detection of complex fusion
structures and novel splice-variants as well.
Research advance 2: Chapter 3 and Chapter 4 describes the design and application of
computational workflows that integrate R-SAP with specialized set of tool in order to
perform qualitative as well as quantitative analysis of gene-fusions and underlying
genomic rearrangements using RNA-Seq and whole genome sequencing data.
Research advance 3: Analysis of 45 breast invasive carcinoma and 10 healthy breast
samples using RNA-Seq based transcriptome assembly resulted in the findings indicating
that an unexpectedly large number of chimeric transcripts are present in both cancerous
and normal breast tissues and that many of these variants may play a significant role in
breast cancer onset and development. The study also finds that the ‘gene-desert’ regions
can also participate in chimeric transcript formation and result in transcriptional de-
regulation of protein-coding genes.
Research advance 4: Whole-genome sequence analysis of six ovarian cancer and six
matched controls (whole blood) revealed that the structural variants can be of germline or
somatically derived, and very few of them have potential to form gene-fusions. RNA-Seq
and gene-expression microarray based analysis indicate that the transcriptional de-
repression of gene-fusions determines their biological and clinical significance in cancer.

1
CHAPTER 1
INTRODUCTION
Cancer is a genetic disease
Cancer is a group of diseases that is characterized by unregulated cell growth and
spread of abnormal cells in the body. Cancer is one of the most lethal diseases and is
responsible for 580,350 deaths per year (1600 per day) alone in the US, and an additional
1,660,290 new cases are expected to be diagnosed this year (ACS 2013). Research
efforts for more than a century have established that the genome plays a central role in
the development of cancer. David von Hansemann, in 1890, found an asymmetric
distribution of chromosomes as a result of multipolar mitosis or aberrant cell divisions in
13 carcinoma samples (von Hansemann 1890). Working with sea urchin eggs, in 1902,
Theodor Boveri suggested that an “incorrect combination of chromosomes” can enable
cells to have “unlimited growth” potential and become malignant (Boveri 1914).
Subsequent work by Robert Schimke showed genome instability and chromosomal
aberrations resulting in gene amplifications that can render cancer cells drug resistant
(Schimke et al. 1978). These findings from the late 19th and early 20th century laid the
foundation for the theory that cancer is caused by abnormalities in the hereditary
material. The theory was further supported by the demonstration that agents that damage
DNA and cause chromosomal alterations cause cancer (Loeb and Harris 2008).
Cancer genomes are characterized by somatic mutations
Chromosomal aberrations and DNA level changes are collectively called
‘mutations’. Depending upon the origin, DNA mutations can be classified as ‘germline’
or ‘somatic’. Germline mutations are inherited mutations that may increase susceptibility
to cancer and lead to familial forms of cancer. For example, mutation in BRCA1 (breast
cancer 1, early onset) and BRCA2 (breast cancer 2, early onset) genes can increase risk of

2
breast cancer by 20 fold (Harris and McCormick 2010) and nearly 15% of ovarian
cancers can be attributed to such mutations (Risch et al. 2006). Somatic mutations, on the
other hand, are DNA level changes acquired during the lifecycle of the cell and passed
along from the progenitor cells through mitotic division (Stratton et al. 2009). DNA
damage in cells is caused by exposure to mutagens such as radiation (including UV
light), tobacco smoke, naturally occurring chemicals such as aflatoxins (Lengauer et al.
1998), and oxidative stress within the cell (Cooke et al. 2003). Most of the damage
caused by mutagens is repaired by the cell; however some may become fixed somatic
mutations due to inefficient repair mechanisms in the cell and result in cancer. Moreover,
intrinsic errors in DNA replication can accelerate the rate of somatic changes (Lengauer
et al. 1998; Stratton et al. 2009). The first cancer causing somatic mutation was reported
in the HRAS gene (Harvey rat sarcoma viral oncogene homolog) in a human bladder
cancer cell line (Reddy et al. 1982). Since then, three decades of research have resulted in
the discovery of nearly 300 genes that are causatively mutated in cancer (Futreal et al.
2004; Forbes et al. 2011) and comprise ~1% of all known human genes. Somatic
mutations are a more prominent cause for cancer progression than inherited mutations.
90% of cancer genes are somatically mutated, 20% show germline mutations and 10%
show both [(Futreal et al. 2004) and http://www.sanger.ac.uk/genetics/CGP/Census/].
Cancer genomes may harbor hundreds to thousands of somatic alterations but only a few
of them confer a selective clonal growth advantage and are causally implicated in
oncogenesis. Such mutations are called ‘driver’ mutations (Greenman et al. 2007;
Vogelstein et al. 2013) . The remainders of the alterations are called ‘passenger’ or
‘bystander’ mutations and may not contribute to cancer development (Futreal et al. 2004).
However, passenger mutations may be the result of causal mutational mechanisms in
cancer and hence they can also provide useful insight into the pathogenesis of cancer
(Pleasance et al. 2010).

3
DNA mutation can encompass a variety of nucleotide changes including point
mutations that are single base pair substitutions; insertions and deletions of base pairs
(indels) and genomic rearrangements (also known as large structural variants) involving
hundreds to millions of base pairs (Lupski and Stankiewicz 2005; Pleasance et al. 2010).
Genomic rearrangements are gross DNA alterations that collectively represent mutational
changes including deletion, insertion, inversion, translocation and transposition (Lupski
and Stankiewicz 2005). Cancer genomes are also subjected to loss or amplification of
large genomic segments that are collectively referred to as ‘copy number alterations’.
Genomic-rearrangements are a prevalent class of mutations that give rise to gene-
fusions
Genomic rearrangements (also known as large structural variants) are among the
most common mutations in cancer (Futreal et al. 2004; Edwards 2010). Cytogenetic
based research over the last 25 years has resulted in more than 600 registered cases of
somatic chromosomal rearrangements in cancer (Mitelman 2000). Over 50,000 cases of
rearrangements in cancer have been reported in more than 11,500 published articles
(Mitelman et al. 2007). Prevalence of genomic rearrangements can be estimated by the
fact that every known tumor type contains at least one documented case of
rearrangement, although the prevalence may vary from 0-100% among patients
(Mitelman et al. 2007). The most frequent mutation in cancer causing genes is
chromosomal translocation that results in oncogenic activation (Futreal et al. 2004;
Stratton et al. 2009). The current catalogue (Forbes et al. 2008) of cancer
16213703mutations includes 317 out of 522 genes that are mutated by translocation.
Currently there are 267 known in acute myeloid leukemia, 155 in acute lymphoblastic
leukemia and 75 in solid tumors.
Genomic rearrangements typically join normally distant genomic loci and can
result in fusion-gene structures. Gene-fusions exert their action via transcription where

4
transcribed mRNA is called a “fusion transcript” or “chimeric RNA”. A fusion transcript
may encode for a fusion protein with oncogenic activity (Rabbitts 1994; Rowley 2001).
For example, in chronic myeloid leukemia (CML), a reciprocal translocation between
chromosomes 9 and 22 results in BCR-ABL gene-fusion (Nowell 1962). As a result the
coiled-coil (CC) oligomerization domain from BCR (breakpoint cluster region) activates
the tyrosine kinase domain from ABL (Abelson murine leukemia viral oncogene homolog
1) that drives CML (McWhirter et al. 1993; Ren 2005). Gene-fusions can aberrantly
appose enhancer or promoter elements of one gene to another gene without disrupting the
protein-coding sequence and result in transcriptional deregulation of the latter gene (Look
1997; Xia and Barr 2005). For example, a deletion on chromosome 21 results in the
oncogenic activation of ERG gene (ETS-related gene) due to its juxtaposition to
TMPRSS2 (Transmembrane protease, serine 2) gene’s promoter in prostate cancer
(Tomlins et al. 2005). Cancer genomes may harbor several genomic rearrangements that
may or may not be functional. Although, functional rearrangements give rise to fusion
RNA by transcription, investigation of genomic aberrations at the transcriptome level is
very important (Ju et al. 2012).
Apart from genomic rearrangements, recent studies have discovered two
additional RNA level mechanisms that can result in gene-fusion transcripts. Co-
transcription or read-through transcription (also known as ‘transcription induced chimera’
or TIC), describes two neighboring genes in the genome that are transcribed into a single
RNA. Inter-genic regions between the two genes and introns are spliced out so that the
resulting mRNA encodes for a new fusion protein (Akiva et al. 2006; Parra et al. 2006).
Fusion-gene transcripts can also be generated at the post-transcription level by trans-
splicing of multiple simultaneously processed pre-mature RNAs from different genes
where the spliceosome ligates exons from two pre-mature RNA molecules in to a single
mRNA (Sullenger and Gilboa 2002; Garcia-Blanco 2003).

5
Genomic rearrangements and gene-fusions are non-random and sometimes cancer-
specific
Genomic rearrangements were initially considered to be random events that occur
by chance and when selected, lead to oncogenesis (Savage 1993; Mitelman et al. 2007).
But recent studies have suggested that genomic rearrangements are triggered by factors
such as chemical and radiation exposure, faulty DNA repair pathways and DNA
replication errors that are also responsible for cancer initiation.
Influences that trigger the genesis of genomic rearrangements are well known now and
can be divided them into four categories that work synergistically in cancer (Aplan 2006;
Mani and Chinnaiyan 2010). First, spatial proximity in the nucleus where rearranged
genes are brought in close proximity in a cell-type and cell division-stage specific
manner, and close proximity correlates to the frequency of translocation (Roix et al.
2003). Second, cellular stress, including genotoxic stress (chemical and radiation
exposure) (Fugazzola et al. 1995), oxidative stress (Barzilai et al. 2002) and replicative
stress (Tuduri et al. 2009) that cause double strand breaks and set off the formation of
genomic rearrangements (Richardson and Jasin 2000)(10864328). Third, inefficient DNA
damage response and faulty repair mechanisms of DNA breaks result in genomic
rearrangements (Boboila et al. 2010; Simsek and Jasin 2010). And fourth, DNA sequence
features such as the presence of repetitive sequences, palindromic sequences, CpG
dinucleotide, and epigenetic modifications, are also known to increase the probability of
genomic rearrangement (Ng et al. 2003; Tsai et al. 2008; Huang et al. 2010).
There are three known cellular mechanisms underlying genomic rearrangements:
Non-allelic homologous recombination (NAHR) where low-copy repeats cause
recombination between two otherwise un-related genomic regions; non-homologous end-
joining (NHEJ) is the faulty double strand DNA break repair that ligates distant genomic
loci; and third, replication fork stalling and template switching (FoSTeS) where the
lagging DNA strand is switched during replication (Aplan 2006; Gu et al. 2008). Insights

6
into the genesis and cellular mechanisms underlying genomic rearrangements and gene-
fusions suggest that the onset of cancer is accompanied by genomic rearrangements since
they share common factors of initiation. The causal role of gene-fusions and their
specificity to cancer further underscores their potential as biomarkers of cancer onset and
progression.
Gene-fusions are employed as biomarkers and therapeutic targets in cancer
Gene-fusions represent the most common class of mutations that are detected in
almost every tumor type (Rowley 2001). Recurrent gene-fusions, in particular,
considered as ‘driving’ or causal mutations are perceived as potential biomarkers and
therapeutic targets in cancer (Mitelman 2000; Laxman et al. 2008). The first consistent
chromosomal rearrangement, known as the ‘Philadelphia chromosome’, was discovered
in chronic myeloid leukemia (CML) by Nowell and Hungerford in 1962 (Nowell 1962).
This rearrangement results in the BCR-ABL gene-fusion resulting in oncogene activation
and is observed in 95% of CML patients. CML patients with this disorder are
administered a tyrosine kinase inhibitor drug, imatinib, to treat the disease. Similarly, the
proto-oncogene, c-MYC, is activated in 90% of the Burkitt’s lymphoma as a result of
translocation to immunoglobulin genes (Cory 1986). Gene-fusions have been
predominantly observed in hematological malignancies, mainly leukemias and
lymphomas, and soft tissue sarcomas, but their application in solid tumors has been
limited (Kumar-Sinha et al. 2008). For example, all solid tumors and epithelial
carcinomas account for 80% of the cancer related deaths but they make up only 27% of
the known cases of karyotypic abnormality and rest is attributed to hematological
disorders[ (Kumar-Sinha et al. 2006; Mitelman et al. 2007),
http://cgap.nci.nih.gov/Chromosomes/]. This discrepancy may seem to indicate that
genomic rearrangements are rare in solid tumors. In reality, chromosomal aberrations in
solid tumors underrepresented due to the poor chromosomal morphology, presence of

7
cytogenetically unrelated clones and presence of very complex karyotypes in solid tumor
samples that make them less amenable to the traditional karyotyping methods (Gorunova
et al. 1998; Kumar-Sinha et al. 2006). Despite technological barriers, advancement in
biological assays and high-throughput genomics has led to major discoveries of several
recurrent fusion genes in solid tumors and other epithelial carcinomas (Edwards 2010).
The first breakthrough was achieved by (Tomlins et al. 2005) when they discovered the
presence of TMPRSS2-ERG (Transmembrane protease, serine 2 and ETS-related gene)
gene-fusion in more than 50% of localized prostate cancers. The ERG gene is an
oncogenic transcription factor that becomes overexpressed as a result of fusion with the
5’UTR from TMPRSS2. Other examples of well documented gene-fusion biomarkers in
solid tumors include ETV6-NTRK3 (ets variant gene 6 and neurotrophic tyrosine-kinase
receptor type 3) that was originally detected in congenital fibrosarcoma and later detected
in secretory breast carcinoma (Knezevich et al. 1998; Tognon et al. 2002). A gene fusion
between echinoderm microtubule-associated protein-like 4 (EML4) and anaplastic
lymphoma kinase (ALK) was first discovered in non-small cell lung carcinoma and it is
observed in 3-13% of the lung cancer patients (Soda et al. 2007). Another example is the
gene-fusion RET-NTRK1 (receptor tyrosine kinase and neurotrophic tyrosine kinase
receptor) that is detected in as many as 50% of thyroid papillary carcinomas (Bongarzone
et al. 1998; Pierotti 2001). Other solid tumors that have at least one reported biomarker
gene-fusion include breast, pancreatic, colon, ovarian and brain tumors (Kumar-Sinha et
al. 2006). Although, the current list of gene-fusion biomarkers for solid tumors is not as
comprehensive as hematologic malignancies, advancement in the sensitivity of the
analytical genomics assays will reveal more widespread occurrences of recurrent gene
fusions in other cancer types.

8
High-throughput DNA sequencing has accelerated the discovery of gene-fusions and
their global patterns in cancer
Early methods to identify genomic rearrangements and gene fusions were high
resolution cytogenetic-based, such as spectral karyotyping followed by fluorescent in situ
hybridization (FISH) or noncytogenetic-based methods such as the modified NIH 3T3
transformation foci assay (Kaye 2009). Development in biological assays led to the
application of array based methods such as aCGH (array comparative hybridization) for
the detection of gene-fusions but these methods are limited in their throughput and
resolution of detection. In recent years, rapid advances in high-throughput DNA
sequencing (also known as next-generation sequencing, NGS) technologies have enabled
the detection of chromosomal aberrations and fusion-genes at single base-pair resolution
(Campbell et al. 2008; Maher et al. 2009a; Stephens et al. 2009) . NGS allows
sequencing of the fragments of target molecules such as DNA or RNA in a massively
parallel way that generates millions to billions of short (50 – 150 bp) reads. The
sequencing protocol typically follows the clonal amplification of the target sequences so
that the output provides a multi-fold coverage (Metzker 2010). Currently available NGS
technologies such as Illumina Hi-Seq, Ion torrent and Pacific Biosciences also allow
sequencing of the cellular transcriptome that harbors expressed fusion genes known as
fusion-gene transcripts or chimeric transcripts (Martin and Wang 2011). Sequencing of
the transcriptome is called RNA-Sequencing or RNA-Seq (Wang et al. 2009). Since
functional mutations in cancer are manifested through transcription, investigation of
genomic aberrations at the transcriptome level becomes very important in isolating
functional or potential driver mutations from the non-functional mutations (Ju et al.
2012).
Deep coverage RNA-Seq provides a comprehensive view of the transcriptome
that enables researchers to systematically analyze cancer cell transcriptomes and uncover
novel and potentially oncogenic fusion-gene transcripts (Maher et al. 2009a; Ozsolak and

9
Milos 2011; Wang et al. 2013). For instance, Maher et al. applied short and long read
RNA-Seq to rediscover BCR-ABL1 in CML cell lines, TMPRSS-ERG in prostate cancer
and additionally, reported multiple novel fusion transcripts associated with prostate
cancer. Targeted sequencing of prostate cancer using artificial exon-exon junctions
uncovered six recurrent TIC (transcription induced chimeras) or read-through gene-
fusion events including SLC45A3-ELK4 that is already a known frequent erythroblast
transformation-specific fusion in prostate cancer (Nacu et al. 2011). Studies involving
RNA-Sequencing of large number of cancer samples have begun to reveal global patterns
and the underlying molecular mechanisms of fusion-genes in solid tumors. For example,
transcriptome sequencing of 24 breast cancer samples resulted in the detection of 15
primary breast tumor subtype specific fusion-gene transcripts (Asmann et al. 2012).
These fusion-gene transcripts can serve as potential biomarkers for breast-cancer
stratification for further targeted therapy. Recently, sequencing of 89 samples (79 breast
cancer and 10 normal samples) discovered gene fusions that were recurrent in 4-6% of
the patients and involved MAST1 and MAST2 genes, and NOTCH-family genes that also
increased the proliferation of benign breast cancer cells (Robinson et al. 2011).
The increasing feasibility and the rapidly decreasing cost of sequencing have
already paved the way for its routine application in cancer research (Voelkerding et al.
2009). Although, unprecedented amounts of data from cancer transcriptomes provides a
new opportunity to uncover novel gene-fusions, it comes with bioinformatics challenges
that need to be addressed. The cancer transcriptome is inherently complex as it contains
novel RNA species such as fusion transcripts and splice-variants generated as a result of
genomic mutations and transcriptional deregulation (Carninci et al. 2008; Costa et al.
2010). Hence the massive amounts of RNA-Seq data from cancer transcriptomes requires
systematic analysis using high-performance bioinformatics tools that can address both
complexity and massiveness of the sequencing data at the same time. In order to address
this challenges we developed and automated multi-threading RNA-Seq analysis pipeline

10
(R-SAP; described in CHAPTER 2; (Mittal and McDonald 2012)) that follows a
systematic and hierarchical characterization scheme to qualitatively and quantitatively
analyze RNA-Seq data from cancer cell transcriptomes. In CHAPTER 3, we apply R-
SAP to analyze 45 breast cancer transcriptomes in order to uncover global patterns of
chimeric transcripts in cancer. In this chapter we create an integrated analysis workflow
using R-SAP and currently available bioinformatics tools for with highly specialized
functionality such as transcriptome assembly, RNA expression estimation and reference
genome alignment. In CHAPTER 4, we expand the applicability of R-SAP to discover
genomic rearrangements using whole genome sequence data from six ovarian cancer
genomes and perform a comparative analysis with the gene-fusions detected in the
transcriptome of the same patients.

11
CHAPTER 2
R-SAP: A MULTI-THREADING COMPUTATIONAL PIPELINE FOR THE
TRANSCRIPTOMICS STUDIES USING HIGH-THROUGHPUT RNA-
SEQUENCING
Abstract
The rapid expansion in the quantity and quality of RNA-Seq data requires the
development of sophisticated high-performance bioinformatics tools capable of rapidly
transforming this data into meaningful information that is easily interpretable by
biologists. Currently available analysis tools are often not easily installed by the general
biologist and most of them lack inherent parallel processing capabilities widely
recognized as an essential feature of next-generation bioinformatics tools. We present
here a user-friendly and fully automated RNA-Seq analysis pipeline (R-SAP) with built-
in multi-threading capability to analyze and quantitate high-throughput RNA-Seq
datasets. R-SAP follows a hierarchical decision making procedure to accurately
characterize various classes of transcripts and achieves a near linear decrease in data
processing time as a result of increased multi-threading. In addition, RNA expression
level estimates obtained using R-SAP display high concordance with levels measured by
microarrays.
Introduction
The cellular transcriptome is the complete set of protein coding mRNAs, non-
coding RNAs and other regulatory RNAs present in a cell (Velculescu et al. 1997). In
eukaryotes, the complexity of the cellular transcriptome is enhanced by the presence of
alternatively spliced RNAs, fusion and other types of chimeric transcripts and transcripts
encoded within previously uncharacterized genomic regions (Carninci et al. 2008; Costa
12
et al. 2010). The complexity of the transcriptome of cancer and other diseased cells can
be even more complex due to deregulation of the cellular splicing machinery, and the
transcription of various genomic mutations that contribute to aberrant cell function
(Skotheim and Nees 2007; Ritchie et al. 2008). For these reasons, transcriptome profiling
has become an important tool, not only in the diagnosis of cancer and other diseases, but
additionally for the identification of putative molecular targets for therapeutic
intervention (Aparicio et al. 2000; Sutherland et al. 2011).
While transcriptomics was first heralded by the introduction of microarray
technologies over two decades ago (Kulesh et al. 1987; Maskos and Southern 1992), the
field is currently undergoing revolutionary expansion by virtue of the application of deep-
sequencing technologies to the quantitative and qualitative characterization of cellular
transcripts (Morozova and Marra 2008). Commonly referred to as “RNA-Seq”, these
high-throughput methodologies involve the massively parallel sequencing of millions of
copies of fragments of cellular transcripts (Wang et al. 2009). Contemporary sequencing
platforms can generate megabytes to gigabytes of data in a single sequencing run
(Morozova and Marra 2008). This magnitude of data not only allows for the
characterization of moderate to high abundant transcripts, it also provides sufficient
coverage and depth to characterize rare and potentially novel low abundant transcripts
that went undetected by earlier methodologies.
The rapid expansion in the quantity and quality of RNA-Seq data requires the
development of sophisticated high-performance bioinformatics tools capable of rapidly
transforming this data into meaningful information that is easily interpretable by
biologists. Current approaches to the analysis of RNA-Seq data involve the alignment of
sequencing reads to a reference genome and subsequent association of these genome
mappings with established transcript models to quantify expression levels and detect

13
mRNA isoforms, fusion genes and other novel transcript structures (e.g., (Mortazavi et al.
2008; Pan et al. 2008; Sultan et al. 2008; Guffanti et al. 2009; Maher et al. 2009b; Berger
et al. 2010; Robertson et al. 2010)). Despite their obvious utility, currently available
analysis tools are not easily installed by the general biologist and most of them lack
inherent parallel processing capabilities widely recognized as an essential feature of next-
generation bioinformatics tools (McPherson 2009; Richter and Sexton 2009).
We present here an automated RNA-Seq analysis pipeline (R-SAP) with built-in
multi-threading capability to analyze and quantitate high-throughput RNA-Seq datasets.
R-SAP is easy to install and follows a hierarchical decision making procedure to
characterize various classes of transcripts. It compares reference genome alignment of
sequencing reads with sets of well-annotated transcripts in order to detect novel isoforms.
Reads that map completely within known exon boundaries are used for gene expression
quantification. Fragmented alignments of sequencing reads are used to detect chimeric
transcripts such as fusion genes. Novel exons detected within previously annotated inter-
genic and intronic regions are also reported. R-SAP modules can be customized by a
user-adjustable set of parameters for particular applications. R-SAP generates output files
that contain transcript assignments for the sequencing reads, gene expression levels, lists
of aberrantly spliced genes and data statistics. The computational outputs can be viewed
with online genome browsers by uploading the R-SAP generated browser compatible
output file. To demonstrate the applicability of the pipeline, we analyzed publically
available RNA-Seq data generated from the Roche 454 and the Illumina GA platforms.
We achieved a linear decrease in the data processing time as a result of increased multi-
threading. RNA expression level estimates obtained using our pipeline displayed high
concordance with levels measured by microarrays. R-SAP program is publicly available
at www.mcdonaldlab.biology.gatech.edu/r-sap.htm.

14
In the following sections, we describe the architecture of the pipeline and results from the
analysis of the test data to evaluate various modules of the pipeline.
Materials and Methods
Overview of the pipeline:
R-SAP compares reference genome mappings of RNA-Seq reads with the
genomic coordinates of known and well-annotated transcripts (reference transcripts or
known transcript models) in order to detect known and new RNA isoforms and, chimeric
transcripts. There are four core modules in R-SAP’s workflow (Figure 2.1): (i) initial
alignment screening, (ii) characterization with reference transcripts (iii) chimeric
transcript detection and (iv) RNA expression quantification. A main wrapper script
controls the flow of data to these core modules (Figure 2.1).
To initiate analyses using R-SAP, the user provides two required inputs for the
pipeline: the sequence alignment file and known transcripts’ coordinate file. Currently
R-SAP accepts alignment files only in psl format that are generated by mapping RNA-
Seq reads to the reference genome using BLAT (Blast like alignment tool) (Kent 2002) or
SSAHA2 (Sequence search and alignment by hashing algorithm) (Ning et al. 2001).
Figure 2.1. Architecture of R-SAP and data flow in the pipeline. Wrapper script
begins the execution of the pipeline and divides the data in to smaller sub-sets. Multiple
threads are created and each core module in each thread is run under the “Control-
module”. Output files are merged by the wrapper script and corresponding output files
are written to the disk.

15
RNA-Seq reads mapping to the genome may result in the alignments scattered across
multiple exons separated by introns. We chose psl as the alignment format for the
pipeline because the scattered alignments are precisely stitched together and reported as a
large single alignment. As a result, for each sequencing read the most likely alignment
and corresponding genomic locus can be readily found in the alignment files. Moreover,
the psl format preserves the orientation of alignment blocks originating from the
contiguous genomic loci enabling their accurate re-mapping to the annotated exons and
determination of associated reference structural variants.
R-SAP is also configured to work with two of the currently available transcript
assemblers: Cufflinks (Trapnell et al. 2010) and Scripture (Guttman et al. 2010).
Assembled transcripts can be supplied to R-SAP either in GTF (Gene Transfer Format)
or in BED (Browser Extensible Data) format. GTF and BED are default output formats
from Cufflinks and Scripture respectively.
Known transcript model files for the reference genome can be obtained from the
UCSC genome database (Fujita et al. 2011), the UCSC table browser (Karolchik et al.
2004) or the Ensembl database (Hubbard et al. 2002). R-SAP accepts known transcript
model file formats in standard table browser format, GTF or BED. The analysis
stringency can be adjusted using a set of cutoff and threshold values (described in
Supplementary Methods) provided by the user at the beginning of the pipeline.
R-SAP begins with the parsing of input data files for the format check and
verification of the input parameters using the main wrapper script. The same wrapper
script then divides the input alignment file into the number of parallel threads specified
by the user (default is one thread). Each part of the input file is supplied to the set of core

16
modules, in parallel. At the completion of each thread run, the main wrapper script
merges the intermediate output files and creates the final set of output files.
(a) Alignment screening:
The first step in the pipeline is to select the most likely alignment for each of the
sequencing reads as reads may have multiple genomic hits. Alignment hits with the
highest alignment identity, alignment score and read coverage among all the genomics
hits are selected as the best alignments (top-scoring) on the genome (see Supplementary
Methods). Top-scoring alignments are then classified as high-scoring if they have only
one best possible alignment with identity and read coverage values above the cutoff
(default 95% and 90%, respectively). Reads that map to multiple genomic loci with
equivalent alignment identity and read coverage are classified as multi-hit reads. Those
reads that produce low quality alignments with identity and/or read coverage below the
threshold values are further analyzed by a separate module of the pipeline to detect
chimeric transcripts (see below). The remaining reads that are low quality alignments are
classified as “discarded”. Both “discarded” and multi-hits reads are excluded from the
further analysis and reported separately.
(b) Characterization with reference transcripts:
High-scoring reads from the alignment module are subjected to the
characterization module where genome mapping coordinates of the sequencing reads are
precisely compared with the transcriptional and exons boundaries of the well annotated
transcripts. Mapping of a read within the known exon boundaries is considered as
indicative of normal splicing whereas out of exon or partial exon mapping is indicative of
aberrant splicing or the presence of a novel isoform. The characterization strategy is
outlined in Figure 2.2. Read alignments that skip exonic bases because of discontinuous
blocked alignment on the reference genome are characterized as exon-deletions in that

17
reference transcript (Figure 2.2B, C). Small deletions (10 bp by default) are permitted in
the alignment in order to tolerate small gaps due to the sequencing errors. Read
mappings, that span multiple exons are used to detect exon-skipping events (Figure
2.2D).
Partial mapping of the sequencing reads onto known exons results in either gene
boundary expansion (Figure 2.2E,F) or extension of exons into introns (Figure 2.2G,H).
Slight extensions in the alignment beyond the exon boundary are tolerated by applying
minimum exon extension cutoff (2 bp default).
Sequencing reads that extend 5’ terminal exons (5’UTR) into upstream promoter
regions (Figure 2.2E) are considered the result of potential new transcription start sites
(alternative TSS). Similarly, reads that extend 3’ terminal exons (3’UTR) into
downstream regions are characterized as potential alternative polyadenylation site
variants (Figure 2.2F). Intron-retentions (or complete intron inclusion) are detected when
a read alignment completely spans an intron including at least part of flanking exons
(Figure 2.2H). Such events are included in the internal-exon-extensions characterizations.
Reads mapping completely within introns are characterized as intron-only reads (Figure
2.2I). Sequencing reads that do not map to any known transcript and fall within a pre-
specified gene -radius (5 kb default setting), on either side of the transcript, are
characterized as neighboring-exons (Figure 2.2J). Clusters of such reads may represent
the existence of new transcriptional boundaries and can be aggregated with the known
transcript models. Reads falling outside the gene-radius are designated as gene-desert
reads (Figure. 2.2K). Some of the high-scoring reads may exhibit multiple
characterizations with the reference transcripts. For example, a read may exhibit internal-
exon-extension simultaneously with a 5’ UTR expansion. Such reads are sub-
characterized as multiple-annotation reads. We apply one additional stringency criterion
during the characterization step to further filter out possible sequencing artifacts.

18
Sequencing reads that expand the transcript boundary by more than 100 kb or have
alignment blocks separated by more than the cutoff distance value (100 kb default
setting) are conservatively reported as uncharacterized and excluded from the further
analysis.
As a default setting, the pipeline characterizes each read with only one best fitting
reference transcript. The best fitting transcript is the one with maximum exon overlap and
minimum non-exonic regions (intron and intergenic) overlap with the read. Reference
transcripts with protein-coding potential are selected over the non-protein-coding
transcripts. In cases where multiple transcripts are equally likely, the best fitting
transcript is selected randomly. The pipeline provides the user with the option to
inactivate all of these defaults settings in which case all possible reference transcript
associations will be displayed.
Figure 2.2. Characterization strategy of R-SAP for high-scoring reads. Read
mappings (black boxes) are compared with the known exon (empty boxes) and intron
(black lines). The larger empty boxes represent coding regions while the smaller empty
boxes represent untranslated regions. A. Read mapping within the known exon. B,C.
Discontinuous blocked alignment resulting in exonic base skipping (dashed-line box).
D. Skipping of third exon. Exon skipping is also characterized as exon-deletion. E.
Extended 5’UTR. F. Extended 3’UTR. G, Exon extended into intron. H. Intron
retention . I. Read mapping completely within the intron. J. Read mapping outside the
permissible (d) gene-radius K. Read mapping outside the permissible (d) gene-radius.

19
(c) Chimeric transcript detection:
Chimeric transcripts may be due to genomic rearrangements such as
translocations and inversions, or transcriptional processes such as co-transcription, trans-
splicing or aberrant intra-genic (within the same gene) splicing (Flouriot et al. 2002;
Mitelman et al. 2005; Guffanti et al. 2009; Maher et al. 2009b). Sequencing reads from
chimeric transcripts are very likely to produce discrete alignments to distant or close
genomic loci. In order to detect candidate chimeric reads, all the reads with top-scoring
alignments displaying low query coverage (below the cutoff coverage value, default
90%) and an alignment identity greater than the cutoff value (default 95%) are selected.
These reads are considered potential chimeric reads only if the region not covered in the
top-scoring alignment of the read is at least 20 bp (default gap threshold). Twenty bp was
selected as the default setting because alignment algorithms will not produce a significant
alignment for the relatively short remaining part of the read. Once the above criteria are
met, alignments are parsed to obtain the alignment pair for the top-scoring alignment
(Figure 2.3A).

20
Alignments are filtered out if the alignment identity is less than the cutoff identity
value (default 95%). The alignment with the highest coverage on the remaining part of
the read and with highest alignment identity is selected as the best possible pairing
alignment. In addition, intra-chromosomal pairing is preferred over inter-chromosomal
pairing. Small overlaps (less than one third of alignment pair’s coverage on remaining
part of the read) and gaps (not more than the gap-threshold, 20 bp default) between the
two read segments corresponding to alignment pairs are allowed. To ensure the validity
and significance of the alignment, chimeric read segments are required to be at least 25
bp long. Thus, chimeric reads shorter than 50 bp are rejected. False positives are further
minimized by excluding chimeric reads that produce alignments from repetitive genomic
regions. If more than one hit are identified for any part of a chimeric read with identity
above the cutoff value and with more than 90% coverage on the same region of read
sequence, the candidate chimeric transcript is rejected as a false positive. The remaining
alignment pairs are associated with reference transcripts and categorized in various
Figure 2.3. Schematic diagram of the detection and annotation of chimeric
transcripts by R-SAP using fragmented genomic alignments. A. Best possible
alignment pairs are selected for the reads displaying significant sequence similarity to the
reference genome. Alignment fragments are then individually compared with known
transcript models. B. Alignment pairs belong to two different genes (inter-chromosomal
or intra-chromosomal). C. Alignment pairs mapped to the same gene but in opposite
orientation on the reference genome. D. Both pairs mapped within the same gene but
their order on the sequencing read is opposite of their alignment order on the
corresponding gene. E, F. At least one alignment pair mapped to the genomic region
with no known gene from the reference gene set.

21
chimeric read structures according to the genic or intergenic regions to which they map
(Figure 2.3B-F).
(d) Expression level quantification:
Reference transcript assignment information for exon-only and intron-only reads
is consolidated from multiple threads into a single file. Expression levels are quantified
using the RPKM (reads per kilobase of exon model per million mapped reads) method
proposed by Mortazavi et al. (Mortazavi et al. 2008). Transcript level RPKM values are
calculated using exon-only reads and similarly the RPKM value for each individual
intron is calculated using intron-only reads. R-SAP estimates expression values only if
the input alignment file is provided in psl format. Since, assembled transcript files do not
contain read level mapping information, expression estimation is not possible using these
files.
Once each of the above modules are run, annotation and data statistics are
collected from various intermediate output files and merged to generate the final output
files. The final set of output files contains RNA level expression files, assignment of
known transcripts to the high-scoring reads and their characterization, chimeric reads
with annotation and data statistics files with distribution of reads over the various classes.
Finally, browser compatible out-put files containing annotation information of all the
reads are generated that can be uploaded to web based genome browsers (such as UCSC
and Ensembl) for the visualization purposes.
Implementation and requirements:
R-SAP was implemented using Perl 5.8.0 (also the minimum version of perl
required to run the pipeline) enabled with multi-threading and is compatible with all
UNIX and Windows based systems. Disk space required during the pipeline run is 1.5 X
the size of the input alignment file.

22
Test datasets
MAQC Universal Reference Human data: The MAQC Universal Reference
Human Poly-A+ selected RNA-Seq data compiled from Mane et al. (Mane et al. 2009)
was obtained from Short Read Archive (SRA accession SRX002934). The data consisted
of 881,555 of Roche’s 454 sequencing reads with an average length of 258 bp from five
454 GS-FLX sequencing runs. 878,275 of those reads were retained after low-complexity
repeat trimming and short read (<20 bp) exclusion (see Supplementary Methods). Raw
microarray data (Affymetrix Human U133Plus2.0) was downloaded from the Gene
Expression Omnibus (GEO accession: GSM589512). Four replicates of TaqMan qRT-
PCR measurements for the same sample were also obtained from Gene Expression
Omnibus (GEO accessions: GSM129641, GSM129640, GSM129639 and GSM129638)
that consisted of expression values for 1044 probes.
ENCODE lymphoblastoid cell line data:
As a short read ultra high-throughput data set, RNA-Seq data for Gm12878
(lymphoblastoid cell line) from ENCODE project (Birney et al. 2007) was downloaded
from hgdownload.cse.ucsc.edu /goldenPath/hg19/encodeDCC/wgEncode
CaltechRnaSeq/wgEncodeCaltechRnaSeqGm12878R2X75N
aIl200FastqRd1Rep1.fastq.gz. The data file contained a total of 87929372 paired-end
Illumina GA reads of read length 75-bp. Microarray intensities (Affymetrix Human Exon
1.0 ST chip) for the same sample were obtained from GEO (accession: GSM472901).
NCBI nucleotide data:
We searched ChimerDB 2.0 (Kim et al. 2010) to obtain the GenBank accession
IDs of the publicly available sequences that are considered chimeric transcripts. Because
these chimeric transcripts were computationally detected, we limited the dataset to the
high confidence set of chimeric transcripts by choosing only those chimeric transcripts

23
that also represented fusion gene pairs in the literature based annotation from ChimerDB
2.0. In this way, we obtained 206 accessions IDs whose sequences were drawn from the
NCBI’s nucleotide database. Test datasets are also summarized in Table A.1-A.2 and
Supplementary Methods.
Methods
All RNA-Seq reads and GenBank sequences were mapped to the reference human
genome (hg18) using BLAT with the default parameters settings for the DNA sequence
alignment in BLAT. We used RefSeq (Pruitt et al. 2007) transcripts (hg18) as our
reference set and the corresponding genomic coordinates were downloaded using UCSC
Table browser.
To demonstrate the applicability of R-SAP, a complete pipeline run was
performed on the MAQC Reference Human RNA-Seq dataset. For the evaluation of
pipeline’s expression estimation and isoform detection performance, we employed the
ENCODE Gm12878 cell line RNA-Seq dataset in addition to MAQC RNA-Seq dataset.
The high confidence chimeric transcript dataset obtained from Chimer DB 2.0 and NCBI
was used for testing R-SAP’s chimer-detection module. To evaluate R-SAP’s RNA-seq
quantifications, the output was compared with the results of microarray gene expression
analyses and TaqMan qRT-PCR measurements carried out on the same cells. R-SAP’s
expression estimation performance was benchmarked using the same RNA-Seq datasets
against Cufflinks (Trapnell et al. 2010) and RSEM (Li and Dewey 2011) while isoform
predictions were compared with those from Trans-ABySS (Robertson et al. 2010) and
Cufflinks. Data analyses and comparison methods used for the different platforms and
programs are summarized in Supplementary Methods.
We performed R-SAP test runs using the default parameter settings (described in
Supplementary Methods) of the pipeline. These default values were previously derived

24
and optimized empirically during the development of R-SAP by running core modules
individually on various RNA-Seq datasets (data not shown here).
Results and Discussion
Demonstration of the applicability of R-SAP using the MAQC dataset
Sequencing tags from the test MAQC Reference Human RNA-Seq dataset were
initially mapped to the human reference genome. We mapped 855,159 (97.3% of the
878,275 cleaned reads, Table 2.1) and analyzed these alignments using R-SAP. More
than half (491,117/855,159 or 57.43%) of the mapped reads were high-scoring (Table
2.1) and were further characterized with the RefSeq transcripts (Table 2.2).
Table 2.1. Results of initial mapping and alignment screening of MAQC Reference
Human RNA-seq data using R-SAP.
Description Reads
Total raw sequencing reads 881,555 Cleaned reads 878,275 Genome mapped reads 855,159
Classification Reads (% genome mapped reads)
High-scoring 491,117 (57.43%) Chimers 8,458 (0.99%) Multi -hits 29,279 (3.42%) Discarded 326,305 (38.16%)

25
As expected from the RNA-Seq data, the majority (299,473/491,117 or 61%) of
the high-scoring reads mapped to the exons (Figure 2.4, Table 2.2). Slightly more than
half (54.42%; 267,279/491,117) of high-scoring reads were exon-only reads that could be
attributable to 24,461 RefSeq transcripts (Table 2.2). RPKM values (expression levels)
for these RefSeq transcripts are presented in Table A.10. R-SAP identified a wide
spectrum of expression values RPKM values) ranging from a minimum of 0.046 for the
TTN (titin or connectin) gene to a maximum of 2,112 for the MTRNR2L2 (humanin- like
protein 2) gene. More than 1% (1.38%; 6,786/491,117) of the high-scoring reads were
found to be associated with exon-deletion events among the 4,850 of the RefSeq
transcripts (Table 2.2). Relatively few (840/6,786 or 12.37%) of the events characterized
by R-SAP as exon deletions were attributable to exon-skipping events corresponding to
620 RefSeq transcripts. While skipping of a maximum of 20 exons was observed, the
majority of the exon skipping events involved skipping of only one exon (Figure 2.5). It
is important to note that the power and accuracy of R-SAP to detect splice variants
Table 2.2. Number (%) of high-scoring reads (obtained from MAQC Reference
Human dataset) partitioned by R-SAP into sub-categories. Also, shown is the number
of RefSeq transcripts represented in each sub-category.
Sub-categories (characterization)
Reads (% high-scoring) Represented RefSeq transcripts
Exon-only 267,279 (54.42%) 24,461 Exon-deletion 6,786 (1.38%) 4,850 AlternativeTSS 1,210 (0.25%) 1,078 Alternative Polyadenylation 2,759 (0.56%) 2,042 Internal-exon-extension 18,419 (3.75%) 7,648 Multiple-annotations 3,020 (0.61%) 1,973 Intron-only 104,824 (21.34%) 22,383 Neighboring-exons 17,935 (3.65%) 5,929 Gene-desert 66,694 (13.58%) Uncharacterized 2,191 (0.45%)
Total high-scoring: 491,117

26
depends completely upon the length of the sequencing reads. For instance, exon-skipping
events are detected when the read spans the flanking exons of the skipped exon. Short
reads from such new splice junctions will not produce significant alignments on the
genome and hence will go undetected. Previously published RNA-Seq studies detect
exon skipping by mapping the short reads to synthetically created library of new splice
junctions (Sultan et al. 2008).
We observed that internal-exon-extension (3.75%, Table 2.2) accounted for more
than the extension of known transcription boundaries (AlternativeTSS and
AlternativePolyadenylation) combined (0.25% + 0.56%, Table 2.2). These transcriptional
events can be further examined in the follow-up analysis.
Figure 2.4. Distribution of the high-scoring reads from MAQC Reference Human
dataset onto RefSeq transcripts. “Exons” includes those reads characterized as Exons-
only, Exon-deletion, Alternative TSS, AlternativePolyadenylation, Internal-exon-
extension and Multiple-annotations. “Intergenic” includes those reads characterized as
gene-desert or neighboring-exon, “Introns” represent reads mapping completely within
introns and “Uncharacterized” are those reads that cannot be characterized with any
RefSeq transcript (distribution is presented in Table 2.2).

27
For example, internal-exon-extension in the last intron or extension of 3’end of
the transcript is indicative of the potential alternative polyadenylation site. Presence of
poly-A tail or poly-T prefix on the reads may confirm the presence of polyadenylation
site (Nagalakshmi et al. 2008). Internal-exon-extension reads also included 361 reads that
showed retention of 305 introns in 275 of the RefSeq transcripts (Table A.3).
The second most frequent category of high-scoring reads identified by R-SAP
(21.34%, Table 2.2) was intron-only reads. While intron-only reads may occasionally
result from the presence of premature mRNAs containing un-spliced introns in
sequencing samples, intron-only reads that are in high abundance may be indicative of
yet-to-be annotated exons. In an effort to separate these potentially new “intronic exons”
from un-spliced introns, RPKM values for each intron is calculated using intron-only
reads. Introns with RPKM values of the same order of magnitude as the RPKM value of
the corresponding annotated transcript are reported by R-SAP as potentially new intronic-
exons. Our pipeline reported 9,707 introns containing potentially new exons that
correspond to 5,890 of the RefSeq transcripts (presented in Supplementary File S3).
Figure 2.5. Frequency of exon skipping in high-scoring reads from MAQC
Reference Human dataset. A total of 893 sequencing reads resulted from the skipping
of 1191 exons corresponding to 645 Hg18 RefSeq known transcripts.

28
About 3% (17,935/491,117) of the high-scoring reads were characterized as neighboring-
exons (Table 2.2). Further examination revealed that the distribution of neighboring-
exons was biased downstream of 3’end of the RefSeq transcripts relative to the 5’ end
(70% 3’end and 30% 5’ end)
Gene-desert was the third most abundant category (13.58%, 66,694/491,117) of
the high-scoring reads (Table 2.2). The remaining ~1% of the high-scoring reads were
delegated to either the multiple-annotations (0.61%, Table A.4) or uncharacterized
(0.45%) category (Table 2.2). Uncharacterized were those that could not be associated
with any known reference transcript by the pipeline. Examples for each type of
characterization from the MAQC Reference Human dataset are displayed in Figure 2.6
(A-M).

29

30

31

32

33

34

35
As MAQC Reference Human sample was obtained from a pool of cancer cell
lines (Supplementary Materials of (Shi et al. 2006)) and since cancer cells have been
previously reported to harbor chimeric transcripts (Mitelman et al. 2005), we expected to
observe such transcripts in our test dataset. R-SAP characterized 8,458 reads (~ 1% of the
855,159l mapped reads) as the chimeric transcripts (Table 2.1). This relative low
abundance of chimeric transcripts is consistent with the fact that prevalence of such
RNA-species is reported to be typically low (37,38). These designated chimers were
further characterized by R-SAP as inter-chromosomal (51.1%) or intra-chromosomal
(48.9%) based on the target genomic regions of the alignment pairs in the chimeric
transcripts (Table 2.3). Nearly 40% of the detected chimeras were intra-genic (type -1
Figure 2.6. Examples of various sub-categories characterized by R-SAP from the test
MAQC Reference Human dataset as they are displayed in the UCSC genome browser
(hg18) snap-shots. Reference genome alignment of the sequence is shown under the track
“Your Sequence from Blat search” (in black). RefSeq gene tracks are displayed under
“RefSeq genes” track (in blue). (A) Exon-only. (B-C) Exon-deletion events in RefSeq
transcripts resulting from the skipping of exonic bases and detected from the discontinuous
blocked alignment of sequencing read. (D) Exon-skipping event. (E) Gene boundary
expansion event at 5’UTR (alternativeTSS) (F) Gene boundary expansion event at 3’UTR
(alternativePolyadenylation) , respectively. (G) Internal-exon-extension. (H) Intron-
retention. (I) Intron-only. (J) Intron-only read sequences were further used for the detection
of potential new “intronic-exon” events that had comparable (same order of magnitude)
expression value (estimated with as RPKM) with the expression value (RPKM) value of the
transcript itself. 3rd intron of gene U2AF2 is shown in the figure with a potential new exon
(pointed by blue arrow). RPKM values are displayed under the track “MAQC Human
Reference” (in orange). (K-L) Sequencing reads that do not fall within any of the RefSeq
transcript boundaries but map within the pre-specified gene radius (‘d’, 5kb default) are
characterized as neighboring-exon (K) while reads that map outside gene-radius are
characterized as gene-desert reads (L). (M) Shows an “uncharacterized” read (under “Use
Supplied Track”) where alignment blocks of the read are separated by more than the cutoff
value (100kb default). Such reads could not be associated or characterized with any RefSeq
transcript and very likely be resulting from cDNA library or sequencing artifact, or
alignment artifact.

36
and type-2), i.e., chimeras likely generated by deletions resulting from loop formation or
other restructurings of the precursor transcript (Table 2.3). Only 13.18% of the detected
chimeras were designated inter-genic chimeras, i.e., chimeras resulting from the potential
fusion of heterologous gene transcripts (Table 2.3). The remainder of the aligned reads
was comprised of “discarded” reads (38.16%, Table 2.1) and multi-hits reads (3.42%,
Table 2.1).
In summary, the MAQC Reference Human RNA-Seq data mapped to 30,074 of
the RefSeq transcripts (27,068 protein coding and 3,006 non-protein coding). R-SAP
classified these detected reference transcripts as either normally or aberrantly spliced
(Figure 2.7).
Table 2.3. Number (%) of chimeric transcripts detected by R-SAP from MAQC
Reference Human dataset and represented RefSeq transcripts
Chimer type Reads (% total chimers)
Inter-chromosomal 4,327 (51.16%) Intra-chromosomal 4,131 (48.84%)
Chimer type Reads (% total chimers)
RefSeq transcripts
Intragenic (type-1) 2,896 (34.24%) 1,677 Intragenic (type-2) 524 (6.20%) 114 Gene-desert 3,923 (46.38%) 253 Inter-genic 1,115 (13.18%) 480
Total chimers 8,458

37
R-SAP’s performance compares favorably with currently popular pipelines
Comparison with Trans-AbySS:
To evaluate the performance of R-SAP against existing pipelines, we compared
R-SAP’s characterization results for the MAQC Reference Human dataset with the
output from another commonly used pipeline, Trans-ABySS. Trans-ABySS is a highly
respected RNA-Seq data analysis pipeline used to detect novel transcriptional events
using the reference genome alignments of contigs obtained after performing a de novo
assembly on short RNA-Seq reads. Since we already had 454 reads that were long
enough to be treated as assembled contigs, we skipped the assembly step and directly ran
the intermediate step of the Trans-ABySS that compares reference genome BLAT
alignment of contigs (long reads) with the known transcript models. We used the
reference genome alignment of 491,117 high-scoring reads (already classified by R-SAP,
Table 2.1) from the MAQC test dataset and RefSeq transcripts (hg18) as reference
transcript models. Out of 491,117 high-scoring reads, Trans-ABySS associated 127,913
Figure 2.7. Distribution of RefSeq transcripts detected by R-SAP using MAQC
Reference Human dataset. “Normally spliced” RefSeq transcripts (5,039 transcripts)
showed no novel transcriptional events. “Single novel event” transcript (15,796 RefSeq
transcripts) and “Multiple novel event” transcripts (9,239 RefSeq transcripts) were detected
to have only one type and more than one type of novel transcriptional event, respectively.

38
(26%) reads with known exons while R-SAP associated more than twice as many
(299,473 or 61%, Figure 2.2 Table 2.2) high-scoring reads with known exons. Of
127,193 exon-associated reads, Trans-ABySS classified 4847 (0.98% of the 491,117
high-scoring) reads as novel transcriptional events (exon-skipping, alternative splice
sites, intron-retention, UTR expansion and new exons) (Table A.5) and the remaining
123,066 (25.05% of the 491,117 high-scoring) reads as those mapping completely within
the known exons. Overall, Trans-ABySS reported a lower number of novel
transcriptional events compared with R-SAP’s characterizations (4,847 v/s 32,194; exon-
deletion, AlternativeTSS, AlternativePolyadenylation, internal-exon-extension, multiple-
annotations; Table 2.2). The lower number of novel transcriptional events detected by
Trans-ABySS may be due to the filtering of all the reads/contigs that have single block
alignments with the reference genome before novel transcriptional events are detected.
Table 2.4 displays the overlap between the characterization categories that were
comparable between R-SAP and Trans-ABySS outputs. R-SAP predictions included
91% to 100% of the Trans-ABySS predictions (Table 2.4).

39
Comparison with Cufflinks/Cuffcompare:
Cufflinks is a widely used ab initio assembler that reconstructs full transcript
structures using genomic alignments of RNA-Seq fragments. Cufflinks also includes a
module, called Cuffcompare that compares the assembled transcripts to reference or
annotated transcripts in order to build transcript structural equivalence classes and also to
detect novel isoforms (Trapnell et al. 2010). In order to compare Cuffcompare
classifications with R-SAP’s characterizations, we used our ENCODE lymphoblastoid
cell line RNA-Seq test data from which 38,524,540 reads were aligned to the human
reference genome (hg18) using TopHat (Trapnell et al. 2009) (see Supplementary
Methods). Transcript assembly on the genomic alignments was performed using
Cufflinks (see Supplementary Methods) that resulted in 76,101 transcripts of length
varying from 73 to 38,345 bp. Assembled transcripts were reported in a GTF file that
contains genomic coordinates of assembled transcripts and their exons. The GTF file was
then used as the input for R-SAP and Cuffcompare. Since TopHat reports only high-
quality alignments, we considered Cufflinks assembled transcripts as high-scoring
Table 2.4. Comparison between R-SAP and Trans-ABySS characterization sub-
categories for the high-scoring reads from MAQC Reference Human dataset (R-
SAP characterizations include reads from “multiple-annotations” category) (Table 2 and
Supplementary Table S4).
R-SAP characterization
Trans-AbySS characterization
Number of associated reads
Characterization overlap
R-SAP Trans-ABySS #Reads %Trans-ABySS
%R-SAP
Exon-skipping Exon-skipping 1419 768 757 98.56% 53.1%
Alternative TSS + PolyAdenylation
Alternative UTR (5’ and 3’) 5314 357
327 91.59% 5.9%
Intron-retention Intron-retention 374 2 2 100% 0.53% Exon-deletion New-intron 9675 259 259 100% 2.7%

40
alignments for R-SAP’s characterization module. RefSeq transcripts (hg18) were used as
a reference annotation set for R-SAP and Cuffcompare (Table A.6 and A.7).
Based on the classification definitions provided in Cuffcompare’s manual (see also
(Trapnell et al. 2010)), we selected those classifications that were comparable with R-
SAP’s characterizations (comparisons are displayed in Table 2.5). Cuffcompare reported
24,752 (32% of 76,101 assembled transcripts) as novel-isoforms while R-SAP detected
40,025 (52.6% of 76,101) novel transcripts. 86% of Cuffcompare’s novel-isoforms were
also reported by R-SAP as either exon-skipping (~97%), exon-deletion (~87%), internal-
exon-extension (~58%), intron-retention (~33%), alternativeTSS (~62%) or
alternativePolyA (~57%) (Table 2.5). While Cuffcompare reported exon-associated
novel transcriptional events as a generic category “novel-isoform”, R-SAP provided a
more comprehensive characterization of novel-transcriptional events. Other R-SAP
characterization classes such as exon-only, intron-only, neighboring-exon and gene-
desert showed even higher overlap of 62%, 99.9% and 100% respectively with
Cuffcompare’ comparable classifications (Table A.8).
Table 2.5. Comparison between R-SAP characterizations and Cuffcompare’s novel-
isoforms classification from transcripts assembled by Cufflinks using ENCODE
Gm12878 cell line RNA-Seq dataset (R-SAP characterizations include reads from
“multiple-annotations” category) (Supplementary Table S6).
R-SAP characterization
Cuffcompare classifications
Number of associated assembled transcripts
Overlap
R-SAP Cuffcompare #Reads %Cuffcompare %R-SAP
Exon-skipping
Novel-isoform
7184
24752
6961 28.12% 96.9% Exon-deletion 3233 2809 11.3% 86.9% Internal-exon-extension
24652
14428 58.3% 58.2%
Intron-retention 5735 1870 7.5% 32.6% AlternativeTSS 6952 4292 17.5% 61.7% AlternativePolyA 9358 5380 21.73% 57.5%
Total novel transcriptional events
40025
21365 86.3% 53.3%

41
Evaluation of RNA expression level quantification
MAQC Human Reference sample:
Comparison between R-SAP’s RPKM values from MAQC Human Reference
sample and gene expression values determined from Affymetrix U133 Plus2.0 resulted in
a significant correlation (Spearman correlation = 0.67, p < 0.0001) (Figure 2.8A) that is
in agreement with the similar correlations previously reported in (Fu et al. 2009; Griffith
et al. 2010). We further evaluated our expression estimates by comparing with TaqMan
qRT-PCR measurements that is generally considered a more accurate abundance
estimation than microarrays. After initial filtering, we retained 962 expressed RefSeq
transcripts from TaqMan qRT-PCR data, of which 727 were also present (RPKM > 0) in
the RPKM estimates from R-RAP. With TaqMan qRT-PCR estimates, we observed a
better correlation of (Spearman correlation = 0.88, p<0.001, Figure 2.8B) of our RPKM
values than those with microarray estimated values.
Figure 2.8. Comparison of R-SAP estimated RPKM vs. Affymetrix microarray and
TaqMan qRT-PCR expression values. A. Correlation of 0.67 (Affymetrix microarray) and
B. 0.88 (TaqMan qRT-PCR) (B.) were obtained using the MAQC Human reference sample
C. A higher correlation of 0.78 (Affymetrix microarray) was obtained using the Gm12878
reference cell line from the ENCODE project.

42
ENCODE lymphoblastoid cell line sample:
To explore the possibility that expression estimates may be further improved by
using higher throughput RNA-Seq data than are available in the MAQC Human
Reference dataset, we used R-SAP to quantify expression levels using RNA-Seq data of a
lymphoblastoid cell line, Gm12878, obtained from ENCODE (Birney et al. 2007) and
compared the results with microarray data (Affymetrix Human Exon 1.0 ST arrays)
generated from the same cell line. We mapped ~54 million sequencing tags to the
reference human genome (alignment details are presented in Table A.9) resulting in a
highly significant correlation (Spearman correlation = 0.77, p < 0.0001) between the
RPKM values and the microarray generated expression values (Figure 2.8C).
In order to benchmark R-SAP’s RNA expression accuracy, we further compared
R-SAP’s RPKM values with those estimated from Cufflinks and RSEM using ENCODE
RNA-Seq dataset. Reference genome alignments for Cufflinks were generated using
TopHat (mapped ~38 million reads) while reference transcript (RefSeq hg18) sequence
alignments were generated by RSEM using BowTie (Langmead et al. 2009) (mapped ~26
million reads). Cufflinks was run in isoform abundance estimation mode in order to
generate FPKM values for RefSeq transcripts. Parameter setting for TopHat, Cufflinks
and RSEM runs are describe in Supplementary Methods. RSEM generated TPM
(transcripts per million) values as abundance measures that were further converted to
comparable RPKM values using the conversion formula described in (Li et al. 2010a).
Since expression values are observed to be robust at 1.0 RPKM for ~40 M
mapped RNA-Seq reads (Mortazavi et al. 2008) and our ENCODE RNA-Seq dataset is
comparable to that, we used only reference transcripts with RPKM ≥ 1 for comparing
expression values between different methods. With Cufflinks RPKM estimates, we
observed a high correlation of 0.84 (p<0.0001). Surprisingly, RSEM’s expression values

43
showed relatively low correlation with RPKM values from R-SAP (Spearman correlation
0.65, p< 0.0001) and from Cufflinks (Spearman correlation 0.40, p<0.0001) (See Figure
2.9 for correlation plots).
The low concordance of RSEM with the R-SAP and Cufflinks expression
quantifications may be due to the fact that only uniquely mapped reads were allowed to
be used for quantification. Also, RSEM inherently uses BowTie as an aligner and Bowtie
is not a gapped or spliced aligner like BLAT, SSAHA2 and TopHat. Hence, reads with
INDELs larger than few base pairs, or those resulting from novel splicing events such as
exon-skipping or exon-extension may fail to map to the transcript sequence. Both of these
factors may have lowered the total number of mapped reads that in-turn may affect the
detection power and quantification accuracy of RSEM. In our ENCODE RNA-Seq
dataset, TopHat mapped nearly 38 million reads where as RSEM mapped only ~26
million reads.
Figure 2.9. Correlation plots of RefSeq transcripts (hg18) quantification estimates from
ENCODE Gm12878 RNA-Seq data using three different methods: R-SAP, Cufflinks and
RSEM. Log2 transformation expression estimates shown here. A Spearman correlation of A.
0.84 (p<0.0001) and B. 0.65 (p<0.0001) was observed when R-SAP’s expression estimates
(Y-axis) were compared with those from Cufflinks (A.) and RSEM (B.) (X-axis). C. Shows
a correlation of .040 (p<0.0001) expression estimates from Cufflinks and RSEM.

44
Evaluation of the chimer-detection module
In order to assess the accuracy of the chimer-detection module of R-SAP, we
compared R-SAP’s chimeric predictions with those 206 high-confidence chimeric
transcripts generated by ChimerDB 2.0. We observed a ~79.6% (164/206) overlap with
the ChimerDB 2.0 predictions (Table A.2). Manual inspection indicated that the 42
chimeric transcripts un-classified by R-SAP had multiple hits on the reference genome
and were thus rejected as false positives by R-SAP during the filtering step in the chimer-
detection module. Although R-SAP’s filtering criteria was designed to minimize false
positives, it should be noted that, RNA-Seq data may inherently contain some chimeric
cDNA artifacts that are generated by template switching during reverse transcription,
and/ or amplification and ligation reactions (Ozsolak and Milos 2011). Further
experimental methods such as RT-PCR followed by re-sequencing should be used to
validate the putative chimeric transcripts generated from RNA-Seq data (Guffanti et al.
2009; Maher et al. 2009b).
Evaluation of R-SAP’s run time performance
We benchmarked R-SAP’s runtime performance and effect of parallelization
against Cufflinks. For the test run purposes, we selected reference genome alignments of
20 million reads from our ENCOE RNA-Seq test dataset that was aligned to the reference
genome (hg18) previously using BLAT and TopHat. These 20 million reads were
selected from high-scoring reads previously classified by R-SAP. In order to make the
comparison between R-SAP and Cufflinks fair, we ran Cufflinks only in its quantification
mode while R-SAP was allowed to run only characterization and transcript expression
estimation modules. RefSeq transcripts (hg18) were used as reference annotation set.
Running time for R-SAP and Cufflinks with varying number of parallel threads is shown

45
in Figure 2.10. Although we observed a near linear scalability in R-SAPs performance,
Cufflinks performed better than R-SAP for any given number of threads.
Cufflinks was implemented in C while R-SAP was implemented using Perl. It has
been previously shown that Perl performs five to ten times slower than C (Prechelt 2000).
Therefore, the relatively slower performance of R-SAP may be attributed to its
implementation in Perl. Also, R-SAP was designed to generate multiple output files to
provide detailed annotation information and data statistics. Writing multiple files
involves extensive number of disk operations that may create high volumes of system-
overheads for large datasets and may ultimately lower the running time of the program.
We also compared the performance of R-SAP with Trans-ABySS by comparing the time
required to perform the characterization of high-scoring reads on MAQC RNA-Seq data.
Figure 2.10. Benchmarking of R-SAP’s running time as compared with Cufflinks. R-SAP (gray line) and Cufflinks (black line) running time (Y-axis) for the quantification
of 20 million reads from ENCODE Gm12878 RNA-Seq dataset was compared. R-SAP
shows near linear scalability as the number of parallel threads (X-axis) are increased.
Inset shows the same plot magnified on of Cufflinks running time.

46
Since Trans-ABySS cannot be run on multiple threads for the characterization step, we
noted processing time on single thread only. R-SAP was observed to be almost twice as
fast as Trans-ABySS (R-SAP: 319.29 minutes, Trans-ABySS: 728.58 minutes). Overall
we observed that R-SAP performs slower than Cufflinks but faster than Trans-ABySS. It
is known that the absolute running time is not an accurate measure of an algorithm’s
performance. More accurate evaluation of the performance is only possible if other
factors such as time and space (memory) complexity, number of instructions and
frequency and duration of function calls are taken into consideration (Cormen et al. 2001)
which is currently beyond the scope of this study.
Summary and Conclusion
R-SAP is a bioinformatics tool for the processing and analyses of the high-
throughput RNA-Seq data that integrates reference genome alignments of sequencing
reads with known transcripts models.
Using three publically available datasets (MAQC, ENCODE and ChimerDB 2.0)
to evaluate different modules of the pipeline, we have shown that R-SAP can
systematically detect novel transcriptional events including various classes of RNA
isoforms and other transcript structures such as intra-genic and inter-genic chimeras. R-
SAP’s performance in categorizing transcripts represents a significant improvement over
currently available pipelines as exemplified by Trans-ABySS and
Cufflinks/Cuffcompare. Moreover, R-SAP’s RNA expression level estimates are highly
correlated with independent gene expression microarray analyses and experimentally
derived qRT-PCR measurements. Currently, R-SAP simply excludes multi-hit reads from
further analysis because they cannot be assigned to unique genomic loci. We expect a
significant improvement in R-SAP’s expression estimates once bias-correction and multi-
hit read re-distribution methods are included in R-SAP’s future releases.

47
R-SAP’s ability to accurately detect alternative splicing and chimeric transcripts
is optimal for sequencing reads longer than 40-50 bp. We do not consider this to be a
significant shortcoming given that most current and envisioned sequencing
methodologies do or soon will generate read lengths well above this threshold (Metzker
2010). R-SAP’s characterizations of sequencing reads are also dependent on the choice of
the reference set of the transcripts. In our test analyses, we conservatively used RefSeq
transcripts as our reference set. We believe that characterization can further be improved
by using a more informative, non-redundant and inclusive set of all established transcript
models such as UCSC, Ensembl, RefSeq and AceView (Thierry-Mieg and Thierry-Mieg
2006; Robertson et al. 2010).
One of our major goals in constructing R-SAP was to develop a pipeline that can
be fine-tuned according to the nature of the data. We sought to achieve this goal by
incorporating various user adjustable cutoffs in the workflow that can be used to alter the
stringency of each analysis. For example, in case of poor quality of the reference genome
or lower quality sequencing reads, a high rate of mismatches and small gaps can be
compensated for by lowering the coverage, identity and/or deletion cutoff values.
Similarly, for poorly annotated exon boundaries where alignments may extend slightly
beyond the edge of the exon, the exon-extension, the cutoff can be increased accordingly
to accommodate for alignment errors at exon boundaries.
The characterization of transcriptomes using RNA-Seq is a multi-facited problem
that includes cataloguing of coding and non-coding transcripts, uncovering and
characterization of novel RNA isoforms and chimeric transcripts, detection of new splice-
sites, discovery of new transcriptional structures, measurement of RNA expression levels
and estimation of RNA isoforms specific expression levels (Wang et al. 2009; Ozsolak
and Milos 2011). We hope that R-SAP will prove useful as a user-friendly bioinformatics

48
tool to compliment more specialized programs in the quantitative and qualitative analysis
of RNA-Seq data.
Acknowledgements
We thank Dr. Nathan J. Bowen for his insightful suggestions during the early
stages of the pipeline development and the Office of Information Technology at Georgia
Institute of Technology for providing access to computing clusters at “Partnership for an
Advanced Computing Environment” (pace.gatech.edu). This work was supported by
grant from Ovarian Cancer Institute, Ovarian Cycle, The Waterfall Foundation, Deborah
Nash Harris Endowment Fund and Robinson Family Foundation.

49
CHAPTER 3
DE NOVO ASSEMBLY AND CHARACTERIZATION OF BREAST
CANCER TRANSCRIPTOMES IDENTIFIES LARGE NUMBERS OF
NOVEL FUSION-GENE TRANSCRIPTS OF POTENTIAL
FUNCTIONAL SIGNIFICANCE
Abstract
Gene-fusion or chimeric transcripts have been implicated in the onset and
progression of a variety of cancers. Massively parallel RNA sequencing (RNA-Seq) of
the cellular transcriptome is a promising approach for the identification of chimeric
transcripts of potential functional significance. We report here the development and use
of an integrated computational pipeline for the de novo assembly and characterization of
chimeric transcripts in 55 primary breast cancer and normal tissue samples. De novo
assembly allowed for the accurate detection of 1959 chimeric transcripts to nucleotide
level resolution and facilitated detailed molecular characterization and quantitative
analysis. A number of the chimeric transcripts are of potential functional significance
including 79 novel fusion-protein transcripts and 80 chimeric transcripts with alterations
in their un-translated leader regions (UTRs). Over 300 chimeric transcripts in the cancer
samples mapped to genomic regions devoid of any known genes. Several ‘pro-
neoplastic’ fusions comprised of genes previously implicated in cancer are expressed at
low levels in normal tissues but at high levels in cancer tissues. Collectively, our results
underscore the utility of deep sequencing technologies and improved bioinformatics
workflows to uncover novel and potentially significant chimeric transcripts in cancer and
normal somatic tissues.

50
Introduction
Gene-fusions are a prevalent class of genetic variants that have been implicated in
the onset and progression of a variety of cancers (Mitelman 2000; Mitelman et al. 2007).
These variants may be generated on the DNA level by genomic rearrangements [e.g.,
large deletions or insertions, inversions and/or chromosomal translocations (Maher et al.
2009b)]. On the RNA level gene-fusion variants may be generated by co-transcription or
transcriptional read-through of neighboring genes (Akiva et al. 2006; Parra et al. 2006),
or by trans-splicing of multiple simultaneously processed pre-mature RNAs from
different genes (Garcia-Blanco 2003). Recurrent gene-fusions in cancers have often been
employed as cancer biomarkers (Mitelman 2000; Laxman et al. 2008) and, in some cases,
as potential candidates for targeted gene therapy (Baselga et al. 1996; Druker et al. 2001).
In recent years, massively parallel RNA sequencing (RNA-Seq) of the cellular
transcriptome has emerged as a promising approach for the identification of previously
uncharacterized fusion-gene or “chimeric” transcripts of potential functional significance
(Maher et al. 2009a; Ozsolak and Milos 2011; Wang et al. 2013). In cancer biology, for
example, a recent RNA-Seq analysis of 24 primary breast cancer samples uncovered 15
subtype specific fusion-genes that may serve as useful biomarkers of drug sensitivities
(Asmann et al. 2012). In another study, analysis of 89 breast cancer and control samples
identified several fusion transcripts involving MAST (microtubule associated serine-
threonine) kinase and Notch-family genes that may be drivers of breast cancer onset
and/or progression (Robinson et al. 2011).
Currently available computational methods for fusion-gene transcript discovery
such as Tophat-Fusion (Kim and Salzberg 2011), SnowShoeFTD (Asmann et al. 2011)
and FusionSeq (Sboner et al. 2010), typically rely upon reference genome mapping of
short (50 -75 bp) paired-end reads generated by the sequencing of both ends (5’- and 3’-)
of an RNA or cDNA fragment. While these methods are relatively rapid, the results can

51
be ambiguous due to the inherent imprecision associated with genome mapping of short
reads (Li et al. 2010a; Li et al. 2010b). In this study, we take an alternative method of
whole transcriptome de novo assembly to screen for fusion transcripts in The Cancer
Genome Atlas (TCGA) RNA-Seq data of 45 primary breast cancer and 10 normal breast
tissue samples. We developed an integrated computational workflow to generate
significantly longer (>800 bp) contiguous sequences or “contigs”. These longer contigs
not only provide greater accuracy in reference genome mapping but also allow for more
reliable identification of splice-variants because longer contigs typically extend across
multiple exons (Martin and Wang 2011). We report here the detection of 1959 chimeric
transcripts including 1535 that are specific to the breast cancer samples, 155 that are
present only in the normal samples and 269 that are present in both the cancer and normal
samples. We found that a number of these fusions are of potential functional significance
including novel fusion-proteins and chimeric transcripts with alterations in their un-
translated leader regions (UTRs). Over 300 breast cancer chimeras mapped to genomic
regions devoid of any known genes. Finally, we identified several ‘pro-neoplastic’
chimers (Li et al. 2008) of potential significance that are suppressed in normal tissue but
activated in cancer tissues. Collectively our findings indicate that an unexpectedly large
number of chimeric transcripts are present in both cancerous and normal breast tissues
and that many of these variants may play a significant role in breast cancer onset and
development.
Methods
For the accurate detection, characterization and quantitative analysis of chimeric
transcripts using RNA-Seq data, we designed a computational workflow (Figure 3.1) that
integrates several existing bioinformatics tools including our previously published
pipeline R-SAP (Mittal and McDonald 2012). The overall workflow is as follows:

52
1. Data pre-processing:
RNA-Seq data (see Supplemental Methods) may contain low-quality bases due to
sequencing errors and fragments of sequencing adapters derived from failed or short
cDNA inserts during the library preparation. Such low quality bases can reduce the
efficiency of the assembler and lead to miss-assembly (Lindgreen 2012). We, therefore,
trimmed low quality bases (quality score < 20) and sequencing adapters from the 3’-end
of the reads using ‘Trim Galore’
(http://www.bioinformatics.babraham.ac.uk/projects/trim galore/). Subsequently the
quality of the data were assessed using FastQC
(http://www.bioinformatics.babraham.ac.uk/projects/fastqc/)
Figure 3.1. Computational workflow for chimeric transcript discovery. The central
blue block shows the workflow, orange boxes represent the tools and programs integrated
with the workflow, purple boxes represent RNA-Seq reads and green boxes represent
datasets from the UCSC genome database. RNA-Seq reads (in fastq format) were
trimmed and only paired-end reads were used for the assembly process. Assembled
contigs (in fasta format) were then aligned to the reference genome and the resulting
alignment files (in pslx format) were analyzed by R-SAP to detect potential chimeric
transcripts. Chimeric transcripts were further characterized by comparing alignment
coordinates with known reference transcripts (BED format) using R-SAP. Part of the
filtering was done by R-SAP internally while additional filtering was done using in-house
perl scripts. A re-conformation step includes alignment of RNA-Seq reads to chimeric
transcript sequences and also to the reference genome using Bowtie1 and Bowtie2,
respectively. Alignment files (in bam format) resulting from RNA-Seq reads to chimer
transcript sequences were used to estimate the raw read-counts by expectation-
maximization using RSEM.

53
2. Transcriptome assembly:
Since, a major objective of this study was to detect chimeric transcripts where two
non-contiguous genomic loci are involved, a reference genome guided assembly
approach could not be used. Hence, we performed de novo assembly (assembly without
the reference genome) using ABySS that is a memory efficient de Bruijn graph
construction based short-read assembler (Simpson et al. 2009). The de novo assembly
process merges short DNA or RNA sequences that share terminal overlapping bases into
a longer contiguous sequence (contig). The length of the terminal overlap or “k-mer
length” is a critical parameter for assembly programs. Unlike genomic libraries, where a
uniform representation of each base pair can be assumed, non-normalized transcriptome
libraries contain a broad range of expressed transcripts and splicing isoforms. Therefore,
complete coverage of the transcriptome cannot be achieved at a single k-mer value
assembly (Robertson et al. 2010). To maximize coverage, we adopted previous
recommendations (Robertson et al. 2010) and varied the k-mer length from half of the
read length up to the full read length in the increments of two base pairs at a time. For
example, for a library with 50bp long reads, we performed assembly for k-mer length of
25, 27, .. 49. Multiple k-mer assemblies were then merged into a single meta-assembly
by using the Trans-ABySS pipeline (Robertson et al. 2010) that combines overlapping
contigs by extension and removes duplicate contigs from the assembly.
3. Chimeric transcript detection and filtering:
Assembled transcripts were aligned to the human reference genome (hg19,
GRCh37) using BLAT (Blast like alignment tool), (Kent 2002). Additional details are
provided in Supplemental Methods. For potential chimeric transcript detection, we
employed our previously developed pipeline R-SAP (Mittal and McDonald 2012) that
efficiently detects gene-fusion events and filters potential false positives and alignment
errors. Chimeric transcripts, representing a fusion-gene event, are very likely to produce

54
discrete alignments to distant or proximate genomic loci. These discrete alignments are
also called as fragmented- or split-alignments. R-SAP performs the characterization of
detected chimeric transcripts by associating the fragmented alignments with reference
transcripts and categorizes various chimeric transcript structures according to the genic or
inter-genic regions to which they map (Figure 3.2). We created a comprehensive set of
224,555 reference transcripts by merging Ensembl (Hubbard et al. 2002) and lincRNA
(large intergenic non-coding RNAs, (Cabili et al. 2011)) annotations for hg19 available
from the UCSC genome (Karolchik et al. 2014). These merged annotations were used as
the known transcript set for analysis by R-SAP.
Figure 3.2. Chimeric transcript detection and characterization by R-SAP. Assembled contigs (black box) representing chimeric transcripts will produce discrete or
fragmented alignments (blue and grey boxes) when mapped to the reference genome. It
will result in the alignment structure where fragments of the assembled contigs will map
to the genomic locations (e.g. chrA and chrB) underlying the fusion-gene formation. This
structure is also called as ‘split-mapping’ of the contig. R-SAP detects split-mapping and
then compares the alignment coordinate of each fragment with the genomic coordinates
of the known reference transcripts (shown in green boxes). Based on the fusion-point
mapping (vertical orange bar on the top), R-SAP can determine the transcripts regions
(such as CDS or UTRs) are involved in the gene-fusion.

55
Chimeric transcripts that were detected and characterized by R-SAP were
subjected to additional stringent filtering in order to minimize potential assembly and
alignment errors. First, to ensure the validity and significance of the alignment, chimeric
transcript fragments were required to be at least 25 bp long and to have an alignment
identity of >95%. Chimeric transcripts with fragments mapping to the same gene were
discarded as potential library artifacts. Similarly, fusion-gene events between two
paralogous genes [as determined using BioMart for Ensembl genes, see: (Flicek et al.
2014)] were also discarded because they may potentially represent alignment errors.
Additional potential chimeric transcripts were discarded if either component
fulfilled at least one of the following filtering criteria: a) Maps to mitochondrial or Y
chromosome; b) Overlaps with genome assembly gaps or maps within 100k bps of
centromere or telomeres (assembly gaps, centromere and telomere coordinates were
obtained from UCSC genome database); c) Maps to genomic region containing ribosomal
RNAs (defined by UCSC genome database); d) Has >50% overlap with the genomic low-
complexity or simple repeat regions (determined by RepeatMasker track in the UCSC
genome table browser).
In order to further filter potentially miss-assembled chimeric contigs, we aligned
the original RNA-Seq reads to the chimeric transcripts using Bowtie (Langmead et al.
2009) in single-end mode and retained only those contigs that had support of at least two
sequencing reads at the fusion breakpoint (Figure 3.3). We also aligned sequencing reads
to the reference genome using Bowtie2 (Langmead and Salzberg 2012) and defined a
chimeric transcript to be supported by mate-pairs if both mates of the same pair map to
the genomic locations involved in the fusion event. We required that each chimeric
transcript be supported by at least two sets of mate-pairs.

56
Chimeric transcripts are generally considered to be in low abundance in the
human transcriptome (Frenkel-Morgenstern et al. 2012). Ninety-five percent (52/55) of
our samples exceeded the sequencing depth of 100 million reads recommended for
optimal detection of low abundance transcripts (Robertson et al. 2010). In addition, the
correlation between the number of reads in the RNA-Seq library and the number of
filtered chimeric transcripts was insignificant (R=0.24, p-value > 0.05) further indicating
our estimates of chimeric transcripts are independent of depth of sequencing coverage.
4. Expression quantification:
RNA-Seq reads were mapped to the transcript sequences using Bowtie and
abundance estimation (raw read counts for each assembled contig) was carried out using
Figure 3.3. Re-confirmation of chimeric transcripts. In order to remove chimeric
transcripts resulting from potential mis-assemblies, we looked for the support for
chimeric transcripts (green-orange boxes) in the original RNA-Seq reads (black boxes).
RNA-Seq reads were mapped to the chimeric transcripts and reads spanning the fusion-
junction (vertical red box) were counted. Reads were also mapped to the reference
genome and the occurrence of mate-pairs mapping to the genomic locations underlying
the gene-fusions confirmed. We consider a chimeric transcripts as ‘confirmed’ if there are
at least two reads supporting the fusion-junction and at least two mate pairs supporting
the genomic alignment of the chimeric transcript.

57
RSEM ((RNA-Seq by Expectation Maximization) (Li and Dewey 2011). In order to
compare the expression across the samples, raw read counts were normalized using the
‘Upper Quartile’ normalization method proposed by Bullard et al (Bullard et al. 2010).
For additional details see Supplemental Methods.
Results
An average of 35 chimeric transcripts per sample were detected in cancerous and
normal breast tissue samples
We analyzed RNA-Seq data from 45 breast adenocarcinoma primary tumors and
10 normal breast tissue samples downloaded from the TCGA project database
(https://tcga-data.nci.nih.gov/tcga/). The RNA-Seq data (Table B.1) were generated by
sequencing total RNA libraries on the Illumina HiSq2000 system in paired-end mode.
The raw data consisted of 50 bp long paired-end reads with an average of 170 million
(from 47 million minimum to 374 million maximum; see Figure 3.4). We developed an
integrated computational workflow that included the ABySS (Simpson et al. 2009) and
Trans-ABySS (Robertson et al. 2010) algorithms to generate long (>800 bp) contiguous
sequences or “contigs”. De novo assembly (see Methods) of 7.8 billion 50 bp long reads
from the 55 RNA-Seq libraries resulted in 12.8 million contigs (an average of 233,000
contigs per samples) with an average length of 860 bps (Table B.1). The R-SAP
algorithm (Mittal and McDonald 2012) was incorporated into the workflow to identify
and characterize chimeric transcripts (Figure 3.1).

58
After subjecting the putative chimeric transcripts to a stringent set of filtering
criteria (see Methods), 2461 high-confidence chimeric transcripts remained. Of these,
nearly 21% were Immunoglobulin (Ig) gene fusions likely due to infiltrating T-cells in
breast tissue and were excluded from further analysis. After this additional filtering,
1959 chimeric transcripts remained with an average of 35 chimeric transcripts per sample
(3 minimum to 121 maximum) (Figure 3.5). We compared chimeric transcripts across all
normal and cancer samples by comparing the genomic alignment coordinates of each
partner fragment of the chimeric transcript and allowing up to six base pairs to vary
around the breakpoint. Out of the 1959 identified chimeric transcripts, 1535 were
detected only in the cancer samples, 155 were detected only in the normal samples and
269 were detected in both the normal and cancer samples (Figure. 3.6A).
Figure 3.4. Sequencing coverage distribution across samples. The X-axis displays the
55 breast tissue samples analyzed in the study and y-axis presents the number of reads in
millions in each sample.
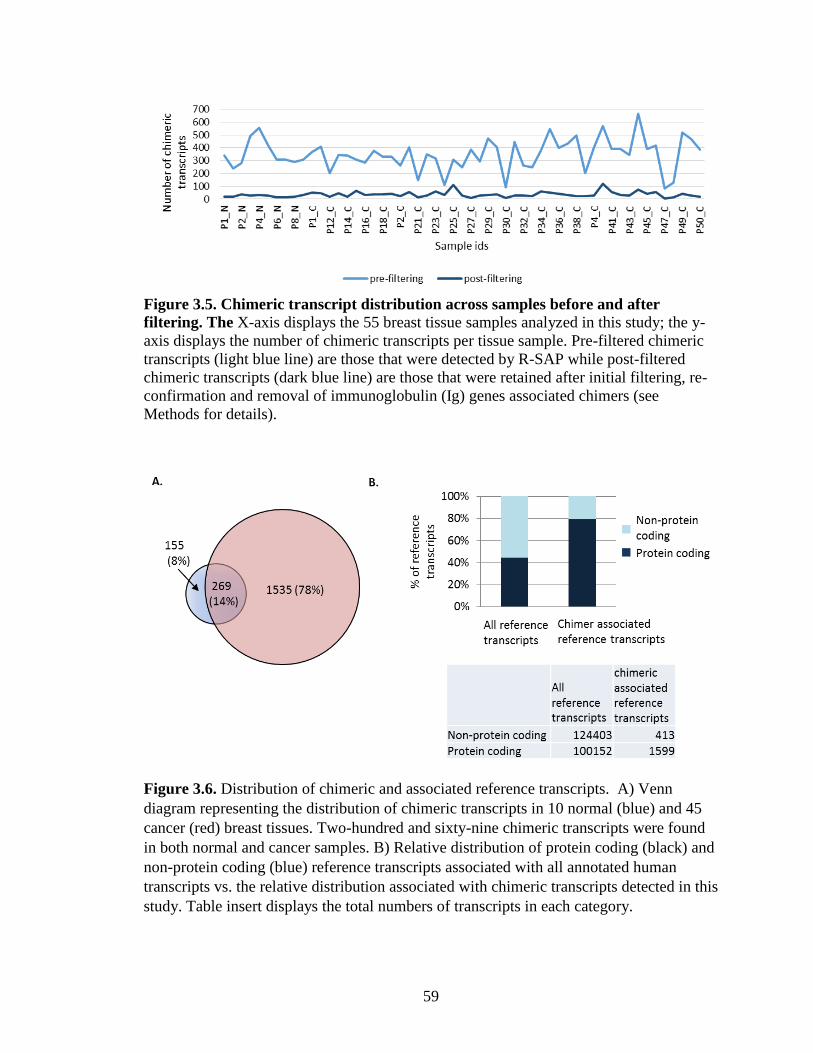
59
Figure 3.6. Distribution of chimeric and associated reference transcripts. A) Venn
diagram representing the distribution of chimeric transcripts in 10 normal (blue) and 45
cancer (red) breast tissues. Two-hundred and sixty-nine chimeric transcripts were found
in both normal and cancer samples. B) Relative distribution of protein coding (black) and
non-protein coding (blue) reference transcripts associated with all annotated human
transcripts vs. the relative distribution associated with chimeric transcripts detected in this
study. Table insert displays the total numbers of transcripts in each category.
Figure 3.5. Chimeric transcript distribution across samples before and after
filtering. The X-axis displays the 55 breast tissue samples analyzed in this study; the y-
axis displays the number of chimeric transcripts per tissue sample. Pre-filtered chimeric
transcripts (light blue line) are those that were detected by R-SAP while post-filtered
chimeric transcripts (dark blue line) are those that were retained after initial filtering, re-
confirmation and removal of immunoglobulin (Ig) genes associated chimers (see
Methods for details).

60
Chimeric transcripts were classified based on structural and functional criteria
A detailed characterization of all chimeric transcripts identified in this study was
carried out using the R-SAP algorithm (Mittal and McDonald 2012) and employing a
comprehensive set of 224,555 reference transcripts (Ensembl version 73 and lncRNAs,
see Methods). Most (98.82%) of the cancer-specific chimeric transcripts overlapped with
at least one reference transcript. Overall 2,012 reference transcripts (corresponding to
1,917 genes) were associated with chimeric transcripts across all breast cancer samples
(Table B.2). Interestingly, the proportion of protein coding reference transcripts
associated with chimeric transcripts was significantly greater (Fisher’s exact test p <
0.0001) than the proportion associated with the entire reference annotation set (Figure
3.6B). This suggests that protein-coding transcripts may be preferentially selected in the
formation of chimeric transcripts.

61
Figure 3.7. Hierarchical classification system for chimeric transcripts. Chimeric
transcripts are depicted as a black-grey box, reference transcripts are represented by blue
and green boxes where thick boxes represent open-reading-frames and thin boxes
represent 5’ and 3 UTRs. An Inter-genic chimera (A) is defined as a chimeric transcript
where components map independently to annotated genes; A ‘gene-desert-I’ chimera
(B) is defined as a chimeric transcript where one component maps to a gene-desert region
(black box) while the other maps to an annotated gene (green); A ‘gene-desert-II’
chimera (C) is defined as a chimeric transcript where both components map to gene-
desert regions. A gene-desert region is defined as the genomic region devoid of any
annotated genes within 5kb of the transcript.
5kb gene-desert region
5kb 5kb 5kb 5kb
gene-desert region gene-desert region
Gene-desert-I
Gene-desert-II C.
Chimeric transcript
3’ UTR
5’ UTR 3’ UTR 5’ UTR
Inter-genic A.
B.

62
To more accurately characterize chimeric transcripts and infer potential functional
significance, we first established a hierarchical classification system (Figure 3.7) where
the chimeric transcripts were divided into three major classes: inter-genic-where the
chimera is composed of two annotated genes; gene-desert-I where the chimera is
composed of one annotated gene and a sequence from an un-annotated or “gene desert”
region (lacking any annotated gene within a 5kb radius); and gene-desert-II where the
chimera is comprised of sequences from two distant ‘gene-desert’ regions. Overall, the
vast majority (>80%) of chimeric transcripts were inter-genic while <18% were gene-
desert-I chimers. Only ~1% of the chimers were comprised of two un-annotated
transcripts (gene desert-II) (Figure 3.8).

63
Figure 3.8. Relative distribution of inter-genic, gene-desert-I and gene desert-II in
(A) cancer samples, (B) in normal tissue samples, and (C) in both cancer and normal
tissue samples. Classification scheme is described in Supplementary Figure 3.3.
A. B.
C.

64
Figure 3.9. Structure based functional classification of chimeric transcripts. Chimeric
transcripts are represented by black and grey boxes; reference transcripts are represented by
blue and green boxes where thick boxes represent exons, gaps represent introns and thin
boxes represent the 5’ and 3’ UTRs. Functional classifications are established by comparing
the reference genome alignment coordinates of chimeric transcript regions (5’UTR, coding
regions or 3’UTR) of the reference transcripts involved in the fusion (spanned by the
chimeric transcript). A) Fusion-protein- Fusion of protein coding sequences from two
different annotated genes where open-reading frames remain intact; B) 5’ UTR- Fusion of 5’
UTR from a gene or gene-desert region with protein coding region of another gene keeping
the open-reading frame intact; C) 3’ UTR – Fusion of a 5’ and protein coding region of a
gene with the 3’ UTR of another gene or gene-desert region keeping the open-reading frame
intact; D) Cryptic splice-site- A novel splice-variant chimera where the breakpoint lies
within a known intron. This group may include inter-genic and gene-desert-I chimeras; E) 3’
truncated-protein- Fusion transcript where the 5’ and coding (in frame) region of one gene is
combined with an out-of-frame coding region of another gene or with the 3’ region of a gene
desert region; F) Novel-RNA- Non-canonical chimeric transcript formation where the
potential function of the transcript, if any, is unknown (e.g., 5’UTR-3’UTR fusions). This
group also includes out-of-frame truncated fusion-protein transcripts.

65
We further classified the detected chimeras into 5 functional sub-categories
(Figure 3.9): A) Fusion-protein- Chimeric transcripts that combine protein coding
sequences (CDS) from two different annotated genes while keeping the open-reading
frames intact; B & C) 5’ or 3’ UTR- UTR exchange from another gene or gene-desert
region in such a way that the original protein-coding region of the chimera remains intact.
This group may include inter-genic and gene-desert-I type chimeras (Figure 3.7); D)
Cryptic splice-site- A novel splice-variant chimera where the breakpoint lies within a
known intron. This group may include inter-genic and gene-desert-I chimeras; E) 3’
truncated-protein- The in-frame coding sequence of the upstream (5’) gene in the chimera
is partially included (truncated) while the coding region of the 3’ gene is not in frame.
This group may include inter-genic and gene-desert-I chimeras; and F) Novel-RNA-
Non-canonical chimeric transcript formation where the potential function of the
transcript, if any, is unknown (e.g., 5’UTR-3’UTR fusions). This group also includes
out-of-frame truncated fusion-protein transcripts. The distribution of the identified cancer
specific chimeras in each of these functional groups is displayed in Figure 3.10A, Table
3.1; see also Tables B.3, B.4).
Table 3.1. Distribution of breast cancer specific chimeric transcript across multiple
structural and functional classes.
inter-genic gene-desert-I gene-desert-II Total
fusion-protein 79 NA NA 79
3' truncated-protein 286 133 NA 419
5' UTR-change 41 4 NA 45
3'UTR-change 145 21 NA 166
cryptic splice-site 289 78 NA 367
novel RNA 400 41 18 459
Total 1240 277 18

66
A.
B.
C.
Figure 3.10. Relative distribution of functional classes of chimeric transcripts present. A)
only in cancer tissue samples; B) only in normal tissue samples; and C) in both normal
and cancer samples.
67
Out of 1535 cancer specific chimers, 5% (79/1535) are fusion-proteins, 3%
(45/1535) are 5’ UTR changes and 11% (166/1535) are 3’ UTR changes. Cryptic splice-
site chimeras are the most abundant class of fusion transcripts (29%, 441/1535). The next
most frequent classes were the 3’ truncated-protein (27%, 419/1535) and novel-RNAs
(25%, 385/1535) (Figure 3.10A). These relative proportions were generally maintained in
the normal specific and overlap class of chimeras (Figure 3.10B, C).
Some fusion-protein transcripts recur across cancer patient samples
Although the functional significance of chimeric transcripts cannot be
unambiguously determined without experimental validation, the recurrence of chimeric
transcripts across multiple patients is sometimes taken as tentative indication of
biological significance (Mitelman 2000). For example, the KRI1-ATRX chimeric
transcript is the most frequently observed chimeric transcript in our study (present in nine
cancer and one normal samples). It involves a fusion between a partial ORF associated
with the KRI1 (KRI 1 homolog) gene and the DEAD helicase domain from the ATRX
(ATP-dependent helicase ATRX) gene. The DEAD box helicases are a family of proteins
involved in ATP hydrolysis dependent DNA and RNA unwinding that, in-turn, regulates
RNA expression and its translational efficiency (e.g., (Tanner and Linder 2001). The
frequency of recurrent chimeric transcripts across cancer samples is shown in Figure 3.11
and Table B.5.

68
Seventy-nine cancer-specific fusions encode protein-coding domains where the
ORFs are maintained
We identified 79 breast cancer specific chimeric transcripts where the fusion
occurs within the protein coding regions of the two participating genes and the open-
reading frames are maintained (Figure 3.10A; Table 3.1). We analyzed the protein coding
domains in these 79 fusion-protein chimeric transcripts using the SMART [simple
modular architecture research tool; (Letunic et al. 2012)] . We found that 38% (30/79) of
the fusion-protein chimers contained functional domains for both genes involved in the
chimera formation (Table B.6). Interestingly, 50% (15/30) of these protein coding fusion-
chimeras involved the novel joining of a signal peptide (2/15) or a trans-membrane
domain (13/15) with a protein coding domain not previously associated with these
functional groups. Signal peptide sequences are components of proteins that are
normally secreted from cells (von Heijne 1985). Trans-membrane (TM) domains are
signaling, transport and subcellular localization components of proteins that are critical to
a variety of inter- and intracellular interactions (Deutsch et al. 2008; Roth et al. 2008; Gui
Figure 3.11. Recurrence of breast cancer associated chimeric transcripts across
patient samples. Shown is the percentage of all cancer chimeric transcripts detected in
one or more cancer patient samples. The vast majority of chimeric transcripts are specific
to individual patients. Inset details the distribution of transcripts found in more than one
sample.

69
and Hagenbuch 2009). Mutations resulting in the gain or loss of TM domains are known
to have a significant effect on cellular functions and molecular interactions (Maeda et al.
2005). Of the 15 chimers associated with signal peptide/TM domain sequences, 12 are
fusions with protein coding sequences (COL27A1, IGFBP4, KDM5A, MDM1, NAP1L2,
NHP2L1, NMT2, PAXIP1, RP11-433C9.2, SMARCA4, STXBP6 and TRIO) not
previously associated with these signaling functions (Figure 3.12).

70

71
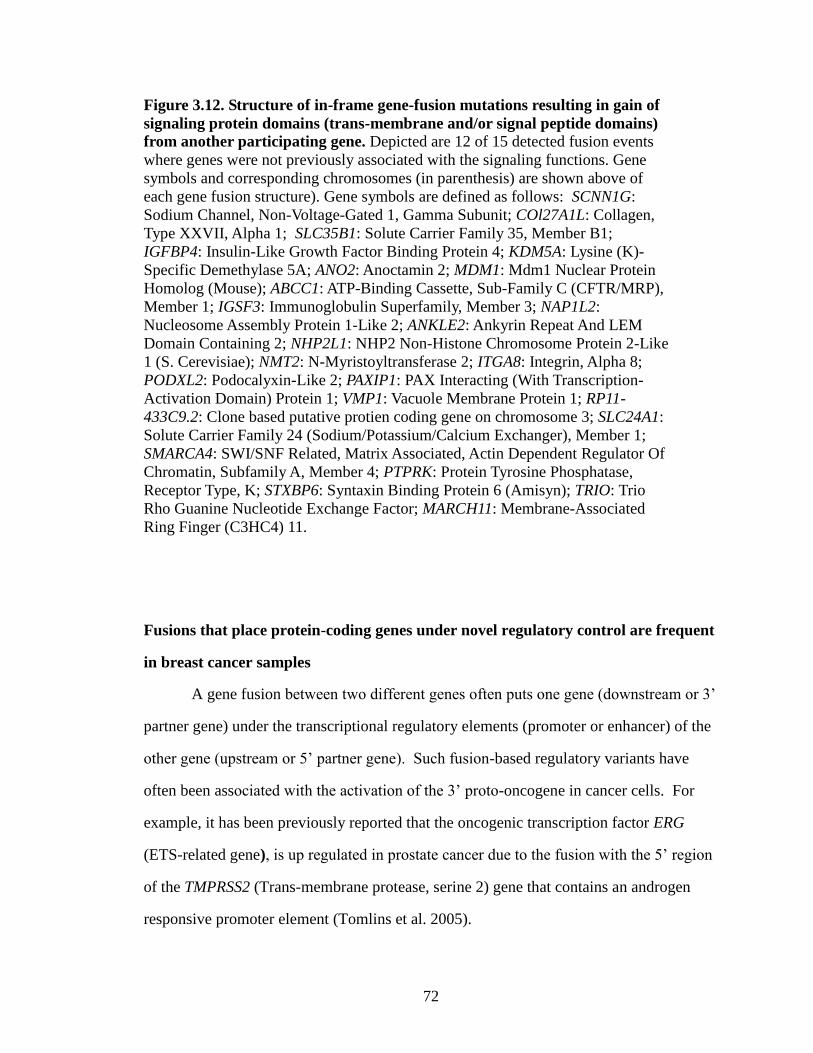
72
Fusions that place protein-coding genes under novel regulatory control are frequent
in breast cancer samples
A gene fusion between two different genes often puts one gene (downstream or 3’
partner gene) under the transcriptional regulatory elements (promoter or enhancer) of the
other gene (upstream or 5’ partner gene). Such fusion-based regulatory variants have
often been associated with the activation of the 3’ proto-oncogene in cancer cells. For
example, it has been previously reported that the oncogenic transcription factor ERG
(ETS-related gene), is up regulated in prostate cancer due to the fusion with the 5’ region
of the TMPRSS2 (Trans-membrane protease, serine 2) gene that contains an androgen
responsive promoter element (Tomlins et al. 2005).
Figure 3.12. Structure of in-frame gene-fusion mutations resulting in gain of
signaling protein domains (trans-membrane and/or signal peptide domains)
from another participating gene. Depicted are 12 of 15 detected fusion events
where genes were not previously associated with the signaling functions. Gene
symbols and corresponding chromosomes (in parenthesis) are shown above of
each gene fusion structure). Gene symbols are defined as follows: SCNN1G:
Sodium Channel, Non-Voltage-Gated 1, Gamma Subunit; COl27A1L: Collagen,
Type XXVII, Alpha 1; SLC35B1: Solute Carrier Family 35, Member B1;
IGFBP4: Insulin-Like Growth Factor Binding Protein 4; KDM5A: Lysine (K)-
Specific Demethylase 5A; ANO2: Anoctamin 2; MDM1: Mdm1 Nuclear Protein
Homolog (Mouse); ABCC1: ATP-Binding Cassette, Sub-Family C (CFTR/MRP),
Member 1; IGSF3: Immunoglobulin Superfamily, Member 3; NAP1L2:
Nucleosome Assembly Protein 1-Like 2; ANKLE2: Ankyrin Repeat And LEM
Domain Containing 2; NHP2L1: NHP2 Non-Histone Chromosome Protein 2-Like
1 (S. Cerevisiae); NMT2: N-Myristoyltransferase 2; ITGA8: Integrin, Alpha 8;
PODXL2: Podocalyxin-Like 2; PAXIP1: PAX Interacting (With Transcription-
Activation Domain) Protein 1; VMP1: Vacuole Membrane Protein 1; RP11-
433C9.2: Clone based putative protien coding gene on chromosome 3; SLC24A1:
Solute Carrier Family 24 (Sodium/Potassium/Calcium Exchanger), Member 1;
SMARCA4: SWI/SNF Related, Matrix Associated, Actin Dependent Regulator Of
Chromatin, Subfamily A, Member 4; PTPRK: Protein Tyrosine Phosphatase,
Receptor Type, K; STXBP6: Syntaxin Binding Protein 6 (Amisyn); TRIO: Trio
Rho Guanine Nucleotide Exchange Factor; MARCH11: Membrane-Associated
Ring Finger (C3HC4) 11.

73
For the 79 fusion-protein chimeric transcripts in cancer, we estimated the fold-
change in gene expression of the 3’ partner genes involved in the fusion relative to their
expression in their normal configurations (i.e., non-chimeric) by comparing the
expression of each of the 3’ partners with the expression of each corresponding non-
chimeric reference transcript in a reference expression database (see Methods). We
found that 24% (19/79) of the 3’ partners displayed a ≥ 2-fold expression increase in
cancer for at least one protein coding domain (Table B.7). Several of the genes involved
in these up-regulated fusions have been previously identified as either cancer biomarkers
or as potential therapeutic targets. For example, the B4GALNT2 (Beta-1,4 N-
acetylgalactosaminyltransferase 2) gene, the 3’ partner in the THRA (Thyroid Hormone
Receptor, Alpha)-B4GALNT2 fusion, has been previously proposed as a prognostic
biomarker of breast cancer (Patani et al. 2008) and is reported to be up regulated in
colorectal and metastatic prostate cancer (Kudo et al. 1998; Barthel et al. 2008). The
ABCC3 (canalicular multispecific organic anion transporter 2) gene, the 3’ partner in the
MED1 (Mediator Complex Subunit 1)-ABCC3 fusion, is known to efflux therapeutic
compounds resulting in multidrug resistance in cancer cells (Dean 2009; Fletcher et al.
2010).
Another class of fusions that may be expected to alter patterns of gene expression
involves the exchange of 5’ or 3’ un-translated leader regions (UTRs) of intact protein
coding sequences. For example, alteration in the poly-A tail attached to 3’UTR and
removal of 5’ cap (7-methyle guanosine) may promote mRNA decay and hence overall
turnover in the cell (Mignone et al. 2002). Additionally, fusions involving the exchange
of a 5’UTR may place a gene under the control of a novel promoter. For example,
chromosomal rearrangements involving UTRs that result in high level expression of ETS
(E26 transformation-specific) gene family members are common events in human
prostate cancer (Tomlins et al. 2005). Similarly, changes in the 3’UTR can alter
microRNA target binding sites leading to changes in the gene expression. For example, in

74
glioblastoma, the FGFR3 (fibroblast growth factor receptor 3) gene has been shown to
escape regulation by the miR-99a microRNA due to a fusion with the 3’UTR of the
TACC3 (Transforming, Acidic Coiled-Coil Containing) gene (Parker et al. 2013).
In our analysis, 14% (211/1535) of chimeras detected in our breast cancer
samples consisted of un-disrupted protein coding sequences fused with heterologous
UTRs. Nearly 21% (45/211) of these are 5’UTR fusions while 79% (166/211) are fusions
with 3’UTRs (Figure 3.10A, Table 3.1). Most (88%, 186/211) of the UTRs were
interchanged between two known genes but 12% of the chimers involved the UTRs of
known coding sequences with sequences from un-annotated ‘gene-deserts’ regions of the
genome (Table 3.1).
We estimated the effects of 5’ and 3’ UTR changes on gene expression by
measuring the fold-change in the expression level of each UTR-protein coding gene
fusion in the cancer samples relative to the protein-coding gene’s average level of
expression in our normal samples (see Methods and Supplemental Methods). The results
indicate that 54 of the UTR-protein coding fusion genes are ≥ 2-fold up-regulated relative
to their wild-type counterparts in normal cells (Figure 3.13; Table B.8). Several of the up-
regulated genes encode transcription factors previously implicated in cancer. For
example, the epigenetic transcriptional regulator proteins CBX3 (chromobox homolog 3)
and CBX4 (chromobox homolog 4) were up regulated in our cancer samples due to
alternative 3’UTRs obtained by gene-fusion. CBX3 has been previously identified as a
potential biomarker for tumor stem cells in osteosarcoma (Saini et al. 2012), while CBX4
has been reported to induce hypoxia-mediated activation of VEGFA (vascular endothelial
growth factor A) and angiogenesis in hepatocellular carcinomas (Li et al. 2014). Another
chimeric transcript up regulated in our cancer samples is a fusion of the transcriptional
regulator-encoding gene, RARA (retinoic acid receptor, alpha), with the 3’ UTR from the
PSME3 (proteasome activator subunit 3) gene. Interestingly, an analogous reciprocal
translocation between the RARA with PML (promyelocyctic leukemia) genes has been

75
previously associated with the primary cytogenetic abnormality leading to acute
promyelocytic leukemia (Reiter et al. 2004).
In our breast cancer samples, 17 genes were estimated to be ≥ 2-fold down-
regulated due to the fusion with novel UTRs (Table 3.1, Figure 3.13, Table B.8). For
example, a fusion between the PTEN (phosphatase and tensin homolog) and the 3’ UTR
of the PIK3C2A (Phosphatidylinositol-4-Phosphate 3-Kinase, Catalytic Subunit Type 2
Alpha) gene resulted in the down regulation of PTEN >2-fold in our cancer samples.
PTEN is a well-known tumor suppressor gene that displays loss-of-function mutations in
many cancers in (e.g., (Chen et al. 2005b).
Other protein coding genes involved in UTR fusions in our cancer samples that
have been previously associated with cancer onset and/or progression are the interferon
gamma receptor 1 (IFNGR1) gene (Duncan et al. 2007), the period circadian clock 2
(PER2) gene (Chen et al. 2005a; Gery et al. 2007), the chloride intracellular channel 4
(CLIC4) gene (Suh et al. 2012), the sorbin and SH3 domain containing 2 (SORBS2) gene
(Alsafadi et al. 2011) and the eukaryotic translation initiation factor 2-alpha kinase
encoding (EIF2AK2) gene (Vorburger et al. 2004; Lee et al. 2013).
Figure 3.13. Gene-expression change due to fusion with heterologous UTRs. Chimera
formation can result in the altered 5’UTR or 3’UTR while keeping the original ORF
intact. Histograms display the number chimeric transcripts where the protein-coding
genes are up-regulated (red) or down-regulated (green) by >2 fold in breast cancer
samples relative to the protein-coding genes (native state) in normal breast tissue.

76
A number of chimeric transcripts include sequences from gene desert regions of the
genome
Previous studies have shown that the human genome is more pervasively
transcribed than previously thought (Consortium et al. 2007). For example, the recent
ENCODE (Encyclopedia of DNA Elements) data release suggests that nearly 80% of the
human genome displays transcriptional functionality in a cell type specific manner (Qu
and Fang 2013). Although many of these transcripts are derived from annotated protein-
coding genes, others may represent long non-encoding RNAs or other non-encoding
regulatory RNAs of currently undetermined function. In our cancer samples, we
identified 338 ‘gene-desert’ chimeras where either one (319, gene-desert-I) or both
components (19, gene-desert-II) of the chimeric transcript maps to the ‘gene-desert’
regions of the genome (Figure 3.9, Table B.9).
We obtained transcription factor binding site (TFBS) predictions based on Chip-
Seq data from the ENCODE project [https://genome.ucsc.edu/ENCODE/; (Rosenbloom
et al. 2013)] for five breast or mammary cell lines (HMEC, HMF, MCF-7, MCF10A-Er-
Src, T-47D). We then searched for active TFBS in the ENCODE database at positions
proximal to gene-desert regions involved in our chimeric transcripts. Since most TFBS
are present within 8kb of the transcription start site of regulated genes (Koudritsky and
Domany 2008), we considered only those TFBS mapping within 8kb of the gene desert
transcripts (Figure 3.14A). Interestingly, all (100%, 319/319) of the gene-desert regions
involved in chimer formation had at least one active TFBS within 8KB of the transcript.
Also, we found that the gene-desert chimeric regions are distributed at distances form
TFBS similar to that observed for annotated reference transcripts (Figure 3.14B). These
findings support the contention that actively transcribed transcripts mapping to gene
desert regions of the genome participate in chimera formation. However, since neither the
structure nor the function of transcripts mapping to these gene-desert regions are
currently known, the potential functional significance of gene-desert chimeras also

77
remains undetermined. Nevertheless, the fact that 9% (28/319) of gene desert chimeric
transcripts involve the fusion of know protein coding sequences with UTRs from gene
desert regions suggests that at least some of these chimeras may represent significant
regulatory variants.
Figure 3.14. Detection of transcription factor binding sites (TFBS) in proximity to
gene-desert regions involved in chimera formation. A. A search was carried out for
documented transcription factor binding sites (TFBS; grey box) within 8kb from gene-
desert transcripts (black box) involved in breast cancer gene fusions. B. At least one
active TFBS is located within 8 KB of gene-desert transcripts involved in gene-fusions in
cancer. The distribution of the locations of TFBS from the gene-desert transcripts (red
line) is identical to that associated with annotated reference transcripts (blue line). The x-
axis is the distance in kilobases of a TFBS detected from a transcript; the y-axis is the
percentage of transcripts with a specific TFBS distance corresponding to X-axis.
5kb gene-desert region
TFBS
8kb Known gene
A.
B.

78
Comparative analysis of chimeric transcripts in normal and cancer samples
identifies potential pro-neoplastic genes
Comparison of chimeric transcripts across all normal and cancer samples was
carried out by comparing the genomic alignment coordinates of each partner fragment of
the chimeric transcript and allowing up to six base pairs to vary around the breakpoint.
Although 88% (1716/1959) of all chimeric transcripts detected were found in the cancer
samples and only 12% (243/1959) in the normal samples, this is largely attributable to the
disproportionate number of samples examined (45 cancer vs. 10 normal). When the
average number of chimers detected per sample is compared, the differences are less
dramatic (normal: 24/sample; cancer: 38/sample) albeit still significant (Student’s t-test
p<1.05E-03).
The unexpected abundance of chimeric transcripts in normal samples and the fact
that the majority of these (> 60%, 269/424; see Figure 3.6) were also present in the
cancer samples, led us to explore these chimerics in more detail. It is possible that at least
some of the chimeric transcripts detected in normal tissue may represent “pro-neoplastic”
fusions whose cancer causing potential is at least partially repressed in normal cells (i.e.,
oncogene expression repressed; tumor suppressor potential amplified). For example,
chimeric transcripts of the well-studied chronic myeloid leukemia causing BCR-ABL
fusion gene have been detected at low levels in the blood cells of healthy individuals as
well (Boquett et al. 2013). Similarly, the anti-apoptotic chimeric transcript comprised of
the zinc finger genes JAZF1 (JAZF zinc finger 1) and JJAZ1 (also known as SUZ12 or
SUZ12 polycomb repressive complex 2) is highly expressed in nearly 50% of all
endometrial stromal sarcomas (Koontz et al. 2001; Hrzenjak et al. 2005), but has also
been detected at low levels in normal endometrial stromal cells as well (Li et al. 2008).
We detected 269 chimeric transcripts that were shared between our normal and
breast cancer samples. Of these, 4 were identified as in frame fusion-protein coding
transcripts of potential pro-neoplastic significance (ZBTB47-FGD1, KRI1-ATRX,

79
CACNA1D-CTNNBL1, and SCAF4-TNRC6A) (Figure 3.15, Table B.10). RNA-Seq reads
were mapped to the assembled contigs representing each of these 4 chimeras and read
counts were estimated using RSEM (RNA-Seq by Expectation Maximization) (Li and
Dewey 2011) and normalized using upper-quartile normalization (Bullard et al. 2010)
(see Methods). Two of the chimeras (ZBTB47-FGD1 and KRI1-ATRX) displayed a >2.5-
fold increase in expression in cancer relative to the normal samples (Figure 3.15A & B;
Table B.10). A third chimera (SCAF4-TNRC6A) displayed a 1.3-fold increase in
expression in the cancer samples while a fourth fusion (CACNA1D-CTNNBL1) displayed
a decrease in expression in the cancer samples (Figure 3.15 C, D; Table B.10).
In the ZBTB47-FGD1 chimeric transcript, a BTB/POZ domain (BR-C, ttk and bab
domain/Pox virus and Zinc finger virus and zinc finger domain) from ZBTB47 (Zinc
Finger And BTB Domain Containing 47) is fused with the RhoGEF (a.k.a., the Dbl
homologous domain), PH (pleckstrin homology) and FYVE domains from FGD1.
Interestingly, a previously identified oncogenic fusion gene (Dbl) was also found to
contain a RhoGEF domain whose over-expression is essential to the Dbl gene’s
oncogenic potential (Cerione and Zheng 1996). Over expression of FGD1 has also been
previously associated with cancer progression in prostate and breast cancer (Ayala et al.
2009). The 3’ member of the KRI1-ATRX fusion (ATRX) has been previously associated
with childhood neuroblastoma (Cheung et al. 2012) and the 3’ member of the CACNA1D-
CTNNBL1 fusion (CTNNBL1), is associated with an anti-apoptotic, tumor suppressive
function (Suzuki et al. 1997; Jabbour et al. 2003) consistent with its reduced expression
in our breast cancer samples.

80
Figure 3.15. Potential pro-neoplastic gene-fusions that are functionally suppressed
in normal breast tissues but activated in cancer tissues. Shown is the structure of four
gene-fusions and associated protein domains that we have characterized as potential pro-
neoplastic fusions. Square boxes with numbers represent exons (5’ gene: orange, 3’ gene:
blue); exons not shown in the figure are represented by a dashed empty box; the red star
represents the fusion point for each chimera; gene symbols and (chromosomal location),
as well as, the number of each fusion transcript detected in normal (N) and cancer (C)
samples is presented above each gene-fusion structure. Protein domains are displayed
under each structure. Histograms on the right display average expression levels of the 3’
members of the fusions in their native or parental (pre-fusion) genes in normal samples
(blue) and the expression of the fusion transcript in cancer samples (orange) bar. Fold
change is shown under each expression plot. All of the 3’ partners of these fusion
transcripts have been previously associated with cancer progression (see text for details).

81
Discussion
The oncogenic potential of gene fusions and fusion transcripts was first
recognized in malignant hematological disorders and childhood sarcomas (Mitelman et
al. 2004). In recent years, the importance of fusions in the onset and progression of a vast
diversity of solid tumors has become more widely appreciated. The rapidly growing
awareness of the extensiveness and potential importance of fusion transcripts in cancer
has been facilitated by the high-throughput transcriptome sequencing of a broad spectrum
of cancer types. The Cancer Genome Anatomy Project (http://cgap.nci.nih.gov/) currently
lists well over 1800 fusions identified in > 63,000 cancer patient samples and it has been
estimated that gene-fusions account for > 20% of human cancer morbidity (Mitelman et
al. 2007).
We present here an integrated computational workflow that not only allows
accurate detection of chimeric transcripts to nucleotide level resolution but also facilitates
detailed molecular characterization and quantitative analysis. We employed this
workflow to analyze 55 breast transcriptomes that, to our knowledge, is the first such
study to explore global patterns and characteristics of chimeric transcripts in any tumor
using a de novo assembly approach.
Since the de novo assembly approach allows for construction of long contigs
capable of traversing multiple exons, we were able to map each known gene associated
chimer to a specific splice-variant. Accurate mapping followed by hierarchical structural
and functional classification enabled us to systematically infer the potential functional
role and biological significance of a number of novel chimeric transcripts. While prior
RNA-Seq based studies have focused primarily on the canonical gene fusion structures of
fusion-protein and UTR associated alterations, our de novo assembly based approach
allowed us to explore other classes of fusion structures such as cryptic-splice sites and
non-canonical RNA structures. Although, the potential functional impact of many of
these atypical structures has yet to be determined, their widespread occurrence in our

82
breast cancer samples strongly suggests that this class of chimeric transcripts warrants
further investigation. In total, we identified 105 novel gene-fusions, 13 of which were
detected across multiple patient samples.
Most previously identified gene-fusions in cancer have been associated with
oncogene activation (Kumar-Sinha et al. 2006). Our findings suggest that gene-fusions
can also result in significant down regulation of potentially significant genes. For
example, while we identified 54 examples of genes being up regulated in cancer due to
fusions with heterologous UTRs, an additional 17 such fusions resulted in a significant
down regulation in gene expression including the well-known tumor suppressor gene
PTEN.
Chimeric transcripts are typically associated with cancer cells but their presence
in normal somatic cells is often overlooked. In our study, we identified a number of
fusion transcripts that are present in both normal and cancer tissues but significantly
differentially expressed in these two tissue types. Several of these were identified as
potential pro-neoplastic fusions where domains previously associated with oncogenic
functions were up regulated in cancer while those previously associated with tumor
suppressor functions were down regulated in cancer.
Finally, we detected a large number of chimeric transcripts mapping partially or
completely to genomic regions devoid of any known genes (“gene deserts”). We observe
that the fusion transcripts involving gene-desert regions can result in the fusion of altered
5’ or 3’ UTRs to known protein-coding genes resulting in significant changes in gene
expression. We also detected the fusion of transcripts mapping to two distinct gene-desert
regions giving rise to novel RNA structures of currently unknown significance.
Overall, our de novo assembly approach has revealed an unexpected prevalence
and diversity of chimeric transcripts in breast cancer tissues and underscores the utility of
deep sequencing technologies and improved bioinformatics workflows to uncover novel
and potentially significant chimeric transcripts in cancer and normal somatic tissues.

83
Acknowledgments
The authors thank the Office of Information Technology at Georgia Institute of
Technology for providing access to computing clusters at ‘Partnership for an Advanced
Computing Environment’ (pace.gatech.edu). This work was supported by grants from
Ovarian Cycle, Deborah Nash Endowment Fund, Josephine Robinson Family and J.D.
Rhodes Trust.

84
CHAPTER 4
IDENTIFICATION AND EXPRESSION ANALYSIS OF GENE
FUSIONS AND OTHER STRUCTURAL VARIANTS IN
OVARIAN CANCER USING HIGH-THROUGHPUT
SEQUENCING
Abstract
Genomic rearrangements or structural variants (SVs) are one of the most common
classes of mutations in cancer. We report here the results of an integrated DNA
sequencing and transcriptional profiling (RNA sequence and microarray gene expression
data) analysis of six ovarian cancer patient samples. Matched sets of control (whole
blood) samples from these same patients were used to distinguish cancer SVs of germline
origin from those arising somatically in the cancer cell lineage. We detected 10,034
ovarian cancer SVs (5518 germline derived; 4516 somatically derived) at base-pair level
resolution. Only 11% of these variants were shown to have the potential to form gene-
fusions and, of these, less than 20% were detected at the transcriptional level.
Collectively, our findings indicate that although gene fusions and other SVs may be
important factors in the onset and progression of ovarian cancer, it may not simply be the
occurrence of these variants but their regulation that ultimately determines their
biological and clinical significance.
Introduction
Cancer genomes are characterized by the presence of several classes of somatic
mutations including point mutations, copy number alterations and chromosomal
rearrangements or structural variants (SVs) (Lupski and Stankiewicz 2005; Pleasance et

85
al. 2010). Of these, SVs are the most frequent (Futreal et al. 2004; Stratton et al. 2009;
Edwards 2010) and include tandem-duplications, inversions, deletions, insertions and
inter-chromosomal translocations (Lupski and Stankiewicz 2005). Although cancer
genomes may harbor hundreds to thousands of SVs, only a handful are considered of
potential functional significance, typically involving protein-coding genes (Korbel et al.
2007; Stephens et al. 2009; Hillmer et al. 2011). Functionally significant SVs often
involve gene-fusions that place protein coding genes under novel regulatory controls
and/or result in the generation of novel fusion proteins (Rabbitts 1994; Rowley 2001;
Mitelman et al. 2007). A well-known example is the reciprocal translocation between
chromosome 9 and 22 resulting in expression of the BCR-ABL fusion protein in chronic
myeloid leukemia (Nowell 1962; Rowley 1973; Lugo et al. 1990).
Advances in the application of the paired-end (or mate-pair) approach to high-throughput
sequencing has made genome-wide surveys of genomic rearrangements possible (Korbel
et al. 2007; Bashir et al. 2008; Campbell et al. 2008; Medvedev et al. 2009; Murphy et al.
2012) and recent studies have uncovered a number of new gene fusions and other SVs of
potential functional significance in a variety of cancer genomes (Stephens et al. 2009;
Quinlan et al. 2010; Hillmer et al. 2011; Jiao et al. 2011; Malhotra et al. 2013). However,
the potential importance of gene-fusions and other SVs to cancer onset and progression
would be compromised if these variants were not expressed. Indeed, recent studies have
revealed that “normal” tissues can harbor transcriptionally repressed “pro-neoplastic”
SVs that only become oncogenic when transcriptionally activated (Li et al. 2008). Thus,
to fully evaluate the functional significance of gene fusions and other SVs in cancers,
DNA sequence analyses should ideally be coupled with transcriptional profiling. In an
effort to address this issue in ovarian cancer, we utilized an integrated computational
workflow to analyze DNA sequencing and transcriptional profiling (RNA sequence and
microarray gene expression data) data from six ovarian cancer patient samples. In
addition, DNA sequence data from matched sets of control (whole blood) samples from

86
these patients were used to distinguish cancer SVs of germline origin from those arising
somatically in the cancer cell lineage. We report here the detection of 10,034 ovarian
cancer SVs (5518 germline derived; 4516 somatically derived) at base-pair level
resolution. Only 11% of these variants were shown to have the potential to form gene-
fusions and, of these, less than 20% were detected at the transcriptional level.
Collectively, our results demonstrate the presence of large numbers of germline and
somatically derived gene-fusions and other SVs in ovarian cancer tissues and underline
the importance of processes regulating the expression of gene-fusions in cancer onset and
progression.
Materials and Methods
Sequencing data acquisition
Whole genome sequencing (WGS) data for six ovarian serous
cystadenocarcinoma and matched somatic control (whole blood) samples were selected
from ‘The Cancer Genome Atlas’ (TCGA, http://cancergenome.nih.gov/) data portal
(https://tcga-data.nci.nih.gov/tcga/) using dbGAP in BAM file format (see Supplementary
Methods for more details).
WGS data consisted of a total of nearly 22 billion (minimum 1.3 billion –
maximum 2.54 billion per sample) 75 - 100 bp long paired-end (in forward-reverse
orientation) reads generated from Illumina GAII instrument. RNA-Seq data consisted of
a total of nearly one billion (minimum 105 million - maximum 243 million per sample)
75 bp long paired-end reads generated from Illumina GA II system. Selected samples and
sequencing data is summarized in Table C.1.

87
BAM files containing sequencing data were sorted using Picard tools’ SortSam
and converted to FastQ format using BamToFastQ program
(http://genome.sph.umich.edu/wiki/BamUtil).
Genomic SV Detection using WGS
Massive amount of whole genome sequencing data presents a challenge in
detecting complex structural variants with high-accuracy. In order to accurately detect
and characterize genomic structural variants, we designed a streamlined workflow
(summarized in Figure 4.1).
Figure 4.1. Integrative data analysis workflow for structural variants. The upper
workflow summarizes detection and validation of SVs using whole genome sequence
data. The bottom left workflow summarizes the detection of fusion-transcripts using
RNA-Seq data. The estimation of differential gene-expression using microarray data is
summarized in the bottom right of the figure.

88
The workflow for the WGS data is described as follows:
SV detection:
Overall quality of the WGS reads were assessed using FastQ. Low quality (Q <
20) bases and adapter sequences were removed from the ends of the reads. The remaining
reads were aligned to the human reference genome hg19 (GRCh37 assembly, UCSC
genome database) using Bowtie2 (Langmead and Salzberg 2012). Unmapped reads were
stored in a separate file. PCR duplicates were removed from the alignment files using
Picard tools’ MarkDuplicate program. Since the highly repetitive/low complexity
genomic regions may result in ambiguous or low confidence alignments, we filtered out
all alignments with mapping quality (MAPQ) < 35. Various classes of large structural
variants (SVs) were detected using SVDetect (Zeitouni et al. 2010). The SVDetect
algorithm searches for clusters of paired-ends reads creating distinct signatures of
structural variants in the alignment file. SV signatures are called if anyone or both of the
inherent characteristic of paired-end sequencing constraints (i.e., library insert-size,
alignment orientation of mates relative to each other) are violated. Based on the clusters
of paired-end signatures, the SVs calls are generated and the location of breakpoints is
estimated. Genomic loci involved in a SV (a.k.a.“links”) are required to be supported by
a minimum number of paired-end reads as determined by the sequencing depth of
coverage (Korbel et al. 2009). Since our samples have different sequencing depths of
coverage, different cutoff values were determined for each sample (summarized in Table
C.2).
Filtering:
We observed that more than 50% of the SV calls were ‘small_duplications’ that
could be the result of artifacts generated during the library preparation. Thus, we
conservatively removed such calls as well those described as ‘co-amplicons’ and
‘undefined’ calls generate from ambiguous paired-end signatures. We further removed all

89
the SV calls that had more than 50% overlap with the low-complexity genomic regions.
Since, reference human genome quality is questionable around the centromere and
telomere regions and near the assembly gaps, we also removed SVs mapping within 100
kilo base-pairs of these regions. Finally, we also removed called SVs that mapped either
to mitochondrial or Y chromosome or currently un-localized regions of the genome
(“Un”, “hap”, etc.).
Targeted assembly of SVs:
The paired-end read approach for SV detection does not provide base-pair level
breakpoint information but rather provides genomic regions that may contain potential
breakpoints. Also, short (75 – 100bp) read mapping to the reference genome may
generate false clusters of paired-end reads resulting in false SV calls. In order to confirm
SV calls generated by SVDetect and to detect the breakpoint at the base-pair resolution,
we performed a targeted de novo assembly for each SV call. De novo assembly is
performed by progressively merging redundant DNA sequences with shared overlapping
ends determined by a pre-specified parameter called ‘k-mer’ length. The goal is to
reconstruct the exact DNA sequence underlying the SV. For the assembly of each SV
call, we included sequencing reads mapping within the 500 bps on either side of the
genomic regions involved in an SV call. Also included are reads that initially could not
be mapped to the reference genome. Since a complete assembly cannot be achieved using
single k-mer length, we performed multiple k-mer length assemblies by varying k-mer
from half of the read length (37 to 50 bp) to the complete read length (75 to 100 bps) in 2
bp increments. Multiple k-mer assemblies were performed using ABySS (Simpson et al.
2009) and later merged using Trans-ABySS (Robertson et al. 2010) that also removes
redundant assembled sequences from the assembly. In order to further expand the
assembly set, we performed multiple k-mer assemblies using an additional assembly
program, Velvet (Zerbino and Birney 2008).

90
Validation and breakpoint detection:
Assembled DNA sequences (also called as contigs) were mapped to the human
reference genome (hg19) using the BWA (Li and Durbin 2010) program that can
independently align parts (also known as fragments) of a DNA sequence to discrete
genomic loci. Such mapping is called split-mapping (Figure 4.2). Genomic coordinates
of the paired-end based SV calls from SVDetect were compared with the fragmented
alignments of the assembled contigs and breakpoints were determine for SV calls
supported by the assembly. For each SV, two breakpoints are detected each
corresponding to the genomic locus participating in the SV formation. Validation and
breakpoint detection was carried out by using our previously developed pipeline, R-SAP
(RNA-Seq analysis pipeline) (Mittal and McDonald 2012), that accurately detects
fragmented alignments (split-mapping) representing potential gene-fusions and/or
genomic rearrangements. R-SAP modules were slightly modified to include intragenic
SVs such as deletions and insertions and other complex SV signatures such as
transpositions that were not detected in the original R-SAP configuration. In order to
minimize false SV calls supported by the assembly, the assembled contigs were aligned
to the reference human genome using an additional alignment algorithm SSAHA2 (Ning
et al. 2001), and the SVs again validated again using R-SAP. In this way, we with a
stringently defined set of SVs for which breakpoints could be detected at the base-pair
resolution.

91
Fusion transcript detection using RNA-Seq
RNA-Seq reads obtained from TCGA were initially subjected to quality and
adapter filtering using FastQC and TrimGalore. Reads were then aligned to the reference
human genome in paired-end mode using TopHat using the ‘fusion-search’ mode.
TopHat-fusion (Kim and Salzberg 2011) searches for potential breakpoints using the
‘split-read’ alignment of sequencing reads that are also supported by additional ‘paired-
end’ reads. Potential fusions reported by TopHat were further evaluated using the
reference transcript annotations that we defined as the merged set of Ensembl (version
73) and lncRNAs available from UCSC genome database(Hubbard et al. 2002; Karolchik
et al. 2004; Cabili et al. 2011). We further required that each fusion be supported by at
least one split-read and one paired-end read alignment. We conservatively discarded
fusions where both ends of the fusion were confined to a single gene loci.
Figure 4.2. Validation and breakpoint detection. Assembly of a SV call representing a
translocation event between two chromosomes (green and orange) is illustrated. SV calls
are generated by SVDetect using paired-end signatures (blue and purple boxes represent
paired-mates). Reads mapping to the genomic regions surrounding them (black boxes)
are assembled using de novo assembly that also included initially unmapped reads.
Assembled contigs shown here as a black line represent the DNA sequence underlying
the translocation event. Contigs are mapped back to the reference genome and if split-
mapping is observed, a SV call is considered validated and breakpoints (shown in red)
are considered detected.
chrA chrB
de novo assembly
split-mapping
paired-end signature detection
unmapped
assembled contig

92
Gene-expression analysis
We downloaded gene-expression microarray data for the ovarian cancer samples
using TCGA data portal. Due to the unavailability gene expression data from of our
matched normal or control set, we utilized as a control microarray data form eight
samples collected from healthy ovarian tissue from independent patients (described in
Table C.3).
The microarray expression data was generated by RNA hybridization to the
Affymetrix HT_HG-U133A gene chips and data files were provided in ‘cel’ format.
Expression values were estimated and normalized by the RMA normalization method
from the cel files using Affymetirx Expression Consol. For each gene, average
expression across all of the eight normal samples and the average value is used as the
denominator for the gene expression fold change calculation in ovarian cancer samples.
Results
DNA sequence analyses
More than 10,000 structural variants (SVs) identified in six ovarian cancer patient
samples
DNA sequencing data of matched sets of six ovarian serous cystadenocarcinoma
and six somatic control (whole blood) tissues were downloaded from the ‘The Cancer
Genome Atlas’ (TCGA, http://cancergenome.nih.gov/) data portal (https://tcga-
data.nci.nih.gov/tcga/) using dbGAP in BAM file format. The raw data consisted of 22
billion 75-100 bp paired-end reads (minimum 1.3 billion – maximum 2.54 billion per
sample; Table C.1). An integrated computational workflow was developed to facilitate
the data analysis (Figure 4.1, see Methods for details).

93
Initial alignments resulted in the mapping of 84% of the DNA-Seq reads to the
human reference genome. A subsequent series of stringent filtering and validation steps
(see Methods) resulted in a total of 35,721 SV calls. To confirm these SVs and to
determine breakpoints at base-pair level resolution, targeted de novo assembly was
performed for each SV call (Figure 4.2). After correcting for multiplicity of confirmed
SVs (presence of the same SV across multiple samples), a total of 14,719 unique SVs
were detected across all samples (Table C.4). Of these, 32% (4,685) were uniquely
present in the somatic control (blood) samples, 31% (4,516) were uniquely present in the
cancer samples and 37% (5518) were present in both the control and the cancer samples
(Figure 4.3, Figure 4.4). We classified those SVs detected in both the cancer and somatic
control samples as germline derived cancer variants since the presence of precisely the
same SV in divergent somatic cell types implies a common clonal (germline) origin.
Those SVs detected exclusively in the cancer samples were classified as somatically
derived cancer variants arising in the cancer cell lineage. Of the 10,034 SVs detected in
the cancer samples, 5518 or 55% were germline derived and 4516 or 45% were
somatically derived.
Figure 4.3. Comparison between germline and cancer SVs. Circles represent the total
number of SVs detected in somatic control (whole blood) (blue circle) and cancer (red
circle) tissue samples collected from six ovarian cancer patients. SVs corresponding to
the overlap region identifies germline derived SVs while non-overlapping cancer SVs are
somatically derived.
4,685 (32%) Somatic control
4,516 (31%) Somatically derived
Total SVs: 14,719
5,518 (37%)
Germline derived

94
The SVs were comprised of seven structural classes: inversions, transpositions,
tandem-duplications (100 bps - 10 million bps in size), deletions (>20 bps), insertions
(>20 bps), inverted-duplications and translocations. The distribution of these SVs across
all samples is summarized in Figure 4.5. The most frequent class of SVs were deletions
and germline derived deletions were >2X more frequent than somatically derived
deletions. Germline and somatically derived inversions and transpositions were present in
approximately equal frequencies while somatically derived SVs were more frequent than
Figure 4.4. Comparison between germline and cancer SVs for individual patient
samples. Circles represent the total number of SVs detected in somatic control (whole
blood) (blue circle) and cancer (red circle) tissue samples collected from each of 6
ovarian cancer patients. SVs corresponding to the overlap region identifies germline
derived SVs while non-overlapping cancer SVs are somatically derived.
P1
31% 26% 43%
P2
36% 38% 26%
P3
31% 40% 29%
P4
33% 40% 27%
P5
38% 33% 29%
P6
18% 41% 41%

95
germline derived variants for all other classes of SVs (insertions, inverted-duplications,
and translocations).
Analysis of the frequency of recurrence of SVs across samples indicates that
germline derived SVs have the highest rate of multiplicity (Figure 4.6). Nearly 55% of
germline derived SVs are present in multiple patient samples reflecting naturally
occurring variation in the human population. In contrast, only 6% of the somatically
derived SVs were detected in more than one tissue sample.
Figure 4.5. Distribution of SVs across structural categories. Somatically derived (red)
and germline derived (green) SVs were further categorized according to the underlying
genomic rearrangement. Deletions were the most abundant category accounting for the
majority (~71%) of the germline derived SVs. Corresponding data is shown in the table
(top right corner). InvDupli: inverted-duplications, TandemDupli: tandem-duplication.

96
Ovarian Cancer SVs can be divided into 3 groups based upon the location of
chromosomal breakpoints
Detected SVs were annotated using a combined set of 224,555 normal reference
transcripts (Ensembl annotations, release 73 and lncRNAs from the UCSC genome
database). We classified SVs detected in our cancer samples into three groups based on
the location of breakpoints relative to the reference transcripts as follows: inter-genic SVs
are defined as variants with breakpoints mapping to two or more annotated genes located
at distant genomic locations; intra-genic SVs are variants with breakpoints mapping
Figure 4.6. Multiplicity of SVs across
samples. X-axis represents multiplicity
(number of occurrences) of somatically
derived (shown in red bars) and germline
derived (shown in green bars) SVs across
cancer samples. Y-axis represents
percentage of SVs present in a particular
multiplicity. Table at the bottom contains
data corresponding to the figure.
97
within a single annotated gene; and gene-desert SVs are variants with breakpoints
mapping to distant locations within genomic regions devoid of annotated genes (“gene
deserts”) (Figure 4.7). Intra-genic SVs are the most abundant class (50%, 5,031/10,034)
followed by gene-desert (39%, 3,942/10,034) and Inter-genic (11%, 1,061/10,034) SVs
(Figure 4.8, Figure 4.9A). Inter-genic SVs are >2X more abundant among somatically
derived variants than among germline derived variants (677 vs. 384, Figure 4.9B) while
the number of intra-genic (2,151 vs. 2,880) and gene-desert SVs (1,688 vs. 2,254) are
approximately equal among somatically derived and germline derived variants.

98
5kb gene-desert region
Assembled transcript
3’ UTR
5’ UTR 3’ UTR 5’ UTR
Inter-genic A.
Intra-genic B.
Intron 3’
5’ Exon
5kb 5kb 5kb 5kb
gene-desert region gene-desert region
Gene-desert C.
Figure 4.7. Structural classification scheme for SVs. SVs are depicted by black-grey
boxes, reference transcripts are represented by the blue and green boxes. Thick boxes
represent open-reading-frame or coding sequences (CDS) while thin boxes represent
5’UTR ( on the left) and 3’UTR ( on the right).
Inter-genic SVs (A) – breakpoints map to annotated genes located at distant genomic
locations; intra-genic SVs (B)- breakpoints map within the same gene; gene desert (C)-
breakpoints map to un-annotated genomic regions (gene deserts).

99
Figure 4.8. Characterization of SVs. Genomic coordinates of SVs and their breakpoint
were compared with the reference transcripts that served as the basis of hierarchical
classification into functionally relevant classes. The total number of SVs in each class is
shown in black font while the numbers in parenthesis represent the distribution of
somatically derived (red) and germline derived (green) SVs.
Figure 4.9. Distribution SVs across functional characterization classes. A.
Distribution of total detected SVs among functional classes. B. Distribution of inter-
genic SVs between somatically derived and germline derived SVs. Inter-genic SVs are
significantly enriched (p-value < 0.05) for somatically derived variants.
A. B.
Somatically derived
Germline derived
100
Inter-genic SVs encompass multiple classes of fusion-genes
We further divided inter-genic SVs based on the location of breakpoints within
the various gene regions, i.e., the promoter region (defined as breakpoint regions within 5
kb up-steam of the transcriptional start site), the 5’ and 3’ untranslated leader regions
(UTRs), and the protein coding sequence (CDS) (Table C.5). Inter-genic SVs where the
5’- partner gene sequence is fused with either a non-protein coding gene (e.g., lncRNA)
or with an unannotated region of the genome (gene-desert) are classified as 5’ truncated
SVs. Finally, inter-genic variants that do not manifest canonical gene structures (5’UTR-
promoter-CDS-3’UTR), display gene components in incorrect orientation (e.g., 5’ UTR-
CDS-promoter-3’UTR, gene desert-3’ CDS, etc.) or otherwise cannot be functionally
evaluated are classified as uncharacterized RNA (Table C.5).
The relative distribution of these sub-classes of inter-genic SVs in the cancer
samples is shown in (Figure 4.10A). The most abundant (37%, 398/1061) sub-class of
inter-genic variants is associated with alterations in the promoter region of genes. These
altered promoter variants along with the less frequent alternative 5’ UTR (4%, 45/1061)
and 3’ UTR (7%, 74/1061) sub-classes all have the potential to alter the expression of
associated genes without altering coding sequences. Inter-genic SVs associated with the
coding regions of genes also have the potential to alter the expression levels (e.g., the 5’
partner gene typically provides the promoter region in addition to 5’ coding sequences
while the 3’ partner may bring novel microRNA binding sites in its 3’ UTR) but may also
generate novel fusion proteins if reading frames are maintained. While only 5%
(20/1061) of the inter-genic SVs involve the fusion of coding regions of different genes,
38% (20/52) of these variants were in frame. Interestingly, the vast majority of the in-
frame gene fusions (85%, 17/20) were somatically rather than germline derived
suggesting that these de novo SVs have either been selectively favored in the cancer cell

101
lineages or selected against in germline lineages or both. The majority of the coding
region inter-gene fusions (62%, 32/52) were out-of-frame.

102
Figure 4.10. Distribution SVs across
functional characterization classes. A.
Inter-genic SVs (germline and somatically
derived); B. Intra-genic SVs (intronic and
exonic).
A.
B.

103
The breakpoints of most intra-genic SVs map to introns
The Intra-genic class of SVs was sub-divided into those with breakpoints
mapping completely within the same intron (intronic) and those where at least one
breakpoint mapped to an exon (exonic) . The vast majority of intra-genomic SVs (94%,
4,744/5,031) were intronic (Figure 4.10B, Table C.6). Although intronic variants may
affect splicing functions, they do not affect coding regions per se. Only 6% (287/5,031)
of the intra-genic SVs grouped into the exonic sub-class. The majority of these exonic
variants (138/287 or 48%) mapped to non-protein coding genes (e.g., lncRNAs) and are
thus of currently undefined significance. The breakpoints of the remaining exonic
variants mapped predominantly within 5’ or 3’ UTRs (5’UTRs: 17/287 or 6%; 3’UTRs:
64/287 or 22%). These intra-genic variants could potentially alter regulatory sequences
involved in gene expression (e.g., upstream regulatory sequences in 5’UTRs or
microRNA binding sites in 3’UTRs). The breakpoint of 24 % (68/287) of the exonic
variants mapped to coding regions (CDS), which are presumed to disrupt the ORF and
are labeled “disruptive” (Table C.6).
Many of the SVs map to gene desert regions
Although nearly 39% (3,942/10,034) of the detected SVs were classified as gene-
desert variants (Figure 4.8, 4.9A), their potential functional significance cannot be
reliably inferred since the structure of transcriptional units within gene-desert regions is
currently unknown.
Gene expression analyses
A minority of gene fusions is transcribed
Inter-genic SVs have the potential to generate gene-fusions. Thus, in an effort to
explore the extent to which this class of potential gene fusions were being expressed in
our cancer samples, we downloaded from the TCGA data portal the results of RNA

104
sequencing (RNA seq) and microarray (Affymetrix) profiling studies carried out on these
same samples. The raw RNA-seq data consisted of 1 billion 75 bp paired-end reads
(minimum 105 million - maximum 243 million per sample) (Table C.1). These data were
again analyzed using the computational workflow outlined in Figure 4.1 (see Methods for
details).
Since inter-genic SVs with breakpoints mapping to the promoter region
(398/1061) cannot be qualitatively distinguished using the RNA seq data, they were
excluded from the RNA seq analysis but are included in the microarray expression
analysis described below. All other classes of inter-genic SVs/gene fusions (coding
region, 5’ truncated, alternative 5’ UTR, alternative 3’ UTR and uncharacterized RNAs)
were included in the RNA seq analysis. The breakpoints of these gene fusion transcripts
were detected in the RNA-Seq data using split-read mapping (see Methods). Since
introns are spliced out during mRNA processing and absent in the RNA-Seq data, we
adjusted intronic SV breakpoints to the closest exon included in the gene fusion. SVs
were categorized as “detected” by RNA seq if transcripts were found in at least one of the
6 cancer samples examined. Based on this criterion, 16% (103/663) of these potential
gene fusions were found to be expressed in the cancer samples. The percentage of the
transcribed germline derived fusions (19%, 30/158) was slightly higher than the
somatically derived fusions (15%, 73/505) (Table C.1, Table C.7).
Only somatically derived coding sequence gene fusions are expressed
All 8 coding-gene fusions detected at the transcript level were somatically
derived. Six of these fusions were in frame. In-frame fusions typically result in novel-
fusion proteins that bring different protein domains together. We analyzed the
rearrangement of protein domains resulting from the 6 in-frame gene fusions using

105
SMART database (http://smart.embl-heidelberg.de/) (Letunic et al. 2012). The fusion-
gene structures and protein domain arrangements are shown in Figure 4.11.

106
INTER-INV_TRANSLOC-UNBAL-chr2-115640273-115640523
1 31-47
DPP10 (chr 2) CACNA1A (chr 19)
No domain CA_ chain _IQ
AT_hook
A.
INTRA-DELETION-UNBAL-chr1-32966800-32967047
1-4 3-5
RP1-27O5.3 (chr 1) ZNF643 (chr 1)
SCOP:d1hava_ BTB
ZnF_C2H2
B.
INTRA-INVERSION-UNBAL-chr13-99068288-99068436
1-16 19-23
FARP1 (chr 13) SLC15A1 (chr 13)
FA FERM_C B41 TM
C.
INTRA-INVERSION-UNBAL-chr9-34244770-34244874
1-5 3-9
UBAP1 (chr 9) KIF24 (chr 9)
No domain Coiled coil
D.

107
Two of the six in-frame gene fusions, FARP1-SLC15A1 (13q32.2 inversion) and
RP1-27O5.3–ZNF643 1p34.2 - 1p35.1 deletion 1p34.2 - 1p35.1 deletion), resulted in a
novel juxtaposition of protein-coding domains. The domains associated with the FARP1-
SLC15A1 fusions are involved in a variety of signal transduction pathways that have
previously been shown to influence cell-cell adhesion, cell migration and morphogenesis
(Clucas and Valderrama 2014). Similarly, the BTB/POZ domain (Broad-Complex,
Tramtrack and Bric a brac) contained within the region of the RP1-2705.3 gene involved
in the RP1-27O5.3–ZNF643 fusion has been previously implicated in ovarian cancer
growth and recurrence (Nakayama et al. 2006). The potential functional significance of
the remaining 4 somatically derived coding region gene fusions is currently unknown
1-2 2-3
DNAJB1 (chr 19) MED26 (chr 19)
No domain No domain
INTRA-LARGE_DUPLI-UNBAL-chr19-14627114-14627345 E.
INTRA-LARGE_DUPLI-UNBAL-chr20-44432723-44432876
1-6 2-8
DNTTIP1 (chr 20) UBE2C (chr 20)
No domain
SCOP:d1arb_
F.
Figure 4.11. Structure of the six transcribed SVs resulting in in-frame gene-
fusions. Figure represents the structure of the gene-fusion and associated protein
domains. Square boxes with numbers represent exons (5’ partner gene: blue, 3’ partner
gene: orange), red lines represent the fusion breakpoint, gene symbols corresponding
chromosomes (in parenthesis) are shown on top of each gene fusion structure).
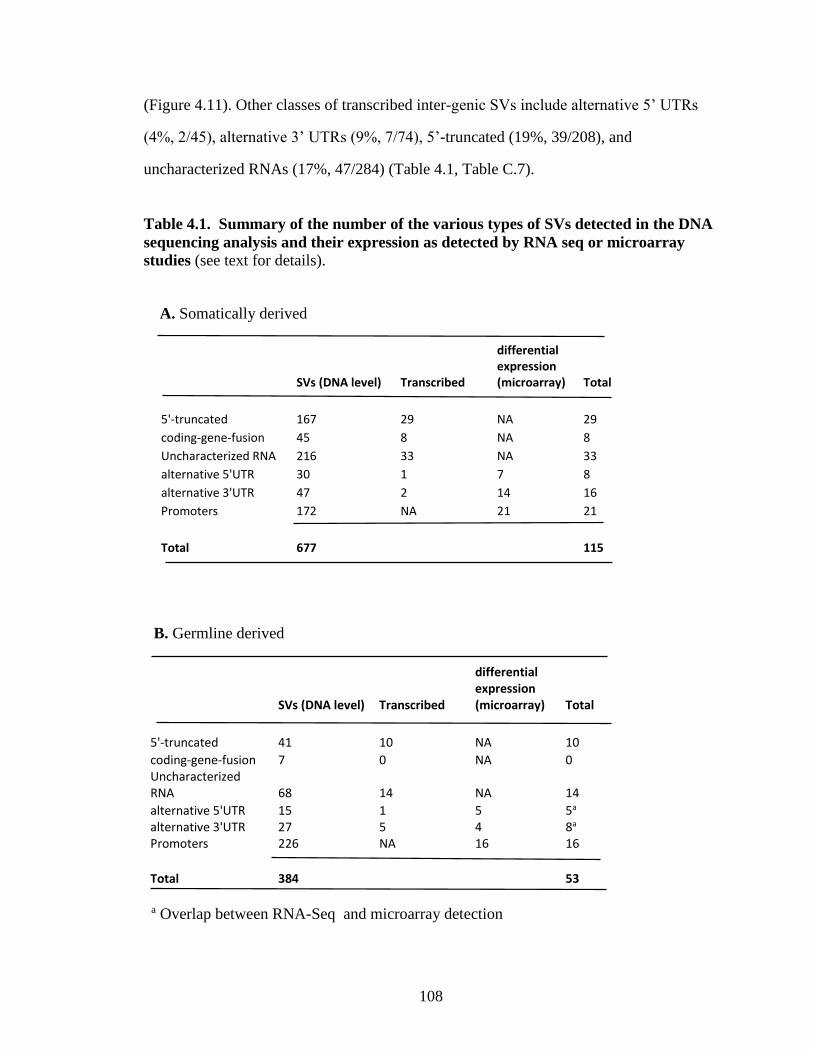
108
(Figure 4.11). Other classes of transcribed inter-genic SVs include alternative 5’ UTRs
(4%, 2/45), alternative 3’ UTRs (9%, 7/74), 5’-truncated (19%, 39/208), and
uncharacterized RNAs (17%, 47/284) (Table 4.1, Table C.7).
a Overlap between RNA-Seq and microarray detection
SVs (DNA level) Transcribed
differential expression (microarray) Total
5'-truncated 167 29 NA 29
coding-gene-fusion 45 8 NA 8
Uncharacterized RNA 216 33 NA 33
alternative 5'UTR 30 1 7 8
alternative 3'UTR 47 2 14 16
Promoters 172 NA 21 21
Total 677 115
SVs (DNA level) Transcribed
differential expression (microarray) Total
5'-truncated 41 10 NA 10
coding-gene-fusion 7 0 NA 0 Uncharacterized RNA 68 14 NA 14
alternative 5'UTR 15 1 5 5a alternative 3'UTR 27 5 4 8a Promoters 226 NA 16 16
Total 384 53
Table 4.1. Summary of the number of the various types of SVs detected in the DNA
sequencing analysis and their expression as detected by RNA seq or microarray
studies (see text for details).
A. Somatically derived
B. Germline derived

109
Microarray analysis
Inter-genic SVs with breakpoints mapping within the promoter region or within
the 5’ or 3’ UTRs leave coding regions unchanged but may be expected to alter patterns
of gene expression. In order to search for possible quantitative changes in expression
associated with these inter-genic SVs, we utilized the results of gene-expression
microarray analyses downloaded from the TCGA data portal for the same six ovarian
cancer patient samples (Note that the 5’-truncated, coding-region and uncharacterized
RNA fusions are not distinguishable in microarray studies and thus were analyzed
exclusively in the RNA seq analyses discussed above). Since gene expression profiles of
normal ovarian tissue from these patient samples were not available, for controls, we
downloaded and utilized the results of gene expression microarray profiles of normal
ovarian tissue from 8 other age-matched women (Table C.3). Expression values were
computed and normalized using the RMA normalization of the cel file data using the
Affymetirx Expression Consol. Fold-change in expression relative to the average of the
eight normal samples was computed for each of the genes associated with inter-genic
altered promoters, as well as altered 5’ and 3‘ UTRs SVs (Table 4.1, Table C.7).
Of the 517 (249 somatically derived and 268 germline derived) gene-fusions
(promoter, alternative 5’UTR and alternative 3’ UTR only) analyzed, 13% (42
somatically derived + 25 germline derived)/517) were differentially expressed (Table 4.1)
including 37 that were up-regulated and 49 that were down-regulated relative to controls
(Table C.7).
Chromosomal translocations are most frequently associated with changes in gene
expression
Chromosomal translocations are the physical basis of gene fusions and, as shown
in Figure 4.12, they are also the most frequent class of variants associated with significant

110
changes in gene expression both for somatically derived (61/122 or 50%) and germline
derived SVs (30/65 or 46%). Although only 6% ((573 + 232)/ (4516 + 5518), Figure 4.5)
of all SVs are associated with translocations, our transcriptional analysis indicates that
they are the most likely class of SVs to be associated with changes in gene expression
(Figure 4.12, Table 4.2, Table C.8).
Table 4.2. Summary of the number of various functional classes of SVs across
multiple structural classes of SVs.

111
A.
B.

112
C.
D.
Figure 4.12. Genomic distribution of inter-genic SVs. A. displays the distribution of
somatically derived inter-genic SVs, B. displays the distribution of those somatically
derived inter-genic SVs that were either transcribed (detected using RNA-Seq) or resulted
in differential gene-expression (measured using gene-expression microarrays). Similar
distributions for germline derived SVs are shown in C and D. Each line (blue:
translocation, red: deletion, green: tandem-duplication, yellow: inverted-duplication,
orange: inversion, grey: insertion, dark grey: transposition) connecting two different
chromosomes (outer circle) represents inter-chromosomal and straight lines restricted to a
single chromosome represent intra-chromosomal rearrangements.

113
Discussion
In this study, we followed an integrated high-throughput computational workflow
to accurately detect a remarkably large number (10,034) of SVs in cancerous tissue
samples isolated from 6 ovarian cancer patients. This value is considerably larger than
previous estimates of the number of SVs in other types of cancer tissues and cell lines
(e.g., (Hillmer et al. 2011) possibly due to the greater accuracy afforded by our de novo
assembly approach and/or because of the exceptional chromosomal instability known to
be associated with ovarian cancers (Wang et al. 2012).
The majority (5518) of our identified SVs were determined to be of germline
origin, apparently reflective of the abundance of naturally occurring SVs believed to be
segregating in human populations (Conrad et al. 2010). An additional large number of
the SVs (4516) identified in the ovarian cancer samples were determined to be of somatic
origin arising de novo in the cancer cell lineage. Somatically derived SVs have recently
been reported to constitute a major fraction of somatic tissue genetic variation in humans
(O'Huallachain et al. 2012) and our findings are consistent with these reports.
While a major fraction of the SVs identified in our study were shown to map to
un-annotated regions of the genome (gene deserts), the functional significance of these
variants is currently unknown. In contrast, inter-genic SVs, while constituting only 11%
of the SVs identified in our study, are the basis of gene-fusions- a well defined class of
SVs demonstrated to be of functional significance in the onset and progression of a
variety of cancers (Korbel et al. 2007; Stephens et al. 2009; Hillmer et al. 2011).
To our knowledge, ours is the first study to analyze both the presence and
expression of SVs in the same panel of ovarian cancer patient samples. Among the most
notable findings coming out of this comparative analysis is the remarkably low
proportion of cancer SVs that are being transcribed. Only 20% of the gene fusions
detected in our DNA seq analysis were detectable in the RNA seq analysis of the same
samples. Remarkably, none of the germline derived gene fusions but all of the

114
somatically derived gene fusions were detectable on the RNA level. This observation
suggests the existence of a regulatory mechanism or mechanisms that can effectively
suppress those older more established SVs segregating in natural populations, but that is
(are) lost or otherwise rendered ineffective in suppressing de novo variants arising in
cancer cell lineages. Consistent with this possibility is the recent finding that a
microRNA (miR-203) that targets and suppresses expression of the BCR-ABL fusion
protein is hypermethylated in several hematopoietic tumors including chronic
myelogenous leukemias and some lymphoblastic leukemias. Re-expression of this
microRNA has been shown to significantly reduce BCR-ABL fusion protein levels and to
coincidently inhibit tumor cell proliferation (Bueno et al. 2008). The relevance of such
regulatory mechanisms to the fact that several gene fusions previously identified as
biomarkers of cancer have recently been found to be present in normal healthy
individuals (Nambiar and Raghavan 2013) remains to be determined.
Further evidence of the importance of the regulation of gene fusions and other SVs in
cancer comes from our microarray analyses. We found that 10-30% of both germline and
somatically derived fusions display a significant change in the expression of those genes
involved in the fusion relative to normal controls. In several cases, changes in the
expression of the protein coding domains involved in the fusions have been previously
associated with cancer onset or progression.
Collectively, our findings are consistent with other recent studies indicating that
gene fusions and other SVs may be more important factors in the onset and progression
of cancer than previously envisioned (Robinson et al. 2011) . Our results further indicate,
however, that it may not simply be the occurrence of these variants in cancers but their
regulation that ultimately determines their biological and clinical significance.

115
Acknowledgements
The authors thank the Office of Information Technology at Georgia Institute of
Technology for providing access to computing clusters at ‘Partnership for an Advanced
Computing Environment’ (pace.gatech.edu) and Roman Mezencev (Georgia Institute of
Technology) for his suggestions during the statistical analysis. This work was supported
by grants from Ovarian Cycle, Deborah Nash Endowment Fund, Josephine Robinson
Family and J.D. Rhodes Trust.

116
CHAPTER 5
CONCLUSIONS
In this dissertation work one of the most common mutations in cancer, gene-
fusions, and their global patterns in breast and ovarian cancer was studied by using high-
throughput DNA sequencing technologies. Chapter 2 describes the bioinformatics
pipeline called R-SAP that we developed and implemented to systematically analyze and
characterize cancer transcriptomes. In Chapter 3, R-SAP is integrated with additional,
more specialized tools, to study gene-fusions in 55 breast cancer and healthy
transcriptomes using RNA-Seq data. Overall a de novo assembly approach uncovered
novel and potentially functional chimeric transcripts and revealed an unexpected
prevalence and diversity of chimera in breast cancer tissues. In Chapter 4, gene-fusions
are studied at the genome level using whole genome sequencing (WGS) data from
ovarian cancer and matched somatic control samples. This study provides insight into the
structure of genomic rearrangements underlying the gene-fusion structures observed in
the cancer transcriptome. Further integration of RNA-Seq and WGS data analyses
reveals the transcriptional consequences of germline and cancer specific structural
variants.
Gene-fusion or chimeric transcripts that originate as a result of genomic
rearrangements have been implicated in the onset and progression of a variety of cancers
(Futreal et al. 2004; Lupski and Stankiewicz 2005; Mitelman et al. 2007). Recurrent
gene-fusions that are also causally implicated in cancer are considered as potential
biomarkers and therapeutic targets (Mitelman 2000; Laxman et al. 2008). Recent
advancements in massively parallel RNA sequencing (or ‘RNA-Seq’) of the cellular
transcriptome is a promising approach for the identification and characterization of
fusion-gene transcripts (Maher et al. 2009a; Metzker 2010). Massive amounts of

117
sequencing data generated from the complex cellular transcriptome poses bioinformatics
challenges that require highly specialized tools (Wang et al. 2013).
CHAPTER 2 presents our R-SAP program, a high-performance and highly-
customizable user friendly bioinformatics pipeline for the analysis of RNA-Seq data. A
built in multi-threading capability allows R-SAP to attain a near linear scalability in
computation time while analyzing high-volumes of sequencing data. One of the
characteristic features of the pipeline is its ability to accurately detect and annotate
chimeric transcripts for their functional inference using a hierarchical characterization
and classification system. R-SAP’s applicability is demonstrated (CHAPTER 2) using
MAQC human reference RNA-Seq data (Mane et al. 2009). Validation of the chimer-
detection module shows 80% sensitivity using a curated set of 206 chimers from
ChimerDB2.0 (Kim et al. 2010). The remaining 20% of reads were filtered out by R-SAP
as ‘ambiguous’ fusions since they were originating from the repetitive regions of the
genome.
In order for R-SAP to accommodate short (< 150 bp) sequencing reads such as
those generated from Illumina and IonTorrent sequencing systems, we configured it to
work with transcriptome assemblers such as Cufflinks, Scripture and Trans-ABySS. This
compatibility is achieved by making use of the standard file formats such as GTF (Gene
Transfer Format) or and BED (Browser Extensible Data) that are standard output from
currently used assembly programs. We demonstrate the applicability of R-SAP to
transcriptome assembly in CHAPTER 3 and further expand its applicability to whole
genome sequence data analysis in CHAPTER 4.
While prior RNA-Seq studies have primarily focused on the canonical gene
fusion structures of fusion-protein and promoter associated transcriptional deregulation,
global patterns of chimers in cancer had yet to be explored. CHAPTER 3 presents the
development and use of an integrated computational pipeline for the de novo assembly
and comprehensive characterization of chimeric transcripts in 55 primary breast cancer

118
and normal tissue samples. De novo assembly resulted in longer contigs that not only
provided greater accuracy in reference genome mapping but also allowed for more
reliable identification of splice-variants because longer contigs typically extend across
multiple exons. The integrated workflow developed in CHAPTER 3 demonstrates that
specialized bioinformatics tools can complement each other and work synergistically. For
example, although R-SAP has inherent filters to exclude ambiguous chimers, it cannot
filter out the miss-assembled transcripts. But with a reconfirmation step using Bowtie and
original RNA-Seq reads, we were able to significantly reduce R-SAP’s false positive
calls. By following a hierarchical functional classification, we were able to uncover a
variety of fusion structure classes such as cryptic-splice sites and non-canonical RNA
structures. Although, their functional consequences cannot be determine currently, their
widespread presence is intriguing enough for further investigation.
Comparative analysis of chimeric transcripts between normal (or control) and
cancer samples resulted in 269 shared chimeras. The presence of chimeric transcripts in
normal samples is typically overlooked but their differential expression in cancer cells
relative to the normal tissue is indicative of their ‘pro-neoplastic’ potential (Li et al.
2008). In CHAPTER 3, we identified four potential ‘pro-neoplastic’ fusions that involved
protein-domains previously implicated in cancer. Such chimeric transcripts are potential
candidates for use as biomarkers for early diagnosis..
Recent studies (Consortium et al. 2007; Qu and Fang 2013) have shown that
transcription is not limited to genes. Previously considered ‘gene-desert’ regions can be
transcribed in a highly cell type specific manner (Cabili et al. 2011; Prensner et al. 2011).
In our study, we found that gene-desert regions can also participate in chimera formation
and serve as alternative UTRs to known protein-coding genes resulting in altered gene-
expression.

119
Gene-fusions predominantly result from genomic-rearrangements that are also
known as structural variants (SVs). CHAPTER 4 presents the study of SVs in ovarian
cancer using high-throughput whole genome sequencing data. Breakpoints associated
with SVs were detected at the nucleotide level resolution by implementing an integrated
computational workflow that also incorporates R-SAP (CHAPTER 2). Systematic and
hierarchical characterization of SVs using the known gene-model revealed several non-
canonical gene-fusion structures that were also observed in the breast cancer
transcriptome (CHAPTER 3). The results provide evidence of the genomic origin of the
diverse gene-fusion structures. Our analysis of genomic rearrangements in ovarian
cancer also confirms our previous observation (CHAPTER 3) of participation of gene-
desert regions in creating gene-fusion structures that can lead to transcriptional
deregulation.
SVs are mainly associated with cancer but in our study we also observed SVs in
the germline samples. We evaluated the differences in the functional significance
between germline-derived and cancer specific (somatically derived) SVs at the
transcriptional level using RNA-Seq and gene-expression microarray. Interestingly,
somatically derived SVs are more likely to result in gene-fusion chimeric transcripts and
also result in transcriptional deregulation as compared with the germline-derived SVs.
For example, transcription of in-frame coding gene-fusions was detected only for
somatically-derived cancer specific SVs and none for germline-derived SVs. Also,
somatically derived SVs resulted in significantly higher numbers of transcriptionally
deregulated genes than germline-derived SVs (CHAPTER 4). We suspected that the
differences in functional consequences of SVs could be attributable to the differences in
the structure of the underlying genomic rearrangements. We observed that the majority of
the germline SVs were simple deletions, while somatically derived SVs were enriched for
more complex genomic rearrangements such as translocations and tandem-duplications.

120
Overall we observed that out of all the detected SVs, only 11% result in potential
gene-fusion structures and out of these, only 20% were detected at the transcriptional
level. Additionally, only somatically derived in-frame coding-gene fusions are expressed
(CHAPTER 4). Collectively, our results demonstrate the presence of large numbers of
germline and somatically derived gene-fusions and other SVs in ovarian cancer tissues
and the importance of processes regulating the expression of gene-fusions in cancer onset
and progression.

121
APPENDIX A
SUPPLEMENTARY INFORMATION FOR CHAPTER 2
Supplementary Methods
Description of pipeline parameters that are adjusted in order to change the
stringency during the pipeline run
Percent identity cutoff: Minimum percent identity to call an alignment hit as
high-scoring (default value is 95%). This cutoff is also the minimum identity required by
each alignment pair in the chimeric transcript detection step.
Percent coverage cutoff: Minimum alignment query coverage to call an alignment
as high-scoring (default value is 90%).
Deletion cutoff: Minimum number of skipped exonic bases from the reference
genome due to the gapped alignment of query read before the read is characterized as
exon-deletion (default value is 10 bp).
Exon extension cutoff: Minimum number of extended bases outside the exon
boundaries to characterize it as internal-exon-extension (if extension is in intron) or
alternativeTSS or alternativePolyadenylation (if the extension is out of the transcriptional
boundaries) (default value is two bp).
Gene radius: Maximum extension of the known transcript in the upstream or
downstream region to include intergeninc region mapped reads in the known gene models
(default value is 5000 bp). This value can be set to zero if all the intergenic mapped reads
need to be characterized as gene-desert.
Gap tolerance: Maximum number of bases required on the query read before it is
designated as chimeric transcript and searched for the alignment pair (default value is 20
bp). This cutoff is also the maximum allowed query bases between the fragmented
alignments of the query sequence.

122
Annotation mode: Two possible values; “unique”, “multi”. “Unique” is the
default setting that will cause the pipeline to characterize each high-scoring read to only
one best fitting known transcript. If set as “multi”, reads will be characterized with all the
known transcripts the read mapped to.
Obtaining data from ChimerDB 2.0
ChimerDB 2.0 (http://ercsb.ewha.ac.kr:8080/FusionGen) (Kim et al. 2010) is a
database of chimeric transcripts (or fusion gene transcripts) that are detected from the
publicly available nucleotide sequences available in databases such as GenBank and SRA
(short read archive). It also reports gene fusion pairs that are previously reported in
literature. We downloaded GenBank accession IDs and corresponding fusion gene pairs
for the chimeric transcripts present in ChimerDB 2.0. Downloaded fusion gene pairs were
cross-referenced against the fusion gene pairs that were reported in literature and also
available at Chimer DB 2.0. We retained only those GenBank accession IDs that had
fusion gene pairs that were also reported previously in the literature. Nucleotide
sequences for the retained GenBank accession IDs were obtained using nucleotide
database (http://www.ncbi.nlm.nih.gov/nuccore) at NCBI. The resulting 206 sequences
were defined as high-confidence dataset of chimeric transcripts that were used as the test
data for testing the chimer detection module in R-SAP.
Raw RNA-Seq data cleaning
454 sequencing reads for MAQC Reference Human dataset were masked for low-
complexity repeats (including simple repeats) using DustMakser (Morgulis et al. 2006)
program before aligning them to the reference genome. Masked regions were trimmed
using in-house perl scripts. Trimmed reads shorter than 20bp were excluded because of
the BLAT’s (Kent 2002) limitation to align such sort reads with high accuracy.

123
Alignment screening and top-scoring hit selection
Command line BLAT (downloaded from http://users.soe.ucsc.edu/~kent/src/)
generated psl and pslx output files don’t have alignment percent identity, percent query
sequence coverage and alignment score. These values were necessary for each alignment
hit in order to sort and prioritize all possible reference genome hits for each sequencing
read.
For alignment score and alignment percent identity calculations, we incorporated
the code available at http://www.genome.ucsc.edu/FAQ/FAQblat.html#blat4 in our
alignment-screening module.
Percent query coverage was calculated as:
((alignment end position in query- alignment start position in query)/(query length)) X
100
In order to obtain the best possible alignment (top-hit), all the alignment hits were
sorted hierarchically first on alignment score, then on percent query coverage (if scores of
the two alignment hits were equal) and finally on percent alignment identity (if coverage
were equal).
Gene expression microarray data analysis
Cel files from Affymetrix Human U133Plus2.0 and Affymetrix Human Exon 1.0
ST V2 obtained from GEO (Gene Expression Omnibus at:
http://www.ncbi.nlm.nih.gov/geo/) were analyzed using Affymetrix Expression Consol
1.1 provided on Affymetrix website www.affymetrix.com. Samples were RMA
normalized, and transcript/gene level expression analysis and probe-set annotation was
done using annotation files (hg18) downloaded from
http://www.affymetrix.com/support/index.affx.

124
TaqMan qRT-PCR data analysis
Four replicates of TaqMan qRT-PCR measurements for MAQC Human
Reference sample were obtained from GEO. Original dataset consisted of normalized
expression values and their presence/absence calls for 1044 probes. Expression value for
each probe was taken as the mean expression values across the four replicates. A probe
was considered expressed if it had at least 75% presence call (present call in at least three
replicates). 973 expressed probes were retained after the filtering. Expressed probes were
then assigned to RefSeq transcripts (hg18) using TaqMan probe annotations provided
under GEO’s platform record for TaqMan (platform: GPL4097). 962 probes were
successfully assigned to RefSeq transcripts and 727 of them were also detected (R-SAP
RPKM > 0) in MAQC Human Reference RNA-Seq data.
ENCODE Gm12878 cell line RNA-Seq data analyses
Running TopHat:
TopHat v1.3.1 (Trapnell et al. 2009) (available at http://tophat.cbcb.umd.edu/)
was used for the human reference genome (hg18) alignment of ENCODE Gm12878
RNA-Seq reads. TopHat was run as:
tophat -m 1 -F 0 -g 1 --coverage-search <bowtie_index> <input_fastq_file>
Using “–g 1” parameter, we allowed only uniquely mapped reads to be reported
by TopHat. Overall 38,524,540 (out of 87,929,372) reads were mapped to the reference
genome. TopHat outputs alignments in bam format that is used as input for Cufflinks
(Trapnell et al. 2010).
Running Cufflinks:
a. Assembly mode:

125
Aligned reads from TopHat were assembled using Cufflinks v1.1.0 (available at
http://cufflinks.cbcb.umd.edu/). Cufflinks was run as:
cufflinks -u -F 0.0 <tophat-alignments>
Transcriptome assembly resulted in 76,101 assembled transcripts. Cufflinks assembled
transcripts are reported in GTF format that contains genomic coordinates of transcript an
putative exons.
a. Abundance quantification mode:
In order to estimate the expression values of RefSeq (hg18) transcripts, we ran Cufflinks
v1.1.0 in its quantification mode. Aligned reads from TopHat and RefSeq transcripts in
GTF format were used as input for Cufflinks. Cufflinks was run as:
cufflinks -G Hg18RefSeq.gtf -u -F 0.0 --overhang-tolerance 3 <tophat-alignments>
Parameter “--overhang-tolerance 3” was used to match R-SAP’s default cutoff for “exon-
extension” (3 bp). Cufflinks reports abundance estimates as FPKM (fragments per
kilobase of transcript per million fragments mapped) that are comparable to RPKM
(reads per kilobase of transcript per million reads mapped) for single end read data.
Running Cuffcompare:
Cufflinks assembled transcripts (from previous step) were compared with RefSeq
(hg18) transcripts using Cuffcompare. Cuffcompare is a module in Cufflinks program
that compares multiple transcript sets (including reference transcripts) in order to
generate transcript structural variant classifications. Cuffcompare was run as:

126
cuffcompare -r Hg18RefSeq.gtf -R -C <cufflinks-transcript-assembly>
Running RSEM:
RSEM v1.1.13 (Li and Dewey 2011) (available at
http://deweylab.biostat.wisc.edu/rsem/) estimates transcript expression values by aligning
RNA-Seq reads to reference transcript sequences. RSEM uses BowTie as an aligner that
is run inherently from RSEM. In order to run RSEM, we supplied original fastq files for
the Gm12878 RNA-Seq data and RefSeq (hg18) transcript sequences that were obtained
using UCSC Table browser (http://genome.ucsc.edu/cgi-bin/hgTables).
RSEM was run in two steps:
1. Preparing reference transcript sequence index:
rsem-prepare-reference <bowtie-path> <Hg18RefSeq.fa>
2. Estimating expression:
rsem-calculate-expression --out-bam --seed-length 28 <bowtie-path> --bowtie-n 3 --
bowtie-e 200 --bowtie-m 1 --phred33-quals
--fragment-length-mean 200 --fragment-length-sd 80 <input-fastq-file> <reference-
transcript-sequence-index>
Cufflinks default values for fragment length distribution mean and standard deviation
were used for RSEM run. RSEM estimated
RSEM reports two measures of abundance estimates: Expected read count from each
transcript and estimated fraction of transcripts made up by a given isoform or gene (τ
value). τ value is generally converted to TPM (transcripts per million) by multiplying by
106 in order to get the expression value of transcripts. TPM value is not directly

127
comparable to RPKM or FPKM value. We converted TPM values to comparable RPKM
values using the conversion formula provided in (Li and Dewey 2011):
RPKMi = (109x τi)/(∑j τilj)
Here i corresponds to the ith RefSeq transcript and j varies from 1 to total number of
RefSeq transcripts. lj is the length (in bp) of jth transcript.

128
Table A.1. Data sources and types of datasets that were used for the demonstration
of R-SAP’s application as well as its performance assessment and testing.
Data Data type Platform Sample Database Database ID/Accession
MAQC
RNA-seq
Single end
sequencing
reads
Roche 454 MAQC
Universal
Human
Reference
RNA
(Sample A)
SRA (Short
read archive
at NCBI)
SRX002934 (Runs:
SRR013995, SRR013996,
SRR013997, SRR013998,
SRR013999)
MAQC
expression
microarray
Cel files
(intensities)
Affymetrix
Human
U133Plus2.0
MAQC
Universal
Human
Reference
RNA
(Sample A)
GEO (Gene
expression
omnibus at
NCBI)
GSM589512
MAQC
TaqMan
qRT-PCR
Normalized
expression
values
TaqMan
Human MAQC
(TAQ,
platform id:
GPL4097)
MAQC
Universal
Human
Reference
RNA
(Sample A)
GEO (Gene
expression
omnibus at
NCBI)
GSM129638, GSM129639,
GSM129640, GSM129641,
ENCODE
RNA-seq
Paired end
75 bp long
reads (insert
length 200
bp)
Illumina
Genome
Analyzer
Gm12878
cell line
complete
Poly-A
selected
UCSC DCC
(UCSC
ENCODE
Data
coordination
center)
wgEncodeCaltechRnaSeqG
m12878R2x75NaIl200Fast
qRd1Rep1
ENCODE
expression
microarray
cel files
(microarray
intensities)
Affymetrix
Human Exon
1.0 ST arrays
Gm12878
cell line
GEO (Gene
expression
omnibus at
NCBI)
GSM472901

129
Table A.2. GenBank accession IDs for the 206 EST and mRNA sequences that were
used as the high confidence test dataset for testing the chimer-detection module of
R-SAP. 164 (~80% of 206) Accession IDs (in red color) were reported as chimer-
transcripts by R-SAP.
AB000268.1 AF492832.1 AY624559.1 EU446645.1 AB300355.1
AB001342.1 AJ131466.1 AY624560.1 FM165197.1 AB300356.1
AB038155.1 AJ131467.1 AY633656.1 FM165198.1 AB300357.1
AB274722.1 AJ251843.1 AY803272.1 L03357.1 AF047022.1
AB275889.1 AJ251844.1 BC008826.1 L22179.1 AF125093.1
AF024541.1 AJ251845.1 D90075.1 M13096.1 AF143407.1
AF031404.1 AJ295163.1 DQ084494.1 M19730.1 AF186109.1
AF041811.2 AJ297349.1 DQ204770.1 M25946.1 AF230662.1
AF060927.1 AJ298917.1 DQ204771.1 M30829.1 AF231996.1
AF060928.1 AJ299261.1 DQ204772.1 M30832.1 AF254086.1
AF060929.1 AJ299262.1 DQ204773.2 M31213.1 AF272376.1
AF060930.1 AJ301611.1 DQ437654.1 M73779.1 AF295356.1
AF060931.1 AJ301612.1 DQ437655.1 S50916.1 AF297746.1
AF102845.1 AJ303089.1 DQ451148.1 S72478.1 AF297747.1
AF113911.1 AJ417079.1 DQ831522.1 S72604.1 AF310722.1
AF123094.1 AJ438986.1 DQ841178.1 S75763.1 AF390893.1
AF125808.1 AJ549094.1 DQ845345.1 S77574.1 AF524261.1
AF125809.1 AJ549095.1 DQ845346.1 U02308.1 AF533988.1
AF177236.1 AJ549096.1 DQ886024.1 U02368.1 AY186998.1
AF177237.1 AJ972402.1 DQ898313.1 U41814.1 AY380223.1
AF177238.1 AM491359.1 DQ898314.1 X03541.1 AY380226.1
AF177239.1 AM491360.1 DQ912588.1 X06418.1 D45915.1
AF186110.1 AM491361.1 DQ912589.1 X62947.1 EU327511.1
AF231995.1 AM491362.1 DQ912590.1 X98708.1 FM165196.1
AF254087.1 AM491363.1 EF051633.1 X98709.1 M82827.1
AF254088.1 AY040324.1 EF158045.1 X98710.1 S71225.1
AF272374.1 AY040555.1 EF374064.1 Y08643.1 S72479.1
AF272375.1 AY043457.1 EF406122.1 Y15913.1 S72621.1
AF272383.1 AY138857.1 EF423615.1 Y15914.1 S72865.1
AF272384.1 AY138858.1 EF525170.1 Y15915.1 S74529.1
AF272385.1 AY138859.1 EF632110.1 Y15916.1 S79325.1
AF297748.1 AY138860.1 EU090248.1 Y15917.1 S79332.1
AF297749.1 AY186997.1 EU090249.1 Y15918.1 S81242.1
AF364037.1 AY187920.1 EU216064.1 Y15919.1 U35622.2
AF373587.1 AY187921.1 EU216066.1 Y15920.1 U41743.1
AF395885.1 AY187922.1 EU216070.1 Y15921.1 X07537.1
AF422798.1 AY380222.1 EU216071.1 Y16346.1 X79200.1
AF477006.1 AY380224.1 EU236680.1 Z35761.1 X85960.1
AF487522.1 AY380225.1 EU236948.1 AB000267.1
AF487905.1 AY624556.1 EU314929.1 AB001343.1
AF487906.1 AY624557.1 EU364772.1 AB012575.1
AF492831.1 AY624558.1 EU432099.1 AB300354.1

130
Table A.3. Intron-retention events detected in MAQC Reference Human dataset
using R-SAP from high-scoring reads that were also characterized as internal-exon-
extension.
Table A.4. Distribution of “multiple-annotations” reads that were detected in
MAQC Reference Human dataset using R-SAP. Since more than one type of novel
transcriptional event was detected in each of the “multiple-annotations” reads, reads
representing characterization sub-categories here may be overlapping. “Exon-skipping”
and “intron-retention” events are already included in “exon-deletion” and “internal-exon-
extension” events.
Characterization sub-category
Reads (Represented RefSeq transcripts)
Internal-exon-extension 18,419 (7,648) Complete intron-retention 361 (275)
Total number of retained introns 305
Total Multiple-annotations 3020
Sub-categories (characterization) Reads
Exon-deletion 2889 (Exon-skipping) (579) Internal-exon-extension 1867 (Intron-retention) (13) AlternativeTSS 563 AlternativePolyadenylation 782

131
Table A.5. Distribution of Trans-ABySS characterized reads that were also
classified as “high-scoring” by R-SAP previously using MAQC Human Reference
RNA-Seq data. RefSeq transcripts (hg18) were used as annotated set of transcripts.
“novel-transcript” are those that could not be mapped to any of the known RefSeq exon
by Trans-ABySS. Novel transcriptional event sub-categories (AS3, AS, AS53,
novel_exon, novel_intron, novel_utr, retained_intron and skipped_exon) have 121
overlapping reads between them. Filtered-out reads are those that were not reported in
any category by Trans-ABySS.
Sub-categories (characterization)
Reads (% total “high-scoring”)
Associated RefSeq transcripts
AS3 1447 (0.29%) 960 AS5 1503 (0.30%) 1031 AS53 24 (0.004%) 22 novel_exon 608 (0.12%) 462 novel_intron 259 (0.05%) 212 novel_utr 357 (0.072%) 190 retained_intron 2 (0.0004%) 1 skipped_exon 768 (0.15%) 568
Total novel-transcriptional events (121 overlapping subtracted from the total sum)
4847(0.98%) 2548
Mapping within known exons 123066 (25.05%) 16211
Total exon-associated 127913 (26.04%) 18759
Novel-transcripts 144173 (29.35%) NA
Total reported 272086 (55.4%) 18759 Filtered-out 219031 (44.6%)
Total high-scoring 491117

132
Table A.6. Distribution of transcripts that were assembled from ENCODE
Gm12878 RNA-Seq data using Cufflinks and then characterized by R-SAP. RefSeq
transcripts (hg18) were used as reference set of transcripts.
Sub-categories (characterization)
Reads (% Cufflinks assembled transcripts)
Represented RefSeq transcripts
Exon-skipping 1,389 (1.82%) 1,186 Exon-deletion 597 (0.78%) 548 AlternativeTSS 1,957 (2.57%) 4,382 Alternative Polyadenylation 2,848 (3.74%) 5,361 Internal-exon-extension 15,416 (20.25%) 6,744 Intron-retention 3,563 (4.68%) 2,059 Multiple-annotations (additional exon-skipping, exon-deletion, alternativeTSS, alternativePolyA, internal-exon-extension and intron-retention)
14,255 (18.73%) 7,667
Total novel-transcripts 40,025 (52.59%) 13,638
Exon-only 8,940 (11.74%) 8,275 Intron-only 10,172 (13.36%) 3,772 Neighboring-exons 3,166 (4.16%) 2,282 Gene-desert 8.582 (11.27%) Uncharacterized 5,216 (6.85%)
Total Cufflinks assembled transcripts
76,101

133
Table A.7. Distribution of transcripts that were assembled from ENCODE
Gm12878 RNA-Seq data using Cufflinks and then classified by Cuffcompare into
structurally variant classes of RefSeq transcripts (hg18).
Cuffcompare
classification Classification
code
Number of reads (% of
assembled transcripts)
Associated
RefSeq
transcripts
Potential novel-isoform j 24,752 (32.52%) 9240
Full match + contained =, c 14,015 (18.41%) 11046
Falling entirely within
intron i 10,149 (13.33%) 3765
Possible polymerase
run (2kb away from
reference transcript)
p 1,772 (2.32%) 1361
Unknown, intergenic u 10,131 (13.31%) 0
Generic reference exon
overlap o 1,389 (1.82%) 1257
Exonic overlap (on
opposite strand) x 765 (1%) 586
Intron overlap ( on
opposite strand) s 306 (0.4%) 297
Single exon with partial
intron overlap (pre-
mRNA fragment)
e 12,822 (16.84%) 4016
Total assembled
transcripts
76,101

134
Table A.8. Comparison between R-SAP’s characterizations and Cuffcompare’s
classification of transcripts that were previously assembled from ENCODE
Gm12878 RNA-Seq dataset using Cufflinks (also see Table 5 and Supplementary
Table S6 and S7 for detailed distribution and comparison of other sub-categories).
R-SAP
characterization Cuffcompare
classification(code)
Number of associated
assembled transcripts
Overlap
R-SAP Cuffcompare #Reads %Cuffcompare %R-SAP
Exon-only Complete match +
contained (=,c) 8940 14015
8699 62% 97.3%
Intron-only Intron-only (i) 10172 10149 10137 99.9% 99.6%
Neighboring-
exon
Polymerase run (p) 3166 1772
1772 100% 55.6%
Gene-desert Unknown-
intergenic (u) 8582 10131
8582 84.71% 100%
Table A.9. Sequencing reads, reference genome alignment and R-SAP
characterization statistics for the ENCODE RNA-seq data for Gm12878 cell line. RPKM values were estimated using exon-only reads that were also classified as high-
scoring reads by R-SAP.
Table A.10. New intronic-exons detected in human RefSeq transcripts (hg18) by R-
SAP from intron-only reads in MAQC Reference Human RNA-Seq dataset.
Please see table on our website:
http://www.mcdonaldlab.biology.gatech.edu/dissertations/mittal.htm
Category Reads
Raw sequencing reads 87,929,372 Total reference genome mapped 54,095,800 Uniquely mapped 49,533,283 Multi-hits 4,562,517 High-scoring 32,815,685 Exon-only 22,390,589
Total RefSeq transcripts detected using Exon-only reads
24,080

135
APPENDIX B
SUPPLEMENTARY INFORMATION FOR CHAPTER 3
Supplementary Methods
RNA-Seq data pre-processing
Forty-five breast adenocarcinoma (BRCA) primary tumors and 10 adjacent
normal breast tissue samples were selected from ‘The Cancer Genome Atlas project’
(TCGA) data portal) and subsequently RNA-Seq raw data files were downloaded from
NCBI-SRA using dbGAP. RNA-Seq data files were downloaded ‘sra’ format that were
further converted to FastQ format files using sra-toolkit
(http://eutils.ncbi.nih.gov/Traces/sra/?view=software).
Filtering of the assembled contigs and chimer detection
Assembled contigs were aligned to the human reference human genome (hg19
from UCSC genome database) using 'Blast Like Alignment Tool (BLAT) (Kent 2002)
that is a specialized program for aligning long RNA stretches to the reference genome.
BLAT reports independent alignment of different fragments of the RNA sequences and
allows long gaps in the alignment that can be representative of introns present in a RNA
sequence. We observed the presence of short stretches of homopolymers (poly As and
poly Ts) towards the ends of the assembled contigs. Such repeats may affect the overall
alignment and may create ambiguous alignments. We, therefore, trimmed homopolymer
repeats as well as other low complexity repeats detected using RepeatMasker
(http://www.repeatmasker.org) and Tandem Repeat Finder
(http://tandem.bu.edu/trf/trf.html, ). Alignment files were exported in ‘.pslx’ format from
BLAT then were supplied to R-SAP as input for detecting chimeric transcripts. Chimeric
transcripts result in fragmented (or split-) alignments where fragments of the chimeric

136
transcripts map to discrete genomic loci. R-SAP detects such alignments and derives the
underlying fusion structure using the known gene models. We combined Ensembl and
lncRNA annotations (available from UCSC genome database) in order to generate a
comprehensive set of known gene models. R-SAP characterized each chimeric transcript
based upon the genic regions (5’UTR, CDS or 3’UTR) of the reference transcripts
intersecting with the genomic loci involved in the chimeric transcript formation.
Expression quantification
We performed a two-way expression estimation on the filtered set of 1959
chimeric transcripts. First we estimated the expression of the reference transcripts
(comprised of Ensembl and lncRNA annotation set) that were involved in the chimer
transcript formation. Reference transcript sequences were obtained from the UCSC
genome database and filtered RNA-Seq reads were mapped using Bowtie. Alignment
files were obtained in “bam” format that were sorted using Samtools (Li et al. 2009).
Abundance was estimated as expected read counts by using RSEM ((RNA-Seq by
Expectation Maximization) (Li and Dewey 2011). Expression values of reference
transcripts were used to calculate the fold change of 5’- and 3’- UTR change associated
chimers in cancer samples relative to the normal samples. Expression values were then
normalized using “Upper quartile normalization” (Bullard et al. 2010).
In order to determine the “pro-neoplastic” potential chimeric transcripts (see main
text), we relied upon the expression of the chimeric transcript itself rather than the
associated reference transcripts. We estimated the expression of shared (detected in
normal and cancer samples) in each of the corresponding samples. RNA-Seq reads were
mapped to the assembled contig representing the chimera and read counts were then
estimated using RSEM. Read counts were normalized using upper-quartile normalization
as proposed by Bullard et al. (Bullard et al. 2010). Expression fold change in cancer

137
relative to normal was computed using the average expression values measured across
cancer and normal samples.
Table B.1. Summary statistics on raw and processed RNA-Seq data from the 55
breast samples used in this study. Additional columns contain statistics on assembled
contigs, initial and final number of chimeric transcripts after filtering. The first sheet in
the excel file contains the data columns and a key describing the data is on the second
excel sheet.
Please see table on our website:
http://www.mcdonaldlab.biology.gatech.edu/dissertations/mittal.htm
Table B.2. Detailed alignment and annotation information on 1959 filtered chimeric
transcripts from 55 samples analyzed in the study. Each chimeric transcript is
represented by a unique ID in the first column. Structural and functional classification (as
described in the text) information is presented in columns S, T and U. Cells in the gene
name columns (‘geneName1’ and ‘geneName2’) with value “none” represent gene-desert
regions. The first sheet in the excel file contains the data columns and a key describing
the data is on the second excel sheet.
Please see table on our website:
http://www.mcdonaldlab.biology.gatech.edu/dissertations/mittal.htm

138
Table B.3: Distribution of structural and functional classes for chimers found only
in normal tissue samples. (A similar table for cancer specific chimers is included in the
main text.)
Table B.4: Distribution of structural and functional classes for chimeras found in
both normal and in cancer tissue samples. (A similar table for cancer specific chimers
is included in the main text.)
inter-genic gene-desert-I gene-desert-II Total
fusion-protein 9 NA NA 9 3' truncated-protein 22 4 NA 26
5' UTR-change 6 2 NA 8 3'UTR-change 18 1 NA 19 cryptic splice-site 41 6 NA 47
novel RNA 39 6 1 46 Total 135 19 1 155
inter-genic gene-desert-I gene-desert-II Total
fusion-protein 23 NA NA 23 3' truncated-protein 53 4 NA 57 5' UTR-change 6 0 NA 6 3'UTR-change 52 0 NA 52
cryptic splice-site 33 15 NA 48
novel RNA 79 4 0 83 Total 246 23 0 269

139
Table B.5: Recurrence of chimeric transcripts across cancer samples. Recurrence is
defined as the number of samples in which a specific chimeric transcript was detected.
The frequency is the chimeric transcript count divided by the total number of chimeric
transcripts.
Table B.6. Cancer specific in-frame fusions where at least one protein domain from
each (5’ and 3’) of the participating genes is covered by the ORFs involved in the
chimera formation. Protein domain names (as defined by SMART database) are present
in columns K and T. The first sheet in the excel file contains the data columns and a key
describing the data is on the second excel sheet.
Please see table on our website:
http://www.mcdonaldlab.biology.gatech.edu/dissertations/mittal.htm
Recurrence frequency percentage
1 1309 93.97 2 55 3.95
3 17 1.22 4 5 0.36
5 5 0.36 6 1 0.07 7 0 0.00 8 0 0.00 9 1 0.07
Total 1393

140
Table B.7. Cancer specific in-frame fusions where 3’ partner gene is up-regulated by
> 2X relative to the intact gene in normal tissue samples. Expression is the normalized
RNA-Seq read counts as estimated using RSEM and followed by upper quartile
normalization. Expression fold change for the 3’- gene is present in column U. The first
sheet in the excel file contains the data columns and a key describing the data is on the
second excel sheet.
Please see table on our website:
http://www.mcdonaldlab.biology.gatech.edu/dissertations/mittal.htm
Table B.8. Cancer specific chimeric transcripts with fused 5’ or 3’ UTRs and having
the ORF of the coding gene intact and displaying > 2X change in expression relative
to the intact gene’s expression in normal tissue. The first sheet in the excel file
contains the key defining column entries. The second sheet contains data for chimeras
with a fused 5’ UTR; the third sheet contains data for chimeras with a fused 3’ UTR. For
5’-UTR fusions, the expression fold change for the 3’ partner gene is calculated; for 3’
UTR fusions, the expression fold change for the 5’ partner gene is calculated. The upper
portion in each data sheet summarizes the down-regulated genes and the lower portion
summarizes the up-regulated genes.
Please see table on our website:
http://www.mcdonaldlab.biology.gatech.edu/dissertations/mittal.htm

141
Table B.9. Detailed information for gene-desert-I and gene-desert-II chimeric
transcripts. The first sheet of the excel file contains the key defining column entries. The
data for cancer specific, normal control and shared chimeric transcripts is presented
separately in second, third and fourth sheets, respectively. Cells in the gene name
columns (‘geneName1’ and ‘geneName2’) with value “none” represent gene-desert
regions.
Please see table on our website:
http://www.mcdonaldlab.biology.gatech.edu/dissertations/mittal.htm
Table B.10. Chimeric transcripts comprised of in-frame fusion gene transcripts
present in both normal and cancer samples. Expression levels are presented as
normalized RNA-Seq read counts as estimated using RSEM and upper quartile
normalization. The first sheet of the excel file contains the key defining column entries.
The second sheet presents the chimeric transcript annotation information. Third sheets
presents the expression values across normal and cancer samples respectively. The
structures of these fusion genes is presented in Figure 3.15.
Please see table on our website:
http://www.mcdonaldlab.biology.gatech.edu/dissertations/mittal.htm

142
APPENDIX C
SUPPLEMENTARY MATERIAL FOR CHAPTER 4
Supplementary Methods
Preprocessing of the whole-genome sequence (WGS) data
Whole genome sequencing data from TCGA was downloaded in BAM format
that also contains metadata about the sequencing libraries. We noticed that the presence
of multiple read-group in each BAM file. Read-groups are typically generated as a result
of multiple sequencing runs of the, use of multiple lanes on the sequencer or difference in
sequencing library preparation protocol for the same sample. For each BAM file, we
collected the more precise information on read-group insert-size distribution by using
SortSam (http://picard.sourceforge.net/command-line-overview.shtml#SortSam)
followed by http://picard.sourceforge.net/command-line-
overview.shtml#CollectInsertSizeMetrics.
Read-groups with the similar mean insert-size and similar insert-size distributions
were merged into single read-groups. Merging of the read-groups resulted in two read-
groups per sample. Estimated mean insert-size and standard-deviation for the insert-size
for each group are summarized in Supplementary Table 2. Since intra-chromosomal
variants detection is done by considering the insert-size and standard-deviation of the
distribution into account, downstream analysis (up to the SV (structural variant)
breakpoint detection using de novo assembly) was done on per 'read-group basis. After
the breakpoint detection, validated SVs from multiple read-groups were merged using the
SV structure and breakpoint information and a non-redundant set of validated SVs was
created for each sample.

143
Inclusion of unmapped reads in the de novo assembly of SVs
After reference genome alignment of the WGS reads, on an average there were
300 million reads that were left unmapped. A subset of these reads may represent those
that are spanning the breakpoints of SVs. So we included the unmapped reads in the de
novo assembly of each SV. Since, on average, there were 19,500 SVs, it was not feasible
to include all of the unmapped reads for the assembly of each SV. Instead, we defined a
subset, called ‘neighborhood junction reads’, of all the unmapped reads for each SVs.
Unmapped reads were mapped to the reference genome using the ‘local alignment’ mode
of BowTie2 (Langmead and Salzberg 2012). Unmapped reads that were mapping
partially within the 500 bp region around the SVs, were selected for the de novo
assembly.
Trimming of assembled contigs
We observed the presence of simple or low-complexity repeats around the edges
of the assembled contig resulting from the de novo assembly. Such repeats can create in
false or ambiguous ‘split’ mapping structures during the reference genome alignment and
can result in false SV validation calls. Also, they can increase the alignment time
significantly since human genome is enriched with simple We, therefore, detected these
repeats at the edges of contigs using RepeatMasker (http://www.repeatmasker.org) and
TRF (Tandem Repeat Finder)(Benson 1999) and trimmed off using custom Perl script.

144
Table C.1. Summary statistics on processed whole genome sequencing data and
detected structural variants from 12 samples (6 control (whole blood), 6 cancer
patient samples). Additional columns include statistics on reference genome alignment,
SV detections, assembled contigs and validation rate of SVs and number of RNA-Seq
reads. First sheet in the excel file contains the keys describing the data columns in the
second sheet.
Please see table on our website:
http://www.mcdonaldlab.biology.gatech.edu/dissertations/mittal.htm
Table C.2. Table describing read-groups in the ovarian WGS data and various
cutoffs used for the SV detection. Each sample is represented by two read-groups that
were originally determined by TCGA following the manual merging of the similar read-
groups. Mean insert-size, standard deviation of the insert-size distribution and SVDetect
cutoff were empirically derived using the reference genome alignment of paired-end
WGS reads. First sheet in the excel file describes the data columns in the second sheet.
Please see table on our website:
http://www.mcdonaldlab.biology.gatech.edu/dissertations/mittal.htm

145
Table C.3. Summary of the ovarian samples used to perform the microarray gene-
expression by TCGA. Each sample is represented by two read-groups that were
originally determined by TCGA following the manual merging of the similar read-
groups. Mean insert-size, standard deviation of the insert-size distribution and SVDetect
cutoff were empirically derived using the reference genome alignment of paired-end
WGS reads. First sheet in the excel file describes the data columns in the second sheet.
Table C.4. Detailed alignment and annotation information on 14,719 validated SVs
from 12 ovarian samples (6 control (whole blood) and 6 ovarian cancer patient
samples) analyzed in the study. The table contains 4,516 somatically derived, 5,518
germline derived and 4,685 somatic control SVs that were originally detected by
SVDetect and later validated using de novo assembly. This table is a non-redundant table
i.e. corrected for the multiplicity of SVs across samples and frequency across samples is
recorded in column O, P and Q. Each SV is represented by a unique Id in the first column
that is followed by columns with SV class, genomic coordinates and breakpoint
information for the SV. Columns T (‘headTx’ )to AA (‘tailGeneStrand’) contain
information on the genes that overlap SV breakpoints were ‘NA’ indicates no overlap
with any known gene. Last three columns define SVs characterization and functional
classification. First sheet in the excel file contains the keys describing data columns in the
second sheet.
Please see table on our website:
http://www.mcdonaldlab.biology.gatech.edu/dissertations/mittal.htm
TCGA sample Id Tissue Tissue source Microarray chip version TCGA-01-0628-11A ovary Solid Tissue Normal Affymetrix HT_HG-U133A TCGA-01-0630-11A ovary Solid Tissue Normal Affymetrix HT_HG-U133A TCGA-01-0631-11A ovary Solid Tissue Normal Affymetrix HT_HG-U133A
TCGA-01-0633-11A ovary Solid Tissue Normal Affymetrix HT_HG-U133A TCGA-01-0636-11A ovary Solid Tissue Normal Affymetrix HT_HG-U133A TCGA-01-0637-11A ovary Solid Tissue Normal Affymetrix HT_HG-U133A TCGA-01-0639-11A ovary Solid Tissue Normal Affymetrix HT_HG-U133A TCGA-01-0642-11A ovary Solid Tissue Normal Affymetrix HT_HG-U133A TCGA-04-1371-01A ovary Primary solid Tumor Affymetrix HT_HG-U133A TCGA-13-0723-01A ovary Primary solid Tumor Affymetrix HT_HG-U133A TCGA-13-0725-01A ovary Primary solid Tumor Affymetrix HT_HG-U133A TCGA-13-0751-01A ovary Primary solid Tumor Affymetrix HT_HG-U133A TCGA-13-0890-01A ovary Primary solid Tumor Affymetrix HT_HG-U133A TCGA-13-1411-01A ovary Primary solid Tumor Affymetrix HT_HG-U133A TCGA-24-0982-01A ovary Primary solid Tumor Affymetrix HT_HG-U133A
TCGA-24-1103-01A ovary Primary solid Tumor Affymetrix HT_HG-U133A TCGA-25-1319-01A ovary Primary solid Tumor Affymetrix HT_HG-U133A

146
Table C.5. Table summarizing the potential functional impacts each class of inter-
genic SV.
Table C.6. Distribution of somatically and germline derived SVs that were
characterized as intra-genic SVs. SVs were classified based on the location of
breakpoints within the same gene. Since intra-genic SVs do not create gene-fusions, they
were not pursued in the RNA-Seq and gene-expression microarray analysis.
Functional class potential functional impacts Detectable by RNA-Seq?
altered promoter Change in gene-expression No
alternative 5'UTR Change in gene-expression Yes
alternative 3'UTR Change in gene-expression Yes
5'-truncated
C-terminal truncated protein from the 5'- (or head) gene, gene-expression may also change Yes
coding-gene-fusion (in-frame) Will encode for a fusion-protein Yes
coding-gene-fusion (out-of-frame) will undergo NMD Yes
uncharacterized RNA
function cannot be inferred but will potentially form structural RNAs Yes
Characterization class
somatically derived germline derived
exonic 147 140
5'UTR 5 12
3'UTR 33 31 disruptive 40 28
non-coding 69 69
intronic 2004 2740 Total 2151 2880

147
Table C.7. Somatically and germline derived inter-genic SVs that were detected by
RNA-Seq or resulted in differential gene-expression as measured by microarray. The table is divided in two parts, Table 7a contains transcription detected by RNA-Seq;
Table 7b contains SVs resulting in differential gene-expression measured by microarray.
Each table is presented in a different excel sheet. Upper half of the sheet contains
‘somatically derived’ SVs and lower half contains ‘germline derived’ SVs. Two
additional sheets contain keys describing the data columns present in Table 7A and 7B.
Please see table on our website:
http://www.mcdonaldlab.biology.gatech.edu/dissertations/mittal.htm
Table C.8. Detailed distribution of functional classes of inter-genic SVs among
various structural classes of SVs. Structural classes of SVs are ‘deletion’, ‘insertion’,
‘inversion’, ‘inverted-duplication’, ‘tandem-duplication’, ‘translocation’ and
‘transposition’. Table 8A (upper half) contains data for somatically derived SVs while
Table 8B (lower half) belongs to germline derived SVs.
Please see table on our website:
http://www.mcdonaldlab.biology.gatech.edu/dissertations/mittal.htm

148
REFERENCES
ACS ACS. 2013. Cancer Facts & Figures 2013. In Atlanta: American Cancer Society;
2013.
Akiva P, Toporik A, Edelheit S, Peretz Y, Diber A, Shemesh R, Novik A, Sorek R. 2006.
Transcription-mediated gene fusion in the human genome. Genome research
16(1): 30-36.
Alsafadi S, Scott V, Pautier P, Goubar A, Lazar V, Dessen P, Lacroix L, Duvillard P,
Morice P, André F et al. 2011. Identification of SORBS2 as a Candidate Marker
To Predict Metastatic Relapse in Breast Cancer [abstract]. In American
Association for Cancer Research, Vol 71, pp. P5-01-07.
Aparicio SA, Caldas C, Ponder B. 2000. Does massively parallel transcriptome analysis
signify the end of cancer histopathology as we know it? Genome biology 1(3):
REVIEWS1021.
Aplan PD. 2006. Causes of oncogenic chromosomal translocation. Trends in genetics :
TIG 22(1): 46-55.
Asmann YW, Hossain A, Necela BM, Middha S, Kalari KR, Sun Z, Chai HS,
Williamson DW, Radisky D, Schroth GP et al. 2011. A novel bioinformatics
pipeline for identification and characterization of fusion transcripts in breast
cancer and normal cell lines. Nucleic acids research 39(15): e100.
Asmann YW, Necela BM, Kalari KR, Hossain A, Baker TR, Carr JM, Davis C, Getz JE,
Hostetter G, Li X et al. 2012. Detection of redundant fusion transcripts as
biomarkers or disease-specific therapeutic targets in breast cancer. Cancer
research 72(8): 1921-1928.
Ayala I, Giacchetti G, Caldieri G, Attanasio F, Mariggio S, Tete S, Polishchuk R,
Castronovo V, Buccione R. 2009. Faciogenital dysplasia protein Fgd1 regulates
invadopodia biogenesis and extracellular matrix degradation and is up-regulated
in prostate and breast cancer. Cancer research 69(3): 747-752.
Barthel SR, Gavino JD, Wiese GK, Jaynes JM, Siddiqui J, Dimitroff CJ. 2008. Analysis
of glycosyltransferase expression in metastatic prostate cancer cells capable of
149
rolling activity on microvascular endothelial (E)-selectin. Glycobiology 18(10):
806-817.
Barzilai A, Rotman G, Shiloh Y. 2002. ATM deficiency and oxidative stress: a new
dimension of defective response to DNA damage. DNA repair 1(1): 3-25.
Baselga J, Tripathy D, Mendelsohn J, Baughman S, Benz CC, Dantis L, Sklarin NT,
Seidman AD, Hudis CA, Moore J et al. 1996. Phase II study of weekly
intravenous recombinant humanized anti-p185HER2 monoclonal antibody in
patients with HER2/neu-overexpressing metastatic breast cancer. Journal of
clinical oncology : official journal of the American Society of Clinical Oncology
14(3): 737-744.
Bashir A, Volik S, Collins C, Bafna V, Raphael BJ. 2008. Evaluation of paired-end
sequencing strategies for detection of genome rearrangements in cancer. PLoS
computational biology 4(4): e1000051.
Benson G. 1999. Tandem repeats finder: a program to analyze DNA sequences. Nucleic
acids research 27(2): 573-580.
Berger MF, Levin JZ, Vijayendran K, Sivachenko A, Adiconis X, Maguire J, Johnson
LA, Robinson J, Verhaak RG, Sougnez C et al. 2010. Integrative analysis of the
melanoma transcriptome. Genome research 20(4): 413-427.
Birney E Stamatoyannopoulos JA Dutta A Guigo R Gingeras TR Margulies EH Weng Z
Snyder M Dermitzakis ET Thurman RE et al. 2007. Identification and analysis of
functional elements in 1% of the human genome by the ENCODE pilot project.
Nature 447(7146): 799-816.
Boboila C, Jankovic M, Yan CT, Wang JH, Wesemann DR, Zhang T, Fazeli A, Feldman
L, Nussenzweig A, Nussenzweig M et al. 2010. Alternative end-joining catalyzes
robust IgH locus deletions and translocations in the combined absence of ligase 4
and Ku70. Proceedings of the National Academy of Sciences of the United States
of America 107(7): 3034-3039.
Bongarzone I, Vigneri P, Mariani L, Collini P, Pilotti S, Pierotti MA. 1998. RET/NTRK1
rearrangements in thyroid gland tumors of the papillary carcinoma family:
correlation with clinicopathological features. Clinical cancer research : an
official journal of the American Association for Cancer Research 4(1): 223-228.

150
Boquett JA, Alves JR, de Oliveira CE. 2013. Analysis of BCR/ABL transcripts in healthy
individuals. Genetics and molecular research : GMR 12(4): 4967-4971.
Boveri T. 1914. Zur Frage der Entstehung Maligner Tumoren. Gustav Fischer: 1-64.
Bueno MJ, Perez de Castro I, Gomez de Cedron M, Santos J, Calin GA, Cigudosa JC,
Croce CM, Fernandez-Piqueras J, Malumbres M. 2008. Genetic and epigenetic
silencing of microRNA-203 enhances ABL1 and BCR-ABL1 oncogene
expression. Cancer cell 13(6): 496-506.
Bullard JH, Purdom E, Hansen KD, Dudoit S. 2010. Evaluation of statistical methods for
normalization and differential expression in mRNA-Seq experiments. BMC
bioinformatics 11: 94.
Cabili MN, Trapnell C, Goff L, Koziol M, Tazon-Vega B, Regev A, Rinn JL. 2011.
Integrative annotation of human large intergenic noncoding RNAs reveals global
properties and specific subclasses. Genes & development 25(18): 1915-1927.
Campbell PJ, Stephens PJ, Pleasance ED, O'Meara S, Li H, Santarius T, Stebbings LA,
Leroy C, Edkins S, Hardy C et al. 2008. Identification of somatically acquired
rearrangements in cancer using genome-wide massively parallel paired-end
sequencing. Nature genetics 40(6): 722-729.
Carninci P, Yasuda J, Hayashizaki Y. 2008. Multifaceted mammalian transcriptome.
Current opinion in cell biology 20(3): 274-280.
Cerione RA, Zheng Y. 1996. The Dbl family of oncogenes. Current opinion in cell
biology 8(2): 216-222.
Chen ST, Choo KB, Hou MF, Yeh KT, Kuo SJ, Chang JG. 2005a. Deregulated
expression of the PER1, PER2 and PER3 genes in breast cancers. Carcinogenesis
26(7): 1241-1246.
Chen Z, Trotman LC, Shaffer D, Lin HK, Dotan ZA, Niki M, Koutcher JA, Scher HI,
Ludwig T, Gerald W et al. 2005b. Crucial role of p53-dependent cellular
senescence in suppression of Pten-deficient tumorigenesis. Nature 436(7051):
725-730.
151
Cheung NK, Zhang J, Lu C, Parker M, Bahrami A, Tickoo SK, Heguy A, Pappo AS,
Federico S, Dalton J et al. 2012. Association of age at diagnosis and genetic
mutations in patients with neuroblastoma. JAMA : the journal of the American
Medical Association 307(10): 1062-1071.
Clucas J, Valderrama F. 2014. ERM proteins in cancer progression. Journal of cell
science 127(Pt 2): 267-275.
Conrad DF, Pinto D, Redon R, Feuk L, Gokcumen O, Zhang Y, Aerts J, Andrews TD,
Barnes C, Campbell P et al. 2010. Origins and functional impact of copy number
variation in the human genome. Nature 464(7289): 704-712.
Consortium EP Birney E Stamatoyannopoulos JA Dutta A Guigo R Gingeras TR
Margulies EH Weng Z Snyder M Dermitzakis ET et al. 2007. Identification and
analysis of functional elements in 1% of the human genome by the ENCODE
pilot project. Nature 447(7146): 799-816.
Cooke MS, Evans MD, Dizdaroglu M, Lunec J. 2003. Oxidative DNA damage:
mechanisms, mutation, and disease. FASEB journal : official publication of the
Federation of American Societies for Experimental Biology 17(10): 1195-1214.
Cormen T, Stein C, Rivest R, Leiserson C. 2001. Introduction to Algorithms. McGraw-
Hill Higher Education.
Cory S. 1986. Activation of cellular oncogenes in hemopoietic cells by chromosome
translocation. Advances in cancer research 47: 189-234.
Costa V, Angelini C, De Feis I, Ciccodicola A. 2010. Uncovering the complexity of
transcriptomes with RNA-Seq. Journal of biomedicine & biotechnology 2010:
853916.
Dean M. 2009. ABC transporters, drug resistance, and cancer stem cells. Journal of
mammary gland biology and neoplasia 14(1): 3-9.
Deutsch EW, Lam H, Aebersold R. 2008. PeptideAtlas: a resource for target selection for
emerging targeted proteomics workflows. EMBO reports 9(5): 429-434.
Druker BJ, Sawyers CL, Kantarjian H, Resta DJ, Reese SF, Ford JM, Capdeville R,
Talpaz M. 2001. Activity of a specific inhibitor of the BCR-ABL tyrosine kinase

152
in the blast crisis of chronic myeloid leukemia and acute lymphoblastic leukemia
with the Philadelphia chromosome. The New England journal of medicine
344(14): 1038-1042.
Duncan TJ, Rolland P, Deen S, Scott IV, Liu DT, Spendlove I, Durrant LG. 2007. Loss
of IFN gamma receptor is an independent prognostic factor in ovarian cancer.
Clinical cancer research : an official journal of the American Association for
Cancer Research 13(14): 4139-4145.
Edwards PA. 2010. Fusion genes and chromosome translocations in the common
epithelial cancers. The Journal of pathology 220(2): 244-254.
Fletcher JI, Haber M, Henderson MJ, Norris MD. 2010. ABC transporters in cancer:
more than just drug efflux pumps. Nature reviews Cancer 10(2): 147-156.
Flicek P, Amode MR, Barrell D, Beal K, Billis K, Brent S, Carvalho-Silva D, Clapham P,
Coates G, Fitzgerald S et al. 2014. Ensembl 2014. Nucleic acids research
42(Database issue): D749-755.
Flouriot G, Brand H, Seraphin B, Gannon F. 2002. Natural trans-spliced mRNAs are
generated from the human estrogen receptor-alpha (hER alpha) gene. The Journal
of biological chemistry 277(29): 26244-26251.
Forbes SA, Bhamra G, Bamford S, Dawson E, Kok C, Clements J, Menzies A, Teague
JW, Futreal PA, Stratton MR. 2008. The Catalogue of Somatic Mutations in
Cancer (COSMIC). Current protocols in human genetics / editorial board,
Jonathan L Haines [et al] Chapter 10: Unit 10 11.
Forbes SA, Bindal N, Bamford S, Cole C, Kok CY, Beare D, Jia M, Shepherd R, Leung
K, Menzies A et al. 2011. COSMIC: mining complete cancer genomes in the
Catalogue of Somatic Mutations in Cancer. Nucleic acids research 39(Database
issue): D945-950.
Frenkel-Morgenstern M, Lacroix V, Ezkurdia I, Levin Y, Gabashvili A, Prilusky J, Del
Pozo A, Tress M, Johnson R, Guigo R et al. 2012. Chimeras taking shape:
potential functions of proteins encoded by chimeric RNA transcripts. Genome
research 22(7): 1231-1242.

153
Fu X, Fu N, Guo S, Yan Z, Xu Y, Hu H, Menzel C, Chen W, Li Y, Zeng R et al. 2009.
Estimating accuracy of RNA-Seq and microarrays with proteomics. BMC
genomics 10: 161.
Fugazzola L, Pilotti S, Pinchera A, Vorontsova TV, Mondellini P, Bongarzone I, Greco
A, Astakhova L, Butti MG, Demidchik EP et al. 1995. Oncogenic rearrangements
of the RET proto-oncogene in papillary thyroid carcinomas from children exposed
to the Chernobyl nuclear accident. Cancer research 55(23): 5617-5620.
Fujita PA, Rhead B, Zweig AS, Hinrichs AS, Karolchik D, Cline MS, Goldman M,
Barber GP, Clawson H, Coelho A et al. 2011. The UCSC Genome Browser
database: update 2011. Nucleic acids research 39(Database issue): D876-882.
Futreal PA, Coin L, Marshall M, Down T, Hubbard T, Wooster R, Rahman N, Stratton
MR. 2004. A census of human cancer genes. Nature reviews Cancer 4(3): 177-
183.
Garcia-Blanco MA. 2003. Messenger RNA reprogramming by spliceosome-mediated
RNA trans-splicing. The Journal of clinical investigation 112(4): 474-480.
Gery S, Virk RK, Chumakov K, Yu A, Koeffler HP. 2007. The clock gene Per2 links the
circadian system to the estrogen receptor. Oncogene 26(57): 7916-7920.
Gorunova L, Hoglund M, Andren-Sandberg A, Dawiskiba S, Jin Y, Mitelman F,
Johansson B. 1998. Cytogenetic analysis of pancreatic carcinomas: intratumor
heterogeneity and nonrandom pattern of chromosome aberrations. Genes,
chromosomes & cancer 23(2): 81-99.
Greenman C, Stephens P, Smith R, Dalgliesh GL, Hunter C, Bignell G, Davies H,
Teague J, Butler A, Stevens C et al. 2007. Patterns of somatic mutation in human
cancer genomes. Nature 446(7132): 153-158.
Griffith M, Griffith OL, Mwenifumbo J, Goya R, Morrissy AS, Morin RD, Corbett R,
Tang MJ, Hou YC, Pugh TJ et al. 2010. Alternative expression analysis by RNA
sequencing. Nature methods 7(10): 843-847.
Gu W, Zhang F, Lupski JR. 2008. Mechanisms for human genomic rearrangements.
PathoGenetics 1(1): 4.

154
Guffanti A, Iacono M, Pelucchi P, Kim N, Solda G, Croft LJ, Taft RJ, Rizzi E, Askarian-
Amiri M, Bonnal RJ et al. 2009. A transcriptional sketch of a primary human
breast cancer by 454 deep sequencing. BMC genomics 10: 163.
Gui C, Hagenbuch B. 2009. Role of transmembrane domain 10 for the function of
organic anion transporting polypeptide 1B1. Protein science : a publication of the
Protein Society 18(11): 2298-2306.
Guttman M, Garber M, Levin JZ, Donaghey J, Robinson J, Adiconis X, Fan L, Koziol
MJ, Gnirke A, Nusbaum C et al. 2010. Ab initio reconstruction of cell type-
specific transcriptomes in mouse reveals the conserved multi-exonic structure of
lincRNAs. Nature biotechnology 28(5): 503-510.
Harris TJ, McCormick F. 2010. The molecular pathology of cancer. Nature reviews
Clinical oncology 7(5): 251-265.
Hillmer AM, Yao F, Inaki K, Lee WH, Ariyaratne PN, Teo AS, Woo XY, Zhang Z, Zhao
H, Ukil L et al. 2011. Comprehensive long-span paired-end-tag mapping reveals
characteristic patterns of structural variations in epithelial cancer genomes.
Genome research 21(5): 665-675.
Hrzenjak A, Moinfar F, Tavassoli FA, Strohmeier B, Kremser ML, Zatloukal K, Denk H.
2005. JAZF1/JJAZ1 gene fusion in endometrial stromal sarcomas: molecular
analysis by reverse transcriptase-polymerase chain reaction optimized for
paraffin-embedded tissue. The Journal of molecular diagnostics : JMD 7(3): 388-
395.
Huang CR, Schneider AM, Lu Y, Niranjan T, Shen P, Robinson MA, Steranka JP, Valle
D, Civin CI, Wang T et al. 2010. Mobile interspersed repeats are major structural
variants in the human genome. Cell 141(7): 1171-1182.
Hubbard T, Barker D, Birney E, Cameron G, Chen Y, Clark L, Cox T, Cuff J, Curwen V,
Down T et al. 2002. The Ensembl genome database project. Nucleic acids
research 30(1): 38-41.
Jabbour L, Welter JF, Kollar J, Hering TM. 2003. Sequence, gene structure, and
expression pattern of CTNNBL1, a minor-class intron-containing gene--evidence
for a role in apoptosis. Genomics 81(3): 292-303.
155
Jiao X, Rosenlund M, Hooper SD, Tellgren-Roth C, He L, Fu Y, Mangion J, Sjoblom T.
2011. Structural alterations from multiple displacement amplification of a human
genome revealed by mate-pair sequencing. PloS one 6(7): e22250.
Ju YS, Lee WC, Shin JY, Lee S, Bleazard T, Won JK, Kim YT, Kim JI, Kang JH, Seo
JS. 2012. A transforming KIF5B and RET gene fusion in lung adenocarcinoma
revealed from whole-genome and transcriptome sequencing. Genome research
22(3): 436-445.
Karolchik D, Barber GP, Casper J, Clawson H, Cline MS, Diekhans M, Dreszer TR,
Fujita PA, Guruvadoo L, Haeussler M et al. 2014. The UCSC Genome Browser
database: 2014 update. Nucleic acids research 42(Database issue): D764-770.
Karolchik D, Hinrichs AS, Furey TS, Roskin KM, Sugnet CW, Haussler D, Kent WJ.
2004. The UCSC Table Browser data retrieval tool. Nucleic acids research
32(Database issue): D493-496.
Kaye FJ. 2009. Mutation-associated fusion cancer genes in solid tumors. Molecular
cancer therapeutics 8(6): 1399-1408.
Kent WJ. 2002. BLAT--the BLAST-like alignment tool. Genome research 12(4): 656-
664.
Kim D, Salzberg SL. 2011. TopHat-Fusion: an algorithm for discovery of novel fusion
transcripts. Genome biology 12(8): R72.
Kim P, Yoon S, Kim N, Lee S, Ko M, Lee H, Kang H, Kim J. 2010. ChimerDB 2.0--a
knowledgebase for fusion genes updated. Nucleic acids research 38(Database
issue): D81-85.
Knezevich SR, McFadden DE, Tao W, Lim JF, Sorensen PH. 1998. A novel ETV6-
NTRK3 gene fusion in congenital fibrosarcoma. Nature genetics 18(2): 184-187.
Koontz JI, Soreng AL, Nucci M, Kuo FC, Pauwels P, van Den Berghe H, Dal Cin P,
Fletcher JA, Sklar J. 2001. Frequent fusion of the JAZF1 and JJAZ1 genes in
endometrial stromal tumors. Proceedings of the National Academy of Sciences of
the United States of America 98(11): 6348-6353.

156
Korbel JO, Abyzov A, Mu XJ, Carriero N, Cayting P, Zhang Z, Snyder M, Gerstein MB.
2009. PEMer: a computational framework with simulation-based error models for
inferring genomic structural variants from massive paired-end sequencing data.
Genome biology 10(2): R23.
Korbel JO, Urban AE, Affourtit JP, Godwin B, Grubert F, Simons JF, Kim PM, Palejev
D, Carriero NJ, Du L et al. 2007. Paired-end mapping reveals extensive structural
variation in the human genome. Science 318(5849): 420-426.
Koudritsky M, Domany E. 2008. Positional distribution of human transcription factor
binding sites. Nucleic acids research 36(21): 6795-6805.
Kudo T, Ikehara Y, Togayachi A, Morozumi K, Watanabe M, Nakamura M, Nishihara S,
Narimatsu H. 1998. Up-regulation of a set of glycosyltransferase genes in human
colorectal cancer. Laboratory investigation; a journal of technical methods and
pathology 78(7): 797-811.
Kulesh DA, Clive DR, Zarlenga DS, Greene JJ. 1987. Identification of interferon-
modulated proliferation-related cDNA sequences. Proceedings of the National
Academy of Sciences of the United States of America 84(23): 8453-8457.
Kumar-Sinha C, Tomlins SA, Chinnaiyan AM. 2006. Evidence of recurrent gene fusions
in common epithelial tumors. Trends in molecular medicine 12(11): 529-536.
-. 2008. Recurrent gene fusions in prostate cancer. Nature reviews Cancer 8(7): 497-511.
Langmead B, Salzberg SL. 2012. Fast gapped-read alignment with Bowtie 2. Nature
methods 9(4): 357-359.
Langmead B, Trapnell C, Pop M, Salzberg SL. 2009. Ultrafast and memory-efficient
alignment of short DNA sequences to the human genome. Genome biology 10(3):
R25.
Laxman B, Morris DS, Yu J, Siddiqui J, Cao J, Mehra R, Lonigro RJ, Tsodikov A, Wei
JT, Tomlins SA et al. 2008. A first-generation multiplex biomarker analysis of
urine for the early detection of prostate cancer. Cancer research 68(3): 645-649.
Lee LR, Teng PN, Nguyen H, Hood BL, Kavandi L, Wang G, Turbov JM, Thaete LG,
Hamilton CA, Maxwell GL et al. 2013. Progesterone enhances calcitriol

157
antitumor activity by upregulating vitamin D receptor expression and promoting
apoptosis in endometrial cancer cells. Cancer prevention research 6(7): 731-743.
Lengauer C, Kinzler KW, Vogelstein B. 1998. Genetic instabilities in human cancers.
Nature 396(6712): 643-649.
Letunic I, Doerks T, Bork P. 2012. SMART 7: recent updates to the protein domain
annotation resource. Nucleic acids research 40(Database issue): D302-305.
Li B, Dewey CN. 2011. RSEM: accurate transcript quantification from RNA-Seq data
with or without a reference genome. BMC bioinformatics 12: 323.
Li B, Ruotti V, Stewart RM, Thomson JA, Dewey CN. 2010a. RNA-Seq gene expression
estimation with read mapping uncertainty. Bioinformatics 26(4): 493-500.
Li H, Durbin R. 2010. Fast and accurate long-read alignment with Burrows-Wheeler
transform. Bioinformatics 26(5): 589-595.
Li H, Handsaker B, Wysoker A, Fennell T, Ruan J, Homer N, Marth G, Abecasis G,
Durbin R, Genome Project Data Processing S. 2009. The Sequence
Alignment/Map format and SAMtools. Bioinformatics 25(16): 2078-2079.
Li H, Wang J, Mor G, Sklar J. 2008. A neoplastic gene fusion mimics trans-splicing of
RNAs in normal human cells. Science 321(5894): 1357-1361.
Li J, Jiang H, Wong WH. 2010b. Modeling non-uniformity in short-read rates in RNA-
Seq data. Genome biology 11(5): R50.
Li J, Xu Y, Long XD, Wang W, Jiao HK, Mei Z, Yin QQ, Ma LN, Zhou AW, Wang LS
et al. 2014. Cbx4 governs HIF-1alpha to potentiate angiogenesis of hepatocellular
carcinoma by its SUMO E3 ligase activity. Cancer cell 25(1): 118-131.
Lindgreen S. 2012. AdapterRemoval: easy cleaning of next-generation sequencing reads.
BMC research notes 5: 337.
Loeb LA, Harris CC. 2008. Advances in chemical carcinogenesis: a historical review and
prospective. Cancer research 68(17): 6863-6872.

158
Look AT. 1997. Oncogenic transcription factors in the human acute leukemias. Science
278(5340): 1059-1064.
Lugo TG, Pendergast AM, Muller AJ, Witte ON. 1990. Tyrosine kinase activity and
transformation potency of bcr-abl oncogene products. Science 247(4946): 1079-
1082.
Lupski JR, Stankiewicz P. 2005. Genomic disorders: molecular mechanisms for
rearrangements and conveyed phenotypes. PLoS genetics 1(6): e49.
Maeda K, Horikoshi T, Nakashima E, Miyamoto Y, Mabuchi A, Ikegawa S. 2005.
MATN and LAPTM are parts of larger transcription units produced by intergenic
splicing: intergenic splicing may be a common phenomenon. DNA research : an
international journal for rapid publication of reports on genes and genomes
12(5): 365-372.
Maher CA, Kumar-Sinha C, Cao X, Kalyana-Sundaram S, Han B, Jing X, Sam L,
Barrette T, Palanisamy N, Chinnaiyan AM. 2009a. Transcriptome sequencing to
detect gene fusions in cancer. Nature 458(7234): 97-101.
Maher CA, Palanisamy N, Brenner JC, Cao X, Kalyana-Sundaram S, Luo S,
Khrebtukova I, Barrette TR, Grasso C, Yu J et al. 2009b. Chimeric transcript
discovery by paired-end transcriptome sequencing. Proceedings of the National
Academy of Sciences of the United States of America 106(30): 12353-12358.
Malhotra A, Lindberg M, Faust GG, Leibowitz ML, Clark RA, Layer RM, Quinlan AR,
Hall IM. 2013. Breakpoint profiling of 64 cancer genomes reveals numerous
complex rearrangements spawned by homology-independent mechanisms.
Genome research 23(5): 762-776.
Mane SP, Evans C, Cooper KL, Crasta OR, Folkerts O, Hutchison SK, Harkins TT,
Thierry-Mieg D, Thierry-Mieg J, Jensen RV. 2009. Transcriptome sequencing of
the Microarray Quality Control (MAQC) RNA reference samples using next
generation sequencing. BMC genomics 10: 264.
Mani RS, Chinnaiyan AM. 2010. Triggers for genomic rearrangements: insights into
genomic, cellular and environmental influences. Nature reviews Genetics 11(12):
819-829.

159
Martin JA, Wang Z. 2011. Next-generation transcriptome assembly. Nature reviews
Genetics 12(10): 671-682.
Maskos U, Southern EM. 1992. Oligonucleotide hybridizations on glass supports: a novel
linker for oligonucleotide synthesis and hybridization properties of
oligonucleotides synthesised in situ. Nucleic acids research 20(7): 1679-1684.
McPherson JD. 2009. Next-generation gap. Nature methods 6(11 Suppl): S2-5.
McWhirter JR, Galasso DL, Wang JY. 1993. A coiled-coil oligomerization domain of
Bcr is essential for the transforming function of Bcr-Abl oncoproteins. Molecular
and cellular biology 13(12): 7587-7595.
Medvedev P, Stanciu M, Brudno M. 2009. Computational methods for discovering
structural variation with next-generation sequencing. Nature methods 6(11
Suppl): S13-20.
Metzker ML. 2010. Sequencing technologies - the next generation. Nature reviews
Genetics 11(1): 31-46.
Mignone F, Gissi C, Liuni S, Pesole G. 2002. Untranslated regions of mRNAs. Genome
biology 3(3): REVIEWS0004.
Mitelman F. 2000. Recurrent chromosome aberrations in cancer. Mutation research
462(2-3): 247-253.
Mitelman F, Johansson B, Mertens F. 2004. Fusion genes and rearranged genes as a
linear function of chromosome aberrations in cancer. Nature genetics 36(4): 331-
334.
-. 2007. The impact of translocations and gene fusions on cancer causation. Nature
reviews Cancer 7(4): 233-245.
Mitelman F, Mertens F, Johansson B. 2005. Prevalence estimates of recurrent balanced
cytogenetic aberrations and gene fusions in unselected patients with neoplastic
disorders. Genes, chromosomes & cancer 43(4): 350-366.

160
Mittal VK, McDonald JF. 2012. R-SAP: a multi-threading computational pipeline for the
characterization of high-throughput RNA-sequencing data. Nucleic acids research
40(9): e67.
Morgulis A, Gertz EM, Schaffer AA, Agarwala R. 2006. A fast and symmetric DUST
implementation to mask low-complexity DNA sequences. Journal of
computational biology : a journal of computational molecular cell biology 13(5):
1028-1040.
Morozova O, Marra MA. 2008. Applications of next-generation sequencing technologies
in functional genomics. Genomics 92(5): 255-264.
Mortazavi A, Williams BA, McCue K, Schaeffer L, Wold B. 2008. Mapping and
quantifying mammalian transcriptomes by RNA-Seq. Nature methods 5(7): 621-
628.
Murphy SJ, Cheville JC, Zarei S, Johnson SH, Sikkink RA, Kosari F, Feldman AL,
Eckloff BW, Karnes RJ, Vasmatzis G. 2012. Mate pair sequencing of whole-
genome-amplified DNA following laser capture microdissection of prostate
cancer. DNA research : an international journal for rapid publication of reports
on genes and genomes 19(5): 395-406.
Nacu S, Yuan W, Kan Z, Bhatt D, Rivers CS, Stinson J, Peters BA, Modrusan Z, Jung K,
Seshagiri S et al. 2011. Deep RNA sequencing analysis of readthrough gene
fusions in human prostate adenocarcinoma and reference samples. BMC medical
genomics 4: 11.
Nagalakshmi U, Wang Z, Waern K, Shou C, Raha D, Gerstein M, Snyder M. 2008. The
transcriptional landscape of the yeast genome defined by RNA sequencing.
Science 320(5881): 1344-1349.
Nakayama K, Nakayama N, Davidson B, Sheu JJ, Jinawath N, Santillan A, Salani R,
Bristow RE, Morin PJ, Kurman RJ et al. 2006. A BTB/POZ protein, NAC-1, is
related to tumor recurrence and is essential for tumor growth and survival.
Proceedings of the National Academy of Sciences of the United States of America
103(49): 18739-18744.
Nambiar M, Raghavan SC. 2013. Chromosomal translocations among the healthy human
population: implications in oncogenesis. Cellular and molecular life sciences :
CMLS 70(8): 1381-1392.

161
Ng HH, Ciccone DN, Morshead KB, Oettinger MA, Struhl K. 2003. Lysine-79 of histone
H3 is hypomethylated at silenced loci in yeast and mammalian cells: a potential
mechanism for position-effect variegation. Proceedings of the National Academy
of Sciences of the United States of America 100(4): 1820-1825.
Ning Z, Cox AJ, Mullikin JC. 2001. SSAHA: a fast search method for large DNA
databases. Genome research 11(10): 1725-1729.
Nowell PC. 1962. The minute chromosome (Phl) in chronic granulocytic leukemia. Blut
8: 65-66.
O'Huallachain M, Karczewski KJ, Weissman SM, Urban AE, Snyder MP. 2012.
Extensive genetic variation in somatic human tissues. Proceedings of the National
Academy of Sciences of the United States of America 109(44): 18018-18023.
Ozsolak F, Milos PM. 2011. RNA sequencing: advances, challenges and opportunities.
Nature reviews Genetics 12(2): 87-98.
Pan Q, Shai O, Lee LJ, Frey BJ, Blencowe BJ. 2008. Deep surveying of alternative
splicing complexity in the human transcriptome by high-throughput sequencing.
Nature genetics 40(12): 1413-1415.
Parker BC, Annala MJ, Cogdell DE, Granberg KJ, Sun Y, Ji P, Li X, Gumin J, Zheng H,
Hu L et al. 2013. The tumorigenic FGFR3-TACC3 gene fusion escapes miR-99a
regulation in glioblastoma. The Journal of clinical investigation 123(2): 855-865.
Parra G, Reymond A, Dabbouseh N, Dermitzakis ET, Castelo R, Thomson TM,
Antonarakis SE, Guigo R. 2006. Tandem chimerism as a means to increase
protein complexity in the human genome. Genome research 16(1): 37-44.
Patani N, Jiang W, Mokbel K. 2008. Prognostic utility of glycosyltransferase expression
in breast cancer. Cancer genomics & proteomics 5(6): 333-340.
Pierotti MA. 2001. Chromosomal rearrangements in thyroid carcinomas: a recombination
or death dilemma. Cancer letters 166(1): 1-7.
Pleasance ED, Cheetham RK, Stephens PJ, McBride DJ, Humphray SJ, Greenman CD,
Varela I, Lin ML, Ordonez GR, Bignell GR et al. 2010. A comprehensive

162
catalogue of somatic mutations from a human cancer genome. Nature 463(7278):
191-196.
Prechelt L. 2000. An empirical comparison of seven programming languages. Computer
33(10): 23-29.
Prensner JR, Iyer MK, Balbin OA, Dhanasekaran SM, Cao Q, Brenner JC, Laxman B,
Asangani IA, Grasso CS, Kominsky HD et al. 2011. Transcriptome sequencing
across a prostate cancer cohort identifies PCAT-1, an unannotated lincRNA
implicated in disease progression. Nature biotechnology 29(8): 742-749.
Pruitt KD, Tatusova T, Maglott DR. 2007. NCBI reference sequences (RefSeq): a curated
non-redundant sequence database of genomes, transcripts and proteins. Nucleic
acids research 35(Database issue): D61-65.
Qu H, Fang X. 2013. A brief review on the Human Encyclopedia of DNA Elements
(ENCODE) project. Genomics, proteomics & bioinformatics 11(3): 135-141.
Quinlan AR, Clark RA, Sokolova S, Leibowitz ML, Zhang Y, Hurles ME, Mell JC, Hall
IM. 2010. Genome-wide mapping and assembly of structural variant breakpoints
in the mouse genome. Genome research 20(5): 623-635.
Rabbitts TH. 1994. Chromosomal translocations in human cancer. Nature 372(6502):
143-149.
Reddy EP, Reynolds RK, Santos E, Barbacid M. 1982. A point mutation is responsible
for the acquisition of transforming properties by the T24 human bladder
carcinoma oncogene. Nature 300(5888): 149-152.
Reiter A, Lengfelder E, Grimwade D. 2004. Pathogenesis, diagnosis and monitoring of
residual disease in acute promyelocytic leukaemia. Acta haematologica 112(1-2):
55-67.
Ren R. 2005. Mechanisms of BCR-ABL in the pathogenesis of chronic myelogenous
leukaemia. Nature reviews Cancer 5(3): 172-183.
Richardson C, Jasin M. 2000. Frequent chromosomal translocations induced by DNA
double-strand breaks. Nature 405(6787): 697-700.

163
Richter BG, Sexton DP. 2009. Managing and analyzing next-generation sequence data.
PLoS computational biology 5(6): e1000369.
Risch HA, McLaughlin JR, Cole DE, Rosen B, Bradley L, Fan I, Tang J, Li S, Zhang S,
Shaw PA et al. 2006. Population BRCA1 and BRCA2 mutation frequencies and
cancer penetrances: a kin-cohort study in Ontario, Canada. Journal of the
National Cancer Institute 98(23): 1694-1706.
Ritchie W, Granjeaud S, Puthier D, Gautheret D. 2008. Entropy measures quantify global
splicing disorders in cancer. PLoS computational biology 4(3): e1000011.
Robertson G, Schein J, Chiu R, Corbett R, Field M, Jackman SD, Mungall K, Lee S,
Okada HM, Qian JQ et al. 2010. De novo assembly and analysis of RNA-seq
data. Nature methods 7(11): 909-912.
Robinson DR, Kalyana-Sundaram S, Wu YM, Shankar S, Cao X, Ateeq B, Asangani IA,
Iyer M, Maher CA, Grasso CS et al. 2011. Functionally recurrent rearrangements
of the MAST kinase and Notch gene families in breast cancer. Nature medicine
17(12): 1646-1651.
Roix JJ, McQueen PG, Munson PJ, Parada LA, Misteli T. 2003. Spatial proximity of
translocation-prone gene loci in human lymphomas. Nature genetics 34(3): 287-
291.
Rosenbloom KR, Sloan CA, Malladi VS, Dreszer TR, Learned K, Kirkup VM, Wong
MC, Maddren M, Fang R, Heitner SG et al. 2013. ENCODE data in the UCSC
Genome Browser: year 5 update. Nucleic acids research 41(Database issue):
D56-63.
Roth L, Nasarre C, Dirrig-Grosch S, Aunis D, Cremel G, Hubert P, Bagnard D. 2008.
Transmembrane domain interactions control biological functions of neuropilin-1.
Molecular biology of the cell 19(2): 646-654.
Rowley JD. 1973. Letter: A new consistent chromosomal abnormality in chronic
myelogenous leukaemia identified by quinacrine fluorescence and Giemsa
staining. Nature 243(5405): 290-293.
-. 2001. Chromosome translocations: dangerous liaisons revisited. Nature reviews Cancer
1(3): 245-250.
164
Saini V, Hose CD, Monks A, Nagashima K, Han B, Newton DL, Millione A, Shah J,
Hollingshead MG, Hite KM et al. 2012. Identification of CBX3 and ABCA5 as
putative biomarkers for tumor stem cells in osteosarcoma. PloS one 7(8): e41401.
Savage JR. 1993. Interchange and intra-nuclear architecture. Environmental and
molecular mutagenesis 22(4): 234-244.
Sboner A, Habegger L, Pflueger D, Terry S, Chen DZ, Rozowsky JS, Tewari AK,
Kitabayashi N, Moss BJ, Chee MS et al. 2010. FusionSeq: a modular framework
for finding gene fusions by analyzing paired-end RNA-sequencing data. Genome
biology 11(10): R104.
Schimke RT, Kaufman RJ, Alt FW, Kellems RF. 1978. Gene amplification and drug
resistance in cultured murine cells. Science 202(4372): 1051-1055.
Shi L Reid LH Jones WD Shippy R Warrington JA Baker SC Collins PJ de Longueville
F Kawasaki ES Lee KY et al. 2006. The MicroArray Quality Control (MAQC)
project shows inter- and intraplatform reproducibility of gene expression
measurements. Nature biotechnology 24(9): 1151-1161.
Simpson JT, Wong K, Jackman SD, Schein JE, Jones SJ, Birol I. 2009. ABySS: a parallel
assembler for short read sequence data. Genome research 19(6): 1117-1123.
Simsek D, Jasin M. 2010. Alternative end-joining is suppressed by the canonical NHEJ
component Xrcc4-ligase IV during chromosomal translocation formation. Nature
structural & molecular biology 17(4): 410-416.
Skotheim RI, Nees M. 2007. Alternative splicing in cancer: noise, functional, or
systematic? The international journal of biochemistry & cell biology 39(7-8):
1432-1449.
Soda M, Choi YL, Enomoto M, Takada S, Yamashita Y, Ishikawa S, Fujiwara S,
Watanabe H, Kurashina K, Hatanaka H et al. 2007. Identification of the
transforming EML4-ALK fusion gene in non-small-cell lung cancer. Nature
448(7153): 561-566.
Stephens PJ, McBride DJ, Lin ML, Varela I, Pleasance ED, Simpson JT, Stebbings LA,
Leroy C, Edkins S, Mudie LJ et al. 2009. Complex landscapes of somatic
rearrangement in human breast cancer genomes. Nature 462(7276): 1005-1010.

165
Stratton MR, Campbell PJ, Futreal PA. 2009. The cancer genome. Nature 458(7239):
719-724.
Suh KS, Malik M, Shukla A, Ryscavage A, Wright L, Jividen K, Crutchley JM, Dumont
RA, Fernandez-Salas E, Webster JD et al. 2012. CLIC4 is a tumor suppressor for
cutaneous squamous cell cancer. Carcinogenesis 33(5): 986-995.
Sullenger BA, Gilboa E. 2002. Emerging clinical applications of RNA. Nature
418(6894): 252-258.
Sultan M, Schulz MH, Richard H, Magen A, Klingenhoff A, Scherf M, Seifert M,
Borodina T, Soldatov A, Parkhomchuk D et al. 2008. A global view of gene
activity and alternative splicing by deep sequencing of the human transcriptome.
Science 321(5891): 956-960.
Sutherland GT, Janitz M, Kril JJ. 2011. Understanding the pathogenesis of Alzheimer's
disease: will RNA-Seq realize the promise of transcriptomics? Journal of
neurochemistry 116(6): 937-946.
Suzuki Y, Yoshitomo-Nakagawa K, Maruyama K, Suyama A, Sugano S. 1997.
Construction and characterization of a full length-enriched and a 5'-end-enriched
cDNA library. Gene 200(1-2): 149-156.
Tanner NK, Linder P. 2001. DExD/H box RNA helicases: from generic motors to
specific dissociation functions. Molecular cell 8(2): 251-262.
Thierry-Mieg D, Thierry-Mieg J. 2006. AceView: a comprehensive cDNA-supported
gene and transcripts annotation. Genome biology 7 Suppl 1: S12 11-14.
Tognon C, Knezevich SR, Huntsman D, Roskelley CD, Melnyk N, Mathers JA, Becker
L, Carneiro F, MacPherson N, Horsman D et al. 2002. Expression of the ETV6-
NTRK3 gene fusion as a primary event in human secretory breast carcinoma.
Cancer cell 2(5): 367-376.
Tomlins SA, Rhodes DR, Perner S, Dhanasekaran SM, Mehra R, Sun XW, Varambally
S, Cao X, Tchinda J, Kuefer R et al. 2005. Recurrent fusion of TMPRSS2 and
ETS transcription factor genes in prostate cancer. Science 310(5748): 644-648.

166
Trapnell C, Pachter L, Salzberg SL. 2009. TopHat: discovering splice junctions with
RNA-Seq. Bioinformatics 25(9): 1105-1111.
Trapnell C, Williams BA, Pertea G, Mortazavi A, Kwan G, van Baren MJ, Salzberg SL,
Wold BJ, Pachter L. 2010. Transcript assembly and quantification by RNA-Seq
reveals unannotated transcripts and isoform switching during cell differentiation.
Nature biotechnology 28(5): 511-515.
Tsai AG, Lu H, Raghavan SC, Muschen M, Hsieh CL, Lieber MR. 2008. Human
chromosomal translocations at CpG sites and a theoretical basis for their lineage
and stage specificity. Cell 135(6): 1130-1142.
Tuduri S, Crabbe L, Conti C, Tourriere H, Holtgreve-Grez H, Jauch A, Pantesco V, De
Vos J, Thomas A, Theillet C et al. 2009. Topoisomerase I suppresses genomic
instability by preventing interference between replication and transcription.
Nature cell biology 11(11): 1315-1324.
Velculescu VE, Zhang L, Zhou W, Vogelstein J, Basrai MA, Bassett DE, Jr., Hieter P,
Vogelstein B, Kinzler KW. 1997. Characterization of the yeast transcriptome.
Cell 88(2): 243-251.
Voelkerding KV, Dames SA, Durtschi JD. 2009. Next-generation sequencing: from basic
research to diagnostics. Clinical chemistry 55(4): 641-658.
Vogelstein B, Papadopoulos N, Velculescu VE, Zhou S, Diaz LA, Jr., Kinzler KW. 2013.
Cancer genome landscapes. Science 339(6127): 1546-1558.
von Hansemann D. 1890. Ueber asymmetrische Zelltheilung in epithel Krebsen und
deren biologische Bedeutung. Virchow's Arch Path Anat 119: 299.
von Heijne G. 1985. Signal sequences. The limits of variation. Journal of molecular
biology 184(1): 99-105.
Vorburger SA, Pataer A, Swisher SG, Hunt KK. 2004. Genetically targeted cancer
therapy: tumor destruction by PKR activation. American journal of
pharmacogenomics : genomics-related research in drug development and clinical
practice 4(3): 189-198.

167
Wang Q, Xia J, Jia P, Pao W, Zhao Z. 2013. Application of next generation sequencing to
human gene fusion detection: computational tools, features and perspectives.
Briefings in bioinformatics 14(4): 506-519.
Wang Z, Gerstein M, Snyder M. 2009. RNA-Seq: a revolutionary tool for
transcriptomics. Nature reviews Genetics 10(1): 57-63.
Wang ZC, Birkbak NJ, Culhane AC, Drapkin R, Fatima A, Tian R, Schwede M, Alsop
K, Daniels KE, Piao H et al. 2012. Profiles of genomic instability in high-grade
serous ovarian cancer predict treatment outcome. Clinical cancer research : an
official journal of the American Association for Cancer Research 18(20): 5806-
5815.
Xia SJ, Barr FG. 2005. Chromosome translocations in sarcomas and the emergence of
oncogenic transcription factors. European journal of cancer 41(16): 2513-2527.
Zeitouni B, Boeva V, Janoueix-Lerosey I, Loeillet S, Legoix-ne P, Nicolas A, Delattre O,
Barillot E. 2010. SVDetect: a tool to identify genomic structural variations from
paired-end and mate-pair sequencing data. Bioinformatics 26(15): 1895-1896.
Zerbino DR, Birney E. 2008. Velvet: algorithms for de novo short read assembly using
de Bruijn graphs. Genome research 18(5): 821-829.


![Breast percent density estimation from 3D reconstructed digital breast tomosynthesis images [6913-43]](https://static.fdokumen.com/doc/165x107/6336264964d291d2a302c4a3/breast-percent-density-estimation-from-3d-reconstructed-digital-breast-tomosynthesis.jpg)