Edge Detection
46
Chapter 5 Edge Detection The early stages of vision processing identify features in images that are relevant to estimating the structure and properties of objects in a scene. Edges are one such feature. Edges are significant local changes in the image and are important features for analyzing images. Edges typically occur on the boundary between two different regions in an image. Edge detection is frequently the first step in recovering information from images. Due to its importance, edge detection continues to be an active research area. This chapter covers only the detection and localization of edges. Basic concepts in edge detection will be discussed. Several common edge detectors will be used to illustrate the basic issues in edge detection. Algorithms for combining edges into contours are discussed in Chapter 6. An edge in an image is a significant local change in the image intensity, usually associated with a discontinuity in either the image intensity or the first derivative of the image intensity. Discontinuities in the image intensity can be either (1) step discontinuities, where the image intensity abruptly changes from one value on one side of the discontinuity to a different value on the opposite side, or (2) line discontinuities, where the image intensity abruptly changes value but then returns to the starting value within some short distance. However, step and line edges are rare in real images. Because of low-frequency components or the smoothing introduced by most sensing devices, sharp discontinuities rarely exist in real signals. Step edges become ramp edges and line edges become roof edges, where intensity changes are not instantaneous but occur over a finite distance. Illustrations of these edge profiles are shown in Figure 5.1. 140
-
Upload
khangminh22 -
Category
Documents
-
view
2 -
download
0
Transcript of Edge Detection
Chapter 5
Edge Detection
The early stages of vision processing identify features in images that arerelevant to estimating the structure and properties of objects in a scene.Edges are one such feature. Edges are significant local changes in the imageand are important features for analyzing images. Edges typically occur onthe boundary between two different regions in an image. Edge detection isfrequently the first step in recovering information from images. Due to itsimportance, edge detection continues to be an active research area. Thischapter covers only the detection and localization of edges. Basic conceptsin edge detection will be discussed. Several common edge detectors will beused to illustrate the basic issues in edge detection. Algorithms for combiningedges into contours are discussed in Chapter 6.
An edge in an image is a significant local change in the image intensity,usually associated with a discontinuity in either the image intensity or thefirst derivative of the image intensity. Discontinuities in the image intensitycan be either (1) step discontinuities, where the image intensity abruptlychanges from one value on one side of the discontinuity to a different valueon the opposite side, or (2) line discontinuities, where the image intensityabruptly changes value but then returns to the starting value within someshort distance. However, step and line edges are rare in real images. Becauseof low-frequency components or the smoothing introduced by most sensingdevices, sharp discontinuities rarely exist in real signals. Step edges becomeramp edges and line edges become roof edges, where intensity changes arenot instantaneous but occur over a finite distance. Illustrations of these edgeprofiles are shown in Figure 5.1.
140
5. EDGE DETECTION 141
Step
Ramp
Line
Roof
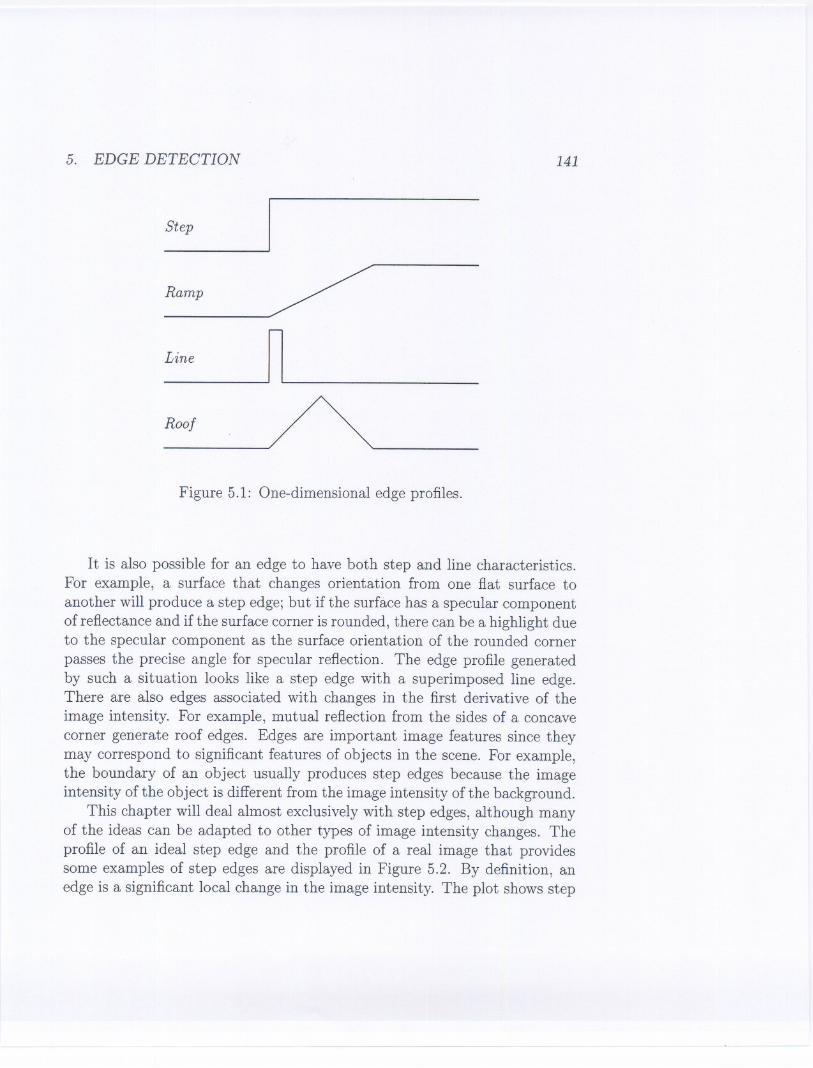
Figure 5.1: One-dimensional edge profiles.
It is also possible for an edge to have both step and line characteristics.For example, a surface that changes orientation from one flat surface toanother will produce a step edge; but if the surface has a specular componentof reflectance and if the surface corner is rounded, there can be a highlight dueto the specular component as the surface orientation of the rounded cornerpasses the precise angle for specular reflection. The edge profile generatedby such a situation looks like a step edge with a superimposed line edge.There are also edges associated with changes in the first derivative of theimage intensity. For example, mutual reflection from the sides of a concavecorner generate roof edges. Edges are important image features since theymay correspond to significant features of objects in the scene. For example,the boundary of an object usually produces step edges because the imageintensity of the object is different from the image intensity of the background.
This chapter will deal almost exclusively with step edges, although manyof the ideas can be adapted to other types of image intensity changes. Theprofile of an ideal step edge and the profile of a real image that providessome examples of step edges are displayed in Figure 5.2. By definition, anedge is a significant local change in the image intensity. The plot shows step
-- --
142 CHAPTER 5. EDGE DETECTION
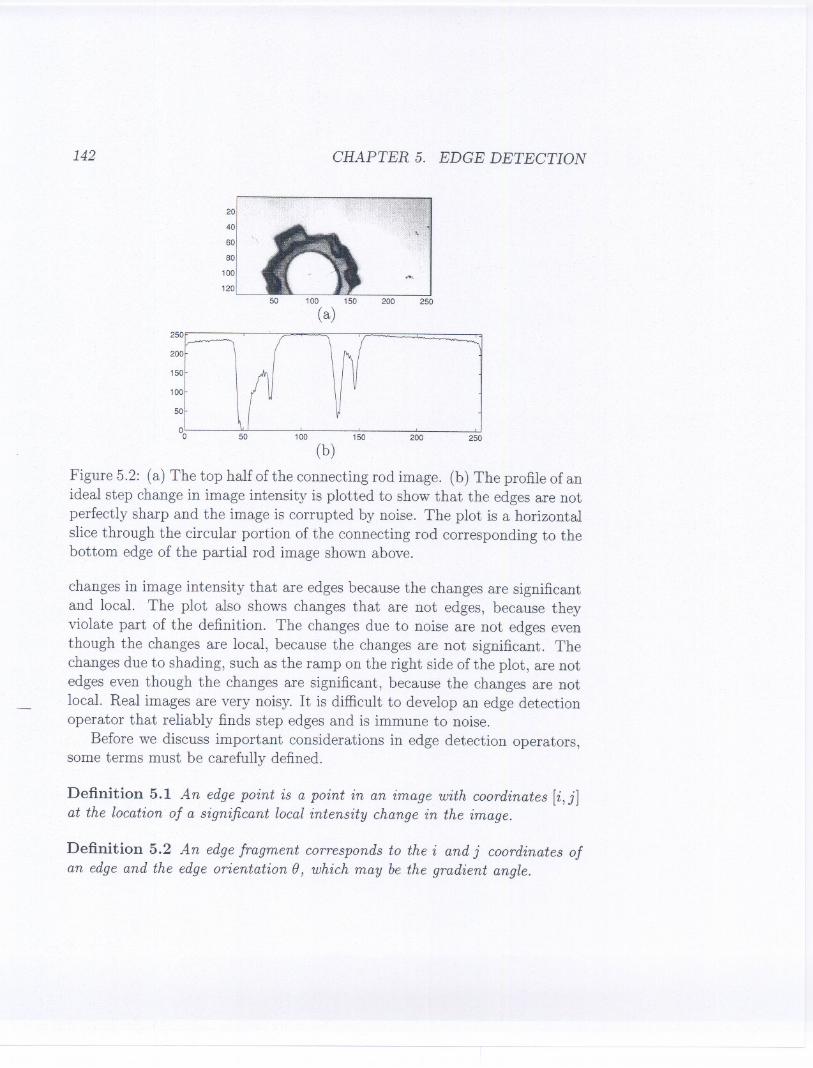
Figure 5.2: (a) The top half of the connecting rod image. (b) The profile of anideal step change in image intensity is plotted to show that the edges are notperfectly sharp and the image is corrupted by noise. The plot is a horizontalslice through the circular portion of the connecting rod corresponding to thebottom edge of the partial rod image shown above.
changes in image intensity that are edges because the changes are significantand local. The plot also shows changes that are not edges, because theyviolate part of the definition. The changes due to noise are not edges eventhough the changes are local, because the changes are not significant. Thechanges due to shading, such as the ramp on the right side of the plot, are notedges even though the changes are significant, because the changes are notlocal. Real images are very noisy. It is difficult to develop an edge detectionoperator that reliably finds step edges and is immune to noise.
Before we discuss important considerations in edge detection operators,some terms must be carefully defined.
Definition 5.1 An edge point is a point in an image with coordinates [i,j]at the location of a significant local intensity change in the image.
Definition 5.2 An edge fragment corresponds to the i and j coordinates ofan edge and the edge orientation e, which may be the gradient angle.
20
40..I
-..-
60
80
100 1- .....
120
50 100 150 200 250
(a)
250
200
150
100
50
00 50 100 150 200 250
(b)
5.1. GRADIENT 143
Definition 5.3 An edgedetectoris an algorithmthat producesa set of edges{edgepoints or edge fragments} from an image.
Definition 5.4 A contour is a list of edgesor the mathematicalcurve thatmodels the list of edges.
Definition 5.5 Edge linking is the process of forming an ordered list of edgesfrom an unordered list. By convention, edges are ordered by traversal in aclockwise direction.
Definition 5.6 Edge following is the process of searching the {filtered} imageto determine contours.
The coordinates of an edge point may be the integer row and columnindices of the pixel where the edge was detected, or the coordinates of theedge location at subpixel resolution. The edge coordinates may be in the co-ordinate system of the original image, but more likely are in the coordinatesystem of the image produced by the edge detection filter since filtering maytranslate or scale image coordinates. An edge fragment may be conceptual-ized as a small line segment about the size of a pixel, or as a point with anorientation attribute. The term edgeis commonlyused for either edgepointsor edge fragments.
The edge set produced by an edge detector can be partitioned into twosubsets: correct edges, which correspond to edges in the scene, and falseedges, which do not correspond to edges in the scene. A third set of edgescan be defined as those edges in the scene that should have been detected.This is the set of missing edges. The false edges are called false positives,and the missing edges are called false negatives.
The difference between edge linking and edge followingis that edge linkingtakes as input an unordered set of edges produced by an edge detector andforms an ordered list of edges. Edge following takes as input an image andproduces an ordered list of edges. Edge detection uses local information todecide if a pixel is an edge, while edge following can use global information.
5.1 Gradient
Edge detection is essentially the operation ofdetecting significant local changesin an image. In one dimension, a step edge is associated with a local peak in
144 CHAPTER 5. EDGE DETECTION
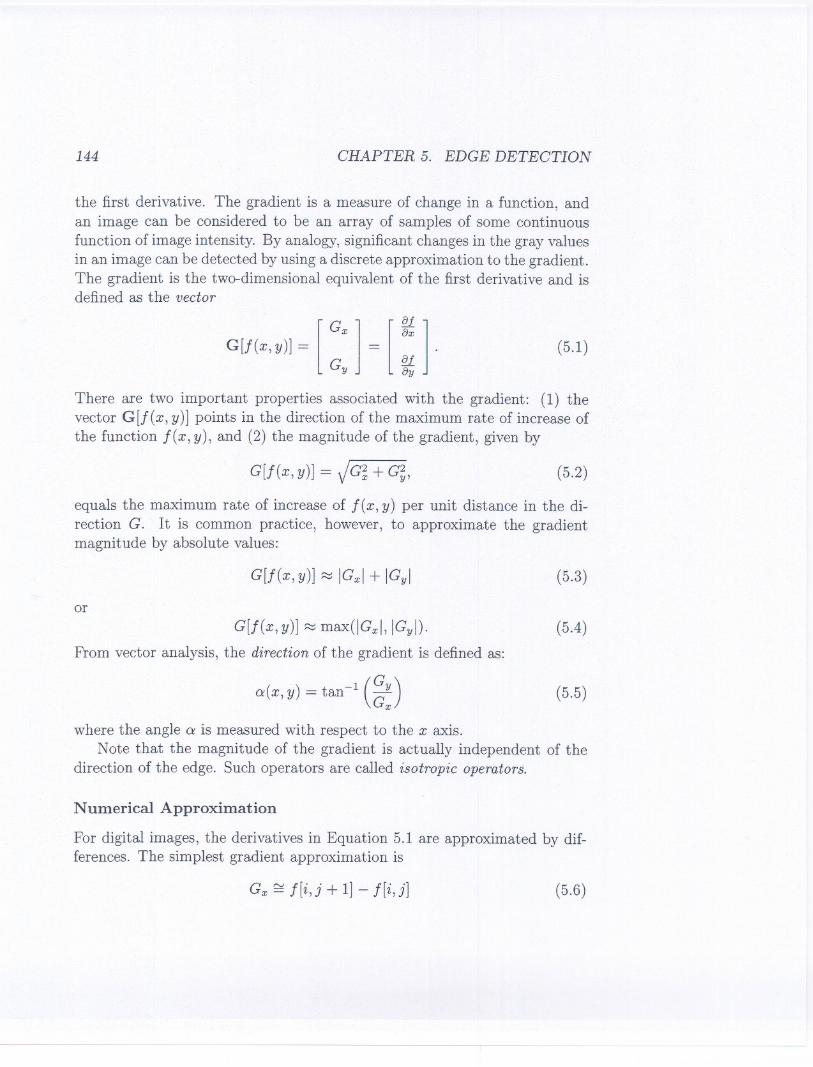
the first derivative. The gradient is a measure of change in a function, andan image can be considered to be an array of samples of some continuousfunction of image intensity. By analogy, significant changes in the gray valuesin an image can be detected by using a discrete approximation to the gradient.The gradient is the two-dimensional equivalent of the first derivative and isdefined as the vector
(5.1)
There are two important properties associated with the gradient: (1) thevector G[j(x, y)] points in the direction of the maximum rate of increase ofthe function j(x, y), and (2) the magnitude of the gradient, givenby
G[J(x, y)] = VG~ + G~, (5.2)
equals the maximum rate of increase of j (x, y) per unit distance in the di-rection G. It is common practice, however, to approximate the gradientmagnitude by absolute values:
(5.3)
or
G[j(x, y)] ~ max(IGxl, IGyl).
From vector analysis, the direction of the gradient is defined as:
(5.4)
a(x, y) = tan-1 (~:) (5.5)
where the angle a is measured with respect to the x axis.Note that the magnitude of the gradient is actually independent of the
direction of the edge. Such operators are called isotropic operators.
Numerical Approximation
For digital images, the derivatives in Equation 5.1 are approximated by dif-ferences. The simplest gradient approximation is
Gx rv j[i,j + 1]- j[i,j] (5.6)
5.2. STEPS IN EDGE DETECTION 145
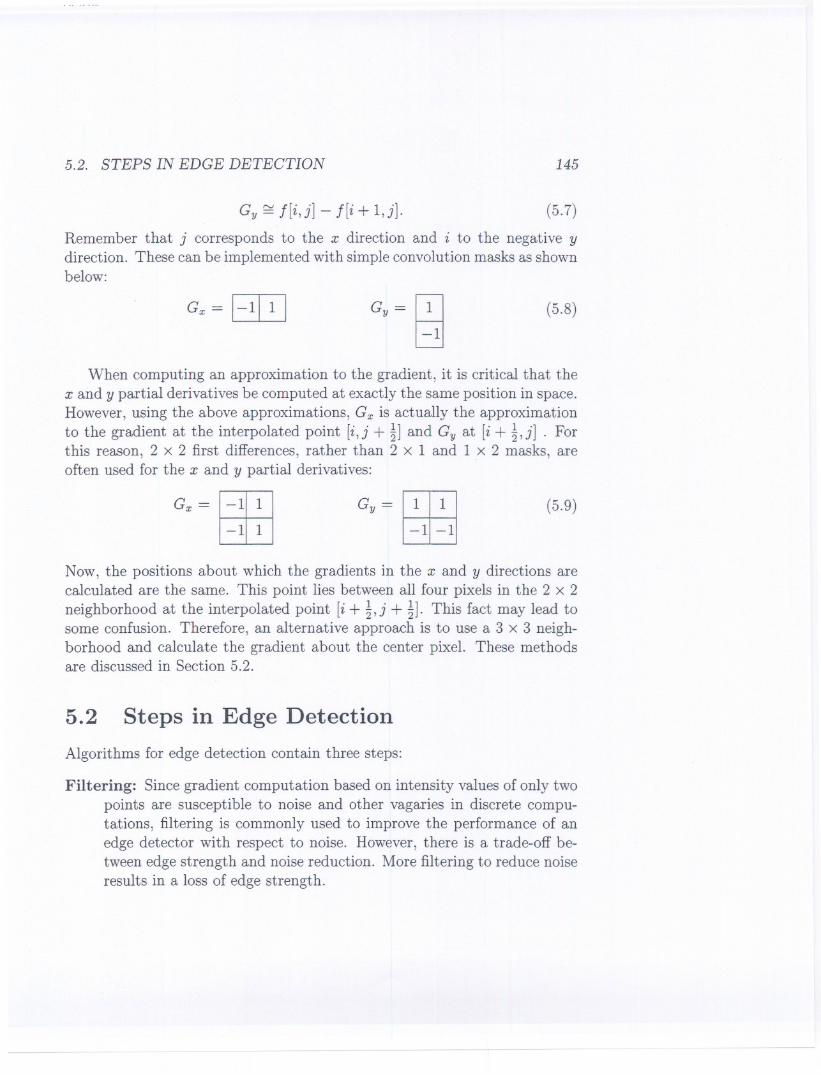
Gy '" j[i, j] - j[i + 1, j]. (5.7)
Remember that j corresponds to the x direction and i to the negative ydirection. These can be implemented with simple convolution masks as shownbelow:
(5.8)
When computing an approximation to the gradient, it is critical that thex and y partial derivatives be computed at exactly the same position in space.However, using the above approximations, Gx is actually the approximationto the gradient at the interpolated point [i,j + ~] and Gy at [i + ~,j] . Forthis reason, 2 x 2 first differences, rather than 2 x 1 and 1 x 2 masks, areoften used for the x and y partial derivatives:
(5.9)
Now, the positions about which the gradients in the x and y directions arecalculated are the same. This point lies between all four pixels in the 2 x 2neighborhood at the interpolated point [i + ~,j + ~]. This fact may lead tosome confusion. Therefore, an alternative approach is to use a 3 x 3 neigh-borhood and calculate the gradient about the center pixel. These methodsare discussed in Section 5.2.
5.2 Steps in Edge Detection
Algorithms for edge detection contain three steps:
Filtering: Since gradient computation based on intensity values of only twopoints are susceptible to noise and other vagaries in discrete compu-tations, filtering is commonly used to improve the performance of anedge detector with respect to noise. However, there is a trade-off be-tween edge strength and noise reduction. More filtering to reduce noiseresults in a loss of edge strength.

146 CHAPTER 5. EDGE DETECTION
Enhancement: In order to facilitate the detection of edges, it is essentialto determine changes in intensity in the neighborhood of a point. En-hancement emphasizes pixels where there is a significant change in localintensity values and is usually performed by computing the gradientmagnitude.
Detection: We only want points with strong edge content. However, manypoints in an image have a nonzero value for the gradient, and not allof these points are edges for a particular application. Therefore, somemethod should be used to determine which points are edge points.Frequently, thresholding provides the criterion used for detection.
Examples at the end of this section will clearly illustrate each of these stepsusing various edge detectors. Many edge detection algorithms include afourth step:
Localization: The location of the edge can be estimated with subpixel res-olution if required for the application. The edge orientation can alsobe estimated.
It is important to note that detection merely indicates that an edge ispresent near a pixel in an image, but does not necessarily provide an accu-rate estimate of edge location or orientation. The errors in edge detectionare errors of misclassification: false edges and missing edges. The errors inedge estimation are modeled by probability distributions for the location andorientation estimates. We distinguish between edge detection and estimationbecause these steps are performed by different calculations and have differenterror models.
Many edge detectors have been developed in the last two decades. Herewe will discuss some commonly used edge detectors. As will be clear, edgedetectors differ in use of the computational approach in one or more of theabove three steps. We will discuss the implications of these steps after wehave discussed the edge detectors.
5.2.1 Roberts Operator
The Roberts cross operator provides a simple approximation to the gradientmagnitude:
G [J[i,j]] = IJ[i,j] - J[i + l,j + 1]1+ IJ[i + l,j] - J[i,j + 1]1. (5.10)
--

5.2. STEPS IN EDGE DETECTION 147
Using convolution masks, this becomes
(5.11)
where Gx and Gy are calculated using the following masks:
Gx= ~ Gy= ~ITE] rn
As with the previous 2 x 2 gradient operator, the differences are com-puted at the interpolated point [i + ~,j + ~]. The Roberts operator is anapproximation to the continuous gradient at that point and not at the point[i,j] as might be expected. The results of Roberts edge detector are shownin the figures at the end of this section.
(5.12)
5.2.2 Sobel Operator
As mentioned previously, a way to avoid having the gradient calculated aboutan interpolated point between pixels is to use a 3 x 3 neighborhood for thegradient calculations. Consider the arrangement of pixels about the pixel [i,j]shown in Figure 5.3. The Sobel operator is the magnitude of the gradientcomputed by
M = 182 + 82V x y'
where the partial derivatives are computed by
8x = (a2 + ca3 + a4) - (ao + ca7 + a6)
8y = (ao + cal + a2) - (a6 + ca5 + a4)
with the constant c = 2.Like the other gradient operators, 8x and 8y can be implemented using
convolution masks:
(5.13)
(5.14)
(5.15)
8 =Y(5.16)
Note that this operator places an emphasis on pixels that are closer to thecenter of the mask. The figures at the end of this section show the perfor-mance of this operator. The Sobel operator is one of the most commonlyused edge detectors.
-1 0 1
-2 0 2
-1 0 1
1 2 1
0 0 0
-1 -2 -1
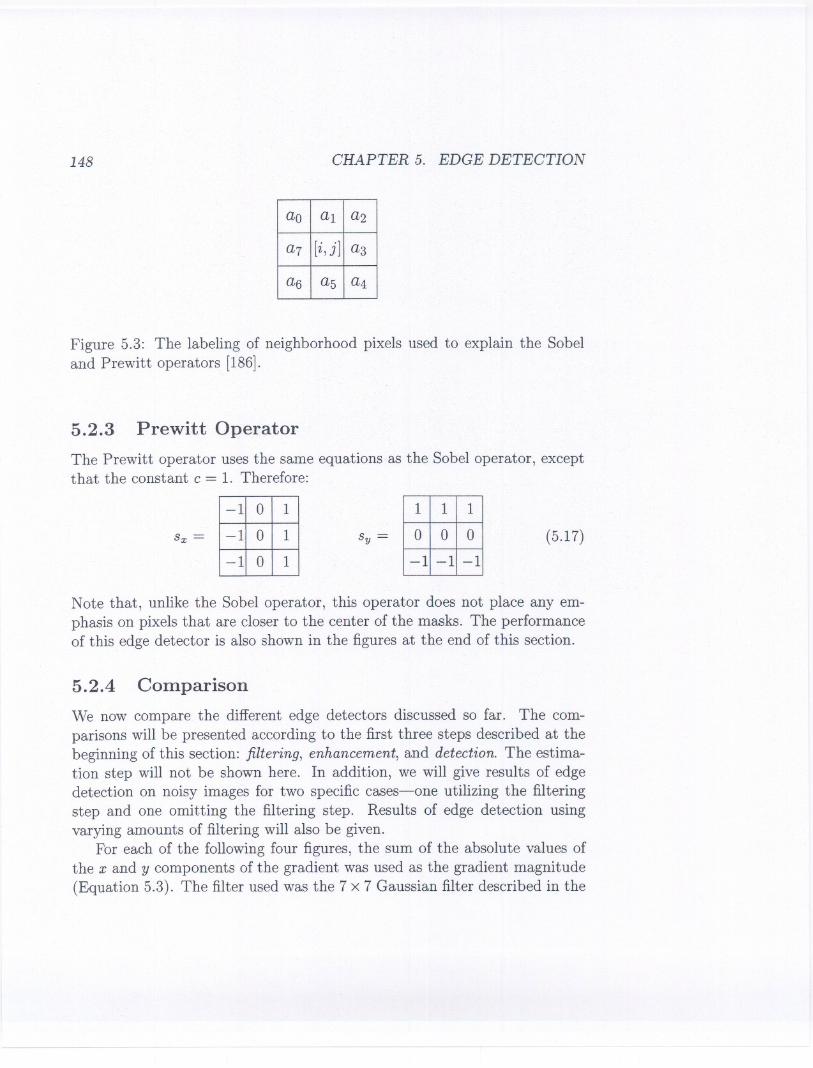
148 CHAPTER 5. EDGE DETECTION
Figure 5.3: The labeling of neighborhood pixels used to explain the Sobeland Prewitt operators [186].
5.2.3 Prewitt Operator
The Prewitt operator uses the same equations as the Sobel operator, exceptthat the constant c = 1. Therefore:
Sx = S =y (5.17)
Note that, unlike the Sobel operator, this operator does not place any em-phasis on pixels that are closer to the center of the masks. The performanceof this edge detector is also shown in the figures at the end of this section.
5.2.4 Comparison
We now compare the different edge detectors discussed so far. The com-parisons will be presented according to the first three steps described at thebeginning of this section: filtering, enhancement, and detection. The estima-tion step will not be shown here. In addition, we will give results of edgedetection on noisy images for two specific cases-one utilizing the filteringstep and one omitting the filtering step. Results of edge detection usingvarying amounts of filtering will also be given.
For each of the following four figures, the sum of the absolute values ofthe x and y components of the gradient was used as the gradient magnitude(Equation 5.3). The filter used was the 7 x 7 Gaussian filter described in the
ao al a2
a7 [i,j] a3
a6 a5 a4
-1 0 1
-1 0 1
-1 0 1
1 1 1
0 0 0
-1 -1 -1
5.3. SECOND DERIVATIVE OPERATORS 149
previous chapter. The threshold values used for detection are given in thecaptions.
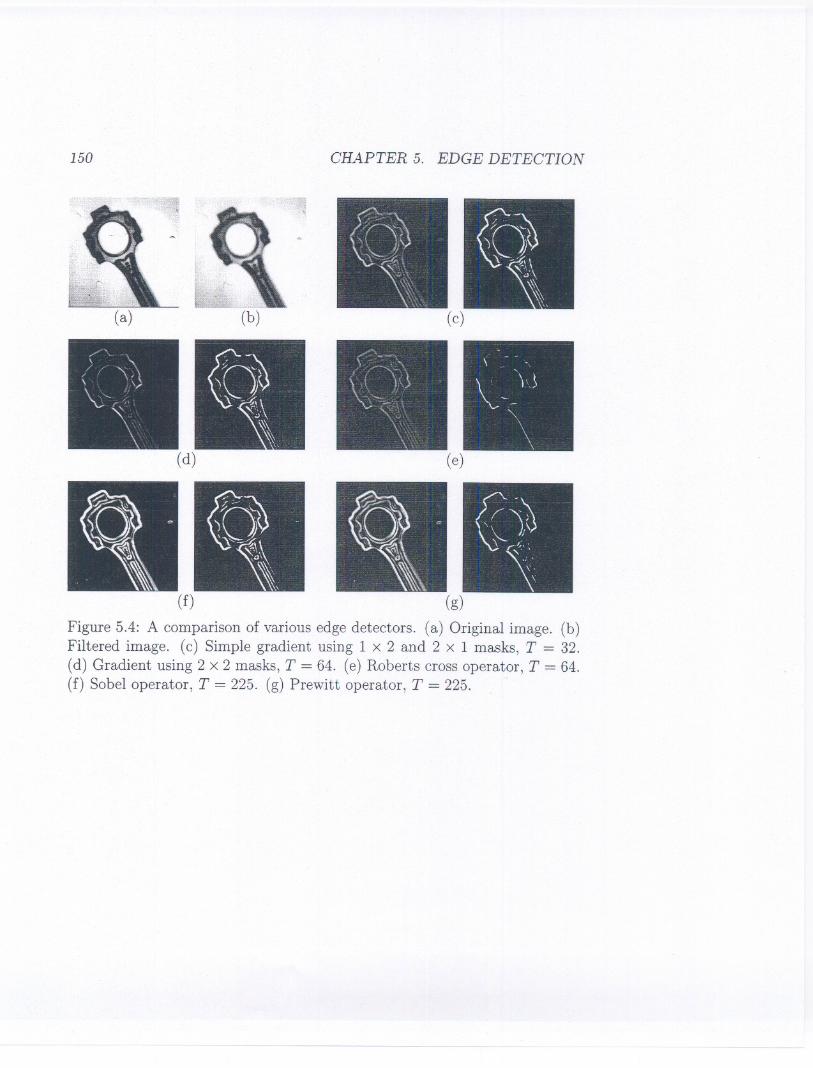
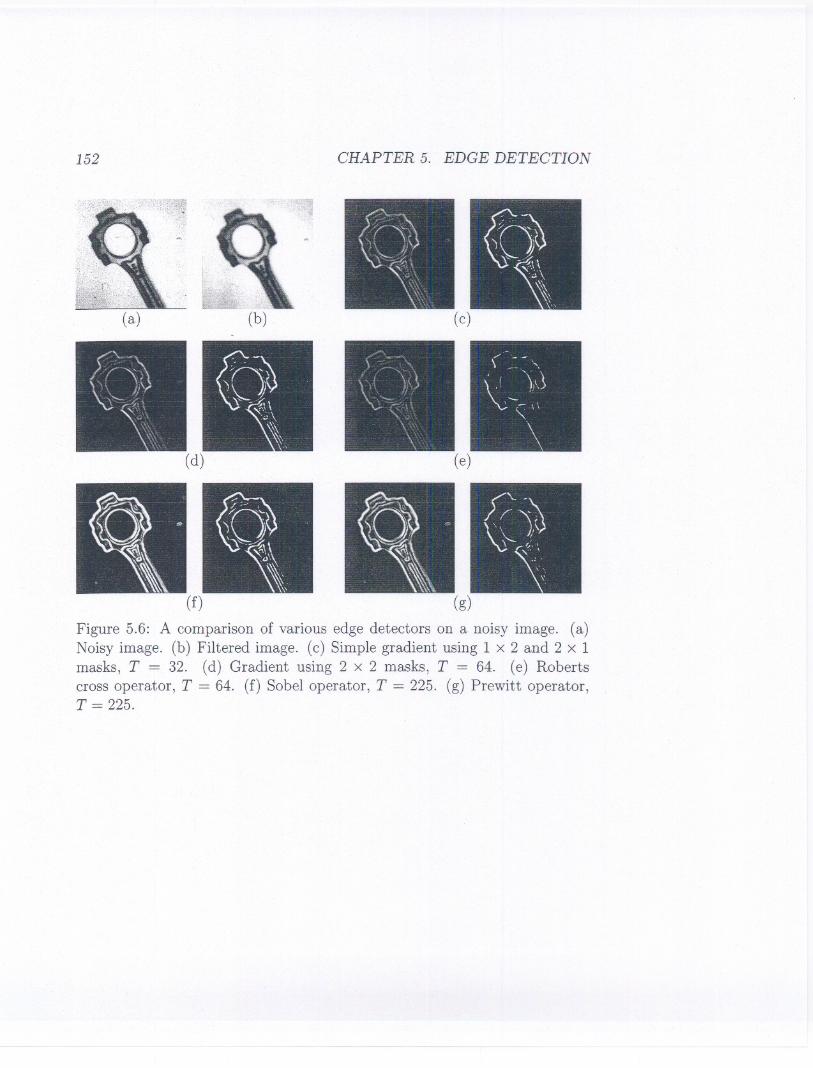
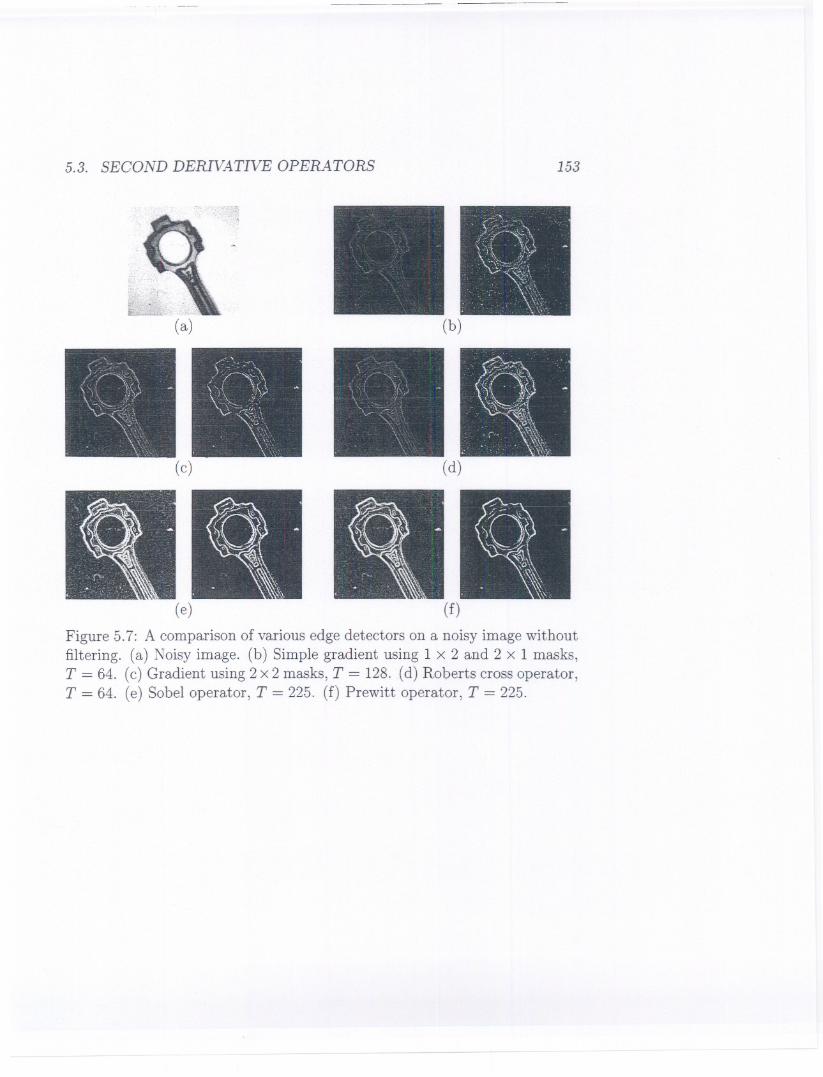
Figure 5.4 shows results of all the edge detection methods discussed so far,from the simple 1 x 2 gradient approximation up to the Prewitt operator.Figure 5.5 shows the results of the edge detectors when the filtering stepis omitted. The next set of images (Figure 5.6) shows the results of edgedetection on the same image now with additive Gaussian noise, (J= 12. Thefilter used was the same Gaussian filter as used in the previous figure. Thefinal series of images (Figure 5.7) shows the results of edge detection on thesame noisy image. However, for these images the filtering step was againomitted. Note the many false edges detected as a result of the noise.
5.3 Second Derivative Operators
The edge detectors discussed earlier computed the first derivative and, if itwas above a threshold, the presence of an edge point was assumed. Thisresults in detection of too many edge points. (Notice the thick lines afterthresholding in Figures 5.4 to 5.7.) A better approach would be to find onlythe points that have local maxima in gradient values and consider them edgepoints, as shown in Figure 5.8. This means that at edge points, there will bea peak in the first derivative and, equivalently, there will be a zero crossingin the second derivative. Thus, edge points may be detected by finding thezero crossings of the second derivative of the image intensity.
Ther:e are two operators in two dimensions that correspond to the secondderivative: the Laplacian and second directional derivative.
5.3.1 Laplacian Operator
The second derivative of a smoothed step edge is a function that crosseszero at the location of the edge (see Figure 5.8). The Laplacian is thetwo-dimensional equivalent of the second derivative. The formula for theLaplacian of a function f (x, y) is
(5.18)
150
(d)
(f)
CHAPTER 5. EDGE DETECTION
(c)
(e)
Figure 5.4: A comparison of variousedge detectors.(a) Original image. (b)
Filtered image. (c) Simple gradient using 1 x 2 and 2 x 1 masks, T = 32.
(d) Gradient using 2 x 2 masks, T = 64. (e) Roberts cross operator, T = 64.
(f)Sobel operator, T = 225. (g)Prewitt operator,T = 225. .

5.3. SECOND DERIVATIVE OPERATORS
L,(a)
(c)
(e)
151
(b)
(d)
(f)
Figure 5.5: A comparison of various edge detectors without filtering. (a)Original image. (b) Simple gradient using 1 x 2 and 2 x 1 masks, T = 64.(c) Gradient using 2 x 2 masks, T = 64. (d) Roberts cross operator, T = 64.(e) Sobel operator, T = 225. (f) Prewitt operator, T = 225.
152
(b)
(d)
(f)
CHAPTER 5. EDGE DETECTION
(e)
f'- - ~
~CJ~
\":~
.
'
, .\'
(g)
Figure 5.6: A comparisonof various edge detectors on a noisy image. (a)Noisy image. (b) Filtered image. (c) Simplegradient using 1 x 2 and 2 x 1masks, T = 32. (d) Gradient using 2 x 2 masks, T = 64. (e) Robertscross operator, T = 64. (f) Sobel operator, T = 225. (g) Prewitt operator,T = 225.
5.3. SECOND DERIVATNE OPERATORS
(a)
(c)
(e)
153
(b)
(d)
(f)
Figure 5.7: A comparison of various edge detectors on a noisy image withoutfiltering. (a) Noisy image. (b) Simple gradient using 1 x 2 and 2 x 1 masks,T = 64. (c) Gradient using 2 x 2 masks, T = 128. (d) Roberts cross operator,T = 64. (e) Sobel operator, T = 225. (f) Prewitt operator, T = 225.

154 CHAPTER 5. EDGE DETECTION
f (x, y)x
f'(x, y)threshold
a bx
"(f x,y)
x
Figure 5.8: If a threshold is used for detection of edges, all points betweena and b will be marked as edge pixels. However, by removing points thatare not a local maximum in the first derivative, edges can be detected more
accurately. This local maximum in the first derivative corresponds to a zerocrossing in the second derivative.
The second derivatives along the x and y directions are approximated usingdifference equations:
However, this approximation is centered about the pixel [i,j + 1]. Therefore,by replacing j with j - 1, we obtain
~~ = j[i,j + 1]- 2j[i,j] + j[i,j - 1], (5.24)
{)2j {)Gx(5.19)- =-
{)x2 {)x
() (J[i,j + 1] - j[i,j])(5.20)-
{)x() j[i,j + 1] {)f[i,j]
(5.21)- -{)x {)x
(J[i,j + 2]- j[i,j + 1])- (J[i,j + 1]- j[i,j]) (5.22)
- j[i,j + 2] - 2j[i,j + 1]+ j[i,j]. (5.23)

5.3. SECOND DERIVATIVE OPERATORS 155
which is the desired approximation to the second partial derivative centeredabout [i,j]. Similarly,
a2f
ay2 = f[i + 1,j] - 2f[i,j] + f[i - 1,j]. (5.25)
By combining these two equations into a single operator, the following maskcan be used to approximate the Laplacian:
(5.26)
Sometimes it is desired to give more weight to the center pixels in the neigh-borhood. An approximation to the Laplacian which does this is
(5.27)
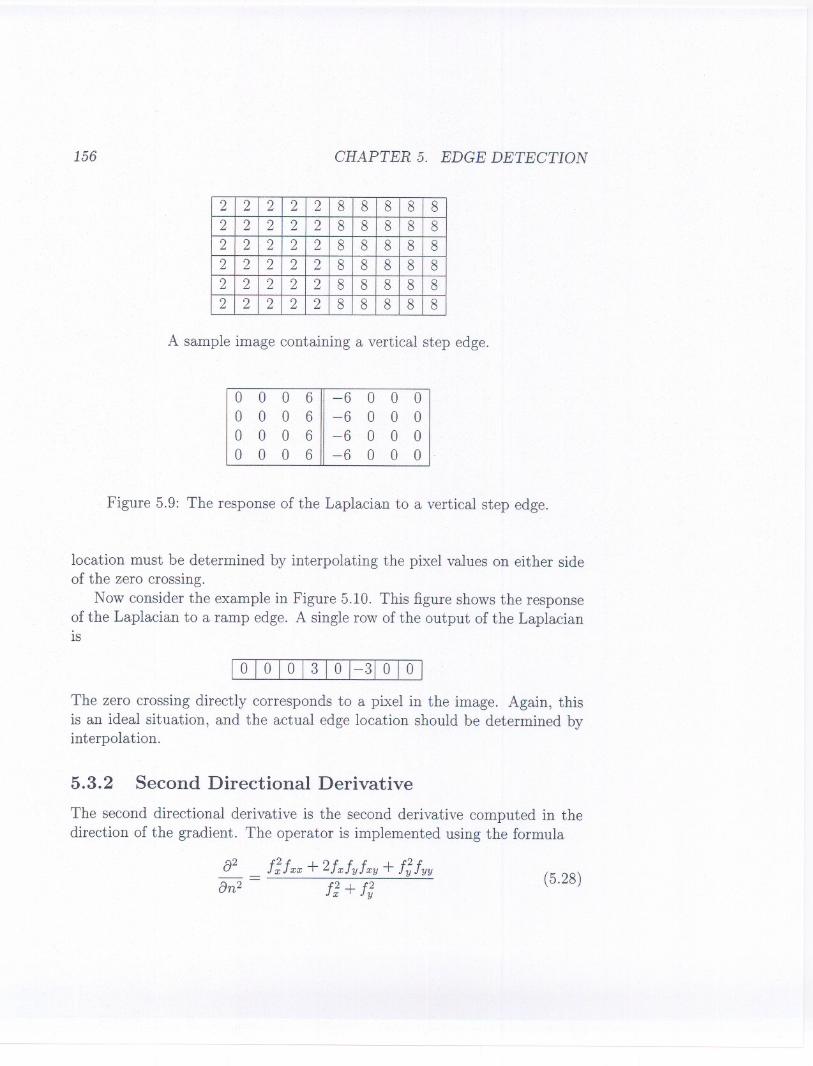
The Laplacian operator signals the presence of an edge when the output ofthe operator makes a transition through zero. Trivial zeros (uniform zeroregions) are ignored. In principle, the zero crossing location can be esti-mated to subpixel resolution using linear interpolation, but the result maybe inaccurate due to noise.
Consider the example shown in Figure 5.9. This figure shows the resultof the Laplacian on an image with a simple step edge. A single row of theresulting image is:
In this example, the zero crossing, corresponding to the edge in the originalimage, lies halfway between the two center pixels. The edge should be markedat either the pixel to the left or the pixel to the right of the edge, as longas it is marked consistently throughout the image. In most cases, however,the zero crossing rarely lies exactly between two pixels, and the actual edge
0 1 0
1 -4 1
0 1 0
1 4 1
4 -20 4
1 4 1
156 CHAPTER 5. EDGE DETECTION
A sample image containing a vertical step edge.
location must be determined by interpolating the pixel values on either sideof the zero crossing.
Now consider the example in Figure 5.10. This figure shows the responseof the Laplacian to a ramp edge. A single row of the output of the LaplacianIS
The zero crossing directly corresponds to a pixel in the image. Again, thisis an ideal situation, and the actual edge location should be determined byinterpolation.
5.3.2 Second Directional Derivative
The second directional derivative is the second derivative computed in thedirection of the gradient. The operator is implementedusing the formula
a2 {;!xx + 2!x!y!xy + !;!yyan2 - F; + !;
(5.28)
2 2 2 2 2 8 8 8 8 82 2 2 2 2 8 8 8 8 82 2 2 2 2 8 8 8 8 82 2 2 2 2 8 8 8 8 82 2 2 2 2 8 8 8 8 82 2 2 2 2 8 8 8 8 8
0 0 0 6 -6 0 0 00 0 0 6 -6 0 0 00 0 0 6 -6 0 0 00 0 0 6 -6 0 0 0
Figure 5.9: The response of the Laplacian to a vertical step edge.

5.4. LAPLACIAN OF GAUSSIAN 157
A sample image containing a vertical ramp edge.
Figure 5.10: The response of the Laplacian to a vertical ramp edge.
The Laplacian and second directional derivative operators are not usedfrequently in machine vision since any operator involving two derivatives isaffected by noise more than an operator involving a single derivative. Evenvery small local peaks in the first derivative will result in zero crossings inthe second derivative. To avoid the effect of noise, powerful filtering meth-ods must be used. In the following section, we discuss an approach whichcombines Gaussian filtering with the second derivative for edge detection.
5.4 Laplacian of Gaussian
As mentioned above, edge points detected by finding the zero crossings of thesecond derivative of the image intensity are very sensitive to noise. Therefore,it is desirable to filter out the noise before edge enhancement. To do this,the Laplacian of Gaussian (LoG), due to Marr and Hildreth [164],combinesGaussian filtering with the Laplacian for edge detection.
2 2 2 2 2 5 8 8 8 82 2 2 2 2 5 8 8 8 82 2 2 2 2 5 8 8 8 82 2 2 2 2 5 8 8 8 82 2 2 2 2 5 8 8 8 82 2 2 2 2 5 8 8 8 8
0 0 o 3 0 -3 0 0o 0 o 3 0 -3 0 0o 0 o 3 0 -3 0 00 0 o 3 0 -3 0 0
158 CHAPTER 5. EDGE DETECTION
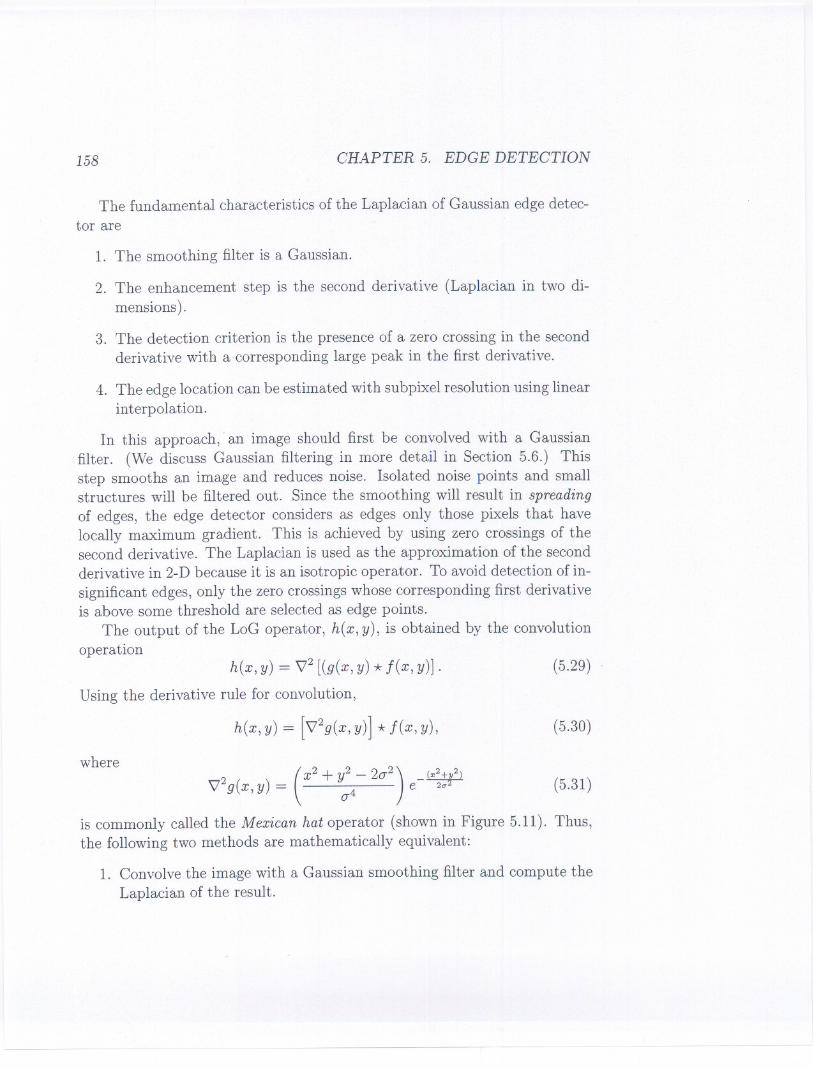
The fundamental characteristics of the Laplacian of Gaussian edge detec-tor are
1. The smoothing filter is a Gaussian.
2. The enhancement step is the second derivative (Laplacian in two di-mensions) .
3. The detection criterion is the presence of a zero crossing in the secondderivative with a corresponding large peak in the first derivative.
4. The edge location can be estimated with subpixel resolution using linearinterpolation.
In this approach,. an image should first be convolved with a Gaussianfilter. (We discuss Gaussian filtering in more detail in Section 5.6.) Thisstep smooths an image and reduces noise. Isolated noise points and smallstructures will be filtered out. Since the smoothing will result in spreadingof edges, the edge detector considers as edges only those pixels that havelocally maximum gradient. This is achieved by using zero crossings of thesecond derivative. The Laplacian is used as the approximation of the secondderivative in 2-D because it is an isotropic operator. To avoid detection of in-significant edges, only the zero crossings whose corresponding first derivativeis above some threshold are selected as edge points.
The output of the LoG operator, h(x, y), is obtained by the convolutionoperation
h(x, y) = \72 [(g(x, y) * j(x, y)] . (5.29)
Using the derivative rule for convolution,
h(x, y) = [\72g(x,y)] * j(x, y), (5.30)
where
(x2 + y2 _2(}2
)(x2+l)
\72g(x, y) = (}4 e- 20" (5.31)
is commonly called the Mexican hat operator (shown in Figure 5.11). Thus,the following two methods are mathematically equivalent:
1. Convolve the image with a Gaussian smoothing filter and compute theLaplacian of the result.
5.4. LAPLACIAN OF GAUSSIAN 159
0.5
.().110
0.1
04
0.3
0.2
0.1
10
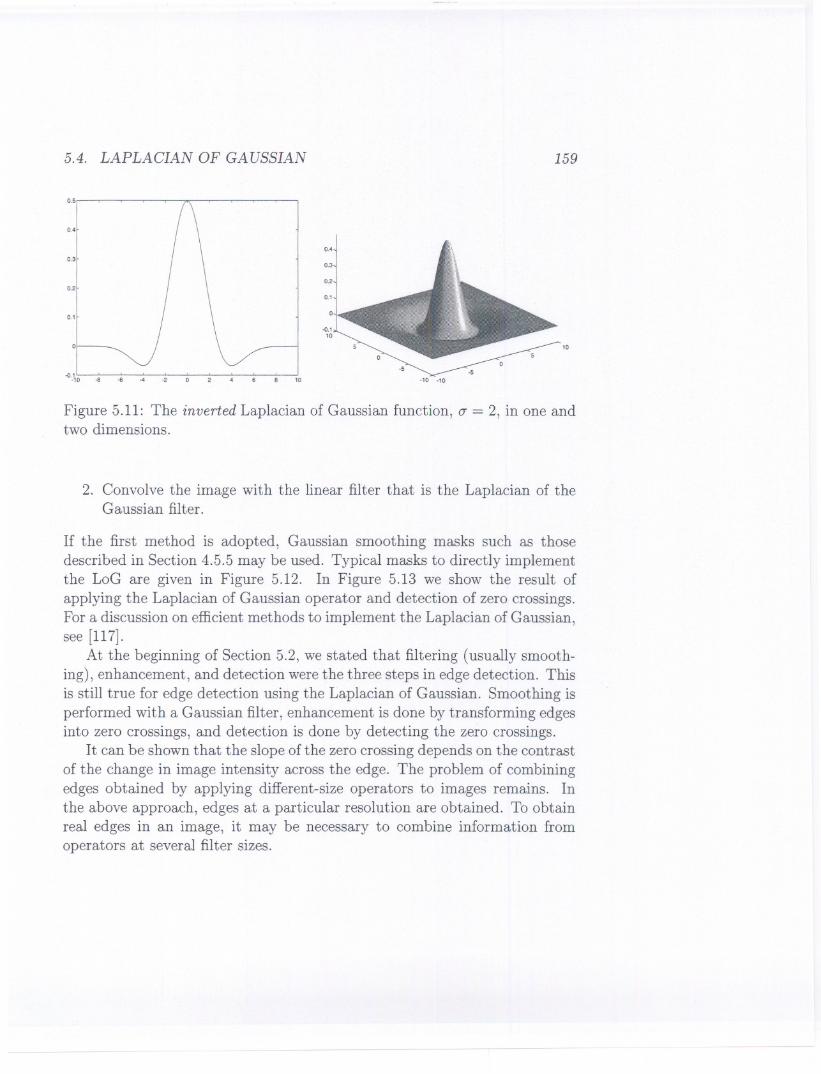
-4>._\0 -8 -6 ... -2 10
Figure 5.11: The inverted Laplacian of Gaussian function, (j = 2, in one andtwo dimensions.
2. Convolve the image with the linear filter that is the Laplacian of theGaussian filter.
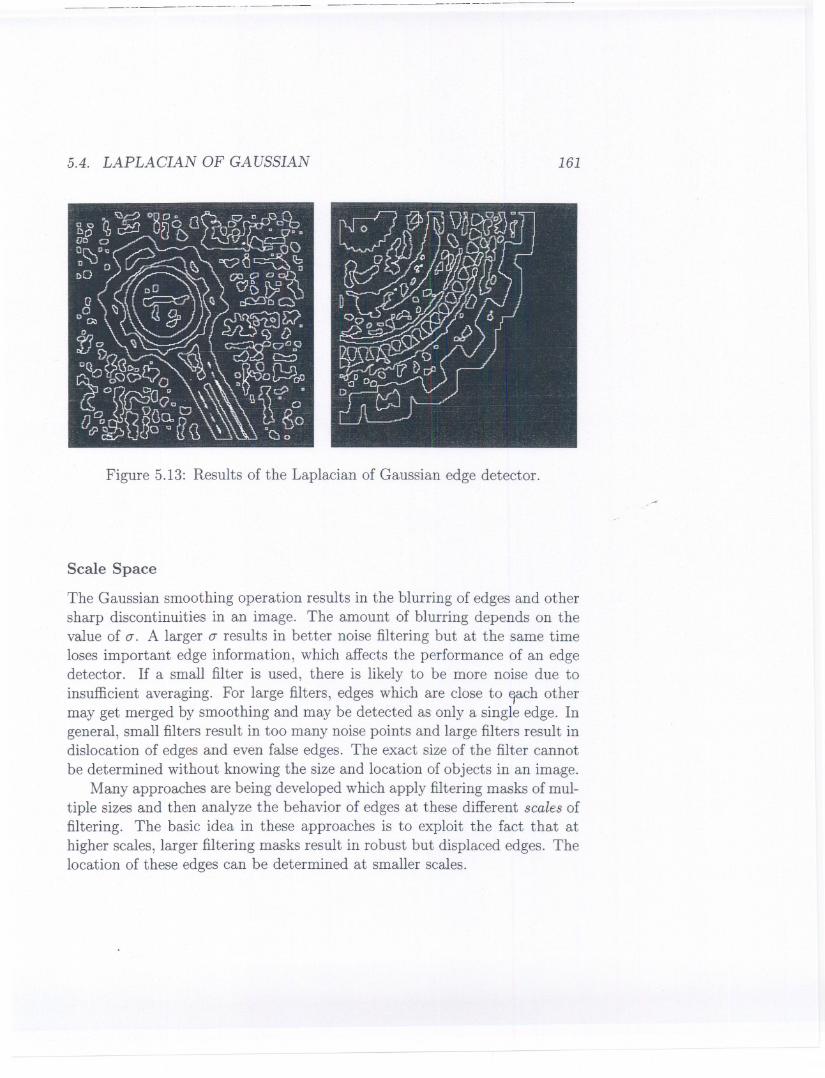
If the first method is adopted, Gaussian smoothing masks such as thosedescribed in Section 4.5.5 may be used. Typical masks to directly implementthe LoG are given in Figure 5.12. In Figure 5.13 we show the result ofapplying the Laplacian of Gaussian operator and detection of zero crossings.For a discussion on efficient methods to implement the Laplacian of Gaussian,see [117].
At the beginning of Section 5.2, we stated that filtering (usually smooth-ing), enhancement, and detection were the three steps in edge detection. Thisis still true for edge detection using the Laplacian of Gaussian. Smoothing isperformed with a Gaussian filter, enhancement is done by transforming edgesinto zero crossings, and detection is done by detecting the zero crossings.
It can be shown that the slope of the zero crossing depends on the contrastof the change in image intensity across the edge. The problem of combiningedges obtained by applying different-size operators to images remains. Inthe above approach, edges at a particular resolution are obtained. To obtainreal edges in an image, it may be necessary to combine information fromoperators at several filter sizes.
160 CHAPTER 5. EDGE DETECTION
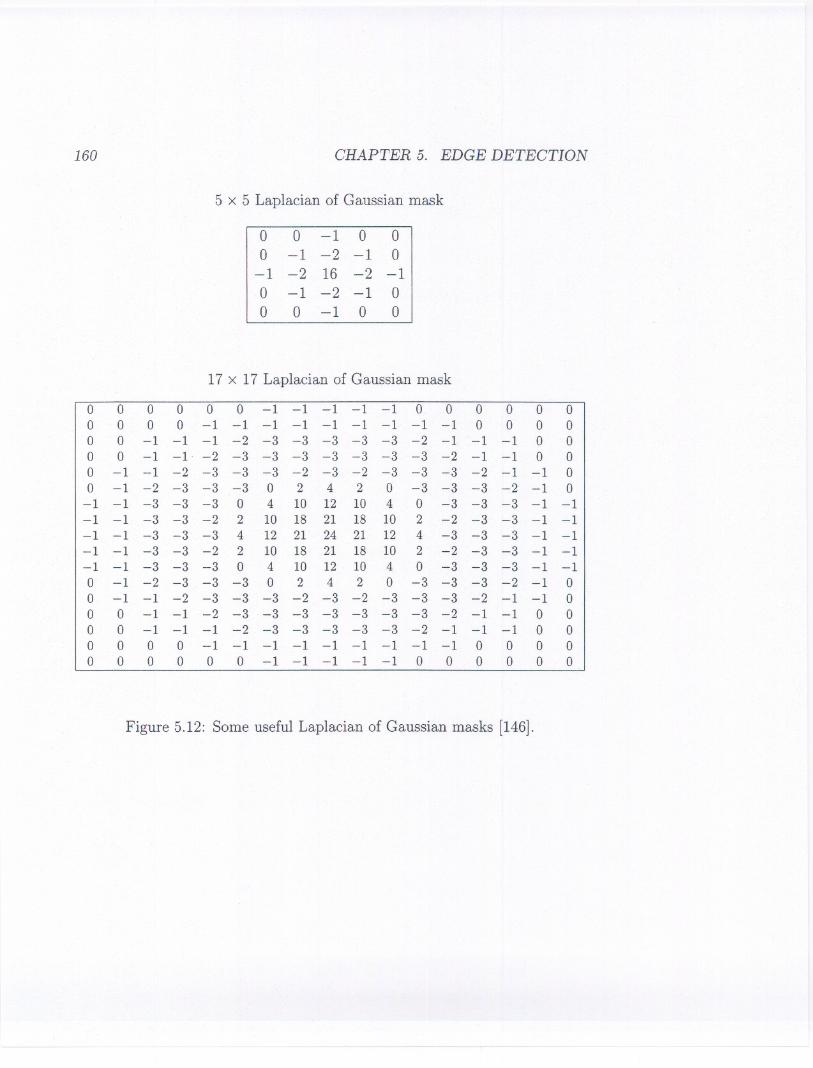
5 x 5 Laplacian of Gaussian mask
17 x 17 Laplacian of Gaussian mask
Figure 5.12: Some useful Laplacian of Gaussian masks [146].
0 0 -1 0 00 -1 -2 -1 0
-1 -2 16 -2 -10 -1 -2 -1 00 0 -1 0 0
0 0 0 0 0 0 -1 -1 -1 -1 -1 0 0 0 0 0 00 0 0 0 -1 -1 -1 -1 -1 -1 -1 -1 -1 0 0 0 00 0 -1 -1 -1 -2 -3 -3 -3 -3 -3 -2 -1 -1 -1 0 00 0 -1 -1 -2 -3 -3 -3 -3 -3 -3 -3 -2 -1 -1 0 00 -1 -1 -2 -3 -3 -3 -2 -3 -2 -3 -3 -3 -2 -1 -1 00 -1 -2 -3 -3 -3 0 2 4 2 0 -3 -3 -3 -2 -1 0
-1 -1 -3 -3 -3 0 4 10 12 10 4 0 -3 -3 -3 -1 -1-1 -1 -3 -3 -2 2 10 18 21 18 10 2 -2 -3 -3 -1 -1-1 -1 -3 -3 -3 4 12 21 24 21 12 4 -3 -3 -3 -1 -1-1 -1 -3 -3 -2 2 10 18 21 18 10 2 -2 -3 -3 -1 -1-1 -1 -3 -3 -3 0 4 10 12 10 4 0 -3 -3 -3 -1 -10 -1 -2 -3 -3 -3 0 2 4 2 0 -3 -3 -3 -2 -1 00 -1 -1 -2 -3 -3 -3 -2 -3 -2 -3 -3 -3 -2 -1 -1 00 0 -1 -1 -2 -3 -3 -3 -3 -3 -3 -3 -2 -1 -1 0 00 0 -1 -1 -1 -2 -3 -3 -3 -3 -3 -2 -1 -1 -1 0 00 0 0 0 -1 -1 -1 -1 -1 -1 -1 -1 -1 0 0 0 00 0 0 0 0 0 -1 -1 -1 -1 -1 0 0 0 0 0 0
----
5.4. LAPLACIAN OF GAUSSIAN
---------------
161
Figure 5.13: Results of the Laplacian of Gaussian edge detector.
Scale Space
The Gaussian smoothing operation results in the blurring of edges and othersharp discontinuities in an image. The amount of blurring depends on thevalue of (J. A larger (J results in better noise filtering but at the same timeloses important edge information, which affects the performance of an edgedetector. If a small filter is used, there is likely to be more noise due to
insufficient averaging. For large filters, edges which are close to Ef8.Chothermay get merged by smoothing and may be detected as only a single edge. Ingeneral, small filters result in too many noise points and large filters result indislocation of edges and even false edges. The exact size of the filter cannotbe determined without knowing the size and location of objects in an image.
Many approaches are being developed which apply filtering masks of mul-tiple sizes and then analyze the behavior of edges at these different scales offiltering. The basic idea in these approaches is to exploit the fact that athigher scales, larger filtering masks result in robust but displaced edges. Thelocation of these edges can be determined at smaller scales.
162 CHAPTER 5. EDGE DETECTION
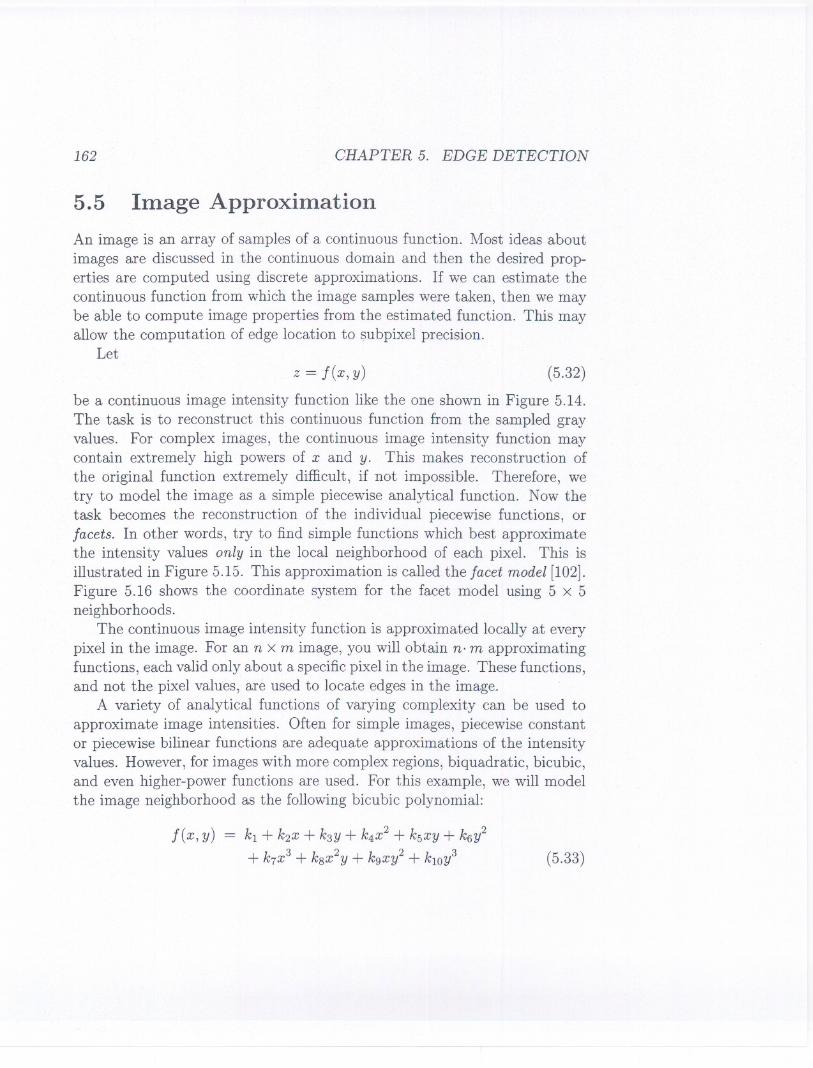
5.5 Image Approximation
An image is an array of samples of a continuous function. Most ideas aboutimages are discussed in the continuous domain and then the desired prop-erties are computed using discrete approximations. If we can estimate thecontinuous function from which the image samples were taken, then we maybe able to compute image properties from the estimated function. This mayallow the computation of edge location to subpixel precision.
Letz = f(x,y) (5.32)
be a continuous image intensity function like the one shown in Figure 5.14.The task is to reconstruct this continuous function from the sampled grayvalues. For complex images, the continuous image intensity function maycontain extremely high powers of x and y. This makes reconstruction ofthe original function extremely difficult, if not impossible. Therefore, wetry to model the image as a simple piecewise analytical function. Now thetask becomes the reconstruction of the individual piecewise functions, orfacets. In other words, try to find simple functions which best approximatethe intensity values only in the local neighborhood of each pixel. This isillustrated in Figure 5.15. This approximation is called the facet model [102].Figure 5.16 shows the coordinate system for the facet model using 5 x 5neighborhoods.
The continuous image intensity function is approximated locally at everypixel in the image. For an n Xm image, you will obtain n. m approximatingfunctions, each valid only about a specific pixel in the image. These functions,and not the pixel values, are used to locate edges in the image.
A variety of analytical functions of varying complexity can be used toapproximate image intensities. Often for simple images, piecewise constantor piecewise bilinear functions are adequate approximations of the intensityvalues. However, for images with more complex regions, biquadratic, bicubic,and even higher-power functions are used. For this example, we will modelthe image neighborhood as the following bicubic polynomial:
f(x, y) = k1 + k2x + k3y + k4X2+ k5xy + k6y2
+ k7X3 + k8x2y + kgxy2 + klOy3 (5.33)

5.5. IMAGE APPROXIMATION 163
300
200
o60
60
100
Figure 5.14: A graphical representation of the continuous image intensityfunction.
Figure 5.15: An illustration of an approximated function within a 5 x 5neighborhood.
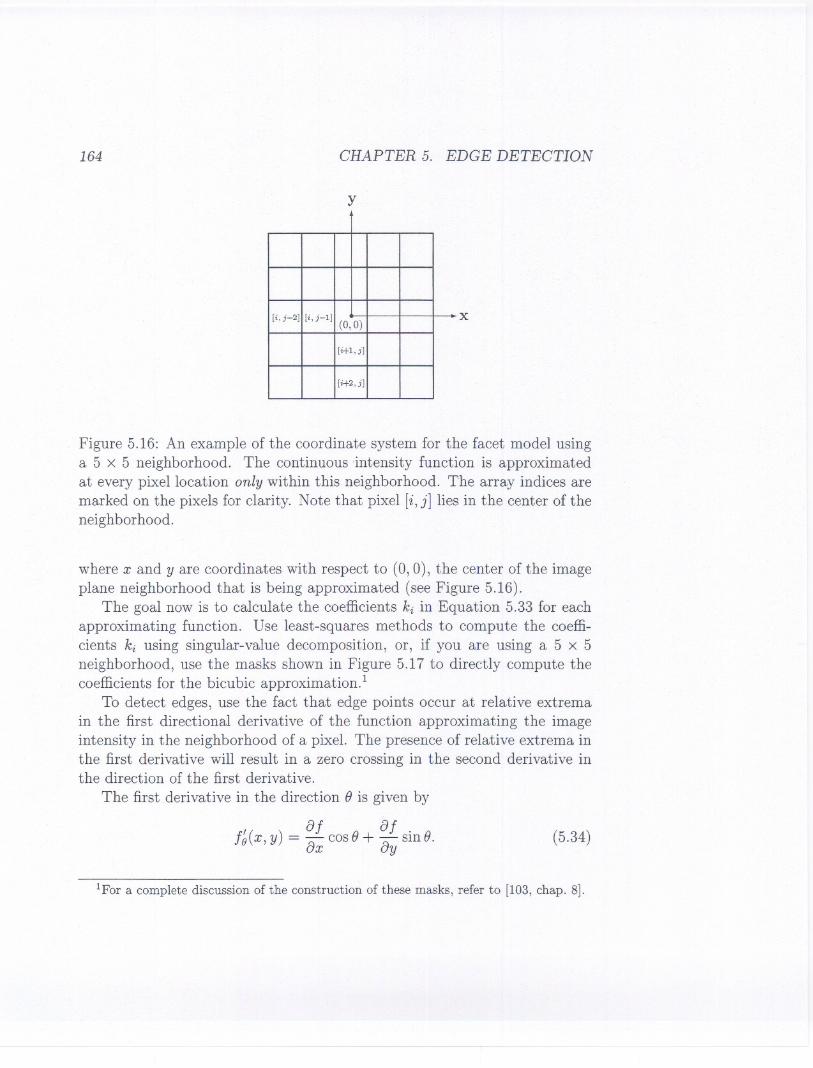
164 CHAPTER 5. EDGE DETECTION
y
x
Figure 5.16: An example of the coordinate system for the facet model usinga 5 x 5 neighborhood. The continuous -intensity function is approximatedat every pixel location only within this neighborhood. The array indices aremarked on the pixels for clarity. Note that pixel [i,j] lies in the center of theneighborhood.
where x and yare coordinates with respect to (0,0), the center of the imageplane neighborhood that is being approximated (see Figure 5.16).
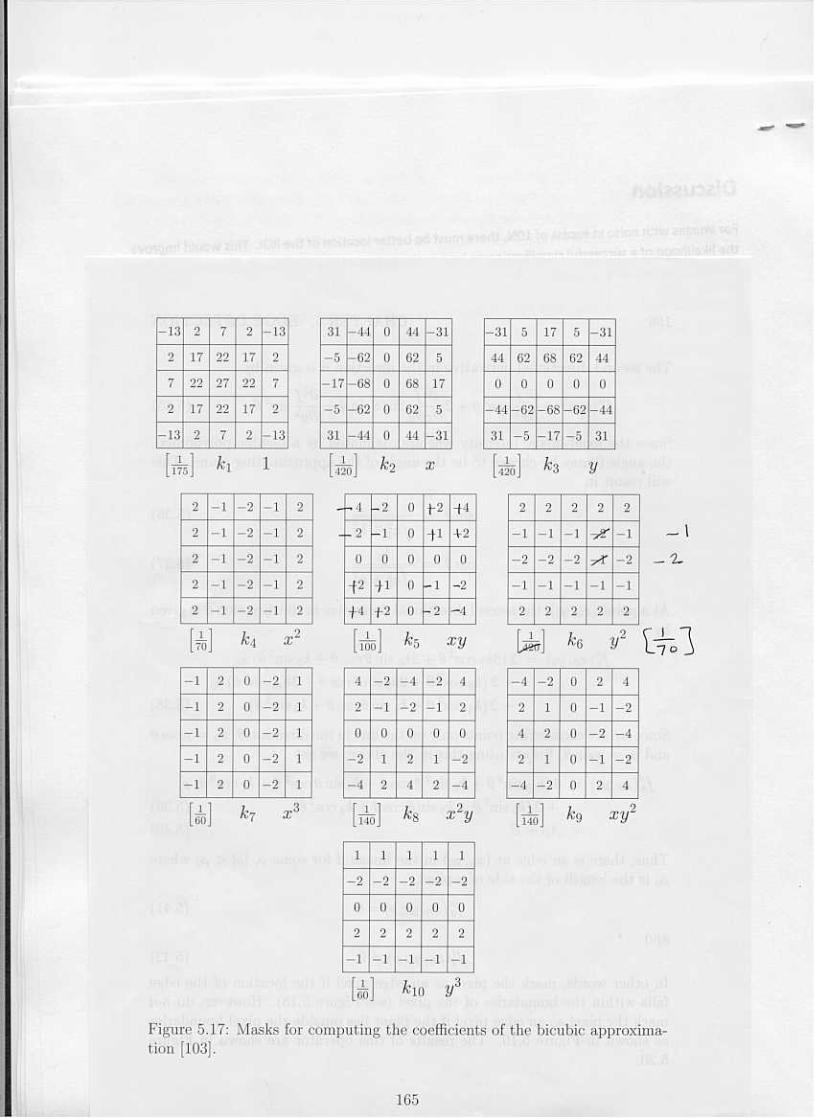
The goal now is to calculate the coefficients ki in Equation 5.33 for eachapproximating function. Use least-squares methods to compute the coeffi-cients ki using singular-value decomposition, or, if you are using a 5 x 5neighborhood, use the masks shown in Figure 5.17 to directly compute thecoefficients for the bicubic approximation.!
To detect edges, use the fact that edge points occur at relative extremain the first directional derivative of the function approximating the imageintensity in the neighborhood of a pixel. The presence of relative extrema inthe first derivative will result in a zero crossing in the second derivative inthe direction of the first derivative.
The first derivative in the direction e is given by
, of. of.fe(x, y) = ox cose+ oy sm e. (5.34)
1For a complete discussion of the construction of these masks, refer to [103, chap. 8].
4
I I I,- 1 I
----
[i,j-2J [i,j-1] 8-(0,0) -
[i+1,j]-
[i+2,jJJ
166 CHAPTER 5. EDGE DETECTION
The second directional derivative in the direction (j is given by
t" ( )82 f 2 (j 2 82f
(j.
(j 82 f . 2 (j ( )J() X, Y = 8x2 cos + 8x8y cos sm + 8y2 sm . 5.35
Since the local image intensity was approximated by a bicubic polynomial,the angle (j may be chosen to be the angle of the approximating plane. Thiswill result in
. k3
sm (j = J (5.36)k~+ k§k2
cos (j = J' (5.37)k~+ k§
At a point (xo, Yo), the second directional derivative in the direction (j is givenby
f~'(xo, Yo) = 2 (3k7cos2(j+ 2ks sin (jcos (j+ kgsin2(j)Xo
+ 2 (ks cos2(j+ 2kgsin (jcos (j+ 3klOsin2(j)Yo
+ 2 (k4cos2(j+ ks sin (jcos (j+ k6sin2(j). (5.38)
Since we are considering points only on the line in the direction (j,Xo = Pcos (jand Yo = Psin (j. Substituting this in the above, we get
f~' (xo, Yo) = 6 (klO sin3 (j + kg sin2 (jcos (j + ks sin (jcos2 (j + k7 cos3 (j) p
+ 2 (k6 sin2(j+ ks sin (jcos (j+ k4cos2(j) (5.39)
= Ap + B. (5.40)
Thus, there is an edge at (xo, Yo) in the image if for some p, Ipl < PowherePo is the length of the side of a pixel,
f~'(xo, Yo;p) = 0 (5.41)
and
f~(xo, Yo;p) i= O. (5.42)
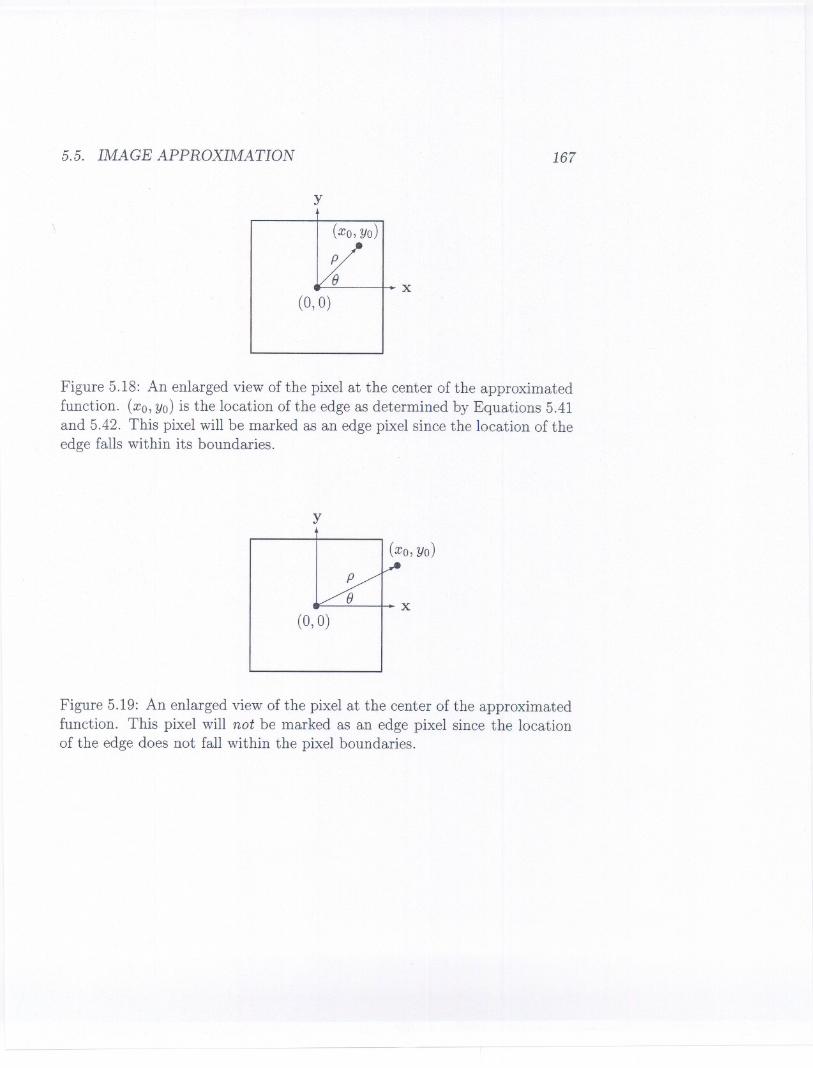
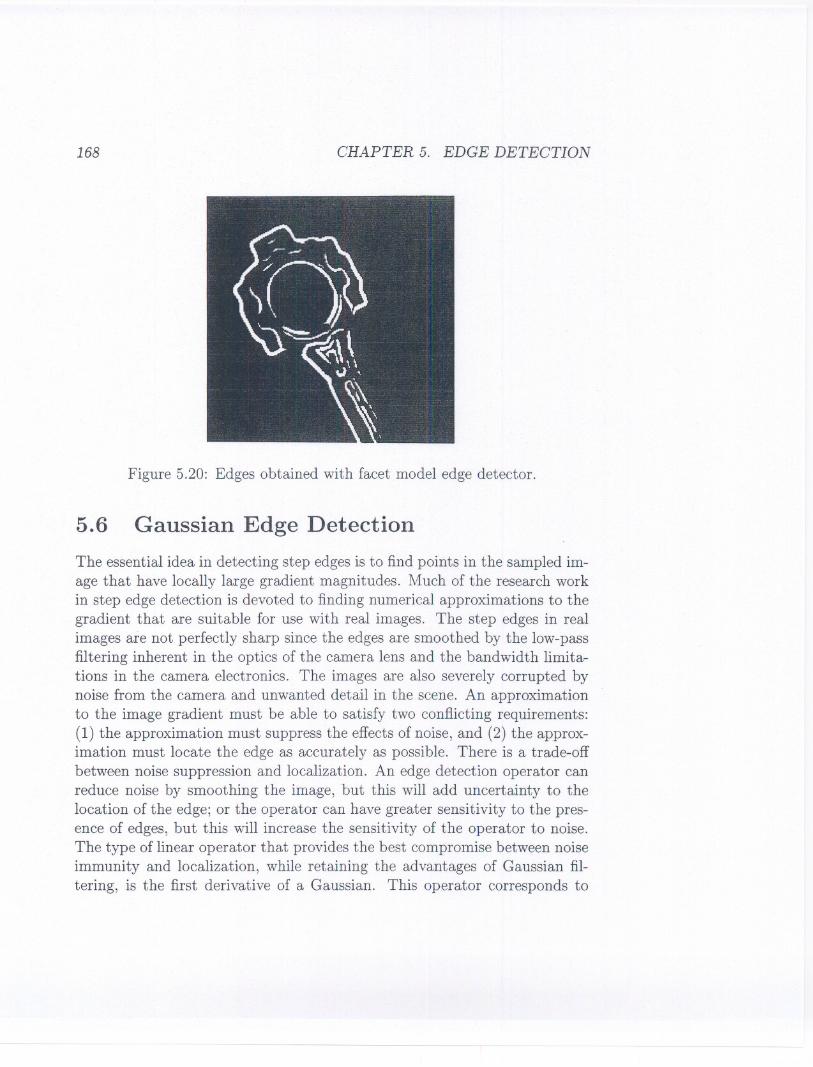
In other words, mark the pixel as an edge pixel if the location of the edgefalls within the boundaries of the pixel (see Figure 5.18). However, do notmark the pixel as an edge pixel if the point lies outside the pixel boundariesas shown in Figure 5.19. The results of this operator are shown in Figure5.20.
5.5. IMAGE APPROXIMATION 167
y
(xo, Yo)".
p
~-(0,0)
x
Figure 5.18: An enlarged view of the pixel at the center of the approximatedfunction. (xo, Yo) is the location ofthe edge as determined by Equations 5.41and 5.42. This pixel will be marked as an edge pixel since the location of theedge falls within its boundaries.
y
(xo, Yo)
(0,0)
Figure 5.19: An enlarged view of the pixel at the center ofthe approximatedfunction. This pixel will not be marked as an edge pixel since the locationof the edge does not fall within the pixel boundaries.
168 CHAPTER 5. EDGE DETECTION
Figure 5.20: Edges obtained with facet model edge detector.
5.6 Gaussian Edge Detection
The essential idea in detecting step edges is to find points in the sampled im-age that have locally large gradient magnitudes. Much of the research workin step edge detection is devoted to finding numerical approximations to thegradient that are suitable for use with real images. The step edges in realimages are not perfectly sharp since the edges are smoothed by the low-passfiltering inherent in the optics of the camera lens and the bandwidth limita-tions in the camera electronics. The images are also severely corrupted bynoise from the camera and unwanted detail in the scene. An approximationto the image gradient must be able to satisfy two conflicting requirements:(1) the approximation must suppress the effects of noise, and (2) the approx-imation must locate the edge as accurately as possible. There is a trade-offbetween noise suppression and localization. An edge detection operator canreduce noise by smoothing the image, but this will add uncertainty to thelocation of the edge; or the operator can have greater sensitivity to the pres-ence of edges, but this will increase the sensitivity of the operator to noise.The type of linear operator that provides the best compromise between noiseimmunity and localization, while retaining the advantages of Gaussian fil-tering, is the first derivative of a Gaussian. This operator corresponds to
5.6. GAUSSIAN EDGE DETECTION 169
smoothing an image with a Gaussian function and then computing the gra-dient. The gradient can be numerically approximated by using the standardfinite-difference approximation for the first partial derivatives in the x andy directions listed in Section 5.1. The operator that is the combination of aGaussian smoothing filter and a gradient approximation is not rotationallysymmetric. The operator is symmetric along the edge and antisymmetricperpendicular to the edge (along the line of the gradient). This means thatthe operator is sensitive to the edge in the direction of steepest change, butis insensitive to the edge and acts as a smoothing operator in the directionalong the edge.
5.6.1 Canny Edge Detector
The Canny edge detector is the first derivative of a Gaussian and closelyapproximates the operator that optimizes the product of signal-to-noise ratioand localization. The Canny edge detection algorithm is summarized by thefollowing notation. Let I[i, j] denote the image. The result from convolvingthe image with a Gaussian smoothing filter using separable filtering is anarray of smoothed data,
Sri, j] = G[i, j; 0"]* I[i, j], (5.43)
where 0"is the spread of the Gaussian and controls the degree of smoothing.The gradient of the smoothed array Sri, j] can be computed using the 2 x 2
first-difference approximations (Section 5.1) to produce two arrays P[i,j] andQ[i, j] for the x and y partial derivatives:
P[i,j] ~ (S[i,j + 1] - S[i,j]
+ Sri + 1,j + 1] - Sri + 1,j])/2
Q[i,j] ~ (S[i,j] - Sri + 1,j]+ S[i,j + 1]- Sri + 1,j + 1])/2.
(5.44)
(5.45)
The finite differences are averaged over the 2 x 2 square so that the x and ypartial derivatives are computed at the same point in the image. The mag-nitude and orientation of the gradient can be computed from the standardformulas for rectangular-to-polar conversion:
M[i,j]
B[i,j]VP[i,jj2 + Q[i,jj2
- arctan(Q[i,j],P[i,j]),(5.46)(5.47)
--- - -
170 CHAPTER 5. EDGE DETECTION
where the arctan function takes two arguments and generates an angle overthe entire circle of possible directions. These functions must be computed ef-ficiently, preferably without using floating-point arithmetic. It is possible tocompute the gradient magnitude and orientation from the partial derivativesby table lookup. The arctangent can be computed using mostly fixed-pointarithmetic2 with a few essential floating-point calculations performed in soft-ware using integer and fixed-point arithmetic [59, chap. 11]. Sedgewick [218,p. 353] provides an algorithm for an integer approximation to the gradientangle that may be good enough for many applications.
Nonmaxima Suppression
The magnitude image array M[i, j] will have large values where the imagegradient is large, but this is not sufficient to identify the edges, since theproblem of finding locations in the image array where there is rapid changehas merely been transformed into the problem of finding locations in themagnitude array M[i, j] that are local maxima. To identify edges, the broadridges in the magnitude array must be thinned so that only the magnitudes atthe points of greatest local change remain. This process is called nonmaximasuppression, which in this case results in thinned edges.
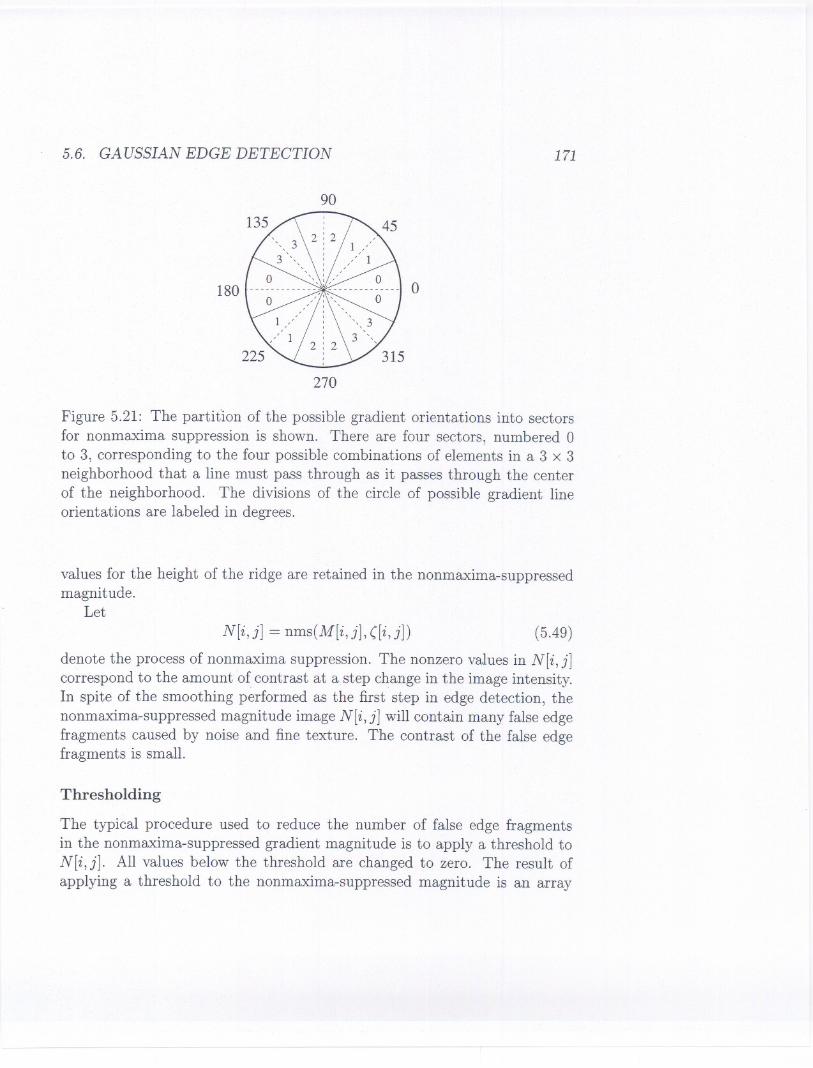
Nonmaxima suppression thins the ridges of gradient magnitude in M[i, j]by suppressing all values along the line of the gradient that are not peakvalues of a ridge. The algorithm begins by reducing the angle of the gradient8[i, j] to one of the four sectors shown in Figure 5.21,
([i,j] = Sector(8[i,j)). (5.48)
The algorithm passes a 3x3 neighborhood across the magnitude array M[i,j].At each point, the center element M[i, j] of the neighborhood is comparedwith its two neighbors along the line of the gradient given by the sector value([i, j] at the center of the neighborhood. If the magnitude array value M[i, j]at the center is not greater than both of the neighbor magnitudes along thegradient line, then M[i,j] is set to zero. This process thins the broad ridgesof gradient magnitude in M[i, j] into ridges that are only one pixel wide. The
2In this context, fixed-point arithmetic is like integer arithmetic except that the numbercarries an implicit scale factor that assumes that the binary point is to the left of thenumber. Fixed-point arithmetic can be implemented using integer arithmetic on manymachines.
5.6. GAUSSIAN EDGE DETECTION 171
90
180 o
270
Figure 5.21: The partition of the possible gradient orientations into sectorsfor nonmaxima suppression is shown. There are four sectors, numbered 0to 3, corresponding to the four possible combinations of elements in a 3 x 3neighborhood that a line must pass through as it passes through the centerof the neighborhood. The divisions of the circle of possible gradient lineorientations are labeled in degrees.
values for the height of the ridge are retained in the nonmaxima-suppressedmagnitude.
Let
N[i, j] = nms(M[i, j], e[i,jD (5.49)
denote the process of nonmaxima suppression. The nonzero values in N[i, j]correspond to the amount of contrast at a step change in the image intensity.In spite of the smoothing performed as the first step in edge detection, thenonmaxima-suppressed magnitude image N[i, j] will contain many false edgefragments caused by noise and fine texture. The contrast of the false edgefragments is small.
Thresholding
The typical procedure used to reduce the number of false edge fragmentsin the nonmaxima-suppressed gradient magnitude is to apply a threshold toN[i,j]. All values below the threshold are changed to zero. The result ofapplying a threshold to the nonmaxima-suppressed magnitude is an array
172 CHAPTER 5. EDGE DETECTION
of the edges detected in the image I[i, j]. There will still be some falseedges because the threshold 7 was too low (false positives), and portionsof actual contours may be missing (false negatives) due to softening of theedge contrast by shadows or because the threshold 7 was too high. Selectingthe proper threshold is difficult and involves some trial and error. A moreeffective thresholding scheme uses two thresholds.
The double thresholding algorithm takes the nonmaxima-suppressed im-age, N[i,j], and applies two thresholds 71 and 72, with 72~ 271, to producetwo thresholded edge images Tdi,j] and T2[i,j]. Since image T2 was formedwith a higher threshold, it will contain fewer false edges; but T2 may havegaps in the contours (too many false negatives). The double thresholdingalgorithm links the edges in T2 into contours. When it reaches the end ofa contour, the algorithm looks in T1 at the locations of the 8-neighbors foredges that can be linked to the contour. The algorithm continues to gatheredges from T1 until the gap has been bridged to an edge in T2. The algorithmperforms edge linking as a by-product of thresholding and resolves some ofthe problems with choosing a threshold. The Canny edge detection algorithmis outlined in Algorithm 5.!.
The edge detection algorithm presented in this section has been run onseveral test images. Figure 5.22 shows the image of a connecting rod. Figures5.23 and 5.24 present the results of applying the edge detection algorithmsummarized in this section to the test image in Figure 5.22. In Figure 5.23,a 7 x 7 Gaussian filter was used to smooth the image before computing thegradient; in Figure 5.24, a 31 x 31 Gaussian filter was used. The nonmaxima-suppressed gradient magnitude for the smaller filter size exhibits excellentfine detail in the edges but suffers from excessive unwanted edge fragments
Algorithm 5.1 Canny Edge Detection
1. Smooth the image with a Gaussian filter.
2. Compute the gradient magnitude and orientation using finite-differenceapproximations for the partial derivatives.
3. Apply nonmaxima suppression to the gradient magnitude.
4. Use the double thresholding algorithm to detect and link edges.
5.7. SUBPIXEL LOCATION ESTIMATION 173
1
-.
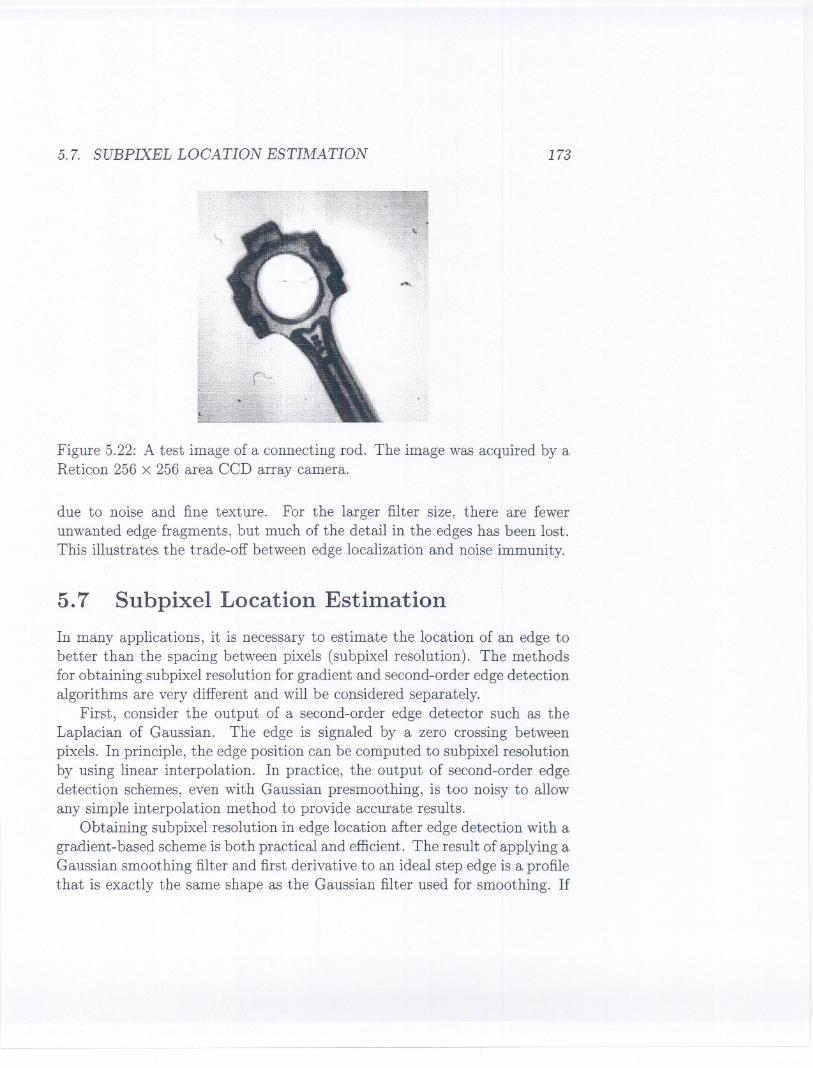
Figure 5.22: A test image of a connecting rod. The image was acquired by aReticon 256 x 256 area CCD array camera.
due to noise and fine texture. For the larger filter size, there are fewerunwanted edge fragments, but much of the detail in the edges has been lost.This illustrates the trade-off between edge localization and noise immunity.
5.7 Subpixel Location Estimation
In many applications, it is necessary to estimate the location of an edge tobetter than the spacing between pixels (subpixel resolution). The methodsfor obtaining subpixel resolution for gradient and second-order edge detectionalgorithms are very different and will be considered separately.
First, consider the output of a second-order edge detector such as theLaplacian of Gaussian. The edge is signaled by a zero crossing betweenpixels. In principle, the edge position can be computed to subpixel resolutionby using linear interpolation. In practice, the output of second-order edgedetection schemes, even with Gaussian presmoothing, is too noisy to allowany simple interpolation method to provide accurate results.
Obtaining subpixel resolution in edge location after edge detection with agradient-based scheme is both practical and efficient. The result of applying aGaussian smoothing filter and first derivative to an ideal step edge is a profilethat is exactly the same shape as the Gaussian filter used for smoothing. If
174 CHAPTER 5. EDGE DETECTION
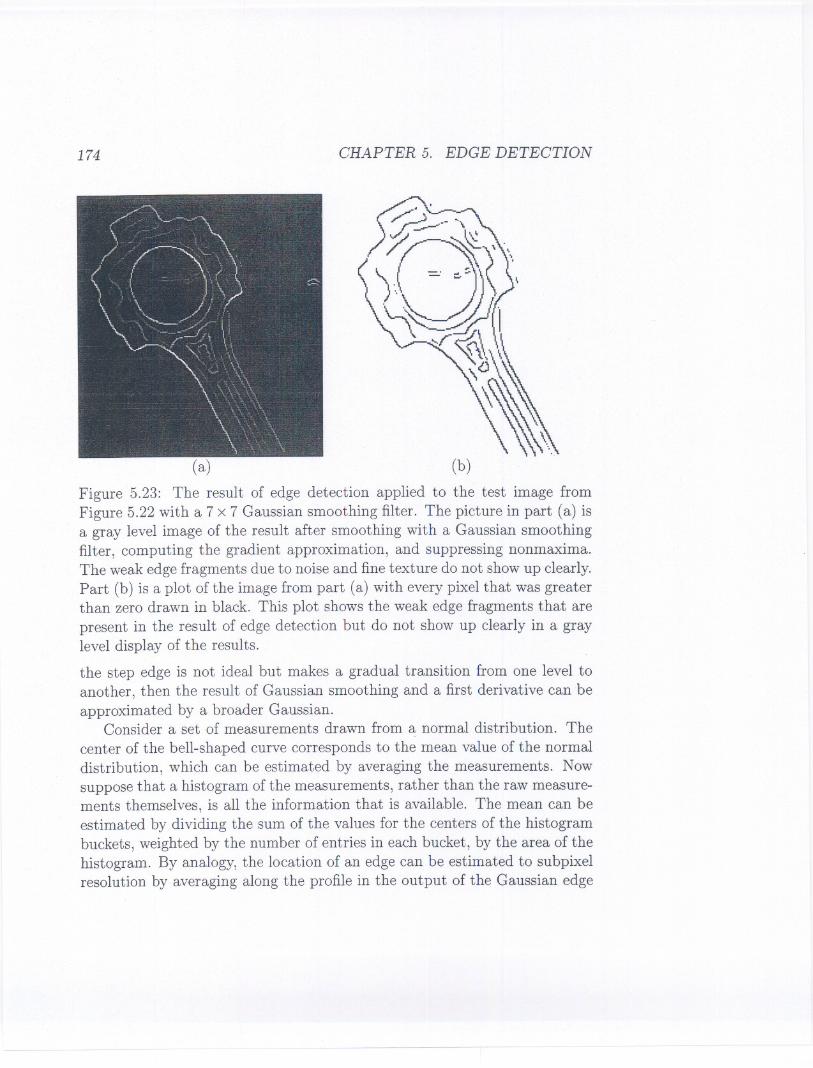
(a)
Figure 5.23: The result of edge detection applied to the test image fromFigure 5.22 with a 7 x 7 Gaussian smoothing filter. The picture in part (a) isa gray level image of the result after smoothing with a Gaussian smoothingfilter, computing the gradient approximation, and suppressing nonmaxima.The weak edge fragments due to noise and fine texture do not show up clearly.Part (b) is a plot of the image from part (a) with every pixel that was greaterthan zero drawn in black. This plot shows the weak edge fragments that arepresent in the result of edge detection but do not show up clearly in a graylevel display of the results.
the step edge is not ideal but makes a gradual transition from one level toanother, then the result of Gaussian smoothing and a first derivative can beapproximated by a broader Gaussian.
Consider a set of measurements drawn from a normal distribution. Thecenter of the bell-shaped curve corresponds to the mean value of the normaldistribution, which can be estimated by averaging the measurements. Nowsuppose that a histogram of the measurements, rather than the raw measure-ments themselves, is all the information that is available. The mean can beestimated by dividing the sum of the values for the centers of the histogrambuckets, weighted by the number of entries in each bucket, by the area of thehistogram. By analogy, the location of an edge can be estimated to subpixelresolution by averaging along the profile in the output of the Gaussian edge
5.7. SUBPIXEL LOCATION ESTIMATION
(a)
175
(b)
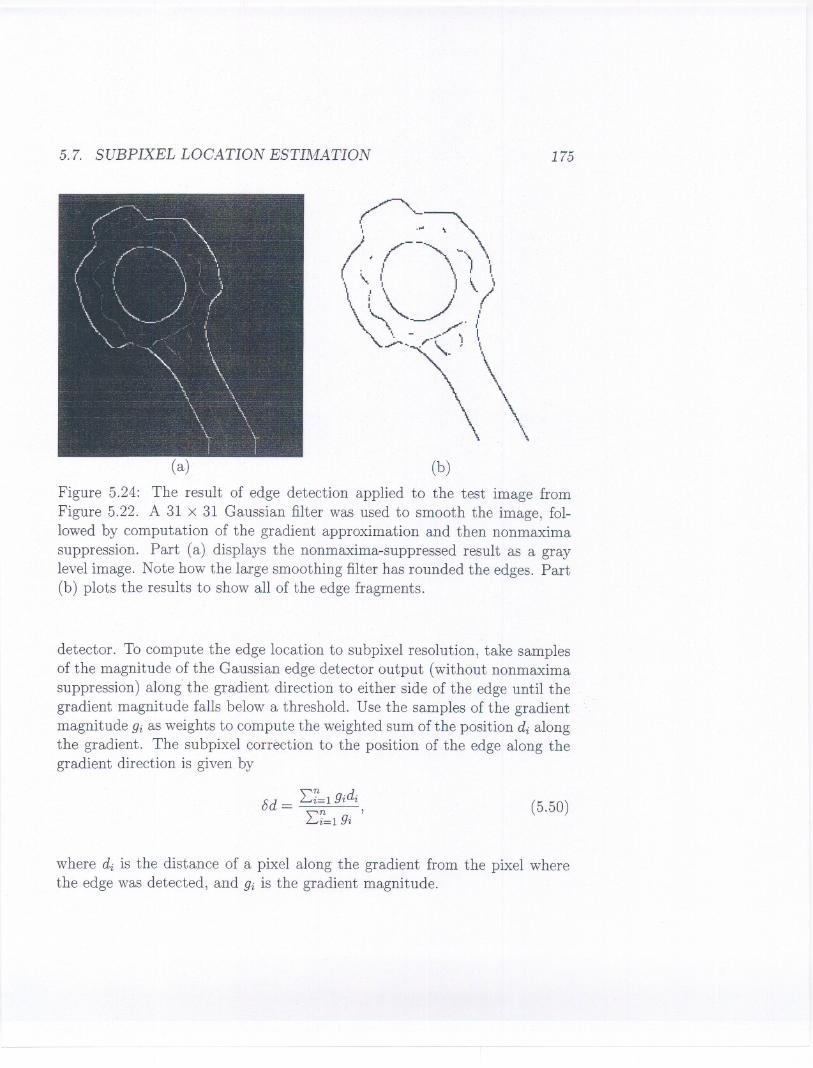
Figure 5.24: The result of edge detection applied to the test image fromFigure 5.22. A 31 x 31 Gaussian filter was used to smooth the image, fol-lowed by computation of the gradient approximation and then nonmaximasuppression. Part (a) displays the nonmaxima-suppressed result as a graylevel image. Note how the large smoothing filter has rounded the edges. Part(b) plots the results to show all of the edge fragments.
detector. To compute the edge location to subpixel resolution, take samplesof the magnitude of the Gaussian edge detector output (without nonmaximasuppression) along"the gradient direction to either side of the edge until thegradient magnitude falls below a threshold. Use the samples of the gradientmagnitude 9i as weights to compute the weighted sum of the position di alongthe gradient. The subpixel correction to the position of the edge along thegradient direction is given by
(5.50)
where di is the distance of a pixel along the gradient from the pixel wherethe edge was detected, and 9i is the gradient magnitude.
176 CHAPTER 5. EDGE DETECTION
A simpler algorithm that is probably as effective is to compute the posi-tion (bX,by) of the edge to subpixel resolution, relative to the pixel where theedge was detected, by applying a first moment calculation to the magnitudeof the gradient of the Gaussian edge detector. The correction can be addedto the coordinates of the pixel to provide a more accurate estimate of edgelocation.
The algorithm for computing the average along the profile of gradientmagnitude, though more complex, has the advantage that the profile can becompared with the ideal profile using statistical techniques and the results ofthis comparison can be used as the criterion for edge detection. If the profileis not close to a Gaussian, the edge does not correspond to the ideal stepmodel. It may not be possible in this case to accurately estimate the edgelocation using the techniques presented in this section.
In Chapter 12, we will present methods for calibrating the coordinatesystem of the image. The integer coordinates of a pixel [i,j] can be mappedto coordinates (x, y) in the image plane of the camera. The correction to theedge location provided by either of the methods for estimating edge locationto subpixel resolution described above is added to the (x, y) coordinates ofthe pixel to obtain the precise location of the edge in the image plane. Thisprecise, calibrated value is what is needed for measuring feature dimensions.
5.8 Edge Detector Performance
Measures for evaluating the performance of edge detectors have been for-mulated by Abdou and Pratt [1] and DeMicheli, Caprile, Ottonello, andTorre [66]. The criteria to consider in evaluating the performance of an edgedetector include
1. Probability of false edges
2. Probability of missing edges
3. Error in estimation of the edge angle
4. Mean square distance of the edge estimate from the true edge
5. Tolerance to distorted edges and other features such as corners andjunctions
5.8.EDGE DETECTOR PERFORMANCE 177
The first two criteria concern the performance of an algorithm as a detectorof edges. The second two criteria concern the performance of an algorithm asan estimator of the edge location and orientation. The last criterion concernsthe tolerance of the edge algorithm to edges that depart from the ideal modelused to formulate the algorithm.
5.8.1 Methods for Evaluating Performance
The performance of an edge detector can be evaluated in two stages: countthe number of false and missing edges and measure the variance (or errordistribution) for the estimated location and orientation.
For a test case, select a synthetic image where the true edges are knownto lie along a contour that can be modeled by a curve with a simple mathe-matical formula-for example, a filled rectangle where the boundary contourcan be modeled by line segments or two filled rectangles where the gap be-tween them is known. Count the number of correct, missing, and false edgesby comparing the results of the edge detector with the original (synthetic)image. This is a harder task than it appears to be. The results vary with thethreshold, smoothing filter size, interactions between edges, and other fac-tors. If you run an edge detector Qverthe test image with no added noise, nosmoothing, and no interactions between edges, then you should get a perfectset of edges (no missing or false edges). Use this set of edges as the standardfor comparison.
Now consider the edges obtained from a test case that has added noise, orother distortions in the image that create missing or false edges. Compute aone-to-one match of edges in the test image to edges in the standard, based onthe criterion of Euclidean distance. Ideally, we should use a proper matchingalgorithm such as the method for the disparity analysis of images presentedin Section 14.3.Edgestoo far fromthe edgesin the standard are falseedges;edges that pair closely with one edge in the standard are correct. After thisprocedure, the edges in the standard that are not paired with one edge inthe test case are missing edges.
This procedure tests an edge detector based only on its ability to indicatethe presence or absence of edges, but says nothing about how accurately theedge locations or orientations are estimated. Compare the locations andorientations of edges in the set of correct edges (computed above) with theoriginal test image. This comparison requires that the model of the test

178 CHAPTER 5. EDGE DETECTION
case be available. For the filled rectangle, the model is the line segmentsthat make up the sides of the rectangle. The edge locations and orientationsmust be compared with a mathematical description of the model of the scenecontours. For each edge with location (x, y), how far is this location from thetrue location? What is the difference between the orientation of the edge andthe orientation of the true curve? The edge location (x, y) could correspondto any point along the contour, but the closest point along the contour isused as the corresponding point, and the distance between the edge pointand the closest point is computed. For a line segment, use the formulas inSection 6.4. Estimate the error distribution from a histogram of locationerrors, or tabulate the sum of the squared error and divide by n - 1, wheren is the number of edges, to estimate the variance (refer to the formula inAppendix B). The orientation error of an edge is measured by comparing theorientation of the edge fragment with the angle of the normal to the curvethat models the scene contour, evaluated at the closest point to the edgepoint.
5.8.2 Figure of Merit
One method to judge the performance of edge detectors is to look at an edgeimage and subjectively evaluate the performance. However, this does notprovide an objective measure of performance. To quantitatively evaluate theperformance of various edge detectors, we should formulate a criterion thatmay help in judging the relative performance under controlled conditions.We observe that in the response of an edge detector, there can be threetypes of errors:
. Missing valid edges
. Errors in localizing edges
. Classification of noise as edges
A figure of merit for an edge detector should consider these three errors.One such figure of merit, called Pratt's figure of merit [196], is:
(5.51)
5.9. SEQUENTIAL METHODS 179
where lA, i[, d, and a are detected edges, the ideal edges, the distancebetween the actual and ideal edges, and a design constant used to penalizedisplaced edges, respectively.
Note that since this figure involves missing edge points, location of edgepoints, and false edge points, it can be applied only to a limited class ofimages. One may generate known objects of controlled contrast at knownlocation and then use the above figure of merit. It is a common practice toevaluate the performance for synthetic images by introducing random noisein images. A plot of signal-to-noise ratio against the figure of merit gives thedegradation in the performance of the detector.
5.9 Sequential Methods
All the edge detectors described above are parallel in nature: they can beapplied at a single pixel, using local information, independent of the resultat other pixels. In practice, the performance of such edge detectors may notbe acceptable due to too many missing edges. The edges detected by suchdetectors have to be linked to form boundaries of objects. Missing edgesresult in breaks in the boundaries. Several methods have been suggestedto improve the performance of edge detection and linking. Such approachesinclude edge following, relaxation, and boundary tracking. We will discussrelaxation in a later chapter.
Edge following tries to use information from the neighborhood of an edgepoint to improve the performance of an edge detector. This approach .mayalso be used to thin edges from a simple edge detector response. The basicapproach is that an edge point looks at its neighbors. If the direction of anedge is compatible with that of its neighbors, the edges are linked; incom-patible edges are removed and, by looking at a large neighborhood, one mayfill in missing edges.
The edge following algorithm scans an image to find a strong edge usedas a starting point for following the boundary of an object. Depending onthe direction of the edge, the edge detector is applied to extend the edge inthe proper direction. One may implement the tracking operation, shown inFigure 5.25, either without backtracking or with backtracking. Using thisapproach, even very weak edge segments of an object may be detected.

180 CHAPTER 5. EDGE DETECTION
Figure 5.25: An illustration of edge following.
5.10 Line Detection
Up to this point, this chapter has discussed only how to detect step edges inimages. Lines are also very important features that may have to be detected.A line can be modeled as two edges with opposite polarity that are close .
together, separated by less distance than the width of the smoothing filter.Edge detection filters are designed to respond to step edges and do not
provide a meaningful response to lines. A separate algorithm must be used todetect lines, and this line detection algorithm will not provide a meaningfulresponse to step edges. One outstanding problem in machine vision is howto combine edge and line detection in a single system.
Lines can be detected with a modified version of the Canny algorithm:perform nonmaxima suppression on the smoothed image instead of the gra-dient magnitude. A line is the derivative of a step, so the derivative step inthe Canny algorithm is unnecessary.
FURTHER READING 181
Further Reading
Edge detection has been one of the most popular research areas since theearly days of computer vision. Roberts [202]and Sobel [225]present twoearly edge detectors that are still commonly used. Some other edge detectorsthat were popular in the early days were by Prewitt [198],Hueckel [116],andFrei and Chen [84]. Many statistical [258]and several filtering approacheshave also been used for edge detection. Algorithms based on the Laplacian ofGaussian [164]and based on the gradient of Gaussian [53]were very popularin the 1980s. The Laplacian of Gaussian edge detection scheme [164]is stilldominant in models of biological edge detection. Haralick [102]presented anedge detection scheme based on the second directional derivative. His schemeincorporated a form of image smoothing based on approximating the imagewith local surface patches.
Although edge detection using Guassian filters of different scales was in-troduced earlier, it began to receive considerable attention after the paperby Witkin [253]. The papers by Yuille and Poggio [260, 261] provided keytheoretical results in this area. Another paper, by Hummel [118], providedadditional results. Shah, Sood, and Jain [220] and Lu and Jain [159, 160]studied interaction among edges at different scales and developed a reason-ing methodology for detecting edges in scale space. Edge focusing is anotherapproach to edge detection in scale space [25].
Another class of edge detection algorithms searches the image or a filteredversion of the image for patterns of image intensity that may be edges. Thesealgorithms combine edge detection with edge linking. The analysis of thepatterns of image intensity can be very elaborate, and these algorithms areusually used only in situations where it is necessary to find edges in imageswith very poor quality. A good treatment of this is provided in [74].
Though many edge detectors have been developed, there is still no well-defined metric to help in selecting the appropriate edge detector for an appli-cation. Lack of a performance measure makes judicious selection of an edgedetector for a particular application a difficult problem. Some discussion ofthis may be found in [103, 196].
---

182 CHAPTER 5. EDGE DETECTION
Exercises
5.1 What is an edge? How does it relate to the boundary of an object?How does it relate to the boundary of a region?
5.2 How can an edge be modeled in an image? Which is the most commonlyused model in edge detection? Why?
5.3 What is an isotropic edge detector? How can you implement it?
5.4 What is a directional edge detector? How can you implement it? Wherewill you use a directional edge detector? Give edge detector masks fordetecting edges oriented at 45° and -450.
5.5 Name all the steps required in edge detection. Can you implement anedge detector by skipping one or more of these steps? How?
5.6 Why is the Laplacian not a good edge operator?
5.7 Describe the Laplacian of Gaussian edge detector. Considering differentsteps in edge detection, show how the Laplacian is not a good edgeoperator, but the Laplacian of Gaussian is.
5.8 How can you select the correct size of the operator in the LoG opera-tors? What factors should you consider in selecting the proper size ofthe operator? Can you have an automatic selection algorithm?
5.9 What is the facet model of an image? How can you use it for edgedetection? Can you use this model for region growing also?
5.10 Compare the Gaussian edge detector with the Laplacian of Gaussian.Use all steps in edge detection and compare what the two operatorsdo at these steps. Where is the difference? Do you think that theirperformances will differ significantly? Explain clearly the differenceand the effect of the difference in edge detection.
5.11 Can edges be located at subpixel resolution? How? Is there any par-ticular approach that will be more suitable for this? Consider subpixeledge location estimation for the gradient, Laplacian, and facet models.Compare the different estimation problems.

EXERCISES 183
5.12 To select a particular edge detector in a machine vision application, weshould know the comparative performance of edge detectors in the typeof application that we are faced with. How can we compare performanceof various edge detectors in an objective manner? List all importantfactors in edge detection and then define a performance measure thatcan be effectively evaluated.
5.13 What is edge tracking? What factors must be considered in edge track-ing?
5.14 The equation for the sloped planar facet model is obtained by settingall terms above k3 to zero, yielding
The error in this approximation is given by
I I
E2 = L L (k3i + k2j + k1- g[i,jJ)2.i=-l j=-l
For the case 1 = 1, estimate the parameters k1, k2, and k3 for thesloped facet model that best approximates the gray levels in the 3 x 3neighborhood given below.
J ·i -1 0 1
j~1
What is the magnitude of the gradient?
5.15 Suppose that an image is smoothed with an n x n Gaussian filter. Dur-ing smoothing, the square filter window is moved across the image. Thepixel at position [i,j] in the upper left corner of the window is replacedby the smoothed value. After smoothing, the gradient magnitude iscomputed using the approximations in Section 5.1. As the 2 x 2 oper-ators are moved across the smoothed image, the pixel at position [i, j]
5 7 93 7 71 3 5

184 CHAPTER 5. EDGE DETECTION
in the upper left corner of the window is replaced by the gradient mag-nitude. After edge detection, the edge location (Xij, Yij) for each edgepixel is computed to subpixel resolution. Where is the edge location inthe coordinate system of the original (unsmoothed) image?
Computer Projects
5.1 Implement the Roberts, Sobel, and Prewitt operators. Apply theseto various images. Do you get edges where you expect them? Manu-ally identify several edge segments and note their locations. Comparethe locations of edge segments given by your program with manuallymarked edges. Are you satisfied? Can you improve your program todo better? Change the threshold values for your detection step and see
. the results.
5.2 Generate a synthetic image that contains one or more known objectswith clear, known intensity discontinuities. You should know the loca-tions of these discontinuities precisely. The rest of the image should bewithout edges. Use any graphics technique or cut and paste using im-age processing programs. Use this image to do systematic experimentswith different edge detectors. Apply the edge detector to the imageand obtain all edges.
Define a measure to evaluate the performance of an edge detector anduse that in all experiments. What factors would you consider in definingthe performance measure? Repeat your experiment by adding noise.You can systematically add random noise using a random number gen-erator . You may also want to systematically change the intensity valuesof the objects and background. Change the threshold values for yourdetection step and see the results.
5.3 Develop a test-bed to generate or acquire images for evaluating the per-formance measure that you defined in the above exercise. Apply eachedge detector that you studied in this chapter, and plot the perfor-mance of various edge detectors by varying the parameters controllingthe quality of images. These curves represent performance character-istics of edge detectors and may be useful in selecting a suitable edgedetector for your application.

COMPUTER PROJECTS 185
5.4 In many applications computational time should also be considered inselecting the proper edge detector. Compute the time requirement,using theoretical and experimental analysis, for each edge detector.Based on the performance measure you defined and determined andthe time requirement, develop a general guideline for selecting an edgedetector in different applications.
5.5 Facet model edge detection:
a. Using the gradient-based edge detection method with sloped pla-nar facets (see Exercise 5.14), detect edges in an image of yourchoice. Specifically, you should do the following:
. Calculate k}, k2, and k3 at each pixel.
. Calculate the gradient at each pixel.
. Identify pixels at which the gradient is above some threshold.
b. Add Gaussian noise to the above images and detect the edges asin part a.
5.6 Detect edges using the cubic facet approximation. In particular, youshould do the following:
. Find the cubic fit coefficients k} to klO at each pixel.
. Find the gradient angle a.
. Find the subpixel deviation p at which the second derivative iszero.
. Find if the zero crossing occurs within the boundary of the pixel.
. Confirm that the first derivative is nonzero and the third derivative
is negative.
. Mark all such pixels as 255 and reset the others to zero.


![[0.93]General Type-2 Fuzzy Sugeno Integral for Edge Detection](https://static.fdokumen.com/doc/165x107/631b12ae19373759090eb1cd/093general-type-2-fuzzy-sugeno-integral-for-edge-detection.jpg)