A NOVEL MORPHOLOGICAL GRADIENT TECHNIQUE FOR EDGE DETECTION USING FUZZY LOGIC
10
[Vanitha, 4(5): May, 2015] ISSN: 2277-9655 (I2OR), Publication Impact Factor: 3.785 (ISRA), Impact Factor: 2.114 http: // www.ijesrt.com © International Journal of Engineering Sciences & Research Technology [131] IJESRT INTERNATIONAL JOURNAL OF ENGINEERING SCIENCES & RESEARCH TECHNOLOGY A NOVEL MORPHOLOGICAL GRADIENT TECHNIQUE FOR EDGE DETECTION USING FUZZY LOGIC R.Vanitha*, G. MohanKumar * M.Tech(Communication System), PRIST University, Puducherry. Assistant Professor, Dept of ECE, PRIST University, Puducherry. ABSTRACT This paper presents the edges characterize boundaries and are therefore a problem of fundamental importance in image processing. Image Edge detection significantly reduces the amount of data and filters out useless information, while preserving the important structural properties in an image. Since edge detection is in the forefront of image processing for object detection, it is crucial to have a good understanding of edge detection algorithms. In this project an edge detection method based on the morphological gradient technique and generalized type-2 fuzzy logic. The theory of alpha planes is used to implement generalized type-2 fuzzy logic for edge detection. In proposed system, a new First order Edge Detection technique is implemented. By applying the new First order techniques on the image to detect its edges, it is found that the modified version of edge map has less noise and less edge corruption. The robustness of the proposed method is analyzed, compared and evaluated using the image quality assessment metrics such as signal to noise ratio(SNR), peak signal to noise ratio (PSNR) and root mean square (RMSE) and the results are presented. KEYWORDS: High Dynamic Range, Multiscale Decomposition, Edge Preservation, Small Area Edge Preservation, GT2FIS INTRODUCTION High dynamic range (HDR) images provide superior picture quality by supporting a very large luminance range, which is comparable to what human vision is able to perceive. On the other hand, existing content is considered to be in low dynamic range (LDR), which allows only a limited range of contrast and is far below the capability of human vision. HDR signals are encoded with at least 10 bits per color channel, as opposed to LDR signals which are represented by only eight bits. Although the majority of today’s displays can support only LDR content, they can all provide much better picture quality if the content is first captured in HDR and then converted to LDR format. Such production pipeline, i.e., shooting in HDR and then rendering to LDR, has been increasingly gaining interest in movie/television production and high-end photography [1]. Many recent computational photography techniques decompose an image into a piecewise smooth base layer, containing large scale variations in intensity, and a residual detail layer capturing the smaller scale details in the image .In many of these applications, it is important to control the spatial scale of the extracted details, and it is often desirable to manipulate details at multiple scales, while avoiding visual artifacts [2] [4]. In this paper, tone mapping for displaying high dynamic range images were studied. Manipulation of image histogram is usually a way to control image contrast. In the work the authors propose a fast global histogram adjustment based tone mapping operator, which effectively utilizes the full dynamic range of display and thus well reproduces global contrast for high dynamic range images. However, this operator cannot better preserve local contrast and details, which is the common draw- back of global tone mapping operators [5].In existing system a generalized type-2 fuzzy edge detection method used the merit of Pratt measure to illustrate the advantages of using generalized type-2 fuzzy logic.A new method for edge detection based on generalized type-2 fuzzy logic and the morphological gradient, which allows for better modeling of the
-
Upload
independent -
Category
Documents
-
view
2 -
download
0
Transcript of A NOVEL MORPHOLOGICAL GRADIENT TECHNIQUE FOR EDGE DETECTION USING FUZZY LOGIC

[Vanitha, 4(5): May, 2015] ISSN: 2277-9655
(I2OR), Publication Impact Factor: 3.785
(ISRA), Impact Factor: 2.114
http: // www.ijesrt.com © International Journal of Engineering Sciences & Research Technology
[131]
IJESRT INTERNATIONAL JOURNAL OF ENGINEERING SCIENCES & RESEARCH
TECHNOLOGY
A NOVEL MORPHOLOGICAL GRADIENT TECHNIQUE FOR EDGE DETECTION
USING FUZZY LOGIC R.Vanitha*, G. MohanKumar
* M.Tech(Communication System), PRIST University, Puducherry.
Assistant Professor, Dept of ECE, PRIST University, Puducherry.
ABSTRACT This paper presents the edges characterize boundaries and are therefore a problem of fundamental importance in image
processing. Image Edge detection significantly reduces the amount of data and filters out useless information, while
preserving the important structural properties in an image. Since edge detection is in the forefront of image processing
for object detection, it is crucial to have a good understanding of edge detection algorithms. In this project an edge
detection method based on the morphological gradient technique and generalized type-2 fuzzy logic. The theory of
alpha planes is used to implement generalized type-2 fuzzy logic for edge detection. In proposed system, a new First
order Edge Detection technique is implemented. By applying the new First order techniques on the image to detect its
edges, it is found that the modified version of edge map has less noise and less edge corruption. The robustness of the
proposed method is analyzed, compared and evaluated using the image quality assessment metrics such as signal to
noise ratio(SNR), peak signal to noise ratio (PSNR) and root mean square (RMSE) and the results are presented.
KEYWORDS: High Dynamic Range, Multiscale Decomposition, Edge Preservation, Small Area Edge Preservation,
GT2FIS
INTRODUCTION High dynamic range (HDR) images provide superior picture quality by supporting a very large luminance range, which
is comparable to what human vision is able to perceive. On the other hand, existing content is considered to be in low
dynamic range (LDR), which allows only a limited range of contrast and is far below the capability of human vision.
HDR signals are encoded with at least 10 bits per color channel, as opposed to LDR signals which are represented by
only eight bits. Although the majority of today’s displays can support only LDR content, they can all provide much
better picture quality if the content is first captured in HDR and then converted to LDR format. Such production
pipeline, i.e., shooting in HDR and then rendering to LDR, has been increasingly gaining interest in movie/television
production and high-end photography [1].
Many recent computational photography techniques decompose an image into a piecewise smooth base layer,
containing large scale variations in intensity, and a residual detail layer capturing the smaller scale details in the image
.In many of these applications, it is important to control the spatial scale of the extracted details, and it is often desirable
to manipulate details at multiple scales, while avoiding visual artifacts [2] [4].
In this paper, tone mapping for displaying high dynamic range images were studied. Manipulation of image histogram
is usually a way to control image contrast. In the work the authors propose a fast global histogram adjustment based
tone mapping operator, which effectively utilizes the full dynamic range of display and thus well reproduces global
contrast for high dynamic range images.
However, this operator cannot better preserve local contrast and details, which is the common draw- back of global
tone mapping operators [5].In existing system a generalized type-2 fuzzy edge detection method used the merit of
Pratt measure to illustrate the advantages of using generalized type-2 fuzzy logic.A new method for edge detection
based on generalized type-2 fuzzy logic and the morphological gradient, which allows for better modeling of the

[Vanitha, 4(5): May, 2015] ISSN: 2277-9655
(I2OR), Publication Impact Factor: 3.785
(ISRA), Impact Factor: 2.114
http: // www.ijesrt.com © International Journal of Engineering Sciences & Research Technology
[132]
uncertainty that exists in processing digital images. Also, to obtain a comparative study of T1FIS, IT2FIS and GT2FIS
fuzzy inference systems as tools to enhance edge detection in digital images.
EDGE DETECTOR USING A GENERALIZED TYPE-2 FUZZY SYSTEM
In this section the Existing model for edge detection based on a generalized type-2 fuzzy inference system (EGT2FIS)
is described. In Fig.1, the block diagram of the generalized type-2 fuzzy inference system for edge detection is
presented.
Input Image
The first step in the whole process is reading an input image for applying the edge detection method. In this case, we
are only considering images with a gray scale.
Obtaining the image gradients
In this step the morphological gradient technique, is applied, to obtain the gradients in the four directions and then use
them as inputs for the exisiting generalized type-2 fuzzy inference system.
Fuzzification
The fuzzifier maps crisp inputs into generalized type-2 fuzzy sets to process within the FLS. In this paper, we will
focus on the type-2 singleton fuzzifier as it is fast to compute and, thus, suitable for the generalized type-2 FLS real-
time operation.Singleton fuzzification maps the crisp input into a fuzzy set, which has a single point of nonzero
membership.
1) Input linguistic variables:
Four inputs are defined, in which each one has three Gaussian membership functions with uncertain mean. The
linguistic variables used for the four inputs are: low, medium, high.
Fig. 1: Block diagram of the generalized type-2 fuzzy inference system for edge detection
In order to adapt the membership functions to the range of gray tones depending on the image, we obtain the maximum,
minimum and middle values of Di and we use these values for calculating the mean of the membership functions, but
adding different sizes of the FOU. For this task, we made tests using different sizes of the FOU for the Di input
variables.

[Vanitha, 4(5): May, 2015] ISSN: 2277-9655
(I2OR), Publication Impact Factor: 3.785
(ISRA), Impact Factor: 2.114
http: // www.ijesrt.com © International Journal of Engineering Sciences & Research Technology
[133]
Inference
Once the input and output variables are defined, with their respective membership functions, the inference process is
performed in the system, and for this the following steps are needed:
1) Define the Fuzzy Rules
The structure of the rules in the generalized type-2 FLS is the standard Mamdani-type FLS rule structure used in the
type-1 FLS and an interval type-2 FLS, but in the paper, we assume that the antecedents and the consequents sets are
represented by generalized type-2 fuzzy sets .So for a type-2 FLS with p inputs 𝑥1 𝜖 𝑋1,…,𝑥𝑝 ∈ 𝑋𝑃 and one output
𝑦∈𝑌, Multiple Input Single Output (MISO), if we assume there are M rules, the kth rule in the generalized type-2 FLS
can be written as follows:
𝑅𝑘:𝐼𝐹 𝑥1 𝑖𝑠 𝐹1𝑘𝑎𝑛𝑑…𝑎𝑛𝑑 𝑥𝑝 𝑖𝑠 𝐹𝑝𝑘, 𝑦 𝑖𝑠 𝐺 𝑘
For modeling the process with the fuzzy system, we consider three rules that help describe the existing relationship
between the image gradients. The fuzzy rules are the following.
Fig. 2 Generalized type-2 fuzzy inference system
a) If (D1 is HIGH) or (D2 is HIGH) or (D3 is HIGH) or (D4 is HIGH) then (S is EDGE)
b) If (D1 is MEDIUM) or (D2 is MEDIUM) or (D3 is MEDIUM) or (D4 is MEDIUM) then (S is EDGE)
c) If (D1 is LOW) and (D2 is LOW) and (D3 is LOW) and (D4 is LOW) then (S is NO_EDGE)
EDGE DETECTION METRICS
There are different types of methods to evaluate the detected edge of an image, which usually apply different
parameters for assessing the abrupt change of color in the pixels. One of the most frequently used techniques is the
figure of merit of Pratt (Figure of Merit; FOM). This measure represents the deviation of an actual (calculated) edge
point from the ideal edge.
PROPOSED METHOD Inspired by techniques in empirical data analysis and morphological image analysis, they use the local extrema of the
input image to extract information about oscillations: The definition of detail is given as the oscillations between local
minima and maxima. Building on the key observation that the spatial scale of oscillations are characterized by the
density of local extrema, an algorithm was developed for decomposing images into multiple scales of superposed
oscillations.
Other edge-preserving image decompositions assume image detail to be low contrast variation. Consequently they
apply filters that extract features with increasing contrast as successive layers of detail.

[Vanitha, 4(5): May, 2015] ISSN: 2277-9655
(I2OR), Publication Impact Factor: 3.785
(ISRA), Impact Factor: 2.114
http: // www.ijesrt.com © International Journal of Engineering Sciences & Research Technology
[134]
SMALL AREA EDGE PRESERVING FILTER
A novel filter is proposed for edge-preserving decomposition of an image. It is different from previous filters in its
locally adaptive property. The filtered image contains local means everywhere and preserves local salient edges. The
salient edges are no longer thought of as large gradients of the whole image, and they are locally adaptive. The reason
for such a proposed method is that, in high dynamic range images the intensity variations in a very small area will be
very high. So such intensity variations should result in a new edge formation. But most of the recent methods filter
the edges globally.
The inside intensity variations in a given area is not taken into account. In other words, one small gradient may also
be an important edge locally. So the definition of salient edge should be changed. The Weighed Least Square filter
approach has defined a salient edge as a large gradient globally [11] while we are defining a salient edge as a relatively
large gradient locally. Therefore the decomposition process is different in that a locally salient but small gradient will
be decomposed into the base layer.
There are two parameters for SAEP: α and β. They are relevant to the filter’s sensitivity to gradient. Alpha (α), balances
between the data term and the smoothness term. Increasing α will produce smoother images. Default value 0.1 Beta
(β), gives a degree of control over the affinities by non-linearly scaling the gradients. The intensity variation points
are taken both in x and y directions of an image.
The image becomes blurred with the increase of α or β, while the details are kept with the decrease of α or β. The
values for α =1 and β = 0.1 is found to always produce satisfactory results, burring details while preserving salient
edges.
dy = diff (image, 1, 1) ---(1)
dy = -alpha./(abs(dy).^beta) ---(2)
dx = diff(image, 1, 2) ---(3)
dx = -alpha./(abs(dx).^beta) ---(4)
The window radius is set as (if it has) a large value for testing the edge preserving effect. It seems that WLS is the
best at smoothing oscillations. Bilateral filter and guided filter are not good at preserving edges. The SAEP seems to
find a place between them. It can preserve edges, but the smoothing seems not good as WLS.
HDR TONE MAPPING USING SAEP A novel filter is proposed for edge-preserving decomposition of an image. It is different from previous filters in its
locally adaptive property. The filtered image contains local means everywhere and preserves local salient edges. A
multiscale decomposition with this filter can be done for manipulating a high dynamic range image, which has three
detail layers and one base layer. Edge-preserving becomes an important property in filtering design to avoid halo
artifacts. This technique decomposes an image into a piecewise smooth base layer and a detail layer.
Researchers and photographers commonly get around this limitation by combining information from multiple
exposures of the same scene. Software can be implemented to automatically combine multiple exposures into a single
high dynamic range radiance map, and then convert this radiance map to an image suitable for display through tone
mapping which uses the small area edge preserving filter that has been experimented in the former section.
The base layer only contains zero gradient information. These assumptions seem useless, because a single
decomposition makes no difference to the original image. As a result, a multi-scale decomposition is applied. That is
an image can be decomposed into a base layer and multiple detail layers:
I= B + DL1 + DL2 + DL3
Thus the proposed system algorithm in Figure 3 is as explained here.
The input HDR radiance map has to be transformed into a HSV color model.We get the luminance simply by averaging
the three channels. And then the luminance is transformed into its logarithm domain. This is a typical operation of
most methods. The logarithm of luminance approximates the perceived lightness. To sufficiently use the domain of
the logarithm function, we need to arbitrarily magnify the luminance 106 times.

[Vanitha, 4(5): May, 2015] ISSN: 2277-9655
(I2OR), Publication Impact Factor: 3.785
(ISRA), Impact Factor: 2.114
http: // www.ijesrt.com © International Journal of Engineering Sciences & Research Technology
[135]
Fig 3: SAEP HDR Tone mapping block diagram
The steps of HDR tone mapping with SAEP filter is as follows:
i. Read HDR image
ii. Change the input image to double precision of HDR image
iii. Convert the RGB image to HSV color model
iv. Compute the intensity (I) by averaging the color channels.
v. Compute the log intensity: L = log2(I)
vi. Scale the image in the range [0,1]
vii. Filter the base layer with a SAEP filter
viii. Find the detail layer using D = L - B
ix. Repeat the filtering to find 3 detail layers
x. Apply the gaining coefficients to each detail layers
xi. Reconstruct the log intensity
xii. Put back the colors and output image is obtained
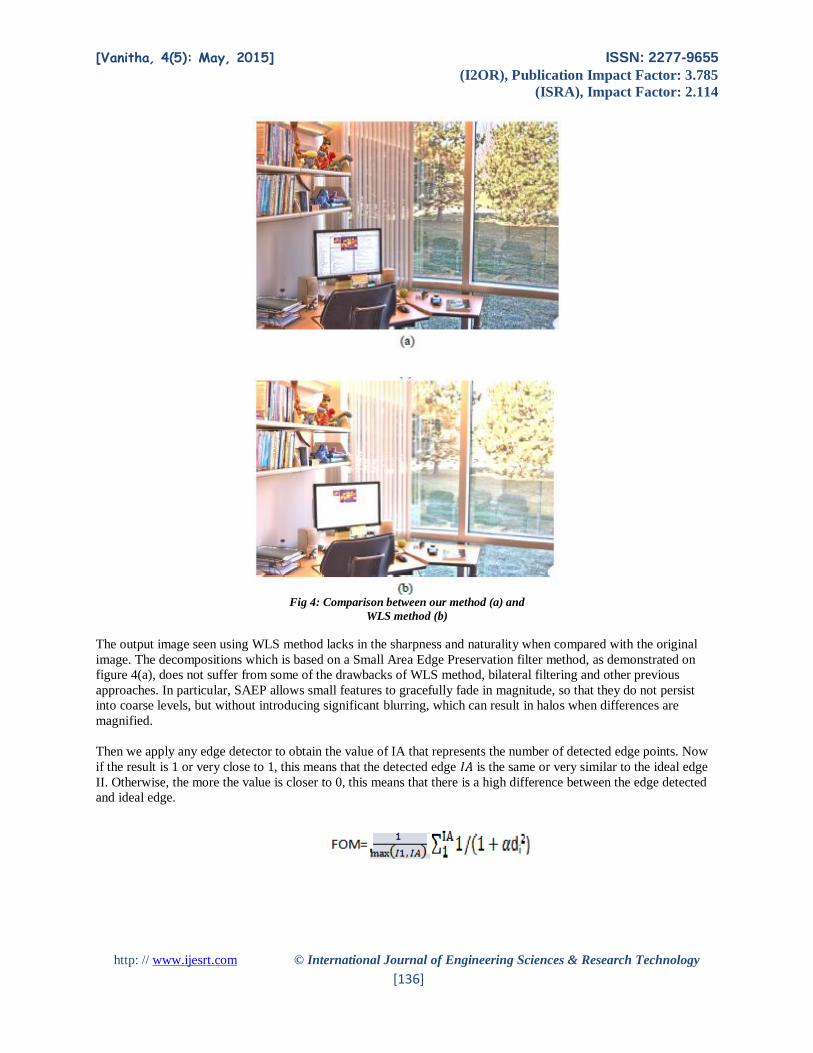
EXPERIMENTAL RESULTS Comparison of the reproduced HDR images obtained by the same process but using different filters SAEP and WLS
is shown in figure 4. The WLS filter is a global optimizer while our SAEP filter is locally adaptive. The image of (a)
seems clearer than that of (b). In the close-ups, the lines of codes on the bright screen and the thin tree branches over
the bright blue sky can be discerned more easily in (a) than that in (b). The SAEP result preserves details everywhere
and looks natural and clean globally.
[Vanitha, 4(5): May, 2015] ISSN: 2277-9655
(I2OR), Publication Impact Factor: 3.785
(ISRA), Impact Factor: 2.114
http: // www.ijesrt.com © International Journal of Engineering Sciences & Research Technology
[136]
Fig 4: Comparison between our method (a) and
WLS method (b)
The output image seen using WLS method lacks in the sharpness and naturality when compared with the original
image. The decompositions which is based on a Small Area Edge Preservation filter method, as demonstrated on
figure 4(a), does not suffer from some of the drawbacks of WLS method, bilateral filtering and other previous
approaches. In particular, SAEP allows small features to gracefully fade in magnitude, so that they do not persist
into coarse levels, but without introducing significant blurring, which can result in halos when differences are
magnified.
Then we apply any edge detector to obtain the value of IA that represents the number of detected edge points. Now
if the result is 1 or very close to 1, this means that the detected edge 𝐼𝐴 is the same or very similar to the ideal edge
II. Otherwise, the more the value is closer to 0, this means that there is a high difference between the edge detected
and ideal edge.
[Vanitha, 4(5): May, 2015] ISSN: 2277-9655
(I2OR), Publication Impact Factor: 3.785
(ISRA), Impact Factor: 2.114
http: // www.ijesrt.com © International Journal of Engineering Sciences & Research Technology
[137]
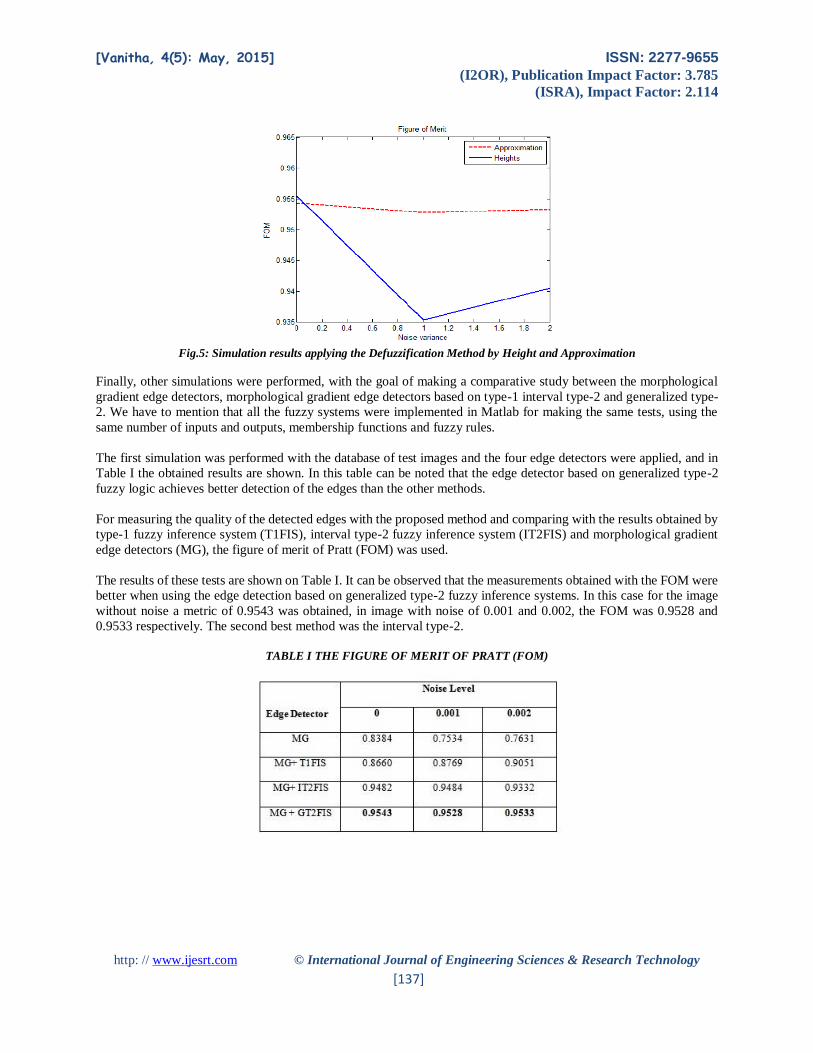
Fig.5: Simulation results applying the Defuzzification Method by Height and Approximation
Finally, other simulations were performed, with the goal of making a comparative study between the morphological
gradient edge detectors, morphological gradient edge detectors based on type-1 interval type-2 and generalized type-
2. We have to mention that all the fuzzy systems were implemented in Matlab for making the same tests, using the
same number of inputs and outputs, membership functions and fuzzy rules.
The first simulation was performed with the database of test images and the four edge detectors were applied, and in
Table I the obtained results are shown. In this table can be noted that the edge detector based on generalized type-2
fuzzy logic achieves better detection of the edges than the other methods.
For measuring the quality of the detected edges with the proposed method and comparing with the results obtained by
type-1 fuzzy inference system (T1FIS), interval type-2 fuzzy inference system (IT2FIS) and morphological gradient
edge detectors (MG), the figure of merit of Pratt (FOM) was used.
The results of these tests are shown on Table I. It can be observed that the measurements obtained with the FOM were
better when using the edge detection based on generalized type-2 fuzzy inference systems. In this case for the image
without noise a metric of 0.9543 was obtained, in image with noise of 0.001 and 0.002, the FOM was 0.9528 and
0.9533 respectively. The second best method was the interval type-2.
TABLE I THE FIGURE OF MERIT OF PRATT (FOM)

[Vanitha, 4(5): May, 2015] ISSN: 2277-9655
(I2OR), Publication Impact Factor: 3.785
(ISRA), Impact Factor: 2.114
http: // www.ijesrt.com © International Journal of Engineering Sciences & Research Technology
[138]
TABLE II SIMULATION RESULT APPLYING DEFUZZIFICATION METHOD BY HEIGHT AND APPROXIMATION
TABLE III
SIMULATION RESULTS APPLYING
MG MG+TIFIS MG+IT2FIS MG+GT2FIS
Otherwise, when fuzzy techniques are used, the value of the FOM increases, which means that the difference between
the ideal edge and detected edge decreases, therefore, we have better control of the uncertainty.
CONCLUSION In this paper, the attempt to reproduce the visual perception of the real world is at the heart of painting and
photography. Artists have long been endeavoring to develop skills in simulating actual reflected light within the
limitation of the medium, since our world generally delivers a much wider range of luminance than pigments can
reflect. Apart from artistic concern, recreating real-scene impressions on limited media is also inevitable in many
vision and graphics applications. The compression is based on the feature of the human visual system (HVS) that it is
less sensitive to the low-frequency components than to the high frequency components. The low-frequency
components are compressed while the high-frequency components are retained. Through this reproduction process,
we can hardly discern the difference between the artificial image and the real scene. Special considerations are also
noted here to avoid artifacts (e.g., halo, the brighter or darker bands around edges).
Edge-preserving becomes an important property in filtering design to avoid halo artifacts. This technique decomposes
an image into a piecewise smooth base layer and a detail layer. The base layer no longer only contains low frequency
band, but it also has salient edges (high frequency). Multi-scale can be used here to decompose progressively another
detail layer from the last decomposed base layer. In other words, the high-frequency information is can be
progressively decomposed from the original image. There is an important property in the decomposition, which is the
residual base layer matches the large-scale shape of the original image signal. The tone mapped images using these
edge-preserving filters give state-of-the-art quality, and they will be visually appealing. The new algorithm will be
aiming to enhance contrast, local detail, color reproduction, and removal of artifacts. The method is also focusing on
the natural rendering of an image for comfortable viewing.
REFERENCES [1] Castorina, S. Battiato, and M. Mancuso, “High dynamic range imaging for digital still camera: An overview,”
J. Electron. Image, vol. 12, no. 3, pp. 459–469
[2] G. Guarnieri, S. Marsi, and G. Ramponi, “High dynamic range image display with halo and clipping
prevention,” IEEE Trans. Image Process., vol. 20, no. 5, pp. 1351–1362, May 2011.
[Vanitha, 4(5): May, 2015] ISSN: 2277-9655
(I2OR), Publication Impact Factor: 3.785
(ISRA), Impact Factor: 2.114
http: // www.ijesrt.com © International Journal of Engineering Sciences & Research Technology
[139]
[3] Hojatollah Yeganeh,, and Zhou Wang “Objective Quality Assessment of Tone-Mapped Images” IEEE
Transactions On Image Processing, Vol. 22, No. 2, February 2013
[4] Jean-Francois, Aujol, Sung Ha Kang “Colour image decomposition and restoration” J. Vis. Communication.
Image R. 17 , 916–928, 2006
[5] Jiang Duan ,MarcoBressan , ChrisDance , GuopingQiu “Tone-mapping high dynamic range images by novel
histogram adjustment” International journal of Pattern Recognition , 1847–1862,2010
[6] Ji Won Lee, Rae-Hong Park, SoonKeun Chang, “Noise Reduction and Adaptive Contrast Enhancement for
Local Tone Mapping” IEEE Transaction On Image Processing,Vol 18,No.4, June 2012
[7] Ji Won Lee,Rae-Hong Park and SoonKeun Chang, “Tone Mapping Using Color Correction Function and
Image Decomposition in High Dynamic Range Imaging” IEEE Transaction On Image Processing,Vol
11,No.3, July 2010
[8] Kun Subr, C. Soler, and F. Durand, “Edge-preserving multiscale image decomposition based on local
extrema,” ACM Trans. Graph., vol. 28, no. 5, pp. 147–155, Dec. 2009
[9] Kyungman Kim, Jonghyun Bae, and Jaeseok Kim “Natural HDR Image Tone Mapping Based on Retinex”
IEEE Transactions on Consumer Electronics, Vol. 57, No. 4, November 2011
[10] E. Reinhard, M. Stark, P. Shirley, and J. Ferwerda, “Photographic tone reproduction for digital images,” in
ACM Trans. Graphics (Proc. SIGGRAPH), 2002, vol. 21, no. 3, pp. 267–276
[11] L. Hu, H. D. Cheng, and M. Zhang, “A high performance edge detector based on fuzzy inference rules,”
Information Sciences, vol. 177, no. 21, pp. 4768–4784, Nov. 2007.
[12] T. Pham and L. Van Vliet, “Blocking artifacts removal by a hybrid filter method,” Proc. ASCI, pp. 249–253,
2005.
[13] O. P. Verma and R. Sharma, “An optimal edge detection using universal law of gravity and ant colony
algorithm,” 2011 World Congress on Information and Communication Technologies, pp. 507–511, Dec.
2011.
[14] P. Agrawal, S. Kaur, H. Kaur, and A. Dhiman, “Analysis and Synthesis of an Ant Colony Optimization
Technique for Image Edge Detection,” 2012 International Conference on Computing Sciences, pp. 127–131,
Sep. 2012.
[15] H. Bustince, E. Barrenechea, M. Pagola, and J. Fernandez, “Interval-valued fuzzy sets constructed from
matrices: Application to edge detection,” Fuzzy Sets and Systems, vol. 160, no. 13, pp. 1819–1840, Jul. 2009.
[16] O. Mendoza, P. Melin, and G. Licea, “A New Method for Edge Detection in Image Processing Using Interval
Type-2 Fuzzy Logic,” 2007 IEEE International Conference on Granular Computing (GRC 2007), pp. 151–
151, Nov. 2007.
[17] O. Mendoza, P. Melin, and G. Licea, “Interval type-2 fuzzy logic for edges detection in digital images,”
International Journal of Intelligent Systems (IJIS), vol. 24, no. 11, pp. 1115–1133, 2009.
[18] P. Melin, O. Mendoza, and O. Castillo, “An improved method for edge detection based on interval type-2
fuzzy logic,” Expert Systems with Applications, vol. 37, no. 12, pp. 8527–8535, Dec. 2010.
[19] R. Biswas and J. Sil, “An Improved Canny Edge Detection Algorithm Based on Type-2 Fuzzy Sets,” Procedia
Technology, vol. 4, pp. 820–824, Jan. 2012.
[20] I. Sobel, “Camera Models and Perception,” Ph.D. thesis, Stanford University, Stanford, CA, 1970.
[21] F. Liu, “An efficient centroid type-reduction strategy for general type-2 fuzzy logic system,” Information
Sciences, vol. 178, no. 9, pp. 2224–2236, May 2008.
[22] A. C. Bovik, The Essential Guide to Image Processing. 2009, pp. 498–500.
[23] Y. Becerikli and T. M. Karan, “A New Fuzzy Approach for Edge Detection 2 Detection of Image Edges,” in
computational intelligence and bioinspired systems. Berlin: LNCS, Springer Verlag., 2005, pp. 943–951.
[24] J. M. Mendel and R. I. B. John, “Type-2 fuzzy sets made simple,” IEEE Transactions on Fuzzy Systems, vol.
10, no. 2, pp. 117–127, Apr. 2002.

[Vanitha, 4(5): May, 2015] ISSN: 2277-9655
(I2OR), Publication Impact Factor: 3.785
(ISRA), Impact Factor: 2.114
http: // www.ijesrt.com © International Journal of Engineering Sciences & Research Technology
[140]
[25] D. Zhai and J. M. Mendel, “Uncertainty measures for general Type-2 fuzzy sets,” Information Sciences, vol.
181, no. 3, pp. 503–518, Feb. 2011.