Edge-to-edge measurement-based distributed network monitoring
23
Edge-to-edge measurement-based distributed network monitoring Ahsan Habib * , Maleq Khan, Bharat Bhargava Department of Computer Sciences, Center for Education and Research in Information, Assurance and Security (CERIAS), Purdue University, West Lafayette, IN 47907, USA Received 1 January 2003; received in revised form 27 June 2003; accepted 15 August 2003 Responsible Editor: G. Pacifici Abstract Continuous monitoring of a network domain poses several challenges. First, routers of a network domain need to be polled periodically to collect statistics about delay, loss, and bandwidth. Second, this huge amount of data has to be mined to obtain useful monitoring information. This increases the overhead for high speed core routers, and restricts the monitoring process from scaling to a large number of flows. To achieve scalability, polling and measurements that involve core routers should be avoided. We design and evaluate a distributed monitoring scheme that uses only edge-to- edge measurements, and scales well to large network domains. In our scheme, all edge routers form an overlay network with their neighboring edge routers. The network is probed intelligently from nodes in the overlay to detect congestion in both directions of a link. The proposed scheme involves only edge routers, and requires significantly fewer number of probes than existing monitoring schemes. Through analytic study and a series of experiments, we show that the pro- posed scheme can effectively identify the congested links. The congested links are used to capture the misbehaving flows that are violating their service level agreements, or attacking the domain by injecting excessive traffic. Ó 2003 Published by Elsevier B.V. Keywords: Network monitoring; Network security; Quality of service; Denial of service 1. Introduction Continuous monitoring of a network domain is necessary to ensure proper operation of the net- work by detecting possible service violations and attacks. Attackers can impersonate a legitimate customer by spoofing flow identities. Network fil- tering [18] at routers can detect such spoofing if the attacker and the impersonated customer are in different domains. Otherwise, the attacks remain undetected. The quality of service (QoS) enabled networks face QoS attacks. In this setting, the at- tacker is a regular user of the network trying to get more resources (a better service class) than what it has signed (paid) for. A QoS network provides different classes of service for different prices, which can entice attackers to steal bandwidth and other network resources. Such attacks involve in- jecting traffic into the network with the intent to * Corresponding author. E-mail addresses: [email protected] (A. Habib), mmk- [email protected] (M. Khan), [email protected] (B. Bharg- ava). 1389-1286/$ - see front matter Ó 2003 Published by Elsevier B.V. doi:10.1016/j.comnet.2003.08.002 Computer Networks 44 (2004) 211–233 www.elsevier.com/locate/comnet
Transcript of Edge-to-edge measurement-based distributed network monitoring
Computer Networks 44 (2004) 211–233
www.elsevier.com/locate/comnet
Edge-to-edge measurement-based distributednetwork monitoring
Ahsan Habib *, Maleq Khan, Bharat Bhargava
Department of Computer Sciences, Center for Education and Research in Information, Assurance and Security (CERIAS),
Purdue University, West Lafayette, IN 47907, USA
Received 1 January 2003; received in revised form 27 June 2003; accepted 15 August 2003
Responsible Editor: G. Pacifici
Abstract
Continuous monitoring of a network domain poses several challenges. First, routers of a network domain need to be
polled periodically to collect statistics about delay, loss, and bandwidth. Second, this huge amount of data has to be
mined to obtain useful monitoring information. This increases the overhead for high speed core routers, and restricts
the monitoring process from scaling to a large number of flows. To achieve scalability, polling and measurements that
involve core routers should be avoided. We design and evaluate a distributed monitoring scheme that uses only edge-to-
edge measurements, and scales well to large network domains. In our scheme, all edge routers form an overlay network
with their neighboring edge routers. The network is probed intelligently from nodes in the overlay to detect congestion
in both directions of a link. The proposed scheme involves only edge routers, and requires significantly fewer number of
probes than existing monitoring schemes. Through analytic study and a series of experiments, we show that the pro-
posed scheme can effectively identify the congested links. The congested links are used to capture the misbehaving flows
that are violating their service level agreements, or attacking the domain by injecting excessive traffic.
� 2003 Published by Elsevier B.V.
Keywords: Network monitoring; Network security; Quality of service; Denial of service
1. Introduction
Continuous monitoring of a network domain is
necessary to ensure proper operation of the net-
work by detecting possible service violations andattacks. Attackers can impersonate a legitimate
customer by spoofing flow identities. Network fil-
* Corresponding author.
E-mail addresses: [email protected] (A. Habib), mmk-
[email protected] (M. Khan), [email protected] (B. Bharg-
ava).
1389-1286/$ - see front matter � 2003 Published by Elsevier B.V.
doi:10.1016/j.comnet.2003.08.002
tering [18] at routers can detect such spoofing if the
attacker and the impersonated customer are in
different domains. Otherwise, the attacks remain
undetected. The quality of service (QoS) enabled
networks face QoS attacks. In this setting, the at-tacker is a regular user of the network trying to get
more resources (a better service class) than what it
has signed (paid) for. A QoS network provides
different classes of service for different prices,
which can entice attackers to steal bandwidth and
other network resources. Such attacks involve in-
jecting traffic into the network with the intent to
212 A. Habib et al. / Computer Networks 44 (2004) 211–233
steal bandwidth or to cause QoS degradation, by
causing other customers� flows to experience
longer delays, higher loss rates, and lower
throughput. Taken to an extreme, this may result
in a denial of service (DoS) attack.
A large variety of network monitoring tools canbe found in [22]. Many tools use SNMP [10],
RMON [34], or NetFlow [12], which are built-in
functionality for most routers. Using these mech-
anisms, a centralized or decentralized model can
be built to monitor a network. The centralized
approach to monitor network latency, jitter, loss,
throughput, or other QoS parameters suffers from
scalability. One way to achieve scalability is to usea hierarchical architecture [2,33]. Subramanyan
et al. [33] design a SNMP-based distributed net-
work monitoring system that organizes monitor-
ing agents and managers in a hierarchical fashion.
Both centralized or decentralized models obtain
monitoring data by polling each router of a net-
work domain, which limits the ability of a system
to scale for large number of flows. The alternativeway of polling is to use an event reporting mech-
anism that sends useful information typically in a
summarized format only when the status of a
monitored element changes. A more flexible way
of network monitoring is by using mobile agents
[25] or programmable architecture [4]. However,
periodic polling or deploying agents in high speed
core routers put non-trivial overhead on them. Wepropose a very low overhead monitoring scheme
that does not involve core routers for any kind of
measurements. Our assumption is that if a net-
work domain is properly provisioned and no user
is misbehaving, the flows traversing through the
domain should not experience a high delay or a
high loss. An excessive traffic due to attacks
changes the internal characteristics of a networkdomain. This change of internal characteristics is a
key point to monitor a network domain.
Edge-to-edge monitoring scheme is studied in
[20], where we devise a network monitoring
mechanism to detect attacks on QoS domains using
network tomography [7,13,17]. This monitoring
mechanism measures the service level agreement
(SLA) parameters, and compares these measure-ments with the values negotiated between a service
provider and a user. To infer SLA parameters, the
tomography-based scheme constructs a tree from
the network topology, and probes the leaves from
the root. Probing all leaves from the root cannot
infer SLA parameters in both directions of a link.
We need to measure loss in both directions of a link
because they can be very different. This pathasymmetry phenomenon is shown in [30]. The
stripe-based monitoring can achieve this with very
high overhead. Our goal is to devise a low overhead
monitoring scheme that can detect attacks in both
directions of all links in a network domain.
The proposed monitoring scheme has two pha-
ses. In the first phase, we continuously measure
edge-to-edge link delays to observe any unusualdelay pattern. All ingress routers (entry points)
sample the incoming traffic to probe latency of the
paths followed by a user packet. This measures the
delay experienced by a user inside the domain. If
thedelay is higher than apre-defined threshold (SLA
value), the edge routers conduct intelligent probing
for loss measurements. For this probing, an overlay
network is formed using all edge routers on top ofthe physical network. The probing does not calcu-
late loss ratio for each individual link, instead, the
congested links (having high losses) are identified
using edge-to-edge loss measurements. Our solu-
tion consists of two methods: simple method and
advanced method. In the simple method, all edge
routers probe their neighbors in clockwise and
counter-clockwise direction. This method requiresonly OðnÞ probing, where n is the number of edge
routers. Through extensive analysis, both analyti-
cal and experimental, we show that the simple
method is very powerful to identify the congested
links to a close approximation. If necessary, we use
the advanced method to refine the solution of the
simple method. The advanced method searches the
topology tree intelligently for probes that can beused to identify the status of the undecided links
from the simple method. When the network is less
than 20% congested the advanced method requires
OðnÞ probes. If the congestion is high, it requires
more probes, however, it does not exceed Oðn2Þ.In the second phase of our monitoring process,
we use the congested links as a basis to identify
edge routers through which traffic are entering intoand exiting from the domain. From exiting edge
routers, we identify the flows that are violating any
A. Habib et al. / Computer Networks 44 (2004) 211–233 213
SLA agreement. If the SLA is violated for delay
and loss, the network is probed to detect whether
any user is stealing bandwidth. The service viola-
tions can indicate a possible attack on the same
domain, or on a downstream domain. In case of a
DoS attack, numerous flows from different sourcesare destined to a victim. These flows aggregate on
their way as they get closer to the victim. Moni-
toring an upstream network domain can detect
these high bandwidth aggregates that could result
in DoS attacks on downstream domains [20,26].
To control the attacks, filters are activated at edge
routers through which flows are entering into a
network domain. We restrained ourselves fromdiscussing on other techniques to detect and pre-
vent DoS attacks. The primary focus of this paper
is monitoring. A detailed discussion and analysis
among different techniques to detect and prevent
DoS attacks can be found in our paper [21].
Using simulation, we conduct a series of ex-
periments to evaluate the proposed monitoring
scheme. We conclude that the distributed moni-toring scheme shows a promise for efficient and
scalable monitoring of a domain. This scheme can
detect service violations, bandwidth theft attacks,
and tell when many flows are aggregating towards
a downstream domain for a possible DoS attack.
The scheme requires low monitoring overhead,
and detects service violations in both directions of
any link in a network domain.The rest of the paper is organized as follows.
The related work is discussed in Section 2. Mea-
suring all necessary network parameters for mon-
itoring purposes is presented in Section 3. It
discusses our proposed monitoring scheme, and
analyzes its strength and limitations. Section 4
explains how to use the monitoring scheme to
detect service violations and DoS attacks. Exper-imental results and discussions are provided in
Section 5. We discuss the advantages of the dis-
tributed monitoring over stripe-based monitoring
in Section 6. We conclude the paper in Section 7.
2. Related work
One common way of monitoring is to log
packets at various points throughout the network
and then extract information to discover the path
of any packet [29]. This scheme is useful to trace an
attack long after the attack has been accom-
plished. The effectiveness of logging is limited by
the huge storage requirements especially for high
speed networks. Stone [32] suggested to create avirtual overlay network connecting all edge routers
of a provider to reroute interesting flows through
tunnels to central tracking routers. After exami-
nation, suspicious packets are dropped. This ap-
proach also requires a great amount of logging
capacity.
Many proposals for network monitoring [6,14]
give designs to manage the network and ensurethat the system is operating within desirable pa-
rameters. In efficient reactive monitoring [14], the
authors discuss ways to monitor communication
overhead in IP networks. Their main idea is to
combine global polling with local event driven
reporting to monitor a network. Breitbart et al. [6]
identify effective techniques to monitor bandwidth
and latency in IP networks. The authors presentprobing-based techniques where path latencies are
measured by transmitting probes from a single
point of control. They describe algorithms for
computing an optimal set of probes to measure
latency of paths in a network, whereas we focus on
measuring parameters without the involvements of
the core routers.
In [11], a histogram-based aggregation algo-rithm is used to detect SLA violations. The al-
gorithm measures network characteristics on a
hop-by-hop basis, uses them to compute end-
to-end measurements, and validates end-to-end
SLA requirements. In large networks, efficient col-
lection of management data is a challenging task.
The authors propose an aggregation and refine-
ment based monitoring approach. The approachassumes that the routes used by SLA flows are
known, citing VPN and MPLS [9] provisioning.
Though routes are known for double-ended SLAs
that specify both ingress and egress points in the
network, they are unknown in cases where the
scope of the service is not limited to a fixed egress
point.
Duffield and Grossglauser [15] propose trajec-tory sampling to infer traffic flows through a do-
main. In this process, each link samples packets
0
k
R R21
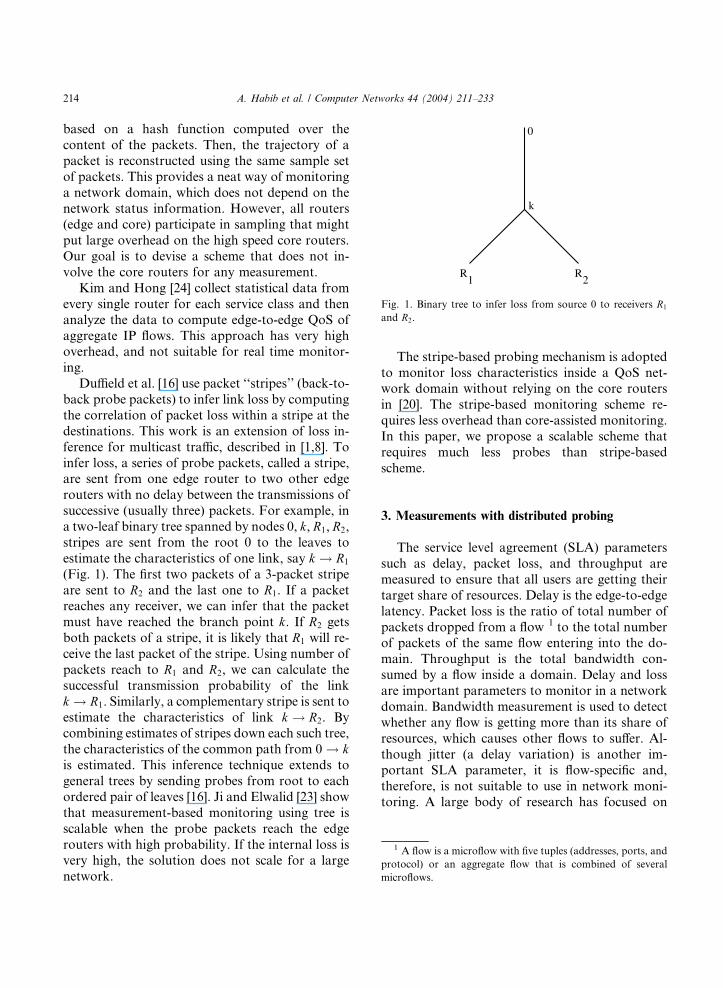
Fig. 1. Binary tree to infer loss from source 0 to receivers R1
and R2.
1 A flow is a microflow with five tuples (addresses, ports, and
protocol) or an aggregate flow that is combined of several
microflows.
214 A. Habib et al. / Computer Networks 44 (2004) 211–233
based on a hash function computed over the
content of the packets. Then, the trajectory of a
packet is reconstructed using the same sample set
of packets. This provides a neat way of monitoring
a network domain, which does not depend on the
network status information. However, all routers(edge and core) participate in sampling that might
put large overhead on the high speed core routers.
Our goal is to devise a scheme that does not in-
volve the core routers for any measurement.
Kim and Hong [24] collect statistical data from
every single router for each service class and then
analyze the data to compute edge-to-edge QoS of
aggregate IP flows. This approach has very highoverhead, and not suitable for real time monitor-
ing.
Duffield et al. [16] use packet ‘‘stripes’’ (back-to-
back probe packets) to infer link loss by computing
the correlation of packet loss within a stripe at the
destinations. This work is an extension of loss in-
ference for multicast traffic, described in [1,8]. To
infer loss, a series of probe packets, called a stripe,are sent from one edge router to two other edge
routers with no delay between the transmissions of
successive (usually three) packets. For example, in
a two-leaf binary tree spanned by nodes 0, k, R1, R2,
stripes are sent from the root 0 to the leaves to
estimate the characteristics of one link, say k ! R1
(Fig. 1). The first two packets of a 3-packet stripe
are sent to R2 and the last one to R1. If a packetreaches any receiver, we can infer that the packet
must have reached the branch point k. If R2 gets
both packets of a stripe, it is likely that R1 will re-
ceive the last packet of the stripe. Using number of
packets reach to R1 and R2, we can calculate the
successful transmission probability of the link
k ! R1. Similarly, a complementary stripe is sent to
estimate the characteristics of link k ! R2. Bycombining estimates of stripes down each such tree,
the characteristics of the common path from 0 ! kis estimated. This inference technique extends to
general trees by sending probes from root to each
ordered pair of leaves [16]. Ji and Elwalid [23] show
that measurement-based monitoring using tree is
scalable when the probe packets reach the edge
routers with high probability. If the internal loss isvery high, the solution does not scale for a large
network.
The stripe-based probing mechanism is adopted
to monitor loss characteristics inside a QoS net-work domain without relying on the core routers
in [20]. The stripe-based monitoring scheme re-
quires less overhead than core-assisted monitoring.
In this paper, we propose a scalable scheme that
requires much less probes than stripe-based
scheme.
3. Measurements with distributed probing
The service level agreement (SLA) parameters
such as delay, packet loss, and throughput are
measured to ensure that all users are getting their
target share of resources. Delay is the edge-to-edge
latency. Packet loss is the ratio of total number of
packets dropped from a flow 1 to the total numberof packets of the same flow entering into the do-
main. Throughput is the total bandwidth con-
sumed by a flow inside a domain. Delay and loss
are important parameters to monitor in a network
domain. Bandwidth measurement is used to detect
whether any flow is getting more than its share of
resources, which causes other flows to suffer. Al-
though jitter (a delay variation) is another im-portant SLA parameter, it is flow-specific and,
therefore, is not suitable to use in network moni-
toring. A large body of research has focused on
A. Habib et al. / Computer Networks 44 (2004) 211–233 215
measuring delay, loss, and throughput in the In-
ternet [27,28]. In this section, we describe tech-
niques to measure each parameter. Delay and
throughput measurements are discussed in details
in [20]. This paper proposes an efficient way that
detect links with high losses using edge-to-edgemeasurements.
The distributed monitoring scheme measures
SLA components and compares the measurements
to the pre-defined values to detect service viola-
tion. There is one monitoring agent that gets
feedback from all other edge routers about delay,
loss, and throughput. The monitoring agent can sit
on any edge router in the network domain. Wenote that the monitoring algorithm can be imple-
mented in a measurement box behind each edge
router assuming there is not congestion in this
connection (measurement box to edge router).
This enables us to deploy our monitoring scheme
without changing the existing infrastructure.
3.1. Delay measurements
To measure delay, the ingress routers copy the
IP header of incoming packet into a new packet
with a certain pre-configured probability. Copying
the header from user traffic to measure delay has a
couple of benefits. First, the probe packet follows
the same path as the user traffic because the route
inside a domain does not change too often. Hence,the probe delay is similar to the delay experienced
by the user. Second, if some links do not have any
traffic, the links will not be probed, which saves the
probing overhead.
The routers encode the current timestamp tingressinto the payload and mark the protocol field of the
IP header with a new value. An egress router rec-
ognizes such packets and removes them from thenetwork. Additionally, the egress routers compute
the edge-to-edge link delay for a packet from the
difference between its own time and tingress. We
ignore minor drifts of the clocks since all routers
are in one administrative domain and can be syn-
chronized fairly accurately. The egress classifies
the probe packets as belonging to flow i of user j,and update the average packet delay, avg delayij,for delay sample delayijðtÞ at time t using an ex-
ponential weighted moving average (EWMA):
avg delayijðtÞ ¼ a� avg delayijðt � 1Þþ ð1� aÞ � delayijðtÞ; ð1Þ
where a is a small fraction 06 a < 1 to emphasize
recent history rather than the current sample
alone.
The egress routers send the average delay to themonitor. If the average packet delay exceeds the
delay guarantee in the SLA (SLAidelay) for flow i,
i.e. avg delayi > SLAidelay, it is an indication of an
SLA violation. If the network is properly provi-
sioned and flows do not misbehave, there should
not be any delay greater than SLAidelay for any flow
i. A high delay can be caused by some flows that
are violating their SLAs or bypassing the SLAchecking, which is an attack.
If the delay exceeds a certain threshold, the
monitor needs to probe the network for loss and
throughput. We discuss the throughput measure-
ment first, and then discuss the loss estimation to
isolate congested links. Identifying the congested
links is necessary to detect egress and ingress
routers involved in high traffic paths, which helpsto detect and control attacks.
The frequency of delay probing is important
because it determines the overhead of the moni-
toring process. A detailed discussion on this issue
can be found in [20]. The main idea here is that
each path is probed with a probability, instead of a
deterministic fashion. This probability changes
with time, which puts uncertainty to the attackers(they do not know and cannot predict it before-
hand). If there are N edge routers in a domain, Ldifferent paths for each router, and each router
select a path for delay probing with a probability
pprobe, the total number of paths need to be probed
for delay is N �L� pprobe. Each probe packet is
20 bytes in size and our experimental results show
that 15–20 probes/s can estimate the delay accu-rately. Another suggestion is to use recent history
of delay to search for any pattern that helps to
predict an attack.
3.2. Throughput measurements
The objective of checking throughput viola-
tion is to ensure that nobody is consuming extra
216 A. Habib et al. / Computer Networks 44 (2004) 211–233
bandwidth (beyond the SLA). The attackers
can send excessive amount of best effort (BE)
traffic to consume bandwidth, because BE traffic
is not controlled at the ingress routers. Con-
sumption of excess bandwidth by any flow can
deteriorate the QoS for many others. This can-not be detected by a single ingress or egress
router, if the user sends through multiple in-
gress routers at a rate lower than the SLA. For
each ingress router, the user does not violate
the SLA but as a whole he does. The service
provider may allow a user to take extra band-
width as long as everybody else is not harmed.
This can depend on the policy of the service pro-vider.
The monitor measures throughput by probing
globally all egress routers when the monitor sus-
pects any violation in delay and loss. Egress rou-
ters of a QoS domain maintain the aggregate flow
rate for each user. This rate is a close approxi-
mation of the bandwidth consumption by each
flow inside the domain [20]. The throughput foruser j is Bj ¼
PNi¼1 B
ij, where Bij is bandwidth
consumed by user j at edge router i and N is
the total number of edges. If SLAjbw is the band-
width guarantee for user j, Bj > SLAjbw indicates
an SLA violation by user j. To detect band-
width theft that does not change delay or loss
pattern, the monitor can periodically poll egress
routers.Throughput measurement is flow-aware, which
raises the concern about scalability. Our solution
to this problem is to conduct this procedure only
for a certain number of flows. If the polling
for throughput measurement is done only for the
flows that are consuming bandwidth higher than a
given threshold. The question is how to set the
threshold so that it is not vulnerable for apotential DoS attack. The threshold is com-
puted based on the link capacity and number of
active flows in such a way that crossing the
threshold really means the flows are consuming
considerable amount of bandwidth. If an attacker
wants to send a large number of flows with
low bandwidth, it will not impact on the
throughput measurement to launch DoS attacksbecause those will not be considered for through-
put polling.
3.3. Loss measurements
Packet loss guarantees made by a provider
network to a customer are for the packet losses
experienced by its conforming traffic inside theprovider domain. Measuring loss by observing
packet drops at all core routers is an easy task. It
imposes, however, an excessive overhead on the
core routers by forcing them to record each drop
entry, and periodically sending it to the monitor.
The stripe-based approach is an edge-to-edge
mechanism, described in Section 2, to measure loss
in a domain.An interesting observation is that service vio-
lation can be detected without exact loss value of
each internal link, instead, it requires to check
whether a link has loss higher than the specified
threshold. Like [5,19], we measure loss using av-
erage values in a recent time frame. The link with a
high loss is referred to as a congested link. It is
defined in Definition 1. The similar congestionmeasure is used in [3]. This congestion model is
simple, and enables us to provide an in-depth
analysis of the system. In future, we plan to use the
model that considers loss correlation [35] among
successive packets.
We propose a new approach to detect links with
high losses by edge-to-edge measurements. The
distributed probing detects all congested linksusing edge-to-edge loss measurements. These links
are used to detect flows that pose threats to other
flows by consuming extra resources.
To apply our distributed probing, we convert
the network topology into tree structure. This
converting process is discussed later in this section.
The tree contains core routers as internal nodes
and edge routers as leaf nodes. Monitoring agentsare deployed in the leaves to collect statistics from
other edge routers to check SLA violations. The
probing agents sit only at the edge routers or at the
measurement boxes and know their neighbors.
The neighbors are determined by visiting the tree
using depth first search algorithm starting from
any edge router, and putting all edge routers in an
ordered sequence. All probing agents form a vir-tual network on top of the physical network. The
probes follow edge-to-edge path in the virtual
network. We equivalently refer the tree topology
A. Habib et al. / Computer Networks 44 (2004) 211–233 217
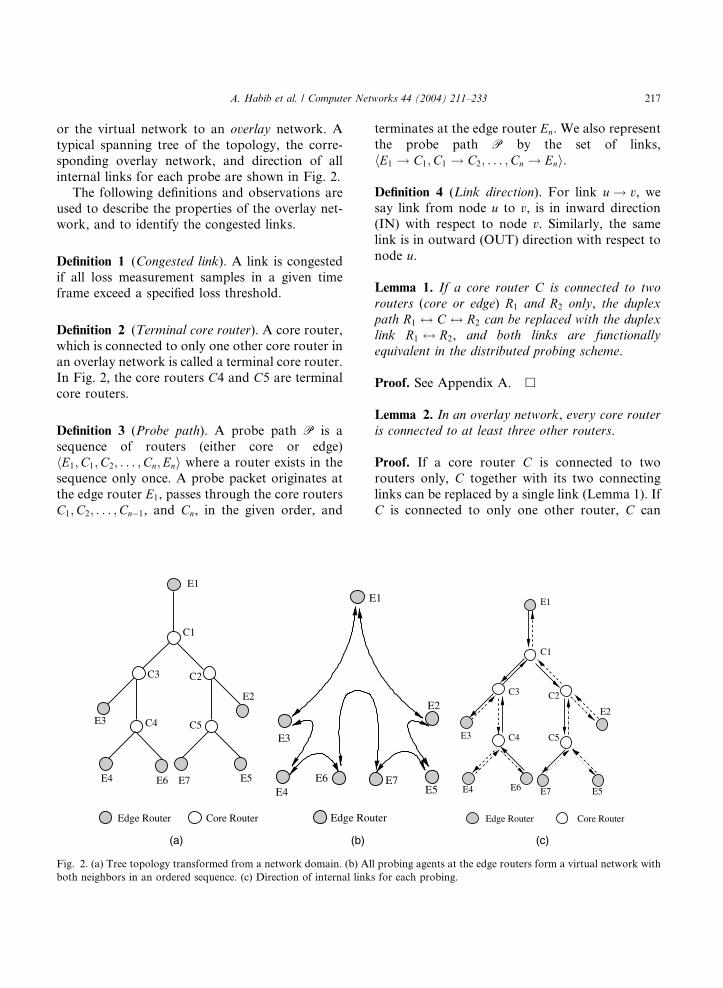
or the virtual network to an overlay network. A
typical spanning tree of the topology, the corre-
sponding overlay network, and direction of all
internal links for each probe are shown in Fig. 2.
The following definitions and observations are
used to describe the properties of the overlay net-work, and to identify the congested links.
Definition 1 (Congested link). A link is congested
if all loss measurement samples in a given timeframe exceed a specified loss threshold.
Definition 2 (Terminal core router). A core router,
which is connected to only one other core router inan overlay network is called a terminal core router.
In Fig. 2, the core routers C4 and C5 are terminal
core routers.
Definition 3 (Probe path). A probe path P is a
sequence of routers (either core or edge)hE1;C1;C2; . . . ;Cn;Eni where a router exists in the
sequence only once. A probe packet originates at
the edge router E1, passes through the core routers
C1;C2; . . . ;Cn�1, and Cn, in the given order, and
E1
C1
E5
C4
E6
Core RouterEdge Router
E2
E7E4
E3 C5
C2C3
Edge Rou
E3
E4E6
E
(a) (b)
Fig. 2. (a) Tree topology transformed from a network domain. (b) Al
both neighbors in an ordered sequence. (c) Direction of internal link
terminates at the edge router En. We also represent
the probe path P by the set of links,
hE1 ! C1;C1 ! C2; . . . ;Cn ! Eni.
Definition 4 (Link direction). For link u ! v, wesay link from node u to v, is in inward direction
(IN) with respect to node v. Similarly, the same
link is in outward (OUT) direction with respect to
node u.
Lemma 1. If a core router C is connected to tworouters (core or edge) R1 and R2 only, the duplexpath R1 $ C $ R2 can be replaced with the duplexlink R1 $ R2, and both links are functionallyequivalent in the distributed probing scheme.
Proof. See Appendix A. h
Lemma 2. In an overlay network, every core routeris connected to at least three other routers.
Proof. If a core router C is connected to two
routers only, C together with its two connecting
links can be replaced by a single link (Lemma 1). If
C is connected to only one other router, C can
ter
E5
E2
E7
1
C1
E1
C4
Edge Router Core Router
C3 C2
E3
E6
C5
E2
E5E7E4
(c)
l probing agents at the edge routers form a virtual network with
s for each probing.
218 A. Habib et al. / Computer Networks 44 (2004) 211–233
never be included in an edge-to-edge probe path,
and can simply be removed. Hence, all core routers
are connected to at least three other routers. h
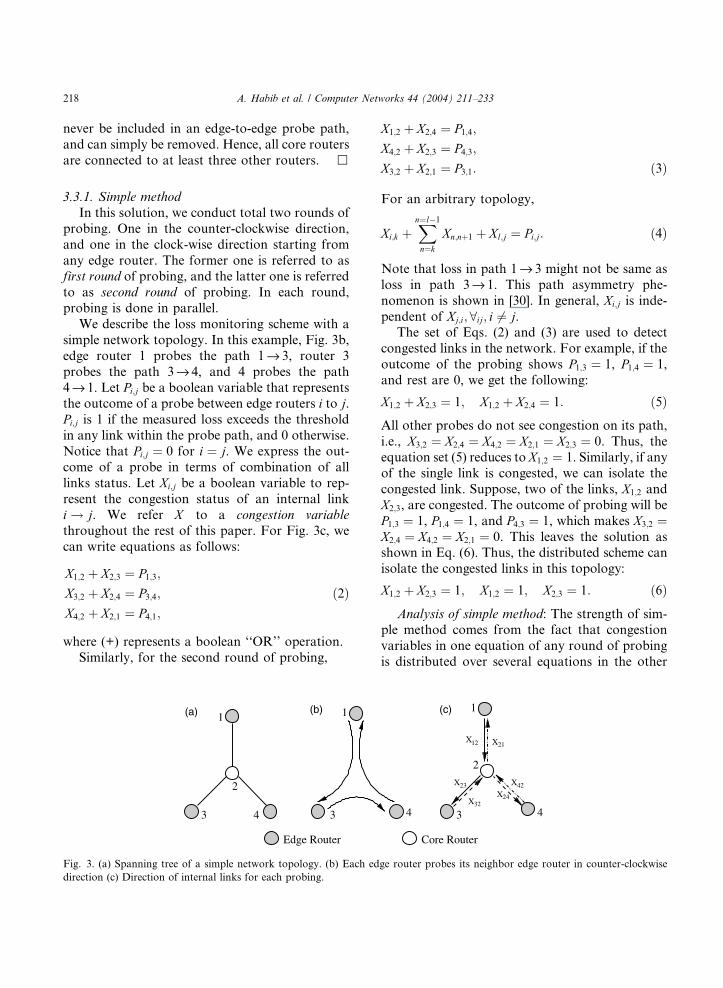
3.3.1. Simple method
In this solution, we conduct total two rounds of
probing. One in the counter-clockwise direction,
and one in the clock-wise direction starting from
any edge router. The former one is referred to asfirst round of probing, and the latter one is referred
to as second round of probing. In each round,
probing is done in parallel.
We describe the loss monitoring scheme with a
simple network topology. In this example, Fig. 3b,
edge router 1 probes the path 1fi 3, router 3
probes the path 3fi 4, and 4 probes the path
4fi 1. Let Pi;j be a boolean variable that representsthe outcome of a probe between edge routers i to j.Pi;j is 1 if the measured loss exceeds the threshold
in any link within the probe path, and 0 otherwise.
Notice that Pi;j ¼ 0 for i ¼ j. We express the out-
come of a probe in terms of combination of all
links status. Let Xi;j be a boolean variable to rep-
resent the congestion status of an internal link
i ! j. We refer X to a congestion variablethroughout the rest of this paper. For Fig. 3c, we
can write equations as follows:
X1;2 þ X2;3 ¼ P1;3;
X3;2 þ X2;4 ¼ P3;4;
X4;2 þ X2;1 ¼ P4;1;
ð2Þ
where (+) represents a boolean ‘‘OR’’ operation.
Similarly, for the second round of probing,
3
2
1 1
34
Edge Router
(a) (b)
Fig. 3. (a) Spanning tree of a simple network topology. (b) Each ed
direction (c) Direction of internal links for each probing.
X1;2 þ X2;4 ¼ P1;4;
X4;2 þ X2;3 ¼ P4;3;
X3;2 þ X2;1 ¼ P3;1: ð3Þ
For an arbitrary topology,
Xi;k þXn¼l�1
n¼k
Xn;nþ1 þ Xl;j ¼ Pi;j: ð4Þ
Note that loss in path 1fi 3 might not be same as
loss in path 3fi 1. This path asymmetry phe-
nomenon is shown in [30]. In general, Xi;j is inde-
pendent of Xj;i; 8ij; i 6¼ j.The set of Eqs. (2) and (3) are used to detect
congested links in the network. For example, if the
outcome of the probing shows P1;3 ¼ 1, P1;4 ¼ 1,
and rest are 0, we get the following:
X1;2 þ X2;3 ¼ 1; X1;2 þ X2;4 ¼ 1: ð5ÞAll other probes do not see congestion on its path,
i.e., X3;2 ¼ X2;4 ¼ X4;2 ¼ X2;1 ¼ X2;3 ¼ 0. Thus, the
equation set (5) reduces to X1;2 ¼ 1. Similarly, if any
of the single link is congested, we can isolate the
congested link. Suppose, two of the links, X1;2 and
X2;3, are congested. The outcome of probing will be
P1;3 ¼ 1, P1;4 ¼ 1, and P4;3 ¼ 1, which makes X3;2 ¼X2;4 ¼ X4;2 ¼ X2;1 ¼ 0. This leaves the solution asshown in Eq. (6). Thus, the distributed scheme can
isolate the congested links in this topology:
X1;2 þ X2;3 ¼ 1; X1;2 ¼ 1; X2;3 ¼ 1: ð6ÞAnalysis of simple method: The strength of sim-
ple method comes from the fact that congestion
variables in one equation of any round of probing
is distributed over several equations in the other
Core Router
X
X
XX
X
12 X
23
3224
42
21
1
2
3 44
(c)
ge router probes its neighbor edge router in counter-clockwise
A. Habib et al. / Computer Networks 44 (2004) 211–233 219
round of probing. If n variables appear in one
equation in the first round of probing, no two (out
of this n) variables appear in the same equation in
the second round of probing (Lemma 3) or vice
versa. This property helps to solve the equation
sets efficiently. Theorem 1 shows that if any singleprobe path is congested with arbitrary number of
links, the simple method can identify all the con-
gested links. In Theorem 2, we show that the
simple method determines the status of a link with
very high probability when the network is less
congested.
Lemma 3. If P and P0 are any probe paths in thefirst and the second round of probing respectively,jP \P0j6 1.
Proof. See Appendix A. h
Lemma 4. For any arbitrary overlay network, theaverage length of the probe paths in the SimpleMethod is 6 4.
Proof. In an overlay network, the number of links
are 2ðeþ c� 1Þ considering both directions of a
link. The edge routers are leaves of the topology
tree whereas the core routers are the internal nodes
of the tree. Number of leaf nodes is greater than
the number of internal nodes. Thus, the number of
links is 6 2ðeþ e� 1Þ ¼ 4e. Number of probepaths in first (or second) round of probing is e, andevery link appears exactly once in each round.
Hence, the average length of a path
6 4e=e ¼ 4. h
Theorem 1. If only one probe path P is shown to becongested in the first round of probing, the simplemethod identifies each congestion link in P.
Proof. Let, the congested probe path be
P ¼ hl1; l2; . . . ; lki and Xi is the congestion vari-
able for link li; 16 i6 k. Xi appears once in the
equations for each round of probing. Let, Xm is in
equation Xm þ f ðSÞ ¼ 1 in the second round of
probing, where S is a set of congestion variables
excluding Xm that appear in the equation. Theexpression f ðSÞ does not contain any of the vari-
ables Xi for 16 i6 k; i 6¼ m (Lemma 3). From first
round of probing, we obtain f ðSÞ ¼ 0, because the
outcome of all probe paths except P is zero in this
round. Thus, we can determine Xm, which is 1,
hence the status of the link lm, for any
16m6 k. h
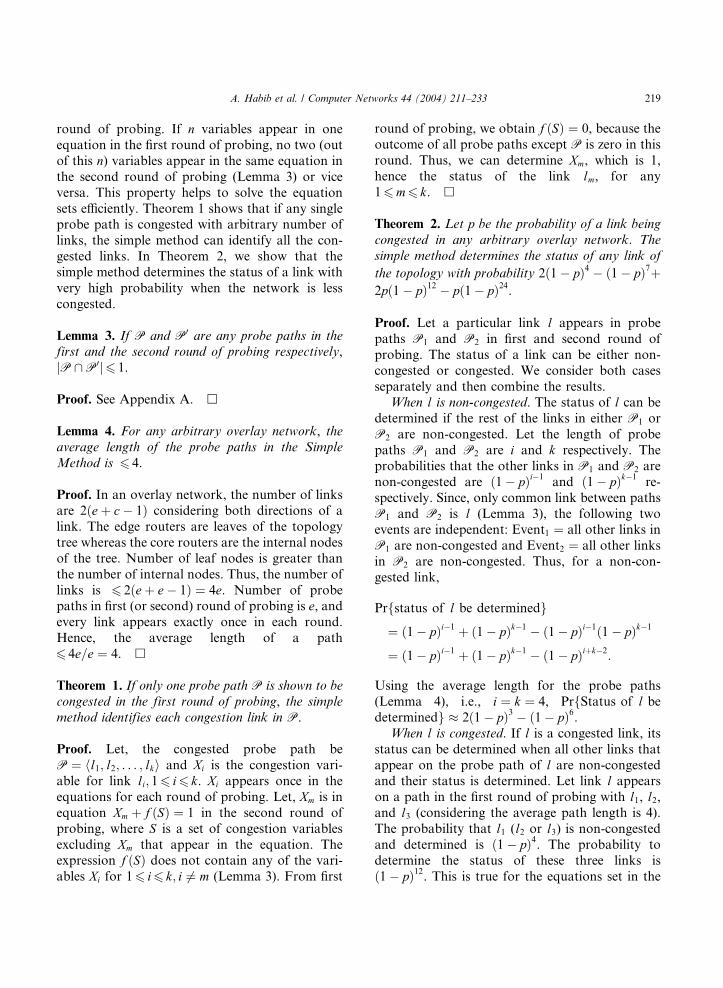
Theorem 2. Let p be the probability of a link beingcongested in any arbitrary overlay network. Thesimple method determines the status of any link ofthe topology with probability 2ð1� pÞ4 � ð1� pÞ7þ2pð1� pÞ12 � pð1� pÞ24.
Proof. Let a particular link l appears in probe
paths P1 and P2 in first and second round of
probing. The status of a link can be either non-
congested or congested. We consider both cases
separately and then combine the results.When l is non-congested. The status of l can be
determined if the rest of the links in either P1 or
P2 are non-congested. Let the length of probe
paths P1 and P2 are i and k respectively. The
probabilities that the other links in P1 and P2 are
non-congested are ð1� pÞi�1and ð1� pÞk�1
re-
spectively. Since, only common link between paths
P1 and P2 is l (Lemma 3), the following twoevents are independent: Event1 ¼ all other links in
P1 are non-congested and Event2 ¼ all other links
in P2 are non-congested. Thus, for a non-con-
gested link,
Prfstatus of l be determinedg
¼ ð1� pÞi�1 þ ð1� pÞk�1 � ð1� pÞi�1ð1� pÞk�1
¼ ð1� pÞi�1 þ ð1� pÞk�1 � ð1� pÞiþk�2:
Using the average length for the probe paths
(Lemma 4), i.e., i ¼ k ¼ 4, PrfStatus of l bedeterminedg � 2ð1� pÞ3 � ð1� pÞ6.
When l is congested. If l is a congested link, its
status can be determined when all other links that
appear on the probe path of l are non-congestedand their status is determined. Let link l appears
on a path in the first round of probing with l1, l2,and l3 (considering the average path length is 4).
The probability that l1 (l2 or l3) is non-congestedand determined is ð1� pÞ4. The probability to
determine the status of these three links is
ð1� pÞ12. This is true for the equations set in the
220 A. Habib et al. / Computer Networks 44 (2004) 211–233
second round, where l appears with variables
other than l1, l2, and l3. Thus, PrfStatus of l bedeterminedg ¼ 2ð1� pÞ12� ð1� pÞ24.
For any link l (congested or non-congested)
PrfStatus ofl be determinedg¼ ð1� pÞ½2ð1� pÞ3 � ð1� pÞ6�þ p½2ð1� pÞ12 � ð1� pÞ24�
¼ 2ð1� pÞ4 � ð1� pÞ7 þ 2pð1� pÞ12
� pð1� pÞ24: �
Fig. 4 shows the probability to determine status
of a link when certain fraction of the links are
actually congested. This figure shows that simple
method determines status of a link with probabil-
ity close to 0.90 when 10% links of a network are
congested. For 20% and 30% congestion, the
probabilities are 0.64 and 0.40 respectively. This
result is validated with the simulation result fortwo different topologies. The simple method does
not help much when 50% or more links are con-
gested. In that case, we use the advanced method
to find probes that can decide the status of unde-
cided links in the simple method.
0 0.2 0.4 0.6 0.8 10
0.1
0.2
0.3
0.4
0.5
0.6
0.7
0.8
0.9
1
Fraction of acutal congested links
Det
ectio
n Pr
obab
ility
Fig. 4. Probability that the simple method determines the sta-
tus of a link of any arbitrary topology. X -axis is the fraction of
total links that are actually congested. The simple method
performs extremely well when less than 20% links of a network
are congested. If a network is more than 50% congested, the
simple method cannot contribute much.
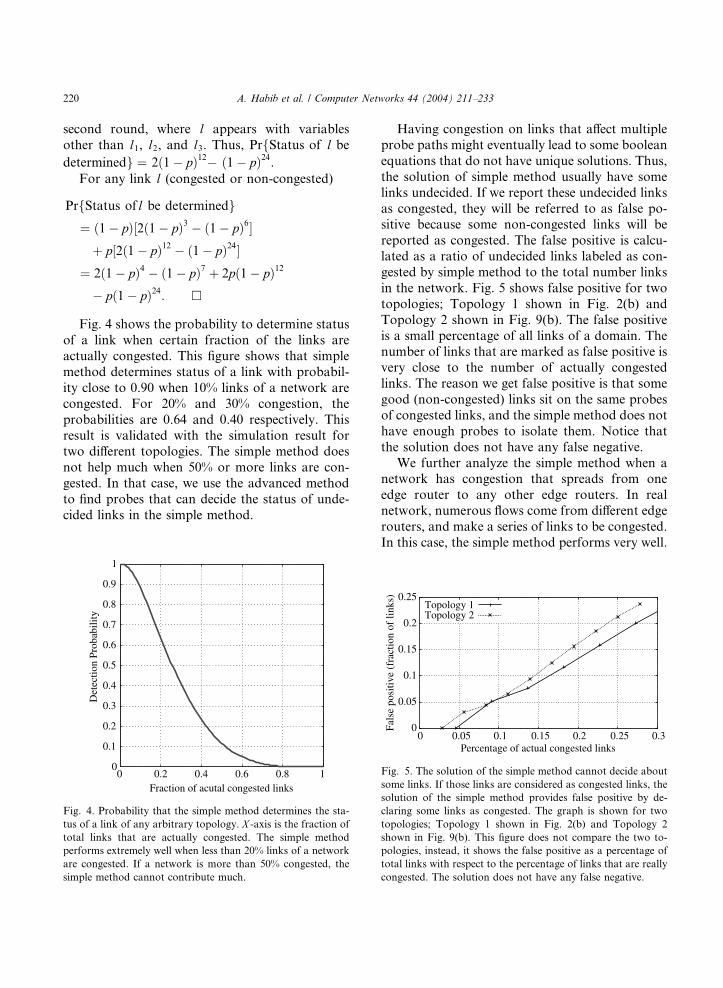
Having congestion on links that affect multiple
probe paths might eventually lead to some boolean
equations that do not have unique solutions. Thus,
the solution of simple method usually have some
links undecided. If we report these undecided links
as congested, they will be referred to as false po-sitive because some non-congested links will be
reported as congested. The false positive is calcu-
lated as a ratio of undecided links labeled as con-
gested by simple method to the total number links
in the network. Fig. 5 shows false positive for two
topologies; Topology 1 shown in Fig. 2(b) and
Topology 2 shown in Fig. 9(b). The false positive
is a small percentage of all links of a domain. Thenumber of links that are marked as false positive is
very close to the number of actually congested
links. The reason we get false positive is that some
good (non-congested) links sit on the same probes
of congested links, and the simple method does not
have enough probes to isolate them. Notice that
the solution does not have any false negative.
We further analyze the simple method when anetwork has congestion that spreads from one
edge router to any other edge routers. In real
network, numerous flows come from different edge
routers, and make a series of links to be congested.
In this case, the simple method performs very well.
0
0.05
0.1
0.15
0.2
0.25
0 0.05 0.1 0.15 0.2 0.25 0.3
Fals
e po
sitiv
e (f
ract
ion
of li
nks)
Percentage of actual congested links
Topology 1Topology 2
Fig. 5. The solution of the simple method cannot decide about
some links. If those links are considered as congested links, the
solution of the simple method provides false positive by de-
claring some links as congested. The graph is shown for two
topologies; Topology 1 shown in Fig. 2(b) and Topology 2
shown in Fig. 9(b). This figure does not compare the two to-
pologies, instead, it shows the false positive as a percentage of
total links with respect to the percentage of links that are really
congested. The solution does not have any false negative.
A. Habib et al. / Computer Networks 44 (2004) 211–233 221
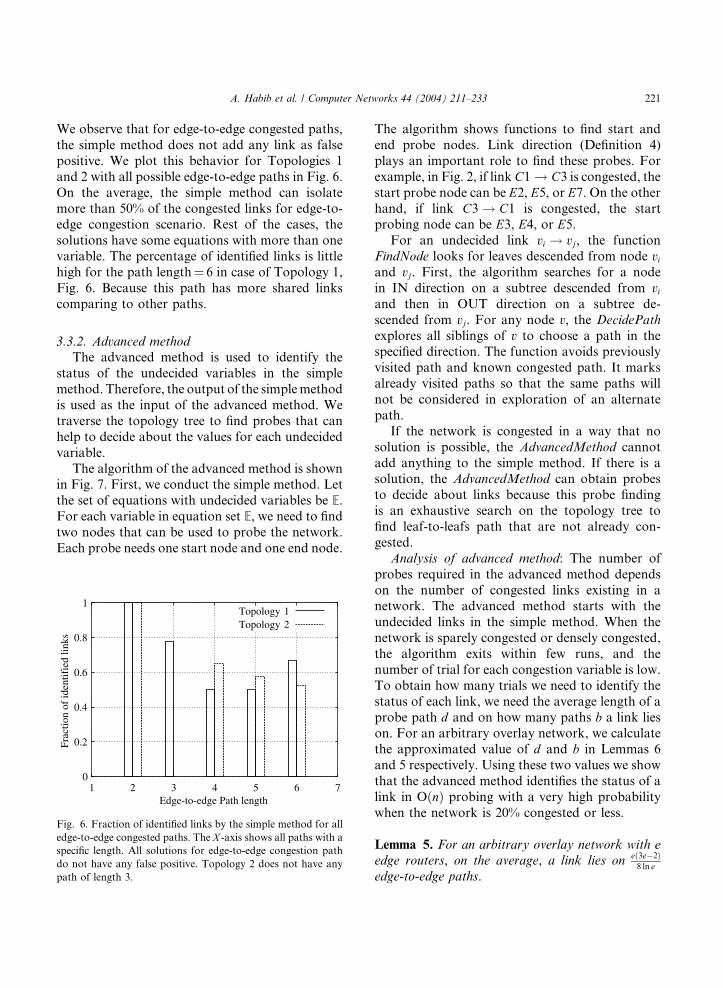
We observe that for edge-to-edge congested paths,
the simple method does not add any link as false
positive. We plot this behavior for Topologies 1
and 2 with all possible edge-to-edge paths in Fig. 6.
On the average, the simple method can isolate
more than 50% of the congested links for edge-to-edge congestion scenario. Rest of the cases, the
solutions have some equations with more than one
variable. The percentage of identified links is little
high for the path length¼ 6 in case of Topology 1,
Fig. 6. Because this path has more shared links
comparing to other paths.
3.3.2. Advanced method
The advanced method is used to identify the
status of the undecided variables in the simple
method. Therefore, the output of the simplemethod
is used as the input of the advanced method. We
traverse the topology tree to find probes that can
help to decide about the values for each undecided
variable.
The algorithm of the advanced method is shownin Fig. 7. First, we conduct the simple method. Let
the set of equations with undecided variables be E.
For each variable in equation set E, we need to find
two nodes that can be used to probe the network.
Each probe needs one start node and one end node.
0
0.2
0.4
0.6
0.8
1
1 2 3 4 5 6 7
Frac
tion
of id
entif
ied
links
Edge-to-edge Path length
Topology 1Topology 2
Fig. 6. Fraction of identified links by the simple method for all
edge-to-edge congested paths. The X -axis shows all paths with a
specific length. All solutions for edge-to-edge congestion path
do not have any false positive. Topology 2 does not have any
path of length 3.
The algorithm shows functions to find start and
end probe nodes. Link direction (Definition 4)
plays an important role to find these probes. For
example, in Fig. 2, if link C1 ! C3 is congested, thestart probe node can be E2, E5, or E7. On the other
hand, if link C3 ! C1 is congested, the startprobing node can be E3, E4, or E5.
For an undecided link vi ! vj, the function
FindNode looks for leaves descended from node viand vj. First, the algorithm searches for a node
in IN direction on a subtree descended from viand then in OUT direction on a subtree de-
scended from vj. For any node v, the DecidePathexplores all siblings of v to choose a path in thespecified direction. The function avoids previously
visited path and known congested path. It marks
already visited paths so that the same paths will
not be considered in exploration of an alternate
path.
If the network is congested in a way that no
solution is possible, the AdvancedMethod cannot
add anything to the simple method. If there is asolution, the AdvancedMethod can obtain probes
to decide about links because this probe finding
is an exhaustive search on the topology tree to
find leaf-to-leafs path that are not already con-
gested.
Analysis of advanced method: The number of
probes required in the advanced method depends
on the number of congested links existing in anetwork. The advanced method starts with the
undecided links in the simple method. When the
network is sparely congested or densely congested,
the algorithm exits within few runs, and the
number of trial for each congestion variable is low.
To obtain how many trials we need to identify the
status of each link, we need the average length of a
probe path d and on how many paths b a link lieson. For an arbitrary overlay network, we calculate
the approximated value of d and b in Lemmas 6
and 5 respectively. Using these two values we show
that the advanced method identifies the status of a
link in OðnÞ probing with a very high probability
when the network is 20% congested or less.
Lemma 5. For an arbitrary overlay network with eedge routers, on the average, a link lies on eð3e�2Þ
8 ln eedge-to-edge paths.
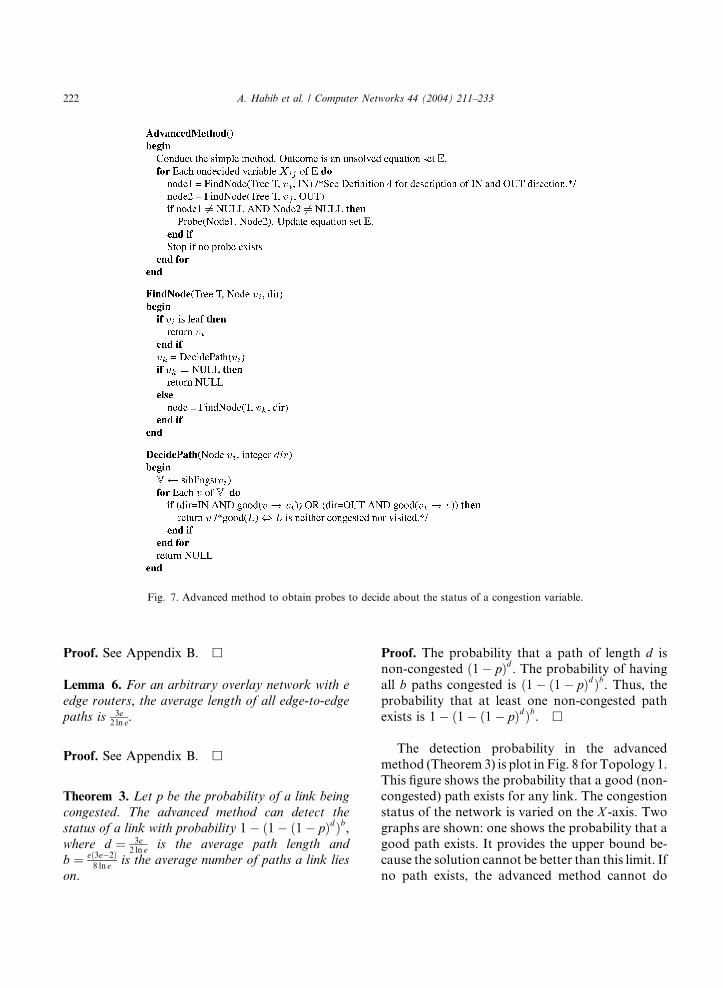
Fig. 7. Advanced method to obtain probes to decide about the status of a congestion variable.
222 A. Habib et al. / Computer Networks 44 (2004) 211–233
Proof. See Appendix B. h
Lemma 6. For an arbitrary overlay network with eedge routers, the average length of all edge-to-edgepaths is 3e
2 ln e.
Proof. See Appendix B. h
Theorem 3. Let p be the probability of a link beingcongested. The advanced method can detect thestatus of a link with probability 1� ð1� ð1� pÞdÞb,where d ¼ 3e
2 ln e is the average path length andb ¼ eð3e�2Þ
8 ln e is the average number of paths a link lieson.
Proof. The probability that a path of length d is
non-congested ð1� pÞd . The probability of having
all b paths congested is ð1� ð1� pÞdÞb. Thus, theprobability that at least one non-congested path
exists is 1� ð1� ð1� pÞdÞb. h
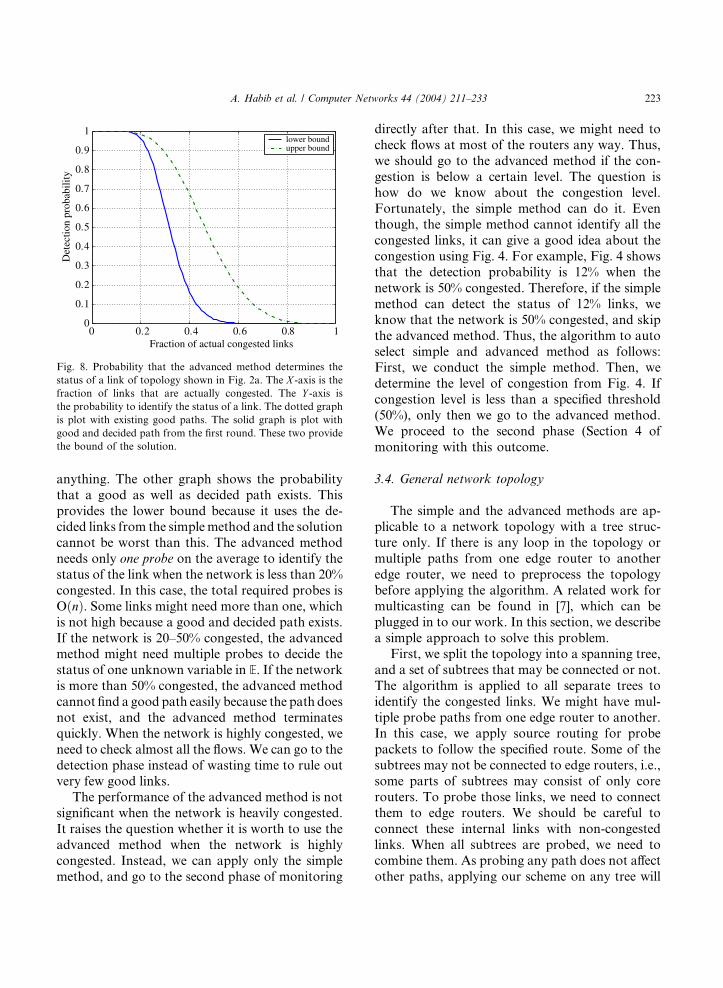
The detection probability in the advanced
method (Theorem 3) is plot in Fig. 8 for Topology 1.This figure shows the probability that a good (non-
congested) path exists for any link. The congestion
status of the network is varied on the X -axis. Two
graphs are shown: one shows the probability that a
good path exists. It provides the upper bound be-
cause the solution cannot be better than this limit. If
no path exists, the advanced method cannot do
0 0.2 0.4 0.6 0.8 10
0.1
0.2
0.3
0.4
0.5
0.6
0.7
0.8
0.9
1
Fraction of actual congested links
Det
ectio
n pr
obab
ility
lower boundupper bound
Fig. 8. Probability that the advanced method determines the
status of a link of topology shown in Fig. 2a. The X -axis is thefraction of links that are actually congested. The Y -axis is
the probability to identify the status of a link. The dotted graph
is plot with existing good paths. The solid graph is plot with
good and decided path from the first round. These two provide
the bound of the solution.
A. Habib et al. / Computer Networks 44 (2004) 211–233 223
anything. The other graph shows the probability
that a good as well as decided path exists. This
provides the lower bound because it uses the de-cided links from the simplemethod and the solution
cannot be worst than this. The advanced method
needs only one probe on the average to identify the
status of the link when the network is less than 20%
congested. In this case, the total required probes is
OðnÞ. Some links might need more than one, which
is not high because a good and decided path exists.
If the network is 20–50% congested, the advancedmethod might need multiple probes to decide the
status of one unknown variable in E. If the network
is more than 50% congested, the advanced method
cannot find a good path easily because the path does
not exist, and the advanced method terminates
quickly. When the network is highly congested, we
need to check almost all the flows. We can go to the
detection phase instead of wasting time to rule outvery few good links.
The performance of the advanced method is not
significant when the network is heavily congested.
It raises the question whether it is worth to use the
advanced method when the network is highly
congested. Instead, we can apply only the simple
method, and go to the second phase of monitoring
directly after that. In this case, we might need to
check flows at most of the routers any way. Thus,
we should go to the advanced method if the con-
gestion is below a certain level. The question is
how do we know about the congestion level.
Fortunately, the simple method can do it. Eventhough, the simple method cannot identify all the
congested links, it can give a good idea about the
congestion using Fig. 4. For example, Fig. 4 shows
that the detection probability is 12% when the
network is 50% congested. Therefore, if the simple
method can detect the status of 12% links, we
know that the network is 50% congested, and skip
the advanced method. Thus, the algorithm to autoselect simple and advanced method as follows:
First, we conduct the simple method. Then, we
determine the level of congestion from Fig. 4. If
congestion level is less than a specified threshold
(50%), only then we go to the advanced method.
We proceed to the second phase (Section 4 of
monitoring with this outcome.
3.4. General network topology
The simple and the advanced methods are ap-
plicable to a network topology with a tree struc-
ture only. If there is any loop in the topology or
multiple paths from one edge router to another
edge router, we need to preprocess the topology
before applying the algorithm. A related work formulticasting can be found in [7], which can be
plugged in to our work. In this section, we describe
a simple approach to solve this problem.
First, we split the topology into a spanning tree,
and a set of subtrees that may be connected or not.
The algorithm is applied to all separate trees to
identify the congested links. We might have mul-
tiple probe paths from one edge router to another.In this case, we apply source routing for probe
packets to follow the specified route. Some of the
subtrees may not be connected to edge routers, i.e.,
some parts of subtrees may consist of only core
routers. To probe those links, we need to connect
them to edge routers. We should be careful to
connect these internal links with non-congested
links. When all subtrees are probed, we need tocombine them. As probing any path does not affect
other paths, applying our scheme on any tree will
Edge Router Core Router
(a)
Edge Router Core Router
(b)
Edge Router Core Router
(c)
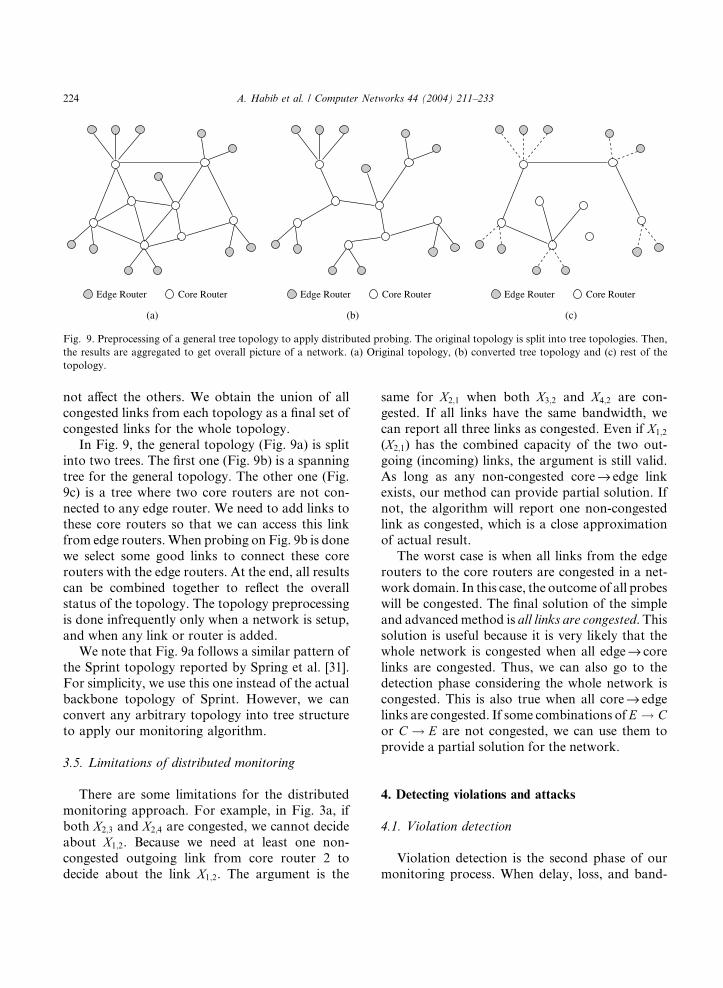
Fig. 9. Preprocessing of a general tree topology to apply distributed probing. The original topology is split into tree topologies. Then,
the results are aggregated to get overall picture of a network. (a) Original topology, (b) converted tree topology and (c) rest of the
topology.
224 A. Habib et al. / Computer Networks 44 (2004) 211–233
not affect the others. We obtain the union of all
congested links from each topology as a final set of
congested links for the whole topology.
In Fig. 9, the general topology (Fig. 9a) is split
into two trees. The first one (Fig. 9b) is a spanning
tree for the general topology. The other one (Fig.
9c) is a tree where two core routers are not con-
nected to any edge router. We need to add links tothese core routers so that we can access this link
from edge routers.When probing on Fig. 9b is done
we select some good links to connect these core
routers with the edge routers. At the end, all results
can be combined together to reflect the overall
status of the topology. The topology preprocessing
is done infrequently only when a network is setup,
and when any link or router is added.We note that Fig. 9a follows a similar pattern of
the Sprint topology reported by Spring et al. [31].
For simplicity, we use this one instead of the actual
backbone topology of Sprint. However, we can
convert any arbitrary topology into tree structure
to apply our monitoring algorithm.
3.5. Limitations of distributed monitoring
There are some limitations for the distributed
monitoring approach. For example, in Fig. 3a, if
both X2;3 and X2;4 are congested, we cannot decide
about X1;2. Because we need at least one non-
congested outgoing link from core router 2 to
decide about the link X1;2. The argument is the
same for X2;1 when both X3;2 and X4;2 are con-
gested. If all links have the same bandwidth, we
can report all three links as congested. Even if X1;2
(X2;1) has the combined capacity of the two out-
going (incoming) links, the argument is still valid.
As long as any non-congested corefi edge link
exists, our method can provide partial solution. If
not, the algorithm will report one non-congestedlink as congested, which is a close approximation
of actual result.
The worst case is when all links from the edge
routers to the core routers are congested in a net-
work domain. In this case, the outcome of all probes
will be congested. The final solution of the simple
and advancedmethod is all links are congested. Thissolution is useful because it is very likely that thewhole network is congested when all edgefi core
links are congested. Thus, we can also go to the
detection phase considering the whole network is
congested. This is also true when all corefi edge
links are congested. If some combinations of E ! Cor C ! E are not congested, we can use them to
provide a partial solution for the network.
4. Detecting violations and attacks
4.1. Violation detection
Violation detection is the second phase of our
monitoring process. When delay, loss, and band-
A. Habib et al. / Computer Networks 44 (2004) 211–233 225
width consumption exceed the pre-defined thres-
holds, the monitor decides whether the network
experiences a possible SLA violation. The monitor
knows the existing traffic classes and the accept-
able SLA parameters per class. For each service
class, we obtain bounds on each SLA parameterthat is used as a threshold. A high delay is an in-
dication of abnormal behavior inside a network
domain. If there is any loss for the guaranteed
traffic class, and if the loss ratios for other traffic
classes exceed certain levels, an SLA violation is
flagged. This loss can be caused by some flows
consuming bandwidths above their SLAbw. Band-
width theft is checked by comparing the totalbandwidth obtained by a user against the user�sSLAbw. The misbehaving flows are controlled at
the ingress routers.
4.2. Detecting DoS attacks
To detect DoS attacks, set of links L with high
loss are identified. For each congested link,lðvi; vjÞ 2 L, the tree is divided into two subtrees:
one is formed by leaves descendant from vi and the
Edge Router Core Router
C4
E1
E5
E6
C1
C3
E3
E4
C5C2E7
E2
Probe 13
Probe 24Probe 46
Probe 67
Probe 75Probe 52
Probe 21
E2
Pr
(a)
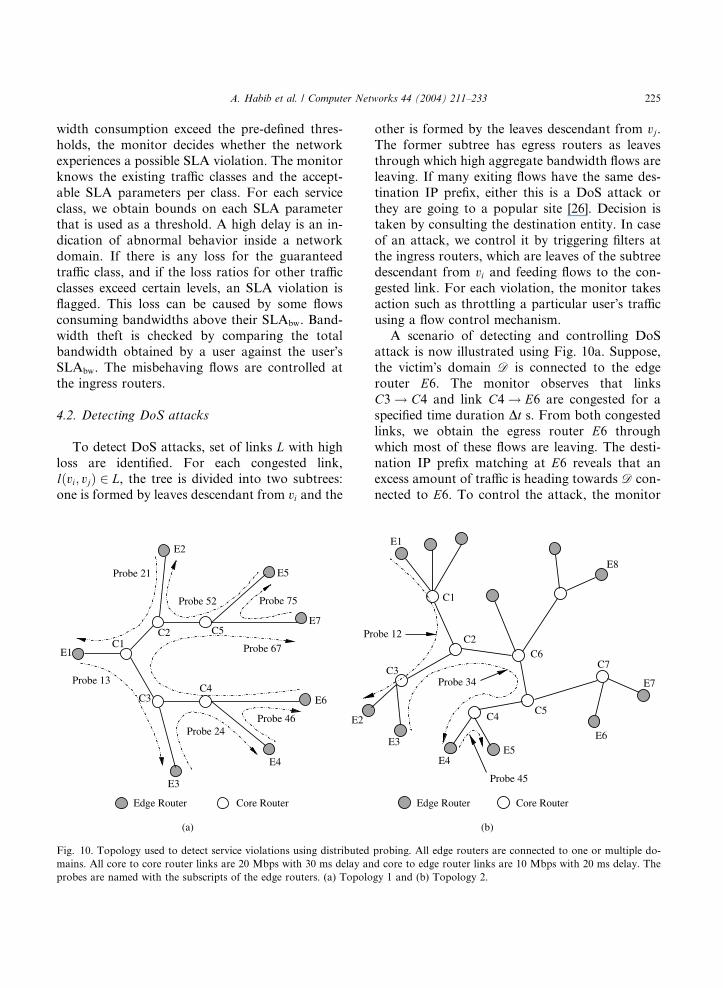
Fig. 10. Topology used to detect service violations using distributed
mains. All core to core router links are 20 Mbps with 30 ms delay an
probes are named with the subscripts of the edge routers. (a) Topolo
other is formed by the leaves descendant from vj.The former subtree has egress routers as leaves
through which high aggregate bandwidth flows are
leaving. If many exiting flows have the same des-
tination IP prefix, either this is a DoS attack or
they are going to a popular site [26]. Decision istaken by consulting the destination entity. In case
of an attack, we control it by triggering filters at
the ingress routers, which are leaves of the subtree
descendant from vi and feeding flows to the con-
gested link. For each violation, the monitor takes
action such as throttling a particular user�s traffic
using a flow control mechanism.
A scenario of detecting and controlling DoSattack is now illustrated using Fig. 10a. Suppose,
the victim�s domain D is connected to the edge
router E6. The monitor observes that links
C3 ! C4 and link C4 ! E6 are congested for a
specified time duration Dt s. From both congested
links, we obtain the egress router E6 through
which most of these flows are leaving. The desti-
nation IP prefix matching at E6 reveals that anexcess amount of traffic is heading towards D con-
nected to E6. To control the attack, the monitor
Core RouterEdge Router
E3
E1
C1
Probe 45
Probe 34
obe 12
E5E4
C7C6
C5
E8
E7
E6
C4
C3
C2
(b)
probing. All edge routers are connected to one or multiple do-
d core to edge router links are 10 Mbps with 20 ms delay. The
gy 1 and (b) Topology 2.
226 A. Habib et al. / Computer Networks 44 (2004) 211–233
needs to identify the ingress routers through which
the suspected flows are entering into the domain.
The algorithm to identify these ingress routers is
discussed in next subsection.
4.3. Flow aggregation and filtering
An important question is how to identify in-
gress routers through which the flows are entering
into the domain. To identify the flow aggregation,
we use delay probes. An ID is assigned to each
router. An ingress router puts its ID on the delay
probe packet. The egress router knows from which
ingress routers the packets are coming. For ex-ample, in Fig. 10a, say egress router E6 is receiving
flows from E1, E2, E3, and E5. These flows ag-
gregate during their trip to E6, and makes the link
C4 ! E6 congested. We traverse the path back-
wards from the egress router to the ingress routers
to obtain the entry points of the flows that are
causing attacks. In this example, all edge routers
can feed the congested links, and they all will becandidates for activating filters. Knowing the in-
gress routers and congested links, we figure out the
entering routers for the flows that are causing the
attacks.
0
20
40
60
80
100
100 120 140 160 180 200
% o
f tr
affi
c
delay (ms)
light loadmedium load
mild attacksevere attack
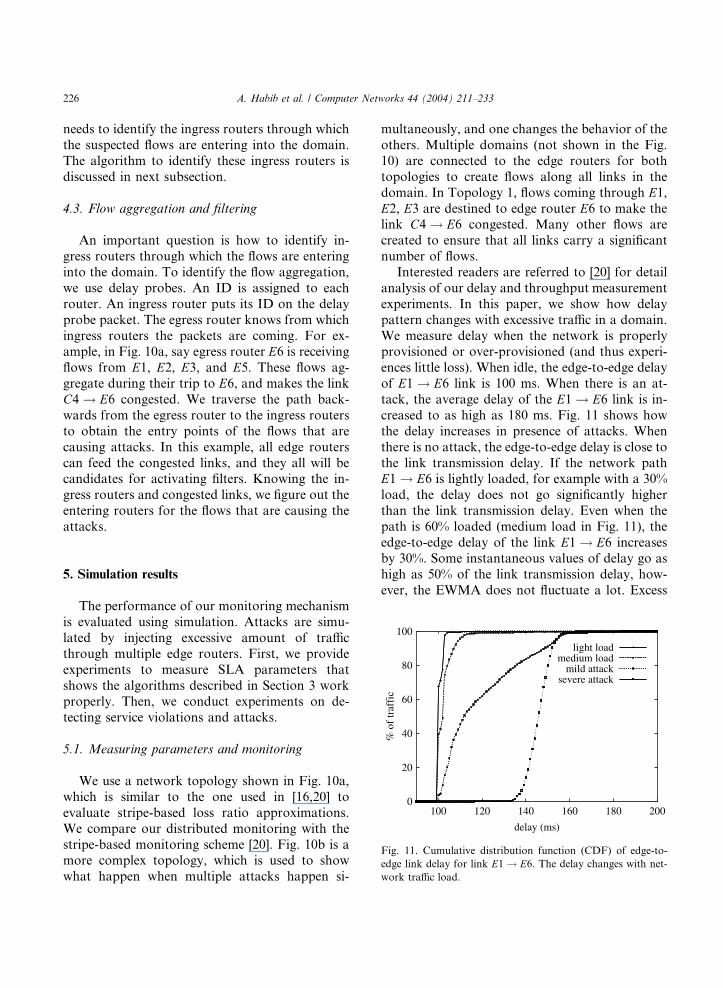
Fig. 11. Cumulative distribution function (CDF) of edge-to-
edge link delay for link E1 ! E6. The delay changes with net-
work traffic load.
5. Simulation results
The performance of our monitoring mechanism
is evaluated using simulation. Attacks are simu-
lated by injecting excessive amount of traffic
through multiple edge routers. First, we provide
experiments to measure SLA parameters that
shows the algorithms described in Section 3 work
properly. Then, we conduct experiments on de-
tecting service violations and attacks.
5.1. Measuring parameters and monitoring
We use a network topology shown in Fig. 10a,
which is similar to the one used in [16,20] to
evaluate stripe-based loss ratio approximations.
We compare our distributed monitoring with the
stripe-based monitoring scheme [20]. Fig. 10b is amore complex topology, which is used to show
what happen when multiple attacks happen si-
multaneously, and one changes the behavior of the
others. Multiple domains (not shown in the Fig.
10) are connected to the edge routers for both
topologies to create flows along all links in the
domain. In Topology 1, flows coming through E1,E2, E3 are destined to edge router E6 to make thelink C4 ! E6 congested. Many other flows are
created to ensure that all links carry a significant
number of flows.
Interested readers are referred to [20] for detail
analysis of our delay and throughput measurement
experiments. In this paper, we show how delay
pattern changes with excessive traffic in a domain.
We measure delay when the network is properlyprovisioned or over-provisioned (and thus experi-
ences little loss). When idle, the edge-to-edge delay
of E1 ! E6 link is 100 ms. When there is an at-
tack, the average delay of the E1 ! E6 link is in-
creased to as high as 180 ms. Fig. 11 shows how
the delay increases in presence of attacks. When
there is no attack, the edge-to-edge delay is close to
the link transmission delay. If the network pathE1 ! E6 is lightly loaded, for example with a 30%
load, the delay does not go significantly higher
than the link transmission delay. Even when the
path is 60% loaded (medium load in Fig. 11), the
edge-to-edge delay of the link E1 ! E6 increases
by 30%. Some instantaneous values of delay go as
high as 50% of the link transmission delay, how-
ever, the EWMA does not fluctuate a lot. Excess
A. Habib et al. / Computer Networks 44 (2004) 211–233 227
traffic introduced by attackers increases the edge-
to-edge delay inside a network domain. Most of
the packets of attack traffic experience a delay 40–
70% higher (Fig. 11) than the link delay. Delay
measurement is thus a good indication of the
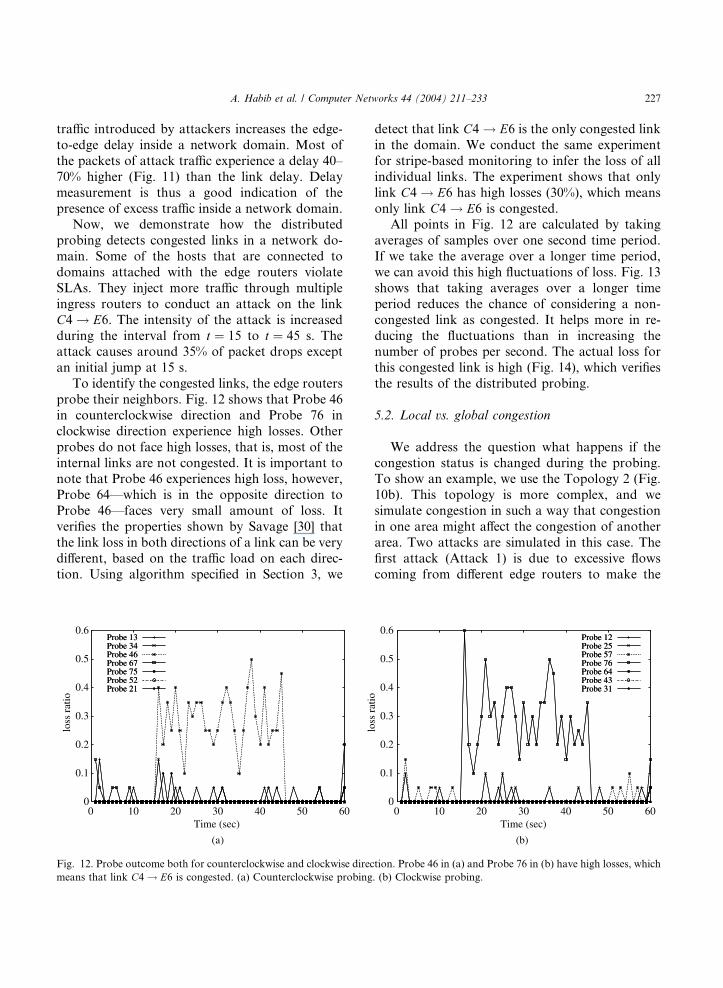
presence of excess traffic inside a network domain.Now, we demonstrate how the distributed
probing detects congested links in a network do-
main. Some of the hosts that are connected to
domains attached with the edge routers violate
SLAs. They inject more traffic through multiple
ingress routers to conduct an attack on the link
C4 ! E6. The intensity of the attack is increased
during the interval from t ¼ 15 to t ¼ 45 s. Theattack causes around 35% of packet drops except
an initial jump at 15 s.
To identify the congested links, the edge routers
probe their neighbors. Fig. 12 shows that Probe 46
in counterclockwise direction and Probe 76 in
clockwise direction experience high losses. Other
probes do not face high losses, that is, most of the
internal links are not congested. It is important tonote that Probe 46 experiences high loss, however,
Probe 64––which is in the opposite direction to
Probe 46––faces very small amount of loss. It
verifies the properties shown by Savage [30] that
the link loss in both directions of a link can be very
different, based on the traffic load on each direc-
tion. Using algorithm specified in Section 3, we
0
0.1
0.2
0.3
0.4
0.5
0.6
0 10 20 30 40 50 60
loss
rat
io
Time (sec)
Probe 13Probe 34Probe 46Probe 67Probe 75Probe 52Probe 21
Probe 13Probe 34Probe 46Probe 67Probe 75Probe 52Probe 21
(a)
Fig. 12. Probe outcome both for counterclockwise and clockwise direc
means that link C4 ! E6 is congested. (a) Counterclockwise probing
detect that link C4 ! E6 is the only congested link
in the domain. We conduct the same experiment
for stripe-based monitoring to infer the loss of all
individual links. The experiment shows that only
link C4 ! E6 has high losses (30%), which means
only link C4 ! E6 is congested.All points in Fig. 12 are calculated by taking
averages of samples over one second time period.
If we take the average over a longer time period,
we can avoid this high fluctuations of loss. Fig. 13
shows that taking averages over a longer time
period reduces the chance of considering a non-
congested link as congested. It helps more in re-
ducing the fluctuations than in increasing thenumber of probes per second. The actual loss for
this congested link is high (Fig. 14), which verifies
the results of the distributed probing.
5.2. Local vs. global congestion
We address the question what happens if the
congestion status is changed during the probing.To show an example, we use the Topology 2 (Fig.
10b). This topology is more complex, and we
simulate congestion in such a way that congestion
in one area might affect the congestion of another
area. Two attacks are simulated in this case. The
first attack (Attack 1) is due to excessive flows
coming from different edge routers to make the
0
0.1
0.2
0.3
0.4
0.5
0.6
0 10 20 30 40 50 60
loss
rat
io
Time (sec)
Probe 12Probe 25Probe 57Probe 76Probe 64Probe 43Probe 31
Probe 12Probe 25Probe 57Probe 76Probe 64Probe 43Probe 31
(b)
tion. Probe 46 in (a) and Probe 76 in (b) have high losses, which
. (b) Clockwise probing.

0
0.05
0.1
0.15
0.2
0.25
0.3
0.35
0.4
0.45
0.5
0 20 40 60 80 100
loss
rat
io
Time (sec)
<-------- Attack 1 ------------------------------------------>
<------------ Attack 2 ------>
Probe 45Probe 34
1
2
0.
4
<-------- Attack 1 ------------------------------------------>
<------------ Attack 2 ------>
Fig. 15. Attack 1 causes link C4 ! E5 congested. However,
Attack 2 comes from all different edge routers to E4, which
causes the traffic of Attack 1 to drop early. As a result Probe 45
is not congested after 50 s.
0
0.1
0.2
0.3
0.4
0.5
0.6
0 10 20 30 40 50 60
loss
rat
io
Time (sec)
link C4-E6
Fig. 14. Actual loss in link C4 ! E6. Other links have low
losses. This verifies that our monitoring scheme detects the
congestion properly.
0
0.05
0.1
0.15
0.2
0.25
0.3
0.35
0 10 20 30 40 50 60
loss
rat
io
Time (sec)
Probe 13Probe 34Probe 46Probe 67Probe 75Probe 52Probe 21
Fig. 13. Probe outcome using 5-s averages for the same ex-
periments shown in Fig. 12a.
228 A. Habib et al. / Computer Networks 44 (2004) 211–233
link C4 ! E5 congested. All of the probes in the
first round are good except ‘‘Probe 45’’. This at-
tack continues up to time T ¼ 50 s (Fig. 15). At
time 50 s, we have another attack (Attack 2),
which is more severe than Attack 1. This attack
causes several links on ‘‘Probe 34’’ path congested.It is interesting to note that Attack 2 actually
causes Attack 1 to be disappeared. Because most
of the traffic that causes Attack 1 on the link
C4 ! E5 are now dropped earlier in their path due
to Attack 2 (Fig. 15).
This experiment shows that a local congestion
might disappear due to a global and severe con-
gestion. The main objective of our work is to pin
point a congestion. However, if the congestion is
changed while an experiment is being conducted, it
catches the latest congestion. The simple method
can complete two rounds of probing within 10–20
s. If both rounds of probing are done in parallel, it
takes only 10 sec. If a congestion does not last for
20 s, we believe that no action is necessary to al-leviate it.
5.3. Detecting attacks
A major advantage of using the SLA monitor is
that it is able to detect denial of service (DoS) and
Distributed DoS (DDoS) attacks in a network
domain. When the monitor detects an anomaly (ahigh delay or a high loss), it polls the edge devices
to obtain the throughput of existing flows. The
egress routers measure the outgoing rate of each
flow. Using these rates, the monitor computes the
total bandwidth consumption by any particular
user. The bandwidth obtained by an user is com-
pared to SLAbw of that user. If any flow gets very
high bandwidth than it should, a DDoS attack isflagged. A DoS attack in a downstream domain
can be detected by identifying the congested links,
and the egress routers connected to the congested
links. Using destination IP address prefix matching
[26], we check whether many flows are aggregating
0
0.1
0.2
0.3
0.4
0.5
0.6
0 10 20 30 40 50 60
loss
rat
io
Time (sec)
Probe 13Probe 34Probe 46Probe 67Probe 75Probe 52Probe 21
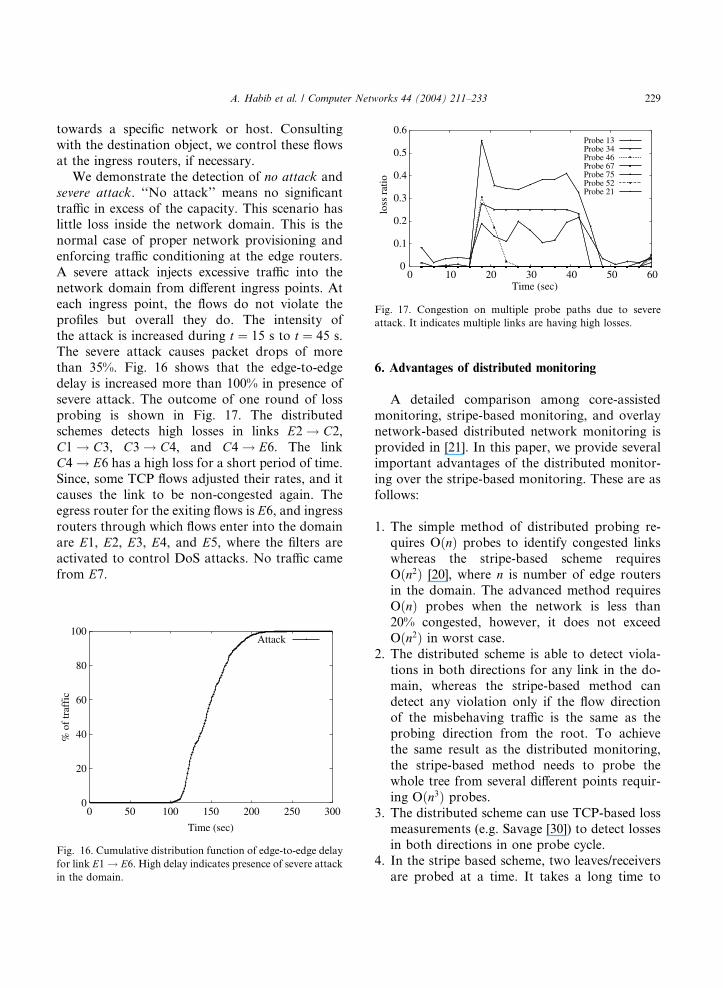
Fig. 17. Congestion on multiple probe paths due to severe
attack. It indicates multiple links are having high losses.
A. Habib et al. / Computer Networks 44 (2004) 211–233 229
towards a specific network or host. Consulting
with the destination object, we control these flows
at the ingress routers, if necessary.
We demonstrate the detection of no attack and
severe attack. ‘‘No attack’’ means no significant
traffic in excess of the capacity. This scenario haslittle loss inside the network domain. This is the
normal case of proper network provisioning and
enforcing traffic conditioning at the edge routers.
A severe attack injects excessive traffic into the
network domain from different ingress points. At
each ingress point, the flows do not violate the
profiles but overall they do. The intensity of
the attack is increased during t ¼ 15 s to t ¼ 45 s.The severe attack causes packet drops of more
than 35%. Fig. 16 shows that the edge-to-edge
delay is increased more than 100% in presence of
severe attack. The outcome of one round of loss
probing is shown in Fig. 17. The distributed
schemes detects high losses in links E2 ! C2,C1 ! C3, C3 ! C4, and C4 ! E6. The link
C4 ! E6 has a high loss for a short period of time.Since, some TCP flows adjusted their rates, and it
causes the link to be non-congested again. The
egress router for the exiting flows is E6, and ingress
routers through which flows enter into the domain
are E1, E2, E3, E4, and E5, where the filters are
activated to control DoS attacks. No traffic came
from E7.
0
20
40
60
80
100
0 50 100 150 200 250 300
% o
f tr
affi
c
Time (sec)
Attack
Fig. 16. Cumulative distribution function of edge-to-edge delay
for link E1 ! E6. High delay indicates presence of severe attack
in the domain.
6. Advantages of distributed monitoring
A detailed comparison among core-assisted
monitoring, stripe-based monitoring, and overlay
network-based distributed network monitoring is
provided in [21]. In this paper, we provide severalimportant advantages of the distributed monitor-
ing over the stripe-based monitoring. These are as
follows:
1. The simple method of distributed probing re-
quires OðnÞ probes to identify congested links
whereas the stripe-based scheme requires
Oðn2Þ [20], where n is number of edge routersin the domain. The advanced method requires
OðnÞ probes when the network is less than
20% congested, however, it does not exceed
Oðn2Þ in worst case.
2. The distributed scheme is able to detect viola-
tions in both directions for any link in the do-
main, whereas the stripe-based method can
detect any violation only if the flow directionof the misbehaving traffic is the same as the
probing direction from the root. To achieve
the same result as the distributed monitoring,
the stripe-based method needs to probe the
whole tree from several different points requir-
ing Oðn3Þ probes.3. The distributed scheme can use TCP-based loss
measurements (e.g. Savage [30]) to detect lossesin both directions in one probe cycle.
4. In the stripe based scheme, two leaves/receivers
are probed at a time. It takes a long time to

230 A. Habib et al. / Computer Networks 44 (2004) 211–233
complete probing the whole tree. If all leaves
are probed simultaneously, in our example,
E1 ! C1 link will face huge amount of traffic
at the same time. On the other hand, the distrib-
uted scheme can do parallel probing quite natu-rally.
1
1
R
R
7. Conclusions
We have developed a distributed network
monitoring scheme to keep a domain safe from
service violations and bandwidth theft attacks. Wedo not measure actual loss of all internal links,
instead, we identify all congested links with high
losses using network tomography and overlay
networks. Our analytic analysis (verified by simu-
lation) shows that even if 20% links of a network
are congested, the status of each link can be
identified with probability P0.98. If the network
is 40% congested, this probability is still high(0:65). However, if the network is more than 60%
congested, this method cannot achieve anything
significant since almost every edge-to-edge path
has one or more congested links. This new to-
mography scheme requires only OðnÞ probes whenless than 20% links are congested, where n is the
number of edge routers. For an OC3 link, the
probe traffic to identify the congested links is0.002% of link capacity. The distributed monitor-
ing requires Oðn2Þ in worst case in contrast to
Oðn3Þ probes required by the stripe-based moni-
toring to detect attacks in both directions of all
links. The distributed monitoring conducts prob-
ing in parallel enabling the system to perform real
time monitoring. The simulation results indicate
that the proposed scheme detects service viola-tions, bandwidth theft attacks, and DoS attacks
caused by flow aggregation towards a victim net-
work domain.
2
2
R
R
C
Fig. 18. Merging links that do not contribute in distributed
probing.
Acknowledgements
The authors thank Mohamed Hefeeda andLeszek Lillen for their valuable comments. This
research is sponsored in part by the NSF grants
ANI 0219110, CCR-001712, and CCR-001788,
CERIAS and IBM SUR grant.
Appendix A
Proof of Lemma 1. Let the core router C is con-
nected to only two other routers R1 and R2 (Fig.
18). No probe path can be constructed that either
includes the link R1 ! C and does not include
C ! R2 or vice versa; or includes R2 ! C and does
not include C ! R1 or vice versa. The traffic that
passes through the link R1 ! C also passes
through C ! R2. The traffic that passes throughthe link R2 ! C also passes through C ! R1.
Therefore, for the purpose of probing, a logically
equivalent overlay network can be constructed by
replacing R1 $ C $ R2 with R1 $ R2. We say that
the link R1 ! R2 is congested if and only if at least
one of the links R1 ! C and C ! R2 is congested,
i.e. the bandwidth of R1 ! R2 is the minimum of
the bandwidths of R1 ! C and C ! R2. Similarly,the bandwidth of R2 ! R1 is the minimum of the
bandwidths of R2 ! C and C ! R1. h
Proof of Lemma 3. Let the link R1 ! R2 (Fig. 19)
appears in pathP in the first round of probing and
path P0 in the second round of probing. If R2 is a
core router, it is connected to at least two other
routers, say R3 and R4 (Lemma 2). P passesthrough the link R2 ! R4 and P0 passes through
the link R2 ! R3. Since the tree cannot have any
cycle, P and P0 never meet again. If R2 is an edge
router, both P and P0 terminates at R2. Therefore,
P and P0 cannot have any common link in their
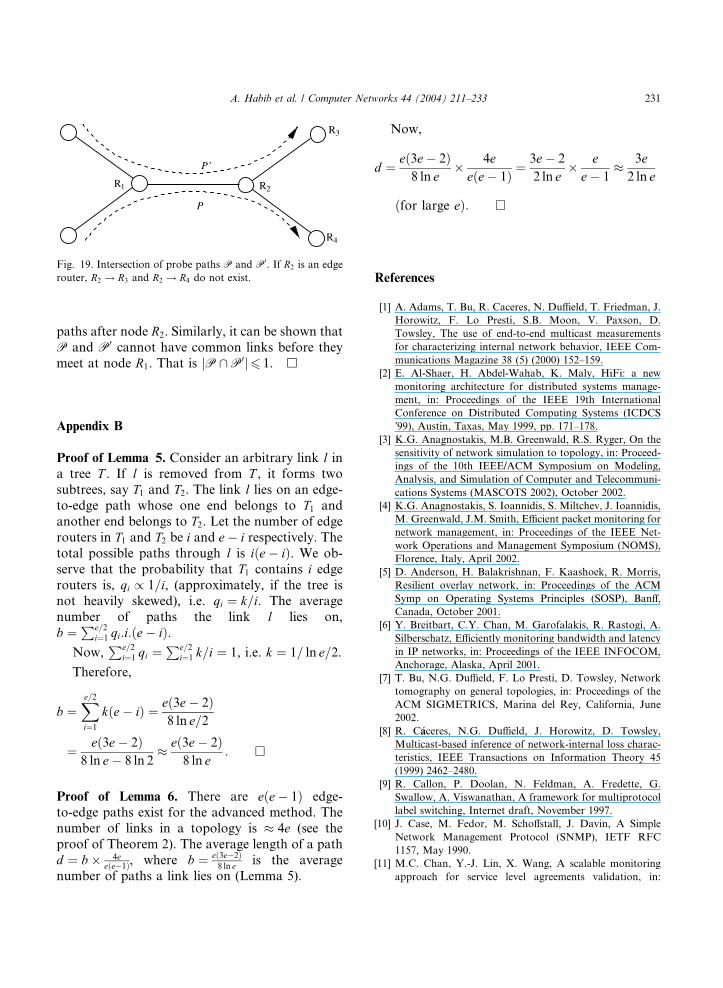
P
P’
3R
4R
2R1R
Fig. 19. Intersection of probe paths P and P0. If R2 is an edge
router, R2 ! R3 and R2 ! R4 do not exist.
A. Habib et al. / Computer Networks 44 (2004) 211–233 231
paths after node R2. Similarly, it can be shown that
P and P0 cannot have common links before they
meet at node R1. That is jP \P0j6 1. h
Appendix B
Proof of Lemma 5. Consider an arbitrary link l ina tree T . If l is removed from T , it forms two
subtrees, say T1 and T2. The link l lies on an edge-
to-edge path whose one end belongs to T1 and
another end belongs to T2. Let the number of edge
routers in T1 and T2 be i and e� i respectively. Thetotal possible paths through l is iðe� iÞ. We ob-
serve that the probability that T1 contains i edgerouters is, qi / 1=i, (approximately, if the tree isnot heavily skewed), i.e. qi ¼ k=i. The average
number of paths the link l lies on,
b ¼Pe=2
i¼1 qi:i:ðe� iÞ.Now,
Pe=2i¼1 qi ¼
Pe=2i¼1 k=i ¼ 1, i.e. k ¼ 1= ln e=2.
Therefore,
b ¼Xe=2
i¼1
kðe� iÞ ¼ eð3e� 2Þ8 ln e=2
¼ eð3e� 2Þ8 ln e� 8 ln 2
� eð3e� 2Þ8 ln e
: �
Proof of Lemma 6. There are eðe� 1Þ edge-to-edge paths exist for the advanced method. The
number of links in a topology is � 4e (see the
proof of Theorem 2). The average length of a path
d ¼ b� 4eeðe�1Þ, where b ¼ eð3e�2Þ
8 ln e is the average
number of paths a link lies on (Lemma 5).
Now,
d ¼ eð3e� 2Þ8 ln e
� 4eeðe� 1Þ ¼
3e� 2
2 ln e� ee� 1
� 3e2 ln e
ðfor large eÞ: �
References
[1] A. Adams, T. Bu, R. Caceres, N. Duffield, T. Friedman, J.
Horowitz, F. Lo Presti, S.B. Moon, V. Paxson, D.
Towsley, The use of end-to-end multicast measurements
for characterizing internal network behavior, IEEE Com-
munications Magazine 38 (5) (2000) 152–159.
[2] E. Al-Shaer, H. Abdel-Wahab, K. Maly, HiFi: a new
monitoring architecture for distributed systems manage-
ment, in: Proceedings of the IEEE 19th International
Conference on Distributed Computing Systems (ICDCS
�99), Austin, Taxas, May 1999, pp. 171–178.
[3] K.G. Anagnostakis, M.B. Greenwald, R.S. Ryger, On the
sensitivity of network simulation to topology, in: Proceed-
ings of the 10th IEEE/ACM Symposium on Modeling,
Analysis, and Simulation of Computer and Telecommuni-
cations Systems (MASCOTS 2002), October 2002.
[4] K.G. Anagnostakis, S. Ioannidis, S. Miltchev, J. Ioannidis,
M. Greenwald, J.M. Smith, Efficient packet monitoring for
network management, in: Proceedings of the IEEE Net-
work Operations and Management Symposium (NOMS),
Florence, Italy, April 2002.
[5] D. Anderson, H. Balakrishnan, F. Kaashoek, R. Morris,
Resilient overlay network, in: Proceedings of the ACM
Symp on Operating Systems Principles (SOSP), Banff,
Canada, October 2001.
[6] Y. Breitbart, C.Y. Chan, M. Garofalakis, R. Rastogi, A.
Silberschatz, Efficiently monitoring bandwidth and latency
in IP networks, in: Proceedings of the IEEE INFOCOM,
Anchorage, Alaska, April 2001.
[7] T. Bu, N.G. Duffield, F. Lo Presti, D. Towsley, Network
tomography on general topologies, in: Proceedings of the
ACM SIGMETRICS, Marina del Rey, California, June
2002.
[8] R. C�aaceres, N.G. Duffield, J. Horowitz, D. Towsley,
Multicast-based inference of network-internal loss charac-
teristics, IEEE Transactions on Information Theory 45
(1999) 2462–2480.
[9] R. Callon, P. Doolan, N. Feldman, A. Fredette, G.
Swallow, A. Viswanathan, A framework for multiprotocol
label switching, Internet draft, November 1997.
[10] J. Case, M. Fedor, M. Schoffstall, J. Davin, A Simple
Network Management Protocol (SNMP), IETF RFC
1157, May 1990.
[11] M.C. Chan, Y.-J. Lin, X. Wang, A scalable monitoring
approach for service level agreements validation, in:
232 A. Habib et al. / Computer Networks 44 (2004) 211–233
Proceedings of the International Conference on Network
Protocols (ICNP), Osaka, Japan, November 2000, pp. 37–
48.
[12] Cisco, Netflow services and applications, Available from
<http://www.cisco.com/>, 2002 May 2000.
[13] M. Coates, R. Nowak, Network tomography for internal
delay estimation, in: Proceedings of the IEEE International
Conference on Acoustics, Speech and Signal Processing,
Salt Lake City, Utah, May 2001.
[14] M. Dilman, D. Raz, Efficient reactive monitoring, in:
Proceedings of the IEEE INFOCOM, Anchorage, Alaska,
April 2001.
[15] N.G. Duffield, M. Grossglauser, Trajectory sampling for
direct traffic observation, IEEE/ACM Transactions on
Networking 9 (3) (2001) 280–292.
[16] N.G. Duffield, F. Lo Presti, V. Paxson, D. Towsley,
Inferring link loss using striped unicast probes, in:
Proceedings of the IEEE INFOCOM, Anchorage, Alaska,
April 2001.
[17] N.G. Duffield, J. Horowitz, F. Lo Presti, D. Towsley,
Network delay tomography from end-to-end unicast mea-
surements, in: Proceedings of the 2001 International
Workshop on Digital Communications 2001 Evolutionary
Trends of the Internet, September 2001.
[18] P. Ferguson, D. Senie, Network Ingress Filtering: Defeat-
ing Denial of Service Attacks which Employ IP Source
Address Spoofing Agreements Performance Monitoring,
IETF RFC 2827, May 2000.
[19] S. Floyd, K. Fall, Promoting the use of end-to-end
congestion control in the Internet, IEEE/ACM Transac-
tions on Networking 7 (4) (1999) 458–472.
[20] A. Habib, S. Fahmy, S.R. Avasarala, V. Prabhakar, B.
Bhargava, On detecting service violations and bandwidth
theft in QoS network domains, Computer Communicatons
26 (8) (2003) 861–871.
[21] A. Habib, M. Hefeeda, B. Bhargava, Detecting service
violations and DoS attacks, in: Proceedings of the Network
and Distributed System Security Symposium (NDSS �03),San Diego, California, February 2003, pp. 177–189.
[22] IEPM, Internet End-to-end Performance Monitoring,
Available from <http://www-iepm.slac.stanford.edu/>
2002.
[23] C. Ji, A. Elwalid, Measurement-based network monitoring
and inference: scalability and missing information, IEEE
Journal on Selected Areas in Communications 20 (4) (2002)
714–725.
[24] J. Kim, J.W. Hong, Distributed QoS monitoring and edge-
to-edge QoS aggregation to manage end-to-end traffic
flows in differentiated services networks, Journal of Com-
munications and Networks 3 (4) (2001) 324–333.
[25] A. Liotta, G. Pavlou, G. Knight, Exploiting agent mobility
for large-scale network monitoring, IEEE Network 16 (3)
(2002) 7–15.
[26] M. Mahajan, S.M. Bellovin, S. Floyd, J. Ioannidis, V.
Paxson, S. Shenker, Controlling high bandwidth aggre-
gates in the network, ACM Computer Communication
Review 32 (3) (2002) 62–73.
[27] V. Paxson, Measurement and analysis of end-to-end
Internet dynamics, Ph.D. thesis, University of California,
Berkeley, Computer Science Division, 1997.
[28] V. Paxson, G. Almes, J. Mahdavi, M. Mathis, Framework
for IP Performance Metrics, IETF RFC 2330, May 1998.
[29] G. Sager, Security fun with OCxmon and cflowd, Internet2
Working Group Meeting, November 98.
[30] S. Savage, Sting: a TCP-based network measurement tool,
in: Proceedings of the USENIX Symposium on Internet
Technologies and Systems (USITS �99), Boulder, Colo-
rado, October 1999.
[31] N. Spring, R. Mahajan, D. Wetherall, Measuring ISP
topologies with rocketfuel, in: Proceedings of the ACM
SIGCOMM, Pittsburgh, Philadelphia, August 2002.
[32] R. Stone, Centertrack: an IP overlay network for tracking
DoS floods, in: Proceedings of the USENIX Security
Symposium, Denver, Colorado, August 2000.
[33] R. Subramanyan, J. Miguel-Alonso, J.A.B. Fortes, A
scalable SNMP-based distributed monitoring system for
heterogeneous network computing, in: Proceedings of the
High Performance Networking and Computing Confer-
ence (SC 2000), Dallas, Texas, 2000.
[34] S. Waldbusser, Remote Network Monitoring Management
Information Base, IETF RFC 2819, May 2000.
[35] Y. Zhang, N.G. Duffield, V. Paxson, S. Shenker, On the
constancy of Internet path properties, in: Proceedings of
the ACM SIGCOMM Internet Measurement Workshop,
November 2001.
Ahsan Habib received B.S. in Com-puter Science and Engineering fromBangladesh University of Engineeringand Technology, Bangladesh. He re-ceived M.S. in Computer Science fromVirginia Tech, Blacksburg and Ph.D.in Computer Science from PurdueUniversity, West Lafayette in 1999 and2003 respectively. His research inter-ests include network security, networkeconomics, peer-to-peer networks, anddistributed systems. Currently, he is apostdoctoral researcher in the Schoolof Information and Management Sys-
tems, University of California at Berkeley.
Maleq Khan received B.S. in ComputerScience and Engineering from Ban-gladesh University of Engineering andTechnology, Bangladesh and M.S. inComputer Science from North DakotaState University, ND. He is currentlyworking toward the Ph.D. degree inComputer Science at Purdue Univer-sity, IN. His research interests includewireless sensor networks, communica-tion networks, and data mining. Hismain research concern is developingenergy-efficient routing scheme forself-configuring sensor networks.
A. Habib et al. / Computer Networks 44 (2004) 211–233 233
Bharat Bhargava received his B.E. de-gree from Indiana Institute of Scienceand M.S. and Ph.D. degrees in EEfrom Purdue University. He is a pro-fessor of computer sciences at PurdueUniversity. His research involves boththeoretical and experimental studies indistributed systems. Currently, he isworking in secure mobile systems,multimedia security and Quality ofService (QoS) as a security parameter.He has proposed schemes to identifyvulnerabilities in systems and net-works, and assess threats to large or-
ganizations. He has developed techniques to avoid threats thatcan lead to operational failures. These ideas and scientific
principles are being applied to the building of peer-to-peersystems, cellular assisted mobile ad hoc networks, and to themonitoring of QoS-enabled network domains. He is a Fellow ofthe Institute of Electrical and Electronics Engineers and of theInstitute of Electronics and Telecommunication Engineers. Hehas been awarded the charter Gold Core Member distinction bythe IEEE Computer Society for his distinguished service. In1999 he received IEEE Technical Achievement award for amajor impact of his decade long contributions to foundations ofadaptability in communication and distributed systems.