A Distributed Wireless Soil Displacement Measurement System for Active Monitoring of the Excavation...
8
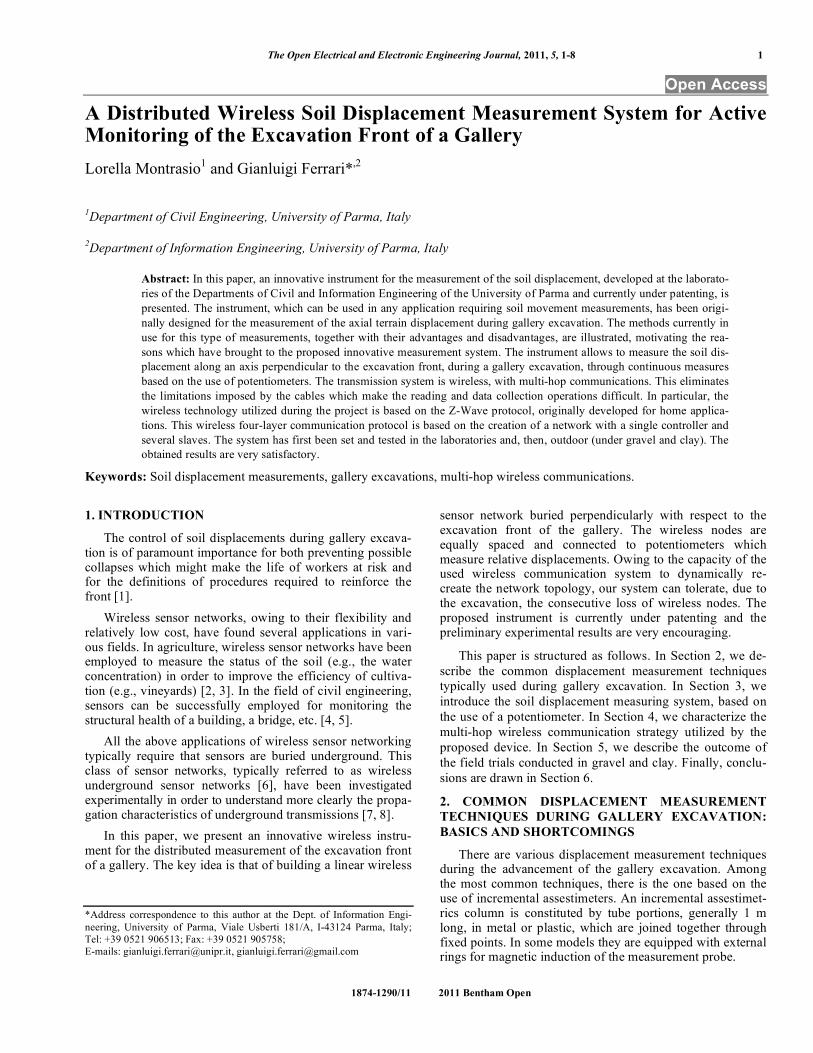
The Open Electrical and Electronic Engineering Journal, 2011, 5, 1-8 1 1874-1290/11 2011 Bentham Open Open Access A Distributed Wireless Soil Displacement Measurement System for Active Monitoring of the Excavation Front of a Gallery Lorella Montrasio 1 and Gianluigi Ferrari* ,2 1 Department of Civil Engineering, University of Parma, Italy 2 Department of Information Engineering, University of Parma, Italy Abstract: In this paper, an innovative instrument for the measurement of the soil displacement, developed at the laborato- ries of the Departments of Civil and Information Engineering of the University of Parma and currently under patenting, is presented. The instrument, which can be used in any application requiring soil movement measurements, has been origi- nally designed for the measurement of the axial terrain displacement during gallery excavation. The methods currently in use for this type of measurements, together with their advantages and disadvantages, are illustrated, motivating the rea- sons which have brought to the proposed innovative measurement system. The instrument allows to measure the soil dis- placement along an axis perpendicular to the excavation front, during a gallery excavation, through continuous measures based on the use of potentiometers. The transmission system is wireless, with multi-hop communications. This eliminates the limitations imposed by the cables which make the reading and data collection operations difficult. In particular, the wireless technology utilized during the project is based on the Z-Wave protocol, originally developed for home applica- tions. This wireless four-layer communication protocol is based on the creation of a network with a single controller and several slaves. The system has first been set and tested in the laboratories and, then, outdoor (under gravel and clay). The obtained results are very satisfactory. Keywords: Soil displacement measurements, gallery excavations, multi-hop wireless communications. 1. INTRODUCTION The control of soil displacements during gallery excava- tion is of paramount importance for both preventing possible collapses which might make the life of workers at risk and for the definitions of procedures required to reinforce the front [1]. Wireless sensor networks, owing to their flexibility and relatively low cost, have found several applications in vari- ous fields. In agriculture, wireless sensor networks have been employed to measure the status of the soil (e.g., the water concentration) in order to improve the efficiency of cultiva- tion (e.g., vineyards) [2, 3]. In the field of civil engineering, sensors can be successfully employed for monitoring the structural health of a building, a bridge, etc. [4, 5]. All the above applications of wireless sensor networking typically require that sensors are buried underground. This class of sensor networks, typically referred to as wireless underground sensor networks [6], have been investigated experimentally in order to understand more clearly the propa- gation characteristics of underground transmissions [7, 8]. In this paper, we present an innovative wireless instru- ment for the distributed measurement of the excavation front of a gallery. The key idea is that of building a linear wireless *Address correspondence to this author at the Dept. of Information Engi- neering, University of Parma, Viale Usberti 181/A, I-43124 Parma, Italy; Tel: +39 0521 906513; Fax: +39 0521 905758; E-mails: [email protected], [email protected] sensor network buried perpendicularly with respect to the excavation front of the gallery. The wireless nodes are equally spaced and connected to potentiometers which measure relative displacements. Owing to the capacity of the used wireless communication system to dynamically re- create the network topology, our system can tolerate, due to the excavation, the consecutive loss of wireless nodes. The proposed instrument is currently under patenting and the preliminary experimental results are very encouraging. This paper is structured as follows. In Section 2, we de- scribe the common displacement measurement techniques typically used during gallery excavation. In Section 3, we introduce the soil displacement measuring system, based on the use of a potentiometer. In Section 4, we characterize the multi-hop wireless communication strategy utilized by the proposed device. In Section 5, we describe the outcome of the field trials conducted in gravel and clay. Finally, conclu- sions are drawn in Section 6. 2. COMMON DISPLACEMENT MEASUREMENT TECHNIQUES DURING GALLERY EXCAVATION: BASICS AND SHORTCOMINGS There are various displacement measurement techniques during the advancement of the gallery excavation. Among the most common techniques, there is the one based on the use of incremental assestimeters. An incremental assestimet- rics column is constituted by tube portions, generally 1 m long, in metal or plastic, which are joined together through fixed points. In some models they are equipped with external rings for magnetic induction of the measurement probe.
-
Upload
independent -
Category
Documents
-
view
1 -
download
0
Transcript of A Distributed Wireless Soil Displacement Measurement System for Active Monitoring of the Excavation...
The Open Electrical and Electronic Engineering Journal, 2011, 5, 1-8 1
1874-1290/11 2011 Bentham Open
Open Access
A Distributed Wireless Soil Displacement Measurement System for Active Monitoring of the Excavation Front of a Gallery Lorella Montrasio1 and Gianluigi Ferrari*,2
1Department of Civil Engineering, University of Parma, Italy
2Department of Information Engineering, University of Parma, Italy
Abstract: In this paper, an innovative instrument for the measurement of the soil displacement, developed at the laborato-ries of the Departments of Civil and Information Engineering of the University of Parma and currently under patenting, is presented. The instrument, which can be used in any application requiring soil movement measurements, has been origi-nally designed for the measurement of the axial terrain displacement during gallery excavation. The methods currently in use for this type of measurements, together with their advantages and disadvantages, are illustrated, motivating the rea-sons which have brought to the proposed innovative measurement system. The instrument allows to measure the soil dis-placement along an axis perpendicular to the excavation front, during a gallery excavation, through continuous measures based on the use of potentiometers. The transmission system is wireless, with multi-hop communications. This eliminates the limitations imposed by the cables which make the reading and data collection operations difficult. In particular, the wireless technology utilized during the project is based on the Z-Wave protocol, originally developed for home applica-tions. This wireless four-layer communication protocol is based on the creation of a network with a single controller and several slaves. The system has first been set and tested in the laboratories and, then, outdoor (under gravel and clay). The obtained results are very satisfactory.
Keywords: Soil displacement measurements, gallery excavations, multi-hop wireless communications.
1. INTRODUCTION
The control of soil displacements during gallery excava-tion is of paramount importance for both preventing possible collapses which might make the life of workers at risk and for the definitions of procedures required to reinforce the front [1].
Wireless sensor networks, owing to their flexibility and relatively low cost, have found several applications in vari-ous fields. In agriculture, wireless sensor networks have been employed to measure the status of the soil (e.g., the water concentration) in order to improve the efficiency of cultiva-tion (e.g., vineyards) [2, 3]. In the field of civil engineering, sensors can be successfully employed for monitoring the structural health of a building, a bridge, etc. [4, 5].
All the above applications of wireless sensor networking typically require that sensors are buried underground. This class of sensor networks, typically referred to as wireless underground sensor networks [6], have been investigated experimentally in order to understand more clearly the propa-gation characteristics of underground transmissions [7, 8].
In this paper, we present an innovative wireless instru-ment for the distributed measurement of the excavation front of a gallery. The key idea is that of building a linear wireless *Address correspondence to this author at the Dept. of Information Engi-neering, University of Parma, Viale Usberti 181/A, I-43124 Parma, Italy; Tel: +39 0521 906513; Fax: +39 0521 905758; E-mails: [email protected], [email protected]
sensor network buried perpendicularly with respect to the excavation front of the gallery. The wireless nodes are equally spaced and connected to potentiometers which measure relative displacements. Owing to the capacity of the used wireless communication system to dynamically re-create the network topology, our system can tolerate, due to the excavation, the consecutive loss of wireless nodes. The proposed instrument is currently under patenting and the preliminary experimental results are very encouraging.
This paper is structured as follows. In Section 2, we de-scribe the common displacement measurement techniques typically used during gallery excavation. In Section 3, we introduce the soil displacement measuring system, based on the use of a potentiometer. In Section 4, we characterize the multi-hop wireless communication strategy utilized by the proposed device. In Section 5, we describe the outcome of the field trials conducted in gravel and clay. Finally, conclu-sions are drawn in Section 6.
2. COMMON DISPLACEMENT MEASUREMENT TECHNIQUES DURING GALLERY EXCAVATION: BASICS AND SHORTCOMINGS
There are various displacement measurement techniques during the advancement of the gallery excavation. Among the most common techniques, there is the one based on the use of incremental assestimeters. An incremental assestimet-rics column is constituted by tube portions, generally 1 m long, in metal or plastic, which are joined together through fixed points. In some models they are equipped with external rings for magnetic induction of the measurement probe.

2 The Open Electrical and Electronic Engineering Journal, 2011, Volume 5 Montrasio and Ferrari
The installation of the tube for the successive measure-ment requires the following steps:
• the probing execution, which can be carried out through core drilling or destruction;
• the installation of the tube portions and of the joints; • the assembly of the assestimetric column; • the insertion, in the hole, of the assestimetric column
and its external cementification to fix the column to the ground.
The hole is excavated perpendicularly to the excavation front and has a length between 20 m and 25 m, and a diame-ter around 10 cm.
The assestimetric column is formed by tubes and joints: the tubes are smooth, whereas the joints have properly rough surfaces, which joins them tightly with the ground. This condition is fundamental for displacement detection, since the displacement of the rocky ground causes the displace-ment of the joints, but not of the tubes in between. The asses-timetric column, once inserted, is covered by concrete. Once the entire tube has been inserted, an operator inserts an asses-timetric probe, which is built in such a way that it can lock inside the joints (properly shaped) and can detect their posi-tions with a precision of the order of 1 mm.
Before the beginning of the excavation, the positions of the joints are recorded. The reading operation is, therefore, manual. Once the front excavation starts, the various tube portions are removed, starting from those close to the front. At a desired rate, the excavation is paused to measure the displacements caused by the excavation itself. An operator inserts the assestimetric probe to measure its current posi-tion. At this point, by computing the difference with respect to the initial position, the displacement caused by the exca-vation is determined. This operation requires complete stop of the building and the off-line (manual) computation of the terrain displacement behaviour.
Even tough the measurement potential of these instru-ments is well recognized, it is necessary to underline, in the case of measurement of extrusion of the excavation front, some of their shortcomings, which are strictly related to the design of the instrument itself and to the manual reading operation.
• The first limitation is given by the suspension of any working and excavation activity at the front to allow the operators to access and measure the recorded dis-placement (the minimum required interruption inter-val is about 1 hour).
• Moreover, there is the need of a mobile platform which can bring the operators to the height required to insert the probe within the instrument. In this situa-tion, the operators run into a highly risky situation, because of the elevation of the platform and of the exposition to the excavation front for at least one hour.
• Another limitation of this measurement technique is the fact that the measurement is not continuous. In fact, each measure is compared directly with the pre-viou one, which could have been carried out even ten days before.
Finally, the overall time including the reading operation in situ and the final processed data, once the access to the front is freed, is not shorter than 4 hours.
On the basis of the above observations, one can conclude that improving this measurement process is fundamental: (1) to guarantee the highest possible security to the excavation workers and the technicians which perform the reading op-erations and (2) to follow the front deformation movements “real-time,” without any discontinuity between a reading operation and the next one.
3. SOIL DISPLACEMENT MEASURING SYSTEM
A displacement measuring system, which maintains the advantages of systems currently in use while overcoming their limitations, has been designed and implemented. It is currently being patented [9,10].
The system was created ex-novo to simultaneously pro-vide:
I. real time measurements; II. measure precision;
III. relatively low cost. The real time measurements are fundamental for the con-
stant monitoring of the displacements and allow for a timely intervention in the case of a hazardous situation.
In order to perform real time measurements the instru-ment should be inserted and maintained in the pipelines and, consequently, destroyed during the advancement of the ex-cavation front, together with the tubes. This requires the choice of specific instruments which are inexpensive and not practical for other engineering purposes.
All traditional real time displacement measuring systems require transmission and power wires. Therefore, the use of the traditional instrumentation is not practical in cases where the instrument is destroyed during the excavation. To resolve this problem we have envisioned and designed a real time measurement system which can transmit information wire-lessly through multi-hop communications, as will be de-scribed in Section 4.
3.1. Choice of the Displacement Measuring System
The designed measurement system is modular, comprised of segments of smooth 1 m-long pipes with connecting joints, similar to the currently existing measurement systems.
The measurement system is based on the monitoring of movements between two successive joints. An internal sys-tem for connecting the joints, over which the local displace-ment measurement system can be inserted, has been de-signed and implemented. The local displacement measure-ment system has been chosen in order to provide precise measures of linear displacements with limited costs. The chosen instrument is the potentiometer.
The principle of operation of the instrument is illustrated briefly in Fig. (1). It is possible to translate a position along a conducting wire or small cylinder simply by detecting the resistance of the portion of conductor comprised between the reference point (one of the extremes) and the current posi-tion; the mathematical law which describes this procedure is linear and very simple (as shown in Fig. 1). Since the resis-

A Distributed Wireless Terrain Displacement The Open Electrical and Electronic Engineering Journal, 2011, Volume 5 3
tance of the wire is typically too low, we resort to a technical gimmick that consists of wrapping circularly the wire around an elongated cylindrical support or overlapping foils equal to the displacement path. In this case, the wire is much longer compared to the previous case. Therefore, for the same dis-placement, the length of the conducting wire which is af-fected by this displacement is much longer with respect to the previous case. The simplicity of the operating principle of the instrument makes it inexpensive and suitable for the intended purpose.
Fig. (1). Operating principle of the potentiometer.
The selected instrument, namely an LT rectilinear dis-placement transducer manufactured by Gefran [11], was tested to verify the measurement accuracy. For this purpose, it was compared with a Linear Voltage Differential Trans-former (LVDT) [12], manufactured by RDP Group [13]. The tests were carried out by imposing the constraint of one splicer per instrument in order to obtain constant speed of execution and thus revealing the difference in readings be-tween the potentiometer and LVDT. The technical character-istics of the considered LT rectilinear transducer can be re-trieved from [11]. In particular, the independent linearity is ± 0.05% and the repeatability is 0.01 mm. We remark, how-ever, that the accuracy of the proposed distributed measure-ment system depends on the chosen potentiometer: in other words, by selecting a more accurate potentiometer, the accu-racy of the overall system can be improved. On the other hand, wireless digital transmissions do not limit the accu-racy, provided that the measured displacement is converted into a sufficiently long binary string to be transmitted.
Measurement campaigns were carried out, in an initial phase, extending the piston of the potentiometer and, in a second phase, compressing it, in order to detect any differ-ence in the instrument’s behavior. The temperature of the laboratory was kept constant during the test. Differences in the displacement measurements were observed between the two instruments and, given the greater precision and reliabil-ity of LVDT, the differences were attributed to an error in the reading of the potentiometer or to data acquisition. Therefore, it was calculated, starting from measurements taken with a tested and reading the voltage values (dimen-sion: [Volt]) of the potentiometer at the lower boundary of the measurement range (with the piston positioned com-pletely within the tool) and at the higher boundary of the measurement range (with the piston positioned completely outside of the tool), how to split the stroke in various seg-ments so that the performance of the piston can be line-arized. The obtained results are shown in Fig. (2). As one can see, the potentiometer behaves linearly. The new tests were carried out with laboratory temperature kept constant.
The obtained results show that the behavior of the potenti-ometer is identical to that of LVDT (overlapping curves).
3.2. Internal Support System of the Potentiometer
The potentiometer connects two successive joints through a system (inside the pipes) which does not alter the deforming aspect and allows the measurement of relative shifts between the joints.
Initially, a joint was made by steel bars that, compared to other materials such as wood, glass fibers, carbon, plastics, deliver lower deformability, ease of processing and relatively low productions costs. Subsequently, the bars were made of PVC pipe (outside diameter of 20mm, internal diameter 17mm), a material which is lighter and can be more easily destroyed during the excavation of the gallery.
Since in the progression of the displacements a mis-alignment can develop between the joints, due to soil dis-placements, the connection between the joints was made ‘flexible’ and able to ‘absorb’ a rotation of few degrees. A hub was thus inserted between the potentiometer and the iron bar to enable the piston to flow along its axis independently of the angle between the potentiometer and the iron bar. This is guaranteed by the axial joint. The chosen hub, shown in Fig. (3), is the IGUBAL AGRM 08, produced by IGUS [14], and the choice for this hub is motivated by the its ease of assembly, lightness, and precision.
Fig. (2). Comparison of the measurement results made with the potentiometer and the LVDT.
On one side, the hubs are screwed on to the iron bar and on the other side to the potentiometer, with the aid of a cy-lindrical adapter. The bar is also tied to the opposite extrem-ity to allow it to attach to the joint and to support the next potentiometer.
Fig. (3). IGUBAL AGRM axial hub.

4 The Open Electrical and Electronic Engineering Journal, 2011, Volume 5 Montrasio and Ferrari
The final potentiometric module is shown in Fig. (4). It consists of the joint potentiometer, the adapter, the axial hub, and the iron bar.
Fig. (4). Potentiometric module, composed of joints, potentiometer, adapter, axial hub, and iron bar.
The final potentiometer was tested and compared with an LVDT to assess the accuracy in measurements, which must be guaranteed to the tenth of a millimeter. The experimental results, shown in Fig. (5), show a substantial coincidence of the readings taken with the developed system and with an LVDT.
Fig. (5). Comparison between the displacement predicted by the new instrument and the one predicted by an LVDT.
At this point, once the basic building block for local dis-placement measurement has been designed and tested, we have developed an innovative multi-hop wireless communi-cation systems to collect the measurements taken by succes-sive potentiometers. This is described in the next section.
4. MULTI-HOP WIRELESS COMMUNICATIONS
4.1. Description of the Wireless Displacement Measure-ment System
The scheme of a joint of the proposed instrument, with the communication module, is shown in Fig. (6), whereas a logical scheme of the complete instrument (given by a se-quence of interconnected basic blocks) is shown in Fig. (7).
In Fig. (6), a potentiometer is connected rigidly to the joint and, simultaneously, transfers the detected data to a radiotransmitter (to which it is connected through a cable).
Fig. (6). Scheme of a joint in the instrument.
Fig. (7). Logical communication scheme between the wireless nodes placed in correspondence to the joints.
Referring to the logical scheme in Fig. (7), the operating principle of our instrument can be described as follows. The extensimetric sensors measure continuously (i.e., with the desidered measurement frequency) the displacements and transmit these data to an external central controller, possibly through multi-hop communications. In other words, besides transmitting the data measured by the associated potentiome-ter, each node can act as a “bridge” for any other node. The external central controller stores the data detected by the measurement instruments, thus allowing a subsequent date processing to monitor in real time the advancement of the excavation front.
The designed instrument shows significant advantages with respect to the traditional measurement systems. In fact, its use does not require any longer to stop the operations of the excavation operations over the gallery front to carry out the displacement measurements, since all communications are wireless and real-time.
4.2. Multi-hop Wireless Network
Sensor networks are receiving an increasing attention in the communication engineering literature, since they repre-sent a fertile research ground and can be successfully used to measure distributed phenomena [15]. In order to do this, the sensing nodes, with their processing and radio transmission equipment, have to be placed over a field to analyze the phe-nomenon and transmit their readings to a central node, o collector, which can make available, e.g., through Internet, the collected data. The number of issues to be considered to implement a network is not small. These issues span from the independence from a single node of the network per-formance to scalability (in other words, a network protocol has be designed so that it can work correctly in both mi-cronetworks and huge networks); from “intelligent” node displacement to the use of an efficient routing protocol which allows the highest possible energy savings so that the network lifetime is maximized; from the transmission fre-

A Distributed Wireless Terrain Displacement The Open Electrical and Electronic Engineering Journal, 2011, Volume 5 5
quency, which needs to be free from legal constraints (free frequencies defined by the considered standards are those around 2.4 GHz and 868 MHz in Europe), to the cost of each single network element.
For the proposed instrument, we have relied on the Z-Wave communication technology [16]. Z-Wave is a wireless communication technology, produced by Zensys [17], de-signed for residential and commercial uses to control and manage applications such as distance measurements, lighting and electric appliances control, smoke detectors, anti-intrusion devices, etc. The idea of the Z-Wave protocol is that of transforming each stand-alone device in a device properly connected to a network which can be monitored and controlled in a wireless fashion. The Z-Wave technology allows the creation of a high quality network at a cost much lower than that of other technologies.
The network will then have to be self-organized, with mesh capabilities, to ensure error-free communications, and, in the presence of faults, to use self-adjusting mechanisms to recreate a reliable network. The Z-Wave technology goes in this direction. In particular, in order to reach the goal of a low-cost network, the radiofrequency platform will have to be integrated, built with low-cost processes, and the embed-ded software will have to be rather “light.”
Because of the relatively small dimensions of a home network, typically composed by a number of nodes lower than 200 units placed over a limited area where nodes com-municate with each other not too frequently (on average, every 5-10 minutes), the Z-Wave protocol envisions, for home control, the use of packets of at most 15 bytes trans-mitted at a data-rate of 9.6 kbps. This allows routing with a negligible amount of collisions.
The Z-Wave protocol is a narrow-band full duplex proto-col designed to guarantee reliable wireless communications in a low-cost control network. The main goal of the protocol is that of sending reliably short control messages from a con-trol unit to one or more network nodes. Although the proto-col is not designed to transmit large amounts of data or to transfer streaming or time-dependent data, this still allows the nodes to send small quantities of data (such as local read-ings) ciclycally (at fixed intervals, through the use of an in-ternal clock at the nodes).
The protocol consists of four layers: the MAC Layer, which controls the radio medium; the Transfer Layer, which controls packet transmission and reception; the Routing Layer, which controls packet routing in the network; and the Application Layer, which controls the integrity of the trans-mitted and received packets. At the bottom of the protocol stack there is the RF medium. In particular, the routing layer of the Z-Wave protocol checks packet routing from one node to another. Both the Controller and the Slaves participate actively in routing a packet in the case that they are listening and have fixed positions. The routing layer is responsible of both the packet transmission and the selection of the relay nodes till the final (destination) node. Moreover, the Control-ler takes care of the network topology discovery and of the routing table update.
There are 2 types of packets which are used whenever a retransmission is required: Routed Singlecast Frame Type and Routed Acknowledge Frame Type. The first type of
packets is reserved for a single node which foresees the use of an acknowledgement containing the relay information. The packet is then forwarded from node to node till it reaches its destination. An illustrative description of this scenario is shown in Fig. (8).
Fig. (8). Logical communication scheme for routed singlecast packets.
The second type of packets, instead, does not contain any data and is used to notify the controller that the routed sin-glecast packet has reached its destination. An illustrative scheme is shown in Fig. (9).
Fig. (9). Logical communication scheme for r routed acknowledge packets.
Up to this point, the network solution adopted is attrac-tive from a lab experiment viewpoint. The use of this net-work directly on the field requires the use of a laptop, con-nected to the Z-Wave node which acts as controller, with continuous energy supply. Similarly, the Controller itself needs to be supplied with energy. An alternative solution, currently under study, consists in placing, between the laptop (to which the Controller, collecting all the data, is connected) and the group of nodes inserted inside the excavation front, another “buffering” controller. The latter has the capability of collecting a given amount of data generated by the slaves and of sending them to the final controller in an independent way, i.e., without being connected through a cable to any device which can store or visualize the data (being it a PC, a palm-device, or another device).
4.3. Operational Principle
The operational principle of the overall system is the fol-lowing. Each node, upon request by the controller (direct or indirect, through the buffering collector), reads the value generated by its connected potentiometer, inserts this value (expressed through a 12-bit word) in a data packet, and sends it. The length of the payload, i.e., the useful bytes (neglect-ing the bytes for the control), is given by:
• 3 bytes for the date; • 3 bytes for the time; • 1 byte to identify the originating node; • 2 bytes for the 12-bit data. The total number of bytes is then 9. On the basis of these
observations, it is possible to determine the maximum num-ber of writing operations on the controller's memory, deter-mining, as a consequence, the network lifetime. Preliminary

6 The Open Electrical and Electronic Engineering Journal, 2011, Volume 5 Montrasio and Ferrari
considerations have shown the applicability of our instru-ment to the problem at hand, since its lifetime is limited by the excavation operations, as described in the following paragraph.
Once the instrument is inserted inside the excavation front, the wireless Z-Wave network self-organizes. In other words, a topology self-forms so that each node can reach, possibly through multi-hop communications, a data collector (e.g., a laptop) placed in front of the excavation front. As the excavation proceeds, the node closest to the front is periodi-cally destroyed. Upon its disappearance, the wireless net-work self-adjusts in order to allow each surviving node to reach the external collector. More precisely: if a node was already directly communicating with the collector, nothing changes (from its viewpoint); if a node was communicating to the just-destroyed node (in order to reach the collector), it will either communicate directly to the collector or find an-other relay to reach the collector.
5. FIELD TRIALS
5.1. Trials Conducted in Gravel
Before starting taking real measuremements, it was nec-essary to setup the experimental site. Two phases of the setup can be identified: the first is the installation of the in-strument; the second is the layering of the instrument with gravel. During the first phase, four instrumental modules are prepared on the ground, with each one of the modules being composed of a wireless node, a potentiometer, the batteries needed for the supply of power and a pipe. The individual modules are then linked together through specifically de-signed joints. The modules are arranged in line to form an instrument with a total length of 4 m. A photo of this instru-ment is shown in Fig. (10).
After the first phase of the experiment preparation the in-strument is layered with substantial quantity of gravel, leav-ing uncovered the ends of the instrument which are placed near the detection site. In this way, it is possible to simulate the conditions of operation in which the instrument might operate once installed in the excavation front. During the experiment, a number of different measurements were taken while simulating different operating conditions. After the instrument has been installed, measurements were first taken with the instrument in the air. In this way, the correct func-tioning of the wireless network without any interference with the radio transmission of data can be verified. Subsequently, the instrument was covered with layers of gravel of increas-ing thickness. With the addition of each layer real time measurements of the relative shift of the module displace-ment are reported. In fact, instrument is subjected to traction (in the longitudinal direction with respect to its axis) and compression (in the direction perpendicular to it).
Once the conditions in which the measurements are car-ried out have been described, we now characterize the ex-perimental trials from the viewpoint of the wireless data transmission. A diagram of the setup used is shown in Fig. (11). The frequency of transmission of the packet (contain-ing the data on increased detected by potentiometer) by on individual wireless node was set to the value of one packet per second. Regardless of the communication conditions (in the air or with layers of gravel of growing thickness), the
Controller of the network receiver packets sent from each of the slave nodes. By monitoring sufficiently long transmis-sion interval it was observed that, occasionally, the package sent by a slave is rarely lost and can not reach the Controller. Moreover, this loss was found to be temporary. In other words, the Slave, having failed to communicate with the controller, does restore its (multi-hop) connection after a few to inter-reading cycles.1
5.2. Trials Conducted in Clay
Initially we deal with the setup of the experimental trial. As seen earlier, two stages can be identified: the first is the installation of the instrument; the second is the covering of
1 An inter-reading cycle coincides with the sequence of read operations of the data sent by the network Slaves, interrogated sequentially one after the other. This inter-reading cycle coincides, therefore, with the time interval between two consecutive interrogations, by the Controller, of the same Slave of the network.
Fig. (10). Instrument (four 1m long modules) laid for experimental measures.
Fig. (11). Logical structure of the considered experimental set-up.

A Distributed Wireless Terrain Displacement The Open Electrical and Electronic Engineering Journal, 2011, Volume 5 7
the instrument with clay (unlike the scenario in subsection 5.1, where the instrument was covered with gravel). During the first phase, five instrumental modules are prepared on the ground, with each module being composed of a wireless node, a potentiometer, the batteries needed for the supply of power, and pipes which do not contain any instrumentation.
The individual modules and pipes are arranged in line and interconnected alternating a module with a pipe. In such a way, an 8 m long instrument is obtained, with the potenti-ometers and the slave nodes of the wireless network one or two meters apart from each other. After the first phase of the experiment preparation, the instrument is layered with about 40 cm of clay, leaving uncovered the ends of the instrument which are placed near the detection site.
In this way, it is possible to simulate the conditions in which the instrument might operate once installed in the ex-cavation front. During the experiment various communica-tion tests were carried out in correspondence to the two dif-ferent operating conditions. After the instrument has been installed, measurements are taken with the instrument in the air. In this way, the correct functioning of the wireless net-work, which is integrated in the instrument, can be tested without any physical interference in the RF transmission of the data. Once the instrument was layered under about 40 cm of clay, real time measurements of the module displacement are made. To do this the instrument is subjected to longitudi-nal traction and perpendicular compressions with respect to its axis.
After describing the conditions in which the measure-ments are carried out, we move to the description of the ex-perimental tests from the wireless data transmission view point. Unlike what has been considered in subsection 5.1, the frequency of transmission of the packet containing the in-formation relative to the elongation of the potentiometer connected to each wireless node was reduced to one packet every 2, instead of the value of one packet per second used in subsection 5.1. This change was made to allow the opera-tor at the detection site to read on the video screen the values of the measures received from the slave nodes. The time between readings, which was 5s in subsection 5.1, was set to 15s. Ten seconds are needed for the 5 slave nodes to transmit the packet (5 packets * 2 s/packet = 10 s) and the remaining five seconds are considered to allow for the net separation between the consecutive readings.
During the communication trials in the air it was ob-served that, occasionally, a packet sent by a slave node is lost and does not reach the controller. The communication between the salve and the controller, however, is fully re-stored after the execution of reading cycles. Again, the nodes affected by this temporary loss of connectivity are slave nodes which have at least a different slave node between them and the controller. Once the first tests were carried out in the air, the instrument was buried under a substantial layer of clay. Under these conditions, tests of data transmission between slave nodes and controller nodes of the network highlight communication problems between slave nodes and controller nodes. In particular, the data packets generated by the slaves placed at four meters from the controller arrive to their destination. Instead, packets sent by the slaves placed at a greater distance are irretrievably lost. Even after the execu-
tion of several reading cycles, only a few packets sent by the slaves placed at a longer distance reach their destination.
We remark that the considered trials were preliminary and our system should be tested in other scenarios and, espe-cially, in operative conditions. It is also possible, by having an accurate characterization of the ground to be excavated, to estimate the wireless propagation characteristics [7] and, therefore, properly design the instrument, e.g., considering a maximum number of nodes or a maximum distance between consecutive nodes. The investigation of this aspect goes be-yond the scope of this paper.
6. CONCLUSIONS
In this paper, we have presented an innovative distributed measurement systems recently developed at the University of Parma. The basic idea was to use serially connected po-tentiometric modules (1m apart from each other) to measure relative displacements. The measured displacements are then collected through a multi-hop wireless communication sys-tems “embedded” inside the tubular instrument. The de-signed (and patented) instrument has been experimentally tested. The obtained results have shown that the instrument is very accurate and, basically, provides the same level of precision of typical LVDT systems. However, the proposed instrument has the potential to significantly reduce the costs involved with active monitoring of the excavation status and to guarantee real-time measurements. Preliminary experi-mental results have shown that the length of the instrument (i.e., the penetration depth in the gallery front) has to be se-lected considering the soil type. For instance, day imposer more stringent limitations than grovel.
ACKNOWLEDGEMENTS
This work was sponsored by So.Ri.Ge. Srl. The authors would like to thank Giovanni Costoncelli (So.Ri.Ge.) for continuous support and useful discussions.
REFERENCES [1] V. A. Kontogianni, and S. C. Stiros, “Induced deformation during
tunnel excavation: Evidence from geodetic monitoring, Engineer-ing Geology,” Application of Geodetic Techniques in Engineering Geology, vol. 79, no. 1-2, pp. 115-126, 3 June 2005.
[2] J. Burrell, T. Brooke, and R. Beckwith, “Vineyard computing: sensor networks in agricultural production,” IEEE Pervasive Com-puting, vol. 3 no. 1, pp. 38-45, 2004.
[3] R. Cardell-Oliver, K. Smettem, M. Kranz, and K. Mayer, “A reac-tive soil moisture sensor network: design and field evaluation,” In-ternational Journal of Distributed Sensor Networks, vol. 1, no. 2, pp. 149-162, 2005.
[4] C. Park, Q. Xie, P. Chou, and M. Shinozuka, “Duranode: wireless networked sensor for structural health monitoring,” IEEE Sensors, Irvine, CA, USA, October/November 2005, pp. 277-280.
[5] M. Li, and Y. Liu, “Underground structure monitoring with wire-less sensor networks,” Proceedings of the 6th International Con-ference on Information Processing in Sensor Networks (IPSN '07), Cambridge, MA, USA, April 2007, pp. 69-78.
[6] I. F. Akyildiz, and E. P. Stuntebeck, “Wireless underground sensor networks: Research challenges,” Elsevier Ad Hoc Networks, vol. 4, pp. 669-686, 2006.
[7] I. F. Akyildiz, Z. Sun, and M. C. Vuran, “Signal propagation tech-niques for wireless underground communication networks,” El-sevier Physical Communication Journal, vol. 2, no. 3, pp. 167-183, September 2009.
[8] A. R. Silva, and M. C. Vuran, “Development of a testbed for wire-less underground sensor networks,” EURASIP Journal on Wireless Communications and Networking, vol. 2010(2010), Article ID 620307, 14 pages. doi:10.1155/2010/620307.
8 The Open Electrical and Electronic Engineering Journal, 2011, Volume 5 Montrasio and Ferrari
[9] L. Montrasio and G. Ferrari, “Metodo e sistema per la misura dis-tribuita di grandezze geotecniche,” Italian patent application n. CR2007A000010, May 2007.
[10] L. Montrasio and G. Ferrari, “Sistema di misura di spostamenti del terreno per applicazioni geotecniche,” Italian patent application n. CR2007A000011, May 2007.
[11] Gefran website, 2010. http://www.gefran.com/. [12] E.O. Doebelin, Measurement Systems: Application and Design,
McGraw-Hill Higher Education: New York, USA, 2004.
[13] RDP Group website, 2010. http://www.rdpe.com/. [14] IGUS website, 2010. http://www.igus.com/ [15] I. F. Akyildiz, W. Su, and K. S. J. Pister. “A survey on sensor net-
works,” IEEE Commun. Mag., vol. 40, no. 8, pp. 102-114, 2003. [16] Z-Wave Alliance website, 2010. http://www.z.wavealliance.org/.
See also ZW0201 Z-Wave Single Chip, 2005. Z-Wave Technical Documentation, pp. 1-24.
[17] Zensys website, 2010. http://www.zen-sys.com/
Received: September 27, 2010 Revised: November 29, 2010 Accepted: December 07, 2010 © Montrasio and Ferrari; Licensee Bentham Open.
This is an open access article licensed under the terms of the Creative Commons Attribution Non-Commercial License (http://creativecommons.org/licenses/ by-nc/3.0/) which permits unrestricted, non-commercial use, distribution and reproduction in any medium, provided the work is properly cited.