Detect abnormalities in mammograms by local contrast thresholding and rule-based classification
Available online at www.sciencedirect.com
www.elsevier.com/locate/cviu
Computer Vision and Image Understanding 109 (2008) 86–96
Note
Robust information clustering incorporating spatial informationfor breast mass detection in digitized mammograms
Aize Cao, Qing Song *, Xulei Yang
School of Electrical and Electronic Engineering, Nanyang Technological University, Singapore 639798, Singapore
Received 25 February 2005; accepted 6 July 2007Available online 1 September 2007
Abstract
In this paper, we investigate a robust information clustering (RIC) algorithm incorporating spatial information for breast mass detec-tion in digitized mammograms. The detection system employs RIC algorithm based on the raw region of interest (ROI) extracted fromglobal mammogram by two steps of adaptive thresholding. Pixels on the fuzzy margin of a mass and noisy data were identified by RICthrough the minimax optimization of mutual information. The memberships of the identified pixels (outliers) were recalculated by incor-porating spatial distance information that takes into account of the influence of a neighborhood of 3 · 3 window. The algorithm is robustin the sense that both peak and valley of image intensity histogram are estimated and the pixels corresponding to valley in the histogramare clustered adaptively to image content. The purpose of the detection system is to locate the suspicious regions of mass candidates inthe mammograms which will be further examined by other diagnostic techniques or by radiologists. The proposed method has been ver-ified with 60 mammograms in the MiniMIAS database. The experimental results show that the detection system has a sensitivity of 90.7%at 2.57 false positives (FPs) per image.� 2007 Elsevier Inc. All rights reserved.
Keywords: Robust information clustering; Minimax optimization of mutual information; Spatial information
1. Introduction
The cancerous tumors are hard to be visually detectedwhen they are embedded in or camouflaged by varying den-sities of parenchymal tissues, particularly, the dense paren-chymal breast tissues. It is a challenging task to detectmasses within such background tissues in screening mam-mography, which has been recommended as the most effec-tive method for the early detection of breast cancer. Inaddition, masses with various sizes and shapes may failto generate a template that presents the common geometricproperties of tumors. A lot of research work based on var-ious theories have been carried out to tackle the problemsof computerized mass detection. Doi et al. [4,33] havedeveloped several methods for automatic detection ofmasses in mammograms. One of the methods employs a
1077-3142/$ - see front matter � 2007 Elsevier Inc. All rights reserved.
doi:10.1016/j.cviu.2007.07.004
* Corresponding author.E-mail address: [email protected] (Q. Song).
nonlinear bilateral-subtraction technique that locates theinitial mass candidates by using multiple subtractedimages. An artificial neural network was used to reducefalse-positive detection resulting from the bilateral subtrac-tion based on various features. In classification, the mainconcern of a mass in question to be malignant was basedon the degree of spiculation.
Other methods of computerized detection and analysisinclude the earlier work done by Li et al. [5]. They pro-posed a Markov random field approach that lies in the cat-egory of region based algorithm to do breast massdetection. The algorithm was reported to have achieved90% sensitivity with 2 FPs/image. Perick et al. [16] pro-posed a two-stage adaptive density-weighted contrastenhancement (DWCE) filter in conjunction with a Lapla-cian-of-Gaussian edge detector for mass detection. Theyreported 96% detection accuracy at 4.5 FPs/image for 25mammograms by using a set of morphological features.Texture features based on gray-level co-occurrence matrices

A. Cao et al. / Computer Vision and Image Understanding 109 (2008) 86–96 87
were studied later for a dataset of 168 cases [17]. A detec-tion accuracy of 80% was achieved at 2.3 FPs/image.Mudigonda and Rangayyan [18] proposed to employGaussian smoothing and sub-sampling operations as pre-processing steps in mass detection. The mass portions aresegmented by establishing intensity links from the centralportions of masses into the surrounding areas. A sensitivityof 81% was achieved at 2.2 FPs/image for mass versus nor-mal tissue. Malignant mass versus benign case classificationresulted in Az = 0.9 under ROC curve for 26 masses. Gra-dient and texture analysis was used in [19] to classifymasses into benign and malignant cases. Some other meth-ods were proposed for the detection of spiculated massesdue to their high likelihood of malignancy [14,30].
Image segmentation is the fundamental task in thesecomputer aided detection systems. It is indeed true thatthe image segmentation needs robust algorithms. Therobustness means that the performance of an algorithmshould be relatively stable for small deviations from theassumed model, or noise and outliers [29]. Recent yearshave seen increasing interests in developing robust cluster-ing algorithms for the applications in computer vision [7,6],image segmentation [32,3,12] and pattern recognition [1].Many robust algorithms have been proposed for fuzzyclustering and a comprehensive review can be found in[29]. Dave [28] proposed robust fuzzy clustering algorithmby introducing the concept of noise cluster in addition to c
clusters. A noise prototype is defined such that it is equi-distant to all the points in the data set, i.e. the noise clusteris determined based on distance measure. In the same year,Krishnapuram [27] published a possibilistic approach forc-means clustering. The membership of each data is apossibilistic membership. Many other robust clusteringalgorithms can be found in the literature, such as [26,13].Wu et al. [9] proposed a new metric to replace the Euclid-ean norm in c-means clustering procedure which is robustto noisy data and outliers. The more recent work of robustclustering is presented in [8].
In this paper, a robust information clustering (RIC)algorithm incorporating spatial information is proposedfor mammographic mass detection as the help of screen-ing mammography. Pixels on the fuzzy margin of a massand noisy data are identified by the RIC based on theminimax optimization of the mutual information. Similarto the general statistical theory in [31,22], the RIC algo-rithm is considered as a learning machine problem withthe limited training data rather than based on the infinitenumber of training data. It is a two-phase minimax opti-mization procedure. Through a minimizing mutual infor-mation scheme and starting from one, the number ofclusters is increased gradually, which minimizes the freeenergy function from high to low temperature. Startingfrom an initial single cluster of all input patterns, anew cluster is added each time as the temperature is low-ered to a critical point. The robust estimation phase iscarried out to maximize the mutual information and esti-mate the outliers. The algorithm is robust in the sense
that both peak and valley of image intensity histogramare estimated simultaneously.
The detection system employs a bottom-up image inter-pretation strategy that includes three major steps: ROIextraction, RIC segmentation incorporating spatial infor-mation and false positive (FP) reduction. The raw regionsof interest (ROIs) were first extracted from the globalmammograms by two steps of adaptive thresholding. ThenRIC algorithm was applied for further segmentation. In thestep of FP reduction, both area and texture features werecalculated for the ROIs in the suspicious cluster resultedfrom the segmentation step, and support vector machine(SVM) [31] was used as the classifier to further reduce thenumber of FPs.
Instead of constructing an artificial system as a high-tech radiologist, the objective of this study intends to serveas the first vision in the process. It aims to locate the suspi-cious regions of mass candidates in the mammograms thatwill be further examined by other diagnostic techniques orby radiologists. The RIC clustering algorithm was usedhere as a technique to partition the entire ROI into distinc-tive meaningful regions to isolate the mass candidates fromtheir background tissues based on the statistical probabilitydistribution of intensity feature. Spatial information wasincorporated during the process of outliers partitions.Experimental results show that the proposed RIC algo-rithm incorporating spatial information is effective in mam-mographic mass detection.
2. Method
2.1. Raw ROI extraction
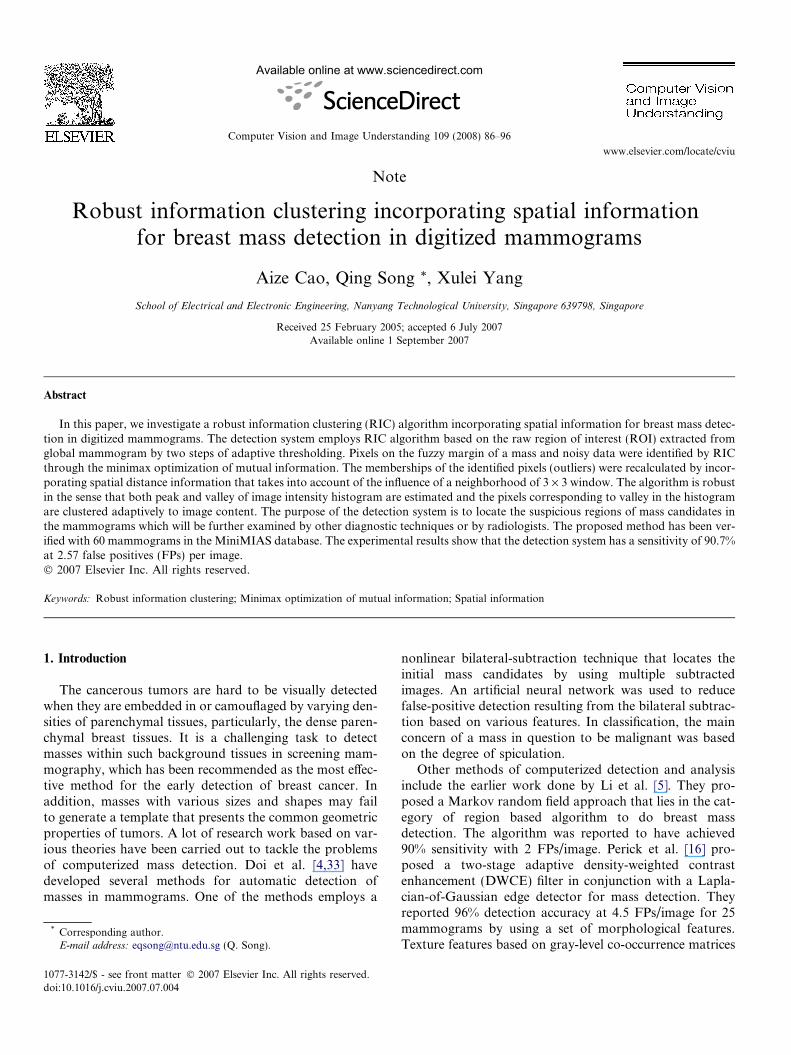
The RIC was applied within certain raw ROI. In thisstudy, two steps of adaptive thresholding were used forROI extraction. There are two main areas in a mammo-graphic image: breast region and non-breast region. In gen-eral, the non-breast region of the digitized magmmogramhas a very low intensity level and a maximum peak in thehistogram. The intensities of the breast region, however,may vary with different patients and depend on the mam-mography conditions. It should be noted that the back-ground objects with high intensity can affect theextraction result of ROI. Therefore, the breast region wasfirst extracted from digitized mammograms by adaptivethresholding. The level of threshold for the breast regionis determined as the mean of the intensities within the win-dow around a pixel. Considering the processing speed, awindow of 4 · 4 was chosen instead of each pixel. Somemammograms in MiniMIAS database contain backgroundobjects with intensity higher than the breast region, or evenhigher than mass region, as shown in Fig. 1. They maydeteriorate the results of raw ROI extraction and final seg-mentation if they are segmented together with the breastregion. Due to the breast region is the major region inthe mammogram that occupies the largest area compared
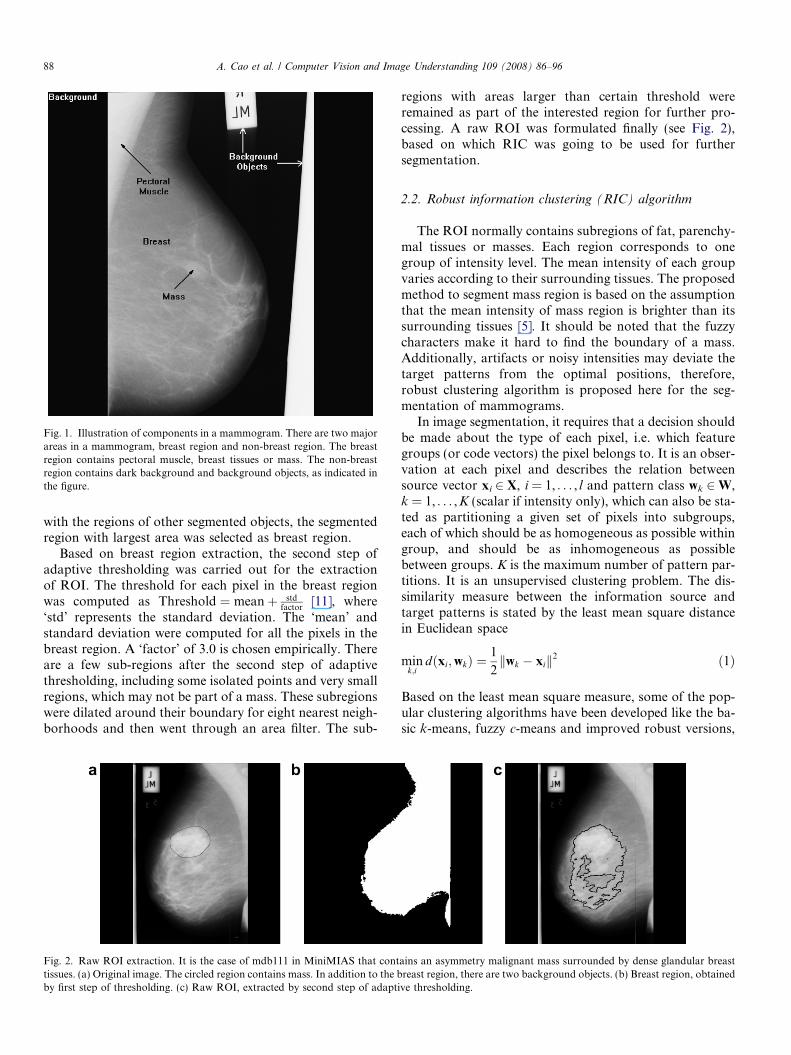
Fig. 1. Illustration of components in a mammogram. There are two majorareas in a mammogram, breast region and non-breast region. The breastregion contains pectoral muscle, breast tissues or mass. The non-breastregion contains dark background and background objects, as indicated inthe figure.
88 A. Cao et al. / Computer Vision and Image Understanding 109 (2008) 86–96
with the regions of other segmented objects, the segmentedregion with largest area was selected as breast region.
Based on breast region extraction, the second step ofadaptive thresholding was carried out for the extractionof ROI. The threshold for each pixel in the breast regionwas computed as Threshold ¼ meanþ std
factor[11], where
‘std’ represents the standard deviation. The ‘mean’ andstandard deviation were computed for all the pixels in thebreast region. A ‘factor’ of 3.0 is chosen empirically. Thereare a few sub-regions after the second step of adaptivethresholding, including some isolated points and very smallregions, which may not be part of a mass. These subregionswere dilated around their boundary for eight nearest neigh-borhoods and then went through an area filter. The sub-
Fig. 2. Raw ROI extraction. It is the case of mdb111 in MiniMIAS that conttissues. (a) Original image. The circled region contains mass. In addition to the bby first step of thresholding. (c) Raw ROI, extracted by second step of adapti
regions with areas larger than certain threshold wereremained as part of the interested region for further pro-cessing. A raw ROI was formulated finally (see Fig. 2),based on which RIC was going to be used for furthersegmentation.
2.2. Robust information clustering (RIC) algorithm
The ROI normally contains subregions of fat, parenchy-mal tissues or masses. Each region corresponds to onegroup of intensity level. The mean intensity of each groupvaries according to their surrounding tissues. The proposedmethod to segment mass region is based on the assumptionthat the mean intensity of mass region is brighter than itssurrounding tissues [5]. It should be noted that the fuzzycharacters make it hard to find the boundary of a mass.Additionally, artifacts or noisy intensities may deviate thetarget patterns from the optimal positions, therefore,robust clustering algorithm is proposed here for the seg-mentation of mammograms.
In image segmentation, it requires that a decision shouldbe made about the type of each pixel, i.e. which featuregroups (or code vectors) the pixel belongs to. It is an obser-vation at each pixel and describes the relation betweensource vector xi 2 X, i = 1, . . . , l and pattern class wk 2W,k = 1, . . . ,K (scalar if intensity only), which can also be sta-ted as partitioning a given set of pixels into subgroups,each of which should be as homogeneous as possible withingroup, and should be as inhomogeneous as possiblebetween groups. K is the maximum number of pattern par-titions. It is an unsupervised clustering problem. The dis-similarity measure between the information source andtarget patterns is stated by the least mean square distancein Euclidean space
mink;i
dðxi;wkÞ ¼1
2kwk � xik2 ð1Þ
Based on the least mean square measure, some of the pop-ular clustering algorithms have been developed like the ba-sic k-means, fuzzy c-means and improved robust versions,
ains an asymmetry malignant mass surrounded by dense glandular breastreast region, there are two background objects. (b) Breast region, obtainedve thresholding.
A. Cao et al. / Computer Vision and Image Understanding 109 (2008) 86–96 89
like robust noise [29] and possibility clustering algorithm[15]. According to Huber [20], a robust procedure can becharacterized as first, it should have a reasonably goodaccuracy at the assumed model; second, small deviationsfrom the model assumptions should impair the perfor-mance only by a small amount; and third, larger deviationsfrom the model assumptions should not cause a catastro-phe. The first requirement is the consideration whetherdata are clean. It plays great importance in statistics andengineering since systems have to be designed such thattheir performance yields accurate estimation. The secondproperty gains much attentions since the data is not cleanin engineering practice, i.e. small deviations should nothave a significant negative effect on the performance. Thethird requirement is related to the concept of breakdownpoint. According to these properties, the most importantone is the robustness to initialization, namely, stable per-formance. Another common scheme of robustness is to re-ject or ignore a subset of the input patterns by evaluatingthe membership function, which can be viewed as a robustweight function to phase out outliers. The robust perfor-mance of the fuzzy algorithms in [28] is explained in a sensethat it involves the memberships of all input patterns of agiven cluster, but not the membership of a particular pat-tern in all clusters.
Suppose the probability distributions of xi and wk arep(xi) and p(wk), respectively, and conditional probabilitydistributions are p(xijwk) and p(wkjxi). For the two basicconcepts in information theory, i.e. rate distortion andchannel capacity, let us first consider the rate distortionfunction that is defined as [24]
RðDðp�ðXÞÞÞ ¼ minpðWjXÞ
Iðp�ðXÞ; pðWjXÞÞ ð2Þ
with the constraintXl
i¼1
XK
k¼1
p�ðxiÞpðwkjxiÞdðwk; xiÞ
6
Xl
i¼1
XK
k¼1
p�ðxiÞ�pðwkjxiÞdðwk; xiÞ ð3Þ
where the mutual information I(p*(X),p(WjX)) is expressedas
Iðp�ðXÞ; pðWjXÞÞ
¼ pðWjXÞXl
i¼1
XK
k¼1
p�ðxiÞpðwkjxiÞ lnpðwkjxiÞPl
i¼1pðwkjxiÞp�ðxiÞ
" #ð4Þ
In these equations, p*(X) is the fixed unconditional pre-probability, p(WjX) is the titled distribution, as
pðwkjxiÞ ¼pðwkÞ expð�dðwk; xiÞ=T ÞPKk¼1pðwkÞ expð�dðwk; xiÞ=T Þ
ð5Þ
and �pðwkjxiÞ is the titled distribution that achieves a mini-mum value in R(D(p*(X))). The rate distortion function isusually investigated in term of a parameter s = � 1/T with
T 2 (0,1). It can be further formulated as a constraintoptimization problem
RðDðp�ðXÞÞÞ ¼ sDðp�ðXÞÞ þ minpðWjXÞ
F ðp�ðXÞ; pðWjXÞÞ ð6Þ
where F(p*(X),p(WjX)) is the DA clustering objective func-tion as (Rose [10])
F ðp�ðXÞ; pðWjXÞÞ ¼ Iðp�ðXÞ; pðWjXÞÞ
� sXl
i¼1
XK
k¼1
p�ðxiÞpðwkjxiÞdðwk; xiÞ � Dðp�ðXÞÞ !
ð7Þ
From these deduction we can see that minimizing the mu-tual information leads to deterministic annealing.
To gain robustness, we focus on the property of densityestimation p(xi) 2 p(X). Instead of the fixed equal distribu-tion p*(xi) = 1/l in the minimization of mutual information(DA) algorithm, maximization of the mutual informationis considered to evaluate different distributions of all inputpatterns of a given cluster, in particular, seeking the outli-ers with p(xi) = 0 and eliminating them from the data setfor the final data partitions. According to information the-ory, the mutual information can also be written in the fol-lowing form
IðX;WÞ ¼ maxpðxi jwkÞ
Xl
i¼1
XK
k¼1
pðxiÞp�ðwkjxiÞ lnpðxijwkÞ
pðxiÞð8Þ
The capacity of a channel (or prototypes wk) expresses themaximum rate at which information can be reliably con-veyed by the channel, defined as [23]
C ¼ maxpðxiÞ
IðX;WÞ ð9Þ
¼ maxpðxiÞ
maxpðxijwkÞ
Xl
i¼1
XK
k¼1
pðxiÞp�ðwkjxiÞ lnpðxijwkÞ
pðxiÞð10Þ
According to Theorem 1 in [23], for a given p*(wkjxi), thecapacity is maximized by
pðxiÞ ¼exp
PKk¼1p�ðwkjxiÞ ln pðxijwkÞ
� �Pli¼1 exp
PKk¼1p�ðwkjxiÞ ln pðxijwkÞ
� � ; ð11Þ
where p*(wkjxi) is the titled (or conditional probability) dis-tribution obtained in the DA step, and the backward tran-sition probability p(xijwk) is obtained through the Bayesformula
pðxijwkÞ ¼pðxiÞp�ðwkjxiÞPli¼1pðxiÞp�ðwkjxiÞ
ð12Þ
Note that the mutual information I(X,W) is not negative.However, the individual item in the sum of the capacitycan be negative. If the ith pattern xi is taken into accountand p�ðwkjxiÞ <
Pli¼1pðxiÞp�ðwkjxiÞ, then the probability
of the kth code vector (mass center) is decreased by the ob-served pattern and gives a negative information about pat-tern xi. Then the particular input pattern may beconsidered as an unreliable pattern (outlier) and its nega-tive effect must be offset by other input patterns.

90 A. Cao et al. / Computer Vision and Image Understanding 109 (2008) 86–96
Therefore, the maximization of the mutual informationprovides a robust density estimation of the noisy pattern(outlier) in term that the average information is over allclusters and input patterns. The robust density estimationand optimization is now to maximize the mutual informa-tion against p(xi) and p(xijwk), i.e., the maximization ofmutual information in (9) is a double maximization for a
priori p(xi) via p(xijwk) in (10) [23]. For any value of i, ifp(xijwk) = 0, then p(xi) should be set equal to zero in orderto obtain the maximum, such that a corresponding trainingpattern xi can be deleted and dropped from further consid-eration in the optimization procedure as an outlier.
The RIC is basically a two-phase iteration clusteringalgorithm, i.e. deterministic annealing clustering to mini-mize the mutual information through (2) and (3), and therobust estimation of the outliers to maximize mutual infor-mation through (9). For more details, comprehensive illus-tration and proof are in [21,23]. The implementation ofRIC is summarized as follows.
1. Fixed p*(xi) = 1/l, do DA clustering [10], obtain the opti-mal titled distribution of p(wkjxi).
2. Let p*(wkjxi) = p(wkjxi), initialize the prior probability ofp(xi) = 1/l, where l is the number of the input patterns.
3. Set
ci ¼ expXK
k¼1
p�ðwkjxiÞ lnp�ðwkjxiÞPl
i¼1pðxiÞp�ðwkjxiÞ
!ð13Þ
4. If
lnXl
i¼1
pðxiÞci � ln maxi¼1;...;l
ci < e ð14Þ
go to step 5, where e > 0, otherwise, set
pðxiÞ ¼ pðxiÞciPl
i¼1pðxiÞci
ð15Þ
go to step 3.5. The input patterns with p(xi) = 0 are estimated as
outliers.6. Do DA clustering for input patterns of all xi with
p(xi) > 0, stop.
The e > 0 is an accuracy control parameter. At the finalpoint of estimation, pixels will be deemed as outliers withp(xi) = 0. Until now all the pixels in ROI belong to twoclusters: outliers and non-outliers. Label zero was assignedto pixels that belong to outliers, and label one was assignedto pixels that belong to the non-outliers. Then the outlierswere going to be partitioned by incorporating spatialinformation.
2.3. Outlier partitions by incorporating spatial information
Since image data has inherent spatial ordering, thespatial information can influence their clustering results,particularly for noisy data and ambiguous data around
an object, which are called outliers that were identifiedin the RIC step. Therefore, we introduce the spatial con-text [2] into the outliers clustering based on the conceptthat the prototypes after RIC clustering are optimized,i.e. the cluster centers are optimal that are fixed for thefurther outliers clustering. The objective distances werecalculated from the identified outliers to the fixed proto-types (centroids).
Consider a 3 · 3 window centered at each outlier.Suppose the image is M · N, the image patterns xi 2 X
are converted into M · N matrix and the location ofan outlier in the image is (m,n), where m 2 (1,M) andn 2 (1, N). The distance of the outlier to kth cluster cen-ter wk is updated as
bd k;m;n¼1
8
X1
h1¼�1
X1
h2¼�1
d2k;m;nk
m;nh1 ;h2þd2
k;mþh1 ;nþh21�km;n
h1 ;h2
� �� �ð16Þ
with (h1,h2) „ (0, 0), and dk,m,n is the distance of the outlierto kth cluster center, dk;mþh1;nþh2
is the distance of the neigh-bor located at (m + h1,n + h2) to kth cluster center. Thekm;n
h1;h2is a weighted function as
km;nh1;h2¼ 1
1þ expð�ðdðm;nÞ;ðmþh1;nþh2Þ � lÞ=rÞ ð17Þ
where parameter d is the distance between the outlier andits neighbors. For the outlier at location of (m,n),dðm;nÞ;ðmþh1;nþh2Þ gives the Euclidean distance between featurevectors xm,n and its neighbor xmþh1;nþh2
, i.e.
dðm;nÞ;ðmþh1;nþh2Þ ¼ ðxm;n � xmþh1;nþh2ÞTðxm;n � xmþh1;nþh2
Þð18Þ
the feature vector xm,n is updated by
bxm;n ¼1
8
X1
h1¼�1
X1
h2¼�1
ðkm;nh1;h2
xm;n þ ð1� km;nh1;h2Þxmþh1;nþh2
Þ ð19Þ
The parameter l is defined as
l ¼ 1
MN
XM
m¼1
XN
n¼1
1
8
X1
h1¼�1
X1
h2¼�1
dðm;nÞ;ðmþh1;nþh2Þ
!ð20Þ
with (h1,h2) „ (0,0).
From these definition we can see that if the feature vec-tor of an outlier is close to its neighbors in feature space,then dðm;nÞ;ðmþh1;nþh2Þ is small. The distance of an outlier isgreatly influenced by its neighbors. Otherwise, it is largelyindependent of its neighbors. The implementation of outli-ers clustering is given as follows:
1. Obtain outliers and the optimal cluster prototypes (orcenters) from RIC.
2. Convert the feature vector into M · N matrix that corre-sponds to the image formulation. Set the maximum iter-ation number L and the value of parameter r.
3. Calculate dðm;nÞ;ðmþh1;nþh2Þ, l, km;nh1;h2
according to (18), (20)and (17).
A. Cao et al. / Computer Vision and Image Understanding 109 (2008) 86–96 91
4. Update the weighted distance bd k;m;n and feature vectorbxm;n according to (16) and (19).5. Go to step 3 if the iteration does not reach the maximum
number L.6. Assign labels to outliers with minimum distance bd k;m;n,
stop.
2.4. Feature extraction
Statistical image texture analysis, which has beendescribed by Raeth et al. [34], was used to improvethe ability of distinguishing normal from abnormalcases. One area and nine texture features were extractedwithin ROIs. Among these texture features, two are thefirst order texture features, i.e. the mean of gray leveland gray variance that describe the hight and shapeof the gray level histogram. The other seven featuresare second order texture features. Two features werecalculated from the first order gradient distribution:mean gradient and variance of gradient. Five featureswere calculated from the gray level co-occurrencematrix: namely energy, inertia, entropy, homogeneityand correlation. The co-occurrence matrices were takenin the North–South, and East–West directions at pixelsspacing of 1.
Based on the feature extraction, support vector machine(SVM) [31] was used as classifier to further classify the ROIinto normal and abnormal case as a help of FP reduction.
60 80 100 120 140 160 180 200 2200
100
200
300
400
500
600
60 80 100 120 10
100
200
300
400
500
600
a b
d e
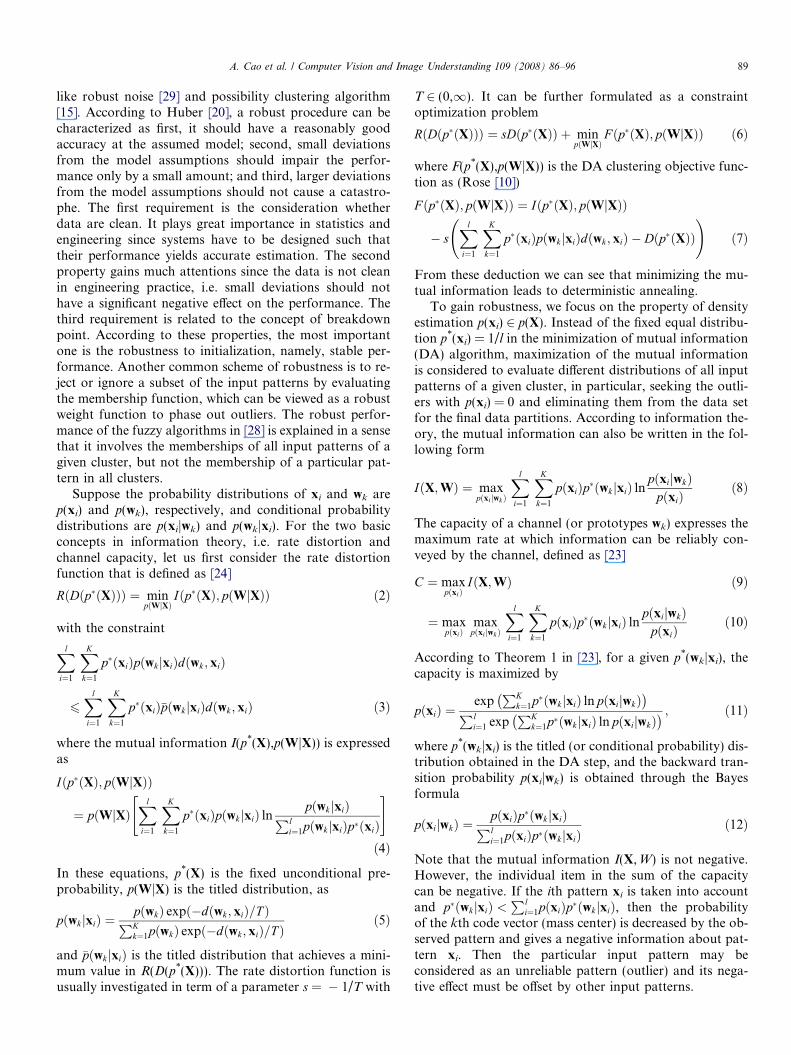
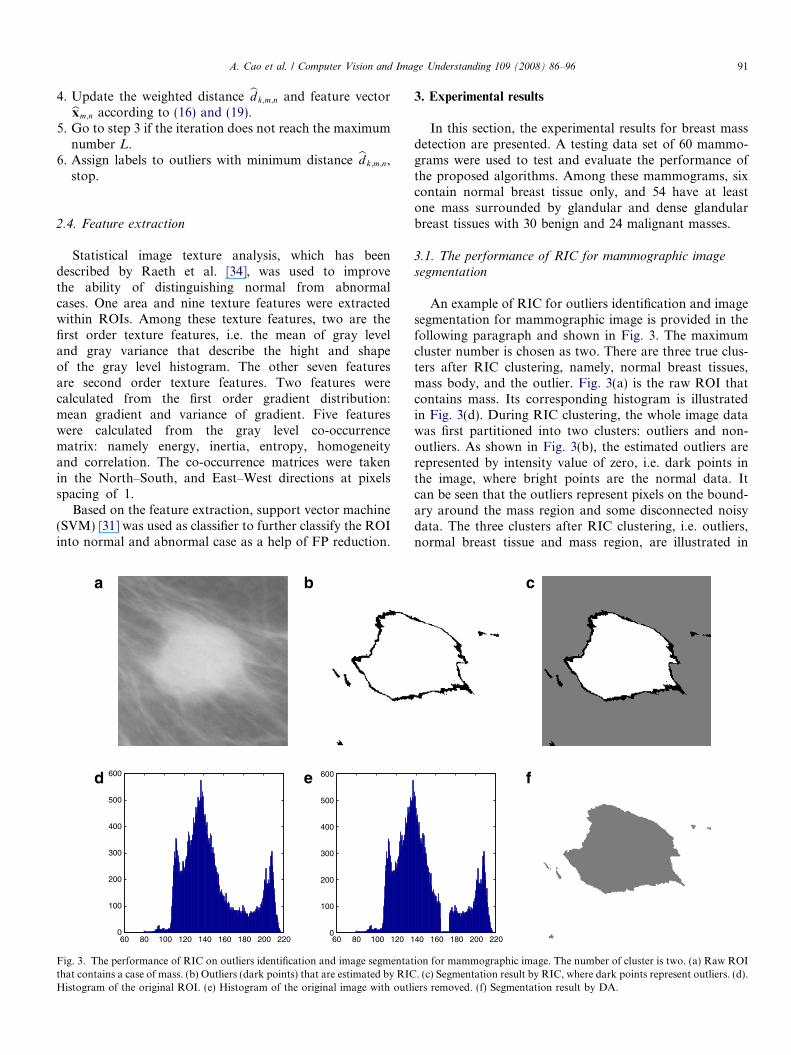
Fig. 3. The performance of RIC on outliers identification and image segmentatthat contains a case of mass. (b) Outliers (dark points) that are estimated by RICHistogram of the original ROI. (e) Histogram of the original image with outl
3. Experimental results
In this section, the experimental results for breast massdetection are presented. A testing data set of 60 mammo-grams were used to test and evaluate the performance ofthe proposed algorithms. Among these mammograms, sixcontain normal breast tissue only, and 54 have at leastone mass surrounded by glandular and dense glandularbreast tissues with 30 benign and 24 malignant masses.
3.1. The performance of RIC for mammographic image
segmentation
An example of RIC for outliers identification and imagesegmentation for mammographic image is provided in thefollowing paragraph and shown in Fig. 3. The maximumcluster number is chosen as two. There are three true clus-ters after RIC clustering, namely, normal breast tissues,mass body, and the outlier. Fig. 3(a) is the raw ROI thatcontains mass. Its corresponding histogram is illustratedin Fig. 3(d). During RIC clustering, the whole image datawas first partitioned into two clusters: outliers and non-outliers. As shown in Fig. 3(b), the estimated outliers arerepresented by intensity value of zero, i.e. dark points inthe image, where bright points are the normal data. Itcan be seen that the outliers represent pixels on the bound-ary around the mass region and some disconnected noisydata. The three clusters after RIC clustering, i.e. outliers,normal breast tissue and mass region, are illustrated in
40 160 180 200 220
c
f
ion for mammographic image. The number of cluster is two. (a) Raw ROI. (c) Segmentation result by RIC, where dark points represent outliers. (d).
iers removed. (f) Segmentation result by DA.

92 A. Cao et al. / Computer Vision and Image Understanding 109 (2008) 86–96
Fig. 3(c). The outlier-free image data were partitioned intotwo clusters, each of which has distinctive intensity. Thehistogram of the original image with outliers removed byRIC algorithm is illustrated in Fig. 3(e). Fig. 3(f) showsthe segmentation result by DA.
Fig. 3(e) demonstrates that a portion of gray levels in theproximity of the valley between the two peeks in histogramare identified automatically by RIC, rather than the one bythe standard clustering method. Because of the estimationof outliers, the suspicious cluster that contains mass hasless number of subregions than that obtained by standardDA. As a result, it reduced the complexity of further anal-ysis. Certain criteria is necessary to relocated the identifiedoutliers into the two clusters optimally.
Fig. 4. Segmentation results comparison. Pixels in the same cluster representedresults in first column, four for the second column, three for the third and fourtFCM. (c) Segmentation results by DA. (d) Segmentation results by PCM. (e)
3.2. Segmentation result for outlier partitions by
incorporating spatial information
We further partitioned the estimated outliers into differ-ent clusters incorporating the spatial information. For thepurpose of comparison, the mammograms were segmentednot only by the proposed spatial RIC algorithm, they werealso segmented by fuzzy c-means (FCM), DA, and one ofthe most popular robust clustering algorithms, named pos-ssibilistic c-means (PCM) clustering algorithm [29] as illus-trated in Fig. 4. The raw ROIs are shown in the rowFig. 4(a) that contain mass. The segmentation results aregiven in row Fig. 4(b)–(e), respectively. Pixels in the samecluster are represented by the same intensity value. The
by the same intensity. The number of cluster is two for the segmentationh columns. (a) The raw ROI in mammograms. (b) Segmentation results bySegmentation results by RIC incorporating spatial information.

A. Cao et al. / Computer Vision and Image Understanding 109 (2008) 86–96 93
same location in ROI may be represented by different inten-sities for different segmentation since the labels are assignedrandomly at the end of clustering. It can be seen that the seg-mentation results by RIC incorporating with spatial infor-mation are able to find optimal boundary of mass with lessnoisy regions compared with FCM, DA and PCM methods.
3.3. FP reduction
FP reduction was performed during the two steps of seg-mentation, i.e. adaptive thresholding and RIC. Since somesubregions were segmented together with ROIs and masses,which may lead further analysis more complex. Thus, fol-lowing each step of segmentation, region growing was per-formed for each subregion that belongs to the suspiciousgroup, and the area of each subregion was calculated. Inthe first step of adaptive thresholding, the object with thelargest area was selected as breast region since it occupiesthe major structure in the mammogram. The raw ROIwas extracted within the segmented breast structure, inwhich two main regions that may contain mass have highintensity: the pectoral muscle and the glandular breast tis-sues. The pectoral muscle represents a predominant densityregion in most mammograms with medio-lateral oblique(MLO) views. The segmentation results will be affected orbiased if it is included in ROI for intensity-based imageprocessing methods. Ferrari et al. [25] proposed a newmethod for the identification of the pectoral muscle basedupon a multi-resolution technique using Gabor wavelets.
Table 1The detection results of the number of suspicious regions per image for RIC,
Mammogram RIC DA FCM PCM
mdb001 1 5 5 1mdb002 1 1 1 1mdb013 7 7 7 8mdb015 8 12 12 6mdb017 3 4 4 4mdb019 7 6 11 7mdb021 7 8 7 3mdb023 4 8 7 5mdb030 10 15 14 10mdb032 10 17 10 7mdb058 4 7 7 5mdb063 2 3 2 6mdb072 2 2 2 3mdb081 1 1 1 1mdb083 9 6 10 10mdb090 5 5 6 0mdb099 14 9 10 8mdb102 3 3 3 8mdb104 5 5 4 3mdb105 4 3 4 1mdb107 6 7 7 5mdb110 3 3 3 3mdb111 2 3 3 2mdb115 1 1 2 1mdb163 2 5 5 2mdb193 2 8 7 5mdb124 2 3 2 3
In this study, the pectoral muscle was identified as the larg-est object among the first ten subregions with area largerthan 200 pixels according to the searching method. RawROI was thus formulated based on the pectoral muscleand noisy points removal.
After the segmentation by RIC incorporating spatialinformation, all the pixels in ROI were grouped into K
clusters. The mean intensity of each cluster is different,where the mean intensity of the cluster that contain masshas the highest value (according to assumption), which iscalled suspicious cluster. There were some subregions orisolated points in the suspicious cluster. The final abnormalcases were identified by SVM classifier based on both areaand texture features extracted from the ROIs in the suspi-cious cluster, where radius based function(RBF) was usedas the kernel function.
4. Detection results
The purpose of final FP reduction is to increase the detec-tion rate. For the complicated diagnosis system, it is able todecrease the computational complexity and allows morecomputationally intensive classifiers to be applied to as fewobjects as possible. In this step, one area and nine texture fea-tures were extracted from each suspicious ROI in the selectedcluster, and SVM was applied as the classifier to classify thethese ROIs into normal and abnormal cases. Correspondingto the target of mammography screening, the purpose of thisstudy is to locate the suspicious areas that may contain mass,
DA, FCM and PCM based on the same raw ROI
Mammogram RIC DA FCM PCM
mdb117 3 3 3 3mdb120 2 3 4 1mdb121 2 1 2 2mdb127 4 7 7 18mdb145 3 5 4 8mdb165 1 1 1 1mdb170 2 2 3 2mdb171 1 2 2 1mdb175 1 2 1 6mdb178 1 2 2 3mdb179 1 2 1 1mdb181 1 1 1 1mdb186 1 4 4 1mdb188 2 1 1 1mdb190 1 1 1 1mdb191 3 5 6 0mdb198 2 5 5 7mdb199 7 5 6 7mdb202 1 7 7 7mdb207 1 1 1 1mdb244 4 5 5 2mdb264 1 1 1 1mdb265 3 4 3 5mdb315 1 1 1 1mdb270 9 8 9 6mdb290 1 1 1 1mdb125 4 4 4 5

94 A. Cao et al. / Computer Vision and Image Understanding 109 (2008) 86–96
therefore, the detection results are evaluated by terms of sen-sitivity and the number of false positives per image.
For the comparison of the detection results, standardclustering methods of FCM and DA, as well as one ofthe most popular robust clustering algorithms PCM, werealso implemented based on the same detection system asspatial RIC, i.e. the image segmentation by spatial RIC,DA, FCM and PCM were based on the same ROIs. By reg-ulating the cluster number in image segmentation, theparameters of threshold and classifier in the step of rawROI selection and abnormal case classification, differentdetection results were obtained. In the experiments, thenumbers of cluster for RIC and PCM were regulated fromtwo to three, and the numbers of cluster for DA and FCMwere from two to six. The detection results for mammo-grams with mass are illustrated in Table 1.
Fig. 5. FROC analysis for the detection systems based on RIC incorpo-rating spatial information, DA, FCM and PCM.
Fig. 6. Detection results for mdb181. (a) Original image. The circled region con
Among the 54 mammograms, thirty masses are embed-ded in glandular breast tissues, and twenty-four masses arewithin dense glandular breast tissues. The proposed detec-tion system incorporating RIC algorithm obtains a sensi-tivity of 90.7% at the false positive of 2.57 per image.The detection result of the detection system incorporatingwith DA is 3.56 FPs per image and 3.59 FPs per imagefor the incorporation of FCM. When incorporation ofPCM, the detection result is 3.91.
Fig. 5 is the free-response ROC (FROC). From this fig-ure, we can see that at the same TP fraction, the number ofFPs by RIC is less than that of DA, FCM and PCM. WhenFP is under 3.5, the performance of RIC and PCM are bet-ter than DA and FCM, i.e. at the same number of FPs perimage, the TP fraction by RIC and PCM are higher thanthat being produced by DA and FCM, where RIC outper-formed PCM. When the number of false positives is largerthan certain value, as 3.9 in this study, the TP fraction ofthese four methods are the same.
Because of the estimation of outliers, RIC can segmentmass body from its background even when it is embeddedin the dense glandular breast tissue with relatively lessnumber of FPs compared with DA, FCM and PCM meth-ods, i.e. RIC has robust capacity in data splitting and esti-mating the noisy points. In addition, due to theincorporation of spatial information, the detected resultsare of benefit for the further mass pattern analysis(i.e.benign or malignant), which is beyond the focus of thispaper and can be discussed in further study. We alsoobserved that the segmented mass region by DA andFCM includes large area of background breast tissueswhich leads to the number of FPs relatively less in someimages. Based on the experimental analysis we can see thatthe detection system incorporating spatial RIC works moreeffective in false positive reduction than the systems basedon DA, FCM and PCM.
tains mass. (b) Detection result of RIC incorporating spatial information.
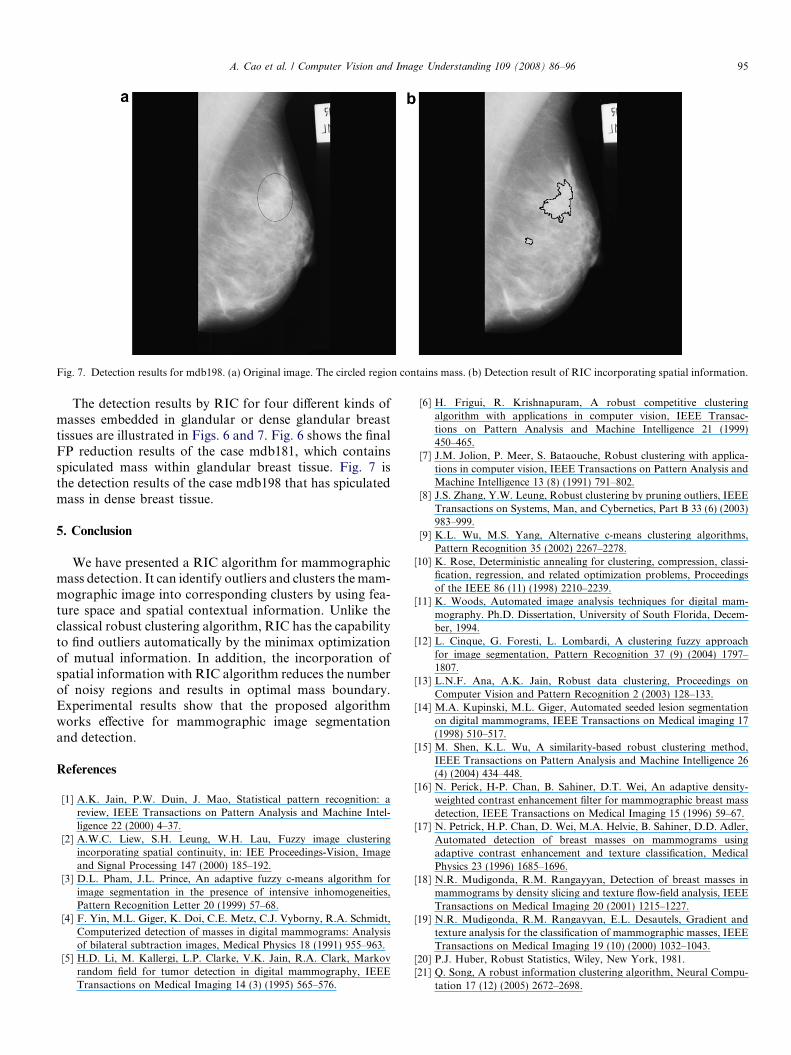
Fig. 7. Detection results for mdb198. (a) Original image. The circled region contains mass. (b) Detection result of RIC incorporating spatial information.
A. Cao et al. / Computer Vision and Image Understanding 109 (2008) 86–96 95
The detection results by RIC for four different kinds ofmasses embedded in glandular or dense glandular breasttissues are illustrated in Figs. 6 and 7. Fig. 6 shows the finalFP reduction results of the case mdb181, which containsspiculated mass within glandular breast tissue. Fig. 7 isthe detection results of the case mdb198 that has spiculatedmass in dense breast tissue.
5. Conclusion
We have presented a RIC algorithm for mammographicmass detection. It can identify outliers and clusters the mam-mographic image into corresponding clusters by using fea-ture space and spatial contextual information. Unlike theclassical robust clustering algorithm, RIC has the capabilityto find outliers automatically by the minimax optimizationof mutual information. In addition, the incorporation ofspatial information with RIC algorithm reduces the numberof noisy regions and results in optimal mass boundary.Experimental results show that the proposed algorithmworks effective for mammographic image segmentationand detection.
References
[1] A.K. Jain, P.W. Duin, J. Mao, Statistical pattern recognition: areview, IEEE Transactions on Pattern Analysis and Machine Intel-ligence 22 (2000) 4–37.
[2] A.W.C. Liew, S.H. Leung, W.H. Lau, Fuzzy image clusteringincorporating spatial continuity, in: IEE Proceedings-Vision, Imageand Signal Processing 147 (2000) 185–192.
[3] D.L. Pham, J.L. Prince, An adaptive fuzzy c-means algorithm forimage segmentation in the presence of intensive inhomogeneities,Pattern Recognition Letter 20 (1999) 57–68.
[4] F. Yin, M.L. Giger, K. Doi, C.E. Metz, C.J. Vyborny, R.A. Schmidt,Computerized detection of masses in digital mammograms: Analysisof bilateral subtraction images, Medical Physics 18 (1991) 955–963.
[5] H.D. Li, M. Kallergi, L.P. Clarke, V.K. Jain, R.A. Clark, Markovrandom field for tumor detection in digital mammography, IEEETransactions on Medical Imaging 14 (3) (1995) 565–576.
[6] H. Frigui, R. Krishnapuram, A robust competitive clusteringalgorithm with applications in computer vision, IEEE Transac-tions on Pattern Analysis and Machine Intelligence 21 (1999)450–465.
[7] J.M. Jolion, P. Meer, S. Bataouche, Robust clustering with applica-tions in computer vision, IEEE Transactions on Pattern Analysis andMachine Intelligence 13 (8) (1991) 791–802.
[8] J.S. Zhang, Y.W. Leung, Robust clustering by pruning outliers, IEEETransactions on Systems, Man, and Cybernetics, Part B 33 (6) (2003)983–999.
[9] K.L. Wu, M.S. Yang, Alternative c-means clustering algorithms,Pattern Recognition 35 (2002) 2267–2278.
[10] K. Rose, Deterministic annealing for clustering, compression, classi-fication, regression, and related optimization problems, Proceedingsof the IEEE 86 (11) (1998) 2210–2239.
[11] K. Woods, Automated image analysis techniques for digital mam-mography. Ph.D. Dissertation, University of South Florida, Decem-ber, 1994.
[12] L. Cinque, G. Foresti, L. Lombardi, A clustering fuzzy approachfor image segmentation, Pattern Recognition 37 (9) (2004) 1797–1807.
[13] L.N.F. Ana, A.K. Jain, Robust data clustering, Proceedings onComputer Vision and Pattern Recognition 2 (2003) 128–133.
[14] M.A. Kupinski, M.L. Giger, Automated seeded lesion segmentationon digital mammograms, IEEE Transactions on Medical imaging 17(1998) 510–517.
[15] M. Shen, K.L. Wu, A similarity-based robust clustering method,IEEE Transactions on Pattern Analysis and Machine Intelligence 26(4) (2004) 434–448.
[16] N. Perick, H-P. Chan, B. Sahiner, D.T. Wei, An adaptive density-weighted contrast enhancement filter for mammographic breast massdetection, IEEE Transactions on Medical Imaging 15 (1996) 59–67.
[17] N. Petrick, H.P. Chan, D. Wei, M.A. Helvie, B. Sahiner, D.D. Adler,Automated detection of breast masses on mammograms usingadaptive contrast enhancement and texture classification, MedicalPhysics 23 (1996) 1685–1696.
[18] N.R. Mudigonda, R.M. Rangayyan, Detection of breast masses inmammograms by density slicing and texture flow-field analysis, IEEETransactions on Medical Imaging 20 (2001) 1215–1227.
[19] N.R. Mudigonda, R.M. Rangayyan, E.L. Desautels, Gradient andtexture analysis for the classification of mammographic masses, IEEETransactions on Medical Imaging 19 (10) (2000) 1032–1043.
[20] P.J. Huber, Robust Statistics, Wiley, New York, 1981.[21] Q. Song, A robust information clustering algorithm, Neural Compu-
tation 17 (12) (2005) 2672–2698.
96 A. Cao et al. / Computer Vision and Image Understanding 109 (2008) 86–96
[22] Q. Song, W.J. Hu, W.F. Xie, Robust support vector machine forbullet hole image classification, IEEE Transactions on Systems, Manand Cybernetics, Part C 32 (2002) 440–448.
[23] R.E. Blahut, Computation of channel capacity and rate-distortionfunctions, IEEE Transactions on Information Theory IT-18 (4)(1972) 460–473.
[24] R.E. Blahut, Principle and Practice of Information Theory, Addison-Wesley, 1988.
[25] R.J. Ferrari, R.M. Rangayyan, J.E.L. Desautels, R.A. Borges, F.Frere, Automatic identification of the pectoral muscle in mammo-grams, IEEE Transactions on Medical Imaging 23 (2) (2004) 232–245.
[26] R.J. Hathaway, J.C. Bezdek, Fuzzy c-means clustering of incompletedata, IEEE Transactions on Systems, Man, and Cybernetics Part B 31(2001) 735–744.
[27] R. Krishnapuram, J.M. Keller, A possibilistic approach to clustering,IEEE Transactions on Fuzzy Systems 1 (2) (1993) 98–110.
[28] R.N. Dave, Robust fuzzy clustering algorithms, in: Second IEEEInternational Conference on Fuzzy Systems, vol. 2, 1993, pp. 1281–1286.
[29] R.N. Dave, R. Krishnapuram, Robust clustering methods: a unitiedview, IEEE Transactions on Fuzzy Systems 5 (1997) 270–293.
[30] R. Zwiggelaar, T.C. Parr, J.E. Schumm, I.W. Hutt, C.J. Taylor, S.M.Astley, C.R.M. Boggis, Model-based detection of spiculated lesions inmammograms, Medical Image Analysis 3 (1998) 1–23.
[31] V.N. Vapnik, Statistical Learning Theory, Wiley, New York,1998.
[32] X.Q. Shen, M. Spann, P. Nacken, Segmentation of 2d and 3d imagesthrough a hierarchical clustering based on region modelling, PatternRecognition 31 (9) (1998) 1295–1309.
[33] Z. Huo, M.L. Giger, C.J. Vyborny, C.E. Metz, Effectiveness of cad inthe diagnosis of breast cancer: an observer study on an independentdatabase of mammograms, Radiology 224 (2002) 560–568.
[34] U. Raeth, D. Schlaps, B. Limberg, I. Zuna, A. Lorenz, G.V. Kaick,W.J. Lorenz, B. Kommerell, Diagnostic accuracy of computerized B-scan texture analysis and conventional ultrasonography in diffuseparenchymal and malignant liver disease, Journal Clinical Ultrasound13 (1985) 87–99.
Copyright © 2022 FDOKUMEN