Genome-wide detection and characterization of positive selection in human populations
11
JOURNAL OF VIROLOGY, Oct. 2010, p. 10852–10862 Vol. 84, No. 20 0022-538X/10/$12.00 doi:10.1128/JVI.00106-10 Copyright © 2010, American Society for Microbiology. All Rights Reserved. Genome-Wide Detection and Characterization of Endogenous Retroviruses in Bos taurus Koldo Garcia-Etxebarria and Begon ˜a Marina Jugo* Genetika, Antropologia Fisikoa eta Animalien Fisiologia Saila, Zientzia eta Teknologia Fakultatea, Euskal Herriko Unibertsitatea, 644 Postakutxa, E-48080 Bilbao, Spain Received 16 January 2010/Accepted 21 July 2010 Endogenous retroviruses (ERVs) are the proviral phase of exogenous retroviruses that become integrated into a host germ line. They can play an important role in the host genome. Bioinformatic tools have been used to detect ERVs in several vertebrates, primarily primates and rodents. Less information is available regarding ERVs in other mammalian groups, and the source of this information is basically experimental. We analyzed the genome of the cow (Bos taurus) using three different methods. A BLAST-based method detected 928 possible ERVs, LTR_STRUC detected 4,487 elements flanked by long terminal repeats (LTRs), and Retrotector detected 9,698 ERVs. The ERVs were not homogeneously distributed across chromosomes; the number of ERVs was positively correlated with chromosomal size and negatively correlated with chromosomal GC content. The bovine ERVs (BoERVs) were classified into 24 putative families, with 20 of them not previously described. One of these new families, BoERV1, was the most abundant family and appeared to be specific to ruminants. An analysis of representatives of ERV families from rodents, primates, and ruminants showed a phylogenetic relationship following their hosts’ relationships. This study demonstrates the importance of using multiple methods when trying to identify new ERVs and shows that the number of bovine ERV families is not as limited as previously thought. Endogenous retroviruses (ERVs) are the proviral phase of exogenous retroviruses that were once inserted into a host germ line and have remained integrated into the host genome for generations. ERVs have been detected in all mammals and a wide range of other vertebrates. Their typical structure is composed of a central part with the three major genes (gag, pol, and env) flanked by two long terminal repeats (LTRs) that were identical when the retrovirus entered the host germ line (4). The biological significance of retrotransposons, including ERVs, ranges from their contributions to mutation, develop- ment, and disease to their roles in gene and genome evolution. In humans, mice, and sheep, for example, an env gene of retroviral origin, acquired independently in the different spe- cies, is involved in placenta morphogenesis (11). It has been suggested that ERVs could be possible contributors to or markers of disease in experimental animals and, in recent years, in human diseases, although their role as the etiological agent remains to be established (11). The expression of ERVs in humans has been linked to poor prognosis in breast cancer (9) and the malignant transformation of melanoma cells (36) and may play a role in multiple sclerosis (28). In addition, ERV-mediated recombination events have had profound ef- fects on shaping hosts’ genomes, and new ERV integrations introduce added variation to the host transcriptomes (11). At present, there is no well-established or accepted standard for naming and classifying ERVs. For human ERVs (HERVs), tRNA complementary to the primer binding site (PBS) has traditionally been used for this purpose. This classification, however, is inaccurate, as proviruses from the same phyloge- netic groups may display differences in the PBS, while other- wise unrelated proviruses may use the same tRNA as a primer. A more useful strategy for classifying ERVs is phylogenetic and related comparisons (11). ERVs are now sorted into three classes depending on the phylogenetic relationship with the exogenous retrovirus genus: class I ERVs are related to the genera Gammaretrovirus and Epsilonretrovirus; class II ERVs are related to the genera Alpharetrovirus, Betaretrovirus, Delta- retrovirus, and Lentivirus; and class III ERVs are related to the genus Spumavirus (8). The availability of whole-genome sequences has made pos- sible genome-wide analyses for the detection of ERVs using bioinformatic tools. In the last years RepeatMasker (A. F. A. Smit, R. Hubley, and P. Green, personal communication), a program designed to identify repetitive sequences using the Repbase database (13), has been widely used to generate an overview of repetitive elements in whole-genome sequences, among them the ERVs. For mammals, other programs have also been used in order to identify ERVs. BLAST-based searches were first used for humans (40, 41) and rodents (2). A program called LTR_STRUC (22) was applied to the chim- panzee genome in combination with a BLAST-based search (29). A new program specifically designed for ERV detection, called Retrotector, has recently been reported (38). The mammalian order Cetartiodactyla has become a major focus of attention in comparative genomics because it com- prises a phylogenetically distant clade of eutherian mammals related to primates, which diverged from a common ancestor 85 million years ago (18). Bos taurus is one of the world’s most important food animal species and is also among the * Corresponding author. Mailing address: Genetika, Antropologia Fisikoa eta Animalien Fisiologia Saila, Zientzia eta Teknologia Fakul- tatea, Euskal Herriko Unibertsitatea, 644 Postakutxa, E-48080 Bilbao, Spain. Phone: 34 94 6015518. Fax: 34 94 6013145. E-mail: begonamarina [email protected]. Published ahead of print on 4 August 2010. 10852
-
Upload
independent -
Category
Documents
-
view
3 -
download
0
Transcript of Genome-wide detection and characterization of positive selection in human populations

JOURNAL OF VIROLOGY, Oct. 2010, p. 10852–10862 Vol. 84, No. 200022-538X/10/$12.00 doi:10.1128/JVI.00106-10Copyright © 2010, American Society for Microbiology. All Rights Reserved.
Genome-Wide Detection and Characterization ofEndogenous Retroviruses in Bos taurus�
Koldo Garcia-Etxebarria and Begona Marina Jugo*Genetika, Antropologia Fisikoa eta Animalien Fisiologia Saila, Zientzia eta Teknologia Fakultatea,
Euskal Herriko Unibertsitatea, 644 Postakutxa, E-48080 Bilbao, Spain
Received 16 January 2010/Accepted 21 July 2010
Endogenous retroviruses (ERVs) are the proviral phase of exogenous retroviruses that become integratedinto a host germ line. They can play an important role in the host genome. Bioinformatic tools have been usedto detect ERVs in several vertebrates, primarily primates and rodents. Less information is available regardingERVs in other mammalian groups, and the source of this information is basically experimental. We analyzedthe genome of the cow (Bos taurus) using three different methods. A BLAST-based method detected 928 possibleERVs, LTR_STRUC detected 4,487 elements flanked by long terminal repeats (LTRs), and Retrotectordetected 9,698 ERVs. The ERVs were not homogeneously distributed across chromosomes; the number of ERVswas positively correlated with chromosomal size and negatively correlated with chromosomal GC content. Thebovine ERVs (BoERVs) were classified into 24 putative families, with 20 of them not previously described. Oneof these new families, BoERV1, was the most abundant family and appeared to be specific to ruminants. Ananalysis of representatives of ERV families from rodents, primates, and ruminants showed a phylogeneticrelationship following their hosts’ relationships. This study demonstrates the importance of using multiplemethods when trying to identify new ERVs and shows that the number of bovine ERV families is not as limitedas previously thought.
Endogenous retroviruses (ERVs) are the proviral phase ofexogenous retroviruses that were once inserted into a hostgerm line and have remained integrated into the host genomefor generations. ERVs have been detected in all mammals anda wide range of other vertebrates. Their typical structure iscomposed of a central part with the three major genes (gag,pol, and env) flanked by two long terminal repeats (LTRs)that were identical when the retrovirus entered the hostgerm line (4).
The biological significance of retrotransposons, includingERVs, ranges from their contributions to mutation, develop-ment, and disease to their roles in gene and genome evolution.In humans, mice, and sheep, for example, an env gene ofretroviral origin, acquired independently in the different spe-cies, is involved in placenta morphogenesis (11). It has beensuggested that ERVs could be possible contributors to ormarkers of disease in experimental animals and, in recentyears, in human diseases, although their role as the etiologicalagent remains to be established (11). The expression of ERVsin humans has been linked to poor prognosis in breast cancer(9) and the malignant transformation of melanoma cells (36)and may play a role in multiple sclerosis (28). In addition,ERV-mediated recombination events have had profound ef-fects on shaping hosts’ genomes, and new ERV integrationsintroduce added variation to the host transcriptomes (11).
At present, there is no well-established or accepted standardfor naming and classifying ERVs. For human ERVs (HERVs),
tRNA complementary to the primer binding site (PBS) hastraditionally been used for this purpose. This classification,however, is inaccurate, as proviruses from the same phyloge-netic groups may display differences in the PBS, while other-wise unrelated proviruses may use the same tRNA as a primer.A more useful strategy for classifying ERVs is phylogeneticand related comparisons (11). ERVs are now sorted into threeclasses depending on the phylogenetic relationship with theexogenous retrovirus genus: class I ERVs are related to thegenera Gammaretrovirus and Epsilonretrovirus; class II ERVsare related to the genera Alpharetrovirus, Betaretrovirus, Delta-retrovirus, and Lentivirus; and class III ERVs are related to thegenus Spumavirus (8).
The availability of whole-genome sequences has made pos-sible genome-wide analyses for the detection of ERVs usingbioinformatic tools. In the last years RepeatMasker (A. F. A.Smit, R. Hubley, and P. Green, personal communication), aprogram designed to identify repetitive sequences using theRepbase database (13), has been widely used to generate anoverview of repetitive elements in whole-genome sequences,among them the ERVs. For mammals, other programs havealso been used in order to identify ERVs. BLAST-basedsearches were first used for humans (40, 41) and rodents (2). Aprogram called LTR_STRUC (22) was applied to the chim-panzee genome in combination with a BLAST-based search(29). A new program specifically designed for ERV detection,called Retrotector, has recently been reported (38).
The mammalian order Cetartiodactyla has become a majorfocus of attention in comparative genomics because it com-prises a phylogenetically distant clade of eutherian mammalsrelated to primates, which diverged from a common ancestor�85 million years ago (18). Bos taurus is one of the world’smost important food animal species and is also among the
* Corresponding author. Mailing address: Genetika, AntropologiaFisikoa eta Animalien Fisiologia Saila, Zientzia eta Teknologia Fakul-tatea, Euskal Herriko Unibertsitatea, 644 Postakutxa, E-48080 Bilbao,Spain. Phone: 34 94 6015518. Fax: 34 94 6013145. E-mail: [email protected].
� Published ahead of print on 4 August 2010.
10852
most biologically interesting due to the unique physiology of itsdigestive, reproductive, and immune systems. The unveiling ofthe cattle genome sequence in 2009 allowed the first compre-hensive effort to catalogue the diversity of transposable ele-ments in the cattle genome (5). Interspersed repeats cover46.54% of the genome. Among these, non-LTR retrotranspo-son LINEs account for 23.29% of the genome, and SINEsaccount for 17.66% of it. LTR retrotransposons, which includeERVs, account for 3.20% of the genome (5).
The cattle genome has also been analyzed experimentally forERV elements. A PCR-based approach (43) detected a num-ber of bovine ERVs (BERVs [here BoERVs]), which wereclassified into four families, named �3, �4, �7, and �9, on thebasis of their similarity to ovine ERVs (OERVs). The struc-tures and sequences of BERV-�3 and the abundant BERV-�4elements were also analyzed. Those studies suggested that theexpansion of the ERV family was more limited in cows than itwas in other artiodactyls such as pigs and sheep (42–44).
To detect ERVs in the cow genome, we used three differentmethods: BLAST-based searches using retroviral sequences,the LTR_STRUC program, and the Retrotector program.ERVs that were detected by at least two of the methods andwhose reverse transcriptase (RT) region was longer than 500nucleotides were used to define bovine ERV families. Finally,representatives from each bovine ERV family and from ERVfamilies from other species were used to study the relationshipbetween the ERVs of different species.
MATERIALS AND METHODS
Genomic sequence. We analyzed the Btau_3.1 version of a Hereford cow (Bostaurus) genome (�7.1 coverage). It was retrieved from the Baylor College ofMedicine (http://www.hgsc.bcm.tmc.edu/projects/bovine/index.html).
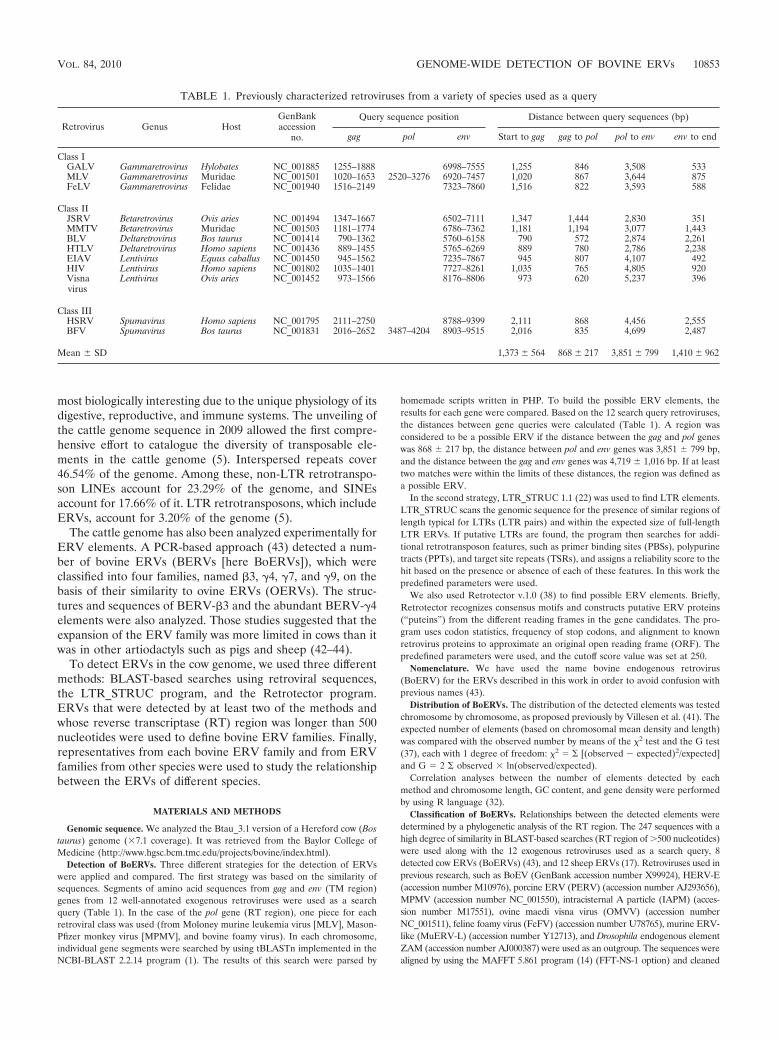
Detection of BoERVs. Three different strategies for the detection of ERVswere applied and compared. The first strategy was based on the similarity ofsequences. Segments of amino acid sequences from gag and env (TM region)genes from 12 well-annotated exogenous retroviruses were used as a searchquery (Table 1). In the case of the pol gene (RT region), one piece for eachretroviral class was used (from Moloney murine leukemia virus [MLV], Mason-Pfizer monkey virus [MPMV], and bovine foamy virus). In each chromosome,individual gene segments were searched by using tBLASTn implemented in theNCBI-BLAST 2.2.14 program (1). The results of this search were parsed by
homemade scripts written in PHP. To build the possible ERV elements, theresults for each gene were compared. Based on the 12 search query retroviruses,the distances between gene queries were calculated (Table 1). A region wasconsidered to be a possible ERV if the distance between the gag and pol geneswas 868 � 217 bp, the distance between pol and env genes was 3,851 � 799 bp,and the distance between the gag and env genes was 4,719 � 1,016 bp. If at leasttwo matches were within the limits of these distances, the region was defined asa possible ERV.
In the second strategy, LTR_STRUC 1.1 (22) was used to find LTR elements.LTR_STRUC scans the genomic sequence for the presence of similar regions oflength typical for LTRs (LTR pairs) and within the expected size of full-lengthLTR ERVs. If putative LTRs are found, the program then searches for addi-tional retrotransposon features, such as primer binding sites (PBSs), polypurinetracts (PPTs), and target site repeats (TSRs), and assigns a reliability score to thehit based on the presence or absence of each of these features. In this work thepredefined parameters were used.
We also used Retrotector v.1.0 (38) to find possible ERV elements. Briefly,Retrotector recognizes consensus motifs and constructs putative ERV proteins(“puteins”) from the different reading frames in the gene candidates. The pro-gram uses codon statistics, frequency of stop codons, and alignment to knownretrovirus proteins to approximate an original open reading frame (ORF). Thepredefined parameters were used, and the cutoff score value was set at 250.
Nomenclature. We have used the name bovine endogenous retrovirus(BoERV) for the ERVs described in this work in order to avoid confusion withprevious names (43).
Distribution of BoERVs. The distribution of the detected elements was testedchromosome by chromosome, as proposed previously by Villesen et al. (41). Theexpected number of elements (based on chromosomal mean density and length)was compared with the observed number by means of the �2 test and the G test(37), each with 1 degree of freedom: �2 � � [(observed expected)2/expected]and G � 2 � observed � ln(observed/expected).
Correlation analyses between the number of elements detected by eachmethod and chromosome length, GC content, and gene density were performedby using R language (32).
Classification of BoERVs. Relationships between the detected elements weredetermined by a phylogenetic analysis of the RT region. The 247 sequences with ahigh degree of similarity in BLAST-based searches (RT region of 500 nucleotides)were used along with the 12 exogenous retroviruses used as a search query, 8detected cow ERVs (BoERVs) (43), and 12 sheep ERVs (17). Retroviruses used inprevious research, such as BoEV (GenBank accession number X99924), HERV-E(accession number M10976), porcine ERV (PERV) (accession number AJ293656),MPMV (accession number NC_001550), intracisternal A particle (IAPM) (acces-sion number M17551), ovine maedi visna virus (OMVV) (accession numberNC_001511), feline foamy virus (FeFV) (accession number U78765), murine ERV-like (MuERV-L) (accession number Y12713), and Drosophila endogenous elementZAM (accession number AJ000387) were used as an outgroup. The sequences werealigned by using the MAFFT 5.861 program (14) (FFT-NS-1 option) and cleaned
TABLE 1. Previously characterized retroviruses from a variety of species used as a query
Retrovirus Genus HostGenBankaccession
no.
Query sequence position Distance between query sequences (bp)
gag pol env Start to gag gag to pol pol to env env to end
Class IGALV Gammaretrovirus Hylobates NC_001885 1255–1888 6998–7555 1,255 846 3,508 533MLV Gammaretrovirus Muridae NC_001501 1020–1653 2520–3276 6920–7457 1,020 867 3,644 875FeLV Gammaretrovirus Felidae NC_001940 1516–2149 7323–7860 1,516 822 3,593 588
Class IIJSRV Betaretrovirus Ovis aries NC_001494 1347–1667 6502–7111 1,347 1,444 2,830 351MMTV Betaretrovirus Muridae NC_001503 1181–1774 6786–7362 1,181 1,194 3,077 1,443BLV Deltaretrovirus Bos taurus NC_001414 790–1362 5760–6158 790 572 2,874 2,261HTLV Deltaretrovirus Homo sapiens NC_001436 889–1455 5765–6269 889 780 2,786 2,238EIAV Lentivirus Equus caballus NC_001450 945–1562 7235–7867 945 807 4,107 492HIV Lentivirus Homo sapiens NC_001802 1035–1401 7727–8261 1,035 765 4,805 920Visnavirus
Lentivirus Ovis aries NC_001452 973–1566 8176–8806 973 620 5,237 396
Class IIIHSRV Spumavirus Homo sapiens NC_001795 2111–2750 8788–9399 2,111 868 4,456 2,555BFV Spumavirus Bos taurus NC_001831 2016–2652 3487–4204 8903–9515 2,016 835 4,699 2,487
Mean � SD 1,373 � 564 868 � 217 3,851 � 799 1,410 � 962
VOL. 84, 2010 GENOME-WIDE DETECTION OF BOVINE ERVs 10853
with Gblocks 0.91 (6) (minimum length of block of 5, allowed gap position with half,minimum number of sequences for a flank position of 146, and maximum number ofcontiguous nonconserved positions of 10). Phylogenetic trees were built by usingthree different methods. One was the neighbor-joining (NJ) method implemented inMEGA 3.1 (19). It relies on p distance using the pairwise deletion option and 1,000bootstrap replicates. A second method was the maximum likelihood (ML) methodimplemented in Phyml 2.4.4 (10). The model used in the analysis was the GTR�Gmodel (� � 2.71), as estimated by Modeltest 3.7 (31) with 1,000 bootstrap replicates.The third method was the Bayesian inference method implemented in MrBayes 3.1(35). Four default-setting Metropolis-coupled Markov chain Monte Carlo methodswere performed in two runs for 106 generations with trees sampled every 100generations. The analysis was set to use the GTR�I�G model. The first 2,500 treeswere discarded in the burn-in, and a 50% majority-rule consensus tree was computedfrom the remaining trees.
The bovine ERV putative families that we detected were defined based on thesupport of phylogenetic trees. A cluster was considered a putative family whenthe clustering was significant in at least two of the phylogenetic methods (boot-strap values of 70 for neighbor joining and maximum likelihood and Bayesianposterior probability of 95 for Bayesian inference). In order to confirm thefamilies with a solitary member, MegaBlast (45) searches were carried out byusing the solitary sequences as a query.
To elucidate the insertion time of elements classified into families, we used thedivergence of LTRs estimated by LTR_STRUC and Retrotector. The dates ofERV insertion can be estimated mainly by the LTR comparison and the indi-vidual divergence relative to a consensus sequence. However, there are manydifficulties in obtaining an accurate consensus sequence, especially for shortinsertions, so, as was done by many other authors, the LTR comparison waschosen for estimates of insertion dates. These divergence figures were thencorrected to account for the presence of multiple mutations at the same site, backmutations, and convergent substitutions by using the Kimura two-parametermodel (16). Nine elements with highly divergent LTRs were not included in thisanalysis. The insertion time of each element was estimated by applying a sub-stitution rate of 2.3 � 109 to 5.0 � 109 to the divergence (12).
The representative members of a BoERV family were chosen as the closestelement to the consensus sequence of the family or, when consensus was notpossible, to the element with fewer stop codons. To build the consensus se-quence, the amino acid sequences of the members of each family were aligned byusing ClustalW (39), and consensus was determined by using the cons programof the EMBOSS suite (33). The distances between individual sequences and theconsensus were calculated by using MEGA 3.1 (number of differences andpairwise deletion options).
PCR amplification of BoERV1 family elements in sheep. In order to amplifyBoERV1 in sheep, PCR was performed with the primers 5 -TGTGCTGAGACAGAGGAAGC-3 (forward) and 5 -CCTATGGCCCTAGTCCCTTC-3 (re-verse) in six samples of Latxa breed sheep. PCR conditions consisted of 5 min at94°C followed by 25 cycles of a 55°C annealing step for 30 s, polymerization at72°C for 30 s, denaturation at 94°C for 30 s, and one final cycle at 72°C for 7 min.Reaction conditions were as follows: 13.1 �l of water, 2 �l of buffer, 0.8 �l ofMgCl2, 0.3 �l of deoxynucleoside triphosphate (dNTP), 0.3 �l of each primer, 0.2�l of Taq, and 3 �l of DNA.
Interspecies comparison. The relationships of the BoERV groups with otherspecies’ ERV groups were analyzed by using a phylogenetic tree. We used 16representative sequences from human ERV families (40), 38 from chimpanzees(29), 27 from mice (2, 23), 7 from rats (2), 14 from sheep (17), 8 from pigs (27),and 24 from cows (our data). The sequences were aligned by using MAFFT (14)(linsi option). Positions with gaps in more than half of the sequences wereeliminated. The tree was constructed by Bayesian inference implemented inMrBayes 3.1 (35) (106 generations; RtREV matrix�G�I).
To estimate the insertion time of the human HERV-S71 element and thechimpanzee CERV3 element, we used the LTR divergence as described previ-ously by Johnson and Coffin (12). The LTRs of each element were aligned withClustalW, and the distance was calculated by using MEGA 3.1 (K2P substitutionmodel). The insertion time was estimated by applying a substitution rate of 2.3 �109 to 5.0 � 109 (12).
RESULTS
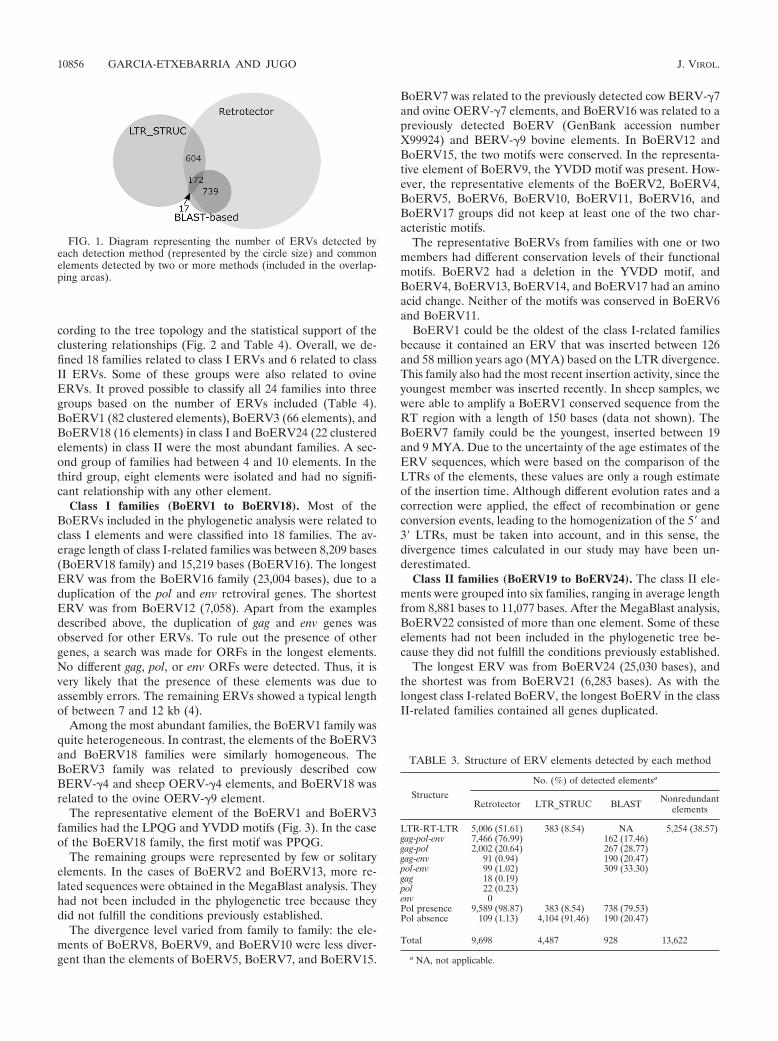
Detection and distribution of ERVs in the cow genome. Inthe cow genome, the BLAST-based search detected 928 ERVs,LTR_STRUC identified 4,487 elements flanked with LTRs,and Retrotector detected 9,698 possible ERVs (Table 2). Only
172 elements were detected by all three methods (Fig. 1). Atotal of 739 of the elements detected by the BLAST-basedsearch were also detected by Retrotector. Retrotector identi-fied 8,183 elements that were not detected by either theBLAST-based search or LTR_STRUC (Fig. 1). The elementsdetected by the three methods were those that were best pre-served from a structural standpoint; e.g., in 81% of the ele-ments detected, Retrotector detected motifs from the NC re-gion of the gag gene, and in 83% of the elements, it detectedmotifs from the RT region of the pol gene. However, theelements detected by a single program and LTR_STRUC andRetrotector together did not provide evidence for these motifsin most cases (35% and 54%, respectively).
The gene compositions of the detected elements also dif-fered from method to method (Table 3). The elements de-tected by Retrotector included the three major genes. Most ofthe BLAST-based search elements included two genes. Sur-prisingly, most of the elements detected by LTR_STRUC didnot include the pol gene. Based on the Retrotector results, 78regions encompassed either a gag or an env ORF longer than500 codons or a pol ORF longer than 700 codons (whichapproached the size of intact viral proteins).
The distribution of the BoERVs was not concordant acrossthe three methods (Table 2). In the BLAST-based search,significantly more elements were detected on chromosomes 18,28, and X than would be expected for a homogeneous distri-bution, while significantly fewer elements were detected onchromosomes 14 and 20. The number of elements thatLTR_STRUC detected in chromosomes 1, 2, and 3 was signif-icantly higher than would be expected for a homogeneousdistribution, while significantly fewer elements were detectedin chromosomes 17, 18, 19, and 22. Retrotector identified sig-nificantly more elements than expected in chromosomes 1, 2, 3,6, 9, and X and fewer elements than expected in chromosomes13, 18, 19, 22, 23, 24, and 25. In these analyses, the significancelevels were similar by the �2 and G tests. Using the G test, theoverall distribution of BoERVs in the entire genome was notsignificantly homogeneous for the three methods.
The number of ERVs detected was strongly and positivelycorrelated with the chromosome size by all three methods(Spearman’s � � 0.7677 and P � 0.001 by BLAST, � � 0.9720and P � 0.001 by LTR_STRUC, and � � 0.9735 and P � 0.001by Retrotector) and inversely correlated with the GC content(� � 0.4968 and P � 0.001 by BLAST, � � 0.7066 and P �0.001 by LTR_STRUC, and � � 0.6979 and P � 0.001 byRetrotector). No significant correlation was observed betweenthe number of ERVs detected and chromosomal gene density.
We conducted a chromosome-by-chromosome search forsolo LTRs based on Retrotector results (data not shown).Based on this analysis, the average rate of solo LTRs/ERVswas 6.06.
Classification of BoERVs. A phylogenetic tree based on thewell-conserved pol gene RT region of selected BoERVs (de-tected with at least two methods and having an RT region with500 nucleotides) with other endogenous and exogenous ret-roviruses showed that most of the elements were related toclass I or class II outgroup elements. Thus, they can be classi-fied as such by homology. No class III-related elements wereobserved (Fig. 2). Based on this tree, the BoERV elementswere classified into 24 families (BoERV1 to BoERV24) ac-
10854 GARCIA-ETXEBARRIA AND JUGO J. VIROL.

TA
BL
E2.
ER
Velem
entsdetected
byeach
method
b
Chrom
osome
Analyzedlength(M
b)
BL
AST
LT
R_ST
RU
CR
etrotector
No.of
ER
Vs
Density
(elements/M
b)�
2test
Pvalue
aG
testP
valueR
esultN
o.ofE
RV
sD
ensity(elem
ents/Mb)
�2
testP
valuea
G-test
Pvalue
Result
No.of
ER
Vs
Density
(elements/M
b)�
2test
Pvalue
aG
testP
valueR
esult
1147
580.39
0.75330.7548
3102.11
0.0108*0.0126*
1727
4.956.3E
10***
2.44E
09***1
2126
430.34
0.47900.4718
2632.09
0.0303*0.0339*
1554
4.400.0117*
0.0131*1
3117
500.43
0.38490.3940
2502.14
0.0128*0.0152*
1540
4.620.0002***
0.0003***1
4111
460.41
0.53610.5419
2011.81
0.86010.8599
4584.13
0.37270.3758
5119
420.35
0.63490.6310
2141.80
0.77490.7743
4974.18
0.22730.2312
6112
490.44
0.30400.3152
2312.06
0.06610.0714
5324.75
1.8E
05***3.09E
05***
17
10135
0.350.5874
0.5820193
1.910.5544
0.5571406
4.020.7640
0.76468
10433
0.320.2957
0.2824199
1.910.5352
0.5380428
4.120.4206
0.42359
9634
0.350.6858
0.6825201
2.090.0541
0.0595424
4.420.0222*
0.0247*1
1096
300.31
0.27970.2653
1942.02
0.16530.1720
3703.85
0.58910.5878
11102
320.31
0.27340.2594
1871.83
0.99750.9975
3753.68
0.13940.1348
1278
370.47
0.16480.1809
1642.10
0.07380.0805
3344.28
0.14840.1536
1384
220.26
0.07590.0604
1331.58
0.08550.0785
2833.37
0.0054**0.0044**
214
8317
0.200.0087**
0.0041**2
1521.83
0.99120.9912
3243.90
0.78710.7866
1576
240.32
0.36260.3488
1542.03
0.20580.2133
3264.29
0.14450.1498
1673
250.34
0.60590.6000
1161.59
0.11810.1099
2713.71
0.27730.2723
1771
230.32
0.44380.4324
1081.52
0.0489*0.0425*
2268
3.770.4218
0.418218
6336
0.570.0120
0.0192*1
911.44
0.0210*0.0166*
2191
3.030.0001***
9.00E
05***2
1964
270.42
0.57320.5798
831.30
0.0013**0.0007***
2174
2.724.1E
07***
8.28E
08***2
2069
160.23
0.0439*0.0301*
2126
1.830.9660
0.9660254
3.680.2351
0.229621
6425
0.390.8792
0.8798107
1.670.3348
0.3277240
3.750.3887
0.384522
6015
0.250.1001
0.079870
1.170.0001***
3.60E
05***2
1712.85
1.2E
05***4.07E
06***
223
4920
0.410.7384
0.741482
1.670.4049
0.398083
1.697.9E
16***
1.06E
19***2
2461
160.26
0.13350.1124
1111.82
0.93820.9382
1993.26
0.0054**0.0041**
225
4320
0.470.3553
0.371867
1.560.1793
0.1682118
2.745.2E
05***
1.85E
05***2
2648
220.46
0.36780.3830
741.54
0.13220.1218
1683.50
0.10460.0978
2744
140.32
0.50790.4959
801.82
0.94180.9418
1523.45
0.08810.0813
2841
270.66
0.0034**0.0079**
166
1.610.2871
0.2771165
4.020.8385
0.838929
4620
0.430.5357
0.544969
1.500.0922
0.0822166
3.610.2247
0.2178X
10070
0.701.03E
07***
1.74E
06***1
1911.91
0.56100.5636
5005.00
1E
07***2.96E
07***
1
Overall
2,448928
0.383.683E
05***
4,4871.83
3.40E
07***9,698
3.961.36E
47***
aSingle
chromosom
eagainst
therest
ofthe
chromosom
es,asin
reference41.
bD
ataare
fromreference
41.�,P
�0.05;
��,P
�0.01;
���,P
�0.001.
1,m
oreE
RV
sthan
expected;2
,fewer
ER
Vs
thanexpected.
VOL. 84, 2010 GENOME-WIDE DETECTION OF BOVINE ERVs 10855
cording to the tree topology and the statistical support of theclustering relationships (Fig. 2 and Table 4). Overall, we de-fined 18 families related to class I ERVs and 6 related to classII ERVs. Some of these groups were also related to ovineERVs. It proved possible to classify all 24 families into threegroups based on the number of ERVs included (Table 4).BoERV1 (82 clustered elements), BoERV3 (66 elements), andBoERV18 (16 elements) in class I and BoERV24 (22 clusteredelements) in class II were the most abundant families. A sec-ond group of families had between 4 and 10 elements. In thethird group, eight elements were isolated and had no signifi-cant relationship with any other element.
Class I families (BoERV1 to BoERV18). Most of theBoERVs included in the phylogenetic analysis were related toclass I elements and were classified into 18 families. The av-erage length of class I-related families was between 8,209 bases(BoERV18 family) and 15,219 bases (BoERV16). The longestERV was from the BoERV16 family (23,004 bases), due to aduplication of the pol and env retroviral genes. The shortestERV was from BoERV12 (7,058). Apart from the examplesdescribed above, the duplication of gag and env genes wasobserved for other ERVs. To rule out the presence of othergenes, a search was made for ORFs in the longest elements.No different gag, pol, or env ORFs were detected. Thus, it isvery likely that the presence of these elements was due toassembly errors. The remaining ERVs showed a typical lengthof between 7 and 12 kb (4).
Among the most abundant families, the BoERV1 family wasquite heterogeneous. In contrast, the elements of the BoERV3and BoERV18 families were similarly homogeneous. TheBoERV3 family was related to previously described cowBERV-�4 and sheep OERV-�4 elements, and BoERV18 wasrelated to the ovine OERV-�9 element.
The representative element of the BoERV1 and BoERV3families had the LPQG and YVDD motifs (Fig. 3). In the caseof the BoERV18 family, the first motif was PPQG.
The remaining groups were represented by few or solitaryelements. In the cases of BoERV2 and BoERV13, more re-lated sequences were obtained in the MegaBlast analysis. Theyhad not been included in the phylogenetic tree because theydid not fulfill the conditions previously established.
The divergence level varied from family to family: the ele-ments of BoERV8, BoERV9, and BoERV10 were less diver-gent than the elements of BoERV5, BoERV7, and BoERV15.
BoERV7 was related to the previously detected cow BERV-�7and ovine OERV-�7 elements, and BoERV16 was related to apreviously detected BoERV (GenBank accession numberX99924) and BERV-�9 bovine elements. In BoERV12 andBoERV15, the two motifs were conserved. In the representa-tive element of BoERV9, the YVDD motif was present. How-ever, the representative elements of the BoERV2, BoERV4,BoERV5, BoERV6, BoERV10, BoERV11, BoERV16, andBoERV17 groups did not keep at least one of the two char-acteristic motifs.
The representative BoERVs from families with one or twomembers had different conservation levels of their functionalmotifs. BoERV2 had a deletion in the YVDD motif, andBoERV4, BoERV13, BoERV14, and BoERV17 had an aminoacid change. Neither of the motifs was conserved in BoERV6and BoERV11.
BoERV1 could be the oldest of the class I-related familiesbecause it contained an ERV that was inserted between 126and 58 million years ago (MYA) based on the LTR divergence.This family also had the most recent insertion activity, since theyoungest member was inserted recently. In sheep samples, wewere able to amplify a BoERV1 conserved sequence from theRT region with a length of 150 bases (data not shown). TheBoERV7 family could be the youngest, inserted between 19and 9 MYA. Due to the uncertainty of the age estimates of theERV sequences, which were based on the comparison of theLTRs of the elements, these values are only a rough estimateof the insertion time. Although different evolution rates and acorrection were applied, the effect of recombination or geneconversion events, leading to the homogenization of the 5 and3 LTRs, must be taken into account, and in this sense, thedivergence times calculated in our study may have been un-derestimated.
Class II families (BoERV19 to BoERV24). The class II ele-ments were grouped into six families, ranging in average lengthfrom 8,881 bases to 11,077 bases. After the MegaBlast analysis,BoERV22 consisted of more than one element. Some of theseelements had not been included in the phylogenetic tree be-cause they did not fulfill the conditions previously established.
The longest ERV was from BoERV24 (25,030 bases), andthe shortest was from BoERV21 (6,283 bases). As with thelongest class I-related BoERV, the longest BoERV in the classII-related families contained all genes duplicated.
TABLE 3. Structure of ERV elements detected by each method
Structure
No. (%) of detected elementsa
Retrotector LTR_STRUC BLAST Nonredundantelements
LTR-RT-LTR 5,006 (51.61) 383 (8.54) NA 5,254 (38.57)gag-pol-env 7,466 (76.99) 162 (17.46)gag-pol 2,002 (20.64) 267 (28.77)gag-env 91 (0.94) 190 (20.47)pol-env 99 (1.02) 309 (33.30)gag 18 (0.19)pol 22 (0.23)env 0Pol presence 9,589 (98.87) 383 (8.54) 738 (79.53)Pol absence 109 (1.13) 4,104 (91.46) 190 (20.47)
Total 9,698 4,487 928 13,622
a NA, not applicable.
FIG. 1. Diagram representing the number of ERVs detected byeach detection method (represented by the circle size) and commonelements detected by two or more methods (included in the overlap-ping areas).
10856 GARCIA-ETXEBARRIA AND JUGO J. VIROL.
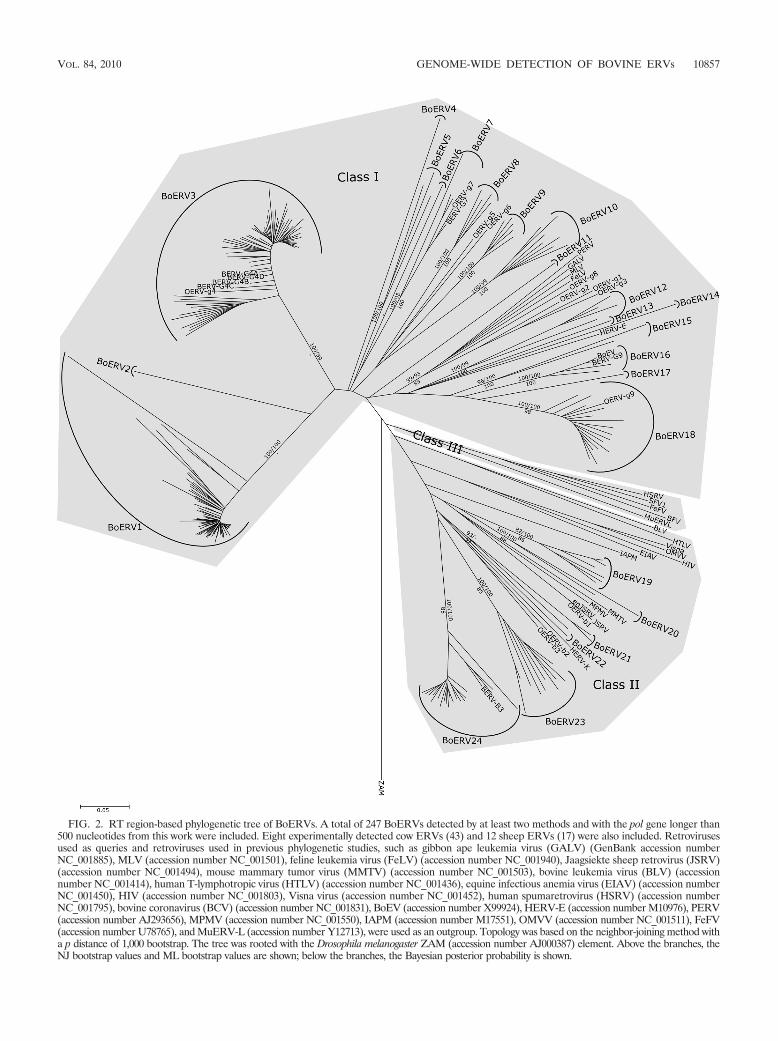
FIG. 2. RT region-based phylogenetic tree of BoERVs. A total of 247 BoERVs detected by at least two methods and with the pol gene longer than500 nucleotides from this work were included. Eight experimentally detected cow ERVs (43) and 12 sheep ERVs (17) were also included. Retrovirusesused as queries and retroviruses used in previous phylogenetic studies, such as gibbon ape leukemia virus (GALV) (GenBank accession numberNC_001885), MLV (accession number NC_001501), feline leukemia virus (FeLV) (accession number NC_001940), Jaagsiekte sheep retrovirus (JSRV)(accession number NC_001494), mouse mammary tumor virus (MMTV) (accession number NC_001503), bovine leukemia virus (BLV) (accessionnumber NC_001414), human T-lymphotropic virus (HTLV) (accession number NC_001436), equine infectious anemia virus (EIAV) (accession numberNC_001450), HIV (accession number NC_001803), Visna virus (accession number NC_001452), human spumaretrovirus (HSRV) (accession numberNC_001795), bovine coronavirus (BCV) (accession number NC_001831), BoEV (accession number X99924), HERV-E (accession number M10976), PERV(accession number AJ293656), MPMV (accession number NC_001550), IAPM (accession number M17551), OMVV (accession number NC_001511), FeFV(accession number U78765), and MuERV-L (accession number Y12713), were used as an outgroup. Topology was based on the neighbor-joining method witha p distance of 1,000 bootstrap. The tree was rooted with the Drosophila melanogaster ZAM (accession number AJ000387) element. Above the branches, theNJ bootstrap values and ML bootstrap values are shown; below the branches, the Bayesian posterior probability is shown.
VOL. 84, 2010 GENOME-WIDE DETECTION OF BOVINE ERVs 10857
Within-group divergence varied. The elements of BoERV23were more divergent than those of BoERV19. The BoERV24group contained some tightly related elements and some highlydivergent ones. The BoERV24 family was related to the pre-viously detected bovine BERV-�3 element. Moreover, we didnot detect class II bovine ERVs related to endogenous Jaag-siekte sheep retroviruses (enJSRVs) in this genome version.
With one exception, the representative elements of the classII-related families conserved the LPQG and YMDD motifs. Inthe BoERV23 family, the LPQG motif was replaced byQPQG, and YMDD was replaced by YLDG.
The oldest class II-related family could be BoERV24, whoseoldest ERV was inserted between 56 and 26 MYA. The newestfamily could be BoERV19 (between 27 and 13 MYA). Inaddition, a member of this family could be the youngest ele-ment, with a recent insertion.
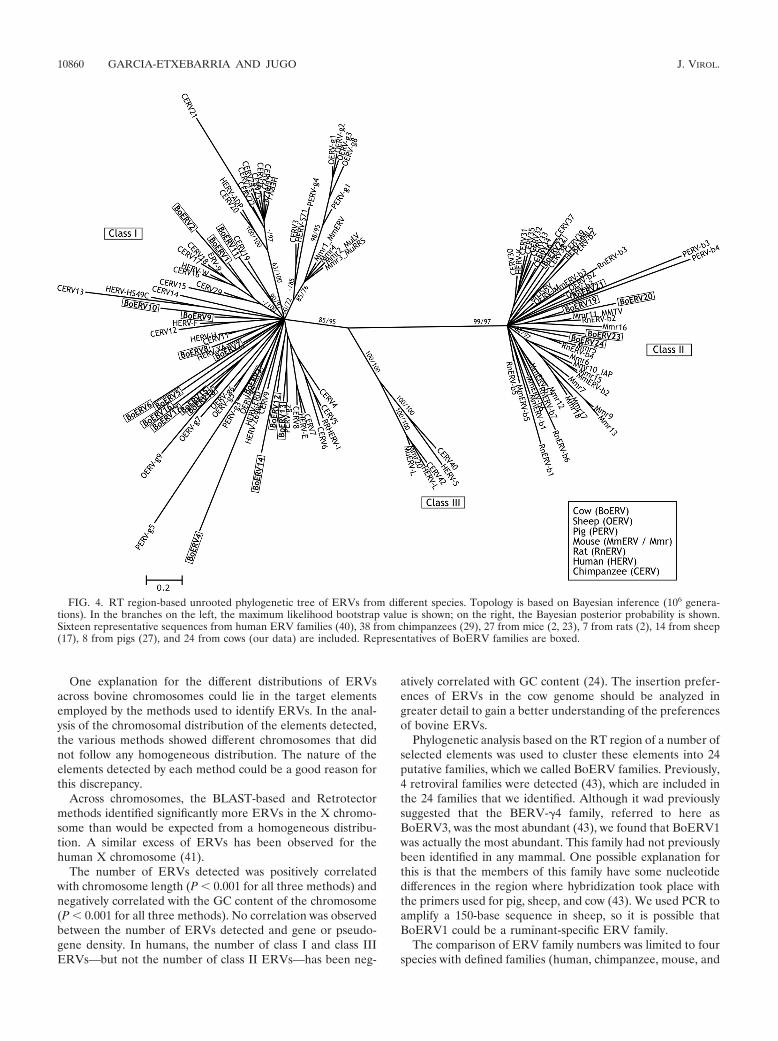
Relationship of BoERVs with ERVs from other species. Inthe phylogenetic tree for the ERVs from cow, sheep, pig,human, chimpanzee, mouse, and rat, ERV elements weregrouped into three classes. Within each class, the representa-tive ERVs clustered following the relationships with their hostgenomes. There was a close relationship between ERVs fromcow and sheep, which clustered together in four phylogeneticlineages (Fig. 4).
The representatives of the different classes were groupedinto polytomic nodes. However, there were clear relationships
between human/chimpanzee families (HERV-I/-ADP andCERV20/21/22/23/24/25), human/chimpanzee/bovine families(ERV9/HERV-W, CERV15/16/17/18/29, and BoERV1/2),chimpanzee/bovine families (CERV19 and BoERV11), andhuman/chimpanzee/mouse families (HERV-L, CERV42, andMuERV-L/Mmr20). There were also suggestions of bovine/ovine relationships (BoERV15/16/17/18 and OERV-G9) andhuman/chimpanzee/porcine/bovine relationships (RRHERV-I/HERV-E, CERV4/5/6/7, PERV-g4, and BoERV12/13/14)(Fig. 4).
Surprisingly, one phylogenetic lineage contained elementsfrom human, chimpanzee, mouse, pig, and sheep species butnot from cows. This lineage was studied in depth, and theinsertion time was estimated by using LTR divergence: thehuman HERV-S71 element was inserted between 19.5 and 8.9MYA, and the chimpanzee CERV3 element was inserted be-tween 33 and 15.8 MYA.
DISCUSSION
This study describes an attempt to systematically identifyand characterize endogenous retroviruses in the cow genome.Although we used only located genomic information, leavingcontigs untested, in this study we identified nearly 10,000 pu-tative BoERVs that were distributed in a nonhomogeneousway across chromosomes. By comparing three different meth-
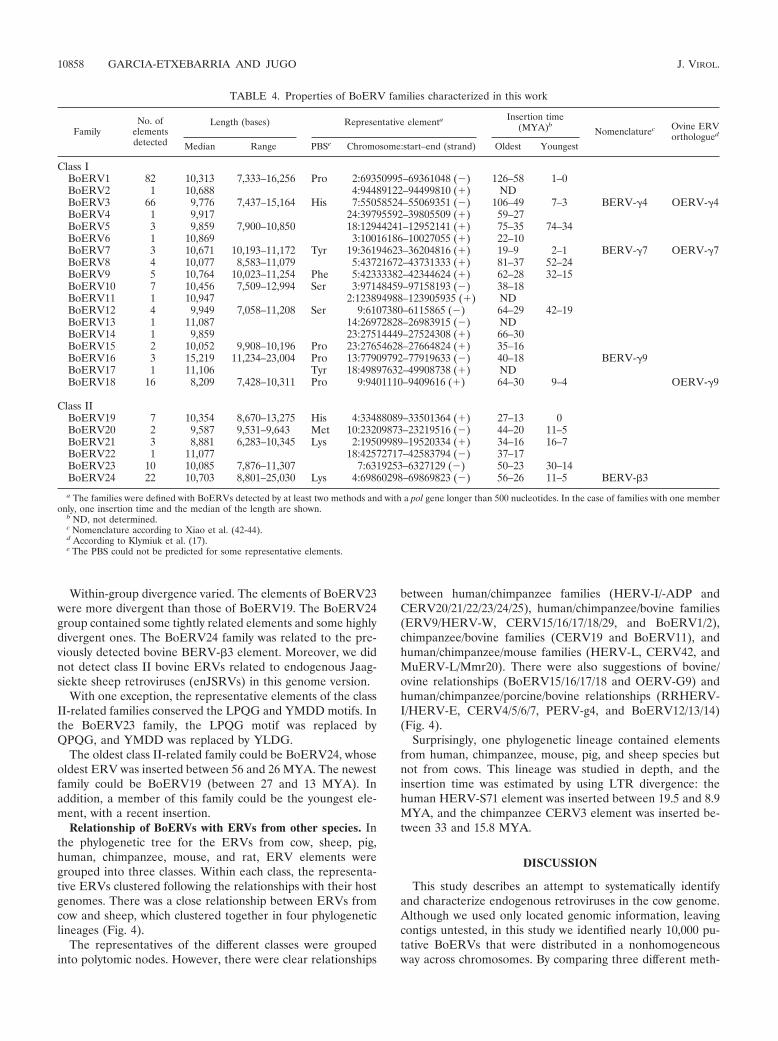
TABLE 4. Properties of BoERV families characterized in this work
FamilyNo. of
elementsdetected
Length (bases) Representative elementa Insertion time(MYA)b
Nomenclaturec Ovine ERVorthologued
Median Range PBSe Chromosome:start–end (strand) Oldest Youngest
Class IBoERV1 82 10,313 7,333–16,256 Pro 2:69350995–69361048 () 126–58 1–0BoERV2 1 10,688 4:94489122–94499810 (�) NDBoERV3 66 9,776 7,437–15,164 His 7:55058524–55069351 () 106–49 7–3 BERV-�4 OERV-�4BoERV4 1 9,917 24:39795592–39805509 (�) 59–27BoERV5 3 9,859 7,900–10,850 18:12944241–12952141 (�) 75–35 74–34BoERV6 1 10,869 3:10016186–10027055 (�) 22–10BoERV7 3 10,671 10,193–11,172 Tyr 19:36194623–36204816 (�) 19–9 2–1 BERV-�7 OERV-�7BoERV8 4 10,077 8,583–11,079 5:43721672–43731333 (�) 81–37 52–24BoERV9 5 10,764 10,023–11,254 Phe 5:42333382–42344624 (�) 62–28 32–15BoERV10 7 10,456 7,509–12,994 Ser 3:97148459–97158193 () 38–18BoERV11 1 10,947 2:123894988–123905935 (�) NDBoERV12 4 9,949 7,058–11,208 Ser 9:6107380–6115865 () 64–29 42–19BoERV13 1 11,087 14:26972828–26983915 () NDBoERV14 1 9,859 23:27514449–27524308 (�) 66–30BoERV15 2 10,052 9,908–10,196 Pro 23:27654628–27664824 (�) 35–16BoERV16 3 15,219 11,234–23,004 Pro 13:77909792–77919633 () 40–18 BERV-�9BoERV17 1 11,106 Tyr 18:49897632–49908738 (�) NDBoERV18 16 8,209 7,428–10,311 Pro 9:9401110–9409616 (�) 64–30 9–4 OERV-�9
Class IIBoERV19 7 10,354 8,670–13,275 His 4:33488089–33501364 (�) 27–13 0BoERV20 2 9,587 9,531–9,643 Met 10:23209873–23219516 () 44–20 11–5BoERV21 3 8,881 6,283–10,345 Lys 2:19509989–19520334 (�) 34–16 16–7BoERV22 1 11,077 18:42572717–42583794 () 37–17BoERV23 10 10,085 7,876–11,307 7:6319253–6327129 () 50–23 30–14BoERV24 22 10,703 8,801–25,030 Lys 4:69860298–69869823 () 56–26 11–5 BERV-�3
a The families were defined with BoERVs detected by at least two methods and with a pol gene longer than 500 nucleotides. In the case of families with one memberonly, one insertion time and the median of the length are shown.
b ND, not determined.c Nomenclature according to Xiao et al. (42-44).d According to Klymiuk et al. (17).e The PBS could not be predicted for some representative elements.
10858 GARCIA-ETXEBARRIA AND JUGO J. VIROL.
ods for ERV detection, we found that each method yieldsdifferent and, in some cases, discordant information.
The BLAST-based search detected the fewest elements (928elements), most of which were also detected by Retrotector.As the criteria used in the BLAST-based search were quitestrict, the elements that it detected could be considered to behighly conserved ERVs.
LTR_STRUC detected 4,487 elements. It identified moreelements without the RT region than did BLAST and Retro-tector. It also detected many elements that were not identifiedby BLAST and Retrotector. Because LTR_STRUC is de-signed to find elements flanked by LTRs, it may be able todetect elements with a noncanonical structure (22).
Retrotector detected the most possible BoERVs (9,698) andhad the most overlapping detections. In most of the elementsdetected by Retrotector, all three main genes were identified.It is thus clear that it is more efficient than BLAST-baseddetection and able to detect elements that are not as highlyconserved (38).
Comparison of different genomes is problematic becausevarious methods have been used to detect ERVs. In previousstudies of human (20), mouse (26), rat (7), dog (21), cat (30),and cow (5), RepeatMasker and Repbase were used to detectrepetitive elements. However, as stated previously by Sperberet al. (38), results from RepeatMasker and Retrotector cannot
be directly compared because the RepeatMasker output isdifficult to organize into proviruses. In addition, Retrotectorrarely detects elements less than 1,000 bp long, and Repeat-Masker can detect much shorter repeats and single LTRs.Moreover, the secondary integration of proviruses into eachother, a feature of old elements, can also be a problem (38).
In a previous study of the cow genome, 142,096 ERVs weredetected with PALS/PILER (5), while we identified 928 withBLAST, 4,487 with LTR_STRUC, and 9,698 with Retrotector.The genome coverage of the elements detected by the differentprograms was also discordant: 1.75% of the genome by PALS/PILER, 0.36% by BLAST, 1.77% by LTR_STRUC, and 4.29%by Retrotector. These data suggest that the coverage is similaror greater with fewer elements. Thus, the abundance of shortelements by methods such as RepeatMasker and PALS/PILERmake cross-species comparisons difficult. In addition, the clas-sification of the elements detected by the different programsadds complexity to the comparison: RepeatMasker uses theRepbase annotation (13; Smit et al., personal communication),and Retrotector uses its own motif database (38). Thus, wefound that RepeatMasker and Retrotector did not routinelysort the same element into the same class. For example, amongERVs classified as class I by the Retrotector method, 64.72%were classified as ERV1 and 35.28% were classified as ERVLby RepeatMasker.
FIG. 3. Partial amino acid sequence of the RT region of the representative ERVs from the 24 putative families. The positions of the functionalmotifs LPQG and YV/MDD are boxed.
VOL. 84, 2010 GENOME-WIDE DETECTION OF BOVINE ERVs 10859
One explanation for the different distributions of ERVsacross bovine chromosomes could lie in the target elementsemployed by the methods used to identify ERVs. In the anal-ysis of the chromosomal distribution of the elements detected,the various methods showed different chromosomes that didnot follow any homogeneous distribution. The nature of theelements detected by each method could be a good reason forthis discrepancy.
Across chromosomes, the BLAST-based and Retrotectormethods identified significantly more ERVs in the X chromo-some than would be expected from a homogeneous distribu-tion. A similar excess of ERVs has been observed for thehuman X chromosome (41).
The number of ERVs detected was positively correlatedwith chromosome length (P � 0.001 for all three methods) andnegatively correlated with the GC content of the chromosome(P � 0.001 for all three methods). No correlation was observedbetween the number of ERVs detected and gene or pseudo-gene density. In humans, the number of class I and class IIIERVs—but not the number of class II ERVs—has been neg-
atively correlated with GC content (24). The insertion prefer-ences of ERVs in the cow genome should be analyzed ingreater detail to gain a better understanding of the preferencesof bovine ERVs.
Phylogenetic analysis based on the RT region of a number ofselected elements was used to cluster these elements into 24putative families, which we called BoERV families. Previously,4 retroviral families were detected (43), which are included inthe 24 families that we identified. Although it wad previouslysuggested that the BERV-�4 family, referred to here asBoERV3, was the most abundant (43), we found that BoERV1was actually the most abundant. This family had not previouslybeen identified in any mammal. One possible explanation forthis is that the members of this family have some nucleotidedifferences in the region where hybridization took place withthe primers used for pig, sheep, and cow (43). We used PCR toamplify a 150-base sequence in sheep, so it is possible thatBoERV1 could be a ruminant-specific ERV family.
The comparison of ERV family numbers was limited to fourspecies with defined families (human, chimpanzee, mouse, and
FIG. 4. RT region-based unrooted phylogenetic tree of ERVs from different species. Topology is based on Bayesian inference (106 genera-tions). In the branches on the left, the maximum likelihood bootstrap value is shown; on the right, the Bayesian posterior probability is shown.Sixteen representative sequences from human ERV families (40), 38 from chimpanzees (29), 27 from mice (2, 23), 7 from rats (2), 14 from sheep(17), 8 from pigs (27), and 24 from cows (our data) are included. Representatives of BoERV families are boxed.
10860 GARCIA-ETXEBARRIA AND JUGO J. VIROL.

rat). In cows, the number of families (24 putative families) washigher than that for mouse (20 families) (23) and lower thanthose for chimpanzee (42 families) (29) and human (31 fami-lies) (15). In the case of rodents, where information is availableonly for class II elements in two species, the number of familiesin cow (six families) was similar to those in rat and mouse(seven families) (2). To the best of our knowledge, no infor-mation is currently available on dog and cat ERV families.
We did not detect any class III-related ERVs. Although thiscould be an artifact due to the distance from the referencesequences used for the BLAST-based search and the limits ofclass III element detection by Retrotector (38), it is more likelybecause the presence of class III ERVs in the cow genome islimited. In fact, although a number of sequences related toclass III were amplified previously by Benit et al. (3), theamplification signal was weak, and these sequences were quiteshort.
The relationship between representatives of the ERV fam-ilies from different species is interesting. In general, the lin-eages of the different ERV groups are divided following thespecies phylogeny, with humans and chimpanzees on one sideand cows, sheep, and pigs on the other side. Representativeelements of the scarce murine class I families were included inour analysis, but their relationship with representative ele-ments of the ERV families of other species remains obscure.Even so, representative elements of the human/chimpanzeegroups and, to a lesser extent, mouse/rat and pig/sheep groupstend to follow the pattern of previously reported comparisonsof each pair (2, 17, 29). Following this pattern, the represen-tative bovine elements cluster with the representative sheepelements, as obtained by experiments (17) with most of thelineages. In some cow breeds, ovine enJSRV-related env, orf-x,and LTR sequences have been detected (25). However, bovineERVs closely related to enJSRVs were not detected in theversion of the genome used in our study. This genome se-quence belongs to a Hereford animal, while Morozov et al.analyzed animals from Simmental and Limousine breeds. Forhumans, it was suggested that a combination of genetic andenvironmental factors could contribute to determining theprevalence of enJSRV-related sequences in different popula-tions (34). Thus, it is possible that different breeds of cow couldalso have different prevalences of enJSRV-related sequences.
Related to the relationship of ERV families of differentspecies, in one lineage, representatives of human, chimpanzee,pig, and sheep groups were present, while cattle elements wereabsent. To account for this absence, we estimated the insertiontime of the elements in this lineage. As there is no genomicinformation available for pigs and sheep, estimates were avail-able only for human (19.5 to 8.9 MYA) and chimpanzee (33 to15.8 MYA) elements. These insertion times were later than thedivergence of ruminants and primates. Based on the weaksupport of the tree topology, a single infection is unlikely. Inthis lineage, two independent infections by a similar virus couldhave been detected, and in the case of ruminants, it is possiblethat cows lost this element at some point.
The absence of some ERV families in cows, compared withsheep and pigs, has prompted some authors to suggest thatcows have a limited number of ERV families (43). Taking intoaccount that the numbers of ERV families described were 31for humans (15), 42 for chimpanzees (29), 20 for mice (23), and
24 putative families for cows (this study), BoERVs may not beas scarce as previously stated. Moreover, we detected onefamily, BoERV1, that had not been detected previously butthat appears to be present at least in ruminants.
As described above, we did not detect any class III elements.It was suggested previously that in primates and mice (18),ERVs related to this class have been subjected to one or twobursts of copy number. If so, it is possible that the difference inthe number of ERV families with primates and mice could bebased on this burst of class III-related ERVs. Finally, thewhole picture could be also confused by the intense selectivebreeding processes that have accompanied the domesticationof cows (4).
In conclusion, we identified several thousand ERVs in thegenome of Bos taurus by three different methods. The numberdetected depended on the technique used, ranging from a lowof 928 using a BLAST-based method to 9,698 using Retrotec-tor. When attempting to detect new ERVs, the use of differentmethods is advisable. ERVs did not appear to be randomlyscattered across the chromosome but were more abundant onsome, especially the X chromosome, than on others. Amongthe 24 detected families, 20 were newly described ERV fami-lies. The most abundant BoERV1 family is described for thefirst time. Finally, representatives of ERV families from ro-dents, primates, and ruminants showed a phylogenetic rela-tionship following their hosts’ relationships.
This is indeed the first genome-wide approach for the de-tection and characterization of bovine endogenous retrovi-ruses. Further in-depth analyses are thus needed to uncoverthe whole picture of these genomic elements in cattle.
ACKNOWLEDGMENTS
K.G.-E. was a recipient of a UPV/EHU grant (Vice-Rectorate ofBasque and Plurilingualism). This work has been partially funded byUPV/EHU by means of projects EHU06/107 and GIU07/62 (B.M.J.).
We thank anonymous reviewers for highly useful comments andimprovements to the manuscript. We thank Maialen Sistiaga for help-ing in the experimental work.
REFERENCES
1. Altschul, S. F., T. L. Madden, A. A. Schaffer, J. Zhang, Z. Zhang, W. Miller,and D. J. Lipman. 1997. Gapped BLAST and PSI-BLAST: a new generationof protein database search programs. Nucleic Acids Res. 25:3389–3402.
2. Baillie, G., L. van de Lagemaat, C. Baust, and D. Mager. 2004. Multiplegroups of endogenous betaretroviruses in mice, rats, and other mammals.J. Virol. 78:5784–5798.
3. Benit, L., J. Lallemand, J. Casella, H. Philippe, and T. Heidmann. 1999.ERV-L elements: a family of endogenous retrovirus-like elements activethroughout the evolution of mammals. J. Virol. 73:3301–3308.
4. Boeke, J., and J. Stoye. 1997. Retrotransposons, endogenous retroviruses,and the evolution of retroelements, p. 343–435. In J. Coffin, S. Hughes, andH. Varmos (ed.), Retroviruses. Cold Spring Harbor Laboratory Press, ColdSpring Harbor, NY.
5. Bovine Genome Sequencing and Analysis Consortium, C. Elsik, R. Tellam,K. Worley, et al. 2009. The genome sequence of taurine cattle: a window toruminant biology and evolution. Science 324:522–528.
6. Castresana, J. 2000. Selection of conserved blocks from multiple alignmentsfor their use in phylogenetic analysis. Mol. Biol. Evol. 17:540–552.
7. Gibbs, R. A., G. M. Weinstock, M. L. Metzger, D. M. Muzny, E. J. Sodergren,et al. 2004. Genome sequence of the Brown Norway rat yields insights intomammalian evolution. Nature 428:493–521.
8. Gifford, R., P. Kabat, J. Martin, C. Lynch, and M. Tristem. 2005. Evolutionand distribution of class II-related endogenous retroviruses. J. Virol. 79:6478–6486.
9. Golan, M., A. Hizi, J. H. Resau, N. Yaal-Hahoshen, H. Reichman, I. Keydar,and I. Tsarfaty. 2008. Human endogenous retrovirus (HERV-K) reversetranscriptase as a breast cancer prognostic marker. Neoplasia 10:521–523.
10. Guindon, S., and O. Gascuel. 2003. A simple, fast, and accurate algorithm toestimate large phylogenies by maximum likelihood. Syst. Biol. 52:696–704.
VOL. 84, 2010 GENOME-WIDE DETECTION OF BOVINE ERVs 10861
11. Jern, P., and J. Coffin. 2008. Effects of retroviruses on host genome function.Annu. Rev. Genet. 42:709–732.
12. Johnson, W., and J. Coffin. 1999. Constructing primate phylogenies frontancient retrovirus sequences. Proc. Natl. Acad. Sci. U. S. A. 96:10254–10260.
13. Jurka, J. 2000. Repbase update—a database and an electronic journal ofrepetitive elements. Trends Genet. 16:418–420.
14. Katoh, K., K. Kuma, H. Toh, and T. Miyata. 2005. MAFFT version 5:improvement in accuracy of multiple sequence alignment. Nucleic AcidsRes. 33:511–518.
15. Katzourakis, A., A. Rambaut, and O. Pybus. 2005. The evolutionary dynam-ics of endogenous retroviruses. Trends Microbiol. 13:463–468.
16. Kimura, M. 1980. A simple method for estimating evolutionary rates of basesubstitutions through comparative studies of nucleotide-sequences. J. Mol.Evol. 16:111–120.
17. Klymiuk, N., M. Muller, G. Brem, and B. Aigner. 2003. Characterization ofendogenous retroviruses in sheep. J. Virol. 77:11268–11273.
18. Kumar, S., and S. Hedges. 1998. A molecular timescale for vertebrate evo-lution. Nature 392:917–920.
19. Kumar, S., K. Tamura, and M. Nei. 2004. MEGA3: integrated software formolecular evolutionary genetics analysis and sequence alignment. Brief.Bioinform. 5:150–163.
20. Lander, S., L. M. Linton, B. Birren, C. Nusbaum, M. C. Zody, et al. 2001.Initial sequencing and analysis of the human genome. Nature 409:860–921.
21. Lindblad-Toh, K., C. Wade, T. Mikkelsen, E. Karlsson, D. Jaffe, M. Kamal,M. Clamp, J. Chang, E. Kulbokas, M. Zody, E. Mauceli, X. Xie, M. Breen,R. Wayne, E. Ostrander, C. Ponting, F. Galibert, D. Smith, P. deJong, E.Kirkness, P. Alvarez, T. Biagi, W. Brockman, J. Butler, C. Chin, A. Cook, J.Cuff, M. Daly, D. DeCaprio, S. Gnerre, M. Grabherr, M. Kellis, M. Kleber,C. Bardeleben, L. Goodstadt, A. Heger, C. Hitte, L. Kim, K. Koepfli, H.Parker, J. Pollinger, S. Searle, N. Sutter, R. Thomas, C. Webber, E. Lander,et al. 2005. Genome sequence, comparative analysis and haplotype structureof the domestic dog. Nature 438:803–819.
22. McCarthy, E., and J. McDonald. 2003. LTR_STRUC: a novel search andidentification program for LTR retrotransposons. Bioinformatics 19:362–367.
23. McCarthy, E. M., and J. F. McDonald. 2004. Long terminal repeat retro-transposons of Mus musculus. Genome Biol. 5:R14.
24. Medstrand, P., L. van de Lagemaat, and D. Mager. 2002. Retroelementdistributions in the human genome: variations associated with age and prox-imity to genes. Genome Res. 12:1483–1495.
25. Morozov, V., A. Morozov, and S. Lagaye. 2007. Endogenous JSRV likeproviruses in domestic cattle: analysis of sequences and transcripts. Virology367:59–70.
26. Mouse Genome Sequencing Consortium, et al. 2002. Initial sequencing andcomparative analysis of the mouse genome. Nature 420:520–562.
27. Patience, C., W. Switzer, Y. Takeuchi, D. Griffiths, M. Goward, W. Heneine,J. Stoye, and R. Weiss. 2001. Multiple groups of novel retroviral genomes inpigs and related species. J. Virol. 75:2771–2775.
28. Perron, H., C. Bernard, J. B. Bertrand, A. B. Lang, I. Popa, K. Sanhadji, andJ. Portoukalian. 2009. Endogenous retroviral genes, herpesviruses and gen-der in multiple sclerosis. J. Neurol. Sci. 286:65–72.
29. Polavarapu, N., N. J. Bowen, and J. F. McDonald. 2006. Identification,
characterization and comparative genomics of chimpanzee endogenous ret-roviruses. Genome Biol. 7:R51.
30. Pontius, J. U., J. C. Mullikin, D. R. Smith, the Agencourt Sequencing Team,K. Lindblad-Toh, S. Gnerre, M. Clamp, J. Chang, R. Stephens, B. Neelam,N. Volfovsky, A. A. Schaffer, R. Agarwala, K. Narfstrom, W. J. Murphy, U.Giger, A. L. Roca, A. Antunes, M. Menotti-Raymond, N. Yuhki, J. Pecon-Slattery, W. E. Johnson, G. Bourque, G. Tesler, the NISC ComparativeSequencing Program, and S. J. O’Brien. 2007. Initial sequence and compar-ative analysis of the cat genome. Genome Res. 17:1675–1689.
31. Posada, D., and K. Crandall. 1998. MODELTEST: testing the model ofDNA substitution. Bioinformatics 14:817–818.
32. R Development Core Team. 2008. R: a language and environment for sta-tistical computing. R Foundation for Statistical Computing, Vienna, Austria.
33. Rice, P., I. Longden, and A. Bleasby. 2000. EMBOSS: the European molec-ular biology open software suite. Trends Genet. 16:276–277.
34. Rocca, S., M. Sanna, A. Leoni, A. Cossu, A. Lissia, F. Tanda, M. Satta, andG. Palmieri. 2008. Presence of Jaagsiekte sheep retrovirus in tissue sectionsfrom human bronchioloalveolar carcinoma depends on patients’ geograph-ical origin. Hum. Pathol. 39:303–304.
35. Ronquist, F., and J. Huelsenbeck. 2003. MrBayes 3: Bayesian phylogeneticinference under mixed models. Bioinformatics 19:1572–1574.
36. Serafino, A., E. Balestrieri, P. Pierimarchi, C. Matteucci, G. Moroni, E.Oricchio, G. Rasi, A. Mastino, C. Spadafora, E. Garaci, and P. S. Vallebona.2009. The activation of human endogenous retrovirus K (HERV-K) is im-plicated in melanoma cell malignant transformation. Exp. Cell Res. 315:849–862.
37. Sokal, R., and F. Rohls. 1969. Biometry: the principles and practise ofstatistics in biological research. W. H. Freeman and Co., New York, NY.
38. Sperber, G., T. Airola, P. Jern, and J. Blomberg. 2007. Automated recogni-tion of retroviral sequences in genomic data—RetroTector. Nucleic AcidsRes. 35:4964–4976.
39. Thompson, J. D., D. G. Higgins, and T. J. Gibson. 1994. CLUSTAL W—im-proving the sensitivity of progressive multiple sequence alignment throughsequence weighting, position-specific gap penalties and weight matrix choice.Nucleic Acids Res. 22:4673–4680.
40. Tristem, M. 2000. Identification and characterization of novel human en-dogenous retrovirus families by phylogenetic screening of the Human Ge-nome Mapping Project database. J. Virol. 74:3715–3730.
41. Villesen, P., L. Aagaard, C. Wiuf, and F. S. Pedersen. 2004. Identification ofendogenous retroviral reading frames in the human genome. Retrovirology1:32.
42. Xiao, R., J. Kim, H. Choi, K. Park, H. Lee, and C. Park. 2008. Character-ization of the bovine endogenous retrovirus beta 3 genome. Mol. Cells25:142–147.
43. Xiao, R., K. Park, H. Lee, J. Kim, and C. Park. 2008. Identification andclassification of endogenous retroviruses in cattle. J. Virol. 82:582–587.
44. Xiao, R., K. Park, Y. Oh, J. Kim, and C. Park. 2008. Structural character-ization of the genome of BERV gamma 4, the most abundant endogenousretrovirus family in cattle. Mol. Cells 26:404–408.
45. Zhang, Z., S. Schwartz, L. Wagner, and W. Miller. 2000. A greedy algorithmfor aligning DNA sequences. J. Comput. Biol. 7:203–214.
10862 GARCIA-ETXEBARRIA AND JUGO J. VIROL.


![GÉOPOLITIQUE ET POPULATIONS AU TCHAD [Geopolitics and populations in Chad]](https://static.fdokumen.com/doc/165x107/631378e5fc260b71020f1c3f/geopolitique-et-populations-au-tchad-geopolitics-and-populations-in-chad.jpg)