Gene Flow and Natural Selection in Oceanic Human Populations Inferred from Genome-Wide SNP Typing
12
Gene Flow and Natural Selection in Oceanic Human Populations Inferred from Genome-Wide SNP Typing Ryosuke Kimura,* Jun Ohashi, Yasuhiro Matsumura,à Minato Nakazawa,§ Tsukasa Inaoka,k Ryutaro Ohtsuka,{ Motoki Osawa,* and Katsushi Tokunaga *Department of Forensic Medicine, Tokai University School of Medicine, Kanagawa, Japan; Department of Human Genetics, Graduate School of Medicine, The University of Tokyo, Tokyo, Japan; àDivision of Health Informatics and Education, National Institute of Health and Nutrition, Tokyo, Japan; §Socio-Environmental Health Sciences, Graduate School of Medicine, Gunma University, Gunma, Japan; kDepartment of Environmental Sociology, Faculty of Agriculture, Saga University, Saga, Japan; and {National Institute for Environmental Studies, Ibaraki, Japan It is suggested that the major prehistoric human colonizations of Oceania occurred twice, namely, about 50,000 and 4,000 years ago. The first settlers are considered as ancestors of indigenous people in New Guinea and Australia. The second settlers are Austronesian-speaking people who dispersed by voyaging in the Pacific Ocean. In this study, we performed genome-wide single-nucleotide polymorphism (SNP) typing on an indigenous Melanesian (Papuan) population, Gidra, and a Polynesian population, Tongans, by using the Affymetrix 500K assay. The SNP data were analyzed together with the data of the HapMap samples provided by Affymetrix. In agreement with previous studies, our phylogenetic analysis indicated that indigenous Melanesians are genetically closer to Asians than to Africans and European Americans. Population structure analyses revealed that the Tongan population is genetically originated from Asians at 70% and indigenous Melanesians at 30%, which thus supports the so-called Slow train model. We also applied the SNP data to genome-wide scans for positive selection by examining haplotypic variation and identified many candidates of locally selected genes. Providing a clue to understand human adaptation to environments, our approach based on evolutionary genetics must contribute to revealing unknown gene functions as well as functional differences between alleles. Conversely, this approach can also shed some light onto the invisible phenotypic differences between populations. Introduction The peopling of Oceania has intrigued anthropologists because it is one of the most mysterious adventures in hu- man history. The first colonization of New Guinea and Aus- tralia by modern humans is thought to have occurred by about 50 thousand years ago (KYA) when these lands formed a continent called Sahul (White and O’Connell 1979; Roberts et al. 1990). These first settlers are consid- ered as ancestors of indigenous Melanesians (Papuans) and Australians, who are anthropologically classified into the Australoid. The second major migration to Oceania was made about 4 KYA by Austronesian-speaking people (Bellwood 1989, 1991). They voyaged to Polynesia during 1-3 KYA. As for the origin of Polynesians, essentially 2 op- posite models have been proposed. One is called the ‘‘Express train’’ model, which supposes that Austronesian-speaking people rapidly dispersed to Polynesia with negligible admix- ture with indigenous Melanesians (Diamond 1988). The other is the ‘‘Entangled bank’’ model hypothesizing that Polyne- sians were derived from Melanesian populations affected by social and trade networks with people from Southeast Asia (Terrell 1988). Between these polar opposites, there are mod- els such as the ‘‘Slow train’’ that suggests significant genetic contributions from both original Austronesian-speaking peo- ple and indigenous Melanesians. To elucidate the origin of these populations, genetic evidence is most direct and informative. It has been well known that indigenous Melanesians and Australians, who have the phenotypes similar to Africans in visible traits such as skin color and hair shape, are genetically closer to Asians than to Africans and Europeans (Nei and Roychoudhury 1993; Zhivotovsky et al. 2004). This fact indicates that the first settlers of Oceania have shared a common ancestry with Asians after the divergence from Europeans. The ge- netic origin of Polynesians is still controversial although a number of studies have focused on this point. The anal- yses of mitochondrial DNA (mtDNA) have supported an Asian origin of Polynesians without admixture with indig- enous Melanesians as expected in the Express train model (Lum et al. 1994, 1998; Melton et al. 1995; Redd et al. 1995), whereas the analyses of the Y chromosome have re- vealed that indigenous Melanesians predominantly contrib- uted to the genetic components of Polynesians as described in the Entangled bank model (Kayser et al. 2000; Su et al. 2000; Capelli et al. 2001). However, both mtDNA and the Y chromosome are haploids that transmit without recombi- nation. Classical studies analyzing autosomal markers have shown different results depending on the marker used (Hill et al. 1985; Serjeantson 1985; O’Shaughnessy et al. 1990; Cavalli-Sforza et al. 1994; Martinson 1996; Serjeantson and Gao 1996). Therefore, analyses using a large number of autosomal loci are required for further elucidation. The first settlers of Oceania, that is, indigenous Mel- anesians and Australians, must have been exposed to var- ious selective pressures due to environmental differences during the long migration from Africa and due to the uniqueness of environments in Oceania after the settlement. They were isolated until recent time and developed their own lifestyle, which might have thus resulted in new selec- tive pressures. Especially, the slow growth, short stature, and lightweight characteristics of New Guineans are gen- erally assumed to reflect an adaptation to the low energy and nutrient densities of diets in which tubers and root crops predominate (Norgan 1995). In contrast, a distinctive char- acteristic of Polynesians is their large body size. From this phenotype, there has been implied the presence of a ‘‘thrifty Key words: adaptive evolution, gene flow, human genome, SNP, Oceania. E-mail: [email protected]. Mol. Biol. Evol. 25(8):1750–1761. 2008 doi:10.1093/molbev/msn128 Advance Access publication June 3, 2008 Ó The Author 2008. Published by Oxford University Press on behalf of the Society for Molecular Biology and Evolution. All rights reserved. For permissions, please e-mail: [email protected] by guest on December 2, 2013 http://mbe.oxfordjournals.org/ Downloaded from
-
Upload
independent -
Category
Documents
-
view
4 -
download
0
Transcript of Gene Flow and Natural Selection in Oceanic Human Populations Inferred from Genome-Wide SNP Typing
Gene Flow and Natural Selection in Oceanic Human Populations Inferred fromGenome-Wide SNP Typing
Ryosuke Kimura,* Jun Ohashi,� Yasuhiro Matsumura,� Minato Nakazawa,§ Tsukasa Inaoka,kRyutaro Ohtsuka,{ Motoki Osawa,* and Katsushi Tokunaga�*Department of Forensic Medicine, Tokai University School of Medicine, Kanagawa, Japan; �Department of Human Genetics,Graduate School of Medicine, The University of Tokyo, Tokyo, Japan; �Division of Health Informatics and Education, NationalInstitute of Health and Nutrition, Tokyo, Japan; §Socio-Environmental Health Sciences, Graduate School of Medicine, GunmaUniversity, Gunma, Japan; kDepartment of Environmental Sociology, Faculty of Agriculture, Saga University, Saga, Japan; and{National Institute for Environmental Studies, Ibaraki, Japan
It is suggested that the major prehistoric human colonizations of Oceania occurred twice, namely, about 50,000 and4,000 years ago. The first settlers are considered as ancestors of indigenous people in New Guinea and Australia. Thesecond settlers are Austronesian-speaking people who dispersed by voyaging in the Pacific Ocean. In this study, weperformed genome-wide single-nucleotide polymorphism (SNP) typing on an indigenous Melanesian (Papuan)population, Gidra, and a Polynesian population, Tongans, by using the Affymetrix 500K assay. The SNP data wereanalyzed together with the data of the HapMap samples provided by Affymetrix. In agreement with previous studies, ourphylogenetic analysis indicated that indigenous Melanesians are genetically closer to Asians than to Africans andEuropean Americans. Population structure analyses revealed that the Tongan population is genetically originated fromAsians at 70% and indigenous Melanesians at 30%, which thus supports the so-called Slow train model. We also appliedthe SNP data to genome-wide scans for positive selection by examining haplotypic variation and identified manycandidates of locally selected genes. Providing a clue to understand human adaptation to environments, our approachbased on evolutionary genetics must contribute to revealing unknown gene functions as well as functional differencesbetween alleles. Conversely, this approach can also shed some light onto the invisible phenotypic differences betweenpopulations.
Introduction
The peopling of Oceania has intrigued anthropologistsbecause it is one of the most mysterious adventures in hu-man history. The first colonization of New Guinea and Aus-tralia by modern humans is thought to have occurred byabout 50 thousand years ago (KYA) when these landsformed a continent called Sahul (White and O’Connell1979; Roberts et al. 1990). These first settlers are consid-ered as ancestors of indigenous Melanesians (Papuans) andAustralians, who are anthropologically classified into theAustraloid. The second major migration to Oceania wasmade about 4 KYA by Austronesian-speaking people(Bellwood 1989, 1991). They voyaged to Polynesia during1-3 KYA. As for the origin of Polynesians, essentially 2 op-posite models have been proposed. One is called the ‘‘Expresstrain’’ model, which supposes that Austronesian-speakingpeople rapidly dispersed to Polynesia with negligible admix-ture with indigenous Melanesians (Diamond 1988). The otheris the ‘‘Entangled bank’’ model hypothesizing that Polyne-sians were derived from Melanesian populations affectedby social and trade networks with people from Southeast Asia(Terrell 1988). Between these polar opposites, there are mod-els such as the ‘‘Slow train’’ that suggests significant geneticcontributions from both original Austronesian-speaking peo-ple and indigenous Melanesians.
To elucidate the origin of these populations, geneticevidence is most direct and informative. It has been wellknown that indigenous Melanesians and Australians, whohave the phenotypes similar to Africans in visible traits suchas skin color and hair shape, are genetically closer to Asians
than to Africans and Europeans (Nei and Roychoudhury1993; Zhivotovsky et al. 2004). This fact indicates thatthe first settlers of Oceania have shared a common ancestrywith Asians after the divergence from Europeans. The ge-netic origin of Polynesians is still controversial althougha number of studies have focused on this point. The anal-yses of mitochondrial DNA (mtDNA) have supported anAsian origin of Polynesians without admixture with indig-enous Melanesians as expected in the Express train model(Lum et al. 1994, 1998; Melton et al. 1995; Redd et al.1995), whereas the analyses of the Y chromosome have re-vealed that indigenous Melanesians predominantly contrib-uted to the genetic components of Polynesians as describedin the Entangled bank model (Kayser et al. 2000; Su et al.2000; Capelli et al. 2001). However, both mtDNA and theY chromosome are haploids that transmit without recombi-nation. Classical studies analyzing autosomal markers haveshown different results depending on the marker used (Hillet al. 1985; Serjeantson 1985; O’Shaughnessy et al. 1990;Cavalli-Sforza et al. 1994; Martinson 1996; Serjeantsonand Gao 1996). Therefore, analyses using a large numberof autosomal loci are required for further elucidation.
The first settlers of Oceania, that is, indigenous Mel-anesians and Australians, must have been exposed to var-ious selective pressures due to environmental differencesduring the long migration from Africa and due to theuniqueness of environments in Oceania after the settlement.They were isolated until recent time and developed theirown lifestyle, which might have thus resulted in new selec-tive pressures. Especially, the slow growth, short stature,and lightweight characteristics of New Guineans are gen-erally assumed to reflect an adaptation to the low energyand nutrient densities of diets in which tubers and root cropspredominate (Norgan 1995). In contrast, a distinctive char-acteristic of Polynesians is their large body size. From thisphenotype, there has been implied the presence of a ‘‘thrifty
Key words: adaptive evolution, gene flow, human genome, SNP,Oceania.
E-mail: [email protected].
Mol. Biol. Evol. 25(8):1750–1761. 2008doi:10.1093/molbev/msn128Advance Access publication June 3, 2008
� The Author 2008. Published by Oxford University Press on behalf ofthe Society for Molecular Biology and Evolution. All rights reserved.For permissions, please e-mail: [email protected]
by guest on Decem
ber 2, 2013http://m
be.oxfordjournals.org/D
ownloaded from
genotype’’ that is associated with saved energy expenditureand efficient fat storage (Neel 1962; Bindon and Baker1997). An alternative explanation for Polynesian’s largebody size is based on the ‘‘Bergman’s rule,’’ a principle thatcorrelates body mass with environmental temperature(Houghton 1990; Bindon and Baker 1997). However, thevalidity of the thrifty genotype and Bergman’s rule hypoth-eses in Polynesians is still open to debate.
Recent advances in DNA technologies have now en-abled us to perform genome-wide single-nucleotide poly-morphism (SNP) typing. The Affymetrix GeneChipHuman 500K arrays used in this study are commerciallyprovided DNA chips that can genotype about 500,000SNPs for each individual. The preponderant number of typ-ing data would assure us of accurate estimation of the ad-mixture rate between Asian and Melanesian lineages inPolynesians. Moreover, genome-wide SNP data are appli-cable to genome-wide scans for genetic regions under pos-itive selection. Several researchers have recently developedmethods to identify signatures of positive selection fromSNP data based on hitchhiking events and selective sweepsand have conducted genome-wide scans using SNP data-bases from the HapMap project and Perlegen Sciences(Kim and Stephan 2002; Sabeti et al. 2002; Nielsen et al.2005; Voight et al. 2006; Wang et al. 2006; Kimura et al.2007; Tang et al. 2007; Williamson et al. 2007). The strategybased on evolutionary genetics has provided cues to revealgenotype–phenotype association (Fujimoto et al. 2008;Kayser, Liu, et al. 2008).
The present study investigates the peopling of Oceaniawith a special focus on the admixture rate between Asianand indigenous Melanesian lineages in Polynesians. Wealso performed genome-wide scans for positive selectionon Oceanic populations. For these purposes, we subjectedan indigenous Melanesian (Papuan) population, Gidra, anda Polynesian population, Tongans, for genome-wide SNPtyping with the Affymetrix GeneChip Human 500K arrayset.
Materials and MethodsSamples
Individuals from 2 Oceanic populations, Gidra in Pap-ua New Guinea (GDP samples, n 5 24) and Tongans fromNukualofa, Kingdom of Tonga (TGN samples, n 5 24),were subjected to our study. The Gidra are Papuan-speakingpeople that inhabit the lowlands of Western Province,Papua, New Guinea. This population has been reportedto have a small size and to be isolated (Ohtsuka 1986). Ton-gans are Austronesian language–speaking people in Poly-nesia. Informed consent for participation was obtained fromall the subjects in their own language. This study was ap-proved by the Research Ethics Committee at The Universityof Tokyo. In addition to these populations, we referred togenotyping data of the HapMap samples that were publiclyprovided by Affymetrix (http://www.affymetrix.com). TheHapMap samples included 30 trios (90 individuals) eachfrom Yoruba from Ibadan in Nigeria (YRI) and US resi-dents with ancestry from northern and western Europe(CEU) and 45 unrelated individuals each from Han Chinese
from Beijing (CHB) and Japanese from Tokyo (JPT) (TheInternational HapMap Consortium 2005). Here, EastAsians (EAS) denote JPT and CHB together. We selectedonly unrelated individuals (parents in trios) from YRI andCEU and also removed a JPT individual that showed highinbreeding. In total, 209 HapMap individuals (60 YRI;60 CEU; 45 CHB; and 44 JPT) were thus used for ouranalyses.
Genotyping and Data Quality Control
SNP genotyping was performed with the AffymetrixGeneChip Human 500K array set. In brief, genomic DNA(250 ng) was digested with a restriction enzyme (NspI orStyI) and ligated to adaptors that recognize the cohesive4-bp overhangs. These fragments were amplified with poly-merase chain reaction using a generic primer that recog-nizes the adaptor sequence. The amplified DNA wasthen fragmented, labeled, and hybridized to a microarraychip. The chip was scanned with Affimetrix GeneChipScanner 3000. The genotypes were determined with Gen-eChip Genotyping Analysis Software based on the Dy-namic Model algorithm, in which a strict confidencethreshold of P 5 0.26 was selected. Only the autosomalSNPs (490,031 SNPs) were analyzed in this study. TheSNPs were filtered with a criterion of missing rate,0.25 in every population (supplementary table S1, Sup-plementary Material online). According to our typing, themissing rates for GDP and TGN were slightly high prob-ably due to DNA quality. We excluded SNPs withP , 0.01 in chi-square test for the Hardy–Weinberg equi-librium, which accounted for 0.024–0.033 of the polymor-phic loci (2.4–3.3 times higher than expected), because itwas highly possible for these SNPs to be mistyped or tobe located on copy number variations. We also removedthose SNPs that were monomorphic in all the populations.Finally, 393,971 autosomal SNPs remained. Because all theSNPs covered 2.7 Gbp of the genome, the average SNP in-terval was 6.8 kbp/SNP.
FST between Populations and Phylogenetic Tree amongIndividuals
For each SNP, we calculated FST between pairs ofpopulations. The genetic distance between each pair of in-dividuals was calculated simply from the average nucleo-tide difference of 2 chromosomes drawn at random fromdifferent individuals. For locus l, the nucleotide differencebetween individuals x and y is defined as hxy,l 5 (d11 þ d12
þ d21 þ d22)/4, where indicator dab is 1 when chromosomea in individual x is different from chromosome b in individ-ual y and zero when otherwise. For biallelic loci, hxy,l canonly take 3 values: 0 (e.g., AA:AA), 1/2 (e.g., AA:AB orAB:AB), and 1 (e.g., AA:BB). The average nucleotide dif-ference between 2 individuals x and y (Hxy) can be obtainedby averaging hxy,l over L analyzed loci. Suppose aX,l and bX,l
are the frequency of the allele A and B, respectively, at locusl in the population X, E(Hxy) 5 R2aX,lbX,l/L ([DX) whenindividuals x and y are randomly extracted from the same
Gene Flow and Natural Selection in Oceania 1751
by guest on Decem
ber 2, 2013http://m
be.oxfordjournals.org/D
ownloaded from

population X. On the other hand, E(Hxy) 5 R(1 � aX,laY,l�bX,lbY,l)/L ([DXY) when individuals x and y are derivedfrom different populations X and Y. Therefore, under a largenumber of loci analyzed, every Hxy value becomes nearlyequal to DX or DXY. From a distant matrix obtained, we con-structed phylogenetic trees of individuals using the Neighbor-Joining method (Saitou and Nei 1987) with Molecular Evo-lutionary Genetics Analysis version 3.1 (Kumar et al. 2004).The length of the outer branch for an individual in the phy-logenetic trees (fig. 1A andB) is nearly equal toDX/2, whereasthe length of the inner branch between 2 populations is nearlyequal to the Nei’s (1973) minimum genetic distance, Dm 5DXY � (DX þ DY)/2. We also performed multidimensionalscaling (MDS) analyses using the distance matrix for individ-uals to observe the homogeneity of the populations (Kruskaland Wish 1978).
Population Structure Analysis
A cluster analysis for population structure was per-formed using the STRUCTURE version 2.0 software pro-gram (Pritchard et al. 2000). Because a number of SNPswere typed and neighboring SNPs were in strong linkagedisequilibrium (LD) with each other, 1/100 of the ‘‘typedSNPs’’ (3,940 SNPs) were selected for a set, and 4 different
sets were used for this analysis. In all runs of the STRUC-TURE algorithm, we used 10,000 Markov chain MonteCarlo replications after a burn-in of length 10,000, witha model of correlated allele frequencies. The number ofgroups from k 5 2 to k 5 5 were tested in a populationmodel with admixture. We averaged the proportions ofmemberships over the 4 different sets that showed almostthe same results.
Estimation of Haplotypes and Missing Genotypes
The estimation of the haplotypes and missing ge-notypes was performed with fastPHASE version 1.2(Scheet and Stephens 2006). We used 5 random starts ofthe expectation-maximization algorithm with population la-bel information. An allele frequency spectrum for each pop-ulation was drawn after estimating the missing genotypes.The LD coefficients, D# and r2, for each population werealso calculated using 48 chromosomes when the physicaldistance between 2 SNPs was less than 250 kb. Althoughhaplotype estimation may be inaccurate, especially for rarehaplotypes in the presence of low LD, the accuracy in thefrequency of major haplotypes would be retained to someextent. Therefore, the inaccuracy in haplotype estimation isthought to have only a slight effect on the following anal-yses for scanning positive selection.
FIG. 1.—Analyses of population phylogeny, structure, and LD. (A and B) Neighbor-Joining trees were constructed with (A) and without (B) TGNindividuals. (C) The proportion of membership for each individual in a STRUCTURE analysis. The number of groups (k) was assumed to be 2–5.(D and E) LD coefficients and physical distance. To calculate the LD coefficients, 48 chromosomes were used in each population.
1752 Kimura et al.
by guest on Decem
ber 2, 2013http://m
be.oxfordjournals.org/D
ownloaded from
Modified Long-Range Haplotype Test
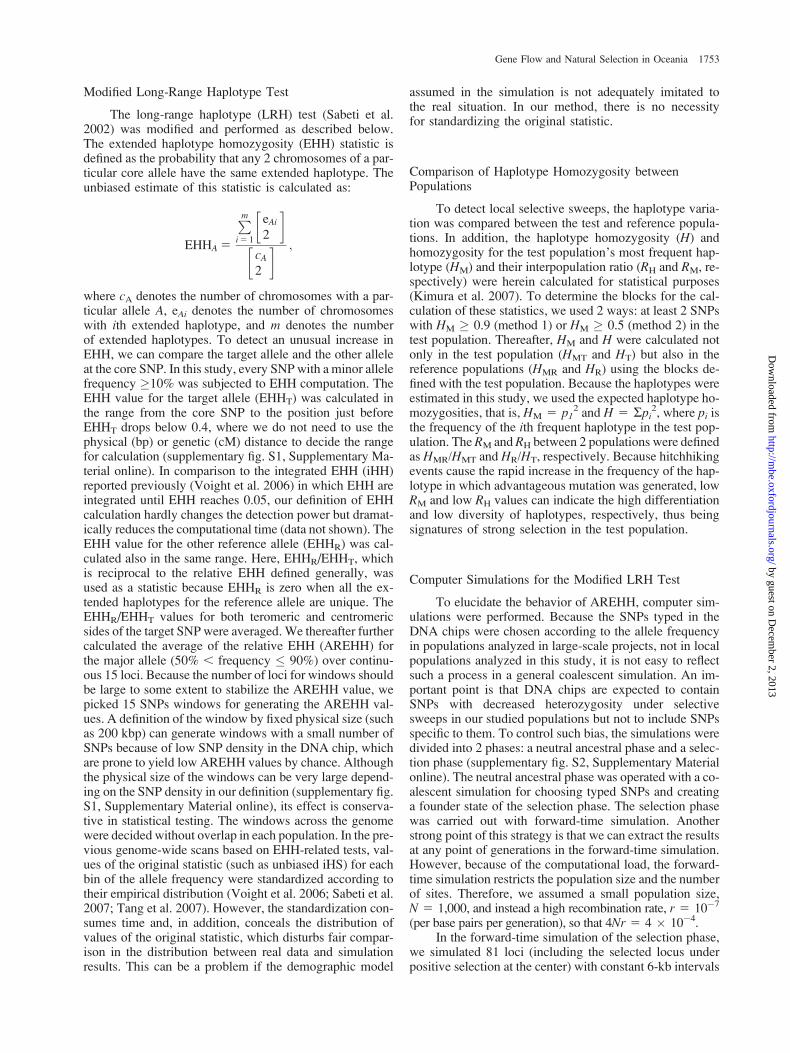
The long-range haplotype (LRH) test (Sabeti et al.2002) was modified and performed as described below.The extended haplotype homozygosity (EHH) statistic isdefined as the probability that any 2 chromosomes of a par-ticular core allele have the same extended haplotype. Theunbiased estimate of this statistic is calculated as:
EHHA 5
Pmi5 1
�eAi2
��cA2
� ;
where cA denotes the number of chromosomes with a par-ticular allele A, eAi denotes the number of chromosomeswith ith extended haplotype, and m denotes the numberof extended haplotypes. To detect an unusual increase inEHH, we can compare the target allele and the other alleleat the core SNP. In this study, every SNP with a minor allelefrequency �10% was subjected to EHH computation. TheEHH value for the target allele (EHHT) was calculated inthe range from the core SNP to the position just beforeEHHT drops below 0.4, where we do not need to use thephysical (bp) or genetic (cM) distance to decide the rangefor calculation (supplementary fig. S1, Supplementary Ma-terial online). In comparison to the integrated EHH (iHH)reported previously (Voight et al. 2006) in which EHH areintegrated until EHH reaches 0.05, our definition of EHHcalculation hardly changes the detection power but dramat-ically reduces the computational time (data not shown). TheEHH value for the other reference allele (EHHR) was cal-culated also in the same range. Here, EHHR/EHHT, whichis reciprocal to the relative EHH defined generally, wasused as a statistic because EHHR is zero when all the ex-tended haplotypes for the reference allele are unique. TheEHHR/EHHT values for both teromeric and centromericsides of the target SNP were averaged. We thereafter furthercalculated the average of the relative EHH (AREHH) forthe major allele (50% , frequency � 90%) over continu-ous 15 loci. Because the number of loci for windows shouldbe large to some extent to stabilize the AREHH value, wepicked 15 SNPs windows for generating the AREHH val-ues. A definition of the window by fixed physical size (suchas 200 kbp) can generate windows with a small number ofSNPs because of low SNP density in the DNA chip, whichare prone to yield low AREHH values by chance. Althoughthe physical size of the windows can be very large depend-ing on the SNP density in our definition (supplementary fig.S1, Supplementary Material online), its effect is conserva-tive in statistical testing. The windows across the genomewere decided without overlap in each population. In the pre-vious genome-wide scans based on EHH-related tests, val-ues of the original statistic (such as unbiased iHS) for eachbin of the allele frequency were standardized according totheir empirical distribution (Voight et al. 2006; Sabeti et al.2007; Tang et al. 2007). However, the standardization con-sumes time and, in addition, conceals the distribution ofvalues of the original statistic, which disturbs fair compar-ison in the distribution between real data and simulationresults. This can be a problem if the demographic model
assumed in the simulation is not adequately imitated tothe real situation. In our method, there is no necessityfor standardizing the original statistic.
Comparison of Haplotype Homozygosity betweenPopulations
To detect local selective sweeps, the haplotype varia-tion was compared between the test and reference popula-tions. In addition, the haplotype homozygosity (H) andhomozygosity for the test population’s most frequent hap-lotype (HM) and their interpopulation ratio (RH and RM, re-spectively) were herein calculated for statistical purposes(Kimura et al. 2007). To determine the blocks for the cal-culation of these statistics, we used 2 ways: at least 2 SNPswith HM � 0.9 (method 1) or HM � 0.5 (method 2) in thetest population. Thereafter, HM and H were calculated notonly in the test population (HMT and HT) but also in thereference populations (HMR and HR) using the blocks de-fined with the test population. Because the haplotypes wereestimated in this study, we used the expected haplotype ho-mozygosities, that is, HM 5 p1
2 and H 5 Rpi2, where pi is
the frequency of the ith frequent haplotype in the test pop-ulation. The RM and RH between 2 populations were definedas HMR/HMT and HR/HT, respectively. Because hitchhikingevents cause the rapid increase in the frequency of the hap-lotype in which advantageous mutation was generated, lowRM and low RH values can indicate the high differentiationand low diversity of haplotypes, respectively, thus beingsignatures of strong selection in the test population.
Computer Simulations for the Modified LRH Test
To elucidate the behavior of AREHH, computer sim-ulations were performed. Because the SNPs typed in theDNA chips were chosen according to the allele frequencyin populations analyzed in large-scale projects, not in localpopulations analyzed in this study, it is not easy to reflectsuch a process in a general coalescent simulation. An im-portant point is that DNA chips are expected to containSNPs with decreased heterozygosity under selectivesweeps in our studied populations but not to include SNPsspecific to them. To control such bias, the simulations weredivided into 2 phases: a neutral ancestral phase and a selec-tion phase (supplementary fig. S2, Supplementary Materialonline). The neutral ancestral phase was operated with a co-alescent simulation for choosing typed SNPs and creatinga founder state of the selection phase. The selection phasewas carried out with forward-time simulation. Anotherstrong point of this strategy is that we can extract the resultsat any point of generations in the forward-time simulation.However, because of the computational load, the forward-time simulation restricts the population size and the numberof sites. Therefore, we assumed a small population size,N 5 1,000, and instead a high recombination rate, r 5 10�7
(per base pairs per generation), so that 4Nr 5 4 � 10�4.In the forward-time simulation of the selection phase,
we simulated 81 loci (including the selected locus underpositive selection at the center) with constant 6-kb intervals
Gene Flow and Natural Selection in Oceania 1753
by guest on Decem
ber 2, 2013http://m
be.oxfordjournals.org/D
ownloaded from
without assuming new mutation. Here, ith locus of jth chro-mosome of the founder generation was denoted by (i, j), notby allelic state, and thus the identical-by-descent state ateach generation could be obtained. We examined thestrength of selection at s 5 0.15 or 0.075 (2Ns 5 300 or150) for codominant selection conditions or at s 5 0 forneutral conditions, where s and s/2 are the selection coef-ficients for homozygotes and heterozygotes, respectively.In addition to the constant population model (N 5 1,000),a population decline (N 5 500) model in the selectionphase was tested (supplementary fig. S2, SupplementaryMaterial online). Under the selection condition, we as-sumed that an advantageous mutation generated in a singlechromosome increases by positive selection. The simula-tion results were extracted at those generations where theadvantageous allele frequencies become 15%, 25%,35%, 45%, 55%, 65%, 75%, and 85% (supplementaryfig. S2, Supplementary Material online), which are nearto 100 and 200 generations in the case of s 5 0.15 and0.075, respectively. Under neutral conditions, the simula-tion results were extracted at 100 or 200 generations.For each parameter setting, the simulation runs were repli-cated 500 times.
The coalescent simulation of the neutral ancestralphase was operated with cosi program (Schaffner et al.2005), which is a modification of Hudson’s ms program.In the simulation, we assumed a 500-kbp region, a constantpopulation size of N 5 1,000, and a mutation rate ofl 5 1.5 � 10�7 (per base pairs per generation) in whichwe have 4Nl 5 6 � 10�4 and sampled all the chromo-somes in the population (2n 5 2N 5 2,000). To choosetyped SNPs, we set 2-kb windows with 4-kb intervals be-tween adjoining windows (total 80 windows). Thereafter,the SNPs with the highest minor allele frequency in everywindow were chosen. These SNPs were relocated to haveconstant 6-kbp intervals, which were used as the founderstate of the selection phase. The coalescent simulationwas then repeated to create 500 founder states.
The results of the selection phase that denoted by (i, j)were connected to the results of the neutral ancestral phaseone by one, and the denotations were replaced by allelicstate. We calculated EHHR/EHHT values for major alleleswith the frequency �90% as described above. In a fewcases that the EHHT value did not decay below 0.4 atthe end SNP (1st or 81st), the EHHR/EHHT value was cal-culated at the end SNP. To compute AREHH, the selectedlocus was excluded, and 15 SNPs around the selected locuswere used. Although our simulation models may lack rig-orousness to imitate the actual demographic history of pop-ulations, they are useful to estimate roughly the behavior ofthe statistic.
To determine the null distribution of the EHH statisticacross the genome under neutrality, we also performed agenome-size neutral simulation as previously reported(Kimura et al. 2007). In brief, a neutral coalescent simulationusing cosi program was performed for African, European,and East Asian populations with a flexible recombinationrate and a fitting demographic model proposed previously(Schaffner et al. 2005). To correct the ascertainment bias ofthe selected SNPs on the Affymetrix 500K chips, we ex-tracted the typed SNPs from the simulation data using a re-
jection method based on the allele frequency spectrum ofthe simulation and real data.
Computer Simulations for RM and RH Test
In the same manner as that described in a previousstudy (Kimura et al. 2007), we simulated the detectionpowers of RM and RH to see the effect of the SNP density,sample size, and the initial number of the advantageous al-leles. We therefore designed 2 constant-size populations(N 5 1,000) that diverged for 200 generations and assumeds 5 0.15 (2Ns 5 300) for a model of complete selectivesweeps. The frequency of the selected allele was set at a sin-gle chromosome or 20% when positive selection began totake effect. In addition, we examined a model of partial se-lective sweeps in which the advantageous mutation reachesan 80% frequency under the positive selection of s 5 0.085(2Ns 5 170) for 200 generations.
Results and DiscussionGenetic Differentiation and Admixture betweenPopulations
FST values exhibited a genetic differentiation betweenGDP and another non-African population which was rela-tively high in comparison to that between any other non-African pairs (supplementary fig. S3, SupplementaryMaterial online). A Neighbor-Joining tree among individ-uals demonstrated the GDP individuals to have a small di-versity within the population (fig. 1A). Taken together,these results are consistent with the fact that this populationhas been isolated and also possessed a small population size(Ohtsuka 1986). A close relationship between TGN andEAS was inferred from the MDS analyses (supplementaryfig. S4, Supplementary Material online) as well as low FST
values, whereas TGN individuals lay between EAS andGDP individuals in the phylogenetic tree (fig. 1A). Becausethe population admixture can distort the shape of the phy-logenetic tree, we reconstructed another tree removing theTGN individuals. In the reconstructed tree (fig. 1B), thebranch length changed but the topology was still retained.This means that indigenous Melanesians have a stronger ge-netic affinity with Asians than with Africans and EuropeanAmericans as previously reported (Nei and Roychoudhury1993; Zhivotovsky et al. 2004).
The results of the STRUCTURE analyses clearly sug-gested Tongans to originate from an admixture populationbetween Asians and indigenous Melanesians (fig. 1C).When the number of groups assumed (k) was 4 in theSTRUCTURE analyses, then individuals in YRI, CEU,EAS, and GDP were assigned to 4 respective groups, whichare thought to correspond to classical human races, that is,Negroid, Caucasoid, Mongoloid, and Australoid. Theseanalyses suggested that the Tongan population is geneti-cally derived from Mongoloid at 70.1%, from Australoidat 27.7%, and from the others at 2.2%, which are propor-tions that are similar to those estimated in some of the pre-vious small-scale studies (Serjeantson 1985; Martinson1996). Most recent studies analyzing a large number of
1754 Kimura et al.
by guest on Decem
ber 2, 2013http://m
be.oxfordjournals.org/D
ownloaded from
autosomal microsatellites have also showed almost samegenetic contributions of Asians and indigenous Melane-sians to Polynesians (Friedlaender et al. 2008; Kayser,Lao, et al. 2008). Only a few individuals showed a smallgenetic contribution from Europeans, thus indicating rela-tively recent immigration. On the other hand, because theproportion of genetic contribution from Asians and Mela-nesians in Tongan individuals was homogeneous, it is sug-gested that the admixture occurred long ago and peoplehave only randomly mated after that. This is also inferredfrom a tight cluster of TGN individuals in the MDS analysisfor the 3 populations (TGN, GDP, and EAS) (supplemen-tary fig. S4, Supplementary Material online). Our resultssupport the Slow train model, obviously ruling out the Ex-press train and Entangled bank models. In addition, the pro-portions observed in this study were compatible with thesex-biased contribution inferred from previous mtDNAand Y-chromosome data, that is, a nearly 100% Asian or-igin for maternal lineage and 35% Asian and 65% indige-nous Melanesian origins for paternal lineage (Kayser et al.2006).
Linkage Disequilibrium
The allele frequency spectra after the estimation of thehaplotype phase and missing genotype with the fastPHASEalgorithm are shown in supplementary figure S5 (Supple-mentary Material online). We calculated LD coefficients,D# and r2, in each population using 48 chromosomes(fig. 1D and E). Both of the coefficients were high inGDP and TGN, low in YRI, and intermediate in EASand CEU, which is thought to reflect their past populationsizes. As for TGN, the high LD coefficients can also be at-tributed partly to the population admixture.
Scans for Selective Sweeps with an LRH Test
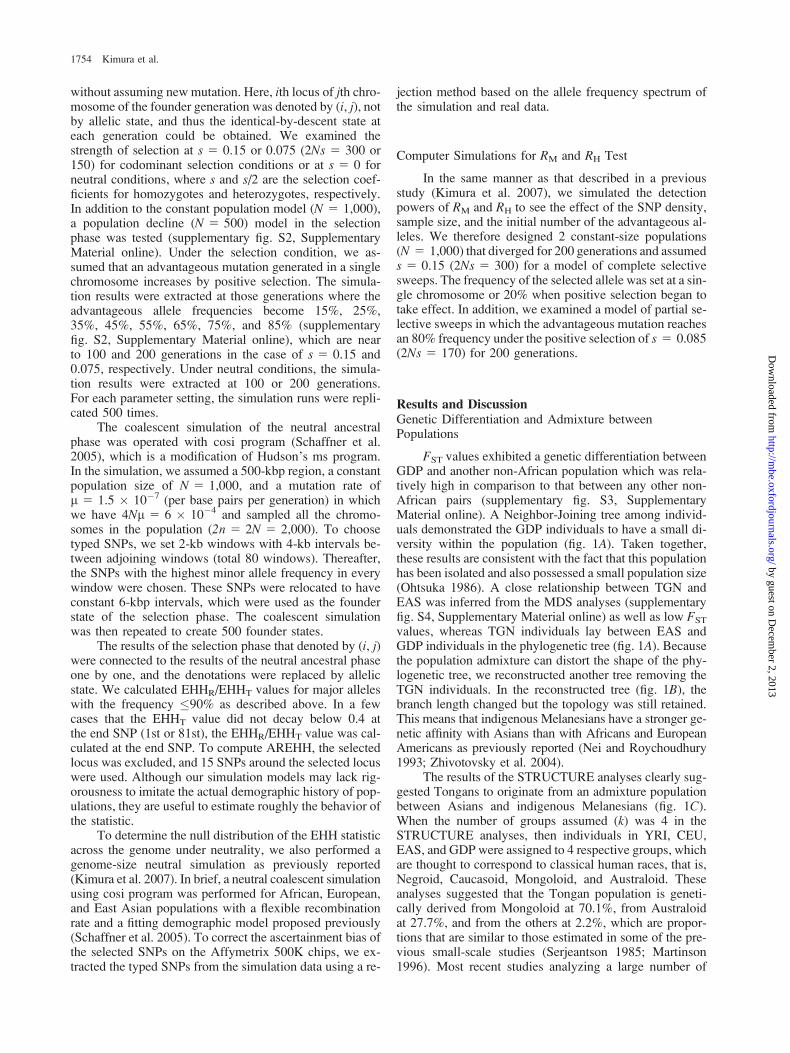
To scan for partial selective sweeps in the genome, weemployed a modified LRH test. Figure 2 represents themanner that the pattern of EHHR/EHHT for SNPs aroundthe selected locus becomes bipolar as the frequency ofthe advantageous allele increases. This indicates thata hitchhiking allele, which generally has a higher frequencythan the selected allele, showed a low EHHR/EHHT valueand the other allele showed a high EHHR/EHHT value.When the frequency of the advantageous allele is stilllow, the distribution of the EHHR/EHHT values is similarto the neutral case, suggesting difficulty of detecting pos-itive selection in such a case. However, after the selectedallele becomes the major allele (over 50%), the major alleleof neighboring SNPs also showed a very low EHHR/EHHT
value. Therefore, we can detect such a signature of strongpositive selection even without typing the locus under se-lection using the EHHR/EHHT values for the major allele ofneighboring SNPs. In this study, we calculated AREHH,that is, the average of the EHHR/EHHT values for alleleshaving a 50–90% frequency over 15 continuous SNPs. Be-fore we applied this method to real data, its performancewas examined with a computer simulation. Figure 3 exhib-
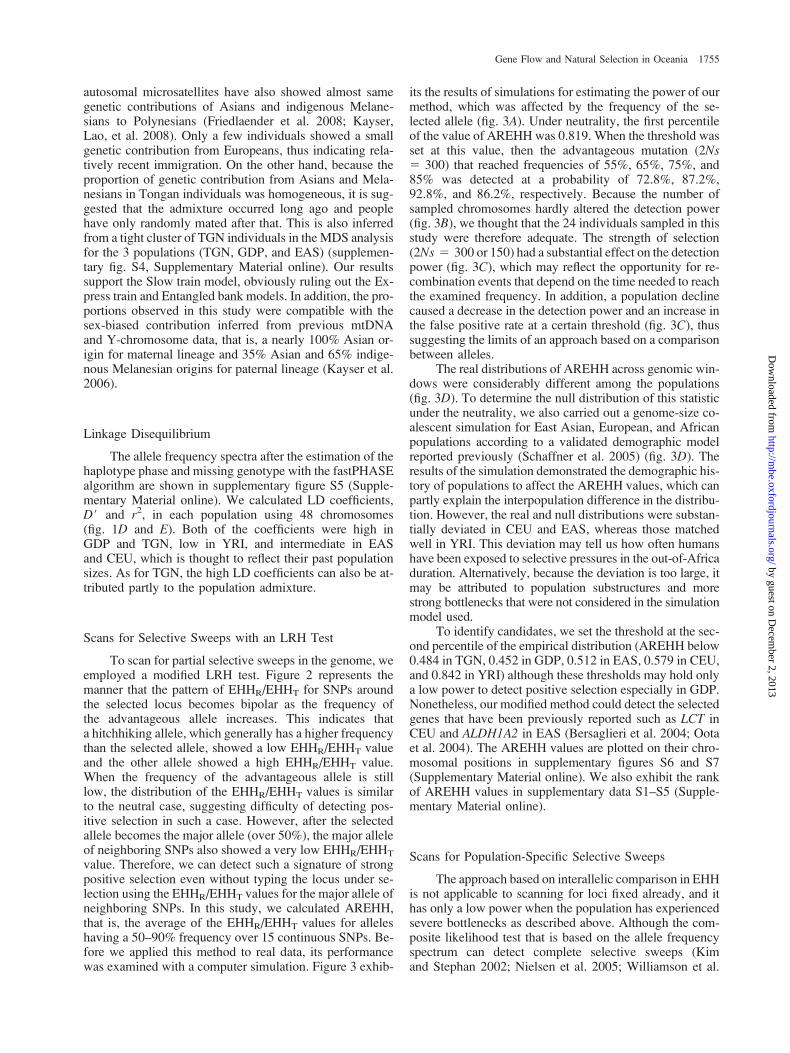
its the results of simulations for estimating the power of ourmethod, which was affected by the frequency of the se-lected allele (fig. 3A). Under neutrality, the first percentileof the value of AREHH was 0.819. When the threshold wasset at this value, then the advantageous mutation (2Ns5 300) that reached frequencies of 55%, 65%, 75%, and85% was detected at a probability of 72.8%, 87.2%,92.8%, and 86.2%, respectively. Because the number ofsampled chromosomes hardly altered the detection power(fig. 3B), we thought that the 24 individuals sampled in thisstudy were therefore adequate. The strength of selection(2Ns 5 300 or 150) had a substantial effect on the detectionpower (fig. 3C), which may reflect the opportunity for re-combination events that depend on the time needed to reachthe examined frequency. In addition, a population declinecaused a decrease in the detection power and an increase inthe false positive rate at a certain threshold (fig. 3C), thussuggesting the limits of an approach based on a comparisonbetween alleles.
The real distributions of AREHH across genomic win-dows were considerably different among the populations(fig. 3D). To determine the null distribution of this statisticunder the neutrality, we also carried out a genome-size co-alescent simulation for East Asian, European, and Africanpopulations according to a validated demographic modelreported previously (Schaffner et al. 2005) (fig. 3D). Theresults of the simulation demonstrated the demographic his-tory of populations to affect the AREHH values, which canpartly explain the interpopulation difference in the distribu-tion. However, the real and null distributions were substan-tially deviated in CEU and EAS, whereas those matchedwell in YRI. This deviation may tell us how often humanshave been exposed to selective pressures in the out-of-Africaduration. Alternatively, because the deviation is too large, itmay be attributed to population substructures and morestrong bottlenecks that were not considered in the simulationmodel used.
To identify candidates, we set the threshold at the sec-ond percentile of the empirical distribution (AREHH below0.484 in TGN, 0.452 in GDP, 0.512 in EAS, 0.579 in CEU,and 0.842 in YRI) although these thresholds may hold onlya low power to detect positive selection especially in GDP.Nonetheless, our modified method could detect the selectedgenes that have been previously reported such as LCT inCEU and ALDH1A2 in EAS (Bersaglieri et al. 2004; Ootaet al. 2004). The AREHH values are plotted on their chro-mosomal positions in supplementary figures S6 and S7(Supplementary Material online). We also exhibit the rankof AREHH values in supplementary data S1–S5 (Supple-mentary Material online).
Scans for Population-Specific Selective Sweeps
The approach based on interallelic comparison in EHHis not applicable to scanning for loci fixed already, and ithas only a low power when the population has experiencedsevere bottlenecks as described above. Although the com-posite likelihood test that is based on the allele frequencyspectrum can detect complete selective sweeps (Kimand Stephan 2002; Nielsen et al. 2005; Williamson et al.
Gene Flow and Natural Selection in Oceania 1755
by guest on Decem
ber 2, 2013http://m
be.oxfordjournals.org/D
ownloaded from
2007), similarly to the aforementioned approach, this testcaptures loci under positive selection even if it has operatedin the common ancestral population. However, we are nowmost interested in the selective sweeps occurring locally inOceanic populations. To detect population-specific selec-tive sweeps, therefore, we calculated the interpopulation ra-tio of haplotype homozygosity, RH, and the interpopulationratio of homozygosity for the test population’s most fre-quent haplotype, RM (Kimura et al. 2007). The RH value
can be an indicator of nucleotide diversity and past recom-bination events, whereas the RM value can be an indicator ofgenetic differentiation like FST. Previous reports (Sabetiet al. 2007; Tang et al. 2007) have proposed similar ap-proaches based on comparison between populations, whichrequire calculation of the interpopulation ratio of EHH val-ues for every allele. In the RH and RM test, we can avoidredundant tests for neighboring SNPs in strong LD witheach other. In addition, the RM value measuring haplotypic
FIG. 2.—Change of the pattern of EHHR/EHHT values around the selected loci. The results of simulations (2Ns 5 300) under the variousfrequencies of the allele under selection (p) are shown. EHHR/EHHT values of SNPs within 200 kb around the selected loci were fractionated (y axis)and counted for each bin of the allele frequency (x axis). The data from 500 replications of simulation are put together. The vertical line represents P.
1756 Kimura et al.
by guest on Decem
ber 2, 2013http://m
be.oxfordjournals.org/D
ownloaded from
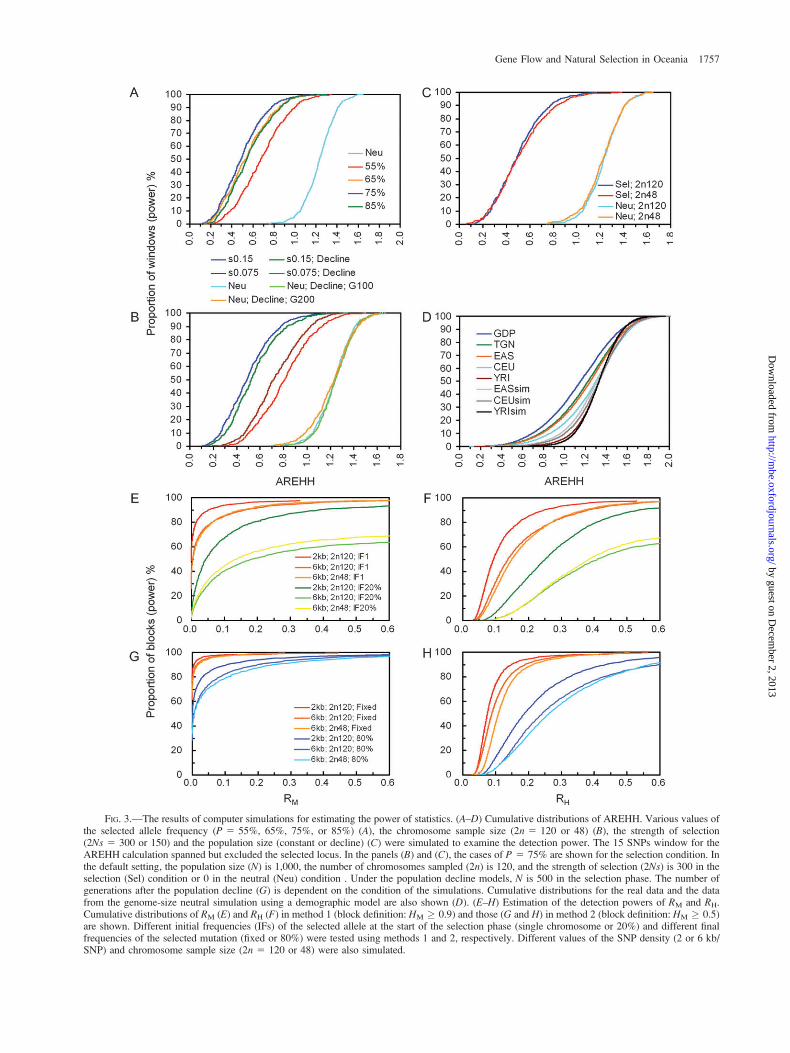
FIG. 3.—The results of computer simulations for estimating the power of statistics. (A–D) Cumulative distributions of AREHH. Various values ofthe selected allele frequency (P 5 55%, 65%, 75%, or 85%) (A), the chromosome sample size (2n 5 120 or 48) (B), the strength of selection(2Ns 5 300 or 150) and the population size (constant or decline) (C) were simulated to examine the detection power. The 15 SNPs window for theAREHH calculation spanned but excluded the selected locus. In the panels (B) and (C), the cases of P 5 75% are shown for the selection condition. Inthe default setting, the population size (N) is 1,000, the number of chromosomes sampled (2n) is 120, and the strength of selection (2Ns) is 300 in theselection (Sel) condition or 0 in the neutral (Neu) condition . Under the population decline models, N is 500 in the selection phase. The number ofgenerations after the population decline (G) is dependent on the condition of the simulations. Cumulative distributions for the real data and the datafrom the genome-size neutral simulation using a demographic model are also shown (D). (E–H) Estimation of the detection powers of RM and RH.Cumulative distributions of RM (E) and RH (F) in method 1 (block definition: HM � 0.9) and those (G and H) in method 2 (block definition: HM � 0.5)are shown. Different initial frequencies (IFs) of the selected allele at the start of the selection phase (single chromosome or 20%) and different finalfrequencies of the selected mutation (fixed or 80%) were tested using methods 1 and 2, respectively. Different values of the SNP density (2 or 6 kb/SNP) and chromosome sample size (2n 5 120 or 48) were also simulated.
Gene Flow and Natural Selection in Oceania 1757
by guest on Decem
ber 2, 2013http://m
be.oxfordjournals.org/D
ownloaded from
differentiation enables us to capture the differentiation ofuntyped polymorphisms more powerfully than the FST
value for each SNP (Kimura et al. 2007).The block definition of HM � 0.9, which we call
method 1 here, is appropriate to detect complete selectivesweeps in which advantageous alleles have reached (near)fixation. When we performed a simulation assuming 2 di-verged populations with a constant size and 6 kb of SNPintervals that is the similar density as mounted on the Af-fymetrix 500K chips, thresholds of RM , 0.05 and RH
, 0.3 realized approximately 80% power (fig. 3E andF). The block definition of HM � 0.5, or method 2, is po-tentialized to detect the alleles under selection that havereached a frequency of over approximately 70%. Figure3G and H shows the detection power for the cases in whicha single advantageous mutation increased to 80% fre-quency, which is lower than the power for a complete se-lective sweep. For a selected allele with 80% frequency, thethresholds of RM , 0.1 and RH , 0.5 had approximatelyan 80% power. As previously reported (Kimura et al. 2007),the distributions of RM and RH shift depend on the demo-graphic history of the populations. Especially, it should benoted that decline of the test population’s size results indownshift of the distributions in both cases of selectionand neutrality. Therefore, if we test a population that hasexperienced a decline in size, then our simulations assum-ing a model with constant-size populations are thought togive conservative estimation of the detection power.
Our first interest is to elucidate whether there are anymutations that were generated after the divergence fromAsians and then reached fixation in Polynesians. For thispurpose, we applied method 1 (HM � 0.9) to the test forTGN using EAS as the reference population (TGN vs.EAS). As a result, we did not observe any block satisfyingthe thresholds of RM , 0.05 and RH , 0.3 (table 1). Tak-ing into account the powerfulness of these thresholds (fig.3E and F), the result suggests that there was no (or few, ifany) mutation newly generated and fixed in Polynesians.Because the dispersal of Austronesian-speaking people isthought to be dated at 6 KYA at the most, then the diver-gence time would be too short for a new mutation on au-tosomes to reach fixation in Tongans. Although the nearfixation of an Austronesian-specific type of mtDNA haspreviously been observed in Polynesians (Redd et al.1995), this would be due to the small population size ofmtDNA that is one-fourth of the autosomal population size.As for Polynesian-specific complete selective sweeps, it re-mains an alternative possibility that old-standing alleles
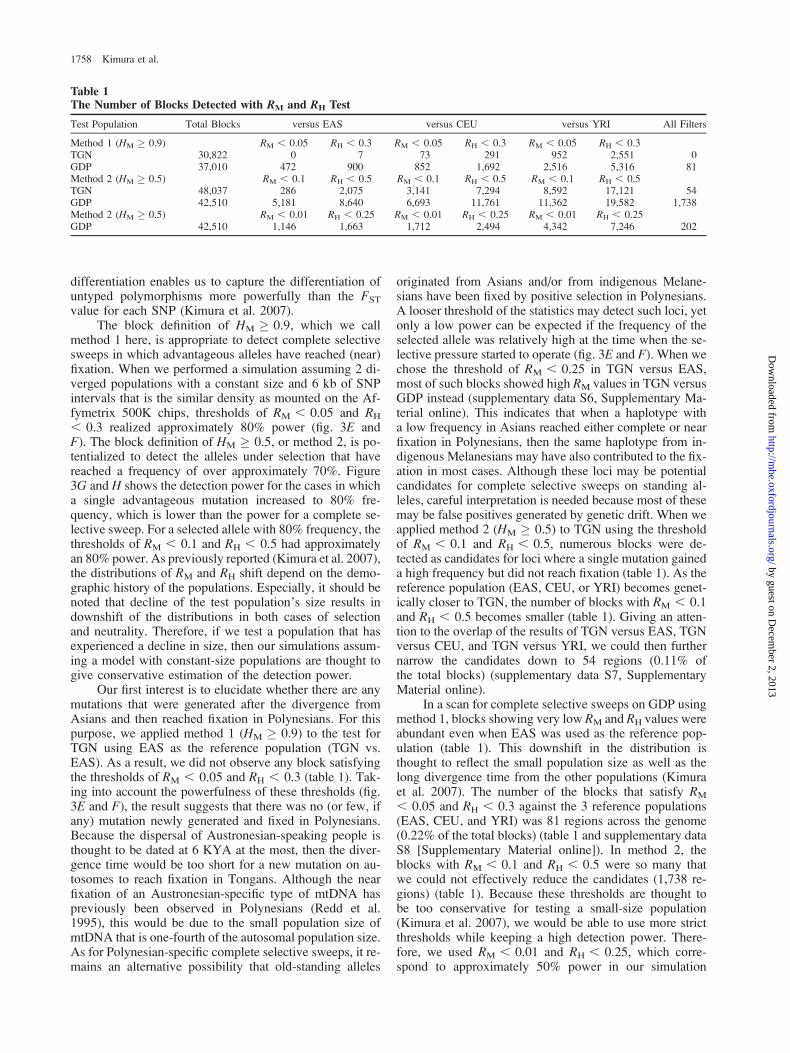
originated from Asians and/or from indigenous Melane-sians have been fixed by positive selection in Polynesians.A looser threshold of the statistics may detect such loci, yetonly a low power can be expected if the frequency of theselected allele was relatively high at the time when the se-lective pressure started to operate (fig. 3E and F). When wechose the threshold of RM , 0.25 in TGN versus EAS,most of such blocks showed high RM values in TGN versusGDP instead (supplementary data S6, Supplementary Ma-terial online). This indicates that when a haplotype witha low frequency in Asians reached either complete or nearfixation in Polynesians, then the same haplotype from in-digenous Melanesians may have also contributed to the fix-ation in most cases. Although these loci may be potentialcandidates for complete selective sweeps on standing al-leles, careful interpretation is needed because most of thesemay be false positives generated by genetic drift. When weapplied method 2 (HM � 0.5) to TGN using the thresholdof RM , 0.1 and RH , 0.5, numerous blocks were de-tected as candidates for loci where a single mutation gaineda high frequency but did not reach fixation (table 1). As thereference population (EAS, CEU, or YRI) becomes genet-ically closer to TGN, the number of blocks with RM , 0.1and RH , 0.5 becomes smaller (table 1). Giving an atten-tion to the overlap of the results of TGN versus EAS, TGNversus CEU, and TGN versus YRI, we could then furthernarrow the candidates down to 54 regions (0.11% ofthe total blocks) (supplementary data S7, SupplementaryMaterial online).
In a scan for complete selective sweeps on GDP usingmethod 1, blocks showing very low RM and RH values wereabundant even when EAS was used as the reference pop-ulation (table 1). This downshift in the distribution isthought to reflect the small population size as well as thelong divergence time from the other populations (Kimuraet al. 2007). The number of the blocks that satisfy RM
, 0.05 and RH , 0.3 against the 3 reference populations(EAS, CEU, and YRI) was 81 regions across the genome(0.22% of the total blocks) (table 1 and supplementary dataS8 [Supplementary Material online]). In method 2, theblocks with RM , 0.1 and RH , 0.5 were so many thatwe could not effectively reduce the candidates (1,738 re-gions) (table 1). Because these thresholds are thought tobe too conservative for testing a small-size population(Kimura et al. 2007), we would be able to use more strictthresholds while keeping a high detection power. There-fore, we used RM , 0.01 and RH , 0.25, which corre-spond to approximately 50% power in our simulation
Table 1The Number of Blocks Detected with RM and RH Test
Test Population Total Blocks versus EAS versus CEU versus YRI All Filters
Method 1 (HM � 0.9) RM , 0.05 RH , 0.3 RM , 0.05 RH , 0.3 RM , 0.05 RH , 0.3TGN 30,822 0 7 73 291 952 2,551 0GDP 37,010 472 900 852 1,692 2,516 5,316 81Method 2 (HM � 0.5) RM , 0.1 RH , 0.5 RM , 0.1 RH , 0.5 RM , 0.1 RH , 0.5TGN 48,037 286 2,075 3,141 7,294 8,592 17,121 54GDP 42,510 5,181 8,640 6,693 11,761 11,362 19,582 1,738Method 2 (HM � 0.5) RM , 0.01 RH , 0.25 RM , 0.01 RH , 0.25 RM , 0.01 RH , 0.25GDP 42,510 1,146 1,663 1,712 2,494 4,342 7,246 202
1758 Kimura et al.
by guest on Decem
ber 2, 2013http://m
be.oxfordjournals.org/D
ownloaded from
assuming constant-size populations (fig. 3G and H). Theseconditions could reduce the candidates down to 202 regions(0.48% of the total blocks) (table 1 and supplementary dataS9 [Supplementary Material online]).
Candidate Regions under Selective Sweeps
The methods used to scan for selective sweeps in thisstudy have their own characteristics. The test usingAREHH is potentialized to detect selective sweeps wherethe selected allele has gained a greater than 50% frequency,but it has not yet reached fixation. This test can detect se-lective sweeps occurring in the common ancestry of differ-ent populations as well as in a local population. In themethod 1 of the RM and RH test (HM � 0.9), the thresholdsof RM , 0.05 and RH , 0.3 detect only loci fixed or nearlyfixed by population-specific positive selection. If a looserthreshold such as RM , 0.25 is used in the same test,we may identify positive selections that have acted onold-standing alleles, but only a low detection power andhigh false positive rate can be expected. Method 2 of theRM and RH test (HM � 0.5) is applicable to a scan for thoseregions where the locally selected allele reached over ap-proximately 70% frequency including fixation. The chro-mosomal positions of the candidate regions detected bythe respective methods are exhibited in supplementary fig-ure S8 (Supplementary Material online). In some regions,the signatures detected by different methods overlapped.Such regions are considered to have a higher possibilityto be true positives. Other regions show the signatureunique to one method, which may be attributed to theuniqueness of the characteristics of the methods or to typeI and type II errors.
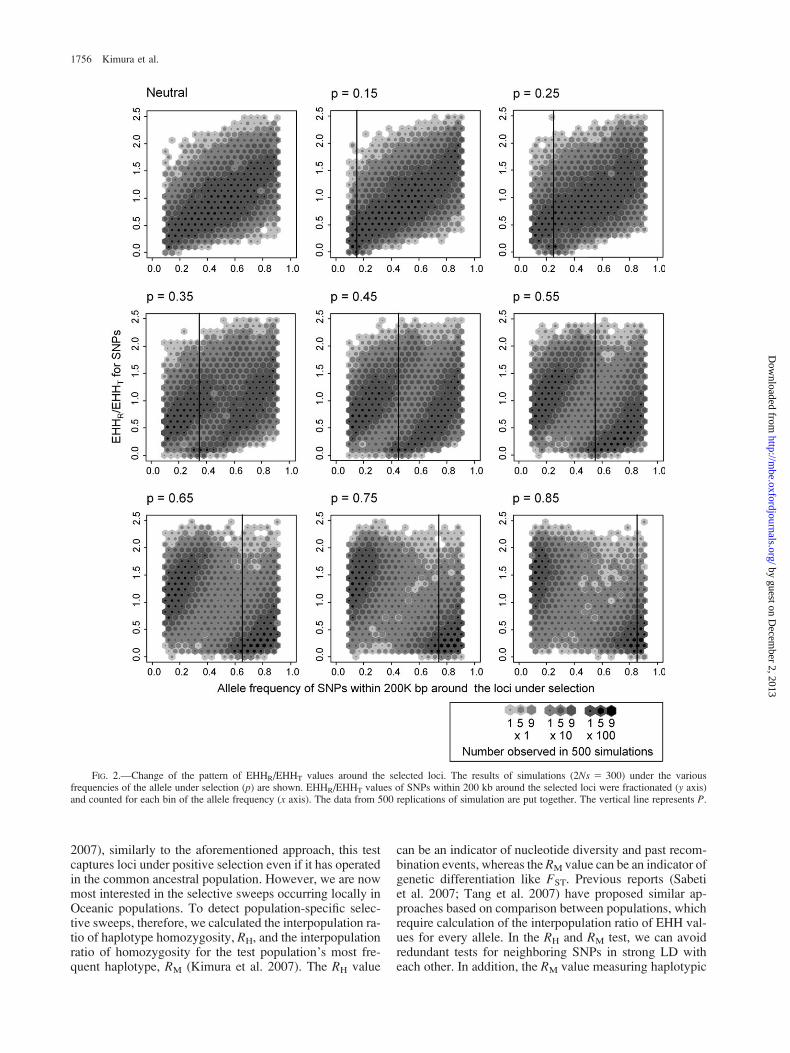
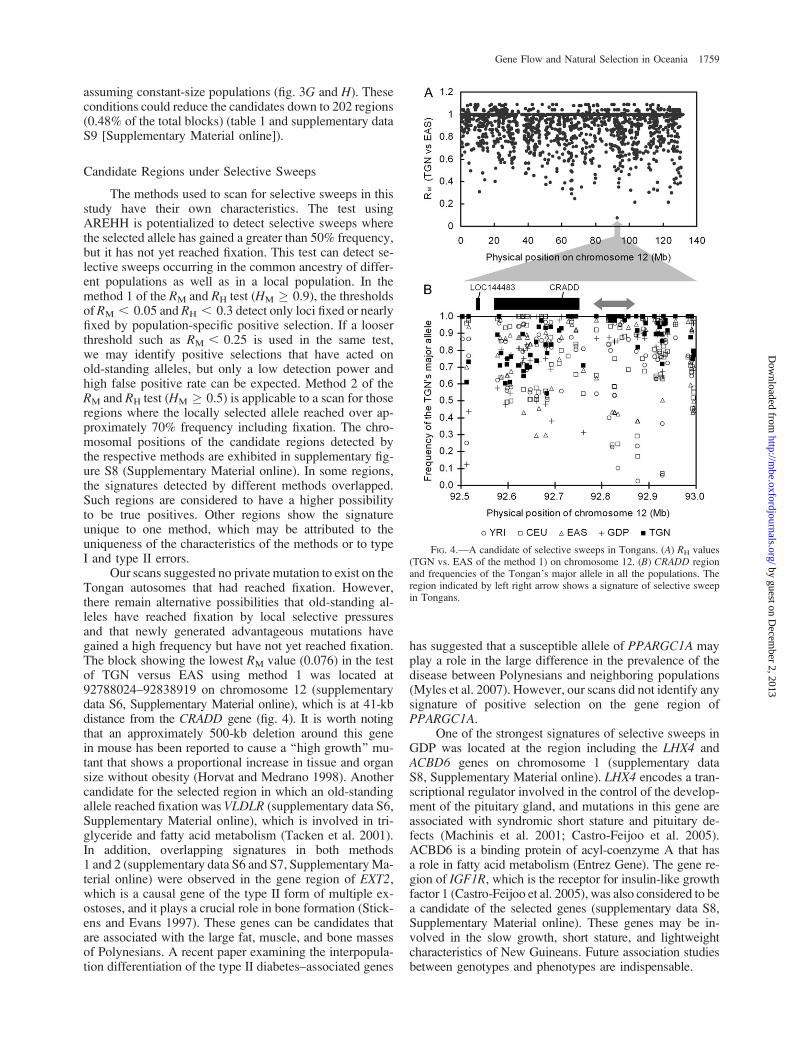
Our scans suggested no private mutation to exist on theTongan autosomes that had reached fixation. However,there remain alternative possibilities that old-standing al-leles have reached fixation by local selective pressuresand that newly generated advantageous mutations havegained a high frequency but have not yet reached fixation.The block showing the lowest RM value (0.076) in the testof TGN versus EAS using method 1 was located at92788024–92838919 on chromosome 12 (supplementarydata S6, Supplementary Material online), which is at 41-kbdistance from the CRADD gene (fig. 4). It is worth notingthat an approximately 500-kb deletion around this genein mouse has been reported to cause a ‘‘high growth’’ mu-tant that shows a proportional increase in tissue and organsize without obesity (Horvat and Medrano 1998). Anothercandidate for the selected region in which an old-standingallele reached fixation was VLDLR (supplementary data S6,Supplementary Material online), which is involved in tri-glyceride and fatty acid metabolism (Tacken et al. 2001).In addition, overlapping signatures in both methods1 and 2 (supplementary data S6 and S7, Supplementary Ma-terial online) were observed in the gene region of EXT2,which is a causal gene of the type II form of multiple ex-ostoses, and it plays a crucial role in bone formation (Stick-ens and Evans 1997). These genes can be candidates thatare associated with the large fat, muscle, and bone massesof Polynesians. A recent paper examining the interpopula-tion differentiation of the type II diabetes–associated genes
has suggested that a susceptible allele of PPARGC1A mayplay a role in the large difference in the prevalence of thedisease between Polynesians and neighboring populations(Myles et al. 2007). However, our scans did not identify anysignature of positive selection on the gene region ofPPARGC1A.
One of the strongest signatures of selective sweeps inGDP was located at the region including the LHX4 andACBD6 genes on chromosome 1 (supplementary dataS8, Supplementary Material online). LHX4 encodes a tran-scriptional regulator involved in the control of the develop-ment of the pituitary gland, and mutations in this gene areassociated with syndromic short stature and pituitary de-fects (Machinis et al. 2001; Castro-Feijoo et al. 2005).ACBD6 is a binding protein of acyl-coenzyme A that hasa role in fatty acid metabolism (Entrez Gene). The gene re-gion of IGF1R, which is the receptor for insulin-like growthfactor 1 (Castro-Feijoo et al. 2005), was also considered to bea candidate of the selected genes (supplementary data S8,Supplementary Material online). These genes may be in-volved in the slow growth, short stature, and lightweightcharacteristics of New Guineans. Future association studiesbetween genotypes and phenotypes are indispensable.
FIG. 4.—A candidate of selective sweeps in Tongans. (A) RH values(TGN vs. EAS of the method 1) on chromosome 12. (B) CRADD regionand frequencies of the Tongan’s major allele in all the populations. Theregion indicated by left right arrow shows a signature of selective sweepin Tongans.
Gene Flow and Natural Selection in Oceania 1759
by guest on Decem
ber 2, 2013http://m
be.oxfordjournals.org/D
ownloaded from
Other candidates of selective sweeps in Oceanic pop-ulations included several interesting genes such as DDX58,SIAT4A (supplementary data S7, Supplementary Materialonline), and IVNS1ABP (supplementary data S8, Supple-mentary Material online), which code molecules relatedwith infection of the influenza A viruses (Wolff et al.1998; Shinya et al. 2006; Mibayashi et al. 2007; Nichollset al. 2007). If we could identify a protective effect of theselected allele against the influenza, these kinds of signa-tures may therefore suggest evidence for the epidemic his-tory of the virus in Oceania and human conquest of thedisease by genetic adaptation.
We observed the candidates of selective sweeps thatinclude no gene or genes whose functions have not beenknown yet. The selected loci should have some phenotypicfunctions because natural selection acts on phenotypes.Therefore, the scans for signatures of selective sweepscan be a trigger to identify genes or DNA sequences withsome important function as well as to determine the func-tional difference between alleles. Such an approach basedon evolutionary genetics, which thus provide clues to under-stand how humans have adapted to our environments, aretherefore also expected to help elucidate the genomic func-tions if further functional and association studies on the can-didates are carried out. Conversely, this approach may alsoshed some light on the invisible phenotypic difference be-tween populations. Our study demonstrated that genome-wide SNP typing systems, which have exerted their powerfor identifying disease-associated polymorphisms (TheWellcome Trust Case Control Consortium 2007), are alsouseful for evolutionary study on human populations.
Supplementary Material
Supplementary table S1, figures S1–S8, and data S1–S9are available at Molecular Biology and Evolution online(http://www.mbe.oxfordjournals.org/).
Acknowledgments
We are grateful to the Gidra people in Papua NewGuinea and the Tongan people for their kind cooperationin providing blood samples. We thank the staff of the De-partment of Health, Western Province of Papua NewGuinea, Dr Tetsuro Hongo at Yamanashi Institute of Envi-ronmental Sciences, Dr Taniela Palu at Ministry of Health,Kingdom of Tonga, Dr Viliami Tangi at Diabetes Clinic,Kingdom of Tonga, Dr Kazumichi Katayama at Kyoto Uni-versity for help in sample collection, and 2 anonymous re-viewers for helpful comments. This study was partlysupported by a Grant-in-Aid for Scientific Research fromthe Ministry of Education, Culture, Sports, Science, andTechnology of Japan. This research was done mainly atthe Department of Human Genetics, Graduate School ofMedicine, The University of Tokyo.
Literature Cited
Bellwood P. 1989. The colonization of the Pacific: some currenthypotheses. In: Serjeantson SW, editor. The colonization ofthe Pacific: a genetic trail. Oxford (UK): Clarendon Press.
Bellwood P. 1991. The Austronesian dispersal and the origin oflanguages. Sci Am. 265:88–93.
Bersaglieri T, Sabeti PC, Patterson N, Vanderploeg T, Schaffner SF,Drake JA, Rhodes M, Reich DE, Hirschhorn JN. 2004. Geneticsignatures of strong recent positive selection at the lactase gene.Am J Hum Genet. 74:1111–1120.
Bindon JR, Baker PT. 1997. Bergmann’s rule and the thriftygenotype. Am J Phys Anthropol. 104:201–210.
Capelli C, Wilson JF, Richards M, Stumpf MP, Gratrix F,Oppenheimer S, Underhill P, Pascali VL, Ko TM,Goldstein DB. 2001. A predominantly indigenous paternalheritage for the Austronesian-speaking peoples of insularSoutheast Asia and Oceania. Am J Hum Genet. 68:432–443.
Castro-Feijoo L, Quinteiro C, Loidi L, Barreiro J, Cabanas P,Arevalo T, Dieguez C, Casanueva FF, Pombo M. 2005.Genetic basis of short stature. J Endocrinol Invest. 28:30–37.
Cavalli-Sforza LL, Menozzi P, Piazza A. 1994. The history andgeography of human genes. Princeton (NJ): Princeton UniversityPress.
Diamond JM. 1988. Express train to Polynesia. Nature. 336:307–308.
Friedlaender JS, Friedlaender FR, Reed FA, et al. (12 co-authors).2008. The genetic structure of Pacific Islanders. PLoS Genet.4:e19.
Fujimoto A, Kimura R, Ohashi J, et al. (15 co-authors). 2008. Ascan for genetic determinants of human hair morphology:EDAR is associated with Asian hair thickness. Hum MolGenet. 17:835–843.
Hill AV, Bowden DK, Trent RJ, Higgs DR, Oppenheimer SJ,Thein SL, Mickleson KN, Weatherall DJ, Clegg JB. 1985.Melanesians and Polynesians share a unique alpha-thalasse-mia mutation. Am J Hum Genet. 37:571–580.
Horvat S, Medrano JF. 1998. A 500-kb YAC and BAC contigencompassing the high-growth deletion in mouse chromo-some 10 and identification of the murine Raidd/Cradd gene inthe candidate region. Genomics. 54:159–164.
Houghton P. 1990. The adaptive significance of Polynesian bodyform. Ann Hum Biol. 17:19–32.
Kayser M, Brauer S, Cordaux R, et al. (15 co-authors). 2006.Melanesian and Asian origins of Polynesians: mtDNA and Ychromosome gradients across the Pacific. Mol Biol Evol.23:2234–2244.
Kayser M, Brauer S, Weiss G, Underhill PA, Roewer L,Schiefenhovel W, Stoneking M. 2000. Melanesian origin ofPolynesian Y chromosomes. Curr Biol. 10:1237–1246.
Kayser M, Lao O, Saar K, Brauer S, Wang X, Nurnberg P,Trent RJ, Stoneking M. 2008. Genome-wide analysisindicates more Asian than Melanesian ancestry of Poly-nesians. Am J Hum Genet. 82:194–198.
Kayser M, Liu F, Janssens AC, et al. (22 co-authors). 2008.Three genome-wide association studies and a linkage analysisidentify HERC2 as a human iris color gene. Am J Hum Genet.82:411–423.
Kim Y, Stephan W. 2002. Detecting a local signature of genetichitchhiking along a recombining chromosome. Genetics.160:765–777.
Kimura R, Fujimoto A, Tokunaga K, Ohashi J. 2007. A practicalgenome scan for population-specific strong selective sweepsthat have reached fixation. PLoS ONE. 2:e286.
Kruskal JB, Wish M. 1978. Multidimensional scaling. NewYork: SAGE Publications.
Kumar S, Tamura K, Nei M. 2004. MEGA3: integrated softwarefor molecular evolutionary genetics analysis and sequencealignment. Brief Bioinform. 5:150–163.
Lum JK, Cann RL, Martinson JJ, Jorde LB. 1998. Mitochondrialand nuclear genetic relationships among Pacific Island andAsian populations. Am J Hum Genet. 63:613–624.
1760 Kimura et al.
by guest on Decem
ber 2, 2013http://m
be.oxfordjournals.org/D
ownloaded from
Lum JK, Rickards O, Ching C, Cann RL. 1994. Polynesianmitochondrial DNAs reveal three deep maternal lineageclusters. Hum Biol. 66:567–590.
Machinis K, Pantel J, Netchine I, et al. (11 co-authors). 2001.Syndromic short stature in patients with a germline muta-tion in the LIM homeobox LHX4. Am J Hum Genet. 69:961–968.
Martinson JJ. 1996. Molecular perspectives on the colonizationof the Pacfic. In: Macie-Taylor CGN, editor. Molecularbiology and human diversity. London: Cambridge UniversityPress. p. 171–195.
Melton T, Peterson R, Redd AJ, Saha N, Sofro AS, Martinson J,Stoneking M. 1995. Polynesian genetic affinities withSoutheast Asian populations as identified by mtDNA analysis.Am J Hum Genet. 57:403–414.
Mibayashi M, Martinez-Sobrido L, Loo YM, Cardenas WB,Gale M Jr, Garcia-Sastre A. 2007. Inhibition of retinoic acid-inducible gene I-mediated induction of beta interferon by theNS1 protein of influenza A virus. J Virol. 81:514–524.
Myles S, Hradetzky E, Engelken J, Lao O, Nurnberg P, Trent RJ,Wang X, Kayser M, Stoneking M. 2007. Identification ofa candidate genetic variant for the high prevalence of type IIdiabetes in Polynesians. Eur J Hum Genet. 15:584–589.
Neel JV. 1962. Diabetes mellitus: a ‘‘thrifty’’ genotype rendereddetrimental by ‘‘progress. Am J Hum Genet. 14:353–362.
Nei M. 1973. Analysis of gene diversity in subdividedpopulations. Proc Natl Acad Sci USA. 70:3321–3323.
Nei M, Roychoudhury AK. 1993. Evolutionary relationshipsof human populations on a global scale. Mol Biol Evol. 10:927–943.
Nicholls JM, Chan MC, Chan WY, et al. (12 co-authors). 2007.Tropism of avian influenza A (H5N1) in the upper and lowerrespiratory tract. Nat Med. 13:147–149.
Nielsen R, Williamson S, Kim Y, Hubisz MJ, Clark AG,Bustamante C. 2005. Genomic scans for selective sweepsusing SNP data. Genome Res. 15:1566–1575.
Norgan NG. 1995. Changes in patterns of growth and nutritionalanthropometry in two rural modernizing Papua New Guineacommunities. Ann Hum Biol. 22:491–513.
Ohtsuka R. 1986. Low rate of population increase of the GidraPapuans in the past: a genealogical-demographic analysis. AmJ Phys Anthropol. 71:13–23.
Oota H, Pakstis AJ, Bonne-Tamir B, et al. (14 co-authors). 2004.The evolution and population genetics of the ALDH2 locus:random genetic drift, selection, and low levels of recombina-tion. Ann Hum Genet. 68:93–109.
O’Shaughnessy DF, Hill AV, Bowden DK, Weatherall DJ, Clegg JB.1990. Globin genes in Micronesia: origins and affinities of PacificIsland peoples. Am J Hum Genet. 46:144–155.
Pritchard JK, Stephens M, Donnelly P. 2000. Inference ofpopulation structure using multilocus genotype data. Genetics.155:945–959.
Redd AJ, Takezaki N, Sherry ST, McGarvey ST, Sofro AS,Stoneking M. 1995. Evolutionary history of the COII/tRNALys intergenic 9 base pair deletion in human mitochon-drial DNAs from the Pacific. Mol Biol Evol. 12:604–615.
Roberts RG, Jones R, Smith MA. 1990. Thermoluminescencedating of a 50,000-year-old human occupation site in northernAustralia. Nature. 345:153–156.
Sabeti PC, Reich DE, Higgins JM, et al. (17 co-authors). 2002.Detecting recent positive selection in the human genome fromhaplotype structure. Nature. 419:832–837.
Sabeti PC, Varilly P, Fry B, et al. (244 co-authors). 2007.Genome-wide detection and characterization of positiveselection in human populations. Nature. 449:913–918.
Saitou N, Nei M. 1987. The neighbor-joining method: a newmethod for reconstructing phylogenetic trees. Mol Biol Evol.4:406–425.
Schaffner SF, Foo C, Gabriel S, Reich D, Daly MJ, Altshuler D.2005. Calibrating a coalescent simulation of human genomesequence variation. Genome Res. 15:1576–1583.
Scheet P, Stephens M. 2006. A fast and flexible statistical modelfor large-scale population genotype data: applications toinferring missing genotypes and haplotypic phase. Am J HumGenet. 78:629–644.
Serjeantson SW. 1985. Migration and admixture in the Pacific.In: Szathmary E, editor. Out of Asia: peopling the Americasand the Pacific. Canberra (Australia): The Journal of PacificHistory. p. 133–145.
Serjeantson SW, Gao X. 1996. The genetic prehistory ofAustralia and Oceania: new insights from DNA analyses.In: Szathmary EJE, editor. Prehistoric Mongoloid dispersals.Oxford: Oxford University Press.
Shinya K, Ebina M, Yamada S, Ono M, Kasai N, Kawaoka Y.2006. Avian flu: influenza virus receptors in the humanairway. Nature. 440:435–436.
Stickens D, Evans GA. 1997. Isolation and characterization ofthe murine homolog of the human EXT2 multiple exostosesgene. Biochem Mol Med. 61:16–21.
Su B, Jin L, Underhill P, et al. (11 co-authors). 2000. Polynesianorigins: insights from the Y chromosome. Proc Natl Acad SciUSA. 97:8225–8228.
Tacken PJ, Hofker MH, Havekes LM, van Dijk KW. 2001.Living up to a name: the role of the VLDL receptor in lipidmetabolism. Curr Opin Lipidol. 12:275–279.
Tang K, Thornton KR, Stoneking M. 2007. A new approach forusing genome scans to detect recent positive selection in thehuman genome. PLoS Biol. 5:e171.
Terrell JE. 1988. History as a family tree, history as an entangledbank: constructing images and interpretations of prehistory inthe South Pacific. Antiquity. 62:642–657.
The International HapMap Consortium. 2005. A haplotype mapof the human genome. Nature. 437:1299–1320.
The Wellcome Trust Case Control Consortium. 2007. Genome-wide association study of 14,000 cases of seven commondiseases and 3,000 shared controls. Nature. 447:661–678.
Voight BF, Kudaravalli S, Wen X, Pritchard JK. 2006. A map ofrecent positive selection in the human genome. PLoS Biol.4:e72.
Wang ET, Kodama G, Baldi P, Moyzis RK. 2006. Globallandscape of recent inferred Darwinian selection for Homosapiens. Proc Natl Acad Sci USA. 103:135–140.
White JP, O’Connell JF. 1979. Australian prehistory: new aspectsof antiquity. Science. 203:21–28.
Williamson SH, Hubisz MJ, Clark AG, Payseur BA,Bustamante CD, Nielsen R. 2007. Localizing recent adaptiveevolution in the human genome. PLoS Genet. 3:e90.
Wolff T, O’Neill RE, Palese P. 1998. NS1-binding protein (NS1-BP): a novel human protein that interacts with the influenza Avirus nonstructural NS1 protein is relocalized in the nuclei ofinfected cells. J Virol. 72:7170–7180.
Zhivotovsky LA, Underhill PA, Cinnioglu C, et al. (17 co-authors). 2004. The effective mutation rate at Y chromosomeshort tandem repeats, with application to human population-divergence time. Am J Hum Genet. 74:50–61.
Yoko Satta, Associate Editor
Accepted May 26, 2008
Gene Flow and Natural Selection in Oceania 1761
by guest on Decem
ber 2, 2013http://m
be.oxfordjournals.org/D
ownloaded from