Samples & Populations - BSU Faculty
35
Samples & Populations (modified) 1 Samples & Populations (a modified CMP unit) Nicole Friend, TrekNorth [email protected] Mary Overlie, TrekNorth [email protected] Data and Statistics unit for 8 th or 9 th graders Special note: The materials in this unit are copyright from CMP, 2 nd edition, Samples and Populations unit. Most districts have transitioned to CMP3, the newest edition of the program. In order to fully teach this unit, teachers would need access to the student pages of the program which can be found in the BSU Math Curriculum Library. Alternatively, CMP 2 nd edition resources can be found quite inexpensively online through sites like Amazon.com. In the interest of trying to stay within the fair use of copyrighted materials, the student pages have been excluded from this lesson set.
-
Upload
khangminh22 -
Category
Documents
-
view
3 -
download
0
Transcript of Samples & Populations - BSU Faculty
Samples & Populations (modified) -‐ 1
Samples & Populations (a modified CMP unit)
Nicole Friend, TrekNorth
Mary Overlie, TrekNorth [email protected]
Data and Statistics unit for 8th or 9th graders
Special note: The materials in this unit are copyright from CMP, 2nd edition, Samples and Populations unit. Most districts have transitioned to CMP3, the newest edition of the program. In order to fully teach this unit, teachers would need access to the student pages of the program which can be found in the BSU Math Curriculum Library. Alternatively, CMP 2nd edition resources can be found quite inexpensively online through sites like Amazon.com. In the interest of trying to stay within the fair use of copyrighted materials, the student pages have been excluded from this lesson set.

Samples & Populations (modified) -‐ 2
These 15 days address three Data and Statistics standards in both 8th grade and in High School
statistics strands, with a focus on data sets that work with discrete mathematics ideas. The 15 days
are composed of 4 different problem solving investigations. This table provides the links between
which standards are addressed in which investigations and the overall goal of the lesson.
Since a majority of our materials are gathered from the CMP, 2nd edition, program, this table
also provides the necessary reference for how the lesson objectives related to the MN standards.
Page Days MN Standard Lesson Lesson Objective Sample
MCA Question
pg. 3-‐8 0 Pretest
pg 9 1 9.4.3.8 Apply probability concepts to real-‐world situations to make informed decisions.
Inv. 1
1.1
Compare sample distributions using various data displays
See 11th Grade
Item Sampler
#21, 22, 23
pg 10 2 1.2
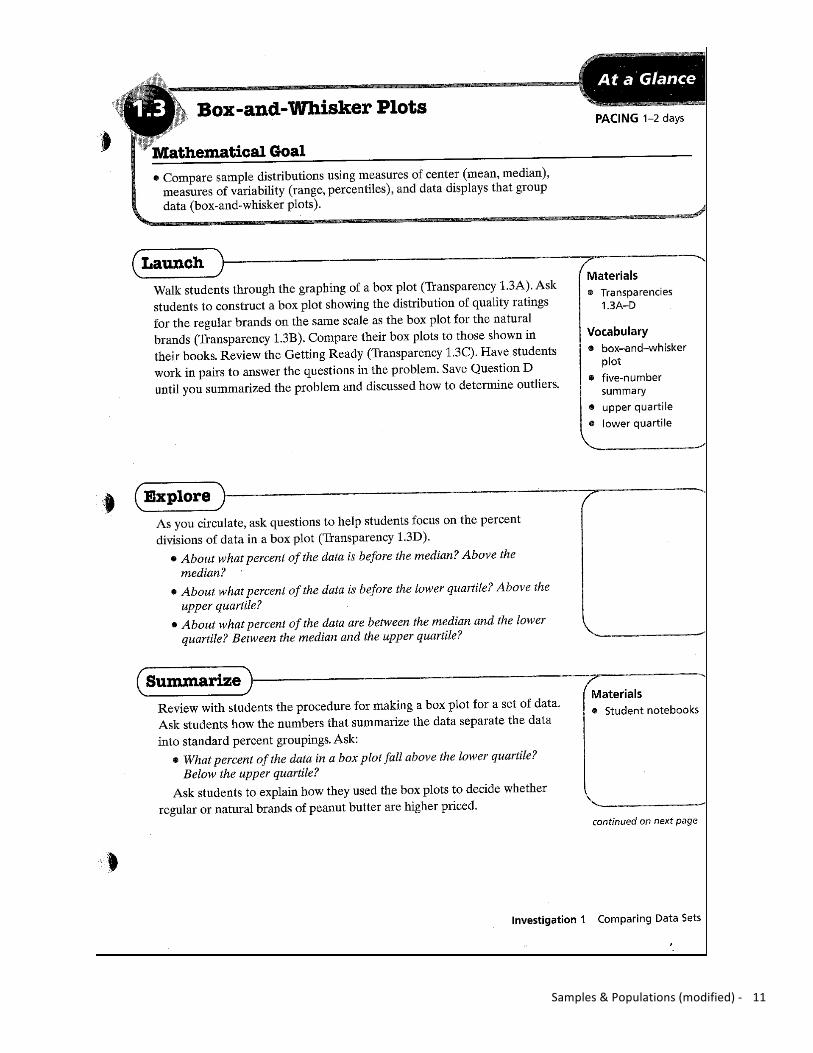
pg 11-‐12 3 1.3
pg 13-‐14 4 9.4.2.3 Design simple experiments and explain the impact of sampling methods, bias and the phrasing of questions asked during data collection. 9.4.3.8 Apply probability concepts to real-‐world situations to make informed decisions.
Inv. 2
2.1 Use data from samples to make predictions about a populations.
pg 15-‐16 5 2.2 Consider various ways of developing a sample plan
pg 17-‐18 6 2.3 Apply elementary probability with spinners or calculators to choosing from random samples.
pg 19-‐20 7 2.4 Use data from a sample to estimate a characteristic of a population.
pg 21 8-‐9
9.4.2.3 Design simple experiments and explain the impact of sampling methods, bias and the phrasing of questions asked during data collection. 9.4.3.8 Apply probability concepts to real-‐world situations to make informed decisions.
Inv. 3
3.1 Distinguish between samples and populations and use information drawn from samples to draw conclusions about populations.
pg 22-‐23 10-‐11 3.2 Apply concepts from probability to select random samples from populations.
pg 24-‐25 12-‐13
8.4.1.1 Collect, display and interpret data using scatterplots. Use the shape of the scatterplot to informally estimate a line of best fit and determine an equation for the line. Use appropriate titles, labels and units. Know how to use graphing technology to display scatterplots and corresponding lines of best fit.
Inv. 4
4.1
Explore relationships between paired values
of numerical attributes
See 8th Grade
Item Sampler
#26 pg 26-‐29 14-‐15
Review
+
Practice
pg 30-‐35 Postest

Samples & Populations (modified) -‐ 3
Name:_____________________
Pretest – Samples & Populations Unit 1.

Samples & Populations (modified) -‐ 4
9.4.3.8

Samples & Populations (modified) -‐ 5
2.
9.4.2.3
Samples & Populations (modified) -‐ 6
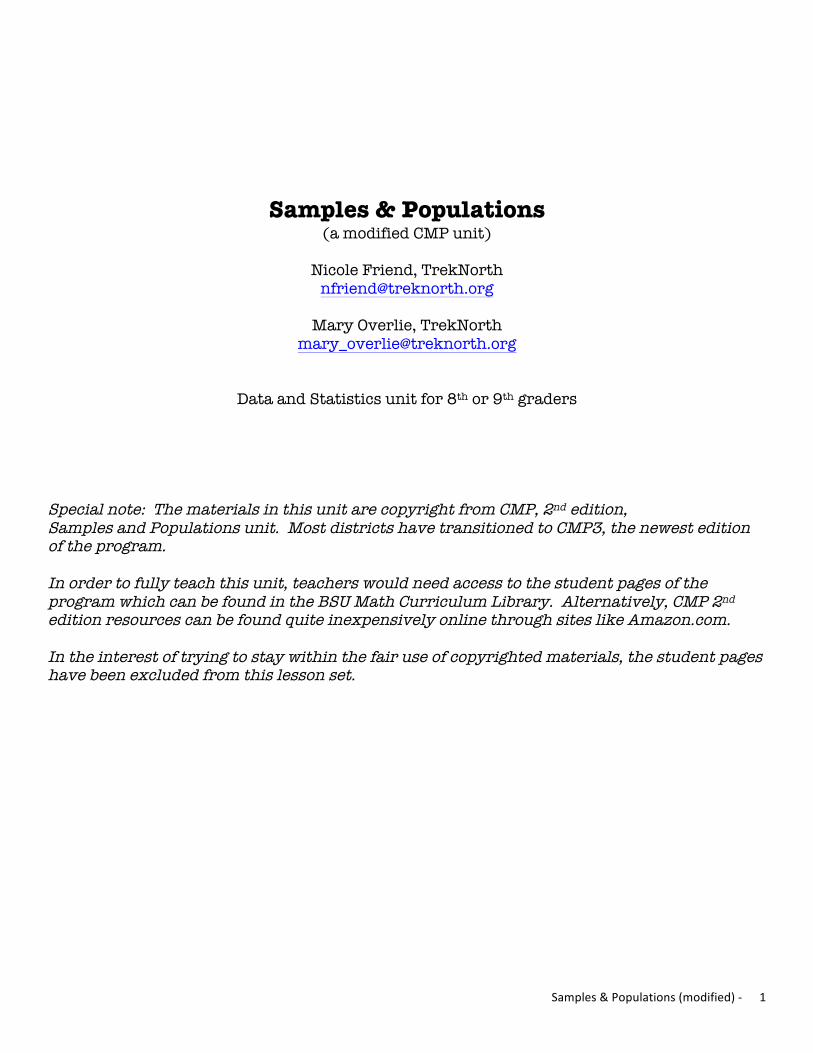
3.
9.4.3.8

Samples & Populations (modified) -‐ 7
4.
8.4.1.1
5.
9.4.3.8

Samples & Populations (modified) -‐ 8
5.
9.4.2.3

Samples & Populations (modified) -‐ 9

Samples & Populations (modified) -‐ 10
Samples & Populations (modified) -‐ 11

Samples & Populations (modified) -‐ 12

Samples & Populations (modified) -‐ 13

Samples & Populations (modified) -‐ 14

Samples & Populations (modified) -‐ 15
Samples & Populations (modified) -‐ 16

Samples & Populations (modified) -‐ 17

Samples & Populations (modified) -‐ 18

Samples & Populations (modified) -‐ 19

Samples & Populations (modified) -‐ 20

Samples & Populations (modified) -‐ 21

Samples & Populations (modified) -‐ 22
Samples & Populations (modified) -‐ 23

Samples & Populations (modified) -‐ 24

Samples & Populations (modified) -‐ 25

Samples & Populations (modified) -‐ 26
Review and Practice Investigation 1
1. What is the median number that was chosen? 2. What percent of students in Ms. Humphrey’s class chose numbers above 15? Explain your reasoning. 3. About how many students chose numbers between 30 and 40? Explain. 4. What were the least and the greatest numbers chosen? 5. Is it possible to determine from the box plot whether one of the students chose the number 27? Explain. 6. Is it possible to determine from the box plot whether one of the students chose the number 4? Explain.
7. Make a box-‐and-‐whisker plot for each set of data.

Samples & Populations (modified) -‐ 27
Investigation 2
3.

Samples & Populations (modified) -‐ 28
Investigation 3
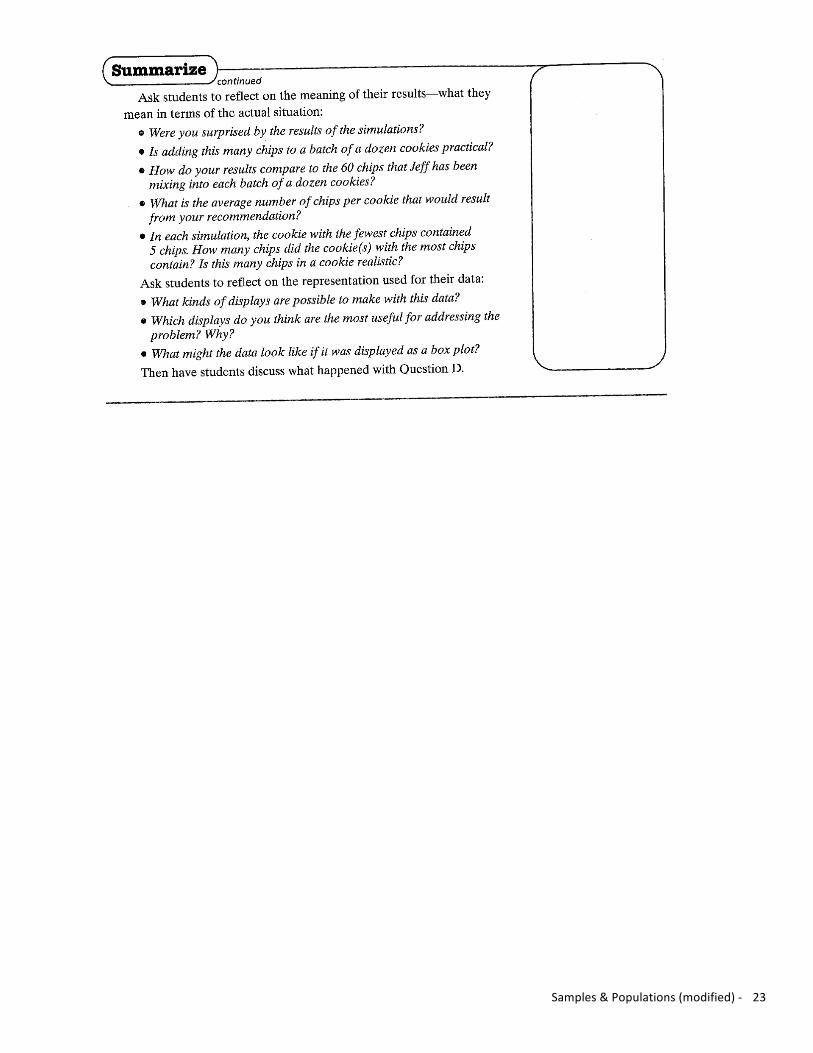
1. Suppose Jeff and Ted decide to change their advertising slogan to “Seven giant chips in every cookie!” They mix 70 chips into a batch of dough and make 10 cookies from the dough. When they remove the cookies from the oven and inspect them, they count the number of chips in each cookie. Their results are shown below. Notice that only 5 of the 10 cookies contained 7 chips or more.
a. Conduct a simulation to determine the number of chips needed to be added to a batch of 10 cookies until each cookie has at least 7 chips. Carry out the simulation five times so that you have five data values for the number of chips needed.
b. What is the minimum number of chips Jeff and Ted should use to be confident that each cookie will have at least 7 chips? Support your answer with statistics and graphs.

Samples & Populations (modified) -‐ 29
Investigation 4
1. Make scatterplots relating the following variables:
a) Sandwich size vs. Calories b) Sandwich size vs. Fat c) Sandwich size vs. Carbohydrates
2. Describe any relationships you see among your three scatterplots. Explain your answers.

Samples & Populations (modified) -‐ 30
Name:_____________________
Post-‐test – Samples & Populations Unit

Samples & Populations (modified) -‐ 31
5.
6.

Samples & Populations (modified) -‐ 32
7.

Samples & Populations (modified) -‐ 33
8.

Samples & Populations (modified) -‐ 34
9.
A. 2 B. 40 C. 250 D. 460
10.
A.166 B. 2003 C. 6000 D. 66,000
11.
Suppose you find have an arrowhead from this site that is not on the scatterplot, with a length of 40 mm. Predict that width of this arrowhead from the given data set.
A. 15 mm B. 17 mm C. 20 mm D. 25 mm

Samples & Populations (modified) -‐ 35
12.
Extra Credit For a class project, students collect data about the number of boys or girls in the families of their classmates.


![GÉOPOLITIQUE ET POPULATIONS AU TCHAD [Geopolitics and populations in Chad]](https://static.fdokumen.com/doc/165x107/631378e5fc260b71020f1c3f/geopolitique-et-populations-au-tchad-geopolitics-and-populations-in-chad.jpg)