Nanobarcoding: detecting nanoparticles in biological samples ...
16
Purdue University Purdue e-Pubs Birck and NCN Publications Birck Nanotechnology Center 11-2012 Nanobarcoding: detecting nanoparticles in biological samples using in situ polymerase chain reaction Trisha Eustaquio Birck Nanotechnology Center, Purdue University, [email protected] James F. Leary Birck Nanotechnology Center, Purdue University, jfl[email protected] Follow this and additional works at: hp://docs.lib.purdue.edu/nanopub Part of the Nanoscience and Nanotechnology Commons is document has been made available through Purdue e-Pubs, a service of the Purdue University Libraries. Please contact [email protected] for additional information. Eustaquio, Trisha and Leary, James F., "Nanobarcoding: detecting nanoparticles in biological samples using in situ polymerase chain reaction" (2012). Birck and NCN Publications. Paper 1287. hp://dx.doi.org/10.2147/IJN.S37433
-
Upload
khangminh22 -
Category
Documents
-
view
3 -
download
0
Transcript of Nanobarcoding: detecting nanoparticles in biological samples ...

Purdue UniversityPurdue e-Pubs
Birck and NCN Publications Birck Nanotechnology Center
11-2012
Nanobarcoding: detecting nanoparticles inbiological samples using in situ polymerase chainreactionTrisha EustaquioBirck Nanotechnology Center, Purdue University, [email protected]
James F. LearyBirck Nanotechnology Center, Purdue University, [email protected]
Follow this and additional works at: http://docs.lib.purdue.edu/nanopub
Part of the Nanoscience and Nanotechnology Commons
This document has been made available through Purdue e-Pubs, a service of the Purdue University Libraries. Please contact [email protected] foradditional information.
Eustaquio, Trisha and Leary, James F., "Nanobarcoding: detecting nanoparticles in biological samples using in situ polymerase chainreaction" (2012). Birck and NCN Publications. Paper 1287.http://dx.doi.org/10.2147/IJN.S37433
© 2012 Eustaquio and Leary, publisher and licensee Dove Medical Press Ltd. This is an Open Access article which permits unrestricted noncommercial use, provided the original work is properly cited.
International Journal of Nanomedicine 2012:7 5625–5639
International Journal of Nanomedicine
Nanobarcoding: detecting nanoparticles in biological samples using in situ polymerase chain reaction
Trisha EustaquioJames F LearyWeldon School of Biomedical Engineering, Purdue University, West Lafayette, IN, USA
Correspondence: James F Leary Weldon School of Biomedical Engineering, Birck Nanotechnology Center, Purdue University, 1205 West State Street, West Lafayette, IN 47907, USA Tel +1 765 494 7280 Fax +1 765 494 0781 Email [email protected]
Background: Determination of the fate of nanoparticles (NPs) in a biological system, or NP
biodistribution, is critical in evaluating an NP formulation for nanomedicine. Current methods
to determine NP biodistribution are greatly inadequate, due to their limited detection thresholds.
Herein, proof of concept of a novel method for improved NP detection based on in situ poly-
merase chain reaction (ISPCR), coined “nanobarcoding,” is demonstrated.
Methods: Nanobarcoded superparamagnetic iron oxide nanoparticles (NB-SPIONs) were char-
acterized by dynamic light scattering, zeta potential, and hyperspectral imaging measurements.
Cellular uptake of Cy5-labeled NB-SPIONs (Cy5-NB-SPIONs) was imaged by confocal
microscopy. The feasibility of the nanobarcoding method was first validated by solution-phase
PCR and “pseudo”-ISPCR before implementation in the model in vitro system of HeLa human
cervical adenocarcinoma cells, a cell line commonly used for ISPCR-mediated detection of
human papilloma virus (HPV).
Results: Dynamic light-scattering measurements showed that NB conjugation stabilized SPION
size in different dispersion media compared to that of its precursor, carboxylated SPIONs (COOH-
SPIONs), while the zeta potential became more positive after NB conjugation. Hyperspectral imag-
ing confirmed NB conjugation and showed that the NB completely covered the SPION surface.
Solution-phase PCR and pseudo-ISPCR showed that the expected amplicons were exclusively
generated from the NB-SPIONs in a dose-dependent manner. Although confocal microscopy
revealed minimal cellular uptake of Cy5-NB-SPIONs at 50 nM over 24 hours in individual
cells, ISPCR detected definitive NB-SPION signals inside HeLa cells over large sample areas.
Conclusion: Proof of concept of the nanobarcoding method has been demonstrated in in vitro
systems, but the technique needs further development before its widespread use as a standard-
ized assay.
Keywords: nanomedicine, in situ PCR, single cell, DNA-functionalized nanoparticles
IntroductionNanomedicine is the application of nanotechnology toward the diagnosis and treatment
of complex diseases. It involves the use of nanometer-sized particles (1–100 nm) that
are precisely engineered to detect and monitor pathologies, deliver targeted therapy,
or a combination of both modalities (“theragnosis” or “theranosis”) – all at the single-
cell level. In essence, nanoparticles (NPs) can be programmed to perform a controlled
sequence of molecular functions, especially in regards to treating malignant cells.
Here, NPs can be designed to release a therapeutic agent based on the extent of the
disease state in the single cell, repair single cells at the molecular level, or induce
“unrepairable” single cells to perish by apoptosis. The multifunctional features of NPs
Dovepress
submit your manuscript | www.dovepress.com
Dovepress 5625
O r I g I N A L r E S E A r C h
open access to scientific and medical research
Open Access Full Text Article
http://dx.doi.org/10.2147/IJN.S37433
International Journal of Nanomedicine 2012:7
offer a continuous system to diagnose and treat diseases at
the earliest possible stage, perhaps before symptoms actu-
ally appear.1,2
Given the extensive number of combinations possible
on an engineered nanomedical system, it is obvious that any
NP formulation possesses distinct physicochemical proper-
ties that influence their biological interaction with single
cells and whole tissues. Moreover, the choice of route of
administration, density, and dosage of NPs influences NP
biodistribution profiles in targeted tissues and nontargeted
systemic organs. There is a rapidly growing body of literature
on the development of multifunctional NPs for theragnos-
tic purposes, but direct comparisons between in vitro and
in vivo studies of similar NP types may not be possible
due to the lack of standardization in study design and data
reporting.3 Furthermore, current metrology to detect NPs is
limited, making it difficult to evaluate NP biodistribution
accurately.3 Although NPs can be thoroughly characterized
by their physicochemical properties, it remains difficult to
predict NP biodistribution profiles and to assess such predic-
tions empirically.
Current NP detection techniques can be classified as
either bulk-cell, in which large numbers of cells or whole
tissues are scanned for the presence of NPs, or single-cell,
in which individual cells are probed for positive NP uptake.
Such analysis methods are often called “sample preserving,”
since they maintain the structure of the biological samples
for NP detection by imaging modalities, which is attractive
for NP biodistribution studies, since spatial location and
NP-induced effects can be evaluated.4 In contrast, there is
also a special class of bulk-cell analysis methods – “sample-
destructive” – that analyzes NP amounts after processing the
biological sample into cell lysates or tissue homogenates.4
Bulk-cell analysis employs imaging methods dependent
on fluorescence labeling (eg, quantum dots),5,6 radiolabeling,7,8
or magnetic cores9–11 to determine NP locations in large
tissues. For example, Gultepe et al synthesized magnetic
cationic liposomes that incorporate superparamagnetic iron
oxide NPs (SPIONs) and studied in vivo biodistribution in
tumor-bearing mice with a combination of magnetic reso-
nance imaging (MRI) and gamma counting of accumulated 111In-labeled magnetic cationic liposomes in systemic organs
after sacrifice.12 In another approach, Haglund et al prepared
peptide-targeted fluorescent quantum dots, directly injected
them into SkBr3 breast cancer tumors in athymic mice,
and analyzed histological tissue sections by fluorescence
microscopy.13 In both instances, NPs can only be detected
when they are present in large aggregates/agglomerates, or
in other words, above the detection threshold of the fluo-
rescence microscope, which is bound by the wavelength of
light. Individual NPs are suboptical and can only be detected
when they are aggregated or agglomerated in large numbers.
Additionally, it is difficult to associate NP uptake with cell
type, especially within histological tissue sections, due to the
relatively large screening area and poor imaging resolution
in bulk-cell analysis.
On the other hand, single-cell analysis techniques are
ultrasensitive, with the capability of detecting small num-
bers of NPs in individual cells. These methods include
flow cytometry (also known as fluorescence-activated cell
sorting),14–17 electron microscopy (EM),18–20 and so-called
super-resolution microscopy.21–24 For example, scanning EM
(SEM) and transmission EM (TEM) are common methods
for imaging NP uptake in vitro and ex vivo. Gupta et al25 and
Gupta and Gupta26 showed the accumulation of SPIONs at the
cell surface by SEM and the location of SPIONs inside single
human fibroblasts by TEM. Even though these techniques
can resolve and detect small numbers of NPs associated with
individual cells, they are not practical for large-scale biodis-
tribution studies, especially in regards to ex vivo analysis of
systemic organs. Unless one knows where to look for NPs,
analysis of NP biodistribution in this manner is extremely
tedious and time-consuming.
As mentioned previously, there is also a special class of
bulk-cell analysis techniques that requires the destruction
of the biological sample before measuring the presence of
NPs. Mass spectrometry, most notably inductively coupled
plasma mass spectrometry,27–29 has been employed success-
fully in quantifying small amounts of NPs due to its very
low detection limits (parts per trillion to parts per million).
Field-flow fractionation is a separation technique that is
gaining ground in quantifying NPs in biological analytes,30
given the possibility of coupling with mass spectrometry. In
addition, chromatography, notably high-performance liquid
chromatography, has been used to identify, quantify, and
purify NPs present in cell lysates and tissue homogenates.31–34
Although these sample-destructive techniques are sensitive
enough to detect single NPs in cell lysates and tissue homo-
genates, these techniques assume that the cells in the original
biological samples were homogeneous, meaning that every
cell takes up an equal fraction of the measured NP amount.
Usually, the NP quantification is normalized by starting
cell number and/or cellular protein mass, classifying these
methods as analyses at the bulk-cell level. This makes it dif-
ficult to discern whether the measured NP amount stemmed
from small, homogeneous NP uptake from all cells or large
submit your manuscript | www.dovepress.com
Dovepress
Dovepress
5626
Eustaquio and Leary

International Journal of Nanomedicine 2012:7
NP uptake within a small subpopulation of cells.35 Likewise,
these techniques do not discriminate between internalized
NPs and NPs fused to the outside of the cell membrane,
because spatial information is lost.
In light of the current limitations, there is an obvious
need for more sensitive and more efficient methods that
(1) detect and measure small numbers of NPs of various
types, ideally single NPs; (2) associate preferential NP uptake
with histological cell type by preserving spatial information
in samples; and (3) allow for relatively quick and accurate NP
detection in in vitro and ex vivo samples for whole-body NP
biodistribution studies. To achieve all of these specifications
currently, one needs to perform complementary methods.
For example, fluorescence microscopy (after fluorescence
labeling) and TEM can be used in tandem for determining
the cellular uptake efficiency and intracellular locations,
respectively, of SPION conjugates.
One method that has the potential to fulfill the require-
ments of an improved NP detection strategy is in situ poly-
merase chain reaction (ISPCR). ISPCR combines the extreme
sensitivity of PCR and the cell-localizing ability of in situ
hybridization, and has been utilized for rapid detection of
HIV-1 in CD4+ cells and human papilloma virus (HPV) in
epithelial tumor tissue.36 In ISPCR, cells or tissue sections
are fixed and digested on glass slides to allow for penetra-
tion of PCR amplification cocktail inside single cells. Using
specific primers, the gene of interest can be amplified in situ
(inside the cell) with labeled nucleotides or primers, and the
labeled PCR products, or amplicons, can then be detected
using enzyme-linked antibodies that specifically bind to the
labeled nucleotides and produce a colorimetric product (after
exposure to a substrate) that can be visualized using a stan-
dard light microscope, or if fluorescently labeled nucleotides
are used, direct imaging under a fluorescence microscope.37,38
The colorimetric or fluorescent signal generated by ISPCR
provides the abilities to optically identify single cells carrying
specific genes of interest in a tissue section and to correlate
cellular genotype to aspects of normal or pathological tissue
morphologies.
Since ISPCR has had success in detecting viral DNA at
a low copy number inside single cells, which is analogous
to the small numbers of NPs that can be present, the ISPCR
technique can be adapted to the detection of single NPs
inside cells. Thus, a novel method for single NP detection
was conceived that incorporates a nonendogenous oligo-
nucleotide (oligo, henceforth) on the NP surface for use as a
unique “nanobarcode” (NB).39–41 After the nanobarcoded NPs
(NB-NPs) are internalized by cells, the NB serves as a forward
primer during ISPCR-mediated signal amplification inside
the cells of fixed samples. As amplicons are generated, they
drift away from the NP, forming a radius of labeled ISPCR
products or amplicons that can be detected at the optical level
(Figure 1A). One can quickly determine which individual
cells in several biological samples contain internalized NPs,
facilitating the quantification/qualification of NP uptake
and the application of specific assays on the NP-positive
cell subpopulation (Figure 1B). For the preliminary detec-
tion scheme, the development of optical signal is based on
digoxigenin (DIG), which is a commonly used colorimetric
detection system in in situ hybridization. A DIG-based detec-
tion system is advantageous over other detection systems
(eg, biotin-streptavidin labeling), since DIG is derived from
the foxglove plant and is not present in mammalian tissues,
reducing nonspecific signals due to endogenous products.36
Figure 2 shows a depiction of the NB system on an NP.
In this paper, proof of concept of the nanobarcoding
method was demonstrated using SPIONs as the model NP
type. First, NB-SPIONs were synthesized and characterized
by size, zeta potential, and hyperspectral imaging measure-
ments. The nanobarcoding method was then tested in cell-free
Figure 1 Depiction of detection of nanobarcoded nanoparticles (NB-NPs) by in situ polymerase chain reaction (ISPCr) in single cells and whole tissues. (A) NB-NPs present inside a single cell (gray circles) are subjected to ISPCR, and the resulting labeled amplicons form a radius of colorimetric or fluorescent signal around each NP, which is visible at the optical level (green circles) (B) Single cells exhibiting the colorimetric or fluorescent signal (green circles) are easily identifiable within a cell monolayer or histological tissue section, denoting the presence of NB-NPs within those cells.
submit your manuscript | www.dovepress.com
Dovepress
Dovepress
5627
Nanobarcoding: detecting nanoparticles using ISPCr

International Journal of Nanomedicine 2012:7
and cell-based systems, with the latter using HeLa (human
cervical adenocarcinoma) as the in vitro model system.
Materials and methodsCell cultureHeLa human cervical adenocarcinoma cells (American Type
Culture Collection [ATCC], Manassas, VA) were cultured in
Eagle’s minimum essential medium (EMEM) supplemented
with 10% (v/v) fetal bovine serum (ATCC). Before SPION
treatment, the medium was changed to Opti-MEM I reduced
serum media (Life Technologies, Carlsbad, CA). All cells
were maintained in T25 tissue-culture flasks at 37°C with
5% CO2/95% ambient air and subcultured every 3–4 days to
maintain exponential growth.
NB-SPION synthesisWater-soluble, carboxylated (COOH) SPIONs (10 nm core
size measured by TEM) were acquired from Ocean NanoTech
(Springdale, AK) and used as purchased. SPIONs (1 mg,
0.86 nmol Fe) were diluted in 0.22 mL of nanograde water.
SPIONs were activated with 0.1 mL 1-ethyl-3-(3-dimethyl-
aminopropyl) carbodiimide (∼10 mM)/sulfo-N-hydroxy-
sulfosuccinimide (∼5 mM) solution for 10 minutes with
continuous vortexing at room temperature. Activated SPIONs
were diluted with 0.5 mL of nanograde water and 5′-amine-
modified, 25-nt NB with sequence 5′-H2 N-(CH
2)
6-AAG
CAC GGG GTC TAA CAC TAT CGC T-3′ (Integrated DNA
Technologies [IDT], Coralville, IA) was added at 10 × molar
excess (8.6 nmol) to a final reaction volume of 1 mL. For
cellular uptake studies, 5′-amine modified NB with a 3′-Cy5
label (IDT) was conjugated to the COOH-SPIONs. The solu-
tion was allowed to react for 24 hours at room temperature
with continuous vortexing. The reactions were quenched by
addition of 20 mM final concentration of Tris-HCl in nano-
grade water (pH 7.0). The NB-SPIONs were washed three
times with nanograde water via magnetic separation at 4°C
and then diluted to 1 mg/mL stock concentration.
NB-SPION characterizationSize (hydrodynamic diameter by dynamic light scattering
[DLS]) measurements were taken using the Zetasizer Nano
ZS (Malvern Instruments, Malvern, UK). COOH-SPIONs
and NB-SPIONs were diluted to 20 µg/mL in nanograde
water, phosphate-buffered saline (PBS), Opti-MEM I, or
serum-free EMEM and transferred to a disposable folded
capillary cell for analysis by the Zetasizer Nano ZS. Three
measurements were taken at room temperature (25°C) using
the Zetasizer Nano software’s automatic mode to choose the
appropriate settings for run length and number of runs per
measurement. For size, the Z-averages are reported. The
Z-average is the intensity weighted mean hydrodynamic size
of the ensemble collection of particles, which is derived from
cumulants analysis of the dynamic light scattering measured
intensity autocorrelation function.
For hyperspectral imaging analysis, COOH-SPIONs
and NB-SPIONs were diluted to 250 µg/mL in nanograde
water. Free NB was diluted to 100 µM in nanograde water.
Samples were submitted to CytoViva (Auburn, AL) for
spectral analysis using the CytoViva Hyperspectral Imaging
System. The mean spectral curves from each sample were
used to characterize the surface chemistry on the NPs. To
determine how much of the SPION surface was covered
with conjugated NB, the spectral mapping function in the
CytoViva Hyperspectral Image Analysis software was
applied with respect to the NB spectral library.
Solution-phase PCr of NB-SPIONsTo test the feasibility of ISPCR, solution-phase PCR was first
performed on the NB-SPION suspension and supernatant.
The supernatant, after magnetically isolating the NB-
SPIONs, was included in PCR reactions to demonstrate
that the PCR products, or amplicons, were derived from
conjugated NB and not free NB remaining in the SPION
suspensions. A synthetic 99-nt single-stranded (ssDNA)
DNA oligo was used as the amplification template (5′-AAG
Figure 2 Depiction of nanobarcoded nanoparticles (NB-NP). (A) NB is conjugated to the surface of NPs; (B) the NB will anneal to a complementary, nonendogenous ssDNA “template;” (C) polymerase chain reaction amplification generates amplicons labeled with digoxigenin (DIG)-labeled deoxyuridine triphosphate; (D) anti-DIg horse radish peroxidase antibodies bind to DIg-labeled amplicons, and a colorimetric product is formed upon exposure to diaminobenzidine substrate by horseradish peroxidase.
submit your manuscript | www.dovepress.com
Dovepress
Dovepress
5628
Eustaquio and Leary

International Journal of Nanomedicine 2012:7
CAC GGG GTC TAA CAC TAT CGC TCG AAG GAC GTC
CGT CGA TGC TAA GTT CCT AGA TTT ATA GCG CAT
TCC CGT TTA GGG ATC TAC GTT AAG GCT-3′), and a
corresponding synthetic 27-nt reverse primer (5′-AGC CTT
AAC GTA GAT CCC TAA ACG GGA-3′) only amplified
the complementary strand of the template after the first
round of PCR (IDT). The NB (forward primer) and reverse
primer were checked for nonspecificity for endogenous DNA
sequences via BLAST (National Center for Biotechnology
Information, Bethesda, MD).
Before NB-SPIONs can be applied to and detected
in cells, it is wise to check for nontargeted amplification
of genomic DNA by the conjugated NB. The model in
vitro system for testing the in situ PCR-based detection
method is HeLa, a human cervical cancer cell line often
used to optimize in situ PCR conditions for detection of
HPV. Thus, genomic DNA should be extracted from HeLa
cells and subjected to solution-phase PCR against the NB.
HeLa cells were grown in a T75 cell culture flask to ∼90%
confluence and harvested via trypsin treatment. The cells
were centrifuged and washed twice with cold PBS and
resuspended to a final concentration of 107 cells/mL in cold
PBS. Using the Blood and Cell Culture Mini Kit (Qiagen,
Valencia, CA), the cells were lysed and protease digested
before purification and elution of genomic DNA from an
anion-exchange resin column. The HeLa genomic DNA
was then precipitated after the addition of isopropanol and
quantified using the NanoDrop 2000 (Thermo Fisher Scien-
tific, Waltham, MA). About 250 ng of HeLa genomic DNA
was loaded into solution-phase PCR reactions with 10.5 µg
NB-SPIONs (HeLa genomic DNA served as template). To
check the integrity of the extracted DNA, primers (2.5 µM
final concentration) for the HPV18 E7 (172 bp amplicon;
forward 5′-CCG AGC ACG ACA GGA GAG GCT-3′, reverse
5′-TCG TTT TCT TCC TCT GAG TCG CTT) and β-actin
(99 bp amplicon; forward 5′-CCA CAC TGT GCC CAT CTA
CG-3′, reverse 5′-AGG ATC TTC ATG AGG TAG TCA GTC
AG-3′) were used to amplify corresponding regions in the
HeLa genomic DNA.42
Solution-phase PCR was performed in a Thermo Hybaid
Sprint Thermal Cycler PCR machine (Thermo Fisher
Scientific) using 12.5 µL 2X GoTaq Colorless Master Mix
(containing 400 µM deoxynucleotide triphosphate and 3 mM
MgCl2, (Promega, Madison, WI), 1 µM reverse primer,
200 ng amplification template, NB-SPION suspension
(1, 3, or 6 µg) or supernatant (1, 3, or 6 µL). Nuclease-
free water was added to a final PCR reaction volume of
25 µL. For positive and negative amplification controls,
either 1 µM free NB or 6 µL DNase-free water was added
instead of SPION suspension or supernatant, respectively.
After 1 minute of denaturation at 94°C, PCR amplification
was then carried out in 30 cycles of 30 seconds at 94°C,
30 seconds at 55°C, and 1 minute at 72°C. In the last cycle,
the elongation step at 72°C was prolonged to 5 minutes.
The PCR reactions were then cooled to 4°C. Amplicons
were detected by agarose gel electrophoresis using a 2%
Divbio Synergel Agarose Additive (BioExpress, Kaysville,
UT)/0.7% agarose gel with 0.5 µg/mL ethidium bromide
(EtBr) in 1 × Tris-acetate-EDTA buffer (Sigma-Aldrich, St
Louis, MO). NB-SPIONs (10 µg) that were not subjected
to PCR were also loaded into the gel as a nonamplification
control. Agarose gel electrophoresis was run at 50 V for
2 hours, and the gel was imaged under ultraviolet light using
the Gel Documentation System (Bio-Rad, Hercules, CA).
Semiquantitative analysis of band densities (also known
as intensity peak size) was performed using ImageJ’s Gel
Analysis Tool.
Cellular uptake of NB-SPIONsHeLa cells were seeded at 5 × 10⁴ cells per cm2 onto 18 mm
glass coverslips placed in a 12-well tissue-culture plate.
After incubating at 37°C/5% CO2 overnight, cells were
washed three times with PBS before the addition of Cy5-
NB-SPIONs at 50 nM and 25 nM final concentrations in
Opti-MEM I Reduced Serum Media. After 24-hour incuba-
tion at 37°C/5% CO2, cells were washed three times with
PBS and fixed in 4% (w/v) paraformaldehyde in PBS for
10 minutes. After washing in PBS, cells were permeabilized
with 0.1% (v/v) Triton X-100 in PBS for 5 minutes. After
blocking cells in 1% (w/v) bovine serum albumin (BSA)
in PBS for 20 minutes, the cells were stained with Alexa
Fluor 488 phallotoxin (F-actin in cytoskeleton, 5 µL per
coverslip) and Hoechst 33342 (cell nuclei, 2 µg/mL final)
(Life Technologies) in PBS for 20 minutes. Coverslips were
mounted onto glass microscope slides using VectaShield
Mounting Medium for Fluorescence (Vector Labs,
Burlingame, CA). Cells were imaged for Cy5 (Ex/Em
648/668), Alexa Fluor 488 phallotoxin (Ex/Em 488/499),
and Hoechst 33342 (Ex/Em 350/461) at 60 × magnification
on a Nikon A1R confocal microscope (Nikon Instruments,
Melville, NY).
Pseudo-ISPCr of NB-SPIONsTo determine if NB-SPIONs can be detected inside
single cells by ISPCR, “pseudo”-ISPCR was performed,
in which NB-SPIONs were applied to cells after fixation
and pretreatment to eliminate issues associated with NP
incubation with live cells. HeLa cells in a T25 culture flask
submit your manuscript | www.dovepress.com
Dovepress
Dovepress
5629
Nanobarcoding: detecting nanoparticles using ISPCr

International Journal of Nanomedicine 2012:7
(∼1 × 10⁶ cells) were washed in PBS, harvested, and seeded
onto sterile APTES (3-aminopropyltriethoxysilane)-treated
glass slides at 40,500 cells/25 µL in two 0.81 cm2 areas per
slide (5 × 10⁴ cells per cm2), which were delineated with a
hydrophobic Pap-Pen. Cells were seeded on the delineated
areas and allowed to dry under sterile conditions. After
incubation, the cells were washed in PBS and fixed in 4%
paraformaldehyde in PBS for 30 minutes at 4°C. After
washing three times in PBS, the cells were permeabilized
with 0.1% (v/v) Triton X-100 in PBS for 5 minutes and
then deproteinized with proteinase K (Sigma-Aldrich) in
PBS for 10 minutes at room temperature. Deproteiniza-
tion was stopped by washing cells in a 0.2% (w/v) gly-
cine in PBS, and then the cells were postfixed in ice-cold
ethanol for 10 minutes. Endogenous peroxidase activity was
blocked by incubating the cells in 0.3% H2O
2 in PBS for
10 minutes at room temperature and then washing quickly
in PBS and then water. Frame-Seal Incubation Chambers
(Bio-Rad) were applied to each cell area on the slide (two
per slide). The ISPCR cocktail was prepared containing
15 µL 2 × GoTaq Colorless Master Mix (Promega), 200 nM
amplification template, 2.5 µM reverse primer, 20 µM DIG-
tagged deoxyuridine triphosphate (DIG-dUTP) (1:10 DIG-
dUTP:deoxythymidine triphosphate [dTTP] ratio), 0.1%
(w/v) BSA, and varying amounts of NB-SPIONs (0.5, 1, 2,
5, or 10 µg). Nuclease-free water was added to a final PCR
reaction volume of 30 µL. For the negative ISPCR control,
nuclease-free water was added in lieu of NB-SPIONs. For
the positive ISPCR controls, free NB (2.5 µM final) was used
in lieu of NB-SPIONs, and HPV18 E7 or β-actin primers
were used in lieu of all NB reagents as “internal” positive
controls. After heating the cocktails to 80°C, the cocktails
were layered over the cells and then sealed using a plastic
coverslip. The slides were then placed on the GeneAmp
In Situ PCR System 1000 (PerkinElmer, Waltham, MA),
which was preheated to 80°C. After 2 minutes of initial
denaturation at 94°C, PCR amplification was then carried
out in 30 cycles of 1 minute at 94°C, 1 minute at 55°C,
and 1 minute at 72°C. In the last cycle, the elongation step
at 72°C was prolonged to 5 minutes. The slides were then
cooled to 4°C.
After thermocycling, the amplification cocktail was
collected from the surface of cells for analysis by agarose
gel electrophoresis. The slides were then washed three
times in PBS for 5 minutes each. Nonspecific sites were
blocked by incubating the slides 1% (w/v) BSA in 50 mM
Tris-HCl/300 mM NaCl (blocking buffer) for 30 minutes.
Anti-DIG antibody from sheep, Fab fragments, conjugated
with polymerized horse radish peroxidase ([POD] Roche
Applied Science, Indianapolis, IN) was added to blocking
buffer at 1.5 U/mL final concentration. The slides were
incubated in the antibody solution for 1 hour at room tem-
perature and then washed three times with Tris-HCl/NaCl
buffer for 10 minutes each. The POD substrate, diamino-
benzidine (DAB), was diluted in peroxide buffer (Roche
Applied Science), and the slides were incubated with the
DAB working solution until cells developed a purple-brown
color. The slides were washed in water, dried, and mounted
in VectaShield Mounting Medium. Bright-field images
of cell samples were obtained with a Nikon Eclipse 80i
microscope (Nikon Instruments) equipped with a MicroPub-
lisher 5.0 RTV camera (QImaging, Surrey, BC, Canada) at
20 × magnification.
ISPCr-mediated detection of NB-SPIONsHeLa cells were seeded at 5 × 10⁴ cells/cm2 in a T25 tis-
sue culture flask or multiwell tissue-culture plates. After
incubating at 37°C/5% CO2 overnight, cells were washed
three times with PBS before the addition of NB-SPIONs
in Opti-MEM I Reduced Serum Media (Life Technolo-
gies, Carlsbad, CA). After 24 hours incubation at 37°C/5%
CO2, the cells were washed three times with PBS before
harvesting by trypsinization. Cells were centrifuged and
then washed with PBS before counting. Cellular smears
(40,500 cells/25 µL) were fixed and pretreated as described
for pseudo-ISPCR. The ISPCR cocktail was prepared con-
taining 15 µL 2 × GoTaq Colorless Master Mix, 200 nM
amplification template, 2.5 µM reverse primer, 20 µM
DIG-dUTP (1:10 DIG-dUTP:dTTP ratio), and 0.1% (w/v)
BSA. Nuclease-free water was added to a final ISPCR
reaction volume of 30 µL. For the negative ISPCR control,
nuclease-free water was added in lieu of amplification
template and reverse primer. Similarly, HPV18 E7 primers
were used for positive ISPCR controls. ISPCR cocktails
were added to cellular smears and sealed with Frame-Seal
Incubation Chambers. ISPCR thermocycling conditions, rev-
elation procedures, and imaging protocols were performed
as described for pseudo-ISPCR.
Statistical analysisStatistical significance between COOH- and NB-SPION
data (size and zeta potential) was computed using Microsoft
Excel’s (Microsoft Corporation, Redmond, WA) Student
t-test function (two-tailed, two-sample unequal variance)
using α = 0.05.
submit your manuscript | www.dovepress.com
Dovepress
Dovepress
5630
Eustaquio and Leary

International Journal of Nanomedicine 2012:7
ResultsNB-SPION characterizationFigure 3 displays size and zeta potential measurements
for COOH- and NB-SPIONs dispersed in different media.
A significant increase in Z-average diameter was observed
after NB conjugation when measured in nanograde water
and PBS (P , 0.05). In general, the Z-average diameter
increases and the zeta potential becomes more positive when
the dispersion medium is composed of more solvent mole-
cules (eg, counterions, amino acids) that can adsorb to the
surface of the NPs. The adsorption of counterions and amino
acids (eg, l-glutamine) to the surface of oligo-functionalized
NPs has been observed previously.43,44 NP agglomeration is
known to occur to some extent in biological and environ-
mental solutions,45 and Opti-MEM I and serum-free EMEM
induce the formation of COOH-SPION agglomerates that
are micron-sized. In contrast, the Z-average diameter of the
NB-SPIONs remained in the nanoscale (Figure 3A). It is
hypothesized that the increase in zeta potential, attributed
to the conjugated NB, stabilizes the SPION size in different
dispersion media. The NP surface becomes more negatively
charged and attracts more positively charged counterions
and/or amino acids to form a thicker boundary layer around
the NP, resulting in a more positive zeta potential. The
zeta potentials are most negative when the SPIONs are
dispersed in nanograde water and most positive when the
SPIONs are dispersed in serum-free EMEM, which was
expected (Figure 3B). The zeta potentials of the COOH- and
NB-SPIONs were statistically different in all dispersion
media (P , 0.05). The difference is most apparent when the
SPIONs were dispersed in nanograde water (−62.43 mV for
COOH-SPIONs and −32.27 mV for NB-SPIONs).
Hyperspectral imaging analysis was performed to confirm
NB conjugation to the SPION surface. Figure 4A shows the
mean spectral responses of COOH- and NB-SPIONs. The
x-axis units are in wavelength in nm, and the y-axis units
are counts of the relative intensity of the reflectance scatter
within the spectral data. The peak intensity of NB-SPIONs is
much lower than that of COOH-SPIONs, indicating that the
light-scattering properties of NB-SPIONs were reduced. In
general, metallic and metal oxide NPs experience a similar
reduction in their reflectance peak when new chemistry is
introduced onto the NPs (Leslie Krauss, CytoViva, email
communication, May 31, 2012). These data show that NB has
been successfully conjugated onto the surface of the COOH-
SPIONs. To determine how much of the SPION surface was
covered with conjugated NB, the spectral mapping function
in the CytoViva Hyperspectral Image Analysis Software was
applied, referencing the NB spectral library (Figure 4B). Each
pixel in the hyperspectral scan of NB-SPIONs (Figure 4C)
that matches the NB spectral library is pseudo-colored red,
and the results show that the NB seems to coat the SPION
entirely (Figure 4D).
Solution-phase PCr of NB-SPIONsAn image of the agarose gel is shown in Figure 5A. The
upper band seen in most of the lanes represents 99-bp
double-stranded DNA (dsDNA) amplicons, and the lower
one is unamplified template, which is ssDNA. The identity
of the upper band is confirmed by the positive amplification
control of free NB in lane 8. The identity of the lower band
is confirmed from the negative amplification control (water)
in lane 7. As apparent in lanes 1–3, the amplification of the
conjugated NB increases with the SPION amount added to
the PCR reaction (Figure 5B). No amplicons were generated
from the supernatants, as seen in lanes 4–6. Retention of
the NB-SPIONs can be observed as thin fluorescent bands
at the bottom of the wells in lanes 1–3 and 9, as expected.
200.00
120.00
80.00
60.00
40.00
20.00
0.00
COOH-SPIONs
NB-SPIONs
Z-a
vera
ge
dia
met
er (
nm
)
Nano-grade-water PBS Opti-MEM I
Dispersion medium
Serum-freeEMEM
A
140.00
160.00
180.00
100.00
−10.00
−40.00
−50.00
−60.00
−70.00
0.00
COOH-SPIONs
NB-SPIONs
Zet
a p
ote
nti
al (
mV
)
Dispersion medium
***
*
* *
* *
B
−30.00
−20.00
Serum-freeEMEM
PBSNano-grade-water Opti-MEM I
34.9155.24
44.2055.22
115.47 1482.3346.89
77.21
−62.43
−32.27 −30.40
−19.57−23.50 −22.90
−12.07−15.77
Figure 3 Size (A) and zeta potential measurements (B) of carboxylated (COOh) and nanobarcoded (NB) superparamagnetic iron oxide nanoparticles (SPIONs) in different dispersion media. Note: Asterisks indicate significant difference between NB-SPION and COOH-SPION samples in the same medium (P , 0.05).Abbreviations: EMEM, Eagle’s minimum essential medium; PBS, phosphate-buffered saline.
submit your manuscript | www.dovepress.com
Dovepress
Dovepress
5631
Nanobarcoding: detecting nanoparticles using ISPCr

International Journal of Nanomedicine 2012:7
500
500 600 700 800 900 1000
1000
1500
2000
Val
ue
Wavelength (nm)
COOH vs NB coatingCOOH-SPIONNB-SPION
0
500 600 700 800 900 1000
1000
2000
3000
Val
ue
Wavelength (nm)
NB spectral library
10 µm 10 µm
A B
C D
Figure 4 (A) Mean spectral responses of nanobarcoded superparamagnetic iron oxide nanoparticles (NB-SPIONs) (red trace) and carboxylated (COOh) SPIONs (white trace). (B) NB spectral library that was used to map pixels in the hyperspectral microscopy image of NB-SPIONs (C), pseudo-color red (D), indicating the presence of NB on the SPION surface.Note: Scale bars are 10 µm. Images provided by CytoViva, Inc, Auburn, AL (http://www.cytoviva.com).
L
100 bp
Retained NB-SPIONs30000
25000
20000
15000
10000
5000
01 µg
100 bp
100 nt
Inte
nsi
ty p
eak
size
3 µg 6 µg 1 µL 3 µL
NB-SPION suspension NB-SPION supernatant Controls
6 µL Water Free NBdsDNA ampliconsssDNA template
1 2 3 4 5 6 7 8 9A B
Figure 5 Agarose gel electrophoresis of nanobarcoded superparamagnetic iron oxide nanoparticle (NB-SPION) suspension and supernatants. (A) gel image: lane L, DNA ladder; lanes 1–3, polymerase chain reactions (PCr) with NB-SPIONs (1, 3, or 6 µg); lanes 4–6, PCrs with SPION-free supernatant (1, 3, or 6 µL); lane 7, PCr reactions without NB (negative water control); lane 8, PCr reactions with free NB (positive control); lane 9, 10 µg NB-SPIONs (nonamplification control). The 100-bp band has been indicated for reference. (B) Semiquantitative analysis of intensity peak size of 99 bp and 99 nt bands by ImageJ.
Since positive EtBr staining is observed and EtBr preferen-
tially stains nucleic acids, this indicates the presence of NB
conjugated to the NP surface. The fluorescence intensity from
the retained NB-SPIONs increases with increasing SPION
volume added to the PCR reaction. Although the NB-SPIONs
were retained in the wells of the agarose gel, the electropho-
retic mobility of the amplicons was not hindered.
PCR performed against HeLa genomic DNA yielded
no detectable amplicons, even for PCR reactions contain-
ing free NB and reverse primer. However, positive-control
primers for HPV18 E7 and β-actin generated the expected
amplicons (172 bp and 99 bp, respectively), indicating that
the extracted DNA was of high integrity (data not shown).
This demonstrates that the NB does not amplify nonspecific
sequences in HeLa genomic DNA. Thus, detection via this
NB sequence would be restricted to NB-SPIONs.
Cellular uptake of NB-SPIONsCellular uptake studies were performed to investigate
whether the in vitro model cell type, HeLa, was able to
submit your manuscript | www.dovepress.com
Dovepress
Dovepress
5632
Eustaquio and Leary
International Journal of Nanomedicine 2012:7
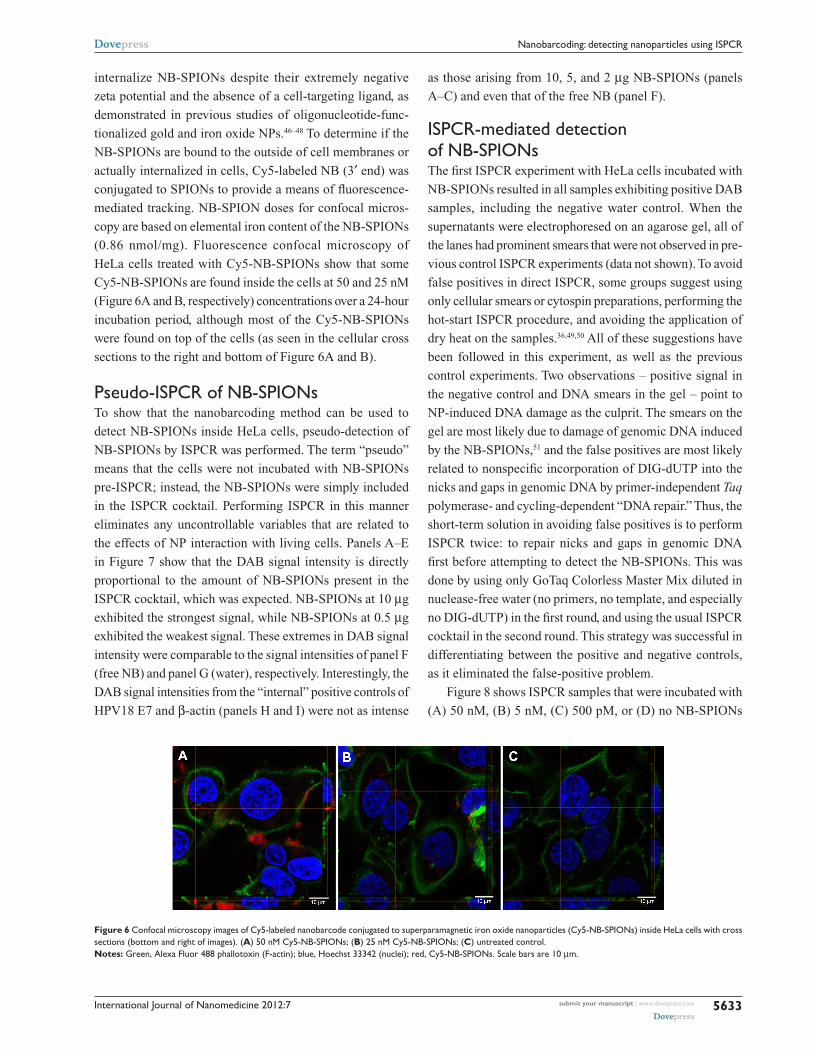
internalize NB-SPIONs despite their extremely negative
zeta potential and the absence of a cell-targeting ligand, as
demonstrated in previous studies of oligonucleotide-func-
tionalized gold and iron oxide NPs.46–48 To determine if the
NB-SPIONs are bound to the outside of cell membranes or
actually internalized in cells, Cy5-labeled NB (3′ end) was
conjugated to SPIONs to provide a means of fluorescence-
mediated tracking. NB-SPION doses for confocal micros-
copy are based on elemental iron content of the NB-SPIONs
(0.86 nmol/mg). Fluorescence confocal microscopy of
HeLa cells treated with Cy5-NB-SPIONs show that some
Cy5-NB-SPIONs are found inside the cells at 50 and 25 nM
(Figure 6A and B, respectively) concentrations over a 24-hour
incubation period, although most of the Cy5-NB-SPIONs
were found on top of the cells (as seen in the cellular cross
sections to the right and bottom of Figure 6A and B).
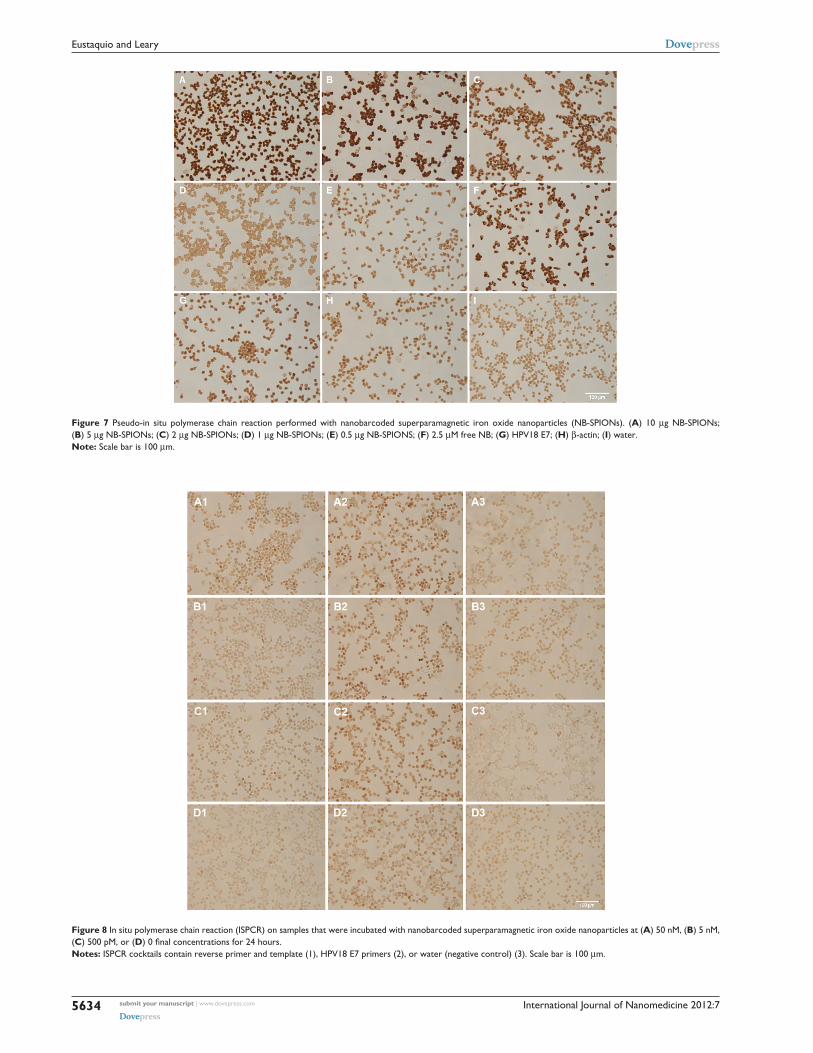
Pseudo-ISPCr of NB-SPIONsTo show that the nanobarcoding method can be used to
detect NB-SPIONs inside HeLa cells, pseudo-detection of
NB-SPIONs by ISPCR was performed. The term “pseudo”
means that the cells were not incubated with NB-SPIONs
pre-ISPCR; instead, the NB-SPIONs were simply included
in the ISPCR cocktail. Performing ISPCR in this manner
eliminates any uncontrollable variables that are related to
the effects of NP interaction with living cells. Panels A–E
in Figure 7 show that the DAB signal intensity is directly
proportional to the amount of NB-SPIONs present in the
ISPCR cocktail, which was expected. NB-SPIONs at 10 µg
exhibited the strongest signal, while NB-SPIONs at 0.5 µg
exhibited the weakest signal. These extremes in DAB signal
intensity were comparable to the signal intensities of panel F
(free NB) and panel G (water), respectively. Interestingly, the
DAB signal intensities from the “internal” positive controls of
HPV18 E7 and β-actin (panels H and I) were not as intense
as those arising from 10, 5, and 2 µg NB-SPIONs (panels
A–C) and even that of the free NB (panel F).
ISPCr-mediated detection of NB-SPIONsThe first ISPCR experiment with HeLa cells incubated with
NB-SPIONs resulted in all samples exhibiting positive DAB
samples, including the negative water control. When the
supernatants were electrophoresed on an agarose gel, all of
the lanes had prominent smears that were not observed in pre-
vious control ISPCR experiments (data not shown). To avoid
false positives in direct ISPCR, some groups suggest using
only cellular smears or cytospin preparations, performing the
hot-start ISPCR procedure, and avoiding the application of
dry heat on the samples.36,49,50 All of these suggestions have
been followed in this experiment, as well as the previous
control experiments. Two observations – positive signal in
the negative control and DNA smears in the gel – point to
NP-induced DNA damage as the culprit. The smears on the
gel are most likely due to damage of genomic DNA induced
by the NB-SPIONs,51 and the false positives are most likely
related to nonspecific incorporation of DIG-dUTP into the
nicks and gaps in genomic DNA by primer-independent Taq
polymerase- and cycling-dependent “DNA repair.” Thus, the
short-term solution in avoiding false positives is to perform
ISPCR twice: to repair nicks and gaps in genomic DNA
first before attempting to detect the NB-SPIONs. This was
done by using only GoTaq Colorless Master Mix diluted in
nuclease-free water (no primers, no template, and especially
no DIG-dUTP) in the first round, and using the usual ISPCR
cocktail in the second round. This strategy was successful in
differentiating between the positive and negative controls,
as it eliminated the false-positive problem.
Figure 8 shows ISPCR samples that were incubated with
(A) 50 nM, (B) 5 nM, (C) 500 pM, or (D) no NB-SPIONs
Figure 6 Confocal microscopy images of Cy5-labeled nanobarcode conjugated to superparamagnetic iron oxide nanoparticles (Cy5-NB-SPIONs) inside heLa cells with cross sections (bottom and right of images). (A) 50 nM Cy5-NB-SPIONs; (B) 25 nM Cy5-NB-SPIONs; (C) untreated control.Notes: green, Alexa Fluor 488 phallotoxin (F-actin); blue, hoechst 33342 (nuclei); red, Cy5-NB-SPIONs. Scale bars are 10 µm.
submit your manuscript | www.dovepress.com
Dovepress
Dovepress
5633
Nanobarcoding: detecting nanoparticles using ISPCr
International Journal of Nanomedicine 2012:7
Figure 7 Pseudo-in situ polymerase chain reaction performed with nanobarcoded superparamagnetic iron oxide nanoparticles (NB-SPIONs). (A) 10 µg NB-SPIONs; (B) 5 µg NB-SPIONs; (C) 2 µg NB-SPIONs; (D) 1 µg NB-SPIONs; (E) 0.5 µg NB-SPIONS; (F) 2.5 µM free NB; (G) hPV18 E7; (H) β-actin; (I) water. Note: Scale bar is 100 µm.
Figure 8 In situ polymerase chain reaction (ISPCr) on samples that were incubated with nanobarcoded superparamagnetic iron oxide nanoparticles at (A) 50 nM, (B) 5 nM, (C) 500 pM, or (D) 0 final concentrations for 24 hours.Notes: ISPCr cocktails contain reverse primer and template (1), hPV18 E7 primers (2), or water (negative control) (3). Scale bar is 100 µm.
submit your manuscript | www.dovepress.com
Dovepress
Dovepress
5634
Eustaquio and Leary
International Journal of Nanomedicine 2012:7
and assayed for (1) NB, (2) HPV18 E7, and (3) nonspecific
background (water). The control samples produced the
expected results. Panels D1 and D3 did not produce intense
DAB signals. In panel D2, the HPV18 E7 produced intense
DAB signals and the expected 172-bp amplicons, which
were validated by agarose gel electrophoresis (data not
shown). The ISPCR samples that were incubated with #5 nM
NB-SPIONs (B1 and C1) appear negative when compared
to their corresponding negative controls (B3 and C3).
However, the ISPCR sample that was incubated with 50 nM
NB-SPIONs (panel A1) appears to exhibit some DAB signal
intensity over background (panel A3).
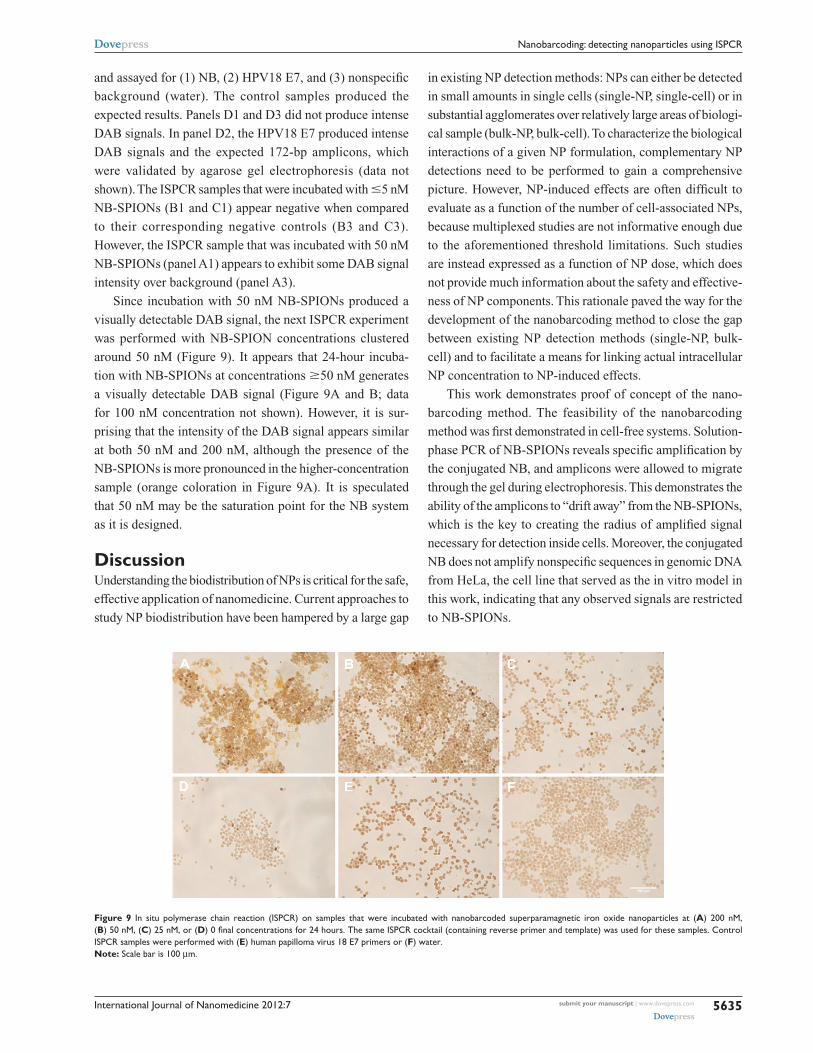
Since incubation with 50 nM NB-SPIONs produced a
visually detectable DAB signal, the next ISPCR experiment
was performed with NB-SPION concentrations clustered
around 50 nM (Figure 9). It appears that 24-hour incuba-
tion with NB-SPIONs at concentrations $50 nM generates
a visually detectable DAB signal (Figure 9A and B; data
for 100 nM concentration not shown). However, it is sur-
prising that the intensity of the DAB signal appears similar
at both 50 nM and 200 nM, although the presence of the
NB-SPIONs is more pronounced in the higher-concentration
sample (orange coloration in Figure 9A). It is speculated
that 50 nM may be the saturation point for the NB system
as it is designed.
DiscussionUnderstanding the biodistribution of NPs is critical for the safe,
effective application of nanomedicine. Current approaches to
study NP biodistribution have been hampered by a large gap
in existing NP detection methods: NPs can either be detected
in small amounts in single cells (single-NP, single-cell) or in
substantial agglomerates over relatively large areas of biologi-
cal sample (bulk-NP, bulk-cell). To characterize the biological
interactions of a given NP formulation, complementary NP
detections need to be performed to gain a comprehensive
picture. However, NP-induced effects are often difficult to
evaluate as a function of the number of cell-associated NPs,
because multiplexed studies are not informative enough due
to the aforementioned threshold limitations. Such studies
are instead expressed as a function of NP dose, which does
not provide much information about the safety and effective-
ness of NP components. This rationale paved the way for the
development of the nanobarcoding method to close the gap
between existing NP detection methods (single-NP, bulk-
cell) and to facilitate a means for linking actual intracellular
NP concentration to NP-induced effects.
This work demonstrates proof of concept of the nano-
barcoding method. The feasibility of the nanobarcoding
method was first demonstrated in cell-free systems. Solution-
phase PCR of NB-SPIONs reveals specific amplification by
the conjugated NB, and amplicons were allowed to migrate
through the gel during electrophoresis. This demonstrates the
ability of the amplicons to “drift away” from the NB-SPIONs,
which is the key to creating the radius of amplified signal
necessary for detection inside cells. Moreover, the conjugated
NB does not amplify nonspecific sequences in genomic DNA
from HeLa, the cell line that served as the in vitro model in
this work, indicating that any observed signals are restricted
to NB-SPIONs.
Figure 9 In situ polymerase chain reaction (ISPCr) on samples that were incubated with nanobarcoded superparamagnetic iron oxide nanoparticles at (A) 200 nM, (B) 50 nM, (C) 25 nM, or (D) 0 final concentrations for 24 hours. The same ISPCR cocktail (containing reverse primer and template) was used for these samples. Control ISPCr samples were performed with (E) human papilloma virus 18 E7 primers or (F) water.Note: Scale bar is 100 µm.
submit your manuscript | www.dovepress.com
Dovepress
Dovepress
5635
Nanobarcoding: detecting nanoparticles using ISPCr
International Journal of Nanomedicine 2012:7
Despite these positive results, validation of the nano-
barcoding method in cell-based systems was challenging.
NB-SPIONs appeared to induce some DNA damage, since
nonspecific signals were seen in ISPCR samples in which the
reverse primer and template were omitted. It was speculated
that the DIG-dUTP was incorporated into nicks and gaps in
the damaged DNA, producing the high background signals.
The short-term solution was to perform ISPCR thermocy-
cling twice: the first time for Taq-mediated DNA repair and
the second time for actual NB amplification. This solution
helped differentiate between the positive HPV18 E7 and
β-actin controls and the negative water control and allowed
the NB-SPION detection signals to emerge. However, the
current NB-SPION concentrations were too high to consider
the observed threshold as single-NP detection, but further
development beyond these feasibility studies may be able
to improve the sensitivity. Nevertheless, these results rep-
resent a major advance in the difficult area of determining
NP biodistributions at single-cell levels. The nanobarcoding
method has been shown to rapidly detect NPs over relatively
large areas with apparently greater sensitivity than confo-
cal microscopy over smaller areas. This is demonstrated by
comparing the ISPCR (Figures 8A1 and 9B) and confocal
microscopy (Figure 6A) results for NB-SPIONs at 50 nM
concentration over a 24-hour exposure period.
Although the basic feasibility of the nanobarcoding
method has been confirmed, the sensitivity of the current
design restricts its power in detecting small numbers of NPs
inside single cells. Comparing the results from the pseudo-de-
tection experiment to the actual ISPCR results provides some
possible explanations for the lack of sensitivity seen thus far.
Pseudo-detection of NB-SPIONs by ISPCR represents the
desired results of the nanobarcoding method: the intensity
of DAB signal is correlated with the amount of NB-SPIONs
present. However, these results were not replicated in actual
ISPCR experiments. The major difference between these two
sets of experiments is applying the NB-SPIONs postfixation
versus prefixation of the ISPCR samples. Nuclease activity
within the cells is speculated to have a detrimental effect on
NB integrity. Other possible reasons for the lack of sensitivity
are inadequacies in the NB system itself, such as deficient
NB conjugation, inefficient cellular uptake, and limitations
in NB signal amplification.
Moreover, the ISPCR results need to be validated
by complementary NP detection methods. Agarose gel
electrophoresis of the ISPCR supernatants was performed
after each ISPCR experiment, but the expected amplicons
were never detected, even though a detection signal was
observed in the cells (data not shown). In contrast, the
expected amplicons for the HPV18 E7 and β-actin positive
controls were always detected in both ISPCR and agarose
gel electrophoresis. Since the SPION core is electron-dense,
TEM, which is considered the gold standard in single-cell NP
detection, should be performed after ISPCR experiments on
NB-SPION-treated samples to approximate the amount of
NB-SPIONs inside each cell. This is a logical choice, since
many protocols have been written on performing ISPCR
directly on TEM grids.52,53
The primary goal of future work should be increasing the
sensitivity of NP detection. To our knowledge, there are two
approaches to improving the sensitivity of the nanobarcoding
method: (1) target amplification by optimizing NB on the
NP itself; and (2) signal amplification by augmenting the
design of the ISPCR protocol. For the first approach, there are
multiple ways to amplify the “target,” which can be defined
as higher amounts of conjugated NB per NP and/or higher
amounts of internalized NPs per cell to increase the detec-
tion signal. First, the NP uptake efficiency can be improved
by adding targeting ligands (eg, antibodies, peptides) to
the NP surface54 or maximizing the density of the NB on
the NP surface by using different conjugation chemistries
and/or reaction schemes.47,55 The former option will definitely
decrease the potential density of the NB on the NP surface
(and subsequently signal amplification), but will provide the
option of targeted cellular uptake. The latter option may also
help guard against digestion by endogenous nucleases.43,56
However, the NB may still be susceptible to some level of
nuclease digestion to the point where it no longer resembles
a functioning PCR primer. The simplest way to increase
nuclease stability is to make the NB double-stranded via
hybridization to a complementary oligo, since dsDNA is
generally more stable than ssDNA.57 Other ways of increasing
nuclease stability involve applying chemical modifications
most commonly used in the synthesis of antisense oligos.
Examples include phosphorothioate, 2-O-methoxyethyl,
2-O-methyl, locked nucleic acid, morpholina, and peptide
nucleic acid.58–61 However, it is not known if these chemical
modifications can be introduced into the NB without hinder-
ing its function as a PCR primer.
The second approach, signal amplification, involves aug-
menting the design of the ISPCR protocol. Currently, revela-
tion of ISPCR amplicons is mediated by direct DIG detection
with POD-linked antibodies and DAB substrate. The most
obvious way to amplify the detection signal from ISPCR
amplicons is to switch over to indirect DIG detection with
primary antibodies against DIG- and POD-linked secondary
submit your manuscript | www.dovepress.com
Dovepress
Dovepress
5636
Eustaquio and Leary

International Journal of Nanomedicine 2012:7
antibodies. Indirect detection is more sensitive, since each
primary antibody can recruit many secondary antibodies
for a more intense signal. Another way is to utilize different
enzymes (eg, alkaline phosphatase) and/or chromogenic
substrates that may be more sensitive and less interfering
than DAB (eg, nitroblue-tetrazolium salt or Fast Red 1–5-
naphethediol in combination with 5-bromo-4- chloro-3 indo-
lyl-phosphate).62 In addition, fluorescence-based detection
can be used with tyramide signal amplification,50 which has
been shown to amplify the detection signal on the order of
500- to 1000-fold when compared to biotin-avidin.63–65
Besides the revelation procedure, another possible way
to amplify the detection signal is by lowering the final con-
centrations of the reverse primer and template in the ISPCR
cocktail. This may provide more operational NB:reverse
primer and NB:template ratios since the effective concentra-
tion of NB may be relatively low due to the small number
of NB-NPs present inside the cells. In addition, the cell’s
architecture already limits the interactions between the NB,
reverse primer, template, and especially the large Taq poly-
merase molecules. Thus, lowering the concentrations of these
reagents may facilitate increased diffusion throughout the
cellular architecture, which ensures more targeted amplicon
production.66
Increasing the sensitivity of the nanobarcoding method
has been stressed throughout this work, but improvements
can also be made toward its specificity. Recall that the NB-
SPIONs induced nicks and gaps in genomic DNA, allowing
the incorporation of DIG-dUTP, which consequently gener-
ated high background signals. The short-term solution was
performing ISPCR to repair the damaged DNA first and
then again to generate NB amplicons. However, this made
the sample more susceptible to injury, since the total number
of heating cycles and the total time spent above 90°C were
doubled. To work around these issues, a combination of PCR
and in situ hybridization (PCR-ISH), also known as indirect
ISPCR, can be used instead of ISPCR. Here, the detection is
based on ISH of a labeled probe to the amplicons, in which
revelation occurs in a sequence-specific manner. Although
this method is theoretically less sensitive than ISPCR, there
is less worry about nonspecific signals and sample damage.
Furthermore, future efforts toward improving the sensitivity
of the current ISPCR protocol could also help to improve the
sensitivity threshold of PCR-ISH.
In addition to improving the specificity of the nano-
barcoding method, PCR-ISH would permit the simultaneous
detection of more than one NP type in the same sample. In
fact, the term “nanobarcoding” itself implies the encoding
of information on an NP. The information that can be gained
is the amounts and locations of certain NPs based on the
color and intensity of the amplified NP detection signal. For
example, two NP types are nanobarcoded with unique NB
sequences. After administration of these NPs, samples are
harvested and prepared for PCR-ISH. After PCR-ISH, the
samples are examined for the expected detection signals from
each NP type. Depending on the application, the effects of
physicochemical properties, targeting mechanisms, route of
entry, and nanotoxicity can be studied simultaneously in one
sample set. This allows for systematic evaluation of several
NP parameters in a reduced sample size with the potential for
less measurement error. Essentially, multiple NP biodistribu-
tion experiments can be performed on a single animal.
Since NP biodistribution studies are often performed
in vivo, the possibility of ex vivo analysis of excised tissues
and organs is quite advantageous. It is often difficult to cor-
relate NP dose and administration route to preferential accu-
mulation in relevant tissues or even distinct cell types within
those tissues. Thus, future work should look into applying
nanobarcoding to NP detection ex vivo in tissues. The basic
steps of the nanobarcoding method are still applicable to
ex vivo samples, but the required optimizations for tissue
sections increase the overall complexity of the procedure.
Ex vivo samples can be (1) fixed and then frozen or embed-
ded in paraffin or (2) frozen and then fixed. In addition, the
deproteinization step needs to be optimized for each tissue
type, since the sample is no longer relatively uniform as it is
in vitro. Moreover, other factors need to be considered, such
as DNA integrity during tissue processing, presence of Taq
polymerase inhibitors, and reduced retention of amplicons
due to the loss of intact cell membranes. This stresses the
importance of improving the sensitivity of the nanobarcod-
ing method before tackling NP detection in ex vivo samples.
Still, the use of the nanobarcoding method ex vivo would
make it a disruptive technology that has the potential to
qualify in vivo NP biodistribution on a single-cell level.
In summary, the power of the nanobarcoding method
will be realized when its sensitivity and specificity can be
optimized. First, the sensitivity of NP detection needs to be
improved by applying the principles of both target and signal
amplification. Second, the specificity can be increased by the
introduction of a post-PCR hybridization step (PCR-ISH),
which would allow for simultaneous detection of more than
one NP type in a single biological sample. Finally, these
improvements would pave the way for precise analysis of in
vivo NP biodistribution via ex vivo samples, which would be
the ultimate utility of the nanobarcoding method.
submit your manuscript | www.dovepress.com
Dovepress
Dovepress
5637
Nanobarcoding: detecting nanoparticles using ISPCr
International Journal of Nanomedicine 2012:7
ConclusionToday, nanomedicine is expanding the possibilities of con-
trolling and monitoring complex diseases. NPs, the instru-
ments of nanomedicine, are being developed at a rapid pace,
with innovative formulations that are often programmed to
perform a specific order of functions at the molecular level.
However, some of the anticipated benefits of nanomedicine
are hyped, due to the lack of predictive models for in vitro
and in vivo NP behavior. This work endeavored to facilitate
the establishment of such models through the development
of the nanobarcoding method, which has the potential to
track small numbers or even single NPs for improved NP
biodistribution studies at the single-cell level. Herein, proof
of concept of the nanobarcoding method has been demon-
strated, but the technique needs further development before
its widespread use as a standardized assay. Notwithstanding,
the wealth of knowledge that can be gained from nanobarcod-
ing has the potential to aid current NP design efforts and
redefine regulatory science such that potentially life-saving
NP formulations can be realized.
AcknowledgmentsThe authors thank Aaron B Taylor in the Bioscience Imaging
Facility at Purdue University for technical assistance with
confocal microscopy and Byron Cheatham and Leslie Krauss
from CytoViva Inc, for the hyperspectral imaging data and
analysis. They also thank the Christopher Columbus Fellow-
ship Foundation for financial support of this work.
DisclosureThe authors report no conflicts of interest in this work.
References1. Haglund E, Seale-Goldsmith MM, Leary JF. Design of multifunctional
nanomedical systems. Ann Biomed Eng. 2009;37(10):2048–2063.2. Seale-Goldsmith MM, Leary JF. Nanobiosystems. Wiley Interdiscip Rev
Nanomed Nanobiotechnol. 2009;1(5):553–567.3. von Eschenbach AC. Nanotechnology: A Report of the US Food and
Drug Administration Nanotechnology Task Force. 2007; Available from: http://www.fda.gov/downloads/ScienceResearch/SpecialTopics/Nanotechnology/ucm110856.pdf. Accessed July 2, 2012.
4. Elsaesser A, Taylor A, de Yanes GS, et al. Quantification of nanopar-ticle uptake by cells using microscopical and analytical techniques. Nanomedicine (Lond). 2010;5(9):1447–1457.
5. Alivisatos AP, Gu W, Larabell C. Quantum dots as cellular probes. Annu Rev Biomed Eng. 2005;7:55–76.
6. Ballou B. Quantum dot surfaces for use in vivo and in vitro. Curr Top Dev Biol. 2005;70:103–120.
7. Aviv H, Bartling S, Kieslling F, Margel S. Radiopaque iodinated copolymeric nanoparticles for X-ray imaging applications. Biomaterials. 2009;30(29):5610–5616.
8. Rahn H, Odenbach S. X-ray microcomputed tomography as a tool for the investigation of the biodistribution of magnetic nanoparticles. Nanomedicine. 2009;4(8):981–990.
9. Cho CF, Ablack A, Leong HS, Zijlstra A, Lewis J. Evaluation of nanoparticle uptake in tumors in real time using intravital imaging. J Vis Exp. 2011;52:2808.
10. Müller K, Skepper JN, Tang TY, et al. Atorvastatin and uptake of ultra-small superparamagnetic iron oxide nanoparticles (Ferumoxtran-10) in human monocyte-macrophages: implications for magnetic resonance imaging. Biomaterials. 2008;29(17):2656–2662.
11. Rahimi M, Wadajkar A, Subramanian K, et al. In vitro evaluation of novel polymer-coated magnetic nanoparticles for controlled drug delivery. Nanomedicine. 2010;6(5):672–680.
12. Gultepe E, Reynoso FJ, Jhaveri A, et al. Monitoring of magnetic targeting to tumor vasculature through MRI and biodistribution. Nanomedicine (Lond). 2010;5(8):1173–1182.
13. Haglund EM, Seale-Goldsmith MM, Dhawan D, et al. Peptide target-ing of quantum dots to human breast cancer cells. Proc SPIE. 2008; 6866:68660S1–68660S8.
14. Al-Hajaj NA, Moquin A, Neibert KD, Soliman GM, Winnik FM, Maysinger D. Short ligands affect modes of QD uptake and elimina-tion in human cells. ACS Nano. 2011;5(6):4909–4918.
15. Meng H, Yang S, Li Z, et al. Aspect ratio determines the quantity of mesoporous silica nanoparticle uptake by a small GTPase-dependent macropinocytosis mechanism. ACS Nano. 2011;5(6):4434–4447.
16. Kumar A, Pandey AK, Singh SS, Shanker R, Dhawan A. A flow cyto-metric method to assess nanoparticle uptake in bacteria. Cytometry A. 2011;79(9):707–712.
17. Zucker RM, Massaro EJ, Sanders KM, Degn LL, Boyes WK. Detection of TiO
2 nanoparticles in cells by flow cytometry. Cytometry A. 2010;
77(7):677–685. 18. Choi J, Zheng Q, Katz HE, Guilarte TR. Silica-based nanoparticle
uptake and cellular response by primary microglia. Environ Health Perspect. 2010;118(5):589–595.
19. Corbalan JJ, Medina C, Jacoby A, Malinski T, Radomski MW. Amorphous silica nanoparticles trigger nitric oxide/peroxynitrite imbal-ance in human endothelial cells: inflammatory and cytotoxic effects. Int J Nanomedicine. 2011;6:2821–2835.
20. Peckys DB, de Jonge N. Visualizing gold nanoparticle uptake in live cells with liquid scanning transmission electron microscopy. Nano Lett. 2011;11(4):1733–1738.
21. Zhong L, Zeng G, Lu X, et al. NSOM/QD-based direct visualization of CD3-induced and CD28-enhanced nanospatial coclustering of TCR and coreceptor in nanodomains in T cell activation. PLoS One. 2009;4(6):e5945.
22. Zhong L, Zhang Z, Lu X, et al. NSOM/QD-based fluorescence- topographic image fusion directly reveals nano-spatial peak-valley polarities of CD69 and CD71 activation molecules on cell-membrane fluctuations during T-cell activation. Immunol Lett. 2011;140(1–2): 44–51.
23. Chang BJ, Lin SH, Chou LJ, Chiang SY. Subdiffraction scattered light imaging of gold nanoparticles using structured illumination. Opt Lett. 2011;36(24):4773–4775.
24. Schübbe S, Cavelius C, Schumann C, Koch M, Kraegeloh A. STED microscopy to monitor agglomeration of silica particles inside A549 cells. Adv Eng Mater. 2010;12(5):417–422.
25. Gupta AK, Berry C, Gupta M, Curtis A. Receptor-mediated target-ing of magnetic nanoparticles using insulin as a surface ligand to prevent endocytosis. IEEE Trans Nanobioscience. 2003;2(4): 255–261.
26. Gupta AK, Gupta M. Cytotoxicity suppression and cellular uptake enhancement of surface modified magnetic nanoparticles. Biomaterials. 2005;26(13):1565–1573.
27. Huang X, Peng X, Wang Y, Shin DM, El-Sayed MA, Nie S. A reexami-nation of active and passive tumor targeting by using rod-shaped gold nanocrystals and covalently conjugated peptide ligands. ACS Nano. 2010;4(10):5887–5896.
28. Zhang X, Xing JZ, Chen J, et al. Enhanced radiation sensitivity in prostate cancer by gold-nanoparticles. Clin Invest Med. 2008;31(3): E160–E167.
submit your manuscript | www.dovepress.com
Dovepress
Dovepress
5638
Eustaquio and Leary
International Journal of Nanomedicine
Publish your work in this journal
Submit your manuscript here: http://www.dovepress.com/international-journal-of-nanomedicine-journal
The International Journal of Nanomedicine is an international, peer-reviewed journal focusing on the application of nanotechnology in diagnostics, therapeutics, and drug delivery systems throughout the biomedical field. This journal is indexed on PubMed Central, MedLine, CAS, SciSearch®, Current Contents®/Clinical Medicine,
Journal Citation Reports/Science Edition, EMBase, Scopus and the Elsevier Bibliographic databases. The manuscript management system is completely online and includes a very quick and fair peer-review system, which is all easy to use. Visit http://www.dovepress.com/ testimonials.php to read real quotes from published authors.
International Journal of Nanomedicine 2012:7
29. Zhu ZJ, Ghosh PS, Miranda OR, Vachet RW, Rotello VM. Multiplexed screening of cellular uptake of gold nanoparticles using laser desorption/ionization mass spectrometry. J Am Chem Soc. 2008;130(43):14139–14143.
30. Deering CE, Tadjiki S, Assemi S, Miller JD, Yost GS, Veranth JM. A novel method to detect unlabeled inorganic nanoparticles and submi-cron particles in tissue by sedimentation field-flow fractionation. Part Fibre Toxicol. 2008;5:18.
31. Chavanpatil MD, Khdair A, Panyam J. Surfactant-polymer nanopar-ticles: a novel platform for sustained and enhanced cellular delivery of water-soluble molecules. Pharm Res. 2007;24(4):803–810.
32. Davda J, Labhasetwar V. Characterization of nanoparticle uptake by endothelial cells. Int J Pharm. 2002;233(1–2):51–59.
33. Ece Gamsiz D, Shah LK, Devalapally H, Amiji MM, Carrier RL. A model predicting delivery of saquinavir in nanoparticles to human monocyte/macrophage (Mo/Mac) cells. Biotechnol Bioeng. 2008;101(5):1072–1082.
34. Lin A, Chen J, Liu Y, et al. Preparation and evaluation of N-caproyl chitosan nanoparticles surface modified with glycyrrhizin for hepatocyte targeting. Drug Dev Ind Pharm. 2009;35(11):1348–1355.
35. DiCarlo D, Lee LP. Dynamic single cell analysis for quantitative biology. Anal Chem. 2006;78(23):7918–7925.
36. Nuovo GJ. PCR in Situ Hybridization: Protocols and Applications. 3rd ed. Philadelphia: Lippincott-Raven; 1997.
37. Bagasra O. Protocols for the in situ PCR-amplification and detection of mRNA and DNA sequences. Nat Protoc. 2007;2(11):2782–2795.
38. Bagasra O. In situ polymerase chain reaction and hybridization to detect low-abundance nucleic acid targets. In: Current Protocols in Molecular Biology. Hoboken, NJ: John Wiley & Sons, Inc.; 2001.
39. Eustaquio T, Leary JF, inventors. Single nanoparticle detection by DNA barcoding for biodistribution studies in nanomedicine. United States patent application 61/363.898; filed 2010.
40. Eustaquio T, Leary JF. Nanobarcoding: a novel method of single nano-particle detection in cells and tissues for nanomedical biodistribution studies. Proc SPIE. 2011;8099:80990V-1–80990V-13.
41. Eustaquio T, Cooper CL, Leary JF. Single-cell imaging detection of nanobarcoded nanoparticle biodistributions in tissues for nanomedicine. Proc SPIE. 2011;7910:79100O-1–79100O-11.
42. Lesnikova I, Lidang M, Hamilton-Dutoit S, Koch J. Rapid, sensitive, type specific PCR detection of the E7 region of human papillomavirus type 16 and 18 from paraffin embedded sections of cervical carcinoma. Infect Agent Cancer. 2010;5(2):1–5.
43. Seferos DS, Prigodich AE, Giljohann DA, Patel PC, Mirkin CA. Polyvalent DNA nanoparticle conjugates stabilize nucleic acids. Nano Lett. 2009;9(1):308–311.
44. Leroux JC, De Jaeghere F, Anner B, Doelker E, Gurny R. An investiga-tion on the role of plasma and serum opsonins on the internalization of biodegradable poly(D,L-lactic acid) nanoparticles by human monocytes. Life Sci. 1995;57(7):695–703.
45. Sharma VK. Aggregation and toxicity of titanium dioxide nanoparticles in aquatic environment – a review. J Environ Sci Health A Tox Hazard Subst Environ Eng. 2009;44(14):1485–1495.
46. Cutler JI, Zheng D, Xu XY, Giljohann DA, Mirkin CA. Polyvalent oligonucleotide iron oxide nanoparticle “click” conjugates. Nano Lett. 2010;10(4):1477–1480.
47. Giljohann DA, Seferos DS, Patel PC, Millstone JE, Rosi NL, Mirkin CA. Oligonucleotide loading determines cellular uptake of DNA-modified gold nanoparticles. Nano Lett. 2007;7(12):3818–3821.
48. Patel PC, Giljohann DA, Daniel WL, Zheng D, Prigodich AE, Mirkin CA. Scavenger receptors mediate cellular uptake of polyvalent oligonucleotide-functionalized gold nanoparticles. Bioconjug Chem. 2010;21(12):2250–2256.
49. Long AA, Komminoth P, Lee E, Wolfe HJ. Comparison of indirect and direct in-situ polymerase chain reaction in cell preparations and tissue sections. Detection of viral DNA, gene rearrangements and chromosomal translocations. Histochemistry. 1993;99(2):151–162.
50. Wiedorn KH, Kuhl H, Galle J, Caselitz J, Vollmer E. Comparison of in-situ hybridization, direct and indirect in-situ PCR as well as tyramide signal amplification for the detection of HPV. Histochem Cell Biol. 1999;111(2):89–95.
51. Singh N, Jenkins GJ, Asadi R, Doak SH. Potential toxicity of super-paramagnetic iron oxide nanoparticles (SPION). Nano Rev. 2010:1.
52. Morel G, Raccurt M. PCR/RT-PCR in Situ Light and Electron Microscopy. Boca Raton: CRC Press; 2003.
53. Bagasra O, Hansen J. In-Situ PCR Techniques. New York: Wiley-Liss; 1997. 54. Seale MM. Design of Targeted Nanoparticles for Multifunctional Nano-
medical Systems [PhD thesis]. West Lafayette: Biomedical Engineering, Purdue University; 2009.
55. Hurst SJ, Lytton-Jean AKR, Mirkin CA. Maximizing DNA loading on a range of gold nanoparticle sizes. Anal Chem. 2006;78(24):8313–8318.
56. Zwanikken JW, Guo PJ, Mirkin CA, de la Cruz MO. Local ionic envi-ronment around polyvalent nucleic acid-functionalized nanoparticles. J Phys Chem C. 2011;115(33):16368–16373.
57. Eder PS, DeVine RJ, Dagle JM, Walder JA. Substrate specificity and kinetics of degradation of antisense oligonucleotides by a 3′ exonuclease in plasma. Antisense Res Dev. 1991;1(2):141–151.
58. Akhtar S, Kole R, Juliano RL. Stability of antisense DNA oligodeoxy-nucleotide analogs in cellular extracts and sera. Life Sci. 1991;49(24): 1793–1801.
59. Gleave ME, Monia BP. Antisense therapy for cancer. Nat Rev Cancer. 2005;5(6):468–479.
60. Kim DW, Kim JH, Park M, et al. Modulation of biological processes in the nucleus by delivery of DNA oligonucleotides conjugated with gold nanoparticles. Biomaterials. 2011;32(10):2593–2604.
61. Rosi NL, Giljohann DA, Thaxton CS, Lytton-Jean AK, Han MS, Mirkin CA. Oligonucleotide-modified gold nanoparticles for intracel-lular gene regulation. Science. 2006;312(5776):1027–1030.
62. Hurtado R, Mikawa T. Enhanced sensitivity and stability in two-color in situ hybridization by means of a novel chromagenic substrate combination. Dev Dyn. 2006;235(10):2811–2816.
63. Andras SC, Power JB, Cocking EC, Davey MR. Strategies for signal ampli-fication in nucleic acid detection. Mol Biotechnol. 2001;19(1):29–44.
64. Werner M, Von Wasielewski R, Komminoth P. Antigen retrieval, signal amplification and intensification in immunohistochemistry. Histochem Cell Biol. 1996;105(4):253–260.
65. Merz H, Malisius R, Mannweiler S, et al. ImmunoMax. A maximized immunohistochemical method for the retrieval and enhancement of hidden antigens. Lab Invest. 1995;73(1):149–156.
66. Altshuler ML. PCR Troubleshooting: The Essential Guide. Hethersett: Caister Academic Press; 2006.
submit your manuscript | www.dovepress.com
Dovepress
Dovepress
Dovepress
5639
Nanobarcoding: detecting nanoparticles using ISPCr