Expectancy Bias in Anxious Samples
15
Emotion Expectancy Bias in Anxious Samples Cindy M. Cabeleira, Shari A. Steinman, Melissa M. Burgess, Romola S. Bucks, Colin MacLeod, Wilson Melo, and Bethany A. Teachman Online First Publication, May 5, 2014. http://dx.doi.org/10.1037/a0035899 CITATION Cabeleira, C. M., Steinman, S. A., Burgess, M. M., Bucks, R. S., MacLeod, C., Melo, W., & Teachman, B. A. (2014, May 5). Expectancy Bias in Anxious Samples. Emotion. Advance online publication. http://dx.doi.org/10.1037/a0035899
-
Upload
independent -
Category
Documents
-
view
1 -
download
0
Transcript of Expectancy Bias in Anxious Samples
Emotion
Expectancy Bias in Anxious SamplesCindy M. Cabeleira, Shari A. Steinman, Melissa M. Burgess, Romola S. Bucks, Colin MacLeod,Wilson Melo, and Bethany A. TeachmanOnline First Publication, May 5, 2014. http://dx.doi.org/10.1037/a0035899
CITATIONCabeleira, C. M., Steinman, S. A., Burgess, M. M., Bucks, R. S., MacLeod, C., Melo, W., &Teachman, B. A. (2014, May 5). Expectancy Bias in Anxious Samples. Emotion. Advanceonline publication. http://dx.doi.org/10.1037/a0035899

Expectancy Bias in Anxious Samples
Cindy M. CabeleiraUniversity of Western Australia
Shari A. SteinmanUniversity of Virginia
Melissa M. Burgess and Romola S. BucksUniversity of Western Australia
Colin MacLeodUniversity of Western Australia and Australian Bushfire
Cooperative Research Centre, Melbourne, Victoria, Australia
Wilson MeloFederal University of Rio Grande do Sul
Bethany A. TeachmanUniversity of Western Australia and University of Virginia
Although it is well documented that anxious individuals have negative expectations about the future, itis unclear what cognitive processes give rise to this expectancy bias. Two studies are reported that usethe Expectancy Task, which is designed to assess expectancy bias and illuminate its basis. This taskpresents individuals with valenced scenarios (Positive Valence, Negative Valence, or ConflictingValence), and then evaluates their tendency to expect subsequent future positive relative to negativeevents. The Expectancy Task was used with low and high trait anxious (Study 1: n � 32) and anxietysensitive (Study 2: n � 138) individuals. Results suggest that in the context of physical concerns, bothhigh anxious samples display a less positive expectancy bias. In the context of social concerns, high traitanxious individuals display a negative expectancy bias only when negatively valenced information waspreviously presented. Overall, this suggests that anxious individuals display a less positive expectancybias, and that the processes that give rise to this bias may vary by type of situation (e.g., social orphysical) or anxiety difficulty.
Keywords: anxiety sensitivity, expectancy bias, extrapolation, trait anxiety
It is well documented that the content of maladaptive cognitions inanxiety tends to be concerned with the prospect of harmful futureevents (Beck & Clark, 1988; Kendall & Ingram, 1989). Those whoare clinically anxious are more likely to have negatively distortedexpectations of the future than are nonanxious individuals (e.g., Ma-cLeod, Tata, Kentish, & Jacobsen, 1997; Miranda & Mennin, 2007).Consistent with this focus, an anxiety-linked negative expectancy biasreflects an inflated tendency for anxious individuals to expect an
increased probability of negative relative to positive events. Thisanticipation of a wide range of negative events has been demonstratednot only in individuals who are clinically anxious (e.g., Borkovec,Alcaine, & Behar, 2004; Dugas et al., 1998), but also in nonclinicalindividuals who are highly trait anxious (e.g., MacLeod & Byrne,1996; Stöber, 2000). Although an anxiety-linked negative expectancybias has been documented, current paradigms do not illuminate theconditions that give rise to this bias.
Cindy M. Cabeleira, Elizabeth Rutherford Memorial Centre for the Ad-vancement of Research on Emotion, School of Psychology, University ofWestern Australia; Shari A. Steinman, Department of Psychology, Universityof Virginia; Melissa M. Burgess and Romola S. Bucks, Elizabeth RutherfordMemorial Centre for the Advancement of Research on Emotion, School ofPsychology, University of Western Australia; Colin MacLeod, Elizabeth Ruth-erford Memorial Centre for the Advancement of Research on Emotion, Schoolof Psychology, University of Western Australia and Australian Bushfire Co-operative Research Centre, Melbourne, Victoria, Australia; Wilson Melo,Institute of Psychology, Federal University of Rio Grande do Sul, PortoAlegre; Bethany A. Teachman, Elizabeth Rutherford Memorial Centre for theAdvancement of Research on Emotion, School of Psychology, University ofWestern Australia and Department of Psychology, University of Virginia.
Cabeleira and Steinman contributed equally to this work.We thank the members of the Program for Anxiety Cognition and
Treatment (PACT) Lab for their insightful comments and suggestions.
We also thank Rae Davidson, Shana Hovitz, Fiona Ritchey, and LennyChan for research assistance. This research was supported in part byNIA R01AG033033 Grant to Bethany Teachman and a ProgrammaticDistinguished Visitor award from the University of Western Australiaawarded to Bethany Teachman. This research was also supportedin part by Australian Research Council Grant DP0879589, and by agrant from the Romanian National Authority for Scientific Research,CNCS – UEFISCDI, project number PNII-ID-PCCE-2011–2-0045,both awarded to Colin MacLeod. It is acknowledged that thisresearch was conducted while Cindy Cabeleira was an InternationalPostgraduate Research Scholarship recipient at the University of West-ern Australia.
Correspondence concerning this article should be addressed toCindy M. Cabeleira, University of Western Australia, School ofPsychology, Faculty of Life and Physical Sciences, M304, 35 StirlingHwy, Crawley, WA 6009, Australia. E-mail: [email protected]
Thi
sdo
cum
ent
isco
pyri
ghte
dby
the
Am
eric
anPs
ycho
logi
cal
Ass
ocia
tion
oron
eof
itsal
lied
publ
ishe
rs.
Thi
sar
ticle
isin
tend
edso
lely
for
the
pers
onal
use
ofth
ein
divi
dual
user
and
isno
tto
bedi
ssem
inat
edbr
oadl
y.
Emotion © 2014 American Psychological Association2014, Vol. 14, No. 1, 000 1528-3542/14/$12.00 DOI: 10.1037/a0035899
1
In this article, two studies are reported that use a paradigm thatprovides individuals with valenced information, and then evaluatestheir tendency to expect positive or negative events to occur in thefuture. This paradigm is used with both highly trait anxious (HTA)and highly anxiety sensitive (HAS) samples. Trait anxiety reflectsthe propensity to become anxious across many different contexts(Spielberger, 1983), whereas anxiety sensitivity reflects the fear ofsymptoms related to anxiety (e.g., bodily sensations, such as aracing heart) and the belief that these sensations have negativephysical, social, or psychological consequences (Reiss, 1991; Re-iss & McNally, 1985).
Although the anxiety-linked tendency to anticipate negativefuture events has been demonstrated using a variety of paradigms,no methodology has revealed the conditions that give rise to thisexpectancy bias in anxious samples. Specifically, it is unclearwhether this bias occurs regardless of the valence of previouslypresented information, or whether it is moderated by the valence ofpreviously presented information. In this article, we consider threepotential hypotheses regarding conditions that may lead to anexpectancy bias.
First, it may be that the expectancy bias seen among anxiousindividuals is pervasive, such that it is shown across situations.Specifically, anxious individuals may have a more negative ex-pectancy bias (relative to nonanxious individuals), regardless ofwhether current or recent events are emotionally negative, areemotionally positive, or are conflicting in emotional valence (i.e.,containing negative and positive elements). This possibility isreferred to as the Pervasive Expectancy Bias Hypothesis(Pervasive-EBH). Pervasive in this context refers to the bias oc-curring irrespective of differently valenced prior information orpreceding events; it does not imply that expectancy biases willpersist regardless of context. If an anxiety-linked tendency to showa more negative expectancy bias (relative to nonanxious individ-uals) is found, but it is moderated by the valence of previouslypresented information, this would refute the validity of thePervasive-EBH. The Expectancy Task allows us to test two suchhypotheses.
The Extrapolation Expectancy Bias Hypothesis (Extrapolation-EBH) suggests that the anxiety-linked elevation in expectations ofnegative future events is moderated by the (negative or positive)valence of previously presented information. Thus, anxious indi-viduals may expect relatively more negative future events becausethey exhibit biased extrapolation from current events, relative tononanxious individuals. For example, anxious individuals may bedisproportionately inclined to infer that negative current eventswill lead to negative future events. Should this be observed, thenthe degree to which anxious (compared to nonanxious) participantsinflate the probability of future negative events will be dispropor-tionately greater when the information they are given indicates thatthese prior events proceeded in a negative manner.
A third hypothesis, the Emotional Weighting Expectancy BiasHypothesis (Emotional Weighting-EBH), refers to the possibilitythat the anxiety-linked expectancy bias is moderated by whether ornot previously presented information is unresolved or mixed withrespect to valence. It is hypothesized that, following the presenta-tion of both positive and negative previous information, anxiousindividuals may be more likely than nonanxious individuals toassign more weight to the negative (rather than positive) informa-tion, construing the overall event as relatively more negative.
Consequently, following the presentation of both positive andnegative previous information, anxious individuals may be morelikely to expect negative future events to occur. The currentresearch presents participants with conflicting (negative and pos-itive) information to test this hypothesis. In summary, the threehypotheses presented here differ in terms of whether an anxiety-linked expectancy bias is moderated by the valence of previouslypresented information.
Evaluating these hypotheses requires a task that provides infor-mation about the manner in which a range of scenarios proceed,and then assesses participants’ expectancies for alternative possi-ble future events that differ in their emotional valence. By manip-ulating the valence of information initially presented in eachscenario, it is possible to investigate the circumstances underwhich biased expectation for future positive versus negative eventswill characterize anxious participants.
In the current article, a paradigm that meets these requirementsis used with two anxious samples: the Expectancy Task (Cabeleira,Bucks, Teachman, & MacLeod, 2010). Originally introduced anddeveloped by Cabeleira et al. (2010) and further validated bySteinman, Smyth, Bucks, MacLeod, and Teachman (2013), theExpectancy Task presents participants with information about arange of hypothetical scenarios. The scenarios relate to physical orsocial events, which may be processed differently by people withdifferent types and levels of anxiety. Most importantly, the sce-narios vary in valence, and can be negative (including only neg-ative and neutral events), positive (including only positive andneutral events), or conflicting in valence (including an equal num-ber of positive and negative events). After reading and imaginingthemselves in the scenarios, participants are required to rate thelikelihood of three future events occurring next, which can benegative, positive, or neutral in valence, on a scale of 1 (veryunlikely to happen next) to 4 (very likely to happen next). Theseratings reveal anxiety-related bias in the relative tendency toexpect positive versus negative future events. By examiningwhether such expectancy bias is influenced by the valence of theinformation provided in the initial scenarios, the three anxiety-linked expectancy bias hypotheses described above can be tested.
In summary, the current studies have two key aims: a) todetermine whether anxious individuals (HTA in Study 1, HAS inStudy 2) show an inflated tendency to anticipate relatively morenegative future events relative to nonanxious individuals, whichwe term an anxiety-linked negative expectancy bias; and b) to testthe three hypotheses described above by evaluating whether sucha bias is moderated by the valence of previous events.
Study 1
Method
Participants. Thirty-two first year psychology undergradu-ates from the University of Western Australia were recruited basedon their score on the Trait form of the State–Trait Anxiety Inven-tory (STAI-T; Spielberger, 1983). The mean trait anxiety score forcollege students (Spielberger) was used to determine cut-off scoresfor inclusion in HTA and LTA groups. To be included in the HTAgroup, participants had to score at least one standard deviation(SD � 9.67) above this mean trait anxiety score (M � 39.35) forcollege students, thus scoring 50 or above on the STAI-T. To be
Thi
sdo
cum
ent
isco
pyri
ghte
dby
the
Am
eric
anPs
ycho
logi
cal
Ass
ocia
tion
oron
eof
itsal
lied
publ
ishe
rs.
Thi
sar
ticle
isin
tend
edso
lely
for
the
pers
onal
use
ofth
ein
divi
dual
user
and
isno
tto
bedi
ssem
inat
edbr
oadl
y.
2 CABELEIRA ET AL.

included in the LTA group, participants had to score at least onestandard deviation below this mean trait anxiety score for collegestudents, thus scoring 29 or below on the STAI-T. There were 16LTA participants (50% female), and 16 HTA participants (50%female). The mean age of the sample was 17.6 years (SD � 1.16;range 17–22 years), and race was reported as follows: 68.8%White, 21.9% Asian, 6.3% Black/African, and 3.1% “other.” TheUniversity of Western Australia’s Human Research Ethics Com-mittee (HREC) approved this study.
Materials.1
Anxiety symptoms. The 20-item STAI (Spielberger, 1983)includes one scale to assess state anxiety (STAI-S) and one scaleto assess dispositional trait anxiety (STAI-T). The reliability(Barnes, Harp, & Jung, 2002) and validity (Spielberger) of thescales are well established, and Cronbach’s alpha was .96 for theSTAI-T and .91 for the STAI-S in the current study.
Expectancy task. The Expectancy Task (Cabeleira et al.,2010) is a computerized reading judgment task designed to eval-uate an individual’s tendency to anticipate positive or negativeevents to occur (labeled “expectancy bias”). The Expectancy Taskinvolves presenting 64 scenarios (in 16 blocks of four) that vary inthe extent to which positive, neutral, or negative events occur, thenasking participants to judge the likelihood of future valencedevents occurring in each of these scenarios. The Expectancy Taskincludes a Scenario Presentation Component and an ExpectancyRating Component.
In the Scenario Presentation Component, participants wereasked to read and imagine themselves in a number of scenarios,each described by six statements: a Title, an Orienting Sentence,and four events (see Appendix for examples). The Title remainedin the center of the computer screen for the duration of the scenariopresentation, while the other five statements appeared directlybelow the Title, and each remained on the screen only until theparticipant pressed the spacebar, signaling that he or she had readthe statement and was ready for the next statement to be shown.The four events in a scenario could be shown in any of threePassage Valence Conditions. In the Positive Valence condition,two positive and two neutral events were presented. In the Nega-tive Valence condition, two negative and two neutral events werepresented. In the Conflicting Valence condition, two negative andtwo positive events were presented. The neutral events were in-cluded to control for amount of information presented in eachcombination (i.e., such that each scenario consistently includedfour events, and each valence was consistently represented by twoevents). Order of valenced events (e.g., positive vs. neutral) withina scenario was counterbalanced. A graphical depiction of theScenario Presentation Component of the Expectancy Task is pre-sented in Figure 1, which provides an illustrative example using ascenario relating to physical concerns delivered in the ConflictingValence condition.
In the Expectancy Rating Component of the task, participantswere asked to think about the likelihood of different specifiedcandidate future events for each of the scenarios they had previ-ously read and imagined themselves in. On each trial, participantsread the Title and Orienting Sentence from one of the previouslyseen scenarios (and the four events previously presented as part ofthat scenario were represented as lines of stars below the orientingsentence), which remained on screen while participants were askedto rate their beliefs concerning the likelihood that each of the three
specific events would happen to them within the scenario theyimagined themselves experiencing. These candidate future eventsincluded one positive event, one negative event, and one neutralevent, presented in a random order. These three candidate futureevents were displayed in the middle of the screen and participantswere instructed to use a scale ranging from 1 (very unlikely tohappen next) to 4 (very likely to happen next) to rate the subjectivelikelihood of each event. A graphical depiction of the ExpectancyRating Component of the Expectancy Task is presented in Figure2, which provides an illustrative example using a scenario relatingto physical concerns delivered in the Conflicting Valence condi-tion. Scenarios were presented in blocks of four so that the load on
1 Additional self-report measures were used in this study and are re-ported elsewhere. For a complete list of measures, please contact Cindy M.Cabeleira.
Going to the Doctor
************************
You find out you need a biopsy done
Going to the Doctor
You go to the doctor’s rooms
Going to the Doctor
Figure 1. A graphical depiction of the Scenario Presentation Componentof the Expectancy Task which provides an illustrative example using ascenario relating to physical concerns delivered in the Conflicting Valencecondition. (Minor visual modifications were made in Study 2.)
Thi
sdo
cum
ent
isco
pyri
ghte
dby
the
Am
eric
anPs
ycho
logi
cal
Ass
ocia
tion
oron
eof
itsal
lied
publ
ishe
rs.
Thi
sar
ticle
isin
tend
edso
lely
for
the
pers
onal
use
ofth
ein
divi
dual
user
and
isno
tto
bedi
ssem
inat
edbr
oadl
y.
3EXPECTANCY BIAS AND ANXIETY

memory would be minimal, with each block being followed by theexpectancy ratings for the future events for the four scenarios. Intotal, 16 blocks of four scenarios were presented in this manner,totaling 64 scenarios.
Scenario event sets. Each of the 64 scenarios presented in thestudy was derived from its own Scenario Event Set. Each ScenarioEvent Set represented a hypothetical scenario related to either aphysical or social concern, and included 11 items: a Title, anOrienting Sentence, and nine candidate events. Of the nine candi-date events, three were positive, three were negative, and threewere neutral (see Appendix). The four events actually presented inthe Expectancy Task for any scenario were selected from itsScenario Event Set, in a manner that took account of the PassageValence Condition for that scenario. Two of the three events ofeach valence to be presented in the scenario were randomly se-lected for display in the Scenario Presentation Component of thetask, whereas the third event of each valence was shown in theExpectancy Rating Component of the task. All Scenario Event Setswere previously validated by an independent sample of 16 raters
(see Cabeleira, 2010). Specifically, all Scenario Event Sets used inthe current study were judged to be relevant to either physical orsocial concerns, and valenced ratings for events were consistentwith the intended valence of each event (i.e., positive, negative, orneutral). Additionally, the positive and negative events were ratedto have equivalent valence intensity.
Procedure. Participants were informed that the experimentwas designed to illuminate how people differ in terms of theirunderstandings of hypothetical scenarios. Participants began thesession by completing the STAI-S. Participants then completedeight practice scenarios of the Expectancy Task, followed by thefull Expectancy Task. At the end of the session, participantsreceived course credit for their participation and were debriefed.
Results
Descriptive statistics. Chi-square tests revealed that the LTAand HTA groups did not differ by gender (�2 � .00, p � 1.000) orrace (�2 � 4.06, p � .541), and an independent samples t testdemonstrated there was no significant difference between the LTAand HTA groups in terms of age, t(30) � .91, p � .37, d � 0.32.An independent samples t test was used to compare both trait andstate anxiety scores at baseline between groups (LTA vs. HTA).As expected, this revealed a significant group difference in traitanxiety, t(30) � 27.79, p � .001, d � 9.82, such that HTAparticipants reported higher trait anxiety than LTA participants.Unsurprisingly, a significant group difference was also observedfor state anxiety, t(30) � 5.16, p � .001, d � 1.82, such that HTAparticipants reported higher state anxiety than LTA participants.Descriptive statistics for age, trait, and state anxiety scores for eachanxiety group are presented in Table 1.
Going to the Doctor
************************
***********************************
The doctor prescribes you medication that can have bad side effects
Going to the Doctor
************************
***********************************
******************************************************
The doctor informs you that you are at a healthy weight
Going to the Doctor
************************
***********************************
******************************************************
*********************************************
The doctor says she is happy with your exercise regime
Figure 1 (continued).Going to the Doctor
You go to the doctor’s rooms
***********************************
******************************************************
*********************************************
*********************************************
RATING? The doctor warns you all your family is at risk of diabetes
The doctor says your heart sounds very healthy
The telephone rings
1 – Very UNLIKELY to happen next
2 – Somewhat UNLIKELY to happen next
3 – Somewhat LIKELY to happen next
4 – Very LIKELY to happen next
Figure 2. A graphical depiction of the Expectancy Rating Component ofthe Expectancy Task which provides an illustrative example using ascenario relating to physical concerns delivered in the Conflicting Valencecondition. (Note that the word “RATING” moves to subsequent statementsonce a rating has been entered. Minor visual modifications were made inStudy 2.)
Thi
sdo
cum
ent
isco
pyri
ghte
dby
the
Am
eric
anPs
ycho
logi
cal
Ass
ocia
tion
oron
eof
itsal
lied
publ
ishe
rs.
Thi
sar
ticle
isin
tend
edso
lely
for
the
pers
onal
use
ofth
ein
divi
dual
user
and
isno
tto
bedi
ssem
inat
edbr
oadl
y.
4 CABELEIRA ET AL.

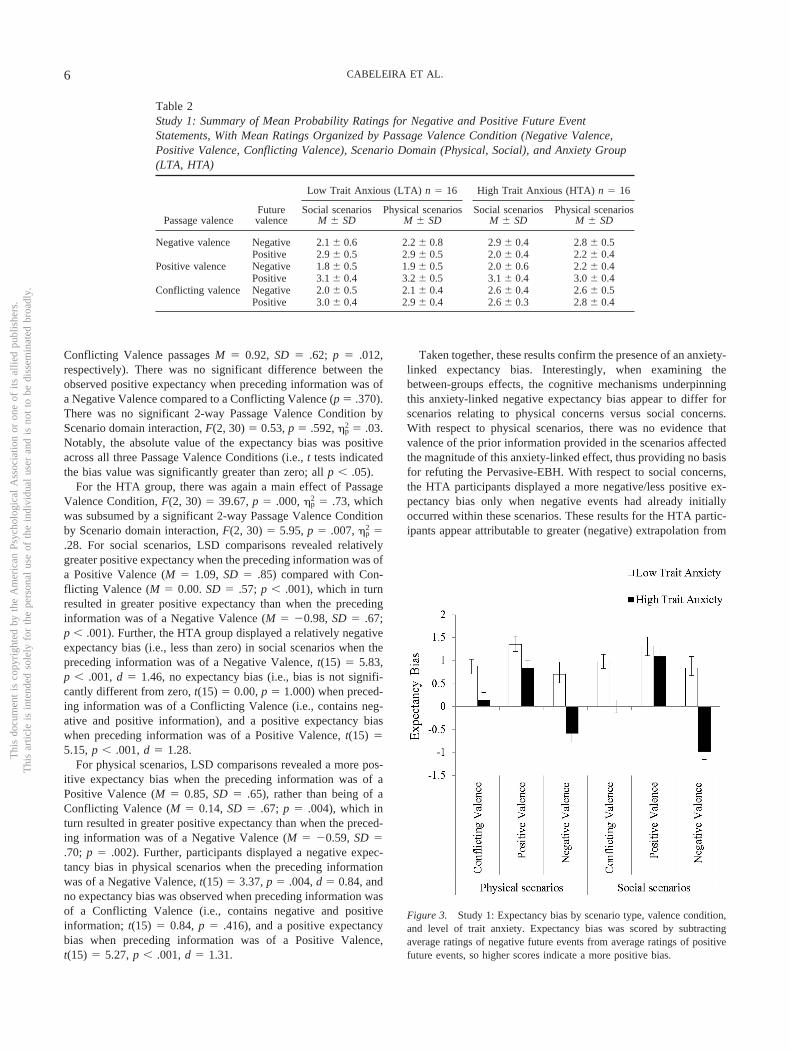
Evidence for expectancy effects.2 The Expectancy Task wasscored by subtracting participants’ average likelihood ratings fornegative future events from their average likelihood ratings forpositive future events to yield an expectancy bias index. Thedecision to create this relative, rather than absolute, bias indexderived from a desire to simultaneously consider the valuing ofpositive and negative choices, given the external validity of need-ing to weigh multiple options simultaneously when predicting thefuture. A score of zero on this index would indicate that there wasno difference between participants’ ratings for the likelihood ofnegative and positive future events. A score on this index that isgreater for Participant A than for Participant B would indicate thatthe former participant exhibited a relatively greater tendency toexpect positive events, while the latter participant demonstrated arelatively greater tendency to expect negative events. A summaryof the mean probability ratings for negative and positive futureevent statements is presented in Table 2, with mean ratings orga-nized by Passage Valence condition (Negative Valence, PositiveValence, Conflicting Valence), Scenario domain (Physical, So-cial), and Anxiety group (LTA, HTA).
A repeated measures analysis of variance (ANOVA) with onebetween-subjects factor of Anxiety Group (LTA, HTA), and twowithin-subjects factors of Passage Valence Condition (PositiveValence, Negative Valence, Conflicting Valence) and ScenarioDomain (Physical, Social), was conducted to examine whether ananxiety-linked difference in negative expectancy bias was evident,and, if so, under which experimental conditions it was observed.The results of the ANOVA revealed a significant main effect ofAnxiety Group, F(1, 30) � 22.71, p � .001, �p
2 � .43, reflectingthe anticipated lower positive expectancy bias index scores for theHTA group (M � 0.86, SD � 0.44) compared with the LTA group(M � 1.01, SD � 0.64).
There was also a main effect of Passage Valence Condition, F(2,29) � 22.74, p � .001, �p
2 � .61. Follow-up analyses showed thatratings of future events differed significantly across the threepassage valence types in the expected direction (all p � .001), suchthat Negative Valence passages (M � �0.01, SD � 1.14) yieldeda relatively less positive expectancy index compared to the Con-flicting Valence passages (M � 0.50, SD � 0.73), which in turnyielded a less positive expectancy index relative to the PositiveValence passages (M � 1.16, SD � 0.68). This suggests that theExpectancy Task is sufficiently sensitive to show expectancies areinfluenced by the valence of prior information.
Importantly, there was a significant 2-way interaction betweenAnxiety Group and Passage Valence Condition, F(2, 29) � 6.46
p � .005, �p2 � .31. This was further embedded in a significant
3-way interaction of Anxiety Group, Passage Valence Condition,and Scenario Domain, F(2, 29) � 3.92 p � .031, �p
2 � .21; seeFigure 3. No other significant effects emerged from this analysis.To understand the 3-way interaction, between group differences inthe expectancy rating data were analyzed separately for eachScenario Domain.
For scenarios related to physical concerns, there was a maineffect of Anxiety Group, F(1, 17.19) � 19.94, p � .001, �p
2, � .40,such that HTA individuals had a less positive expectancy biasrelative to LTA individuals (HTA M � 0.13, SD � 0.42; LTAM � 0.98, SD � 0.63). No significant 2-way interaction ofPassage Valence Condition and Anxiety Group, F(2, 29) � 2.14p � .137, �p
2 � .13, was observed. In other words, both HTA andLTA individuals’ expectancies were similarly affected by thevalence of initial scenarios, indicating that extrapolation fromvalence of initial events did not vary by anxiety group, though theHTA group expected relatively less positive future events in gen-eral.
For scenarios related to social concerns, there was a main effectof Anxiety Group, F(1, 24.13) � 20.88, p � .001, �p
2 � .41, thatwas subsumed by a significant 2-way interaction of Passage Va-lence Condition and Anxiety Group, F(2, 29) � 11.73, p � .001,�p
2 � .45. Independent samples t tests were conducted to comparethe Anxiety Groups’ expectancy index ratings for each PassageValence type for the social scenarios. Results revealed that HTAparticipants showed less positive expectancy bias than LTA par-ticipants when scenarios were initially presented in the NegativeValence condition, t(30) � 5.96, p � .001, d � 2.11; HTAM � �0.98, SD � 0.67, LTA M � 0.84, SD � 1.02, or in theConflicting Valence condition, t(30) � 4.38, p � .001, d � 1.55;HTA M � 0.00, SD � 0.57, LTA M � 0.97, SD � 0.68. There wasno significant Anxiety Group difference in expectancy bias scoreswhen scenarios were initially presented in the Positive Valencecondition, t(30) � 0.79, p � .435; HTA M � 1.09, SD � 0.85,LTA M � 1.32, SD � 0.77, with both groups similarly ratingpositive future events as more likely to occur than negative futureevents. Thus, whenever the initial social scenario contained neg-ative events (i.e., in both the Negative Valence and ConflictingValence conditions), the HTA participants showed lower expec-tancy bias for future positive events, compared to the LTA partic-ipants. However, this was not the case when the initial scenario didnot contain negative events (i.e., in the Positive Valence condi-tion).
To further understand the significant 3-way interaction of Anx-iety Group, Passage Valence Condition, and Scenario Domain,within anxiety group differences were examined next. For the LTAgroup, there was the expected main effect of Passage ValenceCondition, F(1.43, 21.44) � 4.94, p � .026, �p
2 � .25. LeastSignificant Difference (LSD) comparisons revealed relativelygreater positive expectancy when the preceding information wasPositive (M � 1.34, SD � .65) relative to that containing negativeinformation (i.e., Negative M � 0.77, SD � .99; p � .031, and
2 An ANOVA revealed that the order of events (e.g., negative-neutral vs.neutral-negative) presented in the Scenario Presentation Component of thetask did not influence the ratings made in the Expectancy Rating Compo-nent of the task (all p � .05). Thus, order of events was not included as afactor in the analyses presented.
Table 1Study 1: Descriptive Statistics for Low and High TraitAnxious Groups
Measures
Low Trait Anxious (LTA)n � 16M � SD
High Trait Anxious (HTA)n � 16M � SD
Age 17.75 � 1.39 17.38 � 0.89STAI-T 25.88 � 2.63 54.81 � 3.23STAI-S 27.19 � 5.86 40.06 � 8.08
Note. STAI-T � State-Trait Anxiety Inventory – Trait Score; STAI-S �State-Trait Anxiety Inventory – State Score.
Thi
sdo
cum
ent
isco
pyri
ghte
dby
the
Am
eric
anPs
ycho
logi
cal
Ass
ocia
tion
oron
eof
itsal
lied
publ
ishe
rs.
Thi
sar
ticle
isin
tend
edso
lely
for
the
pers
onal
use
ofth
ein
divi
dual
user
and
isno
tto
bedi
ssem
inat
edbr
oadl
y.
5EXPECTANCY BIAS AND ANXIETY
Conflicting Valence passages M � 0.92, SD � .62; p � .012,respectively). There was no significant difference between theobserved positive expectancy when preceding information was ofa Negative Valence compared to a Conflicting Valence (p � .370).There was no significant 2-way Passage Valence Condition byScenario domain interaction, F(2, 30) � 0.53, p � .592, �p
2 � .03.Notably, the absolute value of the expectancy bias was positiveacross all three Passage Valence Conditions (i.e., t tests indicatedthe bias value was significantly greater than zero; all p � .05).
For the HTA group, there was again a main effect of PassageValence Condition, F(2, 30) � 39.67, p � .000, �p
2 � .73, whichwas subsumed by a significant 2-way Passage Valence Conditionby Scenario domain interaction, F(2, 30) � 5.95, p � .007, �p
2 �.28. For social scenarios, LSD comparisons revealed relativelygreater positive expectancy when the preceding information was ofa Positive Valence (M � 1.09, SD � .85) compared with Con-flicting Valence (M � 0.00. SD � .57; p � .001), which in turnresulted in greater positive expectancy than when the precedinginformation was of a Negative Valence (M � �0.98, SD � .67;p � .001). Further, the HTA group displayed a relatively negativeexpectancy bias (i.e., less than zero) in social scenarios when thepreceding information was of a Negative Valence, t(15) � 5.83,p � .001, d � 1.46, no expectancy bias (i.e., bias is not signifi-cantly different from zero, t(15) � 0.00, p � 1.000) when preced-ing information was of a Conflicting Valence (i.e., contains neg-ative and positive information), and a positive expectancy biaswhen preceding information was of a Positive Valence, t(15) �5.15, p � .001, d � 1.28.
For physical scenarios, LSD comparisons revealed a more pos-itive expectancy bias when the preceding information was of aPositive Valence (M � 0.85, SD � .65), rather than being of aConflicting Valence (M � 0.14, SD � .67; p � .004), which inturn resulted in greater positive expectancy than when the preced-ing information was of a Negative Valence (M � �0.59, SD �.70; p � .002). Further, participants displayed a negative expec-tancy bias in physical scenarios when the preceding informationwas of a Negative Valence, t(15) � 3.37, p � .004, d � 0.84, andno expectancy bias was observed when preceding information wasof a Conflicting Valence (i.e., contains negative and positiveinformation; t(15) � 0.84, p � .416), and a positive expectancybias when preceding information was of a Positive Valence,t(15) � 5.27, p � .001, d � 1.31.
Taken together, these results confirm the presence of an anxiety-linked expectancy bias. Interestingly, when examining thebetween-groups effects, the cognitive mechanisms underpinningthis anxiety-linked negative expectancy bias appear to differ forscenarios relating to physical concerns versus social concerns.With respect to physical scenarios, there was no evidence thatvalence of the prior information provided in the scenarios affectedthe magnitude of this anxiety-linked effect, thus providing no basisfor refuting the Pervasive-EBH. With respect to social concerns,the HTA participants displayed a more negative/less positive ex-pectancy bias only when negative events had already initiallyoccurred within these scenarios. These results for the HTA partic-ipants appear attributable to greater (negative) extrapolation from
Table 2Study 1: Summary of Mean Probability Ratings for Negative and Positive Future EventStatements, With Mean Ratings Organized by Passage Valence Condition (Negative Valence,Positive Valence, Conflicting Valence), Scenario Domain (Physical, Social), and Anxiety Group(LTA, HTA)
Passage valenceFuturevalence
Low Trait Anxious (LTA) n � 16 High Trait Anxious (HTA) n � 16
Social scenariosM � SD
Physical scenariosM � SD
Social scenariosM � SD
Physical scenariosM � SD
Negative valence Negative 2.1 � 0.6 2.2 � 0.8 2.9 � 0.4 2.8 � 0.5Positive 2.9 � 0.5 2.9 � 0.5 2.0 � 0.4 2.2 � 0.4
Positive valence Negative 1.8 � 0.5 1.9 � 0.5 2.0 � 0.6 2.2 � 0.4Positive 3.1 � 0.4 3.2 � 0.5 3.1 � 0.4 3.0 � 0.4
Conflicting valence Negative 2.0 � 0.5 2.1 � 0.4 2.6 � 0.4 2.6 � 0.5Positive 3.0 � 0.4 2.9 � 0.4 2.6 � 0.3 2.8 � 0.4
Figure 3. Study 1: Expectancy bias by scenario type, valence condition,and level of trait anxiety. Expectancy bias was scored by subtractingaverage ratings of negative future events from average ratings of positivefuture events, so higher scores indicate a more positive bias.
Thi
sdo
cum
ent
isco
pyri
ghte
dby
the
Am
eric
anPs
ycho
logi
cal
Ass
ocia
tion
oron
eof
itsal
lied
publ
ishe
rs.
Thi
sar
ticle
isin
tend
edso
lely
for
the
pers
onal
use
ofth
ein
divi
dual
user
and
isno
tto
bedi
ssem
inat
edbr
oadl
y.
6 CABELEIRA ET AL.
previous negative events, consistent with the Extrapolation-EBH.When examining the within-group effects, the LTA were perva-sively more positive in their expectations of future events, whilethe expectancies of the HTA group were more consistent with thevalence of previously presented information.
Discussion
This study had two aims: a) to determine whether HTA indi-viduals do indeed show an inflated tendency to expect negativefuture events relative to LTA individuals, and b) to investigatewhether such an anxiety-linked bias is moderated by the emotionaltone of previously presented information. The findings confirmedthat, compared with LTA participants, HTA participants showed amore negative/less positive expectancy bias, consistent with pre-vious research (e.g., Miranda & Mennin, 2007). Furthermore, thepresent study also sheds light on the nature of this bias, revealingthat it differs between high and low anxiety groups depending onthe type of concerns (physical or social) depicted in events.
In scenarios relating to physical concerns, the observed anxiety-linked expectancy bias was not moderated by the emotional tone ofprevious events. Of course the absence of an interaction herecannot be interpreted as absolute evidence for the Pervasive-EBH,given that a conclusion cannot be sustained on the basis of con-firming predicted null results. Perhaps with greater power (e.g., alarger sample size), valence may have moderated the anxiety-linked expectancy bias in physical scenarios, and there are ofcourse numerous other factors not investigated here that couldhave moderated the anxiety-linked effect. Notwithstanding, withrespect to the factors investigated here, the Pervasive-EBH appearsto most parsimoniously accommodate the results.
When participants were required to judge the likelihood offuture events in scenarios related to social concerns, the anxiousparticipants only demonstrated a more negative/less positive ex-pectancy bias than nonanxious participants when negative eventshad already occurred within the initial description of these scenar-ios (i.e., in the Negative Valence and Conflicting Valence condi-tions). This pattern of results is consistent with greater negativeextrapolation, whereby anxious individuals showed an elevatedtendency to infer that future events will continue to be negativewhen previous events have been negative (matching theExtrapolation-EBH).
These different findings for the physical versus social scenarioswere unexpected. As mentioned earlier, sample sizes were small inthis study, thus limiting power to detect significant effects. It ispossible that a pattern of results consistent with the Extrapolation-EBH may have occurred for the physical scenarios if the study wasconducted with a larger sample. Another challenge in interpretingthis difference is that social concerns may be more personallyrelevant for this sample of young, HTA individuals than physicalconcerns, given the automatic “attention-grabbing power of neg-ative social information” (Pratto & John, 1991, p. 380). Thus,perhaps these individuals were more likely to make greater use ofpreviously presented, valenced information in forming their futureexpectations about socially related matters.
In terms of the within anxiety group effects observed, the LTAappeared to have a pervasively positive expectancy bias regardlessof scenario type (i.e., physical or social) or prior valence (thoughdegree of positivity clearly differed by prior valence), whereas the
expectancies of the HTA were more consistent with the valence ofpreceding information (i.e., positive bias in Positive Valence pas-sages, negative bias in Negative Valence passages, and no signif-icant bias in Conflicting Valence passages) for scenarios relatingto both social and physical concerns.
To address issues of power and relevance of scenario concerns,and replicate and extend the findings of Study 1, Study 2 uses amuch larger, alternate anxious sample for which physical concernstend to be more personally relevant.
Study 2
Although the presence of an expectancy bias in trait anxioussamples has been previously explored, it is unclear whether thisphenomenon is consistent across different types of anxious sam-ples, or whether anxiety subtypes differ in their expectancies andthe conditions under which negative expectancy biases arise. Anx-iety sensitivity involves the fear of anxiety-related symptoms,including various bodily sensations (Cox, Parker, & Swinson,1996) and the belief that these sensations have negative physical,social, or psychological consequences (Reiss, 1991; Reiss & Mc-Nally, 1985). Study 2 aims to explore whether an anxiety-linkedexpectancy bias in scenarios relating to physical concerns willonce again not be moderated by the valence of previous events andlinked to a Pervasive Expectancy Bias (in line with the Study 1findings), or whether an Extrapolation Expectancy Bias willemerge (akin to findings for the social scenarios in Study 1). Givenhigh anxiety sensitive (HAS) individuals are known to have con-cerns about the physical consequences of anxiety, the physicalscenarios may be more relevant than they were for the HTA groupin Study 1. No research to the authors’ knowledge has investigatedexpectancy bias in HAS individuals in a manner that can testwhether results are consistent with a Pervasive-EBH,Extrapolation-EBH, or Emotional Weighting-EBH account.
In Study 2, the Expectancy Task was used with low anxietysensitive (LAS) and HAS samples. Only scenarios related tophysical events (e.g., going to the doctor, or exercising) wereincluded in this version of the Expectancy task given our interestin better understanding the nature of expectancies for this materialin a sample known to have concerns about physical sensations(Clark, 1986). Note that the scenarios included did not all perfectlyalign with fears of bodily sensations. Rather, the scenarios in-cluded a broad range of physical concerns. Given the relationshipbetween health anxiety and anxiety sensitivity (e.g., Wheaton,Berman, & Abramowitz, 2010), it is probable that many of thescenarios were personally relevant for participants with HAS, andwe wanted to sample the physical domain broadly. Of note, weused a much larger sample in Study 2, which addresses powerconcerns in Study 1.
Additionally, in Study 2, we consider another potential moder-ator of expectancies—the role of priming concerns tied to thephysical scenarios to make those concerns salient before formingexpectancies. The inclusion of this moderator follows mixed re-sults in the field about the role of such primes in the expression ofcognitive biases in anxious samples. For instance, priming con-cerns related to specific fears have led to enhancement of recallbiases in a spider-fearful sample (e.g., Smith-Janik & Teachman,2008), but also reduction of attention biases in a snake-fearfulsample (e.g., Mathews & Sebastian, 1993). On the contrary, prim-
Thi
sdo
cum
ent
isco
pyri
ghte
dby
the
Am
eric
anPs
ycho
logi
cal
Ass
ocia
tion
oron
eof
itsal
lied
publ
ishe
rs.
Thi
sar
ticle
isin
tend
edso
lely
for
the
pers
onal
use
ofth
ein
divi
dual
user
and
isno
tto
bedi
ssem
inat
edbr
oadl
y.
7EXPECTANCY BIAS AND ANXIETY

ing concerns related to specific fears had no effect on memorybiases in another spider phobic sample (see Study 1 in Watts &Dalgeish, 1991). Thus, we are interested in how an analogousprime tied to physical concerns will alter the expression of expec-tancy bias. It is hypothesized that priming physical concerns willincrease state anxiety for the HAS group, but not the LAS group.In response to this prime, it is tentatively hypothesized that thedifference in expectancy bias between LAS and HAS individualswill be magnified following priming of physical concerns becausethe prime will make those concerns salient, but given prior mixedresults, this evaluation is somewhat exploratory.
Finally, to test whether expectancy bias is related to markers ofanxiety beyond only questionnaire measures of anxious symptoms,a measure of anxiety experienced during an anxiety sensitivity-relevant stressor was included. It is predicted that expectancy biaswill be related to anxiety experienced during an anxiety-relevanttrigger, speaking to the predictive validity of expectancy bias.
Method
Participants. Participants were recruited through the Univer-sity of Virginia’s psychology department participant pool, basedon their responses to the Anxiety Sensitivity Index (ASI; Reiss,Peterson, Gursky, & McNally, 1986). Students who scored 14 orbelow on the total ASI (so they were at least .5 standard deviationsbelow ASI college student norms; Peterson & Reiss, 1992) wereinvited to participate in the LAS group. Students who scored 23 orgreater on the total ASI (so they were at least .5 standard devia-tions above ASI college students norms; Peterson & Reiss) wereinvited to participate in the HAS group.3 One hundred and thirty-nine students participated in the study. One participant was ex-cluded from analyses, as a result of being an outlier in age (8.16years above the rest of the sample’s mean). Sixty-eight LASstudents (63.2% female) and 70 HAS students (65.7% female)were included in analyses. The mean age was 18.84 (SD � .93,range � 17 – 22 years). Seventy-one percent of participantsreported their race as White, 14.5% as Asian, 8.0% as Black/African American, 5.1% as Bi- or multiracial, and 1.4% as “other.”The University of Virginia’s Institutional Review Board (IRB)approved this study.
Materials.4
Anxiety symptoms. The Anxiety Sensitivity Index (ASI; Reisset al., 1986) is a 16-item questionnaire that measures an individ-ual’s concern over symptoms associated with anxiety (e.g., Itscares me when my heart beats rapidly). The ASI has goodreliability and validity (Peterson & Reiss, 1993), and includesitems relevant to physical, social, and mental incapacitation con-cerns. Cronbach’s alpha for the ASI was .95 in the current study.
The Positive and Negative Affect Schedule-Fear Subscale(PANAS-FS; Watson & Clark, 1994) is a widely used self-reportmeasure of affect based on adjective ratings. The PANAS has goodreliability and validity (Watson & Clark). In the current study, onlythe 6-item fear subscale was administered to determine if thephysical sensations prime affected state fear. Across administra-tions, the average Cronbach’s alpha was .82 (range � .74–.87).
Physical sensation prime manipulation. Participants wererandomly assigned to either a physical sensation Prime or NoPrime condition to test the impact of a prime on the expression ofexpectancies. To prime physical sensations relevant to anxiety
(and, in turn, presumably alter state fear for the HAS group),participants in the Prime condition were asked to complete theCandle-Blowing task. This task was derived from the widely usedPanic Control Treatment manual (Barlow & Craske, 1994) and hasbeen used in previous studies examining anxiety reactions (e.g.,Gordon & Teachman, 2008; Steinman & Teachman, 2010). In theCandle-Blowing task, participants were asked to imagine that theirindex finger was a candle that they must blow out repeatedly for 45seconds. To standardize the tempo of breathing, participants wereasked to blow with the beat of a metronome set to 100 beats perminute. Although this task is harmless, it produces temporaryphysical sensations, such as sweating, numbness, dizziness, hotflashes, and tingling.
In the No Prime condition, participants were asked to work ona Word Search Task, which was related to animals. This task wasdesigned to match the conditions for overall time, but not to primeanxiety-sensitive relevant concerns or alter state fear.
Expectancy measure. The Expectancy Task (Cabeleira et al.,2010) used in Study 1 was also used in Study 2 to evaluate thetendency to expect relatively positive versus negative future eventsto occur in the described scenarios. However, this study presentedonly the 32 scenarios relating to physical concerns (and excludedthe 32 scenarios relevant to social concerns). Additionally, giventhe Expectancy Task was originally developed in Australia, minormodifications were made so that the wording was more prototyp-ical of American English (e.g., “queuing” was changed to “waitingin line”).
Physical sensation stressor. To evaluate how expectancy biasis related to anxiety following an anxiety sensitivity-relevant stres-sor, participants were asked to complete the Straw Breathing task.Note this task was completed after the Expectancy Task by allparticipants, unlike the Candle-Blowing task, which was abetween-subjects manipulation that preceded the Expectancy Task.Similar to the Candle-Blowing task, the Straw Breathing task wasderived from the widely used Panic Control Treatment manual(Barlow & Craske, 1994) and has been used in previous studiesexamining anxiety reactions (e.g., Gordon & Teachman, 2008;Steinman & Teachman, 2010). In the Straw Breathing task, par-ticipants were asked to breathe through a thin straw for up to twominutes, while holding their nostrils shut. Similar to the Candle-Blowing task, the straw breathing task is harmless, but elicitstemporary sensations, such as dizziness, suffocation, and light-headedness. Anxiety was measured by the PANAS-FS by askingparticipants to indicate how they felt when their anxiety was at itspeak during the task.
Procedure. Participants were informed that the purpose of thestudy was to investigate how people decide what happens nextafter reading short stories. Participants were unaware that theywere recruited for the study based on their level of anxiety sensi-
3 To be invited to the LAS group, individuals also had to score a 9.71 orbelow on the ASI Physical Concerns Subscale (ASI-PC; matching the onestandard deviation cutoff above the mean of a healthy nonanxious sample;Teachman, Smith-Janik, & Saporito, 2007). To be invited to the HASgroup, individuals also had to score a 12.66 or greater on the ASI-PC(matching the one standard deviation cutoff below the mean of a samplewith panic disorder; Teachman, Smith-Janik, & Saporito, 2007).
4 The materials reported are part of a larger study assessing cognitivebiases in anxiety sensitivity. For a complete listing of measures, pleasecontact Shari A. Steinman.
Thi
sdo
cum
ent
isco
pyri
ghte
dby
the
Am
eric
anPs
ycho
logi
cal
Ass
ocia
tion
oron
eof
itsal
lied
publ
ishe
rs.
Thi
sar
ticle
isin
tend
edso
lely
for
the
pers
onal
use
ofth
ein
divi
dual
user
and
isno
tto
bedi
ssem
inat
edbr
oadl
y.
8 CABELEIRA ET AL.
tivity. After informed consent, participants completed a brief de-mographics form, followed by the PANAS-FS to get a baselinemeasure of state fear. Next, participants were assigned to the Prime(n � 70) or No Prime (n � 68) condition. The prime conditionswere balanced for AS group and for gender. Participants in thePrime condition completed the Candle-Blowing task, while thosein the No Prime condition completed the Word Search task. ThePANAS-FS was administered after both tasks. Next, all partici-pants completed four practice Expectancy Task scenarios that wereunrelated to physical concerns, followed by the full ExpectancyTask (and the PANAS-FS). All participants then completed theStraw Breathing physical sensation stressor followed by thePANAS-FS. Next, participants completed a final administration ofthe PANAS-FS to ensure they did not have residual anxiety at theend of the study. Finally, all participants were fully debriefed.
Results
Descriptive statistics. As predicted, chi-square tests revealedthat the LAS and HAS groups did not differ by gender (�2 � .09,p � .761) or race (�2 � 5.77, p � .217). An independent samplest test demonstrated there was not a significant difference betweenthe LAS and HAS groups in terms of age, t(136) � 1.88, p � .063,d � .32. As expected, the LAS group had significantly lowerbaseline levels of state anxiety (M � 6.62, SD � 1.43) relative tothe HAS group (M � 7.81, SD � 2.52; t(107.87) � 3.42, p � .001,d � .58). Additionally, as expected, chi-square tests revealed thatgender ratio (�2 � .09, p � .761) and race (�2 � 3.05, p � .550)did not differ between participants assigned to the Prime and NoPrime conditions. Further, independent samples t tests revealedthat there was no significant difference between the prime condi-tions in baseline fear as measured by the PANAS-FS, t(135) � .78,p � .439, d � .13 or age, t(136) � 1.63, p � .106, d � .28. SeeTable 3 for descriptive statistics separated by Anxiety Group andPrime Condition.
Effect of prime condition on state fear. To evaluate theeffect of the physical sensation prime condition on state fear(measured by the PANAS-FS), a repeated measures ANOVA withtwo between-subjects factors: Anxiety Group (LAS, HAS) andPrime Condition (Prime, No Prime), and one within-subjects fac-tor: Time (Baseline, Post Prime Condition Task), was conducted.Results indicated a main effect of Time, such that on average, allparticipants reported higher levels of state fear following the primecondition task relative to baseline, F(1, 132) � 5.30, p � .023,�p
2 � .04. Not surprisingly, there was also a main effect of Anxietygroup, indicating that participants in the HAS group reportedhigher levels of state fear than participants in the LAS group, F(1,132) � 15.85, p � .001, �p
2 � .11. Finally, there was the expectedsignificant Time by Anxiety group by Prime Condition interaction,F(1, 132) � 5.93, p � .016, �p
2 � .04.Follow-up tests to understand the interaction showed that, for
the LAS group, there was a main effect of Prime Condition, suchthat participants in the Prime condition reported higher state fearthan those in the No Prime condition, F(1, 65) � 5.14, p � .027,�p
2 � .07. However, no main or interactive effects with Timeemerged (all p � .10). For the HAS group, there was not asignificant main effect of Prime Condition, F(1, 67) � .38, p �.543, �p
2 � .01, or Time, F(1, 67) � 3.81, p � .055, �p2 � .05, but
there was the expected significant Time by Prime Condition in-
teraction, F(1, 67) � 6.50, p � .013, �p2 � .09. As expected, for
HAS participants in the No Prime condition, reported state fearwas not significantly different at the two time points, t(33) � .43,p � .673, d � .07. However, for HAS participants in the Primecondition, reported state fear was significantly higher followingthe Candle-Blowing task, relative to baseline, t(34) � 3.16, p �.003, d � .55. Overall, these results suggest that the CandleBlowing prime increased state fear for the HAS group, but did notchange state fear over time for the LAS group, supporting inter-pretation of the prime as an anxiety sensitivity-relevant stressor.5
Of note, on average, PANAS-FS scores following the prime con-dition tasks were low (M � 7.49, SD � 2.24, range � 6–17),suggesting that although the prime increased fear for the HASgroup, the prime was somewhat weak.
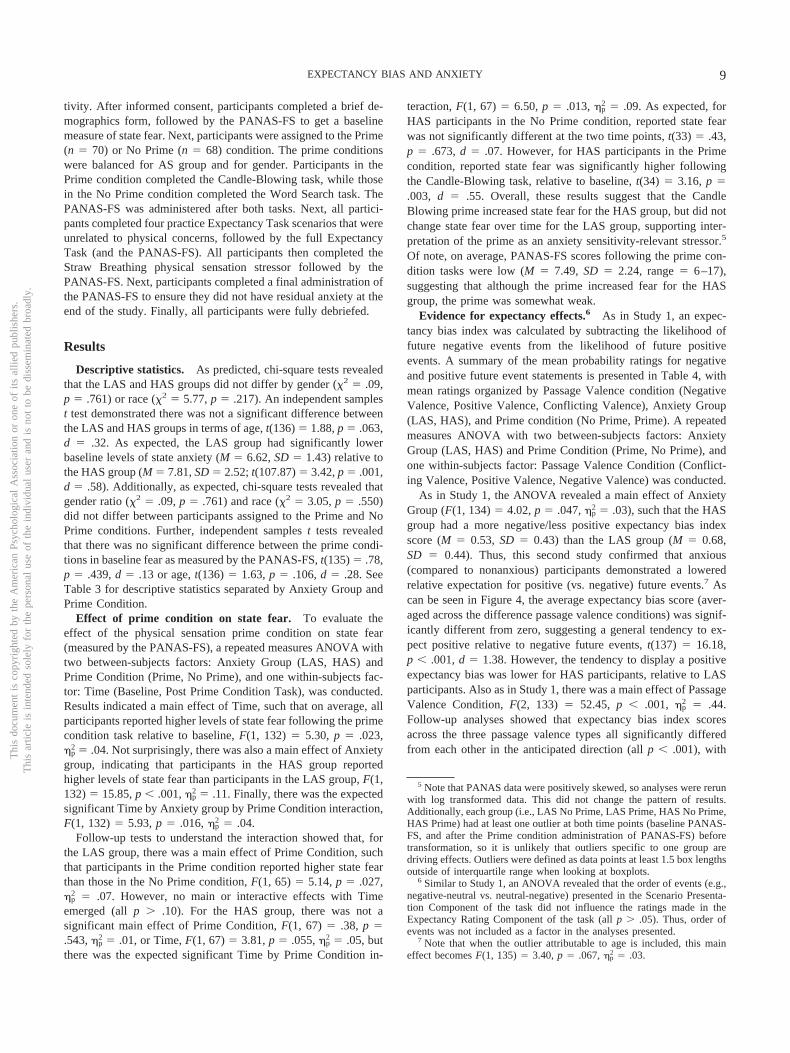
Evidence for expectancy effects.6 As in Study 1, an expec-tancy bias index was calculated by subtracting the likelihood offuture negative events from the likelihood of future positiveevents. A summary of the mean probability ratings for negativeand positive future event statements is presented in Table 4, withmean ratings organized by Passage Valence condition (NegativeValence, Positive Valence, Conflicting Valence), Anxiety Group(LAS, HAS), and Prime condition (No Prime, Prime). A repeatedmeasures ANOVA with two between-subjects factors: AnxietyGroup (LAS, HAS) and Prime Condition (Prime, No Prime), andone within-subjects factor: Passage Valence Condition (Conflict-ing Valence, Positive Valence, Negative Valence) was conducted.
As in Study 1, the ANOVA revealed a main effect of AnxietyGroup (F(1, 134) � 4.02, p � .047, �p
2 � .03), such that the HASgroup had a more negative/less positive expectancy bias indexscore (M � 0.53, SD � 0.43) than the LAS group (M � 0.68,SD � 0.44). Thus, this second study confirmed that anxious(compared to nonanxious) participants demonstrated a loweredrelative expectation for positive (vs. negative) future events.7 Ascan be seen in Figure 4, the average expectancy bias score (aver-aged across the difference passage valence conditions) was signif-icantly different from zero, suggesting a general tendency to ex-pect positive relative to negative future events, t(137) � 16.18,p � .001, d � 1.38. However, the tendency to display a positiveexpectancy bias was lower for HAS participants, relative to LASparticipants. Also as in Study 1, there was a main effect of PassageValence Condition, F(2, 133) � 52.45, p � .001, �p
2 � .44.Follow-up analyses showed that expectancy bias index scoresacross the three passage valence types all significantly differedfrom each other in the anticipated direction (all p � .001), with
5 Note that PANAS data were positively skewed, so analyses were rerunwith log transformed data. This did not change the pattern of results.Additionally, each group (i.e., LAS No Prime, LAS Prime, HAS No Prime,HAS Prime) had at least one outlier at both time points (baseline PANAS-FS, and after the Prime condition administration of PANAS-FS) beforetransformation, so it is unlikely that outliers specific to one group aredriving effects. Outliers were defined as data points at least 1.5 box lengthsoutside of interquartile range when looking at boxplots.
6 Similar to Study 1, an ANOVA revealed that the order of events (e.g.,negative-neutral vs. neutral-negative) presented in the Scenario Presenta-tion Component of the task did not influence the ratings made in theExpectancy Rating Component of the task (all p � .05). Thus, order ofevents was not included as a factor in the analyses presented.
7 Note that when the outlier attributable to age is included, this maineffect becomes F(1, 135) � 3.40, p � .067, �p
2 � .03.
Thi
sdo
cum
ent
isco
pyri
ghte
dby
the
Am
eric
anPs
ycho
logi
cal
Ass
ocia
tion
oron
eof
itsal
lied
publ
ishe
rs.
Thi
sar
ticle
isin
tend
edso
lely
for
the
pers
onal
use
ofth
ein
divi
dual
user
and
isno
tto
bedi
ssem
inat
edbr
oadl
y.
9EXPECTANCY BIAS AND ANXIETY
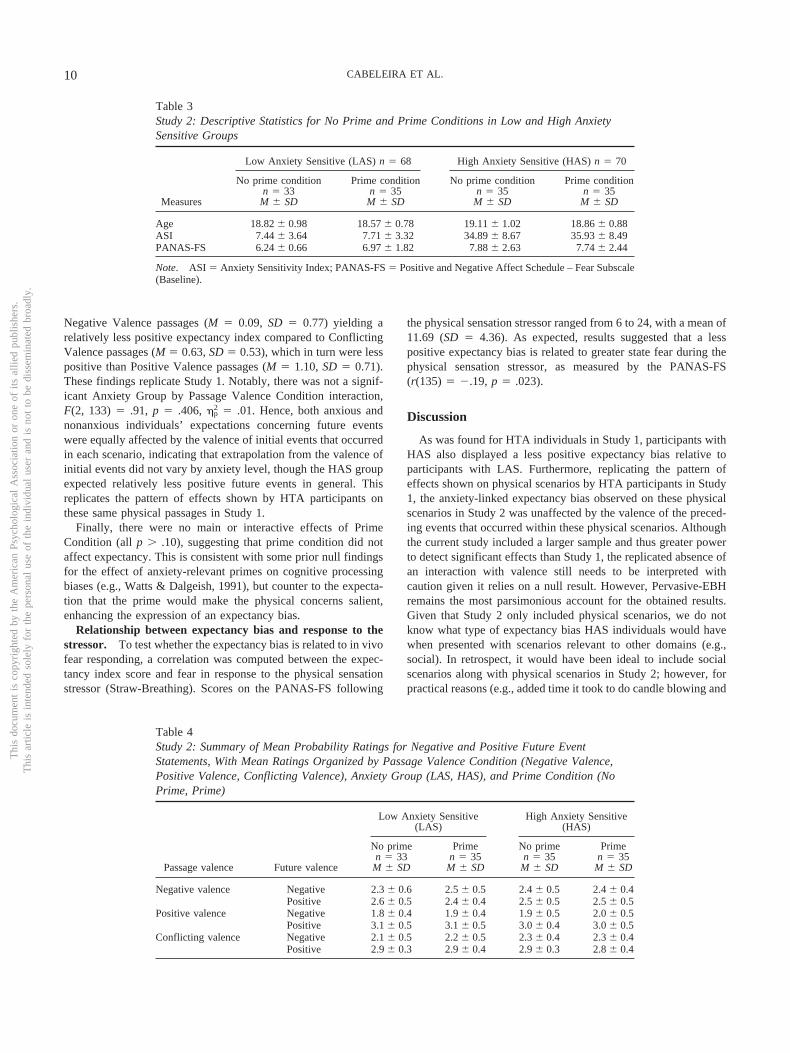
Negative Valence passages (M � 0.09, SD � 0.77) yielding arelatively less positive expectancy index compared to ConflictingValence passages (M � 0.63, SD � 0.53), which in turn were lesspositive than Positive Valence passages (M � 1.10, SD � 0.71).These findings replicate Study 1. Notably, there was not a signif-icant Anxiety Group by Passage Valence Condition interaction,F(2, 133) � .91, p � .406, �p
2 � .01. Hence, both anxious andnonanxious individuals’ expectations concerning future eventswere equally affected by the valence of initial events that occurredin each scenario, indicating that extrapolation from the valence ofinitial events did not vary by anxiety level, though the HAS groupexpected relatively less positive future events in general. Thisreplicates the pattern of effects shown by HTA participants onthese same physical passages in Study 1.
Finally, there were no main or interactive effects of PrimeCondition (all p � .10), suggesting that prime condition did notaffect expectancy. This is consistent with some prior null findingsfor the effect of anxiety-relevant primes on cognitive processingbiases (e.g., Watts & Dalgeish, 1991), but counter to the expecta-tion that the prime would make the physical concerns salient,enhancing the expression of an expectancy bias.
Relationship between expectancy bias and response to thestressor. To test whether the expectancy bias is related to in vivofear responding, a correlation was computed between the expec-tancy index score and fear in response to the physical sensationstressor (Straw-Breathing). Scores on the PANAS-FS following
the physical sensation stressor ranged from 6 to 24, with a mean of11.69 (SD � 4.36). As expected, results suggested that a lesspositive expectancy bias is related to greater state fear during thephysical sensation stressor, as measured by the PANAS-FS(r(135) � �.19, p � .023).
Discussion
As was found for HTA individuals in Study 1, participants withHAS also displayed a less positive expectancy bias relative toparticipants with LAS. Furthermore, replicating the pattern ofeffects shown on physical scenarios by HTA participants in Study1, the anxiety-linked expectancy bias observed on these physicalscenarios in Study 2 was unaffected by the valence of the preced-ing events that occurred within these physical scenarios. Althoughthe current study included a larger sample and thus greater powerto detect significant effects than Study 1, the replicated absence ofan interaction with valence still needs to be interpreted withcaution given it relies on a null result. However, Pervasive-EBHremains the most parsimonious account for the obtained results.Given that Study 2 only included physical scenarios, we do notknow what type of expectancy bias HAS individuals would havewhen presented with scenarios relevant to other domains (e.g.,social). In retrospect, it would have been ideal to include socialscenarios along with physical scenarios in Study 2; however, forpractical reasons (e.g., added time it took to do candle blowing and
Table 3Study 2: Descriptive Statistics for No Prime and Prime Conditions in Low and High AnxietySensitive Groups
Measures
Low Anxiety Sensitive (LAS) n � 68 High Anxiety Sensitive (HAS) n � 70
No prime conditionn � 33M � SD
Prime conditionn � 35M � SD
No prime conditionn � 35M � SD
Prime conditionn � 35M � SD
Age 18.82 � 0.98 18.57 � 0.78 19.11 � 1.02 18.86 � 0.88ASI 7.44 � 3.64 7.71 � 3.32 34.89 � 8.67 35.93 � 8.49PANAS-FS 6.24 � 0.66 6.97 � 1.82 7.88 � 2.63 7.74 � 2.44
Note. ASI � Anxiety Sensitivity Index; PANAS-FS � Positive and Negative Affect Schedule – Fear Subscale(Baseline).
Table 4Study 2: Summary of Mean Probability Ratings for Negative and Positive Future EventStatements, With Mean Ratings Organized by Passage Valence Condition (Negative Valence,Positive Valence, Conflicting Valence), Anxiety Group (LAS, HAS), and Prime Condition (NoPrime, Prime)
Passage valence Future valence
Low Anxiety Sensitive(LAS)
High Anxiety Sensitive(HAS)
No primen � 33M � SD
Primen � 35M � SD
No primen � 35M � SD
Primen � 35M � SD
Negative valence Negative 2.3 � 0.6 2.5 � 0.5 2.4 � 0.5 2.4 � 0.4Positive 2.6 � 0.5 2.4 � 0.4 2.5 � 0.5 2.5 � 0.5
Positive valence Negative 1.8 � 0.4 1.9 � 0.4 1.9 � 0.5 2.0 � 0.5Positive 3.1 � 0.5 3.1 � 0.5 3.0 � 0.4 3.0 � 0.5
Conflicting valence Negative 2.1 � 0.5 2.2 � 0.5 2.3 � 0.4 2.3 � 0.4Positive 2.9 � 0.3 2.9 � 0.4 2.9 � 0.3 2.8 � 0.4
Thi
sdo
cum
ent
isco
pyri
ghte
dby
the
Am
eric
anPs
ycho
logi
cal
Ass
ocia
tion
oron
eof
itsal
lied
publ
ishe
rs.
Thi
sar
ticle
isin
tend
edso
lely
for
the
pers
onal
use
ofth
ein
divi
dual
user
and
isno
tto
bedi
ssem
inat
edbr
oadl
y.
10 CABELEIRA ET AL.
straw breathing tasks) we were unable to include the social sce-narios in this study.
Further, Study 2 demonstrated a relationship between expec-tancy bias index scores and fear experienced during a physicalsensation stressor. This suggests that expectancy bias is related toactual anxiety experienced in response to a stressor (vs. only aquestionnaire measure of trait levels of anxiety sensitivity), andhighlights the predictive validity of expectancy bias. Finally, re-sults suggested that priming a physical stressor did not indepen-dently or interactively affect expectancy bias. Although this iscontrary to the hypothesis that the prime would make physicalconcerns salient, and in turn augment the anxiety-linked expec-tancy bias, it is consistent with past null findings for the effect ofanxiety-relevant primes on processing biases (e.g., Watts & Dal-geish, 1991). Future studies might consider using a stronger prime(that increases state anxiety more than the prime used in thecurrent study) to evaluate whether a stronger physical prime wouldhave a significant impact on the anxiety-linked expectancy bias.
General Discussion
In this article, we report two studies that use the ExpectancyTask, a recently developed paradigm that provides individuals withdifferent forms of valenced information, and then evaluates theirtendency to expect positive or negative events to occur in thefuture. The studies shared two goals: a) to examine expectancybias in anxious (HTA and HAS) samples, and b) to determine theconditions that give rise to expectancy bias. Study 2 had theadditional goal of exploring the effect of priming physical sensa-tions on expectancy.
In both Studies 1 and 2, high anxious (both trait anxious andanxiety sensitive) groups showed a more negative/less positiveexpectancy bias relative to low anxious individuals. In this respect,the results confirm previous evidence of threat expectancy bias intrait anxious participants (e.g., MacLeod et al., 1997; Miranda &
Mennin, 2007) and extend this evidence to anxiety sensitive par-ticipants. Additionally, the results suggested a relationship be-tween expectancy bias and various indicators of anxiety, such thata greater negative expectancy bias was associated with higherlevels of subjective fear experienced during a stressor. This furthersupports an association between anxiety and expectancy bias.
An important feature of the Expectancy Task is that it is de-signed not only to determine whether an expectancy bias exists,but also to illuminate possible cognitive underpinnings of this biasby evaluating the experimental conditions that give rise to the bias.In Study 1, for passages related to social concerns, the HTA grouponly displayed elevated expectancy for negative future eventswhen initial scenarios included negative events, or a mix of neg-ative and positive events. Although speculative, one reason that thenegative expectancy bias may diminish in the context of positivesocial scenarios may be that even HTA individuals likely havemore experience with social interactions going well, so this mayseem more plausible than a potential physical concern turning outwell. Along these lines, it will be interesting in future research toevaluate the expectancy bias in highly socially anxious individuals,given this group may more pervasively expect social interactionsto go badly.
In Study 2, which used only the scenarios related to physicalconcerns, HAS participants demonstrated heightened expectancyfor less positive/more negative future events. This was unaffectedby the valence of the information provided concerning the initialevents that previously took place in each scenario, and is in linewith the Pervasive-EBH. This replicates results from the physicalscenarios from Study 1, and is in line with findings reported bySteinman et al. (2013) from an online version of the ExpectancyTask given to an unselected sample varying in trait anxiety. Pastresearch has suggested that anxious individuals tend to disqualify,or not learn from, past positive experiences (e.g., Beck, 1976;Heimberg & Becker, 2002), which may explain why the HASgroup in Study 2 expected negative future events to occur, evenfollowing Positive Valence or Conflicting Valence scenarios. Fu-ture attempts to manipulate expectancy bias, as is done in cognitivebias modification research (e.g., Mathews & Mackintosh, 2000),can help determine whether the bias is causally related to the onsetor maintenance of anxiety problems.
It is intriguing that valence moderated the anxiety-linked expec-tancy bias when scenarios were related to social concerns (in Study1), but not when events were related to physical concerns (in bothStudies 1 and 2). It would be interesting to determine whether HASindividuals also show greater extrapolation from negative eventswhen processing social scenarios. If they do, this would suggestthat the tendency for anxious individuals to extrapolate morestrongly from prior negative events is more readily observed whenthese negative events are of a social nature. In contrast, if HASindividuals do not display this pattern of results even when pro-cessing social scenarios, this would instead suggest that the mech-anisms that underpin negative expectancy bias may differ acrossanxious samples.
Although we have demonstrated that expectancy bias, observedfor the physical and social scenarios, differs in groups of partici-pants selected on the basis of their differing levels of anxiety, thisdoes not permit the conclusion that anxiety alone is implicated inthe observed effect. Anxiety is correlated with other dimensions oftemperament, such as depression and neuroticism (Jylhä & Isom-
Figure 4. Study 2: Expectancy bias by valence condition and level ofanxiety sensitivity. Expectancy bias was scored by subtracting averageratings of negative future events from average ratings of positive futureevents, so higher scores indicate a more positive bias.
Thi
sdo
cum
ent
isco
pyri
ghte
dby
the
Am
eric
anPs
ycho
logi
cal
Ass
ocia
tion
oron
eof
itsal
lied
publ
ishe
rs.
Thi
sar
ticle
isin
tend
edso
lely
for
the
pers
onal
use
ofth
ein
divi
dual
user
and
isno
tto
bedi
ssem
inat
edbr
oadl
y.
11EXPECTANCY BIAS AND ANXIETY

etsä, 2006). Therefore it would be valuable to include measures ofdepression, and perhaps neuroticism, in addition to anxiety, infuture studies of this nature, to potentially differentiate their re-spective contribution to observed patterns of expectancy bias. Wespeculate that the observed expectancy biases are not unique toanxiety alone, given the prominence of a negative future focus(e.g., hopelessness) in other disorders, like depression. However,the specific nature of expectancy biases may differ in anxiety andin depression. For example, it may be that attenuation of positiveexpectancies may characterize depression, whereas amplificationof negative expectancies may be more characteristic of anxiety.Delineating the patterns of expectancy associated with each di-mension of emotion will be an important objective for futureresearch.
It is important to consider the potential role of response bias inthe observed effects. A response bias effect, reflecting an inflatedtendency to endorse more extreme negative responses, regardlessof actual expectancy, could mimic an expectancy bias in this kindof assessment task. The fact that we obtained different findings forthe physical and social scenarios weighs against the plausibility ofa response bias account. Moreover, the finding that anxiety-linkedexpectancy effects were moderated by the valence of previousevents precludes a response bias explanation of the present groupdifference. Nevertheless, it would be prudent for future research tomore directly assess for response bias effects. For instance, ifnegative and positive foil items (reflecting future events that do notplausibly follow from the previously presented scenarios) wereincluded in the Expectancy Task, then negative response biaswould be directly revealed by preferential endorsement of thenegative foils. Further, to mitigate the impact of such responsebias, future investigators may usefully seek to develop methods ofassessing expectancy that bypass the need for self-report. Forexample, it may be possible to infer a higher level of expectancyfor certain continuation events on the basis of speeded compre-hension latencies to encode such events in a self-paced readingtask. More implicit assessment of expectancy bias would alsoreduce the degree to which observed effects could plausibly beattributed to experimenter demand.
Of note, neither of the present studies found evidence to supportthe Emotional Weighting-EBH. In other words, in both studies, theanxiety-linked expectancy bias was not found to be the strongest inthe Conflicting Valence condition. This finding suggests that anx-ious individuals’ heightened expectancy for future negative events(relative to nonanxious individuals) cannot be solely attributed tothe conflicting nature of previously presented information and theconstrued emotional valence of such information. Given the cur-rent finding, it seems unlikely that anxious individuals’ less pos-itive expectations of the future would be remediated by onlyreducing their tendency to misconstrue emotionally contradictoryinformation as predominantly negative in tone. Rather, it may bebeneficial for clinicians to directly target anxious clients’ biasedpatterns of future expectations across both emotionally conflictingand nonconflicting situations, to encourage the development of anincreased expectation for positive events and a reduced expecta-tion for negative events.
In Study 1, when observing expectancies within each anxietygroup, LTA participants were more positive in their expectan-cies following positive information alone, compared with neg-ative information alone or information conflicting in emotional
valence. However, they tended to have a positive absolute bias(e.g., above zero) in their expectancies across all of thesedifferently valenced conditions, and this was true for bothsocial and physical scenarios. In contrast, the expectancies ofHTA participants were more consistent with the valence ofprevious information, with a positive absolute bias when pre-vious information was positive, a negative bias when previousinformation was negative, and no expectancy bias (neitherpositive or negative) when preceding information was of aconflicting valence. In Study 2, both high and low anxietysensitive participants tended to have a positive absolute expec-tancy bias across passage valence conditions, highlighting theimportance of looking at both relative and absolute bias.
Finally, no effects of priming physical sensations on expec-tancy bias were found in Study 2. This is consistent with pastnull findings for effects of anxiety-relevant primes on process-ing biases (e.g., Watts & Dalgeish, 1991), but inconsistent withother findings suggesting that state anxiety can enhance (Ma-cLeod & Mathews, 1988) or attenuate (Mathews & Sebastian,1993) cognitive biases, and contrary to our hypothesis that theprime would highlight physical concerns and magnify theanxiety-linked expectancy bias. Given that the prime findingswere null, it is difficult to tease apart whether the lack of effectsis meaningful or attributable to a methodological issue. Onepossibility is that the effect of the prime may have simplydissipated quickly, obscuring the opportunity to see its effects.Another possibility is that the prime’s effect was not strongenough to affect expectancy bias. Given the mixed findings inthe literature about the effects of state anxiety on cognitivebiases more broadly, it is clear that more work is needed todetermine the relationship between state anxiety and expec-tancy bias, and the moderators of this relationship.
The current research has some limitations. First, the samplescomprised only young adult, college students, which are not rep-resentative of the general population. Second, analogue, ratherthan clinical, samples were used. However, the anxious partici-pants had very high levels of anxiety symptoms, similar to thosefound in diagnosed samples. Third, as mentioned earlier, depres-sive symptoms were not assessed in these studies. More focusedinvestigation of depressive symptoms would be helpful in evalu-ating the unique contribution of depression and anxiety to differentforms of expectancy bias.
Fourth, our choice to use a relative strategy to calculate thebias index (i.e., subtracting average ratings of negative futureevents from average ratings of positive future events) has theadvantage of simultaneously accounting for ratings of bothpositive and negative events, but has the disadvantage that wecannot determine to what extent the observed expectancy biasesare driven by an evaluation that positive effects are especiallyunlikely or that negative effects are especially likely; an inter-esting question for future research. Similarly, interpretation ofwithin-groups effects (e.g., evaluating whether bias is positive,negative, or does not exist) are somewhat clouded by our use ofa relative strategy to calculate bias, given that we do not havean objective measure of whether the positive and negativeevents occur equally often (i.e., whether they have, or are per-ceived to have, comparable base rates). However, several measureswere taken to validate the Scenario Event Sets (e.g., ensuring thatpositive and negative events had equivalent valence intensity; see
Thi
sdo
cum
ent
isco
pyri
ghte
dby
the
Am
eric
anPs
ycho
logi
cal
Ass
ocia
tion
oron
eof
itsal
lied
publ
ishe
rs.
Thi
sar
ticle
isin
tend
edso
lely
for
the
pers
onal
use
ofth
ein
divi
dual
user
and
isno
tto
bedi
ssem
inat
edbr
oadl
y.
12 CABELEIRA ET AL.

Cabeleira, 2010), which allows for more confidence in interpretingthe results.
Fifth, although it seems unlikely that presenting scenarios inblocks of four (before requiring ratings to be made) would placesignificant demands on memory for younger adults, there was noexplicit measure of the role of memory in this task. This leavesopen the possibility that memory may influence the results foundwhen using this task. Future research could explore this possibilityby varying the number of scenarios presented before the RatingComponent of the task. Lastly, it is possible that participants’perceptions of the frequency with which the candidate futureevents tend to occur in general (i.e., perceived base rates) mighthave influenced their responses, separately from their perceptionsconcerning the likelihood that the candidate events would occurfor themselves in particular. It could be interesting, in futureresearch, to ask participants to provide two expectancy ratings:how likely each event is to occur to others, and how likely eachevent is to occur to oneself.
Despite these limitations, these studies provide valuable newinformation about anxiety-linked expectancy bias, revealedthrough the recently developed Expectancy Task. The resultsconfirm that anxious individuals do display a less positive/morenegative expectancy bias. Furthermore, they demonstrate thatthe conditions that give rise to this bias may differ dependingupon the type of information being processed, with the inflatedexpectation of future negative social events reflecting a height-ened tendency to extrapolate from present negative socialevents, while the inflated expectation of future negative phys-ical events occurred regardless of the valence of prior informa-tion. A better understanding of the cognitive conditions thatgive rise to the negative expectancy bias shown by anxiousindividuals may not only shed light on why they “expect theworst,” but could also identify the processes that can be targetedtherapeutically to attenuate such expectations.
References
Barlow, D., & Craske, M. (1994). Mastery of your anxiety and panic-II.San Antonio, TX: The Psychological Corporation.
Barnes, L. L. B., Harp, D., & Jung, W. S. (2002). Reliability generalizationof scores on the Spielberger State-Trait Anxiety Inventory. Educationaland Psychological Measurement, 62, 603– 618. doi:10.1177/0013164402062004005
Beck, A. T. (1976). Cognitive therapy and the emotional disorders. Ox-ford, England: International Universities Press.
Beck, A. T., & Clark, D. A. (1988). Anxiety and depression: An informa-tion processing perspective. Anxiety Research, 1, 23–36. doi:10.1080/10615808808248218
Borkovec, T. D., Alcaine, O. M., & Behar, E. (2004). Avoidance theory ofworry and generalized anxiety disorder. In R. G. Heimberg, C. L. Turk,& D. S. Mennin (Eds.), Generalized anxiety disorder: Advances inresearch and practice (pp. 77–108). London, England: Guilford Press.
Cabeleira, C. (2010). Age differences in emotional appraisal (Unpublishedhonor’s thesis). University of Western Australia, Australia.
Cabeleira, C., Bucks, R., Teachman, B. A., & MacLeod, C. (June, 2010).Emotional appraisal of ambiguous scenarios in older and youngeradults. Poster presented at the annual meeting of the World Congress ofBehavioral and Cognitive Therapies, Boston, MA.
Clark, D. M. (1986). A cognitive approach to panic. Behaviour Researchand Therapy, 24, 461–470. doi:10.1016/0005-7967(86)90011-2
Cox, B. J., Parker, J. D. A., & Swinson, R. P. (1996). Anxiety sensitivity:Confirmatory evidence for a multidimensional construct. BehaviourResearch and Therapy, 34, 591–598. doi:10.1016/0005-7967(96)00006-X
Dugas, M. J., Freeston, M. H., Ladouceur, R., Rhéaume, J., Provencher,M., & Boisvert, J. (1998). Worry themes in primary GAD, secondaryGAD, and other anxiety disorders. Journal of Anxiety Disorders, 12,253–261. doi:10.1016/S0887-6185(98)00013-9
Gordon, T. L., & Teachman, B. A. (2008). Ethnic group differences inaffective, behavioral, and cognitive markers of anxiety. Journal ofCross-Cultural Psychology, 39, 424 – 446. doi:10.1177/0022022108318224
Heimberg, R. G., & Becker, R. E. (2002). Cognitive-behavioral grouptherapy for social phobia: Basic mechanisms and clinical strategies.New York, NY: Guilford Press.
Jylhä, P., & Isometsä, E. (2006). The relationship of neuroticism andextraversion to symptoms of anxiety and depression in the generalpopulation. Depression and Anxiety, 23, 281–289. doi:10.1002/da.20167
Kendall, P. C., & Ingram, R. E. (1989). Cognitive-behavioral perspectives:Theory and research on depression and anxiety. In P. C. Kendall, K. M.Simon, L. E. Beutrler, H. Arkowitz (Eds.) Comprehensive handbook ofcognitive therapy (pp. 27–53). New York, NY: Plenum Press.
MacLeod, A. K., & Byrne, A. (1996). Anxiety, depression, and the antic-ipation of future positive and negative experiences. Journal of AbnormalPsychology, 105, 286–289. doi:10.1037/0021-843X.105.2.286
MacLeod, A. K., Tata, P., Kentish, J., & Jacobsen, H. (1997). Retrospec-tive and prospective cognitions in anxiety and depression. Cognition andEmotion, 11, 467–479. doi:10.1080/026999397379881
MacLeod, C., & Mathews, A. (1988). Anxiety and the allocation ofattention to threat. The Quarterly Journal of Experimental PsychologyA: Human Experimental Psychology, 40, 653– 670. doi:10.1080/14640748808402292
Mathews, A., & Mackintosh, B. (2000). Induced emotional interpretationbias and anxiety. Journal of Abnormal Psychology, 109, 602–615.doi:10.1037/0021-843X.109.4.602
Mathews, A. M., & Sebastian, S. (1993). Suppression of emotional Stroopeffects by fear-arousal. Cognition and Emotion, 7, 517–530. doi:10.1080/02699939308409203
Miranda, R., & Mennin, D. S. (2007). Depression, generalized anxietydisorder, and certainty in pessimistic predictions about the future. Cog-nitive Therapy and Research, 31, 71–82. doi:10.1007/s10608-006-9063-4
Peterson, R. A., & Reiss, S. (1992). Anxiety sensitivity index manual (2nded.). Worthington, OH: International Diagnostics Systems.
Peterson, R. A., & Reiss, S. (1993). Anxiety Sensitivity Index Revised testmanual. Worthington, OH: IDS Publishing Corporation.
Pratto, F., & John, O. P. (1991). Automatic vigilance: The attention-grabbing power of negative social information. Journal of Personalityand Social Psychology, 61, 380–391. doi:10.1037/0022-3514.61.3.380
Reiss, S. (1991). Expectancy model of fear, anxiety, and panic. ClinicalPsychology Review, 11, 141–153. doi:10.1016/0272-7358(91)90092-9
Reiss, S., & McNally, R. J. (1985). The expectancy model of fear. In S.Reiss & R. R. Bootzin (Eds.), Theoretical issues in behavior therapy (pp.107–121). New York, NY: Academic Press.
Reiss, S., Peterson, R. A., Gursky, D. M., & McNally, R. J. (1986).Anxiety sensitivity, anxiety frequency and the predictions of fearful-ness. Behaviour Research and Therapy, 24, 1–8. doi:10.1016/0005-7967(86)90143-9
Smith-Janik, S. B., & Teachman, B. A. (2008). Impact of priming onexplicit memory in spider fear. Cognitive Therapy and Research, 32,291–302. doi:10.1007/s10608-007-9122-5
Spielberger, C. D. (1983). Manual for the State-Trait Anxiety Inventory(Form Y). Palo Alto, CA: Consulting Psychologists Press.
Thi
sdo
cum
ent
isco
pyri
ghte
dby
the
Am
eric
anPs
ycho
logi
cal
Ass
ocia
tion
oron
eof
itsal
lied
publ
ishe
rs.
Thi
sar
ticle
isin
tend
edso
lely
for
the
pers
onal
use
ofth
ein
divi
dual
user
and
isno
tto
bedi
ssem
inat
edbr
oadl
y.
13EXPECTANCY BIAS AND ANXIETY
Steinman, S. A., & Teachman, B. A. (2010). Modifying interpretationsamong individuals high in anxiety sensitivity. Journal of Anxiety Dis-orders, 24, 71–78. doi:10.1016/j.janxdis.2009.08.008
Steinman, S. A. Smyth, F. L., Bucks, R. S., MacLeod, C., & Teachman,B. A. (2013). Anxiety-linked expectancy bias across the adult lifespan. �Cog-nition and Emotion, 27, 345–355. doi:10.1080/02699931.2012.711743
Stöber, J. (2000). Prospective cognitions in anxiety and depression: Rep-lication and methodological extension. Cognition and Emotion, 14,725–729. doi:10.1080/02699930050117693
Teachman, B. A., Smith-Janik, S. B., & Saporito, J. (2007). Informationprocessing biases and panic disorder: Relationships among cognitive
and symptom measures. Behaviour Research and Therapy, 45, 1791–1811. doi:10.1016/j.brat.2007.01.009
Watson, D., & Clark, L. A. (1994). Manual for the positive and negative affectschedule (expanded form). Iowa City, IA: University of Iowa.
Watts, F. N., & Dalgeish, T. (1991). Memory for phobia-related words inspider phobics. Cognition and Emotion, 5, 313–329. doi:10.1080/02699939108411043
Wheaton, M. G., Berman, N. C., & Abramowitz, J. S. (2010). The contri-bution of experiential avoidance and anxiety sensitivity in the predictionof health anxiety. Journal of Cognitive Psychotherapy, 24, 229–239.doi:10.1891/0889-8391.24.3.229
Appendix
Examples of Scenarios and Components of the Expectancy Task
Example of a Scenario Event Set
Title: Going to the DoctorOrienting Sentence: You go to the doctor’s rooms.Negative: You find out you need a biopsy done.Negative: The doctor prescribes you medication that can have
bad side effects.Negative: The doctor warns you all your family is at risk of
diabetes.Positive: The doctor says your heart sounds very healthy.Positive: The doctor informs you that you are at a healthy
weight.Positive: The doctor says she is happy with your exercise
regime.Neutral: A bird flies past the window.Neutral: The telephone rings.Neutral: You notice a car drive by outside.
Sample Scenarios of Different Valence Types Based onAbove Scenario Event Set
Positive Valence
Title: Going to the DoctorOrienting Sentence: You go to the doctor’s rooms.Positive: The doctor informs you that you are at a healthy
weight.Positive: The doctor says she is happy with your exercise
regime.Neutral: A bird flies past the window.Neutral: You notice a car drive by outside.
Negative Valence
Title: Going to the DoctorOrienting Sentence: You go to the doctor’s rooms.
Negative: You find out you need a biopsy done.Negative: The doctor prescribes you medication that can have
bad side effects.Neutral: A bird flies past the window.Neutral: You notice a car drive by outside.
Conflicting Valence
Title: Going to the DoctorOrienting Sentence: You go to the doctor’s rooms.Negative: You find out you need a biopsy done.Negative: The doctor prescribes you medication that can have
bad side effects.Positive: The doctor informs you that you are at a healthy
weight.Positive: The doctor says she is happy with your exercise
regime.
Example of an Expectancy Rating Trial
Title: Going to the DoctorOrienting Sentence: You go to the doctor’s rooms.How likely is it that . . .Negative: The doctor warns you all your family is at risk of
diabetes.Positive: The doctor says your heart sounds very healthy.Neutral: The telephone rings.
Received March 7, 2013Revision received October 8, 2013
Accepted December 12, 2013 �
Thi
sdo
cum
ent
isco
pyri
ghte
dby
the
Am
eric
anPs
ycho
logi
cal
Ass
ocia
tion
oron
eof
itsal
lied
publ
ishe
rs.
Thi
sar
ticle
isin
tend
edso
lely
for
the
pers
onal
use
ofth
ein
divi
dual
user
and
isno
tto
bedi
ssem
inat
edbr
oadl
y.
14 CABELEIRA ET AL.