Home Bias and Cross Border Taxation
25
Home bias and cross border taxation Anil V. Mishra * , Ronald A. Ratti 1 School of Economics and Finance, University of Western Sydney, Locked Bag 1797, Penrith NSW, Australia Keywords: Float home bias Cross border taxation Dividend imputation Dividend tax credit abstract The relationship between cross border taxation and free float home bias is examined. This explicitly recognizes that insider shares are unavailable to foreigners. Other important explanations for home bias – information asymmetry, behavioural and gover- nance issues – are controlled when examining the impact of cross border tax variables. In our sample of countries about sixty percent (eighty percent) withhold taxes on realized capital gains (divi- dends) of foreign investors and about thirty percent of the mature economies provide imputation of taxes paid on dividend income by domestic corporations. Dividend imputation is a statistically significant impediment to cross border equity flows. A tax credit variable for foreign taxes paid on dividends is constructed and found to be statistically significant in reducing home bias. A rela- tively high foreign tax rate that cannot be offset by tax credits is found to significantly increase home bias. These results hold for float adjusted home bias and traditional international portfolio home bias. Ó 2012 Elsevier Ltd. All rights reserved. 1. Introduction A major literature has focused on why an investor holds far too high a share of his or her wealth in domestic securities compared with the optimal share predicted by the traditional theory of portfolio choice. This literature is comprehensively reviewed in Lewis (1999), Karolyi and Stulz (2003) and Sercu and Vanpee (2007). Within the literature on home bias, international taxes have been widely discussed as a barrier and as a cost of international diversification of investment flows. The link between stock * Corresponding author. Tel.: þ61 9685 9230. E-mail addresses: [email protected] (A.V. Mishra), [email protected] (R.A. Ratti). 1 Tel.: þ61 9685 9346. Contents lists available at SciVerse ScienceDirect Journal of International Money and Finance journal homepage: www.elsevier.com/locate/jimf 0261-5606/$ – see front matter Ó 2012 Elsevier Ltd. All rights reserved. doi:10.1016/j.jimonfin.2012.04.004 Journal of International Money and Finance 32 (2013) 169–193
-
Upload
independent -
Category
Documents
-
view
0 -
download
0
Transcript of Home Bias and Cross Border Taxation

Journal of International Money and Finance 32 (2013) 169–193
Contents lists available at SciVerse ScienceDirect
Journal of International Moneyand Finance
journal homepage: www.elsevier .com/locate/ j imf
Home bias and cross border taxation
Anil V. Mishra*, Ronald A. Ratti 1
School of Economics and Finance, University of Western Sydney, Locked Bag 1797, Penrith NSW, Australia
Keywords:Float home biasCross border taxationDividend imputationDividend tax credit
* Corresponding author. Tel.: þ61 9685 9230.E-mail addresses: [email protected] (A.V. M
1 Tel.: þ61 9685 9346.
0261-5606/$ – see front matter � 2012 Elsevier Ltdoi:10.1016/j.jimonfin.2012.04.004
a b s t r a c t
The relationship between cross border taxation and free floathome bias is examined. This explicitly recognizes that insidershares are unavailable to foreigners. Other important explanationsfor home bias – information asymmetry, behavioural and gover-nance issues – are controlled when examining the impact of crossborder tax variables. In our sample of countries about sixty percent(eighty percent) withhold taxes on realized capital gains (divi-dends) of foreign investors and about thirty percent of the matureeconomies provide imputation of taxes paid on dividend incomeby domestic corporations. Dividend imputation is a statisticallysignificant impediment to cross border equity flows. A tax creditvariable for foreign taxes paid on dividends is constructed andfound to be statistically significant in reducing home bias. A rela-tively high foreign tax rate that cannot be offset by tax credits isfound to significantly increase home bias. These results hold forfloat adjusted home bias and traditional international portfoliohome bias.
� 2012 Elsevier Ltd. All rights reserved.
1. Introduction
A major literature has focused on why an investor holds far too high a share of his or her wealth indomestic securities compared with the optimal share predicted by the traditional theory of portfoliochoice. This literature is comprehensively reviewed in Lewis (1999), Karolyi and Stulz (2003) and Sercuand Vanpee (2007). Within the literature on home bias, international taxes have beenwidely discussedas a barrier and as a cost of international diversification of investment flows. The link between stock
ishra), [email protected] (R.A. Ratti).
d. All rights reserved.

A.V. Mishra, R.A. Ratti / Journal of International Money and Finance 32 (2013) 169–193170
returns and taxes and holdings of domestic and foreign stocks has been examined in models by Black(1974), Stulz (1981) and Errunza and Losq (1989), amongst others. Studies’ recognizing that taxes area potentially important influence on cross border portfolio flows are closely related to the literature onoptimal taxation. Razin et al. (1997) and Devereux (2008) note that production efficiency acrosscountries is preserved when an investor resident in a country faces the same rate of tax on investmentincome without regard to the source of that income, since this ensures equality of pre-tax returns tocapital across countries.2
In practice, taxes on dividends and taxes on realized capital gains are levied on foreign investors inmany countries. For example, in our sample of countries listed in Table 1, 49% withhold taxes onrealized capital gains of foreign investors. In addition, tax advantages can accrue to an investordepending on the source of income. In our sample of mature economies that have resident investorswith foreign income, 52% of the observations are provided imputation of taxes paid on dividendincome by domestic corporations. Imputation eliminates the double taxation of income and dividends.Accordingly shareholders receive a higher income streamunder dividend imputation tax system. Thesefactors have the potential to significantly influence the extent of foreign investment in equity flows.Cross border taxation in foreign country induces a bias towards source country holding domesticfinancial assets because it puts additional cost on holding foreign securities from a source countryinvestors’ perspective. In mitigation, French and Poterba (1991) note that dividend withholding tax byforeign governments can typically be credited against taxes in the investors’ home country.
Sercu and Vanpee (2007) argue that among the potential explanations for equity home bias themost salient seem to be information asymmetries, governance issues and behavioural biases. The otherproposed explanations, hedging domestic risk and implicit and explicit costs of foreign investments,“may not explain much of the actual portfolio choices of investors (p. 18).”3 Cross border taxationbelongs to the implicit and explicit costs of foreign investments category and we find in this paper thatcertain cross border taxation factors do influence free float home bias, that is, home bias aftercontrolling for shares held by insiders. Dahlquist et al. (2003) and others observe that portfolioinvestors can only hold the float adjusted world market portfolio, i.e. a world portfolio of shares notheld by insiders. Controlling for information asymmetries, behavioural bias, insider holdings and othergovernance factors results in finding influence of cross border taxation on free float home bias.
The paper considers the role of cross border taxation on free float equity home bias and on tradi-tional international portfolio home bias over the years 2001–2009 for 49 countries. Dividend impu-tation is established as a statistically significant and robust impediment to cross border equity flows. Atax credit variable for foreign taxes paid is constructed and is found to be statistically significant inreducing home bias. A relatively high foreign tax rate that cannot be offset by tax credits is found tosignificantly increase home bias. These results hold for float adjusted home bias and traditionalinternational portfolio home bias. Results are robust to inclusion of corporate governance variables.Empirical estimation employs Arellano–Bover/Blundell–Bond linear dynamic panel-data methods tocontrol for endogenous variables and for tests of robustness of results.
2 The literature on the theory of optimal taxation considers a number of issues that complicate the analysis. Gordon andVarian (1989) examine a situation in which a country can influence prices in the international securities market, thusproviding an incentive to set taxes to restrict trade in securities and for domestic residents to concentrate portfolios in domesticequity. Gordon and Bovenberg (1986) consider a model when there is asymmetric information between domestic and foreigninvestors and demonstrate that a small open economy might benefit from subsidizing the importation of capital. Huizinga andNielsen (1997) show that with an increase in foreign ownership of firms a higher tax rate on source-based investment incomemay be called for. Baldwin and Krugman (2000) emphasize that bigger countries have larger location-specific rents and greatershelter from tax competition. McGrattan and Prescott (2005) show that a standard growth model can relate tax policy tomarket valuation and explain movements in U.S. and U.K. stock market valuations relative to GDP.
3 Cooper and Kaplanis (1994) estimate the levels of costs required to generate the observed home bias in portfolios consistentwith different levels of risk aversion. Cooper and Kaplanis (2000) show how capital budgeting rules depend on the level ofinvestor costs to cross border investment, both directly and also indirectly through the portfolio specialization they induce.Sercu and Vanpee (2008) find that equity home bias is related to a mixture of risks and frictions, such as information asym-metries, institutional factors and explicit costs. Moor et al. (2010) reconsider the costs to international equity investmentsimplied by standard portfolio theory and find that estimated costs are mostly driven by risk estimates, not by asset holdings.

Table 1Cross border taxation rates and treatment of dividends and imputation (2007).
(1) Country (2) Corporateincome tax
(3) Dividendimputation in homecountry
(4) Dividend tax ratewithheld in foreign country
(5)Foreignequity
(6) Domesticworld marketShare
(7) Floathome bias
Argentina 35 0 0 17.63 0.08 0.82Australia 30 30 15–30 11.51 2.55 0.88Austria 25 0 10–25 33.24 0.30 0.67Belgium 34 0 10–25 41.11 0.65 0.59Brazil 34 0 0–25 0.94 1.07 0.99Canada 36.1 29.4 15–25 18.73 3.41 0.81Chile 17 17 10–35 19.11 0.31 0.81Cyprus 10 0 0 11.66 0.06 0.88Czech
Republic24 0 5–15 15.33 0.10 0.85
Denmark 25 0 0–38 47.96 0.44 0.52Egypt 20 0 0 0.72 0.19 0.99Estonia 22 0 24 63.75 0.01 0.36Finland 26 0 0–28 22.95 0.69 0.77France 33.33 0 10–25 20.70 4.53 0.78Germany 38.36 0 10–25 32.29 3.28 0.67Greece 25 0 0–47 5.45 0.47 0.95Hong Kong 17.5 0 0 16.71 3.16 0.83Hungary 16 0 10–45 13.12 0.08 0.87Ireland* 12.5 0 0–20 0.28India 33.99 0 0–15 0.05 2.89 0.99Indonesia 30 0 10–20 0.32 0.34 0.99Israel 29 0 0–25 7.95 0.28 0.92Italy 37.25 0 10–27 29.58 1.90 0.70Japan 40.69 0 10–20 5.95 11.11 0.93Korea 27.5 13 15–20 6.26 2.01 0.94Lebanon 21 0 10 22.98 0.01 0.77Luxembourg* 29.6 0 7.5–15 0.15Malaysia 27 0 0 2.07 0.55 0.98Mauritius 22.5 0 0,naMexico 28 28 0–25 0.69 0.71 0.99Netherlands 25.5 0 10–15 32.23 1.99 0.67Norway 28 28 15–25 39.29 0.55 0.60New Zealand 33 33 15–30 27.13 0.09 0.73Peru 30 0 4.1 na 0.10Philippines 35 0 15–30 0.11 0.20 0.99Poland 19 0 10–19 3.90 0.36 0.96Portugal 26.5 0 10–20 28.39 0.22 0.72Romania 16 0 3–45 1.73 0.06 0.98Russia 24 0 10–15 0.30 1.68 0.99South Africa 36.89 0 0–15 9.38 0.84 0.91Singapore 20 0 0 19.62 0.94 0.80Slovak
Republic19 0 0 15.40 0.01 0.85
Spain 32.5 0 10–18 12.88 1.81 0.87Sweden 28 0 0–30 23.00 1.34 0.77Switzerland 21.3 0 0–35 16.68 3.47 0.83Thailand 30 0 10 1.17 0.36 0.99Turkey 20 0 15–35 0.02 0.44 0.99UK 30 10 0 23.30 7.29 0.75US 39.3 0 0–30 14.48 36.63 0.77
Note: Data are for 2007 and may differ for other years. Equity data is from CPIS database. Authors’ own calculations. Taxinformation is from OECD tax database, Price Waterhouse Coopers (2008), Tax Rates Worldwide. Definition in Table A.1.Dividend tax rate withheld in foreign country when appearing as a range indicates that investors from different countries aretaxed at different rates by countries listed in column (1). Float home bias is one minus the ratio of foreign equity and foreignworld market share. Ireland and Luxembourg are financial centres. * financial centre.
A.V. Mishra, R.A. Ratti / Journal of International Money and Finance 32 (2013) 169–193 171
A.V. Mishra, R.A. Ratti / Journal of International Money and Finance 32 (2013) 169–193172
The next section discusses cross border taxation in the literature, presents a mean–variance modelwith taxation, and presents measures of cross border taxation relevant for decisions on foreign equityinvestment. Section 3 describes the float adjusted measure of home bias, familiarity, diversificationvariables and governance variables that influence global equity home bias, and summary statistics ofthe variables. Section 4 discusses the empirical specification. Section 5 describes the empirical resultsand Section 6 concludes.
2. Cross border tax
The tax variables utilized in this paper and the motivation for use of these variables are discussed inthis section. The primary goal in this paper is to investigate the effect of cross border taxation on cross-country differences in bilateral home bias. The empirical model will include variables capturingpotential sources of home bias based on the literature of gravity models including distance, language,size, foreign listing, correlation and other proxies for information asymmetries. The objective is to testwhether cross border tax influences are a significant determinant of home bias even after controllingfor these variables. This section will begin with a brief review of work on the link between taxes andholdings of domestic and foreign stocks and then proceed to discuss the mean–variance model andcross border tax variables.
2.1. Literature review
In Black (1974) taxes are proportional to the net holdings of foreign assets and all risky assets aretraded, whereas in Stulz (1981) investors pay a tax proportional to the absolute holdings of riskyforeign assets and not all risky assets are traded. Errunza and Losq (1989) find the effect of partialintegration of markets on the multilateral structure of security returns and holdings within a multi-country model. Cooper and Lessard (1981) examine the effect of differential taxes on foreign invest-ment in an international capital market equilibrium model and Cooper and Kaplanis (1986) deriveefficient portfolios in a world where there are barriers to cross border investment.
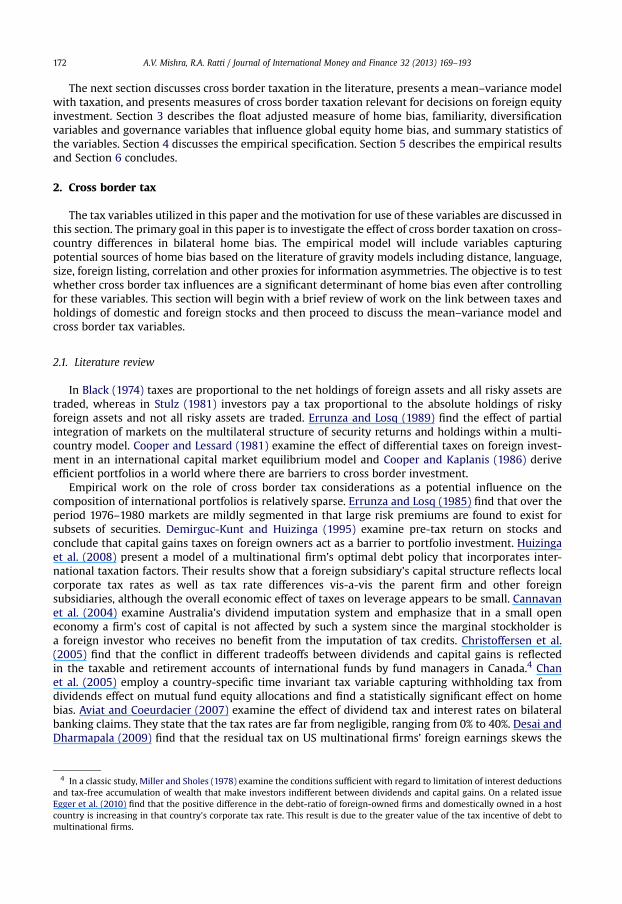
Empirical work on the role of cross border tax considerations as a potential influence on thecomposition of international portfolios is relatively sparse. Errunza and Losq (1985) find that over theperiod 1976–1980 markets are mildly segmented in that large risk premiums are found to exist forsubsets of securities. Demirguc-Kunt and Huizinga (1995) examine pre-tax return on stocks andconclude that capital gains taxes on foreign owners act as a barrier to portfolio investment. Huizingaet al. (2008) present a model of a multinational firm’s optimal debt policy that incorporates inter-national taxation factors. Their results show that a foreign subsidiary’s capital structure reflects localcorporate tax rates as well as tax rate differences vis-a-vis the parent firm and other foreignsubsidiaries, although the overall economic effect of taxes on leverage appears to be small. Cannavanet al. (2004) examine Australia’s dividend imputation system and emphasize that in a small openeconomy a firm’s cost of capital is not affected by such a system since the marginal stockholder isa foreign investor who receives no benefit from the imputation of tax credits. Christoffersen et al.(2005) find that the conflict in different tradeoffs between dividends and capital gains is reflectedin the taxable and retirement accounts of international funds by fund managers in Canada.4 Chanet al. (2005) employ a country-specific time invariant tax variable capturing withholding tax fromdividends effect on mutual fund equity allocations and find a statistically significant effect on homebias. Aviat and Coeurdacier (2007) examine the effect of dividend tax and interest rates on bilateralbanking claims. They state that the tax rates are far from negligible, ranging from 0% to 40%. Desai andDharmapala (2009) find that the residual tax on US multinational firms’ foreign earnings skews the
4 In a classic study, Miller and Sholes (1978) examine the conditions sufficient with regard to limitation of interest deductionsand tax-free accumulation of wealth that make investors indifferent between dividends and capital gains. On a related issueEgger et al. (2010) find that the positive difference in the debt-ratio of foreign-owned firms and domestically owned in a hostcountry is increasing in that country’s corporate tax rate. This result is due to the greater value of the tax incentive of debt tomultinational firms.

A.V. Mishra, R.A. Ratti / Journal of International Money and Finance 32 (2013) 169–193 173
composition of outbound capital flows. Feuerherdt et al. (2010) estimate a value for the frankingcredits that attach to hybrid securities by examining stock price changes around ex-dividend date.They find that cum-dividend day prices on hybrid securities do not include any value for frankingcredits.
2.2. Mean–variance approach
The portfolio model discussed is intended to provide insight into the appropriate functional formfor empirical measures of cross border taxes so as to determine their influence on internationalinvestment flows. A simple mean–variancemodel for an investor is considered. It takes the perspectiveof an investor in country i, who can freely invest in foreign country j. There are no international barriersother than taxation of returns to international equity investments. The investor’s returns are taxedboth at home and in the foreign country. Let rtii and rt
ij be the after tax net returns received by theinvestor in country i on investment in country i and on investment in country j. Let the proportions ofthe portfolio of the investor in country i invested in country i be st
ii and stij in country j be. If Wt is real
wealth of the investor in country i at time t, real wealth at time t þ 1 is given by
Wtþ1 ¼ Wt
�1þ riitþ1s
iit þ rijtþ1s
ijt
�(1)
The objective function of the investor is given by:
U ¼ UðEtWtþ1; EtVarðWtþ1ÞÞ where U1i0; and U2h0 (2)
where Et($) indicates expectations conditional upon information known at time t and Var($) is thevariance–covariancematrix operator. The investor chooses stii and st
ij at the end of time t tomaximize (2)with respect to the constraint stii þ st
ij ¼ 1.Returns to an investor are assumed to arise from dividends and from capital gains. At time t þ 1 let
Dtþ1i be dividends paid in country i in terms of the local currency and let Mt
i be the value of the stockmarket in country i in terms of the local currency at time t. Suppose that in country i the personal taxrate is spi , the tax on corporate income is sci , and the tax on capital gains of foreign investors is sgi . It willbe assumed that capital gains are realized each period.
It is assumed that country i shareholders are paid dividends under a dividend imputation systemwhereby they receive a credit for the tax paid at the company level in proportion fi (the franking ratio)to the amount of tax paid at company level. In the absence of a dividend imputation system, one dollarof dividend income yields (1� spi ) dollars of after tax income. With a non-zero franking rate, one dollarof dividend income now generates fisci /(1 � sci ) dollars to be added to the shareholder’s taxable income(for one of dollar of dividend income the underlying corporate income will be 1/(1 � sci )). Personalincome tax paid by the shareholder when the franking rate is fi will be the personal income tax liabilityminus the tax credit from the franked dividends and is equal to spi {1 þ f isci /(1 � sci )} � f isci /(1 � sci ).
The net return on domestic investment for the investor in country i in t þ 1 is given by
riitþ1 ¼�1� sip
� 1þ sic
1� sicf i!
Ditþ1
MitþMi
tþ1 �Mit
Mit
�1� sig
�(3)
In equation (3) note that net return on domestic investment for the investor rises under dividendimputation, the double taxation of income and dividend is somewhat reduced. A rise in the tax credit tooffset against tax liability, represented by a rise in fi, raises net return on domestic investment. If spi ¼ sci
and dividend imputation is complete (fi ¼ 1), then the first term on the right hand side of equation (3)reduces to Dtþ1
i /Mti and dividends are only taxed at firm level and the shareholder receives the full
dividend without having to pay further tax.The net return on foreign investment for the investor in country i in period t þ 1 will be influenced
by movement in the exchange rate. Let Extij be the exchange rate expressed in country’s i’s currency perunit of foreign currency j at the end of time period t. The net return on investment in country j for theinvestor in country i in period t þ 1 will be given by
A.V. Mishra, R.A. Ratti / Journal of International Money and Finance 32 (2013) 169–193174
rijtþ1 ¼�1� sip �
�1� qijd
�sijd� Dj
tþ1
Mjt
Exijtþ1
ExijtþMj
tþ1Exijtþ1 �Mj
tExijt
MjtEx
ijt
�1� sig
�
��Mj
tþ1 �Mjt
�Mj
t
Exijtþ1
Exijtsjg (4)
In equation (4), qdij represents the extent towhich dividend taxes paid in country j are a tax credit forthe investor in country i, and sdij represents the withholding tax rate on dividends paid to foreigners. sdij
is sensitive to the i,j combination due to provisions in a bilateral tax treaty and/or the absence ofa bilateral tax treaty. The first term on the right hand side of equation (4) represents return due toforeign dividends after taxes, the second term represents domestic capital gains tax on capital gains onforeign equity, and the third term captures capital gains paid to the foreign government (for which it isbeing assumed there is no offset).
The expressions in equations (3) and (4) for rtþ1ii and rtþ1
ij might be examined for differences arisingfrom cross border taxation. Assuming no change in the exchange rate, equation (4) can be re-written as
rijtþ1 ¼�1� sip �
�1� qijd
�sijd� Dj
tþ1
Mjt
þ�Mj
tþ1 �Mjt
�Mj
t
�1� sig � sjg
�(4’)
Comparison of equations (3) and (4) indicates that for a given dollar return in dividends, a positivefranking rate for the domestic corporate tax and a smaller tax credit for dividend taxes paid in a foreigncountry the greater the return advantage to dividends arising from domestic corporations relative todividends arising from foreign corporations. Taxation overall may be greater on capital gains achievedon foreign investment. Demirguc-Kunt and Huizinga (1995) note that developed countries usuallyprovide tax relief for foreign dividend taxes, but do not usually do so for withholding taxes on foreigncapital gains. The latter are normally fully borne by the foreign investor.
In equations (3) and (4), rtþ1ii and rtþ1
ij , the after tax net returns on domestic and foreign investmentare randomvariables at the end of time twhen the decision on the proportion of the portfolio to hold interms of foreign equity is made. The driving random variables behind these random after tax returnsare the rates of dividend payment and capital gains in countries i and j. It is convenient to define a termthat is the sum of (percentage) capital gains and the gross-up for tax of dividends. For country i in thecurrency of country i this is given by
yitþ1 ¼ Ditþ1
Mit
�1
1� sic
�þMi
tþ1 �Mit
Mit
(5)
The expression in equation (5) captures the obvious fact that for a given pre-tax return, there isa tradeoff between dividends paid out and capital gain. Note that in the expression for pre-tax return incountry i in the currency of country i in equation (5) does not include a superscript j. For this reason it isconvenient to identify the randomvariables that drive international returns as being ytþ1
i and ytþ1j with
variances si2 and sj2, respectively, and covariance sij. To simply the analysis the capital gain in country i
is expressed as a fraction lti of ytþ1
i ; that is ltiytþ1i ¼ (Mtþ1
i � Mti)/Mt
i. This allows net return on equity incountry i for the investor in country i in equation (3) to be re-written as:
riitþ1 ¼n�
1� lit
��1� sip
�h1� sic
�1� f i
�iþ lit
�1� sig
�oyitþ1 ¼ aiit y
itþ1 (6)
The net return on equity in country j for the investor in country i in equation (4) becomes:
rijtþ1 ¼�1� sip �
�1� qijd
�sijd�n�
1� ljt
��1� sjc
�h1þ 4
ijtþ1
ioyjtþ1
þ�1� sig
�n�1þ 4
ijtþ1
��ljty
jtþ1 þ 4
ijtþ1
o� sjg
�1þ 4
ijtþ1
�ljty
jtþ1
¼ aijt yjtþ1 þ
�1� sig
�4ijtþ1
(7)
A.V. Mishra, R.A. Ratti / Journal of International Money and Finance 32 (2013) 169–193 175
where 4tþ1ij is the expected appreciation of i’s currency relative to j’s currency between periods t and
t þ 1. It is convenient to assume that 4tþ1ij and lt
i are constants given by 4ij and li.5
Maximizing utility in equation (2) with respect to these proportions gives from the first ordercondition the proportion of the portfolio that the investor in country i will hold in foreign (country j)equity:
sijt ¼Et�aijyjtþ1 þ
�1� sig
�4ij � aiiyitþ1
�gnaii2s2i � 2aiiaijsij þ aij2s2j
o þ aii2s2i � aiiaijsijnaii2s2i � 2aiiaijsij þ aij2s2j
o (8)
where g is the parameter of relative risk aversion,�2U2Wt/U1, si2 is variance of pre-tax return on equityin local currency country i, sj2 is variance of pre-tax return on equity in local currency in country j, andsij is covariance of these returns.
Examination of equation (8) reveals that the influence of any particular tax variable on the share ofa portfolio invested in foreign equity is complex, being dependent upon the values of other taxparameters, the means, variances and covariances of pre-tax returns, and the parameter of relative riskaversion. However, it is possible to discern strong and likely influences of the tax parameters.
For example, the effect on the ratio of foreign equity in the portfolio of an increase in the frankingratio associated with dividend imputation (or a rise in the tax credit to offset against tax liability) willraise the net return of domestic equity investment. With regard to the first term on the right hand sideof equation (8), this has the effect of reducing the numerator and raising the denominator. This effect is(partially) offset by an increase in the second term on the right hand side of equation (8). It is anempirical question as to whether the influence is significant. In the simple case inwhich pre-tax returnon equity in country i in the currency of country i is non-stochastic with value yi we have that anincrease in the franking ratio reduces the share of the portfolio in foreign equity:
vsijtvf i
¼ ��1� li
��1� sip
�sicy
i
gaij2s2j< 0 (9)
The effect of increase in tax on dividends by the foreign government for the investor from country ion the share of the investor’s portfolio in country j equity is given by
vsijtvsjd
¼��1�qijd
��1�lj
��1�sjc
�h1þ4
ijtþ1
i h2�aiiyi��1�sig�4ijtþ1
��aijyj
igaij3s2j
�0; qijd�1 (10)
for parameter values that yield sijt <yj=ð2gaijs2j Þ. We will assume that this condition holds. The effect offoreign taxation of dividends on foreign investment in equation (10) will be mitigated if dividend taxespaid overseas are a tax credit (if qdij is positive rather than zero) for the investor. If all the foreign tax paidis a tax credit (qdij¼ 1), then vsijt =vs
jd ¼ 0 and the foreign taxation of dividends on foreign investment will
not affect stij.Fromdifferentiating equation (8), the effect of an increase in the extent towhich dividend taxes paid
in country j are a tax credit for the investor in country i is given by
vsijtvqijd
¼ sjd�1� lj
��1� sjc
�h1þ 4
ijtþ1
i h2�aiiyi � �1� sig�4ijtþ1
�� aijyj
igaij3s2j
> 0; (11)
The result in equation (11) indicates that for a rise in the value of the tax credit for foreign dividendtaxes paid, foreign investment increases.
5 It is necessary to specify investor expectations about the likely split between dividends and capital gains at the timeportfolio decisions are made. A constant value for lti is one possibility. A less restrictive assumption would be that lti is expectedto be the same in the next time period as it was in the last, i.e. that Etlti ¼ lt�1
i .

A.V. Mishra, R.A. Ratti / Journal of International Money and Finance 32 (2013) 169–193176
The results in this section indicate that home bias will be increased if there is dividend imputationin the investor’s home country, if the corporate income tax is raised in the investor’s home country, ifgovernments tax dividends and capital gains of foreign investors who do not receive tax credits forthese taxes, and that home bias will be decreased if there is a tax credit for foreign dividend taxes paid.
2.3. The tax variables
A number of dummy variables and tax variables will be employed in the empirical analysis. Variablesare defined and data sources are provided in Appendix Table A.1. Empirical analysis will be based on the23 mature economies and the 26 emerging economies listed in Table 1. Table 1 presents information ontaxation in these countries for the year 2007. Dividend imputation rates and dividend tax rateswill differfor the other years in the sample from those reported for 2007. There are 572 foreign countries over2001–2007 and 710 over 2001–2009. A distinction is drawn between the sample periods because of theglobal financial crisis during 2008.6 Results will be presented for 2001–2007 and for 2001–2009.
The corporate income tax rate, sci , taken to be the combined (central and sub-central) marginalstatutory corporate income tax rate on distributed profits, inclusive of surtax (if any) is shown for eachcountry in column (2) of Table 1. The corporate income tax varies between 10% in Cyprus to 40.69% inJapan. In column (3) in Table 1 the rate of corporate income tax imputed to shareholders is provided.During most of 2001–2007, eight developed countries in our sample had dividend imputation systemsin place, although only six during 2005.7 A full (partial) imputation tax system provides full (partial)dividend tax credit at shareholder level for the underlying corporate profits tax. Thus, for exampleAustralia provides full imputation since 100% of the corporate income tax of 30% is imputed toshareholders as reflected in a 30% imputation rate. A (0,1) indicator is utilized for a dividend imputationsystem being in place. The indicator takes the value 1 if there is there is either a full or partial dividendimputation system being utilized in the investor’s home country and zero otherwise. In addition, theactual (or notional) rate of corporate income tax imputed to shareholders as shown in column (3) inTable 1 is utilized as a variable.
The withholding tax rates on dividends paid to foreigners, sdij, is shown in summary form in column(4) of Table 1. For most countries sdij is represented as a range depending on the corresponding foreigncountry. Thus, sdij is sensitive to the i,j designation. In Table 1, for example, for the Philippines, sdij is 15–30%. In Table 2 the withholding tax rates in each country on dividends paid to foreigners from eachcountry are shown in detail. For the Philippines it can be seen that in 2007 the withholding tax rates ondividends paid to investors based in Germany is 15%, in Japan is 25%, and in Greece is 30%. Thewithholding tax rates on dividends paid to foreigners in 2007 vary from 0% (on all foreign investors) ina number of countries including Hong Kong and the U.K. to highs of 47% levied by Greece on Finnishinvestors and 40% levied by Greece on Norwegian investors. The capital gains tax rate, sgi , is the rate thatapplies to realized capital gains by foreign investors and is obtained from various sources includingInternational Master Tax Guide and Price Water House Coopers (PWC) Tax Services.8
An additional category of measure of cross border taxation will be provided by the tax burdens perunit of currency invested introduced by Demirguc-Kunt and Huizinga (1995). The expected tax burdenon capital gains (if realized) and on dividends paid to foreign investors are defined as:
6 Countries’ equity holdings abroad fell quite significantly during 2008 and then recovered (only partly so for most countries)in 2009. For example, the behaviour of UK equity holdings abroad is typical with holdings in 2007 of 1508.7 billion USD, 824.0 billion USD in 2008, and 1079.3 billion USD in 2009. US equity holdings abroad were 5248.0 billion USD in 2007, 2748.4 billionUSD in 2008, and 3.995.3 billion USD in 2009.
7 Australia, Chile, Mexico and New Zealand (Korea and the UK) had full (partial) dividend imputation over 2001–2009.Finland and France changed from full dividend imputation over 2001–2004 to a partial inclusion system in 2005, and Canadaswitched from partial to full dividend imputation in 2009. Norway had partial (full) dividend imputation in 2001 (2002–2005).Spain had partial dividend imputation over 2001–2006 and France had full dividend imputation over 2001–2004. Most of theother countries in Table 1 have either a classical tax system under which company profit is taxed at corporate level and againupon distribution as dividends at shareholder level, or a modified classical system under which dividend income is taxed atpreferential rates (for instance, compared to interest income) at the shareholder level.
8 Capital gains withheld tax rate in foreign country can be obtained from authors on request.

Table 2Dividend tax withheld rates on dividend payment to foreigners (2007).
Taxingcountry
Investor home
aus aust bel can den fin fra ger gre hk ire ita jap net nor nz por sin spa swe swi uk us
arg 0 0 0 0 0 0 0 0 0 0 0 0 0 0 0 0 0 0 0 0 0 0 0aus X 15 15 15 15 15 15 15 30 30 15 15 15 15 15 15 30 15 15 15 15 15 30aust 15 X 15 15 15 10 15 15 15 25 10 15 20 15 15 15 15 10 15 10 15 15 15bel 15 15 X 15 15 15 15 25 15 15 15 15 15 15 15 15 15 15 15 15 15 10 15bra 0 15 15 15 25 10 15 0 0 0 0 15 12.5 15 15 0 15 0 15 25 0 0 0can 15 15 15 X 15 15 15 15 15 25 15 15 15 15 15 15 15 15 15 15 15 15 15chi 35 35 35 15 15 35 15 35 35 35 15 35 35 35 35 15 15 35 10 10 35 15 35cyp 0 10 10 15 10 0 10 10 25 0 0 0 0 0 0 0 0 0 0 5 0 0 0czr 15 10 15 15 15 15 10 15 15 15 15 15 15 10 15 15 15 5 15 10 15 15 15den 15 10 15 15 X 15 15 15 38 28 15 15 15 15 15 15 28 10 15 15 0 15 15egy 0 0 0 0 0 0 0 0 0 0 0 0 0 0 0 0 0 0 0 0 0 0 0est 22 22 22 22 22 22 22 22 22 22 22 22 22 22 22 22 22 22 22 22 22 22 22fin 15 10 15 15 15 X 0 15 13 28 5 15 15 15 15 15 15 15 15 15 10 5 21fra 15 15 15 15 25 15 X 15 25 25 15 15 10 15 15 15 15 15 15 15 25 15 15ger 15 15 15 15 15 15 15 X 25 25 10 15 15 15 15 15 15 15 15 15 15 15 15gre 10 15 15 10 38 47 0 25 X 10 15 15 10 35 40 10 15 10 10 0 35 0 0hk 0 0 0 0 0 0 0 0 0 0 0 0 0 0 0 0 0 0 0 0 0 0 0hun 15 10 10 15 15 15 15 25 45 20 15 10 10 15 10 20 15 10 15 15 10 15 15indi 15 10 15 15 15 10 10 10 0 10 10 10 10 10 15 10 10 15 15 10 10 15 15indo 15 15 15 15 20 15 15 15 20 20 20 15 15 10 15 15 10 15 15 15 15 15 15ire 0 0 20 15 0 0 20 20 15 20 X 15 20 15 15 0 15 20 0 0 0 15 15isr 25 25 15 15 25 15 15 25 25 25 10 10 15 15 25 25 25 10 10 0 15 15 25ita 15 15 15 15 15 15 15 15 15 27 15 X 15 15 15 15 15 10 15 15 15 15 15jap 10 20 15 15 15 15 15 15 20 20 15 15 X 15 15 15 20 15 15 15 15 10 10kor 15 15 15 15 15 15 15 15 15 20 15 15 15 15 15 15 15 15 15 15 15 15 15leb 10 10 10 10 10 10 10 10 10 10 10 10 10 10 10 10 10 10 10 10 10 10 10lux 15 15 15 15 15 15 15 15 7.5 10 15 15 15 15 15 15 15 10 15 15 15 15 15mal 0 0 0 0 0 0 0 0 0 0 0 0 0 0 0 0 0 0 0 0 0 0 0mau na na 10 na na na 15 15 na na na 15 na na na na na na na 15 15 15 namex 15 10 15 15 15 0 5 15 10 25 10 15 15 15 15 15 10 0 15 15 15 0 10net 15 15 15 15 15 15 15 15 15 15 15 15 15 X 15 15 10 15 15 15 15 15 15nor 15 15 15 15 15 15 15 15 20 25 15 15 15 15 X 15 15 15 15 15 15 15 15nz 15 15 15 15 15 15 15 15 30 30 15 15 15 15 15 X 30 15 15 15 15 15 15per 4.1 4.1 4.1 4.1 4.1 4.1 4.1 4.1 4.1 4.1 4.1 4.1 4.1 4.1 4.1 4.1 4.1 4.1 4.1 4.1 4.1 4.1 4.1phi 25 25 15 25 15 15 25 15 30 30 30 15 25 15 25 25 30 25 15 15 15 25 25pol 15 19 10 15 15 15 15 15 15 19 15 10 10 15 15 15 15 10 15 15 15 10 15por 20 15 15 15 10 15 15 15 15 20 15 15 20 10 15 20 X 10 15 10 15 15 15
(continued on next page)
A.V.M
ishra,R.A.Ratti
/Journal
ofInternational
Money
andFinance
32(2013)
169–193
177
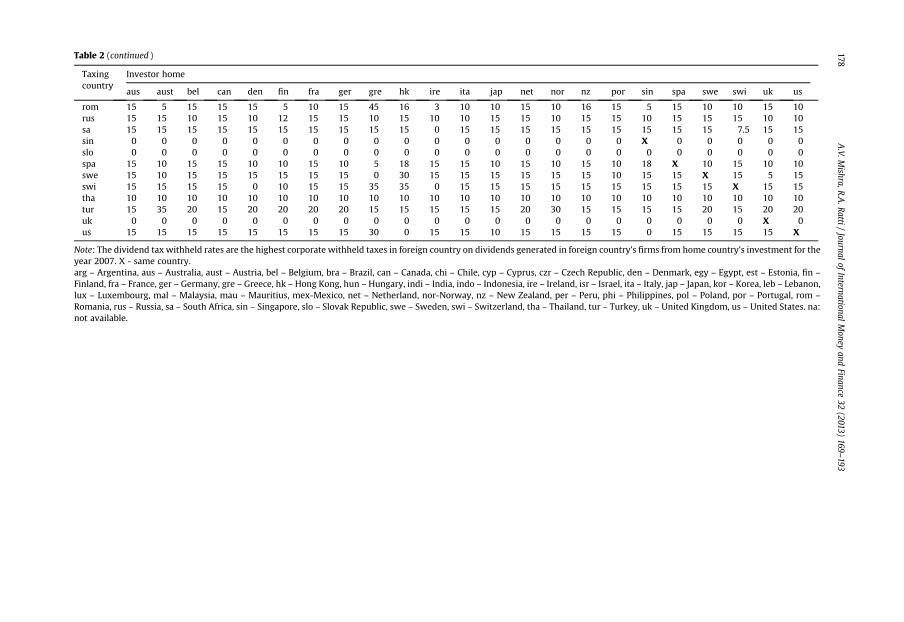
Table 2 (continued )
Taxingcountry
Investor home
aus aust bel can den fin fra ger gre hk ire ita jap net nor nz por sin spa swe swi uk us
rom 15 5 15 15 15 5 10 15 45 16 3 10 10 15 10 16 15 5 15 10 10 15 10rus 15 15 10 15 10 12 15 15 10 15 10 10 15 15 10 15 15 10 15 15 15 10 10sa 15 15 15 15 15 15 15 15 15 15 0 15 15 15 15 15 15 15 15 15 7.5 15 15sin 0 0 0 0 0 0 0 0 0 0 0 0 0 0 0 0 0 X 0 0 0 0 0slo 0 0 0 0 0 0 0 0 0 0 0 0 0 0 0 0 0 0 0 0 0 0 0spa 15 10 15 15 10 10 15 10 5 18 15 15 10 15 10 15 10 18 X 10 15 10 10swe 15 10 15 15 15 15 15 15 0 30 15 15 15 15 15 15 10 15 15 X 15 5 15swi 15 15 15 15 0 10 15 15 35 35 0 15 15 15 15 15 15 15 15 15 X 15 15tha 10 10 10 10 10 10 10 10 10 10 10 10 10 10 10 10 10 10 10 10 10 10 10tur 15 35 20 15 20 20 20 20 15 15 15 15 15 20 30 15 15 15 15 20 15 20 20uk 0 0 0 0 0 0 0 0 0 0 0 0 0 0 0 0 0 0 0 0 0 X 0us 15 15 15 15 15 15 15 15 30 0 15 15 10 15 15 15 15 0 15 15 15 15 X
Note: The dividend tax withheld rates are the highest corporate withheld taxes in foreign country on dividends generated in foreign country’s firms from home country’s investment for theyear 2007. X - same country.arg – Argentina, aus – Australia, aust – Austria, bel – Belgium, bra – Brazil, can – Canada, chi – Chile, cyp – Cyprus, czr – Czech Republic, den – Denmark, egy – Egypt, est – Estonia, fin –
Finland, fra – France, ger – Germany, gre – Greece, hk – Hong Kong, hun – Hungary, indi – India, indo – Indonesia, ire – Ireland, isr – Israel, ita – Italy, jap – Japan, kor – Korea, leb – Lebanon,lux – Luxembourg, mal – Malaysia, mau – Mauritius, mex-Mexico, net – Netherland, nor-Norway, nz – New Zealand, per – Peru, phi – Philippines, pol – Poland, por – Portugal, rom –
Romania, rus – Russia, sa – South Africa, sin – Singapore, slo – Slovak Republic, swe – Sweden, swi – Switzerland, tha – Thailand, tur – Turkey, uk – United Kingdom, us – United States. na:not available.
A.V.M
ishra,R.A.Ratti
/Journal
ofInternational
Money
andFinance
32(2013)
169–193
178

A.V. Mishra, R.A. Ratti / Journal of International Money and Finance 32 (2013) 169–193 179
CTAXijt¼ sjg
Mjt �Mj
t�1
Mjt�1
�1þ 4
ijt
�if Mj
t �Mjt�1 � 0
¼ 0 if Mjt �Mj
t�1 < 0
(12)
DTAXijt ¼ sijd
Djt
j
�1þ 4
ijt
�(13)
Mt�1
respectively,whereMtj is theequitymarket index for country j (in local currency) at theendof timeperiod
t,Dtj/Mt�1
j is dividend yield for country j (Dtj is always non-negative), and 4t
ij is the appreciation of countryi’s currency relative to country j’s currency between periods t � 1 and t. In equations (13) and (14) theactual tax burdens per unit of initial investment are represented. An advantage of CTAXtij and DTAXt
ij overthe tax rates sgi and sdij is that the former vary over time and take the value zero when no taxes are due.
In a world with extensive double taxation treaties the variable tax burden on dividends paid toforeign investors is really a proxy variable for tax credit for foreign taxes paid. About 88% of theobservations on foreign investment in our sample are for countries with countries with a bilateraldouble taxation treaty on dividend tax withheld. Even in those cases where there is no tax treaty,default domestic law applies and there could well be a tax credit for foreign dividend tax paid. An issuealso arises concerning the extent to which dividend tax credits for dividend income for foreigninvestors is not adequate to recapture all the taxes paid.
By analogy with the tax variables constructed by Demirguc-Kunt and Huizinga (1995) a variable forthe tax credit value for foreign dividend taxes paid will be given by:
TaxCredit1ijt ¼ sijdDjt
Mjt�1
�1þ 4
ijt
�if sijd � sic
¼ sicDjt
Mjt�1
�1þ fij
t
�if sijd � sic
(14)
The variable TaxCredit1tij captures the presence of a double taxation treaty in that sdij is generallylarger for the investor from a foreign country with no tax treaty. TaxCredit1tij does capture the situationin which there might be no tax credit when there is no tax treaty with the country in which thedividend is initially taxed. The assumption in equation (14) is that a tax credit is available tax treaty ornot. An alternative measure of tax credit is given by:
TaxCredit2ijt ¼ sjdDjt
Mjt�1
�1þ 4
ijt
�if sijd � sic and TDD ¼ 1
¼ sicDjt
Mjt�1
�1þ fij
t
�if sijd � sic and TDD ¼ 1
¼ 0 if TDD ¼ 0
(15)
In equation (15), the construction of TaxCredit2tij assumes that if there is a double taxation treaty(TDD ¼ 1) the maximum tax credit is available, and if there is not a double taxation treaty (TDD ¼ 0)then the tax credit is zero. The actual tax credit available is likely to be bracketed by TaxCredit1tij andTaxCredit2tij. The correlation of TaxCredit1tij with TaxCredit2tij is 0.93.9
Examination of the variables tax credit value for foreign dividend taxes in equations (14) and (15)and of the tax burden on dividends paid (in country j) to foreign investors from country i in equation
9 In constructing the tax credit variable the corporate income tax has been used as the relevant domestic tax rate againstwhich to compare the rate of tax on dividends levied by the foreign government. For wealthy individual holding foreign equity,the top marginal rate of tax might be more appropriate. For institutional investors holding foreign equity the corporate tax rateis the relevant variable. Use of either the top marginal income tax rate for constructing a tax credit variable yields similar resultsto those reported.

A.V. Mishra, R.A. Ratti / Journal of International Money and Finance 32 (2013) 169–193180
(13) reveals that they are likely to have a strong positive correlation since most countries have doubletaxation treaties. The correlation of DTAXt
ij with TaxCredit1tij is 0.85 and of DTAXtij with TaxCredit2tij is
0.64. For this reason we will not employ more than one of these variables in the same regression, andour expectation is that these variables are associated with less home bias.
3. Home bias and other variables
3.1. Measurement of home bias
In this paper we will examine the influence of cross border taxation on float adjusted home bias.Free float home bias is calculated in recognition that there is a restriction on foreign investor holdingsof foreign securities and that home bias, governance, and optimal corporate ownership have beenlinked in the literature. To ascertain whether the restriction on foreign investor holdings drives resultson the effect of international taxation on free float home bias, rather than the tax differential betweentaxation of domestic and foreign sources of income, the effect of international taxation on traditionalinternational portfolio home bias will also be examined.10
3.1.1. Traditional international portfolio home biasThe traditional measure of home bias is based on the international capital asset pricing models
(ICAPM) developed by Sharpe (1964) and Lintner (1965). Thesemodels assume perfect capital markets,investment and consumption opportunity sets do not differ across countries, and that investors are thesame across countries with respect to risk aversion and information. There are no barriers to inter-national investment, no restrictions on short sales, no taxes, no information asymmetries and no tariffs.If Ij* is the ratio of the market capitalisation of country j in the world market capitalisation, thensecurities from country j should constitute a fraction Ij* of an investor’s portfolio of stocks. If the ratio ofi’s holdings of country j equities to country i’s total equity portfolio is given by Ii*, the traditionalinternational portfolio measure of home bias is given by
HBij ¼ 1� IjiI�j
(16)
3.1.2. Float adjusted home biasIt has been established in the literature that foreign investment and firm governance are related. La
Porta et al. (1999) observe that firms outside the United States are usually controlled by large residentshareholders and that there exists a large home bias in equity holdings. Dahlquist et al. (2003) statethat in countries with poor investor protection, firms tend to be controlled by large share holders sothat foreigners can hold only a small portion of issued shares that are freely traded or floated. Dahlquistet al. (2003) note that these large resident shareholders are controlling shareholders, who would only,if at all, sell their shares as a control bloc for a price significantly above themarket price at which sharestrade.11 They construct an estimate of the world float portfolio of shares available to investors who arenot controlling shareholders. They find that the share of a country’s equities in the stock portfolio of USinvestors is negatively related to the share of the stock market capitalization of the country held bylarge shareholders.
10 Contrasting the effects of international taxation between results obtained from free float home bias and traditionalinternational portfolio home bias is not the only way to ascertain whether tax effects drive results rather than restrictions onownership. Market portfolios could also be constructed in other ways. Baele et al. (2007) employ alternative benchmark marketportfolios depending upon ICAPM, mean variance and Bayesian framework. Clark and Kassimatis (2011) develop a proxy ofinternational market portfolio by discounting macroeconomic cash flows to calculate the value of economy.11 Shares held by the controlling shareholders are also known as closely held shares. The controlling shareholders may beofficers, directors, and their immediate families, and the shares may constitute shares held in trusts, shares held by pensionbenefit plans, and shares held by individuals who hold 5% or more of the outstanding shares. The Japanese closely held sharesrepresent the holdings of the ten largest shareholders.
A.V. Mishra, R.A. Ratti / Journal of International Money and Finance 32 (2013) 169–193 181
Stulz (2005) argues that countries with the weakest governance have a smaller fraction of wealthowned by foreign investors because insiders have a large ownership of shares in such countries. Leuzet al. (2009) state that, in countries with poor disclosure, US investors hold less of the float in firms inwhich the controlling shareholder holds more control rights. Giannetti and Simonov (2006) showa similar result for foreign investors and small Swedish investors. Kho et al. (2009) provide an “optimalcorporate ownership” theory of home bias which states that poor governance is associated witha higher level of insider ownership andmay also lead tomonitoring investors (usually domestic) takinglarge equity positions in the firm. Both these direct and indirect effects of ownership structure limitfloating shares available for portfolio holdings by foreign investors. Miller (2009) provides a detaileddiscussion of work on the connection between governance and home bias.
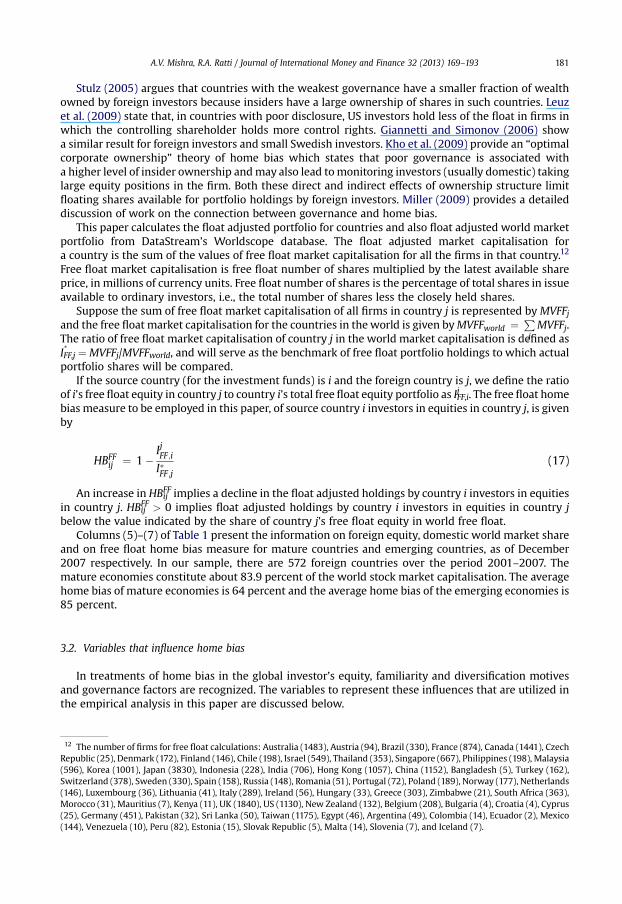
This paper calculates the float adjusted portfolio for countries and also float adjusted world marketportfolio from DataStream’s Worldscope database. The float adjusted market capitalisation fora country is the sum of the values of free float market capitalisation for all the firms in that country.12
Free float market capitalisation is free float number of shares multiplied by the latest available shareprice, in millions of currency units. Free float number of shares is the percentage of total shares in issueavailable to ordinary investors, i.e., the total number of shares less the closely held shares.
Suppose the sum of free float market capitalisation of all firms in country j is represented byMVFFjand the free float market capitalisation for the countries in the world is given byMVFFworld ¼ P
jMVFFj.
The ratio of free float market capitalisation of country j in the world market capitalisation is defined asIFF,j* ¼ MVFFj/MVFFworld, and will serve as the benchmark of free float portfolio holdings to which actualportfolio shares will be compared.
If the source country (for the investment funds) is i and the foreign country is j, we define the ratioof i’s free float equity in country j to country i’s total free float equity portfolio as IFF,ij . The free float homebias measure to be employed in this paper, of source country i investors in equities in country j, is givenby
HBFFij ¼ 1�IjFF;iI�FF;j
(17)
An increase in HBijFF implies a decline in the float adjusted holdings by country i investors in equities
in country j. HBijFF > 0 implies float adjusted holdings by country i investors in equities in country jbelow the value indicated by the share of country j’s free float equity in world free float.
Columns (5)–(7) of Table 1 present the information on foreign equity, domestic world market shareand on free float home bias measure for mature countries and emerging countries, as of December2007 respectively. In our sample, there are 572 foreign countries over the period 2001–2007. Themature economies constitute about 83.9 percent of the world stock market capitalisation. The averagehome bias of mature economies is 64 percent and the average home bias of the emerging economies is85 percent.
3.2. Variables that influence home bias
In treatments of home bias in the global investor’s equity, familiarity and diversification motivesand governance factors are recognized. The variables to represent these influences that are utilized inthe empirical analysis in this paper are discussed below.
12 The number of firms for free float calculations: Australia (1483), Austria (94), Brazil (330), France (874), Canada (1441), CzechRepublic (25), Denmark (172), Finland (146), Chile (198), Israel (549), Thailand (353), Singapore (667), Philippines (198), Malaysia(596), Korea (1001), Japan (3830), Indonesia (228), India (706), Hong Kong (1057), China (1152), Bangladesh (5), Turkey (162),Switzerland (378), Sweden (330), Spain (158), Russia (148), Romania (51), Portugal (72), Poland (189), Norway (177), Netherlands(146), Luxembourg (36), Lithuania (41), Italy (289), Ireland (56), Hungary (33), Greece (303), Zimbabwe (21), South Africa (363),Morocco (31), Mauritius (7), Kenya (11), UK (1840), US (1130), New Zealand (132), Belgium (208), Bulgaria (4), Croatia (4), Cyprus(25), Germany (451), Pakistan (32), Sri Lanka (50), Taiwan (1175), Egypt (46), Argentina (49), Colombia (14), Ecuador (2), Mexico(144), Venezuela (10), Peru (82), Estonia (15), Slovak Republic (5), Malta (14), Slovenia (7), and Iceland (7).

A.V. Mishra, R.A. Ratti / Journal of International Money and Finance 32 (2013) 169–193182
3.2.1. Familiarity and diversification variablesFamiliarity and diversification variables play an important role in investors’ equity investment
decisions (see Coval andMoskowitz (1999, 2001), Huberman (2001), Portes et al. (2001), Sarkissian andSchill (2004), Portes and Rey (2005), Aviat and Coeurdacier (2007) and Mishra (2011)). The followingvariables will be utilized in this study: Foreign Listing, Distance, Size, Language, Transaction Costs andCorrelation.
Foreign listing is the share of a foreign country’s stockmarket that is listed on source country’s stockexchanges (either directly or has issued public debt in the source country). When foreign countriesfirms list equity on source country’s stock exchanges or issue public debt in source country’s markets,barriers to source country’s investors are reduced. Distance is logarithm of distance in kilometresbetween capital city of home country and capital city of foreign country. Size is a country’s marketshare of the world market capitalisation and tests the assumption of the traditional theory of ICAPMthat investors should diversify according to their country’s share of world market capitalisation.
Language is equal to one if source and foreign country share a common language; otherwise itsvalue is zero. Investors prefer to invest in foreign countries that share a common language with theirhome country. Common language may better enable investors to read company financial reports andfinancial press analysis. This may enhance investors’ familiarity with destination countries financialsystem and thus reduce investors’ information costs. High transaction costs associated with tradingforeign equities will increase home bias. The data are derived from Elkins–McSherry Co. (www.elkins-mcsherry.com) and consists of average trading costs (commissions, fees and market impact costs) asa percentage of trade value for active managers. Correlation is the correlation between returns ofsource and foreign country. The correlation coefficient is a proxy for the benefits of diversificationbetween two countries.
3.2.2. Governance variablesGovernance variables have been shown to influence international investment flows (Papaioannou,
2009). We will consider whether the results of the influence of cross border taxation on internationalinvestment are robust to the influence of a number of these variables. The governance variables that wewill consider are the following: Disclosure Intensity, Governance Disclosure, Audit, Anti-director rights,Accounting Standards and Disclosure Requirement. The first three of these variables are from Bushmanet al. (2004) and the last three are from La Porta et al. (1998). The governance variables will enterregression equations as difference between source country value and foreign country value. Ferreiraand Matos (2008) find that all institutions reveal a preference for stocks from countries with gooddisclosure standards.
3.3. Summary statistics on the variables
In Table 3 we report summary statistics for countries in our sample. The home bias measure rangesfrom 0.100 to 0.999. The home bias measure has a mean of 0.777 and the capital gains tax withheldvariable has a mean of 2.014. The transaction cost variable ranges from 13.490 to 141.290 with a meanof 39.777. Common language and high tax are dummy variables. Dividend tax credit1 has a mean of0.332 and dividend tax credit2 has a mean of 0.298.
4. Empirical specification
4.1. The basic regression equation
The primary goal is to investigate the effect of cross border taxation on cross-country differences inbilateral home bias. The empirical model includes different potential sources of home bias and variouscontrol variables (familiarity, diversification, governance and accounting). The objective is to testwhether cross border taxation is a significant determinant of home bias. The basic regression equationfor free float home bias is given by:
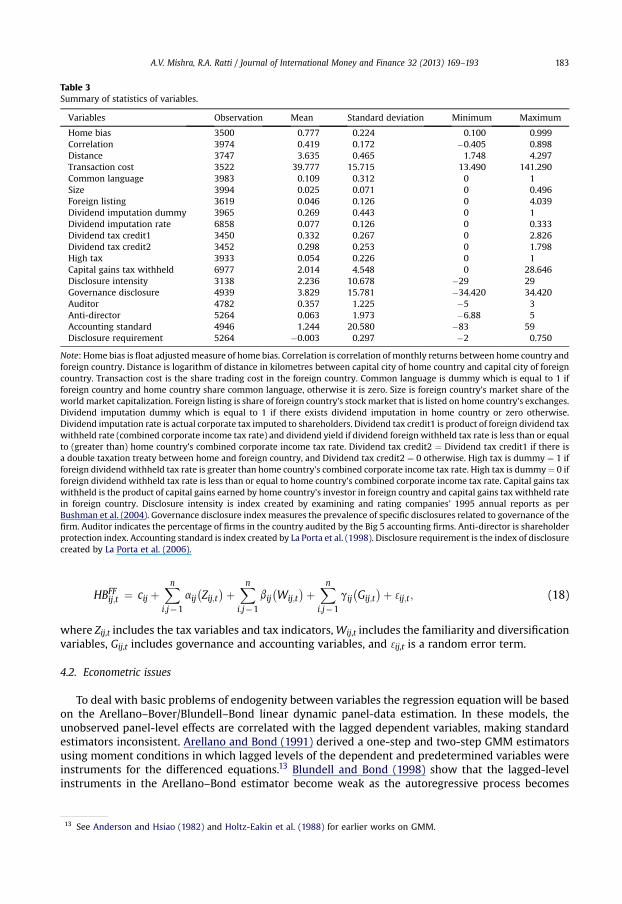
Table 3Summary of statistics of variables.
Variables Observation Mean Standard deviation Minimum Maximum
Home bias 3500 0.777 0.224 0.100 0.999Correlation 3974 0.419 0.172 �0.405 0.898Distance 3747 3.635 0.465 1.748 4.297Transaction cost 3522 39.777 15.715 13.490 141.290Common language 3983 0.109 0.312 0 1Size 3994 0.025 0.071 0 0.496Foreign listing 3619 0.046 0.126 0 4.039Dividend imputation dummy 3965 0.269 0.443 0 1Dividend imputation rate 6858 0.077 0.126 0 0.333Dividend tax credit1 3450 0.332 0.267 0 2.826Dividend tax credit2 3452 0.298 0.253 0 1.798High tax 3933 0.054 0.226 0 1Capital gains tax withheld 6977 2.014 4.548 0 28.646Disclosure intensity 3138 2.236 10.678 �29 29Governance disclosure 4939 3.829 15.781 �34.420 34.420Auditor 4782 0.357 1.225 �5 3Anti-director 5264 0.063 1.973 �6.88 5Accounting standard 4946 1.244 20.580 �83 59Disclosure requirement 5264 �0.003 0.297 �2 0.750
Note: Home bias is float adjustedmeasure of home bias. Correlation is correlation of monthly returns between home country andforeign country. Distance is logarithm of distance in kilometres between capital city of home country and capital city of foreigncountry. Transaction cost is the share trading cost in the foreign country. Common language is dummy which is equal to 1 ifforeign country and home country share common language, otherwise it is zero. Size is foreign country’s market share of theworld market capitalization. Foreign listing is share of foreign country’s stock market that is listed on home country’s exchanges.Dividend imputation dummy which is equal to 1 if there exists dividend imputation in home country or zero otherwise.Dividend imputation rate is actual corporate tax imputed to shareholders. Dividend tax credit1 is product of foreign dividend taxwithheld rate (combined corporate income tax rate) and dividend yield if dividend foreign withheld tax rate is less than or equalto (greater than) home country’s combined corporate income tax rate. Dividend tax credit2 ¼ Dividend tax credit1 if there isa double taxation treaty between home and foreign country, and Dividend tax credit2 ¼ 0 otherwise. High tax is dummy ¼ 1 ifforeign dividend withheld tax rate is greater than home country’s combined corporate income tax rate. High tax is dummy¼ 0 ifforeign dividend withheld tax rate is less than or equal to home country’s combined corporate income tax rate. Capital gains taxwithheld is the product of capital gains earned by home country’s investor in foreign country and capital gains tax withheld ratein foreign country. Disclosure intensity is index created by examining and rating companies’ 1995 annual reports as perBushman et al. (2004). Governance disclosure index measures the prevalence of specific disclosures related to governance of thefirm. Auditor indicates the percentage of firms in the country audited by the Big 5 accounting firms. Anti-director is shareholderprotection index. Accounting standard is index created by La Porta et al. (1998). Disclosure requirement is the index of disclosurecreated by La Porta et al. (2006).
A.V. Mishra, R.A. Ratti / Journal of International Money and Finance 32 (2013) 169–193 183
HBFFij;t ¼ cij þXni;j¼1
aij�Zij;t�þ Xn
i;j¼1
bij�Wij;t
�þ Xni;j¼1
gij�Gij;t
�þ 3ij;t ; (18)
where Zij,t includes the tax variables and tax indicators,Wij,t includes the familiarity and diversificationvariables, Gij,t includes governance and accounting variables, and 3ij,t is a random error term.
4.2. Econometric issues
To deal with basic problems of endogenity between variables the regression equation will be basedon the Arellano–Bover/Blundell–Bond linear dynamic panel-data estimation. In these models, theunobserved panel-level effects are correlated with the lagged dependent variables, making standardestimators inconsistent. Arellano and Bond (1991) derived a one-step and two-step GMM estimatorsusing moment conditions in which lagged levels of the dependent and predetermined variables wereinstruments for the differenced equations.13 Blundell and Bond (1998) show that the lagged-levelinstruments in the Arellano–Bond estimator become weak as the autoregressive process becomes
13 See Anderson and Hsiao (1982) and Holtz-Eakin et al. (1988) for earlier works on GMM.
A.V. Mishra, R.A. Ratti / Journal of International Money and Finance 32 (2013) 169–193184
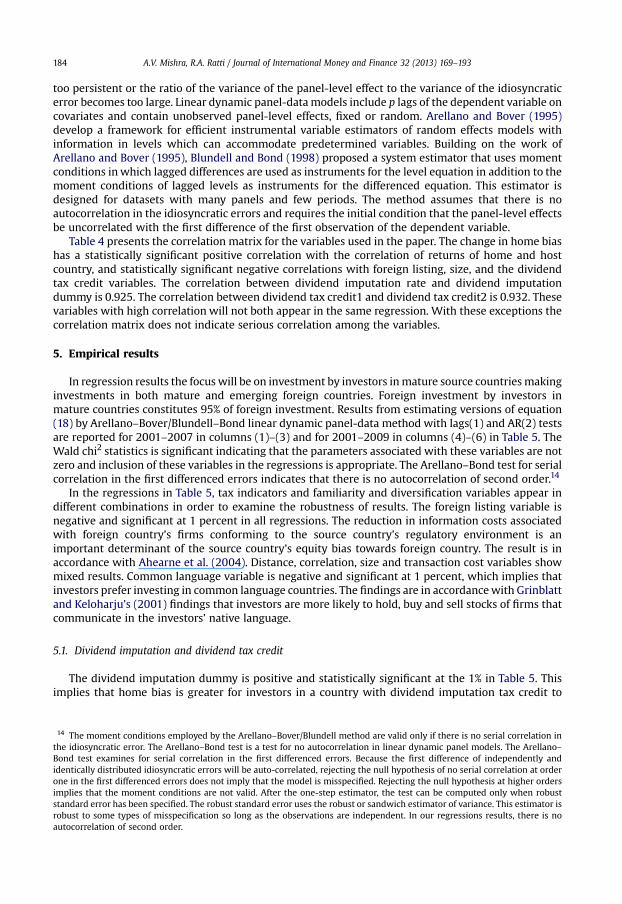
too persistent or the ratio of the variance of the panel-level effect to the variance of the idiosyncraticerror becomes too large. Linear dynamic panel-datamodels include p lags of the dependent variable oncovariates and contain unobserved panel-level effects, fixed or random. Arellano and Bover (1995)develop a framework for efficient instrumental variable estimators of random effects models withinformation in levels which can accommodate predetermined variables. Building on the work ofArellano and Bover (1995), Blundell and Bond (1998) proposed a system estimator that uses momentconditions inwhich lagged differences are used as instruments for the level equation in addition to themoment conditions of lagged levels as instruments for the differenced equation. This estimator isdesigned for datasets with many panels and few periods. The method assumes that there is noautocorrelation in the idiosyncratic errors and requires the initial condition that the panel-level effectsbe uncorrelated with the first difference of the first observation of the dependent variable.
Table 4 presents the correlation matrix for the variables used in the paper. The change in home biashas a statistically significant positive correlation with the correlation of returns of home and hostcountry, and statistically significant negative correlations with foreign listing, size, and the dividendtax credit variables. The correlation between dividend imputation rate and dividend imputationdummy is 0.925. The correlation between dividend tax credit1 and dividend tax credit2 is 0.932. Thesevariables with high correlation will not both appear in the same regression. With these exceptions thecorrelation matrix does not indicate serious correlation among the variables.
5. Empirical results
In regression results the focus will be on investment by investors inmature source countriesmakinginvestments in both mature and emerging foreign countries. Foreign investment by investors inmature countries constitutes 95% of foreign investment. Results from estimating versions of equation(18) by Arellano–Bover/Blundell–Bond linear dynamic panel-data method with lags(1) and AR(2) testsare reported for 2001–2007 in columns (1)–(3) and for 2001–2009 in columns (4)–(6) in Table 5. TheWald chi2 statistics is significant indicating that the parameters associated with these variables are notzero and inclusion of these variables in the regressions is appropriate. The Arellano–Bond test for serialcorrelation in the first differenced errors indicates that there is no autocorrelation of second order.14
In the regressions in Table 5, tax indicators and familiarity and diversification variables appear indifferent combinations in order to examine the robustness of results. The foreign listing variable isnegative and significant at 1 percent in all regressions. The reduction in information costs associatedwith foreign country’s firms conforming to the source country’s regulatory environment is animportant determinant of the source country’s equity bias towards foreign country. The result is inaccordance with Ahearne et al. (2004). Distance, correlation, size and transaction cost variables showmixed results. Common language variable is negative and significant at 1 percent, which implies thatinvestors prefer investing in common language countries. The findings are in accordancewith Grinblattand Keloharju’s (2001) findings that investors are more likely to hold, buy and sell stocks of firms thatcommunicate in the investors’ native language.
5.1. Dividend imputation and dividend tax credit
The dividend imputation dummy is positive and statistically significant at the 1% in Table 5. Thisimplies that home bias is greater for investors in a country with dividend imputation tax credit to
14 The moment conditions employed by the Arellano–Bover/Blundell method are valid only if there is no serial correlation inthe idiosyncratic error. The Arellano–Bond test is a test for no autocorrelation in linear dynamic panel models. The Arellano–Bond test examines for serial correlation in the first differenced errors. Because the first difference of independently andidentically distributed idiosyncratic errors will be auto-correlated, rejecting the null hypothesis of no serial correlation at orderone in the first differenced errors does not imply that the model is misspecified. Rejecting the null hypothesis at higher ordersimplies that the moment conditions are not valid. After the one-step estimator, the test can be computed only when robuststandard error has been specified. The robust standard error uses the robust or sandwich estimator of variance. This estimator isrobust to some types of misspecification so long as the observations are independent. In our regressions results, there is noautocorrelation of second order.

Table 4Correlation matrix.
DHBFF COR DIS TRAN LAN SIZE FL DIM DIM1 DTAXCR1 DTAXCR2 HTD CTAX
DHBFF 1COR 0.049**
(0.013)1
DIS 0.004(0.817)
�0.204***(0.000)
1
TRAN 0.002(0.918)
�0.300***(0.000)
0.131***(0.000)
1
LAN �0.013(0.503)
0.148***(0.000)
0.129***(0.000)
�0.001(0.920)
1
SIZE �0.040**(0.046)
0.153***(0.000)
0.087***(0.000)
�0.259***(0.000)
0.074***(0.000)
1
FL �0.066***(0.000)
�0.007(0.672)
�0.127***(0.000)
0.079***(0.000)
0.074***(0.000)
�0.078***(0.000)
1
DIM 0.017(0.379)
0.112***(0.000)
0.109***(0.000)
�0.024(0.142)
0.203***(0.000)
0.052***(0.001)
�0.070***(0.000)
1
DIM1 0.013(0.504)
0.110***(0.000)
0.137***(0.000)
�0.019(0.256)
0.171***(0.000)
0.046***(0.003)
�0.091(0.000)
0.925***(0.000)
1
DTAXCR1 �0.044**(0.027)
�0.006(0.742)
�0.036*(0.070)
�0.018(0.373)
�0.028(0.159)
�0.043**(0.033)
0.025(0.215)
�0.012(0.549)
�0.008(0.682)
1
DTAXCR2 �0.046**(0.020)
�0.016(0.404)
�0.028(0.153)
�0.000(0.966)
�0.026(0.190)
�0.040**(0.046)
0.022(0.274)
�0.015(0.454)
�0.013(0.491)
0.932***(0.000)
1
HTD 0.000(0.999)
0.026*(0.095)
0.046***(0.005)
0.078***(0.000)
0.022(0.161)
�0.045***(0.004)
�0.040**(0.015)
�0.099***(0.000)
�0.099***(0.000)
�0.007(0.720)
�0.014(0.488)
1
CTAX �0.028(0.157)
�0.034**(0.046)
0.012(0.485)
0.032*(0.072)
0.016(0.340)
�0.020(0.224)
0.005(0.757)
0.031*(0.070)
0.010(0.413)
�0.140***(0.000)
�0.120***(0.000)
�0.002(0.867)
1
Note: DHBFF: First difference of float adjusted measure of home bias. COR: Correlation is correlation of monthly returns betwe home country and foreign country. DIS: Distance logarithm ofdistance in kilometres between capital city of home country and capital city of foreign country. TRAN: Transaction cost is the are trading cost in the foreign country. LAN: Common languageis dummy which is equal to 1 if foreign and home countries share common language, otherwise it is zero. SIZE: Size is forei country’s market share of the world market capitalization. FL:Foreign listing is share of foreign country’s stock market that is listed on home country’s exchanges. DIM: Dividend imputati dummywhich is equal to 1 if there exists dividend imputationin home country or zero otherwise. DIM1: Dividend imputation rate in home country is the actual rate of corporate tax impu d to shareholders. DTAXCR1: Dividend tax credit1 is product offoreign dividend tax withheld rate (combined corporate income tax rate) and dividend yield if dividend foreign withhel x rate is less than or equal to (greater than) home country’scombined corporate income tax rate. DTAXCR2: Dividend tax credit2 ¼ Dividend tax credit1 if there is a double taxatio reaty between home and foreign country, and Dividend taxcredit2 ¼ 0 otherwise. HTD: High tax dummy is dummy ¼ 1 if foreign dividend withheld tax rate is greater than home co try’s combined corporate income tax rate. HTD ¼ 0 if foreigndividend withheld tax rate is less than or equal to home country’s combined corporate income tax rate. CTAX: Capital-ga tax withheld is the product of capital gains earned by homecountry’s investor in foreign country and capital gains tax withheld rate in foreign country. *,**,*** denote significance a 0%, 5% and 1% respectively.
A.V.M
ishra,R.A.Ratti
/Journal
ofInternational
Money
andFinance
32(2013)
169–193
185
enshgnonted tan tuninst 1

Table 5Float adjusted home bias regressions 2001–2007 and 2001–2009.
2001 to 2007 2001 to 2009
(1) (2) (3) (4) (5) (6)
Dividend imputation dummy 0.076***(0.001)
0.078***(0.002)
0.082***(0.001)
0.068***(0.002)
0.060***(0.007)
0.075***(0.001)
Dividend tax credit1 �0.083***(0.009)
�0.092***(0.002)
�0.093***(0.003)
�0.087**(0.018)
�0.102***(0.004)
�0.151***(0.000)
Capital gains tax withheld �0.000(0.209)
�0.000(0.280)
�0.000(0.529)
�0.000(0.476)
�0.000(0.809)
�0.000(0.396)
Correlation �0.140**(0.024)
�0.135**(0.028)
�0.043(0.527)
�0.081*(0.087)
�0.075(0.107)
�0.037(0.501)
Distance 0.014(0.627)
0.076***(0.002)
Foreign listing �0.477***(0.001)
�0.474***(0.001)
�0.533***(0.001)
�0.172***(0.002)
�0.206***(0.000)
�0.215***(0.000)
Size �0.156*(0.092)
�0.106(0.207)
�0.182**(0.048)
�0.124(0.138)
�0.066(0.379)
�0.127(0.135)
Common language �0.095***(0.003)
�0.082***(0.005)
Transaction Cost �0.000(0.277)
�0.000(0.727)
Constant 0.528***(0.000)
0.609***(0.000)
0.539***(0.000)
0.179*(0.054)
0.492***(0.000)
0.427***(0.000)
No. of observations 2408 2400 2235 3110 3100 2893Wald chi2 171.34*** 172.95*** 216.40*** 364.55*** 320.76*** 606.62***Arellano–Bond test m1 �8.3579***
(0.000)�8.118***(0.000)
�8.289***(0.000)
�8.849***(0.000)
�8.834***(0.000)
�8.895***(0.000)
Arellano–Bond test m2 0.244(0.884)
0.122(0.873)
�0.159(0.873)
�1.565(0.117)
�1.459(0.144)
�1.583(0.113)
Note: Float adjustedmeasure of home bias, is the dependent variable. Columns (1)–(3) indicate results for period 2001–2007 andcolumns (4) to (6) indicate results for period 2001–2009. Arellano–Bover/Blundell–Bond estimation with lags(1) and AR(2) tests.Arellano–Bond test for no autocorrelation. Lag value of the dependent variable is not reported. P-values in brackets. Dividendimputation dummy which is equal to 1 if there exists dividend imputation in home country or zero otherwise. Dividend taxcredit1 is product of foreign dividend tax withheld rate (combined corporate income tax rate) and dividend yield if dividendforeignwithheld tax rate is less than or equal to (greater than) home country’s combined corporate income tax rate. Dividend taxcredit2 ¼ Dividend tax credit1 if there is a double taxation treaty between home and foreign country, and Dividend tax cred-it2¼ 0 otherwise. Capital gains tax withheld is the product of capital gains earned by home country’s investor in foreign countryand capital gains tax withheld rate in foreign country. Correlation is correlation of monthly returns between home country andforeign country. Distance is logarithm of distance in kilometres between capital city of home country and capital city of foreigncountry. Foreign listing is share of foreign country’s stock market that is listed on home country’s exchanges. Size is foreigncountry’s market share of the world market capitalization. Common language is dummy which is equal to 1 if foreign and homecountry share common language, otherwise it is zero. Transaction cost is the share trading cost in the foreign country. *,**,***denote significance at 10%, 5% and 1% respectively.
A.V. Mishra, R.A. Ratti / Journal of International Money and Finance 32 (2013) 169–193186
investors. The parameter estimate varies between 0.060 (in column 5) and 0.082 (in column 3) indi-cating that a dividend imputation system raises home bias by between 6.0 and 8.2 percentage points.Dividend imputation at source acts to segment or separate the source country’s equity markets fromthose of the rest of the world (Booth, 1987).15
The dividend tax credit for dividend taxes paid per unit of currency invested, defined as TaxCredit1tij
is negative and statistically significant in all regressions. We also find that TaxCredit2tij variable isnegative and significant for 2001–2007 and for 2001–2009 in regression results (available fromauthors). The average coefficient for dividend tax credit is�0.101, implying that a 10 percent increase in
15 The statistical significance of results for the dividend imputation rate as a replacement for a dividend imputation dummyare also statistically significant at the 1% level with unchanged effects for the other variables. For this reason results will only bepresented for the dividend imputation dummy. Results are available from the authors for the dividend imputation rate in placeof the dividend imputation dummy.
A.V. Mishra, R.A. Ratti / Journal of International Money and Finance 32 (2013) 169–193 187
the dividend tax credit will reduce home bias on average by approximately 1.1 percent. The foreigncapital gains tax variable is statistically insignificant in all regressions. The key finding in Table 5 is thatdividend imputation in the home country and tax credits for dividends tax paid to foreign governmentsare significant determinants of home bias.
5.2. Relatively high tax rates
An interesting question concerns the influence of relatively high taxation. Dividend tax credits inthe cases of high taxation of dividend income for foreign investors are not adequate to recapture all thetaxes paid. To account for this factor we introduce a high tax dummy variable defined as follows:
HighTaxijt ¼ 1if sjd > sic
¼ 0if sjd � sic(19)
where sdi is the tax rate on foreign dividend income of investors and sci is the combined corporateincome tax rate in the investor’s home country. If the foreign tax rate is high relative to the domesticincome tax rate, dividend tax credit cannot offset all foreign taxes paid. Thus we expect the high taxdummy variable defined in equation (19) to be positively associated with home bias.
Results from the inclusion of HighTaxtij in regression equations for float adjusted home bias arereported in columns (1)–(3) of Table 6. The coefficients of the high tax dummy variable are positive andstatistically significant in all regression equations, implying that taxation of dividend income of foreigninvestors at relatively high rates reduces foreign investment.
5.3. Alternative world market portfolio
To determine whether the restriction on foreign investor holdings implied by free float home biasdrives the results on the effect of international taxation, traditional international portfolio home biaswill now replace free float home bias as dependent variable in the regression equations. Results fromestimating equation (18) with traditional international portfolio home bias as dependent variableappear in columns (4)–(6) of Table 6. The dividend imputation, tax credit, and high tax variables arestatistically significant in explaining traditional international portfolio home bias.
Comparison of the results in Table 6 suggests that while the absolute values of the estimatedcoefficients for the effects of dividend imputation and dividend tax credit are smaller for traditionalinternational portfolio home bias than for free float home bias they remain statistically significant. Theresults in columns (4)–(6) of Table 6 suggest that the earlier findings with regard to the effect ofinternational taxation on free float home bias hold with traditional international portfolio home bias asdependent variable.16
5.4. Taxation effects with governance control variables
Table 7 reports regression results when governance control variables are added to the regressions.This will serve as a robustness check onwhether the earlier findings of statistically significant influenceof dividend imputation dummy and dividend tax credit are robust to inclusion of these variables. Theresults in Table 7 indicate that dividend imputation dummy is positive and significant. This implies thathome bias is larger for domestic investors in a country with dividend imputation even in the presenceof governance variables. The dividend tax credit variable is negative and significant implying thatforeigners do not prefer holding stocks in foreign countries with high tax withheld. Foreign listingvariable is negative and highly significant in all regressions. Common language variable is negative andsignificant in all regressions.
16 In extensive other results available from the authors, it is shown the TaxCredit2tij is negative and statistically significant anddividend imputation rate is positive and statistically significant in explaining traditional international portfolio home bias.

Table 6Float adjusted and traditional international portfolio home bias regressions with high tax indicator.
Float adjusted home bias Traditional international portfolio home bias
(1) (2) (3) (4) (5) (6)
Dividendimputationdummy
0.078***(0.001)
0.070***(0.004)
0.088***(0.001)
0.051**(0.015)
0.050**(0.021)
0.071***(0.003)
Dividend taxcredit1
�0.093***(0.005)
�0.090***(0.003)
�0.106***(0.001)
�0.069**(0.049)
�0.078**(0.019)
�0.076**(0.033)
High taxdummy
0.118**(0.045)
0.063**(0.046)
0.171***(0.004)
0.104**(0.045)
0.099*(0.054)
0.149***(0.005)
Capital gainstax withheld
�0.000(0.462)
�0.000(0.509)
�0.000(0.154)
�0.000(0.333)
�0.000(0.497)
�0.000(0.508)
Correlation �0.055(0.396)
�0.047(0.445)
�0.052(0.467)
�0.069(0.229)
�0.068(0.234)
0.006(0.927)
Distance �0.002(0.928)
�0.005(0.851)
Foreign listing �0.505***(0.001)
�0.520***(0.000)
�0.540***(0.000)
�0.659***0.000)
�0.662***(0.000)
�0.559***(0.000)
Size �0.149(0.105)
�0.113(0.173)
�0.198**(0.037)
�0.106(0.117)
�0.062(0.295)
�0.170**(0.023)
Commonlanguage
�0.095***(0.003)
�0.084**(0.013)
Transactioncost
�0.000(0.109)
�0.001*(0.051)
Constant 0.532***(0.000)
0.567***(0.000)
0.558***(0.000)
0.540***(0.000)
0.543***(0.000)
0.502***(0.000)
No. ofobservations
2405 2397 2235 2788 2780 2590
Wald chi2 172.79*** 170.13*** 233.96*** 204.17*** 202.10*** 288.85***Arellano–Bond
test m1�8.517***(0.000)
�8.188***(0.000)
�8.394***(0.000)
�9.126***(0.000)
�8.943***(0.000)
�9.145***(0.000)
Arellano–Bondtest m2
0.303(0.761)
0.205(0.837)
0.075(0.939)
�1.033(0.301)
�1.041(0.297)
�0.991(0.321)
Note: Float adjusted measure of home bias (traditional international portfolio home bias) is dependent variable in columns (1)–(3) (columns (4)–(6)). Time period is from 2001 to 2007. Arellano–Bover/Blundell–Bond estimation with lags(1) and AR(2) tests.Arellano–Bond test for no autocorrelation. Lag value of the dependent variable is not reported. P-values in brackets. Dividendimputation dummy which is equal to 1 if there exists dividend imputation in home country or zero otherwise. High tax dummyis dummy¼ 1 if foreign dividend tax withheld rate is greater than home country’s combined corporate income tax rate and zerootherwise. Dividend tax credit1 is product of foreign dividend tax withheld rate (combined corporate income tax rate) anddividend yield if dividend foreign withheld tax rate is less than or equal to (greater than) home country’s combined corporateincome tax rate. Capital gains tax withheld is the product of capital gains earned by home country’s investor in foreign countryand capital gains tax withheld rate in foreign country. Correlation is correlation of monthly returns between home country andforeign country. Distance is logarithm of distance in kilometres between capital city of home country and capital city of foreigncountry. Foreign listing is share of foreign country’s stock market that is listed on home country’s exchanges. Size is foreigncountry’s market share of the world market capitalization. Common language is dummy which is equal to 1 if foreign and homecountries share a common language, otherwise it is zero. Transaction cost is the share trading cost in the foreign country. *,**,***denote significance at 10%, 5% and 1% respectively.
A.V. Mishra, R.A. Ratti / Journal of International Money and Finance 32 (2013) 169–193188
With regard to the inclusion of the new variables in Table 7 note that the governance variables enterthe regression equations as the difference between source country (the residence of the investor) valueand foreign country value. The disclosure index variable is negative but statistically insignificant. Thegovernance disclosure is negative and statistically significant which implies that other things equal,home bias is less for investors (usually institutional investors) from countries with more disclosure onthe governance firms. The auditor variable is negative and statistically significant implying that forforeign investment in a given country, source country investors have lower home bias if they are froma country with a larger percentage of firms audited by the Big 5 accounting firms. The anti-directorvariable is negative and significant implying that source country investors have lower home bias iftheir country protects their shareholder rights. The accounting standard and disclosure requirementvariables are insignificant. These results that countries with relatively better corporate governance

Table 7Float adjusted home bias regressions with governance variables (2001–2007).
(1) (2) (3) (4) (5) (6)
Dividendimputationdummy
0.081***(0.002)
0.086***(0.001)
0.088***(0.001)
0.085***(0.001)
0.076***(0.002)
0.080***(0.002)
Dividend taxcredit1
�0.090***(0.003)
�0.056*(0.062)
�0.064**(0.037)
�0.069**(0.032)
�0.088***(0.005)
�0.085**(0.006)
Correlation �0.017(0.789)
0.059(0.454)
�0.032(0.637)
0.050(0.496)
�0.019(0.777)
�0.021(0.759)
Foreignlisting
�0.556***(0.000)
�0.526***(0.000)
�0.521***(0.001)
�0.521***(0.001)
�0.727***(0.000)
�0.562***(0.001)
Size �0.146*(0.078)
�0.032(0.723)
�0.176**(0.044)
�0.186**(0.038)
�0.137(0.120)
�0.115(0.229)
Commonlanguage
�0.095**(0.011)
�0.099***(0.008)
�0.093***(0.009)
�0.098**(0.010)
�0.092**(0.024)
�0.088**(0.020)
Disclosureintensity
�0.002(0.210)
Governancedisclosure
�0.005**(0.011)
Auditor �0.040**(0.025)
Anti-director �0.016**(0.045)
Accountingstandard
�0.000(0.854)
Disclosurerequirement
0.006(0.904)
Constant 0.552***(0.000)
0.519***(0.000)
0.527***(0.000)
0.503***(0.000)
0.568***(0.000)
0.534***(0.000)
No. ofobservations
2156 2156 2104 2194 2154 2194
Wald chi2 156.88*** 160.26*** 164.88*** 163.35*** 144.54*** 157.45***Arellano–Bond
test m1�7.763***(0.000)
�7.576***(0.000)
�7.910***(0.000)
�7.794***(0.000)
�7.422***(0.000)
�7.856***(0.000)
Arellano–Bondtest m2
0.134(0.893)
0.006(0.994)
0.007(0.994)
0.083(0.933)
0.033(0.973)
0.126(0.899)
Note: Float adjusted measure of home bias, is the dependent variable. Time period is from 2001 to 2007. Arellano–Bover/Blundell–Bond Estimation with lags(1) and AR(2) tests. Arellano–Bond test for no autocorrelation. Lag value of the dependentvariable is not reported. P-values in brackets. Refer Appendix Table A.1 for definition of dividend imputation dummy, dividendtax credit1, correlation, foreign listing, size and common language. Disclosure intensity is index created by examining and ratingcompanies’ 1995 annual reports as per Bushman et al. (2004). Governance disclosure index measures the prevalence of specificdisclosures related to governance of the firm. Auditor indicates the percentage of firms in the country audited by the Big 5accounting firms. Anti-director is shareholder protection index. Accounting standard is index created by La Porta et al. (1998).Disclosure requirements is the index of disclosure created by La Porta et al. (2006). *,**,*** denote significance at 10%, 5% and 1%respectively.
A.V. Mishra, R.A. Ratti / Journal of International Money and Finance 32 (2013) 169–193 189
exhibit less home bias are similar to those obtained by Beakert and Wang (2009), who observe thatquality of institutions seems to have the incorrect sign.
We also conducted regression tests to check robustness of results upon including governancevariables with dividend imputation rates and found that home bias is larger for domestic investors ina country with dividend imputation and for investments in countries with dividend tax withheld forforeign investors.
5.5. Change in tax rate on holdings in the foreign asset
It is also interesting to examine the effect of a change in the tax rate on the holdings in the foreignasset. The model set up suggests that a change in taxation will affect home bias. The first difference ofdividend tax credit, defined as either DTaxCredit1tij or DTaxCredit2tij as replacement for dividend taxcredit, is negative and statistically significant in regressions equations for home bias (results available

A.V. Mishra, R.A. Ratti / Journal of International Money and Finance 32 (2013) 169–193190
from authors). This provides additional support for the finding that international taxation influencesholdings of foreign securities.
6. Conclusion
In this paper we investigate empirically the roles of cross border taxation for equity home bias ininternational equity flows. In practice taxes on dividends and taxes on realized capital gains are leviedon foreign investors inmany countries. In addition, some countries provide imputation of taxes paid ondividend income by domestic corporations. These factors have the potential to influence the extent offoreign relative to domestic investment.
The strategy in this paper is to build on the findings in the literature on home bias by recognizingand controlling for information asymmetries, behavioural issues, and corporate governance whenexamining the role of cross border taxation. To this end we focus on the relationship between crossborder tax variables and free float home bias. Variables that control for information asymmetry,behavioural and additional governance and transparency factors are introduced into regressionequations along with cross border tax variables.
A tax credit variable for foreign taxes paid is constructed and found to be statistically significant inreducing float adjusted home bias and traditional international portfolio home bias. A relatively highforeign tax rate that cannot be offset by tax credits is found to significantly increase home bias. Taxationof dividend income accruing to foreign investors at relatively excessive rates tends to discourageforeign equity flows. Dividend imputation is a statistically significant impediment to cross borderequity flows. The tax credit under dividend imputation tends to segment international equity marketsfrom the domestic equity market. Investment that would have gone to foreign markets is attracted todomestic markets instead, thereby increasing the extent of home bias.
Cross border tax issues have anumberof implications forfirmbehaviour not considered in this paper.Companies have a number of schemes to cater for different investor clienteles. Some companies seek toprovide tax effective distributions to their foreign shareholders by paying dividends directly from theirforeign branches. Other companies give investors the option of taking their dividend in the form of tax-free bonus shares issued out of share premium reserves. These bonus shares are not taxable, but carry nofranking credits, and hence are targeted at investors who cannot use imputation credits.
Appendix
Table A.1
Data sources of variables.Variables Description and data sources
Home bias Float adjusted measure of home bias.Source: Coordinated Portfolio Investment (CPIS); DataStream.
Dividend imputationdummy
Dummy which is equal to 1 if there exists a dividend imputation at home country.Source: OECD tax database; Price Waterhouse, 2001–2010.
Dividend imputationrate
Dividend imputation rate in home country denotes the actual rate of corporate tax imputed toshareholders.Source: OECD tax database; Price Waterhouse, 2001–2010.
Dividend tax credit1 Dividend tax credit1 is product of foreign dividend tax withheld rate and dividend yield if foreigndividend tax withheld rate is less than or equal to home country’s combined corporate income taxrate. It is the product of home country’s combined corporate income tax rate and foreign dividendyield if foreign dividend tax withheld rate is greater than home country’s combined corporateincome tax.Source: Price Waterhouse, 2001–2010.
Dividend tax credit2 Dividend tax credit2 ¼ Dividend tax credit1 if there is a double taxation treaty between home andforeign country, and Dividend tax credit2 ¼ 0 otherwise.Source: Price Waterhouse, 2001–2010.
Dividend tax withheld Dividend tax rate withheld in foreign country is the dividend tax rate withheld in foreign country onhome country investor’s dividends generated in foreign country.Source: Price Waterhouse, 2001–2010.

Table A.1 (continued )
Variables Description and data sources
Capital gains taxwithheld
Capital gains tax withheld is the product of capital gains earned by home country’s investor inforeign country and capital gains tax withheld rate in foreign country.Source: Price Waterhouse, 2001–2010.
Corporate income tax Corporate income tax is the combined (central and sub-central) marginal statutory corporateincome tax rate on distributed profits, inclusive of surtax (if any).Source: OECD, Tax Rate Worldwide.
Foreign equity Foreign equity is foreign equity holdings of a country relative to country’s total holdings of domesticand foreign equity.Source: Author’s own calculations.
Domestic worldmarket share
Domestic world market share is share of country’s float market capitalisation in world float marketcapitalisation.Source: Author’s own calculations.
Transaction cost Foreign country’s transaction cost.Source: Elkins–McSherry Co. (www.elkins-mcsherry.com).
Language Dummy which is equal to 1 if home and foreign country have the same language, and zerootherwise.Source: CIA – The World Factbook.
Correlation Correlation is correlation of returns of home and host country over the years 1995–2009.Source: MSCI market indices.
Distance Logarithm of distance in kilometres between capital city of home country and capital city of foreigncountry.Source: http://www.timeanddate.com/worldclock/distance.html.
Foreign listing Share of a foreign country’s stock market that is listed on home country’s stock exchanges (eitherdirectly or has issued public debt in the home country).Source: Coordinated Portfolio Investment (CPIS).
Size Foreign country’s market share of the world market capitalization.Source: Market capitalization data is from Standard & Poors Stock Market Factbook (2010).
Disclosure intensity Index created by examining and rating companies’ 1995 annual reports on their inclusion oromission of 90 items which fall into seven categories.Source: Bushman et al. (2004). (The original source is International Accounting and Auditing Trends,Centre for Financial Analysis and Research).
Governance disclosure Index measures the prevalence of specific disclosures related to governance of the firm.Source: Bushman et al. (2004).
Auditor Indicates the percentage of firms in the country audited by the Big 5 accounting firms.Source: Bushman et al. (2004).
Anti-director Shareholder protection index ranging from 0 to 6.Source: La Porta et al. (1998).
Accounting standard Index created by examining and rating companies’ 1990 annual reports on their inclusion oromission of 90 items which fall into seven categories.Source: La Porta et al. (1998).
Disclosurerequirement
Index of disclosure.Source: La Porta et al. (2006).
A.V. Mishra, R.A. Ratti / Journal of International Money and Finance 32 (2013) 169–193 191
References
Ahearne, A.G., Griever, W.L., Warnock, F.E., 2004. Information costs and home bias: an analysis of US holdings of foreignequities. Journal of International Economics 62, 313–336.
Anderson, T.W., Hsiao, C., 1982. Formulation and estimation of dynamic models using panel data. Journal of Econometrics 18,47–82.
Arellano, M., Bond, S., 1991. Some tests of specification for panel data: Monte Carlo evidence and an application to employmentequations. Review of Economic Studies 58, 277–297.
Arellano, M., Bover, O., 1995. Another look at the instrumental variable estimation of error-components models. Journal ofEconometrics 68, 29–51.
Aviat, A., Coeurdacier, N., 2007. The geography of trade in goods and asset holdings. Journal of International Economics 71,22–51.
Baele, L., Pungulescu, C., Horst, J.T., 2007. Model uncertainty, financial market integration and the home bias puzzle. Journal ofInternational Money and Finance 26, 606–630.
Baldwin, R.E., Krugman, P.R., 2000. Agglomeration, Integration and Tax Harmonization. CEPR Discussion Paper No. 2630.Available at SSRN: http://ssrn.com/abstract¼258062.
Beakert, G., Wang, X., 2009. Home Bias Revisited. Available at SSRN: http://ssrn.com/abstract¼1344880.Black, F., 1974. International capital market equilibrium with investment barriers. Journal of Financial Economics 1, 337–352.

A.V. Mishra, R.A. Ratti / Journal of International Money and Finance 32 (2013) 169–193192
Blundell, R., Bond, S., 1998. Initial conditions and moment restrictions in dynamic panel-data models. Journal of Econometrics87, 115–143.
Booth, L., 1987. The dividend tax credit and Canadian ownership objectives. Canadian Journal of Economics 2, 321–339.Bushman, R.M., Piotroski, J.D., Smith, A.J., 2004. What determines corporate transparency? Journal of Accounting Research 42,
207–252.Cannavan, D., Finn, F., Gray, S., 2004. The value of dividend imputation tax credits in Australia. Journal of Financial Economics 73,
167–197.Chan, K., Covrig, V., Ng, L., June 2005. What determines the domestic bias and foreign bias? Evidence from mutual fund equity
allocations world wide. Journal of Finance LX (3), 1495–1534.Christoffersen, S.E.K., Geczy, C.C., Musto, D.K., Reed, A.V., 2005. Crossborder dividend taxation and the preferences of taxable
and non-taxable investors: evidence from Canada. Journal of Financial Economics 78, 121–144.Clark, E., Kassimatis, K., 2011. An alternative measure of the “world market portfolio”: determinants, efficiency, and information
content. Journal of International Money and Finance 30, 724–748.Cooper, I., Kaplanis, E., 1986. Costs to crossborder investment and international equity market equilibrium. In: Edwards, J.,
Franks, J., Mayer, C., Schaefer, S. (Eds.), Recent Developments in Corporate Finance. Cambridge University Press, Cambridge.Cooper, I., Kaplanis, E., 1994. What explains the home bias in portfolio investment? Review of Financial Studies 7, 45–60.Cooper, I., Kaplanis, E., 2000. Partially segmented international capital markets and international capital budgeting. Journal of
International Money and Finance 19, 309–329.Cooper, I.A., Lessard, D.R., 1981. International capital market equilibrium with deadweight costs to foreign investment.
Unpublished paper.Coval, J., Moskowitz, T., 1999. Home bias at home: local equity preference in domestic portfolios. Journal of Finance 54, 2045–
2073.Coval, J., Moskowitz, T., 2001. The geography of investment: informed trading and asset prices. Journal of Political Economy 109,
811–841.Dahlquist, M., Pinkowitz, L., Stulz, R., Williamson, R., 2003. Corporate governance and home bias. Journal of Financial and
Quantitative Analysis 38 (1), 135–157.Demirguc-Kunt, A., Huizinga, H., 1995. Barriers to portfolio investments in emerging stock markets. Journal of Development
Economics 47, 355–374.Desai, M.A., Dharmapala, D., 2009. Taxes, institutions and foreign diversification opportunities. Journal of Public Economics 93,
703–714.Devereux, M.P., 2008. Taxation of outbound direct investment: economic principles and tax policy considerations. Oxford
Review of Economic Policy 24 (4), 698–719.Egger, P., Eggert, W., Keuschnigg, C., Winner, H., 2010. Corporate taxation, debt financing and foreign-plant ownership. European
Economic Review 54, 96–107.Errunza, V., Losq, E., 1985. International asset pricing under mild segmentation: theory and test. Journal of Finance 40, 105–124.Errunza, V., Losq, E., 1989. Capital flow controls, international asset pricing, and investors’ welfare: a multi-country framework.
Journal of Finance 24 (4), 1025–1037.Ferreira, M., Matos, P., 2008. The colors of investors’ money: the role of institutional investors around the world. Journal of
Financial Economics 88, 499–533.Feuerherdt, C., Gray, S., Hall, J., 2010. The value of imputation tax credits on Australian hybrid securities. International Review of
Finance 10 (3), 365–401.French, K., Poterba, J., 1991. Investor diversification and international equity markets. American Economic Review, Papers and
Proceedings, 222–226.Giannetti, M., Simonov, A., 2006. Which investors fear expropriation? Evidence from investors’ portfolio choices. Journal of
Finance 61 (3), 1507–1547.Gordon, R.H., Bovenberg, A.L., 1986. Why is capital so immobile internationally? Possible explanations and implications for
capital income taxation. The American Economic Review 86 (5), 1057–1075.Gordon, R.H., Varian, H.R., 1989. Taxation of asset income in the presence of a world securities market. Journal of International
Economics 26, 205–226.Grinblatt, M., Keloharju, M., 2001. How distance, language and culture influence stockholdings and trades. Journal of Finance 56,
1053–1073.Holtz-Eakin, D., Newey, W., Rosen, H.S., 1988. Estimating vector autoregressions with panel data. Econometrica 56, 1371–1395.Huberman, G., 2001. Familiarity breeds investment. Review of Financial Studies 14 (3), 659–680.Huizinga, H., Nielsen, S.B., 1997. Capital income and profit taxation with foreign ownership of firms. Journal of International
Economics 42, 149–165.Huizinga, H., Laeven, L., Nicodeme, G., 2008. Capital structure and international debt shifting. Journal of Financial Economics 88,
80–118.Karolyi, G.A., Stulz, R.M., 2003. Are financial assets priced locally or globally? In: Constantinidies, G.M., Harris, M., Stulz, R. (Eds.),
The Handbook of the Economic Finance, pp. 975–1020 North Holland, New York.Kho, B.C., Stulz, R.M., Warnock, F.E., 2009. Financial globalization, governance and the evolution of the home bias. Journal of
Accounting Research 47 (2), 597–635.La Porta, R., Lopez-de-Silanes, F., Shleifer, A., Vishney, R., 1998. Law and finance. Journal of Political Economy 106 (6), 1113–1155.La Porta, R., Lopez-de-Silanes, F., Sheifer, A., 1999. Corporate ownership around the world. Journal of Finance 54, 471–517.La Porta, R., Lopez-de-Silanes, F., Sheifer, A., 2006. What works in securities laws? Journal of Finance 61 (1), 1–32.Leuz, C., Lins, K.V., Warnock, F.E., 2009. Do foreigners invest less in poorly governed firms? Review of Financial Studies 28 (6),
3245–3285.Lewis, K., 1999. Trying to explain home bias in equities and consumption. Journal of Economics Literature 37 (2), 571–608.Lintner, J., 1965. The valuation of risky assets and the selection of risky investment in stock portfolio and capital budgets. Review
of Economics and Statistics 47, 103–124.

A.V. Mishra, R.A. Ratti / Journal of International Money and Finance 32 (2013) 169–193 193
McGrattan, E.R., Prescott, E.C., 2005. Taxes, regulations, and the value of U.S. and U.K. corporations. Review of Economic Studies72, 767–796.
Miller, M.H., Sholes, M.S., 1978. Dividends and taxes. Journal of Financial Economics 6, 333–364.Miller, G.S., 2009. Discussion of financial globalization, governance, and the evolution of home bias. Journal of Accounting
Research 47 (2), 637–646.Mishra, A.V., 2011. Australia’s equity home bias and real exchange rate volatility. Review of Quantitative Finance and Accounting
37, 223–244.Moor, L.D., Sercu, P., Vanpee, R., 2010. The plausibility of risk estimates and implied costs to international equity investments.
Journal of Empirical Finance 17, 623–644.Papaioannou, E., 2009. What drives international financial flows: politics, institutions and other determinants. Journal of
Development Economics 88, 269–281.Portes, R., Rey, H., 2005. The determinants of cross border equity flows. Journal of International Economics 65 (2), 269–296.Portes, R., Rey, H., Oh, Y., 2001. Information and capital flows: the determinants of transactions in financial assets. European
Economic Review 45 (4–6), 783–796.Razin, A., Sadka, E., Yuen, C.W., 1997. Quantitative Implications of the Home Bias: Foreign Underinvestment, Domestic Over-
saving, and Corrective Taxation. NBER Working Paper 6339.Sarkissian, S., Schill, M.J., 2004. The overseas listing decision: new evidence of proximity preference. The Review of Financial
Studies 17 (3), 769–809.Sercu, P., Vanpee, R., 2007. Home Bias in International Equity Portfolios: A Review. Available at SSRN: http://ssrn.com/
abstract¼1025806.Sercu, P., Vanpee, R., 2008. Estimating the costs of international equity investments. Review of Finance 12, 587–634.Sharpe, W., 1964. Capital asset prices: a theory of market equilibrium under the condition of risk. Journal of Finance 19, 425–
442.Stulz, R., 1981. On the effects of barriers to international investment. Journal of Finance 36, 923–934.Stulz, R., 2005. The limits of financial globalization. Journal of Finance 60, 1595–1638.