Impact of startup scheme on Francis runner life expectancy
9
Impact of startup scheme on Francis runner life expectancy This article has been downloaded from IOPscience. Please scroll down to see the full text article. 2010 IOP Conf. Ser.: Earth Environ. Sci. 12 012107 (http://iopscience.iop.org/1755-1315/12/1/012107) Download details: IP Address: 142.137.213.170 The article was downloaded on 03/04/2011 at 18:58 Please note that terms and conditions apply. View the table of contents for this issue, or go to the journal homepage for more Home Search Collections Journals About Contact us My IOPscience
-
Upload
hydroquebec -
Category
Documents
-
view
2 -
download
0
Transcript of Impact of startup scheme on Francis runner life expectancy

Impact of startup scheme on Francis runner life expectancy
This article has been downloaded from IOPscience. Please scroll down to see the full text article.
2010 IOP Conf. Ser.: Earth Environ. Sci. 12 012107
(http://iopscience.iop.org/1755-1315/12/1/012107)
Download details:
IP Address: 142.137.213.170
The article was downloaded on 03/04/2011 at 18:58
Please note that terms and conditions apply.
View the table of contents for this issue, or go to the journal homepage for more
Home Search Collections Journals About Contact us My IOPscience

Impact of startup scheme on Francis runner life expectancy
M Gagnon1, S A Tahan1, P Bocher1 and D Thibault2 1Department of Mechanical Engineering, École de technologie supérieure (ÉTS) 1100, rue Notre-Dame Ouest, Montréal, Canada 2Institut de recherche d’Hydro-Québec (IREQ), 1800, boul. Lionel-Boulet, Varennes, J3X 1S1, Canada
E-mail: [email protected]
Abstract. Francis runners are subject to complex dynamic forces which might lead to eventual blade cracking and the need for corrective measure. Damage due to cracks in runner blades are usually not a safety issues but might generate unexpected down time and high repair cost. Avoiding the main damaging operating conditions is often the only option left to plant operators to maximize the life expectancy of their runner. The startup scheme is one of the available parameter which is controlled by the end user and could be used to minimize the damage induced to the runner. In this study, two startup schemes have been used to investigate life expectancy of Francis runner using in situ measurements. The results obtained show that the induced damage during the startup event could be significantly reduced with change to the startup scheme. In our opinion, an optimization of the startup scheme with regard to fatigue damage could extend significantly the life expectancy and the reliability of Francis runner.
1. Introduction A typical Francis runner will spend the majority of its life growing cracks emanating from small defects to a
critical length above which repair need to be done. Because Francis runner rarely exhibit catastrophic failure, the decision to repair or replace the runner is usually a function of cost and time delays rather than safety issues. For plant operator, improved life expectancy means longer time between repair leading to less down time and minimal repair cost. The objective of this study is to investigate the influence of the startup schemes on the life expectancy of Francis runners.
During a Francis runner life, some operating conditions or events induce more damage than others. In a previous study, the runner startup has been identified has one of the most damaging operating conditions [1]. During normal operation, those damaging conditions cannot be completely avoided in which case the expected life will be primarily a function of how many damaging events the runner can sustain. In the design phase, fatigue analysis are often conducted using time to failure approaches which uses S-N curves combined with the Miner’s damage accumulation rule [2,3]. The use of time to failure approaches makes it difficult to define inspection intervals or time to repair because the model has only two states: undamaged or damaged. The availability of information on the extent of the damage is often essential for decision maker to plan corrective actions. In fact, a damage tolerance approach is often more appropriate for the assessment of existing structure. A damage tolerance approach based on fracture mechanics uses the frequency and amplitude of damaging events to evaluate the rate at which a crack will grow. Thus, the remaining life can be estimated as the time to reach a critical crack length above which repairs are needed. Because crack growth model are more complex to use than the typical time to failure approach, damage tolerance is often only reserved to critical structural details. Nevertheless, those two approaches are not completely opposed and can be linked together to maximize the available information [4].
In this study, fracture mechanics will be used to investigate the damage generated during the runner startup. The focus will be on startup because this is a main damaging event that cannot be avoided during normal operation. Furthermore, the scheme used to bring the runner up to speed is defined by the plant operator. The startup scheme is generally adjusted during the runner commissioning and usually not changed afterward. In our opinion, change could be made to optimize the startup scheme in order to significantly reduce the damage
25th IAHR Symposium on Hydraulic Machinery and Systems IOP PublishingIOP Conf. Series: Earth and Environmental Science 12 (2010) 012107 doi:10.1088/1755-1315/12/1/012107
c© 2010 IOP Publishing Ltd 1

induced to the runner blades. Based on these premises, the startup scheme impact on crack propagation in a Francis runner blade will be investigated using strain measurement. Response spectra for two different startup schemes will be derived from in situ measurement made by IREQ (Hydro-Québec research institute). From these response spectra, the rate at which a runner blade crack grows will be analyzed. A simplified operating sequence from startup to complete stop will be used for crack growth calculation in order to maintain the relative importance of the startup with respect to other damaging events. It should be noted that, for the purpose of this analysis only change to the startup scheme will be investigated and the rest of the sequence will remain the same.
The paper will be divided in three sections. First, the concept of damage tolerance and the methodology used to relate measurement to life expectancy will be presented. Then, the strain measurement from the critical location on the runner blade for each startup schemes will be shown. Next, the applicability and limitations of the presented crack growth results will be discussed.
2. Life expectancy Life expectancy in this study will be defined as the necessary time for a defect to become unacceptable and
necessitate corrective measure. A Francis runner, due to its size, can sustain an extensive amount of damage without any safety issues. For plant operator, this means that the critical crack length is more related to repair cost than safety. As the critical length might change from a turbine to another, no assumption will be made on the actual critical crack length. Rather, a comparison of crack length as a function of the number of loading blocks will be presented.
The crack growth calculation will be done in accordance with the fracture mechanic approach presented in the British Standard BS7910:2005 [5]. For the analysis, a two stage crack growth curve was chosen. The crack growth curve is presented in Fig. 1 and the curve parameters are presented in Table 1. It should be noted that the crack growth curve parameters were chosen according to the British Standard BS7910:2005 and are more severe than previously published experimental data for this runner material (ASTM-A743 CA-6NM) in water [6].
Fig. 1 Crack growth curve
Table 1 Crack growth curve parameter
thKΔ Stage 1 Transition point Stage 2
)(2/3 mMPammN C m )(2/3 mMPammN C m
63 (2) 2.1e-17 5.10 144 (4.6) 1.29e-12 2.88 Linear elastic fracture mechanics theory (LEFM) will be used to estimate the crack propagation. For each
crack growth increment, the crack growth rate and stress intensity factor will be calculated with the following equations:
mKCdNda
Δ= for thKK Δ>Δ (1)
25th IAHR Symposium on Hydraulic Machinery and Systems IOP PublishingIOP Conf. Series: Earth and Environmental Science 12 (2010) 012107 doi:10.1088/1755-1315/12/1/012107
2

aYK ⋅Δ=Δ πσ )( (2)
The assumptions made to define the parameters in our crack growth model are: • Flaw type : Corner flaw in plate (BS7910:2005 M3.6) • Initial flaw dimension : 3mm x 3mm • Plate thickness : 57 mm • Plate length : Infinite • Measured strain converted to stress following Hooke’s law • Measurement used as primary membrane stress • Full range stress are applied • Secondary stress are neglected • Stress ratio effects are neglected • Retardation effects are neglected
For this particular Francis runner, the flaw type is representative of an expected crack shape. On the other
hand, the initial flaw dimensions have been arbitrarily defined and are not based on an expected initial flaw shape. Also, the membrane stress assumption will become dubious as the crack grows due to the stress profile in the runner blade. One should expect slower crack growth rate as stress amplitudes are expected to drop with crack growth which might even lead to potential crack arrest. It should be noted that the crack length will be updated after each stress cycles block and each block will be composed of the stress cycles extracted from a simplified operating sequence going from startup to complete stop.
3. Experimental data In situ measurements made by IREQ in summer 2002 at the Beauharnois hydroelectric plant have been used
to obtain the response spectrum of two startup schemes. The Beauharnois facility is a low head run-of-the-river power plant located in Quebec Canada. During these in situ measurements, one of the plant Francis runners was instrumented with strain gauges at critical locations. Only the location where maximum stress is expected will be used for this study. The chosen location is presented in Fig. 2.
Fig. 2 Strain gauge location; (left) Drawing; (right) Picture
From the available data, two startup schemes have been identified. Their selection was based upon the
availability of at least two recorded occurrence of each startup schemes. A total of four dataset was identified. The guide vane opening and rotating speed for each occurrence are presented in Fig. 3. Notice, that almost no significant difference is observed between similar schemes. Furthermore, the response time required to attain synchronous speed is almost identical in both scheme. The recorded strains for each dataset are presented in Fig. 4 and Fig. 5. We observe some variations in response pattern between similar schemes but the overall responses remain the same.
25th IAHR Symposium on Hydraulic Machinery and Systems IOP PublishingIOP Conf. Series: Earth and Environmental Science 12 (2010) 012107 doi:10.1088/1755-1315/12/1/012107
3
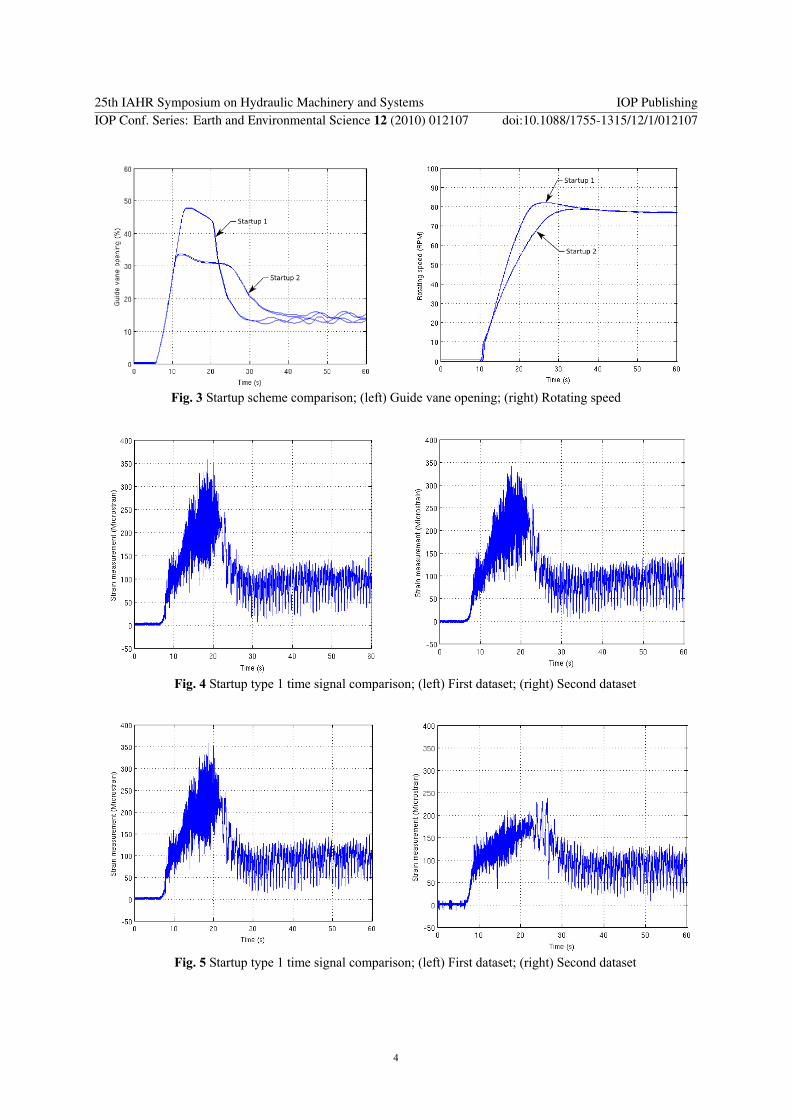
Fig. 3 Startup scheme comparison; (left) Guide vane opening; (right) Rotating speed
Fig. 4 Startup type 1 time signal comparison; (left) First dataset; (right) Second dataset
Fig. 5 Startup type 1 time signal comparison; (left) First dataset; (right) Second dataset
25th IAHR Symposium on Hydraulic Machinery and Systems IOP PublishingIOP Conf. Series: Earth and Environmental Science 12 (2010) 012107 doi:10.1088/1755-1315/12/1/012107
4

The loading block will be composed of three independent recordings, which have been assembled to obtain a simplified operating sequence going from startup to complete stop. The simplified operating sequence is composed of a startup that ends at the spin no load (SNL) condition, a section going from SNL to maximum guide vane opening and a section going from maximum guide vane opening to complete stop. An example of the resulting time signal for each startup scheme is presented in Fig. 6. Notice that our simplified operating sequence contain very limited amount of time in steady state regime (SNL and maximum opening). This simplification will neglect the onset of steady state regime damage and might not be conservative at longer crack length.
Fig. 6 Time signal comparison; (left) Startup type 1; (right) Startup type 2
The stress cycles haves been extracted for each dataset using the rainflow cycle-counting method [7]. The rainflow results are presented Fig. 7 and Fig. 8. Notice that many intermediate stress cycles are found in type 1 startups and absent in the type 2 startups (see circles in the right graphs on figure 7 and 8). Less intermediate stress cycles and lower startup overall amplitude should reduce the crack growth for the type 2 startup.
Fig. 7 Rainflows for each type 1 startup; (left) First dataset; (right) Second dataset
25th IAHR Symposium on Hydraulic Machinery and Systems IOP PublishingIOP Conf. Series: Earth and Environmental Science 12 (2010) 012107 doi:10.1088/1755-1315/12/1/012107
5

Fig. 8 Rainflows for each type 2 startup; (left) First dataset; (right) Second dataset
4. Results and discussion The crack growth results for each dataset are presented in Fig. 9. As expected from the stress cycles extracted
with the rainflow cycle counting, significantly lower crack growth are observed with the type 2 startup. Only small variations are observed between similar schemes. Those are negligible compared with the difference between the startup schemes. Nonetheless, these variations cannot be completely discarded as they increase with time and might be influenced by the assumption made for calculation.
Furthermore, below the onset of steady state regime damage, the life expectancy can be calculated from only the number of runner startup and operating time can be neglected as the damage from the steady state regimes (SNL, maximum guide vane opening, etc.) is considered negligible. However, because of the high number of cycles generated in the steady state regime, as soon as those cycles cross the crack growth threshold significant damage to the runner blade is expected even if cycles amplitudes are small. We noticed in our study that the extreme cycle from the steady state regimes begin to cross the crack growth threshold at a crack length of approximately 4mm and all the damaging cycles are above threshold at a crack length of 10mm.
Even if the study of the damage from the steady state regimes was not part of this study, we still have included in our simplified operating sequence a limited amount of time at steady state. This gives a good idea of the life expectancy below the onset of steady state damage while having a simple but realistic sequence. However, to predict the life expectancy above the onset of steady state damage, the expected amount time at each steady state regime should be included in the analysis.
Fig. 9 Comparison of crack propagation results between startup type 1 and type 2 datasets
25th IAHR Symposium on Hydraulic Machinery and Systems IOP PublishingIOP Conf. Series: Earth and Environmental Science 12 (2010) 012107 doi:10.1088/1755-1315/12/1/012107
6

The relative damage as a function of the number of stress cycle block is presented in Fig. 10. In this figure, all values are presented as the ratio between the crack length and the maximum crack length at each stress cycle block. As seen in the Fig. 9, the difference between the two different startup scheme increase significantly with time. The type 2 startup has generated about half the amount of damage by the time the worst type 1 startup has a crack length of 10mm. With the type 2 startup, the runner will spend more time below the onset of steady state damage hence lengthens the time before the detrimental effect of the steady state regime must be accounted for.
Fig. 10 Relative damage comparison between startup type 1 and type 2 datasets
The results presented in this paper show that the startup scheme has a significant impact on life expectancy of
Francis runner. However, these results cannot be used as a life prediction tool because of the many assumptions and simplifications made during this study. Furthermore, startup scheme should be evaluated as only two startup schemes have been evaluated here. From those data, a proper process optimization could be carried with probably a much longer life expectancy.
5. Conclusions As mentioned previously, Francis runner startup schemes are defined by the hydroelectric plant owner but are
usually not optimized for life expectancy. This study has shown that the optimization of the startup sequence could have a significant impact on life expectancy. Notice that only two different startup schemes have been evaluated in this study and startup with even lower damage should be expected if more measurement were available. However, due to the many simplifications made and the absence of sensitivity analysis, it is difficult to predict the exact lifetime of the Francis runner. In order to obtain more realistic predictions of life expectancy, the presented analysis could be improved by the use of real operating sequences and a more thorough set of assumptions. In our opinion, the results presented in this study should justify a more complete analysis with more in situ measurements. It is important to note that before the onset of steady state regimes damage only two damaging events which have an impact on the life of the runner are observed:
• The overall amplitude of the start to stop sequence, • The larger amplitudes of the startup event.
However, we do not expect every Francis runners to have the same behavior. Startup schemes should be analyzed on a case by case basis. Currently, there are only a few Francis turbines for which strain measurements are available. In the future, more field measurements will be required to develop a better understanding of the relationship between the guide vanes opening rate, the hydraulic force generated and the strain during runner startup.
Acknowledgments The author would like to thank IREQ (Hydro-Québec research institute), the National Sciences and
Engineering Research Council of Canadian (NSERC) and the École de technologie supérieure (ÉTS) for their support and financial contribution.
25th IAHR Symposium on Hydraulic Machinery and Systems IOP PublishingIOP Conf. Series: Earth and Environmental Science 12 (2010) 012107 doi:10.1088/1755-1315/12/1/012107
7

Nomenclature a Flaw length [ mm ] Y Stress intensity correction factor m Exponent in crack growth law ΔK Stress intensity factor range [N/mm3/2] C Constant in fatigue crack growth relationship ΔKth Stress intensity factor range[N/mm3/2] N Fatigue life, in number of load cycles Δσ Applied stress range [MPa]
References [1] Coutu A, Gagnon M and Monette C 2007 Life Assessment of Francis Runners Using Strain Gage Site
Measurements Waterpower XV (Chattanooga, Tennessee, USA) [2] Marcouiller L, Leduc J and Thibault D 2004 Extending Service Life of Turbine Runners at Hydro-Québec
HydroVision Int. Conf. (Montreal, Canada) [3] Leduc J, Marcouiller L and Thibault D 2004 Improving the efficiency of a 200 MW Francis turbine, Part 2:
Structural analysis 22 IAHR Symp. on Hydraulic Machinery and Systems (Stockholm, Sweden) [4] Chryssanthopoulos M and Righiniotis T 2006 “Fatigue reliability of welded steel structures” J.l of
Constructional Steel Research 62 1199-1209 [5] British Standards Institution 2005 BS7910: Guide to methods for assessing the acceptability of flaws in
metallic structures (London, England) [6] Lanteigne J, Sabourin M, Bui-Quoc T and Julien D 2008 The Characteristics of the Steels used in
Hydraulic Turbine runners 24th Symp. on Hydraulic Machinery and Systems (Foz do Iguassu, Brasil, October 27-31)
[7] ASTM International 2005 E1049-85: Standard practice for cycle counting in fatigue analysis Annual book of ASTM standards (Section 3)
25th IAHR Symposium on Hydraulic Machinery and Systems IOP PublishingIOP Conf. Series: Earth and Environmental Science 12 (2010) 012107 doi:10.1088/1755-1315/12/1/012107
8