Genome-wide association studies in diverse populations
12
See discussions, stats, and author profiles for this publication at: https://www.researchgate.net/publication/43160463 Genome-wide association studies in diverse populations Article in Nature Reviews Genetics · May 2010 DOI: 10.1038/nrg2760 · Source: PubMed CITATIONS 256 READS 70 6 authors, including: Ethan M Jewett Stanford University 8 PUBLICATIONS 344 CITATIONS SEE PROFILE All content following this page was uploaded by Ethan M Jewett on 01 December 2016. The user has requested enhancement of the downloaded file. All in-text references underlined in blue are linked to publications on ResearchGate, letting you access and read them immediately.
Transcript of Genome-wide association studies in diverse populations

Seediscussions,stats,andauthorprofilesforthispublicationat:https://www.researchgate.net/publication/43160463
Genome-wideassociationstudiesindiversepopulations
ArticleinNatureReviewsGenetics·May2010
DOI:10.1038/nrg2760·Source:PubMed
CITATIONS
256
READS
70
6authors,including:
EthanMJewett
StanfordUniversity
8PUBLICATIONS344CITATIONS
SEEPROFILE
AllcontentfollowingthispagewasuploadedbyEthanMJewetton01December2016.
Theuserhasrequestedenhancementofthedownloadedfile.Allin-textreferencesunderlinedinbluearelinkedtopublicationsonResearchGate,lettingyouaccessandreadthemimmediately.

Over the past few years, genome-wide association studies (GWA studies) have produced numerous successes in identifying genetic variants that contribute to com-plex human traits1,2. Several factors are recognized3,4 as having markedly increased the number of genotype–phenotype associations documented for a wide range of phenotypes5,6. These include increasingly dense sets of genetic markers and larger sample sizes, improved genomic variation resources, and new statistical tech-niques for genotype imputation7,8 and meta-analysis9,10 that leverage these resources.
However, with a few exceptions, GWA studies have been centred on populations of European descent (BOX 1), and the degree to which knowledge gained from these studies is transferable to other populations has not been extensively investigated. Researchers have begun to seek additional groups in which to investigate widely distributed phenotypes, to study new phenotypes that are more prevalent in non-European populations and to establish the generality of findings obtained initially in Europeans and European-Americans. Indeed, recent reports on Chinese11,12, Japanese13,14 and Korean15,16 populations and on Pacific Islanders from Kosrae17,18 are some of the first in a new wave of GWA studies in non-European populations.
GWA studies in non-European populations may raise several challenges. Will the same results observed in Europeans be detected in diverse worldwide popula-tions? Will causal variants have similar allele frequen-cies and disease risk in different populations? What factors will be the sources of differing results across groups? As the human genetics community diversifies the populations in which GWA studies are performed,
the effort that is likely to be expended on this research program motivates careful consideration of the issues involved in designing the new wave of GWA studies and in interpreting their outcomes.
We argue that expansion of GWA studies to diverse populations is important not only for the ultimate goal of bringing medical advances resulting from genome science to populations worldwide but also for the con-siderable scientific benefits in characterizing risk vari-ants beyond what can be achieved with populations of European descent alone. We begin by reviewing factors that have contributed to the successes of GWA stud-ies in Europeans. Next, we describe how considera-tion of diverse populations has the potential to build on these successes. We then discuss the challenges inherent in GWA studies in diverse populations and the role of population-genetic modelling in investi-gating variation among GWA results across popula-tions. We conclude with a discussion of how further development of genomic resources has the poten-tial to improve prospects for GWA studies in diverse worldwide populations.
Successes in EuropeansFactors influencing the choice of study population. Owing to the expense involved in the execution of GWA studies, it was sensible to perform the first studies in a set of closely related populations for which shared resources could be used. As a first step, a focused effort in which GWA studies of many phenotypes were con-ducted largely in the same populations — and even in the same samples — had several advantages over a dispersed effort that would have considered a larger collection of
*Department of Human Genetics, University of Michigan, Ann Arbor, Michigan 48109, USA.‡Center for Computational Medicine and Bioinformatics, University of Michigan, Ann Arbor, Michigan 48109, USA.§Life Sciences Institute, University of Michigan, Ann Arbor, Michigan 48109, USA.||Department of Biostatistics, University of Michigan, Ann Arbor, Michigan 48109, USA.¶Center for Statistical Genetics, University of Michigan, Ann Arbor, Michigan 48109, USA.#These authors contributed equally to this work.Correspondence to N.A.R. e‑mail: [email protected]:10.1038/nrg2760
Genome-wide association studiesStudy designs in which many markers spread across a genome are genotyped, and tests of statistical association with a phenotype are performed locally along the genome.
Genotype imputationProbabilistic prediction of genotypes that have not been measured experimentally.
Genome-wide association studies in diverse populationsNoah A. Rosenberg*‡§||, Lucy Huang‡#, Ethan M. Jewett‡#, Zachary A. Szpiech‡#, Ivana Jankovic‡# and Michael Boehnke||¶
Abstract | Genome-wide association (GWA) studies have identified a large number of SNPs associated with disease phenotypes. As most GWA studies have been performed in populations of European descent, this Review examines the issues involved in extending the consideration of GWA studies to diverse worldwide populations. Although challenges exist with issues such as imputation, admixture and replication, investigation of a greater diversity of populations could make substantial contributions to the goal of mapping the genetic determinants of complex diseases for the human population as a whole.
G E N O M E - W I D E A S S O C I AT I O N S T U D I E S
R E V I E W S
356 | mAy 2010 | VOlumE 11 www.nature.com/reviews/genetics
© 20 Macmillan Publishers Limited. All rights reserved10

Nature Reviews | Genetics
b
Frac
tiona
l con
trib
utio
n of
dat
e cl
asse
s to
aut
hor w
eigh
ts
0
0.2
0.4
0.6
0.8
1
Author weights
PC1 (41.0% of variance explained)
PC2
(14.1%
of
varia
nce
expl
aine
d)
c13 Sep 2009–22 Jan 2010
21 May 2009–13 Sep 2009
5 Feb 2009–20 May 2009
12 Oct 2008–4 Feb 2009
6 Apr 2008–12 Oct 2008
19 Sep 2007–4 Apr 2008
10 Mar 2005–19 Sep 2007
–0.10
–0.05
0
0.05
0.10
–0.10 –0.05 0 0.05 0.10
USA
GermanyJapan
% o
f G
WA
stu
dies
a
10 Mar
2005
–
19 Se
p 2007
29 Ju
n 200
8–
23 D
ec 20
08
24 D
ec 20
08–
3 May
2009
4 May
2009
–
2 Sep
2009
3 Sep
2009
–
22 Ja
n 2010
19 Se
p 2007
–
24 Ju
n 200
8
3
4 3
Both European and non-European
Entirely European
Entirely non-European
0
10
20
60
80
90
100
70
40
50
30
11 1212
11 14 13
63 6362 58 55 56
14 15 15
3 3
USA U
KG
erm
any
Icel
and
Net
herla
nds
Japa
nIta
lyC
anad
a
Fran
ceC
hina
Spai
nSw
eden
Aus
tral
ia
Finl
and
Switz
erla
ndSo
uth
Kore
a
Belg
ium
Irela
ndC
roat
iaD
enm
ark
Taiw
an
Aus
tria
Sing
apor
ePo
land
Nor
way
Isra
el
Cze
ch R
epub
licM
alay
sia
Turk
ey
Esto
nia
Thai
land
Bulg
aria
Russ
iaM
exic
o
Rom
ania
Chi
le
New
Zea
land
Indo
nesia
Serb
ia
Hun
gary
Slov
aki a
The
Gam
bia
Cos
ta R
ica
Papu
a N
ew G
uine
a
Braz
ilBu
rkin
a Fa
soC
amer
oon
Nig
eria
Sene
gal
Suda
nPo
rtug
al
Trin
idad
and
Tob
ago
Barb
ados
Keny
aM
ali
Gha
naTa
nzan
ia
Slov
enia
Mic
rone
siaV
ietn
amM
a law
iSr
i Lan
ka
Gre
ece
Arg
entin
a
200.
5068
.1537
.02
19.6
821
.52
18.7
712
.20
10.9
5
10.2
310
.60
7.15
6.54
7.24
4.70
5.41
5.82
3.82
2.20
2.28
2.84
3.13
1.64
1.07
0.86
1.61
1.79
0.46
0.50
0.43
0.37
0.74
0.23
0.38
0.39
0.14
0.12
0.09
0.12
0.11
0.13
0.09
0.09
0.07
0.08
0.02
0.01
0.01
0.01
0.01
0.01
0.01
0.07
0.06
0.05
0.05
0.04
0.04
0.04
0.04
0.04
0.03
0.02
0.15
0.04
UK
Netherlands
Iceland
Box 1 | Populations in past genome-wide association studies
To assess the extent to which non-European populations have been incorporated into genome-wide association (GWA) studies, we examined the distribution of study populations across 492 GWA articles in the National Human Genome Research Institute (NHGRI) catalogue of GWA results6,130. This database provides a manually curated list of SNP–phenotype associations (P < 10–5) identified in studies with at least 100,000 SNPs. Article classifications were assessed independently by two raters, with discrepancies resolved by consensus in discussions with a third rater. In the figure, part a tabulates classifications based on whether articles used individuals of European descent, individuals of non-European descent or a combination of individuals of European and non- European descent. Eight articles that provided insufficient information about study subjects are omitted, so that each bar represents 80 or 81 articles, grouped by date. The later date ranges are narrower, indicating that in more recent time periods, more studies have been performed per unit time.
The figure illustrates that most studies (~75%) use populations of European descent exclusively. It is likely that this value underestimates the true percentage of GWA effort devoted to populations of European descent, as the tabulation counts as ‘both European and non-European’ studies in which non-Europeans comprise a small fraction of overall study subjects or in which non-Europeans are part of replication samples examined only for a small number of SNPs. However, a slight trend over time suggests that studies with non-European populations have begun to constitute a larger proportion of the full collection of studies.
We further examined the representation of non-European populations by considering the diversity of the investigators performing the studies (part b). For each article analysed, we assigned weight n
k/n to country k, where
nk is the number of authors with affiliations in country k (splitting multiply
affiliated authors evenly across affiliations), and n is the total number of authors of the article (excluding consortium authors). To examine temporal trends in country representation, the 473 articles (an additional eleven articles with uncertain author affiliations or consortium-only authors were omitted) were divided into seven chronological groups of near-equal size, and for each country, weights were summed across articles to obtain a total ‘author weight’ in each date class. Darker colours represent more recent time periods.
Analysis of GWA author weights reveals that the number of countries represented and the representation of non-European countries, such as China, South Korea and Taiwan, has been increasing. Part c shows a plot of the first two principal components (PC1 and PC2) of a matrix of country representation vectors (n
1/n, n
2/n, n
3/n, and so on), with one point for each
of the 473 articles represented in part b. The vectors shown for the six countries with the highest author weights represent the loadings of these countries for PC1 and PC2, describing the contributions of these countries to the first two principal components. The principal components analysis plot identifies three main categories of articles — those with many UK authors, those with many US authors, and those with many authors elsewhere. Many of the most recent articles, represented by the darkest points, lie near the upper corner (‘elsewhere’) or along the upper edge (collaborations between authors ‘elsewhere’ and US authors).
R E V I E W S
NATuRE REVIEWS | Genetics VOlumE 11 | mAy 2010 | 357
© 20 Macmillan Publishers Limited. All rights reserved10

Principal componentA composite variable that summarizes the variation across a larger number of variables, each represented by a column of a matrix.
LoadingIn a principal components analysis, a quantity that represents the contribution of one of the original variables (columns of the data matrix) to one of the principal components.
SNPA nucleotide site at which two or more variants exist in a population. Most SNPs in genome-wide association studies are biallelic.
Tag SNPA SNP chosen from a larger set of available SNPs for use in an association study. Tag SNPs are generally selected on the basis of favourable linkage disequilibrium properties.
Linkage disequilibriumA statistical association in the occurrence of alleles at separate loci.
Tag-SNP portabilityThe utility of SNPs chosen as tags in one population for use as tags in another population.
populations. The focus on fewer populations aided the development of standard SNP panels, which were assem-bled based on their variability in those populations. It facilitated the use of shared controls in large studies of multiple phenotypes, reducing the effort required for sample collection and genotyping. Finally, it led to the collection by separate investigators of commensura-ble samples, enabling large meta-analyses with closely related populations.
Given these advantages of focusing on specific popu-lations, populations of European descent were a natural choice for early GWA studies. Several European popula-tions with a strong history of human-genetic research — such as the populations of Finland, Iceland and Sardinia — are large enough to make it possible to conduct stud-ies with large samples in the setting of a comparatively homogeneous population. In addition, extensive col-laborations and long-term genetic studies had already been established involving investigators from European countries and from non-European countries with large populations of European descent, such as Australia, Canada and the united States.
Population-genetic factors. Beyond the practical con-siderations that contributed to a focus on populations of European ancestry, specific population-genetic properties of the European population have facilitated the successes of GWA studies in groups of European origin. Allele-frequency variation across populations — a source of false-positive findings in association studies19–21 — is less pronounced in Europe than in other geographic regions22–27. Although large population-genetic studies have detected subtle geographic gradients in allele frequencies across the European continent28–30, as well as within individual countries31,32, well-designed GWA studies in Europeans have generally controlled for the effects of underlying allele-frequency variation, and generally the identification of false positives due to population structure has not been a problem.
The comparatively low level of population structure has further contributed to GWA successes in Europeans through the utility of the Hapmap CEu panel — the ‘Centre d’Étude du Polymorphisme Humain (CEPH) European’ collection of 30 European-American fami-lies genotyped at high density by the International Hapmap Project33,34. Early GWA studies used a tag-SNP approach33,35,36, in which each SNP in a genome-wide subset of SNPs was tested for disease association. It was hoped that each true disease SNP not genotyped in a study would be ‘captured’ through a minimal level of statistical association, or linkage disequilibrium (lD)37–39, with an informative nearby tag SNP included among the genotyped SNPs. The existence of a true disease SNP in an association study would then be detectable through separate associations of the disease SNP and the phenotype with the tag SNP.
In most cases, tag SNPs chosen with the Hapmap CEu panel were indeed ‘portable’ to studies of common variants in other Europeans36,40. Important determinants of tag-SNP portability to a target population are the simi-larity of the target population to the reference panel
from which the tag SNPs were selected, and lD levels in the target population41. lD in Europeans is moderate compared with other populations42,43, so Europeans are not disadvantaged in the tag-SNP approach by this vari-able. Furthermore, portability is enhanced in Europeans owing to the low level of population structure and the resulting high level of genetic similarity between most European populations and the CEu sample41.
The combination of the various population-genetic factors with the pragmatic factors affecting the choice of study populations has uniquely favoured European popu-lations in GWA studies. These factors provide part of the explanation for two outcomes: European GWA stud-ies have produced many successes that can be replicated in different sets of individuals from the same European population as that in which the association was originally detected; and associations in one population of European descent are often replicable in other European popula-tions, sometimes in groups that are quite geographically distant within the European continent.
The case for more populationsThe advantages of European populations in GWA studies suggest that Europeans might productively be used for finding risk variants in non-Europeans. However, European populations contain only a subset of human genetic variation. Populations vary in terms of allele frequencies, biological adaptations and other properties that affect the detectability and importance of risk variants. Several observations suggest that no single population is sufficient for fully uncovering the variants underlying disease in all populations.
First, risk variants can differ in their occurrence across populations. A high-risk variant might only occur in certain populations, as has recently been seen for a car-diomyopathy risk variant at myosin binding protein C, cardiac (MYBPC3) that has a frequency of ~4% in populations of the Indian subcontinent but is rare or absent elsewhere44. Such variants differ substantially in their relevance to different groups.
Second, even if the same variant is present in diverse populations, allele frequencies might differ45,46, as has been seen at transcription factor 7-like 2 (TCF7L2) and potassium voltage-gated channel, KQT-like sub-family, member 1 (KCNQ1) in type 2 diabetes (BOX 2). The particular histories of recombination, mutation and divergence of genealogical lineages in the various populations can influence the ease with which a vari-ant can be mapped, so a variant might be more easily detectable in some populations than in others47,48 (FIG. 1). Populations with lower lD (in which correlations between genotypes extend over shorter distances along a chromosome) might be more suitable for finely local-izing a risk variant once its genomic region has been identified; this is because the genomic distance between disease-associated markers and true risk variants is likely to be smaller in such populations49. localization methods can potentially capitalize on lD differences across populations by identifying variants for which a causal relationship with disease underlies divergent patterns of association signals in a genomic region50.
R E V I E W S
358 | mAy 2010 | VOlumE 11 www.nature.com/reviews/genetics
© 20 Macmillan Publishers Limited. All rights reserved10

Minor allele frequencyThe frequency of the less frequent allele at a biallelic genetic locus.
Expected heterozygosityThe probability for a locus that two alleles drawn from its allele-frequency distribution are distinct.
Ascertainment biasA distortion in results due to the use of a subsample that, in a systematic manner, fails to properly represent a larger sample.
Third, diseases can have differences in prevalence across populations. Although a large portion of this variation undoubtedly results from non-genetic fac-tors, disease prevalence affects both the practicality of obtaining the large sample sizes required by GWA studies for detecting variants with small effects and the relevance to a population of the findings. A limited population focus risks underemphasizing diseases for which prevalence is high in non-European popula-tions, or reducing the power of a study compared with one that uses a larger sample from higher-prevalence populations.
Fourth, risk variants can have different effect sizes in different populations, so that variation across popu-lations can exist in the underlying determinants of the same disease51. The existence of these risk differences, such as for the apolipoprotein E (APOE) ε4 allele in Alzheimer’s disease52, implies that the risk variants that are most relevant in a population might be most easily detected by using samples from the population itself, rather than by using samples from other populations.
The case for using diverse populations in GWA studies has recently been strengthened by the obser-vation that the proportion of phenotypic variation explained by variants discovered through GWA is typi-cally small53. GWA studies have focused on common variants — alleles that were typically present in ances-tral African populations and that spread worldwide with ancient human migrations. Rare variants, which have not been examined to the same extent, provide
one possible genetic source for unexplained phenotypic variation54–56. They might even be responsible for some association signals that are currently attributed to com-mon variants47,57. Because rare variants are usually more recent in origin (as they have not had enough time to increase in frequency and become common), they are more likely to be geographically localized. Separate populations are therefore more likely to differ in their collection of rare alleles than in their collection of common alleles (FIG. 2).
These various reasons — differences in disease-allele frequency and lD patterns, phenotypic prevalence dif-ferences, differences in effect size and differences in rare variants — provide the scientific motivation for GWA studies in diverse populations. Some variants that act in all populations might be more easily iden-tifiable in certain groups owing to the properties of lD and allele frequency in those groups. For some pheno-types with low prevalence in Europeans, studies might be more practical in other groups49. In addition, the use of multiple populations is the only way to uncover true biological variation in underlying risk variants, including biological variation resulting from differ-ences across populations in the occurrence of rare risk alleles.
Challenges in non-EuropeansThe properties of marker ascertainment, tag-SNP port-ability and population structure that have been favour-able to association mapping in Europeans instead pose challenges for studies in many non-European populations.
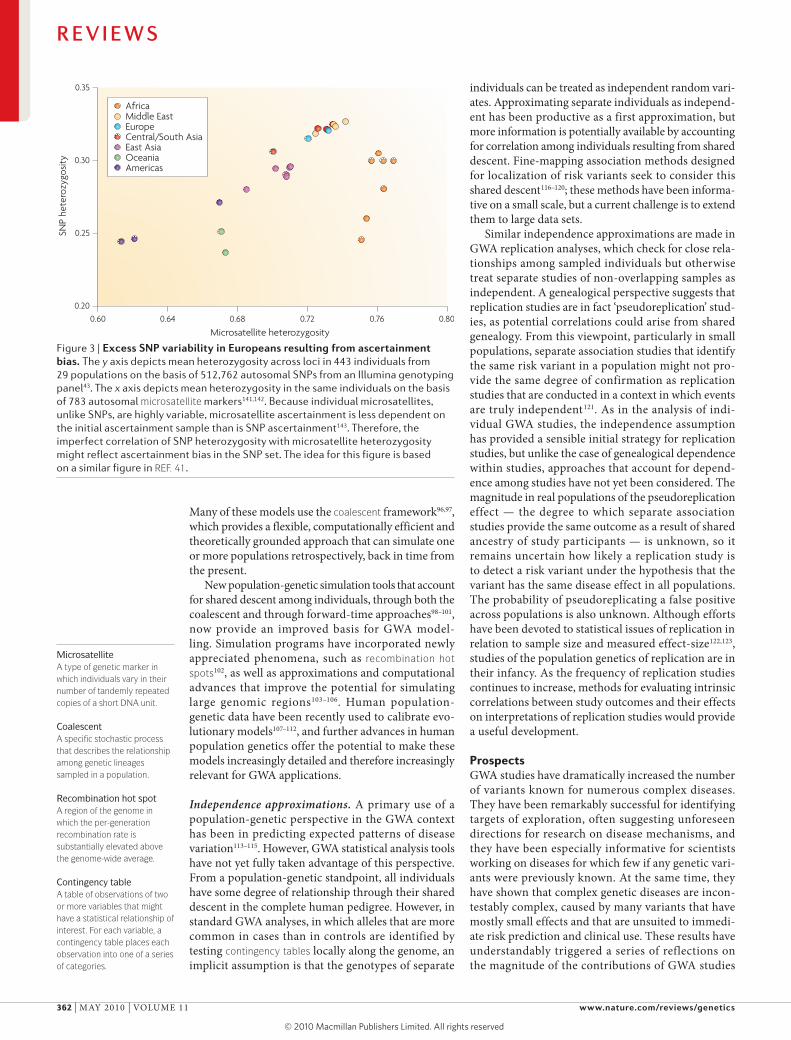
Marker ascertainment. Several investigations have found that the SNPs typically used in GWA studies are in various ways non-random58,59. They can have comparatively higher minor allele frequency (mAF) in Europeans and therefore higher expected heterozygosity than might be predicted on the basis of what is known about other types of markers that have less ascertainment bias (FIG. 3). These observations, which are likely to result from a focus on populations of European ances-try in the initial detection of SNPs, in turn affect the relative proportion of the genome suited to mapping in different populations. Because of ascertainment effects in the development of marker panels, the fraction of the genome that lies within a specified physical distance of at least one variable marker in a standard panel varies across populations. Additionally, the lD statistic r 2 (which measures whether a locus is ‘covered’ by a panel, typically on the basis of its maximal lD with some marker from the panel60) depends on marker-allele frequencies61,62; intermediate-mAF markers have greater potential to produce high r2 values than markers at a range of other minor allele frequencies63. Therefore, ascertainment bias that produces many low-mAF markers in a population can lead to decreased poten-tial to detect phenotypically important alleles across the full range of possible allele frequencies, ultimately reducing the genome-wide utility in the population of standard marker panels.
Box 2 | Common variants for type 2 diabetes
Over the past 3 years, large-scale genetic association studies have uncovered an impressive array of common variants that confer risk for type 2 diabetes (T2D) in populations of European origin131 and now also in East Asian populations13,14. Genome-wide association (GWA) studies of T2D provide a microcosm of the variety of issues that arise when considering association results across populations.
In a study in Icelanders, Grant et al.132 identified common alleles in transcription factor 7-like 2 (TCF7L2) as being associated with T2D, a finding that has been confirmed in many populations, including other Europeans133,134, West Africans135, East Asians136, South Asians137 and Mexican-Americans138. These TCF7L2 SNP alleles seem to have the strongest effect on T2D risk among common variants in Europeans. By analysing data in Europeans and West Africans, Helgason et al.135
narrowed the likely TCF7L2 candidate region using differences in association strength with several TCF7L2-region SNPs in these populations. Subsequent analysis of T2D association in East Asians suggests that whereas genetic effect sizes for these TCF7L2 variants are similar in East Asians, risk allele frequencies are substantially lower, so much larger samples are needed to identify the association139.
The first T2D GWA studies in East Asians identified T2D risk variants in potassium voltage-gated channel, KQT-like subfamily, member 1 (KCNQ1)13,14. A recent meta-analysis in Europeans carried out by the DIAGRAM Consortium detected this same signal with a similar effect size, but at a level not even approaching genome-wide significance due to a much lower risk allele frequency (DIAGRAM Consortium, personal communication). Interestingly, this same meta-analysis identified a second genome-wide significant T2D association signal ~150 kb from those discovered in East Asians.
These examples show the value of carrying out large-scale genetic association studies in multiple populations to elucidate similarities and differences in genetic architecture and to help narrow candidate regions for identified disease-predisposing variants.
R E V I E W S
NATuRE REVIEWS | Genetics VOlumE 11 | mAy 2010 | 359
© 20 Macmillan Publishers Limited. All rights reserved10

Nature Reviews | Genetics
Population 2Population 1
Tag-SNP portability. Ascertainment issues might have contributed to the decreased level of tag-SNP portability seen in some non-European populations compared with predictions based on the lD levels of these populations41. Although tag SNPs chosen from the Hapmap are generally portable to most non- European populations36,40, portability is reduced in low-lD populations and intermediate-lD indigenous populations that are genetically distant from Hapmap reference panels41. Tag-SNP portability can potentially be improved in populations that are genetically intermedi-ate between the primary Hapmap populations by using a mixture strategy to select SNPs for genotyping panels. In this approach, tag SNPs are selected to be informa-tive for a mixture of haplotypes drawn from multiple Hapmap groups rather than from a single group64,65. However, this mixture strategy does not solve the prob-lem of low portability in sub-Saharan African popula-tions, in which lD levels are considerably lower than in other populations43,49,66.
Genotype imputation. Recently, tag-SNP analyses have been augmented by a genotype-imputation approach, in which data analysis is not restricted to SNPs that have been experimentally genotyped. In imputation-based GWA studies7,8,67, densely genotyped reference individuals, typically from the Hapmap Project, pro-vide information for predicting the genotypes at SNP positions measured in the reference data but not in the study sample. These predicted genotypes are then tested for disease association. Imputation is possible because two haplotypes that are identical for a set of nearby markers are likely to share the intervening chromo-somal stretch identically by descent. Therefore, if one of the two haplotypes is genotyped more densely than the
other, genotypes at unmeasured positions in the more sparsely genotyped haplotype can be predicted by copy-ing the genotypes from the more densely genotyped haplotype. Genome-wide imputation of study haplo-types proceeds by locally copying the most appropriate reference haplotypes in a probabilistic manner.
In imputation studies, the reduced portability of tag SNPs to African populations and to populations that, compared with reference groups, are genetically intermediate has resulted in reduced imputation accu-racy for these populations68 and, consequently, reduced statistical power for imputation-based association mapping69. The accuracy of imputation depends largely on the same two factors that influence tag-SNP port-ability. First, the overall level of lD in a study popu-lation reflects the distance over which the genotypic correlations that permit imputation extend, so impu-tation is more accurate in high-lD populations68. Second, imputation accuracy is influenced by the level of genetic relationship of the study population to the reference population8,68, which affects the utility of the haplotypes copied from the reference population when imputing genotypes in the study population. In an assessment of imputation accuracy in 29 populations worldwide, imputation accuracy based on Hapmap reference panels was highest in European populations closely related to the Hapmap CEu panel and low-est in African populations and populations that were genetically intermediate between the panels68 (FIG. 4). As described above for the portability of tag SNPs, the use of mixture panels as reference data in imputation algorithms can improve imputation accuracy for GWA studies in genetically intermediate populations, but imputation in low-lD African populations continues to be a particular challenge49.
Figure 1 | Differences in ‘mappability’ of a risk variant between two populations with different linkage disequilibrium patterns. A disease mutation (orange rectangle) occurs on an ancestral chromosome that contains several marker alleles (green, pink, blue and yellow). Over time, recombination events (diamonds) break down the correlations between the disease mutation and the marker alleles. However, the recombination history differs for populations 1 and 2, separated by a barrier to gene flow (brown vertical line). Consequently, if the pink or blue allele were examined in population 1, a disease association might be found, but it might not be found in population 2. A similar situation applies for the yellow allele, with the roles of the populations reversed. Figure is modified, with permission, from REF. 121 (2009) John Wiley and Sons.
R E V I E W S
360 | mAy 2010 | VOlumE 11 www.nature.com/reviews/genetics
© 20 Macmillan Publishers Limited. All rights reserved10

Nature Reviews | Genetics
Prob
abili
ty o
f non
-zer
o fr
eque
ncy
Minor allele frequency (Europe)0.3 0.50.1 0.2 0.40
1
0.9
0.8
0.7
0.6
0.5
Africa
Middle EastCentral/South AsiaEast Asia
OceaniaAmericas
Admixed populationA population formed recently from the mixing of two or more groups whose ancestors had long been separated.
Admixed populationsIn the effort to improve the potential of GWA studies for diverse human populations, African populations are not the only populations that pose substantial challenges. As described in the previous section, tag-SNP and impu-tation studies have found that indigenous populations that are genetically intermediate between reference groups are among those that require special considera-tion. In these cases, the challenges result largely from the way in which genomic resources have been devel-oped rather than from intrinsic population properties. However, a second form of intermediate population exists in which the challenges are in fact intrinsic.
In admixed populations, individual genomes can be viewed as mosaics of ancestry segments, with different segments arising from different ‘parental’ populations that participated in an admixture process. Admixed populations often have high variation across individu-als in the proportions of ancestry from the various source groups70–72, and in the same way that the use of multiple subgroups of a larger population in an associa-tion study can give rise to false-positive associations, variation in admixture proportions can produce spuri-ous associations of genotypes and phenotypes through their separate associations with ancestry73.
Heterogeneity of admixture has posed a barrier to association mapping in admixed populations. These populations have instead been considered with other designs, such as admixture mapping, in which genomic segments with excess ancestry from a high-prevalence parental population are identified as potential locations for risk variants74–77. The utility of admixture mapping,
which has had some success in mapping loci for traits with strong differences in phenotypic distribution among parental populations78–81, has relied on its rela-tive efficiency compared with GWA. Whereas GWA has typically used tens to hundreds of thousands of markers (or more), admixture mapping requires only a few thousand markers for estimating the ancestry of genomic segments82–85. However, GWA designs have improved, and the efficiency of GWA now exceeds that of admixture mapping over a broad range of pos-sible values for model parameters86. Future analyses in admixed populations might rely on a combination of GWA and admixture-mapping principles that con-siders unusual local ancestry estimates jointly with association signals. In addition, because admixture mapping requires fewer markers, it might continue to be valuable in genomic regions that are poorly covered by typical GWA marker sets.
In the imputation context, it has been largely unclear whether genotypes in an admixed population can be most accurately imputed using a mixture of ref-erence panels from the parental populations or using a comparable reference panel from the admixed popu-lation itself. Numerous techniques are now available for inferring ancestry blocks along the genome under study87–91, and one recent approach uses imputation accuracy as a basis for evaluating inference of ancestry blocks92. These developments now offer the possibil-ity of improving imputation in admixed populations by integrating the inference of admixture and missing genotypes93, either by locally imputing from parental reference panels along the genome (FIG. 5) or by con-currently imputing genotypes and inferring ancestry. Although evaluations in admixed populations of the performance of different imputation approaches have not yet used local ancestry94, it is likely that the intrin-sic challenges of working with admixed populations in GWA studies can be surmounted or at least reduced.
Population-genetic modellingWe have seen that information on the population-genetic properties of individual populations and sets of populations is useful for understanding the features and limitations of GWA studies in diverse populations. Population-genetic data and modelling have had impor-tant roles in the planning of GWA studies from the early stages3,95, and modelling efforts can now help to address concerns about the similarities and differences among GWA results in separate populations.
Population-genetic models begin from the per-spective that the factors that affect the genealogical descent of a disease mutation — such as migrations, changes in population size, natural selection and the local recombination landscape — ultimately affect the distribution of the mutation across individuals in the present. Because the full genetic history of the human population is unknown, population-genetic models based on relatively few parameters can be used instead to simulate plausible histories, to examine the properties of risk variants simulated under the models and to evaluate strategies for detecting these variants.
Figure 2 | effect of frequency in europe on the occurrence of an allele in other regions. The figure illustrates that alleles that are more common in one group, in this case Europeans, are more likely to be present in other groups. It also shows that populations that are geographically closer to Europe, such as populations of the Middle East, tend to have more alleles shared with Europeans than more geographically distant populations, such as those of Oceania. The figure is based on SNP data from supplementary figure twenty-one of REF. 43, which used 512,762 autosomal SNPs in indigenous populations from the Human Genome Diversity Cell Line Panel140, and which standardized sample sizes across groups by evaluating allele frequencies in samples of size 40.
R E V I E W S
NATuRE REVIEWS | Genetics VOlumE 11 | mAy 2010 | 361
© 20 Macmillan Publishers Limited. All rights reserved10
Nature Reviews | Genetics
SNP
hete
rozy
gosit
y
Microsatellite heterozygosity
0.20
0.25
0.30
0.35
0.72 0.800.64 0.68 0.760.60
Americas
AfricaMiddle East
Central/South AsiaEast AsiaOceania
Europe
MicrosatelliteA type of genetic marker in which individuals vary in their number of tandemly repeated copies of a short DNA unit.
CoalescentA specific stochastic process that describes the relationship among genetic lineages sampled in a population.
Recombination hot spotA region of the genome in which the per-generation recombination rate is substantially elevated above the genome-wide average.
Contingency tableA table of observations of two or more variables that might have a statistical relationship of interest. For each variable, a contingency table places each observation into one of a series of categories.
many of these models use the coalescent framework96,97, which provides a flexible, computationally efficient and theoretically grounded approach that can simulate one or more populations retrospectively, back in time from the present.
New population-genetic simulation tools that account for shared descent among individuals, through both the coalescent and through forward-time approaches98–101, now provide an improved basis for GWA model-ling. Simulation programs have incorporated newly appreciated phenomena, such as recombination hot spots102, as well as approximations and computational advances that improve the potential for simulating large genomic regions103–106. Human population- genetic data have been recently used to calibrate evo-lutionary models107–112, and further advances in human population genetics offer the potential to make these models increasingly detailed and therefore increasingly relevant for GWA applications.
Independence approximations. A primary use of a population-genetic perspective in the GWA context has been in predicting expected patterns of disease variation113–115. However, GWA statistical analysis tools have not yet fully taken advantage of this perspective. From a population-genetic standpoint, all individuals have some degree of relationship through their shared descent in the complete human pedigree. However, in standard GWA analyses, in which alleles that are more common in cases than in controls are identified by testing contingency tables locally along the genome, an implicit assumption is that the genotypes of separate
individuals can be treated as independent random vari-ates. Approximating separate individuals as independ-ent has been productive as a first approximation, but more information is potentially available by accounting for correlation among individuals resulting from shared descent. Fine-mapping association methods designed for localization of risk variants seek to consider this shared descent116–120; these methods have been informa-tive on a small scale, but a current challenge is to extend them to large data sets.
Similar independence approximations are made in GWA replication analyses, which check for close rela-tionships among sampled individuals but otherwise treat separate studies of non-overlapping samples as independent. A genealogical perspective suggests that replication studies are in fact ‘pseudoreplication’ stud-ies, as potential correlations could arise from shared genealogy. From this viewpoint, particularly in small populations, separate association studies that identify the same risk variant in a population might not pro-vide the same degree of confirmation as replication studies that are conducted in a context in which events are truly independent121. As in the analysis of indi-vidual GWA studies, the independence assumption has provided a sensible initial strategy for replication studies, but unlike the case of genealogical dependence within studies, approaches that account for depend-ence among studies have not yet been considered. The magnitude in real populations of the pseudoreplication effect — the degree to which separate association studies provide the same outcome as a result of shared ancestry of study participants — is unknown, so it remains uncertain how likely a replication study is to detect a risk variant under the hypothesis that the variant has the same disease effect in all populations. The probability of pseudoreplicating a false positive across populations is also unknown. Although efforts have been devoted to statistical issues of replication in relation to sample size and measured effect-size122,123, studies of the population genetics of replication are in their infancy. As the frequency of replication studies continues to increase, methods for evaluating intrinsic correlations between study outcomes and their effects on interpretations of replication studies would provide a useful development.
ProspectsGWA studies have dramatically increased the number of variants known for numerous complex diseases. They have been remarkably successful for identifying targets of exploration, often suggesting unforeseen directions for research on disease mechanisms, and they have been especially informative for scientists working on diseases for which few if any genetic vari-ants were previously known. At the same time, they have shown that complex genetic diseases are incon-testably complex, caused by many variants that have mostly small effects and that are unsuited to immedi-ate risk prediction and clinical use. These results have understandably triggered a series of reflections on the magnitude of the contributions of GWA studies
Figure 3 | excess snP variability in europeans resulting from ascertainment bias. The y axis depicts mean heterozygosity across loci in 443 individuals from 29 populations on the basis of 512,762 autosomal SNPs from an Illumina genotyping panel43. The x axis depicts mean heterozygosity in the same individuals on the basis of 783 autosomal microsatellite markers141,142. Because individual microsatellites, unlike SNPs, are highly variable, microsatellite ascertainment is less dependent on the initial ascertainment sample than is SNP ascertainment143. Therefore, the imperfect correlation of SNP heterozygosity with microsatellite heterozygosity might reflect ascertainment bias in the SNP set. The idea for this figure is based on a similar figure in REF. 41.
R E V I E W S
362 | mAy 2010 | VOlumE 11 www.nature.com/reviews/genetics
© 20 Macmillan Publishers Limited. All rights reserved10

Nature Reviews | Genetics
Impu
tatio
n ac
cura
cy
Linkage disequilibrium (at 10 kb)
0.80
0.85
0.90
0.95
1.00
0.20 0.25 0.30 0.35 0.40 0.45 0.50
External reference
Internal reference
Adygei
Bantu (Kenya)Balochi
BasqueBantu (S. Africa)
Biaka PygmyBurusho
ColombianCambodian
Bedouin Daur
Kalash
MandenkaLahu
Druze Mbuti PygmyMelanesianMongolaMozabite
MayaPapuanPimaRussianSan
Palestinian UygurYakutYiYoruba
in general4,124–127. GWA is a relatively new approach, and its full contribution will only become clear as the biological properties of the variants it uncovers are further investigated. As the GWA field diversifies its emphasis, attention will shift not only to diverse popu-lations but also to structural variation, interaction effects, rare sequence variation and molecular assays of identified variants.
We and others128,129 have argued that the use of diverse populations will be an essential component of the next phase of GWA work, and we have discussed the benefits that arise from the consideration of GWA studies in diverse populations. As knowledge gained from GWA becomes relevant to medicine, a concern is that health disparities will emerge owing to the bias towards European populations in GWA studies, but using diverse populations in GWA studies can reduce differences in the understanding of underly-ing genetic variation across populations. many GWA studies in diverse populations are now ongoing or are imminent. To achieve their maximal potential, these
studies will profit from deeper investigation of such issues as imputation, admixture and replication, as we have described.
The current GWA strategy of using preselected markers to search for risk variants that are common in human populations is giving way to a paradigm of using whole-genome sequence approaches that can search for rare disease-risk variants as well. Future GWA studies — and some studies now in progress — will incorporate partial or complete genome sequences for some or all of the study participants. For many of the same reasons that GWA studies to date have emphasized populations of European descent, early sequence studies might also have a European focus. As we have seen, however, rare risk variants are likely to be more geographically restricted than the common variants that are currently of interest. Consequently, it will be even more important for multiple populations to be considered in sequence-based GWA studies that are aimed at detecting rare variants than in current studies of common variants.
Figure 4 | Genotype imputation accuracy in 29 populations, with and without external reference panels. Imputation accuracy is plotted as a function of linkage disequilibrium (LD) measured by mean r2 at a distance of 10 kb in a genome-wide data set43. Genotypes in a genome-wide study are hidden and then imputed with two different designs. In the grey shaded region, genotypes in each population are imputed without an external reference panel, so the information for imputing ‘missing’ genotypes comes from other individuals in the population. In the yellow shaded region, genotypes in the population are imputed using a large external reference panel, chosen optimally among 36 mixtures of the HapMap CEU (European-American), CHB+JPT (Chinese and Japanese) and YRI (Yoruba) panels. Colour coding for populations follows that of FIG. 3 (Africa, orange; Middle East, yellow; Europe, blue; Central/South Asia, red; East Asia, pink; Oceania, green; Americas, purple). The regression lines exclude the African populations, and they have coefficients of determination 0.003 (external reference) and 0.953 (internal reference). The figure shows that imputation accuracy based on an internal reference is highly correlated with LD. However, imputation accuracy based on an external reference is not correlated with LD (and instead depends largely on the composition of the particular reference panels available). The figure is based on data in scenarios one, three and six in table three of REF. 68.
R E V I E W S
NATuRE REVIEWS | Genetics VOlumE 11 | mAy 2010 | 363
© 20 Macmillan Publishers Limited. All rights reserved10

Nature Reviews | Genetics
Assemble imputed haplotype
Locally imputed segments
Perform locally optimal imputation
Identify ancestry breakpoints
Haplotype from admixed individual
Reference panel 2
Reference panel 1 GCGTTATGAGTCCATGCGTTATGAATTCAT
GTCCATATTCAT
ACGCTGCGAGTTCACACACTGTGAGCTCAT
ACGCTGCGAACACTGTGA
ACACTGCGA GTCCAT
??A???C????C??T
ACACTGCGAGTCCAT
??A???C????C??T
The 1000 Genomes Project, a large-scale commu-nity effort aimed at producing genome sequence data on ~2,000 diverse individuals, will facilitate sequence-based GWA studies in diverse populations, serving as a public resource for sequence-based GWA studies in the same way that the Hapmap Project provided data for tag-SNP GWA studies. With sequencing, concerns about population biases in marker ascertainment are likely to subside. Furthermore, the larger number of individuals in the 1000 Genomes Project compared with the ini-tial 270 individuals in the Hapmap Project permits the examination of a wider diversity of samples. Therefore, the forthcoming genomic resources already under devel-opment are expected to improve the conditions for the examination of diverse populations in GWA studies.
At the same time, it must be remembered that the worldwide human population and its distribution of disease-risk variation represent the singular outcome of an evolutionary experiment, and large portions of this experiment continue to remain untapped for their potential to contribute to the modern enterprise of human genetics. Each new genetic resource expands the consideration of human diversity but necessarily provides an incomplete picture of its full extent. Therefore, many opportunities exist for identifying new aspects of genetic variation to examine for future resources, as well as for the creative application of worldwide populations in the dis-covery of risk variants, in the characterization of known variants and in the facilitation of these efforts through population-genetic modelling and statistical designs. As technological barriers to the production of genomic data continue to fall, it can be hoped that the community will accept the challenge of capitalizing on the full range of human diversity for the next wave of investigations of the variants that underlie human genetic disease.
Figure 5 | imputation in admixed populations. Admixture segments are estimated in each individual sampled from a genome-wide association study. Consider reference haplotypes from two separate panels (pink and blue boxes). Separately for each admixture segment of a haplotype, alleles are imputed using reference haplotypes from the same population as the inferred source. Within a source population, a haplotype might have alleles imputed from multiple reference haplotypes; this is depicted on the left, where both haplotypes from the same (blue) source population serve as imputation templates. If admixture estimates for a segment are uncertain, conditional imputations can be used; given each of the possible source populations for the segment, the conditional imputation can be weighted by the probability of the source.
1. McCarthy, M. I. et al. Genome-wide association studies for complex traits: consensus, uncertainty and challenges. Nature Rev. Genet. 9, 356–369 (2008).An informative overview of key issues in the field of GWA studies.
2. Frazer, K. A. et al. Human genetic variation and its contribution to complex traits. Nature Rev. Genet. 10, 241–251 (2009).
3. Altshuler, D. et al. Genetic mapping in human disease. Science 322, 881–888 (2008).
4. Hardy, J. & Singleton, A. Genomewide association studies and human disease. N. Engl. J. Med. 360, 1759–1768 (2009).
5. Manolio, T. A. et al. A HapMap harvest of insights into the genetics of common disease. J. Clin. Invest. 118, 1590–1605 (2008).
6. Hindorff, L. A. et al. Potential etiologic and functional implications of genome-wide association loci for human diseases and traits. Proc. Natl Acad. Sci. USA 106, 9362–9367 (2009).An investigation of the properties of GWA findings in the National Human Genome Research Institute (NHGRI) catalogue of published genome-wide association studies.
7. Halperin, E. & Stephan, D. A. SNP imputation in association studies. Nature Biotech. 4, 349–351 (2009).
8. Li, Y. et al. Genotype imputation. Annu. Rev. Genomics Hum. Genet. 10, 387–406 (2009).
9. de Bakker, P. I. W. et al. Practical aspects of imputation-driven meta-analysis of genome-wide association studies. Hum. Mol. Genet. 17, R122–R128 (2008).
10. Zeggini, E. & Ioannidis, J. P. A. Meta-analysis in genome-wide association studies. Pharmacogenomics 10, 191–201 (2009).
11. Garcia-Barcelo, M.-M. et al. Genome-wide association study identifies NRG1 as a susceptibility locus for Hirschsprung’s disease. Proc. Natl Acad. Sci. USA 106, 2694–2699 (2009).
12. Zhang, X.-J. et al. Psoriasis genome-wide association study identifies susceptibility variants within LCE gene cluster at 1q21. Nature Genet. 41, 205–210 (2009).
13. Unoki, H. et al. SNPs in KCNQ1 are associated with susceptibility to type 2 diabetes in East Asian and European populations. Nature Genet. 40, 1098–1102 (2008).
14. Yasuda, K. et al. Variants in KCNQ1 are associated with susceptibility to type 2 diabetes mellitus. Nature Genet. 40, 1092–1097 (2008).
15. Cho, Y. S. et al. A large-scale genome-wide association study of Asian populations uncovers genetic factors influencing eight quantitative traits. Nature Genet. 41, 527–534 (2009).
16. Kim, S.-H. et al. Alpha-T-catenin (CTNNA3) gene was identified as a risk variant for toluene diisocyanate-induced asthma by genome-wide association analysis. Clin. Exp. Allergy 39, 203–212 (2009).
17. Lowe, J. K. et al. Genome-wide association studies in an isolated founder population from the Pacific island of Kosrae. PLoS Genet. 5, e1000365 (2009).
18. Smith, J. G. et al. Genome-wide association study of electrocardiographic conduction measures in an isolated founder population: Kosrae. Heart Rhythm 6, 634–641 (2009).
19. Cardon, L. R. & Palmer, L. J. Population stratification and spurious allelic association. Lancet 361, 598–604 (2003).
20. Ziv, E. & Burchard, E. G. Human population structure and genetic association studies. Pharmacogenomics 4, 431–441 (2003).
21. Tiwari, H. K. et al. Review and evaluation of methods for correcting for population stratification with a focus on underlying statistical principles. Hum. Hered. 66, 67–86 (2008).
22. Rosenberg, N. A. et al. Genetic structure of human populations. Science 298, 2381–2385 (2002).
23. Wang, S. et al. Genetic variation and population structure in Native Americans. PLoS Genet. 3, 2049–2067 (2007).
24. Friedlaender, J. S. et al. The genetic structure of Pacific Islanders. PLoS Genet. 4, e19 (2008).
25. The HUGO Pan-Asian SNP Consortium. Mapping human genetic diversity in Asia. Science 326, 1541–1545 (2009).
26. Reich, D. et al. Reconstructing Indian population history. Nature 461, 489–494 (2009).
27. Tishkoff, S. A. et al. The genetic structure and history of Africans and African Americans. Science 324, 1035–1044 (2009).
28. Heath, S. C. et al. Investigation of the fine structure of European populations with applications to disease association studies. Eur. J. Hum. Genet. 16, 1413–1429 (2008).
29. Lao, O. et al. Correlation between genetic and geographic structure in Europe. Curr. Biol. 18, 1241–1248 (2008).
30. Novembre, J. et al. Genes mirror geography within Europe. Nature 456, 98–101 (2008).References 23–30 provide extensive genome-wide analyses of population structure in individual geographic regions.
31. Jakkula, E. et al. The genome-wide patterns of variation expose significant substructure in a founder population. Am. J. Hum. Genet. 83, 787–794 (2008).
R E V I E W S
364 | mAy 2010 | VOlumE 11 www.nature.com/reviews/genetics
© 20 Macmillan Publishers Limited. All rights reserved10
32. Price, A. L. et al. The impact of divergence time on the nature of population structure: an example from Iceland. PLoS Genet. 5, e1000505 (2009).
33. The International HapMap Consortium. A haplotype map of the human genome. Nature 437, 1299–1320 (2005).
34. The International HapMap Consortium. A second generation human haplotype map of over 3.1 million SNPs. Nature 449, 851–861 (2007).
35. Carlson, C. S. et al. Selecting a maximally informative set of single-nucleotide polymorphisms for association analyses using linkage disequilibrium. Am. J. Hum. Genet. 74, 106–120 (2004).
36. Gu, C. C. et al. On transferability of genome-wide tagSNPs. Genet. Epidemiol. 32, 89–97 (2008).
37. Nordborg, M. & Tavaré, S. Linkage disequilibrium: what history has to tell us. Trends Genet. 18, 83–90 (2002).
38. Slatkin, M. Linkage disequilibrium — understanding the evolutionary past and mapping the medical future. Nature Rev. Genet. 9, 477–485 (2008).
39. Weir, B. S. Linkage disequilibrium and association mapping. Annu. Rev. Genomics Hum. Genet. 9, 129–142 (2008).
40. Xing, J. et al. HapMap tagSNP transferability in multiple populations: general guidelines. Genomics 92, 41–51 (2008).
41. Conrad, D. F. et al. A worldwide survey of haplotype variation and linkage disequilibrium in the human genome. Nature Genet. 38, 1251–1260 (2006).
42. Tishkoff, S. A. & Kidd, K. K. Implications of biogeography of human populations for ‘race’ and medicine. Nature Genet. 36, S21–S27 (2004).
43. Jakobsson, M. et al. Genotype, haplotype and copy-number variation in worldwide human populations. Nature 451, 998–1003 (2008).
44. Dhandapany, P. S. et al. A common MYBPC3 (cardiac myosin binding protein C) variant associated with cardiomyopathies in South Asia. Nature Genet. 41, 187–191 (2009).An example of a high-risk complex disease variant that is absent in Europe but occurs with non-trivial frequency in a non-European population.
45. Myles, S. et al. Worldwide population differentiation at disease-associated SNPs. BMC Med. Genomics 1, 22 (2008).
46. Adeyemo, A. & Rotimi, C. Genetic variants associated with complex human diseases show wide variation across multiple populations. Public Health Genomics 13, 72–79 (2010).
47. McCarthy, M. I. & Hirschhorn, J. N. Genome-wide association studies: potential next steps on a genetic journey. Hum. Mol. Genet. 17, R156–R165 (2008).
48. Teo, Y. Y. et al. Power consequences of linkage disequilibrium variation between populations. Genet. Epidemiol. 33, 128–135 (2009).
49. Teo, Y.-Y. et al. Methodological challenges of genome-wide association analysis in Africa. Nature Rev. Genet. 11, 149–160 (2010).A Review that focuses on particular challenges for GWA studies in Africa.
50. Zaitlen, N. et al. Leveraging genetic variability across populations for the identification of causal variants. Am. J. Hum. Genet. 86, 23–33 (2010).This simulation study argues that fine-mapping of causal variants is improved by the joint analysis of multiple populations. The study provides an approach for selecting multiple-population samples for following up on GWA discoveries.
51. Tang, H. Confronting ethnicity-specific disease risk. Nature Genet. 38, 13–15 (2006).
52. Tang, M. X. et al. The APOE-ε4 allele and the risk of Alzheimer disease among African Americans, whites, and Hispanics. JAMA 279, 751–755 (1998).
53. Maher, B. The case of the missing heritability. Nature 456, 18–21 (2008).
54. Bodmer, W. & Bonilla, C. Common and rare variants in multifactorial susceptibility to common diseases. Nature Genet. 40, 695–701 (2008).
55. Iles, M. M. What can genome-wide association studies tell us about the genetics of common disease? PLoS Genet. 4, e33 (2008).
56. Schork, N. J. et al. Common vs. rare allele hypotheses for complex diseases. Curr. Op. Genet. Dev. 19, 212–219 (2009).
57. Dickson, S. P. et al. Rare variants create synthetic genome-wide associations. PLoS Biol. 8, e1000294 (2010).
58. Nielsen, R. Population genetic analysis of ascertained SNP data. Hum. Genomics 1, 218–224 (2004).
59. Clark, A. G. et al. Ascertainment bias in studies of human genomewide polymorphism. Genome Res. 15, 1496–1502 (2005).
60. Barrett, J. C. & Cardon, L. R. Evaluating coverage of genomewide association studies. Nature Genet. 38, 659–662 (2006).
61. Wray, N. R. Allele frequencies and the r2 measure of linkage disequilibrium: impact on design and interpretation of association studies. Twin Res. Hum. Genet. 8, 87–94 (2005).
62. Eberle, M. A. et al. Frequency-matching SNPs reveals extended linkage disequilibrium in genic regions. PLoS Genet. 2, 1319–1327 (2006).
63. VanLiere, J. M. & Rosenberg, N. A. Mathematical properties of the r2 measure of linkage disequilibrium. Theor. Popul. Biol. 74, 130–137 (2008).
64. Pemberton, T. J. et al. Using population mixtures to optimize the utility of genomic databases: linkage disequilibrium and association study design in India. Ann. Hum. Genet. 72, 535–546 (2008).
65. Egyud, M. R. L. et al. Use of weighted reference panels based on empirical estimates of ancestry for capturing untyped variation. Hum. Genet. 125, 295–303 (2009).
66. Campbell, M. C. & Tishkoff, S. A. African genetic diversity: implications for human demographic history, modern human origins, and complex disease mapping. Annu. Rev. Genomics Hum. Genet. 9, 403–433 (2008).
67. Browning, S. R. Missing data imputation and haplotype phase inference for genome-wide association studies. Hum. Genet. 124, 439–450 (2008).
68. Huang, L. et al. Genotype-imputation accuracy across worldwide human populations. Am. J. Hum. Genet. 84, 235–250 (2009).
69. Huang, L. et al. The relationship between imputation error and statistical power in genetic association studies in diverse populations. Am. J. Hum. Genet. 85, 692–698 (2009).References 68 and 69 provide detailed analyses of genotype imputation in diverse populations.
70. Wang, S. et al. Geographic patterns of genome admixture in Latin American mestizos. PLoS Genet. 4, e1000037 (2008).
71. Silva-Zolezzi, I. et al. Analysis of genomic diversity in Mexican Mestizo populations to develop genomic medicine in Mexico. Proc. Natl Acad. Sci. USA 106, 8611–8616 (2009).
72. Bryc, K. et al. Genome-wide patterns of population structure and admixture in West Africans and African Americans. Proc. Natl Acad. Sci. USA 107, 786–791 (2010).
73. Rosenberg, N. A. & Nordborg, M. A general population-genetic model for the production by population structure of spurious genotype–phenotype associations in discrete, admixed, or spatially distributed populations. Genetics 173, 1665–1678 (2006).
74. McKeigue, P. M. Prospects for admixture mapping of complex traits. Am. J. Hum. Genet. 76, 1–7 (2005).
75. Reich, D. & Patterson, N. Will admixture mapping work to find disease genes? Phil. Trans. R. Soc. Lond. B 360, 1605–1607 (2005).
76. Smith, M. W. & O’Brien, S. J. Mapping by admixture linkage disequilibrium: advances, limitations and guidelines. Nature Rev. Genet. 6, 623–632 (2005).
77. Seldin, M. F. Admixture mapping as a tool in gene discovery. Curr. Op. Genet. Dev. 17, 177–181 (2007).
78. Zhu, X. et al. Admixture mapping for hypertension loci with genome-scan markers. Nature Genet. 37, 177–181 (2005).
79. Freedman, M. L. et al. Admixture mapping identifies 8q24 as a prostate cancer risk locus in African-American men. Proc. Natl Acad. Sci. USA 103, 14068–14073 (2006).
80. Reich, D. et al. Admixture mapping of an allele affecting interleukin 6 soluble receptor and interleukin 6 levels. Am. J. Hum. Genet. 80, 716–726 (2007).
81. Nalls, M. A. et al. Admixture mapping of white cell count: genetic locus responsible for lower white blood cell count in the Health ABC and Jackson Heart studies. Am. J. Hum. Genet. 82, 81–87 (2008).
82. Smith, M. W. et al. A high-density admixture map for disease gene discovery in African Americans. Am. J. Hum. Genet. 74, 1001–1013 (2004).
83. Tian, C. et al. A genomewide single-nucleotide- polymorphism panel with high ancestry information for African American admixture mapping. Am. J. Hum. Genet. 79, 640–649 (2006).
84. Price, A. L. et al. A genomewide admixture map for Latino populations. Am. J. Hum. Genet. 80, 1024–1036 (2007).
85. Tian, C. et al. A genomewide single-nucleotide- polymorphism panel for Mexican American admixture mapping. Am. J. Hum. Genet. 80, 1014–1023 (2007).
86. Risch, N. & Tang, H. Whole genome association studies in admixed populations. Am. J. Hum. Genet. 79, S254 (2006).
87. Falush, D. et al. Inference of population structure using multilocus genotype data: linked loci and correlated allele frequencies. Genetics 164, 1567–1587 (2003).
88. Hoggart, C. J. et al. Design and analysis of admixture mapping studies. Am. J. Hum. Genet. 74, 965–978 (2004).
89. Tang, H. et al. Reconstructing genetic ancestry blocks in admixed individuals. Am. J. Hum. Genet. 79, 1–12 (2006).
90. Sankararaman, S. et al. Estimating local ancestry in admixed populations. Am. J. Hum. Genet. 82, 290–303 (2008).
91. Price, A. L. et al. Sensitive detection of chromosomal segments of distinct ancestry in admixed populations. PLoS Genet. 5, e1000519 (2009).
92. Pasaniuc, B., Kennedy, J. & Mandoiu, I. Imputation-based local ancestry inference in admixed populations. Lect. Notes Comput. Sci. 5542, 221–233 (2009).
93. Pasaniuc, B. et al. Inference of locus-specific ancestry in closely related populations. Bioinformatics 25, i213–i221 (2009).
94. Shriner, D. et al. Practical considerations for imputation of untyped markers in admixed populations. Genet. Epidemiol. 34, 258–265 (2010).
95. Kruglyak, L. The road to genome-wide association studies. Nature Rev. Genet. 9, 314–318 (2008).
96. Hein, J. et al. Gene Genealogies, Variation and Evolution (Oxford Univ. Press, 2005).
97. Wakeley, J. Coalescent Theory (Roberts & Company, 2008).
98. Peng, B. et al. Forward-time simulations of human populations with complex diseases. PLoS Genet. 3, 407–420 (2007).
99. Chadeau-Hyam, M. et al. Fregene: simulation of realistic sequence-level data in populations and ascertained samples. BMC Bioinformatics 9, 364 (2008).
100. Hernandez, R. D. A flexible forward simulator for populations subject to selection and demography. Bioinformatics 24, 2786–2787 (2008).
101. Padhukasahasram, B. et al. Exploring population genetic models with recombination using efficient forward-time simulations. Genetics 178, 2417–2427 (2008).
102. Hellenthal, G. & Stephens, M. msHOT: modifying Hudson’s ms simulator to incorporate crossover and gene conversion hotspots. Bioinformatics 23, 520–521 (2007).
103. McVean, G. A. T. & Cardin, N. J. Approximating the coalescent with recombination. Phil. Trans. R. Soc. Lond. B 360, 1387–1393 (2005).
104. Marjoram, P. & Wall, J. D. Fast ‘coalescent’ simulation. BMC Genet. 7, 16 (2006).
105. Liang, L. et al. GENOME: a rapid coalescent-based whole genome simulator. Bioinformatics 23, 1565–1567 (2007).
106. Chen, G. K. et al. Fast and flexible simulation of DNA sequence data. Genome Res. 19, 136–142 (2009).
107. Marth, G. T. et al. The allele frequency spectrum in genome-wide human variation data reveals signals of differential demographic history in three large world populations. Genetics 166, 351–372 (2004).
108. Schaffner, S. F. et al. Calibrating a coalescent simulation of human genome sequence variation. Genome Res. 15, 1576–1583 (2005).
109. Voight, B. F. et al. Interrogating multiple aspects of variation in a full resequencing data set to infer human population size changes. Proc. Natl Acad. Sci. USA 102, 18508–18513 (2005).
110. Plagnol, V. & Wall, J. D. Possible ancestral structure in human populations. PLoS Genet. 2, 972–979 (2006).
111. Fagundes, N. J. R. et al. Statistical evaluation of alternative models of human evolution. Proc. Natl Acad. Sci. USA 104, 17614–17619 (2007).
112. DeGiorgio, M. et al. Explaining worldwide patterns of human genetic variation using a coalescent-based serial founder model of migration outward from Africa. Proc. Natl Acad. Sci. USA 106, 16057–16062 (2009).
113. Pritchard, J. K. Are rare variants responsible for susceptibility to complex diseases? Am. J. Hum. Genet. 69, 124–137 (2001).
114. Reich, D. E. & Lander, E. S. On the allelic spectrum of human disease. Trends Genet. 17, 502–510 (2001).
R E V I E W S
NATuRE REVIEWS | Genetics VOlumE 11 | mAy 2010 | 365
© 20 Macmillan Publishers Limited. All rights reserved10

115. Di Rienzo, A. Population genetics models of common diseases. Curr. Op. Genet. Dev. 16, 630–636 (2006).
116. Liu, J. S. et al. Bayesian analysis of haplotypes for linkage disequilibrium mapping. Genome Res. 11, 1716–1724 (2001).
117. Morris, A. P. et al. Fine-scale mapping of disease loci via shattered coalescent modeling of genealogies. Am. J. Hum. Genet. 70, 686–707 (2002).
118. Zöllner, S. & Pritchard, J. K. Coalescent-based association mapping and fine mapping of complex trait loci. Genetics 169, 1071–1092 (2005).
119. Minichiello, M. J. & Durbin, R. Mapping trait loci by use of inferred ancestral recombination graphs. Am. J. Hum. Genet. 79, 910–922 (2006).
120. Kimmel, G. et al. Association mapping and significance estimation via the coalescent. Am. J. Hum. Genet. 83, 675–683 (2008).
121. Rosenberg, N. A. & VanLiere, J. M. Replication of genetic associations as pseudoreplication due to shared genealogy. Genet. Epidemiol. 33, 479–487 (2009).
122. Gorroochurn, P. et al. Non-replication of association studies: ‘pseudo-failures’ to replicate? Genet. Med. 9, 325–331 (2007).
123. Zöllner, S. & Pritchard, J. K. Overcoming the winner’s curse: estimating penetrance parameters from case–control data. Am. J. Hum. Genet. 80, 605–615 (2007).
124. Goldstein, D. B. Common genetic variation and human traits. N. Engl. J. Med. 360, 1696–1698 (2009).
125. Hirschhorn, J. N. Genomewide association studies — illuminating biologic pathways. N. Engl. J. Med. 360, 1699–1701 (2009).
126. Kraft, P. & Hunter, D. J. Genetic risk prediction — are we there yet? N. Engl. J. Med. 360, 1701–1703 (2009).
127. Manolio, T. A. et al. Finding the missing heritability of complex diseases. Nature 461, 747–753 (2009).
128. Cooper, R. S. et al. Genome-wide association studies: implications for multiethnic samples. Hum. Mol. Genet. 17, R151–R155 (2008).
129. Need, A. C. & Goldstein, D. B. Next generation disparities in human genomics: concerns and remedies. Trends Genet. 25, 489–494 (2009).
130. Hindorff, L. A., Junkins, H. A., Mehta, J. P. & Manolio, T. A. A catalog of published genome-wide association studies. National Human Genome Research Institute [online], http://www.genome.gov/26525384 (accessed 25 Feb 2010).
131. Zeggini, E. et al. Meta-analysis of genome-wide association data and large-scale replication identifies additional susceptibility loci for type 2 diabetes. Nature Genet. 40, 638–645 (2008).
132. Grant, S. F. et al. Variant of transcription factor 7-like 2 (TCF7L2) gene confers risk of type 2 diabetes. Nature Genet. 38, 320–323 (2006).
133. Groves, C. J. et al. Association analysis of 6,736 U.K. subjects provides replication and confirms TCF7L2 as a type 2 diabetes susceptibility gene with a substantial effect on individual risk. Diabetes 55, 2640–2644 (2006).
134. Scott, L. J. et al. Association of transcription factor 7-like 2 (TCF7L2) variants with type 2 diabetes in a Finnish sample. Diabetes 55, 2649–2653 (2006).
135. Helgason, A. et al. Refining the impact of TCF7L2 gene variants on type 2 diabetes and adaptive evolution. Nature Genet. 39, 218–225 (2007).
136. Luo, Y. et al. Meta-analysis of the association between SNPs in TCF7L2 and type 2 diabetes in East Asian population. Diabetes Res. Clin. Pract. 85, 139–146 (2009).
137. Chandak, G. R. et al. Common variants in the TCF7L2 gene are strongly associated with type 2 diabetes mellitus in the Indian population. Diabetologia 50, 63–67 (2007).
138. Lehman, D. M. et al. Haplotypes of transcription factor 7-like 2 (TCF7L2) gene and its upstream region are associated with type 2 diabetes and age of onset in Mexican Americans. Diabetes 56, 389–393 (2007).
139. Tan, J. T. et al. Polymorphisms identified through genome-wide association studies and their associations with type 2 diabetes in Chinese, Malays, and Asian-Indians in Singapore. J. Clin. Endocrinol. Metab. 95, 390–397 (2010).
140. Cann, H. M. et al. A human genome diversity cell line panel. Science 296, 261–262 (2002).
141. Ramachandran, S. et al. Support from the relationship of genetic and geographic distance in human populations for a serial founder effect originating in Africa. Proc. Natl Acad. Sci. USA 102, 15942–15947 (2005).
142. Rosenberg, N. A. et al. Clines, clusters, and the effect of study design on the inference of human population structure. PLoS Genet. 1, 660–671 (2005).
143. Rogers, A. R. & Jorde, L. B. Ascertainment bias in estimates of average heterozygosity. Am. J. Hum. Genet. 58, 1033–1041 (1996).
AcknowledgementsWe thank L. Hindorff for detailed information on the National Human Genome Research Institute (NHGRI) catalogue of GWA studies, the DIAGRAM Consortium for use of prepubli-cation data, J. Li and S. Zöllner for helpful discussions, and N. Patterson and an anonymous reviewer for comments on a draft of the manuscript. We are grateful to M. DeGiorgio, M. Jakobsson, S. Reddy and P. Scheet for assistance with Box 1 and with figure preparation. Support was provided by US National Institutes of Health grants DK062370, GM081441, HG000376 and HL090564, and by grants from the Burroughs Wellcome Fund and the Alfred P. Sloan Foundation.
Competing interests statementThe authors declare no competing financial interests.
DATABASESEntrez Gene: http://www.ncbi.nlm.nih.gov/geneAPOE | KCNQ1 | MYBPC3 | TCF7L2OMIM: http://www.ncbi.nlm.nih.gov/omimUniProtKB: http://www.uniprot.org
FURTHER INFORMATION1000 Genomes Project: http://www.1000genomes.orgHuman Genome Diversity Cell Line Panel: http://www.cephb.fr/en/hgdp/diversity.phpInternational HapMap Project: http://hapmap.ncbi.nlm.nih.govNature Reviews Genetics article series on Genome-wide association studies: http://www.nature.com/nrg/series/gwas/index.htmlNHGRI list of GWA studies: http://www.genome.gov/26525384
All links Are Active in the online PDf
R E V I E W S
366 | mAy 2010 | VOlumE 11 www.nature.com/reviews/genetics
© 20 Macmillan Publishers Limited. All rights reserved10


![GÉOPOLITIQUE ET POPULATIONS AU TCHAD [Geopolitics and populations in Chad]](https://static.fdokumen.com/doc/165x107/631378e5fc260b71020f1c3f/geopolitique-et-populations-au-tchad-geopolitics-and-populations-in-chad.jpg)