Contaminants in coastal waters of Norway 2020
232
REPORT SNO. 7686-2021 Contaminants in coastal waters of Norway 2020 Miljøgifter i norske kystområder 2020 Photo: Merete Schøyen, NIVA
-
Upload
khangminh22 -
Category
Documents
-
view
5 -
download
0
Transcript of Contaminants in coastal waters of Norway 2020

REPORT SNO. 7686-2021
Contaminants in coastal waters of Norway 2020Miljøgifter i norske kystområder 2020
Phot
o: M
eret
e Sc
høye
n, N
IVA

Norwegian Institute for Water Research
REPORT Main Office NIVA Region South NIVA Region East NIVA Region West NIVA Denmark
Økernveien 94 Jon Lilletuns vei 3 Sandvikaveien 59 Thormøhlensgate 53 D Njalsgade 76, 4th floor NO-0579 Oslo, Norway NO-4879 Grimstad, Norway NO-2312 Ottestad, Norway NO-5006 Bergen Norway DK 2300 Copenhagen S, Denmark Phone (47) 22 18 51 00 Phone (47) 22 18 51 00 Phone (47) 22 18 51 00 Phone (47) 22 18 51 00 Phone (45) 39 17 97 33 Internet: www.niva.no
Title
Contaminants in coastal waters of Norway 2020 Miljøgifter i norske kystområder 2020
Serial number
7686-2021
Date
20.12.2021
Author(s)
Merete Schøyen, Espen Lund, Dag Ø. Hjermann, Anders Ruus, Bjørnar Beylich, Marthe T. S. Jenssen, Lise Tveiten, Jarle Håvardstun, Anne Luise Ribeiro, Isabel Doyer, Kine Bæk, Merete Grung and Sigurd Øxnevad
Topic group
Environmental contaminants - marine
Distribution
Open
Geographical area
Norwegian coast
Pages
174 + appendix
Client(s)
The Norwegian Environment Agency (Miljødirektoratet)
Client’s contact person
Bård Nordbø
Client's publication:
M-2124|2021
Printed NIVA
Project number 210330
Summary
The monitoring programme “Contaminants in coastal waters of Norway” (Miljøgifter i norske kystområder - MILKYS) examines levels, trends and effects of contaminants in biota. The 2020-investigation included analyses of more than 176 different contaminants or biological effect parameters in six species (blue mussel, cod, dogwhelk, common periwinkle, flounder and common eider). The contaminants measured includes metals (Hg, Cd, Pb, Cu, Zn, Ag, As, Ni, Cr and Co), tributyltin (TBT), organochlorines (e.g. PCBs (PCB-7), DDT, HCB, OCS and QCB), PAHs, polybrominated diphenyl ethers (PBDEs), perfluorinated alkylated substances (PFAS), hexabromocyclododecane (α-, γ- and β HBCD), chlorinated paraffins (SCCP, MCCP) and siloxanes (D4, D5 and D6). Biological effects parameters includes imposex (VDSI) and intersex (ISI), OH-pyrene metabolites as a marker of PAH-exposure, ALA-D as a marker of exposure to lead, and EROD as a marker to exposure to planar PCBs, PAHs and dioxines.
In this report, 30 contaminants or biological effects parameters were chosen for statistical analyses of 739 time series (short-term trends for the last 10 years). Of these, there were statistically significant trends in 96 cases: 67 (9.1 %) were downwards and 29 (3.9 %) upwards. The dominance of downward trends indicated that contamination was decreasing. The downward trends were primarily accociated with metals, α-HBCD and PBDEs, and the upward trends with metals. Of the 2020-medians for all 739 time series, 380 cases could be classified against EQS, of which 264 (35.7 %) were below the EQS and 116 (15.7 %) were above. Of the 739 time series, 644 cases could be classified using Norwegian provisional high reference contaminant concentrations (PROREF). Of these, 447 (69.4 %) were below PROREF. The remaining 197 (30.6 %) cases exceeded PROREF: 105 (16.3 %) by a factor of less than two, 57 (8.9 %) by a factor between two and five, 30 (4.7 %) by a factor between five and 10, three (0.5 %) by a factor between 10 and 20, and two (0.3 %) by a factor greater than 20. Some cases warrant special concern, such as high concentrations of several organic contaminants in cod liver from the Inner Oslofjord.
Four keywords Fire emneord
1. Contaminants 1. Miljøgifter 2. Biological effects 2. Biologiske effekter 3. Marine and coastal water 3. Marint og kystvann 4. Norway 4. Norge
This report is quality assured in accordance with NIVA's quality system and approved by:
Merete Schøyen Sissel Ranneklev Morten Jartun
Project Manager Quality Assurance Research Manager
ISBN 978-82-577-7422-6 NIVA-report ISSN 1894-7948
© Norsk institutt for vannforskning/Norwegian Institute for Water Research & Norwegian Environment Agency
The publication can be cited freely if the source is stated.

Contaminants in coastal waters of Norway 2020

Preface
The monitoring programme “Contaminants in coastal waters of Norway” (Miljøgifter i norske
kystområder - MILKYS) investigates contaminants in coastal waters of Norway on a yearly basis.
This report presents the findings from monitoring performed in 2020. MILKYS provides Norwegian
authorities with valuable information on pollutant levels in Norwegian costal waters. Data from
MILKYS are also reported to OSPAR Commission, where 15 Governments and the EU cooperate to
protect the marine environment of the North-East Atlantic. The results from Norway and other
OSPAR countries provide a basis for evaluating the state of the marine environment in the North-
East Atlantic. OSPAR receives guidance from the International Council for the Exploration of the
Sea (ICES). The data are available via the public database Vannmiljø
(https://vannmiljo.miljodirektoratet.no).
The 2020 investigations were carried out by the Norwegian Institute for Water Research (NIVA) by
contract from the Norwegian Environment Agency (Miljødirektoratet). Coordinator at the
Norwegian Environment Agency is Bård Nordbø (deputy coordinator Eivind Farmen) and the project
manager at NIVA is Merete Schøyen (deputy project manager Merete Grung).
Acknowledgments: Thanks are due to many colleagues at NIVA, Eurofins (EF), Norwegian Institute
for Air Research (NILU) and Institute for Energy Technology (IFE). The work was divided as follows:
• Fieldwork and/or sample processing: Espen Lund, Bjørnar Beylich, Lise Tveiten, Merete
Schøyen, Marthe Torunn Solhaug Jenssen, Siri Moy, Marijana Stenrud Brkljacic, Helga Øen
Åsnes, Anne Luise Ribeiro, Isabel Doyer, Jarle Håvardstun, Sigurd Øxnevad, Henriette
Kildahl, Cecilie Singdahl-Larsen, Rita Næss, Norman W. Green, Ingar Becsan and Kirk Meyer
at NIVA, and Kjetil Sagerup and Guttorm Christensen at Akvaplan-niva.
• Metal and organic analyses: Kine Bæk, Alfhild Kringstad, Roger Raanti, Lilian Karlsen,
Elisabeth Lie and their colleagues at NIVA, Maria Kant Pangopoulos and her colleagues at
Eurofins (in Moss and Gfa in Germany), and Stine Marie Bjørneby and her colleagues at
NILU.
• Stable isotope measurements: Ingar Johansen and his colleagues at IFE.
• Imposex/intersex analyses: Lise Tveiten, Bjørnar Beylich and Merete Schøyen at NIVA.
• Biological effects measurements: Maria Thérése Hultman, Tânia Cristina Gomes, Katharina
Bjarnar Løken, Erling Bratsberg and Henrik Jonsson at NIVA.
• Analytical quality assurance: Anne Luise Ribeiro, Isabel Doyer and their colleagues at NIVA.
• Data entry: Dag Hjermann, Espen Lund and Lise Tveiten at NIVA.
• Data programme management and operation: Dag Hjermann, Espen Lund and Jan Karud at
NIVA.
• Data reporting to Vannmiljø: Dag Hjermann.
• Project support responsible: Josephine Nordbø.
• Written assessment: Merete Schøyen, Sigurd Øxnevad, Espen Lund, Anders Ruus (biological
effects methods) and Dag Hjermann (statistical analyses) at NIVA.
• Quality assurance: Sissel Brit Ranneklev and Morten Jartun at NIVA.
A special thanks go to Norman W. Green, the former project manager for MILKYS from 1981 to May
2021. Thanks go also to the numerous fishermen and their boat crews for which we have had the
pleasure of working with.
Oslo, 20 December 2021.
Merete Schøyen
Project Manager
NIVA

NIVA 7686-2021
4
Contents
Contents ..................................................................................................... 4
Summary ..................................................................................................... 6
Sammendrag ............................................................................................... 11
1. Introduction ............................................................................................ 16
1.1 Background ....................................................................................... 16
1.2 Purpose ........................................................................................... 18
2. Material and methods ................................................................................. 20
2.1 Sampling .......................................................................................... 20
2.1.1 Stations ................................................................................. 20
2.1.2 Blue mussel ............................................................................. 24
2.1.3 Dogwhelk and common periwinkle ................................................. 25
2.1.4 Atlantic cod ............................................................................ 25
2.1.5 European flounder .................................................................... 26
2.1.6 Common eider ......................................................................... 26
2.2 Chemical analyses of biological samples ..................................................... 26
2.2.1 Choice of chemical analyses and target species/tissues ........................... 26
2.2.2 Laboratories and brief method descriptions ....................................... 33
2.3 Biological effects analysis ...................................................................... 34
2.3.1 Rationale and overview ............................................................... 35
2.4 Information on quality assurance ............................................................. 36
2.4.1 International intercalibrations ....................................................... 36
2.4.2 Analyses of certified reference materials ........................................... 36
2.5 Stable isotopes ................................................................................... 36
2.6 Treatment of values below the quantification limit........................................ 37
2.7 Classification of environmental quality ...................................................... 41
2.7.1 EQS and PROREF ..................................................................... 41
2.7.2 Derivation of PROREF ................................................................ 42
2.8 Statistical time trend analysis – the model approach ...................................... 46
2.9 Other statistical analyses ...................................................................... 48
2.10 Note on presentation of contaminant tables ................................................ 49
3. Results and discussion ................................................................................ 50
3.1 General information on measurements ...................................................... 50
3.1.1 Levels and temporal trends of contaminants....................................... 50
3.2 Levels and trends in contaminants ............................................................ 57
3.2.1 Overview of metals .................................................................... 57
3.2.2 Mercury (Hg) .......................................................................... 61
3.2.3 Cadmium (Cd) ......................................................................... 72
3.2.4 Lead (Pb) ............................................................................... 76
3.2.5 Copper (Cu) ............................................................................ 79

NIVA 7686-2021
5
3.2.6 Zinc (Zn) ................................................................................ 82
3.2.7 Silver (Ag) .............................................................................. 84
3.2.8 Arsenic (As) ............................................................................ 86
3.2.9 Nickel (Ni) .............................................................................. 89
3.2.10 Chromium (Cr) ........................................................................ 92
3.2.11 Cobalt (Co) ............................................................................. 95
3.2.12 Tributyltin (TBT) ....................................................................... 97
3.2.13 Polychlorinated biphenyls (PCB-7) ................................................. 102
3.2.14 Dichlorodiphenyldichloroethylene (DDE) ........................................ 107
3.2.15 Hexachlorobenzene (HCB), pentachlorobenzene (QCB) and octachlorostyrene (OCS)
110
3.2.16 Polycyclic aromatic hydrocarbons (PAHs) ........................................ 115
3.2.17 Sum carcinogenic polycyclic aromatic hydrocarbons (KPAHs) ................ 116
3.2.18 Anthracene (ANT) .................................................................... 117
3.2.19 Fluoranthene (FLU) .................................................................. 118
3.2.20 Benzo(a)anthracene (B[a]A) ......................................................... 119
3.2.21 Benzo[a]pyrene (B[a]P) .............................................................. 120
3.2.22 Naphthalene (NAP) .................................................................. 121
3.2.23 Polybrominated diphenyl ethers (PBDEs) ......................................... 122
3.2.24 Perfluorinated alkylated substances (PFAS) ...................................... 132
3.2.25 Hexabromocyclododecanes (HBCD) ............................................... 139
3.2.26 Chlorinated paraffins (SCCP and MCCP) ......................................... 144
3.2.27 Siloxanes (D4, D5 and D6) ........................................................... 150
3.3 Biological effects methods for cod ........................................................... 154
3.3.1 OH-pyrene metabolites in bile ...................................................... 154
3.3.2 ALA-D in blood cells ................................................................. 154
3.3.3 EROD-activity ......................................................................... 155
3.4 Analysis of stable isotopes .................................................................... 156
3.4.1 General description of method ...................................................... 156
3.4.2 Results and discussion ............................................................... 157
3.5 Summary of results from Svalbard ........................................................... 161
4. Conclusions ............................................................................................ 165
References ................................................................................................ 167
Appendix A Quality assurance programme 175
Appendix B Abbreviations 181
Appendix C Norwegian provisional high reference contaminant concentrations 195
Appendix D Maps of stations 203
Appendix E Overview of materials and analyses 2019-2020 219
Appendix F Temporal trend analyses of contaminants and biomarkers in biota 1981-2020 229

NIVA 7686-2021
6
Summary
The monitoring programme “Contaminants in coastal waters of Norway” (Miljøgifter i norske
kystområder - MILKYS) examines the levels, trends and effects of contaminants along the coast of
Norway from the Oslofjord and Hvaler region in the southeast to the Varangerfjord in the
northeast. The programme provides a basis for assessing the state of the environment in Norwegian
coastal waters. The monitoring contributes to the Oslo and Paris Commissions (OSPAR’s)
Coordinated Environmental Monitoring Programme (CEMP).
The main finding in 2020 is that most contaminant concentrations in marine organisms showed
downward trends where trends can be detected. In the Inner Oslofjord more contaminants have
higher concentrations than in other areas along the coast and this area warrants special concern.
Furthermore, in this area the investigation found a significant upward long-term (>10 years) trend
for mercury (Hg) in cod fillet (Gadus morhua).
The 2020-investigation monitored blue mussel (Mytilus edulis) at 26 stations, Atlantic cod (Gadus
morhua) at 17 stations, European flounder (Platichthys flesus) at one station, dogwhelk (Nucella
lapillus) at eight stations, common periwinkle (Littorina littorea) at one station and common eider
(Somateria mollissima) at one station. The stations are located both in areas with known or
presumed point sources of contaminants, in areas of diffuse load of contamination like city harbour
areas, and in more remote areas with presumed low exposure to pollution. In 2020 the following
contaminants were monitored: metals (mercury (Hg), cadmium (Cd), lead (Pb), copper (Cu), zinc
(Zn), silver (Ag), arsenic (As), nickel (Ni), chromium (Cr) and cobalt (Co)), tributyltin (TBT),
polychlorinated biphenyls (PCBs), dichlorodiphenyltrichloroethane (DDT, using
dichlorodiphenyldichloroethylene (DDE) - principle metabolite of DDT as an indicator),
hexachlorobenzene (HCB), pentachlorobenzene (QCB), octachlorostyrene (OCS), polycyclic
aromatic hydrocarbons (PAHs), polybrominated diphenyl ethers (PBDEs), per- and polyfluoroalkyl
substances (PFAS), hexabromocyclododecanes (HBCD), short and medium chained chlorinated
paraffins (SCCP and MCCP) and siloxanes (the cyclic volatile methyl siloxanes, cVMS: D4, D5 and
D6). Biological effects parameters were also monitored. These were imposex and intersex
parameters in marine snails as biomarkes of TBT-exposure, OH-pyrene in cod bile as a marker of
PAH-exposure, -aminolevulinic acid dehydrase inhibition (ALA-D) in red blood cells from cod as a
marker of exposure to lead, and cytochrome P450 1A-activity (ethoxyresorufin-O-deethylase,
EROD) in cod liver as a marker of exposure to planar PCBs, PAHs and dioxins.
The monitoring in 2020 supplied data for a total of 3259 data sets (contaminant-station-species) on
176 different contaminants. All results are available via the public database Vannmiljø
(https://vannmiljo.miljodirektoratet.no). 30 of the most important contaminants and biological
effect parameters of the total 176 were chosen for presentation in this report. This selection gave
739 time series; combinations of contaminants, stations, species and tissues. Of these 739, there
were statistically significant temporal short-term trends for the last 10 years (2011-2020) in 96
cases: 67 (9.1 %) were downward trends and 29 (3.9 %) upward trends. The dominance of
downward trends indicated that contamination was decreasing. The downward trends were largely
associated with concentrations of metals, α-HBCD and BDEs.The upward trends were mainly
associated with metals, while many upward short-term trends for PCB-7 were caused by
methodical (artificial) results due to higher limits of quantifications (LOQ).

NIVA 7686-2021
7
The results were assessed using Environmental Quality Standards (EQS). 380 measured time series
were classified, of these 36 % were below and 16 % were above EQS. For 359 time series no EQS has
been developed.
In 2020, medians for 644 time series could be compared to assumed reference levels, by a NIVA-
developed tool denoted Norwegian provisional high reference contaminant concentration
(PROREF). PROREF is a comprehensive set of species-tissue-basis-specific contaminant
concentrations that are statistically low when considering all MILKYS-results for the period 1991-
2016. This tool sets reference concentrations for contaminants, mostly in areas presumed remote
from point sources of contamination, and thus provides a valuable method for assessing
contaminants levels in addition to the risk based EQS. Of the assessed time series, 69 % were lower
than the PROREF and 31 % exceeded the PROREF.
Levels and trends in blue mussel
The concentration of lead in blue mussel was highest at Odderøya in the Kristiansandsfjord. There
were both significant upward long- and short-term trends for lead at Gressholmen and Gåsøya in
the Inner Oslofjord and at Risøy at Risør. There were both significant upward long- and short-term
trends for chromium at Gressholmen and Brashavn in the Varangerfjord.
PCB-7 in blue mussel at all stations exceeded the EQS. The highest PCB-7 concentration was found
in blue mussel at Gressholmen (17.4 µg/kg wet weight, w.w.). In 2020, two new upward long-term
trends and seven new upward short-term trends were found for PCB-7 in blue mussel compared to
2019. However, this is a methodical (artificial) result as described in chapter 2.6. The LOQ
increased from 0.05 to 0.3 µg/kg in 2017.
Applying EQS for PAH in blue mussel, all stations had concentrations below this limit for the PAHs
anthracene, fluoranthene, benzo(a)pyrene, napthalene and benzo(a)anthracene. The highest
concentrations of PAHs in blue mussel were found in the Oslo harbour area.
Concentrations of PBDEs (sum of six compounds – BDE61) in blue mussel were highest in Bodø
harbour area. Except for in Bodø harbour, all blue mussel stations were below PROREF for PBDEs.
Except for at Svolvær airport, all other mussel stations exceeded the EQS for BDE47. All mussel
stations exceeded the EQS for BDE6.
All concentrations of HBCD were below the EQS, and the highest median concentrations of -HBCD
was found in Bodø harbour. Decreasing levels were found, and a significant downward long-term
trend for HBCD was observed in blue mussel from Gressholmen in the Inner Oslofjord.
All concentrations of SCCPs and MCCPs were below the EQS, except for MCCP in blue mussel from
Bodø harbour. There was a significant downward long-term trend for SCCP in mussels from Tjøme
in the Outer Oslofjord. There were both significant upward long- and short-term trends for SCCPs
in blue mussel from Singlekalven in the Hvaler area.
There were only low concentrations of HCB, OCS and QCB, and all concentrations in blue mussels
were lower than the limit of quantification (LOQ). Downward long-term trends were found for HCB
in blue mussel from Færder, Bjørkøya in the Grenlandfjord and Odderøya in the Kristiansandfjord.
1 Sum of BDE congener numbers 28 (tri), 47 (tetra), 99 (penta), 100 (penta), 153 (hexa) and 154 (hexa)

NIVA 7686-2021
8
Levels and trends in cod
For mercury, the concentrations in cod fillet at all stations exceeded the EQS, except for the
reference station at Svalbard. Significant upward long-term (1984-2020) trends for mercury in cod
fillet from the Inner Oslofjord were found both when using the OSPAR method which targets
specific length-groups and when adjusting for fish-length. There were significant upward long-term
trends for mercury in cod fillet from Skågskjera in Farsund, at Bømlo and from Tromsø. Trends
were significant also after adjusting for cod length for the Kristiansand harbour and Farsund. The
highest concentration of mercury was found in cod fillet from the Ålesund harbour (0.210 mg Hg/kg
w.w.). Reasons could be related to factors such as; climate change, more favourable conditions for
methyl Hg formation, increased bioavailability of Hg stored in the sediments, increased access of
cod to contaminated feeding areas due to improved oxygen levels in deep water, changes in what
the cod eat, etc.
All concentrations of PCB-7 in cod liver exceeded the EQS. The highest concentrations of PCB-7 in
cod liver from the Inner Oslofjord is probably related to urban activities in the past in combination
with little water exchange with the outer fjord.
All concentrations of DDE in cod liver were below the EQS. Contamination of this substance is
related to earlier use of DDT as pesticide in agriculture, forestry and orchards along the fjords
(ca. 1945-1970).
All concentrations of PBDEs in cod liver exceeded the EQS for BDE6 and BDE47. The highest median
concentrations of BDE6 were found in Bergen harbour and the Inner Oslofjord, and the lowest level
was observed at Svalbard. BDE47 was the dominant congener in all samples and was significantly
higher in the Inner Oslofjord and Bergen harbour than at Færder and Bømlo. As for PCB-7, the high
concentrations of PBDEs are probably related to urban activities and insufficient water exchange.
PFAS in cod liver has been investigated in several fjords since 2005. PFOS and PFOSA were highest
in cod liver from the Inner Oslofjord. The lowest PFAS concentrations were found in cod from
Svalbard.
All concentrations of hexabromocyclododecanes (HBCD) in cod liver were below the EQS in 2020,
and −HBCD was the most abundant diastereomer. The concentration of −HBCD in cod liver was
significantly higher in the Inner Oslofjord compared to the 12 other cod stations investigated. The
high HBCD concentrations in the Inner Oslofjord is probably related to urban activities. There were
significant long- and short-term downward trends for HBCD in cod liver from Stathelle area in the
Langesundfjord, from Kirkøy, Hvaler and from Bømlo. A significant downward short-term trend was
also found for HBCD in cod liver from the Inner Oslofjord.
Cod liver from Svalbard had highest concentrations of SCCP, and cod from the Inner Oslofjord had
highest concentrations of MCCP. The high concentrations in cod from Svalbard might be a result of
long-range transported pollution. These substances have been found in high concentrations in air at
Svalbard. A significant upward long-term trend was found for MCCP in cod liver from Bømlo. Both
significant downward long- and short-term trends were found for SCCP in cod liver from Bergen
harbour area. There was also a significant downward long-term trend for SCCP in cod liver from the
Inner Sørfjord.
Cod from the Autnesfjord in Lofoten had concentrations of HCB that exceeded the EQS. Significant
downward long-term trends were found for median concentration of HCB in liver of cod from the
Inner Oslofjord, Tjøme in the Outer Oslofjord and from Farsund.

NIVA 7686-2021
9
All concentrations of the siloxane D5 in cod liver were below EQS. D5 was the most dominant, and
the levels were highest in the Inner Oslofjord and lowest at Svalbard. The same pattern was found
for D6.
Levels in flounder
In liver of flounder from Sande in the mid Oslofjord, significant upward short-term trends were
found for cadmium and mercury, and significant downward long-term trends were found for lead
and HCB.
Levels in eider
Contaminants have been analysed in the blood and eggs (homogenate of yolk and albumin) of eider
from Svalbard in this programme since 2017. Concentrations of mercury, lead, arsenic, PFOS and
PFOSA in eggs were almost at the same level as previous years.
For several of the environmental contaminants, the levels were far lower in eider from Svalbard
than in eider from another study in the Inner Oslofjord (Ruus 2018). Concentration of PCB-7 was 19
to 39 times lower in blood and eggs in eider from Svalbard than in eider from the Inner Oslofjord,
respectively. The concentration of BDE47 was 10 times lower in eider eggs from Svalbard compared
with eider eggs from the Inner Oslofjord. The concentrations of PFOS in eider eggs and blood were
also lower in Svalbard than in eider from the Inner Oslofjord, 21- and 25-times lower
concentrations in Svalbard, respectively.
There is a downward tendency for concentration of HCB in blood and eggs of eider for the
monitoring period 2017 to 2020.
Biological effects
The ICES/OSPARs assessment criterion1 (background assessment criteria, BAC) for OH-pyrene in cod
bile was exceeded at all stations investigated (Inner Oslofjord, Inner Sørfjord and Farsund area),
exept for the reference station at Bømlo. This indicates that the fish have been exposed to PAH
compounds. Among the four stations, OH-pyrene concentrations were highest in the Inner Oslofjord
and lowest at Bømlo. Pyrene-concentrations in blue mussels were highest in the Oslofjord
(Akershuskaia), compared to all stations where PAHs were analysed.
The ALA-D activity in the Inner Oslofjord in 2020 was lower than at Bømlo. Reduced activities of
ALA-D reflect higher exposure to Pb. Higher concentrations of Pb in cod liver have generally been
observed in the Inner Oslofjord and Inner Sørfjord compared to Bømlo, as was also the case in
2020.
The median EROD activity was lower in the Inner Sørfjord than in the Inner Oslofjord and at Bømlo,
while the stations in the Inner Oslofjord and Bømlo were not statistically different. High activity of
hepatic cytochrome P450 1A-activity (EROD-activity) normally occurs as a response to planar
organic molecules, such as certain PCBs, PAHs and dioxins. The EROD activities were below the
ICES/OSPARs BAC. Concentrations over BAC would indicate possible impact by planar PCBs, PCNs,
PAHs or dioxins. No concentrations of PAHs in blue mussel exceeded the EQS. Statistically
significant downward trends in EROD activity were observed at all stations investigated.
There were significant downward long-term trends for both TBT concentrations and the imposex
parameter VDSI at seven of eight dogwhelk stations. No effects on dogwhelk (imposex parameter
1 Assessment criteria have specifically been compiled for the assessment of CEMP monitoring data on hazardous substances.
They do not represent target values or legal standards.

NIVA 7686-2021
10
VDSI=0) were observed. For the first time since 1991, there were no effects of TBT on dogwhelk
(imposex parameter VDSI=0) at any of the eight stations in 2017. The 2020 data also confirmed
these results. The synchronous decreases in both TBT concentrations and imposex parameters in
dogwhelk coincides with the TBT bans for longer vessels than 25 meters in 2003 and the global
total ban in 2008. The results shows how regulations, like TBT-bans, can be effective in reducing
levels and effects of environmental contaminants.
Stable isotopes
Stable isotopes of carbon and nitrogen are useful indicators of food origin and trophic levels. The
isotopic signatures were different among stations (geographical variation). However, the results
indicate that the stations show very similar patterns, for both blue mussel and cod, from 2012 to
2020 in terms of isotopic signatures, indicating a geographical difference consistent over time. The
isotopic signatures in mussels from the programme thus provide valuable information about the
isotopic baselines along the Norwegian coast.

NIVA 7686-2021
11
Sammendrag Tittel: Miljøgifter i norske kystområder 2020
År: 2021
Forfatter(e): Merete Schøyen, Espen Lund, Dag Ø. Hjermann, Anders Ruus, Bjørnar Beylich, Marthe
T. S. Jenssen, Lise Tveiten, Jarle Håvardstun, Anne Luise Ribeiro, Isabel Doyer, Kine Bæk, Merete
Grung og Sigurd Øxnevad
Utgiver: Norsk institutt for vannforskning, ISBN 978-82-577-7422-6
Overvåkingsprogrammet «Miljøgifter i norske kystområder – MILKYS» (Contaminants in coastal
waters of Norway) undersøker nivåer, trender og effekter av miljøgifter langs norskekysten fra
Oslofjorden og Hvaler-regionen i sørøst til Varangerfjorden i nordøst. Programmet gir grunnlag for
å vurdere miljøtilstanden i norske kystfarvann. Overvåkingen gir bidrag til Oslo- og
Pariskonvensjonen (OSPAR) og Coordinated Environmental Monitoring Programme (CEMP).
Resultatene for 2020 viser at det hovedsakelig var nedadgående trender, der hvor trender kan
påvises, for konsentrasjoner av de undersøkte miljøgiftene i marine organismer. Indre Oslofjord
peker seg ut som et område der flere miljøgifter har relativt høye konsentrasjoner sammenliknet
med andre områder langs kysten. Dette gir grunnlag for bekymring og behov for nærmere
undersøkelser. I indre Oslofjord ble det observert en signifikant oppadgående langtidstrend
(> 10 år) for kvikksølv (Hg) i torskefilét.
Undersøkelsen inngår som en del av Oslo og Paris konvensjonens (OSPARs) koordinerte
miljøovervåkingsprogram Coordinated Environmental Monitoring Programme (CEMP). I 2020
omfattet overvåkingen miljøgifter i blåskjell (Mytilus edulis) fra 26 stasjoner, torsk (Gadus
morhua) fra 17 stasjoner, skrubbe (Platichthys flesus) fra én stasjon, purpursnegl (Nucella lapillus)
fra åtte stasjoner, strandsnegl (Littorina littorea) fra én stasjon og ærfugl (Somateria mollissima)
fra én stasjon. Stasjonene er plassert i områder med kjente eller antatt kjente punktkilder for
tilførsler av miljøgifter, i områder med diffus tilførsel av miljøgifter slik som byens havneområder
og i fjerntliggende områder med antatt lav eksponering for miljøgifter. Overvåkingen i 2020
omfattet analyser av bl.a. metaller (kvikksølv (Hg), kadmium (Cd), bly (Pb), kobber (Cu), sink (Zn),
sølv (Ag), arsen (As), nikkel (Ni), krom (Cr) og kobolt (Co)), tributyltinn (TBT), polyklorerte
bifenyler (PCBer), pestisider (DDE og heksaklorbenzen (HCB)), pentaklorbenzen (QCB),
oktaklorbenzen (OCB), polysykliske aromatiske hydrokarboner (PAHer), polybromerte difenyletere
(PBDEer), perfluorerte alkylforbindelser (PFAS), heksabromsyklododekan (HBCD), korte- og
mellomkjedete klorparafiner (SCCP og MCCP) og siloksaner (sykliske flyktige metylsiloksaner, cVMS:
D4, D5 og D6). Det ble også gjort overvåking av biologiske effekt-parametere. Dette var imposex og
intersex i marine snegler som biomarkører for TBT-eksponering, OH-pyren i torskegalle som markør
for PAH-eksponering, -aminolevulinsyre dehydrase (ALA-D) i røde blodceller fra torsk som markør
for eksponering for bly, og cytokrom P450 1A-aktivitet (ethoxyresorufin-O-deethylase, EROD) i
torskelever som markør for eksponering for planare PCBer, PAHer og dioksiner.
2020-resultatene omfatter totalt 3259 datasett (miljøgifter-stasjoner-arter) for 176 forskjellige
miljøgifter. Alle resultater er tilgjengelige i den offentlige databasen Vannmiljø
(https://vannmiljo.miljodirektoratet.no). Et utvalg av 30 miljøgifter og biologiske parametere
presenteres i denne rapporten. Dette utvalget består av 739 tidsserier hvorav 96 viste statistisk
signifikante korttidstrender for de siste 10 årene i perioden 2011 til 2020: 67 (9,1 %) var
nedadgående og 29 (3,9 %) var oppadgående. Dominansen av nedadgående trender indikerer
avtagende nivåer av miljøgifter. De nedadgående trendene omfattet metaller, HBCDA og PBDEer.
De oppadgående trendene var i hovedsak for metaller, mens mange oppadgående korttidstrender

NIVA 7686-2021
12
for PCB-7 ble forårsaket av metodiske (kunstige) resultater på grunn av høyere
kvantifiseringsgrenser (LOQ).
I denne rapporten er resultatene primært vurdert i forhold til miljøkvalitetsstandarder
(Environmental Quality Standards, EQS). 380 av de 739 tidsseriene kunne klassifiseres i forhold til
en EQS, og 264 (35,7 %) av disse var lavere enn EQS og 116 (15,7 %) var over EQS. Det fins ikke EQS
for 359 (48,6 %) av tidsseriene.
I 2020 kunne medianer for 644 tidsserier vurderes i forhold til antatte referansenivåer, ved et
NIVA-utviklet verktøy betegnet norsk provisorisk høy referansekonsentrasjon for miljøgifter
(PROREF). PROREF er et omfattende sett med arts-vev-basis-spesifikke miljøgiftkonsentrasjoner
som er statistisk lave når alle MILKYS-resultater for perioden 1991 til 2016 tas i betraktning. Dette
verktøyet angir referansekonsentrasjoner for miljøgifter, hovedsakelig i områder som antas fjernt
fra punktkilder, og er dermed en verdifull metode for å vurdere nivåer av miljøgifter i tillegg til de
risikobaserte EQS. Av de vurderte tidsseriene var 69 % lavere enn PROREF, mens 31 % overskred
denne.
Konsentrasjoner og trender av miljøgifter i blåskjell
Blåskjell fra Odderøya i Kristiansandsfjorden hadde høyest konsentrasjon av bly i denne
undersøkelsen. Det var signifikant oppadgående langtids- og kortidstrend for bly på Gressholmen og
Gåsøya i indre Oslofjord og på Risøy ved Risør. Det var signifikant oppadgående langtids- og
korttidstrend for krom i blåskjell fra Gressholmen og Brashavn i Varangerfjorden.
Konsentrasjoner av PCB-7 i blåskjell overskred EQS ved alle stasjonene. Den høyeste PCB-7
konsentrasjonen var i blåskjell fra Gressholmen (17,4 µg/kg våtvekt, v.v.). I 2020 ble det funnet to
nye oppadgående langtidstrender og syv nye oppadgående korttidstrender for PCB-7 i blåskjell
sammenliknet med 2019. Dette er imidlertid et metodisk (kunstig) resultat som beskrevet i kapittel
2.6. LOQ økte fra 0,05 til 0,3 µg/kg i 2017.
Blåskjell fra Kvalnes i midtre del av Sørfjorden og Utne i ytre del av Sørfjorden hadde
konsentrasjoner av DDE som var mer enn 20 ganger høyrere enn PROREF. Forurensning av denne
miljøgiften i både blåskjell og torsk skyldes tidligere bruk av DDT som sprøytemiddel.
Ingen blåskjellstasjoner hadde konsentrasjoner som overskred EQS for antracen, fluoranten,
benzo(a)pyren, naftalen eller benzo(a)antracen. Det var høyest konsentrasjoner av PAH-
forbindelser i blåskjell fra havneområdet i indre Oslofjord. På Akershuskaia og Gressholmen var det
overskridelse av PROREF for PAHer med en faktor mindre enn to. Nivået av KPAH var høyest i
blåskjell fra Akershuskaia og Gressholmen.
Det var høyest nivå av PBDEer (sum av seks PBDE-forbindelser1) i blåskjell fra Bodø havn. Med
unntak av området ved Svolvær flyplass, var det overskridelse av EQS1 for BDE47 ved alle
blåskjellstasjonene. Det var også overskridelse av EQS for BDE6 på alle blåskjellstasjonene.
Alle konsentrasjonene av HBCD i blåskjell var lavere enn EQS. Det var høyest konsentrasjon av -
HBCD i blåskjell fra Bodø havn. Det ble funnet nedadgående nivåer for HBCD i blåskjell, bl.a. var
det signifikant nedadgående langtidstrend for HBCD i blåskjell fra Gressholmen i indre Oslofjord.
De fleste konsentrasjonene av SCCP og MCCP var lavere enn EQS, bortsett for MCCP i blåskjell fra
Bodø havneområde. Det var en signifikant nedadgående trend for SCCP i blåskjell fra Tjøme i ytre
1 Sum av BDE kongenerer nummer 28 (tri), 47 (tetra), 99 (penta), 100 (penta), 153 (hexa) og 154 (hexa)

NIVA 7686-2021
13
Oslofjord. Det ble påvist både signifikante oppadgående lang- og korttidstrender for SCCP i
blåskjell fra Singlekalven i Hvaler.
Det var kun lave konsenrasjoner av HCB, OCS og QCB, og alle mediankonsentrasjonene i blåskjell
var lavere enn LOQ. Det var nedadgående langtidstrend for HCB i blåskjell fra Færder i ytre
Oslofjord, Bjørkøya i Grenlandsfjorden og ved Odderøya i Kristiansandsfjorden.
Konsentrasjoner og trender av miljøgifter i torsk
Det var overskridelse av EQS for kvikksølv i torskefilét fra samtlige stasjoner, unntatt
referansestasjonen på Svalbard. Torsk fra indre Oslofjord hadde konsentrasjon av kvikksølv i filét
som var mer enn to ganger høyere enn PROREF, og det var signifikante oppadgående
langtidstrender (1984-2020) både med OSPARs metode for spesifikke lengdegrupper og ved
beregning med metode som tar hensyn til fiskelengde. Det var signifikant oppadgående
langtidstrend for kvikksølv i torskefilét fra Skågskjera ved Farsund, Bømlo og Tromsø. Trender for
kvikksølv i torsk fra Kristiansand havn og Farsund var signifikante også etter justering for
fiskelengde. Den høyeste kvikksølvkonsentrasjonen ble funnet i torskefilét fra Ålesund havn
(0,210 mg Hg/kg v.v.). Årsaker kan være relatert til faktorer som; klimaendringer, gunstigere
forhold for metyl Hg-dannelse, økt biotilgjengelighet av Hg lagret i sedimentene, økt tilgang av
torsk til forurensede fôringsområder på grunn av forbedret oksygennivå på dypt vann, endringer i
torskens diett m.m.
Konsentrasjonene av PCB-7 i torskelever var høyere enn EQS. Det var forhøyede nivåer av PCB-7 i
torskelever fra indre Oslofjord og Bergen havn. Den høyeste konsentrasjonen av PCB-7 som ble
observert i torskelever fra indre Oslofjord skyldes trolig forurensning fra lang tid tilbake samt lav
vannutskifting med ytre fjord.
Konsentrasjonene av DDE i torskelever var lavere enn EQS. Forurensning av dette stoffet skyldes
tidligere bruk av DDT i jordbruk, skogbruk og som plantevernmiddel i forbindelse med fruktdyrking
langs fjordene (ca. 1945-1970).
Konsentrasjonene av PBDEer i torskelever var høyere enn EQS for BDE6 and BDE47. De høyeste
nivåene av BDE6 i torskelever ble funnet fra henholdsvis Bergen havn og indre Oslofjord, og lavest
nivå ble observert i torsk fra Svalbard. BDE47 var den dominerende PBDE-forbindelsen i alle
prøvene, og det var signifikant høyere nivåer av denne forbindelsen i torskelever fra indre
Oslofjord og Bergen havn enn i torsk fra Færder og Bømlo. Som for PCB-7, er urban påvirkning og
utilstrekkelig vannutskifting trolig årsaker til de høye nivåene.
Konsentrasjoner av PFAS-forbindelser i torskelever har blitt overvåket i mange fjorder siden 2005.
PFOS og PFOSA var høyest i torskelever fra indre Oslofjord. De laveste PFAS konsentrasjonene ble
registrert i torsk fra Svalbard.
Alle konsentrasjonene av heksabromsyklododekaner (HBCD) i torskelever var lavere enn EQS. Av
HBCDene var -HBCD den mest dominerende diastereomeren. Konsentrasjonen av −HBCD i
torskelever var signifikant høyere i indre Oslofjord enn for de 12 andre undersøkte stasjonene. De
høye konsentrasjonene av HBCD i indre Oslofjord har trolig sammenheng med urbane aktiviteter.
Det var nedadgående nivåer av HBCD på flere stasjoner, bl.a. for Stathelle i Langesundsfjorden,
Kirkøy i Hvaler og fra Bømlo. Det var både signifikante nedadgående lang- og korttidstrender for
HBCD i torskelever fra Kirkøy på Hvaler. Det var også signifikant nedadgående korttidstrend for
HBCD i lever av torsk fra indre Oslofjord.

NIVA 7686-2021
14
Det var høyest konsentrasjon av SCCP i torsk fra Svalbard, og det var høyest konsentrasjon av MCCP
i lever av torsk fra indre Oslofjord. De høye konsentrasjonene av SCCP i torsk fra Svalbard kan
skyldes langtransportert forurensning. Det er målt høye konsentrasjoner av klorparafiner i luft på
Svalbard. Signifikant oppadgående langtidstrend ble påvist for MCCP i torskelever fra Bømlo. Det
var både signifikante nedadgående lang- og kortidstrender for SCCP i torskelever fra Bergen havn.
Også torsk fra Indre Sørfjorden hadde signifikant nedadgående langtidstrend for konsentrasjon av
SCCP.
Torsk fra Autnesfjord i Lofoten hadde konsentrasjon av HCB i lever som overskred EQS. Det ble
påvist nedadgående langtidstrender for median konsentrasjon av HCB i torskelever fra indre
Oslofjord, Tjøme i ytre Oslofjord og fra Skågskjera i Farsund.
Det ble analysert for siloksaner i torskelever, og for D5 var alle konsentrasjonene under EQS. D5
var den mest dominerende forbindelsen. Det var høyest nivå av D5 i torskelever fra indre Oslofjord,
og lavest konsentrasjon i torsk fra Svalbard. Det samme mønsteret ble funnet for D6.
Konsentrasjoner av miljøgifter i skrubbe
Det ble funnet signifikant oppadgående korttidstrender for kadmium og kvikksølv i skrubbelever fra
Sande i midtre Oslofjord, og nedadgående langtidstrender for bly og HCB.
Konsentrasjoner av miljøgifter i ærfugl
Det ble gjort analyser av miljøgifter i blodprøver og egg fra ærfugl fra Svalbard. For flere av
miljøgiftene var nivåene langt lavere enn i ærfugl fra Oslofjorden målt i en annen undersøkelse
(Ruus 2018). Konsentrasjon av PCB-7 var 19 til 39 ganger lavere i henholdsvis blod og egg i ærfugl
fra Svalbard enn i ærfugl fra et annet studie fra indre Oslofjord. Konsentrasjonen av BDE47 var 10
ganger lavere i ærfuglegg fra Svalbard sammenlignet med ærfuglegg fra indre Oslofjord.
Konsentrasjonene av PFOS i ærfuglegg og blod var lavere på Svalbard enn i ærfugl fra indre
Oslofjord, henholdsvis 21 og 25 ganger lavere konsentrasjoner på Svalbard. Det er nedadgående
tendens for konsentrasjon av HCB i prøver av blod og egg av ærfugl fra Svalbard.
Biologiske effekter
ICES/OSPARs vurderingskriterium for bakgrunnsnivå1 («background assessment criteria», BAC) for
OH-pyren i torskegalle ble overskredet på alle undersøkte stasjoner (indre Oslofjord, indre
Sørfjorden, Farsund-området), unntatt på referansestasjonen på Bømlo. Dette viser at fisken har
vært eksponert for PAH. Blant de fire stasjonene var konsentrasjonene av OH-pyren høyest i indre
Oslofjord og lavest ved Bømlo. Pyren-konsentrasjoner i blåskjell var høyest i Oslofjorden
(Akershuskaia), sammenlignet med øvrige stasjoner hvor PAH ble analysert.
ALA-D aktivitet i torsk fra indre Oslofjord var lavere enn i torsk fra Bømlo. Redusert aktivitet av
ALA-D tyder på høyere eksponering for bly. Det har generelt vært høyere konsentrasjoner av bly i
torskelever fra indre Oslofjord og indre Sørfjorden enn i torsk fra Bømlo, hvilket også var tilfelle i
2020.
Median EROD-aktivitet i lever fra indre Sørfjorden var lavere enn i indre Oslofjord og på
referansestasjonen på Bømlo. Det var ingen statistisk forskjell i EROD-aktivitet mellom Oslofjorden
og Bømlo. Høy aktivitet av hepatisk cytokrom P450 1A-aktivitet (EROD-aktivitet) skjer normalt som
en respons på plane organiske molekyler som PCBer, PAH-forbindelser og dioksiner. EROD-
aktiviteten var lavere enn ICES/OSPARs bakgrunnsnivå (BAC). Konsentrasjoner over dette nivået vil
1 Vurderingskriteriene er spesielt utarbeidet for vurdering av CEMP-overvåkingsdata for farlige forbindelser. De
representerer ikke målverdier eller juridiske standarder.

NIVA 7686-2021
15
indikere mulig påvirkning fra plane PCBer, PCNer, PAHer eller dioksiner. Ingen PAH-
konsentrasjoner i blåskjell overskred EQS. Statistisk signifikante nedadgående trender i EROD-
aktivitet ble observert på alle tre stasjoner.
Det ble registrert signifikante nedadgående langtidstrender for både TBT konsentrasjoner og
imposex parameter (VDSI) på syv av de åtte purpursnegl stasjonene. Ingen effekt av TBT i
purpursnegl (imposex parameter VDSI=0) ble funnet. I 2017 var det for første gang siden 1991 ingen
effekter av TBT på purpursnegl (imposex parameter VDSI=0) på noen av de åtte stasjonene.
Undersøkelsen i 2020 bekreftet disse resultatene. Den synkrone nedgangen i både TBT-
konsentrasjoner og imposex-parametere i purpursnegl samsvarer med TBT-forbudene i 2003 for
skip lenger enn 25 meter og det globale totalforbudet i 2008. Resultatene er et godt eksempel på
at lovgivningen som forbyr miljøgifter, slik som TBT, har vært effektiv.
Stabile isotoper
Stabile isotoper av karbon og nitrogen er nyttige indikatorer for opprinnelse av føde, samt av
trofisk posisjon. Isotop-signaturene var forskjellige blant stasjonene (geografiske forskjeller).
Resultatene viste imidlertid at forskjellene i isotopsignatur mellom stasjoner er like i årene 2012-
2020, både for blåskjell og torsk. Dette tyder på at den romlige trenden er stabil over tid.
Isotopsignaturer i blåskjell gir verdifull informasjon om bakgrunnsnivået for isotopsignaturer langs
norskekysten.

NIVA 7686-2021
16
1. Introduction
1.1 Background
The monitoring programme “Contaminants in coastal waters of Norway” (Miljøgifter i norske
kystområder - MILKYS) is administered by the Norwegian Environment Agency (NEA), that monitors
on the levels, trends and effects of hazardous substances in fjords and coastal waters in Norway on
an annually basis. The objective of this monitoring programme is to obtain updated information on
levels and trends of selected environmental pollutants in Norway. The programme also provides a
basis for assessing the state of the environment in Norwegian coastal waters. The monitoring
contributes to the Oslo and Paris Commissions (OSPAR’s) Coordinated Environmental Monitoring
Programme (CEMP). All the results in this report are considered part of the Norwegian contribution
to the CEMP programme as well as to the European Environment Agency (EEA) as part of the
assessment under the EU Water Framework Directive (WFD).
Concentrations of hazardous substances in sediment, pore water, mussels and fish are time-
integrating indicators for the quality of coastal water. Environmental pollutants accumulate and
show higher concentrations in tissues (bioaccumulation) and organisms than in the surrounding
environment (i.e. in water and in some cases sediment). Hence, it follows that substances which
would otherwise be difficult to detect when analysing water or sediment in some instances may
only be detected in organisms. Furthermore, biota concentrations, as opposed to water or
sediment, are of direct ecological importance and also provides information relevant to human
health (dietary exposure assessments and recommendations on food intake) and to commercial
interests involved in harvesting of marine resources.
MILKYS applies the OSPAR CEMP monitoring guidelines (OSPAR 2018). These guidelines suggest inter
alia monitoring of blue mussel, snails and Atlantic cod on an annual basis.
An overview of MILKYS stations in Norway is shown in maps in Appendix D. The program has
previously included monitoring in sediment (Green et al. 2010) and to a larger degree biota, the
main emphasis being monitoring of environmental pollutants and their effects in blue mussel, cod,
dogwhelk, periwinkle, flounder, common eider and sediment in:
• Inner- and Outer Oslofjord, including Hvaler and the Outer Hvaler National Park,
Singlefjord and Grenlandfjord, since 1981
• Sørfjord/Hardangerfjord since 1987
• Orkdalsfjord area and other areas in outer Trondheimfjord, 1984-1996 and 2004-2005
• Arendal and Lista since 1990
• Lofoten since 1992
• Coastal areas of Norway’s northern county Troms and Finnmark since 1994
• Bergen since 2015
• Svalbard since 2017
The previous investigations carried out as part of this monitoring program have shown that the
Inner Oslofjord has elevated levels of polychlorinated biphenyls (PCB-7) in cod liver, mercury (Hg),
lead (Pb) and zinc (Zn) in sediments and elevated concentrations of Hg in cod fillet. Cod liver in
the Inner Oslofjord also revealed the highest median concentration of −HBCD in 2014.
Investigations of the Sørfjord/Hardangerfjord have shown elevated levels of PCB-7,
dichlorodiphenyltrichloroethane (DDT, using dichlorodiphenyldichloroethylene (DDE) - principle
metabolite of DDT as an indicator), cadmium (Cd), Hg and Pb. Investigations in the Orkdalsfjord
focused on three blue mussel stations. The results from these investigations have been reported

NIVA 7686-2021
17
earlier by Green et al. (2007; 2008). MILKYS reports from 2012 are collected on the website of the
Norwegian Environment Agency; https://www.miljodirektoratet.no/ansvarsomrader/overvaking-
arealplanlegging/miljoovervaking/overvakingsprogrammer/basisovervaking/miljogifter-langs-
kysten/
Environmental status has in previous reports been classified according to environmental quality
criteria based on the classification system of the Norwegian Environment Agency (Molvær et al.
1997), or presumed background levels applied in a previous report (Green et al. 2016) (Appendix
C). In this report, the results were assessed primarily in relation to Environmental Quality
Standards (EQS) for priority substances and river basin specific pollutants
(Norwegian_Environment_Agency 2016), according to the EU Water Framework Directive.
Furthermore, in lieu of the aforementioned classification system (i.e. (Molvær et al. 1997)),
Norwegian provisional high reference contaminant concentrations (termed herein as PROREF) have
been calculated based on MILKYS data (see Chapter 2.7).
In addition to monitoring the Oslofjord and the Sørfjord/Hardangerfjord, MILKYS also includes the
annual monitoring of contaminants at selected stations in Lista and Bømlo on the Norwegian South-
and West coast, respectively. During the periods 1993-1996 and 2006-2007, MILKYS also included
sampling of blue mussel from reference areas along the coast from Lofoten to the Russian border.
Fish is also sampled from four key areas north of Lofoten in the Finnsnes-Skjervøy area,
Hammerfest-Honningsvåg area and Varanger Peninsula area. Fish from the Lofoten and Varanger
Peninsula areas are sampled annually. The intention is to assess the level of contaminants in less
polluted reference areas, and to assess possible temporal trends. Figure 1, Figure 2 and Figure 3
indicates which stations were monitored for the 2020-investigation and discussed in this report,
and Appendix D provides maps which also show stations that have been monitored previously.
Biomarkers (or biological effects methods, BEM) were introduced in MILKYS in 1997. Biomarkers
have several definitions. A widely used definition is “a biological response to a chemical or
chemicals that gives a measure of exposure and sometimes, also, of toxic effect” (Peakall 1994).
These “biological responses” range from molecular effects and effects to cells and individual
organisms to effects on community structure and to impacts on the function and structure of
ecosystems. Biomarkers may be indicative of exposure, response or effect and susceptibility
(Timbrell 2009) and can be used to monitor exposures and a wide variety of responses ranging from
abnormal development to early disease indicators. They provide an early warning signal indicating
whether biological systems or an organism is affected by toxic compounds and can assist in
establishing an understanding of the effects and underlying molecular mechanisms involved in
toxicity. Such knowledge cannot be derived from measurements of tissue levels of contaminants
only. One reason is the vast number of chemicals (known and unknown) that are not analysed.
Another reason is the possibility of combined effects (“cocktail effects”) of multiple chemical
exposures. In addition to enabling conclusions on the health of marine organisms, some biomarkers
assist in the interpretation of contaminant bioaccumulation. MILKYS includes monitoring of
imposex and intersex in snails as well as biomarkers in fish. These biomarkers were selected
because they can reflect the impact of specific contaminants or specific groups of contaminants on
organisms, and because they are relatively robust compared to biomarkers.
In MILKYS, the state of contamination is assessed by examining levels, trends and effects
(biomarkers) (OSPAR 2018). Biota is sampled annually. Based on an evaluation of the Norwegian
environmental monitoring (Miljødirektoratet 2012), the programme underwent an extensive
revision in 2012 and again in 2017 in regard to stations and choice of contaminants to be analysed.
Monitoring of flatfish was discontinued in 2012, and only one station at Sande was investigated in
2020. Three more cod-stations were added in 2012, and a fourth added in 2015 and another station
NIVA 7686-2021
18
(Svalbard) was added in 2017 bringing the total to 17. The blue mussel stations were reduced from
38 to 26 in 2012. Investigations of blood and eggs of the eider from Svalbard were also added in
2017.
The contaminants monitored has changed considerably after 2011. Pesticides and dioxin analyses
have been discontinued except for DDTs and HCB at some stations, including the
Sørfjord/Hardangerfjord. However, many new contaminants were added, including analyses of
short- and medium chain chlorinated paraffins (SCCP and MCCP), phenols (e.g. bisphenol A,
tetrabrombisphenol A), organophosphorus flame retardants (PFRs) and stabile isotopes. PFRs were
discontinued in 2017, and phenols were discontinued in 2019. The Norwegian Pollution and
Reference Indices (Green 2011; 2012) are not included in the revised programme and passive
sampling of contaminants in water was included from 2012-2015. The report on the 2017-
investigations also included, for the first time, investigations of siloxanes and microplastics.
Monitoring of microplastics was discontinued after 2017, however, monitoring of siloxanes
continued on an annual basis and included the cod station in the Varangerfjord from 2018.
Many time series previously included in this monitoring programme have been discontinued since
the evaluation in 2012. However, some of the time series were maintained also after 2012. In 2017
additional stations were discontinued, this included one blue mussel station and two flatfish
stations, and from 2018 six more blue mussel stations were discontinued. The results for the
flatfish station in mid Oslofjord that is still being monitored, are included in this report.
Investigation of biological effect in cod from the Inner Sørfjord and from Bømlo on the West Coast
were continued. The results for blue mussel and cod from these investigations are also included in
this report.
All monitoring results from this monitoring programme are made publicly available via annually
reports and Vannmiljø1 and are included in the submission to ICES (including results for eider).
Where possible, MILKYS is integrated with other national monitoring programmes to achieve a
better practical and scientific approach for assessing the levels, trends and effects of
contaminants. In particularly, this concerns sampling for the Norwegian Environmental Specimen
Bank (Miljøprøvebanken, MPB), a programme funded by the Norwegian Ministry of Climate and
Environment to sustain time trend monitoring and local (county) investigations. Other programmes
and monitoring activities that can be relevant are: The Norwegian river monitoring programme –
water quality status and trends (Elveovervåkingsprogrammet – vannkvalitet og -trender),
Ecosystem Monitoring in Coastal Waters (Økosystemovervåking i kystvann (ØKOKYST)),
Environmental Contaminants in an Urban Fjord (Miljøgifter i en urban fjord) as well as MAREANO2
and the Arctic Monitoring and Assessment Programme (AMAP)3, an Arctic Council Working Group.
The first three programmes are operated by NIVA on behalf of the Norwegian Environment Agency.
1.2 Purpose
The main objective of this environmental monitoring programme is to provide an overview of the
status and trends of environmental pollutants in Norwegian marine costal environment as well as to
assess the importance of various sources of pollution.
1 See https://vannmiljo.miljodirektoratet.no/ 2 See http://www.mareano.no/en/about_mareano. MAREANO maps depth and topography, sediment composition,
biodiversity, habitats and biotopes as well as pollution in the seabed in Norwegian offshore areas. 3 See https://www.amap.no/

NIVA 7686-2021
19
MILKYS provides data to State of the Environment Norway (https://www.environment.no/) which
provides the latest information about the state and development of the environment in Norway
and is important as input to Norway's national and international efforts to protect the environment
against pollution and to reduce existing pollution. MILKYS data is part of the Norwegian
contribution to CEMP which aims to deliver comparable data from across the OSPAR Maritime Area,
which can be used in assessments to address the specific questions raised in the OSPAR's Joint
Assessment and Monitoring Programme, and is designed to address issues relevant to OSPAR (2014)
including also OSPAR priority substances (OSPAR 2007). The OSPAR Hazardous Substances Strategy
is to prevent pollution by hazardous substances, by eliminating their emissions, discharges and
losses, to achieve levels that do not give rise to adverse effects on human health or the marine
environment. Under OSPAR, data from MILKYS and other monitoring programmes support this
strategy by:
1. Monitoring the levels of a selection of hazardous substances in biota and water
2. Evaluating the bioaccumulation of priority hazardous substances in biota of coastal waters
3. Assessing the effectiveness of previous remedial action
4. Considering the need for additional remedial action
5. Assessing the risk to biota in coastal waters
6. Fulfilling obligations to EU Water Framework Directive
7. Fulfilling obligations to OSPAR regional sea convention
MILKYS also contributes data to support the implementation of the Water Framework Directive
(WFD) (2000/60/EC 2000) and its daughter directive the Environmental Quality Standards Directive
(EQSD) (2013/39/EU 2013) to achieve good chemical status by assessing the results using EU EQSD
in Norway. In this regard, Norway has supplemented the EQS with their own EQS for River Basin
Specific Pollutants assessed for Ecological status. The results from MILKYS can also be useful in
addressing aspects of the EU Marine Strategy Framework Directive (MSFD) (2008/56/EC 2008). One
of the goals of the WFD and MSFD is to achieve concentrations of hazardous substances in the
marine environment near background values for naturally occurring substances and close to zero
for manmade synthetic substances. OSPAR has also adopted this goal (OSPAR 1998).

NIVA 7686-2021
20
2. Material and methods
2.1 Sampling
2.1.1 Stations
Samples for the investigation of contaminants were collected along the Norwegian coast, from the
Swedish border in the south and to the Russian border in the north, as well as Svalbard (Figure 1,
Figure 2, Figure 3, Appendix D). The sampling involved blue mussel at 26 stations (whereof two
were completely funded by the Ministry of Climate and Environment, see Chapter 1.1), dogwhelk
at eight stations, common periwinkle at one station, cod at 17 stations, flounder at one station and
the common eider at one station.
Samples were collected during 2020 and analysed according to OSPAR guidelines (OSPAR 2003,
2018)1 where these could be applied. The data was screened and submitted to ICES by agreed
procedures ICES (1996) as well as to the national database Vannmiljø. Blue mussel (Mytilus edulis),
dogwhelk (Nucella lapillus), common periwinkle (Littorina littorea) and Atlantic cod (Gadus
morhua) are the target species selected for MILKYS to indicate the degree of contamination in the
sea. Blue mussel is attached to shallow-water surfaces, thus reflecting exposure at a fixed point
(local pollution). Mussels and snails are usually abundant, robust and widely monitored in a
comparable way. The species are, however, restricted to the shallow waters of the shoreline. Cod
is widely distributed and commercially important fish species. It is a predator and, as such, will for
hydrophobic compounds mainly reflect contamination levels in their prey. Recently, however, it
has become increasingly difficult to catch sufficient numbers of adequate size of both blue mussel
and cod. The 2020-programme also included investigation of contaminants in the European
flounder (Platichthys flesus) and the common eider (Somateria mollissima). Deviations from what
was planned for the 2020 sampling and analyses and what was realized, together with what was
realized in the 2019 investigation is shown in Appendix E.
As mentioned above (see Chapter 1.1) the results from some supplementary monitoring to
maintain long-term trends are included in this report. These concern some contaminants in blue
mussel and cod (cf. Table 1).
Some details on methods applied in previous years of monitoring are provided in earlier reports
(Green et al. 2008).
1 See also http://www.ospar.org/work-areas/hasec

NIVA 7686-2021
21
Figure 1. Stations where blue mussel were sampled in 2020. See also station information in
detailed maps in Appendix D.

NIVA 7686-2021
22
Figure 2. Stations where dogwhelk and common periwinkle were sampled in 2020. See also station
information in detailed maps in Appendix D.

NIVA 7686-2021
23
Figure 3. Stations where cod, flounder and the common eider were sampled in 2020. Note insert
map of Svalbard and see also station information in detailed maps in Appendix D.

NIVA 7686-2021
24
2.1.2 Blue mussel
Blue mussel has been proven as a promising indicator organism for contaminants (Beyer et al. 2017).
In general, blue mussel is widely used for monitoring in controlled field studies (Schøyen et al.
2017).
A sufficient number of individuals for three pooled samples of blue mussel were found at nearly all
of the 26 stations. The exceptions being the station in the Grenlandfjord area at Bjørkøya (st. 71A)
where, even after intensive search, only insufficient quantities were found.
In 2020, blue mussel of sufficient size and quantity were found at Færder in the Outer Oslofjord
(st. 36A). For the years 2013-2015 and 2018-2019, mussels were sampled at the alternative site at
Tjøme (st. 36A1) 1 due to insufficient numbers. The two sites are separated by 7.7 km. However,
earlier tests have provided some indication that the results can be viewed collectively with respect
to time trends2. Where time-trend series are presented in this report both stations are referred to
collectively as station 36A.
The stations are located as shown in Figure 1 (see also maps in Appendix D). The stations were
chosen to represent highly polluted or reference stations distributed along the Norwegian coast. It
has been shown that the collected individuals are not all necessarily Mytilus edulis (Brooks and
Farmen 2013), but may be other Mytilus species (M. trossulus and M. galloprovincialis). Possible
differences in contaminant uptake between Mytilus species were assumed to be small and they
were not taken into account in the interpretations of the results for this investigation.
The blue mussel samples were collected from 24th August to 19th December 2020. This is within the
OSPAR guidelines and considered to be outside the mussel spawning season.
Generally, blue mussel was not abundant on the exposed coastline from Lista (southern Norway) to
the north of Norway. The mussel was more abundant in more protected areas and were collected
from dock areas, buoys or anchor lines. All blue mussels were collected by NIVA, except for the
mussels collected in Lofoten and the Varangerfjord, which were collected by local contacts.
The method for collecting and preparing blue mussel was based on the National Standard for mussel
collection (NS 2017). Three pooled samples of approximately 50 individuals (size range of 3-5 cm)
were collected at each station and kept frozen until later treatment. Shell length was measured by
slide callipers. The blue mussel was scraped clean on the outside by using knives or scalpels before
taking out the tissue for the analysis. Mussel samples were frozen (-20C) for later analyses.
For certain stations prior to the 2012-investigations the intestinal canal was cleared for contents
(depuration) in mussels following OSPAR guidelines (OSPAR 2018), cf. (Green et al. 2012). There is
some evidence that for a specific population/place the depuration has no significant influence on
the body burden of the contaminants measured (Green 1989; 1996; 2001). The practice of
depuration was discontinued in 2012.
1 Færder, Outer Oslofjord (st. 36A) has the geo-position 59.02740N and 10.52500E and Tjøme, Outer Oslofjord (st. 36A1) has
the geo-position 59.07357N and 10.42522E. 2 In 2015 one sample from Færder, Outer Oslofjord (st. 36A) was obtained and analyzed in addition to the three samples from
Tjøme, Outer Oslofjord (st. 36A1). The results, where concentrations were above the LOQ, indicated no statistically
difference for Hg, TBT, p-p`-DDE, MCCP and SCCP, but st. 36A1 had significantly higher concentrations of PCB-7, and lower
concentrations of sum of six PBDEs (BDE6) and BDE47. The differences in all cases was less than two.

NIVA 7686-2021
25
2.1.3 Dogwhelk and common periwinkle
Concentrations and effects of organotin on dogwhelk were investigated at eight stations and one
station for common periwinkle (Figure 2, see also maps in Appendix D). TBT-induced development
of irreversible male sex-characters in female dogwhelk, known as imposex, was quantified by the
Vas Deferens Sequence Index (VDSI) analysed according to OSPAR-CEMP guidelines. The VDSI ranges
from zero (no effect) to six (maximum imposex effect) (Gibbs et al. 1987). Detailed information
about the chemical analyses of the animals is given in Følsvik et al. (1999).
Dogwhelk lives on wave-exposed hard bottom areas in the tidal zone. Effects (imposex, ICES (1999))
and concentrations of organotin in dogwhelk were investigated using 50 individuals from each
station. Individuals were kept alive in a refrigerator (at +4°C) until possible effects (imposex) were
quantified, and about 25 females were analysed. All snails were sampled by NIVA except for the
dogwhelk collected in Lofoten and in the Varangerfjord. The snail samples were collected from 7nd
September to 15th October 2020.
TBT-induced development of male sex-characters in female common periwinkle, known as intersex,
was quantified by the intersex stage index (ISI) analysed according guidelines described by Bauer et
al. (1995). The ISI ranges from zero (no effect) to four (maximum intersex effect).
2.1.4 Atlantic cod
Atlantic cod was caught from 17 stations (Figure 3). The goal was to get a minimum of 15 cod from
each station, but for four stations that was not possible. The cod was sampled from 16th August to
1th December 2020. Cod was caught by local fishermen except for the cod in the Inner Oslofjord
(st. 30B) which was collected by NIVA by trawling from the research vessel F/F Trygve Braarud
owned and operated by the University of Oslo (UiO). Instructions were given to the fishermen to
catch coastal cod. Coastal cod is more attached to one place than open ocean cod which migrate
considerably farther than coastal cod. Some spot checks were taken looking at the cross-section
pattern of the otoliths (Stransky et al. 2007) which confirmed, at least for these samples, that only
coastal cod was caught. The otoliths are stored for further verification if necessary. Tissue samples
from each fish were prepared in the field and stored frozen (-20 C) until analysis or the fish was
frozen directly and prepared later at NIVA.
Livers were in general not large enough to accommodate all the analyses planned (see Appendix E).
Tjøme in the Outer Oslofjord (st. 36B), Skågskjera near Farsund (st. 15B), the Inner Sørfjord
(st. 53B), Bømlo in the Outer Selbjørnfjord (st. 23B), Trondheim harbour (st. 80B), Sandnessjøen
area (st. 96B), Austnesfjord in Lofoten (st. 98B1), Tromsø harbour (st. 43B2), Kjøfjord in the Outer
Varangerfjord (st. 10B) and Svalbard (st. 19B) were the 10 stations where all 15 individuals had
sufficient liver size to complete all of the intended analyses. The general lack of material was
partially compensated for by making pooled samples of livers. These are noted in the tables below
(e.g. Table 10). The concerns using pooled samples or small sample size in cod are discussed in an
earlier report (Green et al. 2015).
The age of the fish was determined by noting the number opaque and hyaline zones in otoliths
(Vitale, Worsøe_Clausen, and Ni_Chonchuir 2019). These results, along with results from some other
parameters (e.g. liver weight, shell lengths, dry weight percentages) are publicly available but not
necessarily used for this report.

NIVA 7686-2021
26
2.1.5 European flounder
The monitoring of flatfish (including European flounder) was last reported for the 2011 investigation
(Green et al. 2012), taken out of this programme for the period 2012-2018, but the funding for
chemical analyses for one flounder station (st. 33F Sande in the mid Oslofjord) was continued by the
Ministry of Climate and Environment. Discussion of the results for this station are included in this
report. Fifteen individuals of European flounder were sampled at st. 33F Sande in the mid Oslofjord
(Figure 3).
Flounder was caught 26th August 2020 by a local fisherman, then frozen and sent to NIVA. Tissue
samples from each fish were prepared at NIVA.
2.1.6 Common eider
Contaminants in the Common eider were investigated at one station in Svalbard (Breøyane st. 19N),
which the present study considered as a reference station. Blood samples were collected from 15
individuals (two subsamples from each) and eggs from 15 other individuals on 5th June 2020 (Figure
3). All samples are from adult nesting females.
2.2 Chemical analyses of biological samples
2.2.1 Choice of chemical analyses and target species/tissues
An overview of chemical analyses performed on 2020-samples is shown in Table 1. In the present
study, total Hg (organic and inorganic, here abbreviated to Hg) is reported.

NIVA 7686-2021
27
Table 1. Analyses and target organisms of 2020. The numbers indicate the total of stations
investigated. (See also Appendix B for complete list of chemical codes.)
Parameter
Blu
e m
uss
el
Dogw
helk
Com
mon
peri
win
kle
Cod liv
er
Cod f
ille
t
Flo
under
liver
Flo
under
fillet
Eid
er
blo
od
Eid
er
egg*
Metals 25 1** 17 1 1 1 Cadmium (Cd), copper (Cu), lead (Pb), zinc (Zn), silver (Ag),
arsenic (As), chrome (Cr), nickel (Ni), cobalt (Co) and tin (Sn)
Mercury (total Hg) 26 1** 17 1 1 1
Organotin (MBT, DBT, TBT, TPhT) 7 8 1
PCB-7 (PCB-28, -52, -101, -118, -138, -153, and -180) 24 16 1 1 1
∑DDT (p-p`-DDT, p-p`-DDE***, p-p`-DDD) 15 1** 7 1
PAH**** and KPAH 7
1**
ACNE, ACNLE, ANT, BAA, BAP, BBJF, BKF, BGHIP, CHR, DBA3A, FLE, FLU, ICDP, NAP, PA, PYR
Polybrominated diphenyl ethers (PBDEs) 11 11
1 1
BDE28, 47, 99, 100, 126, 153, 154, 183, 196 and 209
Perfluorinated alkylated substances (PFAS) 6 10
1 1
PFNA, PFOA, PFHpA, PFHxA, PFHxS, PFOS, PFBS, PFOSA
Hexabromocyclododecane (HBCD: α-, β-, γ-HBCD) 11 13 1 1
Chlorinated paraffins (SCCP (C10-C13) and MCCP (C14-C17)) 11 13 1 1
Siloxanes (D4, D5 and D6) 5 1 1
HCB, OCS, QCB 14 1** 7 1 1***** 1*****
*) Homogenate of yolk and albumin. **) Extra analysis of common periwinkle in 2020. ***) Referred to as DDE in the report. ****) For this report the total is the sum of tri- to hexacyclic PAH compounds named in EPA protocol 8310 minus naphthalene (dicyclic)-totalling 15 compounds (see Appendix B).
An overview of the applied analytic methods is presented in Table 2. Metal analyses were moved to
another Eurofins laboratory (WEJ) and a different method was applied1. The new method had LOQs
that were the same or lower with the exception for Ag, which had a LOQ of 0.004 mg/kg w.w.
before and 0.05 mg/kg w.w. with the new methods. This was accepted by Norwegian Environment
Agency on 20th November 2019. Chemical analyses were performed separately for each cod liver, if
possible, otherwise a pooled sampled was taken (see «count» for the relevant tables, e.g. Table
12). Mercury was analysed on a fillet sample from each cod. Furthermore, Biological Effects
Methods (BEM) were performed on individual cod.
1 Standard method prior to 2019 investigation was Standard method NS EN ISO 17294-2, and now is Standard method NS EN
ISO 15763 (2010) except for nickel, silver and zinc which now has Standard method NS EN ISO 17294-2-E29.

NIVA 7686-2021
28
Table 2. Overview of method of analyses (see Appendix B for description of chemical codes). Limit of quantification (LOQ) is indicated. See Chapter
2.2.2 for description of the labs used for the different analysis.
Name [CAS-number] Lab. LOQ Est. uncer-tainty
Standard or internal method Accreditation status
Metals
cadmium (Cd) 7440-43-9 WEJ 0.001 mg/kg 20 % Standard method NS EN ISO 15763 (2010)
ISO 17025, accredited
cadmium (Cd) 7440-43-9 NILU 0.0003 mg/kg 20 % Standard method ISO 17025, accredited
copper (Cu) 7440-50-8 WEJ 0.02 mg/kg 20 % Standard method NS EN ISO 15763 (2010)
ISO 17025, accredited
copper (Cu) 7440-50-8 NILU 0.06 mg/kg 20 % Standard method ISO 17025, accredited
lead (Pb) 7439-92-1 WEJ 0.005 mg/kg 20 % Standard method NS EN ISO 15763 (2010)
ISO 17025, accredited
lead (Pb) 7439-92-1 NILU 0.01 mg/kg 20 % Standard method ISO 17025, accredited
zinc (Zn) 7440-66-6 WEJ 0.5 mg/kg 20 % Standard method NS EN ISO 17294-2-E29
ISO 17025, accredited
zinc (Zn) 7440-66-6 NILU 0.5 mg/kg 20 % Standard method ISO 17025, accredited
silver (Ag) 7440-22-4 WEJ 0.05 mg/kg 20 % Standard method NS EN ISO 17294-2-E29
ISO 17025, accredited
silver (Ag) 7440-22-4 NILU 0.02 mg/kg 20 % Standard method Not accredited but follows the routines and systems of ISO 17025
arsenic (As) 7440-38-2 WEJ 0.001 mg/kg 20 % Standard method NS EN ISO 15763 (2010)
ISO 17025, accredited
arsenic (As) 7440-38-2 NILU 0.03 mg/kg 20 % Standard method ISO 17025, accredited
chromium (Cr). 7440-47-3 WEJ 0.01 mg/kg 20 % Standard method NS EN ISO 15763 (2010)
ISO 17025, accredited
chromium (Cr). 7440-47-3 NILU 0.03 mg/kg 20 % Standard method ISO 17025, accredited
nickel (Ni) 7440-02-0 WEJ 0.01 mg/kg 20 % Standard method NS EN ISO 17294-2-E29
ISO 17025, accredited
nickel (Ni) 7440-02-0 NILU 0.003 mg/kg 20 % Standard method ISO 17025, accredited
cobalt (Co) 7440-48-4 WEJ 0.001 mg/kg 20 % Standard method NS EN ISO 15763 (2010)
ISO 17025, accredited
cobalt (Co) 7440-48-4 NILU 0.002 mg/kg 20 % Standard method ISO 17025, accredited
tin (Sn) 7440-31-5 WEJ 0.01 mg/kg 20 % Standard method NS EN ISO 15763 (2010)
ISO 17025, accredited
tin (Sn) 7440-31-5 NILU 0.002 mg/kg 30 % Standard method Not accredited but follows the routines and systems of ISO 17025
Total-Hg 7439-9-76 WEJ 0.001 mg/kg 25 % Standard method ISO 17025, accredited Total-Hg 7439-9-76 NILU 0.0003-0.003 mg/kg 25 % Standard method ISO 17025, accredited PCB-7
PCB28 7012-37-5 GFA 0.3 µg/kg low fat. 1 µg/kg high fat 40 % Internal method ISO 17025, accredited PCB28 7012-37-5 NILU 0.02-0.2 µg/kg 25 % Standard method ISO 17025, accredited PCB52 35693-99-3 GFA 0.3 µg/kg low fat. 1 µg/kg high fat 30 % Internal method ISO 17025, accredited PCB52 35693-99-3 NILU 0.02-0.2 µg/kg 25 % Standard method ISO 17025, accredited PCB101 37680-73-2 GFA 0.3 µg/kg low fat. 1 µg/kg high fat 40 % Internal method ISO 17025, accredited PCB101 37680-73-2 NILU 0.02-0.2 µg/kg 25 % Standard method ISO 17025, accredited

NIVA 7686-2021
29
Name [CAS-number] Lab. LOQ Est. uncer-tainty
Standard or internal method Accreditation status
PCB118 31508-00-6 GFA 0.01 µg/kg low fat. 1 µg/kg high fat 30 % Internal method ISO 17025, accredited PCB118 31508-00-6 NILU 0.02-0.2 µg/kg 25 % Standard method ISO 17025, accredited PCB138 35065-28-2 GFA 0.3 µg/kg low fat. 1 µg/kg high fat 30 % Internal method ISO 17025, accredited PCB138 35065-28-2 NILU 0.02-0.2 µg/kg 25 % Standard method ISO 17025, accredited PCB153 35065-27-1 GFA 0.3 µg/kg low fat. 1 µg/kg high fat 40 % Internal method ISO 17025, accredited PCB153 35065-27-1 NILU 0.3-0.2 µg/kg 25 % Standard method ISO 17025, accredited PCB180 35065-29-3 GFA 0.3 µg/kg low fat. 1 µg/kg high fat 40 % Internal method ISO 17025, accredited PCB180 35065-29-3 NILU 0.3-0.2 µg/kg 25 % Standard method ISO 17025, accredited p-p`DDT 50-29-3 GFA 0.2 µg/kg low fat. 4 µg/kg high fat 60 % Internal method ISO 17025, accredited p-p`DDE 82413-20-5 GFA 0.05 µg/kg low fat. 1 µg/kg high fat 40 % Internal method ISO 17025, accredited p-p`DDD 72-54-8 GFA 0.1 µg/kg low fat. 2 µg/kg high fat 50 % Internal method ISO 17025, accredited PAHs PAH 16 0.3-5.3 µg/kg 30 % Internal method ISO 17025, accredited acenaphthene 83-32-9 GFA 1.5 µg/kg 30 % Internal method ISO 17025, accredited acenaphthylene 208-96-8 GFA 0.3 µg/kg 30 % Internal method ISO 17025, accredited anthracene 120-12-7 GFA 0.3 µg/kg 30 % Internal method ISO 17025, accredited benzo[a]anthracene 56-55-3 GFA 0.5 µg/kg 30 % Internal method ISO 17025, accredited benzo[a]pyrene 50-32-8 GFA 0.3 µg/kg 30 % Internal method ISO 17025, accredited benzo[b+j]fluoranthene GM GFA 0.5 µg/kg 30 % Internal method ISO 17025, accredited benzo[ghi]perylene 191-24-2 GFA 0.3 µg/kg 30 % Internal method ISO 17025, accredited benzo[k]fluoranthene 207-08-9 GFA 0.3 µg/kg 30 % Internal method ISO 17025, accredited chrysene 218-01-9 GFA 0.5 µg/kg 30 % Internal method ISO 17025, accredited dibenz[a c/a h]anthracene GM GFA 0.3 µg/kg 30 % Internal method ISO 17025, accredited fluorene 86-73-7 GFA 1.5 µg/kg 30 % Internal method ISO 17025, accredited fluoranthene 206-44-0 GFA 1.0 µg/kg 30 % Internal method ISO 17025, accredited indeno[1 2 3-cd]pyrene 193-39-5 GFA 0.3 µg/kg 30 % Internal method ISO 17025, accredited naphthalene 91-20-3 GFA 0.3 µg/kg 30 % Internal method ISO 17025, accredited phenanthrene 85-01-8 GFA 4.0 µg/kg 30 % Internal method ISO 17025, accredited pyrene 129-00-0 GFA 0.6 µg/kg 30 % Internal method ISO 17025, accredited PAH metabolite – OH-pyrene NIVA PBDEs
BDE47 5436-43-1 GFA 0.005 µg/kg mussels. 0.1 µg/kg high fat 30 % Internal method ISO 17025, accredited
BDE47 5436-43-1 NILU 0.1 µg/kg 30-45 % Internal method Not accredited but follows the routines and systems of ISO 17025
BDE99 60348-60-9 GFA 0.01 µg/kg mussels. 0.1 µg/kg high fat 40 % Internal method ISO 17025, accredited
BDE99 60348-60-9 NILU 0.1 µg/kg 30-45 % Internal method Not accredited but follows the routines and systems of ISO 17025
BDE100 189084-64- 8 GFA 0.01 µg/kg mussels. 0.1 µg/kg high fat 40 % Internal method ISO 17025, accredited
BDE100 189084-64- 8 NILU 0.1 µg/kg 30-45 % Internal method Not accredited but follows the routines and systems of ISO 17025
BDE126 366791-32-4 GFA 0.01 µg/kg mussels 50 % Internal method ISO 17025, accredited

NIVA 7686-2021
30
Name [CAS-number] Lab. LOQ Est. uncer-tainty
Standard or internal method Accreditation status
BDE126 366791-32-4 NILU 0.1 µg/kg 30-45 % Internal method Not accredited but follows the routines and systems of ISO 17025
BDE153 68631-49-2 GFA 0.02 µg/kg mussels. 0.1 µg/kg high fat 40 % Internal method ISO 17025, accredited
BDE153 68631-49-2 NILU 0.1 µg/kg 30-45 % Internal method Not accredited but follows the routines and systems of ISO 17025
BDE154 207122-15-4 GFA 0.02 µg/kg mussels. 0.1 µg/kg high fat 40 % Internal method ISO 17025, accredited
BDE154 207122-15-4 NILU 0.1 µg/kg 30-45 % Internal method Not accredited but follows the routines and systems of ISO 17025
BDE183 207122-16-5 GFA 0.03 µg/kg mussels. 0.3 µg/kg high fat 40 % Internal method ISO 17025, accredited
BDE183 207122-16-5 NILU 0.1 µg/kg 30-45 % Internal method Not accredited but follows the routines and systems of ISO 17025
BDE196 32536-52-0 GFA 0.05 µg/kg mussels. 0.3 µg/kg high fat 40 % Internal method ISO 17025, accredited
BDE196 32536-52-0 NILU 0.1 µg/kg 30-45 % Internal method Not accredited but follows the routines and systems of ISO 17025
BDE209 1163-19-5 GFA 0.5 µg/kg mussels. 0.5 µg/kg high fat 50 % Internal method ISO 17025, accredited
BDE209 1163-19-5 NILU 1.0 µg/kg 30-45 % Internal method Not accredited but follows the routines and systems of ISO 17025
α, β, γ-HBCD
134237-50-6 (α isomer), 134237-51-7 (β isomer), 134237-52-8 (γ isomer)
GFA 0.006 ng/g 40 % Internal method, validated ISO 17025, accredited
α, β, γ-HBCD
134237-50-6 (α isomer), 134237-51-7 (β isomer), 134237-52-8 (γ isomer)
NILU 0.03-0.2 µg/kg 40-50 % Internal method Not accredited but follows the routines and systems of ISO 17025
Tetrabrombisphenol A (TBBPA) 79-94-7 GFA 0.5 ng/g 40 % Internal method, validated ISO 17025, accredited
NILU 3-15 µg/kg 30-40 % Internal method Not accredited but follows the routines and systems of ISO 17025
Bisphenol A (BPA) 80-05-7 GFA 1-5 ng/g 40 % Internal method, validated ISO 17025, accredited
NILU 3-15 µg/kg 30-40 % Internal method Not accredited but follows the routines and systems of ISO 17025
PFAS

NIVA 7686-2021
31
Name [CAS-number] Lab. LOQ Est. uncer-tainty
Standard or internal method Accreditation status
PFNA 375-95-1 NIVA 0.4 µg/kg 30 % Internal method, validated Not accredited but follows the routines and systems of ISO 17025
PFOA 335-67-1 NIVA 0.4 µg/kg 40 % Internal method, validated Not accredited but follows the routines and systems of ISO 17025
PFHpA 375-85-9 NIVA 0.4 µg/kg 30 % Internal method, validated Not accredited but follows the routines and systems of ISO 17025
PFHxA 307-24-4 NIVA 0.4 µg/kg 30 % Internal method, validated Not accredited but follows the routines and systems of ISO 17025
PFOS 1763-23-1 NIVA 0.1 µg/kg 25 % Internal method, validated Not accredited but follows the routines and systems of ISO 17025
PFBS 29420-49-3 NIVA 0.1 µg/kg 30 % Internal method, validated Not accredited but follows the routines and systems of ISO 17025
PFOSA 4151-50-2 NIVA 0.1 µg/kg 30 % Internal method, validated Not accredited but follows the routines and systems of ISO 17025
SCCP/MCCP
SCCP (C10-C-13) 85535-84-8 GFA 0.6-3.5 ng/g 50 % Internal method based on AIR OC 147, validated
ISO 17025
SCCP (C10-C-13) 85535-84-8 NILU 0.5-10 µg/kg >50 % Internal method Not accredited but follows the routines and systems of ISO 17025
MCCP (C14-C17) 85535-85-9 GFA 5-10 ng/g 50 % Internal method based on AIR OC 147, validated
ISO 17025, accredited
MCCP (C14-C17) 85535-85-9 NILU 0.5-15 µg/kg >50 % Internal method Not accredited but follows the routines and systems of ISO 17025
Tin compounds
Monobutyltin (MBT) 2406-65-7 (78763-54-9)
GFA 0.5 ng/g 40 % Internal method, validated ISO 17025, accredited
Dibutyltin (DBT) 1002-53-5 GFA 0.5 ng/g 40 % Internal method, validated ISO 17025, accredited Tributyltin (TBT) 688-73-3 GFA 0.5 ng/g 30 % Internal method, validated ISO 17025, accredited Triphenyltin (TPhT) 668-34-8 GFA 0.5 ng/g 40 % Internal method, validated ISO 17025, accredited Siloxanes Octamethylcyclo-tetrasiloxane (D4)
556-67-2 NILU 0,5-2.7 µg/kg 20 % Internal method Not accredited but follows the routines and systems of ISO 17025
Decamethylcyclo-pentasiloxane (D5)
541-02-6 NILU 0,5-1.5 µg/kg 20 % Internal method

NIVA 7686-2021
32
Name [CAS-number] Lab. LOQ Est. uncer-tainty
Standard or internal method Accreditation status
Dodecamethylcyclo-hexasiloxane (D6)
540-97-6 NILU 1.5-2.0 µg/kg 20 % Internal method
Other chlorinated compounds HCB 118-74-1 GFA 1.30 µg/kg Internal method ISO 17025, accredited HCB 118-74-1 NILU 0.05 µg/kg Internal method ISO 17025, accredited OCS 29082-74-4 GFA 0.13 µg/kg Internal method ISO 17025, accredited QCP 608-93-5 GFA 1.3 µg/kg Internal method ISO 17025, accredited SIA 15N/14N IFE 0,1‰ 0,12‰ EA-IRMS Not accredited 13C/12C IFE 0,1‰ 0,12‰ EA-IRMS Not accredited BEM
VDSI NIVA 10-20 % ICES 1999 Not accredited EROD NIVA 10-20 % ICES 1991 Not accredited ALA-D NIVA 20 % ICES 2004 Not accredited OH-pyrene NIVA 0,2 ng/g 30 % Not accredited

NIVA 7686-2021
33
2.2.2 Laboratories and brief method descriptions
The 2020-samples were analysed by Eurofins by Eurofins Environment Testing Norway AS in Moss
(EFM) (dry matter), Eurofins GfA Lab Service GmbH (GFA) (organic parameters including SnOrg)
Hamburg in Germany and Eurofins WEJ Contaminants GmbH (WEJ) (metals) also in Hamburg (see
Table 2). Norwegian Institute for Atmosphere Research (NILU) performed all siloxane-analyses as
well as all analyses (except PFAS) in the blood and eggs (homogenate of yolk and albumin) of the
common eider (Somateria mollissima). NIVA was responsible for all PFAS analyses. Stable isotopes
of nitrogen and carbon were analysed by the Institute for Energy Technology (IFE). A brief
description of the analytical methods can be found in an earlier report (Green et al. 2008).
Metals were analysed at WEJ according to NS EN ISO 17025. Metals were extracted using nitric acid
and quantified using Inductively Coupled Plasma Mass Spectrometry (ICP-MS), except for Cr, which
was determined using GAAS or ICP-Atomic Emission Spectroscopy (ICP-AES). Mercury (total) has
been analysed using Cold-Vapour AAS (CVAAS). Metal analyzed at NILU where added with acid and
digested with high pressure and temperature before determination with ICP-MS.
Polychlorinated biphenyls (PCB-7), BDEs and other halogenated substances were analysed at
Eurofins GFA using GC-MS, except for HBCD that were analysed by LC-MS/MS to be able to
determine the different congeners. The sample where extracted with organic solvent and the
extract cleaned up prior to instrumental analysis.
Samples for analyses of PCB-7, PBDEs and the other halogenated organic contaminants at NILU
were extracted with a suitable organic solvent. The lipid and other interferences are removed with
the use of sulfuric acid and silica SPE (solid phase extraction) before the compounds are detected
with help of GC-HRMS or GC-QTOf-MS. One exception is the determination of HBCD, they were
extracted and cleaned together with the PBDEs, but the quantification was done with LC-TOF-MS.
Polycyclic aromatic hydrocarbons (PAH) were analysed at GFA using a gas chromatograph (GC)
coupled to a mass-selective detector (MSD). The individual PAHs are distinguished by the retention
time and/or significant ions. From 2016 to 2017 there was an increase in LOQs for naphthalene,
which might impact results for this group of compounds but also where they are included in other
summations of PAHs (see Table 2).
All seven potential carcinogenic PAHs (IARC 1987) are included in the list of single components
determined to constitute the total concentration of PAH. For this report the total PAH is the sum
of tri- to hexacyclic PAH compounds which are named in EPA protocol 8310. Naphthalene (a
dicyclic PAH) is not included, hence the total PAH includes 15 compounds. This is so that the
classification system of the Norwegian Environment Agency can be applied (see Appendix C).
Analysis of organotin (TBT, MBT, DBT and TPhT) in N. lapillus and M. edulis were done by NIVA
until 2010. The method included solvent extraction, derivatization and detection by gas
chromatography - mass spectrometry (GC-MS) as described by Følsvik et al. (1999) and
Green et al. (2008). Since 2010, these analyses were carried out by Eurofins GFA Lab Service GmbH
with a method that is similar with the one described for NIVA. One exception was the samples from
2016 which were analyzed at GALAB Laboratories GmbH. Here the extraction was similar, but the
detection was done by gas chromatography – atomic emission detector (GC-AED). All the three labs
are accredited according to ISO 17025, but the analysis at NIVA was not accredited. Quantification
of individual organotin components was performed by using the internal standard method and the
limit of quantification (LOQ) was set individual on each sample. The range of the LOQ was from 0.2
to 5 µg/kg w.w. Quality assurance of organotin analyses included routine analyses of Standard

NIVA 7686-2021
34
Reference Materials and in-house reference materials. All three laboratories have participated in
Quality Assurance of Information for Marine Environmental Monitoring in Europe (QUASIMEME)
international intercalibration exercises of organotin analyses with acceptable results Green et
al. (2017).
Analysis of perfluorinated alkylated substances (PFAS) in blue mussel and cod liver (including
supplementary analyses of stored cod liver samples for the perioded 1990-2009) were done at
NIVA. The general procedures include extractions with solvents using ultrasonic bath before
intensive clean up and LC/MS/MS-analysis (liquid chromatography mass spectrometry) (ESI negative
mode). Since 2013, LC-qTOF (liquid chromatography quadropole time of flight) has been used for
detection and quantification. The LOQ has improved for analyses with regards to the 2016-samples
and later, primarily due to a slight modification in the method and better access to internal
standards. Previously most of the analyses were performed at NIVA, using different procedures and
instrumentation.
Siloxanes, i.e. octamethylcyclotetrasiloxane (D4), decamethylcyclopentasiloxane (D5) and
dodecamethylcyclohexasiloxane (D6) were analysed by NILU. Already established methods based on
liquid/liquid extraction (Warner et al. 2010; 2012) were used to extract and quantify siloxanes.
Biota tissues were extracted using solid-liquid extraction with a biphasic solvent system of
acetonitrile and hexane. Collected extracts from biota tissues were analysed using concurrent
solvent recondensation large volume injection gas chromatography mass spectrometry.
Stabile Isotop Analysis (SIA) is performed by first drying the samples in at least 12 hours, before
they are homogenized and incinerated at high temperature in an element analyzer. The gasses are
separated on a GC column before the isotope ration mass are demined in an isotope ratio mass
spectrometer (IRMS).
For fish, the target tissues for quantification of hazardous substances were liver and fillet (Hg only)
(Table 1), whereas for the biological effects methods (BEM) liver, blood and bile were used (cf.
Table 3). In addition, the age, sex and visual pathological state for each of the individuals was
determined. Other measurements include fish weight and length, weight of liver, liver dry weight
and fat content (% total extractable fat), the fillet dry weight and its % fat content. These
measurements are stored in the database and have been published periodically, the latest edition
in 2008 (Shi, Green, and Rogne 2008).
The shell length of each mussel was measured. On a bulk basis the total shell weight, total soft
tissue weight, dry weight and % fat content was measured. These measurements were stored in the
database and published periodically.
The dogwhelk and common periwinkle were analysed for organotin compounds (see Table 2).
2.3 Biological effects analysis
Four biological effects methods (BEM; biomarker analysis) are assessed using methods described by
ICES (see Table 2) and includes the measurement of OH-pyrene. These methods have been applied
for this investigation, as has been done in previous annual MILKYS investigations. Each method is in
theory generally indicative of one or a group of contaminants. For EROD however, some interaction
effects are known. Analysis of OH-pyrene in bile is not a measurement of biological effects, per se.
It is included here, however, since it is a result of biological transformation (biotransformation) of
PAHs and is thus a marker of PAH exposure. An overview of the methods, tissues sampled and
contaminant specificity is shown in Table 3. One of the major benefits of BEM used at the

NIVA 7686-2021
35
individual level (biomarkers) is the feasibility of integrating biological and chemical methods, as
both analyses are done on the same individual.
Table 3. The relevant contaminant-specific biological effects methods applied.
Code Name Tissue sampled Specificity
OH-pyrene Pyrene metabolite cod bile PAH
ALA-D -aminolevulinic acid dehydrase
inhibition
cod red blood cells Pb
EROD-activity Cytochrome P450 1A-activity cod liver planar PCBs/PCNs,
PAHs, dioxins
TBT Imposex/Intersex whole body organotin
Sampling for BEM-analyses is performed by trained personnel, most often under field conditions.
Analyses for ALA-D and EROD-activity requires that the target fish is kept alive until just prior to
tissue or blood sampling. The tissue samples are removed immediately after the fish are
inactivated by a blow to the head. Samples are then collected and stored in liquid nitrogen.
Analyses of a metabolite of pyrene (OH-pyrene) were done on bile samples stored at -20C.
PAH metabolites were determined at NIVA by HPLC with fluorescence detection. The method
separates individual components from each other after the phase 2 metabolites have been
deconjugated by an enzyme (i.e. both phase 1 and phase 2 metabolites, glucuronide and sulphate
are analyzed).
Analysis of imposex (in dogwhelk) and intersex (in common periwinkle) are measures of effects of
TBT, and are usually performed on fresh samples, but can be performed after the samples have
been frozen.
2.3.1 Rationale and overview
A thorough analysis and review of BEM-results has been performed twice since their inclusion in
1997 (Ruus, Hylland, and Green 2003; Hylland et al. 2009). Clear relationships were shown
between tissue contaminants, physiological status and responses in BEM parameters in cod (Hylland
et al. 2009). Although metals contributed substantially to the models for ALA-D (and also for
metallothionein (MT) included in the programme 1997-2001) and organochlorines in the model for
CYP1A activity, other factors were also shown to be important. Liver lipid and liver somatic index
(LSI) contributed for all three BEM-parameters, presumably reflecting the general health of the
fish. Size or age of the fish also exerted significant contributions to the regression models. It was
concluded that the biological effect methods clearly reflected relevant processes in the fish even if
they may not be used alone to indicate pollution status for specific stations at given times.
Furthermore, the study showed that it is important to integrate a range of biological and chemical
methods in any assessment of contaminant impacts. Through continuous monitoring, a unique BEM
time series/dataset are generated, that will also be of high value as a basis of comparison for
future environmental surveys.
Since the biological effect methods were included in the programme, there have been some
modifications of the methods in accordance to the ICES guidelines (cf. Table 2). In 2002,
reductions were made in parameters and species analysed. There have also been improvements in
the methods, such as discontinuation of single wavelength fluorescence and use of HPLC in the
analysis of bile metabolites since 2000.

NIVA 7686-2021
36
The MILKYS programme for 2020 included four biological effects methods (BEM) (cf. Table 3).
Measures of OH-pyrene and EROD-activity increase with increased exposure to their respective
inducing contaminants. The activity of ALA-D on the other hand is inhibited by contamination (i.e.,
lead), thus lower activity means a response to higher exposure.
The impact of TBT can affect the reproductive capabilities of dogwhelk and common periwinkle.
This impact is assessed when dogwhelk and the common periwinkle are analysed for imposex and
intersex1, respectively see Table 2).
2.4 Information on quality assurance
2.4.1 International intercalibrations The laboratories (NIVA and subcontractor Eurofins) have participated in the Quality Assurance of
Information for Marine Environmental Monitoring in Europe (QUASIMEME), International Food
Analysis Proficiency Testing Services (FAPAS, BIPEA), international intercalibration exercises and
other proficiency testing relevant to chemical and imposex analyses. For chemical analyses, round
2020-1 apply to the 2020-samples. The results are acceptable. These QUASIMEME exercises
included nearly all the contaminants as well as imposex analysed in this programme. The quality
assurance programme is corresponding to the analyses of the 2019 samples (cf. Green et al. 2020 –
M-1894|2020).
NIVA participated in the QUASIMEME Laboratory Performance Studies “imposex and intersex in
Marine Snails BE1” in July-September 2017. Shell height, penis-length-male, penis-length-female,
average-shell-height and female-male-ratio were measured. NIVA got the score satisfactory for all
parameters except number of females for one sample, which got the score questionable. The score
for VDSI was satisfactory for both samples tested. NIVA also participated 12.10.2021, but the score
is not reported yet.
2.4.2 Analyses of certified reference materials
In addition to the QUASIMEME exercises, certified reference materials (CRM) and in-house
reference materials are analysed routinely with the MILKYS samples. Processing and measurement
in CRM are comparable to sample matrices even though in certain cases the matrices differ. It
should be noted that for biota, the type of tissue used in the CRMs does not always match the
target tissue for analysis. Uncertain values identified by the analytical laboratory or the reporting
institute are flagged in the database. The results are also “screened” during the import to the
database at NIVA and ICES.
The laboratories used for the chemical testing are accredited according to ISO 17025:2005.
However, the PFC analysis is not accredited according to this ISO-standard.
2.5 Stable isotopes
Stable isotopes of nitrogen and carbon were analysed by the Institute for Energy Technology (IFE).
Analyses of nitrogen and carbon isotopes were done by combustion in an element analyser,
reduction of NOx in Cu-oven, separation of N2 and CO2 on a GC-column and determination of δ13C
and δ15N at IRMS (Isotope Ratio Mass Spectrometer). Stable isotope ratios were expressed in δ
notation as the deviation from standard (Ruus 2015). Abundances were expressed in notation as
parts per thousand (‰) according to the following:
1 This is the ICES tissue designation Vas Deferens Sequence Index is determined

NIVA 7686-2021
37
X = [(Rsample/Rstandard) - 1] 1000
where X is 13C or 15N and R is the corresponding ratio 13C/12C or 15N/14N. Rstandard for 13C and 15N are
the Vienna Pee Dee Belemnite (VPDB) standard and atmospheric air N2 (AIR), respectively.
2.6 Treatment of values below the quantification limit
Values below the limit of quantification (LOQ) are set to a random number between the LOQ and
half of the value of this limit for calculation for use in time trends, using the median trend over 10
replicates as the trend. This is a simplified, pragmatic approach that often has been
recommended. When most values are over LOQ, and LOQ is stable over time, this returns
reasonable results. When most values are under LOQ, no upward or downward trend are detected,
as desirable. We have previously judged this to be approximately in accordance to OSPAR protocol
(OSPAR 2013). The exact procedure in OSPAR MIME has not been used as it has been in continuous
development, and the code has not been published. However, this method is unreliable when LOQ
changes (see below), and will be replaced by a more modern statistical method in future
assessments. For “sum” variables, individual compounds below LOQ (e.g. PCB-7) have been set to
LOQ. The annual median is classified as less-than if over half of the values are below the LOQ and
is assigned the median value prefixed with a “<” sign in Appendix F. When such values are
presented in tables of the main text, then the cells are shaded, and the LOQ is shown. It should be
noted that the LOQ for the same parameter can vary within and among sets of samples if all the
conditions are not met.
Dominance of values below the LOQ could invalidate the statistical assumption behind the trend
analysis (Rob Fryer, pers. comm. CEFAS, UK). In calculating trends for this report, a time series
must have at most only one “less-than median” provided it is not the first in the series. The effect
that less-than values has on the trend analysis has not been quantified; however, the results should
be treated with caution. Furthermore, if a dataset contains values below LOQ the median takes
these as an average of ten random numbers between half the LOQ and the LOQ.
When evaluating time trends, care must be taken both when LOQs are changed and especially
when several results are below LOQ. There are several reasons for changes of LOQs, but these are
mainly a result of changing lab and/or changes in the analytical method. Traditionally, the
determination of metals is very robust, and usually the LOQs don’t change much over time. A
simple sample preparation will often give a relevant environmental LOQ for most metals assessed
against EQS and other relevant environmental criteria. For the organic pollutants there is often
higher LOQ than what is considered necessary with regards to relevant environmental guidelines
(e.g. EQS) because of technical and cost issues. To achieve the necessary low LOQs the method is
often pushed downwards, and therefore the LOQs can be dependent on the constituent of the
sample. As a result, the LOQ can vary with the sample. To achieve a stable LOQ it must be able to
account for the matrix differences and will therefore be set higher to include changes in matrices
and method variability. This has been implemented to a lesser degree in analysis of organic
environmental pollutants in organisms because of the low EQS for many pollutants. The lipid
content of the sample and the levels of blank samples are typical factors that can affect the LOQ.
For this program, there have been changes in laboratories and methods the last 10 years. In the
program period from 2012, the analytical provider was changed from NIVA to Eurofins Moss.
However, the methods were mainly the same, and only minor changes of the LOQ occurred. For
the program period (starting 2017) the organic pollutants were analysed at Eurofins GFA, leading to
discrepancies in both methods employed and LOQs. For PCBs, the LOQs were increased somewhat

NIVA 7686-2021
38
(except CB118 which was lowered). For BDE, the LOQs were mainly lowered somewhat, while for
PAHs they were increased for some of the congeners. The metal analyses were changed in 2019
where most LOQs were lowered, while for Ag the LOQ was increased.
Figure 4 gives the proportion over LOQ (detection frequency, in %) of the various compounds for
each tissue and Figure 5 gives the observed LOQ (median values) in blue mussel in the various
compounds since 2000.

NIVA 7686-2021
39
Figure 4. Proportion over LOQ (detection frequency, in %) of the compounds for each tissue.

NIVA 7686-2021
40
Figure 5. Observed LOQ (median values) in blue mussel of the various compounds since 2000. The
colors are factors vs. the latest year in the period 2010-2015, with blue colors showing
improvement (lower LOQ) and red colors showing increased LOQ. For some groups, e.g. PFAS,
there were no measurements in these years (shown in light yellow).

NIVA 7686-2021
41
2.7 Classification of environmental quality
2.7.1 EQS and PROREF
There are several systems that can be used to classify the concentrations of contaminants
observed. No system is complete in that it covers all the contaminants and target species-tissues
investigated in this programme. Up to and including 2015 investigations, MILKYS relied largely on a
national classification system prepared by the Norwegian Environment Agency (Miljødirektoratet)
as described by (Molvær et al. 1997). This system was based on high background concentrations
derived from an array of national and international monitoring programme and investigative
literature.
With the ratification of EU Water Framework Directive (WFD) (2000/60/EC 2000) by Norway in 2007
and the subsequent application of the daughter directive on Environmental Quality Standards (EQS)
(2013/39/EU 2013) the assessment of the environment using EQS became imperative. The daughter
directive outlines 45 priority substances or groups of substances. Several of these substances are
monitored by MILKYS. The EQS apply to concentrations in water, and for fifteen substances it also
applies to concentrations in biota (Table 8, Table 9). There is a provision in this daughter
directive which allows a country to develop their own EQS for water, sediment and biota provided
these offer the same level of protection as the EQS set for water. Norway used this approach and
developed their own EQS for biota, water and sediments for “river basin specific pollutants” not
otherwise accounted for by the EU directives (Direktoratsgruppen 2018).
Assessing the risk to human consumption from elevated concentrations of contaminants in seafood
has not been the task of this programme and hence, the EU foodstuff limits have not been applied.
However, it should be noted that the Norwegian Environment Agency communicates the results to
the Norwegian health authorities. However, it should be noted that the background dossiers for the
EQS (2013/39/EU 2013) as well as the national environmental quality standards
(Norwegian_Environment_Agency 2016) applied foodstuff limits if these are lower than the limits
found by assessing risk of secondary poisoning of marine organisms.
Both EU and national standards are referred to collectively in this report as EQS. Both standards
are risk-based, i.e., exceedances of EQS are interpreted as potentially harmful to the environment
and remedial action should be considered.
The application of these standards has been discussed previously (Green et al. 2016), and three
main challenges were noted. The first is that the standards for biota are generally not species or
tissue specific but refer to whole organisms. The second is that the standards are often in large
conflict with the system based on background concentrations (see Chapter 3.8.3 in Green et al.
2016). And lastly, the standards do not address all the contaminants in all the tissues that are
monitored, for example, there are no EQS for metals in biota except for Hg. To address this issue
for this report, and in dialogue with the Norwegian Environment Agency, Norwegian provisional
high reference contaminant concentrations (PROREF) were derived and used in parallel with the
risk-based standards (see method description below).
This report of the 2020-investigations addresses the principle cases primarily where median
concentrations exceeded EQS and secondarily where median concentrations exceeded PROREF
(Table 8, Table 9). Exceedances of PROREF (see derivation explained in Chapter 2.7.2) were
grouped in six factor-intervals: x, 1-2x (between PROREF and two times PROREF), 2-5x, 5-10x, 10-
20x and 20x.

NIVA 7686-2021
42
The EQS and PROREF as well as time trend analyses use concentrations on a wet weight (w.w.)
basis. The choice of basis (i.e. concentrations on a wet weight, dry weight or fat weight basis)
follows the OSPAR approach aimed at meeting several considerations: scientific validity, uniformity
for groups of contaminants for specific tissues and a minimum loss of data. As to the latter, the
choice of basis will affect the number of data that can be included in the assessment, depending
on available information on dry weights, wet weights and lipid weights.
2.7.2 Derivation of PROREF
The MILKYS programme (and its forerunners) have monitored an extensive list of contaminants
along the coast in both impacted and less impacted areas since 1981. The results from this
programme have generated over 400 000 analyses on concentrations of over 100 contaminants in
biota alone. Most of the data concern blue mussel and cod which are the two key monitoring
species for MILKYS. This unique dataset provides a good basis for determining of Norwegian
provisional high reference contaminant concentrations (PROREF) of contaminants mostly in areas
presumed remote from point sources of contamination, and thus provides a valuable method of
assessment of levels of contaminants along the coast of Norway both in impacted and less
impacted areas in addition to EQS.
The derivation of PROREF is derived entirely from MILKYS data. It has two basic steps: the selection
of stations to be used and the calculation of PROREF. The following outlines the approach:
1. Selection of reference stations:
a. Only data from 1991 to 2016 were considered (25 years) on the general assumption
that prior to this time important discharge reductions were not in place.
b. Annual median concentrations were determined for each combination of
contaminant, station, species, tissue and basis (e.g. wet weight).
c. The highest 10 % of these medians were discarded for each station; as this was
considered a reasonable limit to remove medians which had substantially higher
concentrations than other years.
d. In order to get a robust set of stations, we considered only stations which had at
least five years of data, counting only years with at least two analysed samples for
blue mussel stations and 10 analysed samples for cod stations. I.e., we allowed for
some deviance from standard sample size, which according to present procedures
is three for blue mussel and 15 for cod.
e. The stations were ordered by concentration from the lowest to the highest based
on the median of the annual medians.
f. Values below the limit of quantification (LOQ) were set to a random value between
half the LOQ and the LOQ.
g. The station with the lowest concentration was compared to the station with the
next lowest using a t-test where the log-transformed annual medians were used to
determine the variance at the station.
h. If the two stations were not statistically different, these data were compared to
the third lowest station, and this process continued until a significant difference
was noted.
i. All stations that were not statistically different formed the group of reference
stations for a unique combination for contaminant, species, tissue and basis.
2. Application of raw data:
j. All the raw data from the reference stations for the unique combination of
contaminant, species, tissue and basis for the period 1991-2016 were used.
k. PROREF was defined as the upper 95 percentile.

NIVA 7686-2021
43
The upper 90 % and 95 % confidence limits as well as the upper 90 percentile were also calculated.
The upper 95 percentile was consistently higher that the other three limits.
It should be noted that the selection of reference stations can vary depending on the combination
of contaminant, species, tissue and basis. PROREF were also calculated for cod length normalized
to 50 cm.
An overview of the PROREF applied in this report is shown in Appendix C, and a summary
comparing PROREF with the existing EQS and the national classification system used in previous
reports is shown in Table 4. PROREF values were adjusted slightly for the previous report to ensure
that the values used are exclusively from the MILKYS programme. In only four cases did the revised
PROREF lead to a difference of over 20 % and only restricted to blue mussel: 32 and 38 % lower for
As and anthracene, respectively, and 46 and 47 % higher for PCB-7 and BDE6, respectively (Table
4, Appendix C).
In this report assessment of the change in PROREF from 2019 to 2020 is based on the revised
PROREF values. Hence, as a precautionary measure, comparison to PROREF values used previously
(Green et al. 2018) should be avoided.
For this report, 177 PROREF values are defined based on 1 to 29 stations and 1 to 4071 values. For
example, following the procedure outlined above, we were left with only one station to determine
PROREF for, inter alia, TBT and sum carcinogen PAHs (KPAH) in blue mussel and, inter alia, Hg,
PCB-7, BDE6, HBCDA, PYR10 and ALAD in cod. PROREF could not be calculated for three PCBs (PCB-
81, PCB-126 and PCB-169) and PFAS in blue mussel and perfluoroundecanoic acid (PFUdA) in cod
liver because the data did not meet criteria “d” above.
As described above, once the stations to be used as reference are determined, the raw data was
used from these stations to determine the PROREF. Hence it is not only the number stations but
also the variance within each station that can have an influence on PROREF. Concentrations of
individual compounds can, but not always, vary more than a sum that includes the individual
compound, which can lead to a PROREF of a single compound to be considerably higher than the
PROREF of a sum where it is included. A case in point is for the carcinogen PAH BGHIP in blue
mussel which has a PROREF of 2.07 µg/kg w.w. This value is the upper 95 percentile of all 254
BGHIP-concentrations on a wet weight basis from seven stations (98A2, 0123, I304, I306, I307, I913,
and 71A) since 1991 (Appendix C). Whereas the PROREF for the sum of carcinogen PAHs (KPAH) in
blue mussel is 0.62 µg/kg w.w., which is based on only 17 KPAH-concentrations from one station
(98A2) and which is considerably lower than the PROREF for BGHIP.
Thirty-two PROREF values could be compared to 23 EQS. PROREF was lower than EQS in 20 cases
(including some PAHs and PBDEs).
This is the fourth annual MILKYS report where PROREF values have been applied. PROREF values
should be periodically reviewed in the light of further monitoring, the results from reference
localities and introduction of new analytical methods, and/or units.

NIVA 7686-2021
44
Table 4. Overview of Norwegian provisional high reference contaminant concentration (PROREF) used in this report for the stations from which PROREF was derived
(in w.w.). Also shown are the Environmental Quality Standards (EQS) for “biota” 1 (2013/39/EU 2013) and national environmental quality standards 2
(Norwegian_Environment_Agency 2016) (these two are collectively referred to as EQS). The number of stations and the total number of values that were used to
determine PROREF are indicated. The yellow indicates where PROREF has increased or decreased over 20 %, and green and pink cells indicate where PROREF is below
or above the EQS, respectively. (See complete list of PROREF used in this report in Appendix C).
Parameter code
Species Tissue Reference stations Station count
Value count Unit on wet
weight. basis
PROREF-2019 PROREF-2017 PROREF-2017
/ PROREF-2019
EQS EQS/
PROREF-2019
As Mytilus edulis Soft body 31A,I301,I023,30A,I712 5 116 mg/kg 2.503 3.3150 1.3247
Hg Mytilus edulis Soft body 36A,46A,10A2 3 137 mg/kg 0.012 0.0100 0.8197 0.020 1.6393
PCB-S73 Mytilus edulis Soft body 10A2,41A,11X,98A2,64A,97A2 6 194 µg/kg 1.157 0.4891 0.4228 0.6004 0.5187
DDE Mytilus edulis Soft body 43A,41A,10A2,11X 4 147 µg/kg 0.224 0.2240 1.0000 610.0005 2 723.2143
HCB Mytilus edulis Soft body 48A,43A,15A,22A,46A,41A,98A2,11X,30A,10A2,36A 11 473 µg/kg 0.100 0.1000 1.0000 10.000 100.0000
HBCDA Mytilus edulis Soft body I023,97A2,91A2 3 44 µg/kg 0.110 0.1099 1.0000 167.000 1 520.2549
BDE67 Mytilus edulis Soft body 98A2,26A2,91A2,71A,I023,97A2,30A 7 109 µg/kg 0.408 0.1900 0.4657 0.009 0.0208
BDE47 Mytilus edulis Soft body 98A2,26A2,71A,I023,91A2,30A 6 94 µg/kg 0.171 0.1410 0.8270 0.0098 0.0499
SCCP Mytilus edulis Soft body I023,71A,91A2,97A2,26A2,30A 6 90 µg/kg 20.260 20.2600 1.0000 6 000.000 296.1500
MCCP Mytilus edulis Soft body I023,26A2,71A,91A2,97A2,30A 6 89 µg/kg 87.600 87.6000 1.0000 170.000 1.9406
ANT6 Mytilus edulis Soft body 98A2,I131A,I307,I915,I913,71A 6 208 µg/kg 0.800 1.1000 1.3750 2 400.000 3 000.0000
BAA6 Mytilus edulis Soft body I023,98A2 2 32 µg/kg 1.490 1.4900 1.0000 300.000 201.3423
BAP6 Mytilus edulis Soft body 98A2,I307,I131A,I306,I304,30A,I913 7 354 µg/kg 1.200 1.3000 1.0833 5.000 4.1667
FLU6 Mytilus edulis Soft body 98A2,I023 2 32 µg/kg 5.350 5.3500 1.0000 30.000 5.6075
NAP6 Mytilus edulis Soft body I023,98A2,71A 3 47 µg/kg 17.300 17.3000 1.0000 2 400.000 138.7283
TBT Mytilus edulis Soft body 11X 1 20 µg/kg 7.107 7.1065 1.0000 150.000 21.1074
TBT Nucella lapillus Soft body 11G,131G,15G,98G 4 66 µg/kg 23.540 23.5350 0.9998 150.000 6.3721
PCB-7 Gadus morhua Liver 98B1,10B,92B,43B 4 1229 µg/kg 614.000 614.0000 1.0000 0.600 0.0010
DDE Gadus morhua Liver 23B,10B,98B1 3 1498 µg/kg 160.750 160.7500 1.0000 610.0005 3.7947
HCB Gadus morhua Liver 36B,53B 2 1079 µg/kg 14.000 14.0000 1.0000 10.000 0.7143
4-N-NP Gadus morhua Liver 80B,43B2 2 135 µg/kg 131.000 131.0000 1.0000 3 000.000 22.9008
4-N-OP Gadus morhua Liver 43B2,80B 2 135 µg/kg 23.500 23.5000 1.0000 0.004 0.0002
4-T-NP Gadus morhua Liver 43B2,80B 2 135 µg/kg 240.900 240.9000 1.0000 3 000.000 12.4533
HBCDA Gadus morhua Liver 43B2 1 65 µg/kg 7.000 7.0000 1.0000 167.000 23.8571
BDE67 Gadus morhua Liver 98B1 1 173 µg/kg 19.882 19.8800 0.9999 0.009 0.0004
BDE47 Gadus morhua Liver 98B1,36B,23B 3 557 µg/kg 16.000 16.0000 1.0000 0.0098 0.0005
SCCP Gadus morhua Liver 23B,43B2,80B 3 245 µg/kg 154.000 154.0000 1.0000 6 000.000 38.9610
MCCP Gadus morhua Liver 23B,43B2 2 174 µg/kg 392.800 392.8000 1.0000 170.000 0.4328
PFOA Gadus morhua Liver 43B2,13B,80B,53B,36B,98B1,23B,30B 8 1289 µg/kg 10.000 10.0000 1.0000 91.000 9.1000
PFOS Gadus morhua Liver 43B2,80B 2 251 µg/kg 10.250 10.2500 1.0000 9.100 0.8878
Hg Gadus morhua Fillet 10B 1 504 mg/kg 0.056 0.0600 1.0714 0.020 0.3571

NIVA 7686-2021
45
1) Environmental Quality Standard (EQS) as derived from 2013/39/EU and compounds and national environmental quality standards as derived from Arp et al. (2014) and modified by the Norwegian Environment Agency and finalized (Norwegian_Environment_Agency 2016). EQS concern fish unless otherwise stated. An alternative biota taxon or another matrix may be monitored instead as long as the EQS applied provides an equivalent level of protection. 2) The contaminants for which the national environmental quality standards apply are termed in the EU system as “river basin specific pollutants”. 3) Sum of PCB congeners 28, 52, 101, 118, 138, 153 and 180. 4) In Norwegian Environment Agency report (2016) the EQS is 1 µg/kg wet weight, but this was adjusted down to 0.6 (Direktoratsgruppen vanndirektivet, 2018) and is in line with Arp et al. (2014) (Miljødirektoratet, pers. comm. 16th June 2017). 5) For the present study the same limit was applied to DDE (p,p DDE). 6) Applies to Crustaceans and molluscs. (Monitoring of these PAHs not appropriate for fish). Benzo(a)pyrene is considered a marker for other PAHs (2013/39/EU). 7) Sum of BDE congener numbers 28 (tri), 47 (tetra), 99 (penta), 100 (penta), 153 (hexa) and 154 (hexa). 8) Not official EQS for BDE47, but this PBDE is often the most dominant BDE.

NIVA 7686-2021
46
Proposed background assessment criteria (BAC) for EROD, OH-pyrene and VDSI (OSPAR 2013) were
used to assess the results (Table 5).
Table 5. Assessment criteria for biological effects measurements using Background Assessment
Criteria (BAC) and Ecotoxicological Assessment Criteria (EAC) (OSPAR 2013). Note that Assessment
criteria have specifically been compiled for the assessment of CEMP monitoring data on hazardous
substances. They do not represent target values or legal standards (OSPAR 2009).
Biological effect Applicable to: BAC EAC Units, method
EROD cod liver 145 - p mol/min/ mg microsomal protein
OH-pyrene cod liver 0.8* - ng/ml; HPLC-F
VDSI dogwhelk 0.3 2
*) Values in this report are normalized and the unit of the assessment criterion is ng/ml, without normalization to
absorbance at 380 nm. Normalization in this investigation reduced the BAC from 21 to 0.8 ng/ml or by a factor of about 27.
2.8 Statistical time trend analysis – the model approach
A simple model approach has been developed within OSPAR and ICES to study time trends for
contaminants in biota based on median concentration (ASMO 1994). The method has been applied
to Norwegian data and results are shown in Appendix F. The results can be presented as shown in
Figure 6. It should be noted that this robust method has been developed so that it could provide a
rough guide to possible trends in the OSPAR region. Further investigation is necessary to better
understand the factors affecting a particular trend. This may lead to different conclusions. As an
exercise in this respect the times series for Hg in cod fillet from the Inner Oslofjord were examined
more closely (Green et al. 2015).
The model approach uses a Loess1 smoother based on a running six-year interval where a non-
parametric curve is fitted to median log-concentration as defined by Nicholson et al. (1991; 1994;
1997) with revisions (Fryer and Nicholson 1999). The concentrations are on the preferred basis of
wet weight as mentioned above. Supplementary analyses were performed on a dry weight basis for
blue mussel data and lipid weight basis for chlororganic contaminants in blue mussel and fish liver
(see Appendix F). Since some contaminants (e.g. Hg) have tendency to bioaccumulate,
supplementary analyses were performed on concentrations in cod normalized to 50 cm length (as a
proxy for age). For statistical tests based on the fitted smoother to be valid, the contaminants
indices should be independent to a constant level of variance and the residuals for the fitted
model should be log-normally distributed (Nicholson, Fryer, and Larsen 1998). A constant of +1 was
added to VDSI data prior to log transformation to enable analysis of observations that were equal
to zero.
An estimate was made of the power of the temporal trend series expressed as the percent change
that the test is able to detect. The power is based on the percentage relative standard deviation
(RLSD) estimated using the robust method (ASMO 1994), (Nicholson, Fryer, and Larsen 1998). The
estimate was made for series with at least five years of data.
The assessment method used up to and including the 2011 investigation, have differed slightly from
the method now employed by OSPAR. Before a linear trend for the whole time series period was
tested whereas now OSPAR currently uses linear or non-linear tests, based on the number of years
of data with at least one non-censored measurement (i.e. >LOQ, denoted N+). If N+ is 5-6, a linear
trend is tested, if N+ is ≥7, one tests whether there is a significant difference in the smoothed
annual concentration at the beginning of the time series compared the smoothed annual
1 Derived from the term “locally weighted scatter plot smooth”, e.g. used in linear regression.

NIVA 7686-2021
47
concentration at the end of the time series. This report presents an assessment in line with the
current OSPAR approach. The smoothed values were determined for the whole time series. The
whole time series is termed in this report as a long-term trend. The smooth values were also used
as a basis for assessing the trend for the last 10 years of the series, which is referred to in this
report as short-term or recent trend. Be aware that a series may have gaps and short-term trend
may not necessarily include data for 2020. Time series is truncated from the left (omitting early
years) until (1) at least 50 % of the years should have at least one non-censored measurement, and
(2) the first year has at least one non-censored measurement. If the measurements in the most
recent year(s) of the time series are all <LOQ, then the expected concentration in the most recent
year(s) is assumed to be constant.
The term “significant” refers to the results of a statistical analysis at 0.05 significance level used
for detecting differences between the beginning and the end of the time series and can be found in
the tables in Appendix F. In this appendix the statistical significance (p) is given as well as the
annual detectable change (%) that can be detected with statistical probability of 90 % (power) in
two-sided testing with a 10 % significance level (alpha). It can be noted that difference between
significant and not-significant trends is not always readily evident in a figure.
As described in chapter 2.6, 10 upward short-term trends for PCB-7 and one upward short-term
trend for Ag in blue mussel were caused by methodical (artificial) results due to higher limits of
quantifications (LOQ). For each CB parameter, we defined robust increases as increase when there
are at least two years among 2017-2020 that has >50% over LOQ. For each station, we defined
robust PCB-7 increase as having three parameters with robust increase. In addition, we checked
whether there was significant short-term increase of the sum of the medians of CB118, CB138 and
CB153, using only years when all three had ≥50% concentrations over LOQ. The two stations
Vågsvåg (st. 26A2) and Gressholmen (st. 30A) satisfied both criteria for a robust increase.
No attempt has been made to compensate for differences in size groups or number of individuals of
blue mussel or fish in the present study. However, investigations prior to 2007 showed significant
differences between “small” and “large” fish. With respect to blue mussel, there is some evidence
that concentrations do not vary significantly among the three size groups employed for the present
study (i.e. 2-3, 3-4 and 4-5 cm) (WGSAEM 1993).
The statistical analysis of time trends was carried out on all the results, including those for
biological effects parameters. These analyses as well as the figures similar to that shown in Figure
6 were performed using R Statistical Software (R-Core-Team 2021) version 4.0.2 with the packages
nlme (nonlinear mixed effects, version 3.1-148) and mgcv (Generalized Linear Models including
Generalized Additive Models and Generalized Additive Mixed Models, version 1.8-31).

NIVA 7686-2021
48
Figure 6. Example of time series (Hg in cod fillet from the Inner Oslofjord, st. 30B) that shows
the median concentration (dots), running mean of median values (Loess smoother – thick black
line) and 95 % confidence intervals surrounding the running mean (grey zone). A horizontal thick
red line indicates the Environmental Quality Standard (EQS) if it can be applied and if it can be
shown on the scale of concentration provided. A red dot indicates that the median value is above
the EQS, a blue dot indicates that the value is below the EQS (not shown in the example figure),
and a grey dot (not shown in the example figure) indicates that EQS can not be applied. The
horizontal dashed grey lines indicate the lower boundaries relative to PROREF1; where, in addition
to values below PROREF, exceedances are indicated, by a factor of: 1-2, 2-5, 5-10, 10-20 and
greater than 20 (the latter three categories are not shown in the example figure). Note that
PROREF can vary depending on species, tissue and contaminant. A light blue triangle (see for
example Figure 60 B) indicates that the median was below the LOQ. A summary of the trend
analyses is indicated on time series with five or more years and the results, left side of the slash
“/” (i.e. long-term trend which means the entire time series), are indicated by an upward () or
downward () arrow where significant trends were found, or a zero () if no trend was detected.
Where there was sufficient data, a time series analysis was performed for the last ten-year for
the period 2011-2020 (short-term or recent trend) and the result is shown on the right side of the
slash. A small filled square (▪) (not shown in the example figure) indicates that chemical analysis
has been performed, but data either were insufficient to do a trend analysis or was not
presented. Results marked with a star () (not shown in the example figure) indicate that there
is insufficient data above the quantification limit (LOQ) to perform a trend analysis. Note that
scales for the x axis and y axis can vary from figure to figure.
2.9 Other statistical analyses
Specific analyses to test the differences between stations or years were done on the statistical
package R using the non-parametric Tukey-Kramer HSD (Honestly Significant Difference). A
significance level of = 0.05 was chosen.
Statistical analyses (linear regression) on stable isotope data were performed using R software
version 4.0.2 with the packages nlme (version 3.1-148) and mgcv (version 1.8-31). A significance
level of = 0.05 was chosen.
1 PROREF related boundaries are in grey tones and not coloured so as not to be mistaken for color codes applied by Molvær
et al. (1997 – TA-1467/1997) in previous reports.

NIVA 7686-2021
49
2.10 Note on presentation of contaminant tables
Summaries of the results for some organic contaminants are presented in 10 to Table 11. These
tables provide some extensive details and warrant explanation. Some of the analyses, especially of
the “new” contaminants (e.g. HBCD, SCCP/MCCP, BPA and TBBPA), revealed a vast number of
results that are below the limit of quantification (LOQ). This resulted in a number of median values
below the LOQ. It was considered added-value to convey some information about the
concentrations that were quantifiable even though the median was below the LOQ. To achieve
this, Detectable data information (D.d.i.) was introduced. D.d.i. shows the count of concentrations
above the LOQ and the minimum and maximum of these values.
An extract from Table 12 is shown below in Table 6 in regards to the PBDE compound BDE28. With
respect to “Count”, the first number indicates the number of individuals or pooled samples that
were analysed. For example, for blue mussel from Gressholmen three samples were analysed and
all three were pooled samples, and the maximum number of individual mussels that went into the
pooled sample was 50. For cod liver from the Inner Oslofjord there were 12 samples whereof seven
were pooled with a maximum of six fish livers in each pool. This means that analyses were done on
five individual cod (12-7=5). Note that the values for median (“Med.”) and standard deviation
(“S.d.”) are rounded, and for example “0.000” represents a number greater than zero but less than
0.0005. The “D.d.i.” for eider blood from Breøyane is blank and indicates that none of the 15
values were above LOQ, whereas for blue mussel from Gressholmen, the D.d.i. indicates that two
of the three samples had concentrations of BDE28 above LOQ (0.001 µg/kg w.w.). Note that when
a dataset contains values below LOQ, the median takes these as an average of ten random numbers
between half the LOQ and the LOQ (see Chapter 2.6).
Table 6. Example table – extract from Table 12. Count indicates number of samples analysed in
2020. The first number within the parentheses indicates the number of pooled samples included.
The second number within the parentheses indicates the maximum number of individuals used in
any one of the pooled samples. Shaded cells indicate that the median (Med.) was the limit of
quantification (LOQ) and value shown in these cells is this limit. The standard deviation (S.d.) is
based on all values and where values below the LOQ are taken as half. Detectable data
information (D.d.i.) indicates the number of data above the LOQ (if any) and the numbers within
the square brackets indicate the minimum and maximum values in this category. (See text for
more detail).
Component Count BDE28
Species and sampling locality 2020 Med. S.d. D.d.i
Blue mussel
Gressholmen, Inner Oslofjord (st. 30A) 3 (3-50) 0.001 0.000 2 [0.001-0.001]
Tjøme, Outer Oslofjord (st. 36A1) 3 (3-50) 0.001 0.000 1 [0.001]
Cod, liver
Inner Oslofjord (st. 30B) 12 (7-6) 0.298 0.135 12 [0.11-0.6]
Tjøme, Outer Oslofjord (st. 36B) 15 (4-2) 0.198 0.209 15 [0.01-0.74]
Eider, blood
Breøyane, Kongsfjorden, Svalbard (st. 19N) 15 (0-1) 0.006 0.015 0 [n.a.]
Eider, egg
Breøyane, Kongsfjorden, Svalbard (st. 19N) 15 (0-1) 0.006 0.002 1 [0.01]

NIVA 7686-2021
50
3. Results and discussion
3.1 General information on measurements
3.1.1 Levels and temporal trends of contaminants
This report describes findings from monitoring activities conducted as part of MILKYS in 2020. A
selected set of the contaminants (or groups of contaminants) monitored in biota as part of this
monitoring programme is shown in Table 7. A summary of levels and trends for the selected
contaminants and effects in blue mussel, dogwhelk, common periwinkle, cod, flounder and
common eider along the coast of Norway in 2020 is shown in Table 8 and Table 9, respectively.
Details on trend analyses are shown in Appendix F. These results include a total of 3259 data sets
(contaminant1-station-species-tissue) for 176 individual chemical substances. Of these substances,
30 have been selected for particular review in this report. Unless otherwise stated assessment of
trends in the text below refer to long-term trends, i.e. for the whole sampling period2, whereas a
short-term trend refers to the analysis on data for the last 10 years, i.e. 2011-2020 and can also be
referred to as recent trend.
Assessment of levels and short-term trends were performed on a selection of 30 contaminants or
their effects (VDSI/ISI), a total of 739 data series3 for the 2020 data (Table 7). Of the 739 cases,
380 cases could be classified against EQS; 264 (35.7 %) were below the EQS and 116 (15.7 %) were
above the EQS (Figure 7 A, Figure 8 A). For 359 (48.6 %) cases, there are no EQS. Of the 739
cases, 644 could be compared to PROREF, and of these 447 (69.4 %) were below PROREF. The
remaining 197 (30.6 %) cases exceeded PROREF: 105 (16.3 %) by a factor of less than two, 57
(8.9 %) by a factor between two and five, 30 (4.7 %) by a factor between five and 10, three (0.5 %)
by a factor between 10 and 20, and two (0.3 %) by a factor greater than 20 (Figure 7 B, Figure 8
B). Of the 739 data series, significant short-term trends were registered in 96 cases: 67 (9.1 %)
were downward trends and 29 (3.9 %) were upwards (Figure 7 C). The downward trends were
primarily associated with metals, HBCDA and BDEs (Figure 8 C). The upward trends were mainly
associated with metals.
The primary focus in this report has been on identifying which of the 30 selected contaminants and
biomarkers had a median concentration in 2020 that exceeded the EQS. The report secondarily
focused on those contaminants where the Norwegian provisional high reference contaminant
concentration (PROREF) was exceeded, and where significant upward trends were found. To a
lesser extent, the report addressed those cases where no significant trends were found or
significant downward trends were found, as well as those cases where median concentrations in
2020 were below PROREF in combination with significant upward trends. An overview of trends,
classifications and median concentrations is presented in Appendix F. The results are presented by
classes and with results for observed trend analyses. The results were also assessed against EQS
(2013/39/EU 2013), (Norwegian_Environment_Agency 2016).
A summary of the results when assessed by EU EQS (2013/39/EU 2013) and supplemented with
national environmental quality standards (Norwegian_Environment_Agency 2016) is presented in
Appendix C.
1 In this regard «contaminants» include inter alia results from biological effects methods, stable isotopes and some
biological co-variables. 2 This can be as early as 1981 but can vary depending on the station, species-tissue and contaminant. 3 Consisting of one or more annual medians contrasting earlier reports which tallied only datasets of five or more annual
medians.

NIVA 7686-2021
51
Table 7. Selection of 30 contaminants/Biological Effect Methods (BEM) and number of time series
assessed for each target species-tissue. The specific results are shown in Table 9.
Environmental contaminants /Biomarker
Abbreviation
Blu
e m
uss
el
Peri
win
kle
Dogw
helk
Cod,
liver
Cod,
fillet
Flo
under,
liv
er
Flo
under,
fille
t
Eid
er,
blo
od
Eid
er,
egg*
TO
TA
L
Ag Silver 25 1** 17 1 1 1 46
Cd Cadmium 25 1** 17 1 1 1 46
Co Cobalt 25 1** 17 1 1 1 46
Cr Chromium 25 1** 17 1 1 1 46
Total-Hg Mercury, inorganic and organic 26 1** 17 1 1 1 47
Ni Nickel 25 1** 17 1 1 1 46
Pb Lead 25 1** 17 1 1 1 46
PCB-7 Sum of PCB congeners 28+52+101+118+138+153+180 24 16 1 1 1
43
DDE p,p'-DDE (a DDT metabolite) 15 1** 7 1 24
HCB Hexachlorobenzene 14 1** 7 1 1 1 25
HBCDA −hexabromocyclododecane 11 13 1 1 26
BDE-6 Sum of PBDE congeners 28+47+99+100+153+154 11 11 1 1
24
BDE47 PBDE congener 47 11 11 1 1 24
BDE100 PBDE congener 100 11 11 1 1 24
BDE209 PBDE congener 209 11 11 1 1 24
SCCP Short-chain chlorinated Paraffins (C10-C13) 11 13 1 1
26
MCCP Medium-chain chlorinated Paraffins (C14-C17) 11 13 1 1
26
PAHs*** Sum nondicyclic PAHs 7 1** 8
ANT Anthracene 7 1** 8
BAA Benzo[a]anthracene 7 1** 8
B[a]P Benzo[a]pyrene 7 1** 8
FLU Fluoranthene 7 1** 8
NAP Naphthalene 7 1** 8
PFOA Perfluorooctanoic acid 6 10 1 1 18
PFOS Perfluorooctanesulfonic acid 6 10 1 1 18
PFOSA Perfluorooctanesulfonamide 6 10 1 1 18
TBT Tributyltin (formulation basis) 7 1 8 16
TPhT Triphenyltin 7 1 8 16
VDSI/ISI**** Vas Deferens Sequence Index/ Intersex Index 1 8
9
D5 Decamethylcyclopentasiloxane 5 1 1 7
TOTAL 380 18 24 250 17 9 1 20 20 739 *) Homogenate of yolk and albumin. **) Extra analysis of common periwinkle in 2020. ***) For this report the total is the sum of tri- to hexacyclic PAH compounds named in EPA protocol 8310 minus naphthalene (dicyclic)-totalling 15 compounds (see Appendix B). ****) VDSI/ISI is referred to as VDSI in tables and figures.

NIVA 7686-2021
52
A
B
C
Figure 7. Percent of samples (station-species-tissue) in 2020 exceeding EQS (A), in different
categories relating to Norwegian provisional high reference contaminant concentration (PROREF)
(B) and relating to the results from short-term trend analyses for 30 selected
contaminants/Biological Effect Methods (BEM) (C). For blue mussel, 10 upward short-term trends
for PCB-7 and one upward short-term trend for Ag are caused by methodical (artificial) results, as
described in chapter 2.6. These are included in this overview figure (C) and are marked by a star
(*). Details can be seen in Table 9.

NIVA 7686-2021
53
A B C
Figure 8. Count of samples (station-species-tissue) in 2020 exceeding EQS (A), in different
categories relating to Norwegian provisional high reference contaminant concentration (PROREF)
(B) and relating to the results from short-term trends (C) for each of the 30 selected
contaminants/Biological Effect Methods (BEM) (including results from the common eider, cf.
Table 7 (see Appendix B for description of chemical codes). For blue mussel, 10 upward short-
term trends for PCB-7 and one upward short-term trend for Ag are caused by methodical
(artificial) results, as described in chapter 2.6. These are included in this overview figure (C) and
are marked by a star (*). Details can be seen in Table 9.

NIVA 7686-2021
54
Table 8. Assessment of levels of median concentrations of contaminants with respect to EQS (priority
substances* and river basin specific pollutants**) and PROREF in samples collected in 2020 in six species:
blue mussel, cod, flounder, eider duck, common periwinkle and dogwhelk. Tissues***: soft body (for blue
mussel, dogwhelk and common periwinkle), liver*** (cod and flounder except for Hg***), fillet (cod and
flounder, Hg), blood (eider duck) and eggs (eider duck). The grey-shade coding refers to exceedances of
Norwegian provisional high reference contaminant concentration (PROREF): below PROREF (clear) or
exceeding PROREF by a factor of: 1-2, 2-5, 5-10, 10-20 or greater than 20 (see Appendix C). Blue-filled
circles indicate that the EQS was not exceeded and red-filled circles indicate that the EQS was
exceeded. The EQS are set by the Water Framework Directive (WFD), cf. Environmental Quality Standard
Directive (2013/39/EU 2013) or national quality standards (*) by Norwegian Environment Agency (2016)
for hazardous substances in “biota”. Abbreviations for contaminants can be seen in Appendix B.
***In cod and flounder, Hg measured in fillet
Station name Species Tissue***
HG
* *
**
PC
B-7
**
DD
EPP
*
HC
HG
*
HB
CD
A*
BD
E6*
BD
E47
SCC
P*
MC
CP
*
AN
T*
BA
A*
*
BA
P*
FLU
*
NA
P*
PFO
A*
PFO
S*
TBT*
TPh
T*
D5
*
HC
B*
QC
B*
Gressholmen, Inner Oslofjord (st. 30A) Blue mussel Soft body
Akershuskaia, Inner Oslofjord (st. I301) Blue mussel Soft body
Gåsøya, Inner Oslofjord (st. I304) Blue mussel Soft body
Solbergstrand, Mid Oslofjord (st. 31A) Blue mussel Soft body
Færder, Outer Oslofjord (st. 36A) Blue mussel Soft body
Singlekalven, Hvaler (st. I023) Blue mussel Soft body
Kirkøy, Hvaler (st. I024) Blue mussel Soft body
Bjørkøya, Langesundfjord (st. 71A) Blue mussel Soft body
Risøy (st. 76A2) Blue mussel Soft body
Lastad, Søgne (st. I131A) Blue mussel Soft body
Odderøya, Kristiansand harbour (st. I133) Blue mussel Soft body
Gåsøya-Ullerøya, Farsund (st. 15A) Blue mussel Soft body
Kvalnes, Mid Sørfjord (st. 56A) Blue mussel Soft body
Krossanes, Outer Sørfjord (st. 57A) Blue mussel Soft body
Utne, Outer Sørfjord (st. 64A) Blue mussel Soft body
Vikingneset, Mid Hardangerfjord (st. 65A) Blue mussel Soft body
Espevær, Outer Bømlafjord (st. 22A) Blue mussel Soft body
Nordnes, Bergen harbour (st. I241) Blue mussel Soft body
Vågsvåg, Outer Nordfjord (st. 26A2) Blue mussel Soft body
Ålesund harbour (st. 28A2) Blue mussel Soft body
Ørland area, Outer Trondheimsfjord (st. 91A2) Blue mussel Soft body
Mjelle, Bodø area (st. 97A2) Blue mussel Soft body
Bodø harbour (st. 97A3) Blue mussel Soft body
Svolvær airport area (st. 98A2) Blue mussel Soft body
Skallnes, Outer Varangerfjord (st. 10A2) Blue mussel Soft body
Brashavn, Outer Varangerfjord (st. 11X) Blue mussel Soft body
Inner Oslofjord (st. 30B) Cod Liver
Tjøme, Outer Oslofjord (st. 36B) Cod Liver
Kirkøy, Hvaler (st. 02B) Cod Liver
Stathelle area, Langesundfjord (st. 71B) Cod Liver
Kristiansand harbour area (st. 13B) Cod Liver
Skågskjera, Farsund (st. 15B) Cod Liver
Inner Sørfjord (st. 53B) Cod Liver
Bømlo, Outer Selbjørnfjord (st. 23B) Cod Liver
Bergen harbour area (st. 24B) Cod Liver
Ålesund harbour area (st. 28B) Cod Liver
Trondheim harbour (st. 80B) Cod Liver
Sandnessjøen area (st. 96B) Cod Liver
Austnesfjord, Lofoten (st. 98B1) Cod Liver
Tromsø harbour area (st. 43B2) Cod Liver
Hammerfest harbour area (st. 45B2) Cod Liver
Kjøfjord, Outer Varangerfjord (st. 10B) Cod Liver
Svalbard (st. 19B) Cod Liver
Sande, Mid Oslofjord (st. 33F) Flounder Liver
Breøyane (st. 19N) Eider duck Egg
Breøyane (st. 19N) Eider duck Blood
Fugløyskjær, Outer Langesundfjord (st. 71G) Periwinkle Soft body
Færder, Outer Oslofjord (st. 36G) Dogwhelk Soft body
Risøya, Risør (st. 76G) Dogwhelk Soft body
Lastad, Søgne (st. 131G) Dogwhelk Soft body
Gåsøya-Ullerøya, Farsund (st. 15G) Dogwhelk Soft body
Melandsholmen, Mid Karmsundet (st. 227G) Dogwhelk Soft body
Espevær, Outer Bømlafjord (st. 22G) Dogwhelk Soft body
Svolvær airport area (st. 98G) Dogwhelk Soft body
Brashavn, Outer Varangerfjord (st. 11G) Dogwhelk Soft body

NIVA 7686-2021
55
Table 9. Assessment of levels and trends of median concentrations of 30 selected contaminants/Biological Effect Methods (BEM) with respect to the Norwegian
provisional high reference contaminant concentration (PROREF) in samples collected in 2020 in six species: blue mussel, cod, flounder, eider, common periwinkle and
dogwhelk. Tissues: soft body (for blue mussel, dogwhelk and common periwinkle), liver (cod except for Hg) and fillet (cod for Hg). The colour coding indicate to what
degree the measured levels exceed PROREF, with levels below PROREF indicated in white and levels exceeding PROREF by a factor of 1-2, 2-5, 5-10, 10-20 or greater
than 20 highlighted in shades from light grey to black (see also Appendix C). For biota, trend analyses were done on time series with data from five or more years. An
upward () or downward () arrow indicates statistically significant trends, whereas a zero () indicates no trend. A small filled square (▪) indicates that chemical
analysis was performed but the results were insufficient to do a trend analysis. Results marked with a star () indicate that there is insufficient data above the
quantification limit (LOQ) to perform a trend analysis. Methodical (artificial) results, as described in chapter 2.6, are marked both with parentheses and a star (()).
The result from the trend analysis for the entire time series (long-term) is shown to the left of the slash “/”, and the result for the last 10 years (short-term) is shown
to the right of the slash. The results for the length-adjusted trend analyses (concerns only cod) are not shown. (See Appendix B for description of chemical codes).
Abbreviations for contaminants can be seen in Appendix B. For common periwinkle, ISI and not VDSI was measured.
Station name Species Tissue
AG
CD
CO
CR
HG NI
PB
PC
B-7
DD
EPP
HC
B
HB
CD
A
BD
E6
BD
E47
BD
E10
0
BD
E20
9
SCC
P
MC
CP
PA
H
AN
T
BA
A
BA
P
FLU
NA
P
PFO
A
PFO
S
PFO
SA
TBT
TPh
T
VD
SI
D5
Gressholmen, Inner Oslofjord (st. 30A) Blue mussel Soft body / ////// / /////////////// ▪/▪ ▪/▪ ▪/▪ / ▪/▪
Akershuskaia, Inner Oslofjord (st. I301) Blue mussel Soft body / ////// / // ////// / ▪/▪
Gåsøya, Inner Oslofjord (st. I304) Blue mussel Soft body / ////// / // ////// / ▪/▪
Solbergstrand, Mid Oslofjord (st. 31A) Blue mussel Soft body /()////// / // / ▪/▪
Tjøme, Outer Oslofjord (st. 36A1)* Blue mussel Soft body / ////// / ////// ▪/▪ // ▪/▪ ▪/▪ ▪/▪ /
Singlekalven, Hvaler (st. I023) Blue mussel Soft body / ///////() //// ▪/▪ ////////
Kirkøy, Hvaler (st. I024) Blue mussel Soft body / ////// /
Bjørkøya, Langesundfjord (st. 71A) Blue mussel Soft body / ////// ////// ▪/▪ ////////
Risøy (st. 76A2) Blue mussel Soft body / ///////()//
Lastad, Søgne (st. I131A) Blue mussel Soft body / ////// //////
Odderøya, Kristiansand harbour (st. I133) Blue mussel Soft body / ////// / // / ▪/▪
Gåsøya-Ullerøya, Farsund (st. 15A) Blue mussel Soft body / ////// /
Kvalnes, Mid Sørfjord (st. 56A) Blue mussel Soft body / /()//
Krossanes, Outer Sørfjord (st. 57A) Blue mussel Soft body / ///////()//
Utne, Outer Sørfjord (st. 64A) Blue mussel Soft body / ///////()/
Vikingneset, Mid Hardangerfjord (st. 65A) Blue mussel Soft body / ///////()//
Espevær, Outer Bømlafjord (st. 22A) Blue mussel Soft body / ///////()// ▪/▪ ▪/▪ ▪/▪ / ▪/▪
Nordnes, Bergen harbour (st. I241) Blue mussel Soft body / ////// / /////// ▪/▪ ▪/▪ ▪/▪
Vågsvåg, Outer Nordfjord (st. 26A2) Blue mussel Soft body / ////// / //// ▪/▪ //
Ålesund harbour (st. 28A2) Blue mussel Soft body ▪/▪ ▪/▪ ▪/▪ ▪/▪ ▪/▪ ▪/▪ ▪/▪ ▪/▪ / ▪/▪ ▪/▪ / ▪/▪ ▪/▪ ▪/▪ ▪/▪ ▪/▪ ▪/▪
Ørland area, Outer Trondheimsfjord (st. 91A2) Blue mussel Soft body / ////// / //// ▪/▪ //
Mjelle, Bodø area (st. 97A2) Blue mussel Soft body / ////// / ///////
Bodø harbour (st. 97A3) Blue mussel Soft body ▪/▪ ▪/▪ ▪/▪ ▪/▪ / ▪/▪ ▪/▪ ▪/▪ ▪/▪ ▪/▪ ▪/▪ ▪/▪ ▪/▪ ▪/▪ ▪/▪
Svolvær airport area (st. 98A2) Blue mussel Soft body / ///////() ///////////// ▪/▪ ▪/▪ ▪/▪
Skallnes, Outer Varangerfjord (st. 10A2) Blue mussel Soft body / ///////()//
Brashavn, Outer Varangerfjord (st. 11X) Blue mussel Soft body / ///////()//

NIVA 7686-2021
56
Table 9 (cont.)
*) Timeseries includes station at Færder, Outer Oslofjord (st. 36A)
Station name Species Tissue
AG
CD
CO
CR
HG NI
PB
PC
B-7
DD
EPP
HC
B
HB
CD
A
BD
E6
BD
E47
BD
E10
0
BD
E20
9
SCC
P
MC
CP
PA
H
AN
T
BA
A
BA
P
FLU
NA
P
PFO
A
PFO
S
PFO
SA
TBT
TPh
T
VD
SI
D5
Inner Oslofjord (st. 30B) Cod Liver ///////////////// /// ▪/▪
Tjøme, Outer Oslofjord (st. 36B) Cod Liver ///////////////// ///
Kirkøy, Hvaler (st. 02B) Cod Liver //////// / //
Stathelle area, Langesundfjord (st. 71B) Cod Liver /////// / //
Kristiansand harbour area (st. 13B) Cod Liver //////// /////// ///
Skågskjera, Farsund (st. 15B) Cod Liver //////////
Inner Sørfjord (st. 53B) Cod Liver ///////////////// ///
Bømlo, Outer Selbjørnfjord (st. 23B) Cod Liver ///////////////// ///
Bergen harbour area (st. 24B) Cod Liver //////// //// ▪/▪ // /// /
Ålesund harbour area (st. 28B) Cod Liver //////// ///////
Trondheim harbour (st. 80B) Cod Liver //////// //// ▪/▪ // ///
Sandnessjøen area (st. 96B) Cod Liver ////////
Austnesfjord, Lofoten (st. 98B1) Cod Liver ////////////// ▪/▪ // ///
Tromsø harbour area (st. 43B2) Cod Liver //////// /////// /// ▪/▪
Hammerfest harbour area (st. 45B2) Cod Liver ////////
Kjøfjord, Outer Varangerfjord (st. 10B) Cod Liver ////////// ▪/▪
Svalbard (st. 19B) Cod Liver ▪/▪ ▪/▪ ▪/▪ ▪/▪ ▪/▪ ▪/▪ ▪/▪ ▪/▪ ▪/▪ ▪/▪ ▪/▪ ▪/▪ ▪/▪ / ▪/▪ ▪/▪ ▪/▪ ▪/▪ ▪/▪
Sande, Mid Oslofjord (st. 33F) Flounder Liver //////////
Breøyane (st. 19N) Eider duck Blood / ▪/▪ ▪/▪ ▪/▪ ▪/▪ ▪/▪ ▪/▪ ▪/▪ ▪/▪ ▪/▪ ▪/▪ ▪/▪ ▪/▪ ▪/▪ ▪/▪ ▪/▪ ▪/▪ ▪/▪ ▪/▪ ▪/▪
Breøyane (st. 19N) Eider duck Egg ▪/▪ ▪/▪ ▪/▪ ▪/▪ ▪/▪ ▪/▪ ▪/▪ ▪/▪ ▪/▪ ▪/▪ ▪/▪ ▪/▪ / ▪/▪ ▪/▪ ▪/▪ ▪/▪ ▪/▪ ▪/▪ ▪/▪
Fugløyskjær, Outer Langesundfjord (st. 71G) Periwinkle Soft body ▪/▪ ▪/▪ ▪/▪ ▪/▪ ▪/▪ ▪/▪ ▪/▪ ▪/▪ ▪/▪ ▪/▪ ▪/▪ ▪/▪ ▪/▪ ▪/▪ ▪/▪ / ▪/▪ /
Færder, Outer Oslofjord (st. 36G) Dogwhelk Soft body / ▪/▪ /
Risøya, Risør (st. 76G) Dogwhelk Soft body / ▪/▪ /
Lastad, Søgne (st. 131G) Dogwhelk Soft body / ▪/▪ /
Gåsøya-Ullerøya, Farsund (st. 15G) Dogwhelk Soft body / ▪/▪ /
Melandsholmen, Mid Karmsundet (st. 227G) Dogwhelk Soft body / ▪/▪ /
Espevær, Outer Bømlafjord (st. 22G) Dogwhelk Soft body / ▪/▪ /
Svolvær airport area (st. 98G) Dogwhelk Soft body / ▪/▪ /
Brashavn, Outer Varangerfjord (st. 11G) Dogwhelk Soft body / ▪/▪ /

NIVA 7686-2021
57
3.2 Levels and trends in contaminants
3.2.1 Overview of metals In 2020, metals were analysed in blue mussel from 26 stations, in cod from 17 stations, in flounder
from one station and in eider from one station (two tissues were analysed) (Table 1). The results
are discussed in more detail in Chapters 3.2.2 - 3.2.11, and only a brief summary is provided here.
EQS for metals was only applicable for Hg, and it was exceeded at 25 (53 %) of the 47 stations where
samples were taken (Figure 8 A). Applying PROREF to assess the 295 metal concentrations, 62.7 %
of the measured metal concentrations were found to be below PROREF and the rest were above it
(Figure 9 A). Two measurements exceeded PROREF by a factor of more than 10 (one case
for Ag and one case for Pb). Analyses showed that 74.9 % of the data series for metals indicated no
short-term trends, but for 10.5 % of these series for metals, a significant trend was found; 6.5 %
downward and 4 % upward (Figure 9 B).
A
B
Figure 9. Summary for 2020 showing the percent of samples (station-species-tissue) exceeding the
Norwegian provisional high reference contaminant concentration (PROREF) (A) and relating to the
results from short-term trend analyses for seven metals (B). Ten upward short-term trends for
PCB-7 in blue mussel and one upward short-term trend for Ag in blue mussel are caused by
methodical (artificial) results, as described in chapter 2.6. These are included in this overview
figure (B) and are marked by a star (*). Details can be seen in Table 9.

NIVA 7686-2021
58
Table 10. Median concentrations (mg/kg w.w.) and standard deviations for metals in blue mussel, cod liver/filet, flounder liver/filet and eider blood
and eggs in 2020. Count indicates number of samples analysed. The first number within the parentheses indicates the number of pooled samples
included. The second number within the parentheses indicates the maximum number of individuals used in one of the pooled samples. Shaded cells
indicate that the median was below the limit of quantification (LOQ) and the value shown in these cells is the LOQ. The standard deviation (S.d.) is
based on all values and values below the LOQ are taken as half. Detectable data information (D.d.i.) indicates the number of data above the LOQ (if any)
and the numbers within the square brackets indicate the minimum and maximum values in this category. (See also Chapter 2.10 for more details and
Appendix B for description of chemical codes.)

NIVA 7686-2021
59
Component Count AG AS CD CO CR
Species and sampling locality 2020 Med. S.d. D.d.i Med. S.d. D.d.i Med. S.d. D.d.i Med. S.d. D.d.i Med. S.d. D.d.i
Blue mussel
Akershuskaia, Inner Oslofjord (st. I301) 3 (3-50) 0.050 0.000 0 [n.a.] 2.500 0.306 3 [2.1-2.7] 0.270 0.040 3 [0.24-0.32] 0.085 0.007 3 [0.08-0.09] 0.230 0.017 3 [0.23-0.26]
Gressholmen, Inner Oslofjord (st. 30A) 3 (3-50) 0.050 0.000 0 [n.a.] 1.600 0.700 3 [1.4-2.7] 0.180 0.069 3 [0.18-0.3] 0.110 0.028 3 [0.09-0.14] 0.830 0.214 3 [0.83-1.2]
Gåsøya, Inner Oslofjord (st. I304) 3 (3-50) 0.050 0.000 0 [n.a.] 2.700 0.208 3 [2.4-2.8] 0.260 0.026 3 [0.22-0.27] 0.095 0.009 3 [0.09-0.11] 0.420 0.031 3 [0.4-0.46]
Solbergstrand, Mid Oslofjord (st. 31A) 3 (3-50) 0.050 0.000 0 [n.a.] 1.700 0.153 3 [1.6-1.9] 0.140 0.010 3 [0.13-0.15] 0.059 0.007 3 [0.06-0.07] 0.220 0.015 3 [0.2-0.23]
Færder, Outer Oslofjord (st. 36A) 3 (3-50) 0.050 0.000 0 [n.a.] 2.100 0.252 3 [1.8-2.3] 0.100 0.017 3 [0.09-0.12] 0.042 0.006 3 [0.04-0.05] 0.120 0.028 3 [0.08-0.14]
Singlekalven, Hvaler (st. I023) 3 (3-50) 0.050 0.000 0 [n.a.] 1.100 0.100 3 [1-1.2] 0.150 0.015 3 [0.14-0.17] 0.074 0.001 3 [0.07-0.07] 0.330 0.150 3 [0.31-0.58]
Kirkøy, Hvaler (st. I024) 3 (3-50) 0.050 0.000 0 [n.a.] 1.300 0.058 3 [1.3-1.4] 0.260 0.010 3 [0.25-0.27] 0.180 0.035 3 [0.12-0.18] 0.680 0.080 3 [0.61-0.77]
Bjørkøya, Langesundfjord (st. 71A) 1 (1-50) 0.050 0 [n.a.] 1.300 1 [1.3] 0.190 1 [0.19] 0.049 1 [0.05] 0.310 1 [0.31]
Risøya, Risør (st. 76A2) 3 (3-50) 0.050 0.000 0 [n.a.] 2.000 0.115 3 [2-2.2] 0.110 0.017 3 [0.1-0.13] 0.082 0.012 3 [0.06-0.08] 0.120 0.070 3 [0.09-0.22]
Lastad, Søgne (st. I131A) 3 (3-50) 0.050 0.000 0 [n.a.] 1.800 0.153 3 [1.6-1.9] 0.170 0.006 3 [0.17-0.18] 0.080 0.007 3 [0.08-0.09] 0.130 0.026 3 [0.09-0.13]
Odderøya, Kristiansand harbour (st. I133) 3 (3-50) 0.050 0.000 0 [n.a.] 1.400 0.115 3 [1.4-1.6] 0.210 0.021 3 [0.2-0.24] 0.200 0.006 3 [0.2-0.21] 0.200 0.257 3 [0.19-0.64]
Gåsøya-Ullerøya, Farsund (st. 15A) 3 (3-50) 0.050 0.000 0 [n.a.] 3.700 0.351 3 [3.3-4] 0.150 0.010 3 [0.14-0.16] 0.078 0.005 3 [0.08-0.09] 0.092 0.057 3 [0.09-0.19]
Kvalnes, Mid Sørfjord (st. 56A) 3 (3-50)
Krossanes, Outer Sørfjord (st. 57A) 3 (3-50) 0.050 0.000 0 [n.a.] 3.800 0.000 3 [3.8-3.8] 0.240 0.029 3 [0.24-0.29] 0.063 0.019 3 [0.06-0.1] 0.140 0.021 3 [0.13-0.17]
Utne, Outer Sørfjord (st. 64A) 3 (3-50) 0.050 0.000 0 [n.a.] 4.000 0.666 3 [2.9-4.1] 0.160 0.040 3 [0.12-0.2] 0.058 0.013 3 [0.04-0.07] 0.098 0.031 3 [0.07-0.13]
Vikingneset, Mid Hardangerfjord (st. 65A) 3 (3-50) 0.050 0.000 0 [n.a.] 3.300 0.058 3 [3.3-3.4] 0.160 0.017 3 [0.13-0.16] 0.066 0.014 3 [0.06-0.09] 0.160 0.051 3 [0.13-0.23]
Espevær, Outer Bømlafjord (st. 22A) 3 (3-50) 0.050 0.000 0 [n.a.] 8.000 1.793 3 [7.8-11] 0.170 0.035 3 [0.14-0.21] 0.078 0.014 3 [0.07-0.09] 0.100 0.029 3 [0.07-0.13]
Nordnes, Bergen harbour (st. I241) 3 (3-50) 0.050 0.000 0 [n.a.] 3.200 0.200 3 [3-3.4] 0.130 0.006 3 [0.13-0.14] 0.048 0.002 3 [0.05-0.05] 0.180 0.025 3 [0.16-0.21]
Vågsvåg, Outer Nordfjord (st. 26A2) 3 (3-50) 0.050 0.000 0 [n.a.] 2.400 0.173 3 [2.1-2.4] 0.110 0.006 3 [0.11-0.12] 0.037 0.001 3 [0.04-0.04] 0.120 0.026 3 [0.11-0.16]
Ålesund harbour (st. 28A2) 3 (3-50) 0.050 0.000 0 [n.a.] 3.000 0.173 3 [2.7-3] 0.082 0.006 3 [0.08-0.09] 0.045 0.004 3 [0.04-0.05] 0.190 0.012 3 [0.17-0.19]
Ørland area, Outer Trondheimsfjord (st. 91A2)3 (3-50) 0.050 0.000 0 [n.a.] 2.300 0.058 3 [2.2-2.3] 0.150 0.017 3 [0.12-0.15] 0.100 0.011 3 [0.09-0.11] 0.250 0.248 3 [0.23-0.67]
Bodø harbour (st. 97A3) 3 (3-50) 0.050 0.000 0 [n.a.] 2.400 0.173 3 [2.1-2.4] 0.140 0.010 3 [0.13-0.15] 0.081 0.012 3 [0.07-0.1] 0.330 0.076 3 [0.31-0.45]
Mjelle, Bodø area (st. 97A2) 3 (3-50) 0.050 0.000 0 [n.a.] 2.900 0.208 3 [2.8-3.2] 0.170 0.010 3 [0.16-0.18] 0.060 0.006 3 [0.06-0.07] 0.300 0.031 3 [0.26-0.32]
Svolvær airport area (st. 98A2) 3 (3-50) 0.050 0.000 0 [n.a.] 2.100 0.058 3 [2-2.1] 0.190 0.010 3 [0.18-0.2] 0.044 0.003 3 [0.04-0.05] 0.180 0.020 3 [0.16-0.2]
Brashavn, Outer Varangerfjord (st. 11X) 3 (3-50) 0.050 0.000 0 [n.a.] 1.400 0.058 3 [1.3-1.4] 0.240 0.006 3 [0.24-0.25] 0.045 0.003 3 [0.04-0.05] 0.210 0.044 3 [0.2-0.28]
Skallnes, Outer Varangerfjord (st. 10A2) 3 (3-50) 0.050 0.000 0 [n.a.] 1.700 0.058 3 [1.6-1.7] 0.280 0.020 3 [0.26-0.3] 0.041 0.002 3 [0.04-0.04] 0.140 0.030 3 [0.11-0.17]
Cod, liver (all metals except Hg), filet (Hg)
Inner Oslofjord (st. 30B) 12 (7-6) 4.450 4.075 12 [1.4-15] 15.000 9.173 12 [4.8-38] 0.073 0.033 12 [0.01-0.11] 0.080 0.037 12 [0.03-0.14] 0.075 0.012 12 [0.05-0.09]
Tjøme, Outer Oslofjord (st. 36B) 15 (4-2) 1.800 1.960 15 [0.3-6.1] 13.000 7.287 15 [4.6-35] 0.049 0.031 15 [0.02-0.14] 0.050 0.028 15 [0.02-0.12] 0.050 0.020 15 [0.04-0.11]
Kirkøy, Hvaler (st. 02B) 7 (5-2) 0.570 0.340 7 [0.17-1.2] 3.000 1.275 7 [2.3-5.9] 0.015 0.005 7 [0.01-0.02] 0.025 0.003 7 [0.02-0.03] 0.053 0.028 7 [0.03-0.11]
Stathelle area, Langesundfjord (st. 71B) 10 (5-5) 0.955 0.727 10 [0.29-2.5] 4.350 3.645 10 [1.4-14] 0.026 0.016 10 [0.003-0.05] 0.041 0.019 10 [0.01-0.07] 0.060 0.020 10 [0.01-0.08]
Kristiansand harbour area (st. 13B) 7 (5-2) 0.670 0.487 7 [0.4-1.8] 5.200 1.618 7 [2.1-6.2] 0.019 0.015 7 [0.003-0.05] 0.042 0.023 7 [0.01-0.08] 0.044 0.011 7 [0.04-0.07]
Skågskjera, Farsund (st. 15B) 15 (0-1) 1.100 0.864 15 [0.31-3.5] 7.100 3.854 15 [4-16] 0.027 0.014 15 [0.01-0.07] 0.052 0.021 15 [0.03-0.1] 0.022 0.005 15 [0.01-0.03]
Inner Sørfjord (st. 53B) 15 (4-3) 1.500 1.062 15 [0.6-4.1] 3.700 3.471 15 [1.5-15] 0.028 0.028 15 [0.01-0.09] 0.033 0.037 15 [0.008-0.12] 0.048 0.021 15 [0.02-0.1]
Bømlo, Outer Selbjørnfjord (st. 23B) 15 (6-2) 0.290 0.567 15 [0.07-2.1] 5.000 3.457 15 [1.8-14] 0.019 0.028 15 [0.004-0.12] 0.028 0.020 15 [0.007-0.07] 0.059 0.029 15 [0.03-0.15]
Bergen harbour area (st. 24B) 14 (6-2) 1.100 0.596 14 [0.19-2.2] 2.350 2.730 14 [1.2-11] 0.015 0.028 13 [0.002-0.09] 0.043 0.021 13 [0.01-0.07] 0.065 0.038 13 [0.03-0.16]
Ålesund harbour area (st. 28B) 14 (2-2) 0.180 0.592 13 [0.09-1.9] 2.850 0.511 14 [2.2-4.1] 0.011 0.007 14 [0.007-0.03] 0.009 0.009 14 [0.003-0.03] 0.048 0.027 14 [0.02-0.1]
Trondheim harbour (st. 80B) 15 (0-1) 0.780 1.015 15 [0.15-4.1] 5.200 5.918 15 [3-25] 0.034 0.050 15 [0.01-0.2] 0.030 0.016 15 [0.006-0.07] 0.042 0.021 15 [0.01-0.1]
Sandnessjøen area (st. 96B) 15 (0-1) 0.170 0.326 15 [0.07-1.3] 4.100 1.654 15 [2.3-7.9] 0.035 0.031 15 [0.02-0.14] 0.012 0.006 15 [0.009-0.03] 0.043 0.023 15 [0.02-0.09]
Austnesfjord, Lofoten (st. 98B1) 15 (0-1) 0.300 0.560 15 [0.1-2.2] 3.600 3.017 15 [1.7-14] 0.056 0.048 15 [0.01-0.16] 0.020 0.016 15 [0.009-0.06] 0.038 0.037 15 [0.01-0.13]
Tromsø harbour area (st. 43B2) 15 (0-1) 0.380 2.225 15 [0.15-9] 4.400 6.789 15 [1.2-26] 0.120 0.589 15 [0.03-2.4] 0.013 0.010 15 [0.004-0.04] 0.033 0.015 15 [0.02-0.06]
Hammerfest harbour area (st. 45B2) 14 (5-3) 0.425 0.365 14 [0.07-1.1] 4.500 2.730 14 [3-13] 0.160 0.114 14 [0.03-0.43] 0.027 0.016 13 [0.008-0.05] 0.028 0.020 12 [0.01-0.08]
Kjøfjord, Outer Varangerfjord (st. 10B) 15 (5-2) 0.760 0.395 15 [0.08-1.3] 2.700 1.099 15 [1.9-6.3] 0.098 0.055 15 [0.02-0.21] 0.016 0.009 15 [0.004-0.03] 0.038 0.017 15 [0.01-0.07]
Isfjorden, Svalbard (st. 19B) 15 (0-1) 0.130 0.334 12 [0.06-1.2] 2.400 1.311 15 [1.8-6.3] 0.110 0.256 15 [0.07-1.1] 0.012 0.006 15 [0.005-0.03] 0.033 0.015 15 [0.02-0.07]
Flounder, liver (all metals except Hg), filet (Hg)
Sande, Mid Oslofjord (st. 33F) 3 (3-5) 0.060 0.006 3 [0.05-0.06] 4.000 0.833 3 [2.8-4.4] 0.240 0.200 3 [0.09-0.49] 0.120 0.071 3 [0.1-0.23] 0.052 0.022 3 [0.02-0.06]
Eider, blood
Breøyane, Kongsfjorden, Svalbard (st. 19N) 15 (0-1) 0.001 0.001 15 [4e-04-0.002] 0.020 0.022 15 [0.01-0.09] 0.003 0.002 15 [0.001-0.007] 0.003 0.001 15 [0.002-0.005] 0.003 0.055 4 [0.003-0.22]
Eider, egg
Breøyane, Kongsfjorden, Svalbard (st. 19N) 15 (0-1) 0.009 0.010 15 [0.004-0.04] 0.101 0.052 15 [0.06-0.25] 0.0002 0.0001 7 [3e-04-4e-04] 0.007 0.002 15 [0.004-0.01] 0.006 0.013 13 [0.003-0.05]

NIVA 7686-2021
60
Component Count CU HG NI PB ZN
Species and sampling locality 2020 Med. S.d. D.d.i Med. S.d. D.d.i Med. S.d. D.d.i Med. S.d. D.d.i Med. S.d. D.d.i
Blue mussel
Akershuskaia, Inner Oslofjord (st. I301) 3 (3-50) 0.980 0.340 3 [0.86-1.5] 0.013 0.001 3 [0.01-0.01] 0.180 0.012 3 [0.16-0.18] 0.450 0.092 3 [0.39-0.57] 23 8.505 3 [20-36]
Gressholmen, Inner Oslofjord (st. 30A) 3 (3-50) 2.100 0.643 3 [1.1-2.3] 0.015 0.006 3 [0.01-0.02] 0.490 0.254 3 [0.47-0.92] 1.600 0.608 3 [1.5-2.6] 23 3.055 3 [21-27]
Gåsøya, Inner Oslofjord (st. I304) 3 (3-50) 1.000 0.556 3 [0.73-1.8] 0.014 0.003 3 [0.01-0.02] 0.360 0.060 3 [0.3-0.42] 0.470 0.036 3 [0.45-0.52] 22 1.528 3 [21-24]
Solbergstrand, Mid Oslofjord (st. 31A) 3 (3-50) 1.600 0.100 3 [1.5-1.7] 0.013 0.002 3 [0.01-0.01] 0.240 0.021 3 [0.23-0.27] 0.100 0.006 3 [0.1-0.11] 19 1.528 3 [17-20]
Færder, Outer Oslofjord (st. 36A) 3 (3-50) 1.800 0.208 3 [1.5-1.9] 0.006 0.001 3 [0.006-0.008] 0.150 0.031 3 [0.11-0.17] 0.081 0.020 3 [0.07-0.11] 14 1.155 3 [12-14]
Singlekalven, Hvaler (st. I023) 3 (3-50) 1.100 0.590 3 [0.89-2] 0.019 0.004 3 [0.02-0.02] 0.310 0.036 3 [0.29-0.36] 0.110 0.009 3 [0.09-0.11] 18 1.000 3 [17-19]
Kirkøy, Hvaler (st. I024) 3 (3-50) 1.700 0.574 3 [0.89-2] 0.031 0.004 3 [0.03-0.04] 0.480 0.078 3 [0.44-0.59] 0.310 0.090 3 [0.21-0.39] 26 1.732 3 [23-26]
Bjørkøya, Langesundfjord (st. 71A) 1 (1-50) 1.500 1 [1.5] 0.027 1 [0.03] 0.330 1 [0.33] 0.310 1 [0.31] 17 1 [17]
Risøya, Risør (st. 76A2) 3 (3-50) 0.720 0.409 3 [0.51-1.3] 0.012 0.003 3 [0.007-0.01] 0.240 0.092 3 [0.18-0.36] 0.220 0.038 3 [0.16-0.23] 16 2.887 3 [11-16]
Lastad, Søgne (st. I131A) 3 (3-50) 1.100 0.289 3 [1.1-1.6] 0.014 0.003 3 [0.01-0.01] 0.160 0.006 3 [0.16-0.17] 0.190 0.026 3 [0.18-0.23] 14 1.528 3 [12-15]
Odderøya, Kristiansand harbour (st. I133) 3 (3-50) 1.400 0.416 3 [1.2-2] 0.019 0.003 3 [0.02-0.02] 0.710 0.083 3 [0.67-0.83] 3.800 1.701 3 [2.2-5.6] 22 4.583 3 [16-25]
Gåsøya-Ullerøya, Farsund (st. 15A) 3 (3-50) 1.000 0.462 3 [1-1.8] 0.010 0.002 3 [0.01-0.01] 0.180 0.025 3 [0.16-0.21] 0.260 0.046 3 [0.18-0.26] 17 2.646 3 [16-21]
Kvalnes, Mid Sørfjord (st. 56A) 3 (3-50) 0.074 0.017 3 [0.06-0.1]
Krossanes, Outer Sørfjord (st. 57A) 3 (3-50) 0.800 1.175 3 [0.73-2.8] 0.028 0.004 3 [0.02-0.03] 0.130 0.015 3 [0.11-0.14] 0.600 0.102 3 [0.44-0.63] 12 1.000 3 [11-13]
Utne, Outer Sørfjord (st. 64A) 3 (3-50) 0.950 0.425 3 [0.55-1.4] 0.019 0.005 3 [0.01-0.02] 0.130 0.024 3 [0.09-0.13] 0.230 0.035 3 [0.17-0.23] 11 0.577 3 [11-12]
Vikingneset, Mid Hardangerfjord (st. 65A) 3 (3-50) 1.000 0.176 3 [0.85-1.2] 0.016 0.005 3 [0.008-0.02] 0.200 0.006 3 [0.19-0.2] 0.260 0.055 3 [0.17-0.27] 17 0.577 3 [16-17]
Espevær, Outer Bømlafjord (st. 22A) 3 (3-50) 2.200 0.153 3 [2-2.3] 0.016 0.002 3 [0.01-0.02] 0.210 0.055 3 [0.16-0.27] 0.180 0.017 3 [0.15-0.18] 21 1.528 3 [19-22]
Nordnes, Bergen harbour (st. I241) 3 (3-50) 2.500 0.462 3 [1.7-2.5] 0.017 0.001 3 [0.02-0.02] 0.120 0.006 3 [0.11-0.12] 0.570 0.044 3 [0.56-0.64] 19 1.000 3 [18-20]
Vågsvåg, Outer Nordfjord (st. 26A2) 3 (3-50) 1.300 0.115 3 [1.3-1.5] 0.015 0.002 3 [0.01-0.02] 0.094 0.010 3 [0.09-0.11] 0.200 0.035 3 [0.17-0.24] 17 1.528 3 [15-18]
Ålesund harbour (st. 28A2) 3 (3-50) 2.300 0.289 3 [2.3-2.8] 0.016 0.001 3 [0.01-0.02] 0.200 0.025 3 [0.18-0.23] 0.320 0.006 3 [0.32-0.33] 21 0.577 3 [21-22]
Ørland area, Outer Trondheimsfjord (st. 91A2)3 (3-50) 1.100 0.293 3 [0.93-1.5] 0.010 0.001 3 [0.009-0.01] 0.360 0.051 3 [0.29-0.39] 0.170 0.031 3 [0.15-0.21] 15 0.577 3 [14-15]
Bodø harbour (st. 97A3) 3 (3-50) 3.100 0.666 3 [2-3.2] 0.014 0.002 3 [0.01-0.01] 0.250 0.065 3 [0.19-0.32] 0.440 0.061 3 [0.43-0.54] 24 0.577 3 [24-25]
Mjelle, Bodø area (st. 97A2) 3 (3-50) 1.200 0.175 3 [0.96-1.3] 0.022 0.002 3 [0.02-0.02] 0.200 0.042 3 [0.18-0.26] 0.410 0.061 3 [0.4-0.51] 23 3.055 3 [21-27]
Svolvær airport area (st. 98A2) 3 (3-50) 0.890 0.445 3 [0.78-1.6] 0.013 0.002 3 [0.01-0.01] 0.170 0.010 3 [0.16-0.18] 0.180 0.021 3 [0.17-0.21] 14 1.528 3 [13-16]
Brashavn, Outer Varangerfjord (st. 11X) 3 (3-50) 0.710 0.465 3 [0.68-1.5] 0.007 0.001 3 [0.007-0.008] 0.200 0.038 3 [0.19-0.26] 0.120 0.010 3 [0.11-0.13] 13 1.000 3 [12-14]
Skallnes, Outer Varangerfjord (st. 10A2) 3 (3-50) 1.700 0.173 3 [1.4-1.7] 0.006 0.001 3 [0.005-0.007] 0.180 0.012 3 [0.16-0.18] 0.110 0.013 3 [0.1-0.12] 18 1.155 3 [16-18]
Cod, liver (all metals except Hg), filet (Hg)
Inner Oslofjord (st. 30B) 12 (7-6) 5.400 1.700 12 [2.6-8.1] 0.140 0.052 15 [0.07-0.27] 0.101 0.045 12 [0.02-0.17] 0.095 0.066 12 [0.009-0.24] 28 6.900 12 [11-32]
Tjøme, Outer Oslofjord (st. 36B) 15 (4-2) 5.500 2.931 15 [2.5-14] 0.150 0.059 15 [0.04-0.29] 0.038 0.014 15 [0.02-0.07] 0.009 0.006 15 [0.007-0.03] 29 8.268 15 [19-43]
Kirkøy, Hvaler (st. 02B) 7 (5-2) 5.400 3.165 7 [1.3-9.4] 0.076 0.048 15 [0.04-0.2] 0.025 0.011 6 [0.01-0.04] 0.007 0.002 5 [0.007-0.01] 20 3.237 7 [16-25]
Stathelle area, Langesundfjord (st. 71B) 10 (5-5) 6.950 3.941 10 [2.6-15] 0.150 0.117 15 [0.05-0.49] 0.024 0.012 10 [0.02-0.05] 0.014 0.007 9 [0.009-0.03] 28 5.371 10 [19-38]
Kristiansand harbour area (st. 13B) 7 (5-2) 5.400 1.996 7 [3.7-10] 0.048 0.072 15 [0.03-0.32] 0.059 0.020 7 [0.02-0.08] 0.007 0.002 4 [0.007-0.009] 23 7.290 7 [16-35]
Skågskjera, Farsund (st. 15B) 15 (0-1) 12.000 4.692 15 [5.8-21] 0.120 0.045 15 [0.05-0.19] 0.038 0.014 15 [0.02-0.07] 0.005 0.001 9 [0.005-0.01] 34 7.316 15 [22-50]
Inner Sørfjord (st. 53B) 15 (4-3) 8.900 4.072 15 [2.7-20] 0.180 0.112 15 [0.07-0.44] 0.049 0.017 15 [0.02-0.08] 0.014 0.046 15 [0.007-0.19] 28 8.159 15 [19-47]
Bømlo, Outer Selbjørnfjord (st. 23B) 15 (6-2) 3.700 4.594 15 [1.6-16] 0.140 0.061 15 [0.08-0.31] 0.032 0.018 15 [0.02-0.09] 0.006 0.002 8 [0.006-0.01] 20 6.850 15 [10-34]
Bergen harbour area (st. 24B) 14 (6-2) 6.500 3.608 14 [1.2-11] 0.088 0.184 15 [0.03-0.65] 0.053 0.033 13 [0.02-0.12] 0.015 0.007 14 [0.006-0.03] 26 7.979 14 [17-43]
Ålesund harbour area (st. 28B) 14 (2-2) 2.750 1.397 14 [1-5.7] 0.210 0.070 15 [0.01-0.25] 0.024 0.027 12 [0.02-0.12] 0.018 0.011 14 [0.007-0.05] 15 4.555 14 [11-27]
Trondheim harbour (st. 80B) 15 (0-1) 5.100 4.616 15 [0.92-14] 0.091 0.201 15 [0.01-0.68] 0.033 0.013 14 [0.01-0.06] 0.005 0.004 7 [0.007-0.02] 21 10.036 15 [4.5-40]
Sandnessjøen area (st. 96B) 15 (0-1) 2.600 1.564 15 [1.7-7.2] 0.069 0.028 15 [0.04-0.15] 0.029 0.015 15 [0.01-0.06] 0.006 0.002 9 [0.006-0.009] 15 2.330 15 [9.3-19]
Austnesfjord, Lofoten (st. 98B1) 15 (0-1) 5.200 4.022 15 [1.7-15] 0.062 0.027 15 [0.05-0.15] 0.039 0.032 15 [0.01-0.11] 0.005 0.003 7 [0.006-0.01] 21 6.990 15 [14-38]
Tromsø harbour area (st. 43B2) 15 (0-1) 6.400 11.530 15 [0.82-50] 0.065 0.043 15 [0.02-0.17] 0.042 0.025 15 [0.02-0.1] 0.008 0.010 12 [0.006-0.05] 19 8.130 15 [15-48]
Hammerfest harbour area (st. 45B2) 14 (5-3) 5.450 2.518 14 [2-11] 0.042 0.013 15 [0.03-0.08] 0.070 0.041 13 [0.01-0.13] 0.011 0.010 11 [0.005-0.03] 18 4.823 14 [8.8-26]
Kjøfjord, Outer Varangerfjord (st. 10B) 15 (5-2) 3.100 1.584 15 [0.41-5.8] 0.025 0.010 15 [0.002-0.03] 0.036 0.037 13 [0.01-0.14] 0.007 0.002 10 [0.005-0.01] 15 6.776 15 [2.7-27]
Isfjorden, Svalbard (st. 19B) 15 (0-1) 1.600 1.045 15 [0.55-5] 0.017 0.017 15 [0.01-0.07] 0.042 0.013 15 [0.02-0.07] 0.009 0.003 14 [0.008-0.02] 13 4.108 15 [8.1-24]
Flounder, liver (all metals except Hg), filet (Hg)
Sande, Mid Oslofjord (st. 33F) 3 (3-5) 20.000 2.646 3 [19-24] 0.150 0.061 3 [0.06-0.17] 0.034 0.010 3 [0.03-0.05] 0.039 0.034 3 [0.02-0.09] 47 7.937 3 [35-50]
Eider, blood
Breøyane, Kongsfjorden, Svalbard (st. 19N) 15 (0-1) 0.453 0.081 15 [0.33-0.66] 0.111 0.040 15 [0.07-0.19] 0.003 0.030 4 [0.004-0.12] 0.046 0.061 15 [0.02-0.21] 5 0.503 15 [4.1-6]
Eider, egg
Breøyane, Kongsfjorden, Svalbard (st. 19N) 15 (0-1) 1.171 0.161 15 [0.93-1.41] 0.111 0.034 15 [0.08-0.19] 0.005 0.007 15 [0.004-0.03] 0.006 0.003 15 [0.002-0.01] 17 1.825 15 [14.1-20]

NIVA 7686-2021
61
3.2.2 Mercury (Hg)
Mercury (Hg) is found naturally in the earth’s crust and can be spread both from natural sources and
through anthropogenic activity. Mercury can be organic (methylmercury and dimethylmercury),
inorganic (Hg0) or elemental (Hg2+) and has toxic effects on inter alia the nerve system. The toxic
substance can be transported by water and air over long distances and end up in the environment in
completely different parts of the globe than where it was released. With a few exceptions, there is
a general prohibition on the use of Hg in products in Norway. In the present study, total Hg (organic
and inorganic, here abbreviated to Hg), was analysed in blue mussel at 26 stations, in cod fillet at
17 stations, in flounder fillet at one station and in eider blood and eggs at one station (Table 1).
Environmental Quality Standards (EQS) for priority substances
EU has established an EQS of 0.02 mg/kg w.w. in biota (cf. Table 4). Applying this EQS for blue
mussel, concentrations of Hg were above or at the EQS at Kirkøy (st. I024, 0.031 mg/kg w.w.) at
Hvaler, Bjørkøya (st. 71A, 0.027 mg/kg w.w.) in the Langesundfjord, Kvalnes (st. 56A,
0.074 mg/kg w.w.) and Krossanes (st. 57A, 0.028 mg/kg w.w.) in the Sørfjord, and at Mjelle
(st. 97A2, 0.022 mg/kg w.w.) in the Bodø area (Table 8).
The biota standards refer to fish (concentrations in whole fish), except in the case of PAHs, where
reference is made of crustaceans and mollusc (EC 2014), (Fliedner 2018). Therefore, the EQS cannot
be directly compared to concentrations found in specific tissues of fish or blue mussel. We have in
the present study measured Hg in fish fillet, not in whole fish. Converting Hg concentrations in fish
fillet to concentrations in whole fish is uncertain. Using fillet probably represents an overestimate
of the whole fish concentration because Hg accumulates more in the fillet than in other tissues
(Kwasniak and Falkowska 2012). If it is assumed, for this exercise, that the same concentration is
found in all fish tissue types, then the results of Hg (in cod fillet) would have exceeded the EQS at
all stations in 2020, except for the reference station (st. 19B) at Svalbard (0.017 mg/kg w.w.)
(Table 8).
Applying this EQS for flounder liver, the Hg concentration would have exceeded the EQS at Sande
(st. 33F, 0.150 mg/kg w.w.) in the mid Oslofjord (Table 8).
Applying this EQS for eider blood and eggs, the Hg concentrations would have exceeded the EQS
(Table 8).
Levels exceeding PROREF
Blue mussel exceeded the Norwegian provisional high reference contaminant concentration
(PROREF) for Hg by a factor of five to 10 at Kvalnes (st. 56A) in the Sørfjord (Table 9). Mussels
exceeded the PROREF by a factor of two to five at Kirkøy (st. I024) in the Outer Oslofjord, Bjørkøya
(st. 71A) in the Grenlandfjord and Krossanes (st. 57A) in the Sørfjord. For blue mussel, the
exceedances were a factor of up to two at Akershuskaia (st. I301), Gressholmen (st. 30A) and
Gåsøya (st. I304) in the Inner Oslofjord and at Solbergstrand (st. 31A) in the mid Oslofjord. This was
also the result at Singlekalven (st. I023) in the Outer Oslofjord, at Odderøya (st. I133) in the
Kristiansandfjord and at Lastad (st. I131A) at Søgne. This was also observed at Utne (st. 64A) in the
Outer Sørfjord, Vikingneset (st. 65A) in the mid Hardangerfjord, Espevær (st. 22A) in the Outer
Bømlafjord and Nordnes (st. I241) close to Bergen harbour. This was also the result in Vågsvåg
(st. 26A2) in the Outer Nordfjord, Ålesund harbour (st. 28A2), Bodø harbour (st. 97A3), Mjelle
(st. 97A2) in the Bodø area and Svolvær airport area (st. 98A2).

NIVA 7686-2021
62
Cod fillet exceeded PROREF of Hg by a factor of two to five in the Inner Oslofjord (st. 30B), Tjøme
(st. 36B) in the Outer Oslofjord, Stathelle area in the Grenlandfjord (st. 71B), Skågskjera in Farsund
(st. 15B), in the Inner Sørfjord (st. 53B), at Bømlo (st. 23B) and in Ålesund harbour (st. 28B). The
exceedances were a factor up to two at Kirkøy (st. 02B) at Hvaler, Bergen harbour (st. 24B),
Trondheim harbour (st. 80B), the Sandnessjøen area (st.96B), Tromsø harbour (st. 43B2) and
Austnesfjord in Lofoten (st. 98B1).
Increase in PROREF factor since 2019
Blue mussel exceeded PROREF for Hg at Kvalnes (st. 56A) in the mid Sørfjord by a factor of five to
10 in 2020, compared to two to five in 2019. Mussels exceeded PROREF for Hg at Kirkøy (st. I024) at
Hvaler by a factor of two to five in 2020, compared to a factor up to two times in 2019. The mussel
at Akershuskaia (st. I301) and Gåsøya (st. I304) in the Inner Oslofjord, at Lastad (st. I131A) at Søgne
and Vågsvåg (st. 26A2) in the Outer Nordfjord exceeded the PROREF by a factor up to two times in
2020, while there was no exceedance in 2019.
Cod fillet from Stathelle (st. 71B) exceeded the PROREF for Hg by a factor between two and five in
2020, compared to up to two in 2019. Cod fillet from the Sandnessjøen area (st.96B) and Tromsø
harbour (st. 43B2) exceeded the PROREF for Hg by a factor up to two in 2020, compared to below
PROREF in 2019.
Upward trends
In blue mussel, a significant upward long-term trend was found at Gåsøya (st. I304) in the Inner
Oslofjord.
A significant upward long-term trend for Hg was found in the Inner Oslofjord (st. 30B) (Figure 10 A),
at Skågskjera (st. 15B) in Farsund (Figure 11 A), at Bømlo (st. 23B) (Figure 12) and in Tromsø
harbour (st. 43B2) Figure 13. When fish-length was taken into account only, both significant upward
long- and short-term trends were also found for Hg in cod fillet from the Kristiansand harbour
(st. 13B) (Figure 14) and at Skågskjera (st. 15B) in Farsund (Figure 11 B). A significant upward long-
term trend was also found in the Inner Oslofjord (st. 30B) (Figure 10 B), while a significant upward
short-term trend was found at Kjøfjord (st. 10B) in the Outer Varangerfjord when fish-length was
taken into account.

NIVA 7686-2021
63
A
B
Figure 10. Median concentrations (mg/kg w.w.) of mercury (Hg) in cod fillet from the Inner
Oslofjord (st. 30B); no adjustment for length (A) and adjusted for length (B) (see Figure 6 and
Appendix C).

NIVA 7686-2021
64
A
B
Figure 11. Median concentrations (mg/kg w.w.) of mercury (Hg) in cod fillet from Skågskjera
(st. 15B) in Farsund; no adjustment for length (A) and adjusted for length (B) (see Figure 6 and
Appendix C).

NIVA 7686-2021
65
Figure 12. Median concentrations (mg/kg w.w.) of mercury (Hg) in cod fillet from Bømlo (st. 23B);
in the Outer Selbjørnfjord; no adjustment for length (see Figure 6 and Appendix C).

NIVA 7686-2021
66
Figure 13. Median concentrations (mg/kg w.w.) of mercury (Hg) in cod fillet from Tromsø harbour
(st. 43B2); no adjustment for length (A) and adjusted for length (B) (see Figure 6 and Appendix C).

NIVA 7686-2021
67
Figure 14. Median concentrations (mg/kg w.w.) of mercury (Hg) in cod fillet from Kristiansand
(st. 13B) (see Figure 6 and Appendix C).
In flounder at Sande (st. 33F) in the mid Oslofjord, the Hg concentration in fillet was
0.150 mg/kg w.w. and a significant upward short-term trend was observed.
Decrease in PROREF factor since 2019 The concentrations of Hg in cod fillet from the Kristiansand harbour (st. 13B) were below PROREF in
2020, compared to an exceedance of two to five in 2019.
Downward trends
In blue mussel, a significant downward long-term trend was found at Solbergstrand (st. 31A) in the
mid Oslofjord, at Færder (st. 36A1) in the Outer Oslofjord and at Kirkøy (st. I024) at Hvaler. This
was also observed in the Grenlandfjord at Bjørkøya (st. 71A), in the Sørfjord at Krossanes (st. 57A)
(Figure 15) and in the mid Hardangerfjord at Vikingneset (st. 65A). The same result was seen at
Skallnes (st. 10A2) in the Varangerfjord. A significant downward short-term trend was found at
Singlekalven (st. I023) at Hvaler.
1 Timeseries includes alternate station at Tjøme, Outer Oslofjord (st. 36A1).

NIVA 7686-2021
68
Figure 15. Median concentrations (mg/kg w.w.) of mercury (Hg) in blue mussel from Krossanes in
the Outer Sørfjord (st. 57A) (see Figure 6 and Appendix C).
Levels in eider
In eider at Breøyane (st. 19N) in the Kongsfjord at Svalbard, the Hg concentrations were
0.111 mg/kg w.w. in blood, and 0.111 mg/kg w.w. in eggs.
Comparison with other studies
In the present study, blue mussel at Kvalnes in the mid Sørfjord had lower Hg concentration
(median 0.074 mg/kg w.w.) than at Byrkjenes in the Inner Sørfjord in 2019 (mean 0.1 mg/kg w.w.)
in a comparable study (Ruus 2020b). Hg concentrations exceeded EQS at all three blue mussel
stations in the Sørfjord in that survey. The collection of blue mussel in both studies took place
during the autumn.
In the present study, the median concentration of Hg in cod fillet from the Inner Oslofjord
was 0.140 mg/kg Hg w.w. In a comparable study from the Inner Oslofjord in 2020, the mean
concentration was 0.153 mg/kg Hg w.w. (Grung et al. 2021), and the levels are within the same
range. The collection of cod in both studies took place during the autumn.
EC maximum concentration levels for heavy metal concentrations in fish and shellfish are five times
greater, or more, that background concentrations. In all OSPAR regions assessed since 2009 the
average heavy metal concentrations are below EC maximum levels. Mercury concentrations in fish
and shellfish are at or above background in all contaminants assessment areas. The highest
concentrations are found in the Norwegian Trench, Northern North Sea, Southern North Sea and
Irish Sea, at around twice the background concentration (https://oap.ospar.org/en/ospar-
assessments/intermediate-assessment-2017/pressures-human-activities/contaminants/metals-fish-
shellfish/).
Most of the Hg-pollution in Norwegian lakes is now due to atmospherically deposited Hg originating
from other parts of the world (Jartun 2021). The concentration of Hg in trout from Mjøsa showed a
decreasing trend in the period 1980-2005, and showed more or less unchanged concentrations

NIVA 7686-2021
69
during the period 2006-2014 (Løvik 2016). Surveys from 2008 suggests that the length adjusted
average Hg-concentrations in ten perch populations from forest lakes, increased with 63 % since the
early 1990s (Fjeld 2009).
Fifty years of measurements show that Hg concentrations in freshwater fish were lower than before
in Norway, Sweden, Finland and the Kolahalvøya in Russia (Fennoskandia), although Hg coming
through the atmosphere is still a problem (Braaten 2017).
In the present study, Hg concentration (median 0.111 mg/kg w.w.) in eider eggs at Svalbard was
almost at the same level as in a comparable study (median 0.07 mg/kg w.w.) (Hill 2018).
In the present study, the median concentrations were 0.111 mg Hg/kg w.w. in blood and
0.111 mg Hg/kg w.w. in eider eggs from Svalbard. A study of eider from the Inner Oslofjord in 2017,
found mean values of 0.187 mg Hg/kg w.w. in blood and 0.154 mg Hg/kg w.w. in eggs (Ruus 2018).
The Hg concentrations in eider blood and eggs at Svalbard in 2020 was almost within the same range
as in the Inner Oslofjord in 2017.
General, large scale trends
In 2019, 0.5 tons of Hg was released in Norway, and there has been an 80 % reduction in emissions
of Hg and Hg-compounds since 19951.
For the period 1990-2006, OSPAR (2010) found 70-75 % reduction in riverine and direct discharges of
Hg to the North Sea, and sediment from the North Sea showed a predominance of downward over
upward significant trends. This reduction is not so evident for the Norwegian discharges.
Total riverine input of Hg in Norway has been 148 kg in 2017 (Kaste 2018). The riverine inputs of Hg
to different seawater were 63 kg to Skagerrak, 35 kg to the North Sea, 31 kg to the Norwegian Sea
and 20 kg to the Lofoten/Barents Sea, indicating higher input in the southern part of Norway. In
addition to riverine inputs was the contribution by direct discharges from sewage (10 kg) and
industrial (9 kg) effluents amounting to 19 kg or about 11 % of the total (167 kg). In the present
study, several stations with observed increase in Hg are not directly associated with rivers in the
monitoring programme (Kaste 2018).
For the food web in the North East Atlantic Ocean, positive correlations have been found between
concentrations of Hg and dioxins, PCBs, and PBDEs, which accumulate in marine food webs.
Concentrations of Hg increased in the food web from North to South in that ocean area (Ho 2021).
There are some evidences of downward long-term trends for Hg. Downward long-term trends were
found in blue mussel at eight locations. One significant downward short-term trend was found at
Singlekalven in Hvaler. Downward long-term trends were observed in cod fillet at four locations.
When considering the total of 43 possible recent short-term (2011-2020) trends for both cod and
blue mussel, no upward trends were found (Table 9, Figure 16).
1 https://miljostatus.miljodirektoratet.no/kvikksolv

NIVA 7686-2021
70
Figure 16. Frequency of short-term trends (2011-2020) for mercury (Hg) in blue mussel and cod
fillet.
In the present study, there were significant upward long-term trends for Hg in cod fillet from the
Inner Oslofjord, Farsund (Skågskjera), Bømlo and Tromsø harbour. Given the overall reduction in
national Hg emissions and releases mentioned above and strict regulations of Hg use, the increasing
Hg trends are not believed to be related to increased releases from primary sources in Norway, but
could be related to factors such as; climate change, more favourable conditions for methyl Hg
formation, increased bioavailability of Hg stored in the sediments, increased access of cod to
contaminated feeding areas due to improved oxygen levels in deep water, changes in what the cod
eat, etc. Present discharge of Hg to the Inner Oslofjord has been calculated to be around
7.3 kg/year (Berge 2013b). Berge et al. (2013b) estimated the discharges of Hg from various sources
to the Inner Oslofjord; rivers (2.2 kg Hg/year), atmosphere (1.6 kg Hg/year), impermeable surfaces
(2.1 kg Hg/year), wastewater treatment plants (WWTP) (0.9 kg Hg/year) and stormwater runoff
(0.5 kg Hg/year). The riverine input to the Inner Oslofjord from Alna river was 0.08 kg Hg in 2019
(Kaste 2021). VEAS sewage treatment plant reported a discharge of 0.48 kg Hg in 2020 to the Inner
Oslofjord (VEAS 2021).
Another explanation could be atmospheric deposition. Atmospheric deposition is a major source to
the seas surrounding Norway and considerably larger than other sources such as riverine discharges,
shipping and offshore installations (Green 2013). Bjerkeng et al. (2009) found that more than 60 %
of the Hg input to the Bunnefjord was from atmospheric deposition. There was some indication that
Norwegian atmospheric deposition in southern Norway is decreasing for the period 1995-2006, but
this was not statistically confirmed (Wängberg 2010). Newer data show small downward trends for
Hg at Birkenes (19 %) and Zeppelin (10 %), and a larger downward trend is observed in precipitation
than in air for Hg at Lista/Birkenes (Nizzetto 2021).
Emissions of Hg to air from land-based industries showed essentially a decrease from 1999
(436 kg Hg/year) to 2009 (104 kg Hg/year), and the emission was 82 kg Hg/year in 2020 (Figure 17).
The emissions to air varied between 104 kg Hg/year in 2009 to 82 kg Hg/year in 2020 for the period

NIVA 7686-2021
71
2009-2020. The discharges to water from land-based industries were at a maximum in 2000
(36 kg Hg/year), and at a minimum in 2019 (6.7 kg Hg/year). In 2020, the discharges to water were
7.82 kg Hg/year.
Figure 17. Annual emissions of Hg to air and discharges to water from land-based industries for the
period 1994-2020 (data from www.norskeutslipp.no, 05.07.2021). Note that emissions and
discharges from municipal treatment plants, land runoff, transportation and offshore industry are
not accounted for in the figure. New calculation methods for data of emissions and discharges
might lead to changes in calculations of present and previous data.

NIVA 7686-2021
72
3.2.3 Cadmium (Cd)
Cadmium (Cd) is a naturally occurring heavy metal. Sources are agricultural and industrial
emissions, long-range air pollutants and Cd naturally found in small quantities in the earth’s crust.
In the present study, Cd was analysed in blue mussel at 25 stations, in cod liver at 17 stations, in
flounder liver at one station and in eider blood and eggs at one station (Table 1).
Levels exceeding PROREF
Blue mussel at nine stations exceeded the PROREF for Cd by a factor of up to two (Table 9). These
blue mussel stations were at Akershuskaia (st. I301) and Gåsøya (st. I304) in the Inner Oslofjord, at
Kirkøy (st. I024) at Hvaler in the Outer Oslofjord and at Bjørkøya (st. 71A) in the Grenlandfjord. The
same result was found at Odderøya (st. I133) in the Kristiansandfjord and at Krossanes (st. 57A) in
the Outer Sørfjord. This was also found at Svolvær (st. 98A2) in Lofoten, and at Brashavn (st. 11X)
and Skallnes (st. 10A2) in the Varangerfjord.
Cod liver from Hammerfest harbour (st. 45B2) exceeded the PROREF for Cd by a factor up to two.
Increase in PROREF factor since 2019
Blue mussel exceeded PROREF for Cd by a factor up to two in 2020, while there were no
exceedances in 2019 at Akershuskaia (st. I301) and Gåsøya (st. I304).
The Cd concentration in cod liver from Hammerfest harbour (st. 45B2) exceeded the PROREF for Cd
by a factor of two in 2020, while the level was below the limit in 2019.
Upward trends
There was a significant upward long-term trend for Cd in blue mussel at Gåsøya (st. I304) in the
Inner Oslofjord (Figure 18 A). There was a significant upward short-term trend for Cd in blue
mussel at Brashavn (st. 11X) in the Varangerfjord (Figure 18 B).
In cod liver from the Inner Oslofjord (st. 30B), a significant upward long-term trend for Cd was
found (Figure 19).
In flounder at Sande (st. 33F) in the mid Oslofjord, the Cd concentration in liver was
0.240 mg/kg w.w., and a significant upward short-term trend was found.
Decrease in PROREF factor since 2019
Blue mussel at Færder (st. 36A) in the Outer Oslofjord and Utne (st. 64A) in the Outer Sørfjord, had
Cd concentrations below PROREF in 2020, while the concentrations exceeded PROREF by a factor of
two in 2019.

NIVA 7686-2021
73
A
B
Figure 18. Median concentrations (mg/kg w.w.) of cadmium (Cd) in blue mussel from Gåsøya
(st. I304) in the Inner Oslofjord (A) and from Brashavn (st. 11X) in the Varangerfjord (B) (see
Figure 6 and Appendix C).
Figure 19. Median concentrations (mg/kg w.w.) of cadmium (Cd) in cod liver from in the Inner
Oslofjord (st. 30B) (see Figure 6 and Appendix C).

NIVA 7686-2021
74
Downward trends
In blue mussel, there were both significant downward long- and short-term trends at Bjørkøya
(st. 71A) in the Grenlandfjord. There were significant downward long-term trends at Krossanes
(st. 57A) in the Outer Sørfjord, at Vikingneset (st. 65A) in the mid Hardangerfjord and at Nordnes
(st. I241) in Bergen harbour.
In cod liver, there were both significant downward long- and short-term trends for Cd in Ålesund
harbour (st. 28B). There was a significant downward long-term trend in the Inner Sørfjord (st. 53B).
and in the Austnesfjord (st. 98B1) in Lofoten.
Levels in eider
In eider at Breøyane (st. 19N) in the Kongsfjord at Svalbard, the Cd concentrations were
0.003 mg/kg w.w. in blood and <0.0003 mg/kg w.w. in eggs.
Comparison with other studies
In the present study, cod liver from the Inner Oslofjord had concentration
(median 0.073 mg/kg Cd w.w.) in the same range as a comparable study from the Inner Oslofjord in
2020 (mean 0.117 mg/kg Cd w.w.) (Grung et al. 2021). The collection of cod in both studies took
place during the autumn.
General, large scale trends
In 2019, one ton of Cd was released in Norway compared with five tons in 1995 and 43 tons in 1985.
Today, the metal- and mining industries account for the largest emissions1.
Discharges of Cd to water from land-based industries showed a decrease from 2000
(1468 kg Cd/year) to 2020 (82 kg Cd/year) (Figure 20). The emission of Cd to air showed a gradually
decrease from 1999 (560 kg Cd/year) to 2020 (59 kg Cd/year).
1 https://miljostatus.miljodirektoratet.no/tema/miljogifter/prioriterte-miljogifter/kadmium-og-kadmiumforbindelser/
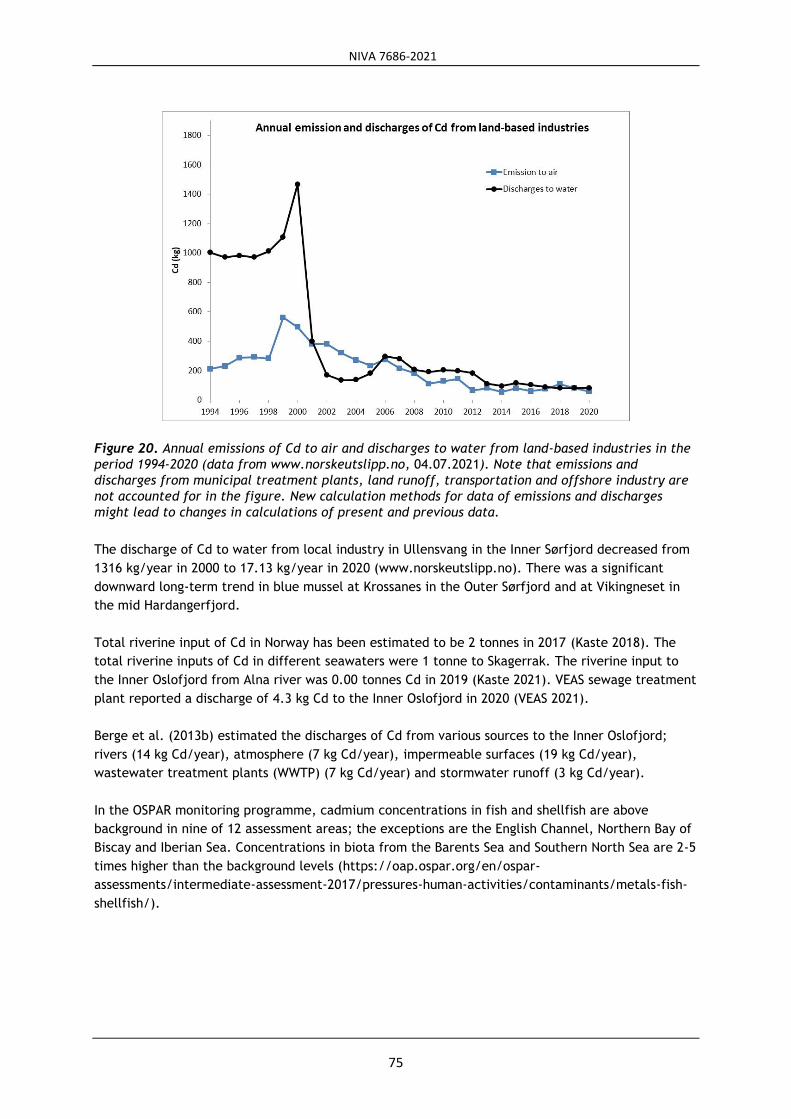
NIVA 7686-2021
75
Figure 20. Annual emissions of Cd to air and discharges to water from land-based industries in the
period 1994-2020 (data from www.norskeutslipp.no, 04.07.2021). Note that emissions and
discharges from municipal treatment plants, land runoff, transportation and offshore industry are
not accounted for in the figure. New calculation methods for data of emissions and discharges
might lead to changes in calculations of present and previous data.
The discharge of Cd to water from local industry in Ullensvang in the Inner Sørfjord decreased from
1316 kg/year in 2000 to 17.13 kg/year in 2020 (www.norskeutslipp.no). There was a significant
downward long-term trend in blue mussel at Krossanes in the Outer Sørfjord and at Vikingneset in
the mid Hardangerfjord.
Total riverine input of Cd in Norway has been estimated to be 2 tonnes in 2017 (Kaste 2018). The
total riverine inputs of Cd in different seawaters were 1 tonne to Skagerrak. The riverine input to
the Inner Oslofjord from Alna river was 0.00 tonnes Cd in 2019 (Kaste 2021). VEAS sewage treatment
plant reported a discharge of 4.3 kg Cd to the Inner Oslofjord in 2020 (VEAS 2021).
Berge et al. (2013b) estimated the discharges of Cd from various sources to the Inner Oslofjord;
rivers (14 kg Cd/year), atmosphere (7 kg Cd/year), impermeable surfaces (19 kg Cd/year),
wastewater treatment plants (WWTP) (7 kg Cd/year) and stormwater runoff (3 kg Cd/year).
In the OSPAR monitoring programme, cadmium concentrations in fish and shellfish are above
background in nine of 12 assessment areas; the exceptions are the English Channel, Northern Bay of
Biscay and Iberian Sea. Concentrations in biota from the Barents Sea and Southern North Sea are 2-5
times higher than the background levels (https://oap.ospar.org/en/ospar-
assessments/intermediate-assessment-2017/pressures-human-activities/contaminants/metals-fish-
shellfish/).
NIVA 7686-2021
76
3.2.4 Lead (Pb)
Lead (Pb) is an element, and both emissions from man-made and natural sources can contribute to
pollution. In the present study, Pb was analysed in blue mussel at 25 stations, in cod liver at
17 stations, in flounder liver at one station and in eider blood and eggs at one station (Table 1).
Levels exceeding PROREF
Blue mussel at Odderøya (st. I133) in the Kristiansandfjord exceeded the Norwegian provisional high
reference contaminant concentration (PROREF) for Pb by a factor of 10 to 20. The exceedance was
by a factor of five to 10 at Gressholmen (st. 30A) in the Inner Oslofjord. The exceedance was by a
factor of two to five at Akershuskaia (st. I301) and Gåsøya (st. I304) in the Inner Oslofjord, Nordnes
(st. I241) in the Bergen harbour area, Krossanes (st. 57A) in the Outer Sørfjord, Bodø harbour
(st. 97A3) and Mjelle (st. 97A2) in the Bodø area. Blue mussel exceeded PROREF by a factor of up to
two at eight stations (Table 9). These stations were Kirkøy (st. I024) at Hvaler in the Outer
Oslofjord, Bjørkøya (st. 71A) in the Grenlandfjord, Risøy (st. 76A2) at Risør and Gåsøya-Ullerøya
(st. 15A) in Farsund. This was also the result at Utne (st. 64A) in the Outer Sørfjord and at
Vikingneset (st. 65A) in the mid Hardangerfjord, at Vågsvåg (st. 26A2) in the Outer Nordfjord and
Ålesund harbour (st. 28A2).
Cod liver from the Inner Oslofjord (st. 30B) exceeded PROREF of Pb by a factor up to two (Table 9).
Increase in PROREF factor since 2019
Blue mussel at Odderøya (st. I133) in the Kristiansandfjord exceeded PROREF of Pb by a factor of 10
to 20 in 2020, while the exceedance was between five and 10 times in 2019. The exceedance of Pb
was between two and five in 2020, while the exceedance was by a factor up to two at Akershuskaia
(st. I301) and Gåsøya (st. I304) in the Inner Oslofjord and at Mjelle (st. 97A2) in the Bodø area in
2019. At Risøy (st. 76A2) at Risør, Vågsvåg (st. 26A2) in the Outer Nordfjord and Gåsøya-Ullerøya
(st. 15A) in Farsund, the concentrations of Pb were below PROREF in 2019, while the exceedances
were by a factor up to two in 2020.
Upward trends
There were both significant upward long- and short-term trends in blue mussel from Gressholmen
(st. 30A) (Figure 21 A) and at Gåsøya (st. I304) (Figure 21 B) in the Inner Oslofjord, and at Risøy
(st. 76A2) at Risør.

NIVA 7686-2021
77
A
B
Figure 21. Median concentrations (mg/kg w.w.) of lead (Pb) in blue mussel from Gressholmen
(st. 30A) (A) and Gåsøya (st. I304) (B) in the Inner Oslofjord (see Figure 6 and Appendix C).
Decrease in PROREF factor since 2019
Blue mussel exceeded PROREF of Pb by a factor between five to 10 in 2020, while the exceedance
was between 10 and 20 in 2019. Blue mussel at Kirkøy (st. I024) exceeded PROREF by a factor up to
two in 2020, while the concentrations exceeded the PROREF by a factor between two and five in
2019. At Singlekalven (st. I023), the concentrations of Pb were below the PROREF in 2020, while the
exceedance was by a factor up to two in 2019.
Downward trends
Of the trend analysis performed for blue mussel, six revealed significant downward long-term trends
(Table 9). Significant downward long-term trends were found at Akershuskaia (st. I301) in the Inner
Oslofjord, at Solbergstrand (st. 31A) in the mid Oslofjord, at Krossanes (st. 57A) in the Sørfjord and
Vikingneset (st. 65A) in the mid Hardangerfjord. This was also observed in blue mussel at Espevær
(st. 22A) in the Outer Bømlafjord and Nordnes (st. I241).
In cod liver, both significant downward long- and short-term trends were found at Tjøme (st. 36B) in
the Outer Oslofjord, at Kirkøy (st. 02B) at Hvaler, in the Kristiansand harbour (st. 13B) and at Bømlo
(st. 23B) in the Outer Selbjørnfjord. This was also found in the Trondheim harbour (st. 80B), in the
Sandnessjøen area (st. 96B), in the Austnesfjord (st. 98B1) in Lofoten and in Hammerfest harbour

NIVA 7686-2021
78
(st. 45 B2). Significant downward long-term trends were found at Skågskjera in Farsund (st. 15B)
and in the Inner Sørfjord (st. 53B). This was also the case at Kjøfjord (st. 10B) in the Varangerfjord.
In flounder at Sande (st. 33F) in the mid Oslofjord, the Pb concentration in liver was
0.039 mg/kg w.w., and a significant downward long-term trend was found.
Levels in eider
In eider at Breøyane (st. 19N) in the Kongsfjord at Svalbard, the Pb concentrations were
0.046 mg/kg w.w. in blood and 0.006 mg/kg w.w. in eggs.
Comparison with other studies
In the present study, concentrations in cod liver from the Inner Oslofjord (median 0.095 mg/kg Pb
w.w.) were in the same range as observed in a comparable study (mean 0.064 mg/kg Pb w.w.) from
the Inner Oslofjord in 2020 (Grung et al. 2021). The collection of cod in both studies took place
during the autumn.
In the present study, Pb concentration (median 0.006 mg/kg w.w.) in eider eggs at Svalbard was
almost at the same level as in a comparable study (median 0.005 mg/kg w.w.) (Hill 2018).
General, large scale trends
In 2019, 78 tons of Pb was released in Norway and there has been a 90 % decline since 19951. Lead-
free gasoline has significantly reduced the emissions, and now the largest emissions come from
ammunition and blowing sand.
There were low levels of Pb in cod liver, and the highest concentration was found in the Inner
Oslofjord (st. 0.066 mg/kg w.w.). EU banned leaded-fuel in road vehicles 1 January 2000, but some
countries had banned the fuel beforehand (e.g. Sweden, Germany and Portugal). The results
indicate that the ban of Pb in gasoline has had a positive effect.
OSPAR (2010) found 50-80 % reduction in riverine and direct discharges of Pb to the North Sea for
the period 1990-2006. While the total riverine input of Pb in Norway was 26 tonnes in 2017, the
riverine inputs of Pb in different areas were 14 tonnes to Skagerrak, 8 tonnes to the North Sea,
3 tonnes to the Norwegian Sea and 1 tonnes to the Lofoten/Barents Sea (Kaste 2018) indicating
higher input in the southern part of Norway. In addition to riverine inputs, comes the contribution
by direct discharges from industrial (1 tonnes) effluents amounting about 7 % of the total
(28 tonnes). The riverine input to the Inner Oslofjord from Alna river was 0.04 tonnes Pb in 2019
(Kaste 2021). VEAS sewage treatment plant reported a discharge of 69 kg Pb in 2020 (VEAS 2021).
Berge et al. (2013b) estimated the discharges of Pb from various sources to the Inner Oslofjord;
rivers (429 kg Pb/year), atmosphere (168 kg Pb/year), impermeable surfaces (544 kg Pb/year),
wastewater treatment plants (WWTP) (79 kg Pb/year) and overflow (60 kg Pb/year).
Discharges of Pb to water from land-based industries in Norway showed a decrease from 2010
(6841 kg Pb/year) to 2020 (926 kg Pb/year) (Figure 22).
1 https://miljostatus.miljodirektoratet.no/tema/miljogifter/prioriterte-miljogifter/bly-og-blyforbindelser/

NIVA 7686-2021
79
Figure 22. Annual emissions of Pb to air and discharges to water from land-based industries in the
period 1994-2020 (data from www.norskeutslipp.no, 04.07.2021). Note that emissions and
discharges from municipal treatment plants, land runoff, transportation and offshore industry are
not accounted for in the figure. New calculation methods for data of emissions and discharges
might lead to changes in calculations of present and previous data.
OSPAR has done monitoring of heavy metals in fish and shellfish in several ocean areas. With the
exception of the Irish and Scottish West Coast, lead concentrations in biota are above background
level. Lead concentrations in biota in the Northern North Sea, Irish Sea and Gulf of Cadiz all are at
2-5 times the background concentration (https://oap.ospar.org/en/ospar-
assessments/intermediate-assessment-2017/pressures-human-activities/contaminants/metals-fish-
shellfish/).
3.2.5 Copper (Cu)
Copper (Cu) is an element. In the past, wood was often impregnated with Cu. Today such use is
prohibited, and the use has been significantly reduced. Under the Biocidal Products Regulation
however dicopper oxide and copper thiocyanate is still permitted as active substances in antifouling
agents in Norway. When copper from metallic copper, copper thiocyanate or cuprous oxide leaches
into marine water in presence of oxygen, the predominant form of the copper is the active
substance, the cupric ion, Cu2+1.
In the present study, Cu was analysed in blue mussel at 25 stations, in cod liver at 17 stations, in
flounder liver at one station and in eider blood and eggs at one station (Table 1).
Levels exceeding PROREF
In 2020, the Cu concentrations exceeded the PROREF in blue mussel by a factor between two to five
in the Bodø harbour (st. 97A3) (Table 9). The exceedance of PROREF was by a factor up to two at
Gressholmen (st. 30A), Solbergstrand (st. 31A) and Færder (st. 36A) in the Oslofjord, at Kirkøy
(st. I024) in the Hvaler area and at Bjørkøya (st. 71A) in the Grenlandfjord. This was also the case at
Odderøya (st. I133) in the Kristiansandfjord, Espevær (st. 22A), Nordnes (st. I241) in the Bergen
harbour, Ålesund harbour (st. 28A2) and Skallnes (st. 10A2) in the Varangerfjord.
1 https://echa.europa.eu/documents/10162/7417a7be-8032-c2d1-08d2-f780b50b3751

NIVA 7686-2021
80
All Cu concentrations in cod liver were below PROREF.
Upward trends
In blue mussel, a significant upward short-term trend was found at Kirkøy (st. I024) in the Hvaler
archipelago and at Nordnes (st. I241) in the Bergen city and harbour area.
In cod liver, a significant upward short-term trend was found at Skågskjera in Farsund (st. 15B)
(Figure 23).
Figure 23. Median concentrations (mg/kg w.w.) of copper (Cu) in cod liver from Skågskjera in
Farsund (st. 15B) (see Figure 6 and Appendix C).
Downward trends
There were both significant downward long- and short-term trends in mussel from Mjelle in the
Bodø area (97A2). A significant downward long-term trend was observed at Gåsøya (st. I304) in the
Inner Oslofjord. Significant downward short-term trends were found at Odderøya (st. I133) in the
Kristiansand harbour, at Lastad (st. I131A) in Søgne and at Brashavn (st. 11X) in the Varangerfjord.
There were significant downward long-term trends for Cu in cod liver from the Inner Oslofjord
(st. 30B) and Tjøme (st. 36B) in the Outer Oslofjord.
Levels in flounder
In flounder at Sande (st. 33F) in the mid Oslofjord, the Cu concentration in liver was
20.0 mg/kg w.w.
Levels in eider
In eider at Breøyane (st. 19N) in the Kongsfjord at Svalbard, the Cu concentrations were
0.453 mg/kg w.w. in blood and 1.171 mg/kg w.w. in eggs.

NIVA 7686-2021
81
Comparison with other studies
In the present study, cod liver from the Inner Oslofjord (median 5.4 mg/kg Cu w.w.) was higher
than in a comparable study from the Inner Oslofjord in 2020 (mean 3.72 mg/kg Cu w.w.) (Grung et
al. 2021). The collection of cod in both studies took place during the autumn.
General, large scale
In the past, wood was often impregnated with Cu, Cr and As. Today is it prohibited to use, and the
use has been significantly reduced. In 2013, 1239 tonnes of Cu were used in the aquaculture
industry to prevent overgrowth of the nets, and 80-90 % leaks into the sea1. This use is still ongoing.
In 2014, 1130 tonnes of copper were sold for use as antifouling agents in Norway, while the
corresponding consumption in 2019 was 1698 tonnes (Grefsrud 2021). This corresponds to an
increase of 50 % over this period.
Discharges of Cu to water from land-based industries showed a gradually decrease from 1998
(19 385 kg Cu/year) to 2015 (5 560 kg Cu/year) (Figure 24). In 2020, the discharges to water were
6551 kg Cu/year.
Figure 24. Annual emissions of Cu to air and discharges to water from land-based industries in the
period 1994-2020 (data from www.norskeutslipp.no, 05.07.2021). Note that emissions and
discharges from municipal treatment plants, land runoff, transportation and offshore industry are
not accounted for in the figure. New calculation methods for data of emissions and discharges
might lead to changes in calculations of present and previous data.
Total riverine input of Cu to marine- and coastal waters in Norway was 165 tonnes in 2017 (Kaste
2018). The total riverine inputs of Cu were 59 tonnes to Skagerrak, 24 tonnes to the North Sea, 45
tonnes to the Norwegian Sea and 36 tonnes to the Lofoten/Barents Sea. The input of Cu along the
coast of the Barent Sea has increased significantly from 1990 to 2018. In addition to riverine inputs,
comes the contribution by direct discharges from sewage (5 tonnes) and industrial (5 tonnes)
effluents and fish farming (1088 tonnes) amounting to 1099 tonnes (Kaste 2018), or about 87 % of
the total (1264 tonnes). The riverine input to the Inner Oslofjord from Alna river was 0.20 tonnes Cu
1 https://www.environment.no/no/Tema/Hav-og-kyst/Fiskeoppdrett/Kobber-og-andre-kjemikalier-i-fiskeoppdrett/

NIVA 7686-2021
82
in 2019 (Kaste 2021). VEAS sewage treatment plant reported a discharge of 0.541 tonnes Cu in 2020
(VEAS 2021).
Berge et al. (2013b) estimated the discharges of Cu from various sources to the Inner Oslofjord;
rivers (2.538 tonnes Cu/year), atmosphere (0.100 tonnes Cu/year), impermeable surfaces
(1.081 tonnes Cu/year), wastewater treatment plants (WWTP) (2.528 tonnes Cu/year) and overflow
(0.229 tonnes Cu/year).
3.2.6 Zinc (Zn)
Zink (Zn) is an element. In the present study, Zn was analysed in blue mussel at 25 stations, in cod
liver at 17 stations, in flounder liver at one station and in eider blood and eggs at one station
(Table 1).
Levels exceeding PROREF
Blue mussel from 13 stations exceeded the Norwegian provisional high reference contaminant
concentration (PROREF) for Zn, but by less than a factor of two (Table 9). These stations were
Akershuskaia (st. I301) and Gressholmen (st. 30A) in the Inner Oslofjord, Solbergstrand (st. 31A) in
the mid Oslofjord, and Singlekalven (st. I023) and Kirkøy (st. I024) at Hvaler. This was also the
result at Odderøya (st. I133) in the Kristiansandfjord and Gåsøya-Ullerøya (st. 15A) in Farsund. This
was also the case at Espevær (st. 22A) in the Outer Bømlafjord, at Nordnes (st. I241) in the Bergen
harbour area and in Ålesund harbour (st. 28A2). The same result was found at Bodø harbour
(st. 97A3), Mjelle (st. 97A2) in the Bodø area and at Skallnes (st. 10A2) in the Varangerfjord.
All Zn concentrations in cod liver were below PROREF.
Increase in PROREF factor since 2019
In 2020, the exceedance in PROREF for Zn was by a factor up to two at six blue mussel stations,
while the concentrations were below this level in 2019. These stations were Gåsøya (st. I304),
Solbergstrand (st. 31A), Kirkøy (st. I024), Espevær (st. 22A), Ålesund harbour (st. 28A2) and Mjelle
(s. 97A2) in Bodø area.
Upward trends
Both significant upward long- and short-term trends were found in blue mussel from Risøy
(st. 76A2).
A significant upward long-term trend was found in cod liver from the Austnesfjord (st. 98B1) in
Lofoten. A significant upward short-term trend was found at Skågskjera in Farsund (st. 15B).
Decrease in PROREF factor since 2019
In 2020, the Zn concentrations in blue mussel were below the PROREF while the exceedance was
less than two times at Færder (st. 36A), Gåsøya-Ullerøya (st. 15A) in Farsund, at Vikingneset
(st. 65A) in the mid Hardangerfjord and at Vågsvåg (st. 26A2) in the Outer Nordfjord.
In cod liver from the Kristiansandfjord (st. 13B), the Zn concentrations was below the PROREF in
2020, compared to an exceedance up to a factor of two in 2019.
Downward trends
In blue mussel, both significant downward long- and short-term trends were found at Lastad
(st. I131A) at Søgne. A significant downward long-term trend was found at Gressholmen (st. 30A) in

NIVA 7686-2021
83
the Inner Oslofjord, Krossanes (st. 57A) in the Outer Sørfjord, Vikingneset (st. 65A) in the mid
Hardangerfjord, Espevær (st. 22A) in the Outer Bømlafjord and at Brashavn (st. 11X) in the
Varangerfjord.
Levels in flounder
In flounder at Sande (st. 33F) in the mid Oslofjord, the Zn concentration in liver was
47.0 mg/kg w.w.
Levels in eider
In eider at Breøyane (st. 19N) in the Kongsfjord at Svalbard, the Zn concentrations were
5.090 mg/kg w.w. in blood and 16.661 mg/kg w.w. in eggs.
Comparison with other studies
In the present study, cod liver from the Inner Oslofjord (median 28.0 mg/kg Zn w.w.) was higher
than a comparable study from the Inner Oslofjord in 2020 (mean 18.2 mg/kg Zn w.w.) (Grung et al.
2021). The collection of cod in both studies took place during the autumn.
General, large scale
Discharges of Zn to water from land-based industries showed a gradually decrease from 1999
(89 290 kg Zn/year) to 2020 (11 367 kg Zn/year) (Figure 25).
Figure 25. Annual emissions of Zn to air and discharges to water from land-based industries in the
period 1994-2020 (data from www.norskeutslipp.no, 05.07.2021). Note that emissions and
discharges from municipal treatment plants, land runoff, transportation and offshore industry are
not accounted for in the figure. New calculation methods for data of emissions and discharges
might lead to changes in calculations of present and previous data, and this is the reason why this
figure for 2019 looked very different than for 2018.
Total riverine input of Zn in Norway has been 407 tonnes in 2017 (Kaste 2018). Total riverine inputs
of Zn were 186 tonnes to Skagerrak, 94 tonnes to the North Sea, 92 tonnes to the Norwegian Sea
and 36 tonnes to the Lofoten/Barents Sea (Kaste 2018), indicating higher input in the southern part

NIVA 7686-2021
84
of Norway. In addition to riverine inputs, comes the contribution by direct discharges from sewage
(20 tonnes) and industrial (16 tonnes) effluents amounting to 36 tonnes or about 8 % of the total
(443 tonnes). The riverine input to the Inner Oslofjord from Alna river was 0.62 tonnes Zn in 2019
(Kaste 2021). VEAS sewage treatment plant reported a discharge of 2202 kg Zn in 2020 (VEAS 2021).
Berge et al. (2013b) estimated the discharges of Zn from various sources to the Inner Oslofjord;
rivers (5397 kg Zn/year), atmosphere (792 kg Zn/year), impermeable surfaces (5534 kg Zn/year),
wastewater treatment plants (WWTP) (4033 kg Zn/year) and storm water runoff (502 kg Zn/year).
3.2.7 Silver (Ag)
Silver (Ag) is an element. Possible sources are the iron and steel industry, cement industry, mining
and landfills. Silver is used as active substance in biocidal products and in treated articles. Under
the biocidal product regulations all active substances must be authorized to be permitted to be
placed on the market. Only silver uses which show acceptable risks, get authorized. Evaluation of
silver as an active substance within the biocidal product regulations is ongoing. Pending the
outcome of this evaluation, four silver compounds are permitted used as biocides in the EU/ EEA-
region. Discharges of wastewater treatment plants (WWTP) and discharges from mine tailings are
considered major and important sources for Ag to the aquatic environment (Tappin et al. 2010). The
Ag nanoparticles from consumer products is important in terms of inputs to wastewater treatment
plants (Nowack 2010). In the present study, Ag was analysed in blue mussel at 25 stations, in cod
liver at 17 stations, in flounder liver at one station and in eider blood and eggs at one station
(Table 1)
Levels exceeding PROREF
The concentrations of Ag at all blue mussel stations were <0.050 mg Ag/kg w.w., which exceeded
the Norwegian provisional high reference contaminant concentration (PROREF) (0.008565 mg
Ag/kg w.w.) by a factor of five to 10 (Table 9).
Cod liver from the Inner Oslofjord (st. 30B) exceeded PROREF of Ag by a factor of two to five. Cod
liver from Tjøme (st. 36B) in the Outer Oslofjord, Stathelle (st. 71B) in the Langesundfjord,
Skågskjera (st. 15B) at Farsund, the Inner Sørfjord (st. 53B) and Bergen harbour (st. 24B) exceeded
PROREF by a factor up to two.
Increase in PROREF factor since 2019
The Ag concentration in cod liver were below PROREF in 2020, while the exceedance was by a
factor up to two in 2019 at Stathelle (st. 71B) in the Langesundfjord, the Inner Sørfjord (st. 53B)
and in the Bergen harbour (st. 24B).
Upward trends
In blue mussel, a significant upward short-term trend was found for Ag at Solbergstrand (st. 31A).
This is a methodical (artificial) result processing the values below LOQ with random pulling of data
between 0.5 LOQ and LOQ, while LOQ increased from 0.004 to 0.05 in 2019 (see details in chapter
2.6).
There were both significant upward long- and short-term trends for Ag in cod liver from Skågskjera
(st. 15B) in Farsund (Figure 26 A) also when adjusted for length (Figure 26 B). A significant upward
short-term trend was found in cod liver from Kjøfjord (st. 10B) in the Varangerfjord.

NIVA 7686-2021
85
A
B
Figure 26. Median concentrations (mg/kg w.w.) of silver (Ag) in cod liver from Skågskjera (st. 15B)
in Farsund; no adjustment for length (A) and adjusted for length (B) (see Figure 6 and Appendix
C).
Downward trends
A significant downward short-term trend was found for Ag in cod liver from the Austnesfjord
(st. 98B1) in Lofoten.
Levels in flounder
In flounder at Sande (st. 33F) in the mid Oslofjord, the Ag concentration in liver was
0.060 mg/kg w.w.
Levels in eider
In eider at Breøyane (st. 19N) in the Kongsfjord at Svalbard, the Ag concentrations were
0.001 mg/kg w.w. in blood and 0.009 mg/kg w.w. in eggs.
Comparison with other studies
In 2020, the highest Ag concentration in the present study was found in cod liver from the Inner
Oslofjord (4.45 mg/kg w.w.), similar levels were observed in 2019 (5.90 mg/kg w.w.), 2018
(2.90 mg/kg w.w.), in 2017 (5.40 mg/kg w.w.), in 2016 (2.40 mg/kg w.w.) and in 2015
(6.85 mg/kg w.w.). Literature is sparse, but in one study equivalent concentrations in the gills of
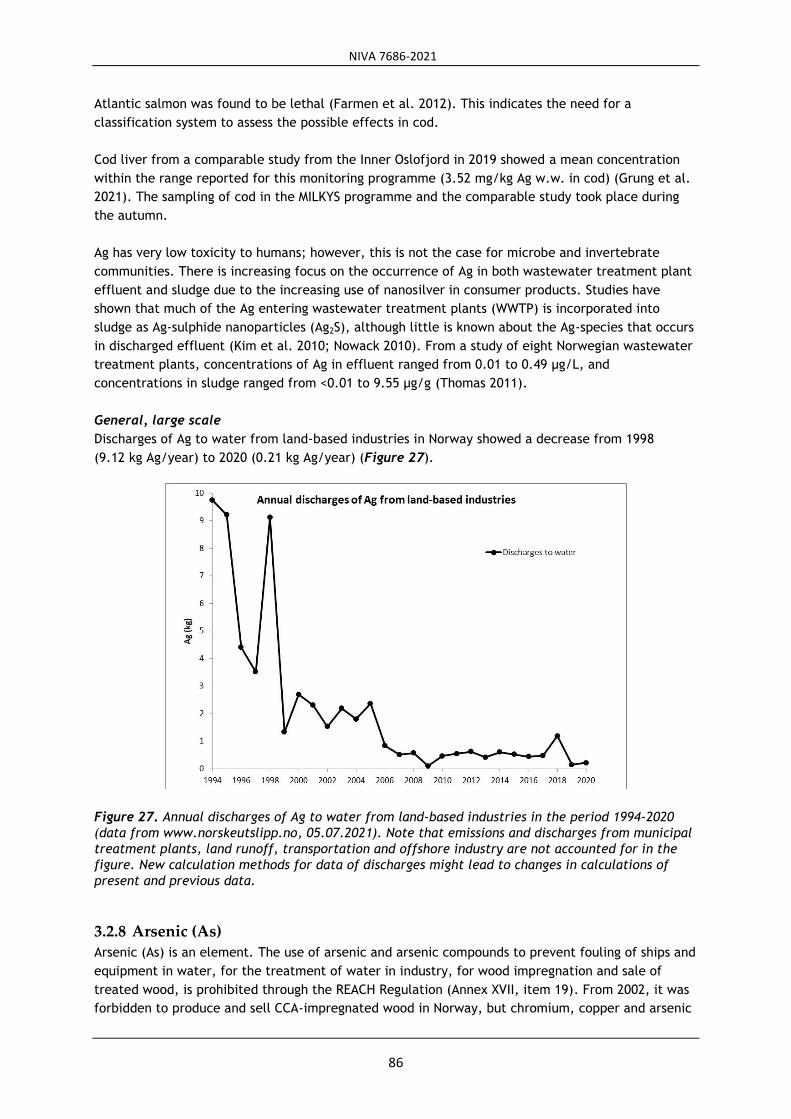
NIVA 7686-2021
86
Atlantic salmon was found to be lethal (Farmen et al. 2012). This indicates the need for a
classification system to assess the possible effects in cod.
Cod liver from a comparable study from the Inner Oslofjord in 2019 showed a mean concentration
within the range reported for this monitoring programme (3.52 mg/kg Ag w.w. in cod) (Grung et al.
2021). The sampling of cod in the MILKYS programme and the comparable study took place during
the autumn.
Ag has very low toxicity to humans; however, this is not the case for microbe and invertebrate
communities. There is increasing focus on the occurrence of Ag in both wastewater treatment plant
effluent and sludge due to the increasing use of nanosilver in consumer products. Studies have
shown that much of the Ag entering wastewater treatment plants (WWTP) is incorporated into
sludge as Ag-sulphide nanoparticles (Ag2S), although little is known about the Ag-species that occurs
in discharged effluent (Kim et al. 2010; Nowack 2010). From a study of eight Norwegian wastewater
treatment plants, concentrations of Ag in effluent ranged from 0.01 to 0.49 µg/L, and
concentrations in sludge ranged from <0.01 to 9.55 µg/g (Thomas 2011).
General, large scale
Discharges of Ag to water from land-based industries in Norway showed a decrease from 1998
(9.12 kg Ag/year) to 2020 (0.21 kg Ag/year) (Figure 27).
Figure 27. Annual discharges of Ag to water from land-based industries in the period 1994-2020
(data from www.norskeutslipp.no, 05.07.2021). Note that emissions and discharges from municipal
treatment plants, land runoff, transportation and offshore industry are not accounted for in the
figure. New calculation methods for data of discharges might lead to changes in calculations of
present and previous data.
3.2.8 Arsenic (As) Arsenic (As) is an element. The use of arsenic and arsenic compounds to prevent fouling of ships and
equipment in water, for the treatment of water in industry, for wood impregnation and sale of
treated wood, is prohibited through the REACH Regulation (Annex XVII, item 19). From 2002, it was
forbidden to produce and sell CCA-impregnated wood in Norway, but chromium, copper and arsenic

NIVA 7686-2021
87
continue to leak from old wood. Therefore, it is assumed that impregnated wood is still the largest
source of arsenic emissions in Norway. Large quantities are still found in, among other places,
wharves, terrace floors and play equipment, and the emissions are therefore still significant. As
evidenced from national monitoring activities, atmospheric long-range environmental transport of
arsenic to Norway has decreased sharply since the 1970s (State of the Environment Norway1).
In the present study, As was analysed in blue mussel at 25 stations, in cod liver at 17 stations, in
flounder liver at one station and in eider blood and eggs at one station (Table 1).
Levels exceeding PROREF
Blue mussel exceeded the Norwegian provisional high reference contaminant concentration
(PROREF) for As by a factor of two to five at Espevær (st. 22A) in the Outer Bømlafjord. The
exceedance was by a factor up to two at Gåsøya (st. I304) in the Inner Oslofjord and Gåsøya-
Ullerøya (st. 15A) in Farsund. This was also the result at Krossanes (st. 57A) and Utne (st. 64A) in
the Outer Hardangerfjord and at Vikingneset (st. 65A) in the mid Hardangerfjord. This was also
observed at Nordnes (st. I241) in Bergen, Ålesund harbour (st. 28A2) and at Mjelle (st. 97A2) in Bodø
area.
Cod liver exceeded PROREF for As by a factor of up to two at the Inner Oslofjord (st. 30B) and
Tjøme (st. 36B) in the Outer Oslofjord.
Increase in PROREF factor since 2019
In 2020, the exceedance of As was between two and five times in blue mussel at Espevær (st. 22A)
compared to a factor up to two in 2019. The exceedance was by a factor up to two times in 2020,
while the concentrations were below PROREF in 2019 at Gåsøya (st. I304) in the Inner Oslofjord,
Gåsøya-Ullerøya (st. 15A) in Farsund, Krossanes (st. 57A) in the Outer Sørfjord and Nordnes
(st. I241) in Bergen.
In cod liver from Tjøme (st. 36B) in the Outer Oslofjord, the concentration of As exceeded the
PROREF by a factor up to two in 2020 compared to no exceedance in 2019.
Upward trends
In blue mussel, a significant upward short-term trend was observed for As at Akershuskaia (st. I301).
In cod liver, both significant upward long- and short-term trends were observed at Skågskjera
(st. 15B) in Farsund.
Decrease in PROREF factor since 2019
In 2020, the As concentrations in blue mussel were below PROREF, compared to an exceedance by a
factor between two and five at Vågsvåg (st. 26A2) and below two at Solbergstrand (st. 31A), Færder
(st. 36A) and Ørland (st. 94A2) in 2019.
Downward trends
In blue mussel, both significant downward long- and short-term trends were observed at Bjørkøya
(st. 71A) in the Grenlandfjord. A significant downward long-term trend was found at Svolvær airport
area (st. 98A2) in Lofoten, and at Skallnes (st. 10A2) and Brashavn (st. 11X) in the Varangerfjord.
1 https://miljostatus.miljodirektoratet.no/tema/miljogifter/prioriterte-miljogifter/arsen-og-arsenforbindelser/

NIVA 7686-2021
88
In cod liver, both significant downward long- and short-term trends were found for As at Skågskjera
(st. 15B) in Farsund. A significant downward long-term trend was found for As at Bømlo (st. 23B).
Levels in flounder
In flounder at Sande (st. 33F) in the mid Oslofjord, the As concentration in liver was 4.0 mg/kg w.w.
Levels in eider
In eider at Breøyane (st. 19N) in the Kongsfjord at Svalbard, the As concentrations were
0.020 mg/kg w.w. in blood and 0.101 mg/kg w.w. in eggs.
Comparison with other studies
In the present study, cod liver from the Inner Oslofjord revealed median concentration of
15.0 mg/kg w.w. in 2020. Reported concentrations in previous years was 19.0 mg/kg w.w. in 2019,
17.5 mg/kg w.w. in 2018, 11.5 mg/kg As w.w. in 2017 and 4.7 mg/kg As w.w. in 2016. Cod liver
from a comparable study from the Inner Oslofjord in 2020 had a mean concentration at the same
level (14.0 mg/kg As w.w.) (Grung et al. 2021). The collection of cod in both studies took place
during the autumn.
In the present study, As concentration (median 0.101 mg/kg w.w.) in eider eggs at Svalbard was
almost at the same level as in a comparable study (median 0.12 mg/kg w.w.) (Hill 2018).
General, large scale trends
In 2017, 23 tons of As and compounds were released in Norway and there has been a 37 % decline
since 1995 (https://miljostatus.miljodirektoratet.no/tema/miljogifter/prioriterte-
miljogifter/arsen-og-arsenforbindelser/). In the past, wood was often impregnated with Cu, Cr and
As. Today such use is no longer permitted.
Discharges of As to water from land-based industries showed an increase from 2008 (501 kg As/year)
to 2010 (2572 kg As/year) (Figure 28). Discharges of As to water was 1477 kg in 2020.

NIVA 7686-2021
89
Figure 28. Annual emissions of As to air and discharges to water from land-based industries in the
period 1994-2020 (data from www.norskeutslipp.no, 05.07.2021). The vertical line at 2005 marks
when the MILKYS-measurements started. Note that emissions and discharges from municipal
treatment plants, land runoff, transportation and offshore industry are not accounted for in the
figure. New calculation methods for data of emissions and discharges might lead to changes in
calculations of present and previous data.
Total riverine input of As in Norway has been 24 tonnes in 2017 (Kaste 2018). Total riverine inputs of
As were 11 tonnes to Skagerrak, 4 tonnes to the North Sea, 5 tonnes to the Norwegian Sea and
3 tonnes to the Lofoten/Barents Sea (Kaste 2018), indicating higher input in the southern part of
Norway. In addition to riverine inputs, comes the contribution by direct discharges from industrial
effluents amounting to 2 tonnes or about 8 % of the total (26 tonnes). The riverine input to the
Inner Oslofjord from Alna river was 0.02 tonnes As in 2019 (Kaste 2021). VEAS sewage treatment
plant reported a discharge of 57 kg As in 2020 (VEAS 2021).
3.2.9 Nickel (Ni)
Nickel (Ni) is an element. In the present study, Ni was analysed in blue mussel at 25 stations, in cod
liver at 17 stations, in flounder liver at one station and in eider blood and eggs at one station
(Table 1).
Levels exceeding PROREF
Blue mussel at Odderøya (st. I133) in the Kristiansandfjord exceeded the Norwegian provisional high
reference contaminant concentration (PROREF) for Ni by a factor of two to five (Table 9). The
exceedances were by a factor less than two at Gressholmen (st. 30A) and Gåsøya (st. I304) in the
Inner Oslofjord and at Singlekalven (st. I023) and Kirkøy (st. I024) at Hvaler in the Outer Oslofjord.
This was also the case at Bjørkøya (st. 71A) in the Langesundfjord and at Ørland area (st. 91A2) in
the Outer Trondheimfjord.
Increase in PROREF factor since 2019
In 2020, blue mussel at Ørland area (st. 91A2) exceeded the PROREF by a factor less than two,
compared to concentrations below PROREF in 2019.

NIVA 7686-2021
90
In cod liver, the Ni concentrations at all stations were below the PROREF in 2020.
Upward trends
Both significant upward long- and short-term trends were found in blue mussel at Gressholmen
(st. 30A) (Figure 29).
Figure 29. Median concentrations (mg/kg w.w.) of nickel (Ni) in blue mussel from 2008 to 2020 at
Gressholmen (st. 30A) in the Inner Oslofjord (see Figure 6 and Appendix C.)
Decrease in PROREF factor since 2019
In 2020, the Ni concentrations in blue mussel exceeded the PROREF by a factor less than two,
compared to 10 to 20 times at Kirkøy (st. I024) and five to 10 times at Singlekalven (st. I023) at
Hvaler in 2019. In 2020, the Ni concentrations were below PROREF, compared to an exceedance by
a factor between two and five at the seven mussel stations; Akershuskaia (st. I301) in the Inner
Oslofjord, Risøy (st. 76A2) at Risør, Gåsøya-Ullerøya (st. 15A) at Farsund, Krossanes (st. 57A) in the
Outer Sørfjord, Vikingneset (st. 65A) in the mid Hardangerfjord, Mjelle (st. 97A2) in the Bodø area
and Bodø harbour (st. 97A3). In 2020, the Ni concentrations were below PROREF at Solbergstrand
(st. 31A) in the mid Oslofjord, compared to an exceedance less than two in 2019. The higher
concentrations of Ni in blue mussel in 2019 indicated contamination during sample preparation.
Downward trends
In cod liver, both significant downward long- and short-term trends were found for Ni at Tjøme
(st. 36B) in the Outer Oslofjord and at Ålesund harbour (st. 28B). A significant downward long-term
trend was found in the Kristiansand harbour (st. 13B) and at Kjøfjord (st. 10B) in the Outer
Varangerfjord.
Levels in flounder
In flounder at Sande (st. 33F) in the mid Oslofjord, the Ni concentration in liver was
0.034 mg/kg w.w.

NIVA 7686-2021
91
Levels in eider
In eider at Breøyane (st. 19N) in the Kongsfjord at Svalbard, the Ni concentrations were
<0.003 mg/kg w.w. in blood and 0.005 mg/kg w.w. in eggs.
Comparison with other studies
In the present study, cod liver from the Inner Oslofjord revealed a median concentration of
0.101 mg Ni/kg w.w. Cod liver from a comparable study from the Inner Oslofjord in 2019 showed a
concentration of 0.152 mg Ni/kg w.w. (Grung et al. 2021). The collection of cod in both studies took
place during the autumn.
General, large scale
Discharges of Ni to water from land-based industries had decreased gradually from 2001
(21 463 kg Ni/year) to 2020 (6 528 kg Ni/year) (Figure 30).
Figure 30. Annual emissions of Ni to air and discharges to water from land-based industries in the
period 1994-2020 (data from www.norskeutslipp.no, 05.07.2021). Note that emissions and
discharges from municipal treatment plants, land runoff, transportation and offshore industry are
not accounted for in the figure. New calculation methods for data of emissions and discharges
might lead to changes in calculations of present and previous data.
Total riverine input of Ni in Norway was 138 tonnes in 2017 (Kaste 2018). Total riverine inputs of Ni
were 34 tonnes to Skagerrak, 13 tonnes to the North Sea, 29 tonnes to the Norwegian Sea and
62 tonnes to the Lofoten/Barents Sea. In addition to riverine inputs, comes the contribution by
direct discharges from sewage (3 tonnes) and industrial (6 tonnes) effluents amounting to 9 tonnes
or about 6 % of the total (147 tonnes). The riverine input to the Inner Oslofjord from Alna river was
0.06 tonnes Ni in 2019 (Kaste 2021). VEAS sewage treatment plant reported a discharge of 259 kg Ni
in 2020 (VEAS 2021).
Berge et al. (2013b) estimated the discharges of Ni from various sources to the Inner Oslofjord;
rivers (684 kg Ni/year), atmosphere (37 kg Ni/year), impermeable surfaces (276 kg Ni/year),
wastewater treatment plants (WWTP) (466 kg Ni/year) and stormwater runoff (40 kg Ni/year).

NIVA 7686-2021
92
3.2.10 Chromium (Cr)
Chromium (Cr) is an element found in several forms that have different toxicities. In the past, wood
was often impregnated with Cr. From 2002, it was forbidden to produce and sell CCA-impregnated
wood in Norway, but Cr, Cu and As continue to leak from old wood. Impregnated wood is therefore
still the largest source of Cr emissions in Norway, accounting for around 63 % of emissions in 2019.
In the present study, Cr was analysed in blue mussel at 25 stations, in cod liver at 17 stations, in
flounder liver at one station and in eider blood and eggs at one station (Table 1).
Levels exceeding PROREF
In blue mussel, the exceedances of the Norwegian provisional high reference contaminant
concentration (PROREF) of Cr were by a factor between two and five at Gressholmen (st. 30A) in the
Inner Oslofjord (Table 9). The exceedance of PROREF was by a factor less than two at Gåsøya
(st. I304) in the Inner Oslofjord and Kirkøy (st. I024) at Hvaler.
The concentration of Cr in cod liver were below the PROREF at all stations.
Increase in PROREF factor since 2019
In 2020, blue mussel exceeded the PROREF by a factor of two to five at Gressholmen (st. 30A),
compared to a factor less than two in 2019. The high concentrations of Cr in blue mussel in 2019
indicated contamination during sample preparation.
Upward trends
There were both significant upward long- and short-term trends in blue mussel at Gressholmen
(st. 30A) in the Inner Oslofjord and at Brashavn (st. 11X) in the Varangerfjord. A significant upward
long-term trend was observed at Gåsøya (st. I304) in the Inner Oslofjord.

NIVA 7686-2021
93
A
B
Figure 31. Median concentrations (mg/kg w.w.) of chromium (Cr) in blue mussel from 2008 or 2009
to 2020 in Gressholmen in the Inner Oslofjord (st. 30A) (A) and Brashavn (st. 11X) (B) (see Figure 6
and Appendix C).
Decrease in PROREF factor since 2019
In 2020, blue mussel at all stations had PROREF for Cr less than a factor of two, except for at
Gressholmen (st. 30A) in the Inner Oslofjord. However, in 2020, mussels from Kirkøy (st. I024) in the
Hvaler archipelago exceeded the PROREF for Cr by a factor between one and two, compared to
more than 20 in 2019. In 2020, the concentrations of Cr were below the PROREF, compared to an
exceedance of 10 to 20 at Singlekalven (st. I023) at Hvaler and an exceedance between five to 10 at
Akershuskaia (st. I301) in the Inner Oslofjord and at Mjelle (st. 97A2) in the Bodø area in 2019. In
2020, the Cr concentrations were below the PROREF, compared to an exceedance between two and
five at the seven stations in 2019; Solbergstrand (st. 31A) in the mid Oslofjord, Risøy (st. 76A2) at
Risør, Odderøya (st. I133) in the Kristiansandfjord, Gåsøya-Ullerøya (st. 15A) in Farsund, Krossanes
(st. 57A) in the Outer Sørfjord, Vikingneset (st. 65A) in the mid Hardangerfjord and Bodø harbour
(st. 97A3).
In 2020, the concentration of Cr in cod liver was below PROREF at Skågskjera (st. 15B) in Farsund,
but the exceedance was by a factor up to two in 2019.

NIVA 7686-2021
94
Downward trends
A significant downward short-term trend was found for Cr at Espevær (st. 22A) in the Outer
Bømlafjord.
Both significant downward long- and short-term trends were found in cod liver from Tjøme (st. 36B)
in the Outer Oslofjord and in the Kristiansandfjord (st. 13B). A significant downward long-term
trend was found in cod liver from the Inner Oslofjord (st. 30B) and Trondheim harbour (st. 80B).
Levels in flounder
In flounder at Sande (st. 33F) in the mid Oslofjord, the Cr concentration in liver was
0.052 mg/kg w.w.
Levels in eider
In eider at Breøyane (st. 19N) in the Kongsfjord at Svalbard, the Cr concentrations were
<0.003 mg/kg w.w. in blood and 0.006 mg/kg w.w. in eggs.
Comparison with other studies
In the present study, cod liver from the Inner Oslofjord revealed a median concentration of
0.075 mg Cr/kg w.w. Cod liver from a comparable study from the Inner Oslofjord in 2020 had mean
concentration of 0.082 mg Cr/kg w.w. (Grung et al. 2021). The collection of cod in both studies
took place during the autumn.
General, large scale trends
In 2017, 39 tons of Cr and Cr-compounds were released in Norway and there has been a 60 % decline
since 1995 (https://miljostatus.miljodirektoratet.no/krom). Each year, 22 tons of Cr leak from
contaminated soil. In the past, wood was often impregnated with Cu, Cr and As. Today is it
prohibited to use, and the use has been significantly reduced.
Emissions of Cr to air and discharges to water from land-based industries had maintained stable
levels the last years and are shown in Figure 32. The discharges to water in 2020 was
1654 kg Cr/years.

NIVA 7686-2021
95
Figure 32. Annual emissions of Cr to air and discharges to water from land-based industries in the
period 1994-2020 (data from www.norskeutslipp.no, 05.07.2021). Note that emissions and
discharges from municipal treatment plants, land runoff, transportation and offshore industry are
not accounted for in the figure. New calculation methods for data of emissions and discharges
might lead to changes in calculations of present and previous data.
Total riverine input of Cr in Norway has been 31 tonnes in 2017 (Kaste 2018). The ranges of total
riverine inputs of Cr were 11 tonnes to Skagerrak, 4 tonnes to the North Sea, 10 tonnes to the
Norwegian Sea and 6 tonnes to the Lofoten/Barents Sea. In addition to riverine inputs, comes the
contribution by direct discharges from sewage (1 tonnes) and industrial (1 tonnes) effluents
amounting to 3 tonnes (Kaste 2018), or about 9 % of the total (34 tonnes). The riverine input to the
Inner Oslofjord from Alna river was 0.02 tonnes Cr in 2019 (Kaste 2021). VEAS sewage treatment
plant reported a discharge of 56 kg Cr in 2020 (VEAS 2021).
Berge et al. (2013b) estimated the discharges of Cr from various sources to the Inner Oslofjord;
rivers (398 kg Cr/year), atmosphere (24 kg Cr/year), impermeable surfaces (706 kg Cr/year),
wastewater treatment plants (WWTP) (152 kg Cr/year) and surface water runoff (50 kg Cr/year).
3.2.11 Cobalt (Co)
In the present study, cobalt (Co) was analysed in blue mussel at 25 stations, in cod liver at
17 stations, in flounder liver at one station and in eider blood and eggs at one station (Table 1).
Levels exceeding PROREF
Blue mussel from Kirkøy (st. I024) at Hvaler in the Outer Oslofjord and Odderøya (st. I133) in the
Kristiansandfjord exceeded the Norwegian provisional high reference contaminant concentration
(PROREF) for Co by a factor of two to five (Table 9). Blue mussel at six stations exceeded PROREF
for Co by a factor of up to two. These stations were Akershuskaia (st. I301), Gressholmen (st. 30A)
and Gåsøya (st. I304) in the Inner Oslofjord, Risøy (st. 76A2) at Risør, Ørland area (st. 91A2) in the
Outer Trondheimfjord and at Bodø harbour (st. 97A3).
Cod liver from the Inner Oslofjord (st. 30B) exceeded the PROREF for Co by a factor less than two.

NIVA 7686-2021
96
Increase in PROREF factor since 2019
In 2020, the Co concentration in blue mussel at Odderøya (st. I133) in the Kristiansandfjord
exceeded the PROREF by a factor of two to five, compared to less than two in 2019. In 2020, there
were an exceedance of the PROREF by a factor less than two, compared to levels below this limit in
2019 at Akershuskaia (st. I301), Gåsøya (st. I304) and Ørland area (st. 91A2).
In 2020, the Co concentration in cod liver from the Inner Oslofjord exceeded the PROREF by a factor
less than two, compared to levels below this limit in 2019.
Upward trends
Both significant upward long- and short-term trends were observed in blue mussel at Gressholmen
(st. 30A) in the Inner Oslofjord. A significant upward short-term trend was seen at Kirkøy (st. I024)
at Hvaler.
Both significant upward long- and short-term trends were observed in cod liver from the
Sandnessjøen area (st. 96B). A significant upward long-term trend was seen for cod liver from
Skågskjera (st. 15B) in Farsund.
Decrease in PROREF factor since 2019
In 2020, there were no exceedance of the PROREF of Co in blue mussel, compared to an exceedance
less than two at Solbergstrand (st. 31A) in the mid Oslofjord, Singlekalven (st. I023) at Hvaler,
Krossanes (st. 57A) and Utne (st. 64A) in the Outer Sørfjord and at Mjelle (st. 97A2) in the Bodø area
in 2019.
Downward trends
A significant downward short-term trend for Co was found in cod liver from the Austnesfjord
(st. 98B1) in Lofoten.
Levels in flounder
In flounder at Sande (st. 33F) in the mid Oslofjord, the Co concentration in liver was
0.120 mg/kg w.w.
Levels in eider
In eider at Breøyane (st. 19N) in the Kongsfjord at Svalbard, the Co concentrations were
0.003 mg/kg w.w. in blood and 0.007 mg/kg w.w. in eggs.
General, large scale trends
Discharges of Co to water from land-based industries showed decreasing values from 2019
(701 kg Co/year) to 2020 (454 kg Co/year) (Figure 33).

NIVA 7686-2021
97
Figure 33. Annual emissions of Co to air and discharges to water from land-based industries in the
period 1994-2020 (data from www.norskeutslipp.no, 05.07.2021). The vertical grey line at 2008
marks when the MILKYS-measurements started. Note that emissions and discharges from municipal
treatment plants, land runoff, transportation and offshore industry are not accounted for in the
figure. New calculation methods for data of emissions and discharges might lead to changes in
calculations of present and previous data.
3.2.12 Tributyltin (TBT)
Tributyltin (TBT) is an organic compound of tin that was used as a biocide especially in marine
antifouling paints until 2008, when it was banned globally. TBT is toxic to marine life and was first
known to be used in the 1960s. Masculinized female marine snails was first described in the late
sixties (Blaber 1970). TBT induces male sex characters onto females, such as imposex in dogwhelk
and intersex in common periwinkle. In female dogwhelk, the TBT effect causes a vas deference and
a pseudopenis that are superimposed onto female genital structures. Sterility and even death of
individuals occur in the most advanced stages. In female common periwinkle, the TBT effect causes
a pathological alteration in the oviduct, development of spermatocytes in ovary or oocytes in the
testis and/or penis. Sterility occurs in the most advanced stages. Common periwinkle is less
sensitive to TBT than dogwhelk and may act as an alternative sentinel when dogwhelk is not found.
In the present study, TBT was analysed in blue mussel at seven stations, dogwhelk at eight stations
and common periwinkle at one station. Imposex (VDSI) was investigated in dogwhelk and intersex
(ISI) in common periwinkle (Table 1).
Environmental Quality Standards (EQS) for priority substances
When applying the EQS for TBT (150 µg/kg w.w.) in biota (“for fish”) on blue mussel
(< 16.0 µg/kg w.w.), dogwhelk (< 3.1 µg/kg w.w.) and common periwinkle (< 0.680 µg/kg w.w.), all
TBT-concentrations were below EQS in 2020 (Table 8), as in 2019.

NIVA 7686-2021
98
Environmental Quality Standards (EQS) for river basin specific pollutants
When applying the EQS for triphenyltin (TPhT) (150 µg/kg w.w.) in biota on blue mussel
(<1.8 µg/kg w.w.), dogwhelk (<2.4 µg/kg w.w.) and common periwinkle (<0.490 µg/kg w.w.), all
TPhT-concentrations were below EQS in 2020, as in 2019 (Table 8).
Blue mussel
Levels exceeding PROREF
Blue mussel in the Inner Oslofjord exceeded the Norwegian provisional high reference contaminant
concentration (PROREF) for TBT by a factor of two to five at Gressholmen (st. 30A) and up to two
times at Akershuskaia (st. I301) (Table 9).
Increase in PROREF factor since 2019
Blue mussel at Gressholmen (st. 30A) exceeded PROREF for TBT by a factor of two to five in 2020,
compared to up to two times in 2019. Mussels at Akershuskaia (st. I301) exceeded PROREF by a
factor up two times in 2020, but did not exceeded this limit in 2019.
Decrease in PROREF factor since 2019
The concentrations of TBT in blue mussel at Odderøya (st. I133) in the Kristiansandfjord were below
the PROREF in 2020, while the exceedance was up to two in 2019.
Downward trends
For blue mussel, there were both significant downward long- and short-term trends for TBT at
Akershuskaia (st. I301) and Gåsøya (st. I304) in the Inner Oslofjord. There were significant
downward long-term trends at Gressholmen (st. 30A) in the Inner Oslofjord, Færder (st. 36A1) in the
Outer Oslofjord, at Odderøya (st. I133) in the Kristiansandfjord and at Espevær (st. 22A) in the
Outer Bømlafjord.
Dogwhelk
Levels of TBT
The TBT levels in dogwhelk were low (<3.1 µg/kg w.w.) at all eight stations.
Downward trends of TBT
There were significant downward long-term trends for TBT at all stations except for at Brashavn
(st. 11G) in the Varangerfjord.
Biological effects of TBT (imposex/VDSI) in dogwhelk
The effects of TBT measured by the imposex parameter VDSI, were zero at all eight stations. All
results were below the OSPARs Background Assessment Criteria (BAC=0.3) (OSPAR 2009) and the
OSPARs Ecotoxicological Assessment Criteria (EAC=2) (OSPAR 2013) in 2020, as in 2019.
Downward trends of VDSI
In dogwhelk, both significant downward long- and short-term trends for VDSI were observed at
Lastad (st. 131G) at Søgne, in the Karmsundet (st. 227G) and at Svolvær airport area (st. 98G) in
Lofoten. Significant downward long-term trends were found at Færder (st. 36G) in the Outer
Oslofjord, Risøya (st. 76G) at Risør, Gåsøya-Ullerøya (st. 15G) in Farsund and at Espevær (st. 22G) in
the Outer Bømlafjord.
1 Timeseries includes alternate station at Tjøme, Outer Oslofjord (st. 36A1).

NIVA 7686-2021
99
Common periwinkle
Levels of TBT
The TBT concentration in common periwinkle at Fugløyskjær (st. 71G) in the Outer Langesundfjord
was 0.68 µg/kg w.w.
Biological effects of TBT (intersex/ISI) in common periwinkle
The effect of TBT in common periwinkle, the intersex parameter ISI, was zero in 2020 at
Fugløyskjær (st. 71G), as in 2019. ISI in common periwinkle is too sensitive for application of BAC
and EAC (OSPAR 2013).
Trends of ISI
The data of ISI in common periwinkle at Fugløyskjær (st. 71G) showed a significant downward long-
term trend.
Comparison with other studies
In another comparable study in a former TBT-polluted fjord arm, Vikkilen close to Grimstad, no
intersex could be seen in common periwinkle in 2018 (Øxnevad 2018). Higher levels of TBT and
intersex were measured close to the shipyard prior to the total ban in 2008 and the removal of the
floating dry dock in 2012. Imposex in dogwhelk and intersex in common periwinkle, both aquatic
living gastropods in the tidal zone, have shown a faster improvement than imposex in the sediment
living netted dogwhelk (Nassarius reticulatus) and common whelk (Buccinum undatum) in the
benthic zone (Schøyen In prep).
General, large scale trends
Long-term use of TBT has led to high concentrations in sediments in fjords and harbours along the
coast. Today, contaminated sediments are the main source of TBT.
In the present programme until 2017, synchronous decreases and significant downward long- and
short-term trends in levels of TBT, VDSI and Relative Penis Size Index (RPSI) were found in
dogwhelk, and the levels were low (Schøyen et al. 2019). The decreases in TBT concentrations and
imposex parameters coincides with the TBT-bans. The results show that the Norwegian legislation
banning application of organotin on ships shorter than 25 meters in 1990, longer than 25 meters in
2003 and the globally total ban for application and use in 2008, has been effective in reducing
imposex. Populations of dogwhelk have recovered all along the Norwegian coastline after the
introduction of bans on the use of TBT in antifouling paint. Former maximum levels of these
markers were detected at coastal sites close to active shipping channels like Færder and
Karmsundet. In populations close to heavy ship traffic, the recovery took longer time than at
remote stations. In the Karmsundet area, a maximum level of 46 % sterile females was measured in
2000, whereas there have not been detected any sterile females at any monitoring station after
2008, the year for the total ban. This recovery has also resulted in low levels of TBT and imposex in
dogwhelk all along the Norwegian coast.
The international convention that was initiated by the International Maritime Organization (IMO) did
not only ban application of organotin on ships after 2003 but also stated that organotin after 2008
could not be part of the system for preventing fouling on ships. VDSI in dogwhelk was around level 4
in all dogwhelk stations before the ban in 2003, except for the Varangerfjord where the VDSI had
been low (<0.3) in the whole monitoring period. It was a clear decline in VDSI as well as TBT at all
stations between 2003 and the total ban in 2008 (Figure 34, Figure 35). In the post-ban period
since 2008, the VDSI levels have been below PROREF (3.68) at all stations, and the levels have

NIVA 7686-2021
100
gradually become zero. A typical example of a decreasing trend is shown for Færder in the Outer
Oslofjord in Figure 36.
Figure 34. Frequency of short-term trends for the concentration of TBT in dogwhelk (2011-2020).
No trends were detected. Concerns about LOQ prevented some trend analyses.
Figure 35. Frequency of short-term trends for VDSI in dogwhelk (2011-2020). No upward trends
were detected.

NIVA 7686-2021
101
Figure 36. Changes in VDSI for dogwhelk from Færder (st. 36G) (1991-2020). The vertical black
lines indicate the ban of TBT in 2003 and total ban in 2008 (see Figure 6 and Appendix C.)
In the post-ban period since 2008, TBT concentrations in dogwhelk have been below PROREF
(23.5 µg/kg w.w.) at all stations. Discharges of TBT and TPhT to water from land-based industries
from 1997 to 2020 is shown in Figure 37, but do not adequately reflect loads to the marine
environment because it does not include discharges from maritime activities for this period and do
not include secondary inputs from organotin contaminated sediments. The values were high in 2003
(487 g TBT and TPhT/year) and 2009 (504 g TBT and TPhT/year), and these peaks were related to
discharges to water from industry in Vestfold in the Outer Oslofjord. The annual discharges were
3.9 g TBT and TPhT in 2020.

NIVA 7686-2021
102
Figure 37. Annual discharges of TBT and TPhT to water from land-based industries in the period
1997-2020 (data from www.norskeutslipp.no, 05.07.2021). No data are reported for 1994-1996. The
vertical grey line at 1997 marks when the MILKYS-measurements of TBT started. The MILKYS-
measurements of VDSI started in 1991. Note that emissions and discharges from municipal
treatment plants, land runoff, transportation and offshore industry are not accounted for in the
figure. New calculation methods for data of discharges might lead to changes in calculations of
present and previous data.
3.2.13 Polychlorinated biphenyls (PCB-7)
Polychlorinated biphenyls (defined here as PCB-7) are a group of chlorinated organic compounds
that previously had a broad industrial and commercial application. There are more than 200
different PCBs. It is estimated that 1300 tons of PCBs were used in products and buildings in
Norway, and that 100 tons remains in products and buildings today1. In the present study, PCB-7 was
analysed in blue mussel at 24 stations, in cod liver at 16 stations, in flounder liver at one station
and in eider blood and eggs at one station (Table 1).
Environmental Quality Standards (EQS) for river basin specific pollutants
When applying the EQS for PCB-7 (0.6 µg/kg w.w.) in biota on blue mussel (see Table 4), the
concentrations at all stations exceeded the limit (Table 8).
When applying the EQS for PCB-7 (0.6 µg/kg w.w.) on cod liver (see Table 4), all stations exceed
this value (Table 8).
Applying this EQS for flounder liver, the concentration of PCB-7 would have exceeded the EQS
(Table 8).
Applying this EQS for eider blood and eggs, the concentrations of PCB-7 would have exceeded the
EQS for eggs but not for blood (0.270 µg/kg w.w.) (Table 8).
1 https://miljostatus.miljodirektoratet.no/tema/miljogifter/prioriterte-miljogifter/polyklorerte-bifenyler-pcb/

NIVA 7686-2021
103
Levels exceeding PROREF
Blue mussel exceeded the Norwegian provisional high reference contaminant concentration
(PROREF) for PCB-7 at all stations (Table 9). The mussels exceeded the limit by a factor of 10 to 20
at Gressholmen (st. 30A) in the Inner Oslofjord and a factor of five to 10 at Akershuskaia (st. I301)
and Ålesund harbour (st. 28A2). The mussels exceeded the limit by a factor of two to five at Gåsøya
(st. I304) in the Inner Oslofjord, Kirkøy (st. I024) at Hvaler, Nordnes (st. I241) in Bergen harbour and
at Bodø harbour (st. 97A3). The exceedance was by a factor up to two at the remaining 17 blue
mussel stations.
The PROREF in cod liver was exceeded by a factor of two to five in the Inner Oslofjord (st. 30B) and
at Bergen harbour (st. 24B). The exceedance in cod liver was by a factor up to two at Ålesund
harbour (st. 28B). There were no exceedances at the remaining 13 cod stations.
Increase in PROREF factor since 2019
In blue mussel, the PROREF for PCB-7 was exceeded by a factor of 10 to 20 in 2020, compared to
between five to 10 in 2019 at Gressholmen (st. 30A). The PROREF was exceeded by a factor of five
to 10 in 2020, compared to between two and five in 2019 at Akershuskaia (st. I301). At Gåsøya
(st. I304) in the Inner Oslofjord and Kirkøy (st. I024) at Hvaler, the PROREF was exceeded by a
factor of two to five in 2020, compared to less than two in 2019.
In 2020, the PROREF for PCB-7 in cod liver from Ålesund harbour (st. 28B) was exceeded by a factor
less than two, compared to levels below PROREF in 2019.
Upward trends
In 2020, two new long-term trends and seven new short-term trends were found for PCB-7 in blue
mussel compared to 2019. For the total of 24 stations, there were upward long-term trends for
three and upward short-term trends for 12 (Table 9). For 10 short-term trends, this is caused by a
methodical (artificial) result processing the values below LOQ with random pulling of data between
0.5 LOQ and LOQ, while LOQ increased from 0.05 to 0.3 µg/kg in 2017 (see chap. 2.6). These
stations are Singlekalven (st. I023), Risøy (st. 76A2), Kvalnes (st. 56A), Krossanes (st. 57A), Utne
(st. 64A), Vikingneset (st. 65A), Espevær (st. 22A), Svolvær (st. 98A2), Skallnes (st. 10A2) and
Brashavn (st. 11X).
There were both upward long- and short-term trends at Risøy (st. 76A2) at Risør, Utne (st. 64A) in
the Outer Sørfjord and Vågsvåg (st. 26A2) in the Outer Nordfjord. A significant upward short-term
trend was found at Gressholmen (st. 30A) (Figure 38 B) in the Inner Oslofjord, Singlekalven
(st. I023) at Hvaler, Kvalnes (st. 56A) in the mid Sørfjord, Krossanes (st. 57A) in the Outer Sørfjord
and at Vikingneset (st. 65A) in the mid Hardangerfjord. This result was also seen at Espevær
(st. 22A) in the Outer Bømlafjord, Svolvær (st. 98A2) in Lofoten, and at Skallnes (st. 10A2) and
Brashavn (st. 11X) in the Outer Varangerfjord.
A significant upward short-term trend was found for PCB-7 in cod liver from the Austnesfjord
(st. 98B1) in Lofoten.
Decrease in PROREF factor since 2019
The PROREF of PCB-7 was exceeded by a factor of two to five in 2020, compared to between 5 to 10
in 2019 at Nordnes (st. I241) in Bergen harbour. In 2020, the PROREF was exceeded by a factor less
than two, compared to an exceedance between two and five at the Ørland area (st. 91A2) in the
Outer Trondheimfjord in 2019.

NIVA 7686-2021
104
In 2020, the PROREF for PCB-7 in cod liver from Ålesund harbour (st. 28B) was less than a factor of
two, compared to no exceedance in 2019.
Downward trends
For blue mussel, there were downward long-term trends at seven out of the total 24 stations (Table
9). These stations were Akershuskaia (st. I301) (Figure 38 A) and Gåsøya (st. I304) (Figure 39 A) in
the Inner Oslofjord and Solbergstrand (st. 31A) (Figure 39 B) in the mid Oslofjord. This was also the
result at Kirkøy (st. I024) at Hvaler and Odderøya (st. I133) in the Kristiansandfjord. This was also
the case at Kvalnes (st. 56A) in the mid Sørfjord and Nordnes (st. I241) in Bergen harbour.
For cod liver, there were significant downward long-term trends at six of the 16 stations. There
were both significant downward long- and short-term trends in cod liver from Kirkøy (st. 02B) at
Hvaler and Hammerfest harbour (st. 45B2). There were significant downward long-term trends at
Tjøme (st. 36B) in the Outer Oslofjord, Bømlo (st. 23B) in the Outer Selbjørnfjord, Trondheim
harbour (st. 80B) and Kjøfjord (st. 10B) in the Outer Varangerfjord. A significant downward short-
term trend was observed in Kristiansand harbour (st. 13B).
The Inner Oslofjord
Blue mussel at Gressholmen (st. 30A) exceeded PROREF by a factor of 10 to 20 in 2020. Mussels at
Akershuskaia (st. I301) exceeded PROREF by a factor of five to 10, while the exceedance was
between two to five at Gåsøya (st. I304). Significant downward long-term trends were detected in
2020 at Akershuskaia and Gåsøya.
Liver from cod caught at 100 m depth in the Inner Oslofjord (st. 30B) exceeded PROREF by a factor
of two to five in 2020.
Levels in flounder
In flounder at Sande (st. 33F) in the mid Oslofjord, the concentration of PCB-7 in liver was
57.194 µg/kg w.w.
Levels in eider
In eider at Breøyane (st. 19N) in the Kongsfjord at Svalbard, the concentrations of PCB-7 were
0.270 µg/kg w.w. in blood and 7.221 µg/kg w.w. in eggs.
Comparison with other studies
In the present study, cod liver from the Inner Oslofjord revealed a median concentration of
2 265.9 µg PCB-7/kg w.w. Cod liver from a comparable study from the Inner Oslofjord in 2020 had
lower mean concentration (1 554 µg PCB-7/kg w.w.) (Grung et al. 2021). The collection of cod in
both studies took place during the autumn.
Historical data on entry of PCB-7 to the Inner Oslofjord is not available. Present entry of PCB-7 to
the fjord has however been calculated to be around 3.3 kg/year (Berge 2013a). Run-off from urban
surfaces is the most important contributor (2.1 kg/year). It is also anticipated that sediments in the
fjord store much of the historic inputs of PCBs, but their role as a current source of PCB-7 for
uptake in biota is unclear. Parts of the Inner Oslofjord are densely populated with much urban
activities. The high concentrations of PCB-7 observed in cod liver are probably related to these
activities both in past and possibly also at present.
In the present study, the concentration of PCB-153 (median 0.099 µg/kg w.w.) in eider blood at
Svalbard was lower than in a comparable study from Svalbard (mean 0.187±0.023.8 µg/kg w.w.)

NIVA 7686-2021
105
(Bustnes et al. 2010). A study of eider from the Inner Oslofjord in 2017, found mean values of
4.697 µg PCB-153/kg w.w. in blood (Ruus 2018).
In the present study, the median concentrations were 0.270 µg PCB-7/kg w.w. in blood and
7.221 µg PCB-7/kg w.w. in eider eggs from Svalbard. A comparable study of eider from the Inner
Oslofjord in 2017, found mean values of 10.519 µg PCB-7/kg w.w. in blood and 138.312 µg PCB-7/kg
w.w. in eggs (Ruus 2018), which was 19-39 times higher concentrations in the Inner Oslofjord
compared to results from Svalbard.
A
B
Figure 38. Median concentrations (mg/kg w.w.) of PCB-7 in blue mussel in the Inner Oslofjord at
Akershuskaia (st. I301 (A), Gressholmen (st. 30A) (B) (see Figure 6 and Appendix C).

NIVA 7686-2021
106
A
B
Figure 39. Median concentrations (mg/kg w.w.) of PCB-7 in blue mussel in the Inner Oslofjord at
Gåsøya (st. I304) (A) and Solbergstrand (st. 31A) (B) (see Figure 6 and Appendix C).
General, large scale trends
In Norway, the use of PCB-7 has been prohibited since 1980, but leakage from old products as well
as landfills and natural deposits and contaminated sediments may still be a source of
contamination. Production and use of PCB-7 are prohibited regionally- and globally through the
Convention on Long-range Transboundary Air Pollution (LRTAP) and the Stockholm Convention.
Emissions of PCB-7 to air and discharges to water from land-based industries are shown in Figure
40. In 2020, the discharges to water were 5.63 g PCBs/year. High emission to air was reported in
2008 (140 g PCBs/year), while the emission was 8.78 g PCBs/year in 2020. Investigations by Schuster
et al. (2010) indicate that emissions in the northern Europe have declined during the period 1994-
2008 by about 50 %.
Berge et al. (2013b) estimated the discharges of PCB-7 from various sources to the Inner Oslofjord;
rivers (0.1 kg PCB-7/year), atmosphere (0.01 kg PCB-7/year), impermeable surfaces
(2.1 kg PCB-7/year), wastewater treatment plants (WWTP) (0.8 kg PCB-7/year) and stormwater
runoff (0.3 kg PCB-7/year).

NIVA 7686-2021
107
Figure 40. Annual emissions of PCBs to air and discharges to water from land-based industries in
the period 1997-2020 (data from www.norskeutslipp.no, 05.07.2021). No data for emissions to air
are reported for 1994-2005 and 2011-2014. No data for discharges to water are reported for 1994-
1996. Note that emissions and discharges from municipal treatment plants, land runoff,
transportation and offshore industry are not accounted for in the figure. New calculation methods
for data of emissions and discharges might lead to changes in calculations of present and previous
data.
3.2.14 Dichlorodiphenyldichloroethylene (DDE)
DDT (dichloro-diphenyl-trichloroethane) is the first modern synthetic pesticides developed in the
1940s. Dichlorodiphenyldichloroethylene (DDE) is a chemical compound formed by the loss of
hydrogen chloride (dehydrohalogenation) from DDT, and DDE is one of the more common breakdown
products. The compounds are used for insects and weed control. Production and use of DTT is
prohibited regionally- and globally through the Convention on Long-range Transboundary Air
Pollution (LRTAP) and the Stockholm Convention, but use of DDT in disease vector control is still
permitted and occurs in several countries (in Africa, South America and India)
(http://chm.pops.int/Implementation/Exemptions/AcceptablePurposes/AcceptablePurposesDDT/ta
bid/456/Default.aspx). In Norway, the use of DDT was restricted in 1969 and the last approved use
of DDT was discontinued in 1988. However, DDT from landfills, agriculture, forestry and orchards
can still be a problem and the possibility of some long-range transport cannot be excluded. In the
present study, dichlorodiphenyldichloroethylene (p,p’-DDE, referred to herein as DDE) was analysed
in blue mussel at 15 stations and in cod liver at seven stations and in flounder at one station (Table
1).
Environmental Quality Standards (EQS) for priority substances
EQS for total DDT is 610 µg/kg w.w., but for the present study we apply the same limit to DDE in
biota (see Table 4). Applying this EQS for blue mussel and liver in cod and flounder, all
concentrations were below EQS. In the present study DDE has been used as a proxy for the priority
substance DDT.
Levels exceeding PROREF
Concentrations of DDE exceeded the Norwegian provisional high reference contaminant
concentration (PROREF) at 10 blue mussel stations (Table 9). The highest concentrations were

NIVA 7686-2021
108
found in the Sørfjord and Hardangerfjord. Blue mussel exceeded PROREF by a factor over 20 at
Kvalnes (st. 56A) in the mid Sørfjord and at Utne (st. 64A) in the Outer Sørfjord. Mussels exceeded
PROREF by a factor of 10 to 20 at Krossanes (st. 57A) in the Outer Sørfjord. Mussel exceeded
PROREF by a factor of five to 10 at Vikingneset (st. 65A) in the mid Hardangerfjord. Mussels at
Gressholmen (st. 30A) in the Inner Oslofjord and at Solbergstrand (st. 31A) in the mid Oslofjord
exceeded PROREF by a factor of two to five. The exceedance was by a factor of up to two at
Akershuskaia (st. I301) and Gåsøya (st. I304) in the Inner Oslofjord, at Odderøya (st. I133) in the
Kristiansandfjord and at Espevær (st. 22A) in the Outer Bømlafjord.
Concentrations of DDE exceeded PROREF by a factor of two to five in cod liver from the Inner
Sørfjord (st. 53B). The exceedance was less than two in cod liver from the Inner Oslofjord (st. 30B).
Increase in PROREF factor since 2019
In 2020, blue mussel at Gressholmen (st. 30A) and Solbergstrand (st. 31A) exceeded the PROREF of
DDE by a factor between two and five, compared to a factor less than two in 2019. The mussel at
Akershuskaia (st. I301) and Odderøya (st. I133) exceeded the PROREF for DDE by a factor less than
two in 2020, while there was no exceedance in 2019.
In 2020, the concentration of DDE in cod liver from the Inner Oslofjord (st. 30B) exceeded the
PROREF by a factor up to two, compared to no exceedance in 2019.
Upward trends
There was a significant upward long-term trend in blue mussel at Kvalnes (st. 56A) in the mid
Sørfjord. There was a significant upward short-term trend in mussel at Espevær (st. 22A) (Figure
41) in the Outer Bømlafjord.
Figure 41. Median concentrations (mg/kg w.w.) of DDE (p,p’-DDE) in blue mussel from 1992 to
2020 at Espevær (st. 22A) on the West coast (see Figure 6 and Appendix C).

NIVA 7686-2021
109
Decrease in PROREF factor since 2019
In 2020, there was an exceedance of PROREF of DDE by less than two in mussel at Espevær
(st. 22A), compared to an exceedance by a factor of two to five in 2019.
Downward trends
Significant downward long-term trends were found in blue mussel at four stations. These stations
were Akershuskaia (st. I301) and Gressholmen (st. 30A) in the Inner Oslofjord, Færder (st. 36 A) in
the Outer Oslofjord and Brashavn (st. 11X) in the Varangerfjord.
Significant downward long-term trends were found for DDE in cod liver from the Inner Oslofjord
(st. 30B), Tjøme (st. 36B) in the Outer Oslofjord, Skågskjera (st. 15B) in Farsund, Bømlo (st. 23B) in
the Outer Selbjørnfjord and Kjøfjord (st. 10B) in the Outer Varangerfjord.
Levels in flounder
In flounder at Sande (st. 33F) in the mid Oslofjord, the concentration of DDE in liver was
26.6 µg/kg w.w.
Comparison with other studies, Sørfjord
In the present study, blue mussel from Krossanes had concentration of 4.0 µg/kg DDE w.w. and
mussels from Utne, on the opposite side of the fjord, had concentration of 7.7 µg/kg DDE w.w.
Mussels from a comparable study in the Sørfjord in 2015 had concentrations of 11 µg DDT/kg w.w.
at Krossanes and 27 µg DDT/kg w.w. at Grimo, on the opposite side of the fjord (Ruus 2016a).
The Sørfjord area has a considerable number of orchards. Earlier use and the persistence of DDT
and leaching from contaminated soil is probably the main reason for the observed high
concentrations of DDE in the Sørfjord area. It must however be noted that the use of DDT products
has been prohibited in Norway since 1970. Green et al. (2004) concluded that the source of DDE in
the Sørfjord was uncertain. Analyses of supplementary stations between Kvalnes and Krossanes in
1999 indicated that there could be local sources at several locations (Green 2001).
A more intensive investigation in 2002 with seven sampling stations confirmed that there were two
main areas with high concentrations, one north of Kvalnes and the second near Urdheim south of
Krossanes (Green 2004). The variations in concentrations of ΣDDT and the ratio between DDT/DDE
(insecticide vs. metabolite) in blue mussel from Byrkjenes and Krossanes corresponds with periods
with much precipitation, and it is most likely a result of wash-out from sources on shore (Skei 2005).
Botnen and Johansen (2006) deployed passive samplers (SPMD- and PCC-18 samplers) at 12 locations
along the Sørfjord to sample for DDT and its derivates in sea water. Blue mussel and sediments were
also taken at some stations. The results indicated that further and more detailed surveys should be
undertaken along the west side of the Sørfjord between Måge and Jåstad, and that replanting of old
orchards might release DDT through erosion. Concentrations of ΣDDT in blue mussel in the Sørfjord
in 2008-2011 showed up to Class V (extremely polluted) at Utne (Ruus 2009, 2010, 2011, 2012).
There was high variability in the concentrations of ΣDDT in replicate samples from Utne, indicating
that this station was affected by DDT-compounds in varying degree, dependent on local conditions.
The highest concentrations of DDE in sediment were observed in mid Sørfjord (Green et al. 2010).
Increased ΣDDT-concentrations in blue mussel from the Sørfjord were discussed (Ruus et al. 2010).
Possible explanations were increased transport and wash-out to the fjord of DDT sorbed to dissolved
humus substances.

NIVA 7686-2021
110
General, large scale trends
Global use, long-distance transport, effects of climate change and the importance of leaching from
contaminated soil are relevant for large scale trends.
3.2.15 Hexachlorobenzene (HCB), pentachlorobenzene (QCB) and
octachlorostyrene (OCS)
Hexachlorobenzene (HCB) was for many years used as a fungicide, and was also used in the
production of rubber, aluminium, dyes and in wood preservation. HCB is formed as a by-product
during the manufacture of other chemicals (mainly solvents) and pesticides. It is an animal
carcinogen and is classified as a probable human carcinogen. After its introduction as a fungicide in
1945, for crop seeds, this toxic chemical was found in all types of food. HCB is very toxic to aquatic
organisms and is very persistent. HCB is included in the Convention on Long-range Transboundary Air
Pollution (LRTAP) and Stockholm Convention and has been banned globally since 2004.
Pentachlorobenzene (QCB, quintochlorobenzene) was used as an intermediate in the manufacture of
pesticides, particularly the fungicide pentachloronitrobenzene. QCB was a component of a mixture
of chlorobenzenes added to products containing PCBs in order to reduce viscosity. QCB has also
been used as a fire retardant. QCB is very toxic to aquatic organisms, it is persistent and
accumulates in the food chain. QCB was banned in the EU in 2002 and globally since 2009 by the
Stockholm Convention on Persistent Organic Pollution. It is also included in the Convention on Long-
range Transboundary Air Pollution (LRTAP).
Octachlorostyrene (OCS) is a by-product of normal industrial processes such as PVC-recycling
activities and aluminium refining operations. OCS has bioconcentration factor values ranging from
8,100 to 1,400,000, which suggests bioconcentration in aquatic organisms is very high.
HCB, OCS and QCB were analysed in blue mussel from 14 stations, cod from seven stations, flounder
from one station and in eider (only HCB) from one station (Table 11).
All concentrations of HCB, OCS and QCB were low, and all median concentrations in blue mussel
were below the limit of quantification (LOQ) (Table 11). Cod from the Austnesfjord in Lofoten (st.
98B1) had highest concentration of HCB, with 14.8 μg/kg w.w. (Figure 44). That same station also
had highest concentration of OCS, with 1.1 μg/kg w.w. No median concentrations of QCB in cod
were above the LOQ.
Environmental Quality standards (EQS) for priority substances
EQS for HCB is 10 μg/kg w.w. The median concentration of HCB in cod liver from the Austnesfjord in
Lofoten (st. 98B1) and Kjøfjord in the Outer Varangerfjord (st. 10B) exceeded the EQS for HCB. EQS
for QCB is 50 μg/kg w.w. No concentrations exceeded the EQS for QCB.
Levels exceeding PROREF
The median concentration of HCB in cod liver from the Austnesfjord in Lofoten (st. 98B1) was
slightly higher than the PROREF for this substance (14 μg/kg w.w.).
Upward trends
There were no upward trends for concentrations of HCB, OCS or QCB.

NIVA 7686-2021
111
Downward trends
Long-term downward trends were found for median concentration of HCB in liver of cod from the
Inner Oslofjord (st. 30A, Figure 42), Tjøme in the Outer Oslofjord (st. 36B) and Skågskjera at
Farsund (st. 15B, Figure 42). Long-term downward trends were also found for HCB in blue mussel
from Bjørkøya in the Grenlandfjord (st. 71A), Færder in the Outer Oslofjord (st. 36A1) and Odderøya
in Kristiansand (st. I133, Figure 42). Long-term downward trends were also found for HCB in
flounder from Sande in the mid Oslofjord (st. 33F).
A downward tendency in concentration of QCB in cod from the Inner Sørfjord was observed, but no
significant trend (Figure 43).
Levels in eider
Median concentration of HCB in blood of eider was 0.201 μg/kg w.w., and median concentration of
HCB in eider eggs was 5.50 μg/kg w.w. The concentration of HCB in blood and eggs of eider has a
downward tendency for the four-year monitoring period.
Levels in flounder
No median concentrations of OCS and QCB in flounder liver were above the limit of quantification
(LOQ). The concentration of HCB in flounder liver was lower than in cod liver. Median concentration
of HCB in flounder liver from Sande in the mid Oslofjord was 1.2 μg/kg w.w.
Comparison with other studies
Another study from the Inner Oslofjord in 2019 reported concentrations of HCB in cod liver in the
range 1.8 to 10.7 μg/kg w.w., and concentrations of QCB in the range 0.2 to 1.3 μg/kg w.w.(Ruus
2020a).
1 Timeseries includes alternate station at Tjøme, Outer Oslofjord (st. 36A1).

NIVA 7686-2021
112
A
B
C
Figure 42. Median concentrations (μg/kg w.w.) of HCB in cod liver from the Inner Oslofjord
(st. 30B) (A), Skågskjera in Farsund (st. 15B) (B) and HCB in blue mussel from Odderøya in
Kristiansand harbour (st. 13B) (C) (see Figure 6 and Appendix C).

NIVA 7686-2021
113
Figure 43. Median concentrations (μg/kg w.w.) of QCB in cod liver from the Inner Sørfjord (st. 53B)
(see Figure 6 and Appendix C).
Table 11. Median concentrations (µg/kg w.w.) of HCB, OCS and QCB in blue mussel, cod liver,
flounder liver and eider blood and egg (only HCB) in 2020. Shaded cells indicate that the median
was below the limit of quantification (LOQ) and value shown in these cells is the LOQ. Detectable
data information (D.d.i.) indicates the number of data above the LOQ (if any) and the numbers
within the square brackets indicate the minimum and maximum values in this category.
Component Count HCB OCS QCB
Species and sampling locality 2020 Med. S.d. D.d.i. Med. S.d. D.d.i. Med. S.d. D.d.i.
Blue mussel
Akershuskaia, Inner Oslofjord (st. I301) 3 (3-50) 0.50 0.00 0 [n.a.] 0.10 0.00 0 [n.a.] 0.50 0.00 0 [n.a.]
Gressholmen, Inner Oslofjord (st. 30A) 3 (3-50) 0.50 0.00 0 [n.a.] 0.10 0.00 0 [n.a.] 0.50 0.00 0 [n.a.]
Gåsøya, Inner Oslofjord (st. I304) 3 (3-50) 0.50 0.00 0 [n.a.] 0.10 0.00 0 [n.a.] 0.50 0.00 0 [n.a.]
Solbergstrand, Mid Oslofjord (st. 31A) 3 (3-50) 0.50 0.00 0 [n.a.] 0.10 0.00 0 [n.a.] 0.50 0.00 0 [n.a.]
Tjøme, Outer Oslofjord (st. 36A1) 3 (3-50) 0.50 0.00 0 [n.a.] 0.10 0.00 0 [n.a.] 0.50 0.00 0 [n.a.]
Bjørkøya, Langesundfjord (st. 71A) 1 (1-50) 0.50 0.00 0 [n.a.] 0.10 0.00 0 [n.a.] 0.50 0.00 0 [n.a.]
Risøya, Risør (st. 76A2) 3 (3-50) 0.50 0.00 0 [n.a.] 0.10 0.00 0 [n.a.] 0.50 0.00 0 [n.a.]
Odderøya, Kristiansand harbour (st. I133) 3 (3-50) 0.50 0.00 0 [n.a.] 0.10 0.00 0 [n.a.] 0.50 0.00 0 [n.a.]
Kvalnes, Mid Sørfjord (st. 56A) 3 (3-50) 0.50 0.00 0 [n.a.] 0.10 0.00 0 [n.a.] 0.50 0.00 0 [n.a.]
Krossanes, Outer Sørfjord (st. 57A) 3 (3-50) 0.50 0.00 0 [n.a.] 0.10 0.00 0 [n.a.] 0.50 0.00 0 [n.a.]
Vikingneset, Mid Hardangerfjord (st. 65A) 3 (3-50) 0.50 0.00 0 [n.a.] 0.10 0.00 0 [n.a.] 0.50 0.00 0 [n.a.]
Espevær, Outer Bømlafjord (st. 22A) 3 (3-50) 0.50 0.00 0 [n.a.] 0.10 0.00 0 [n.a.] 0.50 0.00 0 [n.a.]
Brashavn, Outer Varangerfjord (st. 11X) 3 (3-50) 0.50 0.00 0 [n.a.] 0.10 0.00 0 [n.a.] 0.50 0.00 0 [n.a.]
Skallnes, Outer Varangerfjord (st. 10A2) 3 (3-50) 0.50 0.00 0 [n.a.] 0.10 0.00 0 [n.a.] 0.50 0.00 0 [n.a.]
Cod, liver
Inner Oslofjord (st. 30B) 12 (7-6) 5.05 2.76 12 [2.9-10.4] 0.88 0.38 12 [0.6-1.86] 1.14 0.00 3 [1.03-1.36]
Tjøme, Outer Oslofjord (st. 36B) 15 (4-2) 5.51 2.11 15 [1.99-8.8] 0.33 0.55 12 [0.22-2.2] 1.22 0.00 0 [n.a.]
Skågskjera, Farsund (st. 15B) 15 (0-1) 5.17 1.34 15 [3.4-8.4] 0.56 0.14 15 [0.26-0.72] 1.19 0.00 0 [n.a.]
Inner Sørfjord (st. 53B) 15 (4-3) 5.40 2.74 15 [2.7-12.3] 0.50 0.49 15 [0.23-2] 1.11 0.00 2 [1.09-1.24]
Bømlo, Outer Selbjørnfjord (st. 23B) 15 (6-2) 6.56 3.04 15 [4.1-14.5] 0.30 0.28 11 [0.21-1.01] 1.16 0.00 2 [1.23-1.33]
Austnesfjord, Lofoten (st. 98B1) 15 (0-1) 14.80 4.84 14 [9.2-20] 1.10 0.71 14 [0.38-2.5] 1.14 0.00 4 [1.23-1.39]
Kjøfjord, Outer Varangerfjord (st. 10B) 15 (5-2) 10.20 3.28 15 [6.4-18.4] 0.85 0.36 15 [0.39-1.65] 1.14 0.00 4 [1.13-1.36]
Flounder, liver
Sande, Mid Oslofjord (st. 33F) 3 (3-5) 1.20 0.22 2 [1.2-1.53] 0.12 0.01 0 [n.a.] 1.19 0.00 0 [n.a.]
Eider, blood
Breøyane, Kongsfjorden, Svalbard (st. 19N) 15 (0-1) 0.20 0.13 15 [0.13-0.54]
Eider, egg
Breøyane, Kongsfjorden, Svalbard (st. 19N) 15 (0-1) 5.50 2.32 15 [4.2-11.1]

NIVA 7686-2021
114
Figure 44. Median concentration (µg/kg w.w.) of HCB, OCS and QCB in blue mussel, cod liver,
flounder liver, and eider blood and eggs in 2020. The error bar indicates one standard deviation
above the median.

NIVA 7686-2021
115
3.2.16 Polycyclic aromatic hydrocarbons (PAHs)
Polycyclic aromatic hydrocarbons (PAHs) are a class of organic compounds produced by incomplete
combustion or high-pressure processes. PAHs form when complex organic substances are exposed to
high temperatures or pressures. The main sources of PAH in coastal waters include discharges from
smelting industry and waste incinerators. Creosote impregnated wood is also an important source.
In 2017, 77 tons of PAH was released in Norway, and there has been an 70 % reduction in discharges
of PAH since 1995 (https://miljostatus.miljodirektoratet.no/tema/miljogifter/prioriterte-
miljogifter/polysykliske-aromatiske-hydrokarboner-pah/). The Convention on Long-range
Transboundary Air Pollution (LRTAP) impose parties to introduce measures to control emissions of
PAH to air from major stationary sources. However, emissions and releases continue in Norway and
other countries. High PAH levels are therefore reported in air in Norway, with three to four times
higher concentrations in Southern Norway than in the Arctic, at Svalbard (Nizzetto 2020).
In the present study, PAH1 were analysed in blue mussel at seven stations (Table 1).
PROREF
Blue mussel at two stations exceeded the Norwegian provisional high reference contaminant
concentration (PROREF) for PAH-16 (Table 9) by a factor less than two; Akershuskaia (st. I301) and
Gressholmen (st. 30A) in the Inner Oslofjord.
Increase in PROREF factor since 2019
In 2020, blue mussel at Akershuskaia (st. I301) and Gressholmen (st. 30A) exceeded the PROREF by a
factor up to two, while the levels were below this limit in 2019.
Downward trends
A significant downward long-term trend was observed at Akershuskaia (st. I301) and Gressholmen
(st. 30A) in the Inner Oslofjord.
General, large scale trends
Emissions of PAHs to air and discharges to water from land-based industries can be seen in Figure
45. In 2020, the emission to air was 43 161 kg PAHs, and 25 749 kg PAHs originated from Agder,
according to www.norskeutslipp.no. The discharges to water were 4 177 kg PAHs in 2020, and
893 kg PAHs were from Agder, according to www.norskeutslipp.
1 For this report the total is the sum of tri- to hexacyclic PAH compounds named in EPA protocol 8310 minus naphthalene
(dicyclic)-totalling 15 compounds (see Appendix B).

NIVA 7686-2021
116
Figure 45. Annual emissions of PAHs (PAH-16 EPA) to air and discharges to water from land-based
industries in the period 1994-2020 (data from www.norskeutslipp.no, 05.07.2021). Note that
emissions and discharges from municipal treatment plants, land runoff, transportation and
offshore industry are not accounted for in the figure. New calculation methods for data of
emissions and discharges might lead to changes in calculations of present and previous data.
Berge et al. (2013b) estimated the discharges of PAH-16 from various sources to the Inner Oslofjord;
rivers (35.5 kg PAH-16/year), atmosphere (13.6 kg PAH-16/year), permeable surfaces (20.1 kg PAH-
16/year), wastewater treatment plants (WWTP) (5.8 kg PAH-16/year) and stormwater runoff (2.5 kg
PAH-16/year).
OSPAR has monitored PAH in shellfish in several coastal areas in Europe. Four of the assessment
areas (Northern North Sea, Skagerrak and Kattegat, Irish Sea and Northern Bay of Biscay) show no
statistically significant change in PAH concentrations. Declining PAH concentrations are observed in
four assessment areas (Southern North Sea, English Channel, Irish and Scottish West Coast and the
Iberian Sea), with mean annual decreases in concentrations of between 6.5 % and 3.2 %. PAH
concentrations were below the EAC (European Assessment Criteria), but above the BAC (the OSPAR
Background Assessment Concentration) in all 10 assessment areas. As PAH concentrations in shellfish
were below the EAC, they are unlikely to cause any adverse effects
(https://oap.ospar.org/en/ospar-assessments/intermediate-assessment-2017/pressures-human-
activities/contaminants/status-and-trends-concentrations-polycyclic-aromatic-hydrocarbon/).
3.2.17 Sum carcinogenic polycyclic aromatic hydrocarbons (KPAHs) In the present study, sum carcinogenic polycyclic aromatic hydrocarbons (KPAHs, see Appendix B)
was analysed in blue mussel at seven stations (Table 1).
Levels exceeding PROREF
Blue mussel at all seven stations exceeded the Norwegian provisional high reference contaminant
concentration (PROREF) for KPAHs (Table 9). The exceedances were by a factor of 10 to 20 at
Akershuskaia (st. I301) and Gressholmen (st. 30A) in the Inner Oslofjord, and by a factor of five to
10 at Bjørkøya (st. 71A) in the Langesundfjord and at Lastad (st. I131A) at Søgne. The exceedances

NIVA 7686-2021
117
were by a factor of two to five at Gåsøya (st. I304) in the Inner Oslofjord, at Singlekalven (st. I023)
at Hvaler and at Svolvær airport area (st. 98A2) in Lofoten.
Increase in PROREF since 2019
In 2020, blue mussel at Akershuskaia (st. I301) and Gressholmen (st. 30A) exceeded the PROREF by a
factor of 10 to 20, compared to a factor of five to 10 in 2019.
Downward trends
There were both significant downward long- and short-term trends in blue mussel from Akershuskaia
(st. I301) in the Oslo harbour area, Singlekalven (st. I023) at Hvaler and at Svolvær airport (st. 98A2)
in Lofoten. A significant downward long-term trend was found in mussel at Gressholmen (st. 30A) in
the Inner Oslofjord, while significant downward short-term trends were found at Gåsøya (st. I304) in
the Inner Oslofjord and at Lastad (st. I131A) in Søgne.
3.2.18 Anthracene (ANT) Anthracene is a PAH-compound and is inter alia used as an intermediate in industrial processes and
is formed during combustion. In the present study, anthracene was analysed in blue mussel at seven
stations (Table 1).
Environmental Quality Standards (EQS) for priority substances
The EQS for anthracene is 2400 µg/kg w.w. in biota (relate to crustaceans and molluscs, see
2013/39/EU). Applying this EQS for blue mussel, all stations were below EQS in 2019 (Table 8), as in
previous years.
Levels exceeding PROREF
Blue mussel at three stations had concentrations above the Norwegian provisional high reference
contaminant concentration (PROREF) for anthracene. The exceedance was by a factor of two to five
at Akershuskaia (st. I301), and by a factor less than two at Gressholmen (st. 30A) and Gåsøya
(st. I304) in the Inner Oslofjord.
Increase in PROREF since 2019
In 2020, the PROREF was exceeded by a factor of two to five at Akershuskaia (st. I301), and by a
factor less than two at Gressholmen (st. 30A) and Gåsøya (st. I304), compared to all levels below
PROREF in 2019.
General, large scale trends
Emissions of anthracene to air and discharges to water from land-based industries can be seen in
Figure 46. In 2020, the emission to air was 1 021 kg anthracene. The discharges to water were
39.9 kg anthracene in 2020.

NIVA 7686-2021
118
Figure 46. Annual emissions of anthracene to air and discharges to water from land-based
industries in the period 1994-2020 (data from www.norskeutslipp.no, 05.07.2021). Note that
emissions and discharges from municipal treatment plants, land runoff, transportation and
offshore industry are not accounted for in the figure. New calculation methods for data of
emissions and discharges might lead to changes in calculations of present and previous data.
3.2.19 Fluoranthene (FLU)
Fluoranthene is a PAH-compound. In the present study, fluoranthene was analysed in blue mussel at
seven stations (Table 1).
Environmental Quality Standards (EQS) for priority substances
The EQS for fluoranthene (30 µg/kg w.w.) in biota (relate to crustaceans and molluscs, see
2013/39/EU) was not exceeded in any of the mussel samples (Table 8).
Levels exceeding PROREF
Blue mussel at two stations had concentrations above the Norwegian provisional high reference
contaminant concentration (PROREF) for fluoranthene. The exceedance was by a factor of two to
five at Akershuskaia (st. I301), and by a factor less than two at Gressholmen (st. 30A) in the Inner
Oslofjord (Table 9).
Increase in PROREF since 2019
In 2020, the PROREF was exceeded by a factor of two to five at Akershuskaia (st. I301) and by a
factor less than two at Gressholmen (st. 30A), compared to levels below PROREF in 2019.
Downward trends
There were both significant downward long- and short-term trends at Singlekalven (st. I023) at
Hvaler. A significant downward long-term trend was seen at Akershuskaia (st. I301), Gressholmen
(st. 30A) and Gåsøya (st. I304) in the Inner Oslofjord.

NIVA 7686-2021
119
General, large scale trends
Emissions of fluoranthene to air and discharges to water from land-based industries can be seen in
Figure 47. In 2020, the emission to air was 1 995 kg fluoranthene. The discharges to water were
378 kg fluoranthene in 2020.
Figure 47. Annual emissions of fluoranthene to air and discharges to water from land-based
industries in the period 1994-2020 (data from www.norskeutslipp.no, 05.07.2021). Note that
emissions and discharges from municipal treatment plants, land runoff, transportation and
offshore industry are not accounted for in the figure. New calculation methods for data of
emissions and discharges might lead to changes in calculations of present and previous data.
3.2.20 Benzo(a)anthracene (B[a]A)
Benzo(a)anthracene is a PAH-compound, and the substance is used in industry. In the present study,
benzo(a)anthracene was analysed in blue mussel at seven stations (Table 1).
Environmental Quality Standards (EQS) for river basin specific pollutants
The EQS for benzo(a)anthracene is 304 µg/kg w.w. in biota (relate to crustaceans and molluscs, see
2013/39/EU). Applying this EQS for blue mussel, all concentrations were below EQS (Table 8).
Levels exceeding PROREF
In 2020, blue mussel had concentrations of benzo(a)anthracene exceeding the Norwegian provisional
high reference contaminant concentration (PROREF) by a factor below two at Akershuskaia (st. I301)
and Gressholmen (st. 30A) in the Inner Oslofjord (Table 9).
Increase in PROREF factor since 2019
In 2020, blue mussel at Akershuskaia (st. I301) and Gressholmen exceeded PROREF of
benzo(a)anthracene by a factor up to two, compared to levels below PROREF in 2019.

NIVA 7686-2021
120
Downward trends
There were both significant downward long- and short-term trends at Akershuskaia (st. I301) in the
Inner Oslofjord. A significant downward long-term trend was seen at Gressholmen (st. 30A) in the
Inner Oslofjord and at Lastad at Søgne (st. I131A).
3.2.21 Benzo[a]pyrene (B[a]P) Benzo[a]pyrene (B[a]P) is a PAH-compound, and it is used as raw materials in industry. In the
present study, B[a]P was analysed in blue mussel at seven stations (Table 1).
Environmental Quality Standards (EQS) for priority substances
The EQS for B[a]P is 5 µg/kg w.w. in biota (relate to crustaceans and molluscs, 2013/39/EU).
Applying this EQS for blue mussel, all concentrations of B[a]P were below EQS (Table 8).
Downward trends
Both significant downward long- and short-term trends for B[a]P were found in blue mussel from
Akershuskaia (st. I301) in the Oslo harbour area.
General, large scale trends
Emissions of B[a]P to air and discharges to water from land-based industries can be seen in Figure
48. In 2020, the emission to air was 366 405 kg B[a]P, while it was 645 870 kg B[a]P in 2019. In
2020, the discharges to water were 47 222 kg B[a]P, while they were 62 484 kg B[a]P in 2019.
Figure 48. Annual emissions of B[a]P to air and discharges to water from land-based industries in
the period 1994-2020 (data from www.norskeutslipp.no, 05.07.2021). Note that emissions and
discharges from municipal treatment plants, land runoff, transportation and offshore industry are
not accounted for in the figure. New calculation methods for data of emissions and discharges
might lead to changes in calculations of present and previous data.

NIVA 7686-2021
121
3.2.22 Naphthalene (NAP)
Naphthalene is a PAH-compound. Naphthalene was analysed in blue mussel at seven stations (Table
1).
Environmental Quality Standards (EQS) for priority substances
The EQS for naphthalene is 2400 µg/kg w.w. in biota (relate to crustaceans and molluscs, see
2013/39/EU). Applying this EQS for blue mussel, all concentrations were below EQS (Table 8).
In 2020, all concentrations of naphthalene at all blue mussel stations were <50.00 µg/kg w.w.
Decrease in PROREF factor since 2019
In 2020, the levels of naphthalene exceeded PROREF by a factor of two to five, compared to more
than 20 at Akershuskaia (st. I301) and Gressholmen (st. 30A) in the Inner Oslofjord, at Singlekalven
(st. I023) at Hvaler and at Svolvær airport area (st. 98A2) in Lofoten, due to high detection limits in
2019. In 2020, the levels exceeded the PROREF by a factor of two to five, compared to levels below
PROREF at Gåsøya (st. I304) in the Inner Oslofjord and at Lastad at Søgne (st. I131A) in 2019.
Changes in PROREF from 2019 to 2020 are due to changes in detection limits, considerably higher in
2019.
General, large scale trends
Emissions of naphthalene to air and discharges to water from land-based industries can be seen in
Figure 49. In 2020, the emission to air was 11 576 kg naphthalene. The discharges to water were
1 930 kg naphthalene in 2020.
Figure 49. Annual emissions of naphthalene to air and discharges to water from land-based
industries in the period 1994-2020 (data from www.norskeutslipp.no, 05.07.2021). Note that
emissions and discharges from municipal treatment plants, land runoff, transportation and
offshore industry are not accounted for in the figure. New calculation methods for data of
emissions and discharges might lead to changes in calculations of present and previous data.

NIVA 7686-2021
122
3.2.23 Polybrominated diphenyl ethers (PBDEs)
Polybrominated diphenyl ethers (BDEs) are a group of brominated flame retardants used in a variety
of consumer products. They are used in electrical and electronic products, textiles and cars. In
2013, the consumption of brominated flame retardants in Norway was estimated to 280 tons1. The
most important commercial PBDE mixtures are banned globally by their listing in the Stockholm
Convention. In Norway, production, imports, placing on the market and use of PBDEs is banned.
Regulations are also in place to ensure proper management of PBDE containing wastes and
stockpiles. In the present study, BDEs were analysed in blue mussel at 11 stations, cod liver at 11
stations and in eider blood and eggs at one station (Table 1).
Environmental Quality Standards (EQS) for priority substances
The EQS for brominated diphenylethers (0.0085 µg/kg w.w.) in biota for “fish” is the sum of the
concentrations of congener numbers BDE28, 47, 99, 100, 153 and 154 (sum BDEs). Applying this EQS
for blue mussel, cod liver, and eider blood and eggs, the sum BDEs were above EQS at all stations
(Table 8).
The median concentration of BDE47 in blue mussel, cod liver, and eider blood and eggs exceeded
this EQS at all stations except for blue mussel at Svolvær airport area (st. 98A2) (Table 8). These
results, when one congener alone exceeds the EQS for the sum of six congeners, indicate that the
EQS might not be a useful criterion to judge the condition of the environment with respect to this
contaminant in biota. In the present study, additional assessments of the environmental quality
were therefore conducted using BDE47 as a proxy for the PBDEs (included on the Norwegian List of
Priority Substances2).
Levels exceeding PROREF
Except for blue mussel at st. 97A3 Bodø harbour, the concentrations at all stations were below the
Norwegian provisional high reference contaminant concentration (PROREF) for sum BDEs (28, 47, 99,
100, 153 and 154).
Cod liver from Bergen harbour (st. 24B) exceeded PROREF of sum BDEs (28, 47, 99, 100, 153 and
154) by a factor less than two (Table 9, Table 12, Figure 52).
Decrease in PROREF factor for sum BDEs since 2019
In 2020, blue mussel at Bodø harbour (st. 97A3) exceeded the PROREF by a factor less than two,
compared to no exceedance in 2019.
Downward trends for sum BDEs
Both significant downward short- and long-term trends were found for sum BDEs (28, 47, 99, 100,
153 and 154) in blue mussel from Nordnes (st. I241) in Bergen harbour. A significant downward long-
term trend was found for sum BDE levels in mussel from Gressholmen (st. 30A) in the Inner
Oslofjord, at Færder (st. 36A) in the Outer Oslofjord and at Svolvær (st. 98A2) in Lofoten.
Both significant downward long- and short-term trends were found in cod liver for sum BDE levels
(28, 47, 99, 100, 153 and 154) from the Inner Oslofjord (st. 30B) (Figure 50 A), the Kristiansand
harbour (st. 13B), the Inner Sørfjord (st. 53B), Bømlo (st. 23B) (Figure 50 B), Trondheim harbour
(st. 80B) (Figure 51 A) and Tromsø harbour (st. 43B2) (Figure 51 B).
1 https://miljostatus.miljodirektoratet.no/tema/miljogifter/prioriterte-miljogifter/bromerte-flammehemmere/ 2 https://www.environment.no/topics/hazardous-chemicals/list-of-priority-substances/

NIVA 7686-2021
123
A
B
Figure 50. Median concentrations (mg/kg w.w.) of sum BDEs (28, 47, 99, 100, 153 and 154) in cod
liver from 1993 to 2020 in Inner Oslofjord (st. 30B) (A) and at Bømlo (st. 23B) (B) (see Figure 6 and
Appendix C).

NIVA 7686-2021
124
A
B
Figure 51. Median concentrations (mg/kg w.w.) of sum BDEs (28, 47, 99, 100, 153 and 154) in cod
liver from 2009 to 2020 at Trondheim harbour (st. 80B) (A) and Tromsø harbour (st. 43B2) (B) (see
Figure 6 and Appendix C).
Levels in blue mussel
In 2020, the most dominant congener in mussel was BDE47. BDE47 is a main constituent of the
commercial flame retardant mixture pentabromocyclododecane or pentaBDE. It was detected in all
blue mussel sampled in 2020. The 2020 findings are similar to the finding’s earlier years which found
BDE47 in all samples and showed it to be the predominant congener. The highest median
concentrations of BDE47 were found in mussels from Bodø harbour (st. 97A3)
(0.322 µg BDE47/kg w.w.).
The congeners BDE47, 99 and 100 showed concentrations above the LOQ for half or more of the
samples at all stations (Table 9, Table 12, Figure 53). Concentrations of BDE209 in mussels were
all below LOQ.
The most dominant congener in 2020 was BDE47, which was also the case in 2019. BDE47 was
detected at all stations in 2020, as in 2019. The highest median concentration was found in mussels
from Bodø harbour (st. 97A3) (0.322 µg BDE47/kg w.w.).
Blue mussel from Bodø harbour (st. 97A3) showed significantly higher concentrations of BDE47 than
mussels from all the other stations (Tukey-Kramer HSD test, see also Figure 53).

NIVA 7686-2021
125
Levels in cod liver
In 2020, the most dominant congener in cod liver was BDE47, as for blue mussel. It was detected at
all cod stations sampled in 2020. The 2020 findings are similar to the findings from earlier years
which found BDE47 in all samples and showed it to be the predominant congener. The highest
median concentration of BDE47 was found in cod liver from Bergen harbour
(22.4 µg BDE47/kg w.w.).
The standard deviation varied considerably among stations, also for other PBDEs. The highest
standard deviation was found in cod liver from Bergen harbour (st. 24B) for BDE47 (Table 12) in
2020. It seems like variation was highest in affected areas.
In the urban areas like Oslo and Bergen harbour, some of the BDE-congeners in cod liver showed
higher levels than in remote areas. For example, the dominant congeners BDE47 and BDE100 were
significantly higher in these two harbours than at Færder and Bømlo (Tukey-Kramer HSD test).
PBDEs have been investigated annually in cod liver since 2005. In the Inner Oslofjord (st. 30B), cod
have also been analysed for PBDEs in 1993, 1996 and 2001 (Figure 54). Samples for similar analyses
were also collected from Tjøme (st. 36B) in 1993 and 1996, and from Bømlo (st. 23B) on the west
coast in 1996 and 2001. In 2020, PBDEs were analysed in cod from 11 stations (Table 12). Of the
PBDEs, congeners BDE28, 47, 99, 100, 126 and 154 were above the limit of quantification (LOQ) in
cod liver in at least half of the samples from each station.
Figure 52. Median concentrations (µg/kg w.w.) of PBDEs in cod liver in 2020. The error bar
indicates one standard deviation above the median.

NIVA 7686-2021
126
A
B
Figure 53. Median concentrations (µg/kg w.w.) of PBDEs in blue mussel in 2020; BDE47, BDE99 and
BDE100 (A) and BDE209 (all results below LOQ) (B). The error bar indicates one standard deviation
above the median.

NIVA 7686-2021
127
Table 12. Median concentrations (µg/kg w.w.) and standard deviations (S.d.) for PBDE congeners in blue mussel, cod liver, and eider blood and eggs in
2020. Count indicates number of samples analysed. The first number within the parentheses indicates the number of pooled samples included. The
second number within the parentheses indicates the maximum number of individuals used in one of the pooled samples. Shaded cells indicate that the
median was below the limit of quantification (LOQ) and the value shown in these cells is the LOQ. The standard deviation is based on all values and
values below the LOQ are taken as half. Detectable data information (D.d.i.) indicates the number of data above the LOQ (if any) and the numbers
within the square brackets indicate the minimum and maximum values in this category. BDE6 is the sum of BDE -28, -47, -99, -100, -153 and -154 as used
in the EQS, whereas BDESS is the sum of all PBDEs analysed (see Table 4, see also Chapter 2.10 for more details and Appendix B for description of
chemical codes).
Component Count BDE28 BDE47 BDE99 BDE100 BDE126 BDE153 BDE154
Species and sampling locality 2020 Med. S.d. D.d.i Med. S.d. D.d.i Med. S.d. D.d.i Med. S.d. D.d.i Med. S.d. D.d.i Med. S.d. D.d.i
Blue mussel
Gressholmen, Inner Oslofjord (st. 30A) 3 (3-50) 0.001 0.000 2 [0.001-0.001] 0.047 0.006 3 [0.04-0.05] 0.028 0.006 3 [0.02-0.03] 0.013 0.001 3 [0.01-0.01] 0.002 0.000 0 [n.a.] 0.003 0.001 1 [0.004]
Tjøme, Outer Oslofjord (st. 36A1) 3 (3-50) 0.001 0.000 1 [0.001] 0.020 0.002 3 [0.02-0.02] 0.012 0.002 3 [0.01-0.01] 0.007 0.003 2 [0.006-0.007] 0.002 0.000 0 [n.a.] 0.003 0.000 0 [n.a.]
Singlekalven, Hvaler (st. I023) 3 (3-50) 0.001 0.000 1 [0.001] 0.028 0.001 3 [0.03-0.03] 0.014 0.000 3 [0.01-0.01] 0.005 0.000 3 [0.005-0.005] 0.002 0.000 0 [n.a.] 0.003 0.000 0 [n.a.]
Bjørkøya, Langesundfjord (st. 71A) 1 (1-50) 0.001 0.000 0 [n.a.] 0.039 0.000 1 [0.04] 0.021 0.000 1 [0.02] 0.009 0.000 1 [0.009] 0.002 0.000 0 [n.a.] 0.003 0.000 0 [n.a.]
Nordnes, Bergen harbour (st. I241) 3 (3-50) 0.003 0.001 3 [0.003-0.004] 0.084 0.018 3 [0.08-0.11] 0.046 0.009 3 [0.05-0.06] 0.024 0.007 3 [0.02-0.03] 0.002 0.000 1 [0.002] 0.005 0.002 3 [0.005-0.009]
Vågsvåg, Outer Nordfjord (st. 26A2) 3 (3-50) 0.002 0.001 3 [0.001-0.002] 0.053 0.004 3 [0.05-0.06] 0.034 0.001 3 [0.03-0.04] 0.023 0.002 3 [0.02-0.02] 0.002 0.000 0 [n.a.] 0.003 0.000 0 [n.a.]
Ålesund harbour (st. 28A2) 3 (3-50) 0.001 0.000 2 [0.001-0.001] 0.047 0.008 3 [0.04-0.06] 0.034 0.003 3 [0.03-0.04] 0.015 0.003 3 [0.01-0.02] 0.002 0.000 3 [0.002-0.002] 0.003 0.001 2 [0.003-0.004]
Ørland area, Outer Trondheimsfjord (st. 91A2) 3 (3-50) 0.001 0.000 0 [n.a.] 0.016 0.002 3 [0.01-0.02] 0.006 0.001 3 [0.005-0.007] 0.004 0.001 3 [0.004-0.005] 0.002 0.000 0 [n.a.] 0.003 0.000 0 [n.a.]
Bodø harbour (st. 97A3) 3 (3-50) 0.005 0.001 3 [0.004-0.007] 0.322 0.089 3 [0.28-0.45] 0.194 0.047 3 [0.15-0.25] 0.113 0.020 3 [0.09-0.13] 0.002 0.000 0 [n.a.] 0.010 0.002 3 [0.007-0.01]
Mjelle, Bodø area (st. 97A2) 3 (3-50) 0.001 0.000 0 [n.a.] 0.054 0.004 3 [0.05-0.06] 0.041 0.002 3 [0.04-0.04] 0.023 0.001 3 [0.02-0.02] 0.002 0.000 0 [n.a.] 0.003 0.000 0 [n.a.]
Svolvær airport area (st. 98A2) 3 (3-50) 0.001 0.000 0 [n.a.] 0.007 0.001 3 [0.006-0.008] 0.003 0.001 2 [0.003-0.004] 0.002 0.000 3 [0.002-0.003] 0.002 0.000 0 [n.a.] 0.003 0.000 0 [n.a.]
Cod, liver
Inner Oslofjord (st. 30B) 12 (7-6) 0.298 0.135 12 [0.11-0.6] 15.900 5.472 12 [6.3-24] 0.207 0.258 12 [0.08-1.01] 5.920 1.593 12 [2.9-8.7] 0.234 0.139 12 [0.13-0.63] 0.046 0.033 8 [0.04-0.12]
Tjøme, Outer Oslofjord (st. 36B) 15 (4-2) 0.198 0.209 15 [0.01-0.74] 3.180 6.639 15 [0.51-28] 0.030 0.032 9 [0.02-0.13] 1.120 1.956 15 [0.54-8.3] 0.115 0.073 15 [0.05-0.3] 0.030 0.005 1 [0.05]
Kristiansand harbour area (st. 13B) 8 (6-2) 0.164 0.143 8 [0.08-0.52] 4.115 4.092 8 [1.36-12.2] 0.166 0.110 8 [0.1-0.44] 1.072 1.367 8 [0.2-3.8] 0.065 0.070 7 [0.02-0.21] 0.047 0.024 7 [0.03-0.11]
Inner Sørfjord (st. 53B) 15 (4-3) 0.238 0.191 15 [0.08-0.63] 6.350 7.925 15 [1.99-24] 0.149 0.113 15 [0.04-0.47] 2.280 2.289 15 [0.24-6.9] 0.165 0.161 14 [0.02-0.6] 0.030 0.031 7 [0.04-0.12]
Bømlo, Outer Selbjørnfjord (st. 23B) 15 (6-2) 0.066 0.101 14 [0.02-0.35] 1.410 2.452 15 [0.25-9.9] 0.025 0.051 10 [0.02-0.22] 0.490 0.649 15 [0.07-2.6] 0.057 0.053 13 [0.04-0.22] 0.038 0.019 9 [0.04-0.09]
Bergen harbour area (st. 24B) 14 (6-2) 0.570 1.549 14 [0.13-6] 22.400 70.992 14 [3.1-275] 0.329 0.742 14 [0.03-2.5] 4.545 24.556 14 [0.85-96] 0.074 0.066 14 [0.03-0.24] 0.059 0.073 10 [0.03-0.24]
Ålesund harbour area (st. 28B) 14 (2-2) 0.218 0.180 14 [0.08-0.66] 6.195 4.059 14 [1.56-16.1] 0.236 0.239 14 [0.09-1.07] 1.745 1.416 14 [0.44-5.4] 0.134 0.112 14 [0.03-0.39] 0.048 0.034 12 [0.04-0.14]
Trondheim harbour (st. 80B) 14 (0-1) 0.332 0.286 14 [0.06-0.94] 8.540 15.065 14 [1.52-50] 0.198 0.641 13 [0.04-2.3] 2.120 5.053 14 [0.36-15.8] 0.082 0.119 13 [0.03-0.36] 0.030 0.099 5 [0.04-0.36]
Austnesfjord, Lofoten (st. 98B1) 15 (0-1) 0.228 0.223 15 [0.03-0.82] 4.420 3.560 15 [0.55-14.1] 0.038 0.124 13 [0.02-0.51] 1.040 0.899 15 [0.12-3.5] 0.097 0.128 14 [0.03-0.53] 0.030 0.010 1 [0.07]
Tromsø harbour area (st. 43B2) 15 (0-1) 0.093 0.083 15 [0.04-0.33] 4.990 3.486 15 [1.54-15.3] 0.076 0.060 15 [0.03-0.27] 1.090 1.724 15 [0.44-7.4] 0.063 0.069 15 [0.04-0.29] 0.030 0.002 1 [0.04]
Isfjorden, Svalbard (st. 19B) 15 (0-1) 0.023 0.035 15 [0.01-0.13] 0.347 1.081 15 [0.24-3.6] 0.020 0.004 1 [0.04] 0.074 0.229 15 [0.05-0.73] 0.020 0.038 3 [0.03-0.15] 0.030 0.000 0 [n.a.]
Eider, blood
Breøyane, Kongsfjorden, Svalbard (st. 19N) 15 (0-1) 0.006 0.015 0 [n.a.] 0.027 0.062 3 [0.03-0.04] 0.011 0.026 1 [0.02] 0.006 0.013 1 [0.006] 0.003 0.007 0 [n.a.] 0.010 0.024 0 [n.a.]
Eider, egg
Breøyane, Kongsfjorden, Svalbard (st. 19N) 15 (0-1) 0.006 0.002 1 [0.01] 0.037 0.030 13 [0.03-0.14] 0.013 0.006 9 [0.01-0.03] 0.029 0.016 15 [0.009-0.05] 0.003 0.000 0 [n.a.] 0.010 0.004 4 [0.01-0.02]

NIVA 7686-2021
128
Table 12. (cont.)
Component Count BDE154 BDE183 BDE196 BDE209 BDE6S BDESS
Species and sampling locality 2020 Med. S.d. D.d.i Med. S.d. D.d.i Med. S.d. D.d.i Med. S.d. D.d.i Med. S.d. D.d.i Med. S.d. D.d.i
Blue mussel
Gressholmen, Inner Oslofjord (st. 30A) 3 (3-50) 0.003 0.000 0 [n.a.] 0.005 0.000 0 [n.a.] 0.010 0.000 0 [n.a.] 0.100 0.001 0 [n.a.] 0.095 0.013 0 [n.a.] 0.292 0.015 3 [0.07-0.1]
Tjøme, Outer Oslofjord (st. 36A1) 3 (3-50) 0.003 0.000 0 [n.a.] 0.005 0.000 0 [n.a.] 0.010 0.000 0 [n.a.] 0.100 0.000 0 [n.a.] 0.045 0.006 0 [n.a.] 0.237 0.007 3 [0.04-0.05]
Singlekalven, Hvaler (st. I023) 3 (3-50) 0.003 0.000 1 [0.004] 0.005 0.000 0 [n.a.] 0.010 0.000 0 [n.a.] 0.098 0.015 0 [n.a.] 0.055 0.001 0 [n.a.] 0.247 0.016 3 [0.05-0.06]
Bjørkøya, Langesundfjord (st. 71A) 1 (1-50) 0.003 0.000 0 [n.a.] 0.005 0.000 0 [n.a.] 0.010 0.000 0 [n.a.] 0.101 0.000 0 [n.a.] 0.076 0.000 0 [n.a.] 0.272 0.000 1 [0.08]
Nordnes, Bergen harbour (st. I241) 3 (3-50) 0.012 0.003 3 [0.01-0.02] 0.005 0.000 0 [n.a.] 0.010 0.000 0 [n.a.] 0.100 0.000 0 [n.a.] 0.171 0.039 0 [n.a.] 0.377 0.042 3 [0.17-0.24]
Vågsvåg, Outer Nordfjord (st. 26A2) 3 (3-50) 0.003 0.000 0 [n.a.] 0.005 0.000 0 [n.a.] 0.010 0.000 0 [n.a.] 0.099 0.000 0 [n.a.] 0.118 0.005 0 [n.a.] 0.314 0.006 3 [0.11-0.12]
Ålesund harbour (st. 28A2) 3 (3-50) 0.009 0.002 3 [0.008-0.01] 0.005 0.000 0 [n.a.] 0.010 0.000 0 [n.a.] 0.600 0.200 0 [n.a.] 0.110 0.017 0 [n.a.] 0.900 0.199 3 [0.1-0.13]
Ørland area, Outer Trondheimsfjord (st. 91A2) 3 (3-50) 0.003 0.000 0 [n.a.] 0.005 0.000 0 [n.a.] 0.010 0.000 0 [n.a.] 0.099 0.000 0 [n.a.] 0.033 0.003 0 [n.a.] 0.226 0.002 3 [0.03-0.04]
Bodø harbour (st. 97A3) 3 (3-50) 0.015 0.003 3 [0.01-0.01] 0.005 0.000 1 [0.006] 0.010 0.000 0 [n.a.] 0.100 0.022 0 [n.a.] 0.659 0.160 0 [n.a.] 0.906 0.200 3 [0.54-0.86]
Mjelle, Bodø area (st. 97A2) 3 (3-50) 0.004 0.000 3 [0.004-0.004] 0.005 0.000 0 [n.a.] 0.010 0.000 0 [n.a.] 0.098 0.002 0 [n.a.] 0.125 0.007 0 [n.a.] 0.317 0.010 3 [0.12-0.14]
Svolvær airport area (st. 98A2) 3 (3-50) 0.003 0.000 0 [n.a.] 0.005 0.000 0 [n.a.] 0.010 0.000 0 [n.a.] 0.100 0.001 0 [n.a.] 0.019 0.002 0 [n.a.] 0.210 0.003 3 [0.02-0.02]
Cod, liver
Inner Oslofjord (st. 30B) 12 (7-6) 1.535 0.535 12 [1.09-3.1] 0.050 0.010 1 [0.08] 0.100 0.000 0 [n.a.] 1.000 0.004 0 [n.a.] 24.615 7.129 0 [n.a.] 28.921 8.974 12 [14.1-35]
Tjøme, Outer Oslofjord (st. 36B) 15 (4-2) 0.511 0.477 15 [0.26-1.84] 0.050 0.000 0 [n.a.] 0.100 0.000 0 [n.a.] 1.000 0.000 0 [n.a.] 5.092 9.175 0 [n.a.] 8.128 10.433 15 [1.48-39]
Kristiansand harbour area (st. 13B) 8 (6-2) 0.490 0.318 8 [0.2-1.17] 0.050 0.000 0 [n.a.] 0.100 0.000 0 [n.a.] 1.000 0.071 0 [n.a.] 6.206 5.889 0 [n.a.] 9.065 6.602 8 [2.1-16.6]
Inner Sørfjord (st. 53B) 15 (4-3) 1.270 0.852 15 [0.3-3.2] 0.050 0.000 0 [n.a.] 0.100 0.000 0 [n.a.] 1.000 0.136 0 [n.a.] 10.704 10.698 0 [n.a.] 14.406 11.820 15 [3.2-32]
Bømlo, Outer Selbjørnfjord (st. 23B) 15 (6-2) 0.328 0.265 15 [0.12-1.22] 0.050 0.000 0 [n.a.] 0.100 0.000 0 [n.a.] 1.000 0.000 0 [n.a.] 2.344 3.406 0 [n.a.] 4.531 3.952 15 [0.55-13.6]
Bergen harbour area (st. 24B) 14 (6-2) 1.090 1.111 14 [0.25-4.3] 0.050 0.000 0 [n.a.] 0.100 0.000 0 [n.a.] 1.000 0.274 0 [n.a.] 30.298 97.731 0 [n.a.] 36.002 99.439 14 [4.9-382]
Ålesund harbour area (st. 28B) 14 (2-2) 0.675 0.458 14 [0.42-1.85] 0.050 0.007 1 [0.08] 0.100 0.000 0 [n.a.] 1.000 0.003 0 [n.a.] 8.569 5.899 0 [n.a.] 11.780 6.321 14 [2.9-24]
Trondheim harbour (st. 80B) 14 (0-1) 0.575 1.425 14 [0.12-4.4] 0.050 0.000 0 [n.a.] 0.100 0.000 0 [n.a.] 1.000 0.003 0 [n.a.] 11.569 22.308 0 [n.a.] 16.632 24.470 14 [2.1-74]
Austnesfjord, Lofoten (st. 98B1) 15 (0-1) 0.579 0.530 15 [0.06-2] 0.050 0.000 0 [n.a.] 0.100 0.000 0 [n.a.] 1.000 0.103 0 [n.a.] 6.420 5.242 0 [n.a.] 9.749 6.507 15 [0.81-21]
Tromsø harbour area (st. 43B2) 15 (0-1) 0.379 0.455 15 [0.23-1.78] 0.050 0.000 0 [n.a.] 0.100 0.000 0 [n.a.] 1.000 0.000 0 [n.a.] 6.757 5.610 0 [n.a.] 10.391 5.885 15 [2.4-25]
Isfjorden, Svalbard (st. 19B) 15 (0-1) 0.067 0.179 15 [0.03-0.68] 0.050 0.001 1 [0.05] 0.100 0.000 0 [n.a.] 1.000 0.000 0 [n.a.] 0.560 1.519 0 [n.a.] 2.563 1.715 15 [0.38-4.9]
Eider, blood
Breøyane, Kongsfjorden, Svalbard (st. 19N) 15 (0-1) 0.009 0.020 0 [n.a.] 0.007 0.017 0 [n.a.] 0.013 0.032 0 [n.a.] 0.366 0.851 0 [n.a.] 0.069 0.159 0 [n.a.] 0.613 1.419 3 [0.07-0.12]
Eider, egg
Breøyane, Kongsfjorden, Svalbard (st. 19N) 15 (0-1) 0.019 0.013 15 [0.01-0.06] 0.007 0.000 0 [n.a.] 0.015 0.003 0 [n.a.] 0.366 0.046 0 [n.a.] 0.143 0.060 0 [n.a.] 0.718 0.123 15 [0.08-0.31]

NIVA 7686-2021
129
The Inner Oslofjord
Parts of the Inner Oslofjord are densely populated with several urban activities where PBDEs are
involved. The high concentrations of PBDEs observed in cod are probably related to these activities,
as well as reduced water exchange with the Outer fjord.
In the present study, cod liver from the Inner Oslofjord showed a median concentration of
15.9 µg BDE47/kg w.w., and the mean concentration in a comparable study in 2020 (Grung et al.
2021) was 17.5 µg BDE47/kg w.w. The median concentration of BDE100 was 5.9 µg /kg w.w. in the
present study, while the mean concentration was 5.6 µg/kg w.w. in the comparable study (Grung et
al. 2021). The median concentration of BDE154 was 1.5 µg/kg w.w. in the present study, while the
mean concentration was 1.2 µg/kg w.w. in the comparable study (Grung et al. 2021). The collection
of cod in both studies took place during the autumn.
Levels in eider
In eider at Breøyane (st. 19N) in the Kongsfjord at Svalbard, the concentrations of sum BDEs (28, 47,
99, 100, 153 and 154) were <0.069 µg/kg w.w. in blood and 0.143 µg/kg w.w. in eggs. The
concentrations of BDE47 in eider were <0.027 µg/kg w.w. in blood and 0.037 µg/kg w.w. in eggs.

NIVA 7686-2021
130
Figure 54. Median concentrations (µg/kg w.w.) of PBDEs in cod liver from 1993, 2001 and from the
period 2005 to 2020 in the Inner Oslofjord (st. 30B). When median was below the limit of
quantification (LOQ), the LOQ is used.
Comparison with other studies
Median concentrations for the sum BDEs (BDE28, 47, 66, 49+71, 77, 99, 100, 119, 153, 154, 183 and
209) found at presumed reference stations like Lofoten (8.49 μg/kg w.w.), Færder
(9.61 μg/kg w.w.), Lista (12.9 μg/kg w.w.) and Bømlo-Sotra (23.8 μg/kg w.w.) indicate background
levels in diffusely contaminated areas for cod liver (Fjeld 2005). This is lower than the sum BDEs
(28, 47, 99, 100, 153 and 154) of 24.6 µg/kg w.w. found at MILKYS cod stations in the Inner
Oslofjord (st. 30B) in 2020 (cf. Figure 52).
The congeners BDE47 and 100 were the most dominant in 2020, as in previous years. The low
concentrations of BDE99 could be due to the debromination to BDE47, because BDE99 is more prone
to biotransformation than other common PBDE such as BDE47 (Streets et al. 2006). Furthermore,
BDE47 is also reported to be a more stable congener than BDE99 (Benedict et al. 2007).
Investigations of brown trout (Salmo trutta), smelt (Osmerus eperlanus) and vendace
(Coregonus albula) in lake Mjøsa showed that the decrease was greatest for BDE99, which probably
is due to a biotransformation (debromination) to BDE47 (Fjeld 2012). Since the early 2000s, there
has been a clear reduction of PBDE concentrations in freshwater fish from Mjøsa (Jartun 2021).

NIVA 7686-2021
131
In the present study, the median concentration of PBDE47 (0.037 µg/kg w.w.) in eider eggs from
Svalbard was lower than in another study of eider from three stations in northern Norway and one at
Svalbard (mean 0.12 ± 0.06 µg/kg w.w.) (Harju 2013). A comparable study of eider from the Inner
Oslofjord in 2017, found mean values of 0.385 µg PBDE47/kg w.w. in eggs (Ruus 2018), which was 10
times higher than at Svalbard (0.037 µg PBDE47/kg w.w.).
General, large scale trends
A few time-trend analyses showed upward trends in concentration of PBDE congeners in blue
mussel; significant upward short-term trends were found for both BDE99 and BDE100 in blue mussel
from the Vågsvåg (st. 26A2) in the Outer Nordfjord. BDE99 is a main constituent of the penta-BDE
flame retardant mixtures.
For PBDEs in cod liver, the only significant upward short-term trend was for BDE154 in cod liver
from the Austnesfjord in Lofoten (st. 98B1). BDE154 is a main component of commercial octa-BDE
flame retardant mixtures.
There was a total of 34 significant downward long-term trends (sum BDE not included), 12 were
found in blue mussel and 22 in cod liver. Of 16 significant downward short-term trends, three were
found in blue mussel and 13 in cod liver.
Overall, there were more downward trends (50) for PBDEs than increasing trends for PBDEs (3).
These results of dominating downward trends likely reflect how the restrictions on penta- and octa-
BDE that entered into force for most countries globally in 2010 have resulted in reductions in
emissions and releases. The findings are in line with findings reported in other studies; the general
decreasing trends for the commercial penta-BDE mixture (that includes BDE100) (Law et al. 2014),
declining European emissions of PBDE (Schuster et al. 2010) and lower concentrations of PBDEs in
marine mammals in the Arctic and North Atlantic since 2000 (Rotander et al. 2012). It can be noted
that after 2002 a sharp decline in concentrations of PBDEs (as well as PFASs) was observed in blood
from newborns in New York state (Ma et al. 2013). Furthermore, both the penta- and octa PBDE
mixtures were listed in the Stockholm Convention and has been regulated globally through since
2010.
Emissions of PBDEs to air and discharges to water from land-based industries can be seen in Figure
55. In 2016, the emission to air was 0.03 kg brominated diphenyl ethers. The discharges to water
were 1.7 kg brominated diphenyl ethers in 2017 and 0 kg in both 2019 and 2020.
OSPAR has monitored PBDE concentrations in fish, mussels and oysters in several ocean areas. The
results indicate that the mean concentrations of PBDEs are decreasing in the majority of assessed
areas. The Skagerrak and Kattegat is the exception, where concentrations in biota show no
statistically significant change. The highest mean concentrations of PBDEs in biota were found in
biota in the English Channel and Irish Sea. The lowest concentrations are found in the Iberian Sea
(https://oap.ospar.org/en/ospar-assessments/intermediate-assessment-2017/pressures-human-
activities/contaminants/pbde-fish-shellfish/).

NIVA 7686-2021
132
Figure 55. Annual emissions of PBDEs to air and discharges to water from land-based industries in
the period 1994-2020 (data from www.norskeutslipp.no, 05.07.2021). Note that emissions and
discharges from municipal treatment plants, land runoff, transportation and offshore industry are
not accounted for in the figure. New calculation methods for data of emissions and discharges
might lead to changes in calculations of present and previous data.
3.2.24 Perfluorinated alkylated substances (PFAS)
Perfluorinated alkylated substances (PFAS) are organofluorine compounds used as oil-, stain- and
water-repellent surfactants and in several other applications. There are approximately 6330 PFASs
on the marked globally, and firefighting foam was the largest source to PFOS in the Norwegian
environment until the ban in 20071. In Norway, PFOA in consumer products has been regulated since
June 2014.
In the present study, PFAS were analysed in blue mussel at six stations, cod liver at 10 stations, and
in eider blood and eggs at one station (Table 1, Table 9, Figure 57). PFAS have been analysed
annually in cod liver since 2005, as well as in 1993 for the Inner Oslofjord (st. 30B) and Bømlo
(st. 23B).
Environmental Quality Standards (EQS) for priority substances
The EQS for perfluorooctanesulfonic acid (PFOS) in biota is 9.1 µg/kg w.w. and applies to whole fish
(Directive 2013/39/EU on priority substances in the field of water policy). Applying this for blue
mussel, all stations were below the EQS (Table 8). The EQS cannot be directly compared to
concentrations found in different tissues of fish. We have in the present study only measured PFOS
in liver and have not considered converting liver to whole fish because this conversion is uncertain.
If it is assumed, for this exercise, that the same concentration is found in cod liver as in the whole
fish, then the results of PFOS would not be exceeded at any station (maximum concentration
5.5 µg/kg w.w. in the Inner Oslofjord (st. 30B)) (Table 8). Applying this EQS for eider blood and
eggs, the PFOS concentrations were below the EQS (Table 8).
1 https://miljostatus.miljodirektoratet.no/tema/miljogifter/prioriterte-miljogifter/perfluorerte-stoffer-pfos-pfoa-og-andre-
pfas-er/

NIVA 7686-2021
133
The EQS for perfluorooctanoic acid (PFOA) is 91.3 µg/kg w.w. in biota (2013/39/EU). Applying this
for blue mussel, cod liver, and eider blood and eggs, all concentrations of PFOA were below EQS
(Table 8).
Levels exceeding PROREF
Cod liver from the Inner Oslofjord (st. 30B) exceeded PROREF of PFOSA by a factor less than two.
Downward trends in cod liver
For both PFOS and PFOSA, both significant downward long- and short-term trends were found in cod
liver from the Austnesfjord (st. 98B1) in Lofoten. Both significant downward long- and short-term
trends for PFOSA were found in cod liver from Kristiansand harbour (st. 13B), the Inner Sørfjord
(st. 53B), Bømlo (st. 23B) and Tromsø harbour (st. 43B2). A significant short-term trend for PFOSA
was found in the Trondheim harbour. Significant downward long-term trends were found for PFOS at
Tjøme (st. 36B) in the Outer Oslofjord, in the Kristiansandfjord (st. 13B), in the Inner Sørfjord
(st. 53B) and at Tromsø harbour (st. 43B2). A significant downward long-term trend was found in the
Inner Sørfjord (st. 53B) for perfluorononanoic acid (PFNA).
Levels in blue mussel
Most data for PFAS in blue mussel are not sufficient to analyse trends or PROREF. In blue mussel,
the concentration of PFOS at all stations were below LOQ (<0.100 µg/kg w.w.) except for at Svolvær
airport area (st. 98A2, 0.100 µg/kg w.w.). The concentrations of PFOSA were 0.500 µg/kg w.w. at
Gressholmen (st. 30A), 0.200 µg/kg w.w. at Færder (st. 36A) and 0.100 µg/kg w.w. at Ålesund
harbour (st. 28A2). In blue mussel, all concentrations of PFNA (perfluorononanoic acid) were below
LOQ (<0.500 µg/kg w.w.). The median concentrations of the remaining PFASs were mostly below
LOQ (Table 13).
Levels in cod
In cod liver, the highest median concentration of PFOS was found in the Inner Oslofjord (st. 30B)
(5.5 µg/kg w.w.) and the lowest level was observed at Svalbard (st. 19B, 0.300 µg/kg w.w.) (Figure
57, Figure 58, Table 13). At Tjøme (st. 36B) the PFOS concentrations had decreased from
7.4 µg/kg w.w. in 2018 to 1.4 µg/kg w.w. in 2020. Maximum median concentration of PFOSA was
8.1 µg/kg w.w. in cod liver from the Inner Oslofjord (st. 30B), and a minimum level was found at
Svalbard (st. 19B, <0.100 µg/kg w.w.) (Figure 57, Figure 58). In 2020, the concentration of PFOSA
was higher than PFOS in the Inner Oslofjord (st. 30B) and at Tjøme (st. 36B). PFOSA was
significantly higher in cod liver from the Inner Oslofjord (st. 30B) than any other station (Tukey-
Kramer HSD test). In cod liver, all concentrations of PFNA (perfluorononanoic acid) were below LOQ
(<0.500 µg/kg w.w.) except for in the Inner Oslofjord (0.500 µg/kg w.w.). The median
concentrations of PFOA were below LOQ (Table 13).
Levels in eider
In eider at Breøyane (st. 19N) in the Kongsfjord at Svalbard, the concentrations of PFOS were
0.400 µg/kg w.w. in blood and 1.1 µg/kg w.w. in eggs. The concentrations of PFOA were
<0.500 µg/kg w.w. in blood and <0.500 µg/kg w.w. in eggs.
Comparison with other studies - The Inner Oslofjord
Parts of the Inner Oslofjord are densely populated with much urban activities including presence of
PFOSA in certain products such as fire-fighting foam and consumer products (Herzke 2009). PFOSA
was detected in sewage sludge as a minor constituent (Grung et al. 2021) . PFOSA is a precursor
compound in the production of fluorinated polymers but may also add to the exposure due to their

NIVA 7686-2021
134
degradation into PFOS. The high concentrations of PFOSA observed in cod are probably related to
these sources, as well as reduced water exchange with the Outer Oslofjord.
In the present study, cod liver from the Inner Oslofjord had median concentrations of
5.5 µg PFOS/kg w.w. and 8.1 µg PFOSA/kg w.w. in 2020. Cod liver from a comparable study from
the Inner Oslofjord in 2020 had mean concentrations of PFOS (4.0 µg/kg w.w.) and PFOSA
(9.2 µg/kg w.w.) (Grung et al. 2021) within the same range. There are major differences in PFAS
accumulation at individual level in the comparable study. The collection of cod in both studies took
place during the autumn. PFAS were analysed at NIVA in both studies.
Schøyen and Kringstad (2011) analysed PFAS in cod blood samples from the same individuals as were
analysed for liver in the MILKYS programme in 2009 from the Inner Oslofjord (Green et al. 2010).
They found that PFOSA was the most dominant PFAS-compound with a median level six times higher
than for PFOS. The median level of PFOSA in cod blood was about five times higher than in liver
while the median level of PFOS in cod liver was about 1.5 times higher than in blood. Further, PFNA
was also detected in cod blood. Rundberget et al. (2014) investigated cod from Inner Oslofjord
(st. 30B) in the period 2009 to 2013 and found that blood was the preferred matrix for analysing
PFAS. The levels of PFOS were roughly the same in blood as in liver and bile, but levels of other
PFAS were higher in blood and therefore easier to detect. A study of cod liver from the Inner
Oslofjord in 2012 showed higher median concentration of PFOS, than the median concentration of
PFOSA which was lower in cod from 2012 (Ruus 2014) as opposed to what was observed in the
present study.
Comparison with other studies - The Outer Oslofjord
There were high levels in cod liver at Tjøme in the Outer Oslofjord in 2018 (7.4 µg PFOS/kg w.w.
and 44 µg PFOSA/kg w.w.) compared to 2020 (1.4 µg PFOS/kg w.w. and 2.2 µg PFOSA/kg w.w.). In
2017, Ruus et al. (2018) reported that several PFAS compounds (e. g. PFOS) was found in high
concentrations in the seagulls of the Outer Oslofjord (both blood and eggs), possibly related to
contamination in the area because of an earlier airport in proximity of the colony. Use of
firefighting foam with PFOS at former Rygge Airport at Vansjø has caused contamination of
surrounding terrestrial and aquatic environment (Fjeld 2017). Another study has also related PFAS
concentrations in blue mussel to earlier use of firefighting foam in the area of Mossesundet
(Øxnevad, Brkljacic, and Borgersen 2016).
Comparison with other studies
Valdersnes et al. (2017) found that the levels of PFAS in cod liver along the Norwegian coast were
low. PFOS was the dominant PFAS and was quantified in 72 % of the liver samples. The highest
concentration (21.8 µg PFOS /kg w.w.) was found at Kragerø in the eastern part (Tønsberg/Vrengen,
Sandefjord, Kragerø, Tvedestrand and Lillesand) of Norway. Valdernes et al. (2017) found
geographical differences, with highest PFOS concentrations in the eastern part compared to the
western (Farsund, Flekkefjord, Egersund, Sandnes, Stavanger and Karmsundet) and northern part
(Svolvær, Narvik, Hammerfest and Honningsvåg). This was due to higher population density and
closeness to urbanized and industrialized regions in the Baltic and Northern Europe. Further, cod
from the Northern-Norway had significantly higher liver weight and liver somatic index. The study
found that it is conceivable that both geographical and biological factors contribute to variations in
PFOS levels (Valdersnes et al. 2017).
In the present study, the median concentrations of PFOS (1.1 µg/kg w.w.) and PFOSA
(<0.1 µg/kg w.w.) in eider eggs from Svalbard were almost within the same range as in another

NIVA 7686-2021
135
study of eider from three stations in northern Norway and one at Svalbard
(mean 3.7±2.3 µg PFOS/kg w.w. and 0.26±0.14 µg PFOSA/kg w.w.) (Harju 2013).
In the present study, the median concentrations were 0.400 µg PFOS/kg w.w. in blood and
1.1 µg PFOS/kg w.w. in eider eggs from Svalbard. A study of eider from the Inner Oslofjord in 2019,
found mean values of 9.97 µg PFOS/kg w.w. in blood and 23.21 µg PFOS/kg w.w. in eggs (Ruus
2019). The PFOS concentrations in eider blood and eggs were 21-25 times higher in the Inner
Oslofjord than at Svalbard.
Median concentrations of PFOS in cod liver from presumed reference stations like Lofoten,
Kvænangen/Olderfjord north of Skjervøy and the Varangerfjord indicated that high background
concentrations in diffusely contaminated areas might be around 10 µg/kg w.w. (Bakke 2007). All
concentrations observed in this present study were lower (maximum 4.1 µg/kg w.w.). The average
concentration of PFOS in cod liver from two stations in the North Sea was 1.55 and 0.95 µg/kg w.w.
(Green 2011) and from three stations in the Norwegian Sea was 0.75, 0.82 and 11 µg/kg w.w.
(Green 2012).
PFAS compounds in freshwater fish in Norway have been regularly monitored (Jartun 2021). The
concentrations of long-chained compounds, like PFOS and PFOSA, increased with trophic levels with
the highest levels in brown trout liver. The mean PFOS concentrations in liver from brown trout
(Salmo trutta), European smelt (Osmerus eperlanus), charr (Salvelinus alpinus) and vendace
(Coregonus albula) from the three main lakes (Mjøsa, Randsfjord and Femunden) were in the range
of 0.9–10 µg/kg w.w. While in the same study, the PFOS levels were considerably elevated in perch
(Perca fluviatilis) liver from the Tyrifjord and Vansjø with mean concentrations of 194 and
329 µg/kg w.w., respectively. The national monitoring programme "Monitoring of environmental
contaminants in freshwater ecosystems 2020" (Jartun 2021) showed downward trends for PFOS for
all fish in Lake Mjøsa in 2020 compared to levels in 2013/2014, but the concentrations have seemed
to stabilize the last four years.
General, large scale trends
Five of the 10 cod liver stations had significant downward long-term trends for PFOS. The observed
downward trends could reflect the overall reduction in production and use of PFOS and PFOA for the
past 30 years (Nost et al. 2014; Axmon et al. 2014). A decrease in concentrations of PFOS in Sweden
has been reported for food items (Johansson et al. 2014) and herring (Ullah et al. 2014). A sharp
decline in concentrations of PFAS (as well as PBDEs) after 2002 was found in dried blood spots from
newborns in New York state (Ma et al. 2013).
Discharges of PFAS (per- and polyfluorinated compounds, SPFAS1) to water from land-based
industries are shown in Figure 56. The discharges to water had increased from 330 g PFAS in 2013
to 4 171 g PFAS in 2017, and then decreased to 1 430 g PFAS in 2020.
1 Includes: PFOS, PFOA, 8:2 FTOH, 6:2FTS, C9 PFNA, C10PFDA, C11PFUnA, C12PFDoA, C13PFTrA, C14PFTeA, PFHxS, N-
EtFOSA, N-Me FOSA, N-EtFOSE, N-Me FOSE. (See Appendix B.)

NIVA 7686-2021
136
Figure 56. Annual discharges of PFAS to water from land-based industries for 2013 to 2020 (data
from www.norskeutslipp.no, 05.07.2021). No data for emissions to air are reported, and no data
for discharges to water are reported for 1994-2012. Note that emissions and discharges from
municipal treatment plants, land runoff, transportation and offshore industry are not accounted
for in the figure. New calculation methods for data of emissions and discharges might lead to
changes in calculations of present and previous data.
Figure 57. Median concentrations (µg/kg w.w.) of PFOS and PFOSA in cod liver in 2020. The error
bar indicates one standard deviation above the median (see also Table 13).

NIVA 7686-2021
137
Figure 58. Median concentrations (µg/kg w.w.) of PFOS and PFOSA in cod liver from 1993 and 2005
to 2020 in the Inner Oslofjord (st. 30B).

NIVA 7686-2021
138
Table 13. Median concentrations (µg/kg w.w.) and standard deviations (S.d.) of the PFAS-compounds analysed in blue mussel, cod liver, and eider blood
and eggs in 2020. Count indicates number of samples analysed. The first number within the parentheses indicates the number of pooled samples
included. The second number within the parentheses indicates the maximum number of individuals used in one of the pooled samples. Shaded cells
indicate that the median was below the limit of quantification (LOQ) and the value shown in these cells is the LOQ. The standard deviation is based on
all values and values below the LOQ are taken as half. Detectable data information (D.d.i.) indicates the number of data above the LOQ (if any) and the
numbers within the square brackets indicate the minimum and maximum values in this category. (See Chapter 2.10 for more details and Appendix B for
description of chemical codes).
Component Count PFNA PFOA PFOS PFOSA PFUdA
Species and sampling locality 2020 Med. S.d. D.d.i. Med. S.d. D.d.i. Med. S.d. D.d.i. Med. S.d. D.d.i. Med. S.d. D.d.i.
Blue mussel
Gressholmen, Inner Oslofjord (st. 30A) 3 (3-50) 0.5 0 0 [n.a.] 0.5 0 0 [n.a.] 0.1 0 0 [n.a.] 0.5 0.058 3 [0.4-0.5] 0.4 0 0 [n.a.]
Tjøme, Outer Oslofjord (st. 36A1) 3 (3-50) 0.5 0 0 [n.a.] 0.5 0 0 [n.a.] 0.1 0 0 [n.a.] 0.2 0.058 3 [0.1-0.2] 0.4 0 0 [n.a.]
Espevær, Outer Bømlafjord (st. 22A) 3 (3-50) 0.5 0 0 [n.a.] 0.5 0 0 [n.a.] 0.1 0 0 [n.a.] 0.1 0 0 [n.a.] 0.4 0 0 [n.a.]
Nordnes, Bergen harbour (st. I241) 3 (3-50) 0.5 0 0 [n.a.] 0.5 0 0 [n.a.] 0.1 0 0 [n.a.] 0.1 0 1 [0.1] 0.4 0 0 [n.a.]
Ålesund harbour (st. 28A2) 3 (3-50) 0.5 0 0 [n.a.] 0.5 0 0 [n.a.] 0.1 0 0 [n.a.] 0.1 0 3 [0.1-0.1] 0.4 0 0 [n.a.]
Svolvær airport area (st. 98A2) 3 (3-50) 0.5 0 0 [n.a.] 0.5 0 0 [n.a.] 0.1 0.058 3 [0.1-0.2] 0.1 0 0 [n.a.] 0.4 0 0 [n.a.]
Cod, liver
Inner Oslofjord (st. 30B) 12 (7-6) 0.5 0.116 6 [0.5-0.8] 0.5 0 0 [n.a.] 5.5 2.34 12 [1.4-7.7] 8.1 3.632 12 [3.6-16] 2.05 0.815 12 [0.6-2.6]
Tjøme, Outer Oslofjord (st. 36B) 15 (4-2) 0.5 0 0 [n.a.] 0.5 0 0 [n.a.] 1.4 8.407 15 [0.8-34] 2.2 45.76 15 [0.5-180] 0.7 0.312 14 [0.5-1.7]
Kristiansand harbour area (st. 13B) 8 (6-2) 0.5 0 0 [n.a.] 0.5 0 0 [n.a.] 0.9 0.394 8 [0.7-1.9] 0.15 0.173 4 [0.2-0.6] 0.5 0.139 6 [0.4-0.8]
Inner Sørfjord (st. 53B) 15 (4-3) 0.5 0 0 [n.a.] 0.5 0 0 [n.a.] 1.1 1.523 15 [0.3-5] 0.3 0.933 11 [0.1-3.8] 1 0.446 13 [0.5-1.7]
Bømlo, Outer Selbjørnfjord (st. 23B) 15 (6-2) 0.5 0 0 [n.a.] 0.5 0 0 [n.a.] 1 0.338 15 [0.5-1.6] 0.2 0.181 10 [0.1-0.6] 0.4 0.056 5 [0.4-0.6]
Bergen harbour area (st. 24B) 14 (6-2) 0.5 0 0 [n.a.] 0.5 0 0 [n.a.] 0.85 0.284 14 [0.4-1.4] 0.7 0.598 14 [0.1-2.4] 0.45 0.291 9 [0.4-1.3]
Trondheim harbour (st. 80B) 15 (0-1) 0.5 0.232 1 [1.4] 0.5 0 0 [n.a.] 0.6 1.045 15 [0.2-4.3] 0.4 0.379 15 [0.1-1.3] 0.4 0.188 9 [0.4-0.9]
Austnesfjord, Lofoten (st. 98B1) 14 (0-1) 0.5 0 0 [n.a.] 0.5 0 0 [n.a.] 0.6 0.552 14 [0.3-2.2] 0.35 0.308 14 [0.1-1] 0.4 0.354 7 [0.4-1.6]
Tromsø harbour area (st. 43B2) 15 (0-1) 0.5 0 0 [n.a.] 0.5 0 0 [n.a.] 0.6 0.361 15 [0.1-1.3] 0.2 0.205 10 [0.1-0.6] 0.4 0.091 3 [0.5-0.7]
Isfjorden, Svalbard (st. 19B) 15 (0-1) 0.5 0 0 [n.a.] 0.5 0 0 [n.a.] 0.3 0.474 15 [0.2-1.9] 0.1 0.18 3 [0.1-0.7] 0.4 0.27 3 [0.4-1.3]
Eider, blood
Breøyane, Kongsfjorden, Svalbard (st. 19N) 15 (0-1) 0.5 0 0 [n.a.] 0.5 0 0 [n.a.] 0.4 0.145 15 [0.1-0.6] 0.1 0 0 [n.a.] 0.4 0 0 [n.a.]
Eider, egg
Breøyane, Kongsfjorden, Svalbard (st. 19N) 15 (0-1) 0.5 0 0 [n.a.] 0.5 0 0 [n.a.] 1.1 0.755 15 [0.5-2.8] 0.1 0 0 [n.a.] 0.5 0.129 13 [0.4-0.8]

NIVA 7686-2021
139
3.2.25 Hexabromocyclododecanes (HBCD)
Hexabromocyclododecanes (HBCD) is a persistent organic pollutant; it is toxic, persistent,
bioaccumulates and undergo long-range environmental transport. HBCD is one of the substances
identified as priority hazardous substances (2013/39/EU) and was globally regulated under the
Stockholm Convention in 2013.
HBCD was analysed in liver of cod from 13 stations, in blue mussel from 11 stations, and in blood
and eggs of eider from one station (Table 1).
Environmental Quality Standards (EQS) for priority substances
When applying the EQS for HBCD (167 µg/kg w.w.), all concentrations in blue mussel, cod liver and
eider (blood and eggs) were below EQS in 2020 (Table 8). In the present study −HBCD (coded
HBCDA in the present study) has been used as a proxy for the priority substance sum of the
− − and −HBCD diastereomers (coded HBCDD in the present study).
Levels exceeding PROREF
The median concentration of HBCD in blue mussel from Bodø harbour (st. 97A3) exceeded the
Norwegian provisional high reference contaminant concentration (PROREF) by a factor of two to
five. The median concentration of HBCD has increased at this station since 2018. There were also
median concentrations of HBCD in blue mussel from three other stations that exceeded the PROREF
by a factor of up to two. These stations were Gressholmen, Inner Oslofjord (st. 30A), Nordnes,
Bergen harbour (st. I241) and Ålesund harbour (st. 28A2).
Upward trends
There were no upward trends for HBCD in cod or blue mussel in 2020.
Downward trends
There were significant downward long- and short-term trends for HBCD in cod liver from Stathelle
area, Langesundfjord (st. 71B) (Figure 60 A), Kirkøy, Hvaler (st. 02B), Kristiansand harbour
(st. 13B), Inner Sørfjord (st. 53B) and Bømlo, Outer Selbjørnfjord (st. 23B). A significant downward
short-term trend was also found for HBCD in liver of cod from Inner Oslofjord (st. 30B).
Significant downward long- and short-term trends were found for HBCD in blue mussel from
Færder, Outer Oslofjord (st. 36A1), Nordnes, Bergen harbour (st. I241), Ørland area, Outer
Trondheimfjord (st. 91A2), Mjelle, Bodø area (st. 97A2) and Svolvær airport (st. 98A2).
Levels in eider
The concentration of HBCD in eider egg increased from below LOQ in 2019 to 0.057 µg/kg in 2020.
The concentration of HBCD in eider blood was below the LOQ.
General, large scale trends
Cod from the Inner Oslofjord (st. 30B) had the highest concentration of HBCD (here defined as the
sum of the − − and −diastereomers) in liver (Figure 59, Table 14). Median concentration of
HBCD in cod liver from the Inner Oslofjord was 5.045 µg/kg w.w.
1 Timeseries includes alternate station at Tjøme, Outer Oslofjord (st. 36A1).

NIVA 7686-2021
140
Figure 59. Median concentration (µg/kg w.w.) of HBCD (sum of the − − and −diastereomers)
in cod liver in 2020. The error bar indicates one standard deviation above the median.
A
B
Figure 60. Median concentrations (mg/kg w.w.) of −HBCD (HBCDA) in cod liver from 2012 to
2020 in Stathelle area (st. 71B) in the Langesundfjord (A) and in blue mussel from Gressholmen
(st. 30A) in the Inner Oslofjord (B) (see Figure 6 and Appendix C).

NIVA 7686-2021
141
Table 14. Median concentration (μg/kg w.w.) with standard deviation (S.d.) of α-HBCD, γ-HBCD, β-HBCD and HBCD (sum of α-, γ- and β-diastereomers) in cod liver,
blue mussel and eider blood and eggs in 2020. Count indicates number of samples analysed. The first number within the parentheses indicates the number of pooled
samples included. The second number within the parentheses indicates the maximum number of individuals used in one of the pooled samples. Shaded cells indicate
that the median was below the limit of quantification (LOQ) and the value shown in these cells is the LOQ. The standard deviation is based on all values and values
below the LOQ are taken as half. Detectable data information (D.d.i.) indicates the number of data above the LOQ (if any) and the numbers within the square brackets
indicate the minimum and maximum values in this category. (See Chapter 2.11 for more details and Appendix B for description of chemical codes).
Component Count a-HBCD g-HBCD b-HBCD HBCD
Species and sampling locality 2020 Med. S.d. D.d.i. Med. S.d. D.d.i. Med. S.d. D.d.i. Med. S.d. D.d.i.
Blue mussel
Gressholmen, Inner Oslofjord (st. 30A) 3 (3-50) 0.126 0.007 3 [0.12-0.13] 0.018 0.006 0 [n.a.] 0.006 0.001 0 [n.a.] 0.150 0.013 3 [0.14-0.16]
Tjøme, Outer Oslofjord (st. 36A1) 3 (3-50) 0.019 0.008 1 [0.03] 0.009 0.002 0 [n.a.] 0.006 0.000 0 [n.a.] 0.033 0.010 1 [0.05]
Singlekalven, Hvaler (st. I023) 3 (3-50) 0.035 0.004 3 [0.03-0.04] 0.006 0.000 0 [n.a.] 0.006 0.000 0 [n.a.] 0.047 0.004 3 [0.04-0.05]
Bjørkøya, Langesundfjord (st. 71A) 1 (1-50) 0.023 1 [0.02] 0.007 0 [n.a.] 0.006 0 [n.a.] 0.036 1 [0.04]
Nordnes, Bergen harbour (st. I241) 3 (3-50) 0.130 0.008 3 [0.12-0.14] 0.018 0.003 0 [n.a.] 0.011 0.001 0 [n.a.] 0.158 0.011 3 [0.15-0.17]
Vågsvåg, Outer Nordfjord (st. 26A2) 3 (3-50) 0.052 0.007 3 [0.05-0.06] 0.008 0.001 0 [n.a.] 0.006 0.000 0 [n.a.] 0.067 0.007 3 [0.07-0.08]
Ålesund harbour (st. 28A2) 3 (3-50) 0.117 0.011 3 [0.11-0.13] 0.051 0.002 3 [0.05-0.05] 0.013 0.003 3 [0.009-0.01] 0.179 0.012 3 [0.17-0.2]
Ørland area, Outer Trondheimsfjord (st. 91A2) 3 (3-50) 0.020 0.010 3 [0.02-0.04] 0.006 0.000 0 [n.a.] 0.006 0.000 0 [n.a.] 0.032 0.010 3 [0.03-0.05]
Bodø harbour (st. 97A3) 3 (3-50) 0.440 0.017 3 [0.44-0.47] 0.363 0.027 3 [0.36-0.41] 0.109 0.006 3 [0.1-0.12] 0.936 0.027 3 [0.91-0.96]
Mjelle, Bodø area (st. 97A2) 3 (3-50) 0.025 0.007 3 [0.02-0.03] 0.006 0.000 0 [n.a.] 0.006 0.000 0 [n.a.] 0.037 0.007 3 [0.03-0.04]
Svolvær airport area (st. 98A2) 3 (3-50) 0.011 0.003 0 [n.a.] 0.006 0.001 0 [n.a.] 0.006 0.000 0 [n.a.] 0.024 0.003 0 [n.a.]
Cod, liver
Inner Oslofjord (st. 30B) 12 (7-6) 5.045 5.286 12 [2.3-18.4] 0.062 0.107 6 [0.08-0.33] 0.030 0.022 2 [0.08-0.1] 5.173 5.397 12 [2.4-18.8]
Tjøme, Outer Oslofjord (st. 36B) 15 (4-2) 0.421 0.392 13 [0.05-1.6] 0.029 0.002 0 [n.a.] 0.029 0.002 0 [n.a.] 0.480 0.393 13 [0.1-1.66]
Kirkøy, Hvaler (st. 02B) 8 (6-2) 0.338 0.198 8 [0.07-0.63] 0.029 0.001 0 [n.a.] 0.029 0.001 0 [n.a.] 0.398 0.197 8 [0.13-0.68]
Stathelle area, Langesundfjord (st. 71B) 10 (5-5) 0.282 0.168 10 [0.06-0.67] 0.028 0.002 0 [n.a.] 0.028 0.002 0 [n.a.] 0.338 0.169 10 [0.11-0.73]
Kristiansand harbour area (st. 13B) 8 (6-2) 0.319 0.056 8 [0.25-0.41] 0.028 0.007 1 [0.05] 0.028 0.003 0 [n.a.] 0.367 0.061 8 [0.31-0.49]
Inner Sørfjord (st. 53B) 15 (4-3) 0.553 0.446 15 [0.19-1.64] 0.029 0.002 0 [n.a.] 0.029 0.002 0 [n.a.] 0.612 0.447 15 [0.25-1.7]
Bømlo, Outer Selbjørnfjord (st. 23B) 15 (6-2) 0.221 0.473 14 [0.11-1.96] 0.029 0.013 0 [n.a.] 0.029 0.001 0 [n.a.] 0.278 0.484 14 [0.16-2.1]
Bergen harbour area (st. 24B) 14 (6-2) 1.620 2.252 14 [0.06-7.6] 0.030 0.033 3 [0.06-0.12] 0.028 0.001 0 [n.a.] 1.683 2.274 14 [0.12-7.7]
Ålesund harbour area (st. 28B) 14 (2-2) 0.987 0.479 14 [0.46-2.1] 0.045 0.055 5 [0.12-0.19] 0.029 0.001 0 [n.a.] 1.122 0.501 14 [0.54-2.2]
Trondheim harbour (st. 80B) 15 (0-1) 3.070 3.473 15 [0.05-13.1] 0.066 0.040 11 [0.03-0.16] 0.027 0.002 0 [n.a.] 3.196 3.485 15 [0.11-13.2]
Austnesfjord, Lofoten (st. 98B1) 15 (0-1) 0.978 1.660 14 [0.58-6] 0.028 0.007 1 [0.05] 0.028 0.006 1 [0.05] 1.036 1.669 14 [0.64-6.1]
Tromsø harbour area (st. 43B2) 15 (0-1) 1.600 1.019 15 [0.36-3.9] 0.030 0.009 0 [n.a.] 0.029 0.001 0 [n.a.] 1.670 1.020 15 [0.42-3.9]
Isfjorden, Svalbard (st. 19B) 15 (0-1) 0.315 0.420 15 [0.2-1.86] 0.030 0.001 0 [n.a.] 0.030 0.001 0 [n.a.] 0.375 0.420 15 [0.25-1.92]
Eider, blood
Breøyane, Kongsfjorden, Svalbard (st. 19N) 15 (0-1) 0.030 0.000 0 [n.a.] 0.031 0.000 0 [n.a.] 0.023 0.000 0 [n.a.] 0.084 0.000 0 [n.a.]
Eider, egg
Breøyane, Kongsfjorden, Svalbard (st. 19N) 15 (0-1) 0.057 0.119 15 [0.03-0.5] 0.031 0.000 15 [0.03-0.03] 0.023 0.008 15 [0.02-0.05] 0.111 0.120 15 [0.08-0.56]

NIVA 7686-2021
142
Analysis of cod liver showed that −HBCD was about 100 times higher than in blue mussel on a wet
weight basis (compare Figure 61 and Figure 62). The difference was smaller on a lipid basis.
There are some indications of biomagnification for specific diastereomers of HBCD (Haukås 2009).
Cod liver from the Inner Oslofjord (st. 30B) had concentrations of −HBCD that were significantly
higher than all stations except for Trondheim harbour (st. 80B) (Tukey-Kramer HSD test, see also
Figure 61).
Figure 61. Mean concentration (µg/kg w.w.) of −HBCD in cod liver in 2020. The error bar
indicates one standard deviation above the mean.
Blue mussel from Bodø harbour (st. 97A3) had concentrations of −HBCD that were significantly
higher than for all the other stations (Tukey-Kramer HSD test, see also Figure 62).
Figure 62. Mean concentration (µg/kg w.w.) of −HBCD in blue mussel in 2020. The error bar
indicates one standard deviation above the mean.
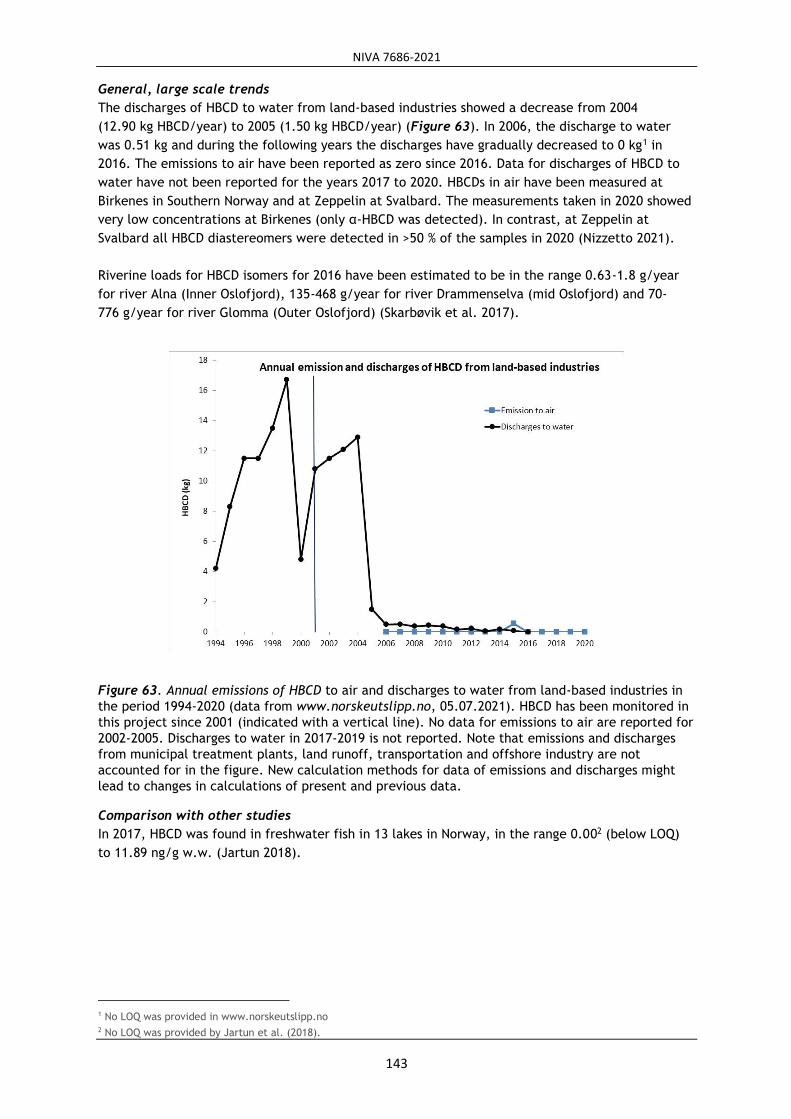
NIVA 7686-2021
143
General, large scale trends
The discharges of HBCD to water from land-based industries showed a decrease from 2004
(12.90 kg HBCD/year) to 2005 (1.50 kg HBCD/year) (Figure 63). In 2006, the discharge to water
was 0.51 kg and during the following years the discharges have gradually decreased to 0 kg1 in
2016. The emissions to air have been reported as zero since 2016. Data for discharges of HBCD to
water have not been reported for the years 2017 to 2020. HBCDs in air have been measured at
Birkenes in Southern Norway and at Zeppelin at Svalbard. The measurements taken in 2020 showed
very low concentrations at Birkenes (only α-HBCD was detected). In contrast, at Zeppelin at
Svalbard all HBCD diastereomers were detected in >50 % of the samples in 2020 (Nizzetto 2021).
Riverine loads for HBCD isomers for 2016 have been estimated to be in the range 0.63-1.8 g/year
for river Alna (Inner Oslofjord), 135-468 g/year for river Drammenselva (mid Oslofjord) and 70-
776 g/year for river Glomma (Outer Oslofjord) (Skarbøvik et al. 2017).
Figure 63. Annual emissions of HBCD to air and discharges to water from land-based industries in
the period 1994-2020 (data from www.norskeutslipp.no, 05.07.2021). HBCD has been monitored in
this project since 2001 (indicated with a vertical line). No data for emissions to air are reported for
2002-2005. Discharges to water in 2017-2019 is not reported. Note that emissions and discharges
from municipal treatment plants, land runoff, transportation and offshore industry are not
accounted for in the figure. New calculation methods for data of emissions and discharges might
lead to changes in calculations of present and previous data.
Comparison with other studies
In 2017, HBCD was found in freshwater fish in 13 lakes in Norway, in the range 0.002 (below LOQ)
to 11.89 ng/g w.w. (Jartun 2018).
1 No LOQ was provided in www.norskeutslipp.no 2 No LOQ was provided by Jartun et al. (2018).

NIVA 7686-2021
144
3.2.26 Chlorinated paraffins (SCCP and MCCP)
Chlorinated paraffins are complex mixtures of polychlorinated organic compounds. They are mainly
used in metal working fluids, sealants, as flame-retardants in rubbers and textiles, in leather
processing and in paints and coatings. Their persistence, bioaccumulation, potential for long-
ranged environmental transport and toxicity imply that they may have harmful environmental
effects at a global level. A global regulation of SCCP has been in place since the end of 2019
through the Stockholm Convention. In 2020, a proposal was made by the UK to list MCCP as a
persistent organic pollutant in Annex A, B or C to the Stockholm Convention. In the present study,
chlorinated paraffins were analysed in liver of cod from 13 stations, in blue mussel from 11
stations, and in blood and eggs of eider from one station (Table 1).
Chlorinated paraffins are subdivided according to their carbon chain length into short chain
chlorinated paraffins (SCCPs, C10-13) and medium chain chlorinated paraffins (MCCPs, C14-17). The
EQS for SCCP and MCCP in biota are 6000 and 170 µg/kg w.w., respectively
(Norwegian_Environment_Agency 2016). SCCPs and MCCPs are persistent in the environment and
has a high potential for bioaccumulation and they are toxic to aquatic organisms (Tomy et al.
1998), they also undergo long-range environmental transport (Nizzetto 2021). Use and production
of SCCPs are prohibited in Norway. However, emission from old or imported products cannot be
excluded. MCCPs are largely used as a flame retardant and as an additive to plastics, such as PVC,
to increase flexibility. To a lesser degree MCCPs are used as a lubricant in machinery for
manufacturing metal products. MCCPs are mainly released to water in effluent from industry using
them as metal working fluids. MCCP has been used to a limited extent in Norwegian production (as
flame retardants, in plastics and as lubricants), but may be found in imported products. There is,
however, considerable uncertainty about the quantities in products used in Norway, and there is an
indication that the discharges from the use of MCCP have been reduced by 40 % from 1995 to
20171. In 2013 there were emissions of 880 kg MCCP to air, discharges of 11340 kg MCCP to water
and 5250 kg MCCP to soil (reported on www.norskeutslipp.no).
Environmental Quality standards (EQS) for priority substances
When applying the EQS for SCCP (6000 µg/kg w.w.) in biota, all concentrations in cod liver, blue
mussel and eider were below the EQS (Table 8). Cod from Svalbard (st. 19B) had the highest
concentration of SCCP, with a median concentration of 59 µg/kg w.w., and high individual
variation. The highest concentration of SCCP in blue mussels were found in Bodø harbour, with a
median concentration of 23 µg/kg w.w.
Environmental Quality Standards (EQS) for river basin specific pollutants
When applying the EQS for MCCP (170 µg/kg w.w.) in biota, all median concentrations of MCCP in
cod liver were below the EQS. Cod from the Inner Oslofjord (st. 30B) had the highest concentration
of MCCPs with a median concentration of 155 µg/kg w.w. High individual variation was observed
(Figure 68, Table 15). There were lower concentrations of MCCP in cod liver in 2020 than in 2019.
No median concentrations of MCCPs in blue mussel or eider were above the EQS.
Levels exceeding PROREF
No median concentrations of SCCPs and MCCPs in cod liver and eider exceeded the PROREF. The
median concentration of SCCPs and MCCPs in blue mussel from Bodø harbour (st. 97A3) exceeded
PROREF by a factor up to two. The median concentration of SCCPs in blue mussel from this station
increased from 12 µg/kg w.w. in 2019 to 23 µg/kg w.w. in 2020, and for MCCPs there was an
increase from 62 µg/kg w.w. in 2019 to 95 µg/kg w.w. in 2020.
1 https://miljostatus.miljodirektoratet.no/tema/miljogifter/prioriterte-miljogifter/klorerte-parafiner-sccp-og-mccp//

NIVA 7686-2021
145
Upward trends
There were significant short- and long-term upward trends for SCCP in blue mussel from
Singlekalven, Hvaler (st. I023) (Figure 64 ). However, the concentrations of SCCPs on this station
were low.
A significant long-term upward trend was found for MCCP in liver of cod from Bømlo, Outer
Selbjørnfjord (st. 23B). The trend in cod was also significant when the data was adjusted for fish
length.
Downward trends
There was a significant long-term downward trend for SCCPs in blue mussel from Færder, Outer
Oslofjord (st. 36A1). There were significant short- and long-term downward trends for SCCPs in
liver of cod from Bergen harbour area (st. 24B) (Figure 65 A), and there was a significant long-
term downward trend for SCCPs in liver of cod from the Inner Sørfjord (st. 53B) (Figure 65 B).
Figure 64. Median concentrations (μg/kg w.w.) of SCCP in blue mussel from Singlekalven, Hvaler
(st. I023) (see Figure 6 and Appendix C.)
1 Timeseries includes alternate station at Tjøme, Outer Oslofjord (st. 36A1).

NIVA 7686-2021
146
A
B
Figure 65. Median concentration of SCCPs in cod liver from Bergen harbour area (st. 24B) (A) and
the Inner Sørfjord (st. 53B) (B) (see Figure 6 and Appendix C.)
Levels in eider
Median concentration of SCCP was 13.0 µg/kg w.w. in eider blood, and 26.0 µg/kg w.w. in eider
egg from Kongsfjord, Svalbard (st. 19N). Median concentration of MCCP was 22.0 µg/kg w.w. in
eider blood and 35.0 µg/kg w.w. in eider egg from the same station. For both SCCPs and MCCPS
there were higher concentrations in eider eggs compared to 2019.
General, large scale trends
Cod from Svalbard (st. 19B) had the highest concentration of SCCPs, with a median concentration
of 59 µg/kg w.w., and high individual variation (Figure 66). However, MCCPs and SCCPs have been
quantified in air at Zeppelin at Svalbard. In 2020 annual mean concentration of SCCPs at Zeppelin
was 510 pg/m3, and for MCCPs 750 pg/m3. These concentrations are one to three orders of
magnitude higher than the concentrations of most of the other POPs (Nizzetto 2021). Cod from
Bergen harbour had also high median concentration of SCCPs (51.0 µg/kg w.w.). The median
concentration of SCCP in blue mussel ranged from 4.0 to 23.0 µg/kg w.w. in the present study and
the highest concentration was found in the samples from Bodø harbour (st. 97A3) (Figure 67).
Cod from the Inner Oslofjord (st. 30B) had highest concentrations of MCCPs, with median
concentration of 155 µg/kg w.w., and cod from Austnesfjord, Lofoten (st. 98B1) had median
concentration of 140 µg/kg w.w. (Figure 68). The concentrations of MCCPs in blue mussel were

NIVA 7686-2021
147
lower than in cod, and ranged from 15.0 to 95.0 µg/kg w.w. Blue mussel from Bodø harbour
(st. 97A3) had the highest concentrations of MCCPs (Figure 69).
Figure 66. Median concentration (µg/kg w.w.) of short chain chlorinated paraffins (SCCP) in cod
liver in 2020. The error bar indicates one standard deviation above the median.
Figure 67. Median concentration (µg/kg w.w.) of short chain chlorinated paraffins (SCCP) in blue
mussel in 2020. The error bar indicates one standard deviation above the median.

NIVA 7686-2021
148
Figure 68. Median concentration (µg/kg w.w.) of medium chain chlorinated paraffins (MCCPs) in
cod liver in 2020. The error bar indicates one standard deviation above the median.
Figure 69. Median concentration (µg/kg w.w.) of medium chain chlorinated paraffins (MCCPs) in
blue mussel in 2020. The error bar indicates one standard deviation above the median.
Comparison with other studies
Cod from the Inner Oslofjord had median concentration of SCCP in liver of 34.0 µg/kg w.w. and
ranging between 28 to 63 µg/kg w.w. Median concentration of MCCP in cod liver from the Inner
Oslofjord was 135 µg/kg w.w. , and ranged between 40 to 310 µg/kg w.w. Ruus et al. (2020a)
found higher levels of SCCP in cod from the Inner Oslofjord (268.7 to 1100.4 µg/kg w.w.).

NIVA 7686-2021
149
Table 15. Median concentrations (µg/kg w.w.) with standard deviation of short chain chlorinated
paraffins (SCCPs) and medium chain chlorinated paraffins (MCCPs) in blue mussel, cod and eider
blood and eggs in 2020. Count indicates number of samples (replicates) analysed. The first number
within the parentheses indicates the number of pooled samples included. The second number
within the parentheses indicates the maximum number of individuals used in one of the pooled
samples. The standard deviation (S.d.) is based on all values and values below the LOQ are taken
as half. Detectable data information (D.d.i.) indicates the number of data above the LOQ (if any)
and the numbers within the square brackets indicate the minimum and maximum values in this
category. (See Chapter 2.10 for more details).
Comments about the results for MCCPs and SCCPs in cod liver in 2020
Most of the concentrations of MCCPS and SCCPs in cod liver were much lower in 2020 than in 2019.
Cod liver is a difficult matrix for analysis of SCCPs and MCCPS, and SCCP and MCCP are also
challenging groups to analyse since they are sums of almost 8000 theoretical congeners (SCCP) and
almost 124 000 theoretical congeners (MCCP). Therefore, they are analysed with a few numbers of
standards and different labs can have different cut-offs for which retention times to include.
Another problem is that in the mass spectrometer, high concentrations of PCBs in cod liver cause
interferences with signals from SCCPs and MCCPs. For these analyses it can be difficult to tell if the
observed signals are caused by high levels of PCBs or from the chlorinated paraffines. Chlorinated
paraffines are also present in many substances in the surroundings, and this can also affect the
analyses. In sum, there are some challenges concerning the analysis of SCCPs and MCCPs, and
therefore quite high uncertainty with regard to the levels of quantification (LOQ).
Component Count SCCP MCCP
Species and sampling locality 2020 Med. S.d. D.d.i Med. S.d. D.d.i
Blue mussel
Gressholmen, Inner Oslofjord (st. 30A) 3 (3-50) 5.00 0.64 3 [4-5.2] 19.00 2.31 3 [15-19]
Tjøme, Outer Oslofjord (st. 36A1) 3 (3-50) 5.00 0.70 3 [4.8-6.1] 18.00 2.89 3 [18-23]
Singlekalven, Hvaler (st. I023) 3 (3-50) 5.00 0.00 3 [5-5] 21.00 2.89 3 [16-21]
Bjørkøya, Langesundfjord (st. 71A) 1 (1-50) 5.00 1 [5] 18.00 1 [18]
Nordnes, Bergen harbour (st. I241) 3 (3-50) 4.70 0.26 3 [4.3-4.8] 16.00 1.53 3 [15-18]
Vågsvåg, Outer Nordfjord (st. 26A2) 3 (3-50) 5.00 0.00 3 [5-5] 18.00 1.53 3 [16-19]
Ålesund harbour (st. 28A2) 3 (3-50) 4.40 0.40 3 [4-4.8] 23.00 4.16 3 [17-25]
Ørland area, Outer Trondheimsfjord (st. 91A2) 3 (3-50) 5.00 0.00 3 [5-5] 39.00 15.00 3 [24-54]
Bodø harbour (st. 97A3) 3 (3-50) 23.00 4.04 3 [23-30] 95.00 11.68 3 [87-110]
Mjelle, Bodø area (st. 97A2) 3 (3-50) 5.00 1.53 3 [4-7] 15.00 1.53 3 [14-17]
Svolvær airport area (st. 98A2) 3 (3-50) 4.00 0.40 3 [4-4.7] 17.00 0.58 3 [16-17]
Cod, liver
Inner Oslofjord (st. 30B) 12 (7-6) 34.00 10.49 12 [28-63] 155.00 77.58 12 [40-310]
Tjøme, Outer Oslofjord (st. 36B) 15 (4-2) 25.00 20.76 15 [16-95] 65.00 52.02 15 [44-250]
Kirkøy, Hvaler (st. 02B) 8 (6-2) 27.50 5.90 8 [25-39] 82.50 126.07 8 [80-440]
Stathelle area, Langesundfjord (st. 71B) 10 (5-5) 38.50 36.17 10 [25-130] 82.00 85.60 10 [67-270]
Kristiansand harbour area (st. 13B) 7 (5-2) 24.00 8.12 7 [19-44] 64.00 14.42 7 [57-100]
Inner Sørfjord (st. 53B) 15 (4-3) 31.00 66.87 15 [24-290] 73.00 4.44 15 [66-83]
Bømlo, Outer Selbjørnfjord (st. 23B) 15 (6-2) 42.00 10.95 15 [35-82] 84.00 54.09 15 [70-290]
Bergen harbour area (st. 24B) 13 (5-2) 51.00 59.44 13 [31-210] 87.00 123.15 13 [55-400]
Ålesund harbour area (st. 28B) 14 (2-2) 21.00 7.20 14 [16-44] 75.50 168.02 14 [50-700]
Trondheim harbour (st. 80B) 15 (0-1) 31.00 7.34 15 [21-54] 71.00 27.04 15 [48-150]
Austnesfjord, Lofoten (st. 98B1) 15 (0-1) 25.00 21.45 15 [20-100] 140.00 67.76 15 [41-270]
Tromsø harbour area (st. 43B2) 15 (0-1) 36.00 32.47 15 [26-160] 80.00 17.07 15 [70-140]
Isfjorden, Svalbard (st. 19B) 15 (0-1) 59.00 31.24 15 [27-140] 84.00 16.65 15 [54-100]
Eider, blood
Breøyane, Kongsfjorden, Svalbard (st. 19N) 15 (0-1) 13.00 13.23 9 [12-50] 22.00 1024.37 13 [11-4004]
Eider, egg
Breøyane, Kongsfjorden, Svalbard (st. 19N) 15 (0-1) 26.00 9.06 15 [11-49] 35.00 23 12 [10-97]

NIVA 7686-2021
150
3.2.27 Siloxanes (D4, D5 and D6)
Siloxanes are chemical compounds consisting of silicon and oxygen substituted with various organic
side chains, and they exist both as linear and cyclic substances. Siloxanes are chemicals used as
synthetic intermediates in silicone polymer productions and can be ingredients in cosmetic and
personal care products. Siloxanes have properties that affect the consistency of personal care
products such as deodorants, skin and hair products to facilitate their use. The chemicals are also
used in mechanical fluids and lubricants, biomedical products, cleaning and surface treatment
agents, paint, insulation materials and cement. Since 1. February 2020, there are restrictions for
D4 and D5 for wash-off cosmetic products in concentrations above 0.1 %1 in the EU/EEA.
Siloxanes, i.e. the cyclic volatile methyl siloxanes (cVMS) octamethylcyclotetrasiloxane (D4),
decamethylcyclopentasiloxane (D5) and dodecamethylcyclohexasiloxane (D6) were analysed in cod
liver at the five stations (Table 1); in the Inner Oslofjord (st. 30B), Bergen harbour (st. 24B),
Tromsø harbour (st. 43B2), Kjøfjord (st. 10B) in the Outer Varangerfjord and in the Isfjord (st. 19B)
at Svalbard (Table 16, Figure 70). Siloxanes were also analysed in eider blood and eggs at one
station at Svalbard (st. 19N Breøyane).
Environmental Quality Standards (EQS) for river basin specific pollutants
When applying the EQS for D5 (15 217 µg/kg w.w.) in biota on cod liver, D5-concentrations were
below EQS at all five stations (Table 8). The EQS for D5 in biota is provided for fish and are based
on analyses on whole fish. Therefore, the EQS cannot be directly compared to concentrations
found in certain tissues of fish. We have in the present study only measured D5 in liver. Converting
concentrations in liver to concentrations in whole fish is uncertain. If it is assumed, for this
exercise, that the same concentration is found in all fish tissue types, then the results of D5 in cod
liver would have been below the EQS for all 2020-samples (Table 8). No individual D5-
concentration exceeded EQS (Table 16).
Levels in cod liver
Data for D4, D5 or D6 in cod liver are not sufficient to analyse trends or PROREF. D5 was the most
dominant cVMS in the Inner Oslofjord (st. 30B) (968.1 µg/kg w.w.). Median D5-concentrations in
cod liver were lowest at Svalbard (6.5 µg/kg w.w.). The same pattern was found for D6 in the Inner
Oslofjord (92.4 µg/kg w.w.) and at Svalbard (3.1 µg/kg w.w.). For D4, the highest concentrations
were also found in the Inner Oslofjord (63.8 µg/kg w.w.) while the lowest concentrations were
found in Kjøfjord (st. 10B) in the Outer Varangerfjord (2.9 µg/kg w.w.)
Levels in eider
In eider at Breøyane (st. 19N) in the Kongsfjord at Svalbard, the concentrations of D4, D5 and D6 in
blood were 0.8, 0.7 and <1.7 µg/kg w.w., respectively. The concentrations of D4, D5 and D6 in
eggs were 1.9, 3.0 and 1.9 µg/kg w.w., respectively.
Comparison with other studies
The Inner Oslofjord
D5 was the dominating compound in all studies of cod from the Inner Oslofjord including this study
and the publications of Powell (2009), Powell et al. (2010; 2018), Ruus et al. (2016b; 2017; 2018,
2019), Schlabach et al. (2008) and Schøyen et al. (2016).
In 2020, median D5 concentration in cod liver from the Inner Oslofjord was 968.1 µg/kg w.w.,
while the mean D5 concentration was 1012 µg/kg w.w. in a comparable study (Grung et al. 2021).
In the current study, median concentrations of D4 and D6 in cod liver from the Inner Oslofjord
1 https://www.miljodirektoratet.no/aktuelt/nyheter/2020/februar-2020/nytt-forbud-mot-bruk-av-miljogifter/

NIVA 7686-2021
151
were 63.7 and 92.4 µg/kg w.w., respectively, while the mean concentrations were
45.8 and 87.2 µg/kg w.w., respectively, in the comparable study. The collection of cod in both
studies took place during the autumn, in August for the Urban fjord programme and in November
for this MILKYS programme. Furthermore, Ruus et al. (2018) found approximately 20 % higher mean
D5-concentrations in cod liver in 2017 (2518.3 µg/kg w.w.) than in 2016 (2065.1 µg/kg w.w.) (Ruus
et al. 2017). In 2015, the median D5 concentration was 1083.3 µg/kg w.w. (Ruus 2016b).
For the period 2011 to 2014, concentrations of D4, D5 and D6 were higher in herring than in cod
(both whole fish) from the Inner Oslofjord (st. 30) (Schøyen 2016). There was a positive correlation
between lipid content and lipid-normalized concentrations of D4, D5 and D6 in cod, but a negative
correlation in herring. Lipid-normalized concentrations of D4, D5 and D6 in cod, herring and shrimp
were lowest in 2014 compared to the period 2011 to 2013.
In 2008, the mean concentrations of D4, D5 and D6 in cod (whole fish) from the Inner Oslofjord
(st. 30B) were 2.6, 61.7 and 4.2 µg/kg w.w., respectively (Powell 2010). In 2006, the concentration
ranges of D4, D5 and D6 in cod liver from the Inner Oslofjord (st. 30B) were 81.2-134.4, 1490.8-
1978.5 and 109.1-151.5 µg/kg w.w., respectively (Schlabach 2008). In 2005, the concentrations of
D4, D5 and D6 in cod liver from the Inner Oslofjord (st. 30B) were 70, 2200 and 74 µg/kg w.w.,
respectively (Kaj 2005).
A literature overview and possible EQS derivation for D5 in biota (fish) is estimated to
833 µg/kg w.w. to protect the environment from secondary poisoning via the food chain (Sahlin
2018).
Siloxanes have been included in the environmental monitoring in Mjøsa since 2010 (Borgå 2012). D5
was detected in highest concentrations in 2020 (Jartun 2021). The mean concentrations were
highest in brown trout (Salmo trutta) (39 µg/kg w.w.), vendace (Coregonus albula)
(23 µg/kg w.w.), European smelt (Osmerus eperlanus) (17 µg/kg w.w.), Mysis (Mysis relicta)
(7.5 µg/kg w.w.) and zooplankton (0.30 µg/kg w.w.) (Jartun 2021). There was a slight decline in D5
concentration in brown trout from 2010 to 2020, and the concentrations have stabilized between
2017 and 2020 (Jartun 2021).
The Arctic
At Svalbard, the highest concentrations of cVMS were found in cod liver from the Adventfjord
(close to Longyearbyen), when compared to the Kongsfjord (close to Ny-Ålesund) and the
Liefdefjord (north-west of Spitsbergen) in 2009 (Warner et al. 2010). The wastewaters from
Longyearbyen are released into the Adventfjord. D5 was the dominant compound in all fjords. In
the Adventfjord, mean concentrations were 57 µg/kg w.w. for D5 and 3.1 µg/kg w.w. for D6, while
D4 not was detected in any cod. Warner et al. (2014) found that concentrations of D4 and D6 were
negatively correlated with fish length and weight, indicating a greater elimination capacity
compared to uptake processes with increasing fish size. Similar correlations were not detected for
D5.
Freshwater
The median D5-concentration in cod liver (968.1 µg/kg w.w.) from the Inner Oslofjord was higher
than the mean concentration in trout liver from Lake Mjøsa in 2020 (39 µg/kg w.w.) (Jartun 2021).

NIVA 7686-2021
152
Figure 70. Median concentration (µg/kg w.w.) of siloxanes D4, D5 and D6 in cod liver in 2020. The
error bar indicates one standard deviation above the median.

NIVA 7686-2021
153
Table 16. Median concentrations (µg/kg w.w.) with standard deviation of siloxanes (D4, D5 and
D6) in cod liver and eider blood and eggs in 2020. Count indicates number of samples (replicates)
analysed. The first number within the parentheses indicates the number of pooled samples
included. The second number within the parentheses indicates the maximum number of
individuals used in one of the pooled samples. Shaded cells indicate that the median was the limit
of quantification (LOQ) and value shown in these cells is the LOQ. The standard deviation (S.d.) is
based on all values and where values below the LOQ are taken as half. Detectable data
information (D.d.i.) indicates the number of data above the LOQ (if any) and the numbers within
the square brackets indicate the minimum and maximum values in this category. (See Chapter
2.10 for more details).
General, large scale trends
These chemicals are highly volatile, and most of emissions occur to the atmosphere. Release to
aquatic environment can also occur through wastewater. In Norway, cosmetics and personal care
products cause the main source of siloxane emission
(https://miljostatus.miljodirektoratet.no/siloksaner). Estimated discharges of siloxanes (D4 and
D5) have increased gradually from 200 tons in 2000, to 387 tons in 2015 and 365 tonnes in 2019
(Figure 71). In 2017, the discharges were 6.25 tonnes.
Figure 71. Estimated discharges of D4 and D5 from 2000 to 2019 (data from
https://miljostatus.miljodirektoratet.no/tema/miljogifter/prioriterte-miljogifter/siloksaner/).
Component Count D4 D5 D6
Species and sampling locality 2020 Med. S.d. D.d.i. Med. S.d. D.d.i. Med. S.d. D.d.i.
Cod, liver
Inner Oslofjord (st. 30B) 14 (0-1) 63.76 50.67 14 [20-216] 968.14 1008.92 14 [162-3963] 92.44 92.44 14 [32-239]
Bergen harbour area (st. 24B) 15 (0-1) 24.53 206.79 15 [3.3-722] 81.54 215.96 15 [5.6-775] 31.42 31.42 15 [2.1-224]
Tromsø harbour area (st. 43B2) 15 (0-1) 9.35 7.46 15 [4.3-34] 105.85 129.58 15 [24-508] 27.06 27.06 15 [7.1-114]
Kjøfjord, Outer Varangerfjord (st. 10B) 15 (0-1) 2.89 1.01 15 [1.66-5.2] 9.02 6.33 15 [2.3-25] 5.70 5.70 15 [3.5-11.9]
Isfjorden, Svalbard (st. 19B) 15 (0-1) 3.16 1.14 15 [1.91-6.9] 6.51 2.08 15 [2.7-10.7] 3.11 3.11 13 [2.4-8.5]
Eider, blood
Breøyane, Kongsfjorden, Svalbard (st. 19N) 17 (0-1) 0.82 0.26 17 [0.61-1.47] 0.75 0.44 17 [0.37-2.3] 1.68 0.13 6 [1.7-2.1]
Eider, egg
Breøyane, Kongsfjorden, Svalbard (st. 19N) 15 (0-1) 1.92 0.48 15 [1.42-3.4] 3.01 0.80 15 [2.2-4.8] 1.89 0.59 15 [1.59-3.1]
0
100
200
300
400
500
600
2000 2002 2004 2006 2008 2010 2012 2014 2016 2018 2020
D4
an
d D
5 (
ton
s)
Estimated discharges of siloxanes (D4 and D5)

NIVA 7686-2021
154
3.3 Biological effects methods for cod
Biological effect methods (BEM) are included in the monitoring programme to assess the potential
pollution effects on organisms. This can hardly be done solely on the basis of tissue concentrations
of chemicals. There are three BEM methods used on cod liver samples (including analyses of
degradation products of PAH in bile). Each method is in theory specific for individual or groups of
chemicals. One of the advantages of these methods used at the individual level is the ability to
integrate biological and chemical endpoints, since both approaches are performed on the same
individuals. The results can be seen in relation to established reference values (OSPAR 2013).
3.3.1 OH-pyrene metabolites in bile Analysis of OH-pyrene in bile is not a measurement of biological effects, per se. It is included here,
however, since it is a result of biological transformation (biotransformation) of PAHs and is thus a
marker of exposure. Quantification methods for OH-pyrene have been improved two times since
the initiation of these analyses in the CEMP/MILKYS programme. In 1998, the
support/normalisation parameter was changed from biliverdin to absorbance at 380 nm. In 2000,
the use of single-wavelength fluorescence for quantification of OH-pyrene was replaced with HPLC
separation proceeding fluorescence quantification. The single wavelength fluorescence method is
much less specific than the HPLC method. Although there is a good correlation between results
from the two methods, they cannot be compared directly.
PAH compounds are effectively metabolized in vertebrates. As such, when fish are exposed to and
take up PAHs, the compounds are biotransformed into polar metabolites which enhances the
efficiency of excretion. It is therefore not suitable to analyse fish tissues for PAH parent
compounds as a measure of exposure. However, since the bile is a dominant excretion route of PAH
metabolites, and since the metabolites are stored for some time in the gall bladder, the bile is
regarded as a suitable matrix for analyses of PAH metabolites as a measure of PAH exposure.
In 2020 the median (non-normalized) concentration of OH-pyrene metabolites in bile from cod in
the Inner Oslofjord (st. 30B) was similar to those in 2019 and resembled the concentrations most
recent years. The absorbance at 380 nm, however, was generally higher in bile from 2020, for
unknown reasons, probably associated with methodological issues (higher dilution). Thus, all
normalized OH-pyrene concentrations are reduced. Median OH-pyrene bile concentration in 2020
was above the ICES/OSPAR assessment criterion (background assessment criteria, BAC) in this area
as well as in fish from the Inner Sørfjord (st. 53B) and at Farsund (st. 15B). At Bømlo (st. 23B,
reference station), median OH-pyrene bile concentrations did not exceed the ICES/OSPAR
assessment criterion in 2020. Note that the unit of the assessment criterion is ng/ml, without
normalization to absorbance at 380 nm. In the Inner Sørfjord (st. 53B), the median concentration
of OH-pyrene metabolites in bile from cod appeared substantially lower (a factor of >10 on a non-
normalized basis) than in 2019. Among the four stations, OH-pyrene concentrations were highest in
the Inner Oslofjord (st. 30B) and lowest in the Bømlo area (st. 23B) (Tukey-Kramer HSD) (Appendix
F). Pyrene-concentrations in blue mussels were highest in the Oslofjord (Akershuskaia), compared
to all stations where PAHs were analysed.
3.3.2 ALA-D in blood cells Inhibited activity of ALA-D indicates exposure to lead. Although ALA-D inhibition is lead-specific, it
is not possible to rule out interference by other metals or organic contaminants. Note that the
protocol for ALA-D analysis was slightly altered (to avoid Hg-containing reagents) in 2017.
The median ALA-D activity at the reference station (Bømlo area; 23B) appeared similar as, or even
slightly higher as, most previous years (since 2013).

NIVA 7686-2021
155
As previously noted, most years up to 2011 the activity of ALA-D in cod was somewhat inhibited in
the Inner Oslofjord (st. 30B), compared to reference stations, i.e. Outer Oslofjord (st. 36B; only
data to 2001), Bømlo (st. 23B), and Varangerfjord (st. 10B; only data to 2001, not shown) (Green et
al. 2016). The median ALA-D activity in the Inner Oslofjord (st. 30B) in 2020 was lower (Tukey-
Kramer HSD) than in Bømlo (st. 23B, reference station, Appendix F). Also, in the Inner Sørfjord
(st. 53B), the median activity of ALA-D appeared slightly lower than at the reference station
(st. 23B) (however not significantly different from neither st. 30B, nor st. 23B; Tukey-Kramer HSD).
The frequent lower activities of ALA-D in cod from the Inner Oslofjord and Inner Sørfjord compared
to the reference station (basis for comparison prior to 2007, 2009-2011 and 2013-2019) indicate the
contamination of lead. Higher concentrations of lead in cod liver have generally been observed in
the Inner Oslofjord and Inner Sørfjord compared to Bømlo, though with a relatively large individual
variation, as was also the case in 2020. Median concentrations of lead in cod liver from the Inner
Oslofjord (st. 30B) and the Sørfjord (st. 53B) were 0.095 mg/kg and 0.014 mg/kg, respectively, in
2020. In the Bømlo area (st. 23B) the median concentration was 0.006 mg/kg. In cod liver,
significant downward long-term trends were found for Pb in cod liver at st. 23B and st. 53B. A
significant downward short-term trend was also observed at st. 23B (Table 9).
3.3.3 EROD-activity
High activity of hepatic cytochrome P450 1A-activity (EROD-activity) normally occurs as a response
to the contaminants indicated in Table 3. It was expected that higher activity would be found at
the stations that were presumed to be most impacted by planar PCBs, PCNs, PAHs or dioxins such
as the Inner Oslofjord (st. 30B). Since 2000, the median EROD-activity has generally been higher in
the Inner Oslofjord compared to the reference station on the west coast (Bømlo, st. 23B). In 2018,
EROD activities in neither the Inner Oslofjord (st. 30B), nor the Inner Sørfjord (st. 53B) were higher
than at the reference station (st. 23B). In 2019, the median EROD activity appeared slightly higher
in the Inner Oslofjord (st. 30B) and slightly lower in the Inner Sørfjord (st. 53B), compared to
Bømlo (st. 23B), but these differences were not statistically different. In 2020, the median EROD
activity was lower in the Inner Sørfjord (st. 53B) than in the Inner Oslofjord (st. 30B) and the
Bømlo area (st. 23B; Tukey-Kramer HSD), while st. 23B and st. 30B were not significantly different.
Statistically significant downward trends in EROD activity were observed on both a long-term basis
(whole data series) and a short-term basis (last 10 years) at Bømlo (st. 23B), on a long-term basis in
the Inner Oslofjord (st. 30B), and on a short-term basis in the Inner Sørfjord (st. 53B) (Figure 72).
Median EROD-activities were below the ICES/OSPAR assessment criterion (background assessment
criteria, BAC). Concentrations over BAC would indicate possible impact by planar PCBs, PCNs, PAHs
or dioxins. No concentrations of PAHs in blue mussel exceeded the EQS.
No adjustment for water temperature has been made. Fish are sampled at the same time of year
(September-November) when differences between the sexes should be at a minimum. Previous
statistical analyses indicated no clear difference in activity between the sexes (Ruus, Hylland, and
Green 2003). It has been shown that generally higher activity occurs at more contaminated stations
(Ruus, Hylland, and Green 2003). However, the response is inconsistent (cf. Appendix F), perhaps
due to sampling of populations with variable exposure history. Besides, there is evidence from
other fish species that continuous exposure to e.g. PCBs may cause adaptation, i.e. decreased
EROD-activity response.

NIVA 7686-2021
156
A
B
Figure 72. Median activity (pmol/min/mg-protein) of EROD in cod liver from 1990 to 2020 in the
Inner Oslofjord (st. 30B) (A) and from 1997 to 2020 in Bømlo (st. 23B) (B). The Norwegian
provisional high reference contaminant concentration (PROREF) and the factor exceeding PROREF
are indicated with horizontal dashed lines (see Figure 6 and Appendix C.)
3.4 Analysis of stable isotopes
3.4.1 General description of method
Stable isotopes of carbon and nitrogen are useful indicators of food origin and trophic levels. 13C
gives an indication of carbon source in the diet of a food web. For instance, it is in principle
possible to detect differences in the importance of autochthonous (native marine) and
allochthonous (watershed/origin on land) carbon sources in the food web, since the 13C signature
of the land-based energy sources is lower (greater negative number) than the autochthonous. Also
15N (although to a lesser extent than 13C) may be lower in allochthonous as compared to
autochthonous organic matter (Helland, Åberg, and Skei 2002), but more important, it increases in
organisms with higher trophic level because of a greater retention of the heavier isotope (15N). The
relative increase of 15N over 14N (15N) is 3-5 ‰ per trophic level (Layman et al. 2012; Post 2002). It
thus offers a continuous descriptor of trophic position. As such, it is also the basis for Trophic
Magnification Factors (TMFs). TMFs give the factor of increase in concentrations of contaminants
per trophic level. If the concentration increase per trophic level can be expressed as:

NIVA 7686-2021
157
Log Concentration = a + b * (Trophic Level)
Then:
TMF = 10b
TMFs has recently been amended to Annex XIII of the European Community Regulation on chemicals
and their safe use (REACH) for possible use in weight of evidence assessments of the
bioaccumulative potential of chemicals as contaminants of concern.
In the present report, the stable isotope data have been applied to elucidate if spatial differences
in contaminant concentrations may partially be attributed to different energy sources between
stations, or that the same species (cod) may inhabit different trophic levels on different stations
(Table 17). Analysis of stable isotopes was included in the programme in 2012, thus the database
now includes nine years. So far for the period 2012-2019 (Green et al. 2020) the results of the
stable isotope analysis (of both blue mussel and cod) have shown a continual geographical pattern,
suggesting a spatial trend persistent in time, and the isotopic signatures in mussels thus provide
valuable information about the isotopic baselines along the Norwegian coast. This information has
e.g. earlier been used to normalize trophic positions of herring gulls, when geographic comparisons
have been made (Keilen 2017). Last year, The 15N data were scrutinized further by deducing the
trophic position of the cod, based on a known baseline in the area, given by the isotopic profile of
blue mussel, inhabiting trophic position 2 (primary consumer, feeding on particulate matter; see
(Green et al. 2020)). This study showed that baseline adjusted trophic position of cod differed
between stations along the Norwegian coast, suggesting that parts of the spatial differences in
contaminant concentrations may be attributed to different trophic positions of the cod at the
different stations, and not merely differences in environmental concentrations between stations.
3.4.2 Results and discussion
The results of the stable isotope analysis in 2020 generally show the same pattern as observed in
2012-2019 (Green et al. 2020) i.e. a continual geographical pattern, suggesting a spatial trend
persistent in time (Figure 73).
As previously, it can be noted that individual cod from the Sørfjord (st. 53B) and Bergen harbour
(station 24B; both in former Hordaland County, now Vestland) stand out with particularly low 15N
signature (Figure 73); Bergen harbour, station 24B, was introduced in 2015. The same is shown for
mussels from the Sørfjord (stations 56A and 57A), indicating that the 15N -baseline of the food
web in the Sørfjord is lower. The reason for this is unknown, but a higher influence of
allochthonous nitrogen is possible. Likewise, isotope signatures of both fish (30B) and mussels (30A
and I304) from the Oslofjord are among the highest observed (Figure 73) indicating a high
baseline. These geographic differences were also observed 2012-2019 (Green et al. 2020).
Interestingly, cod from stations from the North of Norway (Lofoten, 98B1) and Svalbard (19B) show
intermediate 15N values and low 13C values (Figure 73). The same can be observed in mussels
from Northern Norway (98A2). As previously pointed out, the stations generally show very similar
patterns from year to year in terms of isotopic signatures, indicating a geographical trend,
persistent in time.

NIVA 7686-2021
158
Table 17. Summary of analyses of stable isotopes: 13C and 15N in blue mussel, cod and eider in
2020. Statistics shown are count (n), mean and standard deviation. Vienna Pee Dee Belemnite
(VPDB) and atmospheric air (AIR) are standards.
13
CVPDB 15
NAIR
Station ID n mean s.d. n mean s.d.
Presumed less impacted:
Blue mussel (Mytilus edulis) statistics >> 3 -21.12 0.14 3 5.75 0.18
Tjøme, Outer Oslofjord (st. 36A1) 3 -20.12 0.06 3 7.41 0.18
Singlekalven, Hvaler (st. I023) 3 -20.52 0.25 3 7.24 0.37
Bjørkøya, Langesundfjord (st. 71A) 1 -20.15 1 5.04
Gåsøya-Ullerøya, Farsund (st. 15A) 3 -21.31 0.07 3 7.15 0.24
Krossanes, Outer Sørfjord (st. 57A) 3 -20.04 0.27 3 2.50 0.14
Espevær, Outer Bømlafjord (st. 22A) 3 -21.44 0.02 3 5.66 0.14
Vågsvåg, Outer Nordfjord (st. 26A2) 3 -20.66 0.02 3 4.85 0.15
Ørland area, Outer Trondheimsfjord (st. 91A2) 3 -21.11 0.28 3 5.54 0.16
Mjelle, Bodø area (st. 97A2) 3 -21.77 0.17 3 6.37 0.22
Svolvær airport area (st. 98A2) 3 -22.53 0.09 3 5.55 0.12
Brashavn, Outer Varangerfjord (st. 11X) 3 -22.64 0.13 3 5.94 0.12
Atlantic cod (Gadus morhua ) statistics >> 15 -19.67 0.67 15 14.25 0.61
Tjøme, Outer Oslofjord (st. 36B) 15 -18.88 0.43 15 15.86 0.97
Kirkøy, Hvaler (st. 02B) 15 -18.30 2.07 15 14.73 0.48
Skågskjera, Farsund (st. 15B) 15 -19.64 0.64 15 14.97 0.62
Bømlo, Outer Selbjørnfjord (st. 23B) 15 -18.98 0.46 15 13.82 0.46
Sandnessjøen area (st. 96B) 15 -19.60 0.37 15 14.19 0.43
Austnesfjord, Lofoten (st. 98B1) 15 -20.37 0.35 15 14.11 0.71
Kjøfjord, Outer Varangerfjord (st. 10B) 15 -20.44 0.63 15 13.58 0.55
Isfjorden, Svalbard (st. 19B) 15 -21.17 0.37 15 12.77 0.67
Common eider (Somateria mollissima ), blood statistics >> 15 -20.31 0.58 15 10.50 0.77
Breøyane, Kongsfjorden, Svalbard (st. 19N) 15 -20.31 0.58 15 10.50 0.77
Common eider (Somateria mollissima ), egg statistics >> 15 -23.21 0.32 15 9.87 0.50
Breøyane, Kongsfjorden, Svalbard (st. 19N) 15 -23.21 0.32 15 9.87 0.50
Presumed more impacted:Blue mussel (M ytilus edulis) statistics >> 3 -20.56 0.16 3 6.06 0.19
Gressholmen, Inner Oslofjord (st. 30A) 3 -19.59 0.25 3 7.41 0.10
Gåsøya, Inner Oslofjord (st. I304) 3 -19.15 0.30 3 7.90 0.11
Kirkøy, Hvaler (st. I024) 3 -20.24 0.15 3 7.46 0.46
Odderøya, Kristiansand harbour (st. I133) 3 -21.31 0.04 3 6.26 0.06
Kvalnes, Mid Sørfjord (st. 56A) 3 -20.43 0.04 3 2.65 0.44
Nordnes, Bergen harbour (st. I241) 3 -20.68 0.06 3 4.19 0.08
Ålesund harbour (st. 28A2) 3 -20.65 0.22 3 6.08 0.08
Bodø harbour (st. 97A3) 3 -22.40 0.20 3 6.52 0.23
Atlantic cod (Gadus morhua ) statistics >> 15 -19.09 0.77 15 13.39 0.79
Inner Oslofjord (st. 30B) 15 -18.90 0.90 15 15.74 0.73
Stathelle area, Langesundfjord (st. 71B) 15 -18.05 1.00 15 13.59 0.64
Kristiansand harbour area (st. 13B) 15 -18.98 0.76 15 14.13 0.41
Inner Sørfjord (st. 53B) 15 -18.05 0.76 15 11.45 0.95
Bergen harbour area (st. 24B) 15 -19.66 1.23 15 11.00 1.59
Ålesund harbour area (st. 28B) 15 -20.06 0.38 15 13.28 0.55
Trondheim harbour (st. 80B) 15 -18.52 0.86 15 14.05 0.88
Tromsø harbour area (st. 43B2) 15 -19.19 0.76 15 13.95 0.90
Hammerfest harbour area (st. 45B2) 15 -20.41 0.31 15 13.33 0.43
Mean of all blue mussel statistics >> 3 -20.88 0.14 3 5.88 0.19
Mean of all Atlantic cod statistics >> 15 -19.37 0.72 15 13.80 0.70

NIVA 7686-2021
159
A
B
Figure 73. 13C plotted against 15N in for cod (A) and blue mussel (B). Red ellipses indicate the
position of the majority of the samples of cod and blue mussel from the Inner Oslofjord and the
Sørfjord, respectively. See station names and codes in Table 17.
Cod
13C
1
5N
02B
10B
13B
15B
19B
23B
24B
28B
30B
36B
43B2
45B2
53B
71B
80B
96B
98B1-23 -22 -21 -20 -19 -18 -17 -16 -15 -146
8
10
12
14
16
18
Mussel
13C
1
5N
11X
15A
22A
26A2
28A2
30A
36A1
56A
57A
71A
91A2
97A2
97A3
98A2
I023
I024
I133
I241
I304-23,0 -22,5 -22,0 -21,5 -21,0 -20,5 -20,0 -19,5 -19,0 -18,51
2
3
4
5
6
7
8
9

NIVA 7686-2021
160
The biomagnifying properties of mercury are well known. A correlation between 15N and
concentration of Hg in cod could suggest higher concentrations in individuals with higher 15N
(significant linear regression between 15N and Log[Hg]; P=0.0023 R2=0.0362; Figure 74). This may
partly be a result of different exposure, as well as difference in isotopic signature (baseline)
among stations. However, as mentioned, it was previously shown that baseline adjusted trophic
position of cod differed between stations along the Norwegian coast, suggesting that parts of the
spatial differences in contaminant concentrations may be attributed to different trophic positions
of the cod at the different stations. Furthermore, linear regressions isolated for each station
produced significant positive linear relationships between 15N and Log[Hg] for the stations at
Hvaler (st. 02B), Farsund (st. 15B), Svalbard (st.19B), Bømlo (st. 23B), Bergen (st. 24B), Inner
Oslofjord (st. 30B), Hammerfest harbour (st. 45B2) and Trondheim harbour (st.80B).
Figure 74. 15N plotted against the log-transformed concentration of Hg in cod. See station names
and codes in Table 17.
15N ratio in eiders from Svalbard (blood and egg) sampled in 2020 resembled those in 2018-2019
(Figure 75). The values are similar as those measured in eiders (pectoral muscle) from
Kongsfjorden (Svalbard), October 2007 (Evenset et al. 2016). Evenset et al. (2016) estimated the
trophic level of these birds to 3.1-3.4. The 13C ratio in the eiders differed between the two
matrices (blood and egg). The 13C ratio was higher in blood than in eggs (Figure 75) likely related
to different lipid content. It should be noted that samples were not treated to remove carbonates
or lipid before stable isotope analysis. The median C:N ratio was 3.70 in blood and 9.77 in egg, and
a C:N ratio of >3.5 implies the presence of lipids, which may somewhat confound 13C
interpretation, since lipids are 13C-depleted relative to proteins (Sweeting, Polunin, and Jennings
2006). The 13C ratio in the eiders (egg and blood) was also lower than in pectoral muscle of eider
from Svalbard collected in 2007 (Evenset et al. 2016).
Hg, Cod
15N
Log H
g
02B
10B
13B
15B
19B
23B
24B
28B
30B
36B
43B2
45B2
53B
71B
80B
96B
98B16 8 10 12 14 16 18-3,0
-2,8
-2,6
-2,4
-2,2
-2,0
-1,8
-1,6
-1,4
-1,2
-1,0
-0,8
-0,6
-0,4
-0,2
0,0

NIVA 7686-2021
161
Figure 75. 15C plotted against 15N in blood (blue circles) and egg (red squares) of eider from
Svalbard (st. 19N) in 2018 and 2019.
3.5 Summary of results from Svalbard
Investigation of contaminants in samples of cod and eider from Svalbard was included in the
MILKYS programme in 2017. Contaminant levels are monitored in two species from two different
locations; fillet and liver from cod caught in the Isfjord (st. 19B) and blood and eggs from the eider
found in the Kongsfjord (st. 19N) (Table 18). The results are reported in the preceding sections
(see Chapters 3.2 and 0) and summarized here. Where possible, concentrations in cod are
compared to the EQS and PROREF. However, for the eider samples, comparison to the EQS was not
considered justified, and values for PROREF have not yet been established.
Levels in cod As for cod from most of the other stations, the median concentrations in cod liver at Svalbard
exceeded the EQS for PCB-7, BDE6 and BDE47, but were below the EQS for Hg (in fillet), PFOA,
PFOS, D5, −HBCD, SCCP and MCCP (Table 8). Median concentrations of contaminants in cod liver
and cod fillet were generally low (below PROREF), the exception being for Cd which exceeded
PROREF by a factor below two. (Table 9).
Siloxanes, i.e. the cyclic volatile methyl siloxanes (cVMS) octamethylcyclotetrasiloxane (D4),
decamethylcyclopentasiloxane (D5) and dodecamethylcyclohexasiloxane (D6) were analysed in cod
liver for the fourth time at the four stations, including Svalbard. D5, the most dominant cVMS, as
well as D6 were lowest at Svalbard compared to the other sampling stations included in the study
(Figure 70).
The correlation between 15N and contaminant concentration in cod could suggest higher
concentrations in individuals with higher 15N.
Levels in eider
The median concentrations in eider blood and eggs from Svalbard exceeded the EQS for Hg, PCB-7
(in eggs), BDE6 and BDE47 (in eggs), but were below the EQS for PCB-7 (in blood), −HBCD (in
eggs), SCCP, MCCP, PFOA, PFOS, D5 and HCB (Table 8).
Eider
13C
1
5N
Blood
Egg-25 -24 -23 -22 -21 -20 -198,5
9,0
9,5
10,0
10,5
11,0
11,5
12,0
12,5
13,0

NIVA 7686-2021
162
Median concentrations of Hg, Pb and As in eider eggs from Svalbard was almost at the same levels
as observed in a comparable study (Hill 2018). The median concentration of PCB-153
(0.099 µg/kg w.w.) in eider blood at Svalbard was lower than in another study from Svalbard (mean
0.187±0.023.8 µg/kg w.w. after five days of incubation) (Bustnes et al. 2010). The Hg
concentrations in eider blood and eggs at Svalbard in 2020 was almost within the same range as a
study in the Inner Oslofjord in 2017 (Ruus 2018) (see Chapter 3.2.2).
In the present study, the median concentration of PBDE47 was lower, and the concentrations of
PFOS and PFOSA was almost within the same ranges as average concentrations found in another
study of eider from three stations in northern Norway and one at Svalbard (Harju 2013). The PFOS
concentrations in eider eggs and blood were 21 and 25 times higher, respectively, in the Inner
Oslofjord study in 2019 (Ruus 2019) than in this study at Svalbard in 2020 (see Chapter 3.2.24).
The 15N ratios in eider (blood and eggs) from Svalbard were fairly similar to that observed in 2007
(Evenset et al. 2016).

NIVA 7686-2021
163
Table 18. Median concentrations (µg/kg w.w.) and standard deviations for contaminant levels in
cod livers (unless otherwise specified) from the Isfjord (st. 19B) and eider blood and eggs from
Breøyane in Kongsfjord (st. 19N) in 2020. Units are: percent for dry and lipid weight, permille for
stabile isotopes, mg/kg (w.w.) for metals and µg/kg (w.w.) for the remaining substances. Shaded
cells indicate that the median was below the limit of quantification (LOQ) and the value shown in
these cells is the LOQ. The standard deviation (S.d.) is based on all values and values below the
LOQ are taken as half. Detectable data information (D.d.i.) indicates the number of data above
the LOQ (if any) and the numbers within the square brackets indicate the minimum and maximum
values in this category. (See Chapter 2.10 for more details).
Gadus morhua, Liver Somateria mollissima, Blood Somateria mollissima, Egg
Isfjorden, Breøyane, Kongsfjorden, Breøyane, Kongsfjorden,
Parameter Code Svalbard (st. 19B) Svalbard (st. 19N) Svalbard (st. 19N)
Med. S.d. D.d.i. Med. S.d. D.d.i. Med. S.d. D.d.i.
DRYWT% 60.000 8.614 15 [38-66]
Fett 55.100 12.649 15 [25-63] 0.260 0.582 8 [0.08-1.8] 16.985 1.412 15 [15-19.7]
AG 0.130 0.334 12 [0.06-1.2] 0.001 0.001 15 [4e-04-0.002] 0.009 0.010 15 [0.004-0.04]
AS 2.400 1.311 15 [1.8-6.3] 0.020 0.022 15 [0.01-0.09] 0.101 0.052 15 [0.06-0.25]
CD 0.110 0.256 15 [0.07-1.1] 0.003 0.002 15 [0.001-0.007] 0.0002 0.0001 7 [3e-04-4e-04]
CO 0.012 0.006 15 [0.005-0.03] 0.003 0.001 15 [0.002-0.005] 0.007 0.002 15 [0.004-0.01]
CR 0.033 0.015 15 [0.02-0.07] 0.003 0.055 4 [0.003-0.22] 0.006 0.013 13 [0.003-0.05]
CU 1.600 1.045 15 [0.55-5] 0.453 0.081 15 [0.33-0.66] 1.171 0.161 15 [0.93-1.41]
HG (in muscle) 0.017 0.017 15 [0.01-0.07] 0.111 0.040 15 [0.07-0.19] 0.111 0.034 15 [0.08-0.19]
NI 0.042 0.013 15 [0.02-0.07] 0.003 0.030 4 [0.004-0.12] 0.005 0.007 15 [0.004-0.03]
PB 0.009 0.003 14 [0.008-0.02] 0.046 0.061 15 [0.02-0.21] 0.006 0.003 15 [0.002-0.01]
SN 0.022 3.351 15 [0.01-13] 0.002 0.000 2 [0.003-0.003] 0.002 0.002 2 [0.002-0.009]
ZN 13.000 4.108 15 [8.1-24] 5.090 0.503 15 [4.1-6] 16.661 1.825 15 [14.1-20]
CB_S7 12.398 37.296 15 [6.9-140] 0.270 0.080 15 [0.19-0.42] 7.221 4.696 15 [5.5-22]
CB18 0.017 0.006 2 [0.02-0.04] 0.017 0.002 0 [n.a.]
CB28 0.370 0.135 10 [0.34-0.69] 0.013 0.008 10 [0.01-0.04] 0.169 0.131 15 [0.08-0.49]
CB31 0.011 0.006 5 [0.01-0.03] 0.019 0.004 15 [0.02-0.03]
CB33 0.010 0.003 5 [0.01-0.02] 0.010 0.000 0 [n.a.]
CB37 0.010 0.001 2 [0.01-0.01] 0.010 0.000 3 [0.008-0.01]
CB47 0.011 0.004 5 [0.01-0.03] 0.063 0.048 15 [0.03-0.19]
CB52 1.470 2.184 15 [0.76-9.6] 0.012 0.006 4 [0.01-0.03] 0.030 0.006 15 [0.02-0.04]
CB66 0.010 0.004 8 [0.01-0.02] 0.157 0.112 15 [0.05-0.43]
CB74 0.009 0.004 14 [0.007-0.02] 0.200 0.127 15 [0.09-0.56]
CB99 0.018 0.007 15 [0.01-0.03] 0.738 0.418 15 [0.29-1.89]
CB101 2.050 3.983 15 [1.08-16] 0.027 0.002 1 [0.03] 0.055 0.016 15 [0.03-0.09]
CB105 0.014 0.005 15 [0.009-0.03] 0.356 0.279 15 [0.19-1.27]
CB114 0.004 0.003 9 [0.004-0.01] 0.023 0.017 15 [0.01-0.08]
CB118 1.810 5.180 15 [1.01-18.1] 0.029 0.012 9 [0.03-0.06] 1.130 0.822 15 [0.66-3.7]
CB122 0.004 0.002 5 [0.004-0.01] 0.004 0.051 3 [0.06-0.19]
CB123 0.004 0.003 8 [0.004-0.01] 0.019 0.012 15 [0.01-0.06]
CB128 0.012 0.005 15 [0.007-0.03] 0.262 0.212 15 [0.18-0.96]
CB138 2.460 9.157 15 [1.4-33] 0.052 0.018 15 [0.03-0.09] 1.730 1.206 15 [1.19-5.4]
CB141 0.005 0.004 8 [0.005-0.02] 0.010 0.010 13 [0.006-0.04]
CB149 0.028 0.001 1 [0.03] 0.210 0.113 15 [0.06-0.54]
CB153 3.370 13.534 15 [1.89-50] 0.099 0.039 15 [0.06-0.19] 3.820 2.202 15 [2.9-10.1]
CB156 0.006 0.004 15 [0.004-0.02] 0.098 0.089 15 [0.08-0.41]
CB157 0.004 0.004 11 [0.003-0.02] 0.031 0.021 15 [0.02-0.1]
CB167 0.005 0.004 15 [0.004-0.02] 0.093 0.063 15 [0.07-0.29]
CB170 0.008 0.003 14 [0.007-0.01] 0.141 0.138 15 [0.02-0.6]
CB180 0.785 3.403 15 [0.43-12.2] 0.020 0.008 12 [0.02-0.04] 0.596 0.424 15 [0.4-1.96]
CB183 0.010 0.005 13 [0.008-0.02] 0.194 0.159 15 [0.11-0.62]
CB187 0.025 0.008 15 [0.01-0.04] 0.645 0.392 15 [0.37-1.77]
CB189 0.005 0.003 5 [0.006-0.01] 0.011 0.007 15 [0.008-0.03]
CB194 0.008 0.005 5 [0.009-0.02] 0.041 0.030 15 [0.02-0.14]
CB206 0.005 0.003 5 [0.006-0.02] 0.015 0.011 15 [0.007-0.05]
CB209 0.004 0.004 12 [0.002-0.02] 0.011 0.006 15 [0.006-0.03]
Sum-HepCB 0.072 0.024 15 [0.04-0.13] 1.660 1.168 15 [1.28-4.6]
Sum-HexCB 0.133 0.044 13 [0.1-0.22] 4.520 2.565 15 [3.3-11.5]
Sum-PenCB 0.118 0.034 10 [0.07-0.19] 2.540 1.695 15 [1.26-7.7]
Sum-TetCB 0.070 0.027 7 [0.05-0.12] 0.460 0.312 15 [0.19-1.24]
Sum-TriCB 0.075 0.036 8 [0.04-0.14] 0.202 0.136 15 [0.1-0.53]
HCB 0.201 0.129 15 [0.13-0.54] 5.500 2.319 15 [4.2-11.1]
PECB 0.036 0.012 14 [0.02-0.06] 0.578 0.170 15 [0.4-1]

NIVA 7686-2021
164
Table 18. (cont.)
Gadus morhua, Liver Somateria mollissima, Blood Somateria mollissima, Egg
Isfjorden, Breøyane, Kongsfjorden, Breøyane, Kongsfjorden,
Parameter Code Svalbard (st. 19B) Svalbard (st. 19N) Svalbard (st. 19N)
Med. S.d. D.d.i. Med. S.d. D.d.i. Med. S.d. D.d.i.
HBCDA 0.315 0.420 15 [0.2-1.86] 0.030 0.000 0 [n.a.] 0.057 0.119 15 [0.03-0.5]
HBCDG 0.030 0.001 0 [n.a.] 0.031 0.000 0 [n.a.] 0.031 0.000 15 [0.03-0.03]
HBCDB 0.030 0.001 0 [n.a.] 0.023 0.000 0 [n.a.] 0.023 0.008 15 [0.02-0.05]
HBCDD 0.375 0.420 15 [0.25-1.92] 0.084 0.000 0 [n.a.] 0.111 0.120 15 [0.08-0.56]
BDESS 2.563 1.715 15 [2.4-7.5] 0.613 1.419 3 [0.62-1.04] 0.718 0.123 15 [0.63-0.99]
BDE6S 0.560 1.519 15 [0.38-4.9] 0.069 0.159 3 [0.07-0.12] 0.143 0.060 15 [0.08-0.31]
BDE17 0.010 0.000 1 [0.01] 0.006 0.013 0 [n.a.] 0.006 0.003 1 [0.02]
BDE28 0.023 0.035 15 [0.01-0.13] 0.006 0.015 0 [n.a.] 0.006 0.002 1 [0.01]
BDE47 0.347 1.081 15 [0.24-3.6] 0.027 0.062 3 [0.03-0.04] 0.037 0.030 13 [0.03-0.14]
BDE49 0.116 0.152 15 [0.06-0.57] 0.005 0.011 0 [n.a.] 0.005 0.011 3 [0.007-0.05]
BDE66 0.010 0.002 2 [0.01-0.02] 0.004 0.010 0 [n.a.] 0.004 0.012 1 [0.05]
BDE71 0.010 0.000 0 [n.a.] 0.003 0.008 0 [n.a.] 0.003 0.010 1 [0.04]
BDE77 0.010 0.000 0 [n.a.] 0.003 0.008 0 [n.a.] 0.003 0.000 0 [n.a.]
BDE85 0.020 0.000 0 [n.a.] 0.004 0.009 0 [n.a.] 0.004 0.000 0 [n.a.]
BDE99 0.020 0.004 1 [0.04] 0.011 0.026 1 [0.02] 0.013 0.006 9 [0.01-0.03]
BDE100 0.074 0.229 15 [0.05-0.73] 0.006 0.013 1 [0.006] 0.029 0.016 15 [0.009-0.05]
BDE119 0.020 0.010 3 [0.02-0.05] 0.004 0.009 0 [n.a.] 0.004 0.007 4 [0.006-0.03]
BDE126 0.020 0.038 3 [0.03-0.15] 0.003 0.007 0 [n.a.] 0.003 0.000 0 [n.a.]
BDE138 0.030 0.000 0 [n.a.] 0.011 0.026 0 [n.a.] 0.011 0.001 0 [n.a.]
BDE153 0.030 0.000 0 [n.a.] 0.010 0.024 0 [n.a.] 0.010 0.004 4 [0.01-0.02]
BDE154 0.067 0.179 15 [0.03-0.68] 0.009 0.020 0 [n.a.] 0.019 0.013 15 [0.01-0.06]
BDE156 0.030 0.000 0 [n.a.] 0.017 0.039 0 [n.a.] 0.017 0.001 0 [n.a.]
BDE183 0.050 0.001 1 [0.05] 0.007 0.017 0 [n.a.] 0.007 0.000 0 [n.a.]
BDE184 0.050 0.000 0 [n.a.] 0.007 0.016 0 [n.a.] 0.007 0.000 0 [n.a.]
BDE191 0.050 0.000 0 [n.a.] 0.010 0.023 0 [n.a.] 0.010 0.002 0 [n.a.]
BDE196 0.100 0.000 0 [n.a.] 0.013 0.032 0 [n.a.] 0.015 0.003 0 [n.a.]
BDE197 0.100 0.000 0 [n.a.] 0.010 0.025 0 [n.a.] 0.012 0.002 0 [n.a.]
BDE202 0.016 0.038 0 [n.a.] 0.016 0.003 0 [n.a.]
BDE206 0.200 0.000 0 [n.a.] 0.043 0.101 0 [n.a.] 0.055 0.016 0 [n.a.]
BDE207 0.200 0.000 0 [n.a.] 0.027 0.065 0 [n.a.] 0.048 0.017 0 [n.a.]
BDE209 1.000 0.000 0 [n.a.] 0.366 0.851 0 [n.a.] 0.366 0.046 0 [n.a.]
SCCP 59.000 31.240 15 [27-140] 13.000 13.233 9 [12-50] 26.000 9.059 15 [11-49]
SCCP eksl. LOQ 51.500 25.246 8 [30-110]
MCCP 84.000 16.645 15 [54-100] 22.000 1024.365 13 [11-4004] 35.000 22.638 12 [10-97]
MCCP eksl. LOQ 43.500 17.138 8 [29-77]
PFAS 0.400 0.639 15 [0.3-2.4] 0.500 0.145 15 [0.2-0.7] 1.200 0.755 15 [0.6-2.9]
PFDcA 0.500 0.000 0 [n.a.] 0.400 0.000 0 [n.a.] 0.500 0.000 0 [n.a.]
PFHpA 0.500 0.000 0 [n.a.] 0.500 0.000 0 [n.a.] 0.500 0.000 0 [n.a.]
PFHxA 0.500 0.000 0 [n.a.] 0.500 0.000 0 [n.a.] 0.500 0.000 0 [n.a.]
PFHxS 0.100 0.000 0 [n.a.] 0.200 0.074 15 [0-0.3] 0.100 0.000 0 [n.a.]
PFNA 0.500 0.000 0 [n.a.] 0.500 0.000 0 [n.a.] 0.500 0.000 0 [n.a.]
PFOA 0.500 0.000 0 [n.a.] 0.500 0.000 0 [n.a.] 0.500 0.000 0 [n.a.]
PFOS 0.300 0.474 15 [0.2-1.9] 0.400 0.145 15 [0.1-0.6] 1.100 0.755 15 [0.5-2.8]
PFOSA 0.100 0.180 3 [0.1-0.7] 0.100 0.000 0 [n.a.] 0.100 0.000 0 [n.a.]
PFUdA 0.400 0.270 3 [0.4-1.3] 0.400 0.000 0 [n.a.] 0.500 0.129 13 [0.4-0.8]
TBA 0.011 0.026 0 [n.a.] 0.284 0.181 15 [0.12-0.81]
D4 3.164 1.140 15 [1.91-6.9] 0.816 0.262 17 [0.61-1.47] 1.921 0.481 15 [1.42-3.4]
D5 6.506 2.082 15 [2.7-10.7] 0.749 0.435 17 [0.37-2.3] 3.014 0.796 15 [2.2-4.8]
D6 3.113 1.551 13 [2.4-8.5] 1.684 0.134 6 [1.7-2.1] 1.895 0.588 15 [1.59-3.1]
Delta13C (in muscle) -21.26 0.370 15 [-21.86--20.37] -20.48 0.578 15 [-21.23--19.34] -23.16 0.320 15 [-24.03--22.8]
Delta15N (in muscle) 12.60 0.668 15 [12.1-14.6] 10.46 0.767 15 [9.4-12.4] 9.87 0.502 15 [8.8-10.6]
C/N (in muscle) 3.32 0.066 15 [3.2-3.5] 3.70 0.171 15 [3.5-4.1] 9.77 0.745 15 [8.4-11]

NIVA 7686-2021
165
4. Conclusions
The main conclusions from the 2020 investigations were (based on wet weight basis) that:
The environmental quality in Norwegian coastal waters is generally good, with some
exceptions
• The majority (68 %) of the median concentrations that could be assessed against the EQS were
below the EQS.
• The majority (69 %) of the median concentrations that could be assessed against the PROREF
were below the PROREF.
• Statistical analyses showed that downward short-term trends were primarily associated with
metals, −HBCD and BDEs. Upward short-term trends were mainly associated with metals for
cod and blue mussel, while many upward short-term trends for PCB-7 in blue mussel were
caused by methodical (artificial) results due to higher limits of quantifications (LOQ).
• In cod fillet, significant upward long-term trends for Hg were found in the Inner Oslofjord,
Farsund (Skågskjera), Bømlo and Tromsø. While Hg concentration is strongly linked to fish
length, these trends were significant also after adjusting for cod length for the Inner Oslofjord,
Kristiansand harbour and Farsund.
• The Inner Oslofjord had many of the highest concentrations;
o The second highest concentrations of Pb in blue mussel at Gressholmen.
o The highest concentrations of PBDEs, predominantly BDE47 in cod liver.
o The highest PCB-7 concentrations in in cod liver, and in blue mussel from Gressholmen.
o The highest −HBCD (dominant HBCD isomer) concentrations in cod liver.
o The highest MCCP concentrations in cod liver.
• Blue mussel from two stations in the Sørfjord had concentrations of DDE exceeding PROREF by
a factor greater than 20, presumably related to the earlier use of DDT as pesticide in this
orchard district.
• Cod liver from the Outer Oslofjord had highest concentrations of PFOSA.
• In cod liver, the highest concentration of SCCP was found in cod from Svalbard. Blue mussel
samples indicated highest SCCP and MCCP concentrations in Bodø harbour. A significant upward
short-term trend was found for SCCP in blue mussel from Singlekalven, and a significant
upward long-term trend for MCCP was found in cod liver from Bømlo in the Outer
Selbjørnfjord.
• The median concentration of HCB in cod liver from the Austnesfjord in Lofoten, exceeded the
EQS for this substance. Significant long-term downward trends were found for median
concentration of HCB in liver of cod from the Inner Oslofjord, Tjøme in the Outer Oslofjord and
from Farsund.
• In liver of flounder caught at Sande in the mid Oslofjord, significant upward short-term trends
were found for Cd and Hg, and significant downward long-term trends were found for Pb and
HCB.
Contaminant levels at Svalbard are generally low, but Hg levels in common eider is of potential
concern
• Median concentrations of contaminants in cod liver and cod fillet from Svalbard were generally
low.
• Cod liver from Svalbard had highest concentrations of SCCPs. The high concentrations of SCCPs
is might be caused by long-range transported pollution. High concentrations of these
substances have been measured in air at Svalbard.
• D5 was the most dominant siloxane found in cod liver, and the concentrations were highest in
the Inner Oslofjord and lowest in the Isfjord at Svalbard. The same patterns were found for D6.

NIVA 7686-2021
166
• Contaminants were analyzed in the blood and eggs (homogenate of yolk and albumin) of the
eider from Svalbard since 2017. Concentrations of Hg, Pb, As, PFOS and PFOSA in eggs were in
the range as found in comparable studies from the Svalbard region. The Hg concentrations in
eider blood and eggs at Svalbard in 2020 was almost within the same range as reported in a
comparable study in the Inner Oslofjord in 2017. The concentrations of PCB-7, BDE47 (eggs)
and PFOS were higher in eider blood and eggs in the Inner Oslofjord in 2017 than at Svalbard in
2020. There is a downward tendency for concentration of HCB in blood and eggs of eider for
the monitoring period 2017 to 2020.
Biological effect parameters (biomarker analysis) found no effects of TBT but confirm exposure
of PAH, lead and planar halogenated hydrocarbons and other structurally similar compounds
• No observable biological effects of TBT were found in this study; the effects of TBT on
dogwhelk as measured by the imposex parameter VDSI, were zero at all eight stations where
dogwhelk was sampled. The less sensitive intersex parameter ISI was assessed in common
periwinkle at only one station and was found to be zero, indicating no effect of TBT also at this
station.
• The ICES/OSPAR Background Assessment Criteria (BAC) for OH-pyrene in cod bile was exceeded
at all stations investigated, except at the reference station at Bømlo.
• Inhibited ALA-D activity in cod liver from the Inner Oslofjord indicated exposure to Pb and
were in line with observations of high Pb levels in blue mussel at Gressholmen in the Inner
Oslofjord.
• Median EROD-activities were below the ICES/OSPAR assessment criterion at all stations
investigated, and downward trends in EROD activities could be observed at all stations.
Elevated levels in coastal waters near urban centres suggests that these hot-spots are of
concern
• The Inner Oslofjord, and to a lesser degree the harbour areas of Bergen, Kristiansand,
Trondheim and Bodø seem on the whole to be an area where contaminant concentrations tend
to be higher. This is probably due to high population in the relevant watershed areas, a
multitude of urban activities, and former and present use of products containing contaminants.
The Oslofjord has contaminated sediments from previous industry, the densest population and
the highest shipping traffic (number of people per day). A reduced water exchange in the Inner
Oslofjord with the outer fjord will also contribute to higher contaminant concentrations in
water and biota.
• High concentrations of PCB-7 and Hg in cod are reasons for concern, particularly in the Inner
Oslofjord. There is some evidence that elevated concentrations may result from increased fish
length due to poor recruitment of cod in recent years in this area. In the Inner Oslofjord, a
significant upward long-term trend and a significant downward short-term trend were observed
for Hg in cod fillet. When adjusted for fish length, also a significant upward long-term trend
for Hg was found in the Inner Oslofjord.
• Results from stable isotopes of C and N indicate that the stations show very similar patterns
from 2012 to 2020 in terms of isotopic signatures, indicating a geographical difference
consistent over time.
• Some legacy contaminants are still present in elevated levels in Norwegian coastal waters and
give reason for concern.

NIVA 7686-2021
167
References
2000/60/EC, Directive. 2000. 'DIRECTIVE 2000/60/EC OF THE EUROPEAN PARLIAMENT AND OF THE COUNCIL of 23 October 2000 establishing a framework for Community action in the field of water policy', Official Journal of the European Communities, L 327/1: 72.
2008/56/EC, Directive. 2008. 'DIRECTIVE 2008/56/EC OF THE EUROPEAN PARLIAMENT AND OF THE COUNCIL of 17 June 2008 establishing a framework for community action in the field of marine environmental policy (Marine Strategy Framework Directive)', Official Journal of the European Union, L 164/19: 22.
2013/39/EU, Directive. 2013. 'DIRECTIVE 2013/39/EU OF THE EUROPEAN PARLIAMENT AND OF THE COUNCIL of 12 August 2013 amending Directives 2000/60/EC and 2008/105/EC as regards priority substances in the field of water policy', Official Journal of the European Union, L 226/1: 17.
Ahlborg, U. G. 1989. 'Nordic risk assessment of PCDDFs and PCDFs', Chemosphere, 19: 603-08. Ahlborg, U.G., G.B. Becking, L.S. Birnbaum, A. Brouwer, H.J.G.M. Derks, M. Feely, G. Golor, A.
Hanberg, J.C. Larsen, A. K. G. Liem, S.H. Safe, C. Schalatter, F. Warn, M. Younes, and E. Yrjänheikki. 1994. 'Toxic equivalency factors for dioxin-like PCBs. Report on a WHO-ECEH and IPSC consultation, December 1993.', Chemosphere, 28: 1049-67.
Arp, HA, A Ruus, A Macken, and A Lillicrap. 2014. "Kvalitetssikring av miljøkvalitetsstandarder." In, 199. Miljødirektoratet: NIVA og NGI.
ASMO, 1994. 'Draft assessment of temporal trends monitoring data for 1983-91: Trace metals and organic contaminants in biota.', Environmenmental Assessment and Monitoring Committee (ASMO). Document ASMO(") 94/6/1.
Axmon, Anna, Jonatan Axelsson, Kristina Jakobsson, Christian H. Lindh, and Bo A. G. Jonsson. 2014. 'Time trends between 1987 and 2007 for perfluoroalkyl acids in plasma from Swedish women', Chemosphere, 102: 61-67.
Bakke, T., Fjeld, E., Skaare, B.B., Berge, J.A, Green, N., Ruus, A., Schlabach, M., Botnen, H. 2007. 'Kartlegging av metaller og utvalgte nye organiske miljøgifter 2007. Krom, arsen, perfluoralkylstoffer, dikoretan, klorbenzener, pentaklorfenol, HCBD og DEHP. [Mapping of metals and selected new organic contaminants 2006. Chromium, Arsenic, Perfluorated substances, Dichloroethane, Chlorinated benzenes, Pentachlorophenol, HCBD and DEHP.]', NIVA-report 5464: 105.
Bauer, B., P. Fioroni, I. Ide, S. Liebe, J. Oehlmann, E. Stroben, and B. Watermann. 1995. 'TBT EFFECTS ON THE FEMALE GENITAL SYSTEM OF LITTORINA-LITTOREA - A POSSIBLE INDICATOR OF TRIBUTYLTIN POLLUTION', Hydrobiologia, 309: 15-27.
Benedict, Rae T., Heather M. Stapleton, Robert J. Letcher, and Carys L. Mitchelmore. 2007. 'Debromination of polybrominated diphenyl ether-99 (BDE-99) in carp (Cyprinus carpio) microflora and microsomes', Chemosphere, 69: 987-93.
Berge, J. A., Ranneklev, S., Selvik, J. R., Steen, A. O. 2013a. 'The Inner Oslofjord - Compilation of data on pollutant discharges and the occurrence of contaminants in sediment. Indre Oslofjord - Sammenstilling av data om miljøgifttilførsler og forekomst av miljøgifter i sediment.' NIVA-report 6565-2013: 122.
Berge, J.A., Ranneklev, S., Selvik, J.R. og Steen, A.O. 2013b. 'Indre Oslofjord – Sammenstilling av data om miljøgifttilførsler og forekomst av miljøgifter i sediment', NIVA-report 6565-2013: 122.
Beyer, J., N. W. Green, S. Brooks, I. J. Allan, A. Ruus, T. Gomes, I. L. N. Brate, and M. Schoyen. 2017. 'Blue mussels (Mytilus edulis spp.) as sentinel organisms in coastal pollution monitoring: A review', Marine Environmental Research, 130: 338-65.
Bjerkeng, B., Berge, J., Magnusson, J., Molvær, J., Pedersen, A., Schaanning, M. 2009. 'Miljømål for Bunnefjorden. Bidrag til tiltaksanalyse Fase 3 - Prosjekt PURA', NIVA-report 5766-2009: 86.
Blaber, S.J.M. 1970. "The occurrence of a penis-like outgrowth behind the right tentacle in spent females of Nucella lapillus (L.)." In Proceedings of the Malacological Society of London, 231–33. London, UK: Dulau & Co.
Borgå, K., Fjeld, E., Kierkegaard, A. & McLachlan, M. 2012. 'Food Web Accumulation of Cyclid Siloxanes in Lake Mjøsa, Norway.', Environmental Science & Technology, 46: 6347-454.
Botnen, H., Johansen, P. 2006. 'Kartlegging av DDT-nivået langs Sørfjorden i Hardanger - 2006', Høyteknologisenteret. Department of Biology, University of Bergen. Project no. 408165. Report no. 10/2006: 31.

NIVA 7686-2021
168
Brooks, S. J., and E. Farmen. 2013. 'THE DISTRIBUTION OF THE MUSSEL MYTILUS SPECIES ALONG THE NORWEGIAN COAST', Journal of Shellfish Research, 32: 265-70.
Braaten, H. F. V., Åkerblom, S., de Wit, H. A., Skotte, G., Rask, M., Vuorenmaa, J., Kahilainen, K. K., Malinen, T., Rognerud, S., Lydersen, E., Amundsen, P.-A., Kashulin, N., Kashulina, T., Terentyev, P., Christensen, G.), Jackson-Blake, L., Lund, E., Rosseland, B. O. 2017. "Spatial and temporal trends of mercury in freshwater fish in Fennoscandia (1965-2015)." In NIVA report 7179-2017. ICP Waters report 132/2017, 70.
Bustnes, J. O., B. Moe, D. Herzke, S. A. Hanssen, T. Nordstad, K. Sagerup, G. W. Gabrielsen, and K. Borga. 2010. 'Strongly increasing blood concentrations of lipid-soluble organochlorines in high arctic common eiders during incubation fast', Chemosphere, 79: 320-25.
Direktoratsgruppen. 2018. "Veileder 02:2018. Klassifisering av miljøtilstand i vann. Økologisk og kjemisk klassifiseringssystem for kystvann, grunnvann, innsjøer og elver." In Direktoratsgruppen for gjennomføringen av vannforskriften, 222.
EC. 2014. "Common Implementation Strategy for the Water Framework Directive (2000/60/EC). Guidance Document no. 32. On biota monitoring (The implementation of EQSBIOTA) under the Water Framework Directive." 87.
Ervik, A., Kiessling, A., Skilbrei, O, van der Meeren, T. 2003. 'Havbruksrapport 2003. Fisken og havet, særnr. 3-2003'.
Evenset, A., I. G. Hallanger, M. Tessmann, N. Warner, A. Ruus, K. Borga, G. W. Gabrielsen, G. Christensen, and P. E. Renaud. 2016. 'Seasonal variation in accumulation of persistent organic pollutants in an Arctic marine benthic food web', Science of the Total Environment, 542: 108-20.
Farmen, E., H. N. Mikkelsen, O. Evensen, J. Einset, L. S. Heier, B. O. Rosseland, B. Salbu, K. E. Tollefsen, and D. H. Oughton. 2012. 'Acute and sub-lethal effects in juvenile Atlantic salmon exposed to low mu g/L concentrations of Ag nanoparticles', Aquatic Toxicology, 108: 78-84.
Fjeld, E., Bæk, K., Rundberget, J. T., Schlabach, M., Warner, N. A. 2017. 'Miljøgifter i store norske innsjøer, 2016. Environmental pollutants in large Norwegian lakes, 2016', NIVA-report 7184-2017. Report M807-2017 from the Norwegian Environment Agency: 88.
Fjeld, E., Enge, E. K., Rognerud, S., Rustadbakken, A. Løvik, J. E. 2012. 'Environmental contaminants in fish and zooplankton from Lake Mjøsa, 2011', NIVA-report 6357: 63.
Fjeld, E., Rognerud, S. 2009. "Miljøgifter i ferskvannsfisk, 2008. Kvikksølv i abbor og organiske miljøgifter i ørret." In Statlig program for forurensningsovervåking. SFT TA-2544/2009, 66.
Fjeld, E., Schlabach, M., Berge, J.A., Green, N., Egge, T., Snilsberg, P., Vogelsang, C., Rognerud, S., Kãllberg, G., Enge, E.K., Borge, A., Gundersen, H. 2005. 'Kartlegging av utvalgte nye organiske miljøgifter 2004. Bromerte flammehemmere, perfluorerte forbindelser, irgarol, diuron, BHT og dicofol. Screening of selected new organic contaminants 2004. Brominated flame retardants, perfluorinated compounds, irgarol, diuron, BHT and dicofol', NIVA-report 5011: 97.
Fliedner, A., Rüdel, H., Lohmann, N., Buchmeier, G. & Koschorreck, J. 2018. 'Biota monitoring under the Water Framework Directive. On tissue choice and fish species selection.' Environmental Pollution, 235: 129-40.
Fryer, R. J., and M. D. Nicholson. 1999. 'Using smoothers for comprehensive assessments of contaminant time series in marine biota', Ices Journal of Marine Science, 56: 779-90.
Følsvik, N., J. A. Berge, E. M. Brevik, and M. Walday. 1999. 'Quantification of organotin compounds and determination of imposex in populations of dogwhelks (Nucella lapillus) from Norway', Chemosphere, 38: 681-91.
Gibbs, P. E., G. W. Bryan, P. L. Pascoe, and G. R. Burt. 1987. 'The use of the dog-whelk, Nucella-lapillus, as an indicator of tributyltin (TBT) contamination', J. mar. biol. Ass. U.K., 67: 507-23.
Green, N., Hylland, K., Ruus, A., Walday, M. 2004. "Joint Assessment and Monitoring Programme (JAMP). National Comments regarding the Norwegian Data for 2002." In NIVA-report 4778, 223.
Green, N., Hylland, K., Walday, M. 2001. "Joint Assessment and Monitoring Programme (JAMP). National Comments regarding the Norwegian Data for 1999." In NIVA-report 4335, 181.
Green, N. W. 1989. "The effect of depuration on mussel analyses. Report of the 1989 meeting of the working group on statistical aspoects of trend monitoring." In ICES-report, 52-58. The Hague.
Green, N. W., I. Dahl, A. Kringstad, and M. Schlabach. 2008. "Joint Assessment and Monitoring Programme (JAMP). Overview of Norwegian analytical methods 1981-2007." In NIVA-report 5563, 93 pp.

NIVA 7686-2021
169
Green, N. W., M. Schøyen, D. Ø. Hjermann, S. Øxnevad, A. Ruus, M. Grung, B. Beylich, E. Lund, L. Tveiten, Jennsen M. T. S., J. Håvardstun, Ribeiro A. L., I. Doyer, and K. Bæk. 2020. 'Contaminants in coastal waters of Norway 2019. Miljøgifter i norske kystområder 2019', Norwegian Institute for Water Research (NIVA)-report 7565-2020: 195 + appendices.
Green, N. W., M. Schøyen, D.Ø. Hjermann, S. Øxnevad, A. Ruus, A. Lusher, B. Beylich, E. Lund, L.A. Tveiten, J. Håvardstun, M.T.S. Jenssen, A.L. Ribeiro, and K. Bæk. 2018. "Contaminants in coastal waters of Norway 2017." In NIVA report 7302-2018, 230.
Green, N. W., M. Schøyen, S. Øxnevad, A. Ruus, I.J. Allan, D.Ø. Hjermann, T. Høgåsen, B. Beylich, J. Håvardstun, E. Lund, L.A. Tveiten, and K. Bæk. 2015. "Contaminants in coastal waters of Norway 2014." In NIVA report 6917-2015, 220.
Green, N. W., M. Schøyen, S. Øxnevad, A. Ruus, D. Ø. Hjermann, G. Severinsen, T. Høgåsen, B. Beylich, J. Håvardstun, E. Lund, L. Tveiten, and K. Bæk. 2017. 'Contaminants in coastal waters of Norway 2016', NIVA-report 7200-2017: 201 pp.
Green, N. W., M. Schøyen, S. Øxnevad, A. Ruus, T. Høgåsen, B. Beylich, J. Håvardstun, Å. G. Rogne, and L. Tveiten. 2012. 'Hazardous substances in fjords and coastal waters - 2011. Levels, trends and effects. Long-term monitoring of environmental quality in Norwegian coastal waters.', NIVA-report 6432: 264 pp.
Green, N.W., B. Bjerkeng, and Berge J.A. 1996. "Depuration (12h) of metals, PCBs and PAH concentrations by blue mussel (Mytilus edulis)." In Report of the working group on the statisical Aspects of Environmental monitoring. 108-17. Stockholm: ICES.
Green, N.W., Heldal, H.E., Måge, A., Aas, W., Gäfvert, T., Schrum, C., Boitsov, S., Breivik, K., Iosjpe, M, Yakushev, K., Skogen, M., Høgåsen, T., Eckhardt, S., Christiansen, A.B., Daae, K.L., Durand D., Debloskaya, E. 2011. 'Tilførselsprogrammet 2010. Overvåking av tilførsler og miljøtilstand i Nordsjøen', NIVA-report 6187: 251.
Green, N.W., Heldal, H.E., Måge, A., Aas, W., Gäfvert, T., Schrum, C., Boitsov, S., Breivik, K., Iosjpe, M, Yakushev, K., Skogen, M., Høgåsen, T., Eckhardt, S., Christiansen, A.B., Daae, K.L., Durand D., Ledang, A.B., Jaccard, P.F. 2012. 'Tilførselsprogrammet 2011. Overvåking av tilførsler og miljøtilstand i Norskehavet', NIVA-report 6360: 251.
Green, N.W., A. Ruus, Å. Bakketun, J. Håvardstun, Å.G. Rogne, M. Schøyen, L. Tveiten, and S. Øxnevad. 2007. 'Joint Assessment and Monitoring Programme (JAMP). National Comments regarding the Norwegian Data for 2005', NIVA-report 5315: 191.
Green, N.W., M. Schøyen, S. Øxnevad, A. Ruus, I.J. Allan, D.Ø. Hjermann, G. Severinsen, T. Høgåsen, B. Beylich, J. Håvardstun, E. Lund, L. Tveiten, and K. Bæk. 2016. "Contaminants in coastal waters of Norway 2015. Miljøgifter i norske kystområder 2015." In NIVA report 7087-2016, 209.
Green, N.W., M. Schøyen, S. Øxnevad, A. Ruus, T. Høgåsen, B. Beylich, J. Håvardstun, Å.G. Rogne, and L. Tveiten. 2010. "Coordinated environmental monitoring programme (CEMP). Levels, trends and effects of hazardous substances in fjords and coastal waters-2009." In NIVA-report 6048, 287.
———. 2011. 'Coordinated environmental monitoring programme (CEMP). Levels, trends and effects of hazardous substances in fjords and coastal waters-2010', Norwegian Environment Agency Miljødirektoratet, Monitoring report no. 1111/2011 TA 2862/2011. NIVA-report 6239-2011: 252.
Green, N.W., Schøyen, M., Øxnevad, S., Ruus, A., Allan, I., Høgåsen, T., Beylich, B., Håvardstun, J., Rogne, Å.G., Tveiten, L. 2013. "Contaminants in coastal waters of Norway 2012. Miljøgifter i kystområdene 2012." In Norwegian Environment Agency Miljødirektoratet, Monitoring report no. 1154/2013, M 69-2013. NIVA-report 6582-2013, 130.
Grefsrud, E. S., Karlsen, Ø., Kvamme, B. O., Glover, K., Husa, V., Hansen, P. K., Grøsvik, B. E., Samuelsen, O., Sandlund, N., Stien, L. H., Svåsand, T. . 2021. 'Risikorapport norsk fiskeoppdrett 2021 - kunnskapsstatus. Kunnskapsstatus effekter av norsk fiskeoppdrett', Rapport fra havforskningen, 7: 281.
Grung, M., M. Jartun, K. Bæk, A. Ruus, Rundberget, J. T. Allan, I. , B. Beylich, Vogelsang, C., M. Schlabach, L. Hanssen, K. Borgå, and M. Helberg. 2021. "Environmental Contaminants in an Urban Fjord, 2020." 100. NIVA.
Harju, M., Herzke, D., Kaasa, H. 2013. 'Perfluorinated alkylated substances (PFAS), brominated flame retardants (BFR) and chlorinated paraffins (CP) in the Norwegian Environment – Screening 2013', NILU-report OR 31/2013: 105.
Haukås, M. 2009. 'Fate and dynamics of hexabromcyclododecane (HBCD) in marine ecosystems.', Phd dissertation. Department of Biology, Faculty of Mathematics and Natural Sciences, University of Oslo.: 29.

NIVA 7686-2021
170
Helland, A., G. Åberg, and J. Skei. 2002. 'Source dependent behaviour of lead and organic matter in the Glomma estuary, SE Norway: evidence from isotope ratios', Marine Chemistry, 78: 149-69.
Herzke, D., Posner, S., Olsson, E. 2009. 'Surveys, screening and analyses of PFCs in consumer products', Swerea IVF-Project report 09/47, TA-2578/2009: 38.
Hill, J. E. 2018. 'Exposure of the Common Eider (Somateria mollissima) to toxic elements in relation to migration strategy and wintering area'.
Ho, Q.T., Bank, M.S., Azad, A.M., Nilsen, B.M., Frantzen, S., Boitsov, S., Maage, A., Kögel, T., Sanden, M., Frøyland, L., Hannisdal, R., Hove, H., Lundeby, A-K., Nøstbakken, O.J. & Madsen, L. 2021. 'Co-occurrence of contaminants in marine fish from the North East Atlantic Ocean: Implications for human risk assessment.' Environment International, 157.
Hylland, K., A. Ruus, M. Grung, and N. Green. 2009. 'Relationships Between Physiology, Tissue Contaminants, and Biomarker Responses in Atlantic Cod (Gadus morhua L.)', Journal of Toxicology and Environmental Health-Part a-Current Issues, 72: 226-33.
IARC. 1987. 'International Agency for research on Cancer, monographs. Updated 144 August 2007 at HTTP://monographs.iarc.fr/ENG/Classification/crthgr01.php'.
ICES. 1996. 'ICES Environmental Data Reporting Formats. Version 2.2, revision 2-July 1996', ICES. ———. 1999. 'ICES Techniques in Marine Environmental Sciences. No. 24. Biological effects of
contaminants: Use of imposex in the dogwhelk, (Nucella lapillus) as a bioindicator of tributyltin pollution', ICES TIMES 24: 29 pp.
Jartun, M., Fjeld, E., Bæk, K., Løken, K. B., Rundberget, T., Grung, M., Schlabach, M. Warner, N. A., Johansen, I., Lyche, J. L., Berg, V., Nøstbakken, O. J. 2018. 'Monitoring of environmental contaminants in freshwater ecosystems', The Norwegian Environment Agency M-1106-2018: 136.
Jartun, M., Økelsrud, A., Kildahl, H., Øxnevad, S., Rundberget, T., Bæk, K., Enge, E. K., Halse, A. K., Hanssen, L., Harju, M., Johansen, I. 2021. "Monitoring of environmental contaminants in freshwater ecosystems 2020 – Occurrence and biomagnification." 147. NIVA.
Johansson, J. H., U. Berger, R. Vestergren, I. T. Cousins, A. Bignert, A. Glynn, and P. O. Darnerud. 2014. 'Temporal trends (1999-2010) of perfluoroalkyl acids in commonly consumed food items', Environmental Pollution, 188: 102-08.
Kaj, L., Schlabach, M., Andersson, J., Cousins, A. P., Schmidbauer, N., Brorström-Lundén, E. 2005. "Siloxanes in the Nordic Environment." In Nordic Council of Ministers, Copenhagen 2005, 93.
Kaste, Ø., Gunderssen, C. B., Poste, A., Sample, J., Hjermann, D. Ø. 2021. "The Norwegian river monitoring programme 2020 – water quality status and trends " 72. NIVA.
Kaste, Ø., Skarbøvik, E., Greipsland, I., Gundersen, C., Austnes, K., Skancke, L. B., Calidonio, J-L. G., Sample, J. 2018. "The Norwegian river monitoring programme - water quality status and trends 2017." In NIVA-report 7313-2018, 101.
Keilen, E.K. 2017. 'Levels and effects of environmental contaminants in herring gull (Larus argentatus) from an urban and rural colony in Norway.', Master, University of Oslo.
Kim, B., C. S. Park, M. Murayama, and M. F. Hochella. 2010. 'Discovery and Characterization of Silver Sulfide Nanoparticles in Final Sewage Sludge Products', Environmental Science & Technology, 44: 7509-14.
Kwasniak, J., and L. Falkowska. 2012. 'Mercury distribution in muscles and internal organs of the juvenile and adult Baltic cod (Gadus morrhua callarias Linnaeus, 1758)', Oceanological and Hydrobiological Studies, 41: 65-71.
Law, Robin J., Adrian Covaci, Stuart Harrad, Dorte Herzke, Mohamed A. E. Abdallah, Kim Femie, Leisa-Maree L. Toms, and Hidetaka Takigami. 2014. 'Levels and trends of PBDEs and HBCDs in the global environment: Status at the end of 2012', Environment International, 65: 147-58.
Layman, C.A., M.S. Araujo, R. Booucek, C.M. Hammerschlag-Peyer, E. Harrison, A.R. Jud, P. Matich, A.E. Rosenblatt, J.J. Vaudo, L.A. Yeager, D.M. Post, and S. Bearhop. 2012. 'Applying stable isotopes to examine food-web structure: an overview of analytical tools', Biological Reviews, 87: 545-62.
Løvik, J. E., Stuen, O. H., Edvardsen, H., Eriksen, T. E., Fjeld, E., Kile, M. R., Mjelde, M., Skjeldbred, B. 2016. "Forurensningssituasjonen i Mjøsa med tilløpselver 2015." In NIVA-report 7009-2016.
Ma, Wan-Li, Sehun Yun, Erin M. Bell, Charlotte M. Druschel, Michele Caggana, Kenneth M. Aldous, Germaine M. Buck Louis, and Kurunthachalam Kannan. 2013. 'Temporal Trends of Polybrominated Diphenyl Ethers (PBDEs) in the Blood of Newborns from New York State during 1997 through 2011: Analysis of Dried Blood Spots from the Newborn Screening Program', Environmental Science & Technology, 47: 8015-21.

NIVA 7686-2021
171
Miljødirektoratet. 2012. "Evaluering av Klifs overvåking (2011)." 212. Miljødirektoratet (earlier Klima og Forurensningsdirektoratet).
Molvær, J., J. Knutzen, J. Magnusson, B. Rygg, J. Skei, and J. Sørensen. 1997. 'Klassifisering av miljøkvalitet i fjorder og kystfarvann - Veileder 97:03 - 97:03', SFT TA-1467/ 1997: 34.
Nicholson, M. D., N. W. Fryer, and N. W. Green. 1994. "Focusing on key aspects of contaminant trend assessments." In Report of the 1994 meeting of the Working Group on the Statistical Aspects of Environmental Monitoring. St. John's Newfoundland, Canada.
Nicholson, M. D., R. J. Fryer, and J. R. Larsen. 1998. 'Temporal trend monitoring: A robust method for analysing trend monitoring data', ICES Techniques in Marine Envrionmental Sciences.
Nicholson, M. D., R. J. Fryer, and D. M. Maxwell. 1997. "A study of the power of various methods for detecting trends." In ICES CM 1997/Env.11.
Nicholson, M. D., N. W. Green, and S. J. Wilson. 1991. 'Regression-models for assessing trends in cadmium and PCBs in cod livers from the Oslofjord', Marine pollution bulletin, 22: 77-81.
Nizzetto, P.B., Aas, W. and Nikiforov, V. 2020. "Monitoring of environmental contaminants in air and precipitation. Annual report 2019." Norwegian Institute for Air Research.
Nizzetto, P.B., Aas, W., Halworsen, H.L., Nikiforov, V. & Pfaffhuber, K. 2021. "Monitoring of environmental contaminants in air and precipitation. Annual report 2020." In NILU report 12/2021, 149. Norwegian Environment Agency.
Norwegian_Environment_Agency. 2016. "Grenseverdier for klassifisering av vann, sediment og biota – Quality standards for water, sediment and biota." In Norwegian Environment Agency - Veileder, 24. Oslo, Norway.
Nost, T. H., R. Vestergren, V. Berg, E. Nieboer, J. O. Odland, and T. M. Sandanger. 2014. 'Repeated measurements of per- and polyfluoroalkyl substances (PFASs) from 1979 to 2007 in males from Northern Norway: Assessing time trends, compound correlations and relations to age/birth cohort', Environment International, 67: 43-53.
Nowack, B. 2010. 'Nanosilver Revisited Downstream', Science, 330: 1054-55. NS. 2017. 'Vannundersøkelse – Overvåking av miljøgifter i blåskjell (Mytilus spp.) – Innsamling av
utplasserte eller stedegne skjell og prøvebehandling. Water Quality – Monitoring of environmental contaminants in blue mussel (Mytilus spp.) – Collection of caged or native mussels and sample treatment. ', Norsk Standard 9434-2017: 15.
OSPAR. 1998. 'OSPAR Strategy with regards to Hazardous Substances.', OSPAR Commision, Record Annex 34.
———. 2003. "JAMP [Joint Assessment and Monitoring Programme] Guidelines Contaminant-specific biological Effects Monitoring." In OSPAR Commission, 38 pp.
———. 2007. 'OSPAR List of Chemicals for Priority Action (update 2007). OSPAR Convention for the protection of the Marine Environment of the North-East Atlantic.', OSPAR Commision: 6.
———. 2009. 'Agreement on CEMP Assessment Criteria for the QSR 2010', OSPAR Commision, OSPAR agreement number: 2009-2: 7.
———. 2010. 'Quality Status Report 2010', OSPAR Commission, Publication number 497/2010: 177. ———. 2013. "Background document and technical annexes for biological effects monitoring. Update
2013." In Monitoring and assessment Series, 238. OSPAR commissions. ———. 2014. "OSPAR Joint Assessment and Monitoring Programme (JAMP) 2014 – 2021." In
Monitoring and assessment Series, 59. OSPAR commissions. ———. 2018. "CEMP Guidelines for Monitoring Contaminants in Biota." In OSPAR Commission,
Monitoring guidelines, Ref. No: 1992-2, 1-126. Peakall, D. B. 1994. 'The role of biomarkers in environmental assessment (1)', Introduction.
Ecotoxicology, 3: 157–60. Post, D.M. 2002. 'Using stable isotopes to estimate trophic position models, methods, and
assumptions', Ecology, 83: 703-18. Powell, D. E. 2009. 'Cyclic volatile methylsiloxane materials (D3, D4, D5, and D6) in livers of
Atlantic cod (Gadus morhua) from Oslofjord, Norway. Comparison and assessment of analytical methods utilized by Dow Corning Corporation, Evonik Goldschmidt, and the Norwegian Institute for Air Research', HES Study No. 10922-108, Health and Environmental Sciences, Dow Corning Corporation, Auburn, Michigan. Study submitted to Centre Européen des Silicones (CES), a sector group of the European Chemical Industry Council (Cefic), Brussels, Belgium.
Powell, D. E., Durham, J., Huff, D. W., Böhmer, R., Gerhards, R., Koerner, M. 2010. 'Bioaccumulation and trophic transfer of cyclic volatile methylsiloxane (cVMS) materials in the aquatic marine food webs of the Inner and Outer Oslofjord, Norway', Final Report, Dow Corning, HES Study No. 11060-108: 40.
Powell, D. E., M. Schoyen, S. Oxnevad, R. Gerhards, T. Bohmer, M. Koerner, J. Durham, and D. W. Huff. 2018. 'Bioaccumulation and trophic transfer of cyclic volatile methylsiloxanes (cVMS)

NIVA 7686-2021
172
in the aquatic marine food webs of the Oslofjord, Norway', Science of the Total Environment, 622: 127-39.
R-Core-Team. 2021. 'R: A language and environment for statistical computing. R Foundation for Statistical Computing, Vienna, Austria'. https://www.r-project.org/.
Rotander, Anna, Bert van Bavel, Anuschka Polder, Frank Riget, Gudjon Atli Audunsson, Geir Wing Gabrielsen, Gish Vikingsson, Dorete Bloch, and Maria Dam. 2012. 'Polybrominated diphenyl ethers (PBDEs) in marine mammals from Arctic and North Atlantic regions, 1986-2009', Environment International, 40: 102-09.
Rundberget, T., Kringstad, A., Schøyen, M., Grung, M. 2014. 'Tissue distribution of PFAS in Atlantic cod (Gadus morhua) from Inner Oslofjord', In: Nordic Environmental Chemistry Conference - NECC 2014. Reykjavik, Iceland.
Ruus, A., Allan, I., Beylich, B., Bæk, K., Schlabach, M., Helberg, M. 2014. 'Miljøgifter i en urban fjord/Environmental Contaminants in an Urban Fjord', NIVA-report 6714: 120.
Ruus, A., Borgersen, G., Ledang, A. B., Fagerli, C. W., Staalstrøm, A., Norli, M. 2016a. 'Operational monitoring of coastal waters in the Hardanger River Basin, 2015. Tiltaksrettet overvåking av kystvann i vannområdet Hardanger 2015', NIVA-report 6996: 236.
Ruus, A., Bæk, K., Petersen, K., Allan, I., Beylich, B., Schlabach, M., Warner, N., Borgå, K., Helberg, M. 2018. 'Miljøgifter i en urban fjord, 2017. Environmental Contaminants in an Urban Fjord, 2017', NIVA report 7368-2019: 115+appendix.
Ruus, A., Bæk, K., Petersen, K., Allan, I., Beylich, B., Schlabach, M., Warner, N., Helberg, M. 2016b. "Miljøgifter i en urban fjord, 2015. Environmental Contaminants in an Urban Fjord, 2015." In NIVA report 7073-2016, 84 + appendix.
Ruus, A., Bæk, K., Rundberget, T., Allan, I., Beylich, B., Schlabach, M., Warner, N., Borgå, K., Helberg, M. 2019. "Environmental Contaminants in an Urban Fjord, 2018." 99.
Ruus, A., Bæk, K., Rundberget, T., Allan, I., Beylich, B., Vogelsang, C., Schlabach, M., Götsch, A., Borgå, K., Helberg, M. 2020a. 'Environmental Contaminants in an Urban Fjord, 2019', NIVA-report., 7555-2020: 118.
Ruus, A., N. W. Green, A. Maage, C. E. Amundsen, M. Schoyen, and J. Skei. 2010. 'Post World War II orcharding creates present day DDT-problems in The Sorfjord (Western Norway) - A case study', Marine pollution bulletin, 60: 1856-61.
Ruus, A., D. O. Hjermann, B. Beylich, M. Schoyen, S. Oxnevad, and N. W. Green. 2017. 'Mercury concentration trend as a possible result of changes in cod population demography', Marine Environmental Research, 130: 85-92.
Ruus, A., K. Hylland, and N. Green. 2003. "Joint Assessment and Monitoring Programme (JAMP). Biological Effects Methods, Norwegian Monitoring 1997-2001." In NIVA-rapport 4649-2003, 139.
Ruus, A., Kvassnes, A. J. S., Skei, J., Green, N. W., Schøyen, M. 2012. "Monitoring of environmental quality in the Sørfjord 2011 – metals in the water masses, contaminants in organisms. Overvåking av miljøforholdene i Sørfjorden 2011. Metaller i vannmassene. Miljøgifter i organismer." In NIVA-report 6399, 95.
Ruus, A., Ledang, A. B., Kristiansen, T. 2020b. 'Overvåking av kystvann i vannområde Hardanger 2019. Monitoring of coastal waters in the Hardanger River Basin, 2019', NIVA-report 7501-2020: 56 + Appendix.
Ruus, A., Skei, J., Green, N., Schøyen, M. 2010. "Overvåking av miljøforholdene i Sørfjorden 2009. Metaller i vannmassene, Miljøgifter i organismer." In NIVA-report 6018, 92.
Ruus, A., Skei, J., Lundmark, K. D., Green, N. W., Schøyen, M. 2011. "Monitoring environmental conditions in the Sørfjord 2010. Metals in water. Oxygen, nitrogen and phosphorus in water. Contaminants in organisms. Overvåking av miljøforholdene i Sørfjorden 2010. Metaller i vannmassene. Oksygen, nitrogen og fosfor i vannmassene. Miljøgifter i organismer." In NIVA-report 1103, 99.
Ruus, A., Skei, J., Molvær, J., Green, N. W., Schøyen, M. 2009. "Overvåking av miljøforholdene i Sørfjorden 2008. Metaller i vannmassene. Oksygen, nitrogen og fosfor i vannmassene. Miljøgifter i organismer." In NIVA-report 1049, 89.
Ruus, A., Øverjordet, I.B., Braaten, F.V., Evenset, A., Christiensen, G., Heimstad, E.S., Gabrielsen, G., Borgå, K.,. 2015. 'Methylmercury biomagnification in an arctic pelagic web.', Environmental Toxicology and Chemistry, 34: 2636-43.
Sahlin, S., Ågerstrand, M. 2018. "Decamethylcyclopentasiloxane (D5)." In Department of Environmental Science and Analytical Chemistry (ACES), Stockholm University, 32.
Schlabach, M., Strand Andersen, M., Green, N., Schøyen, M., Kaj, L. 2008. "Siloxanes in the Environment of the inner Oslofjord." In NILU report, 986/2007 (TA-2269/2007).

NIVA 7686-2021
173
Schuster, Jasmin K., Rosalinda Gioia, Knut Breivik, Eiliv Steinnes, Martin Scheringer, and Kevin C. Jones. 2010. 'Trends in European Background Air Reflect Reductions in Primary Emissions of PCBs and PBDEs', Environmental Science & Technology, 44: 6760-66.
Schøyen, M., I. J. Allan, A. Ruus, J. Havardstun, D. O. Hjermann, and J. Beyer. 2017. 'Comparison of caged and native blue mussels (Mytilus edulis spp.) for environmental monitoring of PAH, PCB and trace metals', Marine Environmental Research, 130: 221-32.
Schøyen, M., N. W. Green, D. O. Hjermann, L. Tveiten, B. Beylich, S. Øxnevad, and J. Beyer. 2019. 'Levels and trends of tributyltin (TBT) and imposex in dogwhelk (Nucella lapillus) along the Norwegian coastline from 1991 to 2017', Marine Environmental Research, 144: 1-8.
Schøyen, M., Kringstad, A. 2011. 'Perfluoroalkyl compounds (PFCs) in cod blood and liver from the Inner Oslofjord (2009)', NIVA-note N-45/11: 20.
Schøyen, M., Beyer, J., Tveiten, L., Hjermann, D., Håvardstun, J., Berge, J. A., Øxnevad, S. In prep. 'Levels and trends of tributyltin (TBT) and intersex in common periwinkle (Littorina littorea) in the fjord Vikkilen, Norway, from 2005 to 2021'.
Schøyen, M., Øxnevad, S., Hjermann, D. Ø., Mund, C., Böhmer T., Beckmann, K., Powell, D. E. 2016. "Levels of siloxanes (D4, D5, D6) in biota and sediments from the Inner Oslofjord, Norway, 2011-2014." In SETAC Europe 26th Annual Meeting, 22-26 May 2016, Nantes, France, 1.
Shi, L., N. Green, and Å. Rogne. 2008. "Joint Assessment and Monitoring Programme (JAMP). Contaminant and effects data for sediments, shellfish and fish 1981-2006." In Norwegian Pollution Control Authority, Monitoring report no. 1015/2008 TA no. 2369/2008. Norwegian Institute for Water Research projects 80106, 25106, 26106, 27106, report no. 5562-2008), 96 pp. ISBN no. 978-82-577-5297-2.
Skarbøvik, E., I. Allan, J.E. Sample, I. Greipsland, J.R. Selvik, L.B. Schancke, S. Beldring, P. Stålnacke, and Ø. Kaste. 2017. 'Elvetilførsler og direkte tilførsler til norske kystområder - 2016. Riverine Inputs and DIrect Discharges to Norwegian Coastal Waters - 2016.', Norwegian Environment Agency repoert, M-862/2017: 206.
Skei, J., Ruus, A., Måge, A. 2005. "Kildekartlegging av DDT i Sørfjorden, Hordaland. Forprosjekt." In NIVA-report 5038, 44.
Stransky, C., H. Baumann, S.-E. Fevolden, A. Harbitz, H. Høie, K.H. Nedreaas, A.B. Salberg, and T.H. Skarstein. 2007. 'Separation of Norwegian coastal cod and Northeast Arctic cod by otolith morphometry', ICES, CM 2007/L:10.
Streets, S. S., S. A. Henderson, A. D. Stoner, D. L. Carlson, M. F. Simcik, and D. L. Swackhamer. 2006. 'Partitioning and bioaccumulation of PBDEs and PCBs in Lake Michigan', Environmental Science & Technology, 40: 7263-69.
Sweeting, C.J., N.V.C. Polunin, and S. Jennings. 2006. 'Effects of chemical lipid extraciton and arithmetic lipid correctioin on stable isotope ratios of fish tissues', Rapid Communications in Mass Spectrometry, 20: 595-601.
Tappin, A. D., J. L. Barriada, C. B. Braungardt, E. H. Evans, M. D. Patey, and E. P. Achterberg. 2010. 'Dissolved silver in European estuarine and coastal waters', Water Research, 44: 4204-16.
Thomas, K.V., Langford, K.H., Muthanna, T., Schlabach, M., Enge, E.K., Borgen, A., Ghebremskel, M., Gundersen, G., Leknes, H., Uggerud, H., Haglund, P., Liao, Z., Liltved, H. 2011. "Occurrence of selected organic micropllutants and silver at wastewater treatment plants in Norway." In The Norwegian Climate and Pollution Agency report, 53.
Timbrell, J. A. 2009. Priciples of Biochemical Toxicology (Informa Healthcare, London, UK.). Tomy, G. T., A.T. Fisk, J.B. Westmore, and D.C.G Muir. 1998. 'Environmental Chemistry and
Toxicology of Polychlorinated n-Alcanes', Reviews of Environmental Contamination and Toxicology, 158: 53-128.
Ullah, S., S. Huber, A. Bignert, and U. Berger. 2014. 'Temporal trends of perfluoroalkane sulfonic acids and their sulfonamide-based precursors in herring from the Swedish west coast 1991-2011 including isomer-specific considerations', Environment International, 65: 63-72.
Valdersnes, S., B. M. Nilsen, J. F. Breivik, A. Borge, and A. Maage. 2017. 'Geographical trends of PFAS in cod livers along the Norwegian coast', Plos One, 12: 15.
Van_den_Berg, Birnbaum. L., Bosveld A. T. C., and Co-workers. 1998. 'Toxic equivalency factors (TEFs) for PCBs, PCDDs, PCDFs for humans and wildlife.', Environmental Health Perspectdives, 106: 775-92.
VEAS. 2021. 'Årsrapport 2020'. Vitale, F., L. Worsøe_Clausen, and G. Ni_Chonchuir. 2019. 'Handbook of fish age estimation
protocols and validation methods. ', ICES Cooperative Research Report, No. 346: 180.

NIVA 7686-2021
174
Warner, N. A., A. Evenset, G. Christensen, G. W. Gabrielsen, K. Borga, and H. Leknes. 2010. 'Volatile Siloxanes in the European Arctic: Assessment of Sources and Spatial Distribution', Environmental Science & Technology, 44: 7705-10.
Warner, N. A., G. Kozerski, and et al. 2012. 'Positive vs. false detection: A comparison of analytical methods and performance for analysis of cyclic volatile methylsiloxanes (cVMS) in environmental samples from remote regions.', Chemosphere, 93: 749-56.
Warner, Nicholas A., Therese H. Nost, Hector Andrade, and Guttorm Christensen. 2014. 'Allometric relationships to liver tissue concentrations of cyclic volatile methyl siloxanes in Atlantic cod', Environmental Pollution, 190: 109-14.
WGSAEM. 1993. 'The length effect on contaminant concentrations in mussels.', Section 13.2. in the Report of the Working Group on Statistical Aspects of Environmental Monitoring, Copenhagen, 27-30 April 1993. International Council for the Exploration of the Sea. C-M- 1993/ENV:6 Ref.: D and E: 61.
Wängberg, I., Aspmo Pfaffhuber, K., Berg, T., Hakola, H., Kyllönen, K., Munthe, J., Porvari, P., Verta, M. 2010. 'Atmospheric and catchment mercury concentrations and fluxes in Fennoscandia. TemaNord 2010:594. ' Nordic Council of Ministers, Copenhagen 2005: 55.
Øxnevad, S., M. S. Brkljacic, and G. Borgersen. 2016. 'Tiltaksrettet overvåking av Mossesundet i henhold til vannforskriften. Overvåking av Norsk Spesialolje Kambo. NIVA-report 6981-2016: 64.
Øxnevad, S., Tveiten, L. 2018. "Miljøovervåking i Vikkilen i Grimstad i 2018 – to år etter gjennomførte sedimenttiltak. Environmental monitoring in Vikkilen, Grimstad, in 2018 – two years after sediment remediation actions. NIVA-report 7307-2018: 22.

NIVA 7686-2021
175
Appendix A Quality assurance programme


NIVA 7686-2021
177
Information on Quality Assurance International intercalibrations
The laboratories (NIVA and subcontractor Eurofins) have participated in the Quality Assurance of
Information for Marine Environmental Monitoring in Europe (QUASIMEME), International Food
Analysis Proficiency Testing Services (FAPAS, BIPEA), international intercalibration exercises and
other proficiency testing relevant to chemical and imposex analyses. For chemical analyses, round
2020-1 apply to the 2020-samples. The results are acceptable. These QUASIMEME exercises
included nearly all the contaminants as well as imposex analysed in this programme. The quality
assurance programme is corresponding to the analyses of the 2019 samples (cf. Green et al. 2020 –
M-1894|2020).
NIVA participated in the QUASIMEME Laboratory Performance Studies “imposex and intersex in
Marine Snails BE1” in July-September 2017. Shell height, penis-length-male, penis-length-female,
average-shell-height and female-male-ratio were measured. NIVA got the score satisfactory for all
parameters except number of females for one sample, which got the score questionable. The score
for VDSI was satisfactory for both samples tested.
Analyses of certified reference materials
In addition to the QUASIMEME exercises, certified reference materials (CRM) and in-house
reference materials are analysed routinely with the MILKYS samples. Processing and measurement
in CRM are comparable to sample matrices even though in certain cases the matrices differ. It
should be noted that for biota, the type of tissue used in the CRMs does not always match the
target tissue for analysis. Uncertain values identified by the analytical laboratory or the reporting
institute are flagged in the database. The results are also “screened” during the import to the
database at NIVA and ICES.
The laboratories used for the chemical testing are accredited according to ISO 17025:2005.
However, the PFC analysis is not accredited according to this ISO-standard.
Summary of quality control results
Standard Reference Materials (SRM) as well as in-house reference materials were analysed
regularly. Apple juice was used as an in-house reference material for the quality control of the
determination of metals. The reference material for determination of BDEs, HBCDDs, PCBs and
PAHs in blue mussel, as well as BDEs, PCBs and PAHs in liver, was an internal reference (fish oil).
For tin organic compounds the reference material ZRM 81 was used as SRM in mussel tissue. For the
determination of dieldrin, trans-nonachlor and DDTs in blue mussel, internal reference materials
provided by EF GfA Lab services were used, these consisted of fish meal and feedingstuff. For the
quality assurance of chlorinated paraffines spiked fish was used as an in-house reference material,
and spiked fish liver was used for quality control of PFCs.

NIVA 7686-2021
178
Summary of the quality control of results for the 2020 biota samples analysed in 2020-2021. The
Standard Reference Material (SRM) used was ZRM 81 (for mussel tissue). The in-house reference
materials were apple juice, spiked fish oil, spiked fish meal and spiked fish liver. The SRM and in-
house reference materials and quality assurance standards were analysed in series with the
MILKYS samples and measured several times (N) over a number of weeks (W). The values are
reported in the following units (in w.w.): metals (µg/kg), BDE (pg/g), PCB (ng/kg), DDTs (ng/kg),
SCCPs and MCCPs (ng/sample), HBCDDs (ng/g), PAH (pg/g), tin organic compounds (mg/kg), PFCs
(% recovery), and trans-nonachlor (ng/kg). Tissue types were: mussel soft body (SB), fish liver (LI)
and fish fillet (MU). Code Contaminant Tissue type SRM type SRM value
confidence interval N W Mean
value Standard deviation
Ag Silver - - - - - - -
As Arsenic SB/MU/LI Apple juice 109 ± 23 45 8 109 4,9
Cd Cadmium SB/MU/LI Apple juice 106 ± 32 45 8 106,40 4,00
Cr Chromium SB/MU/LI Apple juice 102 ± 17 45 8 104,90 5,70
Co Cobalt - - - - - - -
Cu Copper SB/MU/LI Apple juice 6147 ± 1229 45 8 6365 224
Hg Mercury SB/MU/LI Apple juice 19,4 ± 3,8 45 8 19,20 0,970
Ni Nickel SB/MU/LI Apple juice 111± 26 45 8 113 6,25
Pb Lead SB/MU/LI Apple juice 105 ± 32 45 8 107 3,60
Zn Zinc SB/MU/LI Apple juice 1315 ± 334 45 8 1296 80,0
Sn Tin - - - - - - -
BDE-28 2,2,4’ Tribromodiphenylether SB Internal RM (fish oil) 85.7 ± 25.7 20 10 81,2 4,89
BDE-47 2,2',4,4',-Tetrabromodiphenylether
SB Internal RM (fish oil) 1590 ± 477 20 10 1645,6 56,02
BDE-100 2,2',4,4',6-Pentabromodiphenylether
SB Internal RM (fish oil) 324 ± 97.2 20 10 339,3 13,9
BDE-99 2,2',4,4',5-Pentabromodiphenylether
SB Internal RM (fish oil) 248 ± 74.4 20 10 259,8 9,85
BDE-154 2,2',4,4',5,6'-Hexabromodiphenylether
SB Internal RM (fish oil) 223.5 ± 67.1 20 10 254,1 11,01
BDE-153 2,2’,4,4’5,5’- Hexabromodiphenylether
SB Internal RM (fish oil) 58.5 ± 17.6 20 10 67,7 7,32
BDE-49 2,2',4,5'-tetrabromodiphenyleter
SB Internal RM (fish oil) 431 ± 129.3 20 10 463,4 16,5
BDE-66 2,3',4,4'-Tetrabromodiphenyleter
- - - - - - -
BDE-119 2,3',4,4',6-Pentabromodiphenyl ether
SB Internal RM (fish oil) 30.8 ± 9.24 20 10 33,1 2,21
PCB 52 PCB congener CB-52 SB/MU/LI Internal RM (fish oil) 444,4 +- 133,3 33 12 464,07 25,64
PCB 28 PCB congener CB-28 SB/MU/LI Internal RM (fish oil) 269,7 +- 80,90 33 12 292,34 21,68
PCB 180 PCB congener CB-180 SB/MU/LI Internal RM (fish oil) 4590 +- 1377 33 12 4859,36 322,10
PCB 153 PCB congener CB-153 SB/MU/LI Internal RM (fish oil) 5289 +- 1587 33 12 5116,23 307,78
PCB 138 PCB congener CB-138 SB/MU/LI Internal RM (fish oil) 3605 +- 1082 33 12 3902,88 238,71
PCB 118 PCB congener CB-118 SB/MU/LI Internal RM (fish oil) 883,1 +- 264,9 33 12 927,87 51,53
PCB 101 PCB congener CB-101 SB/MU/LI Internal RM (fish oil) 1647 +- 494,1 33 12 1776,19 322,10
DDEOP o,p'-DDE SB/MU/LI Internal RM (feed) 0.11±0.03 14 10 0,08 0,015
TDEOP o,p'-DDD SB/MU/LI Internal RM (feed) 0.267±0.08 14 10 0,23 0,015
DDTOP o,p'-DDT SB/MU/LI Internal RM (feed) 0.259±0.08 14 10 0,21 0,034
DDEPP p,p'-DDE SB/MU/LI Internal RM (feed) 5.01±1.5 13 10 4,47 0,290
TDEPP p,p'-DDD SB/MU/LI Internal RM (feed) 1.73±0.5 14 10 1,50 0,271
DDTPP p,p'-DDT SB/MU/LI Internal RM (feed) 0.613±0.2 14 10 0,56 0,038
SCCP Short-chain chlorinated Paraffins (C10-C13)
SB/MU/LI Internal RM (spiked fish)
10000 17 13 10540 1062
MCCP Medium-chain chlorinated Paraffins (C14-C17)
SB/MU/LI Internal RM (spiked fish)
10000 17 13 10140 1453
α-HBCDD α-Hexabromocyclododecane SB/MU/LI Internal RM (fish oil) 1.21 ± 0.363 14 11 1,26 0,085
β-HBCDD β- Hexabromocyclododecane SB/MU/LI Internal RM (fish oil) 0.08 ± 0.024 14 11 0,067 0,013
γ-HBCDD γ- Hexabromocyclododecane SB/MU/LI Internal RM (fish oil) 0.32 ± 0.096 14 11 0,38 0,038
BGHIP Benzo[ghi]perylene - - - - - - -
ICDP Indeno[1,2,3-cd]pyrene - - - - - - -
BBJF Benzo[b+j]fluoranthene SB Internal RM (fish oil) 513 ± 154 6 6 551,5 73,5

NIVA 7686-2021
179
Code Contaminant Tissue type SRM type SRM value confidence interval
N W Mean value
Standard deviation
DBA3A Dibenzo[ac,ah]anthracene - - - - - - -
BKF Benzo[k]fluoranthene SB Internal RM (fish oil) 127 ± 62 6 6 153 29
ACNLE Acenaphthylene SB Internal RM (fish oil) 1210 ± 363 6 6 1232,3 239,4
ANT Anthracene SB Internal RM (fish oil) 1040 ± 312 6 6 1187,6 79,6
BAA Benzo[a]anthracene SB Internal RM (fish oil) 511 ± 153 6 6 531,4 109,4
BAP Benzo[a]pyrene SB Internal RM (fish oil) 236 ± 71 6 6 276,1 26,5
CHR Chrysene SB Internal RM (fish oil) 502 ± 151 6 6 598,2 34,7
FLU Fluoranthene SB Internal RM (fish oil) 3230 ± 969 6 6 3629,1 323,3
FLE Fluorene SB Internal RM (fish oil) 4490 ± 1347 6 6 4873,4 377,2
NAP Naphthalene - - - - - - -
PA Phenanthrene SB Internal RM (fish oil) 9110 ± 2733 6 6 9695,5 408,5
PYR Pyrene SB Internal RM (fish oil) 2080 ± 624 6 6 2239,8 309,1
ACNE Acenaphthene SB Internal RM (fish oil) 2140 ± 642 6 6 2071,7 219,3
TBBPA Tetrabromobisphenol-A - - - - - - -
BPA Bisphenol-A - - - - - - -
APO 4-tert-oktylfenol - - - - - - -
APO 4-n-oktylfenol - - - - - - -
APO 4-n-nonylfenol - - - - - - -
MBT Monobutyltinn (MBT) SB ZRM 81 (mussel) 1.5 ± 0.5 5 6 1,96 0,083
DBT Dibutyltinn (DBT) - - - - - - -
TBT Tributyltinn (TBT) SB ZRM 81 (mussel) 2.2 ± 0.7 6 5 1,74 0,034
TPhT Trifenyltinn (TPhT) SB ZRM 81 (mussel) 1.4 ± 0.4 6 6 1,40 0,038
PFBS Perfluorobutane sulphonate LI* In-house spiked liver* 100%1) 5 14 97 3,3
PFHxA Perfluorohexane acid LI* In-house spiked liver* 100%1) 5 14 97 3,3
PFHpA Perfluoroheptane acid LI* In-house spiked liver* 100%1) 5 14 104 2,7
PFOA Perfluorooctane acid LI* In-house spiked liver* 100%1) 5 14 99 3,3
PFNA Perfluorononane acid LI* In-house spiked liver* 100%1) 5 14 99 3,7
PFOS Perfluorooctane sulphonate LI* In-house spiked liver* 100%1) 5 14 99 2,9
PFOSA Perfluorooctane sulphone amide LI* In-house spiked liver* 100%1) 5 14 101 3,1
PFHxS Perfluorohexane sulphonate LI* In-house spiked liver* 100%1) 5 14 90 2,3
PFDA Perfluorodecanoic acid LI* In-house spiked liver* 100%1) 5 14 99 3,7
PFUDA Perfluoroundecanoic acid LI* In-house spiked liver* 100%1) 5 14 100 2,0
PFDS Perfluorodecanesulphonate LI* In-house spiked liver* 100%1) 5 14 91 5,2
Dieldrin - - - - - - -
Trans-Nonachlor SB/MU/LI Internal RM (feed) 1.39±0.4 14 10 1,35 0,239
* For some PFCs the tissue type also contained blue mussel, sea gull egg and blood
1) Recovery of spiked control sample

NIVA 7686-2021
181
Appendix B Abbreviations
(Includes all abbreviations used in MILKYS and forerunner programmes,
and not just those used in the present study.)


NIVA 7686-2021
183
Abbreviation1 English Norwegian Param.
group
ELEMENTS
Al aluminium aluminium I-MET
Ag silver sølv I-MET
As arsenic arsen I-MET
Ba barium barium I-MET
Cd cadmium kadmium I-MET
Ce cerium serium I-MET
Co cobalt kobolt I-MET
Cr chromium krom I-MET
Cu copper kobber I-MET
Fe iron jern I-MET
Hg mercury kvikksølv I-MET
La lanthanum lantan I-MET
Li lithium litium I-MET
Mn manganese mangan I-MET
Mo molybdenum molybden I-MET
Nd neodymium neodym I-MET
Ni nickel nikkel I-MET
Pb lead bly I-MET
Pb210 lead-210 bly-210 I-RNC
Pr praseodymium praseodym I-MET
Se selenium selen I-MET
Sn tin tinn I-MET
Ti titanium titan I-MET
V vanadium vanadium I-MET
Zn zinc sink I-MET
METAL COMPOUNDS
TBT tributyltin (formulation basis
=TBTIN*2.44)
tributyltinn (formula basis
=TBTIN*2.44)
O-MET
MBTIN (MBT) Monobutyltin monobutyltinn O-MET
MBTIN (MBT) Monobutyltin monobutyltinn O-MET
MOT Monooctyltin monooktyltinn O-MET
MPTIN Monophenyltin monofenyltinn O-MET
DBT dibutyltin (di-n-butyltin) dibutyltinn (di-n-butyltinn) O-MET
DBTIN dibutyltin (di-n-butyltin) dibutyltinn (di-n-butyltinn) O-MET
DOT dioctyltin dioktyltinn O-MET
DPTIN diphenyltin difenyltinn O-MET
TBTIN tributyltin (=TBT*0.40984) tributyltinn (=TBT*0.40984) O-MET
TCHT tricyclohexyl-stannylium tricyclohexyl-stannylium O-MET
TPhT-Sn Triphenyltin tin weight
(=TPhT/3)
Trifenyltinn tinn-vekt (=TPhT/3) O-MET
TPhT Triphenyltin ion weight
(=TPhT-Sn*3)
Trifenyltinn ion-vekt (=TPhT-
Sn*3)
O-MET
TTBT tetrabutyltin tetrabutyltinn O-MET
PAHs

NIVA 7686-2021
184
Abbreviation1 English Norwegian Param.
group
PAH polycyclic aromatic
hydrocarbons
polysykliske aromatiske
hydrokarboner
ACNE 3 acenaphthene acenaften PAH
ACNLE 3 acenaphthylene acenaftylen PAH
ANT 3 anthracene antracen PAH
BAA 3, 4 benzo[a]anthracene benzo[a]antracen PAH
BAP 3, 4 benzo[a]pyrene benzo[a]pyren PAH
BBF 3, 4 benzo[b]fluoranthene benzo[b]fluoranten PAH
BKF 3, 4 benzo[k]fluoranthene benzo[k]fluoranten PAH
BJF 3, 4 benzo[j]fluoranthene benzo[j]fluoranten PAH
BBJKF 3, 4 benzo[b,j,k]fluoranthene benzo[b,j,k]fluoranten PAH
BBJKF 3, 4 benzo[b+j,k]fluoranthene benzo[b+j,k]fluoranten PAH
BBKF 3, 4 benzo[b+k]fluoranthene benzo[b+k]fluoranten PAH
BEP benzo[e]pyrene benzo[e]pyren PAH
BGHIP 3 benzo[ghi]perylene benzo[ghi]perylen PAH
BIPN 2 biphenyl bifenyl PAH
BJKF 3, 4 benzo[j,k]fluoranthene benzo[j,k]fluorantren PAH
BKF 3, 4 benzo[k]fluoranthene benzo[k]fluorantren PAH
CHR 3, 4 chrysene chrysen PAH
CHRTR 3, 4 chrysene+triphenylene chrysen+trifenylen PAH
COR coronene coronen PAH
DBAHA 3, 4 dibenz[a,h]anthracene dibenz[a,h]anthracen PAH
DBA3A 3, 4 dibenz[a,c/a,h]anthracene dibenz[a,c/a,h]antracen PAH
DBP 4, 6 dibenzopyrenes dibenzopyren PAH
DBT dibenzothiophene dibenzothiofen PAH
DBTC1 C1-dibenzothiophenes C1-dibenzotiofen PAH
DBTC2 C2-dibenzothiophenes C2-dibenzotiofen PAH
DBTC3 C3-dibenzothiophenes C3-dibenzotiofen PAH
FLE 3 fluorene fluoren PAH
FLU 3 fluoranthene fluoranten PAH
ICDP 3, 4 indeno[1,2,3-cd]pyrene indeno[1,2,3-cd]pyren PAH
NAP 2, 4 naphthalene naftalen PAH
NAPC1 2 C1-naphthalenes C1-naftalen PAH
NAPC2 2 C2-naphthalenes C2-naftalen PAH
NAPC3 2 C3-naphthalenes C3-naftalen PAH
NAP1M 2 1-methylnaphthalene 1-metylnaftalen PAH
NAP2M 2 2-methylnaphthalene 2-metylnaftalen PAH
NAPD2 2 1,6-dimethylnaphthalene 1,6-dimetylnaftalen PAH
NAPD3 2 1,5-dimethylnaphthalene 1,5-dimetylnaftalen PAH
NAPDI 2 2,6-dimethylnaphthalene 2,6-dimetylnaftalen PAH
NAPT2 2 2,3,6-trimethylnaphthalene 2,3,6-trimetylnaftalen PAH
NAPT3 2 1,2,4-trimethylnaphthalene 1,2,4-trimetylnaftalen PAH
NAPT4 2 1,2,3-trimethylnaphthalene 1,2,3-trimetylnaftalen PAH
NAPTM 2 2,3,5-trimethylnaphthalene 2,3,5-trimetylnaftalen PAH

NIVA 7686-2021
185
Abbreviation1 English Norwegian Param.
group
NPD collective term for
naphthalenes, phenanthrenes
and dibenzothiophenes
Samme betegnelse for naftalen,
fenantren og dibenzotiofens
PAH
PA 3 phenanthrene fenantren PAH
PAC1 C1-phenanthrenes C1-fenantren PAH
PAC2 C2-phenanthrenes C2-fenantren PAH
PAC3 C3-phenanthrenes C3-fenantren PAH
PAM1 1-methylphenanthrene 1-metylfenantren PAH
PAM2 2-methylphenanthrene 2-metylfenantren PAH
PADM1 3,6-dimethylphenanthrene 3,6-dimetylfenantren PAH
PADM2 9,10-dimethylphenanthrene 9,10-dimetylfenantren PAH
PER perylene perylen PAH
PYR 3 pyrene pyren PAH
DI-n sum of "n" dicyclic "PAH"s
(footnote 2)
sum "n" disykliske "PAH" (fotnote
2)
P-n/P_S/PAH/PAH-
15
sum "n" PAH (DI-n not
included, footnote 3)
sum "n" PAH (DI-n ikke
inkludert, fotnote 3)
PK-n/PK_S sum carcinogen PAHs
(footnote 4)
sum kreftfremkallende PAH
(fotnote 4)
PAH dI-n + P-n etc. dI-n + P-n mm.
SPAH "total" PAH, specific
compounds not quantified
(outdated analytical method)
"total" PAH, spesifikke
forbindelser ikke kvantifisert
(foreldet metode)
PAH-16 Sum EPA PAH16 Sum EPA PAH16
BAP_P % BAP of PAH % BAP av PAH
BAPPP % BAP of P-n % BAP av P-n
BPK_P % BAP of PK_Sn % BAP av PK_Sn
PKn_P % PK_Sn of PAH % PK_Sn av PAH
PKnPP % PK_Sn of P-n % PK_Sn av P-n
PCBs
PCB polychlorinated biphenyls polyklorerte bifenyler
CB individual chlorobiphenyls
(CB)
enkelte klorobifenyl
CB28 CB28 (IUPAC) CB28 (IUPAC) OC-CB
CB31 CB31 (IUPAC) CB31 (IUPAC) OC-CB
CB44 CB44 (IUPAC) CB44 (IUPAC) OC-CB
CB52 CB52 (IUPAC) CB52 (IUPAC) OC-CB
CB77 5 CB77 (IUPAC) CB77 (IUPAC) OC-CB
CB81 5 CB81 (IUPAC) CB81 (IUPAC) OC-CB
CB95 CB95 (IUPAC) CB95 (IUPAC) OC-CB
CB101 CB101 (IUPAC) CB101 (IUPAC) OC-CB
CB105 CB105 (IUPAC) CB105 (IUPAC) OC-CB
CB110 CB110 (IUPAC) CB110 (IUPAC) OC-CB
CB118 CB118 (IUPAC) CB118 (IUPAC) OC-CB
CB126 5 CB126 (IUPAC) CB126 (IUPAC) OC-CB
CB128 CB128 (IUPAC) CB128 (IUPAC) OC-CB
CB138 CB138 (IUPAC) CB138 (IUPAC) OC-CB
CB149 CB149 (IUPAC) CB149 (IUPAC) OC-CB

NIVA 7686-2021
186
Abbreviation1 English Norwegian Param.
group
CB153 CB153 (IUPAC) CB153 (IUPAC) OC-CB
CB156 CB156 (IUPAC) CB156 (IUPAC) OC-CB
CB169 5 CB169 (IUPAC) CB169 (IUPAC) OC-CB
CB170 CB170 (IUPAC) CB170 (IUPAC) OC-CB
CB180 CB180 (IUPAC) CB180 (IUPAC) OC-CB
CB194 CB194 (IUPAC) CB194 (IUPAC) OC-CB
CB209 CB209 (IUPAC) CB209 (IUPAC) OC-CB
CB-7 CB:
28+52+101+118+138+153+180
CB: 28+52+101+118+138+153+180
CB- sum of PCBs, includes PCB-7 sum PCBer, inkluderer PCB-7
TECBW sum of PCB-toxicity
equivalents after WHO model,
see TEQ
sum PCB- toksisitets ekvivalenter
etter WHO modell, se TEQ
TECBS sum of PCB-toxicity
equivalents after SAFE model,
see TEQ
sum PCB-toksisitets ekvivalenter
etter SAFE modell, se TEQ
PCN polychlorinated naphthalenes polyklorerte naftalen
DIOXINs
TCDD 2, 3, 7, 8-tetrachloro-dibenzo
dioxin
2, 3, 7, 8-tetrakloro-dibenzo
dioksin
OC-DX
CDDST sum of tetrachloro-dibenzo
dioxins
sum tetrakloro-dibenzo dioksiner
CDD1N 1, 2, 3, 7, 8-pentachloro-
dibenzo dioxin
1, 2, 3, 7, 8-pentakloro-dibenzo
dioksin
OC-DX
CDDSN sum of pentachloro-dibenzo
dioxins
sum pentakloro-dibenzo
dioksiner
CDD4X 1, 2, 3, 4, 7, 8-hexachloro-
dibenzo dioxin
1, 2, 3, 4, 7, 8-heksakloro-
dibenzo dioksin
OC-DX
CDD6X 1, 2, 3, 6, 7, 8-hexachloro-
dibenzo dioxin
1, 2, 3, 6, 7, 8-heksakloro-
dibenzo dioksin
OC-DX
CDD9X 1, 2, 3, 7, 8, 9-hexachloro-
dibenzo dioxin
1, 2, 3, 7, 8, 9-heksakloro-
dibenzo dioksin
OC-DX
CDDSX sum of hexachloro-dibenzo
dioxins
sum heksakloro-dibenzo
dioksiner
CDD6P 1, 2, 3, 4, 6, 7, 8-heptachloro-
dibenzo dioxin
1, 2, 3, 4, 6, 7, 8-heptakloro-
dibenzo dioksin
OC-DX
CDDSP sum of heptachloro-dibenzo
dioxins
sum heptakloro-dibenzo
dioksiner
CDDO Octachloro-dibenzo dioxin Oktakloro-dibenzo dioksin OC-DX
PCDD sum of polychlorinated
dibenzo-p-dioxins
sum polyklorinaterte-dibenzo-p-
dioksiner
CDF2T 2, 3, 7, 8-tetrachloro-
dibenzofuran
2, 3, 7, 8-tetrakloro-
dibenzofuran
OC-DX
CDFST sum of tetrachloro-
dibenzofurans
sum tetrakloro-dibenzofuraner
CDFDN 1, 2, 3, 7, 8/1, 2, 3, 4, 8-
pentachloro-dibenzofuran
1, 2, 3, 7, 8/1, 2, 3, 4, 8-
pentakloro-dibenzofuran
OC-DX

NIVA 7686-2021
187
Abbreviation1 English Norwegian Param.
group
CDF2N 2, 3, 4, 7, 8-pentachloro-
dibenzofuran
2, 3, 4, 7, 8-pentakloro-
dibenzofuran
OC-DX
CDFSN sum of pentachloro-
dibenzofurans
sum pentakloro-dibenzofuraner
CDFDX 1, 2, 3, 4, 7, 8/1, 2, 3, 4, 7, 9-
hexachloro-dibenzofuran
1, 2, 3, 4, 7, 8/1, 2, 3, 4, 7, 9-
heksakloro-dibenzofuran
OC-DX
CDF6X 1, 2, 3, 6, 7, 8-hexachloro-
dibenzofuran
1, 2, 3, 6, 7, 8-heksakloro-
dibenzofuran
OC-DX
CDF9X 1, 2, 3, 7, 8, 9-hexachloro-
dibenzofuran
1, 2, 3, 7, 8, 9-heksakloro-
dibenzofuran
OC-DX
CDF4X 2, 3, 4, 6, 7, 8-hexachloro-
dibenzofuran
2, 3, 4, 6, 7, 8-heksakloro-
dibenzofuran
OC-DX
CDFSX sum of hexachloro-
dibenzofurans
sum heksakloro-dibenzofuraner
CDF6P 1, 2, 3, 4, 6, 7, 8-heptachloro-
dibenzofuran
1, 2, 3, 4, 6, 7, 8-heptakloro-
dibenzofuran
OC-DX
CDF9P 1, 2, 3, 4, 7, 8, 9-heptachloro-
dibenzofuran
1, 2, 3, 4, 7, 8, 9-heptakloro-
dibenzofuran
OC-DX
CDFSP sum of heptachloro-
dibenzofurans
sum heptakloro-dibenzofuraner OC-DX
CDFO octachloro-dibenzofurans octakloro-dibenzofuran OC-DX
PCDF sum of polychlorinated
dibenzo-furans
sum polyklorinated dibenzo-
furaner
CDDFS sum of PCDD and PCDF sum PCDD og PCDF
TCDDN sum of TCDD-toxicity
equivalents after Nordic
model, see TEQ
sum TCDD- toksisitets
ekvivalenter etter Nordisk
modell, se TEQ
TCDDI sum of TCDD-toxicity
equivalents after international
model, see TEQ
sum TCDD-toksisitets
ekvivalenter etter internasjonale
modell, se TEQ
BIOICIDES
ALD aldrin aldrin OC-DN
DIELD dieldrin dieldrin OC-DN
ENDA endrin endrin OC-DN
CCDAN cis-chlordane (=-chlordane) cis-klordan (=-klordan) OC-DN
TCDAN trans-chlordane (=-chlordane) trans-klordan (=-klordan) OC-DN
OCDAN oxy-chlordane oksy-klordan OC-DN
TNONC trans-nonachlor trans-nonaklor OC-DN
TCDAN trans-chlordane trans-klordan OC-DN
Triclosan 5-chloro-2-2,4-
dichlorophenoxy)phenol
5-kloro-2-2,4-
diklorofenoxy)fenol
OC-CL
Diuron 3-(3,4-dichlorophenyl)-1,1-
dimethylurea
3-(3,4-diklorofenyl)-1,1-
dimetylurea
OC-CL
Irgarol a triazine (nitrogen containing
heterocycle)
en triazin (nitrogen holdig
heterosykle)
OCS octachlorostyrene oktaklorstyren OC-CL
QCB pentachlorobenzene pentaklorbenzen OC-CL

NIVA 7686-2021
188
Abbreviation1 English Norwegian Param.
group
DDD dichlorodiphenyldichloroethane
1,1-dichloro-2,2-bis-
(4-chlorophenyl)ethane
diklordifenyldikloretan
1,1-dikloro-2,2-bis-(4-
klorofenyl)etan
OC-DD
DDE dichlorodiphenyldichloroethylene
(principle metabolite of DDT)
1,1-bis-(4-chlorophenyl)-2,2-
dichloroethene*
diklordifenyldikloretylen
(hovedmetabolitt av DDT)
1,1-bis-(4-klorofenyl)-2,2-
dikloroeten
OC-DD
DDT dichlorodiphenyltrichloroethane
1,1,1-trichloro-2,2-bis-
(4-chlorophenyl)ethane
diklordifenyltrikloretan
1,1,1-trikloro-2,2-bis-(4-
klorofenyl)etan
OC-DD
DDEOP o,p'-DDE o,p'-DDE OC-DD
DDEPP p,p'-DDE p,p'-DDE OC-DD
DDTOP o,p'-DDT o,p'-DDT OC-DD
DDTPP p,p'-DDT p,p'-DDT OC-DD
TDEPP p,p'-DDD p,p'-DDD OC-DD
DDTEP p,p'-DDE + p,p'-DDT p,p'-DDE + p,p'-DDT OC-DD
DD-n sum of DDT and metabolites,
n = number of compounds
sum DDT og metabolitter,
n = antall forbindelser
OC-DD
HCB hexachlorobenzene heksaklorbenzen OC-CL
HCHG Lindane
HCH = gamma
hexachlorocyclohexane
( BHC = gamma
benzenehexachloride,
outdated synonym)
Lindan
HCH = gamma
heksaklorsykloheksan
( BHC = gamma
benzenheksaklorid, foreldet
betegnelse)
OC-HC
HCHA HCH = alpha HCH HCH = alpha HCH OC-HC
HCHB HCH = beta HCH HCH = beta HCH OC-HC
HC-n sum of HCHs, n = count sum av HCHs, n = antall
EOCl extractable organically bound
chlorine
ekstraherbart organisk bundet
klor
OC-CL
EPOCl extractable persistent
organically bound chlorine
ekstraherbart persistent
organisk bundet klor
OC-CL
PBDEs
PBDE polybrominated diphenyl
ethers
polybromerte difenyletere OC-BR
BDE brominated diphenyl ethers OC-BR
BDE28 2,4,4’-tribromodiphenyl ether 2,4,4’-tribromdifenyleter OC-BR
BDE47 2,2’,4,4’-tetrabromodiphenyl
ether
2,2’,4,4’-tetrabromdifenyleter OC-BR
BDE49* 2,2’,4,5’- tetrabromodiphenyl
ether
2,2’,4,5’- tetrabromdifenyleter OC-BR
BDE66* 2,3’,4’,6- tetrabromodiphenyl
ether
2,3’,4’,6- tetrabromdifenyleter OC-BR
BDE71* 2,3’,4’,6- tetrabromodiphenyl
ether
2,3’,4’,6- tetrabromdifenyleter OC-BR
BDE77 3,3',4,4'-tetrabromodiphenyl
ether
3,3',4,4'-tetrabromdifenyleter OC-BR

NIVA 7686-2021
189
Abbreviation1 English Norwegian Param.
group
BDE85 2,2’,3,4,4’-
pentabromodiphenyl ether
2,2’,3,4,4’-
pentabromdifenyleter
OC-BR
BDE99 2,2’,4,4’,5-
pentabromodiphenyl ether
2,2’,4,4’,5-
pentabromdifenyleter
OC-BR
BDE100 2,2’,4,4’,6-
pentabromodiphenyl ether
2,2’,4,4’,6-
pentabromdifenyleter
OC-BR
BDE119 2,3’,4,4’,6-
pentabromodiphenyl ether
2,3’,4,4’,6-
pentabromdifenyleter
OC-BR
BDE126 3,3’,4,4’,5’-
pentabromodiphenyl ether
3,3’,4,4’,5’-
pentabromdifenyleter
OC-BR
BDE138 2,2’,3,4,4’,5’-
hexabromodiphenyl ether
2,2’,3,4,4’,5’-
heksabromdifenyleter
OC-BR
BDE153 2,2’,4,4’,5,5’-
hexabromodiphenyl ether
2,2’,4,4’,5,5’-
heksabromdifenyleter
OC-BR
BDE154 2,2’,4,4’,5,6’-
hexabromodiphenyl ether
2,2’,4,4’,5,6’-
heksabromdifenyleter
OC-BR
BDE183 2,2’,3,4,4’,5’,6-
heptabromodiphenyl ether
2,2’,3,4,4’,5’,6-
heptabromdifenyleter
OC-BR
BDE196 2,2’,3,3’,4,4’,5’,6-
octabromodiphenyl ether
2,2’,3,3’,4,4’,5’,6-
octabromdifenyleter
OC-BR
BDE205 2,2’,3,3’,4,4’,5,5’,6’-
nonabromodiphenyl ether
2,2’,3,3’,4,4’,5,5’,6’-
nonabromdifenyleter
OC-BR
BDE209 decabromodiphenyl ether Dekabromdifenyleter OC-BR
BDE4S sum of BDE -85, -99, -100, -
119
sum av BDE -85, -99, -100, -119 OC-BR
BDE6S/BDE6 sum of BDE -28, -47, -99, -100,
-153, -154
sum av BDE -28, -47, -99, -100, -
153, -154
OC-BR
BDESS sum of all BDEs sum av alle BDEer OC-BR
HBCDD hexabromocyclododecane (1 2
5 6 9 10
hexabromocyclododecane)
heksabromsyklododekan (1 2 5 6
9 10 heksabromsyklododekan)
OC-BR
HBCDA −hexabromocyclododecane −heksabromsyklododekan OC-BR
HBCDB -hexabromocyclododecane -heksabromsyklododekan OC-BR
HBCDG -hexabromocyclododecane -heksabromsyklododekan OC-BR
TBBPA tetrabrombisphenol A tetrabrombisfenol A OC-CP
BPA bisphenol A bisfenol A OC-CP
HCBD hexachlorobutadiene hexaklorobutadien OC-CL
PFAS perfluorinated alkylated
substances
Perfluoralkylerte stoffer
PFBS perfluorobutane sulfonate perfluorbutan sulfonat PFAS
PFDCA perfluorodecanoic acid perfluordekansyre PFAS
PFDCS ammonium
henicosafluorodecanesulphona
te
ammonium
henikosafluordekansulfonat
PFAS
PFHxA perfluorohexanoic acid perfluorhexansyre PFAS
PFHpA perfluoroheptanoic acid perfluorheptansyre PFAS

NIVA 7686-2021
190
Abbreviation1 English Norwegian Param.
group
PFOA perfluorooctanoic acid perfluoroktansyre PFAS
PFNA perfluorononanoic acid perfluornonansyre PFAS
PFOS Perfluorooctanesulfonic acid Perfluorooktansulfonatsyre PFAS
PFOSA perfluorooctanesulfonamide perfluorooktansulfonamid PFAS
PFUDA perfluoroundecanoic acid perfluorundekansyre PFAS
SCCP short chain chlorinated
paraffins, C10-13
kortkjedete klorerte parafiner,
C10-13
MCCP medium chain chlorinated, C14-
17 paraffins
mediumkjedete klorerte
parafiner, C14-17
Alkylphenols phenols/chlorophenols fenoler/klorfenoler
4-n-NP 4-n-nonylphenol 4-n-nonylfenol
4-n-OP 4-n-octylphenol 4-n-oktylfenol
4-t-NP 4-tert-nonylphenol 4-tert-nonylfenol
4-t-OP 4-tert-octylphenol 4-tert-oktylfenol
stable isotopes stabile isotoper
C/N δ13C /δ15N δ13C /δ15N
Delta15N δ15N δ15N
Delta13C δ13C δ13C
phthalates/organic esters phtalater/organiske estere
BBP benzylbutylphthalate benzylbutylftalat
DBP6 dibutylphthalate dibutylftalat
DBPA dibutyladipat dibutyladipat
DEHA diethylhexcyladipate dietylheksyladipat
DEHP di(2-ethylhexyl)-phthalate di(2-etylhexyl)-ftalat
DEP dietylphthale dietylftalat
DEPA diethyladipat dietyladipat
DIBP diisobutylphthalate diisobutylftalat
DIDP diisodectylyphthalate diisodekylftalat
DIHP diisoheptylphthalate diisoheptylftalat
DINCH 1,2-Cyclohexane dicarboxylic
acid diisononyl ester
1,2-sykloheksan dikarboksyl syre
diisononyl ester
DIPA diisobutyl adipate diisobutyladipat
DMP dimethylphthalate dimetylftalat
DNOP di-n-octylphthalte di-n-oktylftalt
DPF diphenylphthalate difenylftalat
SDD dinonylphthalte+diisononylpht
halate
dinonylftalat+diisononylftalat
TBP tributylphosphate tributylfosfat
TOA tributyl-o-acetylcitrate tributyl-o-acetylcitrate
Triclosan triclosan triklosan
Dodecylphenol dodecylphenol dodecylfenol
Diuron Duiron Durion
Irgarol Irgarol Irgarol

NIVA 7686-2021
191
Abbreviation1 English Norwegian Param.
group
Siloxanes
D4 octamethylcyclotetrasiloxane
D5 decamethylcyclopentasiloxane
D6 dodecamethylcyclohexasiloxane
Dechlorane Plus
DBALD dibromoaldrin Dibromoaldrin
DDC_ANT dechlorane 603 dekloran 603
DDC_BBF dechlorane 601 dekloran 601
DDC_CO dechlorane A dekloran A
DDC_DBF dechlorane 602 dekloran 602
DDC_PA Dechlorane Plus anti Dekloran Plus anti
DDC_PS Dechlorane Plus syn Dekloran Plus syn
HCTBPH dechlorane 604 dekloran 604
NTOT total organic nitrogen total organisk nitrogen I-NUT
CTOT total organic carbon total organisk karbon O-MAJ
CORG organic carbon organisk karbon O-MAJ
GSAMT grain size kornfordeling P-PHY
MOCON moisture content vanninnhold P-PHY
Specific biological
effects methods
ALAD -aminolevulinic acid
dehydrase inhibition
-aminolevulinsyre dehydrase BEM
CYP1A cytochrome P450 1A-protein cytokrom P450 1A-protein BEM
EROD-activity Cytochrome P450 1A-activity
(CYP1A/P4501A1, EROD)
cytokrom P450 1A-aktivitet BEM
OH-pyrene Pyrene metabolite pyren metabolitt BEM
VDSI Vas Deferens Sequence Index BEM
INSTITUTES
EFDH Eurofins [DK] Eurofins [DK]
EFM Eurofins [N, Moss] Eurofins [N, Moss]
GFA Eurofins [DE, GFA] Eurofins [DE, GFA]
EFSofia Eurofins [DE, Sofia] Eurofins [DE, Sofia]
WEJ Eurofins WEJ Eurofins WEJ
FIER Institute for Nutrition,
Fisheries Directorate
Fiskeridirektoratets
Ernæringsinstitutt
FORC FORCE Institutes, Div. for
Isotope Technique and
Analysis [DK]
FORCE Institutterne, Div. for
Isotopteknik og Analyse [DK]
GALG GALAB Laboratories Gmbh [D] GALAB Laboratories Gmbh [D]
IFE Institute for Energy
Technology
Institutt for energiteknikk
IMR Institute of Marine Research
(IMR)
Havforskningsinstituttet
NACE Nordic Analytical Center Nordisk Analyse Center
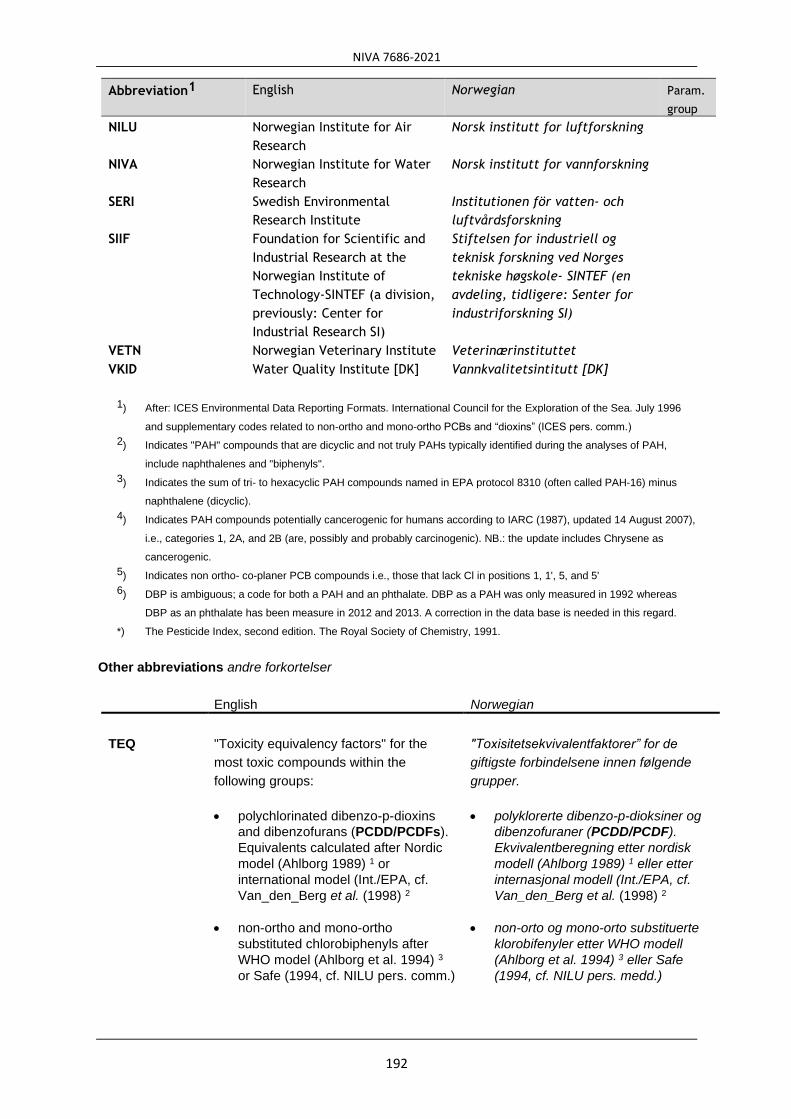
NIVA 7686-2021
192
Abbreviation1 English Norwegian Param.
group
NILU Norwegian Institute for Air
Research
Norsk institutt for luftforskning
NIVA Norwegian Institute for Water
Research
Norsk institutt for vannforskning
SERI Swedish Environmental
Research Institute
Institutionen för vatten- och
luftvårdsforskning
SIIF Foundation for Scientific and
Industrial Research at the
Norwegian Institute of
Technology-SINTEF (a division,
previously: Center for
Industrial Research SI)
Stiftelsen for industriell og
teknisk forskning ved Norges
tekniske høgskole- SINTEF (en
avdeling, tidligere: Senter for
industriforskning SI)
VETN Norwegian Veterinary Institute Veterinærinstituttet
VKID Water Quality Institute [DK] Vannkvalitetsintitutt [DK]
1) After: ICES Environmental Data Reporting Formats. International Council for the Exploration of the Sea. July 1996
and supplementary codes related to non-ortho and mono-ortho PCBs and “dioxins” (ICES pers. comm.)
2) Indicates "PAH" compounds that are dicyclic and not truly PAHs typically identified during the analyses of PAH,
include naphthalenes and "biphenyls".
3) Indicates the sum of tri- to hexacyclic PAH compounds named in EPA protocol 8310 (often called PAH-16) minus
naphthalene (dicyclic).
4) Indicates PAH compounds potentially cancerogenic for humans according to IARC (1987), updated 14 August 2007),
i.e., categories 1, 2A, and 2B (are, possibly and probably carcinogenic). NB.: the update includes Chrysene as
cancerogenic.
5) Indicates non ortho- co-planer PCB compounds i.e., those that lack Cl in positions 1, 1', 5, and 5'
6) DBP is ambiguous; a code for both a PAH and an phthalate. DBP as a PAH was only measured in 1992 whereas
DBP as an phthalate has been measure in 2012 and 2013. A correction in the data base is needed in this regard.
*) The Pesticide Index, second edition. The Royal Society of Chemistry, 1991.
Other abbreviations andre forkortelser
English Norwegian
TEQ "Toxicity equivalency factors" for the
most toxic compounds within the
following groups:
• polychlorinated dibenzo-p-dioxins
and dibenzofurans (PCDD/PCDFs).
Equivalents calculated after Nordic
model (Ahlborg 1989) 1 or
international model (Int./EPA, cf.
Van_den_Berg et al. (1998) 2
• non-ortho and mono-ortho
substituted chlorobiphenyls after
WHO model (Ahlborg et al. 1994) 3
or Safe (1994, cf. NILU pers. comm.)
"Toxisitetsekvivalentfaktorer” for de
giftigste forbindelsene innen følgende
grupper.
• polyklorerte dibenzo-p-dioksiner og
dibenzofuraner (PCDD/PCDF).
Ekvivalentberegning etter nordisk
modell (Ahlborg 1989) 1 eller etter
internasjonal modell (Int./EPA, cf.
Van_den_Berg et al. (1998) 2
• non-orto og mono-orto substituerte
klorobifenyler etter WHO modell
(Ahlborg et al. 1994) 3 eller Safe
(1994, cf. NILU pers. medd.)

NIVA 7686-2021
193
ppm parts per million, mg/kg deler pr. milliondeler, mg/kg
ppb parts per billion, g/kg deler pr. milliarddeler, g/kg
ppp parts per trillion, ng/kg deler pr. tusen-milliarddeler, ng/kg
d.w. dry weight basis tørrvekt basis
w.w. wet weight or fresh weight basis våtvekt eller friskvekt basis
1 ) Ahlborg, U.G., 1989. Nordic risk assessment of PCDDs and PCDFs. Chemosphere 19:603-608.
2 ) Van den Berg, Birnbaum, L, Bosveld, A. T. C. and co-workers, 1998. Toxic equivalency factors (TEFs) for PCBs, PCDDs,
PCDFs for humans and wildlife. Environ Hlth. Perspect. 106:775-792.
3 ) Ahlborg, U.G., Becking G.B., Birnbaum, L.S., Brouwer, A, Derks, H.J.G.M., Feely, M., Golor, G., Hanberg, A., Larsen, J.C.,
Liem, A.K.G., Safe, S.H., Schlatter, C., Wärn, F., Younes, M., Yrjänheikki, E., 1994. Toxic equivalency factors
for dioxin-like PCBs. Report on a WHO-ECEH and IPSC consultation, December 1993. Chemosphere
28:1049-1067.


NIVA 7686-2021
195
Appendix C Norwegian provisional high reference
contaminant concentrations (PROREF) revised 2019


NIVA 7686-2021
197
Norwegian provisional high reference contaminant concentrations (PROREF) for contaminants in blue mussel (Mytilus edulis), perwinkle (Littorina littorea), dogwhelk
(Nucella lapillus) and Atlantic cod (Gadus morhua) for whole soft body, liver and fillet based on MILYKYS data (see Chapter 2.7). All values are on a wet weight
(w.w.) basis. The stations, count and total number of values used to determine PROREF are indicated. Also indicated for comparison to PROREF used previously in
MILKYS reports, e.g. Green et al. (2018), and the risk-based standards (e.g. EU EQS and Water Region Specific Substances) used in this report
(Norwegian_Environment_Agency 2016). The yellow indicates where PROREF has increased or decreased over 20 %, and green and pink cells indicate where PROREF is
below or above the EQS, respectively.
Parame-ter code
Species Tissue Reference stations Station count
Value count
Unit on wet wt. Basis
PROREF-2019
PROREF-2017
PROREF-2017 /
PROREF-2019
EQS EQS/
PROREF-2019
AG Mytilus edulis soft body 26A2,22A,I241,I023,I712,I131A,63A,97A2 8 162 mg/kg 0.009 0.0080 0.9340
AS Mytilus edulis soft body 31A,I301,I023,30A,I712 5 116 mg/kg 2.503 3.3150 1.3247
CD Mytilus edulis soft body I241,26A2,I969 3 106 mg/kg 0.180 0.1800 1.0000
CO Mytilus edulis soft body 26A2,I241 2 34 mg/kg 0.080 0.0791 0.9890
CR Mytilus edulis soft body 52A,15A,26A2,I131A,64A 5 100 mg/kg 0.361 0.3610 1.0000
CU Mytilus edulis soft body I307,I712,63A,I306,I304,57A,51A,64A,I023 9 353 mg/kg 1.400 1.4200 1.0143
HG Mytilus edulis soft body 36A,46A,10A2 3 137 mg/kg 0.012 0.0100 0.8197 0.020 1.6393 MO Mytilus edulis soft body B7,B11,B2,B3,B6,B10,35A,B5 8 207 mg/kg 0.220
NI Mytilus edulis soft body I241,I131A,52A,57A,26A2 5 101 mg/kg 0.290 0.2900 1.0000
PB Mytilus edulis soft body 11X,48A 2 75 mg/kg 0.195 0.1950 1.0000
SN Mytilus edulis soft body 10A2,11X,15A,22A,26A2,30A,31A,35A,57A,63A,64A,65A,69A,71A,91A2,97A2,98A2,I023,I131A,I133,I301,I304,I306,I965,I969,I241,52A,I307,I712
29 625 mg/kg 0.300 0.3000 1.0000
ZN Mytilus edulis soft body 43A,I712,48A 3 49 mg/kg 17.660 17.6600 1.0000
PCB-7 Mytilus edulis soft body 10A2,41A,11X,98A2,64A,97A2 6 194 µg/kg 1.157 0.4891 0.4228 0.600 0.5187
CB28 Mytilus edulis soft body 10A2,11X,15A,22A,36A,41A,43A,44A,46A,48A,56A,57A,63A,65A,69A,84A,91A2,92A1,98A2
19 910 µg/kg 0.120 0.1200 1.0000
CB52 Mytilus edulis soft body 10A2,11X,15A,26A2,41A,43A,64A,65A,69A,84A,97A2,98A2 12 480 µg/kg 0.200 0.2000 1.0000
CB77 Mytilus edulis soft body 76A 1 18 µg/kg 0.010 0.0111 1.1054
CB81 Mytilus edulis soft body 76A 1 18 µg/kg 0.0005
CB101 Mytilus edulis soft body 43A,48A,98A2,97A2,10A2,64A,26A2,11X,41A 9 245 µg/kg 0.200 0.2000 1.0000
CB105 Mytilus edulis soft body 10A2,11X,15A,41A,43A,46A,48A 7 208 µg/kg 0.150 0.1500 1.0000
CB118 Mytilus edulis soft body 43A 1 15 µg/kg 0.070 0.0730 1.0429
CB126 Mytilus edulis soft body 76A 1 18 µg/kg 0.0010
CB138 Mytilus edulis soft body 43A,10A2,11X,41A 4 153 µg/kg 0.200 0.2040 1.0200
CB153 Mytilus edulis soft body 43A,11X,10A2,41A 4 153 µg/kg 0.260 0.2600 1.0000
CB156 Mytilus edulis soft body 10A2,11X,15A,22A,35A,36A,41A,43A,44A,46A,48A 11 399 µg/kg 0.150 0.1500 1.0000
CB169 Mytilus edulis soft body 76A 1 18 µg/kg 0.0001
CB180 Mytilus edulis soft body 10A2,11X,15A,22A,26A2 5 282 µg/kg 0.100 0.1000 1.0000
DDEPP Mytilus edulis soft body 43A,41A,10A2,11X 4 147 µg/kg 0.224 0.2240 1.0000 610.000 2 723.2143 DDTEP Mytilus edulis soft body 84A,36A,71A,31A 4 107 µg/kg 3.000
DDTPP Mytilus edulis soft body 10A2,11X,15A,22A,30A,31A,36A,71A,76A,98A2,I022,I023,I024,I131A,I132,I133,I304,I306,I307,I712
20 644 µg/kg 0.600 0.6000 1.0000

NIVA 7686-2021
198
Parame-ter code
Species Tissue Reference stations Station count
Value count
Unit on wet wt. Basis
PROREF-2019
PROREF-2017
PROREF-2017 /
PROREF-2019
EQS EQS/
PROREF-2019
TDEPP Mytilus edulis soft body 41A,43A,44A,46A,48A,92A1 6 93 µg/kg 0.100 0.1000 1.0000
HCB Mytilus edulis soft body 48A,43A,15A,22A,46A,41A,98A2,11X,30A,10A2,36A 11 473 µg/kg 0.100 0.1000 1.0000 10.000 100.0000 HBCDA Mytilus edulis soft body I023,97A2,91A2 3 44 µg/kg 0.110 0.1099 1.0000 167.000 1 520.2549 HBCDG Mytilus edulis soft body I023,97A2,91A2 3 44 µg/kg 0.030 0.0317 1.0577
HBCDB Mytilus edulis soft body I023,97A2,91A2 3 44 µg/kg 0.020 0.0199 0.9925
HBCDD Mytilus edulis soft body I023,97A2,91A2 3 44 µg/kg 0.147 0.1396 0.9513
BDESS Mytilus edulis soft body 98A2 1 16 µg/kg 0.193 0.193 1.0000
BDE6 Mytilus edulis soft body 98A2,26A2,91A2,71A,I023,97A2,30A 7 109 µg/kg 0.408 0.1900 0.4657 0.009 0.0208 BDE47 Mytilus edulis soft body 98A2,26A2,71A,I023,91A2,30A 6 94 µg/kg 0.171 0.1410 0.8270 0.009 0.0499 BDE99 Mytilus edulis soft body 98A2,91A2,26A2,I023 4 61 µg/kg 0.060 0.0600 1.0000
BDE100 Mytilus edulis soft body 98A2,26A2,I023,91A2,71A 5 79 µg/kg 0.050 0.0510 1.0200
BDE126 Mytilus edulis soft body 71A,97A2,26A2,I023,91A2 5 75 µg/kg 0.050 0.0500 1.0000
BDE153 Mytilus edulis soft body 97A2,26A2,I023,91A2,71A,98A2,30A 7 109 µg/kg 0.050 0.0500 1.0000
BDE154 Mytilus edulis soft body 97A2,26A2,I023,91A2,71A,98A2,30A 7 109 µg/kg 0.050 0.0500 1.0000
BDE183 Mytilus edulis soft body 71A,97A2,26A2,I023,91A2,98A2 6 92 µg/kg 0.300 0.3000 1.0000
BDE196 Mytilus edulis soft body 71A,97A2,26A2,I023,91A2 5 75 µg/kg 0.300 0.3000 1.0000
BDE209 Mytilus edulis soft body 71A,97A2,91A2,I023,26A2 5 75 µg/kg 1.290 1.2920 1.0016
SCCP Mytilus edulis soft body I023,71A,91A2,97A2,26A2,30A 6 90 µg/kg 20.260 20.2600 1.0000 6 000.000 296.1500 MCCP Mytilus edulis soft body I023,26A2,71A,91A2,97A2,30A 6 89 µg/kg 87.600 87.6000 1.0000 170.000 1.9406 PAH16 Mytilus edulis soft body 98A2,I023 2 32 µg/kg 33.828 33.8280 1.0000
PAH-sum Mytilus edulis soft body 98A2,I023 2 32 µg/kg 30.050
KPAH Mytilus edulis soft body 98A2 1 17 µg/kg 0.622
ACNE Mytilus edulis soft body 30A,71A,98A2,I023,I131A 5 177 µg/kg 0.800 0.8000 1.0000
ACNLE Mytilus edulis soft body 30A,71A,98A2,I023,I131A,I132,I133 7 266 µg/kg 1.000 1.0000 1.0000
ANT Mytilus edulis soft body 98A2,I131A,I307,I915,I913,71A 6 208 µg/kg 0.800 1.1000 1.3750 2 400.000 3 000.0000 BAA Mytilus edulis soft body I023,98A2 2 32 µg/kg 1.490 1.4900 1.0000 300.000 201.3423 BAP Mytilus edulis soft body 98A2,I307,I131A,I306,I304,30A,I913 7 354 µg/kg 1.200 1.3000 1.0833 5.000 4.1667 BBJF Mytilus edulis soft body 98A2,I023,I304,I306,I307 5 107 µg/kg 6.240 6.2400 1.0000
BBJKF Mytilus edulis soft body I304,I306,I307,30A 4 96 µg/kg 3.925
BGHIP Mytilus edulis soft body 98A2,I023,I304,I306,I307,I913,71A 7 254 µg/kg 2.070 2.0700 1.0000
BKF Mytilus edulis soft body 30A,98A2,I023,I304,I306,I307,I913 7 167 µg/kg 1.500 1.5000 1.0000
CHR Mytilus edulis soft body 98A2 1 17 µg/kg 0.520 0.5180 0.9962
DBA3A Mytilus edulis soft body 30A,I131A 2 117 µg/kg 0.500 0.5000 1.0000
FLE Mytilus edulis soft body 30A,71A,98A2,I023,I131A,I304,I306,I307,I915 9 364 µg/kg 1.600 1.6000 1.0000
FLU Mytilus edulis soft body 98A2,I023 2 32 µg/kg 5.350 5.3500 1.0000 30.000 5.6075 ICDP Mytilus edulis soft body 30A,71A,98A2,I023,I131A 5 176 µg/kg 1.730 1.7250 0.9971
NAP Mytilus edulis soft body I023,98A2,71A 3 47 µg/kg 17.300 17.3000 1.0000 2 400.000 138.7283 PA Mytilus edulis soft body 98A2,I023,71A 3 47 µg/kg 2.280 2.2800 1.0000
PYR Mytilus edulis soft body 98A2 1 17 µg/kg 1.020 1.0200 1.0000
TBT Mytilus edulis soft body 11X 1 20 µg/kg 7.107 7.1065 1.0000 150.000 21.1074 TCHT Mytilus edulis soft body I301,I133,22A,30A 4 65 µg/kg 2.000 2.0000 1.0000

NIVA 7686-2021
199
Parame-ter code
Species Tissue Reference stations Station count
Value count
Unit on wet wt. Basis
PROREF-2019
PROREF-2017
PROREF-2017 /
PROREF-2019
EQS EQS/
PROREF-2019
MBTIN Mytilus edulis soft body 22A 1 14 µg/kg 0.860 0.8638 1.0044
DBTIN Mytilus edulis soft body 30A,I131A,I201,I205,I304,I306,I307 7 317 µg/kg 4.770 4.7680 0.9996
TBEP Mytilus edulis soft body 26A2,I023,91A2,97A2,30A 5 71 µg/kg 11.300 11.3000 1.0000
TBP Mytilus edulis soft body 30A,I023,97A2,26A2,91A2 5 71 µg/kg 5.960 5.9550 0.9992
TCEP Mytilus edulis soft body 26A2,I023,91A2,97A2,30A 5 71 µg/kg 55.500 55.5000 1.0000
TCPP Mytilus edulis soft body 30A,26A2,97A2,91A2 4 56 µg/kg 40.250 40.2500 1.0000
TDCP Mytilus edulis soft body 26A2,91A2,97A2,I023,30A 5 71 µg/kg 8.930 8.9250 0.9994
TEHP Mytilus edulis soft body 26A2,I023,91A2,97A2,30A 5 71 µg/kg 23.950 23.9500 1.0000
TIBP Mytilus edulis soft body 30A,I023,26A2,97A2,91A2 5 71 µg/kg 9.900 9.9000 1.0000
EHDPP Mytilus edulis soft body 30A,26A2,I023,91A2,97A2 5 71 µg/kg 11.050 11.0500 1.0000
BPA Mytilus edulis soft body 30A,97A2,I023 3 45 µg/kg 7.450 7.4460 0.9995
TBBPA Mytilus edulis soft body 30A,97A2,26A2,I023,71A,91A2 6 87 µg/kg 0.270 0.2669 0.9885
Delta13C Mytilus edulis soft body 97A2,22A,26A2,15A 4 60 ‰ 20.450 -20.4470 -0.9999
Delta15N Mytilus edulis soft body 56A,51A 2 30 ‰ 3.770 3.7743 1.0011
C/N Mytilus edulis soft body 15A,71A,I304,22A,30A,I023,97A2,56A 8 120 % 4.980 4.9810 1.0002
DOT Mytilus edulis soft body I301,I133,22A,30A 4 65 µg/kg 0.990 0.9900 1.0000
MOT Mytilus edulis soft body I301,I133,22A,30A 4 65 µg/kg 0.990 0.9900 1.0000
MBT Littorina littorea soft body 71G 1 5 µg/kg 1.344
DBT Littorina littorea soft body 71G 1 5 µg/kg 1.964
TTBT Nucella lapillus soft body 15G,76G,22G,131G,36G,11G,227G 7 35 µg/kg 1.015
TBT Nucella lapillus soft body 11G,131G,15G,98G 4 66 µg/kg 23.540 23.5350 0.9998 150.000 6.3721 TCHT Nucella lapillus soft body 76G,22G,131G,11G,36G,15G,98G,227G1 8 55 µg/kg 2.330 2.3300 1.0000
MBTIN Nucella lapillus soft body 22G,98G,36G,11G,15G,76G,131G,227G1 8 47 µg/kg 2.180 2.1770 0.9986
DBTIN Nucella lapillus soft body 11G,131G,15G,98G,36G,22G,76G 7 42 µg/kg 1.200 1.2000 1.0000
MPTIN Nucella lapillus soft body 71G 1 5 µg/kg 2.624
DPTIN Nucella lapillus soft body 71G 1 5 µg/kg 1.940
TPhT Nucella lapillus soft body 71G 1 6 µg/kg 1.650 1.6463 0.9977
VDSI Nucella lapillus soft body 11G,15G,131G,76G 4 63 Index 3.680 3.6832 1.0009
DOT Nucella lapillus soft body 76G,22G,131G,36G,15G,11G,98G,227G1 8 55 µg/kg 1.200 1.2000 1.0000
MOT Nucella lapillus soft body 76G,22G,131G,36G,15G,11G,98G,227G1 8 55 µg/kg 1.200 1.2000 1.0000
AG Gadus morhua Liver 80B,10B 2 229 mg/kg 0.930 0.9256 0.9953
AS Gadus morhua Liver 10B,13B,80B,43B2,71B,15B 6 721 mg/kg 12.800 12.8000 1.0000
CD Gadus morhua Liver 80B,67B,15B,23B 4 1655 mg/kg 0.137 0.1365 1.0000
CO Gadus morhua Liver 43B2 1 145 mg/kg 0.060 0.0584 0.9733
CR Gadus morhua Liver 10B,15B,71B,43B2,80B,13B,36B,30B,98B1 9 1176 mg/kg 0.400 0.4025 1.0063
CU Gadus morhua Liver 10B,15B,80B 3 1101 mg/kg 14.000 14.0000 1.0000
NI Gadus morhua Liver 15B,23B,43B2,10B,71B,80B,53B,36B 8 973 mg/kg 0.650 0.6500 1.0000
PB Gadus morhua Liver 92B,36B,67B,43B,15B,43B2,98B1,10B,23B,80B 10 3588 mg/kg 0.050 0.0500 1.0000
SN Gadus morhua Liver 10B,15B,23B,36B,43B2,53B,71B,80B,13B,98B1,30B 11 1381 mg/kg 0.300 0.3000 1.0000
ZN Gadus morhua Liver 98B1,10B,92B,43B2,80B 5 1351 mg/kg 35.000 35.0000 1.0000
PCB-7 Gadus morhua Liver 98B1,10B,92B,43B 4 1229 µg/kg 614.000 614.0000 1.0000 0.600 0.0010

NIVA 7686-2021
200
Parame-ter code
Species Tissue Reference stations Station count
Value count
Unit on wet wt. Basis
PROREF-2019
PROREF-2017
PROREF-2017 /
PROREF-2019
EQS EQS/
PROREF-2019
CB28 Gadus morhua Liver 80B,98B1,23B,67B,10B,43B,92B,53B,43B2 9 3039 µg/kg 8.000 8.0000 1.0000
CB52 Gadus morhua Liver 67B,23B,98B1 3 1385 µg/kg 16.000 16.0000 1.0000
CB101 Gadus morhua Liver 23B 1 554 µg/kg 32.350 32.3500 1.0000
CB118 Gadus morhua Liver 98B1,23B,10B,92B,43B,67B,80B 7 2359 µg/kg 100.000 100.0000 1.0000
CB138 Gadus morhua Liver 98B1,10B,43B,92B 4 1282 µg/kg 157.950 157.9500 1.0000
CB153 Gadus morhua Liver 98B1,10B,92B,43B 4 1282 µg/kg 189.950 189.9500 1.0000
CB180 Gadus morhua Liver 98B1,10B,92B 3 1165 µg/kg 45.800 45.8000 1.0000
DDEPP Gadus morhua Liver 23B,10B,98B1 3 1498 µg/kg 160.750 160.7500 1.0000 610.000 3.7947 DDTPP Gadus morhua Liver 10B,23B,36B,98B1 4 885 µg/kg 13.000 13.0000 1.0000
TDEPP Gadus morhua Liver 23B,92B,36B 3 1303 µg/kg 32.000 32.0000 1.0000
HCHA Gadus morhua Liver 53B,15B,36B,10B,23B,30B,67B,92B,43B,98B1 10 4071 µg/kg 8.000 8.0000 1.0000
HCHG Gadus morhua Liver 53B,10B,92B,36B 4 1602 µg/kg 11.000 12.0000 1.0909 61.000 5.5455 HCB Gadus morhua Liver 36B,53B 2 1079 µg/kg 14.000 14.0000 1.0000 10.000 0.7143 4-N-NP Gadus morhua Liver 80B,43B2 2 135 µg/kg 131.000 131.0000 1.0000 3 000.000 22.9008 4-N-OP Gadus morhua Liver 43B2,80B 2 135 µg/kg 23.500 23.5000 1.0000 0.004 0.0002 4-T-NP Gadus morhua Liver 43B2,80B 2 135 µg/kg 240.900 240.9000 1.0000 3 000.000 12.4533 4-T-OP Gadus morhua Liver 80B,43B2 2 135 µg/kg 20.000 20.0000 1.0000 0.004 0.0002 CYP1A Gadus morhua Liver 23B,53B 2 487 2.070 2.0669 0.9985
EROD Gadus morhua Liver 23B,53B,36B,30B 4 1303 pmol/min/mg protein
192.290 192.2861 1.0000
HBCDA Gadus morhua Liver 43B2 1 65 µg/kg 7.000 7.0000 1.0000 167.000 23.8571 HBCDG Gadus morhua Liver 43B2,80B 2 135 µg/kg 0.890 0.8948 1.0054
HBCDB Gadus morhua Liver 43B2,80B 2 135 µg/kg 0.400 0.4030 1.0075
HBCDD Gadus morhua Liver 43B2 1 65 µg/kg 7.180 7.1960 1.0022
BDESS Gadus morhua Liver 98B1 1 173 µg/kg 21.420 21.4200 1.0000
BDE6 Gadus morhua Liver 98B1 1 173 µg/kg 19.882 19.8800 1.0000 0.009 0.0004 BDE28 Gadus morhua Liver 36B,13B,98B1,23B,43B2 5 701 µg/kg 1.400 1.4000 1.0000
BDE47 Gadus morhua Liver 98B1,36B,23B 3 557 µg/kg 16.000 16.0000 1.0000 0.009 0.0005 BDE49 Gadus morhua Liver 23B,98B1 2 266 µg/kg 3.950
BDE66 Gadus morhua Liver 23B,98B1 2 266 µg/kg 0.595
BDE71 Gadus morhua Liver 98B1,23B,53B,30B 4 553 µg/kg 0.400
BDE77 Gadus morhua Liver 30B 1 122 µg/kg 1.690
BDE85 Gadus morhua Liver 98B1,53B,23B,30B 4 536 µg/kg 1.725
BDE99 Gadus morhua Liver 13B,23B 2 363 µg/kg 0.750 0.7540 1.0053
BDE100 Gadus morhua Liver 98B1 1 173 µg/kg 2.600 2.6000 1.0000
BDE126 Gadus morhua Liver 13B,23B,30B,36B,43B2,80B 6 419 µg/kg 0.100 0.1000 1.0000
BDE138 Gadus morhua Liver 30B,23B,53B,98B1 4 561 µg/kg 0.300
BDE153 Gadus morhua Liver 13B,23B 2 363 µg/kg 0.150 0.1490 0.9933
BDE154 Gadus morhua Liver 98B1,36B 2 323 µg/kg 1.500 1.5000 1.0000
BDE183 Gadus morhua Liver 13B,23B,30B,36B,43B2,53B,80B,98B1 8 1360 µg/kg 0.600 0.6005 1.0008
BDE196 Gadus morhua Liver 13B,23B,30B,36B,43B2,53B,80B,98B1 8 1142 µg/kg 1.000 1.0000 1.0000

NIVA 7686-2021
201
Parame-ter code
Species Tissue Reference stations Station count
Value count
Unit on wet wt. Basis
PROREF-2019
PROREF-2017
PROREF-2017 /
PROREF-2019
EQS EQS/
PROREF-2019
BDE205 Gadus morhua Liver 23B,30B,98B1,53B 4 559 µg/kg 1.500
BDE209 Gadus morhua Liver 13B 1 131 µg/kg 2.000 2.0000 1.0000
SCCP Gadus morhua Liver 23B,43B2,80B 3 245 µg/kg 154.000 154.0000 1.0000 6 000.000 38.9610 MCCP Gadus morhua Liver 23B,43B2 2 174 µg/kg 392.800 392.8000 1.0000 170.000 0.4328 PFAS Gadus morhua Liver 43B2,80B 2 251 µg/kg 11.000 20.0000 1.8182
PFNA Gadus morhua Liver 13B,23B,30B,36B,43B2,80B,98B1,53B 8 1315 µg/kg 5.000 5.0000 1.0000
PFOA Gadus morhua Liver 43B2,13B,80B,53B,36B,98B1,23B,30B 8 1289 µg/kg 10.000 10.0000 1.0000 91.000 9.1000 PFOS Gadus morhua Liver 43B2,80B 2 251 µg/kg 10.250 10.2500 1.0000 9.100 0.8878 PFOSA Gadus morhua Liver 43B2,98B1,53B,80B,23B 5 718 µg/kg 6.245 6.2450 1.0000
PFBS Gadus morhua Liver 13B,36B,43B2,53B,80B,23B,30B,98B1 8 1316 µg/kg 8.000 8.0000 1.0000
TBEP Gadus morhua Liver 43B2 1 65 µg/kg 135.000 135.0000 1.0000
TBP Gadus morhua Liver 43B2 1 65 µg/kg 135.000 135.0000 1.0000
TCEP Gadus morhua Liver 43B2 1 65 µg/kg 477.200 477.2000 1.0000
TCPP Gadus morhua Liver 43B2 1 65 µg/kg 67.600 67.6000 1.0000
TDCP Gadus morhua Liver 43B2 1 65 µg/kg 71.120 71.1200 1.0000
TEHP Gadus morhua Liver 43B2 1 64 µg/kg 334.150 334.1500 1.0000
TIBP Gadus morhua Liver 43B2 1 65 µg/kg 135.000 135.0000 1.0000
EHDPP Gadus morhua Liver 43B2 1 65 µg/kg 66.420 66.4200 1.0000
BPA Gadus morhua Liver 43B2,80B 2 134 µg/kg 2.000 2.0000 1.0000
TBBPA Gadus morhua Liver 80B,43B2 2 135 µg/kg 0.570 0.5675 0.9956
HG Gadus morhua Fillet 10B 1 504 mg/kg 0.056 0.0600 1.0714 0.020 0.3571 ALAD Gadus morhua Blood 53B 1 395 ng/min/mg protein 34.940 34.9390 1.0000
BAP3O Gadus morhua Bile 30B,15B 2 305 µg/kg 2.780 2.7828 1.0010
PA1O Gadus morhua Bile 23B,15B,30B,53B 4 800 µg/kg 6.150 6.1542 1.0007
PYR1O Gadus morhua Bile 23B 1 398 µg/kg 15.840 15.8370 0.9998
TBT Littorina/Nucella soft body 11G,15G,131G,98G 4 66 µg/kg 23.535


NIVA 7686-2021
203
Appendix D Maps of stations
Nominal station positions 1981-2020
(cf. Appendix E)

NIVA 7686-2021
204
Appendix D (cont.) Map of stations
NOTES
The station’s nominal position is plotted, and not the specific positions that may have differed
from one year to another. The maps are generated using ESRI ArcGIS version 10.4.
The following symbols and codes apply:
All years 2020 Explanation Station code
Sediment <number>S
Blue mussel <number>A
Blue mussel I<number/letter> 1)
Blue mussel R<number/letter> 1)
Dogwhelk/Periwinkle <number>G
Prawn <number>C
Atlantic cod <number>B
Flatfish <number>F
Other round fish
Common eider duck <number>N
Town or city
1) Supplementary station used in the blue mussel pollution (I) or reference (R) index of the Norwegian
Environment Agency (Green et al. 2011).

NIVA 7686-2021
205
Maps presenting MILKYS stations in Norway. Numbers refer to map references that follow.
RUSSIA

NIVA 7686-2021
206
MAP 1
MAP 2

NIVA 7686-2021
207
MAP 3
MAP 4

NIVA 7686-2021
208
MAP 5
MAP 6
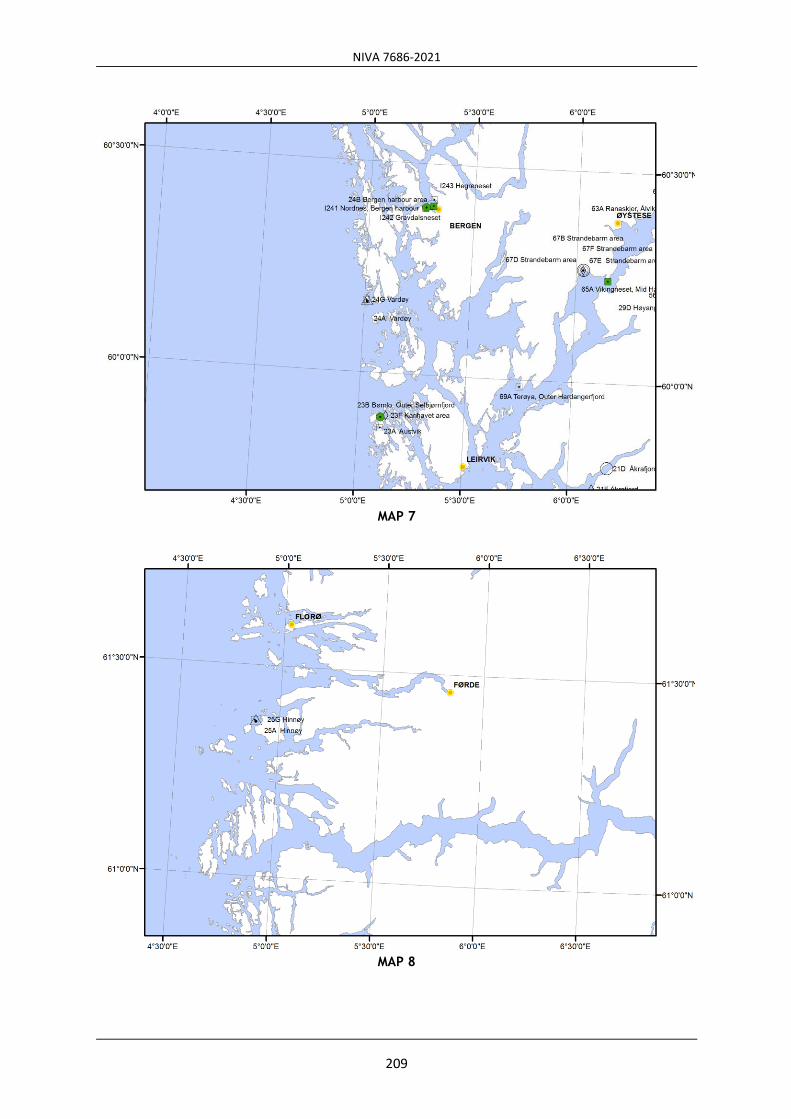
NIVA 7686-2021
209
MAP 7
MAP 8

NIVA 7686-2021
210
MAP 9
MAP 10

NIVA 7686-2021
211
MAP 11
MAP 12
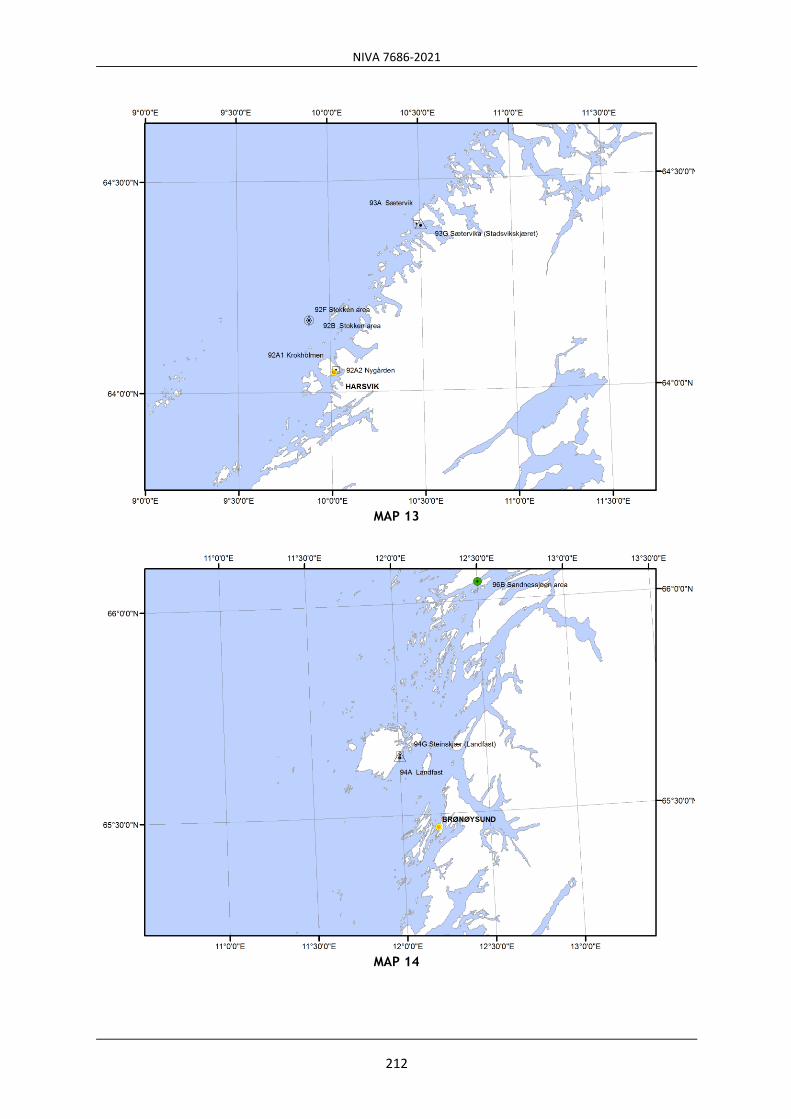
NIVA 7686-2021
212
MAP 13
MAP 14

NIVA 7686-2021
213
MAP 15
MAP 16

NIVA 7686-2021
214
MAP 17
MAP 18

NIVA 7686-2021
215
MAP 19
MAP 20

NIVA 7686-2021
216
MAP 21
MAP 22

NIVA 7686-2021
217
MAP 23
MAP 24


NIVA 7686-2021
219
Appendix E Overview of materials and analyses 2019-2020
Nominal station positions are shown on maps in Appendix D
Year:
2019t - samples taken in 2019
2020p – samples planned in 2020
2020t – samples taken in 2020
Species:
Blue mussel (Mytilus edulis)
Dogwhelk (Nucella lapillus)
Common periwinkle (Littorina littorea)
Atlantic cod (Gadus morhua)
European flounder (Platichthus flesus)
Common eider duck (Somateria mollissima)
Tissue:
SB-Soft body tissue
LI-Liver tissue, in fish
MU-Muscle tissue, in fish
BL-Blood, in fish or eider
BI-Bile, in fish
EG-Eggs (homogenate of yolk and albumin), in eider
Overview follows on next page

NIVA 7686-2021
220
Parameter-group codes (see Appendix B for descriptions of codes) 2019-2020:
code Description Me-SB Nl/Ll-SB Gm-BI Gm-BL Gm/Pf-LI Gm/Pf-MU Sm-BL Sm-EG
I-MET metals 1) X X
I-MET Hg X X X X
ISOTO δ15N and δ13C X X X X
O-BR PBDEs 2) X X X X
OC-CB PCBs 3) X X
OC-CL HCB X X X X
OC-CP SCCP, MCCP X X X X
OC-DD DDT, DDE, DDD X X
OC-HC -, -HCH X X
O-FL PFAS 4) X X X
O-PAH PAHs 5) X X
O-MET TBT 6) X X
SLX Siloxanes7) X
BEM Biological effects
met.8)
Imposex OH-
pyrene
ALA-D EROD-
activity9)
1) Cadmium (Cd), copper (Cu), lead (Pb), zinc (Zn), silver (Ag), arsenic (As), chrome (Cr), nickel (Ni), cobalt (Co)
and tin (Sn).
2) Polybrominated diphenyl ethers (PBDEs), including brominated flame retardants and includes a selection of:
BDE28, BDE47, BDE49, BDE66, BDE71, BDE77, BDE85, BDE99, BDE100, BDE119, BDE138, BDE153, BDE154, BDE183,
BDE205, HBCD.
3) Includes a selection of the congeners: PCB-28, -52,-101,-105,-118,-138,-153,-156,-180, 209, 5-CB, OCS and,
when dioxins are analysed, the non-orto-PCBs, i.e. PCB-77, -81, -126, -169.
4) Includes: PFNA, PFOA, PFHpA, PFHxA, PFOS, PFBS, PFOSA.
5 ) Includes (with NPDs): ACNE, ACNLE, ANT, BAP, BBJF, BEP, BGHIP, BKF. BAA. CHR, DBA3A, DBT, DBTC1, DBTC2,
DBTC3, FLE, FLU, ICDP, NAP, NAPC1, NAPC2, NAPC3, PA, PAC1, PAC2, PAC3, PER, PYR.
6) Includes: DBTIN, DPTIN, MBTIN, MPTIN, TBTIN, TPhT.
7) SLX – Siloxanes includes: D4, D5, D6.
8) Biological effects methods.
9) Cod only.

NIVA 7686-2021
221
Appendix E. Sampling and analyses for 2019-2020 – biota.
Year Latin name Tissue Station Latitude Longitude
I-M
ET
O-M
ET
O-B
R
OC
-CB
OC
-CL
OC
-CP
OC
-DD
OC
-HC
O-F
L
O-P
AH
ISO
TO
BE
M
SLX
2019t Mytilus edulis Whole soft body Akershuskaia, Inner Oslofjord (st. I301) 59.90533 10.73633 3 3 3 3 3 3 3
2020p Mytilus edulis Whole soft body Akershuskaia, Inner Oslofjord (st. I301) 59.90533 10.73633 3 3 3 3 3 3 3
2020t Mytilus edulis Whole soft body Akershuskaia, Inner Oslofjord (st. I301) 59.90533 10.73633 3 3 3 3 3 3 3
2019t Mytilus edulis Whole soft body Gressholmen, Inner Oslofjord (st. 30A) 59.88362 10.71100 3 3 3 3 3 3 3 3 3 3 3
2020p Mytilus edulis Whole soft body Gressholmen, Inner Oslofjord (st. 30A) 59.88362 10.71100 3 3 3 3 3 3 3 3 3 3 3
2020t Mytilus edulis Whole soft body Gressholmen, Inner Oslofjord (st. 30A) 59.88362 10.71100 3 3 3 3 3 3 3 3 3 3 3
2019t Mytilus edulis Whole soft body Gåsøya, Inner Oslofjord (st. I304) 59.85133 10.58900 2 2 2 2 2 2 2 2
2020p Mytilus edulis Whole soft body Gåsøya, Inner Oslofjord (st. I304) 59.85133 10.58900 3 3 3 3 3 3 3 3
2020t Mytilus edulis Whole soft body Gåsøya, Inner Oslofjord (st. I304) 59.85133 10.58900 3 3 3 3 3 3 3 3
2019t Mytilus edulis Whole soft body Solbergstrand, Mid Oslofjord (st. 31A) 59.61550 10.65150 3 3 3 3 3 3
2020p Mytilus edulis Whole soft body Solbergstrand, Mid Oslofjord (st. 31A) 59.61550 10.65150 3 3 3 3 3 3
2020t Mytilus edulis Whole soft body Solbergstrand, Mid Oslofjord (st. 31A) 59.61550 10.65150 3 3 3 3 3 3
2019t Mytilus edulis Whole soft body Færder, Outer Oslofjord (st. 36A) 59.02740 10.52500 3 3 3 3 3 3 3 3 3 3
2020p Mytilus edulis Whole soft body Færder, Outer Oslofjord (st. 36A) 59.02740 10.52500 3 3 3 3 3 3 3 3 3 3
2020t Mytilus edulis Whole soft body Færder, Outer Oslofjord (st. 36A) 59.02740 10.52500 3 3 3 3 3 3 3 3 3 3
2019t Mytilus edulis Whole soft body Singlekalven, Hvaler (st. I023) 59.09511 11.13678 3 3 3 3 3 3
2020p Mytilus edulis Whole soft body Singlekalven, Hvaler (st. I023) 59.09511 11.13678 3 3 3 3 3 3
2020t Mytilus edulis Whole soft body Singlekalven, Hvaler (st. I023) 59.09511 11.13678 3 3 3 3 3 3
2019t Mytilus edulis Whole soft body Kirkøy, Hvaler (st. I024) 59.07905 10.98734 2 2 2
2020p Mytilus edulis Whole soft body Kirkøy, Hvaler (st. I024) 59.07905 10.98734 3 3 3
2020t Mytilus edulis Whole soft body Kirkøy, Hvaler (st. I024) 59.07905 10.98734 3 3 3
2019t Mytilus edulis Whole soft body Bjørkøya, Langesundfjord (st. 71A) 59.02333 9.75367 0 0 0 0 0 0 0 0
2020p Mytilus edulis Whole soft body Bjørkøya, Langesundfjord (st. 71A) 59.02333 9.75367 3 3 3 3 3 3 3 3
2020t Mytilus edulis Whole soft body Bjørkøya, Langesundfjord (st. 71A) 59.02333 9.75367 1 1 1 1 1 1 1 1
2019t Mytilus edulis Whole soft body Sylterøya, Langesundfjord (st. I714) 59.05140 9.70384 0 0 0 0 0 0 0 0
2020p Mytilus edulis Whole soft body Sylterøya, Langesundfjord (st. I714) 59.05140 9.70384 3 3 3 3 3 3 3 3
2020t Mytilus edulis Whole soft body Sylterøya, Langesundfjord (st. I714) 59.05140 9.70384 0 0 0 0 0 0 0 0
2019t Mytilus edulis Whole soft body Risøya, Risør (st. 76A2) 58.73270 9.28104 3 3 3 3 3
2020p Mytilus edulis Whole soft body Risøya, Risør (st. 76A2) 58.73270 9.28104 3 3 3 3 3
2020t Mytilus edulis Whole soft body Risøya, Risør (st. 76A2) 58.73270 9.28104 3 3 3 3 3

NIVA 7686-2021
222
Year Latin name Tissue Station Latitude Longitude
I-M
ET
O-M
ET
O-B
R
OC
-CB
OC
-CL
OC
-CP
OC
-DD
OC
-HC
O-F
L
O-P
AH
ISO
TO
BE
M
SLX
2019t Mytilus edulis Whole soft body Lastad, Søgne (st. I131A) 58.05557 7.70830 3 3
2020p Mytilus edulis Whole soft body Lastad, Søgne (st. I131A) 58.05557 7.70830 3 3
2020t Mytilus edulis Whole soft body Lastad, Søgne (st. I131A) 58.05557 7.70830 3 3
2019t Mytilus edulis Whole soft body Odderøya, Kristiansand harbour (st. I133) 58.13167 8.00167 3 3 3 3 3 3 3 3
2020p Mytilus edulis Whole soft body Odderøya, Kristiansand harbour (st. I133) 58.13167 8.00167 3 3 3 3 3 3 3 3
2020t Mytilus edulis Whole soft body Odderøya, Kristiansand harbour (st. I133) 58.13167 8.00167 3 3 3 3 3 3 3 3
2019t Mytilus edulis Whole soft body Gåsøya-Ullerøya, Farsund (st. 15A) 58.04605 6.91590 3 3 3
2020p Mytilus edulis Whole soft body Gåsøya-Ullerøya, Farsund (st. 15A) 58.04605 6.91590 3 3 3
2020t Mytilus edulis Whole soft body Gåsøya-Ullerøya, Farsund (st. 15A) 58.04605 6.91590 3 3 3
2019t Mytilus edulis Whole soft body Kvalnes, Mid Sørfjord (st. 56A) 60.22050 6.60200 3 3 3 3 3 3
2020p Mytilus edulis Whole soft body Kvalnes, Mid Sørfjord (st. 56A) 60.22050 6.60200 3 3 3 3 3 3
2020t Mytilus edulis Whole soft body Kvalnes, Mid Sørfjord (st. 56A) 60.22050 6.60200 3 3 3 3 3 3
2019t Mytilus edulis Whole soft body Krossanes, Outer Sørfjord (st. 57A) 60.38707 6.68952 3 3 3 3 3 3
2020p Mytilus edulis Whole soft body Krossanes, Outer Sørfjord (st. 57A) 60.38707 6.68952 3 3 3 3 3 3
2020t Mytilus edulis Whole soft body Krossanes, Outer Sørfjord (st. 57A) 60.38707 6.68952 3 3 3 3 3 3
2019t Mytilus edulis Whole soft body Utne, Outer Sørfjord (st. 64A) 60.42390 6.62230 3 3 3
2020p Mytilus edulis Whole soft body Utne, Outer Sørfjord (st. 64A) 60.42390 6.62230 3 3 3
2020t Mytilus edulis Whole soft body Utne, Outer Sørfjord (st. 64A) 60.42390 6.62230 3 3 3
2019t Mytilus edulis Whole soft body Vikingneset, Mid Hardangerfjord (st. 65A) 60.24233 6.15267 3 3 3 3 3
2020p Mytilus edulis Whole soft body Vikingneset, Mid Hardangerfjord (st. 65A) 60.24233 6.15267 3 3 3 3 3
2020t Mytilus edulis Whole soft body Vikingneset, Mid Hardangerfjord (st. 65A) 60.24233 6.15267 3 3 3 3 3
2019t Mytilus edulis Whole soft body Espevær, Outer Bømlafjord (st. 22A) 59.58711 5.15203 3 3 3 3 3 3 3 3 3
2020p Mytilus edulis Whole soft body Espevær, Outer Bømlafjord (st. 22A) 59.58711 5.15203 3 3 3 3 3 3 3 3 3
2020t Mytilus edulis Whole soft body Espevær, Outer Bømlafjord (st. 22A) 59.58711 5.15203 3 3 3 3 3 3 3 3 3
2019t Mytilus edulis Whole soft body Nordnes, Bergen harbour (st. I241) 60.40077 5.30396 3 3 3 3 3 3
2020p Mytilus edulis Whole soft body Nordnes, Bergen harbour (st. I241) 60.40077 5.30396 3 3 3 3 3 3
2020t Mytilus edulis Whole soft body Nordnes, Bergen harbour (st. I241) 60.40077 5.30396 3 3 3 3 3 3
2019t Mytilus edulis Whole soft body Vågsvåg, Outer Nordfjord (st. 26A2) 61.93622 5.04878 3 3 3 3 3
2020p Mytilus edulis Whole soft body Vågsvåg, Outer Nordfjord (st. 26A2) 61.93622 5.04878 3 3 3 3 3
2020t Mytilus edulis Whole soft body Vågsvåg, Outer Nordfjord (st. 26A2) 61.93622 5.04878 3 3 3 3 3

NIVA 7686-2021
223
Year Latin name Tissue Station Latitude Longitude
I-M
ET
O-M
ET
O-B
R
OC
-CB
OC
-CL
OC
-CP
OC
-DD
OC
-HC
O-F
L
O-P
AH
ISO
TO
BE
M
SLX
2019t Mytilus edulis Whole soft body Ålesund harbour (st. 28A2) 62.46585 6.23960 3 3 3 3 3 3
2020p Mytilus edulis Whole soft body Ålesund harbour (st. 28A2) 62.46585 6.23960 3 3 3 3 3 3
2020t Mytilus edulis Whole soft body Ålesund harbour (st. 28A2) 62.46585 6.23960 3 3 3 3 3 3
2019t Mytilus edulis Whole soft body Ørland area, Outer Trondheimsfjord (st. 91A2) 63.65144 9.56386 3 3 3 3 3
2020p Mytilus edulis Whole soft body Ørland area, Outer Trondheimsfjord (st. 91A2) 63.65144 9.56386 3 3 3 3 3
2020t Mytilus edulis Whole soft body Ørland area, Outer Trondheimsfjord (st. 91A2) 63.65144 9.56386 3 3 3 3 3
2019t Mytilus edulis Whole soft body Bodø harbour (st. 97A3) 67.29631 14.39564 3 3 3 3 3
2020p Mytilus edulis Whole soft body Bodø harbour (st. 97A3) 67.29631 14.39564 3 3 3 3 3
2020t Mytilus edulis Whole soft body Bodø harbour (st. 97A3) 67.29631 14.39564 3 3 3 3 3
2019t Mytilus edulis Whole soft body Mjelle, Bodø area (st. 97A2) 67.41271 14.62193 3 3 3 3 3
2020p Mytilus edulis Whole soft body Mjelle, Bodø area (st. 97A2) 67.41271 14.62193 3 3 3 3 3
2020t Mytilus edulis Whole soft body Mjelle, Bodø area (st. 97A2) 67.41271 14.62193 3 3 3 3 3
2019t Mytilus edulis Whole soft body Svolvær airport area (st. 98A2) 68.24917 14.66270 3 3 3 3 3 3 3
2020p Mytilus edulis Whole soft body Svolvær airport area (st. 98A2) 68.24917 14.66270 3 3 3 3 3 3 3
2020t Mytilus edulis Whole soft body Svolvær airport area (st. 98A2) 68.24917 14.66270 3 3 3 3 3 3 3
2019t Mytilus edulis Whole soft body Brashavn, Outer Varangerfjord (st. 11X) 69.89930 29.74100 0 0 0 0 0 0
2020p Mytilus edulis Whole soft body Brashavn, Outer Varangerfjord (st. 11X) 69.89930 29.74100 3 3 3 3 3 3
2020t Mytilus edulis Whole soft body Brashavn, Outer Varangerfjord (st. 11X) 69.89930 29.74100 3 3 3 3 3 3
2019t Mytilus edulis Whole soft body Skallnes, Outer Varangerfjord (st. 10A2) 70.13728 30.34175 0 0 0 0 0
2020p Mytilus edulis Whole soft body Skallnes, Outer Varangerfjord (st. 10A2) 70.13728 30.34175 3 3 3 3 3
2020t Mytilus edulis Whole soft body Skallnes, Outer Varangerfjord (st. 10A2) 70.13728 30.34175 3 3 3 3 3
2019t Littorina littorea Whole soft body Fugløyskjær, Outer Langesundfjord (st. 71G) 58.98496 9.80458 0 1 0 0 0 0 1
2020p Littorina littorea Whole soft body Fugløyskjær, Outer Langesundfjord (st. 71G) 58.98496 9.80458 1 1 1 1 1 1 1
2020t Littorina littorea Whole soft body Fugløyskjær, Outer Langesundfjord (st. 71G) 58.98496 9.80458 1 1 1 1 1 1 1
2019t Nucella lapillus Whole soft body Færder, Outer Oslofjord (st. 36G) 59.02776 10.52560 1 1
2020p Nucella lapillus Whole soft body Færder, Outer Oslofjord (st. 36G) 59.02776 10.52560 1 1
2020t Nucella lapillus Whole soft body Færder, Outer Oslofjord (st. 36G) 59.02776 10.52560 1 1
2019t Nucella lapillus Whole soft body Risøya, Risør (st. 76G) 58.72800 9.27550 1 1
2020p Nucella lapillus Whole soft body Risøya, Risør (st. 76G) 58.72800 9.27550 1 1
2020t Nucella lapillus Whole soft body Risøya, Risør (st. 76G) 58.72800 9.27550 1 1

NIVA 7686-2021
224
Year Latin name Tissue Station Latitude Longitude
I-M
ET
O-M
ET
O-B
R
OC
-CB
OC
-CL
OC
-CP
OC
-DD
OC
-HC
O-F
L
O-P
AH
ISO
TO
BE
M
SLX
2019t Nucella lapillus Whole soft body Lastad, Søgne (st. 131G) 58.02843 7.69902 1 1
2020p Nucella lapillus Whole soft body Lastad, Søgne (st. 131G) 58.02843 7.69902 1 1
2020t Nucella lapillus Whole soft body Lastad, Søgne (st. 131G) 58.02843 7.69902 1 1
2019t Nucella lapillus Whole soft body Gåsøya-Ullerøya, Farsund (st. 15G) 58.04933 6.90117 1 1
2020p Nucella lapillus Whole soft body Gåsøya-Ullerøya, Farsund (st. 15G) 58.04933 6.90117 1 1
2020t Nucella lapillus Whole soft body Gåsøya-Ullerøya, Farsund (st. 15G) 58.04933 6.90117 1 1
2019t Nucella lapillus Whole soft body Melandsholmen, Mid Karmsundet (st. 227G) 59.33960 5.31220 1 1
2020p Nucella lapillus Whole soft body Melandsholmen, Mid Karmsundet (st. 227G) 59.33960 5.31220 1 1
2020t Nucella lapillus Whole soft body Melandsholmen, Mid Karmsundet (st. 227G) 59.33960 5.31220 1 1
2019t Nucella lapillus Whole soft body Espevær, Outer Bømlafjord (st. 22G) 59.58367 5.14450 1 1
2020p Nucella lapillus Whole soft body Espevær, Outer Bømlafjord (st. 22G) 59.58367 5.14450 1 1
2020t Nucella lapillus Whole soft body Espevær, Outer Bømlafjord (st. 22G) 59.58367 5.14450 1 1
2019t Nucella lapillus Whole soft body Svolvær airport area (st. 98G) 68.24699 14.66641 1 1
2020p Nucella lapillus Whole soft body Svolvær airport area (st. 98G) 68.24699 14.66641 1 1
2020t Nucella lapillus Whole soft body Svolvær airport area (st. 98G) 68.24699 14.66641 1 1
2019t Nucella lapillus Whole soft body Brashavn, Outer Varangerfjord (st. 11G) 69.89953 29.74190 1 1
2020p Nucella lapillus Whole soft body Brashavn, Outer Varangerfjord (st. 11G) 69.89953 29.74190 1 1
2020t Nucella lapillus Whole soft body Brashavn, Outer Varangerfjord (st. 11G) 69.89953 29.74190 1 1
2019t Gadus morhua Liver Inner Oslofjord (st. 30B) 59.81265 10.55183 13 14 14 13 12 13 13 5 14 15
2020p Gadus morhua Liver Inner Oslofjord (st. 30B) 59.81265 10.55183 15 15 15 15 15 15 15 15 15 15
2020t Gadus morhua Liver Inner Oslofjord (st. 30B) 59.81265 10.55183 12 12 12 12 12 12 12 12 15 14
2019t Gadus morhua Liver Tjøme, Outer Oslofjord (st. 36B) 59.04050 5 5 6 5 5 5 5 6
2020p Gadus morhua Liver Tjøme, Outer Oslofjord (st. 36B) 59.04050 15 15 15 15 15 15 15 15
2020t Gadus morhua Liver Tjøme, Outer Oslofjord (st. 36B) 59.04050 15 15 15 15 15 15 15 15
2019t Gadus morhua Liver Kirkøy, Hvaler (st. 02B) 59.06482 10.97354 11 11 11 11
2020p Gadus morhua Liver Kirkøy, Hvaler (st. 02B) 59.06482 10.97354 15 15 15 15
2020t Gadus morhua Liver Kirkøy, Hvaler (st. 02B) 59.06482 10.97354 7 8 8 8
2019t Gadus morhua Liver Stathelle area, Langesundfjord (st. 71B) 59.04650 9.70275 13 13 13
2020p Gadus morhua Liver Stathelle area, Langesundfjord (st. 71B) 59.04650 9.70275 15 15 15
2020t Gadus morhua Liver Stathelle area, Langesundfjord (st. 71B) 59.04650 9.70275 10 10 10

NIVA 7686-2021
225
Year Latin name Tissue Station Latitude Longitude
I-M
ET
O-M
ET
O-B
R
OC
-CB
OC
-CL
OC
-CP
OC
-DD
OC
-HC
O-F
L
O-P
AH
ISO
TO
BE
M
SLX
2019t Gadus morhua Liver Kristiansand harbour area (st. 13B) 58.13283 7.98850 9 9 10 10 10
2020p Gadus morhua Liver Kristiansand harbour area (st. 13B) 58.13283 7.98850 15 15 15 15 15
2020t Gadus morhua Liver Kristiansand harbour area (st. 13B) 58.13283 7.98850 7 8 8 7 8
2019t Gadus morhua Liver Skågskjera, Farsund (st. 15B) 58.05138 6.74690 15 15 15 15 15
2020p Gadus morhua Liver Skågskjera, Farsund (st. 15B) 58.05138 6.74690 15 15 15 15 15
2020t Gadus morhua Liver Skågskjera, Farsund (st. 15B) 58.05138 6.74690 15 15 15 15 15
2019t Gadus morhua Liver Inner Sørfjord (st. 53B) 60.09727 6.53972 15 15 15 15 15 15 15 15 15
2020p Gadus morhua Liver Inner Sørfjord (st. 53B) 60.09727 6.53972 15 15 15 15 15 15 15 15 15
2020t Gadus morhua Liver Inner Sørfjord (st. 53B) 60.09727 6.53972 15 15 15 15 15 15 15 15 15
2019t Gadus morhua Liver Bømlo, Outer Selbjørnfjord (st. 23B) 59.89562 5.10857 15 15 15 15 15 15 15 15 15
2020p Gadus morhua Liver Bømlo, Outer Selbjørnfjord (st. 23B) 59.89562 5.10857 15 15 15 15 15 15 15 15 15
2020t Gadus morhua Liver Bømlo, Outer Selbjørnfjord (st. 23B) 59.89562 5.10857 15 15 15 15 15 15 15 15 16
2019t Gadus morhua Liver Bergen harbour area (st. 24B) 60.39664 5.27069 14 14 14 14 14 15
2020p Gadus morhua Liver Bergen harbour area (st. 24B) 60.39664 5.27069 15 15 15 15 15 15
2020t Gadus morhua Liver Bergen harbour area (st. 24B) 60.39664 5.27069 14 14 14 13 14 15
2019t Gadus morhua Liver Ålesund harbour area (st. 28B) 62.46778 6.06862 14 15 15 15
2020p Gadus morhua Liver Ålesund harbour area (st. 28B) 62.46778 6.06862 15 15 15 15
2020t Gadus morhua Liver Ålesund harbour area (st. 28B) 62.46778 6.06862 14 14 10 14
2019t Gadus morhua Liver Trondheim harbour (st. 80B) 63.44562 10.37173 11 11 11 11 11
2020p Gadus morhua Liver Trondheim harbour (st. 80B) 63.44562 10.37173 15 15 15 15 15
2020t Gadus morhua Liver Trondheim harbour (st. 80B) 63.44562 10.37173 15 15 15 15 15
2019t Gadus morhua Liver Sandnessjøen area (st. 96B) 66.04437 12.50355 15 15
2020p Gadus morhua Liver Sandnessjøen area (st. 96B) 66.04437 12.50355 15 15
2020t Gadus morhua Liver Sandnessjøen area (st. 96B) 66.04437 12.50355 15 15
2019t Gadus morhua Liver Austnesfjord, Lofoten (st. 98B1) 68.18577 14.70814 15 15 15 15 15 15 15 15
2020p Gadus morhua Liver Austnesfjord, Lofoten (st. 98B1) 68.18577 14.70814 15 15 15 15 15 15 15 15
2020t Gadus morhua Liver Austnesfjord, Lofoten (st. 98B1) 68.18577 14.70814 15 15 15 15 15 15 15 14
2019t Gadus morhua Liver Tromsø harbour area (st. 43B2) 69.65300 18.97400 15 15 15 15 15 15
2020p Gadus morhua Liver Tromsø harbour area (st. 43B2) 69.65300 18.97400 15 15 15 15 15 15
2020t Gadus morhua Liver Tromsø harbour area (st. 43B2) 69.65300 18.97400 15 15 15 15 15 15

NIVA 7686-2021
226
Year Latin name Tissue Station Latitude Longitude
I-M
ET
O-M
ET
O-B
R
OC
-CB
OC
-CL
OC
-CP
OC
-DD
OC
-HC
O-F
L
O-P
AH
ISO
TO
BE
M
SLX
2019t Gadus morhua Liver Hammerfest harbour area (st. 45B2) 70.65000 23.63333 15 15
2020p Gadus morhua Liver Hammerfest harbour area (st. 45B2) 70.65000 23.63333 15 15
2020t Gadus morhua Liver Hammerfest harbour area (st. 45B2) 70.65000 23.63333 14 14
2019t Gadus morhua Liver Kjøfjord, Outer Varangerfjord (st. 10B) 69.81623 29.76020 0 0 0 0 0 0
2020p Gadus morhua Liver Kjøfjord, Outer Varangerfjord (st. 10B) 69.81623 29.76020 15 15 15 15 15 15
2020t Gadus morhua Liver Kjøfjord, Outer Varangerfjord (st. 10B) 69.81623 29.76020 15 15 15 15 15 15
2019t Gadus morhua Liver Isfjorden, Svalbard (st. 19B) 78.17000 13.46000 15 15 15 15 15 15
2020p Gadus morhua Liver Isfjorden, Svalbard (st. 19B) 78.17000 13.46000 15 15 15 15 15 15
2020t Gadus morhua Liver Isfjorden, Svalbard (st. 19B) 78.17000 13.46000 15 15 15 15 15 15
2019t Gadus morhua Muscle Inner Oslofjord (st. 30B) 59.81265 10.55183 15 15
2020p Gadus morhua Muscle Inner Oslofjord (st. 30B) 59.81265 10.55183 15 15
2020t Gadus morhua Muscle Inner Oslofjord (st. 30B) 59.81265 10.55183 15 15
2019t Gadus morhua Muscle Tjøme, Outer Oslofjord (st. 36B) 59.04050 9 9
2020p Gadus morhua Muscle Tjøme, Outer Oslofjord (st. 36B) 59.04050 15 15
2020t Gadus morhua Muscle Tjøme, Outer Oslofjord (st. 36B) 59.04050 15 15
2019t Gadus morhua Muscle Kirkøy, Hvaler (st. 02B) 59.06482 10.97354 15 15
2020p Gadus morhua Muscle Kirkøy, Hvaler (st. 02B) 59.06482 10.97354 15 15
2020t Gadus morhua Muscle Kirkøy, Hvaler (st. 02B) 59.06482 10.97354 15 15
2019t Gadus morhua Muscle Stathelle area, Langesundfjord (st. 71B) 59.04650 9.70275 15 15
2020p Gadus morhua Muscle Stathelle area, Langesundfjord (st. 71B) 59.04650 9.70275 15 15
2020t Gadus morhua Muscle Stathelle area, Langesundfjord (st. 71B) 59.04650 9.70275 15 15
2019t Gadus morhua Muscle Kristiansand harbour area (st. 13B) 58.13283 7.98850 13 13
2020p Gadus morhua Muscle Kristiansand harbour area (st. 13B) 58.13283 7.98850 15 15
2020t Gadus morhua Muscle Kristiansand harbour area (st. 13B) 58.13283 7.98850 15 15
2019t Gadus morhua Muscle Skågskjera, Farsund (st. 15B) 58.05138 6.74690 15 15
2020p Gadus morhua Muscle Skågskjera, Farsund (st. 15B) 58.05138 6.74690 15 15
2020t Gadus morhua Muscle Skågskjera, Farsund (st. 15B) 58.05138 6.74690 15 15
2019t Gadus morhua Muscle Inner Sørfjord (st. 53B) 60.09727 6.53972 15 15
2020p Gadus morhua Muscle Inner Sørfjord (st. 53B) 60.09727 6.53972 15 15
2020t Gadus morhua Muscle Inner Sørfjord (st. 53B) 60.09727 6.53972 15 15

NIVA 7686-2021
227
Year Latin name Tissue Station Latitude Longitude
I-M
ET
O-M
ET
O-B
R
OC
-CB
OC
-CL
OC
-CP
OC
-DD
OC
-HC
O-F
L
O-P
AH
ISO
TO
BE
M
SLX
2019t Gadus morhua Muscle Bømlo, Outer Selbjørnfjord (st. 23B) 59.89562 5.10857 15 15
2020p Gadus morhua Muscle Bømlo, Outer Selbjørnfjord (st. 23B) 59.89562 5.10857 15 15
2020t Gadus morhua Muscle Bømlo, Outer Selbjørnfjord (st. 23B) 59.89562 5.10857 15 15
2019t Gadus morhua Muscle Bergen harbour area (st. 24B) 60.39664 5.27069 15 14
2020p Gadus morhua Muscle Bergen harbour area (st. 24B) 60.39664 5.27069 15 15
2020t Gadus morhua Muscle Bergen harbour area (st. 24B) 60.39664 5.27069 15 15
2019t Gadus morhua Muscle Ålesund harbour area (st. 28B) 62.46778 6.06862 15 15
2020p Gadus morhua Muscle Ålesund harbour area (st. 28B) 62.46778 6.06862 15 15
2020t Gadus morhua Muscle Ålesund harbour area (st. 28B) 62.46778 6.06862 15 15
2019t Gadus morhua Muscle Trondheim harbour (st. 80B) 63.44562 10.37173 11 11
2020p Gadus morhua Muscle Trondheim harbour (st. 80B) 63.44562 10.37173 15 15
2020t Gadus morhua Muscle Trondheim harbour (st. 80B) 63.44562 10.37173 15 15
2019t Gadus morhua Muscle Sandnessjøen area (st. 96B) 66.04437 12.50355 15 15
2020p Gadus morhua Muscle Sandnessjøen area (st. 96B) 66.04437 12.50355 15 15
2020t Gadus morhua Muscle Sandnessjøen area (st. 96B) 66.04437 12.50355 15 15
2019t Gadus morhua Muscle Austnesfjord, Lofoten (st. 98B1) 68.18577 14.70814 15 15
2020p Gadus morhua Muscle Austnesfjord, Lofoten (st. 98B1) 68.18577 14.70814 15 15
2020t Gadus morhua Muscle Austnesfjord, Lofoten (st. 98B1) 68.18577 14.70814 15 15
2019t Gadus morhua Muscle Tromsø harbour area (st. 43B2) 69.65300 18.97400 15 15
2020p Gadus morhua Muscle Tromsø harbour area (st. 43B2) 69.65300 18.97400 15 15
2020t Gadus morhua Muscle Tromsø harbour area (st. 43B2) 69.65300 18.97400 15 15
2019t Gadus morhua Muscle Hammerfest harbour area (st. 45B2) 70.65000 23.63333 15 15
2020p Gadus morhua Muscle Hammerfest harbour area (st. 45B2) 70.65000 23.63333 15 15
2020t Gadus morhua Muscle Hammerfest harbour area (st. 45B2) 70.65000 23.63333 15 15
2019t Gadus morhua Muscle Kjøfjord, Outer Varangerfjord (st. 10B) 69.81623 29.76020 0 0
2020p Gadus morhua Muscle Kjøfjord, Outer Varangerfjord (st. 10B) 69.81623 29.76020 15 15
2020t Gadus morhua Muscle Kjøfjord, Outer Varangerfjord (st. 10B) 69.81623 29.76020 15 15
2019t Gadus morhua Muscle Isfjorden, Svalbard (st. 19B) 78.17000 13.46000 15 15
2020p Gadus morhua Muscle Isfjorden, Svalbard (st. 19B) 78.17000 13.46000 15 15
2020t Gadus morhua Muscle Isfjorden, Svalbard (st. 19B) 78.17000 13.46000 15 15

NIVA 7686-2021
228
Year Latin name Tissue Station Latitude Longitude
I-M
ET
O-M
ET
O-B
R
OC
-CB
OC
-CL
OC
-CP
OC
-DD
OC
-HC
O-F
L
O-P
AH
ISO
TO
BE
M
SLX
2019t Gadus morhua Blood Inner Oslofjord (st. 30B) 59.81265 10.55183 15
2020p Gadus morhua Blood Inner Oslofjord (st. 30B) 59.81265 10.55183 15
2020t Gadus morhua Blood Inner Oslofjord (st. 30B) 59.81265 10.55183 15
2019t Gadus morhua Blood Inner Sørfjord (st. 53B) 60.09727 6.53972 15
2020p Gadus morhua Blood Inner Sørfjord (st. 53B) 60.09727 6.53972 15
2020t Gadus morhua Blood Inner Sørfjord (st. 53B) 60.09727 6.53972 15
2019t Gadus morhua Blood Bømlo, Outer Selbjørnfjord (st. 23B) 59.89562 5.10857 15
2020p Gadus morhua Blood Bømlo, Outer Selbjørnfjord (st. 23B) 59.89562 5.10857 15
2020t Gadus morhua Blood Bømlo, Outer Selbjørnfjord (st. 23B) 59.89562 5.10857 17
2019t Gadus morhua Bile Inner Oslofjord (st. 30B) 59.81265 10.55183 13
2020p Gadus morhua Bile Inner Oslofjord (st. 30B) 59.81265 10.55183 15
2020t Gadus morhua Bile Inner Oslofjord (st. 30B) 59.81265 10.55183 14
2019t Gadus morhua Bile Skågskjera, Farsund (st. 15B) 58.05138 6.74690 14
2020p Gadus morhua Bile Skågskjera, Farsund (st. 15B) 58.05138 6.74690 15
2020t Gadus morhua Bile Skågskjera, Farsund (st. 15B) 58.05138 6.74690 15
2019t Gadus morhua Bile Inner Sørfjord (st. 53B) 60.09727 6.53972 15
2020p Gadus morhua Bile Inner Sørfjord (st. 53B) 60.09727 6.53972 15
2020t Gadus morhua Bile Inner Sørfjord (st. 53B) 60.09727 6.53972 15
2019t Gadus morhua Bile Bømlo, Outer Selbjørnfjord (st. 23B) 59.89562 5.10857 13
2020p Gadus morhua Bile Bømlo, Outer Selbjørnfjord (st. 23B) 59.89562 5.10857 15
2020t Gadus morhua Bile Bømlo, Outer Selbjørnfjord (st. 23B) 59.89562 5.10857 16
2019t Platichthys flesus Liver Sande, Mid Oslofjord (st. 33F) 59.52833 10.35000 3 3 3 3 3
2020p Platichthys flesus Liver Sande, Mid Oslofjord (st. 33F) 59.52833 10.35000 3 3 3 3 3
2020t Platichthys flesus Liver Sande, Mid Oslofjord (st. 33F) 59.52833 10.35000 3 3 3 3 3
2019t Platichthys flesus Muscle Sande, Mid Oslofjord (st. 33F) 59.52833 10.35000 3
2020p Platichthys flesus Muscle Sande, Mid Oslofjord (st. 33F) 59.52833 10.35000 3
2020t Platichthys flesus Muscle Sande, Mid Oslofjord (st. 33F) 59.52833 10.35000 3
2019t Somateria mollissima Blood Breøyane, Kongsfjorden, Svalbard (st. 19N) 79.00400 12.11000 14 14 14 14 14 14 14 14
2020p Somateria mollissima Blood Breøyane, Kongsfjorden, Svalbard (st. 19N) 79.00400 12.11000 15 15 15 15 15 15 15 15
2020t Somateria mollissima Blood Breøyane, Kongsfjorden, Svalbard (st. 19N) 79.00400 12.11000 15 15 15 15 15 15 15 17
2019t Somateria mollissima Egg Breøyane, Kongsfjorden, Svalbard (st. 19N) 79.00400 12.11000 15 15 15 15 15 15 15 15
2020p Somateria mollissima Egg Breøyane, Kongsfjorden, Svalbard (st. 19N) 79.00400 12.11000 15 15 15 15 15 15 15 15
2020t Somateria mollissima Egg Breøyane, Kongsfjorden, Svalbard (st. 19N) 79.00400 12.11000 15 15 15 15 15 15 15 15

NIVA 7686-2021
229
Appendix F Temporal trend analyses of contaminants and
biomarkers in biota 1981-2020
This Appendix is provided as an EXCEL file separate from this report but described
below.
Only information for those time series that include data for either 2019 or 2020 is
shown. The column headings are as follows:
Parameter Code: are described in Appendix B
IUPAC: International Union of Pure and Applied Chemistry (IUPAC) parameter name (if any).
CAS: Chemical Abstracts Services (CAS) parameter number (if any).
Parameter Name: Common name
Parameter Group: Parameters belong to one of 14 groups
Unit: µg/kg, mg/kg, ng/kg, etc.
Station Code
Station Name
Area: general area (if defined).
County
Water region: Water framework directive (WFD) water region
Water body ID: WFD water body identification
Water body name: WFD water body name
Species:
MYTI EDU-Blue mussel (Mytilus edulis)
LITT LIT-Common periwinkle (Littorina littorea)
NUCE LAP-Dogwhelk (Nucella lapillus)
GADU MOR-Atlantic cod (Gadus morhua)
PLAT FLE European flounder (Platichthys flesus)
SOMA MOL-Common eider (Somateria mollissima)
Tissue:
SB-Soft body tissue
LI-Liver tissue
MU-Muscle tissue
BL-Blood
BI-Bile
EG-Eggs-homogenate of yolk and albumin
Basis: wet weight (WW, WWa), dry weight (DW, DWa) or lipid weight (FB, FBa), the “a” indicates
concentration adjusted to length (concerns only cod).
PROREF: Norwegian provisional high reference contaminant concentration.
V[Year columns]: median value for years 1981-2020. The gray-shade coding refers to relation to
exceedances to Norwegian provisional high reference contaminant concentration (PROREF): below
PROREF (clear) or exceeding PROREF by a factor of: 1-2, 2-5, 5-10, 10-20 or greater than 20
Q[Year columns]: symbol for years 1981-2020 that indicates the relation of the median to
Environmental Quality Standards (2013/39/EU 2013) and other risk-based standards developed
nationally (Norwegian_Environment_Agency 2016), and these are referred to collectively in this
report as Environmental Quality Standards (EQS). Green-filled circle indicates no exceedances and
red-filled circle indicates exceedances of the quality standard.

NIVA 7686-2021
230
N_string_[last/this] year: where “last year” is 2019 and “this year” is 2020. Number of samples
analysed. The first number within the parentheses indicates the number of pooled samples included.
The second number within the parentheses indicates for mussels the total number of individuals used
in all pooled samples and for cod the number individuals in each pooled sample.
SD [last/this] year: standard deviation.
PROREF-class [last/this] year: exceedances to Norwegian provisional high reference contaminant
concentration (PROREF): below PROREF (1) or exceeding PROREF by a factor of: 1-2 (2), 2-5 (3), 5-10
(4), 10-20 (5) or greater than 20 (6) (see Appendix C).
EQS-class [last/this] year: below (1) or above (2) EU Environmental Quality Standard (EQS). Note:
the EU EQRs are based on the whole organism whereas monitoring of fish in MILKYS is on a particular
tissue. Hence, comparison is only relevant if it is assumed that the concentration found is the same
for all tissues in the fish.
EQS threshold this year
Trend p(long) [last/this] year: The statistical significance (p)[year] of the trend for the entire time
series.
Detectable % change(long) [last/this] year: the percent change that can be detected with 90 %
confidence.
First Year(long) [last/this] year: first year in time series.
Last Year(long) [last/this] year: last year in time series.
No. of Years(long) [last/this] year: number of years with data.
Trend p(short) [last/this] year: The statistical significance (p)[year] of the trend for the last 10-year
sampling period.
Detectable % change(short) [last/this] year: the percent change that can be detected with 90 %
confidence.
First Year(short) [last/this] year: first year in time series for the last 10-year sampling period.
Last Year(short) [last/this] year: last year in time series for the last 10-year sampling period.
No. of Years(short) [last/this] year: number of years with data in time series for the last 10-year
sampling period.
Trends [last/this] year: trends in concentrations of contaminants monitored. The analyses were done
on time series with five or more years. An upward () or downward () arrow indicates statistically
significant trends, whereas a zero () indicates no trend. A small filled square (▪) indicates that
chemical analysis was performed, but the results were insufficient to do a trend analysis. Results
marked with a star () indicates that there is insufficient data above the quantification limit (LOQ)
to perform a trend analysis. The result from the trend analysis for the entire time series (long-term)
is shown before the slash “/”, and the result for the last 10 years (short-term) is shown after the
slash.
TREND_CHANGE last year-this year: indicates the difference (if any) between last year’s results and
this year’s results.
PROREF_CHANGE last year-this year: indicates the difference (if any) ) between last year’s results
and this year’s results.
EQS_CHANGE last year-this year: indicates the difference (if any) ) between last year’s results and
this year’s results.
Note on quantification limit in trend analyses: (see Chapter 2.6).

Økernveien 94 • NO-0579 Oslo, NorwayTelephone: +47 22 18 51 00 www.niva.no • [email protected]
NIVA: Norway´s leading centre of competence in aquatic environmentes
The Norwegian Institute for Water Research (NIVA) is Norway’s leading institute for fundamental and applied research on marine and freshwaters. Our research comprises a wide array of environmental, climatic and resource-related fields. NIVA’s world-class expertise is multidisciplinary with a broad scientific scope. We combine research, monitoring, evaluation, problem-solving and advisory services at international, national and local levels.