
Compliance of Indoor Air Contaminants within the Main Prayer ...
Intern. J. Environ. Anal. Chem.Vol. 90, Nos. 3–6, 15 March–15 May 2010, 321–343
Pilot survey of chemical contaminants from industrial and humanactivities in river waters of Spain
Marıa Jesus Martınez Buenoa, Maria Dolores Hernandoab,Sonia Herreraa, Marıa Jose Gomezac, Amadeo R. Fernandez-Albaac*,
Irene Bustamantec and Eloy Garcıa-Calvoc
aPesticide Residues Research Group, Department of Hydrogeology and Analytical Chemistry,University of Almerıa, 04120 La Canada de San Urbano, Almerıa, Spain; bNational Reference
Centre for Persistent Organic Pollutants, University of Alcala, 28871 Alcala de Henares,Madrid, Spain; cFundacion IMDEA-Agua, C/Punto Net 4, 2ª planta, Edificio ZYE, ParqueCientıfico Tecnologico de la Universidad de Alcala, 28805, Alcala de Henares, Madrid, Spain
(Received 21 January 2009; final version received 15 May 2009)
Over the past decades there has been significant progress in the treatment ofsewage and industrial wastewaters in order to minimise discharges of urbaneffluents with lots of contaminants. Nowadays, the status of contamination ofbodies of water continues to be a key task for further environmental managementactions. This paper reports the presence of 88 contaminants belonging to severalchemical groups (pharmaceuticals, personal care products, disinfectants andpesticides), in river waters of the region of Madrid, one of the more denselypopulated areas of Spain. Three different monitoring campaigns were performedover a period of seven months. For quality assessment of river water analyses, ananalytical protocol was developed employing a solid-phase extraction (SPE)method, followed by two methods based on liquid chromatography-massspectrometry (two LC-MS systems with ion trap and time-of-flight analysers)in order to carried out the unequivocal detection and quantification of the targetcontaminants. The method detection limits achieved were in range 0.1–60 ngL�1.Recovery values were higher to 70% for the most of the compounds and only twoanalytes (amoxicillin and tamoxifen) were not recovered with the SPE methodapplied. The results obtained during the monitoring campaign were classified inturn into two categories: contaminants in general called ‘emergents’, and prioritysubstances or candidate pollutants from domestic and industrial activities. Thisclassification allows us to evaluate the impact of both contributions, typicallydomestic and industrial, on the river waters. At the same time it enables us to geta first idea about the effectiveness of the urban wastewater treatment plants(WWTPs) that release the effluents to those rivers in eliminating or removingcontaminants. The concentration ranges detected were between 110 and9942 ngL�1 for emerging contaminants and 1 and 652 ngL�1 for priority orcandidate pollutants.
Keywords: river waters; priority substances; emerging contaminants; pollutionindicators; chemical contaminations; LC-MS/MS
*Corresponding author. Email: [email protected]
ISSN 0306–7319 print/ISSN 1029–0397 online
� 2010 Taylor & Francis
DOI: 10.1080/03067310903045463
http://www.informaworld.com
Downloaded By: [Lozano, Ana] At: 11:13 13 April 2010
1. Introduction
Social and industrial development brings together new sources of water contamination.European rivers have been unwisely used as sewers of discharges of industrial and
domestic wastes, affecting, in consequence, the biodiversity of thousands of kilometres of
waterways, and polluting coastal and marine waters. From 1970, thanks to a range of EUenvironmental directives, the quality of river water across Europe has improved
significantly. Now, in the Member States of the European Union, the chemical quality
of surface waters is controlled under the Water FrameWork Directive (WFD). Within thisframework, the first strategy adopted, in terms of chemical contamination, was the
Decision 2455/2001/EC which established a list of 33 substances or groups of substancesof priority concern due to their persistence, toxicity and widespread use and detection in
rivers, lakes, transitional and coastal waters. The current list includes certain pesticides
and PAHs, benzene, halogenated solvents, flame retardants, plasticers, surfactants andanti-fouling agents. Because of their high risk to animal and plant life in the aquatic
environment and to human health, another eight chemicals have increased the number of
dangerous substances to be controlled to 41. As part of this strategy, the list is intended tobe reviewed and updated every four years for defining environmental quality standards
(EQSs) that allow a sufficient level of protection of inland surface waters and other surface
waters (transitional, coastal and territorial waters). A list of 28 ‘candidate’ pollutants isactually under a review process for identification as possible ‘priority substances’ or as
‘priority hazardous substances’ [1]. Among them, seven are pharmaceuticals and six are
personal care products.Many other organic contaminants from anthropogenic origin, many times called
‘emerging’ contaminants, are the subject of concern among the scientific community
because of their frequent detection in wastewater effluents [2,3] and the potentialcontamination of surface water (rivers, lakes and coastal waters) if the effluents are
discharged directly into the water bodies [3–5]. Numerous publications have been
dedicated to assessing the removal capacity of the wasterwater treatment plants (WWTPs)[6,7] as well as the potential contribution in the contamination of surface waters [8–10].
In Spain, the region of Madrid is one of the most densely populated regions in the
European Union and is characterised by two main areas, a large metropolitan area,predominantly with industrial and service activities, and the far north of the region, which
is a predominantly rural area, mostly uninhabited and with less services and productive
development infrastructures.The study was focused in the determination of two chemical groups, some priority
substances and candidate pollutants (total of nine chemicals), and emerging contami-
nants (79 chemicals, mainly pharmaceuticals and personal care products). From the lastgroup special consideration is paid to nicotine, caffeine and their metabolites. Nicotine,
cotinine, caffeine and paraxanthine can represent an interesting indicator of anthro-
pogenic contamination as a consequence of their widespread detection in the environ-ment and their potential relationship with water contamination levels, giving an
indication of the presence of other chemicals of human activities [11]. This idea is also
supported by the fact of their removal at very high percentages from the efficient urbanwastewater treatment plants [6,12]. This work intended (1) to provide an initial
assessment of the chemical quality of the rivers of the region of Madrid and (2) to
evaluate the capability of nicotine and caffeine as indicators of river water contami-nation from human activities.
322 M.J. Martınez Bueno et al.
Downloaded By: [Lozano, Ana] At: 11:13 13 April 2010
2. Experimental
2.1 Chemicals, standards and materials
All the chemicals included in this study were purchased at analytical grade (purity490%)from Sigma-Aldrich (Steinheim, Germany), except codeine and diazepan, which wereobtained by dissolving a Codeisan tablet (30mg of codeine) from Lab. Belmac (Madrid,Spain) and a valium tablet (10mg of diazepan) from Lab. Andreu (Barcelona, Spain),respectively. The reference compounds, used as surrogate standard, 13C-phenacetin and13C-caffeine, were purchased from Lab. Dr. Ehrenstorfer (Augsburg, Germany). Stockstandard solutions of individual compounds were prepared at a concentration of1–2mgmL�1 in methanol. Working solutions of individual compounds and mixtureswere prepared at different concentration levels, by appropriate dilution of the stocksolutions in methanol or methanol : water (10 : 90, v/v). All the standard solutions werestored at �20�C.
The solvents used including methanol and acetonitrile HPLC grade, were supplied byMerck (Darmstadt, Germany). Water used for LC-MS analysis was generated from aDirect-QTM 5 Ultrapure Water Systems from Millipore (Bedford, MA, USA) with aspecific resistance of 18.2M� cm. Commercial cartridges packed with OasisTM HLB(divinylbenzene/N-vinylpyrrolidone copolymer, 200mg, 6 cc) were purchased from Waters(Mildford, MA, USA). Formic acid (purity, 98%) was obtained from Fluka (Buchs,Germany).
The analytes included in this study, were selected on the basis of previous experience[2,6,13] and due to their widespread use and detection in the surface waters [3,5,14]. Four‘priority substances’ (atrazine, diuron, isoproturon and simazine), three substances subjectto review for identification as possible ‘priority substances’ (carbamazepine, diclofenac andiopamidol) and two as possible ‘priority hazardous substances’ (bisphenol A andclotrimazole) because they pose a particular risk to animal and plant life in the aquaticenvironment and to human health, were also included in this study [1]. They comprise agroup of 88 organic pollutants belonging to different compound categories: pharmaceu-ticals, pesticides, disinfectants, and some of their major metabolites. Among thepharmaceuticals, the following representatives of different therapeutical groups wereselected. Analgesics/anti-inflammatories (acetaminophen, indomethacine, codeine, mefe-namic acid, ketorolac, naproxen, ibuprofen, diclofenac, fenoprofen, ketoprofen, propy-phenazone), antibiotics (metronidazole, sulfamethoxazole, trimethoprim, ciprofloxacin,cefotaxime, ofloxacin, erythromycin, amoxicillin, lincomycin, sulfadiazine, sulfathiazole,sulfapyridine, norfloxacin, tetracycline, sulfamethazine, azithromycin, clarithromycin),lipid regulators (fenofibrate, bezafibrate, gemfibrozil, pravastatin, mevastatin, simvastatin),�-blockers (atenolol, propranolol, sotalol, metoprolol, nadolol), antidepressants (fluoxetine,paroxetine, venlafaxine, citalopram hydrobromide, amitriptyline hydrochloride, clomipra-mine hydrochloride), antiepileptic/psychiatrics (carbamazepine, diazepam, primidone),ulcer healings (ranitidine, omeprazole, famotidine, lansoprazole, loratadine), corticoster-oides (methylprednisolone), diuretics (furosemide, hydrochlorothiazide), bronchodilatadors(salbutamol, terbutaline), contrast agents (iopamidol, iopromide), antineoplastic agents(cyclophosphamide monohydrate, iofosfamide), antiseptics (clotrimazole), selective estro-gen receptor modulator (SERM) (tamoxifen), stimulants (nicotine, caffeine) and anaes-thetics (mepivacaine). A group of major metabolites such as carbamazepine 10,11-epoxide,1,7-dimethylxanthine (paraxanthine), clofibric acid, fenofibric acid, salicylic acid, cotinine,the active product of the antipyretic drug dypirone, 4-methylaminoantipyrine (4-MAA) and
International Journal of Environmental Analytical Chemistry 323
Downloaded By: [Lozano, Ana] At: 11:13 13 April 2010

some of its main metabolites (N-acetyl-4-aminoantipiryne (4-AAA), N-formyl-4-aminoan-tipiryne (4-FAA), 4-dimethylaminoantipiryne (4-DAA), 4-amino-antipiryne (4-AA) andantipyrine) were also included. In addition, a group of six pesticides (atrazine, chlorpyriphosmethyl, chlorfenvinphos, diuron, isoproturon and simazine), one plasticiser (bisphenol A),and two well-known disinfectants (biphenylol and chlorophene), completed the group oftarget compounds.
2.2 Area of study and sampling
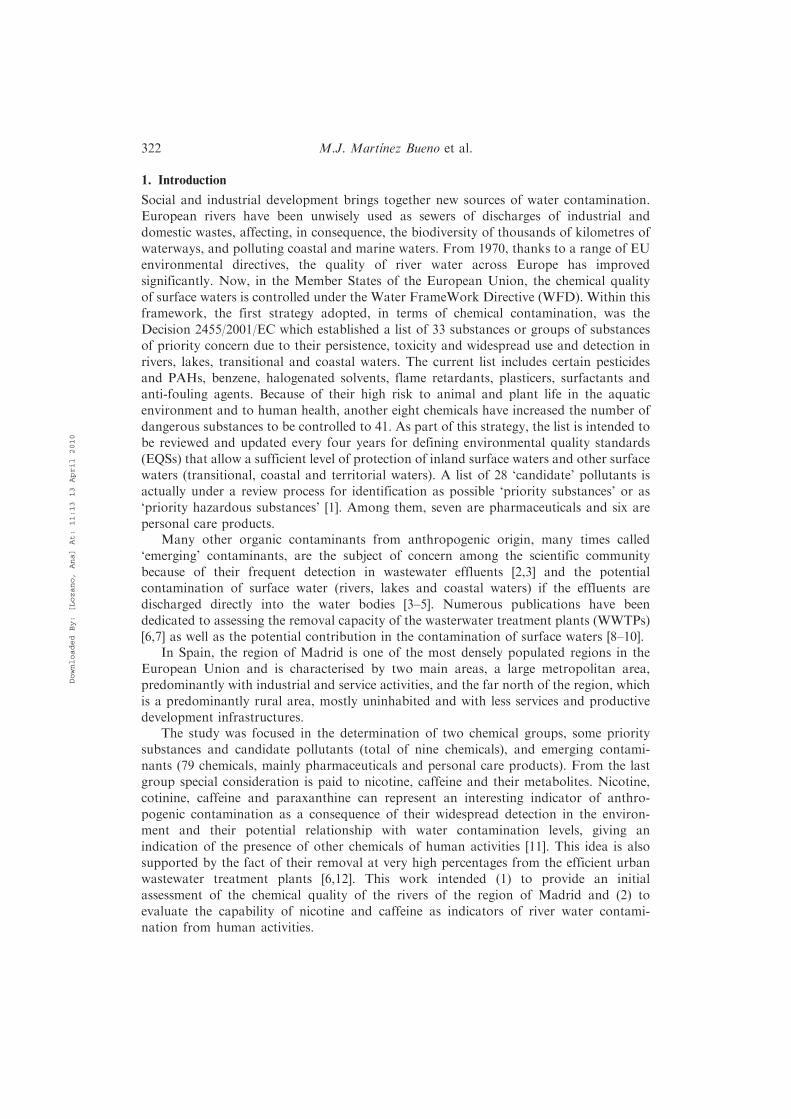
The river samples analysed in this study were collected from three different zones (north,centre and south) located in the centre of Spain (Madrid, Figure 1). This area is the mostdeveloped and densely populated of Spain. It is about 8050 km2 in area and has apopulation of about 6 million. The streams run through several residential, industrial andagricultural areas. So, three areas of the region of Madrid were considerate as benchmarksto study the industrial/agricultural influence and population density in the pollution ofrivers. Area A (north) presents a lower population density and with less services andproductive development infrastructures (see Figure 1). In areas B and C (centre and south)
5A
2A
3A
4A
1A
1B
2B1
2B23B
6B
7B8B
1C1
1C2
7C
9C1
9C2
10C
5A
2A
3A
4A
1A
1B
2B1
2B23B
6B
7B8B
1C1
1C2
7C
9C1
9C2
10C
Figure 1. Map of the studied area and sampling points.**Area: A, B and C (north, centre and south, respectively). 1: Jarama; 2: Henares; 3: Manzanares;4: Aulencia; 5: Lozoya; 6: Tajua; 7: Guadarrama; 8: Perales; 9: Tajo; 10: Alberche. BX and CX:Different sampling points. n.f: not found.
324 M.J. Martınez Bueno et al.
Downloaded By: [Lozano, Ana] At: 11:13 13 April 2010

there is a greater potential contribution to a possible contamination due to increasedindustrial activity and due to a higher population in both areas.
Ten rivers were subject of research in this study. A total of 51 water samples wereanalysed in three different monitoring campaigns performed in February, July andSeptember 2008. Grab water samples (1L) were collected in clean amber glass bottles.Before sample collection, each bottle was properly pre-rinsed. The samples were sentin boxes packed with ice to the laboratory for posterior analysis. Upon reception, sampleswere filtered through a 0.7 mm glass fiber filter (Teknokroma, Barcelona, Spain), stored inthe dark at 4�C until analysis and extracted within 48 h in all the cases.
2.3 Sample preparation and extraction method
Before extraction, samples were previously spiked with 0.1mg of each surrogate standard,13C-phenacetin and 13C-cafeine. A solid phase extraction (SPE) procedure was applied tothe river samples using commercial OasisTM HLB (divinylbenzene/N-vinylpyrrolidonecopolymer) cartridges (200mg, 6 cc) from Waters (Mildford, MA, USA). An automatedsample processor ASPEC XL fitted with an 817 switching valve and an external 306 LCpump from Gilson (Villiers-le-Bel, France) was used for this purpose. HLB cartridges wereconditioned at pH 8, according to the results obtained in previous experiments [2].The procedure for carrying out the extraction of target compounds was the following. TheOasis HLB cartridges were preconditioned with 6mL of MeOH and 5mL of deionisedwater HPLC-grade (pH adjusted to 8 employing NH4OH) at a flow rate of 3mLmin�1.After the conditioning step, aliquots of 400mL of sample (pH adjusted 8) were loaded intothe cartridge. The samples were passed through the cartridges at a flow rate of10mLmin�1. After that, the cartridges were dried by nitrogen stream during approx-imately 15min to remove excess of water and, finally the analytes retained, were elutedwith 2� 4mL of MeOH at a flow of 3mLmin�1. The extracts were evaporated untilalmost dryness using a Turbo-Vap from Zymark (Hopkinton, Massachusetts), with awater temperature at 35�C. Before analysis, the samples were reconstituted with 1mL ofAcN :water, 10 : 90 (v/v) and were then, filtered directly into an analysis vial using a0.45mm PTFE syringe filter (Millipore, USA).
2.4 Liquid chromatography-QLIT-mass spectrometry analysis
The method for the analysis of target compounds was developed with a 3200 QLITMS/MS system (Applied Biosystem, Concord, Ontario, Canada) equipped with anelectrospray ionisation source (ESI). The triple quadrupole/linear ion trap (QqQLIT) is ahybrid system in which the final cuadrupole can operate as conventional mass filter or aslinear ion trap [2]. Chromatographic separation of the analytes was carried out using anHPLC system (Agilent Series 1100) equipped with a reversed phase C-18 analytical columnof 250mm length� 3.0mm I.D and 5 mm particle size (ZORBAX SB, AgilentTechnologies). The analyses were performed using a turbo ion spray source operating inboth positive and negative modes.
For the analysis in positive mode, the compounds were separated using acetonitrile(mobile phase A) and HPLC-grade water with 0.1% formic acid (mobile phase B) at a flowrate of 0.2mLmin�1. A linear gradient progressed from 10% of A (initial conditions) to100% of A in 40min, after which the mobile-phase composition was maintained at 100%
International Journal of Environmental Analytical Chemistry 325
Downloaded By: [Lozano, Ana] At: 11:13 13 April 2010
of A for 10min. The re-equilibration time was 15min. Compounds analysed in negativemode were separated using acetonitrile (mobile phase A) and HPLC-grade water(mobile phase B) at a flow rate of 0.3mLmin�1. LC gradient started with 10% A andlinearly was increased to 100% A, in 10min, after which the mobile-phase compositionwas maintained at 100% A for 10min. The re-equilibration time was 15min. The volumeof injection was of 20 mL in both modes.
The operation conditions for the analysis in positive ionisation mode were thefollowing: ion spray voltage, 5000V; curtain gas, 10 (arbitrary units); GS1 and GS2, 50and 40 psi, respectively; probe temperature, 500�C. The GS1 parameter controls thenebuliser gas for the TurboIonSpray. It helps generate small droplets of sample flow andaffects spray stability and sensitivity. The GS2 parameter controls the auxiliary, gas for theTurboIonSpray probe. It is used to help evaporate the spray droplets. GS2 works inconjunction with the temperature parameter. The parameters used for the analysis innegative ionisation mode were as follows: ion spray voltage, �3500V; curtain gas, 10(arbitrary units); GS1 and GS2, 50 psi; probe temperature, 500�C. Nitrogen served asnebuliser gas and collision gas in both modes. The mass spectrometer was calibratedmanually with a solution of poly-propylene glycol which was introduced via a syringepump to the interface, according to the manufacturer’s instructions.
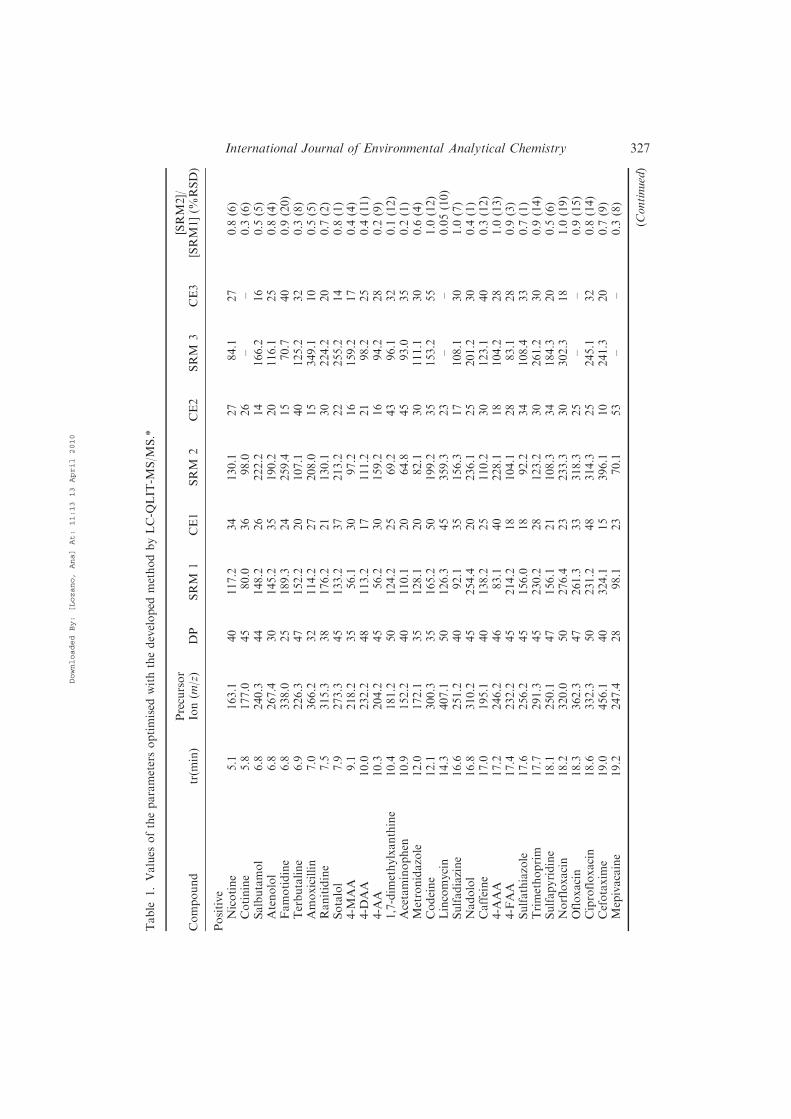
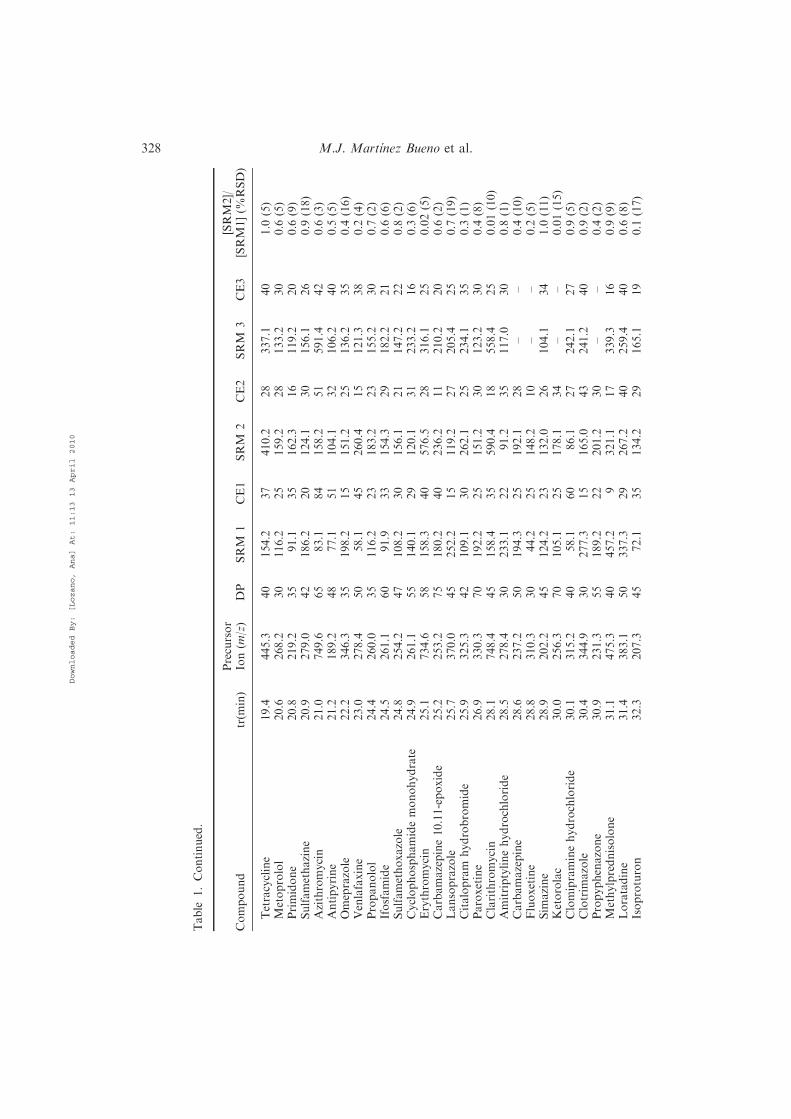
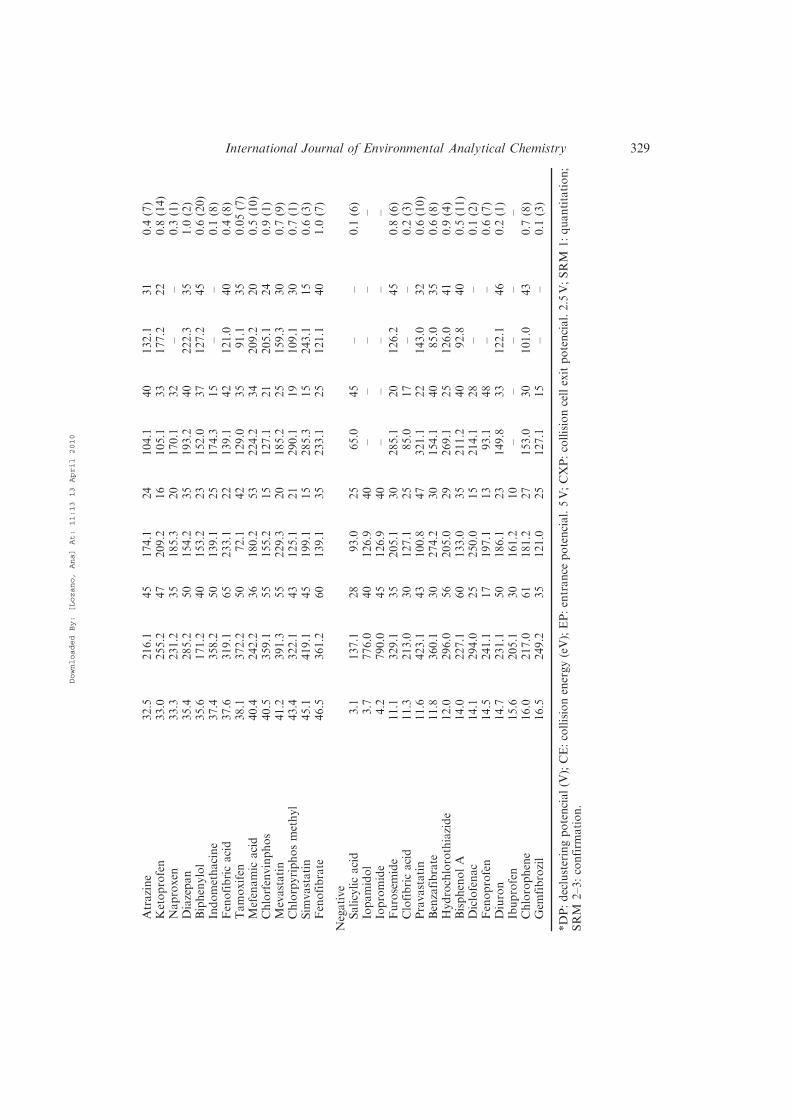
In order to obtain the maximum sensitivity for identification and detection of thetarget compounds, a careful optimisation of all MS parameters was performed for eachanalyte by flow injection analysis (FIA) in the spectrometer of 1mgL�1 solution ofindividual compounds in methanol. The parameters optimised were: declustering potential(DP), entrance potential (EP), collision energy (CE), and collision cell exit potential(CXP). The values of the parameters optimised and the transitions selected in theanalytical method are shown in the Table 1. The MS operated in selected reactionmonitoring mode (SMR) [2] with a resolution set to Low and Unit for Q1 and Q3,respectively. Table 1 also present the compounds analysed in both positive and negativemodes. To obtain well defined and reproducible peaks a number of 10–15 points per peakwas needed to achieve it. For this the dwell time values (time used for monitoring each iontransition) per each SRM transition were optimised, using an extract of river samplespiked at a concentration of 100 mgL�1. For confirmation of analytes, the acquisition atleast two SRM transitions for each compound together with retention time matching andthe monitoring of the SMR ratio (which is the relationship between abundances oftransitions selected for identification and quantification) were needed. The most intenseSRM transition was selected for quantitation purposes (see Table 1). The data acquisitionand processing was carried out using commercial software (Analyst, Applied Biosystems/MDS SCIEX).
An additional experiment was developed for the analysis in negative ionisation modeof the compounds, ibuprofen, iopamidol and iopromide, for which the second transitionwas not detected and therefore additional structural information was necessary forconfirmatory purposes. For this case, the QTRAP system operated combining in the samerun a SRM mode and two enhanced ion scan modes (enhanced product ion, EPI modes)[2]. Two EPI experiments were performed with Q1 set at Low resolution and the linear iontrap scanning from 80 to 800 amu at a rate of 4000 amu/s and a dynamic fill time, with astep size of 0.12 amu. The following parameters were used during the scans: DP:-20V/CE:-10 eV and DP:-40V/CE:-40 eV; CES (collision energy spread): 0 arbitrary units. TheCES parameter controls the spread of the collision energies used when filling the LIT. It isused in conjunction with the Collision Energy (CE) parameter. CES applies only to EPI
326 M.J. Martınez Bueno et al.
Downloaded By: [Lozano, Ana] At: 11:13 13 April 2010
Table
1.Values
oftheparametersoptimised
withthedeveloped
methodbyLC-Q
LIT
-MS/M
S.*
Compound
tr(m
in)
Precursor
Ion(m
/z)
DP
SRM
1CE1
SRM
2CE2
SRM
3CE3
[SRM2]/
[SRM1](%
RSD)
Positive
Nicotine
5.1
163.1
40
117.2
34
130.1
27
84.1
27
0.8
(6)
Cotinine
5.8
177.0
45
80.0
36
98.0
26
––
0.3
(6)
Salbutamol
6.8
240.3
44
148.2
26
222.2
14
166.2
16
0.5
(5)
Atenolol
6.8
267.4
30
145.2
35
190.2
20
116.1
25
0.8
(4)
Famotidine
6.8
338.0
25
189.3
24
259.4
15
70.7
40
0.9
(20)
Terbutaline
6.9
226.3
47
152.2
20
107.1
40
125.2
32
0.3
(8)
Amoxicillin
7.0
366.2
32
114.2
27
208.0
15
349.1
10
0.5
(5)
Ranitidine
7.5
315.3
38
176.2
21
130.1
30
224.2
20
0.7
(2)
Sotalol
7.9
273.3
45
133.2
37
213.2
22
255.2
14
0.8
(1)
4-M
AA
9.1
218.2
35
56.1
30
97.2
16
159.2
17
0.4
(4)
4-D
AA
10.0
232.2
48
113.2
17
111.2
21
98.2
25
0.4
(11)
4-A
A10.3
204.2
45
56.2
30
159.2
16
94.2
28
0.2
(9)
1,7-dim
ethylxanthine
10.4
181.2
50
124.2
25
69.2
43
96.1
32
0.1
(12)
Acetaminophen
10.9
152.2
40
110.1
20
64.8
45
93.0
35
0.2
(1)
Metronidazole
12.0
172.1
35
128.1
20
82.1
30
111.1
30
0.6
(4)
Codeine
12.1
300.3
35
165.2
50
199.2
35
153.2
55
1.0
(12)
Lincomycin
14.3
407.1
50
126.3
45
359.3
23
––
0.05(10)
Sulfadiazine
16.6
251.2
40
92.1
35
156.3
17
108.1
30
1.0
(7)
Nadolol
16.8
310.2
45
254.4
20
236.1
25
201.2
30
0.4
(1)
Caffeine
17.0
195.1
40
138.2
25
110.2
30
123.1
40
0.3
(12)
4-A
AA
17.2
246.2
46
83.1
40
228.1
18
104.2
28
1.0
(13)
4-FAA
17.4
232.2
45
214.2
18
104.1
28
83.1
28
0.9
(3)
Sulfathiazole
17.6
256.2
45
156.0
18
92.2
34
108.4
33
0.7
(1)
Trimethoprim
17.7
291.3
45
230.2
28
123.2
30
261.2
30
0.9
(14)
Sulfapyridine
18.1
250.1
47
156.1
21
108.3
34
184.3
20
0.5
(6)
Norfloxacin
18.2
320.0
50
276.4
23
233.3
30
302.3
18
1.0
(19)
Ofloxacin
18.3
362.3
47
261.3
33
318.3
25
––
0.9
(15)
Ciprofloxacin
18.6
332.3
50
231.2
48
314.3
25
245.1
32
0.8
(14)
Cefotaxim
e19.0
456.1
40
324.1
15
396.1
10
241.3
20
0.7
(9)
Mepivacaine
19.2
247.4
28
98.1
23
70.1
53
––
0.3
(8)
(Continued)
International Journal of Environmental Analytical Chemistry 327
Downloaded By: [Lozano, Ana] At: 11:13 13 April 2010
Table
1.Continued.
Compound
tr(m
in)
Precursor
Ion(m
/z)
DP
SRM
1CE1
SRM
2CE2
SRM
3CE3
[SRM2]/
[SRM1](%
RSD)
Tetracycline
19.4
445.3
40
154.2
37
410.2
28
337.1
40
1.0
(5)
Metoprolol
20.6
268.2
30
116.2
25
159.2
28
133.2
30
0.6
(5)
Primidone
20.8
219.2
35
91.1
35
162.3
16
119.2
20
0.6
(9)
Sulfamethazine
20.9
279.0
42
186.2
20
124.1
30
156.1
26
0.9
(18)
Azithromycin
21.0
749.6
65
83.1
84
158.2
51
591.4
42
0.6
(3)
Antipyrine
21.2
189.2
48
77.1
51
104.1
32
106.2
40
0.5
(5)
Omeprazole
22.2
346.3
35
198.2
15
151.2
25
136.2
35
0.4
(16)
Venlafaxine
23.0
278.4
50
58.1
45
260.4
15
121.3
38
0.2
(4)
Propanolol
24.4
260.0
35
116.2
23
183.2
23
155.2
30
0.7
(2)
Ifosfamide
24.5
261.1
60
91.9
33
154.3
29
182.2
21
0.6
(6)
Sulfamethoxazole
24.8
254.2
47
108.2
30
156.1
21
147.2
22
0.8
(2)
Cyclophosphamidemonohydrate
24.9
261.1
55
140.1
29
120.1
31
233.2
16
0.3
(6)
Erythromycin
25.1
734.6
58
158.3
40
576.5
28
316.1
25
0.02(5)
Carbamazepine10.11-epoxide
25.2
253.2
75
180.2
40
236.2
11
210.2
20
0.6
(2)
Lansoprazole
25.7
370.0
45
252.2
15
119.2
27
205.4
25
0.7
(19)
Citalopram
hydrobromide
25.9
325.3
42
109.1
30
262.1
25
234.1
35
0.3
(1)
Paroxetine
26.9
330.3
70
192.2
25
151.2
30
123.2
30
0.4
(8)
Clarithromycin
28.1
748.4
45
158.4
35
590.4
18
558.4
25
0.01(10)
Amitriptylinehydrochloride
28.5
278.4
30
233.1
22
91.2
35
117.0
30
0.8
(1)
Carbamazepine
28.6
237.2
50
194.3
25
192.1
28
––
0.4
(10)
Fluoxetine
28.8
310.3
30
44.2
25
148.2
10
––
0.2
(5)
Sim
azine
28.9
202.2
45
124.2
23
132.0
26
104.1
34
1.0
(11)
Ketorolac
30.0
256.3
70
105.1
25
178.1
34
––
0.01(15)
Clomipraminehydrochloride
30.1
315.2
40
58.1
60
86.1
27
242.1
27
0.9
(5)
Clotrim
azole
30.4
344.9
30
277.3
15
165.0
43
241.2
40
0.9
(2)
Propyphenazone
30.9
231.3
55
189.2
22
201.2
30
––
0.4
(2)
Methylprednisolone
31.1
475.3
40
457.2
9321.1
17
339.3
16
0.9
(9)
Loratadine
31.4
383.1
50
337.3
29
267.2
40
259.4
40
0.6
(8)
Isoproturon
32.3
207.3
45
72.1
35
134.2
29
165.1
19
0.1
(17)
328 M.J. Martınez Bueno et al.
Downloaded By: [Lozano, Ana] At: 11:13 13 April 2010
Atrazine
32.5
216.1
45
174.1
24
104.1
40
132.1
31
0.4
(7)
Ketoprofen
33.0
255.2
47
209.2
16
105.1
33
177.2
22
0.8
(14)
Naproxen
33.3
231.2
35
185.3
20
170.1
32
––
0.3
(1)
Diazepan
35.4
285.2
50
154.2
35
193.2
40
222.3
35
1.0
(2)
Biphenylol
35.6
171.2
40
153.2
23
152.0
37
127.2
45
0.6
(20)
Indomethacine
37.4
358.2
50
139.1
25
174.3
15
––
0.1
(8)
Fenofibricacid
37.6
319.1
65
233.1
22
139.1
42
121.0
40
0.4
(8)
Tamoxifen
38.1
372.2
50
72.1
42
129.0
35
91.1
35
0.05(7)
Mefenamic
acid
40.4
242.2
36
180.2
53
224.2
34
209.2
20
0.5
(10)
Chlorfenvinphos
40.5
359.1
55
155.2
15
127.1
21
205.1
24
0.9
(1)
Mevastatin
41.2
391.3
55
229.3
20
185.2
25
159.3
30
0.7
(9)
Chlorpyriphosmethyl
43.4
322.1
43
125.1
21
290.1
19
109.1
30
0.7
(1)
Sim
vastatin
45.1
419.1
45
199.1
15
285.3
15
243.1
15
0.6
(3)
Fenofibrate
46.5
361.2
60
139.1
35
233.1
25
121.1
40
1.0
(7)
Negative
Salicylicacid
3.1
137.1
28
93.0
25
65.0
45
––
0.1
(6)
Iopamidol
3.7
776.0
40
126.9
40
––
––
–Iopromide
4.2
790.0
45
126.9
40
––
––
–Furosemide
11.1
329.1
35
205.1
30
285.1
20
126.2
45
0.8
(6)
Clofibricacid
11.3
213.0
30
127.1
25
85.0
17
––
0.2
(3)
Pravastatin
11.6
423.1
43
100.8
47
321.1
22
143.0
32
0.6
(10)
Benzafibrate
11.8
360.1
30
274.2
30
154.1
40
85.0
35
0.6
(8)
Hydrochlorothiazide
12.0
296.0
56
205.0
29
269.1
25
126.0
41
0.9
(4)
BisphenolA
14.0
227.1
60
133.0
35
211.2
40
92.8
40
0.5
(11)
Diclofenac
14.1
294.0
25
250.0
15
214.1
28
––
0.1
(2)
Fenoprofen
14.5
241.1
17
197.1
13
93.1
48
––
0.6
(7)
Diuron
14.7
231.1
50
186.1
23
149.8
33
122.1
46
0.2
(1)
Ibuprofen
15.6
205.1
30
161.2
10
––
––
–Chlorophene
16.0
217.0
61
181.2
27
153.0
30
101.0
43
0.7
(8)
Gem
fibrozil
16.5
249.2
35
121.0
25
127.1
15
––
0.1
(3)
*DP:declusteringpotencial(V
);CE:collisionenergy(eV);EP:entrance
potencial.5V;CXP:collisioncellexitpotencial.2.5V;SRM
1:quantitation;
SRM
2–3:confirm
ation.
International Journal of Environmental Analytical Chemistry 329
Downloaded By: [Lozano, Ana] At: 11:13 13 April 2010
and MS/MS/MS scans. The spectrums generated by an extract of river sample spiked at aconcentration of 1000 mgL�1 and 100 mgL�1, acquired in EPI mode, were stored in a massspectral library, which enables further confirmation of organic compounds in real positivesamples. In this case, confirmation criteria applied to the target compounds in the sampleswere: presence of the characteristic SRM transition at the correct retention time, andthe correct relative ions abundance. However, at low concentrations (approx. 20 mgL�1),it was not possible to carry out the confirmation of the compounds iopromide andiopamidol with any of the modes previously described (SRM and EPI modes), because thestructural information achieved was not sufficient since with the conditions employed,it was only obtained one ion for each compound, being necessary for get an adequateconfirmation to use a Time-of-Flight (TOF) as complementary tool.
2.5 Liquid chromatography-time-of-flight-mass spectrometry
A liquid chromatography-electrospray-ionisation-time-of-flight mass spectrometry(LC-ESI-TOF MS) system, in negative ionisation mode, was used to confirm twocompounds in the samples, iopromide and iopamidol. The analytes were separated using aHPLC system (consisting of vacuum degasser, autosampler and binary pump from AgilentSeries 1100, Agilent Technologies) equipped with a reversed-phase C8 analytical columnof 4.6� 150mm, 5 mm particle size (ECLIPSE XDB, Agilent Technologies). Compoundsanalysed in this mode were separated using acetonitrile as mobile phase A and 0.05%ammonium formate in HPLC-grade water as mobile phase B at a flow rate of0.4mLmin�1. LC gradient started with 20% A and linearly was increased to 100% A,in 8min, after which the mobile-phase composition was maintained at 100% A for 5min.The re-equilibration time was 10min. The volume of injection was of 30 mL. The HPLCsystem was connected to a time-of-flight mass spectrometer (MSD-TOF, AgilentTechnologies, Santa Clara, CA) equipped with an electrospray interface operating underthe following conditions: capillary, 4000V; nebuliser, 40 psi; drying gas, 9 Lmin�1; gastemperature, 325�; skimmer voltage, 60V; octapole dc1, �42.5V; octapole rf, 250V;fragmentor 190V. Spectra were acquired over the m/z 50–1000 range at a scan rate of1 s/spectrum. A second orthogonal sprayer with a reference solution was used as acontinuous calibration in negative ion using the following reference masses: 119.036320and 966.000725m/z (resolution: 11500 (500 at 966.000725m/z). The full mass spectra datarecorded were processed with Agilent MassHunter MSD TOF software. Based on theaccurate mass obtained, all possible elemental compositions for ion fragments with amaximum deviation of 3–4 ppm from the measured mass were calculated.
2.6 Validation study
All the validation studies were performed by using river extracts. Because of the difficultyof obtaining blanks, the samples were previously analysed and the presence of the targetcompounds considered. To minimise matrix effects, due to the presence of matrixinterferences, matrix-matched calibration curves were used for quantitative determina-tions. The linearity in the response was studied by using matrix-matched calibrationsolutions prepared by spiking river extracts at seven concentration levels, ranging from thequantitation limit of each analyte to 0.5mgL�1 in the final extract. Each point wasobtained as the average of three injections. Integrated peak area data of the selected
330 M.J. Martınez Bueno et al.
Downloaded By: [Lozano, Ana] At: 11:13 13 April 2010
quantification SRM transitions (SRM1; see Table 1) were used to construct the curves.The recovery studies (n¼ 3) were carried out, as has been described in Section 2.3 above,by spiking river samples at the concentration level of 0.25 mgL�1. Precision of theanalytical response, determined as relative standard deviation (RSD), was obtained fromrepeated injection (n¼ 5) of a spiked extract at 100 mgL�1 during the same day(repeatability) and on different days (reproducibility). The method detection limits(MDLs) and method quantification limits (MQLs) were determined experimentally fromthe injection of spiked river samples, calculated using the minimum concentration ofanalyte providing signal-to-noise ratios of 3 (for the SRM2 transition) and 10 (for theSRM1 transition) respectively, and considering the preconcentration provided by the SPEmethod applied. They were estimated from the spiked extracted ion chromatograms at thelowest analyte concentration assayed. Confirmation criteria applied to the targetcompounds in the water samples were as follows: presence of two characteristic SRMtransitions at the correct retention time and the correct SRM ratio, relative ion intensity oraccurate mass, depending of the system or mode of analysis employed.
3. Results and discussion
3.1 Analysis of river water samples
The extraction efficiency was investigated for a total of 88 compounds using only onemethod. As has been detailed in Section 2.3 above, the recovery studies were performed bytriplicate, giving relative standard deviation ranging from 2 to 18%. Recoveries of13C-Phenacetin and 13C-Caffeine (use as surrogate standards) were 78% and 77%,respectively, and they allow us to verify an adequate performance of the extraction methodand the elution step. The recovery values for the target analytes were higher than 50% inthe majority of the cases (74 compounds). From them recoveries higher than 70% wasachieved for 65 of these compounds. The extraction efficiency was lower than 50% in 12cases and only 2 analytes were not recovered: amoxicillin and tamoxifen. Among the targetcompounds of this survey monitoring, the extraction method was satisfactory for most ofthe priority substances and ‘candidate’ pollutants selected with recovery values higher than80%, except for diuron (63%), clotrimazole (34%) and iopamidol (20%). These values canbe considered acceptable, taking into consideration the wide range of polarities involvedand the good reproducibility obtained. For a positive identification of the analytes in thewater river samples by LC-QLIT-MS/MS system, the following criteria were taken intoaccount for each compound: monitoring of at least two SRM transitions, retention timeand SRM ratio, verifying which these analytical responses were within a margin of �2%and �20%, respectively, in comparison with the response obtained for the standards.Table 1 presents both SRM1, SMR2 transitions used for identification and quantification,retention time and SRM ratios values. Relative standard deviation of SRM ratio obtainedfrom the matrix-matched calibration curves do not surpass, in any case, a RDS value of20%. In three target compounds (ibuprofen, iopamidol and iopromide), the secondtransition was not detected at low concentration. The confirmation criteria applied tothose compounds in the samples were: presence of the characteristic SRM transition andthe correct relative ions abundance by EPI scans (see Section 2: Experimental, above). Inaddition, the presence of the compounds (iopamidol and iopromide) in river samples wasconfirmed by LC-TOF-MS analysis, where the criterion was based on the determination ofthe accurate masses at the correct retention time of the target compounds. The results of
International Journal of Environmental Analytical Chemistry 331
Downloaded By: [Lozano, Ana] At: 11:13 13 April 2010
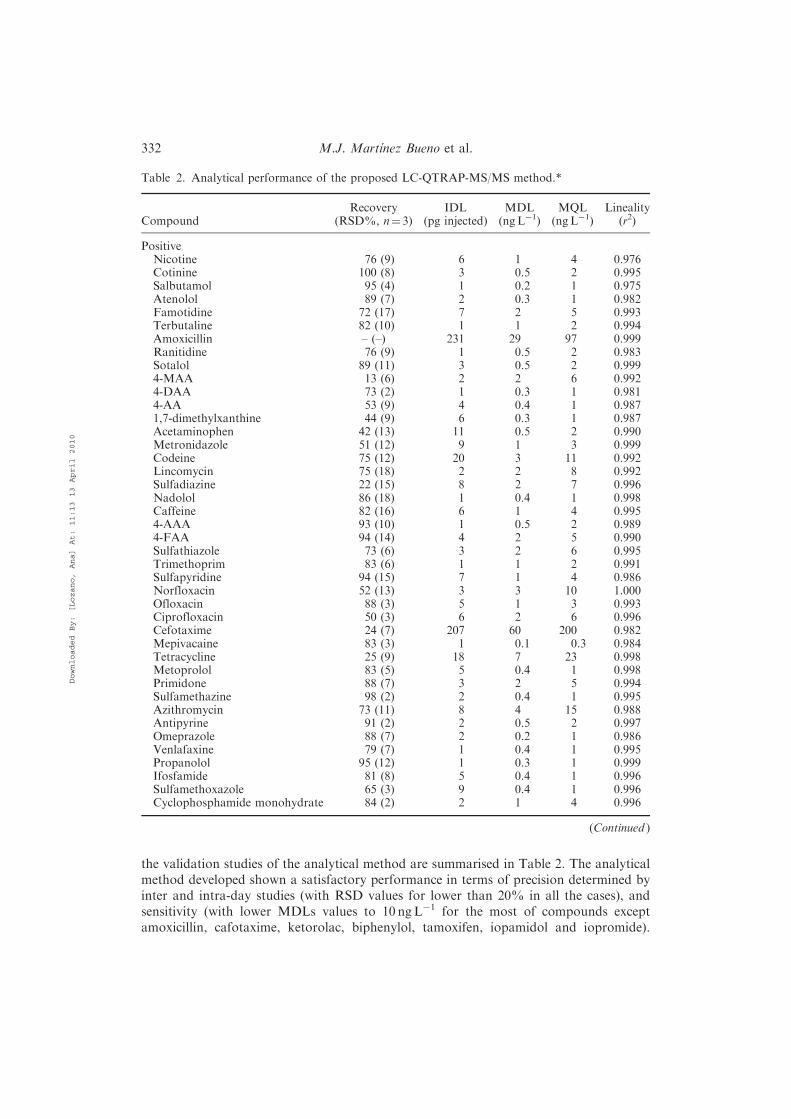
the validation studies of the analytical method are summarised in Table 2. The analyticalmethod developed shown a satisfactory performance in terms of precision determined byinter and intra-day studies (with RSD values for lower than 20% in all the cases), andsensitivity (with lower MDLs values to 10 ngL�1 for the most of compounds exceptamoxicillin, cafotaxime, ketorolac, biphenylol, tamoxifen, iopamidol and iopromide).
Table 2. Analytical performance of the proposed LC-QTRAP-MS/MS method.*
CompoundRecovery
(RSD%, n¼ 3)IDL
(pg injected)MDL
(ngL�1)MQL
(ngL�1)Lineality
(r2)
PositiveNicotine 76 (9) 6 1 4 0.976Cotinine 100 (8) 3 0.5 2 0.995Salbutamol 95 (4) 1 0.2 1 0.975Atenolol 89 (7) 2 0.3 1 0.982Famotidine 72 (17) 7 2 5 0.993Terbutaline 82 (10) 1 1 2 0.994Amoxicillin – (–) 231 29 97 0.999Ranitidine 76 (9) 1 0.5 2 0.983Sotalol 89 (11) 3 0.5 2 0.9994-MAA 13 (6) 2 2 6 0.9924-DAA 73 (2) 1 0.3 1 0.9814-AA 53 (9) 4 0.4 1 0.9871,7-dimethylxanthine 44 (9) 6 0.3 1 0.987Acetaminophen 42 (13) 11 0.5 2 0.990Metronidazole 51 (12) 9 1 3 0.999Codeine 75 (12) 20 3 11 0.992Lincomycin 75 (18) 2 2 8 0.992Sulfadiazine 22 (15) 8 2 7 0.996Nadolol 86 (18) 1 0.4 1 0.998Caffeine 82 (16) 6 1 4 0.9954-AAA 93 (10) 1 0.5 2 0.9894-FAA 94 (14) 4 2 5 0.990Sulfathiazole 73 (6) 3 2 6 0.995Trimethoprim 83 (6) 1 1 2 0.991Sulfapyridine 94 (15) 7 1 4 0.986Norfloxacin 52 (13) 3 3 10 1.000Ofloxacin 88 (3) 5 1 3 0.993Ciprofloxacin 50 (3) 6 2 6 0.996Cefotaxime 24 (7) 207 60 200 0.982Mepivacaine 83 (3) 1 0.1 0.3 0.984Tetracycline 25 (9) 18 7 23 0.998Metoprolol 83 (5) 5 0.4 1 0.998Primidone 88 (7) 3 2 5 0.994Sulfamethazine 98 (2) 2 0.4 1 0.995Azithromycin 73 (11) 8 4 15 0.988Antipyrine 91 (2) 2 0.5 2 0.997Omeprazole 88 (7) 2 0.2 1 0.986Venlafaxine 79 (7) 1 0.4 1 0.995Propanolol 95 (12) 1 0.3 1 0.999Ifosfamide 81 (8) 5 0.4 1 0.996Sulfamethoxazole 65 (3) 9 0.4 1 0.996Cyclophosphamide monohydrate 84 (2) 2 1 4 0.996
(Continued )
332 M.J. Martınez Bueno et al.
Downloaded By: [Lozano, Ana] At: 11:13 13 April 2010
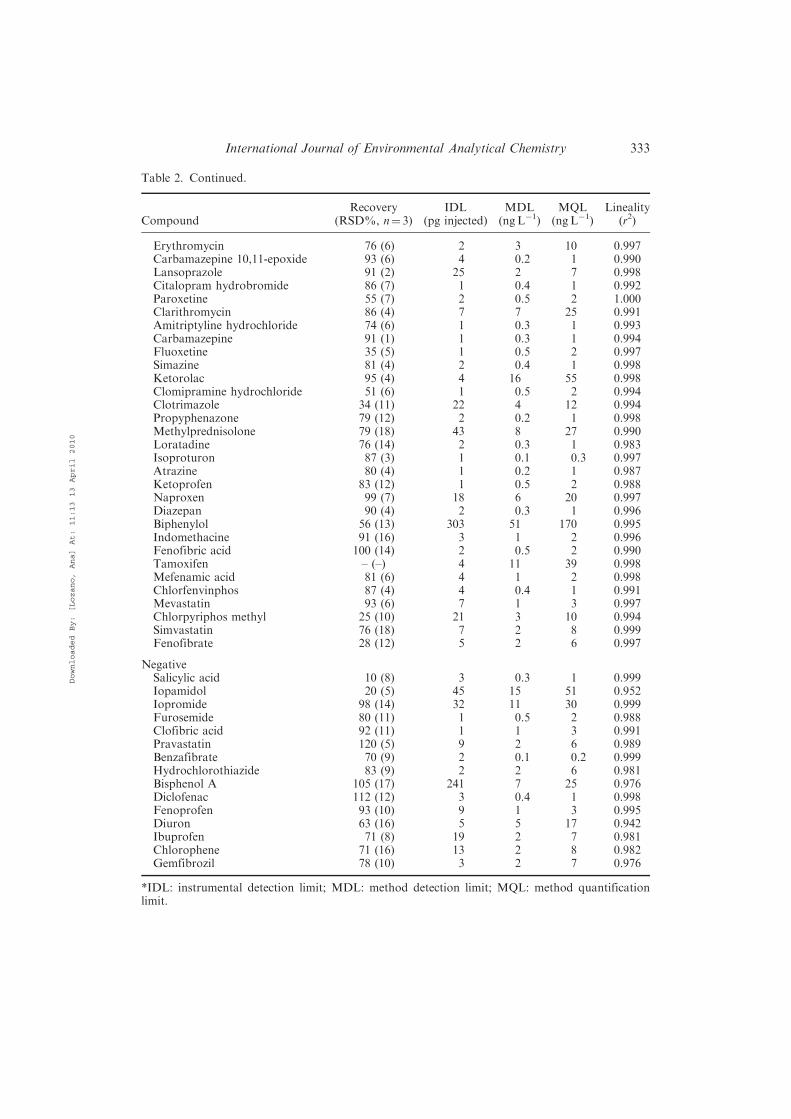
Table 2. Continued.
CompoundRecovery
(RSD%, n¼ 3)IDL
(pg injected)MDL
(ngL�1)MQL
(ngL�1)Lineality
(r2)
Erythromycin 76 (6) 2 3 10 0.997Carbamazepine 10,11-epoxide 93 (6) 4 0.2 1 0.990Lansoprazole 91 (2) 25 2 7 0.998Citalopram hydrobromide 86 (7) 1 0.4 1 0.992Paroxetine 55 (7) 2 0.5 2 1.000Clarithromycin 86 (4) 7 7 25 0.991Amitriptyline hydrochloride 74 (6) 1 0.3 1 0.993Carbamazepine 91 (1) 1 0.3 1 0.994Fluoxetine 35 (5) 1 0.5 2 0.997Simazine 81 (4) 2 0.4 1 0.998Ketorolac 95 (4) 4 16 55 0.998Clomipramine hydrochloride 51 (6) 1 0.5 2 0.994Clotrimazole 34 (11) 22 4 12 0.994Propyphenazone 79 (12) 2 0.2 1 0.998Methylprednisolone 79 (18) 43 8 27 0.990Loratadine 76 (14) 2 0.3 1 0.983Isoproturon 87 (3) 1 0.1 0.3 0.997Atrazine 80 (4) 1 0.2 1 0.987Ketoprofen 83 (12) 1 0.5 2 0.988Naproxen 99 (7) 18 6 20 0.997Diazepan 90 (4) 2 0.3 1 0.996Biphenylol 56 (13) 303 51 170 0.995Indomethacine 91 (16) 3 1 2 0.996Fenofibric acid 100 (14) 2 0.5 2 0.990Tamoxifen – (–) 4 11 39 0.998Mefenamic acid 81 (6) 4 1 2 0.998Chlorfenvinphos 87 (4) 4 0.4 1 0.991Mevastatin 93 (6) 7 1 3 0.997Chlorpyriphos methyl 25 (10) 21 3 10 0.994Simvastatin 76 (18) 7 2 8 0.999Fenofibrate 28 (12) 5 2 6 0.997
NegativeSalicylic acid 10 (8) 3 0.3 1 0.999Iopamidol 20 (5) 45 15 51 0.952Iopromide 98 (14) 32 11 30 0.999Furosemide 80 (11) 1 0.5 2 0.988Clofibric acid 92 (11) 1 1 3 0.991Pravastatin 120 (5) 9 2 6 0.989Benzafibrate 70 (9) 2 0.1 0.2 0.999Hydrochlorothiazide 83 (9) 2 2 6 0.981Bisphenol A 105 (17) 241 7 25 0.976Diclofenac 112 (12) 3 0.4 1 0.998Fenoprofen 93 (10) 9 1 3 0.995Diuron 63 (16) 5 5 17 0.942Ibuprofen 71 (8) 19 2 7 0.981Chlorophene 71 (16) 13 2 8 0.982Gemfibrozil 78 (10) 3 2 7 0.976
*IDL: instrumental detection limit; MDL: method detection limit; MQL: method quantificationlimit.
International Journal of Environmental Analytical Chemistry 333
Downloaded By: [Lozano, Ana] At: 11:13 13 April 2010

MQLs values ranged from 1 to 10 ngL�1 for 72 compounds. The analytical method showalso a good performance in terms of linearity (with correlation coefficients (r2)� 0.98 forthe most of compounds), obtained by using matrix-matched calibration curves.
3.2 Concentration levels of priority substances and ‘candidate’ pollutants
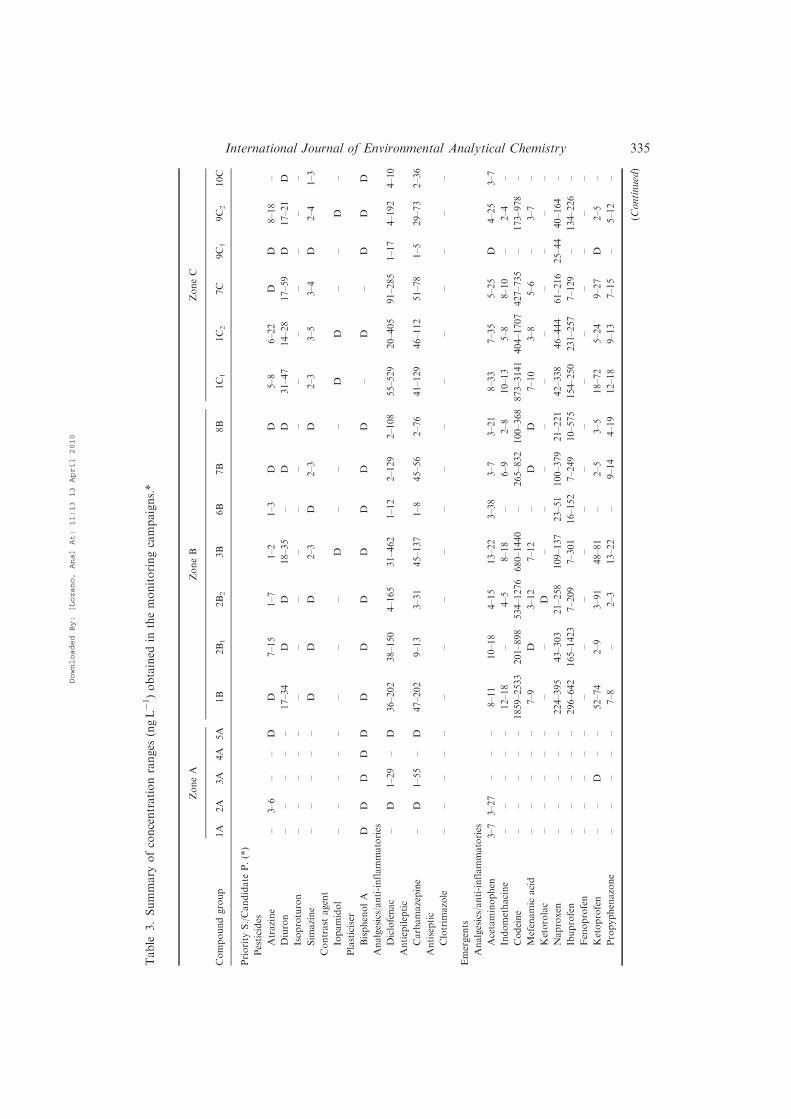
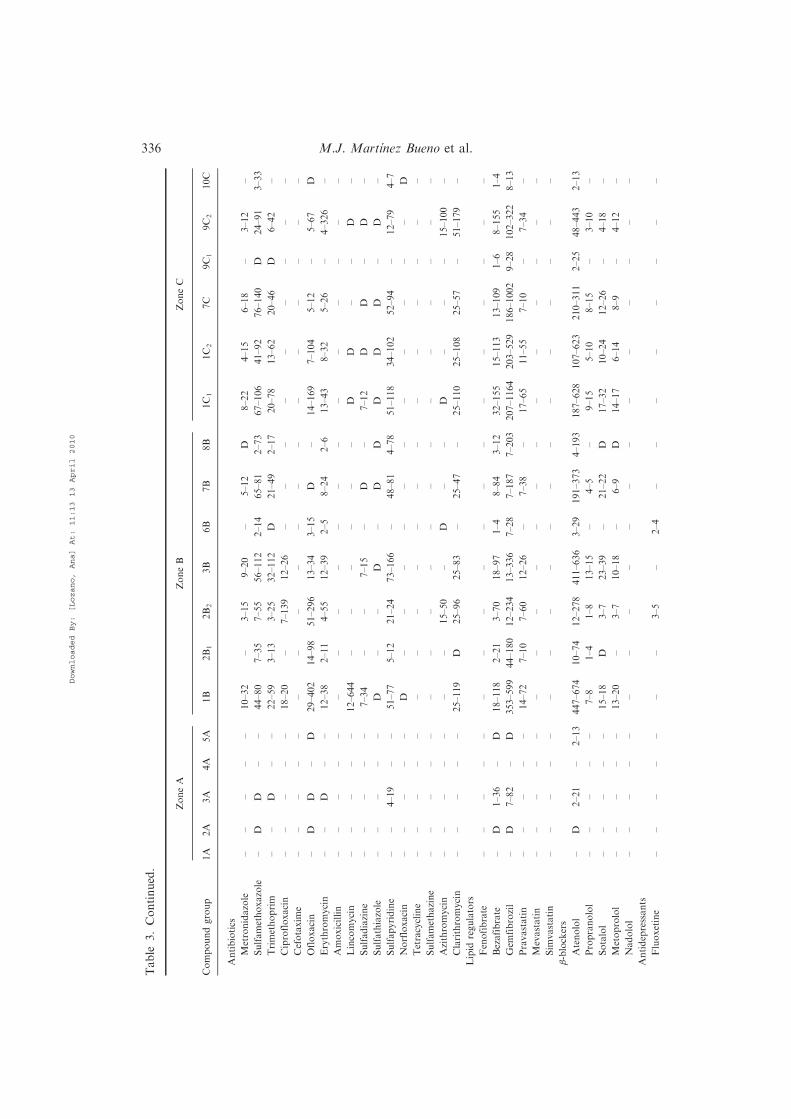
Table 3 shows the concentrations measured of the target compounds for this surveymonitoring of rivers of the region of Madrid. The survey study was carried out duringthree monitoring campaigns, where water samples were collected from rivers of differentareas of the region of Madrid (north, centre and south). The most important hydrologicalcollector in the region is the Tajo basin, that is nourished by the Jarama, the Manzanares,the Alberche and the Guadarrama rivers. Other major rivers in the region of Madrid arethe rivers Lozoya, Guadalix and Henares. The results of the Table 3 are presented infunction of the north area (zone A), centre (zone B) and south (zone C), and for each zone,the sampling points are indicated by numbers. As it has been indicated in Section 2.2above, the three zones are different in terms of population and activities developed. ZoneA (north) is characterised by a lower population density and with less services andproductive development infrastructures. Zone B and C (centre and south) arecharacterised by an important demographic weight and where there is a growingindustrial activity and service activities. The data shown in Table 3 correspond to the rangeof concentrations observed in the river waters during the three monitoring campaignscarried out over a period of seven months.
From the priority substances and ‘candidate’ pollutants analysed, atrazine, diclofenacand carbamazepine were detected in zone A, and in the zones B–C, diuron, simazine,iopamidol, and bisphenol A were also detected. Isoproturon and clotrimazol were notdetected in any of the water samples collected. As can be seen in Table 3, the measuredconcentrations of the priority substances (atrazine, simazine, isoproturon and diuron) didnot surpass the maximum allowable concentration (MAC) established as environmentalquality standards (EQS) for rivers under the WFD. The survey monitoring was carried outover a period of seven months and taking into account the average concentration duringthis period, the measured concentration neither surpasses the annual average (AA) set asEQS. The level of concentration detected for the priority substances was at low ngL�1
while the EQS are at low mgL�1. The ‘candidate’ pollutants diclofenac and carbamazepinewere detected at higher frequency and higher levels of concentration in the zones B and Cthan in zone A. Up to now, ‘candidate’ pollutants are not subject to EQS, but the availabletoxicological information for representative aquatic species can be benchmarks forenvironmental risk assessment. Diclofenac was measured at concentrations ranging from1 to 529 ngL�1, so at these levels of concentrations, some aquatic organisms do not showacute toxic effects; however, long-term effects or chronic effects could not be discarded[15,16]. Bisphenol A seems to be a ubiquitous contaminant but it was found at the limit ofdetection (7 ngL�1) of our methods in most of sampling points.
3.3 Concentration levels of emerging contaminants
As shown in Table 3, there is a clear difference between the detection of emergingcontaminants in the three zones studied. Zone A has a much lower load of emergingcontaminants than zones B and C. That profiles respond with the general increase in
334 M.J. Martınez Bueno et al.
Downloaded By: [Lozano, Ana] At: 11:13 13 April 2010
Table
3.Summary
ofconcentrationranges
(ngL�1)obtained
inthemonitoringcampaigns.*
ZoneA
ZoneB
ZoneC
Compoundgroup
1A
2A
3A
4A
5A
1B
2B1
2B2
3B
6B
7B
8B
1C1
1C2
7C
9C1
9C2
10C
Priority
S./Candidate
P.(*)
Pesticides
Atrazine
–3–6
––
DD
7–15
1–7
1–2
1–3
DD
5–8
6–22
DD
8–18
–
Diuron
––
––
–17–34
DD
18–35
–D
D31–47
14–28
17–59
D17–21
D
Isoproturon
––
––
––
––
––
––
––
––
––
Sim
azine
––
––
–D
DD
2–3
D2–3
D2–3
3–5
3–4
D2–4
1–3
Contrast
agent
Iopamidol
––
––
––
––
D–
––
DD
––
D–
Plasticiser
BisphenolA
DD
DD
DD
DD
DD
DD
–D
–D
DD
Analgesics/anti-inflammatories
Diclofenac
–D
1–29
–D
36–202
38–150
4–165
31–462
1–12
2–129
2–108
55–529
20–405
91–285
1–17
4–192
4–10
Antiepileptic
Carbamazepine
–D
1–55
–D
47–202
9–13
3–31
45–137
1–8
45–56
2–76
41–129
46–112
51–78
1–5
29–73
2–36
Antiseptic
Clotrim
azole
––
––
––
––
––
––
––
––
––
Emergents
Analgesics/anti-inflammatories
Acetaminophen
3–7
3–27
––
–8–11
10–18
4–15
13–22
3–38
3–7
3–21
8–33
7–35
5–25
D4–25
3–7
Indomethacine
––
––
–12–18
–4–5
8–18
–6–9
2–8
10–13
5–8
8–10
–2–4
–
Codeine
––
––
–1859–2533
201–898
534–1276
680–1440
–265–832
100–368
873–3141
404–1707
427–735
–173–978
–
Mefenamic
acid
––
––
–7–9
D3–12
7–12
–D
D7–10
3–8
5–6
–3–7
–
Ketorolac
––
––
––
–D
––
––
––
––
––
Naproxen
––
––
–224–395
43–303
21–258
109–137
23–51
100–379
21–221
42–338
46–444
61–216
25–44
40–164
–
Ibuprofen
––
––
–296–642
165–1423
7–209
7–301
16–152
7–249
10–575
154–250
231–257
7–129
–134–226
–
Fenoprofen
––
––
––
––
––
––
––
––
––
Ketoprofen
––
D–
–52–74
2–9
3–91
48–81
–2–5
3–5
18–72
5–24
9–27
D2–5
–
Propyphenazone
––
––
–7–8
–2–3
13–22
–9–14
4–19
12–18
9–13
7–15
–5–12
–
(Continued)
International Journal of Environmental Analytical Chemistry 335
Downloaded By: [Lozano, Ana] At: 11:13 13 April 2010
Table
3.Continued.
ZoneA
ZoneB
ZoneC
Compoundgroup
1A
2A
3A
4A
5A
1B
2B1
2B2
3B
6B
7B
8B
1C1
1C2
7C
9C1
9C2
10C
Antibiotics
Metronidazole
––
––
–10–32
–3–15
9–20
–5–12
D8–22
4–15
6–18
–3–12
–
Sulfamethoxazole
–D
D–
–44–80
7–35
7–55
56–112
2–14
65–81
2–73
67–106
41–92
76–140
D24–91
3–33
Trimethoprim
––
D–
–22–59
3–13
3–25
32–112
D21–49
2–17
20–78
13–62
20–46
D6–42
–
Ciprofloxacin
––
––
–18–20
–7–139
12–26
––
––
––
––
–
Cefotaxim
e–
––
––
––
––
––
––
––
––
–
Ofloxacin
–D
D–
D29–402
14–98
51–296
13–34
3–15
D–
14–169
7–104
5–12
–5–67
D
Erythromycin
––
D–
–12–38
2–11
4–55
12–39
2–5
8–24
2–6
13–43
8–32
5–26
–4–326
–
Amoxicillin
––
––
––
––
––
––
––
––
––
Lincomycin
––
––
–12–644
––
––
––
DD
––
D–
Sulfadiazine
––
––
–7–34
––
7–15
–D
–7–12
DD
–D
–
Sulfathiazole
––
––
–D
––
D–
DD
DD
D–
D–
Sulfapyridine
––
4–19
––
51–77
5–12
21–24
73–166
–48–81
4–78
51–118
34–102
52–94
–12–79
4–7
Norfloxacin
––
––
–D
––
––
––
––
––
–D
Tetracycline
––
––
––
––
––
––
––
––
––
Sulfamethazine
––
––
––
––
––
––
––
––
––
Azithromycin
––
––
––
–15–50
–D
––
D–
––
15–100
–
Clarithromycin
––
––
–25–119
D25–96
25–83
–25–47
–25–110
25–108
25–57
–51–179
–
Lipid
regulators
Fenofibrate
––
––
––
––
––
––
––
––
––
Bezafibrate
–D
1–36
–D
18–118
2–21
3–70
18–97
1–4
8–84
3–12
32–155
15–113
13–109
1–6
8–155
1–4
Gem
fibrozil
–D
7–82
–D
353–599
44–180
12–234
13–336
7–28
7–187
7–203
207–1164
203–529
186–1002
9–28
102–322
8–13
Pravastatin
––
––
–14–72
7–10
7–60
12–26
–7–38
–17–65
11–55
7–10
–7–34
–
Mevastatin
––
––
––
––
––
––
––
––
––
Sim
vastatin
––
––
––
––
––
––
––
––
––
�-blockers
Atenolol
–D
2–21
–2–13
447–674
10–74
12–278
411–636
3–29
191–373
4–193
187–628
107–623
210–311
2–25
48–443
2–13
Propranolol
––
––
–7–8
1–4
1–8
13–15
–4–5
–9–15
5–10
8–15
–3–10
–
Sotalol
––
––
–15–18
D3–7
23–39
–21–22
D17–32
10–24
12–26
–4–18
–
Metoprolol
––
––
–13–20
–3–7
10–18
–6–9
D14–17
6–14
8–9
–4–12
–
Nadolol
––
––
––
––
––
––
––
––
––
Antidepressants
Fluoxetine
––
––
––
–3–5
–2–4
––
––
––
––
336 M.J. Martınez Bueno et al.
Downloaded By: [Lozano, Ana] At: 11:13 13 April 2010
Paroxetine
––
––
––
––
––
––
––
––
––
Venlafaxine
––
2–11
––
45–68
37–110
28–168
78–134
1–9
54–71
1–57
66–116
40–104
73–195
1–7
20–79
D
Citalopram
hydrobromide
––
––
–10–15
4–7
2–19
9–17
–D
–7–23
6–14
4–7
–3–19
–
Amitriptyline
hydrochloride
––
––
–1–3
––
––
––
1–3
1–3
––
1–4
–
Clomipramine
hydrochloride
––
––
––
––
––
––
––
––
––
Antiepileptic/psychiatrics
Diazepam
––
––
–2–4
–D
5–9
–1–3
1–21
6–7
4–9
4–13
–2–4
–
Primidone
––
5–29
––
31–34
10–24
14–27
50–72
–35–56
12–45
43–76
42–75
37–82
–26–48
5–18
Corticosteroides
Methylpre-
dnisolone
––
––
––
––
––
––
––
––
––
Diuretics
Furosemide
––
––
–81–126
10–18
10–70
47–176
2–13
2–25
2–9
128–150
10–96
54–57
2–13
2–57
–
Hydro-
chlorothiazide
–D
17–135
–D
80–565
34–38
46–406
114–365
7-128
62–180
8–51
181–699
51–1002
368–788
7–50
35–857
7–149
Ulcer
healings
Ranitidine
––
––
–19–63
3–18
3–54
11–31
–3–5
–9–54
3–28
13–16
–2–24
–
Omeprazole
––
––
D2–222
–38–66
––
––
D–
––
––
Famotidine
––
––
–D
–9–100
D–
––
DD
––
4–217
–
Lansoprazole
––
––
–4–36
–4–96
––
––
––
––
––
Loratadine
––
––
–D
–2–10
––
––
DD
––
D––
Bronchodilatadors
Salbutamol
––
––
–2–4
––
2–4
–1–2
–1–2
2–3
2–3
––
–
Terbutaline
––
––
––
––
––
––
––
––
––
Contrast
agents
Iopromide
––
––
––
––
D–
––
28–58
28–36
28–32
–D
–
Serm Tamoxifen
––
––
––
––
––
––
––
––
––
Anesthetics
Mepivacaine
––
––
–5–8
1–2
1–4
7–14
–2–3
1–3
9–15
6–10
3–5
–3–10
–
Antineoplastic
agents
Cyclophosphamide
monohydrate
––
––
––
––
––
––
––
––
––
Iofosfamide
––
––
––
––
––
––
––
––
––
International Journal of Environmental Analytical Chemistry 337
Downloaded By: [Lozano, Ana] At: 11:13 13 April 2010
Table
3.Continued.
ZoneA
ZoneB
ZoneC
Compoundgroup
1A
2A
3A
4A
5A
1B
2B1
2B2
3B
6B
7B
8B
1C1
1C2
7C
9C1
9C2
10C
Pesticides
Chlorpyriphos
methyl
––
––
––
––
––
––
––
––
––
Chlorfenvinphos
––
––
–2–16
2–5
––
–2–24
–D
D2–20
––
–
Disinfectants
Biphenylol
––
––
––
––
––
––
––
––
––
Chlorophene
––
––
––
––
––
––
––
––
––
Stimulants
Nicotine
91–148
46–168
34–114
36–187
40–150
16–38
20–162
34–614
23–55
35–94
11–28
30–129
23–41
23–41
20–43
23–53
18–142
37–67
Caffeine
23–123
55–191
42–166
41–145
23–186
470–1131
81–480
66–280
206–864
75–261
105–209
66–576
76–403
107–382
93–147
46–131
100–262
48–122
Metabolites
Cotinine
10–16
4–24
9–22
5–17
7–28
44–190
18–57
36–87
15–53
22–69
43–64
26–103
47–159
36–77
14–75
17–37
25–93
26–58
1,7-
dim
ethylxanthine
8–23
7–44
13–44
5–16
12–21
63–349
55–67
35–51
53–134
47–91
55–78
49–293
44–243
53–83
52–99
34–75
43–68
32–69
Carbamazepine
10,11-epoxide
––
2–12
––
9–12
–6–7
10–25
–7–11
6–13
8–14
7–16
8–17
–6–12
2–9
Clofibricacid
––
––
–4–69
–3–20
3–10
––
–7–39
4–26
D–
––
Fenofibricacid
––
––
–15–34
2–6
7–38
20–32
––
–2–37
2–7
2–6
––
–
Salicylicacid
10–108
8–119
19–34
4–70
16–37
13–53
5–30
6–33
7–32
37–109
9–24
3–11
10–917
12–35
4–45
6–53
5–25
5–20
4-M
aa
––
––
–10–28
DD
8–28
––
–15–20
6–22
7–22
–6–10
–
4-A
aa
D2–116
54–257
–3–63
842–1322
253–466
124–1169
724–1135
9–153
745–1054
5–715
943–1572
518–1361
811–1255
22–98
410–1207
67–85
4-Faa
–23–52
28–112
–23–35
623–791
139–280
74–552
671–883
8–11
552–620
14–747
526–877
359–876
684–1043
18–40
292–697
35–56
4-D
aa
––
––
––
––
––
––
DD
––
––
4-A
a–
––
––
4–13
2–7
2–8
7–35
–2–4
–2–19
2–20
8–14
–2–10
–
Antipyrine
––
––
–10–18
D3–10
19–67
D14–24
2–28
17–35
15–35
18–44
D16–36
–
Totalloadof(ngL�1)
Priority
S./Candidate
P.(*)
–3–6
2–84
––
116–432
62–170
8–203
112–619
2–22
50–187
2–184
138–652
119–550
171–421
1–22
73–296
5–47
Emergents
116–
442
185–
677
254–
989
157–
432
111–
469
6633–
9942
1194–
4783
597–
7032
5080–
6726
110–
1175
2597–
4882
296–
4679
4122–
8485
2818–
8085
3506–
5723
128–
423
1877–
6360
266–
578
*Zone:A,BandC(north,centreandsouth,respectively).1:Jarama;2:Henares;3:Manzanares;4:Aulencia;5:Lozoya;6:Tajuna;7:Guadarrama;8:Perales;9:Tajo;10:Alberche.
BXandCX:Differentsamplingpoints.(*)Priority
SubstancesandCandidate
Pollutants.D:detected(5
MQL).
338 M.J. Martınez Bueno et al.
Downloaded By: [Lozano, Ana] At: 11:13 13 April 2010
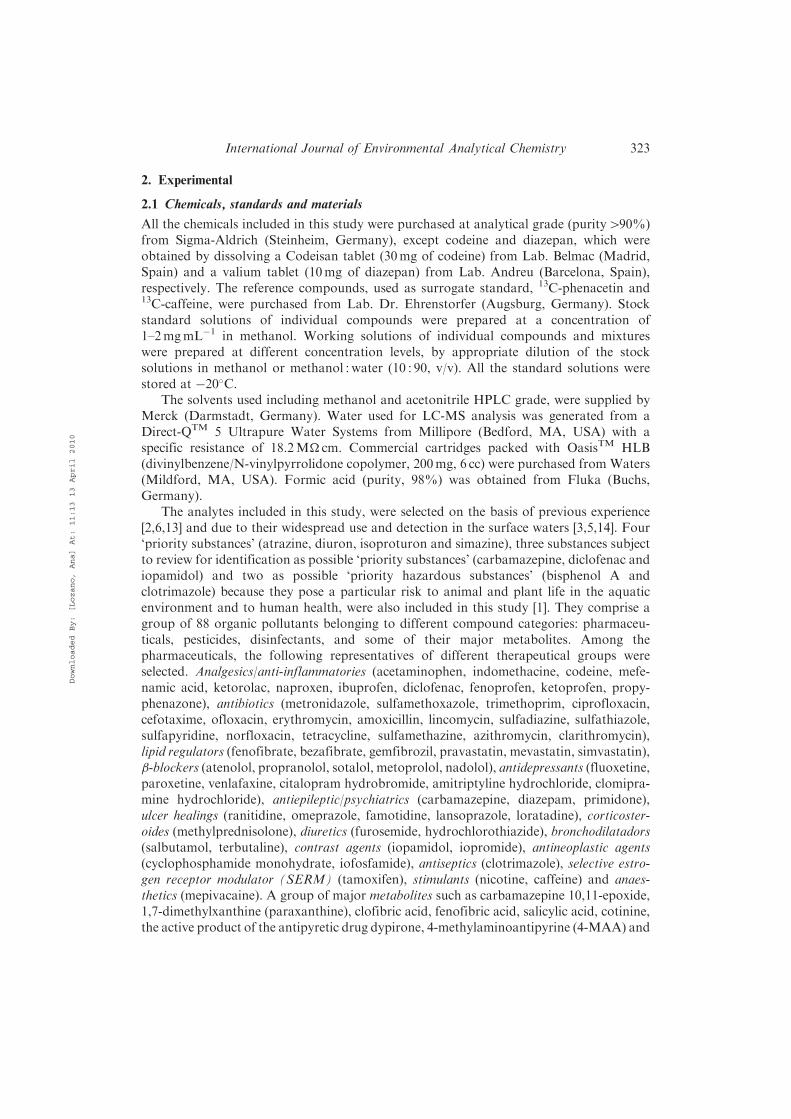
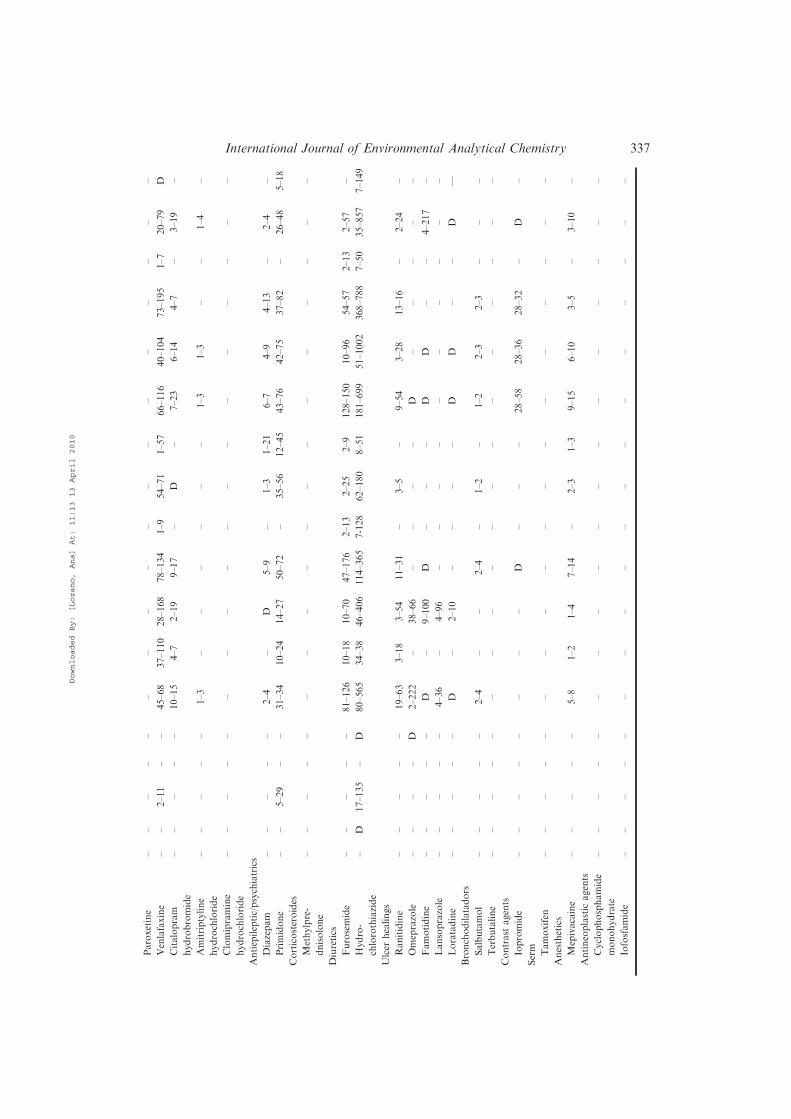
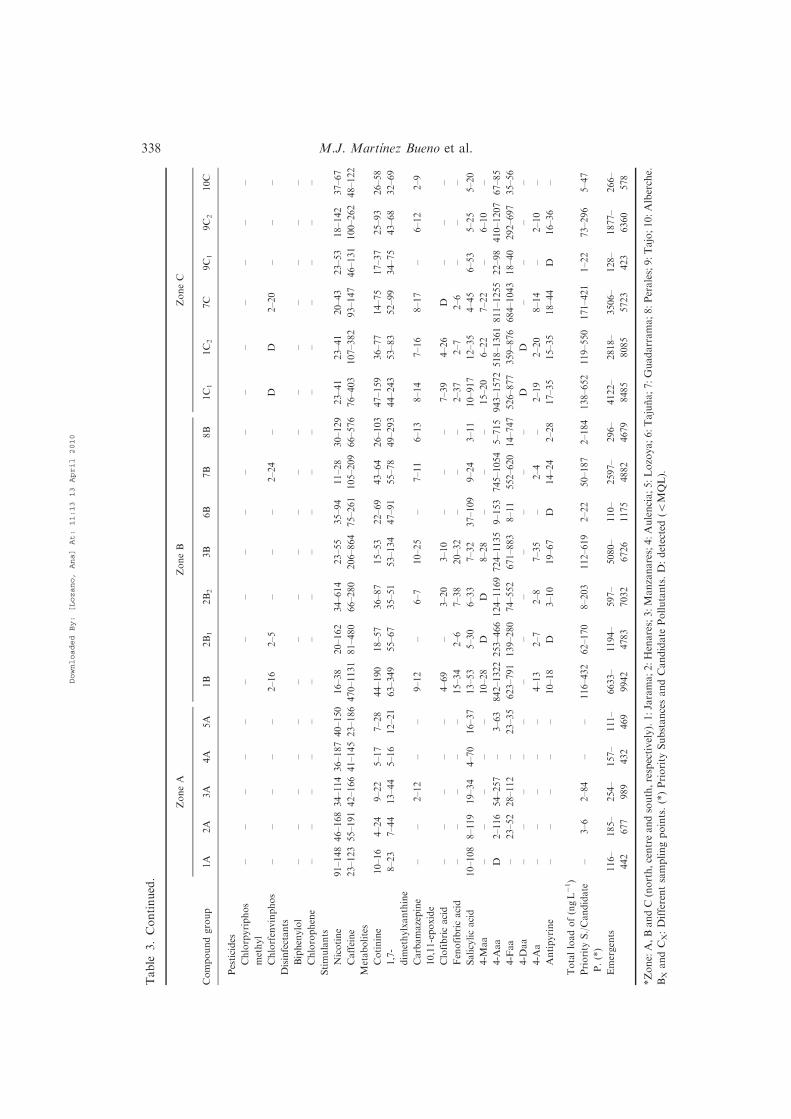
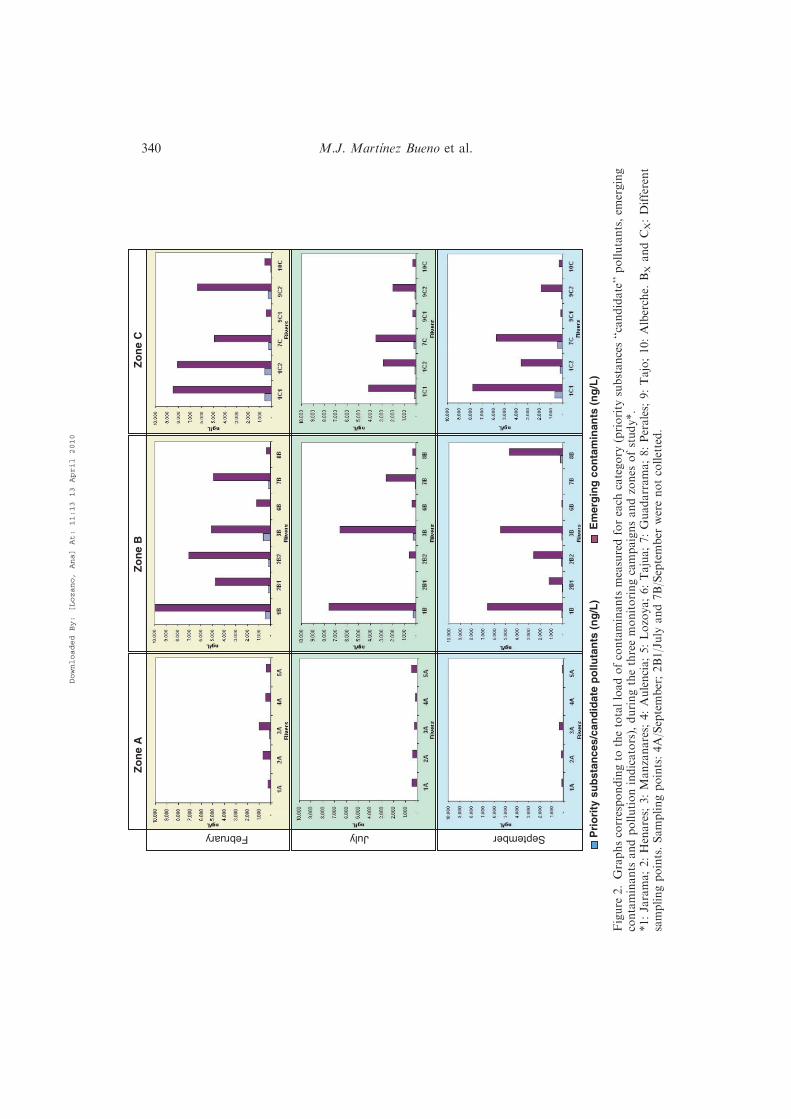
concentration when moving downstream related to the increase in population density andto discharges from WWTPs. The compounds detected in zone A were: acetaminophen,ketoprofen, sulfamethoxazole, trimethoprim, ofloxacin, erytromicyn, sulfapyridine,bezafibrate, gemfibrocil, atenolol, venlafaxine, primidone, hydrochlorothiazide, omepra-zole, and the metabolites: carbamazepine 10,11-epoxide, salicylic acid, 4-AAA and 4-FAA.It represents a total of 18 contaminants from the 75 analysed. However, most of them (56)were measured in most of the sampling points of zones B and C that can be explained in asimilar way as above. The compounds which were not measured in zones B and C were:fenoprofen, cefotaxime, amoxicillim, tetracycline, sulfamethazine, fenofibrate, mevastatin,simvastatin, nadolol, paroxetine, clomipramine hydrochloride, methylprednisolone,terbutaline, cyclophosphamide monohydrate, iofosfamide, tamoxifen, chlorpyriphosmethyl, biphenylol and chlorophene. Ketorolac was only detected in one sample.Among the emerging contaminants detected, some compounds of the therapeutical groupsof analgesic/anti-inflamatories (codeine, ibuprofen), lipid regulators (gemfibrocil) anddiuretics (hydrochlorothiazide) were detected at higher concentrations than the rest ofcompounds surpassing concentrations of 1 mgL�1. Similar values have been reported foribuprofen in surface waters from United Kingdom [17] and for hydrochlorothiazide ineffluents from Italy [18]. This is probably due to the amounts of these compoundsconsumed in the world, in particular, ibuprofen is the third active compound moreconsumed in Spain during 2007 [19]. Other pharmaceuticals, such as naproxen andatenolol, were detected at maximum concentrations of approx. 400 and 600 ngL�1,respectively. The frequency of those detections was very similar in the three samplesanalysed. The metabolites of dypirone, 4-AAA and 4-FAA, were also detected atconcentrations over 1 mgL�1 and at a maximum concentration of approx. 800 ngL�1,respectively. This fact confirms that the monitoring of metabolites and transformationproducts is necessary in these studies [13]. On the other hand, codeine was detected ata highest range of concentration (100–2533 ngL�1) and the metabolites, salicylic acid,4-AAA and 4-FAA, were the most often detected compounds (480%) in the river watersduring the monitoring campaign. Figure 2 shows the results of the total load ofcontaminants measured for each category (priority substances/‘candidate’ pollutants andemerging contaminants), during the three monitoring campaigns and for the differentzones of monitoring. The data is presented as the sum of concentrations (cumulative levels)for each category. In view of the results shown in Table 3, the load of emergingcontaminants in the rivers waters of zones B and C is clearly much higher than in zone Awhich is less densely populated (see Figure 2). Furthermore, considering intra zone B andC data, it is observed higher values in concentration and number of contaminants in rivers1, 2, 3 and 7 with respect to 6, 8, 9 and 10. It can be explained as a consequence of thehigher population of those river areas called Jarama, Manzanares, Henares and Tajo. Itcould draw a relationship between an increased water contamination in function of thedensity of population and the use of pharmaceuticals. Regarding the detection ofpesticides in the three zones, there is no apparent difference, for the pesticides analysedamong agricultural zone (zone A) and industrial zones (B and C).
3.4 Concentration levels of caffeine, nicotine and their metabolites
The utilisation of caffeine, nicotine and their metabolites as potential tracers or indicatorsof human impacts on surface water systems due to their ubiquity is still a subject for
International Journal of Environmental Analytical Chemistry 339
Downloaded By: [Lozano, Ana] At: 11:13 13 April 2010
Zo
ne
AZ
on
e C
February July September
Zo
ne
B
Em
erg
ing
co
nta
min
ants
(n
g/L
)P
rio
rity
su
bst
ance
s/ca
nd
idat
e p
ollu
tan
ts (
ng
/L)
Figure
2.Graphscorrespondingto
thetotalloadofcontaminants
measuredforeach
category
(priority
substances‘‘candidate’’pollutants,em
erging
contaminants
andpollutionindicators),duringthethreemonitoringcampaignsandzones
ofstudy*.
*1:Jarama;2:Henares;
3:Manzanares;
4:Aulencia;5:Lozoya;6:Tajua;7:Guadarrama;8:Perales;
9:Tajo;10:Alberche.
BXandCX:Different
samplingpoints.Samplingpoints:4A/September;2B1/July
and7B/September
werenotcolletted.
340 M.J. Martınez Bueno et al.
Downloaded By: [Lozano, Ana] At: 11:13 13 April 2010
further research, mainly due to the need of a better understanding of how stable they are in
the environment [11] and the need for data to know their background levels expected.
Nicotine, caffeine and their metabolites have been previously reported as promisingindicator candidates of water contamination [20,21]. A widespread detection of these
chemicals in the environment may give weight to their potential relationship with water
contamination due to anthropogenic sources. In this study, levels of caffeine, nicotine and
metabolites have also been determined. As is reported in Table 3, caffeine, nicotine and
their metabolites were detected in all water samples analysed, that is, in all sampling points
and during the three monitoring campaigns. Caffeine was detected at loads higher than
those found for nicotine, except for the sampling points 1A, 4A and 2B2. Although its
metabolites (paraxanthine and cotinine) were also detected, their concentrations were
lower than their parent compounds, except for cotinine in the points 1B, 7B, 1C1, 1C2 and
7C. The concentration values observed in zone A with concentrations typically around or
below 200 ngL�1 that could considered as a background level in our study. On the
contrary, in zones B and C the values are typically in the range of 200–700 and180–500 ngL�1, respectively. Similar values have been obtained in other studies from
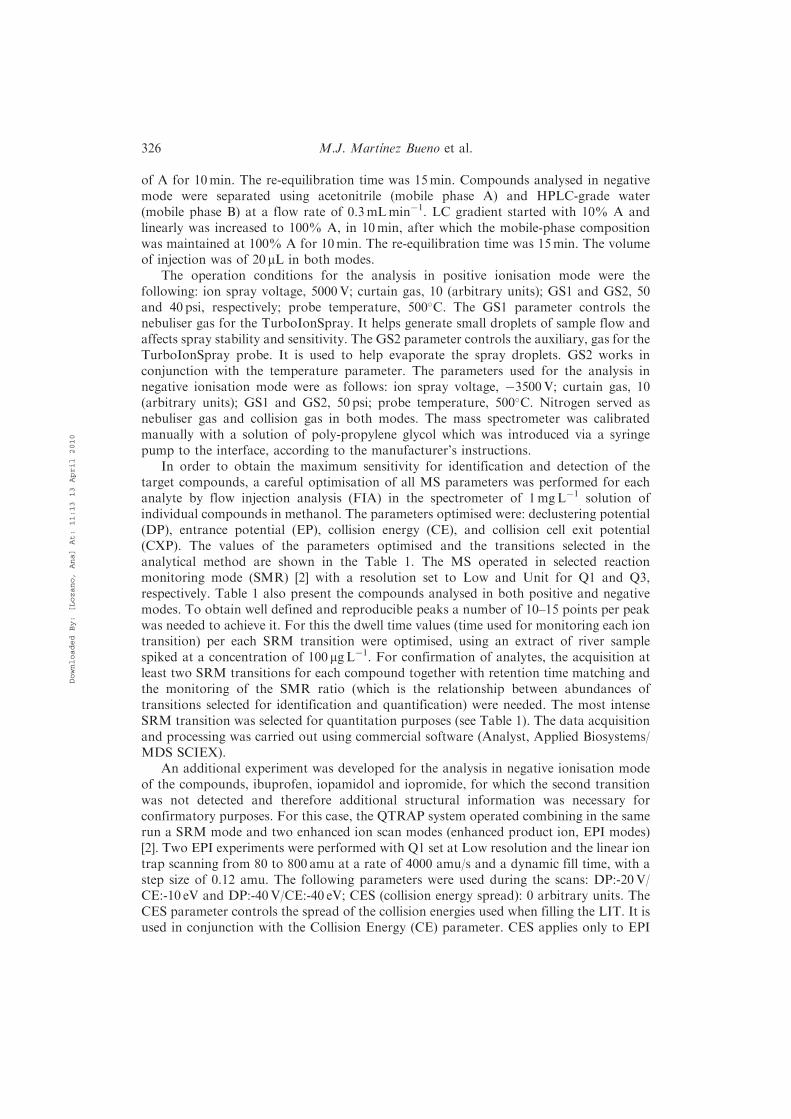
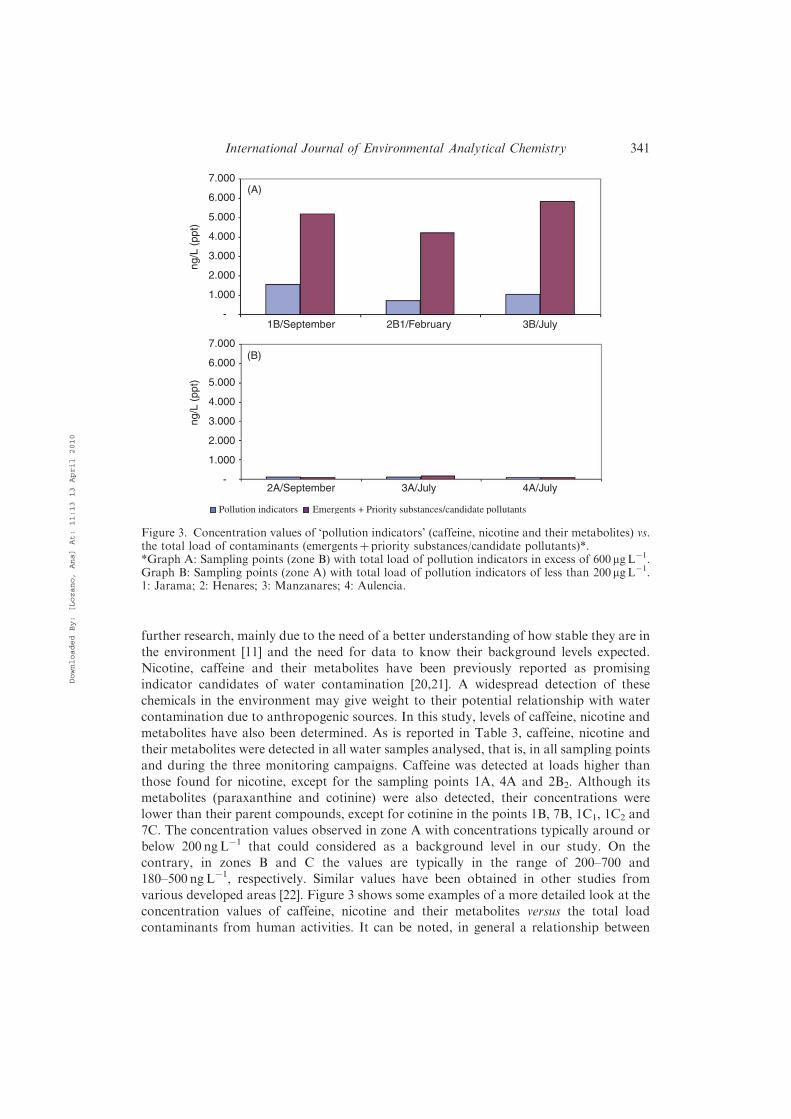
various developed areas [22]. Figure 3 shows some examples of a more detailed look at the
concentration values of caffeine, nicotine and their metabolites versus the total load
contaminants from human activities. It can be noted, in general a relationship between
(A)
(B)
Pollution indicators Emergents + Priority substances/candidate pollutants
7.000
6.000
5.000
4.000
3.000
ng/L
(pp
t)ng
/L (
ppt)
2.000
1.000
1B/September 2B1/February 3B/July
2A/September 3A/July 4A/July
-
7.000
6.000
5.000
4.000
3.000
2.000
1.000
-
Figure 3. Concentration values of ‘pollution indicators’ (caffeine, nicotine and their metabolites) vs.the total load of contaminants (emergentsþ priority substances/candidate pollutants)*.*Graph A: Sampling points (zone B) with total load of pollution indicators in excess of 600mgL�1.Graph B: Sampling points (zone A) with total load of pollution indicators of less than 200mgL�1.1: Jarama; 2: Henares; 3: Manzanares; 4: Aulencia.
International Journal of Environmental Analytical Chemistry 341
Downloaded By: [Lozano, Ana] At: 11:13 13 April 2010
high load of contaminants when the considered indicators presented higher values ofconcentration. The results pointed out the interest in using such compounds as indicatorsof water contamination but obviously more data are necessary to confirm the efficacy ofthose indicators.
3.5 Risk to the aquatic environment
A preliminary screening of the risks to the aquatic compartment has been carried out, bycomparing the predicted environmental concentrations (PEC) of the monitored substancesto the predicted no effect concentration (PNEC), thus obtaining the so-called riskcharacterisation ratio [23]. Existing PNEC values for aquatic organisms have beenobtained from Munoz et al. [24] for 42 of the 88 substances monitored, and an averageconcentration for each substance has been calculated from data in Table 3.This preliminary screening shows that three substances, namely ciprofloxacin, ibuprofenand 4-AAA, exceed the PEC/PNEC value of 1, indicating a potential risk for aquaticorganisms. It must be borne in mind that this simple screening has been performedconsidering average and not peak concentrations, therefore in particular locations PEC/PNEC values above 1 could be found for other substances. However, assessing theenvironmental risks of the 88 pharmaceuticals deserves a more elaborated study, which isbeyond the scope of this paper.
4. Conclusions
This paper reports the first results obtained of a survey monitoring of chemical residues inriver waters of the region of Madrid. As part of this study, an analytical protocol includingSPE procedure and analysis by LC systems with ion trap and time-of-flight detectors hasbeen developed for the detection of a total of 88 compounds. The results obtained duringthe monitoring campaign carried out over a period of seven months were classified in turninto three different categories: emerging contaminants, priority substances or candidatepollutants and pollution indicators. The concentration ranges detected were between 110and 9942 ngL�1 for emerging contaminants and 1 and 652 ngL�1 for priority substances/candidate pollutants. Zones B (centre) and C (south) of the region of Madrid characterisedby an important demographic weight also provide a higher load of contaminants in riverwater, and are higher than zone A (north) which is less densely populated. A preliminaryscreening of environmental risks suggests that some of the monitored contaminants mightbe exceeding aquatic risk thresholds. However, a more detailed study specifically focusingon this subject should be carried out in order to properly assess these risks. Caffeine,nicotine and their metabolites have shown as adequate indicators of contamination fromhuman activities in the area studied.
Acknowledgements
The authors acknowledge the Spanish Ministry of Education and Science (Programa ConsoliderIngenio 2010 CE-CSD2006-004), and the Fundacion Insituto Madrileno de Estudios Avanzados(IMDEA-Agua). M.J. Martınez Bueno acknowledges the research fellowship from the Junta deAndalucıa (Spain) associated with Project TEP232.
342 M.J. Martınez Bueno et al.
Downloaded By: [Lozano, Ana] At: 11:13 13 April 2010
References
[1] European Parliament Legislative Resolution of 22 May 2007 on the Proposal for a Directive ofthe European Parliament and of the Council on Environmental Quality Standards in the Field
of Water Policy and Amending Directive 2000/60/EC [COM(2006)0397 – C6-0243/2006 – 2006/0129(COD)].
[2] M.J. Martinez Bueno, A. Aguera, M.J. Gomez, M.D. Hernando, J.F. Garcıa-Reyes, and
A.R. Fernandez-Alba, Anal. Chem. 79, 9372 (2007).[3] M. Kuster, M.J. Lopez de Alda, M.D. Hernando, M. Petrovic, J. Martın-Alonso, and
D. Barcelo, J. Hydrol. 358, 112 (2008).[4] M.J. Martınez Bueno, M.D. Hernando, A. Aguera, and A.R. Fernandez-Alba, Talanta 77,
1518 (2009).[5] B. Kasprzyk-Hordern, R.M. Dinsdale, and A.J. Guwy, Water Res. 42, 3498 (2008).[6] M.J. Gomez, M.J. Martınez Bueno, S. Lacorte, A.R. Fernandez-Alba, and A. Aguera,
Chemosphere 66, 993 (2007).[7] M. Carballa, F. Omil, J.M. Lema, M. Llompart, C. Garcıa-Jares, I. Rodrıguez, M. Gomez, and
T.A. Ternes, Water Res. 38, 2918 (2004).
[8] M.D. Hernando, M. Mezcua, A.R. Fernandez-Alba, and D. Barcelo, Talanta 69, 334 (2006).[9] C.G. Daughton and T.A. Ternes, Environ. Health Perspect. 107, 907 (1999).[10] T.A. Ternes, Water Res. 32, 3245 (1998).
[11] R.L. Seiler, S.D. Zaugg, J.M. Thomas, and D.L. Howcroft, Ground Water 37, 405 (1997).[12] R. Rosal, A. Rodrıguez, J.A. Perdigon-Melon, M. Mezcua, M.D. Hernando, P. Leton,
E. Garcıa-Calvo, A. Aguera, and A.R. Fernandez-Alba, Water Res. 42, 3719 (2008).[13] M.D. Hernando, M.J. Gomez, A. Aguera, and A.R. Fernandez-Alba, Trends Anal. Chem. 26,
581 (2007).[14] G. Meritxell, M. Petrovic, and D. Barcelo, Talanta 70, 678 (2006).[15] M. Cleuvers, Toxicol. Lett. 142, 185 (2003).
[16] M. Farre, I. Ferrer, A. Ginebreda, M. Figueras, L. Olivella, L. Tirapu, M. Vilanova, andD. Barcelo, J. Chromatogr. A. 938, 187 (2001).
[17] D. Ashton, M. Hilton, and K.V. Thomas, Sci. Total Environ. 333, 167 (2004).
[18] S. Castiglioni, R. Bagnati, R. Fanelli, F. Pomati, D. Calamari, and E. Zuccato, Environ. Sci.Technol. 40, 357 (2006).
[19] http://www.msc.es/biblioPublic/publicaciones/docs/vol32_3FarmacosMayorConsumo.pdf
[20] I.J. Buerge, M. Kahle, H.-R. Buser, M.D. Muller, and T. Poiger, Environ. Sci. Technol. 42,6354 (2008).
[21] I.J. Buerge, T. Poiger, M.D. Muller, and H.-R. Buser, Environ. Sci. Technol. 37, 691 (2003).[22] M. Huerta-Fontela, M.T. Galceran, and F. Ventura, Environ. Sci. Technol. 42, 6809 (2008).
[23] European Commission. Technical guidance document on Risk Assessment Part II. EuropeanCommission and European Chemicals Bureau, Joint Research Centre, Ispra, Italy, 2003.
[24] I. Munoz, M.J. Gomez, A. Molina-Dıaz, M.A.J. Huijbregts, A.R. Fernandez-Alba, and
E. Garcıa-Calvo, Chemosphere 74, 37 (2008).
International Journal of Environmental Analytical Chemistry 343
Downloaded By: [Lozano, Ana] At: 11:13 13 April 2010
Copyright © 2022 FDOKUMEN