Polar organic contaminants in natural drinking water sources ...
268
UvA-DARE is a service provided by the library of the University of Amsterdam (https://dare.uva.nl) UvA-DARE (Digital Academic Repository) Polar organic contaminants in natural drinking water sources and their removal by reverse osmosis A high-resolution mass spectrometry study Albergamo, V. Publication date 2019 Document Version Final published version License Other Link to publication Citation for published version (APA): Albergamo, V. (2019). Polar organic contaminants in natural drinking water sources and their removal by reverse osmosis: A high-resolution mass spectrometry study. General rights It is not permitted to download or to forward/distribute the text or part of it without the consent of the author(s) and/or copyright holder(s), other than for strictly personal, individual use, unless the work is under an open content license (like Creative Commons). Disclaimer/Complaints regulations If you believe that digital publication of certain material infringes any of your rights or (privacy) interests, please let the Library know, stating your reasons. In case of a legitimate complaint, the Library will make the material inaccessible and/or remove it from the website. Please Ask the Library: https://uba.uva.nl/en/contact, or a letter to: Library of the University of Amsterdam, Secretariat, Singel 425, 1012 WP Amsterdam, The Netherlands. You will be contacted as soon as possible. Download date:10 Aug 2022
-
Upload
khangminh22 -
Category
Documents
-
view
1 -
download
0
Transcript of Polar organic contaminants in natural drinking water sources ...

UvA-DARE is a service provided by the library of the University of Amsterdam (https://dare.uva.nl)
UvA-DARE (Digital Academic Repository)
Polar organic contaminants in natural drinking water sources and their removalby reverse osmosisA high-resolution mass spectrometry studyAlbergamo, V.
Publication date2019Document VersionFinal published versionLicenseOther
Link to publication
Citation for published version (APA):Albergamo, V. (2019). Polar organic contaminants in natural drinking water sources and theirremoval by reverse osmosis: A high-resolution mass spectrometry study.
General rightsIt is not permitted to download or to forward/distribute the text or part of it without the consent of the author(s)and/or copyright holder(s), other than for strictly personal, individual use, unless the work is under an opencontent license (like Creative Commons).
Disclaimer/Complaints regulationsIf you believe that digital publication of certain material infringes any of your rights or (privacy) interests, pleaselet the Library know, stating your reasons. In case of a legitimate complaint, the Library will make the materialinaccessible and/or remove it from the website. Please Ask the Library: https://uba.uva.nl/en/contact, or a letterto: Library of the University of Amsterdam, Secretariat, Singel 425, 1012 WP Amsterdam, The Netherlands. Youwill be contacted as soon as possible.
Download date:10 Aug 2022

9 789491 407734
Polar organic contaminants in natural drinking w
ater sources and their rem
oval by reverse osmosis
Vittorio Albergam
o 2019
VITTORIO ALBERGAMO
Polar organic contaminants innatural drinking water sources and their removal by reverse osmosis
a high-resolution mass spectrometry study

Polar organic contaminants in
natural drinking water sources and
their removal by reverse osmosis
a high-resolution mass spectrometry study
ACADEMISCH PROEFSCHRIFT
ter verkrijging van
de graad van doctor aan de
Universiteit van Amsterdam op gezag van de Rector Magnificus
prof. dr. ir. K.I.J. Maex
ten overstaan van een door het College voor Promoties ingestelde commissie,
in het openbaar te verdedigen in de Agnietenkapel
op dinsdag 10 september 2019, te 10:00 uur
door
Vittorio Albergamo
geboren te Napels

2
Promotiecommissie:
Promotor(es): prof. dr. W.P. de Voogt – Universiteit van Amsterdam
prof. dr. ir. W.G.J. van der Meer – Universiteit Twente
Copromotor(es): prof. dr. ir. E. R. Cornelissen – Universiteit Gent
Overige leden: prof. dr. ir. H.J. Bouwmeester – Universiteit van Amsterdam
prof. dr. A.P. van Wezel – Universiteit van Amsterdam
prof. dr. ir. A. R. D. Verliefde – Universiteit Gent
dr. T.L. ter Laak – Universiteit van Amsterdam
dr. W. T. Kok – Universiteit van Amsterdam
Faculteit der Natuurwetenschappen, Wiskunde en Informatica

3
Albergamo, V. 2019. Polar organic contaminants in natural drinking water
sources and their removal by reverse osmosis.
PhD thesis, Institute for Biodiversity and Ecosystem Dynamics, University of
Amsterdam, The Netherlands
ISBN: 978-94-91407-73-4
Cover design by Mabel Zeruche Garza and Vittorio Albergamo
Layout by Vittorio Albergamo
Print by Psiche e Aurora editore, San Donato Val di Comino, Italy
This work was conducted at the Institute for Biodiversity and Ecosystem
Dynamics, University of Amsterdam, at KWR Watercycle Research Institute in
Nieuwegein and at Eawag in Dübendorf, Switzerland. Funding was provided by
the drinking water company Oasen (Gouda, The Netherlands) through the
Efficiency of Small Contaminant Removal by Reverse Osmosis project.
Additional funds were obtained from the European Union FP7 project
SOLUTIONS (grant number 603437) and from the Luxembourg National
Research Fund (FNR) (grant number 12341006) through international
collaborations.

4

5
To my parents, Rosa and Lucio, and my brother, Francesco.

6

7
Table of contents
Chapter 1. General introduction ................................................................. 9
Chapter 2. Target analysis of polar organic micropollutants in natural drinking water sources by liquid chromatography coupled to high-resolution mass spectrometry .................................................................................... 19
APPENDIX A. Supplementary information to Chapter 2 .................... 40
Chapter 3. Removal of polar organic micropollutants by pilot-scale reverse osmosis drinking water treatment .............................................................. 55
APPENDIX B. Supplementary information to Chapter 3 .................... 79
Chapter 4. Removal of polar organic micropollutants by mixed-matrix reverse osmosis membranes .................................................................... 89
APPENDIX C. Supplementary information to Chapter 4 .................. 114
Chapter 5. Non-target screening of a riverbank filtration site .................. 119
APPENDIX D. Supplementary information to Chapter 5 .................. 143
Chapter 6. Combining bioanalysis and non-target screening to evaluate RO drinking water treatment .......................................................................... 165
APPENDIX E. Supplementary information to Chapter 6................... 187
Chapter 7. Synthesis .............................................................................. 213
Summary ............................................................................................... 223
Samenvatting ........................................................................................ 227
References ............................................................................................ 231
List of manuscripts ............................................................................... 261
List of co-authors contributions .......................................................... 263
Acknowledgments ................................................................................ 265

8

9
Chapter 1. General introduction
This chapter provides background information on the research topics covered in this thesis and on the methodologies that have been used. The issue of anthropogenic organic micropollutants in the aquatic environment, with emphasis on polar substances, is presented (1.1). An overview on riverbank filtration as an option to attenuate contaminant concentrations in natural drinking water sources is given (1.2). Reverse osmosis filtration is introduced and the principles behind organic contaminant removal by high-pressure osmotic membranes are explained (1.3). The analytical methodologies to characterise polar micropollutants dissolved in aqueous matrices using liquid chromatography coupled to high-resolution mass spectrometry are described (1.4). A rationale for the work conducted in this thesis, its objectives and outlook are presented and discussed (1.5).

10
1.1. Anthropogenic polar organics in the aquatic environment
The growing production and inclusion of anthropogenic organic compounds in industrial processes, agricultural activities and domestic products is reflected in their ubiquitous detection in the environment and particularly in natural waters. Awareness of the increasing contamination of aqueous environments with polar organics has emerged at the end of the twentieth century and has consolidated to the present days (Loos et al., 2013, 2010; Luo et al., 2014; Schwarzenbach et al., 2006). Polar compounds exhibit an asymmetrical distribution of electrons along their chemical structure, caused by non-shared valence electrons between two constituents atoms in a molecule. A typical example is that of a water molecule (H2O), where two peripheral hydrogen atoms are covalently bonded to a central oxygen, which is left with two lone or non-shared electron pairs. As oxygen is more electronegative than hydrogen, i.e. it exhibits a stronger tendency to pull electrons towards itself, electron density is unequally shared between
constituent atoms. This results in a partial negative electrical charge (-) on
the oxygen region, whereas partial positive charges (+) are left on the peripheral hydrogens. This is valid for all covalent bonds between high and low electronegative atoms. In the structure of a polar molecule these partially charged regions are known as dipoles, and the stronger the dipoles, the higher the molecule’s polarity. Dipoles of opposite charge can undergo attraction driven by a partially electrostatic force known as hydrogen bonding. Weaker than a covalent bond, but stronger than van der Waals interactions, hydrogen bonds take place between hydrogen covalently bonded to a more electronegative atom, called hydrogen bond donor, and an adjacent atom with lone pair electrons, called hydrogen bond acceptor. Typically, water molecules are capable of bringing into solution polar organics exhibiting hydrogen bond donor/acceptor residues on their structure. As a rule of thumb, the stronger the dipoles, the more water-soluble a polar organic compound is. The pH-dependant distribution coefficient (D) can be used to describe the degree of hydrophilicity of a molecule. This value indicates the ratio between concentrations of a compound, including its ionised (i.e. protonated and deprotonated) species, between two immiscible solvents, e.g. a non-polar phase, typically octanol, and a polar phase, typically water. The logarithmic expression of the distribution coefficient, log D, is used to describe polarity of organic compounds, with low (typically 0-2) and negative values indicating a high hydrophilicity (Reemtsma et al., 2016).
As the concentrations in which organic contaminants occur in the environment usually range between nanograms and micrograms per litre, these chemicals are often referred to as micropollutants (MPs). Polar MPs

11
typically enter the aquatic environment via point sources, e.g. industrial and domestic wastewater treatment plants, and non-point sources, e.g. runoffs from irrigation and rainfall events from both agricultural and urban sites (Benotti et al., 2009; Giger et al., 2006; Gray et al., 2017; Kolpin et al., 2002; Lange et al., 2012; Loos et al., 2013, 2010; Nakada et al., 2006; Schwarzenbach et al., 2006; Sui et al., 2010; van Leerdam et al., 2009). Polar organics with domestic use include, e.g., pharmaceutically active compounds, household detergents and personal care products additives. In the case of pharmaceuticals, following administration of a given medication, a series of metabolic pathways that make up the so called xenobiotic metabolism increase the polarity of an active compound, e.g. by addition of a hydroxyl group, to ultimately facilitate excretion from the human body (Rendic, 2002). Design of chemicals included in household and personal care products, instead, may purposely include polar functional groups or residues to confer a desired physicochemical property. For example, amphiphilicity, i.e. the presence of hydrophobic and hydrophilic residues on one molecular structure, allows surfactants in detergent products to remove fats from a surface and be washed away with water. Compounds used or consumed domestically are released in sewer systems reaching wastewater treatment plants, where their removal largely depends on the treatment technologies applied. Likewise, industrial chemicals that exhibit polar residues along their structures might not be fully removed if waste is not adequately treated, remaining dissolved in effluent streams and eventually being released into receiving surface waters (Loos et al., 2013). Polar organics used for agricultural activities, e.g. pesticides, can be washed out from application areas when (moderately) hydrophilic. Pesticides exhibiting hydrophobic moieties, instead, have the ability to sorb onto soil. In some cases, soil microbial communities have shown potential to biodegrade such compounds, leading to formation of transformation products (TPs) that exhibit higher hydrophilicity, water solubility and mobility than their precursor (Björklund et al., 2011) and that can eventually reach groundwater and/or surface waters via runoffs (Weibel et al., 1966). In general, polar MPs dissolved in water can be highly mobile within different environmental compartments, spreading to and diluting into water bodies downstream (including those which might be used as drinking water sources), and thus threatening drinking water quality. Processes involving chemical mass transfer from rivers to groundwater, e.g. bank filtration (Hollender et al., 2018), or from groundwater to surface water, e.g. groundwater exfiltration (Lee et al., 2015), are known to contribute to the widespread occurrence of polar MPs even in areas at a large distance from their emission sources (Schwarzenbach et al., 2006). When persistent, polar MPs can remain in the water cycle indefinitely (Loos et al., 2009; Reemtsma et al., 2016). In addition to this, chemical transformations during water treatment processes and

12
under environmental conditions can occur, increasing the complexity of the chemical mixtures that pollute source waters (Knepper and Karrenbrock, 2006; Schollée et al., 2015, 2018).
1.2. Micropollutants attenuation in riverbank filtration systems
Natural attenuation processes to lower concentrations of polar MPs in source waters can be incorporated in drinking water production trains. In particular, riverbank filtration (RBF) is a notable pre-treatment applied worldwide for its efficiency in terms of low environmental impact and operating costs (Hiscock and Grischek, 2002; Maeng et al., 2011; Tufenkji et al., 2002). As surface water infiltrates the riverbank, biological impurities, suspended particles and in part dissolved organics can be removed at the interface between river water and sub-surface. This transition zone, named hyporheic zone, acts as a biogeochemical reactor. There, organic compounds can be removed as a result of physical retention onto soils by hydrophobic and electrostatic sorption, relevant for (moderately) hydrophobic MPs and cationic MPs, respectively, and by (bio)chemical degradation. As soil organic matter generally exhibits hydrophobic moieties functionalised with acidic groups dissociated at pH values of most natural waters, anionic MPs and neutral hydrophilic compounds are typically not retained by RBF (Hollender et al., 2018), leaving (bio)chemical degradation and dilution into less polluted groundwater as last options for natural attenuation. In RBF systems, removal by transformation of organic compounds is mostly attributed to metabolic activity of soil microbial communities (Hollender et al., 2018; Huntscha et al., 2013; Tufenkji et al., 2002), although to a lesser extent abiotic degradation and hydrolysis can also occur (Schmidt et al., 2007). A key factor to increase the biodegradation potential of RBF systems is the presence of a redox potential gradient (Lewandowski et al., 2011; Schmidt et al., 2007), with the transition from oxic to anoxic water generally resulting in greater microbial biodiversity. Despite biodegradation typically occurs within the first few meters of infiltration (Hollender et al., 2018; Schmidt et al., 2007), further removal can also take place as polar MPs travel through the sub-surface (Schmidt et al., 2007). It has been shown that a long RBF travel time can lead to microbial adaptation and thus greater potential for biotic removal (Bertelkamp et al., 2016). Biodegradation of polar MPs in the environment not only depends on the biogeochemical conditions of the system, but also on the physicochemical properties of the compound. Although indications of the increased biodegradability of certain structural moieties exist, e.g. ethers and carbonyl groups (Bertelkamp et al., 2014), to the present day no solid evidence was found to predict the biological removal of MPs by RBF systems based on chemical structures. Polar MPs that are not biodegraded in RBF

13
systems can ultimately pass the hyporheic zone untransformed, entering the groundwater and aqueous environments downstream (Bertelkamp et al., 2016; Bradley et al., 2014; Hollender et al., 2018; Huntscha et al., 2013; Umar et al., 2017).
1.3. Organic contaminant removal by reverse osmosis
Among the drinking water treatment technologies available to remove dissolved polar organics from source waters, reverse osmosis (RO) with high-pressure membranes has become increasingly popular due to its effectiveness in producing high quality water in a variety of applications (Petersen, 1993). RO is a physical separation process driven by an external pressure on a liquid feed solution causing solvent molecules to be transferred across a semi-permeable membrane. RO membranes act as barriers to separate solutes and suspended particles from a feed water, generating a purified water stream (RO permeate) and a concentrated waste stream (RO concentrate). Depending on the location and the legislations enforced, RO concentrate may need additional treatment before being discharged in the environment given the high concentrations of potentially harmful solutes (Joo and Tansel, 2015; Pérez-González et al., 2012).
RO is an advanced water treatment technology highly applicable to drinking water production. Opposite to oxidative processes , RO per se does not lead to formation of TPs that might have adverse effects to human health as the baseline mechanism behind chemical removal by high-pressure osmotic membranes is physical separation (Wang et al., 2014). Nevertheless, in order for RO to be a TPs-free process, membrane integrity should not be compromised, e.g. by anti-fouling or disinfecting agents (Agus and Sedlak, 2010; Fujioka et al., 2012a). High-pressure RO membranes are dense polymeric filters, with thin-film composite (TFC) membranes being the most commercially successful (Lee et al., 2011; Petersen, 1993). In TFC membranes, the outermost layer in contact with the feed solution, i.e. the active layer, usually consists of cross-linked aromatic polyamide obtained by interfacial polymerisation of 1,3-benzenediamine and trimesoyl chloride on top of a polysulfone layer supported by a polyester web (Petersen, 1993). While the active layer is selective for water molecules and displays a low permeability to salts, the layers underneath provide support to its overall structure and increase the flux of water molecules to the permeate side as they exhibit increasing hydrophilicity (Lee et al., 2011).
The removal of polar MPs by RO membranes is considered to follow a solution-diffusion mechanism, with the passage of organic solutes occurring when chemicals dissolve into the polymeric active layer and subsequently diffuse to the permeate side (Wang et al., 2014; Wijmans and Baker, 1995).

14
To some extent, all solutes potentially partition and diffuse through high-pressure RO membranes, however at a much lower rate than water molecules. Solution-diffusion is in turn influenced by complex solute-membrane interactions that depend on solute’s and membrane’s physicochemical properties, feed water composition and RO operating conditions (Bellona et al., 2004). Overall, neutral polar organics with low and negative log D values are removed according to their size (Bellona et al., 2004; Kimura et al., 2004; Ozaki and Li, 2002). Uncharged (moderately) hydrophobic MPs that display a degree of affinity for the aromatic polyamide layer can adsorb onto active layers and diffuse to the permeate side regardless of compound size (Bellona et al., 2004; Kimura et al., 2003a; Nghiem et al., 2002). RO is an excellent barrier against anionic MPs as these are prevented from reaching the active layer due to electrostatic repulsion by the negatively charged polyamide thin-film (Bellona et al., 2004; Ozaki and Li, 2002; Yüksel et al., 2013). Cationic MPs are less well rejected than anionic MPs as they can electrostatically adsorb onto negatively charged active layers, resulting in a localised decrease in membrane charge, which can promote diffusion to the permeate (Bellona et al., 2004; Fujioka et al., 2015a;
Ozaki and Li, 2002; Verliefde et al., 2008).
1.4. Analytical strategies to characterise polar micropollutants
Liquid chromatography coupled to electrospray ionisation high-resolution mass spectrometry (LC-HRMS) is being increasingly applied to analyse polar MPs dissolved in aqueous matrices (Hernández et al., 2012; Krauss et al., 2010; Richardson, 2010). LC is used to separate organic components based on their affinity to a chromatographic stationary phase, typically packed into a column, through which an aqueous sample is convectively transported by a percolating mobile phase. Compound physicochemical properties, chemistry of both stationary and mobile phases and chromatographic conditions such as temperature, pressure and mobile phase flow rate influence the elution of a molecule in LC systems, characterised by its retention time. HRMS is used to detect the analytes separated by LC after they acquire a charge in an ion source, e.g. electrospray, placed at the interface between the chromatographic instrument and the mass detector. In tandem HRMS applications, ion detection is achievable on two levels: accurate mass full-scan spectra (HRMS1) and accurate mass tandem mass spectra (HRMS2). In HRMS1 full-scans, analytes bearing a charge are separated along an electrical potential according to their mass-to-charge ratio (m/z) until they hit a mass detector. Ions of interest can be isolated, diverted to a cell filled with an inert gas, where collision with gas molecules results in the breakdown of an analyte into detectable fragments, whose

15
information is recorded in HRMS2 spectra. HRMS1 data, i.e. m/z of an ionised analyte and distinctive isotopic peaks at a specific chromatographic retention time, along with HRMS2 data are typically used for compound identification.
Recent mass analysers such as Orbitrap and time-of-flight instruments increased the potential for identification of small molecules, achieving detection with high sensitivity, resolving power and mass accuracy for both molecular ions and fragments (Krauss et al., 2010). These performance characteristics are pivotal for both targeted and non-targeted approaches to characterise polar MPs in environmental matrices by LC-HRMS screenings (but also by gas chromatography-HRMS). Target screening deals with the identification of compounds with known chemical structures, chromatographic behaviour, isotopic peaks, HRMS2 fragments and for which reference standards are available (Hernández et al., 2012; Krauss et al., 2010). A calibration series of increasing concentrations of standards is typically analysed to interpolate the concentrations of the target analytes, provided these are higher than the method’s reporting limits. Non-targeted screening, instead, deals with the identification of unknown analytes for which reference standards are not available. The characterisation of unknowns heavily relies on HRMS data and is undertaken by tentative annotation of accurate mass spectra of ions of interests (Aceña et al., 2015; Hernández et al., 2012; Hollender et al., 2017; Krauss et al., 2010; Schymanski et al., 2014b), i.e. finding the structure that best fits HRMS1 data within a certain degree of mass deviation tolerance, typically 5 ppm, and that can support fragmentation behaviour based on HRMS2 data. In environmental analysis a distinction between suspect and “true” non-target screening is made (Hernández et al., 2012; Hollender et al., 2017; Schymanski et al., 2014b). The goal of suspect screening is to identify compounds expected in a sample. The chemical structures of the suspects are known, while isotopic peaks, HRMS2 fragments and chromatographic behaviour are either known or predictable from compounds physicochemical properties. True non-target screening, instead, aims at identifying compounds for which a priori information of their occurrence in a sample is completely lacking. Data in the LC-HRMS raw files are typically inspected to extract the so called features, i.e. unique pairs of m/z values and chromatographic retention time recorded in full-scan HRMS1 spectra. As thousands of features are acquired by indiscriminate HRMS1 full-scans, a strategy to prioritise ions of interest is typically required. Features prioritisation has evolved from manual inspection of the data to application of computational methods, e.g. statistical analysis and machine learning, to mine HRMS datasets (Hollender et al., 2017; Schollée et al., 2018). Tandem HRMS methods can be set to automatically isolate ions with a given intensity

16
or peak-like intensity trends and acquire HRMS2 spectra. Features prioritised from HRMS1 data and that have triggered HRMS2 spectra acquisition must be further processed to tentatively annotate chemical structures. Candidate structures are typically retrieved from an openly accessible chemical database such as PubChem and ChemSpider (Gindulyte et al., 2015; Pence and Williams, 2010). State-of-the-art non-target screening benefits from open cheminformatics tools such as high-throughput in silico fragmenters, e.g. MetFrag and Sirius (Dührkop et al., 2013; Ruttkies et al., 2016), formula generation software, e.g. GenForm (Meringer et al., 2011), and tools that combine in silico fragmentation with calculation of similarities to open accurate mass spectral libraries, e.g. the MetFusion approach using MetFrag and the mass spectral data repository MassBank (Horai et al., 2010). These and other computational approaches for tentative structure annotation have shown potential to improve compound identification in non-target screening applications (Schymanski et al., 2017).
1.5. Rationale, thesis objectives and outlook
The water demand for intensified industrial and agricultural activities and the drinking water needs of a growing global population are ubiquitously leading to water scarcity and deterioration of freshwater systems, e.g. by reducing river flows and continental groundwater levels, slowing groundwater recharge rates and allowing salinity intrusion in costal aquifers. Global warming due to climate change represents an additional threat, increasing surface water evaporation rates, intensifying precipitations in some areas and extending draughts in others (Dubois, 2011). Altogether these factors enhance the negative impact of the anthropogenic emissions of polar organic chemicals outlined in section 1.1. For instance, dissolved polar contaminant concentrations can increase due to emissions into less abundant aqueous environments, draughts can promote chemical accumulation in agricultural and urban areas leading to more polluted runoffs, whereas intensified precipitations can enhance polar organics dispersal.
In view of these events, natural sources of adequate quality must be found and effective drinking water treatment applied to minimise the human exposure to polar organic MPs, whose health effects are not fully understood yet (Brack et al., 2015; Schriks et al., 2010; Schwarzenbach et al., 2006). In this context, the drinking water utility Oasen (Gouda, The Netherlands), responsible for the production and distribution of potable water in the Dutch province of South Holland, has shown a research-oriented social responsibility by investigating and applying cutting edge high-pressure osmotic membrane filtration technologies to pursue the production of drinking water of impeccable quality. Proposing RO as an ultimate barrier against polar organic MPs, Oasen funded the Efficiency of Small

17
Contaminant Removal by Reverse Osmosis (ECROS) project at the University of Amsterdam and KWR Watercycle Research Institute. Within ECROS, the removal of organic contaminants by stand-alone RO drinking water treatment applied to a riverbank filtrate from a catchment area heavily impacted by anthropogenic activities such as that of the lower Rhine was comprehensively assessed using HRMS as a main analytical tool. The main objectives of the project are:
1. To assess the extent of removal of known and new emerging contaminants, specifically small polar molecules, from a raw riverbank filtrate by standard RO membranes and to relate removal rates to compound physicochemical properties and RO characteristics;
2. To assess whether selected commercially available mixed-matrix
membrane chemistry can outperform standard RO membranes regarding polar organic contaminant removal;
3. To assess the quality of source waters by characterising the identities
and concentration trends of known and unknown emerging contaminants that are persistent and mobile in the aquatic environment;
4. To assess the potential hazard to human health of the feed water and
effluents of optimized RO treatments;
To meet these objectives, an inventory of small polar organic contaminants emerging as a result of societal changes and that may impact (drinking) water quality was selected from scientific literature data. The inventory included compounds that were amenable for analysis by LC-HRMS and that have been reported as critical for source water quality, RO filtration and drinking water treatment in general. A target screening method to detect and quantify these polar chemicals was developed and validated for ultrahigh-performance liquid chromatography coupled to quadrupole time-of-flight high-resolution mass spectrometry. The method relied on both direct injection analysis and sample enrichment to guarantee detection of the target compounds at concentrations in the sub-nanograms per litre range (Chapter 2). A series of RO filtration tests were conducted with a novel hypoxic pilot-scale treatment plant fed with a raw riverbank filtrate. The chemicals selected in Chapter 2 were dosed into the RO feed water and filtration was carried out with a high-pressure commercially available 4-inch RO membrane at standard operating conditions. The target compounds were categorised based on their physicochemical properties and the statistical correlation between property categories and removal rates was investigated (Chapter 3). Further RO filtration experiments were conducted to assess the effects of mixed-matrix membrane chemistry, in particular the performance of

18
nanotechnology-inspired RO membranes in pilot-scale treatment and that of biomimetic membranes embedded with aquaporin water channel proteins in bench-scale RO filtration. In both cases, benchmark RO membranes were additionally used to compare the performance of novel materials with that of the commercial standard (Chapter 4). The detection capabilities of HRMS were combined with the computational power of open source tools for data mining and cheminformatics to conduct a non-target screening with the objective of characterising the identities and trends of persistent and mobile polar organics in a drinking water source consisting of a riverbank filtration system with up to 60-year travel time (Chapter 5). Samples from a full-scale RO drinking water treatment plant fed with raw riverbank filtrate were investigated to assess their potential toxicity using effects-based methods with endpoints relevant for human health and for general genotoxicity. In parallel, a non-target screening relying on open cheminformatics and an openly accessible chemical database with health and environment relevant metadata was performed to characterise potentially toxic polar compounds in the feed water and RO samples (Chapter 6).

19
Chapter 2. Target analysis of polar organic micropollutants in natural drinking water sources by liquid chromatography coupled to high-resolution mass spectrometry
Published work
V. Albergamo, R. Helmus, P. de Voogt (2018) Direct injection analysis of polar micropollutants in natural drinking water sources with biphenyl liquid chromatography coupled to high-resolution time-of-flight mass spectrometry, Journal of Chromatography A, 1596, 53–61. DOI: 10.1016/j.chroma.2018.07.036

20
Abstract
A method for the trace analysis of polar micropollutants (MPs) by direct injection of surface water and groundwater was validated with ultrahigh-performance liquid chromatography using a core-shell biphenyl stationary phase coupled to time-of-flight high-resolution mass spectrometry. The validation was successfully conducted with 33 polar MPs representative for several classes of emerging contaminants. Identification and quantification were achieved by semi-automated processing of full-scan and data-independent acquisition MS/MS spectra. In most cases, good linearity (R2 ≥ 0.99), recovery (75% to 125%) and intra-day (RSD < 20%) and inter-day precision (RSD < 10%) values were observed. Detection limits of 9 to 83 ng/L and 9 to 93 ng/L could be achieved in riverbank filtrate and surface water, respectively. A solid-phase extraction was additionally validated to screen samples from full-scale reverse osmosis drinking water treatment at sub-ng/L levels and overall satisfactory analytical performance parameters were observed for riverbank filtrate and reverse osmosis permeate. Applicability of the direct injection method is shown for surface water and riverbank filtrate samples from an actual drinking water source. Several targets linkable to incomplete removal in wastewater treatment and farming activities were detected and quantified in concentrations between 28 ng/L for saccharine in riverbank filtrate and up to 1 µg/L for acesulfame in surface water. The solid phase extraction method applied to samples from full-scale reverse osmosis drinking water treatment plant led to quantification of 8 targets between 6 and 57 ng/L in the feed water, whereas only diglyme was detected and quantified in reverse osmosis permeate. Our study shows that combining the chromatographic resolution of biphenyl stationary phase with the performance of time-of-flight high-resolution tandem mass spectrometry resulted in a fast, accurate and robust method to monitor polar MPs in source waters by direct injection with high efficiency.

21
2.1 INTRODUCTION
Anthropogenic organic micropollutants (MPs) and their transformation products are ubiquitously detected in the aquatic environment (Loos et al., 2013; Luo et al., 2014; Schwarzenbach et al., 2006). MPs can preferentially remain in the water phase during environmental and water treatment processes based on their polarity and degree of persistence to (a)biotic degradation. These chemicals can reach drinking water, possibly triggering adverse effects on human health (Schriks et al., 2010; Schwarzenbach et al., 2006). In the European Union, regulation to protect natural waters from hazardous substances is implemented, e.g. the Water Framework Directive (EU, 2013). However, most polar MPs known to occur in the aquatic environment are currently overlooked by these regulatory actions (Reemtsma et al., 2016), resulting in the need for accurate, sensitive and robust analytical tools to efficiently monitor source waters.
Hybrid high-resolution mass analysers (HRMS) such as linear ion trap (LTQ) Orbitrap and quadrupole time-of-flight (q-ToF) coupled to either liquid (LC) or gas chromatography (GC) are being increasingly applied for environmental analysis (Hernández et al., 2012; Richardson, 2010; Rochat, 2016). HRMS has dramatically improved the potential for identification of small organic molecules, providing a resolving power, typically defined at full width at half maximum (FWHM), of 500,000 (at m/z 200) and 80,000 (at m/z 400) for modern Orbitrap and ToF detectors, respectively, and a mass error lower than 5 ppm for both precursors and product ions (Rochat, 2016). HRMS can provide sensitivity comparable to that of low-resolution MS (Aceña et al., 2015; Rochat, 2016) and greater selectivity in full-scan acquisitions (Krauss et al., 2010). LC-HRMS/MS represents the obvious tool to screen for polar MPs in water samples in most cases, holding a pivotal role in the elucidation of unknowns (Hollender et al., 2017; Schymanski et al., 2014b) and offering robust quantitative performance (Rochat, 2016).
So far, reversed-phase high-performance LC (RP-HPLC) with octadecyl carbon chain-bonded silica stationary phase (C18) and coupled to hybrid Orbitrap MS equipped with electrospray ionization (ESI) has been the most used setup to quantify small polar MPs in water samples (Bijlsma et al., 2013; Hogenboom et al., 2009; Krauss and Hollender, 2008; Rapp-Wright et al., 2017). The improved sensitivity and dynamic range of more recent q-ToF technology have widened the possibilities for quantitative applications with hyphenated HRMS (Becerra-Herrera et al., 2015; Gómez et al., 2010; Hernández et al., 2012). Recent q-ToFs can be a tremendous asset when coupled to ultrahigh-performance liquid chromatography (UHPLC) (Rochat, 2016), as it provides additional benefits in terms of throughput and

22
chromatographic resolution (Guillarme et al., 2010). Greater efficiency can be achieved by carrying chromatographic separation on core-shell stationary phases (Fekete et al., 2012).
In this context, we explored the capabilities of UHPLC-ESI-q-ToF/MS to screen qualitatively and quantitatively for polar MPs in natural freshwaters. The main objective of this study was to optimise and validate a high-efficiency target screening method to analyse polar MPs in drinking water sources at environmentally relevant concentrations by direct injection analysis. A second objective was to validate a generic solid-phase extraction (SPE) with hydrophilic-lipophilic balance (HLB) for applications requiring sub-ng/L detection limits. To the best of our knowledge we introduce the first accurate-mass screening method for polar MPs in source waters which conjugates LC-HRMS analysis by direct injection, UHPLC separation on a novel core-shell biphenyl analytical column, and semi-automated identification with high confidence and quantification from full-scan HRMS data and MS/MS data recorded in a data-independent acquisition (DIA). Direct injection analysis with UHPLC-ESI-q-ToF/MS should deliver satisfactory performance to detect trace concentrations of MPs with high efficiency thanks to minimum sample preparation, high chromatographic resolution with core-shell technology (Fekete et al., 2012) and semi-automated identification and quantification. Furthermore, hybrid ToF analyses result in identification with confidence higher than low-resolution MS thanks to full-scan MS and DIA MS/MS data (Diaz et al., 2012), offering the advantages of posing no hard limits on full-scan acquisition, the possibility to analyse target and non-target compounds retrospectively, and to apply diverse data mining strategies.
The direct injection analysis method presented in this manuscript was validated for surface water and riverbank filtrate (RBF) with a set of 33 target analytes previously chosen to investigate the efficiency of removal of polar MPs by pilot-scale reverse osmosis (RO) treatment (Albergamo et al., 2019). The compounds were selected from scientific literature data and included chemicals regarded as critical for RO and for the quality of source waters. RP chromatography was chosen not to overlook moderately polar MPs when investigating RO filtration, as hydrophobicity can result in incomplete chemical removal (Kimura et al., 2003a). The biphenyl column was chosen for its aqueous stability, enhanced selectivity compared to phenyl stationary phases, higher selectivity than C18 for aromatic compounds and a larger electron cloud that promotes dipole-dipole interactions with polar analytes (Lomas, 2015). Shape selectivity and polarizability have been identified as the main factors affecting the retention and selectivity with biphenyl stationary phases, with π-π and polar-π being the main interactions involved

23
(Bell et al., 2017). The applicability of our screening method was demonstrated by (i) direct injection analysis of field samples from two drinking water sources consisting of river water and RBF and (ii) SPE followed by analysis of samples from a drinking water treatment plant where
anaerobic RBF is treated by standalone RO.
2.2. MATERIALS AND METHODS
2.2.1. Standards, chemicals and stock solutions
Details are provided in the Appendix A, section A-1.
2.2.2. Sample matrices
RBF, surface water and RO permeate were provided by the drinking water company Oasen (Gouda, The Netherlands) and sampled at different production locations in the Dutch river Rhine basin. RBF and RO permeate grab samples were taken from a full-scale RO treatment plant fed with freshly abstracted bank filtrate from a site located in the province of Utrecht. The surface water grab samples were taken from the river Lek in the village of Lekkerkerk, The Netherlands. All samples were collected in 5L polyethylene bottles and stored in the dark at 2 °C for not more than three months before any procedure was applied. Procedural blanks consisting of ultrapure water were prepared for each batch and treated as samples.
2.2.3. Sample preparation
For analysis of RBF and surface water by direct injection, 990 µl aliquots were transferred to a 2 mL luer polypropylene (PP) syringe fitted with a 0.22 µm disk filter (Nantong FilterBio Membrane Co., Ltd, Nantong, China) and spiked with 10 µl isotope-labelled standards to obtain a concentration of 2 µg/L. The filtrate was collected in 1.5 mL PP LC vials and analysed. A generic solid-phase extraction method was validated for RBF and RO permeate by using Oasis HLB (150 mg) from Waters (Etten-Leur, The Netherlands). The cartridges were placed on a vacuum manifold, conditioned with 5 mL of MeOH and equilibrated with 5 mL of ultrapure water. Samples and procedural blanks, 100 mL (n=4) were transferred to a 250 mL PP bottle, spiked to 50 ng/L with the working isotope-labelled stock mixture and loaded onto the cartridges with the aid of a vacuum pump. After loading, the cartridges were washed with 2 mL of ultrapure water and dried under vacuum for 15 min. The cartridges were then eluted with 4 x 2.5 mL of MeOH by gravity whenever possible or by means of vacuum. The extracts filtered with 0.22 µm PP filters (Filter-Bio, Jiangsu, China) and collected in 15 mL PP falcon tubes before evaporation to 0.5 mL under a gentle nitrogen flow. After

24
evaporation, the extracts were transferred to 1.5 mL PP LC vials and stored in the dark at 2 °C. Prior to UHPLC-q-ToF/MS analysis the extracts were diluted 5 times in ultrapure water to be more compatible with the aqueous mobile phase used for chromatographic separation (see section 2.2.4). The procedure resulted in an enrichment factor of 40 and a concentration of internal standards equal to 2 µg/L to match that of the standards used for the calibration series (see section 2.2.5).
2.2.4. LC conditions and HRMS settings
The analyses were conducted with a UHPLC system (Nexera, Shimadzu, Den Bosch, The Netherlands) coupled to a Bruker Daltonics maXis 4G high resolution q-ToF/MS upgraded with HD collision cell and equipped with a ESI source (Wormer, The Netherlands). Before MS detection the analytes were separated along a reversed-phase core–shell Kinetex biphenyl LC column, having 2.6 µm particle size, pore size of 100 Å and dimensions of 100 x 2.1 mm (Phenomenex, Utrecht, The Netherlands). The mobile phases considered for this study were ultrapure water (eluent A) and MeOH (eluent B). The effects of including acetic acid or formic acid in eluent A were evaluated in terms of number of detectable analytes. The LC gradient expressed as B percentage was 0% at 0 min, 50% at 2.5 min, 100% at 5 and until 7 min. The total flow rate was 0.3 mL/min. The initial conditions (100% A) were re-established for a 4-min equilibration pre-run between consecutive injections. For the analysis, 30 µl of sample were injected for positive ESI mode, whereas 40 µl were injected for negative ESI mode. The column oven and tray temperature were 40 °C and 15 °C, respectively.
The MS detector was internally calibrated before starting an analysis batch and additionally prior to any injection. This was achieved by infusing a 50 µM sodium acetate solution in H2O:MeOH (1:1, v/v) with a loop injection of 20 μl and a loop rinse of 20 μl. Positive and negative ESI were achieved in separate runs with a resolving power of 30,000 to 60,000 FWHM. MS/MS data were recorded in broadband collision induced dissociation (bbCID) mode, a DIA mode in which all ions are fragmented by alternating low and high collision energy, nominally 6 and 25 eV, respectively. More details about MS settings and the reference masses used for MS calibration are given in the Appendix A (Tables A-2, A-3 and A-4).
2.2.5. Target screening and quantification method
Full-scan and bbCID MS/MS data were processed with TASQ (Bruker Daltonics), a two stage algorithm for detection and quantification of target analytes against a user-built database (Samanipour et al., 2017). The database required analytes formulas, retention times and qualifier ions. To

25
select the optimum qualifiers, fragmentation data was generated by analysing a mixture of standards in autoMSMS mode, a data-dependent acquisition (DDA) algorithm that discerns analytes peaks from background and automatically derives the MS/MS acquisition rate from precursor intensities over consecutive scans. These measurements were carried by applying 20 eV collision energy in positive and negative ionization, respectively. Automated annotation of the MS/MS spectra was performed with RMassBank (Stravs et al., 2013). The most intense fragments were manually inspected and checked in the bbCID MS/MS data. Following successful confirmation, the fragments were added to the database as qualifiers of their respective precursors. For analytes showing no fragmentation, adducts other then (de)protonated precursors and isotopic peaks were considered. Full-scan HRMS data were screened for the monoisotopic mass of the (de)protonated target along with [M+Na]+ and [M+NH4]+ adducts and [M-H+CH3COOH]- adducts. Extracted ion chromatograms (EICs) with a mass tolerance of 2 mDa for full-scan data and 5 mDa for bbCID MS/MS data were obtained for the target ions. The retention time window tolerance for quantifier ions was 0.2 min, whereas qualifiers had to deviate no more than 0.02 min from the retention time of their respective quantifier ion. Isotopologue peaks were scored with the mSigma function, which expresses the similarity between experimental and theoretical isotopic patterns calculated from the elemental composition of precursors and fragments. Low mSigma values (<100) indicated good isotopic fit. For identity confirmation, the presence of at least one qualifier ion was set as mandatory. Calibration curves for quantification were calculated by analysing ultrapure water spiked with 16 µg/L of target MPs and serially diluted to obtain 10 concentration levels, with 31.25 ng/L being the lowest concentration of the calibration series (Table A-5). All calibration levels contained 2 µg/L internal standards. Isotope-labelled internal standards were available for 14 compounds. Surrogate internal standards could be assigned to 10 compounds after consideration of structural similarities, a 1-min retention time window and 30% tolerance for procedural losses. For the remaining 11 analytes no internal standard could be used. Calibration lines had to be derived from at least 6 points whose recalculated concentrations were within 30% accuracy from the nominal spiked concentrations and had to display r-squared values greater than 0.99. Where quantification with internal standard could not be carried, an external standard calibration was used instead.
2.2.6. Method Validation
The method was validated for the analysis of RBF and surface water via direct injection and for solid-phase extraction of RBF and RO permeate.

26
Linearity, detection and quantification limits, intra-day and inter-day precision and procedural recoveries comprehensive of sample treatment and potential matrix effects were assessed in two non-consecutive days. The calibration series prepared as described in section 2.2.5 were used to assess linearity. Due to the limited applicability of the signal-to-noise (S/N) approach to full-scan HRMS data (Grund et al., 2016), we have adopted our own strategy based on sensitivity, selectivity and qualifier/quantifier ion ratio. The instrumental quantification limits (IQL) were defined as the lowest concentration of the calibration series capable of generating a quantifier ion peak of at least 1,000 intensity units, extracted from full-scan HRMS data with a mass window or ±2 mDa and with a resolving power of 30,000 FWHM. The qualifier ions were extracted from the bbCID MS/MS data with a mass window of ±5 mDa with a minimum resolving power of 20,000 FWHM and a minimum S/N of 3 was considered whenever possible. For IQL confirmation, the q/Q ion ratio had to deviate not more ±30% from the average ratio observed along different calibration points. The instrumental detection limits (IDL) were set at concentrations 3.3 times lower than the IQL.
For the direct injection method, detection limits (MDL) and quantification limits (MQL), recoveries and precision were investigated in RBF and surface water (n=4) at concentrations matching the 5 lowest points of the calibration series, i.e. 31.25, 62.5, 125, 250, and 500 ng/L. Non-spiked aliquots were analysed to assess background concentrations. All samples were spiked with 2 µg/L internal standards and filtered before analysis. For confirmation of MQL values in different matrices, the lowest quantifiable level within 30% accuracy from its nominal concentration had to comply with the limits’ criteria. The recovery values are reported as the average of the ratio between measured concentrations, subtracted for any background concentration detected in non-spiked samples, and nominal concentrations at levels equal or greater than MQL. Intra-day and inter-day precision are reported as the relative standard deviation (RSD) of replicate measurements at spike concentrations equal or greater than MQL. Recovery values between 75% and 125% with RSD lower than 20% and 10% for intraday and interday repeatability were considered satisfactory.
For the validation of SPE method, detection limit values, recoveries and precision were calculated by analysing RBF and RO permeate samples (n=4) spiked to 50 ng/L unlabelled and labelled standards. Labelled standards were also added to non-spiked samples and procedural blanks. To derive the MQLs and MDLs of the SPE procedure the IDLs and IQLs were corrected for the concentration factor and recovery values of the SPE procedure. Recovery values and precision were calculated analogously to the validation of the direct injection method.

27
2.3. RESULTS AND DISCUSSION
The optimum mobile phase consisted of a mixture of A, ultrapure water 0.05% acetic acid (v/v), and B, pure MeOH. When formic acid was used instead, (iso)phthalic acid, barbital and bisphenol A could not be detected possibly due to its lower pKa compared to acetic acid, which can result in less favourable conditions for deprotonation of weakly acidic analytes in negative ESI mode. The final chromatographic conditions provided sharp peaks with baseline lower than or equal to 0.1 min at FWHM for all analytes except acesulfame and PFBA, which displayed a baseline width of approximately 0.3 min at FWHM. The list of target analytes, their formulas, retention times, ESI mode, internal standards, quantifier and qualifier ions and their ratios is shown in Table A-6 of Appendix A. EICs of all target analytes and isotope-labelled compounds from injection of a standard are given in the Appendix A (A-7). A 7-min chromatographic run with the resolving power of our HRMS detector was sufficient to obtain satisfactory separation. Acesulfame and triclosan were the earliest and latest eluting compounds and displayed a retention time of 2.9 and 6.3 min, respectively. This was in accordance with the retention-elution mechanism in reversed-phase chromatography, with acesulfame being the most hydrophilic compound (log Kow = –1.33) and triclosan the least polar (log Kow = 4.76). Indications about the dead volume were obtained from the retention time of metformin, which was 0.9 min. Isomer separation was satisfactory for the hydroxyquinolines and phthalic and isophthalic acid, whereas the 4- and 5-methyl-1H-benzotriazole could not be separated. Following this finding, only the 4-methyl-1H-benzotriazole was included in the working spike mixture used throughout this study. In the result section this compound is referred to as tolyltriazole and its concentration in environmental samples should be considered as the sum of the concentrations of both isomers. Good MS/MS data were obtained for all analytes except bisphenol A, diglyme and triclosan which showed no significant fragmentation in the working concentration range. Inspection of full-scan HRMS data revealed distinct adducts for bisphenol A and diglyme, i.e. [M-H+CH3COOH]– and [M+NH4]+, respectively. These were used as qualifier ions along with the 37Cl isotopic peak for triclosan. For HFPO-DA, instead, complete in-source fragmentation could be observed, with little to no detection of the [M-H]- ion, therefore the [M–C3F4O3H]– fragment, which displayed the highest signal intensity in full-scan HRMS data, was used as quantifier. As expected in HRMS analysis, satisfactory selectivity could be achieved for MS and MS/MS ions. Calibration curves obtained from at least six spiked concentrations in ultrapure water showed good linearity (expressed as r-squared values greater than 0.99) except for phthalic acid and isophthalic acid, for which linearity in the working concentration range could not be achieved. These compounds, although

28
detectable, were not carried further on with the validation process. The dynamic range from IQL to highest calibration standard covered three orders of magnitude in signal intensity units to the higher end. Detector saturation could be observed following injection of a few hundred picograms on column for most analytes. Satisfactory linearity and qualifier ion ratios across the inspected calibration levels resulted in IQLs ranging from 31.2 to 125 ng/L and IDLs between 9 and 38 ng/L. These results are summarised in Table 2.1.
Table 2.1. Linearity, calibration range and instrumental detection and quantification limits in ultrapure water.
Ultrapure water
Compound Linearity Calibration range IQL IDL
R2 ng/L ng/L ng/L
1H-benzotriazole 0.995 31–4000 31 9 2-(methylamino)pyridine 0.998 31–4000 31 9 2-hydroxyquinoline 0.995 31–4000 31 9 4-hydroxyquinoline 0.996 31–4000 31 9 Tolyltriazole 0.995 31–4000 31 9 6-hydroxyquinoline 0.996 31–4000 31 9 Acesulfame 0.998 63 – 16000 63 19 Antipyrine 0.996 31 – 4000 31 9 Atrazine 0.997 31–4000 31 9 BAM 0.997 63 – 4000 63 19 Barbital 0.999 63 – 4000 63 19 Bentazon 0.999 31–4000 31 9 Bisphenol A 0.993 125 – 4000 125 38 Caffeine 0.996 63 – 4000 63 19 Carbamazepine 0.999 63 – 8000 63 19 Chloridazon 0.995 31 – 2000 31 9 DEET 0.996 31 – 2000 31 9 Diclofenac 0.995 31 – 8000 31 9 Diglyme 0.998 63 – 4000 63 19 Diuron 0.997 31–4000 31 9 HFPO-DA 0.998 31 – 16000 31 9 Ibuprofen 0.997 63 – 4000 63 19 Paracetamol 0.997 63 – 4000 63 19 PFBA 0.998 125 – 8000 125 38 PFOA 0.997 31–4000 31 9 Phenyl urea 0.999 63 – 4000 63 19 Saccharin 0.997 31–4000 31 9 Sulfamethazine 0.997 31–4000 31 9 Sulfamethoxazole 0.995 31–4000 31 9 Tetrabutylammonium 0.996 31–4000 31 9 Triethyl phosphate 0.996 31–4000 31 9 Tetrapropylammonium 0.994 31–4000 31 9 Triclosan 0.999 125 – 8000 125 38
IQL: Instrumental Quantification Limit; IDL: instrumental detection limit.

29
2.3.1. Direct injection validation results
The performance parameters assessed for the validation of direct injection analysis of RBF and surface water are summarised in Table 2.2. In RBF 29 targets displayed recoveries values between 78% and 110%, 24 of which had RSD below 20% and 10% for intra-day and inter-day precision, respectively. In surface water 31 compounds were recovered from 76% to 123%, 27 of which had RSD values equal or lower than 20% and 10% for intra-day and inter-day precision, respectively. The lowest recoveries were observed for 2-hydroxyquinoline in RBF (61±10%) and surface water (63±6%) and barbital in RBF (66±8%). The MQLs provided by the direct injection method in RBF ranged from 21 to 276 ng/L, whereas in surface water the range was 31 to 308 ng/L in surface water. For both matrices the median MQL value was 61 ng/L. An example of detection at MQL is given in Figure 2.1.
Figure 2.1. EICs of 2-hydroxyquinoline (146.0600±0.002, black signal) and its qualifier ion (128.0479±0.002, grey signal) in ultrapure water (a), riverbank filtrate (b) and surface water (c) spiked at 31.25 ng/L.

30
Table 2.2. Direct injection analysis method performance in riverbank filtrate and surface water (n=4)
Riverbank filtrate Surface water
Precision Precision Compound MQL MDL Recovery Intraday Interday MQL MDL Recovery Intraday Interday ng/L ng/L (%) ± SD RSD (%) RSD (%) ng/L ng/L (%) RSD (%) RSD (%)
1H-benzotriazole 63 19 93±16 16.8 7.2 63 19 83±15 18.3 7.7 2-(methylamino)pyridine 26 8 83±13 15.3 3.3 54 16 86±7 8.1 3.3 2-hydroxyquinoline 31 9 61±10 16.4 5.5 31 9 63±6 10.2 4.1 4-hydroxyquinoline 63 19 86±4 4.6 1.4 63 19 95±8 8.5 3.1 Tolyltriazole 31 9 92±8 8.6 3.1 63 19 93±12 13.2 3.1 6-hydroxyquinoline 63 19 78±15 18.9 8.1 63 19 101±18 17.9 7.6 Acesulfame 117 35 128±39 30.3 12.8 n/a n/a 92±13 14 4.9 Antipyrine 63 19 106±15 14.5 6.1 31 9 102±5 4.8 1.1 Atrazine 31 9 95±7 7.2 2.3 31 9 95±11 11.7 4.6 BAM 125 38 110±7 5.9 1.0 63 19 123±23 18.7 7.8 Barbital 276 83 66±8 11.4 4.7 308 93 76±7 9.3 4.0 Bentazon 269 76 102±18 18 4.5 238 76 111±24 21.6 8.3 Bisphenol A 250 76 96±13 13.1 2.9 250 76 95±1 10.6 4.3 Caffeine 63 19 96±14 14.1 4.1 63 19 96±13 13.2 5.3 Carbamazepine 63 19 108±29 26.7 11.3 63 19 95±7 7.9 3.1 Chloridazon 31 9 91±16 17.6 3.5 31 9 81±6 7.4 2.0 DEET 31 9 97±12 12.8 4.0 31 9 93±12 13.2 4.7 Diclofenac 63 19 109±24 22 9.1 63 19 112±26 23.1 8.7 Diglyme 50 15 86±3 3.9 1.6 50 15 86±5 5.7 1.7 Diuron 31 9 99±6 5.9 1.5 31 9 104±2 19 8.2 HFPO-DA 59 19 89±15 17.2 4.7 59 19 92 ±10 11 4.5 Ibuprofen 63 19 104±12 11.5 4.2 125 38 112±11 10.1 3.9 Paracetamol 63 19 93±12 13.1 4.9 63 19 87±12 13.5 4.7 PFBA 133 9 79±47 59.1 31.5 127 9 107±57 53.6 27.7 PFOA 56 19 106±17 16.3 7.0 59 19 111±12 10.8 4.3 Phenyl urea 63 19 81±31 38.2 16.8 63 19 92±15 16.7 7.1 Saccharin 21 9 90±4 4.9 2.0 24 9 95±6 6.5 2.8 Sulfamethazine 31 9 91±25 27.9 8.4 31 9 100±25 24.8 6.5

31
Table 2.2 (continued). Direct injection analysis method performance in riverbank filtrate and surface water(n=4)
Riverbank filtrate Surface water
Precision Precision Compound MQL MDL Recovery Intraday Interday MQL MDL Recovery Intraday Interday
ng/L ng/L (%) ± SD RSD (%) RSD (%) ng/L ng/L (%) RSD (%) RSD (%)
Sulfamethoxazole 31 9 90±6 7 2.6 31 9 94±5 5.8 2.3 Tetrabutylammonium 31 9 95±10 10.2 4.2 31 9 104±19 18.2 7.6 Triethyl phosphate 31 9 93±13 14.2 5.9 31 9 97±9 9.1 3.5 Tetrapropylammonium 31 9 103±12 11.9 4.6 31 9 111±10 9 1.5 Triclosan n/a n/a n/a n/a n/a 125 38 155±31 20 5.5
MQL: Method Quantification Limit; MDL: method detection limit; n/a: not available.

32
The quantitative performance of the direct injection method was compared with that of other methods relying on HPLC coupled to low-resolution MS, for long regarded as the golden standard of quantitation. Hermes et al. published a multi-residue method for direct injection analysis of surface water and bank filtrate with hyphenated triple quadrupole (QqQ) MS sharing 13 analytes with our own target list (Hermes et al., 2018). The MQLs of these analytes ranged from 0.5 to 90 ng/L and from 1 to 75 ng/L in bank filtrate and surface water, respectively. In terms of reported MQLs, our methodology resulted in lower values for 1H-benzotriazole in both matrices. In bank filtrate we obtained comparable MQLs for 3 analytes (ibuprofen, saccharin and sulfamethoxazole) and higher MQLs for 8 analytes (acesulfame, caffeine, carbamazepine, DEET, diclofenac, diuron, tetrabutylammonium and tetrapropylammonium). In surface water the MQLs obtained in the present study were comparable for 5 analytes (1H-benzotriazole, caffeine, ibuprofen, saccharin and sulfamethoxazole) and between 5 to 30 times higher than the reported values for 7 analytes (carbamazepine, DEET, diclofenac, diuron, tetrabutylammonium, tetrapropylammonium and triclosan). In another study, UHPLC coupled to hybrid QqQ-MS provided better quantification limits for carbamazepine, diclofenac, paracetamol and sulfamethoxazole (0.2–6.8 ng/L) injecting 100 µL of surface water (Boix et al., 2015). For caffeine in surface water, the MQL obtained in our study were lower than those achieved with hybrid QqQ-MS by one order of magnitude (Martínez Bueno et al., 2011). Analogously, the MQLs achieved for atrazine in surface water and groundwater by direct injection with hyphenated QqQ-MS were higher than the MQLs validated in our study by a factor of 3 (Beale et al., 2010). UHPLC coupled to quadrupole-linear ion trap MS was used to validate the direct injection analysis of pesticides and organic contaminant in treated wastewater (Campos-Mañas et al., 2017). Compared to our study, the MQLs were higher for diuron, comparable for 6 analytes (antipyrine, DEET, paracetamol, saccharin, sulfamethazine and sulfamethoxazole) and at least a factor of 5 lower for 4 analytes (acesulfame, atrazine, caffeine, carbamazepine). Overall the MQLs achieved in the present study ranged from comparable to higher by one order of magnitude than those achieved by (hybrid) triple quadrupole MS and were comparable to quadrupole-linear ion trap MS. In a few instances MQLs lower than those found in scientific literature were obtained in the present study.
2.3.2. SPE validation results
The performance parameters and results of the validation of the SPE procedure are summarised in Table 2.3. In the development phase we observed poor recoveries and precision for acesulfame and PFBA (data not shown). These compounds were consequently excluded from the validation

33
process. HFPO-DA and saccharin were not considered for SPE as they were added to the target list at a later stage. The majority of the remaining compounds used for SPE validation displayed good recoveries in the investigated matrices. In RBF recoveries within 78% and 114% were obtained for 24 analytes, 21 of which displayed satisfactory RSD for both intraday and interday precision. In RO permeate 26 targets had recoveries between 79% and 122% with RSD lower than 20% and 10% for intra-day and inter-day precision, respectively. The lowest recoveries were observed for barbital (9±2%), bentazon (15±1%) and diglyme (46±20%) in RBF, whereas in RO permeate the lowest recovery was observed for 2-hydroxyquinoline (66±9%). The procedure could not be validated for bisphenol A in RBF due to large standard deviation of the recovery values. This resulted from high background concentrations in one of the two batches processed for validation. For ibuprofen in RBF, a quasi-isobaric interference could be detected in full scan HRMS data within a mass deviation tolerance of 2 mDa or 5 ppm with a resolution of 30,000 FWHM. The chromatograms are shown in Figure 2.2.
Figure 2.2. EICs of ibuprofen (grey) m/z 205.1234±0.002 and its bbCID MS/MS fragment m/z 161.1330±0.005 (black) in a RBF sample spiked to 50 ng/L and extracted with SPE. The quasi-isobaric interference in the full-scan data can be seen at tR 5.9 min
Due to this interference, ibuprofen was quantified in all samples by setting the bbCID MS/MS ion as quantifier and the deprotonated adduct as qualifier. This approach didn’t result in changes in the MQLs of ibuprofen as both full-scan and bbCID MS/MS ions displayed good linearity from 62.5 ng/L onwards. Overall the recoveries observed in both matrices were quite satisfactory, with the most accurate and precise parameters being obtained for the RO permeate. This could be expected given the much simpler matrix
of RO permeate compared to the raw RBF.

34
Table 2.3. Solid-phase extraction method performance for riverbank filtrate and RO permeate (n=4)
Riverbank filtrate RO permeate
Precision Precision Compound MQL MDL Recovery Intraday Interday MQL MDL Recovery Intraday Interday
ng/L ng/L % ± SD RSD (%) RSD (%) ng/L ng/L % ± SD RSD (%) RSD (%)
1H-benzotriazole 0.74 0.23 96±5 9.6 2.6 0.67 0.20 87±4 10.2 2.3 2-(methylamino)pyridine 0.53 0.16 68±16 12.6 10.5 0.52 0.16 67±20 17.3 13.7 2-hydroxyquinoline 0.84 0.25 108±5 4.2 2.1 0.51 0.16 66±9 28.4 8.1 4- hydroxyquinoline 0.88 0.27 114±10 7.0 3.8 0.77 0.23 99±7 9.7 3.6 Tolyltriazole 0.80 0.24 103±7 9.4 3.1 0.80 0.24 103±6 9.6 2.7 6- hydroxyquinoline 0.86 0.26 111±6 4.8 2.6 0.71 0.21 91±7 6.8 3.7 Antipyrine 0.98 0.30 126±9 11.4 3.4 0.80 0.24 103±4 5.2 1.7 Atrazine 0.78 0.23 100±6 5.2 2.8 0.73 0.22 94±11 7.7 5.4 BAM 1.42 0.43 90±4 8.1 2.0 1.46 0.44 93±7 11.4 3.7 Barbital 0.14 0.04 9±2 41.1 14.4 1.87 0.57 119±4 4.4 1.6 Bentazon 0.12 0.04 15±1 4.5 2.8 0.76 0.23 98±9 3.1 3.9 Bisphenol A 2.59 0.79 83±86 71.1 61.1 2.84 0.86 91±7 12.3 4.0 Caffeine 1.35 0.41 86±8 8.9 4.1 0.13 0.04 86±9 9.4 5.0 Carbamazepine 1.50 0.45 95±16 10.2 7.7 1.46 0.44 93±11 7.9 5.1 Chloridazon 0.88 0.27 114±5 2.9 2.1 0.75 0.23 97±11 11.3 5.4 DEET 0.65 0.20 84±6 7.3 3.4 0.61 0.19 79±8 9.9 4.7 Diclofenac 0.67 0.20 86±2 4.2 0.9 0.71 0.22 92±5 5.3 2.6 Diglyme 0.72 0.22 46±20 18.0 20.0 1.28 0.39 81±7 20.1 5.2 Diuron 0.86 0.26 111±6 3.4 2.6 0.74 0.23 96±8 7.2 3.7 Ibuprofen 1.84 0.56 117±27 9.0 10.3 1.46 0.44 93±5 10.5 2.7 Paracetamol 1.53 0.46 97±7 5.3 3.2 1.43 0.43 91±5 10.5 2.6 PFOA 0.66 0.20 85±20 14.5 10.8 0.87 0.26 112±4 2.0 1.6 Phenyl urea 1.23 0.37 78±6 10.0 3.4 1.50 0.45 95±19 14.4 9.2 Sulfamethazine 0.79 0.24 102±7 3.5 3.0 0.75 0.23 97±11 9.0 5.4 Sulfamethoxazole 0.74 0.22 95±4 6.0 2.0 0.81 0.24 104±12 6.1 5.3 Tetrabutylammonium 0.80 0.24 103±11 12.0 4.9 0.76 0.23 98±9 17.2 5.0 Triethyl phosphate 0.61 0.19 79±12 17.1 7.3 0.66 0.20 85±5 8.3 2.9 Tetrapropylammonium 0.88 0.27 114±12 6.4 4.6 0.76 0.23 98±16 13.1 7.6 Triclosan 3.16 0.96 101±14 6.4 4.5 3.81 1.16 122±8 15.0 3.5

35
2.3.3. Analysis of non-spiked field samples
The direct injection method was applied to screen river Lek water and RBF originated from the river Oude Rijn. This bank filtrate was also the feed water of an experimental full-scale RO drinking water treatment plant. The SPE procedure was applied to RBF and RO permeate samples. The results are shown in Table 2.4. Only those analytes are shown that were detected or quantified in at least one of the screened matrices. EICs of the target analytes detected and quantified in RBF and RO permeate are given in the Appendix A (section A-8).
Table 2.4. Target screening results (n=4)
a Surface water; b Riverbank filtrate; c RO permeate; n.d.: not detected; MQL: Method quantification limit, given in Table 2.2 and Table 2.3 for direct injection and solid-phase extraction methods, respectively. < MQL indicates that a peak was detected but the quantification was considered unreliable; * n=3; ** Quantifiable in one replicate;
Screening river Lek samples by direct injection analysis led to the detection of antipyrine, bentazon, DEET, diglyme and PFBA, whereas 1H-benzotriazole, acesulfame, carbamazepine, chloridazon, HFPO-DA and tolyltriazole were quantified at concentrations between 68 ng/L
Direct injection Solid-phase extraction
Compound SW a RBF b RBF b ROP c
ng/L ng/L ng/L ng/L
1H-benzotriazole 73±3* n.d. n.d. n.d. 2-hydroxyquinoline n.d. n.d. < MQL n.d. Tolyltriazole 68±4* n.d. n.d. n.d. Acesulfame 1072±17 n.d. n.d. n.d. Antipyrine < MQL < MQL** 57±1 n.d. BAM n.d. n.d. 39±2 n.d. Bentazon < MQL < MQL 28±1 n.d. Carbamazepine 83±4* n.d. n.d. n.d. Chloridazon 85±7* n.d. 6±1 n.d. DEET < MQL n.d. n.d. n.d. Diglyme < MQL < MQL 22±2 3.6±0.2 HFPO-DA 70±4 n.d. n.d. n.d. PFBA < MQL n.d. n.d. n.d. PFOA n.d. n.d. 9±1 n.d. Saccharin n.d. 28±5 n.d. n.d. Sulfamethazine n.d. n.d. 8±1 n.d. Triethyl phosphate n.d. < MQL 16±2 n.d.

36
(tolyltriazole) and 1 µg/L (acesulfame). EICs of the target analytes detected and quantified in surface water are shown in Figure 2.3.
Figure 2.3. Overlaid EICs of target analytes that could be quantified (grey) and those that were detected, albeit at concentrations below MQLs (blue) in non-spiked surface water samples analysed in positive (a) and negative (b) ESI modes.
These findings are in reasonable to good agreement with scientific literature data. The anticorrosive agents 1H-benzotriazole and tolyltriazole have been detected and quantified in surface water from the same area at higher concentration (Hogenboom et al., 2009; van Leerdam et al., 2009). In accordance with recent literature data (Heydebreck et al., 2015), we quantified HFPO-DA in the river Lek at 70±4 ng/L. However, Gebbink et al. (2017) reported up to 433 ng/L about 30 km downstream, near an emission source. Tidal movement has been shown to occur up to the river Lek sampling point and may explain the levels of HFPO-DA observed in the present study (Gebbink et al., 2017). Based on the identities of the MPs detected in surface water, the main emission pathways could be identified as (i) industrial wastewater treatment plant effluents and (ii) agricultural and livestock farming runoffs. Direct injection analysis of RBF samples led to the detection of antipyrine, bentazon, diglyme and triethyl phosphate at concentrations below MQL, whereas saccharin could be quantified at 28±5 ng/L. The SPE procedure applied to the RBF samples resulted in the quantification of the analytes previously detected by direct injection analysis

37
at concentrations from 6±1 to 57±1 ng/L. Additionally, BAM, chloridazon, diglyme, PFOA and sulfamethazine were also quantified after SPE within this concentration range and only 2-hydroxyquinoline was detected below MQL. The SPE method allowed the quantification of BAM in RBF at concentrations equal to MDL with direct injection, but the analyte could not be detected when RBF was directly injected. This could be explained by the effects of pre-concentration and clean-up resulting from the SPE procedure and by matrix ion suppression in direct injection analysis. BAM was not detectable in RBF spiked to 31 ng/L and directly injected for the validation study. The artificial sweetener saccharin, despite being quantified by the direct injection method, was not detected in the SPE extract. This compound is structurally related to acesulfame, which was excluded from the SPE validation due to poor recoveries observed in the early development phase. These anionic analytes are likely not retained by the HLB sorbent at the conditions resulting from our extraction protocol. Dedicated SPE methods to improve the recovery values of acesulfame and saccharin with HLB sorbent can be found in the scientific literature (Arbeláez et al., 2015; Ordóñez et al., 2012). The compounds detected in RBF were mostly small neutral hydrophilic and anionic MPs. In a recent publication about groundwater quality, antipyrine, bentazon and triethyl phosphate were found in riverbank filtrate from rural areas at significantly higher rates than other groundwater types (ter Laak et al., 2012), thus supporting our findings. The other quantified targets, i.e. BAM (Kuster et al., 2010), sulfamethazine (Batt et al., 2006; Kuster et al., 2010) and the perfluorinated surfactant PFOA (Eschauzier et al., 2010) were also in line with scientific literature in terms of water matrix occurrence and concentrations. The absence of cationic MPs in RBF might be explained by electrostatic sorption onto soils and natural organic matter (Huntscha et al., 2013; Schaffer et al., 2012). Based on the identity of the MPs detected in the bank filtrate, possible sources of pollution could be (i) runoffs from agricultural and livestock farming sites, e.g. in the case of antipyrine, an antipyretic drug for veterinary use, the herbicide bentazon, the sweetener saccharin which is also used as livestock feed additive (Lange et al., 2012), the pesticide metabolite BAM, and the veterinary antibiotic sulfamethazine; (ii) industrial wastewater effluents, e.g. diglyme and triethyl phosphate; (iii) urban wastewater effluents, e.g. acesulfame and saccharin. Diglyme was the only compound detected and quantified in RBF and RO permeate produced from it. RO membranes have been reported to effectively reject uncharged polar organics of molecular weight equal to or larger than 150 Da (Fujioka et al., 2015a; Ozaki and Li, 2002) and anionic MPs almost completely (Lange et al., 2012). Therefore, for most compounds concentrations in the permeate might not be detectable even after SPE.

38
2.4. CONCLUSION
A UHPLC-q-ToF/MS system was used to validate a direct injection analysis method followed by semi-automated data treatment for the detection and quantitation of polar MPs in natural drinking water sources. The application of the direct injection method to environmental samples confirmed the presence of herbicides, sweeteners, pharmaceutically active compounds, anticorrosive agents and industrial chemicals in surface water and to a lesser extent in a RBF fed to a full-scale RO treatment plant. Analytes enrichment via a validated SPE protocol led to detection of further MPs and quantification of those previously detected by the direct injection method. These MPs were screened in RO permeate and not detected except for diglyme, whose concentration was 3.6 ng/L. For RBF, the validated methods should be complementarily applied to guarantee detection of more polar MPs not enriched by SPE, as shown by the case of acesulfame, PFBA and saccharin. Combining the detecting performance of ESI-q-ToF/MS with the efficiency of UHPLC separation and semi-automated data processing resulted in a fast, accurate, and robust analysis method suitable to monitor diverse polar contaminants in natural waters at environmentally relevant concentrations. The SPE method was suitable to further lower the detection limits of MPs in RBF and RO permeate by a factor of 40. The ability of the biphenyl stationary phase to exhibit good chromatographic resolution for analytes of different classes, polarity and structures, suggests its suitability for a larger number of compounds, e.g. analogues and transformation products. Furthermore, the core-shell biphenyl column should be compatible with HPLC applications given its sub-3 µm particle size and the subsequently generated backpressure (Lomas, 2015). The database of target compounds is per se extendable and could be used for suspect screening also in a retrospective way, for instance by incorporating accurate mass MS and MS/MS data of analytes of interest from open spectral libraries such as the MassBank (Horai et al., 2010). Although our screening method relied on semi-automated data processing with vendor software, open-source alternatives exist, e.g. enviMass (Loos, 2016), and should be considered.

39
ACKNOWLEDGMENTS
The present study was funded by the drinking water company Oasen (Gouda, The Netherlands). We would like to thank Willem-Jan Knibbe, Harmen van der Laan and Evgeni Alaminov for facilitating the sampling campaign. Emma Schymanski (Luxembourg Centre for Systems Biomedicine, University of Luxembourg) is acknowledged for providing guidance with RMassBank.

40
APPENDIX A. Supplementary information to Chapter 2
A-1. STANDARDS, CHEMICALS AND STOCK SOLUTIONS
Analytical grade 1H-benzotriazole, 2-(methylamino)pyridine, 2,3,3,3-Tetrafluoro-2-(1,1,2,2,3,3,3-heptafluoropropoxy)propanoic acid (HFPO-DA), 2-hydroxyquinoline, 2,6-dichlorobenzamide, 4-hydroxyquinoline, 5-methyl- and 4-methyl-1H-benzotriazole (hereinafter referred to as tolyltriazole), 6-hydroxyquinoline, acesulfame, atrazine, barbital, bentazon, bisphenol A, caffeine, carbamazepine, chloridazon, N,N-Diethyl-meta-toluamide (DEET), diclofenac, diuron, ibuprofen, isophthalic acid, metformin, paracetamol, perfluorobutyric acid (PFBA), perfluorooctanoic acid (PFOA), phenazone, phenyl urea, phthalic acid, saccharin, sulfamethazine, sulfamethoxazole, tetrabutylammonium, tetrapropylammonium, triclosan, and triethyl phosphate were purchased from Sigma-Aldrich (Zwijndrecht, The Netherlands).The isotope-labelled standards, 1H-benzotriazole-d4, atrazine-d5, bisphenol A-d16, caffeine-13C3, carbamazepine-13C6, diclofenac-13C6, diuron-d6, ibuprofen-d3, paracetamol-d4, and sulfamethoxazole-13C6 were purchased from Sigma-Aldrich (Zwijndrecht, The Netherlands), whereas DEET-d6, sulfamethazine-13C6, triclosan-13C6, and triethyl phosphate-d15 were purchased from Cambridge Isotope Laboratories Inc. (Andover, MA, USA). In-house deionised water was purified with an ELGA water purification system (Veolia Water Technologies Netherlands B.V., Ede, the Netherlands), whereas analytical grade (LC-MS) methanol (MeOH) and acetonitrile (ACN) were purchased from Biosolve (Valkenswaard, The Netherlands). Formic acid and acetic acid were purchased by Merck (Damstadt, Germany). The native compounds were transferred to a 50 mL glass volumetric flask and dissolved in MeOH to obtain a concentration of 100 mg/L. The 4 primary stock mixtures were combined and diluted in MeOH to obtain a working MPs mixture having concentration of 200 µg/L. Stock solutions of each labelled compound were obtained in ACN and varied in concentrations depending if the compounds were purchased in powder form or already dissolved in organic solvent. The stock solutions were combined and diluted to obtain a working mixture of internal standards having concentration of 200 µg/L. ACN was chosen instead of MeOH as sulfamethoxazole-13C6, sulfamethazine-13C6, triethyl phosphate-d15 were bought as ACN solutions.

41
Table A-2. Time-of-flight high-resolution mass spectrometry settings
Positive ESI
Negative ESI
Source End plate offset -500 V +500
Capillary +3500 V -3500
Nebulizer 1 bar 1
Dry gas 8 L/min 8
Dry temperature 200 deg C 200
Tune Funnel 1 RF 200 Vpp 200
isCID Energy 0 eV 0
Multipole RF 200 Vpp 200
Quadrupole ion energy 3 eV 3
Low mass 50 m/z 50
Collision energy 6 eV 6
Collision RF 300 Vpp 300
Transfer time 45 µs 45
Pre pulse storage 8 µs 8
bbCID MS/MS Mass range 20–1000 m/z 50–1000
Spectra rate 3 Hz 3
isCID Energy MS 6 eV 6
isCID Energy MS/MS 25 eV 25
Acquisition time factor MS 1 - 1
Acquisition time factor MSMS 1 - 1

42
Table A-3. Formula and m/z values of the reference masses used for positive ESI-q-ToF/MS calibration
Table A-4. Formula and m/z values of the reference masses used for negative ESI-q-ToF/MS calibration
*Acetic acid included as modifier in eluent A was detectable in negative ESI mode (m/z
59.0138)
Sodium acetate clusters m/z charge
Na(NaC2H3O2)1 104.9923 +1
Na(NaC2H3O2)2 186.9954 +1
Na(NaC2H3O2)3 268.9984 +1
Na(NaC2H3O2)4 351.0015 +1
Na(NaC2H3O2)5 433.0046 +1
Na(NaC2H3O2)6 515.0077 +1
Na(NaC2H3O2)7 597.0107 +1
Na(NaC2H3O2)8 679.0138 +1
Na(NaC2H3O2)9 761.0169 +1
Na(NaC2H3O2)10 843.0278 +1
Na(NaC2H3O2)11 925.0230 +1
Sodium acetate clusters m/z charge
C2H3O2* 59.0138 -1
C2H3O2(NaC2H3O2)1 141.0169 -1
C2H3O2(NaC2H3O2)2 223.0200 -1
C2H3O2(NaC2H3O2)3 305.0231 -1
C2H3O2(NaC2H3O2)4 387.0261 -1
C2H3O2(NaC2H3O2)5 469.0292 -1
C2H3O2(NaC2H3O2)6 551.0323 -1
C2H3O2(NaC2H3O2)7 633.0354 -1
C2H3O2(NaC2H3O2)8 715.0384 -1
C2H3O2(NaC2H3O2)9 797.0415 -1
C2H3O2(NaC2H3O2)10 879.0446 -1
C2H3O2(NaC2H3O2)11 961.0477 -1

43
Table A-5. Concentrations of the calibration series used for quantification of the target compounds
Calibration level [non-labelled] [isotope-labelled]
# ppt ppt
L_10 16000 2000
L_9 8000 2000
L_8 4000 2000
L_7 2000 2000
L_6 1000 2000
L_5 500 2000
L_4 250 2000
L_3 125 2000
L_2 62.5 2000
L_1 31.25 2000
L_0 0 2000

44
Table A-6. Target MPs monitored ions, chromatographic retention times, assigned internal standards, qualifier ion ratios
Compound Formula Quantifier
m/z (Q) tR (min) ESI
mode Internal standard Qualifier m/z (q) q/Q
1H-benzotriazole C6H5N3 120.0556 4.3 + 1H-benzotriazole-D4 92.049 0.1
2-(methylamino)pyridine C6H8N2 109.0760 3.1 + n/a 78.0332 0.15
2-hydroxyquinoline C9H7NO 146.0600 5.0 + Quinoline-D7 128.0479 0.7
4-hydroxyquinoline C9H7NO 146.0600 4.3 + Quinoline-D7 118.0651 0.05
4-methyl-1H-benzotriazole C7H7N3 134.0713 4.8 + 1H-benzotriazole-D4 92.049 0.15
6-hydroxyquinoline C9H7NO 146.0600 4.0 + Quinoline-D7 118.0651 0.2
Acesulfame C4H4HNO4S 161.9867 2.9 - n/a 82.0294 0.2
Antipyrine C11H12N2O 189.1022 5.1 + Atrazine-D5 174.0788 0.05
Atrazine C8H14ClN5 216.1011 5.5 + Atrazine-D5 174.0543 0.5
BAM C7H5Cl2NO 189.9821 4.5 + Caffeine-13C3 174.9527 0.6
Barbital C8H12N2O3 183.0775 4.3 - n/a 140.071 0.05
Bentazon C10H12N2O3S 239.0496 5.1 - n/a 132.0324 0.15
Bisphenol A C15H16O2 227.1078 5.5 - Bisphenol A-d16 287.1289 0.1
Caffeine C8H10N4O2 195.0877 4.8 + Caffeine-13C3 138.0664 0.5
Carbamazepine C15H12N2O 237.1022 5.7 + Carbamazepine-13C6 192.0812 0.2
Chloridazon C10H8ClN3O 222.0429 4.9 + Diuron-d6 104.0494 0.15
DEET C12H17NO 192.1383 5.8 + DEET-D6 91.0538 0.1
Diclofenac C14H11Cl2NO2 294.0094 6.2 - Diclofenac-13C6 250.0188 0.7
Diglyme C6H14O3 135.1016 4.1 + n/a 152.1281 0.5
Diuron C9H10Cl2N2O 233.0243 5.5 + Diuron-d6 218.0981 0.4
HFPO-DA C6HF11O3 328.9677 4.7 - n/a 284.9782 0.35
Ibuprofen C13H18O2 205.1234 6.0 - Ibuprofen-D3 161.133 0.15
Isophthalic acid* C8H6O4 165.0193 4.6 - n/a 121.029 0.3
Metformin** C4H11N5 130.1087 0.9 + n/a n/a n/a

45
Table A-6 (continued). Target MPs monitored ions, chromatographic retention times, assigned internal standards, qualifier ion ratios
Compound Formula Quantifier m/z (Q) tR (min) ESI mode Internal standard Qualifier m/z (q) q/Q
Paracetamol C8H9NO2 152.0706 3.3 + Paracetamol-D4 110.0601 0.3
Tetrapropylammonium C12H28N 186.2216 4.4 + Quinoline-D7 114.1279 0.4
Triclosan C12H7Cl3O2 286.9439 6.3 - Triclosan-13C12 288.9394 0.9
PFBA C4HF7O2 212.9792 3.1 - n/a 168.9889 0.1
PFOA C8HF15O2 412.9664 5.3 - n/a 368.9749 0.5
Phenyl urea C7H8N2O 137.0709 4.0 + Paracetamol-D4 94.0648 0.08
Phthalic acid* C8H6O4 165.0193 4.2 - n/a 121.029 0.4
Saccharin C7H5NO3S 181.9917 3.5 - n/a 105.9601 0.05
Sulfamethazine C12H14N4O2S 279.091 4.9 + Sulfamethazine-13C6 156.0116 0.25
Sulfamethoxazole C10H11N3O3S 254.0594 4.7 + Sulphamethoxazole-13C6 156.0116 0.35
Triethyl phosphate C6H15O4P 183.0781 5.1 + TEP-D15 98.9838 0.9
Tetrabutylammonium C16H36N 242.2842 5.4 + Quinoline-D7 142.1593 0.25
* Compound excluded from the validation study; ** Used to derive dead volume only.

46
A-7 Extracted ion chromatograms (EICs) of analytical standards Figure A-7.1. Positive ESI mode: EICs of target analytes in a standard spiked to 500 ng/L
From top to bottom: 2-(methylamino)pyridine (tR 3.1 min), 1H-benzotriazole (tR 4.3 min), tolyltriazole (tR 4.8 min), diglyme (tR 4.1 min), phenylurea (tR 4.1 min), 6-hydroxyquinoline (tR 4.0 min), 4-hydroxyquinoline (tR 4.3 min), 2-hydroxyquinoline (tR 5.0 min), paracetamol (tR 3.3 min).
2-(methylamino)pyridine
20170516-L_0.5-pos-1_1-06_01_11226.d: EIC C6H8N2 [M+H]+ 109.0760±0.002 All MS, -Spectral Bkgrnd, Smoothed (0.68,1,GA)
1H-benzotriazole
20170516-L_0.5-pos-1_1-06_01_11226.d: EIC C6H5N3 [M+H]+ 120.0556±0.002 All MS, -Spectral Bkgrnd, Smoothed (0.68,1,GA)
Tolyltriazole
20170516-L_0.5-pos-1_1-06_01_11226.d: EIC C7H7N3 [M+H]+ 134.0713±0.002 All MS, -Spectral Bkgrnd, Smoothed (0.68,1,GA)
Diglyme
20170516-L_0.5-pos-1_1-06_01_11226.d: EIC C6H14O3 [M+H]+ 135.1016±0.002 All MS, -Spectral Bkgrnd, Smoothed (0.68,1,GA)
Phenylurea
20170516-L_0.5-pos-1_1-06_01_11226.d: EIC C7H8N2O [M+H]+ 137.0709±0.002 All MS, -Spectral Bkgrnd, Smoothed (0.68,1,GA)
4-hydroxyquinoline 2-hydroxyquinoline
6-hydroxyquinoline
20170516-L_0.5-pos-1_1-06_01_11226.d: EIC C9H7NO [M+H]+ 146.0600±0.002 All MS, -Spectral Bkgrnd, Smoothed (0.68,1,GA)
Paracetamol
20170516-L_0.5-pos-1_1-06_01_11226.d: EIC C8H9NO2 [M+H]+ 152.0706±0.002 All MS, -Spectral Bkgrnd, Smoothed (0.68,1,GA)
0
2
4
4x10
Intens.
0.0
0.5
5x10
Intens.
0.0
0.5
1.0
5x10
Intens.
0
1
2
4x10
Intens.
0.00
0.25
0.50
0.75
5x10
Intens.
0.0
0.5
1.0
5x10
Intens.
0.00
0.25
0.50
5x10
Intens.
0 1 2 3 4 5 6 Time [min]

47
Figure A-7.1 (continued). Positive ESI mode: EICs of target analytes in a standard spiked to 500 ng/L
From top to bottom: triethyl phosphate (tR 5.1 min), tetrapropylammonium (tR 4.6 min), antipyrine (tR 5.1 min), BAM (tR 4.5 min), DEET (tR 5.8 min), caffeine (tR 4.8 min), atrazine (tR 5.5 min).
Triethyl phosphate
20170516-L_0.5-pos-1_1-06_01_11226.d: EIC C6H15O4P [M+H]+ 183.0781±0.002 All MS, -Spectral Bkgrnd, Smoothed (0.68,1,GA)
Tetrapropylammonium
20170516-L_0.5-pos-1_1-06_01_11226.d: EIC C12H28N [M+H]+ 186.2216±0.002 All MS, -Spectral Bkgrnd, Smoothed (0.68,1,GA)
Antipyrine
20170516-L_0.5-pos-1_1-06_01_11226.d: EIC C11H12N2O [M+H]+ 189.1022±0.002 All MS, -Spectral Bkgrnd, Smoothed (0.68,1,GA)
BAM
20170516-L_0.5-pos-1_1-06_01_11226.d: EIC C7H5Cl2NO [M+H]+ 189.9821±0.002 All MS, -Spectral Bkgrnd, Smoothed (0.68,1,GA)
DEET
20170516-L_0.5-pos-1_1-06_01_11226.d: EIC C12H17NO [M+H]+ 192.1383±0.002 All MS, -Spectral Bkgrnd, Smoothed (0.68,1,GA)
Caffeine
20170516-L_0.5-pos-1_1-06_01_11226.d: EIC C8H10N4O2 [M+H]+ 195.0877±0.002 All MS, -Spectral Bkgrnd, Smoothed (0.68,1,GA)
Atrazine
20170516-L_0.5-pos-1_1-06_01_11226.d: EIC C8H14ClN5 [M+H]+ 216.1010±0.002 All MS, -Spectral Bkgrnd, Smoothed (0.68,1,GA)
0.0
0.5
1.0
1.5
5x10
Intens.
0.0
0.5
1.0
5x10
Intens.
0
2
4
5x10
Intens.
0
2
4
4x10
Intens.
0
2
5x10
Intens.
0.00
0.25
0.50
0.75
5x10
Intens.
0
1
5x10
Intens.
0 1 2 3 4 5 6 Time [min]

48
Figure A-7.1 (continued). Positive ESI mode: EICs of target analytes in a standard spiked to 500 ng/L
From top to bottom: chloridazon (tR 4.9 min), diuron (tR 5.5 min), carbamazepine (tR 5.7 min), sulfamethazine (tR 4.9 min), sulfamethoxazole (tR 4.7 min), tetrabutylammonium (tR 5.4 min).
Chloridazon
20170516-L_0.5-pos-1_1-06_01_11226.d: EIC C10H8ClN3O [M+H]+ 222.0429±0.002 All MS, -Spectral Bkgrnd, Smoothed (0.68,1,GA)
Diuron
20170516-L_0.5-pos-1_1-06_01_11226.d: EIC C9H10Cl2N2O [M+H]+ 233.0243±0.002 All MS, -Spectral Bkgrnd, Smoothed (0.68,1,GA)
Carbamazepine
20170516-L_0.5-pos-1_1-06_01_11226.d: EIC C15H12N2O [M+H]+ 237.1022±0.002 All MS, -Spectral Bkgrnd, Smoothed (0.68,1,GA)
Sulfamethazine
20170516-L_0.5-pos-1_1-06_01_11226.d: EIC C12H14N4O2S [M+H]+ 279.0910±0.002 All MS, -Spectral Bkgrnd, Smoothed (0.68,1,GA)
Tetrapropylammonium
20170516-L_0.5-pos-1_1-06_01_11226.d: EIC C16H36N [M+H]+ 242.2842±0.002 All MS, -Spectral Bkgrnd, Smoothed (0.68,1,GA)
Sulfamethoxazole
20170516-L_0.5-pos-1_1-06_01_11226.d: EIC C10H11N3O3S [M+H]+ 254.0594±0.002 All MS, -Spectral Bkgrnd, Smoothed (0.68,1,GA)
Tetrabutylammonium
20170516-L_0.5-pos-1_1-06_01_11226.d: EIC 242.2842±0.002 +All MS, -Spectral Bkgrnd, Smoothed (0.68,1,GA)
0.0
0.5
5x10
Intens.
0
2
4
6
4x10
Intens.
0
1
2
5x10
Intens.
0.0
0.5
1.0
5x10
Intens.
0
1
2
3
5x10
Intens.
0.00
0.25
0.50
0.75
5x10
Intens.
0
1
2
3
5x10
Intens.
0 1 2 3 4 5 6 Time [min]

49
Figure A-7.2. Negative ESI mode: EICs of target analytes in a standard spiked to 500 ng/L
From top to bottom: acesulfame (tR 2.9 min), phthalic (tR 4.2 min) and isophthalic acid (tR 4.6 min), saccharin (tR 3.5 min), barbital (tR 4.3 min), ibuprofen (tR 6.0 min), PFBA (tR 3.1 min), bisphenol A (tR 5.5 min), bentazon (tR 5.1 min), triclosan (tR 6.3 min), HFPO-DA (tR 4.7 min), diclofenac (tR 6.2 min), PFOA (tR 5.3 min).
Acesulfame
20170516-L_0.5-neg-1_1-06_01_11355.d: EIC C4H5NO4S [M-H]- 161.9867±0.002 All MS, -Spectral Bkgrnd, Smoothed (0.69,1,GA)
Isophthalic acid
Phthalic acid
20170516-L_0.5-neg-1_1-06_01_11355.d: EIC C8H6O4 [M-H]- 165.0193±0.002 All MS, -Spectral Bkgrnd, Smoothed (0.69,1,GA)
Saccharin
20170516-L_0.5-neg-1_1-06_01_11355.d: EIC C7H5NO3S [M-H]- 181.9917±0.002 All MS, -Spectral Bkgrnd, Smoothed (0.69,1,GA)
Barbital
20170516-L_0.5-neg-1_1-06_01_11355.d: EIC C8H12N2O3 [M-H]- 183.0775±0.002 All MS, -Spectral Bkgrnd, Smoothed (0.69,1,GA)
Ibuprofen
20170516-L_0.5-neg-1_1-06_01_11355.d: EIC C13H18O2 [M-H]- 205.1234±0.002 All MS, -Spectral Bkgrnd, Smoothed (0.69,1,GA)
PFBA
20170516-L_0.5-neg-1_1-06_01_11355.d: EIC C4HF7O2 [M-H]- 212.9792±0.002 All MS, -Spectral Bkgrnd, Smoothed (0.69,1,GA)
0.0
0.5
4x10
Intens.
0
2
4
4x10
Intens.
0
2
4
4x10
Intens.
0
1
4x10
Intens.
0
2
44x10
Intens.
0
1
24x10
Intens.
0 1 2 3 4 5 6 Time [min]
Bisphenol A
20170516-L_0.5-neg-1_1-06_01_11355.d: EIC C15H16O2 [M-H]- 227.1078±0.002 All MS, -Spectral Bkgrnd, Smoothed (0.69,1,GA)
Bentazon
20170516-L_0.5-neg-1_1-06_01_11355.d: EIC C10H12N2O3S [M-H]- 239.0496±0.002 All MS, -Spectral Bkgrnd, Smoothed (0.69,1,GA)
Triclosan
20170516-L_0.5-neg-1_1-06_01_11355.d: EIC C12H7Cl3O2 [M-H]- 286.9439±0.002 All MS, -Spectral Bkgrnd, Smoothed (0.69,1,GA)
HFPO-DA
20170516-L_0.5-neg-1_1-06_01_11355.d: EIC 284.9782±0.002 -All MS, -Spectral Bkgrnd, Smoothed (0.69,1,GA)
Diclofenac
20170516-L_0.5-neg-1_1-06_01_11355.d: EIC C14H11Cl2NO2 [M-H]- 294.0094±0.002 All MS, -Spectral Bkgrnd, Smoothed (0.69,1,GA)
PFOA
20170516-L_0.5-neg-1_1-06_01_11355.d: EIC C8HF15O2 [M-H]- 412.9664±0.002 All MS, -Spectral Bkgrnd, Smoothed (0.69,1,GA)
0.0
0.5
4x10
Intens.
0.0
0.5
1.05x10
Intens.
0
2000
Intens.
0.0
0.5
4x10
Intens.
0
1
4x10
Intens.
0
2
4x10
Intens.
0 1 2 3 4 5 6 Time [min]

50
Figure A-7.3. Positive ESI mode: EICs of isotope-labelled analytes in a standard
spiked to 2 µg/L
From top to bottom: 1H-benzotriazole-D4 (tR 4.4 min), quinolone-D7 (tR 5.1 min), paracetamol-D4 (tR 3.3 min), caffeine-13C3 (tR 4.8 min), triethyl phosphate-D15 (tR 5.1 min), DEET-D6 (tR 5.8 min), atrazine-D5 (tR 5.4 min), diuron-D6 (tR 5.5 min), carbamazepine-13C6 (tR 5.7 min), sulfamethoxazole-13C6 (tR 4.8 min), sulfamethazine-13C6 (tR 4.9 min).
1H-benzotriazole-D4
20170516-L_0.5-pos-1_1-06_01_11226.d: EIC C6D4HN3 [M+H]+ 124.0807±0.002 All MS
Quinoline-D7
20170516-L_0.5-pos-1_1-06_01_11226.d: EIC C9D7N [M+H]+ 137.1091±0.002 All MS
Paracetamol-D4
20170516-L_0.5-pos-1_1-06_01_11226.d: EIC C8D4H5NO2 [M+H]+ 156.0957±0.002 All MS
Caffeine-13C3
20170516-L_0.5-pos-1_1-06_01_11226.d: EIC C5^13C3H10N4O2 [M+H]+ 198.0977±0.002 All MS
Triethylphosphate-D15
20170516-L_0.5-pos-1_1-06_01_11226.d: EIC C6D15O4P [M+H]+ 198.1722±0.002 All MS
DEET-D6
20170516-L_0.5-pos-1_1-06_01_11226.d: EIC C12D6H11NO [M+H]+ 198.1760±0.002 All MS
Atrazine-D5
20170516-L_0.5-pos-1_1-06_01_11226.d: EIC C8D5H9ClN5 [M+H]+ 221.1324±0.002 All MS
Diuron-D6
20170516-L_0.5-pos-1_1-06_01_11226.d: EIC C9D6H4Cl2N2O [M+H]+ 239.0620±0.002 All MS
Carbamazepine-13C6
20170516-L_0.5-pos-1_1-06_01_11226.d: EIC C9^13C6H12N2O [M+H]+ 243.1224±0.002 All MS
Sulphamethoxazole-13C6
20170516-L_0.5-pos-1_1-06_01_11226.d: EIC C4^13C6H11N3O3S [M+H]+ 260.0795±0.002 All MS
Sulfamethazine-13C6
20170516-L_0.5-pos-1_1-06_01_11226.d: EIC C6^13C6H14N4O2S [M+H]+ 285.1112±0.002 All MS
0.0
0.5
6x10
Intens.
0
16x10
Intens.
0
1
6x10
Intens.
0
2
45x10
Intens.
0
1
6x10
Intens.
0
1
6x10
Intens.
0
6x10
Intens.
0
2
4
5x10
Intens.
0
6x10
Intens.
0
2
4
5x10
Intens.
0
6x10
Intens.
3.0 3.5 4.0 4.5 5.0 5.5 6.0 Time [min]

51
Figure A-7.4. Negative ESI mode: EICs of isotope-labelled analytes in a standard
spiked to 2 µg/L
From top to bottom: diclofenac-13C6 (tR 6.3 min), ibuprofen-D3 (tR 6.0 min), triclosan-13C12 (tR 6.4 min), bisphenol A-D16 (tR 5.5 min)
Diclofenac-13C6
20170516-L_0.5-neg-1_1-06_01_11355.d: EIC C8^13C6H11Cl2NO2 [M-H]- 300.0295±0.002 All MS
Ibuprofen-D3
20170516-L_0.5-neg-1_1-06_01_11355.d: EIC C13D3H15O2 [M-H]- 208.1422±0.002 All MS
Triclosan-13C12
20170516-L_0.5-neg-1_1-06_01_11355.d: EIC ^13C12H7Cl3O2 [M-H]- 298.9841±0.002 All MS
Bisphenol A-D16
20170516-L_0.5-neg-1_1-06_01_11355.d: EIC C15D14H2O2 [M-H]- 241.1956±0.002 All MS
0.0
0.5
1.0
5x10
Intens.
0.0
0.5
1.0
5x10
Intens.
0
1
2
4x10
Intens.
0
1
2
4x10
Intens.
5.00 5.25 5.50 5.75 6.00 6.25 6.50 6.75 Time [min]

52
A-8 Analysis of non-spiked filed samples Figure A-8.1. Extracted ion chromatograms of target analytes quantified (grey) and detected (blue) in riverbank filtrate analysed by direct injection
From top to bottom: diglyme (tR 4.1 min), triethyl phosphate (tR 5.1min), antipyrine (tR 5.2 min), saccharin (tR 3.5 min), bentazon (tR 5.1 min).
diglyme
20170516-M1_0_1_1-40_01_11265.d: EIC C6H14O3 [M+H]+ 135.1016±0.002 All MS, Smoothed (0.68,1,GA)
triethylphosphate
20170516-M1_0_1_1-40_01_11265.d: EIC C6H15O4P [M+H]+ 183.0781±0.002 All MS, Smoothed (0.68,1,GA)
antipyrine
20170516-M1_0_1_1-40_01_11265.d: EIC C11H12N2O [M+H]+ 189.1022±0.002 All MS, Smoothed (0.68,1,GA)
saccharin
20170516-M1_0_1_1-40_01_11394.d: EIC C7H5NO3S [M-H]- 181.9917±0.002 All MS, Smoothed (0.69,1,GA)
bentazon
20170516-M1_0_1_1-40_01_11394.d: EIC C10H12N2O3S [M-H]- 239.0496±0.002 All MS, Smoothed (0.69,1,GA)
2000
4000
Intens.
0
1
4x10
Intens.
0
1
4x10
Intens.
0
2000
4000
Intens.
0
2000
4000
Intens.
3.50 3.75 4.00 4.25 4.50 4.75 5.00 5.25 Time [min]

53
Figure A-8.2. Extracted ion chromatograms of target analytes quantified (grey) and detected (blue) in riverbank filtrate pre-concentrated by solid-phase extraction.
From top to bottom: antipyrine (tR 5.1 min), diglyme (tR 4.1 min), 2-hydroxyquinoline (tR 5.1 min), BAM (tR 4.9 min), chloridazon (tR 4.9 min), triethyl phosphate (tR 5.1min), sulfamethazine (tR 4.9 min), bentazon (tR 5.0 min), PFOA (tR 5.1 min)
Figure A-8.3. Extracted ion chromatogram of diglyme, the only target analyte detected and quantified in RO permeate pre-concentrated by solid-phase extraction.
Antipyrine
20170331-GW_13C-2-pos-1_1-24_01_9809.d: EIC 189.1020±0.002 +All MS, -Spectral Bkgrnd, Smoothed (0.69,1,GA)
Diglyme
20170331-GW_13C-2-pos-1_1-24_01_9809.d: EIC C6H14O3 [M+H]+ 135.1016±0.002 All MS, -Spectral Bkgrnd, Smoothed (0.69,1,GA)
2-hydroxyquinoline
20170331-GW_13C-2-pos-1_1-24_01_9809.d: EIC 146.0600±0.002 +All MS, Smoothed (0.69,1,GA)
BAM20170331-GW_13C-2-pos-1_1-24_01_9809.d: EIC C7H5Cl2NO [M+H]+ 189.9821±0.002 All MS, -Spectral Bkgrnd, Smoothed (0.69,1,GA)
Chloridazon
20170331-GW_13C-2-pos-1_1-24_01_9809.d: EIC C10H8ClN3O [M+H]+ 222.0429±0.002 All MS, -Spectral Bkgrnd, Smoothed (0.69,1,GA)
Triethyl phosphate20170331-GW_13C-2-pos-1_1-24_01_9809.d: EIC C6H15O4P [M+H]+ 183.0781±0.002 All MS, -Spectral Bkgrnd, Smoothed (0.69,1,GA)
Sulfamethazine
20170331-GW_13C-2-pos-1_1-24_01_9809.d: EIC C12H14N4O2S [M+H]+ 279.0910±0.002 All MS, -Spectral Bkgrnd, Smoothed (0.69,1,GA)
Bentazon
20170331-GW_13C-3-neg-1_1-25_01_9880.d: EIC C10H12N2O3S [M-H]- 239.0496±0.002 All MS, Smoothed (0.69,1,GA)
PFOA
20170331-GW_13C-3-neg-1_1-25_01_9880.d: EIC C8HF15O2 [M-H]- 412.9664±0.005 All MS, Smoothed (0.69,1,GA)
0.0
0.5
1.0
6x10
Intens.
0.0
0.5
5x10
Intens.
0.5
4x10
Intens.
0
2
4x10
Intens.
0.0
0.5
4x10
Intens.
0
2
5x10
Intens.
0
2
4x10
Intens.
0.0
0.5
5x10
Intens.
0
2
4x10
Intens.
4.0 4.5 5.0 5.5 6.0 6.5 Time [min]
diglyme
20170331-ROP_13C-1-pos-1_1-19_01_9804.d: EIC 135.1016 [M+H]+ 135.1016±0.002 All MS, Smoothed (0.68,1,GA)
0.5
1.0
1.5
2.0
2.5
4x10
Intens.
3.2 3.4 3.6 3.8 4.0 4.2 4.4 4.6 Time [min]

54

55
Chapter 3. Removal of polar organic micropollutants by pilot-scale reverse osmosis drinking water treatment
Published work
V. Albergamo, B. Blankert, B. Hofs, E. R. Cornelissen, W.-J. Knibbe, W. van der Meer, P. de Voogt (2019) Removal of polar organic micropollutants by pilot-scale reverse osmosis drinking water treatment, Water Research, 148, 535–545. DOI: 10.1016/j.watres.2018.09.029

56
Abstract The robustness of reverse osmosis (RO) against polar organic micropollutants (MPs) was investigated in pilot-scale drinking water treatment. Experiments were carried in hypoxic conditions to treat a raw anaerobic riverbank filtrate spiked with a mixture of thirty model compounds. The chemicals were selected from scientific literature data on the basis of their relevance for the quality of freshwater systems, RO permeate and drinking water. MPs passage and the influence of permeate flux were evaluated with a typical low-pressure RO membrane and quantified by liquid chromatography coupled to high-resolution mass spectrometry. A strong inverse correlation between size and passage of neutral hydrophilic compounds was observed. This correlation was weaker for moderately hydrophobic MPs as their passage is influenced by solute-membrane affinity interactions. Anionic MPs displayed nearly no passage due to electrostatic repulsion with the negatively charged membrane surface, whereas breakthrough of small cationic MPs could be observed. The passage figures observed for the investigated set of MPs ranged from less than 1% to 25%. Statistical analysis was performed to evaluate the relationship between physicochemical properties and passage. The effects of permeate flux were more pronounced for small neutral MPs, which displayed a higher passage after a pressure drop.

57
3.1. INTRODUCTION
The occurrence of organic micropollutants (MPs) in natural drinking water sources is regarded as a high-priority environmental issue (Loos et al., 2013; Luo et al., 2014; Schwarzenbach et al., 2006). In particular, polar MPs can be highly water-soluble and mobile (Reemtsma et al., 2016), potentially reaching source waters and even finished drinking water (Benotti et al., 2009; Eschauzier et al., 2012; Reemtsma et al., 2016). There is concern over the potential effects of the human exposure to trace concentrations of individual compounds or chemical mixtures via drinking water (Brack et al., 2015; Schriks et al., 2010). Consequently, drinking water utilities tend to (i) use the cleanest sources available and (ii) implement advanced treatments to remove unwanted chemicals. Riverbank filtration is an efficient natural pre-treatment used by several drinking water utilities across Europe, capable of lowering biological and chemical impurities as a result of mechanical retention, sorption and (bio)chemical degradation taking place during infiltration of surface water through the riverbank and the sub-surface (Tufenkji et al., 2002). Not all MPs are eliminated by riverbank filtration (Bertelkamp et al., 2014; Huntscha et al., 2013) and therefore additional treatment might still be necessary. In this article we focussed on reverse osmosis (RO) drinking water treatment applied to raw bank filtrate. RO filtration per se doesn’t involve chemical reactions, so that by-products are not expected in the treated water (RO permeate) unless membrane integrity is compromised, e.g. by pre-treatment with disinfection agents such as chlorine or by biofouling (Agus and Sedlak, 2010; Misdan et al., 2012). RO is a physical separation process in which the passage of organic solutes through osmotic membranes is assumed to follow the solution-diffusion model (Wang et al., 2014; Wijmans and Baker, 1995). Complex solute-membrane interactions can promote or hinder the solution-diffusion mechanism. These interactions are steric hindrance (Kimura et al., 2003a; Ozaki and Li, 2002), electrostatic interactions (Nghiem et al., 2006; Verliefde et al., 2008) and hydrophobic-hydrophobic interactions (Kimura et al., 2003a; Verliefde et al., 2009). Solute-membrane interactions are in turn influenced by solute and membrane physicochemical properties, feed water composition and operating conditions (Bellona et al., 2004).
The aim of this study was to quantify the removal of MPs from a raw riverbank filtrate in pilot-scale RO and assess whether a unique RO treatment can be considered for further implementation in lieu of the conventional production chain. This work also aimed to elucidate the transport of organic solutes through RO membranes by relating solute physicochemical properties to passage rates and by assessing the influence of the permeate flux. A series of experiments were performed at the research facility of a drinking water

58
utility in the Dutch province of Zuid-Holland so that an actual source water, i.e. raw anaerobic riverbank filtrate, could be used as RO feed water. We studied the removal of 30 model polar MPs relevant for the water cycle such as herbicides, industrial chemicals, pharmaceuticals, personal care products and metabolites formed under environmental conditions. The effects of the permeate flux were also investigated. We introduce a RO pilot system capable of keeping hypoxic conditions while being operated in recirculation mode. Such system is novel and ensured that the precipitation of the dissolved iron naturally occurring in the bank filtrate used as RO feed water would not take place, de facto preventing membrane fouling. With this paper we report and aim to understand the removal efficiencies of known and emerging MPs, some of which have not been investigated either in bank filtrate or in RO filtration at all, e.g. the polycyclic aromatic hydrocarbons metabolite 2-hydroxyquinoline and its isomer 4-hydroxyquinoline, the industrial chemicals 2-(methylamino)pyridine, phenylurea, tetrapropylammonium and tetrabutylammonium.
3.2. MATERIALS AND METHODS
3.2.1. Standards and chemicals
All chemicals used in this study were of analytical grade. More details are provided in section B-1 of the Appendix B.
3.2.2. MPs selection
Scientific literature data were reviewed to select 30 model MPs based on their detection in natural freshwater, RO permeates, and finished drinking water (Table 3.1). The compounds were amenable for analysis by liquid chromatography coupled to high-resolution mass spectrometry (LC-HRMS). The MPs were assigned to four physicochemical properties categories based on their charge and hydrophobicity. The pH-dependent octanol-water distribution coefficient expressed as log D was used as a measure of hydrophobicity due to the inclusion of ionisable MPs amongst the model compounds. The log D values were calculated at pH 7 to match the pH of the natural water fed to the RO pilot (more details in section 3.2.4). A cut-off value of 2 was used to distinguish between hydrophilic and moderately hydrophobic MPs, in line with previous literature (Fujioka et al., 2015a; Verliefde et al., 2007a). The chemicals were categorised as (i) neutral and moderately hydrophobic (log D(pH7) > 2), (ii) neutral hydrophilic (log D(pH7) < 2), (iii) anionic, and (iv) cationic. The selection ensured that a broad range of physicochemical properties were covered to support the elucidation of the removal mechanism. The molecular weight (MW) distribution ranged evenly from approximately 100 Da to 300 Da, with perfluorooctanoic acid (PFOA)

59
being the only outlier (413.97 Da). The log D(pH7) ranged from -1.5 (acesulfame) to 4.6 (triclosan). A variety of chemical structures were
represented.

60
Table 3.1. List of model MPs with physicochemical properties and selection criteria-matched references
Compound
Molecular weight
(Da)
pKa
(pKb)
a
logD (pH7)
a Class Properties Category b
In freshwater
In RO permeate
In drinking water
2,6-dichlorobenzamide 188.97 12.1 2 Biodegradation
product I
(Björklund et al., 2011;
Malaguerra et al., 2012; Ruff et
al., 2015) (Madsen et al., 2015)
2-hydroxyquinoline 145.05 13.9 2.4 Biodegradation
product I
(Johansen et al., 1997; Mundt
and Hollender, 2005)
Atrazine 215.09 15.8 2.2 Herbicide I
(Benotti et al., 2009; Bohn et al., 2011; Loos
et al., 2010; Ruff et al., 2015; A. Verliefde et al.,
2007a)
(Benotti et al., 2009; Bohn et
al., 2011; Verliefde et al., 2007a)
Bisphenol A 228.29 9.8 4 Personal care
product I
(Benotti et al., 2009; Loos et
al., 2009; Luo et al., 2014; A.
Verliefde et al., 2007a)
(Al-Rifai et al., 2011; Huang et al., 2011;
Kimura et al., 2004; Yangali-Quintanilla et
al., 2010)
(Benotti et al., 2009;
Kleywegt et al., 2011; A. Verliefde et al., 2007a)

61
Table 3.1 (continued). List of model MPs with physicochemical properties and selection criteria-matched references
Compound
Molecular weight
(Da)
pKa
(pKb)
a
logD (pH7)
a Class Properties Category b
In freshwater
In RO permeate
In drinking water
Carbamazepine 236.27 16 2.8 Pharmaceutical I
(Benotti et al., 2009; Loos et al., 2009; Luo
et al., 2014; A. Verliefde et al.,
2007a)
(Cartagena et al., 2013;
Pisarenko et al., 2012)
(Benotti et al., 2009;
Kleywegt et al., 2011; A. Verliefde et al., 2007a)
DEET 191.13 (-0.9) 2.5 Herbicide I (Loos et al., 2010; ter
Laak et al., 2012) (Huang et al.,
2011) (Benotti et al.,
2009)
Diuron 233.09 13.2 2.5 Herbicide I (Loos et al., 2009; Ruff et al., 2015)
(Fujioka et al., 2015b)
Triclosan 287.95 7.6 4.6 Personal care
product I
(Benotti et al., 2009; Loos et al., 2010; Luo
et al., 2014)
(Cartagena et al., 2013;
Huang et al., 2011)
(Benotti et al., 2009)
1H-benzotriazole 119.05 8.6 1.3 Industrial chemical II
(Buerge et al., 2009; Giger et al., 2006; Loos et al., 2009; Ruff et al., 2015)
(Busetti et al., 2015; Loi et al., 2013)
(Wang et al., 2016)
4-hydroxyquinoline* 145.06 10.6 1.8
Biodegradation product II
Barbital 184.19 7.5 0.6 Pharmaceutical II (van der Aa et al.,
2009)
Caffeine 194.19 (-1.2) -0.5 Stimulant II
(Loos et al., 2009; Luo et al., 2014; Ruff
et al., 2015)
(Boleda et al., 2011;
Comerton et al., 2008; Sui et al., 2010)
Chloridazon 221.04 (-1.8) 1.1 Herbicide II (Ruff et al., 2015)

62
Table 3.1 (continued). List of model MPs with physicochemical properties and selection criteria-matched references
Compound
Molecular weight
(Da)
pKa
(pKb)
a
logD (pH7)
a Class Properties Category b
In freshwater
In RO permeate
In drinking
water
Paracetamol 151.16 0.4 1.2 Pharmaceutical II
(Comerton et al., 2008; Fujioka et
al., 2015b; Radjenović et
al., 2008)
Phenazone 188.22 -0.5 0.9 Pharmaceutical II (ter Laak et al.,
2012)
Phenylurea 136.06 13.8 0.9 Industrial chemical II (ECHA, 2016)
Tolyltriazole 133.15 8.8 1.8 Industrial chemical II
(Giger et al., 2006; Loos et al., 2009; Ruff et al., 2015)
(Busetti et al., 2015; Loi et al.,
2013)
Triethyl phosphate 182.15 n/a 1.2
Industrial chemical II
(Bollmann et al., 2012; ter Laak et al.,
2012) (Busetti et al.,
2015)
Acesulfame 162.39 3 -1.5 Sweetener III (Lange et al., 2012;
Ruff et al., 2015) (Busetti et al.,
2015)
(Lange et al., 2012;
Scheurer et al., 2010)
Bentazon 240.28 3.7 -0.2 Herbicide III
(Loos et al., 2009; Ruff et al., 2015; ter Laak et al., 2012)
Diclofenac 295.02 4 1.4 Pharmaceutical III
(Benotti et al., 2009; Loos et al., 2009; Luo et al., 2014; Ruff et al., 2015)
Ibuprofen 206.13 4.8 1.7 Pharmaceutical III (Loos et al., 2009; Luo et al., 2014)

63
Table 3.1 (continued). List of model MPs with physicochemical properties and selection criteria-matched references
Compound
Molecular weight
(Da)
pKa
(pKb)
a
logD (pH7)
a Class Properties Category b
In freshwater
In RO permeate
In drinking
water
PFBA 213.99 1.2 -1.2 Industrial chemical III
(Eschauzier et al., 2013, 2012)
(Eschauzier et al., 2012)
PFBS 299.95 -3.3 0.2 Industrial chemical III
(Eschauzier et al., 2013, 2012, 2010;
So et al., 2007)
(Eschauzier et al., 2012)
PFOA 413.97 -4.2 1.6 Industrial chemical III
(Eschauzier et al., 2013, 2012, 2010; Loos et al., 2009; So et al., 2007)
(Eschauzier et al., 2012)
Sulfamethazine 278.08 7 0.4 Pharmaceutical III (Loos et al., 2009)
Sulfamethoxazole 253.05 6.2 0.1 Pharmaceutical III
(Benotti et al., 2009; Loos et al., 2010, 2009; Ruff
et al., 2015) (Benotti et al., 2009)
2-(methylamino)pyridine 108.07 (6.6) 0.7 Industrial chemical IV ( ECHA, 2016)
Tetrabutylammonium** 242.46 n/a 1.3 Industrial chemical IV
Tetrapropylammonium 186.35 n/a -0.4 Industrial chemical IV
(Kolkman and
Vughs, 2014)
a pKa, pKb and Log D calculated with Chemaxon (http://www.chemicalize.com); b Properties Category I: neutral and
moderate hydrophobic MPs (logD(pH7) > 2); Category II: neutral hydrophilic MPs (logD(pH7) < 2); Category III: anionic MPs; Category IV: cationic MPs. *No published data available, compound is isomer of target MP; **No published data available, compound structurally related to tetrapropylammonium.

64
3.2.3. MPs stock solutions
Stock solutions with a volume of 2 L were prepared by dissolving MPs with Na2SO3 in anaerobic ultrapure water to obtain a concentration of 14 and 28 mg/L of positive and negative MS ionisation, respectively, and 17.5 g/L Na2SO3. For each experiment one stock solution was diluted in 698 L feed water to obtain concentrations of approximately 10 and 20 µg/L per MPs and 50 mg/L Na2SO3 as oxygen scavenger. These concentrations guaranteed the quantification of 99% removal, i.e. 1% passage, based on the analytical method’s detection limits.
3.2.4. RO feed water
Raw anaerobic riverbank filtrate was freshly abstracted from a well field in the premises of the drinking water treatment plant (DWTP) where the experiments were conducted. This bank filtrate is also used as source water by the DWTP where conventional treatment is applied. The feed was kept in hypoxic conditions throughout filtration. Quality parameters are reported in Table B-2.1 of the Appendix B.
3.2.5. Hypoxic RO pilot-scale installation
A pilot-scale RO system was built and operated in recirculation mode to treat anaerobic riverbank filtrate under hypoxic conditions. Such a system was not commercially available or reported elsewhere. The pilot was a closed system consisting of a 720 L stainless steel feed reservoir, a high-pressure pump and one 4-inch membrane pressure vessel. Permeate and concentrate lines were recirculated to the feed reservoir via airtight connections. A detailed description and a picture of the RO pilot are provided in the Appendix B (B-3) and Figure B-3.1, respectively, whereas a diagram displaying the essential features of the system is provided in Figure 3.1. The low pressure RO (LPRO) membrane chosen for this study was an ESPA2-LD-4040 (Hydranautics, Oceanside, CA). This membrane is a typical thin-film composite (TFC) with an active layer of cross-linked aromatic polyamide, designed for low-pressure filtration and employed in a variety of water recycling applications (Fujioka et al., 2012a). The properties of the ESPA2 membrane are summarised in Table 3.2.

65
Figure 3.1. Schematic diagram of the hypoxic RO-pilot system.
Table 3.2. Performance characteristics and properties of a virgin ESPA2 membrane
Performance Properties
Salt rejection a
Permeate flux a
Surface area
Surface roughness b
Contact angle b
Zeta-potential b,c
MWCO d
(%) (m3/day) (m2) (nm) (o) (mV) (Da)
99.4 5.57 7.4 89 25-40 < -20 < 200
a Manufacturer data b Fujioka and Nghiem, 2013 c Tu at al., 2015 d MWCO: Molecular weight cut-off. Source: Yangali-Quintanilla et al., 2010
3.2.6. RO filtration protocol
The 720 L feed reservoir was filled with 698 L of anaerobic riverbank filtrate while being flushed with nitrogen. The MPs were dosed to the feed water with a SMART Digital pump from Grundfos B.V. (Almere, The Netherlands). Filtration was carried at a constant 15% recovery and 25 L m-2 h-1 permeate flux. The temperature was kept at 20 °C. Filtration was conducted for 4 d before taking feed and permeate samples at t=5d to minimize the influence of hydrophobic interactions on the passage of moderate hydrophobic MPs (Verliefde et al., 2007b). When sampling, the feed reservoir was supplied with nitrogen. Feed water and permeate

66
samples (V=200 mL; n=2) were collected in 250 mL polypropylene bottles and frozen immediately. The second part of the study was conducted in a different season and focussed on the effects of operating conditions on the removal of a sub-set of 18 MPs. We assessed the permeate flux as the quality of temperature and pH of the riverbank filtrate at the DWTP location has proven to be very stable in time. We started RO filtration by applying the protocol used for the 30-analyte set. The only difference was the feed temperature, which this time was kept at 13 °C (see Table B-2). After the fourth day of filtration, the permeate flux was kept constant at 10 L m-2 h-1. Samples were then taken at t=2h, t=5h, and t=24h before returning the permeate flux to 25 L m-2 h-1 and repeating the sampling at t=2h, 5h and 24h.
3.2.7. Assessment of solute passage
The rejection equation can be used to quantify the removal of solutes by RO membranes:
R(%) = (1 −CROP
CROF) × 100 (1)
Where CROP and CROF are the permeate and the bulk feed concentrations, respectively. Similarly, the passage can be defined as:
P(%) = (CROP
CROF) × 100 (2)
In principle rejection and passage can be used to describe the same phenomenon, i.e. the removal of a solute by membrane filtration. However, the observed rejection equation (Eq. 1) quantifies the percentage of solute that has been removed during RO filtration, whereas the passage (Eq. 2) quantifies the percentage of solute in the permeate.
Finally, the EC passage was calculated by adapting Eq. 2:
ECP(%) = (ECROP
ECROF) × 100 (3)
where ECROP and ECROF are the electrical conductivity (in µS/cm) in the permeate and the in the bulk feed solution, respectively. Chemical passage was calculated by using Eq. 2 and the values reported in this manuscript are the averages and ranges obtained from experimental duplicates.
Statistical analysis was performed within the R statistical environment (R Core Team, 2017). The analysis was limited to Category I (7 neutral

67
moderate hydrophobic MPs), Category II (10 neutral hydrophilic MPs) and Category III (9 anionic MPs) as only three cationic MPs populated Category IV. One-way analysis of variance (ANOVA) was performed to reject the null hypothesis that different physicochemical properties had the same influence on the passage mean. Pairwise comparisons between categories were conducted with post-hoc Tukey Honestly Significant Difference (HSD) test (Ruxton and Beauchamp, 2008). Both ANOVA and Tukey’s HSD test were calculated with 95% confidence intervals (CI). In addition, the Spearman correlation coefficient (r) was calculated to assess the correlation between passage, molecular weight and hydrophobicity of all model MPs including cationic compounds.
3.2.8. Sample preparation
A sample preparation method validated in our laboratories was adapted to this study (Albergamo et al., 2018). The feed water samples (V=1 mL; n=2) were spiked with 2 µg/L of internal standards and filtered over 0.22 µm PP filters (Filter-Bio, Jiangsu, China) before direct injection analysis. The RO permeate samples (V=200 mL; n=2) were spiked with 100 ng/L of internal standards and concentrated by solid-phase extraction (SPE) with Oasis HLB (150 mg) from Waters (Etten-Leur, The Netherlands). The cartridges were conditioned with 5 mL of methanol and equilibrated with 5 mL ultrapure water. The samples were loaded, the cartridges were washed with 1 mL of ultrapure water and dried under vacuum for 15 min. The cartridges were eluted 4 times with 2.5 mL of methanol and the extracts evaporated to 1 mL, filtered with 0.22 µm PP filters and diluted ten times in ultrapure water before analysis. Aliquots of permeate samples were also collected before sample preparation for direct injection
analysis.
3.2.9. Chemical analysis
The analyses of selected inorganic compounds in the feed water, i.e. ammonium, bicarbonate, calcium, chloride, iron, magnesium, manganese, potassium, and sulphate were performed by Vitens Laboratory Utrecht (Utrecht, The Netherlands) via standard methods conforming to (inter)national standards. The MPs were analysed by applying a LC-HRMS method validated in our laboratories (Albergamo et al., 2018). Feed water samples were analysed by direct injection, whereas RO permeate was enriched with SPE prior analysis. Aliquots of 1 mL RO permeate were collected prior SPE and directly injected to quantify acesulfame and heptafluorobutyric acid (PFBA). An ultrahigh-performance LC system (Nexera, Shimadzu, Den Bosch, The Netherlands) equipped with a core-shell Kinetex 2.6 µm biphenyl 100 Å

68
column (Phenomenex, Utrecht, The Netherlands) was used for chromatographic separation. The mobile phase consisted of deionised water 0.05% acetic acid (A) and methanol (B). A maXis 4G quadrupole time-of-flight high-resolution mass spectrometer equipped with an electrospray ionisation source (ESI-Q-TOF) was operated in positive and negative mode to achieve MS detection (Bruker Daltonics, Wormer, The Netherlands). Full-scan MS and MSMS spectra acquired in broadband collision induced dissociation mode (bbCID) were screened for the accurate masses, retention time (tR), mass accuracy, isotopic fit and MSMS for unambiguous identification of the target analytes. Detailed screening parameters for analytes identification are given in the Appendix B (Table B-4.1). Quantification with internal standards was achieved for all the analytes except acesulfame and PFBA, for which an external standard calibration was used instead. The calibration series used for quantification were prepared in ultrapure water spiked with 32 µg/L and serially diluted to obtain ten concentration factors, with 31.25 ng/L being the lowest concentration. All calibration standards had a final volume of 1 mL and a concentration of isotope-labelled standards equal to 2 µg/L. Calibration curves were obtained from at least six calibration levels and displayed r-squared values greater than 0.99. The evaluation of the direct injection method is described in section B-5 of the Appendix B. The method detection limits (LODs), quantification limits (LOQ) and recoveries are provided in Table B-5.1. Details about the evaluation of the performance of the SPE method are given in section B-6 of the Appendix B. LODs, LOQs and recoveries of the SPE procedure are provided in Table B-6.1.
3.3. RESULTS AND DISCUSSION
3.3.1. Removal of neutral and moderate hydrophobic MPs
Neutral and moderate hydrophobic MPs (log D(pH7)>2) were substantially removed. With the exception of 2-hydroxyquinoline all target analytes displayed a passage lower than 5% (Figure 3.2). The results of triclosan are not reported due to the large deviation between the measurements.

69
Figure 3.2. Passage of neutral and moderate hydrophobic MPs as a function of their MW. The reported passage values are averages and ranges of experimental duplicate results. Ranges are shown when larger than the data point symbol. Conditions: average permeate flux 25 L m-2 h-1, recovery 15%, feed pH 6.8 ±0.1, feed conductivity 830 µS/cm, feed T 20±1 °C.
The hydroxyquinoline isomers selected as target MPs are mid-small organics (145.05 Da) with almost identical physicochemical properties except for the log D(pH7), which is 2.4 and 1.8 for 2- and 4-hydroxyquinoline, respectively. Due to our log D(pH7) = 2 cut-off, the two isomers were assigned to different categories: 2-hydroxyquinoline was regarded as moderate hydrophobic (log D(pH7) > 2), whereas 4-hydroxyquinoline as neutral hydrophilic (log D(pH7) < 2). After 4d, the passage of 2-hydroxyquinoline was 8.1±0.3 % (Fig. 3.2), whereas that of 4-hydroxyquinoline was 3.5±0.1% (Fig. 3.3). While size exclusion represents the main removal mechanism for neutral MPs, the rejection of (moderate) hydrophobic MPs is also influenced by solute-membrane affinity interactions. These MPs can adsorb onto RO membranes due to the affinity between hydrophobic moieties such as aromatic rings and hydrocarbon chains and the active layer of RO membranes (Kimura et al., 2003b; Nghiem et al., 2002). Once membrane saturation is reached the adsorbed MPs can partition through the membrane and diffuse to the permeate side in a process influenced by hydrophobic-hydrophobic interactions and hydrogen bonding (Verliefde et al., 2009). Consequently,

70
a higher rejection of moderate hydrophobic MPs can be observed in the early filtration stages due to the combined effect of adsorption and size exclusion (Kimura et al., 2003b). For this reason, the correlation between passage and size of hydrophobic MPs appears to be weaker than that of neutral hydrophilic MPs. When plotting the passage of moderate hydrophobic MPs as a function of their log D no clear correlation between these variables could be observed (data not shown). The passage differences between the hydroxyquinoline isomers could be explained by the lower hydrophilicity of 2-hydroxyquinoline and therefore its higher affinity for the active layer of the ESPA2 RO membrane, which consisted of aromatic polyamide. Thus, the removal of 2-hydroxyquinoline could also be influenced by solute-membrane affinity interactions in addition to the size exclusion mechanism. The higher hydrophobicity of 2-hydroxyquinoline could be confirmed by its chromatographic behaviour. In a 7-min analysis run with reversed-phase chromatography 2-hydroxyquinoline had a retention time (tR) of 5.03 min, whereas the tR of 4-hydroxyquinoline was 4.03 min. This is also in agreement with earlier work published by our group (Brulik et al., 2013). The second least-well removed moderate hydrophobic MP was bisphenol A, for which we observed up to 4% passage. The result is in accordance with the removal efficiency from spiked raw lake water in a bench-scale RO filtration study (Comerton et al., 2008). In a recent pilot–scale investigation bisphenol A was rejected by approximately 75% by a cellulose triacetate (CTA) RO membrane (Fujioka et al., 2015b).
3.3.2. Removal of neutral hydrophilic MPs
The transport of neutral hydrophilic MPs is mainly hindered by a sieving mechanism, thus the larger the molecule the lower its passage (Bellona et al., 2004; Fujioka et al., 2012a; Kiso et al., 1992; Ozaki and Li, 2002). The MPs selection included 10 uncharged hydrophilic compounds covering a MW range from approximately 100 Da to 300 Da. The overall removal of these MPs was very high with observed passages lower than 5% for almost all compounds. All neutral hydrophilic MPs larger than 180 Da were almost completely removed (passage < 1%). In accordance with scientific literature, a strong correlation between MW and MPs removal by RO membranes was found (Figure 3.3). By adapting a method proposed by López-Muñoz et al. (2009) it was estimated that the cut-off value (MWCO) of the ESPA2 membrane in our operating conditions corresponded to approximately 140 Da, which is in accordance with findings from Yangali-Quintanilla et al. (2010). However, the MWCO of RO membranes is not an absolute value and should be used for semi-qualitative prediction only.

71
Figure 3.3. Passage of neutral hydrophilic MPs as a function of their MW. The reported passage values are averages and ranges of experimental duplicate results. Ranges are shown when larger than the data point symbol. RO conditions reported in Fig. 3.2.
As expected the smallest MPs displayed the lowest removal efficiencies. 1H-benzotriazole (119.05 Da) and tolyltriazole (133.15 Da) showed 25±4% and 17±4% passage, respectively. The third least-well removed neutral hydrophilic MP was phenylurea (136.06 Da), for which we quantified 10±1% passage. To the best of our knowledge, this compound has not been investigated in membrane filtration before. The addition of a methyl group to 1H-benzotriazole resulted in a decreased passage of the methylated derivative (tolyltriazole), which supports size exclusion as main removal mechanism. This is in accordance with previous research, where a correlation between removal and number of methyl groups was observed (Steinle-Darling et al., 2007). The removal efficiencies of benzotriazoles quantified in this study were in close agreement with observations from a full-scale advanced water recycling plant where RO was applied to treat secondary wastewater treatment effluents, where 70% and 85% rejection were observed for 1H-benzotriazole and methyl-1H-benzotriazole, respectively (Loi et al., 2013). In a separate study on advanced water recycling where RO permeate was used for groundwater replenishment the average removal efficiencies were 51% and 53% for 1H-benzotriazole and its methylated derivatives, respectively (Busetti et al., 2015). It is challenging to explain the lower removal efficiencies

72
reported in the latter study since no details about feed water characteristics and RO operational parameters were given by the authors whose goal was the validation of an analytical method. Nevertheless, the lower removal might be attributed to a different feed water composition, higher feed water temperature or to the employment of a more open RO membrane. The benzotriazoles are small emerging contaminants which are frequently and globally detected in the water cycle in the high ng/L to low µg/L range due to their incomplete removal by conventional wastewater treatment (Giger et al., 2006; Loos et al., 2013; van Leerdam et al., 2009). In general, small neutral MPs like the benzotriazoles are not fully retained by LPRO membranes. Observations from a DTWP in which the production chain consisted of riverbank filtration, aeration, a split stream treatment with RO, and full stream active-carbon filtration suggest that the combined treatments are only partially effective on small neutral MPs (Kegel et al., 2010). Observation from a full-scale municipal wastewater treatment plant upgraded with post-ozonation followed by sand filtration (Hollender et al., 2009) showed that a medium ozone dose (0.6 g O3 g-1 DOC) led to 70% removal of 1H-benzotriazole. Where necessary, the passage of small neutral MPs such as the benzotriazoles could be lowered by employing tighter RO membranes. In general, the removal efficiencies of RO drinking water treatment can be maximised following combination with other treatments. However, the smallest neutral polar MPs might still be detectable in the permeate (Boleda et al., 2011).
3.3.3. Removal of ionic MPs
As expected, excellent removal of anionic MPs was observed (passage <1%). The ESPA2 membrane has its isoelectric point at pH 4 (Tu et al., 2015) and a zeta-potential of -40 mV at pH 7 (Fujioka et al., 2013). Consequently, it displayed a net negative charge at the operating feed pH. The electrostatic repulsion between anionic solutes and negatively charged membranes represents an additional mechanism that leads to low passage (Ozaki and Li, 2002) The results are shown in Figure 3.4. Considering the behaviour of neutral polar compounds in RO filtration and the MW of the anionic MPs investigated, steric hindrance should be considered in addition to electrostatic repulsion when interpreting the low passage values of negatively charged MPs observed in this study.

73
Figure 3.4. Passage of anionic (a) and cationic MPs (b) as a function of their MW. The reported passage values are averages and ranges of experimental duplicate results. Ranges are shown when larger than the data point symbol. Grey dots represent removal below detection limits. RO conditions in Fig. 3.2.
Two quaternary ammonium ions were selected as cationic MPs along with 2-(methylamino)pyridine. We observed passage of 2.5±0.1% and 0.3±0.1% for tetrapropylammonium and tetrabutylammonium, respectively, whereas the passage of 2-(methylamino)pyridine, the smallest cation, was 8.8±0.1%. These values, although limited to three compounds only, suggest a decreasing passage trend with increasing MW and a higher transport of cationic MPs compared to anionic MPs of comparable size. Passage of positively charged MPs during RO filtration can be expected due to charge concentration polarization, i.e. a localized increase in concentration of cations onto the negatively charged active layer due to electrostatic attractions, leading to lower rejection (Fujioka et al., 2015a; Verliefde et al., 2008).
3.3.4. Statistical analysis
The passage values of the MPs in Category I, II and III were log-transformed and visualised in a box-and-whisker plot. This highlighted the overall lower passage of anionic MPs compared to neutral compounds (Figure 3.5).

74
Figure 3.5. Box-and-whisker plot illustrating the log-passage range observed for each physicochemical property category, i.e. Category I (neutral and moderate hydrophobic), Category II (neutral hydrophilic), Category III (anionic).
The ANOVA test run on this dataset returned a p-value of 0.00297 with 95% CI, indicating significant difference in the mean passage amongst the three categories. The Tukey’s test showed modest difference between Category I and III (p=0.04077), significant difference between Category II and III (p=0.00264), whereas the differences between Category I and II were not significant (p=0.66295). These results indicate a significant relationship between passage and compound physicochemical properties as categorised in this study and highlight the role of electrostatic repulsion in preventing transport of anionic MPs through TFC RO membranes. However, the additional effects of size should not be excluded when interpreting the low passage of anionic MPs as commented in the previous section (3.3.3). Hydrophobicity expressed as log D had no significant impact on the passage of neutral polar organics. To gain more insights, data of all MPs excluding triclosan (29 compounds) were pulled together and the Spearman correlations between MW, log D and passage were assessed. Passage and MW showed good correlation (r =-0.77, p ≤0.01), contrary to the log D (r =0.20 p =0.31). This highlights (i) the overall relevance of compound size in hindering transport of polar organics through TFC RO membranes and (ii) the lack of relationship between passage and hydrophobicity, which is in line with the results obtained from the ANOVA and the Tukey’s test. The results of the statistical analysis point to compound MW as a prominent physicochemical property and in part to charge to explain the passage of polar MPs through RO membranes. The clear trend between

75
passage and MW can be used to qualitatively predict the passage, especially in RO systems equipped with TFC membranes of known MWCO. For MPs which deprotonate at operating feed water pH, even lower passage figures could be expected. Despite the lack of significance between Category I and Category II, the impact of solute-membrane affinity interactions on the passage of uncharged organics needs further assessment. Caution should be exercised when predicting the passage of neutral compounds exhibiting high log D values as seen for bisphenol A, which displayed 4% passage despite its size of 228.29 Da.
3.3.5. Influence of permeate flux
The overall removal efficiencies of the investigated MPs at t=5 d (data not shown) were comparable to those presented in sections 3.3.1, 3.3.2 and 3.3.3 and therefore the results and discussion in this section are limited to the compounds for which we quantified more than 1% passage, i.e. 1H-benzotriazole, tolyltriazole, 2-hydroxyquinoline, and paracetamol. With the exception of 2-hydroxyquinoline, the highest passages were observed for neutral hydrophilic MPs. In accordance with scientific literature, the effects of the permeate flux were more prominent on the smallest MPs (Fujioka et al., 2012b) and an inverse correlation between passage and permeate flux could be observed (Verliefde et al., 2009). After 2 h of filtration at a permeate flux of 10 L m-2 h-1 no relevant passage variations could be observed with the exception of 2-hydroxyquinoline which increased from 9% to 15%. After 5 h the passage of the four target MPs was almost doubled compared to the previous measurements, whereas after 24 h the passage decreased to values which were higher than those observed at a permeate flux of 25 L m-2 h-1: 1H-benzotriazole passage increased from 22±2% to 30±2%, tolyltriazole from 15±2% to 18±2%, 2-hydroxyquinoline from 8.7±0.2% to 14±4%, and paracetamol from 3.2±0.6% to 4±0.4% for 25 L m-2 h-1 after 2 h and 10 L m-2 h-1 after 24 h respectively. When the flux was set back to 25 L m-2 h-1 the MPs passage after 24 h was comparable to that observed after 4 d of filtration, suggesting repeatability of the methodology and reversibility of the membrane structure. From these measurements we could obtain four different MPs passage profiles as a function of filtration time (Figure 3.6). The behaviour of polar MPs deviated from that of the EC passage, which increased at the lower permeate flux, but remained stable throughout filtration at a given permeate flux (Fig. 3.6–bottom). Based on the EC data, these variations in MPs passage cannot be attributed to changes in membrane properties, e.g. enlargement of intramolecular spaces within the active layer, or membrane charge. The results suggest that the transport of small hydrophilic MPs is enhanced within at least the first 5 h

76
following a pressure drop, possibly due to accumulation onto or within the membrane and subsequent permeation. Unknown matrix effects leading to higher passage cannot be excluded. To the best of our knowledge, the passage profiles obtained from the results of this study have not been reported before and can provide information worth considering when designing MPs rejection experiments from an untreated water matrix by RO in recirculation mode. Based on these results and depending on the quality of the feed water, it can be advised to discharge the permeate produced within at least 5 h following a pressure drop and to monitor the permeate quality during the subsequent 24 h.
Figure 3.6. Influence of permeate flux on MPs passage. MPs passage (top), permeate flux (middle), and EC passage (bottom) are shown as a function of RO filtration time. The reported passage values are averages and ranges of experimental duplicate results. Ranges are shown when larger than the data point symbol. Dashed lines represent the point in time in which the permeate flux was set to a different value. Starting conditions: average permeate flux 25 L m-2 h-1, recovery 15%, feed pH 7.0 ±0.1, feed conductivity 880 µS/cm, feed T 13±1 °C.

77
3.4. CONCLUSIONS
RO proved to be a robust barrier against most polar MPs. Overall, the passage figures observed for the investigated set compounds ranged from less than 1% to 25% in standard conditions. Statistical analysis showed significant influence of physicochemical properties on compound passage. Compound size and passage were highly correlated for neutral MPs, and charge for anionic MPs. Determining key factors were also membrane chemistry and feed water properties.
Neutral and moderate hydrophobic MPs showed an inverse correlation between size and passage. However, in some cases passage values higher than those of a hydrophilic compound of comparable size were observed
Neutral hydrophilic MPs showed a strong correlation between increasing compound size and decreasing passage. When larger than 180 Da, nearly no passage was observed. The smaller uncharged hydrophilic MP, 1H-benzotriazole (119.05 Da), displayed up to 25±5% passage
Anionic MPs displayed almost no passage, whereas minor breakthrough of cationic MPs of comparable size was observed
RO carried at a low permeate flux resulted in higher MPs passage, particularly for small neutral hydrophilic MPs. For at least 5 h following a pressure drop strong passage fluctuations were observed
Overall, the passage-size correlation can be used to qualitatively predict the behaviour of neutral MPs in RO system equipped with TFC membranes of known MWCO. For anionic MPs even lower passage figures could be expected. For neutral MPs the influence of solute-membrane affinity (H-bonding or non-polar interactions) should be taken into account when predicting passage. This study encourages further investigation of RO applied to bank filtrate. Higher removal efficiencies could be achieved by using tighter membranes, larger membrane elements or multi-stage RO.

78
ACKNOWLEDGMENTS
This study was funded by the drinking water company Oasen (Gouda, The Netherlands). We thank Ernstjan van der Weijde and Harmen van der Laan for supporting the planning and logistics at the experimental location. Sandrine Reynes is acknowledged for performing the preliminary SPE tests at the Institute for Biodiversity and Ecosystem Dynamics (IBED), University of Amsterdam. Andrea Carboni (Institut de Physique du Globe de Paris, Sorbonne-Paris-Cité University, France), Wim Kok (Van 't Hoff Institute for Molecular Sciences, University of Amsterdam) and Emiel van Loon (IBED, University of Amsterdam) are acknowledged for providing feedback on the manuscript.

79
APPENDIX B. Supplementary information to Chapter 3
B-1. Standards and chemicals
Analytical grade 1H-benzotriazole, 2-(methylamino)pyridine, 2-hydroxyquinoline, 2,6-dichlorobenzamide, 4-hydroxyquinoline, 4-methyl-1H-benzotriazole (hereinafter referred to as tolyltriazole), acesulfame, atrazine, barbital, bentazon, bisphenol A, caffeine, carbamazepine, chloridazon, N,N-Diethyl-meta-toluamide (DEET), diclofenac, diuron, ibuprofen, paracetamol, heptafluorobutyric acid (PFBA), nonafluorobutanesulfonic acid (PFBS), perfluorooctanoic acid (PFOA), phenazone, phenylurea, sulfamethazine, sulfamethoxazole, tetrabutylammonium, tetrapropylammonium, triclosan, and triethyl phosphate were purchased from Sigma-Aldrich (Zwijndrecht, The Netherlands). The isotope-labelled standards, 1H-benzotriazole-d4, atrazine-d5, bisphenol A-d16, caffeine-13C3, carbamazepine-13C6, diclofenac-13C6, diuron-d6, ibuprofen-d3, paracetamol-d4, and sulfamethoxazole-13C6 were purchased from Sigma-Aldrich (Zwijndrecht, The Netherlands), whereas DEET-d6, sulfamethazine-13C6, Triclosan-13C6,
and triethyl phosphate-d15 were purchased from Cambridge Isotope Laboratories Inc. (Andover, MA, USA). Sodium sulphite (purity ≥98%) and anhydrous sodium hydroxide pellets were purchased from Sigma-Aldrich (Zwijndrecht, The Netherlands). Hydrochloric acid solution (37%) was purchased from Merck Millipore (Amsterdam, The Netherlands). In-house deionised water was purified with an ELGA water purification system (ELGA LabWater, High Wycombe, UK), whereas analytical grade (LC-MS) methanol and acetonitrile were purchased from Biosolve (Valkenswaard, The Netherlands).

80
B-2 RO feed water quality
Table B-2.1. Initial quality parameters of the riverbank filtrate used as RO feed water
Parameter Unit Measured Measured
(permeate flux test)
pH -log[H+] 7.1 7.1
Temperature °C 20 13
EC at 20 °C µS/cm 831 881
Mn+ mg/L 1 n.a.
HCO3- mg/L 429 365
Ca2+ mg/L 128 104
SO42- mg/L 46 79
Cl- mg/L 85 81
Fe+ mg/L 9 n.a.
Mg2+ mg/L 16 17
K+ mg/L 6 5
NH4+ mg/L 4 3
The left-most numeric values were measured in the feed water prior dosing the 30 model MPs, whereas the right-most values refer to the feed water of our second experiment, which focused on the effects of the permeate flux.

81
B-3 Anaerobic RO pilot-scale installation
The system (Figure B-3.1) consisted of a pressurized 720L stainless steel feed reservoir supplied with nitrogen from a cylinder (50L at 200 bar) connected via a pressure valve on the headspace. The feed line was equipped with a high-pressure pump with frequency-controlled high-speed motor (DPVSV 2/26 B, DP-Pumps, Alphen aan den Rijn, The Netherlands) and delivered the feed stream to a 4” fiberglass pressure vessel equipped with a single 4”x40” membrane element. The permeate and concentrate lines were connected to the feed reservoir and used to recirculate the effluent streams. The line leading to the high-pressure pump were made of PVC and those leaving the pump were made of stainless steel. Feed and concentrate flows were regulated by adjusting the frequency of the high-pressure pump and by the needle valve on the concentrate stream, respectively. The permeate flow and process recovery could be monitored online along with feed temperature, pH, redox potential, and feed and permeate electrical conductivity (EC). The flow meters were obtained from Endress+Hauser B.V. (Naarden, The Netherlands). The pH, redox potential, and conductivity meters were obtained from Logisticon (Groot-Ammers, The Netherlands). All process parameters were monitored online by a Memograph M RSG40 (Endress+Hauser B.V., Naarden, The Netherlands). The feed temperature was regulated with an immersed stainless steel coil fed with cooling liquid from a Hyfra Chilly 35 AC (Krunkel, Germany).
Figure B-3.1. Pilot-scale RO filtration system used for this study
.

82
B-4 LC-HRMS screening parameters
Table B-4.1. Screening parameters (molecular formulas, ionisation mode, quantifier and qualifier ions, retention times, and qualifier ion ratio) of the target MPs. Adapted from Albergamo et al. (2018)
Compound Formula ESI mode Quantifier m/z (Q) tR Qualifier m/z (q) q/Q
2,6-dichlorobenzamide C7H5Cl2NO + 189.9821 4.5 174.9527 0.6
2-hydroxyquinoline C9H7NO + 146.0600 5.0 128.0479 0.7
Atrazine C8H14ClN5 + 216.1011 5.5 174.0543 0.5
Bisphenol A C15H16O2 - 227.1078 5.5 28 7.1289 0.1
Carbamazepine C15H12N2O + 237.1022 5.7 192.0812 0.2
DEET C12H17NO + 192.1383 5.8 91.0538 0.1
Diuron C9H10Cl2N2O + 233.0243 5.5 218.0981 0.4
Triclosan C12H7Cl3O2 - 286.9439 6.3 288.9394 0.9
1H-benzotriazole C6H5N3 + 120.0556 4.3 92.049 0.1
4-hydroxyquinoline C9H7NO + 146.0600 4.3 118.0651 0.05
Barbital C8H12N2O3 - 183.0775 4.3 140.071 0.05
Caffeine C8H10N4O2 + 195.0877 4.8 138.0664 0.5
Chloridazon C10H8ClN3O + 222.0429 4.9 104.0494 0.15
Paracetamol C8H9NO2 + 152.0706 3.3 110.0601 0.3
Phenazone C11H12N2O + 189.1022 5.1 174.0788 0.05
Phenyl urea C7H8N2O + 137.0709 4.0 94.0648 0.08
Tolyltriazole C7H7N3 + 134.0713 4.8 92.049 0.15
Triethyl phosphate C6H15O4P + 183.0781 5.1 98.9838 0.9
Acesulfame C4H4HNO4S - 161.9867 3.1 82.0294 0.2
Bentazon C10H12N2O3S - 239.0496 5.1 132.0324 0.15

83
Table B-4.1 (continued). Screening parameters (molecular formulas, ionisation mode, quantifier and qualifier ions, retention times, and qualifier ion ratio) of the target MPs. Adapted from Albergamo et al. (2018)
Compound Formula ESI mode Quantifier m/z (Q) tR Qualifier m/z (q) q/Q
Diclofenac C14H11Cl2NO2 - 294.0094 6.2 250.0188 0.7
Ibuprofen C13H18O2 - 205.1234 6.0 161.133 0.15
PFBA C4HF7O2 - 212.9792 3.1 168.9889 0.1
PFBS C4HF9SO3 - 298.943 4.5 98.9552 0.03
PFOA C8HF15O2 - 412.9664 5.3 368.9749 0.5
Sulfamethazine C12H14N4O2S + 279.091 4.9 156.0116 0.25
Sulfamethoxazole C10H11N3O3S + 254.0594 4.7 156.0116 0.35
2-(methylamino)pyridine C6H8N2 + 109.076 3.1 78.0332 0.15
Tetrabutylammonium C16H36N + 242.2842 5.4 142.1593 0.25
Tetrapropylammonium C12H28N + 186.2216 4.4 114.1279 0.4

84
B-5. Direct injection method performance
Quality parameters of the direct injection analysis of riverbank filtrate (RBF) were evaluated and described by Albergamo et al. (2018). In the present study the same procedure was applied to assess the quality parameters of the direct injection analysis of acesulfame and PFBA in RO permeate. In brief, 1 mL RBF and RO permeate samples (n=4) were spiked at 31.25, 62.5, 125, 250, 500 ng/L and filtered over 0.22 µm PP filters (Filter-Bio, Jiangsu, China) before LC-HRMS analysis. Non-spiked samples were used as procedural blanks. The calibration series used for quantification was prepared in ultrapure water spiked with 32 µg/L and serially diluted to obtain ten concentration factors, with 31.25 ng/L being the lowest concentration. All calibration standards and analysed samples had a final volume of 1 mL and a concentration of isotope-labelled standards equal to 2 µg/L. LC-HRMS analyses were performed as described in section 3.2.9 of Chapter 3. The lowest concentration of the calibration curve was used as reference concentration to determine limits of quantification (LOQs) and limits of detection (LODs) in bank filtrate and RO permeate. The method’s LOQs were confirmed when the detection in a spiked field sample complied with the screening parameters reported in Table B-4.1 and the quantified concentration was within 30% accuracy from the nominal spike level. The detection limits (LODs) were set 3.3 times lower than their correspondent LOQs. The recovery values were the average of the ratios between measured concentrations, subtracted for any background concentration detected in non-spiked samples, and nominal concentrations at levels equal or greater than LOQ (Albergamo et al., 2018).

85
Table B-5.1. Direct injection analysis method performance for riverbank filtrate and RO permeate limited to acesulfame and PFBA (n=4). Adapted from Albergamo et al. (2018)
Compound LOQ LOD Recovery
ng/L ng/L (%±SD)
2,6-dichlorobenzamide 125 38 110±7
2-hydroxyquinoline 31 9 61±10
Atrazine 31 9 95±7
Bisphenol A 250 76 96±13
Carbamazepine 63 19 108±29
DEET 31 9 97±12
Diuron 31 9 99±6
Triclosan* 250 76 158±26
1H-benzotriazole 63 19 93±16
4-hydroxyquinoline 63 19 86±4
Barbital 276 83 66±8
Caffeine 63 19 96±14
Chloridazon 31 9 91±16
Paracetamol 63 19 93±12
Antipyrine 63 19 106±15
Phenyl urea 63 19 81±31
Tolyltriazole 31 9 92±8
Triethyl phosphate 31 9 93±13
Acesulfame 117 35 128±39
Bentazon 269 76 102±18
Diclofenac 63 19 109±24
Ibuprofen 63 19 104±12
PFBA 133 9 79±47
PFBS* 125 38 109±33
PFOA 56 19 106±17
Sulfamethazine 31 9 91±25
Sulfamethoxazole 31 9 90±6
2-(methylamino)pyridine 26 8 83±13
Tetrabutylammonium 31 9 95±10
Tetrapropylammonium 31 9 103±12

86
Table B-5.1 (continued). Direct injection analysis method performance for riverbank filtrate and RO permeate limited to acesulfame and PFBA (n=4). Adapted from Albergamo et al. (2018)
Compound LOQ LOD Recovery
ng/L ng/L (%±SD)
Acesulfame (RO permeate) 63 19 102±19
PFBA (RO permeate) 125 38 113±18
LOQ: Limit of quantification LOD: Limit of detection *Calculated by testing 3 replicates in one day

87
B-6 Solid-phase extraction method performance
Quality parameters of the analysis of RO permeate extracts concentrated by solid-phase extraction (SPE) were evaluated in one day. Sample preparation followed the procedure described by Albergamo et al. (2018) with minor modifications. In brief, 200 mL RO permeate samples (n=4) were spiked to obtain a concentration of 100 ng/L of target analytes and isotope-labelled standards and extracted as described in section 3.2.8 of Chapter 3. Non-spiked samples were used as procedural blanks. The calibration series used for quantification was prepared in ultrapure water spiked with 32 µg/L and serially diluted to obtain ten concentration factors, with 31.25 ng/L being the lowest concentration. LC-HRMS analyses were performed as described in section 3.2.9 of Chapter 3. The SPE method’s limits of quantification (LOQs) and limits of detection (LODs) were calculated by correcting the concentration of the lowest standard of the calibration curves for SPE recoveries and enrichment factor. The recovery values for this method were calculated as the ratios between measured concentrations, subtracted for any background concentration detected in non-spiked samples, and the nominal spike concentration.

88
Table B-6.1. Solid-phase extraction method performance for RO permeate (n=4)
Compound LOQ LOD Recovery
ng/L ng/L % ± SD
2,6-dichlorobenzamide 2.65 0.8 84±10
2-hydroxyquinoline 0.9 0.27 58±16
Atrazine 1.41 0.43 91±7
Bisphenol A 5.88 1.78 94±11
Carbamazepine 2.99 0.91 95±8
DEET 1.16 0.35 75±7
Diuron 1.5 0.46 97±10
Triclosan* 5.5 1.67 88±9
1H-benzotriazole 1.36 0.41 88±9
4-hydroxyquinoline 1.49 0.45 96±9
Barbital 4.03 1.22 128±6
Caffeine 2.43 0.74 77±7
Chloridazon 1.49 0.45 96±11
Paracetamol 2.87 0.87 91±7
Antipyrine 1.58 0.48 102±5
Phenylurea 3.12 0.95 99±9
Tolyltriazole 1.4 0.42 90±9
Triethyl phosphate 1.53 0.47 99±13
Bentazon 1.63 0.49 105±3
Diclofenac* 1.46 0.44 94±5
Ibuprofen 2.77 0.84 88±9
PFBS 7 2.12 112±2
PFOA* 1.27 0.39 82±12
Sulfamethazine 1.5 0.46 97±6
Sulfamethoxazole 1.47 0.45 95±16
2-(methylamino)pyridine 1.05 0.32 68±12
Tetrabutylammonium 1.35 0.41 87±7
Tetrapropylammonium 1.91 0.58 123±19
LOQ: Limit of quantification LOD: Limit of detection *Calculated by testing 3 replicates

89
Chapter 4. Removal of polar organic micropollutants by mixed-matrix reverse osmosis membranes

90
Abstract
To produce high-quality drinking water, reverse osmosis (RO) membranes with mixed-matrix active layers have been proposed to outperform standard polyamide thin-film composite (TFC) membranes. We investigated the passage of 30 persistent polar micropollutants (MPs) in a pilot-scale RO system equipped with a 4-inch zeolite-embedded thin-film nanocomposite (TFN) membrane and fed with raw riverbank filtrate. Additionally, MPs passage was investigated in a bench-scale system equipped with a 1.8-inch aquaporin-embedded RO membrane. Benchmark TFC membranes were used in both systems. In pilot-scale RO, MPs passage did not exceed 15% and 6% with the TFC and TFN membranes, respectively. In bench-scale RO, MPs passage values of up to 65% and 44% were quantified for the aquaporin and TFC membranes, respectively, suggesting a more open structure of the 1.8-inch modules. In both RO systems, uncharged polar MPs displayed the highest passage values. Overall, no statistical differences between passage values were found between TFC and mixed-matrix RO membranes, indicating that nanocomposite and biomimetic membranes are as effective as TFCs of the same module size in preventing breakthrough of polar organics.

91
4.1. INTRODUCTION
Natural waters are ubiquitously polluted with anthropogenic organic micropollutants (MPs) (Schwarzenbach et al., 2006). Of particular concern for the quality of drinking water sources are the emissions of polar MPs via point and nonpoint sources, e.g. domestic wastewater treatment plants effluents (Loos et al., 2009; Luo et al., 2014) and agricultural runoffs (Gray et al., 2017). As polar compounds can preferentially partition into the water phase they can be highly mobile within the water cycle (Reemtsma et al., 2016). If persistent, dissolved MPs can spread to water bodies downstream of their emission sources or accumulate in semi-enclosed aqueous environments. Reports on the link between exposure to trace concentrations of (single) polar MPs and disruption of biological functions of aquatic biota have emerged (Hayes et al., 2010; Kashiwada et al., 2002), raising concern over the adverse effects to human health via insufficiently treated drinking water (Diamanti-Kandarakis et al., 2009; Schriks et al., 2010).
It has been estimated that by 2025 1.8 billion people would inhabit areas affected by water scarcity and about two-thirds of the world's population will live in water-stressed regions as a result of the cumulative effect of water use, population growth, and climate change (FAO, 2007). Advanced water treatment processes relying on osmotic membranes are employed by drinking water utilities to cope with the dramatic increase in clean potable water demand. In particular, reverse osmosis (RO) has shown great potential to remove a wide range of contaminants from a variety of water matrices (Lee et al., 2008; Radjenović et al., 2008). The passage of solutes through RO membranes is assumed to follow the solution-diffusion model, where solutes dissolve into the membrane’s active layer, i.e. the outermost polymeric layer responsible for solute separation, and diffuse through it along a transmembrane chemical potential gradient (Wang et al., 2014; Wijmans and Baker, 1995). The solution-diffusion process can be promoted or hindered by various mechanisms, i.e. size exclusion (Kimura et al., 2003b; Ozaki and Li, 2002), electrostatic attraction or repulsion (Nghiem et al., 2006; Verliefde et al., 2008), and hydrophobic interactions (Kimura et al., 2003a; Verliefde et al., 2009). These mechanisms are in turn influenced by the physicochemical properties of both membrane and solutes, the composition of feed water and operating conditions of RO processes (Bellona et al., 2004; Plakas and Karabelas, 2012).
The most successful RO membranes nowadays are thin-film composite (TFCs) constructed in spiral wound module configuration (Lee et al., 2011; Perreault et al., 2014; Petersen, 1993). A typical TFC membrane consists of three layers, with the outer-most active layer being in contact with the feed

92
solution and typically consisting of cross-linked aromatic polyamide (PA) obtained by interfacial polymerisation of 1,3-benzenediamine and trimesoyl chloride on top of a polysulfone layer, which is in turn supported by a polyester web. PA active layers are selective for water molecules and provide a high salt rejection, whereas the layers underneath provide support to the overall structure and increase water fluxes to the permeate side as they are more hydrophilic than the active layer (Lee et al., 2011). Despite PA-based TFC membranes have improved over the last decades in terms of water permeability and salt rejection, performance enhancements are limited by the permeability and selectivity trade-off relationship, where an increase in water permeability will necessarily result in increased solute passage (Geise et al., 2011; Werber et al., 2016). State-of-the art low-pressure PA-based TFC membranes serve as reference membranes for any novel material developed for RO filtration (Petersen, 1993). The simplicity of modifying the interfacial polymerisation process has allowed producing mixed-matrix membranes to pursue enhancements of the RO performance, e.g. by using organic-inorganic and organic-bioorganic composite active layers (Lee et al., 2011).
In 2007 the first thin-film nanocomposite (TFN) RO membrane was introduced (Jeong et al., 2007). This nanotechnology-enhanced TFC featured a nanocomposite thin layer (<0.2 nm) produced by addition of zeolite nanoparticles during interfacial polymerisation of amino and acid chloride monomers. Zeolites are super-hydrophilic and negatively charged minerals which exhibit a 3-D pore network structure. This network serves as a sieve and it is claimed to provide a preferential flow path for water molecules (Jeong et al., 2007; Lind et al., 2009). Nanocomposite RO membranes have been reported to exhibit higher hydrophilicity and greater permeability, while exhibiting salt rejection comparable to that of a TFC (Hofs et al., 2013; Jeong et al., 2007; Lau et al., 2015; Lind et al., 2009; Pendergast et al., 2013). A variety of nanomaterials have been used to manufacture more permeable and fouling-resistant TFN RO membranes, e.g. titanium dioxide (Kwak et al., 2001), silver nanoparticles (Ben-Sasson et al., 2014) and carbon nanotubes (Vatanpour et al., 2017). These and other nanomaterials used in TFN membranes to enhance the overall performance are discussed in detail elsewhere (Lau et al., 2015; Lee et al., 2011).
In the last decade there has been a growing interest in biomimetic materials for water purification, particularly in aquaporin-embedded membranes. Aquaporins are a family of integral membrane proteins found in all three kingdoms of life at cellular level. These proteins form a pore structure that allows transport of water molecules driven by an osmotic gradient across biological membranes, while rejecting ionic solutes (Agre, 2004; Agre et al.,

93
1993). Kumar et al. showed that recombinant aquaporin AqpZ from a strain of E. coli remained active when incorporated in lipid vesicles and displayed permeability higher by more than one order of magnitude compared to TFC RO membranes, highlighting the potential benefits of developing biomimetic membranes for water treatment (Kumar et al., 2007). After less than a decade, mixed-matrix composite membranes with an organic-bioorganic active layer have been successfully manufactured and marketed. Several studies claimed that aquaporin-embedded RO membranes could outperform TFCs in terms of water permeability and selectivity while providing comparable salt rejection in bench-scale filtration tests (Li et al., 2015; Qi et al., 2016; Shen et al., 2014; Tang et al., 2013; Zhao et al., 2012).
To verify whether novel mixed-matrix membrane chemistry can outperform TFC chemistry regarding the removal of organic solutes, we investigated a set of 30 persistent polar MPs in RO filtration with nanocomposite and biomimetic membranes. A TFN membrane was tested with a pilot-scale RO system, where filtration was applied to a raw riverbank filtrate. Its performance was compared to that of a benchmark TFC membrane. To the best of our knowledge this is the first study in which a commercially available TFN was used in stand-alone RO applied to a natural water in pilot-scale drinking water treatment. Additionally, we characterised water permeability, salt rejection and organic solute passage through an aquaporin-based biomimetic membrane in a bench-scale RO filtration. The aquaporin RO membrane performance was compared to that of a benchmark TFC. No previous studies have attempted quantifying the passage of an extended set of polar MPs through biomimetic RO membranes. The filtration experiments with aquaporin RO membrane included two novel pollutants, i.e. trifluoromethanesulfonic acid (TFMSA) and 2-(Heptafluoropropoxy)-2,3,3,3-tetrafluoropropionic acid (HFPO-DA). These chemicals are emerging contaminants with high societal relevance. TFMSA, a super acid used in industrial applications, was only recently reported as ubiquitous water cycle contaminant (Zahn et al., 2016). HFPO-DA, a chemical introduced to replace perfluorooctanoic acid after it was found to be persistent, bioaccumulative and toxic (Kudo and Kawashima, 2003), was recently confirmed to occur in surface water impacted by wastewater from fluorinated chemical manufacturing and in drinking water produced from it (Gebbink et al., 2017; Versteegh and de Voogt, 2017). Besides being novel in terms of recent discovery in the aquatic environment, both TFMSA and HFPO-DA have not yet been investigated in RO filtration.

94
4.2. MATERIALS AND METHODS
4.2.1. Standards and chemicals
All chemicals used for this work were of analytical grade. More details are provided in the Appendix C (C-1). The model polar MPs tested in this study were chosen from scientific literature data using the following selection criteria: amenability for liquid chromatography-mass spectrometry analysis, detection in natural source waters, in finished drinking water and RO permeates. The target MPs selection is described is section 3.2.2 and elsewhere (Albergamo et al., 2019). The list of the polar MPs is shown in
Table 4.1.

95
Table 4.1. List of model polar MPs and their physicochemical properties
Compound Molecular
weight (Da) a pKa (pKb) a logD (pH7) Charge Chemical classification
1H-benzotriazole 119.05 8.6 1.3 Neutral Industrial chemical 2,6-dichlorobenzamide 188.97 12.1 2 Neutral Biodegradation product 6-hydroxyquinoline 145.06 10.6 1.8 Neutral Biodegradation product Atrazine 215.09 15.8 2.2 Neutral Herbicide Barbital 184.19 7.5 0.6 Neutral Pharmaceutical Bisphenol A 228.29 9.8 4 Neutral Personal care product Caffeine 194.19 (-1.2) -0.5 Neutral Stimulant Carbamazepine 236.27 16 2.8 Neutral Pharmaceutical Chloridazon 221.04 (-1.8) 1.1 Neutral Herbicide DEET 191.13 (-0.9) 2.5 Neutral Herbicide Diuron 233.09 13.2 2.5 Neutral Herbicide Diglyme 134.18 n/a -0.32 Neutral Industrial chemical Paracetamol 151.16 0.4 1.2 Neutral Pharmaceutical Phenazone 188.22 (-0.5) 0.9 Neutral Pharmaceutical Phenylurea 136.06 13.8 0.9 Neutral Industrial chemical Tolyltriazole 133.15 8.8 1.8 Neutral Industrial chemical Triethyl phosphate 182.15 n/a 1.2 Neutral Industrial chemical Acesulfame 162.39 3 -1.5 Negative Sweetener Bentazon 240.28 3.7 -0.2 Negative Herbicide Diclofenac 295.02 4 1.4 Negative Pharmaceutical HFPO-DA* 330.05 3.8 1.34 Negative Industrial chemical PFBA 213.99 1.2 -1.2 Negative Industrial chemical PFBS 299.95 -3.3 0.2 Negative Industrial chemical PFOA 413.97 -4.2 1.6 Negative Industrial chemical Sulfamethazine 278.08 7 0.4 Negative Pharmaceutical Sulfamethoxazole 253.05 6.2 0.1 Negative Pharmaceutical TFMSA* 150.08 -3.43 -1.35 Negative Industrial chemical

96
Table 4.1 (continued). List of model polar MPs and their physicochemical properties
Compound Molecular
weight (Da) a pKa (pKb) a logD (pH7) Charge Chemical classification
2-(methylamino)pyridine 108.07 (6.6) 0.7 Positive Industrial chemical Tetrabutylammonium 242.46 n/a 1.3 Positive Industrial chemical Tetrapropylammonium 186.35 n/a -0.4 Positive Industrial chemical
a pKa, pKb and log D calculated with Chemaxon (http://www.chemicalize.com); * Tested only with 1.8-inch modules (aquaporin-embedded and TFC RO membranes).

97
4.2.1.1. 4-inch modules
For the pilot-scale filtration experiments, the low-pressure RO (LPRO) membrane ESPA2-LD-4040 (Hydranautics) was chosen. The ESPA2 is a TFC with an active layer of cross-linked aromatic polyamide, typically used for filtration of brackish water. This TFC membrane served as benchmark to assess the performance of a TFN membrane, i.e. the mixed-matrix QuantumFlux Qfx-BW75ES brackish water RO membrane (LG NanoH2O).
4.2.1.2. 1.8-inch modules
For the bench-scale filtration experiments, 1.8-inch modules were used. We tested the AQPRTW-1812/150, a biomimetic RO membrane with a PA active layer embedded with aquaporin water channels (Aquaporin A/S), and a TW30-1812-100 (DOW Filmtech), the latter serving as a benchmark membrane for under-the-tap RO applications.
4.2.2. RO filtration systems
4.2.2.1. Hypoxic RO pilot (4-inch)
A pilot-scale RO system capable of keeping hypoxic conditions during filtration was used to investigate the removal of polar MPs from a raw riverbank filtrate by 4-inch TFN and TFC membranes. The membranes were tested in a separate run by applying the same filtration protocol. These experiments were conducted within the premises of a drinking water treatment plant in order to use an actual raw source water as RO feed water, i.e. anaerobic riverbank filtrate. This RO system was recently introduced by our research group and is described in Chapter 3 and in the literature (Albergamo et al., 2019). Briefly, the RO pilot consisted of an airtight stainless steel feed water reservoir (720 L) connected to a nitrogen supply, an immersed stainless steel coil fed with cooling liquid from a Hyfra Chilly 35 AC (by Krunkel), a high-pressure pump with frequency-controlled high-speed motor (DPVSV 2/26 B by DP-Pumps) and one 4-inch membrane pressure vessel. The permeate and concentrate lines were recirculated to the feed reservoir. A schematic diagram of the pilot is given in Figure 4.1. The feed reservoir was filled with approximately 700 L of freshly abstracted anaerobic riverbank filtrate while being flushed with nitrogen. Quality parameters of the feed water measured before dosing the polar MPs are given in Appendix C (Table C-2). A 2-L concentrated solution of polar MPs was prepared as described elsewhere (Albergamo et al. 2019) and dosed to the feed water with a SMART Digital pump (by Grundfos B.V.), resulting in MPs concentration between 10 and 20 µg/L. RO filtration was carried out at a fixed 15% recovery and permeate flux was set to 25 L m-2 h-1. The feed temperature was 14±0.2 °C and the pH was 7.0±0.2. Filtration was

98
conducted for 4d before taking feed and permeate samples at t=96h to ensure equilibration of solute-membrane affinity interactions and avoid overestimating the passage of moderately hydrophobic MPs (Kimura et al., 2003a; Verliefde et al., 2007b). The feed reservoir was supplied with nitrogen during sampling to minimise intrusion of atmospheric oxygen into the system, which would result in precipitation of the dissolved iron naturally occurring in the anaerobic bank filtrate and subsequent fouling of the RO membrane. Feed water and permeate samples (V = 200 mL; n = 3) were collected in 250 mL polypropylene bottles and frozen immediately on site.
Figure 4.1. Schematic diagram of the hypoxic RO pilot displaying the essential features of the system.
4.2.2.2. Bench-scale RO (1.8-inch)
The bench-scale RO system consisted of a 500-L feed reservoir equipped with a chiller (FC1200, Julabo GmbH, Germany), a frequency controlled pump (DPVE2-30 by dp pumps Holland) and a concentrate valve to regulate the feed flow and pressure. Three parallel lines allowed simultaneous filtration with different RO membranes and recirculation of permeate and concentrate lines to the feed reservoir. The feed flow of each line was monitored by built-in rotamers. The feed pressure was monitored with a precision pressure gauge (WIKA 342.11.250 by Wika). The permeate flow was determined by weighing RO permeate collected in a glass cylinder over an exact time window of 30 sec. To investigate the removal of polar MPs by 1.8-inch aquaporin and TFC membranes the feed reservoir was filled with 400-L tap water previously filtered with Melt Blown 1 µm filters (by van

99
Borselen). A 20 mg/L polar MPs stock solution was dosed to the feed water to obtain the total MPs concentration of approximately 40 µg/L. Filtration was carried out by applying a feed pressure of 3 bar to obtain a permeate flux of 20 L m-2 h-1 at 5% recovery for both aquaporin and TFC RO membranes. The feed temperature was 17±0.2 °C and the pH was 6.2±0.1. Feed and permeate samples (V=50 mL; n=3) were collected into 50-mL polypropylene falcon tubes after 4 days and kept in the dark at 2 °C prior to analysis. A schematic diagram of the bench-scale RO system is shown in Figure 4.2.
Figure 4.2. Schematic diagram of the test bench RO displaying the essential features of the system.
4.2.2.3. Characterisation of 1.8-inch RO membranes
The water permeability of the 1.8-inch aquaporin and TFC RO membranes was determined for deionised water (DI), DI with 1 g L-1 NaCl and tap water. The membranes were fitted in parallel pressure vessels and rinsed with demineralised water in one-pass operation for 20 min. The system was reverted to recirculation mode to carry out pure water permeability and salt passage tests. For pure water permeability, a feed pressure of 4 bar at a fixed feed flow of 160 L h-1 was applied. Measurements of feed and concentrate pressure as well as permeate flow were taken four times with 1h interval between each measurement. Further tests involved dosing 1 g L-1 of NaCl to the DI water and conducting RO filtration for 1h without changing operating conditions, i.e. with an applied feed pressure of 4 bar at a fixed feed flow of 160 L h-1. For these tests, water permeability, salt passage (expressed as EC passage), and solute permeability were determined by

100
single measurements. Finally, DI was replaced with locally available low-DOC tap water as this was the feed type chosen to assess MPs passage. This tap water is produced from anaerobic groundwater, treated by aeration and rapid sand filtration and distributed without disinfectant residual. Filtration was carried out by applying a feed pressure of 3 bar at a feed flow of 160 L h-1 and the system was run for 94h. Water permeability was determined 1h after starting RO filtration and subsequently at t=48h, t=72h and t=96h. EC passage and solute permeability were instead quantified by single measurements at the beginning and at the end of the experiment, i.e. at t=1h and t=96h of RO filtration.
4.2.3. Chemical analysis
4.2.3.1. Inorganic analysis
Analysis of inorganics in the riverbank filtrate (feed water of hypoxic RO pilot) were performed by Vitens Laboratory (Utrecht, The Netherlands) via methods conforming to (inter)national standards. Feed water and RO permeate pH and electrical conductivity were analysed at KWR WaterCycle Research Institute (Nieuwegein, The Netherlands) with a Radiometer PHM210 and a Radiometer CDM83, respectively (both by Hach Lange BV).
4.2.3.2. Organic analysis
Aliquots of 1 mL feed water and RO permeate from samples taken as described in sections 2.3.1 and 2.3.2 for the pilot-scale and bench-scale RO, respectively, were spiked with a mixture of isotope-labelled internal standards to obtain a concentration of 2 µg/L. The aliquots were filtered with a 0.22 μm polypropylene filters (by Filter-Bio) and collected in 1.5 mL polypropylene vials. The samples were analysed by liquid chromatography high-resolution mass spectrometry (LC-HRMS) adopting a direct injection method validated for riverbank filtrate and surface water (Albergamo et al., 2018). The method relied on an ultrahigh-performance Nexera LC system (Shimadzu, Japan) equipped with a core-shell Kinetex biphenyl column with a particle size of 2.6 µm, inner diameter of 100 Å and dimensions of 100 x 2.1 mm column (by Phenomenex) for LC separation. The mobile phase eluents were DI 0.05% acetic acid (A) and methanol (B). A maXis 4G quadrupole time-of-flight HRMS (Bruker Daltonics) equipped with an electrospray ionisation source was operated in positive and negative mode to achieve MS detection. Unambiguous identification of the MPs was based on the mass accuracy of full-scan HRMS spectra and MS/MS spectra acquired in broadband collision induced dissociation mode (bbCID), retention time (tR), isotopic it. In the Appendix C, the screening parameters for the model target analytes are provided (Table C-3.1), whereas the recoveries and limits of detection and quantification for direct injection

101
analysis of riverbank filtrate and RO permeate are provided in Table C-3.2. It is noteworthy that while a validation study for the analysis of tap water (bench-scale RO feed water) was not performed, the robustness and applicability of direct injection analysis to other water matrices has been previously shown (Albergamo et al., 2018). Hence, even if uncharacterised matrix effects may occur in tap water, the measurements of the bench-scale RO feed water (n=4) are considered reliable to compare the TFC and aquaporin RO membranes, which were fed in parallel in the bench-scale system. A separate chromatographic method was needed for the analysis of TFMSA. LC separation of TFMSA was achieved on an Acclaim Mixed-Mode WAX-1 column with a particle size of 3 µm, inner diameter of 120 Å and dimensions of 3.0 x 50 mm (Thermo Fisher). The mobile phase eluents were DI (A) and methanol (B), both 5 mM ammonium acetate. A 10-min linear gradient at 90% B and a flow of 0.3 mL/min were used. The sample injection volume was 80 ml.
4.2.4. Assessment of solute passage
The following equation was used to express the passage of solutes by RO membranes:
P (%) = (CROP/CROF) × 100 (1)
where CROP and CROF are the concentrations in the permeate and the feed water, respectively.
The EC passage was calculated as:
EC P (%) = (ECROP/ECROF) × 100 (2)
where ECROP and ECROF are the electrical conductivity (in µS/cm) in the permeate and the in the bulk feed solution, respectively.
Based on the solution-diffusion model the water permeability (A) of RO membranes was calculated by rearranging the permeate flux equation (Wang et al., 2014; Wijmans and Baker, 1995):
JW = A (∆P - Δ) (3)
Where JW is the permeate flux (in L m-2 h-1), ∆P and Δindicate the pressure and osmotic pressure difference across the membrane, respectively.
Similarly, the solute permeability (B) was calculated as:
B = Jw (CROP / CROF - CROP) (4)

102
Finally, one-way analysis of variance (ANOVA) with 95% confidence interval was computed within the R statistical environment (version 3.4) (R Core Team, 2017). This analysis was performed with the purpose of assessing the statistical differences between the passage values quantified for the different membranes. Two ANOVA analyses were performed, one for pilot-scale and for one bench-scale RO filtration, respectively.
4.3. RESULTS AND DISCUSSION
4.3.1. Hypoxic pilot-scale RO performance (4-inch)
In a previous work conducted with the same RO system it was shown that the physicochemical properties of the compounds were significantly related to passage rate through TFC membranes. These properties were specifically size and charge, whereas hydrophobicity did not show statistical significance difference compared to hydrophilicity (Albergamo et al., 2019). Hence, based on these earlier findings and on other literature data, all neutral MPs are discussed together and separately from ionic MPs.
Samples to determine the passage of polar MPs were taken at the 5th day of filtration at a permeate flux of 25 L m-2 h-1 and 15% recovery. The stability of the hypoxic conditions of the feed water was assured by an online redox potential meter, which displayed negative values throughout the duration of the filtration experiments. At the moment of sampling, the TFN membrane displayed a water permeability of 1.22 L m-2 h-1 bar-1 and an EC passage of 1.2%, whereas the TFC showed a water permeability of 1.95 L m-2 h-1 bar-1 and an EC passage of 0.9%. At a fixed feed flow of ≈ 1 m3 h-1 the TFN required a feed pressure of 19.55 bar to match the operating conditions, while the TFC needed 13.35 bar. This was not in line with literature data, which suggested higher water permeability of TFNs compared to TFCs membranes (cf. Chapter 4.1). A lower permeability of the TFN membrane due to compaction was ruled out, as zeolite-embedded polyamide active layers are reportedly less prone to undergo such modifications (Pendergast et al., 2013). Hofs et al. showed that a 4-inch seawater QuantumFlux TFN outperformed a benchmark TFC membrane in water permeability by a factor of 2 in pilot-scale RO applied to tap water with 1 g L-1 NaCl at a permeate flux of 15 L m-2 h-1 and 7% recovery (Hofs et al., 2013). That study found that the TFN was less hydrophilic compared to the TFC based on contact angle measurements. The TFN’s lower permeability observed in our study might be supported by this finding. While Hofs et al. used filtered tap water, we used raw riverbank filtrate as RO feed water, which contained humic and fulvic acids in the low mg L-1 range. Therefore, it could be speculated that the higher affinity for humic and fulvic acids naturally occurring in the bank filtrate could have led to reduced water and solute permeability (Agenson and

103
Urase, 2007; Fujioka et al., 2013; Tang et al., 2007). However, flux decline data to support this statement are not available.
4.3.1.1. Removal of neutral MPs by hypoxic RO pilot (4-inch)
The removal of neutral MPs expressed as compound passage though the TFN and the benchmark TFC membranes is shown in Figure 4.3a. The passage of neutral polar MPs through 4-inch TFC and TFN membranes followed a similar pattern. The TFN, however, proved to be a more effective barrier against neutral polar MPs, for which passage values between 0.1% and 6.1% were quantified. These values ranged from 0.1% to 14.7% when filtration was carried out with the benchmark TFC. The TFN was more effective in rejecting neutral polar MPs with molecular weight below 150 Da and comparable to the TFC for larger neutral MPs. The only exception was the plasticiser bisphenol A, a neutral polar MPs having a log DpH7 of 4, thus exhibiting hydrophobic properties. Bisphenol A displayed 4.2±2.6% and 1.8±0.3% passage through the TFN and TFC RO membranes, respectively. Its incomplete removal by RO with low-pressure TFC membranes has been reported before in literature and it is thought to be caused by affinity interactions with the membrane active layer, ultimately enhancing the solution-diffusion mechanism (Kimura et al. 2004; Comerton et al. 2008). The higher passage of bisphenol A through the TFN could be supported by the higher hydrophobicity of the QuantumFlux nanocomposite as measured by Hofs et al. (Hofs et al. 2013). In order of size expressed as molecular weight, the smallest neutral polar MPs were 1H-benzotriazole (119.12 Da) < tolyltriazole (133. 15 Da) < 6-hydroxyquinoline (145.16 Da) < diglyme (134.17 Da) < phenylurea (136.15 Da) < 6-hydroxyquinoline (145.16 Da). As expected, the smallest neutral polar MP, 1H-benzotriazole, displayed the highest passage through TFC and TFN RO membranes with values of 14.7±1.7% and 6.1±1.1%, respectively. The second least-removed MP was tolyltriazole, which displayed passage values of 8.0±1.5% and 4.1±1.4% with the TFC and TFN RO membranes, respectively. The third least-removed MP was 6-hydroxyquinoline with passage values of 5.5±0.4% and 2.1±0.4% with the TFC and TFN RO membranes, respectively. Overall the passage-size pattern displayed by neutral polar MPs was in accordance with literature on removal of polar organic solutes by TFC (Fujioka et al., 2015a) and TFN RO membranes (Hofs et al., 2013). Hofs at al. investigated the removal of 8 neutral nitrosamines and 21 pharmaceuticals including neutral and ionic compounds by TFN and TFC membranes (Hofs et al. 2013). While both membranes achieved excellent rejections of pharmaceuticals (>99%), most nitrosamines were well rejected (>90%) according to their molecular weight. NDMA, the smallest nitrosamine with a molecular weight of 74.1 Da, was rejected for ≈ 62% and ≈ 74% by the TFN and the TFC RO membrane, respectively. This was partially in accordance with our results, as we also

104
observed a higher passage for the smallest neutral MPs, but in our case the TFN exhibited lower passage values. It is challenging to thoroughly compare our study to that of Hofs et al. as we used a raw natural water as RO feed, whereas they used filtered tap water, which is a much simpler matrix. Considering that similar removal patterns were exhibited by the 4-inch membrane modules tested with the RO-pilot, and that the TFN’s nanoparticle load is estimated to be below 6 wt% (Hofs et al., 2013), it could be assumed that separation of organic solutes by nanocomposite active layers followed the solution-diffusion mechanism through PA for both membranes.
4.3.1.2. Removal of ionic MPs by hypoxic RO pilot (4-inch)
The passage of anionic MPs through TFN and TFC RO membranes is shown in Figure 4.3b. Excellent removal of negatively charged organic solutes was observed for both membranes and passage values lower than 1% were quantified in all cases. It could be assumed that both membranes would exhibit a negative charge at feed water pH due to deprotonation of acidic functional groups on the polyamide (nano)composite (Bellona et al., 2004; Lau et al., 2015; Ozaki and Li, 2002). Literature data supported this assumption as no zeta-potential differences were observed between a QuantumFlux TFN and a benchmark TFC RO membranes (Hofs et al., 2013). Electrostatic repulsion with negatively charged RO membranes prevents anionic MPs from dissolving into the active layer (Nghiem et al., 2006; Verliefde et al., 2008), representing a strong factor enhancing chemical removal by RO.
Good removal of cationic MPs was provided by both membranes tested with the hypoxic RO pilot, with passage values lower than 5% in all cases. The TFN proved to be a more effective barrier for the smallest cationic MP, i.e. 2-(methylamino)pyridine (109.08 Da), for which 2.3% passage was quantified against 4.3% displayed by the TFC. In this case, the better performance of the TFN could be explained by the cation exchange capacity of zeolites embedded in nanocomposite films (Loiola et al., 2012). 2-(methylamino)pyridine was the smallest compound investigated in this study, nevertheless it displayed lower passage than the second-smallest 1H-benzotriazole (119.12 Da), which was uncharged instead. This indicated that additional solute-membrane interactions, likely electrostatic, prevent small cationic MPs to dissolve and diffuse through negatively charged (nano)composite resulting in a lower passage compared to neutral MPs of similar size. The organic ammonium cations were slightly better removed by the TFC, nevertheless in all cases passage values lower than 0.5% were quantified for tetrapropylammonium and tetrabutylammonium (0.4 % and 0.1% passage with both membranes). For these compounds, electrostatic

105
sorption, Donnan exclusion and size exclusion are expected to play a role in restraining chemical mobility through the RO membranes.
Figure 4.3. Passage of neutral polar MPs (a), anionic MPs (b) and cationic MPs (c) through TFN and TFC as a function of compound molecular weight. Error bars are shown when larger than the data point symbol and indicate the standard deviation of the measurements for n=3 samples. Conditions: average permeate flux 25 L m-2 h-1, recovery 15%, feed pH 7.0±0.2, feed conductivity 973±7 µS/cm, feed temperature 14±0.2 °C.
4.3.1.3. Statistical validation of pilot-scale RO results (4-inch)
The passage data of the model MPs quantified in pilot-scale RO filtration were combined, log-transformed and visualised as box-and-whisker plots. These results are shown in Figure 4.4. It can be seen that when pilot-scale RO filtration was carried with the ESPA2, which was the reference TFC, the

106
log-passage displayed by the polar MPs exhibited a slightly larger range compared to that of the TFN. Nevertheless, the median log-passage measured for the two membranes (black lines within each box) were quite comparable, suggesting that no major differences were observed between the TFC and the TFN membranes. The ANOVA assessment returned an F-value of 0.424 and a p-value of 0.518 with a 95% confidence interval. This confirmed that there were no significant differences between the TFN and the benchmark TFC RO membranes.
Figure 4.4. Box-and-whisker plot illustrating the log-passage ranges quantified for 28 polar MPs during filtration with thin-film composite (ESPA2) and thin-film nanocomposite (TFN) RO membranes.
4.3.2. Bench-scale RO (1.8-inch)
4.3.2.1. Aquaporin and TFC RO membranes performance
Water permeability and salt passage of the 1.8-inch aquaporin and benchmark TFC RO membranes were determined in the bench-scale RO system. The performance data are presented in Table 4.2. When deionised water was used as feed water, the aquaporin membrane was more permeable than the TFC by 33-35%. The higher permeability of the aquaporin membrane (Aaquaporin = 10.22±0.03 L m-2 h-1 bar-1) compared to that of the benchmark TFC membrane (ATFC = 7.63±0.12 L m-2 h-1 bar-1) might result from the water-selective protein channels embedded in the bioorganic composite, although a less dense membrane structure could not be ruled out. Upon checking the stability of the filtration performance over 4h, NaCl was added to the DI water to a concentration of 1g L-1. In these conditions,

107
water permeability of the aquaporin membrane decreased by 37%, whereas the TFC membrane displayed a decrease of 26%. In biological systems, comparable levels of salinity result in the closure of the aquaporin protein water channels (Henzler et al., 2004), which could potentially explain the reduction in water permeability of the aquaporin membrane. The TFC displayed salt passage and solute permeability (B) higher than those of the aquaporin membrane by nearly a factor of 2 while exhibiting half of the trade-off value (A/B). This indicated the higher permeability of the aquaporin RO membrane to water molecules and lower selectivity for monovalent ions in high salinity conditions. No substantial differences in the evaluated performance parameters were observed between the aquaporin and TFC membranes over 96h of RO filtration when tap water was used as feed water. In addition, the two membranes displayed a comparable flux decline over time, as shown in Figure 4.5.
Table 4.2. Performance of aquaporin-embedded and benchmark TFC RO membranes (1.8-inch).
Water permeability
(A)
Salt passage
Solute permeability (B)
Trade-off
(A/B)
L m-2 h-1 bar-1 % L m-2 h-1 bar-1
Aquaporin a DI 10.22±0.03 N/A N/A N/A
b DI + NaCl 1g/L
6.34 7.01 1.89 3.35
Tap water c 5.43±1.37 d 2.4±0.4 d 0.39±0.19 13.92
TFC a DI a 7.63±0.12 N/A N/A N/A
b DI + NaCl 1g/L
b 5.39 15.52 3.96 1.36
Tap water c 5.10±0.94 d 2.4±1.1 d 0.39±0.23 13.07 a n=4 (one measurement per hour, value after the ± sign indicates standard deviation of the measurements), feed pressure = 4 bar; b n =1, feed pressure = 4 bar; c n=4 (measured at t=1h, t= 48h, t=72h and t=96h. Value after the ± sign indicates standard deviation of the measurements) and feed pressure = 3 bar; d n=2 (average of measurements taken at t=1h and t = 96h, value after the ± sign indicates the range of the duplicates); N/A = not available.

108
Figure 4.5. Flux decline expressed as permeate flux over time (h) of the aquaporin and TFC RO membranes in bench-scale filtration.
4.3.2.2. Removal of neutral MPs in bench-scale RO (1.8-inch)
The passage of neutral MPs through aquaporin and benchmark TFC RO membranes is shown in Figure 4.6a. The order in which the neutral MPs were removed by the 1.8-inch membranes was similar to that observed in pilot-scale RO filtration, although the passage of uncharged polar MPs smaller than 150 Da was higher in bench-scale. For example, while 1H-benzotriazole displayed 14.7±1.7% with the 4-inch TFC membrane, values of 44±4% and 65±10% were quantified for the 1.8-inch TFC and the aquaporin RO membranes, respectively. As feed water pH and temperature did not differ substantially between bench-scale (pH 6.2±0.1, T=17 °C) and pilot-scale (pH 7.0±0.2, T=14±0.2 °C), the higher passage of neutral MPs and the higher water permeability of the 1.8-inch might result from a more open structure compared to the 4-inch RO membranes. In bench-scale filtration, neutral MPs smaller than 150 Da exhibited higher passage through the aquaporin membrane compared to the TFC membrane. The passage of the five smallest neutral MPs, i.e. 1H-benzotriazole (119,12 Da), tolyltriazole (133.15 Da), diglyme (134.18 Da), phenylurea (136.15 Da) and 6-hydroxyquinoline (145.16 Da) ranged according to size from 44±4% to 19±1% with the TFC membrane, whereas the range for the aquaporin membrane was 65±10% to 30±5%. No differences were observed for larger compounds. Despite evidence of diffusion of small neutral organics and even small peptides through aquaporin water channels exists (Henzler et al., 2004; Kocsis et al., 2018; Uehlein et al., 2007), MPs passage is believed to mostly occur through the PA active layer. This was recently confirmed for aquaporin-embedded PA forward osmosis membranes (Xie et al., 2018). Unfortunately,

109
further RO studies to compare the results of the aquaporin membrane were not found in the literature.
4.3.2.3. Removal of ionic MPs in bench-scale RO (1.8-inch)
The passage of ionic MPs through the biomimetic aquaporin and a benchmark TFC is shown in Figure 4.6b (anionic) and Figure 4.6c (cationic). Variations due to different concentration polarisation conditions were not expected as membrane modules of the same size were used (Verliefde et al., 2008) and the operating conditions were similar during the experiments.
Anionic MPs were extremely well removed and exhibited passage values lower than 1% in all cases with both membranes, except PFBS, which displayed 4% passage with both aquaporin and TFC membranes. In all cases the quantification limits were used as permeate concentrations, leading to overlapping data points in Figure 4.6b. In the present study the passage of TFMSA in RO filtration was quantified for the first time. The dedicated method required to analyse TFMSA was not validated due to time constraints. Nevertheless, its output was considered reliable on the basis of linearity of the calibration series used for quantification (R2=0.9986) and on the standard error of the measured samples (<13%). TFMSA displayed passage of 0.4% with both membranes, indicating that under-the-tap RO modules (1.8-inch) perform as well as the 4-inch membranes in retaining small anionic MPs.
As for cationic MPs (Fig. 4.6c), the ammonium cations displayed less than 1.5% passage through both aquaporin and TFC RO membranes. Surprisingly, the smallest cation 2-(methylamino)pyridine displayed passage comparable to that of 1H-benzotriazole with both aquaporin and TFC RO membranes. This data did not reflect what was observed in the hypoxic RO pilot, where negatively charged DOC naturally occurring in the bank filtrate (pilot-scale RO feed water) might have possibly decreased the passage of small cations further. A lesser charge of the 1.8-inch modules compared to the 4-inch modules could also explain this phenomenon, however supporting zeta-potential measurements of the modules used in this study were not available nor found in literature.

110
Figure 4.6. Passage of neutral polar MPs (a), anionic MPs (b) and cationic MPs (c) through 1.8-inch aquaporin and TFC RO membranes as a function of compound molecular weight. Error bars are shown when larger than the data point symbol and indicate the standard deviation of the measurements for n=3 samples. Conditions: average permeate flux 20 L m-2 h-1, recovery 6%, feed pH 6.2 ±0.1, feed conductivity 237 µS/cm, feed temperature 17 °C.

111
4.3.2.4. Statistical validation of bench-scale RO results (1.8-inch)
The passage values quantified for the model MPs in bench-scale RO filtration were treated as done for the pilot-scale dataset, i.e. the data were combined, log-transformed and visualised as box-and-whisker plots. The results are shown in Figure 4.7. The log-passage ranges and median log-passage determined for the polar MPs were highly comparable for the two membranes. The ANOVA to validate this observation returned an F-value of 0.153 and a p-value of 0.697 with a 95% confidence interval. This indicated that there was no significant difference between the aquaporin and benchmark TFC RO membranes.
Figure 4.7. Box-and-whisker plot illustrating the log-passage ranges quantified for 28 polar MPs during filtration with thin-film composite (TFN) and biomimetic (Aquaporin) RO membranes.
4.4. CONCLUSIONS
In pilot-scale RO filtration applied to a natural water, the overall differences in MPs passage between a 4-inch TFN and a TFC were not significant. Nevertheless, these following conclusions were made:
The TFN was a more effective barrier against neutral polar MPs smaller than 150 Da and comparable for larger molecules. The passage differences between the two membranes became narrower with increasing MPs molecular weight. This indicated that neutral polar MPs are mostly removed according to their size and that the zeolite

112
nanoparticles embedded in the nanocomposite active layer might act as additional sieves.
Anionic MPs were extremely well removed by both TFC and TFN membranes, indicating that electrostatic repulsion prevented diffusion of these chemicals in polyamide-based RO membranes regardless of the presence of embedded additives. Cationic MPs were also well removed by both membranes, although the TFN displayed lower passage of the smallest cation. For the three cationic MPs, passage was lower than that of neutral MPs of comparable size, indicating a substantial contribution of electrostatic interaction in preventing diffusion of small cations to the permeate side.
In bench-scale RO filtration applied to tap water, the overall differences in MPs passage between a 1.8-inch aquaporin-embedded RO membrane and a TFC were not significant. Nevertheless, these following conclusions were made:
The aquaporin-embedded RO membrane for under-the-tap applications was more water-permeable and exhibited a lower EC passage than the benchmark TFC when deionise water was used as feed water, suggesting both higher affinity for water molecules and less affinity for salts. When tap water was used as feed water, higher water permeability resulted in higher organic solute passage as shown by the permeability-selectivity trade-off, highlighting the different behaviour of salts from that of organics.
Anionic MPs were extremely well removed by the 1.8-inch modules, proving the robustness of RO for anionic organics. On the other hand, small cationic MPs were more problematic with the 1.8-inch modules regardless of membrane chemistry.
Our study indicated that while different active layer chemistry can result in different passage values of organic solutes, commercially available nanocomposite and biomimetic RO membranes cannot yet significantly outperform benchmark TFCs. More research on membrane materials is needed to improve the performance of RO against polar MPs and overcome the limitations posed by the permeability-selectivity relationship trade-off.

113
ACKNOWLEDGMENTS
This study was conducted with the ECROS project and was funded by the drinking water company Oasen (Gouda, The Netherlands). Aquaporin A/S (Kongens Lyngby, Denmark) is greatly acknowledged for donating the 1.8-inch biomimetic RO membrane module. Harmen van der Laan, Evgeni Alaminov, Behailu Wolde, Eva Kocbek and Chris Bierman, are acknowledge for assistance with the RO pilot filtration experiments at Oasen. Willem-Jan Knibbe at Wageningen University (The Netherlands) is acknowledged for helpful discussions about the results obtained in this study. Daniel Zahn and Thomas Knepper from the University of Applied Science Fresenius (Idstein, Germany) are acknowledged for donating the TFMSA analytical standard. Rick Helmus is acknowledged for support with setting up the analytical method for TFMSA. Danny Harmsen is acknowledged for assisting with setting up the bench-scale RO system at KWR and for performing the pH measurements.

114
APPENDIX C. Supplementary information to Chapter 4
C-1. STANDARDS AND CHEMICALS
Analytical grade unlabelled standards (purity >95%) of 1H-benzotriazole, 2-(methylamino)pyridine, 2,3,3,3-Tetrafluoro-2-(1,1,2,2,3,3,3-heptafluoropropoxy)propanoic acid (HFPO-DA), 2,6-dichlorobenzamide (BAM), 4-methyl-1H-benzotriazole (tolyltriazole), 6-hydroxyquinoline, acesulfame, atrazine, barbital, bentazon, bisphenol A, caffeine, carbamazepine, chloridazon, N,N-Diethyl-meta-toluamide (DEET), diclofenac, diuron, diglyme, ibuprofen, paracetamol, perfluorobutyric acid (PFBA), perfluorooctanoic acid (PFOA), perfluorobutanesulfonic acid (PFBS), phenazone, phenyl urea, sulfamethazine, sulfamethoxazole, tetrabutylammonium, tetrapropylammonium and triethyl phosphate were purchased from Sigma-Aldrich (Zwijndrecht, The Netherlands).Trifluoromethanesulfonic acid (TFMSA) from Sigma-Aldrich (Schnelldorf, Germany) was donated by the Institute for Analytical Research (IFAR), University of Applied Science Fresenius (Idstein, Germany). The isotope-labelled standards, 1H-benzotriazole-d4, atrazine-d5, bisphenol A-d16, caffeine-13C3, carbamazepine-13C6, diclofenac-13C6, diuron-d6, ibuprofen-d3, paracetamol-d4, and sulfamethoxazole-13C6 were purchased from Sigma-Aldrich (Zwijndrecht, The Netherlands), whereas DEET-d6, sulfamethazine-13C6, triclosan-13C6, and triethyl phosphate-d15 were purchased from Cambridge Isotope Laboratories Inc. (Andover, MA, USA). In-house deionised water was purified with an ELGA water purification system (Veolia Water Technologies Netherlands B.V., Ede, the Netherlands). Analytical grade (LC-MS) methanol (MeOH) was purchased from Biosolve (Valkenswaard, The Netherlands), acetic acid were purchased by Merck (Damstadt, Germany).

115
Table C-2. Quality parameters of the riverbank filtrate dosed in the feed reservoir of the pilot-scale RO system (measured prior to dosing organic micropollutants)
Parameter Unit Value
pH -log[H+] 7.1
Temperature °C 14.2
EC at 20 °C µS/cm 935
Redox potential mV -63
Sodium mg/l 98.9
Potassium mg/l 5.1
Calcium mg/l 100
Magnesium mg/l 16.7
Iron mg/l 0.044
Manganese mg/l 0.386
Hydrogen carbonate mg/l 322
Hardness mmol/l 3.18
Chloride mg/l 120
Ammonium mg/l 1.97
Phosphate mg/l <0,03
Sulphate mg/l 100

116
C-3. UHPLC-ESI-q-ToF/HRMS screening parameters and performance
Table C-3.1. Target MPs monitored ions, chromatographic retention times, assigned internal standards, qualifier ion ratios
Compound Formula Quantifier
m/z (Q) tR
(min) ESI
mode Internal standard Qualifier m/z (q) q/Q
1H-benzotriazole C6H5N3 120.0556 4.3 + 1H-benzotriazole-D4 92.049 0.1
2-(methylamino)pyridine C6H8N2 109.0760 3.1 + n/a 78.0332 0.15
5-methyl-1H-benzotriazole C7H7N3 134.0713 4.8 + 1H-benzotriazole-D4 92.049 0.15
6-hydroxyquinoline C9H7NO 146.0600 4.0 + Quinoline-D7 118.0651 0.2
Acesulfame C4H4HNO4S 161.9867 2.9 - n/a 82.0294 0.2
Antipyrine C11H12N2O 189.1022 5.1 + Atrazine-D5 174.0788 0.05
Atrazine C8H14ClN5 216.1011 5.5 + Atrazine-D5 174.0543 0.5
BAM C7H5Cl2NO 189.9821 4.5 + Caffeine-13C3 174.9527 0.6
Barbital C8H12N2O3 183.0775 4.3 - n/a 140.071 0.05
Bentazon C10H12N2O3S 239.0496 5.1 - n/a 132.0324 0.15
Bisphenol A C15H16O2 227.1078 5.5 - Bisphenol A-d16 287.1289 0.1
Caffeine C8H10N4O2 195.0877 4.8 + Caffeine-13C3 138.0664 0.5
Carbamazepine C15H12N2O 237.1022 5.7 + Carbamazepine-13C6 192.0812 0.2
Chloridazon C10H8ClN3O 222.0429 4.9 + Diuron-d6 104.0494 0.15
DEET C12H17NO 192.1383 5.8 + DEET-D6 91.0538 0.1
Diclofenac C14H11Cl2NO2 294.0094 6.2 - Diclofenac-13C6 250.0188 0.7
Diglyme C6H14O3 135.1016 4.1 + n/a 152.1281 0.5
Diuron C9H10Cl2N2O 233.0243 5.5 + Diuron-d6 218.0981 0.4
HFPO-DA C6HF11O3 328.9677 4.7 - n/a 284.9782 0.35
Ibuprofen C13H18O2 205.1234 6.0 - Ibuprofen-D3 161.133 0.15
Paracetamol C8H9NO2 152.0706 3.3 + Paracetamol-D4 110.0601 0.3
PFBA C4HF7O2 212.9792 3.1 - n/a 168.9889 0.1
PFOA C8HF15O2 412.9664 5.3 - n/a 368.9749 0.5
PFBS C4HF9O3S 298.9430 4.4 - n/a 79.9569 0.04
Phenyl urea C7H8N2O 137.0709 4.0 + Paracetamol-D4 94.0648 0.08
Sulfamethazine C12H14N4O2S 279.091 4.9 + Sulfamethazine-13C6 156.0116 0.25

117
Table C-3.1 (continued). Target MPs monitored ions, chromatographic retention times, assigned internal standards, qualifier ion ratios
Compound Formula Quantifier
m/z (Q) tR
(min) ESI
mode Internal standard Qualifier m/z (q) q/Q
Sulfamethoxazole C10H11N3O3S 254.0594 4.7 + Sulphamethoxazole-13C6 156.0116 0.35
Triethyl phosphate C6H15O4P 183.0781 5.1 + TEP-D15 98.9838 0.9
Tetrabutylammonium C16H36N 242.2842 5.4 + Quinoline-D7 142.1593 0.25
Tetrapropylammonium C12H28N 186.2216 4.4 + Quinoline-D7 114.1279 0.4
TFMSA a CF3SO3H 148.9519 7.3 - n/a 79.9569 n/a a Required dedicated chromatographic method with mixed-mode weak anion exchange stationary phase. Details in section 4.3.2.1.

118
Table C-3.2. Direct injection method recoveries, limits of detection and quantification in riverbank filtrate and RO permeate.
Riverbank filtrate RO permeate a Compound Recovery LOQ LOD Recovery LOQ LOD
(%±SD) ng/L ng/L %±SD ng/L ng/L
1H-benzotriazole 93±16 63 19 113±9 63 19
2-(methylamino)pyridine 83±13 26 8 112±18 35 11
BAM 110±7 125 38 102±13 64 19
6-hydroxyquinoline 78±15 63 19 85±7 31 9
Acesulfame 128±39 117 35 102±19 63 19
Atrazine 95±7 31 9 96±10 31 9
Barbital 66±8 276 83 104±8 60 18
Bentazon 102±18 269 76 94±3 30 9
Bisphenol A 96±13 250 76 108±12 125 38
Caffeine 96±14 63 19 104±11 63 19
Carbamazepine 108±29 63 19 107±17 63 19
Chloridazon 91±16 31 9 106±13 31 9
DEET 97±12 31 9 103±16 31 9
Diclofenac 109±24 63 19 97±10 31 9
Diglyme 86±3 15 53 108±11 68 20
Diuron 99±6 31 9 96±10 31 9
HFPO-DA 89±15 59 19 92±16 39 9
Paracetamol 93±12 63 19 105±13 63 19
PFBA 79±47 133 9 113±18 125 38
PFBS 109±33 b 125 b 38 b 110±19 114 34
PFOA 106±17 56 19 96±13 33 10
Phenazone 106±15 63 19 102±10 31 9
Phenylurea 81±31 63 19 100±13 63 19
Sulfamethazine 91±25 31 9 94±15 31 9
Sulfamethoxazole 90±6 31 9 90±13 31 9
Tetrabutylammonium 95±10 31 9 96±9 31 9
Tetrapropylammonium 103±12 31 9 81±7 31 9
Tolyltriazole 92±8 31 9 102±13 63 19
Triethyl phosphate 93±13 31 9 104±14 31 9
TFMSA c N/A N/A N/A N/A 63 c 19 c
LOQ: Limit of quantification; LOD: Limit of detection; a Calculated by testing 4 replicates in one day (except for TFMSA, see footnote “c”); b Calculated by testing 3 replicates in one day; c Value derived from a calibration series prepared following the procedure described in Chapter 2.2.5 and complying with the criteria set therein.

119
Chapter 5. Non-target screening of a riverbank filtration site
Published work
V. Albergamo, J. E. Schollée, E. L. Schymanski, R. Helmus, H. Timmer, J. Hollender, P. de Voogt (2019) Non-target screening reveals time trends of polar micropollutants in a riverbank filtration system, Environmental Science & Technology, 53, 13, 7584–7594. DOI: 10.1021/acs.est.9b01750

120
Abstract The historic emissions of polar micropollutants in a natural drinking water source were investigated by non-target screening with high-resolution mass spectrometry and open cheminformatics tools. The study area consisted of a riverbank filtration transect fed by the river Lek, a branch of the lower Rhine, and exhibiting up to 60-year travel time. More than 18,000 profiles were detected. Hierarchical clustering revealed that 43% of the 15 most populated clusters were characterised by intensity trends with maxima in the 1990s, reflecting intensified human activities, wastewater treatment plant upgrades and regulation in the Rhine riparian countries. Tentative structure annotation was performed using automated in silico fragmentation. Candidate structures retrieved from ChemSpider were scored based on the fit of the in silico fragments to the experimental tandem mass spectra, similarity to openly accessible accurate mass spectra, associated metadata and presence in a suspect list. 67 unique structures (72 over both ionisation modes) were tentatively identified, 25 of which were confirmed and included contaminants so far unknown to occur in bank filtrate or in natural waters at all, such as tetramethylsulfamide. This study demonstrates that many classes of hydrophilic organics enter riverbank filtration systems, persisting and migrating for decades if biogeochemical conditions are stable.

121
5.1 INTRODUCTION
Thousands of anthropogenic chemicals are released into the aquatic environment via wastewater treatment plant (WWTP) effluents, runoffs and accidental spills (Hermes et al., 2018; Loos et al., 2010, 2009; Luo et al., 2014; Schwarzenbach et al., 2006). Transformation products (TPs) formed during water treatment and under environmental conditions increase the complexity of the chemical mixtures that occur in the environment (Bertelkamp et al., 2014; Hollender et al., 2014; Krauss and Hollender, 2008). Freshwater systems are particularly vulnerable to contamination by polar organic micropollutants (MPs) exhibiting low or negative pH-adjusted log distribution coefficients (log D) as they preferentially partition into the water phase. When persistent, polar MPs can migrate indefinitely throughout the water cycle and reach drinking water sources (Eschauzier et al., 2010; Loos et al., 2009; Reemtsma et al., 2016).
In Europe, riverbank filtration (RBF) is a common drinking water pre-treatment with potential to remove dissolved MPs mainly by sorption and biodegradation as surface water infiltrates through the hyporheic zone (Ascott et al., 2016; Benotti et al., 2012; Henzler et al., 2014; Hiscock and Grischek, 2002; Hollender et al., 2018; Hoppe-Jones et al., 2010; Huntscha et al., 2013; Tufenkji et al., 2002; Verstraeten et al., 2003). Sorption to organic matter can delay the transport of neutral and moderately hydrophobic MPs (logD>3) in RBF systems (Bertelkamp et al., 2014). Ion-exchange capacity of soils can result in the retention of cationic MPs, but it is not effective on anionic MPs. Biodegradation is favoured by a redox potential gradient and long travel time, as they result in greater biodiversity of microbial communities and longer time for adaptation (Bertelkamp et al., 2016, 2014; Ghattas et al., 2017; Henzler et al., 2014; Huntscha et al., 2013; Liu et al., 2016; Schaper et al., 2018).
Liquid chromatography coupled to high-resolution tandem mass spectrometry (LC-HRMS/MS) is the preferred system to analyse most polar MPs in aqueous matrices. The capability of recent mass analysers to achieve sensitive detection with high resolving power (>20,000) and high mass accuracy (<5 ppm) is pivotal to tentatively identify unknown ions via accurate mass spectra without the use of reference standards (Aceña et al., 2015; Hernández et al., 2012; Hollender et al., 2017; Krauss et al., 2010; Schymanski et al., 2014b). In environmental research, these approaches are known as suspect screening and non-target screening (NTS). Suspect screening and NTS are increasingly being applied to environmental samples and are gradually becoming harmonised (Aceña et al., 2015; Hernández et al., 2012; Hollender et al., 2017; Krauss et al., 2010; Schymanski et al.,

122
2014b). Suspect screening aims at identifying pollutants expected in a sample. Commonly, HRMS1 data (mass-to-charge ratios of ionised analytes) is searched for masses of substances of interest suspected to occur in the sample (e.g., for study-specific reasons), typically included in a suspect list. Then, accompanying isotopic (and adduct) peaks, HRMS2 spectra (fragment ions) and retention time (tR) are used to support the identification and confirmation of suspect hits (Hernández et al., 2012; Hollender et al., 2017; Krauss et al., 2010; Schymanski et al., 2014a). Initiatives to improve screening efforts include platforms to share suspect lists, e.g., the NORMAN Suspect List Exchange and the U.S. Environmental Protection Agency (EPA) CompTox Dashboard, and openly accessible accurate mass spectral libraries, e.g., MassBank and MassBank of North America (MoNA). In contrast to suspect screening, NTS aims at identifying compounds without looking for certain masses/substances of interest up front, but rather letting the measured data reveal the masses of interest. Since thousands of ions are acquired indiscriminately in HRMS1 full-scans, a prioritisation strategy is required to select masses of interest. Tentative structures are generally assigned based on candidate searching in chemical databases, e.g. PubChem and ChemSpider (Gindulyte et al., 2015; Pence and Williams, 2010), often using HRMS2 spectra (Hollender et al., 2017; Schymanski et al., 2014b). State-of-the-art NTS benefits from the increased availability of computational tools for prioritisation, e.g., statistical analysis methods (Chiaia-Hernandez et al., 2017; Peter et al., 2018; Schollée et al., 2018, 2015), and cheminformatics tools for high-throughput structure annotation, e.g., in silico fragmenters querying openly accessible chemical databases and accurate mass spectral libraries (Ruttkies et al., 2016). An overview on state-of-the-art cheminformatics tools for structure annotation can be found in the literature (Blaženović et al., 2018; Schymanski et al., 2017, 2015).
In this study, we investigated a natural drinking water source consisting of a riverbank filtrate originated from the Lek, a branch of the river Rhine in The Netherlands. Bank filtration at this site exhibits up to 60-year travel time from riverbank to the furthest of a series of wells built by a drinking water utility. This site can be regarded as a hydrogeological archive, where persistent anthropogenic chemicals from the “post-1950s acceleration” to the present are preserved (Steffen et al., 2015). Our goal was to detect major pollution trends across the bank filtration transect and characterise the identities of mobile MPs by applying state-of-the art NTS. To the best of our knowledge, no previous studies have attempted to investigate time series of non-target polar contaminants in a natural bank filtrate with such an extended travel time. Exposure to over half-century of anthropogenic emissions from intensified industrial and agricultural activities followed by mitigation measures such as wastewater treatment upgrades in the 1990s make this

123
RBF system a unique location to detect contamination time series and investigate persistent and mobile MPs in the aquatic environment using non-targeted analytical approaches. The occurrence of these chemicals is rationalised and their emission sources discussed. Compounds not previously known to occur in bank filtrate were identified, including chemicals that were not known to occur in the water cycle at all.
5.2. MATERIALS AND METHODS
5.2.1 Standards and Reagents
Detailed information on the analytical standards and reagents used for this study are included in the Appendix D (D-1).
5.2.2 Sampling site and sample collection
Anaerobic bank filtrate with residence times from 1 to 60 years was abstracted from a series of wells located in two adjacent production fields, named Schuwacht and Tiendweg, fed by the river Lek, a branch of the Rhine (Figure 5.1). The traveling time at each well was previously investigated by the drinking water utility Oasen (Gouda, The Netherlands) by means of isotopic age dating and hydrogeological modelling (Timmer, 2006). The well fields are located in the municipality of Krimpen aan de Lek, South Holland, The Netherlands, and provide raw water for approximately 7,000 m3 of drinking water per day. Further details on the RBF site including a map of the groundwater flow lines with modelled travel time are given in the Appendix D (D-2). Bank filtrate samples from nine wells of increasing travel time (n=3) were collected in 5L polypropylene bottles from sampling faucets built on each well and immediately transported to the University of Amsterdam (UvA), where they were kept in the dark at 2 °C and extracted next day.

124
Figure 5.1. Map of The Netherlands showing the location of the abstraction wells screened in the present study with well code and travel time in parenthesis.
5.2.3 Solid-phase extraction
The samples were allowed to reach room temperature, then 100 mL was transferred to 250 mL polypropylene bottles and spiked with 100 µL of a mix of 128 isotope-labelled internal standards (IS) available at Eawag at concentration of 1 ng/µl. This resulted in IS concentrations of 1 µg/L in the samples before enrichment by solid-phase extraction (SPE). An offline extraction protocol relying on hydrophilic-lipophilic balance (HLB) sorbent with Oasis cartridges by Waters (Etten-Leur, The Netherlands) was adapted from a procedure described elsewhere (Albergamo et al., 2018) for the enrichment of moderately hydrophobic and polar organics. The adjustments to the extraction protocol were the spike volume and concentrations of IS and the final concentration step, which in the present study resulted in an enrichment factor of 200 as the extracts were diluted 5-fold with deionised water prior LC-HRMS analysis.
5.2.4 LC-HRMS analysis
The samples were analysed at Eawag using LC-HRMS. A high-performance liquid chromatography system (HPLC) consisting of a PAL Autosampler

125
(CTC Analytics, Zwingen, Switzerland), an Accela 1250 mixing pump (Thermo Fisher Scientific, San Jose, United States) and a Waters Xbridge C18 column (2.1 × 100 mm, 3.5 μm) was used. The mobile phase consisted of water (A) and methanol (B), both acidified with 0.1% formic acid. The gradient program expressed as A:B was 90:10 at 0 min, 50:50 at 4 min, 5:95 from 17 to 25 min and 90:10 from 25.1 to 29 min. The flow rate was 200 μL/min and the column temperature was 30 °C. The sample injection volume was 20 µL. This LC method was adopted from a previous application to biologically-treated wastewater (Schollée et al., 2015), where its effectiveness for a wide range of polar and moderately polar MPs was shown. Highly polar MPs may not be sufficiently retained and would require dedicated (extraction and) chromatographic methods. HRMS detection was achieved with a Q-Exactive hybrid quadrupole-Orbitrap (Thermo Fisher) equipped with an electrospray ionisation source (ESI). HRMS1 spectra were acquired for masses ranging from m/z 100 to 1,000, with a resolving power of 140,000 at m/z 200 and a mass error below 5 ppm. HRMS2 spectra were recorded in data-dependent mode with a resolving power of 17,500 (more details in the Appendix D, section D-3.1). Separate analysis runs were conducted for positive and negative ionisation modes with a spray voltage of +4 kV and −4 kV, respectively, and a capillary temperature of 300 °C. Confirmation of the prioritised structures was conducted at the University of Amsterdam. Reference standard materials and sample extracts were analysed with an ultrahigh-performance liquid chromatography (UHPLC) system (Nexera, Shimadzu, Den Bosch, The Netherlands) coupled to a maXis 4G q-ToF/HRMS equipped with an ESI source (Bruker Daltonics, Wormer, The Netherlands). Further details on this system are provided in the Appendix D (D-3.2).
5.2.5 Non-target screening workflow
The NTS workflow consisted of three steps dealing with (i) HRMS1 data pre-processing, (ii) prioritisation and (iii) structure elucidation. Unless stated otherwise, the steps were automated and computed within R (version 3.3.2) (R Core Team, 2017). For data pre-processing, the analyses raw files were converted to centroided mzXML format with ProteoWizard (version 3.0) (Chambers et al., 2012) and imported into enviMass (version 3.4) (Loos, 2016). The enviMass settings used for this study are given in the Appendix D (D-4). Separate projects were created for positive and negative ESI data. Peak picking was performed to determine the non-target features, i.e., unique m/z and retention time (tR) pairs. The 128 isotope-labelled IS were used for mass recalibration, tR alignment and intensity normalisation, i.e. for each measurement the intensities of the picked peaks were normalized using the median deviation of all IS from their individual median profile intensity

126
(Loos, 2015). The features were profiled, i.e., unique IDs were assigned to m/z and tR pairs detected across different samples. Features detected in analysis blanks, procedural blanks and deionised water samples spiked with isotope-labelled IS (termed blind samples) were profiled and subtracted. Profiled features that were not detected in all three replicates or whose tR was <2 min and >24 min were filtered out. The tR filter ensured that highly polar (tR < 2 min) and low polar organics (tR > 24 min) were excluded from the data processing, as data of substances eluting either early or late are known to be of lesser quality with the existing chromatographic method, yielding confident assignment of (quasi-)isobaric substances challenging. For positive data, grouping of the most common single-charge ESI adducts, i.e. [M+H]+, [M+Na]+, [M+NH4]+ and [M+K]+, was additionally performed to define components (Loos, 2015). Other positive adducts, negative adducts and isotopic peaks that were not included here may increase the final number of profiled features.
The profiled features were prioritised by hierarchical cluster analysis (HCA) based on successful applications to lake sediments (Chiaia-Hernandez et al., 2017) and to ozonation in a WWTP (Schollée et al., 2018). Briefly, profile intensities were normalised to the maximum value detected in the whole dataset and dissimilarities expressed as Euclidean distance were calculated with the “stats” package (daisy function). The hierarchical classification of the profiled features was computed with the “cluster” package (hclust function). More details on the application of HCA to profile prioritisation can be found elsewhere (Chiaia-Hernandez et al., 2017; Schollée et al., 2018). The optimal number of clusters (k) was investigated by silhouette analysis computed with the “cluster” package (silhouette function). The average silhouette width, i.e., a dimensionless value indicating whether an object truly belongs to the cluster it was assigned to, was calculated at different k values (Ng and Han, 1994). Once the optimal number of clusters was defined, the 15 most populated clusters were considered for further prioritisation. In order to obtain good quality spectra for structure annotation, 50% of the most intense ions in these clusters were prioritised and their experimental HRMS1 and HRMS2 data extracted using the “RMassBank” package (Stravs et al., 2013).
Tentative structure elucidation was performed with MetFrag command line version 2.3 in batch mode (Ruttkies et al., 2016). Neutral monoisotopic masses of the prioritised features were used to retrieve structures within 5 ppm mass accuracy from ChemSpider (Pence and Williams, 2010). The maximum number of candidates per feature was set to 5,000. The maximum tree depth (MSn) was set to 2. The candidate structures retrieved by MetFrag are fragmented in silico in a combinatorial manner and the fragments matched to the experimental HRMS2 spectra. Additionally, spectral

127
similarities with records in the MoNA spectral library built into MetFrag were calculated using the MetFusion approach (Gerlich and Neumann, 2013). All suspect lists available on the NORMAN Suspect List Exchange as of November 2016 were merged into one large list of 11,922 unique InChIKey codes. The candidate structures were scored based on seven terms: FragScore (in silico fragmentation score); MetFusionOffline (MoNA spectral similarities using the MetFusion approach (Gerlich and Neumann, 2013); CSRefsScores (4 scoring terms: reference count on ChemSpider, reference count on PubMed, reference count on Royal Society of Chemistry and ChemSpider data sources); Suspects (hit in suspect list). The seven scoring terms were normalised by the highest value found among the proposed candidates and equal weighting of 1 was used to calculate the MetFrag Combined Score. An in-house script was used to check for agreement of formulas as calculated by MetFrag and GenFormR (Meringer, 2017). Tentatively annotated spectra and extracted ion chromatograms (EICs) of the non-target features were plotted with the packages “ReSOLUTION” (Schymanski, 2018) and “patRoon” (Helmus, 2018), respectively, for quality control. Finally, identification confidence levels were assigned to all the tentatively annotated features (Schymanski et al., 2014a).
5.3 RESULTS AND DISCUSSION
5.3.1 Data pre-processing, prioritisation and structure annotation
An overview on detection, mass deviation and intensity ranges of the labelled standards is given in the Appendix D (D-5). Pre-processing of HRMS1 spectra with enviMass resulted in 10,850 positive and 7,412 negative profiled features across the transect. The HCA results were visualised by plotting heat maps and dendrograms, shown in Figure 5.2. The HCA classified intensity profiles based on similarities between the detected trends. The results revealed that the data in both polarities were characterised by a series of dynamic trends (clustered at the top of the heat maps) with a high-intensity region between wells LT-P09 and LT-P11, thus in water that originated from the river Lek throughout the 1990s. Additionally, each well seemed to display a set of unique features, visible on the heat maps as high-intensity spots. In the positive data the spots displayed overall increasing dissimilarity with increasing RBF travel time (Figure 5.2a), whereas this behaviour was not observed in the negative data (Figure 5.2b). While it could not be excluded that some compounds would occur only in one well, these profiles might result from detection above peak-picking threshold value exclusively in one well or from lack of detection in all three replicates from adjacent wells.

128
Figure 5.2. Heat maps of the clustered profiles intensities across the riverbank filtration transect in positive (panel a) and negative (panel b) ESI data. Well codes are shown on the x-axes and represent the time line from 1 year (LS-P12) to 60-year (LT-P18) old water. Dendrograms are shown on the y-axes, where the prioritised clusters are marked in red. The colour scale used for profile intensities is illustrated in the legend (upper left).

129
The optimal number of clusters (k) was determined by silhouette analysis. The average silhouette width values for k= 80 were 0.690 and 0.687 for positive and negative data, respectively, indicating reasonable separation of the data (Ng and Han, 1994). The clusters were sorted by the number of profiled features and the 15 most populated clusters were inspected. Inspection of the prioritised trends is discussed in the following section (see “5.3.2 Interpretation of clustered trends”).
The prioritised clusters were populated with 7525 positive and 5123 negative profiled features, of which 3764 and 3845 were prioritised based on their intensity. The “RMassBank” package was used to extract experimental HRMS1 and HRMS2 information, resulting in 1348 and 983 positive and negative profiled features, respectively, with associated fragmentation data. It should be noted that a higher percentage fraction of negative features was prioritised from the 15 most populated clusters on the basis of their intensities, as only about 25% of these ions triggered an HRMS2 acquisition. An overview of the population of each prioritised cluster, the number of features prioritised from these clusters and how many ions triggered HRMS2 acquisitions is shown in the Appendix D (D-6). Candidate structures were assigned to 884 and 550 positive and negative features, respectively, using MetFrag, whereas 369 positive and 345 negative features were excluded from further identification efforts as the maximum number of candidate structures was exceeded (set to 5,000 to reduce runtime issues and eliminate cases with poor likelihood of success, based on experience). The MetFrag results were initially reduced by filtering out candidates with combined score lower than 4 (out of 7) and without any explained HRMS2 peaks. The minimum score filtering criterion proved too strict for negative data, which displayed lower scores overall, mostly due to lack of metadata, poor fit of the in silico fragments to the experimental data or absence from the suspect list. Consequently, for negative data the minimum score was set to 3, including at least one explained HRMS2 peak. The MetFrag Scores plots were visualised for all tentatively annotated features to ease the assessment of the MetFrag results. An example of MetFrag Scores plot for the positive feature m/z 116.0165 detected at tR 2.5 min is provided in Figure 5.3a.

130
Figure 5.3. MetFrag Scores plot of candidate structures to elucidate feature m/z 116.0165 at tR 2.5 min detected in the positive ESI data (panel a). CombScore: Combined Score; NoExplPeaks: number of explained peaks; FragScore: in silico fragmentation score; MetFusionOffline: score for spectral similarities against MassBank of North America (MoNA); AVGCSRefs: average ChemSpider references score (only averaged in the plots); Suspects: hit in suspect list. All plotted scores were normalised to 1 except the MetFusionOffline score (which was normalised during score calculation, but not during plotting, for diagnostic purposes). HRMS2 spectrum of methylisothiazolinone tentatively annotated by MetFrag to elucidate m/z 116.0164 [M+H]+ (panel b). Experimental HRMS2 (MSMS, black line); explained MSMS (ExplMSMS, red dashed line); HRMS1 (MS1, green dashed line).

131
The MetFrag Scores plot in Figure 5.3a shows individual and combined scores assigned to 59 candidates retrieved from ChemSpider and tentatively annotated to elucidate the non-target feature of interest, in this example positive feature m/z 116.0165 (tR=2.5 min). The top 3 ranking structures were methylisothiazolinone, thiazole-5-methanol and 2-methoxy thiazole, which displayed a rounded score of 5.4, 4.4 and 3.8, respectively (CombScore, black line). The structure of methylisothiazolinone could explain 7/16 peaks, whereas the 2nd and 3rd candidates could explain 4/16 peaks (NoExplPeaks, red dashed line). The higher number of matching fragments resulted in a higher in silico fragmentation score for methylisothiazolinone (FragScore, red line). The top 3 candidates did not differ substantially in terms of spectral similarity scores (MetFusionOffline, blue dotted line), which was low overall and indicated lack of similar or matching HRMS2 spectra in the library. The reference scores of the top 3 candidates were comparable, although higher for the first candidate (AvgCSRefs, green dot-dash line). The top 2 candidates also had a suspect hit (Suspects, purple dot). Further processing involved generating a tentatively annotated HRMS2 spectrum from the output of MetFrag and GenFormR. MetFrag retrieved candidate structures from ChemSpider, generated fragments in silico, back-calculated their (de)protonated monoisotopic masses and fitted them to the experimental HRMS2 data. GenFormR instead performed an algebraic calculation on spectral data to find the best formulas fitting the precursor and product ions. As these approaches are complementary, GenFormR was used to gain additional information to MetFrag to enhance the interpretation of the spectra. An example of tentatively annotated spectrum of the highest ranking candidate to elucidate the structure of positive feature m/z 116.0164 is shown in Figure 5.3b. The structure of methylisothiazolinone was eventually confirmed with a reference standard.
Applying the NTS workflow resulted in the tentative annotation of 72 non-target features (all Level 3), 45 from positive clusters and 27 from negative clusters. The full lists of tentatively annotated features, including identification confidence levels, is given in the Appendix D (D-7). Data reduction at the different steps of the workflow is shown in Fig. 5.4.

132
Figure 5.4. Data reduction charts for posit ive ESI (left) and negative ESI (right) data.
Reference standards of 42 compounds were obtained based on availability and price. All chemicals were highest ranking candidates of their respective non-target features, with the exception of atrazine-desethyl-2-hydroxy and metamitron-desamino, which were the second-highest ranking candidates, selected based on expert knowledge and following inspection of the MetFrag scores. Atrazine-desethyl-2-hydroxy was chosen for its higher in silico fragmentation score and spectral similarity score compared to the top candidate. The identification of metamitron-desamino represented an interesting case to demonstrate the importance of analyst judgement. This compound was the second-top ranking structure to explain positive ESI feature m/z 188.0817 at tR 6.55 min with a MetFrag Combined Score of 3.25 and 11/17 explained HRMS2 peaks. The highest ranking structure for this feature was the phosphodiesterase 3 inhibitor amrinone, with a score of 5.74 and 10/17 annotated HRMS2 peaks. The most pronounced differences in the MetFrag scores of these two structures were found in the number of references. Since one of the scoring criteria was the number of PubMed references, it was not surprising that the pharmaceutical amrinone had a higher score than a pesticide TP. However, since nearly all confirmed chemicals originated from either industrial or agricultural activities, metamitron-desamino was thought to be the more likely structure. Reference standards were obtained for both compounds, leading to confirmation of the pesticide metabolite. It is noteworthy that metamitron-desamino would have been missed without amrinone being the first candidate as its MetFrag score was below the cut-off value used for prioritisation of the MetFrag results of the positive ESI data.

133
The candidate structures of 25 out of 42 non-target features were confirmed, resulting in a success rate of 60% against the confirmation subset. An extensive evaluation of the performance of MetFrag can be found in the literature (Ruttkies et al., 2016; Schymanski et al., 2017). Details of the successfully confirmed compounds are shown in Table 5.1. Of the 17 compounds that were not confirmed, 4 could not be detected by the UHPLC-ESI-q-TOF/HRMS system and 13 eluted at a different tR.

134
Table 5.1. List of non-target contaminants confirmed with reference standards
Compound Formula Neutral
mass Adduct
tR
sample tR
standard ChemSpider ID (hyperlinked)
Methylisothiazolinone C4H5NOS 115.0092 [M+H]+ 2.5 2.5 36393
1,3-Benzothiazole C7H5NS 135.0143 [M+H]+ 7.5 7.5 6952
Tetramethylsulfamide * C4H12N2O2S 152.0620 [M+H]+ 4.8 4.8 121689
Atrazine-desethyl-2-hydroxy * C6H11N5O 169.0964 [M+H]+ 3.1 3.0 96906
4-Toluenesulfonamide * C7H9NO2S 171.0354 [M+H]+ 5.6 5.6 6033
Simazine-2-hydroxy C7H13N5O 183.1120 [M+H]+ 4.6 4.5 16505
Metamitron-desamino * C10H9N3O 187.0746 [M+H]+ 6.0 6.0 157884
Benzoguanamine C9H9N5 187.0858 [M+H]+ 5.0 4.9 6797
2,6-dichlorobenzamide * C7H5Cl2NO 188.9748 [M+H]+ 5.0 5.0 15359
Carbendazim * C9H9N3O2 191.0695 [M+H]+ 4.8 4.7 23741
Chlortoluron C10H13ClN2O 212.0716 [M+H]+ 9.1 9.1 25472
Diuron-desmethyl C8H8Cl2N2O 218.0014 [M+H]+ 9.8 9.8 18040
Diphenylphosphinic acid * C12H11O2P 218.0497 [M+H]+ & [M-H]- 7.7 7.7 14810
5-Amino-2-chlorotoluene-4-sulfonic acid * C7H8ClNO3S 220.9913 [M+H]+ & [M-H]- 5.4 5.4 6670
Chloridazon C10H8ClN3O 221.0356 [M+H]+ 6.0 6.0 14790
Naphthionic acid * C10H9NO3S 223.0303 [M+H]+ & [M-H]- 2.0 2.0 6532
Lamotrigine C9H7Cl2N5 255.0079 [M+H]+ 6.7 6.6 3741
Tributyl phosphate * C12H27O4P 266.1647 [M+H]+ & [M-H]- 14.9 15.0 29090
Acesulfame C4H5NO4S 162.9939 [M-H]- 2.5 2.5 33607
O,O-Diethyl thiophosphate * C4H11O3PS 170.0166 [M-H]- 3.6 3.6 635
p-Toluidine-m-sulfonic acid * C7H9NO3S 187.0303 [M-H]- 3.3 3.3 60405 Dibutyl phosphate * C8H19O4P 210.1020 [M-H]- 8.8 8.8 7593 Camphorsulfonic acid * C10H16O4S 232.0769 [M-H]- 5.0 5.0 17438 4-Amino-2,5-dichlorobenzenesulfonic acid * C6H5Cl2NO3S 240.9367 [M-H]- 2.6 2.6 59986 4-Dodecylbenzenesulfonic acid C18H30O3S 326.1915 [M-H]- 17.3 17.3 8172
* Identified in cluster with intensity maxima in the 1990s

135
5.3.2 Interpretation of clustered time trends
Several prioritised clusters displayed trends with intensity maxima in the 1990s (wells LT-P09 and LT-P11), there were seven in the positive ESI data and six in the ESI negative data. The presence of these clusters could be rationalised by the history of anthropogenic emissions and restoration measures in the Rhine basin from the 1950s onwards. River protection programmes coordinated by the International Commission for the Protection of the Rhine (ICPR) resulted in domestic and industrial WWTPs being built between 1970 and 1990 in the Rhine riparian countries (Wieriks and Schulte-Wülwer-Leidig, 2009). A turning point in international river basin management was the 1986 Sandoz accident when 15,000 m3 of water mixed with organophosphorus and organochlorine compounds including pesticides, dyes, solvents and intermediates accidentally entered the upper Rhine in Switzerland, resulting in widespread mortality of fish, macroinvertebrate and plankton communities in the riparian countries downstream (Capel et al., 1988; Verweij, 2017; Wieriks and Schulte-Wülwer-Leidig, 2009). Following the Sandoz accident, the ICPR established the Rhine Action Programme (RAP) to coordinate and implement measures to lower the discharge of hazardous substances. Their goals were achieved in the mid-1990s when substantial reduction of organic emissions, improved oxygen content and biodiversity were reported (Wieriks and Schulte-Wülwer-Leidig, 2009).
Given the high number of (tentatively) identified substances, the discussion of the results is limited to the most significant findings from the confirmed identities, whose profiles are highlighted in Figure 5.5. The cluster shown in Figure 5.5a indicated a net increase of emissions from the 1950s to the 1990s, followed by a moderate but constant decrease in the 2000s. In this cluster a negligible number of profiles displayed intensity maxima in the early 2000s, however these are not discussed further as no candidate structures could be associated to such trends. Based on the known sources and environmental fate of 2,6-dichlorbenzamide (Björklund et al., 2011) (Fig. 5.5a – green line), nonpoint source emissions from agricultural applications of
biocides or sewage farming could explain some profiles.

136
Figure 5.5. Examples of prioritised clusters with identified non-target compounds. On the x-axis the well codes are shown. The bank filtrate travel time was: ≈ 1 year (LS-P12), 6–11 years (LT-P01), 8–11 years (LT-P03), 8–13 years (LT-P05), 10–16 years (LT-P07), 15–20 years (LT-P09), 19–25 (LT-P11), ≈ 40 years (LT-P14), 50–60 years (LT-P18). Fig. 5.5a: Positive ESI cluster with maxima in the 1990s accounting for 231 profiles. The profiles of tetramethylsulfamide (blue), 4-toluenesulfonamide (red), 2,6-dichlorobenzamide (green), and tributyl phosphate (grey) are shown in colour. Fig. 5.5b: Negative ESI cluster with maxima in the 1990s accounting for 286 profiles. The profiles of 4−amino−2,5−dichlorobenzenesulfonic acid (green), camphorsulfonic acid (blue), O,O-diethyl thiophosphate (red), and 5-amino−2−chlorotoluene−4−sulfonic acid (grey) are shown in colour. Fig. 5.5c: Positive ESI cluster with gradual increase from the 1970s and displaying stable intensities throughout the 1990s and early 2000s accounting for 238 profiles. The profiles of metamitron-desamino (yellow), diphenylphosphinic acid (green) and atrazine-desethyl-2-hydroxy (blue) are shown in colour. Fig. 5.5d: Positive ESI cluster with maxima in bank filtrate with 1-year travel time (late 2015) accounting for 834 profiles. All trends significantly overlapped and no plots were manipulated for display purposes. The profiles of lamotrigine (blue) and simazine-2-hydroxy (red) are shown in colour.
Confirming the environmental occurrence of tetramethylsulfamide (TMS) was a novel discovery of the present study (Fig. 5.5a – blue line), highlighting the environmental significance of NTS. No information about production or use of TMS were found on the European Chemical Agency (ECHA) or the

137
US EPA websites. TMS was not present in the NORMAN Suspect Lists Exchange or in accurate mass spectral libraries. A search on PubChem returned 50 patents detailing formulations for the synthesis of dyes, flame retardants and pesticides. TMS can be used for the synthesis of sulphur trioxide-dimethylamine complex, a sulphating reagent for dyestuffs (Gilbert, 1962). TMS can also be a by-product of the synthesis of dimethylsulfamyl chloride, a chemical used in a variety of industrial applications (Hargittai and Brunvoll, 1976), or a by-product of the synthesis of sulfur-containing aziridines chemosterilants (Borkovec and Woods, 1963). The exact source of emissions of TMS, although likely industrial, remains so far unknown. The identity of 4-toluenesulfonamide (4-TSA) in a cluster with maxima in the 1990s was confirmed with a reference standard (Fig. 5.5a – red line). 4-TSA is a plasticizer, an intermediate for the synthesis of pesticides and disinfection by-product of the antimicrobial agent N-sodium-N-chloro-p-toluenesulfonamide. 4-TSA was detected in the Berlin area in surface water, groundwater and bank filtrate at concentrations up to 0.9 µg/L, 14.1 µg/L and 0.24 ng/L, respectively (Richter et al., 2008). The authors pointed to untreated WWTP effluents and sewage farms as sources of sulfonamides and concluded that 4-TSA can help identifying bank filtrate originating from polluted surface water, supporting the results of our study.
A more dynamic intensity trend showing increasing emission from the 1950s to the 1990s followed by a substantial decrease in the 2000s is shown in Figure 5.5b. In this cluster, camphorsulfonic acid (CSA) was tentatively identified and later confirmed, along with the metabolite O,O-Diethyl thiophosphate (DETP), the industrial chemicals 5-Amino-2-chlorotoluene-4-sulfonic acid (ACTSA) and 4-Amino-2,5-dichlorobenzenesulfonic acid (ADCBSA). To the best of our knowledge, this is the first time CSA is confirmed in bank filtrate and its environmental persistence demonstrated (Fig. 5.5b – blue line), highlighting the environmental significance of NTS. CSA was not included in the suspect list and only one reference was found reporting its occurrence in a WWTP effluent from a rubber manufacturing site in Spain (Puig et al., 1996). CSA is used as dopant in the synthesis of polyaniline, a conductive polymer (Lee and Yang, 2010; MacDiarmid and Epstein, 1994). Camphor derivatives, such as CSA, are used as UV filters in cosmetic products and eventually reach surface waters via insufficiently treated domestic WWTP effluents (Silvia Díaz-Cruz et al., 2008). The UV filter terephthalydene dicamphorsulfonic acid (TPDCSA) is unstable under photolysis in aqueous media and uncharacterised degradation product(s) with UV absorbance <290 nm were reported (Serpone et al., 2002). CSA has a UV/Vis absorbance of 285 nm (Huang et al., 2003), suggesting that it may originate from TPDCSA in the environment, rather than exclusively from industrial sources.

138
ACTSA (Fig. 5.5b – grey line) is an important building block for the synthesis of dyes reported to persist in chemical and biological wastewater treatment (LI et al., 2006). Its 2-amino isomer can be obtained from the cleavage of the azo dye Pigment Red 53 and was included in a priority list of 23 unregulated aromatic amines of toxicological concern (Brüschweiler et al., 2014). Limited literature references were found for this compound and to our knowledge this is the first time it is identified in a riverbank filtrate. The REACH registration dossier of ACTSA was submitted by a dye manufacturer with a production site at the river Main, the longest tributary of the Rhine, approximately 500 km upstream of the RBF site. The identity of another dyestuff synthesis intermediate, ADCBSA, was confirmed in this cluster (Fig. 5.5b – green line). This chemical occurs in liquid waste from manufacturing processes; however, liquid waste containing ADCBSA is usually treated separately before being sent to WWTPs because this compound is toxic to microorganisms and inhibits biological treatment (Bednarik et al., 2007). This is the first time ADCBSA is identified in a riverbank filtrate and its persistence reported. Its decreasing intensities in the 2000s might be explained by upgrades of industrial WWTPs with ion exchange resins and/or by decreased production volumes. DETP is a product of mammal metabolism and biological wastewater treatment, as well as an environmental TP of insecticides, flame retardants, plasticisers and industrial chemicals (Rousis et al., 2016; Vidya Lakshmi et al., 2009). Even if nonpoint sources cannot be excluded, the intensity profile of DETP (Fig. 5.5b – red line) suggests industrial or domestic effluents as possible sources. The decrease in the young bank filtrate might be explained by the upgrading of WWTPs and the implementation of more effective regulation in the 2000s in the riparian Rhine countries. The hypothesis about the point sources of DETP was supported by a recent wastewater-based epidemiological study on the human exposure to pesticides, which reported a detection frequency of 7% in domestic WWTP effluents across Europe in concentrations in the low ng/L range (Rousis et al., 2017). We demonstrate that DETP can enter RBF systems, where it can persist and migrate for at least two decades in the dark anaerobic aqueous environments.
Contaminants that entered the RBF in the mid-1970s and displayed stable intensities along the transect were found among the prioritised clusters. In the cluster shown in Figure 5.5c, the metabolites metamitron-desamino, atrazine-desethyl-2-hydroxy and diphenylphosphinic acid (DPPS) were confirmed with their respective reference standards. Metamitron-desamino is the main biodegradation product of the herbicide metamitron, a mobile chemical known to reach surface waters via polluted runoffs or WWTP effluents and with high potential to leach into groundwater. Concentrations of metamitron-desamino up to 680 ng/L have been reported from rivers

139
impacted by urban and agricultural activities (Moschet et al., 2015). Recent research showed that this metabolite can originate from biodegradation in water-sediment systems(Wang et al., 2017). The profile of metamitron-desamino (Fig. 5.5c – yellow line) matched the sales data of its parent compound metamitron, introduced in the European Union in 1975 and displaying a stable sales trend from the mid-1990s onwards (Commission of the European Union, 2002). The lower intensities in the first well might reflect the recent introduction of herbicide formulations with lower concentrations of metamitron combined with other active substances (German Federal Office of Consumer Protection and Food Safety, 2012). DPPS (Fig. 5.5c – green line) is a degradation product of the pharmaceutical precursor triphenylphosphine oxide (TPPO). TPPO was quantified at concentrations below 300 ng/L in bank filtrate with up to 4-year travel time from the same area investigated in our study (Hamann et al., 2016). Literature indicated that DPPS was fully degraded within 30 days in a fixed-bed bioreactor filled with aerobic Rhine water and that a major source of TPPO is located approximately 400 km upstream of the RBF system investigated in the present manuscript (Knepper and Karrenbrock, 2006). DPPS is a highly hydrophilic anionic compound (logDpH7.4 = -1.69; pKa = 2.3), so it is not retarded by bank filtration. For the first time we found that DPPS can be persistent and mobile in the dark anaerobic aqueous environment.
Profiles displaying intensity maxima in well LS-P12 (1-year old water) followed by a sudden decrease in the rest of the transect were assigned to the 2nd and 4th most populated clusters in positive and negative ESI data, respectively (Fig. 5.5d). It could be assumed that such clusters would include profiles of chemicals possibly infiltrated only recently, infiltrated and diluted to below detection level in the older bank filtrate, or formed at the riverbank within 1-year travel time and either degraded further or diluted to undetectable concentrations. In this cluster, lamotrigine, simazine-2-hydroxy, diuron-desmethyl and 1,3-benzothiazole were confirmed with reference standards. The anticonvulsant lamotrigine (Fig. 5.5d – blue line) is known to be persistent to biological wastewater treatment and has been previously detected in surface water (Zonja et al., 2016) and in bank filtrate with short travel time (Huntscha et al., 2013). Detection limited to the first well was not expected, because lamotrigine was first marketed in the EU already in 1993. Literature data on degradation of lamotrigine in anaerobic conditions was not found. Although reductive dehalogenation of aryl halide groups might occur in such conditions (Hartkamp-Commandeur et al., 1996), dechlorinated TPs of lamotrigine were screened for and not detected in the experimental HRMS1 data. A recent study on the fate of pharmaceuticals in soils irrigated with reclaimed wastewater found that lamotrigine (logDpH7.4 = 1.68) displayed the highest sorption affinity to soil compared to carbamazepine (logDpH7.4 =

140
2.28) and its metabolites (Paz et al., 2016). The 6- to 11-year travel time between wells LS-P12 and LT-P01 might have maximised adsorptive interactions and restrained lamotrigine mobility in the sub-surface. Ultimately, the contribution of dilution to undetectable levels in the older bank filtrate could not be determined. It is noteworthy how simazine-2-hydroxy was not detected after at least 11-year travel time (Fig. 5.5d – red line), whereas atrazine-desethyl-2-hydroxy showed persistence across the transect (Fig. 5.5c – blue line). It is unclear whether simazine-2-hydroxy was removed during RBF, transformed further or diluted to undetectable concentrations in the older bank filtrate. Previous studies found that simazine occurred in surface water and groundwater at concentrations up to 10 times lower than atrazine (Sabik et al., 2000). Both triazine herbicides that lead to formation of these TPs were banned in the European Union in 2004. Other known metabolites of atrazine and simazine were screened for in HRMS1 data, but were not detected. These TPs might have been either absent from the RBF transect or occurred at undetectable concentrations. The detection of atrazine-desethyl-2-hydroxy at constant levels might be attributed to the release of atrazine (or TPs) from contaminated river sediments prior to infiltration in the RBF system (Guo et al., 2016). It cannot be excluded that the hydroxylated TP prevailed over other more commonly detected dealkylated metabolites (Kolpin et al., 1998), as the aquifer screened in this study differs from others for being both confined and anaerobic. For example, in a recent screening of three aerobic bank filtration sites, atrazine-2-hydroxy and atrazine-desethyl were found both in low ng/L concentration whereas atrazine-desethyl-2-hydroxy and atrazine-desisopropyl were not detected (Hollender et al., 2018).
5.4 ENVIRONMENTAL IMPLICATIONS
This study contributes to the mounting evidence of environmental persistence of hydrophilic organic compounds and shows that polar substances can be highly mobile in RBF systems with long travel time at stable biogeochemical conditions. More research should be done on this or comparable RBF transects to investigate the fate of the most polar MPs, e.g., with even lower logD values than those identified in this study, which might have been lost during enrichment or insufficiently retained by reversed-phase chromatography. We showed that state-of-the-art NTS relying on open computational tools and performed in a semi-automated manner can be an extremely powerful method to explore water contaminants with HRMS-based methods. Spectra of the substances identified in this study will be uploaded to openly accessible accurate mass spectral libraries to contribute to future screenings. The list of confirmed contaminants has been shared with local drinking water utilities to assess their removal in drinking water

141
treatment. The trend analysis presented here can be useful to manage bank filtration systems with long travel times in catchment areas impacted by anthropogenic activities. In these cases, to avoid contamination with many legacy pollutants, which overall displayed higher normalised intensities in the older water and thus likely occurred at higher concentrations, the use of young groundwater to produce potable water is recommended, whereas advanced treatment should be applied to the old groundwater. In the case of drinking water treatment at the Tiendweg well field, reverse osmosis is applied to maximise micropollutants removal.

142
ACKNOWLEDGMENTS
The authors thank Martin Loos for his support with enviMass and Aurea Chiaia-Hernández and Michael Stravs for helpful discussions at Eawag. The drinking water utility Oasen (Gouda, The Netherlands) is acknowledged for funding the ECROS project at the Institute for Biodiversity and Ecosystem Dynamics, University of Amsterdam. Willem-Jan Knibbe and Hans van Woerden at Oasen are acknowledged for arranging collection of the samples. Funding at Eawag was provided through the EU 7th Framework Programme SOLUTIONS project under Grant Agreement No. 603437. Work at LCSB was supported by the Luxembourg National Research Fund (FNR), grant number 12341006. Three anonymous reviewers are acknowledged for helpful comments.

143
APPENDIX D. Supplementary information to Chapter 5
D-1: Standards and chemicals Methanol (≥ 99.9%) was purchased from Fisher Scientific (Wohlen, Switzerland). Ultrapure water was obtained from a Barnstead Nanopure stationary laboratory water system (Barnstead Nanopure Thermo Scientific, San Jose, U.S.). Formic acid (≥ 98 %) used as mobile phase modifier was purchased from Merck (Darmstadt, Germany). Isotope-labelled internal standards (listed in table D-1.1) used for mass recalibration, tR alignment and intensity normalisation and reference standards (listed in table D-1.2) used for confirmation of chemical identities were purchased from CDN Isotopes (Canada), Dr. Ehrenstorfer (Germany), HPC Standards (Germany), LGC Standards (Switzerland), Molcan (Canada), MolPort (Latvia), Monsanto (Belgium), Novartis (Switzerland), Riedel-de-Häen (Germany), Sigma-Aldrich (Switzerland and The Netherlands), or Toronto Research Chemicals (Canada) at purities ≥ 95% (analytical grade).

144
Table D-1.1. List of isotope-labelled internal standards, their molecular formula and CAS number.
Name Formula CAS
2,2-Difluoro-2-deoxyuridin-13C,15N2 C8H10F2O5[13]C1[15]N2 1233921-75-9
2,4-D-D3 C8H3D3Cl2O3 202480-67-9
2,6-Dichlorbenzamide-3,4,5-D3 C7H2D3Cl2N1O1 1219804-28-0
5-Metyhl-1H-benzotriazole-D6 C7H1D6N3 1246820-65-4
Alachlor-D13 C14H7D13Cl1N1O2 1015856-63-9
Aldicarb (N-methyl-13C-D3-carbamoyl-13C) [13]C2C5H11D3N2O2S1 1261170-77-7
Amisulpride-D5 C17H22D5N3O4S1 1216626-17-3
Atenolol acid-D5 C14H16N1O4D5 1215404-47-9
Atenolol-D7 C14H15D7N2O3 1202864-50-3
Atomoxetine-D3 C17H18D3N1O1 1217776-38-9
Atorvastatin-D5 C33H30D5F1N2O5 222412-82-0
Atrazine-D5 C8H9D5Cl1N5 163165-75-1
Atrazine-2-Hydroxy-D5 C8H10D5N5O1 1276197-25-1
Atrazine-desisopropyl-D5 C5H3D5Cl1N5 1189961-78-1
Azithromycin-D3 C38H69D3N2O12 163921-65-1
Bentazon-D6 C10H6D6N2O3S1 25057-89-0 (unlabelled)
Benzotriazole-D4 C6H1D4N3 1185072-03-0
Bezafibrat-D4 C19H16D4Cl1N1O4 1189452-53-6
Bicalutamid-D4 C18H10D4F4N2O4S1 1185035-71-5
Caffeine-D9 C8H1N4O2D9 72238-85-8
Candesartan-D5 C24H15D5N6O3 1189650-58-5
Carbamazepine-10,11-epoxide-13C, D2 C14H10D2N2O2[13]C1
36507-30-9 (unlabelled)
Carbamazepin-D8 C15H4D8N2O1 298-46-4 (unlabelled)
Carbendazim-D4 C9H5D4N3O2 291765-95-2
Cetirizin-D8 C21H17D8Cl1N2O3 774596-22-4
Chloridazon-D5 C10H3D5Cl1N3O1 1346818-99-4
Chloridazon-desphenyl-15N2 C4H4Cl1N1[15]N2O1 1189649-21-5
Chloridazon-methyl-desphenyl-D3 C5H3D3Cl1N3O1 17254-80-7 (unlabelled)
Chlorotoluron-D6 C10H7D6Cl1N2O1 1219803-48-1
Chlorpyrifos-D10 C9H1D10Cl3N1O3P1S1 285138-81-0
Chlorpyrifos-methyl D6 C7H1D6Cl3N1O3P1S1 2083629-84-7

145
Table D-1.1 (continued). List of isotope-labelled internal standards, their molecular formula and CAS number
Name Formula CAS
Chlothianidin-D3 C6H5D3Cl1N5O2S1 1262776-24-8
Citalopram-D6 C20H15D6F1N2O1 1190003-26-9
Clarithromycin-D3 C38H66D3N1O13 959119-17-6
Climbazol-D4 C15H13D4Cl1N2O2 1185117-79-6
Clofibric acid-D4 C10H7D4Cl1O3 1184991-14-7
Clopidogrel-(+/-)-d4 C15H10D4Cl1N1O2S1 1219274-96-0
Clotrimazol-D5 C22H12D5Cl1N2 1185076-41-8
Clozapine-D8 C18H11D8Cl1N4 1185053-50-2
Codeine-13C,D3 C17H18D3N1O3[13]C1 76-57-3 (unlabelled)
Cyclophosphamid-D4 C7H11Cl2N2O2P1D4 173547-45-0
Cyprodinil-D5 C14H10D5N3 1773496-67-5
Desethylatrazine 15N3 C6H10Cl1N2[15]N3 6190-65-4 (unlabelled)
Diazepam-D5 C16H8Cl1N2O1D5 65854-76-4
Diazinon-D10 C12H11D10N2O3P1S1 100155-47-3
Dicamba-D3 C8H3D3Cl2O3 349553-95-3
Dichlorprop-D6 C9H2D6Cl2O3 120-36-5 (unlabelled)
Diclofenac-D4 C14H7D4Cl2N1O2 153466-65-0)
Diflufenican-D3 C19H8D3F5N2O2 1185009-29-3
Dimethenamid-D3 C12H15D3Cl1N1O2S1 1246816-31-8
Dimethoate-D6 C5H6D6N1O3P1S2 1219794-81-6
Diuron-D6 C9H4D6Cl2N2O1 1007536-67-5
Eprosartan-D3 C23H21D3N2O4S1 1185243-70-2
Erythromycin-13C2 C35H67N1O13[13]C2 114-07-8 (unlabelled)
Fenofibrate-D6 C20H15D6Cl1O4 1092484-56-4
Fluconazol-D4 C13H8F2N6O1D4 1124197-58-5
Fluoxetine-D5 C17H13F3N1O1D5 1173020-43-3
Furosemid-D5 C12H6Cl1N2O5S1D5 1189482-35-6
Gabapentin-D4 C9H13N1O2D4 1185039-20-6
Gemcitabine-13C,15N2 C8H11F2N1O4[13]C1[15]N2 1262897-74-4
Hydrochlorothiazide-C13, D2 C6H6Cl1N3O4S2D2[13]C1 1190006-03-1
Hydromorphone-D3 C17H16D3N1O3 136765-37-2
Ibuprofen-D3 C13H15D3O2 121662-14-4

146
Table D-1.1 (continued). List of isotope-labelled internal standards, their molecular formula and CAS number.
Name Formula CAS
Imidacloprid D4 C9H6D4Cl1N5O2 1015855-75-0
Indomethacin-D4 C19H12Cl1N1O4D4 87377-08-0
Irbesartan-D3 C25H25D3N6O1 1185120-76-6
Irgarol-D9 C11H10D9N5S1 1189926-01-9
Isoproturon-D6 C12H12D6N2O1 217487-17-7
Lamotrigine-13C3,D3 C6[13]C3H4D3Cl2N5 1246815-13-3)
Levetiracetam-D3 C8H11D3N2O2 1217851-16-5
Lidocaine-D10 C14H12N2O1D10 851528-09-1
MCPA-D3 C9H6D3Cl1O3 352431-14-2
Mecl0zine-D8 C25H19D8Cl1N2 1246816-06-7
Mecoprop D6 C10H5D6Cl1O3 1705649-54-2
Mefenamic acid-D3 C15H12D3N1O2 1189707-81-0
Mesotrion D3 C14H10D3N1O7S1 104206-82-8 (unlabelled)
Metformin-D6 C4H5N5D6 1185166-01-1
Methiocarb-D3 C11H12D3N1O2S1 1581694-94-1
Methylprednisolon-D3 C22H27O5D3 18462-27-6 (unlabelled)
Metolachlor-D6 C15H16D6Cl1N1O2 1219803-97-0
Metolachlor-ESA D11 C15H12D11N1O5S1 947601-85-6 (unlabelled)
Metoprolol-D7 C15H18D7N1O3 1292906-91-2
Metronidazol-D4 C6H5D4N3O3 1261392-47-5
Metsulfuron-methyl-D3 C14H12D3N5O6S1 74223-64-6
Morphine-D3 C17H16D3N1O3 67293-88-3
N,N-diethyl-3-methylbenzamide-D10 C12H7D10N1O1 1215576-01-4
N4-Acetyl-Sulfamethoxazol-D5 C12H9D4N3O4S1 1215530-54-3
N4-Acetyl-Sulfathiazol-D4 C11H7D4N3O3S2 127-76-4 (unlabelled).
Naproxen-D3 C14H11O3D3 1094102-82-5
Nelfinavir-D3 C32H42D3N3O4S1 1217629-70-3
Octilinone-D17 C11H2D17N1O1S1 1185109-79-8
O-Desmethylvenlafaxin-D6 C16H19D6N1O2 1062605-69-9
Oxazepam-D5 C15H6Cl1D5N2O2 65854-78-6
Oxcarbazepine-D4 C15H8D4N2O2 1020719-71-4
Paracetamol-D4 C8H5D4N1O2 64315-36-2
Phenazon-D3 C11H9D3N2O1 342821-66-3

147
Table D-1.1 (continued). List of isotope-labelled internal standards, their molecular formula and CAS number.
Name Formula CAS
Pirimicarb-D6 C11H12D6N4O2 1015854-66-6
Pravastatin-D3 C23H33D3O7 1329836-90-9
Primidon-D5 C12H9D5N2O2 73738-06-4
Prochloraz-D7 C15H9D7Cl3N3O2 67747-09-5 (unlabelled)
Propazin-D6 C9H10D6Cl1N5 1655498-05-7
Propiconazol D5 C15H12D5Cl2N3O2 1246818-14-3
Propranolol-D7 C16H14D7N1O2 98897-23-5
Ranitidin-D6 C13H16N4O3S1D6 1185238-09-8
Ritalinic acid-D10 C13H7N1O2D10 19395-41-6 (unlabelled)
Ritonavir-D6 C37H42N6O5S2D6 1217720-20-1
Simazin D5 C7H7D5Cl1N5 220621-41-0
Sotalol-D6 C12H14D6N2O3S1 1246820-85-8
Sulcotrion-D3 C14H10D3Cl1O5S1 99105-77-8
Sulfadiazine-D4 C10H6D4N4O2S1 1020719-78-1
Sulfadimethoxin-D4 C12H10D4N4O4S1 1020719-80-5
Sulfamethazine-13C6 C6[13]C6H14N4O2S1 77643-91-5
Sulfamethoxazol-D4 C10H7D4N3O3S1 1020719-86-1
Sulfapyridin-D4 C11H7D4N3O2S1 1189863-86-2
Sulfathiazol-D4 C9H5D4N3O2S2 1020719-89-4
Tebuconazole D6 C16H16D6Cl1N3O1 107534-96-3 (unlabelled)
Tebutam-D4 C15H19D4N1O1 35256-85-0
Terbutryn-D5 C10H14D5N5S1 1219804-47-3
Terbutylazin-D5 C9H11D5Cl1N5 222986-60-9
Thiamethoxam-D3 C8H7D3Cl1N5O3S1 1294048-82-0
Tramadol-D6 C16H19N1O2D6 1109217-86-8
Triclosan-D3 C12H4D3Cl3O2 1020719-98-5
Trimethoprim-D9 C14H9D9N4O3 1189460-62-5
Valsartan-13C5,15N [13]C5C19H29[15]N1N4O3 137862-53-4
Valsartan-acid-D4 C14H6D4N4O2 164265-78-5
Venlafaxin-D6 C17H21N1O2D6 1062606-12-5
Venlafaxine-N,O-didesmethyl-D3 C15H20D3N1O2 1189468-67-4
Verapamil-D6 C27H32N2O4D6 1329611-24-6

148
Table D-1.2. List of unlabelled reference standards, their molecular formula and CAS number.
Compound Formula CAS
2-Amino-6-methylbenzothiazole C8H8N2S 2536-91-6
1,3-Benzothiazole C7H5NS 95-16-9
1,5-Naphthalenedisulfonic acid C10H8O6S2 81-04-9
1-Naphthol-4-sulfonic acid C10H8O4S 84-87-7
2,3,3,3-Tetrafluoro-2-(1,1,2,2,3,3,3-heptafluoropropoxy)propanoic acid C6HF11O3 13252-13-6
2,6-dichlorobenzamide C7H5Cl2NO 2008-58-4
2,6-Di-tert-butylpyridine C13H21N 585-48-8
2-chloroaniline-5-sulfonic acid C6H6ClNO3S 98-36-2
4-Amino-2,5-dichlorobenzenesulfonic acid C6H5Cl2NO3S 88-50-6
4-Aminoacetanilide C8H10N2O 122-80-5
4-Dimethylaminopyridine C7H10N2 1122-58-3
4-Dodecylbenzenesulfonic acid C18H30O3S 121-65-3
4-Hydroxymetanilamide C6H8N2O3S 98-32-8
4-Toluenesulfonamide C7H9NO2S 70-55-3
5-Amino-2-chlorotoluene-4-sulfonic acid C7H8ClNO3S 88-53-9
Acesulfame C4H5NO4S 55589-62-3
Acetanilide C8H9NO 103-84-4
Amrinone C10H9N3O 60719-84-8
Atrazine-desethyl-2-hydroxy C6H11N5O 19988-24-0
Benzoguanamine C9H9N5 91-76-9
Caffeine C8H10N4O2 58-08-2
Camphorsulfonic acid C10H16O4S 3144-16-9
Carbendazim C9H9N3O2 10605-21-7
Chloridazon C10H8ClN3O 58858-18-7
Chlortoluron C10H13ClN2O 15545-48-9
Dibutyl phosphate C8H19O4P 107-66-4
Diphenylphosphinic acid C12H11O2P 1707-03-5
Diuron-desmethyl C8H8Cl2N2O 3567-62-2
Gestageno C21H30O3 68-96-2
Lamotrigine C9H7Cl2N5 84057-84-1
Metamitron-desamino C10H9N3O 36993-94-9
Methylisothiazolinone C4H5NOS 2682-20-4

149
Table D-1.2 (continued). List of unlabelled reference standards, their molecular formula and CAS number.
Compound Formula CAS
Mexiletine C11H17NO 31828-71-4
Monobenzone C13H12O2 103-16-2
Naphthionic acid C10H9NO3S 130-13-2
O,O-Diethyl thiophosphate C4H11O3PS 5871-17-0
Pargyline C11H13N 306-07-0
p-Toluidine-m-sulfonic acid C7H9NO3S 88-44-8
Simazine-2-hydroxy C7H13N50 2599-113
Tetramethylsulfamide C4H12N2O2S 3768-63-6
Tributyl phosphate C12H27O4P 126-73-8
Zearalenol C18H24O5 36455-72-8

150
D-2: Description of the riverbank filtration site
The studied well fields of the drinking water company Oasen (Gouda, The Netherlands) are situated next to the river Lek, a tributary of the river Rhine in the Netherlands. The wells abstract groundwater from sandy deposits of Pleistocene age at a depth of 10-30 meters below surface level. The aquifer is protected by an overlying aquitard of about 10 meters of peat and clay from the Holocene. The well fields have been operated since 1969. Groundwater abstraction rate from 1969 to 1974 was 1–1.5 million m3/year. From 1975 onward the abstraction rate varied between 1.7–2.3 million m3/year. Various research (1) reveals that, based on the hydro-chemical tracers in this water, the abstracted groundwater originates from the river Lek. Isotope research from 2006 (2) reveals that 93-100% of the abstracted water of well fields Lekkerkerk-Schuwacht and Lekkerkerk-Tiendweg is in fact infiltrated river water from the Rhine. The natural purification processes during the aquifer passage of this river bank improves the water quality considerably. However, the most persistent and mobile pollutants are not fully removed (3,4) which leads to the necessity of advanced purification treatment steps in the drinking water utility like activated carbon or reverse osmosis. The age of the abstracted riverbank filtration groundwater varies with the distance to the river and the hydrogeological conditions and was derived with calibrated hydrogeological groundwater flow models (Figure D-2.1). The Lekkerkerk-Schuwacht wells were built at a distance between 70 and 180 m from the riverbank, allowing abstraction of water with an age between 3 months and 10 years (Mean value: 2 years). As a result, the abstracted river bank groundwater of Lekkerkerk-Schuwacht reflects the relatively recent river water quality. From this well field, the youngest bank filtrate (mean travel time = 1 year) was sampled and considered for this screening study. The Lekkerkerk-Tiendweg wells were built on a transect perpendicular to the riverbank, place between 950 and 1,800 m from the Lek. The age of the water from well field Lekkerkerk-Tiendweg varies between 6 years and > 100 years (Mean value: 20 years), allowing abstraction of groundwater reflecting river water quality from the past decades, when the Lek was much more polluted than nowadays, e.g. from the 1950s to 1980s. Fortunately, thanks to strict regulations and international co-operation, the quality of the river water has improved significantly since 1970 (5). This can be observed from the individual wells of which the samples are taken in well field Lekkerkerk-Tiendweg, that are perpendicularly oriented towards the river. These wells abstract the complete range of historical river water quality from the pre-industrial period (> 100 years old) for the wells that are situated at the greatest distance to the river, to relatively recent river water (at least 6 years old) for the wells closest to the river. The wells in between include the period of maximum river water pollution (30-60 years old).

151
References
1. Stuyfzand, P. J.: KIWA mededeling 89 Drinkwater uit oevergrondwater, Anorganische bestanddelen, 1985;
2. Timmer H., Aandeel oevergrondwater berekend via zuurstof-18 isotopen onderzoek. Internal document Oasen, 2006;
3. Stuyfzand, P.J., 1989. Hydrology and water-quality aspects of Rhine bank groundwater in the Netherlands. J. Hydrol. 106, 341–363;
4. Hamann et al, 2016 The fate of organic micropollutants during long-term/long-distance river bank filtration;
5. http://news.bbc.co.uk/2/hi/europe/1371142.stm (accessed on May 15th 2019) Figure D-2.1. Map of well fields site showing estimated flow lines and modelled travel time.

152
D-3: Additional details on the HRMS systems
D-3.1. Quadrupole-Orbitrap data-dependent acquisition settings Full-scan HRMS1 spectra were acquired at a scan rate of 1Hz for masses ranging from m/z 100 to 1,000 and with a resolving power of 140,000 at m/z 200. HRMS2 spectra were acquired for the five most intense ions detected in each cycle of full-scan HRMS1 for masses ranging from m/z 200 to 2000 and with a resolving power of 17,500. A dynamic exclusion window of 8 seconds was set, i.e. a mass would be temporarily placed on an exclusion list for 8 seconds to ensure that one ion would not dominate all HRMS2 scans. The automatic gain control (AGC) target was set at 200,000 and maximum injection time was 100 milliseconds. For fragmentation, stepped normalised collision energies (NCE) ranging from 15% to 90% were derived from the m/z value of the non-target ions.
D-3.2 UHPLC-ESI-q-TOF/HRMS settings The analyses to confirm the identities of the prioritised non-target features were conducted with a UHPLC system (Nexera, Shimadzu, Den Bosch, The Netherlands) coupled to a Bruker Daltonics maXis 4G high resolution q-ToF/MS upgraded with HD collision cell and equipped with an ESI source (Wormer, The Netherlands). The chromatographic conditions were identical to those described in the manuscript (“LC-HRMS analysis” in Chapter 5.2). The MS detector was internally calibrated before starting an analysis batch and additionally prior to any injection. This was achieved by infusing a 50 μM sodium formate solution in H2O:MeOH (1:1, v/v) with a loop injection of 20 μL and a loop rinse of 20 μL. Positive and negative ESI were achieved in separate runs by acquiring HRMS1 spectra for masses ranging from m/z 50 to 1,000 with a resolving power of 30,000–60,000 at full width at half maximum (FWHM) and with a spray voltage of +3.5 kV and −3.5 kV for positive and negative mode, respectively. The capillary temperature was 300 °C. HRMS2 spectra were recorded in data-dependent acquisition mode (AutoMSMS) with a resolving power of at least 20,000 FWHM.

153
D-4: enviMass settings (version 3.4)
Peak Picking* Extraction of ion chromatograms
o Maximum retention time gap in an EIC (sec): 180 o Maximum m/z deviation of centroid data point from its EIC mean
(ppm): 5 Peak picking
o Minimum number of centroid data points per peak … : 5 o … within a given RT window (sec): 20 o Maximum RT gap to length to be interpolated (sec): 10 o Maximum RT width of a single peak (sec): 120 o Minimum log10(intensity) threshold: 5 o Minimum Signal/Noise: 5 o Minimum Signal/Base: 2 o Maximum possible number of peaks within a single EIC: 3 o Peak intensity: use peak area or peak intensoid? - Intensoid (max
int.) o Peak mass definition: Mean
Advanced settings o Upper log10(intensity) safety threshold: 7 o How often can a peak detection fail to end the recursion? – peak
picking: 2 o Weight for assigning centroid data points to a peak - peak picking:
1 o Percentage of low-intense data points to discard: 0
Instrument / Resolution o 180 Q-Exactive, ExactivePlus/R140000@200
Mass recalibration Positive / Negative ionisation
o Include mass recalibration for positive/negative ion. mode files? - Yes
o Reference compounds - Internal standards o Maximum allowable m/z correction (ppm): 10 o Maximum m/z deviation of centroid data point from its EIC mean
(ppm): 5 o RT tolerance (sec): 30
Replicates o m/z tolerance (ppm): 5 o RT tolerance window of peaks caused by the same analyte
across replicate samples (sec): 30 o Absolute log intensity tolerance X: 5
Screening (Internal Standards)

154
o RT tolerance of peaks relative to their expected RT (sec): 30 o RT tolerance of peaks in an isotopic pattern: (sec): 10 o m/z tolerance (ppm): 5 o Intensity tolerance (%): 30 o Lower intensity threshold: 50000 o Restrict screening to latest files? - FALSE o Cut-off score: 0.8 o Exclude matches below cut-off – FALSE
Normalization
o Include normalization for positive/negative ion. mode files? - Yes o Minimum of screened files covered by each IS profile? (%): 60 o Screening threshold: 0.8 o Minimum number of IS profile peaks: 50 o Use subsampling? – Yes o Number of blank/blind profiles subsample: 100 o Number of sample profiles in subsample:100
Profiling o Maximum number of newest samples to be processed per ion
mode: 100 o Peak mass deviation within profiles: 5 ppm o Peak deviation within profiles: RT tolerance (sec): 30 o Minimum number of IS profile peaks: 50
* Detailed description of the peak picking parameters can be found at the following URL: https://www.envibee.ch/eng/enviMass/topics/peakpicking.htm (Accessed on May 13th 2019)

155
D-5: Overview on detection of the isotope-labelled standards
The masses of the 128 isotope-labelled standards (IS) were screened in all samples in both positive and negative ESI mode the enviMass settings indicated in section D-4. In positive ionisation mode, 75 standards were detected in all samples, whereas in negative mode these were 43. Out of 128 IS, 25 could be ionised in both modes and were found in all samples, whereas 21 were not detected in either positive or negative ionisation mode, likely due to insufficient enrichment. In Figures D-5.1 and Figure D-5.2 the mass deviation and intensity distribution of the IS compounds is shown, along with information on the completeness of isotopic peaks detection (cut-off score = 0.8). In the positive ionisation mode data (Figure D-5.1) it can be seen that overall higher mass accuracy and intensities were obtained, compared to negative data (Figure D-5.2).

156
Figure D-5.1. Log-intensity (x-axis) and m/z deviation (ppm) (y-axis) of the isotope-labelled standards screened in positive ESI mode
Figure D-5.2. Log-intensity (x-axis) and m/z deviation (ppm) (y-axis) of the isotope-labelled standards screened in negative ESI mode

157
D-6: Overview on the data from the 15 most populated clusters
Table D-6.1. Feature population of the prioritised clusters in positive ESI mode, number of prioritised features and associated HRMS2 data.
Top populated cluster
Features in cluster
Intensity-prioritised
Triggered HRMS2
1 974 487 158
2 834 417 111
3 804 402 188
4 763 382 83
5 728 364 84
6 682 341 148
7 632 316 77
8 514 257 78
9 466 233 74
10 238 119 98
11 231 116 45
12 190 95 60
13 185 93 60
14 160 80 31
15 124 62 53

158
Table D-6.2. Feature population of the prioritised clusters in negative ESI mode, number of prioritised features and associated HRMS2 data.
Top populated cluster
Features in cluster
Intensity-prioritised
Triggered HRMS2
1 651 488 89
2 640 480 98
3 473 355 82
4 460 345 64
5 454 341 76
6 427 320 73
7 426 320 90
8 415 311 69
9 398 299 71
10 286 215 100
11 129 97 49
12 106 80 46
13 100 75 20
14 96 72 34
15 62 47 22

159
D-7: Lists of (tentatively) identified substances
Table D-7.1. Details of (tentatively) identified substances prioritised from positive data.
Compound Formula Neutral mass InChIKey
Score (rank) a Suspect
Ident. Level b
RT (min) In well
Methylisothiazolinone C4H5NOS 115.0092 BEGLCMHJXHIJLR-UHFFFAOYSA-N 5.4 Yes 1 2.5
LS-P12 to LT-P11
2-Pyridylethylamine C7H10N2 122.0844 XPQIPUZPSLAZDV-UHFFFAOYSA-N 3.5 (7th) No 3 7.8 All
4,6-Dimethylpyrimidin-2-ol C6H8N2O 124.0637 WHEQVHAIRSPYDK-UHFFFAOYSA-N 4.2 Yes 3 4.4
LS-P12 to LT-P14
5,5-Dimethylhydantoin C5H8N2O2 128.0586 YIROYDNZEPTFOL-UHFFFAOYSA-N 5.2 Yes 3 4.3
LT-P5 to LT-P11
3-Methyladenine C6H7N5 149.0701 FSASIHFSFGAIJM-UHFFFAOYSA-N 5 Yes 3 3.2 LS-P12
Pheniprazine C9H14N2 150.1157 VXTWEDPZMSVFEF-UHFFFAOYSA-N 4.6 No 3 6.1 LT-P7
Norephedrine C9H13NO 151.0997 DLNKOYKMWOXYQA-CBAPKCEASA-N 5 Yes 3 5.5 LS-P12
Tetramethylsulfamide C4H12N2O2S 152.062 WIOVVBRSQYYSMV-UHFFFAOYSA-N 4.4 No 1 4.8 All
4-Phenyl-1,2,3,6-tetrahydropyridine C11H13N 159.1048
OMPXTQYWYRWWPH-UHFFFAOYSA-N 4.3 No 3 4.1
LS-P12 to LT-P09
3-Hydroxy-2,2-dimethyl-N-propylpropanamide C8H17NO2 159.1259
PLXAWTRZKLDSEF-UHFFFAOYSA-N 2.6 (5th) Yes 3 9.6
LS-P12 to LT-P11
Methyl cinnamate C10H10O2 162.0681 CCRCUPLGCSFEDV-BQYQJAHWSA-N 5.4 Yes 3 7.5 LT-P09
Atrazine-desethyl-2-hydroxy C6H11N5O 169.0964 GCKLGRUZDXSATG-UHFFFAOYSA-N 4.4 (2nd) Yes 1 3.1
LS-P12 to LT-P11
5,6-Diamino-1,3-Dimethyluracil C6H10N4O2 170.0804 BGQNOPFTJROKJE-UHFFFAOYSA-N 4.5 No 3 4.5
LT-P05 to LT-P14
4-Toluenesulfonamide C7H9NO2S 171.0354 LMYRWZFENFIFIT-UHFFFAOYSA-N 6.2 Yes 1 5.6 All
Ethanal tetramer C8H16O4 176.1049 GKKDCARASOJPNG-UHFFFAOYSA-N 4.8 Yes 3 4.5 All

160
Table D-7.1 (continued). Details of (tentatively) identified substances prioritised from positive data.
Compound Formula Neutral mass InChIKey
Score (rank) a Suspect
Ident. Level b
RT (min) In well
Methylephedrine C11H17NO 179.131 FMCGSUUBYTWNDP-ONGXEEELSA-N 3.5 (2nd) Yes 3 4.5
LS-P12 to LT-P01
Simazine-2-hydroxy C7H13N5O 183.1120 YQIXRXMOJFQVBV-UHFFFAOYSA-N 4.7 Yes 1 4.6 LS-P12
Metamitron-desamino C10H9N3O 187.0746 OUSYWCQYMPDAEO-UHFFFAOYSA-N 3.3 (2nd) Yes 1 6
LS-P12 to LT-P14
4-hydroxymetanilamide C6H8N2O3S 188.0256 AVQFHKYAVVQYQO-UHFFFAOYSA-N 5.5 Yes 3 6.1
LT-P03 to LT-P11
2,6-dichlorobenzamide C7H5Cl2NO 188.9748 JHSPCUHPSIUQRB-UHFFFAOYSA-N 6.6 Yes 1 5 All
Carbendazim C9H9N3O2 191.0695 TWFZGCMQGLPBSX-UHFFFAOYSA-N 6.7 Yes 1 4.8
LS-P12 to LT-P11
N,N-Dipropyl-1,4-benzenediamine C12H20N2 192.1626
UOWYGPTYSRURDP-UHFFFAOYSA-N 2.3 (8th) No 3 4.2 LS-P12
Isophthalohydrazide C8H10N4O2 194.0804 UTTHLMXOSUFZCQ-UHFFFAOYSA-N 2.1 (3rd) No 3 3.1
LS-P12 to LT-P09
Ethyl tosylamide C9H13NO2S 199.0667 OHPZPBNDOVQJMH-UHFFFAOYSA-N 4.5 Yes 3 8.3
LS-P12 to LT-P11
3-phenoxybenzylalcohol C13H12O2 200.0837 KGANAERDZBAECK-UHFFFAOYSA-N 4.6(2nd) Yes 3 8.1
LT-P09 to LT-P14
2,4-Dimethylaniline-6-sulfonic acid C8H11NO3S 201.0460
CFCXQQUQLZIZPI-UHFFFAOYSA-N 4.3 Yes 3 4.4
LT-P01 to LT-P09
Dicyclohexylcarbodiimide C13H22N2 206.1783 QOSSAOTZNIDXMA-UHFFFAOYSA-N 5.7 Yes 3 8.4 LS-P12
Chlortoluron C10H13ClN2O 212.0716 JXCGFZXSOMJFOA-UHFFFAOYSA-N 5.5 Yes 1 9.1
LS-P12 to LT-P07
Mesitylsulfonylhydroxylamine C9H13NO3S 215.0616 CHKQALUEEULCPZ-UHFFFAOYSA-N 4.3 No 3 3.1 LT-P05
Diethyl acetamidomalonate C9H15NO5 217.0950 ISOLMABRZPQKOV-UHFFFAOYSA-N 5.5 No 3 4.3 LT-P09

161
Table D-7.1 (continued). Details of (tentatively) identified substances prioritised from positive data.
Compound Formula Neutral mass InChIKey
Score
(rank) a Suspect
Ident. Level b
RT
(min) In well
Diuron-desmethyl C8H8Cl2N2O 218.0014 IDQHRQQSSQDLTR-UHFFFAOYSA-N 6.6 Yes 1 9.8 LS-P12
Diphenylphosphinic acid C12H11O2P 218.0497 BEQVQKJCLJBTKZ-UHFFFAOYSA-N 6.4 Yes 1 7.7
LS-P12 to LT-P14
5-Amino-2-chlorotoluene-4-sulfonic acid C7H8ClNO3S 220.9913
VYZCFAPUHSSYCC-UHFFFAOYSA-N 4 Yes 1 5.4
LT-P01 to LT-P18
Chloridazon C10H8ClN3O 221.0356 WYKYKTKDBLFHCY-UHFFFAOYSA-N 5.9 Yes 1 6
LS-P12 to LT-P09
Naphthionic acid C10H9NO3S 223.0303 NRZRRZAVMCAKEP-UHFFFAOYSA-N 5.7 Yes 1 2 All
1,6-Hexanediyl bisacrylate C12H18O4 226.1205 FIHBHSQYSYVZQE-UHFFFAOYSA-N 4.1 Yes 3 9.2
LT-P03 to LT-P05
Ozagrel C13H12N2O2 228.0899 SHZKQBHERIJWAO-AATRIKPKSA-N 4.4 No 3 8.1 LT-P09
Ethyl 2-sulfamoylbenzoate C9H11NO4S 229.0409 CYFKZTWSLPKROH-UHFFFAOYSA-N 3.9 (2nd) No 3 6.4 LT-P09
Lamotrigine C9H7Cl2N5 255.0079 PYZRQGJRPPTADH-UHFFFAOYSA-N 6.8 Yes 1 6.7 LS-P12
1,3,5-Triazin-2-ol, 4,6-di-4-morpholinyl- C11H17N5O3 267.1331
ITWXPXDYRAKSPM-UHFFFAOYSA-N 3.2 (2nd) Yes 3 5.3 LS-P12
Retinal 2 C20H26O 282.1984 QHNVWXUULMZJKD-OVSJKPMPSA-N 5.3 No 3 13.2
LS-P12 to LT-P11
3'-O-Acetylthymidine C12H16N2O6 284.1008 IRFKBRPHBYCMQU-IVZWLZJFSA-N 4.3 No 3 15.3 LT-P09
2,4,6-Tri(2-pyridinyl)-1,3,5-triazine C18H12N6 312.1123
KMVWNDHKTPHDMT-UHFFFAOYSA-N 5.1 No 3 14 LT-P11
Zearalanone C18H24O5 320.1624 APJDQUGPCJRQRJ-LBPRGKRZSA-N 6.4 Yes 3 8.4
LS-P12 to LT-P11
21-Hydroxypregn-4-ene-3,20-dione C21H30O3 330.2195
ZESRJSPZRDMNHY-UHFFFAOYSA-N 3.9 (3rd) Yes 3 17
LS-P12 to LT-P11
a Candidate structure rank shown in parenthesis if different than “1st”; b Identification Confidence Level proposed by Schymanski et al. (2014a).

162
Table D-7.2. Details of the (tentatively) identified substances prioritised from negative ESI data.
Compound Formula Neutral mass InChIKey
Score (rank) a Suspect
Ident. Level b RT (min) In well
1-Naphthol-4-sulfonic acid C10H8O4S 224.0143 HGWQOFDAUWCQDA-UHFFFAOYSA-N
6.9 Yes 3 6.5 All
1-naphthylamine-5-sulfonic acid
C10H9NO3S 223.0303 DQNAQOYOSRJXFZ-UHFFFAOYSA-N
5.6 (2nd) No 3 5.5 LS-P12 to LT-P05
2,3-Diisobutyl-1-naphthalenesulfonic acid
C18H24O3S 320.1446 KBLAMUYRMZPYLS-UHFFFAOYSA-N
3.5 Yes 3 14.2 All
2-Chloroaniline-5-sulfonic acid
C6H6ClNO3S 206.9757 XJQRCFRVWZHIPN-UHFFFAOYSA-N
5.7 No 3 4.4 All
2-Napthol-6-sulfonic acid C10H8O4S 224.0143 VVPHSMHEYVOVLH-UHFFFAOYSA-N
6.0 (2nd) Yes 3 5.1 All
3-[4-(Methoxycarbonyl)phenyl]-1-propanesulfonic acid
C11H14O5S 258.0562 OFGLQSUWZJEIHY-UHFFFAOYSA-N
2.8 (2nd) No 3 5.3 All
4-Amino-2,5-dichlorobenzenesulfonic acid
C6H5Cl2NO3S 240.9367 SJCTXIKOXTUQHC-UHFFFAOYSA-N
5.9 Yes 1 2.6 All
4-Decylbenzenesulfonic acid
C16H26O3S 298.1603 UASQKKHYUPBQJR-UHFFFAOYSA-N
3.8 No 3 16 All
4-Dodecylbenzenesulfonic acid
C18H30O3S 326.1916 KWXICGTUELOLSQ-UHFFFAOYSA-N
6.7 Yes 1 17.3 All
4-Isopropylbenzenesulfonic acid
C9H12O3S 200.0507 CVLHGLWXLDOELD-UHFFFAOYSA-N
3.4 (3rd) No 3 12.4 LT-P09
5-(2-Pyridinyl)-1H-pyrazole-3-carboxylic acid
C9H7N3O2 189.0538 SJBWHTBPIJXUFP-UHFFFAOYSA-N
3.8 No 3 5.1 All
5-Amino-2-chlorotoluene-4-sulfonic Acid
C7H8ClNO3S 220.9913 VYZCFAPUHSSYCC-UHFFFAOYSA-N
4 Yes 1 5.4 LT-P01 to LT-P18

163
Table D-7.2 (continued). Details of the (tentatively) identified substances prioritised from negative ESI data.
Compound Formula Neutral mass InChIKey
Score (rank) a Suspect
Ident. Level b
RT (min) In well
5-Isopropyl-2-methylbenzenesulfonic acid
C10H14O3S 214.0664 OORBHYFTTSLSRU-UHFFFAOYSA-N
3 No 3 7.5 LT-P09
6,7-Dihydroxy-2-naphthalenesulfonic acid
C10H8O5S 240.0092 DKJVSIITPZVTRO-UHFFFAOYSA-N
3.3 No 3 4.1 LS-P12 to LT-P14
Acesulfame C4H5NO4S 162.9939 YGCFIWIQZPHFLU-UHFFFAOYSA-N
6.8 Yes 1 2.5 LS-P12 to LT-P11
Bayer's Acid C10H8O4S 224.0143 HUYJTJXLNBOVFO-UHFFFAOYSA-N
4.3 (3rd) Yes 3 3.4 All
Camphorsulfonic acid C10H16O4S 232.0769 MIOPJNTWMNEORI-UHFFFAOYSA-N
4.4 No 1 5 LT-P03 to LT-P18
Dibutyl phosphate C8H19O4P 210.1021 JYFHYPJRHGVZDY-UHFFFAOYSA-N
6.7 Yes 1 8.8 LS-P12 to LT-P14
Diphenylphosphinic acid C12H11O2P 218.0497 BEQVQKJCLJBTKZ-UHFFFAOYSA-N
6.4 Yes 1 7.7 LS-P12 to LT-P14
Ebert-Merz a-Acid C10H8O6S2 287.9762 VILFVXYKHXVYAB-UHFFFAOYSA-N
5 (2nd) Yes 3 3.2 LT-P05 to LT-P18
Ethyl 2-sulfamoylbenzoate C9H11NO4S 229.0409 CYFKZTWSLPKROH-UHFFFAOYSA-N
3.9 (2nd) No 3 6.5 LT-P01 to LT-P18
Naphthionic acid C10H9NO3S 223.0303 NRZRRZAVMCAKEP-UHFFFAOYSA-N
6.2 Yes 1 2 All
O,O-Diethyl thiophosphate C4H11O3PS 170.0166 PKUWKAXTAVNIJR-UHFFFAOYSA-N
4.2 No 1 3.6 LT-P01 to LT-P18
p-Toluenesulfonic acid C7H8O3S 172.0194 JOXIMZWYDAKGHI-UHFFFAOYSA-N
5.9 Yes 1 6.4 LT-P01
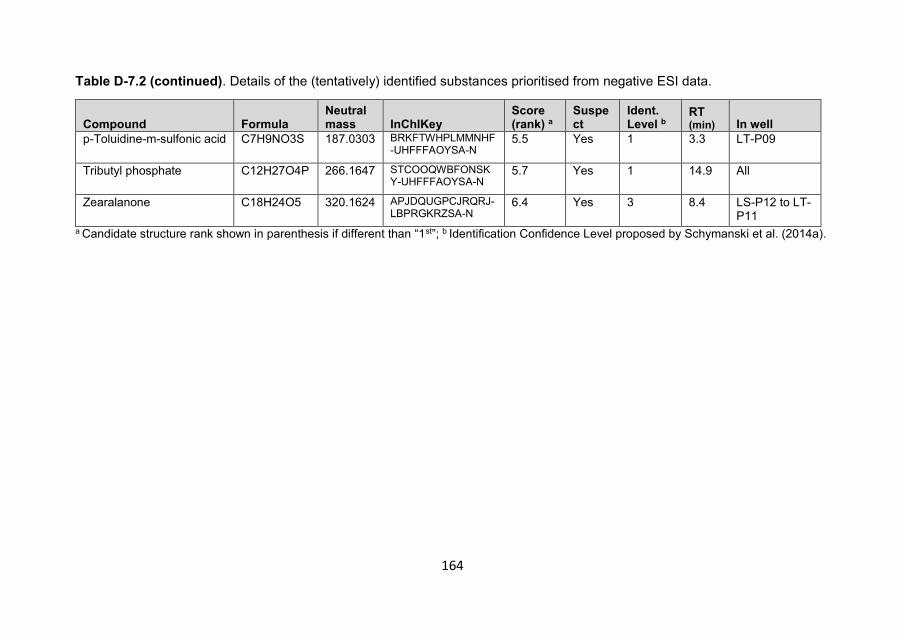
164
Table D-7.2 (continued). Details of the (tentatively) identified substances prioritised from negative ESI data.
Compound Formula Neutral mass InChIKey
Score (rank) a
Suspect
Ident. Level b
RT (min) In well
p-Toluidine-m-sulfonic acid C7H9NO3S 187.0303 BRKFTWHPLMMNHF-UHFFFAOYSA-N
5.5 Yes 1 3.3 LT-P09
Tributyl phosphate C12H27O4P 266.1647 STCOOQWBFONSKY-UHFFFAOYSA-N
5.7 Yes 1 14.9 All
Zearalanone C18H24O5 320.1624 APJDQUGPCJRQRJ-LBPRGKRZSA-N
6.4 Yes 3 8.4 LS-P12 to LT-P11
a Candidate structure rank shown in parenthesis if different than “1st”; b Identification Confidence Level proposed by Schymanski et al. (2014a).

165
Chapter 6. Combining bioanalysis and non-target screening to evaluate RO drinking water treatment

166
Abstract In The Netherlands, stand-alone reverse osmosis (RO) has been proposed to produce high-quality drinking water from raw riverbank filtrate impacted by anthropogenic activities. To evaluate RO’s efficacy in removing organic micropollutants, biological analyses were combined with non-target screening using high-resolution mass spectrometry and open cheminformatics tools. The bank filtrate induced xenobiotic metabolism mediated by the aryl hydrocarbon receptor, adaptive stress response mediated by the transcription factor Nrf2 and genotoxicy in the Ames-fluctuation test. These effects were absent in RO permeate (product water), indicating removal of bioactive micropollutants by RO membranes. In the water samples, 49 potentially toxic compounds were tentatively identified with the in silico fragmentation tool MetFrag using the US Environmental Protection Agency CompTox Chemistry Dashboard database. 5 compounds were confirmed with reference standards and 16 were tentatively identified with high confidence based on similarities to accurate mass spectra in open libraries. Bioactivity metadata of the confirmed chemicals indicated that 2,6-dichlorobenzamide and bentazone could induce xenobiotic metabolism and adaptive stress response, respectively, potentially explaining the effects characterised with the bioanalytical tools. Bioactivity metadata of 7 compounds tentatively identified with high confidence indicated that these structures could induce endpoints observed in the bioanalytical tools. This study shows that riverbank filtration-RO could produce drinking water free of the investigated toxic effects. Additionally, the potential of elucidating chemical structures behind biological activities by non-target screening proved useful to derive cause-effect relationships.

167
6.1. INTRODUCTION
Natural drinking water sources are ubiquitously contaminated with polar organic micropollutants and their transformation products (TPs) (Furlong et al., 2017; Kolpin et al., 2002; Loos et al., 2010; Schwarzenbach et al., 2006). The chemical mixtures that threaten the quality of source waters and drinking water can vary widely, including persistent and pseudo-persistent, i.e. continuously emitted, mobile hydrophilic compounds (Reemtsma et al., 2016). As the potential adverse effects to human health are not fully understood (Brack et al., 2015; Schriks et al., 2010), it is preferred to maximise micropollutant removal from drinking water and to efficiently, comprehensively evaluate its quality.
Reverse osmosis (RO) has shown great potential to remove organic micropollutants from a variety of water matrices (Escher et al., 2011; Fujioka et al., 2012a; Radjenović et al., 2008). RO uses semi-permeable membranes to separate solutes from water molecules under the driving force of an externally applied pressure (Petersen, 1993). Chemical passage through RO membranes follows a solution-diffusion mechanism (Wang et al., 2014), with solvent and solutes independently transported to the permeate side along their transmembrane chemical potential gradient. Diffusion of organics is mainly hindered by compound size and influenced by charge and hydrophobicity of solutes and membrane (Bellona et al., 2004; Wang et al., 2014). As the baseline mechanism behind chemical removal by RO is physical separation, by-products are not expected unless membrane integrity is compromised or the feed water is disinfected (Bellona et al., 2004). Although RO is considered as an energy intensive step when incorporated in conventional treatment trains (Garfí et al., 2016), stand-alone RO applications to produce potable water from natural waters requiring minimum pre-treatment have emerged, representing a new scenario to achieve excellent removal of harmful chemicals and waterborne pathogens with low operational costs and environmental impact (Van der Meer, 2013).
In The Netherlands, RO has been proposed as a single-step treatment to produce high-quality drinking water from riverbank filtrate. Riverbank filtration (RBF) is an energy-efficient process that occurs naturally or can be induced to increase source water quality in catchments areas impacted by anthropogenic activities (Hollender et al., 2018; Hoppe-Jones et al., 2010; Huntscha et al., 2013; Tufenkji et al., 2002; Umar et al., 2017). RBF can attenuate micropollutant concentrations as a result of biodegradation and sorption phenomena taking place mostly in the hyporheic zone (Bertelkamp et al., 2016, 2014) and to a lesser extent in the aquifer (Schmidt et al., 2007). The fate of polar organics largely depends on the biogeochemical conditions of RBF systems and on compound physicochemical properties (Tufenkji et

168
al., 2002). Typically, sorption is effective in retaining non-polar, moderately hydrophobic compounds, as well as cationic compounds by hydrophobic and electrostatic interaction mechanisms, respectively, whereas polar, neutral hydrophilic substances and anionic organics can pass the hyporheic zone unchanged if not biodegraded (Hollender et al., 2018; Huntscha et al., 2013).
To comprehensively assess water quality, a combination of chemical analysis and effect-based methods (EBM) has been proposed recently (Altenburger et al., 2019; Brack et al., 2019). EBMs relying on low-complexity in vivo or cell-based in vitro bioanalytical tools with specific endpoints can be employed to evaluate the adverse effects of (organic) chemicals (Escher and Leusch, 2012), emphasising mixture effects of water samples rather than single components (Wernersson et al., 2015). EBMs focussing on genotoxicity and cytotoxicity emerged in the 1970s (Chang et al., 1981; Ames et al., 1975), whereas reporter genes assays were introduced in the 1990s (Jobling et al., 1998). Nowadays, EMBs are being increasingly integrated in routine applications to evaluate toxicity pathways with biological endpoints relevant for water quality. Sensitive test batteries covering specific and non-specific mode of actions are employed, including bioassays representative for receptor-mediated endocrine disruption, metabolism of xenobiotics and adaptive stress response indicated as minimum requirement (Escher et al., 2014).
Dissolved polar organics are typically characterised by liquid-chromatography coupled to tandem mass spectrometry (LC-MS/MS). The capabilities of recent high-resolution MS (HRMS) have set the basis for suspect screening and non-target screening (NTS), i.e. methodologies to elucidate the structures of unknown ions by tentative annotation of accurate mass full-scan spectra (HRMS1) and tandem mass spectra (HRMS2) without the need for reference standards (Hollender et al., 2017; Krauss et al., 2010; Schymanski et al., 2014b). Suspect screening deals with the tentative annotation of compounds expected to occur in the samples. Typically, suspect chemicals have known structure, fragmentation behaviour and chromatographic retention time. Instead, NTS deals with the elucidation of structures for which a priori information of their occurrence in a sample is not available. State-of-the art NTS uses the high-throughput performance of open cheminformatics tools such as MetFrag (Ruttkies et al., 2016) and SIRIUS (Dührkop et al., 2013), in silico fragmenters that query a chemical database, e.g. PubChem (Gindulyte et al., 2015), to retrieve candidate structures. These are scored on the basis of the fit of the in silico-generated MS fragments to the experimental HRMS2 data and on selected metadata associated to candidate structures. This approach has shown potential to increase chemical identification success rate (Schymanski et al., 2017). The U.S. Environmental Protection Agency (EPA) hosts the CompTox Chemicals

169
Dashboard (Williams et al., 2017), an open database with high-quality, structure-curated data of ~765,000 substances (Richard and Williams, 2002). The structures deposited in the Dashboard are linked to human and ecological hazard data from various sources, including in vitro bioactivity data from ToxCast and Tox21 high-throughput screening programmes (Kavlock et al., 2012; Tice et al., 2013), predicted exposure data from the ExpoCast project (Wambaugh et al., 2013), and a variety of high-interest environmental lists of chemicals. A valuable and so far unique feature of the Dashboard is the accessibility to MS-ready form structures (McEachran et al., 2018). The Dashboard is downloadable, giving the possibility of being used as local database in MetFrag (or other applications). Because of the health- and environment-relevant metadata, the Dashboard is a valuable tool for NTS of environmental contaminants with potential toxic effects (McEachran et al., 2017).
The aim of this study was to evaluate the application of RO as stand-alone treatment step to produce high quality drinking water from a raw riverbank filtrate that originated from the lower Rhine in the Netherlands, using the biological and chemical methods mentioned above. The Rhine catchment area, despite regulatory actions and mitigation measures that substantially improved its ecological status (Verweij, 2017), remains contaminated with anthropogenic organic micropollutants (Brack et al., 2015; Hollender et al., 2014; Ruff et al., 2015) and their removal from the river water by RBF and RO requires continuous monitoring. We adopted a combined approach relying on (i) EBMs representative for endocrine disruption, xenobiotic metabolism, adaptive stress response and genotoxicity relevant for human health and (ii) NTS of LC-HRMS/MS data using open cheminformatics tools in connection with the EPA CompTox Chemistry Dashboard. The bioassay test battery provided a broad coverage of modes of action and represented toxicity pathways relevant for human health known to be triggered by micropollutants in environmental water samples (Brack et al., 2019; Escher et al., 2014; Neale et al., 2017). To our knowledge this is the first effect-based monitoring study of a RO drinking water treatment plant fed with a raw natural freshwater where potentially toxic compounds were characterised by state-of-the-art NTS with open cheminformatics.
6.2. MATERIALS AND METHODS
6.2.1. Full-scale RO treatment plant and sampling
The full-scale RO system was operated for research purposes in the premises of an actual drinking water treatment plant located in the Dutch municipality of Woerden. The system consisted of a three-stage filtration series equipped with ten ESPA2-LD-4040 membrane modules

170
(Hydranautics, Oceanside, CA) in 6:3:1 configuration. The ESPA2 is a thin-film composite with an active layer of cross-linked aromatic polyamide (Lee et al., 2011), currently considered the commercial standard RO membrane. Each step was equipped with flow meters to monitor feed water, permeate and concentrate lines. The RO system was fed with ≈ 9 m3/h of an actual drinking water source consisting of raw anaerobic riverbank filtrate with an average travel time of 30 years and freshly abstracted on site. The RO system was set at 70% productivity, resulting in a permeate flow of ≈ 6.3 m3/h and implying that 30% of the feed water was discarded as RO concentrate. Feed water, RO permeate and RO concentrate samples (n=4) from the same water package were collected in one sampling event. As the quality of the RBF and the conditions of RO are stable throughout time, no variations were expected. The samples were taken from faucets built on the system, transferred to 10L polypropylene bottles and stored in the dark at 2 °C for 12 days before enrichment by solid-phase extraction (SPE).
6.2.2. Sample enrichment by solid-phase extraction
Three enrichment procedures relying on hydrophilic-lipophilic balance (HLB) sorbent material with Oasis cartridges by Waters (Etten-Leur, The Netherlands) were used: one for the reporter gene assays, one for the Ames tests and one for chemical analysis, respectively. The methods, although differing for the sample load and elution solvent composition, covered the same broad range of organic compounds. The final enrichment factor for the reporter gene assays procedure was 1,000x, that for the Ames test was 10,000x and that for chemical analysis was 100x (taking into account dilution in ultrapure water for the extracts to be compatible with the chromatographic mobile phase used for chemical analysis). Details on the different procedures are given in the Appendix E (sections E-1.1, E-1.2 and E-1.3).
6.2.3. Bioanalysis
6.2.3.1. In vitro reporter gene assays
In vitro nuclear receptor reporter gene assays representative for seven endpoints were used to evaluate specific and non-specific toxicity. In these assays, chemicals with receptor affinity (i.e., ligands) cause a ligand-receptor complex to translocate into the nucleus, where expression of a reporter gene is induced by binding of the complex to a receptor-specific response element on the DNA (Escher and Leusch, 2012). Endocrine disruption was assessed with a hormone receptor test battery consisting of four cell lines expressing the human estrogen receptor alpha (ERα-GeneBLAzer), the rat androgen receptor (AR-GeneBLAzer), the human glucocorticoid receptor (GR-GeneBLAzer) and the human progestagenic receptor (PR-GeneBLAzer), respectively. For these bioassays, ligand-receptor binding induced

171
expression of a reporter gene encoding the enzyme -lactamase. Further details including experimental procedures are described in the literature (Nivala et al., 2018). Induction of xenobiotic metabolism was evaluated with two bioassays. The first assay was based on the rat cell line H4L1.1c4 expressing the aryl hydrocarbon receptor containing a chemical-activated luciferase reporter gene (AhR-CALUX). This assay is sensitive to compounds exhibiting dioxin-like activity, which induce the transcription of metabolic enzymes, e.g. the cytochrome P450, that can convert AhR ligands to reactive intermediates (Neale and Escher, 2018). Further details including the procedure adopted for the AhR assay can be found in the literature (Neale et al., 2017; Nivala et al., 2018). The second bioassay to assess the xenobiotic metabolism was based on the human cell line HEK 293H expressing the peroxisome proliferator-activated receptor gamma (PPARγ-
GeneBLAzer) with a reporter gene encoding for -lactamase and followed a procedure described elsewhere (Neale et al., 2017). This assay is representative for the induction of enzymes responsible for glucose, lipid and fatty acid metabolism. Adaptive stress response was evaluated with a methodology by Escher et al. based on AREc32 (Escher et al., 2012), a stable antioxidant response element-driven Nrf2 reporter gene cell line derived from the human breast cancer MCF7 cells with the addition of a luciferase gene. Activation of the oxidative stress response in AREc32 can be triggered by electrophilic chemicals and reactive oxygen species (Escher et al., 2012; Wang et al., 2006).
All sample concentrations were expressed in units of relative enrichment factor (REF), which take into account the SPE enrichment factor and the dilution factor in the bioassay (Escher et al., 2014). The maximum REF used in this study was 100, i.e. the highest enrichment factor in the bioassays was 100 times higher than the water samples. For all assays, cell viability was assessed to ensure that cytotoxicity would not mask the observed effects. For hormone receptor-mediated effects and xenobiotic metabolism, the concentrations (in REF) causing 10% of the maximum effect (EC10) were derived. For the adaptive stress response there is no maximum of effect, so that the concentration causing an induction ratio of 1.5 (ECIR1.5) was derived instead. The IC10, EC10 and ECIR1.5 were converted to toxic units (TU) and effect units (EU), respectively. The derivation of the results of the gene reporter assays is described in the Appendix E (E-2).
6.2.3.2. Ames fluctuation assays
The Ames-fluctuation test based on genetically modified Salmonella typhimurium strains TA98 and TA100 was performed to assess the potential of water samples to induce frame-shift mutations and base-pair substitution,

172
respectively (Ames et al., 1975). The test was performed as reported previously with minor modifications (Heringa et al., 2011). Concentrated water samples and procedure controls were tested in duplicate with and without S9 enzyme mix, in two independent experiments. Solvent control (DMSO) and positive controls (in DMSO) were tested in triplicate. Results were expressed as number of cell culture wells in which a colour change of a pH indicator in the medium was observed. Maximum (10) and minimum (25) average numbers of colour-changed wells were considered for the solvent controls and positive controls, respectively. A chi-square-test was used to determine statistically significant differences (p<0.05). Test conditions were compared to solvent and SPE blanks (procedure controls) for potential false positive results. Samples were considered mutagenic if a statistically significant response was repeated within independent experiments in at least one of the test conditions.
6.2.4. Chemical analysis followed by non-target screening
The SPE extracts were analysed with an ultrahigh-performance LC system (Nexera Shimadzu, Den Bosch, The Netherlands) coupled to a maXis 4G high resolution quadrupole time-of-flight HRMS (q-ToF/HRMS) upgraded with HD collision cell and equipped with a ESI source (Bruker Daltonics, Leiderdorp, The Netherlands). Further details on the LC-HRMS method are given in the Appendix E (E-3). NTS of HRMS data was entirely performed with the software patRoon executed within the R statistical environment (Helmus, 2018; R Core Team, 2017). patRoon is a comprehensive platform that combines openly available cheminformatics tools for NTS and selected vendor software. Further documentation is available on the GitHub repository (Helmus, 2018). An essential description of the workflow is given in this section, whereas the terminology used can be consulted elsewhere (Hollender et al., 2017). The raw LC-HRMS analysis files were converted to centroided mzML format by using an algorithm available in the HRMS system vendor software DataAnalysis (Bruker Daltonics, Wormer, The Netherlands). Processing of the non-target features, i.e. peak-picking, grouping and retention time (tR) alignment, was performed using the OpenMS algorithm within patRoon (Röst et al., 2016). An absolute intensity threshold of 10,000 was considered for peak picking. Feature groups were defined as unique m/z (comprehensive of carbon isotopes signals) and tR pairs occurring in the different sample matrices. A tolerance window of 5 ppm mass accuracy and 20 sec tR was considered. Only features present in all replicates and with intensities at least five times greater than in procedural blanks were kept for further processing. Protonated ([M+H]+) and deprotonated ([M-H]-) ions were considered for post processing of positive and negative electrospray ionisation mode datasets,

173
respectively. The best molecular formula fitting precursor and product ions was calculated using the GenForm algorithm (Meringer et al., 2011). The MetFrag approach was chosen for tentative annotation of the non-target features (Ruttkies et al., 2016). Candidate structures having neutral monoisotopic mass within ± 5 ppm from that of the non-target ions were retrieved from the EPA CompTox Chemistry Dashboard, which was used as local database (EPA’s National Center for Computational Toxicology, 2018). The structures were fragmented in silico and the fragments fitted to the experimental HRMS2 spectra. All candidate structures were scored based on the following scoring terms: (i) FragScore: fit of the in silico fragments to the experimental HRMS2 spectra; (ii) MetFusionScore: spectral similarities to MassBank of North America (MoNA) built within MetFrag with the MetFusion approach (Gerlich and Neumann, 2013; “Mass Bank of North America (MoNA)”); (iii) individualMoNAscore: spectral similarity by candidate structure InChIKey lookup in MoNA; (iv) ExpoCast: median exposure prediction (in mg per kg-body weight per day); (v) ToxCastPercentActive: percentage of active hit calls in ToxCast database; (vi) pubMedReferences: number of literature references in PubMed; (vii) DataSources: data sources on the Dashboard; (viii) CPDatCount: number of consumer products based on the EPA’s Chemicals and Products database. These eight scoring terms were individually normalised by the highest value found among the proposed candidates and equal weighting of 1 was used. An additional score of 1 was added for hits in the following lists: (i) SUSDAT: merged list of >40,000 structures from the NORMAN Suspect List Exchange; (ii) MASSBANK: list of NORMAN compounds on the European MassBank; (iii) TOXSL21: list of substances included in the TOXSL21 programme; (iv) ToxCast: list of substance included in the ToxCast programme. Finally, a formula score was assigned to candidate structures for which consensus between formulas derived by MetFrag and calculated by GenForm was reached. The formula consensus approach was adopted as GenForm performs an algebraic calculation of the best formula fitting precursor and fragment ions accurate masses, whereas MetFrag finds the best candidate structure matching the (de)protonated monoisotopic mass used as query, de facto back-calculating formulas of the in silico fragments. Therefore, the two approaches are complementary and their combination can enhance spectra interpretation.
As the main aim of this NTS was to identify, with the highest possible confidence, micropollutants that could have been responsible for observed effects in the bioanalytical tools, prioritisation of the tentatively annotated features involved filtering out candidate structures that were not present in the MASSBANK list or for which an individual MoNA score could not be assigned. Evaluation of the results included visual assessment of chromatographic peaks and plots of de-noised HRMS2 spectra, as well as

174
inspection of the MetFrag scores. All tentatively annotated structures were assigned identification confidence levels based on the scale proposed by Schymanski et al. (Schymanski et al., 2014a). Whenever possible, this process was aided by calculation of spectral similarity to records in MoNA or MassBank with the R package OrgMassSpecR (Dodder et al., 2017). Spectral matches were reviewed manually by at least three co-authors for plausibility.
6.3. RESULTS AND DISCUSSION
6.3.1. Reporter gene assays
Only AhR-CALUX and AREc32 showed activity, while none of the hormone receptor-mediated effects were induced by the feed water and RO samples. Concentration-effect curves limited to the assays that showed sufficient activity to allow the derivation of EC10 or ECIR1.5 are provided in the Appendix E (E-4), whereas inhibitory concentrations for cytotoxicity (IC10) and effect concentrations for reporter gene activation (EC10 and ECIR1.5) are reported in Table E-5.1. The results depicting the bioassays in which receptor-mediated effects were observed are shown in Figure 6.1.
Figure 6.1. Radar plots of cytotoxicity (left) and receptor-mediated effects (right) expressed in toxic units (TU) and effects units (EU), respectively, depicting the gene reporter assays where effects were induced. ROF = reverse osmosis feed, i.e. riverbank filtrate; ROC = reverse osmosis concentrate; ROP = reverse osmosis permeate.
Lack of induction of hormone receptor-mediated effects could be rationalised based on the chemistry of the agonists of these receptors in relation to the investigated water matrices. Hormones, despite featuring polar functional groups along their structures, are mostly hydrophobic and thus they are expected to be retained in RBF systems by sorption phenomena (Benotti et al., 2012). A recent study observed that RBF could not fully remove

175
estrogenic activity (Plutzer et al., 2018), nevertheless in that study a bank filtrate having a travel time of ≈ 20 days was tested, whereas in our case the travel time of the RBF was on average 30 years. We assumed that a much longer travel time could have maximised hormone removal or dilution to undetectable concentrations. For RO feed water (ROF), the average cytotoxicity expressed as TU was 0.024 in AhR (corresponding to IC10 ≈ 42 REF), whereas in AREc32 the TU
value was 0.011 (IC10 ≈ 89 REF). This indicated that the ROF needed to be enriched 42 and 89 times in order to cause 10% decrease in viability of the AREc32 and AhR cell lines, respectively. While the TU values of ROF were higher in AhR by a factor of 2 compared to AREc32, the greatest difference was observed when the cells were exposed to RO concentrate (ROC). In this case, 0.089 TU (IC10 ≈ 12 REF) to the AhR cell line was quantified, whereas the TU in AREc32 was 0.014 (IC10 ≈ 70 REF). In line with previous literature (Escher et al., 2012), the AREc32 cell line was more robust and less prone to disturbance by non-specific toxicity. In all cases, the RO permeate (ROP) was not cytotoxic within the tested REF range, except in one ambiguous case discussed later in this section, where also receptor-mediated effects were induced. Overall our results indicated that ROP was not cytotoxic within the tested REF range up to REF 100.
RO samples and SPE procedural blanks induced xenobiotics metabolism mediated by the AhR. Procedural blanks were active with an average EU of 0.014 (EC10 ≈ 72 REF), whereas the ROP samples displayed an average EU of 0.017 (EC10 ≈ 69 REF). As these values were comparable, activity of the ROP was attributed to impurities enriched during sample preparation and not to micropollutants that were able to pass the RO membranes. EU of 0.13 (EC10 ≈ 8 REF) and 0.17 (EC10 ≈ 6 REF) were quantified for ROF and ROC, respectively, indicating comparable bioactivity of these matrices at low enrichment factor. A recent study on groundwater impacted by sewage exfiltration found that deep aquifers used as negative controls were equally active as water from shallow groundwater wells in a AhR assay (Lee et al., 2015), indicating that some micropollutants caused effects at levels below the limit of detection of their analytical methods. This highlights the importance of obtaining adequate controls and blank samples as well as the ability to discern between the sensitivity of the bioassays and that of the detector used for targeted chemical analysis. In the cited study the same results were obtained for ERα and GR, whereas in our study no estrogenic and glucocorticoid activities were observed. These results highlight the importance of applying robust barriers against organic micropollutants during drinking water treatment and our study indicates that RO filtration is a suitable barrier to remove potential precursors of carcinogenic compounds.

176
The toxicity pathway representative for oxidative stress response was induced by ROF and ROC, for which EU values of 0.15 (ECIR1.5 ≈ 6.6 REF) and 0.30 (ECIR1.5 ≈ 3.3 REF) were calculated, respectively. Procedural blanks and ROP samples were not active, except for a single ROP replicate, which gave ambiguous results and caused ≈ 10% reduction in cell viability with a very wide standard error at REF ≈ 100. This sample induced the Nrf2 factor with an ECIR1.5 of ≈ 60 REF, corresponding to 0.017 EU. This effect resulted from an unclear interference, as the remaining three replicates did not induce oxidative stress. Escher et al. (Escher et al., 2012) used the reporter gene assay AREc32 to investigate water recycling in an Australian advanced water treatment plant (AWTP), which included RO filtration in the treatment train. In their study, ROF and ROC from the AWTP displayed ECIR1.5 values lower by one order of magnitude compared to our samples. This was not surprising as in their case RO was applied to a wastewater pre-treated with ultrafiltration, a membrane process effective for macromolecules with molecular weight ≥ 1 kDa (Li et al., 2017), thus not suitable against micropollutants, whose size usually does not exceed 300 - 400 Da. A bioassay battery relying on Microtox, E-SCREEN and algal test was used to characterise water quality of samples from the same Australian AWTP (Escher et al., 2011). In that study a mass balance showed good agreement between theoretical and experimental toxic equivalent concentrations in the different RO matrices. We repeated this exercise by using the EU values of samples that were active. Based on a 70% productivity of the RO plant investigated in this study, i.e. an RO concentration factor 3.3 in ROC compared to the ROF, mass balance values of 41% and 62% were calculated for AhR and AREc32 assays, respectively. These numbers indicate that some of the bioactive compounds in the ROC samples were possibly lost during enrichment. A more solid conclusion could not be reached as the SPE recoveries in the different sample matrices were not investigated. More information and a mass balance plot are provided in the Appendix E (E-6).
6.3.2. Ames tests
The results of the Ames-fluctuation tests for S. typhimurium strains TA98 and TA100 with and without the S9 mix are summarised in Table 6.1, whereas plots are given in the Appendix E (E-7). ROF was genotoxic to strain TA98-S9, indicating mutagenicity of micropollutants occurring in the bank filtrate non-mediated by the S9 enzyme mix. One ROF replicate induced genotoxicity in strain TA98+S9, indicating that enzyme-mediated chemical activation resulted in frame-shift mutations in the genome of this particular strain. However, we consider ROF to be non-genotoxic in this condition given the disagreement between replicate tests. Additionally, in condition TA98+S9

177
(and TA100+S9), a decrease of ≈ 25% viability compared to the control was observed when the strain was exposed to ROF, indicating non-specific cytotoxicity of organic components enriched from the bank filtrate that may have resulted in false negative results. In all these cases, genotoxicity was removed by RO as exposure to ROP extracts did not result in S. typhimurium revertants. For condition TA100-S9, genotoxicity of ROF was observed in both duplicate experiments, however this result might be a false positive given the mutagenic effects induced by one of the procedural blanks while negative controls were not mutagenic. One of the replicate ROP samples was also genotoxic to strain TA100-S9, however the effect could not be replicated and may result from impurities introduced during the extraction procedure. It was concluded that while direct genotoxic potential may be present in ROF, ROP was not mutagenic in any of the tested conditions. Supporting literature indicating mutagenicity of groundwater to S. typhimurium strain TA98 without the S9 enzyme mix was found (Haider et al., 2002), although in that study activity was attributed to natural compounds and not anthropogenic pollutants. Another study on drinking water prepared from Dutch groundwater found that, when present, mutagenic activity was predominantly indirect for strain TA98, i.e. without S9, and that in some cases even drinking water was mutagenic to strain TA98-S9 (Kool et al., 1989).
Table 6.1. Ames test results of RO samples
ROF = RO feed water (riverbank filtrate); ROP = RO permeate; + = genotoxic; - = non genotoxicy; a. One out of two procedural blanks was genotoxic in one replicate experiment, but negative controls were not; b One out of two procedural blanks was genotoxic in one replicate experiment, but negative controls were not.
ROF ROP
Test conditions Viability (%) Genotoxicity Viability (%) Genotoxicity
TA98 (-S9) 122±1 positive (++) 130±15 negative (--)
TA98 (+S9) 75±20 negative (-+) 75±19 negative (--)
TA100 (-S9) 107±1 positive (++)a 110±6 negative (-+)b
TA100 (+S9) 75±1 negative (--) 93±16 negative (--)

178
6.3.3. Non-target screening
An overview of the features detected in the ROF (bank filtrate), ROC and ROP is provided in Figure 6.2.
Figure 6.2. Venn diagrams of non-target features in samples from the RO drinking water treatment plant detected in positive (left) and negative (right) electrospray ionisation (ESI) datasets. ROF: RO feed water; ROP: RO permeate; ROC: RO concentrate.
In total, 2423 and 1036 features were detected in positive and negative electrospray ionisation (ESI), respectively, and considered for post processing. The distribution of positive and negative features among the RO water matrices was generally comparable in number except for ROC, in which 1836 and 617 positive and negative features were detected, respectively. In general, a higher number of features was expected in ROC as in this matrix the concentrations of solutes would reach levels up to 3.3 times higher than ROF assuming near-full rejection by RO. The lower number of negative features in ROC might result from ion suppression caused by dissolved organic matter, naturally occurring in this bank filtrate at concentrations around 7-8 mg/L and that might have been carried through the extraction to some extent (Cullum et al., 2004). In addition, ionisation in negative ESI mode might have been suppressed by the acetic acid added to the LC mobile phase as a modifier. Lastly, as excellent rejection of inorganic ions can be achieved by RO (Lee et al., 2011), different adducts could have formed in the ROC samples analysed in positive ESI mode, possibly explaining the higher number of positive features in this matrix. As shown in Fig. 6.2, only about 2/3 and 1/3 of the features detected in ROF were found back in the positive and negative ROC data, respectively. This might result from matrix effects, such as ion suppression, which might have affected both ionisation or extraction efficiency in ROC. Additionally, in ROC we

179
encountered some instances in which early eluting features fell out of the 20 sec tolerance window used to group features amongst water matrices, resulting in a given m/z being assigned to two different feature groups and thus not overlapping between ROF and ROC. This behaviour was not investigated further as these features were nonetheless considered for tentative identification if they complied with the prioritisation criteria. Based on the physicochemical properties behind incomplete chemical removal by RO, it could be assumed that most features detected in ROP, which were overall comparable between the positive and negative datasets, were either small and hydrophilic uncharged compounds, small cationic compounds or uncharged (moderately) hydrophobic compounds exhibiting polar groups ionisable by HRMS (Bellona et al., 2004). Features occurring only in ROP might have been undetectable elsewhere due to matrix effects or some of them might have even leached from the RO the system.
Among the detected features, 1528 positive and 833 negative ions from all sample matrices were assigned a tentative structure by MetFrag. In the positive data, 53 tentatively annotated structures were present in the MassBank list, 24 of which were similar to spectra in MoNA. Additionally, 13 structures not present in the MassBank list were similar to records in MoNA. In the negative data, 28 candidate structures were similar to records in MoNA, 2 of which were also present in the MassBank list. All other structures were not found in spectral libraries and did not have associated bioactivity metadata. The InChIKey identifiers of candidates that exhibited good-quality chromatograms, plausible HRMS2 annotation and that would likely ionise in ESI-HRMS analysis (e.g., neutral polar and ionic organics) were used to query MoNA and the European MassBank. Similarities to relevant spectra were calculated. This approach resulted in the tentative identification of 25 and 24 candidate structures in the positive and negative data, respectively. Analysis of reference standards led to confirmation of 2,6-dichlorobenzamide, phenazone and trimethyl phosphate in the positive ESI data, whereas bentazone and acesulfame were confirmed in the negative ESI data. Supporting spectral library evidence, shown in the Appendix E (E-8) and indicated here in parenthesis next to compound name, was found for the 16 structures. In the positive data 2-phenylethylamine (Fig. E-8.1), benzisothiazolinone (Fig. E-8.4), diethyl phosphate (Fig. E-8.5), diphenylphosphinic acid (Fig. E-8.9), triphenylphosphine oxide (Fig. E-8.10) were assigned identification confidence level 2a, the highest possible without reference standards. Anthranilic acid (Fig. E-8.2), 4-hydroxybenzoic acid (Fig. E-8.3) and fusaric acid (Fig. E-8.6) despite good match with library spectra could not be identified with confidence higher than level 3 as other isomers could not be ruled out. In the case of the triazine TPs 2-hydroxysimazine (Fig. E-8.7) and 2-hydroxyatrazine (Fig. E-8.8), despite

180
good spectral similarity, level 3 was assigned due to (quasi-)isobaric interferences in the experimental HRMS2 data. In the negative data, acamprosate (Fig. E-8.13), saccharin (Fig. E-8.14) and mecoprop (Fig. E-8.16) were assigned level 2a, whereas catechol (Fig. E-8.11), mandelic acid (Fig. E-8.12) and 2-naphthalenesulfonic acid (Fig. E-8.15) could not be assigned a higher level than 3 as other isomers could not be ruled out. All level 2a were assigned based on matching spectra available on MoNA or MassBank, except diphenylphosphinic acid and saccharin for which spectra measured in house were used instead. For compounds identified as level 3 with supporting library spectra, it is important to stress the benefits of establishing a harmonised LC method for NTS in order to use a retention index, which could have increased confidence in the identification of isomers. The chemicals (tentatively) identified with the highest confidence having bioactivity metadata matching the endpoints covered by the bioassay test battery are listed in Table 6.2. In the Appendix E (E-8) the complete lists of (tentatively) identified structures in the positive (Table E-8.1) and negative ESI datasets (Table E-8.2) are provided.

181
Table 6.2. Structures (tentatively) identified, identification confidence level (ICL) and relevant bioactivity metadata
Compound a Formula Class ESI
mode b ICLc
Endpoints with AC50 (µM) d
ToxCast active
(%) Sample matrix e
Benzisothiazolinone C7H5NOS Herbicide + 2a Nrf2 induction (5.82) 30.6 ROF,ROC, ROP
2,6-dichlorobenzamide C7H5Cl2NO Herbicide metabolite
+ 1 AhR induction (60.6) 1.8 ROF, ROC
4-hydroxybenzoic acid C7H6O3 Natural and industrial
+/- 31 AhR induction (49.2);
ER induction (57.2) 1.3 ROF, ROC
Triphenylphosphine oxide C18H15OP Industrial + 2a Nrf2 induction (40.3) 1.8 ROF,ROC, ROP
Acamprosate C5H11NO4S Pharmaceutical - 2a Nrf2 induction (43.6) 1.8 ROF, ROC
Bentazone C10H12N2O3S Herbicide - 1 Nrf2 induction (32.1) 3.3 ROF, ROC
Catechol C6H6O2 Natural and industrial
- 31
Nrf2 induction (12.4);
AhR induction (57.2);
ER induction (71–84)
14.1 ROF, ROC
Mecoprop C10H11ClO3 Herbicide - 2a AhR induction (30.3);
PPAR induction(85.3) 0.6 ROF, ROC
Naphthalene-2-sulfonic acid
C10H8O3S Industrial - 31 AhR induction (40.3) 2 ROF, ROC
Saccharin C7H5NO3S Sweetener - 2a2 AhR induction (43.4) 1.3 ROF, ROC
a Hyperlink to compound bioactivity data on the EPA CompTox Chemistry Dashboard; b Detected adduct: + = [M+H]+; - = [M-H]-; c Identification Confidence Level (Schymanski et al., 2014a); d Data from EPA Chemistry Dashboard, limited to the reporter gene assays included in the test battery used for this study. AC50: active concentration in µM causing 50% of the effects; e Sample matrix in which the compound was (tentatively) identified. ROF: reverse osmosis feed water (riverbank filtrate); ROC: reverse osmosis concentrate; ROP: reverse osmosis permeate; 1 Supporting library evidence found, but insufficient to rule out other isomers; 2 Reference spectrum previously measured in house.

182
6.3.4. Bioactivity of the (tentatively) identified micropollutants
ToxCast data in the EPA Dashboard indicated that 2,6-dichlorobenzamide (BAM) activated a AhR bioassay with an AC50 (active concentration causing 50% of the effects) of 60.6 µM. Chlorobenzamides are potentially mutagenic (Guoguang et al., 2001; Holtze et al., 2007), which might additionally explain the genotoxicity of ROF characterised in the Ames tests. BAM was not detected in ROP, possibly supporting lack of activity of this matrix in both AhR and Ames assays. In previous studies from our group, BAM was quantified at a concentration of 39±2 ng/L in a bank filtrate from the same RBF system that fed the full-scale RO treatment plant (Albergamo et al., 2018) and displayed less than 1% passage in pilot-scale RO drinking water treatment (Albergamo et al., 2019). Amongst the compounds tentatively identified with supporting library evidence, ToxCast data showed that 4-hydroxybenzoic acid, catechol, mecoprop, naphthalene-2-sulfonic acid and saccharin (all detected in ROF and ROC) were active in a different assays based on the AhR gene reporter. Based on the acid dissociation constant (pKa) of 4-hydroxybenzoic acid (pKa = 4.6), mecoprop (pKa = 3.7) and naphthalene-2-sulfonic (pKa < 1), these chemicals would occur in ROF as dissociated acid as the pH value of this water matrix is ≈ 7, additionally supporting their occurrence in bank filtrate (Hollender et al., 2018) and their lack of detection in ROP (Bellona et al., 2004). Mecoprop was identified with highest possible confidence without a reference standard, i.e. lev. 2a, based on matching spectral records on MoNA and presence of distinctive isotopic peaks in both HRMS1 and HRMS2 experimental data. ToxCast data
indicated that mecoprop elicited effects in a PPAR assay with an AC50 nearly 3 times higher, thus less toxic, than that of AhR. Although we did not derive environmental concentrations of micropollutants, it would be plausible that
mecoprop would not occur at levels high enough to induce PPAR-mediated effects. This compound is a household herbicide that has been frequently detected in European WWTP effluents at concentrations up to 2.2 µg/L (Loos et al., 2013). Mecoprop is not retained by RBF systems, leaving biodegradation as sole option of attenuation. Although evidence of degradation in oxic RBF system exist (Huntscha et al., 2013), mecoprop is persistent in anoxic conditions (Williams et al., 2003). Its lack of detection in ROP is in line with the high removal efficiency by RO reported in literature, which was higher than 97% (Kegel et al., 2010). Mecoprop was found to be non-mutagenic to S. typhimurium strains TA98 and TA100 with and without the S9 enzyme (Brkic et al., 2015). Saccharin is an artificial sweetener ubiquitously detected along with acesulfame (confirmed in ROF and ROC), both indicators of the impact of domestic wastewater on natural waters as they are added in high amounts to food and beverages (Lange et al., 2012). As these sweeteners occur in anionic form at pH values of natural waters,

183
they have high mobility potential in the sub-surface (Buerge et al., 2009). Their negative charge can explain detection in the RBF system and lack of detection in RO permeate. The latter is in line with literature data, which reported more than 90% removal by RO for both compounds (Albergamo et al., 2019; Ling et al., 2017). ToxCast data indicated that saccharin induced effects in a AhR assay with an AC50 of 43.4 µM, whereas data for acesulfame were not found. Both sweeteners were not genotoxic to S. typhimurium strain TA100 with and without the S9 enzyme (Ghoshal and Mukherjee, 2008). ToxCast data for bentazone indicated its ability to induce transcription of Nrf2 with an AC50 of 32.1 µM. In line with literature data (Albergamo et al., 2019; Kegel et al., 2010), this chemical is well removed by RO as it was not detected in ROP. Bentazone was identified in 32% of European groundwater and is currently approved for use in the EU (Loos et al., 2010). Bentazone was not mutagenic to S. typhimurium strains TA98 and TA100 with and without the S9 enzyme mix (Brkic et al., 2015). Amongst the tentatively identified chemicals, benzisothiazolinone, acamprosate, catechol and triphenylphosphine oxide, induced transcription of Nrf2. Benzisothiazolinone was the tentatively identified compounds with lowest AC50 (5.82 µM in Nrf2 assay) and the highest ToxCast percent active (31%). In a previous study with the AhR-CALUX variation used here this chemical was not active below cytotoxic concentrations (Neale et al., 2017). This biocide is attenuated in wastewater sludge (Wick et al., 2011), nevertheless indications of its high groundwater contamination potential were found (Surgan et al., 2010), further supporting its tentative identification in the RBF system. Triphenylphosphine oxide is a persistent and toxic industrial chemical released in surface waters via wastewater effluents (Emery et al., 2005). A monitoring study on groundwater from various sources in The Netherlands found that triphenylphosphine oxide was more frequently detected in bank filtrate and confined groundwater, corroborating its tentative identification in the RO feed water (ter Laak et al., 2012). Acamprosate is the active ingredient of a pharmaceutical product to treat alcohol dependence, so far not detected in the environment, but indicated as potential drinking water contaminant (Babua et al., 2013). This chemical is anionic at any natural pH value and is excreted unchanged following therapeutic administration (Wilde and Wagstaff, 1997). This suggests that acamprosate may be released in surface water via domestic wastewater effluents and may pass the riverbank, reaching groundwater and exhibiting mobility in the sub-surface if not biodegraded. Given the lack of further environment-relevant information, its inclusion in future suspect screenings is recommended.
It is noteworthy that although neither effects nor genotoxicity were observed for ROP, benzisothiazolinone, trimethyl phosphate and triphenylphosphine oxide were the only (tentatively) identified in the RO permeate.

184
Benzisothiazolinone (151.18 Da), trimethyl phosphate (140.02 Da) and triphenylphosphine oxide (278.29 Da) are compounds whose physicochemical properties confer critical behaviour in RO filtration. Benzothiazolinone has a pKa of 9.5, thus occurred as a neutral species in ROF, whereas trimethyl phosphate is always uncharged as its structure has no atoms that can be ionised. Benzisothiazolinone has a predicted log octanol-water partition coefficient (logKow) of 1.02, whereas trimethyl phosphate has an experimental logKow of -0.65. Thus, both chemicals are hydrophilic, exhibit no affinity for the aromatic polyamide of which the separation layer of RO membranes is made of and remain dissolved in water, being able to pass through the RO membranes due to their small size. Triphenylphosphine oxide, instead, is also uncharged but exhibits a logKow of 2.83. Despite its larger size, this relatively hydrophobic chemical displays affinity for the aromatic polyamide active layer and likely undergoes adsorption-solution-diffusion onto-through polyamide RO membranes, resulting in breakthrough to the permeate side. Based on ToxCast data, it can be assumed that the concentrations of benzisothiazolinone and triphenylphosphine oxide were too low to trigger oxidative stress even after enrichment of the ROP samples. Nevertheless, as these chemicals were not fully removed they should be closely monitored in RO drinking water treatment processes as higher feed water concentrations might result in potentially toxic concentrations in ROP.
6.4. CONCLUSIONS
RO filtration directly applied to a raw riverbank filtrate in full-scale drinking water treatment was capable of producing potable water that did not induce any detectable adverse effects in the applied EBM battery. Toxicity pathways representative of xenobiotic metabolism, adaptive stress response and genotoxicity were activated by enriched bank filtrate. For the gene reporter assays, it would take no more than 6- to 8-fold concentration of this ROF to induce cellular toxicity pathways. The possible role of RBF in attenuating endocrine disrupting compounds was shown based on the lack of hormone receptor-mediated effects observed when RO feed water was tested. The water investigated in this study originated from anthropogenically impacted surface waters (i.e., the lower Rhine), and the suitability of RBF as drinking water pre-treatment seems confirmed. The bioanalytical tools used in this study indicated that RO is highly effective in removing chemicals that can induce specific and non-specific potentially toxic effects. Applying non-target screening relying on open cheminformatics tools and on an openly accessible chemical database aided the (tentative) identification of these micropollutants, while health-relevant chemical metadata could explain the biological activity observed with effect-based methods for a subset of

185
(tentatively) identified structures. Further confirmation activities and quantification to link chemical results and bioassays will be the scope of follow-up work. The tentatively identified structures could/should be monitored actively in future studies, for which reference standards should be obtained for higher confidence. Overall, identification confidence and success rate could be improved increasing the number of accurate mass spectra deposited in open libraries. Although the approach undertaken in this study is not meant to replace the use of reference compounds in both biological and chemical analysis, it demonstrates the potential of the employed methods to generate useful, real-world data about drinking water quality, increasing the knowledge about occurrence of chemicals in the environment and their behaviour in drinking water treatment.

186
ACKNOWLEDGMENTS
Work at IBED, University of Amsterdam, and part of the work at KWR Watercycle Research Institute were financially supported by the drinking water company Oasen (Gouda, The Netherlands) via the ECROS project. Work at UFZ Leipzig, Eawag and part of the work at KWR Watercycle Research Institute were supported by the EU FP7 project SOLUTIONS (grant number 603437). Work at LCSB (University of Luxembourg) was supported by the FNR (grant number 12341006). Evgeni Alaminov at Oasen is acknowledged for facilitating sampling at De Hooge Boom drinking water treatment plant in Woerden, The Netherlands. The robotic platforms on which the reporter gene assays were performed are a part of the major infrastructure initiative CITEPro (Chemicals in the Terrestrial Environment Profiler) funded by the Helmholtz Association.

187
APPENDIX E. Supplementary information to Chapter 6
E-1. Solid-phase extraction protocols
E-1.1 SPE reporter gene assays
For the reporter gene assays, aliquots of 2 L RO feed water (n=2), 1L RO concentrate(n=2) and 2 L RO permeate (n=4) were enriched. Four replicates of 2 L procedural blanks consisting of ultrapure water were extracted to match the number of replicates of the RO permeate. Oasis HLB (500 mg) from Waters were mounted on a vacuum manifold and conditioned with 10 mL ethyl acetate, 10 mL methanol and 10 mL ultrapure water acidified to pH 2-3 with HCl. All samples were acidified to pH 2-3 with HCl, filtered through a Whatman glass microfiber filters (pore size 1.6 µm) and loaded onto the cartridges with the aid of a vacuum. The cartridges were dried by vacuum and eluted with 10 mL methanol and 10 mL ethyl acetate. The eluates were combined, reduced to dryness by a gentle nitrogen flow and reconstituted with methanol to achieve an enrichment factor of 1000x.
E-1.2 SPE Ames
For the Ames tests, 2 L of RO feed water, 2 L of RO permeate and 2 L ultrapure water acidified to pH 2-3 by addition of HCl were extracted in duplicate with Oasis HLB cartridges (500 mg) by Waters. An air cleaning system relying on a Sep-Pak C18 SPE cartridge (500 mg) by Waters was used to prevent contamination of the samples. Both extraction and air cleaning SPE columns were conditioned with two times 6 mL of a mixture of acetonitrile:methanol 20:80 (v/v), one time 6 mL of pure methanol and two times acidified ultrapure water. The samples were loaded onto the extraction cartridges with the aid of a vacuum, the cartridges washed with two times 6 mL of acidified ultrapure water and eluted six times with 2.5 mL of acetonitrile:methanol 20:80 (v/v). The eluates were evaporated to almost dryness under a gentle nitrogen flow and reconstituted with 200 µL DMSO, resulting in a final concentration factor of 10000x.
E-1.3 SPE LC-HRMS analysis
Enrichment of the samples for LC-HRMS analysis relied on Oasis HLB cartridges (150 mg) by Waters. Aliquots of 100 mL RO feed water, RO permeate, RO concentrate and ultrapure water (n=3) acidified to pH 2 -3 with HCl. The cartridges were placed on a vacuum manifold and conditioned with 5 mL methanol and 5 mL acidified ultrapure water. The samples were loaded with the aid of a vacuum, the cartridges washed with 2 mL of ultrapure water

188
and dried for 15 min. Elution was achieved with 4 times 2.5 mL of MeOH. The eluates were filtered with 0.22 μm PP filters (Filter-Bio, Jiangsu, China) and collected in 15 mL PP falcon tubes before evaporation to 0.2 mL under a gentle nitrogen flow. Prior to UHPLC-q-ToF/MS analysis the concentrated extracts were diluted 5-fold in ultrapure water to be more compatible with the aqueous mobile phase used for chromatographic separation.
E-2. Reporter gene assays data evaluation
Cytotoxicity of the water samples to the different cell lines was derived with a concentration-effect curve fitted with a log-logistic model using slope of the curve and the inhibitory concentration causing 50% reduction in cell viability (IC50).
sample))of log(REF-(logEC50*slope10+1
1-1 = viability Cell (1)
The sample concentration causing 10% reduction in cell viability (IC10) was calculated by applying the following equation:
90
10 log
slope
1-EC50 log = EC10 log
(2)
To evaluate activation of the bioassays, concentration-effect curves as a function of REF were obtained and curves within linearity at low-effect were used to derive activation threshold values expressed as effect concentrations causing 10% of maximum effect (EC10):
slope
10%10EC (3)
As no maximum effect can be observed in adaptive stress response assays, the assessment endpoint was the effect concentration causing an induction ratio of 1.5 (ECIR1.5), i.e. the concentration causing 50% effect increase compared to negative controls (Escher et al., 2014). To ensure linearity of the concentration-effect curves for the AREc32 assay, effects greater than an induction ratios (IR) of 5 were excluded. ECIR1.5 were derived by applying Eq. 4.
slope
0.5
IR1.5EC (4)

189
Standard error of the EC10 and ECIR.1.5 were derived by applying Eq. 5:
slope
slope(SE)IR1.5EC or
slope
slope(SE)10ECSE (5)
To compare the results between assays, the IC10 and EC10 (or ECIR1.5) values were converted to toxic units (TU) and effects units (EU) by applying Eq. 6 and Eq. 7, respectively. TU and EU are comparable to bioanalytical equivalents (BEQ) and can be used for a more direct visualisation of toxicity as, opposite to IC and EC, a high TU value indicates high toxicity.
10IC
1TU (6)
IR1.5EC
1 or
10EC
1EU (7)

190
E-3. LC-HRMS analysis
Chemical analyses were conducted with an ultrahigh-performance LC system (Nexera Shimadzu, Den Bosch, The Netherlands) coupled to a maXis 4G high resolution quadrupole time-of-flight HRMS (q-ToF/HRMS) upgraded with HD collision cell and equipped with a ESI source (Bruker Daltonics, Wormer, The Netherlands).The chromatographic stationary phase was a polar reversed-phase core–shell Kinetex biphenyl LC column having 1.7 μm particle size, pore size of 100 Å and dimensions of 150 × 2.1 mm (Phenomenex, Utrecht, The Netherlands). The mobile phase consisted of (A) pure H2O and (B) MeOH acidified with 0.05% acetic acid (B). The LC gradient program expressed as B% was 0% from 0 to 2 min, 100% B at 17 min and 100% from 17 to 25 min. The flow rate was 0.3 mL/min. The sample injection volume was 20 µL. The MS detector equipped with an electrospray ionisation source (ESI) was internally calibrated before starting an analysis batch and additionally prior to any injection by infusing a 50 μM sodium acetate solution in H2O:MeOH (1:1, v/v) with a loop injection of 20 μL and a loop rinse of 20 μL. Positive and negative ESI were achieved in separate runs by acquiring HRMS1 spectra for masses ranging from m/z 50 to 1,000 with a resolving power of 30,000–60,000 at full width at half maximum (FWHM) and with a spray voltage of +3.5 kV and −3.5 kV for positive and negative ESI modes, respectively. The capillary temperature was 300 °C. HRMS2 spectra were recorded in data-dependent acquisition mode with a resolving power of at least 20,000 FWHM.

191
E-4. Concentration-effect curves
On the left, full concentration–response curves for cell viability (empty symbols) and induction (filled symbols). On the right, linear range of the concentration–effect curve at low effect levels, i.e. ECIR1.5 for the AREc32 assay and EC10 for the AhR assay.
E-4.1. AREc32 assay SPE Blanks (n=4)
-1 0 1 2
1
2
3
4
5
0
2 0
4 0
6 0
8 0
1 0 0
1 2 0
c o n tro l
lo g (c o n c e n tra t io n (R E F ))
ind
uc
tio
n r
ati
o I
R % c
ell v
iab
ility
rela
tive
to c
on
trol
-1 0 1 2
1
2
3
4
5
0
2 0
4 0
6 0
8 0
1 0 0
1 2 0
c o n tro l
lo g (c o n c e n tra t io n (R E F ))
ind
uc
tio
n r
ati
o I
R % c
ell v
iab
ility
rela
tive
to c
on
trol
0 2 0 4 0 6 0 8 0 1 0 0
1
2
3
4
5
c o n c e n tra t io n (R E F )
ind
uc
tio
n r
ati
o I
R
0 5 0 1 0 0
1
2
3
4
5
c o n c e n tra t io n (R E F )
ind
uc
tio
n r
ati
o I
R
-1 0 1 2
1
2
3
4
5
0
2 0
4 0
6 0
8 0
1 0 0
1 2 0
c o n tro l
lo g (c o n c e n tra t io n (R E F ))
ind
uc
tio
n r
ati
o I
R % c
ell v
iab
ility
rela
tive
to c
on
trol
0 5 0 1 0 0
1
2
3
4
5
c o n c e n tra t io n (R E F )
ind
uc
tio
n r
ati
o I
R
-1 0 1 2
1
2
3
4
5
0
2 0
4 0
6 0
8 0
1 0 0
1 2 0
c o n tro l
lo g (c o n c e n tra t io n (R E F ))
ind
uc
tio
n r
ati
o I
R % c
ell v
iab
ility
rela
tive
to c
on
trol
0 5 0 1 0 0
1
2
3
4
5
c o n c e n tra t io n (R E F )
ind
uc
tio
n r
ati
o I
R

192
RO feed water (n=2)
RO concentrate (n=2)
-1 0 1 2
1
2
3
4
5
0
2 0
4 0
6 0
8 0
1 0 0
1 2 0
c o n tro l
lo g (c o n c e n tra t io n (R E F ))
ind
uc
tio
n r
ati
o I
R % c
ell v
iab
ility
rela
tive
to c
on
trol
-1 0 1 2
1
2
3
4
5
0
2 0
4 0
6 0
8 0
1 0 0
1 2 0
c o n tro l
lo g (c o n c e n tra t io n (R E F ))
ind
uc
tio
n r
ati
o I
R % c
ell v
iab
ility
rela
tive
to c
on
trol
0 1 0 2 0 3 0 4 0 5 0 6 0
1
2
3
4
5
6
c o n c e n tra t io n (R E F )
ind
uc
tio
n r
ati
o I
R
0 1 0 2 0 3 0 4 0 5 0 6 0
1
2
3
4
5
c o n c e n tra t io n (R E F )
ind
uc
tio
n r
ati
o I
R
-1 0 1 2
1
2
3
4
5
0
2 0
4 0
6 0
8 0
1 0 0
1 2 0
c o n tro l
lo g (c o n c e n tra t io n (R E F ))
ind
uc
tio
n r
ati
o I
R % c
ell v
iab
ility
rela
tive
to c
on
trol
-1 0 1 2
1
2
3
4
5
0
2 0
4 0
6 0
8 0
1 0 0
1 2 0
c o n tro l
lo g (c o n c e n tra t io n (R E F ))
ind
uc
tio
n r
ati
o I
R % c
ell v
iab
ility
rela
tive
to c
on
trol
0 5 1 0 1 5 2 0 2 5 3 0
1
2
3
4
5
c o n c e n tra t io n (R E F )
ind
uc
tio
n r
ati
o I
R
0 5 1 0 1 5 2 0 2 5 3 0
1
2
3
4
5
c o n c e n tra t io n (R E F )
ind
uc
tio
n r
ati
o I
R

193
RO permeate (n=4)
0 1 0 2 0 3 0 4 0 5 0 6 0
1
2
3
4
5
c o n c e n tra t io n (R E F )
ind
uc
tio
n r
ati
o I
R
-1 0 1 2
1
2
3
4
5
0
2 0
4 0
6 0
8 0
1 0 0
1 2 0
c o n tro l
lo g (c o n c e n tra t io n (R E F ))
ind
uc
tio
n r
ati
o I
R % c
ell v
iab
ility
rela
tive
to c
on
trol
-1 0 1 2
1
2
3
4
5
0
2 0
4 0
6 0
8 0
1 0 0
1 2 0
c o n tro l
lo g (c o n c e n tra t io n (R E F ))
ind
uc
tio
n r
ati
o I
R % c
ell v
iab
ility
rela
tive
to c
on
trol
-1 0 1 2
1
2
3
4
5
0
2 0
4 0
6 0
8 0
1 0 0
1 2 0
c o n tro l
lo g (c o n c e n tra t io n (R E F ))
ind
uc
tio
n r
ati
o I
R % c
ell v
iab
ility
rela
tive
to c
on
trol
-1 0 1 2
1
2
3
4
5
0
2 0
4 0
6 0
8 0
1 0 0
1 2 0
c o n tro l
lo g (c o n c e n tra t io n (R E F ))
ind
uc
tio
n r
ati
o I
R % c
ell v
iab
ility
rela
tive
to c
on
trol
0 5 0 1 0 0
1
2
3
4
5
c o n c e n tra t io n (R E F )
ind
uc
tio
n r
ati
o I
R
0 5 0 1 0 0
1
2
3
4
5
c o n c e n tra t io n (R E F )
ind
uc
tio
n r
ati
o I
R
0 1 0 2 0 3 0 4 0 5 0 6 0
1
2
3
4
5
c o n c e n tra t io n (R E F )
ind
uc
tio
n r
ati
o I
R

194
E-4.2. AhR assay
SPE Blanks (n=4)
0 1 2
0
2 0
4 0
6 0
8 0
1 0 0
0
2 0
4 0
6 0
8 0
1 0 0
1 2 0
c o n tro l
lo g (c o n c e n tra t io n (R E F ))
10% r
es
po
ns
e r
ela
tiv
e
to
ag
on
ist
(TC
DD
)
" IC 1 0 " % c
ell v
iab
ility
rela
tive
to c
on
trol
0 1 2
0
2 0
4 0
6 0
8 0
1 0 0
0
2 0
4 0
6 0
8 0
1 0 0
1 2 0
c o n tro l
lo g (c o n c e n tra t io n (R E F ))
10% r
es
po
ns
e r
ela
tiv
e
to
ag
on
ist
(TC
DD
)
" IC 1 0 " % c
ell v
iab
ility
rela
tive
to c
on
trol
0 1 2
0
2 0
4 0
6 0
8 0
1 0 0
0
2 0
4 0
6 0
8 0
1 0 0
1 2 0
c o n tro l
lo g (c o n c e n tra t io n (R E F ))
10% r
es
po
ns
e r
ela
tiv
e
to
ag
on
ist
(TC
DD
)
" IC 1 0 " % c
ell v
iab
ility
rela
tive
to c
on
trol
0 5 0 1 0 0
0
1 0
2 0
3 0
4 0
5 0
c o n c e n tra t io n (R E F )
% r
es
po
ns
e r
ela
tiv
e
to
ag
on
ist
(TC
DD
)
0 5 0 1 0 0
0
1 0
2 0
3 0
4 0
5 0
c o n c e n tra t io n (R E F )
% r
es
po
ns
e r
ela
tiv
e
to
ag
on
ist
(TC
DD
)
0 5 0 1 0 0
0
1 0
2 0
3 0
4 0
5 0
c o n c e n tra t io n (R E F )
% r
es
po
ns
e r
ela
tiv
e
to
ag
on
ist
(TC
DD
)
0 5 0 1 0 0
0
1 0
2 0
3 0
4 0
5 0
c o n c e n tra t io n (R E F )
% r
es
po
ns
e r
ela
tiv
e
to
ag
on
ist
(TC
DD
)
0 1 2
0
2 0
4 0
6 0
8 0
1 0 0
0
2 0
4 0
6 0
8 0
1 0 0
1 2 0
c o n tro l
lo g (c o n c e n tra t io n (R E F ))
10% r
es
po
ns
e r
ela
tiv
e
to
ag
on
ist
(TC
DD
)
" IC 1 0 "
% c
ell v
iab
ility
rela
tive
to c
on
trol

195
RO permeate (n=4)
0 1 2
0
2 0
4 0
6 0
8 0
1 0 0
0
2 0
4 0
6 0
8 0
1 0 0
1 2 0
c o n tro l
lo g (c o n c e n tra t io n (R E F ))
10% r
es
po
ns
e r
ela
tiv
e
to
ag
on
ist
(TC
DD
)
" IC 1 0 " % c
ell v
iab
ility
rela
tive
to c
on
trol
0 1 2
0
2 0
4 0
6 0
8 0
1 0 0
0
2 0
4 0
6 0
8 0
1 0 0
1 2 0
c o n tro l
lo g (c o n c e n tra t io n (R E F ))
10% r
es
po
ns
e r
ela
tiv
e
to
ag
on
ist
(TC
DD
)
" IC 1 0 " % c
ell v
iab
ility
rela
tive
to c
on
trol
0 1 2
0
2 0
4 0
6 0
8 0
1 0 0
0
2 0
4 0
6 0
8 0
1 0 0
1 2 0
c o n tro l
lo g (c o n c e n tra t io n (R E F ))
10% r
es
po
ns
e r
ela
tiv
e
to
ag
on
ist
(TC
DD
)
" IC 1 0 " % c
ell v
iab
ility
rela
tive
to c
on
trol
0 1 2
0
2 0
4 0
6 0
8 0
1 0 0
0
2 0
4 0
6 0
8 0
1 0 0
1 2 0
c o n tro l
lo g (c o n c e n tra t io n (R E F ))
10% r
es
po
ns
e r
ela
tiv
e
to
ag
on
ist
(TC
DD
)
" IC 1 0 "
% c
ell v
iab
ility
rela
tive
to c
on
trol
0 5 0 1 0 0
0
1 0
2 0
3 0
4 0
5 0
c o n c e n tra t io n (R E F )
% r
es
po
ns
e r
ela
tiv
e
to
ag
on
ist
(TC
DD
)
0 5 0 1 0 0
0
1 0
2 0
3 0
4 0
5 0
c o n c e n tra t io n (R E F )
% r
es
po
ns
e r
ela
tiv
e
to
ag
on
ist
(TC
DD
)
0 5 0 1 0 0
0
1 0
2 0
3 0
4 0
5 0
c o n c e n tra t io n (R E F )
% r
es
po
ns
e r
ela
tiv
e
to
ag
on
ist
(TC
DD
)
0 5 0 1 0 0
0
1 0
2 0
3 0
4 0
5 0
c o n c e n tra t io n (R E F )
% r
es
po
ns
e r
ela
tiv
e
to
ag
on
ist
(TC
DD
)
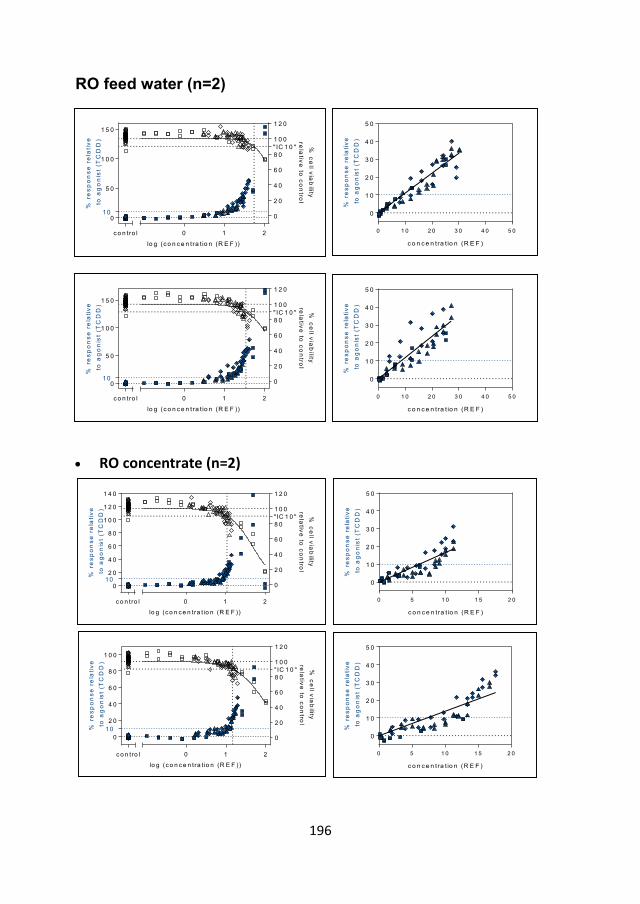
196
RO feed water (n=2)
RO concentrate (n=2)
0 1 2
0
5 0
1 0 0
1 5 0
0
2 0
4 0
6 0
8 0
1 0 0
1 2 0
c o n tro l
lo g (c o n c e n tra t io n (R E F ))
10
% r
es
po
ns
e r
ela
tiv
e
to
ag
on
ist
(TC
DD
)
" IC 1 0 " % c
ell v
iab
ility
rela
tive
to c
on
trol
0 1 0 2 0 3 0 4 0 5 0
0
1 0
2 0
3 0
4 0
5 0
c o n c e n tra t io n (R E F )
% r
es
po
ns
e r
ela
tiv
e
to
ag
on
ist
(TC
DD
)
0 1 0 2 0 3 0 4 0 5 0
0
1 0
2 0
3 0
4 0
5 0
c o n c e n tra t io n (R E F )
% r
es
po
ns
e r
ela
tiv
e
to
ag
on
ist
(TC
DD
)
0 1 2
0
2 0
4 0
6 0
8 0
1 0 0
1 2 0
1 4 0
0
2 0
4 0
6 0
8 0
1 0 0
1 2 0
c o n tro l
lo g (c o n c e n tra t io n (R E F ))
10
% r
es
po
ns
e r
ela
tiv
e
to
ag
on
ist
(TC
DD
)
" IC 1 0 " % c
ell v
iab
ility
rela
tive
to c
on
trol
0 1 2
0
2 0
4 0
6 0
8 0
1 0 0
0
2 0
4 0
6 0
8 0
1 0 0
1 2 0
c o n tro l
lo g (c o n c e n tra t io n (R E F ))
10% r
es
po
ns
e r
ela
tiv
e
to
ag
on
ist
(TC
DD
)
" IC 1 0 " % c
ell v
iab
ility
rela
tive
to c
on
trol
0 5 1 0 1 5 2 0
0
1 0
2 0
3 0
4 0
5 0
c o n c e n tra t io n (R E F )
% r
es
po
ns
e r
ela
tiv
e
to
ag
on
ist
(TC
DD
)
0 5 1 0 1 5 2 0
0
1 0
2 0
3 0
4 0
5 0
c o n c e n tra t io n (R E F )
% r
es
po
ns
e r
ela
tiv
e
to
ag
on
ist
(TC
DD
)
0 1 2
0
5 0
1 0 0
1 5 0
0
2 0
4 0
6 0
8 0
1 0 0
1 2 0
c o n tro l
lo g (c o n c e n tra t io n (R E F ))
10
% r
es
po
ns
e r
ela
tiv
e
to
ag
on
ist
(TC
DD
)
" IC 1 0 " % c
ell v
iab
ility
rela
tive
to c
on
trol

197
E-5. Effect-concentrations
Table E-5.1. Cytotoxicity (IC10) and effect concentration (EC10 and ECIR.15) values in REF units limited to reporter gene assays that were activated by the RO samples.
AhR: aryl hydrocarbon receptor; AREc32: antioxidant response element c32; IC10: inhibitory concentration causing 10% reduction in cell viability; EC10: effect-concentration causing 10% of maximum effect; ECIR1.5: concentration causing 50% effect increase compared to negative controls; SE: standard error; ROF: reverse osmosis feed water; ROC: reverse osmosis concentrate; ROP: reverse osmosis permeate; NC: not converged; NA: not active. a Considered not active as the derived EC values were comparable or lower to those quantified for the SPE blanks.
AhR AREc32
Sample IC10[REF]±SE cytotoxicity
EC10[REF]±SE induction
IC10[REF]±SE cytotoxicity
ECIR1.5[REF]±SE induction
ROF1 51.88±1.12 8.06±0.23 92.04±1.16 6.53±0.23
ROF2 31.48±1.13 7.59±0.35 86.90±1.09 6.69±0.21
ROC1 9.84±1.11 5.31±0.25 56.20±1.10 3.14±0.08
ROC2 13.34±1.11 6.51±0.32 82.79±1.51 3.46±0.14
ROP1 NC NAa NC NA
ROP2 NC NAa NC NA
ROP3 NC NAa NC NA
ROP4 NC NAa NC 60.36±9.54

198
E-6. Toxic Units mass balance
The effects units (EU) of the feed water samples (ROF) compared to the theoretical TU, calculated assuming that 70% of the water volume are going into RO permeate and 30% remain in RO concentrate. This plot was derived by dividing the EU quantified for ROC by the concentration factor resulting from RO filtration, i.e. 3.3. The following equation was used:
EU ROF𝑡ℎ𝑒𝑜𝑟𝑒𝑡𝑖𝑐𝑎𝑙 =EU ROC𝑒𝑥𝑝𝑒𝑟𝑖𝑚𝑒𝑛𝑡𝑎𝑙
3.3
Figure E-6.1. Assay-specific mass balance of the reverse osmosis samples.

199
E-7. Ames-fluctuation test results
Figure E-7.1. Results of Ames test for Salmonella typhimurium strain TA98 with and without the S9 enzyme mix
. Negative control TA98 strains with and without S9 mix: dimethyl sulfoxide (CAS No. 67-
68-5)
Positive controls: o TA98-S9: 20 mg/L 4-nitroquinoline N-oxide (CAS No. 56-57-5) o TA98+S9: 5 µg/L 2-aminoanthracene (CAS No. 613-13-8)

200
Figure E-7.2 Results of Ames test for Salmonella typhimurium strain TA100 with and without the S9 enzyme mix
Negative control TA100 strains with and without S9 mix: dimethyl sulfoxide (CAS No. 67-68-5)
Positive controls: o TA98-S9: 12.5 mg/L nitrofurantoin (CAS No. 67-20-9) o TA98+S9: 5 mg/L 2-aminoanthracene (CAS No. 613-13-8)

201
E-8. Confirmed and tentatively identified compounds detected in RO system
Table E-8.1 Results of non-target screening in the positive electrospray ionisation dataset
Compound Formula Neutral
mass RT
(min)
EPA Dashboard identifier TOX21SL a TOXCAST a
TOXCAST Active (%) EXPOCAST b
Ident. level c
Phenethylamine C8H11N 121.0892 9.0 DTXSID5058773 0 0 0 0 31
Anthranilic acid C7H7NO2 137.0477 10.3 DTXSID8020094 1 0 0 2.02E-07 31
4-Hydroxybenzoic acid C7H6O3 138.03171 11.9 DTXSID3026647 1 1 1.35 3.50E-06 31
Trimethyl phosphate C3H9O4P 140.02387 8.2 DTXSID1021403 1 1 0.68 4.11E-08 1
Methyl styryl ketone C10H10O 146.07321 7.6 DTXSID4025662 1 1 10.44 1.82E-05 3
Benzisothiazolinone C7H5NOS 151.0092 13.4 DTXSID5032523 1 1 30.62 1.25E-05 2a
Diethyl hydrogen phosphate C4H11O4P 154.03953 16.4 DTXSID1044699 0 1 0 0 2a
N-(3-Aminophenyl)propanamide C9H12N2O 164.09501 12.5 DTXSID9044877 1 1 0 1.31E-07 3
4-Toluenesulfonamide C7H9NO2S 171.03543 16.6 DTXSID8029105 1 1 0 3.50E-06 3
Fusaric acid C10H13NO2 179.09468 15.4 DTXSID5023085 1 0 1.56 1.23E-07 31
1,3,5-Triazin-2(1H)-one, 4,6-bis(ethylamino)- C7H13N5O 183.11205 10.3 DTXSID6062547 0 0 0 0 32
Phenazone C11H12N2O 188.09501 12.7 DTXSID6021117 1 1 0 1.88E-08 1
2,6-Dichlorobenzamide C7H5Cl2NO 188.97483 8.2 DTXSID7022170 1 1 1.78 7.42E-08 1
2-Hydroxyatrazine C8H15N5O 197.12771 11.9 DTXSID6037807 0 0 0 0 32
tert-Butyl phenyl glycidyl ether C13H18O2 206.13076 10.3 DTXSID1024702 1 0 0.88 3.70E-08
33
tert-Butyl phenyl glycidyl ether C13H18O2 206.13076 16.4 DTXSID1024702 1 0 0.88 3.70E-08
33
Phosphinic acid, diphenyl- C12H11O2P 218.04971 9.9 DTXSID70168929 0 0 0 0 2a4
7-Diethylamino-4-methylcoumarin C14H17NO2 231.126 9.5 DTXSID9025035 1 1 16.55 3.23E-08 3
Hydroxyvalerenic acid C15H22O3 250.15699 15.0 DTXSID8033564 1 0 0 1.64E-07 3

202
Table E-8.1 (continued). Results of non-target screening in the positive electrospray ionisation dataset
Compound Formula Neutral
mass RT
(min)
EPA Dashboard identifier TOX21SL a TOXCAST a
TOXCAST Active (%) EXPOCAST b
Ident. level c
Triphenylphosphine oxide C18H15OP 278.08612 10.7 DTXSID2022121 1 1 1.78 4.09E-08 2a
4-Androstene-3,17-dione C19H26O2 286.1934 17.3 DTXSID8024523 1 1 11.52 2.20E-07 3
Thiamethoxam C8H10ClN5O3S 291.0193 17.4 DTXSID2034962 1 1 0.61 1.25E-08 3
Zearalenone C18H22O5 318.14681 14.3 DTXSID0021460 1 1 23.84 2.17E-07 3
11-Hydroxy-9-oxo-15,20-cycloprosta-8(12),15,17,19-tetraen-1-oic acid C20H26O4 330.18322 16.6
DTXSID70615382 0 0 0 0 3
Corticosterone C21H30O4 346.21454 16.6 DTXSID6022474 1 1 8.91 2.82E-07 3
a Suspect lists: “1” indicates presence of candidate structure in the list, whereas “0” indicates absence; b ExpoCast median exposure prediction in mg per kg of body weight per day (mg/kg-bw/day); c (Schymanski et al., 2014a); 1 Supporting spectral library evidence found, but it was not possible to rule out other isomers; 2 Supporting spectral library evidence found, but extra peaks in experimental HRMS2 spectrum suggest (quasi-)isobaric interferences; 3 Possibly isomer of candidate structure exhibiting same fragmentation behaviour, but different retention time; 4 Reference spectrum previously measured in house.

203
Table E-8.2. Results of non-target screening in the negative electrospray ionisation dataset
Compound Formula Neutral
mass RT
(min)
EPA Dashboard identifier TOX21SL a TOXCAST a
TOXCAST Active (%) EXPOCAST b
Ident. level c
Catechol C6H6O2 110.0368 3.0 DTXSID3020257 1 1 14.10 4.41E-08 31
4-Hydroxybenzoic acid
C7H6O3 138.0317 6.1 DTXSID3026647 1 1 1.35 3.50E-06 31
D-(-)-Mandelic acid
C8H8O3 152.0474 10.6 DTXSID4046523 1 0 1.83 1.03E-07 31
4-Hydroxy-3-methoxybenzaldehyde
C8H8O3 152.0473 8.3 DTXSID0021969 1 1 4.73 3.08E-05 3
Diethyl hydrogen phosphate
C4H11O4P 154.0395 1.9 DTXSID1044699 0 1 0 0 2a
Acesulfame C4H5NO4S 162.9939 2.8 DTXSID1030606 1 1 0.34 1.15E-06 1
Acamprosate C5H11NO4S 181.0409 4.2 DTXSID6047529 1 1 1.77 2.91E-07 2a
Saccharin C7H5NO3S 182.9990 7.1 DTXSID5021251 1 1 1.35 2.25E-07 2a2
Naphthalene-2-sulfonic acid
C10H8O3S 208.0194 9.8 DTXSID5044788 1 1 2.03 2.06E-07 31
Mecoprop C10H11ClO3 214.0397 14.6 DTXSID9024194 1 1 0.64 7.16E-08 2a
Phosphinic acid, diphenyl-
C12H11O2P 218.0497 11.5 DTXSID70168929
0 0 0 0 2a2
Bentazone C10H12N2O3S 240.0569 12.4 DTXSID0023901 1 1 3.34 1.70E-08 1
8-(2-Ethoxyphenyl)-8-oxooctanoic acid
C16H22O4 278.1519 13.2 DTXSID60645436
0 0 0 0 3
10-(4-sulfophenyl)decanoic acid
C16H24O5S 328.1345 13.1 DTXSID80891332
0 0 0 0 3

204
Table E-8.2 (continued). Results of non-target screening in the negative electrospray ionisation dataset
Compound Formula Neutral
mass RT
(min) EPA Dashboard
identifier TOX21SL a TOXCAST a TOXCAST Active (%) EXPOCAST b
Ident. level c
Pencycuron C19H21ClN2O 328.1343 13.4 DTXSID3042261 1 1 11.21 1.30E-07 33
Pencycuron C19H21ClN2O 328.1343 13.7 DTXSID3042261 1 1 11.21 1.30E-07 33
Cortisone C21H28O5 360.1938 14.9 DTXSID5022857 1 1 3.62 2.20E-07 3
Bucolome C14H22N2O3 266.1631 14.3 DTXSID4048854 1 0 0 1.72E-07 3
4-(4-sulfophenyl)heptanoic acid
C13H18O5S 286.0876 12.4 DTXSID50891662 0 0 0 0 3
Zearalenone C18H22O5 318.1468 12.3 DTXSID0021460 1 1 23.84 2.17E-07 3
11-Hydroxy-9-oxo-15,20-cycloprosta-8(12),15,17,19-tetraen-1-oic acid
C20H26O4 330.1832 16.4 DTXSID70615382 0 0 0 0 3
Corticosterone C21H30O4 346.2145 16.6 DTXSID6022474 1 1 8.909 2.82E-07 3
Prednisolone C21H28O5 360.1938 13.8 DTXSID9021184 1 1 3.62 4.24E-08 3
Methylprednisolone C22H30O5 374.2094 16.3 DTXSID7023300 1 1 3.98 4.52E-08 3
a Suspect lists: “1” indicates presence of candidate structure in the list, whereas “0” indicates absence; b ExpoCast median exposure prediction in mg per kg of body weight per day (mg/kg-bw/day); c (Schymanski et al., 2014a); 1 Supporting spectral library evidence found, but it was not possible to rule out other isomers; 2 Supporting spectral library evidence found, but extra peaks in experimental HRMS2 spectrum suggest (quasi-)isobaric interferences; 3 Possibly isomer of candidate structure exhibiting same fragmentation behaviour, but different retention time; 4 Reference spectrum previously measured in house.

205
Figure E-8.1. Spectral similarity of m/z 122.0964±0.002 [M+H]+ to library spectrum of 2-phenylethylamine.
Reference spectrum: http://mona.fiehnlab.ucdavis.edu/spectra/display/UF023309
Figure E-8.2. Spectral similarity of m/z 138.0549±0.002 [M+H]+ to library spectrum of anthranilic acid.
Reference spectrum: http://mona.fiehnlab.ucdavis.edu/spectra/display/SM884401

206
Figure E-8.3. Spectral similarity of m/z 139.0389±0.002 [M+H]+ to library spectrum of 4-hydroxybenzoic acid.
Reference spectrum: http://mona.fiehnlab.ucdavis.edu/spectra/display/FiehnHILIC000989
Figure E-8.4. Spectral similarity of m/z 152.0164±0.002 [M+H]+ to library spectrum of benzisothiazolinone.
Reference spectrum: http://mona.fiehnlab.ucdavis.edu/spectra/display/EA030111

207
Figure E-8.5. Spectral similarity of m/z 155.0467±0.002 [M+H]+ to library spectrum of diethyl phosphate.
Reference spectrum: https://massbank.eu/MassBank/RecordDisplay.jsp?id=KO000680&dsn=Keio_Univ
Figure E-8.6. Spectral similarity of m/z 180.1019±0.002 [M+H]+ to library spectrum of fusaric acid.
Reference spectrum: http://mona.fiehnlab.ucdavis.edu/spectra/display/BML00612

208
Figure E-8.7. Spectral similarity of m/z 184.1192±0.002 [M+H]+ to library spectrum of 2-hydroxysimazine.
Reference spectrum: http://mona.fiehnlab.ucdavis.edu/spectra/display/AU207903
Figure E-8.8. Spectral similarity of m/z 198.1349±0.002 [M+H]+ to library spectrum of 2-hydroxyatrazine.
Reference spectrum: http://mona.fiehnlab.ucdavis.edu/spectra/display/AU207903

209
Figure E-8.9. Spectral similarity of m/z 219.0569±0.002 [M+H]+ to library spectrum of diphenylphosphinic acid.
Reference spectrum: in house standard measurement
Figure E-8.10. Spectral similarity of m/z 279.0933±0.002 [M+H]+ to library spectrum of triphenylphosphine oxide.
Reference spectrum: http://mona.fiehnlab.ucdavis.edu/spectra/display/SM825001

210
Figure E-8.11. Spectral similarity of m/z 109.0295±0.002 [M-H]- to library spectrum of catechol.
Reference spectrum: https://massbank.eu/MassBank/RecordDisplay.jsp?id=RP012013&dsn=BGC_Munich
Figure E-8.12. Spectral similarity of m/z 151.0401±0.002 [M-H]- to library spectrum of mandelic acid
Reference spectrum: http://mona.fiehnlab.ucdavis.edu/spectra/display/FiehnHILIC001315

211
Figure E-8.13. Spectral similarity of m/z 180.0336±0.002 [M-H]- to library spectrum of acamprosate.
Reference spectrum: http://mona.fiehnlab.ucdavis.edu/spectra/display/EA284861
Figure E-8.14. Spectral similarity of m/z 181.9917±0.002 [M-H]- to library spectrum of saccharin.
Reference spectrum: in house standard measurement

212
Figure E-8.15. Spectral similarity of m/z 207.0121±0.002 [M-H]- to library spectrum of 2-naphthalenesulfonic acid.
Reference spectrum: http://mona.fiehnlab.ucdavis.edu/spectra/display/EA065355
Figure E-8.16. Spectral similarity of m/z 213.0324±0.002 [M-H]- to library spectrum of mecoprop.
Reference spectrum: http://mona.fiehnlab.ucdavis.edu/spectra/display/EA030859

213
Chapter 7. Synthesis

214
7.1. Thesis findings
When the Efficiency of Small Contaminant Removal by Reverse Osmosis (ECROS) project started in August 2014, most knowledge available on the passage behaviour of organic solutes through high-pressure osmotic membranes was generated in controlled lab-scale and bench-scale filtration setups, where RO was applied to either pure water, synthetic waters or recycled wastewater. Only a limited amount of studies focussed on RO drinking water treatment applied to natural sources, which were pre-treated to some extent. Stand-alone RO filtration applied to a raw freshwater was practically unexplored. In most cases, the compounds investigated rarely included persistent and mobile emerging contaminants. Previous RO research heavily focussed on the passage of known chemicals for which removal was required by law. Thus, to some extent the status of contamination of natural drinking water sources has been largely neglected by the membrane science community, whose research mostly focussed on characterising and improving water permeability and salt rejection of RO membranes. The ECROS project largely benefitted from the ongoing technological advances in high-resolution mass spectrometry (HRMS) and from international collaborators willing to share and further develop state-of-the-art methods for chemical characterisation by mining HRMS data. The increased availability of bioanalytical tools for toxicity assessment was also beneficial to ECROS, particularly the gene reporter assay test battery provided by research partners within the European Union’s SOLUTIONS project. The project benefitted from the recent commercialisation of new mixed-matrix RO spiral-wound membrane modules, e.g. nanocomposite and biomimetic, which could therefore be tested on a relevant scale for filtration systems. In this concluding chapter, the four main objectives and the major findings of the ECROS project are summarised.
Objective 1: To assess the extent of removal of known and new emerging contaminants, specifically small polar molecules, from a raw riverbank filtrate by standard RO membranes and to relate removal rates to compound physicochemical properties and RO characteristics.
For this objective, an analytical method to detect and quantify 33 (moderately) hydrophilic compounds considered critical for source waters quality and (RO) drinking water was developed and validated using an ultrahigh-performance liquid chromatography system coupled to quadrupole-time-of-flight tandem HRMS (UHPLC-q-ToF/HRMS). The compounds exhibited a wide range of physicochemical properties such as size (108.07 to 413.97 Da), structural diversity, charge and hydrophobicity (LogKow from -1.33 to 4.76), to aid the elucidation of the influence of compound properties on passage behaviour through RO membranes. The method, which relied on

215
direct injection analysis of natural freshwaters and sample pre-concentration of groundwater and RO permeate with solid-phase extraction, proved efficient, sensitive and robust and ensured identification of target compounds with a high confidence at environmentally relevant concentrations (Chapter 2). This analytical method not only indicated that HRMS can be employed for routine monitoring, lessening the sensitivity gap between high- and low-resolution detectors, but also that a biphenyl stationary phase can satisfactorily retain polar organics in reversed-phase chromatographic separations. Core-shell technology combined with direct injection analysis can substantially improve the screening efficiency in terms of short analysis time and minimal sample preparation. For detection and quantification of trace organics in the sub-nanograms per litre range, solid-phase extraction proved to be a suitable pre-concentration method for riverbank filtrate and RO permeate.
In Chapter 3, we demonstrated that a stand-alone pilot-scale RO for drinking water treatment of a raw riverbank filtrate is effective in removing most micropollutants. Uncharged hydrophilic organics exhibited a strong inverse correlation between size and passage, highlighting the prominence of molecular sieving. The smallest target compound, 1H-benzotriazole (119.05 Da), displayed up to 25 ± 5% passage. The size-passage correlation was weaker for neutral (moderately) hydrophobic compounds, indicating that the affinity interactions between non-polar moieties and the aromatic polyamide active layer can increase the permeation of hydrophobic compounds, likely driven by adsorption prior to solution-diffusion. Commercial standard RO membranes proved to be excellent barriers against anionic organics compared to similarly sized cations, which showed increased permeation. Thus, we found that critical factors behind the passage of organic compounds are both small size and hydrophobicity and to a lesser extent electrostatic interactions.
Objective 2: To assess whether selected commercially available mixed-matrix membrane chemistry can outperform standard RO membranes regarding polar organic contaminant removal;
In Chapter 4, the performance of two mixed-matrix RO membranes was compared to that of standard RO membranes, i.e. aromatic polyamide thin-film composite. A thin-film nanocomposite membrane with a zeolite-embedded active layer was used in pilot-scale RO applied to a raw riverbank filtrate. A biomimetic membrane with an active layer consisting of aquaporin protein water channels embedded into the polyamide active layer was tested in a bench-scale RO system. Although minor differences between standard and mixed-matrix membranes were observed, these were not statistically

216
significant. It was concluded that, at least in the conditions tested in our studies, mixed-matrix membranes cannot yet outperform polyamide-based membranes and that, in the case of aquaporin water channels, a higher water permeability will result in higher solute passage as a result of the permeability-selectivity trade-off. Objective 3: To assess the quality of source waters by characterising the identities and concentration trends of known and unknown emerging contaminants that are persistent and mobile in the aquatic environment; In Chapter 5, HRMS data acquired from samples taken in a riverbank filtration transect with up to 60-year travel time were processed by state-of-the-art non-target screening. Hierarchical cluster analysis was used for trend detection, whereas in silico fragmentation allowed the tentative structure annotation of unknowns. This non-target screening workflow proved very powerful in highlighting trends of persistent and mobile polar organics, most of which were legacy contaminants of industrial activities started in the 1950s and mid-1970s and with maximum emissions in the 1990s. The results reflected (i) increased human activities in the lower Rhine catchment area and (ii) effective implementation of wastewater treatment technologies and international regulation in the Rhine riparian countries. Among 67 persistent and mobile chemicals tentatively identified, 25 polar substances were confirmed. These included environmental contaminants so far unknown to occur in bank filtrate or in the water cycle at all, e.g. tetramethylsulfamide. This work added substantial evidence to the environmental persistence and mobility of hydrophilic organic compounds in riverbank filtration systems with water exhibiting long sub-surface travel time at stable biogeochemical conditions. Trend analysis similar to that performed in this work can help drinking water utilities managing bank filtration systems in highly impacted catchment areas, identifying polluted wells and either avoid groundwater abstraction from those wells or apply advanced treatment to enhance chemical removal in potable water applications. Objective 4: To assess the potential hazard to human health of the feed water and effluents of optimized RO treatments;
In Chapter 6 we provided a preliminary answer to the core question related to the occurrence of polar micropollutants in drinking water sources and their removal by full-scale RO: is RO drinking water safe for human consumption? Bioanalytical tools with endpoints relevant for human health and general genotoxicity were used to screen potential adverse effects of RO feed water and effluents. While toxicity pathways representative of xenobiotic metabolism, adaptive stress response and genotoxicity were induced by the

217
bank filtrate (RO feed water), these selected effects were removed by stand-alone RO filtration. It would take no more than 6- to 8-fold concentration of the feed water samples to trigger toxic pathways, suggesting that although the bank filtrate was not toxic in its native form, it may be in the future if pollutant concentrations increase. RO permeate, instead, showed no toxic effects up to 100-fold concentration, which was the highest concentration tested. The bioanalytical tools used in this study indicated that RO is highly effective in removing both specific and non-specific toxicity. Applying high-throughput non-target screening with open cheminformatics tools and using an openly accessible chemical database with health-relevant metadata aided the (tentative) identification of micropollutants, which could in part explain the biological activity observed with the effect-based methods. This combined approach, while not meant to replace the use of reference standards, needed in chemical and biological analyses to confirm compound identity and bioactivity, respectively, can generate useful, real-world data about drinking water quality and can help deriving cause-effect relationships.
7.2. Scientific implications
LC-HRMS methods for the characterisation of polar micropollutants have clearly corroborated evidence of the persistence and mobility of a growing number of anthropogenic compounds. Recent HRMS instruments can provide enough sensitivity for the detection of organic molecules at environmentally relevant concentrations (e.g., nanograms per litre). Their use for routine target monitoring is recommended as HRMS data can also be screened in non-target manner (retrospectively). The possibility to couple target with non-target screening can extend the scope of qualitative characterisation of organic contaminants beyond target compounds and strengthen arguments for decision making when dealing with polluting industries or environmental agencies. For non-target screening, the use of open cheminformatics tools, openly accessible database and accurate mass spectral libraries is recommended along with increasing the availability of computational expertise in environmental analysis laboratories. Thorough documentation on computational statistics methods is typically accessible and intelligible with minimal computer literacy, so that possibilities to mine HRMS data should be explored. Likewise, information to reproduce applications of in silico fragmentation linked to chemical database has become highly accessible and increasing support from developers is given on dedicated platforms. Nevertheless, non-target screening faces some limitations too. First of all, the availability and costs of reference standards for identity confirmation, which could be overcome by intensifying inter-lab collaborations and sharing of chemicals. Secondly, the “size” of accurate mass spectral libraries should be increased. The spectra of newly identified

218
chemicals should always be deposited on openly accessible libraries to the benefit of future screenings. Lastly, greater effort should be put into deriving more robust retention indices for liquid chromatography applications. This could greatly help discerning between isomers that exhibit the same fragmentation behaviour in tandem HRMS.
Several limiting factors of LC-HRMS analytical methods to detect polar compounds remain. As for chromatography, environmental screenings heavily rely on reversed-phase liquid chromatography (RP) for separation of polar compounds. Generally, RP provides poor or no retention of highly hydrophilic compounds, i.e. those exhibiting negative log distribution coefficients (log D), so that normal phase LC and its variant hydrophilic interaction LC (HILIC) should be additionally employed for more comprehensive screenings. Likewise, sample enrichment by solid-phase extraction with hydrophilic sorbents should be explored to improve the recovery and enhance the detection of highly polar analytes. As per HRMS equipped with electrospray ionisation source, analysis of molecules that cannot be easily protonated/deprotonated remains an issue and further ion sources should be explored.
Part of the work described in this thesis shows that thin-film nanocomposite and aquaporin RO membranes cannot yet outperform thin-film composite chemistry. Nanoparticles and bioengineered materials are in principle embedded in the polymeric active layers to enhance water flux and it is assumed that they are not permeable to organics. As the weight percentage fraction of flux enhancers is usually negligible compared to that of the polymeric component, it is unlikely that such a modification of thin-film chemistry could substantially result in overcoming the permeability-selectivity trade-off, which remains a limiting factor of current RO membranes. It is therefore suggested that completely new membrane chemistry should be explored, e.g. new polymers with a higher degree of cross-linking or the addition of a coating/protective layer to minimise the interaction of organic solutes with the active layer yet allowing the passage of water molecules. Moreover, the efficacy against micropollutants of existing RO membranes relying on new chemistry, e.g. graphene oxide and carbon nanotubes, should be investigated further in scaled-up systems.
7.3. Societal implications
Stand-alone RO filtration can contribute to enhancing the quality of drinking water produced from natural freshwater sources, delivering many benefits to society. Overall, RO operating costs have dramatically decreased, with water permeability and salt rejection of commercial membranes having significantly improved over the last 40 years (Lee et al., 2011). As typically a higher feed

219
water salinity implies higher energy requirements, RO filtration of brackish and freshwater can lower costs and carbon footprint compared to seawater desalination (Muñoz and Fernández-Alba, 2008; Tang et al., 2018). Technological advances in membrane design and energy recovery strategies have narrowed the energy consumption gap with conventional drinking water treatment, which remains only slightly cheaper than trains including RO for micropollutants removal (Garfí et al., 2016). Nevertheless, as RO applications needing minimal pre-treatment like the one investigated in this thesis have emerged, these could represent a new scenario to achieve excellent removal of harmful chemicals and waterborne pathogens with low operational costs and carbon footprint. In a recent report by the Dutch National Institute for Public Health and the Environment it was shown that the environmental impact of drinking water treatment by membrane filtration powered by wind energy can be comparable or less than that of a high-standard conventional treatment (Zijp and van der Laan, 2015). In addition, the ability of RO membranes to effectively purify different water matrices can be advantageous not only for drinking water production, but also for wastewater treatment and for remediation of natural freshwaters, de facto reducing the chemical burden on aqueous environments. Strategies to recycle RO concentrate have emerged (Vanoppen et al., 2015), so that brines could be considered as a medium from which resources, e.g. nutrients and other chemicals, can be recovered rather than a waste effluent needing treatment and disposal. In water stressed regions, RO represents a valuable option to recycle wastewater for non-potable purposes, e.g. irrigation and industrial uses, and for direct or indirect potable purposes, e.g. by sending recycled water to a drinking water treatment plant or by recharge of potable aquifers, respectively. In this regard, the benefits of RO are demonstrated by the notable examples of the five NEWater plants in Singapore (direct reuse) and the Groundwater Replenishment System in California (indirect reuse) (Tang et al., 2018). Overall, the increasing implementation of RO treatment might facilitate meeting “Goal 6” of the United Nation Sustainable Development Goals Fund, which aims at providing universal access to clean water and sanitation globally. Thorough evidence of the safety of recycled water (produced by RO) can today be generated, e.g. by integrating effect-based methods with non-target screening. The combination of such sophisticated tools can be used to demonstrate to the general public that adverse effects to human health can be ruled out and that harmful chemicals otherwise overlooked by target screening are either not present in drinking water or that detectable traces, although not desirable, do not pose a threat. This evidence should be provided to society in an understandable manner as public perception remains an obstacle to the wider acceptance of water recycling. This could be overcome by informing and educating the public on the effectiveness of available technologies with examples of existing

220
recycling schemes. The younger public might be further engaged with examples of recycling plants in life support systems, which allow astronauts to have drinking water in space.
As for anthropogenic organic compounds, available data on persistence, mobility and toxicity should be considered in current water quality regulations and arguably before designing new chemicals for industrial, agricultural and domestic use. Firstly, a simpler process should be established to extend regulatory actions to many unregulated compounds that are being detected in natural waters, e.g. by setting a detection frequency threshold above which monitoring and mitigation measures are required. Secondly, regulation could focus on structural classes rather than covering specific chemical identities, especially for those compounds where a desired function is strictly related to structural features as in the case of perfluorinated surfactants. This might prevent that substances structurally related to chemicals that have been phased-out due to environmental or health concerns would result in posing similar risks. A broad evaluation of chemical persistence, mobility and toxicity should be undertaken for newly designed polar organics, for example by combining QSARs and effect-based methods. Public and private research programmes should join to identify structural features linked to (bio)degradability or even mineralisation of organic compounds and
consider this knowledge for the design of new chemicals.
7.4. Implications for drinking water utilities
The removal of polar organic micropollutants is one of the most challenging aspects of drinking water treatment. Due to the mobile behaviour of hydrophilic compounds, a single barrier to fully prevent their breakthrough is currently not available. To some extent, (sub-)picograms per litre traces, although undetectable, might be present in bottled water as well as in tap water. For drinking water production from natural freshwater systems, pre-treatment by riverbank filtration (RBF) is recommended. RBF will ensure satisfactory removal of biological impurities, suspended particles and natural organic matter with low costs and low environmental impact. Furthermore, the removal of turbidity by RBF is advantageous for drinking water applications relying on spiral wound high-pressure membranes. Ideally, a RBF system with a transition area from oxic to anoxic zones might maximise organic micropollutants removal. Systems with a long residence time provide the additional advantage of having stable biogeochemical conditions, so that substantial changes in raw water quality are typically not expected.
One-pass RO filtration with commercial standard brackish water thin-film composite membranes and applied to a riverbank filtrate has shown to be highly effective in removing neutral polar organics larger than approximately

221
150 Da and ionic compounds. The passage of smaller uncharged hydrophilics, and to a lesser extent that of moderately hydrophobic organics, remains problematic and needs to be tackled further. Where low cost and low environmental impact energy is accessible, the use of membranes with denser, more cross-linked active layers such as those used for seawater desalination might further hinder the passage of small hydrophilic compounds. Moderately hydrophobic compounds that diffuse through aromatic polyamide thin-film composite membranes, instead, might be removed by post-treatment of the RO permeate with processes relying on adsorptive interactions such as activated carbon. In this case, only a small packed bed column would suffice as natural organic matter is not expected in the RO permeate. Additionally, design of RO system relying on multi-pass filtration with denser membranes at the beginning of the treatment line could provide better removal rates and should be investigated further.
As for monitoring activities to characterise organic micropollutants and to ensure that potable water meets quality standards, the use of HRMS is strongly recommended as it provides the additional benefits of performing non-target screening (also retrospectively). The (tentative) identification of micropollutants by non-target screening can provide drinking water utilities with an overview of the status of source waters beyond the pollutants for which monitoring is required by law and can greatly support the selection of adequate treatment technologies to remove newly identified undesired compounds.
The inclusion of effect-based methods in monitoring activities is recommended to drinking water utilities. Bioassays with endpoints relevant to human health should be employed to assess the mixture toxicity of micropollutants occurring in source waters and possibly in finished drinking water. This could confirm that (selected) effects induced by harmful substances are indeed removed by the applied treatment. Moreover, the bioassays provide valuable, complementary information to that generated by chemical analysis. Coupling effect-based methods with non-target screening can provide drinking water utilities with data beyond that required by regulation. In particular, the use of chemical databases with bioactivity metadata may help drinking water utilities in prioritising water pollutants and focusing on substances for which additional removal is desired regardless of their inclusion in existing legislation.

222

223
Summary
Organic micropollutants (MPs) are synthetic chemicals released in the environment or produced by (a)biotic degradation of anthropogenic substances under environmental conditions and during water treatment. The contamination of drinking water sources with small polar substances, typically of molecular weight below 300 Da and displaying low or negative log octanol-water partitioning coefficient (logKow) values, is of particular concern. Polar MPs preferentially partition into the water phase and can be mobile in aqueous media. When persistent, these chemicals can be transported across the water cycle at large distances from their original emission sources. Consequently, there is an increasing need (i) to monitor chemical identities and concentrations in natural waters, (ii) to adopt suitable treatment strategies to remove MPs from drinking water and (iii) to evaluate the possible adverse effects of contaminated drinking water to human health.
In this thesis, liquid-chromatography coupled to high-resolution tandem mass spectrometry (LC-HRMS/MS) was used to investigate the removal of polar MPs by reverse osmosis (RO) drinking water treatment applied to riverbank filtrate and to characterise trends and identities of persistent and mobile compounds in a riverbank filtration system. RO has emerged as a valuable option to efficiently remove polar MPs from a variety of source waters, using semi-permeable membranes to separate solutes from solvent molecules under the driving force of an externally applied pressure.
The first task of this thesis was to develop and validate an analytical method with ultra-high performance LC coupled to time-of-flight HRMS/MS. The method targeted a set of 33 polar MPs with diverse physicochemical properties in terms of hydrophilicity, charge and structure. This analytical work used direct injection analysis and pre-concentration by solid-phase extraction (SPE) with hydrophilic-lipophilic balance sorbent to ensure sub-nanograms per litre traces could be detected and quantified. Direct injection analysis of surface water and groundwater guaranteed detection limits in the range of 9 to 93 ng/L, whereas sub-ng/L levels could be detected in groundwater and RO permeate following enrichment with SPE. This work shows that the chromatographic resolution of biphenyl stationary phase-LC with the performance of time-of-flight HRMS/MS resulted in a fast, accurate method to monitor polar MPs in aqueous matrices.
RO applied to a raw anaerobic riverbank filtrate spiked with the model pollutants was conducted with a pilot-scale system capable of maintaining hypoxic conditions. This pilot plant was equipped with a standard thin-film composite (TFC) RO membrane. Contaminant removal was quantified by

224
LC-HRMS/MS analysis and statistical correlations between removal and compound physicochemical properties were derived. A strong inverse relationship between size and passage of neutral hydrophilic MPs was observed. This correlation was weaker for moderately hydrophobic compounds. Anionic MPs were mostly retained by the membranes due to electrostatic repulsion, whereas breakthrough of small cationic molecules occurred. Passage figures for the investigated compounds varied between less than 1% and 25%.
The performance of TFC membranes was compared to that of thin-film nanocomposite (TFN) and aquaporin-embedded RO membranes in pilot-scale and bench-scale RO, respectively. In pilot-scale RO, up to 15% and 6% MPs passage was quantified for the TFC and TFN membranes, respectively. In bench-scale RO, up to 65% and 44% passage was quantified with the aquaporin and TFC membranes, respectively, suggesting a more open structure of the smaller scale membrane elements. In both RO systems, neutral polar MPs displayed the highest passage. Overall, no statistical differences were found between TFC and mixed-matrix RO membranes.
In parallel to studying chemical behaviour in RO processes, persistent and mobile polar MPs were investigated by non-target MS screening (NTS) in a river bank filtration (RBF) transect where the water travels for 1 to 60 years in the sub-surface. LC-HRMS/MS data were processed by hierarchical clustering to unveil contaminant trends. Cheminformatics tools allowed the (tentative) identification of unknowns, whose candidate structures were retrieved from an openly accessible chemical database. These structures were ranked based on in silico fragmentation, chemical metadata and similarities to open spectral libraries. The workflow led to the tentative identification of 67 organic compounds. The identities of 25 polar substances were confirmed and included environmental contaminants so far unknown to occur in bank filtrate or in the water cycle at all, such as tetramethylsulfamide. This work demonstrated that many classes of hydrophilic organic compounds can enter riverbank filtration systems, persisting in the sub-surface and migrating for decades if biogeochemical conditions are stable.
In the last section of this thesis, NTS was coupled to biological analysis to evaluate toxicity in feed water and effluents of an optimised full-scale RO treatment plant fed with riverbank filtrate. Effect-based methods (EBM) with endpoints relevant for human health and general genotoxicity were chosen for a comprehensive assessment. To explain induction of the investigated toxicity pathways, candidate structures of unknown chemicals detected by LC-HRMS/MS were retrieved from an open database with bioactivity metadata and ranked based on in silico fragmentation. Identification with high confidence was achieved by calculating similarities with accurate mass

225
spectra in open spectral libraries. Induction of xenobiotic metabolism, adaptive stress response and genotoxicy were observed in the feed water (RBF) and RO concentrate. These effects were absent in RO permeate. Among the 49 structures that were tentatively annotated, 5 were confirmed with reference standards and 16 were tentatively identified with high confidence. Bioactivity metadata of some of these chemicals could, in part, explain the effects observed with the bioanalytical tools. This study demonstrated the efficacy of RO in removing potentially hazardous compounds and the usefulness of elucidating chemical structures by NTS to derive cause-effect relationships.
The work described in this thesis shows the potential of RO to remove polar organic pollutants with high efficacy, highlighting its suitability for drinking water applications using natural source waters requiring only a minimum pre-treatment, e.g. riverbank filtrate. Critical compounds related to increased RO passage were identified as being (i) small (< 150 Da) uncharged hydrophilic, (ii) (moderately) hydrophobic without a clear correlation to size and (iii) small cationic (< 186 Da). New membrane chemistry should be explored, as well as scaling-up existing membrane elements based on novel (nano)materials, e.g. graphene oxide and carbon nanotubes. This could improve organic chemical removal by RO and contribute to increasing clean water availability using recycling applications, providing many benefits to society.
The leading role of LC-HRMS for the characterisation of dissolved polar MPs has been shown both in this thesis and elsewhere. Recent HRMS detectors have decreased the sensitivity gap with low-resolution MS, so far considered as the “golden standard”, in such a way that environmentally relevant concentrations can be quantified without necessarily having to pre-concentrate water samples. HRMS-based methods provide the additional benefit of allowing NTS, also retrospectively. The availability of intelligible computational methods and open cheminformatics tools to process HRMS data has boosted the throughput of non-target applications, allowing data analysis, such as trend detection, using sophisticated algorithms and tentative identification of unknown compounds by annotation of accurate mass spectra using chemical database and accurate mass spectral libraries. These methods are valuable to (i) increase knowledge on the behaviour and identification of pollutants in the environment and in water treatment processes, (ii) provide thorough evidence to upgrade (drinking) water treatment trains to tackle the removal of organic chemicals, and (iii) support decision making for contaminant regulation. Coupling EBMs with chemical analysis can provide additional information on possible adverse effects of the chemical mixtures that occur in source waters, allowing drinking water utilities to perform comprehensive water quality assessments.

226

227
Samenvatting
Organische microverontreinigingen (MV) zijn synthetische chemicaliën die terechtkomen in het milieu of worden geproduceerd door (a)biotische afbraak van antropogene stoffen in het milieu en tijdens waterbehandeling. Verontreiniging van drinkwaterbronnen met kleine polaire stoffen met een molecuulgewicht van minder dan 300 Da en met een lage of negatieve log octanol-water partitiecoëfficiënt (logKow) waarde verdienen vooral de aandacht. Polaire MV bevinden zich bij voorkeur in de waterfase en kunnen mobiel zijn in waterig milieu. Wanneer ze persistent zijn, kunnen ze over grote afstanden van hun oorspronkelijke emissiebronnen via de watercyclus worden getransporteerd. Dientengevolge is er een toenemende behoefte (i) om chemische identiteit en concentraties in natuurlijke wateren te monitoren, (ii) geschikte behandelingsstrategieën te implementeren om MV uit drinkwater te verwijderen en (iii) om de mogelijke nadelige effecten te evalueren van vervuild drinkwater op humane gezondheid. In dit proefschrift werd vloeistofchromatografie gekoppeld aan hoge resolutie tandem massaspectrometrie (LC-HRMS/MS) gebruikt om de verwijdering van polaire MV in oeverfiltraat door omgekeerde osmose (RO) drinkwaterbehandeling te onderzoeken en trends en de identiteit te karakteriseren van persistente en mobiele verbindingen in een oeverfiltratiesysteem. RO is een waardevol proces gebleken voor het op een efficiënte wijze verwijderen van polaire MV uit verschillende bronnen van drinkwater, waarbij met behulp van semipermeabele membranen onder de drijvende kracht van extern uitgeoefende druk opgeloste stoffen worden gescheiden van oplosmiddelmoleculen.
Het eerste deel van dit proefschrift beschrijft het ontwikkelen en valideren van een analytische methode met ultra-high performance LC gekoppeld aan time-of-flight HRMS/MS. De methode werd getest met een set van 33 polaire MV met verschillende fysisch-chemische eigenschappen in termen van hydrofiliciteit, lading en structuur. Dit analytische werk maakte gebruik van directe injectie analyse en pre-concentratie door vaste fase extractie (SPE) met een zogenaamde hydrofiele-lipofiele balans sorbent om te zorgen dat sporenconcentraties op het niveau van sub-nanogram per liter konden worden gedetecteerd en gekwantificeerd. Directe injectie analyse van oppervlaktewater en grondwater resulteerde in detectielimieten van 9 tot 93 ng/L, terwijl sub-ng/L-niveaus konden worden gedetecteerd in grondwater en RO-permeaat na pre-concentratie met SPE. Dit werk toont aan dat de chromatografische resolutie van een bifenyl stationaire fase-LC scheiding gekoppeld aan time-of-flight HRMS/MS resulteert in een snelle, nauwkeurige

228
methode om polaire MV in waterige matrices te monitoren. RO toegepast op een onbewerkt anaeroob oeverfiltraat met daaraan toegevoegde modelverontreinigingen werd uitgevoerd in een pilotschaalsysteem waarin hypoxische omstandigheden kunnen worden gehandhaafd. De pilotopstelling was uitgerust met een standaard dunne film composiet (TFC) RO-membraan. Verwijdering van contaminanten werd gekwantificeerd met LC-HRMS/MS-analyse en statistische correlaties werden bepaald tussen verwijdering en fysisch-chemische eigenschappen van de componenten. Een sterk omgekeerd verband tussen grootte en permeatie van neutrale hydrofiele MV werd waargenomen. Deze correlatie was zwakker voor matig hydrofobe verbindingen. Anionische MV werden veelal tegengehouden door de membranen als gevolg van elektrostatische afstoting, terwijl doorbraak optrad van kleine kationen. Permeatie voor de onderzochte verbindingen varieerde tussen minder dan 1% en 25%. De prestaties van TFC-membranen werden vergeleken met die van dunne film nanocomposiet (TFN) en in aquaporine ingebedde RO-membranen op zowel pilootschaal- als laboratoriumschaal RO. Op pilotschaal werd een doorlating van maximaal 15% en 6% MV gekwantificeerd voor respectievelijk de TFC- en TFN-membranen. Met RO op laboratoriumschaal werd een doorlating tot 65% en 44% gekwantificeerd met respectievelijk de aquaporine- en TFC-membranen, wat mogelijk duidt op een meer open structuur van de kleinschaliger membraanelementen. Beide RO-systemen vertoonden de hoogste doorlaat voor neutrale polaire MV. Over het algemeen werden geen statistische verschillen gevonden tussen TFC en mixed-matrix RO-membranen. Tegelijkertijd met het bestuderen van het chemisch gedrag in RO processen, werden persistente en mobiele polaire MV onderzocht met non-target MS-screening (NTS) in een oeverfiltratie (OF) transect, waar het water gedurende 1 tot 60 jaar in de ondergrond doorsijpelde. De LC-HRMS/MS resultaten werden verwerkt met hiërarchische clusteranalyse om temporele trends van vervuilingen te ontdekken. Cheminformatica tools maakten de (tentatieve) identificatie van onbekende stoffen mogelijk, waarbij de mogelijke structuren werden ontleend aan een openlijk toegankelijke chemische databases. Deze structuren werden gerangschikt op basis van in-silico fragmentatie, chemische metadata en overeenkomsten met open spectrale bibliotheken. De workflow leidde tot de tentatieve identificatie van 67 organische verbindingen. De identiteit van 25 polaire stoffen werd bevestigd en omvatte milieuverontreinigingen (zoals tetramethylsulfamide) die tot dusverre niet eerder aangetoond waren in oeverfiltraat of in de watercyclus. Dit werk toonde aan dat veel klassen van hydrofiele organische

229
verbindingen oeverfiltratiesystemen kunnen binnendringen, persistent zijn in de ondergrond en decennialang migreren indien de biogeochemische omstandigheden stabiel zijn. In het laatste deel van dit proefschrift werd NTS gecombineerd met biologische analyse om de toxiciteit te testen van zowel ruw water (oeverfiltraat) als effluenten afkomstig van een geoptimaliseerde behandelingsinstallatie die volledig gebaseerd is op RO en werd gevoed met oeverfiltraat. Een uitgebreide toxiciteitsbeoordeling werd bewerkstelligd met behulp van effect-gebaseerde methoden (EBM) met eindpunten die relevant zijn voor de menselijke gezondheid en algemene genotoxiciteit. Om de inductie in de onderzochte toxiciteitstesten te verklaren werden kandidaatstructuren voor door LC-HRMS/MS gedetecteerde onbekende chemicaliën ontleend aan een open database met bioactiviteitsmetadata en werden deze gerangschikt op basis van in-silico fragmentatie. Identificatie met een hoge mate van betrouwbaarheid werd verwezenlijkt door vergelijking met accurate massaspectra afkomstig van open spectrale bibliotheken. Inductie van xenobiotisch metabolisme, adaptieve stressreactie en genotoxiciteit werd waargenomen in het oeverfiltraat (OF) en het RO-concentraat. Deze effecten waren afwezig in RO-permeaat. Van de 49 structuren die tentatief werden toegekend werden er vijf daadwerkelijk bevestigd met referentiestandaarden en 16 werden met een grote mate van zekerheid geïdentificeerd. Bioactiviteitsmetadata van sommige van deze chemicaliën konden gedeeltelijk de effecten verklaren die waren waargenomen met de uitgevoerde bioanalytische tools. Deze studie toonde de effectiviteit aan van RO voor het verwijderen van toxiciteit (en dus van mogelijk gevaarlijke verbindingen) en het nut van NTS bij het ophelderen van chemische structuren die de waargenomen toxiciteit kunnen verklaren. Het werk beschreven in dit proefschrift demonstreert het potentieel van RO om polaire organische verontreinigingen effectief te verwijderen. Hierbij wordt met name de geschiktheid voor drinkwatertoepassingen benadrukt waar natuurlijke bronwateren zoals oeverfiltraat slechts een minimale voorbehandeling vereisen. Kritieke verbindingen gerelateerd aan verhoogde RO doorlating werden geïdentificeerd als zijnde (i) klein (<150 Da) niet-geladen hydrofiel, (ii) (matig) hydrofoob zonder een duidelijke correlatie met grootte en (iii) klein kationisch (<186 Da). Verder onderzoek zou zich moeten richten op de chemie van nieuwe membraanmaterialen, evenals op het opschalen van bestaande membraanelementen op basis van nieuwe (nano) materialen zoals grafeenoxide en koolstofnanobuizen. Dit kan het verwijderen van organische chemicaliën met RO nog verder verbeteren en bijdragen tot een toename van de beschikbaarheid van schoon water door recyclingtoepassingen, die uiteindelijk vele voordelen bieden voor de

230
maatschappij. De leidende rol van LC-HRMS voor de karakterisering van opgeloste polaire MV is zowel in dit proefschrift als elders aangetoond. De ontwikkeling van moderne HRMS-detectoren heeft het verschil in gevoeligheid ten opzichte van lage resolutie MS (tot dusverre altijd beschouwd als de "gouden standaard") zodanig verkleind dat milieu-relevante concentraties kunnen worden gekwantificeerd zonder dat watermonsters vooraf hoeven te worden geconcentreerd. Op HRMS gebaseerde methoden bieden het extra voordeel dat ze NTS mogelijk maken, zelfs retrospectief. De beschikbaarheid van begrijpelijke computationele methoden en open cheminformatica tools voor het verwerken van HRMS data heeft de snelheid van non-target toepassingen bevorderd. Hierdoor is het mogelijk om data analyse (zoals trenddetectie) uit te voeren met behulp van geavanceerde algoritmen en tentatieve identificatie van onbekende verbindingen te verwezenlijken door annotatie van accurate massaspectra met behulp van databases van chemische stoffen en accurate massaspectrumbibliotheken. Deze methoden zijn waardevol om (i) de kennis over het gedrag en de identificatie van verontreinigende stoffen in het milieu en in waterzuiveringsprocessen te vergroten, (ii) grondig bewijs te verstrekken voor het verbeteren van (drink)waterzuiveringstrategieën om de verwijdering van organische chemicaliën aan te pakken en (iii) het ondersteunen van besluitvorming voor regelgeving op het gebied van contaminanten. Koppeling van EBM met chemische analyse kan aanvullende informatie verschaffen over mogelijke nadelige effecten van mengsels van chemicaliën die in ruw water voorkomen, waarmee drinkwaterbedrijven in staat worden gesteld om een optimale waterkwaliteitsbeoordeling te maken.

231
References
Aceña, J., Stampachiacchiere, S., Pérez, S., Barceló, D., 2015. Advances in liquid
chromatography–high-resolution mass spectrometry for quantitative and
qualitative environmental analysis. Anal. Bioanal. Chem. 407, 6289–6299.
https://doi.org/10.1007/s00216-015-8852-6
Agenson, K.O., Urase, T., 2007. Change in membrane performance due to organic
fouling in nanofiltration (NF)/reverse osmosis (RO) applications. Sep. Purif.
Technol. 55, 147–156.
https://doi.org/https://doi.org/10.1016/j.seppur.2006.11.010
Agre, P., 2004. Aquaporin Water Channels (Nobel Lecture). Angew. Chemie Int. Ed.
43, 4278–4290. https://doi.org/10.1002/anie.200460804
Agre, P., Sasaki, S., Chrispeels, M.J., 1993. Aquaporins: a family of water channel
proteins. Am. J. Physiol. Physiol. 265, F461–F461.
https://doi.org/10.1152/ajprenal.1993.265.3.F461
Agus, E., Sedlak, D.L., 2010. Formation and fate of chlorination by-products in
reverse osmosis desalination systems. Water Res. 44, 1616–1626.
https://doi.org/10.1016/J.WATRES.2009.11.015
Al-Rifai, J.H., Khabbaz, H., Schäfer, A.I., 2011. Removal of pharmaceuticals and
endocrine disrupting compounds in a water recycling process using reverse
osmosis systems. Sep. Purif. Technol. 77, 60–67.
https://doi.org/10.1016/j.seppur.2010.11.020
Albergamo, V., Blankert, B., Cornelissen, E.R., Hofs, B., Knibbe, W.-J., van der
Meer, W., de Voogt, P., 2019. Removal of polar organic micropollutants by
pilot-scale reverse osmosis drinking water treatment. Water Res. 148, 535–
545. https://doi.org/10.1016/j.watres.2018.09.029
Albergamo, V., Helmus, R., de Voogt, P., 2018. Direct injection analysis of polar
micropollutants in natural drinking water sources with biphenyl liquid
chromatography coupled to high-resolution time-of-flight mass spectrometry. J.
Chromatogr. A 1596, 53–61.
https://doi.org/https://doi.org/10.1016/j.chroma.2018.07.036
Altenburger, R., Brack, W., Burgess, R.M., Busch, W., Escher, B.I., Focks, A., Mark
Hewitt, L., Jacobsen, B.N., de Alda, M.L., Ait-Aissa, S., Backhaus, T.,
Ginebreda, A., Hilscherová, K., Hollender, J., Hollert, H., Neale, P.A., Schulze,
T., Schymanski, E.L., Teodorovic, I., Tindall, A.J., de Aragão Umbuzeiro, G.,
Vrana, B., Zonja, B., Krauss, M., 2019. Future water quality monitoring:
improving the balance between exposure and toxicity assessments of real-
world pollutant mixtures. Environ. Sci. Eur. 31, 12.

232
https://doi.org/10.1186/s12302-019-0193-1
Ames, B.N., Mccann, J., Yamasaki, E., 1975. Methods for detecting carcinogens and
mutagens with the Salmonella mammalian microsome mutagenicity test.
Mutat. Res. 31, 347–364.
Arbeláez, P., Borrull, F., Pocurull, E., Marcé, R.M., 2015. Determination of high-
intensity sweeteners in river water and wastewater by solid-phase extraction
and liquid chromatography–tandem mass spectrometry. J. Chromatogr. A
1393, 106–114. https://doi.org/10.1016/J.CHROMA.2015.03.035
Ascott, M.J., Lapworth, D.J., Gooddy, D.C., Sage, R.C., Karapanos, I., 2016.
Impacts of extreme flooding on riverbank filtration water quality. Sci. Total
Environ. 554–555, 89–101.
https://doi.org/10.1016/J.SCITOTENV.2016.02.169
Babua, C., Sreenivasa Rao, B., Suresh Reddy, K.V.N., Naganjaneyulu, B., 2013.
Development and Validation of HPLC Assay Method for the Acamprosate Ca
in Commercial Tablets. Indian J. Adv. Chem. Sci. 2, 46–49.
Batt, A.L., Snow, D.D., Aga, D.S., 2006. Occurrence of sulfonamide antimicrobials
in private water wells in Washington County, Idaho, USA. Chemosphere 64,
1963–1971. https://doi.org/10.1016/j.chemosphere.2006.01.029
Beale, D.J., Kaserzon, S.L., Porter, N.A., Roddick, F.A., Carpenter, P.D., 2010.
Detection of s-triazine pesticides in natural waters by modified large-volume
direct injection HPLC. Talanta 82, 668–674.
https://doi.org/https://doi.org/10.1016/j.talanta.2010.05.030
Becerra-Herrera, M., Honda, L., Richter, P., 2015. Ultra-high-performance liquid
chromatography—Time-of-flight high resolution mass spectrometry to quantify
acidic drugs in wastewater. J. Chromatogr. A 1423, 96–103.
https://doi.org/10.1016/j.chroma.2015.10.071
Bednarik, V., Vondruska, M., Pruckova, Z., Koutny, M., 2007. Disposal of waste
liquor from 2,5-dichlorodisulfanilic acid production. Environ. Technol. 28, 1237–
1243. https://doi.org/10.1080/09593332808618882
Bellona, C., Drewes, J.E., Xu, P., Amy, G., 2004. Factors affecting the rejection of
organic solutes during NF/RO treatment—a literature review. Water Res. 38,
2795–2809. https://doi.org/10.1016/j.watres.2004.03.034
Ben-Sasson, M., Lu, X., Bar-Zeev, E., Zodrow, K.R., Nejati, S., Qi, G., Giannelis,
E.P., Elimelech, M., 2014. In situ formation of silver nanoparticles on thin-film
composite reverse osmosis membranes for biofouling mitigation. Water Res.
62, 260–270. https://doi.org/https://doi.org/10.1016/j.watres.2014.05.049
Benotti, M.J., Song, R., Wilson, D., Snyder, S.A., 2012. Removal of pharmaceuticals
and endocrine disrupting compounds through pilot-and full-scale riverbank

233
filtration, Water Science and Technology: Water Supply.
https://doi.org/10.2166/ws.2011.068
Benotti, M.J., Trenholm, R.A., Vanderford, B.J., Holady, J.C., Stanford, B.D., Snyder,
S.A., 2009. Pharmaceuticals and Endocrine Disrupting Compounds in U.S.
Drinking Water. Environ. Sci. Technol. 43, 597–603.
https://doi.org/10.1021/es801845a
Bertelkamp, C., Reungoat, J., Cornelissen, E.R., Singhal, N., Reynisson, J., Cabo,
A.J., van der Hoek, J.P., Verliefde, A.R.D., 2014. Sorption and biodegradation
of organic micropollutants during river bank filtration: A laboratory column
study. Water Res. 52, 231–241.
https://doi.org/10.1016/J.WATRES.2013.10.068
Bertelkamp, C., Verliefde, A.R.D., Schoutteten, K., Vanhaecke, L., Vanden Bussche,
J., Singhal, N., van der Hoek, J.P., 2016. The effect of redox conditions and
adaptation time on organic micropollutant removal during river bank filtration:
A laboratory-scale column study. Sci. Total Environ. 544, 309–318.
https://doi.org/10.1016/J.SCITOTENV.2015.11.035
Bijlsma, L., Emke, E., Hernández, F., de Voogt, P., 2013. Performance of the linear
ion trap Orbitrap mass analyzer for qualitative and quantitative analysis of
drugs of abuse and relevant metabolites in sewage water. Anal. Chim. Acta
768, 102–110. https://doi.org/10.1016/j.aca.2013.01.010
Björklund, E., Styrishave, B., Anskjær, G.G., Hansen, M., Halling-Sørensen, B.,
2011. Dichlobenil and 2,6-dichlorobenzamide (BAM) in the environment: What
are the risks to humans and biota? Sci. Total Environ. 409, 3732–3739.
https://doi.org/10.1016/j.scitotenv.2011.06.004
Blaženović, I., Kind, T., Ji, J., Fiehn, O., 2018. Software Tools and Approaches for
Compound Identification of LC-MS/MS Data in Metabolomics. Metab. .
https://doi.org/10.3390/metabo8020031
Bohn, T., Cocco, E., Gourdol, L., Guignard, C., Hoffmann, L., 2011. Determination
of atrazine and degradation products in Luxembourgish drinking water: origin
and fate of potential endocrine-disrupting pesticides. Food Addit. Contam. Part
A 28, 1041–1054. https://doi.org/10.1080/19440049.2011.580012
Boix, C., Ibáñez, M., Sancho, J. V., Rambla, J., Aranda, J.L., Ballester, S.,
Hernández, F., 2015. Fast determination of 40 drugs in water using large
volume direct injection liquid chromatography–tandem mass spectrometry.
Talanta 131, 719–727. https://doi.org/10.1016/J.TALANTA.2014.08.005
Boleda, M.R., Galceran, M.T., Ventura, F., 2011. Behavior of pharmaceuticals and
drugs of abuse in a drinking water treatment plant (DWTP) using combined
conventional and ultrafiltration and reverse osmosis (UF/RO) treatments.
Environ. Pollut. 159, 1584–1591. https://doi.org/10.1016/j.envpol.2011.02.051

234
Bollmann, U.E., Möller, A., Xie, Z., Ebinghaus, R., Einax, J.W., 2012. Occurrence
and fate of organophosphorus flame retardants and plasticizers in coastal and
marine surface waters. Water Res. 46, 531–538.
https://doi.org/10.1016/j.watres.2011.11.028
Borkovec, A.B., Woods, C.W., 1963. Aziridine Chemosterilants, in: New Approaches
to Pest Control and Eradication, Advances in Chemistry. AMERICAN
CHEMICAL SOCIETY, pp. 6–47. https://doi.org/doi:10.1021/ba-1963-
0041.ch006
Brack, W., Aissa, S.A., Backhaus, T., Dulio, V., Escher, B.I., Faust, M., Hilscherova,
K., Hollender, J., Hollert, H., Müller, C., Munthe, J., Posthuma, L., Seiler, T.-B.,
Slobodnik, J., Teodorovic, I., Tindall, A.J., de Aragão Umbuzeiro, G., Zhang,
X., Altenburger, R., 2019. Effect-based methods are key. The European
Collaborative Project SOLUTIONS recommends integrating effect-based
methods for diagnosis and monitoring of water quality. Environ. Sci. Eur. 31,
10. https://doi.org/10.1186/s12302-019-0192-2
Brack, W., Altenburger, R., Schüürmann, G., Krauss, M., López Herráez, D., van
Gils, J., Slobodnik, J., Munthe, J., Gawlik, B.M., van Wezel, A., Schriks, M.,
Hollender, J., Tollefsen, K.E., Mekenyan, O., Dimitrov, S., Bunke, D., Cousins,
I., Posthuma, L., van den Brink, P.J., López de Alda, M., Barceló, D., Faust,
M., Kortenkamp, A., Scrimshaw, M., Ignatova, S., Engelen, G., Massmann, G.,
Lemkine, G., Teodorovic, I., Walz, K.-H., Dulio, V., Jonker, M.T.O., Jäger, F.,
Chipman, K., Falciani, F., Liska, I., Rooke, D., Zhang, X., Hollert, H., Vrana, B.,
Hilscherova, K., Kramer, K., Neumann, S., Hammerbacher, R., Backhaus, T.,
Mack, J., Segner, H., Escher, B., de Aragão Umbuzeiro, G., 2015. The
SOLUTIONS project: Challenges and responses for present and future
emerging pollutants in land and water resources management. Sci. Total
Environ. 503, 22–31. https://doi.org/10.1016/j.scitotenv.2014.05.143
Bradley, P.M., Barber, L.B., Duris, J.W., Foreman, W.T., Furlong, E.T., Hubbard,
L.E., Hutchinson, K.J., Keefe, S.H., Kolpin, D.W., 2014. Riverbank filtration
potential of pharmaceuticals in a wastewater-impacted stream. Environ. Pollut.
193, 173–180. https://doi.org/10.1016/J.ENVPOL.2014.06.028
Brkic, D., Gasic, S., Vértesi, A., Karan, V., Neskovic, N., 2015. Genotoxicity of GAL-
57 Herbicide in Salmonella typhimurium and Escherichia coli. Pestic. fitomed.
(Beograd), 21, 317-323
Brulik, J., Simek, Z., de Voogt, P., 2013. A new liquid chromatography–tandem mass
spectrometry method using atmospheric pressure photo ionization for the
simultaneous determination of azaarenes and azaarones in Dutch river
sediments. J. Chromatogr. A 1294, 33–40.
https://doi.org/10.1016/j.chroma.2013.03.079
Brüschweiler, B.J., Küng, S., Bürgi, D., Muralt, L., Nyfeler, E., 2014. Identification of
non-regulated aromatic amines of toxicological concern which can be cleaved

235
from azo dyes used in clothing textiles. Regul. Toxicol. Pharmacol. 69, 263–
272. https://doi.org/10.1016/J.YRTPH.2014.04.011
Buerge, I.J., Buser, H.-R., Kahle, M., Müller, M.D., Poiger, T., 2009. Ubiquitous
Occurrence of the Artificial Sweetener Acesulfame in the Aquatic Environment:
An Ideal Chemical Marker of Domestic Wastewater in Groundwater. Environ.
Sci. Technol. 43, 4381–4385. https://doi.org/10.1021/es900126x
Busetti, F., Ruff, M., Linge, K.L., 2015. Target screening of chemicals of concern in
recycled water. Environ. Sci. Water Res. Technol. 1, 659–667.
https://doi.org/10.1039/C4EW00104D
Campos-Mañas, M.C., Plaza-Bolaños, P., Sánchez-Pérez, J.A., Malato, S., Agüera,
A., 2017. Fast determination of pesticides and other contaminants of emerging
concern in treated wastewater using direct injection coupled to highly sensitive
ultra-high performance liquid chromatography-tandem mass spectrometry. J.
Chromatogr. A 1507, 84–94.
https://doi.org/https://doi.org/10.1016/j.chroma.2017.05.053
Capel, P.D., Giger, W., Reichert, P., Wanner, O., 1988. Accidental input of pesticides
into the Rhine River. Environ. Sci. Technol. 22, 992–997.
Cartagena, P., El Kaddouri, M., Cases, V., Trapote, A., Prats, D., 2013. Reduction
of emerging micropollutants, organic matter, nutrients and salinity from real
wastewater by combined MBR–NF/RO treatment. Sep. Purif. Technol. 110,
132–143. https://doi.org/10.1016/j.seppur.2013.03.024
Chambers, M.C., Maclean, B., Burke, R., Amodei, D., Ruderman, D.L., Neumann,
S., Gatto, L., Fischer, B., Pratt, B., Egertson, J., Hoff, K., Kessner, D., Tasman,
N., Shulman, N., Frewen, B., Baker, T.A., Brusniak, M.-Y., Paulse, C., Creasy,
D., Flashner, L., Kani, K., Moulding, C., Seymour, S.L., Nuwaysir, L.M.,
Lefebvre, B., Kuhlmann, F., Roark, J., Rainer, P., Detlev, S., Hemenway, T.,
Huhmer, A., Langridge, J., Connolly, B., Chadick, T., Holly, K., Eckels, J.,
Deutsch, E.W., Moritz, R.L., Katz, J.E., Agus, D.B., MacCoss, M., Tabb, D.L.,
Mallick, P., 2012. A cross-platform toolkit for mass spectrometry and
proteomics. Nat. Biotechnol. 30, 918.
Chang, J.C., Taylor, P.B., Leach, F.R., 1981. Use of the Microtox®assay system for
environmental samples. Bull. Environ. Contam. Toxicol. 26, 150–156.
Chiaia-Hernandez, A.C., Gunthardt, B.F., Frey, M.P., Hollender, J., 2017.
Unravelling Contaminants in the Anthropocene Using Statistical Analysis of
Liquid Chromatography-High-Resolution Mass Spectrometry Nontarget
Screening Data Recorded in Lake Sediments. Environ. Sci. Technol. 51,
12547–12556. https://doi.org/10.1021/acs.est.7b03357
Comerton, A.M., Andrews, R.C., Bagley, D.M., Hao, C., 2008. The rejection of
endocrine disrupting and pharmaceutically active compounds by NF and RO

236
membranes as a function of compound and water matrix properties. J. Memb.
Sci. 313, 323–335. https://doi.org/10.1016/j.memsci.2008.01.021
Commission of the European Union, 2002. Case No COMP/M.2547 - Bayer / Aventis
Crop Science. REGULATION (EEC) No 4064/89 MERGER PROCEDURE. Off.
J. Eur. Communities.
Cullum, N., Meng, C.K., Zavitsanos, P., 2004. Effect of Sample Matrix on
Suppression of Ionization in Water Samples Using LC-ESI-MS. Agil. Technol.
1–10.
David S. Bell, Daniel Shollenberger, H.C., Bell, D.S., 2017. Evaluation of Retention
and Selectivity Using Biphenyl Stationary Phases. LCGC North Am. 35, 360–
365.
Diamanti-Kandarakis, E., Bourguignon, J.-P., Giudice, L.C., Hauser, R., Prins, G.S.,
Soto, A.M., Zoeller, R.T., Gore, A.C., 2009. Endocrine-Disrupting Chemicals:
An Endocrine Society Scientific Statement. Endocr. Rev. 30, 293–342.
Diaz, R., Ibanez, M., Sancho, J. V, Hernandez, F., 2012. Target and non-target
screening strategies for organic contaminants, residues and illicit substances
in food, environmental and human biological samples by UHPLC-QTOF-MS.
Anal. Methods 4, 196–209. https://doi.org/10.1039/C1AY05385J
Dodder, N., Mullen, K., Dodder, M.N., 2017. Package OrgMassSpecR.
Dubois, O., 2011. The state of the world’s land and water resources for food and
agriculture: managing systems at risk. The Food and Agriculture Organization
of the United Nations and Earthscan.
Dührkop, K., Scheubert, K., Böcker, S., 2013. Molecular formula identification with
SIRIUS. Metabolites 3, 506–516.
Emery, R.J., Papadaki, M., Freitas dos Santos, L.M., Mantzavinos, D., 2005. Extent
of sonochemical degradation and change of toxicity of a pharmaceutical
precursor (triphenylphosphine oxide) in water as a function of treatment
conditions. Environ. Int. 31, 207–211.
https://doi.org/https://doi.org/10.1016/j.envint.2004.09.017
EPA’s National Center for Computational Toxicology, 2018. CompTox Chemicals
Dashboard Metadata Files for Integration with MetFrag. figshare. Dataset.
https://doi.org/10.23645/epacomptox.7525199.v1
Eschauzier, C., Beerendonk, E., Scholte-Veenendaal, P., De Voogt, P., 2012.
Impact of Treatment Processes on the Removal of Perfluoroalkyl Acids from
the Drinking Water Production Chain. Environ. Sci. Technol. 46, 1708–1715.
https://doi.org/10.1021/es201662b
Eschauzier, C., Haftka, J., Stuyfzand, P.J., de Voogt, P., 2010. Perfluorinated

237
Compounds in Infiltrated River Rhine Water and Infiltrated Rainwater in Coastal
Dunes. Environ. Sci. Technol. 44, 7450–7455.
https://doi.org/10.1021/es100471z
Eschauzier, C., Raat, K.J., Stuyfzand, P.J., De Voogt, P., 2013. Perfluorinated
alkylated acids in groundwater and drinking water: Identification, origin and
mobility. Sci. Total Environ. 458, 477–485.
https://doi.org/10.1016/j.scitotenv.2013.04.066
Escher, B., Leusch, F., 2012. Bioanalytical Tools in Water Quality Assessment. IWA
Publishing.
Escher, B.I., Allinson, M., Altenburger, R., Bain, P.A., Balaguer, P., Busch, W.,
Crago, J., Denslow, N.D., Dopp, E., Hilscherova, K., Humpage, A.R., Kumar,
A., Grimaldi, M., Jayasinghe, B.S., Jarosova, B., Jia, A., Makarov, S., Maruya,
K.A., Medvedev, A., Mehinto, A.C., Mendez, J.E., Poulsen, A., Prochazka, E.,
Richard, J., Schifferli, A., Schlenk, D., Scholz, S., Shiraishi, F., Snyder, S., Su,
G., Tang, J.Y.M., Burg, B. van der, Linden, S.C. van der, Werner, I.,
Westerheide, S.D., Wong, C.K.C., Yang, M., Yeung, B.H.Y., Zhang, X.,
Leusch, F.D.L., 2014. Benchmarking Organic Micropollutants in Wastewater,
Recycled Water and Drinking Water with In Vitro Bioassays. Environ. Sci.
Technol. 48, 1940–1956. https://doi.org/10.1021/es403899t
Escher, B.I., Dutt, M., Maylin, E., Tang, J.Y.M., Toze, S., Wolf, C.R., Lang, M., 2012.
Water quality assessment using the AREc32 reporter gene assay indicative of
the oxidative stress response pathway. J. Environ. Monit. 14, 2877–2885.
Escher, B.I., Lawrence, M., Macova, M., Mueller, J.F., Poussade, Y., Robillot, C.,
Roux, A., Gernjak, W., 2011. Evaluation of Contaminant Removal of Reverse
Osmosis and Advanced Oxidation in Full-Scale Operation by Combining
Passive Sampling with Chemical Analysis and Bioanalytical Tools. Environ.
Sci. Technol. 45, 5387–5394. https://doi.org/10.1021/es201153k
EU, 2013. Priority substances in water policy Directive DIRECTIVE 2013/39/EU
AMENDING 2000/60/EC and 2008/105/EC.
European Chemical Agency, 2016. Annex III inventory. URL
https://www.echa.europa.eu/web/guest/information-on-chemicals/annex-iii-
inventory (accessed 1.20.19).
FAO, 2007. Coping with water scarcity - Challenge of the twenty-first century. URL
http://www.fao.org/3/a-aq444e.pdf (accessed 1.20.19).
Fekete, S., Oláh, E., Fekete, J., 2012. Fast liquid chromatography: The domination
of core–shell and very fine particles. J. Chromatogr. A 1228, 57–71.
https://doi.org/https://doi.org/10.1016/j.chroma.2011.09.050
Fujioka, T., Khan, S.J., McDonald, J.A., Henderson, R.K., Poussade, Y., Drewes,
J.E., Nghiem, L.D., 2013. Effects of membrane fouling on N-nitrosamine

238
rejection by nanofiltration and reverse osmosis membranes. J. Memb. Sci. 427,
311–319. https://doi.org/10.1016/j.memsci.2012.09.055
Fujioka, T., Khan, S.J., McDonald, J.A., Nghiem, L.D., 2015a. Validating the rejection
of trace organic chemicals by reverse osmosis membranes using a pilot-scale
system. Desalination 358, 18–26. https://doi.org/10.1016/j.desal.2014.11.033
Fujioka, T., Khan, S.J., McDonald, J.A., Nghiem, L.D., 2015b. Rejection of trace
organic chemicals by a hollow fibre cellulose triacetate reverse osmosis
membrane. Desalination 368, 69–75.
https://doi.org/10.1016/j.desal.2014.06.011
Fujioka, T., Khan, S.J., Poussade, Y., Drewes, J.E., Nghiem, L.D., 2012a. N-
nitrosamine removal by reverse osmosis for indirect potable water reuse – A
critical review based on observations from laboratory-, pilot- and full-scale
studies. Sep. Purif. Technol. 98, 503–515.
https://doi.org/10.1016/j.seppur.2012.07.025
Fujioka, T., Nghiem, L.D., 2013. Modification of a polyamide reverse osmosis
membrane by heat treatment for enhanced fouling resistance. Water Sci.
Technol. Water Supply 13, 1553–1559.
Fujioka, T., Nghiem, L.D., Khan, S.J., McDonald, J.A., Poussade, Y., Drewes, J.E.,
2012b. Effects of feed solution characteristics on the rejection of N-
nitrosamines by reverse osmosis membranes. J. Memb. Sci. 409, 66–74.
https://doi.org/10.1016/j.memsci.2012.03.035
Furlong, E.T., Batt, A.L., Glassmeyer, S.T., Noriega, M.C., Kolpin, D.W., Mash, H.,
Schenck, K.M., 2017. Nationwide reconnaissance of contaminants of emerging
concern in source and treated drinking waters of the United States:
Pharmaceuticals. Sci. Total Environ. 579, 1629–1642.
https://doi.org/https://doi.org/10.1016/j.scitotenv.2016.03.128
Garfí, M., Cadena, E., Sanchez-Ramos, D., Ferrer, I., 2016. Life cycle assessment
of drinking water: comparing conventional water treatment, reverse osmosis
and mineral water in glass and plastic bottles. J. Clean. Prod. 137, 997–1003.
Gebbink, W.A., van Asseldonk, L., van Leeuwen, S.P.J., 2017. Presence of
Emerging Per- and Polyfluoroalkyl Substances (PFASs) in River and Drinking
Water near a Fluorochemical Production Plant in the Netherlands. Environ. Sci.
Technol. 51, 11057–11065. https://doi.org/10.1021/acs.est.7b02488
Geise, G.M., Park, H.B., Sagle, A.C., Freeman, B.D., McGrath, J.E., 2011. Water
permeability and water/salt selectivity tradeoff in polymers for desalination. J.
Memb. Sci. 369, 130–138.
https://doi.org/https://doi.org/10.1016/j.memsci.2010.11.054
Gerlich, M., Neumann, S., 2013. MetFusion: integration of compound identification
strategies. J. Mass Spectrom. 48, 291–298. https://doi.org/10.1002/jms.3123

239
German Federal Office of Consumer Protection and Food Safety, 2012. PSM-
Zulassungsbericht Goltix Gold. URL
https://www.bvl.bund.de/SharedDocs/Downloads/04_Pflanzenschutzmittel/01
_zulassungsberichte/006470-00-05.pdf?__blob=publicationFile&v=2
(accessed 5.10.19).
Ghattas, A.-K., Fischer, F., Wick, A., Ternes, T.A., 2017. Anaerobic biodegradation
of (emerging) organic contaminants in the aquatic environment. Water Res.
116, 268–295. https://doi.org/10.1016/J.WATRES.2017.02.001
Ghoshal, S., Mukherjee, A., 2008. Genotoxicity Testing of Low-Calorie Sweeteners:
Aspartame, Acesulfame-K, and Saccharin AU - Bandyopadhyay, Atrayee.
Drug Chem. Toxicol. 31, 447–457.
https://doi.org/10.1080/01480540802390270
Giger, W., Schaffner, C., Kohler, H.-P.E., 2006. Benzotriazole and Tolyltriazole as
Aquatic Contaminants. 1. Input and Occurrence in Rivers and Lakes. Environ.
Sci. Technol. 40, 7186–7192. https://doi.org/10.1021/es061565j
Gilbert, E.E.E., 1962. The reactions of sulfur trioxide, and its adducts, with organic
compounds. Chem. Rev. 62, 549–589. https://doi.org/10.1021/cr60220a003
Gindulyte, A., Shoemaker, B.A., Yu, B., Fu, G., He, J., Zhang, J., Chen, J., Wang,
J., Han, L., Thiessen, P.A., He, S., Bryant, S.H., Kim, S., Bolton, E.E., 2015.
PubChem Substance and Compound databases. Nucleic Acids Res. 44,
D1202–D1213. https://doi.org/10.1093/nar/gkv951
Gómez, M.J., Gómez-Ramos, M.M., Malato, O., Mezcua, M., Férnandez-Alba, A.R.,
2010. Rapid automated screening, identification and quantification of organic
micro-contaminants and their main transformation products in wastewater and
river waters using liquid chromatography–quadrupole-time-of-flight mass
spectrometry with an accurate-mass database. J. Chromatogr. A 1217, 7038–
7054. https://doi.org/10.1016/j.chroma.2010.08.070
Gray, J.L., Borch, T., Furlong, E.T., Davis, J.G., Yager, T.J., Yang, Y.-Y., Kolpin,
D.W., 2017. Rainfall-runoff of anthropogenic waste indicators from agricultural
fields applied with municipal biosolids. Sci. Total Environ. 580, 83–89.
https://doi.org/https://doi.org/10.1016/j.scitotenv.2016.03.033
Grund, B., Marvin, L., Rochat, B., 2016. Quantitative performance of a quadrupole-
orbitrap-MS in targeted LC–MS determinations of small molecules. J. Pharm.
Biomed. Anal. 124, 48–56. https://doi.org/10.1016/j.jpba.2016.02.025
Guillarme, D., Schappler, J., Rudaz, S., Veuthey, J.-L., 2010. Coupling ultra-high-
pressure liquid chromatography with mass spectrometry. TrAC Trends Anal.
Chem. 29, 15–27. https://doi.org/10.1016/j.trac.2009.09.008
Guo, J., Li, Z., Ranasinghe, P., Bonina, S., Hosseini, S., Corcoran, M.B., Smalley,
C., Kaliappan, R., Wu, Y., Chen, D., others, 2016. Occurrence of atrazine and

240
related compounds in sediments of upper Great Lakes. Environ. Sci. Technol.
50, 7335–7343.
Guoguang, L., Xiangning, J., Xiaobai, X., 2001. Photodegradation of 1-(2-
chlorobenzoyl)-3-(4-chlorophenyl) urea in different media and toxicity of its
reaction products. J. Agric. Food Chem. 49, 2359–2362.
Haider, T., Sommer, R., Knasmüller, S., Eckl, P., Pribil, W., Cabaj, A., Kundi, M.,
2002. Genotoxic response of Austrian groundwater samples treated under
standardized UV (254 nm) disinfection conditions in a combination of three
different bioassays. Water Res. 36, 25–32.
Hamann, E., Stuyfzand, P.J., Greskowiak, J., Timmer, H., Massmann, G., 2016. The
fate of organic micropollutants during long-term/long-distance river bank
filtration. Sci. Total Environ. 545–546, 629–640.
https://doi.org/10.1016/J.SCITOTENV.2015.12.057
Hargittai, I.; Brunvoll, J., 1976. Reinvestigation of the Molecular Structure of N,N-
Dimethyl Sulfamoyl Chloride by Electron Diffraction. Acta Chem. Scand. 30A,
634–640.
Hartkamp-Commandeur, L.C.M., Gerritse, J., Govers, H.A.J., Parsons, J.R., 1996.
Reductive dehalogenation of polychlorinated biphenyls by anaerobic
microorganisms enriched from dutch sediments. Chemosphere 32, 1275–
1286. https://doi.org/https://doi.org/10.1016/0045-6535(96)00039-2
Hayes, T.B., Khoury, V., Narayan, A., Nazir, M., Park, A., Brown, T., Adame, L.,
Chan, E., Buchholz, D., Stueve, T., Gallipeau, S., 2010. Atrazine induces
complete feminization and chemical castration in male African clawed frogs
(Xenopus laevis). Proc. Natl. Acad. Sci. 107, 4612–4617.
https://doi.org/10.1073/pnas.0909519107
Helmus, R., 2018. patRoon R package. URL https://github.com/rickhelmus/patRoon
Henzler, A.F., Greskowiak, J., Massmann, G., 2014. Modeling the fate of organic
micropollutants during river bank filtration (Berlin, Germany). J. Contam.
Hydrol. 156, 78–92. https://doi.org/10.1016/J.JCONHYD.2013.10.005
Henzler, T., YE, Q., Steudle, E., 2004. Oxidative gating of water channels
(aquaporins) in Chara by hydroxyl radicals. Plant. Cell Environ. 27, 1184–1195.
https://doi.org/10.1111/j.1365-3040.2004.01226.x
Heringa, M.B., Harmsen, D.J.H., Beerendonk, E.F., Reus, A.A., Krul, C.A.M., Metz,
D.H., IJpelaar, G.F., 2011. Formation and removal of genotoxic activity during
UV/H2O2--GAC treatment of drinking water. Water Res. 45, 366–374.
Hermes, N., Jewell, K.S., Wick, A., Ternes, T.A., 2018. Quantification of more than
150 micropollutants including transformation products in aqueous samples by
liquid chromatography-tandem mass spectrometry using scheduled multiple

241
reaction monitoring. J. Chromatogr. A 1531, 64–73.
https://doi.org/10.1016/J.CHROMA.2017.11.020
Hernández, F., Sancho, J. V, Ibáñez, M., Abad, E., Portolés, T., Mattioli, L., 2012.
Current use of high-resolution mass spectrometry in the environmental
sciences. Anal. Bioanal. Chem. 403, 1251–1264.
https://doi.org/10.1007/s00216-012-5844-7
Heydebreck, F., Tang, J., Xie, Z., Ebinghaus, R., 2015. Alternative and Legacy
Perfluoroalkyl Substances: Differences between European and Chinese
River/Estuary Systems. Environ. Sci. Technol. 49, 8386–8395.
https://doi.org/10.1021/acs.est.5b01648
Hiscock, K.M., Grischek, T., 2002. Attenuation of groundwater pollution by bank
filtration. J. Hydrol. 266, 139–144. https://doi.org/10.1016/S0022-
1694(02)00158-0
Hofs, B., Schurer, R., Harmsen, D.J.H., Ceccarelli, C., Beerendonk, E.F.,
Cornelissen, E.R., 2013. Characterization and performance of a commercial
thin film nanocomposite seawater reverse osmosis membrane and comparison
with a thin film composite. J. Memb. Sci. 446, 68–78.
https://doi.org/10.1016/j.memsci.2013.06.007
Hogenboom, A.C., van Leerdam, J.A., de Voogt, P., 2009. Accurate mass screening
and identification of emerging contaminants in environmental samples by liquid
chromatography–hybrid linear ion trap Orbitrap mass spectrometry. J.
Chromatogr. A 1216, 510–519. https://doi.org/10.1016/j.chroma.2008.08.053
Hollender, J., Bourgin, M., Fenner, K.B., Longree, P., McArdell, C.S., Moschet, C.,
Ruff, M., Schymanski, E.L., Singer, H.P., 2014. Exploring the Behaviour of
Emerging Contaminants in the Water Cycle using the Capabilities of High
Resolution Mass Spectrometry. Chimia (Aarau). 68, 793–798.
https://doi.org/10.2533/chimia.2014.793
Hollender, J., Rothardt, J., Radny, D., Loos, M., Epting, J., Huggenberger, P., Borer,
P., Singer, H., 2018. Comprehensive micropollutant screening using LC-
HRMS/MS at three riverbank filtration sites to assess natural attenuation and
potential implications for human health. Water Res. X 1, 100007.
https://doi.org/https://doi.org/10.1016/j.wroa.2018.100007
Hollender, J., Schymanski, E.L., Singer, H.P., Ferguson, P.L., 2017. Nontarget
Screening with High Resolution Mass Spectrometry in the Environment: Ready
to Go? Environ. Sci. Technol. 51, 11505–11512.
https://doi.org/10.1021/acs.est.7b02184
Hollender, J., Zimmermann, S.G., Koepke, S., Krauss, M., McArdell, C.S., Ort, C.,
Singer, H., von Gunten, U., Siegrist, H., 2009. Elimination of Organic
Micropollutants in a Municipal Wastewater Treatment Plant Upgraded with a

242
Full-Scale Post-Ozonation Followed by Sand Filtration. Environ. Sci. Technol.
43, 7862–7869. https://doi.org/10.1021/es9014629
Holtze, M.S., Hansen, H.C.B., Juhler, R.K., Sørensen, J., Aamand, J., 2007.
Microbial degradation pathways of the herbicide dichlobenil in soils with
different history of dichlobenil-exposure. Environ. Pollut. 148, 343–351.
Hoppe-Jones, C., Oldham, G., Drewes, J.E., 2010. Attenuation of total organic
carbon and unregulated trace organic chemicals in U.S. riverbank filtration
systems. Water Res. 44, 4643–4659.
https://doi.org/10.1016/J.WATRES.2010.06.022
Horai, H., Arita, M., Kanaya, S., Nihei, Y., Ikeda, T., Suwa, K., Ojima, Y., Tanaka,
Kenichi, Tanaka, S., Aoshima, K., Oda, Y., Kakazu, Y., Kusano, M., Tohge, T.,
Matsuda, F., Sawada, Y., Hirai, M.Y., Nakanishi, H., Ikeda, K., Akimoto, N.,
Maoka, T., Takahashi, H., Ara, T., Sakurai, N., Suzuki, H., Shibata, D.,
Neumann, S., Iida, T., Tanaka, Ken, Funatsu, K., Matsuura, F., Soga, T.,
Taguchi, R., Saito, K., Nishioka, T., 2010. MassBank: a public repository for
sharing mass spectral data for life sciences. J. Mass Spectrom. 45, 703–714.
https://doi.org/10.1002/jms.1777
Huang, H., Cho, H., Schwab, K., Jacangelo, J.G., 2011. Effects of feedwater
pretreatment on the removal of organic microconstituents by a low fouling
reverse osmosis membrane. Desalination 281, 446–454.
https://doi.org/10.1016/j.desal.2011.08.018
Huang, J., Virji, S., Weiller, B.H., Kaner, R.B., 2003. Polyaniline Nanofibers: Facile
Synthesis and Chemical Sensors. J. Am. Chem. Soc. 125, 314–315.
https://doi.org/10.1021/ja028371y
Huntscha, S., Rodriguez Velosa, D.M., Schroth, M.H., Hollender, J., 2013.
Degradation of polar organic micropollutants during riverbank filtration:
Complementary results from spatiotemporal sampling and push-pull tests.
Environ. Sci. Technol. 47, 11512–11521. https://doi.org/10.1021/es401802z
Huntscha, S, Velosa, D.M.R., Schroth, M.H., Hollender, J., 2013. Degradation of
Polar Organic Micropollutants during Riverbank Filtration: Complementary
Results from Spatiotemporal Sampling and Push–Pull Tests.
Jeong, B.-H., Hoek, E.M.V., Yan, Y., Subramani, A., Huang, X., Hurwitz, G., Ghosh,
A.K., Jawor, A., 2007. Interfacial polymerization of thin film nanocomposites: A
new concept for reverse osmosis membranes. J. Memb. Sci. 294, 1–7.
https://doi.org/10.1016/J.MEMSCI.2007.02.025
Jobling, S., Nolan, M., Tyler, C.R., Brighty, G., Sumpter, J.P., 1998. Widespread
Sexual Disruption in Wild Fish. Environ. Sci. Technol. 32, 2498–2506.
https://doi.org/10.1021/es9710870
Johansen, S.S., Hansen, A.B., Mosbœk, H., Arvin, E., 1997. Identification of

243
Heteroaromatic and other Organic Compounds in Ground Water at Creosote-
Contaminated Sites in Denmark. Ground Water Monit. Remediat. 17, 106–115.
https://doi.org/10.1111/j.1745-6592.1997.tb01283.x
Joo, S.H., Tansel, B., 2015. Novel technologies for reverse osmosis concentrate
treatment: A review. J. Environ. Manage. 150, 322–335.
https://doi.org/10.1016/j.jenvman.2014.10.027
Kashiwada, S., Ishikawa, H., Miyamoto, N., Ohnishi, Y., Magara, Y., 2002. Fish test
for endocrine-disruption and estimation of water quality of Japanese rivers.
Water Res. 36, 2161–2166. https://doi.org/10.1016/S0043-1354(01)00406-7
Kavlock, R., Chandler, K., Houck, K., Hunter, S., Judson, R., Kleinstreuer, N.,
Knudsen, T., Martin, M., Padilla, S., Reif, D., Richard, A., Rotroff, D., Sipes, N.,
Dix, D., 2012. Update on EPA’s ToxCast Program: Providing High Throughput
Decision Support Tools for Chemical Risk Management. Chem. Res. Toxicol.
25, 1287–1302. https://doi.org/10.1021/tx3000939
Kegel, F.S., Rietman, B.M., Verliefde, A.R.D., 2010. Reverse osmosis followed by
activated carbon filtration for efficient removal of organic micropollutants from
river bank filtrate. Water Sci. Technol. 61, 2603–2610.
https://doi.org/10.2166/wst.2010.166
Kimura, K., Amy, G., Drewes, J., Watanabe, Y., 2003a. Adsorption of hydrophobic
compounds onto NF/RO membranes: an artifact leading to overestimation of
rejection. J. Memb. Sci. 221, 89–101. https://doi.org/10.1016/S0376-
7388(03)00248-5
Kimura, K., Amy, G., Drewes, J.E., Heberer, T., Kim, T.-U., Watanabe, Y., 2003b.
Rejection of organic micropollutants (disinfection by-products, endocrine
disrupting compounds, and pharmaceutically active compounds) by NF/RO
membranes. J. Memb. Sci. 227, 113–121.
https://doi.org/10.1016/j.memsci.2003.09.005
Kimura, K., Toshima, S., Amy, G., Watanabe, Y., 2004. Rejection of neutral
endocrine disrupting compounds (EDCs) and pharmaceutical active
compounds (PhACs) by RO membranes. J. Memb. Sci. 245, 71–78.
https://doi.org/10.1016/j.memsci.2004.07.018
Kiso, Y., Kitao, T., Jinno, K., Miyagi, M., 1992. The effects of molecular width on
permeation of organic solute through cellulose acetate reverse osmosis
membranes. J. Memb. Sci. 74, 95–103. https://doi.org/10.1016/0376-
7388(92)87075-9
Kleywegt, S., Pileggi, V., Yang, P., Hao, C., Zhao, X., Rocks, C., Thach, S., Cheung,
P., Whitehead, B., 2011. Pharmaceuticals, hormones and bisphenol A in
untreated source and finished drinking water in Ontario, Canada — Occurrence
and treatment efficiency. Sci. Total Environ. 409, 1481–1488.

244
https://doi.org/10.1016/j.scitotenv.2011.01.010
Knepper, T P, Karrenbrock, F., 2006. Pollutants as Byproducts and Degradation
Products of Chemical Syntheses BT - The Rhine, in: Knepper, Thomas P (Ed.),
. Springer Berlin Heidelberg, Berlin, Heidelberg, pp. 235–254.
https://doi.org/10.1007/698_5_033
Kocsis, I., Sun, Z., Legrand, Y.M., Barboiu, M., 2018. Artificial water channels—
deconvolution of natural Aquaporins through synthetic design. npj Clean Water
1, 13. https://doi.org/10.1038/s41545-018-0013-y
Kolkman, A., Vughs, D., 2014. Detecting quaternary ammonium compounds in
water. URL
http://annualreport2014.kwrwater.nl/artikel/detecting_quaternary_ammonium_
compounds_in_water/ (accessed 8.19.17).
Kolpin, D.W., Furlong, E.T., Meyer, M.T., Thurman, E.M., Zaugg, S.D., Barber, L.B.,
Buxton, H.T., 2002. Pharmaceuticals, Hormones, and Other Organic
Wastewater Contaminants in U.S. Streams, 1999−2000: A National
Reconnaissance. Environ. Sci. Technol. 36, 1202–1211.
https://doi.org/10.1021/es011055j
Kolpin, D.W., Thurman, E.M., Linhart, S.M., 1998. The environmental occurrence of
herbicides: the importance of degradates in ground water. Arch. Environ.
Contam. Toxicol. 35, 385–390.
Kool, H.J., Van Kreyl, C.F., Persad, S., 1989. Mutagenic activity in groundwater in
relation to mobilization of organic mutagens in soil. Sci. Total Environ. 84, 185–
199. https://doi.org/https://doi.org/10.1016/0048-9697(89)90382-3
Krauss, M., Hollender, J., 2008. Analysis of Nitrosamines in Wastewater: Exploring
the Trace Level Quantification Capabilities of a Hybrid Linear Ion Trap/Orbitrap
Mass Spectrometer. Anal. Chem. 80, 834–842.
https://doi.org/10.1021/ac701804y
Krauss, M., Singer, H., Hollender, J., 2010. LC–high resolution MS in environmental
analysis: from target screening to the identification of unknowns. Anal. Bioanal.
Chem. 397, 943–951. https://doi.org/10.1007/s00216-010-3608-9
Kudo, N., Kawashima, Y., 2003. Toxicity and toxicokinetics of perfluorooctanoic acid
in humans and animals. J. Toxicol. Sci. 28, 49–57.
https://doi.org/10.2131/jts.28.49
Kumar, M., Grzelakowski, M., Zilles, J., Clark, M., Meier, W., 2007. Highly permeable
polymeric membranes based on the incorporation of the functional water
channel protein Aquaporin Z. Proc. Natl. Acad. Sci. 104, 20719 LP – 20724.
Kuster, M., Díaz-Cruz, S., Rosell, M., López de Alda, M., Barceló, D., 2010. Fate of
selected pesticides, estrogens, progestogens and volatile organic compounds

245
during artificial aquifer recharge using surface waters. Chemosphere 79, 880–
886. https://doi.org/10.1016/j.chemosphere.2010.02.026
Kwak, S.-Y., Kim, S.H., Kim, S.S., 2001. Hybrid Organic/Inorganic Reverse Osmosis
(RO) Membrane for Bactericidal Anti-Fouling. 1. Preparation and
Characterization of TiO2 Nanoparticle Self-Assembled Aromatic Polyamide
Thin-Film-Composite (TFC) Membrane. Environ. Sci. Technol. 35, 2388–2394.
https://doi.org/10.1021/es0017099
Lange, F.T., Scheurer, M., Brauch, H.-J., 2012. Artificial sweeteners---a recently
recognized class of emerging environmental contaminants: a review. Anal.
Bioanal. Chem. 403, 2503–2518. https://doi.org/10.1007/s00216-012-5892-z
Lau, W.J., Gray, S., Matsuura, T., Emadzadeh, D., Paul Chen, J., Ismail, A.F., 2015.
A review on polyamide thin film nanocomposite (TFN) membranes: History,
applications, challenges and approaches. Water Res. 80, 306–324.
https://doi.org/10.1016/J.WATRES.2015.04.037
Lee, D.G., Roehrdanz, P.R., Feraud, M., Ervin, J., Anumol, T., Jia, A., Park, M.,
Tamez, C., Morelius, E.W., Gardea-Torresdey, J.L., Izbicki, J., Means, J.C.,
Snyder, S.A., Holden, P.A., 2015. Wastewater compounds in urban shallow
groundwater wells correspond to exfiltration probabilities of nearby sewers.
Water Res. 85, 467–475.
https://doi.org/https://doi.org/10.1016/j.watres.2015.08.048
Lee, H.-T., Yang, S.-J., 2010. Synthesis and characterization of polyaniline/silica
doped with camphorsulfonic acid and dodecylbenzylsulfonic acid. J. Appl.
Polym. Sci. 116, 934–945. https://doi.org/10.1002/app.31624
Lee, J., Lee, B.C., Ra, J.S., Cho, J., Kim, I.S., Chang, N.I., Kim, H.K., Kim, S.D.,
2008. Comparison of the removal efficiency of endocrine disrupting compounds
in pilot scale sewage treatment processes. Chemosphere 71, 1582–1592.
https://doi.org/10.1016/j.chemosphere.2007.11.021
Lee, K.P., Arnot, T.C., Mattia, D., 2011. A review of reverse osmosis membrane
materials for desalination—Development to date and future potential. J. Memb.
Sci. 370, 1–22. https://doi.org/10.1016/J.MEMSCI.2010.12.036
Lewandowski, J., Putschew, A., Schwesig, D., Neumann, C., Radke, M., 2011. Fate
of organic micropollutants in the hyporheic zone of a eutrophic lowland stream:
Results of a preliminary field study. Sci. Total Environ. 409, 1824–1835.
https://doi.org/https://doi.org/10.1016/j.scitotenv.2011.01.028
Li, C., Ma, Y., Li, H., Peng, G., 2017. A convenient method for the determination of
molecular weight cut-off of ultrafiltration membranes. Chinese J. Chem. Eng.
25, 62–67. https://doi.org/https://doi.org/10.1016/j.cjche.2016.06.014
LI, Changhai, XU, Z., LI, Chunping, 2006. Removal of 5-Amino-2-chlorotoluene-4-
sulfonic and Chlorhydric Acids from Wastewater by Weakly Basic

246
Resin11Supported by the Natural Science Foundation of Jilin Province
(No.990337). Chinese J. Chem. Eng. 14, 696–699.
https://doi.org/https://doi.org/10.1016/S1004-9541(06)60137-7
Li, X., Chou, S., Wang, R., Shi, L., Fang, W., Chaitra, G., Tang, C.Y., Torres, J., Hu,
X., Fane, A.G., 2015. Nature gives the best solution for desalination:
Aquaporin-based hollow fiber composite membrane with superior
performance. J. Memb. Sci. 494, 68–77.
https://doi.org/10.1016/J.MEMSCI.2015.07.040
Lind, M.L., Ghosh, A.K., Jawor, A., Huang, X., Hou, W., Yang, Y., Hoek, E.M. V,
2009. Influence of Zeolite Crystal Size on Zeolite-Polyamide Thin Film
Nanocomposite Membranes. Langmuir 25, 10139–10145.
https://doi.org/10.1021/la900938x
Ling, R., Yu, L., Pham, T.P.T., Shao, J., Chen, J.P., Reinhard, M., 2017. The
tolerance of a thin-film composite polyamide reverse osmosis membrane to
hydrogen peroxide exposure. J. Memb. Sci. 524, 529–536.
https://doi.org/https://doi.org/10.1016/j.memsci.2016.11.041
Liu, P., Farré, M.J., Keller, J., Gernjak, W., 2016. Reducing natural organic matter
and disinfection by-product precursors by alternating oxic and anoxic
conditions during engineered short residence time riverbank filtration: A
laboratory-scale column study. Sci. Total Environ. 565, 616–625.
https://doi.org/10.1016/J.SCITOTENV.2016.05.061
Loi, C.H., Busetti, F., Linge, K.L., Joll, C.A., 2013. Development of a solid-phase
extraction liquid chromatography tandem mass spectrometry method for
benzotriazoles and benzothiazoles in wastewater and recycled water. J.
Chromatogr. A 1299, 48–57. https://doi.org/10.1016/j.chroma.2013.04.073
Loiola, A.R., Andrade, J.C.R.A., Sasaki, J.M., da Silva, L.R.D., 2012. Structural
analysis of zeolite NaA synthesized by a cost-effective hydrothermal method
using kaolin and its use as water softener. J. Colloid Interface Sci. 367, 34–39.
https://doi.org/https://doi.org/10.1016/j.jcis.2010.11.026
Lomas, S., 2015. Identifying the Increased Scope of Core-Shell Technology for
HPLC and UHPLC Chromatographers. Chromatogr. Today Feb/Mar 20, 42–
46.
Loos, M., 2016. enviMass beta version 3.1. Zenodo.
http://doi.org/10.5281/zenodo.48164.
Loos, M.J., 2015. Mining of High-Resolution Mass Spectrometry Data to Monitor
Organic Pollutant Dynamics in Aquatic Systems. ETH Zurich.
Loos, R., Carvalho, R., António, D.C., Comero, S., Locoro, G., Tavazzi, S.,
Paracchini, B., Ghiani, M., Lettieri, T., Blaha, L., Jarosova, B., Voorspoels, S.,
Servaes, K., Haglund, P., Fick, J., Lindberg, R.H., Schwesig, D., Gawlik, B.M.,

247
2013. EU-wide monitoring survey on emerging polar organic contaminants in
wastewater treatment plant effluents. Water Res. 47, 6475–6487.
https://doi.org/10.1016/j.watres.2013.08.024
Loos, R., Gawlik, B.M., Locoro, G., Rimaviciute, E., Contini, S., Bidoglio, G., 2009.
EU-wide survey of polar organic persistent pollutants in European river waters.
Environ. Pollut. 157, 561–568. https://doi.org/10.1016/j.envpol.2008.09.020
Loos, R., Locoro, G., Comero, S., Contini, S., Schwesig, D., Werres, F., Balsaa, P.,
Gans, O., Weiss, S., Blaha, L., Bolchi, M., Gawlik, B.M., 2010. Pan-European
survey on the occurrence of selected polar organic persistent pollutants in
ground water. Water Res. 44, 4115–4126.
https://doi.org/10.1016/j.watres.2010.05.032
López-Muñoz, M.J., Sotto, A., Arsuaga, J.M., Van der Bruggen, B., 2009. Influence
of membrane, solute and solution properties on the retention of phenolic
compounds in aqueous solution by nanofiltration membranes. Sep. Purif.
Technol. 66, 194–201. https://doi.org/10.1016/j.seppur.2008.11.001
Luo, Y., Guo, W., Ngo, H.H., Nghiem, L.D., Hai, F.I., Zhang, J., Liang, S., Wang,
X.C., 2014. A review on the occurrence of micropollutants in the aquatic
environment and their fate and removal during wastewater treatment. Sci. Total
Environ. 473, 619–641. https://doi.org/10.1016/j.scitotenv.2013.12.065
MacDiarmid, A.G., Epstein, A.J., 1994. The concept of secondary doping as applied
to polyaniline. Synth. Met. 65, 103–116. https://doi.org/10.1016/0379-
6779(94)90171-6
Madsen, H.T., Søgaard, E.G., Muff, J., 2015. Reduction in energy consumption of
electrochemical pesticide degradation through combination with membrane
filtration. Chem. Eng. J. 276, 358–364.
https://doi.org/10.1016/j.cej.2015.04.098
Maeng, S.K., Sharma, S.K., Lekkerkerker-Teunissen, K., Amy, G.L., 2011.
Occurrence and fate of bulk organic matter and pharmaceutically active
compounds in managed aquifer recharge: A review. Water Res. 45, 3015–
3033. https://doi.org/https://doi.org/10.1016/j.watres.2011.02.017
Malaguerra, F., Albrechtsen, H.-J., Thorling, L., Binning, P.J., 2012. Pesticides in
water supply wells in Zealand, Denmark: A statistical analysis. Sci. Total
Environ. 414, 433–444. https://doi.org/10.1016/j.scitotenv.2011.09.071
Martínez Bueno, M.J., Uclés, S., Hernando, M.D., Fernández-Alba, A.R., 2011.
Development of a solvent-free method for the simultaneous
identification/quantification of drugs of abuse and their metabolites in
environmental water by LC–MS/MS. Talanta 85, 157–166.
https://doi.org/https://doi.org/10.1016/j.talanta.2011.03.051
Mass Bank of North America (MoNA), Fiehn Lab. UC Davis. URL

248
http://mona.fiehnlab.ucdavis.edu/
McEachran, A.D., Mansouri, K., Grulke, C., Schymanski, E.L., Ruttkies, C., Williams,
A.J., 2018. “MS-Ready” structures for non-targeted high-resolution mass
spectrometry screening studies. J. Cheminform. 10, 45.
https://doi.org/10.1186/s13321-018-0299-2
McEachran, A.D., Sobus, J.R., Williams, A.J., 2017. Identifying known unknowns
using the US EPA’s CompTox Chemistry Dashboard. Anal. Bioanal. Chem.
409, 1729–1735. https://doi.org/10.1007/s00216-016-0139-z
Meringer, E.L.S.& M., 2017. GenFormR package. Eawag, Switzerland.
Meringer, M., Reinker, S., Zhang, J., Muller, A., 2011. MS/MS data improves
automated determination of molecular formulas by mass spectrometry.
MATCH Commun. Math. Comput. Chem 65, 259–290.
Misdan, N., Lau, W.J., Ismail, A.F., 2012. Seawater Reverse Osmosis (SWRO)
desalination by thin-film composite membrane—Current development,
challenges and future prospects. Desalination 287, 228–237.
https://doi.org/10.1016/J.DESAL.2011.11.001
Moschet, C., Vermeirssen, E.L.M., Singer, H., Stamm, C., Hollender, J., 2015.
Evaluation of in-situ calibration of Chemcatcher passive samplers for 322
micropollutants in agricultural and urban affected rivers. Water Res. 71, 306–
317. https://doi.org/10.1016/J.WATRES.2014.12.043
Mundt, M., Hollender, J., 2005. Simultaneous determination of NSO-heterocycles,
homocycles and their metabolites in groundwater of tar oil contaminated sites
using LC with diode array UV and fluorescence detection. J. Chromatogr. A
1065, 211–218. https://doi.org/10.1016/j.chroma.2004.12.098
Muñoz, I., Fernández-Alba, A.R., 2008. Reducing the environmental impacts of
reverse osmosis desalination by using brackish groundwater resources. Water
Res. 42, 801–811. https://doi.org/https://doi.org/10.1016/j.watres.2007.08.021
Nakada, N., Tanishima, T., Shinohara, H., Kiri, K., Takada, H., 2006. Pharmaceutical
chemicals and endocrine disrupters in municipal wastewater in Tokyo and their
removal during activated sludge treatment. Water Res. 40, 3297–3303.
https://doi.org/10.1016/j.watres.2006.06.039
Neale, P.A., Altenburger, R., Aït-Aïssa, S., Brion, F., Busch, W., de Aragão
Umbuzeiro, G., Denison, M.S., Du Pasquier, D., Hilscherová, K., Hollert, H.,
Morales, D.A., Novák, J., Schlichting, R., Seiler, T.-B., Serra, H., Shao, Y.,
Tindall, A.J., Tollefsen, K.E., Williams, T.D., Escher, B.I., 2017. Development
of a bioanalytical test battery for water quality monitoring: Fingerprinting
identified micropollutants and their contribution to effects in surface water.
Water Res. 123, 734–750.
https://doi.org/https://doi.org/10.1016/j.watres.2017.07.016

249
Neale, P.A., Escher, B.I., 2018. In vitro bioassays to assess drinking water quality.
Curr. Opin. Environ. Sci. Heal.
https://doi.org/https://doi.org/10.1016/j.coesh.2018.06.006
Ng, R.T., Han, J., 1994. Efficient and Effective Clustering Methods for Spatial Data
Mining, in: Proceedings of the 20th International Conference on Very Large
Data Bases, VLDB ’94. Morgan Kaufmann Publishers Inc., San Francisco, CA,
USA, pp. 144–155.
Nghiem, L.D., Schäfer, A.I., Elimelech, M., 2006. Role of electrostatic interactions in
the retention of pharmaceutically active contaminants by a loose nanofiltration
membrane. J. Memb. Sci. 286, 52–59.
https://doi.org/10.1016/j.memsci.2006.09.011
Nghiem, L.D., Schäfer, A.I., Waite, T.D., 2002. Adsorption of estrone on
nanofiltration and reverse osmosis membranes in water and wastewater
treatment. Water Sci. Technol. 46, 265 LP – 272.
Nivala, J., Neale, P.A., Haasis, T., Kahl, S., König, M., Müller, R.A., Reemtsma, T.,
Schlichting, R., Escher, B.I., 2018. Application of cell-based bioassays to
evaluate treatment efficacy of conventional and intensified treatment wetlands.
Environ. Sci. Water Res. Technol. 4, 206–217.
https://doi.org/10.1039/C7EW00341B
Ordóñez, E.Y., Quintana, J.B., Rodil, R., Cela, R., 2012. Determination of artificial
sweeteners in water samples by solid-phase extraction and liquid
chromatography–tandem mass spectrometry. J. Chromatogr. A 1256, 197–
205. https://doi.org/10.1016/J.CHROMA.2012.07.073
Ozaki, H., Li, H., 2002. Rejection of organic compounds by ultra-low pressure
reverse osmosis membrane. Water Res. 36, 123–130.
https://doi.org/10.1016/S0043-1354(01)00197-X
Paz, A., Tadmor, G., Malchi, T., Blotevogel, J., Borch, T., Polubesova, T., Chefetz,
B., 2016. Fate of carbamazepine, its metabolites, and lamotrigine in soils
irrigated with reclaimed wastewater: Sorption, leaching and plant uptake.
Chemosphere 160, 22–29.
https://doi.org/10.1016/J.CHEMOSPHERE.2016.06.048
Pence, H.E., Williams, A., 2010. ChemSpider: An Online Chemical Information
Resource. J. Chem. Educ. 87, 1123–1124. https://doi.org/10.1021/ed100697w
Pendergast, M.M., Ghosh, A.K., Hoek, E.M.V., 2013. Separation performance and
interfacial properties of nanocomposite reverse osmosis membranes.
Desalination 308, 180–185. https://doi.org/10.1016/J.DESAL.2011.05.005
Pérez-González, A., Urtiaga, A.M., Ibáñez, R., Ortiz, I., 2012. State of the art and
review on the treatment technologies of water reverse osmosis concentrates.
Water Res. 46, 267–283. https://doi.org/10.1016/J.WATRES.2011.10.046

250
Perreault, F., Tousley, M.E., Elimelech, M., 2014. Thin-Film Composite Polyamide
Membranes Functionalized with Biocidal Graphene Oxide Nanosheets.
Environ. Sci. Technol. Lett. 1, 71–76. https://doi.org/10.1021/ez4001356
Peter, K.T., Tian, Z., Wu, C., Lin, P., White, S., Du, B., McIntyre, J.K., Scholz, N.L.,
Kolodziej, E.P., 2018. Using High-Resolution Mass Spectrometry to Identify
Organic Contaminants Linked to Urban Stormwater Mortality Syndrome in
Coho Salmon. Environ. Sci. Technol. 52, 10317–10327.
https://doi.org/10.1021/acs.est.8b03287
Petersen, R.J., 1993. Composite reverse osmosis and nanofiltration membranes. J.
Memb. Sci. 83, 81–150. https://doi.org/https://doi.org/10.1016/0376-
7388(93)80014-O
Pisarenko, A.N., Stanford, B.D., Yan, D., Gerrity, D., Snyder, S.A., 2012. Effects of
ozone and ozone/peroxide on trace organic contaminants and NDMA in
drinking water and water reuse applications. Water Res. 46, 316–326.
https://doi.org/10.1016/j.watres.2011.10.021
Plakas, K. V., Karabelas, A.J., 2012. Removal of pesticides from water by NF and
RO membranes — A review. Desalination 287, 255–265.
https://doi.org/10.1016/j.desal.2011.08.003
Plutzer, J., Avar, P., Keresztes, D., Sári, Z., Kiss-Szarvák, I., Vargha, M., Maász, G.,
Pirger, Z., 2018. Investigation of estrogen activity in the raw and treated waters
of riverbank infiltration using a yeast estrogen screen and chemical analysis. J.
Water Health 16, 635–645. https://doi.org/10.2166/wh.2018.049
Puig, A., Ormad, P., Sarasa, J., Gimeno, E., Ovelleiro, J.L., 1996. Wastewater from
the manufacture of rubber vulcanization accelerators: characterization,
downstream monitoring and chemical treatment. J. Chromatogr. A 733, 511–
522. https://doi.org/10.1016/0021-9673(95)00866-7
Qi, S., Wang, R., Chaitra, G.K.M., Torres, J., Hu, X., Fane, A.G., 2016. Aquaporin-
based biomimetic reverse osmosis membranes: Stability and long term
performance. J. Memb. Sci. 508, 94–103.
https://doi.org/10.1016/J.MEMSCI.2016.02.013
R Core Team, 2017. R: A Language and Environment for Statistical Computing.
Found. Stat. Comput. Vienna, Austria. URL https//www.R-project.org/.
Radjenović, J., Petrović, M., Ventura, F., Barceló, D., 2008. Rejection of
pharmaceuticals in nanofiltration and reverse osmosis membrane drinking
water treatment. Water Res. 42, 3601–3610.
https://doi.org/10.1016/j.watres.2008.05.020
Rapp-Wright, H., McEneff, G., Murphy, B., Gamble, S., Morgan, R., Beardah, M.,
Barron, L., 2017. Suspect screening and quantification of trace organic
explosives in wastewater using solid phase extraction and liquid

251
chromatography-high resolution accurate mass spectrometry. J. Hazard.
Mater. 329, 11–21. https://doi.org/10.1016/j.jhazmat.2017.01.008
Reemtsma, T., Berger, U., Arp, H.P.H., Gallard, H., Knepper, T.P., Neumann, M.,
Quintana, J.B., Voogt, P. de, 2016. Mind the Gap: Persistent and Mobile
Organic Compounds—Water Contaminants That Slip Through. Environ. Sci.
Technol. 50, 10308–10315. https://doi.org/10.1021/acs.est.6b03338
Rendic, S., 2002. Summary of information on human CYP enzymes: human P450
metabolism data. Drug Metab. Rev. 34, 83–448. https://doi.org/10.1081/DMR-
120001392
Richard, A.M., Williams, C.R., 2002. Distributed structure-searchable toxicity
(DSSTox) public database network: a proposal. Mutat. Res. Mol. Mech.
Mutagen. 499, 27–52. https://doi.org/https://doi.org/10.1016/S0027-
5107(01)00289-5
Richardson, S.D., 2010. Environmental Mass Spectrometry: Emerging
Contaminants and Current Issues. Anal. Chem. 82, 4742–4774.
https://doi.org/10.1021/ac101102d
Richter, D., Massmann, G., Dünnbier, U., 2008. Identification and significance of
sulphonamides (p-TSA, o-TSA, BSA) in an urban water cycle (Berlin,
Germany). Water Res. 42, 1369–1378.
https://doi.org/10.1016/J.WATRES.2007.10.003
Rochat, B., 2016. From targeted quantification to untargeted metabolomics: Why LC-
high-resolution-MS will become a key instrument in clinical labs. TrAC Trends
Anal. Chem. 84, 151–164. https://doi.org/10.1016/j.trac.2016.02.009
Röst, H.L., Sachsenberg, T., Aiche, S., Bielow, C., Weisser, H., Aicheler, F.,
Andreotti, S., Ehrlich, H.-C., Gutenbrunner, P., Kenar, E., Liang, X., Nahnsen,
S., Nilse, L., Pfeuffer, J., Rosenberger, G., Rurik, M., Schmitt, U., Veit, J.,
Walzer, M., Wojnar, D., Wolski, W.E., Schilling, O., Choudhary, J.S.,
Malmström, L., Aebersold, R., Reinert, K., Kohlbacher, O., 2016. OpenMS: a
flexible open-source software platform for mass spectrometry data analysis.
Nat. Methods 13, 741.
Rousis, N.I., Gracia-Lor, E., Zuccato, E., Bade, R., Baz-Lomba, J.A., Castrignanò,
E., Causanilles, A., Covaci, A., de Voogt, P., Hernàndez, F., Kasprzyk-Hordern,
B., Kinyua, J., McCall, A.-K., Plósz, B.G., Ramin, P., Ryu, Y., Thomas, K. V.,
van Nuijs, A., Yang, Z., Castiglioni, S., 2017. Wastewater-based epidemiology
to assess pan-European pesticide exposure. Water Res. 121, 270–279.
https://doi.org/10.1016/J.WATRES.2017.05.044
Rousis, N.I., Zuccato, E., Castiglioni, S., 2016. Monitoring population exposure to
pesticides based on liquid chromatography-tandem mass spectrometry
measurement of their urinary metabolites in urban wastewater: A novel

252
biomonitoring approach. Sci. Total Environ. 571, 1349–1357.
https://doi.org/10.1016/J.SCITOTENV.2016.07.036
Ruff, M., Mueller, M.S., Loos, M., Singer, H.P., 2015. Quantitative target and
systematic non-target analysis of polar organic micro-pollutants along the river
Rhine using high-resolution mass-spectrometry – Identification of unknown
sources and compounds. Water Res. 87, 145–154.
https://doi.org/10.1016/j.watres.2015.09.017
Ruttkies, C., Schymanski, E.L., Wolf, S., Hollender, J., Neumann, S., 2016. MetFrag
relaunched: incorporating strategies beyond in silico fragmentation. J.
Cheminform. 8, 3. https://doi.org/10.1186/s13321-016-0115-9
Ruxton, G.D., Beauchamp, G., 2008. Time for some a priori thinking about post hoc
testing. Behav. Ecol. 19, 690–693.
Sabik, H., Jeannot, R., Rondeau, B., 2000. Multiresidue methods using solid-phase
extraction techniques for monitoring priority pesticides, including triazines and
degradation products, in ground and surface waters. J. Chromatogr. A 885,
217–236. https://doi.org/https://doi.org/10.1016/S0021-9673(99)01084-5
Samanipour, S., Baz-Lomba, J.A., Alygizakis, N.A., Reid, M.J., Thomaidis, N.S.,
Thomas, K. V, 2017. Two stage algorithm vs commonly used approaches for
the suspect screening of complex environmental samples analyzed via liquid
chromatography high resolution time of flight mass spectroscopy: A test study.
J. Chromatogr. A 1501, 68–78.
https://doi.org/https://doi.org/10.1016/j.chroma.2017.04.040
Schaffer, M., Börnick, H., Nödler, K., Licha, T., Worch, E., 2012. Role of cation
exchange processes on the sorption influenced transport of cationic β-blockers
in aquifer sediments. Water Res. 46, 5472–5482.
https://doi.org/10.1016/j.watres.2012.07.013
Schaper, J.L., Seher, W., Nützmann, G., Putschew, A., Jekel, M., Lewandowski, J.,
2018. The fate of polar trace organic compounds in the hyporheic zone. Water
Res. 140, 158–166. https://doi.org/10.1016/J.WATRES.2018.04.040
Scheurer, M., Storck, F.R., Brauch, H.-J., Lange, F.T., 2010. Performance of
conventional multi-barrier drinking water treatment plants for the removal of
four artificial sweeteners. Water Res. 44, 3573–3584.
Schmidt, C.K., Lange, F.T., Brauch, H.-J., 2007. Characteristics and evaluation of
natural attenuation processes for organic micropollutant removal during
riverbank filtration. Water Sci. Technol. Water Supply 7, 1–7.
Schollée, J.E., Bourgin, M., von Gunten, U., McArdell, C.S., Hollender, J., 2018. Non-
target screening to trace ozonation transformation products in a wastewater
treatment train including different post-treatments. Water Res. 142, 267–278.
https://doi.org/https://doi.org/10.1016/j.watres.2018.05.045

253
Schollée, J.E., Schymanski, E.L., Avak, S.E., Loos, M., Hollender, J., 2015.
Prioritizing Unknown Transformation Products from Biologically-Treated
Wastewater Using High-Resolution Mass Spectrometry, Multivariate Statistics,
and Metabolic Logic. Anal. Chem. 87, 12121–12129.
https://doi.org/10.1021/acs.analchem.5b02905
Schriks, M., Heringa, M.B., van der Kooi, M.M.E., de Voogt, P., van Wezel, A.P.,
2010. Toxicological relevance of emerging contaminants for drinking water
quality. Water Res. 44, 461–476. https://doi.org/10.1016/j.watres.2009.08.023
Schwarzenbach, R.P., Escher, B.I., Fenner, K., Hofstetter, T.B., Johnson, C.A., von
Gunten, U., Wehrli, B., 2006. The Challenge of Micropollutants in Aquatic
Systems. Science (80-. ). 313, 1072–1077.
Schymanski, E.L., 2018. ReSOLUTION - SOLUTIONS for High ReSOLUTION Mass
Spectrometry. URL https://github.com/schymane/ReSOLUTION
Schymanski, E.L., Jeon, J., Gulde, R., Fenner, K., Ruff, M., Singer, H.P., Hollender,
J., 2014a. Identifying Small Molecules via High Resolution Mass Spectrometry:
Communicating Confidence. Environ. Sci. Technol. 48, 2097–2098.
https://doi.org/10.1021/es5002105
Schymanski, E.L., Ruttkies, C., Krauss, M., Brouard, C., Kind, T., Dührkop, K., Allen,
F., Vaniya, A., Verdegem, D., Böcker, S., Rousu, J., Shen, H., Tsugawa, H.,
Sajed, T., Fiehn, O., Ghesquière, B., Neumann, S., 2017. Critical Assessment
of Small Molecule Identification 2016: automated methods. J. Cheminform. 9,
22. https://doi.org/10.1186/s13321-017-0207-1
Schymanski, E.L., Singer, H.P., Longrée, P., Loos, M., Ruff, M., Stravs, M.A.,
Ripollés Vidal, C., Hollender, J., 2014b. Strategies to Characterize Polar
Organic Contamination in Wastewater: Exploring the Capability of High
Resolution Mass Spectrometry. Environ. Sci. Technol. 48, 1811–1818.
https://doi.org/10.1021/es4044374
Schymanski, E.L., Singer, H.P., Slobodnik, J., Ipolyi, I.M., Oswald, P., Krauss, M.,
Schulze, T., Haglund, P., Letzel, T., Grosse, S., Thomaidis, N.S., Bletsou, A.,
Zwiener, C., Ibáñez, M., Portolés, T., de Boer, R., Reid, M.J., Onghena, M.,
Kunkel, U., Schulz, W., Guillon, A., Noyon, N., Leroy, G., Bados, P., Bogialli,
S., Stipaničev, D., Rostkowski, P., Hollender, J., 2015. Non-target screening
with high-resolution mass spectrometry: critical review using a collaborative
trial on water analysis. Anal. Bioanal. Chem. 407, 6237–6255.
https://doi.org/10.1007/s00216-015-8681-7
Serpone N., Salinaro A., Emeline A.V., Horikoshi S., Hidaka H., Z.J., 2002. An in
vitro systematic spectroscopic examination of the photostabilities of a random
set of commercial sunscreen lotions and their chemical UVB/UVA active
agents. Photochem Photobiol Sci 1, 970–81.

254
Shen, Y., Saboe, P.O., Sines, I.T., Erbakan, M., Kumar, M., 2014. Biomimetic
membranes: A review. J. Memb. Sci. 454, 359–381.
https://doi.org/10.1016/J.MEMSCI.2013.12.019
Silvia Díaz-Cruz, M., Llorca, M., Barceló, D., Barceló, D., 2008. Organic UV filters
and their photodegradates, metabolites and disinfection by-products in the
aquatic environment. TrAC Trends Anal. Chem. 27, 873–887.
https://doi.org/10.1016/J.TRAC.2008.08.012
So, M.K., Miyake, Y., Yeung, W.Y., Ho, Y.M., Taniyasu, S., Rostkowski, P.,
Yamashita, N., Zhou, B.S., Shi, X.J., Wang, J.X., Giesy, J.P., Yu, H., Lam,
P.K.S., 2007. Perfluorinated compounds in the Pearl River and Yangtze River
of China. Chemosphere 68, 2085–2095.
https://doi.org/10.1016/j.chemosphere.2007.02.008
Steffen, W., Broadgate, W., Deutsch, L., Gaffney, O., Ludwig, C., 2015. The
trajectory of the Anthropocene: The Great Acceleration. Anthr. Rev. 2, 81–98.
https://doi.org/10.1177/2053019614564785
Steinle-Darling, E., Zedda, M., Plumlee, M.H., Ridgway, H.F., Reinhard, M., 2007.
Evaluating the impacts of membrane type, coating, fouling, chemical properties
and water chemistry on reverse osmosis rejection of seven nitrosoalklyamines,
including NDMA. Water Res. 41, 3959–3967.
https://doi.org/10.1016/j.watres.2007.05.034
Stravs, M.A., Schymanski, E.L., Singer, H.P., Hollender, J., 2013. Automatic
recalibration and processing of tandem mass spectra using formula annotation.
J. Mass Spectrom. 48, 89–99. https://doi.org/10.1002/jms.3131
Sui, Q., Huang, J., Deng, S., Yu, G., Fan, Q., 2010. Occurrence and removal of
pharmaceuticals, caffeine and DEET in wastewater treatment plants of Beijing,
China. Water Res. 44, 417–426. https://doi.org/10.1016/j.watres.2009.07.010
Surgan, M., Condon, M., Cox, C., 2010. Pesticide Risk Indicators: Unidentified Inert
Ingredients Compromise Their Integrity and Utility. Environ. Manage. 45, 834–
841. https://doi.org/10.1007/s00267-009-9382-9
Tang, C.Y., Kwon, Y.-N., Leckie, J.O., 2007. Fouling of reverse osmosis and
nanofiltration membranes by humic acid—Effects of solution composition and
hydrodynamic conditions. J. Memb. Sci. 290, 86–94.
https://doi.org/https://doi.org/10.1016/j.memsci.2006.12.017
Tang, C.Y., Yang, Z., Guo, H., Wen, J.J., Nghiem, L.D., Cornelissen, E., 2018.
Potable Water Reuse through Advanced Membrane Technology. Environ. Sci.
Technol. 52, 10215–10223. https://doi.org/10.1021/acs.est.8b00562
Tang, C.Y., Zhao, Y., Wang, R., Hélix-Nielsen, C., Fane, A.G., 2013. Desalination
by biomimetic aquaporin membranes: Review of status and prospects.
Desalination 308, 34–40.

255
https://doi.org/https://doi.org/10.1016/j.desal.2012.07.007
ter Laak, T.L., Puijker, L.M., van Leerdam, J.A., Raat, K.J., Kolkman, A., de Voogt,
P., van Wezel, A.P., 2012. Broad target chemical screening approach used as
tool for rapid assessment of groundwater quality. Sci. Total Environ. 427, 308–
313. https://doi.org/10.1016/j.scitotenv.2012.04.013
Tice, R.R., Austin, C.P., Kavlock, R.J., Bucher, J.R., 2013. Improving the Human
Hazard Characterization of Chemicals: A Tox21 Update. Environ. Health
Perspect. 121, 756–765. https://doi.org/10.1289/ehp.1205784
Timmer, H., 2006. Aandeel oevergrondwater berekend via zuurstof-18 isotopen
onderzoek - Internal Oasen report.
Tu, K. L., Chivas, A. R. & Nghiem, L.D., 2015. Chemical cleaning effects on
properties and separation efficiency of an RO membrane. Membr. Water Treat.
6, 141–160.
Tufenkji, N., Ryan, J.N., Elimelech, M., 2002. Peer Reviewed: The Promise of Bank
Filtration. Environ. Sci. Technol. 36, 422A-428A.
https://doi.org/10.1021/es022441j
Uehlein, N., Fileschi, K., Eckert, M., Bienert, G.P., Bertl, A., Kaldenhoff, R., 2007.
Arbuscular mycorrhizal symbiosis and plant aquaporin expression.
Phytochemistry 68, 122–129.
https://doi.org/https://doi.org/10.1016/j.phytochem.2006.09.033
Umar, D.A., Ramli, M.F., Aris, A.Z., Sulaiman, W.N.A., Kura, N.U., Tukur, A.I., 2017.
An overview assessment of the effectiveness and global popularity of some
methods used in measuring riverbank filtration. J. Hydrol. 550, 497–515.
https://doi.org/https://doi.org/10.1016/j.jhydrol.2017.05.021
van der Aa, N.G.F.M., Dijkman, E., Bijlsma, L., Emke, E., van de Ven, B.M., van
Nuijs, A.L.., de Voogt, P., 2009. Drugs of abuse and tranquilizers in Dutch
surface waters, drinking water and wastewater. Natl. Inst. Public Heal. Environ.
Netherlands.
Van der Meer, W.G.J., 2013. “Het Drinkwaterbedrijf van de Toekomst?”]. Inaugural
Lecture TU Delft, Netherlands. URL http://resolver.tudelft.nl/uuid:7844ed04-
f447-4b01-ac42-d3c665050f81
van Leerdam, J.A., Hogenboom, A.C., van der Kooi, M.M.E., de Voogt, P., 2009.
Determination of polar 1H-benzotriazoles and benzothiazoles in water by solid-
phase extraction and liquid chromatography LTQ FT Orbitrap mass
spectrometry. Int. J. Mass Spectrom. 282, 99–107.
https://doi.org/10.1016/j.ijms.2009.02.018
Vanoppen, M., Stoffels, G., Demuytere, C., Bleyaert, W., Verliefde, A.R.D., 2015.
Increasing RO efficiency by chemical-free ion-exchange and Donnan dialysis:

256
Principles and practical implications. Water Res. 80, 59–70.
https://doi.org/https://doi.org/10.1016/j.watres.2015.04.030
Vatanpour, V., Safarpour, M., Khataee, A., Zarrabi, H., Yekavalangi, M.E., Kavian,
M., 2017. A thin film nanocomposite reverse osmosis membrane containing
amine-functionalized carbon nanotubes. Sep. Purif. Technol. 184, 135–143.
https://doi.org/https://doi.org/10.1016/j.seppur.2017.04.038
Verliefde, A., Cornelissen, E., Amy, G., Van der Bruggen, B., van Dijk, H., 2007.
Priority organic micropollutants in water sources in Flanders and the
Netherlands and assessment of removal possibilities with nanofiltration.
Environ. Pollut. 146, 281–289. https://doi.org/10.1016/j.envpol.2006.01.051
Verliefde, A.R.D., Cornelissen, E.R., Heijman, S.G.J., Hoek, E.M. V, Amy, G.L.,
Bruggen, B. Van der, van Dijk, J.C., 2009. Influence of Solute−Membrane
Affinity on Rejection of Uncharged Organic Solutes by Nanofiltration
Membranes. Environ. Sci. Technol. 43, 2400–2406.
https://doi.org/10.1021/es803146r
Verliefde, A.R.D., Cornelissen, E.R., Heijman, S.G.J., Verberk, J.Q.J.C., Amy, G.L.,
Van der Bruggen, B., van Dijk, J.C., 2008. The role of electrostatic interactions
on the rejection of organic solutes in aqueous solutions with nanofiltration. J.
Memb. Sci. 322, 52–66. https://doi.org/10.1016/j.memsci.2008.05.022
Verliefde, A.R.D., Heijman, S.G.J., Cornelissen, E.R., Amy, G., Van der Bruggen,
B., van Dijk, J.C., 2007. Influence of electrostatic interactions on the rejection
with NF and assessment of the removal efficiency during NF/GAC treatment of
pharmaceutically active compounds in surface water. Water Res. 41, 3227–
3240. https://doi.org/10.1016/j.watres.2007.05.022
Versteegh, J.F.M., de Voogt, P., 2017. Risicoduiding en vóórkomen van FRD-903 in
drinkwater en drinkwaterbronnen bij een selectie van drinkwaterwinningen in
Nederland. RIVM Letter report 2017-0175. https://doi.org/0.21945/RIVM-2017-
0175
Verstraeten, I.M., Heberer, T., Scheytt, T., 2003. Occurrence, Characteristics,
Transport, and Fate of Pesticides, Pharmaceuticals, Industrial Products, and
Personal Care Products at Riverbank Filtration Sites BT - Riverbank Filtration:
Improving Source-Water Quality, in: Ray, C., Melin, G., Linsky, R.B. (Eds.), .
Springer Netherlands, Dordrecht, pp. 175–227. https://doi.org/10.1007/0-306-
48154-5_10
Verweij, M., 2017. The remarkable restoration of the Rhine: plural rationalities in
regional water politics. WATER Int. 42, 207–221.
https://doi.org/10.1080/02508060.2017.1278576
Vidya Lakshmi, C., Kumar, M., Khanna, S., 2009. Biodegradation of Chlorpyrifos in
Soil by Enriched Cultures. Curr. Microbiol. 58, 35–38.

257
https://doi.org/10.1007/s00284-008-9262-1
Wambaugh, J.F., Setzer, R.W., Reif, D.M., Gangwal, S., Mitchell-Blackwood, J.,
Arnot, J.A., Joliet, O., Frame, A., Rabinowitz, J., Knudsen, T.B., Judson, R.S.,
Egeghy, P., Vallero, D., Cohen Hubal, E.A., 2013. High-Throughput Models for
Exposure-Based Chemical Prioritization in the ExpoCast Project. Environ. Sci.
Technol. 47, 8479–8488. https://doi.org/10.1021/es400482g
Wang, J., Dlamini, D.S., Mishra, A.K., Pendergast, M.T.M., Wong, M.C.Y., Mamba,
B.B., Freger, V., Verliefde, A.R.D., Hoek, E.M.V., 2014. A critical review of
transport through osmotic membranes. J. Memb. Sci. 454, 516–537.
https://doi.org/10.1016/j.memsci.2013.12.034
Wang, L., Zhang, J., Sun, H., Zhou, Q., 2016. Widespread Occurrence of
Benzotriazoles and Benzothiazoles in Tap Water: Influencing Factors and
Contribution to Human Exposure. Environ. Sci. Technol. 50, 2709–2717.
https://doi.org/10.1021/acs.est.5b06093
Wang, S., Miltner, A., Kästner, M., Schäffer, A., Nowak, K.M., 2017. Transformation
of metamitron in water-sediment systems: Detailed insight into the
biodegradation processes. Sci. Total Environ. 578, 100–108.
https://doi.org/10.1016/J.SCITOTENV.2016.10.125
Wang, X.J., Hayes, J.D., Wolf, C.R., 2006. Generation of a stable antioxidant
response element--driven reporter gene cell line and its use to show redox-
dependent activation of Nrf2 by cancer chemotherapeutic agents. Cancer Res.
66, 10983–10994.
Weibel, S.R., Weidner, R.B., Cohen, J.M., Christianson, A.G., 1966. Pesticides and
Other Contaminants in Rainfall and Runoff. J. Am. Water Works Assoc. 58,
1075–1084. https://doi.org/10.1002/j.1551-8833.1966.tb01669.x
Werber, J.R., Deshmukh, A., Elimelech, M., 2016. The Critical Need for Increased
Selectivity, Not Increased Water Permeability, for Desalination Membranes.
Environ. Sci. Technol. Lett. 3, 112–120.
https://doi.org/10.1021/acs.estlett.6b00050
Wernersson, A.-S., Carere, M., Maggi, C., Tusil, P., Soldan, P., James, A., Sanchez,
W., Dulio, V., Broeg, K., Reifferscheid, G., others, 2015. The European
technical report on aquatic effect-based monitoring tools under the water
framework directive. Environ. Sci. Eur. 27, 7.
Wick, A., Marincas, O., Moldovan, Z., Ternes, T.A., 2011. Sorption of biocides,
triazine and phenylurea herbicides, and UV-filters onto secondary sludge.
Water Res. 45, 3638–3652.
https://doi.org/https://doi.org/10.1016/j.watres.2011.04.014
Wieriks, K., Schulte-Wülwer-Leidig, A., 2009. Integrated water management for the
Rhine river basin, from pollution prevention to ecosystem improvement. Nat.

258
Resour. Forum 21, 147–156. https://doi.org/10.1111/j.1477-
8947.1997.tb00686.x
Wijmans, J.G., Baker, R.W., 1995. The solution-diffusion model: a review. J. Memb.
Sci. 107, 1–21. https://doi.org/10.1016/0376-7388(95)00102-I
Wilde, M.I., Wagstaff, A.J., 1997. Acamprosate. Drugs 53, 1038–1053.
https://doi.org/10.2165/00003495-199753060-00008
Williams, A.J., Grulke, C.M., Edwards, J., McEachran, A.D., Mansouri, K., Baker,
N.C., Patlewicz, G., Shah, I., Wambaugh, J.F., Judson, R.S., Richard, A.M.,
2017. The CompTox Chemistry Dashboard: a community data resource for
environmental chemistry. J. Cheminform. 9, 61.
https://doi.org/10.1186/s13321-017-0247-6
Williams, G.M., Harrison, I., Carlick, C.A., Crowley, O., 2003. Changes in
enantiomeric fraction as evidence of natural attenuation of mecoprop in a
limestone aquifer. J. Contam. Hydrol. 64, 253–267.
https://doi.org/https://doi.org/10.1016/S0169-7722(02)00206-1
Xie, M., Luo, W., Guo, H., Nghiem, L.D., Tang, C.Y., Gray, S.R., 2018. Trace organic
contaminant rejection by aquaporin forward osmosis membrane: Transport
mechanisms and membrane stability. Water Res. 132, 90–98.
https://doi.org/https://doi.org/10.1016/j.watres.2017.12.072
Yangali-Quintanilla, V., Maeng, S.K., Fujioka, T., Kennedy, M., Amy, G., 2010.
Proposing nanofiltration as acceptable barrier for organic contaminants in
water reuse. J. Memb. Sci. 362, 334–345.
https://doi.org/10.1016/j.memsci.2010.06.058
Yüksel, S., Kabay, N., Yüksel, M., 2013. Removal of bisphenol A (BPA) from water
by various nanofiltration (NF) and reverse osmosis (RO) membranes. J.
Hazard. Mater. 263, 307–310. https://doi.org/10.1016/j.jhazmat.2013.05.020
Zahn, D., Frömel, T., Knepper, T.P., 2016. Halogenated methanesulfonic acids: A
new class of organic micropollutants in the water cycle. Water Res. 101, 292–
299. https://doi.org/10.1016/j.watres.2016.05.082
Zhao, Y., Qiu, C., Li, X., Vararattanavech, A., Shen, W., Torres, J., Hélix-Nielsen,
C., Wang, R., Hu, X., Fane, A.G., Tang, C.Y., 2012. Synthesis of robust and
high-performance aquaporin-based biomimetic membranes by interfacial
polymerization-membrane preparation and RO performance characterization.
J. Memb. Sci. 423–424, 422–428.
https://doi.org/https://doi.org/10.1016/j.memsci.2012.08.039
Zijp, M.C., van der Laan, H., 2015. Life Cycle Assessment of two drinking water
production schemes - RIVM Letter report 2015-0209.
Zonja, B., Pérez, S., Barceló, D., 2016. Human Metabolite Lamotrigine-N2-

259
glucuronide Is the Principal Source of Lamotrigine-Derived Compounds in
Wastewater Treatment Plants and Surface Water. Environ. Sci. Technol. 50,
154–164. https://doi.org/10.1021/acs.est.5b03691

260

261
List of manuscripts
Chapter 2 V. Albergamo, R. Helmus and P. de Voogt (2018) Direct injection analysis of polar micropollutants in natural drinking water sources with biphenyl liquid chromatography coupled to high-resolution time-of-flight mass spectrometry, Journal of Chromatography A, 1596, 53–61. DOI: 10.1016/j.chroma.2018.07.036.
Chapter 3 V. Albergamo, B. Blankert, E.R. Cornelissen, B. Hofs, W.-J. Knibbe, W. van der Meer, P. de Voogt (2019) Removal of polar organic micropollutants by pilot-scale reverse osmosis drinking water treatment, Water Research. 148, 535–545. DOI: 10.1016/j.watres.2018.09.029.
Chapter 4 V. Albergamo, B. Blankert, W. van der Meer, P. de Voogt, E.R. Cornelissen, Polar micropollutants behaviour in reverse osmosis filtration with thin-film nanocomposite and aquaporin-embedded membranes. (Submitted)
Chapter 5 V. Albergamo, J. E. Schollée, E. L. Schymanski, R. Helmus, H. Timmer, J. Hollender, P. de Voogt, Non-target screening reveals time trends of polar micropollutants in a riverbank filtration system, Environmental Science & Technology, 53, 13, 7584–7594. DOI: 10.1021/acs.est.9b01750.
Chapter 6 V. Albergamo, B.I. Escher, E.L. Schymanski, R. Helmus, M. M.L. Dingemans, E. R. Cornelissen, M. H. S. Kraak, J. Hollender, P. de Voogt. Comprehensive evaluation of reverse osmosis drinking water treatment combining bioanalytical tools and non-target screening. (Submitted)

262

263
List of co-authors contributions
Chapter 2
Sample collection, selection of target analytes, analytical standards preparation by VA. Method development by RH and VA. Method validation by VA. Scientific quality assessment by PdV. Manuscript drafted by VA, revised and approved by all co-authors.
Chapter 3
Experimental design by BB, BH and VA. Reverse osmosis filtration experiments, sample collection and analysis by VA. Scientific quality assessment by BB, WJK, ERC, BH, WVdM and PdV. Manuscript drafted by VA, revised and approved by all co-authors.
Chapter 4
Experimental design by BB, ERC and VA. Reverse osmosis filtration experiments, sample collection and chemical analysis by VA. Scientific quality assessment by BB, ERC, WVdM and PdV Manuscript drafted by VA, revised and approved by all co-authors.
Chapter 5
Sample collection and preparation by VA. Chemical analysis by VA and JES. Hierarchical clustering scripting by JSA. Automated structure annotation scripting by ELS. Automated ion chromatogram extraction scripting by RH. All data processing and non-target identity confirmation campaign by VA. Hydrogeological support for interpretation of results by HT. Hierarchical clustering results interpretation supported by JES. Spectra annotation results interpretation supported by ELS. Scientific quality assessment by JH, ELS and PdV. Manuscript drafted by VA, revised and approved by all co-authors.
Chapter 6
Sample collection, preparation, chemical analysis and non-target screening by VA. Ames tests and support for results interpretation by MLD. Gene reporter assays tests and support for result interpretation by BIE. Non-target screening software by RH, database integration and support for spectral similarities interpretation by ELS and RH. Non-target confirmation campaign by VA. Scientific quality assessment by BIE, MLD, ERC, JH, ELS, MHSK and PdV. Manuscript drafted by VA, revised and approved by all co-authors.

264

265
Acknowledgments
First of all, I want to thank my promotors Pim de Voogt and Walter van der Meer, and my co-promotor Emile Cornelissen. Pim and Walter, I am grateful for your trust and for giving me freedom in my research and unlimited access to any facility and knowledge I needed. Pim, apart from your supervision, I have deeply appreciated your openness to dialogue. Emile, I have enjoyed learning from you, I always left our one-to-one meetings with a feeling of encouragement.
Rick Helmus, I am extremely grateful for all the input I received, it was essential to most of my scientific achievements. I will always hold the good memories of our scientific trips to Ascona and New Orleans and I am proud of all that was triggered by what we experienced there.
Emma Schymanski, our interaction left me with invaluable knowledge. I have truly appreciated the mutual respect between us and your scientific and personal support. I am grateful I could always rely on you and hopefully it does not end here.
Juliane Hollender and Jennifer Schollée at Eawag, thanks for being good hosts and for your valuable contribution to my scientific growth. Beate Escher at UFZ Leipzig, Milou Dingemans at KWR and Michiel Kraak at IBED, thanks for your availability and for supervising the bioanalytical work.
Thanks to everybody at Oasen who facilitated my research, particularly Willem-Jan Knibbe, Bastiaan Blankert and Harrie Timmer for the supervision in Gouda, and Harmen van der Laan and Evgeni Alaminov for the logistical support in Kamerik. Bas Hofs, thanks for your supervision while you were part of the team. Additionally, thanks to all the students who helped out in Kamerik, particularly Eva and Behailou. I have particularly enjoyed teaching Sandrine, Jasper and Matthias at the UvA.
Thanks to the tech team at IBED, particularly Rick (again!), Joke, Chiara, Peter, Samira, Eva and Jorien. Chiara, Joke and Rick (again!), thanks for caring about me beyond my lab-related needs. Eugenie, I enjoyed speaking Italian with you. Maria Parras and Maria Dolorita at the IBED secretariaat and Heleen Goedhart at Human Resources, thanks for keeping a smile while helping out with any issue I encountered.

266
Jort, I really enjoyed the time spent together. Mabel and I have been waiting for that barbecue at your place for so long, make it happen bearing in mind we are not intimidated by long flights!
I liked hosting guests from KWR. Ann-Hélène, I have really enjoyed your company and our talks about all (crazy) aspects of life and, of course, about cats. Ana, it was nice to occasionally have lunch together.
Thanks to all my office mates for being friendly and open to nice chats, particularly Liz, Songyu and Jiajia. Although I did not spend much time with my FAME colleagues, I have enjoyed the company and the kindness of Paula, as well as interacting with Tiedo and Milo.
Andrea, thanks for being a lifelong, wise friend. Ke, thanks for the quality friendship in the short time frame we had. I miss our “loop” of coffee, jazz and ramen and I hope we’ll cross paths soon to do that again. Manuel, thanks for your friendship and for letting me inherit your desk! Paul, welcoming you in our house was very natural, thanks for your friendship and company. Berend, thank you for the rock and roll. Hugo and Mara, I have appreciated your occasional company. Bora, I enjoyed your company at the UvA as well as hanging out with you. I owe you a “real” pizza. Ruy, thanks for the chats on the terrace. Mabel, I am immensely grateful for your presence, loyalty and support throughout these years. Thanks for being there to help out with my article graphics (including for this thesis), but most of all for turning our home into a colourful and welcoming environment where I always felt comfortable.
Finally, I want to thank my parents for their overwhelming love and support, I felt you by my side all the time regardless of where in the world I was.