Compliance of Indoor Air Contaminants within the Main Prayer ...
17
Journal of Construction in Developing Countries, 24(2), 105–121, 2019 © Penerbit Universiti Sains Malaysia, 2019. This work is licensed under the terms of the Creative Commons Attribution (CC BY) (http://creativecommons.org/licenses/by/4.0/). Compliance of Indoor Air Contaminants within the Main Prayer Halls of Mosques in Malacca with Malaysia's Indoor Air Quality Standard Nur Baitul Izati Rasli 1 , * Mohd Rodzi Ismail 1,2 , Nor Azam Ramli 1 , Syabiha Shith 1 , Amni Umirah Mohamad Nazir 1 , Noor Faizah Fitri Md Yusof 1 and Nazatul Syadia Zainordin 1,3 Published online: 31 December 2019 To cite this article: Nur Baitul Izati Rasli, Mohd Rodzi Ismail, Nor Azam Ramli, Syabiha Shith, Amni Umirah Mohamad Nazir, Noor Faizah Fitri Md Yusof and Nazatul Syadia Zainordin (2019). Compliance of indoor air contaminants within the main prayer halls of mosques in Malacca with Malaysia's indoor air quality standard. Journal of Construction in Developing Countries, 24(2): 105–121. https://doi.org/10.21315/jcdc2019.24.2.5. To link to this article: https://doi.org/10.21315/jcdc2019.24.2.5 Abstract: This study examined the compliance of indoor air contaminants (total volatile organic compound [TVOC], ozone [O 3 ], carbon monoxide [CO], formaldehyde [CH 2 O], particulate matter [PM 1 , PM 2.5 , PM 5 and PM 10 ] and carbon dioxide [CO 2 ]) during Dhuhr/Friday and Asr prayers with the guideline limits in Malaysia's Industrial Code of Practice (ICOP). Monitoring was conducted from 12:00–5:00 p.m. in three prominent mosques in Malacca City, namely, M1 (a historic mosque; during Dhuhr at 1:07–1:18 p.m. to Asr at 4:31–4:42 p.m.), M2 (a historic mosque; during Friday at 1:38–1:48 p.m. to Asr at 4:33–4:50 p.m.) and M3 (a floating mosque on the Straits of Malacca; during Dhuhr at 1:12–1:27 p.m. to Asr at 4:33–4:50 p.m.). Results show that the mean concentrations of the nine indoor air contaminants in M1, M2 and M3 did not exceed ICOP's limits, except for the ozone concentration in M3 that exceeded the limit at 0.150 ppm. We conclude that the concentration levels of indoor air contaminants in the studied mosques are in compliance with Malaysia's ICOP and the non-compliance issue with regard to the ozone concentration in one of the mosques is due to the mosque's location in a busy coastal and marine area. Keywords: Indoor air quality (IAQ), Mosque, Chemical air contaminant, Particulate matter, Ventilation performance indicator INTRODUCTION Mosques are a tourist attraction in Malacca and have been visited by locals and outsiders since Malacca was declared a heritage city in 2008. For Muslims, mosques represent places of great importance and are unique in their functions and operations. Worshipers or congregators need to feel comfortable, calm and peaceful during their prayers (salāh) or while performing other religious activities within the main prayer halls of mosques. The main prayer hall of a mosque is an indoor space accessible to Muslims and the public. The hall is occupied at least five times a day because Muslims commonly perform five compulsory prayers (salāh) daily. However, the prayer times and durations vary corresponding to areas, regions 1 Environmental Assessment and Clean Air Research (EACAR), School of Civil Engineering, Engineering Campus, Universiti Sains Malaysia (USM), 14300 Nibong Tebal, Pulau Pinang, MALAYSIA 2 School of Housing Building and Planning, Universiti Sains Malaysia (USM), 11800 USM, Pulau Pinang, MALAYSIA 3 Faculty of Environmental Studies, Universiti Putra Malaysia (UPM), 43400 UPM Serdang, Selangor Darul Ehsan, MALAYSIA *Corresponding author: [email protected]
-
Upload
khangminh22 -
Category
Documents
-
view
1 -
download
0
Transcript of Compliance of Indoor Air Contaminants within the Main Prayer ...
Journal of Construction in Developing Countries, 24(2), 105–121, 2019
© Penerbit Universiti Sains Malaysia, 2019. This work is licensed under the terms of the Creative Commons Attribution (CC BY) (http://creativecommons.org/licenses/by/4.0/).
Compliance of Indoor Air Contaminants within the Main Prayer Halls of Mosques in Malacca with Malaysia's
Indoor Air Quality Standard
Nur Baitul Izati Rasli1, *Mohd Rodzi Ismail1,2, Nor Azam Ramli1, Syabiha Shith1, Amni Umirah Mohamad Nazir1, Noor Faizah Fitri
Md Yusof1 and Nazatul Syadia Zainordin1,3
Published online: 31 December 2019
To cite this article: Nur Baitul Izati Rasli, Mohd Rodzi Ismail, Nor Azam Ramli, Syabiha Shith, Amni Umirah Mohamad Nazir, Noor Faizah Fitri Md Yusof and Nazatul Syadia Zainordin (2019). Compliance of indoor air contaminants within the main prayer halls of mosques in Malacca with Malaysia's indoor air quality standard. Journal of Construction in Developing Countries, 24(2): 105–121. https://doi.org/10.21315/jcdc2019.24.2.5.
To link to this article: https://doi.org/10.21315/jcdc2019.24.2.5
Abstract: This study examined the compliance of indoor air contaminants (total volatile organic compound [TVOC], ozone [O3], carbon monoxide [CO], formaldehyde [CH2O], particulate matter [PM1, PM2.5, PM5 and PM10] and carbon dioxide [CO2]) during Dhuhr/Friday and Asr prayers with the guideline limits in Malaysia's Industrial Code of Practice (ICOP). Monitoring was conducted from 12:00–5:00 p.m. in three prominent mosques in Malacca City, namely, M1 (a historic mosque; during Dhuhr at 1:07–1:18 p.m. to Asr at 4:31–4:42 p.m.), M2 (a historic mosque; during Friday at 1:38–1:48 p.m. to Asr at 4:33–4:50 p.m.) and M3 (a floating mosque on the Straits of Malacca; during Dhuhr at 1:12–1:27 p.m. to Asr at 4:33–4:50 p.m.). Results show that the mean concentrations of the nine indoor air contaminants in M1, M2 and M3 did not exceed ICOP's limits, except for the ozone concentration in M3 that exceeded the limit at 0.150 ppm. We conclude that the concentration levels of indoor air contaminants in the studied mosques are in compliance with Malaysia's ICOP and the non-compliance issue with regard to the ozone concentration in one of the mosques is due to the mosque's location in a busy coastal and marine area.
Keywords: Indoor air quality (IAQ), Mosque, Chemical air contaminant, Particulate matter, Ventilation performance indicator
INTRODUCTION
Mosques are a tourist attraction in Malacca and have been visited by locals and outsiders since Malacca was declared a heritage city in 2008. For Muslims, mosques represent places of great importance and are unique in their functions and operations. Worshipers or congregators need to feel comfortable, calm and peaceful during their prayers (salāh) or while performing other religious activities within the main prayer halls of mosques. The main prayer hall of a mosque is an indoor space accessible to Muslims and the public. The hall is occupied at least five times a day because Muslims commonly perform five compulsory prayers (salāh) daily. However, the prayer times and durations vary corresponding to areas, regions
1Environmental Assessment and Clean Air Research (EACAR), School of Civil Engineering, Engineering Campus, Universiti Sains Malaysia (USM), 14300 Nibong Tebal, Pulau Pinang, MAlAYSIA2School of Housing Building and Planning, Universiti Sains Malaysia (USM), 11800 USM, Pulau Pinang, MAlAYSIA3Faculty of Environmental Studies, Universiti Putra Malaysia (UPM), 43400 UPM Serdang, Selangor Darul Ehsan, MAlAYSIA*Corresponding author: [email protected]
Nur Baitul Izati Rasli et al.
106/PENERBIT UNIVERSITI SAINS MALAYSIA
and time zones. The Fajr (dawn) prayer time for Malaysia is from 6:00–7:00 a.m., the Dhuhr (after midday) prayer is from 1:00–2:00 p.m., the Asr (afternoon) prayer is from 4:30–5:30 p.m., the Maghrib (after sunset) prayer is from 7:00–8:00 p.m. and the Isha (evening) prayer is from 8:30–9:30 p.m. The main prayer halls of mosques are fully occupied on Fridays by worshippers as male adult Muslims congregate to listen to sermons and perform the Friday prayer from around 1:00–2:30 p.m. On this holy day, the Dhuhr prayer is replaced by the Friday prayer and the number of vehicles that transport the worshipers to the mosques increases. The indoor conditions of mosques should provide acceptable thermal comfort for worshipers to feel comfortable and calm and leave with a feeling of tranquility and peace (Abdullah, Majid and Othman, 2016). Given that mosques are consistently used by the public, their indoor air quality (IAQ) needs to be monitored because it is threatened by various contaminants from indoor and outdoor sources that considerably affect the indoor environment (Elbayoumi et al., 2014).
However, lee and Chang (2000) reported that indoor pollutant levels could be greater than the outdoor pollutant levels. The factors that affect IAQ include lack of ventilation, poor outdoor air quality, existence of indoor contaminant sources, lack of maintenance, mechanical ventilation and air conditioning (MVAC) installation, water intrusion and resident activity (Fernández et al., 2013; Prihatmanti and Bahauddin, 2014). However, pollutants generated from sources within the indoor environment may lead to higher exposure to indoor air contaminant concentrations in comparison with the outdoors due to the lower air flow in the former. These sources include cleaning procedures, building materials, furniture, furnishing, use of chemical products and general activities.
Several studies in Malaysia have shown that thermal comfort, sick building syndrome (SBS) and displeasure in buildings have become common issues (Amin, Akasah and Razzaly, 2015; Shan et al., 2016). Inadequate ventilation rates and high concentrations of CO2, PM2.5 and biological pollutants have been observed in mosque buildings in Turkey and the Kingdom of Saudi Arabia (Ocak et al., 2012; Hameed and Habeeballah, 2013). Malaysia’s Industrial Code of Practice (ICOP) was established to ensure that employees and occupants are protected from poor IAQ that can adversely affect human health, well-being and productivity (Department of Occupational Safety and Health [DOSH], 2010).
The objective of this study was to assess the level of compliance to the guideline limit in ICOP of nine indoor air contaminants, namely, total volatile organic compound (TVOC), ozone (O3), carbon monoxide (CO), formaldehyde (CH2O), particulate matter (PM1, PM2.5, PM5 and PM10) and carbon dioxide (CO2), during Dhuhr/Friday and Asr prayer times in the main prayer halls of mosques.
MATERIAL AND METHOD
Sampling Locations
This research was conducted in the main prayer halls of three prominent mosques (coded as M1, M2 and M3) in Malacca City. M1 and M2 are historical mosques located in the centre of Malacca City and M3 is a floating mosque located on the man-made Malacca Island and built on stilts above the Straits of Malacca. According to the Malaysian Standard: Architecture and Asset Management of Masjid – Code of Practice (MS 2577: 2014)(MS, 2014), the designs of M1 and M2 are
IAQ Standard of Mosques in Malacca
PENERBIT UNIVERSITI SAINS MALAYSIA/107
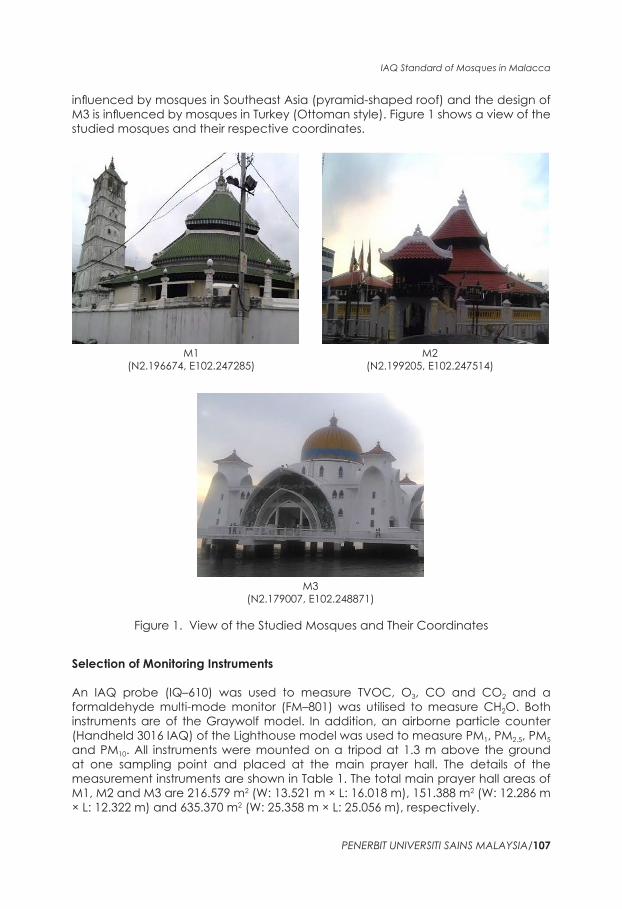
influenced by mosques in Southeast Asia (pyramid-shaped roof) and the design of M3 is influenced by mosques in Turkey (Ottoman style). Figure 1 shows a view of the studied mosques and their respective coordinates.
M1(N2.196674, E102.247285)
M2 (N2.199205, E102.247514)
M3(N2.179007, E102.248871)
Figure 1. View of the Studied Mosques and Their Coordinates
Selection of Monitoring Instruments
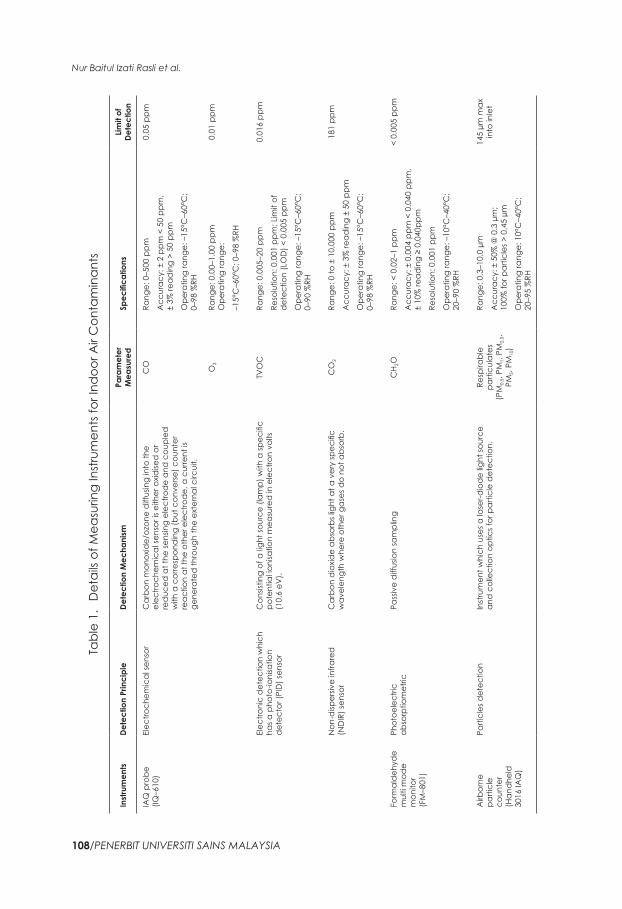
An IAQ probe (IQ–610) was used to measure TVOC, O3, CO and CO2 and a formaldehyde multi-mode monitor (FM–801) was utilised to measure CH2O. Both instruments are of the Graywolf model. In addition, an airborne particle counter (Handheld 3016 IAQ) of the lighthouse model was used to measure PM1, PM2.5, PM5 and PM10. All instruments were mounted on a tripod at 1.3 m above the ground at one sampling point and placed at the main prayer hall. The details of the measurement instruments are shown in Table 1. The total main prayer hall areas of M1, M2 and M3 are 216.579 m2 (W: 13.521 m × l: 16.018 m), 151.388 m2 (W: 12.286 m × l: 12.322 m) and 635.370 m2 (W: 25.358 m × l: 25.056 m), respectively.
Nur Baitul Izati Rasli et al.
108/PENERBIT UNIVERSITI SAINS MALAYSIA
Tabl
e 1.
Det
ails
of M
easu
ring
Inst
rum
ents
for I
ndoo
r Air
Con
tam
inan
ts
Inst
rum
ents
Dete
ctio
n Pr
inci
ple
Dete
ctio
n M
echa
nism
Para
met
er
Mea
sure
dSpec
ifica
tions
Limit
of
Dete
ctio
n
IAQ
pro
be
(IQ–6
10)
Elec
troch
emic
al se
nsor
Car
bon
mon
oxid
e/oz
one
diff
usin
g in
to th
e el
ectro
chem
ical
sens
or is
eith
er o
xidise
d o
r re
duc
ed a
t the
sens
ing
elec
trod
e an
d c
oupl
ed
with
a c
orre
spon
din
g (b
ut c
onve
rse)
cou
nter
re
actio
n at
the
othe
r ele
ctro
de,
a c
urre
nt is
ge
nera
ted
thro
ugh
the
exte
rnal
circ
uit.
CO
Rang
e: 0
–500
ppm
Acc
urac
y: ±
2 p
pm <
50
ppm
, ±
3% re
adin
g >
50 p
pm
Ope
ratin
g ra
nge:
–15
°C–6
0°C
; 0–
98 %
RH
0.05
ppm
O3
Rang
e: 0
.00–
1.00
ppm
Ope
ratin
g ra
nge:
–15°
C–6
0°C
; 0–9
8 %
RH
0.01
ppm
Elec
troni
c d
etec
tion
whi
ch
has a
pho
to-io
nisa
tion
det
ecto
r (PI
D) s
enso
r
Con
sistin
g of
a lig
ht so
urce
(lam
p) w
ith a
spec
ific
pote
ntia
l ioni
satio
n m
easu
red
in e
lect
ron
volts
(1
0.6
eV).
TVO
CRa
nge:
0.0
05–2
0 pp
m
Reso
lutio
n: 0
.001
ppm
; lim
it of
d
etec
tion
(lO
D) <
0.0
05 p
pm
Ope
ratin
g ra
nge:
–15
°C–6
0°C
; 0–
90 %
RH
0.01
6 pp
m
Non
-disp
ersiv
e in
frare
d
(ND
IR) s
enso
rC
arbo
n d
ioxid
e ab
sorb
s lig
ht a
t a v
ery
spec
ific
wav
elen
gth
whe
re o
ther
gas
es d
o no
t abs
orb.
CO
2Ra
nge:
0 to
± 1
0,00
0 pp
m
Acc
urac
y: ±
3%
read
ing
± 50
ppm
Ope
ratin
g ra
nge:
–15
°C–6
0°C
; 0–
98 %
RH
181
ppm
Form
ald
ehyd
e m
ulti
mod
e m
onito
r (F
M–8
01)
Phot
oele
ctric
ab
sorp
tiom
etric
Pass
ive
diff
usio
n sa
mpl
ing
CH 2
ORa
nge:
< 0
.02–
1 pp
m
Acc
urac
y: ±
0.0
04 p
pm <
0.0
40 p
pm,
± 10
% re
adin
g ≥
0.04
0ppm
Reso
lutio
n: 0
.001
ppm
Ope
ratin
g ra
nge:
–10
°C–4
0°C
; 20
–90
%RH
< 0.
005
ppm
Airb
orne
pa
rticl
e co
unte
r (H
and
held
30
16 IA
Q)
Parti
cles
det
ectio
nIn
stru
men
t whi
ch u
ses a
lase
r-dio
de
light
sour
ce
and
col
lect
ion
optic
s for
par
ticle
det
ectio
n.Re
spira
ble
parti
cula
tes
(PM
0.5,
PM1,
PM2.
5, PM
5, PM
10)
Rang
e: 0
.3–1
0.0
µm
Acc
urac
y: ±
50%
@ 0
.3 µ
m;
100%
for p
artic
les >
0.4
5 µm
Ope
ratin
g ra
nge:
10°
C–4
0°C
; 20
–95
%RH
145
µm m
ax
into
inle
t
IAQ Standard of Mosques in Malacca
PENERBIT UNIVERSITI SAINS MALAYSIA/109
Sampling Method
The sampling events in the mosques were conducted for five hours from 12:00–5:00 p.m. The sampling was performed for three days, with one day for each mosque with a carpeted floor. Table 2 summarises the sampling work performed in the three mosques. All of the mosques rely on passive ventilation (i.e. windows and doors) and active ventilation (i.e. fans) systems during prayer time. The doors and windows were kept open during the monitoring period and the fans were switched on during the prayer times only.
The quality assurance and quality control (QA/QC) for Graywolf and lighthouse models was performed by annual factory calibration. All instruments were attached together and the output parameters were displayed on a setup screen. Readings of all the parameters were obtained after 30 minutes to one hour to stabilise. Then, the location was set according to the current time and date of monitoring and the data were set to one-minute real-time average (100% data logging). The instruments were placed at the centre of the main prayer hall and the selected sampling location was at least 0.5 m from the walls, corners and windows but not directly in front of air-conditioning system units and floor fans and not within 2 m of the doors.
Table 2. Sampling Schedule and Activities
Mosque Session Prayer TimeMonitoring Activities(Within Five Hours of Sampling Period)
Parameters Monitored
M1 Dhuhr to Asr prayer
1:07–1:18 p.m.4:31–4:42 p.m.
1. Before Dhuhr/Friday prayer
2. During Dhuhr/Friday prayer
3. Between Dhuhr/Friday and Asr prayer
4. During Asr prayer
TVOC, O3, CO, CH2O, PM1, PM2.5, PM5, PM10, and CO2
M2 Friday to Asr prayer
1:38–1:48 p.m.4:33–4:50 p.m.
M3 Dhuhr to Asr prayer
1:12–1:27 p.m.4:33–4:50 p.m.
RESULTS AND DISCUSSIONS
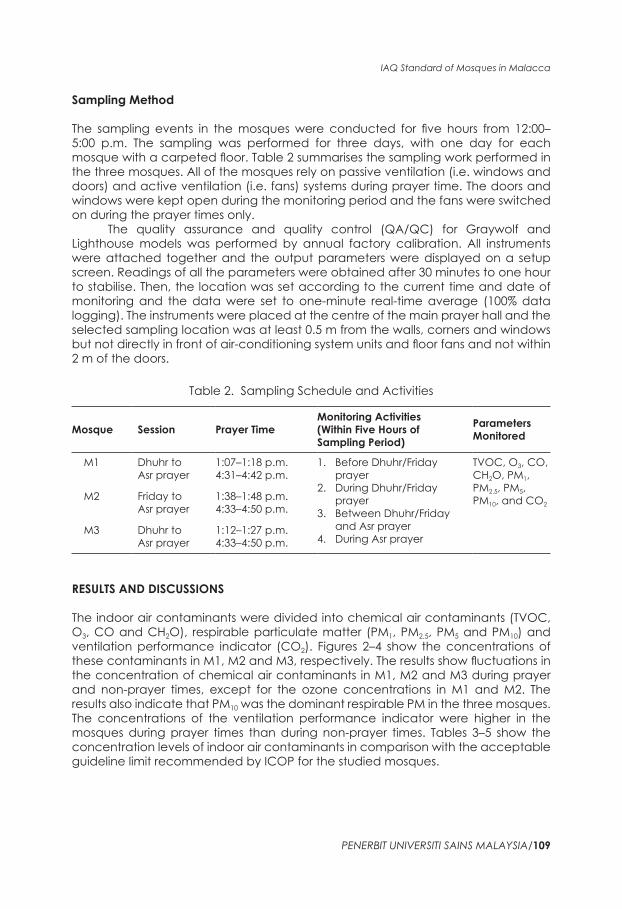
The indoor air contaminants were divided into chemical air contaminants (TVOC, O3, CO and CH2O), respirable particulate matter (PM1, PM2.5, PM5 and PM10) and ventilation performance indicator (CO2). Figures 2–4 show the concentrations of these contaminants in M1, M2 and M3, respectively. The results show fluctuations in the concentration of chemical air contaminants in M1, M2 and M3 during prayer and non-prayer times, except for the ozone concentrations in M1 and M2. The results also indicate that PM10 was the dominant respirable PM in the three mosques. The concentrations of the ventilation performance indicator were higher in the mosques during prayer times than during non-prayer times. Tables 3–5 show the concentration levels of indoor air contaminants in comparison with the acceptable guideline limit recommended by ICOP for the studied mosques.
Nur Baitul Izati Rasli et al.
110/PENERBIT UNIVERSITI SAINS MALAYSIA
(a) Chemical Air Contaminants (TVOC, O3, CO) (*CH2O not detected)
(b) Respirable Particulate Matter (PM1, PM2.5, PM5, PM10)
Figure 2. Concentrations of the Indoor Air Contaminants during Dhuhr to Asr Prayer Times at M1
IAQ Standard of Mosques in Malacca
PENERBIT UNIVERSITI SAINS MALAYSIA/111
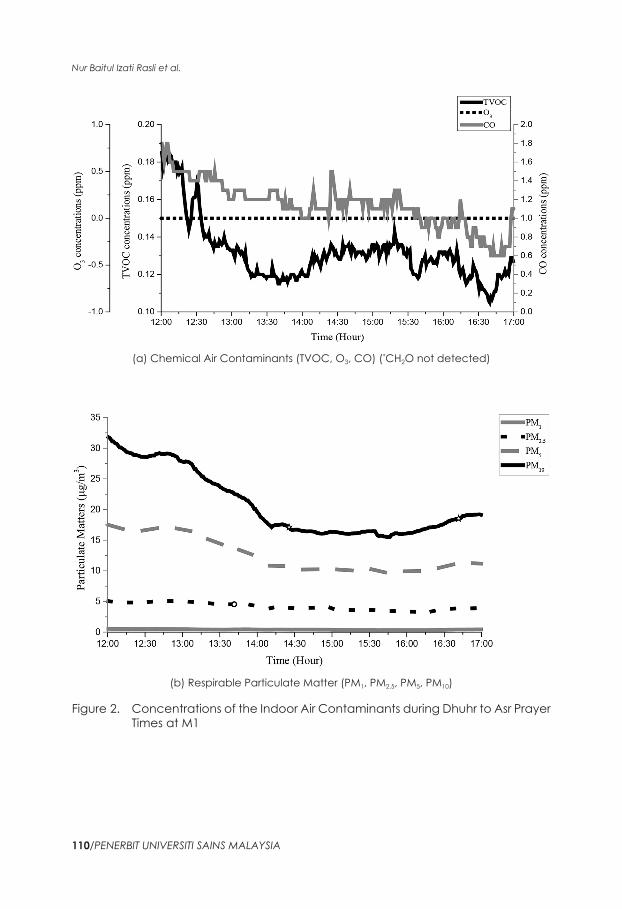
(c) Ventilation Performance Indicator (CO2)
Figure 2. (continued)
(a) Chemical Air Contaminants (TVOC, O3, CO, CH2O)
Figure 3. Concentrations of the Indoor Air Contaminants during Jumaat to Asr Prayer Times at M2
Nur Baitul Izati Rasli et al.
112/PENERBIT UNIVERSITI SAINS MALAYSIA
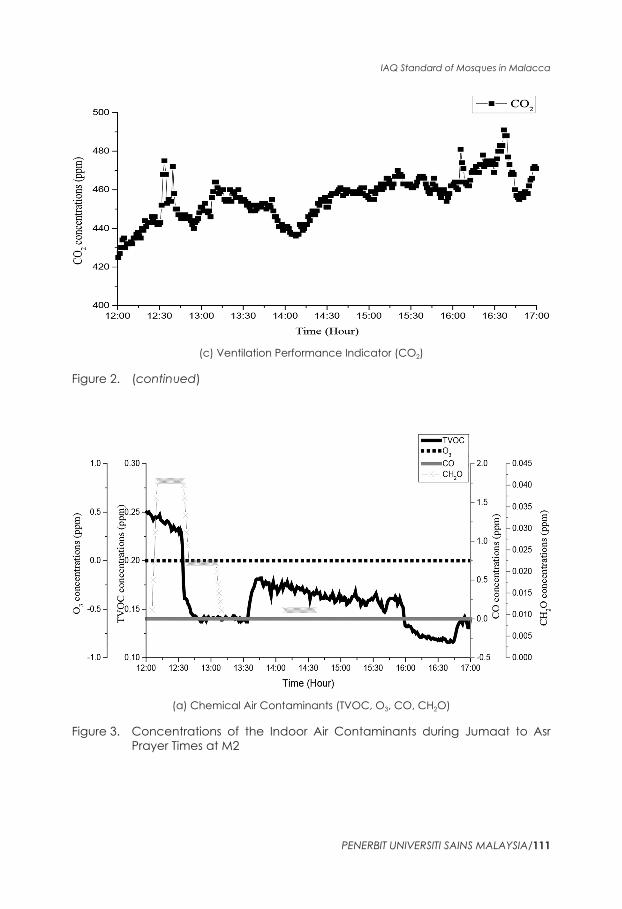
(b) Respirable Particulate Matter (PM1, PM2.5, PM5, PM10)
(c) Ventilation Performance Indicator (CO2)
Figure 3. (continued)
IAQ Standard of Mosques in Malacca
PENERBIT UNIVERSITI SAINS MALAYSIA/113
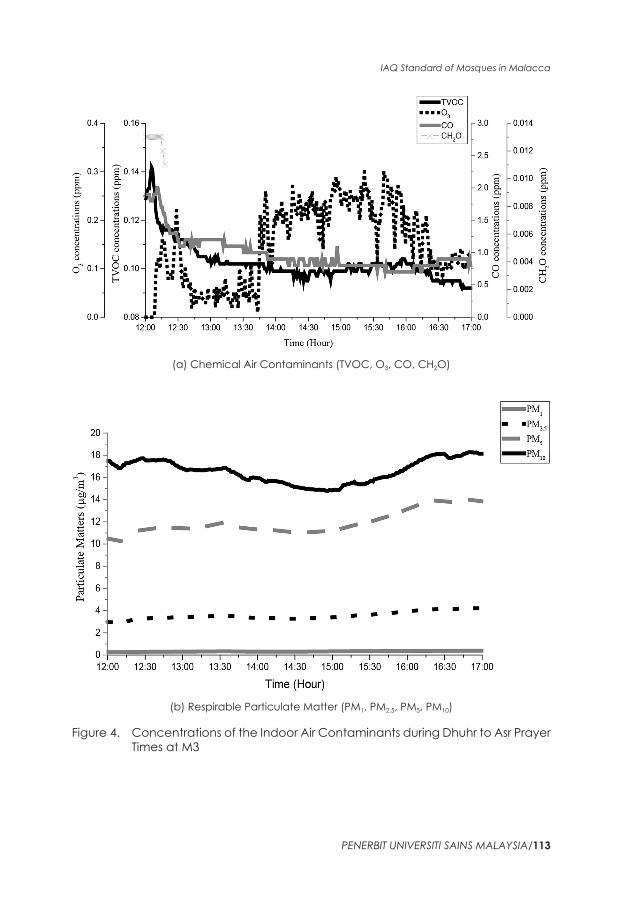
(a) Chemical Air Contaminants (TVOC, O3, CO, CH2O)
(b) Respirable Particulate Matter (PM1, PM2.5, PM5, PM10)
Figure 4. Concentrations of the Indoor Air Contaminants during Dhuhr to Asr Prayer Times at M3
Nur Baitul Izati Rasli et al.
114/PENERBIT UNIVERSITI SAINS MALAYSIA
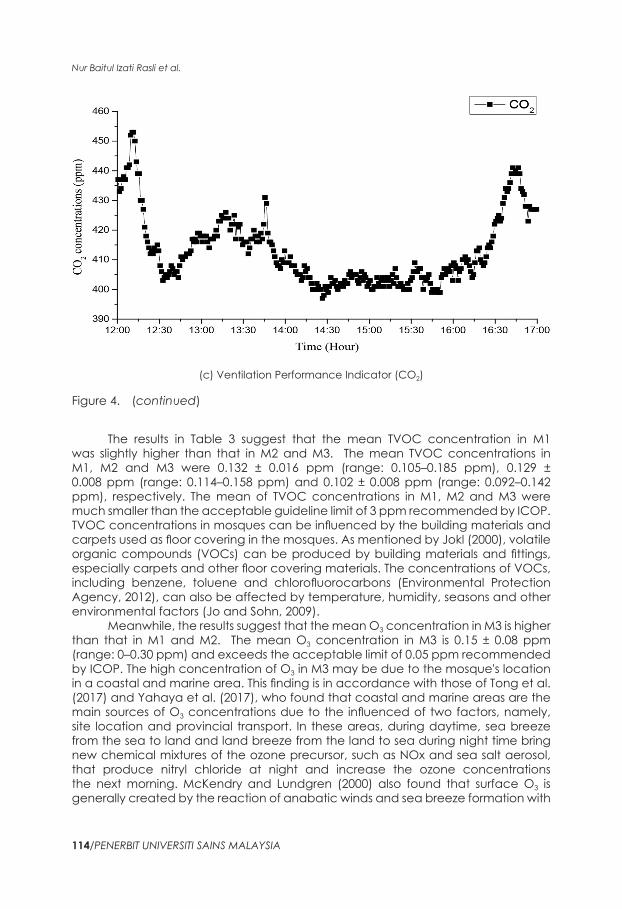
(c) Ventilation Performance Indicator (CO2)
Figure 4. (continued)
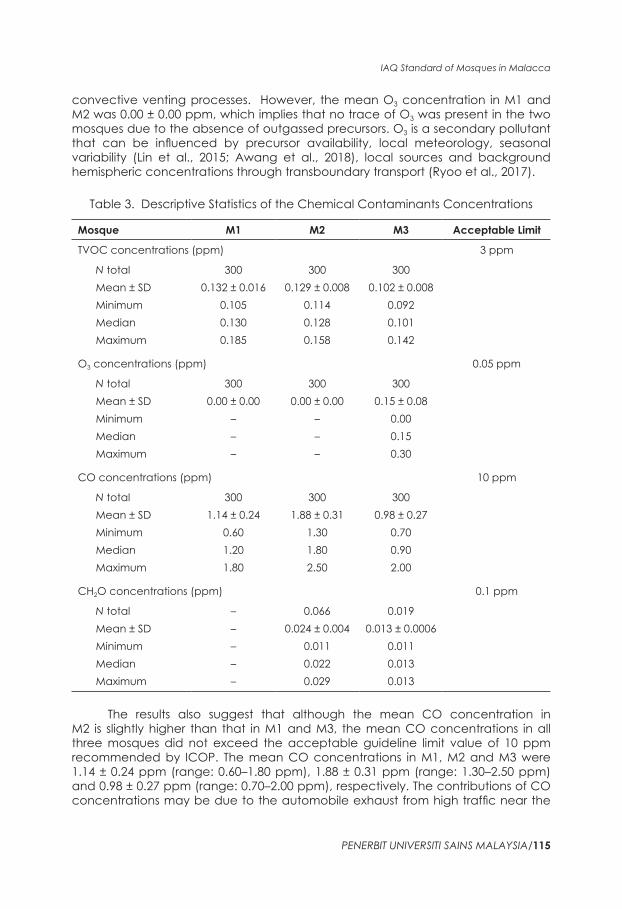
The results in Table 3 suggest that the mean TVOC concentration in M1 was slightly higher than that in M2 and M3. The mean TVOC concentrations in M1, M2 and M3 were 0.132 ± 0.016 ppm (range: 0.105–0.185 ppm), 0.129 ± 0.008 ppm (range: 0.114–0.158 ppm) and 0.102 ± 0.008 ppm (range: 0.092–0.142 ppm), respectively. The mean of TVOC concentrations in M1, M2 and M3 were much smaller than the acceptable guideline limit of 3 ppm recommended by ICOP. TVOC concentrations in mosques can be influenced by the building materials and carpets used as floor covering in the mosques. As mentioned by Jokl (2000), volatile organic compounds (VOCs) can be produced by building materials and fittings, especially carpets and other floor covering materials. The concentrations of VOCs, including benzene, toluene and chlorofluorocarbons (Environmental Protection Agency, 2012), can also be affected by temperature, humidity, seasons and other environmental factors (Jo and Sohn, 2009).
Meanwhile, the results suggest that the mean O3 concentration in M3 is higher than that in M1 and M2. The mean O3 concentration in M3 is 0.15 ± 0.08 ppm (range: 0–0.30 ppm) and exceeds the acceptable limit of 0.05 ppm recommended by ICOP. The high concentration of O3 in M3 may be due to the mosque's location in a coastal and marine area. This finding is in accordance with those of Tong et al. (2017) and Yahaya et al. (2017), who found that coastal and marine areas are the main sources of O3 concentrations due to the influenced of two factors, namely, site location and provincial transport. In these areas, during daytime, sea breeze from the sea to land and land breeze from the land to sea during night time bring new chemical mixtures of the ozone precursor, such as NOx and sea salt aerosol, that produce nitryl chloride at night and increase the ozone concentrations the next morning. McKendry and lundgren (2000) also found that surface O3 is generally created by the reaction of anabatic winds and sea breeze formation with
IAQ Standard of Mosques in Malacca
PENERBIT UNIVERSITI SAINS MALAYSIA/115
convective venting processes. However, the mean O3 concentration in M1 and M2 was 0.00 ± 0.00 ppm, which implies that no trace of O3 was present in the two mosques due to the absence of outgassed precursors. O3 is a secondary pollutant that can be influenced by precursor availability, local meteorology, seasonal variability (lin et al., 2015; Awang et al., 2018), local sources and background hemispheric concentrations through transboundary transport (Ryoo et al., 2017).
Table 3. Descriptive Statistics of the Chemical Contaminants Concentrations
Mosque M1 M2 M3 Acceptable Limit
TVOC concentrations (ppm) 3 ppm
N total 300 300 300Mean ± SD 0.132 ± 0.016 0.129 ± 0.008 0.102 ± 0.008Minimum 0.105 0.114 0.092Median 0.130 0.128 0.101Maximum 0.185 0.158 0.142
O3 concentrations (ppm) 0.05 ppm
N total 300 300 300Mean ± SD 0.00 ± 0.00 0.00 ± 0.00 0.15 ± 0.08Minimum – – 0.00Median – – 0.15Maximum – – 0.30
CO concentrations (ppm) 10 ppm
N total 300 300 300Mean ± SD 1.14 ± 0.24 1.88 ± 0.31 0.98 ± 0.27Minimum 0.60 1.30 0.70Median 1.20 1.80 0.90Maximum 1.80 2.50 2.00
CH2O concentrations (ppm) 0.1 ppm
N total – 0.066 0.019Mean ± SD – 0.024 ± 0.004 0.013 ± 0.0006Minimum – 0.011 0.011Median – 0.022 0.013Maximum – 0.029 0.013
The results also suggest that although the mean CO concentration in M2 is slightly higher than that in M1 and M3, the mean CO concentrations in all three mosques did not exceed the acceptable guideline limit value of 10 ppm recommended by ICOP. The mean CO concentrations in M1, M2 and M3 were 1.14 ± 0.24 ppm (range: 0.60–1.80 ppm), 1.88 ± 0.31 ppm (range: 1.30–2.50 ppm) and 0.98 ± 0.27 ppm (range: 0.70–2.00 ppm), respectively. The contributions of CO concentrations may be due to the automobile exhaust from high traffic near the
Nur Baitul Izati Rasli et al.
116/PENERBIT UNIVERSITI SAINS MALAYSIA
mosques and continuous CO concentrations can cause health issues among the occupants, especially children. For example, Evans et al. (2014) found that the risk of asthma in urban children can be aggravated by CO concentrations.
The highest mean CH2O concentration was observed in M2, followed by M3 and M1. The mean CH2O concentrations in M2 and M3 were 0.024 ± 0.004 ppm (range: 0.011–0.029 ppm) and 0.013 ± 0.0006 ppm (range: 0.011– 0.013 ppm), respectively and the mean CH2O concentration in M1 is less than 0.01 ppm. The mean CH2O concentrations in M1, M2 and M3 did not exceed the acceptable guideline limit of 0.1 ppm recommended by ICOP. The possible sources of indoor CH2O are wood-based materials, flooring materials, insulation materials, coating materials, indoor chemistry and indoor combustion; the disclosure of indoor CH2O is expected to be higher than the outdoor value (Salthammer et al., 2010). CH2O concentrations could exert adverse health effects on humans. Therefore, these concentrations also need to be monitored in indoor environments.
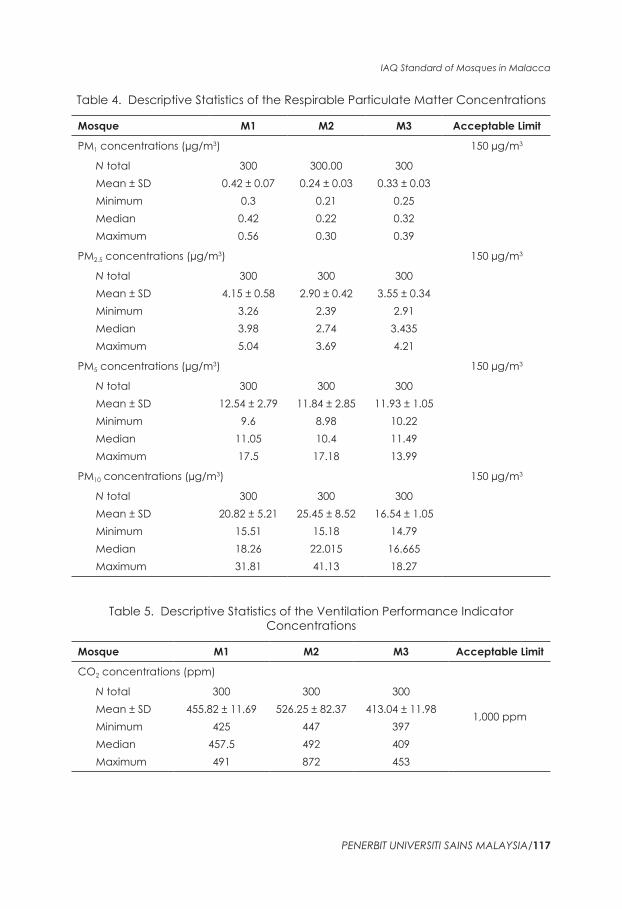
Table 4 shows that the highest mean PM concentrations (PM1, PM2.5 and PM5) were in M1, followed by M3 and M2. The mean PM1 concentrations in M1, M3 and M2 were 0.42 ± 0.07 μg/m3 (range: 0.30–0.56 μg/m3), 0.33 ± 0.03 μg/m3 (range: 0.25–0.39 μg/m3) and 0.24 ± 0.03 μg/m3 (range: 0.21–0.30 μg/m3), respectively. For PM2.5, the mean concentrations in M1, M3 and M2 were 4.15 ± 0.58 μg/m3 (range: 3.26–5.04 μg/m3), 3.55 ± 0.34 μg/m3 (range: 2.91–4.21 μg/m3) and 2.90 ± 0.42 μg/m3 (range: 2.39–3.69 μg/m3), respectively. Meanwhile, the mean PM5 concentrations in M1, M3 and M2 were 12.54 ± 2.79 μg/m3 (range: 9.60–17.50 μg/m3), 11.93 ± 1.05 μg/m3 (range: 10.22–13.99 μg/m3) and 11.84 ± 2.85 μg/m3 (range: 8.98–17.18 μg/m3), respectively. The highest mean PM10 concentration was in M2 (25.45 ± 8.52 μg/m3; range: 15.18–41.13 μg/m3) followed by M1 (20.82 ± 5.21 μg/m3; range: 15.51–31.81 μg/m3) and M3 (16.54 ± 1.05 μg/m3; range: 14.79–18.27 μg/m3). However, the mean PM1, PM2.5, PM5 and PM10 concentrations in M1, M2 and M3 still did not exceed the acceptable limit of 150 μg/m3 recommended by ICOP.
PM is a common indoor pollutant and may cause adverse health effects. These health effects vary from minor respiratory symptoms to increments in morbidity and mortality rates depending on the exposure duration and pollutant concentration (Jedrychowski et al., 2013). The sources of PM inside mosques could be particles resuspended from carpets, infiltration of outdoor particles into the buildings as jemaah or congregators walk inside the mosques and secondary particle formation from the reaction of gaseous pollutants. Thatcher and layton (1995), Ferro, Kopperud and Hildemann (2004) and Fromme et al. (2007) concluded in their studies that resuspension is a function of particle size, occupants' activities and types of floor materials.
Table 5 shows that the highest mean CO2 concentration was in M2, in which jemaah perform the Friday prayer. Their concurrent attendance during Dhuhr time on Fridays increased the number of people in the mosque and therefore contributed to a high CO2 concentration at this time. The maximum CO2 concentration in M2 reached 872 ppm, which is almost twice the maximum concentration values in M1 and M3 (491 and 453 ppm, respectively) but still within the acceptable limit of 1,000 ppm. Reduced ventilation (Ahmed, Rahman and Shahrani, 2004), high number of jemaah and the level of activities of jemaah (Al-Dabbous et al., 2013) might affect CO2 levels in mosques during this time. The mean CO2 concentration in M2 was 526.25 ± 82.37 ppm (range: 447–872 ppm), followed by M1 and M3 with 455.82 ± 11.69 ppm (range: 425–491 ppm) and 413.04 ± 11.98 ppm (range: 397–453 ppm), respectively.
IAQ Standard of Mosques in Malacca
PENERBIT UNIVERSITI SAINS MALAYSIA/117
Table 4. Descriptive Statistics of the Respirable Particulate Matter Concentrations
Mosque M1 M2 M3 Acceptable Limit
PM1 concentrations (µg/m3) 150 µg/m3
N total 300 300.00 300Mean ± SD 0.42 ± 0.07 0.24 ± 0.03 0.33 ± 0.03Minimum 0.3 0.21 0.25Median 0.42 0.22 0.32Maximum 0.56 0.30 0.39
PM2.5 concentrations (µg/m3) 150 µg/m3
N total 300 300 300Mean ± SD 4.15 ± 0.58 2.90 ± 0.42 3.55 ± 0.34Minimum 3.26 2.39 2.91Median 3.98 2.74 3.435Maximum 5.04 3.69 4.21
PM5 concentrations (µg/m3) 150 µg/m3
N total 300 300 300Mean ± SD 12.54 ± 2.79 11.84 ± 2.85 11.93 ± 1.05Minimum 9.6 8.98 10.22Median 11.05 10.4 11.49Maximum 17.5 17.18 13.99
PM10 concentrations (µg/m3) 150 µg/m3
N total 300 300 300Mean ± SD 20.82 ± 5.21 25.45 ± 8.52 16.54 ± 1.05Minimum 15.51 15.18 14.79Median 18.26 22.015 16.665Maximum 31.81 41.13 18.27
Table 5. Descriptive Statistics of the Ventilation Performance Indicator Concentrations
Mosque M1 M2 M3 Acceptable Limit
CO2 concentrations (ppm)
1,000 ppm
N total 300 300 300Mean ± SD 455.82 ± 11.69 526.25 ± 82.37 413.04 ± 11.98Minimum 425 447 397Median 457.5 492 409Maximum 491 872 453
Nur Baitul Izati Rasli et al.
118/PENERBIT UNIVERSITI SAINS MALAYSIA
According to lin and Deng (2003), the indoor CO2 level is one of the common indicators used to measure IAQ. The large number of jemaah during the Friday prayer increases the CO2 concentrations compared with those on normal days. Thus, the ventilation rate and sources of fresh air inside mosques are important factors that need to be considered. According to Mumovic et al. (2009) and Ponsoni and Raddi (2010), CO2 levels inside a building can be controlled by increasing the ventilation rate and sources of fresh air. The high CO2 level during the Friday prayer must be monitored because it could exert adverse effects on human health. Guais et al. (2011) mentioned that CO2 concentrations around or above 1,000 ppm, especially those above 10,000 ppm, are classified as toxicity values.
CONCLUSIONS
This study showed that the mean concentrations of nine indoor air contaminants (TVOC, O3, CO, CH2O, PM1, PM2.5, PM5, PM10 and CO2) in M1 (a historic mosque; monitored during Dhuhr to Asr payers) and M2 (a historic mosque, monitored during Friday to Asr prayers) were still within the acceptable guideline limit recommended by ICOP. However, one of the nine parameters, which is mean O3 concentration in M3 (a floating mosque; monitored during Dhuhr to Asr prayers), exceeded the acceptable guideline limit. The mean O3 concentration in M3 exceeded the acceptable limit at 0.150 ppm because M3 is located in a coastal and marine area. The CO2 level during the Friday prayer in M2 reached 872 ppm, which is close to the acceptable limit of 1,000 ppm recommended by ICOP. This result might be due to reduced ventilation conditions, large number of jemaah and their activities in the mosque. In conclusion, the concentration levels of indoor air contaminants in the prayer halls of the studied mosques in Malacca are in compliance with Malaysia's ICOP and DOSH (2010) and this compliance needs to be sustained to prevent any possible health effects on worshippers during their religious congregations and other activities. Providing adequate ventilation is a means to maintain good IAQ in the mosques. Nevertheless, a non-compliance issue for ozone was observed in one of the mosques due to its location.
ACKNOWLEDGEMENTS
This research was supported by the Ministry of Science Technology and Innovation Malaysia under the SCIENCEFUND 1001/PAWAM/6013607 (06-01-05-SF0766) grant and Jabatan Agama Islam Melaka.
REFERENCES
Abdullah, F.H., Majid, N.H.A. and Othman, R. (2016). Defining issue of thermal comfort control through urban mosque façade design. Proceedings: Social and Behavioral Sciences, 234: 416–423. https://doi.org/10.1016/j.sbspro.2016.10.259.
IAQ Standard of Mosques in Malacca
PENERBIT UNIVERSITI SAINS MALAYSIA/119
Ahmed, A.Z., Rahman, S.A. and Shahrani, S. (2004). CO and CO2 concentrations in naturally-ventilated houses in Malaysia. Paper presented at the PLEA2004: The 21st Conference on Passive and Low Energy Architecture. Eindhoven, The Netherlands, 19–22 September.
Al-Dabbous, A.N., Khan, A.R., Al-Rashidi, M.S. and Awadi, l. (2013). Carbon dioxide and volatile organic compounds levels in mosque in hot arid climate. Indoor and Built Environment, 22(2): 456–464. https://doi.org/10.1177/ 1420326X12441807.
Amin, N.D.M., Akasah, Z.A. and Razzaly, W. (2015). Architectural evaluation of thermal comfort: Sick building syndrome symptoms in engineering education laboratories. Proceedia – Social and Behavioral Sciences, 204: 19–28. https://doi.org/10.1016/j.sbspro.2015.08.105.
Awang, N.R., Ramli, N.A., Shith, S., Zainordin, N.S. and Manogaran, H. (2018). Transformational characteristics of ground level ozone during high particulate events in urban areas of Malaysia. Air Quality, Atmosphere and Health, 11: 715–727. https://doi.org/10.1007/s11869-018-0578-0.
Department of Occupational Safety and Health (DOSH) (2010). Malaysia's Industrial Code of Practice on Indoor Air Quality. Putrajaya: DOSH, Ministry of Human Resources.
Elbayoumi, M., Ramli, N.A., Md Yusof, N.F.F., Yahaya, A.S., Al Madhoun, W. and Ul-Saufie, A.Z. (2014). Multivariate methods for indoor PM10 and PM2.5 modelling in naturally ventilated school buildings. Atmospheric Environment, 94: 11–21. https://doi.org/10.1016/j.atmosenv.2014.05.007.
Environmental Protection Agency (EPA) (2012). An Introduction to Indoor Air Quality (IAQ): Volatile Organic Compounds (VOCs). Washington DC: EPA. Available at: http://www.epa.gov/iaq/voc.html [Accessed on 5 March 2016].
Evans, K.A., Halterman, J.S., Hopke, P.K., Fagnano, M. and Rich, D.Q. (2014). Increased ultrafine particles and carbon monoxide concentrations are associated with asthma exacerbation among urban children. Environmental Research, 129: 11–19. https://doi.org/10.1016/j.envres.2013.12.001.
Fernández, l.C., Alvarez, R.F., Francisco Javier González-Barcala, F.J. and Portal, J.A.R. (2013). Indoor air contaminants and their impact on respiratory pathologies. Archivos de Bronconeumología, 49(1): 22–27. https://doi.org/10.1016/j.arbr.2012.11.004.
Ferro, A.R., Kopperud, R.J. and Hildemann, l.M. (2004). Source strengths for indoor human activities that resuspend particulate matter. Environmental Science and Technology, 38(6): 1759–1764. https://doi.org/10.1021/es0263893.
Fromme, H., Twardella, D., Dietrich, S., Heitmann, D., Schierl, R., liebl, B. and Rüden, H. (2007). Particulate matter in the indoor air of classrooms: Exploratory results from Munich and surrounding area. Atmospheric Environment, 41(4): 854–866. https://doi.org/10.1016/j.atmosenv.2006.08.053.
Guais, A., Brand, G., Jacquot, l., Karrer, M., Dukan, S., Grévillot, G., Molina, T.J., Bonte, J., Regnier, M. and Schwartz, l. (2011). Toxicity of carbon dioxide: A review. Chemical Research in Toxicology, 24(12): 2061–2070. https://doi.org/10.1021/tx200220r.
Hameed, A.A. and Habeeballah, T. (2013). Air microbial contamination at the holy mosque, Makkah, Saudi Arabia. Current World Environment, 2(8): 179–187. https://doi.org/10.12944/CWE.8.2.03.
Nur Baitul Izati Rasli et al.
120/PENERBIT UNIVERSITI SAINS MALAYSIA
Jedrychowski, W.A., Perera, F.P., Spengler, J.D., Mroz, E., Stigter, l., Flak, E. and Jacek, R. (2013). Intrauterine exposure to fine particulate matter as a risk factor for increased susceptibility to acute broncho-pulmonary infections in early childhood. International Journal of Hygiene and Environmental Health, 216(4): 395–401. https://doi.org/10.1016/j.ijheh.2012.12.014.
Jo, W.J. and Sohn, J.Y. (2009). The effect of environmental and structural factors on indoor air quality of apartments in Korea. Building and Environment, 44(9): 1794–1802. https://doi.org/10.1016/j.buildenv.2008.12.003.
Jokl, M.V. (2000). Evaluation of indoor air quality using the decibel concept based on carbon dioxide and TVOC. Building and Environment, 35(8): 677–697. https://doi.org/10.1016/S0360-1323(99)00042-6.
lee, S.C. and Chang, M. (2000). Indoor and outdoor air quality investigation at schools in Hong Kong. Chemosphere, 41(1–2): 109–113. https://doi.org/10.1016/S0045-6535(99)00396-3.
lin, M., Horowitz, l.W., Cooper, O.R., Tarasick, D., Conley, S., Iraci, l.T. and Yates, E.l. (2015). Revisiting the evidence of increasing springtime ozone mixing ratios in the free troposphere over western North America. Geophysical Research Letters, 42(20): 8719–8728. https://doi.org/10.1002/2015Gl065311.
lin, Z. and Deng, S. (2003). The outdoor air ventilation rate in high-rise residences employing room air conditioners. Building and Environment, 38(12): 1389–1399. https://doi.org/10.1016/j.buildenv.2003.07.001.
Malaysian Standard (MS) (2014). MS 2577:2014 Architecture and Asset Management of Masjid: Code of Practice. Kuala lumpur: Department of Standards Malaysia.
McKendry, I.G. and lundgren, J. (2000). Tropospheric layering of ozone in regions of urbanized complex and/or coastal terrain: A review. Progress in Physical Geography, 24(3): 329–354. https://doi.org/10.1191/030913300701542660.
Mumovic, D., Palmer, J., Davies, M., Orme, M., Ridley, I., Oreszczyn, T. and Pearson, C. (2009). Winter indoor air quality, thermal comfort and acoustic performance of newly built secondary schools in England. Building and Environment, 44(7): 1466–1477. https://doi.org/10.1016/j.buildenv.2008.06.014.
Ocak, Y., Kılıçvuran, A., Eren, A.B., Sofuoglu, A. and Sofuoglu, S.C. (2012). Exposure to particulate matter in a mosque. Atmospheric Environment, 56: 169–176. https://doi.org/10.1016/j.atmosenv.2012.04.007.
Ponsoni, K. and Raddi, M.S.G. (2010). Indoor air quality related to occupancy at an air-conditioned public building. Brazilian Archives of Biology and Technology, 53(1): 99–103. https://doi.org/10.1590/S1516-89132010000100013.
Prihatmanti, R. and Bahauddin, A. (2014). Indoor air quality in adaptively reused heritage buildings at a UNESCO World Heritage Site, Penang, Malaysia. Journal of Construction in Developing Countries, 19(1): 69–91.
Ryoo, J.M., Johnson, M.S., Iraci, l.T., Yates, E.l. and Gore, W. (2017). Investigating sources of ozone over California using AJAX airborne measurements and models: Assessing the contribution from long-range transport. Atmospheric Environment, 155: 53–67. https://doi.org/10.1016/j.atmosenv.2017.02.008.
Salthammer, T., Mentese, S. and Marutzky, R. (2010). Formaldehyde in the indoor environment. Chemical Reviews, 110(4): 2536–2572. https://doi.org/10.1021/cr800399g.
IAQ Standard of Mosques in Malacca
PENERBIT UNIVERSITI SAINS MALAYSIA/121
Shan, X., Zhou, J., Chang, V.W.C. and Yang, E.H. (2016). Comparing mixing and displacement ventilation in tutorial rooms: Students' thermal comfort, sick building syndromes and short-term performance. Building and Environment, 102: 128–137. https://doi.org/10.1016/j.buildenv.2016.03.025.
Thatcher, T.l. and layton, D.W. (1995). Deposition, resuspension and penetration of particles within a residence. Atmospheric Environment, 29(13): 1487–1497. https://doi.org/10.1016/1352-2310(95)00016-R.
Tong, l., Zhang, J., Xiao, H., Cai, Q., Huang, Z., Zhang, H. and Qian, F. (2017). Identification of the potential regions contributing to ozone at a coastal site of eastern China with air mass typology. Atmospheric Pollution Research, 8(6): 1044–1057. https://doi.org/10.1016/j.apr.2017.04.005.
Yahaya, N.Z., Ghazali, N.A., Ahmad, S., Mohammad Asri, M.A., Ibrahim, Z.F. and Ramli, N.A. (2017). Analysis of daytime and nighttime ground level ozone concentrations using Boosted regression tree technique. Environment Asia, 10(1): 118–129.