FTIR 2-16 micron spectroscopy of micron-sized olivines from primitive meteorites
Atmos. Chem. Phys., 7, 377–396, 2007www.atmos-chem-phys.net/7/377/2007/© Author(s) 2007. This work is licensedunder a Creative Commons License.
AtmosphericChemistry
and Physics
Comparisons between ground-based FTIR and MIPAS N2O andHNO3 profiles before and after assimilation in BASCOE
C. Vigouroux1, M. De Maziere1, Q. Errera1, S. Chabrillat1, E. Mahieu2, P. Duchatelet2, S. Wood3, D. Smale3,S. Mikuteit 4, T. Blumenstock4, F. Hase4, and N. Jones5
1Belgian Institute for Space Aeronomy (BIRA-IASB), Brussels, Belgium2Institut d’Astrophysique et de Geophysique, University of Liege (ULg), Liege, Belgium3National Institute for Water and Atmospheric Research (NIWA), Lauder, Otago, New-Zealand4Institute of Meteorology and Climate Research (IMK), Forschungszentrum Karlsruhe and University of Karlsruhe,Karlsruhe, Germany5University of Wollongong, Wollongong, Australia
Received: 29 May 2006 – Published in Atmos. Chem. Phys. Discuss.: 1 September 2006Revised: 7 December 2006 – Accepted: 14 January 2007 – Published: 23 January 2007
Abstract. Within the framework of the Network for Detec-tion of Atmospheric Composition Change (NDACC), reg-ular ground-based Fourier transform infrared (FTIR) mea-surements of many species are performed at several loca-tions. Inversion schemes provide vertical profile informa-tion and characterization of the retrieved products which aretherefore relevant for contributing to the validation of MIPASprofiles in the stratosphere and upper troposphere. We havefocused on the species HNO3 and N2O at 5 NDACC-sitesdistributed in both hemispheres, i.e., Jungfraujoch (46.5◦ N)and Kiruna (68◦ N) for the northern hemisphere, and Wol-longong (34◦ S), Lauder (45◦ S) and Arrival Heights (78◦ S)for the southern hemisphere. These ground-based data havebeen compared with MIPAS offline profiles (v4.61) for theyear 2003, collocated within 1000 km around the stations, inthe lower to middle stratosphere. To get around the spatialcollocation problem, comparisons have also been made be-tween the same ground-based FTIR data and the correspond-ing profiles resulting from the stratospheric 4D-VAR dataassimilation system BASCOE constrained by MIPAS data.This paper discusses the results of the comparisons and theusefullness of using BASCOE profiles as proxies for MIPASdata. It shows good agreement between MIPAS and FTIRN2O partial columns: the biases are below 5% for all the sta-tions and the standard deviations are below 7% for the threemid-latitude stations, and below 10% for the high latitudeones. The comparisons with BASCOE partial columns givestandard deviations below 4% for the mid-latitude stations toless than 8% for the high latitude ones. After making somecorrections to take into account the known bias due to theuse of different spectroscopic parameters, the comparisons
Correspondence to:C. Vigouroux([email protected])
of HNO3 partial columns show biases below 3% and stan-dard deviations below 15% for all the stations except ArrivalHeights (bias of 5%, standard deviation of 21%). The re-sults for this species, which has a larger spatial variability,highlight the necessity of defining appropriate collocationcriteria and of accounting for the spread of the observed air-masses. BASCOE appears to have more deficiencies in pro-ducing proxies of MIPAS HNO3 profiles compared to N2O,but the obtained standard deviation of less than 10% betweenBASCOE and FTIR is reasonable. Similar results on profilescomparisons are also shown in the paper, in addition to par-tial column ones.
1 Introduction
MIPAS, Michelson Interferometer for Passive AtmosphericSounding1 (Fischer and Oelhaf, 1996; ESA, 2000), is one ofthe 10 instruments on board the European satellite ENVISATwhich was launched into a sun-synchronous polar orbit at800 km altitude, on March 1, 2002. This Fourier transformspectrometer operates in the mid infrared (4.15–14.6 µm or685–2410 cm−1) and measures high-resolution (0.025 cm−1
unapodised) radiance spectra at the Earth’s limb. It providesday and night vertical profiles of a large number of atmo-spheric species with a complete global coverage of the Earthobtained in 3 days.
Part of the validation of the MIPAS Level 2 products isperformed within the ENVISAT Stratospheric Aircraft andBalloon Campaigns (ESABC) or by comparisons with datafrom other limb sounding instruments such as HALOE (the
1http://envisat.esa.int/instruments/mipas/
Published by Copernicus GmbH on behalf of the European Geosciences Union.

378 C. Vigouroux et al.: Comparisons between g-b FTIR and MIPAS N2O and HNO3
HALogen Occultation Experiment on UARS, the Upper At-mosphere Research Satellite2). Additional independent mea-surements for the validation of MIPAS are perfomed by theground-based Fourier transform infrared (FTIR) solar ab-sorption spectrometers, like those operated in the frameworkof the Network for the Detection of Atmospheric Composi-tion Change (NDACC3, formerly called NDSC, Network forthe Detection of Stratospheric Change). The implementa-tion of the Optimal Estimation Method, described inRodgers(2000), in the inversion schemes of the ground-based FTIRspectra allows the retrieval of low resolution vertical pro-file information (in addition to the standard total columnamounts), and the characterization of the retrieved products.When it comes to verifying the MIPAS profiles at their fullvertical resolution, the FTIR data cannot compete with thehigh vertical resolution measurements coming from balloon,aircraft or limb sounding satellite experiments. The partic-ular benefit of using ground-based FTIR data lies in the factthat these measurements are performed regularly under clear-sky conditions, at many stations distributed over the globe,and thus represent a very interesting complementary data setfor performing a statistically sound validation, and for moni-toring the quality of the MIPAS products on the longer term.These ground-based FTIR data are therefore useful for con-tributing to the validation of MIPAS profiles in the strato-sphere and upper troposphere.
Some preliminary results of MIPAS validation by bal-loon, aircraft, satellite, ground-based measurements, anddata assimilation systems (including BASCOE) have beenpresented in the second workshop on Atmospheric Chem-istry Validation of Envisat (ACVE-2) in May 2004 (ESA,2004a) for all the MIPAS ESA Level 2 products, thatare the vertical profiles of: temperature, H2O, O3, NO2,CH4, N2O (Camy-Peyret et al., 2004), and HNO3 (Oel-haf et al., 2004). In the present study, we focus on amore advanced validation of the MIPAS ESA products forthe year 2003, for N2O and HNO3, a tropospheric sourcespecies and a stratospheric reservoir species respectively,for which the FTIR technique is the only available ground-based source of data during the considered period of MI-PAS operations. Five NDACC stations are involved in thiswork: Kiruna (67.8◦ N, 20.4◦ E, altitude 420 m a.s.l.) andJungfraujoch (46.5◦ N, 8.0◦ E, 3580 m a.s.l.) in the northernhemisphere, and Wollongong (34.4◦ S, 150.9◦ E, 30 m a.s.l.),Lauder (45.0◦ S, 169.7◦ E, 370 m a.s.l.), and Arrival Heights(77.8◦ S, 166.7◦ E, 200 m a.s.l.) in the southern hemisphere.
This paper describes in Sect. 2 the MIPAS ESA Level 2products and, in Sect. 3, the ground-based FTIR vertical pro-file data, including some information concerning the retrievalstrategies used at each station and the characterization of thedata products. BASCOE, a 4D-VAR chemical data assim-ilation system, is described in Sect. 4. In the subsequent
2http://haloedata.larc.nasa.gov/home/3http://www.ndacc.org/
section, we explain the adopted methodology for the com-parisons for which two approaches have been used. First, wehave made the comparisons with the MIPAS offline profiles(v4.61) provided by ESA, taking care to define reasonablecollocation criteria that give enough coincidences to obtainrelevant statistics. Then, to improve the collocations withoutdecreasing the number of coincidences, we have comparedthe ground-based FTIR profiles with the products of BAS-COE. In the current configuration, BASCOE is constrainedwith MIPAS data and thus delivers atmospheric profiles thatcan be considered to be proxies of the MIPAS profiles, at anylocation and any time. In the last part (Sect. 6), we show theresults obtained from the comparisons for both molecules,N2O and HNO3, at the different stations, and try to answerthe following two questions: (1) can we quantify the agree-ment between the MIPAS and the ground-based FTIR data,and (2), what are the benefits of using the results of a dataassimilation system as proxies of MIPAS profiles instead ofthe MIPAS profiles themselves?
2 MIPAS data
The MIPAS Level 2 products are described in the MIPASProduct Handbook4 and in Raspollini et al.(2006). TheMIPAS offline data used here were provided by the ESAv4.61 data processor (ESA, 2004b). They include the N2Oand HNO3 volume mixing ratio (vmr) profiles as well as theatmospheric pressure and temperature vertical distributions.The vertical resolution of the delivered profiles is between 3and 4 km and their horizontal resolution is between 300 and500 km along track.
The individual MIPAS profiles do not cover the same al-titude ranges. We observed that, for the scans used in thepresent study, the upper altitude limits of given MIPAS vmrprofiles are quite constant for all profiles: they are around61 km for N2O and 43 km for HNO3. The lower limits vary alot between a minimum of 6 km for N2O and 9 km for HNO3to greater than 20 km for worst cases. The latter variabilityis due to the presence of clouds: the retrievals of trace gasconcentrations are limited to altitudes above the cloud topheight (for clouds with high opacity in the infrared). Thehighest cloud heights are found, as expected, in the tropicalupper troposphere (sub-visible cirrus) and in the Antarcticpolar vortex (polar stratospheric clouds) (Raspollini et al.,2006). To avoid the need to extrapolate MIPAS profiles be-yond the altitude limits for which retrieved vmr values areprovided, while keeping a statistically relevant data set, wehave restricted the considered MIPAS data set to the scansfor which the lower altitude limit is smaller than or equal to12 km for N2O and 14 km for HNO3. This option will allowus to consider partial column values consistently above 12km for N2O and above 14 km for HNO3, without including
4http://envisat.esa.int/dataproducts/mipas
Atmos. Chem. Phys., 7, 377–396, 2007 www.atmos-chem-phys.net/7/377/2007/

C. Vigouroux et al.: Comparisons between g-b FTIR and MIPAS N2O and HNO3 379
Table 1. Spectral microwindows (cm−1) used for the ground-based FTIR retrievals.
N2O HNO3
Station Microwindow Interfering species Microwindow Interfering specieslimits (cm−1) limits (cm−1)
Kiruna 2481.3−2482.6 CO2, CH4, H2O, O3 867.0−869.6 OCS, H2O, CO2, C2H6, CCl2F22526.4−2528.2 CO2, CH4, H2O, O3 872.8−875.2 OCS, H2O, CO2, C2H6, CCl2F22537.85−2538.8 CO2, CH4, H2O, O32540.1−2540.7 CO2, CH4, H2O, O3
Jungfraujoch 2481.3−2482.6 CO2, CH4 868.476−870.0 OCS, H2O2526.4−2528.2 CO2, CH4, HDO2537.85−2538.8 CH42540.1−2540.7 none
Wollongong 2481.2−2483.5 CO2, CH4 868.47−870.0 OCS, H2O, NH3, CO2872.8 − 874.0 OCS, H2O, NH3, CO2
Lauder & Arrival Heights 2481.2−2483.5 CO2, CH4 868.3−869.6 OCS, H2O, NH3872.8 − 874.0 OCS, H2O, NH3
extrapolated values. However, some scans can have one ortwo missing values that are replaced by interpolated valuesin the profiles.
Because of possible uncertainties in the referencing of theMIPAS profiles versus altitude (Raspollini et al., 2006), wehave adopted a vertical pressure grid for making the com-parisons. Daily pressure data from each station have beenused to convert the FTIR altitude grid (that covers the alti-tude range from the local surface altitude to about 100 km) toa unique pressure grid. The MIPAS retrieved profiles wereinterpolated onto the same pressure grid.
3 Ground-based FTIR data
3.1 Retrieval algorithms
Vertical profile informations can be obtained from high-resolution FTIR solar occultation spectra thanks to the pres-sure broadening of the absorption lines which leads to an alti-tude dependence of the lineshapes. Two different algorithmshave been used in the present work, SFIT2 and PROFFIT9.Both codes are based on a semi-empirical implementationof the Optimal Estimation Method developed byRodgers(2000) and provide the retrieval of molecular vertical profilesby fitting one or more narrow spectral intervals (microwin-dows). The SFIT2 algorithm has been described in previousworks (Pougatchev and Rinsland, 1995; Pougatchev et al.,1995; Rinsland et al., 1998). It was used for the spectral in-version of the FTIR data at all stations except Kiruna. Theprofiles of this latter station have been retrieved using thePROFFIT9 algorithm (Hase, 2000). It has been shown re-cently (Hase et al., 2004) that the retrieved profiles and total
column amounts obtained by these two different algorithmsunder identical conditions are in excellent agreement (within1% for total column amounts of N2O and HNO3).
In both codes SFIT2 and PROFFIT9, the retrieved statevector contains the retrieved volume mixing ratios of the tar-get gas defined in discrete layers in the atmosphere, as wellas the retrieved interfering species column amounts, and fit-ted values for some model parameters. These can include thebaseline slope and instrumental lineshape parameters suchas an effective apodization. For the stations Jungfraujoch,Wollongong, Lauder and Arrival Heights, the atmosphere isdivided in 29 layers, whereas for Kiruna it is divided in 44layers. The 29 layers have a width of 2 km below 50 km,becoming progressively larger towards the top of the atmo-sphere, defined here as 100 km. The widths of the 44 layersof Kiruna progressively grow from 0.4 km at the ground to2.3 km around 50 km altitude.
3.2 Retrieval parameters
The characteristics of the FTIR retrieval results are deter-mined by the selection of microwindows, a priori informa-tions, as well as additional model parameters and retrievalparameter settings. The purpose of this work is not to com-pare the FTIR results among them, but to show whether thereis an agreement between MIPAS and independent FTIR dataat different locations. Except for a common choice of the apriori profiles of the two target gases (see Sect.3.2.2here-after), the FTIR retrievals have been made independently ateach contributing station, with retrieval parameter settingschosen such as to optimise the retrieval results. What is im-portant in the further comparisons is that we take into ac-
www.atmos-chem-phys.net/7/377/2007/ Atmos. Chem. Phys., 7, 377–396, 2007

380 C. Vigouroux et al.: Comparisons between g-b FTIR and MIPAS N2O and HNO3
0 0.05 0.1 0.15 0.2 0.25 0.3 0.350
10
20
30
40
50
60
70
vmr (ppmv)
Alti
tude
(km
)A priori profiles for N
2O
Kiruna Jungfraujoch Jan − MarJungfraujoch Apr − SepJungfraujoch Oct − DecArrival Heights Jan − MarArrival Heights Apr − SepArrival Heights Oct − DecLauder, Wollongong Jan − MarLauder, Wollongong Apr − SepLauder, Wollongong Oct − Dec
0 0.002 0.004 0.006 0.008 0.01 0.012 0.0140
10
20
30
40
50
60
70
A priori profiles for HNO3
vmr (ppmv)
Alti
tude
(km
)
KirunaJungfraujoch Jan − MarJungfraujoch Apr − SepJungfraujoch Oct − DecArrival Heights Jan − MarArrival Heights Apr − SepArrival Heights Oct − DecLauder, Wollongong Jan − MarLauder, Wollongong Apr − SepLauder, Wollongong Oct − Dec
Fig. 1. N2O and HNO3 a priori profiles at all stations.
count the individual characteristics of the retrieval results,expressed in the averaging kernels and associated degrees offreedom for signal (DOFS), as discussed further in Sect.3.3.Also, it is useful to know which spectroscopic data have beenused in the FTIR retrievals, to have a better insight in possi-ble biases associated herewith.
3.2.1 Spectroscopic data and spectral windows
All stations are using the spectroscopic line parametersfrom the HITRAN 2000 database including official updatesthrough 2001 (Rothman, 2003). Wollongong added officialupdates up to August 2002 and additional lines from theSpectroscopic Atlas of Atmospheric Microwindows in theMiddle Infra-Red (2nd edition) (Meier et al., 2004) but thesedo not include changes in the parameters for N2O or HNO3,or for the six interfering species, given in Table1, that arefitted in Wollongong retrievals.
At all stations daily temperature and pressure profiles havebeen taken from the National Centers for Environmental Pre-diction (NCEP).
The retrieval microwindows used at the various stationsare listed in Table1, together with the corresponding interfer-ing species. The a priori profiles of these interfering speciesare scaled simultaneously with the profile inversion of thetarget gases in the spectral fit procedure. Depending on lo-cation and altitude of the site and on spectral characteristics,the impact on the retrievals of fitting additional interferingspecies can be more or less significant. This explains whywe do not always find the same interferers in the same mi-crowindows.
3.2.2 A priori profile information
Because the inversion problem is ill-posed, the Optimal Es-timation Method needs some a priori information about theretrieval state vector parameters, including the a priori ver-tical vmr profilexa , and the associated a priori covariancematrixSa (Rodgers, 2000).
In Fig. 1, we show the a priori N2O and HNO3 verticalprofiles used at each station. For the stations Jungfraujoch,Lauder, Arrival Heights and Wollongong, the a priori profileshave been taken identical to the climatological initial guessprofiles from MIPAS for the corresponding seasons and lat-itude bands (so-called IG2 profiles in the MIPAS ProductHandbook). Three different seasonal profiles are used, repre-sentative of the periods January to March, April to Septemberand October to December.
For the Kiruna station, only one a priori profile is used foreach species, namely the MIPAS IG2 profile for the Aprilto September season corresponding to the latitude of Kiruna.For HNO3 at Kiruna, the MIPAS IG2 profile has been mod-ified below 30 km because it was found more realistic to en-hance the a priori amount of HNO3 near the tropopause.
As explained above, we do not give individual retrievalparameters such as theSa matrices: we prefer to give thecharacterization of the retrieval results because that is the in-formation that is used in the comparisons.
3.3 Characterization of the retrievals
As discussed inRodgers(2000), the Optimal EstimationMethod allows the characterization of the retrievals, i.e., thevertical resolution of the retrieval, its sensitivity to the a prioriinformation and the DOFS. This is obtained by consideringthat the retrieved state vectorxr is related to the true state
Atmos. Chem. Phys., 7, 377–396, 2007 www.atmos-chem-phys.net/7/377/2007/

C. Vigouroux et al.: Comparisons between g-b FTIR and MIPAS N2O and HNO3 381
−0.2 0 0.2 0.4 0.6 0.8 1 1.20
10
20
30
40
50
60
Mixing Ratio Averaging Kernel
Alti
tude
[km
]
33 km29 km25 km21 km17 km13 km9 km5 km1.1 kmSensitivity
Fig. 2. Characterization of the retrieval of N2O at Arrival Heights.Full and dashed lines: Volume mixing ratio averaging kernels(ppmv/ppmv) for the altitudes listed in the legend. Dotted line: Sen-sitivity of the retrieval as a function of altitude.
vectorx by:
xr = xa + A(x − xa) + error terms,
with xa the a priori state vector andA the matrix whose rowsare called the averaging kernels. The retrieved parametersare weighted means of the true and a priori state vector pa-rameters. The weight associated with the true state vectorparameters is given by the averaging kernels matrixA whichwould be the identity matrix in an ideal case where the re-trieval would reproduce the truth. The actual averaging ker-nels matrix depends on several parameters including the so-lar zenith angle, the spectral resolution and signal to noiseratio, the choice of retrieval spectral microwindows, and thea priori covariance matrixSa . The elements of the averagingkernel for a given altitude give the sensitivity of the retrievedprofile at that altitude to the real profile at each altitude, andits full width at half maximum is a measure of the verticalresolution of the retrieval at that altitude. Figures2 and 3show the mean averaging kernels for N2O at Arrival Heightsand for HNO3 at Lauder, respectively. We see that the bestvertical resolution is approximately 8 km for N2O and 10 kmfor HNO3.
The DOFS of the ground-based retrievals are given by thetrace of the averaging kernel matrixA. Thus, they dependon the parameters given previously, which can be differentfor each station and each spectrum. We have calculated, foreach station, their mean value for the data used in this study.We list them for both molecules in Table2. For HNO3 theyvary from 1.9 at the Jungfraujoch station to 2.8 at Lauder. ForN2O they vary from 4.3 at the Jungfraujoch to 3.5 at Wollon-gong. The high value for DOFS for N2O at the Jungfraujoch
−1 −0.8 −0.6 −0.4 −0.2 0 0.2 0.4 0.6 0.8 1 1.2 1.40
10
20
30
40
50
60
Mixing Ratio Averaging Kernel
Alti
tude
[km
]
33 km29 km25 km21 km17 km13 km9 km5 km1.2 kmSensitivity
Fig. 3. Characterization of the retrieval of HNO3 at Lauder.Full and dashed lines: Volume mixing ratio averaging kernels(ppmv/ppmv) for the altitudes listed in the legend. Dotted line: Sen-sitivity of the retrieval as a function of altitude.
is related to the high altitude of the station, that has a strongimpact for tropospheric species.
On top of the kernels plotted in Figs.2 and 3, we haveadded the so-called “sensitivity” of the retrievals at each al-titude to the measurements. This sensitivity at altitudek iscalculated as the sum of the elements of the correspondingaveraging kernel,
∑i Aki . It indicates, at each altitude, the
fraction of the retrieval that comes from the measurementrather than from the a priori information. A value larger thanone means that the retrieved profile at that altitude is over-sensitive to changes in the real profile. It may be compen-sating for poor sensitivity to the true profile at other altitudeswhen the averaging kernels do not allow the separation ofthe altitude ranges correctly. A value close to zero at a cer-tain altitude indicates that the retrieved profile at that alti-tude is nearly independent of the real profile and is thereforeapproaching the a priori profile. In other words, the mea-surements have not significantly contributed to the retrievedprofile at that altitude.
Figure2 shows that the ground-based FTIR measurementsof N2O at Arrival Heights have a sensitivity larger than 0.5from the ground to about 30 km altitude. For the HNO3 re-trievals at Lauder, the measurements have the largest sensi-tivity between 10 and 35 km, as shown in Fig.3. The alti-tude range with better sensitivity does not only depend onthe species considered, but it is also different at the vari-ous stations in agreement with the different values for DOFSgiven in Table2. For making relevant comparisons betweenthe ground-based and satellite data, we focus on the altituderanges in which the sensitivity of the retrieved profiles to themeasurements is sufficiently high. As we intend to comparepartial column amounts, we have adopted a strict criterion to
www.atmos-chem-phys.net/7/377/2007/ Atmos. Chem. Phys., 7, 377–396, 2007

382 C. Vigouroux et al.: Comparisons between g-b FTIR and MIPAS N2O and HNO3
Table 2. Characterization of the retrieved profiles of N2O and HNO3 at each station: statistical mean and standard deviation (1σ ) for oneyear of measurements of the Degrees of Freedom for Signal (DOFS), and Sensitivity Range (S.R.) of the ground-based FTIR retrievals (Gd:ground; TC: total column; PC: partial column). See Sect.3.3for definitions.
N2O HNO3
Station TC S.R. PC PC TC S.R. PC PCDOFS (km) limits (hPa) DOFS DOFS (km) limits (hPa) DOFS
Kiruna 3.6±0.2 Gd–25 182–24 1.3±0.2 2.5±0.5 13–36 132–4 2.0±0.3Jungfraujoch 4.3±0.2 Gd–45 198–1 2.7±0.1 1.9±0.4 10–27 145–15 1.5±0.3Wollongong 3.5±0.2 Gd–30 207–12 1.7±0.1 2.1±0.4 14–32 151–9 1.7±0.2Lauder 3.7±0.3 Gd–30 199–12 1.8±0.1 2.8±0.3 8–34 144–7 2.4±0.2Arrival Heights 3.7±0.2 Gd–28 181–17 1.5±0.1 2.8±0.4 8–34 135–7 2.2±0.2
define the altitude boundaries of these partial columns: thesensitivity, as defined above, must be larger than 0.5, whichmeans that the retrieved profile information comes for morethan 50% from the measurement, or, in other words, that the apriori information influences the retrieval for less than 50%.We have added in Table2 these vertical sensitivity ranges(S.R.) for each molecule at each station.
It is interesting to consider the DOFS for the partialcolumns that will be compared between MIPAS and the FTIRdata. Table2 includes the altitude limits of these partialcolumns, in pressure units. The lower (in altitude) limitscorrespond to the lower limit of the MIPAS data of approxi-mately 12 and 14 km for N2O and HNO3, respectively. Theupper limits agree with the upper limit defined by the FTIRsensitivity at each station. The DOFS for the partial columnswithin these limits are also given in Table2. We note thatalmost all of the information concerning HNO3 from theground-based FTIR is located within the defined partial col-umn limits. On the contrary, for N2O, at least half of theinformation is situated in the troposphere. This can also beseen in Fig.4 where we plot three partial columns averagingkernels for both molecules: one for the partial column usedin the comparisons, the two other for the partial columns inthe altitude ranges above and below the considered one. Theaveraging kernels peak in the right altitude ranges, thereforethe partial columns comparisons will not have any biases in-duced by the limited vertical resolution of the ground-basedFTIR.
The DOFS for the partial columns are larger than one (1.3in the worst case). Therefore, we believe that it is still valu-able to show profile comparisons in Sect.6. But, in all cases,the DOFS are lower than 2.7, thus these profile comparisonsshould not be over-interpreted. The detailed shapes of theprofile comparisons will strongly depend on the individualFTIR averaging kernel shapes and thus on the FTIR retrievalparameters.
4 BASCOE analyses
4.1 Assimilation system and set-up
BASCOE (Belgian Assimilation System of Chemichal Ob-servations from ENVISAT5) is a 4D-VAR data assimilationsystem derived from that described inErrera and Fonteyn(2001) (see Appendix A for a description of the similari-ties and the differences between both systems). BASCOEis based on a 3-D chemical transport model driven by op-erational ECMWF analysis (Daerden et al., 2006). MIPASv4.61 observations of H2O, NO2, O3, CH4, N2O, and HNO3have been assimilated for the year 2003. BASCOE ozoneanalyses have already been validated byGeer et al.(2006)who made intercomparisons of ozone analyses from differ-ent assimilation systems, including BASCOE.
The model calculates the evolution of 59 chemical speciestaking into account the advection, the chemistry and the PolarStratospheric Cloud (PSC) microphysics. In the BASCOEversion used here, the surface area density (SAD) of PolarStratospheric Clouds (PSC) is parameterized in a very simplemanner (see Appendix A). Heterogeneous chemistry is notparameterized, as it is solved simultaneously with gas-phasechemistry. The model extends from the surface up to 0.1 hPausing 37 levels with a horizontal resolution of 5◦ in longi-tude and 3.75◦ in latitude. Data assimilation is done using4D-VAR with an assimilation window of one day. The back-ground error standard deviation is set to 20% of the back-ground field. Correlations are not taken into account and thebackground covariance matrix is therefore diagonal. Addi-tional to the MIPAS random error, a representation error of8.5% that takes into account the difference of resolution be-tween BASCOE and MIPAS has been specified for each as-similated observation (Menard et al., 2000). In order to pre-vent oscillating data entering into BASCOE, only values inthe range [0.2, 200] hPa and [4, 200] hPa are considered forN2O and HNO3, respectively (M. Ridolfi, private communi-cation).
5http://bascoe.oma.be/
Atmos. Chem. Phys., 7, 377–396, 2007 www.atmos-chem-phys.net/7/377/2007/

C. Vigouroux et al.: Comparisons between g-b FTIR and MIPAS N2O and HNO3 383
−0.4 −0.2 0 0.2 0.4 0.6 0.8 1 1.2 1.40
10
20
30
40
50
60
Partial Column Averaging Kernel
Alti
tude
[km
]N
2O at Arrival Heights
0.2 −12.0 km12.0 − 28.0 km28.0 − 100.0 km
−0.2 0 0.2 0.4 0.6 0.8 1 1.20
10
20
30
40
50
60
Partial Column Averaging Kernel
Alti
tude
[km
]
HNO3 at Lauder
0.4 − 14.0 km14.0 − 34.0 km34.0 − 100.0 km
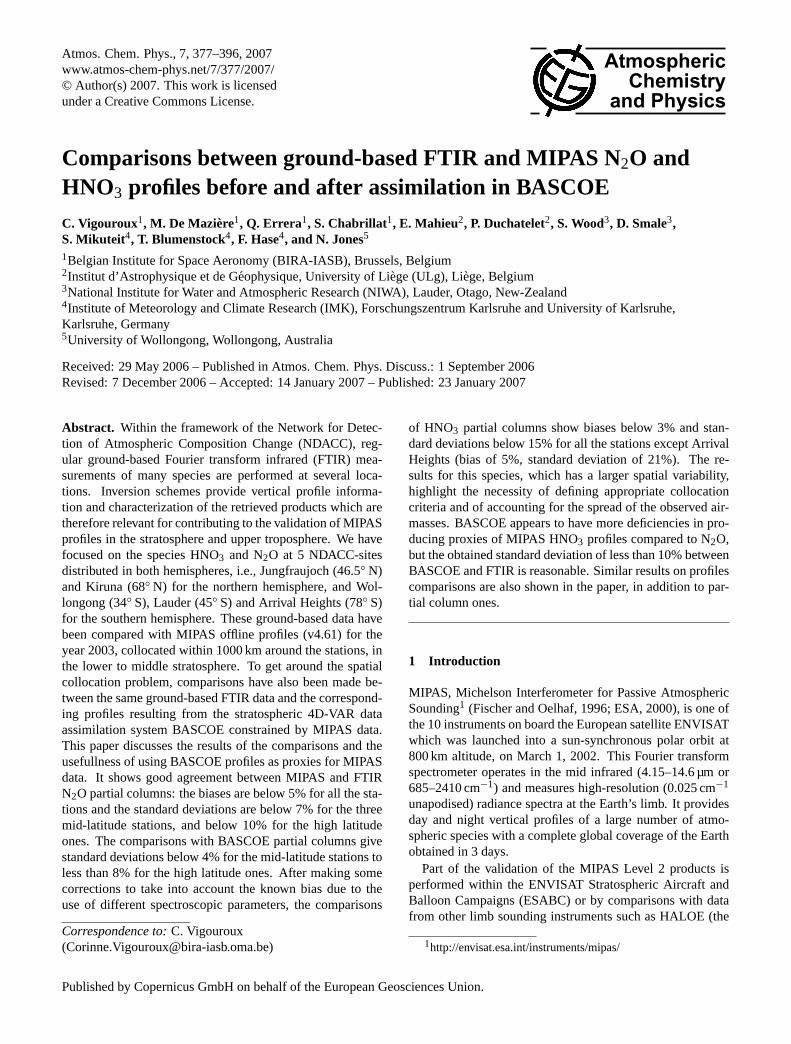
Fig. 4. Partial columns averaging kernels (mol. cm−2/mol. cm−2) for N2O at Arrival Heights and HNO3 at Lauder.
4.2 Comparison with MIPAS observations
In order to evaluate how well BASCOE represents MIPAS,we plot, in Fig. 5, the monthly mean bias (<BASCOE-MIPAS>/<MIPAS>) and standard deviation (1σ ) betweenBASCOE and MIPAS profiles of N2O and HNO3 in five10◦ latitude bands corresponding to each station. Gener-ally, monthly mean N2O biases are within±5%. For somemonths, higher values are observed in the middle-high strato-sphere: above 20 hPa around 75◦S, above 5 hPa around 35◦ Sand 65◦ N and above 3 hPa around 45◦ S and 45◦ N. How-ever, these cases occur in pressure ranges outside the limitsused to compare FTIR and MIPAS, except for the Jungfrau-joch station. For the latter case, one should not take into ac-count profiles comparison with BASCOE for pressures above3 hPa. The effect on the comparison of partial columns ofN2O above 3 hPa is negligible, since there is almost no N2Oat high altitude (see Fig.1). Standard deviations of monthlyN2O comparisons are between 10% to 20% within the pres-sure limits of the comparisons between FTIR and MIPAS, ex-cept for Arrival Heights during local winter. We also observea significant variability from month to month. Nevertheless,this variability is comparable to the estimated assimilationerror (random and representativeness errors).For HNO3, monthly mean biases are generally negative(BASCOE underestimates MIPAS) and vary with altitude,latitude and month. The bias is minimal, within±5%,around 80 hPa in the−80 to−70◦ latitude band, and around100 hPa in the other latitude bands. The biases are largest at150 hPa and between 10 and 20 hPa, and vary from monthto month between−10% and−30% for the worst case ofArrival Heights during local winter. Regarding the standarddeviation, it is minimum around 50 hPa, the altitude at which
the HNO3 mixing ratio reaches its maximum. Within thepressure limits of the comparisons between FTIR and MI-PAS, its value lies between 5% and 20% except at the SouthPole where it can reach 25% in wintertime. Again, this vari-ability is comparable to the estimated assimilation error.
4.3 Discussion
Having the above statistics in mind, we can evaluate to whichextent BASCOE is a proxy of MIPAS. In the case of N2O, wecan say that BASCOE is a good proxy of MIPAS, becausethe bias between both is negligible. However, it is clear thatBASCOE HNO3 cannot be considered as a good absoluteproxy of MIPAS because of the fact that BASCOE under-estimates MIPAS HNO3. This must be kept in mind whenBASCOE will be compared to ground-based FTIR.
In order to check if the five other assimilated species couldinduce a bias in the HNO3 analyses, HNO3 has been as-similated alone for a limited period of time. No differenceswere found between the two sets of analyses. On the otherhand, several sensitivity tests were done regarding the sulfateaerosol SAD, a quantity that is subject to large uncertainties(Kull et al., 2002). These tests result in significant changes inthe agreement between MIPAS and BASCOE analyses. It istherefore expected that a different climatology of SAD thanthe one described in Appendix A would allow the BASCOEHNO3 analyses to be closer to the MIPAS observations. Asmentioned byRood(2005), the problem of bias is perhapsthe greatest challenge facing assimilation.
www.atmos-chem-phys.net/7/377/2007/ Atmos. Chem. Phys., 7, 377–396, 2007

384 C. Vigouroux et al.: Comparisons between g-b FTIR and MIPAS N2O and HNO3
−40 −20 0 20 40
1
10
100
60 to 70 (Kiruna)
bias [%]
Pre
ssur
e [h
Pa]
0 20 40
1
10
100
std. dev. [%]
Pre
ssur
e [h
Pa]
−40 −20 0 20 40
1
10
100
40 to 50 (Jungfr.)
bias [%]
0 20 40
1
10
100
std. dev. [%]
−40 −20 0 20 40
1
10
100
−40 to −30 (Wollong.)
bias [%]
0 20 40
1
10
100
std. dev. [%]
−40 −20 0 20 40
1
10
100
−50 to −40 (Lauder)
bias [%]
0 20 40
1
10
100
std. dev. [%]
−40 −20 0 20 40
1
10
100
−80 to −70 (A.H.)
bias [%]
0 20 40
1
10
100
std. dev. [%]
N2O
−40 −20 0 20 40
1
10
100
60 to 70 (Kiruna)
bias [%]
Pre
ssur
e [h
Pa]
0 20 40
1
10
100
std. dev. [%]
Pre
ssur
e [h
Pa]
−40 −20 0 20 40
1
10
100
40 to 50 (Jungfr.)
bias [%]
0 20 40
1
10
100
std. dev. [%]
−40 −20 0 20 40
1
10
100
−40 to −30 (Wollong.)
bias [%]
0 20 40
1
10
100
std. dev. [%]
−40 −20 0 20 40
1
10
100
−50 to −40 (Lauder)
bias [%]
0 20 40
1
10
100
std. dev. [%]
−40 −20 0 20 40
1
10
100
−80 to −70 (A.H.)
bias [%]
0 20 40
1
10
100
std. dev. [%]
HNO3
Fig. 5. Monthly zonal mean bias and standard deviation (std. dev.) between BASCOE and MIPAS profiles of N2O (top) and HNO3 (bottom),in 10◦ latitude bands around ground-based stations (A.H.: Arrival Heights). In blue: December to May; in red: June to November. For polarregions, monthly statistics are shown only for months where FTIR provides observations. Latitude are specified in◦N.
5 Comparison methodologies
5.1 Vertical smoothing of the MIPAS and BASCOE pro-files to the ground-based FTIR resolution
When making intercomparisons of remote sounders havingdifferent vertical resolutions, one can use the method given
by Rodgers and Connor(2003) to account for that differ-ence. In the present case, the vertical resolution of the MI-PAS data is much higher than that of the ground-based FTIRdata. Therefore the MIPAS profilesxm are considered to beideal profiles compared to ground-based FTIR ones, and theaveraging kernel matrix of MIPAS retrievals is approximated
Atmos. Chem. Phys., 7, 377–396, 2007 www.atmos-chem-phys.net/7/377/2007/

C. Vigouroux et al.: Comparisons between g-b FTIR and MIPAS N2O and HNO3 385
by the identity matrix. Before comparing MIPAS profiles tothe ground-based ones, we smoothed them according to thecharacteristics of the ground-based data, following:
xs = xa + A(xm − xa), (1)
in which xs are the smoothed MIPAS profiles andxa andA are the a priori profile and the averaging kernel matrixof the ground-based FTIR retrievals, respectively. The samesmoothing is applied to the BASCOE profiles.
Having adopted this approach, the vertical smoothing er-ror (Rodgers, 2000), one of the larger FTIR error sources,which comes from the fact that the FTIR retrievals cannotsee the real vertical fine structure of the atmosphere, can beneglected in the uncertainties that are to be considered in thecomparison results.
It is worth noting that the smoothing procedure requiresthe extrapolation of MIPAS profiles beyond the altitude lim-its of the scan. This has been done using the MIPAS initialguess profiles.
From here onwards, we will use the terms MIPAS andBASCOE profiles for the smoothed profiles. The partialcolumns amounts that are discussed in the paper have beencalculated from the smoothed profiles.
5.2 Statistical sets of comparisons
The four statistics defined hereinafter will be described bythe mean value of the differences (the “bias”) between MI-PAS (or BASCOE) and FTIR and their standard deviation(1σ ) (the “scatter”), in percent. To do so, we divide the meanvalue and the standard deviation of the absolute differencesof partial columns and profiles by the mean of the FTIRpartial columns and profiles, respectively. The mean valueand standard deviation of our statistics are thus referring to[<MIPAS-FTIR>±1σ ]/<FTIR> in the tables and figuresof Sect.6. The scatter will be compared to the estimatedrandom error on the differences to discuss the agreement be-tween both instruments. A bias between MIPAS and FTIRwill be called “statistically significant” if the mean<MIPAS-FTIR> is larger than the error on that mean, i.e., larger than3 ∗ σ/
√N , with N the number of coincidences.
5.2.1 Comparisons between MIPAS and ground-based pro-files for two different collocation criteria
In order to obtain a statistically significant set of compar-isons between the MIPAS and ground-based data, we havechosen spatial collocation circles of 1000 km radius aroundeach of the ground-based stations. As the MIPAS tangentpoint can move by more than 200 km in the horizontaldirection during one scan, the criterion is applied such thatat least one tangent point of the scan must lie within thecollocation circle. The requirement on temporal coincidenceis that the recording time difference between the MIPAS andFTIR profile is smaller than 3 h. Each individual MIPAS
profile is compared to the mean of the FTIR profiles thatare within±3 h from the MIPAS measurement time. It isjustified to take the mean of the ground-based measurementsas the concentrations of N2O and HNO3 are not expectedto change in such a short lapse of time. Anyway, whenthe standard deviation of the FTIR data set within these6 h periods is larger than the estimated random error of theFTIR measurements, we reject that coincidence from ourcomparison data set. We do not take the mean of the MIPASscans because their spatial locations and the quality of theprofiles can be very different. This set of comparisons willbe called “Statistics 1” in the paper.
To evaluate the impact of the collocation criterion, we willalso show the results of comparisons of partial columns for acollocation of 400 km radius, with the additional requirementthat all tangent points of the scan must be within the 400 kmradius (“Statistics 2”). The same temporal criterion of±3 his used in “Statistics 2”.
The latter collocation choice leads to very poor statistics.To get around the problem of collocation, we have introducedthe use of profiles obtained by the 4D-VAR data assimilationsystem BASCOE which can be seen as proxies of MIPASprofiles, for the species, altitude ranges and periods discussedin Sect.4.
5.2.2 Two sets of comparisons using the 4D-VAR data as-similation system BASCOE
For the purpose of this work, BASCOE analyses have de-livered vertical profiles of N2O and HNO3, at the loca-tion of each station, four times a day, namely at 00:00 h,06:00 h, 12:00 h and 18:00 h UT. The comparisons betweenthe ground-based FTIR and BASCOE data are divided in twosets. “Statistics 3” compares the means of the FTIR datasets involved in “Statistics 1”, not with the collocated MI-PAS profiles themselves, but with the BASCOE profiles atthe location of the station that are closest in time.
To enlarge the statistics for the comparisons, we also com-pare the BASCOE profiles with the means of the ground-based FTIR data that are available within the six hours timeranges centered around the times of the BASCOE profiles,even if no correlative MIPAS measurements are available inthese periods. This set of comparisons is referred to hereafteras “Statistics 4”.
5.3 Evaluation of data uncertainties
5.3.1 Coincidence and horizontal smoothing errors
A full error analysis for comparisons between remotelysensed data sets includes not only the systematic and randomuncertainties associated with each data set but also the co-incidence and smoothing errors (von Clarmann, 2006). Thechoice of different collocation criteria and the use of BAS-
www.atmos-chem-phys.net/7/377/2007/ Atmos. Chem. Phys., 7, 377–396, 2007

386 C. Vigouroux et al.: Comparisons between g-b FTIR and MIPAS N2O and HNO3
COE analyses as presented above, will allow us to estimateand to minimize the spatial coincidence error between thecompared MIPAS and FTIR data sets, and to assume thatthe temporal coincidence error is close to zero. The verticalsmoothing presented in Sect.5.1 minimises the smoothingerror in the vertical (altitude) coordinate. Additional contri-butions to the coincidence error come from the fact that boththe MIPAS and ground-based FTIR data stem from obser-vations that are integrated measurements along their respec-tive line-of-sights, that may be oriented differently in space.Moreover, the sighted airmasses have a horizontal extension,that depends on the observation geometry and spectral char-acteristics, and that may become as large as 500 km, thuscontributing to the horizontal smoothing error. These addi-tional contributions to the coincidence and smoothing errorsmay become substantial if the observed target species’ con-centrations are non-uniform in space, over distances smallerthan the sampling distances. Under these circumstances, thetarget species’ abundances sampled by FTIR and MIPAS,and therefore also by BASCOE, may be different.
In order to further minimize the coincidence error, we haveverified whether it is useful to apply an additional coinci-dence criteria based on the potential vorticity (PV) at the MI-PAS (or BASCOE) and FTIR locations. It has turned out,however, that under circumstances where there are strong PVgradients – as is the case in local winter-spring at high lati-tudes -, the local PV values do not provide enough informa-tion regarding the PV gradients in the compared airmasses.In other words, we are still left with the horizontal smooth-ing error, which becomes substantial in these cases as well.Therefore, in such circumstances, we have decided to limitthe periods for comparison to local summer-autumn periods,as will be explained further in Sect.6.
Therefore hereinafter (Sect.5.3.2), for the quantitativeevaluation of the uncertainties associated with the compar-isons, we will focus on the random uncertainties associatedwith both data sets. However, the residual coincidence andhorizontal smoothing errors must be kept in mind when wewill discuss the agreement between the data sets, in Sect.6.
5.3.2 Random data uncertainties
We have evaluated the random error covariance matrix on thedifference MIPAS-FTIR using the work ofRodgers and Con-nor (2003) for the intercomparison of remote sounding in-struments, and ofCalisesi et al.(2005) for the regridding be-tween the MIPAS and the FTIR data. As seen before, MIPASprofiles have a much higher vertical resolution than ground-based FTIR profiles, so the random error covariance matrixof the comparison MIPAS-FTIR,Sδ12 in Eq. (22) ofCalisesiet al.(2005), becomes simply:
Sδ12 = Sx1 + AW12Sx2WT12A
T . (2)
Herein Sx1 is the random error covariance matrix of theground-based FTIR retrieved profilex1, A is the FTIR av-
eraging kernel matrix specified on the FTIR retrieval grid,andSx2 is the random error covariance matrix of the MIPASprofile x2 specified on the MIPAS retrieval grid.W12 is agrid transformation matrix, defined by:
W12 = W?1W2, (3)
with W1 and W2 the transformation matrices of the FTIRand MIPAS retrieval productsx1 and x2 to the equivalentretrieval productsy1 andy2, respectively, on the same finegrid:
y2 = W2x2
x1 = W?1y1. (4)
W?1 is the generalized pseudo-inverse ofW1.The random error matrixSx1 for the ground-based FTIR
data has been evaluated for a typical measurement at Kirunawith a solar zenith angle of 70◦ (F. Hase, private communi-cation). For N2O, the random error matrix is dominated bythe contributions from the spectral baseline error, as well asthe temperature profile uncertainties. For HNO3, the spec-tral noise is also a dominant error source. Figure6 showsthe square-root of the variances ofSx1 for the FTIR N2O andHNO3 retrievals at the Kiruna station.
The ESA MIPAS products include individual error covari-ance matrices with each profile: they represent the errors dueto the noise. As only a typical value is used for the ground-based FTIR uncertainty, we have taken for the MIPAS errorcovariance matrix due to noise,Sn, the mean of the matri-ces corresponding to all the MIPAS scans collocated within1000 km around the stations. A very few scans, with particu-larly high error values (larger than two times the mean error),have been rejected from the statistics.
An analysis of the various other sources of error of the MI-PAS retrievals has been made by the Atmospheric, Oceanicand Planetary Physics (AOPP) research team at Oxford Uni-versity6. The systematic errors given by AOPP are typicalones for large latitude bands. These errors are given in per-cent in an altitude grid, and it is assumed that there are nocorrelations between errors, i.e., each systematic error co-variance matrix is diagonal. The systematic errors are di-vided into two parts: purely systematic errors and systematicerrors with random variability. For the discussion about thescatter of the comparisons, we are interested only in the ran-dom error sources (noise and systematic errors with randomvariability, namely: propagation of temperature random er-ror on the retrievals, horizontal gradient effects, uncertaintieson the profiles of interfering species and on the high altitudecolumn). Hereinafter, we will designate this random errorby the short term “uncertainty”. The total error covariancematrix due to all systematic error sources with random vari-ability, Ssyst rand, has been calculated as the mean of the set of
6http://www.atm.ox.ac.uk/group/mipas/err/
Atmos. Chem. Phys., 7, 377–396, 2007 www.atmos-chem-phys.net/7/377/2007/

C. Vigouroux et al.: Comparisons between g-b FTIR and MIPAS N2O and HNO3 387
0 10 20 30 40 500
10
20
30
40
50
60
70
vmr [ppbv]
Alti
tude
[km
]N
2O random errors at Kiruna
Random error FTIRRandom error MIPAS "smoothed"Random error of the difference MIPAS−FTIR
0 0.05 0.1 0.15 0.2 0.25 0.3 0.35 0.4 0.450
10
20
30
40
50
60
70
vmr [ppbv]
Alti
tude
[km
]
HNO3 random errors at Kiruna
Random error FTIRRandom error MIPAS "smoothed"Random error of the difference MIPAS−FTIR
Fig. 6. Ground-based FTIR, MIPAS and (MIPAS-FTIR) random errors (in ppbv) for the N2O and HNO3 retrievals at Kiruna.
individual matrices in vmr units, obtained from the multipli-cation of the typical matrix in percentage with the individualMIPAS profile for each coincidence case.
Then the contribution of the MIPAS uncertainties to thecombined random error covariance matrixSδ12 in Eq. (2) issimply: Sx2=Sn+Ssyst rand.
Figure 6 shows the square-root of the variances of thesmoothed MIPAS profile uncertainty matrix (second term onthe right hand of Eq. 2) for the N2O and HNO3 retrievalsobtained around the Kiruna station, together with the square-root of the variances ofSx1 andSδ12 for the FTIR profile andfor the absolute difference MIPAS-FTIR, respectively.
From the error covariance matrix of the difference MIPAS-FTIR, we have calculated the error1δPC
associated with thedifference of partial columns. This calculation is made ac-cording to:
1δPC= gT Sδ12g, (5)
in whichg is the operator that transforms the volume mixingratio profile in a partial column amount, between the bound-aries that have been defined earlier (Sect.3.3and Table2).
Since we discuss the results of the statistical evaluationsin percentage values in the next section, we calculate therelative error on the partial column differences by dividingthe absolute error (Eq.5) by the mean of the FTIR partialcolumns. This relative random error on the difference be-tween MIPAS and FTIR partial columns is given in Tables3,and5, and will be compared to the standard deviations of thecomparisons statistics to verify whether both instruments arein agreement. This is the subject of the next section.
6 Results of the intercomparisons
6.1 Results for N2O
6.1.1 Comparisons of the partial columns of N2O
Table3 summarizes, for each station, the statistical results ofthe comparisons of the partial columns of N2O for the foursets described in Sect.5.2. As seen in Sect.2, the verticalcoordinate for the comparisons must be pressure rather thanaltitude. The pressure limits of the partial columns are re-peated in the table.
Table 3 shows that there is a good agreement betweenMIPAS and ground-based FTIR partial columns even withthe less constrained collocation criteria (“Statistics 1”). ForKiruna, Jungfraujoch and Lauder, there is no statistically sig-nificant bias between the two instruments considering themeans and their error (about 2%, calculated as explained inSect.5.2) for “Statistics 1”. A small positive bias of 4±2%is obtained at Wollongong, and a negative one of−5±2%at Arrival Heights. The random errors of the relative differ-ences of partial columns, estimated as seen in Sect.5.3.2,are about 6 or 7% as indicated in the table. Agreement be-tween both instruments should give a standard deviation ofthe statistics similar to the estimated random errors. One ex-pects that the remaining discrepancies of a few percent be-tween the two instruments are due to spatial collocation cri-teria that are too wide. “Statistics 2”, made with a reducedcollocation criterion of 400 km, have indeed lower standarddeviations for the three stations where the number of coinci-dences remains statistically relevant (≥10).
The reason why the standard deviation of the statistics isnot reduced at the Kiruna station by using a stricter collo-
www.atmos-chem-phys.net/7/377/2007/ Atmos. Chem. Phys., 7, 377–396, 2007

388 C. Vigouroux et al.: Comparisons between g-b FTIR and MIPAS N2O and HNO3
Table 3. Statistical means and standard deviations[<X-FTIR>±1σ ]/<FTIR> [%] of the N2O partial columns confined between the givenpressure limits. X stands for the MIPAS partial columns collocated within 1000 km (“Statistics 1”) and 400 km (“Statistics 2”) around theground-based stations, or, the BASCOE partial columns corresponding to cases where MIPAS data exist within the adopted collocation times(“Statistics 3”) and for all cases where FTIR ground-based data exist (“Statistics 4”). All X profiles have been smoothed by the ground-basedFTIR averaging kernel matrices as explained in Sect.5.1. The numbers of comparisons included in the different statistics are given betweenparentheses.
N2O [<MIPAS-FTIR>±1σ ]/<FTIR> [<BASCOE-FTIR>±1σ ]/<FTIR>
Station Pressure “Statistics 1” “Statistics 2” Random “Statistics 3” “Statistics 4”limits [hPa] [%] [%] errorα [%] [%] [%]
Kiruna (68◦ N) 182–24 −1±9 (283) −4±9 (6) 6 +0±7 (86) +0±7 (119)Jungfraujoch (46.5◦ N) 198–1 +2±6 (130) +1±3 (10) 6 +0±2 (64) +0±2 (176)Wollongong (34◦ S) 207–12 +4±7 (78) +9±10 (4) 6 +0±3 (31) −1±3 (133)Lauder (45◦ S) 199–12 +0±7 (194) +4±5 (11) 6 +0±4 (89) +1±4 (273)Arrival Heights (78◦ S) 181–17 −5±10 (271) −8±9 (24) 7 −5±6 (48) −4±8 (70)
αSee Sect.5.3.2for the estimation of the error on the relative differences.
Table 4. Same as Table3 but for a reduced (summer-autumn) time period, at Kiruna and Arrival Heights.
N2O [<MIPAS-FTIR>±1σ ]/<FTIR> [<BASCOE-FTIR>±1σ ]/<FTIR>
Station Pressure “Statistics 1” “Statistics 2” Random “Statistics 3” “Statistics 4”limits [hPa] [%] [%] error [%] [%] [%]
Kiruna, June–Oct 182–24 +1±5 (187) +1±4 (4) 6 +0±3 (54) +0±2 (67)Arrival Heights, Jan–March 181–17 −4±5 (126) −4±4 (10) 6 −1±3 (19) −1±3 (31)
cation criteria can be understood from the timeseries of thepartial columns of N2O in this particular case, as shown inFig. 7. We see that the variation of the N2O abundancesis much higher during the winter-spring period (January toend of March), probably related to subsidence in polar vor-tex conditions. Thus, the higher standard deviation of 9%at Kiruna for “Statistics 1” is due to the higher variabilityof N2O in time and space. This makes the collocation crite-rion less adequate for selecting comparable quantities. Thestandard deviation remains high (9%) even if the spatial col-location is set to 400 km. It is probably because in springeven a collocation of 400 km is not sufficient to take into ac-count the N2O spatial variability and because the horizontalsmoothing error (see Sect.5.3.1) is larger during this period.We can however not conclude because of the bad statisticalconditions (only six coincidences, two of them occuring inspring). But a similar problem to Kiruna is encountered atthe Arrival Heights station as seen in Fig.8, with a high vari-ability of N2O in local spring (September to end of Novem-ber), thus giving rise to standard deviations of “Statistics 1”and “2” (10% and 9%, respectively) that are high comparedto the random error of 6%. To confirm this interpretation,the statistics of the comparisons (relative differences betweenFTIR and MIPAS partial column values) at Kiruna and Ar-rival Heights, limited to the local summer-autumn period, aregiven in Table4. They show values for the standard devia-
tions that are in agreement with the expected uncertainty forthe relative differences, and that decrease from “Statistics 1”to “Statistics 2”.
At the Wollongong station, “Statistics 2” suffers from avery small number of coincidences, in which essentially oneout of the four MIPAS scans in coincidence, in early March,is causing the large value of the standard deviation (10%).Eliminating this point reduces the bias and the standard de-viation to 4±3%.
As said before, for the purpose of evaluating the impactof the collocation criteria on the comparison results, wehave also compared the FTIR data with correlative data fromBASCOE analyses, i.e., BASCOE analyses interpolated atthe location of the ground stations as proxies for perfectlycollocated MIPAS measurements, in “Statistics 3” and “4”.A comparison in Table3 of the results for “Statistics 1” tothose for “Statistics 3”, which include identical sets of FTIRmeasurements, shows lower standard deviations in the lattercase, especially for the three mid-latitudes stations. A simi-lar reduction in the standard deviations is observed in Table4for the two high latitude stations, Kiruna and Arrival Heights,when the reduced time period is considered. One also no-tices very small differences between the results (means andstandard deviations) of “Statistics 3” and “Statistics 4” whereBASCOE products are used even when there are no MIPASobservations that satisfy the temporal and spatial collocation
Atmos. Chem. Phys., 7, 377–396, 2007 www.atmos-chem-phys.net/7/377/2007/

C. Vigouroux et al.: Comparisons between g-b FTIR and MIPAS N2O and HNO3 389
4
5
6
7
8
9
10x 10
17
PC
am
ount
[mol
ec. c
m−
2 ]
Partial columns (182−24 hPa) of N2O at Kiruna
FTIRMIPAS < 1000 kmMIPAS < 400 kmBASCOE
Jan 03 Apr 03 Jul 03 Oct 03 Jan 04−40
−20
0
20
40
Diff
eren
ces
[%]
Date
Fig. 7. Upper panel: Partial columns (182–24 hPa) of N2O atKiruna, from ground-based FTIR (green circles), MIPAS (dark blueand light blue stars for selections according to the spatial collocationcriteria of 1000 and 400 km, respectively) and BASCOE (magentatriangles) data. Lower panel: Relative partial column differences(MIPAS-FTIR)/<FTIR> (stars; same colour coding as for upperplot), and (BASCOE-FTIR)/<FTIR> (magenta triangles).
criteria with the FTIR measurements. These results confirmthat BASCOE products can be used reliably as proxies of MI-PAS observations at any time within the considered periods.Still, in the winter-spring periods at high latitudes, where thespatial (and temporal) variability of the N2O partial columnabundances is high, it appears that BASCOE, with its res-olution of 5◦ in longitude and 3.75◦ in latitude, has moredifficulties to correctly capture this variability: the standarddeviations of “Statistics 3” or “4” do not go down to the levelof the random uncertainty (except “Statistics 3” for ArrivalHeights). This is in agreement with Fig.5 which shows thatthe standard deviations of the statistics comparing BASCOEand MIPAS are larger for the months January to March atKiruna, and September to November for Arrival Heights.
One may also notice that the comparisons of BASCOE andFTIR show a significant bias only for Arrival Heights, whenthe whole period January to December 2003 is considered.
From the best cases (mid-latitude stations) of Table 3 andfrom Table 4, we see that the statistical standard deviationsof the observed partial column differences can be slightlysmaller than the estimated random uncertainties associated
4
5
6
7
8
9
10x 10
17
PC
am
ount
[mol
ec. c
m−
2 ]
Partial columns (181−17 hPa) of N2O at Arrival Heights
FTIRMIPAS < 1000 kmMIPAS < 400 kmBASCOE
Jan 03 Apr 03 Jul 03 Oct 03 Jan 04−40
−20
0
20
40
Diff
eren
ces
[%]
Date
Fig. 8. Upper panel: Partial columns (181–17 hPa) of N2O atArrival Heights, from ground-based FTIR (green circles), MIPAS(dark blue and light blue stars for selections according to the spatialcollocation criteria of 1000 and 400 km, respectively) and BASCOE(magenta triangles) data. Lower panel: Relative partial column dif-ferences (MIPAS-FTIR)/<FTIR> (stars; same colour coding as forupper plot), and (BASCOE-FTIR)/<FTIR> (magenta triangles).
with them. This could lead to the conclusion that the uncer-tainty estimates for the FTIR profiles are conservative. How-ever, we’ll see in the profile comparisons in the next sec-tion that the ratio between the statistical standard deviationand the random error varies a lot with altitude (Fig.9). Theoverestimation of the random error appears only in the tro-posphere and lower stratosphere where the amount of N2O isimportant.
6.1.2 Comparisons of the vertical profiles of N2O
Figure 9 shows the statistical means and associated stan-dard deviations of the relative differences between the ver-tical profiles of N2O from the ground-based FTIR observa-tions and MIPAS v4.61 (“Statistics 1”) and BASCOE prod-ucts (“Statistics 3”), at the five contributing stations. The ran-dom error on the difference between MIPAS and FTIR pro-files, i.e., the square-root of the variances ofSδ12 (Eq. 2), arerepresented by the shaded areas around the statistical meansof the MIPAS-FTIR difference profiles. As we show rela-tive differences, the absolute errors have been divided by themean of the FTIR profiles.
www.atmos-chem-phys.net/7/377/2007/ Atmos. Chem. Phys., 7, 377–396, 2007

390 C. Vigouroux et al.: Comparisons between g-b FTIR and MIPAS N2O and HNO3
Table 5. Statistical means and standard deviations[<X-FTIR>±1σ ]/<FTIR> [%] of the HNO3 partial columns confined between thegiven pressure limits. X stands for the MIPAS partial columns collocated within 1000 km (“Statistics 1”) and 400 km (“Statistics 2”) aroundthe ground-based stations, or, the BASCOE partial columns corresponding to cases where MIPAS data exist within the adopted collocationstimes (”Statistics 3”) and for all cases where FTIR ground-based data exist (“Statistics 4”). All X profiles have been smoothed by the ground-based FTIR averaging kernel matrices as explained in Sect.5.1. The numbers of comparisons included in the different statistics are givenbetween parentheses. K.: Kiruna; A.H.: Arrival Heights.
HNO3 [<MIPAS-FTIR>±1σ ]/<FTIR> [<BASCOE-FTIR>±1σ ]/<FTIR>
Station Pressure “Statistics 1” “Statistics 2” Random “Statistics 3” “Statistics 4”limits [hPa] [%] [%] error [%] [%] [%]
Kiruna 132–4 +12±12 (362) +20±7 (6) 3 +5±7 (91) +5±9 (126)K., June-Oct +13±9 (248) +18±6 (4) 3 +4±6 (61) +5±6 (74)Jungfraujoch 145–15 +16±17 (167) +14±12 (14) 4 +6±7 (60) +5±8 (165)Wollongong 151–9 +11±17 (62) +10±3 (2) 4 +12±10 (26) +10±9 (131)Lauder 144–7 +15±13 (132) +17±7 (9) 3 +4±8 (46) +2±9 (138)Arrival Heights 135–7 +19±23 (318) +17±14 (33) 3 +1±13 (51) +2±12 (68)A. H., Jan-March +20±9 (126) +19±5 (10) 3 +12±4 (19) +11±5 (28)
The black horizontal bars in Fig.9 indicate the pressurelimits of the partial columns defined in Table3. As statedbefore, the MIPAS profiles are extrapolated with the MI-PAS initial guess (IG2) values outside the vertical ranges ofthe measurements. The ground-based FTIR profiles and thesmoothed MIPAS profiles tend towards the a priori profilesat altitudes where the sensitivity of the retrievals to the mea-surements tends to zero. This explains why the relative dif-ference profiles and associated errors all tend to zero at highaltitudes.
For Kiruna, we see in Fig.9 a positive bias (below 3%)between MIPAS and FTIR at low altitudes becoming nega-tive (below 5%) for pressure smaller than 100 hPa. This be-haviour is similar for both whole and reduced periods. Con-sidering the error on the mean of the differences (not plottedhere, but calculated as discussed in Sect.5), this bias is statis-tically significant only for pressure smaller than 80 hPa. Thesame kind of shape is seen at Lauder, the higher positive biasat low altitude (below 4%) being also statistically significant.At Jungfraujoch, the bias is positive (below 4%) for pressuregreater than 40 hPa and become negative above (below 5%,for pressure greater than 20 hPa; below 10% above). At Wol-longong, a high positive bias is observed (below 5% for pres-sure greater than 55 hPa with a maximum of 21% at 25 hPa).At Arrival Heights a negative significant bias is seen for thewhole altitude range, below 8% and 5% for the whole andreduced period, respectively. The shape of the bias look verysimilar for both compared data sets, MIPAS and BASCOE.This confirms that for the purpose of the present comparison,the agreement between MIPAS and BASCOE N2O, as seenin Fig. 5, allows the assimilated dataset to be a proxy of thesatellite observations, with continuous coverage in space andtime. This shows also that the biases between each datasetand the FTIR observations is probably not related to colloca-tion issues, but rather to the shapes of the FTIR retrievals. As
the DOFS for the FTIR N2O retrievals between the consid-ered pressure limits is between 1.3 and 2.7 (for Kiruna andJungfraujoch, respectively; see Table2), the detailed shape ofthe FTIR profiles strongly depends on the retrieval settings.
As seen with the partial columns comparisons in Table3,the standard deviations of the relative differences are reducedwhen using collocated BASCOE products instead of the cor-relative MIPAS data. When comparing the random error andthe statistical standard deviations, one should consider thatthe error calculation has been made using a typical case atKiruna where the sensitivity is below 0.5 for altitudes greaterthan 25 km (Table2). We observe that the statistical stan-dard deviations are lower than the estimated random errorfor pressures greater than 100 hPa (around 15.5 km), in thetroposphere and low stratosphere, where the N2O amount isimportant.
6.2 Results for HNO3
6.2.1 Comparisons of the partial columns of HNO3
Analogous to the presentation for N2O in Table3, Table5gives the statistical results, at each station, for the compar-isons between FTIR and MIPAS or BASCOE HNO3 partialcolumn values, according to the four statistical approachesdescribed in Sect.5.2. The partial column limits (in pressureunits) are also included in the second column of Table5.
The first striking observation is that there exists a negativebias between the FTIR and MIPAS data, of order 11 to 19%.A negative bias is expected and has been observed in previ-ous validation work (Oelhaf et al., 2004). It is due to a scal-ing factor that was applied to the HNO3 line intensities in thespectroscopic database used for the MIPAS v4.61 retrievals,mipas−pf3.1 (Flaud et al., 2003a,b; Raspollini et al., 2006),as compared to the databases used for the ground-based FTIRretrievals (HITRAN 2000, see Sect.3.2.1). It is well-known
Atmos. Chem. Phys., 7, 377–396, 2007 www.atmos-chem-phys.net/7/377/2007/

C. Vigouroux et al.: Comparisons between g-b FTIR and MIPAS N2O and HNO3 391
−50 −40 −30 −20 −10 0 10 20 30 40 50
100
101
102
103
[%]
Pre
ssur
e [h
Pa]
N2O at Kiruna
−50 −40 −30 −20 −10 0 10 20 30 40 50
45.5
30.5
15.5
0.0
App
roxi
mat
e al
titud
e [k
m]
[<MIPAS − FTIR> ± 1σ] / <FTIR>[<BASCOE − FTIR> ± 1σ] / <FTIR>Random error on the differences (MIPAS − FTIR)
−50 −40 −30 −20 −10 0 10 20 30 40 50
100
101
102
103
[%]
Pre
ssur
e [h
Pa]
N2O at Kiruna during the reduced period Jun−Oct 2003
−50 −40 −30 −20 −10 0 10 20 30 40 50
45.5
30.5
15.5
0.00
App
roxi
mat
e al
titud
e [k
m]
−50 −40 −30 −20 −10 0 10 20 30 40 50
100
101
102
103
[%]
Pre
ssur
e [h
Pa]
N2O at Jungfraujoch
−50 −40 −30 −20 −10 0 10 20 30 40 50
46.5
30.2
15.8
0.2
App
roxi
mat
e al
titud
e [k
m]
−50 −40 −30 −20 −10 0 10 20 30 40 50
100
101
102
103
[%]
Pre
ssur
e [h
Pa]
N2O at Wollongong
−50 −40 −30 −20 −10 0 10 20 30 40 50
48.5
31.2
16.5
0.2
App
roxi
mat
e al
titud
e [k
m]
−50 −40 −30 −20 −10 0 10 20 30 40 50
100
101
102
103
[%]
Pre
ssur
e [h
Pa]
N2O at Lauder
−50 −40 −30 −20 −10 0 10 20 30 40 50
48.9
31.4
16.3
0.2
App
roxi
mat
e al
titud
e [k
m]
−50 −40 −30 −20 −10 0 10 20 30 40 50
100
101
102
103
[%]
Pre
ssur
e [h
Pa]
N2O at Arrival Heights
−50 −40 −30 −20 −10 0 10 20 30 40 50
50.2
31.9
16.0
0.0
App
roxi
mat
e al
titud
e [k
m]
−50 −40 −30 −20 −10 0 10 20 30 40 50
100
101
102
103
[%]
Pre
ssur
e [h
Pa]
N2O at Arrival Heights during the reduced period Jan−Mar 2003
−50 −40 −30 −20 −10 0 10 20 30 40 50
50.2
31.9
16.0
0.0
App
roxi
mat
e al
titud
e [k
m]
Fig. 9. Statistical means and standard deviations[<X-FTIR>±1σ ]/<FTIR> [%] of the N2O difference profiles. X represents the MIPAScollocated scans within 1000 km around the stations (“Statistics 1”, in blue) or the BASCOE correlative profiles (“Statistics 3”, in magenta).All X profiles have been smoothed by the ground-based FTIR averaging kernel matrices as discussed in Sect.5.1. The numbers of coin-cidences included in both comparison data sets are given in Table3. The black horizontal bars indicate the pressure limits of the partialcolumns defined before (see also Table3). The shaded area represents the random uncertainty on the differences, in % (see Sect.5.3.2).
www.atmos-chem-phys.net/7/377/2007/ Atmos. Chem. Phys., 7, 377–396, 2007

392 C. Vigouroux et al.: Comparisons between g-b FTIR and MIPAS N2O and HNO3
0
0.5
1
1.5
2
2.5x 10
16
PC
am
ount
[mol
ec. c
m−
2 ]
Partial columns (135−7 hPa) of HNO3 at Arrival Heights
FTIRMIPAS < 1000 kmMIPAS < 400 kmBASCOE
Jan 03 Apr 03 Jul 03 Oct 03 Jan 04
−50
0
50
100
Diff
eren
ces
[%]
Date
Fig. 10. Upper panel: Partial columns (135–7 hPa) of HNO3 atArrival Heights, from ground-based FTIR (green circles), MIPAS(dark blue and light blue stars for selections according to the spatialcollocation criteria of 1000 and 400 km, respectively) and BASCOE(magenta triangles) data. Lower panel: Relative partial column dif-ferences (MIPAS-FTIR)/<FTIR> (stars; same colour coding as forupper plot), and (BASCOE-FTIR)/<FTIR> (magenta triangles).
that the difference in the HNO3 spectroscopic parametersbetween HITRAN 2000 and mipas−pf3.1 induces a bias ofabout 14% between the retrieved vmr profiles (Raspollini etal., 2006). The determination of accurate HNO3 line inten-sities is still controversial and in progress (seeFlaud et al.(2006) and the references therein). If the same spectroscopywould have been adopted for the MIPAS and FTIR retrievals,the biases would have been 14% smaller, and thus would nothave been statistically significant except for Arrival Heights.At the latter station, a mean positive bias of 5% would stillbe significant compared to the error on the mean of 4%.
In the case of HNO3, the use of BASCOE analyses asproxies for the MIPAS data appears to be more problematicwhen one is looking at absolute concentration values. Thecomparisons between BASCOE and FTIR do not show thesystematic bias that is observed in the direct MIPAS-FTIRcomparisons, except at Wollongong. The bias between BAS-COE assimilation analyses for HNO3 and the MIPAS HNO3data, discussed in Sect.4 and shown in Fig.5, is clearly seenin Figs.10 and11. Even if the products of BASCOE seemto be closer to the ground-based FTIR products, it is not pos-
0.6
0.8
1
1.2
1.4
1.6
1.8x 10
16
PC
am
ount
[mol
ec. c
m−
2 ]
Partial columns (145−15 hPa) of HNO3 at Jungfraujoch
FTIRMIPAS < 1000 kmMIPAS < 400 kmBASCOE
Jan 03 Apr 03 Jul 03 Oct 03 Jan 04−40
−20
0
20
40
60
Diff
eren
ces
[%]
Date
Fig. 11. Upper panel: Partial columns (145–15 hPa) of HNO3 atthe Jungfraujoch, from ground-based FTIR (green circles), MIPAS(dark blue and light blue stars for selections according to the spatialcollocation criteria of 1000 and 400 km, respectively) and BASCOE(magenta triangles) data. Lower panel: Relative partial column dif-ferences (MIPAS-FTIR)/<FTIR> (stars; same colour coding as forupper plot), and (BASCOE-FTIR)/<FTIR> (magenta triangles).
sible to conclude that the MIPAS measurements of HNO3are too high. Still, BASCOE nicely reproduces the seasonalvariation.
The second noticeable fact in Table5 is that the standarddeviations of all statistics are significantly larger than ex-pected on the basis of the random uncertainties of the rel-ative partial column differences which are only 3 or 4%. Ifthe same spectroscopy had been adopted for the MIPAS andFTIR retrievals, the standard deviation would have decreasedby a factor of 0.86. This would give, for “Statistics 4”, a stan-dard deviation of 4% in the best case of Arrival Heights lim-ited to the January-March period, up to 10% in the worst caseof Arrival Heights when the whole year 2003 is considered.This means that the additional coincidence and horizontalsmoothing errors described in Sect.5.3.1are significant inthe comparisons between the FTIR and MIPAS products. In-deed, the additional uncertainties can largely be explained bythe spatial variability of HNO3. It is clearly seen in Table5by comparing “Statistics 1” and “2”, that a stricter colloca-tion criterion reduces the standard deviations significantly.One could expect that the use of BASCOE would reduce thestandard deviations to the level of the estimated random un-
Atmos. Chem. Phys., 7, 377–396, 2007 www.atmos-chem-phys.net/7/377/2007/

C. Vigouroux et al.: Comparisons between g-b FTIR and MIPAS N2O and HNO3 393
−100 −80 −60 −40 −20 0 20 40 60 80 100
100
101
102
103
[%]
Pre
ssur
e [h
Pa]
HNO3 at Kiruna
45.5
30.4
15.5
0.0
App
roxi
mat
e al
titud
e [k
m]
[<MIPAS − FTIR> ± 1σ] / <FTIR>[<BASCOE − FTIR> ± 1σ] / <FTIR>Random error on the differences (MIPAS − FTIR)
−100 −80 −60 −40 −20 0 20 40 60 80 100
100
101
102
103
[%]
Pre
ssur
e [h
Pa]
HNO3 at Kiruna during the reduced period Jun−Oct 2003
45.5
30.4
15.5
0.0
App
roxi
mat
e al
titud
e [k
m]
−100 −80 −60 −40 −20 0 20 40 60 80 100
100
101
102
103
[%]
Pre
ssur
e [h
Pa]
HNO3 at Jungfraujoch
46.4
30.2
15.8
0.2
App
roxi
mat
e al
titud
e [k
m]
−100 −80 −60 −40 −20 0 20 40 60 80 100
100
101
102
103
[%]
Pre
ssur
e [h
Pa]
HNO3 at Wollongong
48.5
31.2
16.5
0.2
App
roxi
mat
e al
titud
e [k
m]
−100 −80 −60 −40 −20 0 20 40 60 80 100
100
101
102
103
[%]
Pre
ssur
e [h
Pa]
HNO3 at Lauder
48.9
31.4
16.3
0.1
App
roxi
mat
e al
titud
e [k
m]
−100 −80 −60 −40 −20 0 20 40 60 80 100
100
101
102
103
[%]
Pre
ssur
e [h
Pa]
HNO3 at Arrival Heights
50.2
31.9
16.0
0.0A
ppro
xim
ate
altit
ude
[km
]
−100 −80 −60 −40 −20 0 20 40 60 80 100
100
101
102
103
[%]
Pre
ssur
e [h
Pa]
HNO3 at Arrival Heights during the reduced period Jan−Mar 2003
50.2
31.9
16.0
0.0
App
roxi
mat
e al
titud
e [k
m]
Fig. 12. Statistical means and standard deviations[<X-FTIR>±1σ ]/<FTIR> [%] of the HNO3 difference profiles. X represents theMIPAS collocated scans within 1000 km around the stations (“Statistics 1”, in blue) or the BASCOE correlative profiles (“Statistics 3”, inmagenta). All X profiles have been smoothed by the ground-based FTIR averaging kernel matrices as discussed in Sect.5.1. The numbers ofcoincidences included in both comparison data sets are given in columns 1 and 3 of Table5. The black horizontal bars indicate the pressurelimits of the partial columns defined before (see also Table5). The shaded area represents the random uncertainty on the differences, in %(see Sect.5.3.2).
www.atmos-chem-phys.net/7/377/2007/ Atmos. Chem. Phys., 7, 377–396, 2007

394 C. Vigouroux et al.: Comparisons between g-b FTIR and MIPAS N2O and HNO3
certainty, as observed for N2O at the mid-latitude stations,but this is not the case, as shown by “Statistics 3” and “4” inthe table. This means that there are additional uncertaintiesassociated with the use of BASCOE. They could be due to in-appropriate SAD for heterogeneous chemistry (see Sect.4.3)and/or the low resolution of BASCOE (5◦ in longitude and3.75◦ in latitude) which would not be sufficient to reproducethe HNO3 spatial variability, as it was the case for N2O athigh latitude during the period with high variability. We seein Fig. 5 that the standard deviations of the statistics on thedifferences between BASCOE and MIPAS are larger dur-ing the periods of higher variability (January to March forKiruna, and September to November for Arrival Heights).As already said, the horizontal smoothing error contributes tothe observed larger standard deviations. Preliminary evalua-tions of this contribution indicate values that are compatiblewith the residual differences between the observed standarddeviations and random uncertainties (C. De Clercq and J.-C. Lambert, private communication).
6.2.2 Comparisons of the vertical profiles of HNO3
Figure12 presents, for the five stations, the relative differ-ences between the vertical profiles of HNO3 for the twocomparison ensembles, “Statistics 1” and “3”, analogouslyto Fig.9 for N2O.
The profiles comparisons confirm the conclusions as tobias and standard deviations discussed in the previous sec-tion. First, the expected positive bias between MIPAS andFTIR, due to the use of different spectroscopy, is observedin the profiles comparisons. The shape of the bias is differ-ent from station to station: it is mainly located at 100 hPa forJungraujoch and 30 hPa at Kiruna, whereas at Wollongong,Lauder and Arrival Heights (reduced period), the highest bi-ases are observed at about 100 and 15 hPa. A similar shapefor these three stations is not surprising as they used a similarretrieval strategy (choice of micro-windows, a priori covari-ance matrix,...). The DOFS for the FTIR HNO3 retrievalsbetween the considered pressure limits is between 1.5 (forJungfraujoch) and 2.4 (for Lauder); therefore, the detailedshape strongly depends on the retrieval settings. Second,we can see from the different biases obtained using BAS-COE compared to the MIPAS ones, that the assimilation isnot as good as for N2O, as already discussed in Sect.4.Third, we see that the estimated random error (shaded area) islower than the standard deviations, as obtained for the partialcolumns, probably due to high spatial and temporal variabil-ity of HNO3 and the horizontal smoothing effect discussedpreviously. At high altitude, the relative differences go tozero but not the random uncertainty because the error cal-culation uses, for all the stations, a typical averaging kernelmatrix of Kiruna, which has a sentivity different from zeroeven at high altitude.
7 Conclusions
Comparisons have been performed between MIPAS andground-based FTIR vertical profiles of N2O and HNO3, cov-ering the full year of 2003. The MIPAS data were providedby the ESA v4.61 data processor. The FTIR profiles havebeen retrieved at five NDACC sites distributed in latitude,namely Kiruna (68◦ N), Jungfraujoch (46.5◦ N), Wollongong(34◦ S), Lauder (45◦ S) and Arrival Heights (78◦ S). For thefirst time, the same FTIR data have also been compared withcorresponding results from the 4D-VAR data assimilationsystem BASCOE that were obtained in the configuration inwhich BASCOE assimilates the ESA v4.61 products for thesix primary MIPAS species (H2O, O3, NO2, HNO3, CH4,and N2O). This was done to evaluate the impact of the spatialcollocation criteria on the comparison results and to judgethe appropriateness of using BASCOE results as proxies forMIPAS profiles in the stratosphere.
Considering the comparisons between the N2O MIPASand FTIR lower stratosphere partial columns during the year2003, the biases are small and significant only for Wollon-gong (+4±2%) and Arrival Heights (−5±2%). The scatteris less than 7% for the three mid-latitude stations and lessthan 10% for the high latitude ones. This was obtained us-ing a coindicence criterion of 1000 km radius around the sta-tions, and it has been demonstrated that the use of BASCOEreduces the collocation problem: the standard deviations be-tween BASCOE and FTIR partial columns are less than 4%and 7% for the mid-latitude and high latitude stations, re-spectively. It has also been shown that, because the spatialresolution of the BASCOE data used here is limited to 5◦
longitude by 3.75◦ latitude, it represents less accurately theN2O field in regions/periods with high temporal/spatial vari-ability, such as in high latitude winter-spring conditions. Outof these periods, the standard deviation for the high latitudestations is also less than 4%, which is within the estimatedrandom error. BASCOE profiles can indeed be considered tobe good proxies for the MIPAS N2O data.
Regarding the comparisons of HNO3 MIPAS and FTIRpartial columns, a known bias of about 14% due to theuse of different spectral databases (HITRAN 2000 andmipas−pf3.1), has been confirmed. Taking this fact into ac-count, we would not have seen any statistically significantbiases except at Arrival Heights (+5±4%). The standard de-viations, corrected by the factor 0.86 for eliminating the ef-fect of the different line-intensities, would be less than 15%at all stations except Arrival Heights where it would be 21%.These large standard deviations are partly due to the too loosecoincidence criterion of 1000 km. Considering the high spa-tial variability of HNO3, even with a collocation of 400 km,the statistics of the comparisons show standard deviationsthat are larger (by about a factor 2 to 4) than expected on thebasis of the random uncertainty of the MIPAS-FTIR differ-ences. This is explained by the fact that the HNO3 fields ex-hibit variabilities on small (<400 km) spatial scales that can-
Atmos. Chem. Phys., 7, 377–396, 2007 www.atmos-chem-phys.net/7/377/2007/

C. Vigouroux et al.: Comparisons between g-b FTIR and MIPAS N2O and HNO3 395
not be distinguished in the comparisons because the colloca-tion is never perfect. In addition to the collocation problem,the variations of the HNO3 field across the horizontal exten-sion of the probed airmasses, which we call the horizontalsmoothing effect, is a limitation to the agreement betweenboth instruments. The use of BASCOE instead of MIPASprofiles cannot completely solve the collocation and smooth-ing problems. First, the spatial resolution of BASCOE is notsufficient. Second, at present, the horizontal smoothing ef-fect is not taken into account appropriately. But, even then,the standard deviations of comparisons between BASCOEand FTIR are quite reasonable: after correction with the 0.86factor, they are less than 10% for all the stations, during thewhole year 2003. Concerning the biases between BASCOEand MIPAS, it turns out that in its present status, BASCOEdoes not provide as good proxies for the MIPAS HNO3 pro-files as for N2O. A possible explanation of these biases is thechoice of the climatology of surface area density of sulfateaerosols.
This paper has also demonstrated that ground-based FTIRmeasurements, despite their low vertical resolution, are use-full for satellite validation because they allow a statistical ap-proach. They have been solicited for additional validation ef-forts including other independent data from balloon, aircraftand satellite.
Appendix A
This appendix describes the similarities and improvementsbetween the 4D-VAR chemical assimilation system devel-opped by Errera and Fonteyn (2001, hereafter denoted byEF2001) and BASCOE.
A1 Similarities
Both systems are dedicated to assimilation of stratosphericchemical observations. They used the same method (4D-VAR) and the same kind of model (3D-CTM). The adjointof the advection scheme and the chemistry were built in thesame way and both systems are minimized using a Quasi–Newton minimization method (see EF2001 for more details).
A2 Differences
The semi-lagrangian advection scheme used in EF2001 wasreplaced by the Flux Form Semi-Lagrangian (Lin and Rood,1996). The number of species has been raised from 41 to59 to include tropospheric ozone depleting tracers (CFCs,HCFCs, halons, chlorocarbons and bromocarbons). InEF2001, three categories of species are considered: (1) trans-ported and chemically active, (2) only transported, and (3)fixed. This is no more the case. Only two species are con-sidered fixed in BASCOE, namely N2 and O2. All other con-situents are transported and chemically active. The chemicalequation system of BASCOE has been upgraded accordingly.
Two configurations of BASCOE are possible: one withfull PSC microphysics (Daerden et al., 2006) and anotherone with a simple parameterization for PSC surface area den-sity (SAD). We describe now this parameterization since thepresent study uses BASCOE analyses obtained by the sec-ond configuration. This parameterization defines (1) SAD ofice and NAT (nitric acid trihydrate) particles when their oc-currence is possible, and (2) the loss of HNO3 and H2O dueto sedimentation. Ice PSCs are supposed to exist in the win-ter/spring polar regions at any grid point where the temper-ature is colder than 186 K, and NAT PSCs at any grid pointwhere the temperature is colder than 194 K. The SAD is set to10−6 cm2/cm3 in the first case and 10−7 cm2/cm3 in the sec-ond case. Finally, the SAD of the sulphate aerosols are basedon a climatology byHitchman et al.(1994). Early tests us-ing the full PSC microphysics have shown that dividing thisclimatology by a factor 5 was producing better results. Thisfactor has been kept in the present work.
Acknowledgements.The authors thank the European Commission,the Belgian Federal Science Policy Offices and ESA for fundingthis work through the projects UFTIR (EVK-2002-00159), ProdexCINAMON (ESA contracts 15151 and 15064) and TASTE (ESAcontract 18028/04/NL/AR), respectively. They also acknowledgetheir national authorities for supporting the observations and themany people who have participated to them. In addition, we wishto thank the Stiftungsrat of the Jungfraujoch for supporting thefacilities allowing to perform long term and regular observations atthat site. The authors are also grateful to M. Ridolfi (University ofBologne) and U. Cortesi (IFAC-CNR) for discussions on MIPASerrors, and J.-C. Lambert and C. De Clercq (BIRA-IASB) fordiscussions on the interpretations of the results. Finally, theythank G. E. Bodeker for providing the potential vorticity values atLauder and Arrival Heights for the FTIR and collocated MIPASmeasurements.
Edited by: T. Wagner
References
Calisesi Y., Soebijanta V. T., and van Oss R.: Regrid-ding of remote soundings: Formulation and application toozone profile comparison, J. Geophys. Res., 110, D23306,doi:10.1029/2005JD006122, 2005.
Camy-Peyret, C., Dufour, G., Payan, S., Oelhaf, H., Wetzel, G.,Stiller, G., Blumenstock, T., Blom, C. E., Guld, T., Glatthor,N., Engel, A., Pirre, M., Catoire, V., Moreau, G., De Maziere,M., Vigouroux, C., Mahieu, E., Cortesi, U., and Mencaraglia,F.: Validation of MIPAS N2O profiles by stratospheric balloon,aircraft and ground based measurements, Proceedings of the Sec-ond Workshop on the Atmospheric Chemistry Validation of En-visat (ACVE-2), Frascati, 3–7 May 2004, ESA Special Publica-tion SP-562, August 2004.
Daerden, F., Larsen, N., Chabrillat, S., Errera, Q., Bonjean, S.,Fonteyn,. D., Hoppel, K., and Fromm, M.: A 3D-CTM with de-tailed online PSC-microphysics: analysis of the Antarctic winter2003 by comparison with satellite observations, Atmos. Chem.
www.atmos-chem-phys.net/7/377/2007/ Atmos. Chem. Phys., 7, 377–396, 2007

396 C. Vigouroux et al.: Comparisons between g-b FTIR and MIPAS N2O and HNO3
Phys. Discuss., 6, 8511–8552, 2006,http://www.atmos-chem-phys-discuss.net/6/8511/2006/.
Errera, Q. and Fonteyn, D.: Four-dimensional variational chemi-cal assimilation of CRISTA stratospheric measurements, J. Geo-phys. Res., 106, 12 253–12 265, 2001.
ESA: Envisat-MIPAS, An instrument for Atmospheric Chemistryand Climate Research, SP-1229, published by ESA Publica-tions Division, ESTEC, P.O. Box 299, 2200 AG Noordwijk, TheNetherlands, March 2000.
ESA: Proceedings of the Second Workshop on the AtmosphericChemistry Validation of Envisat (ACVE-2), Frascati, 3–7 May2004, ESA Special Publication SP-562, 2004a.
ESA: Envisat-MIPAS Monthly report: March 2004, TechnicalNote, ENVI-SPPA-EOPG-TN-04-0011, 2004b.
Fischer, H. and Oelhaf, H.: Remote sensing of vertical profiles ofatmospheric trace constituents with MIPAS limb-emission spec-trometers, Appl. Opt., 35, 2787–2796, 1996.
Flaud, J. M., Piccolo, C., Carli, B., Perrin, A., Coudert, L. H., Teffo,J. L., and Brown, L. R.: Molecular line parameters for the MIPAS(Michelson Interferometer for Passive Atmospheric Sounding)experiment, J. Atmos. Ocean Optics, 16, 172–182, 2003a.
Flaud, J. M., Perrin, A., Orphal, J., Kou, Q., Flaud, P.-M.,Dutkiewicz, Z., and Piccolo, C.: New anaylsis of theν5+ν9−ν9hot band of HNO3, J. Quant. Spectrosc. Radiat. Transfer, 77,355–364, 2003b.
Flaud, J. M., Brizzi, G., Carlotti, M., Perrin, A., and Ridolfi, M.:MIPAS database: Validation of HNO3 line parameters using MI-PAS satellite measurements, Atmos. Chem. Phys., 6, 5037–5048,2006,http://www.atmos-chem-phys.net/6/5037/2006/.
Geer, A. J., Lahoz, W. A., Bekki, S., Bormann, N., Errera, Q., Es-kes, H. J., Fonteyn, D., Jackson, D. R., Juckes, M. N., Massart,S., Peuch, V.-H., Rharmili, S., and Segers, A.: The ASSET inter-comparison of ozone analyses: method and first results, Atmos.Chem. Phys., 6, 5445–5474, 2006,http://www.atmos-chem-phys.net/6/5445/2006/.
Hase, F.: Inversion von Spurengasprofilen aus hochaufgelostenbodengebundenen FTIR-Messungen in absorption. Wis-senschaftliche Berichte Forschungszentrum Karlsruhe, FZKA6512; ISSN 0947-8620, 2000.
Hase, F., Hannigan, J. W., Coffey, M. T., Goldman, A., Hopfner,M., Jones, N. B., Rinsland, C. P., and Wood, S. W.: Intercompar-ison of retrieval codes used for the analysis of high-resolution,ground-based FTIR measurements, J. Quant. Spectros. Radiat.Transfer, 87, 25-52, 2004.
Hitchman, M. H., McKay, M., and Trepte, C. R.: A climatology ofstratospheric aerosol, J. Geophys. Res., 99(D10), 20 689–20 700,doi:10.1029/94JD01525, 1994.
Kull, V., Riese, M., Tie, X., Wiemert, T., Eidmann, G., Offer-mann, D., and Brasseur, G.: NOy partitioning and aerosol in-fluences in the stratosphere, J. Geophys. Res., 107(D23), 8183,doi:10.1029/2001JD001246, 2002.
Lin, S. and Rood, R. B.: Multidimensional flux–form semi–Lagrangian transport schemes, Mon. Wea. Rev., 124, 2046–2070, 1996.
Meier, A., Toon, G. C., Rinsland, C. P., Goldman, A., and Hase,F.: Spectroscopic Atlas of Atmospheric Microwindows in themiddle Infra-Red, IRF Technical Report 048, ISSN 0284-1738(Institutet for Rymdfysik, Kiruna, Sweden), Appendix E, 2004.
Menard, R., Cohn, S. E., Chang, L. P., and Lyster, P. M.: Assim-ilation of Stratospheric Chemical Tracer Observations Using aKalman Filter. Part I: Formulation, Mon. Wea. Rev., 128, 2654–2671, 2000.
Oelhaf, H., Blumenstock, T., De Maziere, M., Mikuteit, S.,Vigouroux, C., Wood, S., Bianchini, G., Baumann, R., Blom, C.,Cortesi, U., Liu, G. Y., Schlager, H., Camy-Peyret, C., Catoire,V., Pirre, M., Strong, K., and Wetzel, G.: Validation of MIPAS-ENVISAT version 4.61 HNO3 operational data by stratosphericballoon, aircraft and ground based measurements, Proceedingsof the Second Workshop on the Atmospheric Chemistry Valida-tion of Envisat (ACVE-2), Frascati, 3–7 May 2004, ESA SpecialPublication SP-562, August 2004.
Pougatchev, N. S. and Rinsland, C. P.: Spectroscopic study of theseasonal variation of carbon monoxide vertical distribution aboveKitt Peak., J. Geophys. Res., 100, 1409–1416, 1995.
Pougatchev, N. S., Connor, B. J., and Rinsland, C. P.: Infrared mea-surements of the ozone vertical distribution above Kitt Peak, J.Geophys. Res., 100, 16 689–16 697, 1995.
Raspollini, P., Belotti, C., Burgess, A., Carli, B., Carlotti, M., Cec-cherini, S., Dinelli, B. M., Dudhia, A., Flaud, J.-M., Funke, B.,Hopfner, Lopez-Puertas, M., Payne, V., Piccolo, C., Remedios,J. J., Ridolfi, M., and Spang, R.: MIPAS level 2 analysis, Atmos.Chem. Phys., 6, 5605–5630, 2006,http://www.atmos-chem-phys.net/6/5605/2006/.
Rinsland, C. P., Jones, N. B., Connor, B. J., Logan, J. A.,Pougatchev, N. S., Goldman, A., Murcray, F. J., Stephen, T. M.,Pine, A. S., Zander, R., Mahieu, E., and Demoulin, P.: Northernand southern hemisphere ground-based infrared spectroscopicmeasurements of tropospheric carbon monoxide and ethane, J.Geophys. Res., 103, 28 197–28 217, 1998.
Rodgers, C. D.: Inverse methods for atmospheric sounding: The-ory and Practice, Series on Atmospheric, Oceanic and Plane-tary Physics, Vol. 2, World Scientific Publishing Co., Singapore,2000.
Rodgers, C. D. and Connor, B. J.: Intercomparison of remote sound-ing instruments, J. Geophys. Res., 108, 4116–4129, 2003.
Rood, R. B.: Assimilation of stratospheric meteorological and con-stituent observations: a review, SPARC Newsletter No. 25, 31–37, 2005.
Rothman, L. S., Barbe, A., Chris Benner, D., Brown, L. R., Camy-Peyret, C., Carleer, M. R., Chance, K., Clerbaux, C., Dana, V.,Devi, V. M., Fayt, A., Flaud, J.-M., Gamache, R. R., Goldman,A., Jacquemart, D., Jucks, K. W., Lafferty, W. J., Mandin, J.-Y.,Massie, S. T., Nemtchinov, V., Newnham, D. A., Perrin, A., Rins-land, C. P., Schroeder, J., Smith, K. M., Smith, M. A. H., Tang,K., Toth, R. A., Vander Auwera, J., Varanasi, P., and Yoshino,K.: The HITRAN molecular spectroscopic database: Edition of2000 including updates through 2001, J. Quant. Spectros. Radiat.Transfer, 82, 5–44, 2003.
von Clarmann, T.: Validation of remotely sensed profiles of at-mospheric state variables: strategies and terminology, Atmos.Chem. Phys., 6, 4311–4320, 2006,http://www.atmos-chem-phys.net/6/4311/2006/.
Atmos. Chem. Phys., 7, 377–396, 2007 www.atmos-chem-phys.net/7/377/2007/
Copyright © 2022 FDOKUMEN