Comparative study based on sediment characteristics and macrobenthic communities in two Italian...
20
Environ Monit Assess (2010) 160:237–256 DOI 10.1007/s10661-008-0691-x Comparative study based on sediment characteristics and macrobenthic communities in two Italian lagoons Antonietta Specchiulli · Monia Renzi · Tommaso Scirocco · Lucrezia Cilenti · Marisa Florio · Paolo Breber · Silvia Focardi · Simone Bastianoni Received: 17 July 2008 / Accepted: 20 November 2008 / Published online: 19 December 2008 © Springer Science + Business Media B.V. 2008 Abstract The aims of this study were to analyse sediment characteristics and macrobenthic assem- blages in two very close Italian coastal lagoons (Lesina and Varano) and to assess the different behaviour between the two basins and the rela- tionship between sediment matrix and benthic organisms within and between the two lagoons. The comparative study was performed in July 2007 at 13 sampling sites in Lesina lagoon and 15 sites in Varano basin for sediment grain size, total organic carbon (TOC), total nitrogen (TN), total phosphorus (TP) and macrobenthic structure analyses. Both lagoons were generally dominated by fine-grained sediments (clay and silt compo- nents). The average contents of TOC and TN A. Specchiulli (B ) · T. Scirocco · L. Cilenti · M. Florio · P. Breber Department of Lesina (FG), National Research Council—Institute of Marine Science, Via Pola 4, 71010 Lesina, FG, Italy e-mail: [email protected] M. Renzi Department of Environmental Science, University of Siena, Via Mattioli 4, 53100 Siena, Italy S. Focardi · S. Bastianoni Department of Chemical and Biosystems Sciences, University of Siena, Via Aldo Moro 1, 53100 Siena, Italy measured in Lesina was higher than in Varano (3.31% vs 2.52% for TOC and 5,200 μg·g −1 vs 3,713 μg·g −1 for TN); in contrast, the TP was lower (540 μg·g −1 vs 620 μg·g −1 ). Based on mac- robenthic community patterns, the central zone in Varano lagoon and the eastern area in Lesina la- goon were characterised by the lowest abundance (168.7 ind·m −2 and 503.2 ind·m −2 , respectively) and by the lowest number of species, as high- lighted by the diversity indices (Shannon–Wiener, H range was 0.47–1.45 for Lesina and 0.00–1.68 for Varano; Margalef species richness, d range was 0.00–1.67 for Lesina lagoon and 0.00–2.38 for Varano basin). Ordination diagrams suggested an influence of marine and freshwater inputs on the sediment distribution in Varano lagoon and on macrobenthic assemblages in Lesina lagoon. Keywords Coastal lagoon · Italian coast · Macrobenthic assemblages · Multivariate analyses · Sediment characteristics Introduction Coastal lagoons constitute important transition zones between the land and the sea. They are enriched by both the marine and continental inputs and are among the most productive aqua- tic ecosystems (Nixon 1988), playing an impor- tant economic role. They are often nutrient rich
-
Upload
independent -
Category
Documents
-
view
0 -
download
0
Transcript of Comparative study based on sediment characteristics and macrobenthic communities in two Italian...
Environ Monit Assess (2010) 160:237–256DOI 10.1007/s10661-008-0691-x
Comparative study based on sediment characteristicsand macrobenthic communities in two Italian lagoons
Antonietta Specchiulli · Monia Renzi ·Tommaso Scirocco · Lucrezia Cilenti · Marisa Florio ·Paolo Breber · Silvia Focardi · Simone Bastianoni
Received: 17 July 2008 / Accepted: 20 November 2008 / Published online: 19 December 2008© Springer Science + Business Media B.V. 2008
Abstract The aims of this study were to analysesediment characteristics and macrobenthic assem-blages in two very close Italian coastal lagoons(Lesina and Varano) and to assess the differentbehaviour between the two basins and the rela-tionship between sediment matrix and benthicorganisms within and between the two lagoons.The comparative study was performed in July2007 at 13 sampling sites in Lesina lagoon and15 sites in Varano basin for sediment grain size,total organic carbon (TOC), total nitrogen (TN),total phosphorus (TP) and macrobenthic structureanalyses. Both lagoons were generally dominatedby fine-grained sediments (clay and silt compo-nents). The average contents of TOC and TN
A. Specchiulli (B) · T. Scirocco · L. Cilenti ·M. Florio · P. BreberDepartment of Lesina (FG), National ResearchCouncil—Institute of Marine Science,Via Pola 4, 71010 Lesina, FG, Italye-mail: [email protected]
M. RenziDepartment of Environmental Science,University of Siena, Via Mattioli 4,53100 Siena, Italy
S. Focardi · S. BastianoniDepartment of Chemical and Biosystems Sciences,University of Siena, Via Aldo Moro 1,53100 Siena, Italy
measured in Lesina was higher than in Varano(3.31% vs 2.52% for TOC and 5,200 μg·g−1 vs3,713 μg·g−1 for TN); in contrast, the TP waslower (540 μg·g−1 vs 620 μg·g−1). Based on mac-robenthic community patterns, the central zone inVarano lagoon and the eastern area in Lesina la-goon were characterised by the lowest abundance(168.7 ind·m−2 and 503.2 ind·m−2, respectively)and by the lowest number of species, as high-lighted by the diversity indices (Shannon–Wiener,H′ range was 0.47–1.45 for Lesina and 0.00–1.68for Varano; Margalef species richness, d rangewas 0.00–1.67 for Lesina lagoon and 0.00–2.38 forVarano basin). Ordination diagrams suggested aninfluence of marine and freshwater inputs on thesediment distribution in Varano lagoon and onmacrobenthic assemblages in Lesina lagoon.
Keywords Coastal lagoon · Italian coast ·Macrobenthic assemblages ·Multivariate analyses · Sediment characteristics
Introduction
Coastal lagoons constitute important transitionzones between the land and the sea. They areenriched by both the marine and continentalinputs and are among the most productive aqua-tic ecosystems (Nixon 1988), playing an impor-tant economic role. They are often nutrient rich

238 Environ Monit Assess (2010) 160:237–256
(Cauwet 1988; Colombo 1977) as a result of nu-trient input by rivers and recycling between sedi-ment and water column (Nowicki and Nixon 1985;Schleyer and Roberts 1987). They take up 13%of the world coastline (Carrada 1990) and morethan half of the Mediterranean lagoons are ex-ploited for extensive and semi-intensive aquacul-ture (both fish and shellfish; Barnes 1991, 1995).The importance of such a system for fisheriesand aquaculture at global level, and for Italyin particular, directs research towards the studyof the relationships between abiotic environmen-tal factors and the biological productivity. Theecological characteristics of all organisms livingin coastal lagoons are related to environmentalstress due to the alternating inputs of marine andfresh waters, in addition to the increased solublenutrients from surrounding watershed (Carrada1990; Nixon 1982; Perez-Ruzafa et al. 2005; Sfrisoet al. 1992; Taylor et al. 1995). Due to their lowwater turnover and long residence time, manyMediterranean coastal lagoons are greatly af-fected by nutrient loads from their catchments(La Jeunesse and Elliott 2004). The high variabil-ity in chemical, physical and hydrologic parame-ters make them typically unstable environments(Millet and Guelorget 1994) and the concept ofshort- or long-term variations is relative for theseecosystems compared to marine environments(Marzano et al. 2003). Urban development andhuman activity on coastal lagoons have increasedconsiderably in recent years, and the impact onthese productive and economically important en-vironments has become a major concern. Depend-ing on their hydrologic and trophic status, theseenvironments are often affected by severe anoxiccrises followed by mortality events (Lardicci et al.1997; Sorokin et al. 1996). These phenomenamay be exacerbated by organic enrichment, lacedwith fine sediments, nutrients and contaminants(Förstner and Wittmann 1979; Birch 2000), result-ing from the discharged storm water and sewagefrom urban and agricultural areas. This has oftenbeen linked with the deterioration of floral andfaunal habitat characteristics such as water andphysicochemical sediment quality (Corbett et al.1997; Wahl et al. 1997).
In these coastal ecosystems, sediments play animportant role in biogeochemical cycles (Pomeroy
et al. 1965). Much of allochtonous material isincorporated in the sediments, through assi-milation, adsorption and direct sedimentationprocesses of suspended particulate, so they act asa trap of detritus material and mineral nutrientssupply (Lijklema 1986). Organic matter is miner-alized and dissolved nutrients exchanged withinthe interface. Sediment oxygen demand includesbacterial mineralizing activity, oxygen needs fornitrification and benthic fauna respiration (DiToro et al. 1990). Benthic assemblages are cer-tainly the best tool to describe the ecological con-ditions of these systems since macrobenthic faunais highly correlated with the sediment which accu-mulate the multiple sources of organic enrichmentand pollution (Dauer and Alden 1995; Lardicciand Rossi 1998; Le Bris and Glemarec 1996).The present work was performed in two coastallagoons (Varano and Lesina) located in the south-eastern coast of Italy. It is important to empha-size that the two basins are geomorphologicallydifferent and are characterized by very differenttrophic and biological variables. The aims of thisstudy were: (1) to analyse sediment character-istics and macrobenthic assemblages in each la-goon through a combination of univariate andmultivariate analyses; (2) to assess a differentbehaviour between the two lagoons in relationto both sediment variables and macrobenthicstructure; (3) to evaluate the effects of marine andfreshwater inputs on distribution patterns of bothsediment variables and macrofaunal community;(4) to assess if the distribution of benthic or-ganisms within and between the two lagoons arerelated to that of sediment characteristics.
Methods
Study areas
Varano lagoon and Lesina lagoon are twoMediterranean coastal lagoons located withinGargano National Park, a protected area andtourist resort of the SE Italy, (Fig. 1). Despitetheir proximity, the lagoons differ considerablyin geomorphological structure, physical character-istics and surrounding land. Table 1 summarisessome of the main general features of the two
Environ Monit Assess (2010) 160:237–256 239
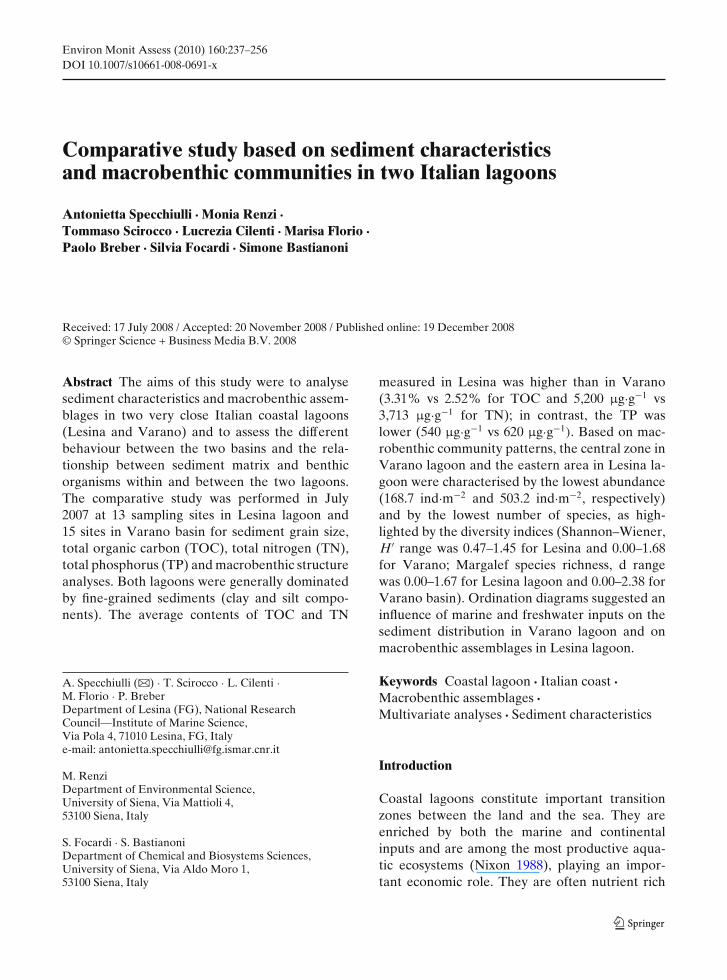
Fig. 1 Location of the two studied lagoons and map showing the sampling sites within each basin
lagoons. Both systems communicate with theAdriatic Sea by means of two artificial channels,located in the western and the eastern side of thetwo lagoons. Due to the low tide excursion andreduced exchange with the adjacent coastal area,water time residence is very long in both systems(Table 1). North-north-western winds are veryfrequent in this area, above all during the winterseason, helping sea water inputs into the lagoon.Strong seasonal variations of temperature (7◦Cin winter and 26–32◦C in summer) and salinity(from 5 to 34 psu) characterize Lesina lagoon(Marolla et al. 1995; Priore et al. 1994). Moreover,
the western part of the lagoon, which receiveswater drained by the intensive aquaculture farms,generally exhibits higher salinity values comparedto the eastern area; this last zone of the lagoonreceives freshwater inputs collecting agriculturaldrainage water from a pumping station locatedsouth of Lesina where the land is lower thanthe average sea level. Varano lagoon shows aregular seasonal cycle of temperature, with thehighest average reached in summer (30◦C) andthe lowest means in winter (8–10◦C), while salinityvalues are relatively constant, ranging between 23and 29 psu (Caroppo 2000; Marolla 1980, 1981;
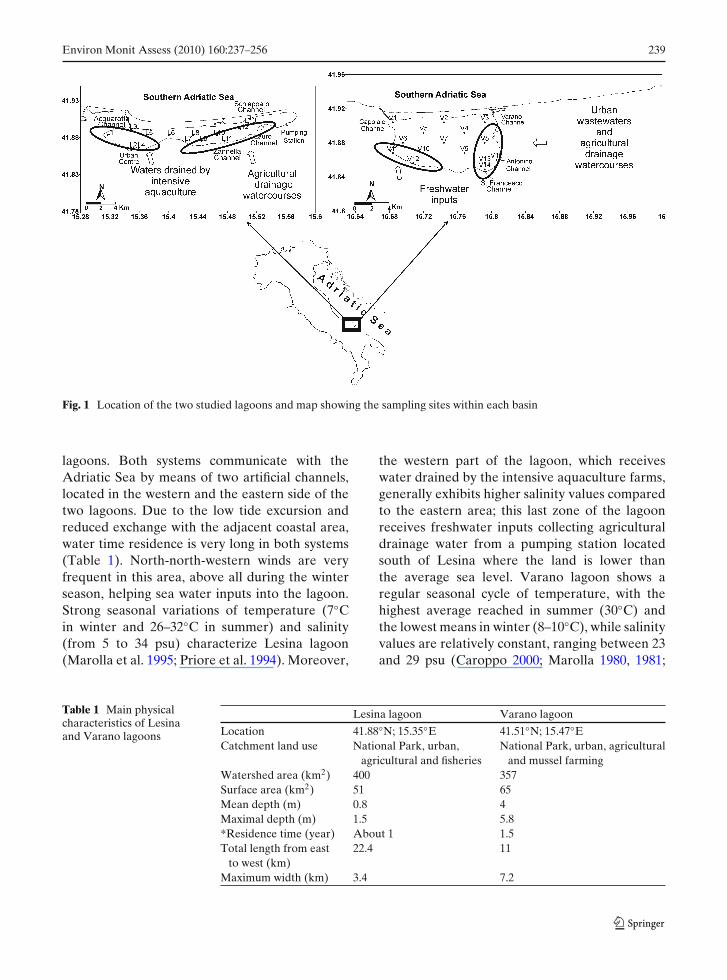
Table 1 Main physicalcharacteristics of Lesinaand Varano lagoons
Lesina lagoon Varano lagoon
Location 41.88◦N; 15.35◦E 41.51◦N; 15.47◦ECatchment land use National Park, urban, National Park, urban, agricultural
agricultural and fisheries and mussel farmingWatershed area (km2) 400 357Surface area (km2) 51 65Mean depth (m) 0.8 4Maximal depth (m) 1.5 5.8*Residence time (year) About 1 1.5Total length from east 22.4 11
to west (km)Maximum width (km) 3.4 7.2
240 Environ Monit Assess (2010) 160:237–256
Specchiulli et al. 2008). It receives freshwaterinputs of approximately 87,000 m3 d−1 with anorganic content mostly originating from urbanand agricultural runoff, fish-farming and zoo-technique activities (Spagnoli et al. 2002; Villaniet al. 2000). The freshwater inputs to the lagooncome from groundwater as springs in the south-western basin of the lagoon, while in the south-eastern zone, surrounding urban wastewaters anddrainage watercourses (from surrounding agricul-tural area) discharge into the lagoon.
The economic relevance of both the lagoonsis mostly related to fishing activity and extensiveaquaculture farming. Moreover, mussels breeding(Mytilus galloprovincialis) was carried out intoVarano lagoon, especially in the northern side ofthe basin, but the fish production has been greatlyreduced over time and in 1995 it was estimatedless than 100 t against 700–800 t of 60–70 years.The mussels, with a production of a few hundredquintals per year, faces significant difficulties inthe summer months for the deficiency of oxygenin the water and consequent reduction in growthof shellfish (Breber and Scirocco 1998).
Sampling
The study was performed in summer season (July2007) at 13 sampling points in Lesina lagoon and15 stations in Varano basin (Fig. 1). Summerprovides the greatest power for trend detectionabout benthic macrofauna and differences amongstressed and non-stressed sites is also greatest inthis season (Alden et al. 1997). Recent effortsto develop biocriteria assumed that summer sam-pling would provide the greatest opportunityfor distinguishing degraded from reference sites(Alden et al. 1997; Engle et al. 1994; Weisberget al. 1997). The differences are probably greatestin summer because it includes the period of great-est hypoxic stress and precedes the fall recruit-ment period when partial recovery might occur.In addition, summer is also the time of highestmetabolic activity for bacteria and therefore theeffects of sediment contamination would be mostsevere. The distribution of sites was not intendedto provide representation of the whole lagoonsurface but to ensure some correspondence in the
positions of sites along environmental gradientsdue to the marine, fresh and groundwater influ-ence (Fig. 1). Three core samples were collectedat each sampling station, using a box-corer (15 ×15 × 15 cm). One core was used for grain-sizedetermination, the second core for measurementsof physicochemical variables and the other onefor an estimate of macrobenthic abundance anddiversity. Resources did not permit triplicate sam-pling for each typology of analysis.
Granulometric analysis
The classification of fine and coarse sedimentsfollowed the scale of Shepard (1954) where sed-iments were partitioned into % sand (2000–63 μm), % silt (63–2 μm) and % clay (<2 μm).Grain-size analyses were carried out, after elimi-nation of the organic fraction with H2O2, by wetsieving, to separate sand from the fine fractions.For sandy fractions, a sieve size >63 μm was used.The weight of the sand trapped by the sieveswas measured, and the percentage with respectto the total weight of sandy sediment fractionwas determined. For fine sediments, a Sedigraph5100 Micromeritics was employed. This instru-ment computes the grain size by estimating thetransmittance produced by an X-ray beam whichcrosses the sediment scattered in a water sample.
Macronutrients quantification in sediments
For the purpose of this study, only the 5-cm toplayer sediment fraction was considered. The per-centage of water content was calculated as theweight difference between wet and dried sedi-ments (dried overnight at 105◦C), in three repli-cates for each sediment sample. Sediment samplesfor physicochemical analyses were homogenized,dried (70◦C, 48 h) in oven until constant weightand weighed. Dried sediments were analysed inorder to determine: total carbon (TC, microgramper gram), total organic carbon (TOC, %), totalphosphorus (TP, microgram per gram) and to-tal nitrogen (TN, microgram per gram). Sampleswere analysed in triplicate; average and standarddeviation (SD) were calculated. Chemicals and

Environ Monit Assess (2010) 160:237–256 241
reagents were analytical grade and glassware wascarefully washed to avoid sample contamination.Determinations of TC and TN were performedby direct total flash combustion using a CHNSElemental Analyzer with a thermo-conductivitydetector TCD (Perkin Elmer, mod. CHN/O 200)according with ICRAM methods (2001). TOCanalyses were performed by preliminary acid di-gestion with HCl 19% and total flash combustion.TP determination was carried out according toAspila et al. (1976) methods, by acid digestionand next quantification using a spectrophotometerUV–VIS (Perkin Elmer, mod 6505) after colori-metric reaction.
Quality assurance/Quality control (QA/QC)
Recoveries and reproducibility were checked byanalysing procedural blanks and reference materi-als purchased from: National Institute of Standardand Technologies (NIST—New York waterwaySediment SRM1944), Institute of EnvironmentalChemistry Academy Sinica Beijing China (Tibetsoil), and NIST (Estuarine Sediment SRM1646a).Analytical blanks were prepared prior to the test-ing samples using the same analytical procedures.A solvent blank was analysed every 15 samples tocheck the response of the instrument detection.Standard reference materials were analysed instatistical replicates (n = 10) to calculate averagesand standard deviation (SD) of recoveries. Mea-sured average recoveries were the follows: TOC101.4% (0.33 SD, SRM1944), TN 94.4% (0.005SD, Tibet Soil), TP 98.9% (3.30 SD, SRM1646a).Concentrations were not recovery corrected.Limit of detection (LOD) was defined as the aver-age blank (n = 10) plus three standard deviation(SD) and were the following: 0.01% for TC, TOC,and TN while 0.001% for TP.
Macrobenthic organisms
Sediment cores for macrofaunal analysis weretaken from each sampling station, sieved (1 mmmesh size) and fauna were preserved in 7%buffered formalin. In the laboratory, samples weresorted, identified to the lowest possible taxonomiclevel, deemed sufficient to detect anthropogenicchanges (Clarke and Warwick 1994; Olsgard et al.
1998; Sommerfield and Clarke 1995; Warwick1988) and counted. Results were expressed perm2. Benthic response variables regarding totalabundance (N, ind m−2), total wet biomass(B, g m−2), diversity (Shannon–Wiener, H′) andspecies richness (Margalef, d) indices were used,as these variables are most often indicative of thecondition of the benthos (Weisberg et al. 1997).
Statistical analyses
All data were analysed using univariate and mul-tivariate methods in order to evaluate: differencesamong sampling sites and between the two la-goons, effects produced by marine and freshwa-ter inputs on both sediment characteristics andmacrobenthic distribution, and relationships be-tween sediment variables and macrozoobenthiccommunities. To reach the proposed target, firststatistical analyses were separately performed oneach system to observe differences among sam-pling sites and relevance in behaviour, and afterdata were plotted all together to evidence generaltrends of variables in the two systems. Princi-pal Components Analysis (PCA) was applied toinvestigate the similarity of sediment variables.The Euclidean distances resemblance matrix wascalculated after fourth square root and log (x + 1)functions transformation and normalization ofsediment variables (Clarke and Green 1988). PCArepresents a powerful technique in multivariatestatistical analysis (Chatfield and Collins 1980), itis conceptually and computationally simple andits ordination axes are interpretable. In spite ofPCA being powerful in defining correlation andsimilarities, it is less flexible in defining dissimi-larities and its distance-preserving properties arepoor (Clarke and Warwick 1998). So, in this study,PCA weaknesses were also tested by non-metricMulti-Dimensional Scale (nmMDS) that has, onthe other hand, a great flexibility both in the defin-ition and conversion of dissimilarities to distancesand its rationale is the preservation of these rela-tionships in the low-dimensional ordination space(Sommerfield and Clarke 1995). Moreover, thisprocedure allowed us to evidence, in both the sys-tems, different contributions of marine and fresh-water inputs in stations segregation. A furtheranalysis of similarities/dissimilarities, the one-way
242 Environ Monit Assess (2010) 160:237–256
ANOSIM test (it allows to check for the signif-icance of differences among groups of samples,using permutation/randomisation methods on re-semblance matrix) was performed on environ-mental variables to test the H0 hypothesis of nodifference in variable distributions between thetwo lagoons.
The statistical analysis of macrobenthic com-munity structure was first performed calculat-ing the univariate diversity indices: abundance(N), total number of species (S), diversity indexof Shannon–Wiener (H′) and Margalef’s speciesrichness (d). These indices were calculated foreach site and ecological information at sites basedon a geospatial gridding method, known as kriging(Matheron and Armstrong 1987), was obtained.Kriging produced visually appealing contour andsurface plots from spaced data. Contours wereconstructed from data using computer packageSURFER version 8.0.
Similarity among sites was analysed by cluster-ing and ordination techniques (nmMDS) basedon Bray–Curtis similarity matrix after square roottransformation of field data adding a dummyvariable of value = 1. Within a community, therelative biomass and abundance of the popula-tion can yield useful information related to thecondition of the environment (Warwick 1986).By plotting the abundance and biomass of eachspecies ranked on the same axis (ABC method:abundance biomass comparison) as a percentagecumulative figure (k-dominance curves), it is pos-sible to show that for a disturbed benthic com-munity, the abundance curve will rise above thebiomass curve and vice-versa for a stable com-munity. Casewell’s neutral model was applied totest differences highlighted by the ABC curveswhile nmMDS was run imposing minimum stress
as 0.01 and restarting the process 9,999 times toevaluate dissimilarities between stress status ofsampling stations (Kruskal 1964; Shepard 1962).Obtained nmMDS results were also superimposedon clusters with resemblance levels of similarityof 40, 60 and 120. In order to confirm observeddifferences in macrobenthic assemblages amongsampling sites and between the two lagoons, dueto marine or freshwater inputs, the ANOSIMtest statistic R (one-way), under null hypothesisthat there are no differences among sites, wasperformed. To evaluate the relationship betweensediment variables and macrobenthic communi-ties, univariate community measures were corre-lated with the main axe of the PCA performedon sediment variables. This BIO-ENV procedureenabled the selection of the abiotic variable subsetthat maximises the rank correlation between bi-otic and abiotic (dis)similarity matrices. Statisticalanalyses were performed using the Primer-E Soft-ware package v6.0 (Plymouth Marine Laboratory,UK) according with Clarke and Warwick (2001).
Results
Sediment characteristics
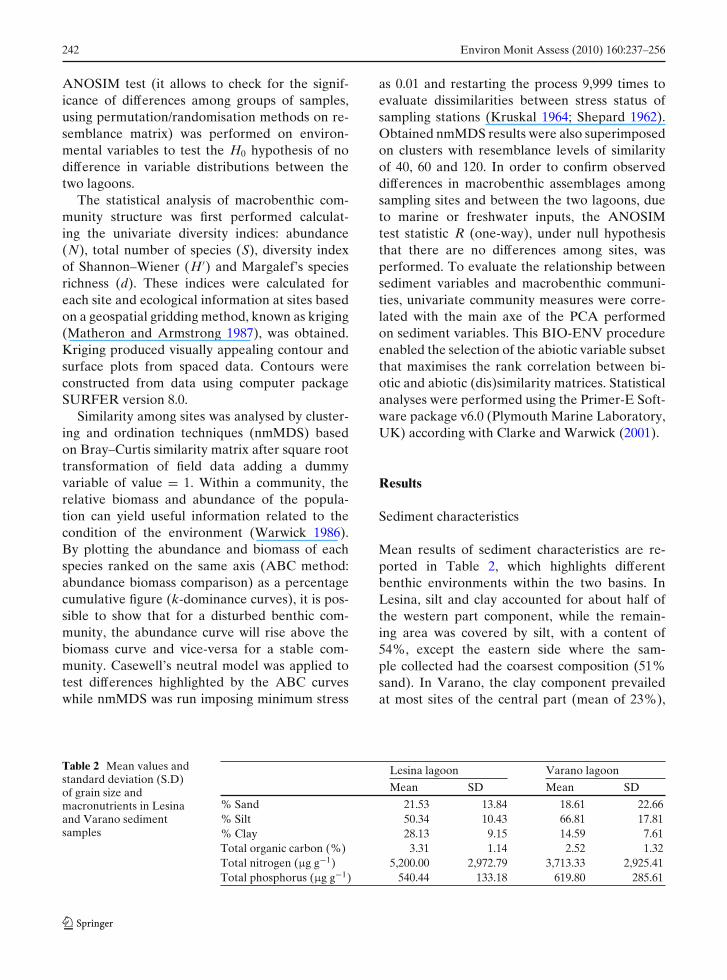
Mean results of sediment characteristics are re-ported in Table 2, which highlights differentbenthic environments within the two basins. InLesina, silt and clay accounted for about half ofthe western part component, while the remain-ing area was covered by silt, with a content of54%, except the eastern side where the sam-ple collected had the coarsest composition (51%sand). In Varano, the clay component prevailedat most sites of the central part (mean of 23%),
Table 2 Mean values andstandard deviation (S.D)of grain size andmacronutrients in Lesinaand Varano sedimentsamples
Lesina lagoon Varano lagoon
Mean SD Mean SD
% Sand 21.53 13.84 18.61 22.66% Silt 50.34 10.43 66.81 17.81% Clay 28.13 9.15 14.59 7.61Total organic carbon (%) 3.31 1.14 2.52 1.32Total nitrogen (μg g−1) 5,200.00 2,972.79 3,713.33 2,925.41Total phosphorus (μg g−1) 540.44 133.18 619.80 285.61

Environ Monit Assess (2010) 160:237–256 243
the silt component (mean of 10%) covered theentire eastern side and part of the southern shore-line, while the sites located along the northernshoreline, where current dynamics prevent theaccumulation of fine particles, had the coarsestcomposition (88% sand). As regard TOC, inLesina, the highest concentration was measuredin the sample collected near to the urban centre(5.28%, station 2L), although values relativelyhigh (3.80–4.67%) were observed in the centralarea of the basin; in Varano, the maximum per-centage was measured at the station located in thesouth-western area (5.45%, station 10V), whilethe south-eastern area was characterised by thelowest values, with a minimum value (0.80%)measured at the station 14V. Lower mean concen-trations of TN were measured in Varano ratherthan in Lesina (Table 2), but the highest value wasrecorded in Varano lagoon at the station locatedin the south-western area (10,900 μg g−1, station10V), while in Lesina, TN was abundant in thewestern and central area (8,000–9,000 μg g−1) near
Table 3 Correlation coefficients between the sedimentvariables and the Principal Components for (a) Lesinalagoon, (b) Varano lagoons and (c) both systems together
PC1 PC2 PC3 PC4 PC5
Lesina% Sand 0.042 0.611 0.426 0.228 0.279% Silt −0.158 −0.319 −0.368 0.604 −0.288% Clay 0.098 −0.304 −0.177 −0.663 0.248TN 0.830 0.294 −0.462 0.065 −0.086TP −0.252 0.093 −0.505 0.195 0.779TOC 0.46 −0.58 0.429 0.319 0.403
Varano% Sand −0.496 −0.216 0.34 −0.66 0.39% Silt 0.539 −0.269 −0.285 −0.45 −0.08% Clay 0.456 0.179 −0.22 −0.158 0.683TN 0.194 0.459 0.546 0.242 0.343TP 0.456 −0.44 0.666 −0.014 −0.207TOC 0.101 0.667 0.118 −0.528 −0.462
Both systems% Sand −0.542 0.042 0.399 0.437 −0.342% Silt 0.514 −0.359 −0.156 −0.168 −0.266% Clay 0.468 0.289 −0.063 0.757 0.332TN 0.199 0.505 0.614 −0.425 0.286TP 0.389 −0.364 0.623 0.158 −0.344TOC 0.179 0.631 −0.218 −0.041 −0.709
Where TN total nitrogen; TP total phosphorus and TOCtotal organic carbonCorrelations significant at the P < 0.01 are shown in italics
Fig. 2 PCA ordination diagram of sediment variables fora Lesina lagoon, b Varano lagoon and c both systemstogether. TP Total phosphorus, TN total nitrogen, TOCtotal organic carbon. Sampling sites are represented bynumber and letter (L for Lesina and V for Varano).Arrows (both slope and length) represent the correlationsbetween sediment variables and the principal axes PC1 andPC2. See Table 3 for correlation coefficients

244 Environ Monit Assess (2010) 160:237–256
to the western sea inlet. TP showed higher values(mean of 800 μg g−1) in the south-eastern sideof Lesina despite minimum value (387 μg g−1)observed at the station 13L close to the easterninlet; lower values (mean of 478 μg g−1) weremeasured at the stations located in the central-western side. In Varano, TP concentrations peakedto 1,131.42 μg g−1 and 1,070.34 μg g−1 at thestations close to the wastewater channels in thesouth-eastern area (14V and 15V, respectively),while the lowest concentrations were measuredat the stations located along the northern shore-line (mean of 208 μg g−1) and along the south-eastern side near the freshwater inputs (mean of246 μg g−1).
Differences in sediment variables withinand between the two lagoons
PCA analysis was run on transformed and nor-malized levels of TOC, TN, TP and grain sizeof sediment samples and produced five principalcomponents for both systems (Table 3). In Lesinalagoon, the first three components (PC1 40.5%,PC2 31.8%, PC3 15.6%) accounted together for87.8% of the total variance in sediment data.The first component PC1 was positively corre-lated with sand %, clay %, TN and TOC, andTN had the highest (positive) correlation, whilethe second component PC2 was positively corre-lated with sand, TN and TP and strong corre-lations were found with sand % (positive) andTOC (negative; Table 3). In Varano lagoon, morethan half of the total system variability (89.9%)was due to the first axis PC1 (50.6%) comparedto the other two ones (PC2 25.9%, PC3 13.2%).The first axis PC1 showed positive correlationswith all sediment variables, except for sand %(negative); the second axis PC2 was positivelyrelated to clay %, TN and TOC (these last vari-ables had the strongest correlation) and negatively
�Fig. 3 MDS ordination diagrams of sediment variables inLesina (a), Varano (b) and both systems together (c). Sucha diagram was performed to assess a possible external in-fluence on sediment variables distribution (see the text forexplanation). A agricultural, U urban, I internal dynamics,M marine and F freshwater inputs
correlated with sand %, silt % and TP (Table 3).By plotting all data together, the total variabilitywas reduced even if significant and the first three
Environ Monit Assess (2010) 160:237–256 245
components (38.4%, 30.1%, 13.8%) accounted for82.3% of the total variance. The first axis PC1was characterized by strong negative correlationwith sand % and positive correlations with theother variables (silt and clay components had thestrongest correlations); silt % and TP had negativecorrelations with the second axis PC2, while thestrongest positive correlations were found withTOC, TN and clay % (Table 3). These resultsindicated that sediment variables correlated withthe first axis had a great significance in explainingthe system variability. In Fig. 2, PCA results wereplotted for Lesina (a), Varano (b) and both sys-tems (c). In Lesina lagoon (Fig. 2a), the most siteslocated in the north-western and central parts ofthe lagoon (1L, 3L, 5L, 6L, 7L, 8L, 9L and 10L)were grouped along the first axis PC1 (stronglyassociated with concentrations of TN), while theydid not show a clear similarity along the secondaxis PC2 which was correlated with sand % and
TOC; moreover, the Fig. 2a indicated that therewas a clear separation of two stations (2L and12L) from the others sites along both the two axesPC1 and PC2. In Varano lagoon (Fig. 2b) therewas a consistent similarity among sites along thefirst axis PC1 (strongly associated with sedimentgrain size), except for the station 2V (on the topleft of the figure); on the other hand, there was aclear separation of sites along the second axis PC2(positively correlated with TOC and TN and neg-atively associated with TP and silt component).Considering the two systems together (Fig. 2c),the two lagoons did not seem to be clearly sepa-rated on the basis of sediment variables; only thestation 2V was clearly separated from the othersites along the first axis PC1 (negatively correlatedwith sand component and positively associatedwith the other variables).
To better explore dissimilarities among stationsand between the two lagoons, nmMDS was per-
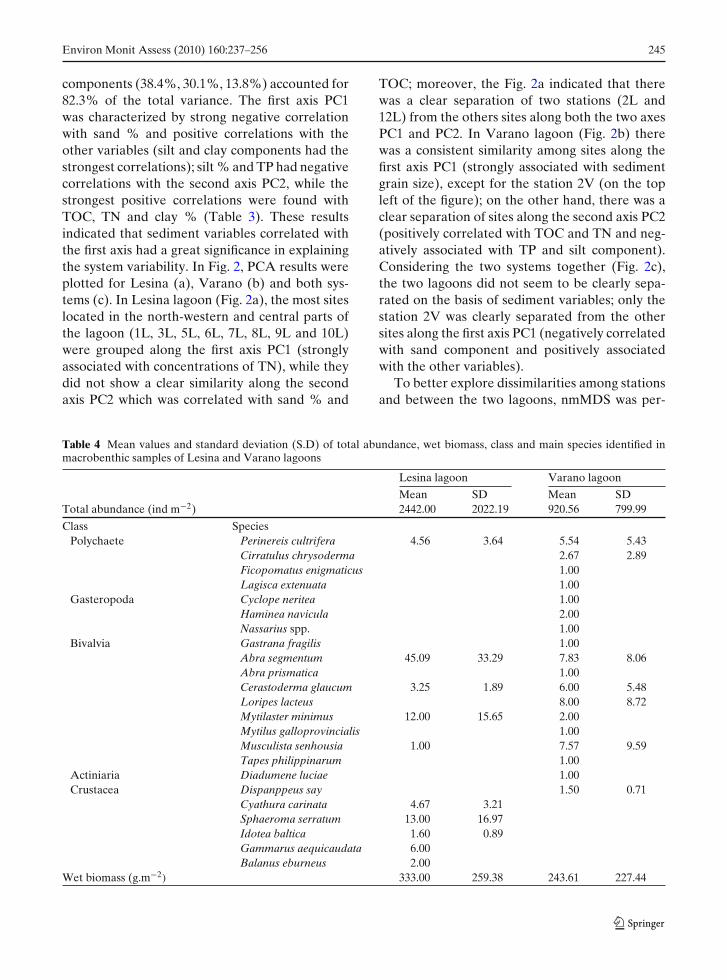
Table 4 Mean values and standard deviation (S.D) of total abundance, wet biomass, class and main species identified inmacrobenthic samples of Lesina and Varano lagoons
Lesina lagoon Varano lagoon
Mean SD Mean SDTotal abundance (ind m−2) 2442.00 2022.19 920.56 799.99
Class SpeciesPolychaete Perinereis cultrifera 4.56 3.64 5.54 5.43
Cirratulus chrysoderma 2.67 2.89Ficopomatus enigmaticus 1.00Lagisca extenuata 1.00
Gasteropoda Cyclope neritea 1.00Haminea navicula 2.00Nassarius spp. 1.00
Bivalvia Gastrana fragilis 1.00Abra segmentum 45.09 33.29 7.83 8.06Abra prismatica 1.00Cerastoderma glaucum 3.25 1.89 6.00 5.48Loripes lacteus 8.00 8.72Mytilaster minimus 12.00 15.65 2.00Mytilus galloprovincialis 1.00Musculista senhousia 1.00 7.57 9.59Tapes philippinarum 1.00
Actiniaria Diadumene luciae 1.00Crustacea Dispanppeus say 1.50 0.71
Cyathura carinata 4.67 3.21Sphaeroma serratum 13.00 16.97Idotea baltica 1.60 0.89Gammarus aequicaudata 6.00Balanus eburneus 2.00
Wet biomass (g.m−2) 333.00 259.38 243.61 227.44
246 Environ Monit Assess (2010) 160:237–256
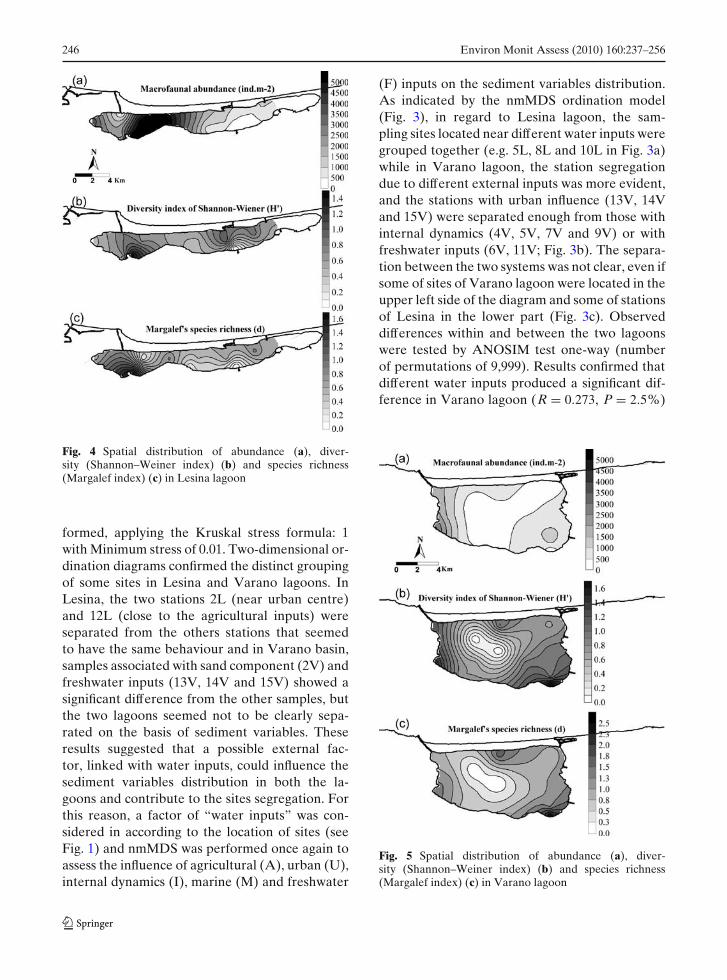
Fig. 4 Spatial distribution of abundance (a), diver-sity (Shannon–Weiner index) (b) and species richness(Margalef index) (c) in Lesina lagoon
formed, applying the Kruskal stress formula: 1with Minimum stress of 0.01. Two-dimensional or-dination diagrams confirmed the distinct groupingof some sites in Lesina and Varano lagoons. InLesina, the two stations 2L (near urban centre)and 12L (close to the agricultural inputs) wereseparated from the others stations that seemedto have the same behaviour and in Varano basin,samples associated with sand component (2V) andfreshwater inputs (13V, 14V and 15V) showed asignificant difference from the other samples, butthe two lagoons seemed not to be clearly sepa-rated on the basis of sediment variables. Theseresults suggested that a possible external fac-tor, linked with water inputs, could influence thesediment variables distribution in both the la-goons and contribute to the sites segregation. Forthis reason, a factor of “water inputs” was con-sidered in according to the location of sites (seeFig. 1) and nmMDS was performed once again toassess the influence of agricultural (A), urban (U),internal dynamics (I), marine (M) and freshwater
(F) inputs on the sediment variables distribution.As indicated by the nmMDS ordination model(Fig. 3), in regard to Lesina lagoon, the sam-pling sites located near different water inputs weregrouped together (e.g. 5L, 8L and 10L in Fig. 3a)while in Varano lagoon, the station segregationdue to different external inputs was more evident,and the stations with urban influence (13V, 14Vand 15V) were separated enough from those withinternal dynamics (4V, 5V, 7V and 9V) or withfreshwater inputs (6V, 11V; Fig. 3b). The separa-tion between the two systems was not clear, even ifsome of sites of Varano lagoon were located in theupper left side of the diagram and some of stationsof Lesina in the lower part (Fig. 3c). Observeddifferences within and between the two lagoonswere tested by ANOSIM test one-way (numberof permutations of 9,999). Results confirmed thatdifferent water inputs produced a significant dif-ference in Varano lagoon (R = 0.273, P = 2.5%)
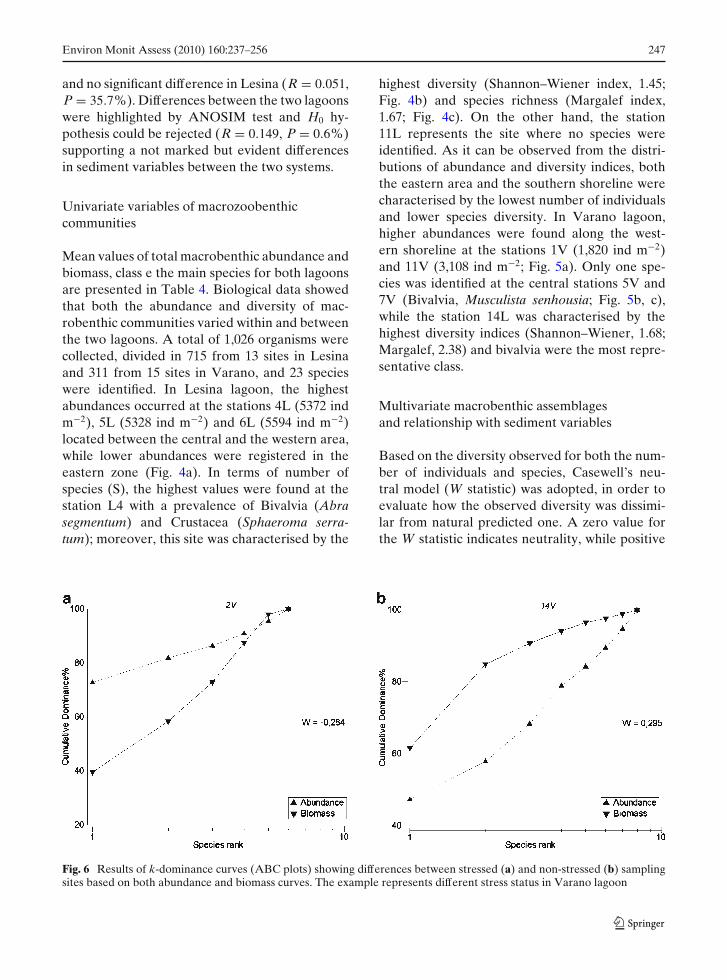
Fig. 5 Spatial distribution of abundance (a), diver-sity (Shannon–Weiner index) (b) and species richness(Margalef index) (c) in Varano lagoon
Environ Monit Assess (2010) 160:237–256 247
and no significant difference in Lesina (R = 0.051,P = 35.7%). Differences between the two lagoonswere highlighted by ANOSIM test and H0 hy-pothesis could be rejected (R = 0.149, P = 0.6%)supporting a not marked but evident differencesin sediment variables between the two systems.
Univariate variables of macrozoobenthiccommunities
Mean values of total macrobenthic abundance andbiomass, class e the main species for both lagoonsare presented in Table 4. Biological data showedthat both the abundance and diversity of mac-robenthic communities varied within and betweenthe two lagoons. A total of 1,026 organisms werecollected, divided in 715 from 13 sites in Lesinaand 311 from 15 sites in Varano, and 23 specieswere identified. In Lesina lagoon, the highestabundances occurred at the stations 4L (5372 indm−2), 5L (5328 ind m−2) and 6L (5594 ind m−2)located between the central and the western area,while lower abundances were registered in theeastern zone (Fig. 4a). In terms of number ofspecies (S), the highest values were found at thestation L4 with a prevalence of Bivalvia (Abrasegmentum) and Crustacea (Sphaeroma serra-tum); moreover, this site was characterised by the
highest diversity (Shannon–Wiener index, 1.45;Fig. 4b) and species richness (Margalef index,1.67; Fig. 4c). On the other hand, the station11L represents the site where no species wereidentified. As it can be observed from the distri-butions of abundance and diversity indices, boththe eastern area and the southern shoreline werecharacterised by the lowest number of individualsand lower species diversity. In Varano lagoon,higher abundances were found along the west-ern shoreline at the stations 1V (1,820 ind m−2)and 11V (3,108 ind m−2; Fig. 5a). Only one spe-cies was identified at the central stations 5V and7V (Bivalvia, Musculista senhousia; Fig. 5b, c),while the station 14L was characterised by thehighest diversity indices (Shannon–Wiener, 1.68;Margalef, 2.38) and bivalvia were the most repre-sentative class.
Multivariate macrobenthic assemblagesand relationship with sediment variables
Based on the diversity observed for both the num-ber of individuals and species, Casewell’s neu-tral model (W statistic) was adopted, in order toevaluate how the observed diversity was dissimi-lar from natural predicted one. A zero value forthe W statistic indicates neutrality, while positive
Fig. 6 Results of k-dominance curves (ABC plots) showing differences between stressed (a) and non-stressed (b) samplingsites based on both abundance and biomass curves. The example represents different stress status in Varano lagoon
248 Environ Monit Assess (2010) 160:237–256
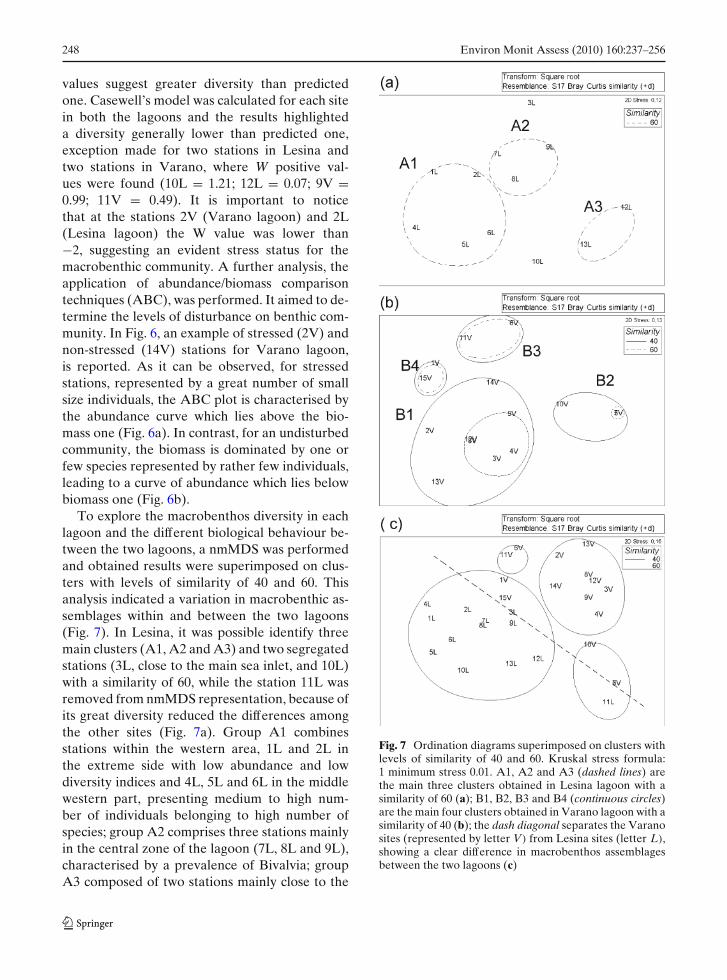
values suggest greater diversity than predictedone. Casewell’s model was calculated for each sitein both the lagoons and the results highlighteda diversity generally lower than predicted one,exception made for two stations in Lesina andtwo stations in Varano, where W positive val-ues were found (10L = 1.21; 12L = 0.07; 9V =0.99; 11V = 0.49). It is important to noticethat at the stations 2V (Varano lagoon) and 2L(Lesina lagoon) the W value was lower than−2, suggesting an evident stress status for themacrobenthic community. A further analysis, theapplication of abundance/biomass comparisontechniques (ABC), was performed. It aimed to de-termine the levels of disturbance on benthic com-munity. In Fig. 6, an example of stressed (2V) andnon-stressed (14V) stations for Varano lagoon,is reported. As it can be observed, for stressedstations, represented by a great number of smallsize individuals, the ABC plot is characterised bythe abundance curve which lies above the bio-mass one (Fig. 6a). In contrast, for an undisturbedcommunity, the biomass is dominated by one orfew species represented by rather few individuals,leading to a curve of abundance which lies belowbiomass one (Fig. 6b).
To explore the macrobenthos diversity in eachlagoon and the different biological behaviour be-tween the two lagoons, a nmMDS was performedand obtained results were superimposed on clus-ters with levels of similarity of 40 and 60. Thisanalysis indicated a variation in macrobenthic as-semblages within and between the two lagoons(Fig. 7). In Lesina, it was possible identify threemain clusters (A1, A2 and A3) and two segregatedstations (3L, close to the main sea inlet, and 10L)with a similarity of 60, while the station 11L wasremoved from nmMDS representation, because ofits great diversity reduced the differences amongthe other sites (Fig. 7a). Group A1 combinesstations within the western area, 1L and 2L inthe extreme side with low abundance and lowdiversity indices and 4L, 5L and 6L in the middlewestern part, presenting medium to high num-ber of individuals belonging to high number ofspecies; group A2 comprises three stations mainlyin the central zone of the lagoon (7L, 8L and 9L),characterised by a prevalence of Bivalvia; groupA3 composed of two stations mainly close to the
Fig. 7 Ordination diagrams superimposed on clusters withlevels of similarity of 40 and 60. Kruskal stress formula:1 minimum stress 0.01. A1, A2 and A3 (dashed lines) arethe main three clusters obtained in Lesina lagoon with asimilarity of 60 (a); B1, B2, B3 and B4 (continuous circles)are the main four clusters obtained in Varano lagoon with asimilarity of 40 (b); the dash diagonal separates the Varanosites (represented by letter V) from Lesina sites (letter L),showing a clear difference in macrobenthos assemblagesbetween the two lagoons (c)
Environ Monit Assess (2010) 160:237–256 249
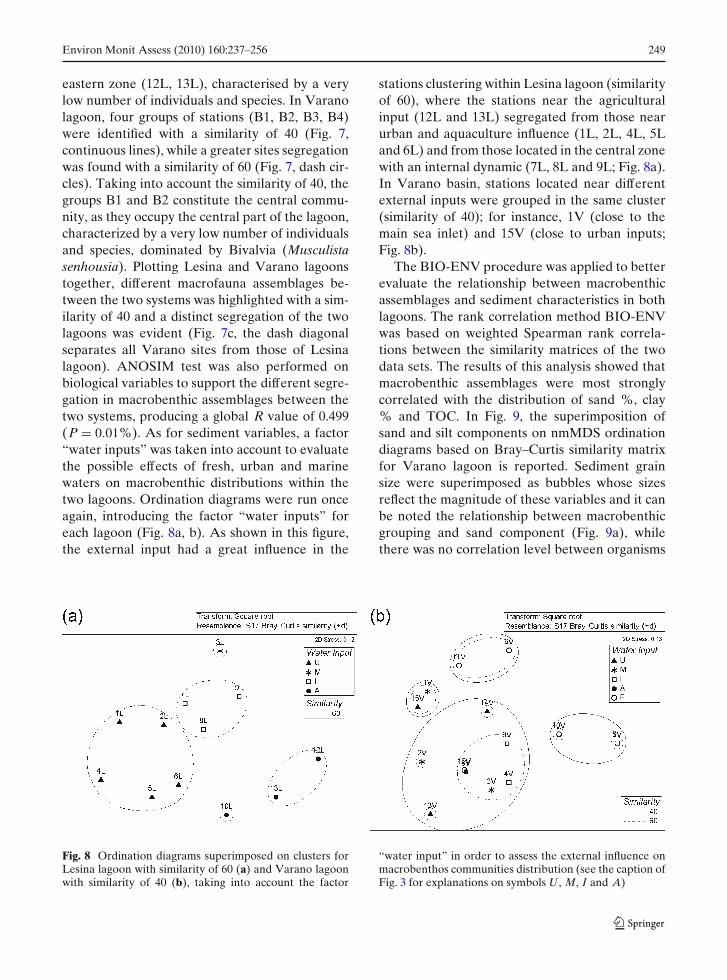
eastern zone (12L, 13L), characterised by a verylow number of individuals and species. In Varanolagoon, four groups of stations (B1, B2, B3, B4)were identified with a similarity of 40 (Fig. 7,continuous lines), while a greater sites segregationwas found with a similarity of 60 (Fig. 7, dash cir-cles). Taking into account the similarity of 40, thegroups B1 and B2 constitute the central commu-nity, as they occupy the central part of the lagoon,characterized by a very low number of individualsand species, dominated by Bivalvia (Musculistasenhousia). Plotting Lesina and Varano lagoonstogether, different macrofauna assemblages be-tween the two systems was highlighted with a sim-ilarity of 40 and a distinct segregation of the twolagoons was evident (Fig. 7c, the dash diagonalseparates all Varano sites from those of Lesinalagoon). ANOSIM test was also performed onbiological variables to support the different segre-gation in macrobenthic assemblages between thetwo systems, producing a global R value of 0.499(P = 0.01%). As for sediment variables, a factor“water inputs” was taken into account to evaluatethe possible effects of fresh, urban and marinewaters on macrobenthic distributions within thetwo lagoons. Ordination diagrams were run onceagain, introducing the factor “water inputs” foreach lagoon (Fig. 8a, b). As shown in this figure,the external input had a great influence in the
stations clustering within Lesina lagoon (similarityof 60), where the stations near the agriculturalinput (12L and 13L) segregated from those nearurban and aquaculture influence (1L, 2L, 4L, 5Land 6L) and from those located in the central zonewith an internal dynamic (7L, 8L and 9L; Fig. 8a).In Varano basin, stations located near differentexternal inputs were grouped in the same cluster(similarity of 40); for instance, 1V (close to themain sea inlet) and 15V (close to urban inputs;Fig. 8b).
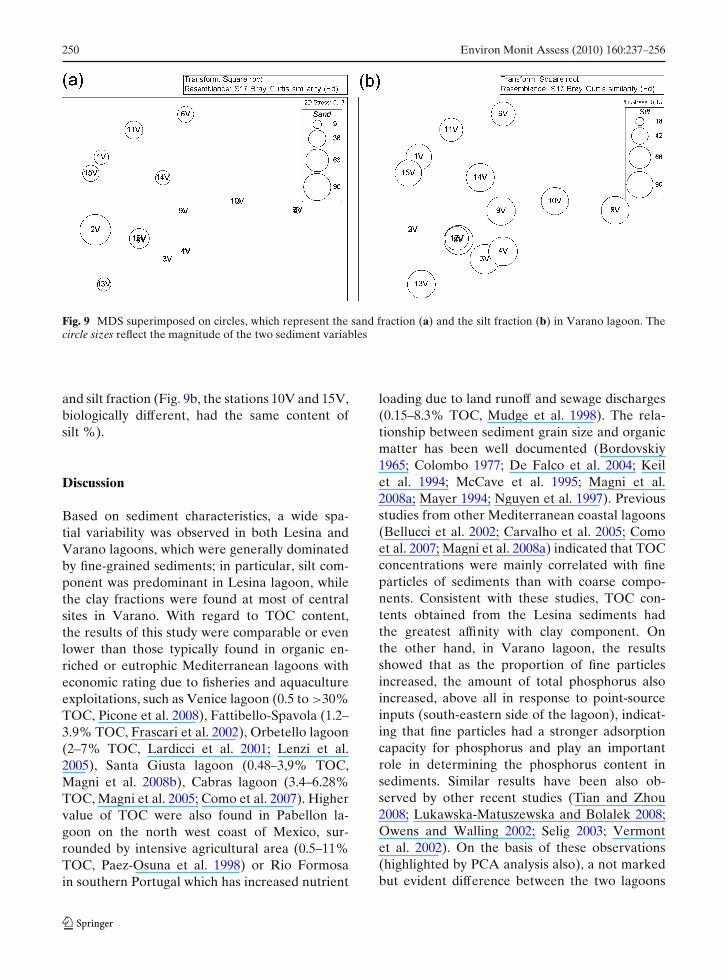
The BIO-ENV procedure was applied to betterevaluate the relationship between macrobenthicassemblages and sediment characteristics in bothlagoons. The rank correlation method BIO-ENVwas based on weighted Spearman rank correla-tions between the similarity matrices of the twodata sets. The results of this analysis showed thatmacrobenthic assemblages were most stronglycorrelated with the distribution of sand %, clay% and TOC. In Fig. 9, the superimposition ofsand and silt components on nmMDS ordinationdiagrams based on Bray–Curtis similarity matrixfor Varano lagoon is reported. Sediment grainsize were superimposed as bubbles whose sizesreflect the magnitude of these variables and it canbe noted the relationship between macrobenthicgrouping and sand component (Fig. 9a), whilethere was no correlation level between organisms
Fig. 8 Ordination diagrams superimposed on clusters forLesina lagoon with similarity of 60 (a) and Varano lagoonwith similarity of 40 (b), taking into account the factor
“water input” in order to assess the external influence onmacrobenthos communities distribution (see the caption ofFig. 3 for explanations on symbols U , M, I and A)
250 Environ Monit Assess (2010) 160:237–256
Fig. 9 MDS superimposed on circles, which represent the sand fraction (a) and the silt fraction (b) in Varano lagoon. Thecircle sizes reflect the magnitude of the two sediment variables
and silt fraction (Fig. 9b, the stations 10V and 15V,biologically different, had the same content ofsilt %).
Discussion
Based on sediment characteristics, a wide spa-tial variability was observed in both Lesina andVarano lagoons, which were generally dominatedby fine-grained sediments; in particular, silt com-ponent was predominant in Lesina lagoon, whilethe clay fractions were found at most of centralsites in Varano. With regard to TOC content,the results of this study were comparable or evenlower than those typically found in organic en-riched or eutrophic Mediterranean lagoons witheconomic rating due to fisheries and aquacultureexploitations, such as Venice lagoon (0.5 to >30%TOC, Picone et al. 2008), Fattibello-Spavola (1.2–3.9% TOC, Frascari et al. 2002), Orbetello lagoon(2–7% TOC, Lardicci et al. 2001; Lenzi et al.2005), Santa Giusta lagoon (0.48–3,9% TOC,Magni et al. 2008b), Cabras lagoon (3.4–6.28%TOC, Magni et al. 2005; Como et al. 2007). Highervalue of TOC were also found in Pabellon la-goon on the north west coast of Mexico, sur-rounded by intensive agricultural area (0.5–11%TOC, Paez-Osuna et al. 1998) or Rio Formosain southern Portugal which has increased nutrient
loading due to land runoff and sewage discharges(0.15–8.3% TOC, Mudge et al. 1998). The rela-tionship between sediment grain size and organicmatter has been well documented (Bordovskiy1965; Colombo 1977; De Falco et al. 2004; Keilet al. 1994; McCave et al. 1995; Magni et al.2008a; Mayer 1994; Nguyen et al. 1997). Previousstudies from other Mediterranean coastal lagoons(Bellucci et al. 2002; Carvalho et al. 2005; Comoet al. 2007; Magni et al. 2008a) indicated that TOCconcentrations were mainly correlated with fineparticles of sediments than with coarse compo-nents. Consistent with these studies, TOC con-tents obtained from the Lesina sediments hadthe greatest affinity with clay component. Onthe other hand, in Varano lagoon, the resultsshowed that as the proportion of fine particlesincreased, the amount of total phosphorus alsoincreased, above all in response to point-sourceinputs (south-eastern side of the lagoon), indicat-ing that fine particles had a stronger adsorptioncapacity for phosphorus and play an importantrole in determining the phosphorus content insediments. Similar results have been also ob-served by other recent studies (Tian and Zhou2008; Lukawska-Matuszewska and Bolalek 2008;Owens and Walling 2002; Selig 2003; Vermontet al. 2002). On the basis of these observations(highlighted by PCA analysis also), a not markedbut evident difference between the two lagoons
Environ Monit Assess (2010) 160:237–256 251
was observed and supported by ANOSIM testthat suggested a greater influence of externalsources on sediment macronutrient distributionsin Varano rather than in Lesina lagoon. In par-ticular, these results indicate that the primarysources of organic matter in the sediments ofLesina lagoon (particularly in the western area)could be related to a high primary production(phanerogams) (Cozzolino 1995; Marzano et al.2003) rather than a loading of high amounts ofurban waste waters, as highlighted by ordinationdiagrams (Fig. 3, no influence of external waterinput). In contrast, in Varano, the greater accu-mulation of TP in the south-eastern zone ratherthan in the deeper central zone, could be dueto the external input from the two main waste-water channels, the S. Francesco and Antoninochannels, which drain waters from the surround-ing agricultural areas (Specchiulli et al. 2008) andphosphorus enters this lagoon in a particulatestate, adsorbing to silt component; otherwise, inthe central area, the organic matter decomposi-tion, enhanced by higher temperatures, could beprevalent compared to deposition processes.
It is well known that lagoon systems are af-fected by water salinity fluctuations due to sea-water exchanges throughout the sea inlets and tofreshwater and urban wastewaters inflows. Thecombination of these factors allows the exchangeof water masses with different physical and chem-ical characteristics (Millet and Guelorget 1994),while ensuring the renewal of water in lagoon(Guélorget and Perthiusot 1992) and determininga selection of macrobenthos community. Salin-ity changes were considered by literature as themajor factor (confining factor) able to determinea spatial segregation in benthic macrofauna as-sessment (Guélorget and Perthuisot 1983; Kiener1978; Vatova 1953). Many studies performedon lagoon systems (not only in Mediterraneanareas) showed that the distribution and abun-dance of macrobenthos followed the salinity gra-dient (Bazaïri et al. 2003; Dye and Barros 2005;Koutsoubas et al. 2000; Maggiore and Keppel2007; Mistri et al. 2001; Mistri 2002). Consis-tent with these studies, in Lesina lagoon, salinityappeared to play an important role in the mac-robenthos community pattern within the basin,even if sediment characteristics seemed to affect
stations distributed near urban and intensive aqua-culture inputs. Multivariate analysis (ordinationdiagrams, Fig. 8) indicated that the macroben-thos assemblages in stations close to the urbaninputs were different from those located in boththe central zone (with internal dynamics) and theeastern zone close to the agricultural effluents;this pattern followed the salinity gradient presentin Lesina lagoon. Nevertheless, a secondary dis-turbance factor was found in the western zoneof the lagoon, close to the urban and intensiveaquaculture influence, where the high sedimentorganic load (TOC), associated with high fine-fraction percentage affect the macrobenthos com-munity’s structure, leading to decreased values forboth abundance and diversity indices (fewer dif-ferent species with a prevalence of Bivalvia-Abrasegmentatum; Fig. 4). These results are consistentwith those obtained by Marzano et al. (2003) forLesina lagoon and, similarly, many studies haveshown a marked influence of organic enrichmenton quali-quantitative composition of macroben-thos community (Gravina et al. 1989; Labruneet al. 2007; Mucha and Costa 1999; Sardà et al.1995; Sordino et al. 1989).
Recent papers showed as also macronutrientenrichment and sediment grain size could deter-mine macrobenthic stress phenomena and conse-quently produce changes in organisms assessment(Bazaïri et al. 2003; De Biasi et al. 2003; Labruneet al. 2007; Lardicci et al. 1997). Consistent withthese studies, granulometry and physicochemicalproperties of sediment explained much of thespatial variability of macrobenthos in Varano la-goon, while the significance of salinity in deter-mining spatial distribution was not highlighted inthis lagoon (Fig. 8). Stations 5V, 7V and 10Vwere all located in the central part of the lagoonwith high content of clay % and both the low-est abundance and diversity indices; in addition,in this area, an extreme reduced abundance ofMusculista senhousia with respect to the bothwestern and eastern sides of the lagoon, was ob-served. Summer hypoxia and anoxia is known togreatly reduce M. senhousia abundance (Mistri2002; Munari 2008). This result suggested thatdecomposition processes of organic matter, cou-pled with low water exchange and high tempera-tures during the summer, could promote quicker

252 Environ Monit Assess (2010) 160:237–256
oxygen depletion in the central part of Varano la-goon rather than in other zones. The eastern sideof the lagoon (3V, 4V, 8V and 9V) was character-ized by finer sediments (silt %), higher content ofTN and an increased species richness with a domi-nance of Polychaetes (Perinereis cultrifera) onBivalvia (Loripes lacteus). One important resultobtained in Varano lagoon was that the effect ofthe two wastewater channels in the south-easternarea on benthic macrofauna is effective and re-stricted to the two stations 13V and 14V (closeto the drainage waters from the surrounding agri-cultural areas) which were characterized by thehighest values of TP, finer particles, decreased or-ganic matter and both the highest species richnessand diversity (Fig. 5). These observations are con-sistent with the model proposed by Pearson andRosemberg (1978) which postulates an increasein species richness as organic matter availabilitydecreases.
The macrobenthos assemblages structure andcomposition found in both Lesina and Varanolagoons were very different, with a higher numberof species in Varano (18) than in Lesina (10).This result could be related to higher salinityfluctuations in Lesina rather than in Varano, asproposed by Wolff (1983). Moreover, dominantspecies found in Lesina lagoon were Abra segmen-tum and Mytilaster minimus and this is agrees withresults obtained by Marchini et al. (2008).
ABC method and values of W statistic wereused to identify community disturbance withineach lagoon. The results of this analysis showedthat in Lesina lagoon, the effects of urban cen-tre on the sites close to the external input wasevident (finer sediments, the highest TOC, fewerdifferent species and high negative value of W),according to the Pearson and Rosenberg model(Pearson and Rosemberg 1978). In contrast, com-paring community structure at the different sam-pling sites in Varano lagoon, it was possible toobserve the existence of disturbance cases notdirectly related to organic loads gradients. The or-ganic load gradient established a sampling stationordination (the highest values of TOC located inthe south-western side of the lagoon), while thebiological disturbance indicators (k-dominancecurves) established another ordination, with themore stressed sites located along the northern
shoreline (in contrast with the response of diver-sity indices), associated with sediment sand com-ponent. Similar results were obtained, with thesame approaches, in other Mediterranean lagoons(Koutsoubas et al. 2000; Lardicci and Rossi 1998;Reizopoulou et al. 1996).
Conclusion
The results of this study have provided the differ-ent behaviour between the two very close coastallagoons. A different source for sediment variablesemerged during the study in the two lagoons; forLesina, primary sources were related to internaldynamics, while in Varano, the influence of ex-ternal input was predominant. The macrobenthiccommunity assemblages seem to reflect the envi-ronmental gradients due to marine and freshwaterinputs in Lesina rather than in Varano lagoon,where macrobenthic pattern variations arose fromphysicochemical properties of sediment, in par-ticular from sand and clay components. A stressstatus for macrobenthic community was observedfor each site within the two lagoons and the resultsshowed no clear difference among sites with urbaneffluents and sea-freshwaters inputs in Varano la-goon, while in Lesina lagoon, the effects of urbancentre on the sites close to the external inputwas evident. Although the sampling has been car-ried out during a critical season (summer), whensevere anoxic crises could be frequent, the ob-servations performed on macrobenthic responsevariables, regarding total abundance, biomass,diversity and species richness indices, allow us toassess that stressed areas were confined to fewsites in both the lagoons.
The relationships between macrobenthic com-munities and sediment variables in Lesina andVarano lagoons could be considered as a pre-liminary survey for supporting further studies onthe other ecosystem components of these two la-goons, including contaminants such as polycyclicaromatic hydrocarbons and some pesticides, asthese factors could also affect benthic organisms(Long et al. 1995). Moreover, these results indi-cate specific correlations between environmen-tal and biological variables in only one season(summer). For this reason, a temporal and spatial

Environ Monit Assess (2010) 160:237–256 253
variation of macrobenthos assemblages in relationto the chancing of ecosystem components for boththe lagoon will be taken into account.
References
Alden, R., III, Weisberg, S. B., Ranasinghe, A., &Dauer, D. M. (1997). Optimizing temporal samplingstrategies for benthic environmental monitoring pro-grams. Marine Pollution Bulletin, 34(11), 913–922.doi:10.1016/S0025-326X(97)00049-0.
Aspila, K. I., Agemiam, H., & Chau, A. S. Y. (1976).A semiautomated method for the determinationof inorganic, organic and total phosphate in sedi-ments. Analyst (London), 101, 187–197. doi:10.1039/an9760100187.
Barnes, R. S. K. (1991). European estuaries and lagoons:A personal overview of problems and possibilities forconservation and management. Aquatic Conservation,1, 79–87. doi:10.1002/aqc.3270010107.
Barnes, R. S. K. (1995). European coastal lagoons, macro-tidal versus microtidal contrasts. Biologia MarinaMediterranea, 2, 3–7.
Bazaïri, H., Bayed, A., Glémarec, M., & Hily, C. (2003).Spatial organisation of macrozoobenthic communi-ties in response to environmental factors in a coastallagoon of the NW African coast (Merja Zerga,Marocco). Oceanologica Acta, 26, 457–471. doi:10.1016/S0399-1784(03)00041-0.
Bellucci, L. G., Frignani, M., Paolucci, D., & Ravanelli,M. (2002). Distribution of heavy metals in sedimentsof the Venice lagoon: The role of the industrial area.The Science of the Total Environment, 295, 35–49.doi:10.1016/S0048-9697(02)00040-2.
Birch, G. F. (2000). Marine pollution in Australia, withspecial emphasis on central New South Wales estu-aries and adjacent continental margin. InternationalJournal of Environment and Pollution, 13, 411–423.doi:10.1504/IJEP.2000.002334.
Bordovskiy, O. K. (1965). Accumulation of organic mat-ter in bottom sediments. Marine Geology, 3, 33–82.doi:10.1016/0025-3227(65)90004-6.
Breber, P., & Scirocco, T. (1998). Open-sea mussel farmingin Southern Italy. Eastfish Magazine, 22, 36–38.
Caroppo, C. (2000). The contribution of picophytoplank-ton to community structure in a Mediterranean brack-ish environment. Journal of Plankton Research, 22,381–397. doi:10.1093/plankt/22.2.381.
Carrada, G. (1990). Le lagune costiere. Le Scienze, 264,32–39.
Carvalho, S., Moura, A., Gaspar, M. B., Pereira, P.,Cancela da Fonseca, L., Falcão, M., et al. (2005).Spatial and inter-annual variability of the macroben-thic communities within a coastal lagoon (Óbidoslagoon) and its relationship with environmental pa-rameters. Acta Oecologica, 27, 143–159. doi:10.1016/j.actao.2004.11.004.
Cauwet, G. (1988). Distribution and accumulation oforganic matter in a tropical coastal lagoon, theTabacarigua lagoon, Venezuela. The Science of theTotal Environment, 75, 261–270. doi:10.1016/0048-9697(88)90039-3.
Chatfield, C., & Collins, A. J. (1980). Introduction to multi-variate analysis. London: Chapman & Hall.
Clarke, K. R., & Green, R. H. (1988). Statistical designand analysis for a “biological effects” study. MarineEcology Progress Series, 46, 213–226. doi:10.3354/meps046213.
Clarke, K. R., & Warwick, R. M. (1994). Changes in ma-rine communities: An approach to statistical analysisand interpretation. Plymouth, UK: Plymouth MarineLaboratory, 183 pp.
Clarke, K. R., & Warwick, R. M. (1998). A taxonomic dis-tinctness index and its statistical properties. Journalof Applied Ecology, 35, 523–531. doi:10.1046/j.1365-2664.1998.3540523.x.
Clarke, K. R., & Warwick, R. M. (2001). Change in marinecommunities: An approach to statistical analysis andinterpretation (2nd ed.). Plymouth: Primer-E.
Colombo, G. (1977). Lagoons. In The coastline (pp. 63–82).Chichester: Wiley.
Como, S., Magni, P., Casu, D., Floris, A., Giordani,G., Natale, S., et al. (2007). Sediment characteristicsand macrofauna distribution along a human-modifiedinlet in the Gulf of Oristano (Sardinia, Italy).Marine Pollution Bulletin, 54, 733–744. doi:10.1016/j.marpolbul.2007.01.007.
Corbett, C. W., Wahl, M., Porter, D. E., Edwards, D., &Moise, C. (1997). Non-point source runoff modelling:A comparison of forested watershed and an urbanwatershed on the South Carolina coast. Journal ofExperimental Marine Biology and Ecology, 213, 133–149. doi:10.1016/S0022-0981(97)00013-0.
Cozzolino, G. C. (1995). Macrofitobenthos della laguna diLesina: Cartografia estiva. Biologia Marina Mediter-ranea, 2(2), 361–363.
Dauer, D. M., & Alden, R. W. (1995). Long-term trendsin the macrobenthos and water quality of the lowerChesapeake Bay (1985–1991). Marine Pollution Bul-letin, 30, 840–850. doi:10.1016/0025-326X(95)00091-Z.
De Biasi, A. M., Benedetti-Cecchi, L., Pacciardi, L., Maggi,E., Vaselli, S., & Bertocci, I. (2003). Spatial het-erogeneity in the distribution of plants and ben-thic invertebrates in the lagoon of Orbetello (Italy).Oceanologica Acta, 26, 39–46. doi:10.1016/S0399-1784(02)01226-4.
De Falco, G., Magni, P., Teräsvuori, L. M. H., & Matteucci,G. (2004). Sediment grain-size and organic carbondistribution in the Cabras lagoon (Sardinia, westMediterranean). Chemistry and Ecology, 20(Suppl I),367–377. doi:10.1080/02757540310001629189.
Di Toro, D. M., Paquin, P. R., Subburamu, K., & Gruber,D. A. (1990). Sediment oxygen demand model:Methane and ammonia oxidation. Journal of Envi-ronmental Engineering, 116, 945–986. doi:10.1061/(ASCE)0733-9372(1990)116:5(945).
Dye, A., & Barros, F. (2005). Spatial patterns of macrofau-nal assemblages in intermittently closed/open coastal
254 Environ Monit Assess (2010) 160:237–256
lakes in New South Wales, Australia. Estuarine,Coastal and Shelf Science, 64, 357–371. doi:10.1016/j.ecss.2005.02.029.
Engle, V. D., Summers, J. K., & Gaston, G. R. (1994).A benthic index of environmental condition ofGulf of Mexico estuaries. Estuaries, 17, 372–384.doi:10.2307/1352670.
Förstner, U., & Wittmann, G. T. W. (1979). Metal pollutionin the aquatic environment. Berlin: Springer.
Frascari, F., Matteucci, G., & Giordano, O. (2002). Evolu-tion of an eutrophic coastal lagoon ecosystem from thestudy of bottom sediments. Hydrobiologia, 475/476387–401. doi:10.1023/A:1020399627807.
Gravina, M. F., Ardizzone, G. D., Scaletta, F., & Chimenz,C. (1989). Descriptive analysis and classification ofbenthic communities in some Mediterranean coastallagoons (Central Italy). Marine Ecology (Berlin), 10,141–166. doi:10.1111/j.1439-0485.1989.tb00071.x.
Guélorget, O., & Perthuisot, J. P. (1983). Le domaineparalique. Expressions géologiques, biologiques etéconomiques du confinement. Trav. Lab. Géologie,Ecole Norm. Sup., Paris 16, 136p.
Guélorget, O., & Perthiusot, J. P. (1992). Paralic ecosys-tems. Vie et Milieu, 42(2), 215–251.
ICRAM (2001). Metodologie analitiche di riferimento(Ministero dell’Ambiente e della Tutela del TerritorioEd.) pp. 150.
Keil, R. G., Tsamakis, E. C., Fuh, C. B., Giddings, J. C., &Hedges, J. I. (1994). Mineralogical and textural con-trols on the organic composition of coastal marinesediments: Hydrodynamic separation using SPLITT-fractionation. Geochimica et Cosmochimica Acta, 58,879–893. doi:10.1016/0016-7037(94)90512-6.
Kiener, A. (1978). Ecologie, physiologie et économie deseaux saumâtres. Paris: Masson.
Koutsoubas, D., Dounas, C., Arvanitidis, C., Kornilios, S.,Petihakis, G., Triantafyllou, G., et al. (2000). Macro-benthic community structure and disturbance assess-ment in Gialova Lagoon, Ionian Sea. ICES Journalof Marine Science, 57, 1472–1480. doi:10.1006/jmsc.2000.0905.
Kruskal, J. B. (1964). Multidimensional scaling by opti-mizing goodness of fit to a non metric hypothesis.Psychometrika, 29, 1–27. doi:10.1007/BF02289565.
Labrune, C., Grémare, A., Amouroux, J. M., Sardá, R.,Gil, J., & Taboada, S. (2007). Assessment of soft-bottom polychaete assemblages in the Gulf of Lions(NW Mediterranean) based on a mesoscale survey.Estuarine, Coastal and Shelf Science, 71, 133–147.doi:10.1016/j.ecss.2006.07.007.
La Jeunesse, I., & Elliott, M. (2004). Anthropogenicregulation of the phosphorus balance in the Thaucatchment–coastal lagoon system (Mediterranean Sea,France) over 24 years. Marine Pollution Bulletin, 48,679–687. doi:10.1016/j.marpolbul.2003.10.011.
Lardicci, C., & Rossi, F. (1998). Detection of stresson macrozoobenthos: Evaluation of some methodsin a coastal Mediterranean lagoon. Marine Envi-ronmental Research, 45, 367–386. doi:10.1016/S0141-1136(98)00099-3.
Lardicci, C., Rossi, F., & Castelli, A. (1997). Analysis ofmacrozoobenthic community structure after severedystrophic crises in a Mediterranean coastal lagoon.Marine Pollution Bulletin, 34, 536–547. doi:10.1016/S0025-326X(96)00164-6.
Lardicci, C., Como, S., Corti, S., & Rossi, F. (2001). Re-covery of the macrozoobenthic community after severdystrophic crises in a Mediterranean coastal lagoon(Orbetello, Italy). Marine Pollution Bulletin, 42, 202–214. doi:10.1016/S0025-326X(00)00144-2.
Le Bris, H., & Glemarec, M. (1996). Marine and brack-ish ecosystems of South Brittany (Lorient and VilaineBays) with particular reference to the effect of the tur-bidity maxima. Estuarine, Coastal and Shelf Science,42, 737–753. doi:10.1006/ecss.1996.0047.
Lenzi, M., Finora, M. G., Persia, E., Comandi, S., Gargiulo,V., Solari, D., et al. (2005). Biogeochemical effects ofdisturbance in shallow water sediment by macroalgaeharvesting boats. Marine Pollution Bulletin, 50, 512–519.
Lijklema, L. (1986). Phosphorus accumulation in sedimentsand internal loading. Hydrological Bulletin, 20, 213–224. doi:10.1007/BF02291164.
Long, E. R., MacDonald, D. D., Smith, S. L., & Calder,F. D. (1995). Incidence of adverse biological effectswithin ranges of chemical concentrations in marineand estuarine sediments. Environmental Management,19, 81–97. doi:10.1007/BF02472006.
Lukawska-Matuszewska, K., & Bolalek, J. (2008). Spa-tial distribution of phosphorus forms in sedimentsin the Gulf of Gdansk (southern Baltic Sea). Conti-nental Shelf Research, 28, 977–990. doi:10.1016/j.csr.2008.01.009.
Maggiore, F., & Keppel, E. (2007). Biodiversity and dis-tribution of polychaetes and molluscs along the Deseestuary (Lagoon of Venice, Italy). Hydrobiologia, 588,189–203. doi:10.1007/s10750-007-0662-1.
Magni, P., Micheletti, S., Casu, D., Floris, A., Giordani,G., Petrov, A., et al. (2005). Relationships betweenchemical characteristics of sediments and macro-faunal communities in the Cabras lagoon (WesternMediterranean, Italy). Hydrobiologia, 550, 105–119.doi:10.1007/s10750-005-4367-z.
Magni, P., De Falco, G., Como, S., Casu, D., Floris,A., Petrov, A. N., et al. (2008a). Distribution andecological relevance of fine sediments in organic-enriched lagoons: The case study of the Cabras lagoon(Sardinia, Italy). Marine Pollution Bulletin, 56, 549–564. doi:10.1016/j.marpolbul.2007.12.004.
Magni, P., Rajagopal, S., van der Velde, G., Fenzi, G.,Kassenberg, J., Vizzini, S., et al. (2008b). Func-tions and ecological status of eight Italian lagoonsexamined using biological traits analysis (BTA).Marine Pollution Bulletin, 56, 1076–1085. doi:10.1016/j.marpolbul.2007.12.004.
Marchini, A., Munari, C., Mistri, M. (2008). Func-tions and ecological status of eight Italian la-goons examined using biological traits analysis(BTA). Marine Pollution Bulletin, 56, 1076–1085.doi:10.1016/j.marpolbul.2008.03.027.

Environ Monit Assess (2010) 160:237–256 255
Marolla, V. (1980). Nota preliminare su alcune caratteris-tiche chimico-fisiche della laguna di Varano durantel’anno 1970. Technical Report of National ResearchCouncil-Institue of Marine Science-Department ofLesina, 17pp.
Marolla, V. (1981). La laguna di Varano: Condizionichimico-fisiche durante l’anno 1975. Technical Re-port of National Research Council-Institue of MarineScience-Department of Lesina, 41pp.
Marolla, V., Franchi, M., Casolino, G., & Maselli, M.M. A. (1995). La laguna di Lesina: Variazione du-rante il 1994 dei principali parametri chimico-fisici.Technical Report of National Research Council-Institue of Marine Science-Department of Lesina,14pp.
Marzano, C. N., Scalera Liaci, L., Fianchini, A., Gravina,F., Mercurio, M., & Corriero, G. (2003). Distribu-tion, persistence and change in the macrobenthosof the lagoon of Lesina (Apulia, southern AdriaticSea). Oceanologica Acta, 26, 57–66. doi:10.1016/S0399-1784(02)01229-X.
Matheron, G., & Armstrong, M. (1987). Geostatistical casestudies. Dordrecht: Reidel.
Mayer, L. M. (1994). Relationships between mineralsurfaces and organic carbon concentrations in soilsand sediments. Chemical Geology, 114, 347–363.doi:10.1016/0009-2541(94)90063-9.
McCave, I. N., Menighetti, B., & Robinson, S. G. (1995).Sortable silt and fine sediment size/composition slic-ing: Parameters for palaeocurrents speed and palaeo-oceanography. Paleoceanography, 10, 593–610. doi:10.1029/94PA03039.
Millet, B., & Guelorget, O. (1994). Spatial and seasonalvariability in the relationships between benthic com-munities and physical environment in a lagoon ecosys-tem. Marine Ecology Progress Series, 108, 161–174.doi:10.3354/meps108161.
Mistri, M. (2002). Persistence of benthic communities: Acase study from the Valli di Comacchio, a NorthernAdriatic lagoonal ecosystem (Italy). ICES Journalof Marine Science, 59, 314–322. doi:10.1006/jmsc.2001.1169.
Mistri, M., Rossi, R., & Fano, E. A. (2001). Structure andsecondary production of a soft bottom macrobenthiccommunity in a brackish lagoon (Sacca di Goro, north-eastern Italy). Estuarine, Coastal and Shelf Science, 52,605–616. doi:10.1006/ecss.2001.0757.
Mucha, A. P., & Costa, M. H. (1999). Macrozooben-thic structure in two Portuguese estuaries: Relation-ship with organic enrichment and nutrient gradients.Acta Oecologica, 20, 363–376. doi:10.1016/S1146-609X(99)00130-7.
Mudge, S. M., East, J. A., Bebianno, M. J., & Barbeira,L. A. (1998). Fatty acids in the Ria Formosa La-goon, Portugal. Organic Geochemistry, 29(4), 963–977.doi:10.1016/S0146-6380(98)00049-7.
Munari, C. (2008). Effects of the exotic invader Mus-culista senhousia on benthic communities of twoMediterranean lagoons. Hydrobiologia, 611, 29–43.doi:10.1007/s10750-008-9459-0.
Nguyen, L. M., Cooke, J. G., & McBride, G. B. (1997).Phosphorus retention and release characteristics ofsewage-impacted wetland sediments. Water Soil AirPollution, 100, 163–179. doi:10.1023/A:1018340028411.
Nixon, S. W. (1982). Nutrient dynamics, primary produc-tion and fisheries yields of lagoons. Oceanologica Acta,5, 357–371.
Nixon, S. (1988). Physical energy inputs and the compara-tive ecology of lake and marine ecosystems. Limnol-ogy and Oceanography, 33, 1005–1025.
Nowicki, B. L., & Nixon, S. W. (1985). Benthic commu-nity metabolism in a coastal lagoon ecosystem. Ma-rine Ecology Progress Series, 22, 21–30. doi:10.3354/meps022021.
Olsgard, F., Sommerfield, P. J., & Carr, M. R. (1998).Relationships between taxonomic resolution, mac-robenthic community patterns and disturbance. Ma-rine Ecology Progress Series, 172, 25–36. doi:10.3354/meps172025.
Owens, P. N., & Walling, D. E. (2002). The phospho-rus content of fluvial sediment in rural and indus-trialized river basins. Water Research, 36, 685–701.doi:10.1016/S0043-1354(01)00247-0.
Paez-Osuna, F., Bojórquez-Leyva, H., & Green-Ruiz, C.(1998). Total carbohydrates: Organic carbon in la-goon sediments as an indicator of organic eventsfrom agriculture and sugar-cane industry. Environ-mental Pollution, 102, 321–326. doi:10.1016/S0269-7491(98)00045-1.
Pearson, T. H., & Rosemberg, R. (1978). Macrobenthicsuccession in relation to organic enrichment and pol-lution of the marine environment. Oceanography andMarine Biology: An Annual Review, 5, 229–311.
Perez-Ruzafa, A., Fernandez, A. I., Marcos, C., Gilabert,J., Quispe, J. I., & Garcia-Charton, J. A. (2005). Spa-tial and temporal variations of hydrological condi-tions, nutrients and chlorophyll a in a Mediterraneancoastal lagoon (Mar Menor, Spain). Hydrobiologia,550, 11–27. doi:10.1007/s10750-005-4356-2.
Picone, M., Bergamin, M., Arizzi Novelli, A., Noventa,S., Delaney, E., Barbanti, A., et al. (2008). Evalua-tion of Corophium orientale as bioindicator for VeniceLagoon: Sensitivity assessment and toxicity-score pro-posal. Ecotoxicology and Environmental Safety, 70,174–184. doi:10.1016/j.ecoenv.2006.06.005.
Pomeroy, I. R., Smith, E. E., & Grant, C. M. (1965). Theexchange of phosphate between estuarine water andsediments. Limnology and Oceanography, 10, 167–172.
Priore, G., La Salandra, G., & Villani, P. (1994). The as-cent of Sparidae and Soleidae Fry in the Lesina la-goon (Foggia-Italy). Bollettino della Società Adriaticadi Scienze LXXV, II, 335–351.
Reizopoulou, S., Thessalou-Legaki, M., & Nicolaidou, A.(1996). Assessment of disturbance in Mediterraneanlagoons: An evaluation of methods. Marine Biology(Berlin), 125, 189–197. doi:10.1007/BF00350773.
Sardà, R., Foreman, K., & Valiela, I. (1995). Macroin-fauna of a southern New England salt marsh, seasonaldynamics and production. Marine Biology (Berlin),121, 431–445. doi:10.1007/BF00349452.
256 Environ Monit Assess (2010) 160:237–256
Schleyer, M. H., & Roberts, G. A. (1987). Detritus cyclingin a shallow coastal lagoon in Natal, South Africa.Journal of Experimental Marine Biology and Ecology,110, 27–40. doi:10.1016/0022-0981(87)90064-5.
Selig, U. (2003). Particle size-related phosphate bindingand P-release at the sediment–water interface in ashallow German lake. Hydrobiologia, 492, 107–118.doi:10.1023/A:1024865828601.
Sfriso, A., Marcomini, A., Pavoni, B., & Orio, A. A.(1992). Macroalgae, nutrient cycles, and pollutantsin the Lagoon of Venice. Estuaries, 15, 517–528.doi:10.2307/1352394.
Shepard, F. P. (1954). Nomenclature based on sand–silt–clayratios. Journal of Sedimentary Petrology, 24, 151–158.
Shepard, R. N. (1962). The analysis of proximities: Mul-tidimensional scaling with an unknown distancesfunction. Psychometrika, 27, 125–140. doi:10.1007/BF02289630.
Sommerfield, P. J., & Clarke, K. R. (1995). Taxonomiclevels, in marine community studies, revisited. MarineEcology Progress Series, 127, 113–115. doi:10.3354/meps127113.
Sordino, P., Gambi, M. C., & Carrada, G. C. (1989).Spatial–temporal distribution of polychaetes in anItalian coastal lagoon (Lago Fusaro, Naples). Cahiersde Biologie Marine, 30, 375–391.
Sorokin, Y. I., Sorokin, P. Y., & Gnes, A. (1996).Structure and functioning of the anthropogenicallytransformed Comacchio lagoonal ecosystem (Ferrara,Italy). Marine Ecology Progress Series, 133, 57–71.doi:10.3354/meps133057.
Spagnoli, F., Specchiulli, A., Scirocco, T., Carapella, G.,Villani, P., Casolino, G., et al. (2002). The Lago diVarano: Hydrologic characteristics and sediment com-position. Marine Ecology (Berlin), 23(Supp. I), 384–394. doi:10.1111/j.1439-0485.2002.tb00036.x.
Specchiulli, A., Focardi, S., Renzi, M., Scirocco, T., Cilenti,L., Breber, P., et al. (2008). Environmental hetero-geneity patterns and assessment of trophic levels intwo Mediterranean lagoons: Orbetello and Varano,Italy. The Science of the Total Environment, 402, 285–298. doi:10.1016/j.scitotenv.2008.04.052.
Taylor, D. I., Nixon, S. W., Granger, S. L., & Buckley, B.A. (1995). Responses of coastal lagoon plant commu-nities to levels of nutrient enrichment: A mesocosmstudy. Estuaries, 22, 1041–1056. doi:10.2307/1353082.
Tian, J., & Zhou, P. (2008). Phosphorus fractions andadsorption characteristics of floodplain sediments inthe lower reaches of the Hanjiang River, China.Environmental Monitoring and Assessment, 137,233–241.
Vatova, A. (1953). Un triennio di ricerche sulle valli dapesca. Nova Thalassia, II(2), 3–17.
Vermont, R. W., McDowell, A. N., & Sharpley, A. T.(2002). Land use and flow regime effects on phospho-rus chemical dynamics in the fluvial sediment of theWinooski River. Ecological Engineering, 18, 477–487.doi:10.1016/S0925-8574(01)00108-2.
Villani, P., Carapella, G., Scirocco, T., Specchiulli, A.,Maselli, M., Schiamone, R., et al. (2000). Progetto Inte-grato di Recupero e Riqualificazione della Zona Umidadella Laguna di Varano. Technical Reports by Con-sorzio ELTCON, 226 pp.
Wahl, M. H., McKellar, H. N., & Williams, T. M. (1997).Patterns of nutrient loading in forested and urban-ized coastal streams. Journal of Experimental Ma-rine Biology and Ecology, 213, 111–131. doi:10.1016/S0022-0981(97)00012-9.
Warwick, R. M. (1986). A new method for detectingpollution effects on marine macrobenthic communi-ties. Marine Biology (Berlin), 92, 557–562. doi:10.1007/BF00392515.
Warwick, R. M. (1988). The level of taxonomic discrimi-nation required to detect pollution effects on marinebenthic communities. Marine Pollution Bulletin, 19,259–268. doi:10.1016/0025-326X(88)90596-6.
Weisberg, S. B., Ranasinghe, J. A., Dauer, D. M.,Schaffner, L. C., Diaz, R. J., & Frithsen, J. B. (1997).An estuarine Benthic Index of Biotic Integrity (B-IBI) for Chesapeake Bay. Estuaries, 20(1), 149–158.doi:10.2307/1352728.
Wolff, W. J. (1983). Estuarine benthos. In B. H. Ketchum(Ed.), Estuaries and enclosed seas (pp. 151–182).Elsevier: Amsterdam.