SEDIMENT CONCENTRATIONS IN THE RIO PUERCO, NEW ...
12
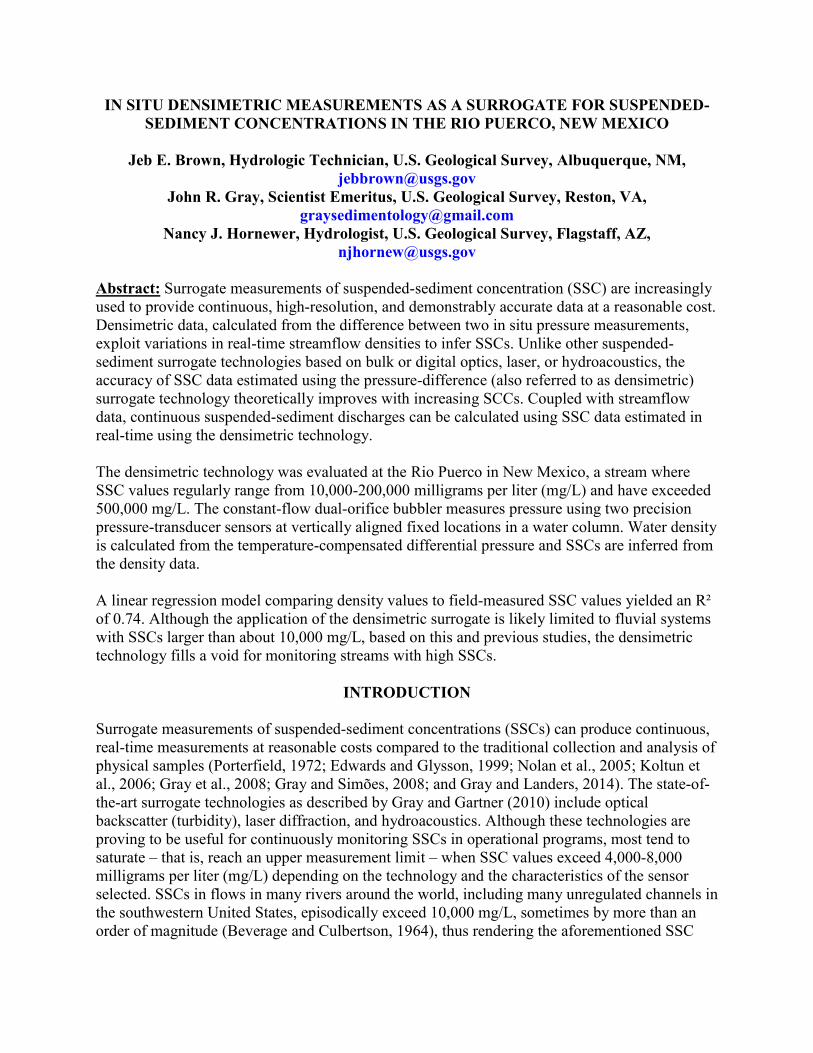
IN SITU DENSIMETRIC MEASUREMENTS AS A SURROGATE FOR SUSPENDED- SEDIMENT CONCENTRATIONS IN THE RIO PUERCO, NEW MEXICO Jeb E. Brown, Hydrologic Technician, U.S. Geological Survey, Albuquerque, NM, [email protected] John R. Gray, Scientist Emeritus, U.S. Geological Survey, Reston, VA, [email protected] Nancy J. Hornewer, Hydrologist, U.S. Geological Survey, Flagstaff, AZ, [email protected] Abstract: Surrogate measurements of suspended-sediment concentration (SSC) are increasingly used to provide continuous, high-resolution, and demonstrably accurate data at a reasonable cost. Densimetric data, calculated from the difference between two in situ pressure measurements, exploit variations in real-time streamflow densities to infer SSCs. Unlike other suspended- sediment surrogate technologies based on bulk or digital optics, laser, or hydroacoustics, the accuracy of SSC data estimated using the pressure-difference (also referred to as densimetric) surrogate technology theoretically improves with increasing SCCs. Coupled with streamflow data, continuous suspended-sediment discharges can be calculated using SSC data estimated in real-time using the densimetric technology. The densimetric technology was evaluated at the Rio Puerco in New Mexico, a stream where SSC values regularly range from 10,000-200,000 milligrams per liter (mg/L) and have exceeded 500,000 mg/L. The constant-flow dual-orifice bubbler measures pressure using two precision pressure-transducer sensors at vertically aligned fixed locations in a water column. Water density is calculated from the temperature-compensated differential pressure and SSCs are inferred from the density data. A linear regression model comparing density values to field-measured SSC values yielded an R² of 0.74. Although the application of the densimetric surrogate is likely limited to fluvial systems with SSCs larger than about 10,000 mg/L, based on this and previous studies, the densimetric technology fills a void for monitoring streams with high SSCs. INTRODUCTION Surrogate measurements of suspended-sediment concentrations (SSCs) can produce continuous, real-time measurements at reasonable costs compared to the traditional collection and analysis of physical samples (Porterfield, 1972; Edwards and Glysson, 1999; Nolan et al., 2005; Koltun et al., 2006; Gray et al., 2008; Gray and Simões, 2008; and Gray and Landers, 2014). The state-of- the-art surrogate technologies as described by Gray and Gartner (2010) include optical backscatter (turbidity), laser diffraction, and hydroacoustics. Although these technologies are proving to be useful for continuously monitoring SSCs in operational programs, most tend to saturate – that is, reach an upper measurement limit – when SSC values exceed 4,000-8,000 milligrams per liter (mg/L) depending on the technology and the characteristics of the sensor selected. SSCs in flows in many rivers around the world, including many unregulated channels in the southwestern United States, episodically exceed 10,000 mg/L, sometimes by more than an order of magnitude (Beverage and Culbertson, 1964), thus rendering the aforementioned SSC
-
Upload
khangminh22 -
Category
Documents
-
view
3 -
download
0
Transcript of SEDIMENT CONCENTRATIONS IN THE RIO PUERCO, NEW ...
IN SITU DENSIMETRIC MEASUREMENTS AS A SURROGATE FOR SUSPENDED-SEDIMENT CONCENTRATIONS IN THE RIO PUERCO, NEW MEXICO
Jeb E. Brown, Hydrologic Technician, U.S. Geological Survey, Albuquerque, NM,
[email protected] John R. Gray, Scientist Emeritus, U.S. Geological Survey, Reston, VA,
[email protected] Nancy J. Hornewer, Hydrologist, U.S. Geological Survey, Flagstaff, AZ,
Abstract: Surrogate measurements of suspended-sediment concentration (SSC) are increasingly used to provide continuous, high-resolution, and demonstrably accurate data at a reasonable cost. Densimetric data, calculated from the difference between two in situ pressure measurements, exploit variations in real-time streamflow densities to infer SSCs. Unlike other suspended-sediment surrogate technologies based on bulk or digital optics, laser, or hydroacoustics, the accuracy of SSC data estimated using the pressure-difference (also referred to as densimetric) surrogate technology theoretically improves with increasing SCCs. Coupled with streamflow data, continuous suspended-sediment discharges can be calculated using SSC data estimated in real-time using the densimetric technology. The densimetric technology was evaluated at the Rio Puerco in New Mexico, a stream where SSC values regularly range from 10,000-200,000 milligrams per liter (mg/L) and have exceeded 500,000 mg/L. The constant-flow dual-orifice bubbler measures pressure using two precision pressure-transducer sensors at vertically aligned fixed locations in a water column. Water density is calculated from the temperature-compensated differential pressure and SSCs are inferred from the density data. A linear regression model comparing density values to field-measured SSC values yielded an R² of 0.74. Although the application of the densimetric surrogate is likely limited to fluvial systems with SSCs larger than about 10,000 mg/L, based on this and previous studies, the densimetric technology fills a void for monitoring streams with high SSCs.
INTRODUCTION Surrogate measurements of suspended-sediment concentrations (SSCs) can produce continuous, real-time measurements at reasonable costs compared to the traditional collection and analysis of physical samples (Porterfield, 1972; Edwards and Glysson, 1999; Nolan et al., 2005; Koltun et al., 2006; Gray et al., 2008; Gray and Simões, 2008; and Gray and Landers, 2014). The state-of-the-art surrogate technologies as described by Gray and Gartner (2010) include optical backscatter (turbidity), laser diffraction, and hydroacoustics. Although these technologies are proving to be useful for continuously monitoring SSCs in operational programs, most tend to saturate – that is, reach an upper measurement limit – when SSC values exceed 4,000-8,000 milligrams per liter (mg/L) depending on the technology and the characteristics of the sensor selected. SSCs in flows in many rivers around the world, including many unregulated channels in the southwestern United States, episodically exceed 10,000 mg/L, sometimes by more than an order of magnitude (Beverage and Culbertson, 1964), thus rendering the aforementioned SSC

surrogate technologies ineffectual when most sediment transport occurs during higher flows. The densimetric SSC surrogate method effectively enables measurements of SSCs – theoretically with improving accuracy – as SSCs rise above about 10,000 mg/L. Although evaluations of the densimetric technology as a surrogate for moderate-to-high SSCs previously have been administered with mixed results (Larsen et al., 2001; Gray et al., 2010), new interest expressed by the Federal Interagency Sedimentation Project, in a surrogate technology capable of operating under high SSCs, has led to revisiting the densimetric technology. Previous Research: Lewis and Rasmussen (1999) used precision-pressure transducers to calculate fluid density in a laboratory using glass-microspheres at an SSC of 542 mg/L to within ± 14 mg/L. Calhoun and Rasmussen (2001) also analyzed differential-pressure readings to estimate SSCs and reported good results in the laboratory. The results of field applications by Calhoun and Rasmussen in two creeks in northern Georgia were less convincing largely due to complications from variations in flow velocity, water temperature, and dissolved solids. Sumi et al. (2002) successfully used two different pressure devices in Japan: (1) a floating, submersible device designed for use in reservoirs, and (2) a differential-pressure device mounted on the banks of a river requiring a submersible pump to deliver water to the sensors. However, the first device was limited to use in reservoirs and the second lacked in situ measurement capability. Hsu and Cai (2010) used two submersible pressure transducers and reported good results in the laboratory. Field results were limited to a single period runoff period, yet the preliminary findings were promising. Larsen et al. (2001) used a prototype dual-orifice bubbler manufactured by Design Analysis Associates, Inc. (use of firm names in this report is for identification purposes only and does not constitute endorsement by the U.S. Geological Survey) for monitoring SSCs in a Puerto Rico stream. The in situ densimetrically derived SSC values generally were synchronous with the runoff hydrograph. However, the authors considered the maximum observed SSC values of about 17,000 mg/L to be marginal with respect to the low-end SSC measurement capability of the non-temperature-corrected device. The technology was considered worthy of additional research in rivers with high SSCs, in part because no other surrogate technology has been identified for monitoring highly concentrated streamflows. The same densimetric dual-orifice bubbler used in Puerto Rico subsequently deployed at the Paria River at Lees Ferry, Arizona (Gray et al., 2010), also yielded mixed results in spite of SSC values that exceeded 100,000 mg/L, or about five times the maximum SSC value measured in the Puerto Rico study. It was surmised that bedforms might have intermittently buried the bottom orifice line, thus rendering as spurious any inferred SSC values. Regarding the Puerto Rico and northern Arizona densimetric tests, Gray et al. (2010) concluded, “In spite of its sound theoretical underpinnings, the field performance of the Double Bubbler in Puerto Rico and northern Arizona, has yet to be fully resolved. Research is continuing into whether development and use of empirical relations from calibration data in lieu of the theoretical considerations are warranted. The required computational scheme presupposes that the SSC in the vertical profile between the sensors is more or less equal to that above the higher sensor. This assumption is difficult to verify and may not be valid. The technology is unreliable
for measuring SSC at less than about 10 g/L [10,000 mg/L], and the actual lower measurement threshold may be at a somewhat larger SSC. The technology is incapable of measuring SSC when the top orifice is out of water. Spurious data are numerous and are believed to be associated with flow turbulence or orifice blockage by bedforms. Continuous pressure-difference measurements may be useful in developing a continuous SSC trace under some circumstances but are not yet considered sufficiently reliable to replace traditional suspended-sediment-monitoring techniques.” In summary, previous studies support the theoretical truism that a positive correlation between SSC and values of fluid density exists in streamflow. However, no previous study has yet conclusively reported reliable, robust field results for inferring SSC values from continuous densimetric measurements. Results of the study described herein add to the knowledge gained from the aforementioned studies by determining the viability of a commercially available instrument for measuring in situ stream water density as a surrogate for SSC.
STUDY SITE AND METHODS Rio Puerco Study Site: The study site (figure 1) is located at the Rio Puerco near Bernardo, New Mexico, U.S. Geological Survey (USGS) streamflow- and suspended-sediment gaging station (08353000) approximately 0.5-mile upstream from the confluence with the Rio Grande. The Rio Puerco is an ephemeral, incised arroyo in northwest New Mexico with a drainage area of 6,080 square miles. Streamflow is generally produced by summer monsoonal storms or dissipating fall tropical storms (Western Regional Climate Center, 2015). The daily discharge record since 1939 reports a maximum of 7,000 cubic feet per second (ft³/s), a median of 39.0 ft³/s and a mean of 126 ft³/s, excluding flows less than 1 ft³/s (USGS, 2015). Except for the headwaters, the stream flows through alluvium and valley fill dominated by fine sand-, silt-, and clay-size sediments in unlimited supply for fluvial transport (Nordin, 1963). The Rio Puerco is renowned for conveying some of the world’s largest SSCs. SSCs regularly range from 10,000 mg/L to 200,000 mg/L; Beverage and Culbertson (1964) reported a value of 564,000 mg/L measured on July 24, 1949.
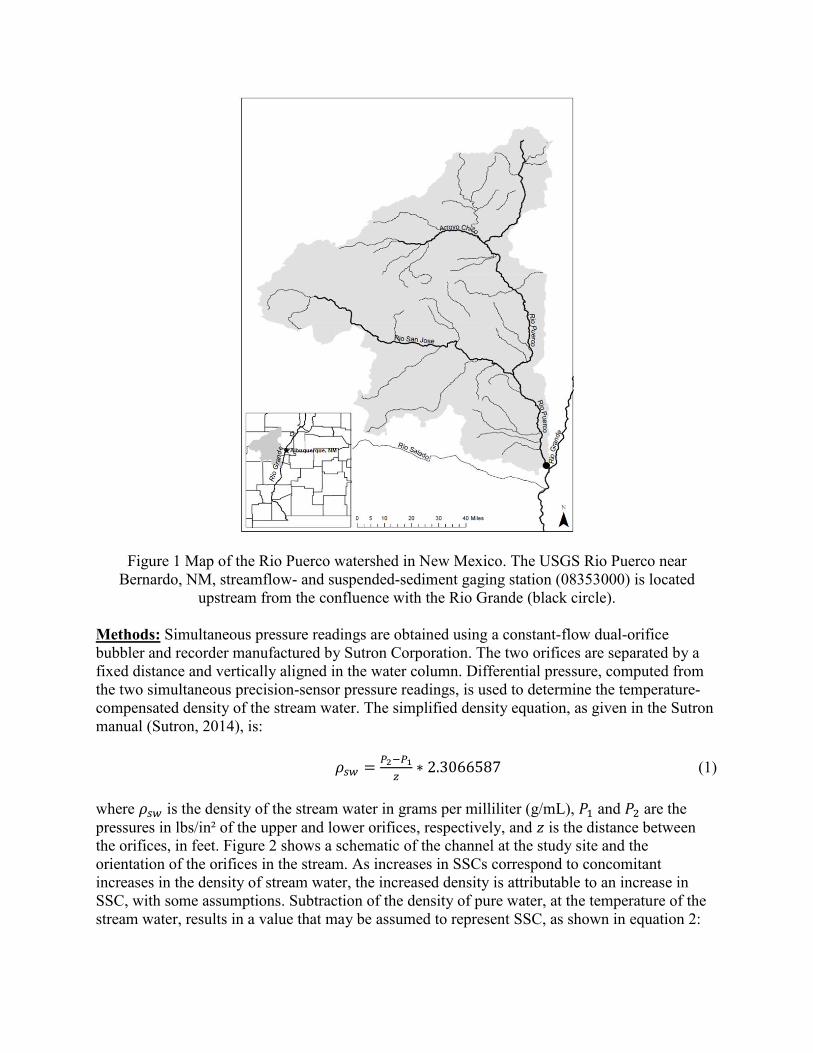
Figure 1 Map of the Rio Puerco watershed in New Mexico. The USGS Rio Puerco near Bernardo, NM, streamflow- and suspended-sediment gaging station (08353000) is located
upstream from the confluence with the Rio Grande (black circle).
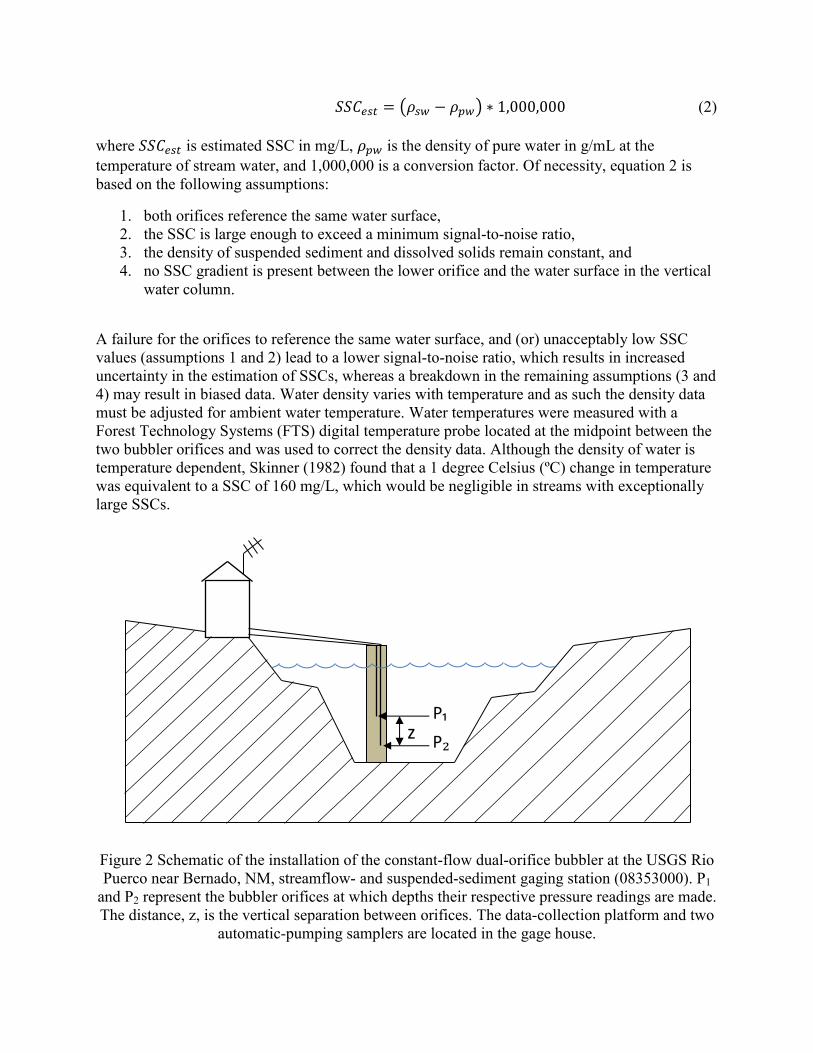
Methods: Simultaneous pressure readings are obtained using a constant-flow dual-orifice bubbler and recorder manufactured by Sutron Corporation. The two orifices are separated by a fixed distance and vertically aligned in the water column. Differential pressure, computed from the two simultaneous precision-sensor pressure readings, is used to determine the temperature-compensated density of the stream water. The simplified density equation, as given in the Sutron manual (Sutron, 2014), is:
𝜌𝑠𝑤 =𝑃2−𝑃1
𝑧∗ 2.3066587 (1)
where 𝜌𝑠𝑤 is the density of the stream water in grams per milliliter (g/mL), 𝑃1 and 𝑃2 are the pressures in lbs/in² of the upper and lower orifices, respectively, and 𝑧 is the distance between the orifices, in feet. Figure 2 shows a schematic of the channel at the study site and the orientation of the orifices in the stream. As increases in SSCs correspond to concomitant increases in the density of stream water, the increased density is attributable to an increase in SSC, with some assumptions. Subtraction of the density of pure water, at the temperature of the stream water, results in a value that may be assumed to represent SSC, as shown in equation 2:
𝑆𝑆𝐶𝑒𝑠𝑡 = (𝜌𝑠𝑤 − 𝜌𝑝𝑤) ∗ 1,000,000 (2) where 𝑆𝑆𝐶𝑒𝑠𝑡 is estimated SSC in mg/L, 𝜌𝑝𝑤 is the density of pure water in g/mL at the temperature of stream water, and 1,000,000 is a conversion factor. Of necessity, equation 2 is based on the following assumptions:
1. both orifices reference the same water surface, 2. the SSC is large enough to exceed a minimum signal-to-noise ratio, 3. the density of suspended sediment and dissolved solids remain constant, and 4. no SSC gradient is present between the lower orifice and the water surface in the vertical
water column.
A failure for the orifices to reference the same water surface, and (or) unacceptably low SSC values (assumptions 1 and 2) lead to a lower signal-to-noise ratio, which results in increased uncertainty in the estimation of SSCs, whereas a breakdown in the remaining assumptions (3 and 4) may result in biased data. Water density varies with temperature and as such the density data must be adjusted for ambient water temperature. Water temperatures were measured with a Forest Technology Systems (FTS) digital temperature probe located at the midpoint between the two bubbler orifices and was used to correct the density data. Although the density of water is temperature dependent, Skinner (1982) found that a 1 degree Celsius (ºC) change in temperature was equivalent to a SSC of 160 mg/L, which would be negligible in streams with exceptionally large SSCs.
Figure 2 Schematic of the installation of the constant-flow dual-orifice bubbler at the USGS Rio Puerco near Bernado, NM, streamflow- and suspended-sediment gaging station (08353000). P1
and P2 represent the bubbler orifices at which depths their respective pressure readings are made. The distance, z, is the vertical separation between orifices. The data-collection platform and two
automatic-pumping samplers are located in the gage house.
P₁
P₂ z
The two orifices at which pressure measurements were made were mounted in the channel with a vertical separation of 2 feet. Subsequent differential-pressure measurements require that the upper orifice be submerged by at least 0.2 foot. In general, the larger the separation between orifices and the greater the depth over the upper orifice, the stronger the derived signal-to-noise ratio, ergo, the greater accuracy of the computed SSCs. Water samples for subsequent SSC analyses were collected using two automatic-pumping samplers (Teledyne ISCO 6712) with intake lines mounted in close proximity to the lower bubbler orifice. The samplers were triggered using a 1640 liquid-level actuator manufactured by Teledyne ISCO and samples were collected every 30 minutes during liquid-level actuator submergence. These point samples were compared with suspended-sediment samples collected manually with a depth-integrating isokinetic sampler using the equal-width-increment methods following USGS sampling protocols (Edwards and Glysson, 1999; Nolan et al., 2005; Gray et al., 2008; Gray and Landers, 2014). Samples were analyzed at the USGS New Mexico Water Science Center’s sediment laboratory by methods described by Guy (1969). The comparison showed that suspended sediment in the stream is well mixed at this site.
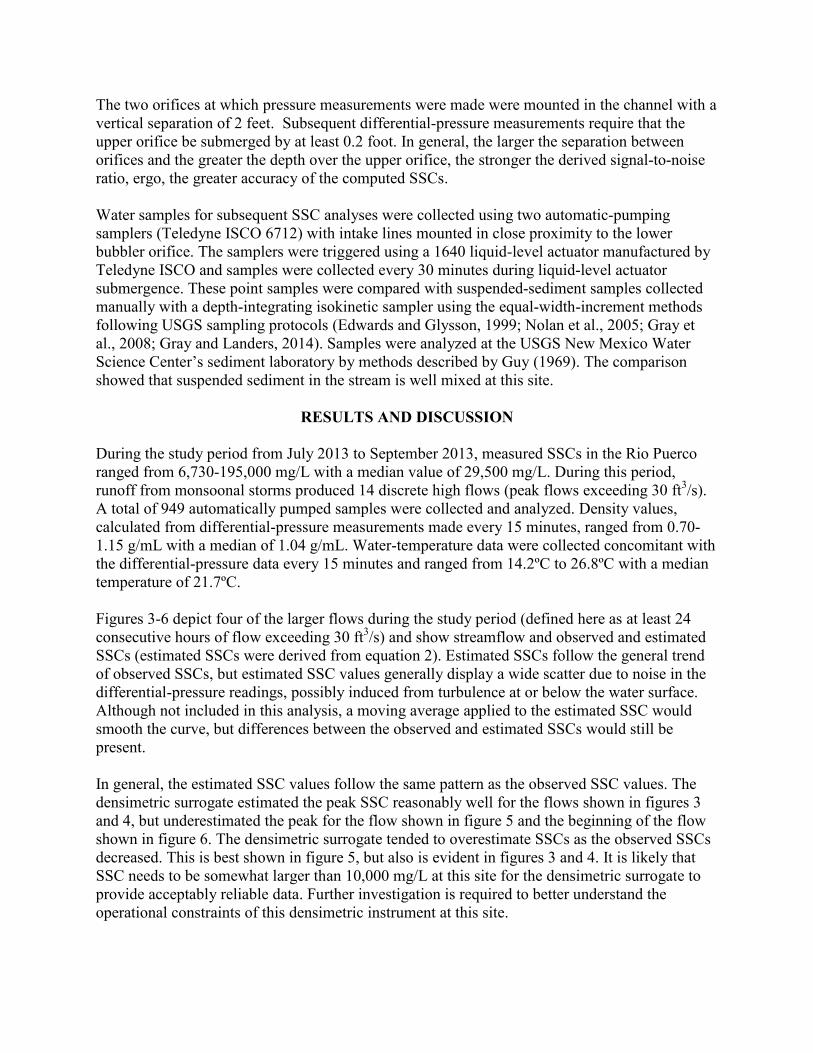
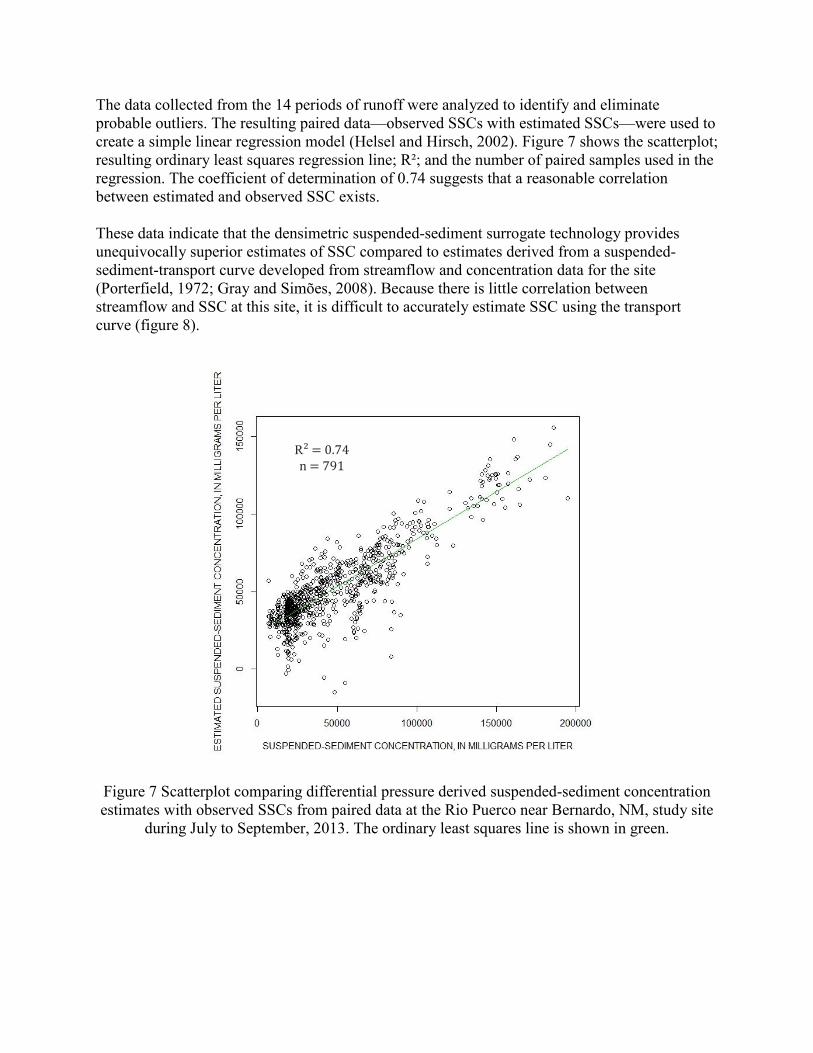
RESULTS AND DISCUSSION During the study period from July 2013 to September 2013, measured SSCs in the Rio Puerco ranged from 6,730-195,000 mg/L with a median value of 29,500 mg/L. During this period, runoff from monsoonal storms produced 14 discrete high flows (peak flows exceeding 30 ft3/s). A total of 949 automatically pumped samples were collected and analyzed. Density values, calculated from differential-pressure measurements made every 15 minutes, ranged from 0.70-1.15 g/mL with a median of 1.04 g/mL. Water-temperature data were collected concomitant with the differential-pressure data every 15 minutes and ranged from 14.2ºC to 26.8ºC with a median temperature of 21.7ºC. Figures 3-6 depict four of the larger flows during the study period (defined here as at least 24 consecutive hours of flow exceeding 30 ft3/s) and show streamflow and observed and estimated SSCs (estimated SSCs were derived from equation 2). Estimated SSCs follow the general trend of observed SSCs, but estimated SSC values generally display a wide scatter due to noise in the differential-pressure readings, possibly induced from turbulence at or below the water surface. Although not included in this analysis, a moving average applied to the estimated SSC would smooth the curve, but differences between the observed and estimated SSCs would still be present. In general, the estimated SSC values follow the same pattern as the observed SSC values. The densimetric surrogate estimated the peak SSC reasonably well for the flows shown in figures 3 and 4, but underestimated the peak for the flow shown in figure 5 and the beginning of the flow shown in figure 6. The densimetric surrogate tended to overestimate SSCs as the observed SSCs decreased. This is best shown in figure 5, but also is evident in figures 3 and 4. It is likely that SSC needs to be somewhat larger than 10,000 mg/L at this site for the densimetric surrogate to provide acceptably reliable data. Further investigation is required to better understand the operational constraints of this densimetric instrument at this site.
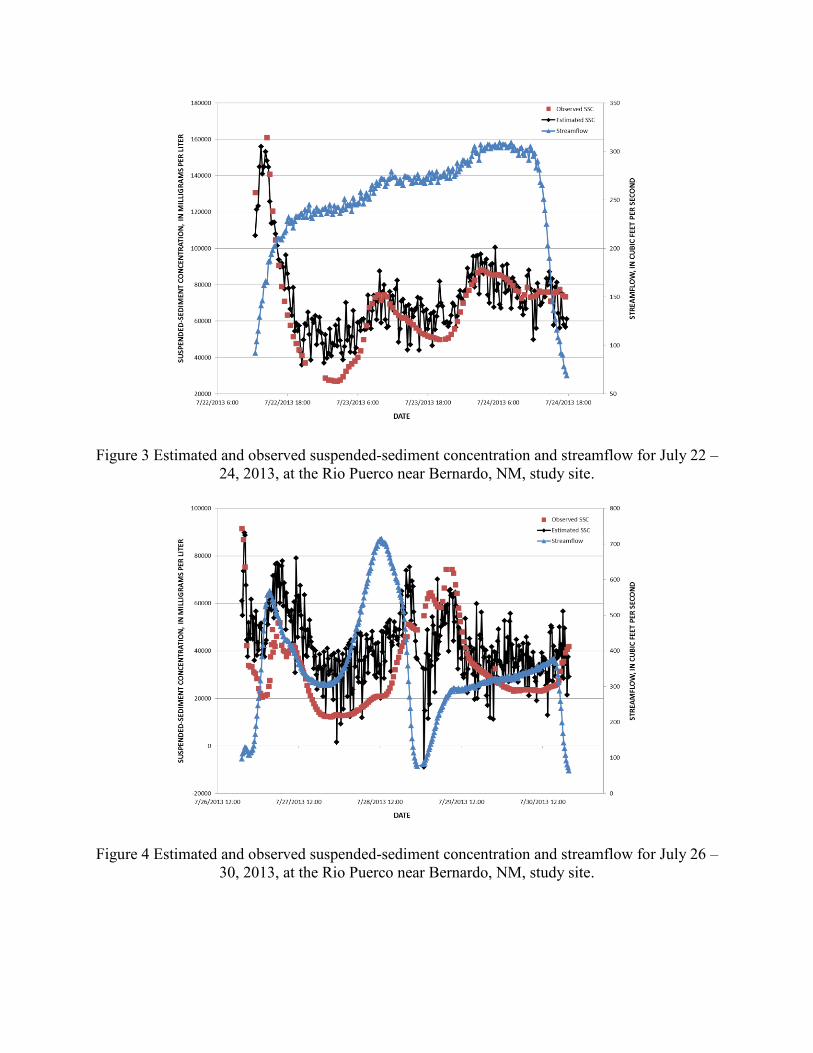
Figure 3 Estimated and observed suspended-sediment concentration and streamflow for July 22 –
24, 2013, at the Rio Puerco near Bernardo, NM, study site.
Figure 4 Estimated and observed suspended-sediment concentration and streamflow for July 26 – 30, 2013, at the Rio Puerco near Bernardo, NM, study site.
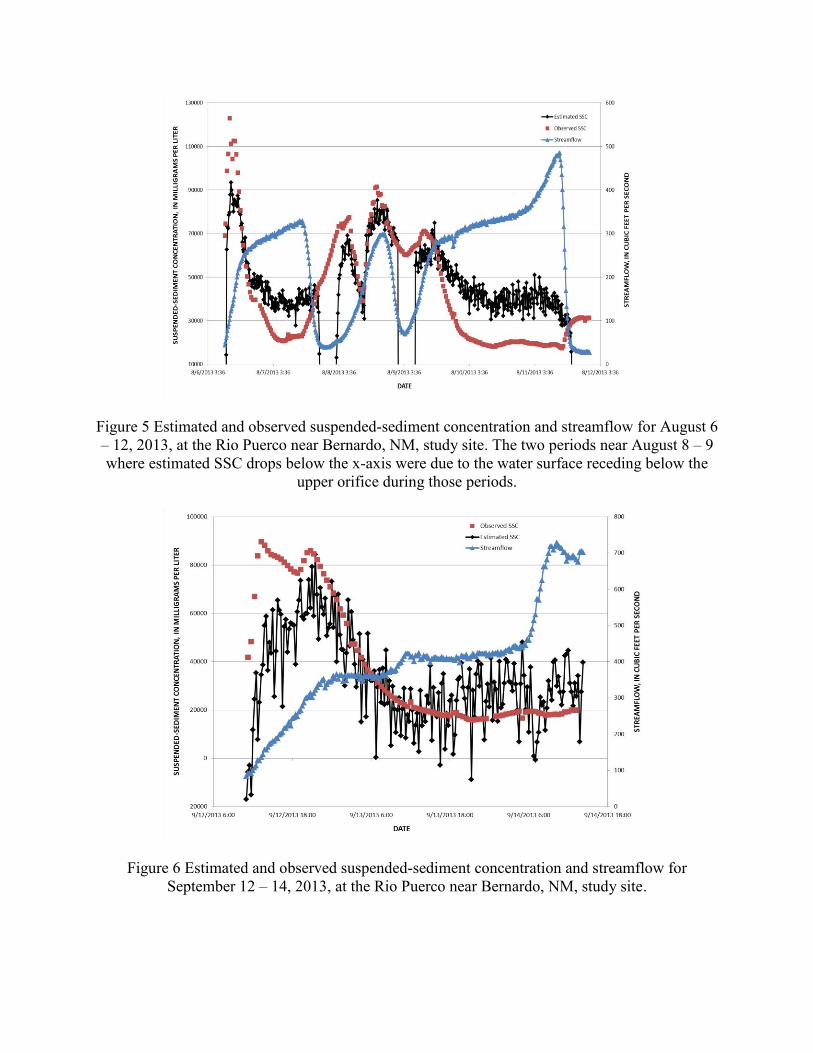
Figure 5 Estimated and observed suspended-sediment concentration and streamflow for August 6 – 12, 2013, at the Rio Puerco near Bernardo, NM, study site. The two periods near August 8 – 9 where estimated SSC drops below the x-axis were due to the water surface receding below the
upper orifice during those periods.
Figure 6 Estimated and observed suspended-sediment concentration and streamflow for September 12 – 14, 2013, at the Rio Puerco near Bernardo, NM, study site.
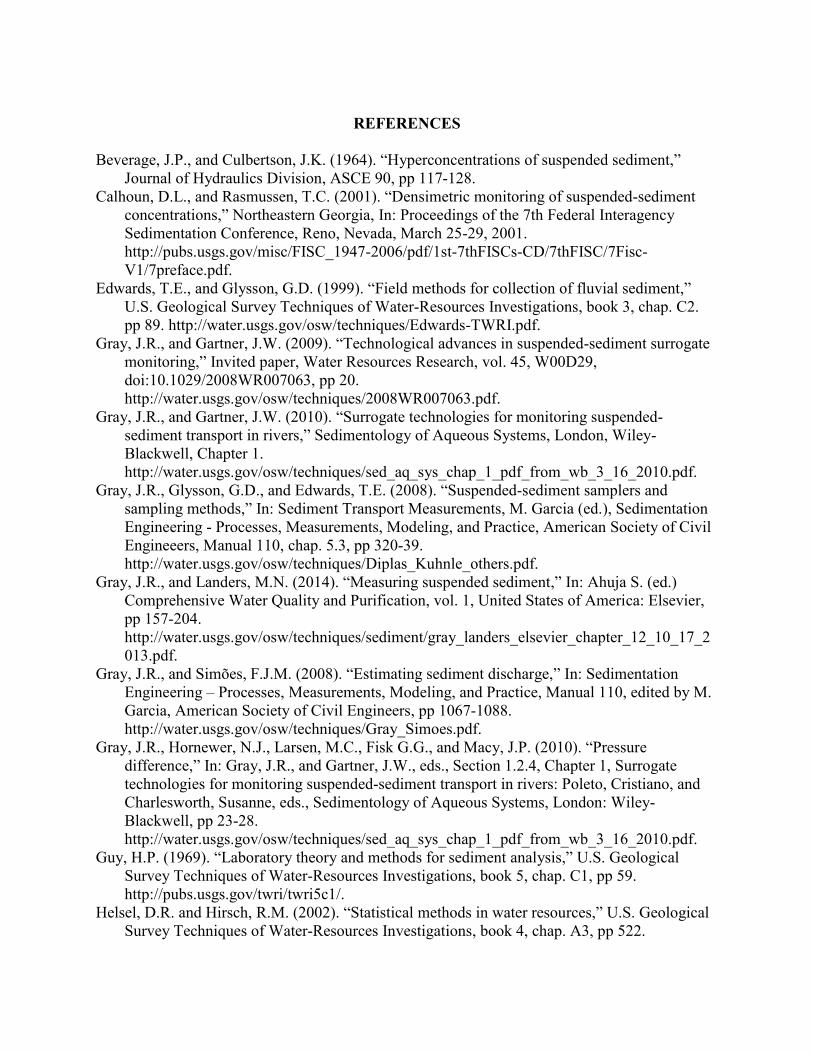
The data collected from the 14 periods of runoff were analyzed to identify and eliminate probable outliers. The resulting paired data—observed SSCs with estimated SSCs—were used to create a simple linear regression model (Helsel and Hirsch, 2002). Figure 7 shows the scatterplot; resulting ordinary least squares regression line; R²; and the number of paired samples used in the regression. The coefficient of determination of 0.74 suggests that a reasonable correlation between estimated and observed SSC exists. These data indicate that the densimetric suspended-sediment surrogate technology provides unequivocally superior estimates of SSC compared to estimates derived from a suspended-sediment-transport curve developed from streamflow and concentration data for the site (Porterfield, 1972; Gray and Simões, 2008). Because there is little correlation between streamflow and SSC at this site, it is difficult to accurately estimate SSC using the transport curve (figure 8).
Figure 7 Scatterplot comparing differential pressure derived suspended-sediment concentration estimates with observed SSCs from paired data at the Rio Puerco near Bernardo, NM, study site
during July to September, 2013. The ordinary least squares line is shown in green.
R² = 0.74 n = 791
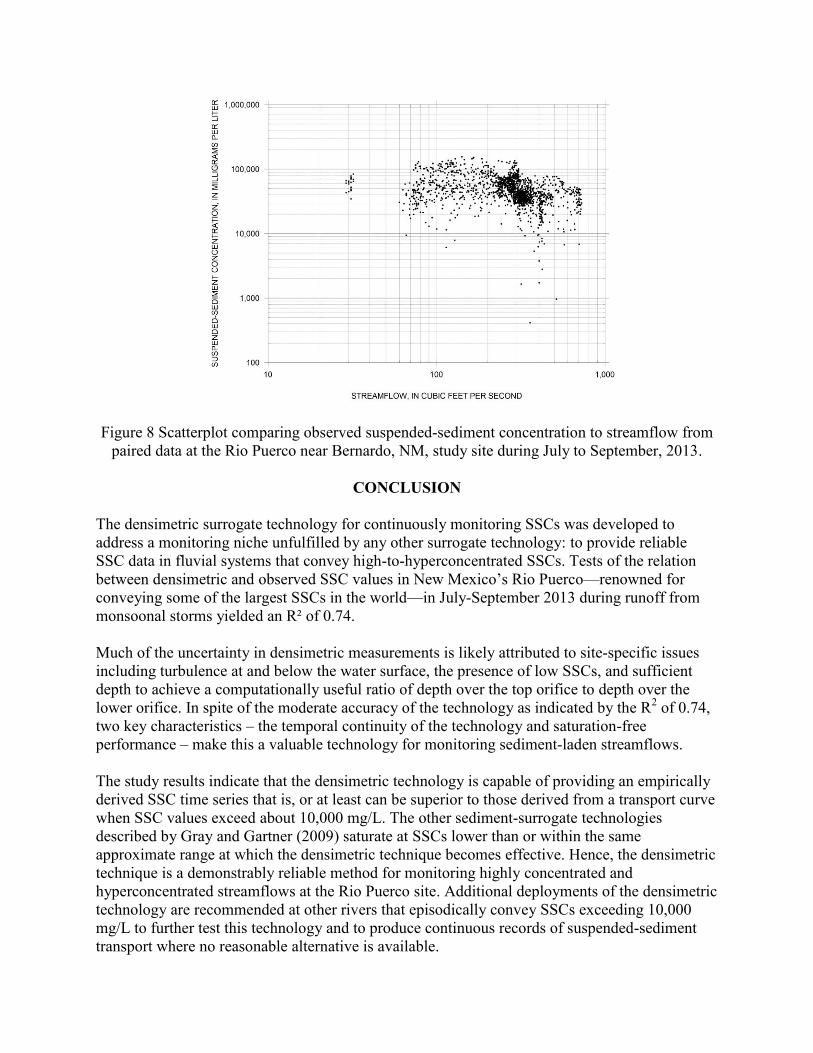
Figure 8 Scatterplot comparing observed suspended-sediment concentration to streamflow from paired data at the Rio Puerco near Bernardo, NM, study site during July to September, 2013.
CONCLUSION
The densimetric surrogate technology for continuously monitoring SSCs was developed to address a monitoring niche unfulfilled by any other surrogate technology: to provide reliable SSC data in fluvial systems that convey high-to-hyperconcentrated SSCs. Tests of the relation between densimetric and observed SSC values in New Mexico’s Rio Puerco—renowned for conveying some of the largest SSCs in the world—in July-September 2013 during runoff from monsoonal storms yielded an R² of 0.74. Much of the uncertainty in densimetric measurements is likely attributed to site-specific issues including turbulence at and below the water surface, the presence of low SSCs, and sufficient depth to achieve a computationally useful ratio of depth over the top orifice to depth over the lower orifice. In spite of the moderate accuracy of the technology as indicated by the R2 of 0.74, two key characteristics – the temporal continuity of the technology and saturation-free performance – make this a valuable technology for monitoring sediment-laden streamflows. The study results indicate that the densimetric technology is capable of providing an empirically derived SSC time series that is, or at least can be superior to those derived from a transport curve when SSC values exceed about 10,000 mg/L. The other sediment-surrogate technologies described by Gray and Gartner (2009) saturate at SSCs lower than or within the same approximate range at which the densimetric technique becomes effective. Hence, the densimetric technique is a demonstrably reliable method for monitoring highly concentrated and hyperconcentrated streamflows at the Rio Puerco site. Additional deployments of the densimetric technology are recommended at other rivers that episodically convey SSCs exceeding 10,000 mg/L to further test this technology and to produce continuous records of suspended-sediment transport where no reasonable alternative is available.
REFERENCES
Beverage, J.P., and Culbertson, J.K. (1964). “Hyperconcentrations of suspended sediment,”
Journal of Hydraulics Division, ASCE 90, pp 117-128. Calhoun, D.L., and Rasmussen, T.C. (2001). “Densimetric monitoring of suspended-sediment
concentrations,” Northeastern Georgia, In: Proceedings of the 7th Federal Interagency Sedimentation Conference, Reno, Nevada, March 25-29, 2001. http://pubs.usgs.gov/misc/FISC_1947-2006/pdf/1st-7thFISCs-CD/7thFISC/7Fisc-V1/7preface.pdf.
Edwards, T.E., and Glysson, G.D. (1999). “Field methods for collection of fluvial sediment,” U.S. Geological Survey Techniques of Water-Resources Investigations, book 3, chap. C2. pp 89. http://water.usgs.gov/osw/techniques/Edwards-TWRI.pdf.
Gray, J.R., and Gartner, J.W. (2009). “Technological advances in suspended-sediment surrogate monitoring,” Invited paper, Water Resources Research, vol. 45, W00D29, doi:10.1029/2008WR007063, pp 20. http://water.usgs.gov/osw/techniques/2008WR007063.pdf.
Gray, J.R., and Gartner, J.W. (2010). “Surrogate technologies for monitoring suspended-sediment transport in rivers,” Sedimentology of Aqueous Systems, London, Wiley-Blackwell, Chapter 1. http://water.usgs.gov/osw/techniques/sed_aq_sys_chap_1_pdf_from_wb_3_16_2010.pdf.
Gray, J.R., Glysson, G.D., and Edwards, T.E. (2008). “Suspended-sediment samplers and sampling methods,” In: Sediment Transport Measurements, M. Garcia (ed.), Sedimentation Engineering - Processes, Measurements, Modeling, and Practice, American Society of Civil Engineeers, Manual 110, chap. 5.3, pp 320-39. http://water.usgs.gov/osw/techniques/Diplas_Kuhnle_others.pdf.
Gray, J.R., and Landers, M.N. (2014). “Measuring suspended sediment,” In: Ahuja S. (ed.) Comprehensive Water Quality and Purification, vol. 1, United States of America: Elsevier, pp 157-204. http://water.usgs.gov/osw/techniques/sediment/gray_landers_elsevier_chapter_12_10_17_2013.pdf.
Gray, J.R., and Simões, F.J.M. (2008). “Estimating sediment discharge,” In: Sedimentation Engineering – Processes, Measurements, Modeling, and Practice, Manual 110, edited by M. Garcia, American Society of Civil Engineers, pp 1067-1088. http://water.usgs.gov/osw/techniques/Gray_Simoes.pdf.
Gray, J.R., Hornewer, N.J., Larsen, M.C., Fisk G.G., and Macy, J.P. (2010). “Pressure difference,” In: Gray, J.R., and Gartner, J.W., eds., Section 1.2.4, Chapter 1, Surrogate technologies for monitoring suspended-sediment transport in rivers: Poleto, Cristiano, and Charlesworth, Susanne, eds., Sedimentology of Aqueous Systems, London: Wiley-Blackwell, pp 23-28. http://water.usgs.gov/osw/techniques/sed_aq_sys_chap_1_pdf_from_wb_3_16_2010.pdf.
Guy, H.P. (1969). “Laboratory theory and methods for sediment analysis,” U.S. Geological Survey Techniques of Water-Resources Investigations, book 5, chap. C1, pp 59. http://pubs.usgs.gov/twri/twri5c1/.
Helsel, D.R. and Hirsch, R.M. (2002). “Statistical methods in water resources,” U.S. Geological Survey Techniques of Water-Resources Investigations, book 4, chap. A3, pp 522.
Hsu, Y., and Cai, J. (2010). “Densimetric monitoring technique for suspended-sediment concentrations,” Journal of Hydraulic Engineering, ASCE, 2010.136, pp 67-73.
Koltun, G.F., Eberle, M., Gray, J.R., and Glysson, G.D. (2006). “User’s manual for the Graphical Constituent Loading Analysis System (GCLAS),” U.S. Geological Survey Techniques and Methods, book 4, chap. C1, pp 50. http://pubs.er.usgs.gov/usgspubs/tm/tm4C1.
Larsen, M.C., Figueroa-Alamo, C., Gray, J.R., and Fletcher, William (2001). “Continuous automated sensing of streamflow density as a surrogate for suspended-sediment concentration sampling,” In: Proceedings of the 7th Federal Interagency Sedimentation Conference, Reno, Nevada, March 25-29, 2001. http://pubs.usgs.gov/misc/FISC_1947-2006/pdf/1st-7thFISCs-CD/7thFISC/7Fisc-V1/7preface.pdf.
Lewis, A.J., and Rasmussen, T.C. (1999). “Determination of suspended sediment concentrations and particle size distributions using pressure measurements,” Journal of Environmental Quality, 28, pp 1490-96.
Nolan, K.M., Gray, J.R., and Glysson, G.D. (2005). “Introduction to suspended-sediment sampling,” U.S. Geological Survey Scientific Investigations Report 2005-5077. http://pubs.er.usgs.gov/pubs/sir/sir20055077.
Nordin, C.F., Jr. (1963). “A preliminary study of sediment transport parameters, Rio Puerco near Bernardo, New Mexico,” U.S. Geological Survey Professional Paper 462-C, pp 21. http://pubs.er.usgs.gov/publication/pp462C.
Porterfield, G. (1972). “Computation of fluvial-sediment discharge,” U.S. Geological Survey, Techniques of Water-Resources Investigations, book 3, chap. C3, pp 66. http://water.usgs.gov/pubs/twri/twri3-c3/.
Skinner, J.V. (1982). “A fluid-density gage for measuring suspended-sediment concentration,” Part A, in Measurement and Analysis of Sediment Loads in Streams, Federal Interagency Sedimentation Project, 125 P.; http://water.usgs.gov/fisp/docs/Report_X.pdf.
Sumi, T., Morita, S., Ochi, T., and Komiya, H. (2002). “Development of the suspended-sediment concentration measuring system with differential pressure transmitter in rivers and reservoirs,” In: Proceedings of the Hydraulic Measurements and Experimental Methods Conference, ASCE.
Sutron (2014). “Accubar constant flow bubble gauge/recorder 56-0133 and dual orifice bubble gauge/recorder 56-0134 operations & maintenance manual,” revision – 1.73, February 14th, 2014. http://www.sutron.com/documents/constant-flow-bubblers-manual-5.pdf.
U.S. Geological Survey (2015). “USGS 08353000 Rio Puerco near Bernardo, New Mexico,” U.S. Geological Survey National Water Information System. http://waterdata.usgs.gov/usa/nwis/uv?site_no=08353000.
Western Regional Climate Center, 2015. “Climate of New Mexico,” http://www.wrcc.dri.edu/narratives/newmexico/.