Importance of sieve size in deep-sea macrobenthic studies
25
1 Importance of sieve size in deep-sea macrobenthic studies Sini Pavithran, *Baban Ingole, Mandar Nanajkar, Reshma Goltekar National Institute of Oceanography, Dona-Paula, Goa. India. Phone no: +91-832-2450242 Fax no: +91-832-2450606 [email protected] , [email protected] , [email protected] , [email protected] ABSTRACT The deep-sea is well known for high benthic biodiversity despite being a low-food environment. However, most deep-sea organisms are very small in size as an adaptation to food limitation. Macrofauna are generally considered to be organisms larger than 0.5 mm and smaller than 3 cm. However, the smaller body size of fauna in the deep sea has led to the use of mesh sizes ranging between 0.25 to 0.5 mm to collect macrofauna, 0.3 and 0.5 mm being the most commonly used mesh sizes for deep-sea sampling. In this study, we tested the effectiveness of sieves of two different mesh sizes (0.3 and 0.5 mm) in assessing macrofaunal diversity, density and biomass. A total of 66 species were obtained with the smaller mesh (0.3 mm), while the larger mesh (0.5 mm) retained only 40 macrofaunal species. Thus, use of larger mesh resulted in the loss of 39% species over the smaller mesh (p=0.0001). However, both sieves yielded high densities of organisms, high species diversity and steep rarefaction curves for nematodes and polychaetes. Using the larger mesh resulted in a significant loss in biomass of 90% and 78% for polychaetes and nematodes respectively. Vertically in the sediment, faunal density was sampled more effectively with the smaller mesh sieve. Our results show a significant reduction in the Author version: Mar. Biol. Res.: 5(4); 2009; 391-398 The final and definitive form of the preprint has been published in the "Marine Biology Research" © 2009 Taylor & Francis; "Marine Biology Research" is available online at http://www.informaworld.com/ with open URL of artilce : http://www.informaworld.com/openurl?genre=article&issn=1745?1019&volume=5&spage=391
Transcript of Importance of sieve size in deep-sea macrobenthic studies

1
Importance of sieve size in deep-sea macrobenthic studies
Sini Pavithran, *Baban Ingole, Mandar Nanajkar, Reshma Goltekar
National Institute of Oceanography, Dona-Paula, Goa.India.Phone no: +91-832-2450242 Fax no: +91-832-2450606 [email protected],[email protected],[email protected],[email protected]
ABSTRACT
The deep-sea is well known for high benthic biodiversity despite being a low-food
environment. However, most deep-sea organisms are very small in size as an adaptation
to food limitation. Macrofauna are generally considered to be organisms larger than 0.5
mm and smaller than 3 cm. However, the smaller body size of fauna in the deep sea has
led to the use of mesh sizes ranging between 0.25 to 0.5 mm to collect macrofauna, 0.3
and 0.5 mm being the most commonly used mesh sizes for deep-sea sampling. In this
study, we tested the effectiveness of sieves of two different mesh sizes (0.3 and 0.5 mm)
in assessing macrofaunal diversity, density and biomass. A total of 66 species were
obtained with the smaller mesh (0.3 mm), while the larger mesh (0.5 mm) retained only
40 macrofaunal species. Thus, use of larger mesh resulted in the loss of 39% species over
the smaller mesh (p=0.0001). However, both sieves yielded high densities of organisms,
high species diversity and steep rarefaction curves for nematodes and polychaetes. Using
the larger mesh resulted in a significant loss in biomass of 90% and 78% for polychaetes
and nematodes respectively. Vertically in the sediment, faunal density was sampled more
effectively with the smaller mesh sieve. Our results show a significant reduction in the
Author version: Mar. Biol. Res.: 5(4); 2009; 391-398
The final and definitive form of the preprint has been published in the "Marine Biology Research" © 2009 Taylor & Francis; "Marine Biology Research" is available online at http://www.informaworld.com/ with open URL of artilce : http://www.informaworld.com/openurl?genre=article&issn=1745?1019&volume=5&spage=391
2
number of species, organism density, and biomass of macrofauna with use of a 0.5 mm
mesh rather than a 0.3 mm mesh and that a sieve of lower mesh size is more suitable for
evaluation of deep-sea macrofauna.
Key words: Abyssal, biomass, density, diversity, macrofauna, mesh size
INTRODUCTION
Among deep-sea organisms, both gigantism and dwarfism occur, evolutionary trends that
can be explained by selection on optimal foraging strategies (Gage and Tyler 1991).
Deep-sea dwarfism is common among a variety of taxa (Shirayama and Horikoshi 1989,
Gage et al 2002, Kaariainen and Bett 2006, Rex et al. 2006). In contrast a few deep-sea
taxa, arthropods in particular, exhibit deep-sea gigantism (Timofeev 2001) including
giant isopods, amphipods, and pycnogonid "spiders". However, studies have revealed that
the average size of individuals becomes smaller with increasing water depth, suggesting
that overall dwarfism is a more common phenomenon than gigantism in the deep sea
(Shirayama and Horikoshi 1989). Numerous biological measures (metabolism, faunal
abundance, biomass production, nutrient recycling, home range size) have been shown to
correlate strongly with individual body size (Peters 1983; Schmidt-Nielsen 1984; Brown
et al. 2004; Kaariainen and Bett 2006). Most studies have argued that food limitation may
be the major contributing factor in controlling optimal body size of deep-sea benthic
organisms, resulting in the predominance of smaller body sizes (Thiel 1975, 1979;
Kaariainen and Bett 2006; Rex et al. 2006). In a food limited environment, the
advantages of having either large or small body size is explained by Thiel (1975). He
suggests that, although the cost of maintaining a given biomass of smaller organisms is
The final and definitive form of the preprint has been published in the "Marine Biology Research" © 2009 Taylor & Francis; "Marine Biology Research" is available online at http://www.informaworld.com/ with open URL of artilce : http://www.informaworld.com/openurl?genre=article&issn=1745?1019&volume=5&spage=391

3
higher than that required to maintain the same biomass of larger organisms, the high
individual food demands of larger animals and the requirements to maintain a critical
population density for reproduction generally favours small body size. The benthic body
size miniaturization hypothesis states that deep-sea communities are dominated by
organisms of small body size (Kaariainen and Bett 2006). Several studies have examined
the effect of sieve size on deep-sea faunal collection (Shirayama and Horikoshi 1989,
Gage et al, 2002) and have recommended the use of increasingly smaller meshed sieves
to study the deep-sea macrofauna. The present study aimed to test the influence of two
different mesh sizes (0.3 mm and 0.5 mm) on deep-sea macrofaunal collection.
The present study was undertaken in the Central Indian Ocean Basin (CIOB), an area of
potential mining activity due to its very high abundance of polymetallic nodules (Prasad
2007), and an area poorly studied in comparison to the Atlantic and Pacific Ocean in
terms of deep-sea biology and taxonomy (Ingole and Koslow 2005).
MATERIALS AND METHODS
Sample processing
A total of 23 stations were sampled onboard R.V. Akademic Boris Petrov from the CIOB
(Fig. 1a & b) between latitude 100 and 16.10 S and longitudes 74.50 and 76.50 E at a water
depth ranging between 4252-5693 m (mean: 5221 m). A single box core sediment sample
was collected with a 0.25 m2 spade box corer (50X50X50 cm size) from each station. To
study the general distribution and composition of macrofauna, three subsamples
(15X15X10 cm) were collected from each box core, each subsample from a different
The final and definitive form of the preprint has been published in the "Marine Biology Research" © 2009 Taylor & Francis; "Marine Biology Research" is available online at http://www.informaworld.com/ with open URL of artilce : http://www.informaworld.com/openurl?genre=article&issn=1745?1019&volume=5&spage=391

4
quadrant of the core. In addition, the vertical distribution of macrofauna was studied by
using a single sediment core sample (PVC coring tube; 12 cm dia. 50 cm length) from the
same box core. The cylindrical core samples were sectioned at a sediment depth of 2, 5,
10, 15, 20, 25 and 30 cm. All sub-samples were preserved in neutralized 5% formalin-
Rose bengal solution prepared in filtered seawater. These samples were later sieved using
two sieves one above the other, the upper sieve being the 0.5 mm and the lower sieve was
0.3 mm. The organisms retained on the respective sieves were collected and sorted
group-wise. Subsequently, specimens were identified to the lowest taxonomic level
possible under a stereomicroscope.
Biomass estimations
The macrofaunal samples were blotted dry with blotting paper. The blotted wet weight of
the macrofaunal groups was measured, using a Mettler Toleda balance (0.000001 g
precision). This data was used to estimate the total biomass as ash-free dry weight
(AFDW) in grams using conventional conversion factors for each of the faunal groups.
These were Polychaeta = wet weight X 0.155, Crustacea = wet weight X 0.225, Mollusca
= wet weight X 0.085, Echinodermata = wet weight X 0.08, miscellaneous groups
including Porifera and Bryozoa = wet weight X 0.155 (Eleftheriou and Basford, 1989).
Data analysis
Macrofaunal group diversity was measured with the software PRIMER (Clark and
Warwick 1994) using the Shannon-Wiener diversity (H’; Shannon and Wiener 1963)
function. Evenness (J; Pielou 1966) and group level richness (d; Margalef 1968) was also
The final and definitive form of the preprint has been published in the "Marine Biology Research" © 2009 Taylor & Francis; "Marine Biology Research" is available online at http://www.informaworld.com/ with open URL of artilce : http://www.informaworld.com/openurl?genre=article&issn=1745?1019&volume=5&spage=391

5
calculated and rarefaction curves of the expected number of species, E(Sn) were
generated using Hurlberts (1971) method. All data were subjected to Shapiro-Wilks test
to check for normality (Statistica 5.5 1999). Mann-Whitney U tests and student’s t-tests
were used to test for significant differences between parameters. Non-parametric Kruskal
Wallis ANOVA was used as a global significance test for differences in macrofaunal
species counts, density and biomass between stations (Statistica 5.5 1999).
RESULTS
Macrobenthic abundance and diversity in the present study showed a marked difference
between the two mesh sizes considered. Density of macrofauna ranged between 0-237
ind.m-2 with the 0.3 mm mesh, while a density of 0-133 ind.m-2 was obtained with the 0.5
mm mesh, resulting in more than a 50% loss in macrofaunal abundance, with the larger
mesh sieve (Table 1). A significant difference was also obtained for the number of
species retained by the two different mesh sizes (Table 1). Significant differences in
macrofaunal density, biomass, and species diversity were also observed between stations
(p<0.001).
Biomass
The macrobenthic biomass retained on the 0.3 mm mesh, ranged between 0 to 2.98 mg.m-
2 (mean: 0.64±0.86sd, n=23), while biomass values for the 0.5 mm mesh was marginally
less, ranging between 0-2.90 mg.m-2 (mean: 0.51±0.79sd, n=23). Polychaetes had the
largest biomass of 0.38 mg.m-2 among the macrofauna retained on the 0.3 mm mesh,
followed next by tanaids (0.12 mg.m-2), then nematodes (0.06 mg.m-2), isopods (0.04
The final and definitive form of the preprint has been published in the "Marine Biology Research" © 2009 Taylor & Francis; "Marine Biology Research" is available online at http://www.informaworld.com/ with open URL of artilce : http://www.informaworld.com/openurl?genre=article&issn=1745?1019&volume=5&spage=391

6
mg.m-2) and harpacticoid copepods (0.03 mg.m-2) (Fig. 2). Bivalves and nemertine
worms had a biomass value of 0.001 and 0.005 mg.m-2, respectively. The biomass of
fauna retained by the 0.5 mm mesh was comparatively low. The greatest difference was a
90% reduction in biomass for polychaetes using the 0.5 mm mesh, followed by a 78%
loss of biomass for nematodes. Tanaidacea showed a loss of 65%, while, Isopoda and
Harpacticoida showed a loss of 45% and 24%, respectively. Bivalves and nemertine
worms did not show any change in biomass between the 0.3 and 0.5 mm mesh. The
overall difference in biomass of macrofauna between the two mesh sieves was
statistically significant (Table 1).
Diversity
A total of 66 species (of 120 individuals) were obtained with the 0.3 mm mesh compared
to only 40 species (of 68 individuals) with the 0.5 mm mesh (Table 2). Of the 120
individuals obtained by the 0.3 mm mesh, nematodes were the dominant group which
consisted of 47 individuals (23 species) followed by polychaetes with 34 individuals (18
species) (Fig. 3a & b). Similarly, with the larger mesh size (0.5mm), of the 68
individuals obtained, 27 were nematodes belonging to 14 species and 20 were
polychaetes belonging to 11 species (Fig. 3a & b).
Thus, the 0.5 mm mesh retained only 57% of the total number of individuals obtained
with the 0.3 mm mesh. Furthermore, in terms of number of species, only 61% of the
species were retained with the 0.5 mm mesh, illustrating that the use of the larger sieve
resulted in the loss of 43% of individuals and 39% of total species. Among the
The final and definitive form of the preprint has been published in the "Marine Biology Research" © 2009 Taylor & Francis; "Marine Biology Research" is available online at http://www.informaworld.com/ with open URL of artilce : http://www.informaworld.com/openurl?genre=article&issn=1745?1019&volume=5&spage=391

7
macrobenthic groups collected, maximum losses with the larger mesh size occurred with
harpacticoids both in terms of diversity (67%) as well as density (78%). No differences
were observed for bivalves and nemertines which were represented by few specimens (3
bivalves and 1 nemertine). The actual number of species for each group is shown in fig.
3b. Some of the species collected on the 0.3 mm mesh were of very small size and
represented only a single individual.
Shannon’s index (H’) values across all taxa ranged between 0-2.5 for the 0.3 mm mesh,
and were slightly less with the 0.5 mm mesh ranging between 0-2.2. The maximum H’
value obtained using a 0.3 mm mesh was for polychaetes (2.8) followed closely by
nematodes (2.7). With the 0.5 mm mesh the highest diversity values obtained were with
nematodes (2.4), followed by polychaetes (2.2) (Fig. 4b), there were no significant
differences in H’ between the two mesh sizes (Table 1).
Pielous evenness parameter (J) ranged from 0.91 to 1 for the 0.3 mm mesh samples and
for the 0.5 mm mesh between 0.93-1. There were no significant differences in J between
the two mesh sizes (Table 1). With the 0.3 mm mesh, polychaetes had the highest J value
(0.95), whereas the highest J values with the 0.5 mm mesh was observed for
harpacticoids (1.0) (Fig. 4b).
Margalef’s richness measure (d) ranged from 0.9 to 4.6 with the 0.3 mm mesh, while d
values ranged from 1.4-3.6 for the 0.5 mm mesh. However, differences were not
The final and definitive form of the preprint has been published in the "Marine Biology Research" © 2009 Taylor & Francis; "Marine Biology Research" is available online at http://www.informaworld.com/ with open URL of artilce : http://www.informaworld.com/openurl?genre=article&issn=1745?1019&volume=5&spage=391

8
significant between the two mesh sieves (Table 1). The highest d values obtained were
with nematodes and polychaetes with both mesh sizes (Fig. 4a & b).
Hulbert’s expected number of species (E(Sn)) ranged between 0-13 for the 0.3 mm mesh
samples, while values were between 0-9 for the 0.5 mm mesh (Fig. 5). But E(Sn) did not
significantly differ between the two meshes (Table 1). The highest E(Sn) value obtained
was with nematodes followed by polychaetes in both meshes (Fig. 4a & b).
Vertical distribution
Density and Diversity
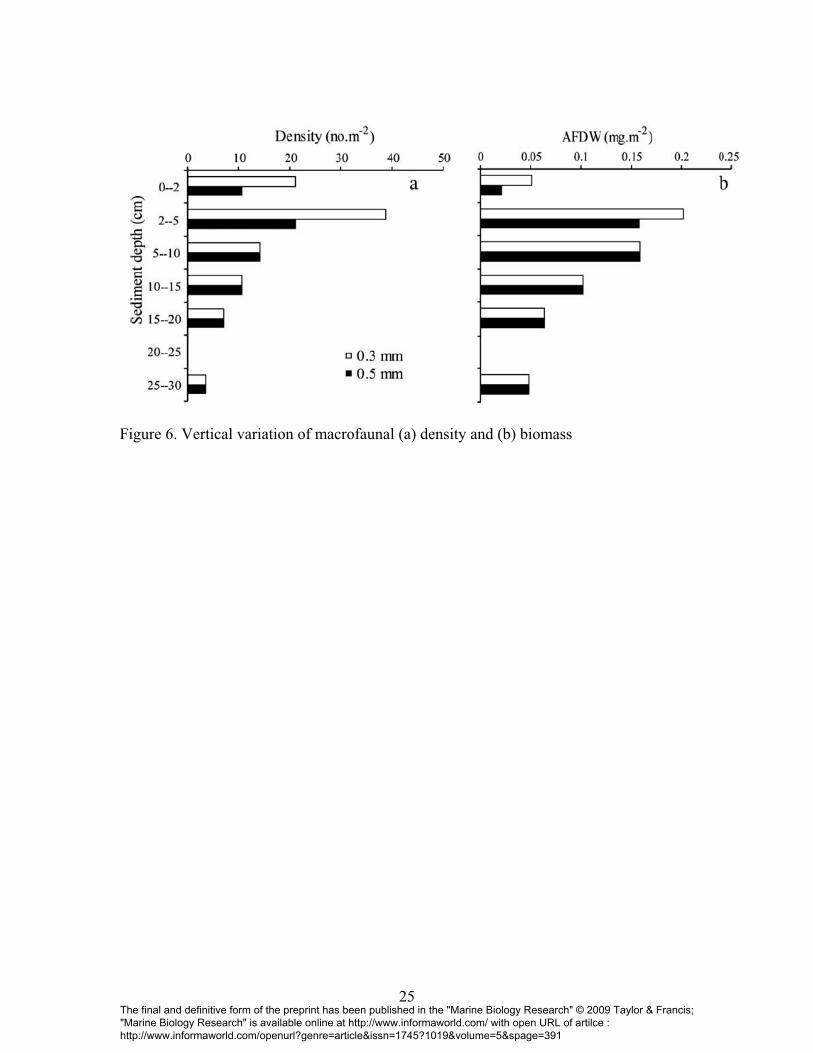
The average density of macrofauna was much higher with the 0.3 mm mesh (60 ind.m-2)
compared to the 0.5 mm mesh (32 ind.m-2) in the top 0-5 cm sediment. Below this depth,
density was similar for both mesh sizes (Fig. 6a). Faunal diversity was also higher in the
top 0-5 cm of sediment using a 0.3 mm mesh compared to the 0.5 mm mesh. Diversity
remained constant for both mesh sizes below 5 cm. Although the average value of faunal
density was lower with the 0.5 mm mesh in the top 5 cm, values did not differ
significantly between the two mesh sizes for the top 5cm sediment (t=1.37, df=6, p=0.22)
as well as for the entire core (40 cm, Table 1).
Biomass
Similar to faunal density measures, average biomass values were higher with the 0.3 mm
mesh compared to the 0.5 mm mesh. The upper 0-2 cm and 2-5 cm sediment layers
averaged, respectively, a 40% and 78% loss of biomass with the 0.5 mm mesh. Below 5
The final and definitive form of the preprint has been published in the "Marine Biology Research" © 2009 Taylor & Francis; "Marine Biology Research" is available online at http://www.informaworld.com/ with open URL of artilce : http://www.informaworld.com/openurl?genre=article&issn=1745?1019&volume=5&spage=391

9
cm, biomass values remained constant for both mesh sizes (Fig. 6b). However,
macrofaunal biomass did not significantly differ between the two sieves in the top 5 cm
(t=0.867, df=6, p=0.42) as well as when the entire core was considered (Table 1).
DISCUSSION
Sieve size influence on the estimation of macrofaunal density, biomass and species
diversity was first documented in coastal waters, wherein use of a 0.5 mm mesh sieve
was found to be more effective than a 1 mm mesh sieve (Reish 1959). Thus 0.5 mm mesh
has been considered the standard size for macrofaunal sampling in the coastal waters.
Due to the low abundance and smaller body size of deep-sea macrofauna, researchers
have been prompted to use smaller mesh sizes in order to retrieve macrofauna in the
deep-sea. Literature surveys have shown the use of sieve sizes ranging between 0.25 to
0.5 mm in deep-sea studies (Sanders et al. 1965; Hessler and Jumars 1974; Gage et al.
2002).
Meio- and macrofaunal organisms in the deep-sea tend towards body size miniaturization
with increased water depth, primarily due to limited food availability, especially at
abyssal depths (Thiel 1979). The Central Indian Ocean has very low surface primary
productivity ranging between 9.06 mg C m-2d-1 to 103.4 mg C m-2d-1 (Matondkar et al.
2005) leading to low sediment organic carbon (Avg. 0.2%). Hence, the food available to
the deep-sea communities in this area is also low, which could explain in part the
diminutive size of macrofauna observed in the present study.
The final and definitive form of the preprint has been published in the "Marine Biology Research" © 2009 Taylor & Francis; "Marine Biology Research" is available online at http://www.informaworld.com/ with open URL of artilce : http://www.informaworld.com/openurl?genre=article&issn=1745?1019&volume=5&spage=391

10
Thus, use of larger sieve sizes (eg. 0.5 mm or 1 mm) for extracting deep-sea metazoans
could potentially underestimate their densities. A significant difference was obtained for
macrofaunal density (>50% loss using 0.5 mm mesh sieve) and biomass between the two
mesh sizes studied (Table 1). Vertical distribution of macrofauna in the sediment did not
generally show a significant difference between the mesh sizes, except for a marginal
increase in density (Fig. 6a) and biomass (Fig. 6b) in the upper 5 cm of sediment with the
finer mesh. In coastal ecosystems, high densities of macrobenthic individuals are also
retained on fine meshed sieves, but due to the extraction of juvenile stages rather than
species with smaller average body sizes (Schlacher and Wooldridge 1996). The present
study reveals that higher numbers of individual organisms obtained with finer mesh
actually include an increase of small sized adults of species that would have passed
through a coarser mesh.
In the present study there was a significant loss of macrofauna using a 0.5 mm mesh
sieve. The loss was greatest for polychaetes, nematodes, harpacticoids and isopods both
in terms of number of specimens and species obtained. Nematodes and harpacticoid
copepods are generally considered to be part of the meiofauna, but their presence in the
0.5 mm and 0.3 mm mesh sieves in the present study has lead to their inclusion with the
macrofauna. Nematodes outnumbered the polychaetes in the present study. A similar
observation was reported by Ingole et al. (2001).
The final and definitive form of the preprint has been published in the "Marine Biology Research" © 2009 Taylor & Francis; "Marine Biology Research" is available online at http://www.informaworld.com/ with open URL of artilce : http://www.informaworld.com/openurl?genre=article&issn=1745?1019&volume=5&spage=391

11
Gage et al. (2002), concluded that, use of 0.5 mm mesh sieves would miss a number of
species that could be collected on 0.425, 0.3 and 0.25 mm mesh sieves. The deep-sea is
thought to harbor a large number of rare species of macrofauna, with samples typically
being composed of many species occurring as singletons or in low numbers (Grassle and
Maciolek 1992). Hence, use of coarse sieves could greatly undersample many small
uncommon species. Accordingly, Gage et al. (2002) recommended a sieve with 0.5 mm
mesh for the purpose of describing macrobenthic biomass in the deep sea (but not
abundance and species richness).
Polychaetes, nematodes and crustaceans (harpacticoids and isopods) considered
separately showed notable differences in occurrence between the two sieve sizes
examined. There were also varying responses in diversity indices for different
macrofaunal groups with the different sieve sizes used, which agrees with the findings by
Gage et al. (2002). It may therefore be inaccurate to use results from one taxonomic
group as a proxy for the total assemblage. Hence, it is suggested that the total
macrofaunal community as a whole be studied and that a mesh of 0.3 mm or finer be
used.
In the abyss, many new species have been found with no sign of the number of species
reaching an asymptote (Gage 1996) and the loss of even a few species in any deep-sea
study could lead to the loss of rare or unknown species. The use of finer mesh will
directly aid in documenting the diversity of the deep-sea habitat more precisely, a crucial
element in understanding global species distributions and their ecological roles.
The final and definitive form of the preprint has been published in the "Marine Biology Research" © 2009 Taylor & Francis; "Marine Biology Research" is available online at http://www.informaworld.com/ with open URL of artilce : http://www.informaworld.com/openurl?genre=article&issn=1745?1019&volume=5&spage=391

12
ACKNOWLEDGEMENTS
The authors acknowledge the Ministry of Earth Sciences, Govt. of India for financial
support for the project on Polymetallic Nodule-Environment Impact Assessment of
Nodule Mining, under which the current work was carried out. We thank Director,
National Institute of Oceanography, for providing the necessary facilities. The first author
would like to thank the CSIR for the fellowship provided for carrying out her Ph.D. work.
We would like to thank Dr. Jürgen Guerrero Kommritz from the Zoologiscehs Museum
Hamburg, Germany, for his help in the identification of tanaids. We are thankful to Dr.
Rahul Sharma, Project leader, PMN-EIA, for providing valuable comments on the
manuscript. We acknowledge the Plymouth Marine Laboratory and the DARWIN
worldwide Pollution-Monitoring Programme for providing training in nematode
identification and PRIMER software package. We also acknowledge three anonymous
reviewers for providing useful and stimulating discussion on the manuscript. This is
contribution no 4373 of NIO, Goa.
REFERENCES
Brown JH, Gillooly JF, Allen AP, Savage VM, West GB. 2004. Toward a metabolic
theory of ecology. Ecology 85:1771_89.
Clarke KR, Warwick RM. 1994. Change in marine communities: An approach to
statistical analysis and interpretation. Plymouth: PRIMER-E Ltd.
The final and definitive form of the preprint has been published in the "Marine Biology Research" © 2009 Taylor & Francis; "Marine Biology Research" is available online at http://www.informaworld.com/ with open URL of artilce : http://www.informaworld.com/openurl?genre=article&issn=1745?1019&volume=5&spage=391

13
Eleftheriou A, Basford DJ. 1989. The macrobenthic infauna of the offshore northern
North Sea. Journal of the Marine Biological Association of the United Kingdom
69(1):123_43.
Gage JD. 1996. Why are there so many species in deep-sea sediments? Journal of
Experimental Marine Biology and Ecology 200:257_86.
Gage JD, Hughes DJ, Gonzalez Vecino JL. 2002. Sieve size influence in estimating
biomass, abundance and diversity in samples of deep-sea macrobenthos. Marine Ecology
Progress Series 225:97_107.
Gage JD, Tyler PA. 1991. Deep-sea Biology: A Natural History of Organisms at the
Deep-sea Floor. Cambridge: Cambridge University Press.
Grassle JF, Maciolek NJ. 1992. Deep-sea species richness: regional and local diversity
estimates from quantitative bottom samples. American Naturalist 139:313_41.
Hessler RR, Jumars PA. 1974. Abyssal community analysis from replicate box cores in
the central North Pacific. Deep-Sea Research 21:185_209.
Hurlbert SH. 1971. The non-concept of species diversity: A critique and alternative
parameters. Ecology 52:577_86.
The final and definitive form of the preprint has been published in the "Marine Biology Research" © 2009 Taylor & Francis; "Marine Biology Research" is available online at http://www.informaworld.com/ with open URL of artilce : http://www.informaworld.com/openurl?genre=article&issn=1745?1019&volume=5&spage=391

14
Ingole BS, Ansari ZA, Rathod V, Rodrigues N. 2001. Response of deep-sea
macrobenthos to a small-scale environmental disturbance. Deep-sea Research II
48:3401_10.
Ingole BS, Koslow JA. 2005. Deep-sea ecosystems of the Indian Ocean. Indian Journal
of Marine Science 34(1):27_34.
Kaariainen JI, Bett BJ. 2006. Evidence for benthic body size miniaturization in the deep
sea. Journal of the Marine Biological Association of the United Kingdom 86:1339_45.
Margalef R. 1968. Perspectives in Ecological Theory. Chicago: University of Chicago
Press.
Matondkar SGP, Nair KKC, Ansari ZA. 2005. Biological characteristics of Central
Indian Basin waters during the southern summer. Marine Georesources and
Geotechnology 23:299_314.
Peters RH. 1983. The Ecological Implications of Body Size. Cambridge: Cambridge
University Press.
Pielou EC. 1966. The measurement of diversity in different types of biological
collections. Journal of Theoretical Biology 13:131_44.
The final and definitive form of the preprint has been published in the "Marine Biology Research" © 2009 Taylor & Francis; "Marine Biology Research" is available online at http://www.informaworld.com/ with open URL of artilce : http://www.informaworld.com/openurl?genre=article&issn=1745?1019&volume=5&spage=391

15
Prasad MS. 2007. Indian exploration for polymetallic nodules in the Central Indian
Ocean. International Seminar on ‘Minerals and Other Resources Found in Marine Areas
beyond the Limits of National Jurisdiction (The ‘Area’)’, Manado, North
Sulawesi, Indonesia.
Reish DJ. 1959. A discussion of the importance of the screensize in washing quantitative
marine bottom samples. Ecology 40(2):307_09.
Rex MA, Etter RJ, Morris JS, Crouse J, McClain CR, Johnson NA, et al. 2006. Global
bathymetric patterns of standing stock and body size in the deep-sea benthos. Marine
Ecology Progress Series 317:1_8.
Sanders HL, Hessler RR, Hampson GR. 1965. An introduction to the study of deep-sea
benthic faunal assemblages along the Gay Head_Bermuda transect. Deep-Sea Research
12:845_67.
Schlacher TA, Wooldridge TH. 1996. How sieve mesh size affects sample estimates of
estuarine benthic macrofauna. Journal of Experimental Marine Biology and Ecology
201:159_71.
Schmidt-Nielsen K. 1984. Scaling _ Why is Animal Size so Important? Cambridge:
Cambridge University Press.
The final and definitive form of the preprint has been published in the "Marine Biology Research" © 2009 Taylor & Francis; "Marine Biology Research" is available online at http://www.informaworld.com/ with open URL of artilce : http://www.informaworld.com/openurl?genre=article&issn=1745?1019&volume=5&spage=391

16
Shannon CE, Wiener N. 1963. The Mathematical Theory of Communication. Urbana, IL:
University of Illinois Press.
Shirayama Y, Horikoshi M. 1989. Comparison of the benthic size structure between
sublittoral, upper-slope and deep-sea areas of the western Pacific. Internationale Review
der gesamten Hydrobiologie 74:1_13.
StatSoft, Inc. 1999.STATISTICAfor windows,www.statsoft.com.
Thiel H. 1975. The size structure of the deep-sea benthos. International Revue der
gesamten Hydrobiologic und Hydrographic 60(5):575_606.
Thiel H. 1979. Structural aspects of the deep-sea benthos. Ambio Special Report
6:25_31.
Timofeev SF. 2001. Bergmann’s principle and deep-water gigantism in marine
crustaceans. Biological Bulletin 28:646_501.
The final and definitive form of the preprint has been published in the "Marine Biology Research" © 2009 Taylor & Francis; "Marine Biology Research" is available online at http://www.informaworld.com/ with open URL of artilce : http://www.informaworld.com/openurl?genre=article&issn=1745?1019&volume=5&spage=391

17
Table 1: Mann-Whitney U and Students t-tests of macrofaunal density, biomass, number of species, and three diversity indices for sieves of two different mesh sizes. Mann-Whitney U test U p n Macrofaunal density 1296 0.0001 132 Macrofaunal biomass 1543 0.004 132 Species 1289 0.0001 132 J 107.5 0.78 29 E(Sn) 190.5 0.101 46 H' 190.5 0.09 46
Student's t-test t p df d 1.141 0.264 27 Sub-samples of PVC pipe Density 0.718 0.486 12 Biomass 0.771 0.298 12
The final and definitive form of the preprint has been published in the "Marine Biology Research" © 2009 Taylor & Francis; "Marine Biology Research" is available online at http://www.informaworld.com/ with open URL of artilce : http://www.informaworld.com/openurl?genre=article&issn=1745?1019&volume=5&spage=391

18
Table 2: List of genus/species obtained on 0.5mm and 0.3 mm mesh sieve Major taxa Family Genus/Species
0.3 mm sieve 0.5 mm sieve Viscocia sp. Viscocia sp.Filoncholaimus sp.. Filoncholaimus sp.
Oncholaimidae
Adoncholaimus sp. Adoncholaimus sp.Oxystominidae Halalaimus sp. Halalaimus sp.
Dolicholaimus sp. Dolicholaimus sp.Ironidae Trissonchulus sp.
Microlaimidae Paramicrolaimus sp. Odantanticoma sp.. Cephalanticoma sp.Anticomidae Cephalanticoma sp.
Ethmolaimidae Comesa sp. Comesa sp.Polygastrophora sp. Polygastrophora sp.Belbolla sp. Belbolla sp.
Enchelidiidae
Calyptronema sp. Calyptronema sp.Linhomoeidae Megadesmolaimus sp.. Phanodermatidae Micoletzkyia sp. Thoracostomopsidae Enoplolaimus sp. Xyalidae Linhystera sp.
Pseudocella sp. Melercylicolaimus sp.Leptsomatidae Melercylicolaimus sp.
Comesomatidae Sabatieria sp. Sabatieria sp.Phanodermatidae Phanoderma sp. Phanoderma sp.Aegialoalaimidae Diplopelloides sp.
Nematoda
Unidentified sp. 1 sp. 1 Axiothella sp. Axiothella sp. Maldanidae Maldane sp. Maldane sp. Hesione sp. Hesione sp. Hesionidae Genus 2 Genus 2
Spionidae Prinospio sp. Prinospio sp. Capitellidae Capitella minima
Levisennia sp. Paraonidae Paradoneis sp.
Orbiniidae Scoloplos sp. Flabelligera sp. Flabelligera sp. Brada sp. Brada sp.
Flabelligeridae
Genus 3 Phyllodocidae Phyllodoce sp. Terebellidae species 1 Goniadidae Glycinde sp. Glycinde sp. Glyceridae Glycera sp. Glycera sp. Eunicidae Lumbriconeries latreilli Lumbriconeries latreilli
Polychaeta
Unidentified sp. 1 sp. 1 Agathotanaidae Paranathura sp. Paranathura sp.
Paraleptognathia sp. Paraleptognathia sp. Tanaidacea
Leptognathiidae Leptognathia sp. Leptognathia sp.
The final and definitive form of the preprint has been published in the "Marine Biology Research" © 2009 Taylor & Francis; "Marine Biology Research" is available online at http://www.informaworld.com/ with open URL of artilce : http://www.informaworld.com/openurl?genre=article&issn=1745?1019&volume=5&spage=391

19
Neotanaidae Neotanais sp. Neotanais sp. Unidentified sp. 1 sp. 1 New Family sp. 1 sp. 1 Canuellidae Canuella sp. Canuella sp. Zosimidae Zosime sp.
Pseudotachidius coronatus Pseudotachidius coronatusPseudotachidiidae Psedotachidius similis
Neobradyidae Marsteinia sp. Argestidae Mesocletodes sp. Huntemanniidae Metahuntemannia sp.
Cervinia sp. Cerviniella sp. Cerviniella sp.
Aegisthidae
Genus 3 Parameiropsis sp. Parameiropsis sp.
Harpacticoida
Ameiridae Genus 2
Bivalvia Montacutidae Montacuta sp. Montacuta sp. Thyasiridae Mendicula sp. Mendicula sp.
Macrostylis sp. Macrostylis sp. Macrostylidea Genus 2 Genus 2
Desmosomatidae Pseudomesus sp.
Isopoda
Haploniscidae. Haploniscus sp. Nemertine Unidentified sp. 1 sp.1
The final and definitive form of the preprint has been published in the "Marine Biology Research" © 2009 Taylor & Francis; "Marine Biology Research" is available online at http://www.informaworld.com/ with open URL of artilce : http://www.informaworld.com/openurl?genre=article&issn=1745?1019&volume=5&spage=391

20
Figure 1. (a) Study area (b) sampling stations and contour map of the site
The final and definitive form of the preprint has been published in the "Marine Biology Research" © 2009 Taylor & Francis; "Marine Biology Research" is available online at http://www.informaworld.com/ with open URL of artilce : http://www.informaworld.com/openurl?genre=article&issn=1745?1019&volume=5&spage=391

21
Figure 2. Variation in macrobenthic biomass due to different mesh sizes
The final and definitive form of the preprint has been published in the "Marine Biology Research" © 2009 Taylor & Francis; "Marine Biology Research" is available online at http://www.informaworld.com/ with open URL of artilce : http://www.informaworld.com/openurl?genre=article&issn=1745?1019&volume=5&spage=391

22
Figure 3. Variation in number of (a) individuals and (b) species for the two mesh sizes
The final and definitive form of the preprint has been published in the "Marine Biology Research" © 2009 Taylor & Francis; "Marine Biology Research" is available online at http://www.informaworld.com/ with open URL of artilce : http://www.informaworld.com/openurl?genre=article&issn=1745?1019&volume=5&spage=391

23The final and definitive form of the preprint has been published in the "Marine Biology Research" © 2009 Taylor & Francis; "Marine Biology Research" is available online at http://www.informaworld.com/ with open URL of artilce : http://www.informaworld.com/openurl?genre=article&issn=1745?1019&volume=5&spage=391

24
Figure 5. Hurlbert’s rarefaction curve for two mesh sizes. E(Sn) = expected number of species; n = observed number of species
The final and definitive form of the preprint has been published in the "Marine Biology Research" © 2009 Taylor & Francis; "Marine Biology Research" is available online at http://www.informaworld.com/ with open URL of artilce : http://www.informaworld.com/openurl?genre=article&issn=1745?1019&volume=5&spage=391
25
Figure 6. Vertical variation of macrofaunal (a) density and (b) biomass
The final and definitive form of the preprint has been published in the "Marine Biology Research" © 2009 Taylor & Francis; "Marine Biology Research" is available online at http://www.informaworld.com/ with open URL of artilce : http://www.informaworld.com/openurl?genre=article&issn=1745?1019&volume=5&spage=391