Erosion and delivery of deposited peat sediment
10
Erosion and delivery of deposited peat sediment Hannu Marttila 1 and Bjørn Kløve 1 Received 31 August 2007; revised 30 January 2008; accepted 25 February 2008; published 11 June 2008. [1] Erosion of deposited organic peat sediments from peat harvesting ditches was studied in both laboratory and field conditions. Peat sediments were placed in a recirculation flume at controlled pH levels and allowed to stabilize from 15 min to 10 d. Afterward, different flow velocities were applied and the peat erosion was measured. The erosion rate was related to the physical properties of peat: the particle size and form, settling velocity, peat type and degree of decomposition (von Post). The mean average settling velocity for the peat was measured to be 0.87 m h 1 . The median sediment particle size was 42 mm, which indicates that the peat sediment is partly cohesive. The deposited sediment formed a loose layer overlaid by more stabilized layers. Critical shear stress for the surface of the loose peat layer was 0.01 N m 2 and for the more consolidated layer was 0.059 N m 2 after a stabilization of three days. The erosion coefficients determined during laboratory study varied between 3.710 4 and 4.1 10 6 kg m 2 s 1 . The determined erosion and sedimentation rates were used to calibrate sediment erosion and deposition models. A new approach was then developed for the uses of these models to simulate peat sediment delivery from field ditches. The model was tested against measured values which were in accordance to observed sediment transport rates. Citation: Marttila, H., and B. Kløve (2008), Erosion and delivery of deposited peat sediment, Water Resour. Res., 44, W06406, doi:10.1029/2007WR006486. 1. Introduction [2] Peatland drainage and peat harvesting lead to hydro- logical changes such as large runoff peaks and increased erosion [Gafni and Brooks, 1986]. The main environmental problem with peat harvesting is the siltation and eutrophi- cation of downstream watercourses by suspended solids (SS) [Sallantaus, 1983; Kløve, 1997]. The main SS loads occur from the erosion of deposited sediment in the ditch network [Kløve, 1998]. Various studies have been carried out to develop methods such as constructed wetlands to reduce negative effects of sediment transport. Research by Kløve [1997] and Marttila [2006] show that a potential treatment alternative would be to temporarily store peak runoff water in large ditch networks. The storage of runoff peaks to reduce sediment erosion has also been tried out on forested peatlands [Amatya et al., 2003]. This method increases sediment deposition and prevents erosion. Further benefits can also be achieved with flood protection when water is more slowly released. Flood water retardation is encouraged in the new European Union floodwater direc- tive. The benefit of peak runoff control depends on various factors, including ditch flow velocities and peat sediment characteristics. However, not enough is known on peat sediment erosion and delivery to sufficiently plan this method and to evaluate benefits. [3] Erosion, transport and settling of fine sediments such as peat and mud are affected by cohesion. The formation of flocks and flocculent settling are strongly affected by particle concentration and properties (size and composi- tion); flow conditions, water temperature, chemistry and microbiology; and electrochemical forces [Droppo et al., 1997; Gardner et al., 1998; Krishnappan et al., 1999; Lau, 1994; McAnally and Mehta, 2000; Ravisangar et al., 2001; Black et al., 2002]. The near-surface structure of deposited cohesive sediment beds depends on the structure of particles, flocks and aggregates that settle on the bed. Sediment stratification structure can be described as the formation of settling aggregates, where sediments layers form as compaction of deposited particles [Krone, 1978, 1999]. Parchure and Mehta [1985] gave a three-zoned description of the erosion strength profile of deposited beds. They discovered that erosion strength increases during the time between the end of the deposition and start of the erosion, which they called ‘‘consolidation’’ time. Furthermore, Lau et al. [2001] noticed that sediment deposition layers have significant influence on sediments erosion. [4] In contrast to noncohesive sediments, presently it is not possible to generally predict the critical erosion stress of cohesive sediments from one or more easily measurable parameters, such as grain size distribution. Sanford and Maa [2001] found that a linear erosion formulation may be used to describe cohesive erosion, simply by allowing critical stress to increase with depth. In this study, the objective was to test and develop this formulation to peat erosion and to develop an approach suitable for predicting sediment yield from erosive peat ditches on peat harvesting 1 Water Resources and Environmental Engineering Laboratory, Depart- ment of Process and Environmental Engineering, University of Oulu, Oulu, Finland. Copyright 2008 by the American Geophysical Union. 0043-1397/08/2007WR006486 W06406 WATER RESOURCES RESEARCH, VOL. 44, W06406, doi:10.1029/2007WR006486, 2008 1 of 10
Transcript of Erosion and delivery of deposited peat sediment

Erosion and delivery of deposited peat sediment
Hannu Marttila1 and Bjørn Kløve1
Received 31 August 2007; revised 30 January 2008; accepted 25 February 2008; published 11 June 2008.
[1] Erosion of deposited organic peat sediments from peat harvesting ditches wasstudied in both laboratory and field conditions. Peat sediments were placed in arecirculation flume at controlled pH levels and allowed to stabilize from 15 min to 10 d.Afterward, different flow velocities were applied and the peat erosion was measured.The erosion rate was related to the physical properties of peat: the particle size andform, settling velocity, peat type and degree of decomposition (von Post). The meanaverage settling velocity for the peat was measured to be 0.87 m h�1. The mediansediment particle size was 42 mm, which indicates that the peat sediment is partlycohesive. The deposited sediment formed a loose layer overlaid by more stabilizedlayers. Critical shear stress for the surface of the loose peat layer was 0.01 N m�2 andfor the more consolidated layer was 0.059 N m�2 after a stabilization of three days. Theerosion coefficients determined during laboratory study varied between 3.7�10�4 and4.1�10�6 kg m�2 s�1. The determined erosion and sedimentation rates were used tocalibrate sediment erosion and deposition models. A new approach was then developedfor the uses of these models to simulate peat sediment delivery from field ditches. Themodel was tested against measured values which were in accordance to observedsediment transport rates.
Citation: Marttila, H., and B. Kløve (2008), Erosion and delivery of deposited peat sediment, Water Resour. Res., 44, W06406,
doi:10.1029/2007WR006486.
1. Introduction
[2] Peatland drainage and peat harvesting lead to hydro-logical changes such as large runoff peaks and increasederosion [Gafni and Brooks, 1986]. The main environmentalproblem with peat harvesting is the siltation and eutrophi-cation of downstream watercourses by suspended solids(SS) [Sallantaus, 1983; Kløve, 1997]. The main SS loadsoccur from the erosion of deposited sediment in the ditchnetwork [Kløve, 1998]. Various studies have been carriedout to develop methods such as constructed wetlands toreduce negative effects of sediment transport. Research byKløve [1997] and Marttila [2006] show that a potentialtreatment alternative would be to temporarily store peakrunoff water in large ditch networks. The storage of runoffpeaks to reduce sediment erosion has also been tried out onforested peatlands [Amatya et al., 2003]. This methodincreases sediment deposition and prevents erosion. Furtherbenefits can also be achieved with flood protection whenwater is more slowly released. Flood water retardation isencouraged in the new European Union floodwater direc-tive. The benefit of peak runoff control depends on variousfactors, including ditch flow velocities and peat sedimentcharacteristics. However, not enough is known on peatsediment erosion and delivery to sufficiently plan thismethod and to evaluate benefits.
[3] Erosion, transport and settling of fine sediments suchas peat and mud are affected by cohesion. The formation offlocks and flocculent settling are strongly affected byparticle concentration and properties (size and composi-tion); flow conditions, water temperature, chemistry andmicrobiology; and electrochemical forces [Droppo et al.,1997; Gardner et al., 1998; Krishnappan et al., 1999; Lau,1994; McAnally and Mehta, 2000; Ravisangar et al., 2001;Black et al., 2002]. The near-surface structure of depositedcohesive sediment beds depends on the structure ofparticles, flocks and aggregates that settle on the bed.Sediment stratification structure can be described as theformation of settling aggregates, where sediments layersform as compaction of deposited particles [Krone, 1978,1999]. Parchure and Mehta [1985] gave a three-zoneddescription of the erosion strength profile of depositedbeds. They discovered that erosion strength increasesduring the time between the end of the deposition andstart of the erosion, which they called ‘‘consolidation’’time. Furthermore, Lau et al. [2001] noticed that sedimentdeposition layers have significant influence on sedimentserosion.[4] In contrast to noncohesive sediments, presently it is
not possible to generally predict the critical erosion stress ofcohesive sediments from one or more easily measurableparameters, such as grain size distribution. Sanford andMaa [2001] found that a linear erosion formulation may beused to describe cohesive erosion, simply by allowingcritical stress to increase with depth. In this study, theobjective was to test and develop this formulation to peaterosion and to develop an approach suitable for predictingsediment yield from erosive peat ditches on peat harvesting
1Water Resources and Environmental Engineering Laboratory, Depart-ment of Process and Environmental Engineering, University of Oulu, Oulu,Finland.
Copyright 2008 by the American Geophysical Union.0043-1397/08/2007WR006486
W06406
WATER RESOURCES RESEARCH, VOL. 44, W06406, doi:10.1029/2007WR006486, 2008
1 of 10
sites. If such a model is successful, it can be used inestimating sediment yields during different years withvariable hydrology and for predicting water protectionbenefits of peak runoff control.
2. Methods
2.1. Characteristics of Peat Sediment
[5] Peat sediment samples were taken from sedimentationbasins of four peat harvesting areas (Luisansuo, Latvasuo,Konnasuo and Miehosuo) located in the Northostrobotniaregion of Finland to determine potential differences betweensediments from different sites. All selected areas were underactive peat harvesting. The differences in sediment proper-ties were determined by the analysis of the peat type, degreeof decomposition (von Post) [Hobbs, 1986], particle sizeand settling velocity. A stereomicroscope was used todiscover the physical characteristics of peat sediment flocks.The particle size from the sediments of all four researchareas was measured with Beckman Coulter LS particle sizeanalyzer, which is based on laser diffraction.[6] The maximum and minimum settling velocity was
determined in a column (diameter 0.15 m and height 0.5 m).In the settling experiment, mixed peat sediment was placedin the top of the settling column and allowed to settle. Themaximum settling velocity was registered when the firstparticles reached the floor. The minimum settling time wasrecorded when no substantial particles were observed in thesuspension. After the settling experiment, the stratificationof settled peat sediments was determined by visual inspec-tion and the loose layer was measured using a tape measure.
2.2. Field Measurements
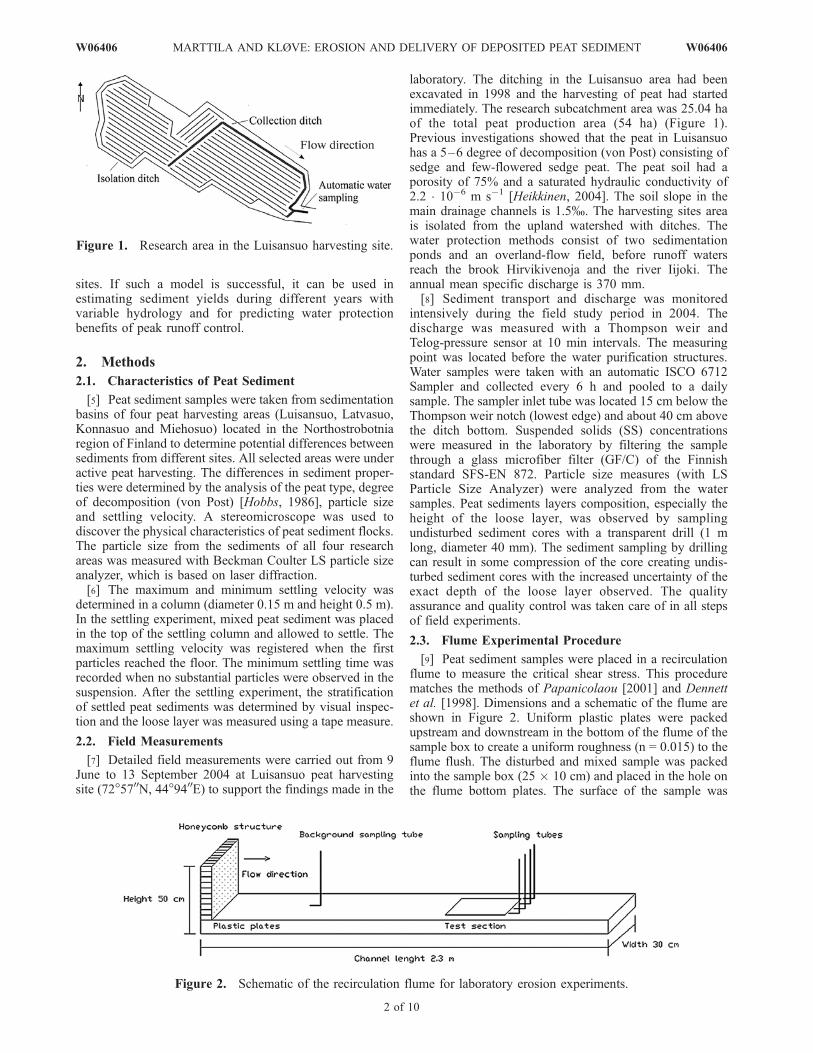
[7] Detailed field measurements were carried out from 9June to 13 September 2004 at Luisansuo peat harvestingsite (72�5700N, 44�9400E) to support the findings made in the
laboratory. The ditching in the Luisansuo area had beenexcavated in 1998 and the harvesting of peat had startedimmediately. The research subcatchment area was 25.04 haof the total peat production area (54 ha) (Figure 1).Previous investigations showed that the peat in Luisansuohas a 5–6 degree of decomposition (von Post) consisting ofsedge and few-flowered sedge peat. The peat soil had aporosity of 75% and a saturated hydraulic conductivity of2.2 � 10�6 m s�1 [Heikkinen, 2004]. The soil slope in themain drainage channels is 1.5%. The harvesting sites areais isolated from the upland watershed with ditches. Thewater protection methods consist of two sedimentationponds and an overland-flow field, before runoff watersreach the brook Hirvikivenoja and the river Iijoki. Theannual mean specific discharge is 370 mm.[8] Sediment transport and discharge was monitored
intensively during the field study period in 2004. Thedischarge was measured with a Thompson weir andTelog-pressure sensor at 10 min intervals. The measuringpoint was located before the water purification structures.Water samples were taken with an automatic ISCO 6712Sampler and collected every 6 h and pooled to a dailysample. The sampler inlet tube was located 15 cm below theThompson weir notch (lowest edge) and about 40 cm abovethe ditch bottom. Suspended solids (SS) concentrationswere measured in the laboratory by filtering the samplethrough a glass microfiber filter (GF/C) of the Finnishstandard SFS-EN 872. Particle size measures (with LSParticle Size Analyzer) were analyzed from the watersamples. Peat sediments layers composition, especially theheight of the loose layer, was observed by samplingundisturbed sediment cores with a transparent drill (1 mlong, diameter 40 mm). The sediment sampling by drillingcan result in some compression of the core creating undis-turbed sediment cores with the increased uncertainty of theexact depth of the loose layer observed. The qualityassurance and quality control was taken care of in all stepsof field experiments.
2.3. Flume Experimental Procedure
[9] Peat sediment samples were placed in a recirculationflume to measure the critical shear stress. This procedurematches the methods of Papanicolaou [2001] and Dennettet al. [1998]. Dimensions and a schematic of the flume areshown in Figure 2. Uniform plastic plates were packedupstream and downstream in the bottom of the flume of thesample box to create a uniform roughness (n = 0.015) to theflume flush. The disturbed and mixed sample was packedinto the sample box (25 � 10 cm) and placed in the hole onthe flume bottom plates. The surface of the sample was
Figure 1. Research area in the Luisansuo harvesting site.
Figure 2. Schematic of the recirculation flume for laboratory erosion experiments.
2 of 10
W06406 MARTTILA AND KLØVE: EROSION AND DELIVERY OF DEPOSITED PEAT SEDIMENT W06406

situated on the same level as the flume bed surface. Theoperation procedures used were tested in several prelimi-nary runs to minimize potential disturbance by local scourdue to potential discontinuity between the plates and thepeat sample. The sample was located 166 cm downstreamof the flume entrance to insure a developed boundary layerat the peat sample. Flow conditions during experimentswhere measured with a current meter as well as dyes.[10] Since only minor differences of particle size and
composition were observed between sediment samplestaken from different harvesting sites, only peat sedimentfrom the Luisansuo peat harvesting site was used in theexperiment. The water pH level in the flume was adjusted to6 with nitric acid, which matches pH levels measured in therunoff waters at Luisansuo (pH 5.8–6.2). Water temperaturewas set to 20�C. Before the erosion experiment was run, thesamples were allowed to stabilize in the flume from 15 minto 10 d to detect the effect of bed consolidation on erosion.For the stabilization series of 15 min, 1, 2, and 3 d was usedwith two replicates, while for the series of 5 and 10 d, onlyone experiment was carried out. After the stabilization time,the sample was run at low shear stress for 15 min to stabilizethe sample for flow conditions. Then the flow was increasedincrementally to a predetermined shear stress/flow speedand the samples from suspension were collected up anddownstream for 30 s. The cycle was repeated for increasingthe applied flow.[11] The peat erosion rate was determined from water
samples taken upstream and downstream of the peatsample. The upstream water sample was considered tobe background concentration and taken with one tube(diameter 0.5 cm, which was bent at 90 degrees angle,Figure 2). Four tubes were placed across the width of thesoil sample just downstream of the sample to measureeroded peat concentration. The tube center was placed 0.5cm above the bed. The erosion was calculated as thedifference between downstream and upstream suspendedthe solid concentration. To obtain the concentration ofsuspended sediments, the samples were filtered through aglass microfiber filter (GF/C) of the Finnish standard SFS-EN 872. The background concentration (upstream sample)was subtracted from the downstream concentration. Erosionwas considered to have taken place if the downstreamconcentration exceeded the background concentration. Theerosion rates (kg m�2 s�1) were calculated usingequation (1). The quality assurance and quality controlwas taken care of in all steps of experimentation.
2.4. Modeling of Sediment Yield
[12] The sediment erosion and delivery were modeledunder the assumptions that peat sediment behaves similarlyto cohesive sediments. It is assumed that the flow anderosion conditions and ditch dimensions are uniform.[13] Results from the laboratory study were used to
model SS load caused by channel erosion at the Luisansuoharvesting site. The SS yield was calculated as the differ-ence between sediment erosion and sediment deposition inthe main drainage channel (total length 1071 m). Erosion inthe smaller drain ditches were not considered as the flowvelocity in these ditches is small (an order of magnitudesmaller). Surface erosion from the production area were notincluded in the calculations as it has been noted that channelerosion is the main source of SS in peat harvesting sites
[Kløve, 1998]. Erosion was modeled using the followingequation [e.g., Kandiah, 1975; Krone, 1999; Sanford andMaa, 2001]:
E ¼ Mtbtc
� 1
� �and if tb < tc; E ¼ 0 ð1Þ
where E is erosion rate (kg m�2 s�1), ob is bottom shearstress (N m�2), tc is critical shear stress of erosion (N m�2)and M is empirical constant (kg m�2 s�1). The sedimenta-tion rate of SS was calculated as a function of shear stressand settling velocity (equation (2)) [e.g., van Rijn, 1993]
D ¼ � 1� ttd
� �ws
C
H
� �; if t < td ð2Þ
where D is the sedimentation rate (kg m�2 s�1), t isboundary shear stress (N m�2), td is critical shear stress ofdeposition, ws is settling velocity (m s�1), H = 0.5 h is themean settling depth (m), h is the water depth (m), and C isthe concentration of settled solids (mg l�1). The values forcritical shear stress of deposition were obtained from thepertinent literature [van Rijn, 1993]. The od values selectedwere 0.06�0.08 N m�2. In the model simulations, thesensitivity of this parameter was checked by measuringchanges on sediment delivery for values ranging from0.06–0.08.[14] For the sediment delivery model, the equation (1)
was modified to peat erosion from field ditches. Theaverage background concentration during low flow periodsCo was added to estimate loads during low flows. The valuecan be obtained from sediment concentrations during lowflow. The mathematical form of the total daily erosion rate(Y) is as follows:
Y ¼X
E � L � pþX
C0 � Q�X
D; ðkg d�1Þ ð4Þ
where En is erosion rate (kg m�2 d�1), tb is shear stress ofthe bed sediment, C0 is the background concentration(kg l�1), Q is the daily average discharge (l d�1), D is thesedimentation rate (kg m�2 d�1), L is length of collectionditch (m) and p is the mean wet perimeter of the collectorditch (m). In the calculation, erosion and deposition wereconsidered equal in all parts of the ditch. The collector ditchsurface area at the base (constant) was used to estimate ratesof erosion and deposition (kg s�1).[15] The shear stress was calculated using Manning and
bed shear stress equations as
t ¼ rgv2n2
h1=3ð3Þ
where r is density of water (1000 kg m�3), g is theacceleration of gravity 9.81 m s�2, v is the flow velocity(m s�1), h is the water depth (m) and n is the Manningnumber. This approach assumes uniform flow. The shearstress in the ditch was calculated with 10 min intervals usingmeasured flow values and equation (3). The water depth (h)in the ditch was obtained from water levels based on theThompson weir measurements at the ditch outlet and theaverage ditch dimensions (0.8 m base width with 1:1 banks).
W06406 MARTTILA AND KLØVE: EROSION AND DELIVERY OF DEPOSITED PEAT SEDIMENT
3 of 10
W06406

[16] Daily measurements of SS yield were used to verifythe model. As SS is measured with filtering though GF/Cfilter, a background concentration C0 (kg l�1 m�2) wasincluded in the model. This is reasonable as the SS at lowflows usually are dissolved solids from, e.g., humic acids.The background concentration was calculated from averageconcentrations during low flow periods and daily back-ground SS load using measured flow.
3. Results and Discussion
3.1. Characteristics of Peat
[17] The characteristics of different sediments from thefour different sites show fairly similar properties. Theaverage median particle size (d50) for all samples from peatharvesting sites was 41.6 mm (Table 1 and Figure 3).Roberts et al. [1998] showed that spherical homogeneousquartz particles are cohesive when the particle size is under40 mm. Peat has a density different from quartz. However,the particle size measurements by microscopy showed thatsmallest particles are round. This indicates that peat sedi-ment is partly cohesive. The difference between the settling
times of different peat sediments was not remarkable. Theaverage maximum settling time in the experiment was 1.69m h�1 and the average minimum settling time was measuredto be 0.06 m h�1.[18] The stratification of settled peat sediments were
studied after column settling experiments. The surfacesediment layer was noticed to change with time for thefirst 3 d. After 3 d of stabilization, no obvious changes inthe surface or peat sediments were detected and themeasured visible loose layer ranged between 1–1.5 cm.Sediments layers developed and the thickness of visibleloose surface layer remained the same for the duration ofobservation (10 d).[19] The stereomicroscope photographs illustrate physi-
cal in homogeneity and fragility the of peat sediment(Figure 4). It contained various particles sizes with differentshapes from round to oblong. The largest particles have anirregular shape as the smaller ones are relatively spherical. Itcan be assumed that the composition of various particle sizesmake peat sediment brittle resulting in the loose surface layerof sediment as observed after the experiment. As Krone[1999], and Parchure and Mehta [1985] suggested, when thefragile flocks settle down to the surface of the sediment, newloose and easily eroded layers are generated. With time, the
Table 1. Results From Beckman Coulter LS Particle Size Analyzer
Peat Harvesting Site Starting Year of Peat Harvesting Peat Type Degree of Decompositiona Median (d50), mm
Luisansuo 1998 SC ja C 5–6 50.9Miehonsuo 1990 CS 4–5 27.5Konnasuo 1993 NSC and SC 5–6 39.1Latvasuo 2004 CS 3–4 48.9
Average 41.6
Peat types C = sedge peatSC = few-flowered sedge peatNSC = sedge peat with twig
material and few flowersCS = sedge-moss peat
avon Post scale.
Figure 3. Particle size distributions of research areas peatsediments measured with Beckman Coulter LS particle sizeanalyzer.
Figure 4. Peat sediment flock takenwith stereomicroscope.
4 of 10
W06406 MARTTILA AND KLØVE: EROSION AND DELIVERY OF DEPOSITED PEAT SEDIMENT W06406

loose layers consolidate as new particles settle to thesediment surface and cohesive bonds are formed.
3.2. Field Experiments on Sediment Delivery
[20] During the research period, the average dischargewas 2.7 l s�1 and the average specific discharge was10.7 l s�1 km�2. The accumulated seasonal precipitationduring the research period was 381 mm (Figure 5) which isclearly above the normal 261 mm. The SS sediment con-centrations at outflow varied from 1.52 to 1542 mg l�1 andaverage concentration was 97 mg l�1. The research periodcontained both dry and rainy seasons with different SSresponse. The summer concentrations with low flowconditions (9 June to 2 August 2004) gave an averageoutflow concentration of 9 mg l�1. Late summer timecontained local storms which produced three flow peakswith average SS concentration of 217 mg l�1.[21] Precipitation and stormflow had a considerable
effect on sediment availability and load. During earlysummer precipitation periods (max 18 mm d�1), no majorflow peaks were observed. The precipitation (58 mm) thatoccurred during the period of 27–28 July caused themaximum flow peak of 71 l s�1 km�2, but the daily SSconcentration was only 22–47 mg l�1. A few days afterthe rainfall, a new storm produced 56 mm of precipita-tion (3–4 August) resulting in a maximum flow peak of293 l s�1 km�2 and caused daily SS concentration of988–93 mg l�1. After the second high flow peak, the maindrain channels were filled with deposited peat sediment.Also, the observed loose surface layer of peat sedimentincreased from height of 0.5 cm to 15 cm. The third highstorm water peak period was the 20–22 August with 42 mmrainfall and maximum peak flow of 135 l s�1 km�2
produced a sediment concentration of 1543–967 mg l�1
due to large amounts of deposited peat sediments and theloose surface layer. After this third high storm water period,the outflow decreased to 11 l s�1 km�2, but the average SSconcentration stayed high (141 mg l�1). During the earlysummer in similar flow conditions, the average SS concen-tration was only 8 mg l�1. The results show that erosion ofpeat sediment was strongly influenced by the amount ofdeposited sediment in the main drainage channel. Settledpeat eroded from the harvesting area during previousthunderstorms and settled in the ditches was easily availablefor transport even with less shear stress. This can partly beexplained by the short consolidation preceding the laststorm enhancing erosion and SS transport.[22] The particle size distribution from the outflow
water samples varied in a complex way, depending onflow conditions and sediment availability (Figure 6). Theresults show that the average particle size distribution(d50) was 72.5 mm before the storm with an averagedischarge of 8.0 l s�1 km�2. The water samples takenduring the discharge 293 l s�1 km�2 show fewer largeparticles compared to the situation before the flow peak.A similar distribution as measured from the Luisansuosediment basin was observed. The decrease of particlesize with increased flow is surprising. It is possible thatlarge particles were not detected in the measured watersample as erosion of large particles could have occurredbefore the sampling event. The decrease in proportion tolarge particles could also be explained by the collapsingof flocks under higher shear stress. After the peak yield (thenext day), a new peak discharge of 57 l s�1 km�2 resulted inan increase of large particles (d50 = 83.9 mm). After the thirdhigh storm water period, the particle size distributions in therunoff water samples had larger particles (d50 = 146.2 mm).
Figure 5. Average and maximum flow (a), daily precipitation (b) and SS daily load (c) in the Luisansuoresearch area during period 9 June to 13 September 2004.
W06406 MARTTILA AND KLØVE: EROSION AND DELIVERY OF DEPOSITED PEAT SEDIMENT
5 of 10
W06406

This was clearly due to surplus of newly deposited peatsediments and considerable erosion.
3.3. Erosion of Peat Sediment in the Laboratory Flume
[23] The erosion was seen as increased suspended sedi-ment concentration with applied shear force on the sedimentbed. In runs with a short stabilization time, the erosionstarted at a low shear force and increased with applied shear(Table 2 and Figure 7). The thin surface layer was erodedwhen the shear stress increased above 0.01 N m�2. When thecritical shear force was reached, the erosion clearly increasedand erosion occurred in the whole peat layer. Two linearcurves could be fitted to explain the erosion below and abovethe critical shear stress (Figure 8). The increase in stabiliza-tion time increased the erosion rate or the slope of both linearcurves. Consequently, after 5 d the first curve had almost noslope and the erosion started from the critical point.[24] Two critical shear values for erosion were observed.
The first shear stress of (0.01 N m�2), eroded the loosesurface layer. The critical stress (tc) for the entire peatdeposits erosion was 0.059 N m�2. At this point the bedstarted to erode despite different stabilization times. Asomewhat lower value was obtained for samples that hadstabilized for less than 2 d. In experiments with astabilization time of 15 min and 24 h, the erosion startedat 0.01 N m�2. It has been found that the critical stress oforganic rich aggregates increases from 0 for 10 N m�2,as the sediment becomes strongly stratified [Dennett etal., 1998; Lavelle and Mofjeld, 1987]. In experiments
with stabilization times of 5 and 10 d, the surface layerbecame more stable but the critical point did not increaseabove 0.059 N m�2. For naturally cohesive mud’s, a widerange of values has been reported, e.g., by Parchure andMehta [1985] to be between 0.04 and 0.62 N m�2. Ourresults on erosion of the loose top layer are in agreementwith in situ estimates of critical shear stresses made forfluff marine sediments, which have ranged between 0.02and 0.05 N m�2 [Jago et al., 2002; Maa et al., 1998;Ravens and Gschwend, 1999; Sanford et al., 1991; Youngand Southard, 1978].[25] The results show that the critical stress of peat
increases with time until it reaches three days of settling.No remarkable changes were observed thereafter. Changesin the critical shear stress can be explained by the compac-tion of peat and consequent strengthening of the sedimentby cohesive forces. With time, physical-chemical bonds aregenerated between the peat particles, which partly consol-
Figure 6. Particle size distributions from the water samples taken from the Luisansuo peatharvesting site.
Table 2. Critical Shear Stress After Different Stabilization Times
StabilizationTimes
Critical ShearStress, N m�2
Critical Shear Stress ofSurface Layer, N m�2
15 min >0.04 0.011 d 0.04 0.012 d 0.05 0.013 d 0.059 0.015 d 0.059 0.0110 d 0.059 0.01
6 of 10
W06406 MARTTILA AND KLØVE: EROSION AND DELIVERY OF DEPOSITED PEAT SEDIMENT W06406

idates peat sediment. The increase of in erosion resistancewith time has also been observed, e.g., by Zreik et al. [1998]for cohesive clay sediment beds.[26] Changes occurred to the surface of the sediment
sample during the flume experiment. At low shear strength,the selective erosion of small particles and small aggregatesoccurred. Large aggregates were erodedwhen the shear stressexceeded the critical value. Only slight erosion from somesmall areas was noted with low shear stress. At higher shearstrength, the loose surface eroded almost completely andlower layers began to erode as chunks. Stone and Krishnap-pan [2003] noticed similar erosion behavior and explained itby aggregate stability resulting erosion of larger flocks whenthe critical shear stress for the aggregate is reached.[27] The erosion rates (E) were calculated using equa-
tion (1). In this research, two different erosion coefficients(M) were discovered for erosion below and above the criticalshear stress. The first for the loose surface layer led to anerosion coefficient (M1) of 4.1�10�6 kg m�2 s�1 and criticalshear stress of 0.01 N m�2. The second erosion coefficient(M2) for the whole peat layer was 3.7�10�4 kgm�2 s�1 and thecritical shear stress 0.059 N m�2. For the fluff marine sedi-ments, Dyer [1986] found that the erosion coefficient variedbetween 5�10�4 and 1.5�10�3 kg m�2 s�1. According to Amoset al. [1996] M was 4�10�4 kg m�2 s�1. Schaaff et al. [2006]observed values varying between 3.4�10�6 kg m�2 s�1 and7.5�10�6 kg m�2 s�1 for the two different layers.[28] In previous studies little attention has been put on
the variance of the M parameter. In the present study, the
Figure 7. Sediment concentrations of different shear stress values and stabilization times.
Figure 8. Two linear equations can be fitted to thelaboratory measurements data of suspended solids concen-tration of eroding peat sediment at increasing shear stressafter 3–10 d of stabilization. The first curve illustrates theerosion of loose top layer of the peat sediment and thesecond curve can be fitted to measurements data aftercritical shear stress of 0.059 N m�2.
W06406 MARTTILA AND KLØVE: EROSION AND DELIVERY OF DEPOSITED PEAT SEDIMENT
7 of 10
W06406

variation of M was higher for small shear stress values(erosion rates) when the erosion equation is fitted throughthe data (Figure 9). The confidence interval for surfaceerosion below the critical shear stress 0.059 N m�2 was0.001 (a = 0.05, s = 0.005) and for erosion above the0.059 N m�2 shear stress was 0.019 (a = 0.05, s = 0.08),where a is range and s is standard deviation. This highervariation of M for low shear stress values could be due tosurface roughness, i.e., erosion occurred first from small-sized peaks on that peat sediment surface, not from thewhole surface area. This observation is also supported byfield experiments were small erosion peaks were notalways simulated correctly.
3.4. Modeling of Outflow SS Concentration
[29] Two critical shear stress values and coefficients areused in the calculation, one for the loose surface layer, andone for the erosion when shear stress exceeded critical valueof the more consolidate layer. The average backgroundconcentration during low flow periods was estimated to
be 9 mg l�1 and this value was added to the daily predictedresults using daily flow values. The mathematical form ofthe total daily erosion rate (Y) is as follows:
Y ¼X
E � L � pþX
C0 � Q�X
D; ðkg d�1Þ ð4Þ
E1 ¼ 4:1 � 10�6 tb0:01
� 1� �
; if 0:01 > tb > 0:059 ð5Þ
E2 ¼ 3:7 _10�4 tb0:059
� 1� �
; if tb > 0:059 ð6Þ
where En is erosion rate (kg m�2 d�1), tb is shear stressof the bed sediment, C0 is the background concentration(kg l�1), Q is daily average discharge (l d�1), D is thesedimentation rate (equation (2)) (kg m�2 d�1), L is thelength of the collection ditch (m) and p is the mean wetperimeter of the collector ditch (m).
Figure 9. Measured versus calculated erosion rate (E) when shear stress was below and above0.059 N m�2 in the laboratory flume experiment. Confidence interval for surface erosion was 0.001(a = 0.05, s = 0.005) and for erosion over shear stress of 0.059 N m�2 was 0.019 (a = 0.05,s = 0.08).
Figure 10. Predicted and measured SS daily load from the Luisansuo peat harvesting site. The upperfigure (a) shows results from dry season period and lower figure (c) shows results from a rainy period.
8 of 10
W06406 MARTTILA AND KLØVE: EROSION AND DELIVERY OF DEPOSITED PEAT SEDIMENT W06406

[30] The observed and predicted SS values are in accor-dance (Figure 10). Especially, the simulations during thetwo latter high flow peaks give a rather good explanation ofthe erosion mechanism in the harvesting site. The erosion inthe main ditch can explain most of the variation in the SSload during these events. However, the erosion during thefirst storm water peak is simulated as too high. This couldbe due to the lack of sufficient sediments in the ditchbefore the peak flow. The field experiments showed thatafter the low flow period, before the first peak, thesediment bed was strongly stabilized and there were littleavailable peat sediments for erosion. The same effects canbe seen in Figure 10a during small peaks in the low flowperiod. As equations (5) and (6) cannot predict this changein the bed, the correct rate of erosion is not alwayscaptured by the model. During low flow periods, thesimulated daily load does not always follow the measuredSS load peaks, and erosion from the main collection ditchcannot be explained reasonably well. During the low flowevents, the daily load can be explained by backgroundconcentrations. However, the main point in the model is tocapture the processes during high flow periods when themajor part of bed sediment is eroded. The value of chosencritical stress of deposition (td) was changed to 0.06, sincethe other chosen value (0.08) was larger than the criticalstress of erosion. Nevertheless, deposition did not have aremarkable affect on results. Further development of themodel should include studies at different sites to verifyand improve the functions during low and high flows. Thedeveloped approach is considerably better than the unitload approach, assuming, e.g., 90 kg ha�1 a�1 of SS forpeat harvesting with simple water protection methods[Ymparistoministerio, 2003], which is used to assessloading from land use such as peat harvesting.[31] The model was sensitive to changes of Manning
value and the hypothesis of starting water level during lowflow. To reach a better agreement between simulated andobserved values a touch of calibration was made byadjusting Manning n from 0.025 to 0.021. This recalibra-tion improved the R2 value from 0.91 to 0.97. Since theused equation is based on changes on physical conditionsdirected at the sediment bed, it is capable to explain erosionforces that occur in the main drain ditch. Also, thedeveloped approach is useful to evaluate annual SS loadswhen runoff is usually continuously registered. It couldalso be used in water protection to assess the effect ofcutting peak flows by temporary water storage in ditchesand ponds.
3.5. Use of the Obtained Results in Water Protection
[32] In practical water protection work, the more impre-cise term of critical flow velocity is used instead of shearstrength. In the flume experiment, the surface layer (looselayer) was eroded when flow velocity reached 0.06 m s�1
and the critical flow velocity when the whole layer waseroded was approximately 0.15 m s�1. The surface criticalflow velocity determined is close to the values estimated byKløve [1998] and Heikkinen [2004]. In the erosion researchby Kløve, no suspended peat sediment erosion occurredbelow the 0.04 m s�1 flow velocity. Also Heikkinenstudied the critical velocity to be 0.08 m s�1. The observedvalue in study is the same value as assumed by Aho andKantola [1985] to be the critical value for flow velocity
(0.15 m s�1). For the most efficient reduction in sedimenterosion, the value of the surface critical flow velocity(0.06 m s�1) should be used, when designing peak runoffcontrol structures. If this flow velocity is not exceeded,only minor bed erosion and suspended solid load to thewater courses can be expected. Especially, the designshould also pay attention to the situations when main ditchcontains considerable amount of erodible peat sediments.For sites where these criteria cannot be met, such as areaswith a small ditch volume, the threshold of 0.15 m s�1
should not be exceeded.
4. Conclusions
[33] Based on peat erosion and sediment transport meas-urements carried out in laboratory and field conditions thefollowing conclusion can be drawn.[34] (1) The characteristics of peat sediments showed
similar properties to samples taken from different peatharvesting sites. The particle size distributions of sedimentswere fairly similar, average (D50) was 42 mm. Averagefalling velocity (wave) for peat sediment was 0.87 m h�1.[35] (2) Both the erosion test and particle size distribution
indicate deposited peat sediment to have cohesive proper-ties. The strengthening of disturbed peat sediment takes upto three days, but in field conditions bio stabilization canalso occur to strengthen the sediment.[36] (3) Critical shear stress of deposited peat sediment
was set to be 0.059 ± 0.001 N m�2 and loose surface layerstarted to erode at the shear stress of 0.01 ± 0.002 N m�2.Two linear equations can be fitted to the measured data.Erosion rate coefficient M for loose surface layer was4.1�10�6 kg m�2 s�1. For the more consolidated layers,the erosion coefficient M was 3.7�10�4 kg m�2 s�1.[37] (4) Peat flocks settling in the sediments surface have
a fragile and loose structure. This can easily influenceerodibility and low critical shear stress of surface layers.[38] (5) Field work and calculations showed similarities
to the laboratory studies. During high peak flows, the mainSS load source is the erosion from the main ditches. Waterprotection methods should be utilized to prevent erosion, asmajor parts of the SS load from the harvesting sites to thewatercourses are generated during peak lows. This can becarried out with runoff detention and the ponding of waterabove the erodible bed deposits.[39] (6) Findings can be used for better instructions of the
dimensioning of water protection methods, such as peakrunoff control dams and sedimentation ponds.
[40] Acknowledgments. The authors would like thank TurveruukkiOy for funding the initial part of the research. The work was written withsupport from KIRSU doctoral school (Academy of Finland), Ministry ofagriculture and forestry, Thule-institute at University of Oulu, Maj and TorNessling- and MVTT-foundations. A word of thanks to the staff of theLaboratory of Water Resources and Environmental Engineering in Univer-sity of Oulu, for supporting us in our every need. We are grateful for thecomments received by three reviewers and editors.
ReferencesAho, M., and K. Kantola (1985), Sedimentation of Suspended Solids in PeatHarvesting Runoff Waters (in Finnish), Governmental Research Center,Espoo, Finland.
Amatya, D., R. Skaggs, J. Gilliam, and J. Hughes (2003), Effects of Orifice-Weir outlet on hydrology and water quality of a drained forested wa-tershed, J. Appl. For., 27, 130.
W06406 MARTTILA AND KLØVE: EROSION AND DELIVERY OF DEPOSITED PEAT SEDIMENT
9 of 10
W06406

Amos, C. L., T. F. Sutherland, and J. Zevenhuizen (1996), The stability ofsublittoral, fine-grained sediments in a subarctic estuary, Sedimentology,43, 1–19.
Black, K., K. Black, T. Tolhurst, D. Paterson, and S. Hagerthey (2002),Working with natural cohesive sediments, J. Hydraul. Eng., 128, 2–8.
Dennett, K., T. Sturm, A. Amirtharajah, and T. Mahmood (1998), Effects ofadsorbed natural organic matter on the erosion of kaolinite sediments,Water Environ. Res., 70, 268–275.
Droppo, I., G. Leppard, D. Flannigan, and S. Liss (1997), The freshwaterflock: A functional relationship of water and organic and inorganic flockconstituents affecting suspended sediment properties, Water, 99, 43–54.
Dyer, K. R. (1986), Coastal and Estuarine Sediment Dynamics, John Wiley,Hoboken, N. J.
Gafni, A., and K. N. Brooks (1986), Hydrologic properties of natural versusmined peatlands, in Advances in Peatlands Engineering (Proceedings),Symposium organized and sponsored by the National Research Councilof Canada, 25–26 August, pp. 184–190.
Gardner, K., T. Theis, and T. Young (1998), The significance of shear stressin the agglomeration kinetics of fractal aggregates, Water Res., 32,2660–2668.
Heikkinen, M. (2004), Design of peak runoff control method for waterprotection on peat harvesting areas (in Finnish), M.Sc. thesis, WaterResources and Environmental Engineering Laboratory, Department ofProcess and Environmental Engineering, Univ. Oulu.
Hobbs, N. B. (1986), Mire morphology and the properties and behaviour ofsome British and foreign peats, Q. J. Eng. Geol., 19, 7–80.
Jago, C. F., C. F. Jago, S. E. Jones, R. J. Latter, R. R. McCandliss,M. R. Hearn, and M. J. Howarth (2002), Resuspension of benthic fluff bytidal currents in deep stratified waters, northern North Sea, J. Sea Res., 48,259–269.
Kandiah, A. (1975), Fundamental aspects of surface erosion of cohesivesoils, Ph.D. thesis, Univ. of California, Davis, Calif.
Kløve, B. (1997), Environmental impact of peat mining; Development onstorm water treatment methods, Ph.D. thesis, Department on WaterResources Engineering, Lund Institute of Technology, Lund University.
Kløve, B. (1998), Erosion and sediment delivery from peat mines, SoilTillage Res., 45, 199–216.
Krishnappan, B., J. Marsalek, W. Watt, B. Anderson, and E. Brelot (1999),Seasonal size distributions of suspended solids in a stormwatermanagement pond, Water Sci. Technol., 39, 127–134.
Krone, R. (1978), Aggregation of suspended particles in estuaries, inEstuarine Transport Processes, edited by B. Kjerfve, Belle W. BaruchLibrary, Mar. Sci., vol. 7, pp. 177–190, Univ. of South Carolina Press,Columbia, SC.
Krone, R. (1999), Effects of bed structure on erosion of cohesive sediments,J. Hydraul. Eng., 125, 1297–1301.
Lau, Y. (1994), Temperature effect on settling velocity and deposition ofcohesive sediments, J. Hydraul. Res., 32, 41–51.
Lau, Y., I. Droppo, and B. Krishnappan (2001), Sequential erosion/depositionexperiments demonstrating the effect of depositional history on sedimenterosion,Water Res., 35, 2767–2773.
Lavelle, J., and H. Mofjeld (1987), Do critical stresses for incipient motionand erosion really exist, J. Hydraul. Eng., 113, 960–963.
Maa, J. P. Y., L. Sanford, and J. P. Halka (1998), Sediment resuspen-sion characteristics in Baltimore Harbor, Maryland, Mar. Geol., 146,137–145.
Marttila, H. (2006), Peak runoff control and sediment transport in the ditchof the peat harvesting sites (in Finnish), M.Sc. thesis, Water resourcesand Environmental Engineering Laboratory, Department of Process andEnvironmental Engineering, Univ. Oulu.
McAnally, W., and A. Mehta (2000), Aggregation rate of fine sediment,J. Hydraul. Eng., 126, 883–892.
Papanicolaou, A. N. (2001), Erosion of cohesive streambeds and banks, inState of Washington Water Research Center Report WRR-08, Departmentof Civil and Environmental Engineering Washington State University.
Parchure, T. M., and A. J. Mehta (1985), Erosion of soft cohesive sedimentdeposits, J. Hydraul. Eng., 111, 1308–1326.
Ravens, T. M., and P. M. Gschwend (1999), Flume measurements ofsediment erodibility in Boston Harbor, J. Hydraul. Eng., 125, 998–1005.
Ravisangar, V., K. Dennett, T. Sturm, and A. Amirtharajah (2001), Effect ofsediment pH on resuspension of kaolinite sediments, J. Environ. Eng.,127, 531–538.
Roberts, J., R. Jepsen, D. Gotthard, and W. Lick (1998), Effects of particlesize and bulk density on erosion of quartz particles, J. Hydraul. Eng.,124, 1261–1267.
Sallantaus, T. (1983), The Load to Watercourses From Peat Mining (inFinnish), University of Helsinki, Department of Limnology, Series D:29,Helsinki.
Sanford, L., and J. Maa (2001), A unified erosion formulation for finesediments, Mar. Geol., 179, 9–23.
Sanford, L. P., W. Panageotou, and J. P. Halka (1991), Tidal resuspension ofsediments in northern Chesapeake Bay, Mar. Geol., 97, 87–103.
Schaaff, E., C. Grenz, C. Pinazo, and B. Lansard (2006), Field and labora-tory measurements of sediment erodibility: A comparison, J. Sea Res.,55, 30–42.
Stone, M., and B. G. Krishnappan (2003), Flock morphology and sizedistributions of cohesive sediment in steady-state flow, Water Res., 37,2739–2747.
van Rijn, L. (1993), Principles of Sediment Transport in Rivers, Estuariesand Coastal Areas, Aqua Publications, Amsterdam.
Ymparistoministerio (2003), Environmental guidelines for peat harvesting(in Finnish), Ministry of Environment, Series 117, Helsinki.
Young, R. N., and J. B. Southard (1978), Erosion of fine-grained marinesediments: Sea-floor and laboratory experiments, Proc. Vol. Geol. Soc.Am., Parts 1 and 2, 89, 663–672.
Zreik, D. A., B. G. Krishnappan, J. T. Germaine, O. S. Madsen, andC. C. Ladd (1998), Erosional and mechanical strength of depositedcohesive sediments, J. Hydraul. Eng., 124, 1076–1085.
����������������������������B. Kløve and H. Marttila, Water Resources and Environmental
Engineering Laboratory, Department of Process and EnvironmentalEngineering, University of Oulu, P.O. Box 4300, Oulu 90014, Finland.([email protected])
10 of 10
W06406 MARTTILA AND KLØVE: EROSION AND DELIVERY OF DEPOSITED PEAT SEDIMENT W06406