Model Uncertainty and Bayesian Model Averaging In Vector Autoregressive Processes
Upload
independentCategory
view
0download
0
Assessment of Coupling between Trans-AbdominallyAcquired Fetal ECG and Uterine Activity by BivariatePhase-Rectified Signal Averaging AnalysisDaniela Casati1*, Tamara Stampalija2, Konstantinos Rizas3, Enrico Ferrazzi1, Cristina Mastroianni1,
Eleonora Rosti1, Mariachiara Quadrifoglio1, Axel Bauer3
1 Department of the Woman, Mother and Neonate, Children’s Hospital Vittore Buzzi, Biomedical and Clinical Sciences School of Medicine University of Milan, Milan, Italy,
2 Unit of Prenatal Diagnosis, Institute for Maternal and Child Health, IRCSS Burlo Garofolo, Trieste, Italy, 3 Department of Cardiology, Munich University Clinic, DZHK
(German Centre for Cardiovascular Research), Ludwig-Maximilians University, Munich, Germany
Abstract
Couplings between uterine contractions (UC) and fetal heart rate (fHR) provide important information on fetal conditionduring labor. At present, couplings between UC and fHR are assessed by visual analysis and interpretation ofcardiotocography. The application of computerized approaches is restricted due to the non-stationarity of the signal,missing data and noise, typical for fHR. Herein, we propose a novel approach to assess couplings between UC and fHR,based on a signal-processing algorithm termed bivariate phase-rectified signal averaging (BPRSA).
Methods: Electrohysterogram (EHG) and fetal electrocardiogram (fECG) were recorded non-invasively by a trans-abdominaldevice in 73 women at term with uneventful singleton pregnancy during the first stage of labor. Coupling between UC andfHR was analyzed by BPRSA and by conventional cross power spectral density analysis (CPSD). For both methods, degree ofcoupling was assessed by the maximum coefficient of coherence (CPRSA and CRAW, respectively) in the UC frequency domain.Coherence values greater than 0.50 were consider significant. CPRSA and CRAW were compared by Wilcoxon test.
Results: At visual inspection BPRSA analysis identified coupled periodicities in 86.3% (63/73) of the cases. 11/73 (15%) caseswere excluded from further analysis because no 30 minutes of fECG recording without signal loss was available for spectralanalysis. Significant coupling was found in 90.3% (56/62) of the cases analyzed by BPRSA, and in 24.2% (15/62) of the casesanalyzed by CPSD, respectively. The difference between median value of CPRSA and CRAW was highly significant (0.79 [IQR0.69–0.90] and 0.29 [IQR 0.17–0.47], respectively; p,0.0001).
Conclusion: BPRSA is a novel computer-based approach that can be reliably applied to trans-abdominally acquired EHG-fECG. It allows the assessment of correlations between UC and fHR patterns in the majority of labors, overcoming thelimitations of non-stationarity and artifacts. Compared to standard techniques of cross-correlations, such as CPSD, BPRSA issignificantly superior.
Citation: Casati D, Stampalija T, Rizas K, Ferrazzi E, Mastroianni C, et al. (2014) Assessment of Coupling between Trans-Abdominally Acquired Fetal ECG andUterine Activity by Bivariate Phase-Rectified Signal Averaging Analysis. PLoS ONE 9(4): e94557. doi:10.1371/journal.pone.0094557
Editor: Shannon M. Hawkins, Baylor College of Medicine, United States of America
Received October 18, 2013; Accepted March 18, 2014; Published April 23, 2014
Copyright: � 2014 Casati et al. This is an open-access article distributed under the terms of the Creative Commons Attribution License, which permitsunrestricted use, distribution, and reproduction in any medium, provided the original author and source are credited.
Funding: The Cure Onlus Foundation provided funds for the research midwife that recruited the patients, and publication expenses. Enrico Ferrazzi is member ofCure Onlus Foundation. Monica Healthcare provided 5 ta-fECG-EHG devices and the software for the extraction of the signal. The funders had no role in studydesign, data analysis, decision to publish, or preparation of the manuscript.
Competing Interests: Monica Healthcare provided 5 ta-fECG-EHG devices and the software for the extraction of the signal. This does not alter our adherence toPLOS ONE policies on sharing data and materials.
* E-mail: [email protected]
Introduction
Labor represents a stress test for the fetus. Indeed, fetal hypoxia
and asphyxia during labor constitute a possible cause of cerebral
palsy and other neurological complications in childhood and
adulthood[1]. Therefore, surveillance of the fetal wellbeing by
intra-partum monitoring is of crucial importance. Analysis of fetal
heart rate (fHR) recordings provides valuable information about
the fetal homeostasis. In fact, fHR variability is an indirect mirror
of an oxygenation and integrity of the autonomous nervous
system[2], and can be altered by specific intrinsic or extrinsic
stimuli. The uterine contractions (UC) generate transient reduc-
tions in utero-placental blood flow to the fetus, which represent a
strong external stimulus to fetal homeostasis capable to modify
fHR[3]. The inter-relationship between UC and fHR might
provide important information about the functional status of fetal
autonomous nervous system during labor. In the vast majority of
deliveries, the intermittent hypoxia to which the fetus is exposed
during UC is well tolerated, but in some cases this is not the case.
Thus, the evaluation of the fetal response to UC as an early
marker of fetal distress and the recognition of fHR patterns that
could reveal compromised fetal oxygenation are of major clinical
interest[4].
Currently, the most common approach to assess the interaction
between fHR and UC is based on the interpretation of standard
PLOS ONE | www.plosone.org 1 April 2014 | Volume 9 | Issue 4 | e94557

cardiotocographic (CTG) method[4], although it has several
disadvantages: 1) only qualitative visual interpretation is feasible,
without quantitative evaluation; 2) there is a high intra- and inter-
observer variability[5,6]; and 3) the interpretation depends on the
expertise of the physician. For these reasons, an objective
computerized approach to assess the couplings between UC and
fHR would be of great clinical value.
Herein, we propose a novel analysis method of coupling
between UC and fHR based on a signal-processing algorithm, first
applied in adult cardiology, termed bivariate phase-rectified signal
averaging (BPRSA)[7–9] and applied to trans-abdominally
acquired uterine electromiography and fetal ECG (fECG). This
method overcomes the limitation of non-stationary signal and
background noise typical for fHR signal. The aim of the study was
to: 1) evaluate the coupling between UC and fHR by BPRSA
analysis; and 2) compare BPRSA analysis to other analytic
approaches.
Materials and Methods
This is a prospective study in which women with a singleton
uneventful pregnancy at term were simultaneously monitored
during labor with standard CTG and a trans-abdominal
electrocardiogram/electrohysterogram (ta-fECG/EHG) recording
device (Monica AN24, Monica Healthcare, Nottingham, UK).
The results of ta-fECG/EHG recordings were blinded to the
managing personnel, and all clinical decisions were taken based on
standard CTG. Women were recruited at Buzzi Children’s
Hospital, Biomedical and Clinical Science School of Medicine,
University of Milan, according to a research protocol named
‘Trans-abdominal fetal ECG and mioelectro-hysterogram (EHG) in term and
post-term pregnancy and delivery’ approved by the ICP (Istituti Clinici
di Perfezionamento) Ethical Committee. All participants gave their
informed written consent.
Fetal ECG and uterine EHG were recorded trans-abdominally
at 300 Hz for the whole length of labor and stored for off-line
analysis. The Uterine Activity was extracted from the slow-wave of
the electro-hysterogram (EHG), i.e. its envelope. The envelope was
obtained by low-pass filtering the rectified fast-wave of the EHG.
The R-R intervals were measured from QRS complexes. The
envelope of the EHG and the R-R intervals were averaged every
two seconds to extract the profile of the UC and the fHR.
To eliminate ectopic beats and compensatory/non-compensa-
tory pauses, HR beats values greater than 200 beats per minutes
(bpm) and less than 50 bpm were filtered out.
For the first step of the analysis, 30 minutes long EHG-fECG
time-series were used for the BPRSA analysis from recordings of
the active stage of labor (from 3 cm of dilation to complete
dilation, before pushing). For this step, the only criteria for
selection was the presence of 30 minutes with ,50% of signal loss.
The 30 minutes length was chosen in order to be long enough to
contain an adequate number of contractions (.3 per ten minutes),
but not too long in order to avoid high signal loss, major non-
Figure 1. Description of the Bivariate Phase Rectified Signal Averaging (BPRSA) method. Panel a) Uterine Activity by EHG (trigger signal):each data point is the average of raw signal every 2 seconds. Each black dot represents an anchor point (EHG increases). Panel b) fetal heart rate byECG (target signal). The empty circles represent anchor points derived from the EHG signal. Panel c) Segments of fetal heart rate to average, centeredaround the anchor point (time windows of 200 seconds, each data point(i) is the average of fHR every 2 seconds). Panel d) phase rectification at theanchor points and signal averaging. Panel e) BPRSA graph representing PRSA transformation of Uterine Activity (grey line) and BPRSA transformationof fetal heart rate (bold line).doi:10.1371/journal.pone.0094557.g001
BPRSA Analysis of Fetal Heart Rate in Labor
PLOS ONE | www.plosone.org 2 April 2014 | Volume 9 | Issue 4 | e94557

stationarities, noise and significant changes in fetal autonomic
reactivity. In each tracing the inter-relations between UC (as trigger
signal), as detected by increasing values of EHG (EHGq), and
synchronous values of fHR (as target signal) were analyzed by means
of the BPRSA algorithm. An experienced clinician in BPRSA
analysis (DC) classified the graphic outputs of BPRSA. Figure 1
summarizes the steps of BPRSA analysis for these two obstetrical
variables. For further readings refer to Bauer[8] and Schu-
mann[7].
The second step was the quantification of coupling between the
trigger and target signals by means of the magnitude squared
coherence method applied to cross power spectral density (CPSD)
analysis. The frequency composition of the signals was calculated
using a Welch-spectral analysis. First we computed spectral
analysis on the EHG signal to obtain the UC frequency domain
of each case. Then, we calculated the maximum coefficient of
coherence (CPRSA) at the specific UC frequency domain consid-
ering significant coherence values greater than 0.50[11,12]. The
coefficient of coherence obtained in this way was compared to
visual analysis.
In the third step, only 30-minutes time-series free of ECG signal
loss were selected (where available) for each fECG-EHG
recording. This was performed in order to apply the strict criteria
of spectral analysis and minimize the effects of artifacts and
background noise. After eliminating ectopic beats as previously
described, a linear interpolation was applied to obtain continuous
signal tracings and linear trends were removed. CPSD analysis was
then performed on the original EHG-fECG signals and on their
PRSA transformations to allow a comparison. The maximum
coefficients of coherence (CRAW and CPRSA, respectively), at the
specific UC frequency domain, were calculated for each case. In
order to estimate the ability of BPRSA analysis to identify
couplings between UC and fHR, the differences between
coherence values were tested by means of non-parametric tests
(paired Wilcoxon sign rank test). Two-tailed p-values less than 0.05
were considered statistically significant. All analyses were per-
formed using Matlab (R2011b, MathWorks) and SPSS 19 (IBM
Corp, Armonk, NY). Fig.1.
Results
Detection and quantification of couplings between UCand fHR by BPRSA
The BPRSA analysis was applied on 73 ta-fECG-EHG tracings
recorded during the first stage of labor. At a visual interpretation
of the BPRSA graphs, a central oscillation of BPRSA signal,
indicating the presence of coupling between UC and fHR, was
visible in 86.3% (63/73) cases (Figure 2a). On contrary, in 13.7%
(10/73) cases no deflection of BPRSA signal was visually identified
suggesting the absence of correlation between UC and fHR signals
(Figure 2b).
The frequency domain of UC obtained by spectral analysis
showed in each tracing a peak around 0.0069 Hz (median,
interquartile range [IQR] 0.0061–0.0078 Hz). The median value
of the maximum coefficients of coherence (CPRSA) between the
univariate PRSA transformation of EHG increases (EHGq) and
BPRSA transformation of fHR time series calculated by CPSD at
the individual UC frequency domain, was 0.76 (IQR 0.60–0.85).
A coherence coefficient .0.50 (denoting presence of significant
cross-correlation between the two signals frequency spectra) was
found in 85% (62/73) cases (Figure 3). When comparing the
results of coupling assessed by visual interpretation and CPSD
analysis there was a disagreement in overall 6/73 cases: in 5/63
cases the presence of coupling assessed by visual interpretation was
not confirmed by CPSD analysis (median CPRSA 0.38, IQR 0.34–
0.47); and in 1/10 case of absence of coupling assessed by visual
interpretation the coherence coefficient turned out significant at
CPSD analysis (CPRSA = 0.64).
Figure 2. Example of bivariate phase rectified signal averaging (BPRSA) graphs: grey line: univariate PRSA transformation ofelectrohysterogram increases (EHGq) time series; black line: bivariate PRSA transformation of fetal heart rate (fHR) values in correspondence to EHGq.The time axis, centered around time 0 (aligned anchors), allows to observe the oscillation of the signals before and after the triggering event (timewindows of 200 seconds, each data point(i) is the average of PRSA-signals every 2 seconds). Panel a: presence of coupling (black line oscillation);panel b: absence of coupling (flat black line).doi:10.1371/journal.pone.0094557.g002
BPRSA Analysis of Fetal Heart Rate in Labor
PLOS ONE | www.plosone.org 3 April 2014 | Volume 9 | Issue 4 | e94557

Figure 4. Comparison of BPRSA with conventional cross spectral analysis: example of detection of coupling by BPRSA. a) 30 minutesrecording of electrohysterogram (EHG, grey line) and fetal heart rate (fHR, black line) free of signal loss; b) cross power spectral density (CPSD)analysis of original signals, CRAW,0.5 at the uterine contraction (UC) frequency domain; c) BPRSA graph showing coupled periodicities; d) CPSDanalysis of PRSA signals, the CPRSA.0.5 at the UC frequency domain proved a significant correlation.doi:10.1371/journal.pone.0094557.g004
Figure 3. Detection of cross-correlations by cross power spectral density (CPSD) analysis applied to PRSA transformed signals: a)30-minutes electrohysterogram and fetal heart rate (EHG-fHR) recording; b) BPRSA graph denoting presence of coupled periodicities between uterinePRSA (grey line) and fHR BPRSA (black line); c) CPSD analysis of PRSA transformed signals. The coefficient of coherence CPRSA shows a significantcorrelation at the UC frequency domain (CPRSA = 0.81).doi:10.1371/journal.pone.0094557.g003
BPRSA Analysis of Fetal Heart Rate in Labor
PLOS ONE | www.plosone.org 4 April 2014 | Volume 9 | Issue 4 | e94557
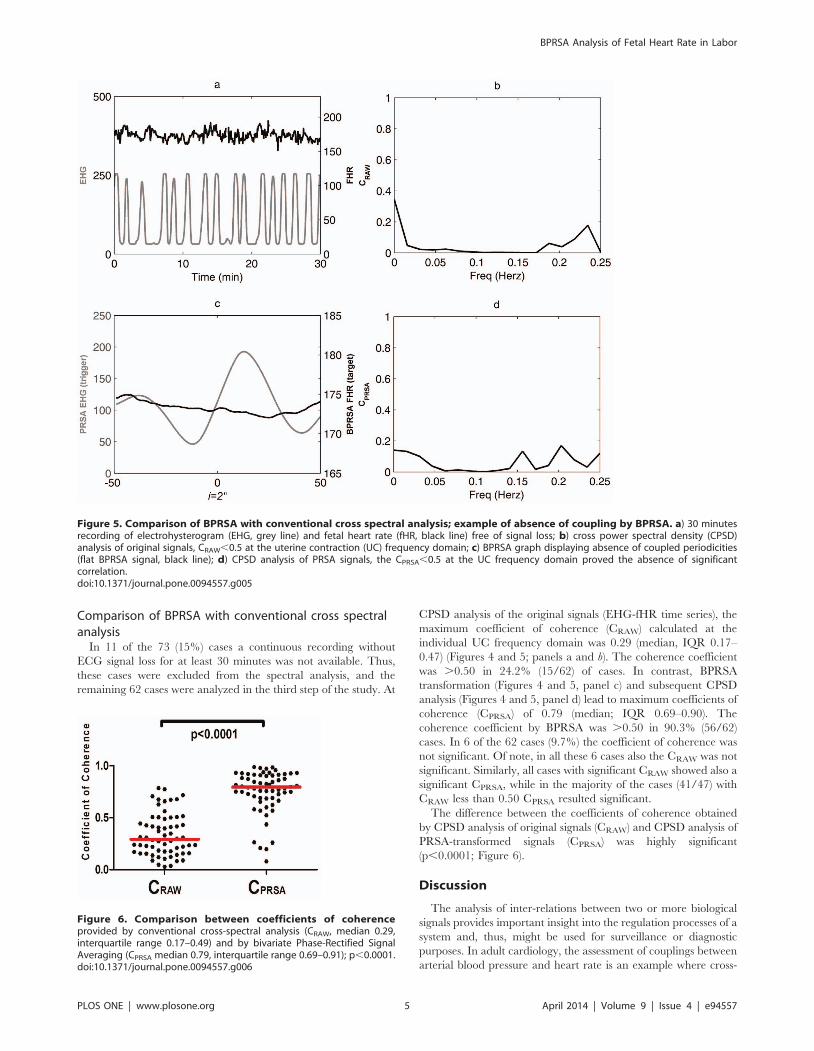
Comparison of BPRSA with conventional cross spectralanalysis
In 11 of the 73 (15%) cases a continuous recording without
ECG signal loss for at least 30 minutes was not available. Thus,
these cases were excluded from the spectral analysis, and the
remaining 62 cases were analyzed in the third step of the study. At
CPSD analysis of the original signals (EHG-fHR time series), the
maximum coefficient of coherence (CRAW) calculated at the
individual UC frequency domain was 0.29 (median, IQR 0.17–
0.47) (Figures 4 and 5; panels a and b). The coherence coefficient
was .0.50 in 24.2% (15/62) of cases. In contrast, BPRSA
transformation (Figures 4 and 5, panel c) and subsequent CPSD
analysis (Figures 4 and 5, panel d) lead to maximum coefficients of
coherence (CPRSA) of 0.79 (median; IQR 0.69–0.90). The
coherence coefficient by BPRSA was .0.50 in 90.3% (56/62)
cases. In 6 of the 62 cases (9.7%) the coefficient of coherence was
not significant. Of note, in all these 6 cases also the CRAW was not
significant. Similarly, all cases with significant CRAW showed also a
significant CPRSA, while in the majority of the cases (41/47) with
CRAW less than 0.50 CPRSA resulted significant.
The difference between the coefficients of coherence obtained
by CPSD analysis of original signals (CRAW) and CPSD analysis of
PRSA-transformed signals (CPRSA) was highly significant
(p,0.0001; Figure 6).
Discussion
The analysis of inter-relations between two or more biological
signals provides important insight into the regulation processes of a
system and, thus, might be used for surveillance or diagnostic
purposes. In adult cardiology, the assessment of couplings between
arterial blood pressure and heart rate is an example where cross-
Figure 5. Comparison of BPRSA with conventional cross spectral analysis; example of absence of coupling by BPRSA. a) 30 minutesrecording of electrohysterogram (EHG, grey line) and fetal heart rate (fHR, black line) free of signal loss; b) cross power spectral density (CPSD)analysis of original signals, CRAW,0.5 at the uterine contraction (UC) frequency domain; c) BPRSA graph displaying absence of coupled periodicities(flat BPRSA signal, black line); d) CPSD analysis of PRSA signals, the CPRSA,0.5 at the UC frequency domain proved the absence of significantcorrelation.doi:10.1371/journal.pone.0094557.g005
Figure 6. Comparison between coefficients of coherenceprovided by conventional cross-spectral analysis (CRAW, median 0.29,interquartile range 0.17–0.49) and by bivariate Phase-Rectified SignalAveraging (CPRSA median 0.79, interquartile range 0.69–0.91); p,0.0001.doi:10.1371/journal.pone.0094557.g006
BPRSA Analysis of Fetal Heart Rate in Labor
PLOS ONE | www.plosone.org 5 April 2014 | Volume 9 | Issue 4 | e94557
correlations between two biological signals are of high clinical
relevance[11,12]. The identification of specific periodic patterns of
HR, undetectable at visual inspection, is feasible by means of
spectral analysis[13–18]. Indeed, fetal acidosis relates to specific
frequency-band changes related to autonomous nervous system
modulation of fHR[16,17]. Although the spectral analysis of the
fHR has been widely investigated[14,16–18], its clinical applica-
tion during labor is largely limited by the need for stationary and
artifacts-free signals. Warrick et al. proposed a nonparametric
system-identification model to explore uterine pressure-fHR
dynamics in terms of impulse response function that proved
successful in detecting fetal distress[19,20]. However, each
methodology, that uses the Doppler as the origin of fHR signal,
might be intrinsically limited due to stochastic error and feto-
maternal HR confusion inherent to the methodology[21].
Moreover, external pressure transducer for UC assessment is
known to underestimate the duration of contractions, and to vary
accordingly to the contact of the pressure sensor and/or
abdominal wall thickness[19]. Thus, the development of a method
capable to assess the association between UC and fHR patterns in
objective and reproducible way, and simultaneously applicable on
non-stationary and noisy signal, would be of great clinical interest.
In the last years, the PRSA technique[10] has emerged as an
alternative approach capable to overcome these shortcomings.
This analytical method is a powerful tool for the detection and
quantification of quasi-periodic oscillations of HR, both in the
cardiologic[22,23] and obstetric fields[24].
We proved that BPRSA, an extension of the original method,
can be applied to trans-abdominally acquired recordings of fECG
and EHG, and is robust to artifacts and missing data[7,9].
Therefore, BPRSA analysis represents a genuine new approach to
investigate modifications of fHR periodicities coinciding with
uterine activity. Following the BPRSA transformation of raw
electrophysiological signals, a clear-cut visual correlation between
fHR patterns and UC periodicities was observed in the majority of
the cases. This proves that in most laboring women there is a close
interdependence between UC and fHR variations that reflects the
homeostasis of the system. Nevertheless, as learnt from the CTG
experience, any qualitative assessment has intrinsic limitations.
Thus, we aimed to verify the reliability of the method through a
mathematical quantitative computation by a conventional method
of coherence evaluation as the magnitude squared coherence
method applied to CPSD analysis of the PRSA transformed
signals. This mathematical computation confirmed the presence of
coupling in the majority of the cases in which the operator
detected a significant BPRSA oscillation. Nevertheless, in 8.2% of
cases there was a disagreement between visual assessment and
CPSD analysis. These findings highlight the key importance of a
computer-base support to the visual interpretation of the
interrelations between two complex signals.
The comparison of PRSA transformed signals to conventional
methods of cross-correlations evaluation (such as CPSD analysis of
original signals) showed significantly better performance of PRSA
method. The latter detected coupling between fHR and UC in
patients where traditional CPSD analysis failed to identify any
correlation. This finding confirms that the analysis of non-
stationary and noise-polluted signals by CPSD method alone,
without extensive pre-processing of raw data, is limited by major
shortcomings, and suggests that the application of PRSA method
prior to spectral analysis significantly improves the quality of the
spectra[7,9]. In addition, the lack of a continuous signal might
represent an insuperable limitation for traditional spectral analysis
(i.e. in our cohort 15% of tracings) that was rode over by the
application of BPRSA method.
Strenghts and limitations of the studyThis is a descriptive methodological study, first of its kind in the
obstetric field, which wants to lay the groundwork for future
clinical application. The evaluation of biological and clinical
significance of different patterns of coupling (or its absence)
between UC and fHR assessed by BPRSA method goes beyond
the purposes of this methodological research and remains to be
determined. These evaluations are the object of ongoing research.
Conclusions
We described a novel computer-based approach, BPRSA, that
can be reliably applied to trans-abdominally acquired EHG-
fECG, for the assessment of the couplings between UC and fHR
patterns. We proved that in the majority of labors fHR is strongly
influenced by uterine activity. The BPRSA method offers the
advantage to overcome the non-stationarity, missing data and
noise, typical of biological signals. Compared to standard
computerized assessment technique of cross-correlations, such as
cross power spectral density analysis, BPRSA is significantly
superior.
Author Contributions
Conceived and designed the experiments: DC TS KR EF AB. Performed
the experiments: DC TS KR CM ER MQ AB. Analyzed the data: DC TS
KR EF AB. Contributed reagents/materials/analysis tools: DC TS KR EF
AB. Wrote the paper: DC TS KR EF CM ER MQ AB.
References
1. Low JA (2004)Determining the contribution of asphyxia to brain damage in the
neonate. J Obstet Gynecol Res. 30: 276–286.
2. DiPietro JA, Irizarry RA, Hawkins M, Costigan KA, Pressman EK (2001) Cross-
correlation of fetal cardiac and somatic activity as an indicator of antenatal
neural development Am J Obstet Gynecol 185: 1421–8.
3. Romano M, Bifulco P, Cesarelli M, Sansone M, Bracale M (2006)Foetal heart
rate power spectrum response to uterine contraction. Med Biol Eng Comput 44:
188–201.
4. Warren R, Arulkumaran SS (2009) Best Practice in Labour and Delivery.
Cambridge University Press, pag.58 .
5. Devane D, Lalor J (2005) Midwives’ visual interpretation of intrapartum
cardiotocographs: intra- and inter-observer agreement. Journal of advanced
Nursing 52(2), 133–141.
6. Nielsen PV, Stigsby B, Nickelsen C, Nim J (1987) Intra- and inter-observer
variability in the assessment of intrapartum cardiotocograms. Acta Obstet
Gynecol Scand 66: 421–424.
7. Schumann AY, Kantelhardt JW, Bauer A, Schmidt G (2008) Bivariate phase-
rectified signal averaging. Physica A 387 5091–5100.
8. Bauer A, Barthel P, Muller A, Kantelhardt JW, Schmidt G (2009) Bivariate
phase-rectified signal averaging—a novel technique for cross-correlation analysis
in noisy nonstationary signals, Journal of Electrocardiology 42: 602–606.
9. Bauer A, Morley-Davies A, Barthel P, Muller A, Ulm K, et al. (2010) Bivariate
phase-rectified signal averaging for assessment of spontaneous baroreflex
sensitivity: pilot study of the technology, Journal of Electrocardiology 43: 649–
653.
10. Bauer A, Kantelhardt JW, Bunde A, Malik M, Schneider R, et al. (2006)Phase-
rectified signal averaging detects quasi-periodicities in nonstationary data.
Physica A 364: 423.
11. LaRovere MT, Bigger JT, Marcus FI, Mortara A, Schwartz PJ (1998) Baroreflex
sensitivity and heart-rate variability in prediction of total cardiac mortality after
myocardial infarction. ATRAMI (Autonomic Tone and Reflexes After
Myocardial Infarction) Investigators. Lancet 351(9101):478–84.
12. Barthel P, Bauer A, Muller A, Huster KM, Kanters JK, et al. (2012)
Spontaneous baroreflex sensitivity Prospective validation trial of a novel
technique in survivors of acute myocardial infarction. Heart Rhythm
9(8):1288–94.
13. Pagani M, Lombardi F, Guzzetti S, Rimoldi O, Furlan R, et al. (1986) Power
spectral analysis of heart rate and arterial pressure variabilities as a marker of
BPRSA Analysis of Fetal Heart Rate in Labor
PLOS ONE | www.plosone.org 6 April 2014 | Volume 9 | Issue 4 | e94557

sympatho-vagal interaction in man and conscious dog. Circulation Research,
The American Heart Association 59: 178–193.14. Taylor JA, Carr DL, Myers CW, Eckberg DL (1998) Mechanisms Underlying
Very-Low-Frequency RR-Interval Oscillations in Humans. Circulation, Amer-
ican Heart Association 98: 547–555.15. Cerutti S, Civardi S, Bianchi A, Signorini MG, Ferrazzi E, et al. (1989) Spectral
analysis of antepartum heart rate variability, Clin. Phys. Physiol. Meas. Vol. 10,Suppl. B, 27–31.
16. Chung DY, Simb YB, Park KT, Yi SH, Shin JC, et al. (2001) Spectral analysis of
fetal heart rate variability as a predictor of intrapartum fetal distress.International Journal of Gynecology & Obstetrics 73: 109–116.
17. Siira SM, Ojala TH, Vahlberg TJ, Jalonen JO, Valimaki IA, et al. (2005)Marked fetal acidosis and specific changes in power spectrum analysis of fetal
heart rate variability recorded during the last hour of labour,BJOG 112(4):418–23.
18. VanLaar JOEH, Porath MM, Peters CHL, Oei SG (2008) Spectral analysis of
fetal heart rate variability for fetal surveillance review of the literature, ActaObstetricia et Gynecologica 87: 300–306.
19. Warrick PA, Hamilton EF, Precup D, Kearney RE (2009) Identification of theDynamic Relationship Between Intrapartum Uterine Pressure and Fetal Heart
Rate for Normal and Hypoxic Fetuses IEEE Transactions On Biomedical
Engineering, Vol. 56, N. 6,20. Warrick PA, Hamilton EF Precup D, Kearney RE (2010) Classification of
Normal and Hypoxic Fetuses From Systems Modeling of Intrapartum
Cardiotocography, IEEE Transactions On Biomedical Engineering Vol. 57,No. 4,
21. Stampalija T, Signaroldi M, Mastroianni C, Rosti E, Signorelli V, et al. (2012)Fetal and maternal heart rate confusion during intrapartum monitoring:
comparison of trans-abdominal fetal electrocardiogram and Doppler telemetry.
J Matern Fetal Neonatal Med Off J Eur Assoc Perinat Med Fed Asia OceanPerinat Soc Int Soc Perinatal Obstet 25(8).:1517–20.
22. Bauer A, Kantelhardt JW, Barthel P, Schneider R, Makikallio T, et al. (2006)Deceleration capacity of heart rate as a predictor of mortality after myocardial
infarction: cohort study. Lancet 367: 1674–81.23. Kantelhardt JW, Bauer A, Schumann AY, Barthel P, Schneider R, et al. (2007)
Phase-rectified signal averaging for the detection of quasi-periodicities and the
prediction of cardiovascular risk, Chaos 17, 015112.24. Huhn EA, Lobmaier S, Fischer T, Schneider R, Bauer A, et al. (2011) New
computerized fetal heart rate analysis for surveillance of intrauterine growthrestriction. Prenat Diagn 31(5):509–14
BPRSA Analysis of Fetal Heart Rate in Labor
PLOS ONE | www.plosone.org 7 April 2014 | Volume 9 | Issue 4 | e94557
Copyright © 2022 FDOKUMEN