Research Note: Sankey diagrams for visualizing land cover dynamics
Upload
khangminh22Category
view
4download
0
Vol.:(0123456789)1 3
Applied Water Science (2020) 10:219 https://doi.org/10.1007/s13201-020-01300-5
ORIGINAL ARTICLE
Assessing the impact of land use and land cover dynamics on water quality of Dal Lake, NW Himalaya, India
Ishtiyaq Ahmad Rather1 · Abdul Qayoom Dar1
Received: 21 April 2020 / Accepted: 30 August 2020 / Published online: 14 September 2020 © The Author(s) 2020
AbstractA dynamic process like land use, if anthropogenically unsustainable, adversely affects the well-being of the land system. Worldwide, water bodies are facing imminent threat due to unsustainable anthropogenic activities. Water quality and ecol-ogy are the two characteristics of water bodies, if not preserved, shall have a direct consequence on the well-being of the human systems. Hence it is essential to understand the causes and consequences of the deteriorating water body systems. The condition is particularly grim in Himalayan water body ecosystems, where unplanned and unchecked urbanization has threatened their very existence. In the present study, the dynamics of land use/land cover (LULC) and its impact on the water quality of Dal Lake in Kashmir Himalaya, India has been assessed. We carried out a detailed study wherein changing LULC is analyzed against the deteriorating trophic status of the Dal Lake using time-series of satellite imagery of the lake’s catchment and its water quality data. Results indicated that the water quality of Dal Lake has remarkably deteriorated due to increased nutrient and sediment loads from the catchment, attributed to significant anthropogenic activities in the catchment. Due to unprecedented LULC changes in the catchment, the forest class shows a significantly negative change since the last four decades (1980–2018), corroborating with the ongoing deterioration of physicochemical characteristics of the lake. The analysis shows an increase in all the agents of eutrophication, such as NO3–N, TP, and COD, from 1990 to 2018. The decrease in forest, agriculture, and floating gardens was observed to show a significant negative correlation with the increase in the decadal average values of the COD, NO3–N, and TP for the same corresponding period. Similarly, a positive correlation was found between the increase in built-up, aquatic vegetation, bare surfaces, and these water quality parameters, establishing a strong relationship between the deteriorating condition of the lake and changing LULC. Our findings indicate that changing LULC of the lake’s catchment is one of the critical factors that has significantly contributed toward the deteriorating ecology and water quality of the Dal Lake. This study shall contribute toward the development of the robust conservation strategy in order to save this urban lake from its untimely death.
Keywords Dal Lake · LULC · Lake water quality · Eutrophication · Conservation strategy
Introduction
Land use (LU) refers to the human employment of land and is the planned hiring and management strategy laced on the land defined by humans (Biswas et al. 1999; Pradhan 2010). On the contrary, land cover (LC) is the natural cover on the land defined by natural processes. It includes the distribu-tion of vegetation, water, desert and ice, and the immedi-ate subsurface, including biota, soil, topography, surface,
and groundwater (Meraj et al. 2012). LULC change is a dynamic process driven by natural phenomena and anthro-pogenic activities that, in turn, compel deviations impacting natural ecosystems (Skilodimou et al. 2003). Such change occurs due to any physical, biological or chemical means, for example, drainage improvements, installation and use of irrigation, building farm dams, pollution and land degrada-tion, vegetation removal, changed fire regime, the spread of weeds and exotic species, and conversion to nonagricultural uses (Addiscott and Thomas 2000).
Changes in LULC have a significant influence on earth system processes such as hydrology, climate, biogeochemi-cal cycles resulting in adverse environmental issues if prom-ulgated unfettered (Bhat et al. 2013, 2014, 2016). Globally,
* Ishtiyaq Ahmad Rather [email protected]
1 Department of Civil Engineering, National Institute of Technology Srinagar, Srinagar, J&K 190006, India

Applied Water Science (2020) 10:219
1 3
219 Page 2 of 18
LULC changes have resulted in deforestation, biodiversity loss, global warming, and an increase in natural disasters, hence causing global environmental change (Hooijer et al. 2004; Altaf et al. 2013; Meraj et al. 2013, 2018). LULC change is considered as the single most crucial variable of global change and is as large as that associated with the climate change, having a significant impact on the environ-ment (Gujree et al. 2017), due to which inventory, assess-ment, and monitoring of LULC change provides a vital input to environmental decision-making (Meraj et al. 2013) and are crucial for further understanding and modeling of change mechanism at different scales (Van De Wiel et al. 2011; Altaf et al. 2014). Many urban land use studies have used satellite images to generate accurate urban land use maps and also detected changes in urban land use/land cover (Javed et al. 2009; Chen et al. 2011; Saghafian et al. 2013; Badar et al. 2013a, b; Valipour 2015; Taloor et al. 2020). The short- and long-term monitoring of LULC change is vital in establishing links between policy decision-making, regula-tory actions, and subsequent land use planning activities for the management of natural resources (Mosbahi et al. 2012; Trabucchi et al. 2013; Jang et al. 2013). Catchment has an essential role in determining the composition of the lake water quality, and LULC change in the catchment affects the downstream environmental processes, particularly the water quality.
The literature review shows that most studies have focused on analyzing the change in catchment LULC with water quality parameters. By discussing the water quality changes due to LULC conversion and modification (Jener-ette and Wu 2001; Lambin and Geist 2006), authors have focused on how it ultimately affects the water quality. Many studies have evaluated the influence of the catchment dynamics and the water quality (WQ) parameters of the lake, such as DO, nitrates, phosphates, TDS, and TSS (Sliva and Williams 2001; Turner and Rabalais 2003; Ahearn et al. 2005). Moreover, a particular type of land cover affects par-ticular WQ parameters. For example, it has been concluded by many studies that agricultural activities in the catchment are a critical criterion determining the pesticides and nitro-gen in the water bodies (Johnson et al. 1997; Smart et al. 1998; Sliva and Williams 2001).
Assessment of the impact of the LULC change on WQ has critical importance in the management of the environ-ment (Engel et al. 2007), due to its role in maintaining the sustainability for biotic life. Moreover, besides water qual-ity, LULC changes have a tremendous role in understand-ing the implications of climate change, runoff potential, and demography (Meyer and Turner 1992; Weng 2001; Beighley et al. 2008).
The study has been carried out on Dal Lake and its catch-ment, Kashmir, NW Himalaya India. Due to tremendous anthropogenic pressures as a result of changing socioeco-nomic conditions in the region, Dal Lake as a system has been affected ecologically as well as hydrologically (Khan 1993a, b). The area in the recent decade has witnessed unprecedented and unplanned urbanization. The untreated sewage from various point and nonpoint sources discharged into the lake has resulted in the complete degradation of the water quality of the lake. Moreover, deforestation, grazing, and agricultural activities in the Dal Lake catchment have resulted in the heavy sediment, and nutrient loads into the lake have accelerated its eutrophication (Badar and Romshoo 2007). Due to an increase in the percent impervious area of the Dal Lake catchment, after a short spell of precipitation, there is quick peak flow in the streams (mainly Telbal Nalla) feeding the Dal Lake that increases the rate of erosion and hence draws more sediment loads into the lake (Pandit and Qadri 1990; Amin and Romshoo 2007).
Water pollution and the resulting degradation of the Dal Lake ecosystem are currently India’s national prior-ity. Environmental groups are raising voices to designate this lake as a Ramsar site so that the conservation of this lake is monitored and funded internationally. Many studies have been carried out to understand the causes behind the lakes’s alarming rate of eutrophication. However, analysis for understanding this phenomenon through the establish-ment of a statistical relationship between changing LULC and WQ is missing. Therefore, the present study was aimed to understand the degrading condition of the lake using long-term relationships between the changing LULC and WQ so that policymakers through informed decision-making could devise strategies aimed at reversing the changes that have resulted in its degradation.
Study area
The present work addresses the impact of decadal LULC change on the water quality of the Dal Lake, Kashmir, India. The study area lies between 34˚5′20″ to 34˚13′40″N lati-tude and 74˚48´35″ to 74˚08′32″E longitude, at an altitude of 1583 m to the north-east of Srinagar city, Jammu and Kashmir, India (Fig. 1). The lake is characterized by vast and diverse watershed in terms of topography, flora and fauna. It spreads over an area of 333 km2. Among the sub-watersheds, Telbal-Dachigam in the north-east is the largest sub-water-shed (~ 230 km2) of Dal catchment comprising nearly 70% of the watershed and divided into the Telbal-Dara (~ 87 km2)

Applied Water Science (2020) 10:219
1 3
Page 3 of 18 219
and Dachigam National Wildlife Reserve (~ 143 km2) sub-watersheds. The average annual rainfall is 650 mm at Sri-nagar and 870 mm at Dachigam. A snow thaw in the higher reaches in the summer season of the watershed results in the maximum discharge in Dachigam and Dara Nallah (Shah et al. 2014).
The Dal Lake catchment is dominated by alluvium, Panjal traps, and agglomerate slates. The water table nicks the hill slopes, which is evidenced by the occurrence of numerous springs in the catchment. It has the drainage pattern of den-dritic type that indicates that the catchment’s rock strata is of lower porosity. The irregular surfaces on the mountains of this catchment are endorsed to this dendritic and trellis drainage pattern. Moreover, the catchment is characterized by a variety of rock types such as sedimentary, metamorphic, and igneous. The critical stream that enters the lake, i.e., the dachigam Telbal Nallah system, is supposed to follow two significant lineaments. Regarding the Dal Lake, it is a multi-basin lake with the generally flowing from east to south-west (Wadia 1953; Bhat 1989).
Materials and methods
Landsat multi-resolution/multi-temporal data were used for this work, comprising of Landsat MSS (15 September 1980, 57 m), TM (21 October 1990, 28.5 m), ETM (19 Sep-tember 2000, 14.25 m), ETM+ (24 October, 2010, 30 m), and OLI (27 September 2018, 30 m). Correction of MSS and TM data was done by, 1:50,000 scale survey of India (SOI) topographic maps using 85 control points (GCP) with the correction RMSE equal to 0.49. ETM, ETM+, and OLI images were co-registered with a corrected TM image using 75 control points with correction RMSE 0.45. In order to save the spectral and radiometric information of the data, all the images were geometrically rectified into the WGS 84 datum and UTM projection using the linear polynomial function and nearest neighbor rectification re-sampling. Image processing and accuracy assessment was performed in ERDAS imagine-14, whereas visual image interpretation was performed in ArcGIS 10.1.
National natural resource management scheme (NNRMS) standards for land use/land cover mapping were followed
Fig. 1 Location of the study area with respect to India and the UT of J&K

Applied Water Science (2020) 10:219
1 3
219 Page 4 of 18
(Dasgupta et al. 2000). Onscreen/visual image interpreta-tion technique was used for classifying different land use/land cover (LULC) observed in the study area (Lillesand and Kiefer 2004). The mapping was performed at a 1:30,000 scale in order to keep landsat MSS data’s low resolution as a common platform for other high-resolution datasets (Javed et al. 2009; Rai 2018; Pall and Meraj 2019). The land use and land cover map of 2018 was validated in the field to determine its accuracy. Overall, 371 reference sample points were chosen for the validation of land use land cover in the field (Vishwakarma et al. 2016; Mishra et al. 2018; Rai 2018). Table 1 shows the error matrix of the 2018 LULC validation. While as for 1980, 1992, 2000, and 2010 LULC maps, we followed Google Earth’s historical imagery and SOI Toposheets for correction purposes during the delinea-tion process (Meraj et al. 2018) and was performed when the ground-truthing of the 2018 map completed. It helped in the judicious use of Google Earth imagery for correction pur-poses of the earlier date maps. The reliability of the LULC is adjudged by the accuracy assessment technique designated by the Kappa coefficient (Foody 2002; Badar et al. 2013a; Meraj et al. 2018; Rather et al. 2018). Kappa coefficient of 0.91 for LULC 2019 revealed significant accuracy of the LULC products generated and was calculated using the fol-lowing formula in Eq. 1
We analyzed the time-series of water quality data from 1990 to 2018. Monthly data of Dal Lake water quality from
(1)k = N
r∑
i=1
X −
r∑
i=1
X
1990 to 1993 was converted into three year’s average to correlate that with the land cover of 1990, decade. Three-year average approach was followed in order to stabilize the dynamics of the water quality of Dal Lake, so that the rela-tion with the LULC could be justified. Similarly, for corre-lating the LULC of 2000, 2010, and 2018, we averaged the water quality of 1999–2001, 2009–2011, and 2017–2019 periods, respectively. The water quality data were obtained from the research and analysis wing of the Lakes and Water-ways Department, Government of Jammu and Kashmir. Fig-ure 2 describes the overall methodology of the present work.
Results
In the following sections, decadal LULC analysis and the change thereof have been presented. Further, the impact of changing LULC on water quality of Dal Lake has also been discussed.
LULC change analysis of the Dal Lake catchment
The results of the LULC of the Dal Lake catchment along with the change analysis are presented in Table 2. The LULC analysis of the study area for the year 1980 revealed that out of eleven LULC classes, forest class was the dominant category in the study area with 135.72 km2 and consti-tuted about 40% of the total watershed area. Scrub covered 58.12 km2 (17.43%), while agriculture constituted 34.43 km2 (10.33%) of the total study area (Fig. 3). Exposed rock
Table 1 Accuracy assessment of LULC of 2018
W water, Sc scrub, Pl plantation, Pa pasture, Fo forest, Fg floating garden, Er exposed rock, Bu built-up, Br bare, AqV aquatic vegetation, Ag agriculture
W Sc Pl Pa Fo Fg Er Bu Br AqV Ag Row total User’s accuracy
Classification dataW 19 0 0 0 0 0 0 0 0 1 0 20 95.00Sc 0 45 0 0 0 0 0 0 0 0 1 46 97.83Pl 0 0 25 0 1 0 0 0 0 0 1 27 92.59Pa 0 1 0 39 0 0 0 0 0 0 1 41 95.12Fo 0 0 0 0 29 0 0 0 0 0 0 29 100.00Fg 0 0 0 0 19 0 0 0 0 1 20 95.00Er 0 0 0 0 0 0 25 0 0 0 0 25 100.00Bu 0 0 0 0 0 0 3 45 0 0 0 48 93.75Br 0 0 0 0 0 0 0 0 30 0 0 30 100.00AqV 0 0 0 0 0 0 0 0 0 35 2 37 94.59Ag 0 0 0 0 3 0 0 0 0 0 45 48 93.75Column total 19 46 25 39 33 19 28 45 30 36 51 371Producer’s accuracy 100.00 97.83 100.00 100.00 87.88 100.00 89.29 100.00 100.00 97.22 88.24Overall accuracy = 95.96

Applied Water Science (2020) 10:219
1 3
Page 5 of 18 219
covered 20.86 km2 (6.25%) followed by built-up (20.15 km2, 6.04%), plantation (18.81 km2, 5.6%), pasture (16.30 km2, 4.9%), water (14.36 km2, 4.31%), floating garden (8.74 km2, 2.62%), bare land (3.80 km2, 1.13%), and aquatic vegetation (2.03 km2, 0.60%).
For the year 1992, though, there had been some changes in the area of certain land cover classes, but the change had not been significant, as shown in Fig. 4, Table 2. For-est is the dominant category again in the study area with 131.84 km2 and constituted about 39% of the total watershed area, followed by scrub (58.12 km2, 17.43%), agricultural land (34.46 km2, 10.33%), exposed rock (23.86 km2, 7.16%), built-up (22.65 km2, 6.79%), plantation (17.03 km2, 5.11%), pasture (16.03 km2, 4.81%), water (13.73 km2, 4.12%), float-ing garden (8.84 km2, 2.65%), bare land (4.50 km2, 1.35%), and aquatic vegetation (2.20 km2, 0.66%). (Table 2).
For the year 2000, the forest was again the dominant class in the study area with 126.83 km2 of area under it, which constituted about 38% of the total watershed area followed by scrub (58.46 km2, 17.53%), agricultural land (29.85 km2, 8.95%), built-up (29.29 km2, 8.78%) (Fig. 5). Exposed rock covered (25.54 km2, 7.66%), pasture (16.56 km2, 4.96%), plantation (15.92 km2, 4.77%), water (11.35 km2, 3.4%),
floating garden (8.75 km2, 2.62%), bare land (6.37 km2, 1.91%), and aquatic vegetation (4.49 km2, 1.34%) (Table 2).
In the year 2010, forest class was the dominant category in the study area with 120.61 km2 of area under its expanse, that constituted about 36% of the total watershed area, fol-lowed by scrub (57.73 km2, 17.31%), built-up (36.83 km2, 11.04%) (Fig. 6).The other dominant classes were exposed rock (27.82 km2, 8.34%), agricultural land (25.45 km2, 7.63%), pasture (17.32 km2, 5.19%), plantation (15.31 km2, 4.59%), water (10.49 km2, 3.14%), bare land (8.79 km2, 2.63%), floating garden (7.68 km2, 2.30%), and aquatic veg-etation (5.36 km2, 1.60%) (Table 2).
For year 2018 again, forest class was the dominant cat-egory in the study area covering 118.3 km2 that consti-tuted about 35% of the total watershed area (Fig. 7), fol-lowed by scrub (58.2 km2, 17.41%), built-up (38.6 km2, 11.55%), exposed rock (28.9 km2, 8.65%), agricultural land (24.10 km2, 7.21%), pasture (17.30 km2, 5.17%), planta-tion (14.9 km2, 4.45%), water (10.7 km2, 3.2%), bare land (9.7 km2, 2.90%), floating garden (7.7 km2, 2.30%), and aquatic vegetation (5.7 km2, 1.70%) (Table 2).
Fig. 2 Flowchart of the overall methodology used
Applied Water Science (2020) 10:219
1 3
219 Page 6 of 18
Decadal LULC change analysis of the Dal Lake catchment
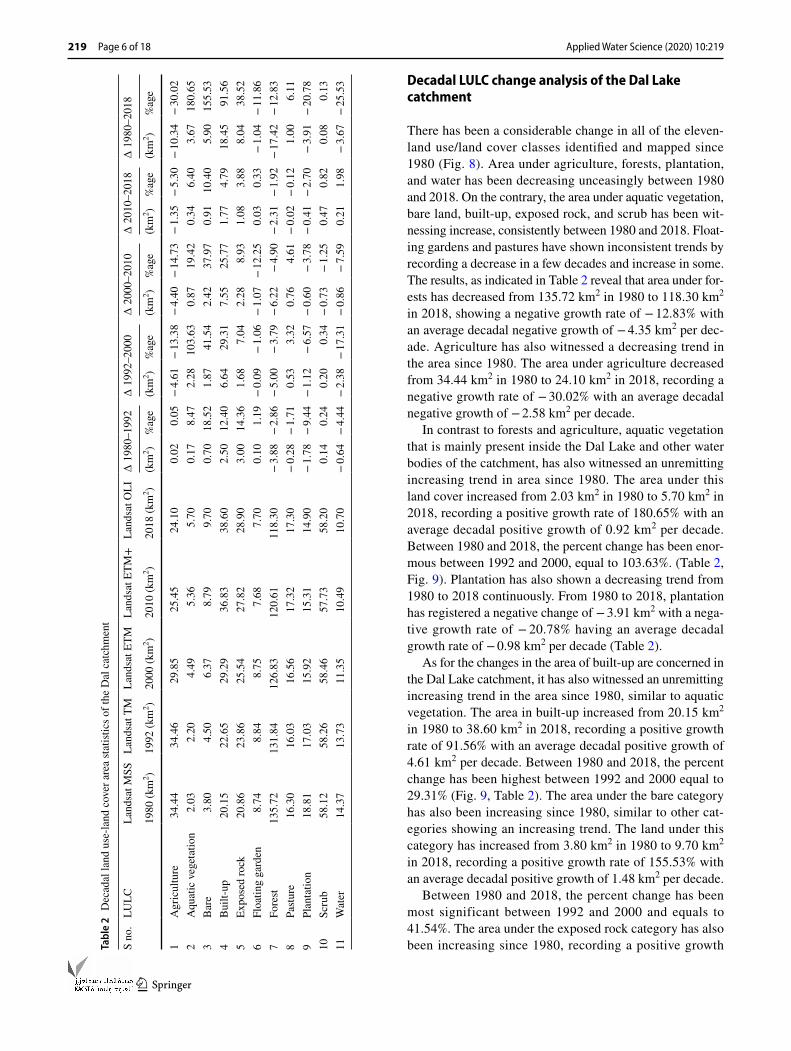
There has been a considerable change in all of the eleven-land use/land cover classes identified and mapped since 1980 (Fig. 8). Area under agriculture, forests, plantation, and water has been decreasing unceasingly between 1980 and 2018. On the contrary, the area under aquatic vegetation, bare land, built-up, exposed rock, and scrub has been wit-nessing increase, consistently between 1980 and 2018. Float-ing gardens and pastures have shown inconsistent trends by recording a decrease in a few decades and increase in some. The results, as indicated in Table 2 reveal that area under for-ests has decreased from 135.72 km2 in 1980 to 118.30 km2 in 2018, showing a negative growth rate of − 12.83% with an average decadal negative growth of − 4.35 km2 per dec-ade. Agriculture has also witnessed a decreasing trend in the area since 1980. The area under agriculture decreased from 34.44 km2 in 1980 to 24.10 km2 in 2018, recording a negative growth rate of − 30.02% with an average decadal negative growth of − 2.58 km2 per decade.
In contrast to forests and agriculture, aquatic vegetation that is mainly present inside the Dal Lake and other water bodies of the catchment, has also witnessed an unremitting increasing trend in area since 1980. The area under this land cover increased from 2.03 km2 in 1980 to 5.70 km2 in 2018, recording a positive growth rate of 180.65% with an average decadal positive growth of 0.92 km2 per decade. Between 1980 and 2018, the percent change has been enor-mous between 1992 and 2000, equal to 103.63%. (Table 2, Fig. 9). Plantation has also shown a decreasing trend from 1980 to 2018 continuously. From 1980 to 2018, plantation has registered a negative change of − 3.91 km2 with a nega-tive growth rate of − 20.78% having an average decadal growth rate of − 0.98 km2 per decade (Table 2).
As for the changes in the area of built-up are concerned in the Dal Lake catchment, it has also witnessed an unremitting increasing trend in the area since 1980, similar to aquatic vegetation. The area in built-up increased from 20.15 km2 in 1980 to 38.60 km2 in 2018, recording a positive growth rate of 91.56% with an average decadal positive growth of 4.61 km2 per decade. Between 1980 and 2018, the percent change has been highest between 1992 and 2000 equal to 29.31% (Fig. 9, Table 2). The area under the bare category has also been increasing since 1980, similar to other cat-egories showing an increasing trend. The land under this category has increased from 3.80 km2 in 1980 to 9.70 km2 in 2018, recording a positive growth rate of 155.53% with an average decadal positive growth of 1.48 km2 per decade.
Between 1980 and 2018, the percent change has been most significant between 1992 and 2000 and equals to 41.54%. The area under the exposed rock category has also been increasing since 1980, recording a positive growth Ta
ble
2 D
ecad
al la
nd u
se-la
nd c
over
are
a st
atist
ics o
f the
Dal
cat
chm
ent
S no
.LU
LCLa
ndsa
t MSS
Land
sat T
MLa
ndsa
t ETM
Land
sat E
TM+
Land
sat O
LI∆
198
0–19
92∆
199
2–20
00∆
200
0–20
10∆
201
0–20
18∆
198
0–20
18
1980
(km
2 )19
92 (k
m2 )
2000
(km
2 )20
10 (k
m2 )
2018
(km
2 )(k
m2 )
%ag
e(k
m2 )
%ag
e(k
m2 )
%ag
e(k
m2 )
%ag
e(k
m2 )
%ag
e
1A
gric
ultu
re34
.44
34.4
629
.85
25.4
524
.10
0.02
0.05
− 4.
61−
13.3
8−
4.40
− 14
.73
− 1.
35−
5.30
− 10
.34
− 30
.02
2A
quat
ic v
eget
atio
n2.
032.
204.
495.
365.
700.
178.
472.
2810
3.63
0.87
19.4
20.
346.
403.
6718
0.65
3B
are
3.80
4.50
6.37
8.79
9.70
0.70
18.5
21.
8741
.54
2.42
37.9
70.
9110
.40
5.90
155.
534
Bui
lt-up
20.1
522
.65
29.2
936
.83
38.6
02.
5012
.40
6.64
29.3
17.
5525
.77
1.77
4.79
18.4
591
.56
5Ex
pose
d ro
ck20
.86
23.8
625
.54
27.8
228
.90
3.00
14.3
61.
687.
042.
288.
931.
083.
888.
0438
.52
6Fl
oatin
g ga
rden
8.74
8.84
8.75
7.68
7.70
0.10
1.19
− 0.
09−
1.06
− 1.
07−
12.2
50.
030.
33−
1.04
− 11
.86
7Fo
rest
135.
7213
1.84
126.
8312
0.61
118.
30−
3.88
− 2.
86−
5.00
− 3.
79−
6.22
− 4.
90−
2.31
− 1.
92−
17.4
2−
12.8
38
Pastu
re16
.30
16.0
316
.56
17.3
217
.30
− 0.
28−
1.71
0.53
3.32
0.76
4.61
− 0.
02−
0.12
1.00
6.11
9Pl
anta
tion
18.8
117
.03
15.9
215
.31
14.9
0−
1.78
− 9.
44−
1.12
− 6.
57−
0.60
− 3.
78−
0.41
− 2.
70−
3.91
− 20
.78
10Sc
rub
58.1
258
.26
58.4
657
.73
58.2
00.
140.
240.
200.
34−
0.73
− 1.
250.
470.
820.
080.
1311
Wat
er14
.37
13.7
311
.35
10.4
910
.70
− 0.
64−
4.44
− 2.
38−
17.3
1−
0.86
− 7.
590.
211.
98−
3.67
− 25
.53

Applied Water Science (2020) 10:219
1 3
Page 7 of 18 219
rate of 38.52% with an average decadal positive growth of 2.01 km2 per decade. This growing trend has been continu-ous with 20.86 km2, 23.86 km2, 25.54 km2, 27.82 km2, and 28.90 km2 for the years 1980, 1992, 2000, 2010, and 2018, respectively. Between 1980 and 2018, the percent change has been biggest between 1980 and 1992 and equating to 14.36%.
In the case of the area under water-extent, it has wit-nessed a decreasing trend since 1980. The area under water decreased from 14.37 km2 in 1980 to 10.70 km2 in 2018, recording a dwindling rate of − 25.53% with an average decadal decline of − 0.92 km2/decade. This declining trend has been continuous with 14.37 km2, 13.73 km2, 11.35 km2, 10.49 km2, and 10.70 km2 for the years 1980, 1992, 2000, 2010, and 2018, respectively. From 1980 to 2018 the per-centage change has been most considerable in the period between 1992 and 2000 and equaled to − 17.3%. In case of floating gardens and pasture categories, both have regis-tered fluctuating trend in area changes in different periods since 1980; floating gardens were decreased from 8.74 km2 in 1980 to 7.70 km2 in 2018, recording a dwindling rate of
− 11.86% with an average decadal decline of − 0.26 km2 per decade. From 1980 to 1992, it registered a positive growth of 1.19%, and the corresponding decades, witnessed a decrease in area equaling to − 1.06 km2 and − 12.25 km2 in the peri-ods 1992–2000 and 2000–2010, respectively. Pasture lands within the catchment witnessed an increase in area with 16.30 km2 in 1980 and 17.30 km2 in 2018, recording an inclining rate of 6.11% with an average decadal incline of − 0.25 km2 per decade. Scrub lands did not witness any sub-stantial changes in the area since 1980.
Discussion
In order to assess the impact of changing LULC on the water quality of the Dal Lake, we performed statistical analysis between the decadal changes in LULC and the time series of water quality data for the Dal Lake. Table 3 shows the area of specific LULC classes and average decadal WQ change. Table 4 shows the correlation matrix between the LULC and
Fig. 3 LULC map of 1980

Applied Water Science (2020) 10:219
1 3
219 Page 8 of 18
changing water quality parameters of the Dal Lake. Vari-ous workers analyzed the temporal variation between water quality variables such as COD, NO3–N, and total phospho-rus, and different land-use types (Cherry et al. 1980; Lucey and Goolsby 1993; McDowell et al. 1995; Yu et al. 2016; Fashae et al. 2019; Jasrotia et al. 2019; Adimalla et al. 2020; Taloor et al. 2020). We observed that change in agriculture class was negatively correlated with the changes in the area of aquatic vegetation, built-up classes in the watershed and COD, NO3–N, and total phosphorus of the Dal Lake during the four decades of analysis (Table 3, Fig. 10). Overall, the area under agriculture is decreasing (30.02%) in the water-shed between 1980 and 2018. This decrease has resulted in the corresponding increase in the area under the built-up class (90.56%) on the land (Table 2). Changes in area under agriculture, floating gardens, and forests are showing posi-tive correlation. All of these LULC’s are decreasing between 1980 and 2018. The area under agriculture decreased due to a corresponding increase in the area under the built-up, bare surface classes in the catchment. Various studies have ascribed an increase in the built-up in the lake catchment to
the increased levels of COD, NO3–N, and TP. Zhang et al. (2010), Moss (2012), and Yadav and Pandey (2017), have shown how built-up contributes to the increased nutrient loads in the lake, thus increasing the concentration of these WQ parameters. We observed that there is an increase in average decadal COD, NO3–N, and TP in the Dal Lake and is reflected with negative correlation between changes in the agricultural area and these water quality parameters (Bhat et al. 2016) (Fig. 10a–e; Tables 3, 4).
Studies such as Lucey and Goolsby (1993), Ayadi et al. (2014), and Rather and Dar (2020) showed that built-up and bare-surface classes in the catchment could supplement the introduction of enhanced loads of fertilizers and phosphates into the lake either through point or nonpoint sources. Such an enhancement is demonstrated finally as increased BOD, COD, and TP concentrations of the lake (Meyer and Lik-ens 1979; Pandey and Kumar 2015; Adimalla and Taloor 2020). We observed that changes in the area under aquatic vegetation class were positively correlated with the changes in COD, NO3–N, and TP of the lake. These parameters show an increase since 1980 and can be related to the increase in
Fig. 4 LULC map of 1992

Applied Water Science (2020) 10:219
1 3
Page 9 of 18 219
aquatic vegetation in the lake. Similar findings have been reported by Makela et al. (2004), Veraart et al. (2011), and Zhao et al. 2013. We also observed that change in the built-up class is negatively correlated with the changes in the area of floating gardens and forests. Studies such as Chan (2010), Meyfroidt and Lambin (2011), Ramachandra et al. (2012), and Dabi and Kporha (2015) demonstrated forests in the catchment had been converted for urbanization as a result of unplanned and unsustainable development. Since 1980, in the Dal Lake catchment, built-up class is increasing at the behest of forests, and floating gardens.
It has been observed that an increase in the area under built-up class is positively correlated with the increase in average COD, NO3–N, and TP of the Lake since 1980. Car-penter et al. (1998) and Khadka and Ramanathan (2013) have shown that the increase in the built-up in the catchment is associated with increased amounts of sewage and runoff and results in the enhanced nutrient loads in the form of nitrates and phosphates into the water body. Similar pro-cesses are taking place in the Dal Lake also. Probst et al.
(1992), Behrendt and Opitz (2000), and Vieux and Moreda (2003) have shown similar observations.
Further, we have observed a decrease in the area under floating gardens of the Dal Lake being negatively correlated with the increase in the average COD, NO3–N, and TP of the lake. Vanni et al. (2001), Guo et al. (2002), and Delpla et al. (2009) have shown that the vegetation within the water bod-ies assimilate nitrates and phosphates as fertilizers, and thus, decrease in the area of vegetation shall lead to increase in the concentrations of these nutrients that enter into the lake system through various sources. Similarly, floating gardens, which are the vegetation patches inside the Dal Lake, helped in the assimilation of nitrates and phosphates from the lake, thereby helping in decreasing their concentration in the lake.
We observed that there is an inverse relationship between the decrease in forest area in Dal catchment and an increase in average COD, NO3–N, and TP of the lake since 1980. In other words, there is a significant negative correlation between them. Similar results have been observed by Saun-ders and Lewis (1988), McDowell and Asbury (1994), McDowell et al. (1995), and Vanderperk (2006) and have
Fig. 5 LULC map of 2000

Applied Water Science (2020) 10:219
1 3
219 Page 10 of 18
attributed deforestation with the increased sediment and nutrient export into the water bodies. Therefore, deforesta-tion in the Dal Lake catchment can be associated with an increase in the lake’s COD, NO3–N, and TP concentration.
Various studies such as National Research Council and Mono Basin Ecosystem Study Committee (1987), Council and Bennett (1993), Habersack and Nachtnebel (1995), Ten-zer et al. (1997), Hernandez and Ernest (1999), Schoonover et al. (2005), Salvia-Castellví et al. (2005), Salomons and Stigliani eds (2012), Mallick (2017), Thakur et al. (2018), Denizman (2018), Jasrotia et al. (2018), and Roy et al. (2018) have shown that sediment–water interactions and the human activities such as agrarian and forestry practices, as well as the release of domestic wastewaters into the water bodies, are statistically related as have been analyzed in the present study.
Conclusion
The changing land-use practices in the Dal catchment have severe repercussions on its ecology and the long-term socioeconomics of the whole Kashmir valley. From
the discussion, it is concluded that the main reason for the deterioration of the water quality of Dal Lake is due to increased nutrient and silt loads from its catchment as a result of unprecedented LULC changes. The results from LULC change analysis indicated that forest class was domi-nant land cover in all the five time-periods with 135.72 km2, 131.84 km2, 126.83 km2 120.63 km2, and 118.30 km2 for 1980, 1992, 2000, 2010, and 2018, respectively, with the most considerable decline of 4.9% during the 2000–2010 decade. Between 1980 and 2018, aquatic vegetation within the lake witnessed an increase of 180.65%, with only 2.03 km2 of area in 1980, and 5.70 km2 in 2018. Contrarily, agriculture witnessed a decrease in the area of 30.02% with 34.44 km2 of land in 1980, that got reduced to 24.10 km2 in 2018.
Over the years, due to an increase in the concentration of nitrate-nitrogen, total phosphorus, and COD, the ecol-ogy of the lake got severely damaged, resulted in adversely affecting its flora and fauna. As is evident from changing LULC and water quality of the Dal Lake from the last four decades, the amount of nitrogen and phosphorus in the lake is tremendous, thereby deteriorating its quality. Further,
Fig. 6 LULC map of 2010

Applied Water Science (2020) 10:219
1 3
Page 11 of 18 219
Fig. 7 LULC map of 2018
Fig. 8 Stacked bar chart showing how LULC categories have changed over last 04 decades in the Dal Lake watershed as percent change

Applied Water Science (2020) 10:219
1 3
219 Page 12 of 18
the sewage discharge from the urban catchment has ampli-fied the eutrophication of the lake as well. As a result, the proliferation of aquatic vegetation has accelerated thereby, adversely affecting its tourism value. We, therefore, recom-mend a broad framework of policies for sustainable man-agement of sewage of the urban Dal Lake catchment, and a concrete action plan for the conservation and restoration of this critical Himalayan Lake. We are hopeful that the results of this study would provide essential inputs to policymakers in understanding the role of land use and land cover changes in impacting the water quality of the Dal Lake to frame an effective and eco-friendly land-use policy for its catchment.
Fig. 9 Stacked bar chart showing area changes (in km2) in LULC categories over last 04 decades in the Dal Lake watershed
Table 3 LULC and WQ parameters at different points of time
Parameter 1992 2000 2010 2018
Agriculture (km2) 34.46 29.85 25.45 24.10Aquatic vegetation (km2) 2.20 4.49 5.36 5.70Built-up (km2) 22.65 29.29 36.83 38.60Floating garden (km2) 8.84 8.75 7.68 7.70Forest (km2) 131.84 126.83 120.61 118.30Avg DO (mg/L) 7.01 7.17 7.66 6.92Avg COD (mg/L) 15.35 16.1 20.85 19.96Avg NO3–N (mg/L) 0.3 0.41 0.61 0.48Avg TP (mg/L) 0.34 0.38 0.4 0.5
Table 4 Correlation matrix between WQ parameters and LULC for 1992, 2000, 2010, and 2018
Bold refers to significant correlation
Ag AqV Bu Fg Fo DO COD NO3–N TP
Ag 1.00AqV − 0.98 1.00Bu − 1.00 0.97 1.00Fg 0.93 − 0.83 − 0.94 1.00Fo 1.00 − 0.96 − 1.00 0.95 1.00DO − 0.29 0.32 0.31 − 0.38 − 0.25 1.00COD − 0.92 0.84 0.94 − 0.99 − 0.93 0.49 1.00NO3–N − 0.86 0.84 0.87 − 0.87 − 0.84 0.74 0.92 1.00TP − 0.86 0.81 0.85 − 0.77 − 0.88 − 0.23 0.70 0.48 1.00

Applied Water Science (2020) 10:219
1 3
Page 13 of 18 219
Fig. 10 a–e Scatterplots of area of LULC classes of the Dal Lake catchment versus WQ parameters of the lake

Applied Water Science (2020) 10:219
1 3
219 Page 14 of 18
Fig. 10 (continued)

Applied Water Science (2020) 10:219
1 3
Page 15 of 18 219
Acknowledgements The authors would like to acknowledge Research and analysis wing of LAWDA (Lake and Water Development Author-ity: an autonomous body of Government of Jammu & Kashmir India), Department of Civil Engineering National Institute of Technology Sri-nagar and Department of Ecology Environment and Remote sensing Jammu & Kashmir India for providing necessary support and relevant data of Dal Lake. We are thankful to the editor and two anonymous reviewers for their valuable suggestions and critical comments on our earlier manuscript that has significantly improved the quality and pres-entation of our manuscript.
Authors contribution RIA did sampling and tests in labs, used software and analyzed data, and prepared the manuscript. AQD conceptualized the study and edited the manuscript.
Compliance with ethical standards
Conflict of interest The authors declare that they have no conflict of interest.
Open Access This article is licensed under a Creative Commons Attri-bution 4.0 International License, which permits use, sharing, adapta-tion, distribution and reproduction in any medium or format, as long as you give appropriate credit to the original author(s) and the source, provide a link to the Creative Commons licence, and indicate if changes were made. The images or other third party material in this article are included in the article’s Creative Commons licence, unless indicated otherwise in a credit line to the material. If material is not included in
the article’s Creative Commons licence and your intended use is not permitted by statutory regulation or exceeds the permitted use, you will need to obtain permission directly from the copyright holder. To view a copy of this licence, visit http://creat iveco mmons .org/licen ses/by/4.0/.
References
Addiscott TM, Thomas D (2000) Tillage, mineralization and leaching: phosphate. Soil Till Res 53:255–273
Adimalla N, Taloor AK (2020) Hydrogeochemical investigation of groundwater quality in the hard rock terrain of South India using Geographic Information System (GIS) and groundwater quality index (GWQI) techniques. Groundwater Sustain Dev 10:100288
Adimalla N, Chen J, Qian H (2020) Spatial characteristics of heavy metal contamination and potential human health risk assessment of urban soils: a case study from an urban region of South India. Ecotoxicol Environ Saf 194:110406
Ahearn DS, Sheibley RS, Dahlgren RA, Anderson M, Jonson J, Tate KW (2005) Land use and land cover influence on water quality in the last free-flowing river draining the western Sierra Nevada, California. J Hydrol 313:234–247
Altaf F, Meraj G, Romshoo SA (2013) Morphometric analysis to infer hydrological behaviour of Lidder watershed, Western Himalaya, India. Geogr J 2013
Altaf S, Meraj G, Romshoo SA (2014) Morphometry and land-cover based multi-criteria analysis for assessing the soil erosion
Fig. 10 (continued)

Applied Water Science (2020) 10:219
1 3
219 Page 16 of 18
susceptibility of the western Himalayan watershed. Environ Monit Assess 186:8391–8412. https ://doi.org/10.1007/s1066 1014-4012-2
Amin A, Romshoo SA (2007) Assessing the hydrologic characteristics of Dal Lake catchment using GIS. In: Proceedings of TAAL 2007: the 12th World Lake Conference (pp 659–667)
Ayadi N, Aloulou F, Bouzid J (2014) Assessment of contaminated sediment by phosphate fertilizer industrial waste using pollution indices and statistical techniques in the Gulf of Gabes (Tunisia). Arab J Geosci. https ://doi.org/10.1007/s1251 7-014-1291-4
Badar B, Romshoo SA (2007) Assessing the pollution load of Dal Lake using geospatial tools. In: Proceedings of TAAL 2007: the 12th World Lake Conference (pp 668–679)
Badar B, Romshoo SA, Khan MA (2013a) Integrating biophysical and socioeconomic information for prioritizing watersheds in a Kash-mir Himalayan Lake: a remote sensing and GIS approach. Environ Monit Assess 185:6419–6445
Badar B, Romshoo SA, Khan MA (2013b) Modeling the catchment hydrological response in a Himalayan Lake as a function of chang-ing land system. Earth Syst Sci 112(2):434–450
Behrendt H, Opitz D (2000) Retention of nutrients in river systems: dependence on specific runoff and hydraulic load. Hydrobiologia 410:111–122
Beighley RE, Dunne T, Melack JM (2008) Impacts of climate vari-ability and land use alterations on frequency distributions of ter-restrial runoff loading to coastal waters in Southern California. J Am Water Resour Assoc 44(1):62–74
Bhat DK (1989) Geology of Karewa Basin, Kashmir. Geol. Survey India Rec., 122
Bhat SA, Meraj G, Yaseen S, Bhat AR, Pandit AK (2013) Assessing the impact of anthropogenic activities on spatiotemporal variation of water quality in Anchar Lake, Kashmir Himalayas. Int J Environ Sci 3(5):1625–1640
Bhat SA, Meraj G, Yaseen S, Pandit AK (2014) Statistical assessment of water quality parameters for pollution source identification in Sukhnag stream: an inflow stream of Lake Wular (Ramsar site), Kashmir Himalaya. J Ecosyst 2014, Article ID 898054. https ://doi.org/10.1155/2014/89805 4
Bhat SA, Meraj G, Pandit AK (2016) Assessing the influence of stream flow and precipitation regimes on water quality of the major inflow stream of Wular Lake in Kashmir Himalaya. Arab J Geosci 9:50. https ://doi.org/10.1007/s1251 7-015-2083-1
Biswas S, Sudhakar S, Desai VR (1999) Prioritization of subwatersheds based on morphometric analysis of drainage basin, district Mid-napore, West Bengal. J Indian Soc Remote Sens 27(3):155–166
Carpenter SR, Caraco NF, Correll DL, Howarth RW, Sharpley AN, Smith VH (1998) Nonpoint pollution of surface waters with phos-phorus and nitrogen. Ecol Appl 8:559–568
Chan NW (2010) Unsustainable development and environmental change in Cameron Highlands. Environ Res Technol 546
Chen L, Qian X, Shi Y (2011) Critical area identification of poten-tial soil loss in a typical watershed of the three Gorges reservoir region. Water Resour Manage 25(13):3445–3463
Cherry RN, Faye RE, Stamer JK, Kleckner RL (1980) Summary of the river-quality assessment of the Upper Chattahoochee River basin. Georgia: US Geological Survey Circular. 811,47
Council TC, Bennett PC (1993) Geochemistry of ikaite formation at Mono Lake, California: implications for the origin of tufa mounds. Geology 21(11):971–974
Dabi M, Kporha MA (2015) Unsustainable development, climate change and floods: interactions and impacts. Int J Sci Technoledge 3(6):278
Dasgupta A, Rao M, Gopalan AKS (2000) The national (natural) resources information system. Int Arch Photogramm Remote Sens 33(B2; PART 2):131–138
Delpla I, Jung AV, Baures E, Clement M, Thomas O (2009) Impacts of climate change on surface water quality in relation to drinking water production. Environ Int 35(8):1225–1233
Denizman C (2018) Land use changes and groundwater quality in Florida. Appl Water Sci 8(5):134
Engel B, Storm D, White M, Arnold J, Arabi M (2007) A hydrologic/water quality model application protocol. J Am Water Resour Assoc 43(5):1223–1236
Fashae OA, Ayorinde HA, Olusola AO, Obateru RO (2019) Landuse and surface water quality in an emerging urban city. Appl Water Sci 9(2):25
Foody GM (2002) Status of land cover classification accuracy assess-ment. Remote Sens Environ 80(1):185–201
Gujree I, Wani I, Muslim M, Farooq M, Meraj G (2017) Evaluating the variability and trends in extreme climate events in the Kashmir Valley using PRECIS RCM simulations. Model Earth Syst Envi-ron 3(4):1647–1662. https ://doi.org/10.1007/s4080 8-017-0370-4
Guo Y, Markus M, Demmissie M (2002) Uncertainty of nitrate-N load computations for agricultural watersheds. Water Resour Res 38(10):3–12
Habersack HM, Nachtnebel HP (1995) Effects of a changing environ-ment on sediment transport in two Austrian river systems. IAHS Publications-Series of Proceedings and Reports-Intern. Assoc Hydrol Sci 226:73–82
Hernandez EA, Ernest AN (1999) Aquatic sediments. Water Environ Res 71(5):948–973
Hooijer A, Klijn F, Pedroli GBM, Van Os AG (2004) Towards sus-tainable flood risk management in the Rhine and Meuse river basins: synopsis of the findings of IRMA-SPONGE. River Res Appl 20(3):343–357
Jang T, Vellidis G, Hyman JB, Brooks E, Kurkalova LA, Boll J, Cho J (2013) Model for prioritizing best management practice imple-mentation: sediment load reduction. Environ Manage 51:209–224
Jasrotia AS, Taloor AK, Andotra U, Bhagat BD (2018) Geoinformatics based groundwater quality assessment for domestic and irrigation uses of the Western Doon valley, Uttarakhand, India. Groundwater Sustain Dev 6:200–212
Jasrotia AS, Kumar R, Taloor AK, Saraf AK (2019) Artificial recharge to groundwater using geospatial and groundwater modelling techniques in North Western Himalaya, India. Arab J Geosci 12(24):774
Javed A, Khanday MY, Ahmed R (2009) Prioritization of subwa-tersheds based on morphometric and land-use analysis using remote sensing and GIS techniques. J Indian Soc Remote Sens 37:261–274
Jenerette GD, Wu J (2001) Analysis and simulation of land-use change in the central Arizona-Phoenix region, USA. Landsc Ecol 16:611–626
Johnson LB, Richards C, Host GE, Arthur JW (1997) Landscape influences on water chemistry in Midwestern stream ecosystems. Freshw Biol 37:193–208
Khadka UR, Ramanathan AL (2013) Major ion composition and sea-sonal variation in the Lesser Himalayan lake: case of Begnas Lake of the Pokhara Valley, Nepal. Arab J Geosci 6(11):4191–4206
Khan MA (1993a) occurrence of a rare euglenoid causing red-bloom in Dal Lake waters of the Kashmir Himalaya. Archiv für Hydro-biologie 127:101–103
Khan MA (1993b) Euglenoid red bloom contributing the environmen-tal pollution of Dal Lake, Kashmir Himalaya. Environ Conserv 20:352–356
Lambin EF, Geist HJ (eds) (2006) Land-use and land cover change: local processes and global impacts. Springer, New York, p 222
Lillesand T, Kiefer R (2004) Remote sensing and image interpretation, 5th edn. Wiley, New York

Applied Water Science (2020) 10:219
1 3
Page 17 of 18 219
Lucey KJ, Goolsby DA (1993) Effects of climatic variations over 11 years on nitrate nitrogen concentrations in the Raccoon River, Iowa. J Environ Qual 22:38–46
Makela S, Huitu E, Arvola L (2004) Spatial patterns in aquatic veg-etation composition and environmental covariates along chains of lakes in the Kokemäenjoki watershed (S. Finland). Aquat Bot 80(4):253–269
Mallick J (2017) Hydrogeochemical characteristics and assessment of water quality in the Al-Saad Lake, Abha Saudi Arabia. Appl Water Sci 7(6):2869–2882
McDowell WH, Asbury CE (1994) Export of carbon, nitrogen, and major ions from three tropical montane watersheds. Limnol Oceanogr 39(1):111–125
Mcdowell WH, Lugo AE, James A (1995) Export of nutrients and major ions from Caribbean watersheds. J N Am Benthol Soc 14:12–20
Meraj G, Romshoo SA, Yousuf AR (2012) Geoinformatics approach to qualitative forest density loss estimation and protection cum con-servation strategy- a case study of Pir Panjal range, J&K, India. Int J Curr Res Rev 04(16):47–61
Meraj G, Yousuf AR, Romshoo SA (2013) Impacts of the Geo-environ-mental setting on the flood vulnerability at watershed scale in the Jhelum basin. M. Phil. dissertation, University of Kashmir, India http://dspac es.uok.edu.in/jspui //handl e/1/1362
Meraj G, Romshoo SA, Ayoub S, Altaf S (2018) Geoinformatics based approach for estimating the sediment yield of the moun-tainous watersheds in Kashmir Himalaya, India. Geocarto Int 33(10):1114–1138. https ://doi.org/10.1080/10106 049.2017.13335 36
Meyer JL, Likens GE (1979) Transport and transformations of phos-phorus in a forest stream ecosystem. Ecology 60:1255–1269
Meyer WB, Turner BL (1992) Human population growth and global land-use/cover change. Annu Rev Ecol Syst 23:39–61
Meyfroidt P, Lambin EF (2011) Global forest transition: prospects for an end to deforestation. Annu Rev Environ Resour 36:343–371
Mishra VN, Rai PK, Prasad R, Punia M, Nistor MM (2018) Modeling based study of Spatio-temporal dynamics of land use and land cover in rapidly developing Varanasi district (India) using remote sensing. In practical geography and xxi century challenges (p 267)
Mosbahi M, Benabdallah S, Boussema MR (2012) Assessment of soil erosion risk using SWAT model. Arab J Geosci. https ://doi.org/10.1007/s1251 7-012-0658-7
Moss B (2012) Cogs in the endless machine: lakes, climate change and nutrient cycles: a review. Sci Total Environ 434:130–142
National Research Council and Mono Basin Ecosystem Study Commit-tee (1987) The Mono Basin ecosystem: effects of changing lake level. National Academies Press
Pall IA, Meraj G (2019) Romshoo SA (2019) Applying integrated remote sensing and feld-based approach to map glacial landform features of the Machoi Glacier valley, NW Himalaya. SN Appl Sci 1:488. https ://doi.org/10.1007/s4245 2-019-0503-7
Pandey AC, Kumar A (2015) Spatio-temporal variability of surface water quality of fresh water resources in Ranchi urban agglomera-tion, India using geospatial techniques. Appl Water Sci 5(1):13–26
Pandit AK, Qadri SS (1990) Floods threatening Kashmir wetlands. J Environ Manage 3(4):299–311
Pradhan B (2010) Flood susceptible mapping and risk area estimation using logistic regression, GIS and remote sensing. J Spat Hydrol 9(2):1–18
Probst JL, Nkounkou RR, Krempp G, Bricquert JP, Thiebaux JP, Olivry JC (1992) Dissolved major elements exported by the Congo and the Ubangi Rivers during the period 1987–1989. J Hydrol 135:237–257
Rai PK (2018) Changing regimes of glaciers in the Garhwal Himalaya region using remote sensing. In: Practical geography and xxi cen-tury challenges (p 475)
Ramachandra TV, Aithal BH, Kumar U (2012) Conservation of wet-lands to mitigate urban floods. J Resour Energy Dev 9(1):1–22
Rather IA, Dar AQ (2020) Spatio-temporal variation in physio-chemi-cal parameters over a 20-year period, potential future strategies for management: a case study of Dal Lake, NW Himalaya India. Envi-ron Technol Inno. https ://doi.org/10.1016/j.eti.2020.10110 2
Rather MA, Farooq M, Meraj G, Dada MA, Sheikh BA, Wani IA (2018) Remote sensing and GIS based forest fire vulnerability assessment in Dachigam National Park, North Western Himalaya. Asian J Appl Sci. https ://doi.org/10.3923/ajaps .2018
Roy K, Karim MR, Akter F, Islam MS, Ahmed K, Rahman M, Datta DK, Khan MSA (2018) Hydrochemistry, water quality and land use signatures in an ephemeral tidal river: implications in water management in the southwestern coastal region of Bangladesh. Appl Water Sci 8(2):78
Saghafian B, Golian S, Elmi M, Akhtari R (2013) Monte Carlo analysis of the effect of spatial distribution of storms onprioritization of flood source areas. Nat Hazards 66:1059–1071
Salomons W, Stigliani WM (eds) (2012) Biogeodynamics of pollutants in soils and sediments: risk assessment of delayed and non-linear responses. Springer
Salvia-Castellví M, Iffly JF, Vander Borght P, Hoffmann L (2005) Dis-solved and particulate nutrient export from rural catchments: a case study from Luxembourg. Sci Total Environ 344(1–3):51–65
Saunders JF, Lewis WM (1988) Transport of phosphorus, nitrogen, and carbon by the Apure River, Venezuela. Biogeochemistry 5(3):323–342
Schoonover JE, Lockaby BG, Pan S (2005) Changes in chemical and physical properties of stream water across an urban–rural gradient in western Georgia. Urban Ecosyst 8(1):107–124
Shah AH, Teli PA, Bhat (2014) Dynamics of land use/land cover change in Dal Lake watershed of Kashmir valley—a remote sens-ing and GIS approach. Int J Adv Inf Sci Technol (IJAIST). https ://doi.org/10.15693 /ijais t/2014.v3i12 .1-9a
Skilodimou H, Livaditis G, Bathrellos G, Verikiou Papaspiridakou E (2003) Investigating the flooding events of the urban regions of Glyfada and Voula, Attica, Greece: a contribution to Urban Geomorphology. Journal Geografiska Annaler 85A(2):197–204
Sliva L, Williams DD (2001) Buffer zone versus whole catchment approaches to studying land use impact on river water quality. Water Res 35:3462–3472
Smart RP, Soulsby C, Neal C, Wade A, Cresser MS, Billett MF, Langan SJ, Edwards AC, Jarvie HP, Owen R (1998) Factors regulating the spatial and temporal distribution of solute concentrations in a major
Taloor AK, Kumar V, Singh VK, Singh AK, Kale RV, Sharma R, Khajuria V, Raina G, Kouser B, Chowdhary NH (2020) Land use land cover dynamics using remote sensing and GIS Techniques in Western Doon Valley, Uttarakhand, India. In: Geoecology of landscape dynamics (pp 37–51). Springer, Singapore
Tenzer GE, Meyers PA, Knoop P (1997) Sources and distribution of organic and carbonate carbon in surface sediments of Pyramid Lake, Nevada. J Sediment Res 67(5):884–890
Thakur N, Rishi M, Sharma DA, Keesari T (2018) Quality of water resources in Kullu Valley in Himachal Himalayas, India: perspec-tive and prognosis. Appl Water Sci 8(1):20
Trabucchi M, Comín FA, O’Farrell PJ (2013) Hierarchical prior-ity setting for restoration in a watershed in NE Spain, based on assessments of soil erosion and ecosystem services. Reg Environ Change. https ://doi.org/10.1007/s1011 3-012-0392-4
Turner RE, Rabalais NN (2003) Linking landscape and water quality in the Mississippi River Basin for 200 years. Bioscience 53:563–572
Valipour M (2015) Land use policy and agricultural water manage-ment of the previous half of century in Africa. Appl Water Sci 5(4):367–395
Applied Water Science (2020) 10:219
1 3
219 Page 18 of 18
Van De Wiel MJ, Coulthard TJ, Macklin MG, Lewin J (2011) Model-ling the response of river systems to environmental change: pro-gress, problems and prospects for palaeo-environmental recon-structions. Earth Sci Rev 104(1–3):167–185
Vanderperk M (2006) Soil and water contamination—from molecular to watershed scale. Taylor and Francis, Balkema, Leiden
Vanni MJ, Renwick WH, Headworth JL, Auch JD, Schaus MH (2001) Dissolved and particulate nutrient flux from three adja-cent agricultural watersheds: a five-year study. Biogeochemistry 54(1):85–114
Veraart AJ, de Bruijne WJ, de Klein JJ, Peeters ET, Scheffer M (2011) Effects of aquatic vegetation type on denitrification. Biogeochem-istry 104(1–3):267–274
Vieux BE, Moreda FG (2003) Nutrient loading assessment in the Illi-nois River using a synthetic approach. J Am Water Resour Assoc 39:757–769
Vishwakarma CA, Thakur S, Rai PK, Kamal MS (2016) Changing land trajectories: a case study from India using a remote sensing-based approach. Eur J Geogr 7(2):61–71
Wadia DN (1953) Geology of India, carboniferous and Permian sys-tems. Tata McGraw Hill, New Delhi
Weng Q (2001) A remote sensing-GIS evaluation of urban expan-sion and its impact on surface temperature in the Zhujiang Delta, China. Int J Remote Sens 22(10):1999–2014
Yadav A, Pandey J (2017) Contribution of point sources and non-point sources to nutrient and carbon loads and their influence on the trophic status of the Ganga River at Varanasi, India. Environ Monit Assess 189(9):475
Yu S, Xu Z, Wu W, Zuo D (2016) Effect of land use types on stream water quality under seasonal variation and topographic charac-teristics in the Wei River basin, China. Ecol Indic 60:202–212
Zhang SY, Liu AF, Ma JM, Zhou QH, Xu D, Cheng SP, Zhao Q, Wu ZB (2010) Changes in physicochemical and biological factors dur-ing regime shifts in a restoration demonstration of macrophytes in a small hypereutrophic Chinese lake. Ecol Eng 36(12):1611–1619
Zhao L, Li Y, Zou R, He B, Zhu X, Liu Y, Wang J, Zhu Y (2013) A three-dimensional water quality modeling approach for exploring the eutrophication responses to load reduction scenarios in Lake Yilong (China). Environ Pollut 177:13–21
Publisher’s Note Springer Nature remains neutral with regard to jurisdictional claims in published maps and institutional affiliations.
Copyright © 2022 FDOKUMEN