Appraisal of land use/land cover of mangrove forest ecosystem using support vector machine
13
1 23 Environmental Earth Sciences ISSN 1866-6280 Environ Earth Sci DOI 10.1007/s12665-013-2628-0 Appraisal of land use/land cover of mangrove forest ecosystem using support vector machine Sudhir Kumar Singh, Prashant K. Srivastava, Manika Gupta, Jay Krishna Thakur & Saumitra Mukherjee
-
Upload
independent -
Category
Documents
-
view
0 -
download
0
Transcript of Appraisal of land use/land cover of mangrove forest ecosystem using support vector machine

1 23
Environmental Earth Sciences ISSN 1866-6280 Environ Earth SciDOI 10.1007/s12665-013-2628-0
Appraisal of land use/land cover ofmangrove forest ecosystem using supportvector machine
Sudhir Kumar Singh, PrashantK. Srivastava, Manika Gupta, JayKrishna Thakur & Saumitra Mukherjee

1 23
Your article is protected by copyright and
all rights are held exclusively by Springer-
Verlag Berlin Heidelberg. This e-offprint is
for personal use only and shall not be self-
archived in electronic repositories. If you wish
to self-archive your article, please use the
accepted manuscript version for posting on
your own website. You may further deposit
the accepted manuscript version in any
repository, provided it is only made publicly
available 12 months after official publication
or later and provided acknowledgement is
given to the original source of publication
and a link is inserted to the published article
on Springer's website. The link must be
accompanied by the following text: "The final
publication is available at link.springer.com”.

ORIGINAL ARTICLE
Appraisal of land use/land cover of mangrove forest ecosystemusing support vector machine
Sudhir Kumar Singh • Prashant K. Srivastava •
Manika Gupta • Jay Krishna Thakur •
Saumitra Mukherjee
Received: 2 October 2012 / Accepted: 24 June 2013
� Springer-Verlag Berlin Heidelberg 2013
Abstract Human activities in many parts of the world
have greatly changed the natural land cover. This study has
been conducted on Pichavaram forest, south east coast of
India, famous for its unique mangrove bio-diversity. The
main objectives of this study were focused on monitoring
land cover changes particularly for the mangrove forest in
the Pichavaram area using multi-temporal Landsat images
captured in the 1991, 2000, and 2009. The land use/land
cover (LULC) estimation was done by a unique hybrid
classification approach consisting of unsupervised and
support vector machine (SVM)-based supervised classifi-
cation. Once the vegetation and non-vegetation classes were
separated, training site-based classification technology i.e.,
SVM-based supervised classification technique was used.
The agricultural area, forest/plantation, degraded mangrove
and mangrove forest layers were separated from the
vegetation layer. Mud flat, sand/beach, swamp, sea water/
sea, aquaculture pond, and fallow land were separated from
non-vegetation layer. Water logged areas were delineated
from the area initially considered under swamp and sea
water-drowned areas. In this study, the object-based post-
classification comparison method was employed for
detecting changes. In order to evaluate the performance, an
accuracy assessment was carried out using the randomly
stratified sampling method, assuring distribution in a
rational pattern so that a specific number of observations
were assigned to each category on the classified image. The
Kappa accuracy of SVM classified image was highest
(94.53 %) for the 2000 image and about 94.14 and 89.45 %
for the 2009 and 1991 images, respectively. The results
indicated that the increased anthropogenic activities in
Pichavaram have caused an irreversible loss of forest veg-
etation. These findings can be used both as a strategic
planning tool to address the broad-scale mangrove ecosys-
tem conservation projects and also as a tactical guide to help
managers in designing effective restoration measures.
Keywords Land use/land cover � Mangrove forest �Pichavaram forest � Support vector machine �Urbanization indices
Introduction
In India, mangrove forests have traditionally been used for
a variety of purposes like, boat-building, tannin extraction,
firewood, stakes for fishing, fodder, etc. In South East Asia,
there is severe drive for the conversion of mangrove lands
to agricultural, industrial, aquaculture, settlement, and
forest plantation purposes (Ministry of Environment and
Forest 1987). Mangrove forests are one of the most
S. K. Singh
K.Banerjee Centre of Atmospheric and Ocean Studies,
Nehru Science Centre, IIDS, University of Allahabad,
Allahabad 211002, India
e-mail: [email protected]
P. K. Srivastava (&)
Department of Civil Engineering, University of Bristol,
Bristol, UK
e-mail: [email protected]; [email protected]
M. Gupta
Department of Civil Engineering, IIT, New Delhi, India
J. K. Thakur
Department Hydrogeology and Environmental Geology, Institute
of Geosciences, Martin Luther University, Halle, Germany
S. Mukherjee
School of Environmental Sciences, Jawaharlal Nehru University,
New Delhi, India
123
Environ Earth Sci
DOI 10.1007/s12665-013-2628-0
Author's personal copy

productive and diverse wetlands on earth. Yet, these unique
coastal tropical forests are among the most threatened
habitats in the world. They may be disappearing more
quickly than inland tropical rainforests, and so far, with
little public notice. Growing in the intertidal areas and
estuary mouths between land and sea, mangroves provide
critical habitat for diverse marine and terrestrial flora and
fauna. Healthy mangrove forests are the key to a healthy
marine ecology (Ranjan et al. 2008, 2010; Prasad and
Ramanathan 2008; Bala Krishna Prasad et al. 2006). The
mangrove also plays an important role in carbon fluxes and
global carbon emissions (Borges et al. 2003). Donato et al.
(2012) found that the mangroves are carbon-rich forests
that also provide ecosystem services such as food,
improved water quality, and storm protection.
Land use/land cover (LULC) changes are an important
element in the global environmental change process (Sri-
vastava et al. 2012a, b, d; Mukherjee et al. 2009; Patel et al.
2013). The detection and monitoring of spatial–temporal
changes using satellite multi-spectral image data have been
a topic of interest in remote sensing (Srivastava et al.
2012d, e; Thakur et al. 2012). Several techniques for
accomplishing change detection have been formulated,
applied and evaluated (Srivastava et al. 2008, 2012c; Patel
et al. 2012; Mukherjee 2004; Gupta and Srivastava 2010).
Change detection generally employs a post-classification
comparison (Green et al. 1994). The post-classification
method compares two or more separately classified images
of different dates (Mouat et al. 1993). It is considered to be
one of the most appropriate and commonly used methods
for change detection (Jensen 1996).
Support vector machine (SVM) method is one of the
latest additions to the existing catalog of image classifi-
cation techniques that support coastal LULC analysis
(Islam et al. 2012). The theory of the SVM was first pro-
posed by Vapnik and Chervonenkis (1971). SVM utilizes a
user-defined kernel function to define a set of non-linear
decision boundaries in the original dataset into linear
boundaries of a higher-dimensional construct (Srivastava
et al. 2012d; Islam et al. 2012; Huang et al. 2002). SVMs
attempt to find the optimal separating hyperplane (OSH)
through an optimization approach utilizing Lagrange
multipliers and quadratic programming methods (Pal and
Mather 2004; Foody and Mathur 2004). SVMs have been
successfully used in many fields (Tong and Chang 2001;
Hua and Sun 2001; Lau and Wu 2008; Sanchez-Hernandez
et al. 2007; Yao et al. 2008). Recently, SVM have been
successfully used in remote sensing arena (Waske and
Benediktsson 2007; Bazi and Melgani 2006; Pal and Foody
2010; Dixon and Candade 2008). Recent research has
demonstrated that SVM showed good classification accu-
racy than other traditional classification techniques such as
Maximum Likelihood Classifier (Srivastava et al. 2012d;
Otukei and Blaschke 2010; Szuster et al. 2011). Therefore,
in this study the SVM-based LULC classification has been
made to uncover the present utilization pattern of the area
and to analyze spatial and temporal changes in mangrove
forest ecosystem using Landsat 5 Thematic Mapper.
Study area
The study site, the Pichavaram mangrove (Lat 11�200 to
11�300N and Long 79�450 to 79�550E), is located between the
Vellar and Coleroon estuaries and has a direct opening to the
Bay of Bengal at Chinnavaikkal. It is an estuarine type of
mangrove that is situated at the confluences of Uppanar, a
tributary of the Coleroon River, 51 km north east of Chid-
ambaram, Cuddalore district, Tamil Nadu. Predominantly,
the studied area is surrounded by fishing villages, agricul-
ture, croplands, aquaculture ponds, and mangrove forests.
This mangrove forest attracts a large number of tourists. The
Pichavaram mangrove wetland has 51 islets and the total area
of the Vellar–Pichavaram–Coleroon estuarine complex is
2,335.5 ha of which only 241 ha is occupied by dense
mangrove vegetation. The Pichavaram mangrove ecosystem
lies between the rivers, Vellar and Coleroon. Therefore,
alluvium soil is dominant in the western part and fluvial
marine and beach sand covers the eastern part of the man-
grove. Geo-morphologically majority of the area is covered
by the floodplains, sedimentary plains, and beach sand. The
soil group of the area is mainly hydrological soil group C
(highest runoff potential) covering more than 50 % of the
area followed by soil group B (moderate runoff potential)
covering nearly 45 % of the area. The weather condition in
the Pichavaram mangrove area is a typical tropical climate,
maximum and minimum temperature ranges from 29 to
36 �C and 18.2 to 25 �C, respectively (Fig. 1).
Data and methodology
Satellite data used in this study
The Landsat 5 TM/ETM? satellite images of Pichavaram
were acquired for three different times i.e., 25 August
1991, 28 October 2000, and 30 January 2009 from the
website (http://www.landsat.org and www.usgs.gov.in).
The path and row of the scene are 142 and 52, respectively,
with 0 % cloud cover. The topographical sheets were
geometrically transformed utilizing the geographic coor-
dinate system and well-distributed geographic control
points were used as references for re-projecting the image
datasets. A root mean square error (RMSE) evaluation was
then performed to assess image to map rectification accu-
racy. The RMSE for the rectified images was less than
Environ Earth Sci
123
Author's personal copy

0.25 m per pixels. All the images were co-registered in
Polyconic projection system with Everest as spheroid.
Subsequently, datasets were re-sampled to 24 pixel
dimensions using a nearest neighborhood algorithm.
Satellite image processing
Atmospheric corrections are not required for remote sens-
ing applications such as in change detection and image
classification for a single date image (Song et al. 2001).
Satellite remote sensing-based classification is the statisti-
cal technique, used to group population of pixels in broad
classes as per their inherent characteristics (DN value), are
of two types—supervised and unsupervised. A hybrid
classification technique (supervised ? unsupervised clas-
sification) was utilized to determine the LULC of the study
area. Unsupervised classification was carried out on the
three datasets of the images separately, using a histogram
peak cluster technique to identify dense areas or frequently
occurring pixels (Lillesand et al. 2004). Thus, using the
spectral signature and color, the classes initially identified
were vegetation and non-vegetation layers. The vegetation
and non-vegetation layers were extracted and treated sep-
arately for further classification using SVM.
SVM classification
The main aim of the SVM method is the generation of a
hyperplane that shows the optimal separation of linearly
separable classes in the decision boundary space (Pal and
Foody 2010; Pal and Mather 2004). From Srivastava et al.
(2012d) and Szuster et al. (2011), suppose a set of training
data with k number of samples is represented by the
Eq. (1).
Fig. 1 Geographical location of
the study area
Environ Earth Sci
123
Author's personal copy

xi; yif g; i ¼ 1. . .k ð1Þ
where x belongs to Rn is an n-dimensional vector and y
belongs to {-1, ?1}, representing the label of each class.
This set of training data can be linearly separated by a
hyperplane if a vector w and a scalar b can satisfy the
following two inequalities (Eqs. 2, 3).
w� xi þ b� 1 for all y ¼ þ1 ð2Þw� xi þ b� 1 for all y ¼ �1 ð3Þ
Also, the equation which represents a constraint must be
satisfied to achieve a hyperplane that completely and
linearly separates the two classes can be expressed as
Eq. (4).
yiðw� xi þ bÞ � 1� 0 ð4Þ
For the cases, where the two classes are not linearly
separable, a set of slack variables fnigi ¼ 1 is introduced to
minimize the number of classification errors where pixels
are classified onto the wrong class hyperplane and is
transformed as Eq. (5).
yi w� xi þ bð Þ� 1� ni; ni� 0 ð5Þ
Since this constraint can be met by continually increasing
the value of ni, a function CP
i¼1 ni, is added to penalize
solutions which exhibit a large value for ni. The C is used
here to control the degree of the penalty administered for
pixels and as such, the optimization problem becomes as
Eq. (6).
Min wk k2=2� �
þ CX
i¼1
ni
" #
ð6Þ
The kernel function used in this study was based on radial
basis function (RBF) because of its high efficiency (Zhu
and Blumberg 2002; Keuchel et al. 2003; Kavzoglu and
Colkesen 2009; Li and Liu 2010). In this study, a
multiclass SVM pair-wise classification strategy was
applied using ENVI image processing environment
version 4.8. The radial-based kernel function is expressed
as Eq. (7).
Radial basis function :
Kðxi; xjÞ ¼ exp �c xi; xj
� ���
��2
� �; c[ 0 ð7Þ
where c is the gamma term in the kernel function.
The penalty parameter was set in all cases to its maxi-
mum value (i.e., 100). For the c parameter a value equal to
the inverse of the number of the spectral bands of the
Landsat TM imagery was specified each time (Petropoulos
et al. 2011; Srivastava et al. 2012d).
Once the vegetation and non-vegetation classes were
separated, training site-based and SVM-based supervised
classification technique was used. This technique involved
selection of training sites from the image based on visual
interpretation, which represents specific land classes to be
mapped. SVM-based classification requires training sets as
reference signatures that are used to classify the whole
population of pixels. The agricultural area, forest/planta-
tion, degraded mangrove and mangrove forest layers were
separated from vegetation layer. Mud flat, sand/beach,
swamp, sea water/sea, aquaculture pond, and fallow land
were separated from non-vegetation layers. Water logged
areas were delineated from the area initially considered
under swamp and sea water-drowned areas. The processed
vegetation and non-vegetation layers are finally mosaiced
to generate one single LULC layer. Thus, 11 LULC classes
have been delineated from the satellite images.
Accuracy assessment
In order to evaluate the performance, an accuracy assess-
ment was carried out using ground control points. The
Kappa measure of accuracy was computed, as given by
Bishop and Fienberg (2007) (Eq. 8)
j ¼ NPr
i¼1 xii �Pr
i¼1 ðxiþÞðxþiÞN2 �
Pri¼1 ðxiþÞðxþiÞ
ð8Þ
where r is the number of rows in the matrix, xii is the
number of observations in row i and column i (the diagonal
elements), xþi and xiþ are the marginal totals of row r and
column i, respectively, and N is the number of observa-
tions. The above-mentioned user’s and producer’s accuracy
measurements are related to commission and omission
errors (Mukherjee et al. 2009; Srivastava et al. 2012d).
Change detection and demographical analysis
Change detection is important to identify areas of land
cover change between the dates of imaging. Post-classifi-
cation comparison is one of the methods for change
detection, which has been employed here. This process
involves independent registration and classification of
multi-date images. The percentage accuracy depends on
the each independent classification used in the analysis as
well as on the registration accuracy, which also has an
impact on accuracy when image differencing is done. The
first task included, assessing the area (hectares) of each
class and the percentage changes between each year (1991,
2000, and 2009) measured against each LULC type. To
analyze the effect of population changes on land cover,
demography is introduced. The change in demography
influenced changes in the pattern of land cover utilization is
then studied. The demographical study involves the anal-
ysis of population estimated from the pre-existing data.
Since the data of 2009 is not available, the 2009 population
Environ Earth Sci
123
Author's personal copy

was estimated from the 1991 and the estimated 2000
baseline population figures of Pichavaram, respectively,
using population estimation formula given in Eq. (9)
(Srivastava et al. 2010).
P ¼ Pb 1þ R=100ð Þn ð9Þ
where, P population of the desired time period, Pb popu-
lation of base year, R rate of growth of population, n time
in year in number (e.g. 1, 2, 3…., n).
Results and discussion
Kappa accuracy of SVM classified images
The Kappa accuracy of SVM classified images was
highest (94.53 %) for 2000 image and about 94.14 and
89.45 % for 2009 and 1991, respectively (Table 1). In
case of mangrove, the highest user’s accuracy was
obtained for the classified satellite imagery of the year
2000 followed by satellite images of the year 1991 and
2009 (both equal to 87.5 %). Furthermore, for the man-
grove class, the SVM returned a producer’s accuracy of
100 %, suggesting that all of the collected validation
samples were also found to belong in the same class. The
user’s accuracy of 87.5 %, for both the years 1991 and
2009, indicates that 87.5 % of the points classified as
mangrove class were expected to be the same area when a
field survey is performed. Similar types of results were
also detected for the forest class, with some outperfor-
mance of 2009 classified image as compared to the 1991
imagery.
LULC distribution
The LULC distributions and their change values are shown
in Tables 2 and 3, respectively. In this study the multi-date
satellite images were classified into eleven classes, namely
sea water/sea, degraded mangrove, mud flat, mangrove,
waterlogged area, aquaculture pond, swamp, beach/sand,
fallow land, forest/plantation, and agriculture area. The
created classes and the proportion of total area covered by
them, provide an insight into the composition of the total
area and changes in the pattern during the considered years
that are 1991, 2000, and 2009. On account of analysis of
these classified images, the information about changes can
be retrieved in spatial composition of different physio-
graphic features. To assess the changes that occurred in the
spatial composition of different geographic features, the
classified image of 1991 (Fig. 2) was compared with the
classified image of 2000 (Fig. 3). In 1991–2000, the results
indicate that there was an increase of 1,302.54 ha in agri-
cultural area; it may be due to decrease in fallow land,
which had been used for agriculture purposes. The increase
of 475.19 ha in area of aquaculture pond was due to
commercial and business purposes to maintain and increase
the local economy of the area, and for the fulfillment of
livelihood of local farmers. The increment of 119 ha in
degraded mangrove revealed that the degradation of man-
grove had occurred for the construction purpose of aqua-
culture pond along the border of mangrove as well as in the
middle of mangrove in patches. An increase of 89.53 ha in
mangrove vegetation was due to utilization of less fallow
land, mudflat for mangrove restoration. The increase of
514.75 ha areas in sea water may be ascribed to inflow of
Table 1 Accuracy table for SVM classified images
LULC class 1991 2000 2009
Producer’s
accuracy (%)
User’s
accuracy (%)
Producer’s
accuracy (%)
User’s
accuracy (%)
Producer’s
accuracy (%)
User’s
accuracy (%)
Agriculture area 100.00 93.28 100.00 97.48 100.00 96.64
Aquaculture pond 100.00 93.33 100.00 93.33 100.00 93.33
Degraded mangrove 88.24 85.71 97.14 97.14 91.67 94.29
Fallow land 50.00 100.00 60.00 75.00 80.00 100.00
Forest/forest plantation 100.00 85.71 100.00 95.92 100.00 93.88
Mangrove 100.00 87.50 100.00 93.75 100.00 87.50
Mud flat 100.00 75.00 85.71 75.00 100.00 75.00
Sand/beach 66.67 66.67 100.00 66.67 75.00 100.00
Sea water/sea 100.00 85.71 83.33 71.43 100.00 85.71
Swamp 98.60 96.84 100.00 92.40 98.14 96.78
Waterlogged area 100.00 96.24 98.67 92.62 100.00 98.88
Overall classification accuracy 89.45 94.53 94.14
Environ Earth Sci
123
Author's personal copy

Bay of Bengal water through river Coleroon and Velar,
which is a physiological phenomenon (tidal effects). There
was an increase of 78.63 ha area of fallow land may be
ascribed to land utilization for future mangrove-related
activity restoration. The decrease of 206.75 ha in area of
forest/forest plantation may have occurred due to the
excessive utilization for fuel, fodder, firewood, agriculture,
and construction of the aquaculture ponds. The 263.38 ha
decrease in mudflat area was due to restoration activities of
mangrove and for aquaculture activities, while the decrease
of land about 1,935.35 ha in sand/beach was due to cov-
erage of sea water/sea, construction of aquaculture ponds,
and restoration of mangrove. About 180.01 ha area was
decreased to swamp, which may be because of conversion
of swamp area into agriculture area or aquaculture pond.
Some of the swamp area along the river was converted into
sea water/sea. Similar trend was also observed with the
waterlogged area which showed a decrease of 193.86 ha.
The comparison of classified images of 2000 (Fig. 3)
and 2009 (Fig. 4) gives overview of the detailed changes
that have occurred in the LULC of Pichavaram during
2000–2009. A number of changes in 9 years was encoun-
tered. The analysis showed that an increase in 1,678.98 ha
in agriculture cover was due to a decrease in degraded
mangrove, forest cover/forest plantation, mangrove vege-
tation cover, mud flat, sand/beach, seawater which had
been used for agriculture purposes. An increase of
643.10 ha in aquaculture pond was due to a decrease in the
area of degraded mangrove, forest cover/forest plantation,
mangrove vegetation, mudflat and sand/beach. It has been
found that there was a decrease in fallow land of 67.94 ha
which may be ascribed to land utilization for the
Table 2 LULC classification and area distribution of Pichavaram (1991, 2000, 2009)
Class names Area in 1991 Area in 2000 Area in 2009
ha (%) ha (%) ha (%)
Agriculture area 15,089.57 26.13 16,392.12 28.49 18,071.10 31.31
Aquaculture pond 179.51 0.31 654.70 1.14 1,297.80 2.25
Degraded mangrove 262.76 0.46 381.76 0.66 188.73 0.33
Fallow land 1,217.81 2.11 1,296.44 2.25 1,228.50 2.13
Forest/forest plantation 1,283.76 2.22 1,077.01 1.87 846.32 1.47
Mangrove 472.40 0.82 561.94 0.98 604.53 1.05
Mud flat 2,458.60 4.26 2,195.22 3.82 2,008.39 3.48
Sand/beach 7,350.43 13.08 5,615.08 9.76 5,525.55 9.57
Sea water/sea 27,674.33 47.93 28,189.08 48.99 26,000.82 45.04
Swamp 1,169.48 2.03 989.46 1.72 1,098.00 1.90
Waterlogged area 379.97 0.66 186.11 0.32 653.38 1.48
SUM 57,538.63 100 57,538.63 100.00 57,538.63 100.00
Table 3 Statistics for LULC changes in the year 1991, 2000, and 2009 images (minus sign represent the increase and positive sign represent the
decrease in area in the given table)
1991–2000 2000–2009 1991–2009
Area (ha) Change (%) Area (ha) Change (%) Area (ha) Change (%)
Agriculture area -1,302.54 -2.25 -1,678.98 -2.91 -2,981.53 -5.16
Aquaculture pond -475.19 -0.82 -643.10 -1.11 -1,118.29 -1.93
Degraded mangrove -119.00 -0.20 193.03 0.33 74.03 0.128
Fallow land -78.63 -0.13 67.94 0.11 -10.69 -0.018
Forest/forest plantation 206.75 0.35 230.69 0.40 437.44 0.75
Mangrove -89.53 -0.15 -42.59 -0.07 -132.13 -0.22
Mud flat 263.38 0.45 186.83 0.32 450.21 0.77
Sand/beach 1,935.35 3.35 89.53 0.15 2,024.88 3.50
Sea water/sea -514.75 -0.89 2,188.26 3.80 1,673.51 2.89
Swamp 180.01 0.31 -108.54 -0.18 71.48 0.12
Waterlogged area 193.86 0.33 -667.27 -1.15 -473.41 -0.82
Environ Earth Sci
123
Author's personal copy

agriculture practices and mangrove restoration. There was
an increase in 108.54 ha of swamp area because of a
decrease in mangrove vegetation, forest cover/forest plan-
tation, and sea water along the rivers. The increase of
667.27 ha in waterlogged area was due to a decrease in the
level of river water. There was a decrease in 193.03 ha in
area of degraded mangrove due to conversion of degraded
mangrove land into agriculture cover, aquaculture pond,
fallow land and swamp. The decrease of about 230.69 ha
areas in forest/forest plantation occurred due to the land
Fig. 2 LULC map of the
Pichavaram area in the year
1991
Fig. 3 LULC map of the
Pichavaram area in the year
2000
Environ Earth Sci
123
Author's personal copy

utilization for agriculture cover and aquaculture pond. The
results are further supported by land conversion into fallow
land, swamp and waterlogged area. A increase of 42.59 ha
in mangrove vegetation indicated that the degraded man-
grove forest gets proper management through which the
mangrove area increased in the Pichavaram belt. There was
a decrease in mudflat area of about 186.83 ha that may be
ascribed to conversion of this cover into agriculture, fal-
low, swamp land. A decrease in 89.53 ha of sand/beach
and 2,188.26 ha of seawater/sea was may be due to con-
version of land into aquaculture pond, swamp, fallow land,
waterlogged area, and agriculture cover. However, changes
due to tidal effect cannot be ignored.
The comparison of classified images of 2009 (Fig. 4)
with 1991 (Fig. 2) indicated that there was an increase in
2,981.53 ha in agriculture area which may be the reason for
decrease in forest cover, utilization of mud flat, swamp area
for agriculture practices. An increase in 1,118.29 ha in
aquaculture pond was because of conversion of some land
of forest cover into aquaculture pond, mud flat, sand/beach,
sea water/sea. The decrease of 74.03 ha area of degraded
mangrove may be ascribed to an increase in aquaculture
and mangrove. An increase in 10.69 ha in fallow land may
be attributed to a decrease in forest cover/forest plantation,
mud flat, sea water/sea, sand/beach swamp. Interestingly, it
was also found that an increase of 132.13 ha of mangrove
vegetation occurred because of utilization of less mudflat,
forest cover, sand/beach, sea water/sea area, and swamp for
mangrove restoration purposes. There was a decrease of
437.44 ha in forest cover/forest plantation because of
excessive utilization for fuel, fodder, fire wood, aquacul-
ture activity, agriculture cover, and fallow land and man-
grove restoration purposes. About 450.21 ha decrease in
mudflat area was due to agriculture cover, fallow land, and
degraded mangrove and for restoration activities of man-
grove and for construction of aquaculture ponds. Decrease
of 2,024.88 ha in sand/beach was because of change in
coverage of agriculture, aquaculture, fallow land, and res-
toration of mangrove. In between 1991 and 2009 the
decrease of 1,673.51 ha area of sea water/sea was due to
construction of aquaculture pond, and conversion of sea
water/sea area into fallow land, waterlogged area and
agriculture cover or tidal changes. It has been found that
there was a decrease of approximately 71.48 ha under
swamp; it may be ascribed to conversion of swamp area
into agriculture cover, aquaculture pond, and fallow land.
The increase of 473.41 ha waterlogged area was due to
decrease in swamp, and mudflat area (Fig. 5).
Demographical study and its relation to changes
in the mangrove forests
The demographical data of the area indicates a higher
population in 1991 as compared to 2000 and 2009. This
demographical data were obtained from Directorate of
census, Tamil Nadu, Government of India for the year
1991 and 2000 (Census Data 1991, 2001). The population
data for 2009 were calculated from the population
Fig. 4 LULC map of the
Pichavaram area in the year
2009
Environ Earth Sci
123
Author's personal copy
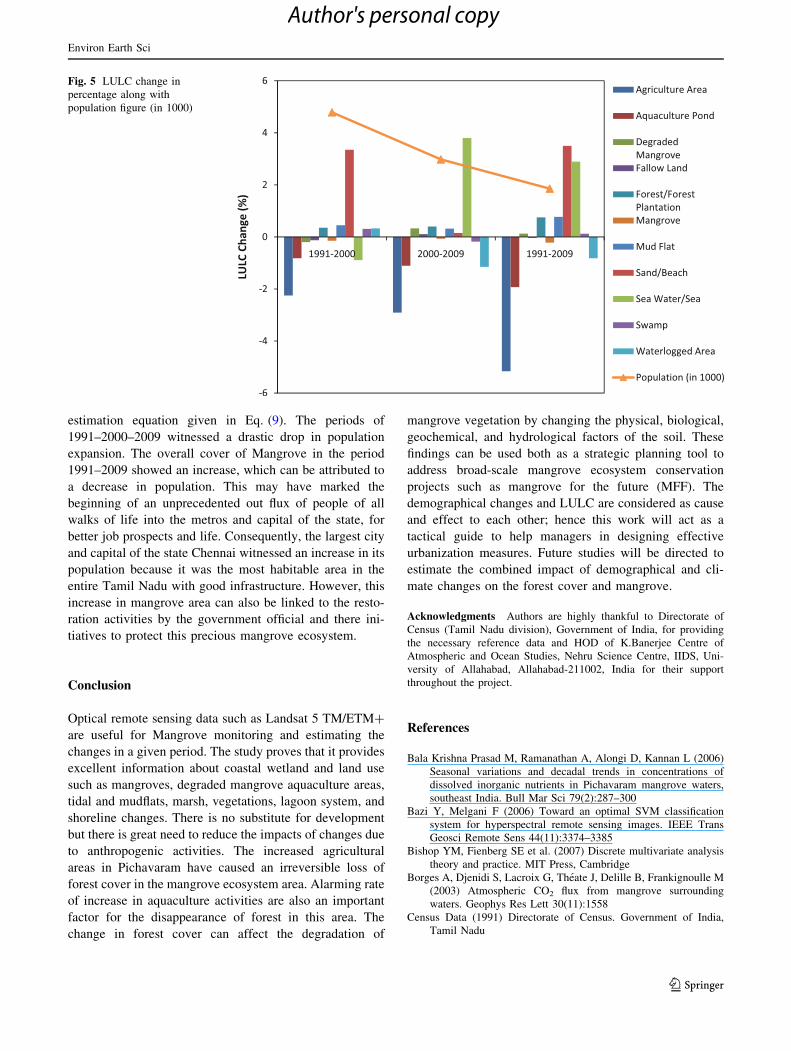
estimation equation given in Eq. (9). The periods of
1991–2000–2009 witnessed a drastic drop in population
expansion. The overall cover of Mangrove in the period
1991–2009 showed an increase, which can be attributed to
a decrease in population. This may have marked the
beginning of an unprecedented out flux of people of all
walks of life into the metros and capital of the state, for
better job prospects and life. Consequently, the largest city
and capital of the state Chennai witnessed an increase in its
population because it was the most habitable area in the
entire Tamil Nadu with good infrastructure. However, this
increase in mangrove area can also be linked to the resto-
ration activities by the government official and there ini-
tiatives to protect this precious mangrove ecosystem.
Conclusion
Optical remote sensing data such as Landsat 5 TM/ETM?
are useful for Mangrove monitoring and estimating the
changes in a given period. The study proves that it provides
excellent information about coastal wetland and land use
such as mangroves, degraded mangrove aquaculture areas,
tidal and mudflats, marsh, vegetations, lagoon system, and
shoreline changes. There is no substitute for development
but there is great need to reduce the impacts of changes due
to anthropogenic activities. The increased agricultural
areas in Pichavaram have caused an irreversible loss of
forest cover in the mangrove ecosystem area. Alarming rate
of increase in aquaculture activities are also an important
factor for the disappearance of forest in this area. The
change in forest cover can affect the degradation of
mangrove vegetation by changing the physical, biological,
geochemical, and hydrological factors of the soil. These
findings can be used both as a strategic planning tool to
address broad-scale mangrove ecosystem conservation
projects such as mangrove for the future (MFF). The
demographical changes and LULC are considered as cause
and effect to each other; hence this work will act as a
tactical guide to help managers in designing effective
urbanization measures. Future studies will be directed to
estimate the combined impact of demographical and cli-
mate changes on the forest cover and mangrove.
Acknowledgments Authors are highly thankful to Directorate of
Census (Tamil Nadu division), Government of India, for providing
the necessary reference data and HOD of K.Banerjee Centre of
Atmospheric and Ocean Studies, Nehru Science Centre, IIDS, Uni-
versity of Allahabad, Allahabad-211002, India for their support
throughout the project.
References
Bala Krishna Prasad M, Ramanathan A, Alongi D, Kannan L (2006)
Seasonal variations and decadal trends in concentrations of
dissolved inorganic nutrients in Pichavaram mangrove waters,
southeast India. Bull Mar Sci 79(2):287–300
Bazi Y, Melgani F (2006) Toward an optimal SVM classification
system for hyperspectral remote sensing images. IEEE Trans
Geosci Remote Sens 44(11):3374–3385
Bishop YM, Fienberg SE et al. (2007) Discrete multivariate analysis
theory and practice. MIT Press, Cambridge
Borges A, Djenidi S, Lacroix G, Theate J, Delille B, Frankignoulle M
(2003) Atmospheric CO2 flux from mangrove surrounding
waters. Geophys Res Lett 30(11):1558
Census Data (1991) Directorate of Census. Government of India,
Tamil Nadu
Fig. 5 LULC change in
percentage along with
population figure (in 1000)
Environ Earth Sci
123
Author's personal copy

Census Data (2001) Directorate of Census. Government of India,
Tamil Nadu
Dixon B, Candade N (2008) Multispectral landuse classification using
neural networks and support vector machines: one or the other,
or both? Int J Remote Sens 29(4):1185–1206
Donato D, Kauffman J, Mackenzie R, Ainsworth A, Pfleeger A
(2012) Whole-island carbon stocks in the tropical Pacific:
implications for mangrove conservation and upland restoration.
J Environ Manage 97:89–96
Foody GM, Mathur A (2004) A relative evaluation of multiclass
image classification by support vector machines. IEEE Trans
Geosci Remote Sens 42(6):1335–1343
Green K, Kempka D, Lackey L (1994) Using remote sensing to detect
and monitor land-cover and land-use change. Photogramm Eng
Remote Sens 60(3):331–337
Gupta M, Srivastava PK (2010) Integrating GIS and remote sensing
for identification of groundwater potential zones in the hilly
terrain of Pavagarh, Gujarat, India. Water Int 35(2):233–245.
doi:10.1080/02508061003664419
Hua S, Sun Z (2001) Support vector machine approach for protein
subcellular localization prediction. Bioinformatics 17(8):
721–728
Huang C, Davis L, Townshend J (2002) An assessment of support
vector machines for land cover classification. Int J Remote Sens
23(4):725–749
Islam T, Rico-Ramirez MA, Han DW, Srivastava PK (2012) Artificial
intelligence techniques for clutter identification with polarimet-
ric radar signatures. Atmos Res 109:95–113. doi:10.1016/j.
atmosres.2012.02.007
Jensen JR (1996) Introductory digital image processing: a remote
sensing perspective, 2nd edn. Prentice-Hall Inc, New Jersey
Kavzoglu T, Colkesen I (2009) A kernel functions analysis for
support vector machines for land cover classification. Int J Appl
Earth Obs Geoinf 11(5):352–359
Keuchel J, Naumann S, Heiler M, Siegmund A (2003) Automatic land
cover analysis for Tenerife by supervised classification using
remotely sensed data. Remote Sens Environ 86(4):530–541
Lau K, Wu Q (2008) Local prediction of non-linear time series using
support vector regression. Pattern Recogn 41(5):1539–1547
Li D-C, Liu C-W (2010) A class possibility based kernel to increase
classification accuracy for small data sets using support vector
machines. Expert Syst Appl 37(4):3104–3110
Lillesand TM, Kiefer RW, Chipman JW (2004) Remote sensing and
image interpretation, 5th edn. John Wiley & Sons Ltd, New York
Mouat DA, Mahin GG, Lancaster J (1993) Remote sensing techniques
in the analysis of change detection. Geocarto Int 8(2):39–50
Mukherjee S (2004) Textbook of environmental remote sensing.
Macmillan India Ltd, New Delhi
Mukherjee S, Shashtri S, Singh C, Srivastava PK, Gupta M (2009)
Effect of canal on land use/land cover using remote sensing and
GIS. J Indian Soc Remote Sens 37(3):527–537
Otukei J, Blaschke T (2010) Land cover change assessment using
decision trees, support vector machines and maximum likelihood
classification algorithms. Int J Appl Earth Obs Geoinf 12:S27–S31
Pal M, Foody GM (2010) Feature selection for classification of
hyperspectral data by SVM. IEEE Trans Geosci Remote Sens
48(5):2297–2307
Pal M, Mather P (2004) Assessment of the effectiveness of support
vector machines for hyperspectral data. Future Gener Comput
Syst 20(7):1215–1225
Patel D, Dholakia M, Naresh N, Srivastava PK (2012) Water
harvesting structure positioning by using geo-visualization
concept and prioritization of mini-watersheds through morpho-
metric analysis in the lower Tapi basin. J Indian Soc Remote
Sens 40(2):299–312. doi:10.1007/s12524-011-0147-6
Patel DP, Gajjar CA, Srivastava PK (2013) Prioritization of Malesari
mini-watersheds through morphometric analysis: a remote
sensing and GIS perspective. Environ Earth Sci 69:2643–2656
Petropoulos GP, Kontoes C, Keramitsoglou I (2011) Burnt area
delineation from a uni-temporal perspective based on Landsat
TM imagery classification using Support Vector Machines. Int J
Appl Earth Obs Geoinf 13(1):70–80
Prasad MBK, Ramanathan A (2008) Distribution of rare earth
elements in the Pichavaram mangrove sediments of the southeast
coast of India. J Coastal Res 24(sp1):126–134
Ranjan RK, Ramanathan A, Singh G (2008) Evaluation of geochem-
ical impact of tsunami on Pichavaram mangrove ecosystem,
southeast coast of India. Environ Geol 55(3):687–697
Ranjan RK, Routh J, Ramanathan A (2010) Bulk organic matter
characteristics in the Pichavaram mangrove–estuarine complex,
south-eastern India. Appl Geochem 25(8):1176–1186
Sanchez-Hernandez C, Boyd DS, Foody GM (2007) Mapping specific
habitats from remotely sensed imagery: support vector machine
and support vector data description based classification of
coastal saltmarsh habitats. Ecol Inform 2(2):83–88
Song C, Woodcock CE, Seto KC, Lenney MP, Macomber SA (2001)
Classification and change detection using Landsat TM data:
when and how to correct atmospheric effects? Remote Sens
Environ 75(2):230–244
Srivastava PK, Mukherjee S, Gupta M (2008) Groundwater quality
assessment and its relation to land use/land cover using remote
sensing and GIS. In: Proceedings of international groundwater
conference on groundwater use—efficiency and sustainability:
groundwater and drinking water issues, Jaipur, India, pp 19–22
Srivastava PK, Mukherjee S, Gupta M (2010) Impact of urbanization
on land use/land cover change using remote sensing and GIS: a
case study. Int J Ecol Econ Stat 18(S10):106–117
Srivastava PK, Gupta M, Mukherjee S (2012a) Mapping spatial
distribution of pollutants in groundwater of a tropical area of
India using remote sensing and GIS. Appl Geomat 4(1):21–32.
doi:10.1007/s12518-011-0072-y
Srivastava PK, Kiran G, Gupta M, Sharma N, Prasad K (2012b) A
study on distribution of heavy metal contamination in the
vegetables using GIS and analytical technique. Int J Ecol Dev
21(1):89–99
Srivastava PK, Han D, Gupta M, Mukherjee S (2012c) Integrated
framework for monitoring groundwater pollution using a geo-
graphical information system and multivariate analysis. Hydrol
Sci J 57(7):1453–1472. doi:10.1080/02626667.2012.716156
Srivastava PK, Han D, Rico-Ramirez MA, Bray M, Islam T (2012d)
Selection of classification techniques for land use/land cover
change investigation. Adv Space Res 50(9):1250–1265. doi:10.
1016/j.asr.2012.06.032
Srivastava PK, Singh S, Gupta M, Thakur JK, Mukherjee S (2012e)
Modeling impact of land use change trajectories on groundwater
quality using remote sensing and GIS. Environ Eng Manage J (in
press)
Szuster BW, Chen Q, Borger M (2011) A comparison of classification
techniques to support land cover and land use analysis in tropical
coastal zones. Appl Geogr 31(2):525–532
Thakur J, Srivastava PK, Singh S, Vekerdy Z (2012) Ecological
monitoring of wetlands in semi-arid region of Konya closed
Basin, Turkey. Reg Environ Change 12(1):133–144. doi:10.
1007/s10113-011-0241-x
Tong S, Chang E (2001) Support vector machine active learning for
image retrieval. In: Proceedings of the ninth ACM international
conference on multimedia. ACM, New York, pp 107–118
Vapnik VN, Chervonenkis AY (1971) On the uniform convergence of
relative frequencies of events to their probabilities. Theory
Probab Appl 16(2):264–280
Environ Earth Sci
123
Author's personal copy

Waske B, Benediktsson JA (2007) Fusion of support vector machines
for classification of multisensor data. IEEE Trans Geosci Remote
Sens 45(12):3858–3866
Yao X, Tham L, Dai F (2008) Landslide susceptibility mapping based
on support vector machine: a case study on natural slopes of
Hong Kong, China. Geomorphology 101(4):572–582
Zhu G, Blumberg DG (2002) Classification using ASTER data and
SVM algorithms: the case study of Beer Sheva, Israel. Remote
Sens Environ 80(2):233–240
Environ Earth Sci
123
Author's personal copy