APPRAISAL REPORT lilliil
342
APPRAISAL REPORT OF ANNUAL WORKPLAN AND BUDGET 2009-10 KARNATAKA (SSA, NPEGEL & KGBV) NUEPA DC lilliil D13370 In respect of: Bagalkot, Bangalore Urban, Bangalore Rural, Belgaum, Bellary, Bidar, Bijapur,- Chamarajanagar, Chikamangalore, Chikamangalore, Chitradurga, Dakshina Kannada, Davanagere, Dharwad, Gadag, Gulbarga, Hassan, Haveri, Kodagu, Kolar, Koppal, Mandya, Mysore, Raichur, Ramanagara, Shimoga, Tumkur, Udupi, Uttarkannada & State Component Plan
-
Upload
khangminh22 -
Category
Documents
-
view
1 -
download
0
Transcript of APPRAISAL REPORT lilliil

APPRAISAL REPORT
OFAN NU A L W O R K P L A N A N D BUDGET
2009-10
KARNATAKA(SSA, NPEGEL & KGBV)
NUEPA DC
lilliilD13370
In respect of: Bagalkot, Bangalore Urban, Bangalore Rural, Belgaum, Bellary, Bidar, Bijapur,- Chamarajanagar, Chikamangalore, Chikamangalore, Chitradurga, Dakshina Kannada, Davanagere, Dharwad, Gadag, Gulbarga, Hassan, Haveri, Kodagu, Kolar, Koppal, Mandya, Mysore, Raichur, Ramanagara, Shimoga, Tumkur, Udupi, Uttarkannada & State Component Plan

t o . NO.
•"neofation Cen««

CONTENTS
S.No. Topic Page No.1. Executive Summary 1
2. Issues 12
3. Comments on States commitments and
Implementation
15
4. Introduction & Planning process 22
5. Educational Indicators 55
6. Components wise Appraisal 63
(1) Access 63
(li) Intervention for out of school children 63
(III) School Infrastructure (Civil works^ 71
(IV) Quality Related Issues, Including, Teachers
and REMS81
(V) SIEMAT 133
(VI) Inclusive Education 134
(VII) Innovative Activitiesa) Computer Aided Learning (CAL)b) Early Childhood Care & Education
(ECCE)c) Education of SC/ST Childrend) Urban Deprived Childrene) Innovation for Children of Minorities
139
(VIII) Girls Educationa. NPEGELb. KGBV
157
-(IX) Strategies for community mobilization 164
(X) Involvement of NGOs 166

S.No. Topic Page No.(XI) Project Management, PMIS and EMIS 166(XII) Special Focus Districts and Minorities 172
7. Comment on the State’s overall direction/ preparedness.
180
8. The major findings of Monitoring Institutes on
implementation of the programme in the State
may be detailed out
181
Appendices:Fact Sheet, Results Frame Work, Tables on physical progress.
Activity Calendar for A.S., Data Tables and Costing.

APPRAISAL REPORT 2009-10
1. Executive Summary of key items
(I) Progress Overview for 2008-09(Rs. in lakh)
SMo.
1.1
1.2
ActivitySanctioned Budget
(2008-09)Achievements (til! 31-03-09)
% age Achievements Remariis
Phy. Fin.New SchoolsUpgraded EGS /New Primary School
313
Upper Primary Schools 450
Teachers2.1 Primary School 626 61.180 0.000 0.00 0.000
2.2 Upper Primary School 551 44.674 0.000 0.00 0.000
2.3 AdditionalTeachers 89 21.360 0.000 0.00 0.000
2.4 RecurringTeachers 21798 27371.896 20814 26682.772 95.49 97.482
Total 23064 27499.110 20814 26682.772 90.25 97.031Teacher Grant 227009 1135.045 218223 1091.116 96.13 96.130Grants for BRC 196 818.320 196 814.356 100.00 99.516
Grants forCRC 2684 2384.228 2684 2240.508 100.00 93.972
Teachers’Training
6.1 In-ServiceTraining 227009 3032.523 205371 2156.212 90.47 71.103
6.2Induction Training - New teachers
6146 184.380 0.000 0.00 0.000
6.3
RefresherCourse-UntrainedTeachers
6.4
BRC & CRC Coordinators & Resource PersonsTotal 233155 3216.903 205371 2156.212 88.08 67.028Intervention for Out of SchoolChildren (No. of Children covered)____
196414 5303.281 160632 4379.272 81.78 82.577
RemedialTeaching 349794 1748.970 349794 1748.970 100.00 100.000

SNo. ActivitySanctioned Budget
(2008-09)Phy. Fin.
Achievements(tiU 31-03-09)
Phy. Fin.
% age AchievementsPhy. Fin.
Remarks
Free Text Books 856319 795.736 856319 795.736 100.00 100.000
10 lED 132297 1543.801 132297 1518.757 100.00 98.37811 Civil Works
11.1 SRC 0.000 0.00011.2 CRC 0.000 0.00011.3 PS Building 313 2817.000 313 2817.000 100.00 100.000
11.4 UPS Building 0.000 0.000
11.5 Building-less(PS) 0.000 0.000
11.6 Building-less(UPS) 0.000 0.000
11.7 AML-aassRoom 5128 24185.600 5128 24179.600 100.00 99.975
11.8 Toilets 3114 588.500 3114 588.500 100.00 100.00011.9 Girls Toilets 256 0.000 256 0.000 100.0011.1 Drinking Water 1621 0.000 1621 0.000 100.00
11.11 Boundary Wall 1 2.400 2.400 100.00 100.00011.12 HM Room 0 0.000 0 0.00011.13 Electrification 15290 764.500 15290 764.500 100.00 100.000
11.14 ResidentialHostel 0 0.000 0.000
11.15 ResidentialSchools 0.000 0.000
11.16 Furniture for UPS 209345 1046.725 177945 1046.725 85.00 100.000
11.17 Major Repairs 2289 834.718 2289 834.719 100.00 100.00011.18 Others (Civil)
Total Civil Works 237357 30239,443 205957 30233.444 86.77 99.980
12 TLE 763 287.600 763 287.600 100.00 100.000
13 MaintenanceGrant 65277 4776.103 59885 4566.330 91.74 95.608
14 School Grant 70821 4005.010 65953 3920.921 93.13 97.90015 REMS 70821 920.673 70821 920.673 100.00 100.000
16 Management&LEP
16.1 Management 29 3257.826 29 3170.202 100.00 97.31016.2 LEP 1719.909 29 1717.553 2900.00 99.863
Total 4977.735 58 4887.755 193.33 98.19217
17.117.217.3
17.4
17.5
InnovationsECCEGirls EducationSC/STComputer Aided LearningMinorityCommunity
17.6 Ufbali dfepfiv^ Children
435.000 159.500435.000
1450.000
217.500
203.000
435.000 100.000
159.500 100.000435.000 100.000
1450.000 100.000
217.500 100.000♦
203.000 100.000
Sanctioned Budget Achievements % ageSNo. Activity (2008-09) (till 31-03-09) Achievements Remarks
Phy. Fin. Ph^ Fin. Phy. Fin.Total 2900.000 1 2900.000 100.000
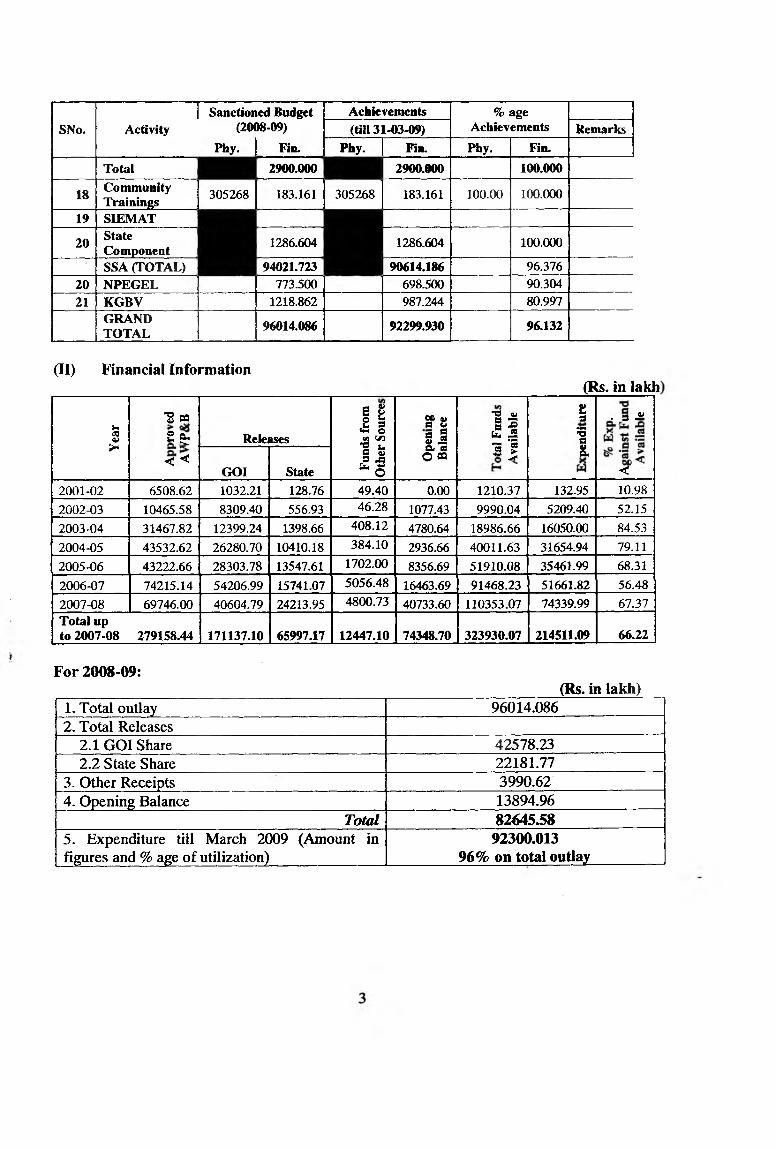
18 CommunityTrainings 305268 183.161 305268 183.161 100.00 100.000
19 SIEMAT
20 StateComponent 1286.604 1286.604 100.000
SSA (TOTAL) 94021.723 1 90614.186 96.37620 NPEGEL 773.500 698:500 90.30421 KGBV 1218.862 987.244 80.997
GRANDTOTAL 96014.086 92299.930 96.132
(II) Financial Information(BLs. in lakh
uiso>>-
■g M 2 ^
< <
ReleasesIIP' " O
CD ue w
ll O CQ
■§ -a § -g to. S 1 1
t.3
1S.
- s ^
<GOI State2001-02 6508.62 1032.21 128.76 49.40 0.00 1210.37 132.95 10.982002-03 10465.58 8309.40 556.93 46.28 1077.43 9990.04 5209.40 52.152003-04 31467.82 12399.24 1398.66 408.12 4780.64 18986.66 16050.00 84.532004-05 43532.62 26280.70 10410.18 384.10 2936.66 40011.63 31654.94 79.112005-06 43222.66 28303.78 13547.61 1702.00 8356.69 51910.08 35461.99 68.312006-07 74215.14 54206.99 15741.07 5056.48 16463.69 91468.23 51661.82 56.482007-08 69746.00 40604.79 24213.95 4800.73 40733.60 110353.07 74339.99 67.37Total upto 2007-08 279158.44 171137.10 65997.17 12447.10 74348.70 323930.07 214511.09 66.22
For 2008-09:(Rs. in lakh)
1. Total outlay 96014.0862. Total Releases
2.1 GOI Share 42578.232.2 State Share 22181.77
3. Other Receipts 3990.624. Opening Balance 13894.96
Total 82645.585. Expenditure till March 2009 (Amount in figures and % age of utilization)
92300.013 96% on total outlay

(Ill) Teams to provide information on:1. Status of State share:
a. funding pattern : 60:40 between GOI and State.b. backlog : No backlog of State Share. The State has released
excess State Share of Rs. 3843.54 lakhc. provision in current yea: : The State has given a confirmation that adequate
State Share will be provided as per the budget provision made during 2009-10.
2. Information on maintaining the level of expenditure in Elementary education as on 1999-2000.
(Rs. in crore)Year Expenditure
1999-2000 1542.0602000-2001 1759.1802001-2002 1784.742002-2003 1758.6802003-2004 2024.2842004-2005 2555.2972005-2006 2699.2102006-2007 2924.5462007-2008 3766.7022008-2009 4663.351
The State is maintaining the level of expenditure in Elementary Education as on 19992000.
(IV) Proposals & Recommendations for 2009-10:(Rs. in lakh)
SNo. InterventionsProposal for fresh
allocation Recommendation
against proposals Remark/ConditionalitiesPhy. Fin. Phy. Fin.
1 New Schools1.1 Upgradation of EGS to PS1.2 PS 317 0.000 317 0.0001.3 UPS 553 0.000 130 0.000 As per 2:1 ratio
Class VIII 104 0.000 0 o m o
State policy notification to merge Cl VIII with Ele. Edn is awaited.
2 Teacher’s SalaryA New Teachers1 PS 690 188.932 690 164.840 2 months.
• 2 »UPS ■ • ' ' 11(^7 ’ '3 3 3 .n 0 ' ' * 580" * '150.800"
As per 2;1 ratio. 13(Cnsw UPS and 450 for UPS approved in 2008-

SNo. InterventionsProposal for fresh
allocationRecommeiidation against proposals Remark/
ConditionalitiesPhy. Fin. Phy. Fin.
093 Additional 15325 4566.850 0 0.000 As per 1:40 PTR
not entitledNew addl. TGT for Cl-VIII 4146 1364.034 0 0.000
Sub Total 21268 6452.926 1270 315.640B Recurring Teachers1 PS 17519 31323.972 17519 28380.7802 UPS 5545 10945.830 5545 10313.7003 Additional Teachers 0 0.000 0 0.000
Sub Total 23064 42269.802 23064 38694.480
3 Teachers’ Grant 246071 1230.355 228885 1144.425 As per working teachers
4 BRC Grant 196 1108.268 196 1037.560 Unit cost @ Rs. 15500/-p.m
5 CRC Grant 2684 3533.326 2684 3276.704
6 Teachers’ Training
6.1 In-service Training 247096 3706.440 228885 3433.275 As per working teachers
6.2 Induction training - New Teachers 19345 580.350 1270 38.100
As per new teachers sanctioned
6.3 Refresher Course- Untrained Teachers
6.4 BRC & CRC Coordinators and Resource Persons 7578 75.780 7578 75.780
Sub Total 274019 4362^70 237733 3547.155
7Interventions for Out of School Children (No of children covered)
7.1 Chinnara Angala Bridge couse Residential 12 months-RBC 26896 2689.600 26896 2689.600
7.2Chinnara Angala Seasonal Bridge course - Resdn. (6 months)- NRBC
8075 403.750 8075 403.750
7.3 Mobile schools 1445 43.350 1445 43.350
7.4 12 months bridge course-NRBC 11478 344.340 11478 344.340
1.5 Tent school 6939 208.170 6939 104.085Unit cost reduced to Rs.1500/- per child.
7.6 Madrasa / Makthab 9787 293.610 9787 293.6107.7 NCLP Schools 4839 145.170 4839 - 145.170
7.8 Summer Remedial Teaching Chaitrada Chiguru 74470 372.350 74470 372.350

SNo. InterventionsProposal for fresh
allocationRecommendation against proposals Remark/
ConditionalitiesPhy. Fin. Phy. Fin.
7.9 4 months seasonal residential school 50 1.650 50 1.650
7.10 Bridge course - Chinnara Angala -NRBC 10000 100.000 10000 50.000
Unit cost reduced to Rs. 500/- per child.
7.11 Home Based Education 14720 441.600 14720 441.600
7.12 Bridge course - Chinnara Angala Resi-2 months 7802 132.634 7802 132.634
7.13 AIE Centers( Transportation, Hardest to reach children) 1476 44.280 1476 44.280
7.14 Innovation Urban Deprived Children 29 203.000 0 0.000 Provided under
Innovation.7.15 Special Enrolment Drive 4530 0.000 4530 0.000
Sub Total 182536 5423.504 182507 5066.419
8 Remedial Teaching 385424 1927.120 311985 623.970
Unit cost restricted to Rs.200/- per child
9 Motivation through field viat 29 435.000 0 0
10 Free Text Books 2721600 2281.320 910389 964.737
Unit cosl restricted to Rs.80/- & Rs.130/- for PS & UPS
11 lED 133160 1597.920 121153 1453.836 HBE provided in OoSC
12 Civil Works12.1 BRC 2 16.000 0 0.000 Priority to ACR12.2 CRC - 183 905.850 0 0.00012.3 Primary School 317 3106.600 317 2853.00012.4 Upper Primary School12.5 Building less (Pry) 5 25.750 0 0.000 Not covered
under the norms12.6 Building less (UP) 2 10.300 0 0.00012.7 Dilapidated Building (Pry) 1 5.150 0 0.000
12.8 Additional Qass Room 5067 26212.050 4769 22600.780 Restricted to the ceiling and Gaps.
12.9 "Additional Rooms for CALC & Edusat 83 ,311.250 0 0.000
Not covered under the norms
12.10 ToUets for CWSN 8683 919.500 1548 774.000 Restricted to the ceiling12.11 Girls Toilet 16882 4220.500 12792 3198.000
12.12 Drinking Water 6617 0.000 0 0.000
12.13 Residential Hostel 3 60.000 0 0.000Not covered under the norms
12.14 Residential Schools
SNo. InterventionsProposal for fresh
allocationRecommendation against proposals Remark/
ConditionalitiesPhy. Fin. Phy. Fin.
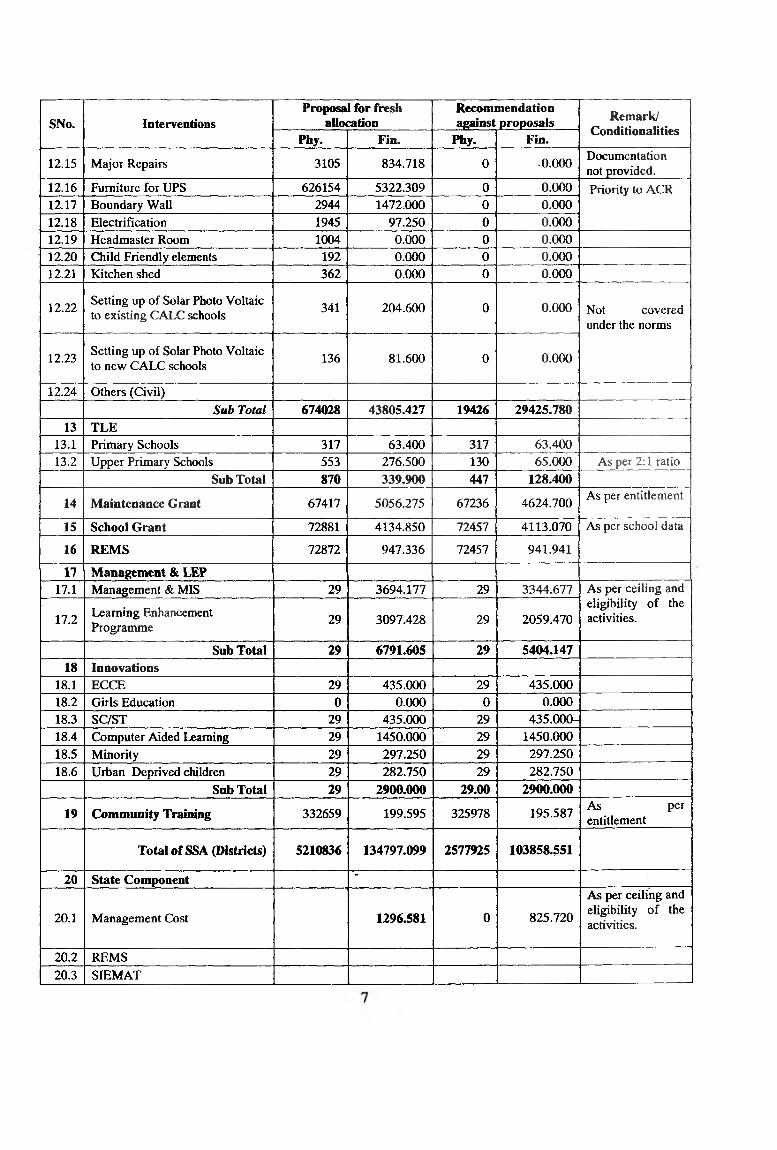
12.15 Major Repairs 3105 834.718 0 -0.000 Documentation not provided.
12.16 Furniture for UPS 626154 5322.309 0 0.000 Priority to ACR12.17 Boundary Wall 2944 1472.000 0 0.00012.18 Electrification 1945 97.250 0 0.00012.19 Headmaster Room 1004 0.000 0 0.00012.20 Child Friendly elements 192 0.000 0 0.00012.21 Kitchen shed 362 0.000 0 0.000
12.22 Setting up of Solar Photo Voltaic to existing CALC schools 341 204.600 0 0.000 Not covered
under the norms
12.23 Setting up of Solar Photo Voltaic to new CALC schools 136 81.600 0 0.000
12.24 Others (Civil)Sub Total 674028 43805.427 19426 29425.780
13 TLE13.1 Primary Schools 317 63.400 317 63.40013.2 Upper Primary Schools 553 276.500 130 65.000 As per 2:1 ratio
Sub Total 870 339.900 447 128.400
14 Maintenance Grant 67417 5056.275 67236 4624.700 As per entitlement
15 School Grant 72881 4134.850 72457 4113.070 As per school data
16 REMS 72872 947.336 72457 941.941
17 Management & LEP17.1 Management & MIS 29 3694.177 29 3344.677 As per ceiling and
eligibility of the activities.17.2 Learning Enhancement
Programme 29 3097.428 29 2059.470
Sub Total 29 6791.605 29 5404.14718 Innovations
18.1 ECCE 29 435.000 29 435.00018.2 Girls Education 0 0.000 0 0.00018.3 SC/ST 29 435.000 29 435.000^18.4 Computer Aided Learning 29 1450.000 29 1450.00018.5 Minority 29 297.250 29 297.25018.6 Urban Deprived children 29 282.750 29 282.750
Sub Total 29 2900.000 29.00 2900.000
19 Community Training 332659 199.595 325978 195.587 As per entitlement
Total of SSA (Districts) 5210836 134797.099 2577925 103858451
20 State Component -
20.1 Management Cost 1296.581 0 825.720
As per ceiling and eligibility of the activities.
20.2 REMS20.3 SIEMAT

SNo. InterventionsProposal for fresh
allocationRecommendation against proposals Remark/
ConditionalitiesPhy. Fin. Phy. Fin.State Total of SSA 5210636 136093.680 2577925 104684.271
21 NPEGEL 950 731.700 921 587.875 New MCS not sanctioned.
22 KGBV 64 3262.370 64 3187.83061 Model III are upgraded to Model I. As per entitlement.
Grand Total (SSA+NPEGEL+KGBV) 5211850 140087.390 2578910 108459.976
(V) Number of small districts getting Rs. 20 lakh should be indicated: NIL
(VI) Total Recommended Budget:(Rs. in lakh)
SNo. Head
Total Proposals Total Recommended Outlay
SpillOver Fresh Total
SpillOver Fresh Total
1 SSA 0 136093J20 136093.320 0 104684^71 104684.2712 NPEGEL 0 731.700 731.700 0 587.875 587.8753 KGBV 0 3262J70 3262.370 0 3187.830 3187.830
Total 0 140087.390 140087.390 0 108459.976 108459.976
(VII) Information on Quality Interventions:(Rs in Lakh)
SNo. Category Financial Recommendation for 2009-10
1 Teacher’s Salary 39010.122 Teacher Grant 1144.4253 BRC 1037.5604 CRC 3276.7045 Teachers’ Training 3547.1556 Remedial Teaching 623.9707 Free Textbooks 964.7378 School Grant 4113.0709 REMS 941.94110 Innovative Activities 2900.00011 NPEGEL 587.875
12 TLE for new schools128.400
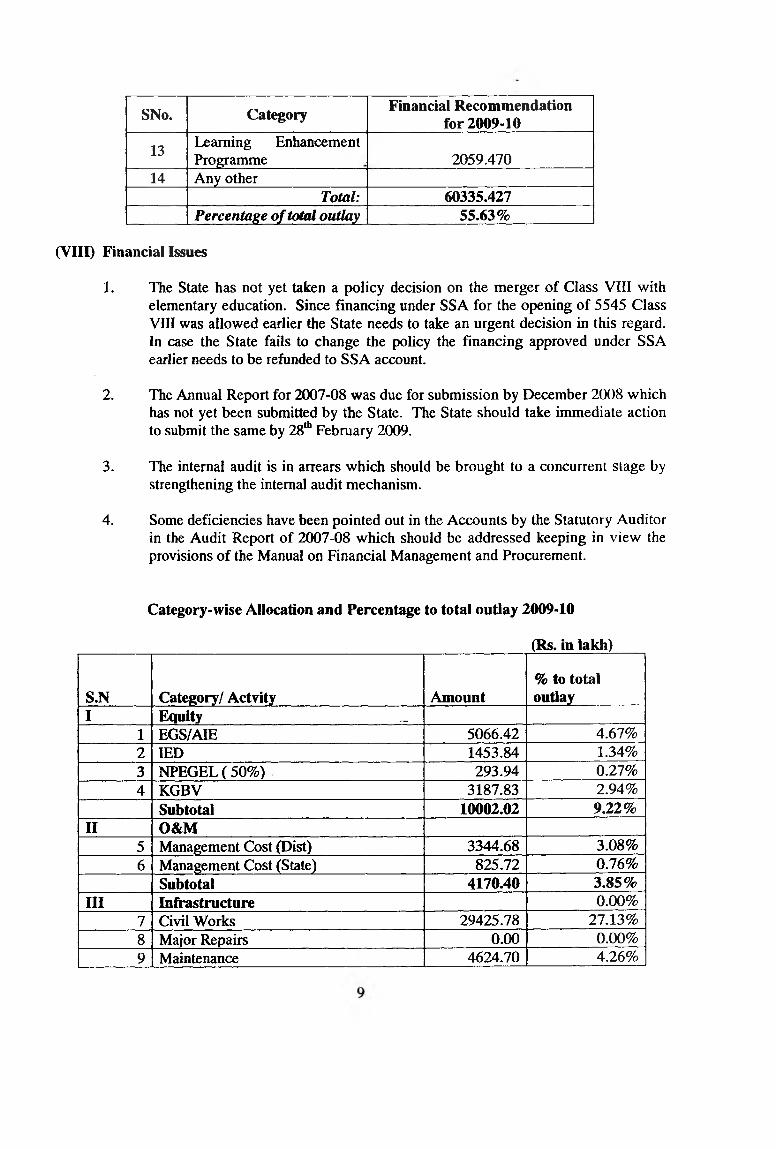
SNo.
13
14
Categoiy
Learning Enhancement Programme____________Any other
Total:Percentage of total outlay
Financial Recommendation for 2009-10
2059.470
60335.42755.63%
(VIII) Financial Issues
1. The State has not yet taken a policy decision on the merger of Class VIII with elementary education. Since financing under SSA for the opening of 5545 Class VIII was allowed earlier the State needs to take an urgent decision in this regard. In case the State fails to change the policy the financing approved under SSA earlier needs to be refunded to SSA account.
2.
3.
4.
The Annual Report for 2007-08 was due for submission by December 2008 which has not yet been submitted by the State. The State should take immediate action to submit the same by 28*'’ February 2009.
The internal audit is in arrears which should be brought to a concurrent stage by strengthening the intemzd audit mechanism.
Some deficiencies have been pointed out in the Accounts by the Statutory Auditor in the Audit Report of 2007-08 which should be addressed keeping in view the provisions of the Manual on Financial Management and Procurement.
Category-wise Allocation and Percentage to total outlay 2009-10
(Rs. in lakh)
S.N Category/ Actvity Amount% to total outlay
I Equity _1 EGS/AIE 5066.42 4.67%2 lED 1453.84 1.34%3 NPEGEL(50%) 293.94 0.27%4 KGBV 3187.83 2.94%
Subtotal 10002.02 9.22%II O&M
5 Management Cost (Dist) 3344.68 3.08%6 Management Cost (State) 825.72 0.76%
Subtotal 4170.40 3.85%III Infi^tructure 0.00%
7 Civil Works 29425.78 27.13%8 Major Repairs 0.00 0.00%9 Maintenance 4624.70 4.26%

S.N Category/ Actvity Amount% to total outlay
10 TLE 128.40 0.12%Subtotal 34178.88 31.51%
IV Quality11 Textbook 964.74 0.89%12 BRC (other than civil works) 1037.56 0.96%13 CRC (other than civil works) 3276.70 3.02%14 School Grant 4113.07 3.79%15 Teacher Grant 1144.43 1.06%16 Remedial Teaching 623.97 0.58%17 Teacher's Training 3547.16 3.27%18 Innovative Activities 2900.00 2.67%19 Community Training 195.59 0.18%20 Research and Evaluation 941.94 0.87%21 LEP 2059.47 1.90%22 NPEGEL ( 50%) 293.94 0.27%
Subtotal 21098.56 19.45%23 Teachers Salary 39010.12 35.97%24 Teachers Salary arrears 0.00 0.00%
Subtotal 39010.12 35.97%Grand Total 108459.98 100.00%
S.No. ActivityApproved
outlay2008-09
Exp.(2008-09)
% age to outlay
Recommended Outlay 2009-10
%change
overprevios
year
Remarks ( Reasons for % change in
outlay to previuos
years outlay)
CommittedExpenditure -
1 Teachers Grant 1135.05 1091.12 96.13% 1144.43 0.83%2 School Grant 4005.01 3920.92 97.90% 4113.07 2.70%
3 MaintenanceGrant 4776.10 4566.33 9S.61% 4624.70 -3.17%
4Block Resource Centre(BRC)AJBRC
818.32 814.36 99.52% 1037.56 26.79%
5 Cluster Resource Centres 2384.23 2240.51 93.97% zne .iQ 37.43%
6In-serviceTeachers'Training
3032.52 2156.21 71.10% 3433.28 13.22%
7 Other (RPs) training 0.00 0.00 0.00% 75.78 0.00%
8 Community frakiing ’ • ’ 183.16 ,18316 , ,100.00%, ,6.X89 ,
9 Free Text Book 795.74 795.74 100.00% 9M.1A 21.24%
10

S.No. ActivityApproved
outlay2008-09
Exp.(2008-09)
% age to outlay
Recommended Outlay 2009-10
%change
overprevios
year
Remarks ( Reasons for % change in
outlay to previuos
years outlay)
10 Interventions for CWSN 1543.80 1518.76 98.38% 1453.84 -5.83%
11 Research & Evaluation 920.67 920.67 100.00% 941.94 2.31%
12 Management & MIS 3257.83 3170.20 97.31% 3344.68 2.67%
13Learning Enhancement Prog. (LEP)
1719.91 1717.55 99.86% 2059.47 19.74%
14 InnovativeActivity 2900.00 2900.00 100.00% 2900.00 0.00%
15 NPEGEL 773.50 698.50 90.30% 587.88 -24.00%16 KGBV 1218.86 987.24 81.00% 3187.83 161.54%
17 RemedialTeching 1748.97 1748.97 100.00% 623.97 -64.32%
18 Teachers Salary (Recurring) 27371.90 26682.77 97.48% 38694.48 41.37%
Variablecomponents
19 Civil Works 29192.72 29192.72 100.00% 29425.78 0.80%
20 Furniture for Govt. UPS 1046.73 1046.73 .100.00% 0.00 -100.00%
21TeachingLearningEquipment
287.60 287.60 100.00% 128.40 -55.35%
22Induction trg for Newly Recruit Trained Teach
184.38 0.00 0.00% 38.10 -79.34%
23Training forUntrainedTeachers
0.00 0.00 0.00% 0.00 0.00%
24 Interventions for OOSC 5303.28 4379.27 82.58% 5066.42 -4.47%
25 New Teachers Salary 127.21 0.00 0.00% 315.64 148.12%
26 STATECOMPONENT 1286.60 1286.60 100.00% 825.72 -35.82% -
GRANDTOTAL 96014.09 92305.93 96.14% 108459.98 12.96%
11

2. Issues
Karnataka is generally recognized as a forward State in terms of education. The State has shown good progress in enrolling out of school children, improving quality and bridging gender gaps.
However there still exist some issues which if unattended will continue to impede tangible progress towards UEE. Key issues among these are;
Issues related with overall planning
• Availability of data and its quality: It was found during appraisal that availability of data, especially comparative data for previous years as also desegregated data is generally not available. This as a result makes it very difficult to do trend analysis or a desegregated analyses for that matter. This problem persists not only with the data on al the components even the financial allocation in components like civil work had to be revise several times. The data is generally very inconsistent and unreliable this requiring repeated, revision
• Single teacher schools: Large numbers of single teacher schools still exist. Despite making commitment on elimination single teacher schools there seems little progress on the ground as according to DISE 2008-09 ( available with the State) there are around 2000 single teacher schools in Karnataka.. The persistence of single teacher schools is attributed to a government policy on providing only one teacher to schools falling in Malnad area with less 20 children.. Tliere is need to review this policy if the single teacher schools are to be eliminated from the State.
• Schools with PTR more than 50: 276 schools have reported PTR in this range despite the fact that the State level PTR is only 29. This underlines the need for rationalization in teacher deployment..
• Dropout rate: Although overall dropout rate of the State has declined to 8.80 ( Dise 0809 available with the State.) however, 15 districts haVe more than state average drop out. The highest being in Raichur 33.40, Bidar 29.90 and Kolar 27.30. Also, 9 districts depict increasing trend from the previous year. Districts with large variation are; Racichur (25.44 in 2007-08 and 33.40 in 2008-09), Bidar (25.20 in 2007-08 and 29.30 in 2008-09), Kolar (9.65 in 2007-08 and 27.30 in 2008-09),Bagalkot (9.86 in 2007-08 and 25.70 in 2008-09). These issues regarding dropout are quite significant and need to be examined to address properly.
• Equity: equity is a major concern in Kamataka where there is a lot of spatial variation on key educational indicators. The seven Northwestern districts and some other districts continue to be lagging substantially on key educational indicators.
SIEMAT: Despite a lot of ground work being done, the State has not been able to operationalise SIEMAT. There is ;need to expedite action to establish and operationalise this very important educational institution in the State,
12
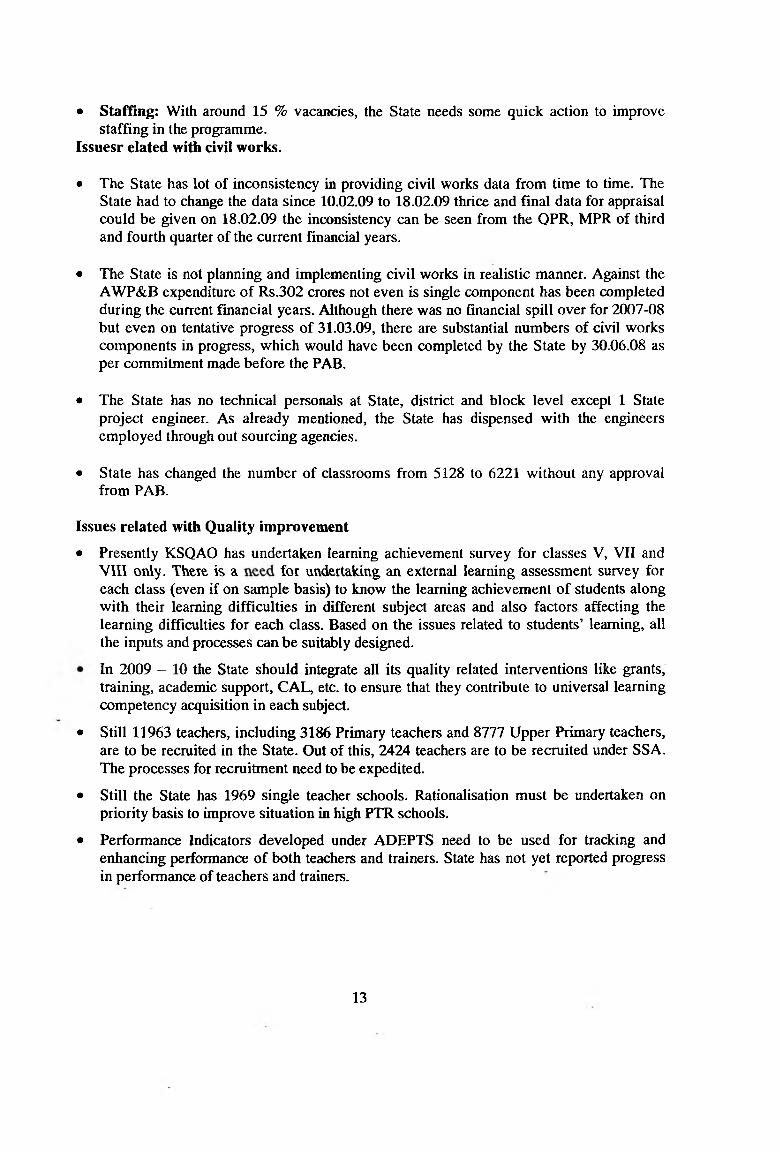
• Staffing: With around 15 % vacancies, the State needs some quick action to improve staffing in the programme.
Issuesr elated with civil works.
• The State has lot of inconsistency in providing civil works data from time to time. The State had to change the data since 10.02.09 to 18.02.09 thrice and final data for appraisal could be given on 18.02.09 the inconsistency can be seen from the OPR, MPR of third and fourth quarter of the current financial years.
• The State is not planning and implementing civil works in realistic manner. Against the AWP&B expenditure of Rs.302 crores not even is single component has been completed during the current financial years. Although there was no financial spill over for 2007-08 but even on tentative progress of 31.03.09, there are substantial numbers of civil works components in progress, which would have been completed by the State by 30.06.08 as per commitment made before the PAB.
• The State has no technical personals at State, district and block level except 1 State project engineer. As already mentioned, the State has dispensed with the engineers employed through out sourcing agencies.
• State has changed the number of classrooms from 5128 to 6221 without any approval from PAB.
Issues related with Quality improvement
• Presently KSQAO has undertaken learning achievement survey for classes V, VII and VUl only. Theie is a for undertaking an external learning assessment survey for each class (even if on sample basis) to know the learning achievement of students along with their learning difficulties in different subject areas and also factors affecting the learning difficulties for each class. Based on the issues related to students’ learning, all the inputs and processes can be suitably designed.
In 2009 - 10 the State should integrate all its quality related interventions like grants, training, academic support, CAL, etc. to ensure that they contribute to universal learning competency acquisition in each subject.
• Still 11963 teachers, including 3186 Primary teachers and 8777 Upper Primary teachers, are to be recruited in the State. Out of this, 2424 teachers are to be recruited under SSA. The processes for recruitment need to be expedited.
• Still the State has 1969 single teacher schools. Rationalisation must be undertaken on priority basis to improve situation in high PTR schools.
• Performance Indicators developed under ADEPTS need to be used for tracking and enhancing performance of both teachers and trainers. State has not yet reported progress in performance of teachers and trainers.
13

Issues related tvith Finance
• The State has not yet taken a policy decision on the merger of Class VIII with elementary education. Since financing under SSA for the opening of 5545 Class VIII was allowed earlier the State needs to take an urgent decision in this regard. In case the State fails to change the policy the financing approved under SSA earlier needs to be refunded to SSA account.
• The Annual Report for 2007-08 was due for submission by December 2008 which has not yet been submitted by the State. The State should take immediate action to submit the same by 28“* February 2009.
• The internal audit is in arrears which should be brought to a concurrent stage by strengthening the internal audit mechanism.
• Some deficiencies have been pointed out in the Accounts by the Statutory Auditor in the Audit Report of 2007-08 which should be addressed keeping in view the provisions of the Manual on Financial Management and Procurement.
14

3. Comments on States commitments and implementation: 2008-09
Commitments Action Taken Remark Appraisal Team
of
(i) 100% access to primary schooling by 2008-09. The State should open all primary schools, upper primary schools and addition of Class VIII sanctioned till 200708 by June 2008. ,
Activities Upto 200'7-08 During 2008-09Target Achmt Target Achmt
Upgradation of EGS to PS 241 241 0 0New Schools 1977 1977 313 313Upgradation of PS to UPS 1658 1658 450 450Adding class Vm to UPS 5444 5444 ,' 101 100
Upto 2007-08,• 241 EGS centers are upgraded to Primary Schools out of
241sanctioned.• 1977 new schools opened, out of 1977 sanctioned.• 1658 primary schools have been upgraded to UPS, out of 1658
sanctioned.• 5444 addition of class VIII to UPS, out of 5444 sanctioned.
During 2008-09,• 313 new schools have been opened, out of 313 sanctioned.• 450 primary schools are upgraded to UPS, out of 450
sanctioned.• 100 addition of class VIII to UPS, out of 101 sanctioned.
Out of 58865 habitations, 6727 habitations were without schooling facility up to 2006-07. Out of which 603 new schools were sanctioned during 2007-08 and 313 new schools were sanctioned during 2008-09. Remaining 5811 habitations are not having schooling facility, as the number of school going age children are
Effort seems to have been made to meet the commitment, which has resulted in near saturation of ace, however, since access is a dynamic phenomenon as more habitations will continue tobecoming eligible. Therefore need for new schools will continue to arise.
15
Commitmeiits ' Action Taken Remark of Appraisal Team
>
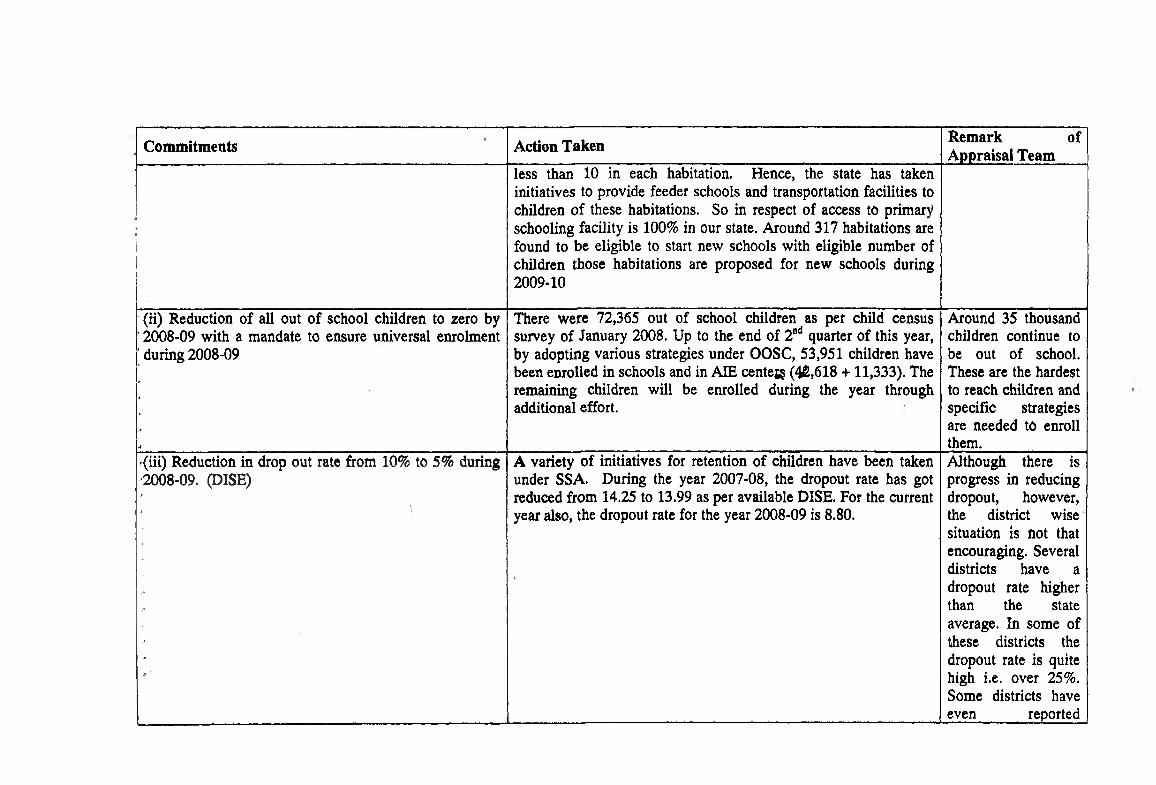
less than 10 in each habitation. Hence, the state has taken initiatives to provide feeder schools and transportation facilities to children of these habitations. So in respect of access to primary schooling facility is 100% in our state. Around 317 habitations are found to be eligible to start new schools with eligible number of children those habitations are proposed for new schools during 2009-10
(ii) Reduction of all out of school children to zero by ’ 2008-09 with a mandate to ensure universal enrohnent ' during 2008-09
There were 72,365 out of school children as per child census survey of January 2008. Up to the end of 2"'* quarter of this year, by adopting various strategies under OOSC, 53,951 children have been enrolled in schools and in AIE centei? (4£,618 + 11,333). The remaining children will be enrolled during the year through additional effort.
Around 35 thousand children continue to be out of school. These are the hardest to reach children and specific strategies are needed to enroll them.
^(iii) Reduction in drop out rate from 10% to 5% during ■2008-09. (DISE)
. \
A variety of initiatives for retention of children have been taken under SSA. During the year 2007-08, the dropout rate has got reduced from 14,25 to 13.99 as per available DISE. For the current year also, the dropout rate for the year 2008-09 is 8.80.
Although there is progress in reducing dropout, however, the district wise situation is not that encouraging. Several districts have a dropout rate higher than the state average. In some of these districts the dropout rate is quite high i.e. over 25%. Some districts have even reported

Commitments Action Taken Remark ofAppraisal Teamincrease in dropout rate. A more focused approach is needed for addressing ;the issues to bring the districts in parity on the indicator of retention
(iv) Reduction in gender gap by2% during 2008-09 from2005-06 level of DISE.
The Total No. of Enrollment since 2002-03 of boys & giirls respectively is as per the following table. Accordingly gender parity/gender gap as follows.
Enrollment/ Gender Parity/ Gender Gap;
Year Boys Girls Total GenderParity
GenderGap
2002-03 4396546 4041364 8437910 0.919213 4.21
2003-04 4502054 4138947 8641001 0.919346 4.20
2D04-05 4528983 4174706 8703689 0.921776 4.07
2005-06 4469905 4174164 8644069 0.933837 3.42
2006-07 4520123 4201525 8721648 0.929516 3.65
2007-08 4440422 4152525 8592947 0.935164 3.35
The commitment made to PAB during 20C8-09 is that the genegap to be reduced by 2% during 2008-09 from 2006-07 level of DISE.
The gender gap in the year 2006-07 is 3.65 & that of 2007-08 is 3.35. The data of 2008-09 is as such not available as the validation is on. The gap has been reduced by 0.3. NPEGEL activities for the year 2008-09 were planned with various objectives of attaining universal Enrollment, Retention & Community participation. Hence concrete activities have been undertaken & accordingly
The gap hs been reduced only by 0.3% against the committed target of 2% , which implies that the commitment has not been met.
17

Commitments I Action Taken Remark of Appraisal Team
gender gap is definitely being reduced in 2008-09.(v) Elimination of single teacher schools to the minimum level based on the enrollment of students and fto schpols without blackboard during 2008-09.
1
Steps have been taken to eliminate single teacher schools to the minimum level based on the enrolmerit of students.
According to 2007-08 EMIS data 2523 single teacher schools are there in Karnataka. As per State Policy the schools in Malnad area with less 20 children will have sin^e teacher. As per DISE 2008-09 data single teacher schools are 1962.
Single teacher schools still exist in sizable number. Also, there is confusion on the definition for calculating the single teacher school viz the figures quoted in the column at right
1 against the sanctioned teachers whereas against working teachers the number gets almost doubled
(vi) Efforts to enhance enrolment of girls from the minority community (Muslims) in KGBV schools in the districts with substantial Muslim population.
1
■ 1 ' 1
2 KGBV Schools exclusively for areas with more than 20% of Muslim population have been started in 2 districts, namely Raichur(Sindhanur) & Koppal(Gangavathi) where in 51 students have been enrolled. Specific instructions & efforts has been made to all KGBVs in enrolling girls from Muslim community and the total no. of 356 girls of Muslim community are studying in KGBVs.
100% enrolment of Muslim girls is reported in the two KGBVs sanctioned in minority concentrated districts. Against total KGBV enrolment of 5442 Muslim girls are reported to be 427 i.e. 8%.
(vii) Quarterly pupil evaluation outcomes to be measured and reported in NCERT Monitoring Tools as
The necessary steps have been taken in this regard. The programme is under process and awaiting for DISE data for
The commitment has not yet been met.

Commitments Action Taicen RemarkAppraisal Team
of
per the schedule. completion(viii) The State should ensure to increase learning level of Class VII children from 73.60% to 80% Class V children from 59.60% to 70% and class III from 69.72% to 80% in 2008-09 over the finding of KSQA 2006-07.
KSQAO is conducting exams to measure the learning achieves ent of children since 2005-06. During the 05-06, the average of children was 50.00 and it increased to 63.80 during 2006-07 and during 2007-08, it is increased to 71.20.Efforts are being made to improve the L.A. further by introducing Remedial Teaching, Oduve Nanu, a reading improvement programme, Nali-Kali etc.
Acton seems to be taken b y the state to meet thiscommitment.
(ix) Follow up on study on Teacher Absenteeism to be shared with GOI by June 2008.
A study on Teachers Absence and Student Attendance in Primary and Upper Primary Schools of Karnataka State is already completed.A copy of the final report is already submitted to the MHRD and also EdCIL. 'The follow up action is being taken at all levels as per the study findings.
Commitment been met
has
(x) Teacher accountability systems and mechanisms to be reexamined and redesigned to ensure:(a) increments and promotions are contingent on (i)
discemable and measured improvement in learning outcomes of school children in their chiurge (ii) use of better classroom practices which encourage child participation, are girl child friendly, remove caste/community basis in classrooms and which lead to overall increase in class learning achievement scores.'
b) teacher awards for teachers who conduct regular inschool remedial teaching with weaker students and enhance overall class achievement levels.
c) Village Education Committee/PTAs/ SDMC’s etc. or equivalent bodies bye law/rules to be amended to include specific classes to monitor teacher
Teachers are accountable to the system in regard to their transaction of curriculum, attendance and conduct. They are accountable to the community and specifically the children in regard to learning attainments and personality development.Till now, there was a paucity of district-wise, State level school specific hard data on Teachers’ Attendance. During the year 200708, a State-wide study on Teachers* Absenteeism, the dynamics thereon, was commissioned by SSA and completed. Findings of the study were disseminated across and within the whole system of administration. Guidelines for follow-up measures were issued to the Districts.A State-wide programme of Capacity Building of SDMCs/CAC of GPs was organized during 07-08. Apart from other subjects. Community monitoring of teachers’ attendance, students’ learning attainment in KSQAO/School examinations were also addressed in
More efforts are needed to meet this commitment. Also the state has to convince itself about the need for such steps beforre it initiates action to address them.
19

Coinmitmeiits Action Taken Remark ofAppraisal Team
A)
attendance; assessment of parental satisfaction with learning levels of children with respect to class teacher/subject teacher; frequency of parent teacher meets and sharing of children’s report card> class work home work with parents; school functions held in which community/parents participated; occasions when parents/local community membersAocal women’s groups must assist the school in distribution of free-textbooks, scholarships and other incentives school Opening day for the academic session and after holiday breaks for winter/festival season etc., and a system for recording teacher attendance with inputs from the c6mmunity and the Block/district education officials.
these programmes.A State-wide programme known as ‘Samudayadatta Shale’ [School reaches out to the Community] is organized twice a year in all the schools. The schools use, the day for Talent identification among children and awareness building athong parents and community about the performance of the sciiOol on various parameters of functioning. During the first such jjrogramme, all the incentives due to children are distributed in pjresence of the community and with the involvement of local leaders who have credibility. The SDMCs are given legal authority to monitor the leave of absence and attendance of teachers. The supervisory, departmental officers, facilitate this arrangement.It is difficult to tailor the aforementioned whole arrangement of Teacher Accountability to increments and promotions as SSA is only an academic support sub-systeiii of the education system. The main administrative system is subject to a complex dynamics of functioning which is not explicitly stated.
,(xi) Ensure budgetary provision of matching state share in the State budget and submit the copy of the same to -GOI in the month of April 2008.
Govt, of Karnataka released it's sharfc of 35% for the year 2008-09. State released Rs.22181.670 upto 30.11.2008
The state needs to improve its progress for meeting the commitment. ■
(xii) The expected outcomes initiatives are as under for the year 2008-09 :-
Indicators Sonrce of Baseline AchievementData P17. U.Pry. Pry. U.Pry
Access Householdsurvery 98% 99.16% 100% 100%
Reduction of out of Do 0.72 Lakh 0.50 lakh
AchievementPrimary Upper Primary
Access 100% 100%Reduction of out of school children
0.33 lakhs
NER 96.10% 95.91%Learning Levels Class VII 71.74 -Learning Levels Class V 71.24 -
The state needs to improve its progress for meeting the commitment. W.r.t. NER, Retention. On other indicators positive progress is made. Data has not been provided for

Commitments Action Taken Remark ofAppraisal Team
schoolchildrenNER DISE data
(6-07) 58.08% 99% 97.5%
Retention Do 91.94 95%
Learning level class Vll
KSQAO(06-07) 62.71% 73%
Learning level Class V
Do 62.76% 72%
Learning level Class III
Do 75.82% 80%
grade III learning achievement.
(xiii) State Committee to properly constitute and ensure holding of meeting of the District Committee for public Representatives to monitor the SSA programme, set up w.r.t to amended SSA framework w.e.f. Aug. 07.
The State has issued on order to all district to constitute District Monitoring Committee in the Chairmanship of concerned member of Parliament of the concerned district as per the MHRD letter dt. 29.8.2007.All the districts constituted DMCs, but in 3 districts, the committees are functional.
Action seems to have been taken.
21

The appraisal of 29 districts and the state component plan pf Karnataka was undertaking during the second and third weak of February 2009 at TSG Delhi.Members of the desk appraisal including Dr. Aarti Srivastava (NUEPA), Sh. K. Gopalan, Sh. Altab Khan, Sh. S.C.Girotra, Ms. Kiran Dogra, Dr. Anupriya Chadda, Seema Rajput, Sh. Girija Shankar, Mr. Jitendra Panda, Mr. Ravi Kant, Mr. J.P.Maohanti, Mr. Binay Pattnayak and Mr. Asadullah (all from TSG). The team shows its gratitude to the state representatives from Karnataka who helped in the process by providing necessary input and clarifications.
It has been mentioned in the AWP&B that the consolidated plan of Karnataka State have been worked upon the actual needs of 29 districts grouped into four divisions of the state for improving the learning levels and ensuring regular participation of children in schools thereby increasing retention and transition and reducing gender and other social gaps.
The document reflects a holistic approach towards UEE with integrated quality and measurable outcomes. Block level EDI has been developed using 2007-2008 data and four broad parametersi.e. access, infrastructure, teacher related indicators and outcomes. This helped in backward districts and Banglore as metro city receiving higher share and other districts with higher EDI receiving lower share bringing about inter district parity.The activities are well listed and detailed keeping the diverse perspectives in view. Several interventions have been upgraded during the current phase. There exists great convergence with NGO and other agencies in allied areas such as water supply sanitation, child labor etc. Special attention is given to minorities £ind metro cities i.e. preparation of book called “Prayatna” for Lambani children and ‘Karnataka Drashan’-an educational tour. Such initiatives bring to light the innovation and context specific bottom- up approach used in planning (habitation and block level). The concerns of the MHRD with respect to urban deprived and the metro city plans for covering out of school children have been duly taken care of in this plan. The state has the capacity to implement the plan in the stipulated time frame. There is however, a lot of data related problem isn the plans. Ther is no menton of the data of previous years to ficiltate trend analysis, also, ther is very little disagregation of data which limits any attempt accertain the micro pocture, in addition to tehse ther are some isus that emerge while assessing the overall direction of the state and preparedness for the coming year, these have been discussed in the following paragraph. „
The State as a whole has made noticeable progress in the components of access and quality. Under these two components it is trying different innovations for example, feeder schools, and the learning programme. The State as a whole is comfortably placed with regard to the other two components i.e. retention and equity, however, at the district level the picture is diverse and there are several districts performance is much below the stat average. There is an overwhelming need to improve planning so as to bridge this gap. Availability and quality of data is a major impediment concerning the preparedness of the state for the implementation in 2009-10. iai^e number of single teacher schools and very high PTR in some schools, along with high dropout in several districts pose a challenge to retention and quality. There is a strong case for teacher rationalization, which needs to be taken up seriously.
4. Introduction & Planning process:-
22
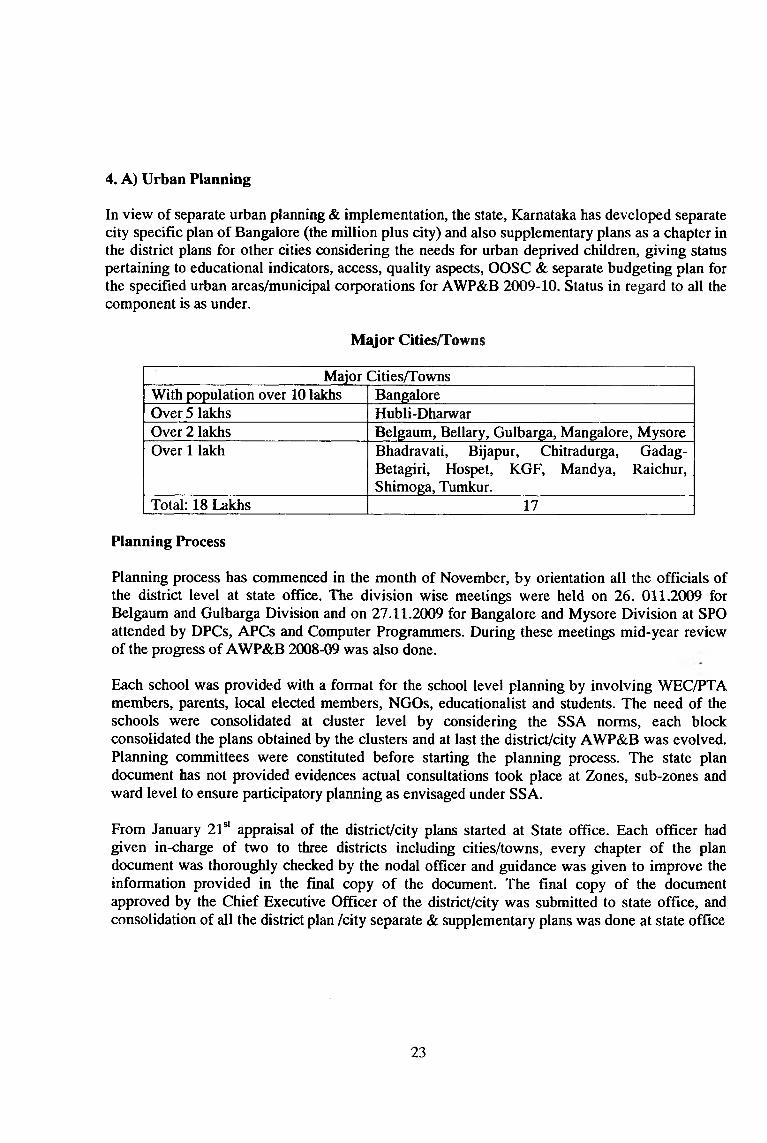
In view of separate urban planning & implementation, the state, Karnataka has developed separate city specific plan of Bangalore (the million plus city) and also supplementary plans as a chapter in the district plans for other cities considering the needs for urban deprived children, giving status pertaining to educational indicators, access, quality aspects, OOSC & separate budgeting plan for the specified urban areas/municipal corporations for AWP&B 2009-10. Status in regard to all the component is as under.
Major Cities/Towns
4. A) Urban Planning
Major Cities/TownsWith population over 10 lakhsOver 5 lakhsOver 2 lakhsOver 1 lakh
Total: 18 Lakhs
BangaloreHubli-DharwarBelgaum, Bellary, Gulbarga, Mangalore, MysoreBhadravati, Bijapur, Chitradurga, Gadag- Betagiri, Hospet, KGF, Mandya, Raichur, Shimoga, Tumkur.________________________
17
Planning Process
Planning process has commenced in the month of November, by orientation all the officials of the district level at state office. The division wise meetings were held on 26. 011.2009 for Belgaum and Gulbarga Division and on 27.11.2009 for Bangalore and Mysore Division at SPO attended by DPCs, APCs and Computer Programmers. During these meetings mid-year review of the progress of AWP&B 2008-09 was also done.
Each school was provided with a format for the school level planning by involving WEC/PTA members, parents, local elected members, NGOs, educationalist and students. The need of the schools were consolidated at cluster level by considering the SSA norms, each block consolidated the plans obtained by the clusters and at last the district/city AWP&B was evolved. Planning committees were constituted before starting the planning process. The state plan document has not provided evidences actual consultations took place at Zones, sub-zones and ward level to ensure participatory planning as envisaged under SSA.
From January 21®* appraisal of the district/city plans started at State office. Each officer had given in-charge of two to three districts including cities/towns, every chapter of the plan document was thoroughly checked by the nodal officer and guidance was given to improve the information provided in the final copy of the document. The final copy of the document approved by the Chief Executive Officer of the district/city was submitted to state office, and consolidation of all the district plan /city separate & supplementary plans was done at state office
23

Component Wise Appraisal of Cities/Urban areas: Kamataka:-
In view of focusing more rigorously in urban areas for effective planning & implementation, thorough analysis & verification pertaining to almost all the component has been done during the appraisal taking into account need based plarming from the ward level up to the state level programmes for achieving universal elementary education in urban areas. The state Karnataka has provided status, progress & proposal for AWP&B 2009-10 in regard to 17 cities/corporation out of the 29 total districts in the state. Following are the component-wise appraisal report for the year 2009-10:
1. Population, Enrolment and Out of school children. (6-lland 11-14 years.)Indicator 6-11 age, group 11-14 age, group Grand
TotalBoys Giris Total Boys Girls Total
PopulationEnrolment
City/Corporation wise information of enrolment, OoSC & Child population
S1.N Name of the city Indicator 6-11 age, group 11-14 age, group Grand
TotalBoys Girls Total Boys Girls Total
1Mangalore
Population 7395 6410 13805 4742 4109 8851 22656Enrolment 13479 13223 26702 8802 8485 17287 43989Out of School 8 5 13 4 1 5 18
2Hubli Darwad
Population 32096 29637 61733 17180 16107 33287 173774Enrolment 32059 29609 61668 17155 16094 33249 173611Out of School 37 28 65 25 13 38 103
3Tumkur
Population 26384 24582 50966 15394 11934 27328 78294Enrolment 24586 22463 47049 17899 14086 31985 79034Out of School 75 40 115 41 16 57 172
4
BangaloreUrban
Population 248928 234899 483827 124770 118683 243453 727280Enrolment 334250 315414 649664 176386 170848 347234 996898Out of School 11753 10324 22077 980 963 1943 24020
5Bijapur
Population 24979 21898 46877 10755 13428 17338 64215Enrolment 22337 21213 43550 11150 10914 22064 65614Out of School 2259 1786 4045 15 19 34 4079
6Chitradurga
Population 6361 5990 12351 3375 3077 6452 18803Enrolment 5953 5642 11595 3375 3076 6451 18046Out of School 8 6 14 0 1 1 15
7
Bellary
Population31600 29205 60805 16165 13973
30138 90943
Enrolment 39,008 37,581 76,589 18,967 17,508 36,475 113,064Out of School 3744 3564" 7308 134 140 274 7582
8Hospet
Population 18741 17403 36144 9785 8698 18483 54627Enrolment 24,052 23,235 47,287 11,948 10,619 22,567 69854Out of School 1834 1759 3593 39 55 94 3687
9 Gadag Population 7764 7335 15099 4224 3853 8077 23176
24

SI.N Name of the city Indicator 6-11 age, group 11-14 age, group Grand
TotalBoys Girls Total Boys Girls Total
Enrolment 9651 8947 18598 6090 5023 - 11113 49187Out of School 29 32 61 22 17 39 100
10Gulbarga
Population 181573 163475 345048 89898 79209 169107 514155Enrolment 234946 214480 449426 87916 76915 164831 614257
Out of School 1776 1928 3704 1819 1822 3641 7345
nKolar
Population 10376 9566 19942 5917 5729 11646 31588Enrolment 9463 9648 19111 5901 5871 11772 30883
Out of School 6 4 10 1 4 5 15
12Belgaum
Population 20307 18033 38340 9113 8150 17263 55603Enrolment - - - - - - -
Out of School 7 3 10 11 4 15 25
13Mandya
Population 4227 3609 7836 2344 2237 4581 12417Enrolment
Out of School 16 17 33 60 4 64 97
14Bhadravathi
Population 43858 41945 85803 22764 22319 45083 130886Enrolment 43,608 41,695 85,303 22,514 22,069 44,583 129886
Out of School 132 102 234 156 163 319 553
15Mysore
Population 34017 32978 66995 19601 20365 39966 106961Enrolment 35959 34554 70513 21575 21348 42923 113436
Out of School 58 36 94 26 17 43 137
16Raichur
Population 22708 20794 43502 11773 10024 108801 -Enrolment 22635 20708 43343 11713 9941 21654 -
Out of School 73 86 159 60 83 143 302
Grand Total
Population 721314 667759 1389073 367800 341895 789854 2105378Enrolinent 851986 798412 1650398 421391 392797 814188 2497819
Out of School 21815 19720 41535 3393 3322 6715 48250
Observation;-
As seen in the above table enrolment of primary section in the current year in the above 16 cities/corporation is 165.03 against the enrolment of upper primary i.e. 814188. Total enrolment as reported is 249.78 at the elementary level in the above 16 cities of the state Karnataka. Report on OoSC as seen in the above table includes potential drop-out as reported by the state in the 16 cities/corporations as shown above.
1.1 Status of Urban Bodies (Million Plus City & Otiier Districts)
Table-ASL. No. District/City (MPC) Nagar Panchayat/
MunidpalltyMunicipal Corp. No. of
ZonesNo. of Wards
Bangalore Urban - 1 4 145
. .. Other Cities/CorDorations1 Mangalore City - - - 45
25

SL. No. District/City (MPC) Nagar Paachayat/ Municipality
Municipal Corp. No. of Zones
No. of Wards
2 DHARWAD HDMC 1 ^ - 103 - Tumkur - - 0 355 Bijapur City - 1 0 356 Chitradurga Chitradurga CMC 0 357 BELLARY 40 1 1 358 HOSPET 23 CMC 1 779 Gadag Gadag-Betagiri 1 1 3510 Gulbarga Gulbarga Municipal
Corporation1 1 55
11 K.G.F 12 1 1 3512 Belgaum Belgaum city CMC Belgaum 2 5913 Mandya Mandya Mandya 0 3514 Bhadravathi Bhadravathi CMC - - 35
15 Shimoga Shimoga CMC - 3516 Mysore Municipality Mysore City
Corporation9 65
17 Raichur Block CMC - 0 35Total
. 20 761
Observation:-
There ate 20 total zones & 12 municipal corporations as reported in the above 12 cities out of 17 cities/corporations given above including the million plus city Banglore urban, remaining other cities did not report any zones rather these cities have municipality & Nagar panchayats. Number of wards as reported above is 761 in the 17 corporations/cities.
1.2 Status of Access (Million Plus Cities & other districts)
Table- B
Sl.No District^City(MPC) PS UPS EGS AIE PS:UPS
No. of Children enrolled
EGS AIEBangaloreUrban
1112 2805 0 222 1:02 0 3014
Other Cities/Corporation
2MangaloreCity
18 108 0 0 - 0 0
3 HDMC , 93 266 1.3 0 04 Tumkur 298 208 0 0 1.4:1 0 05 Bijapur 35 87 0 0 01:02.4 0 06 Chitradurga 15 90 0 0 02:01.7 0 07 BELLARY - - 0 11 1.46 0 2628 HOSPET - - 0 - 1.58 0 -
26

Sl.No District/City(MPC) PS UPS EGS AIE PStUPS
No. of Children enrolled
- EGS AIE
9Gadag-Betagiri
19 37 0 0 1:02 0 0
10 Gulbarga 42 216 0 0 0.724 0 011 K.G.F 83 51 0 4 1.6 0 19612 Belgaum 75 165 0 0 01:01.4 0 013 Mandya 13 23 0 0 0.57 0 014 Bhadravathi 99.59 98.78 0 0 01:00.6 0 015 Shimoga 98.79 99.09 0 0 01:00.6 0 016 Mysore 31 83 0 0 01:02.5 0 0
17RaichurBlock
143 180 0 0 01:01.3 0 0
Total 2175.38 4516.87 0 237 0.48161 0 3472
Observation:-
As observed in tlie above table that 17 cities are having 2175.38 primary schools and 4516.87 upper primary schools and 237 AIE centers respectively. Ratio of PS & UPS as seen is comfortable in these cities. 3472 children of elementary level are enrolled in these AIE centres. Moreover, BeV\at)! & Hospel having no information on schools as seen in the above table although ratio of PS & UPS as shown are 1.46 & 1.58 respectively.
1.3 Progres5-2008-09 Primary & Upper primary)
Sl.No District/City
Primary & Upper PrimarySanctioned Operational-Primary Operational-UPS
PS UPS Buldg.Less With baiklings Buidg. Less With buildings
1 Bangalore Urban 14 0 14 0 0 0Other Cities/Corporation
2 Mangalore 0 0 0 0 0 03 HDMC 0 0 0 34 0 1044 Tumkur 0 0 0 0 0 05 Bijapur 0 0 7 28 3 84
6 Chitradurga 2 - - 2 - -7 BELLARY 0 0 0 92 0 183
8 HOSPET 0 4 0 75 0 1969 Gadag-Betagiri 0 0 0 0 0 010 Gulbarga 42 216 0 42 0 21611 K.G.F 1 0 0 83 0 51
12 Belgaum - 2 - - - -13 Mandya 13 23 1 12 2 21
14 Bhadraavthi 0 0 0 0 0 015 Shimoga 0 2 0 0 0 0
27

SI.No District/City
Primary & Upper PrimarySanctioned Operational-Primary Operational-UPS
PS UPS Buidg.Less With buildings Buidg. Less With buildings
16 Mysore - - 7 23 13 7017 Raichur Block - - 2 119 1 132 "
Total 72 247 31 510 19 1057
Observation:-
As seen in the above table 72 primary schools & 247 upper primary schools sanctioned last year 2008-09 in three cities out of 17 cities/corporations provided above, out of vt'hich 31 primary and 19 upper primary schools are building less as reported in the above table. No information is confirmed for completion of these above building less schools.
1.4 Proposal: Access
SI.No District/City(MPC) PS UPS RBC NRBC Others* PSrUPS
Bangalore Urban 18 5 9 208 01:01.5Other Cities/Corporations
Mangalore 18 108 1HDMC 1.3Tumkur 0 1.4:1Bijapur City 0 0 01:02.4
6 Chitradurga 0 0 0 02:01.7BELLARY 0 0 11 0 1.46HOSPET 0 0 0 1.58
9 Gulbarga 0 0 0 0.72410 K.G.F 0 11 1.611 Belgaum 1:01
12 Mandya 0 0.5713 Bhadravathi 0 1(50) 0 0 01:00.614 Shimoga 0 1(50) 0 01:00.615 Mysore 0 50 50 01:02.516 Raichur Block 21 7 (190) 5(100) 01:01.5
Total 24 51 191 SO 210 0.04732
Recommendation: -
Only three cities out of 17 cities/corporation mentioned above proposed for new primary schools as seen in the above table- Mangalore (18), HDMC (2) and Raichur Block (02). Similarly, five cities are proposing 51 upper primary schools, Raichur Block has maximum proposal i.e. 21. Mangalore is the only corporation which has any information in regard to PS & UPS ratio. Total
28
01
2230 3 2 14
5 3 370007008
0 020 0
2 2 100 0 2
00 0
2

191 RBC & 80 NRBC proposed for this year 2009-10 in the above 10 cities/corporation for urban deprived children.
4. B) Educational Indicators:-
Educational indicators form the basis for planning, monitoring and assessing the actual needs and evaluation of various aspects of education. The major decisions and proposals are made on the basis educational data, it is quite necessary that the data should be reliable and authentic.
Enrolment (All Communities)
A, PRIMARY (2006-07 to 2008-09)Sl.No. Name of
District/City2006^7 2007-08 2008-09
B G Total B G Total B G Total1 Bangalore Urban 309246 290363 599609 264525 247583 512108 334250 315414 649664
Other Cities/Corporation2 Mangalore City NA NA NA 12431 12962 25393 13479 13233 267023 HDMC 33417 37898 71315 40407 38461 78868 42593 40273 828664 Tumkur 20430 20061 40491 24196 21777 45973 24586 22463 47049
5 Bijapur City 19401 18058 37459 20487 19463 39950 22337 21213 435506 Chitradurga 5846 5042 10888 7169 6342 13511 6352 5916 12268
7 BELLARY 40710 38581 79291 42487 39429 81916 39010 37593 766038 HOSPET 23636 22152 45788 25167 23750 48917 24052 23235 47287
9 Gadag-Betagiri 8457 7883 16340 9080 8265 17345 14030 12671 2670110 Gulbarga 69749 64802 134551 76265 70205 146470 56897 52683 10958011 K.G.F 1521 1551 3072 1553 1593 3146 1628 2087 371512 Belgaum 21056 20619 41675 18501 18539 37040 21902 19086 ~40988
13 Mandya 7120 6750 13870 6594 6293 12887 5953 5542 1149514 Bhadravathi 3211 3099 6310 3125 2917 6042 2918 2718 563615 Shfmoga 5758 5313 11071 5376 5019 10395 5219 4912 1013116 Mysore 40786 39035 79821 35463 34278 69741 35941 34509 7045017 Raichur Block 25294 22892 48186 25832 25338 51170 22669 22282 44951
Total 635638 604099 1239737 606227 569252 1175479 660337 622597 1282934Source: DISE
Observation:-
Enrolment trends in the above 17 cities/corporation from 2006-07 to 2008-09 as shown is increased by 43197 only which shows slow progress. Enrolment actually decreased in the year 2007-08. To ensure 100% coverage, state needs to strengthen the survey strategy in the urban/corporation areas.
29

B. UPPER PRIMARY (2006-07 to 2008-09SLNo. Name of
District/City 2006-07 2007-08 2008-09B G Total B G Total B G Total
1 Bangalore Urban 154858 150409 305267 133084 128353 261437 176386 170848 347234
Other Cities/Corporation2 Mangalore City NA NA NA 6465 6520 12985 8802 8485 172873 HDMC 22665 21779 44444 21910 21643 43553 22420 22895 45315
4 Tumkur 14119 12639 26758 14543 12113 26656 17899 14086 319855 Bijapur City 9165 8627 17792 11006 10716 21722 11150 10914 220646 Chitradurga 2454 2095 4549 4346 3568 7914 3699 3857 75567 BELLARY 15112 12667 27779 16783 14655 31438 18972 17511 36483
8 HOSPET 8439 7512 15951 9536 8637 18173 11948 10619 225679 Gadag-Betagiri 3869 3422 7291 4095 3660 7755 8260 6567 14827
10 Gulbarga 171930 149464 321394 183597 164276 347873 233974 212691 44666511 K.G.F 13210 13454 26664 13221 13462 26683 13402 13566 26968
12 Belgaum 8770 8502 17272 6202 6237 12439 9194 8702 1798613 Mandya 2919 2850 5769 2565 2749 5314 2412 2355 476714 Bhadravathi 22038 21046 43084 21834 2019 23853 20867 19561 4042815 Shimoga 32951 31155 64106 31456 30012 61468 31178 29178 6035616 Mysore 21052 21026 42078 15491 15191 30682 15348 15386 3073417 Raichur Block 8400 6693 15093 8332 7245 15577 10477 9265 19747
Total 511951 473340 985291 504466 451056 955522 616388 576486 1192969Source: DISE
Observation
Enrolment n case of upper primary also shows slow progress in the above 17 cities/corporations. It decreased In the year 2007*08, It only increased in the year 2008-09 by 237447 only from 2007-08.
1.2 Enrolment (Social Category Wise)
SI.No. Name of District/City 2006-07 2007-08 2008-09
B G Total B G Total B G Total1 Bangalore
Urban54520 57015 116535 52141 49606 101707 54956 53835 108791
Other Cities/CorporatioD2 Mangalore City NA NA NA 949 908 1857 965 885 1850
3 HDMC 3848 4452 8300 4647 4292 8939 5193 4906 10099
4 Tumkur 3940 3880 7820 4547 4175 8722 4438 4095 85335 Bijapur city 349 322 671 243 278 521 294 318 612
30

SI.No. Name of District/City 2006-07 2007-08 2008-09
6 Chitradiirga 729 742 1471 1274 1074 2348 1067 1053 21207 BELLARY 8005 7413 15418 8484 7754 16238 7988 7562 15550
8 HOSPET 5697 5134 10831 6099 5579 11678 6235 5743 119789 Gadag-Betagiri 1226 1105 2331 1351 1127 2478 1846 1402 324810 Gulbarga 26835 24004 50839 28481 25203 53684 21234 19269 4050311 K.G.F 3998 3656 7654 497 525 1022 4084 3767 7851
12 Belgaum 2060 2075 4135 1529 1581 3110 2293 2135 442813 Mandya 923 943 1866 808 820 1628 769 743 151214 Bhadravathi 876 882 1758 892 918 1810 853 881 173415 Shimoga 924 913 1837 934 918 1852 915 902 181716 Mysore 4782 4662 9444 4447 4294 8741 4409 4188 859717 Raichur Block 3690 3180 ^ 7 0 3390 3080 6470 5270 4676 9946
Total 122402 120378 247780 120713 112132 232805 122809 116360 239169Source: DISE
Observation;-
As seen in the above table that enrolment of the disadvantaged group SC at the primary level dereased in the year 2007-08, it only increased in the year 2008-09 by 6364 only. Planned & proper strategy for identification of the children of this group is necessary in the urban areas as the urban areas consist of maximum number of this group of children.
B. Enrolment-ST (Primary)
SI.No. Name of District/City 2006-07 2007-08 2008-09
B G Total B G Total B G Total1 Bangalore Urban 6863 6468 13331 9787 9097 18884 8343 7562 150905
Other Cities/Corporation2 Mangalore NA NA NA 868 790 1658 854 779 16333 HDMC 1149 1266 2415 1340 1262 2602 1873 1650 3523
4 Tumkur 1493 1403 2896 1308 1345 2653 1372 1298 26705 Bijapur city 349 322 671 243 278 521 294 318 612
6 Chitradurga 364 368 732 734 745 1479 498 467 9657 BELLARY 7376 6960 14336 7552 7101 14653 7476 7085 14561
8 HOSPET 4058 3775 7833 4159 4008 8167 4276 4161 84379 Gadag-Betagiri 285 232 517 329- 277 606 514 507 102110 Gulbarga 4218 4017 8235 4327 4198 8525 5018 4416 943411 K.G.F 140 135 275 150 155 305 111 106 217
12 Belgaum 853 807 1660 649 630 1279 921 779 170013 Mandya 93 93 186 84 95 179 94 78 17214 Bhadravathi 98 56 154 92 74 166 86 64 15015 Shimoga 241 221 462 232 216 448 219 209 428
'16 Mysore ' 1961" ' 1848 3809 " 1911 1816 3727 2035 1918 3953
31

Sl.No. Name of District/City 2006-07 2007-08 2008-09
17 Raichur Block 5915 5910 11825 5895 5700 11595 3138 2721 5859
Total 35456 33881 69337 39660 37787 77447 37122 34118 206240Source: DISE
Observation:-
As observed in the above table that enrolment of ST children shows increasing trend from 2006-07 to 2008-09, it was increased by 12.87 lakhs from 2007-08 to 2008-09. Enrolment trend of girls shows almost significant as compared to boys' enrolment.
C. SC-Upper Primary
SI.No. Name of District/City 2006-07 2007-08 2008-09
B G Total B G Total B G Total1 Bangalore Urban 31154 30197 61351 27104 26169 53273 30686 30669 61355
Other Cities/Con^ration2 Mangalore NA NA NA 409 371 780 551 516 10673 HDMC 2791 2442 5233 2566 2365 4931 2834 2569 5403
4 Tumkur 2692 2485 5177 4266 2465 6731 3324 2717 60415 Bijapur City 1618 1240 2858 2131 1997 4128 1868 1466 3334
6 Chitradurga 520 476 996 1167 1202 2369 554 609 11637 BELLARY 2792 2172 4964 3056 2532 5588 3742 2987 6729
8 HOSPET 1919 1497 3416 2143 1678 3821 2814 2109 49239 Gadag-Betagiri 1755 1519 3274 526 445 971 1162 770 1932
10 Gulbarga 43372 35323 78695 ,44233 36871 81104 56956 48371 10532711 K.G.F 5580 5212 10792 5709 5213 10922 6110 5623 11654
12 Belgaum 837 703 1540 553 522 1075 894 856 175013 Mandya 456 420 876 401 399 800 302 336 63814 Bhadravathi 3318 3359 6677 3345 3402 6747 3221 3299 652015 Shimoga 4856 4778 9634 4872 4819 9691 4820 4797 9617
16 Mysore 3015 2894 5909 2083 2052 4135 1978 1977 395517 Raichur Block 720 796 1516 720 796 1516 2753 2231 4984
Total 107395 95513 202908 105284 93298 198582 124569 111902 236392Source: DISE
Observation:-
As seen in the above table that enrolment of SC children at the upper primary level shows slow progress in the above 17 cities/corporations in the state, Karnataka. It was increased by 37810 from 2007-08 to 2008-09.
32

D. ST-Upper PrimarySI.No. Name of
District/City 2006-07 2007-08 2008-09
B G Total B G Total B G Total1 Bangalore
Urban3201 3140 6341 4926 4692 9618 4101 3748 7849
Other Cities/Corporation2 Mangalore NA NA NA 353 372 725 529 528 10573 HDMC 798 753 1548 753 697 1450 1091 906 19974 Tumkur 925 980 1905 769 754 1523 1220 819 20395 Bijapur 75 84 159 118 144 262 133 96 2296 Chitradurga 241 218 459 531 519 1050 255 249 5047 BELLARY 2584 1992 4576 2838 2272 5110 3349 2872 62218 HOSPET 1464 1275 2739 1626 1428 3054 2164 1791 39559 Gadag-
Betagiri426 355 781 137 107 1806 398 355 753
10 Gulbarga 8087 6428 14515 8391 6818 15209 13775 12070 2584511 K.G.F 212 211 423 99 113 212 222 214 42912 Belgaum 367 307 674 253 245 498 324 319 64313 Mandya 42 44 86 30 27 57 34 27 6114 Bhadravathi 521 486 1007 510 491 1001 489 469 95815 Shimoga 934 978 1912 945 993 1938 915 983 1898
16 Mysore 1061 1058 2119 856 787 1643 855. 834 168917 Raichur
Block1650 500 2150 1650 500 2150 1552 1093 2645
Total 22588 18809 41394 24785 20959 47306 31406 27373 58772Source: DISE
Observation:-
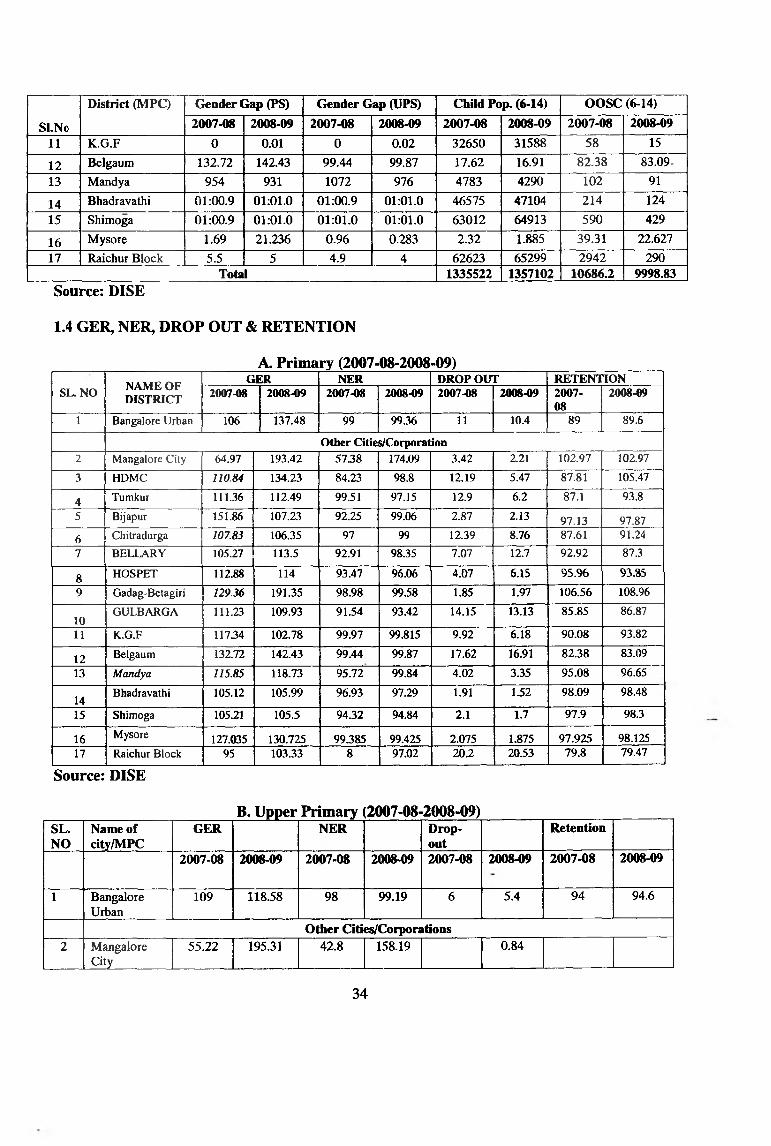
Enrolment of ST children at the upper primary level reflects slow progress as seen in the above table provided by the state. State provided only forT7 cities/corporations. Enrolment increased by 87% in the year 2007-08 and by 80% only in the year 2008-09 respectively.1.3 Gender Gap in Enrolment
District (MPQ Gender Gap (PS) Gender Gap (UPS) Child Pop. (6-14) OOSC (6-14)
SI.No 2007-08 2008-09 2007-08 2008-09 2007-08 2008-09 2007-08 2008-09
1 Bangalore Urban 3.25 3.08 3.52 3.9 701234 727280 3301 4750Other Cities/Corporatiioii
2 Mangalore City - ■ - - - - - - -3 HDMC 3.83 3.18 5021 11.64 120099 106709 261 103
4 Tumkur 6.3 7.2 6.7 6.9 69983 5990O 303 2925 Bijapur 1024 1124 290 236 29482 35326 143 1805
6 Chitradurga 12.54% 10.21% 17.91% 12.23% 17289 17886 67 157 BELLARY 81916 76603 31438 36483 105002 108969 1998 1389
8 HOSPET 48917 47287 18173 22567 59789 64638 369 4889 Gadag-Beiiagiri 4!69 5.05 5.6 11.41 22975 23176 T i3 ‘ ' 10010 GULBARGA 4.14 3.85 5.55 4.76 6.24 5.6 3.52 2.11
33
Sl.Nc
District (MPC) Gender Gap (PS) Gender Gap (UPS) Child Pop. (6-14) OOSC (6-14)2007-08 2008-09 2007-08 2008-09 2007-08 2008-09 2007-08 2008-09
11 K.G.F 0 0.01 0 0.02 32650 31588 58 15
12 Belgaum 132.72 142.43 99.44 99.87 17.62 16.91 82.38 83.09-13 Mandya 954 931 1072 976 4783 4290 102 91
14 Bhadravathi 01:00.9 01:01.0 01:00.9 01:01.0 46575 47104 214 12415 Shimoga 01:00.9 01:01.0 01:01.0 01:01.0 63012 64913 590 429
16 Mysore 1.69 21.236 0.96 0.283 2.32 1.885 39.31 22.62717 Raichur Block 5.5 5 4.9 4 62623 65299 2942 290
Total 1335522 1357102 10686.2 9998.83Source: DISE
1.4 GER, NER, DROP OUT & RETENTION
A. Primary (2007-08-2008-09)
SL.NO NAME OF DISTRICT
GER NER DROP OUT RETENTION2007-08 2008-09 2007-08 2008-09 2007-08 2008-09 2007
082008-«9
1 Bangalore Urban 106 137.48 99 99.36 11 10.4 89 89.6
Other Cities/Corporation2 Mangalore City 64.97 193.42 57.38 174.09 3.42 2.21 102.97 102.973 HDMC 110.84 134.23 84.23 98.8 12.19 5.47 87.81 105.47
4 Tumkur 111.36 112.49 99.51 97.15 12.9 6.2 87.1 93.85 Bijapur 151.86 107.23 92.25 99.06 2.87 2.13 97.13 97.876 Chitradurga 107.83 106.35 97 99 12.39 8.76 87.61 91.247 BELLARY 105.27 113.5 92.91 98.35 7.07 12.7 92.92 87.3
S HOSPET 112.88 114 93.47 96.06 4.07 6.15 95.% 93.859 Gadag-Betagiri 129.36 191.35 98.98 99.58 1.85 1.97 106.56 108.96
10GULBARGA 111.23 109.93 91.54 93.42 14.15 13.13 85.85 86.87
11 K.G.F 11734 102.78 99.97 99.815 9.92 6.18 90.08 93.82
12 Belgaum 132.72 142.43 99.44 99.87 17.62 16.91 82.38 83.0913 Mandya 115.85 118.73 95.72 99.84 4.02 3.35 95.08 96.65
14 Bhadravathi 105.12 105.99 96.93 97.29 1.91 1.52 98.09 98.48
15 Shimoga 105.21 105.5 94.32 94.84 2.1 1.7 97.9 98.3
16 Mysore 127.035 130.725 99385 99.425 2.075 1.875 97.925 98.12517 Raichur Block 95 103.33 8 97.02 20.2 20.53 79.8 79.47
Source: DISE
B. Upper PrimarySL.NO
Name of city/MPC
GER NER Dropout
Retention
2007-08 2008-09 2007-08 2008-09 2007-08 2008-09 2007-08 2008-09
1 BangaloreUrban
109 118.58 98 99.19 6 5.4 94 94.6
Other Cities/Corporations2 Mangalore
City55.22 195.31 42.8 158.19 0.84
2007-08-2008-09)
34

SL.NO
Name of city/MPC
GER - NER Dropout
Retention
3 HDMC 125.97 136.13 85.64 99.51 7.66 3 92.34 974 Tumkur 105.13 112.1 99 81.97 7.74 5.62 92.3 94.385 Bijapur 120.96 100.4 99.91 99.56 3.52 3.4 96.48 96.66 Chitradurga 108.47 106.23 99.01 99.18 14.16 9.31 85.84 90.697 BELLARY 108.85 105 85.31 99.02 11.62 17 88.37 838 HOSPET 104.87 108 77.39 98.94 11.85 18.17 88.15 81.339 Gadag-
Betagiri127.5 207.29 99.27 99.83 6.89 6.35 107.7 108.96
10 GULBARGA 116.25 110.28 89.39 91.88 15.89 14.83 83.29 85.19
11 K.G.F 105.35 103.98 99.97 99.28 12.79 19.83 87.31 81.1312 Belgauin 132.21 141.23 99.63 99.72 13.24 11.89 86.76 88.1113 Mandya 113.09 142.53 88 98.89 5.2 4.97 94.8 95.03
14 Bhadravathi 103.67 103:92 95.15 96.17 3.87 3.43 96.13 96.5715 Shimoga 102.12 102.49 95.82 96.14 3.91 3.52 96.09 96.48
16 Mysore 133.17 144.07 99.525 95.635 3.95 3.8275 96.05 96.17517 Raichur
Block96 90.57 85.3 98.86 22.88 23.65 77.12 76.35
Source: DISE-20C
Observation:-
7
As seen, GER among the 17 cities/corporations is high in Mysore in both the year2006-07 and 2008-09.
Lowest GER as shown is in Raichur City in both the year i.e. 96 & 90 respectively.
Drop out rate as seen in the above table is high i.e. 15 in Guibarga.
Average retention rate as observed is 96% for almost ail the 16 corporations/cities in the state, Karnataka. ^
COMPLETION RATE AND TRA^ SITION RATE
Completion Rate Transition Rate
SI.No Name of the District 2007-08 2008-09 2007-08 2008-091 Bangalore Urban 90 90.79 90 90.79
Other Cities/ Corporations2 Mangalore City 98.67 100 99.75 1003 HDMC 94.76 97.2 94.76 94.24 Tumkur 100 93.8 100 112.345 Bijapur 105.23 107.7 105.23 107.76 chitradurga 99.63 99.78 99.72 99.897 BELLARY 78 79 88.7 848 HOSPET 84 86 97.6 89
. 9 GadagrBfitagiri 97.62 98.63. . 97.83 109.0310 GULBARGA 65.29 67.62 76.85 78.88
35

SI.No Name of the District
Completion Rate Transition Rate
2007-08 2008-09 2007-08 2008-0911 K.G.F 99.85 100 99.85 10012 Belgaum 99.94 117.5 99.94 117.513 Mandya 99.68 96.35 99.68 100.5514 Bhadravathi 93.18 94.34 97.56 98.1215 Shimoga 94.12 94.94 97.82 98.0116 Mysore 91.16 92.76 98.775 99.2917 Raichur Block 74.09 95.33 88.12 81.89
Observation
• Completion rate as observed is more than 100% in Bijapur & 100% in Tumkur.
• Other corporations/cities as shown above are more than 90% completion rate for almost all the year.
OUT OF SCHOOL CHILDREN AND THEIR COVERAGESLNO Name of
District.No. of No. of out school children proposed to be covered under different strategies.
OoSC Mainstreaming EOS NRBC RBC Innovations Other (Migration)
1 BangaloreUrban 4750 3406 - - - -
• Chlnnara Angala (NRBO-1176
• Chinnara Angala (RBC)- 34
• SED -1178• Tent School - 392• Mobile School - 618
Other Cities/Corporations2 Mangalore
City77 52 - - - - 25
3 HDMC 261 203 79 27 97
4 Tumkur 172 42 - 54 26 50 05 Bijapur City 314 314 0 294 20 0 0
6 Chitradurga 67 60 28 327 BELLARY 1389 988 0 0 262 0 726
8 HOSPET 488 617 0 0 0 0 617
9 Kolar K.G.F 4 130 11 9 0 010 Belgauin Belgaum 3 78 2 40 - -11 Mandya 97 97 0 0 50 0 47(SED,
2 months RBC)
12 Bhadravathi 0 0 0 0 0 0-
13 Shimoga 0 0 0 0 0 0 -14 Mysore - - - - - - - _
15 Raichur RaichurBlock
6 140 6 100 - -
Total IS 5792 348 446 562 50 -Source-Districts/ :ity Plan
36

Observation:-
As seen in the above table that Million Plus City, Bangalore Urban has 4750 OOSC, for M'hich the following strategies are proposed to adopt this year 2009-10;
• Chinnara Angala (NRBC)-1176
• Chinnara Angala (RBQ- 34
• SED-1178
• Tent School — 392
• Mobile School-618
Posit on & Progress: A IE & M ainstream ing
Name of No. of AIE Centers Enrolment No. of AIE Centers runningSI. NO Dist./City Sanctioned operational for more than 1 years1 Bangalore Urban 222 222 3014 54
Other Cities/Corporations2 Mangalore City 0 0 0 03 HDMC 0 0 0 04 Tumkur 0 0 0 05 Bijapur City 0 0 0 06 Chitradurga - - - -7 BELLARY 35 30 737 08 HOSPET 7 7 189 09 Gadag-Betagiri - - - -
10 GULBARGA 0 0 0 011 K.G.F 4 4 100 012 Belgaum 7 7 36 -
13 Mandya14 Shimoga 3 0 0 015 Bhadravathi 4 0 0 016 Mysore 64 64 313 1:0517 Raichur Block 35 35 180 01:01.3Source-:- State plan/State Report
1.3 Proposal: AIE Centers
District Name of Zone/Municipality
AIE Centers Proposed-2009-10
RBCs Children NRBCs Children Worksite Schools ChildrenBangalore
UrbanBangalore Urban 12 613 12 607 0 0
Other Cities/Corporations
37

District Name of Zone/Municipality
AIF, Centers Proposed-2009-10
RBCs Children NRBCs Children Worksite Schools ChildrenDashingKannada
Mangalore City -
Dharwad HDMC NA NA 5 103Tumkur Tumkur 3 125 2 54 5 75Bijapur Bijapur City 3 124 0 0 6 300Chitradurga Chitradurga - - - - - -
BELLARY BMP 15 247 2 50 - -
HOSPET CMC 4 69 1 25 - -
Gadag ^ Gadag-Betagiri 3 100 10 92 - -
Gulbarga Gulbarga (N) 3 75 2 25 - -
Gulbarga (S) 3 75 2 25 - -
Belgaum Belgaum 3 78 2 40 - -
Mandya Mandya 1 50 0 0 - -
Shimoga Bhadravathi 0 0 0 0 - -
Shimoga Shimoga 0 0 0 0 - -
Observation:-
• As reflected in tlie above table tliat 50 RBC centres, 38 NRBCs & llworksite schools are proposed in the 10 cities/corporations for the year 2009-10. Bangalore urban proposed 12 RBC & 12 NRBCs to cover 1220 children in the urban areas/corporations.
• Last year 2008-09,381 AIE centres were sanctioned which are almost operational as reported by the state in these 17 corporations/cities in the state.
• No report on other existing figure in other corporations in the urban areas.
1.4 PLANNING FOR URBAN SLUMS
Status of SlumsSI.No Cities/MC Notified Slams No. of Wards Number of
SchoolsRatio of PS
& UPSPS UPS
1 Bangalore Urban 293 145 141 139 01:01.0Other Cities/Comorations
2Mangalore City Corporation
NA 45 4 27 NA
3 HDMC 67 67 93 266 1.34 Tumkur5 Bijapur City 14 8 7 3 01:00.5
6 Chitradurga 1 35 - 1 6 1:03
7 BELLARY 1 35 92 183 1.98
8 HOSPET 1 77 75 121 1.613
9 Gadag-Betagiri 42 35 19 37 1:0210 GULBARGA 36 55 5 31 1:16
38

SJ.No Cities/MC Notified Slums No. of Wards Number of Schools
Ratio of PS &UPS
PS UPS11 K.G.F 1 35 1 0 0 -12 Belgaum 10 10 11 14 1:0113 Mandya 17 35 13 23 0.5714 Bhadravathi 0 0 0 0 015 Shimoga 0 0 0 0 016 Mysore 75 64 66 313 1:0516 Raichur Block - 35 143 180 01:01.3
Total 555 681 671 1343
Observation:-
• As reported by the state in the above table that these cities/corporations have 555 notified slums under 681 wards.
• 671 primary schools as reported are running in these areas whereas there are 1343 upper primary in the 17 corporations given above. Ratio of PS & UPS as given above is favorable.
• There is no report of unserved pockets/small habitatioas in the larger as well as smaller cities/corporations as reported by the state.
• A fresh survey is needed covering other small pockets/slums dwellers where schooling or any other facility is not available.
Strategies that covered Slums Children-2008-09
Si.NoDistrict/City (MPC) No. of
Slums WardStrategies Covered
RBC NRBC Mobile Schools Others1 Bangalore Urban 293 145 2 4 8 12
Other Cities/Corporation
2Mangalore City Corporation
NA 45 1 NA NA NA
3 HDMC 67 67 27 79 974 Tumkur5 Bijapur City 14 8 120 0 0 06 Chitradurga 5 5 - - - 17 BELLARY 1 35 0 0 0 08 HOSPET 1 77 0 0 0 09 Gadag-Betagiri 42 35 1 310 GULBARGA 36 55 180 50 0 011 Belgaum 10 10 112 Mandya 17 35 0 0 0 6413 Bhadravathi 0 0 0 0 0 014 Shimoga Q 0 0 0 0 015 Mysore 12 8 48 33 66
39

SI.NoDistrict/City (MFC) No. of
Siums WardStrategies Covered
RBC NRBC Mobile Schools Others16 Raichur Block - 35 - - - -
Total 498 560 379 170 74 174
Strategies to cover for Slums Children-2009-1
District/City No. of Slums Ward Strategies/Intervention Children to be Covered
Bangalore Urban 293 145
RBC NANRBC 2000
Tent School
NAMobile School andChinnara Angala
Other Cities/CorporationsMangalore City NA NA NA NAHDMC NA 67 NRBC 32Tumkur NABijapur City 14 8 Asha Kirana / RBC 124Chitradurga 5 5 HBE 1BELLARY 1 35 109 109HOSPET 1 77 177 177Gadag-Betagiri 42 35 1 12Gulbarga 36 55 Madarasa/RBC/NRBC 161Beigaum 10 10 1-NRBC 14Mandya 17 35 12RBC& 2 Months
RBC48
Bhadravathi 0 0 0 0Shimoga 0 0 0 0
Mysore _ 75 65
NRBC 30RBC 50
Mobile School 60Tent School 30
Special Enr Drive 50Transportation 30
Home Based education 15Raichur Block - - - -
Total 494 537 287 2943
Observation & Recommendation:-
• As seen 494 slums under the 537 wards vkIII be covered by various strategies/interventions as mentioned in the above table.
Banglore Urban will cover the children of slums through the following strategies: RBC, NRBCs, Tent Schools, Mobile Schools and Chinnara Angala
40

1.5 Urban Deprived Children Proeress-2008-09 (Rs. In lakhs)
No. City/Districts No.ofM CTarget - Achievement
Phy Fin Phy Fin
Bangalore Urban 85 1786 50 585 10Other Cities/Corporations
Mangalore City 1 - - - -
HDMC 1 261 - 203 -
Tumkur 35 - 419.96 - 419.96Bijapur City 1 797 7 578 4.046Chitradurga 67 6 0.01 6 0.01BELLARY 1 65 1 65 1Gadag-Betagiri 1 1 0.18 1 0.18GULBARGA 1+11 1345 7 1324 6.93K.G.F 1 ' 0 0 0 0Belgaum - - - - -
Mandya 1 91 0 64 0Bhadravathi - 36 - 36 -Shimoga - 72 - 72 -Mysore - - - - -Raichur Block - - - - -
Total 194 4460 485.15 2934 442.126AWP&B 2009-10-City & state Plan
The urban deprived children to be covered-2009-10.No. of City/Districts No. of MC -i-Municipal
CouncilsUrban deprived
childrenBangalore Urban 1- 5777
Other DistrictsMangalore City 1 0HDMC 1 103Tumkur 0 0Bijapur City 1 82Chitradurga 1 15BELLARY 1 1163HOSPET - 1 968Gadag-Betagiri 1 98GULBARGA 1+11 1303K.G.F 1 6Belgaum 1 175Mandya 1 97Bhadravathi CMC 200Shimoga CMC 200Mysore 65 137Raichur Block - -
Total 76 10324
41

Strategies to cover the urban deprived children in Million Plus CityCity/District
Bangalore Urban
Strategy/InterventionPeriodical survey will be done.Sensitizing the conununity.Creating an enabling environment through community development centers Meeting and feed back20 days residential camp and year long survey follow up initiatives School adoption programSchool with multi-storey system in absence of land Counting activities that were initiated during the previous year Sandya kalika Kendra Special learning centre’s TransportationPre - nursery in urban GLPS and GHPS
Recommendation:-
As seen, there are 10324 urban deprived children identified in the 17 corporations/cities having 76 municipal corporations. Bangalore million plus city alone has 5777 urban deprived children which are proposed to cover through the above strategies in the Bangalore city alone. It is recommended by the appraisal team for this year 2009-10.
Activities Proposed for 2009-10 in the urban Zones/Municipality
District (MPC) Name of Zones/Municipality
Number of Schools Activity
Children to be covered
Phy FinPeriodical survey 126 15.12
Sensitizing the community 126 15.12
p«H
Creating an enabling environment through community development
centers
27 24.813
Bes■s
Meeting and feed back 126 -15.12
eo- a
fl
BBMP 1880 20 days residential camp and year long survey follow up initiatives
450 13.18
School adoption program 14 7
School with multi-storey system in absence of land
300 1662
Counting activities that were initiated during the previous year 450 12.6
Sandya kalika Kendra - -
Special learning centre’s 450 12.6Transportation 2988 89.64
- Pre - nursery in urban GLPS and GHPS 720 566.41
Other Cities/CorporationsNew Schools 3 -
HDMC
New Teachers Salary including additional Teachers 319 95.062Teachers Salary ( Recurring) 60 94.58
42
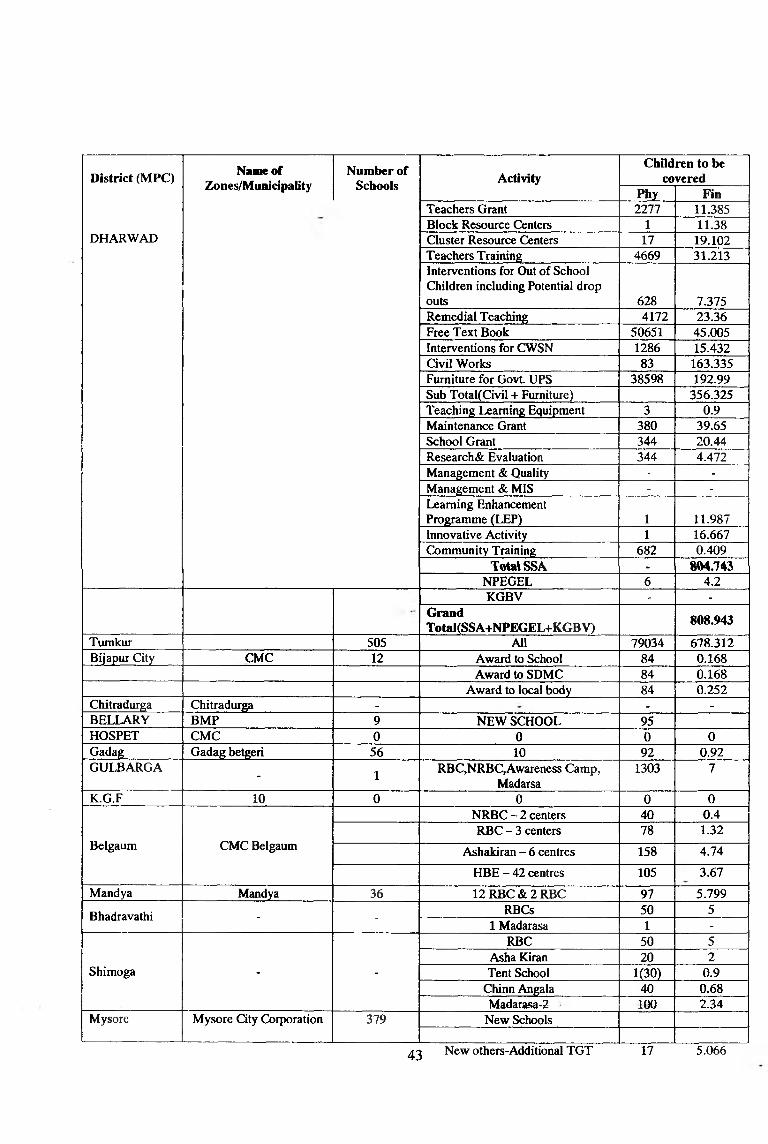
District (MPC)
DHARWAD
Name of Zones/Municipality
Number of Schools Activity
Children to be covered
Phy FinTeachers Grant 2277 11.385Block Resource Centers 1 11.38Cluster Resource Centers 17 19.102Teachers Training 4669 31.213Interventions for Out of School Children including Potential drop outs 628 7.375Remedial Teaching 4172 23.36Free Text Book 50651 45.005Interventions for CWSN 1286 15.432Civil Works 83 163.335Furniture for Govt. UPS 38598 192.99Sub Total(Civil + Furniture) 356.325Teaching Learning Equipment 3 0.9Maintenance Grant 380 39.65School Grant 344 20.44Research& Evaluation 344 4.472Management & Quality - -
Management & MIS - -
Learning Enhancement Programme (LEP) 1 11.987Innovative Activity 1 16.667Community Training 682 0.409
Total SSA . 804.743NPEGEL 6 4.2KGBV - -
GrandTotai(SSA+NPEGEL+KGBV) 808.943
Tumkur 505 All 79034 678.312Bijapur City CMC 12 Award to School 84 0.168
Award to SDMC 84 0.168Award to local body 84 0.252
Chitradurga ChitraduTga - _ -
BELLARY BMP 9 NEW SCHOOL 95HOSPET CMC 0 0 0 0Gadag Gadag betgeri 56 10 92 0.92GULBARGA - 1 RBC,NRBC,Awareness Camp,
Madarsa1303 7
K.G.F 10 0 0 0 0
Belgaum CMC Belgaum
NRBC - 2 centers 40 0.4RBC - 3 centers 78 1.32
Ashakiran - 6 centres 158 4.74HBE - 42 centres 105 3.67
Mandya Mandya 36 12RBC&2RBC 97 5.799
Bhadravathi - - RBCs 50 51 Madarasa 1 -
Shimoga - -
RBC 50 5Asha Kiran 20 2Tent School 1(30) 0.9
Chinn Angala 40 0.68Madarasa-2 100 2.34
Mysore Mysore City Corporation 379 New Schools
43 New others-Additional TGT 17 5.066

District (MPC) Name of Zones/Municipality
Number of Schools Activity
(BA/B.Ed ) for Class VIIITeaciiers Salary ( Recurring)
Teachers GrantBlock Resource Centres
Quster Resource CentresTeachers Training
Interventions for Out of School Children
Remedial TeachingFree Text Book
Civil WorksAdditional Class rooms
Toilets / UrinalsSeparate Girls Toilet
Drinking Water FacilityBoundary WallElectrificationMajor Repairs
Additional Rooms for CALC & Edusat
special Toilets for CWSNSetting up of Solar Photo Voltaic
to existing CALC schoolsSetting up of Solar Photo Voltaic
to new CALC schoolsFurniture for Govt. UPS
Mairtenance Gvanl
Children to be covered
1791
113615
47
35
12
24
10
50
10
6584152
Fin
41.158.9550.68
23.06822.718
29.1532.13
37.9840
242.050
8.75
1.2
37.525
4.232.91520.95
School Grant 293 17.23Research & EvaluationCommunity Training 1960
NPEGELTotal
3.8091.1760.7
616.38Raichur Block 323 59181
1.6 URBAN RESOURCE CENTRES
To ensure academic support and monitoring of the schools performance, urban resource centers play crucial role in bringing up the status of elementary education for UEE in the urban areas. As informed, state has 20 UBRCs in the state to the support the same. Separate urban coordinators are not so far placed; it is being looked after by the coordinators who are responsible for the whole district.
44
2
0000
9
8 06
0 8
6
7
0
0

S.No. Name of the District/City
'(MFC)
No. ofUBRCs-2008-09No. of
UCRCs under UBRC
Total
No. of Teacher in
URCs
No. of Schools in URCs
Sanctioned Operational PS UPS PS UPS
1Bangaloreurban - - - - - - - -
Other Clties/Corporations2 Mangalore NA NA NA NA NA NA NA NA3 HDMC 1 1 1 1 161 1797 93 2664 Tumkur 1 1 1 1 23 6 298 2085 Bijapur city - - - - - - - -
6 Chitradurga - - - - - - - -
7 BELLARY - - - - - - - -
8 HOS2ET - - - - - - -
9 Gadag-Betagiri
1 1 5 6 79 331 19 37
10 GULBARGA 2 2 8 10 84 2080 42 21611 K.G.F - - - - - - -
12 Belgaum 1 1 9 173 1196 50 11313 Mandya 0 0 0 0 0 0 0 014 Shimoga NA NA NA NA NA NA NA NA15 Bhadravathi NA NA NA NA NA NA NA NA16 Mysore 1 1 10 10 104 760 66 31317 Raichur
BlockNA NA NA NA NA NA NA NA
Total 7 7 34 28 624 6170 568 1153
Proposal for UBRC/UCRC:This year no UBRC is being proposed in the state, although it is suggested to the state to ensure the proper operationalisation of the existing URCs for further strengthening the academic support in the urban areas. As informed by the state that it has 20 URCs still existing in the state for academic support in the urban areas only.
1.7 Civil works
Schools Sanctioned & Progress-2008-09Districl/City-MFC Schools sanctioned (2008-09) Buildings Constructed In progress
PS UPS PS UPS PS UPSBangalore Urban 14 0 4 0 10 0
Other Cities/CorporationsMangalore - - - - - -
HDMCTumkur - - - - - -
Bijapur city 0 0 0 0 0 0chitradurga 2 - 2 - 2BELLARY 0 0 0 0 0 0HOSPET 0 0 0 0 0 0Gadag'BetagiriGULBARGA 0 0 0 0 0 0
45

District/City-MPC Schools sanctioned (2008-09) Buildings Constructed In progressPS UPS PS UPS PS UPS
K.G.F 1 0 1 0 1 0Belgaum - - - - - -
Mandya 0 0 0 0 0 0Bhadravathi 0 0 0 0 0 0Shimoga 0 2 _ 0 0 0 0Mysore - - - - - -
Raichur Block - - - - - -
Total 3 2 3 0 3 0
Sanctioned & Progress (ACR)
District/CityACR
(2(Sanctioned
K)8-09) Completed In Progress Remark
PS UPS PS UPS . -
Bangalpre Urban - 255 - - 255 100 ACR under metro city plan
Other Cities/ConIMrationsMangalore city 0 3 3 -
HDMC 34 11 23 -
Tumkur 4 7 - - 11 -
Bijapur City 10 0 0 0 10 -
Chitradurga 2 - 2 - -
BELLARY 100 0 0 0 100 -HOSPET 34 0 0 0 9 25 - Yet to StartGadag-Betagiri 3 10 13GULBARGA 6 10 0 0 16 -K.G.F 5 7 0 0 12 -Belgaum 1& S9 - . 77 -
Mandya 2 0 0 0 2 -
Bhadravathi 4 13 0 0 17 -
Shimoga 0 27 0 0 27 -
Mysore - - - - - -
Raichur Block 24 56 - - 80 -
Total 212 226 2 11 400 -
1.8 Proposal-ACR
DistrictACR Name of Block/MC/Ward
Remarks/CommentsPS UPS PS UPS
Bangalore Urban 242 500 Ward-9 Ward-9 300 Under Metro City.Other Cities/Corporation
Mangalore City - 7 - - Under City, no name of ward is mentioned
DHARWAD - 15 - HDMC Under HDMC
Tumkur 3 39 - - No name of ward/zone/block is mentioned
Bijapur City 0 7 - -No name of ward/zone/block is mentioned
Chitradurga 4 6 - -No name of ward/zone/block is mentioned
46

DistrictACR
PS UPS
Name of Block/MC/Ward
PS UPSRemarks/Comments
BELLARY 0 260 BELLARY Under Bellary Corp.HOSPET 0 215 HOSPET Hospet Block (U)
GADAG 12 23 Gadag-Betafiiri Gadag Betagiri (U)
GULBARGA 20 GLB GLB GLBKOLAR 60 65 4 3 PS & 4UPSBelgaum 12 26 49 89 49 PS &80 UPSMandya 0 Mandya(S) Mandya
Bhadravathi No name of ward/zone/block is mentioned
Shimoga 25 No name of ward/zone/block is mentioned
Mysore Ward name is not mentionedRaichur Block 74 96 Ward name is not
mentionedTotal 417 1322 53 92
Observation:-
In the given above 17 cities/corporations, 417 ACR at the primary level & 1322 ACR at the upper primary level are proposed. Similarly, 53 primary schools and 92 upper primary schools are also proposed in this year AWP&B 2(H -10. No separate report is provided for other urban areas. Recommendation for the above is being done under the access component in their respective districts.
1.9 Quality indicatorsSCR
District/City Zones/Municipality No. of Schools SCR-2008-09 SCR-2009-10Bangalore Urban 1 1418 4 7 .94 - 41.13
-Other Cities/CorporationsMangalore City - 32 17.59 20HDMC 1 138 35.11 29.51Tumkur NA 507 NA NABijapur City NA 122 27 26chitradurga NA 54 01:22.4 1:21BELLARY 1 275 28.5 NAHOSPET 1 196 31 NAGadag-Betagiri 1 - 56 50 60.46GULBARGA GULBARGA 258 25.64 24.62K.G.F NA NA NA NA-K.G.F 1 134 496 49.6Belgaum CMC Belgaum 138 28.94 28Mandya Mandya 36 NA NABhadravathi CMC NA 1:22 1:21Shimoga CMC NA 1:21 1:20
Mysore 9 379 137.52 136.21
47
53
1 0
9
5 8
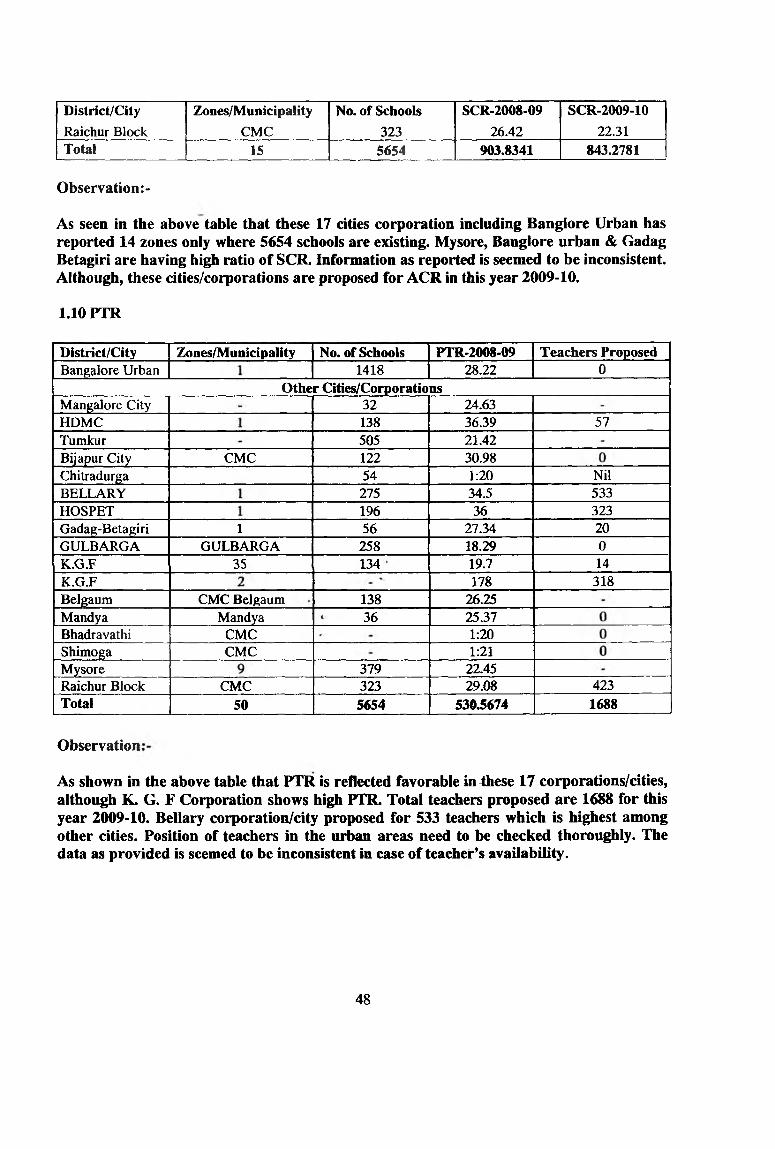
District/City Raichur Block
Zones/MunicipalityCMC
No. of Schools323
SCR-2008-0926.42
SCR-2009-1022.31
Total 15 5654 903.8341 843.2781
Observation:-
As seen in the above table that these 17 cities corporation including Bangiore Urban has reported 14 zones only where 5654 schools are existing. Mysore, Bangiore urban & Gadag Betagiri are having high ratio of SCR. Information as reported is seemed to be inconsistent. Although, these cities/corporations are proposed for ACR in this year 2009-10.
1.10 PTR
District/City Zones/Municipality No. of Schools PTR-2008-09 Teachers ProposedBangalore Urban 1418 28.22 0
Other Cities/CorporationsMangalore City 32 24.63HDMC 138 36.39 57Tumkur 505 21.42Bijapur City CMC 122 30.98Chitradurga 54 1:20 NilBELLARY 275 34.5 533HOSPET 196 36 323Gadag-Betagiri 1 56 27.34 20GULBARGA GULBARGA 258 18.29K.G.F 35 134 19.7 14K.G.F 178 318Belgaum CMC Belgaum 138 26.25Mandya Mandya 36 25.37Bhadravathi CMC 1:20Shimoga CMC 1:21
Mysore 379 22.45Raichur Block CMC 323 29.08 423Total 50 5^4 530J674 1688
Observation
As shown in the above table that PTR is reflected favorable in4hese 17 corporations/cities, although K. G. F Corporation shows high PTR. Total teachers proposed are 1688 for this year 2009-10. Bellary corporation/city proposed for 533 teachers which is highest among other cities. Position of teachers in the urban areas need to be checked thoroughly. The data as provided is seemed to be inconsistent in case of teacher’s availability.
48
0

2. Teachers Training-2008-09
District/City (MPC) Zones/Municipality Schools No. of Teachers In-Service training
Bangalore Urban 1 1880 12109 32519Other Cities/Corporations
Mangalore City - 32 918 9.18HDMC 1 278 2277 2277Tumkur - 505 1863 1863Bijapur Bijapur City 122 778 620chitradurga - 54 398 398*15 daysBELLARY 1 275 2354 2354HOSPET 1 196 1466 1466Gadag-Betagiri 1 56 410 358GULBARGA GULBARGA 258 2164 2164Belgaum £MC Belgaum 163 1369 1369Mandya Mandya 36 141 141Bhadravathi CMC ■ - 1144 -
Shimoga CMC - 1468 -
Mysore 9 114 1277 1277Raichur Block CMC 323 1486 1486Total 14 2412 19513 15384.18
2.1 Teachers Recruitment/Rationalization: Progress & ProposalTabie-A
District/City (M PQ Teachers Sanctioned-2008-09 In Serv ce-2008-09 Proposed-2009-10PS 1 UPS PS UPS PS UPS
Bangalore Urban 28 1 - - - - 185Other Cities/Corporations
Mangalore City 4 698 4 698 4 698HDMC - 161 1797 11 46Tumkur - - - - - -
Bijapur 0 0 0 0 7Chitradurga 04 04 - 00 00BELLARY 0 0 0 0 18 548HOSPET 0 0 0 0 0 332Gadag-Betagiri - - 79 331 0 20GULBARGA 0 0 84 2080 0 0K.G.F 2 0 178 318 0 0Belgaum 153 871 136 833 - -
Mandya 26 115 26 115 26 115Bhadravathi 0 1 294 910 0 0Shimoga 0 2 S16 1152 0 0Mysore - - - . - - -
Raichur Block 46 89 336 1150 439 1470Total 263 1776 1614 9384 498 3236
Recommendation/Observation:-
As seen in the table 263 primary teachers & 1776 upper primary teachers were sanctioned last year in 2008-09. State reported the status of existing teachers in the 17
49

corporations/cities as given above, where 1614 primary & 9384 upper primary teachers are at present working in these urban areas. In the AWP&B 2009-10 state proposed for 498 primary teachers and 3236 upper primary teachers for the above cities in the state.
Table-BSl.No District/City Teachers rationalisation- Need for rationalization
(MPC) 2008-09PS UPS PS UPS
1 Bangalore Urban 0 0 0 0Other <2ities/Corporations
2 Mangalore City - - - -
3 HDMC - - - -
4 Tumkur - - - -
5 Bijapur 0 0 0 06 Chitradurga 0 0 07 BELLARY 268 1813 0 5488 HOSPET 228 1154 0 3329 Gadag-Betagiri 0 0 0 0
10 GULBARGA 0 0 0 011 K.G.F 0 0 0 012 Belgaum 0 0 0 013 Mandya 0 0 0 014 Bhadravathi 0 0 0 015 Shimoga 0 0 0 016 Mysore 0 0 0 017 Raichur Block 0 0 0 0
Total 496 2967 0 880
Observation
As reported in the above table those 496 primary teachers & 2967 upper primary teachers were rationalized in the above corporations/cities. Similarly, state planned to rationalize 880 upper primary teachers only in these urban/corporation areas in the year 2009-10.
2.3 Urban Academic Support Structure
Sl.No District/City URCs No. of Coordinator Remarks/Observation
1 Bangalore Urban - - -
Other Cities/Corporations
2 Mangalore - - No Report of URC
3 HDMC 1 1 One URC reported
4 Tumkur 1 - 29 Fake Report
5 Bijapur City - - No URCS/Proposal
6 Chitradurga - - No URCS/Proposal
7 BELLARY 1 1 Favourable
50

SI.No District/City URCs No. of Coordiaator Remarks/Observation
8 HOSPET - - No report on URCs
9 Gadag-Betagiri 1 1 Favourable
10 GULBARGA 2 2 Favourable
11 K.G.F - - No URC/Proposal
12 Belgaum 1 1 Favourable
13 Mandya 0 0 No URC/Proposal
14 Bhadravathi 0 0 No URC/Proposal
15 Shimoga 0 0 No URC/Proposal
16 Mysore 10 10 Favourable
17 Raichur Block 0 0 No URC/Proposal
Total 17 45 -
2.4 C onvergenceSI.No District/City Local
Bodies/lnstitutions/Depart.Area of Convergence-
2008-09Area of Convergence-
2009-101 Bangalore Urban Labour department Schools Schools2 BBMP Schools Schools3 Social welfare Schools Schools4 Education Education5 Other Cities/Districts6 Mangalore - - -
7Tumkur -
Building repairs toilet, drinking water
Building repairs toilet, drinking water
8 Dharwad~
9
chitradurga
City municipality, rotary club ,youth associations,
inner wheel club ,W«&CD,labour etc
Mainstreaming OOSC and child labour,HBE
volunteers.
Mainstreaming OOSC and child labour,HBE
volunteers
10 BELLARY 1 (vishwa bharathi CWSN CWSN11 HOSPET Kalaniketana-DDRC bly)12 LCMC l.C M C13 Gadag-Betagiri 1 2. WCD 2. WCD14 3. Health Dept. 3. Health Dept.15 4. SW Dept. 4. SW Dept.16 GULBARGA NCLP (Labour Dept) Urban Urban + Slum17 K.G.F 218 Belgaum19 Mandya 0 0 020 Bhadravathi Nil Nil Nil21 Shimoga Nil Nil Nil22 Mysore - - -
51

SI.No District/City LocalBodies/lnstltutions/Depart.
Area of Convergence- 2008-09
Area of Convergence- 2009-10
23 Raichur Block - - -
2.5 Monitoring & Supervision Mechanism in Urban AreasThere is no report on monitoring mechanism in the urban areas. State reported that monitoring has been executing by the URC, CRCs & WEC at the schools and cluster levels.
2.6 NGOs Involvement in Urban AreasDistrict/City (MPC) MC/Ward
NumberName of NGOs involved Intervention
Bangalore Urban BBMP 145 Baduku Ashakirana and ECCE
Other Cities/CorporationsMangalore City Velored
-Deeds
Jamayyatulah FalahPrajna Counselling Center
HDMC 67 5OOSC/IED/GIRLS
EDURajarajeshwari Society Adolescent Girls campDarul Ulum Madarsa Madarsa
Salfiya Madarsa MadarsaA1 Hasmi Madarsa Madarsa
Chitradurga 18 PRAJA YATNA Community trainingBELLARY 35 5 ooscHOSPET 77 3 ooscGadag-Betagiri 35 4
oosc Strategies, Girls Edn. HBE.
GULBARGA 55 7 NCLPK.G.F
35ANTHARAGANGE VIDYA
SAMSTHE-KOLAR,RATHNA TRUST,
ASHAKIRAN
Belgaum 2 HBE2 - Ashakiran centres
Mandya 35 S.B.Education Trust, Mandya. Janaraksha Trust Mandya.
Ashakirana, Adoloscent Girls Awareness Camp.
Bhadravathi 0 Nil NilShimoga 0 Nil NilMysore 65 Vimochana -NGO Adolescent campRaichur Block 35 7 -
Total 527 37 -Source: State Report
Observation:-
As observed in the above table that 37 NGOs have been involving in imparting elementary education for different interventions as mentioned above in these 17 corporations/cities. All these interventions/centres are existing in the above 527 ward in these cities.
52

2.7 M ainstream in e Strategy o f the NG O s InterventionsDistrict/(MPC) Name of NGO Intervention Children Enrolled
Baduku NRBC, Ashakirana and ECCE 9032
Bangalore UrbanSurabhi ECCE 5040Samgra Janbhivruddi Samste
RBC, NRBC and Ashakiran 254
Swarna Anu Shakthi NRBC and RBC J 60Vidyaniketana Ashakirana 45Shyamala Vidya vardhak Sangha
RBC 50
Pragathi NRBC 70Rastothana parishat Ashakirana 23Niranthara ECCE and Ashakirana 1420Saheli NRBC 52Hindu Seva Prathistana Ashakirana 25Bharatiya Seva Samste RBC and Ashakirana 90Samaja Vikasa Kendra Ashakirana 42Samaja Seva Samste Ashakirana 25Sneha Bharathi Ashakirana 25Nandhi Education Trust Ashakirana 25Curds NRBC 25
Other Cities/CorporationsMangalore City Prajna Counselling
CenterAshakirana 43
HDMC MAHEZ EDUCATION SOCIETY DHARWAD
OOSC 25
Tumkur SBQRDS RBC 26SPANDANA HBE 91
Bijapur CityLoyolo Edn Society Asha Kirana 60Ekata Training Center Asha Kirana 50Rajarajeshwari Society Adolescent Girls camp 200Darul Ulum Madarsa Madarsa 59Salfiya Madarsa Madarsa 134A1 Hasmi Madarsa Madarsa 120
Chitradurga Praja yatna Special Enrollment Drive 60BELLARY 5 OoSC 220HOSPET 3 OoSC 150
Gadag-Betagiri
1) Zenkar Society, Gadag
12 RBC 25
2) Kamadenu 06SRBC 253) Samarpana Society Sindanur
12 NRBC 25
4) Navodaya Society Haveri
HBE 53
GULBARGAVishwa Seva Mission NCLP 50Margadarshi NCLP 50Grama Kirana NCLP 50
53

District/(MPC) Nameof NGO Intervention Children Enrolled
Sahara NCLP 50Al-Fatiriia NCLP 50Al-Farha NCLP 50Karnataka Mahila Vividodesh Sangh
NCLP 50
K.G.F ANTHRAGAGE VIDYA SAMSTHE KOLAR
HOME BASED EDUCATION 24
Belgaum
1.) AshaJyoti HBE 1072.) New Education
society
1) Asha Jyoti Asha Kiran 1752) Veerrani Kittur
ChennammaMandya 0 0Bhadravathi Nil Nil 0Shimoga Nil Nil 0Mysore - - -
Raichur Block
Jannachetana Raichur OoSC & NCLP 100Spanda welfare Trust OOSC& NCLP 150Akshara Pratishtana OoSC & NCLP 100Swarna Raichur OoSC & NCLP 100HRD Society OoSC & NCLP 100
Swamy Vivekanada Society
OoSC & NCLP 100
INGRID OoSC & NCLP 150
2.8 NPEGEL/KGVB in Url>an AreasDistrict/City(MPC)
MCAVardNumber/Slums
No. ofNPGEL Centers
ChildrenEnrolled
No. of KGVB
ChildrenEnrolled
Bangalore Urban 1 1 1205 0 0Ot lier Cities/Corporal ion
Mangalore CityHDMC 10 1 667 0 0 -Tumkur 0 0 0 0 0Bijapur City 35 9 12940 0 0Chitradurga 0 0 0 0 0BELLARY 35 24 1230 1 98HOSPET 77 15 322 1 84Gadag-Betagiri 0 0 0 0 0GULBARGA 55 8 764 1 100K.G.F 0 0 0 0 0Belgaum 59 0 0 0 0
54
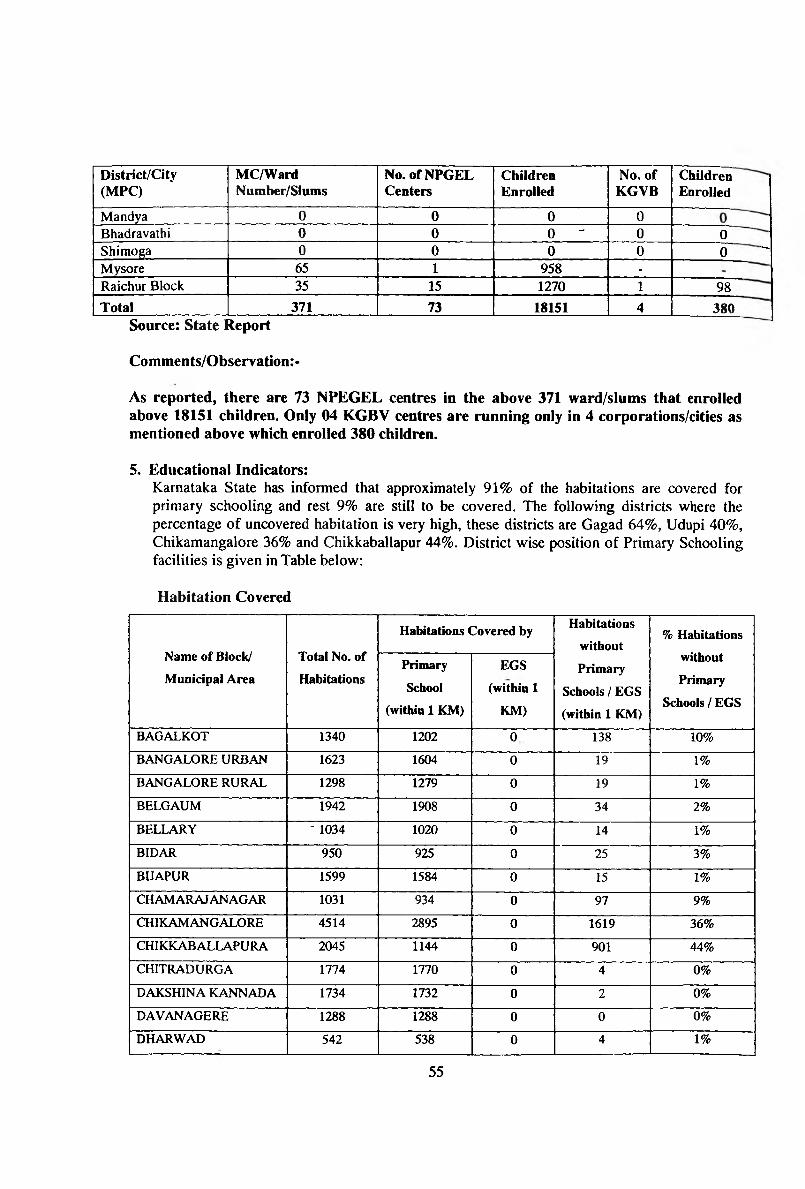
District/City(MFC)
MC/WardNumber/Siums
No.ofNPGELCenters
ChildrenEnrolled
No. of KGVB
ChildrenEnrolled
Mandya 0 0 0 0Bhadravathi 0 0 0 - 0 0Shimoga 0 0 0 0 0 ^Mysore 65 1 958 -Raichur Block 35 15 1270 1 98Total 371 73 18151 4 380
Source: State Report
Comments/Observation:*
As reported, there are 73 NPEGEL centres in the above 371 ward/slums that enrolled above 18151 children. Only 04 KGBV centres are running only in 4 corporations/cities as mentioned above which enrolled 380 children.
5. Educational Indicators:Karnataka State has informed that approximately 91% of the habitations are covered for primary schooling and rest 9% are still to be covered. The following districts where the percentage of uncovered habitation is very high, these districts are Gagad 64%, Udupi 40%, Chikamangalore 36% and Chikkaballapur 44%. District wise position of Primary Schooling facilities is given in Table below:
Habitation Covered
Name of Block/
Municipal Area
Total No. of
Habitations
Habitations Covered by Habitations
without
Primary
Schools/EGS
(within 1 KM)
% Habitations
without
Primary
Schools / EGS
Primary
School
(within 1 KM)
EGS
(within 1
KM)
BAGALKOT 1340 1202 0 138 10%
BANGALORE URBAN 1623 1604 0 19 1%
BANGALORE RURAL 1298 1279 0 19 1%
BELGAUM 1942 1908 0 34 2%
BELLARY - 1034 1020 0 14 1%
BIDAR 950 925 0 25 3%
BIJAPUR 1599 1584 0 15 1%
CHAMARAJANAGAR 1031 934 0 97 9%
CHIKAMANGALORE 4514 2895 0 1619 36%
CHIKKABALLAPURA 2045 1144 0 901 44%
CHITRADURGA 1774 1770 0 4 0%
DAKSHINA KANNADA 1734 1732 0 2 0%
DAVANAGERE 1288 1288 0 0 0%
DHARWAD 542 538 0 4 1%
55
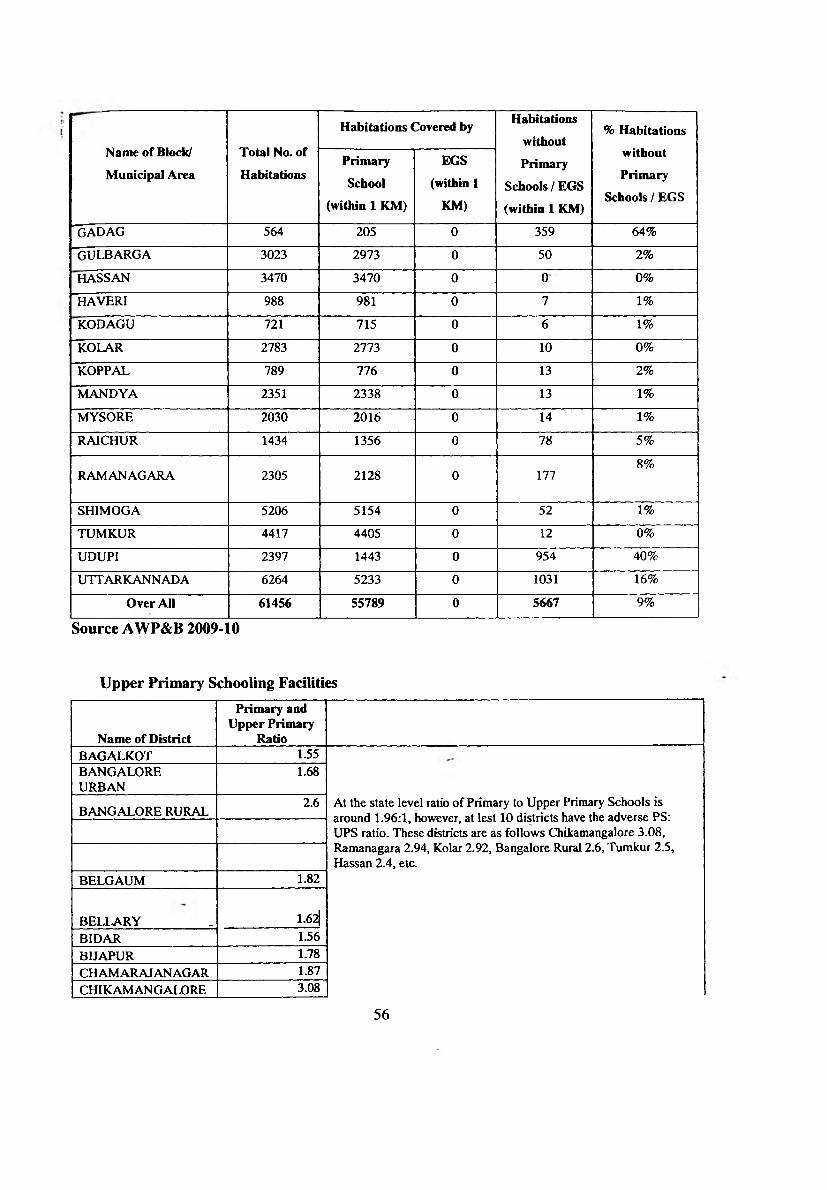
Name of Block/
Municipal Area
Total No. of
Habitations
Habitations Covered by Habitations
without
Primary
Schools / EGS
(within 1 KM)
% Habitations
without
Primary
Schools / EGS
Primary
School
(within 1 KM)
EGS
(within 1
KM)
g a d a g 564 205 0 359 64%
GULBARGA 3023 2973 0 50 2%
HASSAN 3470 3470 0 0 0%
HAVERI 988 981 0 7 1%
KODAGU 721 715 0 6 1%
KOLAR 2783 2773 0 10 0%
KOPPAL 789 776 0 13 2%
MANDYA 2351 2338 0 13 1%
MYSORE 2030 2016 0 14 1%
RAICHUR 1434 1356 0 78 5%
RAMANAGARA 2305 2128 0 1778%
SHIMOGA 5206 5154 0 52 1%
TUMKUR 4417 4405 0 12 0%
UDUPI 2397 1443 0 954 40%
UTTARKANNADA 6264 5233 0 1031 16%
Over All 61456 55789 0 5667 9%
Source AWP&B 2009-10
Upper Primary Schooling Facilities
Name of District
Primary and Upper Primary
RatioBAGALKOT 1.55BANGALOREURBAN
1.68
BANGALORE RURAL2.6 At the state level ratio of Primary to Upper Primary Schools is
around 1.96:1, however, at lest 10 districts have the adverse PS; UPS ratio. These districts are as follows Chikamangalore 3.08,Ramanagara 2.94, Kolar 2.92, Bangalore Rural 2.6, Tumkur 2.5, Hassan 2.4, etc.
BELGAUM 1.82
BELLARY . 1.621BIDAR 1.56BIJAPUR 1.78CHAMARAJANAGAR 1.87CHIKAMANGALORE 3.08
56

Name of District
Primary and Upper Primary
RatioCHIKKABALLAPURA 2.19CHITRADURGA 1.88DAKSHINAKANNADA
1.33
DAVANAGERE 1.81DHARWAD 1.37GADAG 1.44GULBARGA 1.88HASSAN 2.4HAVERI 1.62KODAGU 1.51KOLAR 2.92KOPPAL 1.8MANDYA 2.13MYSORE 1.93RAICHUR 2.12RAMANAGARA 2.94SHIMOGA 1.99TUMKUR 2.56UDUPI 1.48UTTARKANNADA 2.14Over All 1.96
Source AWP&B 2009-10
Enrolment Pry & U. Pry Level
SLNo District Name2007-08 2008-09
B G T B G T7 Bidar 48879 47721 96600 47,133 47,171 94,304
26 Mysore 75458 73893 149351 74,620 73,066 147,686
3 Bangalore North 73369 71154 144523 78,434 76,597 155,03122 Kolar 41711 40662 82373 41,321 40,352 81,67315 Darwad 51335 49878 101213 50,540 48,924 99,464
4 Bangalore South 105674 103515 209189 97,952 94,251 192,20320 Haveri 44037 42561 86598 44,378 42,597 86,97519 Hasana 43527 42406 85933 43,831 41,929 85,76024 Madhugiri 27978 27018 54996 27,226 25,970 53,196
28 Ramnagara 27055 25237 52292 25,873 24,614 50,48729 Shimoga 47347 45948 93295 47,252 44,698 91,950
10 Chikkaballapura 33555 31825 65380 33,080 31,189 64,26911 Chikkodi 72274 65669 137943 29,513 27,801 57,314
9 Chatnarajanagar 25169 24022 49191 24,983 23,518 48,501
2 Bangalore Rural 25173 23621 48794 24,285 22,850 47,135
57

SI.No District Name2007-08
B G2008-09
B
16 Davanagere 56469 52957 109426 55,517 52,154 107,671Belgaum 57620 54394 112014 63,875 59,852 123,727
21 Kodagu 14570 13549 28119 15,384 14,393 29,777
13 Chitradurga 46036 42603 88639 45,246 42,082 87,32818 Gulbarga 50269 46278 96547 57,265 53,229 110,494
32 Uttara Kannada 40351 37466 77817 40,429 37,514 77,94325 Mandya 44927 42275 87202 44,737 41,472 86,20931 Udupi 29843 27448 57291 29,562 27,232 56,794
12 Chikmagalore 29689 27822 57511 71,180 65,399 136,579
14DakshinaKannada 58350 53367 111717 58,404 53,458 111,862
17 Gadag 30586 27992 58578 31,611 28,495 60,106Bagalkot 52941 47581 100522 52,494 47,294 99,788Bellary 66882 56941 123823 65,700 58,034 123,734
30 Tumkur 45819 40026 85845 46,698 41,000 87,698Bijapur 63978 54534 118512 66,618 58,266 124,884
23 Koppal 47727 42068 89795 39,441 33,690 73,13127 Raichur 46674 37107 83781 45,533 38,433 83,96633 Yadgir 29414 22023 51437 30,651 23,686 54,337
State Total 1554686 1441561 2996247 1,550,766 1,441,210 2,991,976
Times Series Enrolment
YearPrimary Upper Primary
Boys Giris All Boys Giris All
2004-05 3003460 2816824 5820284 1525523 1357882 2883405
2005-06 2967111 2790668 5757779 1502794 1383496 2886290
2006-07 2955183 2769823 57250061564940 1431702
2996642
2007-08 2885736 2710964 5596700 1554686 1441561 2996247
2008-09 2859996 2682420 5542416 1550766 1441210 2991976
Source AWP&B 2009-10
Observation:-
Overall enrolment in the year 2007-08 at the primary level was 5542416 as reported by the state in which boys’ enrolment exceeds girls’ enrolment Enrolment mai^inally decline in the year 2008-09 by 54284. District Bangalore South has the highest enrolment i.e. 367744 in the year 2008-09 whereas district Kodagu has the lowest enrolment i.e. 48771. District Kodagu has the highest Girls enrolment. Similarly at the upper primary
58

level, enrolment declined by 4271 from 2007-08 to 2008-09 boys enrolment exceeds girls’ enrolment. District Bidar has the highest Girls enrolment at upper primary level.
Gender Gap in Enrolment
District% Share of
Girls in Enrolment
Gender Gap in Enrolment Sex Ratio
Bagalkot 47% 5.2 980Bellary 47% 6.2 969Bijapur 47% 6.7 950Gadag 47% 5.2 969Koppal 46% 7.9 983Raichur 46% 8.5 983Tumkur 47% 6.5 967Source: DISE 2008-09 & AWP&B 2009-10
At the state level Gender Gap in enrolment at primary level is 3.2 P.P. and the upper primary level is 3.7 P.P.. At the Upper primary level few districts have adverse gender gap these are Raichur 8.5, Koppal 7.9, Bijapur 6.7, Tumkur 6.5 and Bellary 6.2.
Gross Enrolment Ratio (GER) at Elementary level:2004-05 2005-06 2006-07 2007-08
BOYS GIRLS TOTAL BOYS GIRLS TOTAL BOYS GIRLS TOTAL BOYS GIRLS TOTAL111.84 110.51 111.20 109.44 108.13 108.80 103.45 112.07 107.76 104.86 113.60 109.23
Source: AWP&B 2009-10
At the elementary level GER has improved from the year 2006-07. GER of the girls is better than the boys.
GER at present:
GER - 2008-09
Primary Upper Primary
106.90 10730
For the year 2008-09 state provide GER Primary and Upper primary level so the unavailability of time series data at primary and upper primary level appraisal team not found any trend at above mention level.
Source: AWP&B 2009-10
NET ENROLMENT RATIO (NER) at Elementary level
2004-05 2005-06 2006-07 2007-08BOYS 97.95 98.26 99.66 97.16
GIRLS 97.82 98.12 97.29 94.86
TOTAL 97.89 98.19 98.47 96.01
Source: AWP&B 2009-10
59
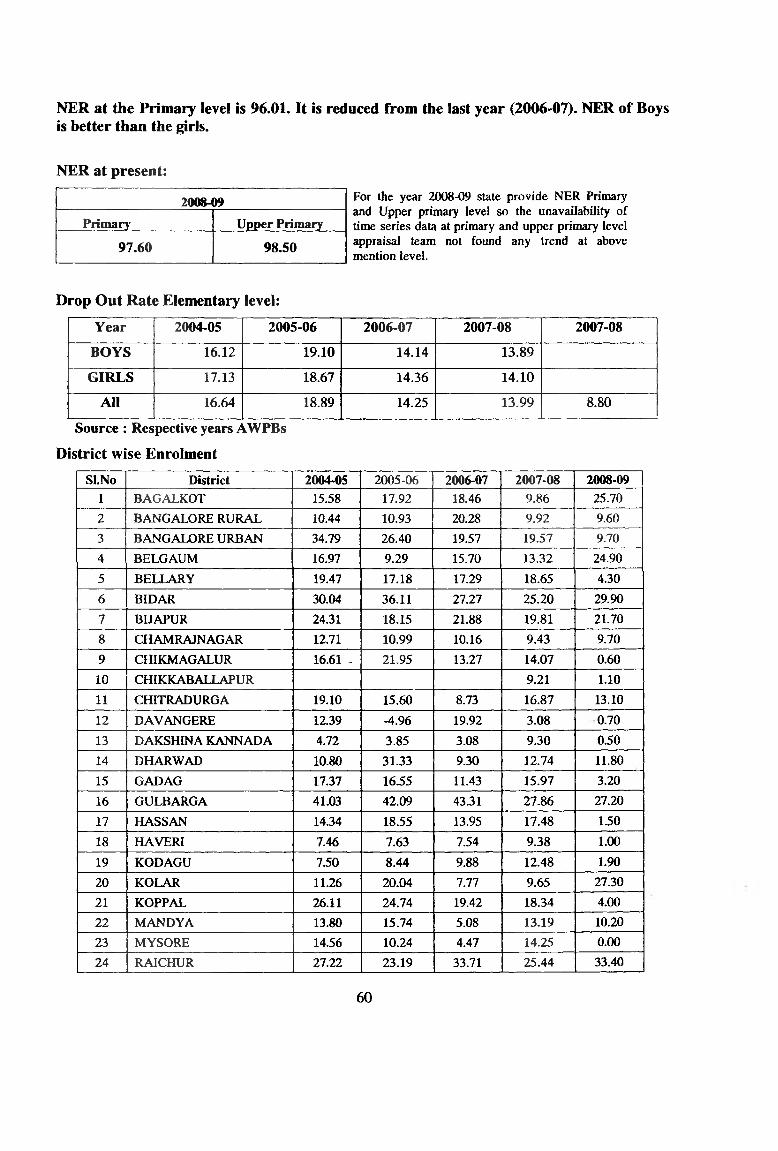
NER at the Primary level is 96.01. It is reduced from the last year (2006-07). NER of Boys is better than the girls.
NER at present:
2008-09Primary Upper Primary
97.60 98.50
For the year 2008-09 state provide NER Primary and Upper primary level so the unavailability of time series data at primary and upper primary level appraisal team not found any trend at above mention level.
Drop Out Rate Elementary level:
Year 2004-05 2005-06 2006-07 2007-08 2007-08
BOYS 16.12 19.10 14.14 13.89
GIRLS 17.13 18.67 14.36 14.10
All 16.64 18.89 14.25 13.99 8.80
Source : Respective years AWPBs
District wise Enrolment
SI.No District 2004-05 2005-06 2006-07 2007-08 2008-091 BAGALKOT 15.58 17.92 18.46 9.86 25.702 BANGALORE RURAL 10.44 10.93 20.28 9.92 9.603 BANGALORE URBAN 34.79 26.40 19.57 19.57 9.704 BELGAUM 16.97 9.29 15.70 13.32 24.905 BELLARY 19.47 17.18 17.29 18.65 4.306 BIDAR 30.04 36.11 27.27 25.20 29.907 BUAPUR 24.31 18.15 21.88 19.81 21.708 CHAMRAJNAGAR 12.71 10.99 10.16 9.43 9.709 CHIKMAGALUR 16.61 - 21.95 13.27 14.07 0.6010 CHIKKABALLAPUR 9.21 1.1011 CHITRADURGA 19.10 15.60 8.73 16.87 13.1012 DAVANGERE 12.39 -4.96 19.92 3.08 0.7013 DAKSHINA KANNADA 4.72 3.85 3.08 9.30 0.5014 DHARWAD 10.80 31.33 9.30 12.74 11.8015 GADAG 17.37 16.55 11.43 15.97 3.20
16 GULBARGA 41.03 42.09 43.31 27.86 27.2017 HASSAN 14.34 18.55 13.95 17.48 1.50
18 HAVERl 7.46 7.63 7.54 9.38 1.0019 KODAGU 750 8.44 9.88 12.48 1.90
20 KOLAR 11.26 20.04 7.77 9.65 27.3021 KOPPAL 26.11 24.74 19.42 18.34 4.0022 MANDYA 13.80 15.74 5.08 13.19 10.2023 MYSORE 14.56 10.24 4.47 14.25 0.0024 RAICHUR 27.22 23.19 33.71 25.44 33.40
60

SI.No District 2004-05 2005-06 2006-07 2007-08 2008-0925 RAMANAGARA 10.45 17.8026 SHIMOGA 10.82 10.96 7.90 14.42 6.1027 TUMKUR 11.60 10.74 9.97 9.97 11.7028 UDUPI 6.98 2.61 1.90 1.90 0.2029 UTTARAKANNADA 11.16 4.45 22.37 5.56 0.40
Total 16.64 18.89 14.25 13.99 8.80Source : Respective years AWPBs
15 districts have more than state average drop out rate. The highest being in Raichur 33.40, Bidar 29.90 and Kolar 27.30.
20 districts show declining trend from the previous years. The highest being in Haveri (9.38 in 2007-08 and 1.00 in 2008-09),Hassan (17.48 in 2007-08 and 1.5 in 2008-08), Chikmagalur (14.07 in 2007-08 and 0.M in 2008-09) and Maysore (14.25 in 2007-08 and0.0 in 2008-09).
9 districts depict increasing trend from the previous year. Districts with large variation are; Racichur (25.44 in 2007-08 and 33.40 in 2008-09), Bidar (25.20 in 2007-08 and 29.30 in 2008-09), Kolrar (9.65 in 2007-08 and 27.30 in 2008-09),Bagalkot (9.86 in 200708 and 25.70 in 2008-09).
Transition Rate from class V to VI
Table- 8District 2004-05 2005-06 2006-07 2007-08 2008-09
Bellary 89.17 89.27 83.34 90.02 86Gulbarga 79.84 75.34 76.93 81.44 78.88Raichur 76.43 78.69 68.16 80.79 76.98
State Total 92.93 92.27 93.93 i>2.62 94.96Source: DISE of Respective 'Years
Transition rate from primary to upper primary is 94.96%. Districts which need corrective measures are Raichur (76.98), Gulbarga (78.88) and Bellary (86.(X)).
Teachers
PTR
2005-06 2006-07 2007-08 20018-09
Primary UpperPriniai7 Primary Upper
Primary Primary UpperPrimary Primary Upper
Primary
2631 34.65 21.85 31.01 20.99 29.25 17.48 27.07
61

PTR at the primary level is 17.48 and U. Pry is 27.07. However, at the district level, DISE 2008-09 has reported several schools with a much higher PTR e.g. sdiools with PTR >60=130 and those >100=35.
2007-08 2008-09
Primary Upper Primary Primary Upper Primary
>60 >100 >60 >100 >60 >100 >60 >100
369 87 348 136 96 IS 130 35
Single Teacher Schools
2006-07 2007-08
Primary Upper Primary Primary Upper Primary
5,634 302 4,878 265
There is urgent need of teacher rationalization in the state at primary level. Data suggests that there are 4878 at Pry level and 265 at U. Pry level schools in the state having single teacher schools. 18% schools are single teacher schools. According to the state representative the single teacher schools are 1962 concerning the position of working teacher. The figure of single teacher schools 4878 according to the state the status on sanction teacher. Many of these schools according to the state having provided with second teacher on deputation which is not reflected in sanctions.
Educational Development Index
LevelOverall State Access Infra Teacher Outcome
Value Rank Value Rank Value Rank Value Rank Value RankPry(06-07) 0.653 12 0.537 12 0.677 17 0.670 17 0.662 5
Pry(07-08) 0.699 11 0.540 14 0.691 18 0.711 15 0.880 1
U. Pry(06-07) 0.708 9 0.694 5 0.757 18 0.731 17 0.638 8
U. Pry(07-08) 0.787 8 0.775 8 0.765 19 0.795 17 0.819 2
Overall EDI ranking of the State is 11* at the Primary level and 9“' rank at the Upper Primary level. The EDI value of the state is increased from the previous year.
At the Primary level 15 districts is in 1** Quartile, 9 districts is in 2“* Quartile, 3 districts are in 3 “* Quartile and 6 districts are in 4*'' Quartile.
Simileirly in case of Upper Primary level 24 districts are in 1*‘ Quartile, 3 districts are in 2',nd
Quartile and 6 districts are in 3* Quartile.
62

6. Components wise Appraisal: .Under each of the topics below, the pattern to be followed in general should be: first the progress made till last year, then the current proposals and followed by the analysis of the comments.
(I) Access
• State policy on opening of new schools:
The State representative intimated about the state policy on opening of-
• Primary School:As per the Government order, a habitation having no school will become eligible to get a lower primary school, if the population of the habitation exceeds 100. While proposing a school the authorities will consider the population of the habitation and the number of the children means the number of children must be more than 10.
• Upper Ptimary School:If the children walk more than 3 kms to attend a higher primary school, in such cases the 5'*' passed out students number must not be less than 20 in plain areas and 15 in Malnad (hilly tract).
• Availability of Schooling facilities:
Table: Information on Schools
Category Govt. Aided Private TotalPrimary 23696 272 2652 26620Up. Primary 22334 2177 6210 30721Total 46030 2449 8862 57341
Table: Habitation and Access (Primary)
s
Vi§
1
ECoda3
Habitations covered by
3^ OIf
"oo
s ^S mS E ^5 ‘i . l
£a
l i « aa V0 AS1 s.m <»S eg -
a u
S 3 ■BE2 cn
X £
z
' o
S X . 2 ^
a 1
■s3
12
“ § o 2
3 1 Z M
.S
“1 Vi
Bagalkot 1340 1202 0 138 27 - 0 103 0Banglore Urban 1623 1604 0 19 2 0 17 0Banglore Rural 1298 1279 0 19 0 0 19 0Belgaum 1942 1908 0 34 34 0 0 0Bellary 1034 1020 0 14 14 0 0 0Bidar 950 925 0 25 25 0 0 0Bijapiir 1599 1584 0 15 13 0 2 0Chamarajanagar 1031 934 0 97 0 0 97 391
63

— •*>« (J1s
so'Aa
03S3'5ss
Habitations covered by
9-"
“oos i1 ^ l i ,£■§.1
.2 - «
^ § s ao ml ! ^ s.K R
± CMja OMlU
± a £ .60s i
| £ S <2
0>z"ob
oo"2g q
1 1 M <2
uSCO
■ s 2IS 2 " 5
*<£3 O Q
i i
aS
b 1 g
PU M ^Chikamangalore 4514 2895 0 1619 0 0 1619 0Chikkaballapura 2045 1144 0 901 0 0 901 0Chitradurga 1774 1770 0 4 0 0 4 79Dakshina Kannada 1734 1732 0 2 2 0 0 0Davangere 1288 1288 0 0 0 0 0 0Dharwad 542 538 0 4 3 0 1 0Gadag 564 205 0 359 0 0 359 0Gulbarga 3023 2973 0 50 50 0 0 0Hassan 3470 3470 0 0 0 0 0 0Haveri 988 981 0 7 7 0 0 0Kodagu 721 715 0 6 0 0 6 99Kolar 2783 2773 0 10 10 0 0 0Koppal 789 776 0 13 13 0 0 0Mandya 2351 2338 0 13 0 0 13 0Mysore 2030 2016 0 14 14 0 0 0Raichur 1434 1356 0 78 2 0 76 0Ramanagara 2305 2128 0 177 78 0 0 0Shimoga 5206 5154 0 52 6 0 46 0Tumkur 4417 4405 0 12 12 0 0 0Udupi 2397 1443 0 954 1 0 953 0Uttarkannada 6264 5233 0 1031 4 0 992 3257
Total 61456 55789 0 5667 317 0 5208 3826
Out of 61456 habitations in the state, 55789 habitations are served with primary schools. Out of this 5667 habitations are not covered by p r im ^ school with in 1 km. As per the state norm (for 10 children and 100 population one school)
A. Primary
(1) Opening of new primary school (new school+ upgradation of EGS to PS) till 2008-09
2005-06 2006-07 2C107-08 2008-09 TotalSan Ach San I Ach San Ach San Ach San Ach281 281 716 1 716 655 655 313 313 2812 2812
64

(2) EGS to PS
Year Sanctioned Achieved2005-06 - -
2006-07 189 1892007-08 52 522008-09 0 0
Total 241 241
Performance of the state has been satisfactorv in achieving the set targets upto 2007-08.
B. Upper Primary
Status of opening of new upper primary schools (upgradation of PS to UPS + adding class VIII to UPS) sanctioned till 2008-09
2002-03 2003-04 2004-05 2005-06 2006-07 2007-08 2008-08 Total0 3162 610 370 2666 370 551 7729
Table: Habitation and Access (Upper Primary)s.n« Districts Total BO.
ofhabitafioiis
No. ot habitatioii having UPS with in3 iun
No. o( tUgiblc habitations for UPS as per distance andpopulationnorms
PrimaT^andupperprimaryratio
No. of UPS eUgible. as per 2 :1 ratio
GapinUPS
RecommendedUPS
1 Bagalkot 1340 1059 24 1.55 659 0
2 Banglore Urban 1623 1623 18 1 .6 8 934 0
3 Banglore Rural 1298 1248 2 2.60 580 134 2
4 Belgaum -1942 1888 54 1.82 1649 0
5 Bellary 1034 1 0 2 2 26 1.62 707 0
6 Bidar 950 915 35 1.56 708 0
7 Bijapur 1599 1599 17 1.78 1 0 1 0 0
8 Chamarajanagar 1031 1 0 2 2 0 1.87 416 0
9 Chikamangalore 4514 2348 28 3.01 814 267 281 0 Chikkaballapura 2045 881 40 2.24 795 8 8 401 1 Chitradurga 1774 1768 0 1 .8 8 892 0
1 2 DakshinaKannada
1734 1734 0 1.33 584 0
13 Davangere 1288 - 1281 7 1.81 742 0
14 Dharwad 542 533 9 1.37 415 0
15 Gadag 564 412 0 1.44 320 0
16 Gulbarga 3023 2936 87 1 .8 8 1425 0
17 Hassan 3470 3470 0 2.40 1317 2 2 2
18 Haveri 988 988 0 1.62 599 0
19 Kodagu 721 704 0 1.51 215 0
2 0 Kolar 2783 2745 3 2.92 969 306 32 1 Koppal 789 730 59 1.80 478 0
65

s.no Districts Total no. ofhabitations
No. of habitation having UPS with in 3 km
No. of eligible habitations for UPS as per distance andpopulationnorms
Primaryandupperprimaryratio
No. of UPS eligible as per 2 :1 ratio
GapinUPS
RecommendedUPS
2 2 Mandya 2351 2329 0 2.13 928 5623 Mysore 2030 2 0 1 0 2 0 1.93 1032 0
24 Raichur 1434 1333 1 0 1 2 . 1 2 730 42 4225 Ramanagara 2305 2305 0 2.94 711 22726 Shimoga 5206 1 4530 8 1.99 996 0
27 Tumkur 4417 4411 6 2.56 1823 400 6
28 Udupi 2397 1359 0 1.48 425 0
29 Uttarkannada 6264 4577 9 2.14 1106 72 9Total 61456 53760 553 1.96 23973 1812 130
Number of habitations having UPS facility within 3 km area is 53760 out of total 61456 habitations existing in the state. Out of them number of eligible habitations for UPS facility as per distance and population norm is 553.
Tfprssa
U it/t • r ijejm. * '
1 -> »'T'> > Olfe'
rr- tI if -•V
... . ^ ■ ’‘ v V .
Table: Status of EGSNo. of EGS sanctioned
till 2007>08Total number of EGS
functioningNo. of EGS completing 2 years or more in 2009-10
1039 Sfil
IE. Interventions for Out of School Children
I. Progress over view for 200^-09
SI.No. Activity
Sanctionedbudget
Achievement till (31J.09)
% age Achievement
Phy Fin Phy Fin Phy FinIntervention for out of school children 181760 5354.82 158670 4360.76 87.30 81.44
66

Reduction in OOSC over the Years
2007-08 2008-09 2009-106 - 1 0 years 134782 45590 1787111-14 years 39790 27377 17766
Total 174572 72967 - 35637
Out of School Children - Karnataka
2007-08 2008-09
— 6-10years—• — 11-14years Total
State is putting its best efforts for reduction of all Out of School ChUdren to ^ r o ^ it is clearly reflected in the above graph.
Remaining 7182 children will be eru'olled during the year with additional efforts. Therefore, the state has logically explained the reduction of OOSC.
Table: Status of Out of School Children
Age in years 2008-09
2009-10Uncovered children
from last yearNew Identified OOSC as per
surveyB G Total B G Total B G Total Total
6 - 1 0 22921 22669 45590 1621 1563 3184 7610 7077 146873563711-14 13600 13135 26735 2352 1646 3998 6794 6794 13768
Strategies of the state for providing access to OOSC:
The state tends to adopt number of strategies to provide access to all eligible habitations viz.
• Feeder school• Transportation facilities• 12 months NRJBC• Chiimara Angala
67

2 months NRBC 2 months RBC 12RBCSeasonal Residential Bridge Centres (SRBC) Asha Kiran (for potential dropouts)Mobile schoolTent schoolHome based educationNational Child Labour Project (NCUP)HBE
Table; Progress & Mainstreaming
DistrictChildren enrolled in AIE/Bridge courses 2008-09
Children Mainstreamed till 2008-09
Children proposed to be enrolled in AIE/ Bridge course during 2009-10
Children proposed to be mainstreamed in 2009-10
Bagalkote 1451 1218 467 459Bangalore Rural 361 307 166 166Bangalore Urban 6280 2646 4750 3449Belgaum 1920 1228 492 456Bellary 3853 2964 2299 2299Bidar 3946 2228 1320 1320Bijapur 4993 2631 2966 1951Chamarajanagar 1401 1261 1178 1110Chikballapura 1255 931 985 875Chikmagalur 387 227 325 325Chitradurga 836 836 503 503Dakshina Kannada 512 512 149 149Davanagere 1605 1225 753 753Dharwad 655 438 322 322Gadag 3122 3087 1628 1628Gulbarga 16127 12358 . 7284 6814Hassan 360 ^ 194 250 220Haveri 1000 907 567 567Kodagu 241 192 177 177Kolar 1100 547 393 328Koppal 3935 3090 2377 2377Mandya 425 352 486 316Mysore 1186 607 850 850Raichur 4811 4516 2359 2228Ramanagar 545 273 299 238Shimoga 927 656 1024 854Tumkur 848 674 683 572Udupi 252 68 228 228Uttara Kannada 849 749 357 253Total 65183 46922 35637 * 31787
68
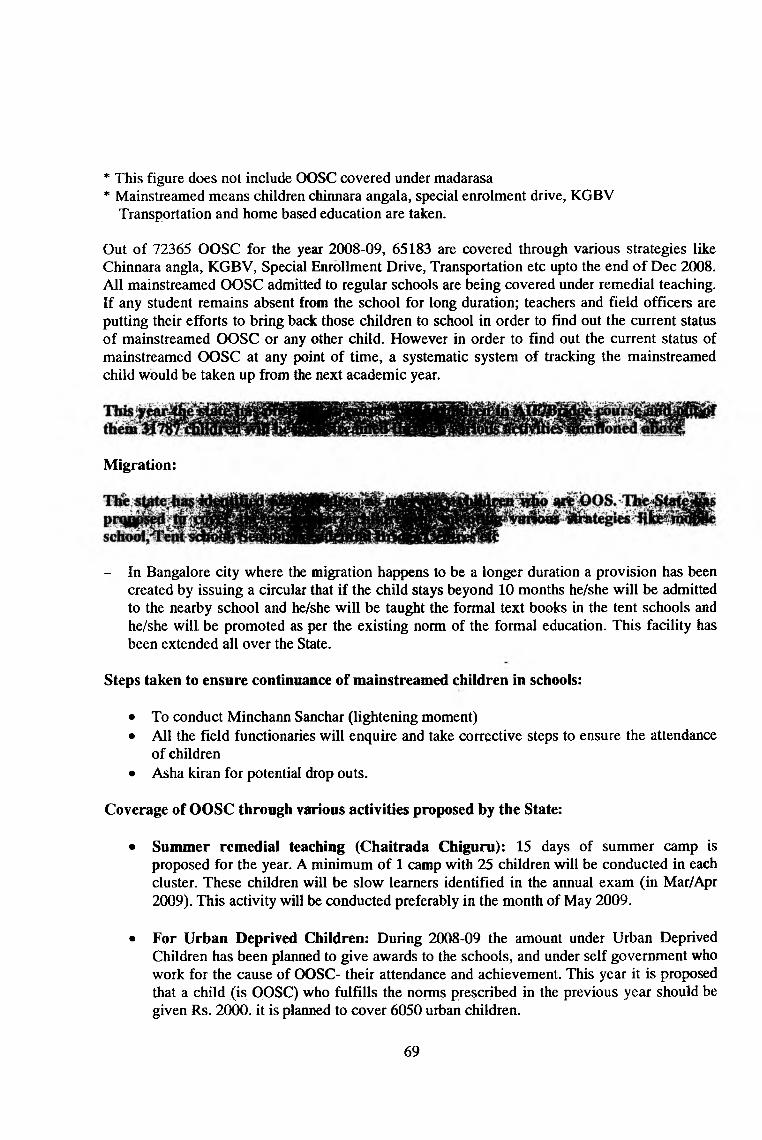
* This figure does not include OOSC covered under madarasa* Mainstreamed means children chiiuiara angala, special enrolment drive, KGBV
Transportation and home based education are taken.
Out of 72365 OOSC for the year 2008-09, 65183 are covered through various strategies like Chinnara angla, KGBV, Special Enrollment Drive, Transportation etc upto the end of Dec 2008. All mainstreamed OOSC admitted to regular schools are being covered under remedial teaching. If any student remains absent from the school for long duration; teachers and field officers are putting their efforts to bring back those children to school in order to find out the current status of mainstreamed OOSC or any other child. However in order to find out the current status of mainstreamed OOSC at any point of time, a systematic system of tracking the mainstreamed child would be taken up from the next academic year.
Migration:
- In Bangalore city where the migration happens to be a longer duration a provision has been created by issuing a circular that if the child stays beyond 10 months he/she will be admitted to the nearby school and he/she will be taught the formal text books in the tent schools and he/she will be promoted as per the existing norm of the formal education. This facility has been extended all over the State.
Steps taken to ensure continuance of mainstreamed children in schools:
• To conduct Minchann Sanchar (lightening moment)• All the field functionaries will enquire and take corrective steps to ensure the attendance
of children• Asha kiran for potential drop outs.
Coverage of OOSC through various activities proposed by the State:
• Summer remedial teaching (Chaitrada Chiguru): 15 days of summer camp is proposed for the year. A minimum of 1 camp with 25 children will be conducted in each cluster. These children will be slow learners identified in the annual exam (in M ar//^r 2009). This activity will be conducted preferably in the month of May 2009.
• For Urban Deprived Children: During 2008-09 the amount under Urban Deprived Children has been planned to give awards to the schools, and under self government who work for the cause of OOSC- their attendance and achievement. This year it is proposed that a child (is OOSC) who fulfills the norms prescribed in the previous year should be given Rs. 2000. it is planned to cover 6050 urban children.
69

• Conducting Deaddiction camps and hand holding activity: A NGO namely “Sathi” is working with street children discloses that there are children who do not attend the school regularly but loiter on the street and come back home in the evening which coincides the
. school timings. Thus this is planned to identify such children using the service of NGO and conduct deaddiction camps and place them in the schools they were studying. This programme will cover 450 children.
• To retain the strategies of previous years viz. 12 NRBC, 12 RBC, 6 SRBC, 2 months Chinnara Angala, Tent schools, HBE, Mobile school, NCLP.
• To extend OOSC strategies for the previous year’s OOSC to check the potential drop outs.
Networking with NGOs:
There are number of NGOs striving hard in achieving UEE and strengthening the hands of the Education Department to provide Quality education and to increase the enrolment in the school. Some NGOs are particularly working for the OOSC children. Their contribution in the field of education is laudable. Some of them are:
1. Akshara Pratisthana2. BOSCO3. Jeevika4. Sumangali Sevashram5. Rashrothana Parishat
Break up of Expenditure for proposed interventions during 2009-10
Strateev Proposed for age group 7-10 and 11-14
SI.No Name of the StrategyNo. of
centres
OOSC Coverage of 2009-10Continuin
gandPotentialdropouts
GrandTotal
UnitCost
TotalAmount
Coverage Proposed for 7-10
Coverage Proposed for 11-14 Total
1 12 RBC 538 218 5196 5414 21482 26896 0.100 2689.6
2
12 NRBC(transporta tion+feede r school+NRBC) 36 277 847 1124 9605+749 11478 0.030 344.34
32 RBC (Chinnara angala) 313 6851 951 7802 0 7802 0.017 132.634
’ 42 NRBC (Chinnara angala) 1000 6538 3462 10000 0 10000 0.005 50
5 Madarasa 196 2591 1259 3850 5937 9787 0.030 293.616 Tent Schools 278 667 393 1060 5879 6939 0.015 104.0857 Mobile Schools 20 192 208 400 1045 1445 0.030 43.358 HBE ■ 14148 572 _ 572 14148 14720 0.030 441.69 NCLP ' 97 563 563 4276 4839 0.030 145.1710 6 SRBC 162 0 8075 8075 0.050 403.7511 Special enrolment 4530 4530 0 4530 0.000 012 4SRS 50 0 50 0.033 1.65
70

Strategy Proposed for age eroup 7-10 and 11-14 ^
OOSC Coverage of 2009-10
SI.No Name of the StrategyNo. of
centres
Coverage Proposed for 7-10
Coverage Proposed for 11-14 Total
Continuingand
Potentialdropouts
GrandTotal
UnitCost
TotalAiDoiiiii
13 Summer Camp 2700 0 74470 74470 0.005 372 3s
14
AIE Centres (Tranasportation, hardest to reach) 1476 1476 0.030
---
. 44.2RTotal 17906 17731 35637 147142 182507 5066.41 Q
* Calendar of above mentioned events has been annexed as Annexure-A
(III) School Infrastructure (Civil works)
Overview of the performance of last year and the bottlenecks:-
The State has shown Rs nil as spill over of AWP&B 2008-09. The State has shown cumulative allocation ending 31** December 2008 as Rs.196855.70 lakhs and expenditure of Rs.151300.11 lakhs. The allocation as worked out by TSG is Rs. 133747.69 lakhs. The cumulative % expenditure works out to 113.12% of actual allocation. However while submitting tentative cumulative progress ending 3T‘ March 2009, the State has worked out cumulative allocation of Rs. 131060.628 and expenditure of the same amount, there by achieving 100% financial expenditure. Now coming to physical achievement, against target of 358611 components, State has completed only 117460 and 241151 components are in progress leaving nil components yet to be started. The appraisal team discussed in detail that how they will be completing the component in progress without any financial spill over. The State team was adamant to show nil spill over from 2008-09 budgets as they had done last year. The PAB may see how the State will fulfill the commitment of completing huge civil works components in progress. The above mentioned components do not include component of furniture of 2008-09. It is pertinent to mention that State although had nil financial spill over in 2007-08 but has following component which are still being shown as in progress tentatively on 31.03.09 after one year.
BRC - 17CRC - 312Primary School - 457Additional Classrooms - 5405Other Components - ?
In addition to above all components of AWP&B 2008-09 are in progress, without even a single component completed during the whole years. This shows State has utilized the full civil works fund without completing any components there by making no utilization against Rs.302.47 crores expenditure.
71

Table: 1 Cumulative Progress 2008-09 (as on 31** Dec. 08) (given by State)
"sTn ^ Activity StateTargets
Targets Completed Inprogress
Financial (in iakh)
Expenditure Cm iakh)
1. BRC 90 90 75 15T " CRC 1401 1411 1114 297
' 3 7 Primary School 3160 3287 2430 8574. Building less (PS)
" 5. Dilapidated (PS)6. Upper Primary
School0 0 0 0
133747.697. ACR Primary 39683 39272 29809 9363 1 CllAA 118. ACR UPS9. Toilet Primary 24491 26684 23314 1177 196855.7010 Toilet UPS
11. DWS (PS) 21438 21438 21438 012. DWS (UPS)
Total 90263 92182 78180 11709Source: Progress report ending 31st December 2008.
As per progress report, against 90263 component intimated by states 78180 are completed (86% completion.) and 11709 are in progress, leaving a balance of 374 components yet to start. The State has given the progress mentioned above for works sanctioned up to 2007-08. The progress shov s that even the balance v orks up to 2007-08 are yet in progress and some components still to start. It is further mentioned that the State has shown 100% financial achievement on 31*' March 2008. This clearly shows that the State is not giving actual physical and fmancial progress at the time of AWP&B by showing nil spill over but large number components remain in progress and not started even up to 31®‘ December 2008. This situation has to be arrested, because this gives wrong picture about the States achievements.
Table: 2 Physical and financial progress (AWP&B) during 2008-09 (as on 31** Dec. 08)
SNo. ActivityTarget
for2008-09
Completed Inprogress
Approved Outlay for 2008-09,
including spill over (in lakh)
Expenditure till 3 r ‘ March
2009 (in lakh)
1. BRC 0 0 0
30239.44
50487.13
2. CRC 0 0 03. Primary School 313 0 3134. Upper Primary
School0 0 - 0
5. ACR 5128 0 454396042.7197. Toilet 1177 0 883
8. Drinking Water facility
1621 0 0
Total 8239 0 5739Source: Progress report ending 31st December 2008.
The actual budget approved by FAB is Rs. 30239.44 lakhs for the year 2008-09. However, the state is showing allocation of Rs.96042.719 lakhs with an expenditure of Rs. 50487.13 lakhs.
72
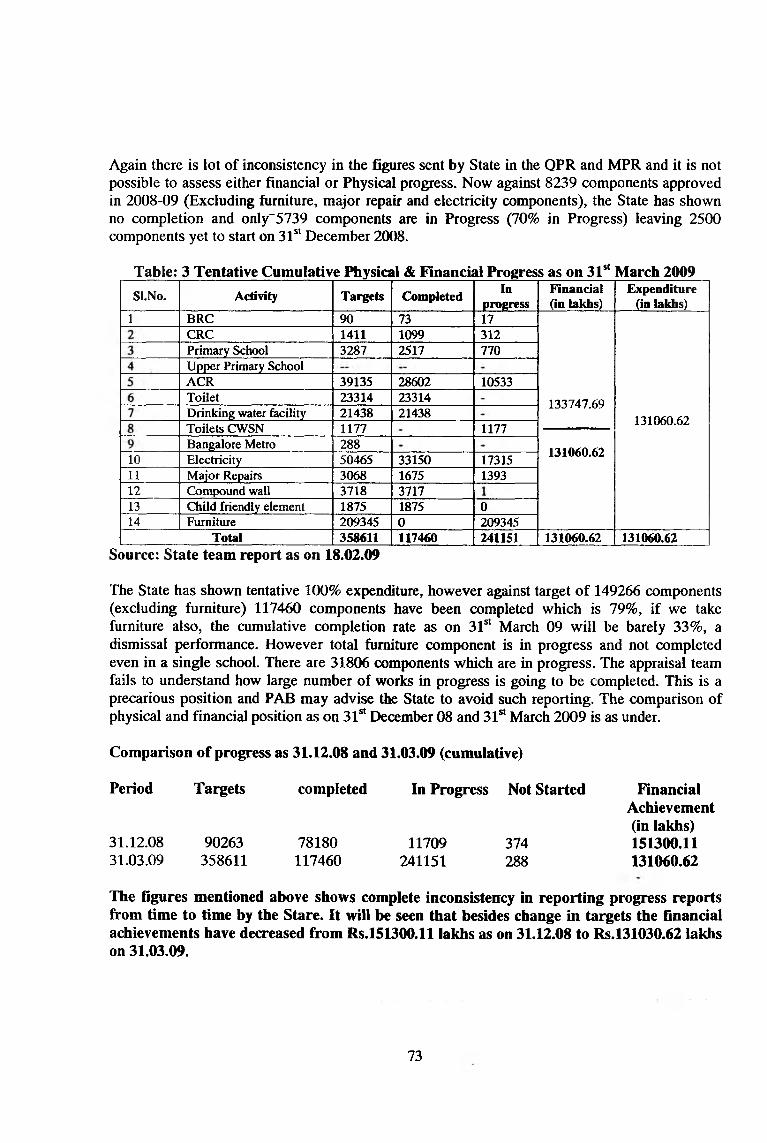
Again there is lot of inconsistency in the figures sent by State in the OPR and MPR and it is not possible to assess either financial or Physical progress. Now against 8239 components approved in 2008-09 (Excluding furniture, major repair and electricity components), the State has shown no completion and only“ 5739 components are in Progress (70% in Progress) leaving 2500 components yet to start on 31*‘ December 2008.
Table: 3 Tentative Cumulative Physical & Financial Progress as on 31'“ March 2009SI.No. Activity Targets Completed In
progressFinaacial (in lakhs)
Expenditure (in iakiis)
1 BRC 90 73 17CRC 1411 1099 312Primary School 3287 2517 770Upper Primary SchoolACR 39135 28602 10533Toilet 23314 23314Drinking water facility 21438 21438
133747.69
Toilets CWSN 1177 1177131060.62
Bangalore Metro 28810 Electricity 50465 33150 17315 131060.62
11 Major Repairs 3068 1675 139312 Compound wall 3718 371713 Child friendly element 1875 1875 014 Furniture 209345 0 209345
Total 358611 117460 241151 131060.62 131060.62Source: State team report as on 18.02.09
The State has shown tentative 100% expenditure, however against target of 149266 components (excluding furniture) 117460 components have been completed which is 79%, if we take furniture also, the cumulative completion rate as on 31®* March 09 will be barely 33%, a dismissal performance. However total furniture component is in progress and not completed even in a single school. There are 31806 components which are in progress. The appraisal team fails to understand how large number of works in progress is going to be completed. This is a precarious position and PAB may advise the State to avoid such reporting. The comparison of physical and financial position as on 31®‘ December 08 and 31®‘ March 2009 is as under.
Comparison of progress as 31.12.08 and 31.03.09 (cumulative)
Period Targets
31.12.0831.03.09
90263358611
completed
78180117460
In Progress Not Started
11709241151
374288
Financial Achievement (in lakhs) 151300.11 131060.62
The figures mentioned above shows complete inconsistency in reporting progress reports from time to time by the Stare. It will be seen that besides change in targets the financial achievements have decreased from Rs.151300.11 lakhs as on 31.12.08 to Rs.131030.62 lakhs on 31.03.09.
73

Table: 4 Tentative AWP&B 2008-09 Physical & Financial Progress as on 31** March 09
Si.No. Activity
Tai^etsfor
2008-09Completed In
progress
Approved for 2008-09
including spiii over (in laMi)
Expenditure (in Lakhs)
1 BRC - - - - -
2 CRC - - - - -
3 Primary School 313 - 313 2817 28174 UpperPrimary School - - - - -
5 ACR 6221 - 6221 23639.80 23639.806 Toilet CWSN 1177 - 883 588.50 588.507 Drinking water
facility- - - - -
8 Bangalore Metro classrooms
100 - 100 554 554
9 Electrification 15290 - 15290 764.50 764.50Compound wall 1 - 1 2.40 2.40
10 Major Repair 1393 - 1393 834.718 834.71811 Furniture 209345 - 209345 1046.725 1046.725
Total 233840 0 233840 30247.643 30247.643Source: State team report on 18.02.09
If we peruse the progress reported ending 31*‘ December 2008 and tentative progress reported ending 31®‘ March 09, there is hardly any similarity between the two reports. This clearly shows the inconsistency in data reporting from time to time. This also gives impression of casual reporting of the progress report by the Karnataka States.
Comparison of reports as on 31.12.08 and 31.03.09 (AWP&B 2008-09)
Period Targets completed In Progress Not Started
31.12.0831.03.09
8239233840
0
05739233840
25000
Financial Achievement
(In lakhs)50487.13
30247.643The in- consistency in data is quite evident.
Table: 5 Anticipated Details of Physical and financial spill over for 2008-09as on 31 March 20C9)
SI.No. Activity
Physical
TotalTarget
for2008-09
Spilloverfrom
2007-08
Spilloveramou
ntWork in progress
Worknot
started1 BRC 17 0 17 - 17 Nil2 CRC 312 0 312 - 3123 Primary School 770 0 770 313 4574 Upper Primary School - 0 - - -
5 ACR 10533 0 10533 5028 5505
74

Si.No. Activity
Physical
TotalTarget
for2008-09
Spilloverfrom
2007-08
Spillover
amount
Work in progress
Worknot
started9 Bangalore metro classrooms 288 0 288 100 1887 Drinking water facility - 0 - -
8 Electrification 17315 0 17315 15290 20259. Boundary Wall 1 0 1 0 110 Major Repairs 1675 0 1675 0 -
11 Child friendly element 0 0 0 0 -
12 CWSN Toilets 1177 0 1177 1177 -
13 Furniture 209345 0 209345 209345 -
Total 241433 0 241433Source: State Report reported on 1
The State has shown 241433 components in progress including 209345 furniture components. If we do not talce into account the furniture component, the balance civil works components will be 32088 consisting of various civil works items mentioned from SI. No. 1 to SI. No 12. Whether the State will be in a position to complete civil works components and furniture components without any spill over is a big question mark.
Table: 6 Assessments of Gap & Proposals
SI. No Activity Status as on 1-4-09
Proposed in 2009-10 Gap
Recommendation by appraisal team
1. BRC 0 2 0 No justification, hence not recommended
2. CRC 0 183 0 No justification, hence not recommended
3. N.S.B 317 317 - Recommended - 3174. A.C.R 7710 7710 - Recommended -4547
5.Additional rooms for CALC & Edusat
1284 1284 -Not recommended
6. Bangalore Metro classrooms 300 300 - Recommended- 222
7. Toilets 7812 6844 968 To be provided through convergence
8. Girls Toilets 21988 18076 3912 Reconunended -12792
9. Drinking Water 10574 6617 3957 To be provided through convergence
10. Boundary wall 18880 5593 13287Not recommended because of not implementation of guidelines
11. Major Repair primary 1309 1309
Not recommended because of not implementation of guidelines
12. Major Repair UPS 1767 1767Not recommended because of not implementation of guidelines
13. Special Toilet CWSN 1691 1691 Recommended-1548
14. Setting of solar photo voltaic to 1865 1865 - Not reconmiended
75

SI. No Activity Status as on 1-4-09
Proposed in 2009-10 Gap
Recommendation by appraisal team
existing CASC schools
15. Furniture 1247651 1247651 - Not Recommended
Total 1322848 1300909 22124
The State has saturated school infrastructure gaps particularly for new school buildings primary, classrooms barring girl’s toilets, boundary wall and major repair. The boundary wall and major repair have not been recommended because State has not been able to fulfill the guidelines issued by MHRD. The district wise detail school Infrastructure is appended below.
Table: 7 District wise details of school infrastructure recommended by Appraisal team for 2009-10
School Buildings Additional Class Rooms
Separate Girls Toilet
Special Toilet for CWSN
Total CW Outlay
Phy Fin Phy Fin Phy Fin Phy Fin Fin27 243.00 222 1043.40 334 83.50 0 0.00 1369.90
2 18.00 60 282.00 439 109.75 12 6.00 415.750 0.00 272 1464.88 422 105.50 27 13.50 1583.88
34 306.00 454 2133.80 395 98.75 18 9.00 2547.5514 126.00 350 1645.00 695 173.75 94 47.00 1991.7525 225.00 109 512.30 500 125.00 146 73.00 935.3013 117.00 69 324.30 1187 296.75 15 7.50 745.550 0.00 14 65.80 524 131.00 200 100.00 296.800 0.00 139 653.30 1110 277.50 200 100.00 1030.800 0.00 35 164.50 636 159.00 50 25.00 348.500 0.00 120 564.00 150 37.50 58 29.00 630.502 18.00 150 705.00 231 57.75 88 44.00 824.750 0.00 192 902.40 141 35.25 14 7.00 944.653 27.00 90” 423.00 0 0.00 18 9.00 459.000 0.00 134 629.80 214 53.50 18 9.00 692.30
50 450.00 400 1880.00 1000 250.00 60 30.00 2610.000 0.00 44 206.80 1523 380.75 8 4.00 591.557 63.00 190 893.00 64 16.00 79 39.50 1011.500 0.00 27 126.90 40 10.00 15 7.50 144.40
10 90.00 125 587.50 148 37.00 30 15.00 729.5013 117.00 235 1104.50 0 0.00 0 0.00 1221.500 0.00 70 329.00 775 193.75 170 85.00 607.75
14 126.00 233 1095.10 468 117.00 0 0.00 1338.102 18.00 78 366.60 554 138.50 24 12.00 535.10
78 702.00 300 1410.00 668 167.00 7 3.50 2282.506 54.00 61 286.70 160 40.00 7 3.50 384.20
12 108.00 222 1043.40 316 79.00 90 45.00 1275.40
1 9.00 32 150.40 98 24.50 100 50.00 233.904 36.00 342 1607.40 0 0.00 0 0.00 1643.40
76

School Buildings Additional Class Rooms
Separate Giris- Toilet
Special Toilet for CWSN
Total CW Outlay
Phy Fin Phy Fin Phy Fin Phy Fin Fin0 .0 0
317 2853.00 4769 22600.78 12792 3198.00 1548 774.00 29425.78
Analyzed DISE data o f2008-09 (30th September 2008) by State along with analysis of DISE 2006-07 as assessed by TSG in respect of ACR is appended below for comparison.
Table: 8SL. No districts Gap in Classrooms as per
DISE 2008-09/ actual SurveyGap in Classrooms as per
DISE 2006-071. Bagalkot ......................222 602. Bangalore Urban 442 6683. Bangalore Urban 119 3044. Belgaum 1423 125. Bellary 981 -6566 . Bidar 109 -8027. Bijapur 69 -5868. Chamarajangar 14 -1219. Chikkamangalore 139 17810. Chikkabailipura 3511. Chitradurga 120 29612. Dakshin Kannada 150 -48513. Davanagere 256 -13814. Dharwad 90 -87515. Gadag 227 -24316. Gulbarga 400 -101917. Hassan 44 95218. Haveri 283 -28319. Kodagu 27 -7420. Kolar 125 113721. Koppal 405 46822. Mandya 70 ~ 60623. Mysore 233 21624. Raichur 78 31725. Ramanagara 949 -4426. Shimoga 61 23527. Tumkur 222 114028. Udupi 32 14129. Uttarkannada 385 632
Total 7710 7362
The DISE data 2006-07 after computing ta i^ t approved by PAB for 2006-07, 2007-08 and2008-09 along with DISE data of 2008-09 an alyst by State shows ACR gaps as 7362 and 7710 classrooms respectively. The major difference in the gaps is particularly for 12 districts out of 29 district of the State where the gaps had already been saturated upto2008-09. however for all intent and purposes the DISE data for 2008-09 has been taken for filling the gaps of classrooms in all the 29 districts and have been recommended in the AWP&B 2009-10.
77

B. Major Repairs
Table: 9 Proposal for Major Repairs
Name of the District ProposalPhysical Financial
District 1 -District 2District 3
Total:
1309 Primary School 1767 Upper Primary school
834.718
The state has proposed for 1309 Primary School and 1767 Upper Primary School for major repair for the AWP&B 2009-10. Each district have given name of the school where the repair work is to be done along with the year of construction. The district are proposing major repair except following guidelines.
• The State has not provided photographs and estimation along with the district plan.
• In absence of engineers at district and block level, districts have not been able to provide decentralized system of technical and financial assessment and approval for major repair at district level.
• State has not developed repair manual so far.
In view of above the appraisal team is not recommending msgor repairs in AWP&B 200910. The govt, of Karnataka had approved in the EC meeting dated for re-appropriation of amount sanctioned by PAB in 2008-09 in respect of electrification in Uttar Kannada to re-appropriate for major repairs in tiie same districts. The State has been already allocated proportionate amount as per MHRD guidelines in AWP&B 2008-09 and hence the reappropriation is not recommended.
Table: 10 PS SANCTIONED YEARWISE
Schools 2 0 0 1 0 2
2 0 0 2 03
200304
200405
200506
200607
200706
200809
TotalSanctioned
Schoolsopened
SchoolBuilding 194 42 407 204 0 716 655 313 2531 2531
Table: 11 PS BUILDINGS SANCTIONED YEARWISE
Schools 2 0 0 1 0 2
2 0 0 2 03
200304
2004-OS
200506
200607
2007-OS
200809 Total Sanctioned
SchoolBuilding - - 608 352 616 743 655 313 3287
The Additional P.S school buildings approved are building less primary schools. There is no gap for primary school building
78

Table: 12 Unit Cost for 2009-10
SI.No
Component Unit cost 2008-09 amount in lakhs
Unit cost revised by the
States
Remarks
1. Classrooms 4.700Classrooms to Bangalore Metro City
5.540
Boundary Wall 2.40Electrification 0.050
The unit cost of 2008-09 already
approved by PAB is to be taken for 2009
1 0
Primary school 9.00Furniture per child 0.005
The size of class room for unit cost at Si No 1 is of size 30’X20’ with a verandah of 8’X30’ which is much more than the IS code.
Third party evaluationsThird party Quality Assurance and Technical Audit of civil works are entrusted to four technical consultants for the year 2007-08.
To carryout the technical evaluation of the quality of Civil works visiting each work site 5 times,i.e. at the foundation level, plinth level, lintel level. Roof level, and at finishing stage during the construction of the buildings and also under take testing of materials like Sand, Bricks, Cement and Steel brought for construclion at the site of the building and also undertake test of concrete cubes at the laboratory. They also furnish the completion certificate and quality construction of the building, in each visit and also quality of the building after completion.
State is likely to engaged 4 agencies for third party evaluation for different division and the case is lying for approval for 2008-09. The State has not been able to finalize bid although almost all civil works components of 2008-09 have since started and all components are in progress. The appraisal teams feel that the work of third party evaluation should simultaneously start as soon as the civil works component begins.
School Mapping:The State has started Infrastructure Survey for school mapping of Govt, elementary schools through professional agencies to facilities better plaiming and to asses provision of infrastructure facilities in schools. In the first phase, the State has about 22294 schools out of 46030 schools for which survey has been taken up. The State will be taking up balance School mapping of 23,736 schools during 2009-10.
Convei^ence with T.S.C:From 2006-07 the State is having convergence with State level and District level implementing
total sanitation campaign i.e. Zilla Panchayath for providing toilets and Drinking water facilities. The effort will be made to fill the gaps. In the PAB of AWP&B 2008-09 State has requested department of rural development to instruct the State agency implementing DW&TSC for implementing these facilities and place funds at the disposal of SDMC for quicker implementation. The appraisal team discussed the matter with State team and it was informed that the direction given in PAB stand implemented and now funds are being placed at the disposal of SDMC.
79

Environment assessmentThe environmental assessment of schools are being conducted by the District and Block engineers, A Assessment of about 2000 School are completed and further work is in progress. 1/3 rd of School will be completed by May 2009.
The assessment R a sterThe assessments Register of Schools are maintained at school level, Block level, and at District level.
Supervision of Structure:School infrastructure was being supervised by Block Engineer at Block level and overall supervision of District, by the District Engineer engaged through, out sourcing. Total 33 District Engineers and 202 Block engineers were supposed to look after the Supervision of School infrastructure. HoweverlSO Block Engineers and 30 District Engineers had been working up to and of 30"' Jan 09.
The Out source Agency has been terminated with effect from 1*‘ February 2009 and there are no block level district level and State level engineer except 1 State project engineer who is on deputation from PWD. The direction has been given by State to district authorities to recruit Engineers at the District and block level on contract basis. The position as on 18.02.09 is as under.
State level District level Block levelSanctioned Available Sanctioned Available Sanctioned Available
6 1 33 0 202 0
Against approved strength of 241 engineers the state has only 1 engineers at State level. The appraisal team recommends that State may recruit all the engineers at the earliest possible.
State has now sent E-mail on 19.02.09 that the management structure on 19.02.09 is as under
SI No Details District Engineers Block Engineers1 State Project office 6 5 * -
2. District level 33 33 - -
3. Block level - - 202 202
As reported by State the appraisal team is confused, which statement i.e detail given by State team as 18.02.09 or the statement on 19.02.09 is correct.
Issues:• The State has lot of inconsistency in providing civil works data from time to time.
The State had to change the data since 10.02.09 to 18.02.09 thrice and final data for appraisal could be given on 18.02.09 the inconsistency can be seen from the QPR, MPR of third and fourth quarter of the current financial years.
• The State is not planning and implementing civil works in realistic manner. Against the AWP&B expenditure of Rs.302 crores not even is single component has been
80

completed during the current financial years. Although there was no financial spill over for 2007-08 but even on tentative progress of 31.03.09, there are substantial numbers of civil works components in progress, which would have been completed by the State by 30.06.08 as per commitment made before the PAB.
The State has no technical personals at State, district and block level except 1 State project engineer. As already mentioned, the State has dispensed with the engineers employed through out sourcing agencies.
State has changed the number of classrooms from 5128 to 6221 without any approval from PAB.
(IV) Quality Related Issues, Including, Teachers and REMS
1. Information about Learning Achievement (LA) Surveys:
a. Nature and frequency of Learning Achievement Surveys in the StateAt present the State conducts Karnataka Schools Quality Assessment Organisation (KSQAO) for selected classes every year. In 2008 - 09 it included classes 5, 7 and 8. In rest of the classes teachers undertake tests to assess performance of students in different subject areas.
Based on the satisfactory acquisition of competencies children are categorized into A (achievers) and B (non - achievers). Non - achievers are provided remedial support before and after regular classes every day to enhance their understanding and skill acquisition in different subjects.
The State does not have a detailed profile of students’ learning achievement in different subjects through an external assessment survey. KSQAO in 2008 - 09 was limited to classes 5, 7 and 8 only.
There is a need for undertaking an external learning assessment survey for each class (even if on sample basis) to know the learning achievement of students along with their learning difficulties in different subject areas and also factors affecting the learning difficulties for each class. Based on the issues related to students’ learning, all the inputs and processes can be suitably designed.
Other than this, the State has feedback from DISE and NCERT learning achievement surveys.
• Feedback from DISE
Learning achievement as per DISE
DISE Refer Year
Class V Class VII
Passed Passed with >60%
% of Children Passed with >60%
Passed Passed with > 60%
% of Children Passed with > 60%
2003-04 1,047,834 570,978 54.49 800,734 454,192 56.722004-05 1,059,726 541,360 51.08 906,795 443,985 48.962005-06 939,198 709,469 75.54 830,697 595,050 71.632006-07 977,743 640,449 65.50 830,170 545,382 65.702007-08 656,799 579,940 8830 565,001 493,665 87.37
81

As per DISE results, performance of students both at Primary and Upper Primary levels is brilliant with more than 88% children at Primary level and more than 87% children at Upper Primary level scoring more than 60% marks. This is the best performance in the country. Also it shows an improving trend in the students’ performance over the years. This is commendable and certainly deserves appreciation. The State needs to maintain this trend of improvement and strive for universal quality education.
• Findings of NCERT Study on Learning Achievement (BAS & MAS)
Learning Achievement of Class III, V and VIII Students in Karnataka
Comparison between BAS & MAS - Class III
StatesMathematics Achievement Language AchievementBAS MAS Difference
(MAS-BAS)BAS MAS Difference
(M AS-BAS)Karnataka 68.45 59.66 -8.79 69.96 69.00 -0.96INDIANational Average
58.25 60.92 2.67 63.12 67.53 4.41
Difference 10.20 -1.26 - 06.84 1.47 -
Source: NCERT surveys
This table reflects a decrease in score of students in Mathematics. The State needs to look into this matter on priority basis and strengthen its Mathematics initiatives in early Primary grades.
Comparison between BAS & MAS - Class V
States Mathematics Language EVS
BAS MAS BAS MAS BAS MASECaraataka 46.03 57.48 58.63- 64.56 51.46 60.34
All India(National Average)
46.51 48.46 58.57 60.31 50,30 52.19
Difference -0.48 9.02 0.06 4.25 1.16 8.15
Source: NCERT surveys
This table reflects improvement in both BAS and MAS. However the scores are not promising and need to improve further.
82

Comparison between BAS & MAS - Class VIII
States Mathematics Language Science Social Science
BAS MAS BAS MAS BAS MAS BAS MASKarnataka 43.30 40.57 63.68 51.73 46.47 41.53 59.96 47.80All India (National Average)
39.17 41.50 53.86 56.13 41.30 41.75 46.19 46.94
Difference 4.13 -0.93 9.82 -5.60 5.17 -0.22 13.77 0.86Source: A Baseline Study (Oct 2006) and Midterm Assessment Study - NCERT, New Delhi. (NCERT BAS and MAS)
It is a matter of concern tliat students have scored less in MAS than in BAS at class VIII level. The State needs to look at the learning difficulties identified by the NCERT study and try to strengthen all inputs and processes focusing on those learning difficulties. This is the only way to improve performance of students in the future tests.
At the same time, the State has undertaken own learning achievement surveys to study the learning levels of students in the State. Findings of the study are discussed below.
KSQAO Analysis:
5*** StandardSubject Medium
Kannada Urdu Marathi Tamil Telugu1st Language 68.74 70.77 77.35 67.76 67.20Ilnd Language 73.04 75.56 78.07 68.18 72.57Mathematics 67.07 71.55 77.04 69.92 65.43Science 71.55 73.85 78.21 65.05 65.41Social Science 67.60 71.18 75.50 - 63.57 62.86Part-B 77.65 76.69 81.68 72.99 71.41Total 70.95 73.27 77.97 66.25 67.48
Source: KSQAO surveys
7*** StandardSubject Medium
Kannada Urdu Marati Tamil Telugu1st Language 71.98 74.17 80.84 68.07 70.91Ilnd Language 72.46 75.89 78.97 69.91 74.10Mathematics 65.29 70.21 74.73 62.69 56.54Science 72.62 74.78 80.36 65.64 63.98Social Science 67.58 70.25 74.23 63.21 61.28Part-B 78.88 76.91 81.63 75.52 72.36Total 71.47 73.46 78.21 67.12 67.17
Source: KSQAO surveys
83

In the State’s own studies (KSQAO) score of the students is ok. One must appreciate that every year in the month June the State authorities along with teachers across the State take oath the following way to ensure that quality education is ensured. Following are some of the State’s commitments officially.
KARNATAKA SCHOOLS TOWARDS QUALITY EDUCATION
CHARTER
The agreed goals have been expressed and declared in the form of a ‘Quality charter’. At the State level the charter was signed by the Hon’ble Chief Minister, Minister for Primary& Secondary Education, top level officers of the department, representatives of the community. Office bearers of teachers association, etc. in a public function held at Vidhana soudha on 15th of June 2006.
Education, especially Elementary Education (Class 1 through 8), has been recognized as the key factor in Human Development. Education is both a means to socio-economic development as well as an end in itself, creating educated and responsible members of society and citizens of the country.
We, the Government of Karnataka and the Education Department of the State, working closely with other stakeholders - parents, communities and civil society representatives, have had success in providing schools and in enrolling children in primary schools. However we still have some way to go in the area of Quality of Learning. We recognize that Quality is in itself, possibly the most significant factor in ensuring attendance and retention of our children in schools.
The Annual Oath is as follows:
We hereby commit ourselves and our fellow citizens of Karnataka, to achieve the following goals cumulatively, in each and every Government and aided primary and higher primary school in the State by April 2008 - 09• Enrolment of 6 to 14 age group of children• Ensuring 75% attendance• Ensuring 60% of enrolled children achieving 80% of the prescribed competencies
We will need the support of every stakeholder to meet this huge challenge - the support of every parent whose child studies in our schools, the support of every other member of the community, the support of each and every teacher and head teacher in our schools. Every officer in the Department will need to dedicate every ounce of energy and creativity to make this dream a reality. We will also need the support of philanthropic institutions and organizations in adopting our schools and helping them acquire required infrastructure support.
Our starting point is the Karnataka Schools towards Quality Education program. The KSQAO assessment done has provided us detailed information on the current state of learning quality in each school. All our offices will use this valuable information to design and implement the steps we need to take at various levels -class, school, cluster, block. District and State to ensure that every child in the state has acquired the understanding and learning expected of
84

her/him. This assessment shall be held every year and provide us regular feedback for improvement in delivery of quality learning.
We shall regularly communicate our plans and our actual achievements, both successes and failures with each of our stakeholders and take your inputs towards achieving Quality Learning in every school in our state. We look forward to making this challenging and exciting journey with each of you.
Honorable Minister for Primary Ministerand Secondary Education, KarnatakaGovernment of Karnataka
State Project Director,Sarva Shiksha Abhiyan Education
Honorable Deputy Chief Minister Honorable Chief
Government of Karnataka Government of
Commissioner,Department of Public Instruction
Secretary, Primary and Secondary
Director, DSERT Director, Primary Education Director, Other Exams
Signing of similar charter and declaration of commitment towards achievement of quality in education has been made at all the ZillaPanchayats, Taluk Panchayats, Gram Panchayats and all the schools of the state vnvoWvng officials of the department, teachers, SDMCs and elected representatives at different levels.
Observations on Learning Achievement (LA) Surveys:
SI.No.a.
Components
Nature and frequency of Learning Achievement Surveys in the State (NCERT’s national learning achievement surveys, other surveys of similar nature, state’s own annual learning achievement surveys, etc.)
Approach
At present the State conducts KSQAO for selected classes every year. In2008 - 09 the State undertook tests for classes 5,7 and 8 . In rest of the classesteachers undertake tests to assess performance of students indifferent subject areas.
Strength
the
of
are
Based on satisfactory acquisition competencies children categorized into A (achievers) and B (non - achievers). Non - achievers are provided remedial support before and after regular classes to enhance their understanding and skill acquisition.
Limitation
The State does not have a detailed profile o f students’ learningachievement in different subjects through an external assessment survey. KSQAO in 2008 -09 was limited to classes 5 ,7 and 8 .
Recommendation
There is a need fo undertaking aiexternal learnin; assessment survey fo each class (even if oi sample basis) to knov the learnin;achievement ostudents along witi their learnin?difficulties in differen subject areas and alsi factors affecting thi learning difficultie; for each class. Basei on the issues related ti students’ learning, al the inputs am processes can b suitably designed.A study may__bb. L A of students (subject Presently the State Results
85
are Similar results are
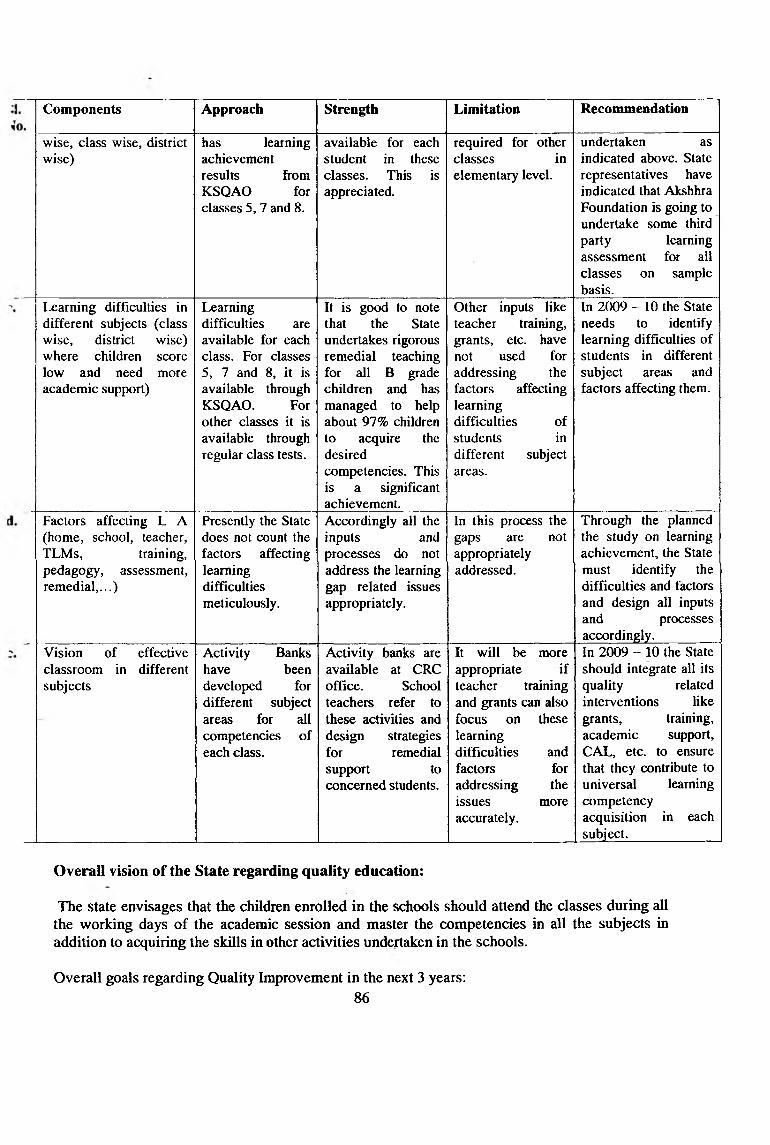
Components Approach Strength Limitation Recommendation
wise, class wise, district wise)
has learning achievement results fromKSQAO for classes 5, 7 and 8.
available for each student in these classes. This is appreciated.
required for other classes inelementary level.
undertaken asindicated above. State representatives have indicated that Akshhra Foundation is going to undertake some third party learningassessment for all classes on sample basis.
Learning difficulties in different subjects (class wise, district wise) where children score low and need more academic support)
Learningdifficulties are available for each class. For classes 5, 7 and 8, it is available through KSQAO. For other classes it is available through regular class tests.
It is good to note that the State undertakes rigorous remedial teaching for all B grade children and has managed to help about 97% children to acquire the desiredcompetencies. This is a significant achievement.
Other inputs like teacher training, grants, etc. have not used for addressing the factors affecting learningdifficulties of students indifferent subject areas.
In 2009 - 10 the State needs to identify learning difficulties of students in different subject areas and factors affecting them.
Factors affecting L A (home, school, teacher, TLMs, training,pedagogy, assessment, remedial,...)
Presently the State does not count the factors affecting learning difficulties meticulously.
Accordingly all the inputs andprocesses do not address the learning gap related issues appropriately.
In this process the gaps are not appropriately addressed.
Through the planned the study on learning achievement, the State must identify the difficulties and factors and design all inputs and processes accordingly._________
Vision of effective classroom in different subjects
Activity Banks have beendeveloped for different subject areas for all competencies of each class.
Activity banks are available at CRC office. School teachers refer to these activities and design strategies for remedialsupport toconcerned students.
It will be more appropriate if teacher training and grants can also focus on these learningdifficulties and factors foraddressing the issues moreaccurately.
In 2009 - 10 the State should integrate all its quality related interventions like grants, training, academic support, CAL, etc. to ensure that they contribute to universal learning competency acquisition in each subject._____________
Overall vision of the State regarding quality education:
The state envisages that the children enrolled in the schools should attend the classes during all the working days of the academic session and master the competencies in all the subjects in addition to acquiring the skills in other activities undertaken in the schools.
Overall goals regarding Quality Improvement in the next 3 years:86

• All the children enrolled in the schools remain in the system till they complete the elementary schooling.
• The learning of the children is enhanced by at least 10%every year.• Gender and social discrimination is eliminated.
Nature of desired pedagogic processes and learning environment for each subject area:
Language: Each class has sufficient pictorial and textual materials required for the children to learn to read and write. Teachers give sufficient opportunities for the children to master the language skills by engaging them in fruitful discussions, debates, elocution competitions etc. Sufficient number of reading books is available for children.
Mathematics: Teachers provide the children with low cost and no cost materials to practice the fundamental skills of mathematics like addition, subtraction, multiplication and division. Teachers organize melas in which children take part as sellers and buyers thus finding meaning in many of the mathematical aspects such as length, measures, weight, height, profit and loss, cost price, selling price, etc. thus making mathematics nearer to their life.
Science: The teachers go to the classroom with models, charts; live examples so that children do not only hear but also observe, collect data, develop critical thinking. The children learn many things by doing not by mere rote memorization. The teachers have large number of charts, models, and apparatus to conduct experiments in the classroom.
Social Science: Children engage themselves in discussions on the various historical, geographical and political aspects of their villages. The children gain hands on experience in various aspects by undertaking excursions, visits to post office, museums, railway station, bus station hills, rivers, valleys, etc.
Arts Education:Literary and cultural activities organized very frequently to draw out the cultural and literary talents in the children.
Development of Verifiable Learning Indicators class-wise and subject-wise;The monitoring and supervisory staff will be motivated to observe if the teachers are providing sufficient learning experiences to the children in various subjects; They will also guide the teachers on how to organize the learning experiences for children to draw out the best in them.
2. Designing of all inputs and related processes:
a. Community contribution to learning in 2008-09:As per the State and district plans, the State emphasizes on community cooperation for school development and learning enhancement. Following initiatives have been highlighted in the Plans.
• The Department appealed community to participate in the process of preparation and implementation Academic plan. (Each school was instructed to prepare School Academic Plan (SAP) by identifying the students who are below the expected level of learning and plan to improve their learning levels through defined strategies and activities.
• Accordingly, parents and community members assemble in the school on the eve of samudayadatta shale (School towards community) programme. During the programme, the
87
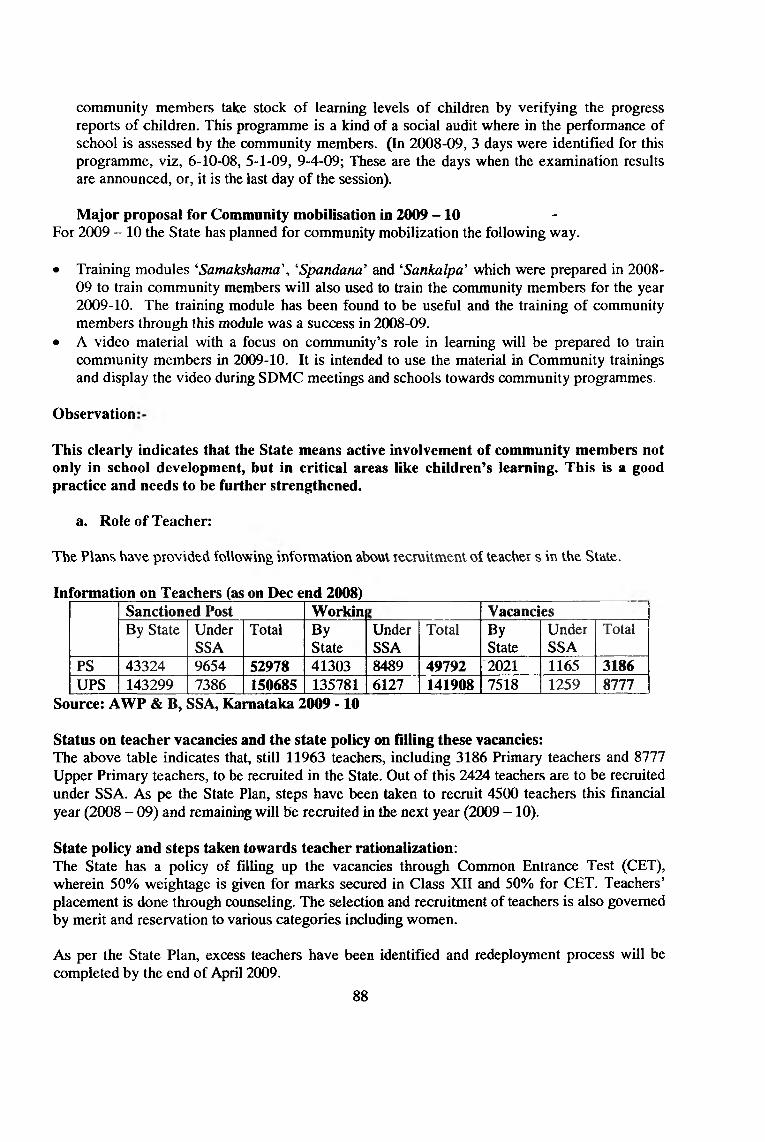
community members take stock of learning levels of children by verifying the progress reports of children. This programme is a kind of a social audit where in the performance of school is assessed by the community members. (In 2008-09, 3 days were identified for this programme, viz, 6-10-08, 5-1-09, 9-4-09; These are the days when the examination results are announced, or, it is the last day of the session).
Major proposal for Community mobilisation in 2009 - 10 -For 2009 - 10 the State has planned for community mobilization the following way.
• Training modules ‘Samakshama', ‘‘Spandana" and ‘Sankalpa' which were prepared in 200809 to train community members will also used to train the community members for the year2009-10. The training module has been found to be useful and the training of community members through this module was a success in 2008-09.
• A video material with a focus on community’s role in learning will be prepared to train community members in 2009-10. It is intended to use the material in Community trainings and display the video during SDMC meetings and schools towards community programmes.
Observation
This clearly indicates that the State means active involvement of community members not only in school development, but in critical areas like children’s learning. This is a good practice and needs to be further strengthened.
a. Role of Teacher:
The Plans have provided foUowmg mfovmation abouV lecniitmenl of leacher s in the State.
Information on Teachers (as on Dec end 2008)Sanctioned Post Workin VacanciesBy State Under
SSATotal By
StateUnderSSA
Total ByState
UnderSSA
Total
PS 43324 9654 52978 41303 8489 49792 2021 1165 3186UPS 143299 7386 150685 135781 6127 141908 7518 1259 8777
Source: AWP & B, SSA, Karnataka 2009 -10
Status on teacher vacancies and the state policy on filling these vacancies:The above table indicates that, still 11963 teachers, including 3186 Primary teachers and 8777 Upper Primary teachers, to be recruited in the State. Out of this 2424 teachers are to be recruited under SSA. As pe the State Plan, steps have been taken to recruit 4500 teachers this financial year (2008 - 09) and remaining will be recruited in the next year (2009 - 10).
State policy and steps taken towards teacher rationalization:The State has a policy of filling up the vacancies through Common Entrance Test (CET), wherein 50% weightage is given for marks secured in Class XII and 50% for CET. Teachers’ placement is done through counseling. The selection and recruitment of teachers is also governed by merit and reservation to various categories including women.
As per the State Plan, excess teachers have been identified and redeployment process will be completed by the end of April 2009.
88

Performance in reference to appointment of teachers:Recruitment is made on the basis of exclusive merit through computerized system. There shall be an examination, the results of which will be accounted for 50% and rest 50% will be from PUC and D. Ed. Examination. Entire process is transparent and exclusively merit oriented.
Recruitment of teachersSanctionef PAB till Oi
1 in W)9
Recruited by March 09
Honorarium in Rs. pm
Selected by
Regular Para Regular Para Regular Para State/ Distt./ Community
Primary 9654 0 9654 0 10,000 - DDPIUp. Primary 7386 0 7386 0 10,000 - DDPI
Source: AWP & B, SSA, Karnataka 2009 -10
Number of single teacher schools:As per DISE 2008 - 09, there are still 1969 single teacher schools.Strategies of the districts/ state for achieving the goal of no school with single teacher in2009-10:
The Plans indicated some important steps undertaken by the State Government for actualizing non- existence of single teacher schools in the State.
• GoK has initiated steps close down schools having strength less than 5 and to shift those children to nearby school by arranging transportation.
• Other schools having strength between 10 and 20 will be arranged with two teachers by shifting excess teachers. The process will be completed by the end of April 2009.
• Schools having 6 to 10 will be continued with single teacher at present.
This is a good initiative of the State and promises to bring down the number of single teacher schools.
Information on PTRNumber o schools in respect of PTR State>40 >50 >60 >70 >80 >100 PTR1657 409 132 51 43 50 28 : 1
Source: AWP & B, SSA, Karnataka 2009 -10
Requirement of teachers based on the enrollment of the current year (separately for PS and UPS):As per the existing PTRs, none of the districts qualifies to get additional teachers as the PTR is within 40:1. However, to introduce Nali Kali system the State needs to have one teacher over 30 children after re-deployment of excess teachers. Based on this equation, it needs a total of 19471 additional teacher posts. This figure includes up-gradation and additional TGTs also.
89

Total requirement of Additional teachers ( as per PTR of 40; 1)______
Number proposed in 2009-10 Gap
0 19471Source: AWP & B, SSA, Karnataka 20( 19-10
Observation:The Plans have indicated that after the KSQAO results and other learning achievement results are available the system looks forward to the teachers in their concerned schools to work on renewed and effective classroom processes to improve learning achievement of students. This reflects a commitment of the State to improved children’s learning. However, it is clearly seen that the State does not work on specific learning difficulties and ways to address them in an organized manner. Hence the pressure on the teachers is bound to be heavy without preparing them appropriately for the job. In this case the State needs to prepare bit more. It needs to look at the learning difficulties in each subject, class and area more carefully based students’ performance in the tests. Such issues need to be addressed in an organized manner through integrated inputs and processes related to grant utilization, teacher training, and academic support from CRCs, BRCs, etc. This is equally crucial to prepare the concerned teachers through renewed pedagogical approaches. Without empowering the teachers it may not be possible to do justice to children’s learning in all learning difficulties. The State needs to work on this issue this year onwards.
Regarding the necessity of additional teachers, the Appraisal Team agrees that a Nali Kali classroom with more than 30 children would not be effective enough to do justice to every child’s learning. At the same time, the Appraisal Team is constrained by the existing SSA norms and would not be able to recommend additional teachers. The Team would recommend for the foWowing nev' teachers:
i. 634 new Primary teachers against the new 317 schools to be opened.ii. 130 new Upper Primary teachers for the new UP schoolsiii. 450 new UP teachers for class VII of the newly opened UP schools in 2008 - 09.
This is an addition to the existing UP schools with only class VI.iv. Also the recurring salary for 23067 teachers is recommended for the existing
teachers.
• School readiness:
For improving the school readiness the State has undertaken several initiatives. Some of the significant initiatives are as follows.
In KSQAO, the State defines quality as “Enroll all eligible children and retain them in the system. They should qualify for promotion to the next class on performance.” This implies that there will be total admission in each school, total attendance, percentage of universal retention & desired marks/grades, universal promotion to next class. This has been officially declared by the State. As advocacy activities the State has promoted the following.
• Creating awareness in teachers through Shala Kaipidi (School handbook)• Brochures and posters to each school, offices and public• Pamphlets to parents and publics
90

• Awareness to officers / field workers through the programs -like - SATCOM based orientation and Face-to-Face - Mukhamukhi
• Public awareness through - Radio Samvada, Advertisement in FM Radio and Publication in News paper / Shikshana Varthe (Educational news)
For assessing the learning levels of students, the State undertakes School level examinations and a state level assessment through KSQAO. The assessment helps teachers to formulate School Academic Plan (SAP) which gives status of scholastic achievement of every child subject wise and competency wise. In addition to this, DSERT has prepared a guideline with fundamental competencies for every class subject wise and conducts divisional level workshops to identify the children who have not attained the expected levels of competencies.
For the same, processes of identification have been narrated in the Plans as follows.
• Pre test is conducted on the basis^of DSERT Guidelines and children are classified into two categories, Grade-A and Grade-B. Grade A children are those who have attained 100% in all the competencies. Grade-B children are those who have not attained 100% .
• KSQAO Assessment results are considered for classes 5 and 7
• Semester examinations of March-2008 examinations
All the children in Grade - B are provided remedial teaching and mainstreamed. School Academic Plan with time line is prepared to develop competencies and also to mainstream children.
In 2008 - 09, the remedial teaching activity was initiated in tiie state from July 2008. All the schools have prepared Academic Plan as per the guidelines and training given by the DSERT and also children who needed the additional academic support.Remedial teaching classes were conducted either one hour before or after the school hours. DIETS have prepared Activity Banks to enable the teachers for the activities of remedial teaching ^
• Activity Banks prepared by DIETs are used• Reading cards, activity banks were used.• Exposure visits, guest teacher classes were organized. Stationary like copy books, note
books pens, pencils, crayons geometry box provided to children.• Priority was given to SC, ST, children, girl child and minority children.• Monitoring of the programme was done through external agency• Evaluation of the prograirmie is in the progress
This way there was a pressure on each school to identify the low performing learners and extend the desired remedial teaching to each one as per her requirement. This certainly required lot of preparation at the school level in terms of materials, teachers, activities and assessment.
As per the Plans, the schools will reopen after summer vacations to the academic session 200910 during the last w ^k of May 20(j9. The textbooks and other incentives such as uniforms, school bags etc. will all be supplied to the schools before the last week of May 2009. A meeting of the School Development and monitoring Conmiittee will be held during the last week of May
91

2009 and the parents will be persuaded to send their wards to the schools on the very first day of reopening of the school.
Advertisements will also be given in the news papers of state and regional circulation on the reopening of the schools, importance of education and the public will be appealed to send their wards without fail to schools. A{^)cals from the political dignitaries will also be published in the news papers. ~
Each school develops a School Academic Plan for the academic year. The slow learners and the learning deficiencies shall be identified and measures taken to address the same.The school grant and teacher grant will also be distributed to the concerned during the first week of June 2009. The teachers will be encouraged to use the same and make the schools, classes interesting and attractive for the children.
The community also engages themselves in identifying the children not enrolled in the schools, persuades the parents to enroll their wards to schools and in admitting the child to schools. It also collects the materials required for their schools by voluntary donations and contributions.
This is a good practice of the State which needs to be further strengthened by appropriately identifying learning difficulties of each students and factors contributing to them. This has already been discussed before.
■ Curriculum and textbooks:
Information about Curriculum/ Syllabus
Stage Curriculum developed by
Year of renewal
WhetherPublished
Available with Tr. Trainers
A\ai\ablewithSchools/Trs.
Based on Plans for further renewal
Primary DSERT 2008-09 To be published
To be circulated
To be circulated
NCF2005
RecentlyrevisedU. Pry. DSERT 2008-09
Source: AWP & B, SSA, Karnataka 2009 -10
Languages in which textbooks are published: The State Plan has indicated that textbooks have been published in all South Indian languages including Tamil, Telugu, Hindi, Urdu, Malayalam, English and Kannada.
Development of textual materials:The following table throws light on the status of textbooks.
Information about Textbooks
ClassTextbooksdevelopedby
Year of Publicat ion
Year of renewal
No. of Books
Cost of total set of text, books*
Plansforrenewal
Class I DSERT 2000-01 - 04
81.86
2009-10Class II DSERT 2000-01 - 04 2009-10Class III DSERT 2001-02 - 04 2009-10Class rv DSERT 2001-02 - 04 2010-11Class V DSERT 2001-02 - 05 2010-11
92

ClassTextbooksdevelopedby
Year of Publicat ion
Year of renewal
No. of Books
Cost of total set of text books*
Plansforrenewal
Class VI DSERT 2002-03 06 2011-12Class VII DSERT 2003-04 06 123.77 2011-12Class VIII DSERT 2002-03 07 2011-12
Source: AWP & B, SSA, Karnataka 2009 -10
* includes workbooks.Note:l) Prior to 1-4-2006 DSERT was the agency for publication of text books. W.e.f. 1-4
2006The Karnataka Text Book Society ® came into existence.
2) Text books are published in Kannada, English, Hindi, Urdu, Marathi, Telugu, Tamil,Malayalam, Konkani, Kannada, & Konkani, Devanagari.
3) DSERT continues to be the agency for curriculum and syllabus designing and renewal
Textbooks in 2008 - 09 have been provided to all children on time, i. e., books were available in schools before it opened for the new session. This is reflected in following tables. State Government has provided free textbooks to all Government school children from own budget. Free textbooks from SSA budget are being provided to children (classes I to YllI) in Government aided schools and Nali Kali schools (only for self learning materials in form of TLMs and workbooks for classes I and II of all schools including Government and Government aided ones). Till now textbooks for classes I and II were provided to all Government school children from State budget This year the same is being asked from SSA.
Timeliness of Distribution of Free TextbooksStage Academic session
begins fromDate of distribution in 2008-09
Proposed date for distribution in 2009-10
PS 1st of June May 2008 April 2009UPS 1®‘ June
Source: AWP & B, SSA, Karnataka 2009 -10
Target, Achievement & ProposalTarget for 2008-09 Achievement in 2008-09 Proposal for 2009-10Physical Financial Physical Financial Physical Financial
PS 245958 327.047 245958 327.047 437537 371,906UPS 610361 653.595 610361 653.595 472852 638.35
Source: AWP A B, SSA, Karnataka 2009 -10
Recommendation: The Team recommends the proposal of the State to provide free textbooks to children in Government - aided schools as proposed.
■ Use of Teaching Learning Materials:Progress and utilization of school grant and TLE grant in 2(X)8-09:
Overall progress of Grant Distribution (Teacher grant, School grant, TLE grant)
93

Distribution of Grants Progress in 2008-09 Proposal10
for 2009-
PhysicalTarget
Achievement Percentage of Achievement
Physical Financial
a. Teacher grant @ Rs. 500/- per teacherPrimary level 60512 60512 100% 54167 270.835Upper Primary level 166497 166497 100% 192085 960.425b. School grantPrimary level @ Rs. 5000 per school 47623 47623 100% 48341 2417.05Upper Primary level @ Rs. 7000 per school
23198 23198 100% 24434 1710.038
c. TLE grantNew Primary schools© 20,000/-per school
313 313 100% 317 63.40
New Upper Primary schools© 50,000/per school
450 450 100% 525 262.500
Source: AWP & B, SSA, Karnataka 2009 - 1(9
Progress of effective use of TLM grants in 2008-09: As per the Plans, all the Primary and Upper primary schools provided with TLM grants utilised the funds as per the guidelines. In 2008-09, the State office developed a guidebook regarding the utilisation of different grants in an effective manner.
Plans for effective utilization of TLM, school grant and TLE grant in 2009-10:
As per the Plans, Ihc TLM grant, school giant and teacher grant will be distributed to the concerned during the first week of June 2009 through the SDMCs. The teachers will be encouraged to use the same and make' the schools, classes interesting and attractive for the children. The utilization of the school grant will be monitored by the SDMCs. The community also collects the materials required for their schools by voluntary donations and contributions. The teachers will be oriented on the preparation of Teaching Learning Materials at the Cluster Level Sharing Workshops organized during that month. Best practices will be show cased and the teachers will be motivated to develop the TLMs according to their requirements.
Recommendation: —Keeping in view the good progress of the State in 2008 - 09, the Appraisal Team recommends the proposal of the State for grants as proposed for PAB approval.
• Active pedagogy:
Regarding the desired shifts in teacher instructional time, student learning opportunity time, and active student participation in the classroom processes, the State Plan has indicted following new developments in approach to classroom pedagogy: Trainings in vacation only, proper utilisation of instructional time through training and teaching and learning materials prepared by the teachers themselves.
As a strategy towards this the Plans have proposed the following activities under LEP in 2009 - 10:
94

Primary level: .■ Extension of Nali Kali to all government schools for classes 1 and 2 from the year 2009-10
and for class 3 and 4 from 2010-11.■ Language cum Mathematics cum EVS Kit for class 1 and 2 to be used in Nali Kali
Methodology
Upper Primary level:■ Preparation of Mathematics and Science Kits for upper primary schools■ Preparation of Maths, posters for Upper Primary level
Learning Enhancement Programme (Pr>'.);The Plans have indicated that,• Reading card programme is already implemented in the state in the name of Oduve Nanu (I
read) in all districts in all Primary schools.• To make classroom transaction activity based in class 1 and 2 Nali Kali method is going to
be implemented in all the govenunent schools
Learning Enhancement Programme (Upper Pry.):• To make Science and Mathematics Teaching activity oriented and learning guarantee Science
and Mathematics Mela, Quiz programs are proposed• The State has also proposed to constitute Resource Groups at District, Block and Cluster
level to provide man to man support and online teacher support• The Stale has also proposed to develop Kits, Teacher manuals in science and mathematics
Salient features of the Learning Enhancement ProgrammeGoals related to quality improvement in 2009-10
Major activities under LEP
Type of materials required
ExpectedLearningoutcomes
Coverage (No. of districts, schools & children)
UnitCost
Total Cost in Rs. in lakh
Primary level 0Development of Nali kali kit for strengthening basic reading, writing and numeracy skills at classes 1 and 2
Providing LearningmaterialsProvidingLanguage cum Mathematics Kit
ActivitycardsReadersTLM
A ll children will achieve expected level of achievement ofcompetencies
All government schools in the state (45000 schools)
R s4000 1800.00(LEP)
Nali Kali materials for Classes 3 and 4
Printing and supplying Learning Materials
Activitycards
A ll children w ill achieve expected level of achievement ofcompetencies
All government schools in the state (45000 schools)
Rs. 4000 1800.00(Schoolgrant)
Upper PrimaryMaking class room transaction activity based and child
Development.2. PreparationMathematicsposters.
All children will achieve expected level of
All government schools in the state (23,223 schools)
Rs. 500 116.115(LEP)
95

Goals related to quality improvement in 2009-10
Major activities under LEP
Type of materials required
ExpectedLearningoutcomes
Coverage (No. of districts, schools & children)
UnitCost
Total Cost in Rs. in lakh
Primary level 0
centered achievementofcompetencies
Reducing the learning gap in subjects Science andMathematics
Science Kit Guidelines
All government schools o f the state(23,223 schools)
Rs 617.3 143.356(LEP)
Total 2059.471Source: AWP & B, SSA, Karnataka 2009 -10
Information about Learning Enhancement programmeSNo.
District Cost for Learning Enhancement programme
% Cost to total outlay of District
1. Bagalkot 97.50 2%2. Bangalore Rural 25.20 2%3. Bangalore Urban 98.00 2%4. Belgaum 154.25 2%5 Bellary 120.50 2%6 Bidar 75.00 2%7 Bijapur 104.00 2%8 Chamarajanagar 31.80 2%9 Chikballapura 47.00 2%0 Chickmagalore 49.00 2%11 Chitradurga 60.00 2%12 D.K 52.00 2%13 Davanagere 56.90 2%14 Dharwad 42.00 2%15 Gadag 41.50 2%16 Gulbarga 203.00 2%17 Hassan 48.50 2%18 Haveri 61.25 2%19 Kodagu 21.50 2%20 Kolar 43.50 2%21 Koppal 72.59 2%22 Mandya 36.50 2%23 Mysore 81.00 2%24 Ramanagara 33.00 2%25 Raichur 129.08 2%26 Shimoga 59.00 2%27 Tumkur 90.00 2% .28 Udupi 26.40 2%29 Uttarakannada 99.50 2%
Total 2059.47Source: AWP & B, SSA, B m a ta k a 2009 -10
96
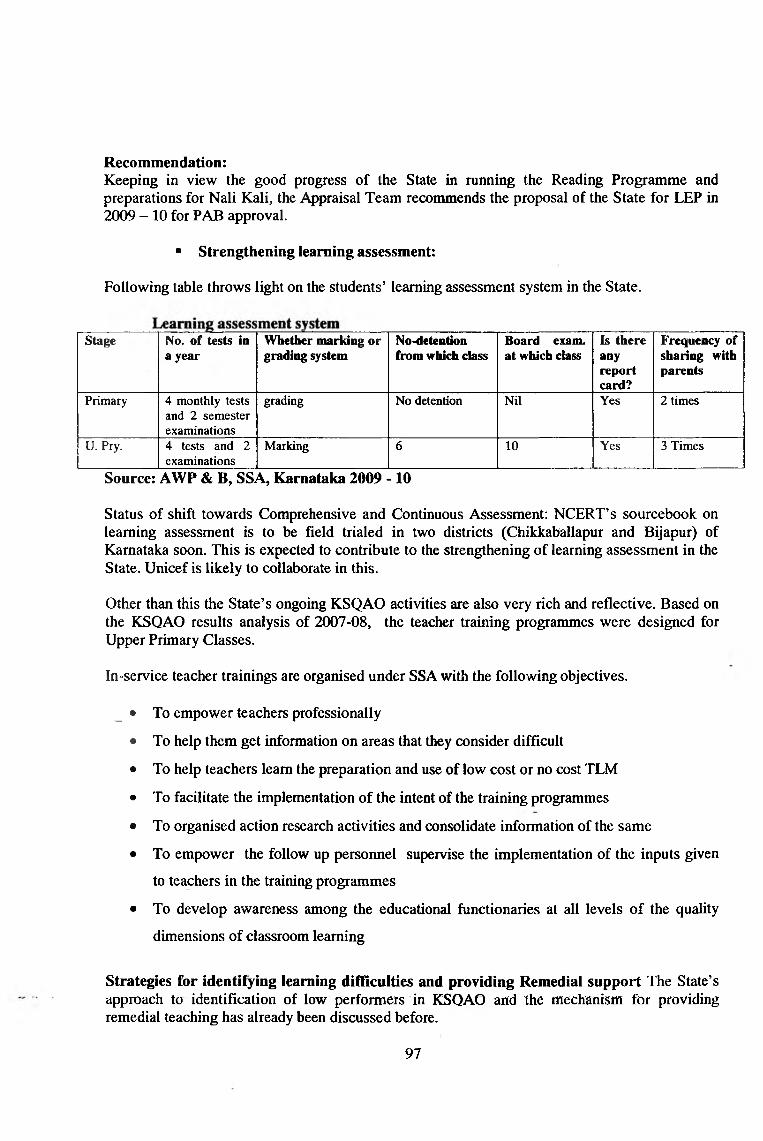
Recommendation:Keeping in view the good progress of the State in running the Reading Programme and preparations for Nali Kali, the Appraisal Team recommends the proposal of the State for LEP in 2009 - 10 for PAB approval.
■ Strengthening learning assessment:
Following table throws light on the students’ learning assessment system in the State.
Stage No. of tests in a year
Whether marking or grading system
No-detention from which class
Board exam, at which class
Is there any report card?
Frequency of sharing with parents
Primary 4 monthly tests and 2 semester examinations
grading No detention Nil Yes 2 times
U. Pry. 4 tests and 2 examinations
Marking 6 1 0 Yes 3 Times
Source: AWP & B, SSA, Karnataka 2009 -10
Status of shift towards Comprehensive and Continuous Assessment; NCERT’s sourcebook on learning assessment is to be field trialed in two districts (Chikkaballapur and Bijapur) of Karnataka soon. This is expected to contribute to the strengthening of learning assessment in the State. Unicef is likely to collaborate in this.
Other than this the State’s ongoing KSQAO activities are also very rich and reflective. Based on the KSQAO results analysis of 2007-08, the teacher training programmes were designed for Upper Primary Classes.
In-service teacher trainings are organised under SSA with the following objectives.
_ • To empower teachers professionally
• To help them get information on areas that they consider difficult
• To help teachers learn the preparation and use of low cost or no cost TLM
• To facilitate the implementation of the intent of the training programmes
• To organised action research activities and consolidate information of the same
• To empower the follow up personnel supervise the implementation of the inputs given
to teachers in the training programmes
• To develop awareness among the educational functionaries at all levels of the quality
dimensions of classroom learning
Strategies for identifying learning difficulties and providing Remedial support The State’s approach to identification of low performers in KSQAO and the mechanism for providing remedial teaching has already been discussed before.
97

The following table shows progress of remedial teaching in 2008-09.
Progress of remedial teachingFund allocated in
2008-09 in Rs. lakhPhysical Target'
(Children)Physical
achievement till Mar. 2009
Financial achievement till
Mar. 2009
% of achievement
Physical Financial
1748.97 349789 349789 1748.97 100% 100%Source: AWP & B, SSA, Karnataka 2009 -10
Plan for Remedial Teaching in 2009-10:Proposed budget: It is proposed to take up this activity with physical target of 379955 children with a unit cost of Rs. 500/- child amounts to Rs. 1899.776 Lakhs. The State has proposed to utilise this amount for the development of Science and Mathematics kit for Upper Primary and for Nali Kali programme.
In 2009 - 10, the State proposes to undertake remedial teaching for 10% of children of the total enrolment. The State Plan has indicated that in previous years, the learning time and instruction time was increased by one hour a day in all the schools. This year it is proposed to enable teachers to teach effectively and students to learn better.
The activities proposed under this intervention is
1. This year the State aims to work on Mathematics and Science subjects. The teachers will be enabled to teach Science and Matnematics by providing them manuals, kits and additional trainings.
2. On the basis of the Science and MalViema\ics kils developed by NCERT workshops will be conducted to teachers at the district level and all the upper primary schools will develop their own Kits
3. Early reading programme of NCERT will be piloted in 4 districts for classes 3 and 4 as the Nali Kali programme addresses this in class 1 and 2.
4. The SC, ST, Muslim minority and gjrl children identified will be provided stationery like Notebooks, Copy writing book, Geometry box, Crayons, Pencil, Pen etc.,
5. Reading cards supplied during 2008-09 will be used for the improvement of reading skills in children '
6. A special programme to improve the writing ability was launched during February 2009 in all the schools. This programme will be continued for this year too with the help of community and parents.
As per the State Plan, unit cost for the intervention will be Rs. 500 per child which amounts to Rs 1965.115 lakh.
Recommendation:The Appraisal Team appreciates the initiatives of the State to identify the learning gaps the rigorous remedial practices in classrooms across the State. At the same time, it is bound by the SSA norms while recommending for remedial teaching in the State in 2009 - 10. Keeping in view the good performance of the State in 2009 -1 0 , the Team recommends for remedial teaching for children in 5% of the schools @ Rs. 200 per child.
98
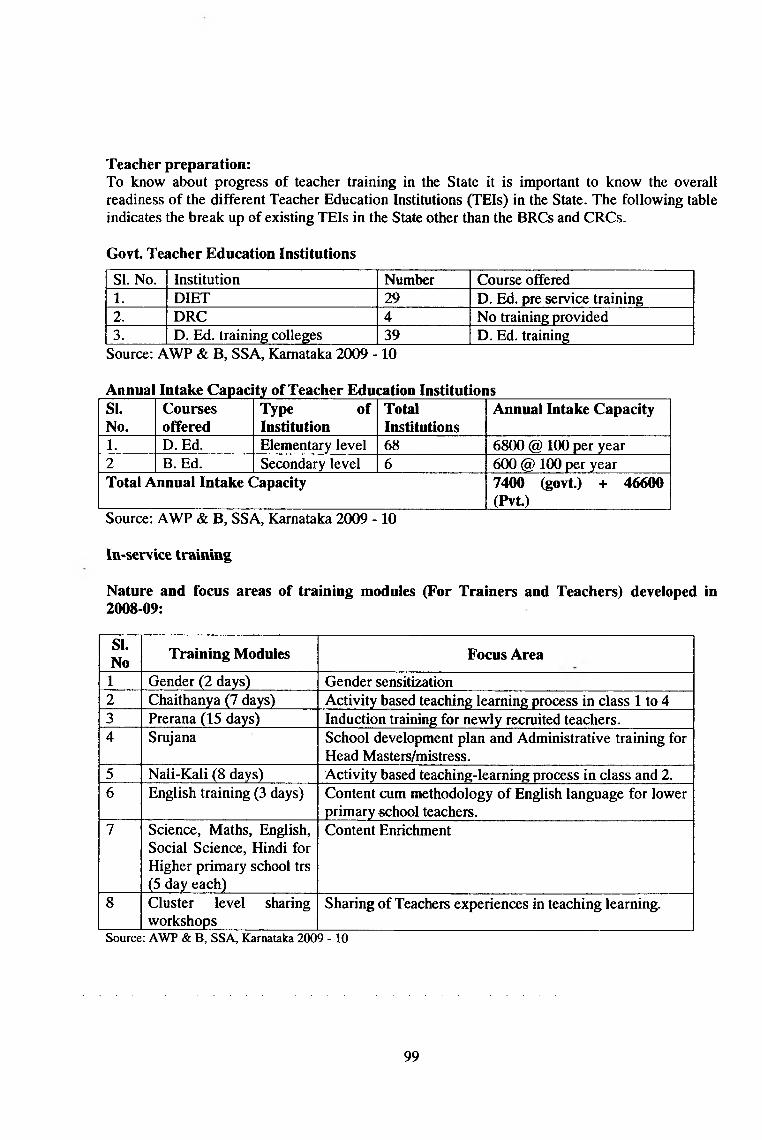
Teacher preparation:To know about progress of teacher training in the State it is important to know the overall readiness of the different Teacher Education Institutions (TEIs) in the State. The following table indicates the break up of existing TEIs in the State other than the BRCs and CRCs.
Govt. Teacher Education Institutions
SI. No. Institution Number Course offered1. DIET 29 D. Ed. pre service training2. DRC 4 No training provided3. D. Ed. training colleges 39 D. Ed. training
Source: AWP & B, SSA, Karnataka 2009 -10
Annual Intake Capaci ty of Teacher Education InstitutionsSI.No.
Coursesoffered
Type of Institution
TotalInstitutions
Annual Intake Capacity
1. D.Ed. Elementary level 68 6800 @ 100 per year2 B. Ed. Secondary level 6 600 @ 100 per yearTotal Annual Intake Capacity 7400 (govt.) + 46600
(Pvt.)Source: AWP & B, SSA, Karnataka 2009 -10
In-service training
Nature and focus areas of training modules (For Trainers and Teachers) developed in 2008-09:
SI.No Training Modules Focus Area
1 Gender (2 days) Gender sensitization2 Chaithanya (7 days) Activity based teaching learning process in class 1 to 43 Prerana (15 days) Induction training for newly recruited teachers.4 Srujana School development plan and Administrative training for
Head Masters/mistress.5 Nali-Kali (8 days) Activity based teaching-learning process in class and 2.6 English training (3 days) Content cum methodology of English language for lower
primary school teachers.7 Science, Maths, English,
Social Science, Hindi for Higher primary school trs (5 day each)
Content Enrichment
8 Cluster level sharing workshops
Sharing of Teachers experiences in teaching learning.
Source: AWP & B, SSA, Karnataka 2009 -10
99

Break-up of In-service Trainings conducted during 2008-09
SI.No
Activity(training) Target group Duration Physical
Target Level
1 Gender In service Trs 02 162051 LPS and HPS2 Chaithanya In-service teachers and
Newly recruited Trs7 6146 LPS
3 Prerana Newly recruited Trs 15 6146 LPSHPS
4 Srujana Head Teachers 05 220005 Nali-Kali In-Service Trs 08 28000 LPS6 English In-Service Trs 02 93706 LPS7 English In-Service Trs 05 93706 HPS8 Hindi In-service Trs 04 68345 HPS9 Cluster
Leveltrainings
All teachers 01 227009 LPS and HPS
Source: AWP & B, SSA, Karnataka 2009 - 10
Induction training
Progress of Induction Teacher Training (During 2008-09)
Stage Duration of training (detailed break up)
Teachers recruited (up to end March
2008)
Teachers trained (up to March
2008)
Percentage of Achievement
1 Prerana Chaitanya (Activity based teaching-learning cluster level sharing workshop
Nil 9640 (Teachers recruited in the year 2008-09 are trained)
11.7 man days of Training
Source: AWP & B, SSA, Karnataka 2009 -10
Training of Untrained TeachersIt is good to note that there are no un-trained teachers in the State. Hence there is no need for training as well.
Type of training
Tai^et foi 200
' training in 8-09 Achievement % of achievement T ai^t for 2009-10
Physical Financial Physical Financial Physical Financial Physical FinancialIn
service 227009 31.78 27.00 14mandays 80.33 246252 3078.15
Induction 6148 184.38 6148 118.00 11.7 mandays 63.9 11088 332.64
, Untrained No Jntrained teachers in the StateSource: AWP & B, SSA, Karnataka 2009 -10
100

Proposal for In-service Training for 2009-10:The following areas have been identified for providing inputs in the year 2009-10
SINo Programmes Target groups Days
New programmes for 2009-101 Analysis and Teacher’s Resource Books and
Student’s Activity Books for classes 1-4________1-4 teachers 04
Evaluation Training Trs of LPS/HPS 03Hindi - Kali-Khili Part II Trs of HPS 04Jeevan Vijnana II Trs of HPS 05Bimba II (gender training) Trs of HPS 03Chaitanya II (Kannada & Social Sciences) Trs of HPS/LPSTOT 07Chaitanya II (Science and Mathematics) Trs of HPS/LPS/TGT 07
8 Chaitanya II - English TrsofHPS/LPSTOT 07Chaitanya III (8 subjects taught in HS) TrsofHS 04Nali-kali TrsofLPS 09
10 Eradication of Child Labour TrsofHPS/LPSATGT 0111 Learning of Special Children Trs of HPS/LPS/TGT 05Programmes continued from the previous years1 Hindi - Kali-Khili Part I Trs of HPS 04
Jeevana Vijnana I Trs of HPS 05Nannolagina Nanu TrsofLPS 03Bimba I (Gender Training) Trs of LPS/HPS 02
Source: AWP & B, SSA, Karnataka 2009 - 10
Altogether it will be 20 days training, (as per SSA norms)
The objectives of the above programmes are as follows.
i. Analysis and Teacher’s Resource Books and Student’s Activity Books for classes 1-4:English has been introduced from classes 1-4 from the year 2007-08. For this purpose Teachers Resource Books, and Student’s Activity Books have been supplied. Monthly teleconferences covering all teachers teaching 1-4 English were also organised for providing on going support. However, teachers seem to find it difficult to implement the programme making use of the resource books and coordinating them with the student’s activity books. In the year 2009-10 the revised editions of these books are going to be supplied. Hence it was felt that a training programme in this regard would be of much use to the teachers. The training is organised at three levels
• State Level Training of RPs - 5 RPs X 33 Ednl Dist = 165 RPs• Dist Level Training - 5 RPs X 202 Blocks = 1010 RPs• Block Level - All teachers teaching 1-4 English in all government and aided schools
Objectives:a. To educate the teachers in coordinating the Teacher’s Resource Books and the Student’s
Activity Booksb. To help teachers use the Resource Books for their own empowerment
101
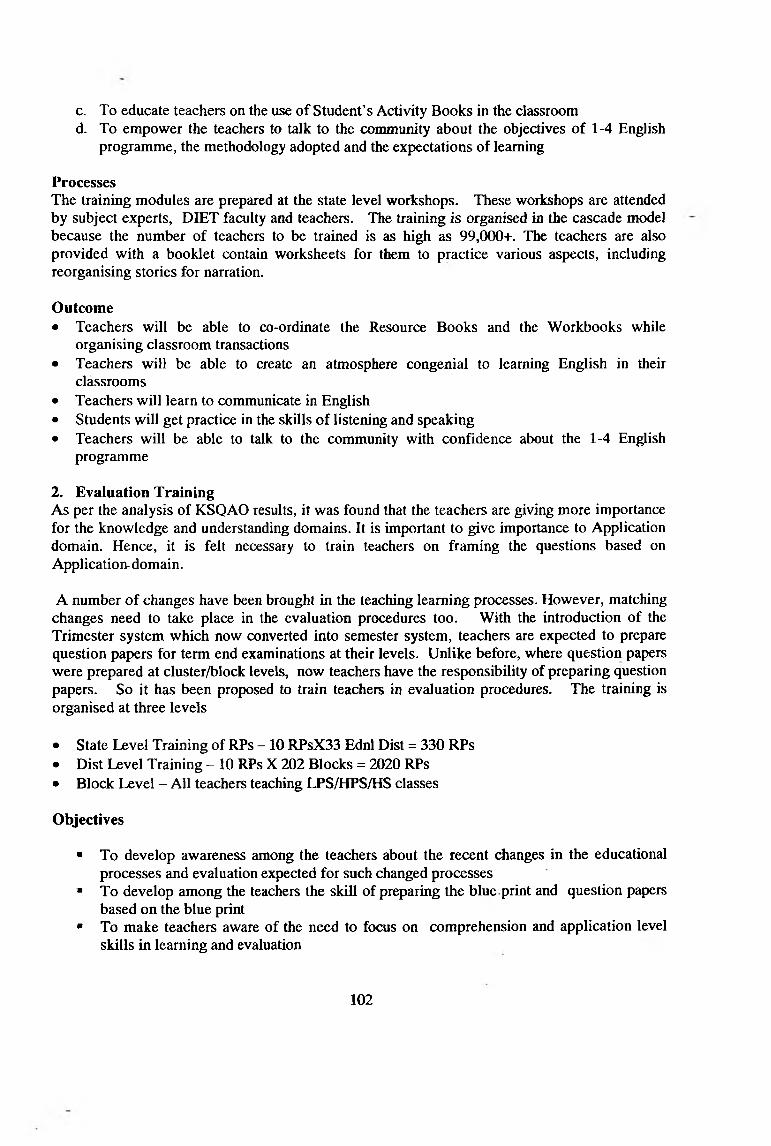
c. To educate teachers on the use of Student’s Activity Books in the classroomd. To empower the teachers to talk to the community about the objectives of 1-4 English
programme, the methodology adopted and the expectations of learning
ProcessesThe training modules are prepared at the state level workshops. These workshops are attended by subject experts, DIET faculty and teachers. The training is organised in the cascade model because the number of teachers to be trained is as high as 99,000+. The teachers are also provided with a booklet contain worksheets for them to practice various aspects, including reorganising stories for narration.
Outcome• Teachers will be able to co-ordinate the Resource Books and the Workbooks while
organising classroom transactions• Teachers will be able to create an atmosphere congenial to learning English in their
classrooms• Teachers will learn to communicate in English• Students will get practice in the skills of listening and speaking• Teachers will be able to talk to the community with confidence about the 1-4 English
programme
2. Evaluation TrainingAs per the analysis of KSQAO results, it was found that the teachers are giving more importance for the knowledge and understanding domains. It is important to give importance to Application domain. Hence, it is felt necessary to train teachers on framing the questions based on Application^ domain.
A number of changes have been brought in the teaching learning processes. However, matching changes need to take place in the evaluation procedures too. With the introduction of the Trimester system which now converted into semester system, teachers are expected to prepare question papers for term end examinations at their levels. Unlike before, where question papers were prepared at cluster/block levels, now teachers have the responsibility of preparing question papers. So it has been proposed to train teachers in evaluation procedures. The training is organised at three levels
• State Level Training of RPs - 10 RPsX33 Ednl Dist = 330 RPs• Dist Level Training - 10 RPs X 202 Blocks = 2020 RPs• Block Level - All teachers teaching LPS/HPS/HS classes
Objectives
■ To develop awareness among the teachers about the recent changes in the educational processes and evaluation expected for such changed processes
' To develop among the teachers the skill of preparing the blue print and question papers based on the blue print
■ To make teachers aware of the need to focus on comprehension and application level skills in learning and evaluation
102

ProcessesThe training modules are prepared at the state level workshops. These workshops are attended by subject experts, DIET faculty and teachers. The training is organised in the cascade model because the number of teachers to be trained is very high. The teachers are given on hand experiences in preparing blue prints and question papers.
Outcome1. Teachers will develop awareness about the need to reorient themselves to changed views
of classroom learning and evaluation procedures2. Teachers will be able to facilitate the skills of application of classroom learning into real
life situations among children3. Teachers will understand the importance of evaluation and its implications for facilitating
quality learning in schools
3. Hindi - Kali-KhUi ^ a r t l lIn quite a number of schools in the state, Hindi teachers have not been recruited exclusively. The number of teachers who can teach Hindi is very less. Under such circumstances, learning of Hind can not be meaningful. In the year 2008-09, elaborate training programmes were conducted for teachers teaching Hindi in UPSs. The training gave inputs about the basics of teaching Hindi. The training is organised at three levels
• State Level Training of RPs - 5 RPsX33 Ednl Dist = 165 RPs• Dist Level Training - 5 RPsX 202 Blocks = 1010 RPs• Block Level - All teachers teaching HPS classes/teaching Hindi in all government and
aided schools
Objectives■ To help teachers of higher primary schools develop insights into the teaching learning
processes of Hindi■ To provide training in writing Hindi lesson plans■ To train teachers in speaking simple Hindi■ To train teachers in learning and teaching simple granmiar■ To train teachers in the preparation of question papers and valuing Hindi papers
ProcessesThe training modules have been prepared at the state level with guidelines for the RPs This year it is proposed to take up training at a higher level, including grammar, letter writing, methodology of teaching prose and poems. The RPs will provide training to teachers teaching Hindi in organising learning experiences in Hindi classes.
Outcome . -• Teachers will learn to teach Hindi in a simple manner• Even those teachers who are not exclusively appointed for teaching Hindi will learn to write
simple lesson plans for teaching Hindi• Teachers learn to prepare and use different TLM and activities in Hindi classes• Teachers learn the skill of preparing question papers
103
4. Jeevan Vijnana IIIt is important that every individual develops right values and good practices in life in order to lead and happy and healthy life. The physical and mental health has to be maintained for the development of all round personality. Teachers will have to integrate such inputs in their regular lessons. So the teachers of a school will have to work as one team in order to develop these skills among children across the subjects. The teachers of LPS were trained in Jeevan Vijnana in the year 2004. Now teachers teaching in HP schools are considered for training. Issues relating to personality development found in different textbooks are noted and appropriate methodology for handling those areas is planned. Inputs regarding social, physical and emotional life are given. Since Physical and Health Education is to be taught from the year 2009-10, this training is planned to help teachers take up this subject even if the schools don’t have a regular PET. The training is organised at three levels
• State Level Training of RPs - 5 RPsX33 Ednl Dist = 165 RPs• Dist Level Training - 5 RPsX 202 Blocks = 1010 RPs• Block Level - All teachers teaching HPS classes
Objectives -■ To develop awareness among the teachers about the need to maintain good physical and
mental health and develop the same■ To educate them in the art of developing the five-faceted personality■ To help teachers develop the activities for developing the five-faceted personality of each
of the child■ To train teachers in teaching Physical and Health Education in all classes
ProcessesThe training modules have been prepared at the state level, based on the training organised in the year 2004. The focus is on the development of healthy personalities among children. The training programme is organised in a cascade model. The RPs will be trained in the month of March and the teachers will be trained during the summer and Dasara holidays.
Outcome• Teachers will develop five-faceted personality• Teachers will strive to develop the five-faceted personality among children• Teachers will identify areas that could be used to develop student personality in the
textbooks that they handle• Teachers will be able to provide experiences through activities for developing good
personality traits among children
5. Bimba II (gender training)The initial training Bimba I threw light on the gender disparities found in schools based on statistical evidence available. It is important that the gender sensitization programmes include the gender inequalities even in the society of which the school is a part. Teachers need to discuss how gender disparities can be ended. The inequalities found in the modem society, the means of fighting such gender inequalities right at the school level need to be discussed with the teachers. The school level issues are a reflection of the societal life. It is from this larger perspective that the gender issues need to be analysed, understood and sorted out. The training is organised at three levels •
104
• State Level Training of RPs - 5 RPsX33 Ednl Dist = 165 RPs• Dist Level Training - 5 RPsX 202 Blocks = 1010 RPs• Block Level - All teachers teaching HPS classes
Objectives■ To develop among the teachers the ability to identify gender disparities in the society■ To develop among the teachers the skill of promoting gender equality through curricular
and co-curricular subjects■ To help teachers create an environment of gender equality in the class■ To help teachers create gender equality in the school and the society
ProcessesBased on Bimba I, this training module called Bimba II is prepared by a state team of RPs. The training will take place in the cascade mode at three levels. The RPs who handled Bimba I are the ones who are going to handle Bimba II also. The training is spread in the summer and Dasara holidays.
Outcome• Teachers will come to know of gender inequalities in the society through statistical
evidence.• Teachers will develop the skills of creating gender awareness among learners using the
curricular and co-curricular inputs• An environment of gender equality will be established in the school and the community
Chaitanya IIThe newly recruited teachers are given training making use of two packages called Prerana and Chaitanya. These teachers need to be trained extensively in the procedures of activity based teaching adopted at the upper primary level. For this Chaitanya II had been prepared in 2002-03. This module has been revised based on the present requirements. So this training is organised for teachers teaching upper primary classes, who have had the initial Chaitanya I training. The same RPs who have been handling Chaitanya I and unrevised edition of Chaitanya II will continue with this revised edition. This programme will include three packages as shown below.
Package 1 - Kannada and Social Sciences - 7 days Package 2 - Mathematics and Science - 7 days Package 3 - English - 7 days
Objectives■ To educate the teachers in an activity based child centred methodology of classroom
transactions■ To help teachers write their notes of lesson based on the changed classroom processes■ To train teachers in the preparation and use of low cost, no cost TLM■ To make the teachers aware of the qualities that they need to inculcate as teachers of
different subjects■ To help them identify and collect more information on the subjects they are teaching
ProcessesThe RPs who are already training teachers in Chaitanya I and II are well versed in this approach to facilitating classroom learning. They will be given new modules with notes for them to
105
organise training sessions. This 7 day package will give the teachers training in organising activity based learning processes. There is a special focus on teacher qualities. In the course of the training the teachers will also learn about how they should look at their profession, how they need to update their knowledge and other resources.
Outcome• Teachers will adopt activity based teaching learning strategies in their classrooms• Teachers will come to know of qualities of a good facilitator• Teachers will learn to prepare and use low cost, no cost TLM• Teachers will learn to continuously update their knowledge base• Classrooms will have a general orientation towards experiential learning
6. Chaitanya III (04 days each for 8 subjects)Karnataka has adopted activity based, learner centred teaching learning strategies from classes I to VII. It is just right that this approach continues to class VIII too because the students would find it difficult to cope with lecture methods or any other teacher centre methods. It is also important that the leamers use more and more application level strategies for learning at this level because they are capable of independent thinking. They can also conceptualise issues from a broader perspective. In order to meet such learner abilities Chaitanya III has been plaiuied for teachers teaching class VIII.
Objectives■ To introduce activity based, learner centred strategies at the high school level■ To facilitate self learning and applying concepts learnt to real life situations at the high
school level through well trained teachers■ To enable the teachers to adopt new, innovative methods in the classrooms■ To provide scope for project based learning in high school classes and train teachers in
these procedures
ProcessesThis four day training will be organised in CTEs/DIETS and in BRCs. The RPs will be trained at the state level who will in turn conduct district level programmes. Sometimes, depending on the number of teachers available the training could be organised at the block level too. Relevant modules for Kaimada, English, History, Geography, Mathematics, Physics, Chemistry, Biology have been prepared at the state level which are going to be used during training.
Outcome• Teachers teaching class VIII will know the merits of activity based teaching• Teachers will leam to provide for experiential learning in their classrooms• Teachers will adopt activity based classroom strategies• Project based learning will be extensively used in classrooms
7. Nali-kaiiNali-kali training strategies have been adopted right from 1994 in Mysore district. From 200910 it is proposed to adopt this approach in all schools in the state except Kalikayatna schools where in a constructivist approach to classroom learning is being implemented. The Nali-kali approach makes use of graded learning cards aimed at facilitating self learning with minimum guidance from the teachers. The teacher training strategies include a 9 day residential training
106

where in teachers are extensively trained in understanding the way learning cards are arranged, the activities to be adopted and the general philosophy adopted.
8. Eradication of Child LabourThis one day package is given to all teachers. One of the major problems faced in realising UEE is child labour. It has now been felt that there is a need to develop awareness among teachers about child labour and ways and means of fighting it at the school and community level. This will also include ensuring community partnership in putting an end to child labour. The training module has been prepared at the state level. The BRPs and other experts will give the training at the block levels.
9. Learning of Special ChildrenThis area has always demanded a constant update. Though there are lERTs to help teachers in this regard, it is now felt that teachers need to be sensitised to the learning needs of special children. This wili ifidude identtfying 4^ifl)iag problems of children and working towards a remediation. More than branding children with special needs, it is important to see them as a part of the class. Teachers will be trained in such inclusive strategies in this training.
Guidelines on organizing cluster level sharing workshops• In the academic year 2009-10, each teacher has to undergo 5 days cluster level sharing
workshops. These workshops are to be conducted in the months of July 09, September09, November 09, December 09, January 10.
• The cluster level sharing workshops are to be conducted separately for lower primary school teachers and higher primary school teachers.
• All cluster level workshops should be based on the curriculum/syllabus and related to the teaching-learning problems, performance indicators. Discussion on student’s enrolment, attendance, reasons and remedies for the learning backwardness could be held. Discussions/Interactions could be held on how school, school environment, teacher attitudes, teaching-leaming process could be changed in the backdrop of children. The discussions could be organized on the presentation of specific cases on the issues related to pedagogy, classroom interactions and school enviromnent, learning backwardness, success stories, innovative teaching-ieaming methods. -
• Discussions on the class wise subject/content based issues/problems could be held.• The issues/problems related to classroom teaching/learning could be discussed. The
following strategy can be used regarding this.• All teachers have to list the issues/hard spots related to the content/ methodology of their
teaching subject. The list has to be handed over to cluster Resource persons/cluster Assistant education officer (CAEO). This can be done by mailing the list though post or CRP/CAEO can collect the list during their school visits.
(Note: The learning difficulties in the curricular areas could be on the KSQAO results o f last 3 years.) ^
These needs of trainings have been consolidated before one or two months of training dates.
These needs of training are to be analyzed by the group of resource persons. The resource persons are to be get ready for the discussions on the day of workshop. The resource persons can give a demonstration lesson for a small group of students; The other teachers observe and make points on the demonstration lesson. The classroom teachers are also to be encouraged to conduct innovations/ experiments on new methods of teaching and successful innovations can be shared.
107

The cluster level sharing workshops has to serve as a platform to teachers for all these innovations.
■ Teachers can share their experiences on how children learn, methods/principles of learning, reasons for absenteeism to schools and backwardness in learning. The teachers can present their ‘cases’ in the meeting based on their experiences. Teachers can also share their successful teaching/learning experiences in the meetings.
■ Teachers/Resource persons can demonstrate the preparation of teaching-learning materials and also usage of these materials in the classes. Hie teaching-learning materials which are useful for the teaching of hard spots are to be prepared / demonstrated in the workshops.
■ The Nali-Kali teachers can share their classroom experiences on ‘Nali-Kali’ method.
Main features of cluster level sharing workshop• There should be scope for teacher’s participation.• Good Discussion on classroom experiences should be held. The methodology shouldn’t
be like traditional classroom teaching.• Resource persons should act as facilitators.• There should be continuity from one meeting to another.
There should be discussion on whether the issues raised in the previous meeting are solved?• There should be scope for the preparation/demonstration of teaching learning materials.• CAEOs should actively participate and CRPs should act as facilitators.• BEO/BRC/BRP/DDPI and DIET office faculty should participate in these workshops.
These officers should monitor the successful organization of these workshops.• The workshops will be organized class wise.• The environment in these workshops will be such that the teachers openly participate in
the workshop.
Note:1.
2.
3.
Clusters/block/District level resource teams comprising of subject wise expert teachers are to be constituted to provide resource support to teachers. Email ids/address/phone numbers of all such resource persons could be circulated to all the teachers. Teachers can clarify their doubts by interacting with resource persons.Teachers have to use their teacher grant for the preparation of teaching-learning materials.The facilitator has to document the proceedings of the Cluster Level Sharing workshops.
Time Subject Method10.00-10.30 Registration10.30-10.45 ice breaking Group Activity10.30-12.00 Discussion on classroom processes. discussion by teachers- on
specific ‘cases’ (Case -Study)12.00-12.30 Tea break12.10-1.30 )iscussion on hard spots related to
ig (subject wise class wise)Discussion/Sharing/Group activity (Resource persons/teachers)
108

Time Subject . Method1.30-2.30 lunch break2.30-..30 Demonstration lesson on a specific
theme by Resource personsDemonstration by Resource fjersons
3.30-3.45 Tea break3.45-5.30 Preparation/ Demonstration of teaching-
learning materialsWorkshop by ( Resource persons)
Source: AWP & B, SSA, Karnataka 2009 -10
Special initiatives for disadvantaged groups (such as MLE for tribal areas):A book named Prayatna has been published. It is in the form of a dictionary having Lambani tribal language and Kannada equivalent terminologies. This book is useful to teachers as well as children specially for classes I and II.
Chinnara Karnataka Darshan Programme envises an excellent exposure to tribal children.
SC focused expenditure constitutes 14.19% of the total proposals for 2009 - 10.
Effectiveness of CAL and other educational technologies like EduSat in quality improvement:
The details of the programmes to be implemented during 2009-10 are as follows:1. Group Teaching and Learning
Annual Maintenance Cost.Analysis on learning achievement of students at Upper Primary level (CAL schools vs. general schools)To start CAL programme, the school needs to have a separate room for organising equipments. Site preparation like electirification, purchase of furniture, security to room etc. would be of greater importance for implementing CAL project.Materials developed in collaboration with APF and EDC are being used and the collaboration will continue for this year.EDC and Intel Teach are collaborating with SSA in training BRPs and CRPs on the implementing strategies of CAL programme.Circular will be issued to the field functionaries to transform CAL schools into centre for learning for the larger coverage of children.The monitoring of Quality assurance of CAL programme would be taken up from 200910 by making it as an additional item in QMT.The documentation of good practices of CAL programme will be initiated during 2009-10
10. The procurement of computer equipments would be taken up for more number of schools during 2009-10. It is planned to cover atleast 453 schools during 2009-10.
2.3.
4.
5.
6.
7.
8.9.
The plan of CAL for 2009-10 has been developed with a view to address the key issues like quality monitoring, orientation of supervisory officer, documentation of good practices and especially taking the note of more coverage of children. This indicates that the CAL activities have been designed with an aim to enhancing the coverage and learning achievement of students at Upper Primary level. This is a good planning.
109

Edusat programmes in the State:The Primary Education Pilot project in distance mode is being implemented in collaboration with ISRO, GoK and various other agencies. Studio, Hub and up linking facilities have been set up at DSERT, Bangalore. 885 primary schools from Chamarajanagar district were selected for the primary education part of the project. Motivated by its first pilot, ISRO established ROTs and Solar Power Packs in 885 schools of Gulbarga District during 2006-07. Further the Programme has4?een extended to 1000 schools of Bangalore Rural and Ramanagar District.
Till now, 458 video lessons have been produced by DSERT and EDC. Cost for the hardware installation was borne by the state government and the cost for producing films and their telecasting is being met out of SSA funds. Infrastructure set up by ISRO through BEL on turn key basis.
Video lessons were prepared based on the hard spots of different subjects and are telecasted from the Studio while the children in schools watch those lessons. Teachers conduct Pre and Post telecast activities to reinforce the learning.
Timings of Telecast:a. Monday to Friday: 2.00 to 2.30 pm and 3.30 to 4.00 pmb. Saturday: 10.00 to 10.30 am and 10.40 to 11.10 am
The telecast schedule intimated to all the schools in advance through a teachers’ handbook. The lessons supplement classroom teaching and provide resource support. It is reinforcement of learning through different approaches thereby bringing in permanent learning.
Coverage:c. No. of districts - 4d. No. of Schools - 2603e. Beneficiaries - 5,32,966 children
Impact Study on EduSat Programme:The Edusat Project was evaluated by R.I.E., Mysore in the year 2007.
■ The important findings of the report is that the launch of EDUSAT has helped in providing quality instruction through video programmes to students studying in the interior villages. _
■ The improvement in other areas such as ability to narrate/explain things, increase in attention span/concentration and interest/desire among students to look forward to see video films are really noteworthy.
■ The attendance has been around 80% that is definitely satisfactory.■ The teacher involvement during the broadcast as facilitator and conduct of Pre and Post
broadcast activity, and their gain in information about concepts, methods (perceived) is note worthy.
■ However there are certain areas, which require attention/reinforcement.■ They include additional training to teachers to integrate video lessons to classroom teaching
and timetable, establishing technical support at the block level to attend to technical problems.
110

RoTs installation for Teacher Training and KGBVs■ Block Resource Centres of the districts were provided with receive only terminals and solar
power pack enabling in-service teachers training through tele mode.■ Receive Only Terminals were also supplied, installed and made functional in the DIETs and
the DPOs of the district.■ RoTs and SPPs have been installed in KGBVs and BRCs sanctioned under SSA which help
the girls of KGBVs to watch Edusat lessons and get attracted to these residential schools for learning and completing their courses successfully.
■ RoTs and SPPs (Solar Power Packs) have been installed in new BRCs opened under SSA which helps them to get teleconference programmes telecasted from the State.
■ Nearly 40 trainings/orientations/reorientations have been telecasted furing 2008-09 upto Jan2009 for addressing teachers, Cluster Assistant Education Officers, SDMCs etc.
Satellite Interactive TerminalsRoTs are one way video ndtwo way aiidio but SITs have an advantage over RoTs with two way video facility. SITs installed in all the DIETs of the state during 2007-08 with the help of ISRO and Vishveshwaraiah Technology University.
SITs have helped SSA and the department in conducting more meaningful interactions with the personnel on the other end. This has increased the commitment and involvement of the district officials as they are motivated to be watched by the entire state. This has also lead to very active participation from the districts, in the sense, officers/resource persons sitting in other district can address the issues directly from their home district without traveling to the state capital and also can use display materials to support their talk. The programme have covered 5 telecosts mainly in training teachers on English subject training and Sevadal training.
Activity wise PEP progress as on 31.12.2008
S.No. Programmes
Financial progress (Rs. In Lakhs)
1 Printing and supply of4Celi Kali and Edusat Handbooks 6.002 Radio programme broadcasting charges 30.613 Training programme to faculties of DIETs regarding management of
Satellite Interactive Terminals0.20
4 Broadcasting charges towards Shikshana Samvada - Phone in programme 1.195 Salary of Technicians maintaining Hub established at DSERT 0.83
Total Expenditure (up to Dec - 2008) 32.96Source: DSERT report
PLAN FOR 2009-10; .Budget outlay of Distance Education Programrne is as follow for the year 2009-10
SI.No. Activity Units
Cost (In Rs. lakhs)
EDUSAT Pregramme:1 Broadcast fee for radio programmes to be
broadcasted from Akashvani80.00
111
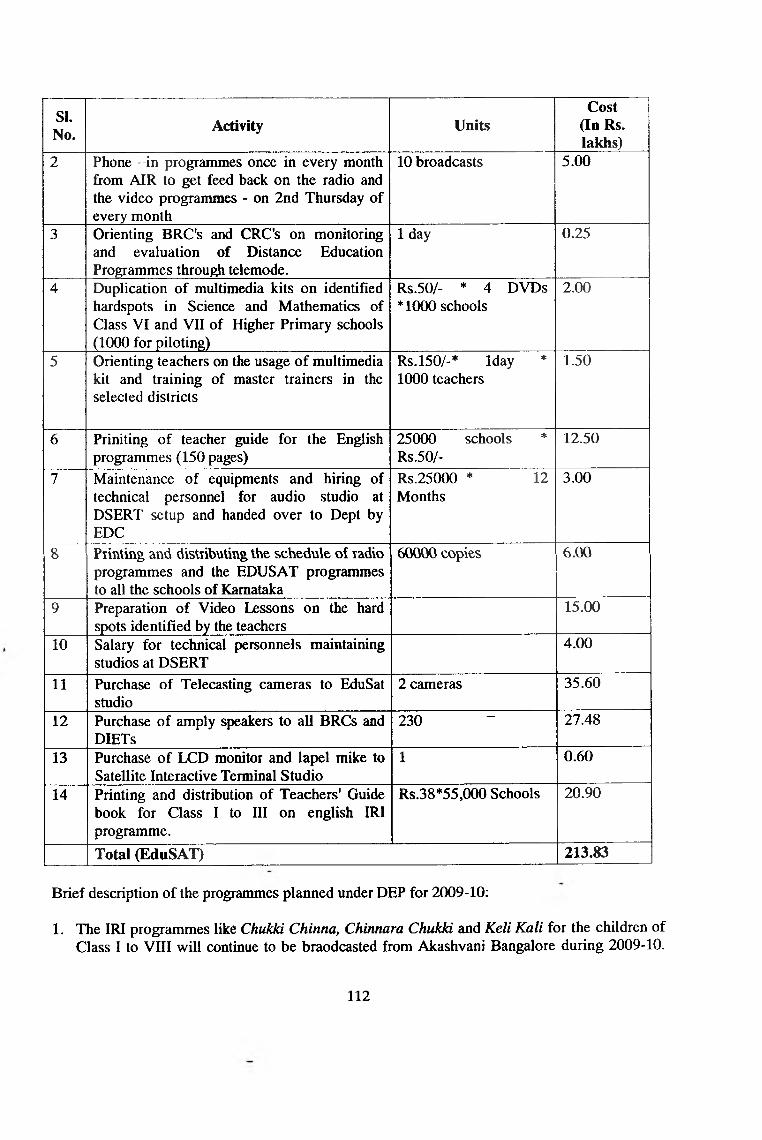
SI.No. Activity Units
Cost (In Rs. lakhs)
2 Phone -in programmes once in every month from AIR to get feed back on the radio and the video programmes - on 2nd Thursday of every month
10 broadcasts 5.00
3 Orienting BRC's and CRC's on monitoring and evaluation of Distance Education Programmes through telemode.
1 day 0.25
4 Duplication of multimedia kits on identified hardspots in Science and Mathematics of Class VI and VII of Higher Primary schools (1000 for piloting)
Rs.50/- * 4 DVDs *1000 schools
2.00
5 Orienting teachers on the usage of multimedia kit and training of master trainers in the selected districts
Rs.150/-* Iday * 1000 teachers
1.50
6 Priniting of teacher guide for the English programmes (150 pages)
25000 schools * Rs.50/-
12.50
7 Maintenance of equipments and hiring of technical personnel for audio studio at DSERT setup and handed over to Dept by EDC
Rs.25000 * 12 Months
3.00
8 PiinVmg and distiibuting the schedule of ladio programmes and the EDUSAT programmes to all the schools of Karnataka
60000 copies 6.00
9 Preparation of Video Lessons on the hard spots identified by the teachers
15.00
10 Salary for technical personnels maintaining studios at DSERT
4.00
11 Purchase of Telecasting cameras to EduSat studio
2 cameras 35.60
12 Purchase of amply speakers to all BRCs and DIETS
230 - 27.48
13 Purchase of LCD monitor and lapel mike to Satellite Interactive Terminal Studio
1 0.60
14 Printing and distribution of Teachers' Guide book for Class I to III on english IRI programme.
Rs.38*55,000 Schools 20.90
Total (EduSAT) 213.83
Brief description of the programmes planned under DEP for 2009-10:
1. The IRI programmes like Chukki Chinna, Chinnara Chukld and Keli Kali for the children of Class I to VIII will continue to be braodcasted from Akashvani Bangalore during 2009-10.
112

This programmes covers all the schools of the state benefiting around sixty lakh children. The broadcasting charges planned under this programme is Rs.80.00 lakhs.
2. Phone - in programmes will be continued during 2009-10 also to discuss new policies in the department and for the monitoring and feedback on the programmes being implemented in the field, on every 2"** Thursday of every month from AIR, Bangalore. The budget planned for this programme is Rs.5.00 lakhs.
3. The orientation of BRC's and CRC's on monitoring and evaluation of Distance Education Programmes is necessary to bring in convergence of quality initiatives with the Telemode programmes and trainings. One day telemode training will be given to all the BRCs and CRCs of the state during 2009-10 and the budget required for the programme is Rs.25,000/-.
4. Audio and Video multimedia kits developed by EDC on the identified hard spots in Mathematics and^^ctence ef Oass VI arid VII will be duplicated and supplied to 1000 schools of selected districts on pilot basis during 2009-10. The teachers need more input in the subjects like Science and Mathematics to help them facilitate learning in the classroom. The budget estimated for this project is Rs. 2.00 lakhs.
5. Training is necessary to teachers on the usage of multimedia kits in the classroom for the effective integration of classroom activities. Training of 5 days to each teacher of 1000 schools where the multimedia kits would be supplied, will be held during 2009-10. The estimated cost for this activity is Rs.1.50 lakhs.
6. EDC has developed a teacher guide on English teaching which helps teachers in making optimum utilisation of English programmes being broadcasted through AIR. These books need to be printed and supplied to all the schools and the estimated cost for this programme is Rs. 12.50 lakhs.
7. An audio studio was setup by EDC for producing Educational Audio CDs and Cassettes. This studio was placed in DSERT. Now EDC has handed over all the equipment of the studio to DSERT. The department intends to utilise this facility and continue to get benefit of this studio through identifying and appointing a technical person for editing and producing educational audio materials. For the maintenance of equipments and hiring of technical persormel for audio studio at DSERT, the estimated cost for this progranmie is Rs.3.00 lakhs.
8. Printing and distributing the schedule of radio programmes and the^EDUSAT programmes will be continued for 2009-10 to facilitate all 60,000 schools to utilise the programme to the optimum extent. The estimated cost for this is Rs.6.00 lakhs for 2009-10.
9. More video lessons need to be prepared based on the demand from the teachers and classroom practitioners. A budget of Rs.15.00 laksh has been estimated and budgeted for 2009-10 for identifying and agency to produce video lessons.
10. DSERT is running two studios in its premises which includes an SIT studio with two way audio and two way video facilities. The studios have been extensively used by the department in training, orientation and monitoring activities to reach larger population at a go. The maintenance of the hubs of these studios has been outsourced to the external
113

agencies. For the maintenance of hubs and salary of the technical personnel, Rs.4.00 lakhs is estimated and budgeted during 2009-10.
11. As the existing telecasting cameras of EduSat studio is not giving quality output, purchase of telecasting cameras is very essential. Rs.35.60 lakhs is estimated for 2 such cameras during 2009-10.
12. Tele-mode programmes need clarity of voice at the receiving end for them to receive the programme and understand what has been discussed. To address nearly 50 participants in each training programme in every BRC and DIET, it is felt necessary to provide amply speakers to 202 BRCs and 27 DIETs. The budget estimated for this activity is Rs.27.48 lakhs.
13. The Quality Controlling Committee of Studios set up at DSERT have recommended for LCD monitor and lapel mike for the newly started SIT studio to improve the quality of programme telecased. Rs.0.60 lakhs is estimated for this activity.
14. Radio is an effective media and has been used in the classroom as an interactive media for the joyful learning of children. Teachers were provided with guide book to facilitate in managing classroom for effective interaction. The only guide book needs to be given to teachers teaching class I to III is the English Guide Book. Book has been prepared by EDC and the same needs to be distributed to all the schools of the state. Rs.20.90 lakhs has been planned during 2009-10 for printing and distribution of Teachers’ Guide Book on English for IRI programme.
The \olal budget for the Distance Education Piogramme is Rs.213.83 lakhs which is planned under Other Innovative Activities of AWP&B of 2009-10. All the above Distance Education Programmes will be implemented through DSERT.
Nature of research and action research: (REMS)
A. State Level Activities:The State Research Advisory Committee has been reconstituted at the State level under the chairmanship of the State Project Director for the years 2008-09 and 2009-10 for effective implementation of the REMS activities in the State. The two sub committees on Training & Pedagogy and Research & Development activities have been constituted for necessary support to the State, District and Sub District level structures in the areas of Training, Pedagogy, Research and Development activities.
The State Project Offlce has implemented the following major activities during 2008-09 at the State Level with co-ordination of other departments. Universities, Educational Institutions, Non- Govemment Organisations, and voluntary Associations etc.:
1. Commrssioning of Researches:• 25 major research studies have been commissioned at State Project Office, SSA-Kamataka
during last three years (2005-06, 2006-07 and 2007-08). The districts are instructed to take up the local specific research studies as per the approved activities under REMS in AWP/B.
• The issues are mainly focused on the Sarva Shiksha Abhiyan Programmes with community participation are specifically focused in the areas of the studies.
114

• The studies are conducted by some of the Universities, Autonomous Educational special reference to achieve the goals of Universalisation of Elementary Education. The quality issues on universal access, retention, learning achievement and Institutions, Reputed NGOs and Individual Researchers. -
2. Experimental Projects:a) Kalika Yatna Programme, a learning initiative by -PrajayatnaKalika Yatna is an innovative approach adopted in Bilikere Cluster of Mysore district as a Pilot Project for 3 years (2005-06 to ^X)7-08) with co-ordination of an NGO, Prajayatna, Bangalore. It is based on integral approach and constructivism concept of National Curriculum Framework (NCF) 2005, where enormous opportunities are provided for teachers in preparing the Self Learning Materials, Local Specific Curriculum and so on. It is an approved activity for 2008-09 under REMS intervention.
This programme is extended to all Government schools of the 14 clusters in Hunsur Block, Mysore district during 2008-09 from classes 1 to 5th Std., based on the field experiences, inhousing review reports and also external evaluation study report.
b) District Quality Education Programme (DQEP) in coordination of BGVS and NL4S, Bangalore.
District Quality Education Programme is implemented as a Pilot Project in Chamarajnagar District for 3 years (2005-06 to 20(n-08) with aimed to enhance capacity building among the Academic Resource Centres of districts and sub-districts such as, DIETs, BRCs and CRCs with co-ordination of National Institute of Advanced Studies, Bangalore.
The project is continued in 3 clusters o f Chamanynagar district through Bharathiya Vijnana Samithi (BGVS) based on the previous experiences of the project implemented by National Institute of Advanced Studies (NIAS), Bangalore for the year 2009-10.
It is proposed to conduct an Impact Study in the lines of findings / experiences o f the above referred Action Project The necessary decisions will be taken to adopt the innovative strategies and good practices of the project based on the outcomes in all other DIETs also.
3. Multi Centric StudiesA Multi-Centric study on “Effectiveness of In-service Teachers’ Training with special reference to Chaitanya, Nalikali and English training Programme’ has been taken by the State Project Office, Sarva Shiksha Abhiyan, Karnataka through all 27 DIETs in the State. The study is under progress and the process of tabulation of Data is being done in this regard.
It is also planned to take up an independent comprehensive impact study on effectiveness of Inservice teachers’ training programme in the forth coming year i.e., 2009-10 under REMS-SSA.
4. Educational SeminarIt is planned to organize a State level Seminar on Quality Issues in the month of March 2009. There will be Area-wise 5 -6 panels along with a heterogeneous groupof teachers, functionaries of all levels, educationists, academicians, administrators, NGOs, Universities and other research institutions. The major areas of the Quality Dimensions proposed for the Seminar are,
115

■ Access related issues : Status of Infrastructure facility in the State - Schooling facility■ Teacher and Teacher Preparation - Teacher Accountability, Teacher Absence and
Students Attendance■ Learning Opportunity Time■ Learning Achievement Level of the Students■ Monitoring Mechanism - SDMCs /CACs / Departmental Structure■ Current Trends and Challenges ahead at the elementary level in order to achieve the goals
of Universalisation of Elementary Education.■ Status and role of Academic Structure in the State : CRCs, BRCs and DIETs
5. Meeting and Workshops:• Periodical Research Advisory Committee Meetings have been conducted.• Organised Workshops for preparation of modules, Monographs on Action Research, Lab
Area and Multi Centric studies etc.
6. Exposure Visits / Study tours:The State Project Office has organized exposure visits to selected districts/ blocks of
' Tamilnadu for Block and District level heterogeneous groups consist of teachers. Cluster Resource Persons, Block Resource Persons, Block Education Officers, DDPIs (Administration), DIET Principals, Teachers’ Association Representatives etc. to understand the strategies adopted in Activity Based Learning Programme (ABL) implemented in Tamilnadu. The Block and District level teams consist of 10 members each. There were around 250 batches consist of 2500 members.
A team of officers from the State Project Office visited the ABL programme of Chennai and prepared guidelines for observing the key points at the tm e of their visits. The DIETs are instructed to submit a district report on the basis of their interactions and experiences out of their visits.
The ABL programme is similar to NALIKALI programme implemented in Multi Graded classes’ situation of Karnataka. The relevant strategies of the success stories of the ABL programme also may be adopted in this regard. However this programme provides enormous opportunities to the teachers and functionaries to share their experiences.
7. KSQAO Assessment:• Funding for External Assessment of Learning achievement of the students of 5 & 7 classes
and External Evaluation of school / children performance by Karnataka School Quality Assessment Organisation (KSQAO).
• Karnataka State Quality Assessment Organisation has been set up in 2005 on the issue of assessment of quality in Education based on the Education Report of Dr. Raja Ramanna Task force , the recommendation of ARC Report - 2001 and Eduvision document of 2003.
8. Publication of Educational Magazine / News Letters / Bulletins:a. State level News Letter Shlkshana Varthe:'Shikshana Varthe' is an educational magazine publishing at state level and distributing to all the government and aided schools of the State under REMS component. Shikshanavarthe has been published during 2008-09 aimed for documentation and dissemination of the success stories, action research findings, Innovative classroom practices, community campaigns, departmental circulzirs, memos etc.
116

This News letter contains the articles related to the quality issues especially elementary education including innovative practices in the Classroom Transactions, Action Research studies conducted by the teachers and field functionaries, success stories, important circulars, Government orders and so on. -
b. Regional Level News papers publication:As per the recommendations of Dr. D.M. Nanjundappa report on Regional Imbalances in Karnataka, the regional newspapers will be published aiming to focus on the regional specific issues. The newspapers include teaching learning processes, evaluation procedures, education status of the division etc.
■ Belgaum division :Jeevaiia Shikshana, an educational magazine will be published and supplied to all Government and aided primary schools in Belgaum division (Belgaum, Chikkodi, Dharwad, Gadag, Haveri, Uttara Kannada, Bijapur and Bagalokot) through Dharwad DIET.
■ Gulbarga Division:Jeevana Vikas, an educational magazine will be published and supplied to all Government and aided primary schools in Gulbarga division (Gulbarga, Yadagiri, Raichur, Koppal, Bellary and Bidar) through Additional Commissionarate of Public Instruction Gulbarga.
9. Publication of Monographs:The State Project Office has taken necessary initiatives to publish Monographs and other Training Modules related to research activities.
A revised teacher-training module on Action Research has been prepared at the State Level with coordination of Regional Institute of Education, Mysore, ISEC, Bangalore and other experts. The process of Printing and Supply is under progress.
A handbook on Research & Development activities has been designed with coordination of ISEC, Bangalore and other experts in order to get capacity building among the DIET faculty and CTE lecturers. It is also planned to conduct workshops in the month of March 2009 for the DIET faculty and CTE lecturers in this regard.
10. Prathibha Karanji Programme:Prathibha Karanji is an innovative programme conducted at various levels such as School,
Cluster, Block, District and also State to encourage the pupils to achieve all round development. This programme focuses on assessing the performance of non-scholastic activities among the students as a part of evaluation.
• Sarva Shiksha Abhiyan has funded Rs. 20.00 lakh for conducting Prathibha Karanji Programme aimed to assess the ability of children in co-curricular activities at elementary level. The programme was conducted under Monitoring & Supervision of the Director of Public Instruction, Secondary Education, Karnataka.
• Rs.5.00 Lakhs have been allocated for the minority Government Primary Schools to conduct the similar type of Prathibha Karanji programme to the students studying in minority institutions.
117

11. Progress Cards:The Competency and Semester based progress cards have been designed at the State level and distributed to all students from 1 to 8 classes. This programme helped the school level to record the achievement levels of the students for documentation and dissemination with parents and community. The relevant strategies have been taken as a part of evaluation process in this regard.
12. Quality Monitoring Tools:The State has taken necessary initiatives in implementation and follow up activities on Quality Monitoring Tools designed by NCERT, New Delhi. The following activities have been conducted in order to collect the required information and qualitative analysis at all levels.
Capacity Building Programme:i) State Level Work Shop:• A one day State level Work Shop has been organized for Master Resource Persons (MRPs)
on Quality_Monitoring Tools on 21*‘ June 2(X)8 at State Project Office, Bangalore. All DIETs (27) - REMS facilitators / lecturers and Assistants Prograrmme coordinators (APCs) of District Project Offices SSA (33) were participated in the workshop. The discussions were made regarding obtain information and follow up of the QMT tools at district and subdistrict levels. The School Level Formats (SLF), Cluster Level Formats (CLF), District Level Formats (DLF) were demonstrated and interacted with the participants on local specific issues. The necessary guidelines were given on tentative schedule of the regional and district level workshops and also schedule of the data submission in the prescribed formats.
ii) D i\isiona\ Work shops :A one day divisional workshop has been organized on QMT Formats for District level and Block level field functionaries in all the four educational divisions of Karnataka.
iii) District / Block level workshopsDistrict / Block level workshops have been conducted on QMT for Cluster Assistant Education
Officers (CAEOs) and Cluster Resource Persons (CRPs)
iv) Cluster level workshopsCluster level workshops are also conducted at Cluster Resource Centers for Head Teachers and SDMC Presidents with coordination of Cluster Assistant Education Officers (CAEOs).
v) School level workshopsA one day workshops are organised for Teachers and other stake holders on QMT tools and uses at school level.
Major provisions on QMT formats• NCERT Quality Monitoring Tools have been translated, printed and also supplied to all
levels.• The process of information collection has been made at school level.• The information has been consolidated at all levels.• The State level Data of the 1*‘ quarter 2008-09 on QMT has been sent to NCERT and the
qualitative analysis has been made at all levels. The necessary strategies are being adopted
118

on the findings of the analysis particularly related to enrolment, attendance, learning achievement, monitoring and supervision aspects.
State Specific Modifications -• The required information on QMT related to Enrolment, Attendance and Learning
Achievement (SLF I & III, CLF I & III, BLF I & III and DLF I & III) has been collected through DISE softvi^are.
• The Computer Programmers, APCs, ASOs and concerned persoimel have been trained in this regard.
Major Research Studies conducted at State level during 2008-09:The following tw o major studies have been considered as commitments of AWP/B 2008-09 and conducted in the State by using the Terms of Reference (TOR), Tools and guidelines of the National level. (I)
1. Studies as per commitments of AWP & B 2008-09
SI. No. 1Title of the Study
Study on Teacher Absence and Students Attendance in Primary and Upper Primary Schools of Karnataka State".
ResearchInstitution
Catalyst Management Services, Pvt. Ltd., Bangalore
Objectives The main objectives of this study are to:■ Find out the extent of teacher absence and the reasons;■ Identify the personal and school level factors of teacher absenteeism;■ Measure the effects of teachers attendance on students attendance and
achievementStatus completedMsyorFindings
■ The overall TA in the state as observed during the three rounds of the survey indicates that 20% of the teachers are absent due to various reasons,
■ The most being leave on personal grounds (12.6%) and education related work including training (6%).
■ The influence of teacher personal factors on TA indicates that gender and distance from residence to school have significant influence on TA.
■ The three main school related variables that have significant influence on the TA in good performing schools are the student teacher ratio, student attendance and availability of infrastructure facilities.
■ The student achievement in good performing HPS is influenced mainly by the number of SDMC meetings
Remarks/ActionTaken
A copy of the Final Report has already been sent to the MHRD and EdCIL, New Delhi.Follow up activities are being at all levels to increase Learning Opportunity Time for students.
SI. No. 2Title of the Study
“ A Validation Sample Study on DISE Data 2007-08(30 -09-2007) in three districts of Karnataka (Udupi, Haveri and Raichur).
Research Centre for Multi-Disciplinary Development Research (CMDR), Dharwad119

InstitutionObjectives The broad objectives of the present study are:
i) to examine the role of DISE as laid down when introduced;ii) to verify and validate the data collected through DISE earlier (DISE);iii) to study the usefulness of DISE data required for achieving the goal of
Primary and Higher Primary education;iv) to assess the successful working of DISE units at the district level and school
level;v) to verify the infrastructure availability (HW,SW, other such accessories,
trained computer personnel etc) at the DISE units at both district and school level;
vi) to assess the competence and awareness of head teacher and the computer personnel about DISE;
vii) to examine the evidence of sharing/dissemination of data collected through DISE;
viii) to suggest appropriate measures for improving the quality of DISE data._____Status completedMajorFindings
The overall deviation of DISE data from Post Enumeration Survey (PES) data taking into consideration all the items and sub items for all the three districts is1.3 giving a precision level of 98.7 percent.The errors in statistics can be acceptable up to 5 percent.The present study based on the sample of 5 percent schools gives the error of 1.3 percent which is statistically negligible.
Remarks/ActionTaken
A copy of the Final Report has already been sent to the MHRD and NUEPA, New Delhi.The Action points of the study arc being followed in the process of DISE 2008.
I I. Other major studies conducted at Stalte level during 2008-i09:SI.No.
Title of the Study Research Institution/ Researcher
Status MajorFindings
Remarks/ActionTaken
1. Study on “Impact of Sarva Shiksha Abhiyan initiatives on Universalisation of Elementary Education in Karnataka with special reference to concerns of Quality and Equity”.
Public Affairs Centre, Bangalore
underprogress
2 A Multi Centric Study on “Effectiveness of Inservice Teachers Training with Special Reference to Nalikali, Chaitanya and English Trainings”.
All 27 DIETS in the State.
underprogress
3 Validation study on “Children's Census Data 2008”.
CMDR, Dharwad underprogress
4 "Effect of School and Home Factor on the Attendance of Children at Primary Stage in Karnataka State"
Bangalore University, Bangalore.
Progress
5 “Effectiveness of Bharathiya Vidya Software Programme implemented in Karnataka.”
Dr. S.N. Unachigi, Chief Functionary, Bangalore-560070
Progress
6 "Universalisation of Elementary Education of Minorities in Karnataka State - of a given quality and with in the specified time-frame. (A research proposal for survey, Secondary data
Al-Ameen Residential School Trust, A.R.S. Campus, Post Box No. 18, Malur Road,
Progress
120

SI.No.
Title of the Study Research Institution/ Researcher
Status MajorFindings
Remarks/ActionTaken
analysis, Experimental projects & a scheme for up-scaling for the whole state)."
Hoskote- 562114.
7 "Ascertaining the nature of use of ICT in selected elementary schools in and around Bangalore."
R.V. EducationalConsortium,Bangalore.
Progress
Proposed Research studies / impact evaluation for 2009-10SLNo. Area Topic Remarks
A. Priority Areas1 Training
&Pedagogy
“An Evaluation of Effectiveness of Nalikali Programme 2008-09 in Karnataka State”.
Proposals will be invited through advertisements.
2 Access “A Comparative Study of Rates of Transition from 7 to 8 and 8 to 9 classes in Higher Primary Schools Up-graded by the SSA and other Non-upgraded Schools.”
Scrutiny of the Research proposals, Designing of Terms of Reference {TOR), MOU etc. will be made under the guidance ofSRAC.
B Other Important AreasI Language “Effectiveness of Reading Programme
(Oduvenanu) 2008-09 in Karnataka State.”
2 ComputerEducation
“Impact of Computer Assisted Learning Centres Initiated under Innovative Education of SSA in Karnataka.”
3 Out of SchoolChildren(OOSC)
“Effectiveness of the Residential Bridge Courses and Non-residential Bridge Courses in mainstreaming Out of School Children.”
4 Out of SchoolChildren(OOSC)
“Impact of Chirmara Angala Programme Adopted for Out of School Children in Karnataka.”
5 TeachingLearningMaterials
“Effectiveness in Allocation Mid Utilisation of TLM grant for In-service Teachers in Govenmient Schools.”
6 Quality “A Critical study on Functioning of BRCs and CRCs as an Academic Structure for Qualitative Improvement of Elementary Education.”
-
Proposed studies for the year 2009-10:
Monitoring Mechanism:■ Mpnitoring, Supeivision and Interaction activities with Functionaries at all levels.■ The REMS unit has been assisting the MHRD Team (ISEC and RIE) is its ‘External
M onitoring’ functions of SSA in the State. Timely supply of data, co-ordination of
121

Monitoring and Supervision visits to districts, facilitation of feedback to district ofHcers on Monitoring and Supervision review of MHRD Review teams at periodical meetings at State OfHce, are included in this assistance.
■ The State Project Office personnel have been nominated as nodal officers to all the districts to monitor implementation and progress of SSA programmes periodically.
■ Periodical meetings have been convened to monitor the progress of the district level and necessary steps have been taken for effective implementation of the programmes.
B. DISTRICT LEVEL ACTIYITIES:The DIETs are considered as nodal / implementing agencies at the district level for REMS activities. The District Research Advisory Conmiittees are constituted in the DIETs for proper guidance in effective implementation of the REMS approved activities at the District Level in this regard. Financial provision has been made to the DIETs for implementing the REMS activities at district and sub-district levels such as school, cluster and block as per the approval of AWP/B 2008-09. The progress overview has been explained briefly in the concerned districts Annual Work Plans 2009-10.
The major activities entrusted to the DIETs are:• The districts level research studies are commissioned by the DIETs and follow up action for
documentation and dissemination have been taken under the guidance of District Research Advisory Committees (DRAC).
• Convening periodical meetings / workshops of DRACs.• Organising Educational Seminars related to quality issues / UEE• Documentation / Abstracts on Action Research / Research Studies• Monographs and Research Publications• Field Visits / Monitoring Activities• Evaluation of Sarva Shiksha Abhiyan Programmes• Publications; District level News Letters / Bulletin / Journals etc.,• Multi Centric Studies: Effectiveness on in-service teachers’ training.• Quality Monitoring Formats: Workshops, Data submission. Analysis and follow up activities.• Lab Area Studies: Conducting Lab Area studies on the district / local specific issues at the
DIET level.• Organising and Monitoring TLM and Metric Melas from school level to the district level.• Exposure visits to Activity Based Learning (ABL) Programme, Tamilnadu.
C. BLOCK AND SUB BLOCK LEVEL ACTIVITIES:At the Block Level, Block Research Advisory Committees are constituted in order to get guidance for implementing the REMS activities like, constitution of Research Advisory Committees, organising meetings and workshops, oi^anising TLM and Metric Melas, follow up of Quality Monitoring Tools etc. H ie State Project Office and also the DIETs are engaged in the monitoring and review of progress periodically.
The DIETs and BRCs are monitoring and guiding the schools in conducting Action Research Studies including documentation and dissemination of findings at school, cluster and block levels of workshops, training programmes, seminars, providing News Letters etc. are conducted in this regard.
Proposed Activities under REMS for the year 2009-10
122
As per the Plans, the State has developed a need based plan which focused the district specific activities. This plan includes the activities on Research, Evaluation agenda along with Monitoring Mechanism.There is provision of total Rs. 946.075 lakhs @ a unit cost of Rs. 1300/- per school per annum for 72775 schools in the State. The REMS activities will be implemented at different levels right from school level to the State level. The State level activities will be implemented under the guidelines of State Research Advisory Committee and the Subcommittees. The district and sub-district level activities will be implemented under the guidance of District Research Advisory Committees, Block Research Advisory Committees and the Cluster Research Advisory Groups. The approved activities will be implemented and monitored with coordination of Universities, Educational Institutions, Research Institutions, Non Goveniment Organisations etc. The DIETs are considered as impleitienting and monitoring agencies for the entire sub-state level. The periodical reviews will be made at all levels through the monitoring mechanism.
There is a financial provision made for the district and sub-district levels @ Rs. 300/- per school per annum. The remaining fiind will be spent at die State level as per the approved activities. However the ultimate beneficiaries are the grass root level stakeholders.
The following activities are proposed based on the district annual plans and the requirement at the State level.
School / Clustei / Block and Distiict Level AclivUies:Action Research Studies:It is proposed to conduct Action Research studies at the school level. The modules on
Action Research have already been provided to the schools, clusters, blocks and DIET level. The workshops and trainings will be arranged out of the training component for strengthening the capacity on research activities among teachers and other functionaries at block and district level. The documentation and dissemination will be made at monthly sharing meetings in the cluster level. The DIETs will publish research abstracts on action research studies and other research studies, news letters for documentation and dissemination of the findings. _
Teaching Learning Material (TLM) and Metric Mela:There is a provision of teacher grant @ Rs. 500/- per teacher per annum for preparation of need based and no cost-low cost Teaching Learning Materials (TLM) at school level under SSA programme. A 3 day ‘ Tarani” training workshop on preparation and usage o f TLM has been conducted for teachers at block level. Thence it is proposed to provide a dias for sharing their experiences with other teachers and schools in the TLM melas.
Metric Mela provides enormous opportunities for creativity related to classroom practices and innovative strategies adopted in teaching mathematics at elementary level. Therefore it is proposed to conduct both TLM and Metric Melas at all levels based on experience of the previous year. The best once will be selected and honoured at all levels.Strengthening of monitoring mechanism among SDMC / CAC / PRI members:
It is proposed to conduct a one day workshop at school I cluster / block levels for strengthening the monitoring mechanism particularly related to quality dimensions. These
123

workshops will be focused on the components of Quality Monitoring Tools, School Level Formats, Community perception towards schools etc.
Meetings and Workshops;The periodical meetings and workshops will be conducted at all levels right from school
level to the state level as per the requirement and approval for effective implementation and monitoring of the REMS activities.
Educational Seminars;The Educational Seminars will be conducted on the aspects of Universalisation of Elementary Education, Training and Pedagogy, Quality Issues, Evaluation procedures. Innovative practices and experimental projects related to classroom transaction, learning achievement of the students etc. at block, district and State level. The documentation and follow up activities will be taken as per the discussions and out come of the seminars.
External Evaluation - KSQAO;The external evaluation will be conducted to assess the learning achievement level of the students and also the performance of schools. The evaluation will be conducted by Karnataka School Quality Assessment Oi^anisation (KSQAO). The analysis of the results will be made at all levels right from school level to the state level and necessary steps will be taken to overcome the identified problems. The reports will be made to access at all levels both in hard and soft copies.
Prathibha Karanji Programme;Prathibha Karanji is an innovative programme adopted to assess the capabilities of the students at elementary level (1-8) in co-curricular activities. The talents of the children both in curricular and co-curricular activities will be identified and honoured at all levels. The winners among 7“* standard students will be selected for Chinnara Karnataka Darshana educational tour.
Research studies and Impact Evaluation;The research studies will be selected in the identified areas and specific issues. The issues related to enrolment, retention, dropouts, access, Muslim and Tribal population, girls education, inclusive education, distance education, educational technology, attendance of students and teachers, classroom processes, assessment of students’ achievement will be focused in selection of the studies. The impact evaluation also will be conducted on ongoing programmes to know effectiveness of the programmes. Some of the on going studies will be continued for the year 2009-10 as per the MOU and TORs.
Popularisation of the Source Books on AssessmentSourcebooks on learning assessment have been published by NCERT in 2008. The NCF 2005 propounds a significant pedagogical shift in education towards a constructivist paradigm for learning and teaching, which would require suitable adjustment in textbook writing, classroom transaction and learner assessment.
The Same Books on Assessment have been prepared by NCERT for classes 1-5 in Language, Mathematics, EVS and Art Education. The some Books aim at bringing about
124

changes and improvement in the eusting assessment and practices followed in primary classes in schools across the country.
A team of 5 members o f the State representatives have participated in the national level seminar organised by NCERT, New Delhi held at Tirupati, (Andra Pradesh) from 6-8 Jan. 2009. The Action Plan has been prepared and submitted to NCERT based on the guidelines provided in the workshop to conduct a pilot study be selected two districts in the State. The pilot project will be taken with estimated cost if Rs. 65.97 lakhs under REMS for the year 2009-10.
The major components of the plan are as follows:For the Popularisation of the NCERT source books on the assessment of 1 to 5 standards in
1. Background:National Level workshop on NCERT Source books held at Thirupathi, Andra Pradesh & Pedagogical Practices in the State: Nali-kali, Multi Grade Teaching ^MCT), Multi Level Teaching (MLT), KalikaYatna (Learning Initiatives), and Competency Based Teaching (CBT), Activity Based Teaching (ABT) etc
2. Implementation of the source Books: July 2009 to March 2010 (June 2009 Baseline Assessment & Bridge course)
3. Methodology: Survey Method: Experimental Pilot Study
4. Sample: Purposive Sampling (Northern Karnataka: 01 & Southern Karnataka: 01)Number of Districts: 02 Number of blocks : 13 Number of Clusters: 169Number of Schools: 3508 (All Govt and Aided Kannada Medium Primary Schools) Nuimber of Students: 2,88,117 (All students in classes 1 to 5 in both 2 districts)
5. Tools: NCERT Source books 1 to 5 (excluding Hindi since it introduces from 6th class.)
II. Preliminary Activities:a. Translation of the tools in the Regional languageb. Familiarisation of the Source books / Pilot study among the administrators / Policy Makers like , DDPIs( Admn), DDPIs (Devt), BEOs, BRCCs, CAEOs, ECOs, CRPs, etc.c. Constitution of the core group: Heterogeneous group, selected teachers, BRPs, CRPs, DIET
faculty, volunteers &state level personal(15-20)d. Appraisal of the group
• Face to Face interaction• Integration of different types assessment tools adopted in different personnel / project
officer• Orientation of Teachers & other field functionaries of concerned sampling areas• Face to Face interaction - 2 days• Cascade mode fi-om SPO, DSERT,DIET, to the school level ( MRPs to RPs )• 2 day teleconference
e. Exposure visit to Kerala along with UNICEF representatives for interactionf. Administering the tool
125

g-h.
Collection of dataAnalysis of all level data & consolidation at state level
6. Draft Report -
7. Presentation of the Draft report;• Discussion / interaction with the field functionaries with all the stake holders
8. Final report based on the feed back
Monthly Wall Magazine:Adamya Chetana, an NGO has conducted a pilot study on implementation of “Monthly Wall Magazine” in Bangalore, Dharwad and Gulbarga districts. This programme helps in enhancing reading skills among the students at elementary stage particularly from 6-8 classes. It contains useful information related to education, sports, music, language activities, political, social and economical aspects also. The State has planned to adopt the similar strategies based on the above pilot project in the State. This programme will be supported by the above NGO logically.
The estimated cost of Rs. 86.95 lakhs is proposed in the AWP/B 2009-10 to cover the entire State.
Recommendation:The State has planned in ameticulous way for REMS activities in 2009 - 10. Keeping in view good progress in 2008 - 09 the Appraisal recommends the proposal for REMS for PAB approval.
Academic support systems
Academic support through BRCs, CRCs 'and DIETs
Block Resource Centres:Information about BRCsTotal no of Blocks
BRCssanctioned
BRCsfunctional
BRPssanctioned
BRPsrecruited
BRC meetings held in 2008-09
CRC/School visits in 2008-09
% of effectiveness of BRCs
202 202 164* 1010 756 Monthly 15 to 20 schools per month
Good
Source: AWP & B, SSA, Karnataka 2009 - 1 0*It may be noted that 38 BRCCs are on working on deputation from schools as BRCCs. This makes the total number ofBRCCs202(100%).
Major Role of BRCs, BRPs and CRPs (Gist): -As per the Plans, role and responsibilities of BRCs, BRPs and CRPs have been circulated to all the BRCs and CRPs in the form of book. The text is in Kannada. The important ones are listed below.
Analysing the learning levels of children in the Block and comparing it with the other blocks in the district and State
126
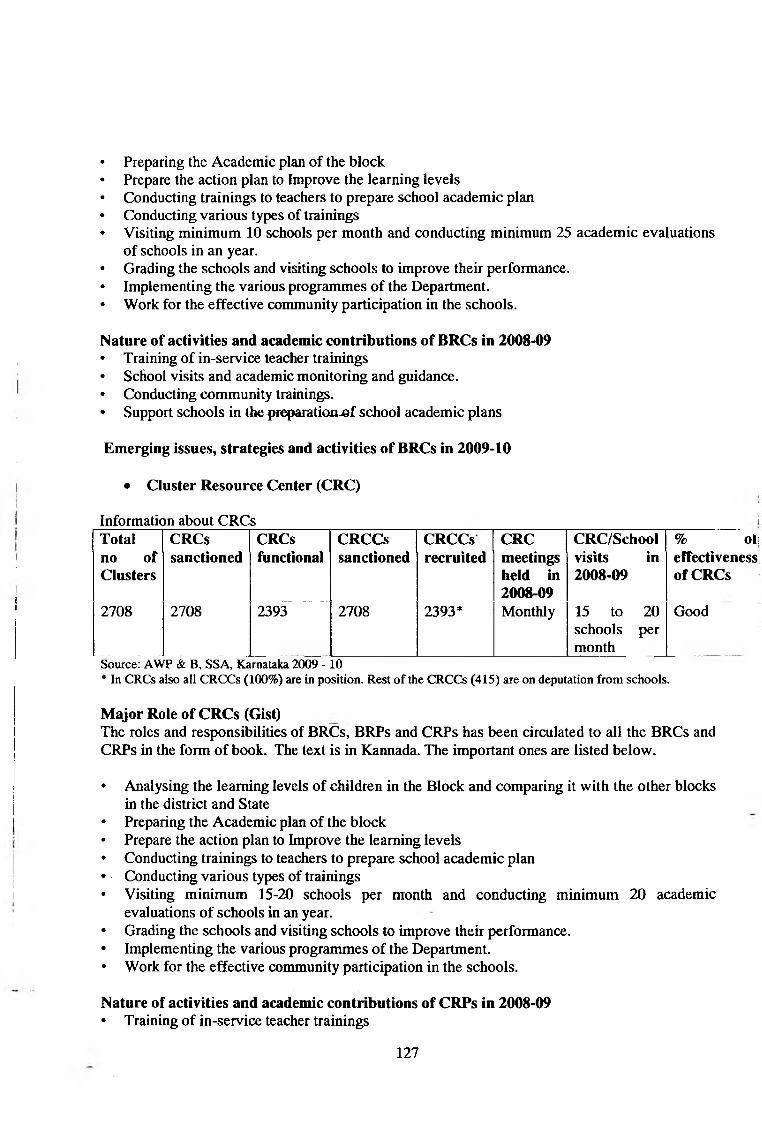
• Preparing the Academic plan of the block• Prepare the action plan to Improve the learning levels• Conducting trainings to teachers to prepare school academic plan• Conducting various types of trainings• Visiting minimum 10 schools per month and conducting minimum 25 academic evaluations
of schools in an year.• Grading the schools and visiting schools to improve their performance.• Implementing the various programmes of the Department.• Work for the effective conmiunity participation in the schools.
Nature of activities and academic contributions o f BRCs in 2008-09• Training of in-service teacher trainings• School visits and academic monitoring and guidance.• Conducting community trainings.• Support schools in thepreparation-of school academic plans
Emerging issues, strategies and activities of BRCs in 2009-10
• Cluster Resource Center (CRC)
Information about CRCsTotal no of Clusters
CRCssanctioned
CRCsfunctional
CRCCssanctioned
CRCCsrecruited
CRC meetings held in 2008-09
CRC/School visits in 2008-09
% o t effectiveness of CRCs
2708 2708 2393 2708 2393* Monthly 15 to 20 schools per month
Good
Source: AWP & B. SSA, Karnataka 2009 -10• In CRCs also all CRCCs (100%) are in position. Rest of the CRCCs (415) are on deputation from schools.
Major Role of CRCs (Gist)The roles and responsibilities of BRCs, BRPs and CRPs has been circulated to all the BRCs and CRPs in the form of book. The text is in Kannada. The important ones are listed below.
• Analysing the learning levels of children in the Block and comparing it with the other blocks in the district and State
• Preparing the Academic plan of the block• Prepare the action plan to Improve the learning levels• Conducting trainings to teachers to prepare school academic plan• - Conducting various types of trainings• Visiting minimum 15-20 schools per month and conducting minimum 20 academic
evaluations of schools in an year.• Grading the schools and visiting schools to improve their performance.• Implementing the various programmes of the Department.• Work for the effective community participation in the schools.
Nature of activities and academic contributions of CRPs in 2008-09• Training of in-service teacher trainings
127

• School visits and academic monitoring and guidance.• Conducting community trainings.• Support schools in the preparation of school academic plan
Capacity Building of BRC/CRC personnel:
Duration Focus areas Duration Focus areasBRCC 10 days in
phasedmanner
Training on Job-ChartAcademic support and monitoringGrading of schools .Performance standards trackingManagerial training and other related matters______
BRPs 10 days inphasedmanner
Training on Job-ChartAcademic support and monitoringGrading of schools ,Performance standards trackingManagerial training and other related matters______
CRPs 10 days inphasedmanner
Training on Job-Chart Academic support and monitoring Grading of schoolsManagerial training and other related matters
Source: AWP & B, SSA, Karnataka 2009 -10
Resource Groups & Subject Expert Forums
Academic Resource Groups:The State has attempted to strengthen its Academic Resource Groups at different levels. The State formed strong resource groups at different levels who meet on regular basis and plan for pedagogical strengthening in the State.
4. Quality Management for Quality Assurance:a. Nature of Quality monitoring in the State
The State has taken necessary initiatives in implementation and follow up activities on Quality Monitoring Tools designed by NCERT, New Delhi. The following activities have been conducted in order to collect the required information and qualitative analysis at all levels.
Capacity Building Programme: -State Level Work Shop, Divisional Work shops, District / Block level workshops, Cluster level
workshops, School level workshops have been conducted in order to familiarisation of the QMT formats and follow up activities.
M ajor provisions on QMT formats• NCERT Quality Monitoring Tools have been translated, printed and also supplied to all
levels.• The process of information collection has been made at school level.• The information has been consolidated at all levels. ,• The State level Data of the 1** quarter 2008-09 on QMT has been sent to NCERT and the
qualitative analysis has been made at all levels. The necessary strategies are being adopted on the findings of the analysis particularly related to enrolment, attendance, learning achievement, monitoring and supervision aspects.
128

State Specific Modifications• The required information on QMT related to Enrolment, Attendance and Learning
Achievement (SLFI & III, CLF I & III, BLF I & III and DLF I & III) has been collected through DISE software.
• The Computer Programmers, APCs, ASOs and concerned personnel have been trained in this regard.
b. Findings o f Quality Monitoring Tools (Nature of issues and how they have been addressed)
The Quality Monitoring Tools have addressed the following issues on Quality Dimensions.■ Students enrolment and retention■ Teacher Attendance and Students’ Attendance■ Learning Opportunity Time■ Learning Achievement Level of the Students■ Community Perception towards functioning of school system■ Monitoring Mechanism■ Performance o f the academic structures o f various levels like, CRCs, BRCs and DIETs in
monitoring and supporting Qualitative improvement of the elementary education.
Follow up Activities:The necessary follow up activities have been taken at all levels based on the analysis made for overcoming the problems raised in the QMT report. The analyses have been made at all levels and particularly in the district and sub district levels under the supervision o f the DIETs.
Nature of Performance Indicators for teachers and trainers for 2009 - 10Performance Indicators for Iteachers and trainersMajor performance indicators identified for School teachers 2009-10
M ajor performance indicators identified for CRC Personnel 2009-10
Major performance indicators identified for BRC Personnel 2009-10
All children attend classes regularly _
Identify Resource teacher and create cluster resource team
Identify Resource teacher and create block resource team.
Achievement analysis will be done subject wise, and competency wise
Provide teacher support through this resource team (man to man support programme/school based support
Provide teacher support through this resource team (man to man support programme/school based support)
School academic plan will be prepared to address the learning gaps
Recognize resource persons from the community and use them for teacher support programme
Recognize resource persons from the community and use them for teacher support programme
Parents and community share the SAP and monitor the progress the children periodically
School wise performance analysis will be done. (Q.M.T, KSQAO)
School wise performance analysis will be done and documented. (Q.M.T, KSQAO)
DIET, BRCs, CRCs, CAEOs share the SAP,
Provide online teacher support
Provide online teacher support
129

M ajor performance indicators identified for School teachers 2009-10
Major performance indicators identified for CRC Personnel 2009-10
M ajor performance indicators identifled for BRC Personnel 2009-10
identify the gaps and provide teacher support.
-
All children will develop the skill of reading, writing and basic innumeracy
Develop CRC;s as a resource center for teacher
Develop BRC;s as a resource center for teacher.
Learning opportunity will be, time will be increased
Works as a counseling center for children, parents and community
Works as a counseling center for children, parents and community
TLM will be developed for science and mathematics
School Visit; Models the pedagogy in actual classroom, shows it can be done , discusses/addresses issues boosts teachers Confidence, shares good practices observed in other schools, facilitates interaction among teachers in the school
School Visit: Models the pedagogy in actual classroom, shows it can be done , discusses/addresses issues boosts teachers Confidence, shares good practices observed in other schools, facilitates interaction among teachers in the school
Schools made neat ,hygienic, attractive by organizing the TLM ,infrastructure
Anange for visits of teachers to each others school to observe good practices helping them to reflect
Arrange for visits of teachers to each others school to observe good practices helping them to reflect
Teacher plans and teaches according to student profile developed by him thus a different approach is visible
Sets short term objectives for each school with time line
.Sets short term objectives for each school with time line
Source: AWP & B, SSA, Karnataka 2009 -10
Progress in 2008-09:As a part of Teacher supporting activity following performance indicators were identified for school, BRC and CRCs. during 2008-09. State and district level workshops were organized for BRCs and CRCs in turn CRCs conducted training programme for Headmasters
Activities initiated in the district:• Identified the learning levels of children subject wise and Prepared School Academic plan• Planned for effective teaching( Remedial Teaching, TLM, Reading Programme)• Activity banks prepared by DIETs and made available in clusters. As per the requirements
teachers used the activities from these books ‘ .• Samudaayadatta Shaale (School towards Community) programme a quarterly social audit
programme was conducted in every school thrice in the year.• SDMC trainings conducted and made parents to take up the responsibility to monitor the
progress of their children and plan for the better.• The goals, activities of the department and role of parents were published quarterly in the
news papers. By this, awareness was created in the community.
130

Also the following activities were carried out.• Iday training to AEOs and CRCs by BRCs• Sharing workshops of AEOS and CRPs -• Cross visits• Sharing the findings and re-planning• Training to BRCs and BRPs -DPO and DIETs
The achievement of these standards was monitored through SDMC meetings, Samudaayadatta Shaale (School towards Community) School visits, Review meetings. Experience sharing workshops.
Activities proposed for the implementation o f this activity:It is a non budgeted activity needs readiness and determination from the schools, BRC and CRCs.At the same time the DPO, DIET, BRC and CRC should motivate the next. The AWPB2009-10 targeted learning enhancement and the standards are designed in that context.
The standard identified will have some amount of freedom to schools to change some of standards which are already achieved. The standards are provided to schools in the following format and based on the status the activities will be planned.
Standards Present status Desiredstatus
Timeline Strategies
X ? VAll children attend classes regularly
Source: AWP & B, SSA, Karnataka 2009 -10
X: No Achievement ? : Not confirmed V: Achieved
■ The State has proposed to organise a state level meeting with DIET and District cocoordinators in the month of June-2009 and share Ihe standards identified and fix the timeline.
■ In turn the District project coordinators in coordination with DIET organise one day workshop to BRC and CRc and share the standards and prepare the timeline and action plan in June 2009
■ The sharing meeting of teachers of July2009 at cluster level will share the standards and work out the strategies to achieve these standards and include in School Academic plan
Tracking Activities■ The Samudaayadatta Shaale (School towards conmiunity) programme is the platform to
review the progress of schools and plan for further improvement.■ During school visits the supervisory staff observe the achievement in schools and record
in the enabling tool.■ Review meetings of BRC,CRC and Headmasters
131

Observation:This is very important for the State to track and enhance performance o f teachers and trainers in 2009 - 10. The State must report its progress to MHRD/ TSG on quarterly basis.
Overall Quality Initiatives in the State:It is impressive to note that the State has undertaken a wide range of quality related interventions to improve quality of elementary education under SSA. Now, the major challenge before the State is to integrate all these interventions and focus them for learning enhancement o f students. The State seems to be on track and integrated moves for learning enhancement might prove the point.
Broad recommendations for Quality improvementBasing on the above discussion the Appraisal recommends the following way for activities related to overall quality improvement under SSA.
Recommendation for activit ies related to qualitySI.No.
Interventions Proposed Recommenc led RemarksPhysical Financial
(Rs. in lakh)
Physical Financial(Rs.in lakh)
1. Teacher recruitmentNew Teachers Salary (P.S.) 634 188.932 634 188.932 @ 2 teachers per
School for 2 monthsNew Teachers Salary (UPS) 52-5 156.450 130 38.740 @ 1 teacher per
School for 2 monthsNew Teachers Salary (UPS) 450 134.100 450 134.100 @ 1 tr. for class
VIII for 2 monthsAddl. Teachers against PTR 19471 6243.863 0 0 Not recommended
Dist. PTR < 40:1.* Recurring 23067 42269.802 23067 42269.802 As per norms2. Traininga. In service (PS+UPS) 246252 3734.280 228885 2288.850 @ 100 / tr. / day
228885 1144.425 @ 50 / tr. / dayb. Induction training - 19345 580.350 1270 38.100 Only approved trs.
Training of untrained teachers 0 0 0 0 Not applicableTraining of BRC, CRC Personnel
7578 75.78 Only for RPs
Remedial teaching 385424 1927.120 311985 623.970 @ Rs. 200 per child for children from 5% schools
4.(a)
Free Textbooks (PS) 437537 371.906 437537 350.030 Only for govt, aided school children; Govt. school children from State Govt.
<b) Free Textbooks (UPS) 472852 638.35 472852 614.708
1Sub Total
910389 1010.256 910389 964.7375.(a)
TLM Grant (P) 54167 270.835 50762 253.810 As per actual
(b) TLM Grant (UP) 192085 960.425 178123 890.615 As per actualSub Total 246252 1231.26
132

SI.No.
Interventions ProposedPhysical Financial
(Rs. lakh)
in
Recommencniysical
edFinancial(Rs.in lakh)
Remarks
6.
ia iSchool Grant (P) 48341 2417.050 47946 2397.300 As per actual
School Grant (UP) 24234 1710.38 24511 1715.770 As per actualSub Total 72575 4127.43 72457 4113.07
7.(a) TLE Grant (P) 317 63.4 317 63.40 As per actualTLE Grant (UP) 525 262.5 130 65.00 As per actual
(c) UPS Not covered under OBB 0 0Sub Total 842 325.9 447 128.4
8 .
9.LHP 46086 3097.428 29 districts 2059.471BRCs 196 1108.628 196 1097.068 As per actual
10. CRCs 2684 3465.032 2684 3465.032 As per actual
(V) SIEMATThe State was sanctioned the SIEMAT quite some time ago. Regarding SIEMAT, the State has furnished following information.
The State Government had decided to set up SIEMAT as an autonomous organization under the Societies Registration Act. A study team from SSA visited, SISLEP, Allahabad, and Uttara Pradesh, to draw lessons fro the setting up of SISLEP in the State, and submitted its report.The State government has decided to christen SIEMAT as State Institute for School Leadership, Educational Planning and Management (SISLEP)It has been decided to locate the SISLEP in Dharwad city, 480 Kms away from Banglore, the Capital City of the State, as well as a centrally located place in the State.
DIET, Dharwad agreed to provide adequate land space, nearly 1.4 hectares of land for SISLEP. This land has been earmarked for setting up of SIEMAT. This is Government land. DIET, Dharwad was directed to give complete details of this land. The details have been received. It is proposed to appoint a Special Officer for finalization of civil works-license, permits, facilities, design, etc., and oversee Constmction at Dharwad.
Framing of Bye-laws and Service Rules and Regulations was outsourced. An MOU was entered into for this purpose with KILPAR (Karnataka Institute for Law and Parliamentary Affairs), Bnaglore. The documents prepared by KILPAR and other documents relating to SISLEP were discussed at a meeting convened by the Secretary, Primary & Secondary School Education, GoK ; and finalized the same.A vision document on SISI£P was also drafted. A note to Cabinet was submitted [Governor’s Rule] by the Sarva Shiksha Abhiyan Mission Directorate for clearance of SIEMAT/SISLEP proposal with all the supporting documents [Date of submission 25.09.2008]
The pending proposal was placed at the 4“' meeting of the Governing Council of Sarva Shiksha Abhiyan Mission held on 02.01.2(X)9 as an agenda item. The Governing Council meeting had been chaired by the honorable Chief Minister of the State. The honorable Education Minister briefed the Governing Council regarding the establishment of SIEMAT. The honorable Chief Minister directed the Governing Council to put up the proposal before the cabinet.
The appraisal team is concerned over very slow progress on establishment and operaionalisation of SIEMAT. SIEMAT was sanctioned quite some time ago the token
133

amount was approved which was later withdrawn Despite a lot of ground level work being done the outcome i.e. establishment of SIEMAT and its operaionaliaiton has not yet happened. Quick action should be expedited to complete the formalities and establish this much desired institution quickly.
(VI) Inclusive Education
Over the past 3 years, the State has done some commendable work in the area of IE. Some activities like undertaking special survey for identification of CWSN, appointing resource teachers @ 3 per block, converging with a large number of NGOs and training of volunteers for home based education of CWSN are specifically being carried out by the State of Karnataka.
Progress on IE in 2007-08
• 91.78% CWSN covered• 606 resource teachers have been appointed• 67.16% CWSN provided with aids and appliances• All teachers have been trained on IE through the in-service teacher training and 6.93%
given special training on IE. 24678 teachers trained through 45/90 day training• 113 NGOs have been involved in the IE programme• 59.31% schools made barrier-free• 100% expenditure on IE in 2008-09.
In the year 2008-09 the state had identified 132297 CWSN and the total Budget provided the State was Rs 1567.564 lakhs. The physical and financial progress of the state is given below.
District wise progress on IE
Name of the District
No. of CWSN identifi ed
No. of CWSN enrolle d in schools
No. ofCWSNcoveredthrougEGS/AIE
No. ofCWSNcoveredthroughHBE
No. of CWSN provided Aids & Appliance
No. ofNGOsInvolved
No. of Resource teacher appointe d
No. of schoolsmadebarrierfree
%school s made barrie rfree
Bagalkote 6702 6126 0 576 862 2 18 1122 88
Bangalore (R) 3011 2562 0 449 519 - 4 12 750 65
Ramnagar 2168 1898 0 270 503 5 12 1032 74
Bangalore (U) 10327 9237 0 1090 1338 3 27 318 31
Belgaum 9043 7422 0 1621 1476 7 42 1943 62
Bellary 4267 3604 33 630 530 7 24 1254 93
Bidar 3971 3346 0 625 440 6 15 1056 89
Bijapur 5505 5056 40 409 1138 2 21 1875 100
Chamaraja 3747 3367 0 380 337 1 15 154 12
134

ime of the District
No. of CWSN identifi ed
No. of CWSN enrolle d ia schools
No. ofCWSNcoveredthrougEGS/AIE
No. of CWSN covered
-through HBE
No. of CWSN provided Aids & Appliance
No. ofNGOsInvolved
No. of Resource teacher appointe d
No. of schoolsmade barrie r free
% schi s m bar rfr
nagar
.0 Chikkaballapur 2813 2466 0 347 596 2 18 490 31
.1 Chikmagalore 2840 2467 0 373 776 3 24 511 32
12 Chitradurga 4082 3783 0 299 950 4 18 874 51
13 D. Kannada 6250 5691 0 559 711 4 21 831 89
14 Davanagere 4355 4054 0 301 1899 5 21 1182 52
15 Dharwad 3459 2850 0 609 348 6 18 608 86
16 Gadag 2446 2122 0 324 472 2 18 250 33
17 Gulbarga 9562 8217 1345 1462 4 33 2609 100
18 Hasana 2342 1973 0 369 938 3 24 1499 58
19 Haveri 3536 3133 0 403 177 4 21 644 56
20 Kodagu 1692 1483 0 209 78 1 9 278 68 '1
21 Kolar 2454 2125 0 329 259 2 18 919 48
22 Koppala 3115 2844 0 271 557 5 12 562 59
23 Mandya 4698 4028 0 670 175 5 24 817 45
24 Mysore 5071 4747 0 324 132 3 27 1339 69
25 Raichur 5114 4742 0 372 106 3 15 400 20
26 Shimoga 6458 5912 0 546 772 3 21 1200 55
27 Turakur 6349 5601 0 748 809 10 30 1428 39
28 Udupi 1595 1080 149 366 915 3 15 570 100
29 U. Kannada 5325 4587 0 738 1430 4 33 787 36
Total 132297 116523 222 15552 20705 113 606 27302 60%
Progress for IE 2008-09
S. Activities Budget ExpenditureNo. Phy ' Fin (in lakhs) Phy Fin (in
lakhs)1. Assessment & measurement
Camps. Rs. 15,000/- per camp202 30.30 202 30.30
2. Provision of Aids & Appliances Rs 1500/- per child
9765 146.45 20705 146.45
3. lERT’s Salary (TA/DA) 606 610.88 606 610.884. Awareness Programme
Community, CRC & BRC etc2250 45.00 2250 45.00
135

S. Activities Budget ExpenditureNo. Phy Fin (in lakhs) Phy Fin (in
lakhs)2000/- per cluster
5. Long term training course Rs. 4000 Per teacher
1500 60.00 1500 60.00
6. HBE volunteer training Rs. 100 X 10 days
6211 62.11 6211 " 62.11
7. Parents training 119138. Strengthening of Resource
centers 20000/- per center197 39.40 197 39.40
9. HBE volunteers remuneration per child Rs 3594
15552 558.99 15552 558.99
10. District coordinator Salary (TA/DA)
17.28 17.28
11. Workshop/Meetings 31 10.00 31 10.0012. Teleconference 1.00 1.0013. Braille Book 800 4.00 800 4.0014. State Co ordinator Salary 2.16 2.16
Total 1587.56 1587.56
CWSN identified in 2009-10
The stale has identified 135301 CWSN out of total child population of 85,3^^392 which is 1.58% of the total child population.
S. No Category No. of CWSN1. Visually Impaired 228162. Hearing Impaired 215943. Mentally Retarded 26030 -4. Orthopedically Handicapped 252475. Learning Disability 237856. Multiple Disability 15829
Total 135301
t .
4o.District Name No. of
CWSNIdentified
% CWSN against child popu
No. of CWSN enrolled in school
No. o f CWSN proposed to cover through EGS/AIE
No. o f CWSN proposed to cover through HBE
(Bagalkote 6182 1.98 5593 7 582Bangalore (R) 3186 2.57 2830 3 353
r Ramnagar 2059 1.57 1761 5 293j Bangalore (U) 7074 0.72 6559 76 439, Belgaum 8545 1.21 7066 8 14711 Bellary 4122 1.1 3583 37 502
136
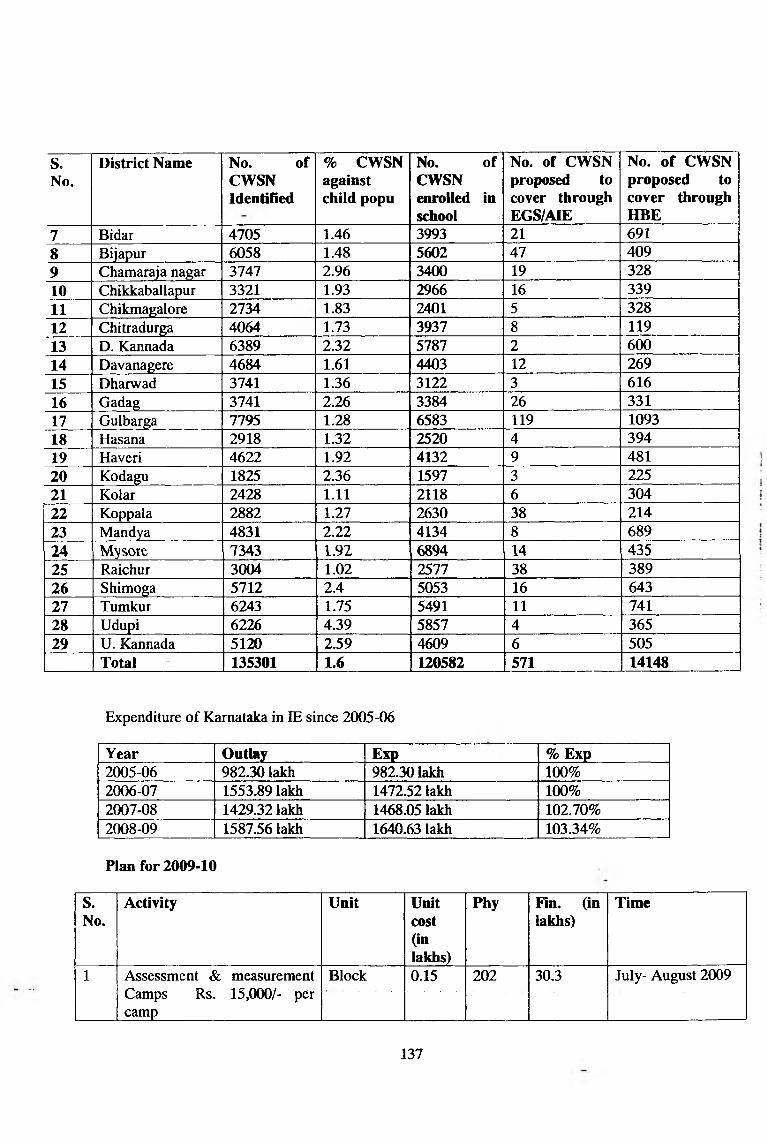
S.No.
District Name No. ofCWSNIdentified
% CWSN against child popu
No. of CWSN enrolled in school
No. of CWSN proposed to cover through EGS/AIE
No. of CWSN proposed to cover through HBE
7 Bidar 4705 1.46 3993 21 6918 Bijapur 6058 1.48 5602 47 4099 Chamaraja nagar 3747 2.96 3400 19 32810 Chikkaballapur 3321 1.93 2966 16 33911 Chikmagalore 2734 1.83 2401 5 32812 Chitradurga 4064 1.73 3937 8 11913 D. Kannada 6389 2.32 5787 2 60014 Davanagere 4684 1.61 4403 12 26915 Dharwad 3741 1.36 3122 3 61616 Gadag 3741 2.26 3384 26 33117 Gulbarga 7795 1.28 6583 119 109318 Hasana 2918 1.32 2520 4 39419 Haveri 4622 1.92 4132 9 48120 Kodagu 1825 2.36 1597 3 22521 Kolar 2428 1.11 2118 6 30422 Koppala 2882 1.27 2630 38 21423 Mandya 4831 2.22 4134 8 68924 Mysore 7343 1.92 6894 14 43525 Raichur 3004 1.02 2577 38 38926 Shimoga 5712 2.4 5053 16 64327 Tumkur 6243 1.75 5491 11 74128 Udupi 6226 4.39 5857 4 36529 U. Kannada 5120 2.59 4609 6 505
Total 135301 1.6 120582 571 14148
Expenditure of Karnataka in IE since 2005-06
Year Outlay Exp % Exp2005-06 982.30 lakh 982.30 lakh 100%2006-07 1553.89 lakh 1472.52 lakh 100%2007-08 1429.32 lakh 1468.05 lakh 102.70%2008-09 1587.56 lakh 1640.63 lakh 103.34%
Plan for 2009-10
S.No.
Activity Unit Unitcost(inlakhs)
Phy Fin. (in lakhs)
Time
1 Assessment & measurement Camps Rs. 15,000/- per camp
Block 0.15 202 30.3 July- August 2009
137

S.No.
Activity Unit Unitcost(inlakhs)
Phy Fin. (in lakhs)
Time
2 Provision of Aids & Appliances Rs. 1500/- per CWSN
ChUd 0.015 20000 300.00 November- December 2009
3 Awareness Programme (Cormnunity) CRC & BRC level Rs. 2,000/- per CRC
Cluster 0.02 2544 50.88 June- July 2009
4 Training of parents of CWSN Rs.50 X 2 Days
Parents 0.001 20000 20.00 August- September 2009
5 Long term training course (90 days) Rs.4000 Per teacher
Teacher 0.03 1125 33.75 October- December 2009
6 HBE volunteer training Rs.l00X4days
Volunteers 0.004 6540 26.16 October 2009
7 Strengthening of Resource centers Rs 40,000/- per center
Center 0.20 202 40.40 November- December 2009
8 W orkshop/Meetings/T A/DA at the State/ district level @ Rs. 30,000/- at the district level and 1.066 lakh at the Slate level
District 0.3 29 9.766 Monthly
9 Development of Publicity materials level @ Rs. 20,000/- at the district level and 1.00 lakh at the State level
District 0.2 29 6.80 November 2009
10 Braille Books for blind Children 0.0060 1000 6.00 June 2009
11 Corrective surgery Children 0.05 800 40.00 September- December 2009
12 Braille Training for teachers (lOdays) @ 50 teachers per district @ Rs. 200/- per day
Teachers 0.02 1100 22.00 May 2009
13 Training for IERT«&CRC(3 days) @ 50 teachers per district @ Rs. 200/- per day
Teachers 0.0060 1500 9.00 Through out year
14 Escort Facility Rs 150/- per child
Children 0.015 1500 22.50 Through out year
15 lERT teachers Salary lERT 0.115 606 836.28 Through out yearTotal 1453.836
138
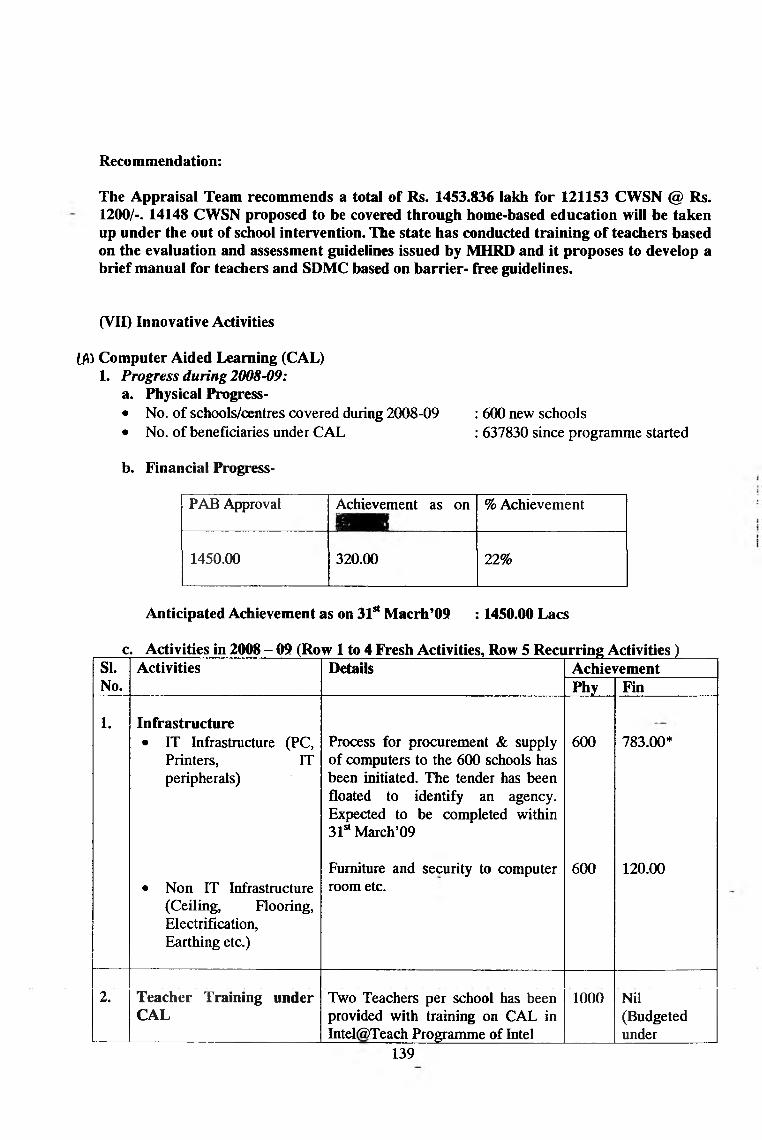
The Appraisal Team recommends a total of Rs. 1453.836 lakh for 121153 CWSN @ Rs. 1200/-. 14148 CWSN proposed to be covered through home-based education will be taken up under the out of school intervention. The state has conducted training of teachers based on the evaluation and assessment guidelines issued by MHRD and it proposes to develop a brief manual for teachers and SDMC based on barrier- free guidelines.
Recommendation:
(VII) Innovative Activities
ifi) Computer Aided Learning (CAL)1. Progress during 2008-09:
a. Physical Progress-• No. of schools/centres covered during 2008-09• No. of beneficiaries under CAL
: 600 new schools : 637830 since programme started
b. Financial Progress-
PAB Approval Achievement as on % Achievement
1450.00 320.00 22%
Anticipated Achievement as on 31** Macrh’09 :1450.00 Lacs
c. Activities in 2008 - 09 (Row 1 to 4 Fresh Activities, Row 5 Recurring Activities)SI. Activities Details AchievementNo. Phy Fin
1. Infrastructure• IT Infrastructure (PC,
Printers, IT peripherals)
Process for procurement & supply of computers to the 600 schools has been initiated. The tender has been floated to identify an agency. Expected to be completed within 31““ March’09
600 783.00*
• Non IT Infrastructure (Ceiling, Flooring, Electrification,Earthing etc.)
Furniture and security to computer room etc.
600 120.00
2. Teacher Training under CAT,
Two Teachers per school has been provided with training on CAL in Intel(®Teach Programme of Intel
1000 Nil(Budgetedunder
139

SI.No.
Activities Details AchievementPhy Fin
Teacher Training of Pedagogy)
3. Content/ Software Development By EDC and APF Nil
4. Any Other Activity
Edusat/Keli kali Being implemented through DSERT. Funds has been released to DSERT for 29 districts® 10.00 lacs
29 200.00
5. Recurring Activities• Maintenance of
Infrastructure
• Refresher Training to Teachers
• Support for Additional Infrastructure
• Programme Expansion
Maintenance of Computers provided during earlier years to 29 districts @ Rs.5.00 lacs
Additional Infrastructure
29 145.00*
202.00*
Total 320.00* The anticipated total expenditure by 31'‘ March’09 is 1450.00 lacs
2. Proposal for 2009-10:a. Physical-• No. of schools/centres to be covered during 2009-10: 735 new schools• No. of beneficiaries to be covered under CAL: 220500
b. Detailed Activity Wise break up for 2009 -10 - (Row 1 to 4 Fresh Activities, Row 5
SI.No.
Activities Details AchievementPhy Fin
1. Infrastructure• r r Infrastructure (PC, Printers,
IT peripherals)
• Non IT Infrastructure (Ceiling, Flooring, Electrification, Earthing etc.)
PCs for 735 [email protected] lacs
Site preparation for 735 [email protected] lacs
735
735
904.05
220.50
140

SI. Activities Details - AchievementNo. Phy Fin2. Teacher Training under CAL Training of one teachers per CALC
school on Group Teaching & Learning for five [email protected]
BRPs. CRPs and Teachers capacity building In collaboration with Intel and EDC
2455 18.41
Nil
3. Content/ Software Development Contents provided by Azim Premji Foundation and EDC are being used
Nil
4. Any Oflier ActivityStudy on learning achievement of students at Upper Primary level (CAL schools vs. general schools)
Will be done under REMS Nil
Quality assurance and larger coverage in schools (CAL)
Transforming CAL schools into Centre for Learning
Nil
Quality monitoring and performance tracking (REMS, CAL)
quality monitoring and performance tracking of CAL programme, will be made as a part of QMT
Nil
Documentation & sharing of good practices
This will be done under the heads of Media & Documentation
5. Recurring Activities• Maintenance of Infrastructure AMC of PCs 307.04
Total — 1450.00
3. Observation:The state had taken up the Computer Assisted Learning programme under Sarva Sikhya Abhiyan to strengthen the dassroom transaction processes. With a policy level guideline to identify the schools on the basis of location, strength, availability of basic resources like rooms & electricity the state had covered 540 schools in 2004 -05,1000 schools during 2005 to 2007, 315 schools in 2007 - 08 & 600 schools in 2008 - 09. The total coverage under CAL programme in the state since its initiation is 2455 schools benefitting 637830 children. -
The state had built up a pool of resources of 98 multimedia content CDs developed in collaboration of Azim Premji Foundation & EDC on the listed hard spots from all topics of Class 111 to VIII. The CDs have been replicated and provided to the Computer Aided Learning schools. The state has tied up with Intel (Intel Teach programme) & EDC (Group Teaching & Learning) for teacher training activities on CAL. Content based IT training has been given to 400 BRCs of 18 districts. These Master trainers are providing training to 10 CAL teachers in his / her block on the ‘Getting Started Course.
141

In the year 2008 - 09 the state had taken up Edusat & radio programmes under this intervention. Regarding the CAL activities the state’s progress is not very impressive. The state has been able to make expenditure only up to 22% of the total allocated amount as on the date. The progress of procurement & supply process of computers to the 600 schools to be covered this year is in very early stage. As understood the delay was due to the non availability the committee members of Technical-Advisor Panel (TAP) for Education Deptt., Kamatak which was to finalize the technical specifications for the procurement. As reported by the state the technical specifications have been released by now & the procurement process is expected to be completed within 31*‘ March’09. However, in general the state plan of action should must see that &e infrastructural setup is completed at the earliest possible to move ahead with the rest of the activities of the intervention.
In 2009 - 10 the state has proposed to take up 735 new schools. With experiences of the previous year, the state must take timely action to ensure that the infrastructure setup (both IT & Non IT) is provided in time to the schools. The state has proposed for few capacity building activities on CAL, one of which is Group Teaching & Learning software which engages up to 25 students & one teacher in highly interactive and entertaining learning activities, and also provides a rich set of educational resources for the teacher to use in many different ways. Besides other activities on quality related issues, the state has proposed to undertake a study on the learning achievement of students at Upper Primary level (CAL schools vs. General schools) to know the impact of CAL intervention and find out the difficulties in implementation. Another issue that needs to be mentioned here is that, an amount of 307.04 lacs has been proposed under the maintenance activities for AMCs of the PCs & peripherals without mentioning any unit based calculation. As represented by the state the calculation has been made on the basis of evaluations made by KEONICS (The Kamatak Electronics, A Kamatak Govt. Undertaking). The proposal in this regard could have been more detailed.
However the plan proposed by the state reflects the state’s interest to expand the coverage of Computer Aided Learning activities both in quantitative & qualitative directions.
' 4. Recommendation:The appraisal team recommends the proposal and activities of the state.
^ Early Childhood Care & Education (ECCE)
Progress overview (2008-09)
During the year 2008-09, the FAB has approved an amount of Rs. 435.00 iakhs @ Rs. IS lakhs per district under ECCE for 29 districts. Accordingly the state has spent Rs. 435.00 lakhs for undertaking the ECCE activities. Accordingly the state has undertaken the following activities:
• Conducted meetings in Zero grade schools with field functionaries of the Bangalore districts and formulated the strategies to commence zero grade schools and the classroom activities to be followed.
• Established Zero grade schools in Bangalore urban district to provide Early Child Education to the under age children who are enrolled to class 1.
142

Extended the Anganwadi timings where the children are dropping out and absent to the school because of sibling care along with volunteer.620 Zero grade schools are started in primary school premises. Out of budget approved of Rs. 435.00 lakhs, the state has spent Rs. 240.25 lakhs and the balance amount of Rs. 240.205 lakhs is released to Woman and Child Welfare Department to provide TLM material for all the districts.
Some of the ECCE activities undertaken in Bangalore (S & N) are given below:
S. No. District Name Tarcet Achievement ExpenditureCenter Children Center Children Amount in Lakhs
1 Bangalore (S) 320 8000 298 4057 106,328502 Bangalore (N) 300 7500 246 4662 88.431
Total 620 15500 544 8719 194.7595
3Woman & Child Welfare Department
Providing TLM Material @ Rs. 500 for each Anganwadi centre 240.205
Total 435.00
Statement showing the details of the ECCE activities (Physical & Financial) at district level
ECCE (Rs. In Lakhs)
S.No.
Financial PhysicalDistrict Funds
sanctioned during PAB 2008-09
FundsUtilised rarget (No. of Children) Innovative Activities
Undertaken CoveraL
29 districts 435.00 435.00 15,500 - 15,500
Details are given below:1. Baealkot 15.00 15.00 15,500 • Conducted meetings 15,500
2. Rural 15.00 15.00 in Zero grade schools with field
3. BangaloreUrban 15.00 15.00 functionaries of the
Bangalore districts4. Beleaum 15.00 15.00 and formulated the5. Bellarv 15.00 15.00 strategies to6. Bidar 15.00 15.00 commence zero7. Biiapur 15.00 15.00 grade schools and8. Chamrajnagar 15.00 15.00 the classroom9. Chickmacalur 15.00 15.00 activities to be10. Chitradurea 15.00 15.00 followed.
• Established 2^ro grade schools in Bangalore urban district to provide Early Child Education to the
11. DakshinaKannada 15.00 15.00
12. Davangere 15.00 15.0013. Dhafwad 15.00 15.0014. Gadag 15.00 15.0015. Gulbarea 15.00 15.00
143

ECCE (Rs. In Lakhs)
S.No.
Financial Physical
District Funds sanctioned during PAB 2008-09
FundsUtilised Target (No. of Children) Ipnovative Activities
Undertaken Coverage
16. Hassan 15.00 15.00 under age children17. Haveri 15.00 15.00 who are enrolled to18. Kodaeu 15.00 15.00 class 1.19. Kolar 15.00 15.00 • Extended the20. Koppal 15.00 15.00 Anganwadi timings21. Mandya 15.00 15.00 where the children22. Mvsore 15.00 15.00 are dropping out and23. Raichur 15.00 15.00 absent to the school
because of sibling care along with volunteer.
• 620 Zero grade schools are started in primary school
24. Shimoea 15.00 15.0025. Tumkur 15.00 15.0026. Udupi 15.00 15.00
27. UttaraKannada 15.00 15.00
28. Ramanagara 15.00 15.0029. Chikballapur 15.00 15.00 premises.
Total 435.00 435.00 15,500 - 15,500
Proposal 2009-10 (ECCE)The state during the year 2009-10 needs an amount of Rs. 435.00 lakhs @ Rs. 15 lakhs per district under ECCE for 29 districts. The proposed activities for 2009-10 are given below;
• The state during the year 2009-10 (AWP&B 2009-10) proposed to continue 620 Zero grade schools in Bangalore.
• It is proposed to organize workshops to Anganwadi workers at the block level regarding the activities to be taken up as a continuum or preparing, process to get children in to primary schools. They will be exposed to the Nali-Kali activities. Thus they could initiate these activities in Anganawadis and the process helo the child when He/ She joins primary school.
• It is proposed to conduct sharing workshops of Anganwadis and CRPVto monitor the preparedness of children for primary education and also to monitor the dropout children and out of school children because of sibling care.
Statement showing the details for the funds required to undertake ECCE activities
SI.No. Particulars unit Unit cost
in rupees Amount in Lakhs
1 Countinuation of Zero grade school. School 37172 230.4650
23 days training for Anganwadi workers (Anganwadi workers 40301XRsl00X3days)
Anganawadiworker 100 120.9030
3CRP’s ,Cluster and Blocklevel gender co-ordinators and Anganwadi workers quarterly sharing meeting
Anganawadiworker 50 60.4515
144

(Aw-40301XRs50Xdays 3)
41 day teleconference for anganwadi workers with CRP’s (Aw 40301XRS 50Xdayl)
Anganawadiworker 50 20.1505
5State level RPs training(Blocks 202 X 5 RPs x Rs. 100 x 3days)
MRP 100 3.0300
Total 435.0000
Action plan/ Activity Calendar under ECCE component of SSA for the year 2009-10 & District wise Activities proposed during 2009-10 under ECCE Innovation
SI. No.
1 .
2.
3.
4.
5.
Particulars1 day teleconference for anganwadi workers with CRP’s(Aw 40301XRS 50 X day 1)_________________State level RPs training(Blocks 202 X 5 RPs x Rs. 100 x 3 days)Countinuation of Zero grade school.3 days training for Anganwadi workers (Anganwadi workers 40301 X Rs. 100 X 3 days)CRP’s, Cluster and Blocklevel gender coordinators and Anganwadi workers quarterly sharing meeting (Aw 40301 X Rs. 50 X days 3)
Months
April 09 - May 09
April 09 - May 09
March 09 - June 09
June 09 - March 09
June 09 to March 10
Detail of Innovative strategies:• Financial breakup/ Implication with time frame work: : Rs. 15 lakhs X 29 districts = Rs.
435.00 lakhs• Monitoring Mechanism: The entire ECCE Programme is monitored by Block, District
and State level SSA Officials• Out comes: School readiness to children, enhance the skills of the primary entrants.
RecommendationsThe appraisal team recommends Rs. 435.00 lakhs @ Rs. 15 lakhs per district in 29 districts for undertaking the ECCE activities for the year 2(X)9-10.
^.Education of SC/ST ChildrenDuring the year 2008-09, the PAB has approved an amount of Rs. 435.00 lakhs @ Rs. 15 lakhs per district under SC/ST for 29 districts. Accordingly the state has spent Rs. 435.00 lakhs for undertaking the SC/ST activities. A special innovative Chinnara Karnataka Darshana tour programme for the meritorious girls and boys of SC/ST community studying in i' conducted in collaboration with the Karnataka State Tourism Development (KSTDC). Accordingly the state has undertaken the following activities:
standard is Corporation
145

District wise Progress against SC/ST Innovation activities during 2008--09
S.No. Districts
SC/ST (Rs. In Lakhs)FinancialFunds sanctioned during PAB 2008-09
Fundsutilised
Physical
Target (No. 01
children)
Innovative i Activities undertaken
Coverage
29 districts 435.00 435.00 21,654 21,654
Details are given below:1. Baealkot 15.00 15.00
2. BanealoreRural 15.00 15.00
3. BanealoreUrban 15.00 15.00 1. A special
4. Beleaum 15.00 15.00 innovative5. Bellarv 15.00 15.00 Chinnara6. Bidar 15.00 15.00 Karnataka7. Biiamir 15.00 15.00 Darshana8. Chamrajnagar 15.00 15.00 tour9. Chickmaealur 15.00 15.00 programme10. Chitradurea 15.00 15.00 for the
meritorious girls and boys of SC/ST community studying in 7* standard is conductedm
11. DakshinaKannada 15.00 15.00
12. Davangere 15.00 15.0013. Dharwad 15.00 15.0014. Gadas 15.00 15.00 21,654 21,65415. Gulbarea 15.00 15.0016. Hassan 15.00 15.0017. Haveri 15.00 15.0018. Kodaeu 15.00 15.00
111collaboratio n with the Karnataka
19. Kolar 15.00 15.00 -
20. KoDoal 15.00 15.0021. Mandya 15.00 15.00 State22. Mysore 15.00 15.00 Tourism23. Raichur 15.00 15.00 Developme
nt24. Shimoea 15.00 15.0025. Tumkur 15.00 15.00 Corporation
(KSTDC).26. Udupi 15.00 15.00
27. Uttara - Kannada 15.00 15.00
28. Ramanagara 15.00 15.0029. Chikballapur 15.00 15.00
Total 435.00 435.00 21,654 - 21,654
146

The pro ^ress of Chinnara Kamata ka Darshana program for ithe year 200i8-09 is as follows:
SI NO District No.Blocks
No ofBatchesBlockwise
No. ofAdditionalBatches
Total No. ofBatches
Total No. of Children - benefited from CKD
1 Bagalkot 6 12 1 13 6502 Bangalore(R) 4 8 1 9 4503 Bangalore U 9 18 20 10004 Ramanagara 4 8 1 9 4505 Belgaum 14 28 30 15006 Bellary 8 16 1 17 8507 Bidar 5 10 1 11 5508 Bijapur 7 14 1 15 7509 Chamarajanagar 5 10 1 11 55010 Chikkamagalore 8 16 16 80011 Chitradurga 6 12 1 13 650
12 DashinaKannada 7 14 14 700
13 Davanagere 7 14 1 15 75014 Dharwad 6 12 1 13 65015 Gadag 6 12 1 13 65016 Gulbarga 11 22 24 120017 Hassan 8 16 1 17 85018 Haveri 7 14 1 15 75019 Kodagu 3 6 1 7 35020 Kolar 6 12 1 13 65021 Chikkaballapur 6 12 1 13 65022 Koppal 4 8 1 9 45023 Mandya 8 16 1 17 85024 Mysore 9 18 1 19 95025 Raichur 5 10 1 11 55026 Shimoga 7 14 1 15 75027 Tumkuru 10 20 2 22 110028 Udupi 5 10 - 10 50029 Uttara Kannada 11 22 - 22 1100
202 404 29 433 21650
Major issues in universalizing the primary education in SC/ST context;
Proposal (2009-10 SC/ST):
Innovative activities would be executed in order to supplement the competencies of SC/ST children. An allocation of Rs. 15.00 lakhs is made during 2009-10.
• Chinnara Karnataka Darshana is Jin innovative programme which is an educational tour programme, free of cost to the children. It is implemented by State Govenmient under
147

SSA. This Activity is planned with an intention to supplement the classroom learning of the children by integrating school activities with outside world and society. Chinnara Karnataka Darshana is conducted in collaboration with the State Tourism Development Corporation. The progranune has been successfully implemented since 2004.
• Chinnara Karnataka Darshana is a 4 day tour programme for students free of cost, with high standard amenities. The students are at present studying in 7th grade in Government Schools.
• The activity is not only sight seeing. A dairy to note the observation is provided. Cultural program and competitions will be organized during the tour programme. Prizes are being given to those who write dairy of the experience during the tour program.
• In order to improve the teaching level of SC/ST boys and all girls studying in Vll standard an irmovative activity knowin as “Chirmara Karnataka Darshana” an educational tour or Chinnara Mela is to be conducted during 2009-10. During this tour children will visit the places like National Park, Sea, Harbour, important monuments, historical places, some factories and dams which supplement the academic aspects in social science. Similarly the visits to the places I Bangalore VIZ., Vishweshwaraiah Industrial and Technological Museum and Jawaharlal Nehru Planetarium etc., will supplement the science aspects.
District wise Activities proposed during 2009-10 under SC/ST Innovation
S. Districts SC/STNo Funds proposed
during FAB 2009-10
InnovativeActivitiesproposed
Target (No. of children)
29 districts 435 lakhsChinnaraKarnatakaDarshana
21,654
Details are given below:1. Basalkot 15 lakhs Chinnara 21,6542. Bangalore Rural 15 lakhs Karnataka3. Bangalore Urban 15 lakhs Darshana4. Belsaum 15 lakhs5. Bellarv ^ 15 lakhs6. Bidar 15 lakhs7. Biiapur 15 lakhs8. Chamrajnagar 15 lakhs9. Chickmaealur 15 lakhs10. Chitradurea 15 lakhs11. Dakshina Kannada 15 lakhs12. Davangere 15 lakhs13. Dharwad 15 lakhs14. Gadae 15 lakhs15. Gulbar^a 15 lakhs -16. Hassan 15 lakhs17. Haveri 15 lakhs18. Kodaeu 15 lakhs
148

s.No Districts SC/ST
Funds proposed during PAB 2009-10
InnovativeActivitiesproposed
Target (No. of children)
19. Kolar 15 lakhs20.
21.KoppalMandya
15 lakhs15 lakhs
22. Mysore 15 lakhs23. Raichur 15 lakhs24. Shimoga 15 lakhs25. Tumkur 15 lakhs26. Udupi 15 lakhs27. Uttara Kannada 15 lakhs28. Ramanagara 15 lakhs29. Chikballapur 15 lakhs
Action plan/ Activity Calendar under SC& ST component of SSA for the year 2009-10
District wise Activities proposed during 2009-10 under SC& STpokpokjp- Innovation
SI. No. Particulars Months
1. Issue of circulars lo field level functionaries to conduct Chinnara Karnataka Darshana April 09 - May 09
2. Obtaining list of students June 09 - July 09
3.Printing and distribution of Chinnara Karnataka Darshana booklets and distribution of booklet at District and Block level
Aug. 09 - Sept. 09
4. Correspondence with KSTDC for MOU for tour facility Oct. 095. Actual visit for Chinnara Karnataka Darshana Nov. 09 - Feb. 10
6. Obtaining field report fi’om the students and awarding prizes to the best report done by the students March 2010
Detail of Innovative strategies:
• Objective of activities: Exposure to cultural diversity. To improve the classrcons, learning environment and enhancement of quality of education, the state wants to implement the Chinnara Karnataka Darshana activities in all the districts.
• Strategies proposed; (Month vv ise activity calendar) (April 2009 to March 2010)• Financial breakup/ Implication with time frame work : Rs. 15 lakhs X 29 districts = Is.
435.00 lakhs• Monitoring Mechanism; The entire Chinnara Karnataka Darshana is monitored by Block,
District and State level SSA Officials• Outcomes: Retention of ST/ST children
Recommendation
The appraisal team recormnends Rs. 435.00 lakhs @ Rs. 15 lakhs per district in 29 districts for undertaking the SC/ST activities like Chinnara Karnataka Darshana for the year 2009-10.
149

Urban Deprived ChildrenRapid urbanization due to industrialization and modernization in the country has led to mushrooming of slums. Basic amenities for the slum dwellers like water sanitation are scant let alone education for their wards. Education is a luxury item for many in slums. Similarly for the out of school children family of the urban areas. There is no reason for not sending their wards to school when there were better facilities and opportunities for schooling perhaps poverty and lack of awareness. There is one face of the problem. There are instances where is a child attends the school but irregularly and later on the streets and to back to home in the evening learning no room for suspicion. There are occasions the children have been indulged in unhealthy activities because of easy accessibility. In order to bring back to the track we need some progremmes. The OOSC activities do not suffice to take the problems of urban deprived children.Progress of 2008-09
An amount of Rs. 203.002 lakhs under urban deprived innovation was sanctioned last year 200809 to cover all categories of urban deprived children in the urban areas of the state, Karnataka through only two main activity/intervention i.e. development of graded reading series and awards to local bodies and SDMC in all the 29 districts although break-up of budget allocation district- wise is not available in the state component plan. Progress report pertaining to physical & finance will be available by the end of March 2009.
Proposal for AwP&B 2009-10 is as under:
Objectives• To support and incentivize the UDC who attain the expected levels of learning attainment
and attendance• To foster healthy behavior that are irregular to the school/oosc who have gone array from
the expected norms.• To provide a safe place (transit homes) for those children who run away from homes,
destitute and street children.
Focus group• OoSG of urban area whose performance would be incentivized.• Children who are involved in unhealthy activities such drinking, smoking, theft and
irregular to the school are the focus group for dedication camps and further monitoring.• Run away children. Street children and destitute would be provided a safe place to dwell
for a shorter duration (transit homes).
S tra t^ les proposedFollowing are the strategies proposed under urban deprived innovation for the year 2009-10: Incentives to UDC
• The OoSG who are mainstreamed by various activities of oosc intervention are given incentive provided they attend the school at least for 75% of school days and 60% plus learning attaiimients. It is proposed to deposit 2000/- rupees in the child bank account.
150

• Dedication camps and handholding activity: school going /oosc children involved in unhealthy activities such as consuming school, smoking theft are given treatments in deadition cum counfellings comps conducted for duration of 20 days. Later they will be monitored by volunteers and motivate them to attend schools regularly and involving in studies. This strategy will be adopted in Banglore urban areas.
Transit Homes• Transit Homes as shelter homes fro the destitute and street children and children who left their
homes. The parents will be contacted and possible measures are taken to send them home. Meanwhile they are given bridge course education. Children who could not go back home will be housed in Ashokirrana and institutions run by NGOs for such children. This strategy will be adopted in Banglore urban areas.
Monitoring and supervisionThe process of incentivization running of deaddition comps and transit homes are monitored byblock, district and state level officers and the progress will be reviewed in KDP meetings andMulti level review meetings.
Expected outcomes• There will be increase in the retention rate of oosc and learning levels of udc.• Healthy habits are fostered among the UDC.
Linkage with UEE• Awareness camps will be held in slum areas and other OOSC pockets of urban area.• Minority intervention awareness camps for father and mother will be held in OOSC
pockets.• Ashakirama and other centers urn by the NGOs would be utilized to put transit home
children in use of necessity.
Activities proposed and related details
Activity Details Proposedmonth
Districtscovered
Unitcost
Phy.Target
Fin.Target
Incentives UDC
• Issuance of circuliir.• Awareness
campaign.
• Admitting the children to school.
• Awarding incentives.
April - May - 09
June-July August - 09 June- August -09
Feb - Mar 09
29 0.2 6050 121.00
De-addiction camps and Hand
.^holding activities
• Identification of children.
• Dead diction and consulting camp.
May, June July - 09 or as and when requiredJTilf-’M arW ’
Bangaloreurban
«area» » »0.01067
V V » %
3000 V V % ■
32.00
151

activity Details Proposedmonth
Districtscovered
Unitcost
Hiy.Target
Fin.Target
• Hand holding activities.
July to July - 10
-
I'ransit Homes
• Identifying
• Street children
• Consulting and sourcing the address of parts.
• Keeping In other residential homes.
April to March - 09
Do
Do
BangloreUrbanarea
1112 4.50 50.00
Jamps for doloscent girls D urban areas
• Camps conducted at the block level for HPS in urban areas.
July - August
Urban areas of all 29 districts
26933 0.3948 19.150
Total 9500 282.750
RecommendationThe appraisal team concerned about tlie slow progress under this head which need to execute to ensure better outcome and enable to enhance towards coverage of this deprived section in the urban areas. The capms for adolescent girls should specifically focus urban deprived girls so as to make the intervention target specific as prescribed by the norm. The above proposal is recommended by the appraisal team for the above interventions and suggested to focus only in the larger urban areas of the state.
1 . Innovation for Children of MinoritiesSince Karnataka, state has one minority concentrated district, Dakshin Kanada having 20% and above minority and three more minority districts including the above district as identified by PMO (Bidar, Gulbarga & also Dakshin Karmada). Moreover, Karnataka has 18 minority concentrated towns where focus for minority children should be given more under the innovation programme so that children may be brought in the fold of elementary education and also to ensure mainstreaming of the children into the formal schools.
Progress made during 2008-09Following table shows the progress report under minority iimovation last year 2008-09 covering all the 29 districts. This strategy was sanctioned for the first time during 08-09.
152

Class average achievement of children - medium wise - 07-08.Standard Kannada
Medium ~UrduMedium
MarathiMedium
TamilMedium
TeluguMedium
V 71.78 74.64 78.55 67.68 69.12VII 72.69 75.12 78.43 68.57 68.01
It is true that because of Social and linguistic reasons these chunk will keep away from the Social interaction. To a little extent it is often true among the Teachers and Children of Minority Community. Thus a special thrust is being given to the Minority Education while planning during 08-09. The following State programmes have been planned and implemented.
Awareness programme for Religious and Community leaders65 religious Heads of Muslim Community have been called at Block level to interact twice during 08-09. The BRC, Surapura, Gulbarga district informs that the response was good and they were well motivatedto work for the cause ef education of the Community.
Awareness programme for Muslim parents.Separate workshops for Muslim mothers and fathers have been organized for 65+65 members in each block. The workshop has been conducted twice in a year in order to sustain the tempo. There was a good response from the parents.
Seminars for the children of Minority Community.100 minority childien in two batches were involved in Seminais relating to Science and Mathematics - in each block. The children are selected from 7th Standard.
Block level Fairs for minority children.Two fairs (mela) exclusively for minority children have been organized at the block level. One in Science fair and the other is Literacy fair. Lecture, eloquence, essay competitions and exhibiting the improvised aides prepared by the children are a few events found in these fairs.
Hikes and Field Study.Both activities are clubbed in the same event. Hike focuses on recreation and development of valour among the children. Where as Field Study’s main objective is to relate the class room knowledge to the field reality. Generally the children of higher classes are preferred. A group of 50 children in each block take part in this activity.
Seminars for Urdu Teacher.Three day seminar on different themes has been organized for Urdu teachers. The seminar duration may be broken for one day / two day as per the requirement of the block. The themes of the Seminar vary from teaching subjects and to that of Socio-economic factors which interplay for the backwardness of the communities and the solutions. *
Learning ComersLibrary books worth of 1-40 lakhs rupees purchased by PAC and distributed to the Minority Schools.
Qthei: aftiyitieiiIf the fund is surplus then the district can think of the following activities namely providing Dictionaries and Laboratory materials to the Minority Schools.
153

Progress of Minority Activities upto March 2009.
SINO.
Minority CommunityFinancial PhysicalTotal Amount per District
Target Achievement Target Achievement upto
March, 20091 Awareness programme
for religious and community leaders.
0.1 20.2 20.2 13130 13130
2 Awareness programme for Mothers of Muslim minority children.
0.1 20.2 20.2 13130 13130
3 Awareness programme for Fathers of Muslim minority children.
0.1 20.2 20.2 13130 13130
4 Block level seminars for educationally backward minority children.
0.1 20.2 20.2 20200 20200
5 Monthly block level melas for educationally backward minority children.
0.1 40.4 40.4 20200 20200
6 3 days semmais foi 50 Urdu teachers 0.05 4.35 4.35 10100 10100
7 Hikes and Field visits 0.1 20.02 20.02 10100 10100Learning comers and other activities 1.4 40.6 40.6 285571 285571
■ 8 !i11
1) Supply of dictionaries to selected students of 5th std of below poverty line.
0.0007 20.00 20.00 56 56
19j
2) Providing Lab equipments for selected schools.
0.2 11.5 11.5 13130 13130
7.5 217.5 217.5 398747 398747
ObservationAs seen in the above table that the progress made by the state under minority innovation shows slow progress which need to execute in time to ensure better improvement. It is also reported by the state that the programme may be completed in March 2009. Therefore, actual utilization of funds under this head has not been reflected. This is also observed that state did not give more emphasize in the minority concentrated districts & towns.
154

PROPOSALKarnataka, state proposed the same activities/interventions as adopted last year 2008-09. This year AWP&Bs, the coverage of minority children will be more in the minority concentrated districts & towns.
ObjectivesTo make the minority community to feel the importance of their children Education and
motivate the community leaders to promote the cause of UEE-more particularly the Retention part. To provide a wide opportunity for the children and the teachers to interact which in turn facilitate better understanding of the concepts. They learn and teach- leading to the improvement of the quality of Education to strengthen the learning facilities (Library - Laboratory) leading towards quality.
Focus Group• The awareness programmes compass Muslim leaders; and parents of Muslim children.• The seminar, meals target minority children more particularly the Muslim children and
Urdu Teachers.• Learning comer, and Laboratory are given to minority schools with due weitage to the
Urdu schools.• Though there are three minority SFD viz- D.K, Bodar, and Gulbarg district in the state
the activities proposed are uniform through out the state. Few activities are combined at block level and others are conducted at district level.
Monitoring and supervisionCAEO at the sub block level; BEO/BRC at the block level and DDPI at the district level and SFD at the state level are directly responsible for the monitoring and super vision. There are other officers such as DIET; Divisions and state level officers are also supervising the activity undertaken. Besides school development, monitoring committee of block and district level implementation activities oversee the programmes undertaken. Karnataka development programme (KDP) monthly meetings are conducted at different levels viz-Blcok, District and state level. Here the progress of education matters is revised. -
Expected out comesEnrolment and retention rate of minority children will increase because of increased participation of the coimnunity leaders and parents. The quality of learning environment improves- leading to the increased participation of learners. Ultimately the learning levels of minority children will be upward.
Linkage with UEE activitiesEnrolment Drives will be organized in the areas of minority dominated packets. Incentive Schemes to the departments will be monitored so as to reach the minority institutes over time. The training programmes of minority language medium teachers will be monitored. The urban deprived children incentivized scheme will focus on minority OOSC. Awareness among madarsa about the scheme of SSA will be more. Alolesant girls compared will be organized for minority girls. KSQAO/Research activities would be fostered in minority schools. The BRGF and sector development scheme are used for the upliftment of minority Education. It was requested to cOngtrflct^Hdstfel buildings fb furf A^hMaJaflia’fof Muglifn fliifiofity’ afid to op^tf hdstglsln liiies of KGBV.
155

Activities proposed and Related DetailsThere are 29 districts in the state and 33 Educatiosned districts. Certain activities are committed at block and district level. Total available amount would be 217.5
Activities Details o f the Activity
Coverage ofBlocks/District
Unitcost
Phy.Target
Fin.Target
Proposed month conduct task
to
Awareness programme for religious and com. Leaders
• 65 Members from each block will be trained 2 days in a year. One at the beginning and other in the middle of the year in order to make them to motivate the community to send their wards to the school (75 / day/ person___________
202 0.1 13130 20.2 June andSeptember, 09
Awareness pgm. for Muslim children mothers
130 mothers one day work shop. Roles and responsibility- awareness building consulting would be done at this work shop ( 75/ day/ person_______
202 0.1 26260 20.2 June-July-09
Awareness pgm. for Muslim children fathers.
• 130 fathers one day work shop. Roles and responsibility- awareness building counseling would be done at this work shop ( 75/ day/ person_______
202 0.1 26260 20.0 June - July 09
Block level seminars for minority children
•7“‘ std. Min children participate in one day seminar or correct affairs. 130 students in each block take part in the activity 75 nos. /day/present______
202 0.1 26260 20.2 Nov - Dec 09
Block level fairs &
• Two separate mela on science and 202 0.1 20200+202
00 20.2 Oct- Nov. 09
156

Activities Details of the Activity
Coverage ofBlocks/Distnet
Unitcost
Phy.Target
Fin.Tai^et
Proposed month conduct task
Melas. literacy will be organized at block 100/day/person
Three day seminars for urdu teacher
• Three day seminar at District level for 50 teachers
29 0.05 1450 4.35 Aug - Sep-09
Hikes and field visits
’ Visit the places of Edu importance bridges the gaps class roomlearning. 50children fare food are met
29 1.4 406 40.60 Aug - Sept OS
Supply of dictionary
' Poor (BPL) minority children will be given dictionary________
29 0.007 285571 20.00 September
LaboratoryEquipments
•Minority HPS will be given science articly________
29 0.2 56 11.15 September
Camps for adoscloscent girls
Camps conducted at thee block level for three days - cover health , hygene & life skiils etcc
All 29districts(202Blocks)
0.3948 26933 79.750
Total 455823 297.250
July - Augast
RecommendationAfter detail analysis by the appraisal team, it is being suggested that state has to submit the last year progress report by the end of March 2009 as revealed in the above explanation. The above intervention/activities proposed for AWP&B 2009-10 should be strictly focus in the minority concentrated districts & towns only. The capms for adolescent girls should specifically focus children of minorities so as to make the intervention target specific as prescribed by the norm. The above proposal is recommended subject to approval by the PAB.
(VIip Girls Education-Special programmes to promote education of girls have been under taken by the State Government. Free Uniforms, Free Text books. School bags, Note books. Fee exemption and Mid-day meal facilities are extended to promote girl’s education. The State is providing free education to all categories of girls up to Class XII of Govenunent and Aided institutions.
157

Gender parity index:
Year 2002-03 2007-08Girls 0.9192 0.9352
Dropout rate of Girls is reducing:
Year 2001-02 2007-08Girls 32.93 13.99
Girls Achievement:
As per the KSQAO assessment of 2007-08 the girl’s achievement is given in the on going table.
S.No. Class All girls Category wise eirls achievement
SC ST Min Others1 5 72.15 67.96 69.02 73.49 74.12 7 72.99 68.85 69.53 74.45 74.63
The commitment made to PAB during 2008-09 is that the gender gap to be reduced by 2% during 2008-09 from 2006-07 level of DISE.
The gender gap in the year 2006-07 is 3.65 & that of 2007-08 is 3.35. The data of 2008-09 vs as such not available as the validation is on.
Progress of adolescent camps for girls during 200S-09 (5.5 lakhs per district is the PAB approved amount):
To address the issues like dropout, low attendance, child marriage and to enhance self esteem and self confidence of the girls Jagruthi Shibhira (Adolescent camps) was conducted under innovative activities for gjrls. This also aims prevention of adolescent girls from dropping out of education system. 36 camps per each district have been organized and others are under progress. During these activities assistance of 65 NGOs were also taken and 52200 girls participated in adolescent camps. In these camps it was attempted to educate girls regarding empowerment, child rights, puberty health related aspects, health & hygiene, menstruation and related psychological knowledge etc.
Description of Districts wise camps and children given below:
S.No. District Target No. of children Achievement during
2008-091 Bagalkot 1800 18002 Bangalore(R) 1800 18003 Bangalore U 1800 1800
158

S.No. District Tai^et No. of children Achievement during
2008-094 Ramanagara 1800 18005 Belgaum 1800 18006 Bellary 1800 18007 Bidar 1800 18008 Bijapur 1800 18009 Chamarajanagar 1800 180010 Chikkamagalore 1800 180011 Chitradurga 1800 180012 Dashina Kannada 1800 180013 Davanagere 1800 180014 Dharwad 1800 180015 -Giuiag 1800 180016 Gulbarga 1800 180017 Hassan 1800 180018 Haveri 1800 180019 Kodagu 1800 180020 Kolar 1800 180021 Chikkaballapur 1800 180022 Koppal 1800 180023 Mandya 1800 180024 Mysore 1800 180025 Raichur 1800 180026 Shimoga 1800 180027 Tumkuru 1800 180028 Udupi 1800 180029 Uttara Kannada 1800 1800
Total 52200 52200
Recommendation for 2009-10The State had proposed to replicate same activities for the year 2009-10 as it has imparted great success in retaining girls and prevent adolescent girls from dropping out of education system. Rs. 159.50 lakh @ 5.50 lakh per district. However, at the very last hour, the State decided to seek funding for thses activities from the budget heads of Innovative Activities for Mnority and Urban Deprived Children as the innovation on gils’ was becoming the fifth innovation except CAL, which is beyond norms for supporting innovative activities as 5 includiong CAL.. Hence there remains no proposal under Innovation for gjrls as the upper limit of maximum 5 innovative activities is met. '
a) NPEGEL
NPEGEL programme is being implemented in 61 EBBs and 917 clusters of 18 Districts.
This also includes 4 Urban Slums. 71 clusters are beinc managed bv Mahila Samakhya.
159

All the 921 model cluster schools (MCS) includmg 4 urban slums sanctioned andapproved till year 2008-09, have been made operational. Besides, the state has taken upthe following activities:• Excursion and sharing programme is being organized for 3763 girls who are
mainstreamed through OOSC strategies and the children of 5“', 6*'', 7*'' who have performed well in their school examination.
• Vocational skills like tailoring, embroidery, Knitting; Doll making. Preparation of daily usage materials are practiced in 3 to 4 schools of each cluster covering 54946 girls.
• Marshal arts training was organized for 40 children of different schools of different clusters.
• Various activities like role play - street play - Dharana - have been undertaken - to bring awareness. Though its effect is intangible a solid example which supports the effectiveness of Meena Group.
• Handwriting improvement programme and class hand written monthly magcizine and school hand written yearly magazine tasks have been planned and being implemented in the clusters and The 5,6,7th Standard girl children of the Hinter land school have taken up the local issues such as local History, Geography etc. and they have prepared the projects.
• Excursion and sharing, counseling centre, Carrier guidance training provided to 74585 girls amounting Rs. 92.80 lakh.
• Reading and Hand writing programmes. Academic competitions were organized for 24448 girls amounting Rs. 23.13 lakh.
• Field trips to neighborhood places conducted for 2279 girls amounting Rs. 5.84 lakh.• 600 Sports promotion centre were opened and sports meet were organized for 3353
girls.• Camps on awareness of child rights and Mothers Mela were organized covering around
16483 Mothers and Girl’s.• Meena Mela is being conducted in every cluster covering around 20,000 girls.• Teacher training on Gender sensitization issues is being imparted to 300 teachers in
different blocks.• Health and Hygiene camps for aroimd 10, 000 girls is beiog^ organized to bring
awareness among girl child about their health and hygiene issues.• For promotion of retention of girls best attendance and performance certificates
provided in 254 clusters.
Physical Progress during 2008-09
Financial progress In Lakhs
Year Out lay approvedTotal Fund
AvailableExpenditure
% of Expenditure
against Outlay
Approved
% of Expenditure
against Total
Fund Available
2004-05 1127.29 1127.300 0.00% 0.00%
2005-06 1607.51 1550.852 406.456 25.28% 26.21%
2006-07 1653.51 2968.111 918.942 55.58% 30.96%
160

Year Out lay approvedTotal Fund
AvailableExpenditure
% of Expenditure
against Outlay
Approved
% of Expenditure
against Total
Fund Available
2007-08 9583.31 2359.566 840.842 8.77% 35.64%2008-09 1218.86 1885.972 514.132 42.18% 27.26%
Total 15190.48 9891.801 2680372 17.65% 27.10%
During the year 2008-09, the State was sanctioned a budget of Rs 1218.86 lakhs. The
achievement is Rs514.132 lakh (42.18%), which is a low expenditure.
Proposal for 2009-10• The State has proposed Rs. 731.700 lakh for 950 clusters.
• The State has proposed 29 new MCS are proposed for the year 2009-10.
• 1 Bicycle to every cluster gender coordinator in each block amounting to Rs. 28.50 lakh.
• Focus interventions for retention of girls and improvement of the quality and learning
activities are proposed which includes vocational skill training, health and hygiene camps
and meena campaign, mathematics and science fare, coaching for Navodya Vidyalaya
entrance examination and community mobilisation activities etc.
Some of the proposed activities are given in the table below:
SI.
No.Activities
Target
(Children
per cluster)
Financial Activity Description
1 Vocational Skill Training 150 0.15 Vocational Training and remuneration for
equipments.
2 Award of best Meena of
team
02 0.05 Best Meena team would be selected and recognized
at the block sharing workshop.
3 Excursion and sharing 125 0.10 Short trip to the local places -which includes field
study also.
4 Counseling Center 300 0.10 Assisted by Meena group- Conducts carrier
guidance; (01) girls related Problems, (03) conducts
Health check up (03) in addition to the one time
annual Health checkup.
5 Navodaya Vidyalaya
Entraoce Ejcainiijatipn. ,
tutoring
300 0.03 One month programme will be organized at the MCS
level, , , ,
161

SI.
No.1
Activities
Target
(Children
per cluster)
Financial Activity Description
6 Empowerment of girls 250 0.06 Where Meena teams exist will be empowered in
marshal arts; yoga, cycling; theatre skills;
7 Meena Activities 75 0.10 Conducts awareness camps, networking for regular
attendance takes lead role in the school activities;
HPS will having the Meena team conducts
Individual, School wise activities, conducts sports
meeting co- curricular activities which focus on
cultural and literary activities and competitions
8 Cluster level
co-curricular
Activities(Other) Meena
Package
125 0.1 02 days fair - which include - exhibition o f products
the girls have,prepared, cultural and literary activities
few competitions would be held. Part of the amount
is shared from community mobilization.
9 Community Mobilization 125 0.10 Mothers Mela at each cluster, block level and
awarding best neighborhood mother.
0.70
Recommendation for 2009-10• The Appraisal team recommends the proposal of Rs. 589.306 lakh for 62 blocks
including 921 clusters in the State.• The appraisal team does not recommend any amount for 29 new clusters in absence of
detailed activity plan. Further, since the programme is in its siztth year, thrfore it does not seem liogicla t fund new clusters at this stae. Mpreover, ther stete has made only 42% expenditure upto Jnauary 2009. _
• Proposal for purchasing of bicycle not recommended from NPEGEL funds.
b. KGBVUnder the scheme of Kasturba Gandhi Balika Vidyalaya (KGBV), residential schools at upper primary level (Class VI to VIII) are set up for out of school girls predominantly belonging to SC, ST, OBC and minority communities in educationally backward blocks of the country.
162

Status of KGBV
Model No. of KGBVs No. of KGBVs No. of girls enrolled -sanctioned operational SC ST OBC BPL Min Total
I 03 03 29 2 0 53 20 104
III 61 61 2140 820 1367 831 366 5524
Total 64 64 2169 822 1367 884 386 5628
Observations:
• All the sanctioned 64 KGBVs are made operational. Out of it 03 are under Model I and 61 are Model IIL Comprising 90% of the targeted enrollment
• Out of 64 KGBVs 35 are miming through SSA Society and 29 by Mahila Samakhya• % of Muslim girls’ eru'ollment in Muslim concentration blocks is only 4%, which is an area
of concern.• Out of 64 KGBV buildings only 37 are completed, 23 are under progress and 4 are yet to
start. The state has committed to complete under constmction building by end of June, 2009 and would take up 4 unconstructed building by March, 2009.
• KGBVs are monitored at different levels starting from cluster to State. Quarterly review meetings of gender coordinators ate also conducted at block, and district levels.
• There is 7 teaching staff in the existing KGBVs; out of it 3 are on deputation. Warden and 3 part time teachers who have been out sourced from the Agency/NGO and including craft teacher, physical instructor, Hindi teacher. The auxiliary staff includes watchman, one office assistant, peon etc.
Financial Progress
S.No. Year Outlay
ApprovedTotal Fund Available
Expenditure till December,
2008
% of Expenditure
against Outlay Approved
% of Expenditure against Total
Fund Available1 2004-05 1127.29 1127.300 0.00 0.00% 0.00%2 2005-06 1607.51 1550.852 406.456 25.28% 26.21%3 2006-07 1653.51 2968.111 918.942 55.58% 30.96%4 2007-08 958.31 2359.566 840.842 87.74% 35.64%5 2008-09 1218.86 1885.972 514.132 42.18% 27.26%
Total 6565.48 9891.801 2680.372 42.18% 27.26%
Above table reflects under utilization of funds since inception of the scheme. Similarly also in 2008-09 The State has been able to come up with only 42.18% utilization, which is a low expenditure.
163

The State has mainly Following Proposals:
1. The State has proposed to change the type of model from model III to model I for 61 KGBVs already sanctioned. The State has mentioned that in later stage it has observed that girls of KGBVs are feeling difficulty in coping with regular school children because they are from drop out and out of school category and need specific pedagogical transactions in the classrooms.
2. The State has proposed an amount of Rs. 3262370 lakh.
Recommendation for 2009-10:The enrolment in 61 KGBVs seems to be encouraging but girls due to different level of educational backgrounds. Who were out of school girls also, need special pedagogical support which can be provided within the residential schooling only. Hence the appraisal team recommends the proposed change from model III to model I.
An amount of Rs. 3187.830 lakh is recommended. Out of which an amount of Rs. 1509.750 lakh is a differential cost due to change of model. An amount of Rs. 1678.080 lakh is for recurring. Rent is recommended for 32 [email protected] lakh which comprises 48.00 lakh.
Issues:■ Under utilization of funds■ Enrolment of Muslim girls is less in blocks having over 20% Muslim population.■ Capacities of KGBVs are not fully utilized.■ Construction of 4 KGBVs is yet to start.
(IX) Strategies for community mobilization:
Progress in 2008-09
Proposal for 2009-10
PAB approval (2008-09) Achievement Percentage %
Phy Fin Phy Fin Phy Fin
305268 183.1608 419038 183.1608 137.26 100
Activities initiated in the year 2008-09
Community Mobilization is one of the major intervention under SSA, which enhances education awareness among parents and communities.
\.Samudaayadatta Shaale (School towards Community) Progranmie shared the progress of children with parents and discussed the reasons for gaps and planned for joint efforts to improve the learning of their children.
2.State has developed clear linkages with the PRI members at all the three levels i.e., Panchayat, Block, Districts which is appreciable.
164

3.The training modules were revised, printed and distributed to all the concerned in the year 2008-09 with the participation of NGOs who are active in Community Mobilization training activities in the State.
• Spandana - a resource book which contains the Model Bye-Laws development and importance of SDMCs. This book was supplied to each school of th State and to all the Master Resource Persons. This book serve as literature for the SDMC trainings which help for the Master Resource Persons and schools for the constitution of SDMCs.
• Sankalapa - a Training Design for the 1 day training of SDMC-CAC members.
• Samakshama - Literature for SDMC-CAC members. This book is self explanatory in nature, which provides basic info on the roles and responsibilities of the SDMC-CAC members and serves as work book to note down the details of SDMC meeting dates, decision taken in meeting and other useful information. This book helps each SDMC-CAC member to understand his roles and functions.
4.Workshops and trainings were organized for the State level master resource person. Divisional level MRPs, District MRPs, BRPs, on different issues related to Community Mobilization.
5.Others programmes like. School opening ceremony, awareness campaigns. School adoption programme. Media coverage on countdown for school reopening. Educational tour for SC/ST/Minority children’swere also conducted during 2008-09.
Proposal for 2009-10
Community Training
Target 2009-10 .
Phy Fin
325978 195.58
Activities to be undertaken in the year 2009-10
1. The workshop under training programmes organized for the State level master resource person. Divisional level MRPs, District MRPs, BRPs, on different issues related to Community Mobilization will continue.
2. The state plan shows that community members are involved in the preparation of school academic plan. Each school prepares school academic plan to improve the learning levels of the children,. The learning levels of the children are assessed and those children who are below the expected level are taught6 with iimovative strategies and activities. For this programme, DSERT has developed an activity bank and supplied to teachers. The teachers can make use the activity bank and teach the children. The parents, SDMC members, community members and elected representatives participate in the preparation of SphpoJ Aca^depiip ^rogr^nnnq^ wjtii^^hjs pprepiablg ,
165

3. Educational tour ''Chinnara Karnataka Darshana’ will be organized for the SC/ST/Minority children’s in the State.
4. Other activities like conferences, seminars, awareness programs etc for the SC/ST/Minority communities will be organized in the year 2009-10.
5. Each school will conduct enrollment drives, management of MDM, Conducting the children’s senses, Pratibha Karanji progranmie (Programme on compilation of cultural activities) with the participations of SDMC and CAC members at village level.
The efforts put by the State to mobilize the community through grassroot structure like SDMC and CAC, Teachers, Parents and Gram Panchayats is appreciable. However Mechanisms should be developed at the State, District and block levels for the follow-up of each activity undertaken.
State proposal for activity pertaining to community mobilization is recommended.
(X) Involvement of NGOs
The GIAC is functional in the State, 3 meetings were held during 2008-09. During these
meetings, a total of NGO proposals were considered, out Of the proposals considered,
the GIAC approved 48 proposals. All the 48 proposals approved during this year are
being implemented. Status of NGO involvement is shown is the table below.
Status of NG<0 Involvement
Functional Area No. of NGOs involved in 2008-09
No. of NGOs likely to involve in 2009-10
1. lED 51 512. AIE/AS interventions 402 4503. Pedagogy 4 4 *4. Community Training 79 795. Girls Education 38 45Total 574 629
(XI) Project Management
Table: Staff Position
Level Staffsanctioned
Staff filled Vacant %
SPO 66 57 9 14DPO 272 233 39 15BRC + CRC 3418 2938 480 14
166

As shown in the table there are around 15% vacancies in the State. The need therefore is to fill these vacancies at the earliest.
Details of staffing at various levelsin different components is provided below.
SI.No. Cadre No. of Posts
Sanctioned/Date
No. ofPostsfilled
Date of Sanction
I SPO LEVEL 27.10.031 State Project Director 1 12 Director (Programmes) 1 13 Joint Director 2 24 Sr. Programme Officer 3 3
Chief Accounts Officer 1 1
5 Programme Officer 6 6
21.1.2008 - 2 posts upgraded to PO from JPO
6 Jr. Programme Officer 7 424.5.2007 - 3 posts
sanctioned
7 Technical Assist. 7 4
6-TA,. 1 Art master sanctioned on 24.5.207
8 System Anaiysist 1 19 Computer Programmers 2 2
10 Data Entry Operators/CCl 9 6
3 DEO post sanctioned on 24.5.2007
11 Accounts Supdt. 2 212 Manager 1 113 Supdt. 1 114 Executive Engineer 1 ' 115 FDA 5 216 Stenographer 2 117 Group D 6 618 Drivers 4 411 DISTRICT LEVEL 27.10.03
1District Project Coordinator 33 27 -
2 Accounts Supdt. 33 26Computer programmer 33 33
3 Data Entry Operators 66 664 Programme Officers 66 665 FDA/SDA 66 54^ . P rp u p P _ _ . , . . 27 , . .27 , , , -n V % X % -II E-GOVERNANCE 4.5.05
167

SI.No. Cadre No. of Posts
Sanctioned/Date
No. ofPostsfilled
Date of Sanction
1 Programme Officer 1 12 Jr. Programme Officer 6 5 24.05.20073 Computer Programmers 5 2 24.05.20074 Data Entry Operator 1 1 -
5 Technical Asst. 1 24.05.2007III KSOAG1 Joint Director 1 1 30.11.20072 Sr. Asst. Director 1 13 Asst. Director 3 3
Asst. Project Co-ordinator 10 10
IV KSQEProgramme Officer 1 1Jr Programmer 3
V DEO,s at BLOCK 202 202
VI INTERNAL AUDIT WINGInternal Audit Officer 4 4Auditors 13 13Accounts assts 27 27
DDPII is the DPC who is mainstreamed and getting salary from the department. The ADPC gets salary from the SSA
The details of activities recommended under Management Cost is shown blow.
Cost Estimation of State Interventions for AWP & B 2009-10
SI.
No.Activity Fin
1 Salary of Staff 357.030
2 Office Expenditure 83.620
3 MIS 10.00
4 Media Activity and Documentation 71.60
5 Capacity Building, Workshop, Orientation, Meetings etc.
123.469
6 POL/Hiriing of Vehicles 89.00
Total 825.719
168

(Rs. In laidi)
' 2008-09 2009-10
District Consolidation of Management Cost 2009-10 - SSA Karnataka
SI.No M A N A G EM EN TC O ST
U nitCost Unit A pproved Expenditure Proposal Recom m ended
Fin Fin Phy Fin Phy Fin
1 Furniture & Equipment to DPO 2.000 56.00 56.00 29 55.00 29 49.00
2 Contingency to DPO 2.500 RevenueDistrict 75.00 72.08 29 71.50 29 68.00
3 Vehicle hiring /POL 5.000 RevenueDistrict 142.00 118.55 29 •136.75 29 131.25
4 Salary of staff at DPO 22.500 EducationDistrict 608.64 561.30 33 732.00 33 718.66
TA/MeetingExpences 2.000 Revenue
District 58,00 53.15 29 55.00 29 54.50
5 Contracual staff salary
RevenueDistrict 438.38 426.45 270 504.12 270 497.58
6Contigency to DDPI (ADM) 0.00024 Teachw 49.50 49.39 223860 53.73 223860 53.73
7 Contigency to DDPI (DEV) DIET 0.50000 Revenue
District 0.00 0.00 28 14.00 28 14.00
8 Contigency to BEG'S 0.00180 Teacher 327.79 310.56 223860 322.36 223860 318.63
10
Printing of Account's Register (Block & District) & Other Books,District Progress Dairy
0.006 School 207.47 207.46 13071 70.20 13071 65.29
11 Meeting Exp>enses (D ie , GIC etc) 1.000 Revenue
District 30.40 26.70 44 . 31.40 44 30.90
12 TA to ECOs 0.036 ECOs 34.16 30.89 972 34.63 972 34.63
13 TA to CRCs 0.036 CRCs 98.06 93.69 2728 98.21 2728 96.69
14Additional TA to
BRCs/CRCs/IERTSas per KCSR
5.000 RevenueDistrict 137.00 128.76 - 409 122.75 409 121.25
15 DGC/BGC/CGC Salary & TA DA 0.660 Revenue
District 182.52 146.88 328 252.29 328 251.45
Salary to OOSC coordinators 0 107.29 5 103.52
19 Conftnutiity ' mobilisation
1- *• -n • KSve'fiue’District 163.88 167.38 29 168.13 29 159.29
169

SI.No M ANAGEM ENTCOST
UnitCost U nit Approved E xpenditure Proposal Recommended
Fin Fin Phy Fin Phy Fin
21 Children Census expenses
RevenueDistrict 118.99 110.21 29 114.50 29 5.00
22 MP3 Players to Urdu LPS 0.016 Urdu LPS 85.86 79.61 0 2.90 0 2.90
23 lERT Salary RevenueDistrict 123.35 128.70 0 0.00 0 0.00
25 Miscellaneous 10.000 RevenueDistrict 447.00 419.64 29 253.50 29 114.01
26 Naxal Belts provision 20.000RevenueDistrict 21.50 23.50 29 542.00 29 0.00
Monitoring by DIET 0.000 Block 0.00 0.00 0 0.00 0 0.00
Accounts people to maintain Block and School level accounts
82.97 80.90 29 238.50 38 191.50
Consultancy Charges - Civil Engineer 29.83 29.83 29 326.00 29 262.90
M ANAGEM ENT COST Total
3628.32 3242.89 4306.74 3344.68
24 Science Lab 15.000RevenueDistrict 0.00 90.25 29 435.00 29 410.31
Science and Maths Education n UPS 0.020 Revenue
District 135.00 120.00 22154 443.08 21542 115.43
Nali Kali Provisions 0.070 Nali Kali schools 504.34 460.07 45120 1942.78 44447 1472.72
Early Reading Programme 0.008
No of BRCs 0.00 39.42 10897 87.18 8912 61.01
LEP Total 62434 569.92 0 2908.03 0 2059.48
M angem ent cost-t- L EP Total
4252.65 3543.33 9 6856.72 10 5404.15
A. PMIS and EMIS Activity
State has working on E-Govemance containing various activities like DISE, Less Paper Office, Monthly Monitoring Review, and Teachers Transfer Software. In each district MIS sections are operating successfully with necessary Hardware, Software and LAN and internet facility. In the State office there are enough numbers of computers Hardware & Software with UPSs and Printers and LAN and internet facility. All the server related works relating to web site is done through VPN connection.
PMIS: In addition to DISE we are using some of the other software as follow:
Less paper Office: software is implementing at the SSA state office and office of the commissioner of public instructions. We can able trace the files and letter which are the
170

movement in the office. Publics also can able to find out the file location and its minimum content of that.
Monthly Monitoring Review (MMR): It will use full to monitor the financial and physical progress. This soft ware was developed in house with the help of SSA programmers. And it is maintained at the office of the commissioner of public instruction.
Teacher Transfer Software: In the state teacher transfer will be council basis, department will use this software for the teacher transfer.
Ever year
Additional Module DISE Software: State was last year added five additional modules to existing DISE with the help of NUEPA Technical Staff. Additional modules will cover class wise-caste wise-subject wise results and incentives, Mid-day-meals information, title wise indent for free text books etc. This information is very use full to state level as well as district and sub district level
Web PortalRegarding SSAMIS.NIC.IN web portal, 21 districts completed 3' *’ Quarter data entry and 2 are in progress. For Quarter 27 districts had completed and 2 districts is in progress. Fro the 2"** Quarter 28 districts had completed and 1 district is in progress.
DISE Activity Schedule
State has proposed detail plan of activity under DISE as bellow
SI.No. Activities under DISE Month1 Training and Schools finalization o f 2009-10 1"‘ Week o f June2 Printing o f DCF formats and distributions of formats July and 1®* W eek of
Aug3 Training to District officials regarding DCF formats 2“* Week o f Aug4 Training to Block and Cluster ofHcials 3'“ Week o f Aug5 Selection o f agency for the 5% sample survey 3"* week o f Aug6 Training to School Head Masters 1®‘ Week Sept7 Data filling at Schools level 1*‘ and 2" week of
Sept8 Data verification by SDMCs at the time o f Samudayadatta
Sala programme at schools2“* week o f Sept
9 Submission DCF to CRCs 2"’' Week o f Sept10 100% verification o f DCFs by CRPS 3'“ week of Sept11 Submission o f DCFs to BRCs 3''* Week o f Sept12 10 % of DCF verification by BRPs with Schools records 4* week o f Sept13 Training to Data Entry Operators 4"' week of Sept .14 Data Entry at Block level 3 weeks in Oct15 5% Data verification By District officials I®* and 2"“ week o f Oct17 Supervision of Data entry process by the programmers At time of data entry18 Consistence check at block level 4“' week of Oct19 Generation o f reports at block level and verification by the
CRPS1®‘ week of Nov
20 . . , Gorreetioftslf any - , , , , , . . , , I®'-'and' 2'’ week* of Nov
171

Sl.No. Activities under DISE Month3"* week o f Nov21 Data submission to districts
20 Report Generation and Comparison with the last years data 3'“ week o f Nov4“ week o f Nov21 Corrections if any
22 Reports Generation and analysis by the district officials 1 week o f Dec23 Submission of data to state along with the certification 2^ week o f Dec
Providing data_to agency for comparison 2 week o f Dec24 Report generation and verification with the last years data 3™ week o f Dec
3"* and 4“’ week o f Dec25 Merging district data into STEPS26 Data analysis, EDI Calculation and presentation to district
and state officials4 week o f Dec
27 Data submission NUEPA & MHRD(TSG) 1 week o f Jan28 Data Generation for the budget preparation 2^ week o f Jan29 Publications 2 ^ week o f Jan
Proposals for 2009-10: The State has proposed an amount of Rs. 280.00 lakhs towards management and MIS activities. The management activities reflect staff salaries, e-govemance workshops, training and other contingent expenditure at State and district level. The MIS activities represent undertaking of DISE, its analysis and other allied activities concerned to development of data base at State and district level.
(XII) Special Focus Districts and Minorities
A. Special Focus Districts: Karnataka state has 05 special focus districts. Chikballapura, district falls under ‘A’ category of special focus districts having gaps in ratio of PS & UPS. Karnataka has no districts under SFD ‘B’ category. District, Gulbarg falls in ‘C’category having OOSC >20,000. There are 04 districts under ‘D’ category namely-Bidar, Dakshinkanada, Gulbarg & Kolar respectively.
PROGRESS-2008-09
The appraisal team sought for the progress report of 2008-09 pertaining to schools, ACR, EGS, AIE & teachers for the 05 SFD districts. Progress related to the above components is as under:
Schools & ACR (2008-09)Table-I
^ stric ts
NEW SCHOOLPRIMARYTARGET
PROGRESS
UPSTARGET
PROGRESS
ACRPRIMARYTARGET
PROGRESS
UPSTARGET
PROGRESS
:;;hikballapura 20 20 74 74 223 223 74 74Bidar 0 0 0 0 115 115 0 0!3akshinKanada 0 0 157 157 0 0GulbargaKolarTotal
50883
50
83
7513162
7513162172
7451361376
7451361376
7513162
7513162

EGS & AIE (SFD-A)Table- II
Districts(SFD-A)
EGS AIETARGET PROGRESS TARGET PROGRESS
Chikballapura 0 0 25 25SFD-B
No districtsSub Total 0 0 25 25
Teachers (SFD-A)Table- III
Districts(SFD-A)
f S - TEACHERS U.P.S- TEACHERS PSiUPSTARGET 1 PROGRESS TARGET PROGRESSChikballapura 129 1 129 121 121 2.19:1SFD-BNo districtsSub Total 129 129 121 121 2.19:1
CATEGORY ‘C’ Table-I
SFD-C(00 sc>20,000)
NEW SCHOOL ACRPRIMARY UPS PRIMARY UPS
TARGET PROGRESS TARGET PROGRESS TARGET PROGRESS TARGET PROGREGulbarga 50 50 0 75 745 745 75 75SFD-C (Gender Gaps)No districtsSub Total 50 50 0 75 7.45 745 75 75
Tab e- IIEGS AIETARGET PROGRESS TARGET PROGRESS0 0 2295 22950 0 2295 2295
Table- IIISFD-C RBC _ AIDED MADARSA(00 sc > 20,000) TARGET PROGRESS TARGET PROGRESSGulbat^a 9200 9200 0 0SFD-C (Gender Gaps)No districts
Sub Total 9200 9200 0 0
173

Table- IV
S*D-C(0 0 s c > 20,000) P.S- TEACHERS
U.P.S-TEACHERS
PSrUPSGulbarga 2615 2615 533 533 1.88:1SFD-C (Gender Gaps)No districtsSub Total 2615 2615 533 533 1.88:1
CATEGORY ‘D’-(Sociai Category gaps)
Table-I
SFD-D(0 0 s c > 2 0 ,000)
NEW SCHOOL ACRPRIMARY UPS PRIMARY UPS
TARGET PROGRESS TARGET PROGRESS TARGbl PROGRESS TARGET PROGRESS
Bidar 0 0 0 0 115 115 0 0DakshinKanada 5 5 0 0 157 157 0 0Gulbarg 50 50 75 75 745 745 75 75Kolar 8 8 13 13 136 136 13 13
SFD-C (Gender Gaps)N o d istric ts
Sub Total 63 63 88 88 1153 1153 88 88
Table- IISFD-D
(0 0 sc > 20,000)EGS AIETARGET PROGRESS TARGET PROGRESS
Bidar 0 0 867 867DakshinKanada 0 0 0 0Gulbai^ 0 0 2295 2295Kolar 0 0 41 41Sub Total 0 0 3203 3203
Table- IIISFD-D
(00 sc > 20,000)RBC AIDED MADARSATARGET PROGRESS TARGET PROGRESS
Bidar 1238 1238 - 0 0DakshinKanada 50 50 0 0Gulbai^ 9200 9200 0 0Kolar
1026 1026 00
174

- SFD-C (Gender Gaps)No districtsSub Total 11514 11514 0 0
Table- IV
SFD-D(QOSC>20,000)
P.S- TEACHERSU.P.S-TEACHERS
PS:UPSBidar 500 500 374 374 1.56:1Dakshin Kanada 154 154 220 220 1.33Gulbarg 2615 2615 608 608 1.88Kolar 175 175 127 127 2.92SFD-C (Gender Gaps)No districtsSub Total 3444 3444 1329 1329
Observation
As per the observation by the appraised team, the following points are reflected for the above special focus districts.
• Progress of 2008-09 in regard to PS, UPS, civil works (ACR), AIE centres, teacher’s recruitment & rationalisation shows 100% achievement in all the SFDs districts.
• Districts Chikballapura (SFD-A) & Kolar (SFD-D) shows high ratio of PS & UPS, for which state proposed upper primary schools to saturate the gaps.
• Other remaining three
PROPOSALAs reported in the districts plan and as informed by the state team 87 new primary schools, 164 upper primary schools, 546 ACR, 518 new teachers for new schools, 630 additional teachers only in two SFD district (Gulbarga 624 & Kolar 06) & 48559 teachers for in-service training are being proposed for this year AWP&B 2009-10.
175

CATEGORY-A & B
tricts- Civil works (fres i) New School TeachersTextBooks
D-A
New PS (Inc.buidingless)
New ups(inc.buildingless) ACR PS UPS
New Teacher s for New School
Addl.TeachersAgainstExcessEnrolment
Teacherstraining(inservice)
FreeTextBooks
ikballapura 0 0 109 0 40 40 0 5371 62385D-Bb Total 0 1 0 1 109 0 40 40 0 5371 1 62385
CATEGORY C ’
SFD-C(00sc> 20,000
Civil works (fres h)NewSchool Teachers
TextBooks
New PS (Inc.buidingless)
New ups (Inc.building less) ACR PS UPS
New Teachers for New School
Addl.TeachersAgainstExcessEnrolment
Teacherstraining(inservice
FreeTextBooks
Gulbarga 50 0 400 50 87 279 624 16922 43330SFD-C (Gender Gaps)No districtsSub Total 50 0 400 50 87 279 624 16922 43330
176

CATEGORY ‘D’ (Social category Gaps)
Districts
Civil works (fresh)
New PS(Inc.buidingless)
New ups (Inc.buildingless)_____
ACR
NewSchool
PS UPS
Teachers
New Teachers for New School
Addl.TeachersAgainstExcessEnrolment
Teacherstraining(inservice)
Text Books
Free Text Books
Bldar 25 35 25 25 35 159 0 8459 62385DakshlnKanada 0 8471 74205Gulbarg 50 87 50 50 87 279 624 16922 43330Kolar 10 10 10 36 7236 15724SubTotal 87 125 87 87 125 478 630 41088 195644
RecommendationAs per the norms & need based assessment the above proposals of schools, ACR, teachers & teachers training are recommended except for the district Gulbarga wrhich shows data discrepancy in number of ACR proposed and also there is favourable ratio of PS & UPS, therefore, proposal for PS & UPS in the district Gulbarga may not be recommended. Further, it is being observed that reasons for the need of PS«fcUPS in the above district, Gulbarga have not been detailed.
Special focus districts Issues
Chikballapura (SFD-A)
• No of HPS are less when comparing to LPS and 40 primary schools are proposed to be upgraded
Gulbarga (SI 'U-C)
• SC dominated district,• migration is existing in some part
district,• Naxal influence exists in two blocks
namely Sedeun and Chincholi,• 20.43 % of OOSC existing in the
district.Geographically rainfall is scant
SFD-D
Bidar • Muslim dominated area, moderately high OOSC,
Dakshin Kanada
• Naxal influence in blocks like Puttur, Sulya and Belthangadi,
• Even though it is coming under Muslim -dominated district n© iJrdu Medium schools exist.
177
0

Special focus districts Issues
-
• Mojority of the minority children study Urdu as one of the language.
Kolar• SC dominated and Muslim dominated
district with 3 EBBS.
Strategies in the Special Focus Districts
District Strategies 2009-10SFD-A
Chikballapura Unitcost OOSC Fin
Chinnara Angala Bridge couse Residential 12 months-RBC 0.1 955 95.5Chinnara Angala Seasonal Bridge course - Resdn. (6 months)- NRBC 0.05 90 4.512 months bridge course-NRBC 0.03 106 3.18Tent school 0.03 55 1.65Madrasa / Makthab 0.03 110 3.3NCLP Schools 0.03 100 3Summer Remedial Teaching Chaitrada Chiguru 0.005 2250 11.25Bridge course - Chinnara Angala 0.01 175 1.75Bridge course - Chinnara Angala Resi-2 months 0.017 166 2.822Innovation Urban Deprived Children 7 1 7Special Enrolment Drive 26 0Sub Total
4034 133.952SFD-C
GulbargaChinnara Angala Bridge couse Residential 12 months-RBC 0.1 2295 229.5Tent school 0.03 408 12.24Madrasa / Makthab 0.03 1673 50.19NCLP Schools ■ 0.03 275 8.25Summer Remedial Teaching Chaitrada Chiguru 0.005 3850 19.25Bridge course - Chinnara Angala 0.01 2565 25.65
178
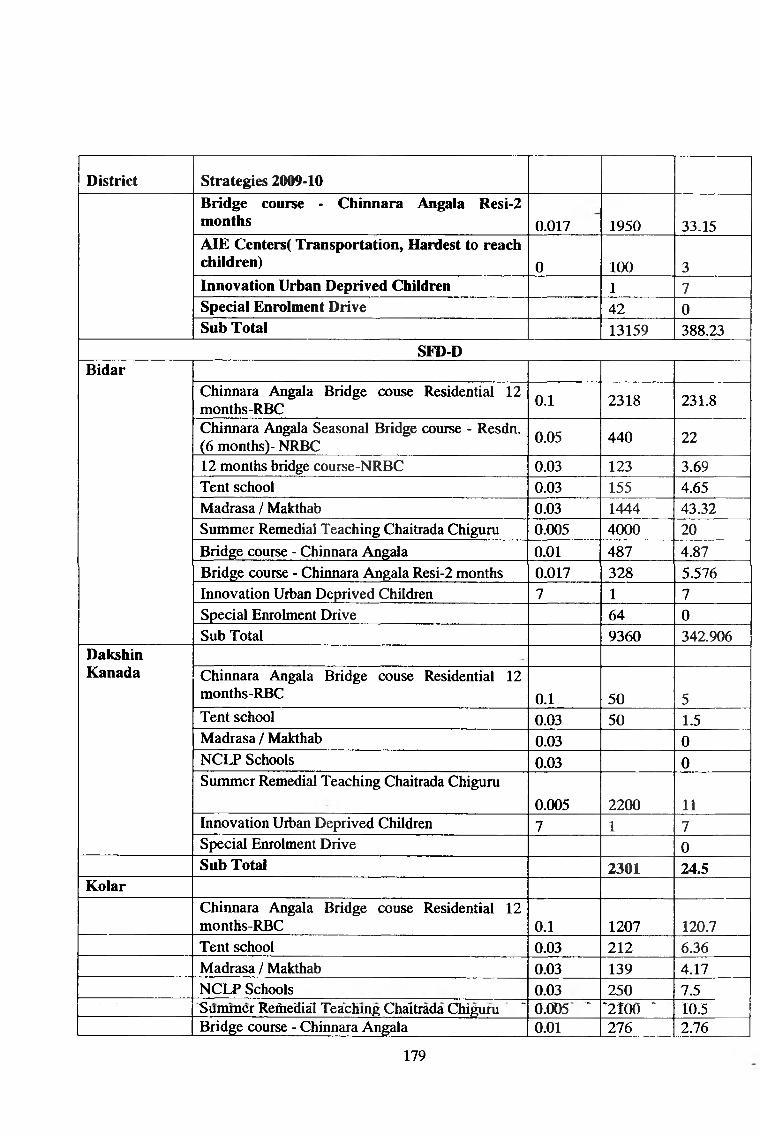
District Strategies 2009-10Bridge course - Chinnara Angala Resi-2 months 0.017 1950 33.15A l£ Centers( Transportation, Hardest to reach children) 0 100 3Innovation Urban Deprived Children 1 7Special Enrolment Drive 42 0Sub Total 13159 388.23
SFD-DBidar
Chinnara Angala Bridge couse Residential 12 months-RBC 0.1 2318 231.8
Chinnara Angala Seasonal Bridge course - Resdn. (6 months)- NRBC 0.05 440 22
12 months bridge course-NRBC 0.03 123 3.69Tent school 0.03 155 4.65Madrasa / Makthab 0.03 1444 43.32Summer Remedial Teaching Chaitrada Chiguru 0.005 4000 20Bridge course - Chirmara Angala 0.01 487 4.87Bridge course - Chinnara Angala Resi-2 months 0.017 328 5.576Innovation Urban Deprived Children 7 1 7Special Enrolment Drive 64 0Sub Total 9360 342.906
DakshinKanada Chirmara Angala Bridge couse Residential 12
months-RBC 0.1 50 5Tent school 0.03 50 1.5Madrasa / Makthab 0.03 0NCLP Schools 0.03 0Surtmier Remedial Teaching Chaitrada Chiguru
0.005 2200 11Innovation Urban Deprived Children 7 1 7Special Enrolment Drive 0Sub Total 2301 24.5
KolarChinnara Angala Bridge couse Residential 12 months-RBC 0.1 1207 120.7Tent school 0.03 212 6.36Madrasa / Makthab 0.03 139 4.17NCLP Schools 0.03 250 7.5Summer Refiiedial Teaching Chaitrada Chiguru “ 0.005 ' ’2100 ' 10.5Bridge course - Chinnara Angala 0.01 276 2.76
179

District Strategies 2009-10Innovation Urban Deprived ChildrenSub Total 4185 158.99
Grand Total 33039 1048.578
B. Minority interventionBidar, Gulbarga and Dakshina Kannada are the three districts having minority community in the State and categorize as Special Focus District for the purpose.
• The strategies provided last year were opening of 20 new primary schools, 74 new upper primary school in Bidar district, 50 Primary school and 75 upper primary schools in Gulbarga district and 5 new primary schools in Dakshina Kannada district to cover the school-less habitations.
• The outlays approved for these three districts were Rs. 2202.133 lakh for Dakshina Kannada district, Rs. 10676.297 lakh for Gulbarga district and Rs. 3310.448 for Bidar district. The overall allocation for the minority in Karnataka under SSA was 16.92% of the total outlay.
• As informed by the state that all the schools approved last are already operational.• 1153 ACR in primary schools and 88 ACR in the upper primary schools approved last
2008-09 are built. All targets are already achieved.• 3444 primary teachers and 1329 upper primary teachers sanctioned last year in these
three minority concentrated districts are also recruited.• For the year 2009-10 state proposed 87 primary schools and 125 upper primary schools
in the above minority districts.• 478 new teachers for new schools and 630 additional teachers are also proposed in this
year.• 41088 teachers are proposed to provide in-service teachers training in the 2009-10 for
this minority concentrated districts.
Observation
• Dakshin Kanada district has no Urdu medium schools as the majority of the children medium is Urdu language.
• ^ Bidar is the Muslim dominated district having high OOSC.• State couldn’t identify the minority children to be covered in the madarsa/maktabs, no
report on the coverage of children in the madarsas/maktabs in these minority concentrated districts.
State is strictly advised to focus the strategies under innovation & OOSC in these districts and also suggested to conduct a fresh survey to identify the deprived section of this conmiunity.
7. Comment on the State’s overall direction/ preparedness towards meeting the expected outcomes identified for 2009-10
The State as a whole has made noticeable progress in the components of access and quality. Under these two components it is trying different innovations for example, feeder schools, and the learning progranmie. The State as a whole is comfortably placed with regard to the other two components i.e. retention and equity, however, at the district level the picture is diverse and there
180

are several districts performance is much below the stat average. There is an overwhelming need to improve planning so as to bridge this gap. Availability and quality of data is a major impediment concerning the preparedness of the state for the implementation in 2009-10. large number of single teacher schools and very high PTR, along with high dropout in several states pose a challenge to retention and quality. There is a strong case for teacher rationalization, which needs to be taken up seriously.
8. The major findings of Monitoring Institutes on implementation of the programme in the State
For the state of Karnataka the Institute for Social & Economic Change, Bangalore and Regional Institute of Education, Mysore are two Monitoring Institution. The key findings of the end half yearly monitoring report for the period 1.10.2007 to 31.03.2008 is given below:
INSTITUTE^^e*SeG^AL &^BGGNOMlC CHANGE, BANGALORE STATE; KARNATAKA
Key observations o f the 2nd half yearly monitoring report Period o f l^ October, 2007 to 31^ March, 2008 District’s Covered: Bellary, Bagalkote, Koppala and Gulbarga
1. Opening of Schools (both prim ary and upper primary):District (1) Bagalkote4 Primary Schools in Bagalkote and 1 Upper Primary School in Jamakhandi blocks are shown as
opened without any sanction in the year. This needs clarification. The district needs to hasten release of money so that the work can begin.
2. Civil worksDistrict (1) Bagalkote 'Thus the overall progress under civil works may be considered satisfactory. However, the difference in the figures reported by the SPO and the DPO needs clarification. The quality of the civil works quite satisfactory. Further, it is also noticed from the field data that more than 90 % of the SDMC members in the district had been trained for technical supervision; the SDMC manual was available with more than 99 % of the SDMC members, the engineer had visited the site 6-7 times during construction. All these parameters reflect satisfactory progress, which is praiseworthy.
District (2) BellaryThe quality of the civil works is found to be quite satisfactory. Further, it is also noticed from the field data that more than 90 % of the SDMC members in the district had been trained for technical supervision; the SDMC manual was available with more than 99 % of the SDMC members, the engineer had visited the site 6-7 times during construction. All these parameters reflect satisfactory progress, which is praiseworthy.
3. TextbooksDuring the year 2007-08, text books are supplied free of cost along with work books to
children studying in aided primary schools for class I to VIII under SSA intervention.
181

District (1) BagalkoteFrom the field data it is noticed tliat 6 out of 60 scliools had short supply. While 4 and 2 schools each had short supply in Bagalkot and Jamakhandi respectively, Badami block had none. The shortage in supply was noticed in class 2, 3, and 7 for various subjects.
District (2) BellaryNo data received from the SPO for the district. However, the state reports that there is 100 per cent coverage across the districts suggesting the same for this district also.
District (3) GulbargaNo data received from the SPO for the district. However, the state reports that there is 100 per cent coverage across the districts suggesting the same for this district also. There is 100% coverage and all schools have distributed the same to June 10.
District (4) KoppalaNo data received from the SPO for the district. However, the state reports that there is 100 per cent coverage across the districts suggesting the same for this district also.
4. School grants District (1) BagalkoteIt is commendable that the district has been able to utilize the funds for school grant to the tune of 94.55 percent during the first quarter itself. From the DPO data it is seen that the number of schools which received grants is 504 primary & 757 upper primary , which adds upto 1261. The difference needs to be explained.
District (2) BeilaryOut of which only 73.7 per cent only has been utilized. This is regrettable since il is already close of the school year. From the SPO data it is noticed that the same figures as given in AWP & B is seen. The state has also reported that the funds haVe been released to the schools.
District (3) Gulbai^aHence the district is required to note that it should include this also while reporting for Gulbarga. But the date of receipt varied from as early as 2"** month to as late as 12“* month., only 74% of the schools had utilised the grant in the current year, which is a cause of concern.. It is also noticed that during the previous year, the utilization across the schools varied. The variation across the schools ranged from 20%. This is worrisome.
District (4) Koppala95% of the funds allocated under this has been utilized. Since it is the last quarter, this should have been utilsied,. Well before.
5. Teachers and Teacher Trainings District (1) BagalkoteTeachersThe district has utilized over 56.0 per cent of the grant under this and the immediate concern is to put new teachers in place as this grant has not been spent adequately. There appears to be large scale vacancy in all these. Thus the district needs to immediately start the recruitment so that the teaching -learning is not affected in schools due to absence of teachers. On the day of visit however, 267 teachers out of the 319 teachers in position were present in the school thereby
182

schools revealing 17 per cent absenteeism due to various reasons. This is a cause for concern and the district needs to take cognizance of the same.
Teacher Training -Quarter the coverage in this sector is adequate excepting for the new recruitees. Hence the district needs to gear up for enhancing the target coverage during the next quarter period. The district had a target of 267 newly recruited teachers for 30 days orientation. Out of this 125 teachers have been covered. More than 82 per cent of the schools have reported about the availability of training calendar and also the system of monitoring and providing feed back in the district. Although the themes for teacher training cover almost all co-curricular subjects, still a large majority of the teachers have demanded for training in Maths, English, Science, Computers, Social Science and Nali-Kali. This reflects that the existing training content and technique perhaps mat not be adequate in the respective co-curricular subjects. The district needs to take note of this and coordinate with the DIET to organize training for the same.
District (2) Bellary TeachersThe district has utilized the grant to the extent of 70% only which is a sad reflection as it is already closing term for the schools. As new recruitments are done as per the state policy, there is a need to streamline the procedural hurdles. From the SPO data it is noticed that the new teachers sanctioned for new primary, upgraded and old schools based on T:P ratio is 554. This figure is different from the one seen in the AWP«feB. Hence needs clarification. On the day of visit the actual number of teachers present was 342, which works out to 87.02 per cent, suggesting 13.0% teacher absenteeism in the district, which could be considered on the higher side.
Teacher TrainingIt is regretting to note that the district shows a poor record of only 42.74% of the teachers had been trained even towards the close of the school term. The themes for teacher training seem to cover almost all co-curricular subjects. Interestingly teachers in the district have demanded training in Computers, and Yoga, TTie district needs to take note of this and coordinate with the DIET to organize training for the same.
District (3) Gulbai^a TeachersThe inconsistency in the figures reported by the SPO and the AWP&B needs to be rectified. The state has reported that guidelines have been issued to all the districts to go ahead with counseling. On the day of visit however, 663 teachers out of the 752 teachers in position were present in the school accounting for 88.2 per cent. Thus the teacher absenteeism in the district is about 12.05 %, which is worrisome..
Teacher TrainingBy the end of even the last quarter, the coverage of teachers under training is only 58.0 per cent and the fund utilization is only 33.39 per cent. The district needs to gear up for enhancing the target coverage immediately as it is vitally linked with quality of learning in schools. For new recruitees, the target is 720 teachers and all of them are covered under training, Thus the district performance with respect to in-service although appears to be satisfactory. From the DPO data, it is seen that the target for teacher tfaimng is 12129 in the district which is quite different fi'om the AWP&B. It is noticed that there is full coverage. Although it deserves appreciation for full
183

coverage, yet the discrepancies in the figures need to be clarified. Considerable number of BRC/CRCs have to strengthen their monitoring support system.. The themes for teacher training seem to cover almost all co-curricular subjects. Interestingly teachers in the district have demanded training in Computers, Yoga, Hindi and school administration. The district needs to take note of this and coordinate with the DIET to organize training for the same.
District (4) Koppala -TeachersThe district is expected to complete the remaining recruitment immediately. On the day of visit however, 180 teachers out of the 214 teachers in position were present in the school thereby schools revealing 16.0 per cent absenteeism due to various reasons. This is a cause for concern and the district needs to take cognizance of the same.
Teacher TrainingThe utilization under this is 40.0% suggesting a poor record even towards the end the term. As this is directly linked to instructional quality this is a cause of worry. The district performance with respect to in-service although appears to be satisfactory.
6. Teaching Learning Material (TLM) grants:District (1) BagalkoteA large number of materials prepared by the teachers using this grant were also displayed in the schools visited. Most commonly charts, models, flash cards predominantly using thermo coal and KG cardboard were visible in the schools. It is heartening to note that 99 per cent of the schools have reported that children use and handle the TLM. An overwhelming majority of the teachers also reported that they have received training in TLM.
7. EGlSand AlE/NRBCandRBC District (1) BagalkoteThe volunteer has been trained by the NGO camp (Ekalavya) for 8 days. However, with respect to their academic attainments, majority of them were lagging behind. Clearly they all needed much more academic support than their counterparts in the mainstream schools. The district needs to monitor their learning attainments with much more seriousness and see that the existing resource persons provide suitable guidance and support.
8. Children with special needs (CWSN)District (1) BagalkoteFrom the field data it is seen that 8 out of the 82 sample schools selected had CWSN who had received aids and appliances. Only 2 children had problems in using the same. Only 31 % of the schools had ramp facility and only 3 schools reported about HB support to severely disabled and also about counseling to parents of the CWSN. Thus there seems to be lack of information relating to this among regular school teachers. Hence the district needs to gear up and orient the regular teachers also about this information. Thus the district needs to be complemented for promoting good attendance among the CWSN.
9. National programme for Girls at Elementary level District (1) BagalkoteThe learning attainments of children in class 6 & 7 was rather low. Somehow the teacher seem to play the gender focus little low and the gender coordinator’s role in strengthening this aspect deserves special attention. Particularly the head teacher in the NPEGEL needs to be proactive
184

and the positive environment to motivate towards this needs to be played by the gender coordinator.
10. Kasturba Gandhi Balika Vidyalayas District (1) BagalkoteAll staff were in place and all the equipment and boarding facilities were found adequate.
District (2) BellaryNO KGBV planned for the current year. However there are already 6 KGBVs functioning in the district with a total cost of Rs.94.26 lakh, out of which only 53.5% has been utilized, thereby indicating poor implementation. As per the SPO data, 3 are run by the department and another 3 by the Mahila Samakhya.
11. Research and Evaluation District (1) BagalkoteBut sadly not a single pie has been utilized under this. The district needs to immediately attend to this.
12. Functioning of VEC’S District (1) BagalkoteAs seen from the AWP&B the district has allocated Rs.3.054 lakh towards SDMC training for a physical target of 5090. But sadly not a single pie has been utilized under this. The district needs to immediately attend to this. Overall the SDMC’s ccontribution in terms of promotmg school environment, enrolment, attendance of teachers and students is found to be satisfactory. All SDMCs are maintaining proper records of the funds received.
District (2) BellaryA poor 14.0 per cent fund only is utilized suggesting poor progress in implementation. Overall the SDMC’s contribution in terms of promoting school environment, enrolment, attendance of teachers and students is found to be satisfactory. All SDMCs are maintaining proper records of the funds received.
District (3) Gulbai^aAs seen from the AWP&B the district has allocated Rs.6.5 lakh towards SDMC training for a physical target of 10782. But sadly not a single pie has been utilized under this. The district needs to immediately attend to this.
District (4) KoppalaThe district has done a commendable job by utilizing the entire allocations under this.
13. Staffing at District level and State level
District (1) BagalkoteLooking at the staffing pattern in the State, the information provided by the SPO reveals on the whole satisfactory picture for the district. There are no vacancies.
185

REGIONAL INSTITUTE OF EDUCATION, MYSORE STATE: KARNATAKA
Key observations of the 2nd half yearly momtoring report Period o f October, 2007 to 31^ March, 2008 District's Covered: Hassan, Davangere, Raichur andBidar
Executive Summary: Hassan
Based on the performance of the Hassan district, it’s strengths and weaknesses are enumerated as follows.
1. Opening of new SchoolsThe district has done well by way of opening sanctioned schools, appointing sanction number of teachers and also enabling SDMC to take up the construction work.
2. Civil works
(1) SDMC has been trained by technical persons for execution of civil works in only 20% of the schools but not in the remaining 80% of the schools. But the district says, it has trained 95% of the SDMCs.
(2) On the issue of the availability of community manual, it was found to exist in about 16% of the schools visited by the project team. But the district says, wherever civil works is sanctioned, it has compulsorily given manual.
(3) There is a conflict whether there is a convergence of total sanitation campaign and swajaladhara scheme in Hassan district. This needs to be clarified by the district.
3. Textbooks:The distribution of free textbooks is good in Hassan. There are some cases of short supply of books.
4. School Grants(1) The school grants have been received at different points of the year. It would be
appropriate to ensure its reach at one point quickly.(2) The percentage of utilisation of school grants is not satisfactory in the district(3) Only two thirds of the schools have received guidelines for utilisation of the school grants
while one third has not received guidelines. But, the district says, it has given guidelines to all schools.
5. Teachers and Teacher training:(1) On the issue of in-service training programme, it has been able to train good number of
teachers for 19 mandays per teacher, with proper preparation.(2) There are no habitually absenting teachers.(3) The rapport between the teachers and the students is good in Hassan district.(4) The DIET of Hassan is extending full support to the implementation of SSA by way of
providing support in training activities.
186

(5) Perhaps the follow-up after the training is weak in Hassan. This needs to be strengthened by the district.
(6) The BRCs and the CRCs are not able to make the school visits as much as they want to make. A better planning and execution are little necessary.
6. Teacher grants(1) The aided schools have been given teachers’ grants.(2) The TLMs prepared are kept in the classrooms where children can touch and feel. This is
important.(3) Teaches are also trained in the development of TLM's.(4) These grants are expected to reach the teachers within one month from the date of the
commencement of the school. While, that has not happened in this district
7. AIEAIE activities are g o in g s weU.
8. CWSN(1) The district has been doing a good job by way of counselling the parents of the CWSN.(2) The attendance of the CWSN in regular schools is impressive.(3) The aids and appliances supplied to the children are of a poor quality. This needs to be
improved.(4) The planning of the needs of the home-based education needs to be done child wise.
9. NPEGEL(1) NPEGEL is going on well in the district.(2) The activities of NPEGEL are documented periodically and sent to the state.(3) There is a need to discuss issues about gender sensitised TLM which is not perhaps
properly understood by the district.
10. KGBVThe KGBV centre is running well.
11. EMIS ~On the whole, the data generation system is in place..
12. Research and evaluation(1) DIET is instrumental in undertaking different activities under REMS.(2) DIET has been able to cover a wide range of activities it had planned for itself.
13. SDMCs(1) The number and composition of SDMCs in the district is impressive.(2) SDMCS’ meetings are satisfactory. '(3) SDMCs are supportive to schools. '(4) The district has not been able to complete its training programmes for SDMCs as
planned. But, the district says it has covered 95% of the training to SDMCs.
14. Staffing at state and the districtThere-are some vacancies at the sub district level, which needs to be filled
187

15. Mid Day Meal(1) The quality and quantity of food served is very satisfactory. Hot food is being served in
the district.(2) SDMCs also take part in the supervision work of midday meal in schools.(3) As regards the adequacy of the cooking vessels, it is not found to exist in about 17% of
the cases.(4) Around 30% of the schools do not have pukka kitchen.
16. Other issues(1) On an average, schools have run for 231 days, which is a very satisfactory thing.(2) Continuous and comprehensive assessments are used in all the schools.(3) The under aged and the over aged children is not a big number in the district.(4) Dropping out of the school and grade repetition is not too high. However, it should be
further minimized..(5) The rapport between the teachers and students is good.(6) On the whole, SDMCs are very helpful to the schools.(7) 57% Schools do not have adequate play materials
188
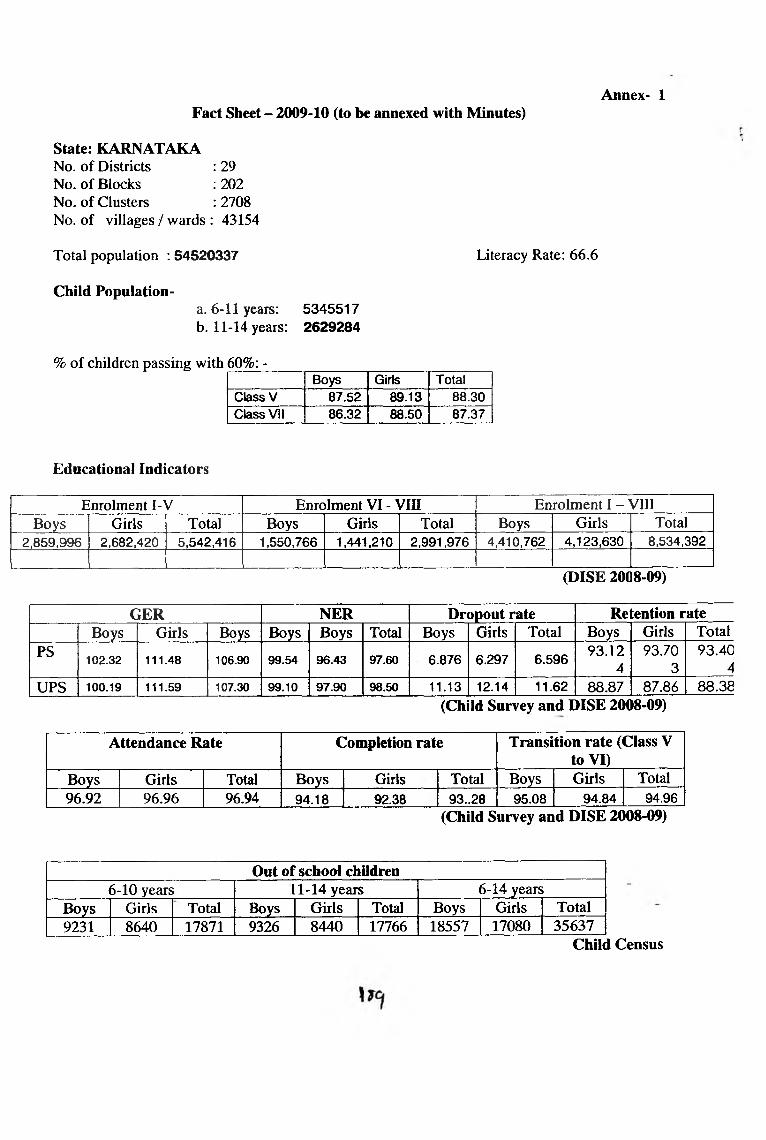
Annex- 1Fact Sheet - 2009-10 (to be annexed with Minutes)
State: KARNATAKANo. of DistrictsNo. of BlocksNo. of ClustersNo. of villages / wards
29202270843154
Total population ; 54520337
Child Population-
Literacy Rate; 66.6
a. 6-11 years: 5345517b. 11-14 years; 2629284
% of children passing with 60%: -Boys Girls Total
Class V 87.52 89.13 88.30Class VII 86.32 88.50 87.37
Educationai Indicators
Enrolment I-V Enrolment VI -) /III Enrolment I - VIIIBoys Girls Total Boys Girls Total Boys Girls Total
2,859,996 2,682,420 5,542,416 1,550,766 1,441,210 2,991.976 4,410,762 4,123,630 8,534,392
(DISE 20C«-09)
GER NER Dropout rate Re tention rateBoys Girls Boys Boys Boys Total Boys Girls Total Boys Girls Total
PS 102.32 111.48 106.90 99.54 96.43 97.60 6.876 6.297 6.596 93.124
93.703
93.404
UPS 100.19 111.59 107.30 99.10 97.90 98.50 11.13 12.14 11.62 88.87 87.86 88.38(Chi Id Survey and I»ISE 20C►8-09)
Attendance Rate Completion rate Transition rate (Class V to VI)
Boys Girls Total Boys Girls Total Boys Girls Total96.92 96.96 96.94 94.18 92.38 93..28 95.08 94.84 94.96
(Child Survey and DISE 2008-09)
Out of school children6-10 years 1-14 years 6-14 years
Boys Girls Total Boys Girls Total Boys Girls Total9231 8640 17871 9326 8440 17766 18557 17080 35637
Child Census

Other IndicatorsTarget for 2008-09 Target Achieved Target for 2009-K
1. Coverage of Out of school children
72365 65183 35637
2. Dropout rate 13.99% 10.365% 9%3. Attendance rate
(i) Student Attendance rate - Primary
97% 96.72% 98%
(ii) Student Attendance rate - Upper Primary
97% 96.99% 98%
4. Achievement level(i) Primary
Learning levels for Qass III Percentage in Maths : 68.45 Percentage in Language : 69.96 (2003: NCERT National Assessment Sample Survey- Round I, Round II)
Learning levels for class V Percentage in Maths : 46.03 Percentage in Language : 58.63 Percentage in EVS : 5L46 (2005: NCERT National Assessment Sample Survey - Round 1, Round II)
Learning levels for Qass VII/VIII Percentage / Percentage in Maths : 43.30 Percentage / Percentage in Language : 63.68 Percentage / Percentage in Science : 46.47 Percentage / Percentage in Social Science : 59.96 (2002: NCERT National Assessment Sample Survey - Round I, Round II)
80%(ii) Upper Primary
5. Teacher Attendance Rate 100 99
Teacher Attendance level at primary and upper primary: 78% (21 % absent due to OOD 1% un-authorized absent)
100
6. No of single teacher school 1962 Schools having less 10 children are continued with single teacher only as per State norms
7. No of schools with PTR > 50 -- 276 0
Source: Child Census, DISE2008, Independent Study on teacher attendance, NCERT.
q o

Recommendation/Approval for 2009-10
New Primary schools (including upgradations)Sanctioned till
2008-09Opened till March 2009
Completed Teachersprovided
TLEProvided
Recommendation/ Approval in
2009-10313 313 313 626 yes 317Up gradation of PS oUPS
Sanctioned till 2008-09
Opened till March 2009
Completed Teachersprovided
TLEProvided
Recommendation/Approval
450 450 450 450 Yes 130
EGSApproved till
2008-09Centers running as
on March 2009Centers to be
upgraded to PSCente:contii
200
rs to be lued in 9-10
Centers to be closed
Centers Children Centers Children Centres Children Centers Children Centers Children2171 Target
notfixed
0 — — — —
Sub-District Structures functioning
Targetfor
2008-09
Achievement till March 2009
Recommendation / Approval for 2009-10
No. of BRCs 176 176 176No. of URCs 20 20 20No. ofCRC 2684 2684 2684Resource persons 2038 1949 2174
Teachers under SSASanctioned till
2008-09In position Recommendation/Approval in 2009-10
Against new schools
Additionalteachers
Total
PSUPS
23064 20399 1270 0 1270
Teacher TrainingProgress for 2008-09 Recommendation /
Type of training No. of teachers Duration (No. of day) of the training
Approval for 2(X)9-10
Target Achievement Target Achievementa In service 227009 227009 17 15 228885b new recruits 6146 6146 30 1270
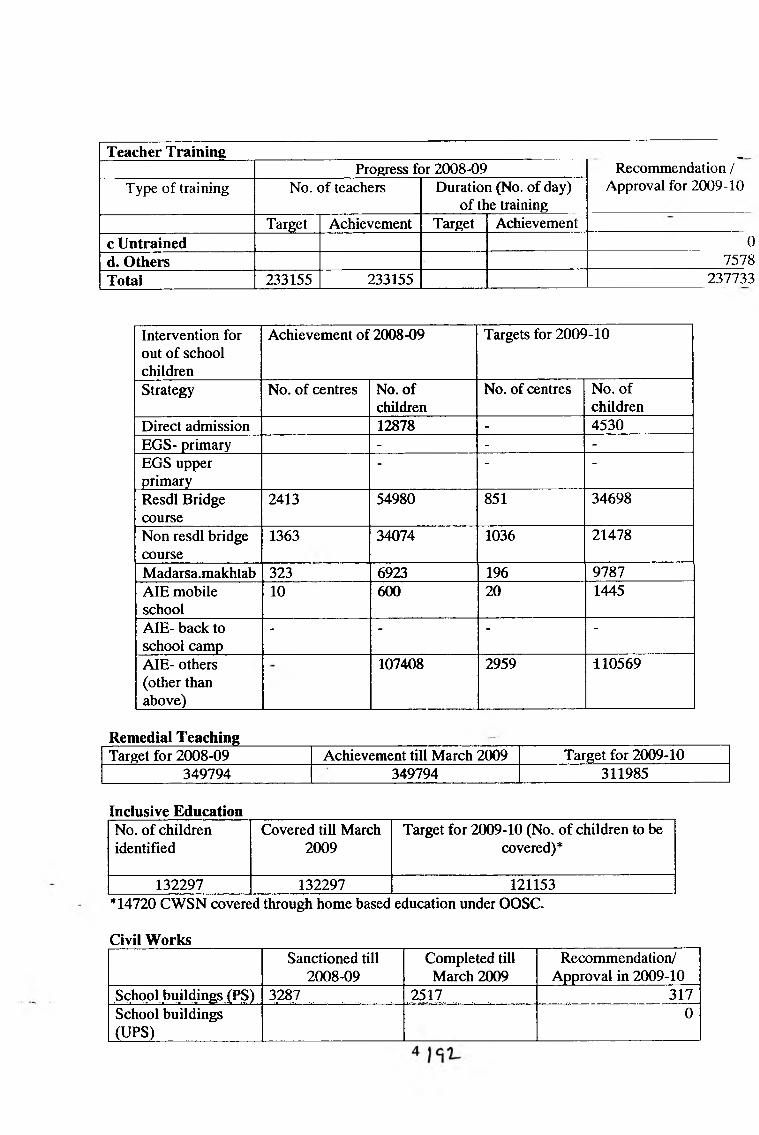
Teacher TrainingProgress for 2008-09 Recommendation /
Approval for 2009-10Type of training No. of teachers Duration (No. of day) of the training
Target Achievement Target Achievementc Untrained 0d. Others 7578Total 233155 233155 237733
Intervention for out of school children
Achievement of 2008-09 Targets for 2009-10
Strategy No. of centres No. of children
No. of centres No. of children
Direct admission 12878 - 4530EGS- primary - - -
EGS upper primary
- - -
Resdl Bridge course
2413 54980 851 34698
Non resdl bridge course
1363 34074 1036 21478
Madarsa.makhtab 323 6923 196 9787AIE mobile school
10 600 20 1445
AIE- back to school camp
- - - -
AIE- others (other than above)
107408 2959 110569
Remedial TeachingTarget for 2008-09 Achievement till March 2009 Target for 2009-10
349794 349794 311985
Inclusive EducationNo. of children identified
Covered till March 2009
Target for 2009-10 (No. of children to be covered)*
132297 132297 121153*14720 CWSN covered through home based education under OOSC.
Civil WorksSanctioned till
2008-09Completed till March 2009
Recommendation/ Approval in 2009-10
School buildings (PS) 3287 2517 317School buildings (UPS)
0

Sanctioned till 2008-09
Completed till March 2009
Recommendation/ Approval in 2009-10
AdditionalClassrooms
38930 28602 4769
Drinking Water ' 21438 21438 0Toilets 23314 23314 14340Special Toilet for Girls
12792
Major repairs - PS 3068 1675Major repairs - UPSResidential HostelFurniture 209345 — 1247651
REMSNo. of research studies
carried out during 2008-09No. of research studies
recommendation/Approval for 2009-10
Research 128 180
Innovation:
ECCEProgress for 2008-09 Recommendation/Approval;for 2009-10
No. of centers No. of children enrolled
FinancialNo. of centers
No. of children
Financial
29 15500 435.000 29 15500 435.00
Girls EducationProgress for 2008-09 Recommendation/Ap jroval for 2009-10
(Girls Beneficiaries) Financial (No. of Girls) Financial52200 159.500 52200 159.500
SC/STProgress for 20C8-09 Recoimnendation/Approval for 2009-10
(No. of Beneficiaries) Financial (No. of Beneficiaries) Financial21654 435.000 21654 435.000
CALProgress for 2008-09 Recommendation/Approval for 2009-10
No. of schools covered
No. of children covered Financial
No. of schools to be covered
No. of children to be covered
Financial
600 New schools
2455 since
637830 Since start of programme
320.00 As on
31.12.2008
735 new schools
220500 1450.000

Progress for 2008-09 Recommendation/Approval for 2009-10No. of schools covered
No. of children covered Financial
No. of schools to be covered
No. of children to be covered
Financial
start of programme
1450.00anticipated
by31.03.09
Urban Deprived Children
Progress for 2008-09 Target for 2009-10(No. of Beneficiaries) Financial (No. of Beneficiaries) Financial
28286 203.002 9500 203.000Minority Interventions
Progress for 2008-09 Target for 2009-10(No. of Beneficiaries) Financial (No. of Beneficiaries) Financial
429823 217.500 429823 217.500
Community MobilizationTarget for
2008-09Progress till March 2009
Recommendation/ Approval for 2009-10
No. of VECs/SDMCs ------- 46030( In all Schools)
No. of SMCs/PTA/MTA — — —
No. of VEC members to be trained 305268 305268 325978
NPEGELMajor Activities Target for 2008-09 Progress for 2008-09 Recommendation/
ApprovalPhysical Financial Physical Financial Physical Financial
Non Recurring 56 128.8 56 16.8 0 0
Recurring 921 644.7 485361 644.7 921 589.306
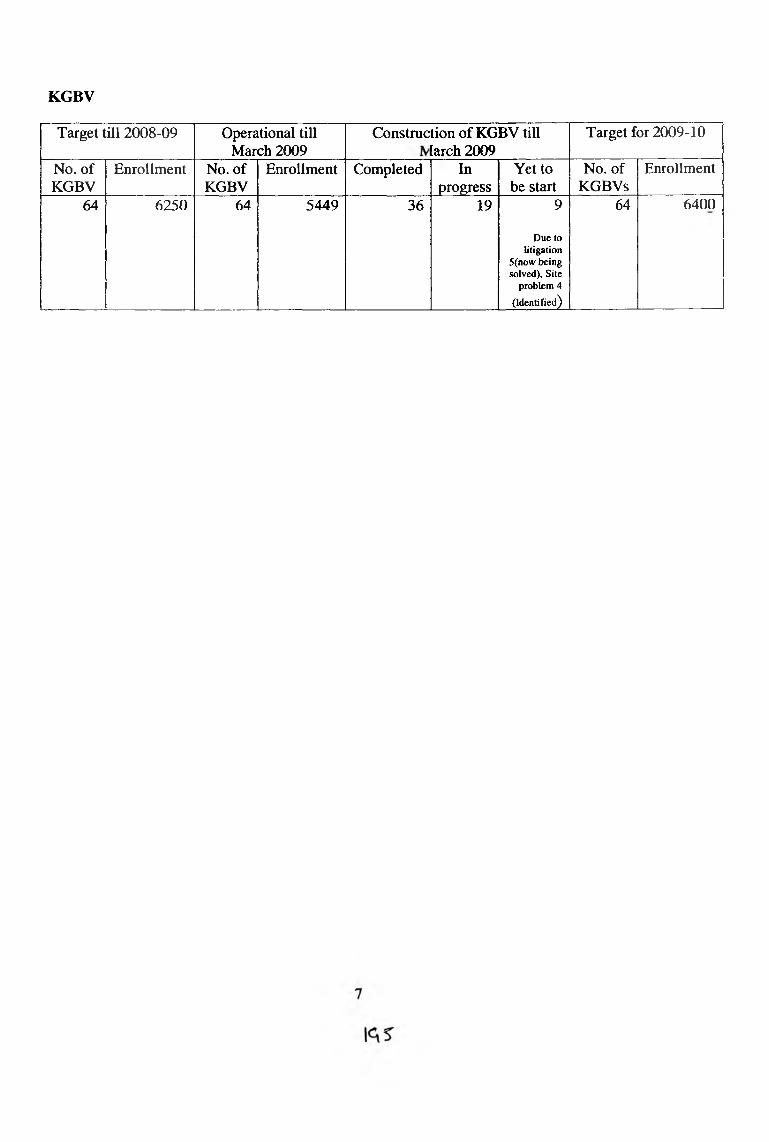
KGBV
Target till 2008-09 Operational till March 2009
Construetion of KGBV till [arch 2009
Target for 2009-10
No. of KGBV
Enrollment No. of KGBV
Enrollment Completed Inprogress
Yet to be start
No. of KGBVs
Enrollment
64 6250 64 5449 36 19 9
D ue to litigation
5(now b eing solved). S ite
problem 4
(Id en tified )
64 6400

&
s.No Outcome Indicators Data source* Baseline as In 2007<08
proposed achievement 2008-09
Achievement 200809
Proposed achievement in 2009-10
Proposed achievement in 2010-11
Proposed achievement In 2011-12
GOAL I: All children In School / EGS centrci / Alteraative tnd Innovative Education centns
1Number of children aged 6-14 years not enrolled in School / EOS Centres / AIE Centres
Stale UH Surveys 2007-08) 84750 72365 65183 65183 0 0
2 Number of children enrolled in schools2005 : DISE)
8592947All children proposed to
be enrolled8534392
All children proposed to be enrolled
All children proposed to be enrolled
All children proposed to be enrolled
3 Ratio of Primary to Upper Primary Schools (2005 ! DISB) 2.05 As per state Norms 1.86 As per state Norms As per state Norms As per state Norms
4Number of children with special needs (CWSN) enrolled in school or alternative system including home based education
PMIS Report Children with Spl Needs : 67228, Home Based: 6228
All children proposed to be enrolled
65994 CWSN children are enrolled, Homebased: 13348
All children proposed to be enrolled
All children proposed to be enrolled
All children proposed to be enrolled
GOAL I I : BHdging gender and sodal category gaps
5 OIrls, increase as a share of students enrolled at Primary and Upper Primary level. (2005; DISB) 48.32
All children proposed to be enrolled 48.31 All children proposed
to be enrolledAll childret^ proposed
to be. enrolledAll children proposed
to.be enrolled
6Scheduled Castes & Schedule Tribe children increase as a share of students enrolled in Primary and Upper Primary Schools
(2005: DISE) 26.68All children proposed to
be enrolled27.07 All children proposed
to be enrolledAll children proposed
to be enrolledAll children proposed
■ to be enrolled
GOAL I I I : Universal Retention
7Transition rates from Primary to Upper Primary to increase (2005iDISEl
92.62 93 94.96 95 100 100
8 Retention at Primary level f2005:DJSE) 94.12 94.12 93.40 95.44 100 1009 Retention at elementary level (200S;OISB) 86.01 86.01 •* 88.38 91.20 . 100 100 .
GOAL IV; Education of Satisfiictoiy Quality
10
Provision of quality inputs to improve leamlns
(i) Teachers ( DOE :PTR) ;DISE Primary ■ 1:21 (PTR), Upper Primary ; 30 (PTR)
Primary -1:21 (PTR), Upper Primary: 30
(PTR)
Primary -1:18, Upper Primary: 1:28
1: 30 at class I & 11 in nil school through
introduction Nali Kali System
NA NA
(li) Teaching Learning Material-. :DISB 100% 100% 100% 100% 100 %■ 100%11 Process indicators on quality
• Teacher Training PMI Report 100% 100% 70.58% 100% NA NA
• Teacher support & Academic Supervisiont
PMIS ReportPercentage of BRC/CRC are operational. BRC : 97 % , B RP: 100 % , C R P : 100 %
Percentage of BRC/CRC are operational. BRC: 100 % , BRP : 100 % , C R P : 100 %
Percentage of BRC/CRC are operational. B R C : 100 % , B RP; 100 % , C R P: 100 %
Percentage of BROCRC are operational. BRC ; 100 % , BRP : 100 % , CRP : 100 %
NA NA

n«sults Frame Work 2009-10 of Karnataka State
(iii) Classroom Practices DISE&PMISREPORT
Statewise number of schools reporting change in classroom practices / use of innovative methoiodies, 13691 school-N aii Kali All schools Keli Kali schools Gulbarga& Chamartyanagar with EdusatNo of instructional Days- 210
Statewise number of schools reporting change in classroom practices / use of innovative methoiodies, 13691 school - Nali Kali All schools Keli Kali schools GulbargaA Chamarajanagar with Edusat
Statewise number of schools reporting change in classroom practices / use of innovative methoiodies; 13691 school-N ali KaliAll schools Keli Kali schools Gulbarga& Chamarajanagar with EdusatNo. of instructional
days232
No. of instructional days232
NA NA
(iv) Pupil Assessment by States DISH & PMIS REPORT
(v) Attendance Rates
!>cnooi level unit tests ana semester scheme of finilinilinil i« in nrartim____
KSQAO Semister examination
Pupil assessment system p p p is place in school NA NA
; Students (2006: InihtwfMlM fludy&DISE
89.19 ((F ) 89.53 (UP)
100% To be provided by the State
- Teachers (2006; Independent tludyftPlSE 79.5 for P& UP 100% To be provided by the
State
12 Accountability to the community[As per repon of indcpendcnl study
2007-08)
All SDMCt are supervising the school ictlvitiet.
All SDMC» *re supervising the Khool sctivities.
All SDMCi are supervising the school activities.
All SDMCsare supervising the school activities.
All SDMCsat* supervising the ichool activities.
All SDMCs ire supervising the school activities.
13
National comparable student achievement level(Lei^ing levels for Qass mPerdentage in MathsPercjentage in Language) i
(2003: NCErV Nuionil Aueuitwi
Sunple Survey)
UanlBg level hr Om ni-«inMtlht4Z34
%lnluigu*ie 48.48 Lntalmhnllbrau V-
« In Mithi 46.03 %inLuigu«gt 58.63
% In BVS 51.46
LMntaf level for CIsi in-% in MUhs 47.34
% Inluiguigc 53.48 I,cwi«ta( level tor Cki V-
% In Muhs 51.03 * inUnguage 63.63
» in EVS 55.46
NA NA NA NA
* Ai In NatlMwl R«uR« Framtwerk** PAB had fixed the target of 92% whereas the state while showing the progreee has Indicated as B6.0%. Hence thi* needs to be resolved.

ANNEXUKES

TABLES ON PHYSICAL
PFIOGRESS SINCE2001

CONSOLIDATE PROGRESS REPORT
N o. I n te r v e n t io n s K a r o a U t k a S ta te
T o t a l
A p p r o v e d
(U p to 2008
09)
A c h ie v e m e n t
( C o m p le te d /C o v e r a
g e U p to 31 M a r c h ,
2009 )*
%
A c h ie v e m e n
t
R e m a r k s
) P r im a ry S e t ''O l O p e n n in g 2812 2812 100,00
■ - - .
2 U p p e r P r im a ry O p e n n in g ■ 7729 7729 100.00-
3 T e a c h e r s ' R e c ru i tm e n l 21798 21798 100.00
4 P r im a ry S c h o o l B u ild in g 5780 5780 100.00
5 U p p e r P r im a ry S c h o o l B u ild in g 0 0 0 .00
6 A d d itio n a l C la s s R o o m s (A C R ) 39395 28602 72 .60
7 D r in k in g W a te r F a c ility 21438 21438 100.00
S T o ile l F a c i l i ty 24491 23314 95.19
() K G B V F u n c t io n a l 6 4 64 100.00
10 K G B V B iii ld in n C o n s tru c tio n 64 36 ^ 56.25
36 B u ild in g s a ie c o m p le li 'd and 28
in p ro g ress
] ! In s e rv ic e T e a c h e r ’s T ra in in g (20 d a y s)* 227009 227009 100.00
A ll te ach e rs a re g iv en tra in in g . 9.07
m a n d a y s ach iev e d as o n D oc 2008
' 12 N e w T e a c h e r 's T ra in in g (30 d ay s)* 6146 9733 158.36
13 U n tra in e d T e a c h e r ’s T ra in in g (30 d ay s)* 0 0 0.00
14 D is t. o f fre e te x t b o o k * 856319 856319 100.00
-
15 D is t. o f T e a c h e r s ' g ran t* 227009 218223 96 .13
16 D is t . o f S c h o o J g ran t* 70821 68578 96 .83
17 D is t. o f T L E g ra n t* 763 763 100.00
A
Y 18 R e m e d ia l T e a c h in g * 349794 349794 100.00
19 O u t o f S c h o o l C h ild re n * 72365 65183 90 .08
20 P r o g re s s o n In c lu s iv e E d u c a tio n * 132297 ■ 129986 98.25
15774 C W S N c h ild re n a re en ro lle d
in E G S /A IE a n d H o m e b a s e d ed u ca tio n . 114212 c h i ld re n are
e n ro lle d in sch o o ls .’
21 P ro g re s s o n N P E G E L (M C S ) 950 921 96.95
•A p p ro v e d a n d A c h ie v e m e n t o f y e a r 2008-09 o n ly
1 9 ^

Report
SI.No District
P r im a ry S c h o o l O n e n n in g ,
T otal A pproved (U pto 2008
09)
Aciiicvcm cnt (Completecl/Co
verage Up to 31 M arch ,
2009)
A chicvcincm
U p p e r P r im a ry S c h o o l O p e n n in g
Total A pproved (Upto 2008
09)
A chievem ent (C om pleted/C overage Up to
31 M arch , 2009)
%A chievem ent
T e a c h e r s ' R e c ru i tn - ic n i
T otal A pproved
(U pto 200809)
AchievcinciU (C om pleted/ C overage Up to 31 M arch ,
2009)
%A chievem ent
Bagalkote 113 113 100.00 219 219 100.00 1330 2660 200.00Bangalore Rural 100.00 259 259 100.00 547 1094 200.00Bangalore Urban 136 138 100,00 260 260 100.00 671 1342 200.00Belgaum 140 140 100.00 662 662 100.00 1550 3100 200.00Bellary 77 77 100.00 351 351 100.00 1426 2852 200.00Bidar 166 166 100.00 411 411 100.00 751 1502 200.00Bijapur 234 234 100.00 554 554 100.00 1508 3016 200.00C ham arajanagar 38 38 100.00 136 136 100.00 402 804 200,00Chikballapura #DIV/0! O.OO 26 52 0.00
10 Chikm agalur 92 92 100.00 169 169 100,00 608 1216 200,0011 Chitradurga 167 167 100.00 205 205 100,00 594 1188 200.0012 D akshina K annada 50 100.00 229 229 100.00 374 748 200.0013 D avanagere 6 6 66 100.00 236 2 36 100.00 355 710 200.0014 Dharwad 42 42 100.00 246 2 46 0.00 538 1076 200.0015 G adag 31 31 100,00 153 153 0.00 346 692 200.0016 Gulbarga 471 471 100.00 948 948 100.00 2843 5686 200.0017 Hassan 67 67 100.00 127 127 100,00 238 476 200.0018 Haveri 42 42 100.00 287 287 0.00 564 1128 200.0019 Kodagu 68 68 ,100,00 37 37 0.00 186 372 200.0020 Kolar 59 59 100.00 274 274 100.00 524 1048 200.0021 Koppal 80 80 100.00 261 261 0.00 849 1698 2C0.0022 M andya 0.00 103 103 100.00 139 278 200.0023 Mysore 29 29 100.00 209 209 100.00 823 1646 200.0024 Raichur 189 189 100.00 404 404 0.00 1949 3898 200.0025 Ramanagar 100,00 12 12 100,00 10 o.oo26 Shimoga 109 109 100.00 234 234 100.00 698 1396 200.0027 Tumkur 143 143 100.00 216 216 100.00 710 1420 200.0028 Udupi 27 27 100.00 81 81 100.00 456 912 200.0029 Uttara Kannada 160 160 100.00 446 446 100.00 1031 318 30 .84
Total 2812 2812 100.00 7729 772 9 100.00 22041 42 3 3 8 192 .09
1
3 2 224
5
67
809 00 0
6 6
6 6 5
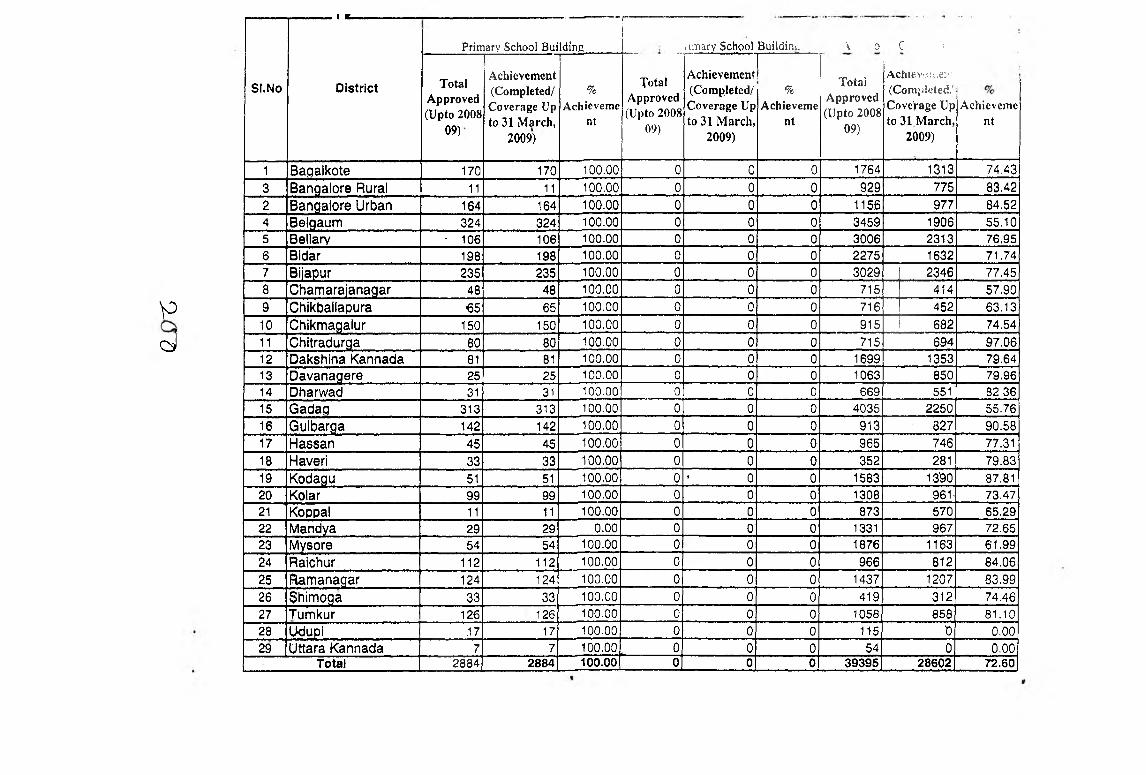
p
d
SI.No
1 1 I I 1 ■..............................
D is tr ic t
. . . . . - -
Primary School BuildiriE iimary School Building ■\ 0 c '■
T otal A pproved (U pto 2008
09)
T.................A chievem ent (C om pleted/ C overage Up to 31 M arch ,
2009)
%A chievem e
nt
T otalA pproved(Upto 2008
09)
A chievem ent (C om pleted/ C overage Up to 31 M arch ,
2009)
%A chievem e
n t
T ota! A pproved (U pto 2008
09)
Achievo:;\eu (C om pk'ted/ Covei-age Up to 31 M arch ,
2009)
A chievem cnt
1 Bagalkote 170 170 100.00 0 0 0 1764 1313 74 .43
3 Bangalore Rural 11 11 100.00 0 0 0 929 775 83 .42
2 Bangalore Urban 164 164 100.00 0 0 0 1156 977 84 .524 Belgaum 324 324 100.00 0 0 0 3459 1906 5 5 .105 Beilarv • 106 106 100.00 0 0 0 3006 2313 76 .956 Bidar 198 198 100.00 0 0 0 2275 1632 7 1 .747 Bijapur 235 235 100.00 0 0 0 3029 2346 77 ,458 C ham arajanagar 48 48 100,00 0 0 0 715 414 5 7 .9 0
9 Chikballapura 6 5 65 100.00 0 0 0 716 45 2 63,13
10 dhikm agalur 150 150 100.00 0 0 0 915 682 7 4 ,54
11 Chitradurga 80 80 100.00 0 0 0 715 694 9 7 .0 612 Dakshina Kannada 81 81 100.00 0 0 0 1699 1353 79 ,64
13 D avanagere 25 25 100,00 0 0 0 1063 850 7 9 .9614 Dharwad 31 31 100.00 0 0 0 669 551 82.3615 G adag 313 313 100.00 0 0 0 4035 2250 55 .76
16 Gulbarga 142 142 100.00 0 0 0 913 ■ 827 90 .58
17 Hassan 45 45 100.00 0 0 0 965 746 77.31
18 Haveri 33 33 100.00 0 0 0 352 281 79 .83
19 Kodagu 51 51 100.00 0 ■ 0 0 1583 13’90 87,8120 Kolar 99 99 100.00 0 0 0 1308 961 ' 73 ,4721 Koppal 11 11 100.00 0 0 0 873 570 6 5 .2922 Mandya 29 29 0 .00 0 0 0 1331 967 72.6523 Mysore 54 54 100.00 0 0 0 1876 1163 6 1 .99
24 Raichur 112 112 100.00 0 0 ’ 0 966 812 8 4 .06
25 flam an agar 124 124 100.00 0 0 0 1437 1207 8 3 .9926 Shim oga 33 33 100.00 0 0 0 419 . 312 74 .4627 Tum kur 126 126 100.00 0 0 0 1058 858 81 .1028 Udupi 17 17 100.00 0 0 0 115 0 0 ,00
29 U ttara Kannada 7 7 100.00 . 0 0 0 54 0 0 ,00Total 2 8 8 4 2884 100.00 0 0 0 39395 28602 72 .60

Keport
SI.No District
Drinkine Water Facility . Toilet Facility KGBV Functional
T otal A pproved (U pto 2008
09)
Achievement
(Comp)etc d /C overag e Up to 31
M arch , 2009)
%
Achievem ent
T otal A pproved (Upto 2008
09)
A chievem ent (C om pleted/ C overage Up to 31 M arch ,
2009)
%A chievem e
n t
T otal A pproved (U pto 2008
09)
Achie(Com pverage
M arc)
f'cm cnt letcd/Co Up to 31 li, 2009)
%A chievem ent
1 Bagalkote 532 532 100.00 797 797 100,00 6 ■ 6 100.003 Bangalore Rural 1255 1255 100.00 1295 1295 100.00 0 0 0.002 Bangalore Urban 725 725 100.00 675 675 ,100.00 0 0 0.004 3e|gaum 985 985 100.00 1614 1614 100,00 4 4 100.005 Bellary 634 634 100.00 741 741 100.00 6 6 100,006 Bijdar 579 579 100.00 670 670 100.00 4 4 100.007 Bi apur 755 755 100.00 845 845 100.00 5 5 100.008 C ham arajanagar 450 450 100.00 453 453 100.00 0 0 0,009 Chikballapura 0 0 #DIV/0! 0 0 #DIV/0! 4 4 100.0010 C hikm agaiur 955 955 100.00 1030 1030 100.00 0 0 0.0011 Chitradurga 1035 1035 100.00 1115 1115 100.00 2 2 100.0012 Dakshifia Kannada 453 453 100.00 448 448 100.00 0 • 0 0.0013 D avanagere 916 916 100.00 921 921 100.00 1 1 100,0014 Dharwad 409 409 100.00 487 487 100.00 2 2 100.0015 G adag 245 245 100.00 385 385 100.00 2 2 100,0016 Gulbarga 1520 1520 100.00 1475 1475 100,00 10 10 100.0017 Hassan 1325 1325 100.00 1110 1110 100,00 1 1 . 100.0018 Haverl 900 900 100.00 650 650 100.00 0 ■ 0 0.0019 Kodagu 247 247 100.00 ‘ 271 271 100.00 0 , 0 ' 0.0020 Kolar 1113 1113 100.00 1239 1239 100.00 3 ■ 3 100.0021 Koppal 344 344 100.00 508 508 100.00 5 ' 5 100.0022 Mandya 509 509 100.00 507 507 100.00 0 0 0.0023 Mysore 803 803 100,00 919 919 '100.00 1 ■ 1 100.0024 Raichur 450 450 100.00 875 875 100.00 6 6 ■ 100.0025 R am anapar 0 0 #DIV/0! 0 0 #DIV/0! 1 , 1 ' 100.0026 Shim oga 1060 1060 100.00 965 965 100.00 0 0 0.0027 Tum kur 1410 1410 100.00 1450 1450 100.00 1 . 1 100.0028 Udupi 455 455 . 100,00 590 590 100.00 0 ■' 0 '0.0029 U ttara Kannada 1374 1374 100.00 1279 1279 100.00 0 ' - , 0 0.00
Total 2 1 4 3 8 21 4 3 8 100 .00 24491 2 3 3 1 4 95.19 64 ■ 64 ‘ 100.00

oo
, tJ p ii 2l/0S 09)
to 3 i 2009)
I ' i)9, i
/ i a / . 2009)
1i , • ;
1 B agalkote 6 ’ 2 33,33 7927 7927 100 61 ■ 93 152.46
3 Bangalore Rural 0 0 0.00 9013 9013 100 503 235 46 .72
2 Bangalore Urban 0 0 0 .00 10432 10432 100 28 ' 91 3 2 5 .0 04 Belgaum 4 2 50.00 18042 18042 100 463 580 125 ,27
5 Beliary 6 5 83.33 8363 8363 100 815 1082 132 .76
6 Bidar 4 3 75.00 8073 8073 100 226 724 3 2 0 ,35
7 Bijapur 5 1 2 0 .0 0 10322 10322 100 683 90 13.18
8 C ham araianaqar 0 0 ' 0 .00 4037 4037 100 53 86 ■ 162.26
9 Chikballapura 4 4 100.00 0 0 #DIV/0! 0 0 0 .00
10 C hikm agalur 0 0 0.00 6527 6527 100 58 • 136 2 34 .4811 Chitradurga 2 2 100.00 7802 7802 100 263 372 141 .44
12 Dakshina Kannada 0 0 0.00 8236 8236 100 10 80 .0013 D avanagere 1 1 100.00 8596 8596 100 245 166 6 7 ,7614 Dhanwad 2 1 50 .00 6470 6470 100 168 1150 6 84 ,52
15 G adag 2 1 50 .00 5476 5476 100 0 144 0 .00
16 G ulbarga 10 3 30100 14509 14509 100 200 2251 1125 ,5017 Hassan 1 1 100.00 8723 ' 8723 100 44 144 3 27 .27
18 Haveri 0 0 0.00 6219 6219 100 40 233 582 .50
19 Kodagu . 0 0 0.00 2499 2499 100 60 255 4 25 .00
20 Kolar 3 3 100.00 11387 11387 100 348 350 100.57
21 Koppal 5 3 60.00 5020 5020 100 242 0 0.00
22 M andya 0 0 0.00 7748 7748 100 100 77 77.00
23 Mysore 1 1 100,00 10361 10361 100 196 206 105 .10
>24 Raichur 6 1 16.67 6012 6012 100 501 626 124.9525 R am anagar 1 1 100.00 0 0 0 0 0 0 .00
26 Shim oqa 0 0 0.00 8025 8025 100 16 , 174 1087 ,50
27 Tum kur 1 1 100.00 13599 13599 100 595 380 6 3 .87
28 Udupi 0 0 0,00 5352 5352 100 0 65 0 .00
29 U ttara Kannada 0 0 0.00 8239 8239 0 228 15 6 .58Total 64 36 56.25 227009 227009 100 6146 9733 158.36

jxcpu l I
SI.No District
Untrained Teacher's Training (30 days)*
T o ta l A pproved (U pto 2008
09)
A chievem ent (C om pleted/
C overage Up to 31 M arch ,
2009)
%A chievcm c
nt
Dist. o f free text book*
T otal A pproved
(Upto 2008. 09)
A chievem ent (C om pleted/ C overage Up to 31 M arch ,
2009)
%A chievem e
n t
Dist. ofT eadhers ' grant
TotJil A pproved (U pto 2008
09)
A chievem ent (Conjplfeted/ C overage Up to 31 M arch ,
2009)
%A chievem ent
Bagal.kote 0 19589 19589 100.00 7927 7927 100.00Bangalore Rural 14599 14599 100.00 4152 3936 94.80Bangalore Urban 148294 148294 100.00 10432 8058 77 .24
Belgaum 36771 36771 100.00 18042 18042 100.003eilary 23193 23193 100.00 8363 8363 100.00Bidar 20671 20671 100.00 8073 8073 100.003ijapur 37 2 9 9 37299 100.00 10322 10132 98.16C ham ara janagar 12933 12933 100.00 4037 3964 98.19Chikballapura 10672 10672 100.00 5074 5018 98.90
PO 10 Chikm agalur 11000 11000 100.00 6527 6187 94.7911 Chitradurga 25524 25524 100.00 7802 7802 100.0012 Dakshina K annada 78775 78775 100.00 8236 6840 83.0513 Davanagere 40075 40075 100.00 8596 8337 96.9914 Dharwad 40890 40890 100.00 6470 6470 100.0015 Gadag 13723 13723 100.00 5476 4958 90.5416 Gulbarga 44863 44863 100.00 14509 14509 100.0017 Hassan 19431 19431 100.00 8723 8723 100.0018 Haveri 15531 15531 100.00 6219 6079 97.7519 <odagu 9279 9279 100.00 2499 2499 100.0020 Kolar 20067 20067 100.00 6313 6123 96.9821 Koppal 6270 6270 100.00 5020 5020 1O0.OO22 Mandya 15677 15677 100.00 7748 6641 85.7123 Mysore 32533 32533 100.00 10361 10042 96.9224 Ralchur 9921 9921 100.00 6012 6012 100.0025 Ramanagar 24396 24396 100.00 4861 4572 94.0526 Shimoga 23065 23065 100.00 8025 ■ 8025 100.0027 Tumkur 36584 36584 100.00 13599 13082 96.2028 Udupi 41706 41706 100.00 5352 4550 85.0129 Uttara K annada
Total22988
85631922988
856319100.00100.00
8239227009
8239218223
100.0096.13

v >
Dist. o f School crant* Dist, of TLE grant* 1
SI.No District T otal A pproved (U pto 2008
09)
A chievem ent (C om pleted/
C overage Up to 31 M arch ,
2009)
%Achievem ent
Total A pproved (U pto 2008
09)
!
/vchl:-fi;mcnt (C om pleted/C overage Up to
31 M arch , 2009)
%A chievem e
n t
T o ta l A pproved (Upto 2008
09)
, A chievem ent (C om pieted /i overage Up to
31 M arch , 2009)
1 .
%A chievem ent
1 Bagalkote 2119 2119 100.00 35 35 100.00 9408 9 4 0 8 100.00
3 Bangalore Rural 1590 1573 98.93 10 10 100.00 14309 14309 100.00
2 Bangalore Urban 2540 2540 100.00 14 14 100.00 21187 '2 1 1 8 7 100.00
4 Belgaum 4784 4784 100.00 147 147 100.00 28 7 2 8 28728 100,00
5 Bellary 2186 2186 100.00 14 14 100.00 10119 10119 100 .00
6 Bidar 2379 2379 100,00 94 94 100,00 14148 , 14148 100.00
7 Bijapur 3028 2968 • 98 .02 42 42 100.00 13123 13123. 100.00
8 C ham arajanagar 1243 1243 100.00 0 0 0 ,00 5297 5297 100 .00
9 Chikballapura 2143 2143 100.00 0 0 0 .00 9171 9171 100.00
10 C hikm agalur ' 2319 2319 100.00 4 4 100 .00 9961 9961 100 ,00
11 Ghitradurga 25 1 2 2512 100.00 39 • 39 100 .00 10594 10594 100 ,0012 D akshina Kannada 2012 2003 99 .55 5 5 100.00 13392 ■ 13392 100 ,00
13 D avanagere 22 6 6 2266 100.00 10 10 100 .00 9329 , 9329 100 ,00
14 Dharwad 1386 1384 9 9 .86 2 2 100.00 6324 , 6324 100 ,00
15 G adag 1066 1066 100.00 0 0 0 .00 4743 4743 100 .00
16 G ulbarga 3811 , 3811 100.00 125 125 100 .00 22356 2 2 3 5 6 100,00
17 Hassan 3690 3690 100.00 29 29 100.00 15574 , 15574 100,00
18 Haveri 2094 1844 ■ 88 .06 20 20 100 .00 8854 , 88 5 4 100.0019 Kodagu 694 694 100.00 3 3 100 .00 3083 : 30 8 3 - 100 .0020 Kolar 2514 1930 76 .77 21 21 100 .00 15120 ;1 5 1 2 0 100.00
21 Koppal 1406 1406 100.00 45 45 100 .00 63 2 4 : 6324 100 .00
22 Mandya 2702 2715 100.48 0 0 0 .00 11779 11779 100,00
23 Mysore 3031 3073 101.39 0 0 0 .00 13598 13598 100.00
24 Raichur 1782 T796 100.79 46 46 100.00 8222 8222 100 .00
25 R am anagar 1895 1432 75.57 18 18 100.00 8064 8064 100.00
26 Shim oga 2934 2934 100.00 11 11 100.00 12649 . 12649 100.0027 Tum kur 5123 5123 100.00 18 18 100.00 21661 ■ 21661' 100 .00
28 Udupi 1414 1414 100.00 3 3 100.00 5929 5929 100 .00
29 Uttara K annada 4158 3231 77.71 8 8 100.00 16748 16748 100,00
Total 70821 68 5 7 8 96.83 763 763 100 .00 349794 34 9 7 9 4 100 .00

Report
SI.No District
Out of School Children *
T otal A pproved (U pto 2008
09)
A chievem ent (C om pleted/ C overage Up to 31 M arch ,
2009)
%Achieveme
lit
Progress on Inclusive Education
T ota l A pproved
(U pto 200809)
A chievem ent (C om pleted/C overage Up to
31 M arch , 2009)
%A chievem e
n t
Progress on N PEG EL (M CS)
T ota l A pproved (U pto 2008
09)
A chievem ent (C om pleted/ C overage Up to 31 M arch ,
2,009)
%A chievem e
nt
Sagalkote 1492 1451 97 ,25 6702 9 0 ,8 6 74 66 91 .89
Bangalore Rural 157 361 229 ,94 3011 8 8 .93 0,00
Bangalore Urban 457 6280 1374,18 10327 7 2 .0 2 10 10.00
Belgaunn 3301 1920 58.16 9043 6 3 .72 43 43 100.003ellary 1442 3853 267 .20 4267 76.51 84 84 100.00Bidar 4581 3 9 4 6 86.14 3971 100.00 65 65 100.003ijapur 2 4 1 6 4993 2 0 6 .66 5505 100.00 99 99 100.00
o
C ham arajanagar 5275 1401 26 .56 3747 100.00 0.00Chikballapura 1672 1255 75 .06 2813 100.00 57 57 100.00
10 Dhikmacjalur 561 3 8 7 68 .98 2 8 4 0 7 8 .32 0.0011 Chitradurg.a 1181 836 70 .79 4082 7 9 .72 28 28 100.0012 Dakshina Kannada 480 512 106.67 6250 100.00 0.0013 Davanagere 1745 1605 91 .98 4355 100.00 16 16 100.0014 Dharwad 671 655 97 ,62 3459 100.00 29 29 100,0015 G adag 3032 3122 102.97 2446 100,00 22 16 72.7316 Gulbarga 229175 16127 70.19 9562 100,00 147 147 100.0017 Hassan 451 360 79 .82 2342 100.00 21 21 100.0018 Haveri 1184 1000 84.46 3536 100.00 0.00
19 Kodagu 208 241 115.87 1692 6 8 .47 0,0020 <olar 622 1100 176.85 2454 87.11 63 63 100,0021 Koppal 1788 3935 220 .08 3115 100.00 62 62 100.0022 Mandya 4458 425 9.53 4698 83.95 0.0023 Vlysore 731 1186 162.24 5071 100.00 17 17 100.0024 Raichur 1424 4811 337 .85 5114 100.00 85 77 90.5925 ^^amanagar 5842 545 9.33 2168 74.52 14 14 100.0026 Shlmoga 1311 927 70.71 6458 100,00 0,0027 Tu'mkur 1277 848 66.41 6349 100,00 14 14 100,0028 Jdupi 197 252 127.92 1595 100,00 0,0029 J ttw a Kannada 1434 849 59.21 5325 86 ,80 ___0 0,00
Total 72365 65183 90.08 132297 93.04 950 96.95

PROGRESS OF CIVIL WORKS (Additional Classrooms)
s.No DistrictAdditional Classrooms (ACR) Sanctioned (Yearwlse) Total
S anc tionedR oom s
C om pletedR oom ; in p ro g ress
yet to be s ta rted
%com pleted2001-02 2002-03 2003-04 2004-05 2005-06 2006-07 2007-08 2008-09
1 Bagalkote 2 1 200 251 378 445 206 281 1764 1313 440 , 11 74.43
2 Bangalore Rural 3 130 130 265 196 167 38 929 775 135 19 83.42
3 Bangalore Urban 72 0 92 260 340 237 0 155 1156 977 179 0 84.524 Belgaum 0 2 100 220 465 1066 604 1002 3459 1906 1534 19 55.10
5 Bellary 0 33 120 170 270 1811 ' 228 374 3006 2313 693 0 76.95
6 Bidar 1 0 135 140 196 1580 0 223 2275 1632 643 ' 0 71.74
7 Bijapur 1 0 225 300 , 330 1737 77 359 3029 2346 683 0 77.45
8 Cham arajanagar 6 3 65 85 170 46 210 130 715 414 281 20 57.90
9 Chikmagalur 0 0 45 70 195 32 308 66 716 452 264 . 0 63.1310 Chitradurga 40 0 , 80 70 196 239 97 193 915 ' 682 233 0 74.5411 D. Kannada 20 0 60 130 262 86 0 157 715 694 20 1 97.0612 Davana^ere 0 0 60 105 240 947 147 200 1699 1353 346 0 . 79.64
13 Dharwad 1 3 130 75 , 190 417 109 138 1063 850 212 1 79.96
14 Gadag 1 19 100 85 134 , 103 90 137 669 551 118 . 0 82.36
15 Gulbarga 0 3 175 135 312 2196 469 745 4035 2250 1737 48 55.76
16 Hassan 0 25 55 100 295 242 148 48 913 827 86 0 90.58
17 Haver! 1 3 125 110 295 185 85 161 965 746 219 0 ^77,3118 Kodaqu 0 0 15 62 129 0 105 , 41 352 281 70 1 . 79.8319 Kolar . 1 2 150 200 445 540 109 136 1583 1390 191 2 87.81
20 .Koppal 0 11 75 100 255 526 112 229 1308 961 347 ’ 0 73.47
21 Mandya 0 0 135 178 253 0 223 84 873 570 295 8 65,29
22 Mysore 144 144 468 133 169 273 1331 967 355 9 72.65
23 Raichur 1 2 200 180 352 506 224 411, 1876 1163 661 . 52 61.9924 Shlmoga 0 0 125 170 322 49 180 120 966 812 154 0 . 84.06
25 Tumkur ' 75 270 515 281 219 77 1437 1207 228 , 2 83.99
26 Udupi 0 0 50 50 154 0 70 95 419 312 107 ’ 0 74.46
27 Uttara Kannada 0 0 125 95 210 250 199 179 1058 858 200 0 81 .10
28 Ch'ikballapura 0 0 115 115 115 . 0.00
29 Ram anagar - - 0 0 54 54 54 — 0.00
30 yadgiri 0 0,00
31 Madhugiri 0 0.0032 Chikkodi 0 0 0.00
. State Total 150 107 2991 3885 7636 13850 4555 6221 39395 28602 106Q0 193 72.60

PROGRESS OF CIVIL WORKS (Primary School Buildings)
S.N o D istric tP rim ary S c lio o l B uild in( s S a n c tio n e d (Y earw ise) Total
SanctionedBuidlings
CompletedBuidlings in
, progress2001-02 2002-03 2003-04 2004-05 2005-06 2006-07 2007-08 2008-09
1 Bagalkote 0 0 43 15 36 27 23 26 170 170 11
2 Bangalore Rural 0 0 5 5 0 0 1 0 11 11 1
3 Bangalore Urban 0 0 50 0 50 50 0 14 164 164 11
4 Belgaum 0 0 125 50 11 100 5 33 324 3^4 33
5 Bellary 0 0 20 14 19 23 28 2 106 106 19
6 Bidar 0 0 22 2 11 64 79 20 198 198 79
7 Bijapur 0 0 0 14 14 36 129 1 42 235 235 51
8 Cham arajanagar 0 0 21 10 7 7 3 0 48 48 13
9 Chikmagalur 0 0 20 20 0 11 12 2 65 65 11
10 Chitradurga 0 0 20 21 19 , 27 44 19 150 150 38
11 Dakshina Kannada 0 0 26 5 26 14 4 5 80 80 ■ . 5
12 Davanagere 0 0 25 14 4 27 4 7 81 81 7
13 Dharwad 0 0 0 * 7 11 3 2 2 25 25 10
14 Gadag 0 0 2 0 10 12 7 0 31 . 31 • 0
15 Gulbarga 0 0 65 62 5 70 61 50 313 313 ■ 5016 Hassan 0 0 27 8 61 29 2 15 142 142 , 1017 Haver! 0 0 0 0 .3 0 22 20 45 45 27
18 Kodagu 0 ■ 0 15 ^ 6 0 3 6 3 33 33 ■ 0
19 Kolar 0 0 0 0 6 11 26 8 51 51 ■ 0
20 Koppal 0 0 30 6 0 25 27 11 99 99 2121 Mandya 0 0 0 0 ' 11 0 0 0 11 i l ' 022 Mysore 0 0 0 0 1 12 16 0 29 29 1323 Raichur . 0 . 0 0 0 0 18 36 0 54 . 54 2124 Shimoga 0 0 20 15 18 41 13 5 112 112 5
25 Tumkur 0 0 22 34 0 31 21 16 124 124 24
26 Udupi 0 0 10 9 0 8 3 3 33i '
0
27 Uttara Kannada 0 0 40 35 5 10 32 4 126 126 9
28 Chikbailapura 0 0 0 0 3 0 14 0 17 17 0
29 Ramanagar 0 0 0 0 0 0 1 6 7 i7 730 Yadgiri 285 84 369 36931 Madhugiri 032 Chikkodi 0 0 0 0 0 0 34 0 34 6 58
S ta te T otal 0 0 608 352 616 743 655 1 313 3287 3259 504

i^ROGRESS OF PRIMARY SCHOOLS OPENING(New schools + Upgradation of EGS to PS)
SI.No D istrictPrim ary S ch o o ls S anc tioned (Yearwise) Total
SanctionedSfiinooisO pened
%Achievement2001-02 2002-03 2003-04 2004-05 2005-06 2006-07 2007-08 2008-09
1 Baaalkote 0 0 0 0 36 28 23 26 113 ■ 113 100.00
3 Banqalore Rural 0 0 0 0 0 0 2 0 2 , 2 100.00
2 Bangalore Urban 59 0 65 0 0 0 0 14 138 138 100.004 Belgaum 0 0 0 ' 0 11 57 39 33 140 140 100.00
5 Beliary 0 0 0 8 19 20 28 2 77 ' 77 100.006 Bidar 0 0 22 0 11 34 79 20 ' 166 166 100.007 B ijapur 0 0 0 13 14 36 129 42 234 234 100.008 Chamaraianagar 0 . 0 14 0 7 14 3 0 38 38 100.009 Chikballapura 0 Q 0 0 0 0 0 0 0 0 0.0010 Chikmagalur 0 1 34 5 19 19 12 2 92 92 100.0011 Chitradurga 13 14 12 13 26 26 44 19 167 , 167 100.0012 Dakshina Kannada 26 0 0 5 4 6 4 5 50 50 100.0013 Davanagere 5 0 20 5 11 14 4 7 66 66 100,0014 Dharwad 0 0 0 7 10 2 l 2 2 42 42 100.0015 Gadag 0 0 2 0 5 17 7 0 31 ■ 31 100.0016 Gulbarga 0 0 127 41 61 131 61 50 471 471 100.0017 Hassan 0 13 14 3 20 2 15 67 67 100.0018 Haveri 0 1 0 0 0 0 0 22 20 42 42 100.0019 Kodagu 0 9 26 7 6 11 6 3 68 68 100.0020 Kolar 0 0 0 0 0 11 40 8 59 . 59 100.0021 Koppal 0 0 0 6 11 25 27 11 80 80 100.0022 Mandya 0 0 0 5 1 0 0 0 6 6 100,0023 Mysore b 0 0 0 13 16 0 29 29 100.0024 Raichur 0 0 0 11 18 124 36 0 189 ■ 189 100.0025 Ramanagar 0 0 0 0 0 0 0 6 6 6 100.0026 Shimoga 33 0 0 22 0 36 13 5 109 109 100.0027 Tumkur 20 0 22 37 5 22 21 16 143 143 100.0028 Udupi 0 5 1 4 3 8 3 3 27 27 . 100.0029 Uttara Kannada 38 0 48 15 0 23 32 4 160 160 100.00
S ta te Total 194 42 407 204 281 716 655 313 2812 2812 100,00

PROGRESS OF UPPER PRIMARY SCHOOLS OPENING (Upgradation of PS to UPS + Adding class VIII to UPS)
Si: U pper Prim ary Schools Sanctioned (Yearw ise) Total %
NoL/isirici
2001-02 2002-03 2003-04 2004-05 2005-06 2006-07 2007-08 2008-09 Sanctioned ';'©p'ena^"' Achievement
1 B agalko te 0 0 22 0 20 84 84 9 ■219 100.00
2 B ang a lo re R ural 0 0 108 50 0 66 25 10 100.00
3 B angalo re U rban 0 0 216 0 11 33 0 0 ' 2 6 0 ^ # ^ 6 P 100.004 B elgaum 0 0 300 0 0 224 24 114 662 100.00
5 Bellary 0 0 121 0 19 157 42 12 100,00
6 BIdar 0 0 165 0 16 156 0 74 411 100.00
7 B ijapur 0 0 165 208 9 172 0 0 554 100.00
8 C hannara janagar 0 0 32 0 6 98 0 0 1 3 6 iW ^ 1 :3 .d 100.00
9 C hikballapura 0 0 0 0 0 0 0 0 0.00
10 C h ikm ag a lu r 0 0 99 6 15 42 5 2 1 100.0011 C hitradurga 0 0 79 28 10 39 15 34 2 0 5 | ^ ^ ^ | f 5 100.00
12 D aksh ina K an n ad a 0 0 101 9 0 119 0 0 2 2 9 ^ ^ ^ ^ . 100.00
13 D a v a n a g e re 0 0 71 35 0 127 0 3 2 3 e i i ^ ^ i 100.0014 D harw ad 0 0 66 0 11 169 0 0 246 100,0015 G ad ag 0 0 40 0 0 109 4 0 1 5 3 | a % . 4 ^ 1^)0,00
16 G u lbarga 0 0 249 0 205 339 55 100 100.0017 H assan ' 0 0 63 4 16 27 3 14 127 100.0018 H averi 0 0 101 0 0 186 0 0 100.0019 K odagu 0 0 35 0 0 .2 0 0 37 100.0020 Kolar 0 0 192 0 0 43 26 13 274 100.0021 Koppal 0 0 101 112 0 0 0 48 261 100,0022 M andya , 0 0 95 4 0 0 4 0 103 100,00
23 M ysore 0 0 83 9 0 105 12 0 209 100.0024 R alchur 0 0 81 25 22 152 30 94 4 0 4 l f t f e l 3 | 100.00
: 25 R a m a n a g a r 0 0 0 0 0 0 0 12 100.00
26 S h im oga 0 0 99 10 0 107 12 6 234 100.0027 T um kur 0 0 162 9 8 26 9 2 2 1 6 ® | # 2 1 '6 ' 100.00
■28 Udupi 0 0 37 0 2 42 0 0 61 100.0029 U ttara K an n ad a 0 0 279 101 •0 42 20 4 446 100,00
State Total 0 0 3162 610 370 2666 370 551 7729 100.00

SI.No
District
Teachers Sanctioned (Yearwlse)
2001-02 2002-03 2003-04 2004-05 2005-06 2006-07 2007-08 Total T eachers Sanctioned
1 Bagalkote 0 0 1042 0 36 140 112 13302 Bangalore Rural 0 0 266 347 20 66 204 ■ 903
3 Banqalore UrBan 0 0 232 50 11 33 466 : 7924 Belgaum 0 0 800 23 19 518 179 .1539
5 Bellary 0 6 273 87 43 498 530 1431
6 Bidar 0 0 325 17 14 224 180 7607 Bijapur 0 0 539 234 30 244 540 , 15878 Chamaraianagar 0 0 233 21 0 126 9 3899 Chikbaiiapura 0 0 0 0 0 0 250 ' 25010 Chikmagalur 0 0 306 14 26 93 95 ■ 53411 ^Ciiitradurga 0 0 157 r 54 28 179 175 ' 593
12 Dakshina Kannada 52 0 145 19 73 131 0 420
13 Davanagere 31 0 111 r 58 io'' 155 0 36514 Dharwad 0 0 234 14 29 225 58 ; 56015 Gadag 0 0 182 0 18 143 0 34316 Gulbarga 300 0 203 602 18 601 0 172417 IHassan 26 0 91 4 53 67 0 24118 Haveri 0 0 334 " 0 21 186 23 56419 Kodagu 0 0 125 14 14 24 3 i 18020 Kolar 0 0 192 25 11 65 0 293
21 Koppal 0 0 250 284 12 50 252 848
22 Mandya 0 0 95 14 24 0 12 1 145
23 Mysore 0 o[ 583 18 18 151 80 ' 85024 Ralchur 0 0 481 75 26 477 916 ' ’ 197525 Ramanagar ,0 0 0 0 0 0 0 026 Shimoga 257 0 99 54 278 179 106 97327 Tumkur 163 0 302 83 193 70 92 90328 Udupi 0 0 83 8 17 58 0 166
29 Uttara Kannada 76 0 596 55 109 88 216 1140State Total 905 0 1 8279 2174 1151 4791 4498 21798

PROGRESS OF CIVIL WORKS (Upper Primary School Buildings)
SNo
_1011
12
1314
_15_16
JZ._1819
_22
i i
2627
_2829
D istrict
U pper P rim ary S choo l B uild ings S an c tio n ed (Y earw lse)
2001-02 2002-03 2003-04 2004-05 2005-06 2006-07 2007-08 2008-09
BagaikoteBangalore RuralBangalore UrjaanBelgaiimBellaryBIdarBijapurChamarajanagarChikballapuraChikmagalurChitradurga
Dakshina Kannada
DavanagereDharwadGadagGulbargaHassanHaveriKodaguKolarKoppaliVlandvaMysoreRaichurRamanagarShimogaTumkurUdupiUttara Kannada
S ta te Total
NIL
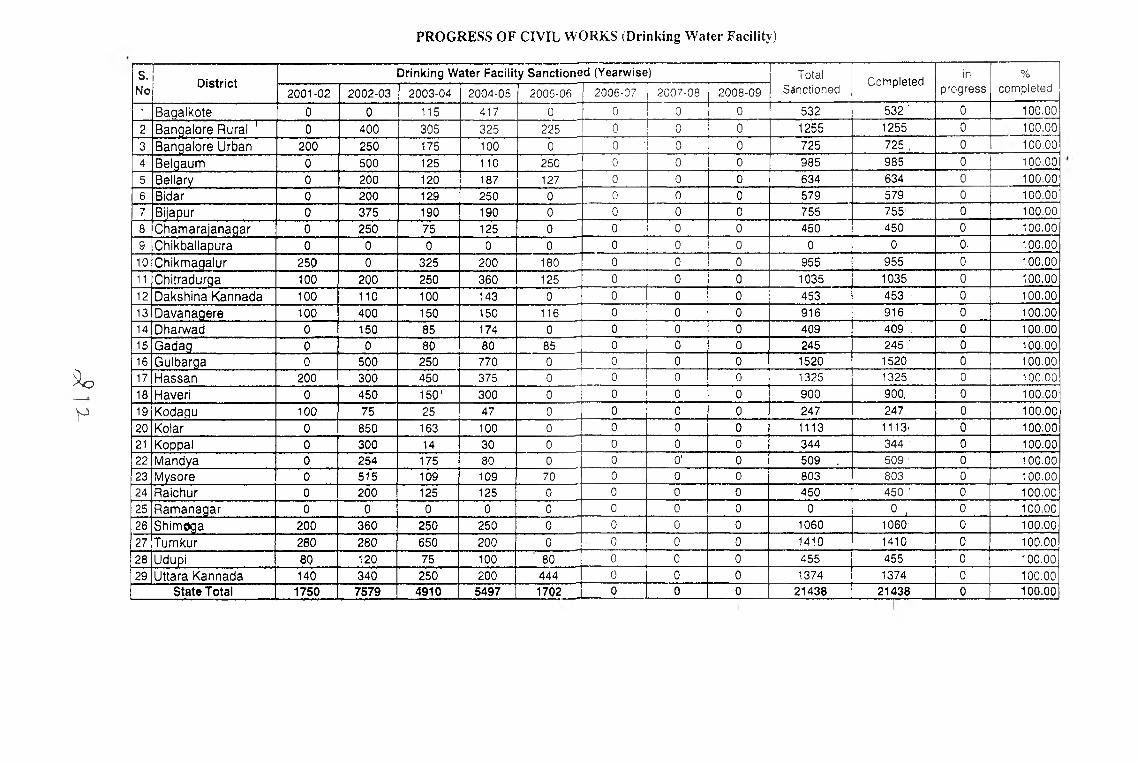
PROGRESS OF CIVIL WORKS (Drinking Water Facility)
S.No
D istric tD rinking W ater Facility S a n c tio n e d (Y earw ise) Total
SSnctionedCompleted
inprogress
%completed2001-02 2002-03 2003-04 2004-05 2005-06 2006-07 2007-08 2008-09
1 Bagalkote 0 0 115 417 0 0 0 0 532 532 ■ 0 100.00
2 Bangalore Rural ^ 0 400 305 325 225 0 0 0 1255 1255 0 100.00
3 Bangalore Urban 200 250 175 100 0 0 • 0 0 725 725 , 0 100.004 Belgaum 0 500 125 110 250 0 0 0 985 985 0 100.00
5 Bellary 0 200 120 187 127 0 0 0 634 634 0 100.006 Bidar 0 20,0 129 250 0 0 0 0 579 579 0 100.007 Biiapur 0 375 190 190 0 0 0 0 755 755' 0 100.00
8 Chamarajanagar b 250 75 125 0 0 0 0 450 450 0 100.00
9 Chikballapura 0 0 0 0 0 0 0 0 0 0 0. 100.0010 Chikmagalur 250 0 325 200 180 0 0 0 955 955 0 100.0011 Chitradurga 100 200 250 3,60 125 0 0 0 1035 1035 0 100.0012 Dakshina Kannada 100 ' 110 100 143 0 0 0 0 453 453 : 0 100.0013 Davanagere 100 400 150 150 116 0 0 0 916 916 0 100.0014 Dharwad 0 150 85 174 0 0 0 0 409 409 , 0 100.0015 G a d a g 0 0 80 80 85 0 0 0 245 245 ■ 0 100.0016 Gulbarga 0 500 250 770 0 1 0 0 0 1520 1520 0 100.0017 Hassan 200 300 450 375 0 0 0 0 1325 1325 0 100.00
18 Haveri 0 450 150' 300 0 0 0 0 900 900 0 100.0019 Kodagu 100 75 25 47 0 ^ 0 0 0 247 247 0 100.0020 Kolar 0 850 163 100 0 0 0 0 1113 1113i 0 ioo:oo21 Koppal 0 300 14 30 0 0 0 0 344 344 ' 0 100.0022 Mandya 0 254 175 80 0 0 o' 0 509 , 509 0 100.0023 Mysore 0 515 109 109 70 0 0 0 803 803 0 100.0024 Raichur 0 200 125 125 0 0 0 0 450 450 ' 0 100.0025 Ramanagar 0 0 0 0 0 0 0 0 0 0 , 0 100.0026 Shinn oga 200 360 250 250 0 0 0 0 1060 1060' 0 100.0027 Tumkur 280 280 650 200 0 0 0 0 1410 1410 0 100.0028 Udupi 80 120 75 100 80 0 0 0 455 455 0 100.0029 Uttara Kannada 140 340 250 200 444 0 0 0 1374 1374 0 100.00
S ta te T otal 1750 7579 4910 5497 1702 0 0 0 21438 21438 0 100.00
S o
V
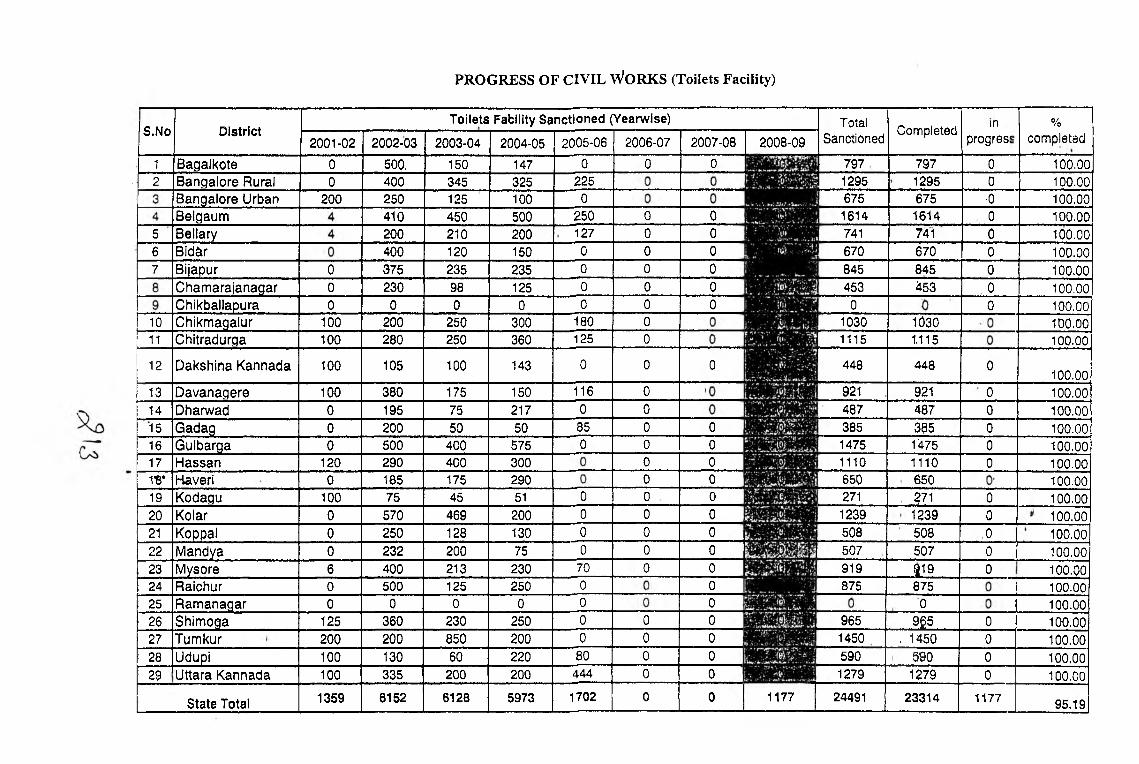
PRO G RESS OF CIVIL W O RK S (Toilets Facility)
1011
12
13141516171-6*
1920
21
22232425262728
S.No District
BagalkoteB angalore RuralBangalore UrbanBelgaumBellaryBldarBijapurC ham arajanagarC hikballapuraC hikm agalurChitradurga
D akshina K annada
D avanagereDharwadG adagG ulbargaHassanHaveriKodaguKolarKoppalM andyaMysoreRaichurR am anagarShim ogaTum kurUdupi
29 LIttara K annada
State Total
Toilets Fabliity Sanctioned (Yearwise)
2001-02
0
200
100100
100
100
120
100
125200100
100
1359
2002-03
500,400250410200400375230
200280
105
38019520050029018575
570250232400500
360200130335
8152
2003-04
15034512545021012023598
250250
100
1757550
40040017545
469128200213125
23085060
200
6128
2004-05
147325100500200150235125
300360
143
15021750
57530029051
20013075
230250
250200220200
5973
2005-06
0225
250127
180125
116
85
. 070
80444
1702
2006-07
02007-08
02008-09
1177
Total Sanctioned
79712956751614741670845453
10301115
448
921487385147511106502711239508507919875
96514505901279
24491
Completed
79712956751614741670845453
10301,115
448
92148738514751110650
i l l12395085078198750
9g5, 1450
590
1279
2 3 3 1 4
mprogress
0
■0
1177
%completed
100.00100.00
100.00100.00100.00100.00100.00100.00
100.00
100.00100.00
100.00100.00
100.00100.00100.00100.00100.00100.00100.00100.00
100.00
100.00100.00100.00100.00100,00100,00100.00
95.19
102 0
00 0 0
00 0506 0 0 0
0 0 007 00 0 0 000 0 00 0 0 0 0 0
00
0 0 0 0
0 0000 00 0 00
0 0 0 000 0 00 00
0 0 0 00 0 00 0
00 00 00 00 00 06 0
0 000 00 0 0 00 0 0 00 0 0 0
0 0 00 0 00 0

S.N0
D istrictBRC Building S anc tioned (Yearwise) Total
SanctionedBuidlings
CompletedBuic^lings in
progressBuidlings
yet to start%
completed2001-02 2002-03 2003-04 2004-05 2005-06 2006-07 2007-08 2008-09
1 B ag a lk o te 0 0 0 0 0 0 0 0 0 0 0 0 0.00
2 B an g a lo re Rural 0 0 0 0 1 0 0 0 1 1 0 0 ■ 100.003 B an g a lo re U rban
1--------------2 0 2 0 0 0 5 0 9 4 0 5 44.44
TK —'4 B elgaiip i 0 0 0 0 0 0 2 0 2 0 0 2 0.00
5 Bellary 0 0 0 0 0 0 1 0 1 0 . 1 0 0.00
6 Bidar 0 0 0 0 0 0 0 0 0 0 '0 0 0.00
7 Bijapur 0 0 0 0 0 0 0 0 0 0 0 0 0.00
8 C h a m a ra ja n a g a r 0 0 0 0 0 0 1 '0 1 0 0 ' 1 0.00
9 C hlkballapura 0 0 0 0 0 0 0 0 0 0 0 0 0.0010 C hikm agalu r 2 0 3 2 0 0 1 0 8 7 1 0 87,5011 C h itrad u rg a 1 0 2 3 0 0 0 0 6 6 ,0 ■ 0 100.0012 D ak sh in a K an n ad a 1 0 2 2 0 0 2 0 7 5 2 0 71.4313 D av a n a g e re 2 0 2 1 0 0 1 0 6 5 0 1 83.33
14 D harw ad 0 0 0 0 0 0 1 0 1 0 ■ 0 1 0.00
15 G ad ag 0 0 0 0 0 0 1 0 1 0 . 1 0 \ 0.00
16 G u lb arg a 0 0 0 0 0 0 1 0 1 1 ■0 0 100.0017 H a ssa n ' 2 0 3 3 0 0 0 0 8 8 0 0 100.0018 Haveri 0 0 0 . 0 0 b 0 0 0 0 0 0 0.0019 K oda^u 2 0 1 0 0 0 0 0 3 3 0 0 100.00
20 Kolar 0 0 0 0 0 0 0 0 0 . 0 0 0 0.00
21 Koppal 0 0 0 0 ■ 0 0 0 0 0 0 0 0 0.00
22 M andya 0 0 0 0 0 0 1 0 1 0 0 ' 1 0.00
23 M ysore 0 0 0 0 0 0 1 0 1 1 0 0 100.0024 R aichur 0 0 0 ■0 O' 0 0 0 0 0 0 0 0.0025 R a m a n a g a r 0 0 0 0 0 0 0 0 0 0 ' 0 0 0,0026 S h im o g a 2 ’ 0 3 2 0 0 0 0 7 7 0 0 100.0027 T um kur 4 0 3 3 0 0 0 0 10 10 '0 0 100.0028 Udupi 2 0 1 0 0 ' 0 ' 2 0 5 5 '0 0 100.00
29 U ttara K an n ad a 2 0 4 4 1 0 0 0 11 10 1 0 90.91
S ta te Total 22 0 26 20 2 0 20 0 90 73 6 11 81.11
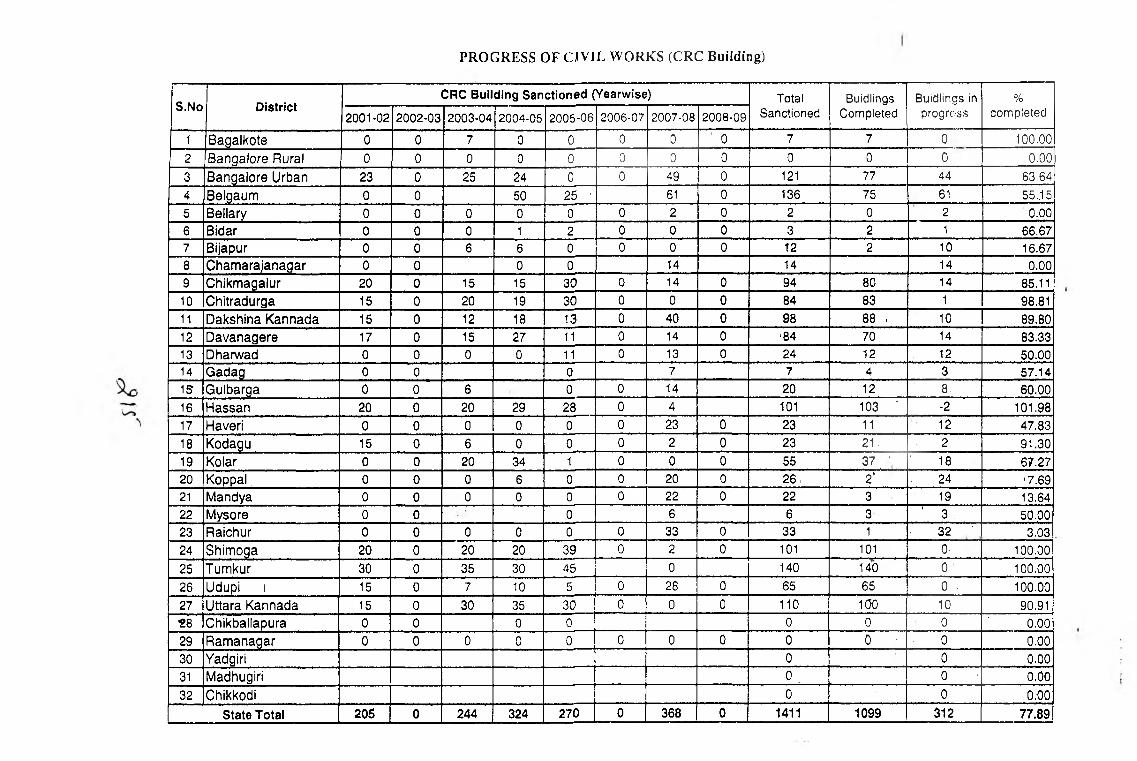
PROGRESS OF CJVIL WORKS (CRC Building)
S.No DistrictCRC Building Sanctioned (Yearwise) Total
SanctionedBuidlings
CompletedBuidlings in progress
%completed2001-02 2002-03 2003-04 2004-05 2005-06 2006-07 2007-08 2008-09
1 Bagalkote 0 0 7 0 0 0 0 ' 0 7 7 0 100,00
2 Bangalore Rural 0 0 0 0 0 0 0 0 0 0 0 0.00
3 Bangalore Urban 23 0 25 24 0 0 49 0 121 77 44 63.64
4 Belgaum 0 0 50 25 ■ 61 0 136 75 61 55..15
5 Beilary 0 0 0 0 0 0 2 0 2 0 2 0.006 Bidar 0 0 0 1 2 0 0 0 3 2 1 66.677 Bijapur 0 0 6 6 0 0 0 0 T2 2 10 16.678 Cham arajanagar 0 0 0 0 14 14 14 0.009 Chikmagalur 20 0 15 15 30 0 14 0 94 80 14 85.1110 Chitradurga 15 0 20 19 30 0 0 0 84 83 1 98.8111 Dakshina Kannada 15 0 12 18 13 0 40 0 98 88 . 10 89.8012 Davanagere 17 0 15 27 11 0 14 0 '84 70 14 83.3313 Dharwad 0 0 0 0 11 0 13 0 24 12 12 50.0014 Gadag 0 0 0 7 7 4 3 57.1415 Gulbarga 0 0 6 0 0 14 20 12 8. 60.0016 Hassan 20 0 20 29 28 0 4 101 103 ^ -2 101.9817 Haveri 0 0 0 0 0 0 23 0 23 11 12 47.83
18 Kodagu 15 0 6 0 0 0 2 0 23 21. 2 91.3019 Kolar 0 0 20 34 1 0 0 0 55 . 3 7 , ' ' 18 67.2720 K oppal, 0 0 0 6 0 0 20 0 26. 2 ' . 24 '7.6921 Mandya 0 0 0 0 0 0 22 0 22 3 19 13.6422 Mysore 0 0 0 6 6 3 ' 3 , 50.0023 Raichur 0 0 0 0 0 0 33 0 33 1 • 32 ' . 3.0324 Shimoga 20 0 20 20 39 0 2 0 101 101 O' 100.00
25 Tum kur 30 0 35 30 45 0 140 140 . 0 100.00
26 Udupi i 15 0 7 10 5 0 28 0 65 65 0 . 100.0027 Uttara Kannada 15 0 30 35 30 0 0 0 110 100 10 90.9128 Chikballapura 0 0 0 0 0 0 ' 0 ' 0.0029 R am anagar 0 0 0 0 0 0 0 0 0 0 ■ . 0 0.0030 Yadgiri 0 0 0.0031 Madhugiri 0 0 ' 0.00
32 Chikkodi 0 0 0.00
State Total 205 0 244 324 270 0 368 0 1411 1099 312 77.89

SINo.
District
in Service Teachers' Training (20
Days) *
New Teachers' Training (30 Days)
1
Untrained Teachers' Training (60 Days)
D istribution of Free Text Booi<s
Approved in 2008-09
Acliievem ent
%Achleveme ' nt
A p p ro v ed in 2008
09
Achievement
%Achieve
ment
A pprov ed in 2008
. 09
Achievement
%Achieve
ment' ,
Approve d In
2008-09
Achievement
%Achieve
ment
1 Bagalkote 7927 7927 100,00 61 93 152.46 0 0 0 19589 19589 100.00
2 Bangalore Rural 9013 9013 100.00 503 235 46.72 0 0 0 14599 14599 100.00
3 Bangalore Urban 10432 10432 100.00 28 91 325,00 0 0 0 .148294 148294 100,00
4 Belgaum 18042 18042 100.00 463 580 125.27 0 0 0 36771 36771 100.00
5 Bellary 8363 8363 100,00 815 1082 132.76 0 0 0 23193 ,23193 100,00
6 Bidar 8073 8073 100.00 226 724 320.35 0 0 0 20671 20671 100,00
7 Bijapur 10322 10322 lOOlOO 683 90 13.18 0 0 0 37299 37299 100.00
8 C ham arajanagar 4037 4037 100.00 ' 53 86 162.26 0 0 0 12933 12933 100.00
9 Chikballapura .9 0 0.00 6 0 0.00 0 6 0 10672 10672 100,00
10 Chikmagalur 6527 6527 100.00 58 136 234.48 0 0 0 11000 11000 100,00
11 Chitradurga 7802 7802 100.00 263 372 141.44 0 0 ,0. 25524 25524 loo.no
12 D akshlna K annada 82368236 100.00 10 8 80.00 0 0 ■ 0 ' • 78775 78775 100.00
13 D avanagere 8596 8596 100.00 245 166 67,76 0 0 0 40075 .40075 1£)0,U0
14 Dharwad 6470 6470 100.00 168 1150 684.52 0 0 0 40890 40890 100.00
G ada^ 5476 5476 100.00 0 144 0.00 0 0 0 ■ 13723 13723 100,00
G ulbarga ' 14509 14509 100.00 200 2251 1125.50 0 0 0 44863 44863 100,00
15 H assan 8723 8723 100.00 44 144 327.27 0 0 0 19431 ■ 19431 100,00
Haveri 6219 6219 100.00 40 233 582.50 0 0 0 15531 15531 100,00
16 Kodagu 2499 2499 100.00 60 255 425.00 0 0 0 9279 9279 100,00
20 Kolar 11387 11387 100.00 348 350 100.57 0 0 0 20067 20067 100,0021 Koppal 5020 5020 100.00 242 0 0,00 0 b 0 6270 6270 100.00
22 Mandya 7748 7748 100.00 100 77 77.00 ‘ 0 0 0 .15677 15677 100-00
23 Mysore 10361 10361 100.00 196 206 105.10 0 0 0 32533 32533 100,00
24 Raichur 6012 6012 100.00 501 626 124.95 0 0 0 9921 9921 100,00
25 R am anagar '6 0 0.00 , 0 . 0 0.00 0 0 0 24396 24396 100,00
26 Shim oga 8025 8025 100.00 16 174 1087.50 0 0 0 , 23065 23065 100,00
27 Tumkur 13599 13599 100.00 595 380 63.87 0 0 0 36584 36584 100.00
28 UdLipi 5352 5352 ■ 100.00 0 65 0.00 0 0 0 41706 41706 100,00
29 Uttara K annada 8239 8239 100.00 228 15 6.58 0 0 0 22988 . 22988 100,00
State Total 227009 227009 100.00 6146 9733 158.36 0 0 0 856319 856319 I, 100.00
Note : * Achievemetn as per anticipated date 8 31st March, 2009.

PROGRESS OF PEDAGOGY
SIN o.
D is tr ic t
D is t r ib u t io n o f T e a c h e r G ra n t D is t r ib u t io n o f S c h o o l G ra n t D is t r ib u t io n o f T L E G ra n t
1
l^ e m e d ia l T e a c h in g
A p p ro v e din
2 0 0 8 -0 9
A c h ie v em e n t
%A c h ie v e m
e n t
A p p ro v e din
2 0 0 8 -0 9
A c h ie v em e n t
%A c h ie v e
m e n t
A p p ro v e d in 2 0 0 8 -
A c h ie v em e n t
%A c h ie v e
m e n t I
a p p ro v e d in
^0 0 8 -0 9
A c h ie v e me h t
. % A c h ie v e
m e n t
1 Bagalkote 7927 7927 100.00 2119 21)9 100.00 35 .•15 100.00 “ 9408 940S 100.002 Bangalore Rural 4152 3936 94,80 1590 1573 98.93 10 10 100.00 14309 14309 100.003 Bangalore Urban 10432 8058 77,24 2540 2540 100.00 14 14 100.00 21187 21187 100.004 Belgaum 18042 18042 100,00 4784 4784 100.00 147 147 100,00 28728 28728 100,005 Bellarv 8363 8363 100,00 2186 2186 100.00 14 14 100.00 10119 10119 100.006 Bidar 8073 8073 100,00 2 3 7 9 2379 100,00 94 94 100.00 14148 14148 100,007 Bijapur 10322 10132 98,16 3028 2968 98.02 42 42 100,00 13123 13123 100,00e Channaraianagar 4037 3964 98,19 1243 1243 100.00 0 0 0.00 5297 5297 100,009 Chikballapura 5074 5018 98.90 2143 2143 100.00 0 0 0.00 9171 9171 100,0010 Chlkmagalur 6527 6187 94.79 2319 2319 100.00 4 4 100.00 ' 9961 9961 ^100.0011 Chitradurga 7802 7802 100,00 2512 2512 100.0Q 39 39 100.00 10594 10594 , 100.00
12 D akshina K annada8236 6840 83.05 2012 2003 99.55 5 5 100.00 13392 13392 100.00
13 O avanagere 8596 8337 96.99 2266 2266 100.00 10 10 100,00 9329 9329 loo .oo14 Dharwad 6470 6470 100,00 1386 1384 99.86 2 2 100.00 , 6324 6324 100.00,
G adag 5476 4958 90,54 1066 1066 100.00 0 0 0.00 4743 4743 100.00Gulbarga 14509 14509 100.00 3811 3811 100.00 125 125 100.00 22356 22356 100.00
15 H assan 8723 8723 100.00 3690 3690 100.00 29 29 100.00 15574 15574 100.00Hai/eri 6219 6079 97.75 2094 1844 88.06 20 20 100.00 8854 8854 100.00
16 Kodagu 2499 2499 100.00 694 694 100.00 3 3 100.00 ' 3083 3083 100.0020 Kolar 6313 6123 96,98 2514 1930 76.77 21 21 100,00 15120 15120 100,0021 Koppal 5020 5020 100.00 1406 1406 100.00 45 45 100.00 6324 6324 100.0022 Mandya 7748 6641 85.71 2702 2715 100.48 0 0 0.00 , 11779 11779 100.0023 Mysore 10361 10042 96.92 3031 3073 101.39 0 6 0.00 ' ■13598 13598 100.0024 Ralchur 6012 6012 100.00 1782 1796 100.79 46 46 100.00 8222 8222 100.0025 Ramar^aga^ 4861 4572 94.05 1895 1432 75.57 18 18 100.00 8064 8064 100.0026 Shim oga 8025 8025 100.00 2934 2934 100.00 11 11 100.00 ' 12649 12649 100.0027 Tumkur 13599 13082 96.20 5123 5123 100.00 ' 18 18 100.00 ’ 21661 21661 100.0028 Udupl 5352 4550 85.01 1414 1414 100.00 3 3 100.00 ; 5929 5929 100,0029 Uttara K annada 8239 8239 100.00 4158 3231 78 8 8 loO 16748 16748 100
State Total 227009 218223 96.13 70821 68578 96.83 763 763 100.00 349794 349794 100.00
Note : * Achievemetn ajNote : * Achievemetn as per anticipated date 8 31 st March, 2009.
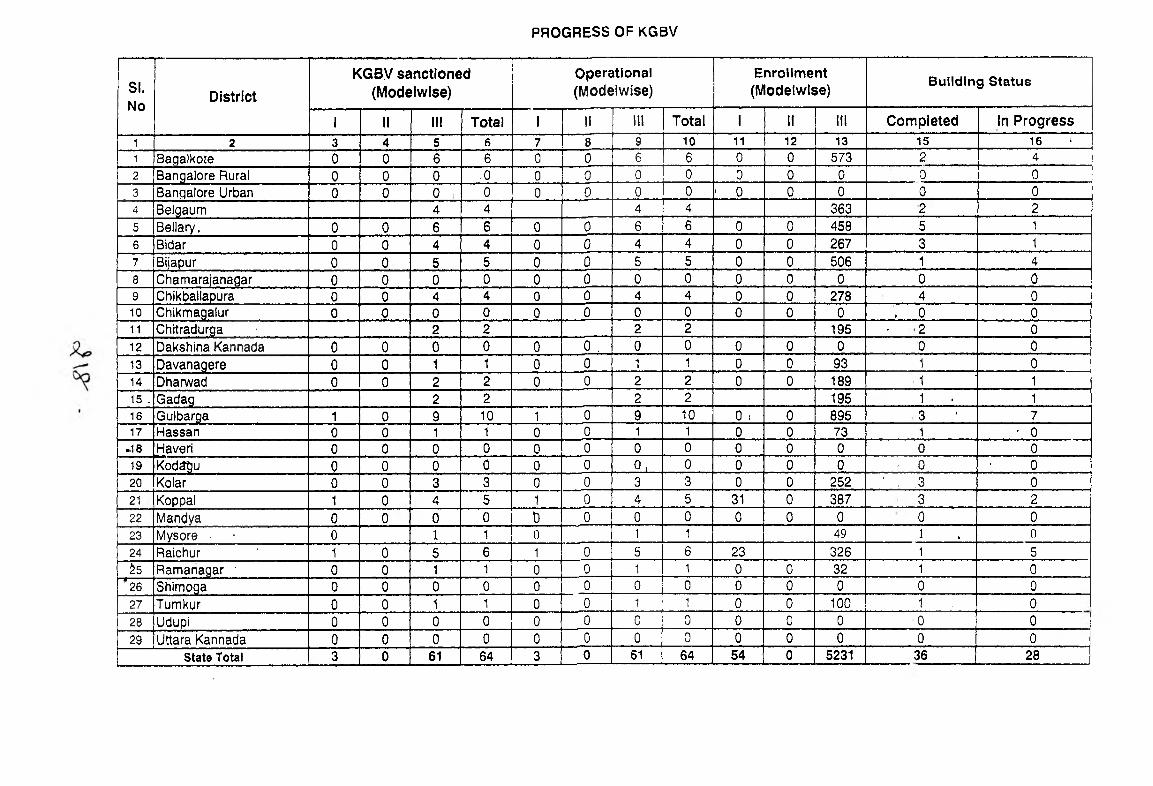
PROGRESS OF KGBV
SI.No District
KGBV sanctioned (Modelwise)
Operational(Modelwise)
Enrollment(Modelwise)
B u ild in g S ta tu s
1 II III Total 1 II ill Total 1 II III Completed In Progress1 2 3 4 5 6 7 s 9 10 11 12 13 15 16 ‘1 Bagalkote 0 0 6 6 0 0 6 6 0 0 573 2 4
2 Bangalore Rural 0 0 0 .0 0 0 0 0 0 0 0 0 03 Bangalore Urban 0 0 0 : 0 0 0 0 0 ' 0 0 0 0 04 Belgaum 4 4 4 4 363 2 2
5 Bellary, 0 0 6 6 0 0 6 6 0 0 458 5 1
6 Bidar 0 0 4 4 0 0 4 4 0 0 267 3 1
7 Bijapur 0 0 5 5 0 0 5 5 0 0 506 1 48 Chamarajanagar 0 0 0 0 0 0 0 0 0 0 0 0 09 Chikballapura 0 0 4 4 0 0 4 4 0 0 278 4 010 Chikmagalur 0 0 0 0 0 0 0 0 0 0 0 , 0 011 Chitradurga • 2 2 2 2 195 • 2 012 Dakshina Kannada 0 0 0 0 0 0 , 0 0 0 0 0 ■ 0 013 Davanagere 0 0 1 1 0 0 1 1 0 0 93 1 014 Dharwad 0 0 2 2 0 0 2 2 0 0 189 ■ 1 ■ 115 . Gadag 2 2 2 2 195 1 . 116 Gulbarga 1 0 9 10 1 0 9 10 0 . 0 895 3 • 717 H a s s a n 0 0 1 1 0 0 1 1 0 0 73 1 • 0
-16 H averi 0 0 0 0 0 0 0 0 0 0 0 0 019 Kodsgu 0 0 0 0 0 0 0 , 0 0 0 0 . 0 • 020 Kolar 0 0 3 3 0 0 3 3 0 0 252 ' . ,3 021 Koppal 1 0 4 5 1 0 4 5 31 0 387 3 2
22 Mandya 0 0 0 0 D 0 0 0 0 0 0 0 023 Mysore ■ ■ 0 1 1 0 ] 1 49 1 . 024 Raichur ' 1 0 5 6 1 0 5 6 23 326 1 55 Ramanagar ■ 0 0 1 1 0 0 1 1 0 0 32 1 0
’'26 Shimoga 0 0 0 0 0 0 0 0 0 0 0 0 027 Tumkur 0 0 1 1 0 0 1 1 0 0 100 1 . 028 Udupi 0 0 0 0 0 0 0 0 0 0 0 0 029 Uttara Kannada 0 0 0 0 0 0 0 0 0 0 0 0 0
State Total 3 0 61 64 3 0 61 64 54 0 5231 36 28

PROGRESS OF OUT OF SCHOOL CHILDREN (OoSC) - (2008-09 - Progress upto Dec 2008)
Note* RBC Includes : 12 RBC + 2 Months Chlnnara Angela (RBC)’ NRBC :12 NRBC + 2 Months Chlnnara Angala (NRBC)+ ‘ Transportation +Feeder s c t io o l
* Other Intervention includes : HBE + Tent+ NCLP + KGBV +Mobilo* Mainstreamed : 2 Months Chlnnara Angala (RBC + NRBC) + HBE + KGBV+ Special Enrollment DHvo
SI.No District TotalOoSC
Direct enrolment In regular school
Enrolment In EGS
No. or EGS centers
RBC NBBC Madarasa,
Other Intervention, Total
coverage ) mainstraamed Covaraga mainitrearriad Covaraga molnalraamad Covaraga malnstraamad Coverage molnetraanied1 3 a » 5 Q 7 e ft 10 11 12 13 14 ■ 15 16
1 Bagalkote 1492 660 330 230 170 170 52 239 158 1451 1218
2 Bangalore Rural 157 216 7 7 9 9 0 129 75 361 307
3 Bangalore Urban 457 1178 264 35 1868 1316 1712 1258 117.'. 6280 26464 Belgaum 3301 459 164 164 460 128 18 819 477 1920 1228
5 Bellary 1442 711 1478 919 1033 1033 0 631 301' 3853 2964
6 BIdar 4581 140 • 1520 1080 763 718 823 700 290 3946 22287 Bljapur 2416 1227 1105 619 668 489 1180 813 296 4993 26318 Chamarajanagar S275 515 222 141 561 561 55 48 ^4 1401 '?f.i9 Chlkballapura 1672 343 215 216 260 216 248 189 1^7 1255 93110 Chlkmagalur 561 34 108 108 160 0 0 85 q5 ■ 387 22711 Chltradurga 1181 441 190 190 156 156 0 49 49 836 83612 □akshlna Kannada 480 341 4 4 47 47 0 120 IJO 512 51213 Davanagere 1745 151 945 793 353 240 100 56 . 41 1605 122510 Ohanwad ' 671 181 27 27 1 18 118 110 219 112 655 43815 Gadag 3032 0 No EGS No EGS 913 913 2048 2013 0 161 161 3122 308716 Gulbarga 22975 257 4080 3135 8787 8285 982 2021 681 16127 1235817 Hassan ■ 451 78 77 47 118 40 30 57 29 , 360 19418 Haverl ' 1184 484 130 130 269 224 48 ' 69 69 1000 907
19 Kodagu 208 111 75 75 49 0 0 6 6 241 19220 Kolar 622 238 30 , 0 32 0 79 721 309 1100 54721 Koppal 1788 1387 1329 945 949 592 68 202 166 ' 3935 309022 Mandya 4458 148 142 94 0 0 0 135 110 425 35223 Mysore 731 290 183 135 290 93 0 423 89 1186 60724 Halchur 1424 2019 875 678 1547 1547 78 292 272 4811 4516
26 Ramanagar 5842 106 40 40 77 69 52 270 58 545 27326 Shimoga 1311 493 106 86 6 6 170 152 71 927 656
27 Tum kur 1277 3471
190 159 117 117 108 86 51 . 848 674
28 Udupi 197 0 0 0 184 0 0 68 68 252 68
29 Uttara Kannada 1434 323 202 202 179 140 61 84 84 849 749
Stata Total 72365 12878 0 0 14951 11171 21278 18327 5974 0 10102 4546 65183 46922
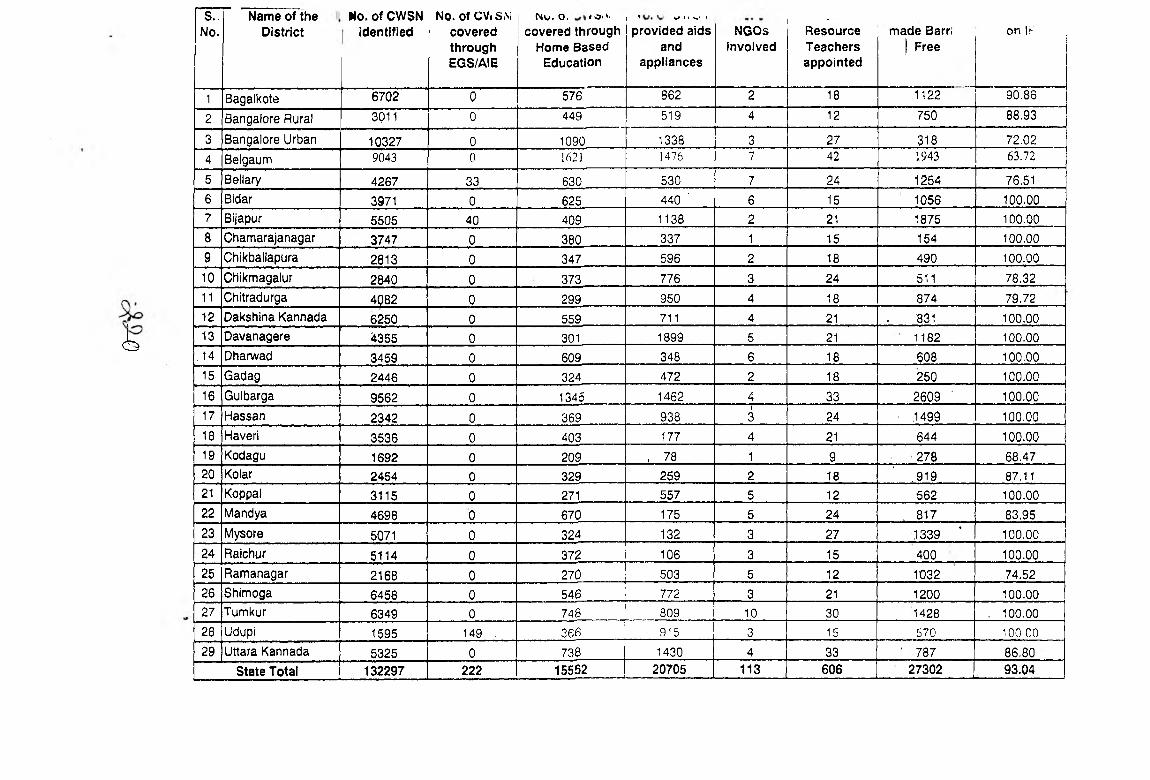
<3
S..No.
Name o f the District
No. of CWSN identified
No. of CVn SM covered through EGS/AIE
Nwi. O. •oivcovered through
Home Based Education
, ^ 1 1 w «provided aids
and appliances
NGOsinvolved
1 *■ ■ ResourceTeachersappointed
made Barri Free
on r>- ,
1 Bagalkote 6702 0 576 862 2 18 1122 90.86
2 Bangalore Rural 3011 0 449 519 4 12 750 88.93
3 Bangalore Urban 10327 0 1090 1338 3 27 318 72.02
4 Belgaum 9043 0 1621 1476 7 42 1943 63.72
5 Bellary 4267 33 630 530 7 24 1254 76.51
6 BIdar 3971 0 625 440 ’ 6 15 1056 100,007 Bijapur 5505 40 409 1138 2 21 1875 100.00
8 Chamarajanagar 3747 0 380 337 1 15 154 100.00
9 Chikbailapura 2813 0 347 596 2 18 490 100.00
10 CHikmagalur 2840 0 373 776 3 24 511 78,32
11 Chitradurga 4082 0 299 950 4 18 874 79.72
12 Dakshina Kannada 6250 0 559 711 4 21 . 831 100.0013 Davanagere 4355 0 301 1899 5 21 1182 100.00
, 14 Dharwad 3459 0 609 348 6 18 608 100,00
15 Gadag 2446 0 324 472 2 18 250 100.00
16 Gulbarga 9562 0 1345 1462 4 33 2609 100,00
17 Hassan 2342 0 369 93813 24 ■ ,1499 100.00
18 Haveri 3536 0 403 177 4 21 644 100.00
19 Kodagu 1692 0 209 . 78 1 9 278 68,4720 Kolar 2454 0 329 259 2 18 ’ .919 87.1121 Koppal 3115 0 271 557 5 12 562 100.0022 Mandya 4698 0 670 175 5 24 . 817 83,95
23 Mysore 5071 0 324 132 3 27 '1339 ’ 100.00
24 Raichur 5114 0 372 106 3 15 400 100.00
25 Ramanagar 2168 0 270 503 5 12 r032 74.52
26 Shimoga 6458 0 546 772 3 21 1200 100.0027 Tumkur 6349 0 748 809 10 30 1428 . 100.00
28 Udupi 1595 149 . 366 915 3 15 570 100 00
29 Uttara Kannada 5325 0 738 1430 4 33 '■ 787 86,80
State Total 132297 222 15552 20705 113 606 27302 93.04

NPEGEL Progress
Si.No.
District
No of Blocks No. of clustersNo- of clusters in urban
slumsNo. of Model Cluster
School (MCS) cumiativeNo. of Girls enrolled in
MGS
1
Construction of Additional Classrooms
Cumulative Target till 2008-09
CumulativeAchievement
Cumulative Target till 2008-09
CumulativeAchievement
Cumulative Target till 2008-09
CumulativeAchievement
Cumulative Target till 2008-09
CumulativeAchievem ent
Cumulative Target till
. 2008-09
CumulativeAchievement
1- Bagalkote 6 6 74 68 0 0 74 68 91478 64 642’ Bangalore Rural 0 0 0 0 1 1 0 0 7739 14 143i Bangalore Urban 0 0 10 1 1 1 10 1 0 ' 1 14.; Belgaum 4 4 43 43 0 ' 0 43 43 78591 . 52 525; Bellary 6 6 84 84 0 0 84 84 . 5488 ; 73 726; BIdar 4 4 65 65 0 0 65 65 '12667 ' 65 57 ^7. Bijapur 5 5 99 9d 0 0 99 99 132260 ■ 93 93'8, C ham arajanagar 0 0 0 0 0 0 0 0 0 0 09 Chikballapura 4 4 57 57 0 0 57 57 10758- • ’ 57 ' 5710 Chikmagalur 0 0 0 0 0 0 0 0 0 0 011 Chltradurga 2 2 28 28 0 0 28 28 26850 28 2812’ Dakshlna Kannada 0 0 0 0 0 0 0 0 0 0 013' D avanagere 1 1 16 16 0 0 16 16 17008 14 1414' Dharwad i 2 2 29. 29 1 1 29 29 7560 22 2115i Gadag 2 2 22 16 ' 0 0 22 16 0 24 2416; Gulbarga 10 10 147 147 0 0 147 147 27290 1 121 12117; H assan 1 1 21 21 0 0 21 21 1785 , 21 2018i Haveri 0 0 0 0 0 0 0 0 0 0 019; Kodagu 0 0 0 0 0 0 0 0 0 0 020 Kolar 3 3 63 63 0 0 63 63 37750 33 6321 Koppal 4 4 62 62 0 0 62 62 3991 62 5922 , Mandya 0 0 0 0 0 0 0 0 0 0 023^ Mysore 1 1 17 17 1 1 17 17 1766 17 1724 Raichur 5 5 85 77 0 0 85 77 15772 77 7725 ■ R am anagar 1 1 14 14 - - '14 14 0 0 026 ■ Shimoga 0 0 0 0 0 0 0 0 0 0 027 • Tumkur 1 1 14 14 0 0 14 14 5582 14 14
28 ‘ Udupi 0 0 0 0 0 0 0 0 0 0 029 ■ Uttara Kannada 0 0 0 0 0 0 0 0 0 0 0
State Total 62 62 950 921 4 4 950 921 484335 882 868

NPEGEL Progress
f
SI,No.
District
C o n stru c tio n of Drinking W ater Facility
ElectrificationNo. of ECCE C en tres
op en ed under NPEGEL No. Of C hildren
covered in ECCE
c en tre s
A ward to b es S chool/T eaclii
t9 r’ Learning
th rough Open S ch o o ls (No. of girls covered)
Cumulative Target till 2008
09
CumulativeAchievement
Cum ulative Target till 2008-09
CumulativeAchievem ent
Cumulative Target till 2008-09
CumulativeAchievem ent
Target for 2008-09
A ;h:1
1 Bagalkote 64 64 64 64 110 80 2044 110 107, 02 Bangalore Rural 14 14 14 14 0 0 0 0 0 03 Bangalore Urban 1 1 1 1 2 2 554 Belgaum 52 52 52 525 Bellary 73 72 73 73 140 140 0 0 0 06 BIdar 65 64 65 65 65 65 675 65 62 4757 Bijapur 93 93 93 938 Cham arajanagar 0 0 0 0 0 0 0 0 0 09 Chikballapura 55 55 55 55 0 0 0 57 5 7 ’ 235810 Chikmagalur 0 0 0 0 0 0 0 0 0 011 Chitradurga 28 28 28 28 0, 0 0 28 28 452112 Dakshina Kannada 0 0 0 0 0 0 0 0 0 013 D avanagere 14 14 14 14 28 28 512 0 0 014 Dharwad 22 18 22 22 4 0 75 29 33 015 Gadag 24 24 24 24 0 0 0 16 16 016 Gulbarga 121 121 121 121 0 0 0 0 0 . 017 H assan 21 20 21 21 0 0 0 0 0 018 Haverl 0 ,0 0 0 0 0 0 0 , 0 ' 019 Kodagu 0 0 0 0 0 d 0 0 0 020 Kolar 63 63 63 63 0 0 0 0 0 021 Koppal 62 59 62 62 0 0 0 0 0 ' 022 Mandya O' 0 0 0 0 0 0 0 0 023 Mysore 17 17 17 17 0 0 0 0 0 024 Ralchur 77 77 77 77 0 0 0 0 0 ’ 025 Ram anagar 0 0 6 0 8 3 58 - - ■ -
2& Shimoga 0 0 0 0 0 0 0 0 0 027 Tumkur 14 14 14 14 0 0 0 28 , 28 1247828 Udupi 0 0 0 0 0 0 0 0 ' 0 ' 029 Uttara kannada 0 0 0 0 0 0 0 0 0 ' 0
State Total 880 870 880 880 357 318 3419 333 331 19832
)VD
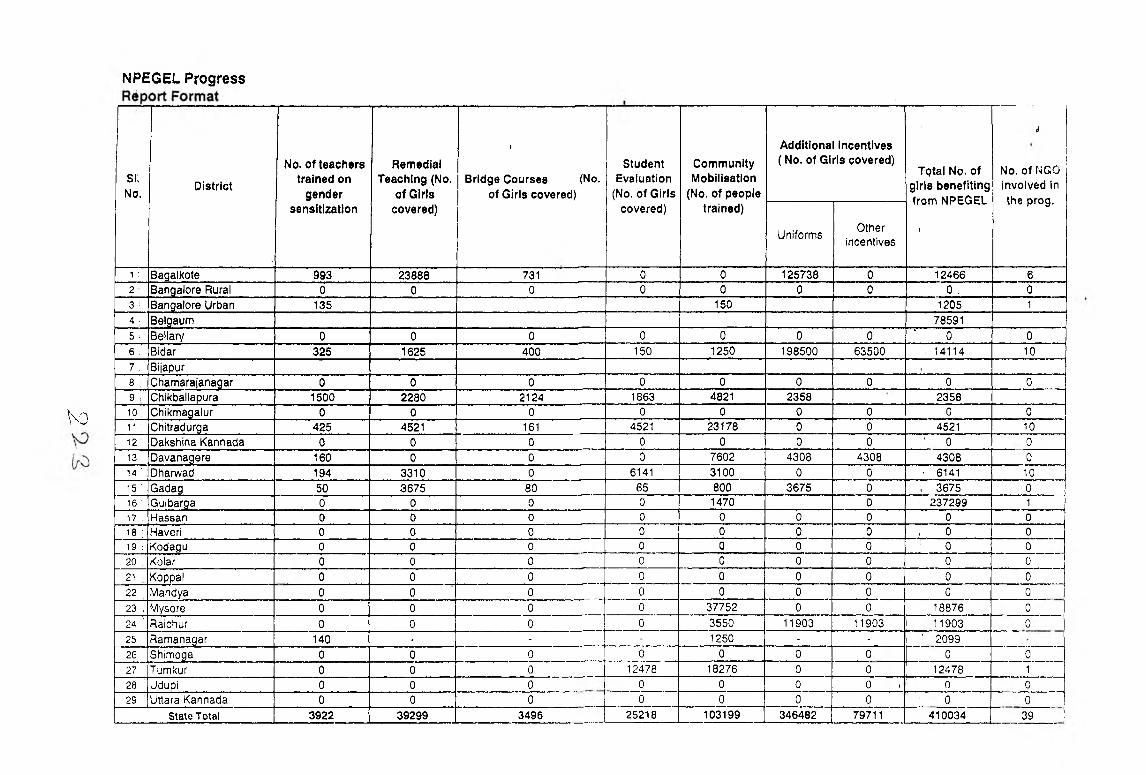
NPEGEL Progress
sr.No.
D is tric t
I
No. o f teachers tra ined on
gender sens itiza tion
Remedial Teach ing (No.
o f G irls covered)
1
Bridge Courses (No. o f G irls covered)
Student Evaluation
(No. of G irls covered)
C om m unity M ob ilisa tion
(No. o f people trained)
A dd itiona l incen tives ( No. o f G irls covered)
Total No. o f g ir ls bene fiting from NPEGEL
1
i
1No. o f NGO involved in the prog.
UniformsOther
Incentives
1 : Bagalkote 993 23888 731 0 0 125738 0 12466 62 Bangalore Rural 6 0 0 0 0 0 0 0 . 03 : Bangalore Urban 135 150 1205 1
4 ■ Belgaunn 785915 : Bellary 0 0 0 0 0 0 0 ■ 0 06 : Bidar 325 1625 400 150 1250 198500 63500 ■ 14114 107 : Biiapur , ,8 : Chamarajanagar 0 0 0 0 0 0 0 0 09 . Cliikballapura 1500 2280 2124 1863 4821 2358 2358
1 0 : Chlkmagalur 0 0 0 0 0 0 0 0 011 Chitradurga 425 4521 161 4521 ^3178 0 0 4521 1012 Dakshina Kannada 0 0 0 0 0 0 0 ' 0 013 ' Davanagere 160 0 0 0 7602 4308 4308 , 4308 01 4 ' Dharwad 194 3310 0 6141 3100 0 0 ' 6141 101 5 ■ Gadag 50 3675 80 65 800 3675 0 , 3675 016 : Gulbarga 0 0 0 0 1470 0 • 237299 11 7 : Hassan 0 0 0 0 0 0 0 0 01 8 : Haveri 0 0 0 0 0 0 0 , 0 01 9 : Kodagu 0 0 0 0 0 0 0 ■ 0 02 0 : Kolar 0 0 0 0 0 0 0 0 021 Koppal 0 0 0 0 0 0 0 ' 0 02 2 Mandya 0 0 0 0 0 0 0 0 02 3 , Mysore 0 0 0 0 37752 0 0 18876 02 4 ; Raichur 0 0 0 0 3550 11903 11903 11903 0
2 5 : Ramanagar 140 • - 1250 - - ' 20992 6 Shimoga 0 0 0 0 0 0 0 0 02 7 Tumkur 0 0 0 1 2 4 7 8 18276 0 0 12478 12 8 Udupi 0 0 0 0 0 0 0 . ' 0 0
2 9 Uttara Kannada 0 0 0 0 0 0 0 ' 0 0
State Total 3922 39299 3496 25218 103199 346482 79711 410034 39
Vo
l A L E N D A R O F
A C I T I V I T Y O F
A L T E R . N A T 1V E
S C H O O L I N G

’
>»s
B3s3 1
<
?a.o00
Os9oO .
? ■>OZoQ
oc■-)
oJDiSi
awS
o
^ ■
' o
(Tis
o1c3
Rerrsar'Ks
Chinnara Angala
□ Printing + Distribution of books V
1 1n Training EVS/Teachers V
11
Lj Opening 16'" 1
0 Running the ccntres. V i
n Main streaming 16'"11
□ Monitoring V \' ■ si v' j \ V V
Tent School i
□ Identify in the locations V IV 1 V 1 V as requiredV Opening & running ' V ! vl 'j V as required□ EVS/Teachers/APC (and training)
'! '
□ Issuing filled in migration cords ns 1■equired
Home based Education1 1
n Identification V 1!
C Selection and placing EVS V i□ Training the EVS V - i□ Running the centres V V V V ■ V V i \' V1 V
Mobile School 1
- Convincing the parents V V i ;
]()

J lo
£
Calendar o f Events
k>>2
?es
§3?603<
Cl9
zo
oe
o-M 01
1
o o1-HJ•2
0
1Remarks
□ Starting Chinnara Angala Centres & running V V V
□ Mainstreaming V□ Monitoring V V V V V V V V W V
NCLP (New)□ Review wing the conditions of NCLP Schools regarding infrastructure , child related centre
«
As and when the centre opens, usually in the month of April / May
□ Release of money to D C□ , Monitoring the Main streamingSpecial Enrolment Drive□ Mainstreaming V□ Monitoring V V V V V
Feeder School□ Opening V□ Appointing teachers V . ■ '
D Training V□ Books / Uniforms V□ Review VTransportationn Entreating the agency / Private party
x/ i1
□ Payment V !I < s/ V V VMadarasa (New)
1,

NOo
U<
>»(QS
?cs§s
saos<
Cu<uso0
0 9> o1 1 1 . .
1 T. t ' 1 .
^ ! J- i
□ Making MOU V1
1
n Opening V iQ EVS Appointment V '
C EVS training V i
n Sctiooling V V V / V V V V V V V
□ Madarasa (Old) V . V V V. V V V V V V
RBC / Asha Kirana J______□ Making MOU V 1□ Opening V '
□ EVS / Teachers deputation V 1 '
□ Purchase of the articles . V
□ EVS training V
□ Running the centres V ■ V V V V V V V V V V
□ Mainstreaming V
□ Monitoring V V V V V T V V V V V
NRBC1 '
□ Making MOU V□ Opening V - , J□ EVS/Teachers deputation V --------
I 1
n Purchase of the articles V
□ EVS training V i;.1 Running the centres V V V V V ! V %' V V V V V
□ Monitoring V V V V V V 1 V J V V V V V „ , ' . , ..
12
D A T A T A B L E S

POPULATION
N a m e ; K A R N A T A K A ---------------------------------------------------------- :-------------------------------- --------------
S NoN a m e o f B lo c k /
M u n ic ip a l A re a
Population all eommunftyTotal Population All CommunHv
PopufalionPopulation
Danaity S«R RatioUrban Rural SC i)T Mu •Ikn
r«i»i U»l« T»(»< U*l« TnU) M*‘* , Totl.1 % to total pop
Mai* ToUl •/.to te tA lpop
u«t» Tat»t % to total ■pop
2264S2 221062 44 7534 632005 615275 1247280 868457 636357 1694814 1,-40974 1?6466 257440 15 2 47385 47384 94769 5 59 71366 66908 138294 8 16 251 980
B A N Q A LO R e URBAN 726256 636020 1362276 406201 370529 777137 1132457 1006956 2139413 105348 1?7260 362608 16.9 20396 18410 38806 3 81 HA NA NA NA 29B 90S
3 0 A N G A LO R £ RURAL 09524 9^792 192334 337966 320669 658634 437409 413479 850968 f)4663 91919 186602 21 9 22343 21327 43670 5.13 32721 31622 64335 7 66 324 9S5
4 BEUGAUM 519712 492704 101241.6 1628034 1 5 6 6 8 U 3194848 1990721 1907629 3898386 233431 228589 462020 11.9 122988 120472 243460 6 2 5 UK NA^ NA NA 314 960
s 8E LLA R Y 361160 345670 708850 668534 651756 1320290 1029714 997426 2027140 10B536 185682 374218 16 5 183662 180976 364638 17 99 NA NA NA NA 240 9 f9
BIOAR 161914 136957 300871 609108 592395 1201503 812301 730695 1502996 153649 145163 298612 19.9 93455 88764 182219 12.12 216378 194613 410991 57,34 276 949
7 B iJA P U fl 342019 325260 667266 723282 687560 1410837 926433 680504 1806929 ' i r n O B 163146 334254 18 5 1S4S5 14596 30051 1.66 ^JA MA NA NA 172 950
d CHAM ARAJANAQ AR 7S387 72614 u d 2 1 ^ 414498 401566 816064 489695 474380 964275 1 U 8 8 8 108453 223341 2 3 2 21260 20574 41834 4 34 14433 1 4 l t6 28589 2 96 189 971
9 CHIKAW ANGALORE 1,13546 108619 232365 456856 456120 912976 574392 564939 1159331 i? 0 6 2 5 118638 239263 20 6 386267 85586 471853 40.70 86155 8781 • 173974 15.01 158 984
to C H IKKA6ALLAPU R A 17429Q 174290 331686 358509 350273 700782 518329 500567 1018896 lf i6 4 2 0 161441 327070 32 2 82141 78430 160571 15 76 . NA ' N ^ NA NA 276 960
n CHiTRAO URQ A 127200 116241 245621 547864 515368 1061432 783213 7405T9 1523792 1-/98S7 169004 348861 22.9 137314 128702 266016 17 46 34513 3427S 68788 4 51 180 955
12 DAKSHINA KANNAOA 363777 365625 729302 574657 693771 1168426 938434 959296 1897730 64856 64391 129247 0 1 27893 27976 55869 0 0 3 NA UA NA NA 433 942
t3 DAVANAGERE 270674 262576 642260 637646 609797 1247443 917320 872373 1789693 r/0 3 6 0 162862 333222 18 6 106932 102769 209701 11 72 NA NA NA NA 302 952
U DHARW AO 45192& 429966 881917 3>1275 351061 722336 623204 761049 1604253 67007 64962 131969 8 2 36234 34208 70442 4 39 161712 153464 315177 19 65 377 949
tS GAOAG 173623 166136 341861 319972 310022 629994 493795 478160 971955 68453 66257 134710 1 3 9 12234 11708 23942 2 46 67307 51934 109241 11.24 ' ^ 969
16 G ULBARGA 440446 4121>5 852621 1152343 1125958 2270301 1592789 1538133 1978588 3^5974 351621 717595 3 6 3 77926 76259 164195 7 79 NA NA NA NA 193 966
17 HASSAK 1577eife 146448 306243 70706s1 710899 1417964 660641 833545 T694186 1644-17^ 156419 310866 18 3 18743 19500 38243 2 26 90366 81953 172318 10.17 253 1004
19 HAVER! 153640 145266 298906 586667 552287 1136954 740307 697553 1437660 1(54676 85098 189774 13 2 79648 66490 146139 10.09 M 3007 106648 219664 15.28 298 944
i» k o o a g u 326 2 ^ 37630 75382 237087 236092 473179 274831 273729 548561 33759 33663 67422 12.3 23007 23108 46115 8 4 1 34206 31709 65915 120 2 134 996
20 KOLAR 176626 177861 356685 526346 5?1243 1087584 706167 741668 1447847 204139 192569 396717 27.4 33405 32715 66105 4 57 350 977 0 0 0 308 972
2 t KOPPAL 103623 97763 201386 499182 496531 995693 603312 592777 1196089 02736 92473 185209 15.5 70063 68525 136588 11 59^ 12313 11614 i!3927 2,00 166 983
22 MANOVA 139461 134771 274222 744276 766714 1510990 8fl3727 901465 *r«5?1P T ? 0 3 3 ?4«055 t3 f» «4T1 8275 f) 04 S in p 5024 101.1? 0 6 1
23 M YSORE 645379 SI3S30 2J65445 499291 46M J7 N90266j 1124rw.U4 J in jM 4 2 Ki<i^2r> 0 59 !SiA NA MA NA .185 ^44
24 RAICHUR 235696 222662 4S6598 669466 575096 1140661 801362 797757 1509119 »56519 155244 311763 1 9 5 152080 150962 303042 18 95 173138 159756 332894 20 82 245 983
2S r a m a n a g a r a M 0 M 2 104480 216062 414112 401372 616484 624694 505852 1030546 97120 93929 191077 16 5 9194 8691 14885 (.44 N/y NA NA NA 328 9>57
76 SHIM OQA 29^086 260396 67C483 639300 629832 1069198 828686 810230 1636885 141914 94612 236526 14.4 10761 13178 32939 2 0 1 521S3 1012 97353 5 9 5 194 978
^ 2 7 TUMKUR 322436 302679 626317 1486076 1446682 2933968 1610614 1748761 3660276 368146 344446 702592 19.7 157871 151580 309161 8 69 NA NA NA NA 244 967
2fl UOUPJ f 0 t i7 » 1P6178 432397 I t 77002 1361663 2628666 396383 460411 646794 33345 34344 67669 6 0 20671 43751 5.17 34783 34914 69687 8 33 267 1130
^9 u t t a r k a n n a o a 179729 171946 351675 516048 495201 1011248 694713 667565 1362924 63892 52300 106192 7.8 14788 14025 28813 2,11 73239 ■ 79816 153C34 I1-23 i 132 971
7262113 6«66786 16069707 17706642 17609197 43134973 28246676 27466416 64620337 4136603 3047602 8064114 . 14-8 2090633 1724516 36071S6 6.62 1191881 1081303 3316029 4 36 ............??« 883
)o-^3
Source: Census 2001

Table 2
LITERACY RATE
Name: KARNATAKA
S.NoName of B lock/ Municipal Area
, Literacy RateRural Female Literacy RateAll Communities SC ST Muslim
Male Female Total Male Female Total Male Female Total Male Female Total1 2 3 4 s 6 7 8 9 10 11 12 13 14 15
1 BAGALKOT 69.84 45.72 57.32 47,63 38.14 47.40 38.66 30,14 42,90 NA NA ' NA 40.552 BANGALORE RURAL 79.82 59.83 69.82 NA NA 55.30 NA NA 56,20 NA NA NA 50.903 BANGALORE URBAN 87.90 77.50 83.00 NA NA 70,20 NA NA ‘ 72,80 NA NA NA 60.804 BELGAUM 76.01 51.45 63.73 57.48 32,87 45.28 23.82 73.22 36,16 NA NA NA 45.655 BELUVRY 68,76 45.01 57,04 52,40 32,20 42.30 48.60 27.40 41,10 NA NA NA .37,996 BIDAR 72.50 48.80 60.90 57.08 47,00 52.00 50,56 46.82 48,69 56.30 46.74 51.52 43,647 BIJAPUR 69.90 43.50 57.40 NA NA 47.20 NA NA 46,20 NA NA NA 52,388 CHAMARAJANAGAR 59.00 42.50 50.90 35.33 20.13 27.98 31.30 '16.91 24,22 19.37 15.19 17.28 25,769 CHIKAMANGALORE 80.00 65,63 72.83 46.38 45.26 45.82 38.34 34.87 36,61 46.46 44.73 '45.59 64.5510 CHIKKABALLAPURA 63,71 46,33 55.02 50,47 42.01 46.24 51,37 43,65 47,51 NA NA NA 47.9011 CHITRADURGA 74,30 54,27 j 64.50 54,66 34.87 44.99 56.33 32.54 46,18 NA NA NA 49.6012 DAKSHINA KANNADA 81,42 88,12 74.86 63,57 49.72 56.67 65.74 63.46 64,56 NA NA 72,62 72.6213 DAVANAGERE 76.44 58.45 67.67 51.79 32.32 42.27 55.51 36,73 46.30 NA NA NA 52.1714 DHARWAD 81.04 62.20 71.87 80.80 61.90 71.60 80.80 61,90 71.60 62.35 57,90 66,80 47.7015 GADAG 79.55 52.58 66.27 29,51 9.45 19.60 43.44 17.19 30.57 30.05 28.14 29.10 46.3616 GULBARGA 61.80 37.90 50.00 41,13 22.05 31.78 35.40 16,80 26,20 NA NA NA 24.3017 HASSAN 78.04 63.30 68.60 61,74 49.31 61.05 58.56 46,73 57.11 46.37 39.18 42.77 48.1318 HAVERI 77.60 57.40 67.80 51,36 49.30 50.30 59.20 58,10 58.70 49.20 47.20' 48.20 54.2019 KODAGU 83.70 72.30 78.00 NA NA 64.90 NA NA 40.40 NA NA NA 70,1020 KOLAR 67.98 52.38 60.29 47,52 42.06 44,82 44.56 40,62 42,57 NA NA NA 45,91 -
, 21 KOPPAL 69.15 40.76 55.02 40,12 3S..68 37.90 42.93 18,26 30,59 NA NA NA 35.8022 MANDYA 70,71 51.62 61,21 54,81 36.94 ‘ 45.88 54,61 38,71 46.79 49.61 33.71 41.66 41,0223 MYSORE 70.90 55.80 63,50 50,94 35.67 43.42 48,92 32,61 40,95 NA NA NA 51,8424 RAICHUR 61.50 35.90 48,80 NA NA 38.80 NA NA 29.00 NA NA NA . 23,9525 RAMANAGARA ' 70.53 44.25 61.30 NA NA NA NA NA NA NA NA' NA , 47,4026 SHIMOGA 82.39 66,56 115.68 72,37 69.54 107.28 70,78 67,64 1 104,60 65.41 62.14 ' ,63.78 66,8827 ■ TUMKUR 79.29 60.76 70.09 60.00 42,65 51.33 64.25 48.09 56.17 NA NA ' NA , 57,0928 UDUPI ' ■ ■ 88.20 75.20 81.20 80.99 70,57 70.10 68.87 61,97 69.60 NA NA : NA 73,0029 UTTARKANNAOA 82.08 72.36 77.22 67,73 59,30 63.52 59.76 53.27 56,55 53.82 49.52 51.63 65.28
TOTAL ■ ■ 76.10 56.90 66.60 NA NA 52.90 ' NA NA 48.30 NA NA ' NA 48.00
A oA dQV
Source: Census 2001

Table : 3 BASIC ADMINISTRATIVE INDICATORS
Name; KARNATAKA
S. No.Name o f Block/ M unicipal Area
No. of Educational B locks (if any)
No. Of BRC/UBRC
CRCNo. of
villages/ Wards*
No. of Habitation
No. t)f Pancliayats
1 2 3 4 5 6 7 81 BAGALKOT 6 6 74 623 1340 1912 BANGALORE URBAN 9 9 126 693 1623 2103 BANGALORE RURAL 4 4 68 1298 1298 984 BELGAUM 14 12 168 1495 1942 5535 BELLARY 8 8 112 543 1034 1896 BIDAR 5 5 70 717 9S"0 1767 BIJAPuk 7 5 76 823 1599 1998 < QHAMARAJANAGAR 5 5 70 464 1031 1219 CHIKAMANGALORE 8 8 102 861 4514 ■ 23210 CHIKKABALLAPURA 6 6 69 1102 2045 16411 ‘CHITRADURGA 6 6 84 1358 1774 18912 DAKSHINA KANNADA 7 1 7 88 379 1734 21413 DAVANAGERE 7 7 98 2117 1288 23014 DHARWAD 6 6 84 407 542 13515 GADAG 6 6 54 4232 564 10616 GULBARGA 11 11 154 1360 3023 36517 HASSAN 8 8 ■ 112 393 3470 28b18 HAVERJ 7 7 98 1747 988 20p19 KODAGU 3 3 42 1149 721 10520 KOLAR 6 5 87 1392 2783 16821 KOPPAL 4 4 56 1324 789 13722 MANDYA 8 8 112 1395 2351 24623 MYSORE 9 8, 112 5284 2030 23524 RAICHUR 5 5 70 636 1434 16425 RAMANAGARA 4 4 60 2137 2305 13826 SHIMOGA ' 7 7 98 5284 5206 26027 TUMKUR . 10 10 140 2537 4417 32128 UDUPI 5 5 70 255 2397 14529 UTTARKANNADA . 11 11 154 1149 6264 219
Total 202 196 2708 43154 61456 6027Source:Census 2001 and BRC Reports* For Urban Areas
Year: 2008-09

Table : 4 HABITATIONS AND ACCESS (PRIMARY)
Name: KARNATAKA
S.No.
Name of Block/ Municipal Area
Total No.
Habitations Covered by Habitations
withoutHabitations without Primary Schools I EGS
ofHabitations
Primary School (within 1
KM)
Sgs(vylthln 1
KM)
Primary Schools /
EGS (within 1 KM)
Habitations Ellgibla for PS as per slate
norms
No, Of Children In such (Col. 7)
Habitations
Habitations not eligible PS but
bllglble for EGS
No, of Children In
such (Col. 9) Habitations
Habitations not Eligible for PS/EGS
No. Of Children In s.uch (Col. 11) Habitations
1 2 3 4 5 , 6 7 8 9 10 11 121 BAGALKOT . 1340 1202 0 138 27 11 8 0 103 02 BANGALORE URBAN 1623 1604 0 19 0 0 0 0 17 ' . 03 BANGALORE RURAL 1298 1279 0 19 2 25 0 0 17 04 BELGAUM 1942 1908 0 34 34 510 0 0 0 05 BELLARY 1034 1020 0 14 14 0 0 0 0 ■ 06 BIDAR 950 925 0 25 25 1050 0 0 0 ' 07 BIJAPUH 1599 1584 0 15 13 0 0 0 2 ' 08 CHAMARAJANAGAR 1031 934 . 0 97 0 0 0 0 97 . ’ 3919 CHIKAMANOALORE 4514 2895 0 1619 0 0 0 0 1619 • 010 CHIKKABALLAPURA 2045 1144 0 901 0 0 0 0 901 011 CHITRADURQA 1774 1770 0 4 0 0 0 0 4 ■, 7912 3AKSHINA KANNADA 1734 1732 0 2 2 23 0 0 0 ‘ , 013 DAVANAQERE 1288 1288 0 0 0 0 0 0 0 , 014 DHARWAD 542 538 0 4 3 0 0 0 1 ' 015 bADAG 564 205 0 359 0 0 0 0 359 ■ 016 GULBARGA 3023 2973 0 ' 50 50 750 0 0 0 017 HASSAN 3470 3470 0 0 0 0 0 0 p 018 HAVERI 988 981 0 7 7 118 0 0 0 019 KODAQU 721 715 0 6 0 0 0 0 6 9920 KOLAR 2783 2773 0 10 10 192 0 0 0 I . 021 KOPPAL 789 776 0 13 13 170 0 0 0 ‘ • 022 MANDYA 2351 2338 ■ 0 13 0 0 0 0 13 023 MYSORE 2030 2016 0 14 14 0 0 0 0 • . 024 RAICHUR 1434 1356 0 78 2 922 0 0 76 025 RAMANAQARA 2305 2128 0 177 - 78 0 99 0 0 026 SHIMOGA 5206 5154 n 52 6 0 0 0 46 027 TUMKUR 4417 4405 0 12 12 241 0 0 0 02 8 UDUPI 2397 1443 0 954 ' 1 50 0 0 9 5 3 029 UTTARKANNADA 6264 5233 0 1031 4 2 35 0 992 3 2 5 7
Total 61456 55789 0 5667 317 4064 1421 0 5206 3826Source; Dististrict Statistics and OISE 2C08-09 Year :2008-09

HABITATIONS AND ACCESS (UPPER PRIMARY)
ijO
S.No.
Name o f B lo ck / M u n ic ip a l A rea
Total No. of Habitations
No. Of t^labitations having UPS fac ility in 3
KM Area
No. of Habitation s w itliou t
UPS facility in 3
KM area
1-------------------—No. of eligible
schoolless habitations for
UPS as per distance and population
norms
No.of Primary Schools (Govt, &
Govt. Aided)
1
No.of Upper Primary School
(Govt. & Govt. Aided)
Primary and Upper
Primary fRatIo
No. Of UPS eligible as pe '
2:1 ratio
1
Gap In UPS
1 2 3 4 5 6 7 8 9 10 111 BAGALKOT 1340 1059 281 24 1318 852 1,55 659 02 BANC3AU0RE URBAN 1623 1623 , 0 2 1868 1115 1.68 934 03 BANGAl6 r E RURAL 1296 1248 50 18 1160 446 2,60 580 1345 BELQAUM 1942 1888 54 54 3298 1811 1,82 1649 06 BELLARY 1034 1022 12 26 1413 872 1.62 707 07 BIDAR 950 915 35 35 1416 910 1.56 708 08 BUAPUR 1599 1599 0 17 2019 1135 1.76 1010 09 CHAMARAJANAGAR 1031 1022 9 0 831 445 1.87 416 010 CH)K;AMAiiJGALORE 4514 234B 2166 40 1627 528 3.08 814 28611 crfiKK^BALLAPURA 2045 881 1164 0 1589 726 2.19 7^5 , 6913 CHITRADURGA 1‘774 1768 6 0 1784 948 1,88 892 014 OAKSHINA KANNADA 1734 1734i 0 0 1168 875 1,33 584 0•15 DAVANAGERE 1288 1281 7 7 1483 819 1.81 742 016 DMAriWAD 542 533 9 9 830 605 1.37 415 017 GADAG 564 412 152 0 640 443 1.44 320 018 GULBARGA 3023 2936 87 87 2850 1520 1,88 1425 019 HASSAN 3470 3470 0 0 2633 1095 2.40 1317 22220 HAVERI 988 988 0 0 1198 740 1.62 599 021 KODAGU i 721 704 17 0 429 284 1.51 ' 215 022 KOLAR' 2783 2745 38 3 1938 663 2.92 969 30623 KOPPAL 789 730 59 59 955 532 1.80 478 025 MANDYA 2351 2329 22 0 1856 872 2.13 928 5626 MYSORE 2030 2010 20 20 2064 , 1069 1.93 1032 0
.27 RAICHUR 1434 1333 101 101 1459 688 2.12 • 730 4228 RAMANAGARA 2305 2305 0 0 1421 484 2.94 711 22729 SHIMOGA 5206 4530 676 8 1991 1003 1.99 ?96 030 TUMKUR 4417 4411 6 6 3646 1423 2.56 1823 40031 UDUF’ I 2397 1359 1038 0 850 574 1.48 425 032 UTTARKANNADA 6264 . 4577 1687 9 2212 1034 2.14 1,106 72
Total 61456 53760 7696 525 47946 24511 1.96 23973 1814Source: Oististrict Statistics and DISE 2008-09 Year ;2008-09

Table 4B
Availability of Access For Focus Group
O o
SI.No.
Name o f B lock
SC Population ST Population ' Muslim Population
Villages w itli more than 40% SC popuila tlon
Village w ithout
school Pry.School
w ith in 1 l<m.
With out UPS within
3 km
Village with more than 40% ST population
Village w ithout pry
school with in 1 km
w ithou t ups w ith in 3 km
Village with more than 40%
Muslim population
Village w ithout pry school
w ith in 1 km
w ithout ups w ith in 3 km
1 2 3 4 5 6 7 8 9 . 10 111 BAGALKOT 40 0 40 0 0 0 25 0 02 BANGALORE URBAN 0 0 1 0 0 0 0 0 0 '03 BANGALORE RURAL 21 0 0 10 0 0 41 0 04 BELGAUM 0 0 0 0 0 0 0 0 , 05 BELLARY 0 0 0 0 0 0 0 0 06 BIDAR' 72 0 0 0 0 0 32 15. ■07 BIJAPUR 0 0 0 0 0 0 2 ■ 0 08 CHAMARAJANAGAR 76 0 ■ 0 44 11 16 11 0 09 CHIKAMANGALORE 111 0 0 39 0 0 38 0 ■ 010 CHIKKABALLAPURA 710 0 40 165 0 0 27 0 011 CHITRADURGA 242 0 0 258 0 0 27 ' 0 012 DAKSHINA KANNADA 0 0 0 0 0 0 25 2 , 013 DAVANAGERE 195 0 0 49 0 2 10 0 014 DHARWAD 10 0 0 2 ' 0 0 0 0 015 GADAG 41 0 41 0 0 0 1 0 016 GULBARGA 275 0 0 74 0 0 105 0 017 HASSAN 358 0 0 12 0 0 . 89 0 ' 018 HAVERI 40 0 d 22 0 0 226 0 019 KODAGU 0 0 0 0 0 0 0 0 020 KOLAR 439 4 0 49 0 0 36 3 021 KOPPAL 13 4 9 3 0 3 5 3 222 MANDYA 16 0 0 0 0 0 4 0 023 MYSORE 324 0 0 200 0 0 0 0 : 024 RAICHUR 172 3 13 104 5 12 30 4- 1025 RAlilANAGARA 2305 0 0 0 0 0 308 0 026 SHlMOGA 0 0 0 0 0 0 0 0 027 TUMKUR 262 2 2 136 0 0 79 ■0 ' ' . ■ 028 UDUPI 0 0 0 0 0 0 0 0 029 UTTARKANNADA 23 0 23 8 0 1 27 1 0
Totai 5745 13 168 1235 16 34 1148 29 12Source; D ististrict S tatistics and DiSE 2008-09 Year :2008-09


CHILD POPULATION (11-14 AGE GROUP)

LO

ENROLMENT AND OUT OF SCHOOL CHILDREN {6-14 age group)
N a m * Of S ta t* : KAANATAK>XO u t o f S ch o o l C h» d ra n (11-14 a g t ^ ro u p j
S.No. BleeVMuntclpal Area All CommunKi** I 8C ST Mui»m j Ali Cemmunllloa SC ST MuoHm ,
B Q T B Q T B G T B G 1 1 ® ! G1T % Of Child
Pop. B G T % of $C Child Pep. B G T % Of ST Ch»d
Pop. B G T \ ol Mnt 1 Child Pop I
! 3 B ! • j 1 » (0 n ■ 2 13 »4 >S >’ ia 10 20 2< 22 23 24 29 20 27 29 2* M i» ; BAGAi KOT sooit •aiu MiN| •*9<| •tor •raM »•» }4M >»40 5»M Hi* ■100’ *)« 250 0 20 34 <9 93 0 0* a 3 a 00( 29 *« t>Wi,2 SANOAUOAE UABAN lHMt| irM«« MM«{ 9QM* 410> jr4» 7Ma »R0 «u IM) 09« 240 2M 470 0 14 •3 *0 ••2 oa >«• M* . ' Ji BANOAIOAE N«a«| UM 4MT| •0*0 I9»f ••r MM >»)» 99»* »4M 55 I W 0 M * 0 <2 17 0 ** 2 0 0* 9 R24 • 2 0 »4 321 ■ 13 0**;4 • B€L0AUM »MO«sj It62«i M09m| 1U)^ urjf 3I0»* UM »3I* •W yyt'i ’ »«0J« >»**> >64 M 290 010 •a 13 32 001 • I 12 13 a-oi »3 t • 1 QOi9 WCt>RV M7«l|1 MMl IWMl) <«ia <0M1 l«l«« MMM IMMIf IMIM Tin 7M> <4aao 430 *41 •n 070 IM IM 327 o.ta| IM 12* 232 0.10 42 20 a2 0Q9a eiDAH 1 4Tt7l ^>..1 n«4 IMM HIM •Mt itii 1M0» 009 •M IJ87i I4ft 2ia «sa o.«o ao a3 «M o.ia 32 23 09 n.«« 91 •J *9 0 10T • •iMniA 1 ■wmI ««»«0 a#M* tttr loea X9M I2>r« *aoi »4«M 7*0 »o»» im 1.44 140 240 3*9 0.3t ■ 9 a 11 0.01 1*9 4>« TM 0 •• CHAMAAAJANAQAft luaaj iMM «tot] 1M9 9MC ioe« ai4 ia*a in 240 an 1.20 44 13 *7 090 M at 140 0.2» 14 * 99 o'jr• ’icMiKAMANOALO«E mH •nu| mi ma i«a«9i 14T* i«4r NM tm M>7 am 10T M • «« 0)4 ** a* >33 a.2> *' 2 II 002 9 ? 10 Oft?10 ;CMIKMBALIAPC«A* 9MM| 9MM *<aM{ M4«| KN «M14 tttJ •OM NT* 3401 MM aoM Ui M> *44 I.BO I4f IS* 300 0.47 40 M • 0» 0.10 107 30- 140 0 2>n ' «um| 4MM tmil ntOTi n«M tmai MS' wo« 1TM« »mJ ana M»t mJ S7» T74 O.M tao 13* 27a 0.31 M •4 IM 0.10 94 9« 02 0 *1M ‘6ii^HllU4MhA0A ^ «tm| 4109 37»J 92M mi IM« IMS Jltt 14mJ iat«2 UOM (•» U* OM 11 13 >4 0.03 7 M 10 0.0» 49 92 07 0 M13 ; OAV OBRE 4l7wj 4VM* W4»t[ im J tMtl ttm M40 osai KMl «trj «ao ias7« 9U «at 417 0.4* lift to 2M 0.14 20 20 40 OM 40 21 M oc»14 IhA^sr— — •Mnj' ..•d M«a| iia ion* IMS mr im tOtlJi tIMS xtaoz a? if U4 Otft u ia 43 0.04 a 9 a 0.01 13 rl 24 OOJ19 •OAOAO 9i«n| m J «M M«» n*» «N9 WM n«4 1U U2 0.M M M *10 oia 13 7 10 o.'i* 14 29 37 ecfc19 ' OULSAAOA ’•n»| UM >4D««j tmr| ta«M «1M8 M0« tm «srs * nais H29 IMM MOO >•>« 9281 an MO i«a«i 1M» 1 41 13* 109 Ml 0.21 330 202 001 0.4J17 HAS8AN msi|' 4«ki» «T«| m J no» 10»* >et« in» aoM JB0« MM M 92 112 ot> n «a M o.ool 4 2 0 ILQ1 a 9 a oo<i« !HAVERI M*7ii| «mr Ntn( UlJ MOt ItMQl 4»l« 4t»T MM M9 «M79 f»l M 217 0.M J7 M n 040 a 0 10 9.99 41 ♦* a? 0 0711 KOOAOU * iN^ \*n» W7«y| m J at* *9T9 tM1 MM aui I7M M97 tr 71 4* 0.1« • «» 10 o.ool 19 0 23 O.M 3 0 2 0.01» KOLAR raOMl «MM at«Mj urn* 4»n ««• ••01 «!7M MN« ««a* 9t M 14* 0.11 30 3* •o e.ool r 4 II 001 U 11 34 0 0221 KOPPAL ioMi| u*ri HOtT] »rad 49M MS3 •«M atai SMa{ M*B sni •4* «2ia 2M •17 909 932 000 *« IM fO» 0J« 94 30 •• OMu UANDVA Mm| MtM •MMl wrrt fliy« 1tt>4 •tt t*r» ia««{ • N MM a»4 r> 327 0.40 M ta 04 0.01 4. *. » 001 130 a'' 140 021n MVfdflE T««td TMM t47«M| 14MJ m>t M*4 MOa IHM m» 7W1 t4«a« 27 204 470 M at <20 OM M 09 •8P 00* ta i» 40 i 003I* •UiCMUR «M4«i itr«^ ■■ i tNl mm m«T Mtl nta IMM taM M10 «•••> afs TO* «32> >49 140 lao 334 0.M 149 200 9BI 03* 79 aoH 144 o.*»a UkWANAOARA IM?l( X4«14l M4«?i liul 4m tossi • J iwl im HM Mor aM5 1M 40 IM o:m >« 14 4* 0.10 * 9 13 003 ai 9 94 onV iBHIIMOOA 4mi| umu •iMoj tMt S47< mr fOM »440 4U 37* a«a 0.90 IM •04 309 OM 31 91 09 0 07 30 94 04 Ofir27 TVUKUA rHM( Mflt l«4J?9| tfM( I40M MOM •tM MM UM« u*\ ano 1l»1 2«a U2 370 02« M «> 121 O.M ta 19 31 OOf 1M 13 110 «0I|29 UOUPt m*4 mn 9«Ml| ii$i| tm 2M1 t04t t«M »7\ t«M a)4« 4T 9t TO 0.1« 10 a ia 0.03 a 0 10 0.0» * 7 II 0 0229 Ottapkannada 9»Mi| 90710 •4M«| vin a*M MM 1t4* nji »74 %w a:«a tosar I0« H iU 0t« * 4' 12 002 0 0 0 000 04 17 01 0 >3
Total iMiwrj im$9T wMn •IMM >MM4 r»Mai ia»<7 itini IQ2M*904 1 1*711 0.M MM »sit.a oitJ 0.2* 1*72 1114.24 2i*a 0*9 2or 1273 904» M2
(/O(T^
Sewe«: ChMtfrtn Survty Pre)tolt« Ol»e 30O9-OI

INFORMATION AND PLANNING FC'
Name of State; KAR^’ ------ -
S oC/O
S.No.Name of Block/ Municipal Area
S ta tu s & A qNever' E
6-8 years
nroiied AN
, S -n years 11-14 years |a.' . X :l ■ <
age Group
B G T B G T B G T 1 B G ■ T1 2 3 4 5 6 7 8 9 10 11 21 . 22 231 BAGALKOT 14379 13354 27733 89 85 174 94 124 218 14562 13563 281252 BANGALORE UR0AN 17435 15061 32496 1124 1109 ^233 841 784 1625 19400 16954 ' 363543 BANGALORE RURAL 2328 2136 4464 41 22 63 36 19 55 2405 2177 45824 b e l g A u m 30327 27190 57517 96 58 154 162 86 248 30585 27334 579195 BELLARY 12350 12007 24357 373 403 776 617 683 1300 13340 13093 264336 BIDAR 9703 9007 18710 310 246 556 351 299 650 10364 9552 ,199167 BIJAPUR 23071 20416 43487 461 464 925 867 913 1780 24399 21793 - 461928 CHAIVIARAJANAGAR 2927 2681 5608 218 175 393 399 248 647 3544 3104 ■ 66489 c h ik a m a n g a l o r e 4539 4204 8743 143 141 284 334 277 611 5016 4622 ' 963810 c h ik k a b a l l a p u r a 3095 2776 5871 43 42 85 113 62 195 3251 2900 ' 615111 CHITRADURGA 5281 4699 9980 69 77 146 161 155 316 5511 4931 ,1044212 DAKSHINA KANNADA 7490 6656 14146 25 16 41 20 ' 14 34 7535 6686 1422113 d a Va n a g e r e 7521 6907 14428 118 107 225 237 196 433 7876 7210 ' 1508614 d h a r w a d 4729 4483 9212 67 46 113 87 59 146 4883 4588 947115 GADAG 6775 6075 12850 236 2^3 489 460 461 921 7471 6789 1426016 g u l b a r g a 26155 24594 50749 1466 1525 2991 1821 1818 3639 29442 27937 5737917 HASSAN • 3549 3387 6936 50 51 101 62 54 116 3661 3492 715318 HAVERI 9552 8791 18343 91 70 161 177 108 285 9820 8969 1878919 KODAGU 1753 1653 3406 44 34 78 33 28 61 1830 171b 354520 KOLAR 6030 5507 11537 73 73 146 105 88 193 6208 5 6 ^ 1187621 k 6 > i^a l 11213 10934 22147 398 453 851 572 648 1220 12183 12036 2421822 m a Kid y a 2919 2492 5411 109 47 156 209 56 265 3237 259|5 583223 IVIYSORE 5767 5192 10969 162 116 278 279 204 483 6208 5512 1172024 RAICHUR 13835 13498 27333 475 499 974 530 580 1110 14840 14577 , 2941725 r a iv ia Ma g a r a 2459 2215 4674 56 29 85 126 39 165 2641 228 3 492426 SHIMOGA 6085 5513 11598 162 108 270 352 259 611 6599 5880 1247927 fu ^ K U R 7693 6989 14682 257 134 391 75 51 126 8025 7174 1519928 UDUPI 2429 2190 4619 50 34 84 54 43 97 2533 2267 480029 , u t t a r k a n n a d a 6720 5965 12685 39 27 d6 120 64 184 6879 6056 12935
Total 258109 236572 494681 6845 6444 13289 9294 8440 I 7 7 3 4 I 274248 251456 S25704Source: C h ild ren S urvey 2008-09

Table 8
OUT OF SCHOOL CHILDREN WITH REASONS
U:)
Name of StaterKARNATAKA
S. ■ No.
Name o1 Block/ Municipal Area
No. of out of school children as
per household survey (5-6)
No. of out of school children
as per household survey (7-14)
No of out of school children with reason
Lack of Interest
Lack Of Access
Household ' Work Migration Earning
Compulsion FailureSocio
CulturalReasons
Non;fiexlbility In School Timing and System of
School
Others Total
1 2 3 4 5 6 7 8 9 10 11 121 BAGALKOT : 27658 467 35 10 118 29 77 0 30 0 168 4672 BANGALORE URBAN ' 31604 4750 218 211 490 2209 584 0 380 556 102 47503 BANGALORE RURAL 4416 166 5 1 13 96 1 8 42 - 1664 BELGAUM 57427 492 492 4925 BELL^RV 24134 ’ 2299 99 33 708 393 632 36 83 .0 315 22996 BIDAR 18596 1320 248 54 300 129 259 75 81 20 1.54 13207 BIJAPUR 43226 2966 < 2966 2966e , CHAMARAJANAGAR 5470 1178 241 84 186 284 128 0 144 53 ■ 58 11789 CHIKAMANGALORE 5826 325 80 9 43 98 14 0 2 0 79 32510 CHIKKABALLAPURA 8653 985 148 . .28 260 127 138 22 91 . 5 166 9S511 CHITRADURGA 9939 503 66 32 178 154 45 0 28 0 0 . 50312 DAKSHINA KANNADA 14072 149 21 0 1 121 0 0 6 0 .0 14913 DAVANAGERE 14333 753 91 4 153 144 38 0 35 0 288 75314 DHARWAD 9149 322 322 • 32215 o 'Ada6 12632 1628 72 0 481 581 37 0 249 0 208 162816 QULBARGA 50095 7284 263 50 1994 241 2838 69 1819 10 0 728417 HASSAN 6963 250 63 2 >14 78 18 0 15 3 57 25018 HAVERi . 18222 567 2 0 204 0 0 361 56719 KODAGU 3368 177 32 9 0 97 0 2 11 0 26 17720 KOLAR 11483 393 22 0 153 187 31 0 0 '.0 0 ■ 39321 KOPPAL 21841 2377 234 0 348 331 318 25 237 0 ,884 237722 MANDYA 5346 486 0 45 28 34 37 0 171 0 171 48623 MYSORE 10870 850 84 123 104 1 59 24 180 25 251 85024 RAICHUR 27058 2359 625 230 663 305 267 269 235925 HAMANAGARA 4625 299 . 45 0 4 51 74 0 0 0 125 29926 SHIMOGA 11455 1024 19 96 22 74 179 4 23 • 1 606 102427 TUMKUR 14516 683 146 0 89 69 104 0 127 ■ 0 148 ■ 68328 UDUPI 4572 228 0 0 0 76 135 0 0 0 17 ■ 22829 UTTARKANNADA . 12578 357 77 3 20 23 16 0 9 0 209 357
Total 1 490067 35637 2936 901 6389 6239 6029 526 3729 ■ 715 8173 35637Source: Children Survey 2008-09

COVERAGE OP OUT OF JIC'H-'oi. CH!l.DR~ m i wOEr '•iFFERENT STRATEGIES
Name of State; KARNATAKA
S. No. a io cK /M u n ic ip a l AreaNo. o f O o9C aa No. o( OoSC
aa pe r HHS (7.14)
r^o. o f O fit 0 Schot C h ild ren p ropo«d to be coverad und« r d fffa ren t a>ratog)»» in C u rran l Yasr
No. o l C h ild ren (o be d ire c tly enro lled In
S chool
No. Of C h ild ren to be enro lled In
EQS
No. 0/ EGS Centre
No. o f C hildren to b» enro lled in
NRBC
1
No. of NRBC 1 Centre
I
No. Ol C hildren (0 b« enro tled In
RBC
No. o f f^BC Centra
No. Of C h ild ren to b« e n ro lled in
Madarsa/M aktab
No. o f M aderee/Maktab
No, O fC •n ro lli S lra ia
Er^follt
h lld ren lo be »d in other jy {8 p e c la l le n t Drive)
1
No. o f C enter*Tota l No. of
C h ild ren to be enro lled
Total No. ol O e n ie ff j
1 Z 3 4 5 6 9 9 10 J1 12 13 14 15 18 17
1 BAGALKOT 27658 467 27658 0 0 0 0 275 10 5 1 ' ,1 0 4 31 467 : 42
2 b a n g a l o r e URBAN 31804 4750 31604 0 0 139<1 139 613 12 1301 26 I 1442 130 4750 315
3 BANGALORE FiURAL 4416 166 4416 0 0 75 3 91 4 0 0 0 0 166 7
4 8EL0AUM 57427 492 57427 0 0 40 2 38S 15 36 1 43 0 505 1H
5 8ELLARY 24134 2299 24134 0 0 655 26 1390 32 0 0 429 0 2402 50
6 QIDAR 10596 1320 ' 18596 0 0 6!0 2-1 596 IB 0 0 74 0 1280 •127 BUAPUR 43226 2966 43226 0 0 840 03 176 4 1015 20 635 0 2866 107
8 CHAMARAJANAGAR 5470 1178 5470 0 0 400 16 i 310 9 60 1 400 0 1176 26
9 CHIKAMANGALORE 5826 325 5826 0 0 0 0 2-17 9 0 0 78 10 325 13
10 CHIKKA0ALLAPURA 985 8653 0 0 28 ' i '1 356 10 110 2 26 0 7 73
n c h it r a d u r o a 9939 503 9939 0 n ---------------- .............. ; M3 P 0 0 ?«4 31 .... ... .......J
12 o a k s h in a k a n n a d a 14072 149 14072 I 0 0 ■ 0 0 0 0 90 3?
13 o a v a n a o e r e '14333 753 14333 0 0 70 3 1 587 23 0 0 143 15 800 114 o h a r w a d 9149 322 9149 0 0 n*} 7 0 0 0 0 150 6 323 13 1
15 GADAO ’ 12632 ' 1628 12632 0 0 50 334 13 0 0 44 26 1628 9^ 1
16 g u l b a r g a 50095 7284 50095 0 0 266F. ?03 3145 102 4 70 9 715 137 6995
17 h a s s a n 6903 250 6903 0 0 0 ■ 0 too 2 30 1 85 0 215 3
ie HAVER! 10222 567 19222 0 0 V.5 , 6 310 13 0 0 ■ P 0 463 ly
19 KODAGU 3368 177 3368 0 0 0 0 121 5 0 0 56 0 177 5 **
20 KOLAR 11493 393 11483 0 0 27e 1 11 0 65 1 163 55 504 67
21 KOPPAL 21841 2377 21841 0 0 853 ~ l ?'5 1 550 22 0 0 S32 39 2235 »>5
22 MANDVA S3 46 486 5346 0 0 0 0 i 315 11 170 3 1 1 406 '5
23 MYSORE 10870 650 10870 0 0 M ! 850 27 0 0 250 0 1450 41
24 RAICHUR 27058 2359 27058 0 0 77P 31 j 1255 41 131 3 305 1 2469 76
25 RAMANAOARA 4625 299 4625 0 0 100 ^ d 100 4 61 38 1 299 10
26 SHIMOGA 11456 1024 11455 0 0 M ; 0 350 9 170 3 504 105 1024 1 1 ^
27 TUMKUR 14516 683 14516 0 0 1? 1 0 , 402 14 111 2 ’ 158 0 603 ' 1626 UOUPI 4572 228 4572 0 0 r> i 0 I 149 3 0 0 5 5 154
29 UTTARKANNAOA 12578 357 12578 0 0 e i ^ 49 2 104 2 . 123 14 357 21
Tota l 490067 3S637 40C067 0 0 ■ 11124 57o 13216 420 3850 78 7447 647 38637 1816
S o
Source; ChUdrtn Survey 2008*00 Y«ar :200S*09

Table 9A
CONTINUING CENTERS FROM PREVIOUS YEAR
O
Name of State: KARNATAKA
S.NO B lock/ M un ic ipa l Area
No. of Children Continuing InEGS
(children)no. of centre
RBC(children)
no. of centre
NRBC(children)
no. of centre
Madarsa/Makatab
(children)
No. of centre
Others(children)
No. o f . cen tre .
T6tal(children)
Total No. Of centre
1 2 3 4 5 6 7 8 9 10 11 12 13 141 BAGALKOT 0 0 990 20 0 0 170 3 5508 76 6668 992 BANGALORE URBAN 0 0 541 11 205 205 1687 34 5637 , 126 8070 376
•3 BANGALORE RURAL 0 0 50 1 6 6 0 0 2376 62 2432 694 BELGAUM 0 0 1650 33 536 11 20 0 6637 ' 165 8843 2095 BELLARY 0 0 2950 59 0 0 0 0 5798 118 8748 1776 BIDAR 0 0 2050 41 0 0 1333 27 5237 170 8620 2387 BIJAPUR 0 0 1700 34 83 2 , 0 0 7535 197 9318 2338 CHAMARAJANAGAR 0 0 180 4 0 0 57 1 1829 60 2066 659 CHIKAMANGALORE 0 0 400 8 585 585 0 0 3369 109 4354 70210 CHIKKABALLAPURA 0 0 765 15 0 0 0 0 2835 • 90 3600 10511 CHITRADURGA 0 0 795 16 0 0 0 0 2515 88 3310 10412 DAKSHINA KANNADA 0 0 50 1 0 0 0 0 2801 88 2851 8913 OAVANAGERE 0 0 , 575 12 226 226 608 12 3810 123 5219 37314 DHARWAD 0 0 150 3 0 0 110 2 2492 69 2752 7415 GADAG - 0 0 1200 24 0 0 0 0 1682 54 2882 7816 GULBARGA • 0 0 1100 22 100 100 1203 24 5127 154 7530 30017 HASSAN 0 0 0 0 0 0 0 0 3195 109 3195 10918 1 HAVER! 0 0 643 13 60 60 50 1 4097 133 4850 20719 KODAGU 0 0 150 3 5447 5447 0 0 1350 42 6947 549220 KOLAR 0 0 1207 24 0 0 74 1 2767 84 4048 10921 KOPPAL 0 0 1325 27 190 190 0 0 3515 128 5030 34522 MANDYA 0 0 857 17 223 223 0 0 3840 126 4920 36623 MYSORE 0 0 573 11 253 135 500 10 3871 126 5197 28224 RAICHUR 0 0 0 0 0 0 0 0 391 0 391 025 RAMANAGARA 0 0 140 3 0 0 14 0 3411 120 3565 12326 SHIMOGA 0 0 40 1 2500 2500 0 0 3503 116 6043 261727 TUMKUR 0 0 830 17 0 0 0 0 4317 140 5147 15728 UDUPI 0 0 1 0 200 191 0 0 3951 140 4152 33129 UTTARKANNADA 0 0 650 13 0 0 111 2 4446 157 5207 172
Total 0 0 21562 433 10614 9881 5937 117 107842 3169 145955 13600
Source; Children Survey 2008-09 Year ;2008-09

Municipal Area C£R NER1 wu/JOTI I A . . , , .
Dropout Repet’ys ; k . .1 2 O 4 5 e 7 8 5 ':01 8AGALK0T 101,71 95.13 -,S.57 o.3i , -,00.70 99.74 i 2.152 BANGALORE URBAN 137.48 99.36 5.14 5.14 118,58 99.19 4.53 4.53b BANGALORE RURAL 89.94 99.30 2.63 1.69 93,35 99.33 6.93 3.024 BELGAUM 104.78 95.34 14.10 0.01 102,94 99.80' 10.84 0.035 BELMkRY 114.00 96.60 3.40 3.13 103.00 99.11 0.89 32.336 BIOAR 117.27 97.41 13.34 2.22 116.72 98.88 1.6.58 1.917 BIJAPUn 105.66 95.77 8.85 3.59 106.97 99.59 10.96 5.438 c h am ar ajan ag / iIr 104.59 99.31 7.08 0.86 i 109.04 99.26 2.57 1.139 CHIKAMANQALORE 107.35 99.82 0.19 0.49 111.58 99.76 0.44 0.4210 GHIKKABALUPURA 103.89 99.28 0.29 0.85 105.83 99.14 0.79 1.2011 CHITRADURGA 102.10 99.36 6.55' 0.37 103.28 98.53 .6.53 0.47 .12 fiAKSHINAt^NNADA' 120.97 98.86 0.73 0.00 127.38 99.24 0.02 .0.00 ,13 DAVANAGERE 110.86 99.18 0.20 0.60 107.22 99.64 0.31 1.1214 OHARWAD 126.50 94.66 1.44 1.30 123.17 99.71 10.36 1.7815 GADAG 135.29 ' 95.02 1.28 4.28 133.90 99.29 , 1.92 3.65,16 GULBARGA 109.90 93.40 12.84 2.89 107.70 97,30 14.68 5.73'17 HASSAN 113.39 99.66 0.8S 0.19 106.41 99.14 0.61 0.2418 HAVgRI' 113.65 95.85 0.68 0.58 106.65 99.77 0.32 1.45.19 KODAGU 118.22 99.55 p.94 0.56 117.18 99.00 0.94 0.4920 KOLAR 101.64 99.67 10.15 0.15 103.19 99.37 17,19 0.1521 KOPPAL 108.00 95.58 0.81 3,16 142.00 98.96 3.14 10.4322 m andVa 109.77 99.67 6.51 0.47 120.46 98.93 3.69 0.5523 mVsore 126.25 99i25 0.00 0,72 127.60 99.44 o.oo 0.8624 RAICHUR 110.74 95.23 11.37 2,59 103.79 96.34 14.07 5.3425 ramAn ag ar a 93.19 99.21 0.79 0,69 97.99 99.40 17.04 15.2526 SHIMOGA 109.21 96.25 2.82 0,99 104,20 95.93 3,25 1.1627 TUMKUR 103.34 93.53 3.66 0,48 104,14 84.36 7.56 0.4628 UDUPI 111.08 99.27 0.06 , 0,00 112,06 99.40 0.14 O.QO29 UTTARKANNADA 101.25 99.83 0.17 0,26 107,49 99.74 0.26 0.52
Total ■ 106.90 97.60 4.60 1.45 107.30 98.50 5.71 , 3.51 '
Source: Children Survey 2008-09 and DISE 2008-09 Year :2008-09
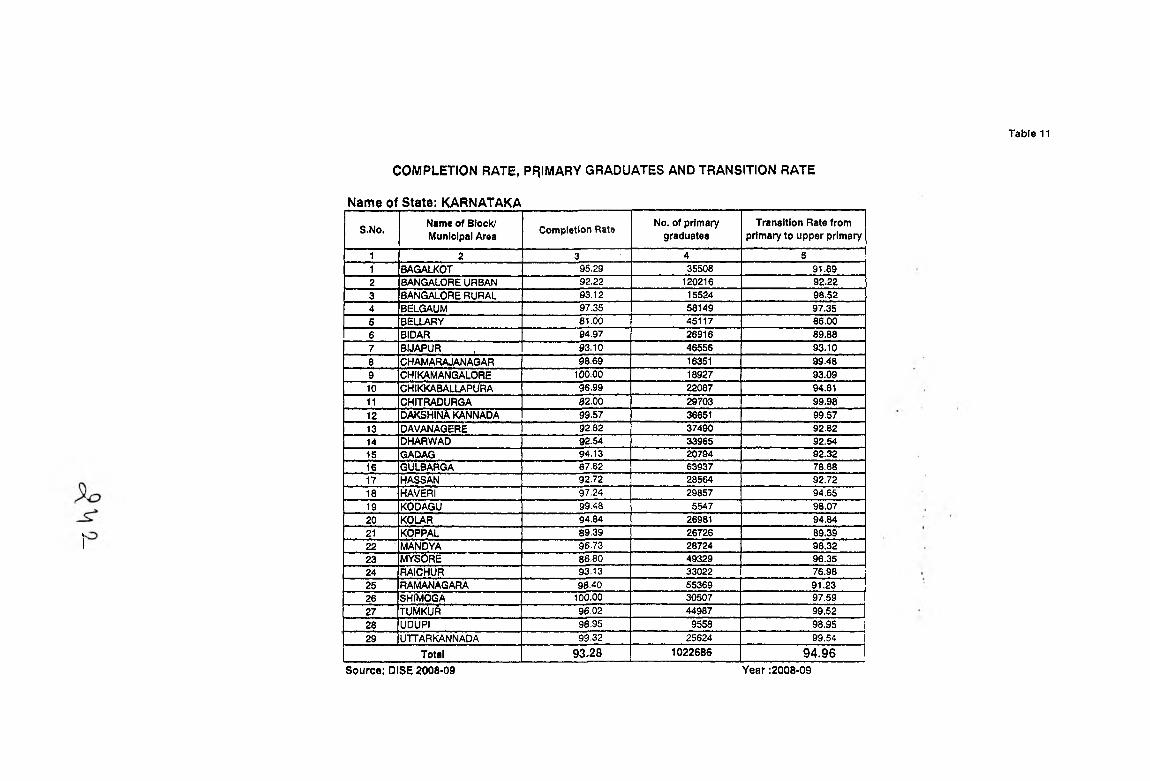
Table 11
COMPLETION RATE, PRIMARY GRADUATES AND TRANSITION RATE
Name of State: KARNATAKA
S.No. Name of Block/ Municipal Area
Completion Rate No. of primary graduates
Transition Rate from primary to upper primary
1 2 3 ‘ 4 51 BAGALKOT 95,29 35508 91.892 BANGALORE URBAN 92.22 120216 92.223 BANGALORE RURAL 93.12 15524 98.524 BELGAUM 97.35 58149 97,355 BELLARY 81.00 45117 86.006 BIOAR 64.97 26916 89.887 BIJAPUR , 03.10 46556 93.108 CHAMARAJANAGAR 98.b 16351 99.489 CHIKAMANGALORE 100.00 18927 93.0910 c hikkaballapu 'ra 96.99 22087 94.8111 CHITRADURGA 02.00 29703 99.9812 dakshinA KANNADA 99.57 36651 99.5713 DAVANAGERE 92.82 37490 92.8214 DHARWAD 92.54 33965 92.5415 GADAG 94.13 20794 92.3216 GULBARGA 07.62 63937 78.8817 HASSAN 92.72 28564 92.7218 HA\/ERi 97,24 29857 94,6519 KODAGU 99.48 5547 98,0720 KOLAR 94.84 26981 94,8421 KOPPAL 89.39 26726 89.3922 MANDYA 96.73 28724 98,3223 MYSORE 86.80 49329 96,3524 RAICHUR 93.13 33022 76,9825 RAMANAGARA 96.40 55369 91,2326 SHI\10GA 100.00 30507 97,5927 TUMKUI^ 96.02 44987 99,5228 UDUPI 90.95 9558 98,9529 UTTARKANNADA 99.32 25624 99,54
Total 93.28 1022686 9 4 .9 6Source; DISE 2008-09 Year :200B-09

Table 12
EGS AND UPGRADATiONName of State; KARNATAKA
Name of B locK/M uniclpal . Area
No. Of EGS centers upgraded up to 2008-09
Facilities Provided in Upgraded EOS center (PS) No. Of EGSiNo. of EGS
centers runnJrtfl for ?
No. of ECS Reason for not
upgrading
S. Buiiclings 1 Teacher 1 TLE Center Enrolment centers proposed Remaining
SanctionedActaully
Upgraded Sanctioned Corhpleted Sanctioned Recruited Sanctioned Providedrunning at
present
lu ii i i i i iy iv i £ 1
or more than 2 years
to be up graded in current year
Centres
1 2 3 4 5 6 7 8 9 10 11 12 13 ' .14 15 161 BAGALKOt e 8 8 8 16 16 8 8 0 0 0 0 02 BANGALORE URBAN 0 ' 0 0 0 0 0 0 0 0 0 0 0 03 BANGALORE RURAL 0 0 0 0 0 0 ■ 0 0 0 0 0 0 04 BELCiAUM 32 32 32 32 64 64 32 32 0 0 0 0 05 b e l LXr y 5 1 5 5 5 10 10 5 5 0 0 , 0 0 06 BIDAR 19 19 19, 19 38 ' 38 19 19 0 0 0 0 ■ 07 b ija p u r 32 32 32 32 64 64 32 32 0 0 0 0 08 CHAMARAJANAGAR 3 3 3 3 6 6 3 3 0 0 0 0 09 M ! i i s a s m c t a w a : « 1 . 1 1 1 1 2 Z 1 1 0 0 0 . 0 010 c k ik k a s a l l a p u r a 0 0 0 0 0 0 0 0 . 0 0 0 0 0 ,11 c h it r a 'd u Rg a 1 1 1 1 2 2 ' 1 1 0 0 ' 0 , 0 0
12 d a k s h im a 1 1 1 1 2 2 1 1 0 0 0 ■ 0 0 1
13 DAVANAGERE 2 ' 2 ' 2 2 4 4 * 2 2 0 0 0 ,.Q. 014 d h a r Wa d 4 4 4 4 8 0 4 4 0 0 0 0 015 GADAG 0 0 . 0 0 0 0 0 0 0 0 0 0. 016 g u l b X r g a 6 6 6 6 12 12 6 6 0 0 0 0 017 HASSAN 4 4 4 4 8 8 4 I 4 0 0 0 0 018 HAVERI 0 0 0 0 0 0 0 0 0 1 0 0 0 019 KODAGU ? 2 2 2 4 4 2 2 0 0 0 020 KOLAR 11 11 11 11 22 22 11 11 0 0 0 0 021 KOPPAL 25 ' 2S 25 25 50 50 25 .| 25 0 0 0 .0 022 MANDYA 0 0 6 0 0 0 0 0 0 0 0 0 023 MYSORE 2 2 2 2 4 A 2 2 0 0 0 0 0
24 RAICHUR 51 51 51 51 102 1 0 2 _ _ 51 51 0 0 i 0 , 0 025 RAMANAGARA 0 0 0 0 0 ' 0 0 0 0 0 0 026 SHlMOGA 0 0 0 0 0 6 ^ 0 0 0 0 0 • 0 ♦ . 0. .27 TUMKUR 14 ’ 12 12 12 ■ - - 2 4 24 12 12 0 0 0 • 0 ■ 028 UDUPI 4 4 4 4 8 8 4 4 0 0 0 0 029 u t t a r k a n n a o a 16 16 16 16 32 32 16 16 0 0 0 0 1
1 Total 1 241 241 241 241 482 482 241 241 0 0 0 . . . . 0 1
A d
Oq
Source: District Statistics Year :2008-09

SCHOOLSTablelS
s. No Block/ Municipal Area
Primary Schools/ Primary Section In UPS or Secondary School
Upper Primary Schools/ Upper Primary Section in Secondary School Total Sciiools for Grants
Qovt. Including
local bodiesGovt.aided
Unaided PrivateTotal
Govt. Including
local bodies
Govt.aided
Unaided PrivateTotal
Govt.Including
localbodies
Govt.aided
Unaided PrivateTotal No Of LPS
SectionsNo Of HPS sections,
Recognized
Unreeognized
RecognIzed
Unreeognized
Recognized
Unreoognized
1 2 3 4 S 6 7 8 9 10 11 12 13 14 IS 16 17 18 191 BAGALKOT 485 3 103 0 ■ 591 815 37 173 0 1,025 1,300 40 276 0 1,616 1,318 852
'2 BANGALORE URBAN 719 46 347 0 1,112 720 395 1,690 0 2,805 1.439 441 2,037 0 3,917 1,868 1,115■3 BANGALORE RURAL 717 1 40 0 758 436 10 110 0 556 1,153 11 '150 0 1,314 1,160 4464 BELGAUM 1,526 19 245 0 1,790 1,745 66 382 0 2,193 3,271 85 627 0 3,983 3,298 1,811;5 BELLARY 559 2 168 0 729 820 52 212 0 1,084 1,379| 54 380 0 1,813 1,413 872,6 BIDAR 513 0 97 0 610 723 107 159 0 1,069 1,236 167 256 0 1,679 1,416 9107 BIJAPUR 864 38 119 0 1,021 1,031 104 167 0 1,302 1,895 142 286 '0 2,323 2,019 1,135'8 CHAMARAJANAGAR 389 7 37 0 433 413 32 67 0 512 802 39 104 0 945 831 4459 CHIKKABALLAPURA 1,105 1 38 0 1,144 500 28 181 0 709 1,605 29 219 0 1,853 1,589 72610 CHIKKAMANGALORE 879 1 63 0 943 705~^ 21 112 0 838 1,584 22 175 0 1,781 1,627 52811 CHITRADURGA 849 6 78 0 933 8 8 0 67 100 0 1,048 1,730 73 178 0 1,981 1,784 94812 DAKSHINA KANNADA 293 19 62 0 374 659~1 216 180 0 1,055 952 235 242 0 1,429 1,168 87513 DAVANAGERE 685 > 153 0 845 714 105 192 0 1,011 1,399 112 345 6 1,856 1,483 81914 DHARWAD 245 11 91 0 347 534 71 145 0 750 779 82 236 0 1,097 830 605^5 GADAG 208 2 44 0 254 421 22 89 0 532 629 24 133 0 786 640 4431i6 GULBARGA 1,317 24 105 0 1,446 1,407 113 309 0 1,829 2,724 137 414 0 3,275 2,850 1,520
HASSAN 1,562 3 62 0 ■ 1,627 1,051~' ■ 44 212 0 1,307 2,613 47 274 ,0 2,934 2,633 1,09518 HAVERl 464 2 8.0 0 546 716~' 24 95 0 835 1,180 26 175 0 1,381 1,198 7401'9 KODAGU 148 1 25 0 ■ 174 276~1 8 77 0 361 , 424 9 102 0 535 429 28420 kOLAR 1,288 1 50 0 1,339 621 42 198 D 861 1,909 43 248 9 2,200 1,938 6632:1 KOPPAL 438 2 90 0 530 524 8 107 d 639 962 10 197 0 1,169 955 5322i2 MANDYA 1,0i'3 2 77 0 1,092 840 32 201 0 1,073 1,853 34 278 0 2,165 1,856 87223 MYSdRE 1,005 8 121 0 1,134 964 105 322 0 1,391 1,969 113 443 0 2,525 2,064 ,1,06924 RAICHUR 784 2 110 0 896 671 17 155 0 843 1,455 19 265 'o 1,739 1,459 68825 RAMANAGARA 953 2 34 0 989 462 22 107 0 591 1,415 24 141 0 1,580 1,421 48426 SHIMOGA 1,00^ 3 81 0 1,088 950 53 214 0 1,217 1,954 56 295 ■ 0 2.305 1,991 1,00327 TUMKUR 2,225 31 98 0 2,354 1,369 54 243 0 1,666 3,594 85 341 0 4,020 3,646 1,42328 UDUPI 268 18 26 0 312 363 211 81 0 655 631 229 107 0 967 850 574zb UTTARKANNADA 1,191 10 29 0 . 1,230 1,003 31 78 0 1,112 2,194 41 107 0 2,342 2,212 1,034
1 Total 23,696 272 2,673 0 26,641 22334 2177 6358 0 30869 46,030| 2,449 9,031 0 57,510 47,^46 24,511
-S-
Source; DISE 2008-09 Year:2008-09

Upper Primary Schools for GirlsState Policy for Openning of Girls School
Name of State; KARNATAKA
Table13A
SI.No. Block/ Municipal'Area
Total no. of Govt. UP Schools
Total no. of Existing
Govt. Girls UP Schools
Entitlement for Girls UP Schools as per state
policy
Total no. of proposed Girls UP
Schools in AWP&B 2008
09
Rennaining Gap of Girls UP Schools
(7=5-6) •
1 2 3 4 5 6 7 .1 BAGALKOT 815 56 0 0 02 BANGALORE URBAN , 7201 1 0 0 03 BANGALbRE RURAL 436 4 0 0 04 BELGAUM 1,745 95 0 0 05 BELLARY 820 9 0 0 06 BIDAR 7231 ' 14 0 0 07 BIJAPUR 1,031 102 0 0 08 CHAMARAJANAGAR 413 3 0 0 09 GHIKKABALLAPURA 500 7 0 0 010 CHIKKAMANGALORE 705 6 0 0 011 CHITRADURGA 881 9 0 0 012 DAKSHINA KANNADA 6591 2 0 0 013 DAVANAGERE 714 19 0 0 014 DHARWAD 534 52 0 0 015 GADAG 421 55 0 0 016 GULBARGA • 1,407 22 0 0 017 HASSAN 1,051 17 0 0 018 HAVER 1 716 40 0 0 019 KODAGU 276 0 0 0 020 KOLAR 621 6 0 0 O:21 KOPPAL 524 ' 18 0 0 022 MANDYA 840 12 0 0 023 MYSORE 964 “ 1 14 0 0 024 RAlbHUR 671 16 0 0 025 RAMANAGARA 462 3 0 0 026 SHIMOGA 950 9 0 0 027 TUMKUR ' 1,369 8 0 0 028 UDUPI 363 0 0 0 029 UTTARKANNADA 1,003 15 0 . 0 0
Total 22334 614 0 0 0Source: DISE 2008-09 and BRC Reports Y e a r ; 2008-09

S io
Madarsa/MaqtabTable13B
Name of State: KARNATAKA
s. No Block/Municipal Area1
No. of Recognised* Maqta^/Madarsa
No-of Madarsa to
whom grants provided in
2008-09
Studentsenrolment
No. of Education Volunteers
No. of Un Recognised
Maqtab/Madar sa
Studentsenrolment
No. of Education Volun^^ers
1 2 3 4 5 ' 6 7 8, • 91 BAGALKOTE .15 5 170 10 10 2162 02 BANGALORE URBAN 0 27 1712 54 26 1502 03 BANGALORE RURAL 0 0 3 61 04 BELGAUM 6 1 18 2 11 512 , 05 BELU\RY 3 0 26 2123 06 BIDAR 1 13 823 26 19 2757 07 BIJAPUR 26 7 1180 14 5 558 08 CHAMARAJANAGAR 0 2 71 4 ' 09 CHIKKABALLAPUR 1 6 248 12 010 CHIKKAMAGALUR 0 0 6 178 , 011 CHITRDURGA 0 1 0 42 1696 . 012 DAKSHINA KANNADA 0 0 0 0 ■ 013 DAVANGERE 5 6 408 12 2 014 DHARWAD 0 ' 2 110 4 30 650 • 015 GADAG' 1 0 2 23 016 GULBARGA 12 38 1165 76 33 3959 017 HASSAN 0 ‘ 1 30 2 0 018 HAVERI 0 1 48 2 28 2317 . 019 KODAGU 0 0 119 72 020 KOUVR 0 3 79 6 ' 021 KOPPAL 2 1 4 136 8 3 2092 022 MANDYA 0 0 8 320 0 .23 MYSORE 0 0 13 ,681 024 RAICHUR 0 5 152 10 1 208 ’ 025 RAMANAGARA 0 1 52 2 026 SHIMOGA 0 1 170 2 20 796 027 TUMKUR 0 14 190 28 11 431 028 UDUPI 0 0 5 228 , 0291 UTTAR KANNADA 0 3 61 6 24 1986 0
Total 72 140 6823 ^80 447 25312 0Source; DISE 2008-09 and BRC Reoorts ''PC VO..''iCi

SCHOOL GRANT (UPPER PRIMARY SCHOOL/UPPER PRIMARY SECTION)Table 13C
Name of District: KARNATAKA
S.No, Block/ Municipal ZoneGovt Aided
TotalPrimary
TotaiUpper
PriamryPrimary UpperPrimary
Primary UpperPrimary
Tota
1 BAGALKOT 1,283 815 , 35 37 1,318 852 2 1702 BANGALORE Uf^BAN 1,438 7 ^ 430 395 1,868 1,115 2 9833 BANGALORE RURAL 1,149 4 ^ 11 10 1,160 446 1 ,'6064 BELGAUM 3,243 1,745 55 66 3,298 1,811 5,1095 BELLARY 1,361 820 52 52 1,413 872 2,2856 BIDAR 1,230 723 186 187 1,416 910 2,3267 BIJAPUR 1,880 1,031 139 104 2,019 1,135 3,1548 CHAMARAJANAGAR 792 413 39 32 831 445 1,2769 c h ik a m a n g a l o r e 1,567 705 22 21 1,589 726 2,31510 CHIKKABALUSkPURA 1,599 500 28 28 1,627 528 2,15511 CHITRADURGA 1,716 , 881 68 67 1,784 948 2,73212 DAKSHINA KANNADA 942 659 226 216 1,168 875 2,04313 d avanAg er e 1,384 714 99 105 1,483 819 2,30214 DHARWAD 772 534 58 71 830 605 1,43515 GADAG 620 421 20 22 640 443 1,08316 GULBARGA 2,713 1,407 ' 137 113 2,850 1,520 4,37017 HASSAN 2,587 1,051 46 44 2,633 1,095 3,72818 HAVERI 1,174 716 24 24 1,198 740 1,93819 KODAGU 422 276 7 8 429 284 71320 KOLfl^R 1,895 621 43 42 1,938 663 '2,60121 KOPPAL 945 524 10 8 955 532 1,48722 MANDYA . . 1,824 840 32 32 1,856 872 2,72823 MYSORE ' 1,955 964 109 105 2,064 1,069 3,13324 RAICHUR 1,443 671 16 17 1,459 688 2,14725 RAMANAGARA 1,399 462 22 22 1,421 484 1,90526 SHIMOGA 1,938 950 53 53 1,991 1,003 2,99427 TUMKUR 3,574 1,369 72 54 3,646 1,423 , 5,06928 UDUPl 629 363 221 211 850 574 ;1,42429 UTTARKANNADA 2,183 1,003 29 31 2,212 1,034 3,246
Total 45,657 22,334 2,289 2,177 47,946 24,511 72,457

T»bS«14TEACHERS (PRIMARY SCHOOL/PRIMARY SECTION)
Nam* of Stotat: KARNATAKA
S.No. Block/ Municipal Ar«a
T«teh«r« in Government School*Teachere In Oovemment Mded
Schoota Total no. of Teachers
% olFemale
TeachersPrimaryAlona
Primary 4 Middle
Primary + Secondary
PrimaryAlone
Primary ♦ Middle
Primary ♦ Secondary
2 3 4 5 6 7 8 9 ' 10
1 BAGALKOT 1,178 0 0 9 0 0 1,167 68.36
2 BANGALORE URBAN 1,649 0 200 0 0 1,840 24.04
3 BANGALORE RURAL 1.469 0 0 1 0 0 1,470 54.72
4 BELQAUM 3,620 0 0 92 0 0 3,712 126.87
5 BELlARY 1.507 0 0 5 0 0 1,512 62.16
6 BIDAR 1,551 0 0 0 0 0 1,561 64.30
7 BUAPUR 1.959 0 0 114 0 0 2.073 66.47
8 CHAMARAJANAGAH B99 Q 0 18 0 0 917 63.04
9 CHIKAMANGALORE 1,691 0 0 12 1,703 63.82
10 CHIKKABALLAPURA 2,196 0 0 1 0 0 ' 2,1 »7 63.32
11 c h it r a d u r q a 1,758 p 0 29 1,787 64.82
12 DAKSHINA KANNADA 674 0 0 112 0 0 786 37.54
13 OAVANAGERE 1.710 0 0 30 • • 1,740 60.81
14 OHARWAO 679 0 0 39 0 0 718 45.40
15 GADAG 647 0 0 11 0 0 658 55.60
16 g u lb a r q a 3,550 0 0 100 0 0 3,650 125.84
17 HASSAN 3,150 0 0 14 0 0 3,173 60.03
18 HAVER! 1,182 0 0 7 0 0 1,189 67.42
19 KODAGU 331 0 0 5 0 0 336 31.41
20 KOLAR 2,641 0 0 2 b 0 2,643 53.79
21 KOPPAL 1,132 0 c 15 0 0 1,147 64,36
22 MANDYA 1.987 . 0 0 1 0 0 1,988 64.39
23 MYSORE 2,450 0 0 58 0 0 2,608 52.86
24 RAICHUR 1,960 0 0 25 0 0 1,985 62.08
25 RAMANAGARA 1,936 0 0 6 0 0 1,942 53.53
26 SHIMOQA 2,044 0 0 9 0 0 2,053 55.12
27 TUMKUR 4,420 0 0 58 0 0 4,478 114.53
28 UDUPI 611 0 0 74 0 0 685 55.63
29 UTTARKANNADA 2,388 0 0 29 0 0 2,417 46.42' Total 52,978 0 0 1076 0 0 54054 55,42
Source: OISE 200B-09 Year: 2008-09

REQUIREMENT OF ADDITIONAL TEACHER (PRIMARY)T a b l5 l4 A
Name of State: KARNATAKA
S.NO Block/ Municipal Area
Teachers in Primary Schools
Students Enrolment in
Govt. Primary School^
Entitlement or Teachers at
1:40 ratio
Entitlement of Teachers
minimum 2 teachers in each school
Sanctioned Posts Working
1
PTR w.r.t. Sanctioned
Posts
PTR w.r.t. Working
Posts
Single Teacher Schools after
Rationalization
Entitlement of Addi.
Teach'ers for Primary
By State Under SSA Total By State Under SSA Total
1 2 3 4 5 6 7 8 9 10 11 12 13 . 14 151 BAGALKOT 26,174 654 970 855 323 1,178, 829 290 1,119 22.22 23.39 0 0
2 BANGALORE URBAN 34,930 873 1,438 1,451 198 1,649 1,402 206 1,608 21.18 21.72 23 1423 Ba n g a l o r e r u r a l 19,423 486 1,434 1,426 43 1,469 1,389 40 1,429 13.22 13.59 0 04 BELGAUM ' 69,789 1745 3,052 2,569 1057 3,620 2,537 798 3,335 19.28 20.93 0 05 BELLARY 34,075 . 852 1,118 1,335 172 1,507 1,227 150 1,377 22.61 24.75 3 2176 BIDAR 31,016 775 1,026 1,316 235 1,551 1,273 231 1,504 20.00 , 20.62 • 0 07 BIJAPUR 41,219 1030 1,728 1,517 442 1,959 1,485 358 1,843 21.04 22.37 28 08 C HAMARAJANAGAR 14,149 354 778 837 62 899 771 57 828 15.74 ■ ' 17.09 0 09 c h iKa m ASig a l Or ^ 20,897 522 2.210 1,545 146 1,691 1,435 135 1,570 12.36 ' 13,31 169 010 CHIKKABALLAiPURA 33,030 826 1,758 2,067 129 2,196 1,991 119 2,110 15.04 15.65 0 0
11 c h it r a d u r 6 a ■ 26,083 652 1,698 1,188 570 1,758 1,215 485 1,700 14.84 , 15.34 110 012 DAKSHINA KANNADA 10,925 273 586 580 94 674 550 68 618 16.21 ■ 17.68 0 0
13 DAVANAGERE 30,008 750 1,370 1,608 102 1,710 1,508 102 1,610 17.55 18.64 64 214 DHARWAD 15,556 389 490 615 64 679 585 56 641 22.91 . 24.27 27 2715 GADAG 14,467 361 416 592 55 647 553 54 607 22.34 23.82 0 016 GULBARGA 95,812 2395 2,634 2,720 830 3,550 2,596 730 3,326 26.99 28.81 , 0 017 HASSAN 38,491 962 3,124 3,029 130 3,159 2,962 85 3,047 12.18 '12.63 1 018 HAVERI 21,650 641 928 1,098 84 1,182 1,018 44 1,062 18.32 20.39 0 019 KODAGU 4,497 112 296 289 42 331 274 38 312 13.59 14.41 15 0
- 20 . KOLAR 41,959 1049 2,576 2,527 114 2,641 2,485 90 2,575 15.89 , 16,29 0 621 KOP^’AL 31,245 781 876 964 168 1,132 909 146 1,055 27.60. 29.62 0 022 MAND.YA 28,531 713 2,026 1.961 26 1.987 1.804 13 1,817 14.36 ' ' 15.70 0 0
23 MYSORE 39,616 990 2,010 2,395 S.S 2,450 2,224 50 2,274 16.17 , ' ' 17.42 0 024 RAICHUR 48,806 1220 1,568 954 1006 <1,960 938 953 1,891 24.90 25.81 37 316
25 r a m a n Ja g a r a ’ 26,932 673 1,906 1,773 163 1,936 1.724 116 1,840 13-91 14.64 204 026 SHIMOGA 28,923 723 2,008 2,036 400 2,044 1,523 400 1,923 14.15 15.04 0 027 t u m k u r ' 58,795 1470 4,450 1 3.930 490 4,420 3,716 443 4,159 1.3.30 14.14 219 0
28 UDUPI 9,036 226 536 535 76 611 510 67 577 14.79 15.66 0 0
29 u t t a r k a n n a d a 30,128 753 2,382 1,603 765 2,388 1,368 767 2,135 12.62 , 14.11 138 43
Total 926152 23154 47,392 45309 8061 52978 42801 7091 49892 17.48 18.56 1038 753
Source: DISE 2008-09 Year:2008-09

TEACHERS (UPPER PRIMARY SCHOOL/UPPER PRIMARY SECTION)Table15
Name of District: KARNATAKA
S.NO. Block/ Municipal Zone
Teachers in Government Schools
Teachers in Government Aided Schools
Total No. of Teachers
% o fFemale
TeachersUpperPrimary
Upper Primary + Secondary
UpperPrimary
Upper Primary + Secondary
1 2 3 4 5 6 7 81 BAGALKOT 6,197 0 385 0 6,582 58.112 BANGALORE URBAN 5,492 0 3,316 0 8,808 18.813 BANGALORE RURAL 2,516 0 59, 0 2,575 44.575 BELGAUM 13,445 0 803 0 14,248 • 53.016 BELLy^RY 7,047 0 493 0 7,540 ■ 53.837 BIDAR 5,184 0 1,232 0 6,416 ■ 56.038 BIJAPUR 7,356 0 626 0 7.98? 60.209 CHAMARAJANAGAR 2,695 0 242 0 2,937 49.9810 CHIKAMANGALORE 4,389 0 167 0 4,556 . 52.9511 CHIKKABALLAPURA 2,935 0 239 0 3,174 . 53.8613' CHITRADURGA 5,392 0 373 0 5,765 52.2714 DAKSHINA KANNADA 4,408 0 2,314 0 6,722 ' 26.2415 DAVANAGERE ^ 5,148 0 750 0 5,898 54.2316 DHARWAD 4,540 0 804 0 5.344 39.7217 GADAG 3,465 0 282 0 3,747 ■ 58.6018 GULBARGA 11,013 0 996 0 12,009 . 56.5319I HASSAN 5,143 0 332 0 5,475 52.4020 HAVERI 5,203 0 199 0 5,402 58.4121 KODAGU 1,740 0 86 0 1,826 ■ 25.0322 KOLAR - 3,646 0 373 0 4,019 ’ 43.1923 k o p p a L 4,178 0 87 0 4,265 60.5325 MANDYA 4,519 0 253 0 4,772 56.5526 MYSORE 6,855 0 734 0 7,589 44.6827 RAICHUR 5,457 0 231 0 5,688 54.5228 RAMANAGARA 2,664 0 188 0 2,852 47.53
' 29 SHIMOGA 5,196 0 400 0 5,596 45.5330 TUMKUR 7,274 0 342 0 7,616 50.7031 UDUPI 2,265 0 1,730 0 3,995 38.2232 UTTARKANNADA 5,323 0 328 0 5,651 32.63
Total 150,685 0 18364 0 169049 42.39Source: DISE 200a-nQ
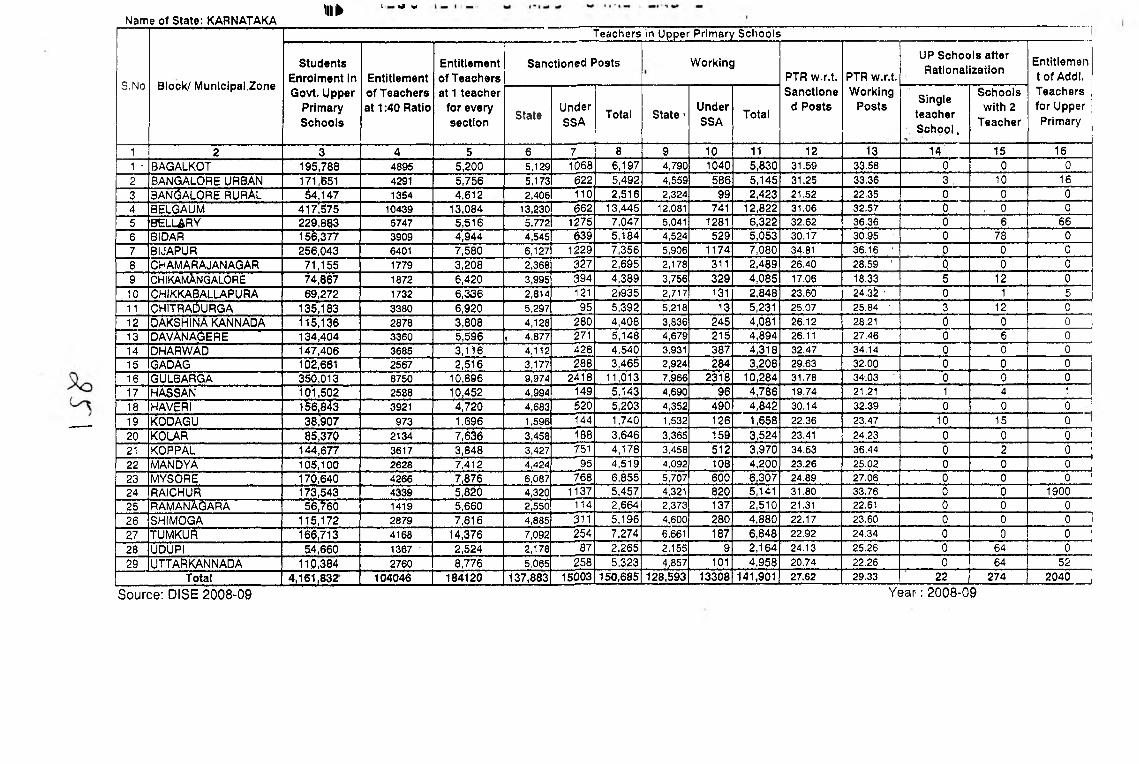
Name of State: KARNATAKAm
S.NO B lock/ M unlcipal.Zone
Teachers in Upper Prim ary Schools
S tudents E nro lm ent In G ovt. Upper
Prim ary S chools
Entitlem ent o f Teachers at 1:40 Ratio
Entitlem ent o f Teachers at 1 teacher
fo r every section
Sanctioned Posts W orkingPTR w .r.t. Sanctione
d Posts
PTR W.r.t, W orking
Posts
UP S choo ls after R a tionalization
Entitlem en t o f Addl. Teachers fo r Upper Prim aryState
UnderSSA
Total S ta te 'UnderSSA
TotalS ingle
teacherS cho o l,
S choo ls w ith 2
Teacher
1 2 3 4 5 6 7 8 9 10 11 12 13 14 ' 15 161 ■ BAGALKOT 195,788 4895 5,200 5,129 1068 6,197 4,790 1040 5,830 31.59 33.58 0 0 02 BANGALORE URBAN 171,651 4291 5,756 5,173 622 5,492 4,559 586 5,145 31.25 33.36 3 , 10 163 BANGALORE RURAL 54,147 1354 4,612 2,406 110 2,516 2,324 99 2,423 21.52 22.35 0 0 04 BELGAUM 417;675 10439 13,084 13,230 662 13,445 12.081 741 12,822 31.06 32.57 0 , 0 05 8ELLARY 229,883 5747 5,516 5,772 1275 7,047 5,041 1281 6,322 32.62 36,36 0 6 666 BIDAR 15^,377 3909 4’,944 4,545 639 5,184 4,524 529 5,053 30.17 30.95 ■ 0 78 07 BIJAPUR 256,043 6401 7,580 6,127 1229 7,356 5,906 1174 7,080 34.81 36.16 ' 0 0 08 CHAMARAJANAGAR 71,155 1779 3,208 2,368 327 2,695 2,178 311 2,489 26.40 28.59 ' Q 0 69 c h ik a m An g a l o r e 74,86^ 1872 6,420 3,995 394 4,389 3,756 329 4,085 17.06 18.33 5 12 010 CHIKKA8ALLAPURA 69,272 1732 6,336 2,814 121 2)935 2,717 131 2,848 23.60 24,3^ • 0 1 511 c h it r a S u r g a 135,183 3380 6,920 5,297 95 5,392 5,218 13 5,231 25,07 25.84 ■ 3 12 012 OAKSHINA KANNADA ^15,136 2878 3,808 4,128 280 4,408 3,836 245 4,081 26.12 28.21 0 0 013 d a v A n a g e r e ' 134,404 3360 5,596 I 4,877 271 5,148 4,679 215 4,894 26.11 27.46 0 6 014 DHARWAD 147,406 3685 3,116 4,112 428 4,540 3,931 387 4,318 32.47 34.14 0 0 015 g a d a g 102,661 2567 2,516 3.177 288 3,465 2,924 284 3,208 29.63 32.00 0 0 016 g u l b a r g a 350,013 8750 10,896 9,974 2418 11,013 7,966 2318 10,284 31.78 34,03 ' 0 0 017 HASSAN 101,502 2538 10,452 4,994 149 5,143 4,690 96 4,786 19.74 21,21 1 4 118 h a v e r i 156,843 3921 4,720 4,683 620 5,203 4,352 490 4,842 30.14 32.39 0 0 019 k o d a g u 38;907 973 1,696 1,596 144 1,740 1,532 126 1,658 22.36 23.47 10 15 020 k o l a r 85,370 2134 7,636 3,458 188 3,646 3,365 159 3,524 23.41 24.23 0 0 021 KOPPAL 144,677 3617 3,848 3,427 751 4,178 3,458 512 3,970 34.63 36.44 0 2 022 MANDYA 105,100 2628 7,412 4,424 95 4,519 4,092 108 4,200 23.26 25,02 0 0 023 MYSORE 170.640 4266 7,876 6,087 768 6,855 5,707 600 6,307 24.89 27.06 ' 0 0 024 RAICHUR 173,543 4339 5,820 4,320 1137 5,457 4,321 820 5,141 31.80 33,76 0 0 190025 r a m a n A g a r a 5h,760 1419 5,660 2,550 114 2,664 2,373 137 2,510 21.31 22.61 0 0 026 SHIMOGA 115,172 2879 7,816 4,885 311 5,196 4,600 280 4,880 22,17 23.60 0 0 027 TUMKUR 166,713 4168 14,376 7,092 254 7,274 6,661 187 6,848 22.92 24,34 0 0 028 UDUPI 54,660 1367 ■ 2,524 2,178 87 2,265 2,155 9 2,164 ' 24.13 25.26 0 64 029 UTTARKANNADA 110,384 2760 8,776 5,065 258 5,323 4,857 101 4,958 20.74 22.26 0 64 52
Total 4,161,832 104046 184120 137,883 15003 150,685 128,593 13308 141,901 27.62 29.33 22 274 2040
Source; DISE 2008-09 Y ear:2008-09
I 4 w

T a b le is
TRAINED AND UNTRAINED TEACHERS
Name of State: KARNATAKA
S.No Block/ Municipal Afea
Primary teachers Upper Primary Teachers,
WorkingTeachers Trained* %age
Untrained
%age WorltlngTeachers Trained %age
Untrained
%ageThpsa
who have received 60 days training
Those who have
not received 60 days tralnlna
Total
Those who have received 60 days training
Those who have
not received 60 days tralnlna
. Total
1 2 3 4 5 6 7 8 9 10 11 12 13 14 15 16*1 BAGALKOT 1,119 1,119 100 0 0 0 0.00 5,830 5830 100 0 0 0 0.002 BANGALORE NORTH 1.608 1,608 100 0 0 0 0.00 5,145 5145 100 0 0 0 0.003 BANGALORE RURAL 1.429 1421 99.44 0 8 8 0.56 2,423 2423 100 0 0 0 0.005 BELQAUM 3.335 3335 . 100 0 0 0 0.00 12.822 12822 100 0 < c 0 0.006 BELLARY 1,377 1377 100 0 0 0 0.00 6,322 6322 100 0 0 0 0.007 BIDAR 1,504 r 1504 100 0 0 0 0.00 5.053 5053 100 0 . 0 0 0.008 bijapOr 1.S43 1843 100 0 0 0 0.00 7,080 7080 100 0 0 0 0.009 CHAMARAJANAGAR 828 828 100 0 0 0 0.00 2,489 2489 100 0 0 0 0.0010 c hikam ang al6 re 1,570 1570 100 0 0 ^ 0 0.00 4,085 4085 100 0 . 0 0 0.0011 c h Ikkaballapur a 2,110 2110 100 0 0 0 0.00 2.848 2848 100 0 0 0 0.00t3 chitradurga 1,700 1700 100 0 0 0 0.00 5,231 5231 100 0 0 0 0.0014 DAKSHINA KAfiNADA 618 610 98.71 0 8 8 1.29 4.081 4081 100 0 0 0 0.0015 davanagere 1,610 1610 100 0 0 0 0.00 4.894 4894 100 0 0 0 0.0016 DHARWAD 641 641 100 0 0 0 0.00 4.318 4318 100 0 0 0 0.0017 GADAG 607 607 100 0 0 0 0.00 3,208 3208 100 0 0 6 0.0018 GULBARGA. 3,326 3326 100 0 0 0 0.00 10.284 10284 100 0 0 0 0.0019 HASSAN 3,047 3047 100 0 0 6 0.00 4,786 4786 100 0 0 0 0.0020 HAVERI 1,062 1062 100 0 0 0 0.00 4.842 4842 100 0 0 0 0.0021 KOOAGU 312 ■ ■ ■ '304 97.44 0 8 8 2.S6 1.688 1650 99.52 0 8 8 0.4822 KOLAR 2,575 2575 100 0 0 0 0.00 3.524 3,524 100 0 0 0 0.0023 KOPPAL 1,055 1055 100 0 0 0 0,00 3,970 3.970 100 0 0 0 0.0025 MANDYA 1,817 1817 100 0 0 0 0.00 4.200 4.200 100 0 .0 0 0.0026 MYSORE 2,274 2274 100 0 0 0 0.00 6,307 6,307 100 0 0 0 0.0027 rai6 hur 1,891 1891 100 0 0 0 0.00 5,141 5.141 100 0 0 0 0.0026 RAMANAGARA 1,840 1840 100 ' 0 0 0 0.00 2.510 2.510 100 0 0 0 0.0029 SHIMOGA 1,923 1923 100 0 0 0 0.00 4.880 4,880 100 0 0 0 0.0030 TUMKUR 4,169 4159 100 0 0 0 0.00 6.848 6.848 100 0 0 0 0.0031 UDUPI 577 677 100 0 0 0 0.00 2.164 2,164 100 0 0 0 0.0032 UTTARKANNADA 2,135 2135 100 0 0 0 0.00 4.958 4,958 100 0 0 0 0.00
Total 49892 49868 99.95 0 24 24 0.05 141901 141893 99.99 0 8 8 . 0,01Source: * Trained
DISE 2008-09 as per NCTE guidelines
Year; 2008-09,

EXISTING SCHOOL (GOVERNl\/lENT) INFRASTRUCTURE
Table 17
Name o1 State: KARNATAKA
SI B lo ck /m u n lc lp M l At9»T o ta l N o .o f S c h o o l*
T o ta l N o .o f S c h o o l* H *v in 9 o w n b u ild in g
T o ta l No. o f e l is a ro o m *No. o f ic h o o ls
w ith o u t D/W«ter l i c l l l t y
No. o1 s c h o o lf w ith o u t com m on
T o ile t fa c ility
No. o f sc h o o ls w ith o u t g ir ls T o ile t
No. o fc c h o o ls w ith o u t A o c e is ram ps
G sp In c lass ro o m s as per D IS E /a c tu il
s u rv s y 200D-09
No. o f sch o o l
w ith o u t HM room s
P fim s ry S ch o o ls S anc tion ed S o fa r
P3 b u lld lh g
sanctJone d so fs r .
U pper P rim a ry S ch o o ls
S a n c tio n e d So fs r
UPS b u ild in g s a c n tio n a d so
Is r
p UP P y p P UP P UP p UP P UP P UP
1 2 3 4 3 4 S « 7 s g 10 11 12 13 14 16 18 17 18 IS 20
1 BAGAUKOT 1 ,2 8 3 8 1 5 1,151 7 4 6 1 ,2 3 6 5 ,4 3 9 173 2 57 151 106 3 34 3 93 2 7 8 184 2 2 ? ' 340 . 0 0 0 0
2 BANfiALOPie URBAN 1 ,4 3 8 7 2 0 1,251 6 2 9 1 ,6 4 6 4 ,9 5 3 8 8 55 151 55 2 86 141 3 66 281 4 4 2 0 138 138 150 150
3 BANGALORE RURAL 1 ,1 4 9 4 3 6 1 ,1 2 0 4 2 3 1 ,4 0 8 2 ,4 2 6 162 , 6 5 8 7 2 7 351 88 481 134 119 4 33 6 6 3 04 BELGAUM 3 ,2 4 3 1 ,7 4 5 3 ,0 4 1 1 ,6 5 7 3 ,4 7 8 1 2 ,1 2 8 372 4 0 3 4 4 6 2 3 4 1,021 6 5 4 9 0 9 3 92 1423 718 . 9 7 97 2 15 0
5 BELLABY 1,361 8 2 0 1 ,2 7 6 7 68 1,661 5 ,9 5 4 65 65 152 144 3 87 3 7 0 164 9 8 981 ■ 3 8 8 77 77
6 BIDAR 1 ,2 3 0 723 1 ,1 2 4 681 1 ,7 0 7 4 ,3 4 8 2 3 5 185 2 5 8 198 4 04 4 4 2 3 7 6 3 52 109 39 502 5 02 6 9 6 6 987 BIJA^UR 1 ,6 ^ 0 1,03.1 i . e d s 1,0iD9 2 ,3 3 4 7 ,8 8 9 145 192 201 164 6 3 9 5 5 7 2 5 69 5 2 6 2 8 7 287 2 0 8 0
e c h a m a r a ja n Ia q a r 7 92 4 1 3 7 6 2 401 6 6 9 2 ,4 3 7 90 76 84 34 2 9 5 241 2 9 2 2 04 14 2 32 31 53
9 CHIKt<AMANGALOI^E 1 ,5 6 7 7 0 5 1 ,5 1 2 6 7 6 2 ,1 3 9 2 ,6 8 6 322 61 4 27 74 8 90 2 2 2 721 3 3 6 , 139 160 65 .84 51 710
10 c h ix k a b a l l a p u r a 1 ,5 9 9 5 0 0 1 ,5 6 0 4 8 2 1 ,7 5 9 3 ,9 6 7 85 3 8 43 17 471 167 8 2 5 2 6 6 35 1101 0 0 0 0
11 CHITRAOURQA 1 ,7 1 6 881 1 ,6 5 5 8 4 8 1,B 80 4 ,9 1 9 3 46 3 4 0 149 9 9 4 6 5 3 1 9 5 0 9 2 5 8 120 5 27 140 140 110 0
12 DAKSHINA k An NADA 9 4 2 6 5 9 9 2 0 6 3 d 8 0 7 4 ,3 9 2 20 63 21 54 115 117 55 56 150 543 47 47 0 0
13 o a v a n a q e r e 1 ,3 8 4 7 1 4 1 ,3 4 6 6 8 6 1 ,6 7 7 4 ,5 7 3 163 79 189 83 4 4 4 3 0 8 4 0 9 1 89 2 56 0 , 51 51 4 4
14 d h a r w a d 7 7 2 5 3 4 721 Sob 7 5 7 4 ,8 2 5 47 81 60 6 3 162 2 4 5 2 8 24 90 2 44 3? 4S 0 015 (j ADAQ . 6 2 0 421 5 9 2 401 6 3 6 3 ,1 0 6 35 6 2 41 4 9 136 167 82 66 2 27 0 ■ 2 0 5 191 4 12 401
16 QULBAfiiGA ^ ,7 1 3 1 ,4 0 7 2 ,5 1 1 1 ,3 1 3 4 ,0 1 1 1 0 ,7 1 5 351 2 9 9 6 18 3 46 1 ,0 2 9 8 5 0 751 36.6 4 0 0 0 4 0 4 4 0 4 ■ 0 017 HASSAN 2 ,5 8 7 1,051 2 ,5 7 7 1 ,0 2 8 2 ,8 ’71 5 ,0 6 0 4 4 3 141 347 90 1 ,1 8 0 '3 5 2 1 0 2 4 3 20 4 4 94 1 4 0 4 0 51 51
18 HAVERI 1 ,1 7 4 7 1 6 1 ,1 2 4 691 1 ,1 0 3 4 ,701 0 0 1 62 59 2 7 4 2 6 8 3 0 4 2 1 6 2 83 481 ' 4 2 42 0 0ie KODAQU 4 2 2 2 7 6 4 0 2 2 6 0 ' ■ ■ 372 1 ,7 1 1 0 0 9 13 41 4 5 8 0 5 6 . 27 0 1 4 6 27 26 1 0
20 KOLAR 1 ,8 9 5 ^ 621 1 ,8 9 0 6 1 0 2 ,5 4 9 3 ,1 8 2 151 44 3 95 1 0 0 9 77 2 97 9 0 2 ' 241 125 , 61 3 8 3 8 27 27
21 KOPPa L ■ 9 4 6 b 2 4 8 9 8 4 9 8 1 .0 8 6 3 ,3 8 4 89 113 123 53 3 1 9 2 5 6 2 08 78 4 0 5 .4 1 8 . ^ 75 75 15 15
22 MAN0Y/\ 1 ,8 2 4 8 4 6 1 ,7 7 6 801 2 ,0 6 5 4 ,6 0 6 253 1 28 197 74 6 73 2 74 8 4 8 3 95 70 2 25 0 0 0 023 MYSORE 1 ,9 6 6 9 $ 4 1 ,8 6 2 9 0 5 2 ,2 2 4 5 ,8 9 8 143 34 127 4 9 3 5 9 165 . 4 6 2 2 1 7 2 3 3 9 6 8 2 8
24 RAICHUR 1 ,4 4 3 071 1 ,2 4 2 6 2 3 , 1 ,9 0 4 3 ,9 3 3 3 19 144 3 0 5 131 4 38 2 37 6 05 2 6 8 7 8 2 2 7 178 65 173
25 r a m a n X'5a r a 1 .3 9 9 4 6 2 1 ,3 4 5 4 3 7 1 ,8 0 9 2 ,5 2 2 1 2 54 110 159 31 4 4 3 113 6 5 4 145 9 4 9 70 12 12 28 16
26 s h im o q a 1 ,9 3 8 9 5 0 1 ,8 9 9 9 1 8 2 ,0 5 4 4 ,9 3 6 181 123 102 59 4 3 3 2 9 9 8 8 6 6 3 2 61 , 5? .27 TUMKUR 3 ,5 7 4 1 ,3 6 9 3 ,4 5 0 1 ,3 1 8 4 ,1 9 5 6 ,9 1 0 6 2 8 3 19 257 97 971 3 1 9 172 0 6 3 4 2 22 0 ' 140 140 43 0
is UDUPI 6 2 9 3 63 5 9 8 S41 6 7 7 2 ,2 5 5 21 12 31 36 68 31 62 2 8 3 2 4 8 6 2 6 8 2 6 2 3 6 3 342
29 u t t a r k a n n a o a 2 ,1 8 3 1 ,0 0 3 9 8 7 2j215 4 ,9 0 8 169 81 104 39 7 9 4 4 5 5 9 3 9 4 5 7 3 8 5 9 4 6 139 139 2 2
Total 4 5 ,6 5 7 Z2,3d4 43,591 21,261 53,029 1 3 9 ,2 6 2 5 ,3 5 0 3 ,5 7 0 5 .2 9 6 2 ,5 7 8 1 4 .3 9 9 8 ,3 9 2 1 4 ,9 4 2 6 ,8 9 8 7 7 1 0 92B 5 3 1 8 8 2 9 5 9 2841 , 2 4 1 6
O o
SourceiDISE 2008-09 Year: 2008-09

Table 18 Information on Govt. Upper Primary Schools Without Furniture
Table 18
Name of State: KARNATAKA
S.No Block/ Municipal Area Total No, of Govt. UPS
No, otUPS Sanctioned under SSA Since 2001
UPS Provided TIE under SSA
as non 0B3 School Since
2001
Balance UPS {6=3-4-5)
No, o1 Govi, UPS without
Furniture (Out of Col, 6)
Enrolment in these Govt, ,
UPS
1 2 3 4 5 6 7 81 BAGALKOT 815 0 0 815 85 694952 BANGALORE URBAN 720 150 159 411 53 225303 BANGALORE RURAL 436 29 • 29 378 59 120005 BELGAUM 1745 101 0 1644 500 1366376 BELLARY 820 118 14 638 350 341867 BIDAR 723 98 60 565 158 974078 BUAPUR 1031 208 208 615 672 762969 CHAMARAJANAGAR 413 110 122 173 24 950010 ■ CHIKAMANGALORE 500 51 51 398 , 102 710711 CHIKKABALLAPURA 705 0 50 655 260 3441713 CHITRADURGA 881 110 0 771 1155 S7597
14 DAKSHINA KANNADA 659 0 20 639 6 639315 DAVANAGERE 714 3 96 615 78 5^00016 DHARWAD 534 0 163 371 353 14633317 GADAG 421 0 0 421 66 , 734718 GULBARGA 1407 390 195 822 512 9557519 HASSAN 1 1051 51 51 949 17 1S20220 HAVERI ' 716 0 0 716 285 4455621 KODAGU 276 0 0 276 ■ 140 1535822 KOLAR 621 27 27 567 60 780023 KOPPAL ■ 524 15 0 509 281 4734525 MANDYA 840 0 8 832 16 895326 MYSORE 964 , 27 320 , 617 . 40 6622927 RAICHUR 671 173 173 325 269 6729528 RAMANAGARA 462 96 0 366 34 695029 SHIMOGA 950 0 0 950 4 2740030 TUMKUR 1369 43 1 21 1305 182 ' 1034031 UDUPI 363 0 0 363 2 458832 UTTARKANNADA 1003 2 58 943 163 56814
Total 22334 1810 1825 18699 5926 1247650Source: D1SE= ?nnfl.rici

S.No. Slock' Municipal A/s • Identified eiFolied iri Schools
i . '/ssrv 1 EG.; <' _H t:
te&ofiers to “ ; apppointed
, n ■ '■ iC' - :i
1 2 3 4 1 5 7 g1 BAGALKOT 6182 4658 0 582 0 0 56002 BANGALORE SOUTH ■3186 3891 0 439 1 0 ^7473 7074 2151 - 353 12 614 67214 BELGAUM 8545 7103 0 1471 0 1301 70745 BELU\RY 4122 4122 0 502 515 262 36206 BIDAR 4705 4014 0 691 247 0 40147 BIJAPUR 6058 3358 0 409 0 0 56498 CHAMARAJANAGAR 3747 3747 0 328 15 0 34199 c h ik a m a n g a Lo r e 3321 2716 0 3281 20 165 299310 c h ik k Xb a l l a p u r a 2734 1936 0 339' 32 337 239511 c h it r a d u r g a 4064 4048 0 119 10 389 394512 d a k s h in a k a n n a d a 6389 6359 0 600 0 0 578913 d a v a >Ja 6 e r e ■ 4684 1 4355 0 269 i 418 105 441514 DHARWAD 3741 3586 0 616 18 722 3125IS Sa d a g 3741 3027 0 331 0 63 341016 GULBARGA 7795 7068 0 1093 46 0 6702
■ 17 HASSAN 2918 2342 0 394 ! 24 0 252418 HAVERI 4622 *4622 0 481 516 503 414119 KODAGU 1825 1825 0 2251 9 0 160020 KOUR 2428 2428 0 3041 16 125 212421 KOPPAL 2fe8i2 2155 0 214 13 92 2668 ,22 MANDYA 4831 4831 0 689 24 0 414223 MYSORE 7343 7778 0 435 27 0 690624 RAICHUR 2059 3004 0 293 15 50 176625 RAMANAGARA 3004 1803 - 389 12 350 261526 SHIMOGA 1 5712 5163 0 643 0 350 506927 TUMKUR 6243 6243 0 741 30 1298 550228 UDUPI i 6226 6226 0 365 15 97 586129 UTTARKANNADA 5120 4624 0 505 4 1039 4615
1 Tot&l 135301 119183 0 14148 2039 7862 121153
6 ;316670748545412247056058374733212734406463894684374137417795291846221 8 2 5
2428288248317343205930045712624362265 1 2 0
Source: lERT Reports Y e ir : 2008-09

Table 20
Details of Schools besed on the no of ClassroomsName of State: KARNATAKA
SI. No
1
Name of Block/ Municipal Area
Primary Schools Ipper Primary School p to 3 Class RoomMore than 3 Class
rooms TotalAvaragfe @ Rs
0.075 LakhEligible
having upto 3
classrooms
having more than
3cljissrooms
having upto 3
classrooms
having m ore
than 3 classroo
ms
PhyFin (@Hs.0.05Lakh)
PhyFin (@ Rs.0.1 Lakh)
Phy Fin Phy F;n Phy Fin
1 2 3 4 7 8 9 ' 10 11 12 13 14 15 16. ^7 181 b a g a l k o t 1,077 194 53 746 1,130 56.500 940 94.00 2,070 150.500 2,070 155.250 2,070 150.5002 BANGALORE URBAN 1,219 191 61 646 1,280 64.000 837. 83.70 2,117 147.700 2,117 158.775 2,117 147.7003 BANGALORE RURAL 1,056 89 34 400 ^1 ,0 90 54.500 489 48.90 1,579 103.400 1,579 118.425 1,579 103.4004 BELGAUM 2,806 400 164 1,562 2,970 148.500 1,962 196.20 4,932 344.700 4,932l 369.900 4,932 344.700
■*5 BELLARY 1,078 266 , 24 769 1,102 55.100 1,035 103.50 2,137 158.600 2,137 160.275 2,137 158.6006 BIDAR ■ 934 262 42 652 976 48.800 914 91.40 1,890 140.200 1,890 141.750 1,890 140.2007 BIJAPUR 1.608 262 31 983 1,639 81.950 1,245 124.50 2,884 206.450 2,884 ■216.300 2,884 206.4508 CHAMARAJANAGAR 713 60 36 369 749 37.450 429 42.90 1,178 80.350 1,176 88.350 1,178 80.3509 CHIKKAMANGALORE 1,432 121 28 660 1,460 73.000 781 78.10 2,241 151.100 2,241 168.075 2,241 151.10010 CHIKKABALUPURA 1,471 116 52 439 1,523 76.150 555 55.50 2,078 131.650 2,078 155:850 2,078 131.65011 CHITRADURGA 1,513 200 110 761 1,623 81.150 961 96.10 2,584 177.250 2.584 193.800 2,584 177.25012 pAKSHINA KANNADA 794 137 17 630 811 40.550 767 76.70 1,578 117.250 1,578 11^350 1,578 117.25013 pAVANAGERE 1,200 183 27 675 1,227 61.350 858 85.80 2,085 147,150 2,085 , 156.375 2,085 147.15014. pHARW AD 652 120 7 521 659 32.950 641 64.10 1,300 97.050 1,300 97,500 1,300 97.05015 GADAG 500 114 10 400 510 25.500 514 51.40 1,024 76.900 1,024 76.800 1,024 76.80016 GULBARGA 2,163 523 93 1,286 2,256 112.800 1,809 180.90 4,065 293.700 4,065 304.875 4,065 293.70017 HASSAN 2,456 121 99 929 2,555 127.750 1,050 105.00 3,605 232.750 3,605 270.375 3,60S 232.75018 HAVERl 1,031 134 33 675 1,064 53.200 809 80.90 1,873 134.100 1,873 140.475 1,873 134.10019 KODAGU 328 79 5 256 333 16.650 335 33.50 668 50.150 668 50.100 668 50.10020 Ik o l a r 1,728 168 72 , 538 1,800 90.000 706 70.60 2,506 160.600 2,506 187.950 2j506 160.60021 K'OPPAL 798 145 38 470 836 41.800 615 61.50 1,451 103.300 1.451 108.825 1,451 103.30022 MANDYA 1,724 105 66 755 1,790 89.500 860 86.00 2,650 175.500 2,650 198.750 2,650 175.50023 MYSORE 1,743 187 44 891 1,787 89.350 1,078 107.80 2,865 197.150 2,865 214i875 2,865 197.15024 r a ic h u r 1,223 212 109 550 1,332 66.600 762 76.20 2,094 142.800 2,094 157.050 2,094 142.80025 RAMANAGARA 1,302 88 41 406 1,343 67.150 494 49.40 1,837 116.550 1,837 137.775 1,837 116.55026 SHltybGA 1,823 114 76 864 1,899 94.950 978 97.80 2,877 192.750 2,877 215.775 2,877 192.75027 t u m k u r 3,356 207 125 1,230 3,481 174.050 1,437 143.70 4,918 317.750 4,918 368.850 4,918 317.75028 UDUPi 555 67 12 347 ' 567 28.350 414 41.40 981 69.750 981 73.575 981 69.75029 u t t a r k a n n a d a 2,030 144 153 842 2.183 109.150 986 98.60 3,169 207.750 3,169 237.675 3,169. 207 .750
Total 40,313 5,009 1,662 20,252 41.975 2,098.750 25,261 2526.1 d 67,236 4,624.850 67,236 5042.700 67,236 4,624.700Source: DISE 2008-09 Year;2008-09

Information regarding Resource Persons for BRC/UBRC/CRCName of State: KARNATAKA
S. No. Block/ Municipal Area No, of. Schools NO of BR(
NO, o f Eligible BRPs (>100 sphools in each b lock)
No. of BRPs proposed by the
state
No.of BRP Posts sanctioned during
DPEP & being funded by state {In case of
DPEP Distt.X*)
No.of BRPs eligible
under SSA
Total No. of RPs ■
1 2 3 4 5 6 7 8 91 BAQALKOT 2170 6 120 30 90 30 1202 BAI^QALORE URBAN 2983 9 180 180 0 180 1803 BANGALORE RURAL 1606 4 80 0 102 1024 BELQAUM 5109 12 240 96 144 96 2405 BdlLARY 2285 8 160 51 109 51 1606 BIDAR 2326 5 100 14 66 14 ' 1007 BIJAPUR 3154 ‘ 5 100 22 78 22 1008 CHAMARAJANAGAR 1276 5 100 34 66 34 1009 CHIKAMANGALORE 2315 8 160 10 0 160 16010 CHIKKABALLAPURA 2155 6 120 162 108 12 12011 CHITRADURGA 2732 6 120 120 0 120 12012 DAKSHINA KANNADA 2043 7 140 140 0 140 , 14013 DAVANAGERE 2302 7 140 140 0 140 140
' 14 OHARWAD 1435 6 120 51 69 51 120,15 GAOAG 1083 6 120 59 61 59 1'2016 GULBARGA 4370 11 220 40 180 40 ■ 22017 HASSAN 3728 8 160 160 0 160 16018 HAVERI 1938 7 140 41 99 41 14019 KODAGU 713 3 60 60 0 60 60
! 20 K O U R 2601 5 100 0 100 0 10021 KOPPAL 1487 4 80 24 56 24 8022 MANDYA 2728 8 160 22 138 22 16023 m Vs o r e 3133 8 160 26 134 26 16024 RAICHUR 2147 5 100 32 94 6 10025 RAMANAGARA 1905 4 80 32 48 32 SO26 SHIMOGA 2994 7 140 140 ' 0 140 14027 TUMKUR 5069 10 200 200 0 200 20028 UDUPI 1424 5 100 100 0 100 , 100 ■29 UTTARKANNADA 3246 11 220 220 , 0 220 220
Total 72457 196 3920 2206 1762 2180 3942
Source: DISE 2008-09
(*) 120 B R P s e n g a g e d in Edn b locks u n d e r D P E P a re exc lu d e d .

Tab!o22
COMPUTER AIDED LEARNING (CAL)
S o
Name of State: KARNATAKA
S.No. Block/ Municipal Area No. of Govt. UP Schools
Schools covered under CAL
No. of Beneficiaries
No. of leachers trained on CAL
No. of Schools to be covered this year
1 2 3 4 5 6 71 BAGALKOT 815 . 83 25935 231 112 BANGALORE URBAN . 720 93 29149 186 293 BANGALORE RURAL 436 53 13242 54 294 BELGAUM' 1,745 80 9258 502 505 BELLARY 820 99 34650 479 7006 BIDAR 723 95 . 13250 193 107 BIJAPUR 1 1,031 110 25793 72 108 CHAMARAJANAGAR 413 53 6217 180 159 CHlfcfkMANGALORE 500 68 8577 204 4110 CHlkKABALLAPURA 705 48 34475 88 3>11 CHITRADURGA 881 86 17638 172 14-12 DAKSHINA KANNADA 659 90 18707 180 5013 DAVANAGERE 714 85 12656 85 3014 DHARWAD 534 ' 68 21678 . 625 2115 GADAG 421 59 8673 177 35316 GULBARGA 1,407 135 51013 16 11,17 HASSAN 1,051 100 3480 200 4018 HAVER! 716 87 29704 92 919 KODAGU 276 ' ‘53 11052 25 720 KOLAR 621 62 19397 22 2521 KOPPAL 524 65 14078 135 4622 MANDYA 840 91 19081 261 2223 MYSORE 964 102 28837 204 5024 RAICHUR 671 77 17835 ‘ 191 626 RAMANAGARA 462 57 3321 74 2026 SHIMOGA 950 59 11283 223 5027 TUMKUR ^ 1,369 95 22694 190 5128 UDUPl 363 74 ' 15065 140 2029 UTTARKANNADA 1,003 85 16898 176 130
Total 22334 2312 543636 5377 1887Source : DIse 2008-09 and District Statistics ,
Please Specify rural block with (R) and municipal Area with(U)

s .1
JZi
Name of State: KARNATAKAInformation regarding NPEGEL
S.No. Block/ Municipal Area No. of EBB No. ofMCS MCS in Urban Slums No. of girls enrolled i in MCS
1 2 3 4 5 61 BAGALKOT 6 68 0 124662 Ba n g a l o r e u r b a n 0 1 4 12053 BANGALORE RURAL 1 0 0 04 BELGAUM 4 43 0 05 ^ELLARY 6 84 0 55636 BIDAR 4 65 0 141147 felJAPUR 5 99 0 330838 6 h a m a r a ja n a g a r 0 0 0 09 CHIKAMANGALORE 0 0 0 010 CHIKKABALLAPURA 4 57 0 445611 c h iVr a d u Rg a 2 28 0 452112 DAKSHINA KANNADA 0 0 0 013 DAVANAGERE' 1 16 0 403814 OHARWAD 2 29 0 0 '15 g a d a g 2 16 0 367516 g u l b a r g a 10 147 0 121017 HASSAN 1 21 0 168018 (haVeri 0 0 0 019 KODAGU 0 0 0 020 KOLAR 7 63 0 315021 KOPPAL 4 62 022 MANDYA 0 0 0 023 MYSORE 1 17 . 0 1887624 RAICHUR 5 77 0 1190325 ^RAMANAGARA 0 14 0 026 SHIMOGA 0 0 0 027 TUMKUR 1 14 0 205228 UDLIPI 0 0 0 029 UTTARKANNADA 0 0 0 0
Total 66 921 4 122012Source: BRC Reports 2008-09 Year:2008-09

Table 24 (KGBV)
Information on KGBVName o f S tate : KARNATAKA
S. No Block/ Municipal AreaKGBV sanctioned (Modelwlse)
1
Operational(Morielwise)
Enrolment(Modelwise)
Enrolm ent (Social ca te jo ryw ise ) Building Status
1 II III Total 1 II III Total 1 II III Total SC ST OBC Muslims BPL TotalCompI
etedProgre
■ 1 2 3 4 5 6 7 8 9 . 10 11 12 13 14 15 16 17 18 , 19 20 15 16■ 1 BAGALKOT 0 0 6 6 0 0 6 6 0 0 579 579 202 51 213 59 54 579 2 4; 2 BANGALORE URBAN 0 0 0 0 0 0 0 0 0 0 0 0 0 0 0 0 , 0 0 0 0. 3 BANGALORE RURAL 0 1 0 1 0 1 0 1 0 0 0 0 0 0 0 0 '■ 0 0 0 0
4 BELGAUM 0 4 0 4 0 4 , 0 4 0 0 0 0 0 0 0 0 0 0 0 0■ 5 BELLARY 0 0 6 6 0 0 6 6 0 0 272 272 90 90 75 12' 5 272 5 0• 6 BIDAR 0 4 0 4 0 4 0 4 0 0 0 0 170 100 83 14 0 367 3 1. 7 BIJAPUR 0 0 5 5 0 0 5 5 0 0 5 5 201 23 169 27 86 506 5
8 CHAMARAJANAGAR 0 0 0 0 0 0 0 0 0 0 0 0 0 0 0 0 0 0 0 09 CHIKAMANGALORE 0 0 0 0 0 0 0 O' 0 0 0 0 0 0 0 0 0 0 0 0
■ 10 C H IK K A B A LU P U R A 0 0 4 4 0 0 4 4 0 0 290 290 147 56 32 5 50 290 4 0■ 11 GHITRADURGA 0 0 2 2 0 0 2 2 0 0 195 195 57 62 29 1 46 195 0 0; 12 DAKSHINA KANNADA 0 0 0 0 0 0 0 0 0 0 0 0 0 0 0 0 0 0 0 0
13 DAVANAGERE 0 0 1 1 0 0 1 1 0 0 100 100 61 13 4 3 19 100 1 014 DHARW AD 0 0 2 0 2 0 2 0 0 0 '0 59 37 28 4 39 186 1 0
•15 GADAG 0 0 2 2 0 0 2 2 0 0 200 200 88 25 54 1'5 ■ 18 200 0 2;16 GULBARGA . 1 0 9 10 1 0 9 10 1 0 9 10 365 60 69 227 166 887 3 217 HASSAN 0 0 1 1 0 0 1 1 . 0 0 1 1 32 2 0 1 38 73 yes 018 HAVERI 0 6 . 0 0 0 0 0 0 0 . 0 0 0 0 0 0 0 0 0 0 019 KODAGU 0 0 6 0 0 0 0 0 0 0 6 0 0 0 0 0 0 0 0 0
•20 KOLAR 0 0 3 3 0 0 3 3 0 0 279 279 126 33 7 76 37 279 3 0:21 KOPPAL 0 0 4 4 0 0 4 4 0 0 415 415 149 99 77 63 • 27 415,22 MANDYA 0 0 0 0 0 0 0 0 0 0 0 0 0 0 0 0 0 0 0 023 MYSORE 0 0 1 1 0 0 1 1 0 0 49 49 10 4 35 49 YES•24 RAICHUR 0 0 5 5 0 0 5 r 5 0 0 0 0 0 0 0 0 0 0 0 0;25 RAMANAGARA 0 0 0 0 0 0 0 0 0 0 0 0 0 0 0 0 0 0 0 0,26 SHIMOGA 0 0 0 0 0 0 0 0 0 0 0 0 0 0 0 0 ' 0 0 0 027 TUMKUR 0 0 1 1 0 0 1 1 0 0 100 100 46 9 45 0 0 100 0 0■28 ubupi 0 0 0 0 0 0 0 0 ‘ 0 0 0 0 0 0 0 0 0 0 0 0•29 UTTARKANNADA 0 0 0 0 0 0 0 0 0 0 0 0 0 0 0 0 0 0 0 0
Total 1 11 50 62 1 11 50 62 1 0 2494 2495 1802 664 920 527 585 4498 22 14
Spurce; BRC Reports 2008-09 Year: 2008-09

Table-25
R em ed ia l Teach ing
SI.No District No of Govt.and Aided Schools Enrolment 5 % of
SchoolsNo of Children for remidial teaching
1 BAGALKOT 2,170 258,668 109 97482 BANGALORE URBAN 2,983 381,112 149 153773 BANGALORE RURAL 1,606 88,716 80 71555 BELGAUM - 5,109 . 581,143 255 177636 BELLARY 2;285 313,648 114 101957 BIDAR 2.326 . 264,267 116 103748 BIJAPUR 3,154 353,893 158 141309 CHAMARAJANAGAR 1,276 110,552 64 572410 CHIKKABALLAPURA 2,155 121,835 108 965911 CHIKKAMANGALORE 2,315 126,261 116 1037413 CHITRADURGA 2,732 202,538 137 1225214 OAKSHINA KANNADA 2,043 218,003 102 912215 DAVANAGERE 2,302 222,419 115 1028516 DHARWAD 1,435 213,347 72 643917 GADAG 1,083 140,030 54 482918 GULBARGA 4,370 526,903 219 1478419 HASSAN 3,728 175,872 186 1663420 HAVER! ■ 1,938 210,457 97 867521 KODAGU 713 55,074 36 322022 KOLAR 2,601 159,785 130 1162623 KOPPAL 1,487 199,192 74 661825 MANDYA 2,728 167,923 136 1216326 MYSORE 3,133 278,210 157 1404127 RAl'CHUR 2,147 250,622 107 956928 RAMANAGARA 1,905 106,148 95 8496 .29 SHIMOGA 2,994 185,213 150 - 1341530 TUMKUR 5,069 281,793 253 18,48031 UDUPI 1,424 112,971 71 635032 UTTARKANNADA 3,246 173,356 - 162 14488
Total 72457 6479951 3622 311985
lo

Class Wise Enrolmanet in Aided Schools
SI.No. DistrictNo of Aided
Schooi(inoluding Secendary)
Class 1 Class 2 Class 3 ' Class 4 Class 5 Total Class 1-5
Boys Girls Total Boys Girls Total Boys Girls Total Boys Girls Total Boys Girls Total Boys G irls Total
1 0AGALKOT 40 831 682 1,513 766 613 1,379 769 681 1.4,50 813 675 1,488 807 600 . ,'427 3,986 3,251 7,237
2 BANGALORE URBAN 441 7,918 8,555 16,473 7,926 8,642 16,568 8,290 8,814 17,104 8,525 9,226 17,751 8,859 9,965 18,824 41,518 45,202 86,720
3 BANGALORE RURAL 11 172 187 359 183 156 339 182 166 348 205 151 356 190 163 353 932 823 1,7554 BELGAUM 85 1,480 1,015 2,495 1,511 965 2,476 1,585 989 2,574 1,531 966 2,497 1,656 1,113 2,769 7,763 5.048 12,8115 BELLARY 54 1,316 1,522 2,838 1,351 1,447 2,798 1,338 1.430 2,768 1,298 1,415 2,713 1,428 1,425 2,853 5,731 7.239 13,970
6 BIOAR 187 4,375 4,180 8,555 4,414 4,061 8,475 4,482 4,178 8.660 4,485 4,195 8,680 4,396 4,105 8,501 22,152 20,719 42,8717 BIJAPUR 142 1.897 1.739 3,636 1,686 1,527 3,213 1,850 1.890 3,740 1,830 1,863 3,693 2,048 2,034 4,082 9,311 9,053 18,364
8 CHAMAHAJANAGAH 39 771 724 1.495 819 756 1,575 841 775 1,616 884 800 1.684 796 770 1,566 4,111 3,825 7,936
9 CHIKKABALLAPURA 29 549 523 1,072 565 518 1,083 • 574 514 1.088 635 538 1,173 611 514 1,125 2,934 2,607 5,541
10 CHIKKAMANGALORE 22 471 486 957 518 508 1,026 542 523 1,065 498 529 1,027 590 524 1,114 2,619 2,570 5,189
11 CHITRADURGA 73 1,130 984 2,114 1,092 1,011 2,103 1,064 970 2,034 1,150 978 2,128 1,205 1,019 2,224 5,641 4,962 10,603
12 DAKSHINA KANNADA 235 3,662 3,440 7,102 3,865 3,721 7,586 1 4,174 3.908 8,082 4,590 4,284 8.874 4,599 4,296 8,895 20,890 19,649 40,539
13 DAVANAGERE 112 2.016 1,887 3,903 2,092 1,832 3,924 2.153 1,941 4,094 2,224 1,941 4.165 2,330 1,974 4,304 10,815 9.575 20,39014 DHARWAD 82 1,696 1,505 3,201 1,604 1,520 3,124 1,698 1,477 3,175 1,783 1,665 3,448 1,831 1,856 3,687 8.612 8,023 16,63515 QADAG 24 442 362 604 3S5 389 774 393 407 BOO 443 363 806 531 431 962 2^194 1,952 4,14616 GUL8ARGA 137 3,458 3,253 6,711 3,460 3,311 6,771 3,438 3,196 6,634 3,480 3,174 6,654 3,020 2,689 5,709 16,856 15,623 32,47917 HASSAN 47 737 764 1,501 717 709 1,426 i w 731 1.471 835 750 1,585 829 782 .1,611 3,858 3,736 7,59418 HAVER! 26 557 538 1,095 624 495 1,119 585 492 1,077 613 493 1,106 574 517 1,091 2,953 2.535 5,488
19 KODAGU ■ 9 251 230 481 267 234 501 272 262 534 287 296 583 320 330 650 1,397 1,352 2,749
20 KOWR 43 603 696 1,299 612 672 1.284 597 713 1,310 653 785 1,438 753 798 J,551 3,218 3,664 6,882
21 KOPPAL 10 310 210 520 269 216 485 316 191 507 304 190 494 329 170 499 1.528 977 2,505
22 MANOYA 33 638 694 1,332 662 670 1,332 711 721 1,432 683 726 1,409 769 679 1,448 3,463 3,490 6,953
23 MYSORE 113 1,824 1,993 3,817 1,882 2,100 3.982 1,976 2,247 4,223 2,107 2,262 4,369 2,155 2,363 4,518 9,944 10.965 20,90924 RAICHUH 19 428 632 1.060 423 652 1,075 477 675 1.152 455 666 1,121 485 693 1,178 2,268 3,318 5.586
25 RAMANAGARA 24 492 453 945 512 490 1,002 545 465 1,010 575 522 1.097 586 515 1,101 2.710 2,445 5,15526 SHIMOGA 56 826 880 1,706 943 889 1.832 936 984 1,920 1,080 1,052 2,132 1 105 1,085 2,190 4,890 4,890 9,78027 tUWKUR 85 786 606 1.392 759 632 1,391 881 617 1,498 1,041 662 1.703 1,195 686 1,881 4,662 3,203 7,86528 UDUPi 229 1,916 1,861 3,777 2,192 2,164 4.356 2,315 2,257 4,572 2,519 2,402 4,921 2,491 2,390 4,881 11,433 11,074 22,507
29 UTTARKANNADA 41 701 571 1,272 703 614 1,317 646 S04 1,250 649 589 1,238 725 576 1,301 3,424 2,954 6,378Total ' 2,448 7,013 20,700 27,713 42,802 41,514 84,316 4«.370[ “ Z.BIIJ 97,188 46,175 44,158 90,333 47,213 45,062 92,275 222,813 214,724 437,537
\ 0

S o
Sl.No DistrictClass 6 Cl«ss 7 Class 8 Total 6-8 Total 1-B
Boys Girls Total Boys Girls Total Boys Girls Total Boys Girls Total Boys Girls Total
1 BAGALKOT 364 . 665 1,629 968 643 1,611 5,272 3,698 6,970 7,204 5,006 . 12.210 11,190 ’ . 19.447
2 elNGALdRE URBAN 9,01<l 10,257 19,271 9,178 10,488 19,666 12,541 ' 12,912 25,453 30,733 33,657 64,390 72.J5 1 78,859. 151,110
l\ leANGALORE RURAL 22§ 195 423 242 211 453 1,610 1,810 3,420 2,080 2,216 4.296 3 ,0 t2 3 ,0 3 9 6.051
4 IBELGAUM 2,182 1,960 4,142 2,356 2,139 4,495 18,835 16.285 35,120 23,373 20,384 43.757 3 1 , f3 6 25^432 5 6 ,5 68
S BELLAFiV 1,47^ 1,438 2,914 1,419 1,432 2,851 3,514 2,740 6,254 6,409 5,610 12.019 13,140 12,849 25,989
6 Ib (d a r 3,992 3,810 7,d02 3,719 ‘ 3.427 7,146 2.294 2.272 4,566 10,005 9,509 19.514 3 2 ,1 5 7 3 0 ,2 2 b ' 6 2 ,3 8 5
7 BIJAPUR 1,724 1.634 3,358 1,696 1,607 3,303 8,791 6.874 15,665 12,211 10,115 22.326 2 1 ,5 2 2 1 9 ,1 6 8 40,690
R CHAMARAJANAGAR 904 836 1,740 909 814 1,723 1.599 1,470 3,069 3.412 3,120 6,532 7 ,5 2 3 6,945 1 4,468
9 CHIKKABALLAPURA 713 613 1,326 736 536 1.272 1.850 1.674 3,524 3.299 2,823 6,122 6 ,2 3 3 5 ,4 3 0 1 1,663
10 c h )k k a m a n g a l 6 r e 5 69 574 1,143 550 588 1.138 3.011 3,191 6,202 4.130 4,353 8,483 6,749 6 .9 2 i 1 3 ,672
11 ic h It r a d u r g a 1,3 5 3 1,153 2,506 1,432 1,190 2,622 7.124 6.878 14.002 9.909 9,221 19,130 15,550 1 4 ,1 83 2 9 ,7 3 3
12 IDAKSHINA KANNAOA 5 ,5 0 4 4 .8 5 2 1 0,356 5 ,5 2 2 4,945 10,467 6.740 6.103 12,843 17,766 15,900 33.666 3 8 ,6 5 6 3 5 ,5 4 9 7 4 ,2 0 5
13 DAVANAQEfte 2,64'4' 2,318 4,962 2 ,4 5 6 2,310 4,766 5.772 5.689 11.461 10,872 10,317 21,189 2 1 ,6 8 7 1 9 .8 62 41,57914 OHAftWAD 2,239 2 ,0 7 5 4,514 2,196 2,303 4,499 ' 6.914 5.963 11,877 10,349 10,341 20,690 18.961 1 8 ,3 6 4 3 7 ,3 2 5
15 GADAG 6 y4 4 5 8 1,1 3 2 719 601 1,320 3,966 2,593 6,559 5,359 3,652 9,011 7 ,5 5 3 5 .6 0 4 13,157
16 GULBARGA 2,874 2,6 2 3 5 ,4 9 7 2,849 2,505 5,354 2,232 1,803 4,035 7,955 6,931 14,886 24,811 22,5 5 4 4 7 ,3 6 5
17 HASSAN 9 04 8 73 1,777 890 858 1,748 3.981 3,781 7,762 5,775 5,512 11,287 9 ,6 3 3 9 .2 4 8 18,881
18 . MAVERI 6 8 9 560 1,249 695 635 1,330 4.686 4,382 9,068 6,070 5,577 11,647 9 ,0 2 3 8 112 1 7 ,1 35
19 IkciBASu 3 32 370 702 332 334 666 1.775 1,776 3.551 2,439 2,480 4,919 3,836 3, 7,668
H o k 6 l a R 844 1,003 1,847 828 1.006 1,834 2.413 2.749 5,162 4,085 4,758 8,843 7,303 8 422 15,72521 kOPPAL 421 190 611 399 212 611 1,652 744 2,396 2,472 1,146 3,618 4,000 2 123 6,123
22 MANOYA 9^7 79fe 1,786 956 827 1,783 3.083 3.002 6.085 5,026 4,628 9,654 8,489 8. 118 16,60723 m ys6 re 2,34^ 2.52^ 4,871 2,267 2,592 4.859 5,126 4,487 9.613 9,735 9,608 19,343 19,679 20^73 40,25224 fiAlCiHUR 627 721 1,348 652 666 1,318 807 868 1.675' 2.086 2,255 4,341 4,354 5,573 9,927
25 r a Ma n a g a r a 745 630 1,375 788 644 1,432 2.661 2,374 5.035 4.194 3,648 7.842 6,904 12,99726 SHIMOGA 1,1.63 1,162 . 2,325 1,162 1,156 2,318 4.620 4,296 8.916 6.945 6,514 13,559 11,835 1,1.504 23,339
27 jruM K un 1,841 956 2,797 2,037 912 2.949 12.307 9,958 22.265 16.185 11,826 28,011 20,847 15,029 35,876
28 ubupi 1771 2,782 5,553 2,871 2,806 5,677 2.935 2,696 5.631 8.577 8.284 16,861 20,010 19,358 39,368
29 u t t a r k a n n a o a 948 8^4 1,642 1,021 909 1,930 5,974 4,960 10.934 7.943 , 6.763 14,706 11,367 9,717 21,084
Total 51.668 48,930 100,598 51,845 49,296 101,141 143,085 128,028 271,113 246,598 226,254 472,052 469,411 440,978 910,389

Community Training
Name: KARNATAKA Table No: 27
S. No. Name of Block/ Municipal Area No. of villages
No of Community
Member Eleligible(@ 4 per Village)
No of schools In Rural (Govt
and Aided)
No of Community
Member Eleiigible(@ 2 per School)
No of schools in
Urban (Govt and Aided)
No of Community
Member Eleligible(@ 3 per School)
TotalCommunity members fo r Training '
1 2 61. BAGALKOT 623 2492 1,908 3,816 262 786 7,094.2 BANGALORE URBAN 693 2772 ^ 1,392 2,784 1,591 4,773 10,329'3 BANGALORE RURAL 1298 5192 1,539 3,078 67 . 201 8,4714 BELGAUM 1495 5980 4,695 9,390 414 1,242 16,6125 BELLARY 543 2172 1,926 3,852 359 1,077 7,1016 BIDAR 717 2868 1,924 3,848 402 1,206 7,9227 BIJAPUR 823 3292 2,770 ‘ 5,540 384 1,152 9,9848 CHAMARAJANAGAR 464 1856 1,164 2,328 112 336 4,5209 c h ik a m a n Ga l o r e 1102 4408 2,175 4,350 140 420 9,178'10 CHIKKABALLAPURA 861 3444 2,029 4,058 126 378 7,88011 CHITRADURGA 1358 5432 2,517 5,034 215 1 645 11,111
" 1 2 - DAKSHINA KANNADA 379 1516 1,639 3,278 404 1,212 6,00613 DAVANAGERE 2117 8468 2,006 4,012 296 888 13,36814 DHARW AD 407 1628 1,078 2,156 357 1,071 4,855,'15 GADAG 4232 16928 906 1,812' 177 531 19,27116 GULBARGA 1360 5440 3,865 7,730 505 1,515 14,68517 HASSAN 393 1572 3,522 7,044 206 618 9,234IB HAVER! 1747 6968 1,763 3,526 175 525 11,03919 KODAGU 1149 4596 692 1,384 21 63 6,04320 KOLAR 1392 5568 2,408 4,816 193 579 10,963'21 KOPPAL 1324 5296 1,384 2,768 103 309 8,37322 MANDYA 1395 5580 2,588 5,176 140 420 11,176 ■23 MYSORE 5284 21136 2,730 S,460 403 1,209 27,80524 RAICHUR 2137 8548 1,781 3,562 124 372 12,48225 RAMANAGARA 636 2544 1,971 3,942 176 528 7,01426 SHIMOGA 5284 21136 2.703 5,406 291 873 27,41527 TUMKUR 2537 10148 4,792 9,584 277 831 20,5632B UDUPI 255 1020 1,142 2,284 2,82 846 4,15029 UTTARKANNADA 1149 4596' 3,000 6,000 246 738 11,334
Total 43154 172616 64,009 128,018 8,448 25,344 325,978Source:Census 2001 and BRC Reports and DISE 2008-09 Year: 2008-09

Table-28
Stragegy Proposed for age group 7-10 and 11-14
le of the Strategy
OOSC Coverage of 2009-10 Contiuningand
Potentialdropouts
GrandTotal
Coverage Proposed for 7-10
Coverage Proposed for 11-14
Total
» > - 218 5196 5414 2t482 26896182 . 704 886 • - 0 886
"r School 0 0 0 749 749spoliation 95 143 238 9605 9843
■Chinnara angala) 6851 951 7802 0 7802--r. (Chinnara angala) 6538 3462 10000 0 10000
'jtisa 2591 1259 3850 5937 9787Schools 667 393 1060 5879 6939
,le Schools 192 208 400 . 1045 1445572 572 14148 14720
p 563 563 4276 4839o r - 50 50;i3c 0 8075 8075' 322 322 0 322
cia! enrolment 4530 4530 0 4530Canp 0 74470 74470
0 29 29
Centers (Transportation j to reach) 1476 1476
Total 17906 17731 35637 147221 182858
^ 0 '


CT-

ANNUAL WOOK PLAN ANO BUOGET St«t» Siimm«ry Tor «<sMj
" 2ooV.Ti>
, j r i i p W i f i " !•« « • m btMk
'TMeftM irg • M^4e• ai tfac*
-. 7 T a ^
Fr#*M prapOMi * «plN avtr Un« cett
J47096 J»70.96« j 24708«( 2<70.S60 0.010
m m
«.4 |rrah gfer-UnlriMTMC ralenc^RC coonHweri'and'
MOiV/OI *01V/Ol 0 060 o.«po|•OlV/0’ iO'V'fl '■ 0 fVJy 0 010| 75.7m| 7578
43«2.S7oi ?7a01»:w» Tato~1 iMiiwew *'*» 0«l of Sehaci— m s iU L
*OlVVOI
_ e . w
ooool 00007 2 lEaB C*w triljP ]~
O0QQ 0 000lo o o odO(?
ICh»v\an Angila Bm iw m I BrWg* ‘ < • A«»dn. {« moniht)
30 .670 ~3Q.67(}403.7S0|
"744?
403.760
43 3iO
0 0 5 0
0 630coae^. o e » l
>og»112 mofii>s> bfldgt eevf»f»MRBC 1 3 0 2 2 344 340
7.7 ITnnchoo l Qoaoj- i S i #£ iiv /o r'
0,030o!5m
0 .01&
Z E ET T iN i
0-003 0.000 *DIV/OI o.ooc0 .(> « t4s't?0lInclF b 9 ? .tM - iS 2 E t4&:i 70 145 17-0
?ift
a g i a a t a t e i -372.350|
t W iL ,50|
Ai
. , iBrido* ewTM • Ctitvwra Anaih
I H E S O.IIOO
ioo.ooo| lOOCSIl '< 7 « m E0 0 3 0
CanlM( TrMewfit'an,E g @ -
403|
»t3iv;oi
~ m q T0.0000.000'
c.ooo]3 2
oooc ip iv /o i
Hpiv/Ol0 .(K »
0 ( i5 l
3n.ooo| 203.000
- m a m
0.0C9
« E
0.000aoo<_ jS io
!tuftT»W 437» .272 ] 13070 R423.S04I 1M S 3 6 I S4a3.gQ4 taa»>7- C ______________
8.1 IB tw ^tw eN np j i j a0.009
O.QOC 1927.12pl 3y6 42 '4 r 10.000J£32S 1 7DIV/0I
927.120 ■MS20 3ii8gg 623 070" " 0 5 5 5- i 2 i - 2 S l 435.000
M 3B 70l»ub ToUl Z382.120I 3W 4B 3I 23B2.120 ' Q.OOO» |Ff— TwrtBaah
'2-226|iF fM (M beel< for l.y wta « l t1t9t Mfpsit
j fn a u M book tor VI-VHIiM al
|W prti^ lw<cf.N ilK»i ^
644.911 47771a
~ 0 ^loe
ff.OC’ 1264.1631 180697617»6.7>» - s t t i is . 2:220 -m « » J J » 2 p i,.a 7 2 i y o j , . ^ 6 1 , 3 2 0
W! n r■T6f[
TTHZ i E B1643^]
J2S2»7uaa9T J i l l JsM
_0£220012 133160 -2522,
1697.9801 ia » Wjsszm
1697.920 J21J53J il i5 3i i n w
2*fil£2S
11 ICMIWoriiin . t tSAC QQQO »DIV/OI #O IV /0! 16.0001 2} 16.000 0.000 0.000
0.000 #DIV/0l «OIV/Ol 906.850| 163| 90S.SS0 0,000 0,00011.3 |8cho«l BuMng* M4
0.000 100 317 317j 3106.600 9.000 317 2S63,00<p 317 2653.000• m o! U fo t #DIV/0I «DIV/0! 0.0001 S. 150 0 000}2 t6 ‘,»»0<
0.000 #D1V/0I (ilDlV/OI 25.750! 5,150
3,230f0.000 #DIV/01 # D IV /0 I 5 .150 10.3001 10,300 5.150 0,000
111 iA«ti0.000 #D IV /0! i>DlV/0! 5.1501
24550.0501Q.QOOi
: ^ i c iiH fo«mi 0.000 100 100 24550.050, 21370.900 4547 21370 .900
* |pinfl^teftMw.oC>y 11.10 rroll*ii/Uflnil*
s.i4o[ 100
0000 «D1V/0I
1662,000 222
0.000 .0 .0 0 0 3196 000
0.0001 Q'>l< To<» # p lV /0 ' 12792 3 19 8 00 0
1.12 lO'hNIno W il>r PicHty 0000 # D lV /0 ' O.OQO,100 1472,0001 2944 0.000 .0,000
I |s»p»f(nyi w»n
MS ieiwinnottion«DIV/0! 0 0001
97.250<O.OQO 0000
i» d O 0,000 100 10 0 ! 0,COO 0 050 1945 97.250
7oooolo .o o o i
#DIV/Of piV/Qi I o.coa o.ooo! 1004 0,060 0.0000.000 #O IV /0 ' t fp lV /O ’ i 0 000 O.OOOt 0.000 0.000
*O iv/oi
f d
98.973
10
0.012
6.0004,950
9.800
5.150 0.0005,150 25,7501.S
0,0005.150
4.700
0 250
0 .500
1946 0 .0500,000
192


A N N U AL W ORK PLAN AND BU D GFT . R um m srv In ' 2009.10 (KAP N A TAKA )
M«wUnH u»)| t o
' ' )006« j 200*-''“ a*»m,n.„d,i>onj00».-0 ]
NH 31 OS.»M ta«*f«9i UM c**t ClXllOw T«|*I |
•MlWT)t FlH Mty Ftn Phy Ftn F>f>N Fw S j l S a p i n R ^ B S S ^ E S i B
! 0 0.0^0 C OOOO 0 0.000 «CyV/0! «niV/OI 0 00(' 64' O.vC^ 64 O-OOOI 64 OOOO 0 64 O-OOOjCt.
0 nite n A AM ft n rvM #nr\y/ni «iMV/oi 0 ooc 64 0 ooo 64 0 000 &• 0 090 0 04 0 oooloV V WU U V VUU •WIViv" u.v^^ w.vwv v-w v| w vv v v-wi^p/
•W W 1 well Iw to r » W t «MiWi>«eMf0rfOeMii
0 O.OOO 0 0.000 0 0.000 ffDIV/OI «OlV^< 3 00C : e« o.oooj 6« o.ooo m o ooo o o« o.ooojo
• 0 f l S 5 B j t e l * g / i w * i r t e-Q.<g-
1«l
0.000| 6j O.OOOj o| 1 0.000| i0C |iCX V W | 0.000| 0,500| 64| 34.TOO| 64| 34.700| 0600 | 64| 32.000| o( 64| 32 000(32 j»0 k««ii 1 «l O .iR t 61 O.iasi cl o.oool «oo( toc^ ooool O .w i ..9<i . . ^ JO O l 58,1.W{ ©♦W f ............W . . .3«.*00L Oi. . W! 544001384 . 1
IlM , -------------------------------- ■ -----------------------10 ni7«W' pm s*i OH l s « I 9 1.932 6 t.«32 0 0.000 IQC 'OM OOOO 0.760 64 46.000 64 48.000j 0-760 64 40.000 ' 0 64 4000046
»0 Um w iiM n w 'fW 'v * • o - c _ f * ^ 1' i l 0.99H « 0 99t oi o.oool lOCi tOO OOOC 0.$0c M frOOOOj SO.OOO O.BOO 64 $\.200 9 04 S1.200fSl-210 0 0.16 h M ' ' ' « fl ol 0.0001 lool 0 000 o .tso M d .eo^ m o .e ^ i o .iso m 9 000 0 $4 9.600I9.6110 O.if ei 0.3ft0{ V ”o . » ~ o l oooS! 10S ^ 0.000 0.150 «4 5!w o| 5» 9.600 o .iso « 9.600 0 « 9«oo»r«’>0 »iwt|W ie#IW ||mw»ei 01 6 i M 02SO 01 Q O M 0000 4.800 ^2 I&3.e00j 3 ) 1S3600 V500 H 40 000 0 32 4 8 . 0 ^ 6
S\ o O T ■ ' I o !« 5 « O.OW « w «l 1 »C)iVW 0.000 0-300 64 1 9.20« M 19JOO 0400 64 t».200 0 M »9 200^19.2TtMAwwftai 1f,t» ' • 1219.M ij SM 9 « 4 .IU d 19914A 9000l 79 090 0 3 0 ^ 64 i7M .M d 64 irM .W O 2M 70 04 1«7f.O80 O.OOti 64 1678.08ft 1678.06gwwJ JoW (I w wnwrini * n ^ * r ■ ; 6j - - ' *W • T ^ Of 186 .1 « | w ooj »1 o.ooo S3J30 M -- W ^ T p l . W a * J7 0 ‘ 6VT10 M 3167.630 ,0.000 64 - »167J3oj I1U .7606

District-wise and intervention-wise summary lor 2009-10SSA, Karnataka
Annex-
(Rs. In lal<h)
S.No. Aetivllles
NewUhR' Bagalkote Bangalore Rural Bangalore Urban
unit Fresh Out lay 200910 Spill over Total Outlay Fresh Out lay 2009
10Spillover Total Outlay Fresh Out lay 2009
,10Spillover
Total Outlay
Phy Fin Fin Phy Fin Phy Fin Fin Phy Fin Phy Fin Fin Phy Fin1.0 New Schools1.1 Upgradation of EGS to PS 0.000 0 0 0 0 0 , 01.2 New Prlamary schools 0 .000 27 27 2 2 0 01.3 Upgraded New UPS 0.000 0 0 2 2 0 01.4 Adding class Viii to UPS 0.000 0 0 0 0 0 02 New Teachers Salary (PS)
2.1 Primary Teachers (Regular) 0.240 Teacher 54 14.040 0.000 54 14.040 4 1.040 0.000 4 1.040 0 . 0.000 0.000 0 0.0002.2 Primary Teachers (Para) 0 0.000 0.000 0 0,000 0 0.000 0.000 0 0.000 0 0,000 0,000 0 0.0002.3 Upper Primary Teachers (Regular) 0.240 Teacher 0 0.000 0.000 0 0.000 2 0.520 0.000 2 0.520 0 0.000 0.000 0 0.000
24 Additional teachers for UPS uDoraded orevlous vear 9 2.340 0,000 9 2.340 10 2.600 0.000 10 2.600 0 0.000 0.000 0 0.000
2.5 Upper Primary Teachers- TGT 0.240 Teacher 0 0.000 0.000 [ 0 0.000 0 0.000 0.000 0 0.000 0 0.000 0.000 0 * 0.000
Additional Teachers Against PTR k
2.6 New Additional Teachers PS as per 1:40 PTR (Regular) 0 .240 T eacher 0 0.000 0.000 0 0.000 0 0.000 0.000 0 0.000 0 0.000 0.000 0 0.000
2.r New Additional Teachers - PS as per l:30(Reaular) 0 0.000 0.000 0 0.000 0 0.000 0.000 0 0.000 0 0.000 0.000 0 0.000
2.8 New Additional Teachers-UPS as per 1:40 (Reaular) 0 .240 Teacher 0 0.000 0.000 0 0.000 0 0.000 0.000 0 0.000 0 , 0.000 0.000 0 0.000
2.9 New AddHlonal Teachers - UPS 1:30(Reqyiar) 0 .240 0 0.000 0 .000 0 0.000 0 0.000 0.000 0 0.000 0 0.000 0.000 0 0.000
2.10 Teachers Under OBB 0 0.000 0.000 0 0,000 0 0.000 0.000 0 0.000 0 0.000 0.000 0 0,000
2.11 New olhers-Additional TGT (BA/B.Ed ) for Class Villi 0 .240 Teacher 0 0.000 0.000 0 0.000 0 0.000 0.000 0 0.000 0 , 0.000 0.000 0 0.000
Sub Total(2.01 to 2.11) 63 16.380 0,000 63 16.380 16 4.160 0.000 16 4.160 0 0.000 0.000 0 0.000Teachers Salary ( Recurring) ,
2.12 Primary Teachers (Regular) 1.170 Teacher 1181 1913.220 0.000 1181 1913.220 69 111.780 0.000 69 111.7^0 671 1087.020 0.000 671 1087.0202.13 Additional Teachers (lERT)' 1 .440 0 0.000 0.000 0 0.000 0 0.000 0.000 0 0.000 0 , 0.000 0.000 0 0.0002.14 Trained Graduate Teachers 1.530 Teacher 210 390.600 6.000 210 390.600 84 156.240 0.000 84 156.240 149 277.149 0.000 149 277.1402.15 Upper Primary Teachers (Para) 6 0.000 0.000 0 0.000 0 0.000 0.000 0 0.000 0 ' o.ooo 0.000 0 0.000
2.16 Upper Primary Teachers- Head Master 0 0.000 0.000 0 0.000 0 0.000 0.000 0 0.000 0 ■ o.ooo 0.000 0 0.000
2.17 Additional Teachers PS (Regular) 0 0.000 0.000 0 0.000 0 0.000 0.000 0 0.000 0 0.000 0.000 0 0.0002.18 Additional Teachers - PS (Para) 0 0 .000 0.000 0 0.000 0 0.000 0.000 0 0.000 b ' 0.000 0.000 0 0,000
2.19 Additional Teachers ■ UPS (Regular) 0 0,000 0,000 0 0,000 0 0.000 0.000 0 0.000 0 0.000 0,000 0 0.000
2.20 Additional Teachers • UPS (Para) 0 0,000 0,000 0 0.000 0 0.000 0,000 0 0.000 0 ■ 0.000 0,000 0: 0,0002.21 Teachers Under OBB 0 0.000 0.000 0 0.000 0 0.000 0.000 0 0.000 0 0,000 0.000 0 0,000
2.22 Olhers-AddHlonai TGT (BA/B,Ed) for Class VIII 0 0.000 0.000 0 0.000 0 0.000 0.000 0 0.000 0 0,000 0.000 0 0,000
2.23 Arrears of Salary of SSA leachers 0 0,000 0.000 0 0.000 0 0.000 0.000 0 0.000 0 0.000 0.000 0 0,000Sub Total (2.12 to 2.23) 1391 2303.820 0.000 1391 2303.820 153 268.020 0.000 153 268.020 820 13,64.160 0.000 820 1364.160Sub Total (New teacher»*1*aeher» Recurring) 1454 2320.200 0.000 1454 2320.200 169 ' 272.180 0.000 169 272.180 820 1364.160 0.000 820 1364.160
3.0 Teachers Qrant3.1 Teachers grant - PrimaTy T eacher 1125 5.625 0.000 1125 5.625 1431 7.155 0.000 1431 7.155 1781 8,905 0.000 1781 8.905

District-wise and intervention-w«se summaf'y for 2009*10SSA. Karnataka
Annex-
{Rs. In lakh)
s.No, Activities unit
Bagalkote Bangalore Rural Bangalore Urban
Fresh Out lay 200910 Spill over Total Outlay Fresh O utlay 2009
10Spillover Total Outlay
Fresh Out lay 200910
Spillover Total Outlay
Phy Fin Fin phy Fin Phy Fin Fin Phy Fin Phy Fin Fin Phy Fin
3.2 Teachers grant - UPS 0.005 Teacher 6787 33.935 0.000 6787 33.935 2790 13.950 i 0.000 2790 13,950 10861 ■ 54.305 0,000 10861 54 305
Sub Totai 0.005 7912 39.560 0.000 7912 39,560 4221 21.105 0.000 4221 21.105 1264'2 63.210 0.000 12642 63,210
4 Block RMOurce Centres4.1 Salary of Resource Persons BRP 0 0,000 0.000 0 0,000 0 0.000 0.000 0 0,000 54 ■ 100.440 0,000 54 100,440
4.2 Furniture Grant 1.440BRCente
r 0 0.000 0,000 0 o.oco 0 0.000 0.000 0 0,000 '■o' 0.000 0,000 0 0,000
4.3 Contingency 1.000BRCente
r6 1.200 0.000 6 1.200 4 0.800 0.000 4 0,800 9 1,800 0,000 9 1.800
4.4 Meeting & TA allowance 0.200 BRCenter 6 0,540 ' 0.000 6 0.540 4 0.360 0.000 4 0,360 9 0,810 0,000 9 0.810
4.5 TLM grant 0.090BrtC ente
r6 0,300 0,000 6 0.300 4 0.200 0.000' 4 0.200 9 0.450: ' 0,000 9 0.450
4.6 BRO Building Maintenance 0.050BRCente
r0 0,000 0.000 0 0.000 0 0.000 0.000 0 0.000 0 0,000 0.000 0 0.000
Sub Total 0.000 6 2.040 O.OMi 6 2.040 4 1.360 0.000 4 1.360 9 103.500 0.000 9 103.500S Cluster Resource Centres
5.1 Salary ol Resource Persona CHP 30 55.800 0 ,000^ 30 55.800 0 0.000 0,000 0 0.000 126 234,360 0.000 126 234,3605.2 Furniture & equipment 1.440 CRC 0 0,000 0.000 0 0.000 0 0,000 0.000 0 0.000 . 0 ' 0.000 0.000 0 0,0005.3 Conllfgenoy 0.100 CRC 74 2.220 0.000 74 2.220 52 1.560 0.000 52 1.560 126 3.780 0.000 126 3,7805.4 Meeting & TA allowance 0.030 CRC 74 2.664 0.000 74 2.664 52 1.872 0.000 52 1.872 •126 4,536 0.000 126 4.5365.5 TLM grant, 0 .036 CRC 74 0,740 0,000 74 0.740 52 0.520 0.000 52 0.520 126 1.260 0,000 126 1.2605.6 CRC Building Mointfenanco 0,010 C R li 0 o.obo 0,000 0 0.000 0 0.000 0,000 0 b.doo 0 0.000 0.000 b 0,000
Sub Total 0 .000 74 61.424 0.000 74 61.424 52 3.952 0.000 52 3.952 126 ' 243.936 0.000 126 243.9366 Training
6.1 Teachers Irg. - in service at block level 0.014 Teacher 7912 79,120 0,000 7912 79.120 4221 42,210 0,000 4221 42,210 12642 126,420 0,000 12642 126,420
8.2 Teacners trg. - in service at block level at cluster level 7912 39.560 0,000 7912 39.560 4221 21,105 0.000 4221 21.105 12642 63,210 0,000 12642 63,210
6.3 induction training for Newly Recruit Trained Teachers 0.028 Teachor . 63 1.890 0,000 63 1.890 16 0.480 0.000 16 0,480 0 0,000 0.000 0 0,000
6.4 Training for- Untrained Teachers 0 0,000 0,000 0 0 000 0 0.000 0.000 0 0,000 0 0,000 0,000 0 0,000
6.5 BRC/iSRC coordinators and resource Dersons 0,010 230 2.300 0,000 230 2.300 163 1.630 0.000 163 1,630 350 ■ 3,500 0,000 350 3,500
Sub Total 8205 122.870 0,000 8205 122.870 4400 65.425 0.000 4400 65.425 12992 193.130 0.000 12992 193.130
7 Interventions for Out of School Children
1
7.1 eS'S Centre (PS) 0 0,000 0.000 0 0,000 0 0.000 0,000 0 0,000 0 0.000 0,000 0 0,0007.2 EGS Centre (UP) 0 0,000 0.000 0 0,000 0 0.000 0,000 0 0,000 0 0.000 0.000 0 0,000
7.3 Chihnara Angala Bridge couse Residential 12 months-RBC o.too 1064 106,400 0.000 1064 106,400 50 5.000 0.000 50 5.000 1154 . 115.400 0,000 1154 115.400
7.4 Chinnara Angala Seasonal Bridge course - Resdn. (6 months)- NRBC 0,050 center 125 6.250 0.000 125 6.250 0 0,000 0,000 0 0.000 0 ' 0.000 0,000 0 0.000
7.5 Mobile schools 0.03q child 0 0,000 0.000 0 0.000 0 0,000 0.000 0 0.000 1300 ' 39.000 0,000 1300 39.0007.6 12 months bridge course-NRBC o.osq child 0 0,000 0,000 0 0.000 0 0.000 0.000 0 0.000 1537 ' 46,110 0.000 1537 46.1107.7 Tent school 0.030 center 250 3.750 0.000 250 3.750 312 4.680 0.000 312 4.680 1902 , 28,530 0.000 1902 28.530
V
p»-jaron7

Dlstrict-wlfte 3nd lntervention>wi$e summary for 2009*10SSA. Karnataka
(Rs. In lakh)
Annex-
rJew UnK Bagalkot* Bangalore Rural Bangalore Urban
S.No. Activities unit Fresh Out lay 200910 Spill over TotaJ Outlay Fresh Out lay 2009
10Spillpver Total Outlay Fresh Out lay 2009
10 ■Spillover
Total Outlay
Phy Fin Fin Phy Fin Phy Fin Fin Phy Fin Phy 1 Fin Fin Phy Fin7.0 Madrasa / Makthab 0.030 child 178 5.340 0.000 178 5.340 0 0.000 0,000 0 0,000 2988 . 89,640 0,000 2988 89.6407.9 INCLP Schools 0.030 S ch o d 2700 81.000 0.000 2700 81.000 150 4,500 0,000 150 4,500 0 ' 0.000 0,000 0 o.bod60 Summer Remedial Teaching
Chaitrada Chiauru 0.005 Child 1850 9.250 0.000 1850 9.250 1560 7,800 0.000 1560 7.800 3150 15,750 0.000 3150 15.750
8.1 |4 months seasonal lesldenlial school 0.023 child . 0 0,000 0,000 0 0,000 0 0.000 0.000 0 0,000 0 0,000 0,000 0 0,000
8.2 [Bridge course • Chlnnara Angala 0.010 child 0 0.000 0,000 0 0 000 75 0,375 0 000 75 0 375 700 3,500 0,000 700 3 500
6.3 |Homev8ase<i Education 613 18,390 0,000 613 18.390 353 10.590 0.000 353 10.590 539| 16,170 0,000 539 16,170
8.4 iBrldge course - Chlnnara Angaia lResl-2 months 0.017 i 201 3.417 0,000 201 3.417 91 1.547 0,000 91 1,547 0 0,000 0.000 0 0.000
85 lAlE Centers( Transportation. Hardest Ito reach children) 0.000 7 0,210 0.000 7 0.210 52 1,560 0,000 52 1,560 37 1.110 0.000 37 1.110
8,6 llnnovatlon Urban Deprived Children 0.007 0 0.000 0.000 0 0,000 0 0,000 0.000 0 0.000 0 0,000 0,000 0 0.000
8.7 jspeclal Enrolment Drive 75 0.000 0.000 75 0,000 0 0,000 0,000 0 0.000 187 , 0.000 0.000 187 0,000ISub Total 7063 234.007 0.000 7063 234.007 2643 36.052 0.000 2643 36.052 13494 355.210 0,000 , 13494 355.210
8 iRemtdlal Ttaehing8.1 iRemidlal teaching 0.006 child 9748 19.496 ' 0.000 9748 19.496 7155 14,310 0,000 7155 14,310 15377 30.754 0,000 15377 30,7548.2 |Motlvatk>n through field trips 0.017 0 0.000 0.000 0 0.000 0 0,000 0,000 0 0,000 0 0.000 0,000 0 0.000
ISub Total 9748 19.496 0.000 9748 19.496 7155 14.310 0,000 7155 14.310 15377 30.754 0.000 15377 30.7549 iFr»» Text Book
: 9.1iFree text book for l-V std all children of aided schools 0.001 Child 7237 5.790 0:000 7237 5.790 1755 1,404 0.000 1755 1,404 86720 69.376 0,000 86720 69,376
9.2 Free text book (or Vl-Vlli std all children of-aWed schools 0.001 Child 12210 15.873 0.000 12210 15,873 4296 5,585 0,000 4296 5,585 64390 ,83 .707 0,000 64390 83.707
9.3 Iwork books lor Nali Kali 0.001 Child 0 0.000 Q.OOO , 0 0.000 0 0.000 0,000 0 0,000 b 0.000 0.000 0 0,000ISub Total 19447 21.663 0.000 19447 21.663 6051 6.989 0.000 6051 6.9B9 151110 153.083 o.coo 151110 153.063
10. jlnterventlon* tor CWSN10.1 iProvision ot disabled children 0.012 child 5600 67,200 0,000 5600 67.200 2833 33.996 ' 0.000 2833 33.996 6635 79,620 0,000 6635 79.620
|Sub Total 5600 67.200 0.000 5600 6^.200 2833 33.996 0.000 2833 33.996 6635 79.620 0.000 6635 79.62011 1 Civil W ork!
11.1 BRC 8.000 0 0,000 o.boo 0 0.000 0 0,000 0,000 0 0,000 0 0,000 0.000 0 0,00011.2 CRC 4.850 building () 0.000 0.000 0 0.000 0 0.000 0.000 0 0,000 0 0.000 0,000 0 0,00011.3 School Buildings 9.800 building 27 243.000 0.000 27 243.000 2 18.000 0.000 2 18.000 0 ■ 0.000 0,000 0 o.octo11.4 Dilapidated 2.000 school 0 0.000 0.000 0 0.000 0 0.000 0,000 0 0.000 0 0.000 0,000 0 0.00011.5 Building less (Pry) 0 0.000 . 0.000 0 0.000 0 0.000 0.000 0 0.000 , 0 0.000 0,000 0 0.00011.6 Building less (UP) 0 0,000 0.000 0 0.000 0 0.000 0.000 0 0.000 0 0.000 0,000 0 0.00011.7 Dilapidated Building (Pry) 0 0.000 0.000 0 0.000 0 0.000 0,000 0 0.000 0 0,000 .0,000 0 0.00011.8 Additional class rooms 5.150 Room 222 1043.400 0,000 222 1043,400 60 282.000 0.000 60 282.000 50 235,000 0.000 50 235,000
11.9 Additional diass Room to Bangalore [Metro Citv 5.535 0 0.000 0,000 0 0,000 0 0,000 0,000 0 0.000 222 1229.880 , 0.000 222 1229.880
11,10 IToilets/Urinals 0.000 school 0 0.000 0.000 0 0.000 0 0,000 0,000 0 0.000 0 ■ 0.000 0.000 0 0.00011,11 Separare Girls Toilet 334 83.500 0.000 1 334 . 83,500 439 109.750 0,000 439 109.7S0 422 105.500 0,000 422 105.50011.12 prinking Water Facility 0 0.000 0.000 0 0.000 0 0,000 0.000 0 0,000 0 0.000 0.000 0 0.00011,13 Boundary Wall 0.500 school 0 0.000 0.000 0 0.000 0 0,000 0.000 0 0.000 0 ' ■ 0,000 0.000 0 0,00011,14 Iseperatlon Wall 0 0.000 0.000 0 0,000 oj 0.000 0,000 0 0.000 0 0,000 0,000 0 0.000
iX)
Page 3 o f . r :
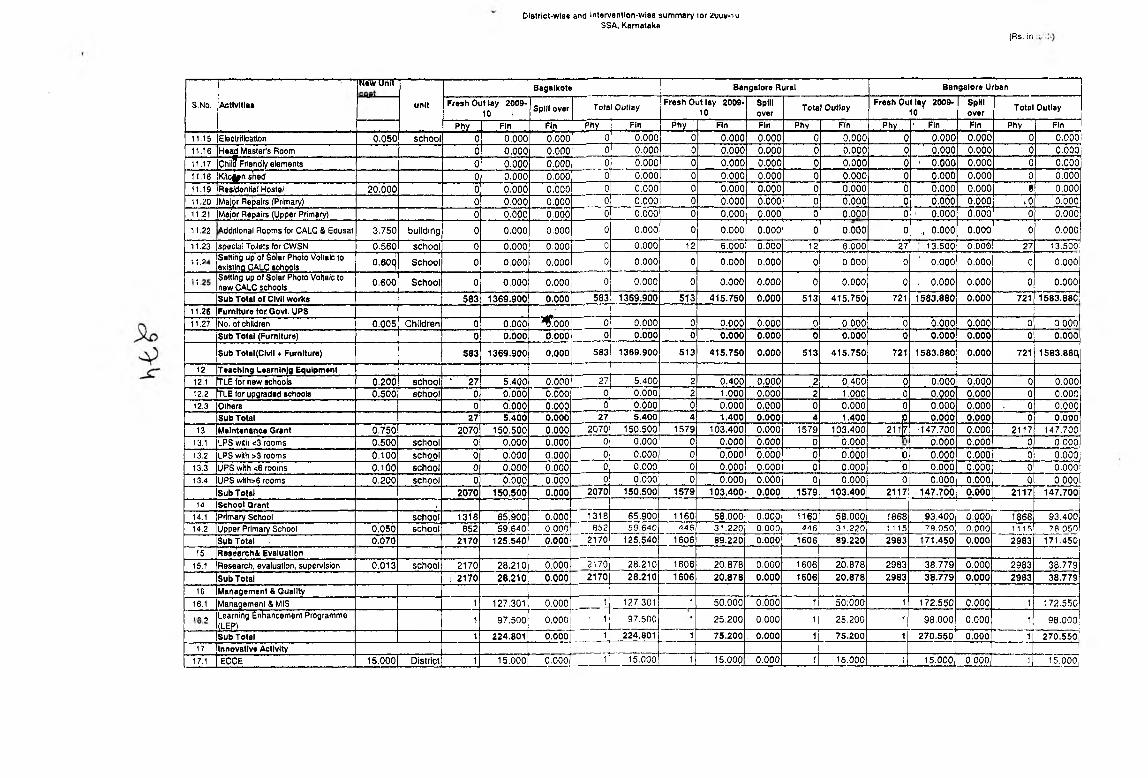
District-wise and intervention-wise summary vor zuu»-iuSSA. Karnataka
(Rs. in
S.No. jActlvitlas
New Onii
unit
Bagalkote Bangalore Rural Bangalore Urban
Fresh Out lay 2009- ID 1 Spill over Total Outlay Fresh Out lay 2009
10Spillover Total Outlay Fresh O utlay 2009
10 'T SpHI
over Total Outlay
Phy Fin Fin phy Fin Phy Fin Fin Phy Fin . .Phy . ■ Fin Fin Phy Fin11.15 lEleclriflcatlon 0.050 school 0 0.000 0.000 0 0.000 0 0.000 0.000 0 0,000 0 0.000 0.000 0 0,00011.16 |Hoa<l Master's Room 0 0.000 0.000 0 0.000 0 0.000 0.000 0 0.000 0 ' 0,000 0.000 0 0.00011.17 jchii? Friendly eloments 0 0.000 0.000 0 0.000 0 0.000 0.000 0 0.000 ■0 ' 0 .000 0.000 0 0.00011.19 iK itc^nshed 0 0.000 0.000 0 0.000 0 0.000 0.000 0 0.000 0 0.000 0.000 0 0.00011.19 iResidontial Hostel 20.000 0 0.000 0.000 0 0.000 0 0.000 0.000 0 0.000 0 0.000 0.000 e 0.00011.20 jM ^ r Repairs (Primary) 0 0.000 0.000 0 0.000 0 0.000 0.000 0 0.000 0 0.000 0.000 ,0 0.00011.21 |Ma(or Repairs (Upper Primary) 0 0,000 0.000 0 0.000 0 0.000 0.000 0 0.000 0 ' 0.000 0.000 0 0.000
11.22 Additional Ropms (or CALC & Edusat 3.750 building 0 0.000 0,000 0 0.000 0 0.000 0.000 0 o.ooo 0 „ 0.000 0.000 0 0.000
11.23 Ispsclal Toilets for CWSN 0.560 school 0 0.000 0.000 0 0.000 12 6.000 0.000 12 6.000 27 13.500 0.000 27 13.500, , j ISetting up of Solar Photo Voltaic to ' ' ■ lexistina CALC schools 0.60C) School 0 0.000 0,000 0 0.000 0 0.000 0.000 0 0.000 0 ’ 0.000 0.000 0 0.000
., l^fllting up of Solar Photo VoSalc to ' Inew CALC schools 0.600 School 0 0.000 0,000 0 0.000 0 0.000 0.000 0 0.000 0 , 0.000 0.000 0 0.000
ISub Total o f Civil works 583 1369.900 0.000 583 1369.900 513 415.750 0.000 513 415.750 721 1583.880 0.000 721 1583.88011.26 iFurnlture toriGovt. UPS11.27 |No. Of Children 0.005 Children 0 0.000 'C ooo 0 0.000 0 0.000 0.000 0 0.000 0 0.000 0.000 0 0.000
I'Sub Total (Furniture) 0 0.000 0,000 0 0.000 0 0.000 0.000 0 0.000 0 ’ 0.000 0.000 0 0.000
jsub Total(CMI ♦ Furniture) SS3 1369.900 0.000 583 1369.900 513 415.750 0.000 513 415.750 721 1583.880 0.000 721 1583.88Q
12 iTeachIng Learnlnjg Equipment12.1 I t lE for new schools 0.200 school • 27 5.400 0.000 27 5.400 2 0.400 0.000 2 0.400 0 0,000 0.000 0 0.00012.2 frLE for upgraded schools 0.500 school 0 0.000 0.000 0 0.000 2 1.000 0.000 2 1.000 0 0,000 0.000 0 ^ o.ooo12.3 pthers 0 0.000 0.000 0 0.000 0 0.000 0.000 0 0.000 0 0.000 0,000 . O' 0,000
ISub Total 27 5.400 0.000 27 5.400 4 1.400 0.000 4 1.400 p 0.000 0.000 0 0.00013 iMalntenance Grant 0.750 2070 150.500 0.000 2070 150.500 1579 103.400 0.000 1579 l"03,400 21 Ip ■147.700 0.000 2117 147.700
13.1 |LPS with <3 rooms 0.500 school 0 0.000 0.000 0 0.000 0 0.000 0.000 0 0,000 0,000 0.000 0 0.00013.2 |LPS with >3 rooms 0.100 school 0 0.000 0.000 0 0.000 0 0.000 0.000 0 0.000 0 0,000 0.000 0 0.00013.3 lUPS with <6 rooms 0.100 school 0 0.000 0.000 0 0.000 0 0.000 0.000 0 0.000 fo 0.000 0.000 0 0.00013.4 lUPS wHh>6 rooms 0.200 school 0 0.000 0.000 0 0.000 0 0.000 O.OOO 0 0.000 0 0.000 0.000 0 0.000
ISub Total 2070 150.500 0.000 2070 150.500 1579 103.400 0.000 1579 103.400 2117 147.700 0.000 2117 147.70014 jSchool Orant ,
14.1 iPrimary School school 1318 65.900 0.000 1318 65.900 1160 58.000 0.000 1160 58.000 1868 93.400 0.000 1868 93.40014.2 1 Upper Primary School 0,050 school 852 59.640 0,000 S52 59 640 446 31.220 0.000 446 31,220 1 115 70,050 0.000 1115 78 050
ISub Total . 0,070 2170 125.540 o.oo'ol 2 i7 0 l 125,540 1606 89.220 0.000 1606 89.220 2983 171.450 0.000 2983 171.45015 |Re«e'arch& Evaluation
1
15.1 Iflesearch, evaluation, supervision 0.013 school 2170 28.210 0.000 2170 28.210 1606 20.878 0.000 1606 20.878 2983 38.779 0.000 2983 38.779
Tsub Total 1 2170 28.210 0.000 2170 28.210 1606 20.878 0.000 1606 20.878 2983 38.779 0.000 2983 38.77916 iManagement & Quality
16.1 IManagement & MIS 1 127.301 0.000 1 127.301 1 50.000 0.000 1 50:000 1 172.550 0.000 1 172.550, , , (Learning Enhancement Programme
l(LEP)1 97.500 0.000 ■ 1 97.500 1 25.200 0.000 1 25.200 1 98.000 0.000 1 98.000
ISub Total 1 224.801 0.000 1 224.B01 1 75.200 . 0.000 1 75.200 1 270.550 0.000 1 270.55017 jinnovatlve Activity
17.1 lECCE 15.0001 D istrict 1 15.000 0.000 1 15.000 1 15.000 0.000 1 15.000 1 15.000 0.000 1 15.000

DIstrict'Wlse and intervention-wise summary for 2009<10SSA, Karnataka
(R s . in la k h )
SNO, Activities
Newr i/n it cost
unit
Bagalkote j Bangalore Rural Bangalore Urban
Fresh Out lay 200910 Spill over Total Outlay
1 Fresh Out lay 200910
Spillover
Total OutlayFresh Out lay 2009-
IDSpillover
1 1 I Total Outlay !
Phy Fin Fin Phy Fin Phy Fin Fin Phy Fin Phy Fin Fin ■ Phy Fin
17,2 Girls Education 0.000 . D istrict o' 0.000 0.000 0 0.000 0 0.000 0.000 0 0.000 0 ■ 0.000 0.000 0 0.00017,3 SC/ST 15.000 D istrict 1 15.000 0.000 1 15.000 1 15.000 0.000 1 15.000 1 15.000 0.000 ' 1 15.00017.-1 Comp. Edn. 50.000 District 1 50.000 0.000 1 50.000 1 50.000 0.000 1 50.000 1 ■50.000 0.000 1 50.00017.5 ivlinority Community 10.250 District 1 10.250 0.000 1 10.250 1 10.250 0.000 1 10.250 1 10.250 o.ooo 1 10.25017.6 Urban Deprived Children 9.750 D istrict 1 9.750 0.000 1 9.750 1 9.750 0.000 1 9.750 1 • 9.750 0.000 1 9.75017.7 others 0.000 0 0.000 0.000 0 0.000 0 0.000 0.000 0 0,000 0 0.000 0.000 0 0.000
Sub Total 100.000 1 100.000 0.000 1 100.000 1 100.000 0.000 1 100.000 1 100.000 0.000 1 100.00018 Community Training 1
18-1 Community Training 0.001 member 7094 4,256 0.000 7094 4.256 10329 6.197 0.000 10329 6.197 8471 5.083 ■ 0.000 8471 5.083
19.0 Sub Total 7094 4.256 0.000 7094 4.256 10329 6.197 0.000 10329 6.197 8471 5.083 0.000 8471 5.083Total o( SSA(Oi«trleto) , 73625 4897.067 0.000 73625 4897.067 43167 1267,414 0.000 43167 1267.414 230482 4904.045 0.000 230492 4904.045
m m
'■.t'niuv . - ' ' " I '". -M
' - .
,v. : -‘)
, • ,!
• - ' ; ■ . '.■’l
i. 'V
■ i 'y w S u
• '■ Vi.-) ■
' .i.*S ' ' ~ ■: ~ y.
- ..1;. . '
.if
.e' ;;hl
. . 3 ' 4 )• - .. ' . "x<!
. i.
r S - ; ; - :
r v ; : C \19 State Componant 1 ■ ■ /,
19.1 Manaoemont 0 0.000 0.000 0 0.000 ° i 0.000 0.000 0 0.0001 0 0,000 ' 0.000 0 0.00019.2 REMS . ' 0 0.000 0.000 0 ,1 0.000 0 0.000 0.000 0 0.000 0 0.000 ■0.000 0 0.00019.3 SIEMAT 0 0.000 0.000 0 0 .0 00 , 0 : 0 .000 0.000 0 0.000 0 0.000 0.000 0 0,000
Sub Total 0 0.000 0.000 0 0.000 01 0.000 0.000 0 0.000 0 0.000 0.000 0 0.000SJATjESSA'TOTAl;-^ ■ ■ . 73625 4897^67 0.000 73625 4897.067 43167 1267;414 = o ;w o •‘43167 1267’;414 230482 4SO:4iO«S 1 o;ooo 230482 4904.045
20 NREGEL•00.1 No of EBBS 6 6 ol 0 0 020.2 No. of Urban slums 0 0 0 0 4 4 i
20.3 No.of clusters covered 0.100 MCS 68 68 0 0 10 1020.4 [No of clusters In urban slums 0.050 MCS 0 0 1— . - ., 0 0 '0 ' 0 it
A Civil w orks . .7 ]A Const.of ACR Including
toilets,drlni<inn Water,electrification 0 0.000 0.000 0 0.000 0 0.000 0.000 0 0.000 ’ -0 0.000 0.000 • 0 0.000
TLE 1
B One time grant of TLE,Library, SDorts. Vocational T rainino 0 0.000 0.000 0 0.000 0 0.000 0.000 0 0.000 0 0.000 0.000 0 0.000
Spill over as per PaB fyllnules 08-09 0 0.000 0.000 0 0.000 0 0.000 0.000 0 0.000 '0 0.000 0.000 0 0.000
Total Non recurring cost(Fre*h'i.splll over)
— .........
i0 0.000 0,000 0 0.000 0 0.000 0.000 0 o .o v ol 0.000 0.000 0.000
C Recurring r

District-wise and if^tervention-wise summflry for 2009*10SSA. Karnataka
(Rs. In lakh)
s.No. Activities
Unit
unit
Bagalkote Bangalore Rural Bangalore Urban 1
FreahOutlay 2009-ro Spill over
Prosh Out lay 2009- Total Outlay ' ' sp illover Total Outlay Fresh Ou lay 2009
0Spillover Total Outlay
Phy Fin Fin Phy 1 Fin Phy Fin Fin Phy 1 Fin Phy Fin Fin Phy 1 Fin
1.0
Malntsnance of schools,part time instructor (o MCS, provision of We skills,bicycles,vocational tralnfng,transportatlon charges etc,.
68 10.200 0,000 68 10.200
i
0 0.000 0.000 0 0.000 1 0.150 0.000 1
li»
j
0.1501
2.0 Award to best schooWeacher 68 3.400 0.000 681 3.4001 0 0.000 0.000 0 0.000 1 , 0,050 0 . 0 ^ 1 0.050
aoStudent evaluation,Remedial Teaching,Bridge courses & alternative Schools
68 13,600•
0.000 68r 1: 13 600' 0 0.000
i0 000 0 0.000 1 0,200 o.ooo 1 0 200|
4.0 Learning through Open schoools 68 13,600 0.000 68 13.600 0 0.000 O.OOO 0 0.000 1 0.200 0.000 1 0.,100i'
5.0 Teacher Training 0 0,000 0.000 0 0.000 0 0.000 0.000 0 0.000 0 0.000 0.000 ■ 0 0.0006,0 Child care centers for 2 centers 0 0,000 0.000 0 0.000 0 0.000 0.000 0 0.000 0 0.000 6.000 0 0,0007,0 other 0 0,000 0.000 0 0.000 0 0.000 0.000 0 0.000 0 o .v o 0.000 0 0.000
Sub Total 6B 40.BOO 0.000 66 40.800 0 0.000 0.000 0 0.000 1 0.600 0.000 1 0.600
DAdditional Incentives (unifor stationery, work book, escorts in difficult areas etc.l i
1,0 Primary 0 0.000 0.000 0 0.000 0 0.000 0.000 b 0.000 0 0,000 0.000 0 0,000
2.0 Upper Primary 0 0.000 0.000 0 0,000 0 0.000 0,000 0 0.000 ■0 ' 0.000 . 0.000 0 o.oaoSub Total 0 0.000 0.000 0 0.000 0 0.000 0.000 0 0.000 0 0.000 0.000 0 0.000Community Mobilisation 0.250 HdCS 68 2.604 0,000 68 2,604 0 0.000 0.000 0 0.000 1 0.038 0.000 1 0,038Sub Total • 68 2.604 0.000 68 2.604 0 0.000 0.000 0 0.000 1 0.038 0.000 1 0.03B
- - - 68 43.404 ; • :^iOOQ z ^ o m o •"‘ •tg;a3821 KQBV '
20,1 No of KOBVs sanctioned 0 0 0 0 0 • 0
2(3.2 Non Raourring 0 0 0 0 0 0
1,0
Construction of Building 15.00 School 6 126.300 0.000 6 126,300 0 0.000 0,000 0 0.000 0 0.000 0.000 0 0,000Boundary Wall 2.50 School 6 9.000 0.000 6 9,000 0 0.000 o.ooo 0 0,000 0 0,000 0.000 0 0.000Borlng/Hand pump 6 6.000 6.o‘6o 6 6,000 0 0.000 0,000 0 0,000 0 0.000 0.000 0 0,000eiBctrfclty/water charges 6 1.200 0.000 6 ' 1,200 0 0.000 0,000 0 0.000 0 0.000 0.000 0 0.000
2,0 PumKure / Equipment (Including kKchen eaulomentl 6 3.000 0.000 6 3,000 0 0.000 0.000 0 0.000 . 0 0.000 0.000 0 0.000
3,0T1.M and equipment Including library books 3.00 School 6 3.000 0.000 6 3,000; 0 0.000 0.000 0 0,000 0 0.000 0.000 0 0.000
4,0 Bedding 0.75 School 6 0.000 0.000 6 0.000 0 0.000 0.000 0 0.000 0 , 0.000 0.000 0 0,000Spill over as per PaB Minutes 200708 0 0.000 0.000 0 0,000 0 0.000 0.000 0 0,000 0 0.000 0.000 0 0,000
Total Non-recurring 21.25 6 143.500 0.000 6 148.500 0 0.000 0.000 0 0.000 0 0.000 o.ooo ^ 0 0.000
Recurring ’
1,0f^aintenance per girl Per month <$ Rs, 750/- 9.00
100Children
6 54.000 0.000 6 54,000 0 0.000 0.000 0 0.000 0 0.000 0.000 0 0.000
2,0 Stipend per girt per month @ Rs.SO/-0.60
100Children 6 3.600 0.000 6 3.600 0 0.000 0,000 0 0.000 0 0.000 0.000 0 0.000
3.0 Suppiementary TLM,stationary and other educational materials 0.60
100ChiWren
6 3.600 0.000 6. . . . I
3.600 0 0.000 0,000 0 0.000 0 . 0.000 0.000 0 0,000j

District-wise and Intervention-wise summary for 2009-10SSA. Karn8tal<8
Annex-
(Rs. In lakii)
s’ no.
----------------------1-----------------------------
Activities
New unit
unit
Bagalkotc Bangalore Rural Bangalore Urbi\n
FreahO utlay 200910 Spill over Total Outlay
Fresh Out lay 200910
Spillover
Total Outlay Fresh Out lay 200910 ,
Spillover
Total Outlay
Phy Fin Fin phy Fin Phy Fin Fin Phy Fin Phy Fin Fin Phy Fin
4.0 Examination Fee 0,01 School 6 0,120 0,000 6 0.120 0 0.000 0.000 0 0,000 0 0.000 0 0 0 0 0 0.000
5,0
Salaries
6,49
Schdol 6 72,000 0,000 6 72,000 0 O.OOC 0.000 0 0,000 0 0,000 0,000 0 0,0001 ,Ona Warden2, Four full time teachers 1
two urdu leaofiers(only for blocks with muslim population above 20% and selelcted urban areas)lf required
1
3, Tfiree Dart time teachers4. One full time accountant 15, Two Supportslaff(accDunt/Assi5tant/Chowkldar/Peon)6, One head Cook and one assistant cook for 50 girls and 2 assistant cok for 100 oirls
6,0 Vocational training / specific skill trg 0.40 School 6 3.000 0.000 6 3,000 0; 0.000 0.000: 0 0.000 0 0.000 0.000 0 0.000
7,0 Electricity / water charges 0.50 School 6 3,600 0.000 6 3,600 0 0.000 0.000 0 0.000 0 0.000 0.000 0 0.000
8,0 Medical care/contlngencles ® Rs.750/- per girl. 0.75
100Children
61
4.500 0.000 6 4,500 0 0.000 0.000 0 0.000 0 0.0001
0.000 0 0,000
9,0 Misc. Including maintenance 0.40 School 6 4.800 0,000 6 4.000 d 0.000 0.000 6 0.000 0 0.000 0.000 0 0.00010,0 Preparatory camps 0.15 School 6 0.900 0.000 6 0.900 0 0.000 0.000 0 0.000 0 0.000 0.000 0 0.00011,0 P.TAZ school functkjns 0.15 School 6 0.900 0.000 6 0.900 0 0.000 0.000 0 0.000 0 0.000 0.000 0 0.00012,0 Provision of Rent (Smonths) 3 4.500 0.000 3 4.500 0 0.000 0.000 0 0.000 0 0.000 0.000 0 0.00013,0 Capacity Building 6 1,800 0.000 6 1.800 0 0.000 0.000 0 0.000 0 0.000 . 0.000 0 0.000
Total Recurring 19.05 6 157.320 0.000 6 157.320 0 0.000 0.000 0 0.000 0 0.000 0.000 0 0.000Grand Total {Non recurring * . rteufHng) > ' 6 305.820 1 0.000 6 305.620 0 0.000 - . 0 orooo 1 ...;^o V : ;:.o-?Po ■ o.oao 0 0.000

h :>
S.No. Activities
Belgaum Beliary Bidar
Fresh Out lay 200910 Spill over Total Outlay
Fresh Out lay 2009- ID
Spillover Total Outlay Fresh Out lay 2009
10Spillover Total Outlay
Phy l=in Fin Phy Fin Phy Fin Fin Phy Fin Phy Fin , Fin Fin1.0 N*w School* r1.1 Upgradalion of EGS to PS 0 0 0 0 0 01,2 New Priamary schools 34 34 14 14 25 251.3 Upgradsd Now UPS ^ 0 0 0 0 0 t ■ 01.4 Adding class VIII to UPS 0 0 0 0 0 02 N«w T uehers Salary (PS)
2.1 Primary Teachers (Regular) 68 17,680 0.000 68 17,680 28 7,280 0.000 28 7,280 50 13.000 0,000 50 13.0002.2 Primary Teachers (Para) 0 0,000 0.000 0 0,000 0 0,000 0.000 0 0,000 0 0,000 0.000 0 0,0002.3 Upper Primary Teachers (Regular) 0 0,000 0.000 , 0 0,000: 0 0,000 0.000 0 0,000 0 0.000 0,000 , 0 0,000
2.4 Additional teachers forllPS uparaded previous year 114 29.640 0,000 114 29,640: 12 3.120 0.000 12 3,120 74 19,240 , 0.000 74 19.240
2.5 Upper Primary teachers- f e f 0 0.000 0,000 0 0,000 0 0.000 0.000 0 0,000 0 0,000 0,000 0 0,000
Additional Teachera Against PTR
2.6 i>lew Additional Teachers PS as per l-,40 PTR (Reaular) 0 0.000 0,000 0 0,000 0 0.000 0.000 0 0,000 0 0,000 0.000 0 0.0^0
2.7 Nevir Additional teachers - PS as per l:30(fleQulan 0 0.000 0.000 0 0,000 ' 0 0,000 0.000 0 0,000 0 0,000 0,000 0 0-000
2.B NewAddltlonalTeachors-UPS as per 1:40 (Reflular) 0 0.000 0,000 0 0,000 0 0,000 0.000 0 0,000 0 ■0,000 0.000 0 0,000
2.9 New AddKlonal Teachers ■ UPS 1:30(Reqular) 0 0.000 o,6oo 0 0,000 0 0,000 0.000 0 0,000 0 0,000 0,000 0 0,000
2.10 , teachers Under OBB 0 0.000 0,000 0 0,000 0 0,000 0.000 0 0,000 0 0,000 0,000 0 0,000
2.11New o'thers-Addltional TGT (BA/B,Ed } fa,'-Clas3 VIII 0 0.000 0,000 0 0,000 0 0,000 0.000 0 0,000 0 , 0,000 0,000 0 0,000
Sub Total(?.01 to 2.11) ' 182 47,320 0.000 182 47,320 40 10.400 0.000 40 10,400 124 32,240 0.000 124 32.240Teachera Salary ( Recurring)
2.12 Pilimary Teachers (Regular) 1272 2060.640 0,000 1272 2060.640 1150 1863.000 0.000 1150 1863,000 574 929,880 0,000 574 929,8802.13 Additional teachers (lERT) 0 0.000 0,000 0 0,000 0 0,000 0.000 0 0,000 0 0,000 0,000 0 0,0002.14 Trained Graduate Teachers 447 831.420 0,000 447 831,420 297 552,420 o.ood 297 552,420 300 558,000 0,000 300 558,0002,15 Upper Primary Teachers (f’ara) 0 0.000 0,000 0 0.000 0 0.000 0.000 0 0,000 0 0,000 0,000 0 0,000
2.16Upper Primary Teachers- Head Master 0 0.000 0,000 0 DOOO 0 0,000 0,000 0 0,000 0 0,000 0,000 0 0,000
2,17 Additlonfll Teachers PS (Regular) 0 0.000 0,000 0 0 000 0 0,000 0,000 0 0,000 0 0,000 0,000 0 0,0002,18 AddWonal Teachers - PS (Para) 0 0.000 0,000 0 0.000 0 0,000 0,000 0 0,000 0 0,000 0,000 0 0,000
2,19 Additlonai Teachers - UPS (Regular) 0 0.000 0,000 0 0,000 0: 0,000 0,000 0 0,000 0 0,000 0,000 0 0.000
2,20 Additional Teachers - UPS (Para) 0 0.000 0,000 0 0,000 0 0,000 0,000 0 0,000 0 0,000 0.000 0 0,0002,21 teachers UnderOBB 0 0.000 0,000 0 0,000 0 0,000 0,000 0 0,000 0 0,000 0.000 0 0,000
2,22Olhers-Addltlonal T fiT (BA/B,Ed) for Class VIII 0 0.000 0,000 0 0,000 0 0,000 0,000 0 0,000 0 0,000, 0.000 0 0,000
2,23 Arrears of Salary of SSA teachers 0 0.000 ' 0,000 0 0,000 0 0,000 0,000 0 0,000 0 0,000 0,000 0 0,000• u b Total (2.12 to 2.23) 1719 2892.060 0.000 1719 2892.060 1447 2415,420 0.000 1447 2415.420 874 1487,880 0.000 874 1487,880Sub Total (New teachers^^Teachers Recurring) 1901 2939.380 0.000 1901 2939.380 1487 2425.820 0.000
., J_________1487 2425.820 998 1520.120 0.000 998 1520.120
3,0 Teacher* Grant3,1 Teachers grant - Primary 3423 17.115 0,000 3423 17,115 1382 6.910 0,000 1382 6,910 1504 7,520 0,000 1504 7,520

OtfttricVwise and intervention*wi$e summary for 2009*10SSA, Karnataka
(Rs. in lakh)
Annex*
S.No. Activities
Beigaum Bellary ' Bidar
Fresh Out lay 200810 Spill over Total Outlay
Fresh Out lay 200910
Spillover Totai Outlay Fresh Out lay 2009
10Spill ,over Total Outlay
Phy Fin Fin Phy Fin Phy Fin Fin Phy Fin Phy Fin ' ' Fin ' Phy Fin3.2 Teachers qrant ■ UPS 15062 75,310 0.000 15062 75.310 7381 36.905 0.000 7381 36.905 6743 33,715 0.000 6743 33,715
Sub Total 18486 92.425 0.000 18485 92.425 , 8763 43.815 0.000 8763 43.815 8247 41.235 0.000 8247 41.2354 Block Resource Centres
4,1 Salary of Resource Persons 0 0.000 0.000 0 0,000 6 11.160 0,000 6 11,160 0 0.000 ' 0,000 0 0,000
4.2 Furniture Grant 0 0.000 0.000 0 0.000 0 0,000 0.000 0 0,000 0 0,000 ' p.OOO 0 0,000
4.3 Contingency 12 2.400 0,000 12 2.400 8 1,600, 0.000 8 1,600 5 1,000 '0,000 5 1,000
4.4 Meeting 8i TA allowance 12 1.080•
0,000 12 1,080 8 0,720 0.000 8 0.720 5 0.450 .0,000 5 0,450
4.5 TLM grant ' 12 0.600 0,000 12 0,600 8 0.400 0.000 8 0.400 5 o,2sb 0,000 5 0,250
4.S BRG Building Maintenance 0 0.000 0,000 0 0.000 0 0.000 0.000 0 0.000 0 0,000 ',0,000 0 0,000
Sub Total 12 4.080 0.000 12 4,080 8 13.880 0.000 a 13.880 S 1.700 0.000 5 1.7005 Cluster Resource Centres
6.1 Salary of Resource Persons 96 178.560 0.000 96 178.560 45 83,700 0.000 45 83,700 14 26,040 0.000 14 26,0405.2 Furniture & equipment 0 ' 0.000 0,000 0 0.000 b 0.000 0.000 0 0,000 0 0,000 0.000 0 0.0005.3 Contingency 163 5.040 0,000 168 5.040 112 3.360 0.000 112 3,360 70 2.166 0,000 70 2.1005.4 Meeting & TA allowance 163 6.048 0,000 168 6.048 112 4.032 0.000 112 4,032 70 2,520 0,000 70 2.5205.5 TLM grant 168 1.680 0,000 168 1.680 112 1,120 0,000 112 1.120 70 6 ,706 0.000 70 0.7005.6 CnC Building Malntrenance 0 0 000 0,000 0 0.000 0 0.000 0.000 0 0.000 0 O.OOfc 0,000 0 0.000
Sub Total 168 191.328 0.000 168 191.328 112 92.212 0.000 112 92.212 70 31,360 0,000 70 31 .3606 Training 1
6.1 Teachers trg. • In sen/lce at block level 18485 184,850 0,000 18485 184.850 8763 87.630 0,000 8763 87.630 8247 82,470 0,000 8247 82.470
6.2 Teachers trg. ■ In service at block level at cluster level 18435 92.425 0,000 18485 92.425 8763 43.815 0,000 8763 43.815 8247 41.235 0.000 8247 41.235
6.3induction training for Newly Recruit Trained Teachers 182 5.460 0,000 182 5.460 40 1.200 0,000 40 1.200 124 3.720 0.000 124 3.720
6.4 Training for- Untrained Teachers 0 0000 0.000 0 0.000 0 0.000 0,000 0 0.000 0 6.606 0.000 0 0.000
6.5 BRC/CRC coordinators and resource persons 576 5.760 0,000 576 5.760 308 3.080 0,000 308 3,080 241 2.410 0.000 241 2.410
Sub Total 19243 288.495 0.000 19243 288.495 9111 135.725 0.000 9111 135.725 8612 129.835 ,0.000 8612 129.835
7 Interventions tor Out o f School Children
7.1 EGS Centre (PS) 0 0,000 0,000 0 0.000 0 0,000 0,000 0 0,000 0 0.000 0.000 0 0.0007.J EGS Centre (UP) 0 0,000 0.000 0 0.000 0 0.000 0,000 0 0,000 0 0.000 0.000 0 0:000
7.3 Chlnnara Angaia Bridge oouse ResWentiai 12 monihs-RBC 1650 165.000 0,000 1650 165.000 4150 415.000 0,000 4150 415.000 2318 231.800 ■0.000 2318 ■231.800
7.4 Chlnnara Angaia Seasonal Bridge course • Hesdn. (6 months)- NHBG 0 0.000 0.000 0 0.000 1425 71.250 0,000 1425 71.250 440 22.000 0.000 440 22.000
7.5 Mobile schools 0 0.000 0.000 0 0.000 0 0.000 0,000 0 0,000 0 0.000 0.000 0 0.0007.6 12 months bridge course-NRBC 546 16.380 0.000 546 16.380 0 0.000 0.000 0 0,000 123 3.690 0.000 123 3.69077 Tent school 990 14.850 0.000 990 14.850 1120 16.8001 0.000 1120 16,800 155 2.325 o.ooo 155 2,325

District-Wise and intervention-wise summary for 2009*10SSA. Karnataka
(R». in lakh)
s.No. Activities
Belgavm Bellary BIdar
Fresh Out lay 200910 Spill over Total Outlay
Fresh Out lay 2009- ID
Spillover , Total Outlay Fresh Out lay’ 2009-
IDSpillover Total Outlay
Phy Fin Fin Phy Fin Phy 1 Fin Fin Phy Fin Phy Fin Fin Phy Fin
7.8 Madrasa/MaWhab , 56 1.680 0.000 56 1.680 o! o.obo 0.000 0 0,000 1444 43.320 . 0.000 1444 43.320
7.9 NCLP Schools 0 0.000 0.000 0 0.000 400( 12.000 0.000 400 12.000 0 0.000 0,000 0 O.OOO
8.0 Summar Remedial Teaching Chaitrada Chlouru 4125 20.625 0.000 4125 20.625 2350j 11.750 0.000 2350 11,750 4000 20,000 0,000 4000 20.000
8.1 4 months seasonal residential school 50 1.650 0.000 50 1 650 0 0.000 0.000 0 0.000 0 0.000 0,000 0 0,000
8.2 Bridge course • Chinnara Angala 40 0.200 0,000 40 0 200 655 3.275 0.000 655 3.275 487 2,435 0,000 487 2.435
83 Home Based Education 1471 44.130 0.000 1471 44 130 502 15.060 0.000 502 15.060 691 20.730 0,000 691 20.730
8.4 Bridge course - Chinnara Angala Resi-2 months 386 6.562 0.000, 386 6,562 198 3.366 0.000 198 3.366 328 5.576 0 000 328 5.576
8.5 AIE Centers( Transportation. Hardest to rdach children) 95 2.850 0.000 95 2.850 4 0.120 0.000 4 0.120 7 0.210 0,000 7 0,210
8.6 Innovation Urban Deprived Children 0 0.000 0.000 0 0.000 9 0.000 0.000 0 0.000 0 0.000 0.000 0 0.000
8.7 Special Enrolment Drive 29 0.000 0.000 29 0.000 354 0.000 O.ooo 354 0.000 64 O.OOO 0,000 64 0.000
Sub Total 9438 273.927 0.000 9438 273.927 11158 548.621 0.000 11158 548.621 10057 352.086 0.000 10057 352.086
8 Remedial Teaching8.1 Remldlal teaching 17763 35.526 0.000 ' 17763 35.526 10195 20.390 0.000 10195 20.390 10374 20.748 0.000 10374 20.7488,2 Motivation through field trips 0 0.000 0.000 0 0.000 0 0.000 0,000 0 0.000 0 0.000 0.000 . 0 0.000
Sub Total 17763 35.526 0.000 17763 35.526 10195 20.390 p.ooo 10195 20.390 10374 20.748 0.000 10374 20.7489 Free Text Book
9.1 ■l^ree text book (or l-V sid all children of aided schools 12811 10.249 0,000 12811 10.249 13970 11.176 0.000 13970 11.176 42871 34.297 0.000 42871 34.297
9.2 Free text book for VI-VIII std all children of aided schools 43757 56.884 0.000 43757 56.884 12019 15.625 0.000 12019 15.625 19514 25.368 ' 0.000 19514 25.368
9.3 Work books for Nali Kali . 0 0.000 0.000 0 0.000 0 0.000 0.000 0 0.000 0 0,000 ' 0.000 0 0.000
Sub Total 56568 67.133 0.000 56568 67.133 25989 26.801 0.000 25989 26.801 62385 59.665 0.000 62985 59.665
10 Interventlona (or CWSN10.1 Provision of disabled children 7074 84.888 0.000 7074 84.888 3620 43.440 0.000 3620 43.440 4014 48.168 0.000 4JD14 48.168
Sub Total 7074 84.8S8 0.000 7074 84.888 3620 43.440 0.000 3620 43.440 4014 48.16tf 0.000 4014 48.16811 Civil Work*
11.1 BRC 0 0.000 0.000 0 0.000 0 0.000 0.000 0 0.000 0 o.ooo . 0.000 0 0.00011.2 CRC 0 0.600 0.000 0 0.000 0 0.000 0.000 0 0.000 0 0.000 , 0.000 0 0.00011.3 School Buildings 34 306.000 0.000 34 306.000 14 126.000 0.000 14 126.000 25 225.000 - o.ooo 25 225.00011,4 Dilapidated 0 0.000 0,000 0 0.000 0 0.000 0.000 0 0.000 0 0.000 ' o.o'oo 0 0.00011,5 Building lesa (Pry) 0 0.000 0,000 0 0.000 0 0.000 0.000 0 0.000 0 0.000 0.000 0 0.000
11,6 Building lest (UP) 0 0.000 0.000 0 0.000 0 0.000 0.000 0 0.000 0 o.ooo , 0,000 0 0.00011.7 Dilapidated Building (Pry) 0 0.000 0.000 0 0.000 0 0.000 0.000 0 0.000 0 0.000 0.000 0 0.000
11.8 Additional class rooms 454 2133.800 0 000 454 2133.800 350 1645.000 0,000 350 1645.000 109 512,300 0,000 109 512,300
11.9 Additional Class Room to Bangalore Metro CItv 0 0.000 0.000 0 0.000 0 0.000 0.000 0 0.000 0 0.000 ' 0,000 0 0.000
11.10 Toilets/Urinals 0 0.000 0.000 0 0.000 0 0.000 0,000 0 0.000 0 O.OOO 0.000 0 0.00011.11 Separare Girls Toilet 395 98.750 0.000 395 98.750 695 173.750 0.000 695 173.750 500 125.000 0.000 500 125.00011.12 Drinking Water Facility ' 0 0.000 o.oon 0 0.000 0 0.000 0.000 0 0.000 0 0,000 0.000 0 0.00011,13 Boundary Wall 0 0.000 0.000 0 0,000 0 0.000 o.oob 0 0.000 0 0,000 0.000 0 0.00011.14 Separation Wall 0 0.000 0.000 0 1 0.000 0 0.000 0.000 0 0.000 0 0,000 o.ooo 0 0.000
Annex-

District-wise and intervention-wise summary for 2009-10SSA. Karnataka
Annex-
(Rs. in lakh)
S.No. Activities
Belgaum Bellary . Bldar
Fresh Out lay 2009- ID Spill over Totel Outlay
Fresh Out lay 2009. 10
Spillover Total Outlay Fresh Out ley 200
10*- Spill
over Total Outlay
Phy Fin Fin Phy Fin Phy Fin Fin 1 Phy Fin Phy Fin ! Fin Phy Fin11.15 ElBctrlfication 0 0,000 0.000 0 0,000 0 0.000 O.OOOl 0 0.000 0 o.oOo 0.000 0 0.00011.16 Head Master's Room 0 0.000 0,000 0 0,000 0 0.000 0.000 0 0.000 0 0.000 . 0.000 0 0.00011,17 Cliild Friendly elements 0 0.000 0.000 0 0.000 0 0.000 0.000 0 0.000 0 0.000 0.000 0 0,00011.18 Kitchen shed 0 0.000 0.000 0 0.000 0 0.000 0.0001 0 0.000 0 0.000 0.000 0 0.00011.19 Residential Hostel 0 0.000 0.000 0 0.000 0 0.000 O.OOOl 0 0 .000 0 0,000 0.000 0 0.00011.20 Major Repairs (Primary) 0 0.000 0.000 0 0.000 0 0.000 O.OOOl 0 0.000 0 0.000 0.000 0 0.00011.21 Ma|or Repairs (Upper Primary) 0 0.000 0,000 0 0.000 0 0.000 O.OOOl 0 0.000 0 0.000 0.000 0 0,00011.22 Additional Rooms for CALC & Edosai 0 0.000 0,000 0 0.000 0 0.000 o.ooo| 0 0.000 0 0.000 . 0.000 0 c.ooo11.23 special Toilets for CWSN ia 9.000 0.000 18 9.000 94 47.000 O.OOOl 94 47.000 146 73.000 0.000 146 73.000
11.24 Setting up of Solar Photo Voltaic to existlno CALC schools 0 0,000 0.000 0 0.000 0 0.000 o.oool 01 0.000 01 O.ooo . 0.000 0 0.000
11.25 SettlnB up of ^ la r Photo Voltaic to new CALC schools 0 0.000 0.000 0 0.000 0 0.000 o.oooi 0 0,000 0 .o.ooo 0.000 0 0.000
Sub Total of Civil work* 901 2547.550 0.000 901 2547.550 1153 1991,750 o.oool 1153 1991.750 780 935.300 0,000 780 935,30011.26 Furniture for O ovt UPS 111.27 No. of children 0 0.000 0.000 0 0.000 0 0.000 0,0001 0 0.000 0 0.000 0.000 0 0.000
Sub Tou t (Furniture) 0 ' 0.000 0.000 6 0.000 0 0.000 o.oool 0 0.000 0 0.000 0.000 0 0.000
Sub Tetal(Clvll * Furniture) 901 2547.550 0.000 901 2547.550 1153 1991.750 0.000| 1153 1991,750 780 935,300 0,000 780 935,30012 Teaching Learnlnjg Equipment 1
12.1 TLE lor new schools 34 6.800 0.000 34 6.800 14 2.800 o.oool 14 2.800 25 5,000 , 0,000 25 5.00012.2 . TLE for upgraded schools 0 0.000 0.000 0 0.000 0 0.000 0,0001 0 0,000 0 0,00(D 0.000 0 0.00012.3 Others 0 0,000 0,000 0 0.000 0 0,000 o.oool 0 0,000 0 0.60,0 0,000 0 0.000
Sub Total 34 6.B00 0.000 34 6.800 14 2,800 o.oool 14 2,800 25 5.000 , 0,000 25 ;i 00013 Maintenance Grant 4932 344,700 0.000 4932 344.700 2137 158.600 0,000 2137 158.600 1890 140,200 0,000 1890 140.200
13.1 LPS with <3 rooms 0 0.000 0,000 0 0.000 0 0.000 o.oool 0 0.000 0 o;ooo 0.000 0 0 00013.2 LPS with >3 rooms 0 0,000 0,000 0 0.000 0 0.000 o.oool 0 0.000 0 0,000 0,000 0 0 00013.3 UPS with <6 rooms 0 0.000 0,000 0 0.000 0 0.000 0,0001 0 0,000 0 0,000 . 0 .000 0 0.00013.4 UPS wilh>6 rooms 0 0.000 0.000 0 0.000 0 0.000 0.000 0 0.000 0 0,000 0.000 0 0.000
Sub Total 4932 344.700 0.000 4932 344.700 2137 158.600 0,000 2137 158.600 1890 140.200 0,000 1890 140,20014 School Qrant
14.1 Primary School 3298 164.900 0.000 3298 164.900 1413 70,650 0.000 1413 70.650 1416 70.800 0.000 1416 70.80014.2 Upper Primary School 1811 126,770 0.000 1811 126.770 872 61,040 0.000 872 61.040 910 63.700 ■0.000 910 63.700
Sub Total 5109 291.670 0.000 5109 291.670 2285 131.690 0,000 2285 131,690 2326 134.500 0,000 2326 134,50015 Re*earch& Evaluation '
15.1 Research, evaluation, supervision 5109 66,417 0.000 5109 66,417 2285 29,705 0.000 2285 29.705 2326 30.238 ' 0 .000 2326 30.238Sub Total 5109 66.417 0.000 5109 66.417 2285 29.705 0.000 2285 29.705 2326 30.238 0.000 2326 30,238
16 Management & Quality16.1 Management & MIS 1 222,136 0.000 1 222.136 1' 151,083 0,000 1 151.083 1 135,721 0.000 1 135.721
16.2 Learning Enhancement Programme (LEP)- 1 154.250 0,000 1 164.250 1 120,500 0,000 1 120.500 1 75.000 .0 .0 0 0 1 75.000
Sub Total 1 376.386 0.000 1 376,386 1 271.583 0.000 1 271.583 1 210,721 0.000 1 210,72117 Innovative Activity i
17.1 ECCE 1 15,000 0.000 1 15.000 1 15,000 0.000 1 15.000 1 15.000 0.000 1 15.000

s.No. Activities
Belgaum Beilary 1 Bidar
Fresh Out ley 200910 Spill over Total Outlsy
Fresh Out lay 200910
Spillover Total Outlay
Fresh Out lay 200910
Spill ’ over Total Outlay |
1Phy Fin Fin Phy 1 Pin Phy Fin Fin Phy Fin Phy Fin Fin Phy Fin 1
17.2 Girls Education 0 O.OOOj 0.000 0 0.000 0 0.000 0.000 0 0.000 0 0.000 , 0 .000 0 0 00017.3 SC/ST 1 15.0001 0.000 1 15.000 1 15.poo 0.000 1 15,000! 1 15,000 0.000 1 15.00017.4 Comp. Edn. 1 50.000 0.000! 1 50.000 : f 50.000 0,000 1 50.000, 1 50.000 ,0.000 1 50.00017.5 Minority Community 1 10.250 o.ooo' 1 10.250 1 10.250 0.000 1 10.250' 1 10,250 0 OOP 1 10,25017.6 Urban Deprived Children 1 9.750 0.000 1 9 75C' 1 9.750 0,000 1 9,750 1 9.750 ' 0.000 1 9 75017.7 others . 0 0.000 0.000 0.000,1 0 0.000 0,000 0 0,000 0 O.OOO ,0 .000 0 0,000
Sub Total 1 100.000 0.000 1 100.000! 1 100.000 6.000 1 100.000 1 100,000 0.000 1 100.00018 Community Trelning
18.1 Community Training 16612 9.967 0.000 16612 9.967 7101 4.261 0.000 7101 4.261 7922 4.753 ' 0.000 7922 4 753
19.0 Sub ToIbI 16612 9.967 0.000 16612 9.967 7101 4.261 0.000 7101 4.261 7922 4.753 0.000 7922 4.753Tota^of SSA(DlttrioU) 163351 7720.672 0.000 163351 7720.672 654201 6041.0921 o.oool 85420 6041.092 120033 3765.6291 0.000 1200331 3765.629
■■''r ■'; ’’...............'.i", .' ■■■■ iiv'j vij '<V.i-i , •''"“i i <.*;
J t ; .......
m w i v -
• '3- ?.- •. .. il'-■•i ■!«•/ .. : l v ' . '
i« S lat* Component ' I ■ ■ ■ ■19,1 Management o! o.ooo! o.ooo' ol o.doo 0 0.000 0.000 0 0.000 0 0.000 0.000 0 0.00019.2 REMS 0; 0,000 0.000 0 0.000 0 0.000 0.000 0| 0.000 0 0.000 0.000 0 0.00019.3 !SIEMAT 0 o.oool 0.000 0 0.000 0 0.000 0.000 O' 0.000 0 0.000 0.000 0 0.000
Sub Total 0 0.000 0.000 0 0.000 0 0.000 0.000 0, 0.000 0 0.000 ‘0.000 0 0.000kl=AT6'8Sft TOTAL .■ ' ^163351 7720.672 0.000 163351 7720.672 85420 6041.092 0.000 85420 6041.092 120033 3765.629 0.000 120033 3765.629
20 NPEGEL--------1
20.1 No of EBBS. 0, 0 6 6 4 420.2 |No. of Urban slums 01 0 6 6 0 020.3 !No.of clusters covered 0 0 0 0 0 020.4 No of clusters In urban slums 0 0 84l 84 0 o:
A CKril work*
A Const.of ACR Including toilets,drlnklnawater.electrlfication 0 0.000 0,000 0 0.000 1 0 0.000'1 0.000! 0 0.000 0 0.000 0.000
10 0,000
TLE
B One time grant of TLE,Library, sports. Vocational Tralnino
0 0.000 0.000 0 o.ooo! 0 0.000 0.000! 0 0.0001
0 0.000 0.000 0: 0.000
|Spill over as per PaB Minutes 08-09 0 0.000 0.000 0 o.oool 0 0.000 o.oooi 0 0.000 0 0.000 0.000 0| 0.000
Total Non recurring cost(Fresh.>spill over)
0 0.000 0.000 0 0.000 0 0.000 0.000 0 0.000 0 0.000 0.000 0 0.000
C Recurring , ,
p»0« 12 of 77

DIstrlct-wlse and intervention-wise summary for 2009*10SSA, Karnataka
Annex-
{Rs. In lakh)
Go
S.No. Activities
Belgaum Bellary Eldar
FreahO utlay 200910 Spill over Total Outlay
Fresh Out lay 2009- Spillover
Total Outlay FreahO utlay 200910
. Spill over
Total Outlay
Phy Fin Fin Phy Fin Phy Fin Fin Phy Fin Phy Fin Fin Phy 1 Fin
6.450 0.000 1 43 6.450 84 12.600 0,000 84 12.600 65 9.750 0.000 65 9.7501.0 instructor to MCS, provision of life skills.blcyclss,vocational iralnins.transportatlon charges etc,.
43
2.0 Award to best schoolAaaoher 43 2.150 0.000 43 2.150 84 4.200 0,000 84 4.200 65 , 3.250 .0.000 65 3.250
3.0Student evaluation,Remedial Teaching,Bridge courses & alternative Schools
43 3.600 0.000 43 8.600 84 16.800 0.000 84 16.800 65 13.QO0 0.000 65 13.000
4,0 Learning through Open schoools 43 8.600 0.000 43 8.600 84 16.800 0.000 84 16.800 65 13.000 ' o.obo 65 13.0005.0 Teacher Training 0 0.000 0.000 0 0.000 0 0.000 0.000 0 0.000 0 0.000 0.000 0 0.0006.0 Child care centers for 2 centers 0 0.000 0.000 0 0.000 0 0.000 0.000 0 0.000 0 0.000 0.000 0 0.0007.0 other 0 0.000 0.000 0 0.000 0 0.000 0.000 0 0.000 0 O.OOO 0.000 , 0 0.000
Sub Total 43 25.800 0.000 43 23.800 84 50.400 0.000 84 50.400 65 39.000 0.000 65 39.000
DAdditional Incentives (unlfor stationery, work book, escorts in diffkiull areas etc,)
1.0 Primafy 0 0.000 0.000 0 0.000 0 0.000 0.000 0 0.000 0 O.OOO ■0.000 0 O.OOO2.0 Upper Primary 0 0.000 0.000 0 0.000 0 0.000 0.000 0 0.000 0 0.000 0.000 0 0.000
Sub Tola! 0 (i.OOO 0.000 0 0.000 0 0.000 0.000 0 0.000 0 0.000 0.000 0 0.000Community Mobilisation 43 1.647 0.000 43 1.647 84 3.217 0.000 84 3.217 65 2,489 0.666 65 , 2.489Sub Total 43 1.647 0.000 43 1.647 84 3.217 0.000 84 3.217 65 2.489 0.000 65 2.489TOfnilti(l<l»6Geu)~::5- - ■ ' j ' 43 ■ o.eoQ 43 27.447 84 =:-S3.617; - ‘ OHJOO - 65 ':V :'41 i4«8 ^ 'jo .o oo 65 41.489
21 KGBV ,
20.1 No of KGBVs sanctioned 4 4 6 6 4 4
20.2 Non Recurring 0 0 0 0 0 0
1.0
Construction of BulUIng 4 84.200 0.000 4 84.200 6 126,300 0.000 6 126.300 4 84.200 0.000 4 84.200Boundary Wall 4 6.000 0.000 ■ 4 6.000 6i 9.000 0.000 6 9.000 4 6.000 0.000 4 6.000Boring/Hand pump 4 4.000 0.000 4 4.000 6 6,000 0 0 0 0 6 6.000 4 4,000 0.000 4 4.000Bectriclty/water charges 4 C.800 0.000 4 0.800 6 1,200 0.000 6 1.200 4 0.800 0,000 4 0.800
2.0 Furniture / Equipment (Including kitchen eauipmenO 4 2.000 0.000 4 2.000 6 3,000 0.000 6 3.000 4 2.000 0.000 4 2.000
3.0 TLM and equipment Including library books 4 2.000 0.000 4 2.000 6 3.000 0.000 6 3.000 4 2.000 0.000 4 2.OO0
■t.O Bedding 4 0.000 0.000 4 0,000 1 6 0,000 0,000 6 0.000 4 O.OOO 0.000 4 0.000Spill over as per PaB Minutes 2007- OB 0 0.000 0.000 0 0.000 0 0,000 0.000 0 0.000 0 0.000 O.ooo 0 0.000
Total Non-recurring 4 99.000 0.000 4 99.000 6 148.500 0.000 6 148.500 4 99.000 0.000 4 99.000Recurring ( 1
1.0Maintenance per girl Per month @ Rs. 750/- 4 36.000 0.000 4 36.000 6 54.000 0.000 6 54.000 4 36.000 0,000 4 36,000
2.0 Sllpend per girl per month @ Rs,S0y- 4 2.400 0.000 4 2.400 6 3,600 0.000 6 3.600 4 2.400 ' 0 .000 4 2.400
3,0Supplementary TLM.stallonary and other educational materials
4 2.400 o.obo 4 2.400 6 3.600 0,000 6 3.600 4 2.400 0.000 4 2.400

Oistrict'wlse and mtcrveniion-wise surnmary for 2009-10SSA, Karnataka
(Rs. in !pkh)
S No. Activities
5«lgaum
Fresh Out fey 2009< 10
Phy Fin
Split Qver Total Outiny
Phy Pin
Bellary
Fresh Out lay 200910
Phy Fin
SpilloverFin
Total Outlay
Phy Fin
BIdar
Fresh Out lay 2009* 10
Phy Fin
SpilloverFin
Total Outlay
Phy Fin
4.0 Examination Fee 0.000 0.000 0.080 0.120 0.000 0,120 0.080 0,000Salaries1.0ne\AOne Warden
48:550 00060.080
2. Four foil time teachers
two urdu ieachers(only for blocks witti tnuslitn population above 20% and selelcled urban areas)lf required
S-0 3. Three part time teachers_________^ iccounfani5. Two Supportstaff(accounl/Asslslant/Chowl<ldar/Peon)€. One head Cook and >ne assistant cook for SO giris and 2 assistant cok fo r i 00 girls_______________________
6.0 Vocational training / specific skill trg 2.000 0.000 2,000 3.000 0.000 3,000 2.000 0.000 2.000
7,0 Electricity / water charges 2.400 0.000 2,400 3.600 0.000 3.600 2.400 0.000 2.400
8.08,0
Medical care/conllngencies ® Hs.7501- per girl.Misc. including maintenance
3.000 0.000 3.000 4 500 0.000 4,500
3.200 0.000 3.200 4,aoo 0.000 4,800
3,000 0,000
3,200 0,0003,000
3.20010.0 Preparatory camps 0.600 0.000 0.600 0,900 0.000 0.900 0,600 0.000 0,60011.0 P.T.A / school functions 0.600 0.000 0.600 0.900 0,000 0,900 0.600 0.000 0.60012.0 Provision of Rent (Bmonths) 3.000 0.000 3 000 1,500 0.000 1.500 1.500 0,000 1,50013,0 Capacity Building 1.200 0.000 1,200 1.800 0.000 1.800 1.200 0.000 1.2P0
Total Recurring 104.880 0.000 104.880 154.320 0.000 154.320 103,360 0.000 103.380
0,000 203.880 302>820 ‘ o.6 po ; soaaza- — W
0.000 202.380
6 6 A 44
6 66 6
6 6
6 66 66 6
666

District-wise and intorvcntion-NMise summary for 2009-10SSA. Karnataka
Annex*
{Rz. in lakh)
s.No. Activities
Bljapur Chamarajanagar Chlkballapura
Fresh Out lay 200910
Spillover
Total OutlayFresh Out lay 2009
10Spillover Total Outlay Fresh Out lay 2009
10Spillover Total Outlay o
Phy Fin Fin Phy Fin Phy Fin Fin Phy Fin Phy Fin Fin Phy Fin 11.0 New Schools11 Upgradalion o( EGS lo PS 0 0 Oi 0 0 01.2 New Priamary schools 13 13 0 0 0 01.3 Upgraded New UPS 0 0 0 0 40 401.4 Adding class VIII lo UPS 0 , 0 0 0 0 02 New Teacher* Salary (PS)
2.1 Primary Teachers (Regular) 26 6.760 0.000 26 6.760 0 0.000 0.000 0 0.000 0 -0.000 0,000 0 0.0002.2 Primary Teachers (Para) 0 0.000 0.000 0 0.000 0 0,000 0.000 0 0,000 0 0.000 0,000 0 0.0002.3 Upper Primary Teachers (Regular) 0 O.OOO 0.000 0 0.000 0 0.000 0,000 0 0,000 40 10.400 0,000 40 10.400
2.4 AddHional teachers for UPS upgraded previous vear 0 0.000 0.000 0 0.000 0 0,000 0,000 0 0,000 0 0.000 ' 0,000 0 0,000
2.5 Upper Primary Teachers- TGT 0 0.000 0.000 0 0.000 I 0 0,000 0,000 0 0,000, 0 0.000 0,000 0 0,000
Additional Teaeheri Against PTR
2.6 New Additional Teachers PS as per 1.’40 PTR Reaular) 0 0.000 0.000 a 0.000 0 0 ,000 0.000 o; 0,000 0 0,000 0,000 0 o.ooo
2.7 New Additional teachers • PS as per 1:30(ReS|Ulart................ 0 o.ooo' 0.000 0 0.000 0 0,000 0 .0 0 0 0 0 .0 0 0 0 0 ,0 0 0 0 ,0 0 0 0 0 .0 0 0
2.8 New Additional Teachers-UPS as per i:40 (ReBuiar). 0 0 .0 0 0 0 .0 0 0 0 0 .0 0 0 0 0 ,0 0 0 0 .0 0 0 0 0 .0 0 0 0 0 ,0 0 0 6 ,0 0 0 0 0 .0 0 0
2.9 New Additional Teachers - UPS t:30(Reaular) , 0 0 .0 0 0 0 .0 0 0 0 0.000 0 0 ,0 0 0 o.ooo 0 0,000 0 0.000 0,000 0 0.000
2.10 Teachers Under OBB 6 0.000 0.000 0 0.000 0 0,000 0,000 ,0 0,000 0 0,000 0,000 0 0.000
2.11 New others-Additlonal TGT (BA/B.Ed r for Class VIII 0 0.000 0.000 0 0.000 0 0,000 0.000 0 0.000 0 0,000 0,000 0 0.000
SubTotal(2.01 to 2.11) 26 6.760 0.000 26 6.760 0 0.000 0.000 0 0.000 40 10.400 0.000 40 10.400Teacheri Salary ( Recurring)
2.12 Primary Teachers (Regular) 1325 2146.500 0.000 1325 2146.500 271 439,020 0.000 271 439.020 129 208,980 ■ 0.000 129 208.9802.13 Addltlonal Teachers (lERT) 0 0.000 0.000 0 0.000 0 0,000 o.ooo 0 0,000 0 0,000, 0.000 0 0.0002.14 Trained Graduate Teachers 346 643.560 0.000 346 643.560 118 219,480 o.bbo 118 219,480 121 225,060 .ft.ooo 121 225.0602.15 Upper Primary Teachers (Para) 0 0.000 0.000 0 0.000 0 0,000 0.000 0 0,000 0 0,000, 0.000 0 0.000
2.16 Upper Primary Teachers- Head Master 0 0.000 0.000 0 0.000 0 0,000 0.000 0 0,000 0 0,000 0.000 0 0.000
2.17 Additional Teachers PS (Regular) 0 10.000 0.000 0 0.000 0 0,000 0.000 0 0,000 0 0,0110 0,000 0 0.0002 18 Additional Teachers - PS (Para) 0 0.000 0.000 0 0.000 0 0,000 0,000 0 0,000 0 0,000 o.ooo 0 0.000
2.19 Additional Teachers • UPS (Regular) 0 0.000 0.000 0 0.000 0 0.000 0,000 0 0,000 0 0,000 O.ooo 0 0.000
2.20 Additional Teachers • UPS (Para) 0 0.000 0.000 0 0.000 0 0.000 0.000 0 0.000 0 0.000 '0.000 0 0.0002,21 Teachers Under OBB 0 0.000 0.000 0 0.000 0 0.000 0.000 0 0.000 6 0.000 0.000 0 0.000
2.22 Others-AddKlonal TGT (BA/B.Ed) for Class VIII 0 0,000 0.000 0 0.000 0 0.000 o.ooo 0 0.000 0 0,000 0.000 0 0.000
2.23 Arrears ol Salary of SSA teachers 0 0.000 0.000 ' 0 0.000 0 0.000 0.000 .0 0.000 0 .0,000 0.000 0 0.000Sub Total (2.12 lo 2.23) 1671 2790.060 0.000 1671 2790.060 389 658.500 0.000 389 658,500 250 434.040 0.000 250 434.040Sub Total (New teachers4.Teachers Recurring^ 1697 2796.820 0.000 1697 2796.820 389 658.500 0.000 389 658.500 290 444.440 0.000 290 444.440
3.0 Teacher* Grant3.1 Teachers grant - Primary 1944 9.720 0.000 1944 9,720 840 4.200 0.000 840 4.200 2111 10,55' 0,000 2111 10.555!

DIstrici-wlse and intervention-wise summary for 2009-10SSA, Karnataka
(Rs. in lakh)
BIJspur Chemarajanagar Chikballapura
s.No Activities Fresh Out lay 200910
Spillover
Total OutlayFresh Out lay 2009
10Spillover Total Outlay Fresh Out lay 2009
10Spillover
Total Outlay
1 Phy Fin Fin Phy Fin Phy Fin Fin Phy Fin Phy Fin Fin Phy Fin
3.2 (Teachers grant ■ UPS 8423 42.115 0,000 8423 42.115 2994 14.970 0,000 2994 14,970 3413 17.065 ■ o.(joo 3413 17,065ISub Total 10367 51.835 0.000 10367 51.835 3834 19.170 0.000 3834 19.170 5524 27,620 0.000 , 5524 27,620
4 iBIoek Resource Centres4,1 ISalary of Resource Persons 0 0.000 0,000 0 0.000 6 11,160 0,000 6 ' 11,160 0 0.000 ,0.000 0 0.000
4.2 Furniture Grant 0 0.000 0,000 0 0.000 0 0,000 0,000 0 0.000 0 0.000 0.000 0 0,000
4.3 Contingency 5 1.000 0,000 5 1.000 ' 5 1,000 0,006 5 1,000 6 1.200 0.000 6 , 1,200
4.4 Meeting & TA allowance 5 0.4501
0,000 5 0.450 5 0,450 0,000 5 0,450 6 0.540 . 0.000 6 0.540
4.5 |t LM grant 5 0,250 0,000 5 0,250 5 ' 0,250 0,000 5 0.250 6 0 ,3,00 0.000 6 0.300
4.6 BnC Building Mainlenance 0 0.000 0.000 0 0 000 0 O.DOO 0.000 0 0.000 0 . 0 000 0,000 0 0,000
ISub Total 5 1.700 0.000 5 1.700 5 12.860 0.600 5 12.860 6 2.040 0.000 6 2.0405 jCluster Resource Centres *
5.1 l^aiary of Resource Persons 22 40.920 0,000 22 40.920 28 52.080 6.000 28 52.080 12 22,320 0.000 12 22.3205.2 jFurniture & equipment 0 0.000 0,000 0 0.000 0 0,000 0.000 0 0,000 0 O.OOOi ,0.000 0 0.0005.3 Conilngeney 70 2.100 0,000 70, 2.100 70 2,100 0,000 70 2,100 70 2,100 0.000 70 2.1065.4 Meeting & TA allowance 70 2.520 0,000 70 2.520 70 2,520 0,000 70 2,520 70 2,520 0.000 70 2,5205.5 ITLM grant 70 0,700 0,000 70 0.700 70 0,700 0,000 70 0,700 70 0,700 0,660 70 0,7005.6 Ic n c Building Maintrenance 0 0.000 0,000 0 0.000 0 0,000 0,600 0 0.000 0 0,000 0,000 0 0,000
ISub Total 70 46.240 0.000 70 46.240 70 57.400 0.000 70 57.400 70 27.640 0.000 70 27.6406 iTralnlng
6.1 fTeiachers irg. - In sen/ice at block llevei 10367 103.670 0,000 10367 103.670 3834 38.340 0.000 3834 38.340 5524 55,240 0.000 5524 55,240
6.2 p'eachets trg. - In service at block level al cluster level 10367 51.835 0,000 10367 51.835 3834 19,170 0.000 3834 19,170 5524 27,620 0.000 5524 27,620
6.3 jlnduction training for Newly Recruit ITralned Teachers 26 0.780 0,000 26 0.780 0 0,000 0,000 0 0,000 40 1,200 , 0.000 40 1.200
6.4 ITralnlng for- Untrained Teachers 0 0.000 0,000 0 0.000 0 0,000 0.000 0 0,000 0 0.000 0.000 0 0,000
6.5 &RC/CRC coordinators and resource Ipersons 244 2.440 0.000 244 2.440 207 2,070 0,000 207 2,070 61 0,610 0.000 61 0.610
[Sub Total 10637 158.725 0.000 10637 158.725 4041 59.580 0.000 4041 59.580 5625 84.67o1 0.000 5625 84.670
7 [interventions for Out of School IChlldren ._ . j . . . .
7.1 IeGS Centre (PS) 0 0.000 0.000 0 0.000 0 0.000 0,000 0 0,000 0 0.000 0.000 0 0.0007.2 |EGS Centre (UP) 0 0.000 0.000 0 0.000 0 6.006 0.600 0 0.000 0 0.000 0.000 0 0.000
7.3 IChinnara Angala Bridge couse iResldentiai 12 months-RBC 1876 187.600 .0.090 1876 187.600 330 33.000 0.000 330 33.000 955 95.500 0,000 955 95,500
7.4 Chinnara Angala Seasonal Bridge course ■ Resdn. (6 months)- NRBC 4000 200,000 0.000 4000 200.000 0 0.000 0.000 0 0,000 90 4.5,00 , 0,000 , 90 4,500
7.5 llVlobile schools 0 0.000 0.000 0 0.000 0 0,000 0.000 0 0,000 0 0,000 0.000 0 . 0,0007.6 |12 months brkige course-NRBC ’ 134 4,020 0,000 134 4,020 0 0,000 0.000 0 0.000 106 3.180 0,000 106 3,1807.7 |Tent school 200 3.000 0,000 200 3,000 0 0,000 0.000 0 0.000 55 0.825 0,000 55 0,825
Pafje 18 of 77

District-wise ar^d Intervention-wise summsry for 2009-10SSA, Karnataka
Annex-
<Rs. In lakh)
SNo, Activities
Bijapur Chamarajanagar Chlkballapura
Fresh Out lay 200910
Spillover
I- ■Total Outlay
Fresh Out lay 200910
Spillover Total Outlay Fresh Out lay 2009-
IDSpillover Total Outlay
Phy Fin Fin Phy ' Fin Phy Fin Fin Phy Fin Phy Fin Fin Phy Fin7,8 Madrasa / Maldtiab 1015 30.450 0.000 1015 30.450 125 3.750 0.000 125 3.750 l i e 3.300 ' O.OOO 110 3.3007,9 NCLP Schools 450 13.500 0.000 450 13,500 0 0.000 0.000 0 0.000 100 3.000 .0 .0 0 0 100 3.000
8,0 Summgr Remedial Teaching Charlrada Chiguru 2475 12.375 0.000 2475 12 375 1500 7.500 0.000 1500 7.500 2250 11,250 ' 0.000 2250 11.250
8,1 4 months seasonal residential school 0 0.000 0.000 0 0,000 0 0.000 0.000 0 0.000 0 0,000 0 000 0 0 000
8,2 Bildge course - Chlnnara Angala 789 3.945 0.000 789 3.945 400 2,000 0,000 400 2.000 175 0.875 0,000 175 0,875
8,3 Home Based Education 409 12.270 0,000 409 12,270 328 9,840 0,000 328 9.840 339 10,170 ' 0.000 339 10.170
8,4 Bridge course - Chinnara Angala Resi-2 rronths 0 0.000 0,000 0 0 000 160 2.720 0.000 160 2.720 166 2 322 0.000 166 2,822
8,5 AIE Cenlers(Transportallon. Hardest to reach children) 2 . 0.060 0,000 2 0,060 15 0.450 0.000 15 0.450 39 1,170 0,000 39 1 170
8.6 Innovation Urban Deprived Children , 0 o.obo 0,000 0 0,000 0 0,000 o.boo 0 0.000 0 0 000 0,000 0 0 000
8.7 Special Enrolment Drive 808 0.000 0.000 808 0 000 400 0 000 0 000 400 0.000 26 o,oob 0,000 26 0,000Sub Total 12158 467.220 0,000 12158 467.220 325B 59,260 0.000 3258 59.260 4411 136.59E 0.000 4411 136.592
8 Remadlai Teaching8.1 Remldlal teaching 14130 28.260 0.000 14130 28.260 5724 11,448 0,000 5724 11.448 9659 19,31 0.000 9659 19,3188,2 Motivation through field trips 0 0.000 0.000 0 0,000 0 0,000 0.000 0 0.000 0 0,00 0,000 0 0 000
Sub Total 14130 26.260 0,000 14130 28,260 5724 11,448 0,000 5724 11.448 9659 19.318 0.000 9659 19,3189 Free Text Book 1
9,1 Free text book for l-V std all children of aided schools 18364 14.691 0.000 18364 14,691 7936 6.349 0.000 7936 6.349 5541 4,433 0,000 5541 4,433
9.2 Free text book for Vl-Vllt std all children o< aided schools 22326 29.024 0.000 22326 29,024 6532 8.492 0,000 6532 8.492 6122 7,95? 0.000 6122 7,959
9,3 Work books for Nall Kail 0 0.000 0.000 0 0,000 0 0.000 0.000 0 0,000 0 OOOO 0,000 0 0.000Svib Total 40690 43.715 0.000 40690 43.715 14468 14.840 0,000 14468 14.840 11663 12,391 0.000 11663 12.391
to Interventlone for CWSN10.1 Provision of disabled children 5649 67.788 0.000 5649 67,788 3419 41.028 0,000 3419 41.028 2982 35,784 0.000 2982 35,784
Sub Total 5649 67.788 0.000 5649 67,788 3419 41.028 0.000 3419 41,028 2982 35.784 0,000 2982 35,78411 Ctvit W orkt
11.1 BRC 0 0.000 0,000 0 0,000 0 0.000 0.000 0 0,000 0 0.000 0,000 0 0,00011.2 CRC 0 0.000 0.000 0 0.000 0 0.000 0.000 0 0.000 0 0.000 , 0,000 0 0,00011.3 School Buiklings 13 117,000 0.000 13 117.000 0 0.000 0.000 0 , 0.000 0 0,000 0.000 0 0,00011.4 Dilapidated 0 0.000 0.000 0 0.000 0 0.000 0.000 0 0.000 0 0.000 0,000 0 0,00011.5 Building less (Pry) 0 0.000 0,000 0 0.000 0 0.000 0.000 0 0,000 0 0,000 0,000 0 0.00011.6 Building less (UP) 0 0.000 0,000 0 0.000 0 0.000 0,000 0 0.000 0 0.000 0.000 0 0.00011,7 DllapUaled Bulkting (Pry) 0 0.000 0.000 0 0.000 0 0.000 0,000 0 0,000 0 0.000 a,ooo 0 0.00011.8 Additional class rooms 69 324.300 0.000 69 324.300 14 65.800 0.000 14 65.800 139 653.300 0,000 139 653.300
11.9 Additional Class Room to Bangatore Metro Cltv 0 0.000 0.000 0 0.000 0 0.000 0.000 0 0.000 0 O.ooo ' 0.000 0 0,000
11.10 Toilets/Urinals 0 0.000 0,000 0 0.000 0 0.000 0.000 0 0,000 0 0.000 0.000 0 0.00011,11 Separare Girls Toilet 1187 296.750 0.000 1187 296.750 524 131.000 0.000 524 131.000 1110 277.500 0.000 1110 277.50011,12 Drinking Water Facility 0 0,000 0.000 0 0.000 0 0.000 0.000 0 0.000 0 o.ogo 0.000 0 0.00011,13 BountJary Wall 0 0.000 0,000 0 0.000 0 0.000 0.000 0 0.000 0 0.000 0.000 0 0.00^11,14 Seperatlon Wall 0 0,000 0,000 0 0.000 0 0.000 0.000 0 0.000 0 o.ooo! 0.000 0 0.000
Pago 17 of 77

SSA, Karnataka(R s.in iakh)
S.No, jAetivitles
Bt|apur Chamarajanagar Chlkballapura
Fresh Out lay 200910
Spillover Total Outi«y
Fresh Out lay 200910
Spillover
Total OutlayFresh Out lay 2009
10Spillover
Total Outlay
Phy Fin Fin Phy pin Phy Fin Fin Phy Fin Phy Fin Fin Phy Fin
il.tsnEleolrificalion 0 0.000 0.000 0 0.000 0 0.000 0,000 0 0,000 0 0.000 I 0.000 0 0.00011,16 |Head Master's Room 0 0.000 0.000 0 0 000 0 0.000 0.000 0 0,000 0 0.000 0.000 0 0,00011 17 Ichiia Friendly elements 0 O.DOD 0.000 0 0 000 0 0.000 0-000 0 0,000 0 0.000 0.000 0 0,000
11,18 i Kitchen shed 0 0.000 0.000 0 0 000 0 0.000 0.000 0 C,000 0 0.000 0.000 0 0.00011.19 1 Residential Hostel 0 . 0.000 0.000 0 0 000 0 0.000 0.000 0 0,000 0 0.000 0,000 0 0.00011 20 iMajor Repairs (Primary) 0 ' 0.000 0 000 0 0 000 0 0.000 0.000 0 0.000 0 0.000 0.000 0 0,00011.21 |Major Repairs (Upper Primary) 0 0.000 0 000 01 0.000 oi 0.000 0.000 0 0.000 0 0.000 0,000 0 0.000
11.22 Addiliunal Rooms for CALC & Edusot 0 0.000 0.000--------- T- [
Oi 0 OOOl 01 0.000 1 . 1 . .0.000 0 0.000 0 . 0.000 0,000 0 0 000
11.23 Ispeciai Toilets lo( CWSN 15 7.500 0.000 15 7.500 200 100.000 0.000 200 100.000 200 100.000 0.000 200^ 100.0001 j ISettIng up Of Solar Photo Voltaic to
lexIstinQ <:a l C schools0 0.000 0.000 0 0.0001 0
1 , .0.000 0.000 0 0.000 0 0.000 0.000 o' 0.000
I [Setting up o( Solar Photo Voltaic to ' mew c a l c schools 0 0.000 0.090 0 0.000 0 0.000 0.000 0 0,000 0 0.000 0 .0 0 0.000
|Sub Total o( Civil works 1284 745.550 0.000 1284 745,550 738 296.800 0.000 738 296.800 1449 1030,800 0,000 1449 1030.80011.26 iFurnlture lo rG o ^ . UPS11.27 |No. of children 0 0.000 0.000 6 0,000 0 0,000 0.000 0 0,000 0 0,000 0.006 0 0,000
|Sub Total (Furniture) ■ 0 0.000 0.000 0 0,000 0 0.066 0.000 0 0.000 0 0.000 b.oool 0 0.000
Sub Tot«l(Clvll ♦ Furniture) 1284 745.550 0.000 1284 745,550 738 296.800 0.000 738 296.800 1449 1030.800 . 0.000 1449 1030.800
12 iTeaehlng Le>rnln)g Equipment '
12.1 |TLE for new schools 13 2.600 0.000 13 2.600 0 0,000 0.000 0 0,000 0 0,000 ' 0,000 0 0,00012.2 |TLE tor upgraded schools 0 0.000 0.000 0 0,000 0 0.000 0,000 0 0,000 40 20,000 . 0,000 40 20,00012.3 jOthers 0 0,000 0.000 o' 0.000 0 0.000 0,000 0 0,000 0 0,000 0,000 0 0,000
Sub Total 13 2.600 0.000 13 2.600 0 0.000 0.000 ' 0 0.000 40 20.000 0.000 40 20,00013 IMalntensnce Grant 2884 206,450 0,000 2884 206.450 1178 80.350 0,000 1178 80.350 2078 131,650 0,000 2078 131.650
13 1 |LPS with <3 rooms 0 0,000 0,000 0 0.000 0 0.000 6,060 0 0,000 0 0.000 ’ 0,000 0 0.00013.2 Il PS with >3 rooms 0 0,000 0.000 0 0.000 0 0.000 0,000 0 0,000 0 0.000 0,000 0 0.00013.3 luPS with <6 roorrs 0 o.bod 0.000 0 0.000 0 0,000 0.000 0 0,000 0 , 0.000 0 ,000, 0 0.00013.4 UPS wlth>S rooms 0 0.000 0.000 0 0.000 0 0,000 0,000 0 0,000 0 0,000 0,000 0 0.000
Isub Total 2884 •206.450 0.000 2884 206.450 1178 80.350 0.000 1178 80.350 2078 131.650 0,000 2078 131.65014 Ischool Grant
14.1 iPHmary School 2019 100.950 0.000 2019 100.950 Si3'i 41.550 0,000 831 41.550 1627 81.350 0.000 1627 81.35014.2 [upper Primary School 1135 79.450 0.000 1135 79.450 445I 31.150 0.000 445 31.150 528 36.960 0.000 1 , 528 36.960
ISub Total 3154 180.400 0.000 3154 180.400 1276 72,700 0.000 1276 72.700 2155 118.310 0.000 2155 118.31016 |R »earch& Evaluation 1 I
15,1 IResearoh, evaluation, super,rlslon 3154 41.002 o.boo 3154 41.002 1276 16.588 0.000 1276 16,588 2155 28,015 0.000 2155 28.015|Sub Total 3154 41.002 0.000 3154 41,002 1276 16,588 0,000 1276 16.588 2155 28.o!i5 0.000 2155 28,015
16 iManaBament & Quality16.1 {Management & MIS 1 164.955 0.000 1 164.965 1; 63.900 0,000 1 63,900 1 94,000 ' 0.000 1 94.000, . , Learning Enhancement Programme
l(LEP) 1 104.000 0,000 1 104,000 1j 31,800 0,000 1 31,800 1 47.000 0.000 1 47.000
|sub Total 1 268.955 0.000 1 268.955 1! 95,700 0.000 1 95,700 1 141.000 0.000 1 141.00017 jinnovatlvB Activity ' I !
17.1 lECCE 1 15,000 0,000 1 15 o ra 1| 15.000 0,000 1 15,000 1 15.000 0.000 1 l<fe.000
Page 13 of 77

Oistricl-wlse and Intervention-wise sumrppry lor 2009-10SSA, Kornataka
Annex-
(Rs. in lakh)
S.No. Activltlfl*
Bljapur , Chamarajanagar Chlkballapura ^
Fr^sh Out lay 2009* 10
Spillover Total Outlay Fresh Out lay 2009*
‘ 10Spillover Total Outlay FrashO utlay 2009*
10Spill
. over Total Outtay
Phy Fin Fin Phy Fin Phy Fin Fin Phy Fin Phy Fin Fin Phy Fin17.2 i Girls Education 0 0.000 0.000 o' O'OOO 0 o,ooo' 0,000' 0 0.000 0 0.000 0.000, 0 0,00017.3 SC/ST i 1 15,000 0,000 1 15.000 1 15.000! 0,000 , 1 . 15.000 1 15,000 o.ooo' 1 15,00017.4 comp. Edn, 1 50.000, 0.000 1 50.000 1 50.000 0.000 1 50.000 1 50,000 0.000 1 50.00017.5 Minority Community 1 10.250, 0,000 r - ■ ", 10,250, 1 10.250 0.000 1 10.250 1, 10,250 0,000 1. 1C,25017,6 Urban Deprived Children 1 9.750 0.000 1 9,750 1 9.750 1 o.ooo! 1 9.750 1: 9.750 0.000 1 9,75017,7 others 0 0.000 0.000 0 o,oboi 0 0.000 0.000 0 0,000 6 ’ .0.000 0.000 0 0.000
Sub Total 1 100.000 0.000 1 100.000 1 100.000 0.000 i 100.000 1 100.000 0.000 1 . 100.00018 Community Training
18.1 Community Training 9984 5.990 0.000 9984 5.990 4520 2,712 0.000 4520 2,712 7880 4.728 0.000 7880 4.728
19.0 Sub Total 69S4 5.990 0.000 9984 5.990 4520i 2.712 0.000 4520 2.712, 7880 4.728 0.000 7880 4.728TpUl of $SA(Oi«trlct») 115878 5213.250 0.000 115878 5213.?50 441981 1598.936 0.000 44198 1598.936 55989 2364.998 0.000 55969 2364.998
t .[j 5
.ii P j r . i ' ; , r . ■ ; ■ ■' .■..' i.i •, -
7 V - ; ^ '£ y
tV-V"'.'''! , 't !■ r : 3 ■ le i i
- ~-Ki>
L '( IV'.E„ .M . V',
r,:;: :
£ \ ;; If ill!*!! ' '<’1
»- . u‘!
i -- '.'‘ ' i V, ■ !( '' '‘ v,
I . '- '.- ;* l:- . '
19 State Component ■ ■ 1 1 119.1 Management o' 0.000 0.000 0 0,000 0 o.oboi o.boo 0 O.OOOi 0 | 0,000] 0.000 0 0.00019.2 REMS 0! 0,000' 0.000 ol 0,000 o' o.oooi o.ooo! 0 o.ooo' 0 0 .000 ' 0.000 0 0.00019,3 SIEMAT 0 0.000 0.000 61 0,000 01 o.oooi o.ooo! 0 0,000' o! o.oooi 0.000 0 0,000
Sub Total 0 0.000 0.000 0 0.000 0 0.000 0.000 0 0.000 0 0.000 ,0.000 0 0.000STATE SSA TOTAL 115878 5213.250 0.000 115878 5213.250 44198 1598.936 0.000 44198 1598.936 55989 2364^998 ? 0.060 55989 2364.998
20 NPEQEL20.1 No o( EBBs 5 51 0 1 0 4I 420.2 I'ip; of Urban slums 0 01 0| 0 2 ' 220,3 No of clusters covered 99 99 0 0 57 , 5720,4, o( clusters In urban slums o' 0 0 0 1 1
A Civil work*
A donst.of ACfl Including itollets.drlnkina water,electrification 0 0.000 0.000 0 o.oooi 0 0.000 0.000 0 0.000 0 0.000 , 0.000 0 0,000
TLE
BOne time grant of TLE,Library. sDons,Vocational T rainino 0 0,000 0.000 0 0.000 0 0.000 0,000 0 0.000 0 6.000 ,0 ,000 0 0.000
iSpill over as per PaB Minutes 08-09 0 0.000 0.000 0 0.000 ! 0 0.000 0,000 0 0.000 0 o.odio 0.000 0 o.ooo
Total Non recurring cosl(Fre8li+8plll over) 0 0.000 0.000 0 0.000
10 0.000 0.000
1— . —I0 0.000 0
10.000 0.000 0 0.000
C iRecurrIng L J
y ‘ m. l

District-wise and intervention-wise summary for 2009-10SSA. Karnataka
(Rs. in \,y
S.No, Activities
Bijapur Chamarajanegar Chlktjailapura
Fresh Out ley 200910 •
Spillover Total Outloy
Fresh Out lay 200910
Spillover
Total OutlayFresh Out lay 2009
10Spillover
Total Outlay
Phy Fin Fin Phy 1 Fin Phy 1 Fin' Fin Phy Fin Phy Fin Fin Phy Fin
99 14.850 0.000
• 1
0.000 0 0.000 57 0.000 57 8.5501.0 Instructor to MCS, provision of IKe skills.blcycles,vocational tralning.Iransportaiton charges elc..
99 14,8.50I
0} 0 000 8,5 iO
2.0 Award ro best school/teacher 99 4.950 0.000 99 4.950i 0 0.000 0.000 0 0,000 57 2,8 iO 0.000 57 2 850
3.0Student evaluation.Remedial Teaching,Bridge courses i alternative Schools
99 19.800 0.000 99 19 800 oi 0.00 0 0.000 0 0,000 57 1 1 ,4 )0 0,000 57 I 1 400
4.0 Learning through Open schoools 99 19.800 0.000 99 Iy.600 O ', G 000 0000 0 0.000 57 1 1,400 0.000 57 1 1 4005.0 Teacher Training 0 0.000 O.QOO n ^ OOOOi Oi 0.000 0.000 0 0.000 0 0,000 0.000 0 0 0006.0 ChlW care centers for 2 canters 0 0.000 0.000 0 ooool Ol 0.000 0.000 0 0.000 0 0,000 0.000 0 0.0007.0 other 0 0.000 0.000 .0 0.000 0 0.000 0,000 0 0.000 0 0,000 0.000 0 0.000
Sub Total 99 59.400 0.000 99 59,400 0 0.000 0.000 0 0.000 57 34.200 0.000 57 34,200
DAdditional Incentives (unlfor stationer/, work book, escorts in difficult areas etc.)
i1
1.0 Primary 0 0.000 0.000 0 0.000 0 0.000 0.000 0 0.000 0 0.000 0.000 0 0.0002.0 Upper Primary 0 0.000 0.000 0 0.000 0 0.000 0,000 0 0,000 0 0.000 0.000 0 0.000
Sub Total 0 0 .000 0.000 0 0.000 0 0.000 0.000 0 0.000 0 0.000 0.000 0 0.000Community Mobilisation 99 3.791 0.000 99 3.791 0 0.000 0.000 0 0.000 57 2.183 0.000 57 2.183Sub Total 99 3.791 0.000 99 3.791 0 0.000 0.000 0 0.000 57 2.183 0.000 57 2,183
■ R ;6 3 . t8 1 0.000 99 63.191 0 0.000 0.000 0 , 0;000 . , ; 5 ‘7 36.383 ! 0.000 57 36,36321 KGBV
20.1 No 0) KGBVa sanctioned 5 5 0 0 4 4
20.2 Non Recurring 0 0 0 0 0 0
1.0
Constnjctlon of Bulkllns s 105.250 0.000 5 105.250 0 0.000 0,000 0 0,000 4 84,200 0.000 4 84.200Boundary Wall ' 5 7.500 0.000 5 7,500 0 0,000 0,000 0 0,000 4 6.000 0,000 '4 6.000Boring/Hand pump S S.OOO 0.000 5 5,000 0 0.000 0.000 0 0.000 4 4.000 0.666 4 4,000ElsctrteltyMater charges 5 1.000 0.000 S 1.000 0 0,000 0.000 0 0.000 4 ' 0.800 0,000 4 0.800
2.0 Furniture / Equipment (Including kitchen eouipmem) 5 2.500 0.000 5 2.500 0 0.000 0.000 0 0,000 4 2.000 0.000 4 2.000
3.0 and equipment Including library books 5 ■ 2.500 0,000 5 2.500 0 0,000 0.000 0 0,000 4 2,000 0,000 4 2.000
4.0 Bedding 5 0.000 0.000 5 0.000 0 0,000 0,000 0 0,000 4 0,000 0.000 4 0.000Spill over as per PaB Minutes 2007- OS 0 0.000 0.000 0 0.000 0 0,000 0.000 0 0,000 0 0.000 0.000 0 0.000
Total Non-recurring 5 123.750 0,000 5 123.750 0 0.000 0.000 0 0.000 4 99.000 0.000 4 99.000Recurring
1.0Maintenance per girl Per month @ Rs. 750/- 5 45.000 0.000 5 45.000 0 0,000 0,000 0 0,000 4 , 36.000 , 0,000 4 36.QD0
2.0 Stlpend per girl per month @ Rs.50/- 5 3.000 0.000 5 3.000 0 0,000 0,000 0 0,000 4 a.400 0,000 ' 4 2.400
3.0 ’ Supplementary TLf^,stationary and other educational materials 5 3.000 0.000 5 3.000 0 0.000 0,000 0 0,000 4 2,400 ' 0,000 4 2.400
Page 20 of 77

Distrlct'Wise and lntervention<wlse summary for 2009*10SSA, Karnataka
Annex*
(Pa. in lakh)
V
S.No,
A.O
5.0
6.0
7.0
8,0
9.0
2 Four (ull time teachers
two urdu teacti0rs(only for blocks witli musllm population above 20% and selelcted urban areas)if required
3. Ttiree part time teachers
10.0
11.012.013.0
Activities
Examination FeeialarlesOne Warden
J h r g e ^^O ceM J. Two Supi
ilj time accountants. Two Support staff(account/Asslstant/Chowki<iar/Pe on)6. One head Cook and one assistant cook (or SO girls and 2 assistant cok tor 100 girls_______________________
Vocational training / specific skill trg
Electricity I Water charges
(i/ledlcal care/contingencies @ Rs.750/- per girl._____________Misc. including maintenancePreparatory campsP.T.A I school functionsProvision of Rent (Smonths)Capacity BulkllnBTotal Recurring
Bljapur
Fresh Out lay 200910
Phy Fin0.100
60.000
2.500
3.000
3.750
4.0000.7500.7506.0001.500
133.350
SpilloverFin0.000:0.000
0,000
0.000
0.000
0.0000.0000.0000.0000.0000.000
Total Outlay
Phy Fin0.100
60.000
2.500
3.000
3 750
4.0000.7500.7506.0001.500
133.350
Chamarajanagar
Fresh Out lay 2009. 10
Phy Fin0.0000.000
0.000
0.000
0.000
0.0000.0000.0000.0000.0000.000
SpilloverFin0.0000.000
0.000
0.000
0.000
0.0000.000o.poo0.0000.0000.000
Total Outlay
Phy Fin0.0000.000
0.000
0.000
0.000
0.0000,0000.0000,0000.0000.000
Chlkballapura
Fresh Out lay 200910
0,08048,000
2,000
2,400
3 000
3.200,0.6000.6003.0001.200
104.880
SpilloverFln_,0.0000.000
0.0000.000
0.000
0.0000.0000.0000.0000.0000 .000
Total Outlay
Phy Fin
4 ^ 0
2.000
2,400
3.000
3,2000,6000,600,3.0001.200
104.680
203.8B0
Ph5 45 45 5 4 4
5 0 05
0 05 5
0 05 5
5 0 055 0 05
0 05 50 04 4
5 5 005 5

0l3tn'c(-wise and interventlon-wiRC summary for 2009-10SSA, Karnataka
(R8. in J«kh)
S.No. jActlvltlM
Chikmagslur Chitradurga .Oakahlna Kannada
Fresh Out lay 200910
Spillover Total Outlay
i=re»hOutlay 200910
Spillover Total Outlay Fresh Out lay 2009-10 Spill
pver Total Outlay
. Phy Fin Fin Phy 1 Fin Phy Fin Fin Phy Fin Phy Fin' .Fin Phy Fin1.0 [New Schools(.1 lUpgradatlon of EGS to PS 6 0 0 ,0 0 01,2 Inow Prlamafy schools 0 0. 0 0 2 21.3 lUpgradedNewUPS 28 28 0 0 0 01.4 (Adding class VIII to UPS 0 0 0 0 0 02 |n iw Teach*rs Salary (PS)
2.1 iPrimaiV Teachers (Regular) 0 0.000 0.000 0 0 .000 0 0.000 0.000 0 0,000 4 1.040 0.000 4 1.0402.2 jPrimary Teachers (Para) 56 0.000 0.000 56 0.000 0 0.000 0.000 0 0.000 0 o.o(5b ■ 0 .000 0 0.0002.3 Upper Primary Teachers (Regular) 28 7.280 0.000 28 7,280 0 0.000 0.000 0 0,000 0 0.000 0 .000 ■0 0.000, ^ lAddHlonal teachers for UPS
luDoraded previous year 2 0.520 0.000 2 0,520 20 5.200 0.000 20 5.200 C 0.900 0.000 0 0.000
2.5 [upper Primary Teachers-TGT 0 1 0.000 0.000 0 0,000: 0 O.OOO: 0.000 0 0.000 0 0.000 0.000 0 0,000
' |Addltlonal Teaehsra Against PTR
, j, INaw AdditlonarTeachers PS as per ll;40PTR(R9aular) 0 0.000 0.000 0 o.oop 0 0.000 0.000 0 0.000 0 0.000 ,0.000 0 0,000
j I'NiewAdditibn^ Teachers - PS as per l1:30(Reoular) 0 0,000 0,000 0 0,000 0 0.000 0.000 0 0.000 0 0.000 0,000 . 0 0,000
2.0 New Additional Teachers-UPS as per 1 ;40 (Reoularl 0 0.000 0.008 a 0.000 0 0.000 0.000 0 0,000 0 0,000 0.000 0 0,000
2.9 • New Additlanal Teachers ■ UPS 1:30(Reoular) 0 0.000 0,000 0 0.000 0 0.000 0.000 0 0.000 0 0,000 0.000 ,0 0,000
2.10 Teachers Under 066 0 0.000 0.000 0 0.000 0 0.000 0.000 0 0.000 0 0,000 0.000 0 0,000
2.11klewbthers-Add'itlonalTGT (BA/B.£d ) for Class VIII 0 0.000 0.000 0 0.000 0 0.000 0.000 0 0.000 0 0.000 0.000 0 0,000
Sub Total(2.01 to 2.11) 86 7.800 0.000 86 7.800 20 5.200 0.000 20 5.200 4 1.040 0.000 4 , 1.040Teachers Salary ( Recurring) 1
2.12 Primary Teachers (Regular! 436 706.320 0.000 436 706.320 570 923.400 0.000 570 923.400 154 249.480 , 0,000 154 249,4802.13 Additional Teachers (lERt) 0 0.000 0.000 0 0.000 0 0,000 0.000 0 0,000 0 0,000 : 0,000 0 0.0002.14 Trained Graduate Teachers 104 193.440 0.000 104 193.440 95 176,700 0.000 95 176.700 220 409.200 0.000 220 409.2002.15 Upper Primary Teachers (Para) 0 0.000 6.000 0 o,oool 0 o.odo 0.000 Oj 0,000 0 0:000 0.000 0 0.000
2.16 Upper Primary Teachers- Head Master 0 0.000 0.000 0 0.000 0 0.000 0.000 , 0 0.000 0 ■0.000 0.000 0 0,000
2.17 Addltional Teachers PS (Regular) 0 0.000 0.000 0 0.000 0 0.000 0,000 0 0.000 0 0.000 0.000 0 0,0002.18 Additional Teachers - PS (Para) 0 0.000 0.000 0 0.000 0 0.000 0.000 0 0.000 0 0.000 0,000 0 0.000
2.19 Additional Teachers • UPS (Regular) 0 0.000 0.000 0 0 000 0 0.0001 0.000 0 0.000 0 0.000 0.000 ' 0 0.000
2.20 Additional Teachers - UPS (Para) 0 0.000 0.000 0 0.000 0 0.000 0.000 0 d.ooo 0 0.000 0.000 0 0.0002.21 Teachers Under OBB 0 0.000 0.000 0 0.000 0 0,000 0.000 0 0.000 0 0,000 0.000 0 0,000
2.22 Others-AdditionaltGt{BA/B.ed) for Class VIII 0 0.000 0.000 , 0 0.000 0 0,000 0.000 0 0.000 0 ■ o.obo 0.000 0 o-.ooo
2.23 Arrears Of Salary of SSA tftachers 0 0.000 0.000 0 0.000 0 0,000 0.000 0 0.000 0 0.000 ,0.000 0 0,000Sub Total (2.12 to 2.23) 540 899.760 0.000 540 899.7501 665 1100.1001 0.000 665 1100,100 374 658.680 0.000 ■ 374 658.680Sub Total (New teachers+Teachers Recurring) 626 907.560 0.000 626 907..560 685 1105,300 0.000 685 1105.300 378 659.720 0.000 378 659.720
3.0 Teachers Grant3.1 Teachers grant • Primary 1579 7.895 0.000 1579 7.895 1733 8,665 0.000 1733 8.665 678 3.390 0,000 678 3'.390
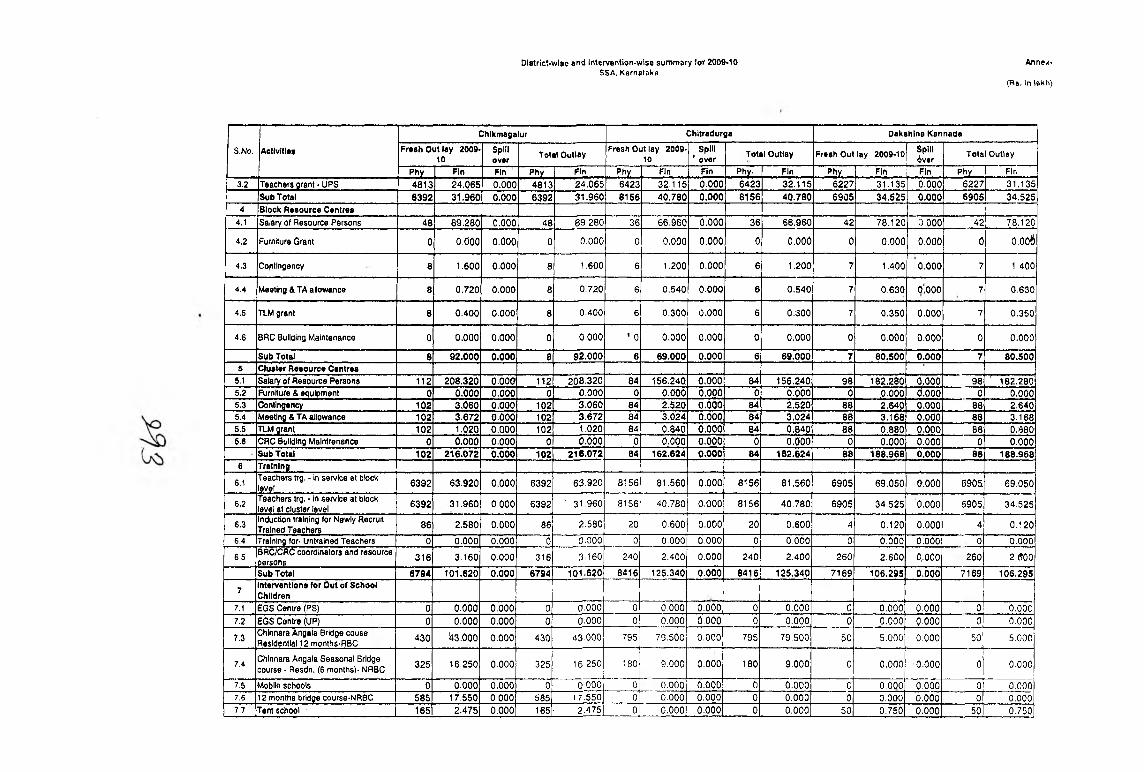
DIstrict'Wlse and intervention-wise summary lo r 2009*10SSA, Karnstaka
{Rs. in Jakh)
Annex-
S.No. Aclivllles
Chikmagalur Chltradurga Dakshlna Kannada
Fresh Out lay 200910
Spillover Total Outlay
Fresh Out lay 200910
Spill ' over Total Outlay Fresh Out lay 2009-10 Spill
iv « r Total Outlay
Phy Fin Fin .Phy fin Phy Fin Fin Phy. Fin Phy Fin Fin Phy 1 Fin3.2 Teachers orant • UPS 4813 24.065 0.000 4813 24.065 6423 32.115 0.000 6423 32.115 6227 31.135 0.000 6227 31.135
Sub Total 6392 31.960 0.000 6392 31.960 6156 40.780 0.000 8156 40.780 6905 34.525 0,000 6906 34,5254 Block Rasource Centres
4.1 Salary of Resource Persons 48 89.280 0.000 48 89,280 36 66.960 0.000 36 66.960 42 78.120 D.OOO 42 78,120
4.2 Furniture Grant 0 0.000 0.000 0 0.000 0 0.000 0.000 0 0.000 0 0.000 0:000 0 0.006
4.3 Cortllnoency 8 1.600 0.000 8 1.600 6 1.200 0.000 6 1.200 7 1.400 0.000 7 1,400
4.4 Meeting & TA allowance 8 0.720 0.000 8 0 720 6 0.540 0,000 6 0.540 7 0.630 o'.ooo 7 0.630
4.5 TLM grant 8 0.400 0.000 8 0.400 6 0.300 0.000 6 0.300 7 0.350 0,000 7 0.350
4.6 BfiC Building Maintenance 0 0.000 0.000 0 0,000 ' 0 0.000 0.000 0 0.000 0 0,000 0,000 0 0,000
Svib Total 8 92.000 0.000 8 92.000 6 69.000 0.000 6 69.000 7 80.500 0.000 7 80.5005 Cluster Resource Centre* '
5.1 Salary of Resource Persons 112 208.320 0.000 112 208,320 84 156.240 0.000 84 156.240 98 182.286 0,6661 98 ' 182.2805.2 Furniture & equipment 0 6.000 0.000 0 0.000 0 0.000 0,000 0 0.000 0 0.000 6,000 0 0,0005.3 Contingency 102 3,060 0.000 102 3.060 84 2.520 0,060 84 2.520 88 2,640 0,000 88 2.6405.4 Meeting & TA allowance 102 3.672 6.000 102 3.672 84 3.024 0.000 84 3,024 88 3,168 0,000 86 3.168S.S TLM grant ,102 1.020 0.000 102 1.020 84 0.840 0,000 84 0,840 88 0,880 0,000 88 0.8805.6 CRC Building Maintrenance 0 o.boo 0.000 0 0.000 0 0.000 0,000 0 0.600 0 0,000 0.000 0 0.000
Sub Total 102 216.072 0,000 102 216.072 84 162.624 0.000 84 162.624 88 188.968 0.000 88 188.9686 Training
6.1 Teacliers trg. • in service at block level. 6392 63.920 0.000 6392 63.920 8156 81,560 0.000 8156 81,560 6905 69,050 0,000 6905 69.050
6,2 teachers trg. • in service at block level at cluster level 6392 31.960 0.000 6392 ’ 31.960 8156 40.780 0,000 8156 40.780 6905 34.525 0,000 6905 34.525
6.3 induction training for Newly Recruit Trained Teachers 86 2.580 0.000 86 2.580 20 0-600 0.000 20 0.600 4 0.120 0.000 4 0.120
6.4 Training for- Untrained Teachers 0 0.000 0.000 0 0.000 0 0.000 0.000 0 0.000 0 0.000 0.000 0 0.000
6.5 BRC/CRC coordinators and resource persons 316 3,160 0.000 316 3.160 240 2.400 0.000 240 2.400 260 2.600 Q.OOO 260 2 ,ff00
Sub Total 6794 101.620 0,000 6794 101.620 8416 125.340 0,000 6416 125.340 7169 106.295 0,000 7169 106,295
7 Interventions for Out ol School Children
7.1 EGS Centre (PS) 0 0.000 0.000 0 0.000 0 0.000 0.000 0 0.000 0 O.OOO 0,000 0 0,0007.2 EGS Centre (UP) 0 0.000 0.000 0 0,000 0 0.000 0.000 0 0.000 0 0.000 0,000 0 0,000
7.3 Chinnara Angaia Bridge couee Residential 12 months-RBC 430 H3.000 0.000 430 43.000 795 73.500 0.000 795 79.500 50 5.000 0.000 50 5,000
7.4 Chinnara Angaia Seasonal Bridge course - Resdn. (6 months)- NRBC 325 16,250 0.000 325 15 250 180 9.000
10.000 180 9.000 0 0.000 •0.000 0 0.000
7.5 Mobile schools 0 0.000 0.000 0 0 000 0 0.000 0.000 0 0.000 0 0.000 0.000 0 0,0007.6 12 months bridge course-NRBC 585 17.550 0.000 585 17.550 0 0.000 0.000 0 0.000 0 0.000 o.ooo 0 0.0007.7 Tent school 1651 2.475 0.000 165 ■ 2.475 0 0.000 0.000 0 0.000 50 0.750 0.000 50 0,750

SSA, Karnataka Annex-
(Rs. In lakh)
S.No.
17,7
Activities
17.2 _Glrls_Education_17.3 SC/ST ^
17.517,6
Comp. Edn.Minority CommunllyUrban Deprived ChildrenothersSub Total
ChlkmagalurFresh Out lay 2009
10Phy Fin
0.00015.00050.00010,2509.750
01 0,000 T l in n nnn i
SpilloverFin
0.0000.0000.0000.000
Total Outl«y
_Ph
0.000o.o5n nnnI
Fin0.000
15.00050.00010.250_9_750
0.000
ChitradurgaFresh Out lay 2009
10FinPhy
I 10.000
15.00050.00010.2509.7500.000
SpilloverFin0.0000.0000.0000.0000.0000.000
Total Outlay
Phy Fin
0,000;15,00050.00010,250
9.7500.000
Dakshlna Kannacfa
Fresh Out lay 2009-10
Phy Fin
0.00015.00050.00010,250
9.750,0.000
SpilloverFin
■0.0000,0000 ,0000,000Q,0000,000
Total Outlay
Phy
0,00015.00050 00010 2509,7500.000
District-wise tind intervention-wise summary for 2009-10 SSA, KarnotaKn
Annex-
(Rs. In lakh)
S.No. Activities
Chikmagelur Chitradurga Dakshlna Kannada
Fresh Out lay 200910
Spillover
Total OutlayFresh Out lay 2009
10Spillover Total Outlay FroshO utlay 2009-10 «pHI
ov«Total Outlay
Phy Fin Fin Phy Fin Phy Fin Fin Phy Fin Phy Fin Fin Phy Fin
7.8 Madrasa / Makthab 0 0.000 o-ood 0 0.000 0 0.000 0.000 0 0-000 0 0.000 0.000 0 0.000
7.9 NCLP Schools 0 0.000 0.000 0 0 000 115 3.450 0.000 115 3.450 0 0.000 O.OOO 0 0.000
6.0Summer Remedial Teaching Chaitrada Chiouru 2550 12.750 0.000 2550 12.750 2100 10.500 0.000 2100 10.500 2200 11.000 0.000 220,0 11.000
8.1 4 months seasonal residential school 0 0.000 0.000 0 OOOOl 0 0.000 0.000 0 0-000 0 0.000 0.000 0 0.000
8.2 Bridoe course - Chinnara Angala 0 0.000 0.000 0 0.000 76 0.380 0.000 76 0.380 0 0.000 0.000 0 O.OOO
8.3 Home Based Education 338 10.140 0.000 338 10.140 150 4.500 0.000 150 4.500 630 -18.900 0.000 630 18.900
8.4 Bridge course - Chinnara Angala Resl-2 months 217 3.689 0.000 217 3 689 143 2.431 0-000 143 2.431 0 0.000 0.000 0 0.000
8.5AIE Centers( Transportation, Hardest to reach children) 162 4.860 0.000 162 4-860 49 1.470 0.000 49 1.470 14 0.420 6.000 14 0.420
S.6 Innovatbn Urban Deprived Children 0 0.000 0,000 0 0.000 0 0,000 0.000 0 0.000 0 0.000 0,000 0 0.000
8.7 Special Enrolment Drive 68 0,000 0.000 68 0.000 253 0.000 0,000 253 0.000 0 ,0,000 0,000 0 0.000
Sub Total 4840 110.714 0.000 4840 110.714 3861 111.231 0.000 3861 111.231 2944 36.070 0.000 2944 36.070
8 Remedial Tt«ehlng8.1 Rernldlai teaching 10374 20.748 0.000 10374 20.748 12252 24.504 0.050 12252 24,504 9122 18,244 0.000 9122 18,244
8.2 Motivation through field trips 0 0.000 0.000 0 0.000 0 0.000 0.000 0 0.000 0 0,000 0,000 0 o.oooSub Total 10374 20.748 0.000 10374 20.748 12252 24.504 0.000 12252 24.504 9122 18.244 0.000 9122 18.244
9 Free text Book
9.1Free text book lor l-V std all chlUren of aided schools 5189 4.151 0.000 5189 4.151 10603 8.482 0.000 10603 8.482 40539 32.431 0.000 40539 32,431
9.2l^ree text tiook for Vi-Vili std all children of aided schools____________ 8483 11.028 0.000 8483 11.028 19130 24.869 0.000 19130 24.869 33666 ' 43,766 0,000 33666 43.766
9.3 Work books tor Nall Kail 6 0.000 0,000 0 0.000 0 0.000 0.000 0 0.000 0 O.OOO 0.000 0 0-000
Sub Total 13672 15.179 0.000 13672 15.179 29733 33.351 0.000 29733 33.351 74205 76.197 0.000 74205 76,197
10 Interventions (or CWSN10.1 Provision of disabled children 2406 28.872 0,000 2406 28.872 3945 47.340 0 .000 3945 47.340 5789 69:466 0.000 5789 69.468
Sub Total 2406 28.872 0.000 2406 28.872 3945 47.340 0.000 3945 47.340 5789 69.468 0.000 5789 68.468< * '
Fin

SSA, Karnataka<Rs. in lakh)
Chikmagalur Chltradurga Dakshina KannadaS.No. Activities Fresh OiJ tiay 2009
10 ■Spillover Total Outlay
Fresh Out lay 200910
Spillover Total Outlay Fresh Out lay 2009-10 Spill
overTotal Outlay
Phy Fin Fin Phy .1 Fin Phy Fin Fin Phy Fin Phy Fin Fin Phy11,15 0 0.000 0.000 f 0 ,000 0 0.000 0.000 0 0.000 0 O.OQO 0,000 0 0.00011,16 Head Master's Room. 0 0.000 0.000 0.000 ' 0 0.000 0.000 0 0,000 0 0.000 0,000 0 0.00011.17 ChUd Friendly elements 0 O.OOO 0.000 0 0.000 0 0,000 0.000 0 0.000 0 0 .000 0.000 0 0.00011,18 xltchen shed 0 O.OOO 0.000 0 0,000 0 0.000 0.000 0 0,000 0 0 ,000 0.000 0 0.00011.19 Residential IHostel 0 0.000 0.000 0 0 .000 0 0.000 0,000 0 0,000 0 0 .000 0,000 0 0.00011.20 Ma|or Repairs (Primary) 0 0.000 0.000 0 O.OOO 0 0.000 0 .000 0 0.000 0 0.000 6,000 0 0.00011.21 Ma|or Repairs (Upper Primary) 0 0.000 0.000 0 0,000 0 0.000 0.000 0 0.000 0 r 0.000 0.000 0 0.000
District-wise and Intorventlon-wiso summary for 2009-10 SSA. Karnataka
(Rs. In lakh)
S.No,
--------- ------- ..
Activities
Chifimagaiur Chltradurga Dakshina Kannada
Fresh Out lay 200910
Spillover Total Outlay
Fresh Out lay 200910 ,
Spillover Total Outlay Fresh Out lay 2009-10
Spillover
Total Outlay
Phy Fin Fin Phy Fin Phy Fin Fin Phy Fin Phy Fin Fin Phy Fin
0 0.000 0.000 0 0.000 28, 4,200 0.000 28 4.200 0 0.000 0,000 0 0.0001,0 Instructor to MCS, provlston of life skllis.blcycles,vocational training,transportation charges etc..
2.0 Av<ard to best school/teacher 0 0.000 0.000 0 0.000 28 1.400 0.000 28 1.400 0 0.000 , 0.000 0 0.000
3.0Student evaluatton,Remedial Teaching.Brkjge courses & alternativs Schools
0 0.000 0.000 0 0.000 28 5.600 0.000 28 5.600 0 0.000 0.000 0 0.000
4.0 Learning through Open schoools 0 0.000 0.000 0 0,000 28 5.600 0.000 28 5.600 0 0.000 0.000 0 0.0005,0 Teacher Training 0 0.000 0.000 0 0.000 0 0.000 0.000 0 0.000 0 0.000 0.000 0 0.0006,0 Child care centers (or 2 centers 0 0,000 0.000 0 0.000 0 0.000 0.000 0 0.000 0 0,000 0,000 0 o.ooo7,0 other 0 0,000 0.000 0 0,000 0 0.000 0.000 0 0.000 0 0,000 0,000 0 0.000
Sub Total 0 0.000 0.000 0 0 ,000 28 16.800 0.000 28 16.800 0 0.000 0 .000 0 0.000
DAdditional InoentivBS (unifor stationery, work book, escorts in dIfflcuK areas etc.)
1.0 Primary 0 0.000 0.000 0 0.000 0 0.000 0.000 0 0,000 0 0.000 o.ooo , o1 0.0002.0 Upper Primary 0 0.000 0.000 0 0.000 0 0.000 0.000 0 0.000 0 0.000 o.oool , 0 0.000
Sut> Total 0 0 .M 0 0.000 0 0.000 0 0.000 0.000 0 0.000 0 0.000 o.oool 0 0.000Community Mobilisation 0 0.000 0.000 0 0.000 28 1.072 0.000 28 1.072 0 O.OOO 0.000' -0 0,000Sub Total 0 0.000 0.000 0 0.000 28 1.072 0.000 28 1.072 0 0.000 0.000 ol 0.000
6 .000 -■ ■ “ 2 8 r 17:872 5^^o;ooo ;>■: 0 .000
21 KQBV
20.1 No of KQBVs sanctioned 0 0 2I
2 0 0
20.2 Non Recurring 0 0 0 0 0 0
1 1 Construction of Building 0 0.000' 0.000 0 0.000 2 42.100 0.000 2 42.100 0 O.OOOl 0;000 0 ' 0,0001
1.0 Boundary Wall 0 0000 ; 0,000: 0 0.000 2 3.000 0.000 2 3.000 0 0.000 0.000 O' 0.000Boring/Hand pump 0 0 ,000 ' 0 ,000 ' 0 0.000 2 2.000 0.000 2 2.000 O' '0.000 0.000 01 o.ooo'
X t k a * A A A A

SSA. Karnfltoka(Rs. in lakh)
Chlkm«g»lur j Chltradurga Dakshlna Kanneda !
S.No. Activities Fresh Out lay 200910
Spillover
Total OutlayFrssh Out lay 2009
10Spillover
Total Outlay Fresh Out lay 2009-10 Spillover
Total Outlay j1 ............ .,. . . J
Phy 1 Fin Fin Phy Fin Phy Fin Wn Phy Fin Phy Fin Fin Phy Fin
4.0 Exaniinatlon Fee 0 0.000 0.000 0 0.000 2 0.0401 0,000 2 0.040 0 0.000 , 0.000 0 0.000Salaries ' 0 0.000 o,oo6 0 0.000 2 24.000 0,000 2 24.000 . 0 0.000 . o.ooo 0 0.0001 .One Warden .2.Four(ull lime teachers
two Urdu teachers(oniy (or blocKs with musllm population above 20% and seleicted urt>an areas)lf required
5,0 3. Three oatt time teachers 1 14. One hjii time accountant
1 1
Two Support staff(account/A88istant/ChowkWar/Peon)6. One head Cook and one assistant cook for 50 girls and Z assistant cok fortOOairis i
6.0 Vocational training / specific skill trg 0 0.000 0,000 0 o.ooo; 2 1.000 0.000 2 : , 1,000 0 0.000 . 0.000 0 0.0007.0 Electricity / water charges 0 0.000 0.000 0 0.000 2 '1 1.200 0.000 2 1.200 0 0.000 0.000 0 0.000
8,0 Medical care/contingeiicies @R8.r§o/= par girl: 0 0.000 0.000 0 0.000 1 2 '
I" ' " i 1.5001 0.000 2 1.500 0 0.000 0.000 0 0.000
9.0 Misc. including maintenance 0 0,000 0.000 0 0.000 1 2 !1 1 .eobl 0.000 2 1,600 0 0.000 0.000 0 0.00010.0 Preparatory camps 0 0.000 O.OOOj 0 0.000 2 i 0.300 0.000 2 0.300 0 0.000 0.000 0 QQQO11,0 P.T.A/school functions 0 0,000 Q.ooo' 0 , D.ODD 2 . 0.300 0.000 2 0.300 0 0.000 ' 0.000 0 0.00012.0 Provision of Rent (Bmonths) 0 0,000 0.0001 01 0.000 0 0.000 0.000 0 0.000 0 0,000 0.000 0 0.00013.0 Capacity Building 0 0,000 0.000 0 0.000 2 0.600 0.000 2 0.600 0 0.000 0.000 0 0.000
Total Recurring 0 0.000 0.000 0 0.000 2 50.940 0.000 2 50.940 0 0.000 0 .06b 0 0.000iOrand;1'<4|M,d^(MI,fM,urrltig * . 0 O.OOQ . Q.QOO 0 0.000 2 100.440 vO-ORPi . 100;44P 0 o.cAo
m
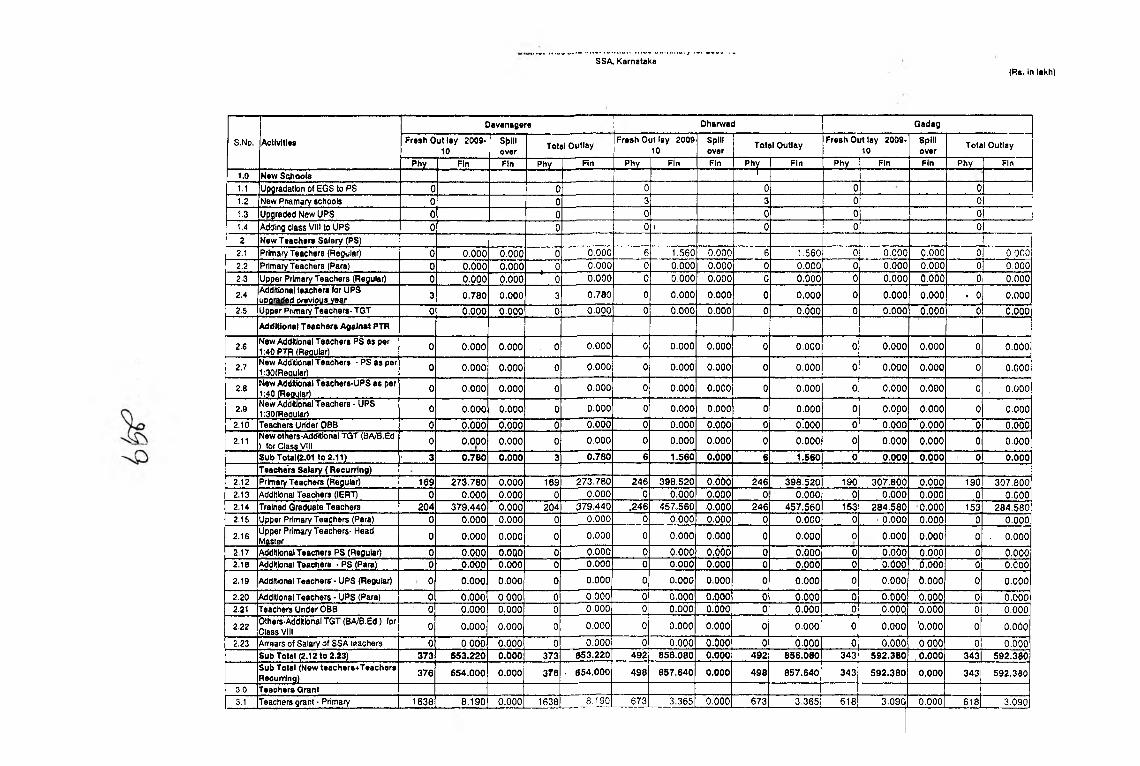
SSA. Karnataka(Rs. in lakh)
S.No. Actlvltlas
Oavanagere Dharwad Gadag
Fresh Out lay 200910
Spillover Total Outlay
Fresh Out lay 2009 10
Spillover Total Outlay
Fresh Out lay 200910
Spillover Total Outlay
Phy Fin Fin Phy Fin Phy Fin Fin Phy Fin Phy Fin Fin Phy Fin1.0 New Schools 1
1.1 Upgradatlon of EGS to PS 0 0 0 0 0 01.2 New Priamary schools 0 0 3 3 0 011.3 Upgraded New UPS 0 0 0 0 0 01.4 Adding class Vill to UPS 0 0 0 1 0 0 02 New Teachers Salary (PS)
2.1 Primary Teachers (Regular) 0 0 .000 0.000 0 0.000 6 1,560 0.000 6 1.560 0 0,000 0.000 0 0 0002.2 Primary Teachers (Para) 0 0.000 0.000 1 0 0.000 0 0,000 0.000 0 0.000 0 0.000 0.000 0 0.0002.3 Upper Primary Teachers (Regular) 0 0 .000 0.000 0 0.000 0 0,000 0.000 0 0.000 0 0.000 0.000 0 o.ooo2.4 Additional teachers for UPS
UBOraded orevious year 3 0.780 0.000 3 0.780 0 0.000 0.000 0 0.000 0 0.000 0.000 . 0 0.000
2.5 Upper Primary Teachers- TQT 0 0.000 0.000 0 0.000 0 0,000 0.000 0 0 .000 0 0.000 0.000 0 0.000
Additional Teachers Against PTR
2.6 New Additional Teachers PS as per 1:40 PTR (ReflUiar) 0 0 .000 0.000 . 0 0.000 1 0 0.000 0.000 0 0.000 0 0,000 0,000 0 0.000
2.7 New Additional Teachers - PS as per 1:30(Reauiar) 0 0.000 0.000 0 0.000 0 0.000 0.000 0 0.000 0 0 .000 0.000 0 0.000
2.8 New Additional Teaehers-UPS as per 1:40 (Reouiar) 0 0.000 0.000 0 0.000 0 0.000 0,000 0 0.000 0 0 .000 0.000 0 . 0.000
2.9 New Additional Teachers • UPS 1:30(Reoular) 0 o.ooa 0.000 0 0.000 0 0.000 0.000 0 0.000 0 o.opo 0.000 0 0.000
2.10 Teachers Urfder OBB 0 0.000 0.000 0 0.000 0 0.000 0.000 0 0.000 0 0 .000 0.000 0 0.000
2.11 Newothers-AddUkjnaiTGT (BA/B.Ed ) for Class VIII 0 0 .000 0.000 0 0.000 0 0.000 0.000 0 0.000 0 0.000 0.000 0 0.000
Sub Tots|(2.01 to 2.11) ' 3 0 .780 0.000 3 0.780 6 1.560 0.000 6 1.560 0 0 .000 0.000 0 0.000t eache'rs Salary { Recurring)
2.12 Primaiy Teachers (Regular) 169 273.780 0.000 169 273,780 246 398.520 O.OOO 246 398.520 190 307.800 0.000 190 307.8002.13 Additional Teachers (lERT) 0 0.000 0.000 0 0.000 0 0.000 0.000 0 0.000 0 0.000 0.000 0 0.0002.14 Trained Graduate Teachers 204 379.440 0.000 204 379.440 .246 457,560 ■0.000 246 457.560 153 284.580 0.000 153 284.5802.15 Upper Primary Teachers (Para) 0 0.000 0.000 0 0.000 0 0.000 0.000 0 0.000 0 ' 0 .000 0.000 b 0.000
2.16 Upper Primary Teachers- Head Master 0 0.000 0.000 0 0.000 0 0,000 0.000 0 0 .000 0 0.000 o.ooo 0 . 0.000
2,17 AddHionai Teachers PS (Regular) 0 0 .000 O.OQO 0 0.000 0 0.000 0.000 0 0 .000 0 0.000 0.000 0 0,0002.18 AddHlonal Teachers - PS (Para) 0 0.000 0.000 0 0.000 0 0.000 0.000 0 0 .000 0 o.ooo O.ooo 0 0.000
2.19 AddKlonai Teachers - UPS (Regular) 0 0.000 0.000 0 0.000 0 0,000 0.000 0 0.000 0 0.000 O.OOO 0 0.000
2.20 Additional Teachers - UPS (Para) 0 0.000 0.000 0 0.000 0 0.000 0,000 0 0.000 0 0.000 0.000 0 0.0002.21 Teachers Under OBB 0 0.000 0.000 0 0,000 0 0.000 0.000 0 0.000 0 0.000 o.ooo 0 0.000
2.22 Others-Additionai TGT (BA/B.Ed) tor Class VIII 0 0.000 0.000 0 0.000 0 0.000 0.000 0 0 .000 0 0.000 '0.000 0 0.000
2.23 Arrears of Salary of SSA teachers 0 0.000 0,000 0 0.000 0 0.000 0.000 0 0.000 0 0.000 0.000 0 0.000Sub Total (2.12 to 2.23) 373 653.220 0.000 373 653.220 492 856.080 0.000 492 856.080 343 592.380 . 0 .000 343 592.380Sub Total (Newteachers+Teachers Recurring) 376 654.000 0 .000 3T8 , 654.000 498 857.640 0.000 498 857.640 343 592 .380 0.000 343 592.380
3.0 Teachers Grant3.1 Teachers grant • Primary 1638 8.190 0.000 1638 8.190 673 3.365 0.000 673 ’ 3.365 618 3.090| 0.000 618 3.090

SSA, Karnataka(Rs. in lakh)
S.No. Activities
Davanagere Ohsnwad ■ Qadag
Fresh Out lay 200910
Spillover
Total OutlayFresh Out lay 2009.
10Spillover Total Outlay Fresh Out lay 2009
10Spill
' overTotal Outlay
Phy 1 Fin Fin Phy Fin Phy Fin Fin Phy Fin Phy Fin . Fin Phy Fin
3.2 Teachers grant - UPS 6446 32.230 0.000 6446 32.230 5632 28.160 0.000 5,632 28.160 3917 19.585 0.000 3917 19.585Sub Total 8084 40.420 0.000 8084 40,420 6305 31,525 0.000 6305 31.525 4535 22.675 0.000 4535 22.675
4 Block Resource Centres' 4.1 Salary o) Resource Persons 42 78.120 0.000 42 78.120 6 11.160 0.000 6 11.160 6 11.160 ■ 0.000 6 11,160
4.2 Furniture Grant 0 0.000 0.000 0 0.000 0 0.000 0.000 0 0.000 0 0.000 . 0.000 ' 0 0.000
4,3 Contingency 7 1.400 0.000 7 1.400 6 1.200 0.000 6 1.200 6 1.200 0.000 ■ 6 1.200
4.4 Meeting & TA allowance 7 0.630 0.000 7 0.630 6 0.540 0.000 6 0.540 6 0.540 0.000 6 . 0.540
4.5 TLM grant 7 ' 0 .350 0.000 7 0.350 0.300 0.000 6 0.300 6 0,300 ■0.000 6 0.300
4.6 6RC Building Maintenance 0 0.000 0.000 0 0.000 0 0.000 0.000 0 0.000 0 0,000 0.000 0 o.poo
Sub Total 7 80.500 0.000 7 80.500 6 13.200 0.000 6 13.200 6 13.200 0.000 6 13.1005 Cluster Resource Centres
5.1 Salar^ of Bosource Persons 98 182.280 0.000 98 182.280 45 83,700 0,000 45 8 1 7 0 0 53 98.580 0.000 53 98.5805.2 Furniture & equipment 0 0.000 0.000 0 0.000 0 0.000 0.000 0 0,000 0 0.60b . 0.000 0 0.0005.3 Contingency 98 2.940 0.000 98 2.940 84 2,520 0.000 - 84 2,520 54 1.620 •0.000 54 1,6205.4 Meelisfi tt'TA allowance 98 3.528 0.000 98 3,528 84 3.024 0,000 84 3,024 54 1,944 0.000 54 1,9445.5 TU |#r»-,l 98 0,980 0.000 98 0.980 84 0.840 0.000 84 0,840 54 0.540 0.000 54 0.5405.6 • CRC Building Maintrenance 0 0.000 0.000 0 0.000 0 0.000 0.000 0 0.000 0 0,000 0.000 0 0.000
Sub Total 98 189,728 0.000 98 189.728 84 90,084 0,000 84 90.084 54 102.684 0.000 54 102,6846 Training
6.1 Teachers Irg. • In service SI blocl< level 8084 80.840 0.000 8084 80,840 6305 63.050 0,000 6305 63.050 4535 45.350 0.000 4535 45.350
6.2 Teachers trg. - in service at block level at cluster level 8084 40.420 0.000 8084 40,420 6305 31.525 0,000 6305 31,525 4535 22.675 0.000 4535 22,675
6.3Induction training tor Newly Recruit Trained Teachers 3 0.090 0.000 3 0,090 6 0.180 0,000 , 6 0 ,180 0 0.000 0.000 0 0,000
6.4 Training for- Untrained Teachers 0 0.000 0.000 0 0,000 0 0.000 0.000 0 0.000 0 0 .000 , 0.000 0 0.000
6.5 0RC/CRC coordinators and resource persons 570 5.700 0.000 570 5,700 163 1.630 0,000 163 1.630 117 1 170 0.000 117 1 170
Sub Total 8657 127.050 0.000 8657 127.050 6474 96.385 0.000 6474 96,385 4652 69.195 0.000 4652 69,195
7 Interventions for Out o f School Children
7.1 EGS Centre (PS) . 0 0.000 0.000 0 0.000 0 0.000 0,000 0 0,000 0 0.000 0.000 0 0.0007.2 EGS Centre (UP) 0 .0 .000 0.000 < 0 0.000 0 0.000 0,000 0 0.000 0 0 .000 0.000 0 0.000
7.3 Chlnnara Angala Bridge couse Residentlai12 months-RBC 575 57.500 0.000 575 57.500 150 15.0C0 0.000 150 15.000 1200 120.000 0,000 _1200 120.000
7.4 Chlnnara Angala Seasonal Bridge course • Resdn. (6 months)- NR8C 300 15.000 0.000 300 15,000 0 0.000 0,000 0 0.000 0 0.000 0.000 0 0,000
7.5 Mobile schools 0 0,000 0,000 0 0.000 0 0.000 0.000 0 0,000 0 0.000 '0 .0 00 0 0,0007.6 12 months bridge course-NHBC 1l'3 3.390 0,000 113 3.390 0 0.000 0.000 0 0.000 0 0.000 0.000 0 0.0007.7 Tent school 300 4.500 0.000 300 4.500 150 2.250 0.000 150 2.250 0 0,000 0.000 0 , O'. 000

DIslrlct-wlso and [ntervcn(ion-wlse summary lor 2009-t0SSA, KernataKo
(Rs.InlaKh)
Davanagere Dharwad 1 Gadag 1
S.No. A etlvflla i Fresh Out lay 200910
Splliover Total Outlay Fresh Out lay 2009
10Spillover Total Outlay Freeh Out lay 2009
10Spillover Total Outlay -
Phy Fin Fin 'P hy Fin Phy Fin Fin Phy Fin Phy Fin -FItl Phy Fin?.8 iMBdtasa/MaMhsb 60e 18,24C O.OOC ..6081 18,240 110 3,300 O.OOO . 110 3 ,300 0 0.000 OiOOO c1 . 0 .000
1 7,9 ’ iNCLP Schools -c 0,000 O.OOOl 01 0.000 0 0,000 0.000 0 0.000 0 0.000 0X)00 G1 0 ,000
S.0 Isummor Remedial Taaehlng Ichaltroda CMauru 2940 14,700 o.oool 29401 14.700 1*725 8.625 0.000 '7 2 5 8 .625 ’ 350 6.750 0,600 13501 6 ,750
8.1 |4 months seasonal residential school 0 0.000 o .ooo j 01 0,000 0 0.000 0.000 0 0 .000 0 p.ooo o.!ooo 0 0 ,000
8.2 jBridge course • Chlnnara Angala 70 0.350 o.oool 70 0.350 173 0.865 0 .000 173 0.865 1250 6.250 0 .000 .1250 6.250
8-3 1-lome Based Education 285 8.550 O.OOC|| 285 8.550 616 '8 .4 8 0 0.000 616 18.480 357 10,710 0 ,000 357 10.710
8,<1 IBrldge course • Chlnnara Angala 1 Real-2 months 587 9.979 0.0001 587 9.979 0 0.000 0.000 0 0,000 334 5,678 o iooo 334 5.678
8,5' [AIE CenterafTransporjalion, Hardest no reach children) • 32 0.960 0 .000 32 0.960 4 0.120 0.000 4 0,120 0 0,000, 0 ,000 0 0.000
' 8.6 innovation ^rtian Deprived Children 0 0.000 0.000 1 0 0.000 0i'~ ....... —1 0.000 0.000 0 0 ,000 0 0,000 o.ooOj 0 0,000
8.7 iSpeclal Enrolment Orlvs 126 0.000 0.000 128 0.000 150 0.000 0.000 150 0.000 18 .0,000 o .ooo 18 0.000|Sub Total 5938 133.169 0.000 1 5938 133,169 3078 I 48.640 0 .0 0 ^ 3078 48,640 4509 149 ,388 0.000 4509 - 149,388
e |Ren|edlal Teaching8.1 jflsm'ldlafteachlng ■ i 0285( 20,570 0,000 1 10285 ■ 20,570 6439 I 12.878 0.000 6439 12,878 4829 9.658 o.ooo 4829 9.6588.2 (Mottvattonijirough field trips 01 0 ,000 0.000 0 0,000 0 0.000 o.ooo 0 0,000 0 , 0.000 O.oool 0 0.000
ISubTolal • 1028511 20.570 0.000 1 10285 20.570 6439| 12,878 0.000 6439 12.87?! 4829 9.658 o.oool 4829 9,6Se9 jFrae Text Sook 1
9.1 Free text book for 1-V sId all children of aided schools 20390 j 16.312 0.000 I 20390 16.312 16635| 13.308 0.000 16635 13,308 4146 3.317 0 .000 4146 3,317
' 9.2 bree le ^ bfeck for VI-VIII std all IchlWren ol aided schools 21189 27,548 0,000 1 21189 27.546 20690 ’ 26.897 0.000 20690 26.897) 9011 11.714 0.000 9011 11,714
9.3 Vork books.fof Nall KaU oi1 0 ,000 0,000 I 0 0 .000 oi 0.000 0.000 0 o.oool 0 0.000 0.000 0 0.000isut>Tot«r ' ■ ■ 4157911 43.056 0 .000 1 41579 43.858 373251 40.205 0 ,000 37325 40,20S| 13157 15.031 0,000 13157 15,031
10 linterventlonB for CWSN 1 110.1 jProvision of disabled children 44151! 52.980 0,000 I 4415 52.980 31251 37.5001 0,000 3125 37.5001 3410 40,920 Q,OO0[ 3410 40.920
|Sub Tqtal 441 S| 52.9B0 0 .000 1 4415 52,980 31251 37.S00I O.POO 3125 37,5001 3410 40.920 0,0001 3410 40,92011 J Civil Work* ■ 1 1 ! ' .
11.1 BRC ol 0,000 o.ooolI 0 0 .000 o( o.oool 0 .000 0 o.oool 0 0.000 o.oool 0 0,00011.2 CRC . 01 0 .000 o.oool1 0 0 .000 0| o.oooj 0,000 0 o.oool 0 O.OOO 0.0001 0 0,00011.3 SchooiauikHngs Ol 0 .000 o.oool 0 0.000 3| 27,0001 0,000 3 27.0001 0 0.000 0,000| 0 , 0.00011.4 joilaplddted ol 0 .000 o.oool' 0 0 ,000 01 o-.oooj 0,0001 0 o.oool 0 0,000 o.oool 0 0,00011.5 BulkJlngless (Pry) ol 0 ,000 '■o,ooo( 0 0,000 Ol o.oool o ,oool 0 o.oooj Oi 0.000 o .ooo i 0 0 ,00011.6 Building iess (UP) ol 0 ,000 0,0001 0 0.000 Ol o.oool 0.0001 0 o.oool 61 0.000 o.oool 0 ■ 0 ,000
1 ( .7 - Dilapidated BuDdlng (Pry) 0.000 o .o o o l 0 0.000 ot■ o.oool o.o.oof ol o .oool oi 0 .000 0,0001 0 0,00011.8 lAdditlonal class roorns 192 91J2,’400 0.000 ' 192 902.400 90| 423,0001 o.oobF 901 423.0001 134| 629.800 o.oool 134 629,600
11.9 Additional Class Room to Bangalore Metro City : ■ 0 0 .000 0.000 0 0.000 0 o.oool o.oooj o| o.ooo| o[ o.oooj p .ooo j 0 o,ooo[
11.10 Toilets/Urinals 0 0,000 0,000 0 0.000 0 o.oool . o.oool ol o.oool oi 0,000| 0,0001 0 o.ooo!11.11 Separare Girls Toilet f 141 35.250 0.000 141 35.250 0 o.oool o.ooo! 01 o.oool 2141 53,500] o.oool 214 53.500)11.12 Drinking Water Facility 0 0 .000 O.-OOO 0 0.000 0 o.oool o.oool ol 0.0001 Ol o,oool o.oool 0 0.000111.13 ISounda^WaN ' 0 0 .000 0,000 0 0.000 0 0.000 o.oool '01 o.oool ol 0,000| o.oool 0 o.oool11.14 {seperatlon Wall 0 0 .000 0,000 0 0.000 0 0.000 o.oool ■ ol o.oool o l o.oool o.oool o l o.oool

~ ’ SSA, Karnataka
Davanager* 11 Dhsrwad Gadag
S.No. Activltlas- Fresh Out lay 2009i- 10
Spillover
Total Outlay Fresh Out lay 2009^ 1 10 1
Spill o v tr ,
1Total Outlay
Fresh Out lay 200910
Spillovar
Total Outlay
Phy Fin ' Fin’ Phy 1 Fin ■1 Phy Fin 1 F in ’ P h y Fin ■ Phy j Fin, Fin T Phy F(n
11.15 eiBCtrlflcaUon 0 o.ooot o.oool 0 o.oool 0 o.oool p.ooo 0 0,000 0 0.000,1 'O.OOOj 0 0.0001T.16 Hsad Master's Hoorn 0 0.000 0,000 0 0.0001 0 O.OOOI ’ 0.000 0 0.000 0 0.000* 0.000 0 p.ooo11.17 Child FilandV slemBtils ' o| o'.ooo o.oool 0 0,000 0 0.000 0.000 0 0.000 0 o.oooj1 o.boo 0 b.bob11.IB KHchen shod ’ * 0 0.000 0,0001 o! 0,000 ' 0 o.oool o.'ooo 0 0,000 ■ ° ' o.oool1 o:ooo o|1 0,00011.19 RasWenllal Hostal ' ' 0 ■ o.boo o.oool 01 o.oool 0 o.oooi 0.000 0 0,000 6 o,ooo|r-o :ooo i o| 0.000
Ma)or Ftepairs (Primary) oj 0.000 o.oool 0 0.000 1 0 o.oooi 0.000 0 0,000 0 o.ooq i O.OOQIt ol 0.000n .z i" Majoi’ Rwairs (Uppsr Primary) 0 0.000 o.oool 0 0.000 1 0 0.0001 0.000 0 0,000 6i o.oob ' o.oooj 0| 0.000
11.22'• . f 1
AdUltlonal Rooms fi;r CALC & Edusat 0 0.000 0.0001 0 0,000 0 o.oooj 0,000 0 0,000 o| o,ooo| O.OOQ“ 1
0,000
11.23 special ToBats tor CWSN 14 7.000 0,0001 14 7.000 18 9,0001 0.000 ie 9,000 181 9.OO0 0.000 18| 9,000
11.24 Saninsi up l Solar Photo Voltaic to Bxislino CALC schools 0 0.000 0,0001 0 0.000 0 0,0001 0.000 0 0,000 o| o.oooj tf.ooo I o| 0.000
11.2S Ssttlijo up of Solar Photo Voltab lo new CALC schools 0.000 0.000 0 0.000 0 O,0Q0j O.opp 0 0.000 o| j'o.oobl ,0.0001 ' . 0.000
ISub Total 6 t Civil work» ' 347 $44.6S0 0.000 347 944.650 111 459.0001 0.000 111 469.000^ 3661 692r300l 0 .000 1 3661 692.300I t . 26 Purnltura for Qovt. UPS ' ' 1 ’ 1 1 1 *. I 1 111.27 No. ofchlldron** O' 0.000 0.000 0 0,000 0 O.OOOI 0.000 0 0,000 ol o.oool '.0,000 1 0.000
ISub Total (Fum itor*)’ o f 0.000 o.oool 0 0.000 0 o .oool 0 .000 0 0 .000 o L o .ooo j 0 .000\
0.000
Sub Total(C lvlU Furnltufa) 347| 944 .650 0.000 347 944.650 1111
459.000 0 .000 111 4S9.000 36e j 6 92 ,300 l p.OOO1 366 , 692.300
12 1Teaching ILearnlnjg Equlpmsnt 1 1 1 1 ' 1 . 112,1 ITLE for’SBW schools oi 0 ,000 0.000 • ^ • 0 0,000 3 0.600 0.000 3 0.600 ol o.oool 0,000 of 0.0001 2 i ] TIE Mr Opgracfed achools oj 0,000 0.000 0 '6.000 ■ 0 0.000 0.000 0 0,000 o l o.b'ool 0,000 0| 0.00012.3 1osiers • o| 0.000 o.oool 0 0.000 , 0 o.oool • o'.ooo .0 0.000 ol 0;<300l 0.000 ■ 0.000
ISub Total of 0.000 o.oooi 0 0 .000 3 0.600 :v :o o o 3 0.600 ol' ' bsbboi '0 .0 0 0 0| p.ooo13 1Malntsnance Orant .20b '5| 147.150 o.oool 2085 147.150 I ' 1300 97.050 o;ooo 1300 97.050 1024( 76.8001 0.000 1024) 76.800
13.1 1LPS wlih.<3 rooms' 0) 0.000 0.0001 0 0.000 0 o.oool 0.000 '6 0,000 ■ Ol .O’.OOOj '0,0001 b ■ O.OOOI13.2' LPS wtili >3 rooms .. Of 0.000 0,000 0 0.000 0 0.000 0.000 0 0.000 ’■ 0 6,boot ■ 0.000 0 o.oool13.3 UPS with <8 rooms ol 0'.000 0,000 0 0.000 ‘ 0 6 m q ^0.000 0 0.000 ol o.obo'l O.OOQI b O.OOOI13'.4 UPS vylthi6 room* ' °] 0,000 . o.oool 0 0.000 0 o.oool 0.000 0 0,000 01 'O.OOOI • 0,000 ol o.oob I
ISub Total 20B5I ‘147.150 0.000 20851I 147.150 1300 97,050 0;000 1300 97.050 10241 , ■76.S001 0 .000 10241 76.800!14 1School Grant ' 1 j . _ _ ' 1 1 1 1
14.1 Primary School ■ 14831 74.150 0,0001 148311 74.150 830 ' 41.500 0.000 630 , 41,500 6401 32.0P9I 0,000 6401 32,000114.2 j UpporPrWary School 8191 57.330 0,0001 8191 57.330, 6051 42.350 0.000 605 42.350 4431 31.01(51 0,000 4431 31.0101
ISub Total . 23021 131.480 0.000 2302 131.4801 14351 83.850 0.000 1435 83.850 10831 63.016| 0 .000 1033] 63.010115 I;Res«arch& Evaluation , j 1 1 n . ■
15,1 |:Hessarch, evaluationT suparvlslon 23021 29,926 o.oool 2302 29.926 1435 18.655 0,000 1436 18.655 10831 14.079] 0 .000 10031 14.0791' ISub Total ’’ " 23021 29.925 o.boo] 2302 29.9261 1435 18.655 0.000 1435 18.655 10631 14.0791 0.000 ib 's 3 l 14.0791
16 iManagemant 4 Quality ' 1I 1 . 1 . _ 1! : 1 _ _ 116.1 Managameni & MIS * 1| 104.024 o.ooolI 1 104.0241 1 84.S00I 0,000 1 84,500 ' i 83.50!fi| ■0,000 l l 83.5001
16.2 Loarnlfi5 Enhancamani Programme (LEP) l | 56.900 j 0.000| ) 56,9001 1 42,000l o.oooj 1 42,000 '1 41.5O0] 0 ,000 1 41,500|
Isub Total . 1| 160.924| 0 .000 1 160.9241 1 126.SOO! 0.000 1 126,500 i j 125.0001 0.000 l | 125,0001■ 17 Innovstiv# Activity _ 1 ' ■ 1 1 ! 1 ...... 1 <' 17.1 1eCQE i ! 15.0001 o.oool 1 15.000 1| 15,0001 0.000 1 15.000 1', 15,0001 0,000 i ! 15.000!
Y
Page 32 of 77

District-wise iind intervention-wise sumn^ary for 2009-10SSA, Karnataka
Annex-
(Rs. in lakh)
1 Davanaqer6 ■ 1 Dharwad Gadag
s.No, Activities Fresh Out lay 200910
Spillover Total Outlay
1 Fresh Out lay 2009; 10
Spillover Total Outlay
Fresh Out lay 200910
~"Spili ” oVer
j T otBl Outlay |
Phy Fin Fin Phy Fin Phy Fin Fin Phy Fin Phy Fin Fin Phy Fin17,2 Girls Eciucalion 0 0.000 0.000 0 0 000 0 0.000 0.000 0 0.000 0 0.000 0.000 0 0 00017.3 SC/ST 1 15.000 0.000 1 15.000 1 15,000 0.000 1 15.000 1 15.000 0,000 1 15.00017,4 Comp. Edn. 1 50.000 0.000 1 50.000 1 50,000 0.000 1 50.000 1 50.000 0.000 1 50.00017,5 Minority Community 1 10.250 0.000 1 10.250 ' 1 10,250 o.ooo , 1 10.250 1 10.250 6.000 1 10,25017.6 Urban Deprived Ctiildren 1 9.750 0.000 ' 1 9.750 1 9,750 0.000 1 9 750 1 9.750 0,000 1 9.75017,7 others 0 0.000 0.000 0 0.000 0 0.000 0.000 0 0.000 0 0.000 0.000 0 0.000
Sub Total 1 100.000 0.000 1 100.000 1 100.000 0.000 1 100.000 1 100.000 0.000 1 100.00018 Community Training
18,1 Community Training 13368 8.021 0.000 13368 8.02i1 4855 2.913 0.000 4855 2.913 19271 11.563 0.000 19271 '11.563
19.0 Sub Total 13368 8.021 0.000 13368 8.021 4855 2.913 O.QOO 4855 2.913 19271 11.563 0.000 19271 11.563
ivn .>.-'■I'Ii U'm !: ; - . . .
_. ........:
99845 2864.426 99845 2>64.426 72475 2116.625 58324 2097.883 K E ^ S8324
8
2097.883
w m19 s ta l l Component
-I-' ' , ,‘, i ! ‘ f ■„ : , 1
19.1 Management 0 0.000 0,000 1 0 0.000 0 0.000 0.000 01 0.000 0 0.000 0..000 0 o.ooo19.2 flEMS 0 0.000 0.000 0 0.000 0 0,000 0.000 0 0.000 0 0.000, O.QOO 0 0.00019.3 SIEMAT 0 0,000 0.000 0 0.000 0 0.000 0.000 0 0,000 0 O.QOO 0.000 . 0 0.000
Sub Total 0 0.000 0.000 ______0 0.000 0 0.000 0.000 0 0.000 0 O.OOp p.ooo 0 0.000■ .f:2864r426 £2»64,42fl 72475 -2 1 li;6 2 S ^148324 ;i209k8»3! Sf QiOOb •58324 f'2097.883
20 NPEGEL 120.1 No of EBBS 1 1 2 2 2 220.2 No. of Urban skims 0 0 1 1 0 020.3 No.of clusters covered 16 16 29 29 16 1620,4 No of clusters In urt>an slums 0 0 1 1 Oi 0
A CM! works ■
A Const.of ACR Including toliets.drlnklna water,electrification 0 0.000 0.000 0 0.000 0 0.000 0.000 0 0.000 0 0,000 0.000 0 ■ 0.000
TLE
B One time grant of TLE,Ubrary, soorls.Vocatlonal Tralnlno 0 O.QOO 0.000 0 0.000 0 0.000 0.000 0 0.000 0 0.000 0.000 0 . 0.000
Spill over as per PaB Minutes 06-09 0 0.000 0.000 0 0.000 0 0.000 0.000 0 0.000 0 o.ooq 0.000: 0 0.000Total Non rscurrlng co»t(Fr»sh+»plll over) 0 0.000 0.000 0 0.000 0 0.000 0.000 0 0.000 0 o.opo 0.000 0 0.000
C Recurring

S.No. jActiwitl**
Davansgare Oharwad I Gadag
FreahO utlay 200910*
Spillover Total Outlay
Fresh Out lay 2009,10
Spillover
Total OutlayFreahO utlay 2009
10Spillover
Total Outlay
Phy Fin Fin Phy Fin Phy Fin Fin Phy Fin Phy Fin Fin Phy Fin
16 2.400 0.000 16 2.4C0 29 4.350 0.000 29 4.350 16 2.40( 0,000 16 2.400. instructor to MCS, provision of life skills,bicycles,vocational training,transportation charges etc..
2.0 ]Awar(i to best school/teaoher 16 0.800 0.000 16 0.800 29 1.450 0.000 29 1.450 16 0.80( 0,000 16 0.800iStudeni evaluatfon.ftemedlai
3.0 Teaching,Bridge courses & alternative Schools
16 3,200 0.000 16 3,200 29 5.800 0.000 29 5.800 16 3.20(J 0,000 16 3.200
4.0 fLearning through Open schoools 16 3.200 0.000 16 3,200 . 29 5,800 0.000 29 5.800 16 3.200 0.000 16i . 3.2005.0 iTeacher Training 0 0.000 0.000 0 0.000' 0 0.000 0.000 0 0.000; 0 o.ooO 0.000 0| 0.0006.0 Child care centers (or 2 centers 0, 0.000 o.oool 0 0.000 0 0.000 0.000 0 0.0001 0 0.000 0,000 0 0.0007.0 |other o; 0.000 0.000 0 0.000 0 0.000 0.000 0 0.000! 0 0.000 0,000 0 [ 6.000
|Sub Total 16 9.600| 0.000 16 9,600 29 17,400 0,000 29 17,400' 16 9.600 0.000 1 a ■ 9.600lAdditlonal Incentives (unilor
D stationery, worl< book, escorts in Idifflcult areas etc.l
11
1.0 iPrimary 0 0.000 0.000 01r O.OOOi 0 0.000 0,000 0 0.000 0 0.000 o.ooo' 0 ; 0.0002.0 TUpper Primary 0 d.ooo 1 d.ooo r 0.000 0 0.000 0.000 0 0,000, 0 0,000 0.000' 0 0.000
Sub Tou t 0 0.000 0.000 o' 0.000 0 D.ooo 0.000 0 0.000 0 0,000 0.000 0 0.000jCommunltv Mobilisation 16 0.613 O.OQO 1
0.613 29 1.111 0,000 29 1.111 16, 0,616 • 0 ,000 16 0.616|Sub Total le l 0 .613 0,000 16 0.613 29 1,111 0.000 29 1,111 16 0.61« 0.000 1 6 0.616
:.-o.oi}o • ■ 16 10.213 i 9 •18.511 ' ff ib b o 18.511 rle, ■=•10.216 ; 0.000 15 10.21621 ' IKGBV
20.1 |n o o (KQBVs sanctioned 1 I 1 2, ' 2 2l 2
20,2 jwon Recurring 0 0 0! 0 0 0
Iconstruotlon ot BuHdlng 1 21.050; 0.000 1 21.050 2 42,100 0.000 2 42.100 2 42.100 0,000 2 42.100. . iBoundary Wall 1 1.500 o.ooo 1 1.500 211 3,000 0.000 2 3.000 2 ! 3,000 0.000 2 3.000
1 1.000 0.000 1 1.000 2 2.000 0,000 2 2.000 2 2,000 0,000' 2 2.000lEieotrielty/water eharges 1 0.200 0.000 1 0.200 2 0.400 0,000 2 0,400 2 0,400 0,000 2 0.400
. . IFurn^urB / Equipment (Including Ikltohen eaulDment) 1 0,500 0.000 1 0.500 2 1.000 0.000 2 1.000 2 1.000 0,000 2 1.000
„ P'LM and equipment Including libraryIbooks
1 , 0 ,5001 1
0,000n1 0.500 2 1.000 0,000 2 1.000 2 1.000 0,000 2 1.000
4.0 IBeddlng 1 0,000 0,000 1 0.000 2 0.000 0,000 2 0.000 2 0.000 ■ 0,000 2 0.000Spill over as per PaB Minutes 2007
106 0 0,000 0,000 0 0.000 0 0,000 0,000 0 0.000 0 0.000 0,000 0 0.000
[Total, Non-recurring 1 24,750 0.000 1 24.750 2 49.500 0.000 2 49,500 2 49.5b0 0,000 2 49.500jRecurrlhg 1
, . [Maintenance per girl Per month @ |Rs,750/-
) 9 ,000 0,000:
1 9.000 2 18,000 0,000 2 18.000 I 2 18,000 . 0.000 2 18.000
3 0 , jstlpend per girl per month @ Rs.50/- 1 0,600 0,000 1 0.500 2 1.200 0,000 2, 1.200 2 1.200, , 0.000 2 1.200
' {other educational materials { >r,JWji
/ l i W | 1 j>nf| 0.0001
2 1.2001
2- . . .A
1.200 .. — , ., ,,1
, 0.000 ■J,
2_______ 1
1.200
Page 34 of 77

SSA. Karnataka(Rs. In lakh)
a
S.No.
4.0
5.0
6.0
7.0
8.0
9.0
M
Activities
Examlnalion Fee
l.One Warden2. Four full lime teachers
10.0
t1.012.013.0
two Urdu teachers(only for blocks with muslim population above 20% and selected urban areasjlf required
3. Three part time teachers4. One full time accountant5. Two Support sta(f(account;Assistant/Chowkldar/Pe ,onl6. One head Cook and one asslslant cook for SO girls and 2 assistant cok for <00 oirls_______________________
Vocational training / specific skill trg
ElectrlcitY / water chargesMedical care/contingencles ® Rs.750/- per girl.fvllsc. Including malniefiancePreparatory campsP.T.A I school functionsProvision of Rent (Smonths)Capacity BuildingTotal RecurringGrand Total (Non recurring + recurring)
‘ Davanagere
FrethOutlay 200g- 10
Phy Fin0.020
j s m
0.500
0.600
0.750
0.8000.1500.1500.0000.300
25.470
50.220
SpilloverFin0.0000.000
0,000
0.000
0.000
0.0000.0000.0000.0600.0000.000
0.000
Total Outlay
Fin0.020
12.000
0.500
0.600
0,750
08000,1500.1500,0000.300
25.470
50.220
Oharwad
Fresh Out lay 2009 10
Phy Fin0.040
24.000
1.000
1.200
1.500
1.6000,3000.3001,5000,600
52.440
101.940
SpilloverFin0.0000000
0.000
0,000
0.000
0.0000,0000,0000,0000.0000.000
0.000
Total Outlay
Phy Fin0.040
24.000
1.000
1.200
I.SOOi
1.6000.3000.3001.5000.600
52.440
10 i;940
Qadag
Fresh Out ley 2009' 10
Phy Fin0.040
24.000
1.000
1.200
1.500
1,6000,3000,3001.5000.600
52.440
101.940 0.000
SpilloverFin0.000
~ M qp
0.000
0.000
0.000
0.0000.0000.0000.0000.0000.000
Total,Outlay
'Phy Fin0040
24 OOP
1,000
1.200
1,500
1.6000.3000,3001,5000,600
52,440
101,940
Page 35 ol 77
22
2 2 2 2
2 2 2 2
22
2 2 2 22 2 2 22 2 2 2
12 22 2
2 2 2 2
2 2 2
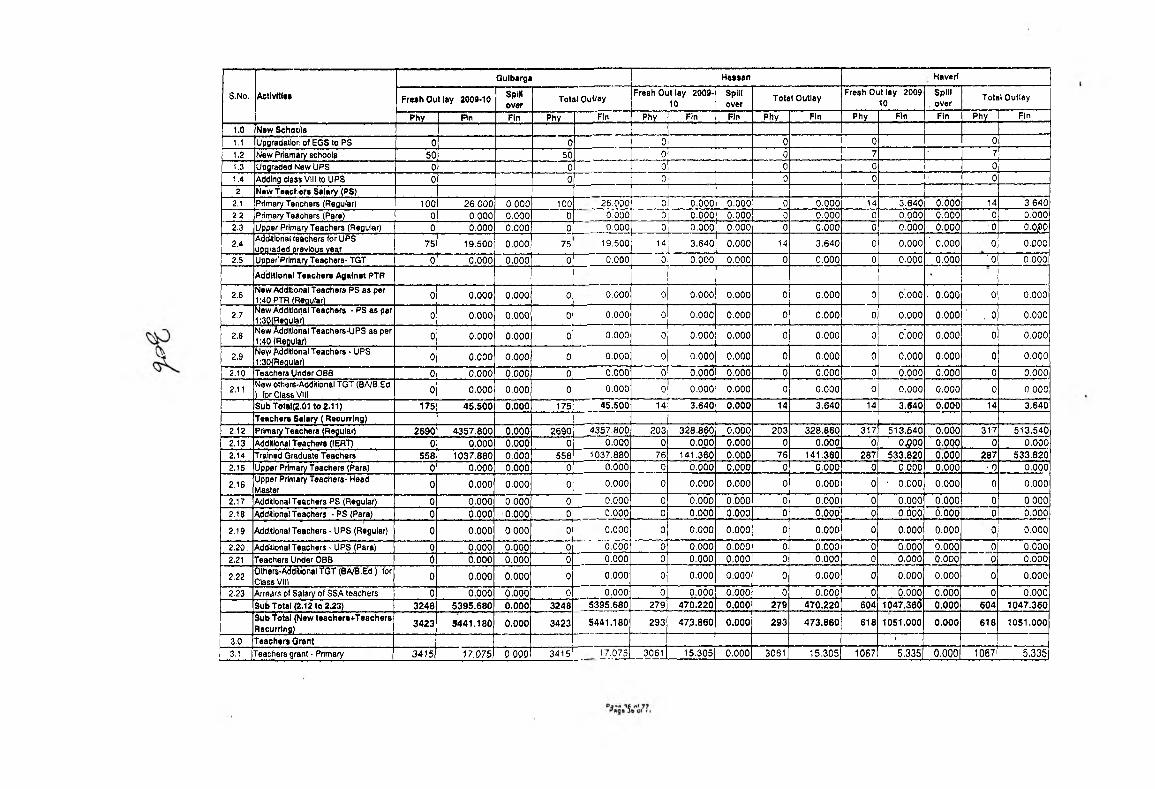
S.No, AcllvKI**
Quibarga Hassan Haverl
Fresh Out lay 2008-10 Spinover
Total OutlayFresh Out lay 2009
10Spillover Total Outlay
Fresh Out lay 2009' 10
Spill , over
Total Outlay
Phy 1 Fin Fin Phy Fin Phy Fin Fin Phy Fin Phy Fin Fin Phy Fin
1.0 New Schools1.1 Upgmdatbr: of ECS to PS 0 0 0 0 0 01,2 New Priamary schools 50 50 0 0 7 ' 71.3 Upgraded New UPS 0 0 0 0 0 01.4 Adding class VIII to UPS 0 0 0 0 0 02 New Teachers Salary (PS)
2.1 Primary Tenchers (Regular) 100 26.000 0.000 100 26.000 0 0,000 0.000 0 0.000 14 3.640 0,000 14 3.6402,2 Primary Teachers (Pare) 0 0.000 0.000 0 0,000 0 0.000 0.000 0 0.000 0 0,000 0.000 0 0.0002.3 Upper Primary Teachers (Regular) 0 0.000 0.000 0 0,000 0 0,000 0,000 0 0.000 0 0,000 o.ooo ■0 O.O/DO
2.4 Additional teachers for UPS uoaraded previous vear 75 19.500 0.000 75 I 19,500 14 3.640 0.000 14 3.640 0 0,000 ' 0.000 0 ; O.DOO
2.5 Upper'Prlmary Teachers- TGT 0 0.000 0,000 0 0,000 0 0,000 0.000 0 0.000 0 OiOOO 0.000 ' 0 0.000
Additional Teachers Against PTR ■
2.6 New Additional Teachers PS as per 1:40 PTR (Reoular) 0 0.000 0.000 0, 0.000 0 0,000 0.000 0 0.000 0 0,000 . 0.000 0 0.000
2.7 New Addltlorlal Teachers - PS as par 1:30(Reaular) 0 0.000 0.000 0 0.000 0 0.000 0.000 0 0.000 0 0,000 0.000 ■ , 0 0.000
2.8 New AddRlonalTeachers-UPS as per 1:40 (Reoular) 0 0.000 0.000 0 0,000 0 0.000 0.000 0 0.000 0 o 'oo o 0.000 0 0.000
2.9 Nev>' Additional Teachers - UPS 1:30(Reauiar) 0 0.000 0.000 0 0.000 0 0.000 0.000 0 0.000 0 0.000 0.000 0 0.000
2.10 Teachers Under OBB 0 0.000 0.000 0 0,000 0 0.00(i 0.000 0 0.000 0 0.000 0.000 0 0.000
2.11 New others-Additional TGT (BA/8,Ed ) for Class VIII 0 0.000 0.000 0 0,000 0 0.000 0.000 0 0.000 0 0,000 0.000 0 0.000
SubTotaKZ.OI to 2.11) 175 45.S00 0.000 175 45.500 14 3.640 0.000 14 3.640 14 3.640 0.000 14 3,640Teacheri Salary ( Recurring)
2.12 PrimaryTeachera (Regular) 2690 4357.800 0.000 2690 4357,800 203 328.860 0.000 203 328.860 317 513.540 0.000 317 513.5402.13 Additional Teachers (lERT) 0 0.000 0.000 0 6.000 0 0.000 0.000 0 0.000 0 0 ^ 0 0 0.000 0 0.0002.14 Trained Graduate Teachers 558 1037.880 0.000 558 1037.880 76 141,360 0.000 76 141.360 287 533.820 0,000 287 533.8202,15 Upper Primary Teachers (Para) 0 0.000 0.000 0 ^ 0,000 0 0.000 0,000 O' 0,000 0 0.000 0.000 ■ 0 0.000
2.16Upper Primary Teachers- Head Master 0 0.000 0.000 0 0,000 0 0.000 0,000 0 0.000 0 ' 0.000, 0 ,000 0 0.000
2,17 Addltlonal Teachers PS (Regular) 0 0.000 0.000 0 0,000 0 0.000 0,000 0 0.000 0 0.000 0,000 . 0 0.0002.18 Additional Teachers - PS (Para) 0 0.000 0.000 0 0,000 0 0.000 0,000 0 0.000 0 0,000 0,000 0 0.000
2.19 Additional Teachers • UPS (Regular) 0 0.000 0,000 0 0,000 0 0.000 0.000 0 0.000 0 0.000 0.000 0 0.000
2,20. Additional Teachers ■ UPS (Para) 0 0.000 0.000 0 0,000 0 0,000 0.000 0 0.000 0 0,000 0.000 0 0.0002.21 Teachers Under 0 0 8 0 0.000 0.000 0 0,000 0 0.000 0.000 0 0.000 0 0,000 0 .000 0 0.000
2.22Others-AddilionaltGT{0A/0.Ed) for Class VIII 0 0,000 0.000 0 0,000 0 0.000 0.000 0 0.000 0 0:000 0.000 0 0.000
2.23 Arrears of Salary of SSA teachers 0 0.000 0.000 0 0,000 0 0.000 0.000 0 0.000 0 0.000 , 0,000 0 0.000Sub Total (2.12 to 2.23) 3248 5395.680 0.000 3248 5395.680 279 470.220 0.000 279 470.220 604 1047.36di 0.000 604 1047.360Sub to ta l (New lea ch e rt+ f eachers Racurrlng) 3423 S441.180 0.000 3423 5441.180 293 473.860 0.000 293 473.860 618 1051.000 0.000 618 1051,000
3,0 Teachers Grant '
3.1 Teachers grant - Pnmary 3 4 !5 | 17.075 0 000 3415 17.075 3061 15,305 0.000 3061 15.305 lo e ? ! 5.335 0.000 1067 5,336

SSA, Karnataka(Rs. in lakh)
Gulbarga Hassan Haver!
S.No. Actlv llle t Fresh Out lay 2009-10 Spillover
Total OutlayFresh Out lay 2009
10Spill 1 over
Total Outlay Fresh Out lay 200910
Spillover
Total Outlay
Phy Fin Fin Phy Fin Phy Fin Fin Phy 1 Fin 1 Phy 1 Fin Fin 1 Phy Fin3.2 Teachers gram - UPS 12141 60.705 0,000 12141 60.705 6012 30.060 o.dobl 6012 30.060 5678 28,390 0,0001 5678 28.390
Sub Total 15556 77.780 0.000 15556 77,780 9073 45.365 6,co o l 9073 45.365 6745 33.725 o .ooo j 6745 33.7254 Block Reiouree Centres 1
4,1 Salary of Resource Persons 6 11.160 0,000 6 11.160 48 89.280 o.oool 48 89.280 0 0,000 o.ooo'l 0 0.000
4,2 Furniture Grant 0 0,000 0,000 0 0.000 0 0,000 0,000 0 0,000 0 0,000 o,ooo| 0 0.000
4.3 Comingency 11 2,200 0,000 11 2.200 8 1.600 0.000 8 1,600 7 1,4S0 ■ 6.000i ^1.400
4.4 Meeting & TA allowance 11 0,990 0 ,000 11 0.990 8 0.720 0,000 8 0,720 7 0,630 0,000 7 0,630
4.5 TLM grant 11 0,550 0,000 11 0.550 8 0.400 0,000j 8 0 ,400 7 0,350 0.000 7 0,350
4.6 BRC Building Maintenance 0 0,000 0.000 0 0,000 0 0.000 o,ooo| 0 0.000 0 0.000 0,0001 °
0.000
Sub Total 11 14.900 0.000 11 14.900 8 92.000 o.oool 8 92.000 7 2.380 ' 0.000 1 7 2.3805 Cluster Reiouroe Centres . 1
5.1 Salary of Resource Persons 34 63,240 0,000 34 63,240 112 208.320 0,0001 112 208 ,320 41 76.260 ■ 0,0001 41 76.2605.2 Furniture & equipment 0 0.000 0 ,000 0 r 0,000 0, 0,000 o.oool 0 0 ,000 0 0,000 , 0,000 1 ° 0.0005.3 Contingency 154 4,620 0.000 154 ^ 4,620 112 3,360 o.oool 112 3 .360 98 2,940 0,000 1 98 2,9405.4 Meeting &TA allowince 154 5,544 0,000 154 5.544 112 4,032 o,oool 112 4 ,032 98 3-,528 ' 0,000 L 98 3,5285.5 TLM grant 154 1.540 0 .000 154 1.540 112 1,120 o,oob| 112 1,12(3 98 0 .990 o.oool 98 0,9805.6 CRC Building Malntrenance 0 0.000 0 .000 0 0.000 0 0 ,000 0,0001 0 0,000 0 0,000 ’ 0,000 I 0 0,000
Sub Total 154 74.944 0.000 154 74,944 112 216.832 o.ooo l 112 216.832 98 83.706 0.000 1 98 83.7086 Trailnlng 1
6.1 Teacheta trg. ■ In service at block evel , 15556 155,560 0,000 15556 155.560 9073 90.730 o,oool1 9073 90.730 6745 67.450 0,000 I 6745 67 450
6,2 Teachers trg. • in service at block evel at cluster l^vel 15556 *77,780 0,000 15556 77,780 9073 45.365 o.oool1 9073 45.365 6745 33.725 0.000 1 6745 33.725
6.3 nduction training (or Newly Recruit Trained Teachers 175 5.250 0.000 175 5.250 14 0.420 o.oool1 14 0.420 14 0 .4 |0 | 0 ,000 1 141 0.420
6.4 Training for- Untrained Teachers 0 0.000 o.odo 0 0.000 0 o.odo 0,000| 0 0.000 0 0.000 ■ o.oool 0 0.000
6,5 BRC/CRC coordinators and resource oersons 432 4,320 0,000 432 4,320 121 1.210 o,ooo| 121 1,210 220 2 .2(|o . o .oool 220 2.200
Sub Total 16163 242.910 0.000 16163 242.910 9208 137.7^5 o.oool 9208 137.725 6979 103.795 0,000 1 6979 103.795
7 nterventlons (or Out o( School Children
1
7.1 EGS Centre (PS) 0 0,000 0,000 0 0.000 0 0.000 , 0,000 0 o,oool 0 0.000 ' 0,000ii 0 o .o o i7,2 EGS Centre (UP) 0 0,000 0.000 0 0.000 0 0,000 0,0001 0 0.000 0 0.000 0,000! 0 o .c n o7,3 Chlnnara Angaia Bridge couse
Residertliai 12 months-RBC 2295 229.500 0.000 2295 229.500 100 10.000 o.oooj 100 10.000 643 64.300 0,000 643 64.300
7,4 Chlnnara Angaia Seasonal Bridge course - Resdn. (6 months)- NRBC 0 0.000 0.000 0 0-000 0 0.000 o.ooo| 0 0.000, 550 27.500 O.OOO 550 27 500
7,5 Mobile schools 0 0.000 0.000 0 0.000 0 0.000 o.oool 0 0,000 0 0.000 ' 0,000 0 0.0007,6 12 months bridge course-NRBC 100 3.000 0.000 100 3,000 0 0,000 o.oooj 0 0,000 60 1.800 0,000 60 1.8007,7 Tent school 408 6,120 0.000 408 6,120 75 1.125 o.oool 75 1.125 125 1,875 0,000 125 1.875
p«98 37 Si 77

Disthct*wiso ancJ intervention-wise summary for 2009-10SSA, Karnataka '
(Rs. in lakh)
s.No. Activities
Quibarga Hassan Haveri
Fresh Out lay 2009-10 Spillover
Total OutlayFresh Out lay 2009
10Splliover Total Outlay
Fresh Out lay 200910 ' .
Spiiiover Total Outlay
Phy Fin Fin Phy Fin Phy Fin Fin Phy Fin Phy Fin Fin Phy Fin
7,8 Madrasa / Makthab :1673 50.190 0.000 1673 50.190 30 0.900 0.000 30 0.900 50 ■ 1.500 0.000 50 1.5007,9 NCIP Schools 275 8.250 0.000 275 8.250 0 0.000 0.000 0 0.000 0 0.006 0.000 0 0.000
8,0 Summer Remedial Teaching Chattrada Chlauru 3850 19.250 0.000 3050 19,250 2725 13.625 0.000 2725 13,625 2940 14.700 0.000 2S40 14,700
8.1 4 months seasonal residential school 0 0.000 0.000 0 0,000 0 0.000 0.000 0 0.000 0 , 0.000 0.000 0 0,000
8.2 Bridge course • Chlnnara Angala 2565 12.825 0.000 2565 12.825 0 0,000 0.000 0 0.000 145 0.725 'o.ooO 145 0.725
8.3 Home Based Education 1215 36.450 0.000 1215 36,450 394 11.820 0.000 ' 394 11.820 481 14.430 0.0001 481 14.430
8,4 Bridge course - Chlnnara Angala Hesl-2 months 1950 33.150 0.000 1950 33,150 0 0,000 0.000 0 0.000 318 5.406 0.000 318 5.406
8,5 Aie Centers( Transportation, Hardest to reach children) 4 0,120 0.000 4 0,120 192 5,760 0.000 192 5.760 ' 7 0.210 0,000 7 0.210
8,6 nnovatlon Urban Deprived Children 0 0.000 0.000 0 0.000 0 0.000 0.000 0 0,000 0 0.000 0.000 , 0 0.000
8,7 Special Enrolment Driwo 42 0.000 0.000 42 ' 0.000 85 0,000 0.000 85 0.000 0 0.000 0 ,000 0 0.000Sub Total 14377 398.855 0,000 14377 398.855 3601 43.230 0.000 3601 43.230 5319 132.446 0.000 5319 132.446
8 Remedial Teaching '
8.1 Remldial teaching 14784 1 29.568 0.000 14784 29.568 16634 33.268 0.000 166i34 33.268 8675 17.350 0.000 8675 17.3508.2 Motivation through field trips 0 0.000 0.000 0 r 0.000 0 0.000 0.000 0 0.000 0 0.000 0,000 0 0.000
Sub Total 14784 29.568 0.000 14784 29.568 16634 33.268 0.000 16634 33.26B 8675 17.350 0.000 8675 17.350‘ 9 Free Text Bool<
9,1 Free text book for l-V std all children of aided schools 32479 25.983 0.000 32479 25,983 7594 6.075 0.000 7594 6.075 5488 4.390 0.000 5488 4.390
9,2 Free text book for VI-VIII std all children of akled schools 14886 19.352 0.000 14886 19.352 11287 14.673 0.000 11287 14.673 11647 , 15.141 0,000 11647 15.141
9,3 Work books for Nall Kali 0 0.000 0.000 0 0.000 0 0.000 0,000 0 0.000 0 O.OOOl 0.000 0 0.000Sub Total 47365 45.335 0.000 47365 45.335 18881 20.748 0.000 18881 20.748 17135 19.532 0.000 17135 19.532
to Inleiventlon* (or CWSN10.1 Provision of disabled children 6702 80.424 0.000 6702 80.424 2524 30,288 0.000 2524 30.288 4141 49.692 0,060 414Jj 49.692
Sub Total 6702 80.424 0.000 6702 80.424 2524 30.288 0.000 2524 30.288 4141 49.692 0,000 4141 49.69211 Civil Works
11.1 BRC ■ 0 0.000 0.000 0 0.000 0 0.000 0,000 0 0.000 0 0.000 0,000 0 0.00011.2 CRC 0 0.000 0.000 0 0.000 0 0,000 0.000 0 0.000 0 0.000 0.000 0 0,00011.3 School Bulkllngs 50 450.000 0.000 50 450,000 0 0.000 0.000 0 0.000 7 63.000 0.000 7 63,00011.4 Dllapklated 0 0.000 0.000 0 0.000 0 0.000 0.000 0 0.000 0 O.OQO 0.000 ■ 0 0.00011.5 Building less (Pry) 0 0.000 0,000 0 0.000 0 0.000 0.000 0 0.000 6 0.000 o'.ooo 0 0.00011.6 Bulldins lass (UP) 0 0.000 0.000 0 0.000 0 0.000 0.000 0 0.000 0 0.000 0,000 0 0.00011.7 Dilapidated Building (Pry) 0 0.000 0.000 0 0.000 0 0.000 0.000 0 0.000 6 0.000 0,000 0 o.ooo11,8 Additional classrooms 400 1880.000 0,000 400 1880.000 44 206.806 6.000 44 206.800 190 893.0001 O.OQO 190 893.000
11,9 Adliltlonal Class Room to BangaloreMetro C»v 0 0.000 0.000 0 0,000 , 0 0.000 0.000 0 0.000 0 0.000| 0 .000 0 0,000
11,10 Toilets / Urinals 0 0.000 0.000 0 0,000 0 0.000 0.000 0 0.000 0 O.OOOl 0.000 0 0,00011.11 Separare Girls Toilet 1000 250.000 0.000 1000 250,000 1523 380.750 6.000 1523 380.750 64 16.000i 0.000 64 16,00011.12 Drinking Water Facility 0 0.000 0.000 . 0 0.000 0 0.000 0.000 0 0 .000 0 o.oOol 6.000 0 0.00011.13 Boundary Wall 0 0.000 0.000 0 00 00 0 0.000 0.000 0 0.000 0 O.OOol 0.000 . 0 0.00611.14 Seperaiion Wall 0 • 0.000 0,000 0 0,000 0 0,000 0.000 0 0.000 0 o,o6o! 0.000 0 0,000

District-Wise und intervention-wise summary for 2009-10SSA, Karnataka
Annex-
(Rs, In lal<h)
S.No. Activities
Gulbarga Hassan Havcrl
Fresh Out lay 2009-10 Spillover
' Total Outlay Fresh Out lay 200910
Spillover Total Outlay Fresh Out lay 2009
10Spillo v tf Total Outlay
Phy Fin Fin Phy Fin Phy Fin Fin Phy Fin Phy Fin Fin >Phy 1 Fin
147 22,050 0.000 147 22.050 21 3.150 0,000 21 3,150 0 0,000 0.000 0 0.0001.0 Instructor to MCS, provision of llfo skllls.blcycles,vocational training,transportation ciiarges etc..
2.0 Award 10 best sclioot/teacher 147 7,350 0.000 147 7.350 21 1.050 0,000 21 1,050 0 0,000 O.QOO 0 0.000
3.0Student evaluation,ftemedlai Teaching,Bridge courses & alternative Schools
147 29.400 0,000 147 29.400 21t
4.200 0.000 21 4,200 0 0.000 0.000 0 0.000
4.0 Learning ttirough Open schoools 147 29.400 0.000 147 29.400 21 4.200 0.000 21 4,200 0 0,000 0.000 0 0.0005,0 Teactier Training 0 0.000 0.000 0 0.000 0 O.OOO 0.000 0 0,000 0 0,000 0.000 0 0.0006,0 Child care centers for 2 centers 0 0.000 0.000 0 0.000 0 0,000 0,000 0 0.000 0 0,000 0.000 0 0.0007,0 other 0 0.000 0.000 0 0.000 0 0,000 0.000 0 0.000 0 0,000 0.000 0 0.000
Sub Total 147 88.2to0 0.000 147 88.200 21 12.600 0.000 21 12.600 0 0.000 0.000 0 0.000
0Addltkjnal'incenllves (unlfor slatloneiy. work book, escorts In difficult areas etc.)
1,0 Primary 0 0.000 0.000 0 0.000 0 0,000 0,000 0 0,000 0 0.000 0.000 0 0.0002.0 Upper Primary 0 0,000 0.000 0 0.000 0 0,000 0,000 0 0.000 0 0.000 0.000 0 0.000
Sub Total 0 0.000 0.000 0 0.000 0 0.000 0.000 0 0.000 0 0.000 0.000 0 0.000Community ftloblllsallon 147 5.630 0.000 147 5.630 21 0.804 0.000 21 0.804 0 0,000 0.000 0 0.000Sub Total 147 5.630 0.000 147 5.630 . 21 0.804 6.060 21 0.804 0 0.000 0.600 0 0.000
f OiOOO t<eK-5i 4T ^ . ; / 93.830 ■ 0.00021 KGBV
20,1 No of KQBVs sanctioned 10 1 10 ' 0 0 0 0
20.2 Not( Recurring 0 0 0 0 0 0
1.0
Conslnjctlon of Building 9 189.450 0.000 9 189.450 1 21,050 0.000 1 21.050 0 0.000 1 0.000 d 0.000Boundary Wall 9 13.500 0,000 9 13,500 1 1,500 0.000 1 1.500 0 o.oOo ■ 0.000 0 0.000Boring/Hand pump ' 9 9.000 0.000 9 9,000 1 1,000 0,000 1 1,000 0 0.000 , 0.000 0 0.000Electrtelty/water charges 9 1.800 0.000 9 1,800 1 0.260 0.000 1 0,200 0 0,000 0.000 0 0,000
2.0 =urniture / Equipment (including kitchen eauioment) 9 ■ 4,500 0.000 9 4,500 1 0,500 0,000 1 O.SOO 0 0.000 ' 0.000 0 0,000
3.0 xLlkt and equipment Including library books 9 4.500 0,000 9 4,500 1 0,500 0,000 1 0,500 0 0,000 0.000 0 0,000
<1,0 Bedding 9 0.000 0.000 9 0.000 1 0.000 0.000 1 0,000 0 0,000 0.000 0 0,000Spill over a^ per PaB Minutes 200708 0 0.000 0,000 0 0.000 0 0.000 0,000 0 0,000 0 0,000 0.000 0 0,000
Total Non-recurring 9 222.750 0.000 9 222.750 1 24.750 0.000 1 24.750 0 0.000 0.000 0 0.000Recurring
1.0 Maintenance per girl Per month @ Rs. 750/- 10 90.000 0,000 10 90,000 9.000 0,000 1 9,000 0 0,0 )0 0.006 0 0,000
2,0 Stipend per girl per month @ Rs.50/- 10 6.000 0,000 10 6,000 1 0,600 0.000 1 0,600 0 0.0 30 0.000 0 0,000
3.0 Supplementary TLM,statlonary and other educational materials 10 6.000 0.000 10 6.000 1 0,600 0,000 1 0,600 0 0.0130 0,000
10 0.080

SSA, Karnataka(Rs. in lakh)
V -
S.Mo, Actlvltlas
■t.o
5,0
6.0
7,0
8,0
9.0
Examination Fee
two Urdu leachers(only (or blocks with muslim population above 20% and selelcted urban areas)lf required
3, Three pari time teachers4. One full time accountantS. Two Support slaf1(account/AssislanVChowkldar/Peonl
10,011.012,013.0
1,One Warden 'Four tull time teachers
6, One head Cook and one assistant cook for SO girls and 2 assistant cok for 100 girls
Vocational training I specific skill trg
Electricity / water chargesMedical care/contlngencles ® Rs.750/-per girl,_____________Misc, Including maintenancePreparatory campsP .f !'a / school functions"Provision o( Rent (Sii^onths)Capacity BuildingTotal Reeurrlng
Gulberga
Fresh Out lay 2009-10
Phy
1010
10
10
10
101010
1010
Fin
0,200'120-00,0
5,000
6.000
7,500:
8.0001.5001.500
13,5003,000
26S.200
490.9SO
SpilloverFin
0,0000,000
0,000
0,000
0.000
0,0000.0000.0000.0000,0000.000
Total Outlay
1010
Fin
0,200
Haasan
Fresh Out lay 200910
Phy
10
10
10
10
1010
10
10
10
5.000
6.000
7.500
8,0001.5001,500
13,5003,000
268.200
490.950
‘ 8^2:28
Fin0,020
H M
0,500
0,600
0,750;
0,8000,1500,1501,5000,300
26,970
SpilloverFin0.0000.000
0,0000,000
0.000
0.0000.0000,0000.0000.0000.000
51.720 0.000
Total Outlay
Phy Fin0,020
12,000
0,5000,600
0,750
0.8000,1500,1501,5000.300
26.970
SI'.720
Ho'/erl
Fresh Out lay 2009; 10
Phy Fin’ 0.000 3 M
0,000
0,000
0.000
0.0000,0000.000o.ooo0.0000.000
SpillovorFin
0,0000,000
0,000
0,000
0,000
0.0000,000o.oop0.0000.0000.000
0,000 0.000
Total Outlay
Phy
■ 0
Fin0,0000.000
0.000
0,000
0,000
0,0000,0000,0000,0000,0000.000
0.000
00
0 0
0 0
0
00 010 0
01 0900
0 0
0 0

Olstrict-wlse and intervention-wise summary for 2009-10SSA, Karnataka
Annex-
(Rs. in lakh)
S.No. Activities
Kodagu ' Kolar Koppai . ’
Fresh Out lay 200910
Spillover Total Outlay
Fresh Out lay 2009- ID
Spillover
Total OutlayFresh Out lay 2009-
ID ' Spill oyer Total’outlay
Phy Fin Fin I Phy Firt Phy Fin Fin Phy Fin Phy Fin ■ Fin Phy 1 Fin1.0 New Schools 11.1 Upgradatlon of EGS to PS 0 0 0 0 0 01.2 New Prian^ary schools 0 0 10 10 13 131.3 Upgraded New UPS , 0 0 3 3 0 01.4 Adding class VIII to UPS 0 0 0 0 0 02 New Teeehers Salary (PS)
2.1 Primary Teachers (Regular) 0 0.000 0.000 0 0,000 20 5.200 0000 20 5.200 26 6.760 0,000 26 6.7602.2 Primary Teachers (Para) 0 0.000 0.000 0 0.000 0 0.000 0.000 0 0.000 0 0,000 0.000 0 0,0002,3 Upper Primary Teachers (Regular) 0 0.000 0.000 0 0 000 5 0.780 0.000 3 0.780 0 O.OOO 0.000 0 0.000
2,4 Additional teachers for UPS uDaraded previous year 0 0.000 0.000 0 ’ 0.000 13 3.380 0.000 13 3.380 34 8,840 0.000 34 8,840
2.5 Upper Primary Teachers- TGT 0 0.000 0,000 0 0.000 0 0.000 0.000 0 0.000 0 0.000 0.000 0 0,000
Additional Teachers Against PTR
2.6 New Additional Teachers PS as per 1:40 PTR (Reaular) 0 0.000 0,000 0 0.000 0 0.000 0.000 0 0.000 0 0.000 0 .000 , 0 0.000
2.7 New Additional Teachers - PS as per l.'SO/fleauiar) 0 0.000 0.000 0 0.000 0 0.000 0.000 0 0.000 0 0.000 0,000 0 0.000
2.8 New Addklohal Teachers-UPS as per 1:40 (Reaular)............... .
0 0.000 0.000 0 0.000 0 0.000 0.000 0 ' O.OOO 0 0.000 ■0.000 0 0.000
2.9 New Additional Teachers - UPS 1:30(Reaul«r) . 0 0.000 0,000 0 0.000 0 0.000 0.000 0 0.000 0 0.000 ■ 0.000 0 0,000
2.10 Teachersi Under OBB 0 0.000 0.000 0 0.000 0 0.000 0.000 0 o.'ooo 0 0,000 0.000 0 0,000
2,11 New others-AddltlonalTQT (BA/B.Ed ) tor Class Vlti 0 0.000 0.000 0 0,000 0 0.000 0.000 0 0.000 0 0.000 0.000 0 0.000
Sub Total(2.01 to 2.11) 0 0 .0()0 0.000 0 0.000 36 9.360 0.000 36 9.360 60 15.600 0.000 60 15.600Teachers Salary ( Recurring)
2,12 Primary Teachers (Regular) 144 233.280 0.000 144 233.280 188 304.560 0.000 188 304,560 728 1179.360 . 0.000 728 1179.3602.13 Additkinal Teachers (lERT) 0 0.000 0.000 0 0.000 0 0.000 0.000 0 0.000 0 0.000 0.600 0 0.0002,14 Trained graduate Teachers - 42 78.'120 0.000 42 78.120 114 212 .040 ., 0.000 114 212.040 191 355,260 0.000 191 355.2602,15 Upper Primary Teaohers (Para) 0 0.000 0.000 0 0.000 0 0.000 0.000 0 0,000 0 0.000 D.OOO 0 0.606
2,16 Upper Primary Teachers- Hoad Master 0 o.oop 0,000 0 0.000 0 0.000 0.000 0 0.000 0 0.000 0.000 0 . 0.000
2,17 Additional Teachers PS (Regular) 0 0.000 0.000 0 0.000 0 0.000 0.000 0 0.000 0 0.000 0.000 0 0.0002,18 Additional Teachers • PS (Para) 0 0.000 0.000 0 0.000 0 0.000 0.000 0 0.000 0 0.000 0.000 0 0.000
2,19 Additional Teachers ■ UPS (Regular) 0 0.000 0.000 0 0.000 0 0.000 0.000 0 0.000 0 0.000 0.000 0 0.000
2,20 Additional Teachers - UPS (Para) 0 0.000 0.000 ‘ 0 0.000 0 0.000 0.000 0 0.000 0 0.000 0,000 0 0.0002.21 Teachers Under 08B 0 0.000 0.000 0 0.000 0 0.000 0.000 0 0.000 0 0.000 ■O.OOO 0 0.000
2.22 Olhers-Addltional TGT (BA/B.Ed) for Class VIII 0 0.000 0.000 0 0.000 0 0.000 0.000 0 0.000 0 0.000 0.000 0 0.000
2,23 Arrears of Salary of SSA teachers 0 0.000 0.000 0 0.000 0 0.000 0.000 0 0.000 0 0.090 D.OOO 0 0.000Sub Total (2.12 to 2.23) 186 311.400 0.000 186 311.400 ‘ 302 516.600 0.000 302 516.600 919 1534.620 0.000 919 1534.620
Recurring) 186 311.400 0.000 186 311.400 338 525.960 0.000 338 525.960 979 1550.220 0.000 979 1550.220
3.0 Teachers Grant3.1 Teachers grant - Primary 317 1.585 0.000 317 1.585 2577 12.885 0.000 2577 12.885 1069 5.345 , 0.000 1.069 5,345

District-wise and inlervention-wise summary for 2009-10SSA. Karnatako
Annex-
(Rs. m iBkb)
Kodagur "
1 KolarI
Koppal
S.No. Actlvltia* Fresh Out lay 200910
Spillover
Total Outlay1 Fresh Out lay 2009
10Spillover Total Outlay
Fresh Out lay 200910 Spill over Total Outldy
Phy Fin Fin Phy Fin Phy I Fin Fin Phy Fin Phy 1 Fin Fin Phy Fin
3,2 Teachers grant - UPS 1987 9.935 0.000 1987 9.935 4304 21.520 0,000 4304 21.520 4451 22,255 0.000 4451 22.253
Sub Total 2304 11.520 0.000 2304 11.520 6881 ' 34.405 0.000 6881 34.405 5520 27.600 0.000 5520 27.6004 Block Retouree Cantras
4,1 Salary of Resource Persons 18 33.480 0.000 18 33.480 0 0,000 0.000 0 0.000 0 0.000 . 0.000 0 0.000
4,2 Furniture Grant 0 0.000 0,000 0 0 000 0 0,000 ' 0.000 0 0.000 0 0,000 0.000 0 0,000
4,3 Contlngenci' 3 0.600 0,000 3 0,600 5 1,0001
0,000 5 1.000 4 0.800 0.000 ’ A 0.800
4,4 Meeting & TA allowance 3 0.270 0,000 3 C1.270 5 0,4501
0.000 5 0.450 4 0,360 0,000 4 0,360
4,S TLM grant 3 0,150 0.000 3 CJ,150 5 0,250 0,000 5 0.250 4 0.200 , 0.000 4 0,200
4,6 BRC BulWIno Maintenance 0 0.000 0.000 0 0 ,000 o' 0.000 0.000 0 0.000 . 0 0.000 , 0.000 0 0,000
Sub Total 3 34.600 0.000 3 3A.S00 5 1.700 0.000 5 1.700 4 1.360 0.000 4 1.3605 Cluatar Reteuroe Centrm
5.1 Salary of Resource Persons 42 78.120 0.000 42 70.120 0 0.000 0.000 0 0,000 24 44.640 • 0 .000 24 44.6405.2 Furniture & equipment 0 0.000 0.000 0 0.000 0 0.000 0.000 0 0.000 0 0.000 0,000 0 0.0005.3 Contingency 42 1.260 0.000 42 1.260 84 2.520 O.OOO 84 2.520 56 1.680' 0..Q00 56 1,6805.4 Meeting & TA allowance ■ 42 1.512 0,000 42 1.512 ' 84 3.024 0.000 B4 3.024 56 2.016 Q.OOO 56 2.0165.5 TLM grant 42 0.420 0.000 42 0.420 84 0.840 0.000 84 0.840 56 0,560 0.000 56 0.5605.6 CRC Building Malntrenanco 0 0.000 0.000 0 0 ,000 0 0.000 0.000 0 0.000 0 ,0 .0 0 0 • , 0.000 0 . 0.000
Sub Total 42 81.312 o.oeo 42 81.312 04 6.384 0.000 84 6.384 56 48.896 0.000 56 48.8966 Training’
6,1 Teachers trg. - In service at block level 2304 23.040 0.000 2304 23,040 6881 68,810 0.000 6881 68.810 5520 55.200 ' 0.000 S520 S5.200
6.2 Teachers tig. • In service at block 2304 11.520 0.000 2304 11.520 6881 34.405 0.000 6881 34.405 5520 27,600 . 0.000 5520 27.600
6.3 Inductfon training for Newly Recnjit Trained Teachers 0 0.000 0.000 0 0.000 36 1.080 0.000 36 1,080 60 1.800 ' 0.000 60 1,800
6.4 Training for- ymralned Teachers , 0 0.000 0.000 0 0.000 0 0.000 0.000 0 0.000 0 0.000 0.000 0 ■ 0,000
6.5 BRCi/CflC coordinators and resource persons 86 0.860 0.000 86 0,860 273 2.730 0.000 273 2.730 150 1.500 , 0.000 1'50 1,500
Sub Total 2390 35.420 0.000 2390 , 35,420 7190 107.025 0.000 7190 107.025 5730 86.100 0.000 5730 86.100
7 Iriterventlon* for Out of School Children
7.1 EQS Centre,(PS) 0 0.000 0.000 0 0,000 0 0.000 0.000 0 0.000 0 0.000 0,000 0 0,0007.2 EQS Centre (UP) 0 0.000 0,000 0 0,000 0 0,000 0.000 0 6.000' 0 0,000 0,000 0 0.000
7.3 Chlnnara Angala Brklge couse Residential 12 months-RBC 150 15.000 0.000 150 15,000 1207 120.700 0.000 1207 120.700 1325 132,500 0.000 1325 132,500
7.4 Chlnnara Angala Seasonal Bridge course • Resdn. (6 months)- NRBC 0 0.000 0.000 0 0,000 0 0.000 0.000 0 0.000 550 27,500 , 0,000 550 27,500
7,5 Mobile schools . 0 0.000 0.000 0 0 000 0 0,000 0,000 0 0,000 0 0.000 ■ 0,000 0 0,0007,6 12 months brWge course-NRBC 4528 135.840 0,000 4528 135,840 0 0,000 0.000 0 0.000 190 5.700 0,000 190 5,7007.7 Tent school 50 0,750 0.000 50 0,750 212 3,180 0,000 212 3,180 100 1.500 0,000 100 1,500
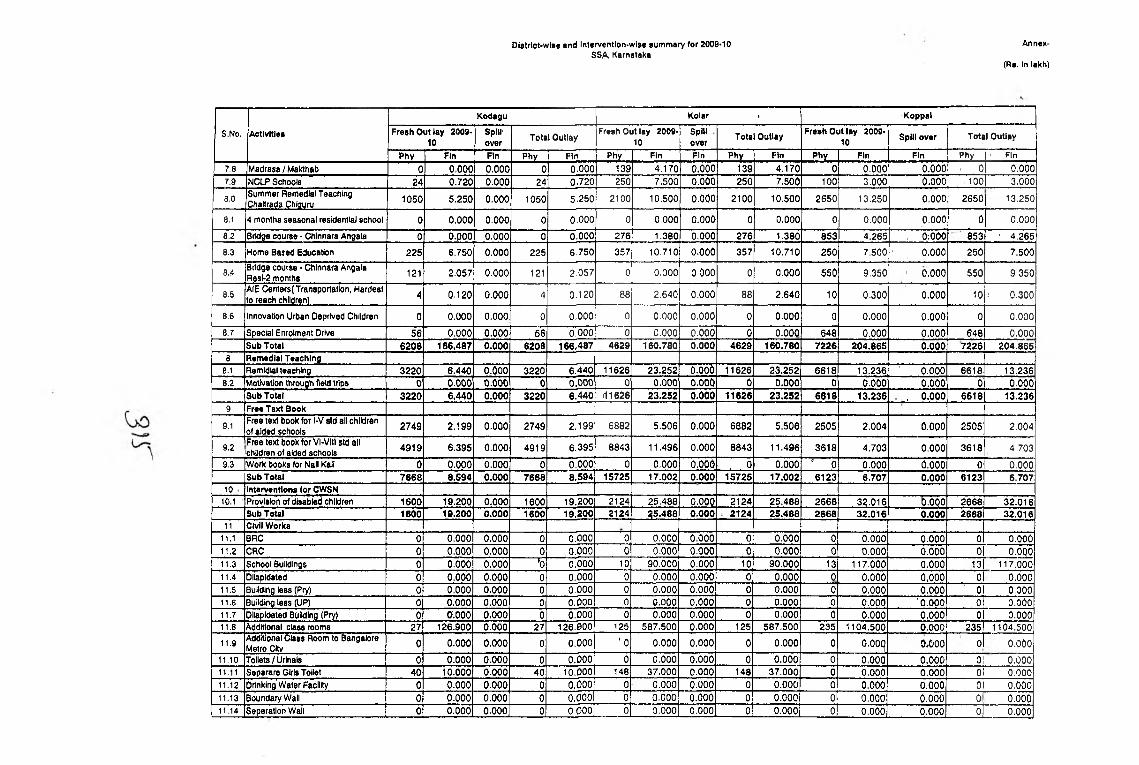
DIstrlet-wlse and intervention-wise summary (or 2009-10SSA, Karnataka
Annex-
(Rs. in lakli)
S.No. Activities
Kodagu Kolar > ' Koppal
Fresh Out lay 2008- ID
Spill'over Total Outlay
Fresh Out lay 200910
Spill , over
Total OutlayFresh Out lay 2009
10 Spill over Total Outlay
Phy 1 Fin Fin Phy 1 Fin Phy Fin Fin Phy Fin Phy Fin Flh Phy 1 ■ Fin78 Madrasa / Makthab 0 0.000 0.000 0 0.000 139 4.170 0,000 139 4.170 0 0.000 0.000 . , 0| 0.0007.9 NCLP Schools 24 0.720 0.000 24 0.720 250 7,500 O.OOO 250 7.500 100 3,000 0.000 .1001 3,000
8.0 Summer Remedial Teaching Chaltrada Chiauru 1050 5.250 0.000 1050 5.250 2100 10.500 0,000 2100 10.500 2650 13.250 0,000 2650| 13.250
8.1 4 months seasonal residential school 0 0.000 0.000 0 0.000 0 0.000 0.000 0 0.000 0 0.000 0.000 o| 0.000S.2 Bridge course - Chlnnara Angala 0 0.000 0.000 0 0.000 276 1.380 0.000 276 1.380 853 4.265 , O'.OOO 8531 ■ 4.2658.3 Home Based Education 225 6.750 0.000 225 6,750 357 10.710 O.OOO 357 10.710 250 7.500 ■ 0.000 250| 7.500
8.<) Bridge course • Ctilnnara Ar\gala Rssl-2 months 121 2.057 0.000 121 2,057 0 0,000 0 000 0 0.000 550 9.350 ' 0.000 55o| 9.350
8.5AIEC«ntofs( Transportation, Hardest to reach children) 4 0,120 0.000 4 0.120 88 2.640 0.000 88 2.640 10 0.300 0.000 10|; 0.300
8.6 Innovation Urban Deprived Children 0 0.000 0.000 0 0,000 o: 0.000 0.000 0 0.000 0 0.000 0.000 o[ 0.0008.7 Special Enrolment Drive 56 0.000 0.000 56 0,000 0 0.000 0.000 0 0.000 648 0.000 0.000 6481 0.000
Sub Total 6208 166.487 0.000 6208 166,487 4629 160.780 0.000 4629 160.780 7226 204.865 0.000 72261 204.8658 Remedial Teaching 1
8.1 Remidial teaching 3220 6.440 O.OOO 3220 6.440 11626 23.252 o.oo'o 11626 23.252 6618 13.236 ' 0.000 66 is l 13.2368.2 MoVwatton through Held trips 0 0.000 0.000 0 0.000 0 0.000 o.ooO 0 0.000 0 0.000 0.000 01 0.000
Sub Total 3220 6.440 0.000 3220 6.440 111626 23.252 0.000 11626 23.252 6618 13.236 . , 0 .000 66181 13.2369 FreeTaxt Book 1
9.1 Free text book for l-V std all children of aided schools 2749 2.199 0,000 2749 2.199 6882 5.506 0.000 6882 5.506 2505 2.004 0.000 250s| 2.004
9.2 Free text book tor VI-VIII std all ichlldren of aided schools 4919 6.395 0.000 4919 6.395 8843 11.496 0.000 8843 11.496 3618 4,703 0.000 3618| 4,703
9.3 Work books for Nall Kali 0 0.000 0.000 0 0,000 0 0,000 0.000 . 0 0,000 ' 0 0,000 0.000 0| 0.000Sub Total 7668 8.S94 0.000 7668 8.594 15725 17.002 0.000 15725 17.002 6123 6,707 0.000 61231 6 .707
10 . Intarventlons lo r CWSN 110.1 ' Proviston of disabled children 1600 19.200 0.000 1600 19.200 2124 25,488 0.000 2124 25.488 2668 32,016 b.ooo 26681 32.016
Sub Total 1600 19.200 0.000 1600 19.200 2124 25.488 O.OOO 2124 25.488 2668 32.016 0.000 26681 32.01611 Civil Works 1
11.1 BRC 0 0.000 0.000 0 0.000 0 0.000 0,000 0 0.000 0 0.000 0.000 ol 0.00011.2 CRC 0 0.000 0.000 0 0.000 0 0.000 0.000 0 0.000 0 0.000 0.000 01 0.00011.3 School Buildings 0 0.000 0.000 'o 0.000 10 90.000 0.000 10 90.000 13 117.000 0.000 13| 117.00011.4 Dilapidated 0 0,000 0.000 0 0.000 0 0.000 0.000 0 0,000 0 0.000 0,000 oi 0.00011.5 Building less (Pry) 0 0.000 0,000 0 0.000 0 0,000 0.000 0 0,000 0 0.000 o;ooo ' 01 0,00011.6 Building less (UP) 0 0.000 0.000 0 O.OOO 0 0.000 0,000 0 0.000 0 0.000 '0.000 0 0,00011.7 Dilapidated Building (Pry) 0 0,000 0,000 0 0,000 0 0.000 0.000 0 0.000 0 0.000 0,000 0 0.00011,8 Additional class rooms 27 126.900 0.000 27 126.000 125 587.500 0.000 125 587,500 235 1104.500 0.000 235 1104,50011.9 Additional Class Room to Bangalore
Metro Cltv 0 0.000 0,000 0 0.000 '0 0.000 0.000 0 0,000 0 o.ooq 0,000 0 0.00011.10 Toilets/Urinals 0 0.000 0.000 0 0.000 0 0.000 0,000 0 0.000 0 0,000 0,000 ol 0,00011.11 Separare Girls Toilet 40 10.000 0.000 40 10.000 148 37.000 0.000 148 37.000 0 0.000 O.OOO 01 0,00011.12 Drinking'Water Facility 0 0.000 0.000 0 0.000 0 0,000 0.000 0 0.000 0 0.000 0.000 01 0,00011.13 Boundary Wall 0 0.000 0.000 0 O.OOO 0 0.000 0.000 0 0.000 0 0.000 0,000 0 0.00011.14 Separation Wall 0 0.000 0.000 0 0 000 0 0.000 0.000 0 0.000 0 O.OOO 0.000 0 0.000

Dl8trict*wise and int?rvention'Wlse summary for 2009-10SSA. Karnataka
Annex-
(Rs. in lakh)
s.No. Activities
Kodagu Kolar Koppal
Fresh Out lay 200910
spillover
Total OutlayFresh Out lay 2009
10Spillover Total Outlay
Fresh Out lay 200910 Spill over Total OutUy
Phy Fin Fin Phy Fin Phy Fin Fin Phy Fin Phy Fin Fin Phy Fin
11.15 Electrification 0 6.000 0.000 0 0 000 0 0,000 0.000 0 0.000 0 0.000 0.000 0 0.000
11.16 Head Master's Room 0 0,000 0.000 0 0 000 0 0,000 0.000 0 0.000 0 0.000 ' 0.000 6 0.000
11.17 Ctilld Friendly elements 0 0.000 0.000 0 0.000 0 0.000 0.000 0 0.000 0 0.000 0.000 0 o.'ooo
11.18 Kitchen shed 0 0,000 0.000 0 0,000 0 0.000 0.000 0 0.000 0 0.000 O.ooo 0 0,00011.19 Residential Hostel 0 0,000 0.000 0 o.oo'o 0 0.000 0.000 0 0.000 0 0.000 0.000 0 0.000
11.20 Ma|or Repairs (Primary) 0 0.000 0.000( 0 0,000 0 O.OOO 0.000 '0 0.000 0 0.000 0.000 0 0.000
11.21 Major flepejrs (Upper Primary) 0 0.000 0.000 0 0 000 0 0.000 0.000 0 0.000 0 o.ooo ' o.ooo 0 0.000
11.22 Addltional Rooms for CALC & Edusat 0 0.000 0.000 0 0,000 0 0.000 0.000 0 0.000 0 0.000 0.000 0 0,000
11.23 special Toilets (o' CWSN 15 7.500 0.000 151 7.500 30 . 15.000 0,000 30 15,000 0 0.000 0.000 ' 0 0,000
11.24 feet<lna up of Solar Photo Voltaic to existlna CALC schools 0 0.000 0.000 0 0,000 0 0.000 0,000 0 0.000 0 0.000 0.000 0 0.000
11.25Setting up of Solar Photo Voltaic to new CALC schools oj O.OOOj 0.000 0 0.000 0 0.000 o.poo 0 0.000 0 o.ooo 0.000 0, 0,000
Sub Total o l Civil worlcs 821 144.400 0.000 *82 14^.400 313 729.500 0.000 313 729.500 248 1221.500 0.000 248 1221.50011.26 Furniture (or Govt. UPS i11.27 No. of children Ol 0.000 o.oooi 0' 0 .000 0 0.000 0,000 0 ' 0 .000 0 0,000 , 0 .000 0 0.000
Sub Total (Furniture) bi 0.000 o.oboi 0 0.000 0 0.000 0.000 ^ 0.000 0 0.000 0.000 . 0 0.000
Sub Tot«l(Civll + Furniture) 82| 144.400 o.ooo 82 144.400 313 729.500 0.000 313 729.500 248 1221,500 0.000 248 1221.500
12 Teaching Lsarnlnjg Equipment 112.1 TL^ for new schools Ol 0.000 0.000 0 0.000 10 2.000 0.000 10 2,000 13 2.600 0.000 13 2,60012.2 TLE for upgraded schools bl 6.000 0.000 0 0.000 3 1.500 0.000 3 1.500 0 0.000 ' o.ooo' 0 0,00012.3 Others Oi 0.000 0.000 0 0.000 0 0.000 0.000 0 0.000 0 0.000 6,000 0 0.000
Sub Total oj 0.000 0.000 0 0.000 13 3.500 0.000 13 3.500 13 2.600 . O.OOOj 13 2,60013 Maintenance G ra n t' 668| 50.100 0.000 668 50.100 2506 160.600 0.000 2506 160.600 1451 103,300 ' 0,000 1451 103.300
13.1 LPS with <3 rooms 0| 0.600 0.000 0 0.000 0 0.000 0.000 0 0.000 0 0.000 , 0.000 0 0,000
13.2 LPS with >3 rooms 0] 0.000 0.000 0 0.000 0 0.000 0.000 0 0.000 0 0.000 ’ 0.000 0 0.00013.3 UPS wHh <6 rooms 01 o.bod 0.000 0 0.000 0 0.000 0.000 0 0.000 0 0.000 ' o .ooo 0 0.00013,4 UPS wi1h>6 rooms ol 0.000 o.oob 0 0.000 0 0.000 0.000 0 0,000 0 0.000 , 0 .000 0 0.000
Sub Total 6681 50.100 0.000 668 50.100 2506 160.600 0.000 2506 160.600 1451 103.300 o.ooo 1451 103.30014 School Qrant 1
14.1 Primary School 4291 21.450 0.000 429 21.450 1933 96.900 0.000 1938 96.900 955 47.750 : 0 .000 955 47.75014.2 Upper Primary School 2841 19.880 0.000 284 19.880 663 46.410 0.000 663 46.410 532 37.240 0.000 532 37.240
Sub Total 7131 41.330 0.000 713' 41.330 2601 143.310 0.000 2601 143,310 1487 84.990 0.000 1487 84.99016 Research& Evaluation 1
15,1 Research, evaluation, supervision 7131 9.269 0.000 713 9.269 2601 33.813 0.000 2601 33.813 1487 19.331 0.000 1487 19.331Sub Total 7131 9.269 0.000 713 9.269 2601 33,813 0.000 2601 33.813 1487 19.331 0.000 1487 19.331
16 Management & Quality 116,1 Management & MIS 1 i 43.500 0.000 1 43.500 1 88.000 o'.o'oo 1 88.000 1 128.124 , 0.000 1 128.124
16,2 Learning Enhancement Programme (LEP) 1| 21.500 0.000 1 21.500 1 43,500 0.000 1 43 500 1 72.590 0.000 1 72.590
Sub Total l | 65.000 0.000' 1 65,000 131.500 0.000 1 131.500 1 200.714 0.000 1 200,71417 innovative Activity 1
17,1 ECCE 1| 15.000 0.000 1 15.0001 1 15.000 0.000 1 15.0001 1 15.000 0.000 1 15.000

Plstrlct-wls« «nd Inlorvsntlon-wlse summsiy lo r 200B>10 SSA, Karnattka
. ftnnex-
tn lakh)
C o
S.No. Activities
Girls Educsllon
ICotnp. Edn.17.5 |Mlno>lly Community17.6 lUrtjan DBprtvod Chlldrfln
KodsguFre«hO ut(ay 2009
' 10
Phy
ICommunlly Training
.Community Training
|Tota lo fS S A (D litrle ts)
60-J3
6043
Fin0.000
15.00050.00010.2509.7500.000
100.000
3.626
3.626
Spillov«r Total Outlay
Fin PhyO.OOOl0.0000.00010.0001O.OOOl0.0001■0,0001
O.OOOl 6043
0.0001 6043
Fin
0.00015.00050.00010.2509.7500.000
100.000
3.626
3,626
KolarFresh Out lay 2009'
10Fin0.000
15,000
10963
1096367601
50.00010.2509.7500,000
100.000
spillovar Total Outlay
Fin I Phy0,0001 00.0000,000o.oool6,6oo'o.oool0.0001
6.578 0.00 10963
6,578 o.oool 109632210.796) 0,000| .67601
Fin0.000
15.00050.00010.2509,7500,000
100,000
6.576
6.5782210.796
t^oppalFresh Out lay 2009-j
10Spin over
Phy
8373
837347965
Fin0,000
15.0001
Total Outlay
Phy
50.000] 0,000110.2501 o.oool9.7501 O.OOOio.oool O.OOi
100.000 o.oboj
5,024 0,000 8373
5.024 o.oool 8373•3706.459 0.000 47985
Fin0.000
15,00050.0,00I0.2SO9.7500.000
100.000
5.024
5.024.3708.459
19.119.219.3
StMeComponenlMahagamflntREMSSIEMAT
20.120,220.320,4
Sub Total
NPEGEL
o.ooo0.0000.0000.000
0.0000.0000.0000,000
0,0000,0000,0000,000
0.006J O.OOO■0.000 0 ,000o.oool O.OOO0 .000 0 .000
O.OOCt0,0000,0000,000
0.0000,0000,0000,000
0.0000.0000.0000.000
0.0000,0000^00
0] o jioo S 3 7 0 8 ^ ^
NoofEBSsNo. of Uitian slumsN0.0I clustarg coveredNo of cluster* Irtuiban slumsCivil WOfiM ________________Const.of ACR Includlna loltets.drlnldna water,aletlfificallonTLEOne time grant of TLE.Ubtaiy, sports.Vocational Tralnlnq
Spin over as per PaB Minutes OS-OSTotal Non reeunrlng co8t(Fr»»h*ip lll over)flecurring
0.000
0.000
0.000
0.000
0.000
0.000
0.000
0.000
0 0 .000
0.000
0.000
0.000
0,000
.0.000
0,000
0.000
0,000
0,000
0,000
0.000
01J9L0|
0.000
o| 0,000
'0.000
0(; 0.000
621
0.000
0,000
0,000
0,000
0',000
0.000
(3.000
0.000
627
0.00(J
0.000
0.000
0,000
0 0 0
1 1
0 0 00 0 01 11 1 1
0 00 0 0 00 0 0 0 0
00 0 0 0 00 0 0 0 0
0 3 40 0 c 0 00 0 D0 0 c 0 0
A
0 0 0 0 0
B 0 0 0 0 0
00 0 0 0
0 0 0 0
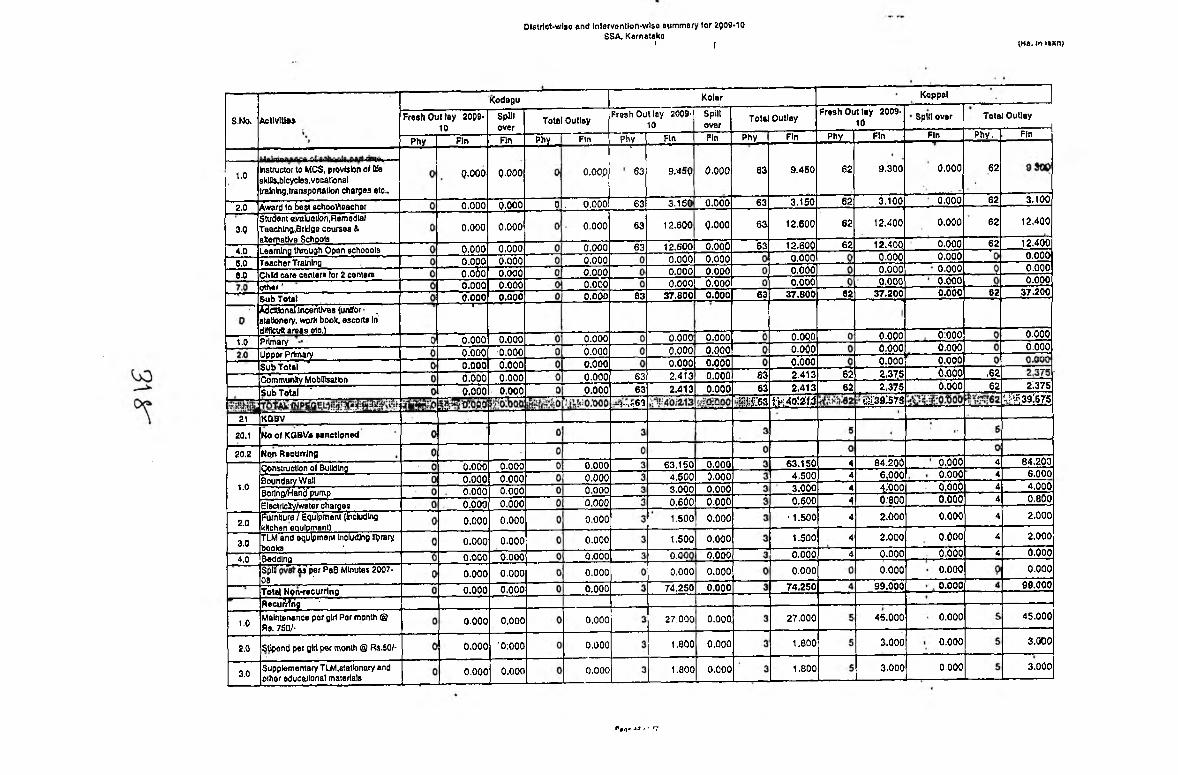
Olstriet-wise end In tervontion^lse Bummary (or 2009-10 SSA. Kernateko
‘ ( (Ha. in iiK n )
S.No.
1.0
Actlvttiss
Instnjctor U MCS, provision of Va skins,bicycles,voutlonal training,IranspOfUUon charges «tc.,
2.0 Award 10 besi gcheoVlaacher
3.0Sludent avaluaton.Hemsdlal TBachlng,BtUfl8 courses i altemaliyB Schools________
4.0B.O
Learning through Open schoools
8.0Teacher TrainingChild care centara tor 2 centerso«t«<'Sub TotalAdcSfenaUjncehthres (un#or~ 7 stalk>nary. work book, escorta In' difficult areas eto.l______________
1.0 PrimaryUpper PrtmaySub Total
20,1
20.2
1.0
2.0
3.0
4.0
Community Mi Sub Total ■
Mobilisation
21 KQBV
No of KQBV* Mnctloned
Non RsBUrrinsConstnjctk>n of BulidlnpBoundary WailBortrig/Mahy pumpElectflclty/waterchargesFurniture / Equipment (including tBchen eQulomanllTLM and eqUlpmant Including lltiraiy books______________;_____________Bedding
1.0
2.0
3,0
Spllf as' per^aS Minutes 200708 •___________________ _Total Npn-fecufrlng flaeuPrlrifl 'Maintenance per girl Per month ® fls. 750/-
Stipend pet gW pe« month @ Rs.SO/-
Supplementary TLM.etattonaiy and other educational materials
Kodegu
Fresh O u tlay 20Q9- 10
Phy Fin
Q.OOO
0.000
0,000
0.0000.000
' o.obo0.0000,000 — r—
0.0000.00010.0000,000
spilloverFin
Q.OOO
0.000
0.000
0,0000.000O.OOOl0.0000.000
0.000■0.0000.0000.000
0.0000.0000.0000.0000.000
0.0000.000
0.0000.000
0.000
0.000
0.000
0.0000.0000.0000.0000.000
0.0000.0000.0000.000
0.000
•O;O00
0.000
Total OutlayFresh Out lay 2009'|
10Phy Fin
o.oop
0 . 0 .000
0.000
0.0000.000_,0.0000.0000.000
0.0000.0000.0000.0000.0000 .000 0.000
0.0000.0000.0000.000
0.000
0.000
0.000
0.000
0.000
0.000
0.000
0.000
Kolar
Spillover
Phy
63
63
63
63
B3
6363
-j-.yiT63
Fin Fin
9.-45P 0.000
3.150 0.000
12.600 g.ooo
12.6001 0,000O.OOOl 0.000O.OOOl 0.0000.0001 0 .000
37.6001 0.000
0 .000 0.0000 .000 0 .0000,0001 0 .0002.413 Q.OOO2.413 0.000
63.1501 0.0004.5001 5.0003 .0 0 ^ O.OOO0 . 6 0 ^ 0.000
1.500 0.000
1,500 O.OOO
o,a Q.OOO
0.000 0.000
Total Outlay
Phy Fin
63
63
63
63
63
S363
' jg j ia a i:H4o:2:<3
74.250 0.000
27.000 0.000,
1.800 0 .000
1.800 0 .000
9.450
3.150
12.600
12.600O.OQOO.OOQ0.000
37.800
O.OQOO.OOOl0.0002.4132.413
63.1504,5003.0000.600
•1,500
1.5000.000
0.000
74.250
27.000
1.800
1.800
Koppal
Fresh Out lay 200910
Phy
62
62
62
62
62
6262
Fin
9.300
3.100
12,400
12.4000.0000.0000.000
37.200
0.000O.OOQ0.0002,3752,375
sgr39;S7S
84.^006,0004^0000;800
2.000
2.000
0.000
0.000
99.000
45.000
3.000
3.000
Spill over
Fin
0.000
0.000
0.000
0,0000.0000.0000.0000.000
0:0000.0000,0000,0000.000
0.0000,000o.oo50.000
0.000
0.0000.0000.000O.OOOl
0.000
0.000
0,000
Totel Outlay
Phy.
62
62
62
62
62
,6262
Ffn
3.100
12.400
12.400o.ooaO.OQO0.000
37.200
0.0000.000
2'.375'.5‘ 39 ;575
84.2006.0004.0000.800
2.000
2,000
0.000
0.00098.000
45.000
3.000
3.000

DIstrict’Wlfie and Interventlon-wise summary for 2000'10SSA, Karnataka
(Rs. in lakh)
S.No. Activities
Kodagu Kolar Koppal
Fresh Out lay 200910
Spillover Total Outlay
Fresh Out lay 200910
Spillover Total Outlay
Fresh Out lay 200910 Spill over Total Outlay
Phy Fin Fin Phv 1 Fin Phy Fin Fin Phy Fin Phy Fin Fin Phy Fin4.0 Examination Fee 0 0.000 0.000 0 0.000 3 0,060 0 000 3 0,060 5 0,100 0,000 5 0,100
b.O
Salaries .. . 6 0.000 0.000 0 0.000 3 36,000 0,000 3 36,000 5 60.000 0,000 5 60,000I.One Warderi2. Pouf full lime teachers
two Urdu teachers(only for blocks with musllm population above 20% and selalcled urban areas)lf required
3. Three Dart time teachers4, One full time accountant5. Two SupportiStaff(account/Assi3tant/ChpwWdar/Peon)6. One head Cook and one assistant cook for 60 girls and 2 assistant cok fonOOolrls
6.0 Vocatkinal training! specific skill trg 0 0.000 0.000 , 0 0.000 3 1.500 0.000 3 1.500 5 2,500 0.000 5 2.500
7.0 ElectrlcitV / water charges 0 0.000 0.000 0 0.000 31 1.800 0.000 3 1.800 5 3.000 O.OOO slr 3.OO0
8.0 Medical care/contingencles ® Rs.750/- per girl, 0 0.000 0.000 0 0.000 3 2.250 0.000 3 2.250 5 3.750 0.000 5 3.750
9.0 Misc. Including maintenance 0 0.000 0.000 0 0.000 3 2.400 0.000 3 2.400 5 4,000 o.ooo 5 4.00010.0 Preparator/ camps 0 0.000 0.000 0 0.000 3 0.450 0.000 3 0.450 5 0,750 0.000 5 0.75011.0 PT.A/school functions 0 0.000 o.ooo 0 0.000 3 0,450 0.000 3 0.450 5 0.750 O.OOO 5 0 ,75012.0 Provlston o( Rent (Smonths) 0 0.000 0.000 0 0.000 0 0,000 0.000 0 0.000 1 1.500i 0,000 1 1.50013.0 Capacity Bulkling 0 0.000 0.000 0 0.000 d 0,900 0.000 3 0.900 5 1.500 0.000 5 1.500
Total Recurring 0 0.000 0.000 0 0.000 3 76.410 0.000 3 76.410 5 128.850 , 0.000 5 128.850
'Qrattd Total (Nttn rM ^rrln g * r».currinB) " .
0 .000 0.000 0 0 .000 3 150.660 o.otfo r :r^ S ': '3 - -1SG;660 2 27 .360 ■0.000 • 5 227.350
m m M K M M i
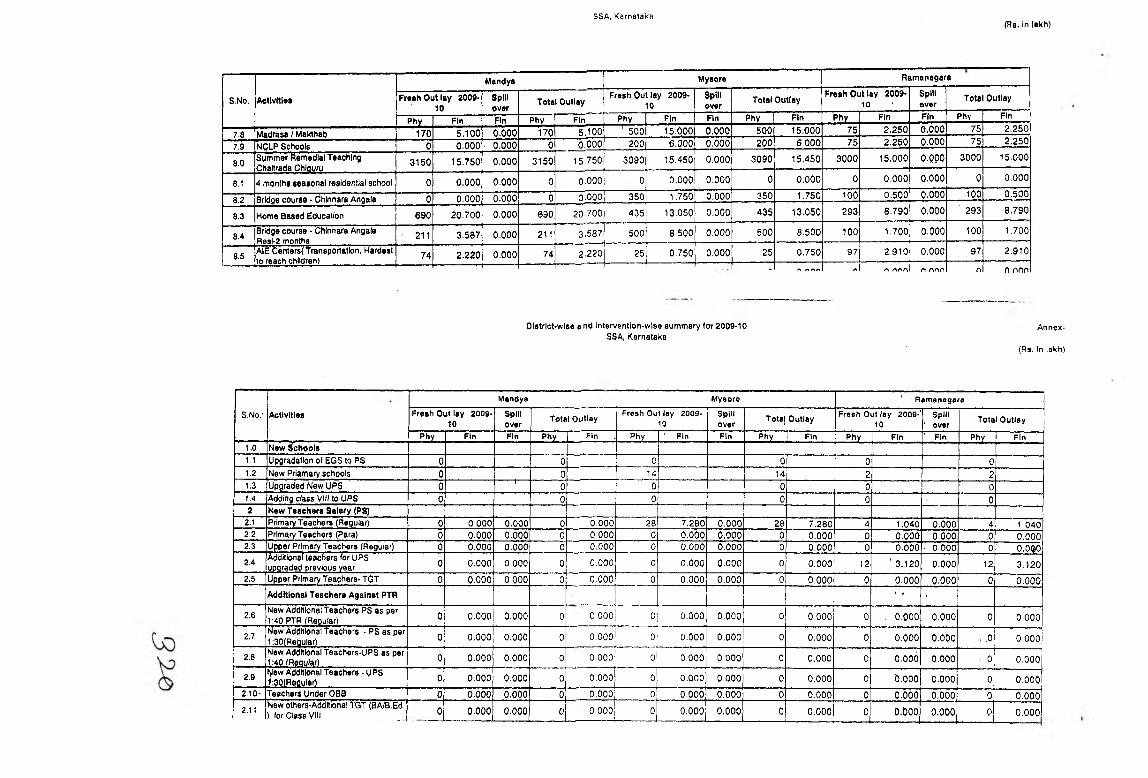
SSA, Karnataka(Rs. in lakh)
S.No. Actlvitle*
Mendya Mysore Ramansgar-----------------a
Fresh Out lay 200910
Spillover
Totol OutloyFresh Out lay 2009-
IDSpillover Total Outlay
Fresh Out lay 200910 ■
Spillover Total1 Outlay
Phy Fin Fin Phy Fin Phy Fin Fin Phy Fin Phy Fin Fin Phy Fin
7.8 Madrasa / Makthab 170 5.100 0.000 170 5.100 ' 500 15.Q00 0.000 500 15.000 75 2.250 0.000 75 2.250
7.9 NCLP Schools 0 0.000 • 0.000 0 0.000 200 6.000 0,000 200 6.000 75 2.250 0.000 75 2.250
8.0Summer Remedial Teaching Chattrada Chlauru 3150 15.750 0.000 3150 15.750 3090 15.450 O.OOO 3090 15.450 3000 15.000 o.ppo , 3000 15.000
8.1 4 months seasonal residential school 0 0.000 0.000 0 0.000 0 0.000 0.000 0 0,000 0 0.000 0.000 0 0.000
8.2 Bridge course ■ Chlnnara Angala 0 0.000 0.000 0 0.000 350 1.750 0.000 350 1.750 100 0.500 0,000 100 0,500
8.3 Home Based Education 690 20.700 0.000 690 20 700 435 13,050 0.000 435 13.050 293 8.790 0.000 ' 293 8.790
8.4Bridge course - Chlnnara Angala Besi-2 months 211 3.587 0.000 211 3.587 500 8.500 0,000 500 8,500 100 1.700 ,0.000 100 1,700
8.5Aie Centers( Transportation, Hardest to reach children) 74 2.220 0.000 74 2.220 25 0.750 0.000 25 0,750 97 2,910 0.000 97 2.910
- ----- r\ A AOr» n nnn n n nnn
Olstrlct-wlse and Intervention-wise 8Uff\mary far 2009-10 SSA, Karnataka
Annex-
(Rs. In lakh)
S.No,' Activities
Mandyo Mysore ' Ramonogara
Fresh Out lay 200910
Spillover
Total Outlay Fresh Out lay 200910
Spillover Totaj Outlay Fresh Out lay 2009-'
10Spill
' over Total Outlay
Phy Fin Fin Phy Fin . Phy • Fin Fin Phy Fin Phy Fin ' Fin Phy Fin1.0 New Schools1.1 Upgradation ol EGS to PS 0 0 0 0 0 01,2 New Prlamary schools 0 0 14 14 2 21,3 Upgraded New UPS 0
10 0 0 0 0
1.4 Adding class VIII to UPS 0 0 0 0 0 02 New Teachers Salary (PS)
2.1 Primary Teachers (Regular) 0 0.000 0.000 0 0.000 28 7.280 0.000 28 7.280 4 1.040 0.000 4 1,0402,2 Primary Teachers (Para) 0 0.000 0.000 0 : 0.000 0 0.000 0.000 0 0.000 0 0.000 0.000 .0 0.0002.3 Upper Primary Teachers (Regular) 0 0,000 0.000 0 0,000 0 0.000 0.000 0 0.000 0 0.000 • 0.000 0 ■ 0 .0902,4 Additional teachers fer UPS
UDoraded orevlous year 0 0,000 0.000 0 0,000 0 0.000 0.000 0 0.000 12. ' 3.120 0.000 12 3.1202,5 Upper Primary Teachers- TGT 0 0.000 0.000 0 0,000 0 0.000 0.000 0 0,000 0 0.000 0.000 0 0.000
Additional Teacher* Against PTR ' ■ ■
2,6 New Additional Teachers PS as per 1:40 PTR (Reoular) 0 0,000 0.000 0 OOOD 0 0.000 0.000 0 0,000 0 , 0.000 0.000 0 0.000
2.7 New AddHlonal teachers - PS as per 1:30(Reqular) 0 0.000 0.000 0 0-000 0 0.000 0.000 0 0,000 0 0.000 0.000 ■ .0 0.000
2.8 New Additional Teachers-UPS as per 1:40 (Reoular) 0 0.000 0.000 0 0,000 0 0.000 0,000 0 0,000 0 0.000 0.000 0 0.000
2.9 r|lBw Additional Teachers • UPS f:30(Reaular) 0 0.000 0.000 0 0,000 0 0.000 0,000 0 0,000 0 b.ooo 0.000 0 0.000
2.10- Teachers Under CBS 0 0.000 0.000 0 0,000 0 0.000 0,000 0 0,000 0 0.000 0.000 0 0.0002.11 New others-Addltional TGT (BA/B.Ed
) for Class VIII _ 0 0.000 0.000 0 0,000 0 0.000 0,000 0 0,000 0 o.boo 0.000 0 0.000

Di»trlct-wlse and-intervontlon-wlss sumnnsry lo r 2009-10SSA, KornotaKa
Annox-
(Rs. In lakh)
S.No. Aclfvftie*
Mandya Mysore RamonagaraPrcsh OiU tle y ZOOS-
10Spillover Total Outlay Frcoh Out lay 2009
10Spillover Total Outlay FroshO utlay 2009
10j Spill 1 over
1Tola) Outlay
Phy Fin f in Phy Fin Phy F)n Fin Phy Fin Pliy 1 Fin j Fin Phy Fin3.2 T&acrters c^ant • UPS 5143 25,715 0.000 5143 25.715 7676 38.380 0,000 7676 38.380 30841 1S.420 j 0.000 3084 15.420
Sub Total 6964 34.820 0.000 6964 34.820 9992 49.960 0.000 9992 49.960 49281 24.6401 0.000 492S 24.6404 Block Contre$ ' - f ' " i
4,1 Salary of Resource Persons 6 11.160 0 .000 6 M.16Q 0 0,000 0.000 0, 0,000 0 0.000 j 0.000 0 0.0004.2 Furniture Grar f 0 0.000 0.000 0 O.OOOi 0 o.oooj1 0 .000 O' 0 ,000 0 I 0 .000
11 0 .000 0 0.000
4.3 Contingency' 8 1.600 0.000 8 !.600 | 8 i.e o o l1
0.000 8 1.600 4
i---------- ------
0.800f — 1
0.000 4 0.800
1 4.d Meeting & TA altowance ' 8 0 .720
.. , j
0.0001 81
C 720| e '!
0 .720 0.000 8 0.720 4 0.360 0.000 4 0,360|
1 -c r. _______ .1 . , . . 1 . . , J 1. . . . ..j
- 1 " - - • ' ■ ' 1
u ta in c l'W i^ fi; u nu t(itc ;rv t; iu tt^ ii'w i!> v o u i i i i i i t i i jr iv j SSA, Karnataka
(Rs. in lakh)
f " 1 ................................... ■“ Mandye Mysore Ramanaeara
S.Nd. j Activities Freeh Out lay ^009- 10
Spillover
Total Outlay Fresh Out lay 200910
Spill over’ • Total Outlay Fresh Out lay 2009-1
10 1Spiltover Total Outlay
j f Phy Fin Fin Phy. . Fin Phy Fin Fin Phy Fin Phy Rn 1 Fin Phy Fin
11.15 tE)eclrBlc3lton 0 0 ,000 0 ,000 0 0.000 0 0.000 0.000 0 0.000 0 o.oool ' 0 .000 0 ■ 0.00011.16 |Head Mastai's Room ' 0 0 .000 OvOOO 0 0.000 0 0.000 , , 0 .000 0 0.000 0 0.000 0,000 0 0.00011.17 icWW Frtendly elements 0 0,000 0.000 0 0.000 0 0,000 o-:ooo 0 0 ,000 0 0.000 O'.OOO 0 0.00011.18 iKSchen shed 0 0 ,000 0.000 0 0.000 0 0.000 0 .000 0 0.000 0 0.000 q.ooo 0 0 .00011.19 iResWenllal Hostel 0 0 .000 0.000 0 0.000 0 0,000 O.O'OO 0 0,000 0 0.000 0.000 0 0.00011.20 IMajo; Repairs (Primary) 0 0.000 0.000 0 0,000 0 O.OOO! 0,000 . 0 0.000 0 o.ooof 0.000 0 0.00011.21 iMa(or Repairs (Upper Pr(mary) 0 0.000 0.000 0 0.000 0 0.000 0.000 0 0.000 0 O.OOOi -O f lO O 0 0.000
11.22 Udditional Rooms ter CALC & Edusat 0 0.000 0.000 0 0.000 0 0,000 0.000 0 0.000 0 o.oool i.ooo 0 0.000
11,23 [special Toilets for CWSN 170 85,000 0.000 170 85.000 0 0,000 0,000 0 0 .000 24 '1 ^0 0 0 0,000 24 (2 .0 0 0, . . jSettIng up of Solar Photo Voltaic to
kxtstlno CALC schools 0 0.000 0.000 0 0,000 ' 0 0.000 0.000 0 0 .000 0 o.oool •0,000 0 0.000
, , , , Setting up ol Solar Photo Voltate to Inew CALC schools 0 0.000 o.opo 0 0,000 0 0,000 0.000 0 j 0.000 0 o.ooo) 0.000 0 0.000
|Sub Total o tC M I works 1015 607 .750 0.000 1015 607.750 715 1338.100 0.000 7151 1338.1001 658 535 .1C0 I 0.000 6S6 535.10011.26 iFurnlftire (Of Qovt. UPS 1
j 111.27 INo. ofchndren ^ - 0 0,000 0.000 0 0.000 0 0.000 0.000 1 Ol O.OOOi! 0 o.oool O'.OOO ol O.OOOI
^ u b Total (Furniture) 0 0.000 0.000 0 0.000 0 0.000 0.000 oj1 o.ooolI-- ' Oli 0.000 O.OOOI Ol O.OOOi. — >-------------------------- -Sub ToUI(Clvll * FumKure) 1018 607.750 0.000 1015 607.750 715 1336.100 O.OOQ 7 is | 1338.100|! 658 535.1 ool 0.000 6sej 535,100|
12 |Te»chlBB LeernlnjB Equipment 1 1 - 1 1 1 112.1 [TLE lor new schools 0 0.000 0.000 0 0.000 14 2,800 o.oob 141 2,8001 2 0,400/ O.OOOI 2| O.4OOI12.2 ITLE tor upg^sdsd schools 0 0.000 0.000 0 0.000 . 0 0.000 o,oool 0) o.ooof 0 o.oool O.OOOi ■ o.oool12.3 lothars 6 b.ooo 0.000 0 0.000 0 0,000 o .ooof oj o.oool ol 0,000) o.oool 01 O.OOOi
teii'b Total 0 0.000 0.000 • 0 0.000 14 2.8001 O.QOOj 2.800! s i 0.4001 O.OOOI 2 I o.oool
13 iMalntenanee Grant • | a65« 175,500 0.000 2650 175.500 2865 197.1501 O.OOOIA
28651ni
. 197^1501 n n n n i'
1B37 In/
116.550! rt non/ (
o.ooolO.OOOI
18371 • 01
116.5501o.ooqI

17.217.317,4.17,517,617.7
18,1
19.0
GIris EiJjcallooSC/STComp. Edn.MinorilY CommunityUi^an Ocpiivtd Childrenolh*rsSub TotalC onw ijn ltY T r«ln ln^'
Gommunlly Training
Sub TotalTotal o f SSA(Dis1rlct>)
Mandya
FreahO utlay 2009 10
Phy
11176
11176
Fin
■ 0 .00015.00050.00010,2509.7500.000
100.000
6.706
6.706
SpinoverFin
0.000'0.0000.0000.0000.0000.0000.000
ox>oo0.0000.000
Tatal Outlay
Phy
11176
Fin0.000
15.00050.00010.2509.7500,000
100,000
6,706
11178/ 6.706,732061 1845,271
Myaoro
Fresh Out lay 200910
Phy ■
27805
27805
Fin0.000
15.00050.00010.2509.7S0o.Ooo
100.000
16.663
16.683
ip in' ovar
Fin0.0000.0000,0000.0000.0000,0000.000
0,000
0.000
Total Outlay
Phy Fin0,000
15,00050.00010.2509.7500.000
1 lOO.OOOj
27805 16,683
2780511268311
16.683
niihna
F rcanO utlay 2009.1 SpMI 10 I I ovar
7014
7014
Fin Fin0 ,000| 0 .000
15.000 0,00050,000|- 0,00010,2501 O.OQO9.750 0,0000,0001 0 .000
100,0001 0 ,000
4,208 0.000
4.2081 0.000 7014
Total Outlay
Phy Fin I' o,oool15.0001
■ 1
7014
10 . ISIata Compoi’-a.'il . ■ ’ 1 ! ■ '19.1 Mandgel^enl ' 0 0.000, 0.000 0 O.OOOl 0 0.000| o.ooo! 6 0.000 ' ■' 0 0.000 0.000 0 0.00019.2 inEMS" 0 0.000 O.OOOl 0 0.000 0 0.000] O.OOOl O' 0.000 0 d.ooo 0.000 0 0.00019.3 SIEMAT . 6 0.000 o.ock) 0 0.000 0 0.000' O.OOOl . ol 0.000 0 0.000 . 0.000 0 0.000
Isub Total 0 o.boo 0.00& ______0 0.000 0 0.000 b.ooo 0 O.OOOl 0 0.000' 0.000 ol 0.000!ii73206| <-’$1845^1 ti;:tt3aoo j>^045;27;li ;jVl2683.l‘ •’■^ossrsai lihabBsV !i40S5;2Sl: i:l5i39S8' :;!i:665386|si0;000
20 NPEOEL ' I !20.1 Mo ot EBBa ■ .0 0 1 1 1 ■ 120.2 No. Of Utban slums 0 0 0 0 0 02d.3' No.of cfcnars coverad 0 0 0 0 ■ ol 02b.4 In'o of.chnlera In urtian slums 0 0 0 0 0 ' 0A CMI WOTka. ^n s l.o i ACfl Including
pilels.drViklna vwiof.o'scttlficatlon C O.QOO 0.000' 0 0.000 0 0.000 0.000 0 0.0001 o'.-1
o.ooo' 0.000 ■ 0 0.000
TLE ■ ." ■ ' 1 ■
_ pr«tim8B«''lolTLE.U5rary, soorts,Vocational Training 0 0.000 0.000 0 0.000 6 0.000 0.000 0 0.000 0 0,000 0.000 0 0.000
Spin over as p«r PaB Minutes 08-09 0 0.000 0.000 0 0.000 0| 0.000 0.000 0 0.000 0| 0.000 •0.000 0 0.000Total Non racurrlnf eoat(Fraah*aplll ovaO . 0 0.000 0.000 0 0.000 01 0.000 b oob 0.000 o' 0.000 0.000 0 0.000
C jRacutTtng ' i ' ■ ' ‘

SSA.KernM8ko(n». (n Iftkh)
O o
u
S.No. Activities
1.0
2.0
3.0
4.05.06.07,0
1.0
Additional in^ «nth/ee (unilor itaikinary, vwik book, escorts In difflcun iw a a 8(c.l______________
2.0Prlm'atyUpper PtimarySub TQtsICommunlly MobiUsatton
21
20.1
20.2
1.0
2.0
3.0
4.0
1.0
Ualnl»n»w» of K t nnte fnt* tinInstnjctor to MCS, provision of IKs6kiOs,blcycle},vocsllonalIralnlng,transportation c ^ iy e « etc..
MandysF rashO utlay Z009-
. 10Phy
Award to best schooVteacherStudent evaluatlon.nemsdlal Tsactilng.BridBB courses &’ allematK'e Schoolslia m lng Ihrouflh Open sehoootsTeacher TrainingChild cate caniars (or 2 centersotherSub Total '
Sub Total
KQBV
HoalKQBVaaanetloned
Hon RecurrlnBCpnstfucAton of PoUdlno■SoundaiyWetBgoring/Hand pump
EigetricHy/water charges•Furntturo I Squlpmsni {Inctudlng(lichen equlpmenllru»l and equipment Indudlno libraryoote _________
BeddingSpUl ov f r a s per PaB Minutes 2007-o sTotal Non-reeurrfngRecurringMaintenance per girl Per month @ Hs.750/-
2.0
3.0
Stipend per oirl par month @ Rs.SW-
Supplementary TLM,stationary and other educational materials
0
Fin
0,000 I
0.000
0,000
SpilloverFin
0.000
0.000
0.000
0.000 0 .0000.000 0.0000.000 . o .o o o0 .000 0.0000 .000 0.000
0,0000.0000.0000.0000.000
t^SS>o:ooQ
o.ooo0,0000,000
Q,0 0 0 |
0,000
0.000
0,000
0.000
0.000
0,000
0 .000
o.oop
0.0000.0000.0000,0000.000
i i s o o o
Total Outlay
_ p h ^ Fin
0.000
0.000
0.000
Mysore
FroshOuUay 200910
Phy
17
17
17
0,000 170,0000.0000,0000.000 17
0.000o .o o o l0.0000.000 17o.oool 17
0.000 0 .0 0 ^0.0000.000
o .o o o ro 'oo o l
o.oool o .ooo l
o .o o d 0.000
0.000 0.000
0.000 0.000
0,000 0 .000 0
0.000 0 .000
Fin
Spillover Total OuUay
Fin Phy
2.550
0.850
3.400
3.40010 ,0000 .0000,000
10.200
0.0000.00010 .0000.6510 .6 S 1
21.0601i ; 5 o a1.000
0 .200
0.500
0.500
0 .000
0 .000
1 2 4 .7 5 0
0.000 17
0.000 17
0.000 17
0 .000 17o.oool0.000o .ooy0 .000 17
Fin
2.550
0.8S0
3.400
3.4000 .0000.0000.000
10.800
O.OQOl0.0000 .0000 .000 170.000 17
o.oool0 . W0.000 '
O.OOOj
0.000
0.000
0.000
0.000
0.000
0 ,000 0.000
0.000
■0,000
0.000
0.000
9.000
0.600
0.600
0,000
0.000
0,000
0 ,000. 0 ,000
0 .0000.651
Romanagara
Fresh Out toy 2009 10
Phy Fin
14 2.100
14 0 .700
14 2.800
14 2,000O.OOO0.0000.000,
14 8.400
0.0000 ,0000 ,000
14 0.5360.651 14 0.636
iv;>Via:9'3ie
21 .OSOl ai.Osoi ,5 o o r i.5oa1.000 ■ 1.0000.200 0.200
0.500 0.500
SpilloverFin
0.000
0,000
. o;ooo
0.0000,0000,0000.0090.000
0,000OlOOO0.0000 .0000.000
0.000
Total QuUay
Phy
14
Fin
2.100
14
14
14
14
1414
Wfi 'OOO
■ o M TQ.oool
0.700
2,800
2.8000.0000.0000.0008.400
0.0000.0000.0000.6360,636
2 1 .0 5 0
1,500
o.ooo l
0 ,000
0.500 0,500 0.000
1.000
0.2000.500
0.500
o.oool o.oooH o.oool0 .000 0 0 .000 ■ 0 .000
24.750 1 24.750 ' 0.000T
9.000 1 9.000 0.000
0.600 0.600 0.000
0.600 0.600 0.000
0.000
0.00024.750
9.000
0.600,
P«3<i 65o(77
O' 0
0 0
0 0
00 0 0 000 0 0 0 0 00 0 0 0 00 0
D
0 00 0 00 0 0 0 0 00 0 0 0 0 00 0
0 0
0 0 0 0 0 000 0000 0 1
0
0 10 0 00 1
0 0 1
0 0 1
0 0

Distrlet-wlso a n i) lntorv«ntion-wise summary lo t 2009-10SSA, Karrtataka
Annex-
(n». In iBkh)
1 Mandya Mysore Rsmanegara
S.Nq. Ac<lvH)»s Fresh Out lay 200810
Spillover
Total OutlayFreeh Out lay 2009
10sp illover
Total OutlayFresh Out ley 2008
10'■ Spill
overTotal Outlay
Pljy Fin Fin Phy Fin Phy Fin Fin ■ Phy Fin Phy Fin Fin Phy Fin
0.0 ewmlnBtlon Fee . 0 j 0:000 0.000 0 0.000 1 0.020 0.000 1 0 .Q20 1 0.620 0.000 1 0.020Salart^ ' ' 6 ' D.obo o.coo 0 0,000 1 12.006; 0.000 1 t l b o l ) ' 1 . i 2.fl'6b 0,000 t 1 2 .q6ot.Otr^’WsMen ,2. Fm r full tims teachers
two ijrdii t*achor8(only for bloelcs with musUm population abov« 20% and salelctetf urban aj«as)» reqvlred 1 '
i1
5.0 3. Thfoo Dart lime leaehe/s4. One lulllimo accouhlant -----------------
S. Two Suppotl 'slafl(accounyAjSlslant/Cho>wkk(ar/Pe0I ^ 1
1 !
B. One hftsd Cooh and one assistant cook for so gMs and 2 assistant col« lorlOOairls .
6.0 Vocatlpnal lialntng / speclilc skill trg 0 0.000 0.000 0 0.000 1 0.500 0.000 1 o.soo 0,500 0.000 1 0.500
7.0 Eleclridty / water charges 0 0,000 0.000 0 0.000 1 0.600 0.000 6.600 t 0 .600 • 6,000 1 0.600
a.o Medical eafB/eontingenefes ig fis.75p;- pat flirt. 0 0,000
!0.000 0 0.000 1 0.750 0.000 1 0.750 0-750 0.000
■0.750
9.0 Misc. incliKiing malnlenanca 6i o.oool 0.000 0 0.000 1 0.800 0.000 1 t O.BOO ' '1 0.800 ■ O.GOO 1 o.eoo10.0 . Prsparatgry camps ’ 0 0,000 O.QOO 0 o.boo 1 0.150 0,000 0.16Q '1 0 .150 0.000 1 0.15011.0 P.T. A / school (unctions • 0 0,000 0.000 0 0.000 1 0 .150 0.000 0.150 1 6.150 0.000 1 0 ,15012.0 Pfwiston of Rent (amonltis) 0 0.000 0.000 0 0.000 0 0.000 0.000 0.000 i 1 1.500 '0 .000 1 1.500la.o Capacity BuMkip - 0 0 ,000 0 .000 0 O.QOO o.aoQ 0.006 1 0,300 6.300' " 6.660 1 0.300
Total ReeUrrlha 0 0.000 0,000 . ? 0.000 i 25.470 O-OQO 1 m m i S i 1 1 ' ^aio^ai
I- ■ M m I S i i 8 ^
i W M l I

DIstrM-wlsa and Intervcntlon-wise summary for 2008-10SSA, Karnoloka
Annex'
(R9. In takfi)
nalehur Shlmoga Tumkur
S.No. lActivltle*1
Fresh Out lay 200910
SpWover Total Outlay Fresh Out lay 2009
10Spillover Total Outlay
1
1-----------------------------------Fresh Out lay 2009-10 Spill
overTotal Outlay
I !■ Phy Fin Fin Phy Fin Phy 1 Fin Fin Phy 1 Fin Phy Fin Fin Phy Fin1.0 ^ e w Schools I T " ■ 11,1 lupgradatlorrofEGSlo PS '0 c ol 0 6 1 c . It,2 [NewPrlarnSVysofioote ’ 76 78 ' £ 6 12 121,3 jupgratfad NewUPS 42 42 C1 0 6 61,4 lAddhg class VIJI to'UPS 0 0 C1 0 d ■02 H now Teachers Salary (PS) 1
2,1 jpilmaryTBachefS (Regular) 156 4C.S60 0.000 136 40.560 12 3.120 0.000 12 3.120 24 6.2401I 0,0.00 24| 6,2402,2 iPrimary.Toachers (Para) r ■ 0 ' 0 .000 0.000 0 0.000 0 0.000 0,000 0 0.000 0 0.0001 0 .000 01 0.0002,3 lUppar Primary Teachers (Regular) 42 10.920 0.000 42 10.920 0 0.000 0.000 0 0.000 6 1.560 0 ,0 0 0 ' 61 1.560
2,4 lAddltJonal teachers for OPS luDflradad previous vear ,46 11.960 0.000 46 11.960 6 1.560 0.000 6 1.560 2 O.520 II 0 ,000 0.520
2,5 [upper Primary Teachers- TGT Ol O.OOO 0.000 0 0.000 0 0.000 0.000 0 0.000 0 0.000 o.ddo. . 01 O.OOOjAdditlonal Teachera Against PTR
2,6 iNsw AddMi^al Teachers PS es per h:40PTf((Reqular).............. ol 0.000 0.000 0 0.000 0 O.ooo 0.000 0 0.000 0 o.ooo] 0.000 olf 0.000
2,7 iNewAddiUohal Teachers - PS as pet 1:30((^eaular) 0 0.000 0.000 0 ' O.OOO 0 0.000 0.000 0 0 ,000 0 O.oool 0,000 ol 0.000
2,8 Now Additional Teachers-UPS as per 1 ;40 (Reaular) ol 0.000 0.000 0 0.000 0 0.000 0.000 0 0,000 0 0 ,000 ] 0 ,000 of 0,000
2,9 New Additional Teachers • UPS 1:30(Reaular) ol 0.000 0.000 0 0.000 0 0.000 o.ooo 0 0,000 0 o.oooj O.ooo o| 0.000
2,t0 Teachers Under OBB 0 0.000 '6 .0 00 0 0.000 0 0.000 0.000 0 0.000 0 0,000 0.000 o). 0 0 0 0
2,11 Nev» olhers-Addllional TGT (BA/B.Eti 1) lor Class vni ' ° l 0.000 0,000 0 o.oool 0 0,000 0.000 0 o.oOo 0 0 .000 0,000 o] 0.000Sub Total(2.01 to 2.11) 244| 63.440 0 .000 244 63.440) IS 4.630 0.000 13 4 .660 32 8.320 0.000 32| 6.320|t«»char» Salary ( Recurring) 1 1
2,12 Prima'ry Teachers (Reguler); 1 9 5 ^ 3168.720 0.000 1956 3168,7201 551 892,620 0,0001 551 692 .620 571 925.0201 0 .000 5711 925.0202,13 Addnbnal Teachers (lEHT) 0 0.000 0.000 0 0.000 [ 0 o.oool 0.0001 0 0.000 0 O.OOO 0,000 o l. 0.0002.14 Trained Graduate teachers 187 347.820{ . 0.000 187| 347.820| 160 297,600i o.oool 160 297.6001 173 321.780 0,000 1731 321.7802.15 lUpper Primary Teachera (Para) 0 0,000 ' 0 .000 O' o.oboi 0 0.000 o.odo! 0 o.oool 0 0.000 0.000 01 0.0002.1S Upper Primary Teachers- Head
Master ol o.oooj 0.000 0 0,0001 0 0.000 o.ooo| 0 o.oooj 0 o.oool 0.000 o [ 0.000
2.17 A'ddltlonal Teachers PS (Regular) 0 O.OOOl 0.000 0 o.oool 0 0.000 o ,6 qo[ 0 o.oool 0 6.000 o.oool • 01 . O.ooo2.IB Additional Teachers -PS(P8ta) •d o.oool 0.000 0 o.oool P 0 .000 o.oool 0 o.oool 0 0.000 d.oooi 01 0.0002.19 [Additional Teachers - UPS (Regular) ■ o| o.ooo[ 0.000 0 o.oooF 0 0,000 o,ooo| 0 0.0001 0 0 . 0 ^ o'.oool 0 ! O.COO
2.20 Additional Teachers - UPS (Para) 0 o.oool 0.000 0 o.oool 0 O.OOOl o.oool 0 o.oool 0 o.oooj o.oool ' 61 0.0002.21 iTpachers Upder OBB O.oool . O.ooo 0 o.oooj 0 0.000 o.oool 0 0.000 i 0^ 0,000 0,600 ol 0.0002.22 6 thers-Addltlonai TGT (BWB.Ed) for
Class VIII o! o.oooj 0.000 0 o.ooo[ 0 0.000 o.ooo) 0 0 .000 ) 0 O.QOo) 0 .000) ol O.ooo2.23 (■Arrears of Salary of SSA leachers
■ ° o.oooj 0.000 0 0.000 0 0,000 0.000 0 .0.000 . b 0.000 o.oooF 0] 0.000■ ISub Total (2.12 to’ 2.23) . 2143 3S16.S40I 0.000 2143 3516.540 711 1190.220 o.ooof 711 1190.220 744 1246,800 0,000l 744 1246.8001
Sub Total (New tsachers+Teachsrs jRecurrinq) 2387 3579.98o| 0.000 2387 3579.980| 729 1194.900 0.000) 729 1194,900 776 1255,12o[ o.oooj 775) 12SS.12o{
3.0 {Teachera Grant i . 1 .. r !3.1 (Teachers grant - Primary | 19051 9.5251 0,000 1905 ' 9.5251 1932 9.6601 o.oool 1932 9,660 4209 21.0451 '0 .000 ! 4209) 21.045
A 3
P ag* 57 ' i t 77

District-wise en0 Interventlon-wlso summary for 2009-10SSA. Karnataka
(Rb. In )akh)
■j Ralchur Shimoga Xumkur
S.NO ADtivltlsa FreahO utlay 20DB- 10
Spillover
Total Outlay Fresh Out lay 2009! 10
Spillover Total Outlay ' Freeh Out lay 2009-10 Totat Outlay
1 Phy 1 Fin Fin . Phy Fin ‘ Phy Fin Fin Phy •Fin Phy ' Flrt 1 Fin Phy Fin3.2 iTeachers granl 'UPS 5 7 8 ^ 28.945 0.000 5789 28.945 ’ 59B8 29.940 0.000 5968 29.940 8538 42.6901 0 .000 8538 42.690
|sub Totol ' T694I 38.470 0,000 7694 ’ 38,470 7920 39.600 0.000 7920 39,600 12747 63.735 0 .000 12747 63.735
4 iBIffCk WMCureo'Cenlf** 14.1 jsaiaiy of flesource Parsons
' °’ 0.00(5 0 .000 0 O.OOO! 42 78'. 120 0.000 42 78 .120I ■ 60 111.600 0^000 .- 60 111.600
4.2 Furniture Grant' °
0.000 0 .000 0 0.000 . 0 0,000 0.000 P 0,00() 0 0 ,000 ' 0 .000 0 0.000
4.3 jcontlngency 5 1:000 0 .000 5 1.000 7 11400 0.000 7 1,400 2.0001 o iooo '• 10 2.000
4,4 jMeetlng & TA allowance , S 0 .450 0,000 5 0.450 7 ' 0 .630 0.000 7 0 .630 10 • 0,900i ■ O.OOO ,10 0.900
4.5 TLM flram 5 0.250 0,000 S 0.250 7 0,350 0 .000 7 0,350 '0 0 ,5001 , 0 .000 10 0.500
4.6 BRC BiiMng Maintenance 0.000 0.000 0 0,000 0 0.000 0.000 0 O.OOOi1 ° , 0,000 ■ 0 ,000 .0 0.000
ISub Total ' ' s 1.700 0.000 6 1,700 7 80.500 0.000 7 . 80.5001 ’ 10 116.000 1 0.000 10 116.0005 C lutter Ratouree Centres ' ' f
S,1 ISalarytol'nesource'Peraons ' '32| "5 9 .5 2 0 0.000 32 59,520 98 182.280 0 ,000 98 182.260 1 140 260,400.1 0 ,000 140 260,400S.2 (Furniture & equipment ’ ° 0.000 0.000 0 0.000 6 0,000 0 .00b ' 0 o.booi1 . 0 .000 0 ,000 0 0.000S.3 Icontlnpenoy,' ' 70 2.100 0.00,0 70 2.100 98 2.940 0.060 98 2.940 1 1'40 ^.'2001 ’ o.boo 140 4.2005.4 iMaellno & TA allowance ■ 70 2.520 0.06b 70 2.5201 9B 3.528 ■ 0 .000 98 3.5261 140 5.040 I.' 0.000 140 5.040
' 5.S It l m grant ’ . 70 0 .700 0.006 70 0.700 98 o'gao' 0,QOO 98 0.980l 140 ,1 .400)' O.OOO 140 1.400S.6 ICRC building Mslntrenanco 6 0,000 0.000 0 0.000 0 0.000 ■ 0 .000 0 ' o.oool ' . 0 0,000 [■ O.boo 0 0,000
ISub Total ■ r . 7ol 64.640 0.060 70 64.840 > '9 0 189.728 c.ooo 98 ■ 189.7281 140 271.040 V 0 .000 140 271.0406 iTralnina' ’ ■
6.1 Teachers trg, - In service at block level 7694| 76.940 0.000 7^94 76.940 7920 79.200 0,000 7920 79,20011 12747 127.^70 1 0,000 12747 127.4(70
6.2Teacher* trg. > in service a1 block
llevel at cluater level 7694| 38,470 0.000 7694 38.470 7920 39,600 0.000 ' 7920 39.600|1 12747 63.735 I ' 0,000 12747 63'.735
6.3 ^nflucliorrliB inlnfl fot Newly Recruit jTralned Teachers 244| 7,320 1 0.000 244 7.320 18 0.540 0.000 18 0,540 I 32 0.960 1 ,0.000 32 0 .960
6.4 ITraining tor- Untrained Teachers ' 0 0,600 0.000 0 0.000 0 0,000 0.000 0 r 0,00611 0 0.000 O.OOO 0 0.000
6.5 Ib RC/CRC coorJlnators and res’ourcs iDersons 224| 2,240 0.000 224 2.240 375 3.750 0,000 375 3 ,750 1 ?30 3.300 1 0,000 330 3,300
ISub Tota^ ' 6I 62 I 124.970 0,000 6162 124.970 8313 123,090 0.000 8313 123.0901 13-|09 195.465 1 O.OOO 13109 195,465
7 jln tfiven tlona for p u t o f School ' 1 Children '
1
7.1 |E(5S Cenua (PS) 0| 0.000 0.000 0 0.000 0 0,000 0,000 0 0.000 ■ 0 0 ,( 00 0,000 0 0,0007.2 I'eGS Centro (UP)' “ 6 0.000 0.000 =0 0,000 0 0,000 0,000 6 0 .000 ! 0 0.(1 00 0,000 0 0.000
7.3 I'Chinhara Angara Bridge couse IHeslde'nflal 12 rnonths-RBC 48i | 48,100 0,000 481 48.100 200 20,000 0.000 200 20.000 924 92,< 00 0.000 924 92,400
7.4 Ichlnnara Angafa Seasonal BrlUge jcourse • ReSdn. (6 montha)- NRBC 0 0.000 0.000 0 0.000 0 0.000 0.000 0 0.000 0 0 .( 00 0.000 0 0.000
7.5 IMoblle-sehools. 0 0.000 0.000 0 0.000 0 0.000 0.000 0 0 .06^ 0 ’ 0.(|!00 0.000 0 0,0007.6 |'l 2 montha bhd'ge ccurse-NRSC 0 0.000 0.000 0 0.000 2500 75.000 0.000 2500 75.000 201 8.430 6.606 281 8.4307 .7 ' ITenfjchSol ’ 0 ! 0.000 0.000 0 0.000 30 0,450 0.000 30 0 .450 75 1.1 25 0.000 75 1.125
Pipe S6nf 77

SSA, Karnataka(Rs. In lakh)
S.No. ActlvHI**
Raichur Shlmoge Tum)«ur
Fresh Out lay 200910
Spillover Total Outlay
Fresh Out lay 200910
Spillover Total Outlay Fresh Out jay 2009-10 Spill
overTotal Outlay
f>hy Fin Fin Phy Fin Phy i Fin Fin 1 Phy Fin Phy Fin Fin Phy 1 Fin7.8 Madrasa / Makthab 131 3.930 0.000 131 3.930 170 5.100 0.000 170 5,100 0 0,000 0,000 01 0.0007.9 NCLP Schools 0 0 .000 0.000 0 0.000 0 0.000 0,000 0 0,000 0 0,000 0,000 0! 0.000
8.0 Summer Remedial Teaching ■ ChaKrada Chloum 0 0.000 0.000 0 0.000 2940 14.700 0.000 2940 14,700 3500 17.500 0.000 3500 17.500
8.1 4 months seasonal residential school 0 0.000 0.000 0 0.000 '0 0.000 0.000 0 0.000 0 0.000 0,000 0 0.000
8.2 Bridge course - Chlnnara Angala 728 . 3.640 0.000 728 3.640 0 0.000 0,000 0 0.000 12 0.060 0.000 12 0.0608.3 Home Based Education 389 11.670 0.000 389 11.670 740 22.200 0.000 740 22.200 741 22.230 0,000 741 22.230
8.4 Bridge course - Chlnnara Angala Resl-2 months 774 IS -IS S 0.000 774 13.158 110 1.870 0.000 110 1,870 308 5.236 0,000 308 5.236
8.5 AIE Centers! transportation, Hardest to reach children) 10 o.doo 0.000 10 . 0.300 56 1.680 0.000 56 1,380 195 5.850 0,000 195 5.850
8.6 Innovation Urban Deprived Children 0 0.000 0.000 0: 0.000 0 0.000 0.000 0 0,000 0 0,000 0.000 0 0.000
8.7 Special Enrolment Drive 245 0.000 0.000 245 0.000 377 0.000 0.000 377 0,000 158 0,000 0,000 158 0.000Sub T ou t I 2756 80.798 0.000 2758 80.798 7123 141.000 0 .000 7123 141.000 6194 152.831 0 .000 6194 152.831
a Remedial Teaching8.1 Remldlal teaching 9569 19.138 0 .000 9569 19.138 13415 26,830 0.000 13415 26.830 18480 36,960 0,000 184S0 36.9608.2 Motivation through field trips 0 O.OOO 0.000 ,0 b.ooo 0 0,000 0.006 0 0 .000 0 0.060 0,000 0 0.000
Sub Total 9569 19.138 0.000 9569 19.138 13415 26.830 0.000 13415 26.830 18480 36.960 , 0 .000 18480 36.9609 Free Text Book
9.1 Free text book tor l-V std all chlklren of aided schools 5586 4.469 0.000 5586 4.469 9780 7.824 O.OOO 9780 7.824 7865 6.292 0,000 7865 6.292
9.2 Free text book for VI-VIII std all children of aided schools 4341 5.643 0.000 4341 5.643 ,13559 17.627 0,000 13559 17.627 28011 36.414 0.000 28011 36.414
9.3 Work books for Nall Kail 0 0.000 0.000 0 0.000 0 0.000 0.000 0 0,000 0 0.0.00 0.000] 0 0.000Sub Total 9927 10.112 0.000 9927 10.112 23339 25.451 0.000 23339 25.451 35876 42.706 o.oooi 35876 42,706
10 Intervention* for CWSN 110.1 Provision of disabled chlklren 2615 31.380 0.000 2615 31.380 5069 60.828 0.000 5069 60,828 5502 66.024 0:000| 5502 66,024
■ Sub Total 261S 31.380 0.000 2615 31.380 ' 5069 60.828 0 .000 5069 60.628 5502 66.024 0.0001 5502 66.02411 Civil W orki 1 1
11.1 BRC 0 0.000 0.000 0 O.OOO 0 0.000 0.000 0 0,000 0 O.OOO o.oooi 61 0.00011.2 CRC 0 0.000 0.000 0 0.000 0 0.000 0.000 0 0,000 0 0,000 o.oool 01 0.00011.3 School BulMlngs 78 702.000 0.000 78 702.000 6 ^4 ,000 0 .000 6 54,000 12 108.000 0,0001 12| 108.00011.4 Dilapidated 0 0.000 0.000 0 0.000 0 0.000 0.000 0 0,000 0 0.000 o.oooi 0| 0.00011.6 Building less (Pry) 0 0.000 0.000 0 ;0.000 0 0.000 0.000 0 0.000 0 0,000 o.oooi Ol 0.00011.6 Building less (UP) 0 0.000 0,000 0 0.000 0 0.000 0,000 0 0.000 0 0,000 o.oooi ol 0.00011.7 Dilapidated BulWlng (Pry) 0 0.000 , 0 .000 G 0.000 0 0.000 0.000 0 0,000 0 6.000 o.oooi oj 0,00011.8 AddHkinal class rooms 300 1410.000 0.000 300 1410.000 61 286.700 0,000 61 286.700 222 1043.400 Q,66oi 222| 1043,40011.9 Additional Class Room to Bangakire
Metro City 0 0.000 0.000 0 0.000 0 0.000 0,000 0 0 .000 0 O.OOO 0,000] ‘ o| 0.00011.10 Toilets/Urinal* 0 0.000 0.000 0 0.000 0 0.000 0,00D 0 0,000 ■ 0 (J;000 o.oooi ol o.oooi11.11 Separare 3lrts Toilet 668 167.000 0.000 668 167.000 160 40.000 O.OOO 160 40.000 316 79.000 o.oooi 31 si 79.00011.12 Drinking Water Facility 0 0.000 0.000 0 0.0*00 0 0.000 0,000 0 0.000 0 0.000 6.0001 01 0,00011.13 Boundary Wall 0 0 ,000 0.000 0 0.000 0 0.000 0.000 0 O.OQO 0 0 .000 0..060 oi 0.00011.14 Seperation Wall 0 0 .000 0.000 0 O.CKJO 0 0.000 0,000 0 0,000 0 o.ooo o.oooi ■ ol 0.000
U 3

S.No. Aetlvltle*
Ralchur Shlmoga Tumkur
F reahO ullay 200910
Spillover Total Outlay
Fresh Out lay 200910
Spillover Total Outlay Fresh Out lay 2009-1 a
Spillover Total Outlay
Phy 1 Fin Fin Phy Fin Phy Fin Fin Phy _ Fin Phy Fin Fin Phy Fin ,
11.15 Electrlficallon 0 0.000 0,000 0 0,000 0 0.000 0.000 0 0.000 0 0.000 0.000 0 0.000^1.16 Head Master's Room 0 0.000 0,000 0 0.000 0 0.000 0.000 0 0.000 0 0.000 0.000 0 0.00011.17 ChlW Friendly elements 0 0.000 0,000 0 0.000 0 0.000 0.000 0 0.000 0 o.ooo 0.000 0 0.000
11.18 Kitchen shed 0 0.000 0,000 0 0.000 0 0.000 0.000 0 0.000 0 0.000 .0 .000 0 0.00011.19 Residential Hostel 0 0.000 0,000 0 0.000 0 0.00(5. 0.000 0 0.000 0 0.000 0.000 0 0.00011.20 Major Repairs (Primary) 0 0.000 0,000 0 0.000 0 0.000 0,000 0 0.000 0 O.OOO o.ooo 0 0.00011.21 Major Repairs (Upper Primary) ' .0 0.000 0.000 0: 0.000 0 0.000 0.000 0 0.000 0 0,000 . 0.000 0 0.000
11.22 Additional Roems for CALC & Edusat 0 0.000 0.000 0 0.000 0 0.000 0.000 0 0.000 0 O.OOO 0.000 0 0.000
11.23 special Toilets for CWSN 7 ^ 3.5Q0 0.000 7 3 500 7 3.500 0.000 7 3.500 90 45.000 0.000 90 45.000
11.24 Setting up ot Solar Photo Voltaic to exlstlno CALC schools 0 0.000 0.000 0 0 .000 0 0.000 0.000 0 0.000 0 O.OOO '0 .0 00 0 0.000
11.25 SeWno UP of Solar Photo Voltaic to new CALC schools 0 0.000 o.oooj 0 ' 0,000 0 0.000 0.000 0 0.000 0 0.000 0.000 0 0.000
Sub Total o f Civil works 105'3 2282.6001 O.OOOl 1053 2282^500 234 384.200 0.000 234 384.200 640 1275.400 0.000 640 1275.400
11.26 Furnllure lo r Oovt. UPS -------1 - .........1
11.27 No. of children 0 0.000 0,000! 0 0.000 0 0,000 0.000 0 0.000 0 0,000 ' b .oob 0 0.000Sub Total (Furnllure) 0 0.000 o.oooi 0 0.000 0 0.000 0.000 0 0.000 0 0.000 0,000 0 0.000
Sub Total(Clvll + Furniture) 1053 2282.500 0.000 1053 2282,500 234 384,200 0.000 234 384.200 640 1275.400 0,000 640 1275.400
12 Teaching Learnlnjg Equipment12.1 TLE for new schools 78 15.6001 0.000 78 1S.600 6 1.200 0.000 6 1.200 12 2.400 0.000 12 2.40012.2 TLE for upgraded schools 42 21.0001 0.000 42 21.000 0 0.000 0.000 0 0.000 6 3.000 0,000 6 3.00012.3 Others 0 O.OPOl 0.000,L 0 0.000 0 0.000 0.000 0 0.000 0 0.000 0,000 0 0.000
Sub Total 120 36.600 0.000 120 3(5.600 6 1.200 0.000 6 1.200 18 5,400 o.ooo 18 5.40013 Maintenance Grant 2094 142.8001 0,000 2094 142.800 2877 192.750 0,000 2877 192.750 4918 317,750 0,000 4918 317.750
13.1 LPS with <3 rooms ' 0 O.OOOl 0,000 0 0.000 0 0.000 0.000 0 o.Qoo 0 o.obo 'o,o6o 0 0.00013.2 LPS with >3 rooms 0 o.oooi 6,000 0 0 ,000 0 0.000 0.000 0 6.000 0. 0.000 ■ 0.000 ■ 0 0.00013.3 UPS wKh <6 rooms 0 O.OOol 0,000 0 0,000 0 0.000 0.000 0 b.OOO 0 0.000 0.000 0 0.00013.4 UPS with>6 rooms 0 o.oooi 0,000 0 0,000 0 0.000 0.000 0 O.OOO 0 0.000 o.ooo! 0 0.000
Sub Total 2094 142.800| 0.000 2094 142.800 2877 192.750 0.000 2877 192.750 4918 317,750 0,000 4918 317.76014 S cho4 Orant ■■■ r ....... ...
14.1 P r lm ^ Stiiiiool 1459 72,9501 0,000 1459 72,950 1991 99.550 0.000 1991 99.550 3646 182.300 . 0,000 3646 182.30014.2 Upper Primary School' 688 48,160| 0,000 688 48.160 1003 70.210 0.000 1003 70.210 1423 99.610 'o.obo 1423 99.610
Sub Total 2147 121,110| 0.000 2147 121.110 2994 169.760 0.000 2994 169.760 50^9 281.910 ' 0.000 5069 281.91015 Ree«irchA Evaluation 1 1
15.1 Research, evaluation, supervision 2147 27,91 l l 0,000 f u 7 27.911 2994 38.922 0.000 2994 38.922 5069 65.897 ■ 0 .000 5069 65.897Sub ToUl 2147 27.911| b.OOO 2147 27.911 2994 38.922 0.000 2994 38.922 5069 65.897 ' 0,000 5069 65,897
16 Management & Quality !16.1 Management & MIS 1 118.848| o.obo 1 118.848 1 114.474 0.000 1 114,474 1 171,377 0,000 1 171,377
16,2 Learning Enhancement Programme(LfP)
1 129.080| 0,000 1 129.080 1 59.000 0.000 1 59.000 1 90.000 ■ 0 ,000 1 90,0p0Sub Total 1 247.92e| 0.000 1 247.9281 1 173.474 0.000 1 173.474 1 261.377 0,000 1 261.377
17 Innovative Activity 117.1 ^CCE. 1 15.0001 0.000 1 15.000 1 15.000 0.000 1 IS.OOOl 1 15.0001' 0,000 1] 15,000

DIstrlct-wlse and Intervention-wise summary for 2009-10SSA, Karnataka
Annex-
(R*. In (akh)
S.No. Acllvities
Ralchur Shlmoga Tumkut
Fresh Out lay 200910
Spillover Total Outlay
Fresh Out lay 200910
Spillover Total Outlay Fresh Out lay 2009-1 ol Spill
overTotal Outlay
Phy Fin Fin 1 Ptw Fin Phy Fin Fin Phy Fin Phy Fin Fin Phy Fin17.2 Girls Education 0 0.000 1 O.OOOl 0 0.000 0 0.000 0.000^ 0 O.OOOl 0 O.ooo O'.OOO ’ 0 0.00017,3 SC/ST 1 15.000 0.000 1 15.000 1 15.000 0.000 1 15.000 1 1 ^ 0 0 0 0.000 1 15.00017-t, Comp. Edn. 1 50.000 0.000 1 50,000 1 50,000 0,000 1 50.000 1 5Q.000 0.000 1 50.00017.S Minority Community 1 10.250 0.000 1 10,250 1 10,250' 0.000 1 10.250 1 10.250 0.000 1 10,25017.6 Urban Deprived Children 1 9.750 0,000 1 9,750 1 9.750 0.000 1 9.750: 1 9.750 0.000 1 9.75017.7 others 6 0.000 O.OOOl 0 0,000 0 0,000 0,000 0 O.OOOl 0 0.000 0.000' 0 0,000
Sub Total 1 100.000 o.ooo; 1 100.000 1 100.000 0.000 1 100.000 1 100.000 0,000 1 100.00018 Community Training
18.1 Community Training 12482 7.489 0.000 12482 7,489 27415 16.449 0,000 27415 16 449 20563 12,338 0,000 20563 12.338
19.0 Sub Total 12482 7.489 0.000 12482 7.489 27415 16.449 0.000 27415 16.449 20563 12.338 oloOQ 20563 12.338Total olSSA(OI«trlets) ' 63232 6917.726 0.000 63232 6917.726 102535 2968.682 0.000 102535 2958.682 129113 4518.953 o;poo 12«113 4518.953
^ K i ■« v;j«'a -sw saiK ai. ■ ' I . I - ' i - u - i ' i . i - r i % . .a
j ; . V i ; # ! " ' —U m p i
19 State Component19,1 (Management 0 0.000 0 000 0 0,000 0 0,000 0,000 0 0,000 0 0.000 0.000 0 0.00019.2 REMS 0 0.000 0.000 0 o.ooo 0 0.000 0.000 0 0.000 0 0.000 0..000 0 0.00019.3 SiEMAT 0 0.000 0.000 0 0,000 0 0,000 0.000 0 0.000 0 0.000 0.000 0 0.000
Sub Total 0 0.000 o.ooo 0 0.000 0 0.000 0.000 0 0.000 0 0.000 o.ooo 0 0.000STATE 6 8 * TOTAL 63232 6917.726 0.000 63232 6917.726 102535 2958,682 0.000 102535 2 9 6 8 .6 8 ^ 129113 4518.953 0.000 129113 4518.963
20 NPEGEL20.1 No oi EBBs 5 5 0, 0 1 120.2 NIo. ot Urban slums 0 0 o' 0 0 020.3 No.ol blusters covered 8 0 0 0 020.4 No of clusters In urban slums 01 ol 0 O' 0 0
A Civil works
A Const.of ACH including tollets.drinkina water,siectrification 0 0.000 0.000' 0 0.000 o.oool 0.000 0 0.000 0 0.000 0.000 0 ' 0.000
TLE
B One tima grant of TLE,Library, SDOrts,Vocational Tralnlna 0 0.000 0.000 0 0.000 0 0.000 0.000 0 0.000 0 0.000 0:000 0 0.000
Spill over as per PaB Minutes 08-09 0 0.000 o.oool 0 0.000 0 0,000 cf.coo 0 0.000 0 0.000 0,000 0 0.000
Total Non recurring cost(Fresh+8plll over)
.............10 0.000 0.000 0 0.000 0 0.000 0 .000 6 0.000 0 0.000 0.000 0 0.000
C Recurring
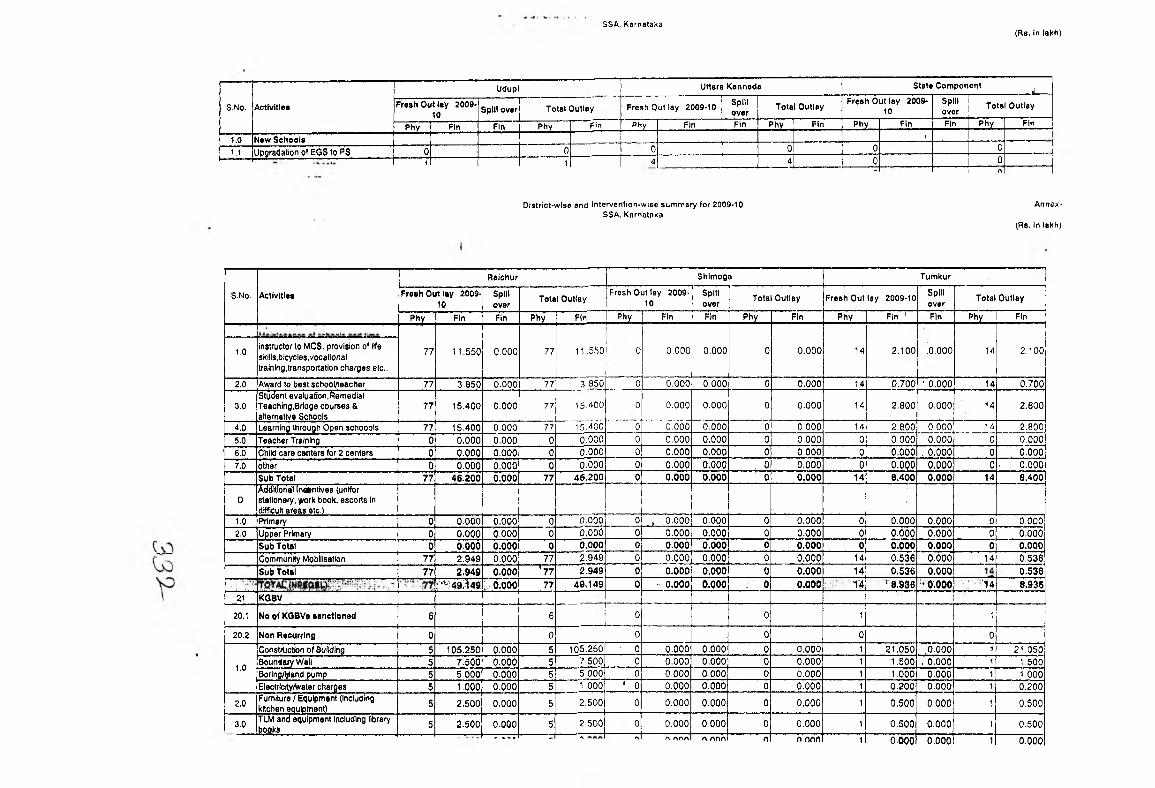
SSA. Karnataka(Rs. in lakh)
S.No. Activities
Udupl Uttara Kannada State Component ^
Fresh Out lay 200010 Spill over Total Outlay Fresh Out lay 2009-10 Spltl
overTotal Outlay
Fresh Out lay 200d*10
Spillover
Total Outlay
Phy Fin Fin Phy F=in Phy Fin Fin Phy Fin Phy Fin 1 Fin Phy Fin
1.0 New Schools t
1.1 Ijpgradation of EGS to PS 0 0 0 0 0 0
1 1 4 4 0 0'' - r\
DIatrict-wise end intervention-wise summary for 2009-10 S$A, Karnatolo
Annex-
(n&. in lakh)
S.No. Actlv ltlts
Raiehur Shlmoga Tumkur
Fresh Out lay 200910
Spillover
Total OutlayFresh Out lay 2009
10Spillover Total Outlay Fresh Out ley 2009-10 Spill
over Total Outlay
Phy Fin Fin Phy Fin Phy Fin Fin Phy Fin Phy Fin ' Fin Phy r Fin
77 11.550 0.000 77 11 ,5.‘j0 i 0 0.000 0.000 ■ 0 0.000 14 2,100 .0.000 14 2.1001.0 instructor to MCS, provision of life skills,bicycles,vocational training,transportation charfles etc.,
2.0 Avyard to best schpolAeacher 77 3.850 0.000 77 3.350 0 0.000 0.000 0 0.000 14 0.700 ■ 0,000 14 0,700
3.0Student evaluation,l^emsdial Teaching,Bridge courses & alternative Schools
77 15.400 0.000 77 15-‘400' 0 0.000 0.000 0 0.000 14 2.800 0.000 ' 14 2.600
4.0 Learning through Open schoools 77 15.400 0,000 77 IS.-lOO 0 0.000: 0,000 0 0.000 14 2,800 0.000 14 2,0005.0 Teacher Training 0 0,000 0.000 0 0.000 0 0.000' 0,000 0 0.000 0 0,000 0,000 0 0,0006.0 Child care centers for 2 centers 0 0.000 0.000 0 0.000 0 0.000 0,000 0 0,000 0 6,066 , 0,000 0 0.0007.0 other 0 0.000 0,000 0 0.000 0 0.000 0.000 0 0,000 0 O.OQO 0.000 0 ■ 0,000
Sub Total 77 46.200 0.000 77 46.200 0 0.060 0.000 0 0.000 14 8.400 0.000 14 8.400
DAddltioria'I ln«ntlves (unlfor stationery, ^ r k book, escorts in difricult areas etc.)
1.0 Primary 0 0.000 0,000 0 0.000 0 , 0.000 0.000 0 0,000 0 0,000 0,000 .0 0.0002.0 Upper Primary 0 0.000 0.000 0 0,000 0 0.000 0.000 0 0,000 0 0.000 0.000 0 0.000
Sub Total 0 0.000 0.000 0 0.000 0 0.000 0.000 0 0.000 0 0.000 0.000 0 0.000Community Mobilisation 77 2.949 0.000 77 2.949 0 o.obd 0.000 0 0,000 14 0.536 0.600 14 0.536Sub Total 77 2.949 0.000 '7 7 2.949 0 0.000 0.000 0 0.000 14 0.536 0.000 0.536
;:'^?49 :U S : 0.000 77 49.149 0 • o.ooo 0.000 : 0 o.ooo 1'4 ’ 8.936 ■’ 1^000 ■ '14 8.93621 KOBV
20.1 No of KQBVt sanctioned 6 6 0 0 1 1
20.2 Non Recurring 0 0 0 0 0 0
1.0
ConstfUctlon of Building 5 105.250 0.000 5 105.250 ‘ 0 0.000 0.000 0 0,000 1 21.050 ,0.000 1 21.050Bountefy Wall 5 7.500 0.000 5 7.500 0 0.000 0.000 0 0,000 1 1.500 , 0.000 1 1.500Sorlng/IjlBnd pump 5 5.000 0.000 5 5.000 0 0.000 0.000 0 0,000 1 1,000 0,000 1 1.000Electricity/Water charges 5 1.000 0.000 5 1.000 ' 0 0.000 0.000 0 0,000 1 0.200 0,000 1 0.200
2.0 Furniture / Equipment (Including kitchen eaulpment) 5 2.500 0.000 5 2.500 0 0.000 0.000 0 0,000 1 0.500 0,000 1 0.500
3.0 TLM and equipment including llbraty books 5 2.500 0.000 5 2.500 0 0.000 0.000 0 0.000 1 0.500 0 .000 1 0.500
• ‘ ■ - ' ' fS r» ArvA n non n n nrih 1 0.000 0,000 1 0.000

Districl^wlse end inlcrvcnlion-wise summary for 2009*10SSA> KornatflkQ
(Ra. In rokh)
S,No. Activities
Ralehur ■ Shlmega . Tum liur
Fresh Out lay 2009-■10
Spillover Tot^l Outlay
Fresh Out ley 200910
Spinover
Totol Outlay Fresh Out lay 2009-10Spillover
Total Outlay
Phy Fin Fin Phy Fin Phy Fin Fin Phy Fin Phy Fin Fin Phy Flo
4.0 Examination Fe* 6 0 .120 0.000 6 ■ 0 .120 0 0.000 0.000 0 0 .000 1 0 .020 0 ,000 1 0.020Salaries • ' ■ 6 72.000 0.000 6 72.(5oO 0 0.000 0.000 0 0,000 1 ‘ 12.000 0 .000 1 12.0001.0ns Warden ■
2. Four full time teacherstrs r hlAr>^e «wllK I
(R9. In IflKti)
1
S.(lo. Actlvllles
Udupi Uttera Kannada state'Component iFresh Out lay 2009
10 s p ill over Total OutlayI1 Fresh Out lay 2009-10 Spill
over Total Outlay Freah OUt lay 200910 ' .
Spillover
------------- --------------1Total Outlay ^
Phy^ Fin Fin Phy , Fin Phy Fin Fin Phy Fin Phy Fin ' Fin Phy Fin3,2 Teachers grant - UPS 3623 18.115 0,000 3623 18,115 5797 28.985 0 ,000 5797’ 28.985 0 O'.OOO ■ 0 .000 c 0,000
Sub Total ^ 4236 21.180 0.000 4236 21.180 7953 39.765 0 .000 79531 39.765 0 0.000 0.000 0 0.0004 Block ReSoui^ee Centres
4,'l ISalaty of Resource Persons 30 55.800 • 0,000 30 55.800 66 122.760 0,000 66 122.760 0 0,000 • 0 .000 0 0,000
4.2 Furniture Grant 0 ' 0 .000 0 .000 0 0.000 0 0 .000 0,000 0 0.000 0 0,000 0 ,000 0 0,000
4,3 Contingency ' 5 1.000 .0,000 5 1 ooo' 11 2.200 O.OOOl1
V 2,200 0 0 .000 o!poo 0 0,000
4.4 Meeting ^ TA allowance 5 0 .450 0.000 S 0.4501 1
11---------- ----
0 .990 0 ,000 11 0.990 0 0,00p , 0 ,000 0 0.000
4.5 TLM gram ' . 5 0 .250 0 .000 ■5 0 ,250 11 0.550 0 .000 11 0.550 0 0 ,000 0,000 0 0 ,000
4.6 BRC SulWIng Ma^tsnance ^ 0 0.000 o.oool *0 0,0001
0| 0.000 0 ,000 0 0 ,000 0 p.ooo ’ 0 ,000 0 0.000Sub Total 5 57.500 0.000 5 57.5001 11 126.500 11 126.500 0 , 0.000 0.000 0 0.000
5 ICIuater'Resource Centres I5.1 ISalaiy of Resource^ Persons 70 130.200 0.000 70 130,200 154 286.440 0 ,000 154 286 .440 ol 0.000 0.000 0 0.0005.2 Iritmhure & equipment 0 aooo 0.000 • 0 0 .000 0 0 .000 0 .000 0 0 .000 0 0 .000 o.'ooo 0 0.0005.3 [Contingency " ' ' 70 2.100 o.oool 70 2,100 154 4 .620 0 ,000 154 4.620 0 0 .000 0 .000 0 0.0005.4 iMeetlng & TA allowance 70 2 .520 0 ,000 . 70 2.520 154 5.544 0 .000 154 5,644 0 0.000 ■ 0.0001 0 o.oaS5.5 TLM grant 70 ■ 0 .700 ■ 0 .000 70! 0,700 154 1.540 0 ,000 154 ; 1.540 0 0.000 .o.oool .0 0.0005.8 CflC Biiflding Malntrenance 0 0 .000 O'.OOO 01 0 ,000 0 0 .000 0 .000 0 0.000 0 o.'ooo o.ooo! ■ 0 o.ooo
Sub Total ' ’ ' 70 135.520 0,000 701 135.520 154 298 .144 0.000 154 298 .144 0 0.000 o.oool 0 0.0006 Train Wa ' . 1 I
8.1 Teachers trg. ■,ln'3ervlce at block4236 42,360 | o .oooj 4236 42.360 7953 79.530| 0 .0 0 0 | 7953 79.530 0 . o.oooj •' o.oooj ■ 0 0.000
6.21-----------Teichers trg^- in service at block
level at clustef level 4236 21 .180 | 0.000| 4236 21,180 7953 39 .7 65 j. o .o o o j- 7953 39,765 0 0,000 o.oooj 0------- r*-
o.opo6.3 Induction training for Newly Recruit
Trained Tsaehers 2 0,060| 0.000| 2 0.060 21 0 .630| 0 .000 | 21 0,630 0 0,000 ■ o.oooj 0 0.0006.4 Training for- Untrained Teachers 0 0.000 0 .000 0 0,000 0 o .o o o l' 0 .000 0 0,000 0 o.boo ‘ o.oool 0 0.0006.5 BRC/CRC coordinators and resource
persons 197 1.97o| o.oool 197 1.970 360 3.600 o.oooj 360 3.600 0 o.oool o.oooj 0 0.000Sub Total . 4435 65.S70 o.ooo! 4435 65.5701 83341 123.525 0 ,000 83341 123.5251 0 0.000 0.000 ol 0.000
! 7In lerventlon* lo r Out ot School Children ( 1 r 1 1 1EQS Centre (PS) ' 0
01, -r o.oool 0,000
o.oool 0,000. 0
^ . .0O.oool 01 o.oool o.oool 0 o.ooq of o .o o o l 0.0001 o l n o o o l

uisinct-w ise ari'i ln(orvcntion-wisc summary (or 2009-10SSA. Kernntako Arnox.
in lakh]
S.No.
)7.2i r .3<7.417.5(?.6
AclMtles
Girls Education.'S&/ST' Comp. Edn.Mlnoflly fcommunHyUrban De prlvsd ChiWran
Udupi
Fresh O i/l lay 200910
Phy Fin0.000
15,000!
UHara Kannada
Spill over
Fin0.0000.000
1 50.0001 10,250
9,7500.000
0.0000.0000.0000.000
Total Outlay
Phy Fin Q.QOO
15,00050.00010.2509.7S00.000
Fresh Out lay 2009-10
Phy
Spillover Total Outfay
Fin0.000 0,000
15.0001 0.00050,0001 0 .00010,2501 0 .0009.750 0 .000
Phv rln
0.00015.00050.00010,250
9.7500.000
• StalB Component
F rish Ou! (ay 20p9. I Spll! 10 • I over Total Outlay
Fin Fin0 .000 O.OOOlo,oo,o| o.oooT
_ P ^
O.OOOl O.OOOl0.000 O.OOOl
O.OOOl
0.0000.0000.0000.000
17,7 othersISub Total 100.000 o.oon
O.OOOl 0 .0000.0000.000 O.OOOl
J 0 .000 0| 0.000
Olstrict-wlse and intervention-wise summary (or 2009-10 SSA, Karnatnka
Anncx-
(Fta. In lakh)
'■ 1 " ----------------
s'.No, A d lv ltle *
Udupi Uttara Kannada State Compon ent
Fresh.Outlay 200910 Spill over Total Outlay Fresh Out lay 2009-10 Spill .
ever'Total Outlay
Fresh Out !ay 2009-' 10 ■
SplUover
Tota1 Outlay
Phy Fin Fin , Phy Fin Phy Fin Fin PtiV Fin Phy Fin Fin Fin
7.8 Madrasa / Makthab 0 6.000 0.000 0.000 215 6,450'' '■:o.6oo 215 ' 6 :450 0 0,000 ■ 0.000 0 0.600
7,9 NCLP Schools 0 0.000 0,000 0 o:ooo 0 O.OOO 0.000 0 0.000 0 J o.oo'o 6,000 0 . 0.000^ Summer Fiomadlal Teaching
Chaitrada Chlquru ■ 3SO0 17.500 0.000 3500 17.500 3850 19.250 0.000 3850 19.250 0 ' . 0.000 0,000 0 0.000
S.1 |4 months seasonal residential school 0 0.000 0,000 0 0.000 0 O.OOO 0.000 0 0.000 0 0.000 0.000 0 0.000
B.2 iBridge course • Chlnnara Aiigaia ' • 0 d.boo^ 0.000 0 o.ooo"' 81 0.405 0,000 ' 81 0,405 0 0.000 0.000 0 o.ftoo
8.3 Home Based Educatton 370 11.100 0.000 370 11.100 519 15.570 0.000 519 15.570 0 0 ,00.6 0,000 0 6.000
„ . jBrkJge course ■ Chlnnara Angaia ' lHesl-2 months
0 0.000 0,000 0 0,000 .49 0.833 O.OQO 49 0,833 0 1 0 ,009 • 0.000 .0 0.000
■ g AIE Centers( Transportation, Harijflst [to teach children) 15 0.450 0.000 15 0.450 180 5.400 0.000 180 5,400 0 ■ 0,000 0.000 0 0.000
8,8 Innovation Urban Daprlvad Children 0 0,000 ■ 0,000 0 0,000 0 0.000 0.000 0 0,000 0 ' 9,000 0.000 0 0.000
0.7 Special Enrolment Drive 0 0.000 0.000 • b 0.000 109 b.ooo’' 0,000 109 0.000 0 0.000 0.000 0 0.000
. Sub t o t a l ' ■ 4320 ’ 51.325 0.000 4320 51.325 5743 117.408 ' 0.000 5743 117.408 0 0.000 0.000 0 0.000
' S Rtitio'dlal T e ifh ln ge'.l Ramlillal teac^ng 6350 12.700 0,000 6350 12.700 14488 28.976'' 0.000 14488 28.976 0 -0.000 0.000 0 0,000
8.2 Motivation through (ield trips 0 0.000 0.000 0 0,000 6 0.000 0.000 0 0.000 0 ' 0,000 0.000 0 0.000■■ SubYotal ■ ■ ' ' ' 63S0 12.700 0.000 6350 12.700 14489 2 8 .9 7 ? 0.000 14488 28.976 0 0.000 0.000 0 0.000
9 jFree Text Book. Free text book (or l-V std all children
lot aided schools22507 18.006 0.000 22507 18,006 6378 5,102 0,000 6378 5.102 0 ^,000 0.000 0 Q.fiOO
„ Pree text book for std al! chtldren of ald«d schools 16861 21.919 0,000 16861 21,919 14706 19,118 0,000 14706 19.118 0 p.ooo 0,000 0 O.OOO
9.3 Work books for NaTl Kali 0 0.000 0.000 0 0.000 0 0,000 6,000 0 0.000 0 p.dbo 0.000 0 0,000
■ Sub Total " ' ■ 3936S 39.025 0.000 39368 39.925 2 1 0 b'4 24.220 0 .000 21084 24.220 6 p.bob 0.000 0 0.000
10 inlerv»nlioS» (or CWSN ” 1 110.1 Provision of disabled ciillclron 5861 70,332 0.000 5861 70.332 4615 55.380 0,000 4615 55.380 0 p.ooo 0,000 8 0.000
Ifiiih Tn»«| ■ 6061 70.332 0 .000 5861 ro .3 3 2 4615 55,386^ 0.000 4615 55.380 0 0.000 0,000' ‘ 0 O.OOO. >
1

DIstrlct-wiso and lnt«rvonuon*wi3o fiummary ror SSA, Kernotake
<Rs. In lakh)
S.No. Activities
11.15 1Eteetrmoatlon11.16 |Head MastBf'8 Room. 11.17' IChlJd FrtondV elements11,18 (Kltohanshed11,19 iResldentla] Hostel11.20 IMalof Repairs (Pflmaiy)11-21 iMajor Rapalfs (Uppei Primatv>
Udupl
FreahO utlay 2 0 0 9 -L T ,0 Split ov«f Tots! Outlny
Phy Fin Fin I Phv Fin0 .0 0 0 1 . 0 .0 0 0 1 0.000o:ooo0.000
0.000o.oool
0.000
o.oool o.oool0.0000.000
o.oool- 0.000)o.oool ■ o.oool
0 0,0000.000
Uttara Kannoda
Fresh Out lay 2009-10
o,oonl f) nnnr
Fin0.000
' 0.0000.0000.0000.0000.000
SpilloverFin0 .000 ,
0.0000,0000,0000.0000.000
Total Outlay
Phy Fin0.0000.0000.0000.0000,0000.000
Slate Component
Fresh Out lay 2009-: Spill 10 1. over
Phy Fin Fino.oool' 0.0000.0001 ' 0 .000o .o o o l 0.0000.0001 0 .000o.oool 0.000o.tiooi- o.oool
Total Outlay
Phy I Fin01 o.oool
n
o.oool0.0001o.ooolo.ooolo.oool
u nu ir iiu rv L * iu iv ii* ’Wi9«; o u m n ia * / c v v 8 - ik /SSA, Karnataka
(Rs. In lakh)
. . . , . ,
S.No, Aetlvltlea
' Udupl uttara Kannade state Component '
F reahO utlay 200910
Spill over Total Outlay FreahO utlay 2009-10 Spillover
Total OutlayFresh Out lay 2009- . Spill
10 ' overT ou l Outlay
Phy Ftn Fin Phy 1 Fin Phy Fin Fin Phy Fin Phy Fin Fin Phy Fin .
0 0 .000 0.000
1 ,
01 0 .000
(
0 0.000
1
0,000 0 0.000 0 0,000 0.000 ,01
(
Instnjotor to MCS, provision of Mb skills,blcyols3,voCBt!onal
|irainlno,lranapprtatlon charees etc.,
0.000
2.0 Award to best schoolAeacher 0 0.000 0.000 0 0.000 0 0,000 0.000 0 0.000 0 , o.oool o.ooo 0 0.000Siufiant evaluation,Reinedlal
3.0 Tea;hlng.Brldgs courses & alternative Schools
0 0.000 0.000 0 0,000, 0 i
0.000 0.000 0 0.000 0 o.oooj 0.000 0 0.000
4,0 Ijearrirtg ttiroiigh Opan sehooote 0 0.000 0 .000 0 0.000 0 0.000 0,000 • 0 o.oooi oj o.oob! 0.000 0 0.0005.D Teacher Training ' 0 0 .000 0.000 0 0.000 0 o.obo 0,000 0 o.oool 0 o.oool 0,000 0 o.ooo6.0 Child care centers for 2 centers 0 0.000 0,000 0 0.000! 0 o.ooo 0.000 0 o.oooi 61 o.oool 0.000 . 0 0.0007.0 other 0 0.000 0,000 , 0 O.oooi 0 0.000 0,000 0 o.oool 0 | o.oool 0,000 0 0.000
Sub Total 0 0 .000 0.000 0 0.000 0 0.000 0.000 0 0.0001 oj O.oooj 0.000 0 0.000Additional IncenSKres (unUor
0 stallonery, work bpok. escorts In difllcult areas e tc j 1 . i
.
1.0 Primary 0 0 ,000 0.000 0 0.000 0 0.000 0.000 0 o.oool 0 | o.oool 0.000 .0 0.0002,0 lUpper Primary 0 0.000 0.000 0 0,000 0 0.000 0.000 0 o.oooi o| . 0.0001 0.000 ■ 0 0.000
Sub Total 0 O.O0O 0.000 0 0.000 . 0 0 .000 0 .000 0 o.oooi 01 o.oool 0.000 •0 0.000Community Mobilisation 0 0.000 0 .000 0 0,000 0 0.000 0.000 0 o.oool oi 0 -0001. o.ooo 0 ■ 0.000Sub Total ‘ 0 0 .000 0 .000 0 0.000 0 0.000 0.000 0 o.oooj oj . 0.000 ) 0,000 '0 0.000
iltOiOOO it. , ,> 0 4 0 0 BiiiOT.Ooo21 KQBV 1 1 ' 1
20.1 No of KQBVi.«anctloned 0 0 0 0 ° l ' 1 ■0
1 20.2 |Non Recuir^hg 0 , 0 0 0 1 o| ■ • ' J . . . .' ConstnictloA of building 0 0.000 0.000 0 0.000 0 0.000 0.000 0 O.OOOl 0| o.ooo O.OOOI . o l 0 .000t BoundaryWall 0 0.000 0,000 0 0,000 0 0 ,000 0.000 0 o.oooi oi 0.000 0,0001 ■ ol o.ooo lr ’ Boring/Hantf pump 0 0.000 0,000 0 0,0001 0 0.000 0.000 0 o .o o o l 01 -o .ooo l o .ooo ! • oi o.ooo l
ElectrlcltyMater charges . 0 . 0 .000 0.000 0 o.oool d 0,000 0,000 0 o .o oo l 01 o .o o o i 0 .0 00 ' o l O.OOOI2 g |Fumlture / Equipment (including 0 ' ' 0.000 o.ooo , . .J 3 1 1 n n a & i— -------- (Jj o .o io l 01 o .o o o i o .o o o l o i o .ooo i

District-wise «nd inten/ention-wise'summary for 2009-t0 ^SSA, Karnataka
DiBtrIct-wl39 and Intervenllon-wiss summary (or 2009-10 S3A, Karnataka
Annex-
(Rs. In iQkli)
S.No.
Ai
ActMtiea
Udupi Uttara Kannada ' stale Component
Fresh Out lay 2009> 10 Spin over ‘ Totol Outlny Fresh Out lay 2009-10 spill
overTotal Outlay
Fresh O utlay .i009-'to , ’
Spill ^ over 1 Total Outlay
Phy Fin ' Fin Phy Fin. Phy Fin Fin ' 1 Fin Phy 1 Fin ' Fin j Phy 1 Fin
4.0 ' ExamlnaltofiiPee 0 0 ,000 , 0.000 0 0.000 0 0.000 0.000 0 0.000 0! ' • 0,000 r o.booj 01 0.000
5.0
Saiarles . ■ ...................... . 0 ' 0 .000 ' 0.006 0 0,000 0 o.odo 0,000 _ Q 0.000 0 0,00011 0,OQO, O' 0.0.00^1.0ne Warden - 12.' Four lull lim'e isaohers ■
two urdu laachsrstonly tor blocks with rnijsllm posulatlon above 20% and selelctsd urban areas)lf requiren
•
3. Three part lima teachers : 14 .0ns full tlm’s accountant 1S. Two Suap^qrtslaH(aceoJnt«ssistani/Chowi(War/Pe onl '1 <
1 1
e.TDna fwad Cook and one assistant cook tor 50 gills and 2 assistant cok (or 100 alrls 1
i
6.0 Vocational triining / specific skill irg 0 0.000 0.000 0 | 0.000 0 0.000 0.000 0 0.000 oj 0,000 0.000 0 o.oop
7.0 Elsctrlclly / water eharpas . o' 0.000 o.oool ol o.oool 0 0.0001 0,000 0 0,000 0 0,060 0.600 0 : 0.000
8.0Medical care/contlnssndes €> Rs.750/- par girl. 0 | 0.000 . 0.000 0 0.000 Ol 0.000 0,000 0 0.000 0 0.000 0,000 0.000
9.0 Misc. Including maintenanca o' 0,000 0.000 0 0,000 O' 0.000 0.006 0 0.000 0 0.000 0.000 1 ' ol 0.00010.0 PrBparatory'camps- o' 0.000 0.000 . 0 r 0,060 0 0.000 0.000 0 0.000 0 0.000 0 .000 ' d! 0,00011,0 P.T.A/ school junctions 0 0.000 0.000 0 0.000 0 0.000 0 .000 . 0 0.000 0 ! o,o(jo 0.000 ol 0.00012.0 Provision of Rent (fimontfis) 0 0.000 0.000 0 0.000 0 0.000 o.oool ol 0.000 0 0.000 0.000 6! 0.00013.0 Capacity Building"* 0 | 0.000 o;ooo 0 0.000 0 , 0.600 0.000 0 0.000 0 i . 0.000 0.000 ol 0,000
Total Racurrtno 0 ’ 0.000 0.000 0 0.000 0 0.000 0.000 0 0.000 0 1 O.OOO 0.000 0 0,000
^ .o b o i i i i i S i i ?
im m t
o

District-wise and intervention-wise summary for 2009*10SSA. KarnBtaks
(R». In lekh)
DUtrict-wiSfl ano intervention-wiso summery ror 2009*10 SSA, Karnataka
A nn e x-
(Rs. tn la k b )
Grand Total
S.No. Activities Fresh Out lay 2009-10 Spillover Total Outlay
Phy Fin Fin Phv Fin7.8 Madrasa / Makthab 9787 293.610 0.000 9787 293 .6107,9 NCLP Schools 4639 145,170 0.000 4839 145.170
0.0 Summer Remedial TeacWrg ■ Chaitrada Chiauru 74470 372,350 0,000 74470 372.350
0.1 A months seasonal residential school 50 1.650 0.000 50 1.650
8.2 Bridge course ■ Chlnnara Angala . 10000 50.000 0,000 10000 50.000
8.3 Hpme Based Education 14720 441.600 0,000 14720 441.600
0.4 Bridge course - Chlnnara Angala Resl-2 months 7802 132.634 0,000 7802 132.634
0.S AIE Centers! Transportation, Hardest to reach children) 1476 44.280 0.000 1476 44.280
8.6 Innovation Urban Deprived Children o: 0.000 0.000 0 0.000
8.7 Special Enrolment Drive 4530 0.000 0.000 4530 0.000Sub Total 182507 5096.419 0^000 182507 5066.419
B Remedial Taaching '8,1 Remldlal teaching 311985 623.970 0,000 311985 623.9708.2 Motivation through field trips 0 0,000 0.000 0 0,000
Sub TQtal 311985 623.970 0.000 311985 623.9709 Free te x t Book
9.1 Pr»e text book for l-V std ail children of sided schools
437537 350.030 0.000 437537 350.030
9.2 Free text book for VI-VIII std all children of aided schools 472852 614.708 0,000 472852 614 .708
9.3 Work books for Nall Kali 0 0,000 0.000 0 0,000Sub Total 910389 964.737 0.000 910389 964.737
10 Intsrventlon* fo r CWSN10.1 Provision of disabled children 121153 1453,836 0.000 121153 1453.836
Sub Total 121153 1453.636 0.000 121153 1453.83611 Civil Works •
11.1 8RC 0 ‘ 0 .000 0,000 0 0.00011.2 CRC 0 0 .000 0,000 0 0 .00011.3 School Buildings 317 2853.000 0.000 317 2853 ,00011.4 DilapMated , 0 0 .000 0.000 0 0 .00011.5 Building ;teSs<Pry) 0 0.000 o.ooo 0 0 ,0001V6 Building tess (UP) 0 0.000 0.000 0 0 .00011,7 Dilapidated Building (Pr/) 0 0,000 O.QOO 0 0 .00011.8 Additional class rooms 4547 21370,900 0,0001 4547 2 1370 .900
11.9 Additional Class Room to Bangalore Metro Citv ■ 222 1 22 9 ,880 ' 0,000.. 222 1229,880
I 11.10 Toilets/Urinals ‘ 0 0 ,000 . 0 .000. 0 0 .0001 11.i i ' S m xH aw fiM iToM . i in i j i . W ' n 'lV vn 1:>T09 /VVl

SSA, K a r n n tn k a
(Rs. In lakh)
S.No. Activities
Grand Total
FrethO utley 2009-10 Spillover Total Outlay
PhY Fin Fin Phy Fin
lUaintananra nf trh n n it natt lima____
OistricVwlse and intervention-wise summary for 2009-10 SSA. Karnataka
Annex-
(Rs. in lakh)
S.No. Activities
Grand Total
Fresh Out lay 2009-10 Spillover Total Outlay
Phy Fin Fin Phy Fin11.15 Electrification 0 0 , 0 0 0 o:ooo 0 0 , 0 0 0
11.16 H«ad Master's Room 0 0 . 0 0 0 0 . 0 0 0 0 0 . 0 0 0
11.17 Child Frlandiy elements 0 0 , 0 0 0 0 . 0 0 0 0 0 . 0 0 0
11,18 Kitchen shed 0 0 . 0 0 0 0 . 0 0 0 0 0 . 0 0 0
11.19 Residential Hostel 0 0 . 0 0 0 0 . 0 0 0 0 0 . 0 0 0
11.20 Major Repairs (Primary) 0 0 . 0 0 0 0 . 0 0 0 0 0 . 0 0 0
11.21 Major Repairs (Upper Primary) 0 0 . 0 0 0 0 . 0 0 0 0 0 . 0 0 0
11.22 Additional Rooms lor CA1.C & Edusai 0 0 . 0 0 0 •0.000 0 0 . 0 0 0
11.23 special Toilets for CWSN 1548 774,000 0 . 0 0 0 1548 774.000
11.24 Setting up of Solar Photo Voltaic to existlna CALC schools
0 0 . 0 0 0 o.'ooo 0 0 . 0 0 0
11.25 Setting up of Solar Plioto Voltaic to new CALC schools 0 0 , 0 0 0 0 . 0 0 0 0 0 . 0 0 0
Sub Total o f Civil works 19426 29425.780 0.000 19426 29425.78011.26 Furniture for Qovt. UPS11.27 No. of children • 0 0 , 0 0 0 0 , 0 0 0 0 0 . 0 0 0
Sub Total (Furniture) 0 0 . 0 0 0 0.000 0 0.000
Sub Total(Clvll + Furniture) 19426 29425.780 0.000 19426 29425.780
12 Teaching Learnlnjg Equlpinent12.1 TLE for new schools 317 63,400 0 , 0 0 0 317 63,40012.2 TLE for upgraded schools 130 65.000 0 , 0 0 0 130 65,00012.3 Others 0 0 . 0 0 0 0 , 0 0 0 0 0 , 0 0 0
Sub Total 447 128.400 0.000 447 128.40013 Maintenance Grant 67236 4624.700 0 , 0 0 0 67236 4624.700
13.1 LPS with <3 rooms 0 0 . 0 0 0 0 , 0 0 0 0 0 . 0 0 0
13.2 LPS with >3 rooms 0 0 . 0 0 0 0 . 0 0 0 0 0 . 0 0 0
13.3 UPS with <6 rooms 0 0 . 0 0 0 0 . 0 0 0 0 0 . 0 0 0
13.4 UPS with>6 rooms 0 0 . 0 0 0 0 , 0 0 0 0 0 . 0 0 0
Sub Total 67236 4624.700 0.000 67236 4624.700U School Grant 1
14.1 Primary School 47946 2397,300 0 , 0 0 0 47946 2397.30014.2 Upper Primary School | 24511 1715,770 0 , 0 0 0 24511 1715.770
Sub Total ■ 72457 4113.070 0.000 72457 4113.070Evflluatlon

District-Wise end intervention-wise summary for 2009-10SSA, KarnatakB
Annex-
(R». in lakh)
Qrand Total
S.No, Activities Fresh Out lay 2009-10 Spiiiover Total Outlay
Phy , Fin Fin Phy Fin17.2 Girls Education 0 0.000 0.000 0 0.00017.3 SC/ST 29 435.000 0.000 29 435,000
aiU ) I u ) :- - J : O :
2 :cw
>
on
![Colombia - Loan 2611 - P006794 - Staff Appraisal Report [SAR]](https://static.fdokumen.com/doc/165x107/6328219a6d480576770d9dea/colombia-loan-2611-p006794-staff-appraisal-report-sar.jpg)