Single Technology Appraisal Tafamidis for treating ... - NICE
Upload
khangminh22Category
view
1download
0
© National Institute for Health and Care Excellence 2019. All rights reserved. See Notice of Rights. The content in this publication is owned by multiple parties and may not be re-used without the permission of the relevant copyright owner.
Single Technology Appraisal
Lenalidomide for previously untreated multiple myeloma [ID474]
Committee Papers
© National Institute for Health and Care Excellence 2019. All rights reserved. See Notice of Rights. The content in this publication is owned by multiple parties and may not be re-used without the permission of the relevant copyright owner.
NATIONAL INSTITUTE FOR HEALTH AND CARE EXCELLENCE
SINGLE TECHNOLOGY APPRAISAL
Lenalidomide for previously untreated multiple myeloma [ID474] Contents: The following documents were considered by the Committee at a meeting on 1 February 2018: 1. Pre-Meeting Briefing
2. Final Scope and Final Matrix of Consultees and Commentators
3. Company submission from Celgene
4. Clarification letters
• NICE request to the company for clarification on their submission
• Company response to NICE’s request for clarification
5. Patient group, professional group and NHS organisation submission from:
• Leukaemia CARE
• Myeloma UK
• UK Myeloma Forum (UKMF)
• NHS England The NCRI-ACP-RCP endorsed the UKMF statement
6. Expert statements from:
• Dr Karthik Ramasamy, Consultant Haematologist, Oxford University Hospitals – clinical expert, nominated by Celgene
• Dr Matthew Streetly, Consultant Haematologist, Guys and St. Thomas NHS Foundation Trust – clinical expert, nominated by the UKMF
7. Evidence Review Group report prepared by Southampton Health Technology Assessment Group The Evidence Review Group report was updated after the factual accuracy check to correct the errors identified
8. Evidence Review Group report – factual accuracy check
After the February 2018 meeting the company replaced their complex Patient Access Scheme with a simple discount. The following documents were considered by the Committee: 9. The steps to replace the lenalidomide complex patient access scheme
(PAS) with a simple discount – March 2019 from Celgene
10. Evidence Review Group critique of March 2019 document – prepared by the Peninsular Technology Assessment Group
© National Institute for Health and Care Excellence 2019. All rights reserved. See Notice of Rights. The content in this publication is owned by multiple parties and may not be re-used without the permission of the relevant copyright owner.
Any information supplied to NICE which has been marked as confidential, has been
redacted. All personal information has also been redacted.
Pre-meeting briefingLenalidomide in combination with dexamethasone for previously untreated multiple myeloma [ID474]
This slide set is the pre-meeting briefing for this appraisal. It has been prepared
by the technical team with input from the committee lead team and the committee
chair. It is sent to the appraisal committee before the committee meeting as part
of the committee papers. It summarises:
• the key evidence and views submitted by the company, the consultees and
their nominated clinical experts and patient experts and
• the Evidence Review Group (ERG) report
It highlights key issues for discussion at the first appraisal committee meeting and
should be read with the full supporting documents for this appraisal
Please note that this document includes information from the ERG before the
company has checked the ERG report for factual inaccuracies.
The lead team may use, or amend, some of these slides for their presentation at
the Committee meeting
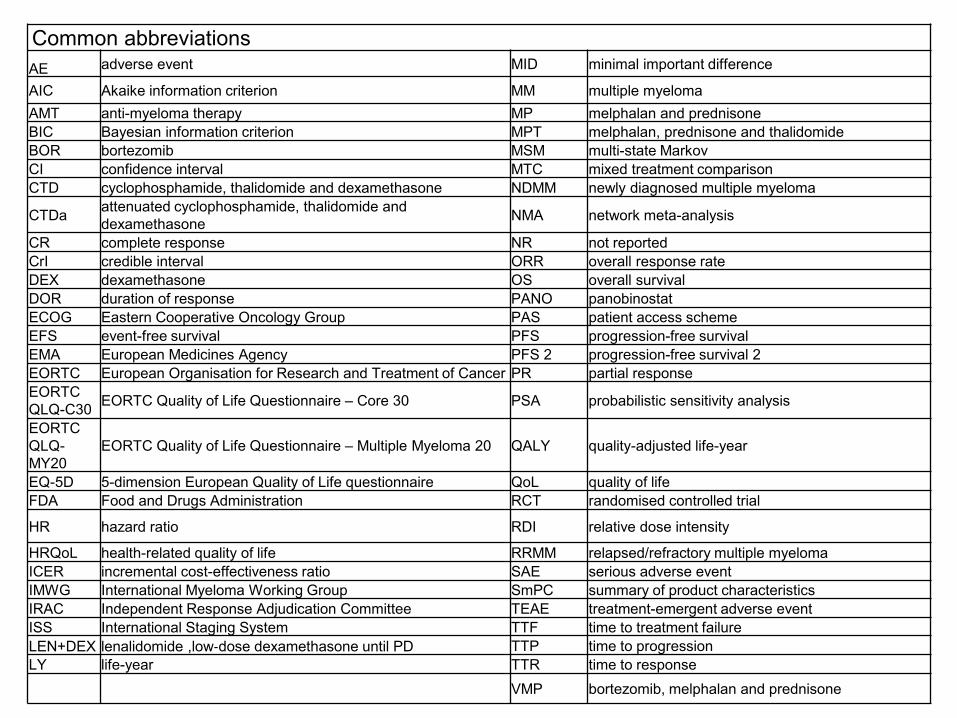
Common abbreviations
AE adverse event MID minimal important difference
AIC Akaike information criterion MM multiple myeloma
AMT anti-myeloma therapy MP melphalan and prednisone
BIC Bayesian information criterion MPT melphalan, prednisone and thalidomide
BOR bortezomib MSM multi-state Markov
CI confidence interval MTC mixed treatment comparison
CTD cyclophosphamide, thalidomide and dexamethasone NDMM newly diagnosed multiple myeloma
CTDaattenuated cyclophosphamide, thalidomide and
dexamethasone NMA network meta-analysis
CR complete response NR not reported
CrI credible interval ORR overall response rate
DEX dexamethasone OS overall survival
DOR duration of response PANO panobinostat
ECOG Eastern Cooperative Oncology Group PAS patient access scheme
EFS event-free survival PFS progression-free survival
EMA European Medicines Agency PFS 2 progression-free survival 2
EORTC European Organisation for Research and Treatment of Cancer PR partial response
EORTC
QLQ-C30EORTC Quality of Life Questionnaire – Core 30 PSA probabilistic sensitivity analysis
EORTC
QLQ-
MY20
EORTC Quality of Life Questionnaire – Multiple Myeloma 20 QALY quality-adjusted life-year
EQ-5D 5-dimension European Quality of Life questionnaire QoL quality of life
FDA Food and Drugs Administration RCT randomised controlled trial
HR hazard ratio RDI relative dose intensity
HRQoL health-related quality of life RRMM relapsed/refractory multiple myeloma
ICER incremental cost-effectiveness ratio SAE serious adverse event
IMWG International Myeloma Working Group SmPC summary of product characteristics
IRAC Independent Response Adjudication Committee TEAE treatment-emergent adverse event
ISS International Staging System TTF time to treatment failure
LEN+DEX lenalidomide ,low‐dose dexamethasone until PD TTP time to progression
LY life-year TTR time to response
VMP bortezomib, melphalan and prednisone

Multiple myelomaDisease background
• Bone marrow cancer affecting plasma cells (a type of white blood cell)
• Cancerous plasma cells produce large amounts of an abnormal antibody
known as paraprotein, which supress the production of normal blood
cells (white, red and platelets). Paraproteins do not have the capacity to
fight infection.
• Common symptoms
• Bone pain, fractures, anaemia, infections, hypercalcaemia
• Characterised by multiple relapses
• Incidence and survival
• 5,501 people diagnosed in the UK in 2014, that is 2% of all cancer
diagnoses
• 45% of diagnoses in people aged 75 and over (2012 to 2014)
• 5-year survival rate is approximately 47%3

CONFIDENTIAL
Marketing
authorisation
Indicated as combination therapy for people with Newly
Diagnosed Multiple Myeloma (NDMM) who are not
eligible for transplantation
Administration
& dose
• Oral, 25 mg/day on days 1–21 of a 28 day cycle. Taken
until disease progression or unacceptable toxicity
• Contraindications for lenalidomide are the same as
thalidomide: pregnancy and hypersensitivity
Mechanism of
action
A structural analogue of thalidomide. Has anti-neoplastic,
anti-angiogenic, pro-erythropoeitic and
immunomodulatory properties.
Cost New approved complex PAS where cost of lenalidomide
is capped at ** cycles (previously 26 cycles)
Average cost per course without PAS: £*******
Average cost per course with PAS: £******
Source: Table B.2 (page 15-16), company submission
Lenalidomide (Revlimid) Celgene
4
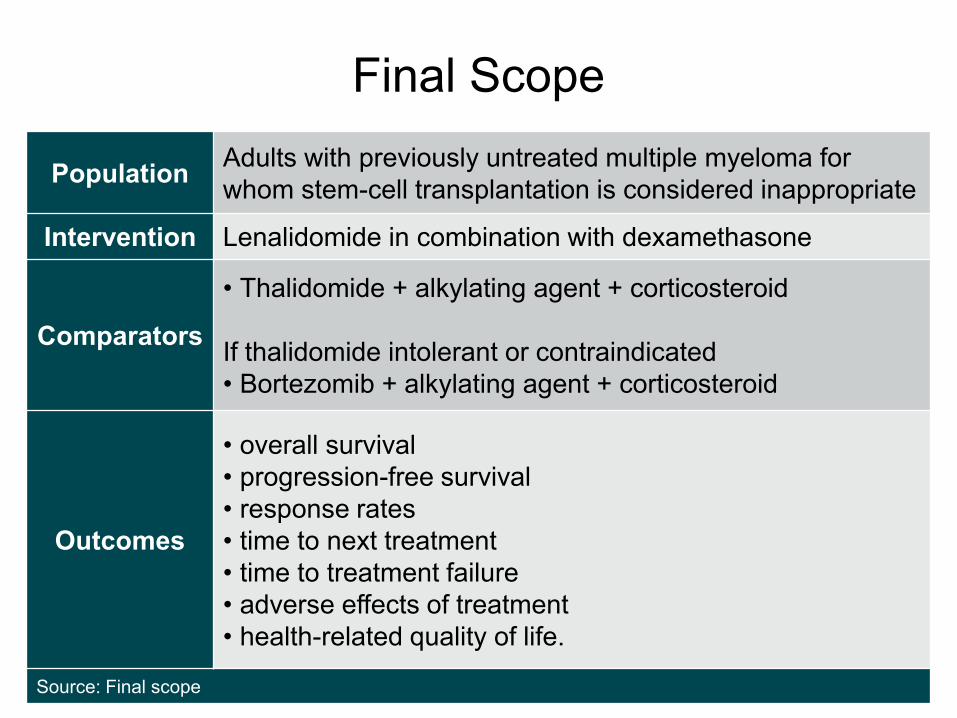
Final Scope
5
PopulationAdults with previously untreated multiple myeloma for
whom stem-cell transplantation is considered inappropriate
Intervention Lenalidomide in combination with dexamethasone
Comparators
• Thalidomide + alkylating agent + corticosteroid
If thalidomide intolerant or contraindicated
• Bortezomib + alkylating agent + corticosteroid
Outcomes
• overall survival
• progression-free survival
• response rates
• time to next treatment
• time to treatment failure
• adverse effects of treatment
• health-related quality of life.
Source: Final scope
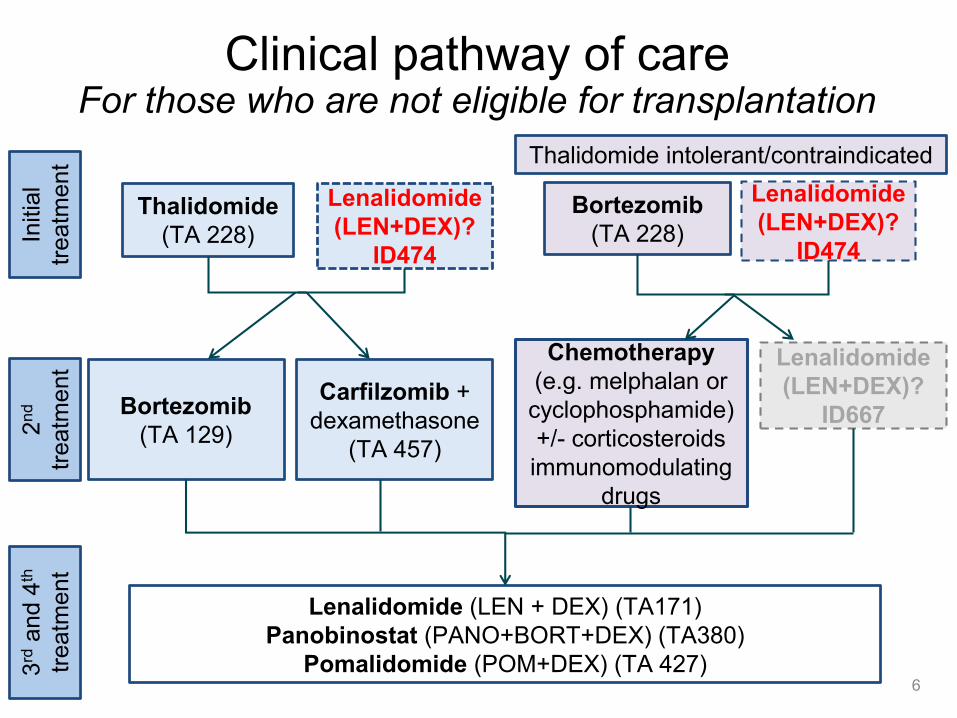
Clinical pathway of careFor those who are not eligible for transplantation
6
Thalidomide
(TA 228)
Lenalidomide (LEN + DEX) (TA171)
Panobinostat (PANO+BORT+DEX) (TA380)
Pomalidomide (POM+DEX) (TA 427)
Bortezomib
(TA 228)
Bortezomib
(TA 129)
Chemotherapy
(e.g. melphalan or
cyclophosphamide)
+/- corticosteroids
immunomodulating
drugs
2n
d
treatm
ent
3rd
and 4
th
treatm
ent
Initia
l
treatm
ent
Lenalidomide
(LEN+DEX)?
ID474
Lenalidomide
(LEN+DEX)?
ID474
Thalidomide intolerant/contraindicated
Carfilzomib +
dexamethasone
(TA 457)
Lenalidomide
(LEN+DEX)?
ID667

Company’s decision problem
7
MPT
(thalidomide +
melphalan +
prednisone)
VMP
(bortezomib +
melphalan +
prednisone)
Initia
l
treatm
ent
Lenalidomide
(LEN+DEX)?Lenalidomide
(LEN+DEX)
Thalidomide intolerant/contraindicated
CTD (cyclophosphamide
+ thalidomide +
dexamethasone) not
considered relevant
because unlicensed,
and clinically equivalent
to MPT, with similar
costs
Company explicitly focus value
proposition on thalidomide intolerant or
contraindicated population, as
LEN+DEX not cost effective when
compared with thalidomide
Subsequent therapies
Company model that people have subsequent treatment or retreatment with
thalidomide, bortezomib or lenalidomide based regimes

Company’s decision problemERG comments
• A meta-analysis published as a conference abstract identified by the
ERG indirectly compared MPT with CTD and reported no difference
between the 2 in PFS and OS
• Expert advice to the ERG estimates that around 50% of patients may be
intolerant or contraindicated to thalidomide. Intolerance is subjective and
factors influencing the choice of treatment vary
• Whilst adverse effects of thalidomide can be difficult to tolerate some
patients still prefer thalidomide as it is an oral therapy in comparison to
bortezomib which is administered either intravenously or subcutaneously
• Cyclophosphamide, bortezomib and dexamethasone (CVD) is an
alternative bortezomib-based 1st line treatment used in the UK.
• The ERG notes that it is unlicensed for 1st line use
• Searches did not identify any relevant trial evidence that would allow it to be
compared to lenalidomide.
8

Patient expert comments
• Patients and their carers place a very high value on treatments that put
their myeloma into remission for as long as possible, prolong their life and
allow them to enjoy normal day-to-day life
• Range of symptoms including bone pain, tiredness, unexplained weight
loss, frequent and persistent infections etc. These can collectively and
individually impact hugely on patients’ quality of life
• Unmet need for treatments with a different mechanism of action. Some
patients may tolerate a treatment well and others may not
• Lenalidomide may be of particular benefit to people who have peripheral
neuropathy (either pre-existing or drug related), as they cannot take
thalidomide and are also unlikely to tolerate bortezomib
• Most patients welcome the option of an oral regimen
• Frail and elderly patients, who are more susceptible to side-effects, would
benefit particularly from a two drug rather than a three drug combination9
Clinical expert comments
• Generally in the UK for those receiving thalidomide-based treatment,
CTD is used in preference to MPT as this was one of the arms of the
UK-based Myeloma IX trial that influenced clinical practice significantly
• MPT is considered relatively equivalent to CTD
• Lenalidomide results in better quality of life compared with CTD/MPT
due to much lower rate of peripheral neuropathy
• Quality of life is also likely to be improved due less hospital attendance
and ease of administration
• Main concomitant medication required with lenalidomide is the use of
aspirin or low molecular weight heparin to reduce the risk of thrombosis
(this is also required for thalidomide-based treatments)
• Key benefit of lenalidomide is being able to treat elderly age group and
people with neuropathy
10
Clinical effectiveness evidence
Company submission section 4
11
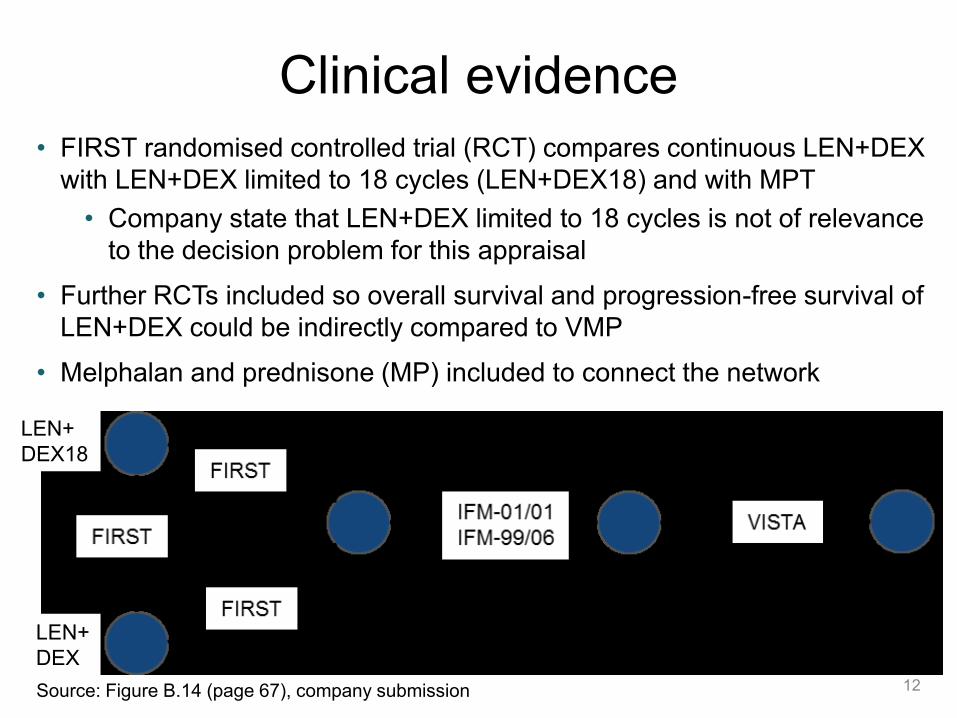
Clinical evidence
12
• FIRST randomised controlled trial (RCT) compares continuous LEN+DEX
with LEN+DEX limited to 18 cycles (LEN+DEX18) and with MPT
• Company state that LEN+DEX limited to 18 cycles is not of relevance
to the decision problem for this appraisal
• Further RCTs included so overall survival and progression-free survival of
LEN+DEX could be indirectly compared to VMP
• Melphalan and prednisone (MP) included to connect the network
Source: Figure B.14 (page 67), company submission
LEN+
DEX18
LEN+
DEX
Clinical evidenceERG comments
13
• Evidence for lenalidomide is based on a large international multi-centre
RCT (n=1623 patients randomised), included a range of relevant
outcomes measures, and had mature results (median follow-up of 67
months)
• No significant differences between age, gender, race or biochemical
parameters between treatment arms in the FIRST trial
• All the RCTs in the network are of good methodological quality and have
been included in previous NICE appraisals
• However, none of the included trials specifically recruited people who
were intolerant or who had contraindications to thalidomide
• Clinical expert advice to the ERG suggests that results would unlikely
to be different in those patients
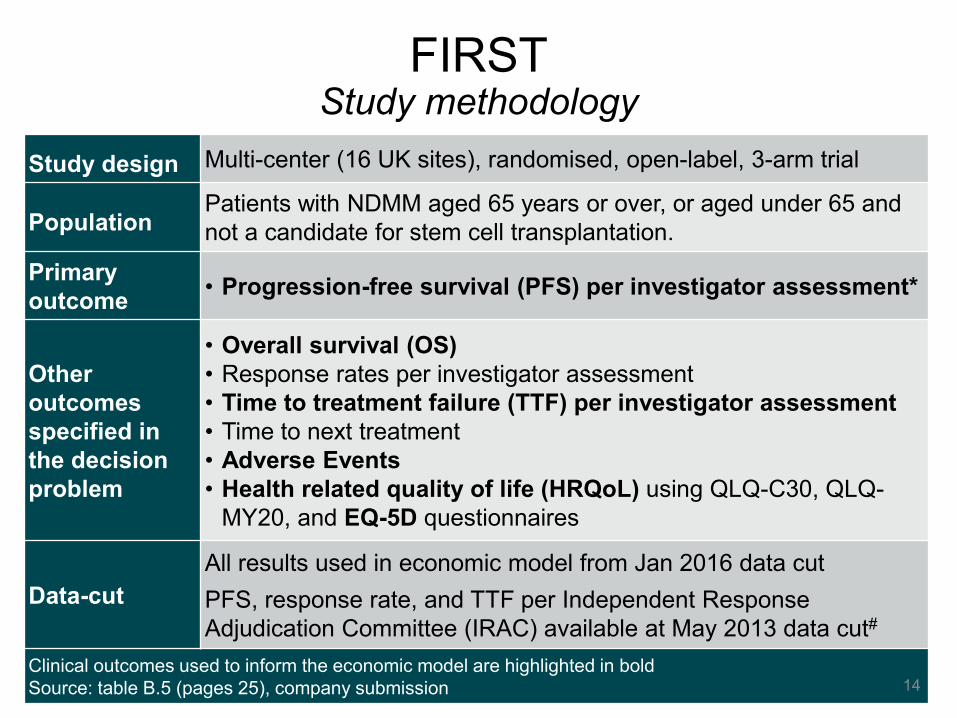
Study design Multi-center (16 UK sites), randomised, open-label, 3-arm trial
PopulationPatients with NDMM aged 65 years or over, or aged under 65 and
not a candidate for stem cell transplantation.
Primary
outcome• Progression-free survival (PFS) per investigator assessment*
Other
outcomes
specified in
the decision
problem
• Overall survival (OS)
• Response rates per investigator assessment
• Time to treatment failure (TTF) per investigator assessment
• Time to next treatment
• Adverse Events
• Health related quality of life (HRQoL) using QLQ-C30, QLQ-
MY20, and EQ-5D questionnaires
Data-cut
All results used in economic model from Jan 2016 data cut
PFS, response rate, and TTF per Independent Response
Adjudication Committee (IRAC) available at May 2013 data cut#
Clinical outcomes used to inform the economic model are highlighted in bold
Source: table B.5 (pages 25), company submission
FIRSTStudy methodology
14
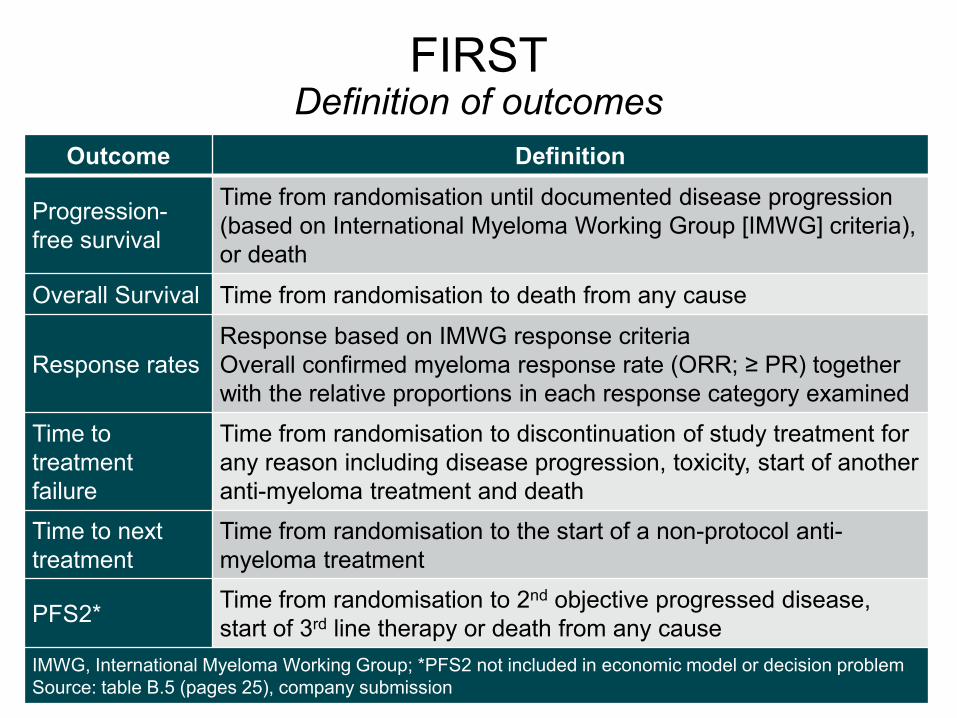
FIRSTDefinition of outcomes
15
Outcome Definition
Progression-
free survival
Time from randomisation until documented disease progression
(based on International Myeloma Working Group [IMWG] criteria),
or death
Overall Survival Time from randomisation to death from any cause
Response rates
Response based on IMWG response criteria
Overall confirmed myeloma response rate (ORR; ≥ PR) together
with the relative proportions in each response category examined
Time to
treatment
failure
Time from randomisation to discontinuation of study treatment for
any reason including disease progression, toxicity, start of another
anti-myeloma treatment and death
Time to next
treatment
Time from randomisation to the start of a non-protocol anti-
myeloma treatment
PFS2*Time from randomisation to 2nd objective progressed disease,
start of 3rd line therapy or death from any cause
IMWG, International Myeloma Working Group; *PFS2 not included in economic model or decision problem
Source: table B.5 (pages 25), company submission

FIRSTPatient Characteristics
Characteristic
FIRST (n = 1,623*)
LEN+DEX (n = 535) MPT (n = 547)
Median age, years (min–max)
73.0 (44.0–91.0)
73.0 (51.0–92.0)
% ≤ 75 years / >75 yearsa 65.2 / 34.8 65.6 / 34.4
Male, n (%) 294 (55.0) 287 (52.5)
% RaceAsian / Black / Caucasian 7.5 / 1.7 / 88.6 8.0 / 0.9 / 89.8
% ECOG PS 0 / 1 / 2 / ≥3 29.0 / 48.0 / 22.2 28.5 / 50.3 / 20.3
% ISS stagingb
Stage I or II / Stage III 59.6 / 40.4 59.0 / 41.0
% Cytogenetic riskc
Adverse / non-adverse risk / favourable hyperdiploidy / normal
31.8 / 55.7 /20.9 / 27.1
34.6 / 51.6 /18.6 / 25.8
Multiple myeloma subtype
IgA / IgG / Not available#
#Includes light chain disease25.8 / 62.4 / 9.2 22.5 / 64.0 / 11.0
Source: adapted from table B.12 (page 35-37), company submission 16
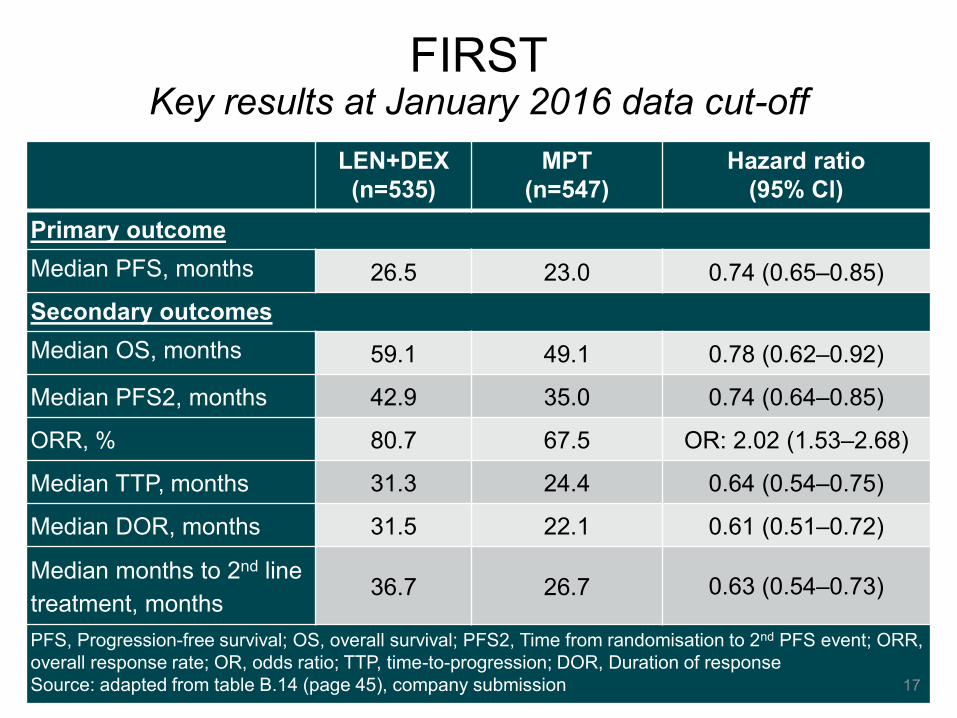
FIRSTKey results at January 2016 data cut-off
LEN+DEX
(n=535)
MPT
(n=547)
Hazard ratio
(95% Cl)
Primary outcome
Median PFS, months 26.5 23.0 0.74 (0.65–0.85)
Secondary outcomes
Median OS, months 59.1 49.1 0.78 (0.62–0.92)
Median PFS2, months 42.9 35.0 0.74 (0.64–0.85)
ORR, % 80.7 67.5 OR: 2.02 (1.53–2.68)
Median TTP, months 31.3 24.4 0.64 (0.54–0.75)
Median DOR, months 31.5 22.1 0.61 (0.51–0.72)
Median months to 2nd line
treatment, months36.7 26.7 0.63 (0.54–0.73)
PFS, Progression-free survival; OS, overall survival; PFS2, Time from randomisation to 2nd PFS event; ORR,
overall response rate; OR, odds ratio; TTP, time-to-progression; DOR, Duration of response
Source: adapted from table B.14 (page 45), company submission 17
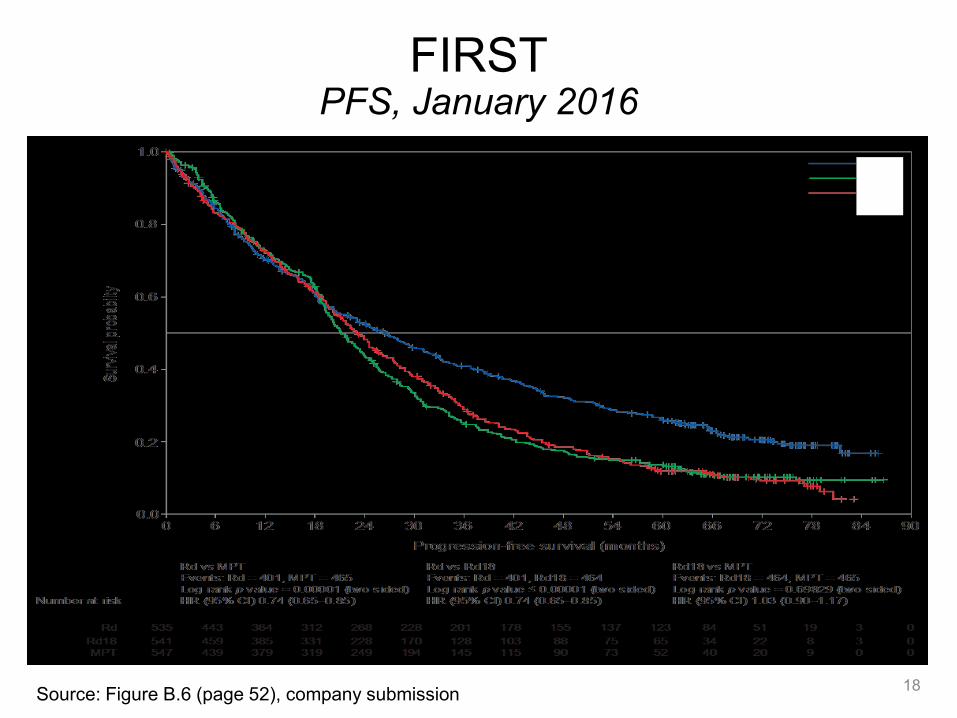
FIRSTPFS, January 2016
18Source: Figure B.6 (page 52), company submission
LEN+DEX
LEN+DEX18
MPT
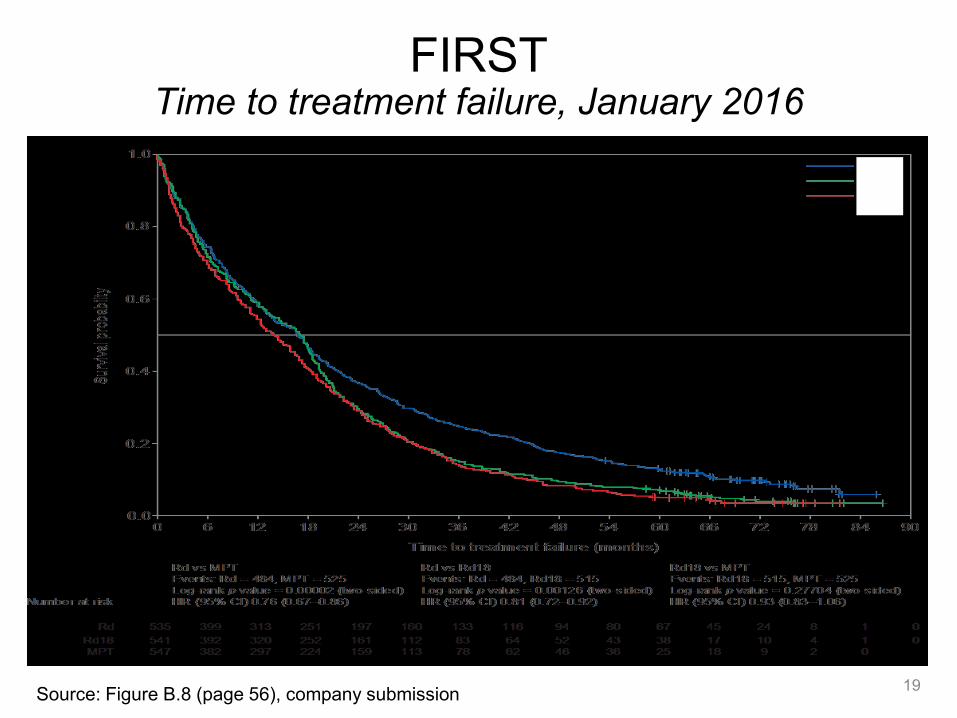
FIRSTTime to treatment failure, January 2016
19Source: Figure B.8 (page 56), company submission
LEN+DEX
LEN+DEX18
MPT
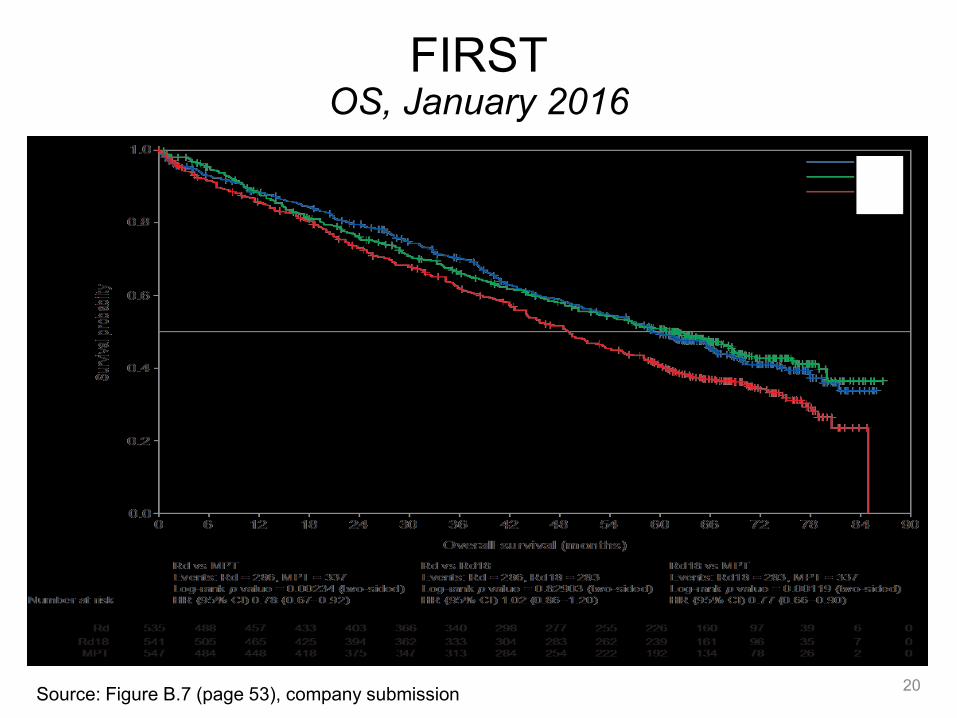
FIRSTOS, January 2016
20Source: Figure B.7 (page 53), company submission
LEN+DEX
LEN+DEX18
MPT
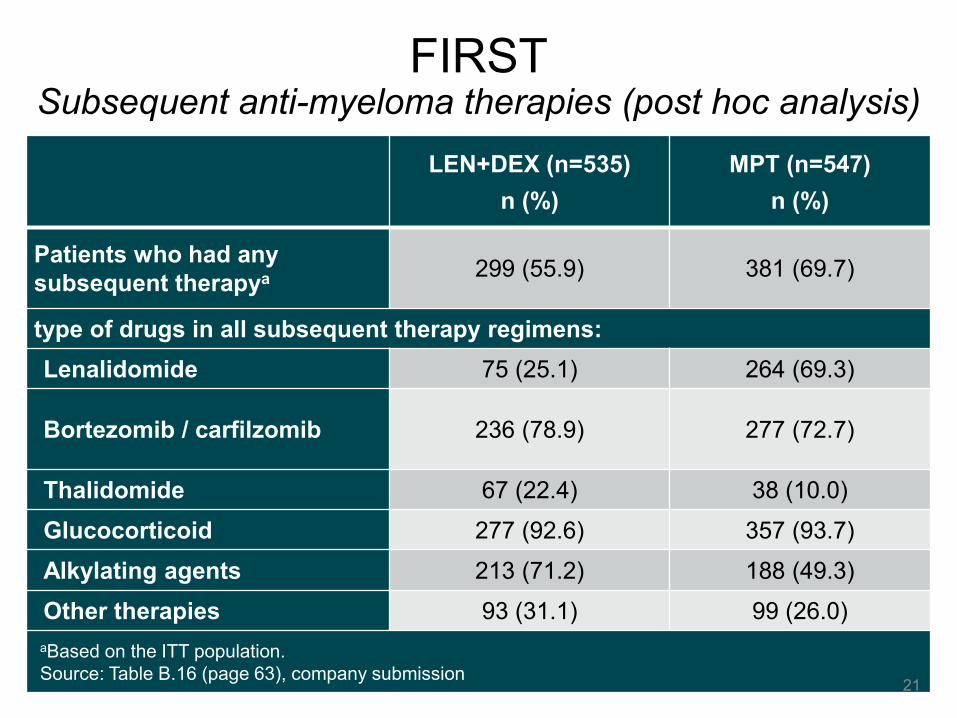
FIRSTSubsequent anti-myeloma therapies (post hoc analysis)
LEN+DEX (n=535)
n (%)
MPT (n=547)
n (%)
Patients who had any
subsequent therapya 299 (55.9) 381 (69.7)
type of drugs in all subsequent therapy regimens:
Lenalidomide 75 (25.1) 264 (69.3)
Bortezomib / carfilzomib 236 (78.9) 277 (72.7)
Thalidomide 67 (22.4) 38 (10.0)
Glucocorticoid 277 (92.6) 357 (93.7)
Alkylating agents 213 (71.2) 188 (49.3)
Other therapies 93 (31.1) 99 (26.0)
aBased on the ITT population.
Source: Table B.16 (page 63), company submission21
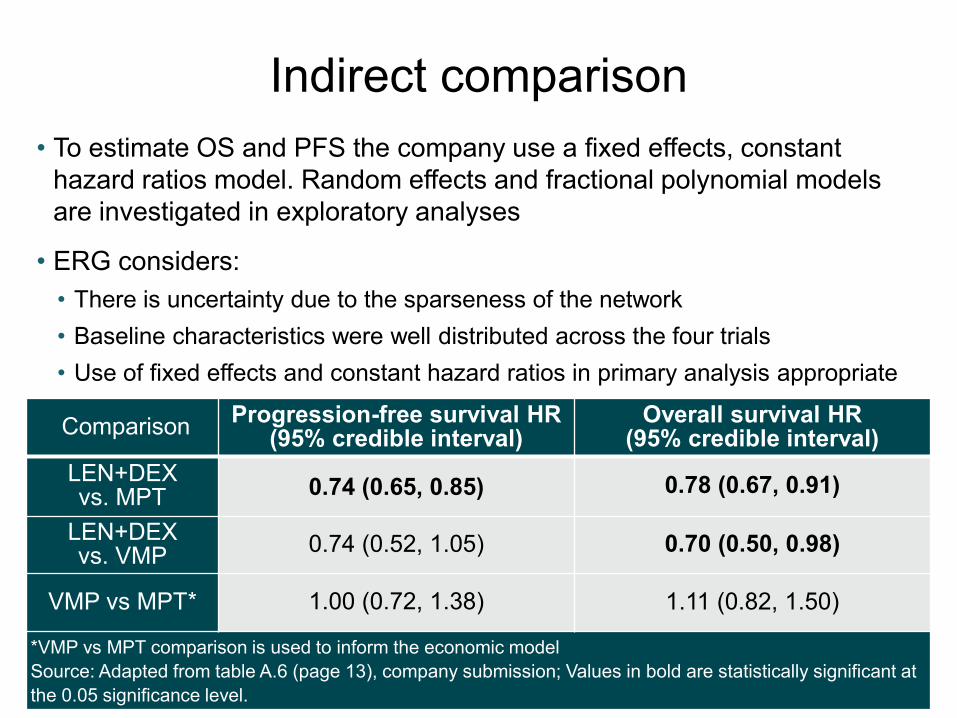
Indirect comparison
22
ComparisonProgression-free survival HR
(95% credible interval)Overall survival HR
(95% credible interval)
LEN+DEX vs. MPT 0.74 (0.65, 0.85) 0.78 (0.67, 0.91)
LEN+DEX vs. VMP
0.74 (0.52, 1.05) 0.70 (0.50, 0.98)
VMP vs MPT* 1.00 (0.72, 1.38) 1.11 (0.82, 1.50)
*VMP vs MPT comparison is used to inform the economic model
Source: Adapted from table A.6 (page 13), company submission; Values in bold are statistically significant at
the 0.05 significance level.
• To estimate OS and PFS the company use a fixed effects, constant
hazard ratios model. Random effects and fractional polynomial models
are investigated in exploratory analyses
• ERG considers:
• There is uncertainty due to the sparseness of the network
• Baseline characteristics were well distributed across the four trials
• Use of fixed effects and constant hazard ratios in primary analysis appropriate

Health-related quality of life (HRQoL)EQ-5D
23
• EQ-5D-3L data collected from FIRST trial used in the economic model
• No difference between LEN+DEX and LEN+DEX limited to 18 cycles, so
company pooled results to compare with MPT
• ERG assessed unpooled HRQoL and concluded pooling appropriate
• Statistically significant improvements from baseline, but no statistically
significant difference between arms
Source: Figure B.11 (page 61), company submission
• Only EORTC VMP HRQoL data
from the VISTA trial (see next
slide)
• VMP EQ-5D values obtained by
mapping from EORTC data
LEN+DEX
MPT

Health-related quality of life (HRQoL)EORTC QLQ-C30
24
• VMP showed clinically meaningful, transitory HRQoL decrements with
VMP and relatively lower HRQoL vs. MP during early treatment cycles
• No significant differences reported between treatment groups for
LEN+DEX and MPT, although LEN+DEX demonstrated significantly
greater reduction in disease symptoms and side effects of treatment
FIRST trial VISTA trial
Source: Figure B.9 (page 59), company submission and Figure 1, Delforge 2012
LEN+DEX
MPT
Adverse events
25
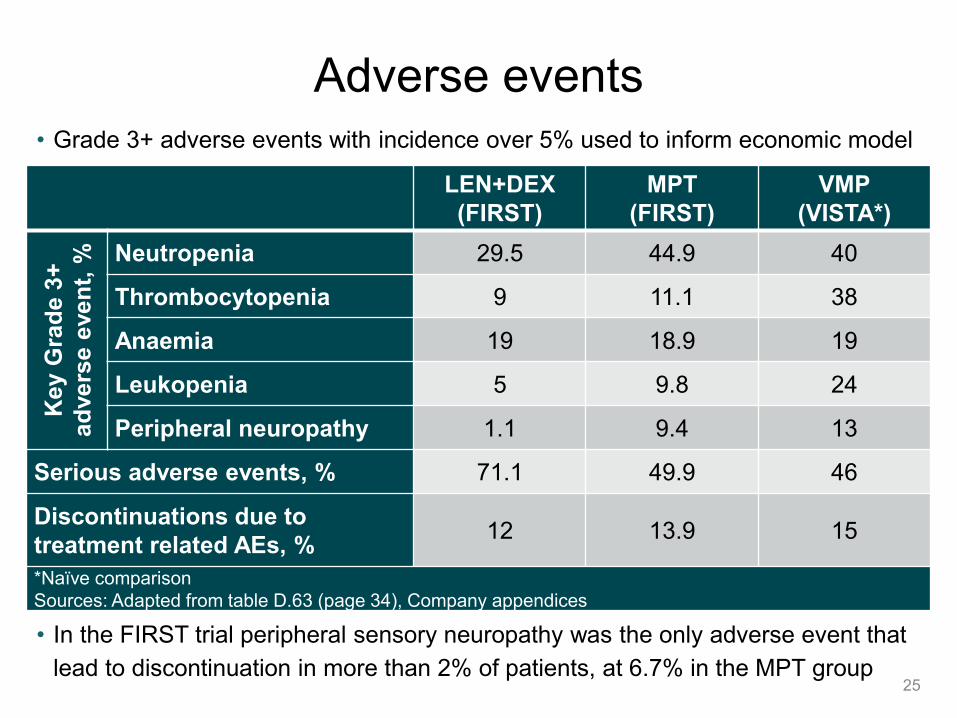
• Grade 3+ adverse events with incidence over 5% used to inform economic model
• In the FIRST trial peripheral sensory neuropathy was the only adverse event that
lead to discontinuation in more than 2% of patients, at 6.7% in the MPT group
LEN+DEX
(FIRST)
MPT
(FIRST)
VMP
(VISTA*)
Key
Gra
de 3
+
ad
vers
e e
ven
t, % Neutropenia 29.5 44.9 40
Thrombocytopenia 9 11.1 38
Anaemia 19 18.9 19
Leukopenia 5 9.8 24
Peripheral neuropathy 1.1 9.4 13
Serious adverse events, % 71.1 49.9 46
Discontinuations due to
treatment related AEs, %12 13.9 15
*Naïve comparison
Sources: Adapted from table D.63 (page 34), Company appendices

Key issues for considerationClinical evidence
26
• Where will the technology be used in the treatment pathway?
• Is it acceptable to focus the value proposition on those
unable to have thalidomide?
• Do the comparator regimes chosen by the company
represent established NHS practice in England?
• Do the subsequent treatment therapies used in the trial
company represent NHS practice in England?
• Is the clinical evidence generalisable to UK clinical practice
for people who are unable to take thalidomide?
• Is the company’s approach to the indirect comparison
appropriate to make a comparison of LEN+DEX vs. VMP?
• Is the technology clinically effective?

Cost effectiveness evidence
Company submission section 5
27
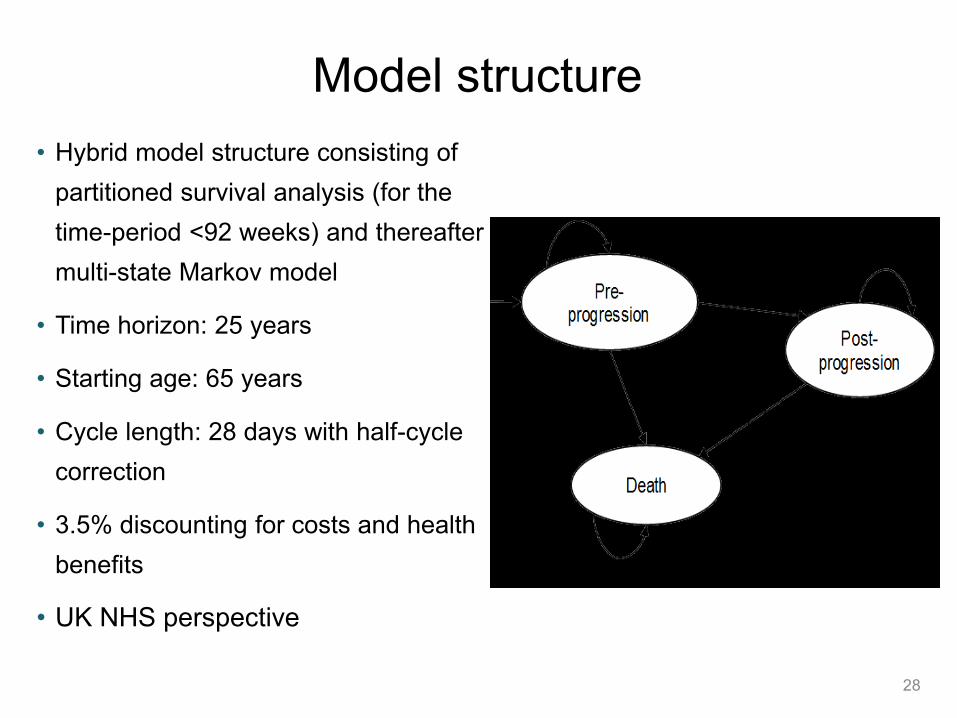
Model structure
28
• Hybrid model structure consisting of
partitioned survival analysis (for the
time-period <92 weeks) and thereafter a
multi-state Markov model
• Time horizon: 25 years
• Starting age: 65 years
• Cycle length: 28 days with half-cycle
correction
• 3.5% discounting for costs and health
benefits
• UK NHS perspective
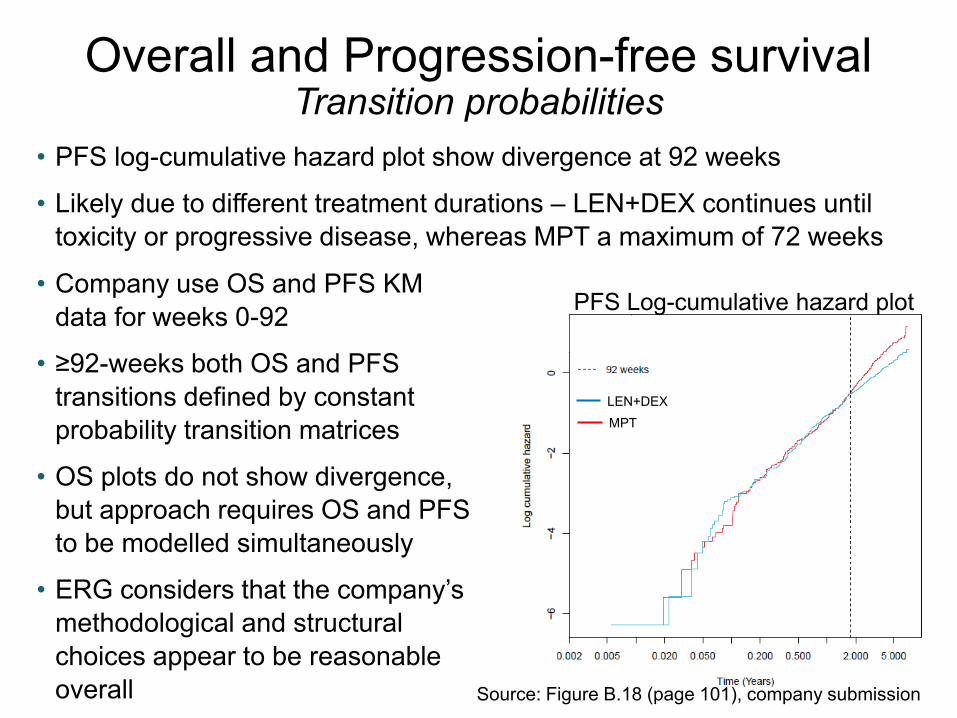
Overall and Progression-free survivalTransition probabilities
• PFS log-cumulative hazard plot show divergence at 92 weeks
• Likely due to different treatment durations – LEN+DEX continues until
toxicity or progressive disease, whereas MPT a maximum of 72 weeks
29
• Company use OS and PFS KM
data for weeks 0-92
• ≥92-weeks both OS and PFS
transitions defined by constant
probability transition matrices
• OS plots do not show divergence,
but approach requires OS and PFS
to be modelled simultaneously
• ERG considers that the company’s
methodological and structural
choices appear to be reasonable
overall Source: Figure B.18 (page 101), company submission
PFS Log-cumulative hazard plot
LEN+DEX
MPT
Overall and Progression-free survivalRd and MPT
30Source: figure B.19 (page 102), company submission
• Company and ERG consider model provides a good fit to the observed
Kaplan-Meier data
PFS OS
Overall and Progression-free survivalVMP
31
• HRs for VMP versus MPT from the NMA were applied to the MPT PFS
and OS curves predicted by the model
• The mean HRs of VMP vs MPT were 1.00 for PFS and 1.11 for OS
• MPT chosen as reference treatment due to relative maturity of the MPT
data, it also being a fixed-duration therapy and the regimen also
including melphalan and prednisone.
• The ERG notes that MPT is closer than LEN+DEX to VMP in the network
of trials diagram. It considers that the approach taken is appropriate.
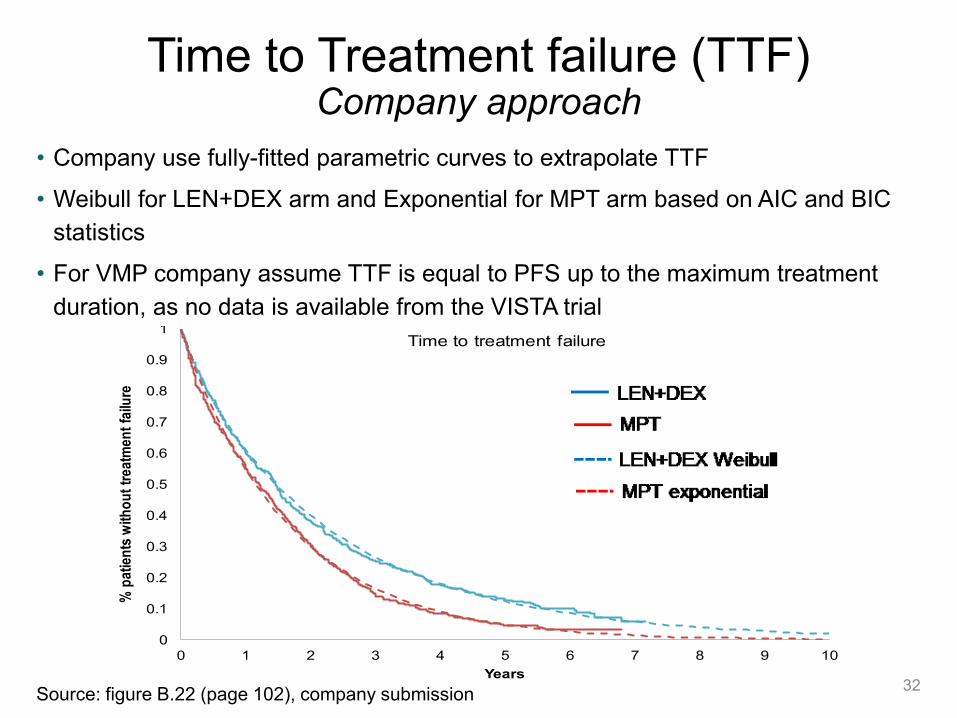
Time to Treatment failure (TTF)Company approach
32
• Company use fully-fitted parametric curves to extrapolate TTF
• Weibull for LEN+DEX arm and Exponential for MPT arm based on AIC and BIC
statistics
• For VMP company assume TTF is equal to PFS up to the maximum treatment
duration, as no data is available from the VISTA trialRd Weibull MPT Exponential
Years 0 2 4 6 8 10
Rd 535 204 95 32 0 0
MPT 547 168 46 12 0 0
Number at risk
0
0.1
0.2
0.3
0.4
0.5
0.6
0.7
0.8
0.9
1
0 1 2 3 4 5 6 7 8 9 10
% p
atie
nts
with
ou
t tr
eatm
ent
failu
re
Years
Time to treatment failure Rd KM
MPT KM
Rd Weibull
MPTExponential
Source: figure B.22 (page 102), company submission

Time to Treatment failure (TTF)ERG comments
33
• ERG note that TSD14 states the same parametric curve should be fitted
for both treatment arms
• Weibull distribution visually provides a better overall fit for both
LEN+DEX and MPT than the exponential distribution
• ERG considers that assuming the TTF curve for VMP is equal to PFS
curve is inconsistent with the approach taken for LEN+DEX and MPT
• As PFS for MPT and VMP are similar (HR=1), ERG consider a better
approach is for the TTF curve for VMP to be equal to that of MPT
0.00
0.10
0.20
0.30
0.40
0.50
0.60
0.70
0.80
0.90
1.00
0.0 1.0 2.0 3.0 4.0 5.0
He
alt
h s
tate
uti
lity
va
lue
Years
Health State Utility Values over Time
PF Utility Rd PF Utility MPT PF Utility VMP Progressed Utility
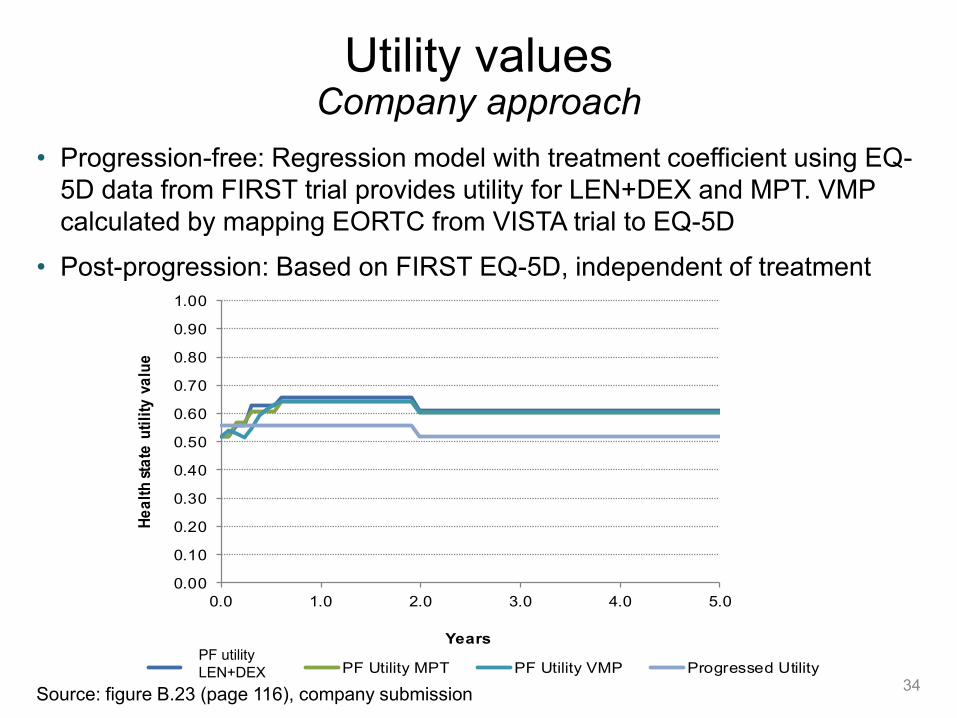
Utility valuesCompany approach
34
• Progression-free: Regression model with treatment coefficient using EQ-
5D data from FIRST trial provides utility for LEN+DEX and MPT. VMP
calculated by mapping EORTC from VISTA trial to EQ-5D
• Post-progression: Based on FIRST EQ-5D, independent of treatment
Source: figure B.23 (page 116), company submission
PF utility
LEN+DEX
Utility valuesERG comments
35
• ERG consider it appropriate to include a treatment coefficient (which leads
to slightly higher LEN+DEX utilities) as this accounts for the expected
improvement in treatment-related AEs for LEN+DEX compared with MPT
• However, no good evidence that higher utilities continue after MPT
treatment stopped. ERG prefer that utilities are the same after this point
• VMP is administered in 42 day treatment cycles, whereas the utility has
been assigned to 28 day cycles. ERG correct this error in their analysis
• Company does not use mapping algorithms used in TA228. However this
is not expected to have a large impact on model results
• ERG considers that the utilities are uncertain because:
• utilities for progressed disease are based only on a single outpatient
visit post-progression
• utility values used for VMP are mapped from EORTC
• company does not state how missing HRQoL data were estimated

Resources use and costs
36
• Dosing data for drug costs taken directly from the FIRST trial for LEN+DEX and
MPT. VMP costs estimated using proportion of eligible patients on LEN+DEX
• Company investigated using mean relative dose intensity to estimate costs
in a scenario analysis
• Company also included administration costs, concomitant medications, and
costs for adverse events
• ERG note that administration cost of VMP is based on ‘Daycase and
Regular Day/Night’ cost code. The ERG prefer to also include Outpatient
administration costs (£199 and £212 for 1st and subsequent chemotherapy
administrations respectively)
• ERG had several comments on the subsequent treatment assumptions
• Otherwise, ERG concluded that the approach taken by the company for
estimating health care resources and costs is reasonable
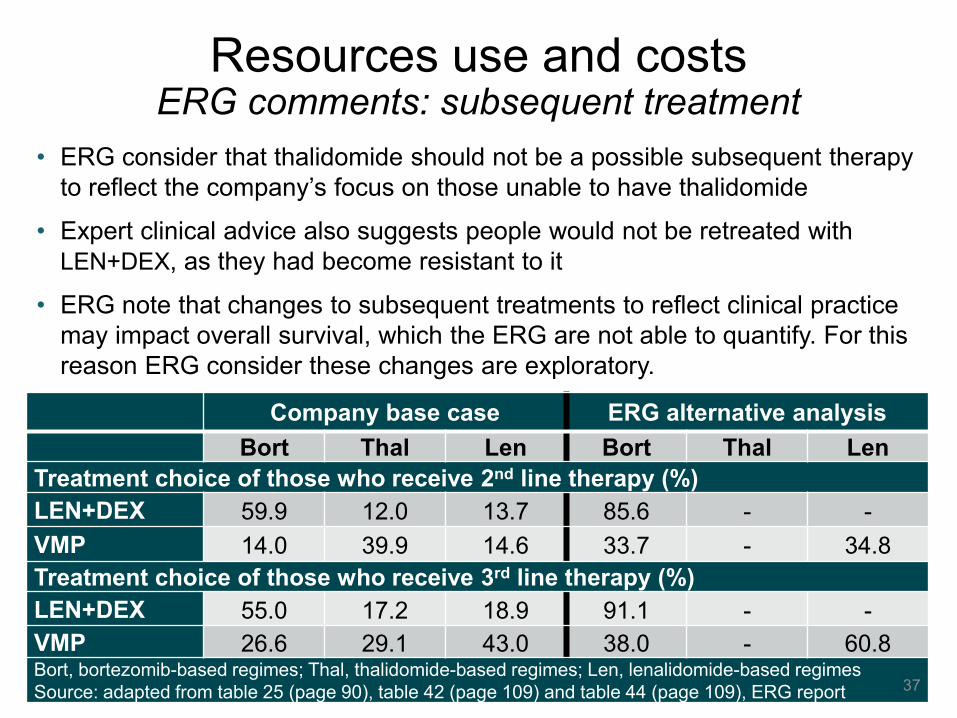
Company base case ERG alternative analysis
Bort Thal Len Bort Thal Len
Treatment choice of those who receive 2nd line therapy (%)
LEN+DEX 59.9 12.0 13.7 85.6 - -
VMP 14.0 39.9 14.6 33.7 - 34.8
Treatment choice of those who receive 3rd line therapy (%)
LEN+DEX 55.0 17.2 18.9 91.1 - -
VMP 26.6 29.1 43.0 38.0 - 60.8Bort, bortezomib-based regimes; Thal, thalidomide-based regimes; Len, lenalidomide-based regimes
Source: adapted from table 25 (page 90), table 42 (page 109) and table 44 (page 109), ERG report
Resources use and costsERG comments: subsequent treatment
37
• ERG consider that thalidomide should not be a possible subsequent therapy
to reflect the company’s focus on those unable to have thalidomide
• Expert clinical advice also suggests people would not be retreated with
LEN+DEX, as they had become resistant to it
• ERG note that changes to subsequent treatments to reflect clinical practice
may impact overall survival, which the ERG are not able to quantify. For this
reason ERG consider these changes are exploratory.
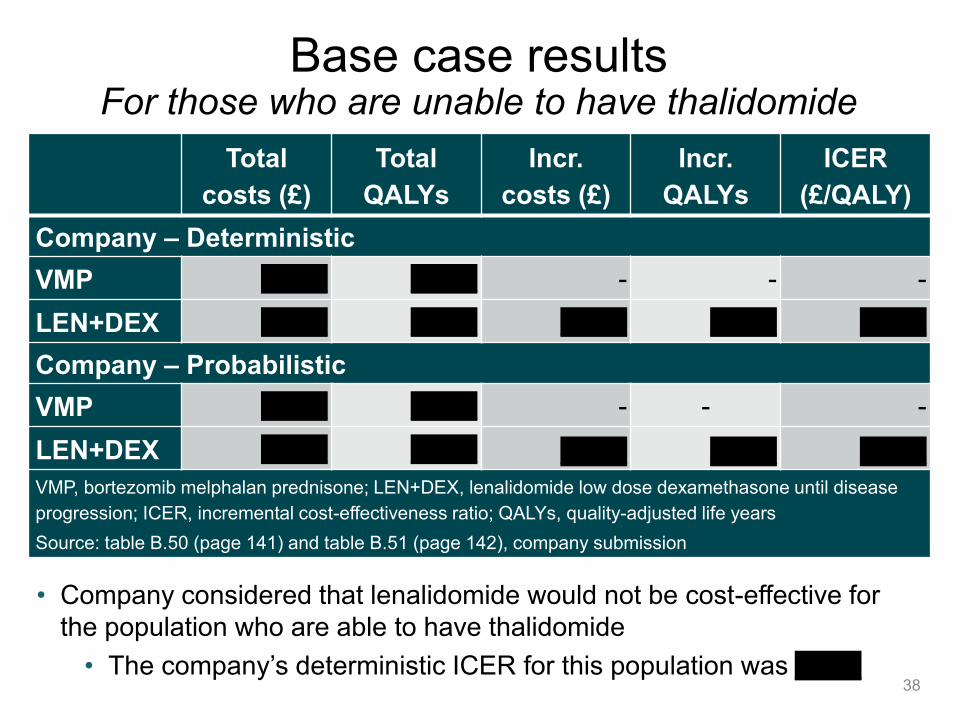
Base case resultsFor those who are unable to have thalidomide
38
Total
costs (£)
Total
QALYs
Incr.
costs (£)
Incr.
QALYs
ICER
(£/QALY)
Company – Deterministic
VMP £***** £***** - - -
LEN+DEX £***** £***** £***** £***** £*****
Company – Probabilistic
VMP £***** £***** - - -
LEN+DEX £***** £***** £***** £***** £*****
VMP, bortezomib melphalan prednisone; LEN+DEX, lenalidomide low dose dexamethasone until disease
progression; ICER, incremental cost-effectiveness ratio; QALYs, quality-adjusted life years
Source: table B.50 (page 141) and table B.51 (page 142), company submission
• Company considered that lenalidomide would not be cost-effective for
the population who are able to have thalidomide
• The company’s deterministic ICER for this population was £*****
Sensitivity analysesProbabilistic sensitivity analysis
• 1000 iterations; variation based upon distributional information
• *** probability LEN+DEX is cost-effective at £30,000 per QALY
39Source: figure B.24 (page 142), company submission

Sensitivity analysesTornado diagram
40Source: figure B.26 (page 143), company submission
• ICER sensitive to varying the overall survival hazard ratio

Incr. CostsIncr.
QALYICER
Company base-case model XXXXX XXXXX XXXXX
Scenario analyses
No difference in OS between VMP
and MPTXXXXX XXXXX XXXXX
+ equal subsequent therapy use
between VMP and MPTXXXXX XXXXX XXXXX
Source: table 39 (page 107), ERG report and table B.52 (page 146), company submission
Key scenario analysesEquivalence between VMP and MPT
41
• Company and ERG note that OS HR for VMP versus MPT in the NMA
has a wide credible interval (OS HR 1.11, 95% Crl: 0.82, 1.50)
• ERG note that clinical outcomes for VMP and MPT were similar in TA228
• Company state that an equivalent OS would lead to an increase in
subsequent LEN+DEX use than reported in VISTA trial, and therefore
prefer a scenario which also includes equivalent subsequent therapy

CONFIDENTIAL
Incr. CostsIncr.
QALYICER Change
Company base-case model XXXXX XXXXX XXXXX -
Scenario analyses
New PAS (XX cycle cap)
operational in comparator armXXXXX XXXXX XXXXX XXXXX
Source: table 46 (page 111), ERG report
Key scenario analysesPAS implementation
• Lenalidomide has a new complex PAS which will become operational on
positive guidance from ID474 or the ongoing ID667 appraisal
• The new complex PAS restricts the cost of lenalidomide to XX cycles,
whereas the old (currently operational) PAS caps the cost to 26 cycles
• All analyses assume that any subsequent lenalidomide treatment in the
comparator arm is capped at 26 cycles
42
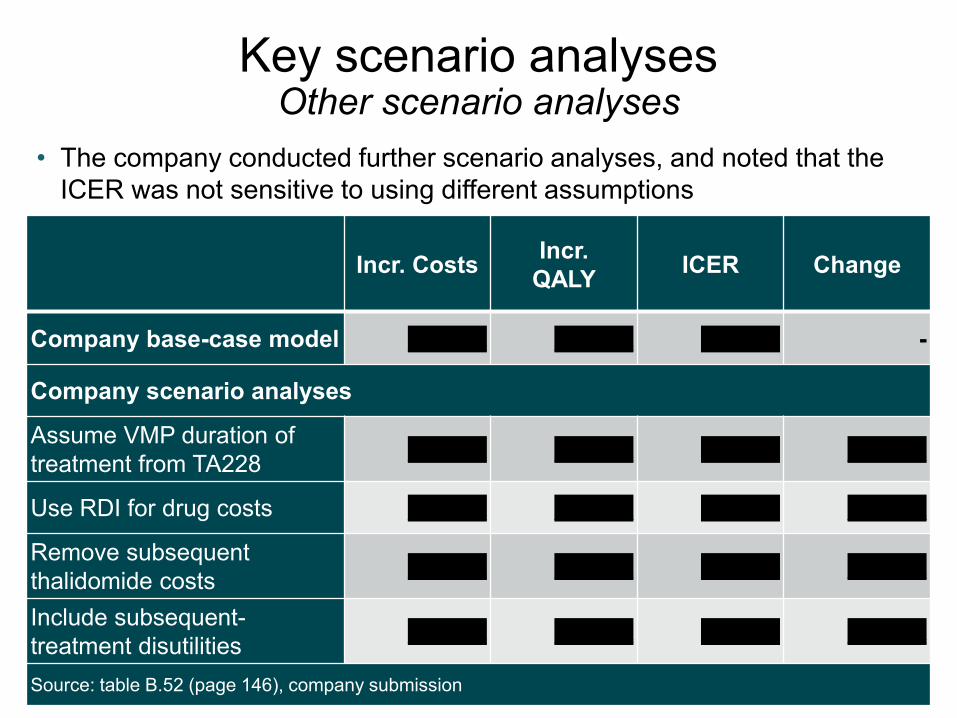
Key scenario analysesOther scenario analyses
43
• The company conducted further scenario analyses, and noted that the
ICER was not sensitive to using different assumptions
Incr. CostsIncr.
QALYICER Change
Company base-case model XXXXX XXXXX XXXXX -
Company scenario analyses
Assume VMP duration of
treatment from TA228XXXXX XXXXX XXXXX XXXXX
Use RDI for drug costs XXXXX XXXXX XXXXX XXXXX
Remove subsequent
thalidomide costsXXXXX XXXXX XXXXX XXXXX
Include subsequent-
treatment disutilitiesXXXXX XXXXX XXXXX XXXXX
Source: table B.52 (page 146), company submission
Incr. costs Incr. QALYs ICER Change
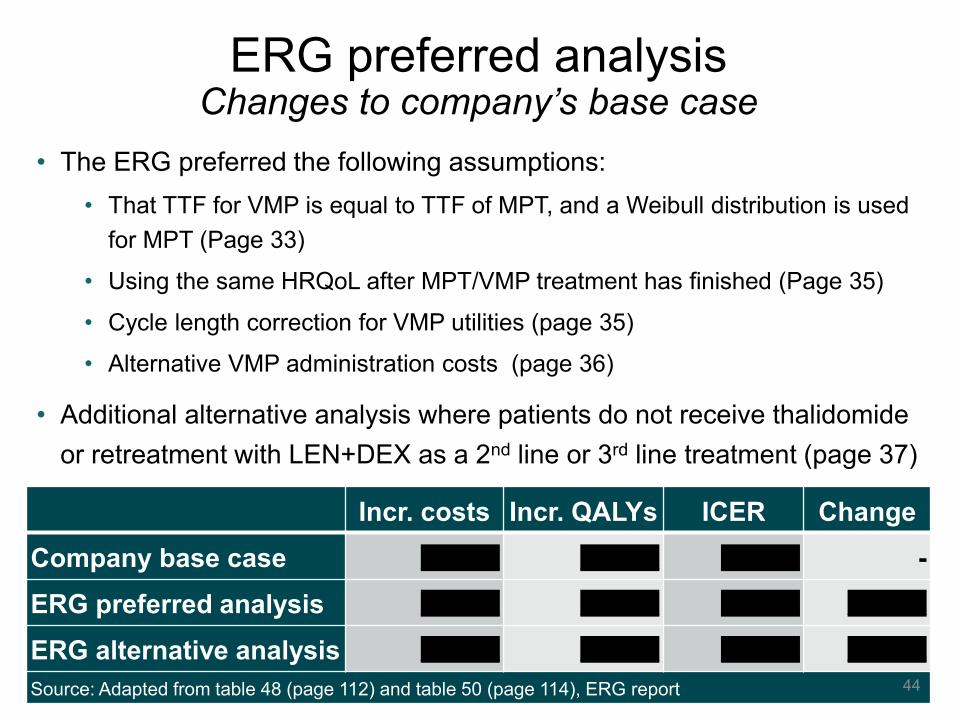
Company base case XXXXX XXXXX XXXXX -
ERG preferred analysis XXXXX XXXXX XXXXX XXXXX
ERG alternative analysis XXXXX XXXXX XXXXX XXXXX
Source: Adapted from table 48 (page 112) and table 50 (page 114), ERG report
ERG preferred analysisChanges to company’s base case
44
• The ERG preferred the following assumptions:
• That TTF for VMP is equal to TTF of MPT, and a Weibull distribution is used
for MPT (Page 33)
• Using the same HRQoL after MPT/VMP treatment has finished (Page 35)
• Cycle length correction for VMP utilities (page 35)
• Alternative VMP administration costs (page 36)
• Additional alternative analysis where patients do not receive thalidomide
or retreatment with LEN+DEX as a 2nd line or 3rd line treatment (page 37)
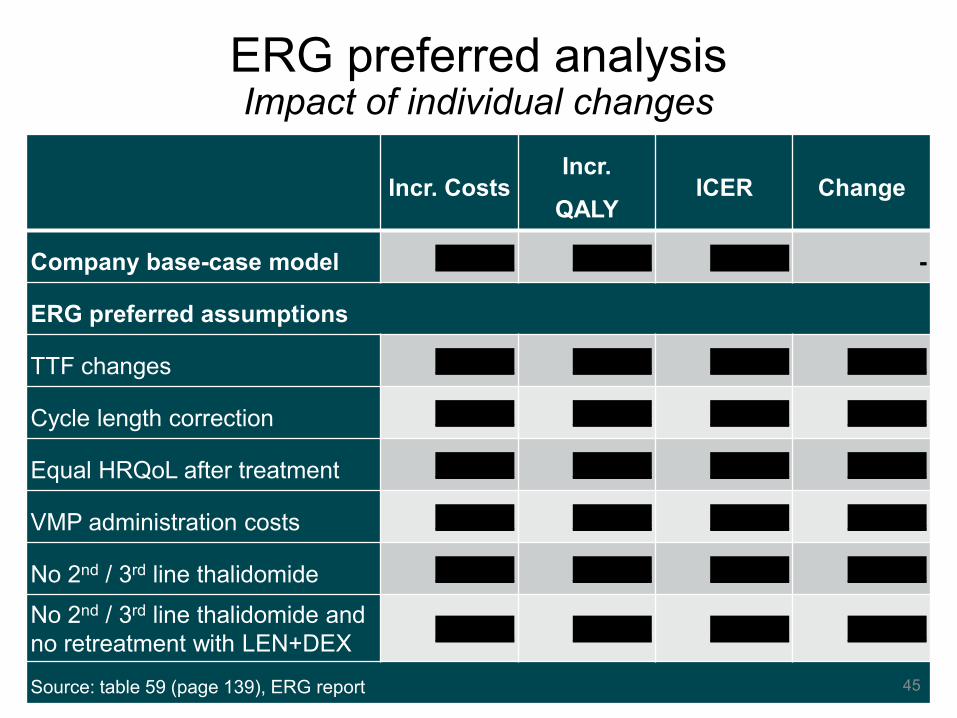
Incr. CostsIncr.
QALYICER Change
Company base-case model XXXXX XXXXX XXXXX -
ERG preferred assumptions
TTF changes XXXXX XXXXX XXXXX XXXXX
Cycle length correction XXXXX XXXXX XXXXX XXXXX
Equal HRQoL after treatment XXXXX XXXXX XXXXX XXXXX
VMP administration costs XXXXX XXXXX XXXXX XXXXX
No 2nd / 3rd line thalidomide XXXXX XXXXX XXXXX XXXXX
No 2nd / 3rd line thalidomide and
no retreatment with LEN+DEXXXXXX XXXXX XXXXX XXXXX
Source: table 59 (page 139), ERG report
ERG preferred analysisImpact of individual changes
45

ERG CommentsConclusions
46
• Model structure is appropriate and consistent with the clinical disease pathway.
The approach provided a good fit against the observed trial data from MM-020.
• The company has appropriately tested a range of their key model assumptions.
Alternative scenarios provided broadly similar results to the base case.
• HRQoL used follows NICE reference case. However, some uncertainty around
values for progressed disease and values taken by mapping from EORTC
• Health care resources and costs are reasonable. There is some uncertainty
around the costing of subsequent treatment costs.
• Although the clinical trials used in the model did not specifically recruit patients
who are unable to take thalidomide, expert clinical advice to the ERG is that this
would not influence the generalisability of the clinical effectiveness outcomes
• The ERG’s preferred base case analysis increases the ICER from the company’s
base case analysis, but it remains below £30,000 per QALY.
Innovation
• Company consider that lenalidomide represents a step-change in the
management of transplant-ineligible NDMM, as:
• Compared with thalidomide and bortezomib, it has a different
mechanism of action and toxicity profile, which allows for continuous
use to suppress residual disease and extend the period of first
remission.
• As an oral therapy, lenalidomide provides an alternative to IV and
injectable therapies such as bortezomib, which have to be given in
the hospital setting.
• It may be given in a two-drug combination that does not include
melphalan, which may be more tolerable to older frail patients.
47

End-of-life criteria
48
• The company do not consider lenalidomide meets the
criteria for end-of-life
• The median survival in the comparator arm is 49.1 months
• The ERG agree with the company conclusion
Equality
49
Issue identified at scoping stage:
• People with multiple myeloma attend specialist treatment units for
injectable treatment. These patients are often less mobile or live a long
distance from their treatment centre meaning they are less likely to
receive these treatments
Preliminary view as to what extent these potential equality
issues need addressing by the Committee
• The benefits of different mode of administration will be taken into
account in the appraisal.
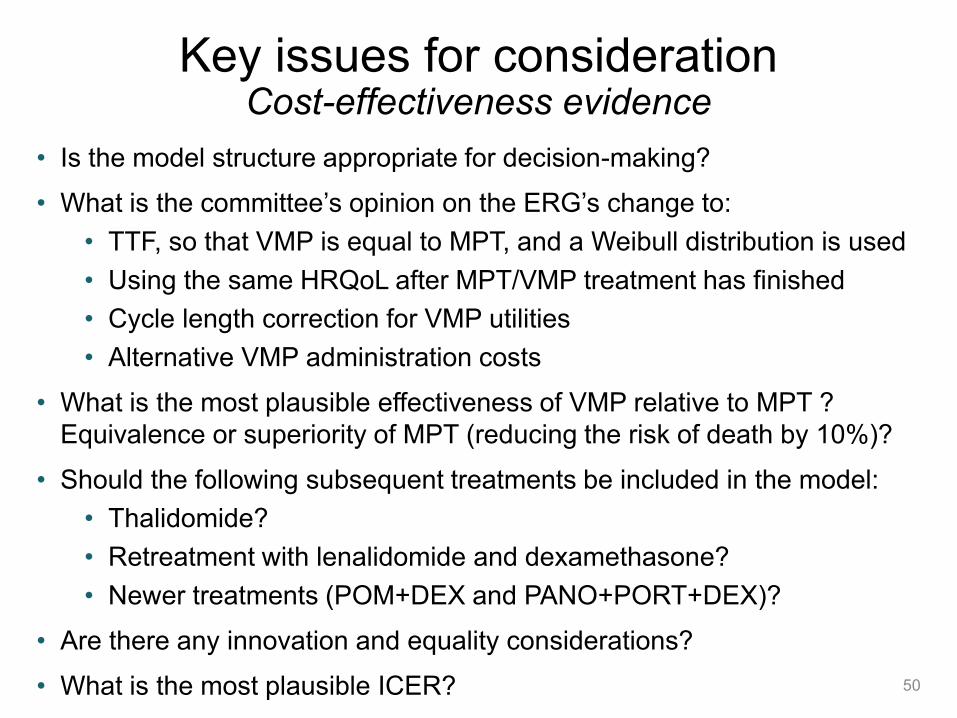
Key issues for considerationCost-effectiveness evidence
• Is the model structure appropriate for decision-making?
• What is the committee’s opinion on the ERG’s change to:
• TTF, so that VMP is equal to MPT, and a Weibull distribution is used
• Using the same HRQoL after MPT/VMP treatment has finished
• Cycle length correction for VMP utilities
• Alternative VMP administration costs
• What is the most plausible effectiveness of VMP relative to MPT ?
Equivalence or superiority of MPT (reducing the risk of death by 10%)?
• Should the following subsequent treatments be included in the model:
• Thalidomide?
• Retreatment with lenalidomide and dexamethasone?
• Newer treatments (POM+DEX and PANO+PORT+DEX)?
• Are there any innovation and equality considerations?
• What is the most plausible ICER? 50
Authors
• Thomas Strong
Technical Lead
• Ahmed Elsada
Technical Adviser
• with input from the Lead Team:
• Susan Faulds – clinical lead
• Chris O'Regan – cost lead
• Nigel Westwood – lay lead
51

Company evidence submission template for Lenalidomide (ID474) © Celgene Inc. (2017). All rights reserved Page 1 of 163
NATIONAL INSTITUTE FOR HEALTH AND
CARE EXCELLENCE
Single technology appraisal
Lenalidomide for previously untreated multiple myeloma [ID474]
Document B
Company evidence submission
October 2017
File name Version Contains confidential information
Date
ID474 Lenalidomide Document B SUBMITTED 230419 [redacted]
4 Yes 23 April 2019

Company evidence submission template for Lenalidomide (ID474) © Celgene Inc. (2017). All rights reserved Page 2 of 163
Contents
B.1 Decision problem, description of the technology and clinical care pathway ............. 11 B.1.1 Decision problem ............................................................................................. 11 B.1.2 Description of the technology being appraised ................................................. 15 B.1.3 Health condition and position of the technology in the treatment pathway........ 17 B.1.4 Equality considerations .................................................................................... 23
B.2 Clinical effectiveness ............................................................................................... 24 B.2.1 Identification and selection of relevant studies ................................................. 24 B.2.2 List of relevant clinical effectiveness evidence ................................................. 24 B.2.3 Summary of methodology of the relevant clinical effectiveness evidence......... 25 B.2.4 Statistical analysis and definition of study groups in the relevant clinical effectiveness evidence .................................................................................................... 37 B.2.5 Quality assessment of the relevant clinical effectiveness evidence .................. 43 B.2.6 Clinical effectiveness results of the relevant trials ............................................ 43 B.2.7 Subgroup analysis ........................................................................................... 64 B.2.8 Meta-analysis .................................................................................................. 66 B.2.9 Indirect and mixed treatment comparisons ....................................................... 66 B.2.10 Adverse reactions ............................................................................................ 71 B.2.11 Ongoing studies ............................................................................................... 80 B.2.12 Innovation ........................................................................................................ 80 B.2.13 Interpretation of clinical effectiveness and safety evidence .............................. 82
B.3 Cost effectiveness ................................................................................................... 92 B.3.1 Published cost-effectiveness studies ............................................................... 92 B.3.2 Economic analysis ........................................................................................... 94 B.3.3 Clinical parameters and variables .................................................................. 100 B.3.4 Measurement and valuation of health effects ................................................. 108 B.3.5 Cost and healthcare resource use identification, measurement and valuation 116 B.3.6 Summary of base-case analysis inputs and assumptions .............................. 136 B.3.7 Base-case results .......................................................................................... 140 B.3.8 Sensitivity analyses ....................................................................................... 141 B.3.9 Subgroup analysis ......................................................................................... 149 B.3.10 Validation ....................................................................................................... 149 B.3.11 Interpretation and conclusions of economic evidence .................................... 151
B.4 References ............................................................................................................ 153
Company evidence submission template for Lenalidomide (ID474) © Celgene Inc. (2017). All rights reserved Page 3 of 163
List of Tables
Table 1 The decision problem ............................................................................................. 12
Table 2 Technology being appraised .................................................................................. 15
Table 3 Current clinical pathway of care for patients with multiple myeloma in England ...... 22
Table 4 Summaries of NCCN evidence blocks for Rd vs relevant comparators ................... 23
Table 5 Clinical effectiveness evidence ............................................................................... 25
Table 6 Patient eligibility criteria for MM-020 ....................................................................... 27
Table 7 MM-020 study drug, dose and duration .................................................................. 28
Table 8 MM-020 dose adjustments based on patient age and renal function ...................... 29
Table 9 Use of concomitant therapy during the active treatment phase in the safety
population ........................................................................................................................... 29
Table 10 Outcome measures for MM-020 and relevance to economic model. .................... 31
Table 11 Summary of MM-020 methodology ....................................................................... 33
Table 12 Baseline characteristics of patients in MM-020 ..................................................... 35
Table 13 Summary of statistical analyses used in MM-020 ................................................. 39
Table 14 Summary of key efficacy outcomes from study MM-020 (ITT population) ............. 45
Table 15 Myeloma response rates (investigator assessment; ITT population for MM-020) . 54
Table 16 Number of patients who received salvage therapy by type of drugs in all regimens
(ITT population, study MM-020) .......................................................................................... 63
Table 17 Summary of the trials used to carry out the NMA ................................................. 66
Table 18 Results of fixed effects constant HRs NMA of OS ................................................ 67
Table 19 Basic parameter estimates of 2nd order FP model (p1=1, p2=0); OS ................... 69
Table 20 Results of fixed effects constant HRs NMA of PFS (with EMA-censored MM-020
data) ................................................................................................................................... 69
Table 21 Basic parameter of 2nd order FP model (p1=1, p2=1); PFS with EMA-censored
MM-020 data ....................................................................................................................... 70
Table 22 TEAEs that occurred in ≥ 10% of patients of any grade in either treatment group by
system organ class and preferred term (safety population) and corresponding Grade 3/4
TEAEs in the MM-020 study ................................................................................................ 75
Table 23 End-of-life criteria ................................................................................................. 91
Table 24 Summary list of published cost-effectiveness studies ........................................... 93
Table 25 Features of the economic analysis ....................................................................... 97
Table 26 Intervention and comparator regimens ................................................................ 99
Table 27: MSM probability transition matrices – 28-day probabilities ................................ 102
Table 28: Parametric curves fitted to time to treatment failure data and their statistical fit . 107
Table 29: Mixed-effects (patient as random effect) regression model results of utility
~progression ..................................................................................................................... 111
Company evidence submission template for Lenalidomide (ID474) © Celgene Inc. (2017). All rights reserved Page 4 of 163
Table 30: Mixed effects (patient as random effect) regression model results of utility ~ time
quartiles (categorical) + treatment + (time quartiles [categorical]*treatment) (interaction) .. 113
Table 31: VMP ‘progression-free’ utility relative to baseline over time ............................... 113
Table 32: EQ-5D values derived by mapping the EORTC QLQ-C30 scores from
Gulbrandsen et al.110 by the NICE ERG in TA228 ............................................................. 114
Table 33: Literature sourced subsequent treatment utilities .............................................. 115
Table 34: Patient baseline characteristics ......................................................................... 117
Table 35: First-line drug costs ........................................................................................... 118
Table 36: First-line and prophylaxis regimen drug costs .................................................... 120
Table 37 Health state costs ............................................................................................... 122
Table 38: AE frequency by treatment arm and cycle ......................................................... 124
Table 39: AE costs per event ............................................................................................ 125
Table 40: Routine laboratory tests and monitoring procedures patterns per year .............. 126
Table 41: Transfusion rates............................................................................................... 127
Table 42: Routine laboratory tests and monitoring procedures unit costs .......................... 128
Table 43: Subsequent treatment time inputs ..................................................................... 132
Table 44: Subsequent-line drug costs ............................................................................... 134
Table 45: Post-progression treatment durations ................................................................ 135
Table 46: Proportion of patients on subsequent therapy and total costs ............................ 135
Table 47: Summary of variables applied in the economic model ....................................... 136
Table 48: Base case assumptions..................................................................................... 138
Table 49: Base case results (with PAS) – vs MPT ............................................................ 140
Table 50: Base case results (with PAS) – vs VMP in the subgroup of patients who are
unable to tolerate or have contraindications to thalidomide ............................................... 141
Table 51: Probabilistic incremental cost-effectiveness analysis results (with PAS) ............ 141
Table 52: Scenario analyses – Rd versus VMP ................................................................. 146
Table 53: Median PFS (months), estimated in the model compared to reported values .... 150
Table 54: Four-year OS (%) and median OS (months), estimated in the model compared to
reported values ................................................................................................................. 151
Company evidence submission template for Lenalidomide (ID474) © Celgene Inc. (2017). All rights reserved Page 5 of 163
List of Figures
Figure 1 Characteristic pattern of remission and relapse following conventional
chemotherapy in multiple myeloma ..................................................................................... 18
Figure 2 MM-020 study design ............................................................................................ 26
Figure 3 Kaplan–Meier plots of PFS (based on IRAC review using IMWG criteria) for MM-
020 (ITT population, FDA censoring rules) .......................................................................... 48
Figure 4 Kaplan–Meier plots of PFS (based on IRAC review using IMWG criteria) for MM-
020 (ITT population, EMA censoring criteria) ...................................................................... 50
Figure 5 Kaplan–Meier plots of PFS (investigator review using IMWG criteria) for MM-020
(ITT population, FDA censoring criteria) .............................................................................. 51
Figure 6 Kaplan–Meier plots of PFS (investigator review using IMWG criteria) for MM-020
(ITT population, EMA censoring criteria) ............................................................................. 52
Figure 7 Kaplan–Meier plots of final OS for MM-020 (ITT population) ................................. 53
Figure 8 Kaplan–Meier plots of TTF (based on investigator assessment; ITT population for
MM-020) ............................................................................................................................. 56
Figure 9 Cross-sectional analysis of mean QLQ-C30 change from baseline per assessment
visit and at study discontinuation in the Rd and MPT groups for MM-020 ............................ 59
Figure 10 Cross-sectional analysis of mean QLQ-MY20 change from baseline per
assessment visit and at study discontinuation in the Rd and MPT groups for MM-020 ........ 60
Figure 11 Cross-sectional analysis of mean EQ-5D change from baseline per assessment
visit and at study discontinuation in the Rd and MPT groups for MM-020 ............................ 61
Figure 12 Linear mixed-model repeated-measures analysis of mean change from baseline at
18 months in the Rd and MPT groups for MM-020 .............................................................. 62
Figure 13 Linear mixed-model repeated-measures analysis of mean difference in change
from baseline at 18 months in the Rd and MPT groups for MM-020 .................................... 62
Figure 14 Network of trials included in the analysis ............................................................. 67
Figure 15 Results of fixed-effects 2nd order fractional polynomial model NMA of OS; hazard
ratios over time vs. MPT ..................................................................................................... 68
Figure 16 Results of fixed-effects 2nd order fractional polynomial model NMA of PFS with
EMA-censored MM-020 data; hazard ratios over time vs. MPT ........................................... 70
Figure 17: Markov model structure ...................................................................................... 95
Figure 18: Log-cumulative hazards plot of Rd and MPT .................................................... 101
Figure 19: KM plots of survival with superimposed MSM model ........................................ 102
Figure 20: KM plots of health state transitions with superimposed MSM model ................. 104
Figure 21: Modelled progression-free and overall survival ................................................ 106
Figure 22: Time to treatment failure curve fits and KM data .............................................. 108
Figure 23: Health state utility values over time .................................................................. 116
Company evidence submission template for Lenalidomide (ID474) © Celgene Inc. (2017). All rights reserved Page 6 of 163
Figure 24: Cost-effectiveness plane .................................................................................. 142
Figure 25: Cost-effectiveness acceptability curve .............................................................. 142
Figure 26: Results of one-way sensitivity analysis – Rd vs. VMP ...................................... 143
Company evidence submission template for Lenalidomide (ID474) © Celgene Inc. (2017). All rights reserved Page 7 of 163
Abbreviations
AE adverse event
AIC Akaike information criterion
AMT anti-myeloma therapy
ANC absolute neutrophil count
ASCO American Society of Clinical Oncology
ASCT autologous stem cell transplant
ASH American Society of Hematology
BCSH British Committee for Standards in Haematology
BIC Bayesian information criterion
BNF British National Formulary
BOR bortezomib
CEAC cost-effectiveness acceptability curves
CI confidence interval
CODA convergence diagnosis and output analysis
CSR clinical study report
CTD cyclophosphamide, thalidomide and dexamethasone
CTDa attenuated cyclophosphamide, thalidomide and dexamethasone
CR complete response
CrCl creatinine clearance
CrI credible interval
DEX dexamethasone
DOR duration of response
DSMC Data Safety Monitoring Committee
EBMT European Group for Blood and Marrow Transplantation
ECG electrocardiogram
ECOG Eastern Cooperative Oncology Group
EFS event-free survival
EHA European Haematology Association
EMA European Medicines Agency
eMIT electronic market information tool
EORTC European Organisation for Research and Treatment of Cancer
EORTC QLQ-C30 EORTC Quality of Life Questionnaire – Core 30
EORTC QLQ-MY20 EORTC Quality of Life Questionnaire – Multiple Myeloma 20
EPAR European Public Assessment Report
EQ-5D 5-dimension European Quality of Life questionnaire
ERG evidence review group
ESA erythropoietin stimulating agents
ESMO European Society for Medical Oncology
Company evidence submission template for Lenalidomide (ID474) © Celgene Inc. (2017). All rights reserved Page 8 of 163
FDA Food and Drugs Administration
G-CSF granulocyte-colony stimulating factor
HMRN Haematological Malignancy Research Network
HR hazard ratio
HRG healthcare resource group
HRQoL health-related quality of life
ICER incremental cost-effectiveness ratio
IFM Intergroupe Francophone du Myelome
IMiD® immunomodulatory drug
IMWG International Myeloma Working Group
IRAC Independent Response Adjudication Committee
ITT intent-to-treat
ISPOR International Society for Pharmacoeconomics and Outcomes Research
ISS International Staging System
IV intravenous
1L first line
2L second line
3L third line
LDH lactate dehydrogenase
LLoT last line of treatment
LY life-year
MDS myelodysplastic syndrome
MID minimal important difference
MIMS monthly index of medical specialities
MM multiple myeloma
MP melphalan and prednisone
MPR melphalan, prednisone and lenalidomide
MPR-R melphalan, prednisone and lenalidomide followed by lenalidomide
maintenance
MPT melphalan, prednisone and thalidomide
MRC Medical Research Council
MSM multi-state Markov
MTA multiple technology appraisal
MTC mixed treatment comparison
NCCN National Comprehensive Cancer Network
NDMM newly diagnosed multiple myeloma
NICE National Institute for Health and Care Excellence
NK natural killer
NMA network meta-analysis
NR not reported

Company evidence submission template for Lenalidomide (ID474) © Celgene Inc. (2017). All rights reserved Page 9 of 163
OLEP open-label extension phase
ORR overall response rate
OS overall survival
OWSA one-way sensitivity analysis
PANO panobinostat
PAS patient access scheme
PD progressive disease
PFLY progression-free life-year
PFS progression-free survival
PFS2 progression-free survival 2
PO per os (orally)
PP post-progression
PPS post-progression survival
PPLY post-progression life-year
PPP pregnancy prevention programme
PR partial response
PrePS pre-progression
PRISMA Preferred Reporting Items for Systematic Reviews and Meta-Analyses
PSA probabilistic sensitivity analysis
QALY quality-adjusted life-year
QoL quality of life
RBC red blood cell
RCT randomised controlled trial
Rd lenalidomide and low‐dose dexamethasone until disease progression
RD lenalidomide and high-dose dexamethasone
RDI relative dose intensity
Rd18 18 cycles of lenalidomide and low‐dose dexamethasone
RRMM relapsed/refractory multiple myeloma
SACT Systemic Anti-Cancer Therapy
SAE serious adverse event
SC subcutaneous
SD stable disease
SE standard error
SIGN Scottish Intercollegiate Guidelines Network
SLR systematic literature review
SmPC summary of product characteristics
SoC standard of care
SPM second primary malignancy
STA single technology appraisal
TEAE treatment-emergent adverse event
Company evidence submission template for Lenalidomide (ID474) © Celgene Inc. (2017). All rights reserved Page 10 of 163
TSD technical support document
TTF time to treatment failure
TTP time to progression
TTR time to response
VAT value added tax
VGPR very good partial response
VMP bortezomib, melphalan and prednisone
VTE venous thromboembolism
WCBP women of childbearing potential
WTP willingness-to-pay
Company evidence submission template for Lenalidomide (ID474) © Celgene Inc. (2017). All rights reserved Page 11 of 163
B.1 Decision problem, description of the technology and
clinical care pathway
B.1.1 Decision problem
The objective of this single technology appraisal (STA) is to appraise the clinical and
cost effectiveness of lenalidomide according to its license variation allowing its use in
transplant-ineligible newly diagnosed multiple myeloma (NDMM) patients. This
license variation was granted by the European Medicines Agency (EMA) in February
2015.1,2
The final scope was issued in August 2017 as detailed in Table 1.

Company evidence submission template for Lenalidomide (ID474) © Celgene Inc. (2017). All rights reserved Page 12 of 163
Table 1 The decision problem
Final scope issued by NICE Decision problem addressed in the company submission
Rationale if different from the final NICE scope
Population Adults with previously untreated MM for
whom stem-cell transplantation is considered
inappropriate.
Adults with previously untreated MM for
whom stem-cell transplantation is considered
inappropriate.
Intervention Lenalidomide in combination with
dexamethasone
Lenalidomide in combination with
dexamethasone
Comparator (s) • Thalidomide in combination with an
alkylating agent and a corticosteroid
For people who are unable to tolerate, or
have contraindications to thalidomide:
• Bortezomib in combination with an
alkylating agent and a corticosteroid
• Thalidomide in combination with an
alkylating agent and a corticosteroid
For people who are unable to tolerate, or
have contraindications to thalidomide:
• Bortezomib in combination with an
alkylating agent and a corticosteroid
CTD was not considered a
relevant thalidomide-based
combination as it is
unlicensed. MPT was
considered a suitable proxy
for CTD as it was deemed
by clinical specialists who
took part in TA2283 to be
equivalent in terms of
efficacy and toxicity, and is
also similar in terms of
cost.
Outcomes The outcome measures to be considered
include:
• overall survival
• progression-free survival
• response rates
• time to next treatment
• time to treatment failure
• adverse effects of treatment
The outcome measures to be considered
include:
• overall survival
• progression-free survival
• response rates
• time to next treatment
• time to treatment failure
• adverse effects of treatment
Company evidence submission template for Lenalidomide (ID474) © Celgene Inc. (2017). All rights reserved Page 13 of 163
• health-related quality of life. • health-related quality of life.
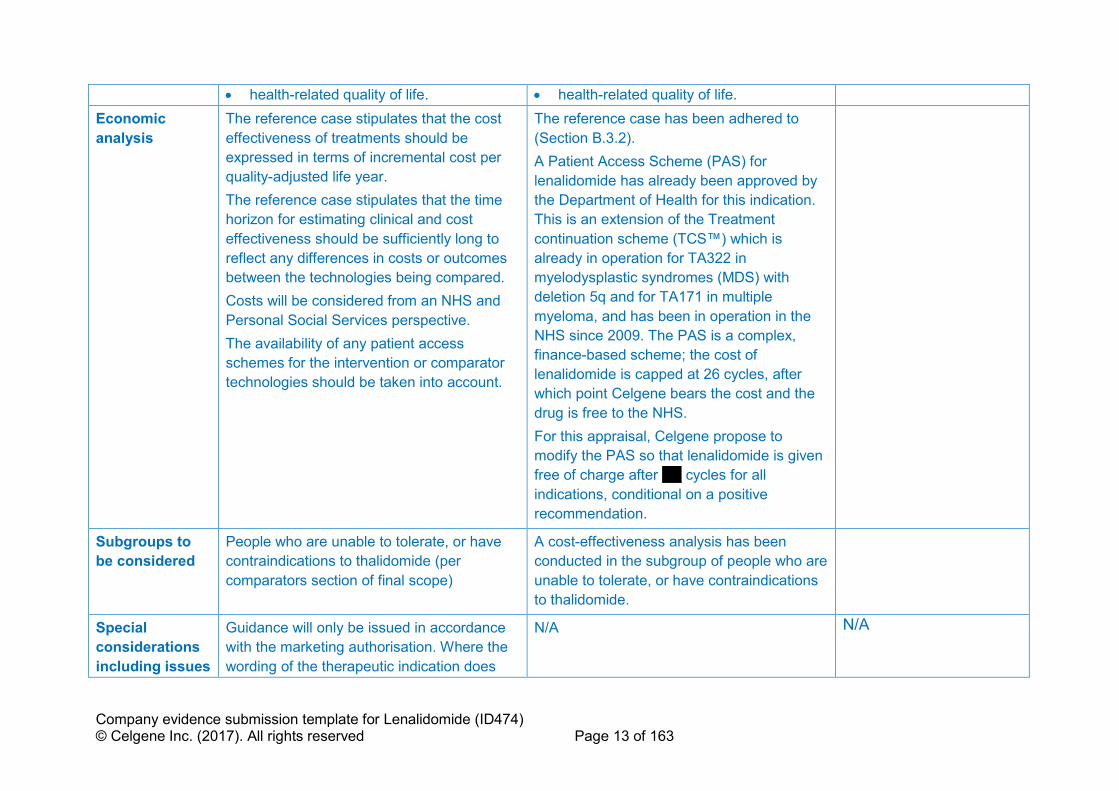
Economic
analysis
The reference case stipulates that the cost
effectiveness of treatments should be
expressed in terms of incremental cost per
quality-adjusted life year.
The reference case stipulates that the time
horizon for estimating clinical and cost
effectiveness should be sufficiently long to
reflect any differences in costs or outcomes
between the technologies being compared.
Costs will be considered from an NHS and
Personal Social Services perspective.
The availability of any patient access
schemes for the intervention or comparator
technologies should be taken into account.
The reference case has been adhered to
(Section B.3.2).
A Patient Access Scheme (PAS) for
lenalidomide has already been approved by
the Department of Health for this indication.
This is an extension of the Treatment
continuation scheme (TCS™) which is
already in operation for TA322 in
myelodysplastic syndromes (MDS) with
deletion 5q and for TA171 in multiple
myeloma, and has been in operation in the
NHS since 2009. The PAS is a complex,
finance-based scheme; the cost of
lenalidomide is capped at 26 cycles, after
which point Celgene bears the cost and the
drug is free to the NHS.
For this appraisal, Celgene propose to
modify the PAS so that lenalidomide is given
free of charge after ''''''' cycles for all
indications, conditional on a positive
recommendation.
Subgroups to
be considered
People who are unable to tolerate, or have
contraindications to thalidomide (per
comparators section of final scope)
A cost-effectiveness analysis has been
conducted in the subgroup of people who are
unable to tolerate, or have contraindications
to thalidomide.
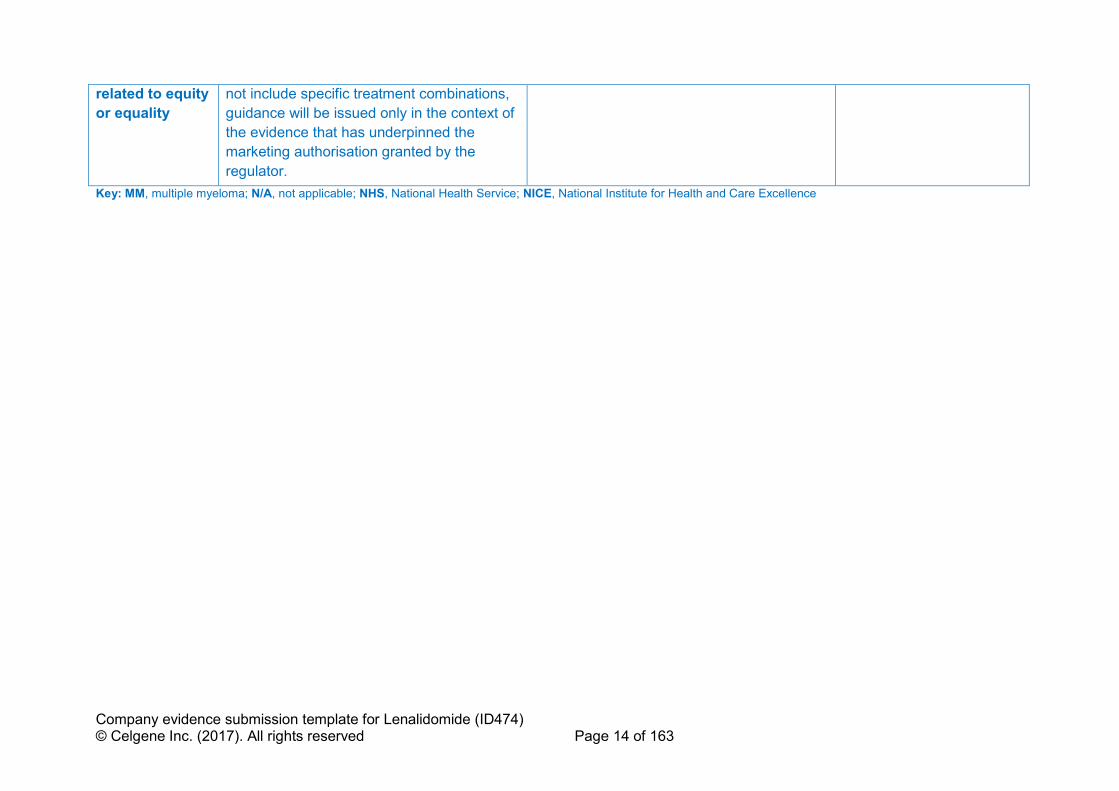
Special
considerations
including issues
Guidance will only be issued in accordance
with the marketing authorisation. Where the
wording of the therapeutic indication does
N/A
N/A
Company evidence submission template for Lenalidomide (ID474) © Celgene Inc. (2017). All rights reserved Page 14 of 163
related to equity
or equality
not include specific treatment combinations,
guidance will be issued only in the context of
the evidence that has underpinned the
marketing authorisation granted by the
regulator.
Key: MM, multiple myeloma; N/A, not applicable; NHS, National Health Service; NICE, National Institute for Health and Care Excellence
Company evidence submission template for Lenalidomide (ID474) © Celgene Inc. (2017). All rights reserved Page 15 of 163
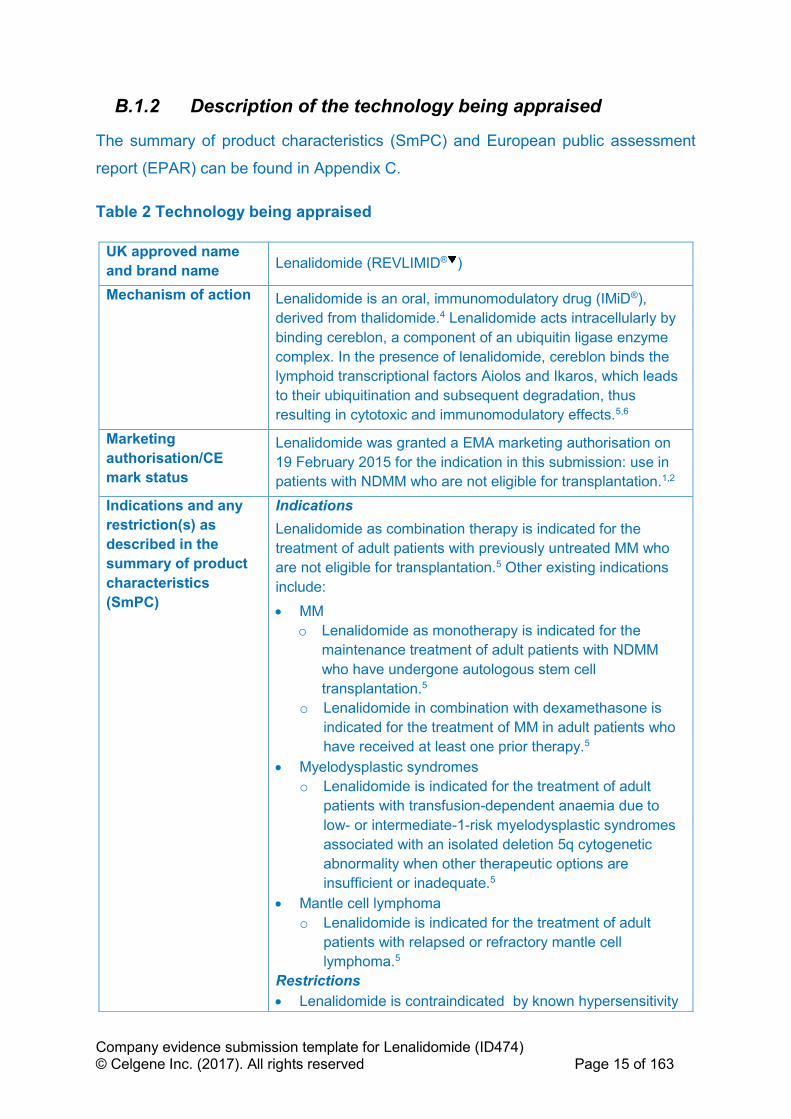
B.1.2 Description of the technology being appraised
The summary of product characteristics (SmPC) and European public assessment
report (EPAR) can be found in Appendix C.
Table 2 Technology being appraised
UK approved name
and brand name Lenalidomide (REVLIMID® )
Mechanism of action Lenalidomide is an oral, immunomodulatory drug (IMiD®),
derived from thalidomide.4 Lenalidomide acts intracellularly by
binding cereblon, a component of an ubiquitin ligase enzyme
complex. In the presence of lenalidomide, cereblon binds the
lymphoid transcriptional factors Aiolos and Ikaros, which leads
to their ubiquitination and subsequent degradation, thus
resulting in cytotoxic and immunomodulatory effects.5,6
Marketing
authorisation/CE
mark status
Lenalidomide was granted a EMA marketing authorisation on
19 February 2015 for the indication in this submission: use in
patients with NDMM who are not eligible for transplantation.1,2
Indications and any
restriction(s) as
described in the
summary of product
characteristics
(SmPC)
Indications
Lenalidomide as combination therapy is indicated for the
treatment of adult patients with previously untreated MM who
are not eligible for transplantation.5 Other existing indications
include:
• MM
o Lenalidomide as monotherapy is indicated for the
maintenance treatment of adult patients with NDMM
who have undergone autologous stem cell
transplantation.5
o Lenalidomide in combination with dexamethasone is
indicated for the treatment of MM in adult patients who
have received at least one prior therapy.5
• Myelodysplastic syndromes
o Lenalidomide is indicated for the treatment of adult
patients with transfusion-dependent anaemia due to
low- or intermediate-1-risk myelodysplastic syndromes
associated with an isolated deletion 5q cytogenetic
abnormality when other therapeutic options are
insufficient or inadequate.5
• Mantle cell lymphoma
o Lenalidomide is indicated for the treatment of adult
patients with relapsed or refractory mantle cell
lymphoma.5
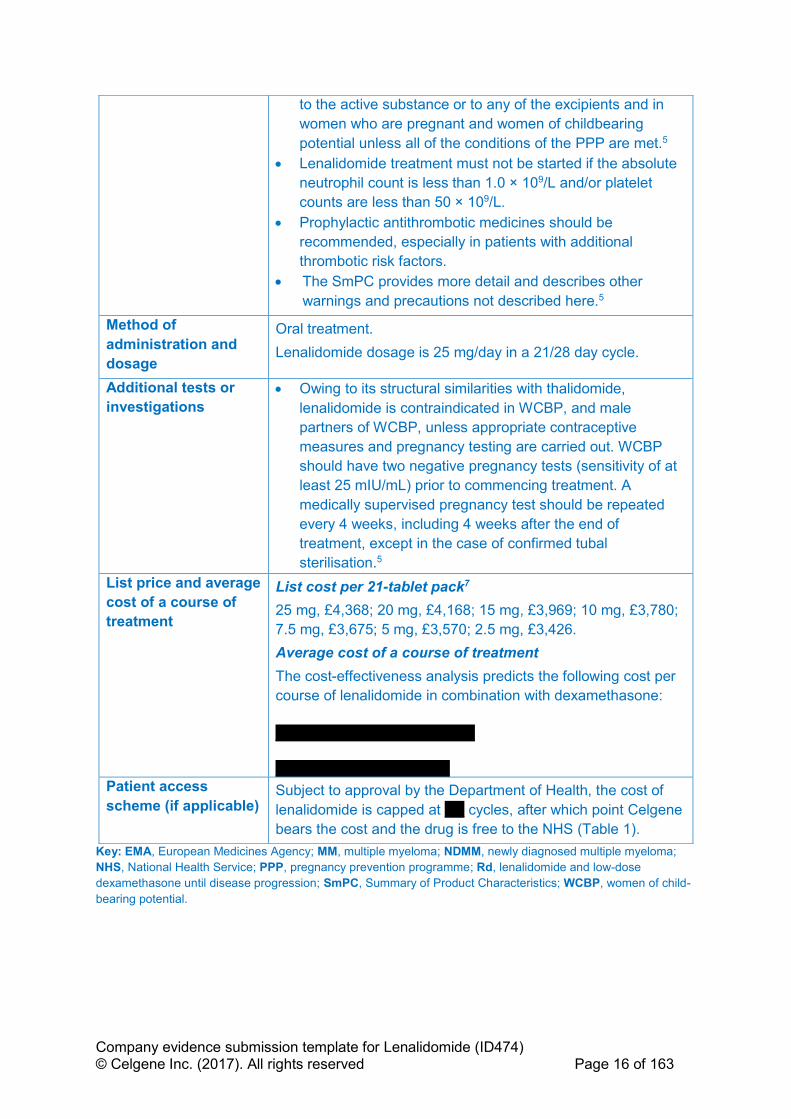
Restrictions
• Lenalidomide is contraindicated by known hypersensitivity
Company evidence submission template for Lenalidomide (ID474) © Celgene Inc. (2017). All rights reserved Page 16 of 163
Key: EMA, European Medicines Agency; MM, multiple myeloma; NDMM, newly diagnosed multiple myeloma;
NHS, National Health Service; PPP, pregnancy prevention programme; Rd, lenalidomide and low-dose
dexamethasone until disease progression; SmPC, Summary of Product Characteristics; WCBP, women of child-
bearing potential.
to the active substance or to any of the excipients and in
women who are pregnant and women of childbearing
potential unless all of the conditions of the PPP are met.5
• Lenalidomide treatment must not be started if the absolute
neutrophil count is less than 1.0 × 10⁹/L and/or platelet
counts are less than 50 × 109/L.
• Prophylactic antithrombotic medicines should be
recommended, especially in patients with additional
thrombotic risk factors.
• The SmPC provides more detail and describes other
warnings and precautions not described here.5
Method of
administration and
dosage
Oral treatment.
Lenalidomide dosage is 25 mg/day in a 21/28 day cycle.
Additional tests or
investigations
• Owing to its structural similarities with thalidomide,
lenalidomide is contraindicated in WCBP, and male
partners of WCBP, unless appropriate contraceptive
measures and pregnancy testing are carried out. WCBP
should have two negative pregnancy tests (sensitivity of at
least 25 mIU/mL) prior to commencing treatment. A
medically supervised pregnancy test should be repeated
every 4 weeks, including 4 weeks after the end of
treatment, except in the case of confirmed tubal
sterilisation.5
List price and average
cost of a course of
treatment
List cost per 21-tablet pack7
25 mg, £4,368; 20 mg, £4,168; 15 mg, £3,969; 10 mg, £3,780;
7.5 mg, £3,675; 5 mg, £3,570; 2.5 mg, £3,426.
Average cost of a course of treatment
The cost-effectiveness analysis predicts the following cost per
course of lenalidomide in combination with dexamethasone:
''''''''''''''''''''''' ''''''''''''''''''''''''' ''''''' ''''''''''''
'''''''''''''''''''' '''''''''''''''''''' '''''''' ''''''''''
Patient access
scheme (if applicable) Subject to approval by the Department of Health, the cost of
lenalidomide is capped at ''''''' cycles, after which point Celgene
bears the cost and the drug is free to the NHS (Table 1).

Company evidence submission template for Lenalidomide (ID474) © Celgene Inc. (2017). All rights reserved Page 17 of 163
B.1.3 Health condition and position of the technology in the
treatment pathway
B.1.3.1 Overview of the disease
Multiple myeloma (MM) is a rare, incurable, malignant haematological disease
arising from the monoclonal expansion of plasma cells in the bone marrow.8,9 It
represents approximately 1% of all incident cancers globally and results in more than
43,000 deaths annually worldwide.10 MM is primarily a disease of the elderly, and the
median age at diagnosis ranges, by study, from 69 to 73 years.11,12 At diagnosis,
more than two-thirds of patients are aged ≥ 65 years12 and nearly half are aged
≥ 75 years.13
Patients suffer from a range of debilitating symptoms, including skeletal destruction,
which arises from activation of osteoclasts by MM cells and leads to lytic bone
lesions (80% of patients), pathological fractures (26%), bone pain (58%), mobility
problems, osteoporosis (23%), impaired bone marrow function, hypercalcaemia
(symptomatic or asymptomatic; 10–30% of patients), anaemia (75% of patients) and
general ill health.14-17 Secretion of M-proteins by plasma cells results in renal
insufficiency (up to 50%) and kidney failure, and patients are more susceptible to
recurrent infections because of a compromised B-cell lineage.16-18 The course of
disease is not uniform and varies according to factors related to:
• the patient (age, frailty and renal function)17,19
• tumour load, assessed by the International Staging System (ISS) as well as
Durie and Salmon stages of classification20,21
• cytogenetic anomalies, including translocations (4;14) and (14;16) and
deletion 17p22,23 (these high-risk cytogenetic anomalies were incorporated into
a revised ISS staging system in 2015)24
• sensitivity of the tumour to treatment.25
While treatment can result in remission, the course of the disease in response to
current treatment regimens is characterised by cycles of remission and relapse.26
Many patients relapse because of the continued presence of resistant cells in the
bone marrow in the form of minimal residual disease27 which is an independent
predictor of progression-free survival (PFS) and overall survival (OS), or they will

Company evidence submission template for Lenalidomide (ID474) © Celgene Inc. (2017). All rights reserved Page 18 of 163
discontinue therapy due to toxicity, for example peripheral neuropathy.17,28 With
increasing lines of therapy, there is a decreasing duration of response (DOR) and
ultimately development of refractory disease.17,26,29 Figure 1 shows the typical
pattern of MM patient remission and relapse in response to treatment.
Figure 1 Characteristic pattern of remission and relapse following conventional chemotherapy in multiple myeloma
Key: MGUS, monoclonal gammopathy of undetermined significance.
Source: Borello 2012.26
This pattern of regression and remission and the presence of minimal residual
disease suggest that continuous therapy is required to suppress residual disease,
maximise depth of response and prolong the first remission, a key factor in patient
survival.26,27,30 This is particularly important for older transplant-ineligible patients
who may not respond to rescue therapy at the time of first relapse or have the
opportunity to receive multiple lines of treatment.31,32 Furthermore, the period of first
remission is likely to be when patients enjoy the best quality of life (QoL) over the
duration of the disease.29,33 This is echoed in National Institute for Health and Care
Excellence (NICE) guidance TA228, where the committee stated that “The main
objective of first-line therapy is to achieve a period of stable disease (termed the
plateau phase) for as long as possible, thereby prolonging survival and maximising
quality of life”.3
Company evidence submission template for Lenalidomide (ID474) © Celgene Inc. (2017). All rights reserved Page 19 of 163
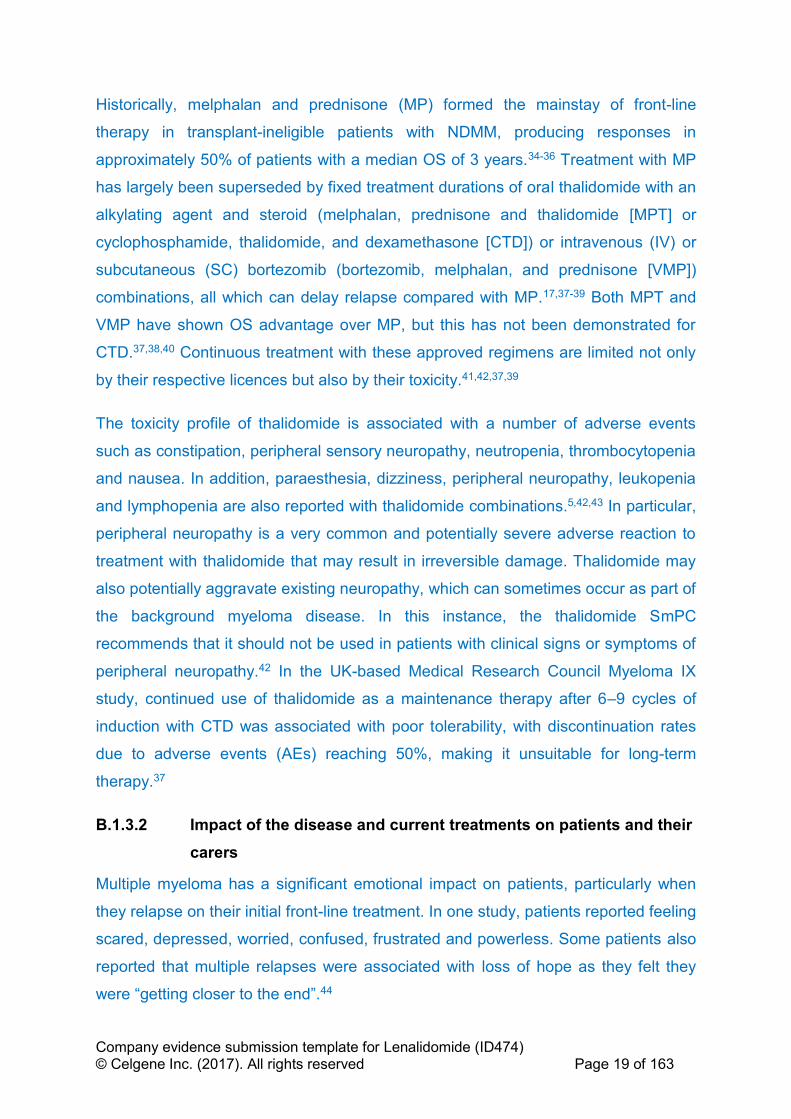
Historically, melphalan and prednisone (MP) formed the mainstay of front-line
therapy in transplant-ineligible patients with NDMM, producing responses in
approximately 50% of patients with a median OS of 3 years.34-36 Treatment with MP
has largely been superseded by fixed treatment durations of oral thalidomide with an
alkylating agent and steroid (melphalan, prednisone and thalidomide [MPT] or
cyclophosphamide, thalidomide, and dexamethasone [CTD]) or intravenous (IV) or
subcutaneous (SC) bortezomib (bortezomib, melphalan, and prednisone [VMP])
combinations, all which can delay relapse compared with MP.17,37-39 Both MPT and
VMP have shown OS advantage over MP, but this has not been demonstrated for
CTD.37,38,40 Continuous treatment with these approved regimens are limited not only
by their respective licences but also by their toxicity.41,42,37,39
The toxicity profile of thalidomide is associated with a number of adverse events
such as constipation, peripheral sensory neuropathy, neutropenia, thrombocytopenia
and nausea. In addition, paraesthesia, dizziness, peripheral neuropathy, leukopenia
and lymphopenia are also reported with thalidomide combinations.5,42,43 In particular,
peripheral neuropathy is a very common and potentially severe adverse reaction to
treatment with thalidomide that may result in irreversible damage. Thalidomide may
also potentially aggravate existing neuropathy, which can sometimes occur as part of
the background myeloma disease. In this instance, the thalidomide SmPC
recommends that it should not be used in patients with clinical signs or symptoms of
peripheral neuropathy.42 In the UK-based Medical Research Council Myeloma IX
study, continued use of thalidomide as a maintenance therapy after 6–9 cycles of
induction with CTD was associated with poor tolerability, with discontinuation rates
due to adverse events (AEs) reaching 50%, making it unsuitable for long-term
therapy.37
B.1.3.2 Impact of the disease and current treatments on patients and their
carers
Multiple myeloma has a significant emotional impact on patients, particularly when
they relapse on their initial front-line treatment. In one study, patients reported feeling
scared, depressed, worried, confused, frustrated and powerless. Some patients also
reported that multiple relapses were associated with loss of hope as they felt they
were “getting closer to the end”.44
Company evidence submission template for Lenalidomide (ID474) © Celgene Inc. (2017). All rights reserved Page 20 of 163
As the disease progresses, patients not only face a worse prognosis but also a
greater symptomatic burden including the cumulative effects of treatment.25,44,45 It is
therefore important, particularly in older transplant-ineligible patients to delay relapse
and maximise the benefit of front-line treatment while preserving QoL. Treatment
with VMP has been show to impact QoL compared to MP.46 Similarly, patients
receiving MPT have been shown to have more disease symptoms and side effects of
treatment relative to the lenalidomide based treatment (see section B.2.6.11).47
In addition to the symptomatic, health-related quality of life (HRQoL) and anxiety
burden of the disease itself, current treatments also add to the patient burden.
Treatment options, including bortezomib, require IV or SC administration in a
hospital setting and are associated with at least four hospital visits per month.41 Such
a requirement for frequent hospital visits is a particular issue for patients with MM
who are often frail, elderly and have mobility problems related to their condition.19,48
The disease and its treatment also impacts employment. One study showed that
only half of patients who underwent intensive MM treatment were still employed after
diagnosis, with a mean age of 61 years.49
Caregivers are also affected; treatment for MM often involves, weeks or months
away from home, requiring a large time commitment from caregivers as well as
patients themselves.49 Caregivers can suffer financial difficulties as a result of a
relative being diagnosed with MM; they may suffer from loss of wages, difficulty in
paying bills, lack of sick leave and premature use of retirement funds.50
B.1.3.3 Clinical pathway of care and context of the proposed use of the
technology
Table 3 shows the current clinical pathway of care in England and the proposed
placement of lenalidomide and low-dose dexamethasone given until disease
progression (Rd) within the pathway. Rd will not displace thalidomide as a first-line
treatment option for transplant-ineligible patients with NDMM, rather it is envisaged
that Rd is likely to partially displace first-line bortezomib combinations and lead to a
reduction in the use of lenalidomide in subsequent lines of therapy. Use of
bortezomib with an alkylating agent and steroid has been recommended as first-line
Company evidence submission template for Lenalidomide (ID474) © Celgene Inc. (2017). All rights reserved Page 21 of 163
treatment by NICE only for patients who are unable to tolerate or who have
contraindications to thalidomide.3,51
Lenalidomide has an improved safety profile compared with thalidomide which
means that patients who are unable to tolerate or who have contraindications to
thalidomide may also benefit from Rd in addition to bortezomib combinations.5,31,42,43
Patients who receive thalidomide are more likely to suffer from AEs such as
constipation, peripheral sensory neuropathy (up to 20% of patients with MM present
with peripheral neuropathy at diagnosis28), neutropenia, thrombocytopenia, nausea,
paraesthesia and dizziness.43 In practice, patients who present with predisposing
conditions that make them more susceptible to these AEs may benefit from receiving
Rd. Providing physicians with the ability to prescribe Rd will allow a wider choice of
therapeutic options and treatment to be tailored to patients’ individual needs.
Within this submission, a cost-effectiveness analysis comparing Rd with VMP shows
efficacy advantages of Rd. In addition, Rd offers both advantages in term of toxicity,
QoL and administration compared to bortezomib combinations.

Company evidence submission template for Lenalidomide (ID474) © Celgene Inc. (2017). All rights reserved Page 22 of 163
Table 3 Current clinical pathway of care for patients with multiple myeloma in England
Therapy line
Guidance Transplant eligible patients with MM Transplant ineligible patients with MM
1st Line NICE TA31152
NICE TA2283
• BOR + DEX or BOR + THAL + DEX induction
followed by ASCT52
• THAL+ alkylating agent + corticosteroid (e.g.
MPT)3
• If THAL intolerant /contraindicated BOR + MP3
o Proposed use of Rd
2nd Line NICE TA12953
NICE TA45754
• BOR ± DEX having received 1 prior therapy53
• CAR + DEX having received 1 prior therapy which did not include BOR
• LEN + DEX (subject to ongoing NICE appraisal)
• Conventional chemotherapy (including cyclophosphamide and melphalan) ± steroida
• A minority of patients may receive a second ASCT
3rd Line onwards
NICE TA17155
NICE TA38056
• LEN + DEX55
• PANO + BOR + DEXb 56
4th Line onwards
NICE TA42757
CDF 201758
• POM + LoDEX57
• Daratumumab monotherapy (subject to ongoing NICE appraisal)
• BEN combinationsd (via CDF) where all other treatments contraindicated or inappropriate 58
• Conventional chemotherapy (inc. cyclophosphamide and melphalan) ± steroid ± THAL re-treatmentc a Primarily received by patients who cannot tolerate THAL, have received BOR at first-line and have recently initiated 2nd line treatment as BOR retreatment is no longer
funded by the CDF therefore availability is limited. b PANO+BOR+DEX is reimbursed in patients who have received ≥ 2 prior lines of treatment including BOR + IMiD; c THAL retreatment can only be used in patients who are THAL eligible (i.e., not those who are THAL intolerant or contraindicated); d BEN is usually used at 4th line onwards (via the CDF).
Key: ASCT, autologous stem cell transplant; BEN, bendamustine; BOR, bortezomib; CAR, carfilzomib; CDF, National Cancer Drugs Fund; DEX, dexamethasone; IMiD,
immunomodulatory drug ; LEN, lenalidomide; LoDEX, low dose dexamethasone; MM, multiple myeloma ; MP, melphalan, prednisone; MPT, melphalan, prednisone,
thalidomide; NICE, National Institute for Health & Care Excellence; PANO, panobinostat; POM, pomalidomide; Rd, lenalidomide and low-dose dexamethasone until disease
progression; THAL, thalidomide.
Sources: NICE TA311, 201452; NICE TA228, 2011;3 NICE TA129, 2007;53 NICE TA457, 2017 ;54 2009;55 NICE TA380;56 NICE TA427;57 NHS CDF List, 2017.58

Company evidence submission template for Lenalidomide (ID474) © Celgene Inc. (2017). All rights reserved Page 23 of 163
B.1.3.4 Supporting Clinical Guidelines Relevant to this Submission
A number of clinical practice guidelines have been published on the treatment of
NDMM.17,18,59-61 Some, like the British Committee for Standards in Haematology
(BCSH),17 pre-date the licensing of lenalidomide for transplant-ineligible patients;
however some of the more up to date guidelines refer to the use of Rd based on
MM-020 study results.60,61
European guidelines
The European Society for Medical Oncology (ESMO) has recently (2017) published
MM specific clinical practice guidelines dealing with treatment of patients with
transplant-ineligible NDMM.60 These guidelines recommend either VMP or Rd
(based on data from MM-020,31 the pivotal trial in this submission) as a first option
for symptomatic transplant-ineligible NDMM patients outside of clinical trials.
National Comprehensive Cancer Network guidelines (United States)
The National Comprehensive Cancer Network (NCCN) recommends Rd as a
Category 1 option (i.e. based on high-level evidence, with uniform NCCN consensus
that the intervention is appropriate) for treatment of patients with NDMM who are
ineligible for transplantation.61 The NCCN scores Rd as 4 out of 5 for efficacy, safety,
quality of evidence and consistency of evidence, which is higher than or equivalent
to the scores for comparative agents (Table 4).61
Table 4 Summaries of NCCN evidence blocks for Rd vs relevant comparators
Rd VMP MPT
Efficacy 4 4 4
Safety 4 3 3
Quality of evidence 4 4 4
Consistency of evidence 4 4 4
(5 = best, and 1 = worst)
Key: MPT, melphalan, prednisone and thalidomide; NCCN, National Comprehensive Cancer Network; Rd,
lenalidomide and low-dose dexamethasone until disease progression; VMP, bortezomib, melphalan, and
prednisone.
Source: NCCN, 2016.61
B.1.4 Equality considerations
No equality issues relating to the use of lenalidomide have been identified or are
anticipated.
Company evidence submission template for Lenalidomide (ID474) © Celgene Inc. (2017). All rights reserved Page 24 of 163
B.2 Clinical effectiveness
B.2.1 Identification and selection of relevant studies
Appendix D provides full details of the systematic literature review (SLR) used to
identify and select clinical evidence relevant to this submission. Of the 23 studies
identified by the SLR (eligibility criteria are detailed in Table 56), only 4 studies were
considered relevant to the decision problem specified in the final scope (Table 1); 1
study containing lenalidomide (MM-02031,43) and 3 studies containing evidence for
comparators used to form the network meta-analysis described in Section B.2.9.
B.2.2 List of relevant clinical effectiveness evidence
Details of MM-020 are given in Table 5 including primary and secondary outcomes
and which of these were used in the economic model.
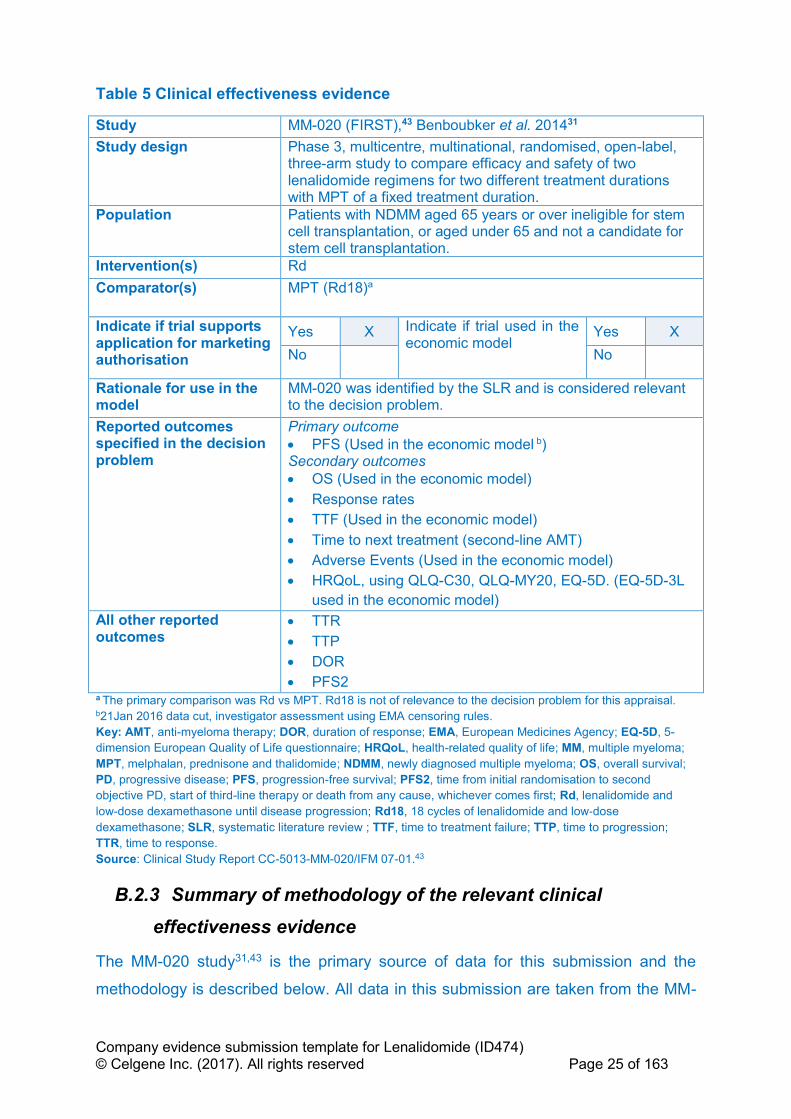
Company evidence submission template for Lenalidomide (ID474) © Celgene Inc. (2017). All rights reserved Page 25 of 163
Table 5 Clinical effectiveness evidence
Study MM-020 (FIRST),43 Benboubker et al. 201431
Study design Phase 3, multicentre, multinational, randomised, open-label, three-arm study to compare efficacy and safety of two lenalidomide regimens for two different treatment durations with MPT of a fixed treatment duration.
Population Patients with NDMM aged 65 years or over ineligible for stem cell transplantation, or aged under 65 and not a candidate for stem cell transplantation.
Intervention(s) Rd
Comparator(s) MPT (Rd18)a
Indicate if trial supports application for marketing authorisation
Yes X Indicate if trial used in the economic model
Yes X
No
No
Rationale for use in the model
MM-020 was identified by the SLR and is considered relevant to the decision problem.
Reported outcomes specified in the decision problem
Primary outcome
• PFS (Used in the economic model b) Secondary outcomes
• OS (Used in the economic model)
• Response rates
• TTF (Used in the economic model)
• Time to next treatment (second-line AMT)
• Adverse Events (Used in the economic model)
• HRQoL, using QLQ-C30, QLQ-MY20, EQ-5D. (EQ-5D-3L
used in the economic model)
All other reported outcomes
• TTR
• TTP
• DOR
• PFS2 a The primary comparison was Rd vs MPT. Rd18 is not of relevance to the decision problem for this appraisal. b21Jan 2016 data cut, investigator assessment using EMA censoring rules.
Key: AMT, anti-myeloma therapy; DOR, duration of response; EMA, European Medicines Agency; EQ-5D, 5-
dimension European Quality of Life questionnaire; HRQoL, health-related quality of life; MM, multiple myeloma;
MPT, melphalan, prednisone and thalidomide; NDMM, newly diagnosed multiple myeloma; OS, overall survival;
PD, progressive disease; PFS, progression-free survival; PFS2, time from initial randomisation to second
objective PD, start of third-line therapy or death from any cause, whichever comes first; Rd, lenalidomide and
low-dose dexamethasone until disease progression; Rd18, 18 cycles of lenalidomide and low‐dose
dexamethasone; SLR, systematic literature review ; TTF, time to treatment failure; TTP, time to progression;
TTR, time to response.
Source: Clinical Study Report CC-5013-MM-020/IFM 07-01.43
B.2.3 Summary of methodology of the relevant clinical
effectiveness evidence
The MM-020 study31,43 is the primary source of data for this submission and the
methodology is described below. All data in this submission are taken from the MM-
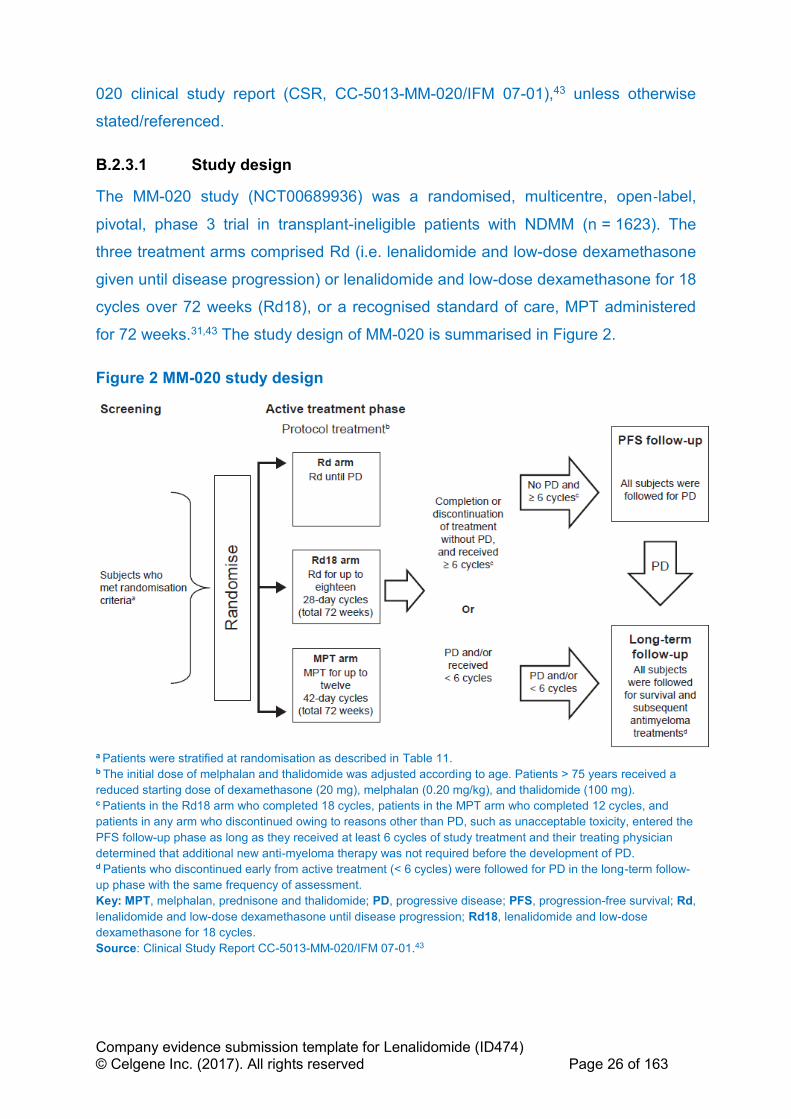
Company evidence submission template for Lenalidomide (ID474) © Celgene Inc. (2017). All rights reserved Page 26 of 163
020 clinical study report (CSR, CC-5013-MM-020/IFM 07-01),43 unless otherwise
stated/referenced.
B.2.3.1 Study design
The MM-020 study (NCT00689936) was a randomised, multicentre, open‐label,
pivotal, phase 3 trial in transplant-ineligible patients with NDMM (n = 1623). The
three treatment arms comprised Rd (i.e. lenalidomide and low-dose dexamethasone
given until disease progression) or lenalidomide and low-dose dexamethasone for 18
cycles over 72 weeks (Rd18), or a recognised standard of care, MPT administered
for 72 weeks.31,43 The study design of MM-020 is summarised in Figure 2.
Figure 2 MM-020 study design
a Patients were stratified at randomisation as described in Table 11. b The initial dose of melphalan and thalidomide was adjusted according to age. Patients > 75 years received a
reduced starting dose of dexamethasone (20 mg), melphalan (0.20 mg/kg), and thalidomide (100 mg). c Patients in the Rd18 arm who completed 18 cycles, patients in the MPT arm who completed 12 cycles, and
patients in any arm who discontinued owing to reasons other than PD, such as unacceptable toxicity, entered the
PFS follow-up phase as long as they received at least 6 cycles of study treatment and their treating physician
determined that additional new anti-myeloma therapy was not required before the development of PD. d Patients who discontinued early from active treatment (< 6 cycles) were followed for PD in the long-term follow-
up phase with the same frequency of assessment.
Key: MPT, melphalan, prednisone and thalidomide; PD, progressive disease; PFS, progression-free survival; Rd,
lenalidomide and low-dose dexamethasone until disease progression; Rd18, lenalidomide and low-dose
dexamethasone for 18 cycles.
Source: Clinical Study Report CC-5013-MM-020/IFM 07-01.43
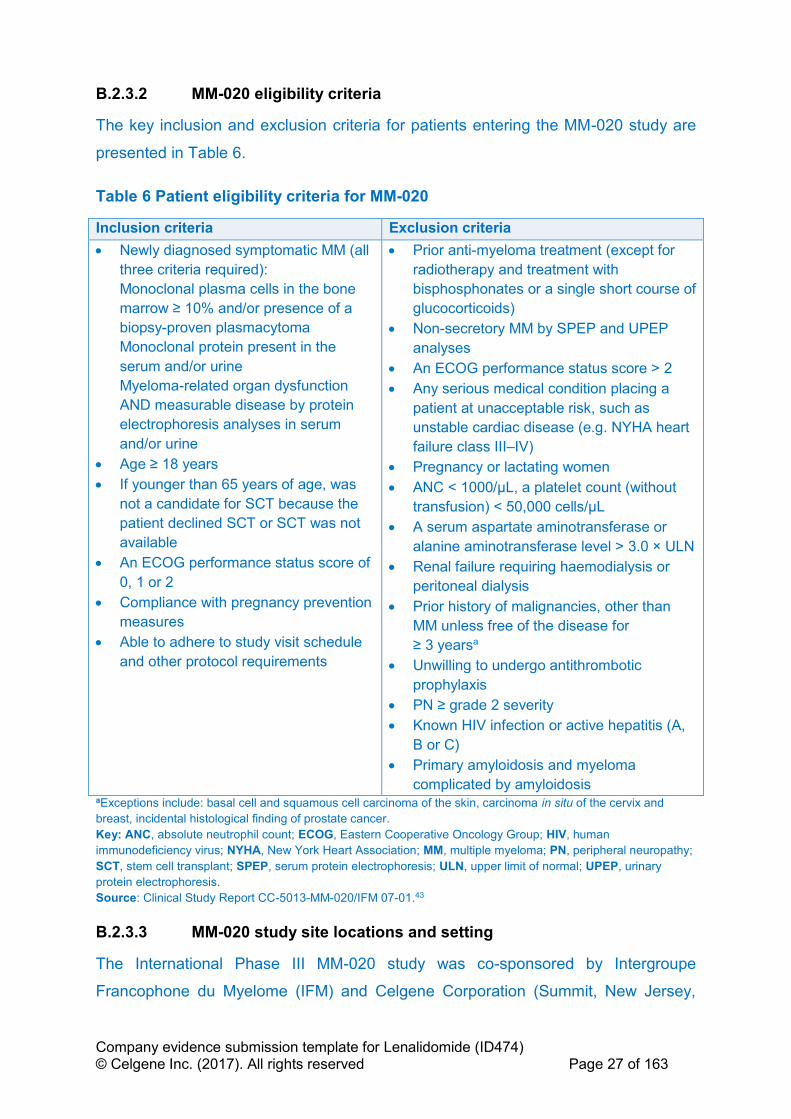
Company evidence submission template for Lenalidomide (ID474) © Celgene Inc. (2017). All rights reserved Page 27 of 163
B.2.3.2 MM-020 eligibility criteria
The key inclusion and exclusion criteria for patients entering the MM-020 study are
presented in Table 6.
Table 6 Patient eligibility criteria for MM-020
Inclusion criteria Exclusion criteria
• Newly diagnosed symptomatic MM (all
three criteria required):
Monoclonal plasma cells in the bone
marrow ≥ 10% and/or presence of a
biopsy-proven plasmacytoma
Monoclonal protein present in the
serum and/or urine
Myeloma-related organ dysfunction
AND measurable disease by protein
electrophoresis analyses in serum
and/or urine
• Age ≥ 18 years
• If younger than 65 years of age, was
not a candidate for SCT because the
patient declined SCT or SCT was not
available
• An ECOG performance status score of
0, 1 or 2
• Compliance with pregnancy prevention
measures
• Able to adhere to study visit schedule
and other protocol requirements
• Prior anti-myeloma treatment (except for
radiotherapy and treatment with
bisphosphonates or a single short course of
glucocorticoids)
• Non-secretory MM by SPEP and UPEP
analyses
• An ECOG performance status score > 2
• Any serious medical condition placing a
patient at unacceptable risk, such as
unstable cardiac disease (e.g. NYHA heart
failure class III–IV)
• Pregnancy or lactating women
• ANC < 1000/μL, a platelet count (without
transfusion) < 50,000 cells/μL
• A serum aspartate aminotransferase or
alanine aminotransferase level > 3.0 × ULN
• Renal failure requiring haemodialysis or
peritoneal dialysis
• Prior history of malignancies, other than
MM unless free of the disease for
≥ 3 yearsa
• Unwilling to undergo antithrombotic
prophylaxis
• PN ≥ grade 2 severity
• Known HIV infection or active hepatitis (A,
B or C)
• Primary amyloidosis and myeloma
complicated by amyloidosis aExceptions include: basal cell and squamous cell carcinoma of the skin, carcinoma in situ of the cervix and
breast, incidental histological finding of prostate cancer.
Key: ANC, absolute neutrophil count; ECOG, Eastern Cooperative Oncology Group; HIV, human
immunodeficiency virus; NYHA, New York Heart Association; MM, multiple myeloma; PN, peripheral neuropathy;
SCT, stem cell transplant; SPEP, serum protein electrophoresis; ULN, upper limit of normal; UPEP, urinary
protein electrophoresis.
Source: Clinical Study Report CC-5013-MM-020/IFM 07-01.43
B.2.3.3 MM-020 study site locations and setting
The International Phase III MM-020 study was co-sponsored by Intergroupe
Francophone du Myelome (IFM) and Celgene Corporation (Summit, New Jersey,
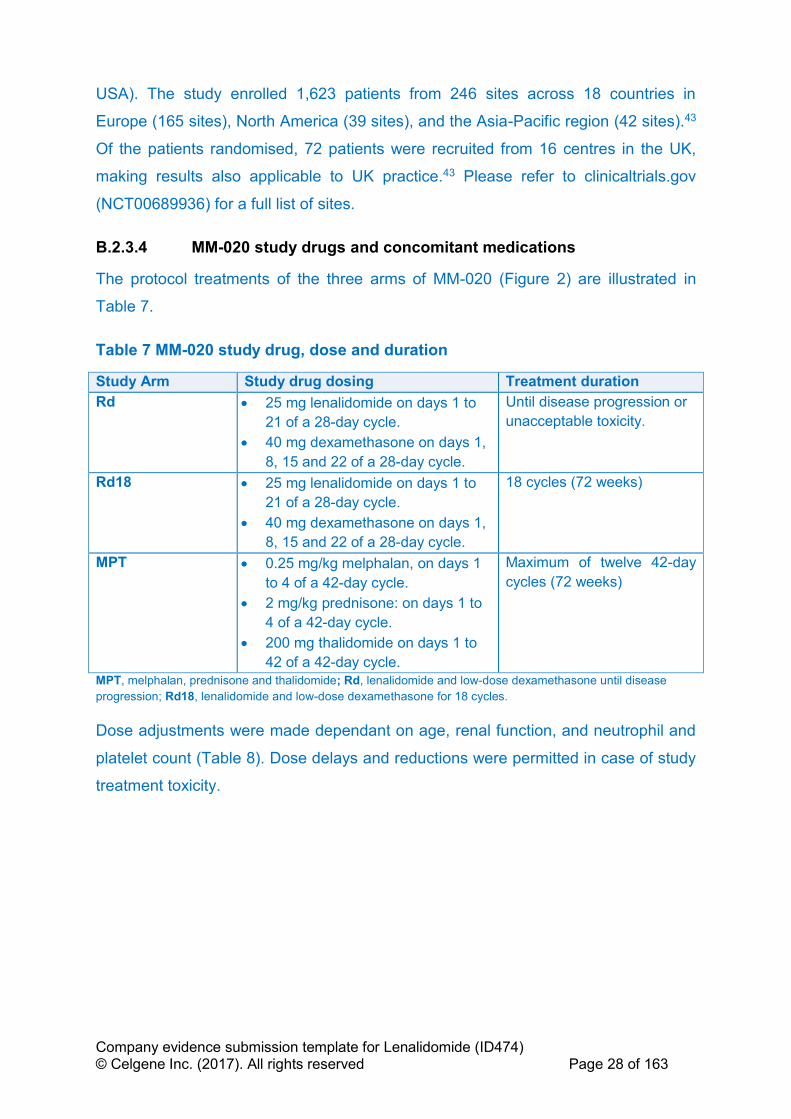
Company evidence submission template for Lenalidomide (ID474) © Celgene Inc. (2017). All rights reserved Page 28 of 163
USA). The study enrolled 1,623 patients from 246 sites across 18 countries in
Europe (165 sites), North America (39 sites), and the Asia-Pacific region (42 sites).43
Of the patients randomised, 72 patients were recruited from 16 centres in the UK,
making results also applicable to UK practice.43 Please refer to clinicaltrials.gov
(NCT00689936) for a full list of sites.
B.2.3.4 MM-020 study drugs and concomitant medications
The protocol treatments of the three arms of MM-020 (Figure 2) are illustrated in
Table 7.
Table 7 MM-020 study drug, dose and duration
Study Arm Study drug dosing Treatment duration
Rd • 25 mg lenalidomide on days 1 to
21 of a 28-day cycle.
• 40 mg dexamethasone on days 1,
8, 15 and 22 of a 28-day cycle.
Until disease progression or
unacceptable toxicity.
Rd18 • 25 mg lenalidomide on days 1 to
21 of a 28-day cycle.
• 40 mg dexamethasone on days 1,
8, 15 and 22 of a 28-day cycle.
18 cycles (72 weeks)
MPT • 0.25 mg/kg melphalan, on days 1
to 4 of a 42-day cycle.
• 2 mg/kg prednisone: on days 1 to
4 of a 42-day cycle.
• 200 mg thalidomide on days 1 to
42 of a 42-day cycle.
Maximum of twelve 42-day
cycles (72 weeks)
MPT, melphalan, prednisone and thalidomide; Rd, lenalidomide and low-dose dexamethasone until disease
progression; Rd18, lenalidomide and low-dose dexamethasone for 18 cycles.
Dose adjustments were made dependant on age, renal function, and neutrophil and
platelet count (Table 8). Dose delays and reductions were permitted in case of study
treatment toxicity.
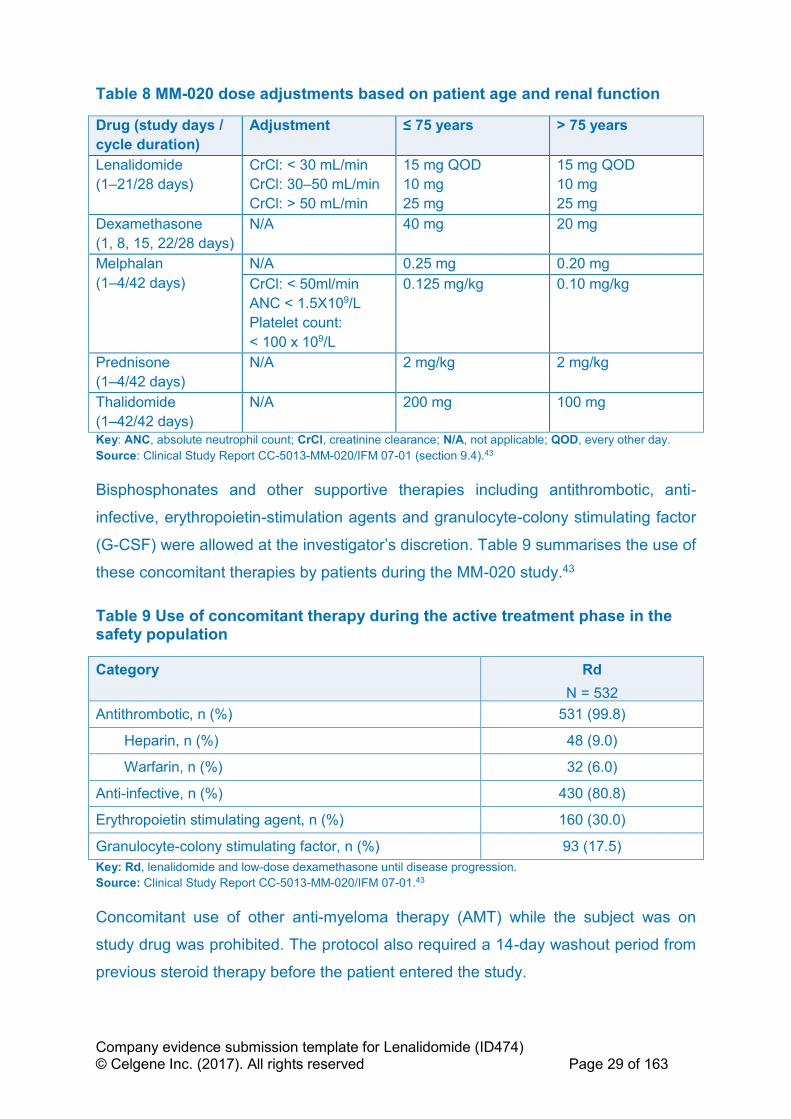
Company evidence submission template for Lenalidomide (ID474) © Celgene Inc. (2017). All rights reserved Page 29 of 163
Table 8 MM-020 dose adjustments based on patient age and renal function
Drug (study days /
cycle duration)
Adjustment ≤ 75 years > 75 years
Lenalidomide
(1–21/28 days)
CrCl: < 30 mL/min
CrCl: 30–50 mL/min
CrCl: > 50 mL/min
15 mg QOD
10 mg
25 mg
15 mg QOD
10 mg
25 mg
Dexamethasone
(1, 8, 15, 22/28 days)
N/A 40 mg 20 mg
Melphalan
(1–4/42 days)
N/A 0.25 mg 0.20 mg
CrCl: < 50ml/min
ANC < 1.5X10⁹/L
Platelet count:
< 100 x 109/L
0.125 mg/kg 0.10 mg/kg
Prednisone
(1–4/42 days)
N/A
2 mg/kg
2 mg/kg
Thalidomide
(1–42/42 days)
N/A 200 mg 100 mg
Key: ANC, absolute neutrophil count; CrCl, creatinine clearance; N/A, not applicable; QOD, every other day.
Source: Clinical Study Report CC-5013-MM-020/IFM 07-01 (section 9.4).43
Bisphosphonates and other supportive therapies including antithrombotic, anti-
infective, erythropoietin-stimulation agents and granulocyte-colony stimulating factor
(G-CSF) were allowed at the investigator’s discretion. Table 9 summarises the use of
these concomitant therapies by patients during the MM-020 study.43
Table 9 Use of concomitant therapy during the active treatment phase in the safety population
Category Rd
N = 532
Antithrombotic, n (%) 531 (99.8)
Heparin, n (%) 48 (9.0)
Warfarin, n (%) 32 (6.0)
Anti-infective, n (%) 430 (80.8)
Erythropoietin stimulating agent, n (%) 160 (30.0)
Granulocyte-colony stimulating factor, n (%) 93 (17.5)
Key: Rd, lenalidomide and low-dose dexamethasone until disease progression.
Source: Clinical Study Report CC-5013-MM-020/IFM 07-01.43
Concomitant use of other anti-myeloma therapy (AMT) while the subject was on
study drug was prohibited. The protocol also required a 14-day washout period from
previous steroid therapy before the patient entered the study.
Company evidence submission template for Lenalidomide (ID474) © Celgene Inc. (2017). All rights reserved Page 30 of 163
B.2.3.5 Outcome measures
There have been a number of analyses in the course of study MM-020. Current
status is that the final planned PFS and OS data are available. Table 10 highlights
outcomes measures specified in the scope, relevant outcome data available and the
associated data used in the economic model.
The main data presented in this submission are:
• 24 May 2013: pre-planned data cut-off date for final PFS analysis based on
assessments by an Independent Response Adjudication Committee (IRAC)
using International Myeloma Working Group (IMWG) response criteria62 with a
median follow-up of 37 months. At this time sufficient events had occurred to
trigger final analysis of PFS. A planned interim analysis of OS was conducted
at this time point.31,43
• 21 January 2016: pre-planned data cut-off for final OS, with a median follow-
up of 67 months. At this time point post-hoc updated analysis of PFS,
progression-free survival 2 (PFS2), time to progression (TTP), time to
treatment failure (TTF), duration of response (DOR), time to response (TTR),
time to second AMT and overall response rate (ORR) by investigator were
conducted, with a median follow up of 67 months.43
Throughout this submission, data are presented primarily for the most up-to-date
data cut from 21 January 2016.43
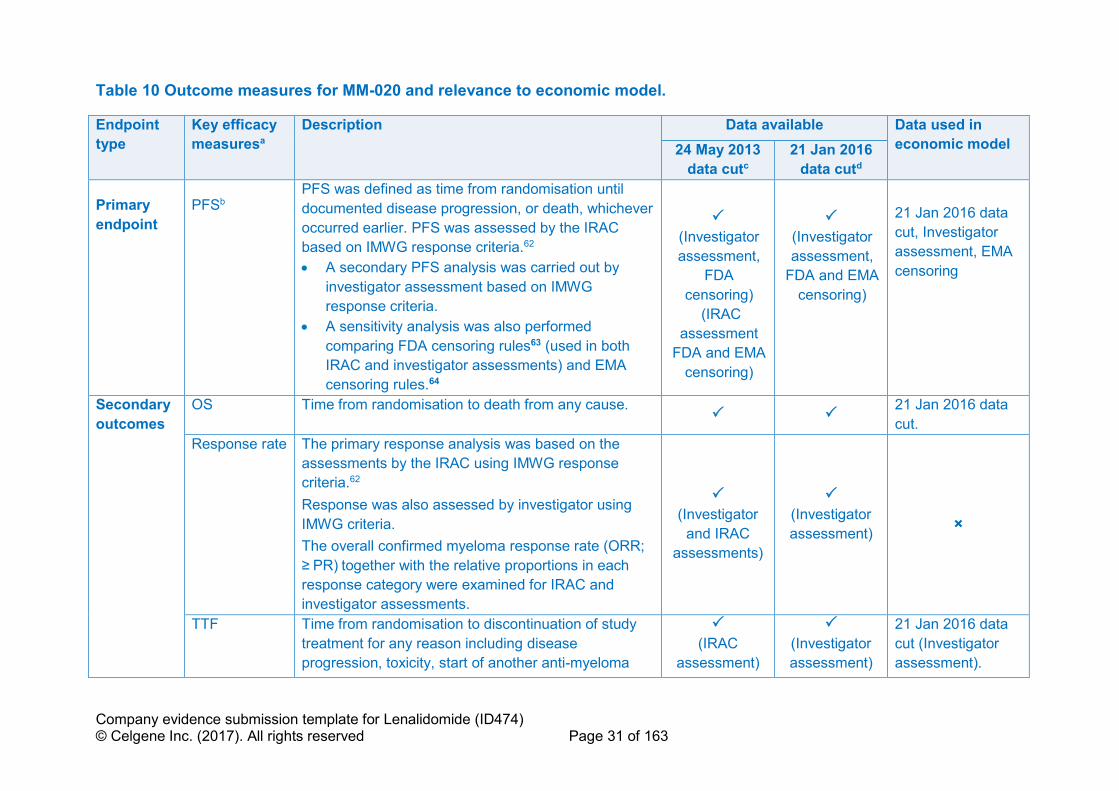
Company evidence submission template for Lenalidomide (ID474) © Celgene Inc. (2017). All rights reserved Page 31 of 163
Table 10 Outcome measures for MM-020 and relevance to economic model.
Endpoint
type
Key efficacy
measuresa
Description Data available Data used in
economic model 24 May 2013
data cutc
21 Jan 2016
data cutd
Primary
endpoint
PFSb PFS was defined as time from randomisation until
documented disease progression, or death, whichever
occurred earlier. PFS was assessed by the IRAC
based on IMWG response criteria.62
• A secondary PFS analysis was carried out by
investigator assessment based on IMWG
response criteria.
• A sensitivity analysis was also performed
comparing FDA censoring rules63 (used in both
IRAC and investigator assessments) and EMA
censoring rules.64
(Investigator
assessment,
FDA
censoring)
(IRAC
assessment
FDA and EMA
censoring)
(Investigator
assessment,
FDA and EMA
censoring)
21 Jan 2016 data
cut, Investigator
assessment, EMA
censoring
Secondary
outcomes
OS Time from randomisation to death from any cause.
21 Jan 2016 data
cut.
Response rate The primary response analysis was based on the
assessments by the IRAC using IMWG response
criteria.62
Response was also assessed by investigator using
IMWG criteria.
The overall confirmed myeloma response rate (ORR;
≥ PR) together with the relative proportions in each
response category were examined for IRAC and
investigator assessments.
(Investigator
and IRAC
assessments)
(Investigator
assessment)
×
TTF Time from randomisation to discontinuation of study
treatment for any reason including disease
progression, toxicity, start of another anti-myeloma
(IRAC
assessment)
(Investigator
assessment)
21 Jan 2016 data
cut (Investigator
assessment).
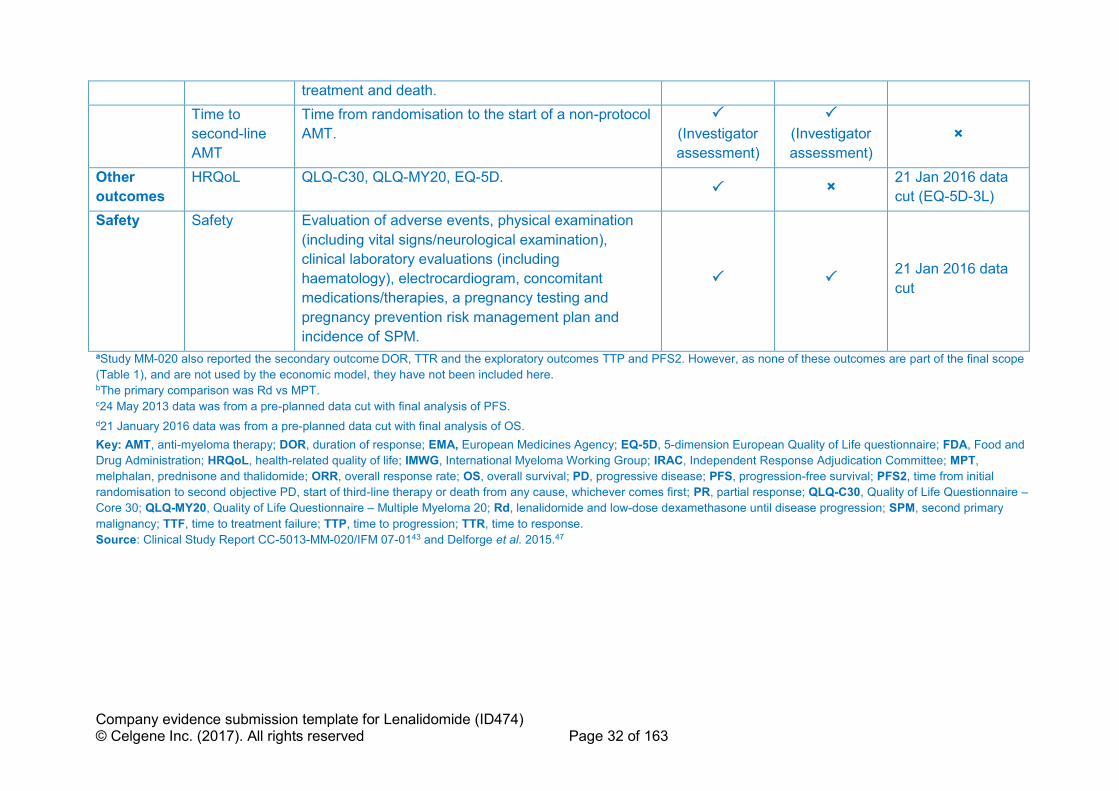
Company evidence submission template for Lenalidomide (ID474) © Celgene Inc. (2017). All rights reserved Page 32 of 163
treatment and death.
Time to
second-line
AMT
Time from randomisation to the start of a non-protocol
AMT.
(Investigator
assessment)
(Investigator
assessment)
×
Other
outcomes
HRQoL QLQ-C30, QLQ-MY20, EQ-5D. ×
21 Jan 2016 data
cut (EQ-5D-3L)
Safety Safety Evaluation of adverse events, physical examination
(including vital signs/neurological examination),
clinical laboratory evaluations (including
haematology), electrocardiogram, concomitant
medications/therapies, a pregnancy testing and
pregnancy prevention risk management plan and
incidence of SPM.
21 Jan 2016 data
cut
aStudy MM-020 also reported the secondary outcome DOR, TTR and the exploratory outcomes TTP and PFS2. However, as none of these outcomes are part of the final scope
(Table 1), and are not used by the economic model, they have not been included here. bThe primary comparison was Rd vs MPT. c24 May 2013 data was from a pre-planned data cut with final analysis of PFS.
d21 January 2016 data was from a pre-planned data cut with final analysis of OS.
Key: AMT, anti-myeloma therapy; DOR, duration of response; EMA, European Medicines Agency; EQ-5D, 5-dimension European Quality of Life questionnaire; FDA, Food and
Drug Administration; HRQoL, health-related quality of life; IMWG, International Myeloma Working Group; IRAC, Independent Response Adjudication Committee; MPT,
melphalan, prednisone and thalidomide; ORR, overall response rate; OS, overall survival; PD, progressive disease; PFS, progression-free survival; PFS2, time from initial
randomisation to second objective PD, start of third-line therapy or death from any cause, whichever comes first; PR, partial response; QLQ-C30, Quality of Life Questionnaire –
Core 30; QLQ-MY20, Quality of Life Questionnaire – Multiple Myeloma 20; Rd, lenalidomide and low-dose dexamethasone until disease progression; SPM, second primary
malignancy; TTF, time to treatment failure; TTP, time to progression; TTR, time to response.
Source: Clinical Study Report CC-5013-MM-020/IFM 07-0143 and Delforge et al. 2015.47

Company evidence submission template for Lenalidomide (ID474) © Celgene Inc. (2017). All rights reserved Page 33 of 163
B.2.3.6 Summary of MM-020 methodology
MM-020 methodology is summarised in Table 11.
Table 11 Summary of MM-020 methodology
Study details MM-020
Location 246 centres treatment centres in 18 countries.
Design Phase 3, multicentre, multinational, randomised, open-label, three-arm
study to compare efficacy and safety of two lenalidomide regimens for
two different treatment durations with MPT of a fixed treatment duration.
Duration of core
study
Rd or Rd18 or MPT treatment phase. Follow-up until
progression/relapse or survival in all three arms.
Method of
randomisation
1:1:1 randomisation using a validated interactive voice-response system
(IVRS)
Designated research personnel were assigned unique access code
envelopes, which authorised them to call the IVRS to randomise patients
into the study. The IVRS presented a menu of questions, to identify the
patient, confirm eligibility and enter stratification information. Following
confirmation that the patient could be randomised, the IVRS assigned a
randomisation identification number to the patient. The patient was
issued a study drug kit corresponding to the randomised treatment
group. Confirmation was sent to the study site and to Celgene.
Blinding Open-label with assessor blinding. The study team was blinded to the
data until after the database lock following the targeted number of
events for the final analysis of PFS (the primary endpoint) being met. PD
was confirmed by the IRAC who were blinded to treatment allocation.
Patient
stratification
Age (≤ 75 years vs > 75 years)
ISS disease stage (I or II vs III)
Country/region
Protocol
treatment
Rd: 25 mg lenalidomide on days 1 to 21 and 40 mg dexamethasone on
days 1, 8, 15 and 22 of a 28-day cycle, both until disease progression or
unacceptable toxicity
Rd18: 25 mg lenalidomide on days 1 to 21, and 40 mg dexamethasone
on days 1, 8, 15 and 22 of a 28-day cycle for a total of 18 cycles (72
weeks)
MPT: melphalan: 0.25 mg/kg, days 1 to 4; prednisone: 2 mg/kg on days
1 to 4; 200 mg thalidomide on days 1 to 42 for a maximum of twelve 42-
day cycles (72 weeks)
Dose adjustments were made dependant on age, renal function, and
neutrophil and platelet count. Dose delays and reductions were
permitted in case of study treatment toxicity.
All patients received protocol-specified antithrombotic prophylaxis.

Company evidence submission template for Lenalidomide (ID474) © Celgene Inc. (2017). All rights reserved Page 34 of 163
Bisphosphonates and other supportive therapies were allowed at the
investigator’s discretion.
No cross-over between treatment groups was allowed.
Efficacy
assessment
Response was assessed according to the International Myeloma
Working Group criteria,62 at the start of each treatment cycle and every
28 days during the follow-up phase.
Primary
endpoint
(including
scoring
methods and
timings of
assessments)
The primary endpoint was PFS (per FDA censoring rules). Response
was assessed at 28-day intervals during both treatment (to PD
development or cycle end) and follow-up phases. PFS was censored at
the date when the response assessment determined lack of progression
for those patients who discontinued the active treatment phase or the
PFS follow-up phase before documentation of PD. If a patient initiated a
new AMT regimen, then PFS was censored at the date of the last
progression-free response assessment before the start date of the new
regimen.
Other endpoints OS, ORR (CR, VGPR and PR), TTR, DOR, TTF, time to second-line
AMT, HRQoL, TTP and PFS2
Primary and
secondary
comparisons
For all efficacy endpoints, the primary comparison was between Rd and
MPT, and the secondary comparisons were between Rd and Rd18,
Rd18 and MPT, and Rd + Rd18 and MPT.
Subgroup
analyses
Age group (≤ 75 years, > 75 years), baseline ISS (stages I or II, stage
III), country: North America and Pacific Region (USA, Canada, Australia
and New Zealand), Europe (Austria, Belgium, France, Germany,
Greece, Italy, Portugal, Spain, Sweden, Switzerland and UK), and Asia
(China, Taiwan and Republic of Korea), sex and race.
Other clinical features identified as possible prognostic factors for
response in patients with MM could be used as an exploratory analysis;
PFS, OS and ORR could be compared between treatment arms based
on the EE population using the same analysis for the ITT analyses.
Exploratory analyses were conducted for PFS and OS to assess the
demographic and prognostic factors that most affected treatment
outcome and to adjust the treatment comparisons for these variables.
The variables to be evaluated included age, sex, baseline ISS score,
baseline ECOG performance status, and other relevant baseline
characteristics, such as cytogenetic abnormalities. Subsequently,
corresponding subgroup analyses could be performed for PFS and OS.
Logistic regression could be used in an exploratory manner for time-to-
event variables to assess the effects of risk factors on response rates.
Summaries of demographic and baseline disease characteristics,
duration of treatment, follow-up time for surviving subjects, and analyses
of PFS, PFS2, and OS were generated for subjects with CR or VGPR to
further our understanding of PFS, PFS2, and OS in this subgroup of
subjects.
Duration of Median of 37.0 (range 0 to 56.7) months at the time of primary endpoint
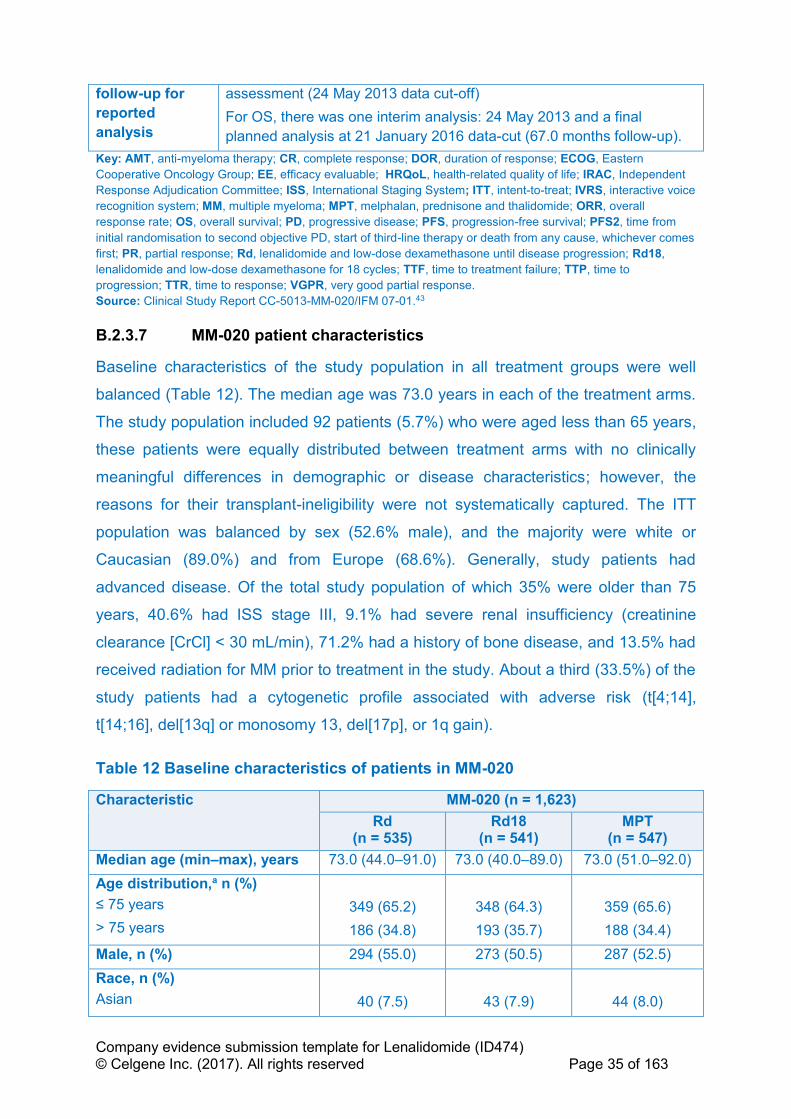
Company evidence submission template for Lenalidomide (ID474) © Celgene Inc. (2017). All rights reserved Page 35 of 163
follow-up for
reported
analysis
assessment (24 May 2013 data cut-off)
For OS, there was one interim analysis: 24 May 2013 and a final
planned analysis at 21 January 2016 data-cut (67.0 months follow-up).
Key: AMT, anti-myeloma therapy; CR, complete response; DOR, duration of response; ECOG, Eastern
Cooperative Oncology Group; EE, efficacy evaluable; HRQoL, health-related quality of life; IRAC, Independent
Response Adjudication Committee; ISS, International Staging System; ITT, intent-to-treat; IVRS, interactive voice
recognition system; MM, multiple myeloma; MPT, melphalan, prednisone and thalidomide; ORR, overall
response rate; OS, overall survival; PD, progressive disease; PFS, progression-free survival; PFS2, time from
initial randomisation to second objective PD, start of third-line therapy or death from any cause, whichever comes
first; PR, partial response; Rd, lenalidomide and low-dose dexamethasone until disease progression; Rd18,
lenalidomide and low-dose dexamethasone for 18 cycles; TTF, time to treatment failure; TTP, time to
progression; TTR, time to response; VGPR, very good partial response.
Source: Clinical Study Report CC-5013-MM-020/IFM 07-01.43
B.2.3.7 MM-020 patient characteristics
Baseline characteristics of the study population in all treatment groups were well
balanced (Table 12). The median age was 73.0 years in each of the treatment arms.
The study population included 92 patients (5.7%) who were aged less than 65 years,
these patients were equally distributed between treatment arms with no clinically
meaningful differences in demographic or disease characteristics; however, the
reasons for their transplant-ineligibility were not systematically captured. The ITT
population was balanced by sex (52.6% male), and the majority were white or
Caucasian (89.0%) and from Europe (68.6%). Generally, study patients had
advanced disease. Of the total study population of which 35% were older than 75
years, 40.6% had ISS stage III, 9.1% had severe renal insufficiency (creatinine
clearance [CrCl] < 30 mL/min), 71.2% had a history of bone disease, and 13.5% had
received radiation for MM prior to treatment in the study. About a third (33.5%) of the
study patients had a cytogenetic profile associated with adverse risk (t[4;14],
t[14;16], del[13q] or monosomy 13, del[17p], or 1q gain).
Table 12 Baseline characteristics of patients in MM-020
Characteristic MM-020 (n = 1,623)
Rd (n = 535)
Rd18 (n = 541)
MPT (n = 547)
Median age (min–max), years 73.0 (44.0–91.0) 73.0 (40.0–89.0) 73.0 (51.0–92.0)
Age distribution,a n (%)
≤ 75 years
> 75 years
349 (65.2)
186 (34.8)
348 (64.3)
193 (35.7)
359 (65.6)
188 (34.4)
Male, n (%) 294 (55.0) 273 (50.5) 287 (52.5)
Race, n (%)
Asian
40 (7.5)
43 (7.9)
44 (8.0)
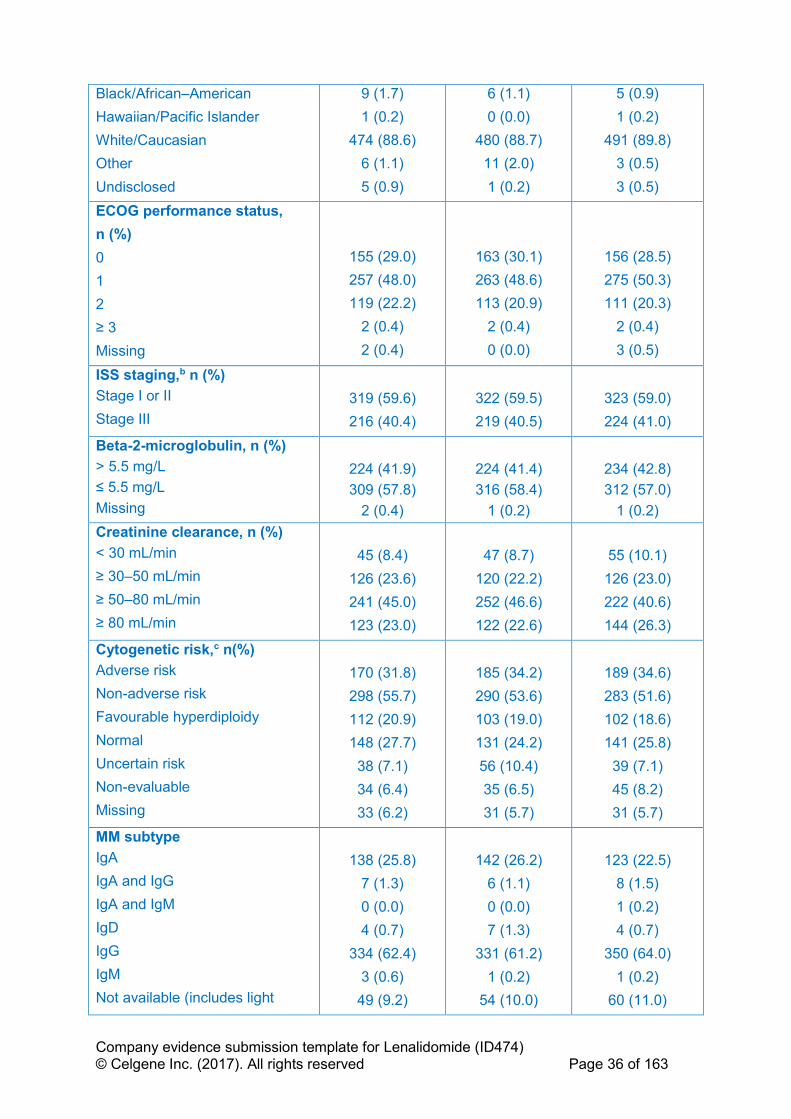
Company evidence submission template for Lenalidomide (ID474) © Celgene Inc. (2017). All rights reserved Page 36 of 163
Black/African–American
Hawaiian/Pacific Islander
White/Caucasian
Other
Undisclosed
9 (1.7)
1 (0.2)
474 (88.6)
6 (1.1)
5 (0.9)
6 (1.1)
0 (0.0)
480 (88.7)
11 (2.0)
1 (0.2)
5 (0.9)
1 (0.2)
491 (89.8)
3 (0.5)
3 (0.5)
ECOG performance status,
n (%)
0
1
2
≥ 3
Missing
155 (29.0)
257 (48.0)
119 (22.2)
2 (0.4)
2 (0.4)
163 (30.1)
263 (48.6)
113 (20.9)
2 (0.4)
0 (0.0)
156 (28.5)
275 (50.3)
111 (20.3)
2 (0.4)
3 (0.5)
ISS staging,b n (%)
Stage I or II
Stage III
319 (59.6)
216 (40.4)
322 (59.5)
219 (40.5)
323 (59.0)
224 (41.0)
Beta-2-microglobulin, n (%)
> 5.5 mg/L
≤ 5.5 mg/L
Missing
224 (41.9)
309 (57.8)
2 (0.4)
224 (41.4)
316 (58.4)
1 (0.2)
234 (42.8)
312 (57.0)
1 (0.2)
Creatinine clearance, n (%)
< 30 mL/min
≥ 30–50 mL/min
≥ 50–80 mL/min
≥ 80 mL/min
45 (8.4)
126 (23.6)
241 (45.0)
123 (23.0)
47 (8.7)
120 (22.2)
252 (46.6)
122 (22.6)
55 (10.1)
126 (23.0)
222 (40.6)
144 (26.3)
Cytogenetic risk,c n(%)
Adverse risk
Non-adverse risk
Favourable hyperdiploidy
Normal
Uncertain risk
Non-evaluable
Missing
170 (31.8)
298 (55.7)
112 (20.9)
148 (27.7)
38 (7.1)
34 (6.4)
33 (6.2)
185 (34.2)
290 (53.6)
103 (19.0)
131 (24.2)
56 (10.4)
35 (6.5)
31 (5.7)
189 (34.6)
283 (51.6)
102 (18.6)
141 (25.8)
39 (7.1)
45 (8.2)
31 (5.7)
MM subtype
IgA
IgA and IgG
IgA and IgM
IgD
IgG
IgM
Not available (includes light
138 (25.8)
7 (1.3)
0 (0.0)
4 (0.7)
334 (62.4)
3 (0.6)
49 (9.2)
142 (26.2)
6 (1.1)
0 (0.0)
7 (1.3)
331 (61.2)
1 (0.2)
54 (10.0)
123 (22.5)
8 (1.5)
1 (0.2)
4 (0.7)
350 (64.0)
1 (0.2)
60 (11.0)

Company evidence submission template for Lenalidomide (ID474) © Celgene Inc. (2017). All rights reserved Page 37 of 163
chain disease)
a Patients were stratified at randomisation by age (≤ 75 years vs > 75 years). b Patients were stratified at randomisation by stage (stage I or II vs stage III). c Cytogenetic risk categories are mutually exclusive.
Definitions: adverse risk categories: t(4;14), t(14;16), del(13q) or monosomy 13, del(17p), 1q gain; non-
adverse risk categories: favourable hyperdiploidy (t[11;14], gains of 5/9/15, normal, a normal result, gains other
than 5/9/15, IgH deletion, and uncertain risk. Probes used for analysis cannot place patient in any of the other
risk categories. Not evaluable: no specimen received, test failure or insufficient number of cells available for
analysis.
Key: ECOG, Eastern Cooperative Oncology Group; Ig, immunoglobulin; ISS, International Staging System; MM,
multiple myeloma; MPT, melphalan, prednisone and thalidomide; Rd, lenalidomide and low-dose dexamethasone
until disease progression; Rd18, lenalidomide and low-dose dexamethasone for 18 cycles.
Source: Clinical Study Report CC-5013-MM-020/IFM 07-01.43
B.2.4 Statistical analysis and definition of study groups in the
relevant clinical effectiveness evidence
B.2.4.1 MM-020 sample size
The primary analysis of study MM-020 was to compare PFS in patients treated with
Rd and those treated with MPT for 72 weeks. A total of approximately 1,590 patients
(530 in each arm) were enrolled, with accrual of about 67 patients per month for
24 months. With a 24-month accrual period and 36-month follow-up after the study
closed to accrual, a sample size of 530 patients in each treatment arm would have
80% power to detect a hazard rate ratio of 1.25 using a 2-sided log-rank test with an
overall significance level of 0.05. This calculation was based on the following
assumptions: an improvement in median PFS of 25% being clinically relevant; an
exponential overall PFS distribution with a constant failure rate; uniform accrual
during the accrual period and an approximate 10% annual drop-out rate with an
exponential distribution.
Taking into account the third treatment arm (Rd18) as part of a secondary analysis to
compare efficacy between Rd, Rd18 & MPT, the information required for a log-rank
test to have 80% power was expected to be achieved when approximately
950 patients, across all treatment arms, had disease progression or had died.
The comparison of final OS was planned for when all patients had been followed for
5 years or had died or been lost from follow-up before 5 years. Median survival was
estimated to be 56 months in the Rd treatment arm and 45 months in the MPT
treatment arm and was assumed to have an exponential distribution. With
530 patients in each treatment arm, a total of 597 deaths were expected in the two

Company evidence submission template for Lenalidomide (ID474) © Celgene Inc. (2017). All rights reserved Page 38 of 163
arms within 5 years (896 deaths across all three treatment arms). Based on survival
curves reflective of a 25% improvement in median OS and 597 deaths, a two-sided
log-rank test with a significance level of 0.05 would have a power of 78%.
B.2.4.2 MM-020 populations
The intent-to-treat (ITT) population was defined as all patients who were
randomised, independent of whether they received study treatment. All patients in
the ITT population were analysed according to the treatment they were randomised
to receive and not according to what they actually received, if different.
The efficacy-evaluable population was defined as ITT patients who met protocol
requirements (either met eligibility criteria and/or had measurable disease at
baseline) and were evaluated after receiving at least one dose of study treatment.
The safety population was defined as all randomised patients who received at least
one dose of the study treatment. Drug exposure and all safety analyses (including
AEs, deaths, serious adverse events [SAEs] and laboratory test results) were based
on the safety population. Patients were analysed according to the initial treatment
received.
B.2.4.3 MM-020 statistical analysis
A hierarchical, group sequential-testing procedure with appropriate alpha-spending
functions, multiple-arm comparison and multiplicity-adjustment was used to control
the family-wise type-I error rate in the interim and final analyses of endpoints. For
PFS, the stopping boundaries for the interim analysis were based on an α-spending
function of the O’Brien-Fleming type with an overall one-sided α = 0.025.65.The two
OS comparisons (Rd vs MPT and Rd18 vs MPT) were adjusted with Bonferroni
procedure, in which a group sequential test with a one-sided type-I error probability
of α/2 (0.0125) was run separately for each comparison. The stopping boundaries for
the OS interim analyses were based on an α-spending function of the Pocock type
with an overall one-sided α = 0.0125 for each of the two OS comparisons.65,66 The
other secondary endpoints were summarised at the interim analysis. No formal
stopping rules were employed for these endpoints.
Details of the statistical analyses undertaken in MM-020 are described in Table 13.
All efficacy endpoint analyses were based on the ITT population.
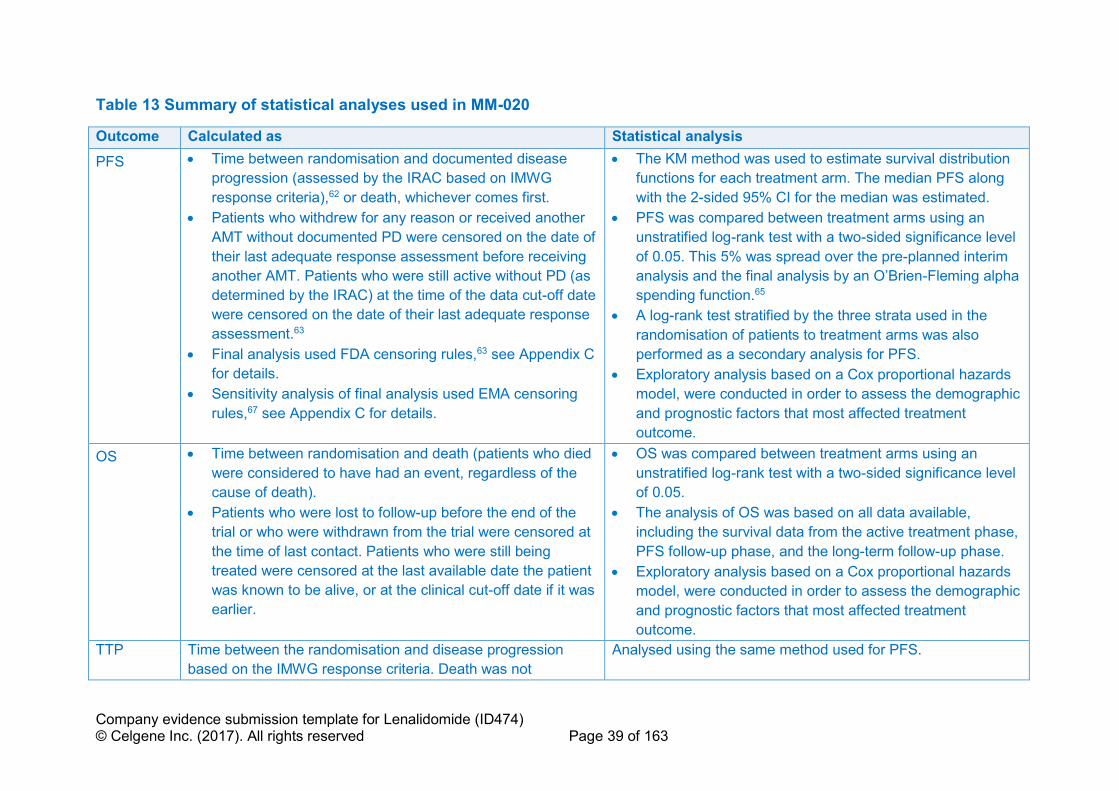
Company evidence submission template for Lenalidomide (ID474) © Celgene Inc. (2017). All rights reserved Page 39 of 163
Table 13 Summary of statistical analyses used in MM-020
Outcome Calculated as Statistical analysis
PFS • Time between randomisation and documented disease
progression (assessed by the IRAC based on IMWG
response criteria),62 or death, whichever comes first.
• Patients who withdrew for any reason or received another
AMT without documented PD were censored on the date of
their last adequate response assessment before receiving
another AMT. Patients who were still active without PD (as
determined by the IRAC) at the time of the data cut-off date
were censored on the date of their last adequate response
assessment.63
• Final analysis used FDA censoring rules,63 see Appendix C
for details.
• Sensitivity analysis of final analysis used EMA censoring
rules,67 see Appendix C for details.
• The KM method was used to estimate survival distribution
functions for each treatment arm. The median PFS along
with the 2-sided 95% CI for the median was estimated.
• PFS was compared between treatment arms using an
unstratified log-rank test with a two-sided significance level
of 0.05. This 5% was spread over the pre-planned interim
analysis and the final analysis by an O’Brien-Fleming alpha
spending function.65
• A log-rank test stratified by the three strata used in the
randomisation of patients to treatment arms was also
performed as a secondary analysis for PFS.
• Exploratory analysis based on a Cox proportional hazards
model, were conducted in order to assess the demographic
and prognostic factors that most affected treatment
outcome.
OS • Time between randomisation and death (patients who died
were considered to have had an event, regardless of the
cause of death).
• Patients who were lost to follow-up before the end of the
trial or who were withdrawn from the trial were censored at
the time of last contact. Patients who were still being
treated were censored at the last available date the patient
was known to be alive, or at the clinical cut-off date if it was
earlier.
• OS was compared between treatment arms using an
unstratified log-rank test with a two-sided significance level
of 0.05.
• The analysis of OS was based on all data available,
including the survival data from the active treatment phase,
PFS follow-up phase, and the long-term follow-up phase.
• Exploratory analysis based on a Cox proportional hazards
model, were conducted in order to assess the demographic
and prognostic factors that most affected treatment
outcome.
TTP Time between the randomisation and disease progression
based on the IMWG response criteria. Death was not
Analysed using the same method used for PFS.
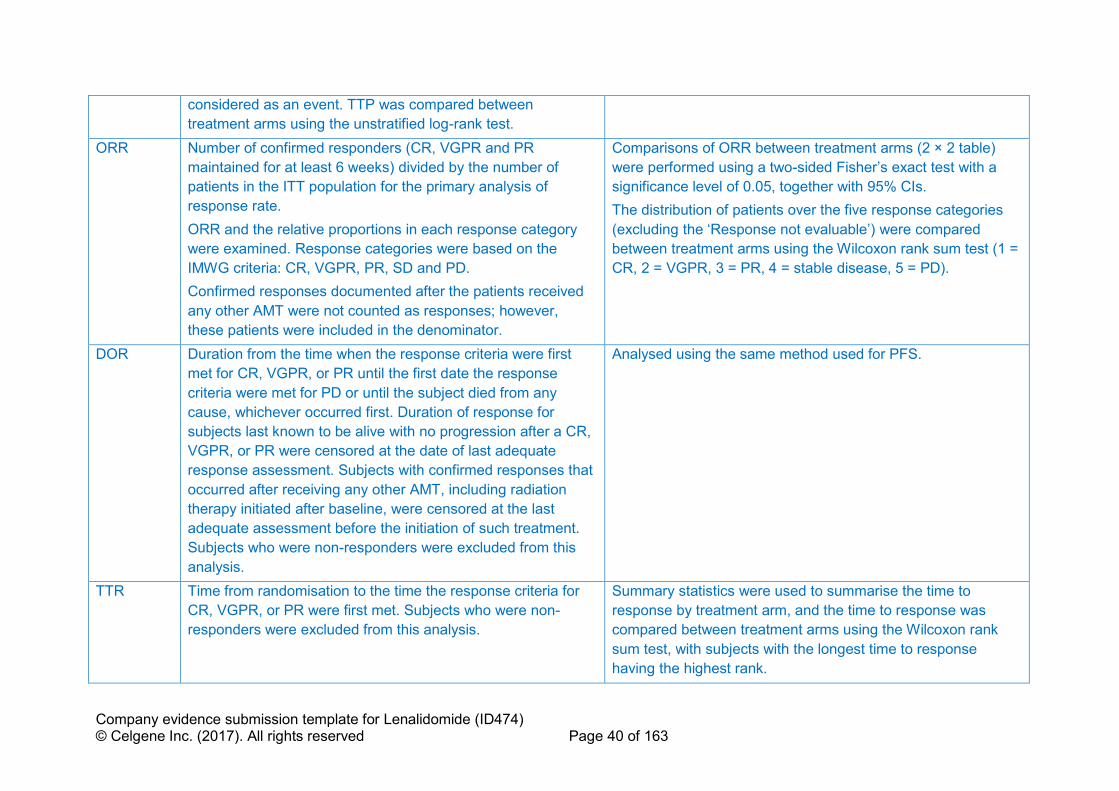
Company evidence submission template for Lenalidomide (ID474) © Celgene Inc. (2017). All rights reserved Page 40 of 163
considered as an event. TTP was compared between
treatment arms using the unstratified log-rank test.
ORR Number of confirmed responders (CR, VGPR and PR
maintained for at least 6 weeks) divided by the number of
patients in the ITT population for the primary analysis of
response rate.
ORR and the relative proportions in each response category
were examined. Response categories were based on the
IMWG criteria: CR, VGPR, PR, SD and PD.
Confirmed responses documented after the patients received
any other AMT were not counted as responses; however,
these patients were included in the denominator.
Comparisons of ORR between treatment arms (2 × 2 table)
were performed using a two-sided Fisher’s exact test with a
significance level of 0.05, together with 95% CIs.
The distribution of patients over the five response categories
(excluding the ‘Response not evaluable’) were compared
between treatment arms using the Wilcoxon rank sum test (1 =
CR, 2 = VGPR, 3 = PR, 4 = stable disease, 5 = PD).
DOR Duration from the time when the response criteria were first
met for CR, VGPR, or PR until the first date the response
criteria were met for PD or until the subject died from any
cause, whichever occurred first. Duration of response for
subjects last known to be alive with no progression after a CR,
VGPR, or PR were censored at the date of last adequate
response assessment. Subjects with confirmed responses that
occurred after receiving any other AMT, including radiation
therapy initiated after baseline, were censored at the last
adequate assessment before the initiation of such treatment.
Subjects who were non-responders were excluded from this
analysis.
Analysed using the same method used for PFS.
TTR Time from randomisation to the time the response criteria for
CR, VGPR, or PR were first met. Subjects who were non-
responders were excluded from this analysis.
Summary statistics were used to summarise the time to
response by treatment arm, and the time to response was
compared between treatment arms using the Wilcoxon rank
sum test, with subjects with the longest time to response
having the highest rank.
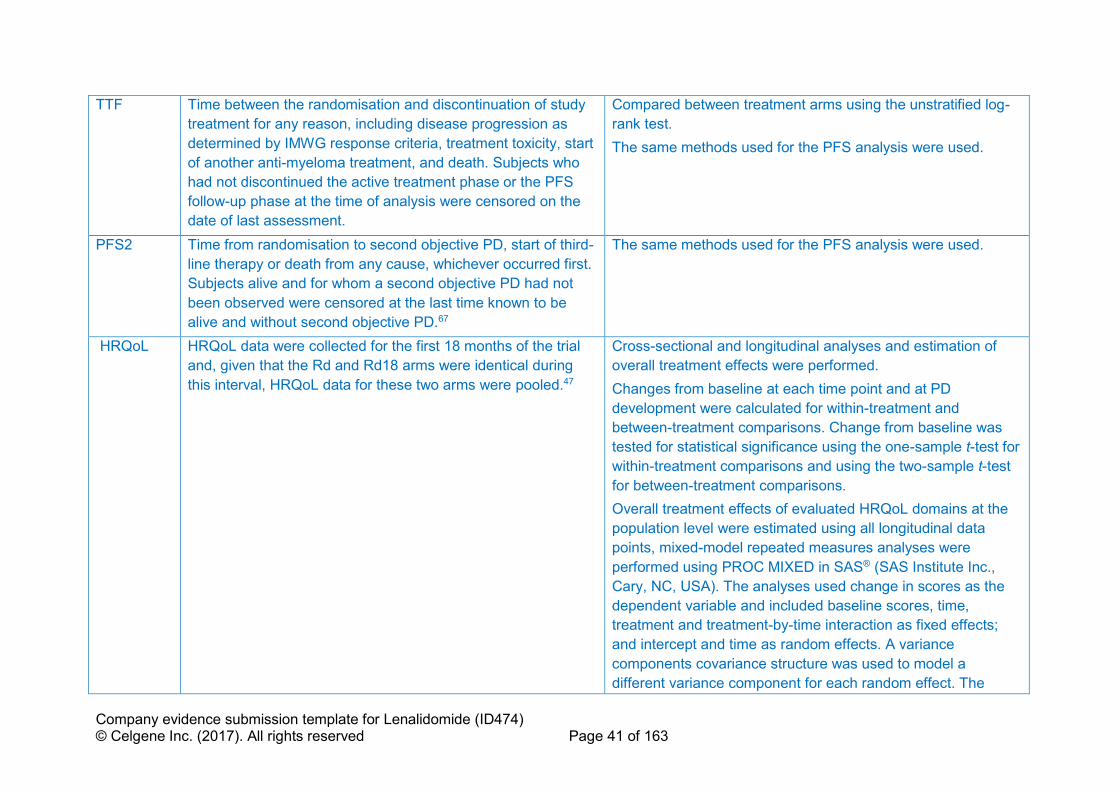
Company evidence submission template for Lenalidomide (ID474) © Celgene Inc. (2017). All rights reserved Page 41 of 163
TTF Time between the randomisation and discontinuation of study
treatment for any reason, including disease progression as
determined by IMWG response criteria, treatment toxicity, start
of another anti-myeloma treatment, and death. Subjects who
had not discontinued the active treatment phase or the PFS
follow-up phase at the time of analysis were censored on the
date of last assessment.
Compared between treatment arms using the unstratified log-
rank test.
The same methods used for the PFS analysis were used.
PFS2 Time from randomisation to second objective PD, start of third-
line therapy or death from any cause, whichever occurred first.
Subjects alive and for whom a second objective PD had not
been observed were censored at the last time known to be
alive and without second objective PD.67
The same methods used for the PFS analysis were used.
HRQoL HRQoL data were collected for the first 18 months of the trial
and, given that the Rd and Rd18 arms were identical during
this interval, HRQoL data for these two arms were pooled.47
Cross-sectional and longitudinal analyses and estimation of
overall treatment effects were performed.
Changes from baseline at each time point and at PD
development were calculated for within-treatment and
between-treatment comparisons. Change from baseline was
tested for statistical significance using the one-sample t-test for
within-treatment comparisons and using the two-sample t-test
for between-treatment comparisons.
Overall treatment effects of evaluated HRQoL domains at the
population level were estimated using all longitudinal data
points, mixed-model repeated measures analyses were
performed using PROC MIXED in SAS® (SAS Institute Inc.,
Cary, NC, USA). The analyses used change in scores as the
dependent variable and included baseline scores, time,
treatment and treatment-by-time interaction as fixed effects;
and intercept and time as random effects. A variance
components covariance structure was used to model a
different variance component for each random effect. The
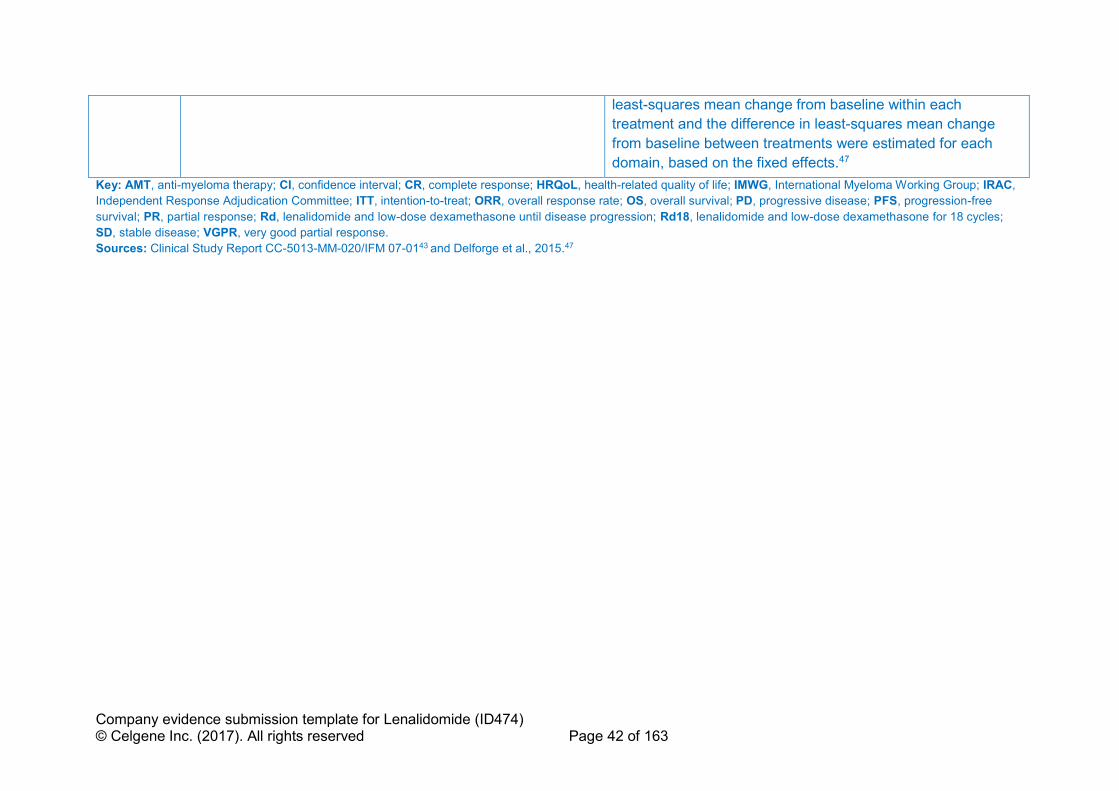
Company evidence submission template for Lenalidomide (ID474) © Celgene Inc. (2017). All rights reserved Page 42 of 163
least-squares mean change from baseline within each
treatment and the difference in least-squares mean change
from baseline between treatments were estimated for each
domain, based on the fixed effects.47
Key: AMT, anti-myeloma therapy; CI, confidence interval; CR, complete response; HRQoL, health-related quality of life; IMWG, International Myeloma Working Group; IRAC,
Independent Response Adjudication Committee; ITT, intention-to-treat; ORR, overall response rate; OS, overall survival; PD, progressive disease; PFS, progression-free
survival; PR, partial response; Rd, lenalidomide and low-dose dexamethasone until disease progression; Rd18, lenalidomide and low-dose dexamethasone for 18 cycles;
SD, stable disease; VGPR, very good partial response.
Sources: Clinical Study Report CC-5013-MM-020/IFM 07-0143 and Delforge et al., 2015.47

Company evidence submission template for Lenalidomide (ID474) © Celgene Inc. (2017). All rights reserved Page 43 of 163
B.2.4.4 MM-020 participant flow
Figure 32, Appendix D presents a CONSORT image depicting patient flow in trial
MM-020. Of the 2,030 patients screened, 407 were excluded for either not meeting
inclusion criteria (n = 283) and/or meeting at least one exclusion criterion (n = 130).
Between 29 August 2008 and 10 March 2011, 1,623 patients were enrolled and
randomised in a 1:1:1 ratio to Rd (n = 535), Rd18 (n = 541) or MPT (n = 547).
Overall, fewer patients (86.5%) in the Rd group discontinued from the study (i.e. no
longer receiving study treatment and also not in PFS follow-up phase) than in either
the Rd18 (95.2%) or MPT (95.6%) groups. The most common reasons for study
discontinuation were disease progression (50.7% with Rd, 66.9% with Rd18, 61.6%
with MPT) and AEs (12.0% with Rd, 13.1% with Rd18, 13.9% with MPT). Up to the
21 January 2016 data cut-off, 52 patients (9.7%) were still receiving treatment in the
Rd group. All patients in the Rd18 and MPT groups had either discontinued or
completed 72 weeks of treatment. Fewer patients in the MPT group completed the
full 72 weeks of study treatment (43.9%) than patients in the Rd18 group (51.9%).
B.2.5 Quality assessment of the relevant clinical effectiveness
evidence
The quality assessment of study MM-020 is shown in Table 66 Appendix D. MM-020
is a high-quality study relevant to the decision problem.
B.2.6 Clinical effectiveness results of the relevant trials
B.2.6.1 MM-020: summary of efficacy data
Table 14 summarises the key efficacy outcomes from study MM-020.
• Rd treatment produced statistically significantly better outcomes than MPT in
terms of PFS (by IRAC and Investigator review, using either Food and Drug
Administration [FDA] or EMA censoring rules), PFS2, DOR, TTR, ORR, TTF,
TTP and time to second AMT. In addition, Rd treatment led to a statistically
significantly longer OS compared with MPT and an associated 10 month
improvement in OS.31,43
• The improved PFS with Rd is accompanied by an improvement in HRQoL.
Relative to MPT, Rd demonstrated a significantly greater reduction in disease
Company evidence submission template for Lenalidomide (ID474) © Celgene Inc. (2017). All rights reserved Page 44 of 163
symptoms and side effects of treatment. Rd also demonstrated consistent
clinically meaningful improvement in utility on the 5-dimension European
Quality of Life questionnaire (EQ-5D) at all post-baseline assessments except
at month 1.47
• Depth of response (≥ very good partial response [VGPR]) was greater in
patients who received Rd (48.6%) than in patients who received MPT
(30.5%). In patients who had a best response of ≥ VGPR, the PFS and OS
benefit of Rd over MPT was even more profound:
o Median PFS of 52.5 months for arm Rd compared with 31.8 months for
the MPT arm (HR 0.52; 95% CI: 0.40–0.66).43
o Median OS of 79.5 months for arm Rd compared with 55.7 months for
the MPT arm (HR 0.63; 95% CI: 0.48–0.83).43
• Rd treatment produced statistically significantly better outcomes than 18
cycles of Rd in terms of PFS (by IRAC and Investigator review using FDA and
EMA censoring rules), DOR, TTF, TTP and time to second AMT.31,43
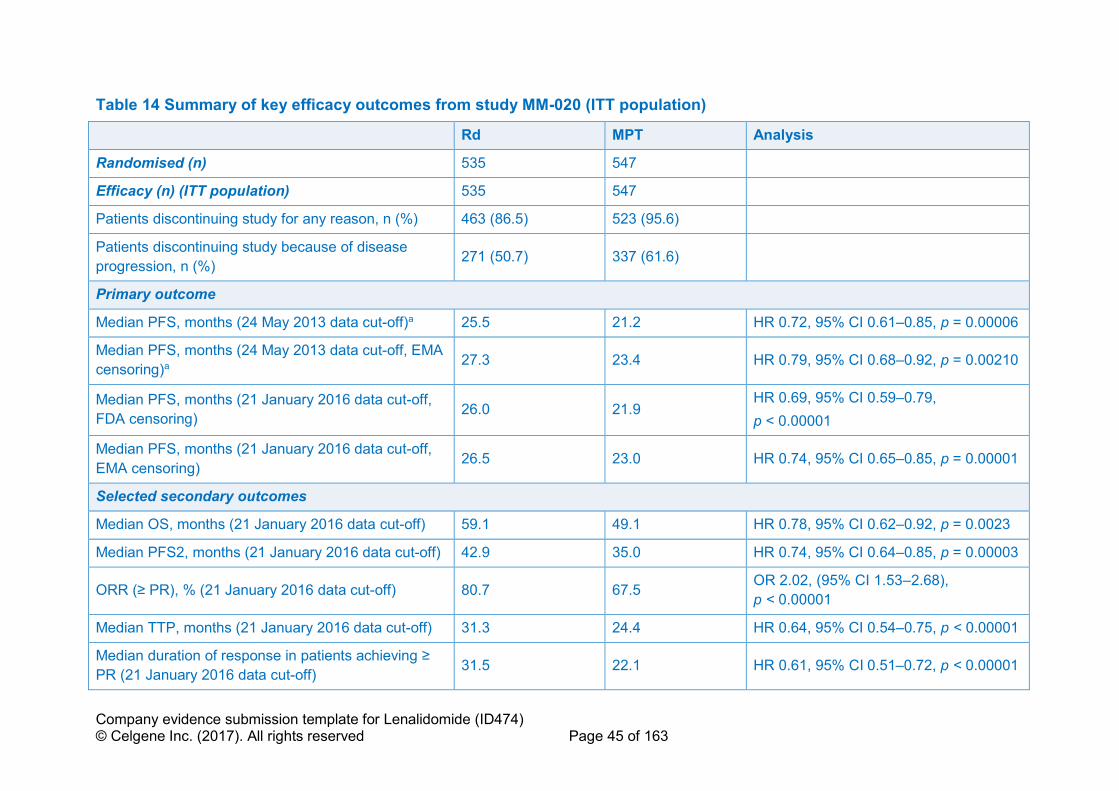
Company evidence submission template for Lenalidomide (ID474) © Celgene Inc. (2017). All rights reserved Page 45 of 163
Table 14 Summary of key efficacy outcomes from study MM-020 (ITT population)
Rd MPT Analysis
Randomised (n) 535 547
Efficacy (n) (ITT population) 535 547
Patients discontinuing study for any reason, n (%) 463 (86.5) 523 (95.6)
Patients discontinuing study because of disease
progression, n (%) 271 (50.7) 337 (61.6)
Primary outcome
Median PFS, months (24 May 2013 data cut-off)a 25.5 21.2 HR 0.72, 95% CI 0.61–0.85, p = 0.00006
Median PFS, months (24 May 2013 data cut-off, EMA
censoring)a 27.3 23.4 HR 0.79, 95% CI 0.68–0.92, p = 0.00210
Median PFS, months (21 January 2016 data cut-off,
FDA censoring) 26.0 21.9 HR 0.69, 95% CI 0.59–0.79,
p < 0.00001
Median PFS, months (21 January 2016 data cut-off,
EMA censoring) 26.5 23.0 HR 0.74, 95% CI 0.65–0.85, p = 0.00001
Selected secondary outcomes
Median OS, months (21 January 2016 data cut-off) 59.1 49.1 HR 0.78, 95% CI 0.62–0.92, p = 0.0023
Median PFS2, months (21 January 2016 data cut-off) 42.9 35.0 HR 0.74, 95% CI 0.64–0.85, p = 0.00003
ORR (≥ PR), % (21 January 2016 data cut-off) 80.7 67.5 OR 2.02, (95% CI 1.53–2.68),
p < 0.00001
Median TTP, months (21 January 2016 data cut-off) 31.3 24.4 HR 0.64, 95% CI 0.54–0.75, p < 0.00001
Median duration of response in patients achieving ≥
PR (21 January 2016 data cut-off) 31.5 22.1 HR 0.61, 95% CI 0.51–0.72, p < 0.00001
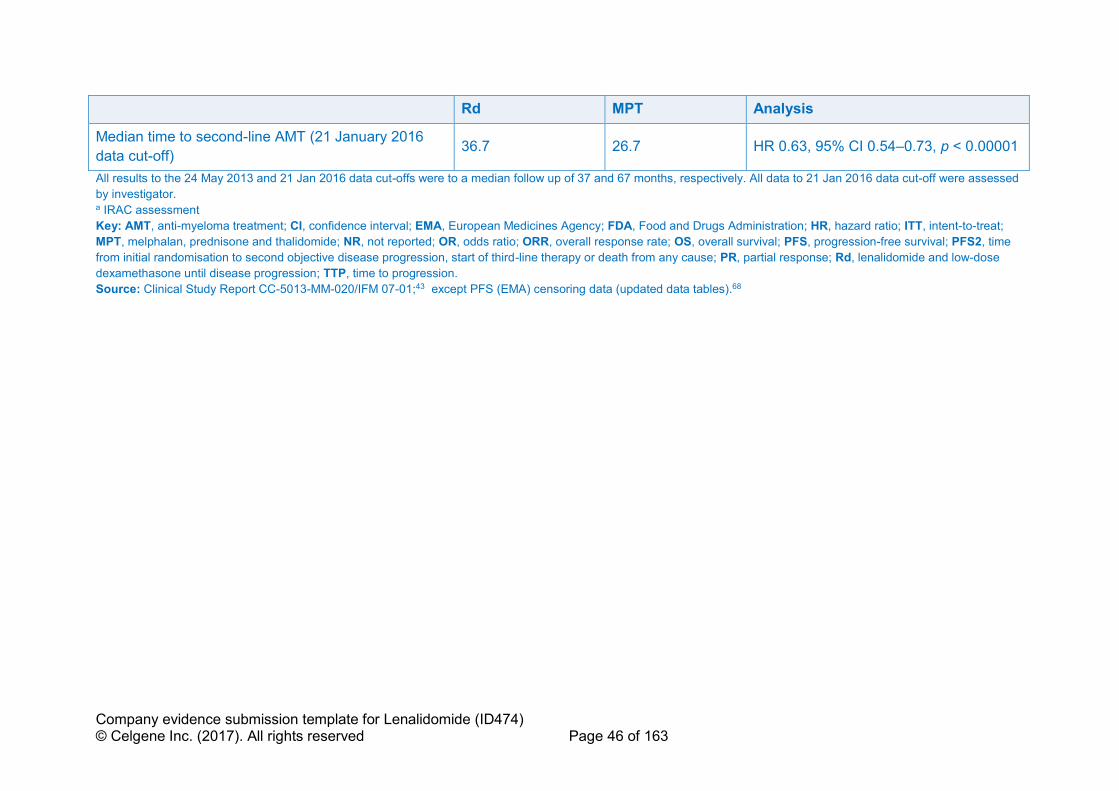
Company evidence submission template for Lenalidomide (ID474) © Celgene Inc. (2017). All rights reserved Page 46 of 163
Rd MPT Analysis
Median time to second-line AMT (21 January 2016
data cutoff) 36.7 26.7 HR 0.63, 95% CI 0.54–0.73, p < 0.00001
All results to the 24 May 2013 and 21 Jan 2016 data cut-offs were to a median follow up of 37 and 67 months, respectively. All data to 21 Jan 2016 data cut-off were assessed
by investigator. a IRAC assessment
Key: AMT, anti-myeloma treatment; CI, confidence interval; EMA, European Medicines Agency; FDA, Food and Drugs Administration; HR, hazard ratio; ITT, intent-to-treat;
MPT, melphalan, prednisone and thalidomide; NR, not reported; OR, odds ratio; ORR, overall response rate; OS, overall survival; PFS, progression-free survival; PFS2, time
from initial randomisation to second objective disease progression, start of third-line therapy or death from any cause; PR, partial response; Rd, lenalidomide and low-dose
dexamethasone until disease progression; TTP, time to progression.
Source: Clinical Study Report CC-5013-MM-020/IFM 07-01;43 except PFS (EMA) censoring data (updated data tables).68

Company evidence submission template for Lenalidomide (ID474) © Celgene Inc. (2017). All rights reserved Page 47 of 163
B.2.6.2 MM-020 overview
In this section, efficacy results are presented by data cut-off. The primary endpoint
analysis for PFS, as at the 24 May 2013 data cut-off, was published in the New
England Journal of Medicine for a median follow-up of 37 months.31 As described
earlier (see section B.2.3.5), for this cut-off, response data were independently
verified and were used for the primary endpoint analysis of PFS; for OS, this was a
planned interim analysis.31,43
The second analysis included in this section is from an updated data cut-off on
21 January 2016 representing a median of 67.0 months follow-up.43
B.2.6.3 MM-020 progression-free survival
PFS results: IRAC assessment, (FDA censoring criteria), 24 May 2013 data cut-
off (primary end-point)
Final PFS data for study MM-020 demonstrate that Rd until disease progression was
a more effective regimen than administration of MPT therapy for a set duration of
72 weeks. At the planned 24 May 2013 analysis, the required number of events had
been surpassed, allowing the final PFS analysis. Figure 3 shows Kaplan–Meier
estimates of PFS based on the IRAC review for the primary comparison between Rd
and MPT.
The primary outcome analysis showed a 28% reduction in the risk of disease
progression or death with Rd compared with MPT given for 72 weeks. (hazard ratio
[HR] 0.72; 95% confidence interval [CI] 0.61–0.85; p = 0.00006). The difference in
median PFS between Rd (25.5 months) and MPT (21.2 months) was 4.3 months. At
4 years, 35% of patients receiving Rd, compared with 15% receiving MPT, remained
event-free.43
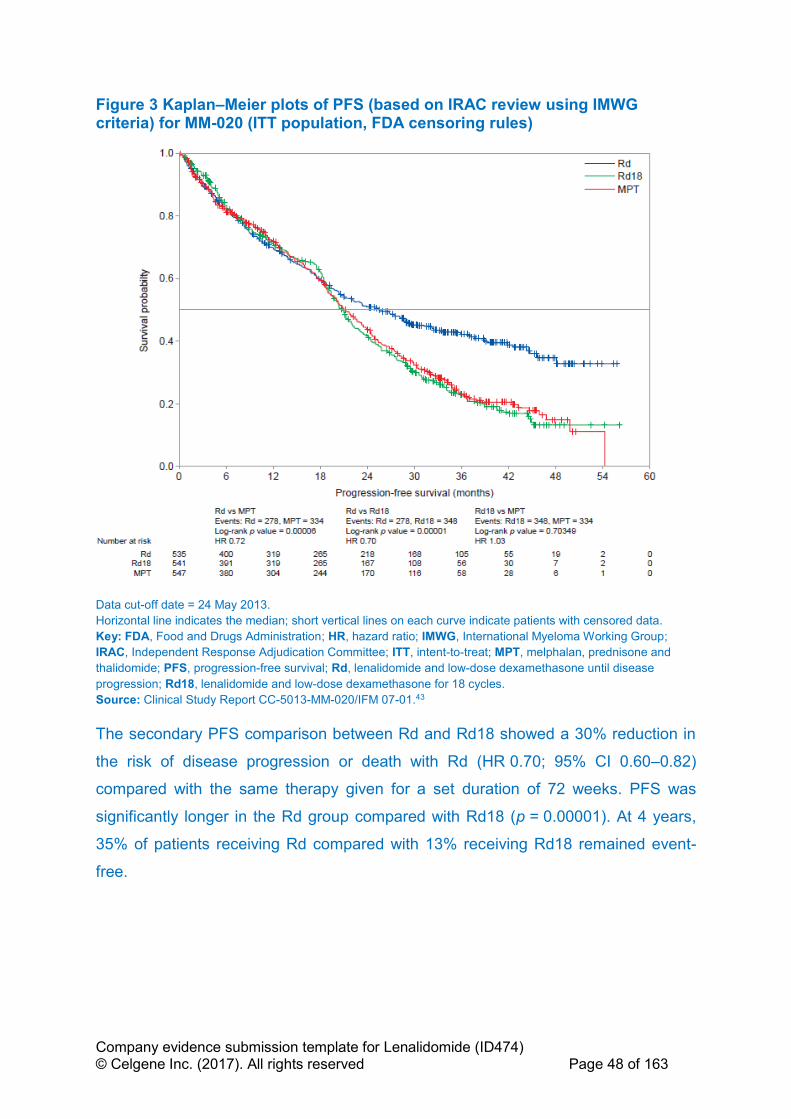
Company evidence submission template for Lenalidomide (ID474) © Celgene Inc. (2017). All rights reserved Page 48 of 163
Figure 3 Kaplan–Meier plots of PFS (based on IRAC review using IMWG criteria) for MM-020 (ITT population, FDA censoring rules)
Data cut-off date = 24 May 2013.
Horizontal line indicates the median; short vertical lines on each curve indicate patients with censored data.
Key: FDA, Food and Drugs Administration; HR, hazard ratio; IMWG, International Myeloma Working Group;
IRAC, Independent Response Adjudication Committee; ITT, intent-to-treat; MPT, melphalan, prednisone and
thalidomide; PFS, progression-free survival; Rd, lenalidomide and low-dose dexamethasone until disease
progression; Rd18, lenalidomide and low-dose dexamethasone for 18 cycles.
Source: Clinical Study Report CC-5013-MM-020/IFM 07-01.43
The secondary PFS comparison between Rd and Rd18 showed a 30% reduction in
the risk of disease progression or death with Rd (HR 0.70; 95% CI 0.60–0.82)
compared with the same therapy given for a set duration of 72 weeks. PFS was
significantly longer in the Rd group compared with Rd18 (p = 0.00001). At 4 years,
35% of patients receiving Rd compared with 13% receiving Rd18 remained event-
free.
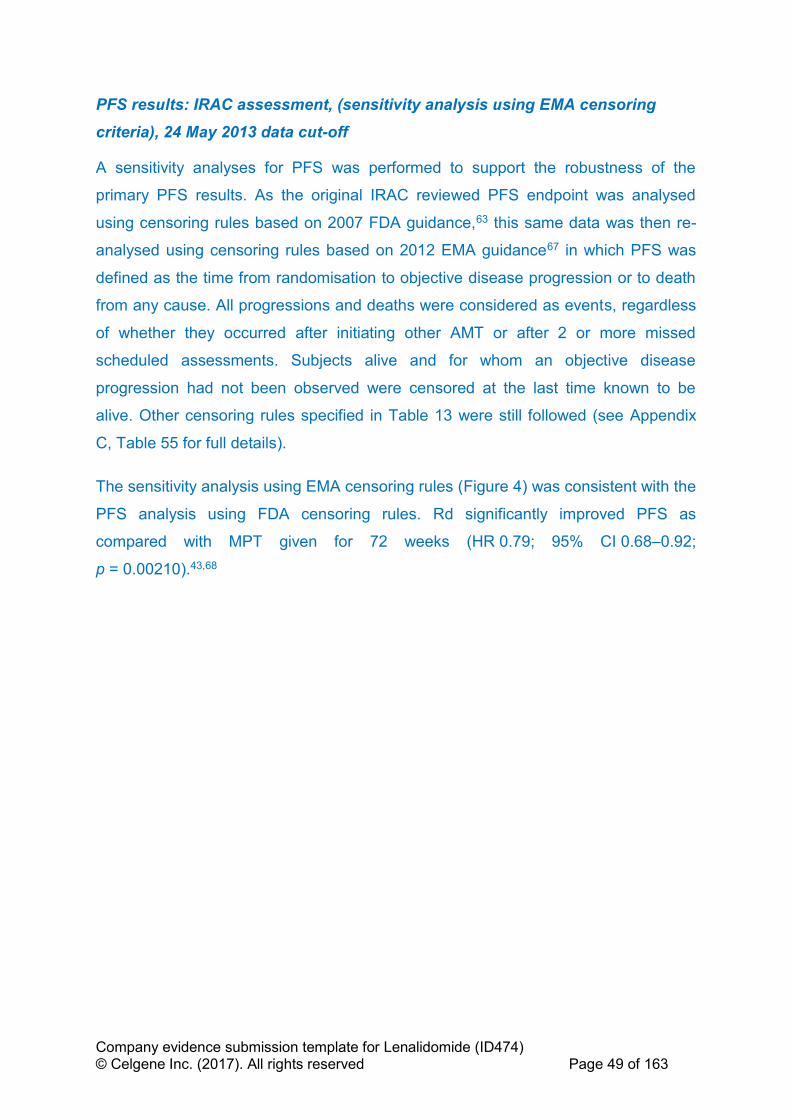
Company evidence submission template for Lenalidomide (ID474) © Celgene Inc. (2017). All rights reserved Page 49 of 163
PFS results: IRAC assessment, (sensitivity analysis using EMA censoring
criteria), 24 May 2013 data cut-off
A sensitivity analyses for PFS was performed to support the robustness of the
primary PFS results. As the original IRAC reviewed PFS endpoint was analysed
using censoring rules based on 2007 FDA guidance,63 this same data was then re-
analysed using censoring rules based on 2012 EMA guidance67 in which PFS was
defined as the time from randomisation to objective disease progression or to death
from any cause. All progressions and deaths were considered as events, regardless
of whether they occurred after initiating other AMT or after 2 or more missed
scheduled assessments. Subjects alive and for whom an objective disease
progression had not been observed were censored at the last time known to be
alive. Other censoring rules specified in Table 13 were still followed (see Appendix
C, Table 55 for full details).
The sensitivity analysis using EMA censoring rules (Figure 4) was consistent with the
PFS analysis using FDA censoring rules. Rd significantly improved PFS as
compared with MPT given for 72 weeks (HR 0.79; 95% CI 0.68–0.92;
p = 0.00210).43,68

Company evidence submission template for Lenalidomide (ID474) © Celgene Inc. (2017). All rights reserved Page 50 of 163
Figure 4 Kaplan–Meier plots of PFS (based on IRAC review using IMWG criteria) for MM-020 (ITT population, EMA censoring criteria)
Data cut-off date = 24 May 2013.
Horizontal line indicates the median; short vertical lines on each curve indicate patients with censored data.
Key: CI, confidence interval; EMA, European Medicines Agency; HR, hazard ratio; IMWG, International Myeloma
Working Group; IRAC, Independent Response Adjudication Committee; ITT, intent-to-treat; MPT, melphalan,
prednisone and thalidomide; PFS, progression-free survival; Rd, lenalidomide and low-dose dexamethasone until
disease progression; Rd18, lenalidomide and low-dose dexamethasone for 18 cycles.
Source: Clinical Study Report CC-5013-MM-020/IFM 07-01.43,68
PFS results, investigator assessment, 21 January 2016 data cut-off
Updated PFS results by investigator assessment using IMWG criteria (using FDA
censoring rules) based on the later 21 January 2016 data cut off (Figure 5) were
consistent with those based on IRAC and investigator at the earlier 24 May 2013
data cut off. The risk of disease progression or death was reduced with Rd
compared with MPT (HR 0.69; 95% CI 0.59–0.79; p < 0.00001) and Rd18 (HR 0.70;
95% CI 0.60–0.81; p < 0.00001).43 The median PFS was Rd (26 months), Rd 18
(21 months) and MPT (21.9 months). At 5 years, 27% of patients receiving Rd
compared to 11% receiving Rd18 and 9% receiving MPT remained event-free.
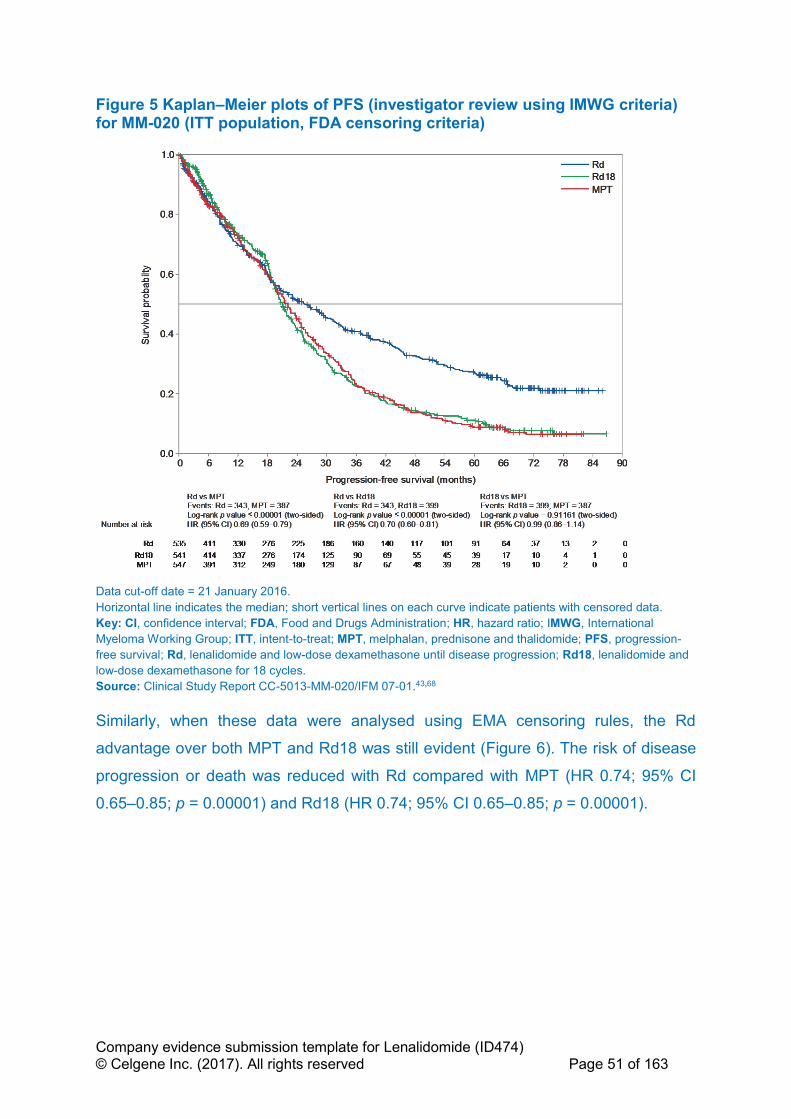
Company evidence submission template for Lenalidomide (ID474) © Celgene Inc. (2017). All rights reserved Page 51 of 163
Figure 5 Kaplan–Meier plots of PFS (investigator review using IMWG criteria) for MM-020 (ITT population, FDA censoring criteria)
Data cut-off date = 21 January 2016.
Horizontal line indicates the median; short vertical lines on each curve indicate patients with censored data.
Key: CI, confidence interval; FDA, Food and Drugs Administration; HR, hazard ratio; IMWG, International
Myeloma Working Group; ITT, intent-to-treat; MPT, melphalan, prednisone and thalidomide; PFS, progression-
free survival; Rd, lenalidomide and low-dose dexamethasone until disease progression; Rd18, lenalidomide and
low-dose dexamethasone for 18 cycles.
Source: Clinical Study Report CC-5013-MM-020/IFM 07-01.43,68
Similarly, when these data were analysed using EMA censoring rules, the Rd
advantage over both MPT and Rd18 was still evident (Figure 6). The risk of disease
progression or death was reduced with Rd compared with MPT (HR 0.74; 95% CI
0.65–0.85; p = 0.00001) and Rd18 (HR 0.74; 95% CI 0.65–0.85; p = 0.00001).

Company evidence submission template for Lenalidomide (ID474) © Celgene Inc. (2017). All rights reserved Page 52 of 163
Figure 6 Kaplan–Meier plots of PFS (investigator review using IMWG criteria) for MM-020 (ITT population, EMA censoring criteria)
Data cut-off date = 21 January 2016.
Horizontal line indicates the median; short vertical lines on each curve indicate patients with censored data.
Key: CI, confidence interval; EMA, European Medicines Agency; HR, hazard ratio; IMWG, International Myeloma
Working Group; ITT, intent-to-treat; MPT, melphalan, prednisone and thalidomide; PFS, progression-free
survival; Rd, lenalidomide and low-dose dexamethasone until disease progression; Rd18, lenalidomide and low-
dose dexamethasone for 18 cycles.
Source: Clinical Study Report CC-5013-MM-020/IFM 07-01.43,68
B.2.6.4 MM-020 overall survival
For the final analysis of OS (21 January 2016 data cut-off,) the median follow-up
time for all surviving patients was 67.0 months.43 There were 906 deaths across the
treatment groups (56% [906/1623] of the ITT population, which represented 100%
study information (896 pre-specified events for the final OS analysis). For the
comparison of Rd versus MPT, there were a total of 623 events across the treatment
groups (58% [623/1082] which represented 100% information (597 pre-specified
events for the final OS analysis).
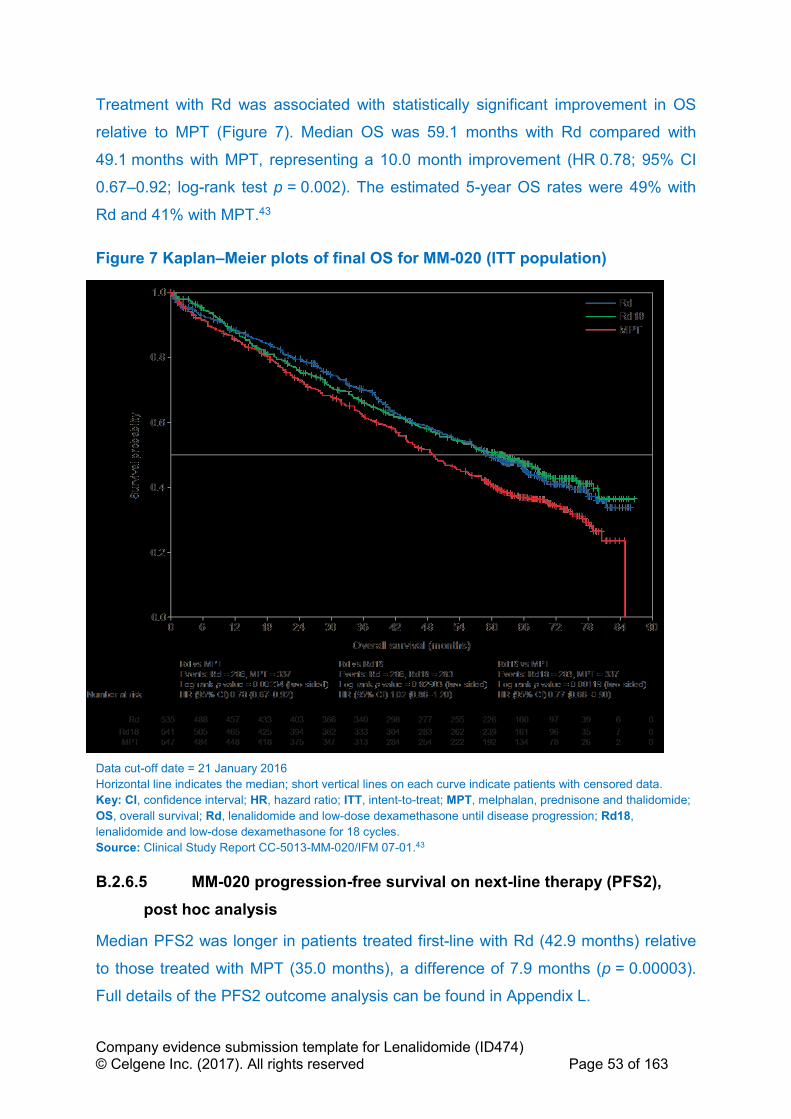
Company evidence submission template for Lenalidomide (ID474) © Celgene Inc. (2017). All rights reserved Page 53 of 163
Treatment with Rd was associated with statistically significant improvement in OS
relative to MPT (Figure 7). Median OS was 59.1 months with Rd compared with
49.1 months with MPT, representing a 10.0 month improvement (HR 0.78; 95% CI
0.67–0.92; log-rank test p = 0.002). The estimated 5-year OS rates were 49% with
Rd and 41% with MPT.43
Figure 7 Kaplan–Meier plots of final OS for MM-020 (ITT population)
Data cut-off date = 21 January 2016
Horizontal line indicates the median; short vertical lines on each curve indicate patients with censored data.
Key: CI, confidence interval; HR, hazard ratio; ITT, intent-to-treat; MPT, melphalan, prednisone and thalidomide;
OS, overall survival; Rd, lenalidomide and low-dose dexamethasone until disease progression; Rd18,
lenalidomide and low-dose dexamethasone for 18 cycles.
Source: Clinical Study Report CC-5013-MM-020/IFM 07-01.43
B.2.6.5 MM-020 progression-free survival on next-line therapy (PFS2),
post hoc analysis
Median PFS2 was longer in patients treated first-line with Rd (42.9 months) relative
to those treated with MPT (35.0 months), a difference of 7.9 months (p = 0.00003).
Full details of the PFS2 outcome analysis can be found in Appendix L.

Company evidence submission template for Lenalidomide (ID474) © Celgene Inc. (2017). All rights reserved Page 54 of 163
B.2.6.6 MM-020 myeloma response rates
Treatment with Rd was associated with a higher ORR compared with MPT. As of the
21 January 2016 data cut-off, 80.7% of patients receiving Rd responded (≥ partial
response [PR]) as compared with 67.5% of patients receiving MPT (p < 0.00001).
The proportion of patients with complete response (CR) or VGPR indicated a deeper
quality of response to therapy with Rd (48.6%) than with MPT (30.5%). Response
data are summarised in Table 15.
Table 15 Myeloma response rates (investigator assessment; ITT population for MM-020)
Rd
(n = 535)
Rd18
(n = 541)
MPT
(n = 547)
Responsea, n (%)
CR + VGPR 260 (48.6) 255 (47.1) 167 (30.5)
CR 119 (22.2) 110 (20.3) 68 (12.4)
VGPR 141 (26.4) 145 (26.8) 99 (18.1)
PR 172 (31.6) 170 (31.4) 202 (36.9)
SD 66 (12.3) 83 (15.3) 116 (21.2)
PD 10 (1.9) 6 (1.1) 17 (3.1)
NEb 27 (5.0) 27 (5.0) 45 (8.2)
Dichotomized response
CR, VGPR or PR 432 (80.7) 425 (78.6) 369 (67.5)
SD, PD or NEb 103 (19.3) 116 (21.4) 178 (32.5)
Comparison between treatment arms
Rd vs MPT (odds ratio, p valuec) 2.02 (95% CI 1.53–2.68), p < 0.00001
Rd vs Rd18 (odds ratio, p valuec) 1.14 (95% CI 0.85–1.54), p = 0.40500
Rd18 vs MPT (odds ratio, p valuec) 1.77 (95% CI 1.35–2.32), p = 0.00004
Data cut-off date = 21 January 2016. a Best response of a patient. b Including patients who did not have any response assessment data, or NE. c From Fisher’s exact test with normal approximation.
Key: CI, confidence interval; CR, complete response; ITT, intent to treat; MPT, melphalan, prednisone and
thalidomide; NE, not evaluable; PD, progressive disease; PR, partial response; Rd, lenalidomide and low-dose
dexamethasone until disease progression; Rd18, lenalidomide and low-dose dexamethasone for 18 cycles; SD,
stable disease; VGPR, very good partial response.
Source: Clinical Study Report CC-5013-MM-020/IFM 07-01.43
B.2.6.7 MM-020 duration of response and time to response
Among responders to treatment (≥ PR, see Table 15), response was faster and more
durable in the Rd group than the MPT group. Using the 21 January 2016 data cut-
Company evidence submission template for Lenalidomide (ID474) © Celgene Inc. (2017). All rights reserved Page 55 of 163
off, the median time to first response was 1.8 months with Rd and 2.8 months with
MPT.43 Furthermore, duration of response was longer for patients treated with Rd
(31.5 months) compared with those treated with MPT (22.1 months; HR 0.61; 95%
CI 0.51–0.72; p < 0.00001), see also Appendix L.
B.2.6.8 MM-020 time to progression
Analysis of TTP by investigator based on IMWG criteria was consistent with the PFS
results, showing notable differences between the treatment groups in favour of Rd.
Using the 21 January 2016 data cut-off, the TTP analysis indicates a 36% reduction
in the risk of disease progression for patients treated with Rd compared with those
treated with MPT (HR 0.64; 95% CI 0.54–0.75). The median TTP with Rd was
31.3 months, compared with 24.4 months with MPT (a difference of 6.9 months;
p < 0.00001). At 5 years, 33.5% of patients receiving Rd and 10.4% of patients
receiving MPT remained event-free.43,68
B.2.6.9 MM-020 time to treatment failure
Analysis of TTF was consistent with PFS, showing notable differences in favour of
Rd. Using the 21 January 2016 data cut-off, Rd was associated with a 24%
reduction in the risk of discontinuing study treatment for any reason compared with
MPT (HR 0.76; 95% CI 0.67–0.86). The TTF was longer in the Rd group
(16.9 months) than in the MPT group (14.1 months; p = 0.00002).43 The Kaplan–
Meier curve shows clear and superior benefits of Rd versus MPT in controlling the
disease and consequently delaying time to treatment failure (Figure 8).43 It is
noteworthy that in the TTF analysis, the Kaplan–Meier curves for Rd (treatment
continued until disease progression) and for Rd18 (treatment duration 72 weeks)
overlap until around 18 months, while the MPT (treatment duration 72 weeks) curve
separates at an earlier time point.

Company evidence submission template for Lenalidomide (ID474) © Celgene Inc. (2017). All rights reserved Page 56 of 163
Figure 8 Kaplan–Meier plots of TTF (based on investigator assessment; ITT population for MM-020)
Data cut-off date = 21 January 2016.
Horizontal line indicates the median; short vertical lines on each curve indicate patients with censored data.
Key: CI, confidence interval; HR, hazard ratio; ITT, intent to treat; MPT, melphalan, prednisone and thalidomide;
Rd, lenalidomide and low-dose dexamethasone until disease progression; Rd18, lenalidomide and low-dose
dexamethasone for 18 cycles; TTF, time to treatment failure.
Source: Clinical Study Report CC-5013-MM-020/IFM 07-01.43,68
B.2.6.10 MM-020 time to second-line therapy
Using the 21 January 2016 data cut-off, the median time to second-line AMT was
significantly longer with Rd (36.7 months) than with MPT (26.7 months; HR 0.63;
95% CI 0.54–0.73; log-rank test p < 0.00001).43 At 5 years after randomisation, 82%
of patients who initially received MPT had gone on to receive a second-line therapy
compared with 64% of patients in the Rd group. These data support the argument
that Rd helps to provide more tolerable and sustained disease control, delaying the
need for a second anti-myeloma regimen. This could be particularly beneficial for
older patients who may not have the opportunity or capacity to receive multiple lines
of treatment.
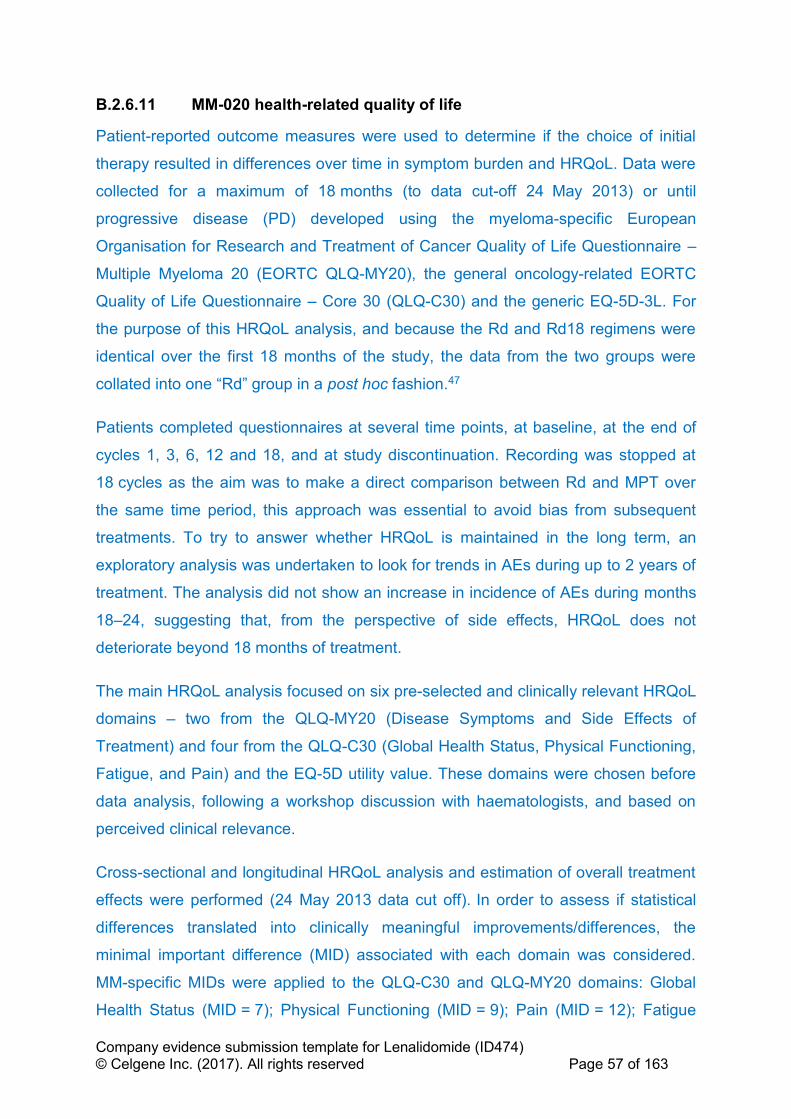
Company evidence submission template for Lenalidomide (ID474) © Celgene Inc. (2017). All rights reserved Page 57 of 163
B.2.6.11 MM-020 health-related quality of life
Patient-reported outcome measures were used to determine if the choice of initial
therapy resulted in differences over time in symptom burden and HRQoL. Data were
collected for a maximum of 18 months (to data cut-off 24 May 2013) or until
progressive disease (PD) developed using the myeloma-specific European
Organisation for Research and Treatment of Cancer Quality of Life Questionnaire –
Multiple Myeloma 20 (EORTC QLQ-MY20), the general oncology-related EORTC
Quality of Life Questionnaire – Core 30 (QLQ-C30) and the generic EQ-5D-3L. For
the purpose of this HRQoL analysis, and because the Rd and Rd18 regimens were
identical over the first 18 months of the study, the data from the two groups were
collated into one “Rd” group in a post hoc fashion.47
Patients completed questionnaires at several time points, at baseline, at the end of
cycles 1, 3, 6, 12 and 18, and at study discontinuation. Recording was stopped at
18 cycles as the aim was to make a direct comparison between Rd and MPT over
the same time period, this approach was essential to avoid bias from subsequent
treatments. To try to answer whether HRQoL is maintained in the long term, an
exploratory analysis was undertaken to look for trends in AEs during up to 2 years of
treatment. The analysis did not show an increase in incidence of AEs during months
18–24, suggesting that, from the perspective of side effects, HRQoL does not
deteriorate beyond 18 months of treatment.
The main HRQoL analysis focused on six pre-selected and clinically relevant HRQoL
domains – two from the QLQ-MY20 (Disease Symptoms and Side Effects of
Treatment) and four from the QLQ-C30 (Global Health Status, Physical Functioning,
Fatigue, and Pain) and the EQ-5D utility value. These domains were chosen before
data analysis, following a workshop discussion with haematologists, and based on
perceived clinical relevance.
Cross-sectional and longitudinal HRQoL analysis and estimation of overall treatment
effects were performed (24 May 2013 data cut off). In order to assess if statistical
differences translated into clinically meaningful improvements/differences, the
minimal important difference (MID) associated with each domain was considered.
MM-specific MIDs were applied to the QLQ-C30 and QLQ-MY20 domains: Global
Health Status (MID = 7); Physical Functioning (MID = 9); Pain (MID = 12); Fatigue

Company evidence submission template for Lenalidomide (ID474) © Celgene Inc. (2017). All rights reserved Page 58 of 163
(MID = 10); Disease Symptoms (MID = 10) and Side Effects of Treatment (MID = 6).
The Walters and Brazier MID of 0.07 was applied to the EQ-5D utility. Rigorous MID
methods, in which the mean and 95% CIs of change must meet the MID, were
applied.
Compliance with the questionnaires was similar between treatment arms at the end
of the first treatment cycle, and after 3 and 6 months (≥ 84%); however, at months 12
and 18, compliance rates were lower among patients randomised to MPT than to Rd.
At study discontinuation, there was no statistical difference between groups,
compliance rates stood at 53–59% in both treatment arms.
Both Rd and MPT led to statistically significant symptom relief. Rd and MPT showed
statistically significant (p < 0.05) reductions in pain (QLQ-C30 Pain and QLQ-MY20
Disease Symptoms domains) at all post-baseline assessments (Figure 9 and Figure
10). However, when the MID score of 12 for Pain was applied, Rd demonstrated
clinically meaningful improvement at months 6 and 12, compared to MPT. Further,
Rd demonstrated a significantly greater reduction in QLQ-MY20 Disease Symptoms
compared with MPT at month 3 (p = 0.04), and an overall lower symptom score
across all assessments (Figure 10). The Rd group also showed significant
improvement in Fatigue from baseline at month 3, month 6 and month 12 (Figure 9).
Although Rd and MPT showed worsening in the QLQ-MY20 Side Effects of
Treatment domain, the Rd group showed consistently lower scores, indicating fewer
or less severe side effects, across all post-baseline assessments, with all but month
18 being statistically significantly (p < 0.05) lower than the MPT group (Figure 10).
The Side Effects of Treatment domain narrowly missed being clinically significant in
favour of Rd compared with MPT when a MID of 6 was applied: the MPT maximum
score was 5.6, compared with 3.3 with Rd.47
Both Rd and MPT improved patients’ HRQoL from baseline over the duration of the
study across all pre-selected domains of the questionnaires, but HRQoL dropped at
progression. Statistically significant improvements (p < 0.05) from baseline were
observed for Rd and MPT for functional scales Global Health Status, Physical
Functioning, and EQ-5D utility (Figure 9 and Figure 10) at all time points after the
first cycle, however no significant differences were reported between treatment arms.

Company evidence submission template for Lenalidomide (ID474) © Celgene Inc. (2017). All rights reserved Page 59 of 163
The Rd group demonstrated consistent clinically meaningful improvement in HRQoL
as measured by EQ-5D at all post-baseline assessments except at month 1. The
MPT group only demonstrated clinically meaningful improvement at month 3.47
Figure 9 Cross-sectional analysis of mean QLQ-C30 change from baseline per assessment visit and at study discontinuation in the Rd and MPT groups for MM-020
+ Significant within-group change from baseline (p < 0.05, 1-sample t-test).
* Significant between-group difference in change from baseline (p < 0.05, 2-sample t-test). a Stable disease can occur at any time point.
Key: EORTC, European Organisation for Research and Treatment of Cancer; HRQoL, health-related quality of
life; MPT, melphalan, prednisone and thalidomide; QLQ-C30, Quality of Life Questionnaire – Core 30; Rd,
lenalidomide and low-dose dexamethasone until disease progression; SD, stable disease.
Source: Delforge et al. 2015.47

Company evidence submission template for Lenalidomide (ID474) © Celgene Inc. (2017). All rights reserved Page 60 of 163
Figure 10 Cross-sectional analysis of mean QLQ-MY20 change from baseline per assessment visit and at study discontinuation in the Rd and MPT groups for MM-020
+ Significant within-group change from baseline (p < 0.05, 1-sample t-test).
* Significant between-group difference in change from baseline (p < 0.05, 2-sample t-test). a Stable disease can occur at any time point.
Key: EORTC, European Organisation for Research and Treatment of Cancer; HRQoL, health-related quality of
life; MPT, melphalan, prednisone and thalidomide; QLQ-MY20, Quality of Life Questionnaire–Multiple Myeloma
module; Rd, lenalidomide and low-dose dexamethasone until disease progression; SD, stable disease.
Source: Delforge et al. 2015.47
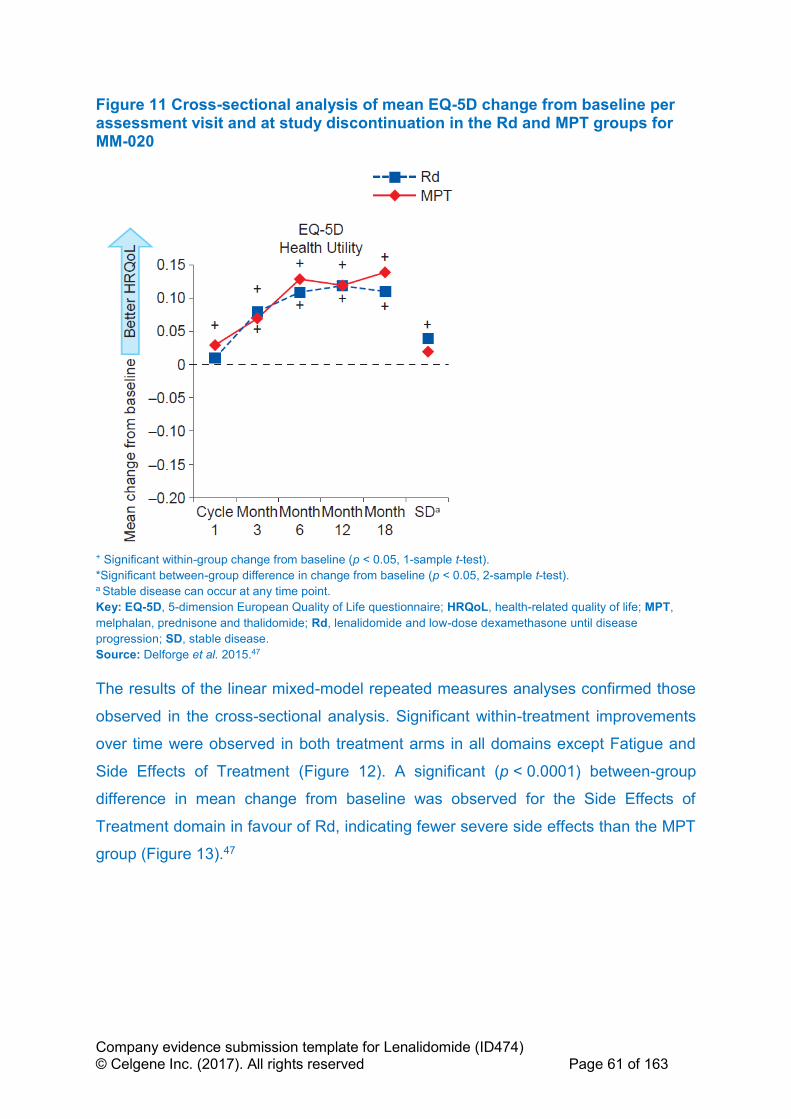
Company evidence submission template for Lenalidomide (ID474) © Celgene Inc. (2017). All rights reserved Page 61 of 163
Figure 11 Cross-sectional analysis of mean EQ-5D change from baseline per assessment visit and at study discontinuation in the Rd and MPT groups for MM-020
+ Significant within-group change from baseline (p < 0.05, 1-sample t-test).
*Significant between-group difference in change from baseline (p < 0.05, 2-sample t-test). a Stable disease can occur at any time point.
Key: EQ-5D, 5-dimension European Quality of Life questionnaire; HRQoL, health-related quality of life; MPT,
melphalan, prednisone and thalidomide; Rd, lenalidomide and low-dose dexamethasone until disease
progression; SD, stable disease.
Source: Delforge et al. 2015.47
The results of the linear mixed-model repeated measures analyses confirmed those
observed in the cross-sectional analysis. Significant within-treatment improvements
over time were observed in both treatment arms in all domains except Fatigue and
Side Effects of Treatment (Figure 12). A significant (p < 0.0001) between-group
difference in mean change from baseline was observed for the Side Effects of
Treatment domain in favour of Rd, indicating fewer severe side effects than the MPT
group (Figure 13).47

Company evidence submission template for Lenalidomide (ID474) © Celgene Inc. (2017). All rights reserved Page 62 of 163
Figure 12 Linear mixed-model repeated-measures analysis of mean change from baseline at 18 months in the Rd and MPT groups for MM-020
*p < 0.05.
Key: EORTC, European Organisation for Research and Treatment of Cancer; EQ-5D, 5-dimension European
Quality of Life questionnaire; HRQoL, health-related quality of life; MPT, melphalan, prednisone and thalidomide;
QLQ-C30, Quality of Life Questionnaire – Core 30, QLQ MY20, Quality of Life Questionnaire – Multiple Myeloma
module; Rd, lenalidomide and low-dose dexamethasone until disease progression.
Source: Delforge et al. 2015.47
Figure 13 Linear mixed-model repeated-measures analysis of mean difference in change from baseline at 18 months in the Rd and MPT groups for MM-020
*p < 0.05. Key: EORTC, European Organisation for Research and Treatment of Cancer; EQ-5D, 5-dimension European
Quality of Life questionnaire; HRQoL, health-related quality of life; MPT, melphalan, prednisone and thalidomide;
QLQ-C30, Quality of Life Questionnaire – Core 30, QLQ MY20, Quality of Life Questionnaire–Multiple Myeloma
module; Rd, lenalidomide and low-dose dexamethasone until disease progression.
Source: Delforge et al. 2015.47
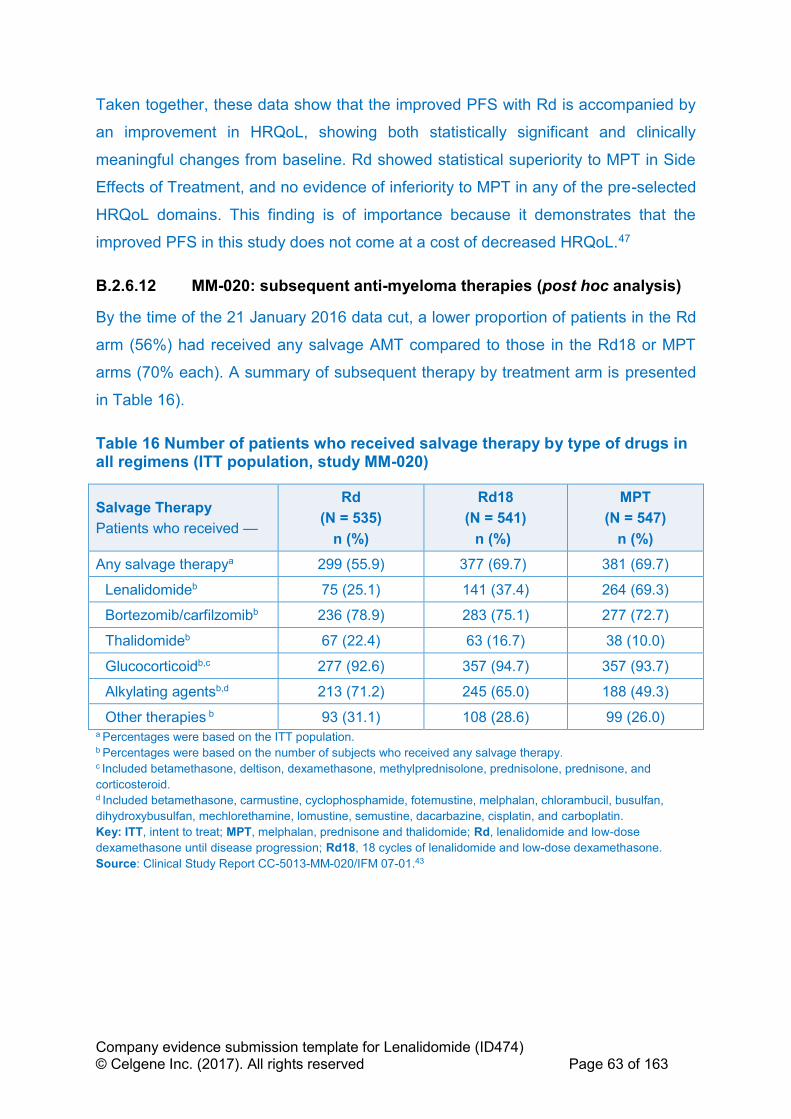
Company evidence submission template for Lenalidomide (ID474) © Celgene Inc. (2017). All rights reserved Page 63 of 163
Taken together, these data show that the improved PFS with Rd is accompanied by
an improvement in HRQoL, showing both statistically significant and clinically
meaningful changes from baseline. Rd showed statistical superiority to MPT in Side
Effects of Treatment, and no evidence of inferiority to MPT in any of the pre-selected
HRQoL domains. This finding is of importance because it demonstrates that the
improved PFS in this study does not come at a cost of decreased HRQoL.47
B.2.6.12 MM-020: subsequent anti-myeloma therapies (post hoc analysis)
By the time of the 21 January 2016 data cut, a lower proportion of patients in the Rd
arm (56%) had received any salvage AMT compared to those in the Rd18 or MPT
arms (70% each). A summary of subsequent therapy by treatment arm is presented
in Table 16).
Table 16 Number of patients who received salvage therapy by type of drugs in all regimens (ITT population, study MM-020)
Salvage Therapy
Patients who received —
Rd
(N = 535)
n (%)
Rd18
(N = 541)
n (%)
MPT
(N = 547)
n (%)
Any salvage therapya 299 (55.9) 377 (69.7) 381 (69.7)
Lenalidomideb 75 (25.1) 141 (37.4) 264 (69.3)
Bortezomib/carfilzomibb 236 (78.9) 283 (75.1) 277 (72.7)
Thalidomideb 67 (22.4) 63 (16.7) 38 (10.0)
Glucocorticoidb,c 277 (92.6) 357 (94.7) 357 (93.7)
Alkylating agentsb,d 213 (71.2) 245 (65.0) 188 (49.3)
Other therapies b 93 (31.1) 108 (28.6) 99 (26.0) a Percentages were based on the ITT population. b Percentages were based on the number of subjects who received any salvage therapy. c Included betamethasone, deltison, dexamethasone, methylprednisolone, prednisolone, prednisone, and
corticosteroid. d Included betamethasone, carmustine, cyclophosphamide, fotemustine, melphalan, chlorambucil, busulfan,
dihydroxybusulfan, mechlorethamine, lomustine, semustine, dacarbazine, cisplatin, and carboplatin.
Key: ITT, intent to treat; MPT, melphalan, prednisone and thalidomide; Rd, lenalidomide and low-dose
dexamethasone until disease progression; Rd18, 18 cycles of lenalidomide and low-dose dexamethasone.
Source: Clinical Study Report CC-5013-MM-020/IFM 07-01.43

Company evidence submission template for Lenalidomide (ID474) © Celgene Inc. (2017). All rights reserved Page 64 of 163
B.2.7 Subgroup analysis
B.2.7.1 MM-020 stratification factors
Selected pre-planned subgroup analyses were performed comparing the different
treatment regimens in terms of PFS, PFS2, OS and myeloma response outcomes.
The following pre-planned subgroups were analysed based on stratification factors:
• Age group (≤ 75 years, > 75 years)
• Baseline ISS disease stage (stages I or II, stage III)
• Geographical region: data grouped into three regions for analysis according to
clinical practice: North America and Pacific Region (USA, Canada, Australia
and New Zealand), Europe (Austria, Belgium, France, Germany, Greece,
Italy, Portugal, Spain, Sweden, Switzerland and UK) and Asia (China, Taiwan
and Republic of Korea).
B.2.7.2 MM-020 additional pre-planned subgroup analysis
Pre-planned subgroup analysis (PFS, PFS2 OS and myeloma response outcomes)
was also performed for the following groups:
• Sex (male, female)
• Race (White or Caucasian, Asian, other)
• Parameters of prognostic significance (e.g. baseline cytogenetic categories
(high risk versus non-high risk: non-high risk was patients with favourable
hyperdiploidy, normal, and uncertain risk cytogenetic risk profiles) and
baseline renal function (≥ 80 mL/min, ≥ 50 mL/min, ≥ 30 mL/min,
< 30 mL/min).
B.2.7.3 MM-020 statistical methods for subgroup analysis
Each subgroup was evaluated separately using analysis methods described for the
primary and secondary efficacy outcomes. If too few patients fell into any subgroup,
analysis within that subgroup may not have been performed or alternative cut-off
points may have been considered. Details of statistical analyses undertaken in MM-
020 are described earlier (Table 13).

Company evidence submission template for Lenalidomide (ID474) © Celgene Inc. (2017). All rights reserved Page 65 of 163
B.2.7.4 MM-020 PFS analysis by subgroup
PFS was evaluated in a variety of subgroups (including the three stratification
factors, as well as subgroups defined by sex, race, CrCl, baseline albumin, lactate
dehydrogenase (LDH), Eastern Cooperative Oncology Group (ECOG) performance
status, and cytogenetic risk profile examined and parameters of prognostic
significance). The results, illustrated as a Forest plot in Appendix E, Figure 33, were
consistent with primary ITT analysis showing a benefit for Rd over MPT in the
majority of subgroups, except for those with too few patients (e.g. LDH levels
≥ 200 U/L and Asian race).
A table of PFS by age and ISS stage (investigator assessment, 21 Jan 2016 cut-off)
can be found in Appendix E, Table 68.
B.2.7.4.1 PFS based on response (post hoc analysis)
A secondary analysis was conducted to look at PFS outcomes by depth of response.
There were 260 patients in arm Rd, and 167 subjects in arm MPT with a best overall
response of ≥ VGPR based on investigator assessment. PFS was longer in arm Rd
compared with that in arm MPT for this subgroup of subjects. The improvement in
median PFS time between arm Rd (52.5 months) and arm MPT (31.8 months) was
20.7 months, with a 48% reduction in the risk of disease progression or death for
subjects treated with Rd compared with those treated with MPT (HR 0.52; 95% CI:
0.40–0.66).
B.2.7.5 MM-020 OS analysis by subgroup
OS subgroup analysis was also generally consistent with the overall ITT population,
except for the smaller subgroups of patients with severe renal function insufficiency
(HR 1.20, 95% CI 0.76–1.92).43 HR by subgroup for the comparison of OS between
arm Rd vs arm MPT (ITT population) can be found in Appendix E, Figure 34.
OS based on response (Post Hoc analysis)
A secondary analysis was conducted to look at OS outcomes by depth of response.
In patients who achieved ≥ VGPR the median OS for patients receiving Rd was
79.5 months compared with 55.7 months for patients receiving MPT
(HR 0.63; 95% CI 0.48–0.83).
Company evidence submission template for Lenalidomide (ID474) © Celgene Inc. (2017). All rights reserved Page 66 of 163
B.2.8 Meta-analysis
N/A
B.2.9 Indirect and mixed treatment comparisons
The evidence on PFS and OS identified by the SLR (Table 62) described in
Appendix D was synthesised using NMA. A summary of the methodology and
outcomes of the 4 studies used in the NMA is presented in Appendix D, Table 60. All
studies were deemed high quality using a Cochrane risk of bias analysis, Appendix
D, Table 67. A description of the NMA methods is also provided in Appendix D.
B.2.9.1 Overview of the NMA
The trials included in the NMA are summarised in Table 17 and the network is shown
in Figure 14. As described in Appendix D, of the 23 studies identified by the search
and full text screening, only the following 4 trials which provided direct or indirect
evidence on comparisons of licensed doses of Rd, MPT, or VMP were included in
the NMA; FIRST/MM-020, IFM-01/011, IFM-99/06, and VISTA. MP was included
within the network to allow connection of VMP to the network via the VISTA trial.
Table 17 Summary of the trials used to carry out the NMA
Study MP MPT VMP Rd
IFM-99/06 (Facon38) Yes Yes
IFM 01/01 (Hulin69) Yes Yes
VISTA (San Miguel;
Mateos39,40,70)
Yes Yes
FIRST/MM-020
(Benboubker31)a
Yes Yes
a PFS and OS data taken from MM-020 CSR43 and data on file,68 both 21 January 2016 data cut off.
Key: MP, melphalan and prednisone; MPT, melphalan, prednisone, and thalidomide; NMA, network meta-
analysis; Rd, lenalidomide and low-dose dexamethasone until disease progression; Rd18, 18 cycles of
lenalidomide and dexamethasone; VMP, bortezomib, melphalan, and prednisone.
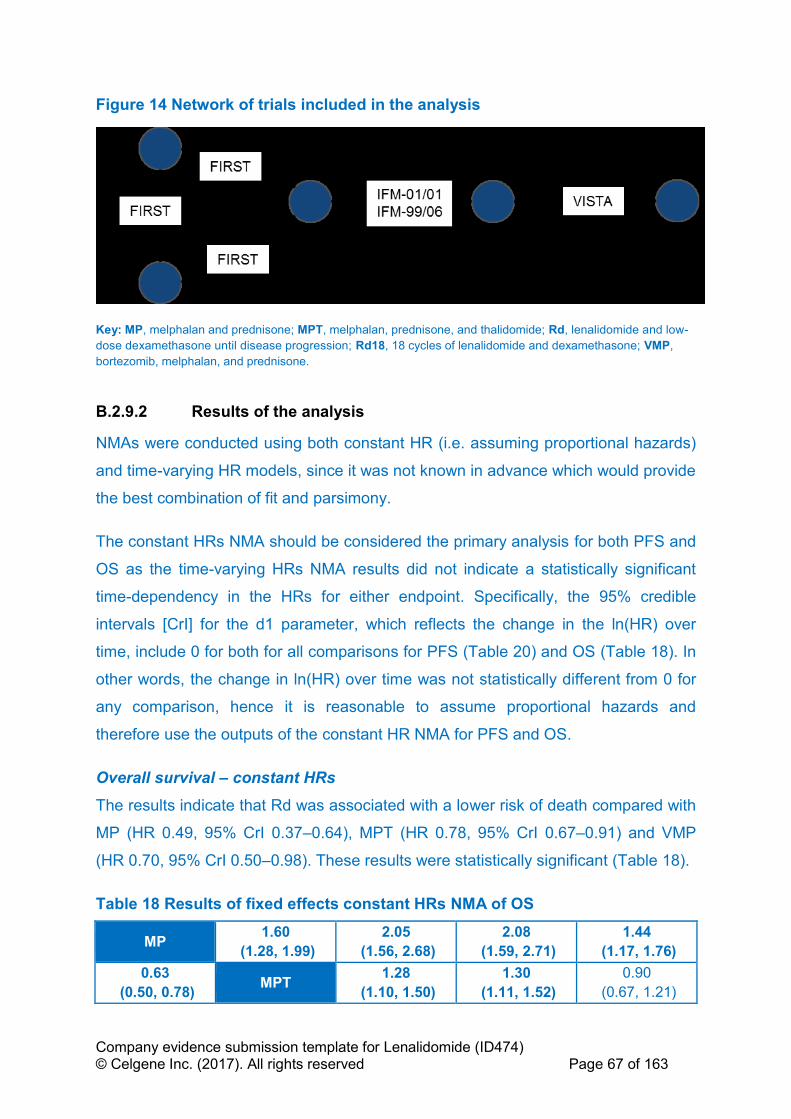
Company evidence submission template for Lenalidomide (ID474) © Celgene Inc. (2017). All rights reserved Page 67 of 163
Figure 14 Network of trials included in the analysis
Key: MP, melphalan and prednisone; MPT, melphalan, prednisone, and thalidomide; Rd, lenalidomide and low-
dose dexamethasone until disease progression; Rd18, 18 cycles of lenalidomide and dexamethasone; VMP,
bortezomib, melphalan, and prednisone.
B.2.9.2 Results of the analysis
NMAs were conducted using both constant HR (i.e. assuming proportional hazards)
and time-varying HR models, since it was not known in advance which would provide
the best combination of fit and parsimony.
The constant HRs NMA should be considered the primary analysis for both PFS and
OS as the time-varying HRs NMA results did not indicate a statistically significant
time-dependency in the HRs for either endpoint. Specifically, the 95% credible
intervals [CrI] for the d1 parameter, which reflects the change in the ln(HR) over
time, include 0 for both for all comparisons for PFS (Table 20) and OS (Table 18). In
other words, the change in ln(HR) over time was not statistically different from 0 for
any comparison, hence it is reasonable to assume proportional hazards and
therefore use the outputs of the constant HR NMA for PFS and OS.
Overall survival – constant HRs
The results indicate that Rd was associated with a lower risk of death compared with
MP (HR 0.49, 95% CrI 0.37–0.64), MPT (HR 0.78, 95% CrI 0.67–0.91) and VMP
(HR 0.70, 95% CrI 0.50–0.98). These results were statistically significant (Table 18).
Table 18 Results of fixed effects constant HRs NMA of OS
MP 1.60
(1.28, 1.99)
2.05
(1.56, 2.68)
2.08
(1.59, 2.71)
1.44
(1.17, 1.76)
0.63
(0.50, 0.78) MPT
1.28
(1.10, 1.50)
1.30
(1.11, 1.52)
0.90
(0.67, 1.21)
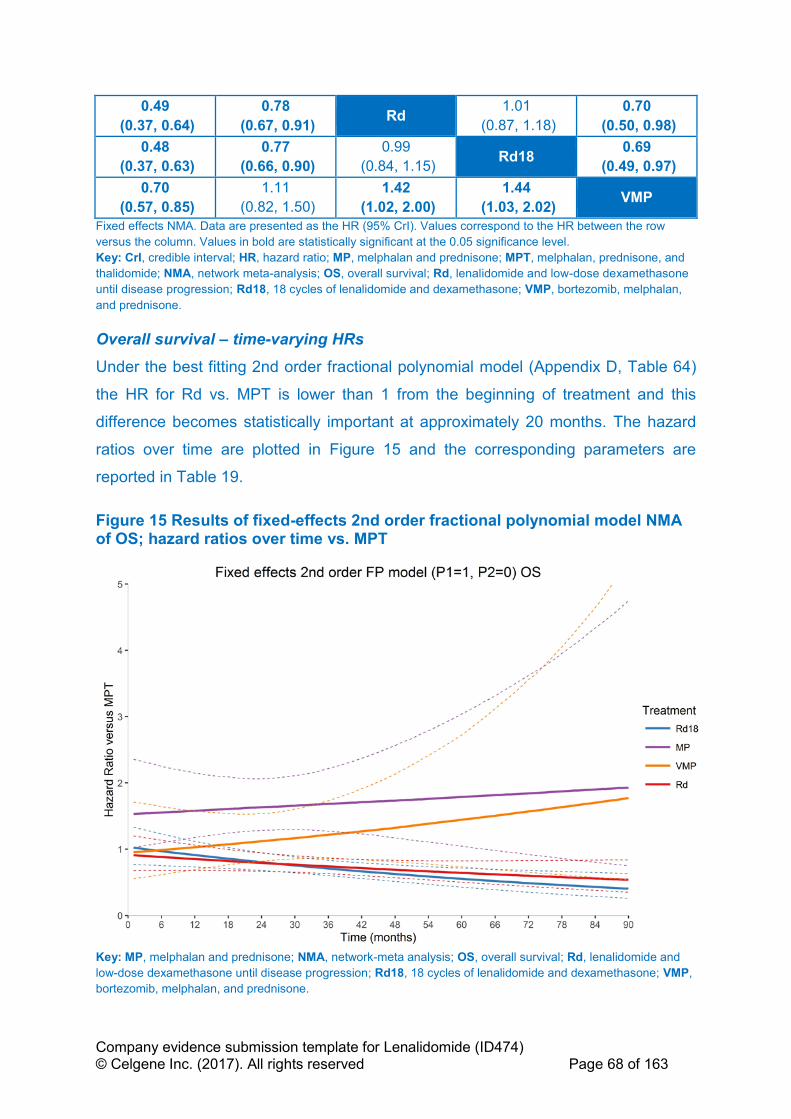
Company evidence submission template for Lenalidomide (ID474) © Celgene Inc. (2017). All rights reserved Page 68 of 163
0.49
(0.37, 0.64)
0.78
(0.67, 0.91) Rd
1.01
(0.87, 1.18)
0.70
(0.50, 0.98)
0.48
(0.37, 0.63)
0.77
(0.66, 0.90)
0.99
(0.84, 1.15) Rd18
0.69
(0.49, 0.97)
0.70
(0.57, 0.85)
1.11
(0.82, 1.50)
1.42
(1.02, 2.00)
1.44
(1.03, 2.02) VMP
Fixed effects NMA. Data are presented as the HR (95% CrI). Values correspond to the HR between the row
versus the column. Values in bold are statistically significant at the 0.05 significance level.
Key: CrI, credible interval; HR, hazard ratio; MP, melphalan and prednisone; MPT, melphalan, prednisone, and
thalidomide; NMA, network meta-analysis; OS, overall survival; Rd, lenalidomide and low-dose dexamethasone
until disease progression; Rd18, 18 cycles of lenalidomide and dexamethasone; VMP, bortezomib, melphalan,
and prednisone.
Overall survival – time-varying HRs
Under the best fitting 2nd order fractional polynomial model (Appendix D, Table 64)
the HR for Rd vs. MPT is lower than 1 from the beginning of treatment and this
difference becomes statistically important at approximately 20 months. The hazard
ratios over time are plotted in Figure 15 and the corresponding parameters are
reported in Table 19.
Figure 15 Results of fixed-effects 2nd order fractional polynomial model NMA of OS; hazard ratios over time vs. MPT
Key: MP, melphalan and prednisone; NMA, network-meta analysis; OS, overall survival; Rd, lenalidomide and
low-dose dexamethasone until disease progression; Rd18, 18 cycles of lenalidomide and dexamethasone; VMP,
bortezomib, melphalan, and prednisone.

Company evidence submission template for Lenalidomide (ID474) © Celgene Inc. (2017). All rights reserved Page 69 of 163
Table 19 Basic parameter estimates of 2nd order FP model (p1=1, p2=0); OS
Treatment d0
estimate
d0
variance d0 CrI
d1
estimate
d1
variance d1 CrI correlation
MPT Reference
Rd18 ''''''''''' ''''''''''' ''''''''''' ''''''''''' ''''''''''' ''''''''''' '''''''''''
MP ''''''''''' ''''''''''' ''''''''''' ''''''''''' ''''''''''' ''''''''''' '''''''''''
VMP ''''''''''' ''''''''''' ''''''''''' ''''''''''' ''''''''''' ''''''''''' '''''''''''
Rd ''''''''''' ''''''''''' ''''''''''' ''''''''''' ''''''''''' ''''''''''' '''''''''''
d0 is the treatment effect with constant HR; d1 reflects the change in the log(HR) over time.71
Progression-free survival – constant HRs (with EMA-censored MM-020 data)
Rd demonstrated the lowest risk of disease progression or death compared with MP
(HR 0.41, 95% CrI 0.33–0.52), MPT (HR 0.74; 95% CrI 0.65–0.85) and VMP (HR
0.74; 95% CrI 0.52–1.05). The comparisons of Rd with MP and MPT were
statistically significant (Table 20).
Table 20 Results of fixed effects constant HRs NMA of PFS (with EMA-censored MM-020 data)
MP 1.79
(1.47, 2.17)
2.42
(1.91, 3.06)
1.74
(1.37, 2.19)
1.79
(1.39, 2.32)
0.56
(0.46, 0.68) MPT
1.35
(1.18, 1.54)
0.97
(0.85, 1.11)
1.00
(0.73, 1.38)
0.41
(0.33, 0.52)
0.74
(0.65, 0.85) Rd
0.72
(0.63, 0.82)
0.74
(0.52, 1.05)
0.58
(0.46, 0.73)
1.03
(0.90, 1.18)
1.39
(1.22, 1.59) Rd18
1.03
(0.73, 1.46)
0.56
(0.43, 0.72)
1.00
(0.72, 1.38)
1.35
(0.95, 1.92)
0.97
(0.68, 1.37) VMP
Fixed effects NMA. Data are presented as the HR (95% CrI). Values correspond to the HR between the row
versus the column. Values in bold are statistically significant at the 0.05 significance level.
Key: CrI, credible interval; EMA, European Medicines Agency; HR, hazard ratio; MP, melphalan and prednisone;
MPT, melphalan, prednisone, and thalidomide; NMA, network meta-analysis; PFS, progression-free survival; Rd,
lenalidomide and low-dose dexamethasone until disease progression; Rd18, 18 cycles of lenalidomide and
dexamethasone; VMP, bortezomib, melphalan, and prednisone.
Progression-free survival – time-varying HRs (with EMA-censored MM-020
data)
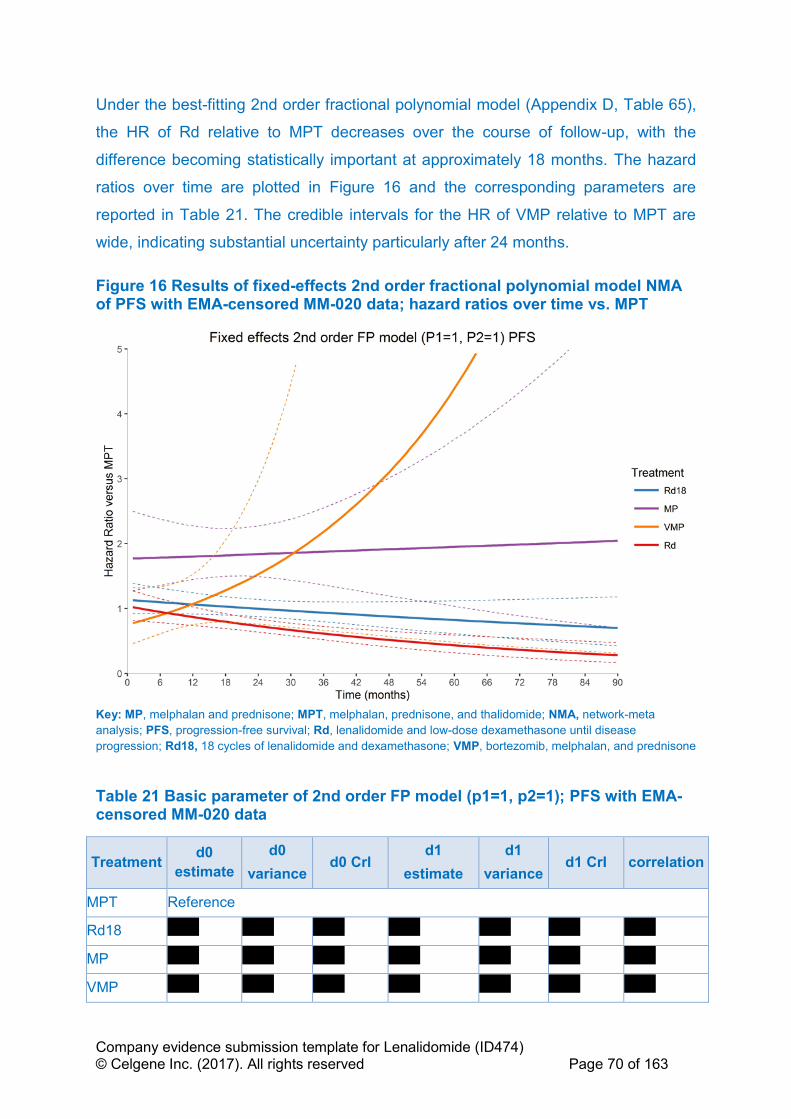
Company evidence submission template for Lenalidomide (ID474) © Celgene Inc. (2017). All rights reserved Page 70 of 163
Under the best-fitting 2nd order fractional polynomial model (Appendix D, Table 65),
the HR of Rd relative to MPT decreases over the course of follow-up, with the
difference becoming statistically important at approximately 18 months. The hazard
ratios over time are plotted in Figure 16 and the corresponding parameters are
reported in Table 21. The credible intervals for the HR of VMP relative to MPT are
wide, indicating substantial uncertainty particularly after 24 months.
Figure 16 Results of fixed-effects 2nd order fractional polynomial model NMA of PFS with EMA-censored MM-020 data; hazard ratios over time vs. MPT
Key: MP, melphalan and prednisone; MPT, melphalan, prednisone, and thalidomide; NMA, network-meta
analysis; PFS, progression-free survival; Rd, lenalidomide and low-dose dexamethasone until disease
progression; Rd18, 18 cycles of lenalidomide and dexamethasone; VMP, bortezomib, melphalan, and prednisone
Table 21 Basic parameter of 2nd order FP model (p1=1, p2=1); PFS with EMA-censored MM-020 data
Treatment d0
estimate
d0
variance d0 CrI
d1
estimate
d1
variance d1 CrI correlation
MPT Reference
Rd18 ''''''''''' ''''''''''' ''''''''''' ''''''''''' ''''''''''' ''''''''''' '''''''''''
MP ''''''''''' ''''''''''' ''''''''''' ''''''''''' ''''''''''' ''''''''''' '''''''''''
VMP ''''''''''' ''''''''''' ''''''''''' ''''''''''' ''''''''''' ''''''''''' '''''''''''
Company evidence submission template for Lenalidomide (ID474) © Celgene Inc. (2017). All rights reserved Page 71 of 163
Rd ''''''''''' ''''''''''' ''''''''''' ''''''''''' ''''''''''' ''''''''''' '''''''''''
d0 is the treatment effect with constant HR; d1 reflects the change in the log(HR) over time.71
B.2.10 Adverse reactions
B.2.10.1 Safety evidence from MM-020
Safety data reported are from the MM-020 study CSR to a data cut-off of
21 January 2016.43 Data for all 1,613 patients who received at least one dose of any
study drug were included.43 Safety outcomes assessed in the MM-020 study
included evaluation of AEs, vital signs, neurological examination, clinical laboratory
evaluations (including haematological), electrocardiogram (ECG), pregnancy testing
and pregnancy prevention risk management, and incidence of second primary
malignancy (SPM).
B.2.10.2 Adverse reactions reported in MM-020
Extent of exposure to study treatment: treatment duration and intensity
The treatment duration and cumulative exposure to treatments, per treatment group
within the safety population, are summarised in Table 69, Appendix F.43 The median
treatment duration in the Rd group was 80.2 weeks (range, 0.7–374.1) compared
with 72 weeks in the Rd18 group (range, 0.9–102.6) or 67.1 weeks in the MPT group
(range, 0.1–110.0). The difference in treatment duration can mainly be attributed to
study design, which proposed that the Rd arm be continued until disease
progression.43
As of the 21 January 2016, 208 patients in the Rd group (39%) were treated for
> 2 years; 138 patients (26%) were treated for > 3 years; 96 patients (18%) were
treated for > 4 years; 72 patients (13.5%) were treated for > 5 years and 30 patients
(6%) were treated for > 6 years. The median number of cycles on study treatment
was 19.0 cycles (range, 1–92 cycles) in the Rd group, 18.0 cycles in Rd18 group
(maximum number of cycles allowed per protocol) and 10.0 cycles in the MPT group
(below the maximum 12 cycles allowed per protocol). The total number of person-
years on study treatment in each treatment arm was 1130 in the Rd group, 587 in
the Rd18 group and 549 in the MPT group.
Company evidence submission template for Lenalidomide (ID474) © Celgene Inc. (2017). All rights reserved Page 72 of 163
For patients receiving Rd and Rd18, the median relative dose intensities (RDIs) for
lenalidomide and dexamethasone were ''''''''''''''' and '''''''''''''''''', respectively. In the MPT
arm, the median RDIs for melphalan, prednisone and thalidomide were 0.9, 1.0 and
0.8, respectively. More patients receiving Rd18 completed lenalidomide treatment at
the full planned dose as compared with patients receiving thalidomide or melphalan
in the MPT arm. Most patients who continued lenalidomide plus low-dose
dexamethasone beyond 18 cycles (i.e. in the Rd arm) did so with limited need for
additional dose reductions of both study drugs.
Treatment-emergent adverse events
AEs were more likely to occur shortly after treatment initiation and decrease in
frequency over time. Almost all patients (> 99%) in all three treatment arms had at
least one treatment-emergent AE (TEAE) during active treatment (Table 22).43
The most frequently reported AEs across the study included constipation,
neutropenia and anaemia, followed by peripheral oedema, diarrhoea, fatigue,
nausea, back pain, asthenia, peripheral sensory neuropathy, thrombocytopenia,
rash, insomnia and dyspnoea. Constipation, nausea, peripheral sensory neuropathy
and neutropenia were reported more frequently in the MPT group than in patients
receiving Rd or Rd18. While less frequent, the AEs of muscle spasm, pneumonia,
decreased appetite, hyperglycaemia and weight decreased were reported more
frequently (with a between-group difference of ≥ 5%) for Rd18 compared with MPT,
and the AEs of peripheral oedema, paraesthesia, dizziness, vomiting, tremor,
peripheral neuropathy, thrombocytopenia, leukopenia and lymphopenia were
reported more frequently in the MPT group than in the Rd18 group.43
AEs were generally reported at a higher frequency for Rd than Rd18, possibly
reflecting its longer treatment duration. Cataract, which is a well-known toxicity
associated with prolonged glucocorticoid administration,72 was reported in more than
twice as many patients receiving continuous Rd. Cataract has been observed with
lenalidomide in combination with dexamethasone for a prolonged period of time and
this potential AE is described in the lenalidomide (REVLIMID®) SmPC.5

Company evidence submission template for Lenalidomide (ID474) © Celgene Inc. (2017). All rights reserved Page 73 of 163
Grade 3–4 treatment-emergent adverse events
In patients receiving MPT, 88.7% had at least one grade 3–4 TEAE compared with
80.2% in patients receiving Rd18, despite the similar 72-week, protocol-specified
treatment duration (Table 22). In patients receiving Rd, 86.3% reported a grade 3–4
TEAE.43 Blood and lymphatic system disorder AEs, including neutropenia, anaemia,
thrombocytopenia, leukopenia, lymphopenia and febrile neutropenia, were the most
frequently reported grade 3–4 AEs in each treatment group. Grade 3–4 neutropenia
was notably more frequent in patients receiving MPT (44.9%) than with Rd18
(26.5%) and Rd (29.5%). Grade 3–4 thrombocytopenia and leukopenia were also
more frequent in the MPT group occurring at rates at least 2% higher than those
observed in patients receiving Rd and Rd18.
In addition, grade 3–4 nervous system disorder AEs such as peripheral sensory
neuropathy were also notably more frequent in patients receiving MPT (Rd [1.1%],
Rd18 [0.4%] and MPT [9.4%]). Grade 3–4 infections and infestations TEAE were
reported in 31.6% of patients treated with Rd and in 21.9% and 17.2% of patients in
the Rd18 and MPT groups, respectively.
The incidence of grade 3–4 TEAEs was also stratified according to age: ≤ 75 years
and > 75 years. Fewer grade 3 or 4 TEAEs were reported in patients aged
≤ 75 years receiving Rd or Rd18 than in those receiving MPT (84.7% with Rd, 77.3%
with Rd18, 89.4% with MPT).43 For patients > 75 years of age, TEAE rates were
similar among treatment groups (89.2% with Rd, 85.4% with Rd18, 87.5% with
MPT). The pattern and types of TEAE reported in each of the two age groups was
similar to that reported in the overall ITT population.73 Through dose adjustments
and monitoring, Rd can be an effective and tolerable option even in elderly and frail
patients.
Serious treatment-emergent adverse events
All treatment-emergent SAEs that were reported in ≥ 1% of patients in any treatment
arm are summarised in Appendix F, Table 70.
The frequency of all treatment-emergent SAEs was higher for patients receiving Rd
(71.1%) and Rd18 (57.0%) than with MPT (49.9%).43 Few individual SAEs occurred
at a rate of ≥ 2% in any treatment arm. The most frequently reported SAEs in the

Company evidence submission template for Lenalidomide (ID474) © Celgene Inc. (2017). All rights reserved Page 74 of 163
study in all arms were infections and infestations affecting 24.4%, and these were
often respiratory infections. The most frequently occurring SAE was pneumonia,
which was reported in 11.1% patients receiving Rd, 8.9% patients receiving Rd18
and 6.5% patients receiving MPT.
In terms of treatment-emergent SAEs related to any study drug, these were similar
for patients receiving the MPT and Rd18 regimens, but were more frequent in the
group receiving Rd, reflecting the longer drug-exposure time in this arm. Most drug-
related SAEs in each arm were reported with frequencies of 3% or less, except for
pneumonia (Rd 5.8%, Rd18 4.3% and MPT 3.0%); pulmonary embolism (Rd 3.8%,
Rd18 2.8% and MPT 3.1%) and deep vein thrombosis (Rd 3.4%, Rd18 1.9% and
MPT 1.5%).43

Company evidence submission template for Lenalidomide (ID474) © Celgene Inc. (2017). All rights reserved Page 75 of 163
Table 22 TEAEs that occurred in ≥ 10% of patients of any grade in either treatment group by system organ class and preferred term (safety population) and corresponding Grade 3/4 TEAEs in the MM-020 study
Rd, n (%) (n = 532) Rd18, n (%) (n = 540) MPT, n (%) (n = 541)
System Organ Class All grade
AEs
Grade 3/4 All grade
AEs
Grade 3/4 All grade
AEs
Grade 3/4
Patients with ≥ 1 AE 529 (99.4) 459 (86.3) 536 (99.3) 433 (80.2) 539 (99.6) 480 (88.7)
General Disorders and Administration Site Conditions 446 (83.8) 139 (26.1) 430 (79.6) 126 (23.3) 423 (78.2) 106 (19.6)
Oedema (peripheral) 219 (41.2) 18 (3.4) 169 (31.3) 10 (1.9) 215 (39.7) 16 (3.0)
Fatigue 180 (33.8) 42 (7.9) 177 (32.8) 46 (8.5) 154 (28.5) 31 (5.7)
Asthenia 155 (29.1) 45 (8.5) 123 (22.8) 33 (6.1) 125 (23.1) 32 (5.9)
Pyrexia 125 (23.5) 17 (3.2) 102 (18.9) 7 (1.3) 76 (14.0) 7 (1.3)
Gastrointestinal Disorders 437 (82.1) 82 (15.4) 411 (76.1) 58 (10.7) 412 (76.2) 67 (12.4)
Diarrhoea 251 (47.2) 25 (4.7) 208 (38.5) 18 (3.3) 89 (16.5) 8 (1.5)
Constipation 235 (44.2) 12 (2.3) 212 (39.3) 10 (1.9) 285 (52.7) 29 (5.4)
Nausea 157 (29.5) 5 (0.9) 128 (23.7) 4 (0.7) 165 (30.5) 13 (2.4)
Vomiting 102 (19.2) 4 (0.8) 68 (12.6) 2 (0.4) 109 (20.1) 10 (1.8)
Abdominal pain 73 (13.7) 8 (1.5) 41 (7.6) 6 (1.1) 30 (5.5) 3 (0.6)
Dyspepsia 59 (11.1) 2 (0.4) 28 (5.2) 1 (0.2) 36 (6.7) 0 (0.0)
Dry mouth 38 (7.1) 0 (0.0) 38 (7.0) 0 (0.0) 62 (11.5) 1 (0.2)
Musculoskeletal and Connective Tissue Disorders 414 (77.8) 108 (20.3) 367 (68.0) 91 (16.9) 312 (57.7) 77 (14.2)
Back pain 181 (34.0) 39 (7.3) 145 (26.9) 34 (6.3) 116 (21.4) 28 (5.2)
Muscle spasms 115 (21.6) 3 (0.6) 102 (18.9) 3 (0.6) 61 (11.3) 4 (0.7)
Arthralgia 111 (20.9) 9 (1.7) 71 (13.1) 8 (1.5) 67 (12.4) 8 (1.5)
Bone pain 91 (17.1) 17 (3.2) 77 (14.3) 15 (2.8) 62 (11.5) 14 (2.6)
Pain in extremity 91 (17.1) 9 (1.7) 66 (12.2) 8 (1.5) 61 (11.3) 7 (1.3)
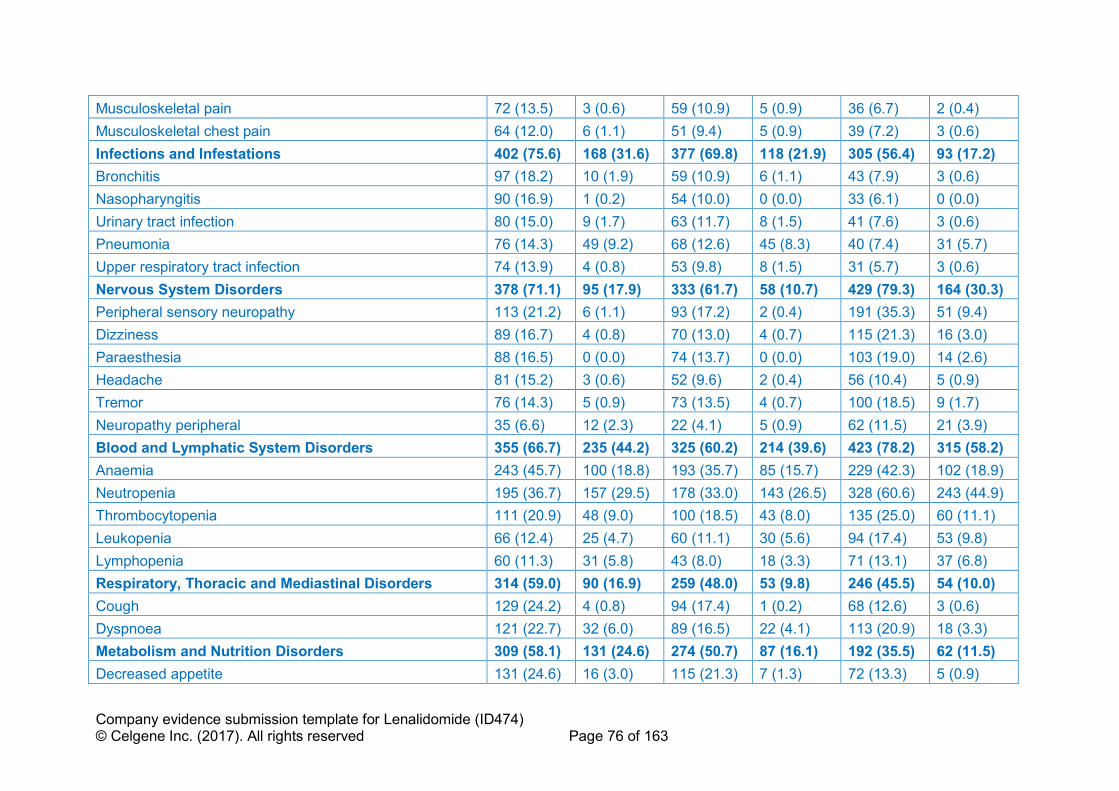
Company evidence submission template for Lenalidomide (ID474) © Celgene Inc. (2017). All rights reserved Page 76 of 163
Musculoskeletal pain 72 (13.5) 3 (0.6) 59 (10.9) 5 (0.9) 36 (6.7) 2 (0.4)
Musculoskeletal chest pain 64 (12.0) 6 (1.1) 51 (9.4) 5 (0.9) 39 (7.2) 3 (0.6)
Infections and Infestations 402 (75.6) 168 (31.6) 377 (69.8) 118 (21.9) 305 (56.4) 93 (17.2)
Bronchitis 97 (18.2) 10 (1.9) 59 (10.9) 6 (1.1) 43 (7.9) 3 (0.6)
Nasopharyngitis 90 (16.9) 1 (0.2) 54 (10.0) 0 (0.0) 33 (6.1) 0 (0.0)
Urinary tract infection 80 (15.0) 9 (1.7) 63 (11.7) 8 (1.5) 41 (7.6) 3 (0.6)
Pneumonia 76 (14.3) 49 (9.2) 68 (12.6) 45 (8.3) 40 (7.4) 31 (5.7)
Upper respiratory tract infection 74 (13.9) 4 (0.8) 53 (9.8) 8 (1.5) 31 (5.7) 3 (0.6)
Nervous System Disorders 378 (71.1) 95 (17.9) 333 (61.7) 58 (10.7) 429 (79.3) 164 (30.3)
Peripheral sensory neuropathy 113 (21.2) 6 (1.1) 93 (17.2) 2 (0.4) 191 (35.3) 51 (9.4)
Dizziness 89 (16.7) 4 (0.8) 70 (13.0) 4 (0.7) 115 (21.3) 16 (3.0)
Paraesthesia 88 (16.5) 0 (0.0) 74 (13.7) 0 (0.0) 103 (19.0) 14 (2.6)
Headache 81 (15.2) 3 (0.6) 52 (9.6) 2 (0.4) 56 (10.4) 5 (0.9)
Tremor 76 (14.3) 5 (0.9) 73 (13.5) 4 (0.7) 100 (18.5) 9 (1.7)
Neuropathy peripheral 35 (6.6) 12 (2.3) 22 (4.1) 5 (0.9) 62 (11.5) 21 (3.9)
Blood and Lymphatic System Disorders 355 (66.7) 235 (44.2) 325 (60.2) 214 (39.6) 423 (78.2) 315 (58.2)
Anaemia 243 (45.7) 100 (18.8) 193 (35.7) 85 (15.7) 229 (42.3) 102 (18.9)
Neutropenia 195 (36.7) 157 (29.5) 178 (33.0) 143 (26.5) 328 (60.6) 243 (44.9)
Thrombocytopenia 111 (20.9) 48 (9.0) 100 (18.5) 43 (8.0) 135 (25.0) 60 (11.1)
Leukopenia 66 (12.4) 25 (4.7) 60 (11.1) 30 (5.6) 94 (17.4) 53 (9.8)
Lymphopenia 60 (11.3) 31 (5.8) 43 (8.0) 18 (3.3) 71 (13.1) 37 (6.8)
Respiratory, Thoracic and Mediastinal Disorders 314 (59.0) 90 (16.9) 259 (48.0) 53 (9.8) 246 (45.5) 54 (10.0)
Cough 129 (24.2) 4 (0.8) 94 (17.4) 1 (0.2) 68 (12.6) 3 (0.6)
Dyspnoea 121 (22.7) 32 (6.0) 89 (16.5) 22 (4.1) 113 (20.9) 18 (3.3)
Metabolism and Nutrition Disorders 309 (58.1) 131 (24.6) 274 (50.7) 87 (16.1) 192 (35.5) 62 (11.5)
Decreased appetite 131 (24.6) 16 (3.0) 115 (21.3) 7 (1.3) 72 (13.3) 5 (0.9)
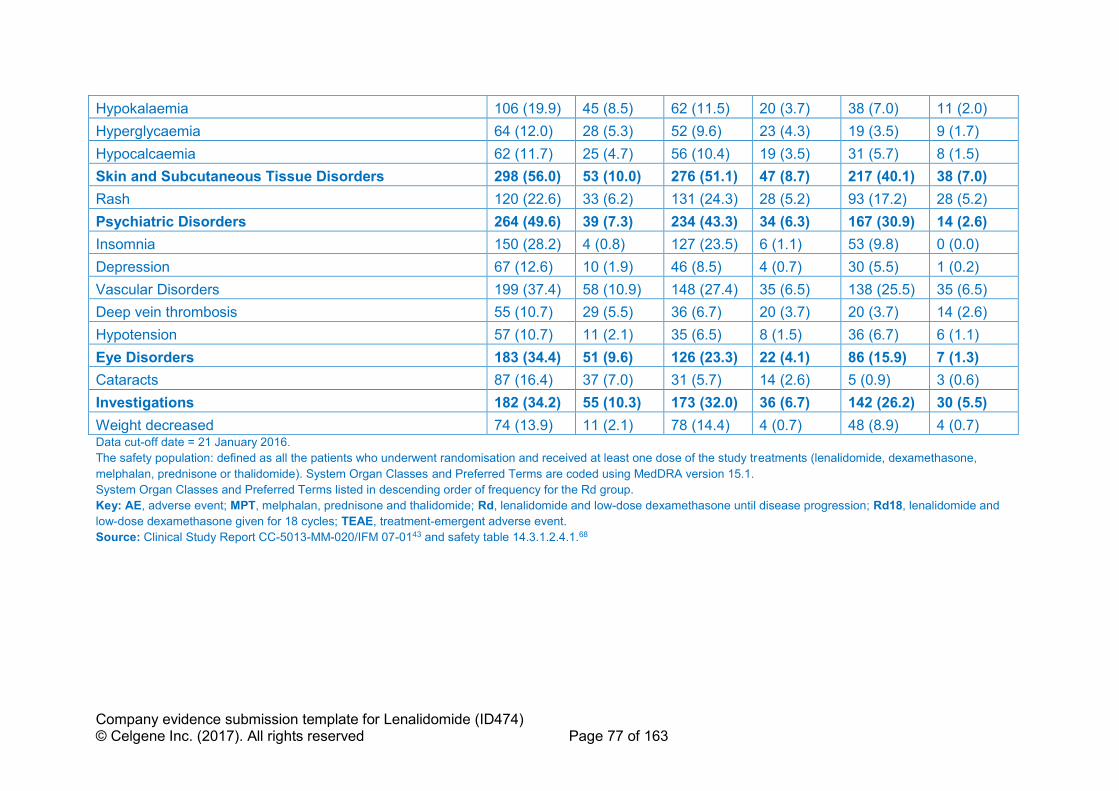
Company evidence submission template for Lenalidomide (ID474) © Celgene Inc. (2017). All rights reserved Page 77 of 163
Hypokalaemia 106 (19.9) 45 (8.5) 62 (11.5) 20 (3.7) 38 (7.0) 11 (2.0)
Hyperglycaemia 64 (12.0) 28 (5.3) 52 (9.6) 23 (4.3) 19 (3.5) 9 (1.7)
Hypocalcaemia 62 (11.7) 25 (4.7) 56 (10.4) 19 (3.5) 31 (5.7) 8 (1.5)
Skin and Subcutaneous Tissue Disorders 298 (56.0) 53 (10.0) 276 (51.1) 47 (8.7) 217 (40.1) 38 (7.0)
Rash 120 (22.6) 33 (6.2) 131 (24.3) 28 (5.2) 93 (17.2) 28 (5.2)
Psychiatric Disorders 264 (49.6) 39 (7.3) 234 (43.3) 34 (6.3) 167 (30.9) 14 (2.6)
Insomnia 150 (28.2) 4 (0.8) 127 (23.5) 6 (1.1) 53 (9.8) 0 (0.0)
Depression 67 (12.6) 10 (1.9) 46 (8.5) 4 (0.7) 30 (5.5) 1 (0.2)
Vascular Disorders 199 (37.4) 58 (10.9) 148 (27.4) 35 (6.5) 138 (25.5) 35 (6.5)
Deep vein thrombosis 55 (10.7) 29 (5.5) 36 (6.7) 20 (3.7) 20 (3.7) 14 (2.6)
Hypotension 57 (10.7) 11 (2.1) 35 (6.5) 8 (1.5) 36 (6.7) 6 (1.1)
Eye Disorders 183 (34.4) 51 (9.6) 126 (23.3) 22 (4.1) 86 (15.9) 7 (1.3)
Cataracts 87 (16.4) 37 (7.0) 31 (5.7) 14 (2.6) 5 (0.9) 3 (0.6)
Investigations 182 (34.2) 55 (10.3) 173 (32.0) 36 (6.7) 142 (26.2) 30 (5.5)
Weight decreased 74 (13.9) 11 (2.1) 78 (14.4) 4 (0.7) 48 (8.9) 4 (0.7) Data cut-off date = 21 January 2016.
The safety population: defined as all the patients who underwent randomisation and received at least one dose of the study treatments (lenalidomide, dexamethasone,
melphalan, prednisone or thalidomide). System Organ Classes and Preferred Terms are coded using MedDRA version 15.1.
System Organ Classes and Preferred Terms listed in descending order of frequency for the Rd group.
Key: AE, adverse event; MPT, melphalan, prednisone and thalidomide; Rd, lenalidomide and low-dose dexamethasone until disease progression; Rd18, lenalidomide and
low-dose dexamethasone given for 18 cycles; TEAE, treatment-emergent adverse event.
Source: Clinical Study Report CC-5013-MM-020/IFM 07-0143 and safety table 14.3.1.2.4.1.68
Company evidence submission template for Lenalidomide (ID474) © Celgene Inc. (2017). All rights reserved Page 78 of 163
Other events of interest: second primary malignancies
In MM-020 at the data cut-off of 21 January 2016, the median follow-up time for
surviving patients in the safety population was 67.1 months (range, 0.1–
86.8 months).43 A total of 192 (11.9%) of the 1,613 patients in all three treatment
groups experienced at least one SPM. Overall, the proportion of patients with SPMs
were similar for all three treatment groups (Rd [11.5%], Rd18 [11.1%] and MPT
[13.1%]; see Appendix F, Table 71). The proportion of patients with invasive
haematological and solid tumour SPMs were similar for the Rd and Rd18 groups
(6.8% and 7.0%, respectively). A higher frequency of invasive SPMs was observed
in the MPT group (8.5%). Of the patients (n = 20) with invasive haematological
SPMs, 3 patients were in the Rd group, 2 in the Rd18 group and 14 were in the MPT
group.
In a separate meta-analysis of pooled data from 3,254 patients with NDMM, it was
shown that the increased risk of developing haematological SPMs was mainly driven
by coexposure to the use of IMiDs and melphalan.74 It is also worth noting that in the
meta-analysis, the incidence of death due to myeloma or treatment-associated AEs
were substantially higher than those due to SPMs74 an observation reflected in study
MM-02043 and recognised in a recently published consensus paper by the IMWG.75
Death
At the 21 January 2016 data cut-off, a lower proportion of patients receiving Rd had
died (53.4%, [284/532]) when compared with patients receiving MPT (62.1%
[336/541]). In the Rd18 treatment group the overall percentage of deaths was similar
to that for patients receiving Rd (52.4%, [283/540]). The most common cause of
death in these treatment groups was MM (19.9%, 23.5%, and 27.5%, for Rd, Rd18
and MPT respectively). Other common causes of death were Infections accounting
for 9.2%, 5.7%, and 8.5% of deaths, respectively, and death attributable to cardiac
disorders in 5.8%, 5.2% and 3.7%, respectively.43
Treatment discontinuations, dose reductions and dose interruptions
Most treatment discontinuations in MM-020 were due to disease progression 50.7%
[271/535] in patients receiving Rd, compared with 66.9% [362/541] and 61.6%
[337/547] in patients receiving Rd18 and MPT, respectively. Few patients
Company evidence submission template for Lenalidomide (ID474) © Celgene Inc. (2017). All rights reserved Page 79 of 163
discontinued treatment because of AEs; the discontinuation rates were 12.0%,
13.1% and 13.9% in patients receiving Rd, Rd18 and MPT, respectively.43
Across all treatment groups, dose interruptions were more common than dose
reductions. TEAEs leading to dose interruption of thalidomide occurred for 71.9% of
patients receiving MPT compared with an interruption of lenalidomide in 68.0% and
55.7% of patients receiving Rd and Rd18, respectively. Dose reductions of
thalidomide occurred for 47.0% of patients receiving MPT compared with a reduction
of lenalidomide in 41.4 and 28.7% of patients receiving Rd and Rd18, respectively.
In some patients, TEAEs led to lenalidomide or thalidomide discontinuation.
Thalidomide was discontinued in 27.0% of patients receiving MPT compared with
lenalidomide discontinuation in 25.6% and 17.2% of patients receiving Rd and Rd18,
respectively. AEs in the nervous system disorders system organ class (SoC) led to
discontinuations of thalidomide in 12.6% of patients receiving MPT compared with
3.6% and 1.9% discontinuations of lenalidomide in the Rd and Rd18 treatment
groups, respectively. No specific, individual AEs led to discontinuation of any study
drug in more than 2% of patients in any treatment arm, except for peripheral sensory
neuropathy leading to discontinuation of thalidomide in 6.7% of patients receiving
MPT.
Additional safety issues
Potential teratogenic risk, may be important to consider with regard to use of
lenalidomide combinations in patients with transplant-ineligible NDMM, as described
in the lenalidomide SmPC ‘Special warning and precautions for use’.5
B.2.10.3 Safety summary for lenalidomide in transplant-ineligible NDMM
Safety analyses of MM-020 indicate that the Rd treatment regimen is manageable
and that the superior efficacy of Rd over MPT is not compromised by increased
toxicity.43 The safety profiles of MPT and Rd in MM-020 were consistent with the
safety profiles of these regimens established by previous studies.38,69,76 Importantly,
extension of Rd treatment beyond 36 months resulted in only a limited increase in
AEs compared with Rd18 or MPT regimens.43
Rd was associated with fewer haematologic and neurologic toxic events, a moderate
increase in infections, and fewer second primary malignancies than MPT,31,43 a
Company evidence submission template for Lenalidomide (ID474) © Celgene Inc. (2017). All rights reserved Page 80 of 163
current first-line regimen for transplant-ineligible patients with NDMM in the UK.3 In
MM-020, the rate of discontinuation as a result of AEs was lower with Rd treatment
than with MPT. In addition, extended treatment with Rd beyond 72 weeks was
associated with only a small increase in infections and thromboembolic events
compared with stopping treatment.43 It appears that long-term AEs with Rd beyond
72 weeks, such as a two-fold increase in the incidence of cataracts, are at least
partly driven by glucocorticoids. This is a common finding in elderly patients with
myeloma, indicating the need to investigate alternative ways to deliver
glucocorticoids.72
The toxicity profile of Rd in study MM-020 supports the principle that Rd is
appropriate for use as a continuous treatment in patients with MM.5 This approach is
important to keep residual disease at bay for as long as possible,26 maximise the
duration of the first remission and prevent deterioration in the QoL of patients.31,47 In
the UK, the existing frontline treatment options of either thalidomide or bortezomib in
combination with an alkylating agent and a corticosteroid are limited to fixed
treatment durations of 12 or 9 cycles, respectively, not only by their respective
licenses but also by their toxicity.17,37,38,41,42,69
B.2.11 Ongoing studies
In transplant-ineligible patients with NDMM, there are no ongoing company-
sponsored studies from which new evidence will become available in the timeline
specified.
B.2.12 Innovation
Lenalidomide represents a step-change in the management of transplant-ineligible
NDMM, it has the following innovative characteristics, which are meaningful to both
patients and the NHS:
• Compared with thalidomide and bortezomib, it has a different mechanism of
action and toxicity profile, which allows for continuous use to suppress
residual disease and extend the period of first remission.
• As an oral therapy, lenalidomide provides an alternative to IV and injectable
therapies such as bortezomib, which have to be given in the hospital setting.
Company evidence submission template for Lenalidomide (ID474) © Celgene Inc. (2017). All rights reserved Page 81 of 163
Impact of different mechanism of action and toxicity profile
As a synthetic derivative of thalidomide, lenalidomide was developed with the aim of
improving efficacy and reducing toxicity. Lenalidomide is more potent than
thalidomide with regard to its anti-proliferative activity, anti-inflammatory properties
and ability to stimulate Th1 cytokines, T-cells and natural killer cells.4 These
differences in molecular structure and activity result in an improved efficacy and
toxicity profile compared with thalidomide and allow continuous treatment with
lenalidomide until disease progression.31,43 This approach helps suppress residual
disease, extending the period of first remission, which is particularly important for
older transplant-ineligible patients who may not respond to rescue therapy at the
time of first relapse or have the opportunity to receive multiple lines of treatment due
to cumulative treatment toxicities or comorbidities.31,32
Lenalidomide can also be given in a two-drug combination that does not include
melphalan and, as such, may be more tolerable to older frail patients. Melphalan is a
cytotoxic drug associated with many undesirable effects, including myelosuppression
and hair loss. Melphalan is not suitable for long-term treatment because of its toxicity
profile, including leukaemogenic properties.77 Melphalan is associated with
haematological toxicity and increased risk of SPM when given alone,78-80 or in
combination with IMiD®s.74
Reduction in patient burden and NHS resource use
Lenalidomide is an oral therapy that provides an alternative treatment to IV and
subcutaneous therapies. The combination of lenalidomide and low-dose
dexamethasone can be self-administered by patients at home. This is expected to be
more convenient, easier and less distressing for patients than use of either IV or
injectable combinations (e.g. VMP), particularly for elderly and frail individuals as
well as those who live far away from hospitals. This is highly relevant when
considering continuous treatment. The use of an oral agent provides patients with a
greater sense of control over their disease and less interruption of their daily
(including work) lives compared to IV and SC treatments.49 81
Company evidence submission template for Lenalidomide (ID474) © Celgene Inc. (2017). All rights reserved Page 82 of 163
B.2.13 Interpretation of clinical effectiveness and safety
evidence
Current clinical practice in the UK for patients with transplant ineligible NDMM makes
use of the thalidomide and bortezomib based regimens, as advised by NICE
guidance TA228.3 These regimens are licensed for fixed treatment durations of
between 9 and 12 cycles owing to associated toxicity issues.41,42 As MM is
characterised by regression and remission, and ultimately treatment failure,
indicating the presence of residual disease even in patients who initially show a
complete clinical response to treatment,26 continuous therapy is required to maintain
suppression of surviving tumour cells and extend the period of first remission.26,27,30
Rd Efficacy
The efficacy of lenalidomide in transplant-ineligible NDMM has been demonstrated in
study MM-020, one of the largest trials in this population to date, comparing
continuous use of Rd to progression with a current standard of care (MPT).31,43 Rd
demonstrated a significant improvement in PFS compared with MPT: 43,68
• Final PFS by IRAC review using FDA censoring rules at the 24 May 2013 data
cut off showed a 28% reduction in the risk of disease progression or death
with Rd compared with MPT given for 72 weeks (HR 0.72; 95% CI 0.61–0.85;
p = 0.00006).
• Updated PFS by investigator using FDA censoring rules at the
21 January 2016 data cut off demonstrated consistent results (HR 0.69; 95%
CI 0.59–0.79; p < 0.00001).
• When these PFS data were analysed using EMA censoring rules, the Rd
advantage over both MPT and Rd18 was still evident.
Rd demonstrated a significant improvement in OS compared with MPT:43
• Risk of death reduced by 22% (HR 0.78; 95% CI 0.62–0.90; p = 0.002) with a
10.0-month improvement in median OS.
Rd delivered a significantly quicker TTR and higher ORR (≥ PR) compared with
MPT.43
• In Rd patients who had a best response of ≥ VGPR (48.6%), the PFS and OS
benefit of Rd over MPT was even more profound:

Company evidence submission template for Lenalidomide (ID474) © Celgene Inc. (2017). All rights reserved Page 83 of 163
o Median PFS of 52.5 months for the Rd group compared with
31.8 months for MPT (HR 0.52; 95% CI: 0.40–0.66)
o Median OS of 79.5 months for the Rd group compared with
55.7 months for MPT (HR 0.63; 95% CI: 0.48–0.83).
Rd treatment led to a longer DOR, TTP, time to second AMT and PFS2 compared to
MPT:43,68
• Rd demonstrated sustained disease control delaying the time to second-line
AMT: Rd (36.7 months) compared with MPT (26.7 months; HR 0.63; 95% CI
0.54–0.73; p < 0.00001).
Finally, an indirect treatment comparison has demonstrated significantly longer OS
and a PFS benefit with Rd compared with VMP (PFS, HR 0.74; 95% Crl 0.52–1.05;
OS, HR 0.70; 95% Crl, 0.50–0.98).
Rd Safety
A continuous treatment approach requires agents that have acceptable toxicity
profiles with limited detrimental impact on patients’ QoL. Lenalidomide has a different
safety profile to thalidomide and bortezomib that allows treatment until disease
progression.5 In study MM-020, the improved PFS with Rd is accompanied by an
improvement in HRQoL,47 lower rates of haematological AEs, haematological SPMs
and peripheral sensory neuropathy compared with MPT. Most AEs associated with
Rd tended to occur within the first 18 months of therapy and decreased over time.
Continuing Rd beyond 18 months was associated with only a small increase in AEs
compared with stopping treatment after 18 cycles.43
• Grade 3 or 4 AEs with Rd occurred slightly less frequently than with MPT
(86.3% vs 88.7% of patients, respectively) despite the longer duration of
treatment.43 A moderate increase in infections, which can be an underlying
feature of the disease, was observed in the Rd group; however, most cases of
infection occurred in the absence of neutropenia.43
• Patients receiving MPT discontinued treatment sooner and more frequently
prior to disease progression than patients receiving Rd. In addition, there
were more AEs leading to treatment discontinuation in the MPT arm despite
the shorter 72-week treatment duration.43
Company evidence submission template for Lenalidomide (ID474) © Celgene Inc. (2017). All rights reserved Page 84 of 163
• Rd tolerability was good regardless of patient age, an important factor in the
transplant-ineligible MM population which includes a high proportion of older
patients.43
• In comparison with patients receiving thalidomide combinations, patients
receiving Rd experience less peripheral neuropathy,38,43,69,82 paraesthesia,43
nausea,43 dizziness,43 constipation,38,43,69 and neutropenia.7 The UK MRC
Myeloma IX study has shown that the toxicity associated with thalidomide
combinations limits long-term treatment exposure. This led the authors to
conclude that “use of agents with better tolerability profiles, such as
lenalidomide may produce better results”.83
• Worsening of neuropathy was rarely seen in trials of Rd43,84 and rates of
peripheral neuropathy were low compared to what is generally seen for
thalidomide combinations.38,42,82 In addition, as a two-drug combination that
does not include melphalan, Rd may be more tolerable for older frail patients.
• Lenalidomide is structurally related to thalidomide, a known teratogen a
pregnancy prevention programme (PPP) has been established to reduce the
risk of foetal exposure.5
Rd quality of life
Multiple myeloma causes deterioration in HRQoL, which decreases as the burden of
illness increases over time with progression of the disease.85 Delaying disease
progression and maintaining QoL is therefore an important treatment goal,17
especially amongst older patients. In MM020 the EORTC QLQ-C30 was used in
addition to the EORTC QLQ-MY20 and EQ-5D, with results showing both statistically
significant and clinically meaningful changes in HRQoL from baseline.47
• Relative to MPT, Rd demonstrated a significantly greater reduction in disease
symptoms and side effects of treatment, and no evidence of inferiority to MPT
in any of the pre-selected HRQoL domains. Rd also demonstrated consistent
clinically meaningful improvement in utility on the EQ-5D.
These findings demonstrate that the improved PFS with Rd does not come at a cost
of decreased HRQoL.47
Company evidence submission template for Lenalidomide (ID474) © Celgene Inc. (2017). All rights reserved Page 85 of 163
B.2.13.1 Clinical effectiveness of Rd relative to current comparator
treatments
In terms of efficacy, toxicity and HRQoL, Rd given until disease progression offers
considerable benefit over MPT, which was deemed by clinical specialists who took
part in the NICE TA228 assessment as equivalent to the unlicensed combination of
CTD.3 The NMA conducted as part of this submission also shows efficacy
advantages of Rd given until disease progression over VMP.
Comparative toxicity and health related quality of life
All relevant comparators to lenalidomide, namely bortezomib and thalidomide-based
regimens, are licensed for fixed treatment durations of between 9 and 12 cycles
respectively due to associated toxicity.41,42 In key studies of MPT patients reported
an increased incidence of AEs, notably cytopenias, thrombosis, fatigue and
peripheral neuropathy.17 MPT can require numerous dose modifications because of
cytopenia. Within the SLR, rates of grade 3–4 neutropenia ranged between 23 and
48%,31,38,69 grade 3–4 thrombocytopenia between 3 and 14%31,38 and grade 3–4
peripheral neuropathy between 2 and 9%.31,38,69 In addition, between 13.9% and
45%38,43,69 of patients discontinued because of a treatment-related AE (Appendix D).
In the VISTA study, VMP was associated with a significant worsening of QoL during
the first 3–6 cycles of treatment and peripheral sensory neuropathy was reported
more frequently than with MP.39,46 In the VISTA study rates of grade 3–4
neutropenia, thrombocytopenia and peripheral neuropathy were 40, 38 and 13%
respectively.40,70 In addition, 15% of patients discontinued because of a treatment-
related TEAE (see Appendix D).70
The safety profile of Rd is manageable and allows treatment until disease
progression with a low rate of discontinuation due to AEs (12%), which was lower
than MPT (13.9%) given for 72 weeks. It is also associated with low rates of grade
3–4 peripheral neuropathy (1%) and its efficacy does not come at the expense of
QoL.43,47
Lenalidomide’s improved safety profile means that patients who are unable to
tolerate or who have contraindications to thalidomide may also benefit from Rd in
addition to bortezomib combinations.5,31,42,43 In practice, patients who present with

Company evidence submission template for Lenalidomide (ID474) © Celgene Inc. (2017). All rights reserved Page 86 of 163
predisposing conditions that make them more susceptible to thalidomide AEs may
benefit from receiving Rd.
Rd as an oral therapy
As an oral therapy, Rd can be self-administered by patients at home. In comparison,
bortezomib based regimens, require patients to attend hospital (either in a day case
or outpatient setting) to receive SC or IV administration twice weekly for the first four
28-day cycles followed by weekly administration thereafter.41
Clinical expert opinion
Through consultation with an Expert Advisory Panel of clinicians from England and
Wales, It was highlighted that for older transplant-ineligible patients it is important to
achieve a long first remission with treatment.86 Clinical experts at the Advisory Panel
highlighted:86
• MM-020 studied a patient cohort reflective of typical practice.86 Specifically,
the study included a large proportion of elderly patients and a reasonable
percentage of patients with severe renal insufficiency.
• The case for continuous treatment with Rd is particularly strong in older
patients, to achieve the longest PFS upfront. Rd through its oral formulation
and toxicity profile enables the drug to be delivered continuously, unlike other
agents such as bortezomib where the evidence is more limited.
• The OS data for Rd in MM-020 is impressive, particularly when compared with
thalidomide-based and bortezomib-based regimens, and considering the age
of patients in the trial.
• As an oral treatment Rd that may reduce pressure on day unit services.
• The toxicity profile of treatments in the older transplant-ineligible population is
important and Rd is well tolerated.
This is further supported by a scoring exercise by the NCCN which scores Rd higher
for safety (4 out of 5) than MPT and VMP (both 3 out of 5). It is also important to
point out that the NCCN recommends Rd as a Category 1 option for treatment of
patients with NDMM who are ineligible for transplantation.61
Company evidence submission template for Lenalidomide (ID474) © Celgene Inc. (2017). All rights reserved Page 87 of 163
B.2.13.2 Strengths and limitations of the clinical evidence base
Strengths
The MM-020 study is one of the largest ever conducted in patients with transplant-
ineligible NDMM (n = 1623). Baseline characteristics of the MM-020 study
populations in all 3 treatment arms were well balanced in terms of median age, age
distribution, ISS stage, performance status, cytogenetics and parameters of
prognostic significance (e.g. baseline renal impairment).43
Efficacy was assessed using outcomes and time points that are consistent with
previous regulatory submissions.67 Primary and key secondary outcomes were
assessed by IRAC review based on IMWG criteria an international standard for the
assessment of response in MM studies.62 To ensure an unbiased assessment of the
data, the IRAC reviewed all efficacy data in a blinded manner (independent of
investigator-reported response), and determined the response to therapy and time to
progressive disease for each patient. Although the study was open-label the
sponsor’s study team was blinded to the study treatment code prior to the final
analysis of PFS.43
The primary endpoint was PFS, which was significantly improved in patients
receiving Rd therapy compared to MPT. PFS may be a purer measure of a drug’s
efficacy than OS because it eliminates potential differential bias from previous or
subsequent treatments. PFS is increasing used as a primary outcome measure and
the EMA have concluded that “in this setting, PFS is an acceptable primary
endpoint”.87
Results from pre-specified subgroup analyses suggest that the overall findings from
study MM-020 would be transferable to the range of patients typically presenting at
clinics in UK clinical practice, including older age groups. A PFS benefit in favour of
Rd versus MPT was observed in most subgroups. When those subgroups defined as
stratification factors (age, ISS stage, geographic region) were subject to statistical
analysis, a significant PFS advantage for Rd over MPT was shown in all subgroups,
except for those categories with relatively small patient numbers that likely suffered
from a statistical under-powering.43
Company evidence submission template for Lenalidomide (ID474) © Celgene Inc. (2017). All rights reserved Page 88 of 163
MM-020 also included a wide range of secondary outcomes highly relevant to MM
including OS, myeloma response, DOR, TTR, TTF, time to second-line AMT and
HRQoL. OS is still considered a gold standard in demonstrating clinical efficacy in
oncology,88 being an unambiguous endpoint that is relatively insensitive to
investigator interpretation and directly reflects clinical benefit to patients. The positive
impact of Rd therapy on OS (a 22% reduction in the risk of death relative to MPT)43
is therefore an important finding that, coupled with the concomitant HRQoL benefit
derived from an extended PFS,43,47 adds to the significant weight of evidence.
PFS2 was an exploratory endpoint used to assess whether first-line treatment
introduces treatment resistance disease in the subsequent line of therapy. The EMA
has acknowledged the value of this alternative endpoint when maintenance
regimens are under assessment.67 PFS2 for Rd was significantly superior compared
with MPT, supporting the long-term benefit from an extended first PFS with Rd
treatment. The median PFS2 data for Rd help to rule out possible negative effects of
this treatment on the next line of therapy.
HRQoL was included as an endpoint to measure the impact of the disease and of
treatment on patients’ QoL. This is an important outcome for patients, especially
elderly patients86 and was measured using validated oncology-specific and MM-
specific questionnaires. The results show that the improved PFS with Rd is
accompanied by an improvement in HRQoL.47
Finally, the MM-020 dataset is also now mature and all primary and secondary
endpoints have been met, with 52.1% of patients on the Rd arm having experienced
a progression and 53.5% of patients having died. This data maturity allows greater
certainty around the longer term outcomes of Rd treatment.
Limitations
MM-020 did not include VMP despite this regimen being used in the UK and Europe.
VMP could not be included, as this regimen was first approved for use in June 2008,
which was after the start of the MM-020 study.43 Instead, in this submission, an
indirect comparison was used to compare Rd with VMP, via NMA, which shows
statistically significant OS for Rd over VMP. At the time when the MM-020 study was
being designed, MPT was chosen as a comparator because it was, and still is, a
Company evidence submission template for Lenalidomide (ID474) © Celgene Inc. (2017). All rights reserved Page 89 of 163
standard first-line treatment regimen for elderly patients with NDMM. CTDa was
developed as an alternative regimen to MPT by UK investigators and studied in the
UK Myeloma IX study which compared CTDa with MP.17,82 Outside of the UK, CTDa
is not widely used and as such was not considered an appropriate comparator for
the study.
Some pre-specified subgroups of MM-020 included few patients
The patient numbers are low in some of the pre-specified subgroups and thus no
conclusions can be drawn from the results.43 For example, only 142 patients were in
the high risk cytogenetics group (defined as 4;14, 14;16 and del17p) across the three
arms of the study. Among patients with a non-adverse cytogenetic risk profile, the
risk of disease progression or death was reduced by 35% in the Rd treatment group
compared with MPT (HR 0.65; 95% CI 0.52–0.81); however, for those who did have
an adverse cytogenetic risk profile, the risk was non-significantly reduced by 18%
(HR 0.82; 95% CI 0.63–1.07).
B.2.13.3 Relevance of the evidence base to the decision problem
Evidence from MM-020 is highly relevant as it included the same population in which
Rd would be used in clinical practice in the UK: transplant-ineligible NDMM. Of the
1,623 patients randomised, 72 patients were recruited from 16 centres in the UK,
making results applicable to UK practice. The Expert Advisory Panel of clinicians
from England and Wales, highlighted that MM-020 studied a patient cohort reflective
of typical practice.86 Specifically, the study included a large proportion of elderly
patients and a reasonable percentage of patients with severe renal insufficiency. At
baseline, 35% of patients were > 75 years old, 41.6% had ISS Stage III disease,
9.1% had severe renal insufficiency (CrCl < 30 mL/min), 71.2% had a history of bone
disease, and 13.5% had received radiation for MM prior to treatment in the study.43
The results indicate that patients aged over 75 years tolerate Rd until disease
progression.43 There was no relevant difference in grade 3–4 toxicity between
patients younger and older than 75 years of age.43,73 On viewing these data, the
Expert Advisory Panel noted that patients in this age group will often not receive any
treatment because of concerns over toxicity.86 Transplant-ineligible patients are a
particularly heterogeneous clinical group that includes fit elderly patients as well as
patients considered as unfit or frail.89 Drug-related treatment complications are

Company evidence submission template for Lenalidomide (ID474) © Celgene Inc. (2017). All rights reserved Page 90 of 163
prevalent among elderly or frail patients with MM and may lead to premature
discontinuation from treatment or lower dose intensities.19 Indeed, BSCH guidelines
highlight that the aim of therapy in patients who are older and less fit is to achieve
the maximum durable response to treatment with minimal treatment-related
toxicity.17
For elderly, unfit or frail patients who are not eligible for high-dose therapy and stem
cell transplant, the IMWG recommend that treatment be adapted and highlight that a
two-drug combination can improve tolerance without jeopardising drug activity.90 This
view was supported by The Expert Advisory Panel, who highlighted that treatment
toxicity can be a limiting factor for older transplant-ineligible patients with NDMM and
that there may be advantages of giving some patients the two-drug combination Rd
over a three-drug bortezomib or thalidomide combination. This is particularly
important in patients over 75 years of age, where response to treatment and toxicity
are of importance.86
The comparator included in MM-020 is relevant to the decision problem. MPT was
chosen because: 1) there is good evidence supporting its efficacy over MP;91 2) it is
the only licensed thalidomide combination in this patient population;42 and 3) it is
recommended by the ESMO Clinical Practice Guidelines for MM, and is a standard
regimen for NDMM in Europe.59,60 The efficacy and safety of MPT have been
investigated in a series of large studies and meta-analysis and MPT has shown OS
benefit over MP.91 The EMA considered MPT as the standard of care in Europe and
considered both MPT and Rd, as given in MM-020, as appropriate treatment
regimens.2 MM-020 is the first, large, phase 3 study to compare the efficacy and
safety of Rd with a current SoC, MPT (rather than MP) given for a fixed number of
cycles, in transplant-ineligible patients with NDMM.43
B.2.13.4 Factors influencing internal and external validity
Study MM-020 is considered to have high internal validity (see Table 66, Appendix
D) with results that are relevant to clinical practice in the UK.
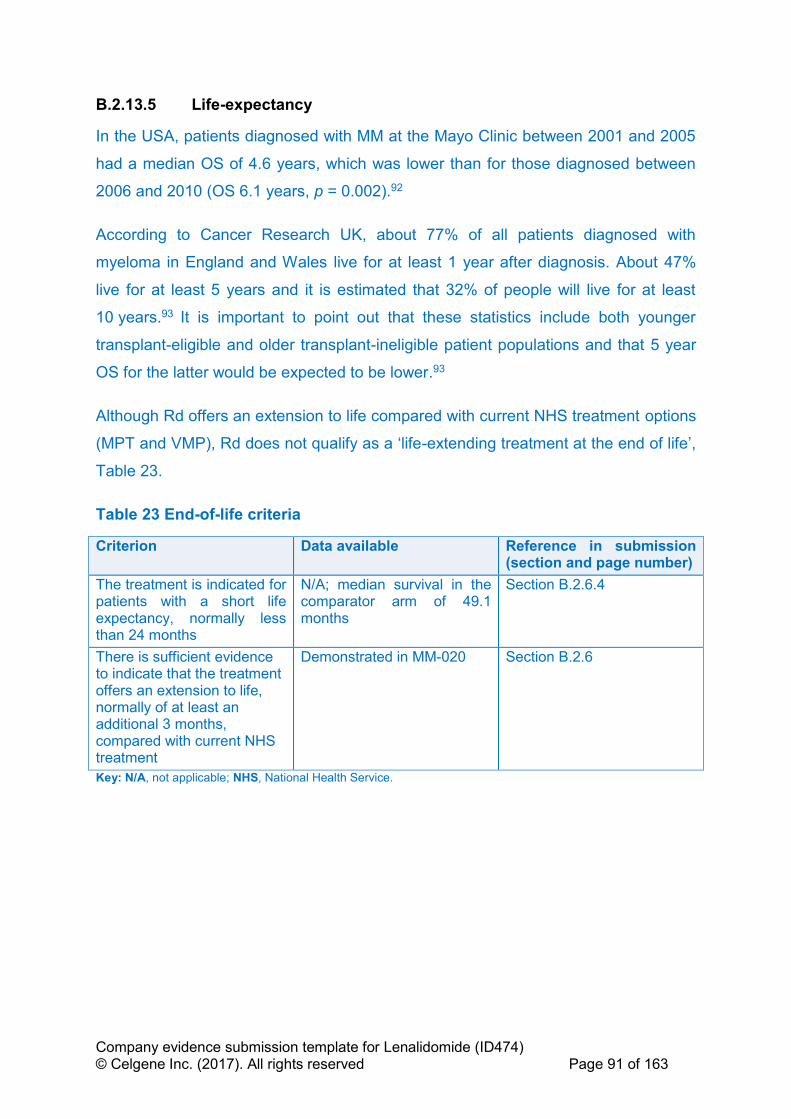
Company evidence submission template for Lenalidomide (ID474) © Celgene Inc. (2017). All rights reserved Page 91 of 163
B.2.13.5 Life-expectancy
In the USA, patients diagnosed with MM at the Mayo Clinic between 2001 and 2005
had a median OS of 4.6 years, which was lower than for those diagnosed between
2006 and 2010 (OS 6.1 years, p = 0.002).92
According to Cancer Research UK, about 77% of all patients diagnosed with
myeloma in England and Wales live for at least 1 year after diagnosis. About 47%
live for at least 5 years and it is estimated that 32% of people will live for at least
10 years.93 It is important to point out that these statistics include both younger
transplant-eligible and older transplant-ineligible patient populations and that 5 year
OS for the latter would be expected to be lower.93
Although Rd offers an extension to life compared with current NHS treatment options
(MPT and VMP), Rd does not qualify as a ‘life-extending treatment at the end of life’,
Table 23.
Table 23 End-of-life criteria
Criterion Data available Reference in submission (section and page number)
The treatment is indicated for patients with a short life expectancy, normally less than 24 months
N/A; median survival in the comparator arm of 49.1 months
Section B.2.6.4
There is sufficient evidence to indicate that the treatment offers an extension to life, normally of at least an additional 3 months, compared with current NHS treatment
Demonstrated in MM-020 Section B.2.6
Key: N/A, not applicable; NHS, National Health Service.

Company evidence submission template for Lenalidomide (ID474) © Celgene Inc. (2017). All rights reserved Page 92 of 163
B.3 Cost effectiveness
B.3.1 Published cost-effectiveness studies
A summary of the studies identified by the SLR (Appendix G) is presented in Table
24. The relevance of each study that was extracted to the decision problem is
summarised below:
• Picot 201194,95 is the assessment report on the clinical effectiveness and
cost-effectiveness of bortezomib and thalidomide in combination regimens
with an alkylating agent and a corticosteroid for the first-line treatment of
multiple myeloma from TA228.
• Garrison 201396 is a cost-effectiveness analysis of initial treatment of multiple
myeloma with VMP vs. MPT or lenalidomide plus MP with continuous
lenalidomide maintenance treatment. The study adopts a US payer
perspective, however was included because it provides relevant information
on model structure. ICERs for pairwise compairsons of VMP in the south-east
quadrant reported as “VMP cost-saving” were corrected in the extractions.
• Usmani 201697 investigates the cost-effectiveness of Rd vs. VMP in
transplant-ineligible patients with NDMM. Although US based, this publication
compares Rd and VMP and provides relevant information on model structure.
• Celgene 200998 is the company submission for thalidomide in TA228.
Extractions were based on the associated summary reported by Picot 2011
given adequate data were provided in this publication. Results were extracted
from the tabulated base-case results for the Celgene submission.
• Janssen-Cilag 200999 is the company submission for bortezomib in TA228.
Extractions were based on the associated summary reported by Picot 2011
given adequate data were provided in this publication. Results were extracted
from the tabulated base-case results for the Janssen–Cilag submission.
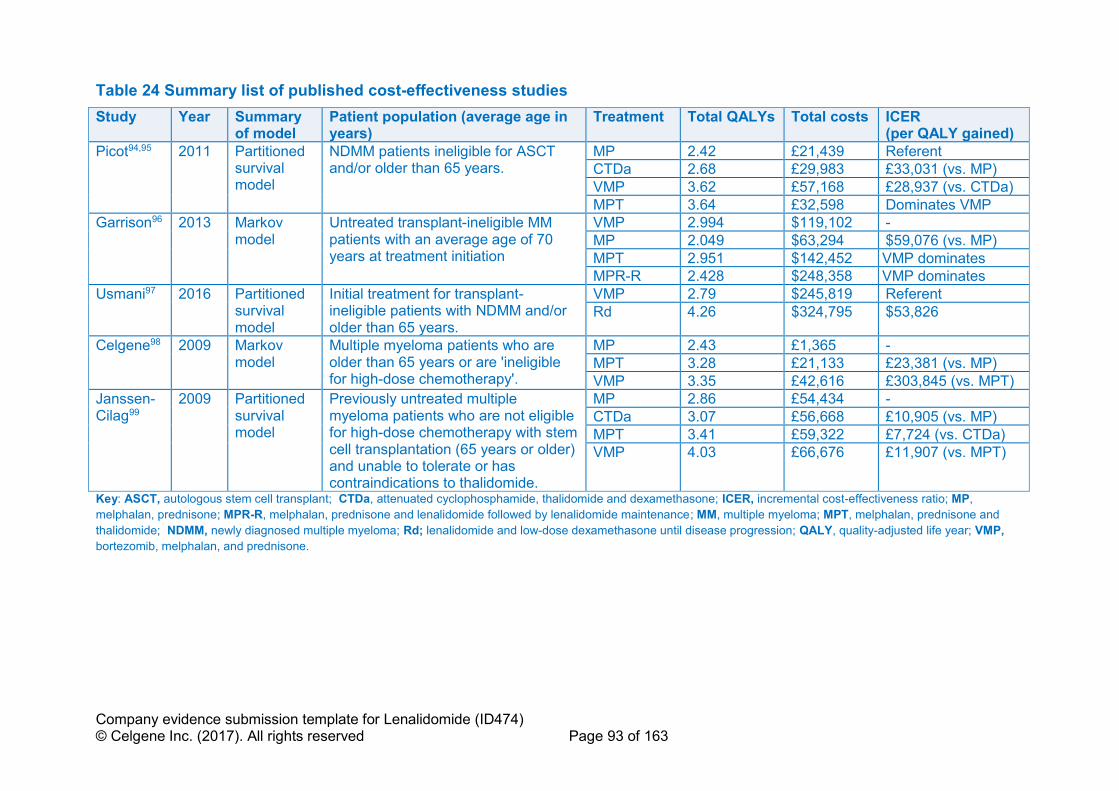
Company evidence submission template for Lenalidomide (ID474) © Celgene Inc. (2017). All rights reserved Page 93 of 163
Table 24 Summary list of published cost-effectiveness studies
Study Year Summary of model
Patient population (average age in years)
Treatment Total QALYs Total costs ICER (per QALY gained)
Picot94,95 2011 Partitioned survival model
NDMM patients ineligible for ASCT and/or older than 65 years.
MP 2.42 £21,439 Referent
CTDa 2.68 £29,983 £33,031 (vs. MP)
VMP 3.62 £57,168 £28,937 (vs. CTDa)
MPT 3.64 £32,598 Dominates VMP
Garrison96 2013 Markov model
Untreated transplant-ineligible MM patients with an average age of 70 years at treatment initiation
VMP 2.994 $119,102 -
MP 2.049 $63,294 $59,076 (vs. MP)
MPT 2.951 $142,452 VMP dominates
MPR-R 2.428 $248,358 VMP dominates
Usmani97 2016 Partitioned survival model
Initial treatment for transplant-ineligible patients with NDMM and/or older than 65 years.
VMP 2.79 $245,819 Referent
Rd 4.26 $324,795 $53,826
Celgene98 2009 Markov model
Multiple myeloma patients who are older than 65 years or are 'ineligible for high-dose chemotherapy'.
MP 2.43 £1,365 -
MPT 3.28 £21,133 £23,381 (vs. MP)
VMP 3.35 £42,616 £303,845 (vs. MPT)
Janssen-Cilag99
2009 Partitioned survival model
Previously untreated multiple myeloma patients who are not eligible for high-dose chemotherapy with stem cell transplantation (65 years or older) and unable to tolerate or has contraindications to thalidomide.
MP 2.86 £54,434 -
CTDa 3.07 £56,668 £10,905 (vs. MP)
MPT 3.41 £59,322 £7,724 (vs. CTDa)
VMP 4.03 £66,676 £11,907 (vs. MPT)
Key: ASCT, autologous stem cell transplant; CTDa, attenuated cyclophosphamide, thalidomide and dexamethasone; ICER, incremental cost-effectiveness ratio; MP,
melphalan, prednisone; MPR-R, melphalan, prednisone and lenalidomide followed by lenalidomide maintenance; MM, multiple myeloma; MPT, melphalan, prednisone and
thalidomide; NDMM, newly diagnosed multiple myeloma; Rd; lenalidomide and low-dose dexamethasone until disease progression; QALY, quality-adjusted life year; VMP,
bortezomib, melphalan, and prednisone.

Company evidence submission template for Lenalidomide (ID474) © Celgene Inc. (2017). All rights reserved Page 94 of 163
B.3.2 Economic analysis
As no UK model was identified which included Rd, a de novo economic model was
developed to evaluate the cost-effectiveness of Rd in transplant-ineligible patients
with NDMM. A description of the model and key features of the analysis is presented
in the subsequent sections.
B.3.2.1 Patient population
In line with marketing authorisation and final scope, the cost-effectiveness analysis
evaluates Rd in transplant-ineligible NDMM patients, using data for the ITT
population from MM-020. The patient baseline patient characteristics from MM-020
are presented in Table 12.
The final scope also identifies a subgroup of patients who are unable to tolerate, or
have contraindications to thalidomide. The comparator for this subgroup is VMP. A
comparison with VMP has also been provided by indirectly comparing the ITT
populations of MM-020 and VISTA. None of the trials included in the evidence
network required patients to be intolerant or have contraindications to thalidomide;
however, based upon the advice of clinical experts and the differences in toxicity
profile and mechanism of action between thalidomide and lenalidomide, it was
concluded that patients who present with predisposing conditions that make them
more susceptible to thalidomide AEs may benefit from receiving Rd (Section B.2.13
and B.1.3.3 provide further details on the difference in toxicity profile of lenalidomide
and thalidomide). This population could include patients with bowel disease,
neuropathy, sleep disorders or who are extremely frail. For elderly, unfit or frail
patients who are transplant-inelgible, the IMWG recommend that treatment be
adapted and highlight that a two-drug combination can improve tolerance without
jeopordising drug activity.90 As such, use of data from the ITT population of these
trials was considered appropriate for the cost-effectiveness analysis in the subgroup
of patients who are unable to tolerate, or have contraindications to thalidomide.
The whole licensed population is being submitted for. However, a cost-effectiveness
case cannot be made against MPT due to thalidomide’s low acquisition cost.
Instead, we ask the Committee to consider the evaluation comparing Rd with VMP in
the identified subgroup (people who are unable to tolerate, or have contraindications

Company evidence submission template for Lenalidomide (ID474) © Celgene Inc. (2017). All rights reserved Page 95 of 163
to thalidomide). VMP is recommended by NICE in TA228 for patients not eligible for
transplant and who are unable to tolerate or have contraindications to thalidomide.3
B.3.2.2 Model structure
In line with recent NICE DSU guidance (TSD 19),100 the following were considered
when selecting the modelling approach: the structural link between health states,
and associated issues identified in previous oncology appraisals55 using parametric
survival modelling (such as crossing of PFS and OS curves in deterministic and
probabilistic sensitivity analysis [PSA]) and the availability of patient-level data from
the key trials.100
A Markov model (Figure 17) was developed,101 using multi-state modelling (MSM).
The model included three health states: ‘progression-free’, ‘progressive disease’ and
‘death’ (Figure 17). All patients start in ‘progression-free’; within each model cycle
patients can then either remain ‘progression-free’, transit to ‘progressive disease’ (if
they experience disease progression) or transit to ‘death’ (if they experience fatal
progression). After entering ‘progressive disease’, within each model cycle patients
either remain in this state or transit to ‘death’. This structure captures the two key
aspects of MM – survival and quality of life, which is impacted by disease
progression and the effects of treatment being received.
Figure 17: Markov model structure
In this state-transition model, OS is a function of all individual transitions in the
model, with the rate of death reflecting the evolving proportion of patients in the
Progression-free
Progressive disease
Death

Company evidence submission template for Lenalidomide (ID474) © Celgene Inc. (2017). All rights reserved Page 96 of 163
progressed state and the differences in mortality between progression-free and
progressed patients. Therefore, there is structural link between mortality and earlier
progression events that is not captured when PFS and OS are modelled
indepdently,100 such as in partitioned survival models where the extrapolation of OS
depends only on within-trial trends in mortality.
A multi-state Markov model describes how individuals move between a series of
states in continuous time. For an individual in state 𝑟 at time t, the next state (𝑠) to
which the individual moves and the time of the change are governed by a set of
transition intensities: 𝑞𝑟𝑠. Intensities, like hazards, represent the instantaneous risk of
moving from state 𝑟 to state 𝑠 (e.g. 𝑞12 is the instantaneous risk of moving from
‘progression-free’ to ‘progressive disease’). For the model structure defined in Figure
1, the transition intensity matrix 𝑄(𝑡) is defined as:
𝑄(𝑡) = [𝑞11 𝑞12 𝑞13
0 𝑞22 𝑞23
0 0 0]
The primary output of the MSM analysis is a transition probability matrix: 𝑃(𝑡), the
𝑝𝑟𝑠 element of which denotes the probability of moving from state 𝑟 to state 𝑠 in each
cycle.
𝑃(𝑡) = [
𝑝11 𝑝12 𝑝13
0 𝑝22 𝑝23
0 0 1]
For example, 𝑝12 is the probability of moving from ‘progression-free’ to ‘progressive
disease’. To calculate the estimated number of patients in each state in each cycle,
the probability transition matrices are multiplied out. For example, if the number of
patients at the previous cycle in ‘progression-free’, ‘progressive disease’ and ‘death’
was 𝑥, 𝑦 and 𝑧, respectively, the model would estimate state occupancy in the
current cycle as follows:
• Progression-free = (𝑝11 ∗ 𝑥)
• Progressive disease = (𝑝12 ∗ 𝑥) + (𝑝22 ∗ 𝑦)
• Death = (𝑝13 ∗ 𝑥) + (𝑝23 ∗ 𝑦) + (1 ∗ 𝑧)
PFS and OS curves were produced by calculating the following:
• PFS; ‘progression-free’ state occupancy at each time-point.
• OS; sum of ‘progression-free’ and ‘progressive disease’ state occupancy
Health effects are calculated as both life years (LYs) and quality-adjusted life years
(QALYs). Costs and health effects are accrued based on the proportion of patients in
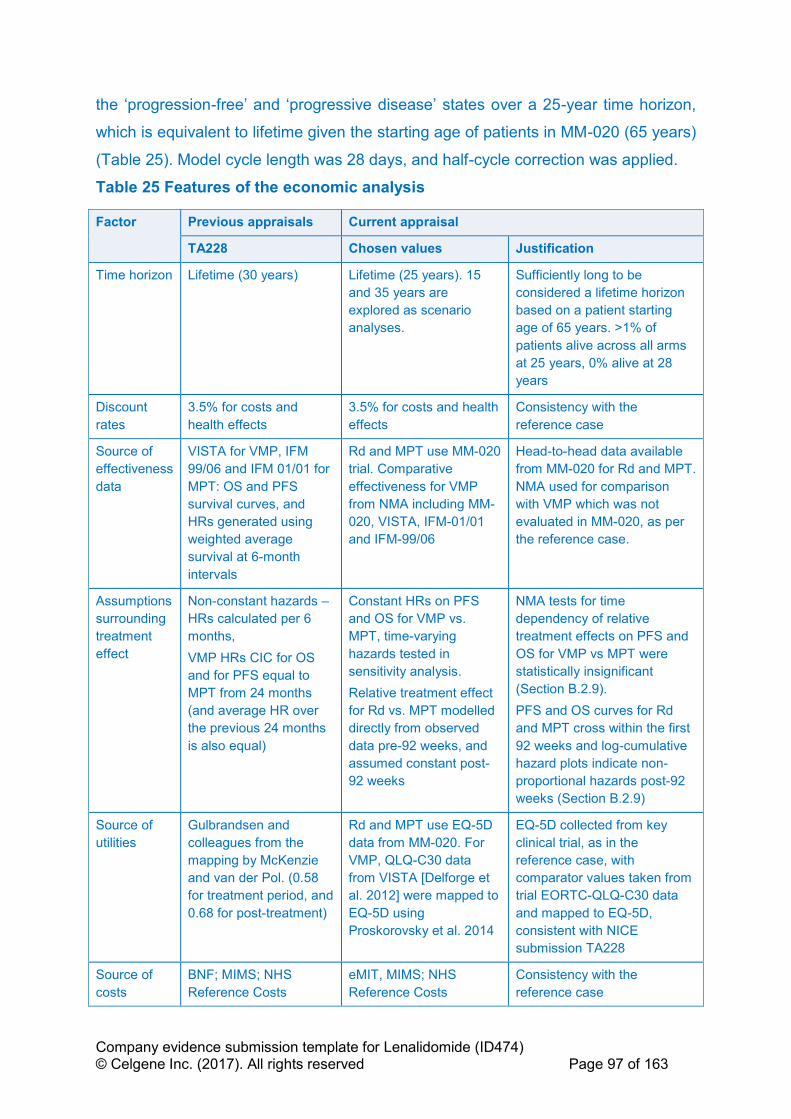
Company evidence submission template for Lenalidomide (ID474) © Celgene Inc. (2017). All rights reserved Page 97 of 163
the ‘progression-free’ and ‘progressive disease’ states over a 25-year time horizon,
which is equivalent to lifetime given the starting age of patients in MM-020 (65 years)
(Table 25). Model cycle length was 28 days, and half-cycle correction was applied.
Table 25 Features of the economic analysis
Factor Previous appraisals Current appraisal
TA228 Chosen values Justification
Time horizon Lifetime (30 years) Lifetime (25 years). 15
and 35 years are
explored as scenario
analyses.
Sufficiently long to be
considered a lifetime horizon
based on a patient starting
age of 65 years. >1% of
patients alive across all arms
at 25 years, 0% alive at 28
years
Discount
rates
3.5% for costs and
health effects
3.5% for costs and health
effects
Consistency with the
reference case
Source of
effectiveness
data
VISTA for VMP, IFM
99/06 and IFM 01/01 for
MPT: OS and PFS
survival curves, and
HRs generated using
weighted average
survival at 6-month
intervals
Rd and MPT use MM-020
trial. Comparative
effectiveness for VMP
from NMA including MM-
020, VISTA, IFM-01/01
and IFM-99/06
Head-to-head data available
from MM-020 for Rd and MPT.
NMA used for comparison
with VMP which was not
evaluated in MM-020, as per
the reference case.
Assumptions
surrounding
treatment
effect
Non-constant hazards –
HRs calculated per 6
months,
VMP HRs CIC for OS
and for PFS equal to
MPT from 24 months
(and average HR over
the previous 24 months
is also equal)
Constant HRs on PFS
and OS for VMP vs.
MPT, time-varying
hazards tested in
sensitivity analysis.
Relative treatment effect
for Rd vs. MPT modelled
directly from observed
data pre-92 weeks, and
assumed constant post-
92 weeks
NMA tests for time
dependency of relative
treatment effects on PFS and
OS for VMP vs MPT were
statistically insignificant
(Section B.2.9).
PFS and OS curves for Rd
and MPT cross within the first
92 weeks and log-cumulative
hazard plots indicate non-
proportional hazards post-92
weeks (Section B.2.9)
Source of
utilities
Gulbrandsen and
colleagues from the
mapping by McKenzie
and van der Pol. (0.58
for treatment period, and
0.68 for post-treatment)
Rd and MPT use EQ-5D
data from MM-020. For
VMP, QLQ-C30 data
from VISTA [Delforge et
al. 2012] were mapped to
EQ-5D using
Proskorovsky et al. 2014
EQ-5D collected from key
clinical trial, as in the
reference case, with
comparator values taken from
trial EORTC-QLQ-C30 data
and mapped to EQ-5D,
consistent with NICE
submission TA228
Source of
costs
BNF; MIMS; NHS
Reference Costs
eMIT, MIMS; NHS
Reference Costs
Consistency with the
reference case

Company evidence submission template for Lenalidomide (ID474) © Celgene Inc. (2017). All rights reserved Page 98 of 163
Key: BNF, British National Formulary; HR, hazard ratio; PH, proportional hazards; MPT, melphalan, prednisone
and thalidomide; NHS, National Health Service; NICE, National Institute for Health and Care Excellence; NMA,
network meta-analysis; PFS, progression-free survival; RCT, randomised controlled trial; Rd; lenalidomide and
low-dose dexamethasone until disease progression; TA, technology appraisal; VMP, bortezomib, melphalan and
prednisone.
B.3.2.3 Intervention technology and comparators
In line with the final scope, the model conducts pairwise comparisons of Rd with the
following comparators;
• Thalidomide in combination with melphalan and prednisone (MPT)
• Bortezomib in combination with melphalan and prednisone (applicable to the
subgroup of people who are unable to tolerate, or have contraindications to
thalidomide) (VMP)
As described in Table 1, CTD was not considered a relevant thalidomide-based
combination as it is unlicensed. MPT was considered a suitable proxy for CTD as it
was deemed by clinical specialists who took part in TA228 to be equivalent in terms
of efficacy and toxicity, and is also similar in terms of cost.
The doses of the interventions and comparator treatments were implemented as per
their marketing authorisations and the clinical trials which inform clinical
effectiveness in the economic model (Table 26).
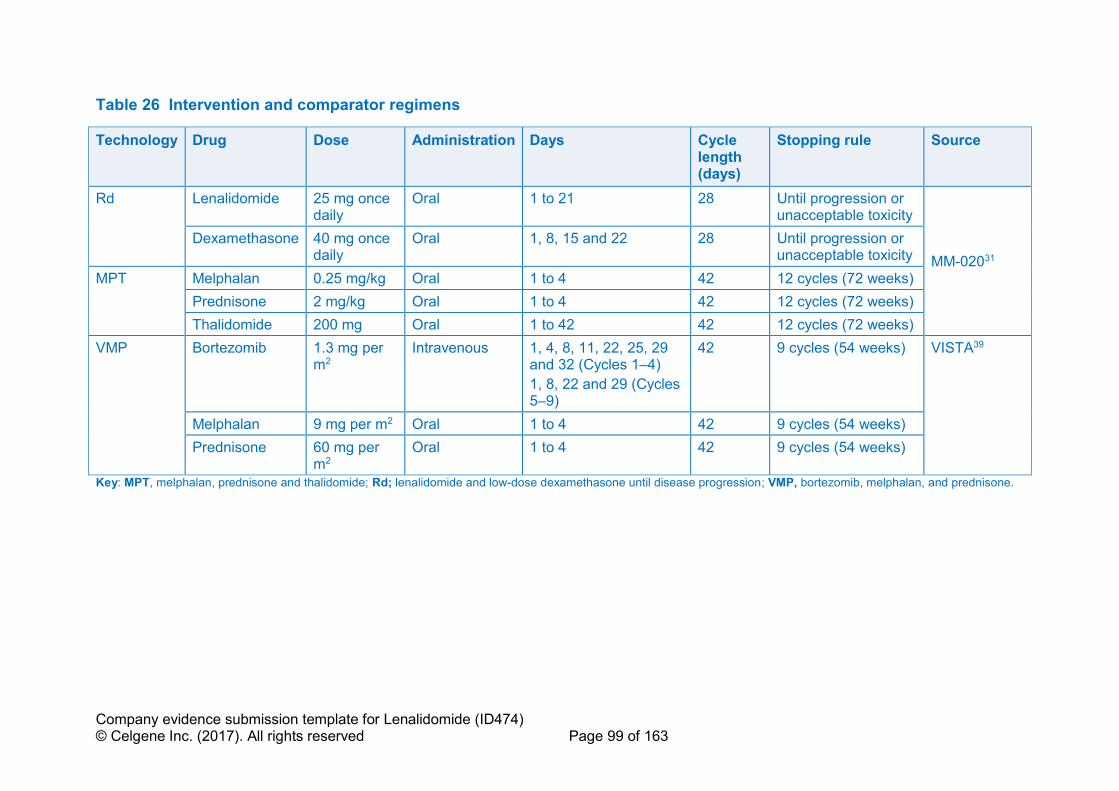
Company evidence submission template for Lenalidomide (ID474) © Celgene Inc. (2017). All rights reserved Page 99 of 163
Table 26 Intervention and comparator regimens
Technology Drug Dose Administration Days Cycle length (days)
Stopping rule Source
Rd Lenalidomide 25 mg once daily
Oral 1 to 21 28 Until progression or unacceptable toxicity
MM-02031
Dexamethasone 40 mg once daily
Oral 1, 8, 15 and 22 28 Until progression or unacceptable toxicity
MPT Melphalan 0.25 mg/kg Oral 1 to 4 42 12 cycles (72 weeks)
Prednisone 2 mg/kg Oral 1 to 4 42 12 cycles (72 weeks)
Thalidomide 200 mg Oral 1 to 42 42 12 cycles (72 weeks)
VMP Bortezomib 1.3 mg per m2
Intravenous 1, 4, 8, 11, 22, 25, 29 and 32 (Cycles 1–4)
1, 8, 22 and 29 (Cycles 5–9)
42 9 cycles (54 weeks) VISTA39
Melphalan 9 mg per m2 Oral 1 to 4 42 9 cycles (54 weeks)
Prednisone 60 mg per m2
Oral 1 to 4 42 9 cycles (54 weeks)
Key: MPT, melphalan, prednisone and thalidomide; Rd; lenalidomide and low-dose dexamethasone until disease progression; VMP, bortezomib, melphalan, and prednisone.
Company evidence submission template for Lenalidomide (ID474) © Celgene Inc. (2017). All rights reserved Page 100 of 163
B.3.3 Clinical parameters and variables
The evidence used within the economic model is in line with evidence presented to
inform comparative effectiveness (section B.2.6). The comparisons of Rd to MPT
were made using head to head data from the MM-020 trial. VMP was incorporated
based on the HRs for PFS and OS estimated by the NMAs described in B.2.9.
B.3.3.1 Progression-free and overall survival: Rd and MPT
The latest available data for the ITT population from MM-020 were used for Rd and
MPT (data cut-off, 21 January 2016).43,68 Analysis of PFS was based on EMA
censoring rules and the investigator’s assessment of progression;68 this was used
instead of the IRAC assessment, as the IRAC was disbanded in 2013.
The analysis of OS for the 21 January 2016 data cut-off reported 623 death events
across the Rd and MPT treatment arms,43 which represents 58% of the ITT
population. Not every patient in the MM-020 trial was followed until disease
progression and/or death; therefore, it is necessary to extrapolate PFS and OS over
lifetime.
PFS and OS for Rd and MPT were generated from the individual transitions of the
MSM model (Section B.3.2). This analysis was conducted in the R package msm.102
The PFS hazard was not constant over time. The PFS KM curves from the MM-020
trial for Rd and MPT (Figure 19) overlapped until approximately 92 weeks post-
randomisation, after which the curves separate in favour of Rd. The separation of the
curves continued to widen with longer follow-up. This delayed treatment effect is also
reflected in the log-cumulative hazard plots (Figure 18) and cumulative hazards
(Figure 42) for PFS. These plots suggest that the delayed treatment effect for Rd on
PFS is driven by an increase in the hazard for MPT rather than a decrease in the
hazard for Rd. For OS, the log-cumulative and cumulative hazards plots (Figure 18
and Appendix L, Figure 42) and KM (Figure 19) do not show a similar pattern.
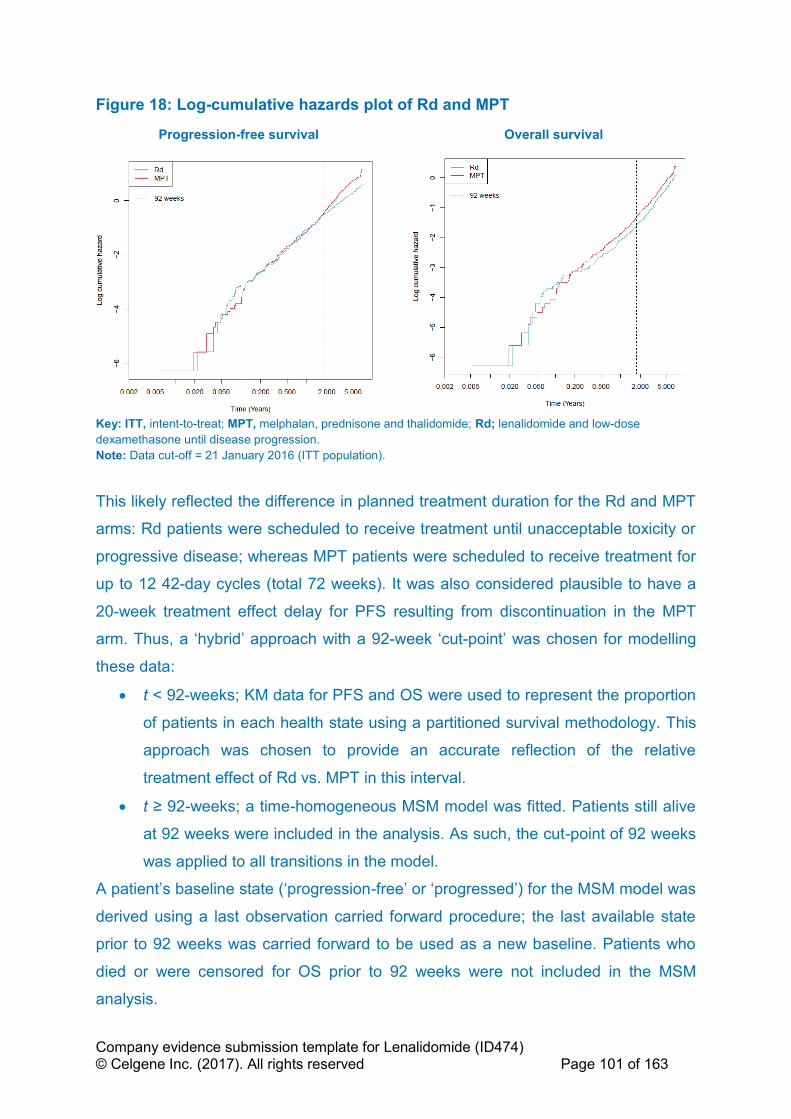
Company evidence submission template for Lenalidomide (ID474) © Celgene Inc. (2017). All rights reserved Page 101 of 163
Figure 18: Log-cumulative hazards plot of Rd and MPT
Progression-free survival Overall survival
Key: ITT, intent-to-treat; MPT, melphalan, prednisone and thalidomide; Rd; lenalidomide and low-dose
dexamethasone until disease progression.
Note: Data cut-off = 21 January 2016 (ITT population).
This likely reflected the difference in planned treatment duration for the Rd and MPT
arms: Rd patients were scheduled to receive treatment until unacceptable toxicity or
progressive disease; whereas MPT patients were scheduled to receive treatment for
up to 12 42-day cycles (total 72 weeks). It was also considered plausible to have a
20-week treatment effect delay for PFS resulting from discontinuation in the MPT
arm. Thus, a ‘hybrid’ approach with a 92-week ‘cut-point’ was chosen for modelling
these data:
• t < 92-weeks; KM data for PFS and OS were used to represent the proportion
of patients in each health state using a partitioned survival methodology. This
approach was chosen to provide an accurate reflection of the relative
treatment effect of Rd vs. MPT in this interval.
• t ≥ 92-weeks; a time-homogeneous MSM model was fitted. Patients still alive
at 92 weeks were included in the analysis. As such, the cut-point of 92 weeks
was applied to all transitions in the model.
A patient’s baseline state (‘progression-free’ or ‘progressed’) for the MSM model was
derived using a last observation carried forward procedure; the last available state
prior to 92 weeks was carried forward to be used as a new baseline. Patients who
died or were censored for OS prior to 92 weeks were not included in the MSM
analysis.

Company evidence submission template for Lenalidomide (ID474) © Celgene Inc. (2017). All rights reserved Page 102 of 163
Log-cumulative hazards of PFS for Rd and MPT showed diverging of curves from 92
weeks, with the assumption of proportional hazards not appearing to hold (Figure
18). The log-cumulative hazards of OS for Rd and MPT were not parallel after 92
weeks, but MSM functionality requires PFS and OS to be modelled simultaneously.
Therefore, one set of matrices was generated per arm, rather than including
treatment as a covariate. The corresponding transition probabilities are presented in
Table 27.
Table 27: MSM probability transition matrices – 28-day probabilities
From/to Rd MPT
Progression-
free
Progressive
disease
Death Progression-
free
Progressive
disease
Death
Progression-
free
''''''''''' ''''''''''' ''''''''''' ''''''''''' ''''''''''' '''''''''''
Progressive
disease
''''''''''' ''''''''''' ''''''''''' ''''''''''' ''''''''''' '''''''''''
Death 0 0 1 0 0 1
Key: MPT, melphalan, prednisone and thalidomide; MSM, multi-state Markov; Rd; lenalidomide and low-dose
dexamethasone until disease progression.
Estimates of PFS and OS were calculated using these probability transition matrices
(Figure 19; Figure 43 and Figure 44 in Appendix L). It can be observed that the MSM
model fits the observed data well post-92 weeks.
Figure 19: KM plots of survival with superimposed MSM model
Progression-free survival
Overall survival
Key: ITT, intent-to-treat; KM, Kaplan–Meier; MPT, melphalan, prednisone and thalidomide; MSM, multi-state
modelling; Rd; lenalidomide and low-dose dexamethasone until disease progression; trt, treatment.
Notes: Data cut-off = 21 January 2016 (ITT population). The final drop in overall survival is due to the number
at risk going from 1 to 0 at 85 months.
Company evidence submission template for Lenalidomide (ID474) © Celgene Inc. (2017). All rights reserved Page 103 of 163
In line with TSD 19,100 the fit of the MSM was also assessed for each transition.
Mapping individual transitions to the patient-level data is shown in Figure 20:
• ‘Progression-free’ to ‘progressive disease’: the MSM slightly underestimates
the rate of events for both treatments until 4 years, and slightly overestimates
at later time points (where there is a reduced number of patients at risk).
• ‘Progression-free’ to ‘death’: the MSM fits the observed data reasonably well,
with a slight tendency for the MSM to overestimate the rate of events until 4
years, and underestimate the rate of events at later time points (where there is
a reduced number of patients at risk).
• ‘Progressive disease’ to ‘death’: the MSM fits the observed data well, even
when there are a limited number of patients at risk of death. These curves
predicted for Rd and MPT lie on top of one another, indicating that PPS is
similar for the two treatments (the cycle probabilities for Rd and MPT are '''''''''''
and ''''''''''', respectively) (Table 27). This is clinically plausible, as Rd has been
accepted to have a post-progression treatment effect due to its
immunomodulatory mechanism of action,55 which could be balanced by the
use of subsequent Rd on the MPT arm. A scenario assuming equal post-
progression survival for Rd and MPT is tested in sensitivity analysis.
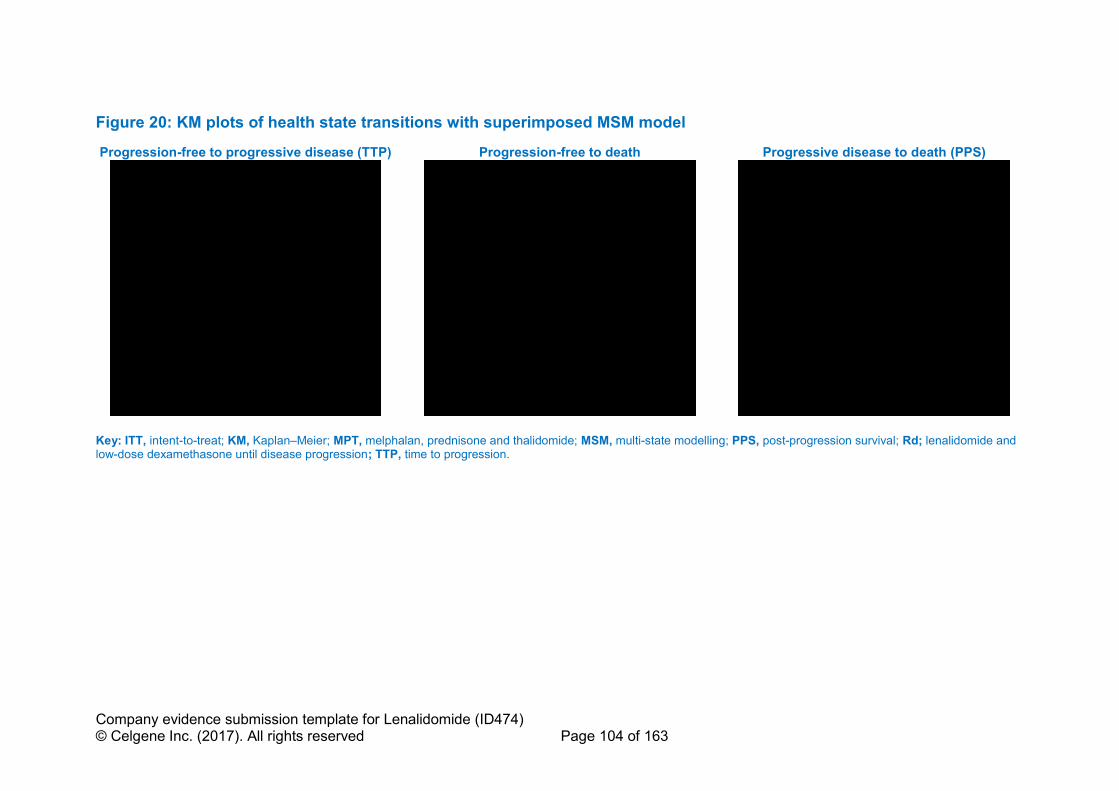
Company evidence submission template for Lenalidomide (ID474) © Celgene Inc. (2017). All rights reserved Page 104 of 163
Figure 20: KM plots of health state transitions with superimposed MSM model
Progression-free to progressive disease (TTP)
Progression-free to death
Progressive disease to death (PPS)
Key: ITT, intent-to-treat; KM, Kaplan–Meier; MPT, melphalan, prednisone and thalidomide; MSM, multi-state modelling; PPS, post-progression survival; Rd; lenalidomide and low-dose dexamethasone until disease progression; TTP, time to progression.

Company evidence submission template for Lenalidomide (ID474) © Celgene Inc. (2017). All rights reserved Page 105 of 163
B.3.3.2 Progression-free and overall survival: VMP
To estimate PFS and OS for VMP, HRs for VMP versus MPT from the NMA were
applied to the MPT PFS and OS curves predicted by the model (Section B.2.9). The
mean HRs for PFS and OS were 1.00 and 1.11 respectively; the corresponding PFS
and OS curves are presented in Figure 21.
MPT was chosen as the reference treatment due to the relative maturity of the MPT
data which inform the transitions, it also being a fixed-duration therapy and the
regimen also including melphalan and prednisone.
Constant HRs are used in the base case hence assuming proportional hazards for
VMP vs. MPT, as the time-varying NMA did not predict a statistically significant time
dependency in the VMP HRs for PFS and OS (Section B.2.9.2). However, the point
estimates of the HR did show some potentially meaningful changes over time. As
such, the outputs of the time-varying HRs NMA are used as scenario analyses to
test the impact of the proportional hazards assumption for VMP vs. MPT. The only
trial in the network containing data on VMP (VISTA) provided maximum follow-up for
PFS of 27 months, and the estimated HRs of VMP vs. MPT from the NMA after this
point are associated with susbtantial uncertainty. As such, the estimated HRs at the
maximum follow-up for each endpoint are applied for lifetime.
Using the constant OS HR from the NMA for VMP vs. MPT of 1.11 yields shorter
post-progression survival for VMP than Rd and MPT (given PFS for VMP is equal to
MPT). This is likely a consequence of the subsequent therapy use in the VISTA trial
compared to MM-020; patients in VISTA received more thalidomide in second-line in
comparison to MM-020 where patients received more lenalimdomide and bortezomib
(Table 46). A scenario assuming equal OS and equal subsequent treatment use for
VMP vs. MPT is modelled in sensitivity analysis.
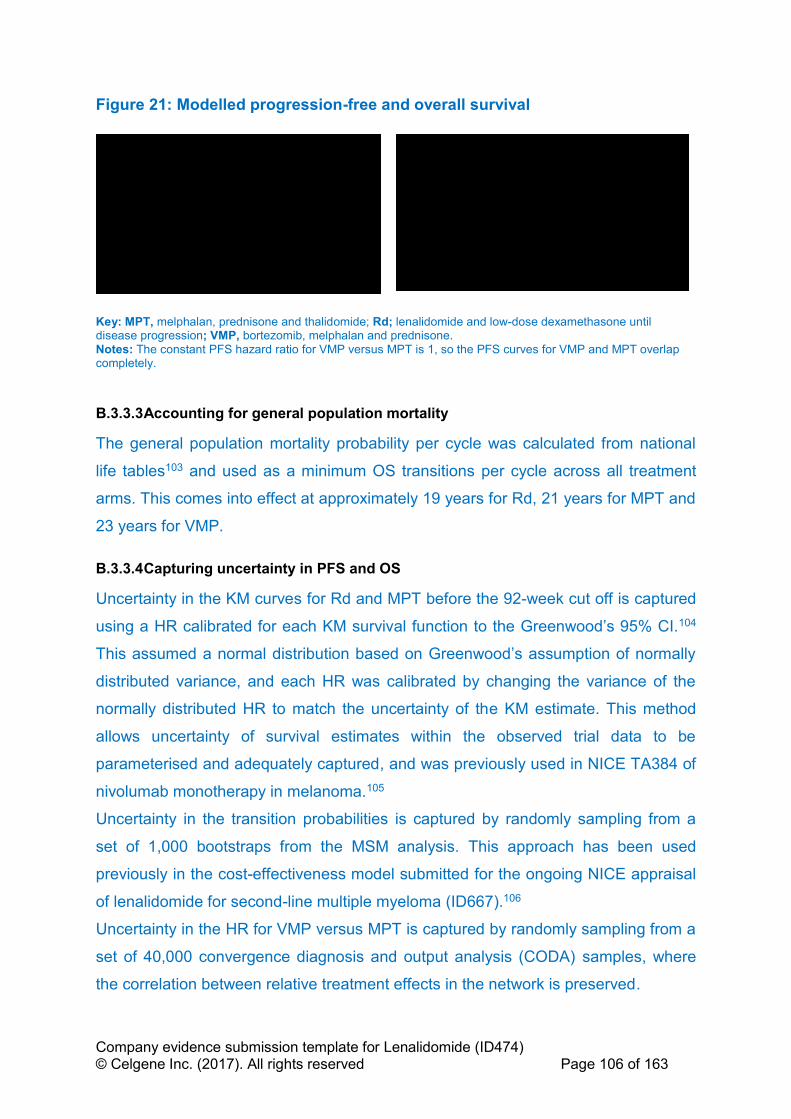
Company evidence submission template for Lenalidomide (ID474) © Celgene Inc. (2017). All rights reserved Page 106 of 163
Figure 21: Modelled progression-free and overall survival
Key: MPT, melphalan, prednisone and thalidomide; Rd; lenalidomide and low-dose dexamethasone until disease progression; VMP, bortezomib, melphalan and prednisone. Notes: The constant PFS hazard ratio for VMP versus MPT is 1, so the PFS curves for VMP and MPT overlap completely.
B.3.3.3 Accounting for general population mortality
The general population mortality probability per cycle was calculated from national
life tables103 and used as a minimum OS transitions per cycle across all treatment
arms. This comes into effect at approximately 19 years for Rd, 21 years for MPT and
23 years for VMP.
B.3.3.4 Capturing uncertainty in PFS and OS
Uncertainty in the KM curves for Rd and MPT before the 92-week cut off is captured
using a HR calibrated for each KM survival function to the Greenwood’s 95% CI.104
This assumed a normal distribution based on Greenwood’s assumption of normally
distributed variance, and each HR was calibrated by changing the variance of the
normally distributed HR to match the uncertainty of the KM estimate. This method
allows uncertainty of survival estimates within the observed trial data to be
parameterised and adequately captured, and was previously used in NICE TA384 of
nivolumab monotherapy in melanoma.105
Uncertainty in the transition probabilities is captured by randomly sampling from a
set of 1,000 bootstraps from the MSM analysis. This approach has been used
previously in the cost-effectiveness model submitted for the ongoing NICE appraisal
of lenalidomide for second-line multiple myeloma (ID667).106
Uncertainty in the HR for VMP versus MPT is captured by randomly sampling from a
set of 40,000 convergence diagnosis and output analysis (CODA) samples, where
the correlation between relative treatment effects in the network is preserved.
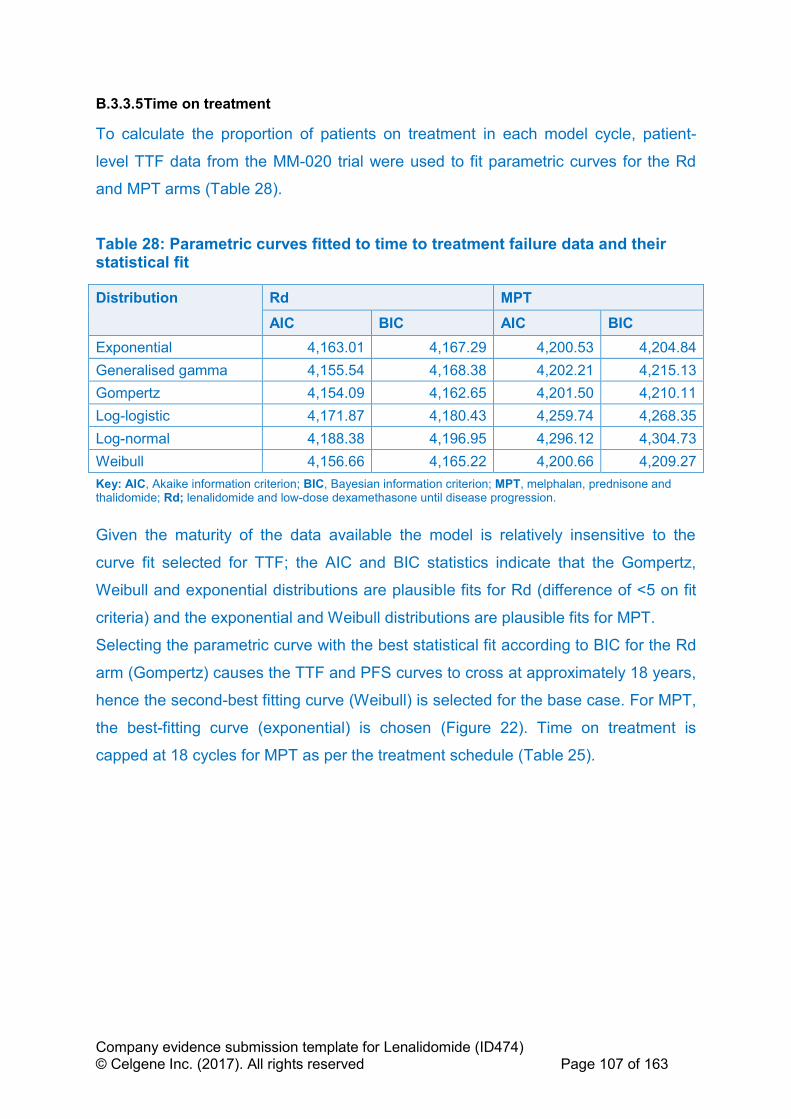
Company evidence submission template for Lenalidomide (ID474) © Celgene Inc. (2017). All rights reserved Page 107 of 163
B.3.3.5 Time on treatment
To calculate the proportion of patients on treatment in each model cycle, patient-
level TTF data from the MM-020 trial were used to fit parametric curves for the Rd
and MPT arms (Table 28).
Table 28: Parametric curves fitted to time to treatment failure data and their statistical fit
Distribution Rd MPT
AIC BIC AIC BIC
Exponential 4,163.01 4,167.29 4,200.53 4,204.84
Generalised gamma 4,155.54 4,168.38 4,202.21 4,215.13
Gompertz 4,154.09 4,162.65 4,201.50 4,210.11
Log-logistic 4,171.87 4,180.43 4,259.74 4,268.35
Log-normal 4,188.38 4,196.95 4,296.12 4,304.73
Weibull 4,156.66 4,165.22 4,200.66 4,209.27
Key: AIC, Akaike information criterion; BIC, Bayesian information criterion; MPT, melphalan, prednisone and thalidomide; Rd; lenalidomide and low-dose dexamethasone until disease progression.
Given the maturity of the data available the model is relatively insensitive to the
curve fit selected for TTF; the AIC and BIC statistics indicate that the Gompertz,
Weibull and exponential distributions are plausible fits for Rd (difference of <5 on fit
criteria) and the exponential and Weibull distributions are plausible fits for MPT.
Selecting the parametric curve with the best statistical fit according to BIC for the Rd
arm (Gompertz) causes the TTF and PFS curves to cross at approximately 18 years,
hence the second-best fitting curve (Weibull) is selected for the base case. For MPT,
the best-fitting curve (exponential) is chosen (Figure 22). Time on treatment is
capped at 18 cycles for MPT as per the treatment schedule (Table 25).

Company evidence submission template for Lenalidomide (ID474) © Celgene Inc. (2017). All rights reserved Page 108 of 163
Figure 22: Time to treatment failure curve fits and KM data
Key: KM, Kaplan–Meier; MPT, melphalan, prednisone and thalidomide; RD; lenalidomide and low-dose dexamethasone until disease progression; VMP, bortezomib, melphalan and prednisone. Note: KM data shown are time to treatment failure; completing all 12 MPT treatment cycles does not count as a failure event.
In the absence of patient-level data for VMP, TTF is assumed equal to PFS up to the
maximum treatment duration (nine 42-day cycles). This is more conservative than
the assumption used in TA228 to estimate VMP treatment costs; in the AG model,
the maximum scheduled treatment duration (all patients on nine 42-day cycles) is
used for modelling time on treatment, with no correction for progression or
discontinuation from treatment.107 This has been tested in scenario analyses, using
assumptions from TA228 and using the TTF:PFS ratio from Rd MM-020 trial data.
B.3.4 Measurement and valuation of health effects
Multiple myeloma is an incurable disease. Maintaining good HRQL is an important
goal in the care of people with myeloma, allowing them to make the most of their
remaining life.108 The uncontrolled growth of myeloma cells has many
consequences, including skeletal destruction, bone marrow failure, suppression of
normal immunoglobulin production and renal insufficiency.109 Symptoms include:
Rd Weibull MPT Exponential
Years 0 2 4 6 8 10
Rd 535 204 95 32 0 0
MPT 547 168 46 12 0 0
Number at risk
0
0.1
0.2
0.3
0.4
0.5
0.6
0.7
0.8
0.9
1
0 1 2 3 4 5 6 7 8 9 10
% p
ati
en
ts w
ith
ou
t tr
ea
tme
nt
failu
re
Years
Time to treatment failure Rd KM
MPT KM
Rd Weibull
MPTExponential

Company evidence submission template for Lenalidomide (ID474) © Celgene Inc. (2017). All rights reserved Page 109 of 163
bone pain, fatigue, infectious complications and reduced physical function and
mobility.108,110 There is evidence that patients with myeloma report more symptoms
and problems than those with other haematological cancers.111
Section B.1.3.2 provides an overview of MM and its impact on patients and their
carers. In addition to physical symptoms, multiple myeloma patients can suffer
considerably from fear of recurrence and uncertainty about the future due to the
relapsing nature of the disease. Additionally, the complexity, the difficulty of
treatment and frustration with the limited treatment options available can combine to
lead to patients feeling a loss of independence and inability to plan for the future.108
As discussed in B.2.13, lenalidomide is an oral therapy and can therefore be self-
administered at home, with only outpatient consultations during treatment. Using an
oral agent such as lenalidomide reduces the treatment burden on both patients and
carers, relative to IV and SC treatments. This is particularly important for patients
with multiple myeloma who are often frail, elderly and have mobility problems related
to their condition.112,113
B.3.4.1 Health-related quality-of-life data from clinical trials
In MM-020, HRQL was measured using EORTC QLQ-C30, EORTC QLQ-MY20 and
the EQ-5D-3L (Section B.2.6.11). MM-020 therefore provides utility data that are
consistent with the NICE reference case.
B.3.4.2 Mapping
The data collected in the MM-020 trial using the EORTC QLQ-C30 and QLQ-MY20
were not mapped to estimate health state utilities because EQ-5D data were also
available.
B.3.4.3 Health-related quality-of-life studies
The utility data reported by Delforge 2015,47 the one study identified by the SLR, are
not presented here given that this is a subsequent publication of the MM-020 trial,
which is discussed in section B.3.4.1.
This was supplemented by a targeted search of ISPOR proceedings and NICE
submissions to identify disutilities for subsequent therapy and lines of treatment in
multiple myeloma patients. Four articles were found (Table 33), and the impact of
their identified subsequent disutilities are tested in scenario analysis. 56,114-116
Company evidence submission template for Lenalidomide (ID474) © Celgene Inc. (2017). All rights reserved Page 110 of 163
B.3.4.4 Adverse reactions
The impact of adverse reactions on HRQL was not modelled separately as
differences in HRQL between treatment arms due to adverse reactions are assumed
to be captured by the time-dependent treatment covariates used in the ‘pre-
progression’ utility calculations.
B.3.4.5 Health-related quality-of-life data used in the cost-effectiveness
analysis
Given the model structure, it was necessary to estimate utility values for the following
health states:
• Progression-free: this includes first-line treatment and associated AEs
• Progressive disease: this includes second and third-line treatment and
associated AEs
B.3.4.5.1 Health state utilities for Rd and MPT
To align with the NICE reference case, the EQ-5D data from MM-020 were used for
Rd and MPT. To determine the best predictors of HRQL, several analyses were
conducted, including:
• Analysis by progression status
• Analysis by progression status and treatment
o In the Rd arm, there was 2,239 and 257 non-progressed and
progressed observations, respectively
o In the MPT arm, there was 2,172 and 269 non-progressed and
progressed observations, respectively
• Analysis for observations in the non-progressed state according to time since
baseline
• Analysis for observations in the non-progressed state according to time since
baseline and treatment received
Mixed-effects regression modelling was used to account for autocorrelation (a
patient’s future EQ-5D scoring is partly predicted by the observations they have
already provided).
B.3.4.5.2 Analysis by progression status
Table 29 presents results of the mixed-effects regression analysis of utility by
progression status. Progression is predicted to yield a significant but small reduction

Company evidence submission template for Lenalidomide (ID474) © Celgene Inc. (2017). All rights reserved Page 111 of 163
in utility (-0.028; p=0.014). This indicates the impact of progressing from first to
second-line treatment does not have a substantial impact on patients HRQL as
measured within the clinical trial (it should be noted that this is likely a function of the
data only covering 1 visit post progression)..
Table 29: Mixed-effects (patient as random effect) regression model results of utility ~progression
Key: DF, degrees of freedom; Pr, probability; SE, standard error.
B.3.4.5.3 Analysis by progression status and treatment
The regression model with covariates for treatment and progression status is
presented in Appendix L, Table 102. Although progression is still seen to cause a
significant reduction in utility score (-0.028; p=0.014), the treatment effect for Rd is
non-significant (p=0.755), thus the regression model without a treatment covariate
(Table 29) is used for all treatments (Rd, MPT and VMP) for their utility in the
‘progressive disease’ health state.
B.3.4.5.4 Analysis for observations in the ‘progression-free’ state according to
time since baseline
Analysis of utility by time for patients in the ‘progression-free’ state was conducted by
firstly grouping time into categories to define changes in utility over time. A scatter
plot of the data divided by the time quartiles is presented in Appendix L, Figure 45.
The plot shows a tendency towards increased quality of life as time increases. Data
from MM-020 also show that the rate of AEs substantially reduces within both the Rd
and MPT arms over time as clinicians are able to identify and manage these events
via dose adjustment/concomitant treatment.
The following quartiles were used to group time, based on the number of
observations over time:
• Q1: 0.00-4.00 weeks
• Q2: 4.00-12.00 weeks
• Q3: 12.00-28.86 weeks
Company evidence submission template for Lenalidomide (ID474) © Celgene Inc. (2017). All rights reserved Page 112 of 163
• Q4: >29.86 weeks
The use of quartiles was preferred over continuous time as it is unlikely that
treatment will have a continuous positive impact in the long term on patients’ quality
of life after the observations within the clinical trial, and performing the analysis using
time as a continuous variable did not provide a significant effect. The use of this
method also allows the influence of short-term treatment related AEs for patients
receiving high-dose treatment to be separated from the long-term disease control
effects of treatments. Quartiles were chosen purely on a mathematical basis, i.e.
during the first quartile (the first 4 weeks), a quarter of the total HRQL measurements
were taken.
B.3.4.5.5 Analysis for observations in the ‘progression-free’ state according to
time since baseline and treatment received
Appendix L, Table 103 presents the regression analysis results for utility in non-
progressed patients against time quartiles and treatment. The utility score is seen to
significantly increase over time in Q2, Q3 and Q4. Patients who received Rd had a
small increase in utility score (0.006) compared to MPT; although again this result is
non-significant (p=0.718).
Table 30 presents the regression analysis results for utility in progression-free
patients against time quartiles and treatment with an interaction between the time
quartiles and treatment. The interaction term was not significant for all time points
(interaction p= 0.4229) indicating that treatment effects do not significantly change
over time. Although this interaction is not significant, this is included in the base case
as individual AE quality of life impacts associated with each treatment are not
modelled separately, and this interaction is expected to capture any treatment-
specific adverse event disutilities. The intercept and coefficient inputs are tested in
one-way and PSA using a multivariate normal distribution, with the treatment effect
and interaction terms removed in scenario analysis.

Company evidence submission template for Lenalidomide (ID474) © Celgene Inc. (2017). All rights reserved Page 113 of 163
Table 30: Mixed effects (patient as random effect) regression model results of utility ~ time quartiles (categorical) + treatment + (time quartiles [categorical]*treatment) (interaction)
Solution for Fixed Effects
Effect timeQ Treatment Estimate Standard Error DF t Value Pr > |t| Alpha Lower Upper
Intercept 0.5189 0.01424 1054 36.43 <.0001 0.05 0.4909 0.5468
timeQ Q2 0.04964 0.01418 3275 3.50 0.0005 0.05 0.02185 0.07744
timeQ Q3 0.09003 0.01327 3275 6.78 <.0001 0.05 0.06400 0.1161
timeQ Q4 0.1266 0.01415 3275 8.95 <.0001 0.05 0.09883 0.1543
timeQ Q1 0 . . . . . . .
trtf Rd 0.001768 0.01995 3275 0.09 0.9294 0.05 -0.0374 0.04089
timeQ*trtf Q2 Rd -0.01286 0.01996 3275 -0.64 0.5193 0.05 -0.0520 0.02627
timeQ*trtf Q3 Rd 0.01805 0.01842 3275 0.98 0.3271 0.05 -0.0181 0.05416
timeQ*trtf Q4 Rd 0.008863 0.01955 3275 0.45 0.6503 0.05 -0.0295 0.04719
Key: DF, degrees of freedom; MPT, melphalan, prednisone and thalidomide; Pr, probability; Q, quartile; Rd; lenalidomide and low-dose dexamethasone until disease progression; timeQ, time quartile; trtf, treatment.
3.4.5.5.1 Health state utility values for VMP
For VMP, published HRQL results from the VISTA trial were used.46 In this published
report, the authors provided the EORTC QLQ-C30 mean functional and symptom
scores (stratified by treatment) for all randomised participants in the VISTA trial
taken over the 9 cycles of treatment and at the end-of-treatment visit. The mean
relevant domain scores for all visits in the progression-free phase were extracted
and mapped onto EQ-5D values; the mapping was based on a published algorithm
developed from data for 159 patients with MM.117
Based on the derived mean EQ-5D values, changes in utility values from baseline
during the ‘progression-free’ state over time were estimated (Table 31). Compared
with the treatment-specific utility values for Rd, the utility values for VMP are often
lower during the first several cycles of treatment (Figure 23). This is consistent with
the fact that HRQL (based on the published data from the VISTA trial) was
compromised during the VMP treatment phase.46 In the base case, the model
assumes equal baseline utility for VMP and Rd to not induce bias in the cost-
effectiveness estimates.
Table 31: VMP ‘progression-free’ utility relative to baseline over time
Cycle (per 4
weeks)
Mapped utility
score from
VISTA
Change
from
baseline
Modelled change
from baseline
Estimated
value for VMP
assuming 0.53
at baseline*
Rd MPT
1 0.507 +0.000 +0.000 +0.000 0.521
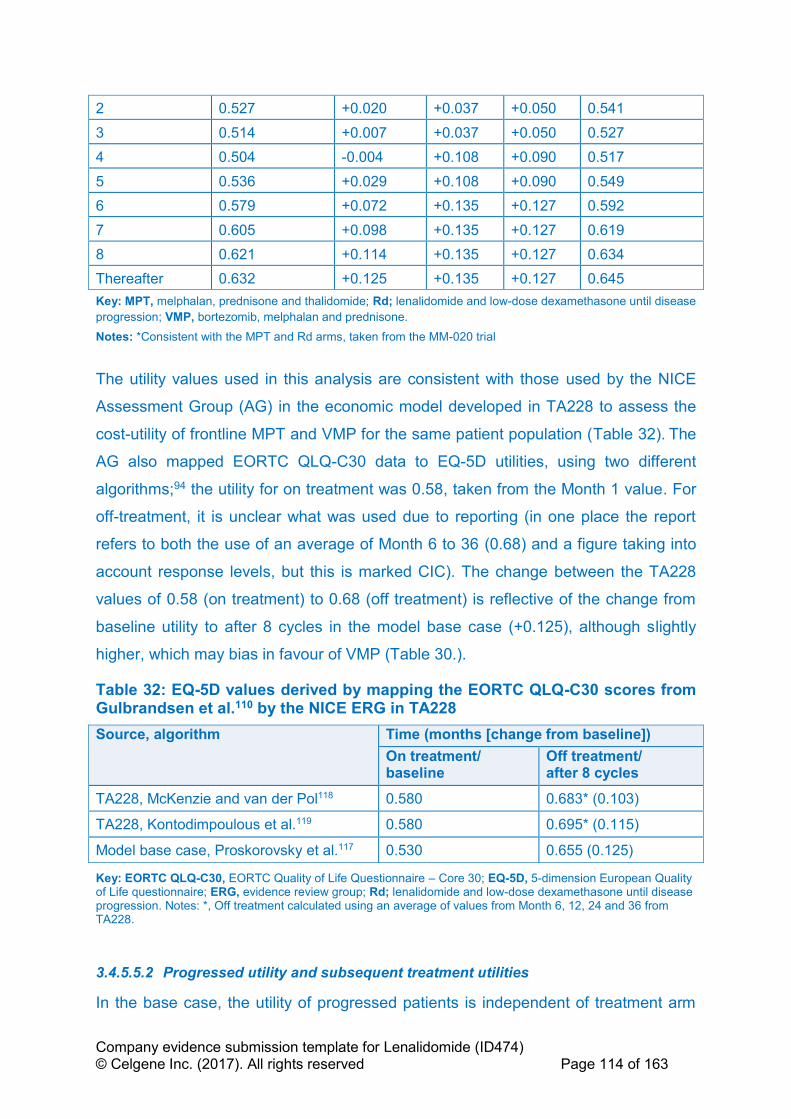
Company evidence submission template for Lenalidomide (ID474) © Celgene Inc. (2017). All rights reserved Page 114 of 163
2 0.527 +0.020 +0.037 +0.050 0.541
3 0.514 +0.007 +0.037 +0.050 0.527
4 0.504 -0.004 +0.108 +0.090 0.517
5 0.536 +0.029 +0.108 +0.090 0.549
6 0.579 +0.072 +0.135 +0.127 0.592
7 0.605 +0.098 +0.135 +0.127 0.619
8 0.621 +0.114 +0.135 +0.127 0.634
Thereafter 0.632 +0.125 +0.135 +0.127 0.645
Key: MPT, melphalan, prednisone and thalidomide; Rd; lenalidomide and low-dose dexamethasone until disease
progression; VMP, bortezomib, melphalan and prednisone.
Notes: *Consistent with the MPT and Rd arms, taken from the MM-020 trial
The utility values used in this analysis are consistent with those used by the NICE
Assessment Group (AG) in the economic model developed in TA228 to assess the
cost-utility of frontline MPT and VMP for the same patient population (Table 32). The
AG also mapped EORTC QLQ-C30 data to EQ-5D utilities, using two different
algorithms;94 the utility for on treatment was 0.58, taken from the Month 1 value. For
off-treatment, it is unclear what was used due to reporting (in one place the report
refers to both the use of an average of Month 6 to 36 (0.68) and a figure taking into
account response levels, but this is marked CIC). The change between the TA228
values of 0.58 (on treatment) to 0.68 (off treatment) is reflective of the change from
baseline utility to after 8 cycles in the model base case (+0.125), although slightly
higher, which may bias in favour of VMP (Table 30.).
Table 32: EQ-5D values derived by mapping the EORTC QLQ-C30 scores from Gulbrandsen et al.110 by the NICE ERG in TA228
Source, algorithm Time (months [change from baseline])
On treatment/ baseline
Off treatment/ after 8 cycles
TA228, McKenzie and van der Pol118 0.580 0.683* (0.103)
TA228, Kontodimpoulous et al.119 0.580 0.695* (0.115)
Model base case, Proskorovsky et al.117 0.530 0.655 (0.125)
Key: EORTC QLQ-C30, EORTC Quality of Life Questionnaire – Core 30; EQ-5D, 5-dimension European Quality of Life questionnaire; ERG, evidence review group; Rd; lenalidomide and low-dose dexamethasone until disease progression. Notes: *, Off treatment calculated using an average of values from Month 6, 12, 24 and 36 from TA228.
3.4.5.5.2 Progressed utility and subsequent treatment utilities
In the base case, the utility of progressed patients is independent of treatment arm
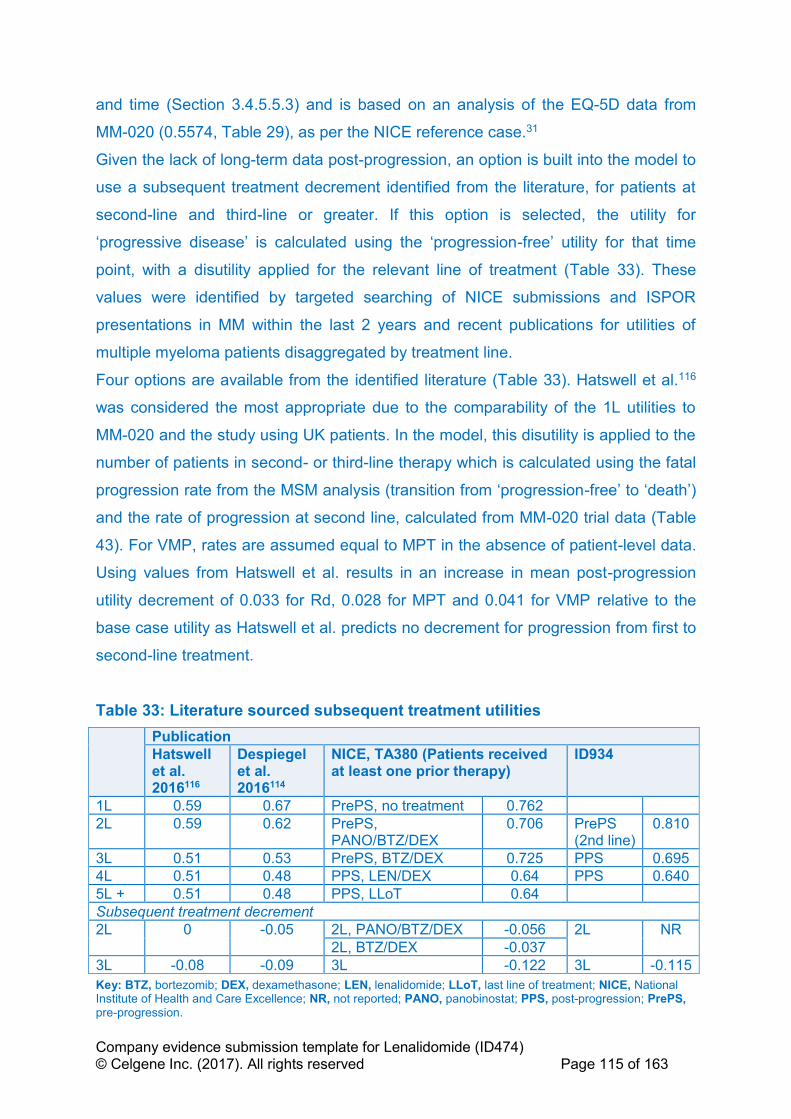
Company evidence submission template for Lenalidomide (ID474) © Celgene Inc. (2017). All rights reserved Page 115 of 163
and time (Section 3.4.5.5.3) and is based on an analysis of the EQ-5D data from
MM-020 (0.5574, Table 29), as per the NICE reference case.31
Given the lack of long-term data post-progression, an option is built into the model to
use a subsequent treatment decrement identified from the literature, for patients at
second-line and third-line or greater. If this option is selected, the utility for
‘progressive disease’ is calculated using the ‘progression-free’ utility for that time
point, with a disutility applied for the relevant line of treatment (Table 33). These
values were identified by targeted searching of NICE submissions and ISPOR
presentations in MM within the last 2 years and recent publications for utilities of
multiple myeloma patients disaggregated by treatment line.
Four options are available from the identified literature (Table 33). Hatswell et al.116
was considered the most appropriate due to the comparability of the 1L utilities to
MM-020 and the study using UK patients. In the model, this disutility is applied to the
number of patients in second- or third-line therapy which is calculated using the fatal
progression rate from the MSM analysis (transition from ‘progression-free’ to ‘death’)
and the rate of progression at second line, calculated from MM-020 trial data (Table
43). For VMP, rates are assumed equal to MPT in the absence of patient-level data.
Using values from Hatswell et al. results in an increase in mean post-progression
utility decrement of 0.033 for Rd, 0.028 for MPT and 0.041 for VMP relative to the
base case utility as Hatswell et al. predicts no decrement for progression from first to
second-line treatment.
Table 33: Literature sourced subsequent treatment utilities
Publication
Hatswell et al. 2016116
Despiegel et al. 2016114
NICE, TA380 (Patients received at least one prior therapy)
ID934
1L 0.59 0.67 PrePS, no treatment 0.762
2L 0.59 0.62 PrePS, PANO/BTZ/DEX
0.706 PrePS (2nd line)
0.810
3L 0.51 0.53 PrePS, BTZ/DEX 0.725 PPS 0.695
4L 0.51 0.48 PPS, LEN/DEX 0.64 PPS 0.640
5L + 0.51 0.48 PPS, LLoT 0.64
Subsequent treatment decrement
2L 0 -0.05 2L, PANO/BTZ/DEX -0.056 2L NR
2L, BTZ/DEX -0.037
3L -0.08 -0.09 3L -0.122 3L -0.115
Key: BTZ, bortezomib; DEX, dexamethasone; LEN, lenalidomide; LLoT, last line of treatment; NICE, National Institute of Health and Care Excellence; NR, not reported; PANO, panobinostat; PPS, post-progression; PrePS, pre-progression.

Company evidence submission template for Lenalidomide (ID474) © Celgene Inc. (2017). All rights reserved Page 116 of 163
3.4.5.5.3 Age-adjusted utilities
Utilities are adjusted by average age of the patients in the model using the age-
banded utility values from Kind et al.120 As the average age of patients in the model
is 73, the utilities are only adjusted once, as patients move from the 65–74 age
bracket, to the 75+ age bracket. The ‘progression-free’ utility for each treatment arm
and the ‘progressive disease’ are plotted over time in Figure 23.
Figure 23: Health state utility values over time
Key: MPT, melphalan, prednisone and thalidomide; PF, progression-free; Rd; lenalidomide and low-dose dexamethasone until disease progression; VMP, bortezomib, melphalan and prednisone.
B.3.5 Cost and healthcare resource use identification,
measurement and valuation
The NHS schedule of reference costs was appropriate for costing as the clinical
management of the condition is currently costed in the NHS in terms of reference
costs.
B.3.5.1 Intervention and comparators’ costs and resource use
The patient characteristics used for dosing (including subsequent therapies)
according to the product SmPC are presented in Table 34; these data were sourced
from the MM-020 trial.
0.00
0.10
0.20
0.30
0.40
0.50
0.60
0.70
0.80
0.90
1.00
0.0 1.0 2.0 3.0 4.0 5.0
He
alt
h s
tate
uti
lity
va
lue
Years
Health State Utility Values over Time
PF Utility Rd PF Utility MPT PF Utility VMP Progressed Utility
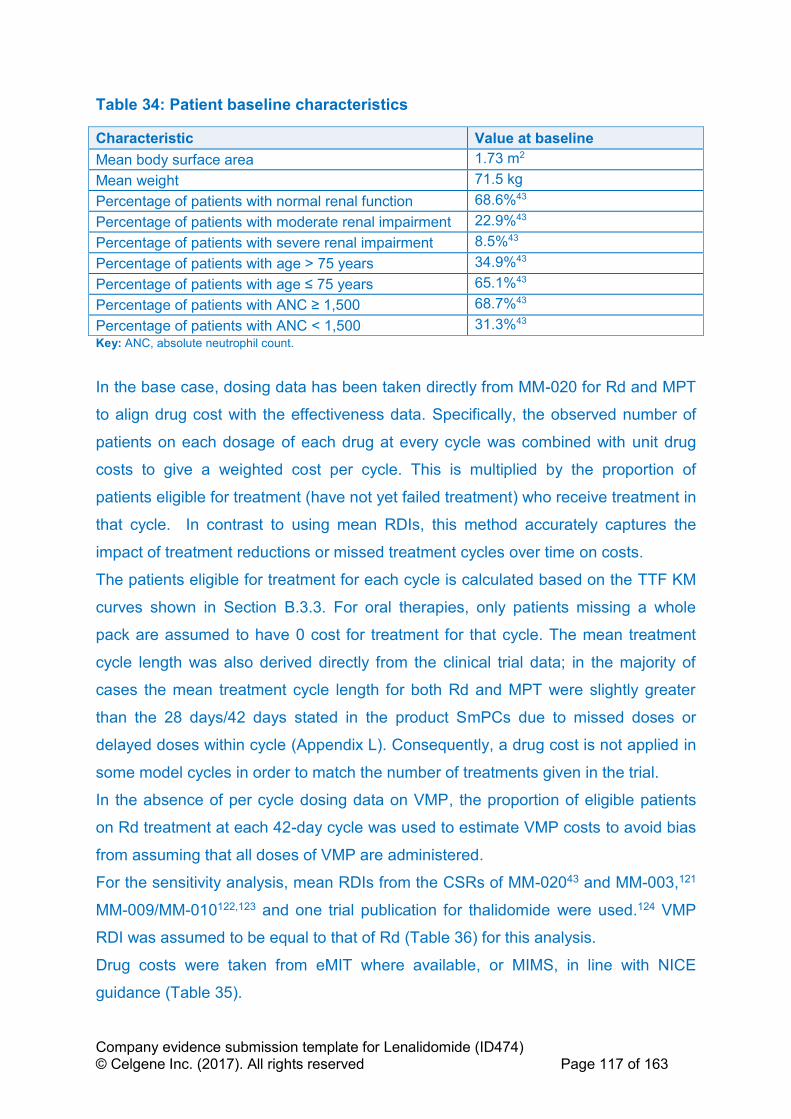
Company evidence submission template for Lenalidomide (ID474) © Celgene Inc. (2017). All rights reserved Page 117 of 163
Table 34: Patient baseline characteristics
Characteristic Value at baseline
Mean body surface area 1.73 m2
Mean weight 71.5 kg
Percentage of patients with normal renal function 68.6%43
Percentage of patients with moderate renal impairment 22.9%43
Percentage of patients with severe renal impairment 8.5%43
Percentage of patients with age > 75 years 34.9%43
Percentage of patients with age ≤ 75 years 65.1%43
Percentage of patients with ANC ≥ 1,500 68.7%43
Percentage of patients with ANC < 1,500 31.3%43
Key: ANC, absolute neutrophil count.
In the base case, dosing data has been taken directly from MM-020 for Rd and MPT
to align drug cost with the effectiveness data. Specifically, the observed number of
patients on each dosage of each drug at every cycle was combined with unit drug
costs to give a weighted cost per cycle. This is multiplied by the proportion of
patients eligible for treatment (have not yet failed treatment) who receive treatment in
that cycle. In contrast to using mean RDIs, this method accurately captures the
impact of treatment reductions or missed treatment cycles over time on costs.
The patients eligible for treatment for each cycle is calculated based on the TTF KM
curves shown in Section B.3.3. For oral therapies, only patients missing a whole
pack are assumed to have 0 cost for treatment for that cycle. The mean treatment
cycle length was also derived directly from the clinical trial data; in the majority of
cases the mean treatment cycle length for both Rd and MPT were slightly greater
than the 28 days/42 days stated in the product SmPCs due to missed doses or
delayed doses within cycle (Appendix L). Consequently, a drug cost is not applied in
some model cycles in order to match the number of treatments given in the trial.
In the absence of per cycle dosing data on VMP, the proportion of eligible patients
on Rd treatment at each 42-day cycle was used to estimate VMP costs to avoid bias
from assuming that all doses of VMP are administered.
For the sensitivity analysis, mean RDIs from the CSRs of MM-02043 and MM-003,121
MM-009/MM-010122,123 and one trial publication for thalidomide were used.124 VMP
RDI was assumed to be equal to that of Rd (Table 36) for this analysis.
Drug costs were taken from eMIT where available, or MIMS, in line with NICE
guidance (Table 35).
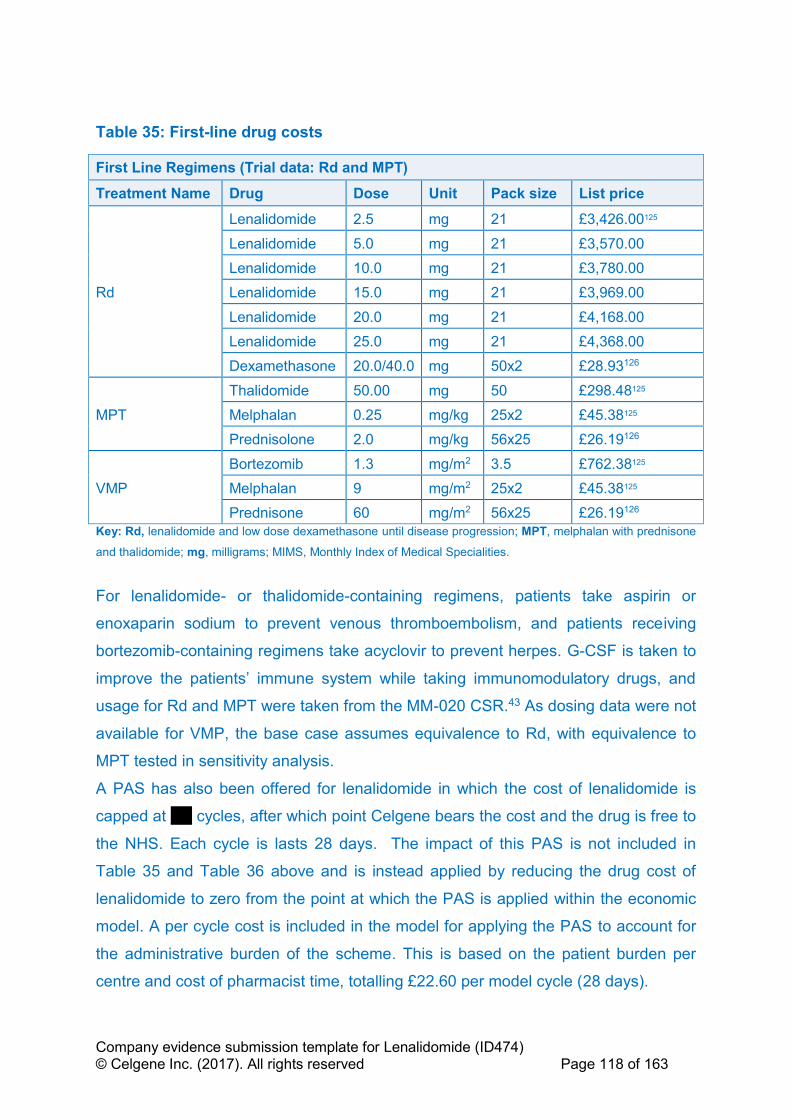
Company evidence submission template for Lenalidomide (ID474) © Celgene Inc. (2017). All rights reserved Page 118 of 163
Table 35: First-line drug costs
First Line Regimens (Trial data: Rd and MPT)
Treatment Name Drug Dose Unit Pack size List price
Rd
Lenalidomide 2.5 mg 21 £3,426.00125
Lenalidomide 5.0 mg 21 £3,570.00
Lenalidomide 10.0 mg 21 £3,780.00
Lenalidomide 15.0 mg 21 £3,969.00
Lenalidomide 20.0 mg 21 £4,168.00
Lenalidomide 25.0 mg 21 £4,368.00
Dexamethasone 20.0/40.0 mg 50x2 £28.93126
MPT
Thalidomide 50.00 mg 50 £298.48125
Melphalan 0.25 mg/kg 25x2 £45.38125
Prednisolone 2.0 mg/kg 56x25 £26.19126
VMP
Bortezomib 1.3 mg/m2 3.5 £762.38125
Melphalan 9 mg/m2 25x2 £45.38125
Prednisone 60 mg/m2 56x25 £26.19126
Key: Rd, lenalidomide and low dose dexamethasone until disease progression; MPT, melphalan with prednisone
and thalidomide; mg, milligrams; MIMS, Monthly Index of Medical Specialities.
For lenalidomide- or thalidomide-containing regimens, patients take aspirin or
enoxaparin sodium to prevent venous thromboembolism, and patients receiving
bortezomib-containing regimens take acyclovir to prevent herpes. G-CSF is taken to
improve the patients’ immune system while taking immunomodulatory drugs, and
usage for Rd and MPT were taken from the MM-020 CSR.43 As dosing data were not
available for VMP, the base case assumes equivalence to Rd, with equivalence to
MPT tested in sensitivity analysis.
A PAS has also been offered for lenalidomide in which the cost of lenalidomide is
capped at ''''''' cycles, after which point Celgene bears the cost and the drug is free to
the NHS. Each cycle is lasts 28 days. The impact of this PAS is not included in
Table 35 and Table 36 above and is instead applied by reducing the drug cost of
lenalidomide to zero from the point at which the PAS is applied within the economic
model. A per cycle cost is included in the model for applying the PAS to account for
the administrative burden of the scheme. This is based on the patient burden per
centre and cost of pharmacist time, totalling £22.60 per model cycle (28 days).
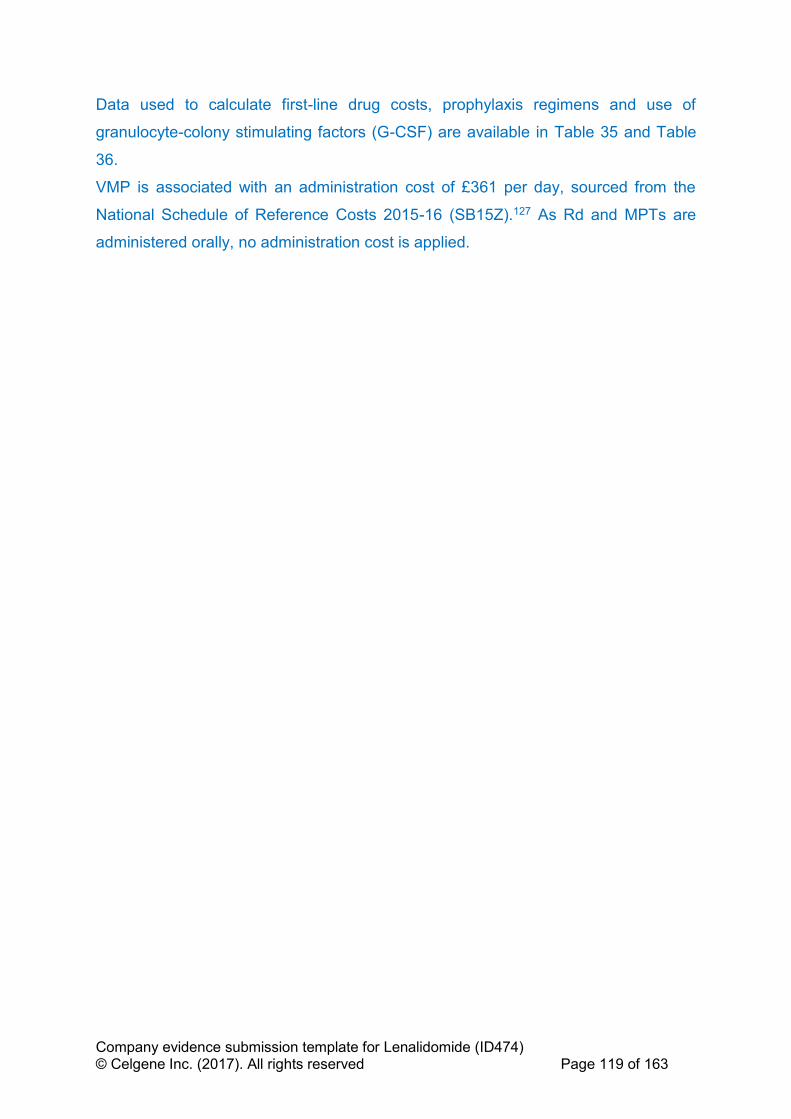
Company evidence submission template for Lenalidomide (ID474) © Celgene Inc. (2017). All rights reserved Page 119 of 163
Data used to calculate first-line drug costs, prophylaxis regimens and use of
granulocyte-colony stimulating factors (G-CSF) are available in Table 35 and Table
36.
VMP is associated with an administration cost of £361 per day, sourced from the
National Schedule of Reference Costs 2015-16 (SB15Z).127 As Rd and MPTs are
administered orally, no administration cost is applied.
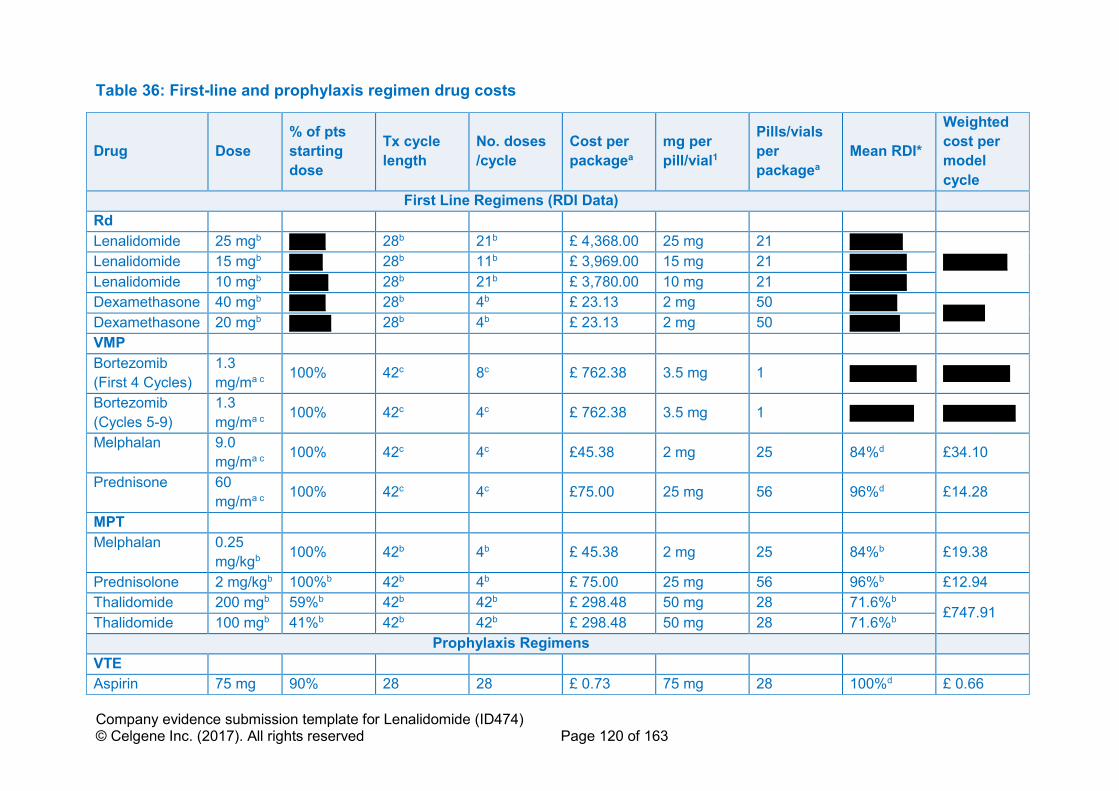
Company evidence submission template for Lenalidomide (ID474) © Celgene Inc. (2017). All rights reserved Page 120 of 163
Table 36: First-line and prophylaxis regimen drug costs
Drug Dose
% of pts
starting
dose
Tx cycle
length
No. doses
/cycle
Cost per
packagea
mg per
pill/vial1
Pills/vials
per
packagea
Mean RDI*
Weighted
cost per
model
cycle
First Line Regimens (RDI Data)
Rd
Lenalidomide 25 mgb ''''''''''''' 28b 21b £ 4,368.00 25 mg 21 '''''''''''''''''''
''''''''''''''''''''''' Lenalidomide 15 mgb '''''''''''' 28b 11b £ 3,969.00 15 mg 21 ''''''''''' ''''''''
Lenalidomide 10 mgb '''''''''''''' 28b 21b £ 3,780.00 10 mg 21 '''''''''' '''''''''
Dexamethasone 40 mgb ''''''''''''' 28b 4b £ 23.13 2 mg 50 ''''''''''''''''' '''''''''''''''
Dexamethasone 20 mgb ''''''''''''''' 28b 4b £ 23.13 2 mg 50 ''''''''''''''''''
VMP
Bortezomib
(First 4 Cycles)
1.3
mg/ma c 100% 42c 8c £ 762.38 3.5 mg 1 '''''''''''''''''''''''' ''''''''''''''''''''''''
Bortezomib
(Cycles 5-9)
1.3
mg/ma c 100% 42c 4c £ 762.38 3.5 mg 1 ''''''''''''''''''''''' ''''''''''''''''''''''''''
Melphalan 9.0
mg/ma c 100% 42c 4c £45.38 2 mg 25 84%d £34.10
Prednisone 60
mg/ma c 100% 42c 4c £75.00 25 mg 56 96%d £14.28
MPT
Melphalan 0.25
mg/kgb 100% 42b 4b £ 45.38 2 mg 25 84%b £19.38
Prednisolone 2 mg/kgb 100%b 42b 4b £ 75.00 25 mg 56 96%b £12.94
Thalidomide 200 mgb 59%b 42b 42b £ 298.48 50 mg 28 71.6%b £747.91
Thalidomide 100 mgb 41%b 42b 42b £ 298.48 50 mg 28 71.6%b
Prophylaxis Regimens
VTE
Aspirin 75 mg 90% 28 28 £ 0.73 75 mg 28 100%d £ 0.66

Company evidence submission template for Lenalidomide (ID474) © Celgene Inc. (2017). All rights reserved Page 121 of 163
Enoxaparin
Sodium 30 mg 10% 28 28 £30.27 40 mg 10 100%d £ 6.35
Herpes
Aciclovir 400 mg 100% 28 28 £ 3.02 400 mg 56 100%d £ 1.50
Granulocyte-colony stimulating factor (G-CSF)
Drug Dose as
sold
Unit Pack cost Pack size Cost per
unit
Dosing Dose
applied
Cost per dose
Filgrastim 3000000
0.0 MU/ml £263.52a 5 £0.00
500,000
units/kg 38950000 £68.43
Treatment
Patients receiving G-
CSF during Active
Treatment Phase (%)
Instantaneous rate Patients receiving G-
CSF per cycle (%) Cost per cycle
Rd 17.50%b 13.89% 1.06% £0.72
MPT 34.80%b 30.89% 2.34% £1.60
VMP 17.50%d 13.89% 1.06% £0.72
Key: G-CSF, granulocyte colony stimulating factor; kg, kilograms; mg, milligram; MPT, melphalan, prednisone and thalidomide; No, number; Rd, lenalidomide and low-dose
dexamethasone until disease progression; RDI, relative dose intensity; Tx, treatment; VTE, venous thromboembolism; VMP, bortezomib, melphalan and prednisone.
Note: a, Source: MIMs, Accessed Jan 2017125; b, Source: MM-020 CSR, 2016.43; c, Source: VISTA – San Miguel et al., 200839; d, Assumption; e, includes administration cost; *, trial dosing for first-
line regimens, rather than RDI, is applied in the base case.
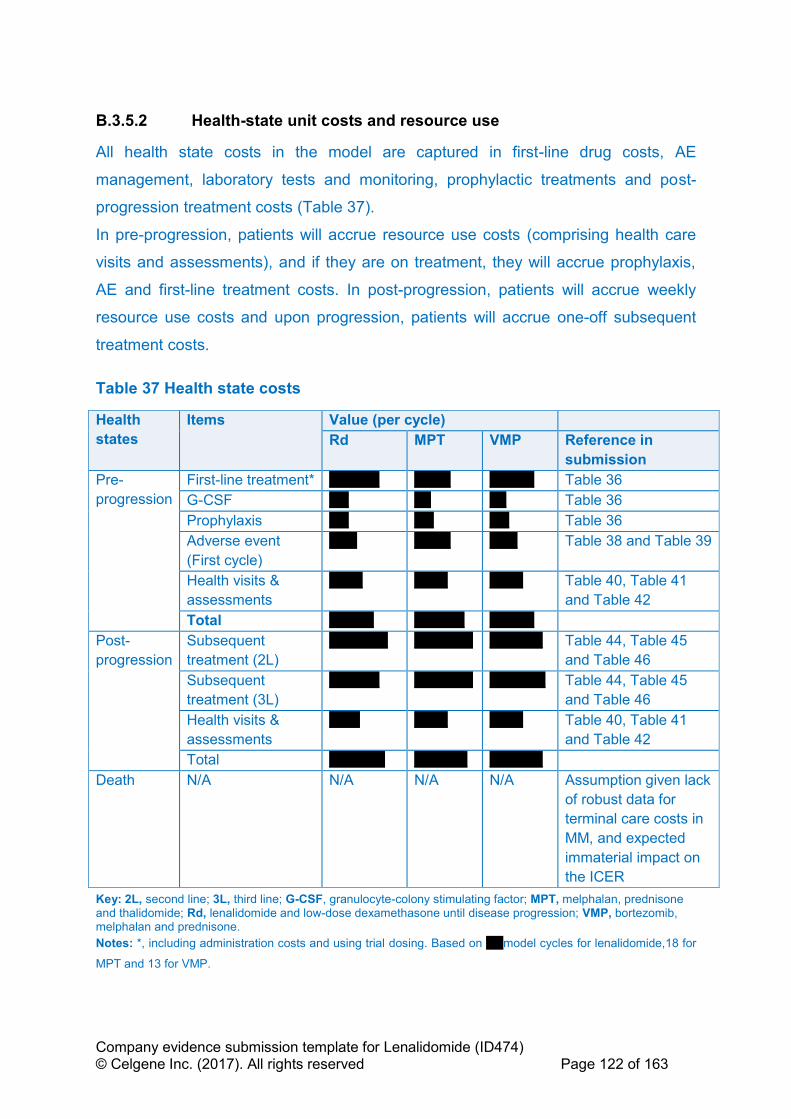
Company evidence submission template for Lenalidomide (ID474) © Celgene Inc. (2017). All rights reserved Page 122 of 163
B.3.5.2 Health-state unit costs and resource use
All health state costs in the model are captured in first-line drug costs, AE
management, laboratory tests and monitoring, prophylactic treatments and post-
progression treatment costs (Table 37).
In pre-progression, patients will accrue resource use costs (comprising health care
visits and assessments), and if they are on treatment, they will accrue prophylaxis,
AE and first-line treatment costs. In post-progression, patients will accrue weekly
resource use costs and upon progression, patients will accrue one-off subsequent
treatment costs.
Table 37 Health state costs
Health
states
Items Value (per cycle)
Rd MPT VMP Reference in
submission
Pre-
progression
First-line treatment* '''''''''''''''''' ''''''''''''' '''''''''''''''' Table 36
G-CSF ''''''' '''''' '''''' Table 36
Prophylaxis ''''''' ''''''' ''''''' Table 36
Adverse event
(First cycle)
'''''''''' ''''''''''''' '''''''''' Table 38 and Table 39
Health visits &
assessments
'''''''''''' '''''''''''' '''''''''''' Table 40, Table 41
and Table 42
Total '''''''''''''''' '''''''''''''''''' ''''''''''''''''
Post-
progression
Subsequent
treatment (2L)
''''''''''''''''''''' ''''''''''''''''''''' ''''''''''''''''''' Table 44, Table 45
and Table 46
Subsequent
treatment (3L)
'''''''''''''''''' ''''''''''''''''''''' '''''''''''''''''''' Table 44, Table 45
and Table 46
Health visits &
assessments
''''''''''' '''''''''''' '''''''''''' Table 40, Table 41
and Table 42
Total '''''''''''''''''''' ''''''''''''''''''' '''''''''''''''''''
Death N/A N/A N/A N/A Assumption given lack
of robust data for
terminal care costs in
MM, and expected
immaterial impact on
the ICER
Key: 2L, second line; 3L, third line; G-CSF, granulocyte-colony stimulating factor; MPT, melphalan, prednisone and thalidomide; Rd, lenalidomide and low-dose dexamethasone until disease progression; VMP, bortezomib, melphalan and prednisone.
Notes: *, including administration costs and using trial dosing. Based on '''''' model cycles for lenalidomide,18 for
MPT and 13 for VMP.
Company evidence submission template for Lenalidomide (ID474) © Celgene Inc. (2017). All rights reserved Page 123 of 163
B.3.5.3 Adverse reaction unit costs and resource use
Costs associated with managing Grade 3 and 4 AEs that occurred during the
treatment phase in ≥ 5% of patients were included in this analysis. Frequencies were
taken from the MM-020 trial for Rd and MPT,43 and from VISTA for VMP70 (Table
38).
Costs per each AE were derived from the NHS National Schedule of Reference
Costs for 2015-2016.127 When healthcare resource groups (HRGs) were used, day
case codes were assumed (except for hyperglycaemia, where non-elective inpatient
short stay was assumed). The costs per event used in the model are shown in Table
39.
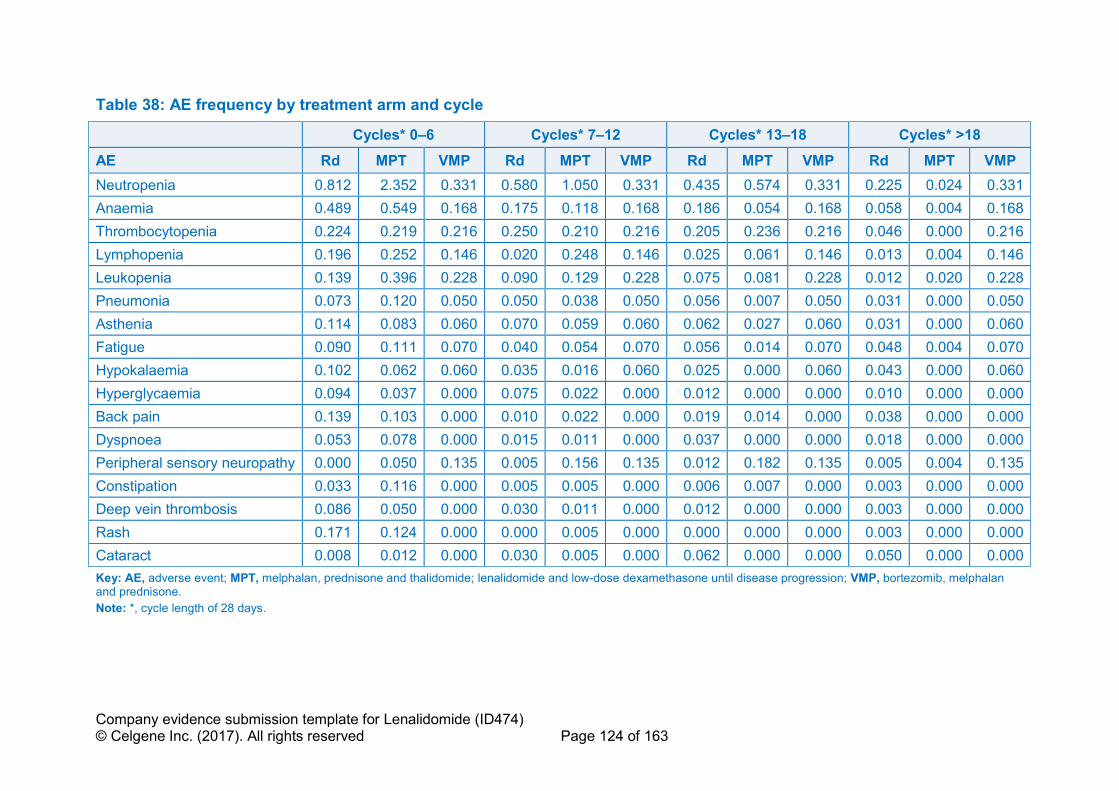
Company evidence submission template for Lenalidomide (ID474) © Celgene Inc. (2017). All rights reserved Page 124 of 163
Table 38: AE frequency by treatment arm and cycle
Cycles* 0–6 Cycles* 7–12 Cycles* 13–18 Cycles* >18
AE Rd MPT VMP Rd MPT VMP Rd MPT VMP Rd MPT VMP
Neutropenia 0.812 2.352 0.331 0.580 1.050 0.331 0.435 0.574 0.331 0.225 0.024 0.331
Anaemia 0.489 0.549 0.168 0.175 0.118 0.168 0.186 0.054 0.168 0.058 0.004 0.168
Thrombocytopenia 0.224 0.219 0.216 0.250 0.210 0.216 0.205 0.236 0.216 0.046 0.000 0.216
Lymphopenia 0.196 0.252 0.146 0.020 0.248 0.146 0.025 0.061 0.146 0.013 0.004 0.146
Leukopenia 0.139 0.396 0.228 0.090 0.129 0.228 0.075 0.081 0.228 0.012 0.020 0.228
Pneumonia 0.073 0.120 0.050 0.050 0.038 0.050 0.056 0.007 0.050 0.031 0.000 0.050
Asthenia 0.114 0.083 0.060 0.070 0.059 0.060 0.062 0.027 0.060 0.031 0.000 0.060
Fatigue 0.090 0.111 0.070 0.040 0.054 0.070 0.056 0.014 0.070 0.048 0.004 0.070
Hypokalaemia 0.102 0.062 0.060 0.035 0.016 0.060 0.025 0.000 0.060 0.043 0.000 0.060
Hyperglycaemia 0.094 0.037 0.000 0.075 0.022 0.000 0.012 0.000 0.000 0.010 0.000 0.000
Back pain 0.139 0.103 0.000 0.010 0.022 0.000 0.019 0.014 0.000 0.038 0.000 0.000
Dyspnoea 0.053 0.078 0.000 0.015 0.011 0.000 0.037 0.000 0.000 0.018 0.000 0.000
Peripheral sensory neuropathy 0.000 0.050 0.135 0.005 0.156 0.135 0.012 0.182 0.135 0.005 0.004 0.135
Constipation 0.033 0.116 0.000 0.005 0.005 0.000 0.006 0.007 0.000 0.003 0.000 0.000
Deep vein thrombosis 0.086 0.050 0.000 0.030 0.011 0.000 0.012 0.000 0.000 0.003 0.000 0.000
Rash 0.171 0.124 0.000 0.000 0.005 0.000 0.000 0.000 0.000 0.003 0.000 0.000
Cataract 0.008 0.012 0.000 0.030 0.005 0.000 0.062 0.000 0.000 0.050 0.000 0.000
Key: AE, adverse event; MPT, melphalan, prednisone and thalidomide; lenalidomide and low-dose dexamethasone until disease progression; VMP, bortezomib, melphalan and prednisone.
Note: *, cycle length of 28 days.
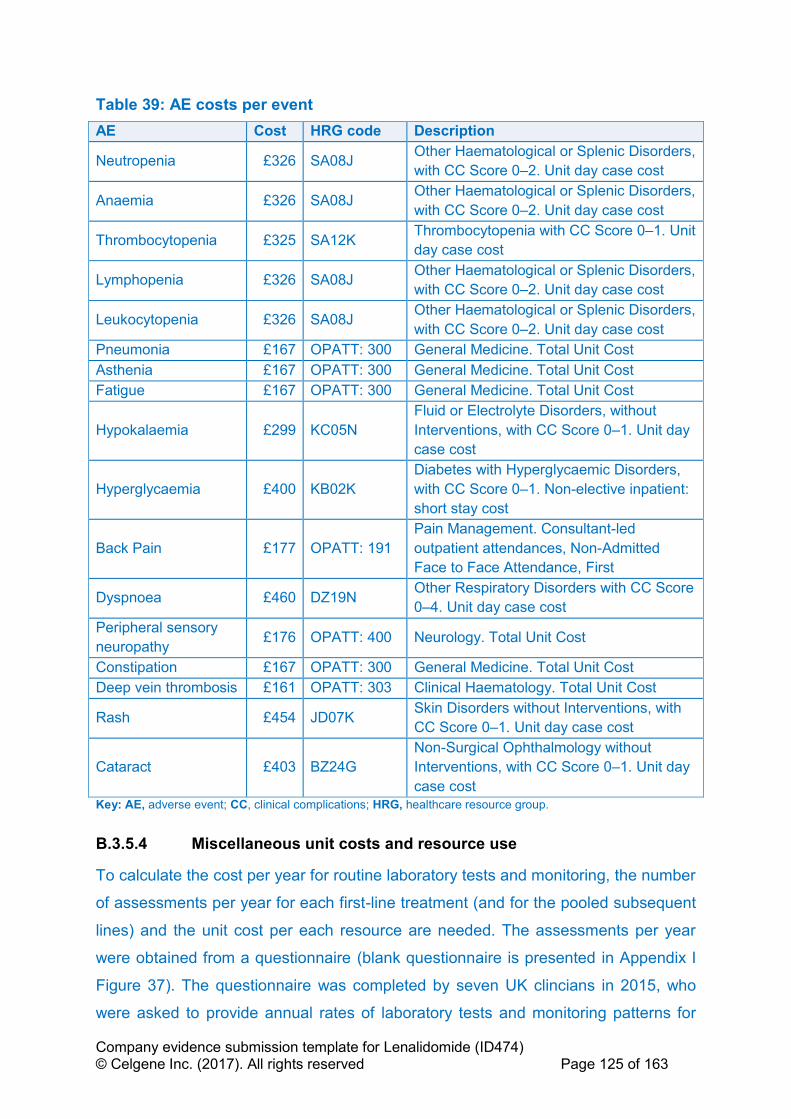
Company evidence submission template for Lenalidomide (ID474) © Celgene Inc. (2017). All rights reserved Page 125 of 163
Table 39: AE costs per event
AE Cost HRG code Description
Neutropenia £326 SA08J Other Haematological or Splenic Disorders,
with CC Score 0–2. Unit day case cost
Anaemia £326 SA08J Other Haematological or Splenic Disorders,
with CC Score 0–2. Unit day case cost
Thrombocytopenia £325 SA12K Thrombocytopenia with CC Score 0–1. Unit
day case cost
Lymphopenia £326 SA08J Other Haematological or Splenic Disorders,
with CC Score 0–2. Unit day case cost
Leukocytopenia £326 SA08J Other Haematological or Splenic Disorders,
with CC Score 0–2. Unit day case cost
Pneumonia £167 OPATT: 300 General Medicine. Total Unit Cost
Asthenia £167 OPATT: 300 General Medicine. Total Unit Cost
Fatigue £167 OPATT: 300 General Medicine. Total Unit Cost
Hypokalaemia £299 KC05N
Fluid or Electrolyte Disorders, without
Interventions, with CC Score 0–1. Unit day
case cost
Hyperglycaemia £400 KB02K
Diabetes with Hyperglycaemic Disorders,
with CC Score 0–1. Non-elective inpatient:
short stay cost
Back Pain £177 OPATT: 191
Pain Management. Consultant-led
outpatient attendances, Non-Admitted
Face to Face Attendance, First
Dyspnoea £460 DZ19N Other Respiratory Disorders with CC Score
0–4. Unit day case cost
Peripheral sensory
neuropathy £176 OPATT: 400 Neurology. Total Unit Cost
Constipation £167 OPATT: 300 General Medicine. Total Unit Cost
Deep vein thrombosis £161 OPATT: 303 Clinical Haematology. Total Unit Cost
Rash £454 JD07K Skin Disorders without Interventions, with
CC Score 0–1. Unit day case cost
Cataract £403 BZ24G
Non-Surgical Ophthalmology without
Interventions, with CC Score 0–1. Unit day
case cost
Key: AE, adverse event; CC, clinical complications; HRG, healthcare resource group.
B.3.5.4 Miscellaneous unit costs and resource use
To calculate the cost per year for routine laboratory tests and monitoring, the number
of assessments per year for each first-line treatment (and for the pooled subsequent
lines) and the unit cost per each resource are needed. The assessments per year
were obtained from a questionnaire (blank questionnaire is presented in Appendix I
Figure 37). The questionnaire was completed by seven UK clincians in 2015, who
were asked to provide annual rates of laboratory tests and monitoring patterns for
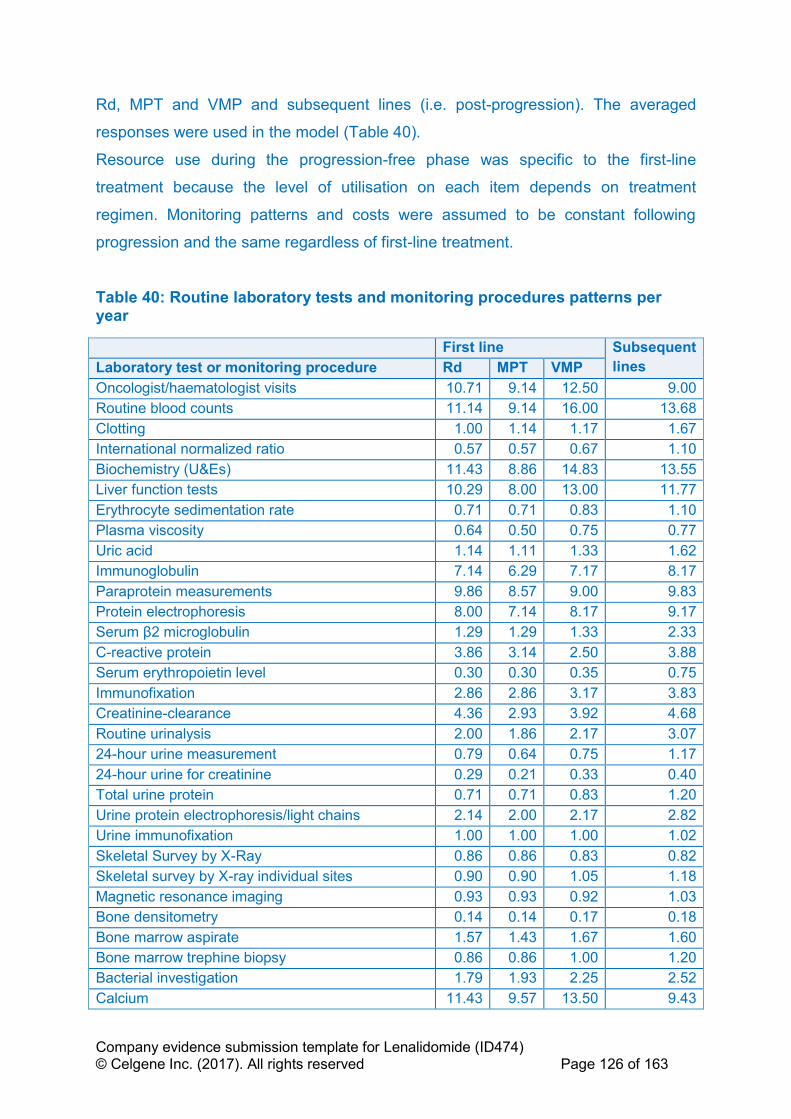
Company evidence submission template for Lenalidomide (ID474) © Celgene Inc. (2017). All rights reserved Page 126 of 163
Rd, MPT and VMP and subsequent lines (i.e. post-progression). The averaged
responses were used in the model (Table 40).
Resource use during the progression-free phase was specific to the first-line
treatment because the level of utilisation on each item depends on treatment
regimen. Monitoring patterns and costs were assumed to be constant following
progression and the same regardless of first-line treatment.
Table 40: Routine laboratory tests and monitoring procedures patterns per year
First line Subsequent
lines Laboratory test or monitoring procedure Rd MPT VMP
Oncologist/haematologist visits 10.71 9.14 12.50 9.00
Routine blood counts 11.14 9.14 16.00 13.68
Clotting 1.00 1.14 1.17 1.67
International normalized ratio 0.57 0.57 0.67 1.10
Biochemistry (U&Es) 11.43 8.86 14.83 13.55
Liver function tests 10.29 8.00 13.00 11.77
Erythrocyte sedimentation rate 0.71 0.71 0.83 1.10
Plasma viscosity 0.64 0.50 0.75 0.77
Uric acid 1.14 1.11 1.33 1.62
Immunoglobulin 7.14 6.29 7.17 8.17
Paraprotein measurements 9.86 8.57 9.00 9.83
Protein electrophoresis 8.00 7.14 8.17 9.17
Serum β2 microglobulin 1.29 1.29 1.33 2.33
C-reactive protein 3.86 3.14 2.50 3.88
Serum erythropoietin level 0.30 0.30 0.35 0.75
Immunofixation 2.86 2.86 3.17 3.83
Creatinine-clearance 4.36 2.93 3.92 4.68
Routine urinalysis 2.00 1.86 2.17 3.07
24-hour urine measurement 0.79 0.64 0.75 1.17
24-hour urine for creatinine 0.29 0.21 0.33 0.40
Total urine protein 0.71 0.71 0.83 1.20
Urine protein electrophoresis/light chains 2.14 2.00 2.17 2.82
Urine immunofixation 1.00 1.00 1.00 1.02
Skeletal Survey by X-Ray 0.86 0.86 0.83 0.82
Skeletal survey by X-ray individual sites 0.90 0.90 1.05 1.18
Magnetic resonance imaging 0.93 0.93 0.92 1.03
Bone densitometry 0.14 0.14 0.17 0.18
Bone marrow aspirate 1.57 1.43 1.67 1.60
Bone marrow trephine biopsy 0.86 0.86 1.00 1.20
Bacterial investigation 1.79 1.93 2.25 2.52
Calcium 11.43 9.57 13.50 9.43

Company evidence submission template for Lenalidomide (ID474) © Celgene Inc. (2017). All rights reserved Page 127 of 163
Albumin 11.43 9.14 13.00 12.77
Lactate dehydrogenase 2.43 2.29 3.17 3.43
Key: MPT, melphalan, prednisone and thalidomide; Rd, lenalidomide and low-dose dexamethasone until disease
progression; U&Es, urea and electrolytes; VMP, bortezomib, melphalan and prednisone.
Platelet and red blood cell transfusions are accounted for separately using data from
the MM-020 CSR.43 For VMP, rates for RBC transfusions were taken from NICE
TA228 Assessment Report3 as the percentage of patients requiring transfusions. For
platelet transfusion, the base case assumes equivalence to Rd (Table 41).
Table 41: Transfusion rates
Procedure Rd MPT VMP
RBC transfusion 0.20 0.20 0.29
Platelet transfusion 0.11 0.09 0.11
Key: MPT, melphalan, prednisone and thalidomide; RBC, red blood cell; Rd, lenalidomide and low-dose dexamethasone until disease progression; VMP, bortezomib, melphalan and prednisone.
Unit costs for each routine laboratory test were obtained from the 2015–2016
national schedule of reference costs.127 The national average unit cost, currency
code, and description for each test and procedure is shown in Table 42.
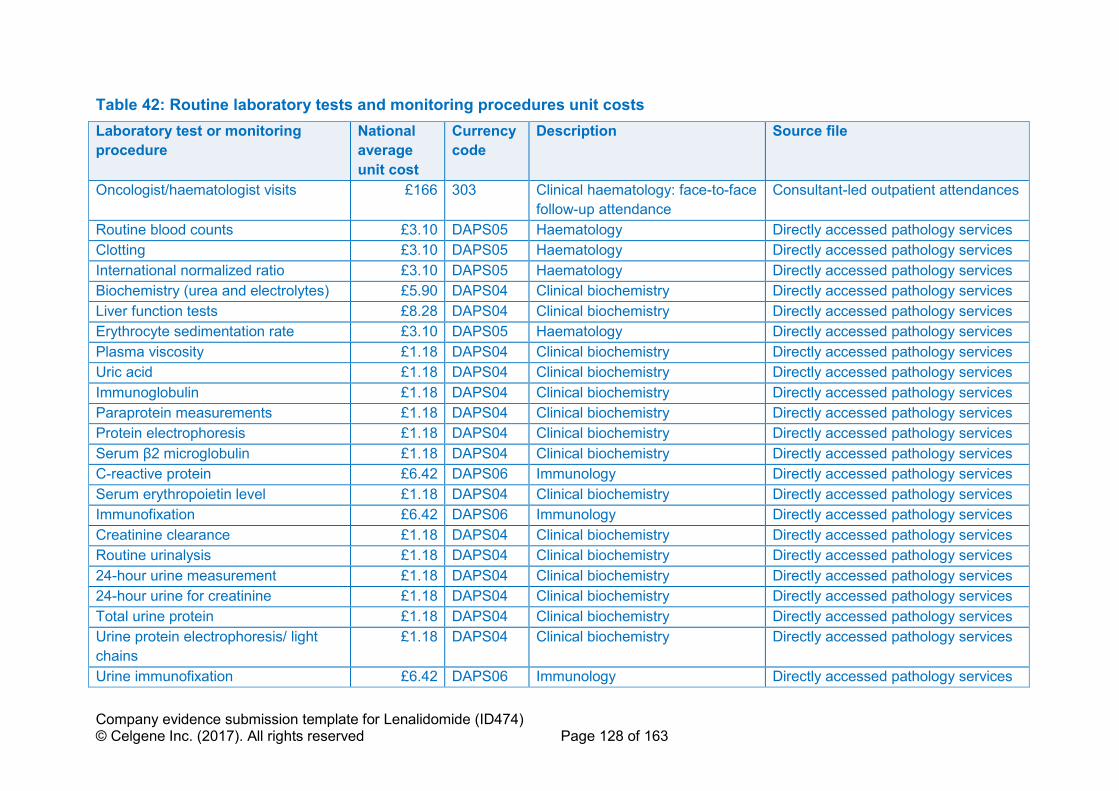
Company evidence submission template for Lenalidomide (ID474) © Celgene Inc. (2017). All rights reserved Page 128 of 163
Table 42: Routine laboratory tests and monitoring procedures unit costs
Laboratory test or monitoring
procedure
National
average
unit cost
Currency
code
Description Source file
Oncologist/haematologist visits £166 303 Clinical haematology: face-to-face
follow-up attendance
Consultant-led outpatient attendances
Routine blood counts £3.10 DAPS05 Haematology Directly accessed pathology services
Clotting £3.10 DAPS05 Haematology Directly accessed pathology services
International normalized ratio £3.10 DAPS05 Haematology Directly accessed pathology services
Biochemistry (urea and electrolytes) £5.90 DAPS04 Clinical biochemistry Directly accessed pathology services
Liver function tests £8.28 DAPS04 Clinical biochemistry Directly accessed pathology services
Erythrocyte sedimentation rate £3.10 DAPS05 Haematology Directly accessed pathology services
Plasma viscosity £1.18 DAPS04 Clinical biochemistry Directly accessed pathology services
Uric acid £1.18 DAPS04 Clinical biochemistry Directly accessed pathology services
Immunoglobulin £1.18 DAPS04 Clinical biochemistry Directly accessed pathology services
Paraprotein measurements £1.18 DAPS04 Clinical biochemistry Directly accessed pathology services
Protein electrophoresis £1.18 DAPS04 Clinical biochemistry Directly accessed pathology services
Serum β2 microglobulin £1.18 DAPS04 Clinical biochemistry Directly accessed pathology services
C-reactive protein £6.42 DAPS06 Immunology Directly accessed pathology services
Serum erythropoietin level £1.18 DAPS04 Clinical biochemistry Directly accessed pathology services
Immunofixation £6.42 DAPS06 Immunology Directly accessed pathology services
Creatinine clearance £1.18 DAPS04 Clinical biochemistry Directly accessed pathology services
Routine urinalysis £1.18 DAPS04 Clinical biochemistry Directly accessed pathology services
24-hour urine measurement £1.18 DAPS04 Clinical biochemistry Directly accessed pathology services
24-hour urine for creatinine £1.18 DAPS04 Clinical biochemistry Directly accessed pathology services
Total urine protein £1.18 DAPS04 Clinical biochemistry Directly accessed pathology services
Urine protein electrophoresis/ light
chains
£1.18 DAPS04 Clinical biochemistry Directly accessed pathology services
Urine immunofixation £6.42 DAPS06 Immunology Directly accessed pathology services

Company evidence submission template for Lenalidomide (ID474) © Celgene Inc. (2017). All rights reserved Page 129 of 163
Skeletal survey by X-ray £181.56 DAPF Direct access plain film (six sites
assumed)
Directly accessed diagnostic services
Skeletal survey by X-ray individual
sites
£30.26 DAPF Direct access plain film Directly accessed diagnostic services
Magnetic resonance imaging £213.17 RA05Z MRI scan, two or three areas, with
contrast
Diagnostic imaging – outpatient
Bone densitometry £70.71 RA15Z Dexa scan Diagnostic imaging – outpatient
Bone marrow aspirate £266.83 SA33Z Diagnostic bone marrow
extraction
Procedures in outpatients – clinical
haematology
Bone marrow trephine biopsy £30.77 DAPS02 Histopathology and histology Directly accessed pathology services
Bacterial investigation £7.63 DAPS07 Microbiology Directly accessed pathology services
Calcium £1.18 DAPS04 Clinical biochemistry Directly accessed pathology services
Albumin £1.18 DAPS04 Clinical biochemistry Directly accessed pathology services
Lactate dehydrogenase £1.18 DAPS04 Clinical biochemistry Directly accessed pathology services
RBC transfusion £122.35 National Health Service (NHS). Blood and DTS pricing proposals for 2017/18.128
Platelet transfusion £178.19 National Health Service (NHS). Blood and DTS pricing proposals for 2017/18.128
Key: MRI, magnetic resonance imaging; RBC, red blood cell; NHS, National Health Service.
Company evidence submission template for Lenalidomide (ID474) © Celgene Inc. (2017). All rights reserved Page 130 of 163
B.3.5.5 Subsequent treatment costs
The majority of patients (94%) receive subsequent lines of anti-myeloma treatment
after experiencing progressive disease. Thus, OS and costs are influenced by the
cumulative effects of multiple lines of treatment.
Costing of subsequent treatments in the model, and subsequent treatment disutilities
for scenario analyses, were based upon the following data:
• Distribution of patients on treatments (based on the percentage of
progressions being fatal, and probability of subsequent progression)
• Drug costs
• Duration of treatment
For simplicity, the model assumes subsequent treatment starts upon progression,
however it is recognised in clinical practice that there may occasionally be a short
delay between the progression assessment and intiation of subsequent treatment.
Additionally, AE costs associated with each treatment were not included in post-
progression cost estimations as these represent a very small proportion of
incremental cost. However, costs of resource utilisation for disease monitoring (i.e.
laboratory and monitoring tests) were calculated for patients in the ‘progressive
disease’ state, independent of treatment. Rates of transfusion in the post-
progression state were assumed to be the average of Rd, MPT and VMP.
The distribution of subsequent treatments is sourced from the MM-020 trial for Rd
and MPT, and from the VISTA trial for VMP (Table 45) to avoid bias from a mismatch
between subsequent treatment costs and the effectiveness data (i.e. OS) used in the
economic model. This is in response to previous MM submissions which have come
under criticisms from ERGs due to subsequent treatment costs not matching the
effectiveness data used in the model.56,129
The subsequent treatment data from the MM-020 and VISTA trials provide
comparable information on the number of patients on lenalidomide-, bortezomib- or
thalidomide-based therapies. Calculations are therefore based on the cycle costs for
lenalidomide, bortezomib and thalidomide only, multiplied by the associated mean
number of cycles (Table 45).
Scenario analysis is provided to test the model sensitivity to subsequent treatment
assumptions (cost of subsequent treatments removed plus subsequent treatment
and OS assumed equal between VMP and MPT).

Company evidence submission template for Lenalidomide (ID474) © Celgene Inc. (2017). All rights reserved Page 131 of 163
B.3.5.5.1 Distribution of patients on treatment
Time from first to second progression (Table 43) was taken from the MM-020 CSR
for Rd and MPT.43 There was a lack of data on VMP for these two inputs and, as
such, the base case assumes equivalence to MPT given this is the reference
treatment for the HR for OS for VMP; note this is likely biased in favour of VMP as a
shorter time to second-line progression would be expected based upon the shorter
OS seen for VMP versus MPT from the NMA. Patients in subsequent lines of therapy
are calculated as follows:
• The difference in progression-free patients between cycles is multiplied by 1
minus the fatal progression rate (Table 43) to give the number of newly
progressed patients moving into second-line; this is used to calculate the cost
of second-line therapy.
• The number of newly progressed patients is added to the number of second-
line patients from the previous cycle multiplied by 1 minus the calculated cycle
probability of second progression or death (Table 43) to determine the number
of patients remaining between first and second progression – this is used to
calculate the number of patients remaining at second-line, and those receiving
a post-progression disutility if selected in scenario analysis.
• The number of patients entering third-line is calculated by multiplying the
number of patients remaining in second-line in the previous cycle by the cycle
probability of progression, and 1 minus the second-line fatal progression rate,
taken from Stadtmauer et al.130 (17.5% for Rd, with MPT and VMP assumed
equal). This is used to calculate the cost of third-line subsequent therapy.
• Those remaining in third-line or beyond are calculated as the number of
progressed patients minus the number of patients remaining in second-line,
and is used to calculate the disutility of third-line and beyond, if subsequent
treatment disutilities are chosen.
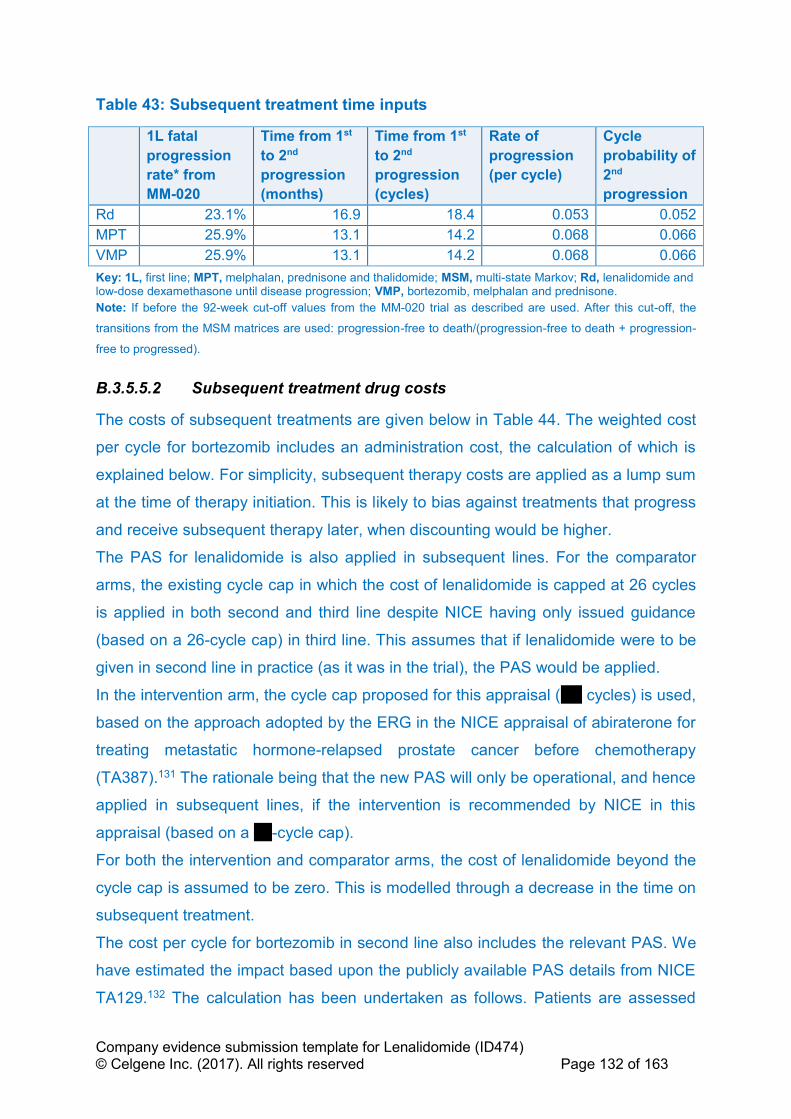
Company evidence submission template for Lenalidomide (ID474) © Celgene Inc. (2017). All rights reserved Page 132 of 163
Table 43: Subsequent treatment time inputs
1L fatal
progression
rate* from
MM-020
Time from 1st
to 2nd
progression
(months)
Time from 1st
to 2nd
progression
(cycles)
Rate of
progression
(per cycle)
Cycle
probability of
2nd
progression
Rd 23.1% 16.9 18.4 0.053 0.052
MPT 25.9% 13.1 14.2 0.068 0.066
VMP 25.9% 13.1 14.2 0.068 0.066
Key: 1L, first line; MPT, melphalan, prednisone and thalidomide; MSM, multi-state Markov; Rd, lenalidomide and low-dose dexamethasone until disease progression; VMP, bortezomib, melphalan and prednisone.
Note: If before the 92-week cut-off values from the MM-020 trial as described are used. After this cut-off, the
transitions from the MSM matrices are used: progression-free to death/(progression-free to death + progression-
free to progressed).
B.3.5.5.2 Subsequent treatment drug costs
The costs of subsequent treatments are given below in Table 44. The weighted cost
per cycle for bortezomib includes an administration cost, the calculation of which is
explained below. For simplicity, subsequent therapy costs are applied as a lump sum
at the time of therapy initiation. This is likely to bias against treatments that progress
and receive subsequent therapy later, when discounting would be higher.
The PAS for lenalidomide is also applied in subsequent lines. For the comparator
arms, the existing cycle cap in which the cost of lenalidomide is capped at 26 cycles
is applied in both second and third line despite NICE having only issued guidance
(based on a 26-cycle cap) in third line. This assumes that if lenalidomide were to be
given in second line in practice (as it was in the trial), the PAS would be applied.
In the intervention arm, the cycle cap proposed for this appraisal (''''''' cycles) is used,
based on the approach adopted by the ERG in the NICE appraisal of abiraterone for
treating metastatic hormone-relapsed prostate cancer before chemotherapy
(TA387).131 The rationale being that the new PAS will only be operational, and hence
applied in subsequent lines, if the intervention is recommended by NICE in this
appraisal (based on a ''''''-cycle cap).
For both the intervention and comparator arms, the cost of lenalidomide beyond the
cycle cap is assumed to be zero. This is modelled through a decrease in the time on
subsequent treatment.
The cost per cycle for bortezomib in second line also includes the relevant PAS. We
have estimated the impact based upon the publicly available PAS details from NICE
TA129.132 The calculation has been undertaken as follows. Patients are assessed
Company evidence submission template for Lenalidomide (ID474) © Celgene Inc. (2017). All rights reserved Page 133 of 163
after four cycles of treatment. If they achieve less than a partial response, they are
refunded the costs of the drug that they incurred. Lee et al., 2008,133 report that 92%
and 69% in the bortezomib arm of the APEX trial completed at least two and four
cycles, respectively. The primary reasons for discontinuation were progressive
disease (29% of bortezomib arm), AEs (20%) and patient request (5%). We assume
that the residual 46% discontinued because of stable disease. Considering the best
responses reported by Richardson et al., 2005 (38% complete or partial response,
8% minor response),134 this is reasonable. Thus 8% completed at most two cycles
and 31% completed at most four cycles. Of those who discontinued, 75% did so
because of progressive or stable disease. Therefore 8%*75% were eligible for rebate
at two cycles and 31%*75% were eligible for rebate at four cycles. The impact of
excluding this PAS has been tested in scenario analysis.

Company evidence submission template for Lenalidomide (ID474) © Celgene Inc. (2017). All rights reserved Page 134 of 163
Table 44: Subsequent-line drug costs
Drug Dose Tx cycle length
No. doses per cycle
Cost per Packagea
mg per pill/viala
Pills/Vials per packagea
RDI Weighted cost per cycle
Lenalidomide 25 mgb 28b 21b £4,368.00 25 mg 21 '''''''''''''''''' '''''''''''''''''''''''
Bortezomib 1.3 mg/mb c 25d 4c £762.38 3.5 mg 1 '''''''''''''''' '''''''''''''''''''''''''
Thalidomide 200 mge 28e 28e £298.48 50 mg 28 71.6%h £842.02
Key: kg, kilograms; mg, milligram; No, number; Tx, treatment.
a, Source: MIMs, accessed Jan 2017.125 '''' ''''''''''''''''''' '''''''''''''''''''''''''''''''' '''' ''''''''''''''' ''''' ''''''' ''''''''''''''''''''''' '''''''''' ''''''''''''''''''''''''''''' ''''' '''''''' ''''''''''''''''''''' c, Source: APEX – Richardson et al., 2005.134 d, Average bortezomib cycle length in APEX: eight cycles of 21 days + three cycles of 35 days = 273 days/11 cycles = 25 days/cycle e, Source: Waage et al., 2010;137 f Assumption. g, Includes administration cost; h, MM-010.123

Company evidence submission template for Lenalidomide (ID474) © Celgene Inc. (2017). All rights reserved Page 135 of 163
B.3.5.5.3 Subsequent treatment use
Table 45 shows the duration of each subsequent therapy by line of treatment. As the
treatments have different durations, costs are applied as a one-off upon initation of
second- or third-line treatment. The duration of subsequent therapy is assumed not
to be impacted by the treatment received in the ‘progression-free’ state. Duration of
treatment for lenalidomide is adjusted for the PAS application, by assuming an
exponential distribution for time on subsequent treatment as a simplification.
Table 45: Post-progression treatment durations
Treatment at each line Source(s) of the data Mean cycles used
in model
Second line
Lenalidomide-based
therapy
MM-009 and MM-010 (no multiple prior
relapses)135,136 ''''''''''''
Bortezomib-based therapy APEX134 5.0
Thalidomide-based therapy OPTIMUM124 7.0
Third line
Lenalidomide-based
therapy
MM-009 and MM-010 (no multiple prior
relapses)135,136 ''''''''
Bortezomib-based therapy APEX134 5.0
Thalidomide-based therapy OPTIMUM124 7.0
Key: MPT, melphalan, prednisone and thalidomide; NICE, National Institute for Health and Care Excellence.
Table 46: Proportion of patients on subsequent therapy and total costs
1L Received
subsequent
therapy
Therapy received Source Total
costs
2L Bort Thal Len
Rd 299 179 36 41 MM-020 CSR,43 Table 42 ''''''''''''''''''''
MPT 381 170 25 150 MM-020 CSR,43 Table 42 '''''''''''''''''''
VMP 178 25 71 26 Mateos et al., 2010.70 ''''''''''''''''''
3L+ Bort Thal Len
Rd 180 99 31 34 MM-020 CSR,43
Salvage_reg34, d_pop survi2
'''''''''''''''''''
MPT 231 133 13 130 MM-020
CSR,43Salvage_reg34, d_pop
survi2
'''''''''''''''''''''
VMP 79 21 23 34 Mateos et al., 2010.70 ''''''''''''''''''''
Key: 1L, fist line; 2L, second line; 3L, third line; CSR, clinical study report; MPT, melphalan, prednisone and
thalidomide; Rd, lenalidomide and dexamethasone until progression; VMP, bortezomib, melphalan and
prednisone.
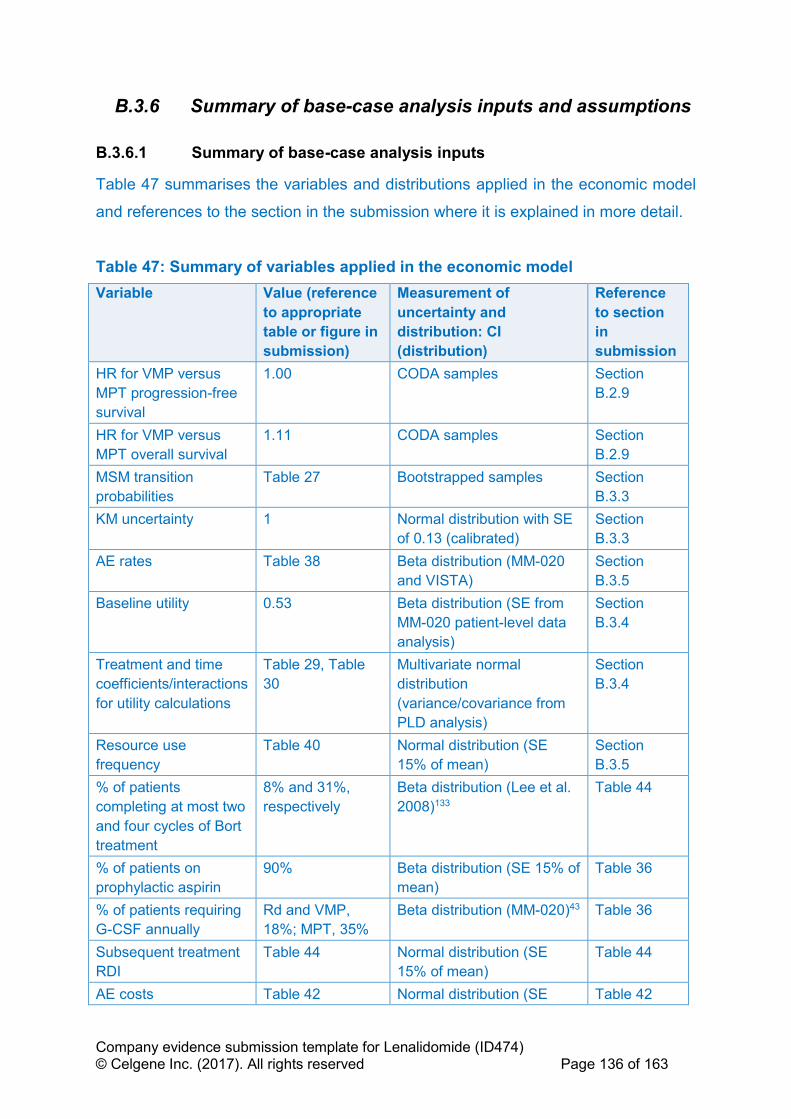
Company evidence submission template for Lenalidomide (ID474) © Celgene Inc. (2017). All rights reserved Page 136 of 163
B.3.6 Summary of base-case analysis inputs and assumptions
B.3.6.1 Summary of base-case analysis inputs
Table 47 summarises the variables and distributions applied in the economic model
and references to the section in the submission where it is explained in more detail.
Table 47: Summary of variables applied in the economic model
Variable Value (reference
to appropriate
table or figure in
submission)
Measurement of
uncertainty and
distribution: CI
(distribution)
Reference
to section
in
submission
HR for VMP versus
MPT progression-free
survival
1.00 CODA samples Section
B.2.9
HR for VMP versus
MPT overall survival
1.11 CODA samples Section
B.2.9
MSM transition
probabilities
Table 27 Bootstrapped samples Section
B.3.3
KM uncertainty 1 Normal distribution with SE
of 0.13 (calibrated)
Section
B.3.3
AE rates Table 38 Beta distribution (MM-020
and VISTA)
Section
B.3.5
Baseline utility 0.53 Beta distribution (SE from
MM-020 patient-level data
analysis)
Section
B.3.4
Treatment and time
coefficients/interactions
for utility calculations
Table 29, Table
30
Multivariate normal
distribution
(variance/covariance from
PLD analysis)
Section
B.3.4
Resource use
frequency
Table 40 Normal distribution (SE
15% of mean)
Section
B.3.5
% of patients
completing at most two
and four cycles of Bort
treatment
8% and 31%,
respectively
Beta distribution (Lee et al.
2008)133
Table 44
% of patients on
prophylactic aspirin
90% Beta distribution (SE 15% of
mean)
Table 36
% of patients requiring
G-CSF annually
Rd and VMP,
18%; MPT, 35%
Beta distribution (MM-020)43 Table 36
Subsequent treatment
RDI
Table 44 Normal distribution (SE
15% of mean)
Table 44
AE costs Table 42 Normal distribution (SE Table 42

Company evidence submission template for Lenalidomide (ID474) © Celgene Inc. (2017). All rights reserved Page 137 of 163
Variable Value (reference
to appropriate
table or figure in
submission)
Measurement of
uncertainty and
distribution: CI
(distribution)
Reference
to section
in
submission
15% of mean)
1L fatal progression
probability (pre-cut off)*
Rd: 23.1%; MPT:
25.9%; VMP:
25.9%
Beta distribution (MM-020)43 Table 43
Time from first to
second progression
(months)
Rd: 16.9; MPT:
13.1; VMP: 13.1
Normal distribution (MM-
020)
Table 43
Duration of subsequent
treatment
Table 45 Normal distribution (SE
15% of mean)
Table 45
Key: CI, confidence interval; HR, hazard ratio; RDI, relative dose intensity.
Notes: *, uncertainty in fatal progression post-cut-off is captured in the MSM bootstraps.
B.3.6.2 Assumptions
Table 48 details the assumptions used in the economic model and provides a
justification for each one. Section B.3.8.3 lists the assumptions that are varied in the
scenario analysis.

Company evidence submission template for Lenalidomide (ID474) © Celgene Inc. (2017). All rights reserved Page 138 of 163
Table 48: Base case assumptions
Assumption Justification Reference in
submission
ITT populations of trials in the evidence
network are representative of patients who
are unable to tolerate or have
contraindications to thalidomide
Based on the advice of clinical experts and the differences in toxicity profile and
mechanism of action between thalidomide and lenalidomide, patients who present with
predisposing conditions that make them more susceptible to thalidomide AEs may benefit
from receiving Rd.
Section B.3.2
Progression and death are linked events
that require modelling simultaneously
Rates of death from progression-free and progressed health states are different, with
MSM reflecting the growing proportion of patients in the progressed health state
influencing death rates
Section B.3.2
Relative efficacy between Rd and MPT
changes after 92 weeks
Log-cumulative hazards of PFS for Rd and MPT arms diverge Section B.3.3
Equal PPS between Rd and MPT after trial
follow-up
The post-progression survival benefit expected from Rd is anticipated to be balanced by
the subsequent use of Rd in the MPT arm
Section B.3.3
Proportional hazards between MPT and
VMP
The time-varying HRs NMA results did not indicate a statistically significant time-
dependency in the HRs for either PFS or OS.
Sections B.2.9
and B.3.3
Cycle hazards on each treatment are not
lower than the general population
None of the modelled treatments are expected to provide overall survival benefits greater
than that of the general population
Section B.3.3
Equal resource use post-progression Simplifying assumption given none of the modelled treatments are expected to require
substantial treatment-specific healthcare visits or assessments
Section B.3.5
AE rates for Rd and MPT change every 6
cycles, and are only applied in pre-
progression
Patients likely to experience an AE will do so at the start of treatment, with serious AEs
causing discontinuation, making them less frequent at later cycles. No modelled
treatments are expected to cause AEs after treatment discontinuation and progression
Section B.3.5
AE-related disutility is captured in treatment
covariate from utility analysis
Progression-free utility is calculated dependent on treatment, and it is expected that
disutilities from AEs will be captured in the questionnaires completed by these patients
Section B.3.4
Utility status is dependent on time,
treatment, age and progression
Analysis of EQ-5D data from MM-020 has indicated a significant effect of time and
treatment on utility of ‘progression-free’.
Section B.3.4
Utility post-progression is equal between
arms
None of the modelled treatments are expected to provide a post-progression utility benefit,
with patient level data analysis not identifying any significant effect
Section B.3.4
''''''''''''' ''''''''''''''''' ''''''''''' ''''''''''''''''''' '''' '''''''''''''' ''''' '''''''' ''''''''''' ''''''''''''''''''''''''' '''''''''' '''''''''''' '''''''''''' ''''' ''''''' ''''''''''''''''''''' ''''' '''''''''' '''''' ''''''''''''' '''''''''''''''''' ''''' ''''''''''''''''''''' '''''''''''''''' ''''''' ''''''''''''''''''''''''
Section B.3.5
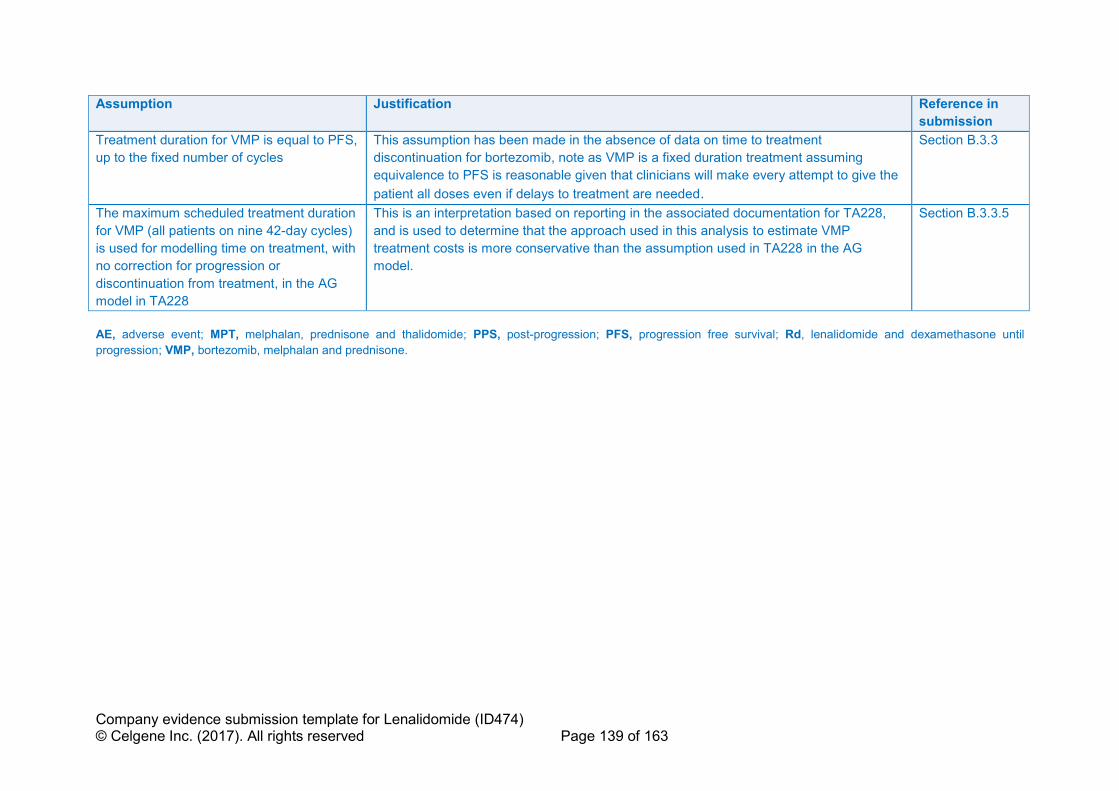
Company evidence submission template for Lenalidomide (ID474) © Celgene Inc. (2017). All rights reserved Page 139 of 163
Assumption Justification Reference in
submission
Treatment duration for VMP is equal to PFS,
up to the fixed number of cycles
This assumption has been made in the absence of data on time to treatment
discontinuation for bortezomib, note as VMP is a fixed duration treatment assuming
equivalence to PFS is reasonable given that clinicians will make every attempt to give the
patient all doses even if delays to treatment are needed.
Section B.3.3
The maximum scheduled treatment duration
for VMP (all patients on nine 42-day cycles)
is used for modelling time on treatment, with
no correction for progression or
discontinuation from treatment, in the AG
model in TA228
This is an interpretation based on reporting in the associated documentation for TA228,
and is used to determine that the approach used in this analysis to estimate VMP
treatment costs is more conservative than the assumption used in TA228 in the AG
model.
Section B.3.3.5
AE, adverse event; MPT, melphalan, prednisone and thalidomide; PPS, post-progression; PFS, progression free survival; Rd, lenalidomide and dexamethasone until
progression; VMP, bortezomib, melphalan and prednisone.
Company evidence submission template for Lenalidomide (ID474) © Celgene Inc. (2017). All rights reserved Page 140 of 163
B.3.7 Base-case results
Two base-case analyses are presented:
• Rd vs. MPT, representing the analysis in the wider population of patients with
NDMM for whom stem-cell transplantation is considered inappropriate. As
described in Section B.3.2.1, a cost-effectiveness case cannot be made in this
population due to thalidomide’s low acquisition cost.
• Rd vs. VMP, in the subgroup of patients who are unable to tolerate, or have
contraindications to thalidomide (in line with the final scope and TA2283). As
described in Section B.3.2.1, this is the evaluation we ask the Committee to
consider.
All results are presented based on the proposed PAS in which the cost of
lenalidomide is capped at ''''' cycles. Results based on the existing PAS in which the
cost of lenalidomide is capped at 26 cycles are presented in Appendix P.
B.3.7.1 Base-case incremental cost-effectiveness analysis results
B.3.7.1.1 Rd vs. MPT
The base-case results for Rd versus MPT are shown in Table 49. Rd is associated
with '''''''''''' incremental QALYs per patient, and an increase in overall costs of
''''''''''''''''''''' per patient. The ICER is '''''''''''''''''' per QALY gained.
Table 49: Base case results (with PAS) – vs MPT
Technologies Total
costs
Total
LYs
Total
QALYs
Inc.
costs
Inc.
LYs
Inc.
QALYs
ICER (per
QALY)
MPT ''''''''''''''''''' ''''''''''' '''''''''''
Rd '''''''''''''''''''' '''''''''''' '''''''''''' ''''''''''''''''''''' '''''''''' '''''''''' ''''''''''''''''''''
Key: MPT, melphalan plus prednisone plus thalidomide; Rd, lenalidomide low dose dexamethasone until disease
progression; LYs, Life years; QALY, quality adjusted life year; Inc., incremental
B.3.7.1.2 Rd vs. VMP in the subgroup of patients who are unable to tolerate
or have contraindications to thalidomide
The base case results for Rd versus VMP are shown in Table 50. Rd is associated
with '''''''''' incremental QALYs per patient, and an increase in overall costs of ''''''''''''''''''
per patient. The ICER is '''''''''''''''''' per QALY gained.

Company evidence submission template for Lenalidomide (ID474) © Celgene Inc. (2017). All rights reserved Page 141 of 163
Table 50: Base case results (with PAS) – vs VMP in the subgroup of patients who are unable to tolerate or have contraindications to thalidomide
Technologies Total
costs
Total
LYs
Total
QALYs
Inc.
costs
Inc.
LYs
Inc.
QALYs
ICER (per
QALY)
VMP ''''''''''''''''''' ''''''''''' '''''''''''
Rd '''''''''''''''''''' '''''''''''' '''''''''''' ''''''''''''''''''''' '''''''''' '''''''''' ''''''''''''''''''''
Key: VMP, Bortezomib Melphalan Prednisone; Rd, lenalidomide low dose dexamethasone until disease
progression; LYs, Life years; QALY, quality adjusted life year; Inc., incremental
B.3.8 Sensitivity analyses
Sensitivty analyses for the comparison of Rd vs. MPT are not presented given a
cost-effectiveness case cannot be made in this population due to thalidomide’s low
acquisition cost (Section B.3.2.1).
B.3.8.1 Probabilistic sensitivity analysis – Rd versus VMP
A PSA was performed by varying all inputs simultaneously over 1,000 iterations,
based upon their distributional information (see Section B.3.6.1). The results are
presented on a cost-effectiveness plane (Figure 24) and as cost-effectiveness
acceptability curves (CEACs). Results from the PSA are presented below in Figure
24 and Table 51, with survival and QALYs contributing more uncertainty than costs.
Table 51: Probabilistic incremental cost-effectiveness analysis results (with PAS)
Technologies Total
costs
Total
LYs
Total
QALYs
Inc.
costs
Inc.
LYs
Inc.
QALYs
ICER (per
QALY)
''''''''''''' ''''''''''''''''''' ''''''''''' '''''''''''
''''''' '''''''''''''''''''' '''''''''''' '''''''''''' ''''''''''''''''''''' '''''''''' '''''''''' ''''''''''''''''''''
Key: VMP, Bortezomib Melphalan Prednisone; Rd, lenalidomide low dose dexamethasone until disease
progression; LYs, Life years; QALY, quality adjusted life year; Inc., incremental
Company evidence submission template for Lenalidomide (ID474) © Celgene Inc. (2017). All rights reserved Page 142 of 163
Figure 24: Cost-effectiveness plane
Key: PSA, probabilistic sensitivity analysis; QALY, quality adjusted life year; VMP, bortezomib melphalan prednisone; WTP, willingness-to-pay.
Based on the CEAC (Figure 25) there is a ''''''''''' and ''''''''''' likelihood that Rd is cost-
effective at willingness-to-pay thresholds of £20,000 and £30,000 per QALY
respectively.
Figure 25: Cost-effectiveness acceptability curve

Company evidence submission template for Lenalidomide (ID474) © Celgene Inc. (2017). All rights reserved Page 143 of 163
Key: Rd, lenalidomide and low dose dexamethasone until disease progression; VMP, bortezomib melphalan
prednisone.
B.3.8.2 Deterministic sensitivity analysis – Rd versus VMP
A series of one-way sensitivity analyses (OWSA) were performed to evaluate the
sensitivity of the model ICER to individual inputs, holding all else constant. In the
deterministic sensitivity analysis, the lower and upper bounds of a parameter were
often set to ± 1.96*SE of the base case value (or mean), where SE was obtained
from its source data. Alternatively, confidence intervals were used where available.
However, when such information was not available, the upper and lower bounds
were assumed to be within ± 15% of the base case value. In a few cases, variation
of a model parameter in deterministic sensitivity analysis was done per the NICE
guidelines (e.g. 0% and 5% for discount rate).
All parameters described in Section B.3.6 are varied, aside from the MSM matrices
which are only varied in the PSA due to their non-standard distribution.
Figure 26 presents a tornado diagram with parameters shown in descending order of
ICER sensitivity.
Figure 26: Results of one-way sensitivity analysis – Rd vs. VMP
Key: DoT, duration of treatment; HR, hazard ratio; MPT, melphalan plus prednisone plus thalidomide; OS,
overall survival; Rd, lenalidomide and low dose dexamethasone until disease progression; TTF, time to treatment
failure; VMP, bortezomib melphalan prednisone.

Company evidence submission template for Lenalidomide (ID474) © Celgene Inc. (2017). All rights reserved Page 144 of 163
The model is relatively insensitive to the majority of parameters, with no parameters
other than the OS HR for VMP ''''''''''''''''''' '''''''' '''''''''''' ''''' ''''''''''''''''''' '''''''''''''''' '''''''''''''''''''''' '''''''''
'''''''''' '''''''' '''''''''''''''''''' '''''''''' ''''''''''''''''''''' '''''''''''''''''''' '''''''' ''''''''''''' '''' ''''''''''''''''''''' ''''''''''''''' '''''''''''''''''''''.
The parameters with the greatest impact on model outcomes were the HR for VMP
overall survival, discount rate, parameters for time to treatment failure and utility
inputs. However, the analysis varying the HR for VMP should be treated with caution
as this fails to capture the correlation of this parameter with others in the model, such
as subsequent therapy costs which would be associated with such variations in OS;
this is addressed in the scenario analyses (Section B.3.8.3).
B.3.8.3 Scenario analysis – Rd versus VMP
The extensive range of scenarios tested are detailed in Table 52. The ICER is
relatively insensitive to these analyses, with no scenarios '''''''''''''''''' '''''''' '''''''''''''' '''''
''''''''''''''''''' '''''''''''''' ''''''''''''''''''''''' ''''''''''' '''''''''' '''''''''''''''''''' '''''''''''''''''''' '''''''' ''''''''''''' ''''' '''''''''''''''''' '''''''''''''''
'''''''''''''''''' ''''''''' ''''''''''''' ''''''''''''''''''''''''' ''''''''''''''''''' '''''''''''''''''''''''''' ''''' '''''''' ''''''''''''''. Key results are as
follows:
• Equal OS and subsequent therapy for VMP and MPT – assuming equivalent
OS for VMP vs. MPT (based on the statistical insignificance of the HR
estimated by the NMA) combined with the assumption of equivalent
subsequent therapy use ''''''''''''' ''''' '''''''' '''''''''''''''''''''''' '''''''''''''. Given equal PFS was
estimated by the NMA for VMP vs. MPT, variations in OS for VMP vs. MPT
should be considered to result from the impact of variations in subsequent
therapies on post-progression survival, hence this scenario is arguably more
informative than the OWSA of the VMP HR for OS which fails to capture such
correlation.
• Remove all subsequent treatment costs – setting all subsequent therapy costs
to zero '''''''''''''''''''' ''''''' '''''''''''' ''''''' '''''''' '''' ''''''''''''''''''''' per QALY gained.
• Equal PPS for Rd and MPT – the MSM analysis predicted a marginally lower
per cycle probability of death from progressive disease for Rd vs. MPT
(0.0194 vs. 0.0195 respectively). ''''''''''''''''''''''' '''''''' '''''''''''''''''''''''' '''''''''''' ''''''''' ''''''
''''''''''''''''''''''' ''''''''''''''' '''''' ''''''' '''''''''''' '''''''''''''''''''''' ''''''''' '''''''''''''' '''''''''''''''''.
• Time-varying HRs for VMP and Rd vs. MPT – although the proportional
hazards assumption was not violated for either Rd or MPT, the point
estimates of the HR did show some potentially meaningful changes over time.
Company evidence submission template for Lenalidomide (ID474) © Celgene Inc. (2017). All rights reserved Page 145 of 163
Relaxing the proportional hazards assumption for the period in which the HR
was observed for each comparison '''''''''''''''''' ''''''' '''''''''''' ''''''' ''''''' ''''' '''''''''''''''''' ''''''''
''''''''''''''''' ''''''''''' '''' '''''''''''''''''''''''''''''''''''' ''''''''''''''' '''''' ''''''' ''''''''''''''''''''''''' ''''''' '''''' ''''''' ''''''''' ''''''''
'''''''''''''''''''''''' ''''''''' '''''' '''''''''''' ''''''' '''''''''''' ''''''''''' ''''''''''''
• Remove treatment coefficient and interaction terms for utility calculations –
these effects were not statistically significant however were included to
capture the impact of treatment-related adverse events for Rd. ''''''''''''''''''''' '''''
'''''''''''''' ''''''''''''''' '''''''''' '''''' ''''''''''''''''''''''''''' ''''''''''''''''' '''''' ''''''''' '''''''''''' '''''''''''''''''''' ''''''' '''''''''''''''
'''''''''''''''''''
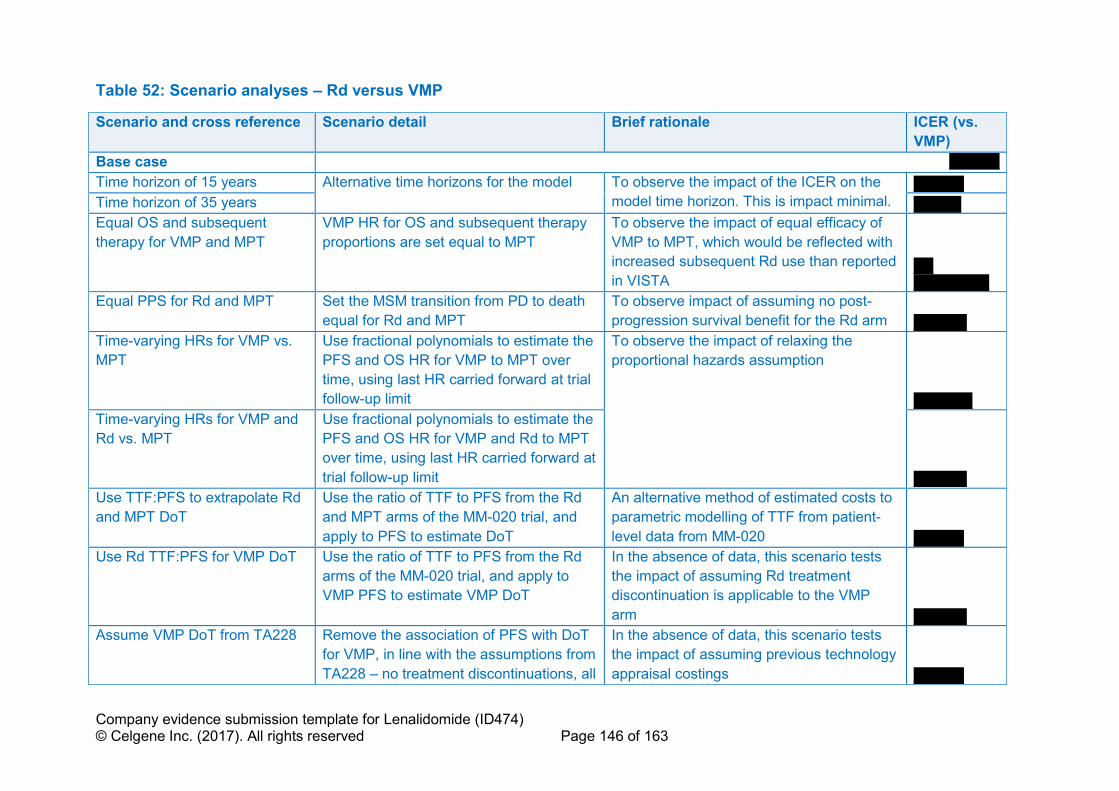
Company evidence submission template for Lenalidomide (ID474) © Celgene Inc. (2017). All rights reserved Page 146 of 163
Table 52: Scenario analyses – Rd versus VMP
Scenario and cross reference Scenario detail Brief rationale ICER (vs.
VMP)
Base case ''''''''''''''''''
Time horizon of 15 years Alternative time horizons for the model To observe the impact of the ICER on the
model time horizon. This is impact minimal. ''''''''''''''''''
Time horizon of 35 years '''''''''''''''''
Equal OS and subsequent
therapy for VMP and MPT
VMP HR for OS and subsequent therapy
proportions are set equal to MPT
To observe the impact of equal efficacy of
VMP to MPT, which would be reflected with
increased subsequent Rd use than reported
in VISTA ''''''' '''''''''''''''''''''''''''
Equal PPS for Rd and MPT Set the MSM transition from PD to death
equal for Rd and MPT
To observe impact of assuming no post-
progression survival benefit for the Rd arm '''''''''''''''''''
Time-varying HRs for VMP vs.
MPT
Use fractional polynomials to estimate the
PFS and OS HR for VMP to MPT over
time, using last HR carried forward at trial
follow-up limit
To observe the impact of relaxing the
proportional hazards assumption
'''''''''''''''''''''
Time-varying HRs for VMP and
Rd vs. MPT
Use fractional polynomials to estimate the
PFS and OS HR for VMP and Rd to MPT
over time, using last HR carried forward at
trial follow-up limit '''''''''''''''''''
Use TTF:PFS to extrapolate Rd
and MPT DoT
Use the ratio of TTF to PFS from the Rd
and MPT arms of the MM-020 trial, and
apply to PFS to estimate DoT
An alternative method of estimated costs to
parametric modelling of TTF from patient-
level data from MM-020 ''''''''''''''''''
Use Rd TTF:PFS for VMP DoT Use the ratio of TTF to PFS from the Rd
arms of the MM-020 trial, and apply to
VMP PFS to estimate VMP DoT
In the absence of data, this scenario tests
the impact of assuming Rd treatment
discontinuation is applicable to the VMP
arm '''''''''''''''''''
Assume VMP DoT from TA228 Remove the association of PFS with DoT
for VMP, in line with the assumptions from
TA228 – no treatment discontinuations, all
In the absence of data, this scenario tests
the impact of assuming previous technology
appraisal costings ''''''''''''''''''
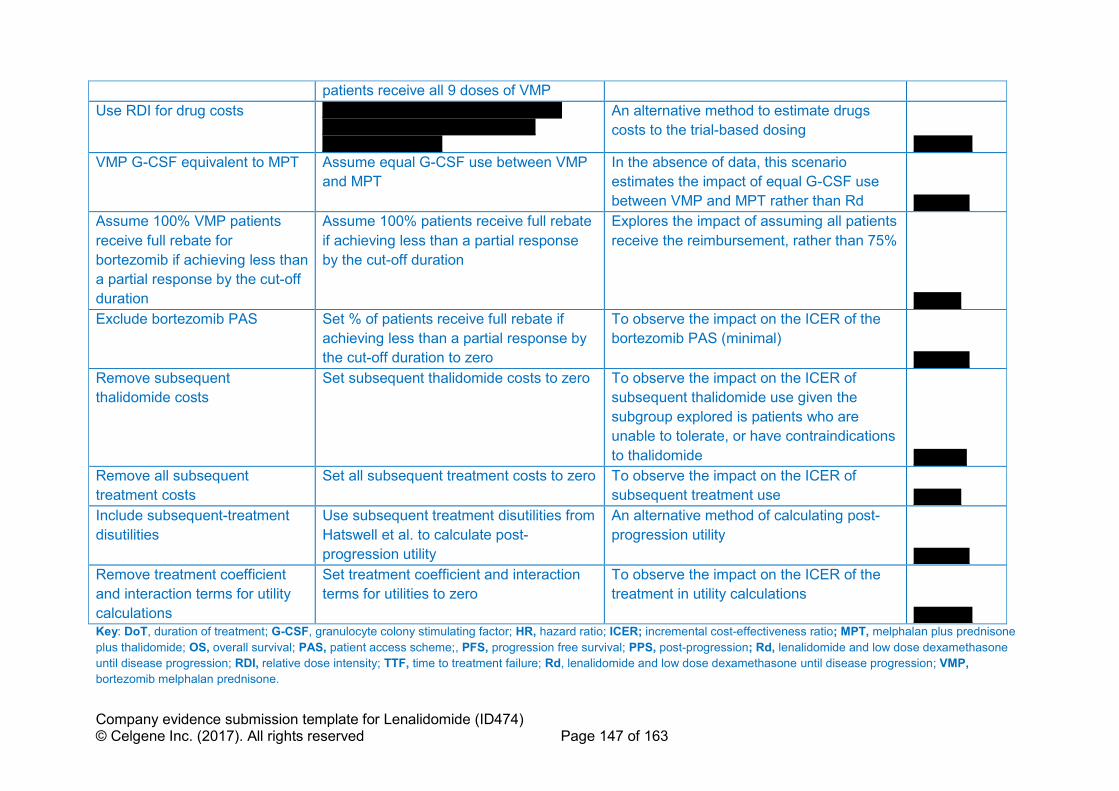
Company evidence submission template for Lenalidomide (ID474) © Celgene Inc. (2017). All rights reserved Page 147 of 163
patients receive all 9 doses of VMP
Use RDI for drug costs '''''''''' ''''''''''''' ''''''''' ''''''''''' '''''''''''''''''' ''''''' ''''''''' '''''''''''' ''''''''' ''''''''''' ''''''''''' '''''''''''' '''''''''''''' ''''''''''''''''''''''' ''''''' ''''''''''
An alternative method to estimate drugs
costs to the trial-based dosing '''''''''''''''''''''
VMP G-CSF equivalent to MPT Assume equal G-CSF use between VMP
and MPT
In the absence of data, this scenario
estimates the impact of equal G-CSF use
between VMP and MPT rather than Rd ''''''''''''''''''''
Assume 100% VMP patients
receive full rebate for
bortezomib if achieving less than
a partial response by the cut-off
duration
Assume 100% patients receive full rebate
if achieving less than a partial response
by the cut-off duration
Explores the impact of assuming all patients
receive the reimbursement, rather than 75%
'''''''''''''''''
Exclude bortezomib PAS Set % of patients receive full rebate if
achieving less than a partial response by
the cut-off duration to zero
To observe the impact on the ICER of the
bortezomib PAS (minimal)
''''''''''''''''''''
Remove subsequent
thalidomide costs
Set subsequent thalidomide costs to zero To observe the impact on the ICER of
subsequent thalidomide use given the
subgroup explored is patients who are
unable to tolerate, or have contraindications
to thalidomide '''''''''''''''''''
Remove all subsequent
treatment costs
Set all subsequent treatment costs to zero To observe the impact on the ICER of
subsequent treatment use '''''''''''''''''
Include subsequent-treatment
disutilities
Use subsequent treatment disutilities from
Hatswell et al. to calculate post-
progression utility
An alternative method of calculating post-
progression utility
''''''''''''''''''''
Remove treatment coefficient
and interaction terms for utility
calculations
Set treatment coefficient and interaction
terms for utilities to zero
To observe the impact on the ICER of the
treatment in utility calculations
''''''''''''''''''''' Key: DoT, duration of treatment; G-CSF, granulocyte colony stimulating factor; HR, hazard ratio; ICER; incremental cost-effectiveness ratio; MPT, melphalan plus prednisone
plus thalidomide; OS, overall survival; PAS, patient access scheme;, PFS, progression free survival; PPS, post-progression; Rd, lenalidomide and low dose dexamethasone
until disease progression; RDI, relative dose intensity; TTF, time to treatment failure; Rd, lenalidomide and low dose dexamethasone until disease progression; VMP,
bortezomib melphalan prednisone.
Company evidence submission template for Lenalidomide (ID474) © Celgene Inc. (2017). All rights reserved Page 148 of 163
B.3.8.4 Summary of sensitivity analyses results
The analyses indicate the comparison between Rd and VMP is robust, ''''''''''' '''''''''
'''''''''''''''''''''''''''''''''''''''' '''''''''''''''''''''' '''''''' ''''''''''''' '''''''''''''' '''''''' '''''''''''''''''' ''''''''''''''''''''''''''''''''''''''
'''''''''''''''''''''''''
Although OWSA identified the VMP OS HR as having the greatest impact on the
ICER, the values used for the HR are the 95% credible intervals from the CODA
samples, and the analyses assume no correlation between the associated change in
OS for VMP and any other parameter. Thus, this analysis result should be
interpreted with caution. When attempting to address this bias in the scenario
analysis by assuming OS and subsequent therapy use were equal for VMP vs. MPT
(in line with equality of PFS), Rd domainted VMP.
B.3.9 Subgroup analysis
Aside from the population of patients who are unable to tolerate or have
contraindications to thalidomide, no other subgroups were considered in this
submission.
B.3.10 Validation
B.3.10.1 Validation of cost-effectiveness analysis
Upon completion of programming, the model was validated by internal and external
modellers. A programmer (other than the one who built the model) reviewed all
formulas and labelling in the model. Following this first validation step, an extreme
value analysis was conducted. This involved inputting sensible upper and lower
bounds (e.g. £0 for costs, but not negative costs) into the model one parameter at a
time and observing the corresponding changes in the results. Where it was not
sensible to vary only one parameter or the expected effect on the results was not
straightforward, a related group of parameters was varied simultaneously. The
results were checked against their expected impact or the predicted direction of
change for the varied parameter(s). For example, setting all AEs costs to zero would
result in £0 for AE management across all treatment arms. The model was also
validated and the modelling strategy and methodology critiqued by an academic
health economist.
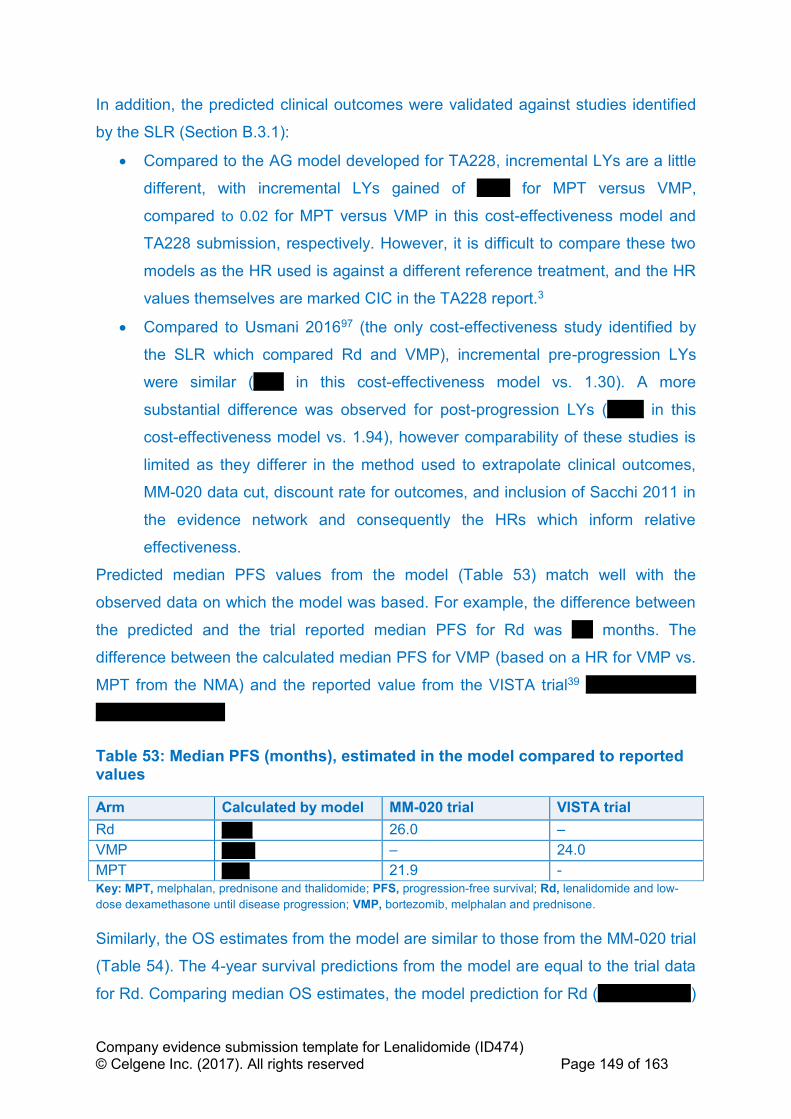
Company evidence submission template for Lenalidomide (ID474) © Celgene Inc. (2017). All rights reserved Page 149 of 163
In addition, the predicted clinical outcomes were validated against studies identified
by the SLR (Section B.3.1):
• Compared to the AG model developed for TA228, incremental LYs are a little
different, with incremental LYs gained of ''''''''''' for MPT versus VMP,
compared to 0.02 for MPT versus VMP in this cost-effectiveness model and
TA228 submission, respectively. However, it is difficult to compare these two
models as the HR used is against a different reference treatment, and the HR
values themselves are marked CIC in the TA228 report.3
• Compared to Usmani 201697 (the only cost-effectiveness study identified by
the SLR which compared Rd and VMP), incremental pre-progression LYs
were similar ('''''''''' in this cost-effectiveness model vs. 1.30). A more
substantial difference was observed for post-progression LYs ('''''''''''' in this
cost-effectiveness model vs. 1.94), however comparability of these studies is
limited as they differer in the method used to extrapolate clinical outcomes,
MM-020 data cut, discount rate for outcomes, and inclusion of Sacchi 2011 in
the evidence network and consequently the HRs which inform relative
effectiveness.
Predicted median PFS values from the model (Table 53) match well with the
observed data on which the model was based. For example, the difference between
the predicted and the trial reported median PFS for Rd was ''''''' months. The
difference between the calculated median PFS for VMP (based on a HR for VMP vs.
MPT from the NMA) and the reported value from the VISTA trial39 ''''' ''''''''''''' ''''''''''''''
'''''''''''''''' '''''''''''''''''''''''''
Table 53: Median PFS (months), estimated in the model compared to reported values
Arm Calculated by model MM-020 trial VISTA trial
Rd ''''''''''' 26.0 –
VMP '''''''''''' – 24.0
MPT '''''''''' 21.9 -
Key: MPT, melphalan, prednisone and thalidomide; PFS, progression-free survival; Rd, lenalidomide and low-
dose dexamethasone until disease progression; VMP, bortezomib, melphalan and prednisone.
Similarly, the OS estimates from the model are similar to those from the MM-020 trial
(Table 54). The 4-year survival predictions from the model are equal to the trial data
for Rd. Comparing median OS estimates, the model prediction for Rd (''''''''''' '''''''''''''''''')

Company evidence submission template for Lenalidomide (ID474) © Celgene Inc. (2017). All rights reserved Page 150 of 163
was '''''''''''''' '''''''''''''''''''''''' to that observed in the MM-020 trial (59.1 months). The
predicted median OS for MPT was '''''''''''''' ''''''' ''''''''''''''''''' '''''''''''' '''''''''''''''''' of that observed
in MM-020 (49.1 months).
Predicted median OS for VMP ''''''''''' ''''''''''''''''''' '''''''''' ''''''''''''''' than the observed median
OS (56.4 months) from the VISTA trial. This is likely because the MPT arm of the
MM-020 trial is used as the reference for the HR for OS for VMP and the study
population in the VISTA trial seemed to be healthier compared to patients enrolled in
the MM-020 trial, who are older (median age: 73 years versus 71 years) and sicker
(ISS stage 3: 40% versus 35%).
Table 54: Four-year OS (%) and median OS (months), estimated in the model compared to reported values
Arm Calculated by model FIRST (MM-020) trial VISTA trial
4-year OS Median OS 4-year OS Median OS Median OS
Rd ''''''''''''''' '''''''''''' 58.99% 59.1 –
VMP '''''''''''''''' ''''''''''' – – 56.4
MPT '''''''''''''' '''''''''''' 51.67% 49.1 – Key: MPT, melphalan, prednisone and thalidomide; OS, overall survival; Rd, lenalidomide and low-dose
dexamethasone until disease progression; VMP, bortezomib, melphalan and prednisone.
B.3.11 Interpretation and conclusions of economic evidence
Despite the improvement in PFS and OS with the use of VMP and MPT in
transplant-ineligible patients with NDMM, most patients relapse within about 2 years
and experience a high rate of drug toxicities and poor HRQL. A clear unmet need still
exists for this population as MM is characterised by regression and remission, and
ultimately treatment failure, indicating the presence of residual disease even in
patients who initially show a complete clinical response to treatment.26 One of the
principle advantages of Rd is that it can be given as continuous treatment based on
its toxicity profile.5 Rd treatment has been clearly shown to have long-term superior
clinical benefits over MPT in the MM-020 trial and over VMP in the NMA.
The model uses the latest cut off (21 January 2016, median follow-up of 67 months)
of patient-level data from the ITT population of the MM-020 study, and uses a
structure that captures the key aspects of the disease regarding benefits and costs
and reflects the most recent NICE DSU guidance on cancer modelling.100
This evaluation focuses on the cost-effectiveness of Rd vs. VMP in the subgroup of
patients who are unable to tolerate or have contraindications to thalidomide, as a
Company evidence submission template for Lenalidomide (ID474) © Celgene Inc. (2017). All rights reserved Page 151 of 163
cost-effectiveness case for cannot be made for Rd when compared against MPT due
to thalidomide’s low acquisition cost. Compared to VMP, this evaluation replicates
the clinical benefits for Rd predicted by the NMA (i.e. prolonged PFS and OS),
yielding incremental QALYs of '''''''''''. This is predominantly driven by gains in the
‘pre-progression’ state stemming from the continuous nature of Rd. These benefits
were accrued at reasonable additional costs ''''''''''''''''''''''''; ''''''''''''''''''''''''' ''''''''''''
''''''''''''''''''''''''''' ''''''''''''' ''''''' '''''' '''''''' ''''''''''''' '''''' '''''''''''''''''' '''' '''''''''''''''''''''''''''''''''' '''''''''''''' ''''''''''''''''''''''
''''''''''' '''''''' '''''''''' '''''''''''''''' ''''' ''''''''''''''''''''''''''''''''''' '''''' ''''''''
This yields an ICER for Rd vs. VMP of '''''''''''''''''' per QALY gained when the PAS is
applied. The corresponding probability that Rd is cost-effective at a decision
threshold of £30,000 per QALY is ''''''''''. Moreover, the ICER was insensitive to
OWSA and a range of scenario analyses exploring key assumptions. Adopting a HR
for OS for VMP of 0.82 (lower 95% credible interval from NMA) ''''''''' '''''''' ''''''''''
''''''''''''''''''' '''''''''''' ''''''''''''''''' '''''' ''''''''''''' '''''' '''''''' ''''''' ''''''''''''' '''''''''''''''' '''''''''''''''''' ''''''' '''''''''''''', however
this may be subject to bias as previously described, and hence should be interpreted
with caution. Analyses attempting to correct this bias reinforced the cost-
effectiveness of Rd.
In conclusion, these results indicate Rd is a cost-effective use of NHS resources in
patients who are unable to tolerate or have contraindications to thalidomide, and
should be recommended for this patient population to help to address the unmet
medical need faced by these patients.
Key limitations include the lack of maturity of HRQL data where few observations are
available post progression (although again scenarios using external literature show
that the base case which uses only the trial data presents a conservative estimate of
the ICER) and a lack of data for VMP for some parameters necessitating the use of
assumptions based upon data for Rd and MPT.

Company evidence submission template for Lenalidomide (ID474) © Celgene Inc. (2017). All rights reserved Page 152 of 163
B.4 References
1. European Medicines Agency. Revlimid EMEA/H/C/000717 (authorisation). 19 Feb 2015. Available from: http://www.ema.europa.eu/docs/en_GB/document_library/EPAR_-_Procedural_steps_taken_and_scientific_information_after_authorisation/human/000717/WC500056024.pdf (Accessed 25 October 2017).
2. European Medicines Agency. Committee for Medicinal Products for Human Use (CHMP) assessment report, Revlimid EMEA/H/C/000717/X/0073/G. 11 February 2015. Available from: http://www.ema.europa.eu/docs/en_GB/document_library/EPAR_-_Assessment_Report_-_Variation/human/000717/WC500184943.pdf. (Accessed 25 October 2017).
3. National Institute for Health and Care Excellence. NICE TA228. Bortezomib and thalidomide for the first-line treatment of multiple myeloma. July 2011. Available from: https://www.nice.org.uk/Guidance/ta228 (Accessed 25 October 2017).
4. Quach H, Ritchie D, Stewart AK et al. Mechanism of action of immunomodulatory drugs (IMiDS) in multiple myeloma. Leukemia 2010;24:22–23.
5. Medicines.org.uk. eMC. REVLIMID® 25mg hard capsules – summary of product characteristics. Last updated 25 May 2017. Available from: http://www.medicines.org.uk/emc/medicine/19841 (Accessed 25 October 2017).
6. Stewart AK. Medicine. How thalidomide works against cancer. Science 2014;343:256–7.
7. MIMS Clinics. REVLIMID®. July 2017. Available from: http://www.mims.co.uk/drugs/cancer/antineoplastics/revlimid (Accessed 25 October 2017).
8. Hoffbrand AV, Catovsky D, Tuddenham EGD. 2005. Postgraduate Haematology (fifth edition). Available from: http://download.e-bookshelf.de/download/0000/5972/42/L-G-0000597242-0002362915.pdf (Accessed 25 October 2017).
9. Morgan GJ, Walker BA, Davies FE. The genetic architecture of multiple myeloma. Nat Rev Cancer 2012;12:335–48.
10. World Health Organization. GLOBOCAN 2012: Estimated Cancer Incidence, Mortality and Prevalence Worldwide in 2012. Available from: http://globocan.iarc.fr/Pages/fact_sheets_population.aspx. (Accessed October 2017).
11. Haematological Malignancy Research Network (HMRN). Patient's age and treatment for haematological malignancy 2014: a report from the haematological malignancy research network (HMRN) Network data, 2004–2012.
12. Howlader N, Noone AM, Krapcho M et al. SEER cancer statistics review, 1975–2014, National Cancer Institute. Bethesda, MD, Available from: https://seer.cancer.gov/statfacts/html/mulmy.html (Accessed 25 October 2017).
13. Cancer Research UK. Cancer Stats Myeloma - UK, 2014. Available from: http://www.cancerresearchuk.org/health-professional/cancer-statistics/statistics-by-cancer-type/myeloma#heading-Two (Accessed 25 October 2017).
14. Rajkumar SV, Kumar S. Multiple Myeloma: Diagnosis and Treatment. Mayo Clin Proc 2016;91:101–19.
15. Kyle RA, Gertz MA, Witzig TE et al. Review of 1027 patients with newly diagnosed multiple myeloma. Mayo Clin Proc 2003;78:21–33.
16. International Myeloma Foundation. Multiple myeloma: Concise Review of the Disease and Treatment Options. 2016 (2nd Ed). Available from: https://www.myeloma.org/sites/default/files/images/publications/UnderstandingPDF/concisereview.pdf. (Accessed 25 October 2017).
17. Bird JM, Owen RG, D’Sa S et al. Guidelines for the diagnosis and management of multiple myeloma 2014. Available from:
Company evidence submission template for Lenalidomide (ID474) © Celgene Inc. (2017). All rights reserved Page 153 of 163
http://www.bcshguidelines.com/documents/MYELOMA_GUIDELINE_Feb_2014_for_BCSH.pdf (Accessed 25 October 2017).
18. Dimopoulos MA, Sonneveld P, Leung N et al. International Myeloma Working Group Recommendations for the Diagnosis and Management of Myeloma-Related Renal Impairment. J Clin Oncol 2016;34:1544–57.
19. Palumbo A, Bringhen S, Ludwig H et al. Personalized therapy in multiple myeloma according to patient age and vulnerability: a report of the European Myeloma Network (EMN). Blood 2011;118:4519–29.
20. Durie BG, Salmon SE. A clinical staging system for multiple myeloma. Correlation of measured myeloma cell mass with presenting clinical features, response to treatment, and survival. Cancer 1975;36:842–54.
21. Greipp PR, San Miguel J, Durie BG et al. International staging system for multiple myeloma. J Clin Oncol 2005;23:3412–20.
22. Fonseca R, Bergsagel PL, Drach J et al. International Myeloma Working Group molecular classification of multiple myeloma: spotlight review. Leukemia 2009;23:2210–21.
23. Shaughnessy JD, Jr., Haessler J, van Rhee F et al. Testing standard and genetic parameters in 220 patients with multiple myeloma with complete data sets: superiority of molecular genetics. Br J Haematol 2007;137:530–6.
24. Palumbo A, Avet-Loiseau H, Oliva S et al. Revised International Staging System for Multiple Myeloma: A Report From International Myeloma Working Group. J Clin Oncol 2015;33:2863–9.
25. Hajek R. Strategies for the treatment of multiple myeloma in 2013: moving toward the cure, multiple myeloma – a quick reflection on the fast progress, Prof. Roman Hajek (Ed.), ISBN: 978-953-51-1083-5, InTech, DOI: 10.5772/55366. 2013. Available from: http://www.intechopen.com/books/multiple-myeloma-a-quick-reflection-on-the-fast-progress/strategies-for-the-treatment-of-multiple-myeloma-in-2013-moving-toward-the-cure (Accessed 25 October 2017).
26. Borrello I. Can we change the disease biology of multiple myeloma? Leuk Res 2012;36 Suppl 1:S3–12.
27. Rawstron AC, Gregory WM, de Tute RM et al. Minimal residual disease in myeloma by flow cytometry: independent prediction of survival benefit per log reduction. Blood 2015;125:1932–5.
28. Richardson PG, Delforge M, Beksac M et al. Management of treatment-emergent peripheral neuropathy in multiple myeloma. Leukemia 2012;26:595–608.
29. Kumar SK, Therneau TM, Gertz MA et al. Clinical course of patients with relapsed multiple myeloma. Mayo Clin Proc 2004;79:867–74.
30. Paiva B, Gutierrez NC, Rosinol L et al. High-risk cytogenetics and persistent minimal residual disease by multiparameter flow cytometry predict unsustained complete response after autologous stem cell transplantation in multiple myeloma. Blood 2012;119:687–91.
31. Benboubker L, Dimopoulos MA, Dispenzieri A et al. Lenalidomide and dexamethasone in transplant-ineligible patients with myeloma. N Engl J Med 2014;371:906–17.
32. Yong K, Delforge M, Driessen C et al. Multiple myeloma: patient outcomes in real-world practice. Br J Haematol 2016;175:252–264.
33. Mohty B, El-Cheikh J, Yakoub-Agha I et al. Treatment strategies in relapsed and refractory multiple myeloma: a focus on drug sequencing and 'retreatment' approaches in the era of novel agents. Leukemia 2012;26:73–85.
34. Blade J, San Miguel JF, Alcala A et al. Alternating combination VCMP/VBAP chemotherapy versus melphalan/prednisone in the treatment of multiple myeloma: a randomized multicentric study of 487 patients. J Clin Oncol 1993;11:1165–71.
35. Osterborg A, Bjorkholm M, Bjoreman M et al. Natural interferon-alpha in combination with melphalan/prednisone versus melphalan/prednisone in the treatment of multiple
Company evidence submission template for Lenalidomide (ID474) © Celgene Inc. (2017). All rights reserved Page 154 of 163
myeloma stages II and III: a randomized study from the Myeloma Group of Central Sweden. Blood 1993;81:1428–34.
36. Cooper MR, Dear K, McIntyre OR et al. A randomized clinical trial comparing melphalan/prednisone with or without interferon alfa-2b in newly diagnosed patients with multiple myeloma: a Cancer and Leukemia Group B study. J Clin Oncol 1993;11:155–60.
37. Morgan GJ, Davies FE, Gregory WM et al. Long-term follow-up of MRC Myeloma IX trial: survival outcomes with bisphosphonate and thalidomide treatment. Clin Cancer Res 2013;19:6030–8.
38. Facon T, Mary JY, Hulin C et al. Melphalan and prednisone plus thalidomide versus melphalan and prednisone alone or reduced-intensity autologous stem cell transplantation in elderly patients with multiple myeloma (IFM 99-06): a randomised trial. Lancet 2007;370:1209–18.
39. San Miguel JF, Schlag R, Khuageva NK et al. Bortezomib plus melphalan and prednisone for initial treatment of multiple myeloma. N Engl J Med 2008;359:906–17.
40. San Miguel JF, Schlag R, Khuageva NK et al. Persistent overall survival benefit and no increased risk of second malignancies with bortezomib-melphalan-prednisone versus melphalan-prednisone in patients with previously untreated multiple myeloma. J Clin Oncol 2013;31:448–55.
41. Medicines.org.uk. eMC. Velcade 3.5mg powder for solution for injection – summary of product characteristics. Last updated 1 March 2017. Available from: http://www.medicines.org.uk/emc/medicine/17109 (Accessed 25 October 2017).
42. Medicines.org.uk. eMC. Thalidomide Celgene 50 mg hard capsules – summary of product characteristics. Last updated 16 February 2017. Available from: http://www.medicines.org.uk/EMC/medicine/21005/SPC/Thalidomide+Celgene+50+mg+Hard+Capsules/ (Accessed 25 October 2017).
43. Celgene Corporation. Lenalidomide (REVLIMID®). A phase III, randomized, open-label, 3-arm study to determine the efficacy and safety of lenalidomide (REVLIMID®) plus low-dose dexamethasone when given until progressive disease or for 18 four-week cycles versus the combination of melphalan, prednisone, and thalidomide given for 12 six-week cycles in patients with previously untreated multiple myeloma who are either 65 years of age or older or not candidates for stem cell transplantation (IFM 07-01). Clinical study report CC-5013-MM-020/IFM 07-01. 31 August 2016 (data cutoff: 21 January 2016).
44. Hulin C, Hansen T, Laurenson S, Streetly M. A European study of the emotional and physical impact of relapse on patients with multiple myeloma. Abstract presented at the19th Congress of the European Haematology Association (EHA), 12–15 June 2014, Milan, Italy. Abstract P635.
45. Snowden JA, Ahmedzai SH, Ashcroft J et al. Guidelines for supportive care in multiple myeloma 2011. Br J Haematol 2011;154:76–103.
46. Delforge M, Dhawan R, Robinson D, Jr. et al. Health-related quality of life in elderly, newly diagnosed multiple myeloma patients treated with VMP vs. MP: results from the VISTA trial. Eur J Haematol 2012;89:16–27.
47. Delforge M, Minuk L, Eisenmann JC et al. Health-related quality-of-life in patients with newly diagnosed multiple myeloma in the FIRST trial: lenalidomide plus low-dose dexamethasone versus melphalan, prednisone, thalidomide. Haematologica 2015;100:826–33.
48. Ashcroft J, Bagguley T, Smith A, al. e. 2013. Skeletal-related events in myeloma: A population-based study. Abstract 3158. 55th Meeting of the American Society of Hematology (ASH). New Orleans, LA, USA, 7–10 December, 2013.
49. Goodwin JA, Coleman EA, Sullivan E et al. Personal financial effects of multiple myeloma and its treatment. Cancer Nurs 2013;36:301–8.
50. Kurtin S, Lilleby K, Spong J. Caregivers of multiple myeloma survivors. Clin J Oncol Nurs 2013;17 Suppl:25–32.
Company evidence submission template for Lenalidomide (ID474) © Celgene Inc. (2017). All rights reserved Page 155 of 163
51. National Institute for Health and Care Excellence. NICE guideline (NG35]. Myeloma: diagnosis and management. February 2016. Available from: https://www.nice.org.uk/guidance/ng35/chapter/Recommendations#managing-newly-diagnosed-myeloma (Accessed 25 October 2017).
52. National Institute for Health and Care Excellence. NICE TA311. Bortezomib for induction therapy in multiple myeloma before high-dose chemotherapy and autologous stem cell transplantation ERG report. 23 April 2014. Available from: https://www.nice.org.uk/Guidance/TA311 (Accessed 25 October 2017).
53. National Institute for Health and Care Excellence. NICE TA129. Bortezomib monotherapy for relapsed multiple myeloma. October 2007. Available from: https://www.nice.org.uk/Guidance/ta129 (Accessed 25 October 2017).
54. National Instititute for Health and Care Excellence. Carfilzomib for previously treated multiple myeloma, 19 July 2017 (TA457). Available at, https://www.nice.org.uk/guidance/ta457 (Accessed, 05 October 2017).
55. National Institute for Health and Care Excellence. NICE TA171. Lenalidomide for the treatment of multiple myeloma in people who have received at least one prior therapy. April 2014. Available from: https://www.nice.org.uk/guidance/ta171 (Accessed 25 October 2017).
56. National Institute for Health and Care Excellence. NICE TA380. Panobinostat for treating multiple myeloma after at least 2 previous treatments. January 2016. Available from: https://www.nice.org.uk/guidance/ta380 (Accessed 25 October 2017).
57. National Institute for Health and Care Excellence. NICE TA427. Pomalidomide for multiple myeloma previously treated with lenalidomide and bortezomib. January 2017. Available from: https://www.nice.org.uk/guidance/ta427 (Accessed 25 October 2017).
58. NHS England. Cancer Drugs Fund List. ver1.41 17 October 2017. Available from: https://www.england.nhs.uk/wp-content/uploads/2017/10/national-cdf-list-v1.47.pdf (Accessed 25 October 2017).
59. Engelhardt M, Terpos E, Kleber M et al. European Myeloma Network recommendations on the evaluation and treatment of newly diagnosed patients with multiple myeloma. Haematologica 2014;99:232–42.
60. Moreau P, San Miguel J, Sonneveld P et al. Multiple myeloma: ESMO Clinical Practice Guidelines for diagnosis, treatment and follow-up. Ann Oncol 2017;28:iv52-iv61.
61. National Comprehensive Cancer Network. NCCN Guidelines Version 3. 2017. NCCN Evidence Blocks: Myeloma Therapy. Available from: https://www.nccn.org/professionals/physician_gls/pdf/myeloma_blocks.pdf (Accessed 05 October 2017).
62. Durie BG, Harousseau JL, Miguel JS et al. International uniform response criteria for multiple myeloma. Leukemia 2006;20:1467–73.
63. Food and Drug Administration. Guidance for industry: clinical trial endpoints for the approval of cancer drugs and biologics. May 2007. Available from: http://www.fda.gov/downloads/Drugs/GuidanceComplianceRegulatoryInformation/Guidances/ucm071590.pdf (Accessed 25 October 2017).
64. Committee for Medicinal Products for Human Use (CHMP). Appendix 1 to the guideline on the evaluation of anticancer medicinal products in man (CHMP/EWP/205/95 Rev. 3): Methodological considerations for using progression-free survival (PFS) as primary endpoint in confirmatory trials for registration, 2008. Available from: http://www.ema.europa.eu/docs/en_GB/document_library/Scientific_guideline/2009/12/WC500017736.pdf (Accessed March 2017).
65. DeMets DL, Lan KK. Interim analysis: the alpha spending function approach. Stat Med 1994;13:1341–52; discussion 1353–6.
66. Tamhane AC, Mehta CR, Liu L. Testing a primary and a secondary endpoint in a group sequential design. Biometrics 2010;66:1174–84.

Company evidence submission template for Lenalidomide (ID474) © Celgene Inc. (2017). All rights reserved Page 156 of 163
67. European Commission. Guideline on the evaluation of anticancer medicinal products in man. December 2012. Available from: http://www.ema.europa.eu/docs/en_GB/document_library/Scientific_guideline/2013/01/WC500137128.pdf (Accessed 25 October 2017).
68. Celgene Corporation. Data on File. 2017. 69. Hulin C, Facon T, Rodon P et al. Efficacy of melphalan and prednisone plus
thalidomide in patients older than 75 years with newly diagnosed multiple myeloma: IFM 01/01 trial. J Clin Oncol 2009;27:3664–70.
70. Mateos MV, Richardson PG, Schlag R et al. Bortezomib plus melphalan and prednisone compared with melphalan and prednisone in previously untreated multiple myeloma: updated follow-up and impact of subsequent therapy in the phase III VISTA trial. J Clin Oncol 2010;28:2259–66.
71. Jansen JP. Network meta-analysis of survival data with fractional polynomials. BMC Med Res Methodol 2011;11:61.
72. Jobling AI, Augusteyn RC. What causes steroid cataracts? A review of steroid-induced posterior subcapsular cataracts. Clin Exp Optom 2002;85:61–75.
73. Hulin C, Facon T, Shustik C et al. Effect of age on efficacy and safety outcomes in patients with newly diagnosed multiple myeloma (NDMM) receiving lenalidomide and low-dose dexamethasone (Rd): the FIRST trial. Blood 2014;124:81.
74. Palumbo A, Bringhen S, Kumar SK et al. Second primary malignancies with lenalidomide therapy for newly diagnosed myeloma: a meta-analysis of individual patient data. Lancet Oncol 2014;15:333–42.
75. Musto P, Anderson KC, Attal M et al. Second primary malignancies in multiple myeloma: an overview and IMWG consensus. Ann Oncol 2016.
76. Rajkumar SV, Jacobus S, Callander NS et al. Lenalidomide plus high-dose dexamethasone versus lenalidomide plus low-dose dexamethasone as initial therapy for newly diagnosed multiple myeloma: an open-label randomised controlled trial. Lancet Oncol 2010;11:29–37.
77. Medicines.org.uk. eMC. Melphalan Celgene 50 mg Powder and Solvent solution for injection/infusion – summary of product characteristics. Last updated 11 August 2015. Available from: https://www.medicines.org.uk/emc/medicine/703 (Accessed 25 October 2017).
78. Bergsagel DE, Bailey AJ, Langley GR et al. The chemotherapy on plasma-cell myeloma and the incidence of acute leukemia. N Engl J Med 1979;301:743–8.
79. Cuzick J, Erskine S, Edelman D, Galton DA. A comparison of the incidence of the myelodysplastic syndrome and acute myeloid leukaemia following melphalan and cyclophosphamide treatment for myelomatosis. A report to the Medical Research Council's working party on leukaemia in adults. Br J Cancer 1987;55:523–9.
80. Finnish Leukaemia Group. Acute leukaemia and other secondary neoplasms in patients treated with conventional chemotherapy for multiple myeloma: a Finnish Leukaemia Group study. Eur J Haematol 2000;65:123–7.
81. Liu G, Franssen E, Fitch MI, Warner E. Patient preferences for oral versus intravenous palliative chemotherapy. J Clin Oncol 1997;15:110–5.
82. Morgan GJ, Davies FE, Gregory WM et al. Cyclophosphamide, thalidomide, and dexamethasone (CTD) as initial therapy for patients with multiple myeloma unsuitable for autologous transplantation. Blood 2011;118:1231–8.
83. Morgan GJ, Gregory WM, Davies FE et al. The role of maintenance thalidomide therapy in multiple myeloma: MRC Myeloma IX results and meta-analysis. Blood 2012;119:7–15.
84. Dimopoulos MA, Chen C, Spencer A et al. Long-term follow-up on overall survival from the MM-009 and MM-010 phase III trials of lenalidomide plus dexamethasone in patients with relapsed or refractory multiple myeloma. Leukemia 2009;23:2147–52.
85. Rizzo M, Xu Y, Panjabi S, Iheanacho I. A Systematic Literature Review of the Humanistic Burden of Multiple Myeloma. Presented at the ISPOR 17th Annual European Congress • November 8–12, 2014 • Amsterdam, The Netherlands
Company evidence submission template for Lenalidomide (ID474) © Celgene Inc. (2017). All rights reserved Page 157 of 163
86. Celgene Corporation. Multiple Myeloma Advisory Board Meeting 6th May 2015, The Royal College of Physicians, London. (Data on file 150525).
87. European Medicines Agency. Committee for Medicinal Products for Human Use (CHMP) assessment report, Revlimid EMEA/H/C/000717/X/0073/G. 11 February 2015. Available from: http://www.ema.europa.eu/docs/en_GB/document_library/EPAR_-_Assessment_Report_-_Variation/human/000717/WC500184943.pdf. (Accessed October 2017).
88. Pazdur R. Endpoints for assessing drug activity in clinical trials. Oncologist 2008;13 Suppl 2:19–21.
89. Ludwig H, Avet-Loiseau H, Blade J et al. European perspective on multiple myeloma treatment strategies: update following recent congresses. Oncologist 2012;17:592–606.
90. Ludwig H, Miguel JS, Dimopoulos MA et al. International Myeloma Working Group recommendations for global myeloma care. Leukemia 2014;28:981–92.
91. Fayers PM, Palumbo A, Hulin C et al. Thalidomide for previously untreated elderly patients with multiple myeloma: meta-analysis of 1685 individual patient data from 6 randomized clinical trials. Blood 2011;118:1239–47.
92. Kumar SK, Dispenzieri A, Lacy MQ et al. Continued improvement in survival in multiple myeloma: changes in early mortality and outcomes in older patients. Leukemia 2014;28:1122–8.
93. Cancer Research UK. Cancer survival for common cancers, 2014. Available from: http://www.cancerresearchuk.org/health-professional/cancer-statistics/statistics-by-cancer-type/myeloma (Accessed 25 October 2017).
94. Picot J, Cooper K, Bryant J, Clegg AJ. The clinical effectiveness and cost-effectiveness of bortezomib and thalidomide in combination regimens with an alkylating agent and a corticosteroid for the first-line treatment of multiple myeloma: a systematic review and economic evaluation. Health Technol Assess 2011;15:1–204.
95. Cooper K, Picot J, Bryant J, Clegg A. Comparative cost-effectiveness models for the treatment of multiple myeloma. Int J Technol Assess Health Care 2014;30:90–7.
96. Garrison LP, Jr., Wang ST, Huang H et al. The cost-effectiveness of initial treatment of multiple myeloma in the U.S. with bortezomib plus melphalan and prednisone versus thalidomide plus melphalan and prednisone or lenalidomide plus melphalan and prednisone with continuous lenalidomide maintenance treatment. Oncologist 2013;18:27–36.
97. Usmani SZ, Cavenagh JD, Belch AR et al. Cost-effectiveness of lenalidomide plus dexamethasone vs. bortezomib plus melphalan and prednisone in transplant-ineligible U.S. patients with newly-diagnosed multiple myeloma. J Med Econ 2016;19:243–58.
98. Celgene Ltd. Multiple technology appraisal of bortezomib and thalidomide for the first-line treatment of multiple myeloma. London: NICE 2009.
99. Janssen–Cilag. Bortezomib and thalidomide for the rst-line treatment of multiple myeloma: bortezomib (Velcade). London: NICE 2009.
100. Woods B, Sideris E, Palmer S, et al. NICE DSU Technical Support Document 19: Partitioned survival analysis for decision modelling in health care: a critical review. Available at, http://scharr.dept.shef.ac.uk/nicedsu/wp-content/uploads/sites/7/2017/06/Partitioned-Survival-Analysis-final-report.pdf. (Accessed, 30 August 2017). 2017.
101. Kay R. A Markov model for analysing cancer markers and disease states in survival studies. Biometrics 1986;42:855-65.
102. Jackson CH. Multi-state models for panel data: the msm package for R. J Stat Softw 2011; 38:1–28G.
103. Office for National Statistics. National life tables, UK: 2013–2015. Trends for the UK and constituent countries in the average number of years people will live beyond their

Company evidence submission template for Lenalidomide (ID474) © Celgene Inc. (2017). All rights reserved Page 158 of 163
current age measured by "period life expectancy", analysed by age and sex. 29 September 2016.
104. Collett D. Modelling Survival Data in Medical Research. Texts in Statistical Science, Second Edition ed. Florida, USA: Chapman & Hall, 2003, p.24-5.
105. National Institute for Health and Care Excellence. Nivolumab for treating advanced (unresectable or metastatic) melanoma (TA384). Available at, https://www.nice.org.uk/guidance/ta384 (Accessed 25 October 2017).
106. National Institute for Health and Care Excellence. Multiple myeloma – lenalidomide (post bortezomib) (part rev TA171) [ID667], 2016. Available from: https://www.nice.org.uk/guidance/indevelopment/gid-tag452 (Accessed 25 October 2017).
107. National Institute for Health and Care Excellence. The clinical and cost-effectiveness of bortezomib and thalidomide for the first-line treatment of multiple myeloma: a systematic review and economic evaluation, https://www.nice.org.uk/guidance/ta228/documents/assessment-report3 (Accessed, 25 October 2017). 2010.
108. Osborne TR, Ramsenthaler C, Siegert RJ et al. What issues matter most to people with multiple myeloma and how well are we measuring them? A systematic review of quality of life tools. Eur J Haematol 2012;89:437–57.
109. Ludwig H, Beksac M, Blade J et al. Current multiple myeloma treatment strategies with novel agents: a European perspective. Oncologist 2010;15:6–25.
110. Gulbrandsen N, Hjermstad MJ, Wisloff F. Interpretation of quality of life scores in multiple myeloma by comparison with a reference population and assessment of the clinical importance of score differences. Eur J Haematol 2004;72:172–80.
111. Johnsen AT, Tholstrup D, Petersen MA, Pedersen L, Groenvold M. Health related quality of life in a nationally representative sample of haematological patients. Eur J Haematol 2009;83:139–48.
112. Ashcroft J, Bagguley T, Smith A et al. 2013. Skeletal-related events in myeloma: A population-based study. 55th American Society of Hematology (ASH) Annual Meeting and Exposition. New Orleans, LA: United States of America.
113. Palumbo A, Bringhen S, Ludwig H et al. Personalized therapy in multiple myeloma according to patient age and vulnerability: a report of the European Myeloma Network. Blood 2011;118:4519-29.
114. Despiegel N, Touboul C, Flinois A, et al. Quality of Life of Patients Treated for Multiple Myeloma in France in a Real-World Setting. International Society for Pharmacoeconomics and Outcomes Research. Vienna, Austria. 29 October - 2 November 2017. PRM143. 2016.
115. National Institute for Health and Care Excellence. TA457. Carfilzomib for treating multiple myeloma in people who have received at least one prior therapy. July 2017. Available at, https://www.nice.org.uk/guidance/ta457 (Accessed, 25 October 2017).
116. Hatswell AJ, Couturier C, Ito T. Utility By Treatment Line In Multiple Myeloma; Analysis of Over 9000 EQ-5Q-3L Questionnaires from the Emmos Registry. . Value in Health 2016;19:A348.
117. Proskorovsky I, Lewis P, Williams CD et al. Mapping EORTC QLQ-C30 and QLQ-MY20 to EQ-5D in patients with multiple myeloma. Health Qual Life Outcomes 2014;12:35.
118. McKenzie L, van der Pol M. Mapping the EORTC QLQ C-30 onto the EQ-5D instrument: the potential to estimate QALYs without generic preference data. Value Health 2009;12:167–71.
119. Kontodimopoulos N, Aletras VH, Paliouras D, Niakas D. Mapping the cancer-specific EORTC QLQ-C30 to the preference-based EQ-5D, SF-6D, and 15D instruments. Value Health 2009;12:1151–7.
120. Kind P, Hardman G, Macran S. UK Population norms for EQ-5D (discussion paper 172). Available at,
Company evidence submission template for Lenalidomide (ID474) © Celgene Inc. (2017). All rights reserved Page 159 of 163
http://www.york.ac.uk/media/che/documents/papers/discussionpapers/CHE%20Discussion%20Paper%20172.pdf. (Accessed 25 October 2017). 1999.
121. Celgene Corporation. MM-003: Pomalidomide (CC-4047) CC-4047-MM-003 A phase 3, multicenter, randomized, open-label study to compare the efficacy and safety of pomalidomide in combination with low-dose dexamethasone versus high-dose dexamethasone in subjects with refractory or relapsed and refractory multiple myeloma. Last patient visit for interim data cutoff: 01 Mar 2013 Release date of report: 09 Dec 2013. Data on file.
122. Celgene Corporation. MM-009: Lenalidomide (REVLIMID®) Protocol CC-5013 MM-009 A multicenter, randomized, parallel-group, double-blind, placebo-controlled study of cc 5013 plus dexamethasone versus dexamethasone alone in previously treated subjects with multiple myeloma. Data cutoff for extended follow-up for survival 23 Jul 2008 Release date of report: 09 Dec 2008. Data on file.
123. Celgene Corporation. MM-010: Lenalidomide (REVLIMID®) Protocol CC-5013 MM-010 A multicenter, randomized, parallel-group, double-blind, placebo-controlled study of cc 5013 plus dexamethasone versus dexamethasone alone in previously treated subjects with multiple myeloma. Data cutoff for extended follow-up for survival 02 Mar 2008 Release date of report: 09 Dec 2008. Data on file.
124. Kropff M, Baylon HG, Hillengass J et al. Thalidomide versus dexamethasone for the treatment of relapsed and/or refractory multiple myeloma: results from OPTIMUM, a randomized trial. Haematologica 2012;97:784–91.
125. Monthly Index of Medical Specialities (MIMS). 2017. Available at www.mims.co.uk (Accessed 25 October 2017).
126. Department of Health. Drugs and pharmaceutical electronic market information (eMit) 2017. Available at, https://www.gov.uk/government/publications/drugs-and-pharmaceutical-electronic-market-information-emit (Accessed, 25 October 2017).
127. Department of Health. NHS reference costs 2015 to 2016. 15 December 2016. Available at, https://www.gov.uk/government/publications/nhs-reference-costs-2015-to-2016 (Accessed, 25 October 2017).
128. Blood and DTS pricing proposals for 2014/2015. Available from: https://www.gov.uk/government/uploads/system/uploads/attachment_data/file/443179/NHSBT_report_2014-15.pdf (Accessed 25 October 2017), 2013. Available (Accessed).
129. National Institute for Health and Care Excellence. Daratumumab for multiple myeloma (ID933]. In development, expected publication date: July 2017. Available from: https://www.nice.org.uk/guidance/indevelopment/gid-ta10076 (Accessed 25 October 2017).
130. Stadtmauer EA, Weber DM, Niesvizky R et al. Lenalidomide in combination with dexamethasone at first relapse in comparison with its use as later salvage therapy in relapsed or refractory multiple myeloma. Eur J Haematol 2009;82:426–32.
131. National Instititute for Health and Care Excellence. NICE TA387. Abiraterone for treating metastatic hormone-relapsed prostate cancer before chemotherapy is indicated, 27 April 2016. Available at, https://www.nice.org.uk/guidance/ta387 (Accessed, 25 October 2017).
132. National Instititute for Health and Care Excellence. NICE TA129. Bortezomib monotherapy for relapsed multiple myeloma. October 2007. Available from: https://www.nice.org.uk/guidance/ta129/resources/bortezomib-monotherapy-for-relapsed-multiple-myeloma-pdf-82598141743045 (Accessed April 2015).
133. Lee SJ, Richardson PG, Sonneveld P et al. Bortezomib is associated with better health-related quality of life than high-dose dexamethasone in patients with relapsed multiple myeloma: results from the APEX study. Br J Haematol 2008;143:511–9.
134. Richardson PG, Sonneveld P, Schuster MW et al. Bortezomib or high-dose dexamethasone for relapsed multiple myeloma. N Engl J Med 2005;352:2487–98.
135. Weber DM, Chen C, Niesvizky R et al. Lenalidomide plus dexamethasone for relapsed multiple myeloma in North America. N Engl J Med 2007;357:2133–42.
Company evidence submission template for Lenalidomide (ID474) © Celgene Inc. (2017). All rights reserved Page 160 of 163
136. Dimopoulos M, Spencer A, Attal M et al. Lenalidomide plus dexamethasone for relapsed or refractory multiple myeloma. N Engl J Med 2007;357:2123–32.
137. Waage A, Gimsing P, Fayers P et al. Melphalan and prednisone plus thalidomide or placebo in elderly patients with multiple myeloma. Blood 2010;116:1405–12.
138. Magarotto V BS, Offidani M, et al. Triplet vs doublet lenalidomide-containing regimens for the treatment of elderly patients with newly diagnosed multiple myeloma. Blood 2016;127.
139. Niesvizky R, Flinn IW, Rifkin R et al. Community-Based Phase IIIB Trial of Three UPFRONT Bortezomib-Based Myeloma Regimens. J Clin Oncol 2015;33:3921-9.
140. Facon T, Dimopoulos MA, Hulin C et al. Updated Overall Survival (OS) Analysis of the FIRST Study: Lenalidomide Plus Low-Dose Dexamethasone (Rd) Continuous vs Melphalan, Prednisone, and Thalidomide (MPT) in Patients (Pts) With Newly Diagnosed Multiple Myeloma (NDMM). Clinical Lymphoma, Myeloma and Leukemia15:e134.
141. Facon T, Dimopoulos MA, Dispenzieri A et al. Final Analysis of Overall Survival from the First Trial. Blood 2016;128:241-241.
142. Facon TD, Meletios Athanasios;Dispenzieri, Angela;Catalano, John;Belch, Andrew R.;Cavo, Michele. Final Survival Analysis From the FIRST Trial: Lenalidomide Plus Low-Dose Dexamethasone Until Progression (Rd Cont) v Melphalan, Prednisone and Thalidomide (MPT), and Rd for 18 Cycles (Rd18) for Transplant-Ineligible (TNE) Patients (Pts) With Newly Diagnosed Multiple Myeloma. Clinical Lymphoma Myeloma and Leukemia 2017;17:e63-e64.
143. Anonymous. Bortezomib plus doxorubicin combination slows progression of multiple myeloma. 2007.
144. Benboubker L, Dimopoulos MA, Dispenzieri A et al. Lenalidomide and dexamethasone in transplant-ineligible patients with myeloma. New England Journal of Medicine 2014;371:906-17.
145. Lu J, Lee JH, Huang S-Y et al. Continuous Treatment with Lenalidomide and Low-Dose Dexamethasone in Transplant-Ineligible Patients with Newly Diagnosed Multiple Myeloma in Asia: Subanalysis of the First Trial. Blood 2015;126:4240-4240.
146. Dimopoulos MA, Palumbo A, Hajek R et al. Factors that influence health-related quality of life in newly diagnosed patients with multiple myeloma aged >= 65 years treated with melphalan, prednisone and lenalidomide followed by lenalidomide maintenance: results of a randomized trial. Leukemia & lymphoma 2014;55:1489-97.
147. Lokhorst HM, Schmidt-Wolf I, Sonneveld P et al. Thalidomide in induction treatment increases the very good partial response rate before and after high-dose therapy in previously untreated multiple myeloma.[Erratum appears in Haematologica. 2008 Mar;93(3):480 Note: Verhoef, Gregor [removed]; Delforge, Michel [added]; Breitkreuz, Iris [corrected to Breitkreutz, Iris]]. Haematologica 2008;93:124-7.
148. Merz M, Salwender H, Haenel M et al. Subcutaneous <em>versus</em> intravenous bortezomib in two different induction therapies for newly diagnosed multiple myeloma: an interim analysis from the prospective GMMG-MM5 trial. Haematologica 2015;100:964-969.
149. Westin J, Rodjer S, Turesson I et al. Interferon alfa-2b versus no maintenance therapy during the plateau phase in multiple myeloma: a randomized study. Cooperative Study Group. British Journal of Haematology 1995;89:561-8.
150. White DJ, Bahlis NJ, Marcellus DC et al. Lenalidomide plus melphalan without prednisone for previously untreated older patients with multiple myeloma: A phase II trial. Clinical Lymphoma, Myeloma and Leukemia 2013;13:19-24.
151. Einsele H, Vogel M, Muller J et al. Results from two phase 3 studies of post-transplant bortezomib (BTZ) consolidation vs observation (OBS) in patients with newly diagnosed multiple myeloma (NDMM). Haematologica 2015;100.
152. Gentile MM, V.;Offidani, M.;Musto, P.;Bringhen, S.;Teresa Petrucci, M.;Gay, F.;Larocca, A.;Uccello, G.;Petrungaro, A.;Vigna, E.;Greco, R.;Grazia Recchia, A.;Tripepi, G.;Ria, R.;Di Raimondo, F.;Palumbo, A.;Morabito, F. Lenalidomide and
Company evidence submission template for Lenalidomide (ID474) © Celgene Inc. (2017). All rights reserved Page 161 of 163
low-dose dexamethasone (Rd) versus bortezomib, melphalan, prednisone (VMP) in elderly newly diagnosed multiple myeloma patients: a comparison of two prospective trials. American journal of hematology 2017.
153. Gulbrandsen N, Hjermstad MJ, Wisloff F. Interpretation of quality of life scores in multiple myeloma by comparison with a reference population and assessment of the clinical importance of score differences. European Journal of Haematology 2004;72:172-180.
154. Beksac M, Haznedar R, Firatli-Tuglular T et al. Addition of thalidomide to oral melphalan/prednisone in patients with multiple myeloma not eligible for transplantation: Results of a randomized trial from the Turkish Myeloma Study Group. European Journal of Haematology 2011;86:16-22.
155. Facon T, Mary JY, Pegourie B et al. Dexamethasone-based regimens versus melphalan-prednisone for elderly multiple myeloma patients ineligible for high-dose therapy. Blood 2006;107:1292–8.
156. Ludwig H, Hajek R, Tothova E et al. Thalidomide-dexamethasone compared with melphalan-prednisolone in elderly patients with multiple myeloma. Blood 2009;113:3435-42.
157. Hungria VT, Crusoe EQ, Maiolino A et al. Phase 3 trial of three thalidomide-containing regimens in patients with newly diagnosed multiple myeloma not transplant-eligible. Annals of Hematology 2016;95:271-8.
158. Mateos MV, Oriol A, Martinez-Lopez J et al. Bortezomib, melphalan, and prednisone versus bortezomib, thalidomide, and prednisone as induction therapy followed by maintenance treatment with bortezomib and thalidomide versus bortezomib and prednisone in elderly patients with untreated multiple myeloma: A randomised trial. The Lancet Oncology 2010;11:934-941.
159. Mateos MV, Oriol A, Martinez-Lopez J et al. Do we still need the alkylators as part of the upfronttreatment of elderly newly diagnosed multiple myeloma patients? Updated follow-up of GEM2005MAS65 Spanish trial comparing VMP vs VTP as induction. Haematologica 2014;99.
160. Mateos MV, Martinez-Lopez J, Hernandez MT et al. Comparison of sequential vs alternating administration of bortezomib, melphalan and prednisone (VMP) and lenalidomide plus dexamethasone (Rd) in elderly patients with newly diagnosed Multiple Myeloma (MM) Patients: GEM2010MAS65 trial. Blood122:CONFERENCE START: 2013 Dec 7 CONFERENCE END: 2013 Dec 10.
161. Morgan GJ, Davies FE, Gregory WM et al. Cyclophosphamide, thalidomide, and dexamethasone (CTD) as initial therapy for patients with multiple myeloma unsuitable for autologous transplantation. Blood 2011;118:1231-1238.
162. Palumbo A, Bringhen S, Liberati AM et al. Oral melphalan, prednisone, and thalidomide in elderly patients with multiple myeloma: updated results of a randomized controlled trial. Blood 2008;112:3107–14.
163. Palumbo A, Bringhen S, Caravita T et al. Oral melphalan and prednisone chemotherapy plus thalidomide compared with melphalan and prednisone alone in elderly patients with multiple myeloma: randomised controlled trial. Lancet 2006;367:825–31.
164. Palumbo A, Hajek R, Delforge M et al. Continuous lenalidomide treatment for newly diagnosed multiple myeloma. New England Journal of Medicine 2012;366:1759-1769.
165. Palumbo A, Bringhen S, Larocca A et al. Bortezomib-melphalan-prednisone-thalidomide followed by maintenance with bortezomib-thalidomide compared with bortezomib-melphalan-prednisone for initial treatment of multiple myeloma: updated follow-up and improved survival. Journal of Clinical Oncology 2014;32:634-40.
166. Palumbo A, Bringhen S, Rossi D et al. Bortezomib-melphalan-prednisone-thalidomide followed by maintenance with bortezomib-thalidomide compared with bortezomib-melphalan-prednisone for initial treatment of multiple myeloma: A randomized controlled trial. Journal of Clinical Oncology 2010;28:5101-5109.
Company evidence submission template for Lenalidomide (ID474) © Celgene Inc. (2017). All rights reserved Page 162 of 163
167. Palumbo A, Bringhen S, Rossi D et al. Overall Survival Benefit for Bortezomib-Melphalan-Prednisone-Thalidomide Followed by Maintenance with Bortezomib-Thalidomide (VMPT-VT) Versus Bortezomib-Melphalan-Prednisone (VMP) in Newly Diagnosed Multiple Myeloma Patients. Blood 2012;120:200-200.
168. Sacchi S, Marcheselli R, Lazzaro A et al. A randomized trial with melphalan and prednisone versus melphalan and prednisone plus thalidomide in newly diagnosed multiple myeloma patients not eligible for autologous stem cell transplant. Leukemia and Lymphoma 2011;52:1942-1948.
169. San-Miguel J, Blade J, Shpilberg O et al. Phase 2 randomized study of bortezomib-melphalan-prednisone with or without siltuximab (anti-IL-6) in multiple myeloma. Blood 2014;123:4136–42.
170. Stewart AK, Jacobus S, Fonseca R et al. E1A06: A phase III trial comparing melphalan, prednisone, and thalidomide (MPT) versus melphalan, prednisone, and lenalidomide (MPR) in newly diagnosed multiple myeloma MM). Haematologica 2014;99.
171. Stewart AK, Jacobus S, Fonseca R et al. Melphalan, prednisone, and thalidomide vs melphalan, prednisone, and lenalidomide (ECOG E1A06) in untreated multiple myeloma. Blood 2015;126:1294-1301.
172. Wijermans P, Schaafsma M, Termorshuizen F et al. Phase III study of the value of thalidomide added to melphalan plus prednisone in elderly patients with newly diagnosed multiple myeloma: The HOVON 49 study. Journal of Clinical Oncology 2010;28:3160-3166.
173. Zweegman S, Holt Bvd, Mellqvist U-H et al. Randomized Phase III Trial in Non-Transplant Eligible Patients with Newly Diagnosed Symptomatic Multiple Myeloma Comparing Melphalan-Prednisone-Thalidomide Followed By Thalidomide Maintenance (MPT-T) Versus Melphalan-Prednisone-Lenalidomide Followed By Maintenance with Lenalidomide (MPR-R); A Joint Study of the Dutch-Belgian Cooperative Trial Group for Hematology Oncology (HOVON) and the Nordic Myeloma Study Group (NMSG). Blood 2014;124:179-179.
174. Facon TL, Jae Hoon;Moreau, Philippe;Niesvizky, Ruben;Dimopoulos, Meletios Athanasios;Hajek, Roman;Osman, Muhtarjan;Aggarwal, Sanjay;Klippel, Zandra;San Miguel, Jesus. Phase 3 Study (CLARION) of Carfilzomib, Melphalan, Prednisone (KMP) v Bortezomib, Melphalan, Prednisone (VMP) in Newly Diagnosed Multiple Myeloma (NDMM). Clinical Lymphoma Myeloma and Leukemia 2017;17:e26-e27.
175. National Institute for Health and Care Excellence. Decision Support Unit technical support document 2. A generalised linear modelling framework for pairwise and network meta-analysis of randomized controlled trials. Available from: https://www.ncbi.nlm.nih.gov/pubmedhealth/PMH0088912/pdf/PubMedHealth_PMH0088912.pdf (Accessed 25 October 2017).
176. Dempster AP. The direct use of likelihood for significance testing. . Statistics and Computing. 1997;7:247-252.
177. Higgins JP, Altman DF, Gotzsche PC et al. The Cochrane Collaboration's tool for assessing risk of bias in randomised trials. BMJ 2011;343.
178. Moreau P, San Miguel J, Ludwig H et al. Multiple myeloma: ESMO Clinical Practice Guidelines for diagnosis, treatment and follow-up. Ann Oncol 2013;24 Suppl 6:vi133–7.
179. Sacchi S, Marcheselli R, Lazzaro A et al. A randomized trial with melphalan and prednisone versus melphalan and prednisone plus thalidomide in newly diagnosed multiple myeloma patients not eligible for autologous stem cell transplant. Leuk Lymphoma 2011;52:1942–8.
180. Dimopoulos MA, Delforge M, Hajek R et al. Lenalidomide, melphalan, and prednisone, followed by lenalidomide maintenance, improves health-related quality of life in newly diagnosed multiple myeloma patients aged 65 years or older: results of a randomized phase III trial. Haematologica 2013;98:784–8.
Company evidence submission template for Lenalidomide (ID474) © Celgene Inc. (2017). All rights reserved Page 163 of 163
181. Dimopoulos MA, Palumbo A, Hajek R et al. Factors that influence health-related quality of life in newly diagnosed patients with multiple myeloma aged >/= 65 years treated with melphalan, prednisone and lenalidomide followed by lenalidomide maintenance: results of a randomized trial. Leuk Lymphoma 2014;55:1489–97.
182. Booth CM, Eisenhauer EA. Progression-free survival: meaningful or simply measurable? J Clin Oncol 2012;30:1030–3.
.
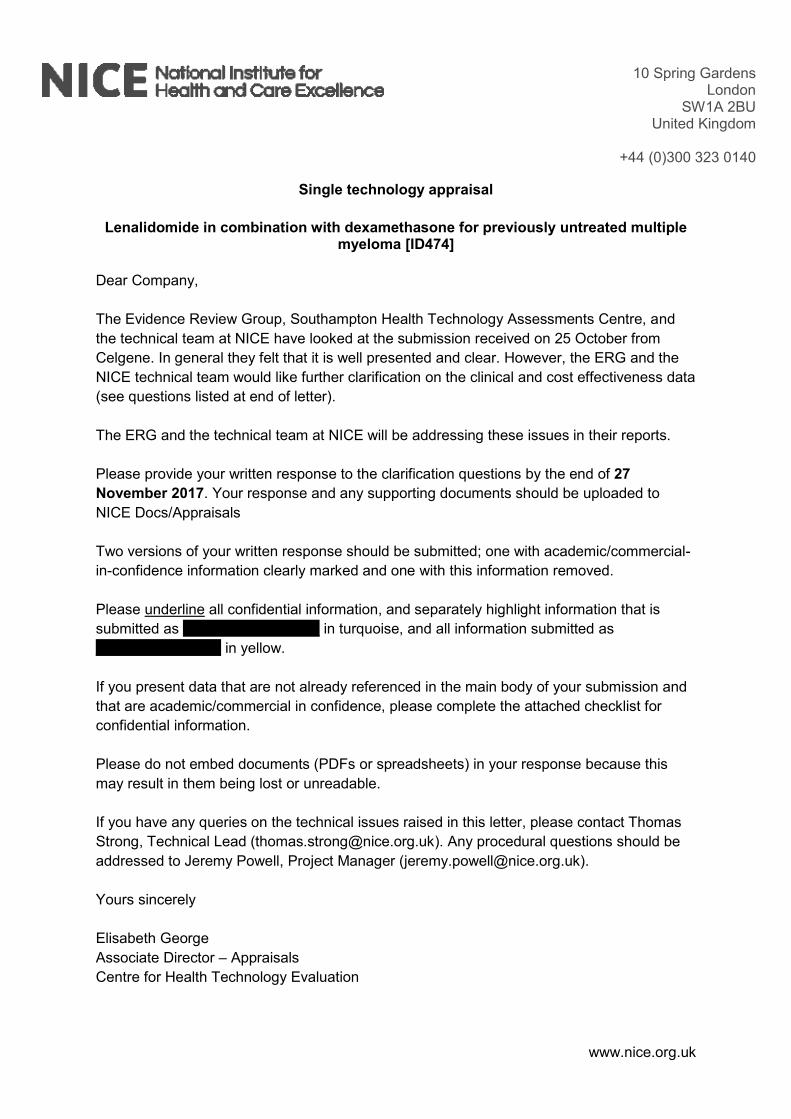
10 Spring Gardens London
SW1A 2BU United Kingdom
+44 (0)300 323 0140
www.nice.org.uk
Single technology appraisal
Lenalidomide in combination with dexamethasone for previously untreated multiple myeloma [ID474]
Dear Company,
The Evidence Review Group, Southampton Health Technology Assessments Centre, and
the technical team at NICE have looked at the submission received on 25 October from
Celgene. In general they felt that it is well presented and clear. However, the ERG and the
NICE technical team would like further clarification on the clinical and cost effectiveness data
(see questions listed at end of letter).
The ERG and the technical team at NICE will be addressing these issues in their reports.
Please provide your written response to the clarification questions by the end of 27
November 2017. Your response and any supporting documents should be uploaded to
NICE Docs/Appraisals
Two versions of your written response should be submitted; one with academic/commercial-
in-confidence information clearly marked and one with this information removed.
Please underline all confidential information, and separately highlight information that is
submitted as ************************ in turquoise, and all information submitted as
********************** in yellow.
If you present data that are not already referenced in the main body of your submission and
that are academic/commercial in confidence, please complete the attached checklist for
confidential information.
Please do not embed documents (PDFs or spreadsheets) in your response because this
may result in them being lost or unreadable.
If you have any queries on the technical issues raised in this letter, please contact Thomas
Strong, Technical Lead ([email protected]). Any procedural questions should be
addressed to Jeremy Powell, Project Manager ([email protected]).
Yours sincerely
Elisabeth George
Associate Director – Appraisals
Centre for Health Technology Evaluation
10 Spring Gardens London
SW1A 2BU United Kingdom
+44 (0)300 323 0140
www.nice.org.uk
Encl. checklist for confidential information
Section A: Clarification on effectiveness data
FIRST trial (MM-020)
A1. Please provide details of the use of concomitant therapy during the active treatment
phase for the MM-020 trial for all randomised groups, as details reported in Table 9
(page 29, Document B) are for the continuous lenalidomide group only (safety
population).
A2. Page 33 of Document B states that all patients received protocol-specified
antithrombotic prophylaxis. The supplementary appendix of the Benboubker New
England Journal of Medicine paper states that patients could, after 4 months, switch
to low-dose aspirin at the investigator’s discretion. How many patients switched to
aspirin?
A3. We note a discrepancy in the statistical power calculation for the primary endpoint of
PFS between the company submission and the trial journal publication. There is a
difference in the expected hazard ratio, as underlined below.
In B.2.4.1 it states: “A total of approximately 1,590 patients (530 in each arm) were
enrolled, with accrual of about 67 patients per month for 24 months. With a 24-month
accrual period and 36-month follow-up after the study closed to accrual, a sample
size of 530 patients in each treatment arm would have 80% power to detect a hazard
rate ratio of 1.25 using a 2-sided log-rank test with an overall significance level of
0.05.”
In the journal publication it states: “We estimated that 1590 patients (530 per
treatment group) would need to be enrolled to provide the study with 80% power to
detect a hazard ratio of 0.80 for disease progression or death (continuous
lenalidomide–dexamethasone vs. MPT), using a two-sided log-rank test with a
significance level of 0.05, including one interim analysis”.
We also note there is inconsistency in these hazard ratios in the trial protocol
(appended to the journal article) on pages 350 and page 391.
Could you explain the discrepancy?
A4. On page 41 of Document B it states that: “given that the Rd and Rd18 arms were
identical during this interval, HRQoL data for these two arms were pooled”. Please
present HRQoL results separately for the Rd and Rd18 groups in order for us to
assess if there were any differences between the groups.

10 Spring Gardens London
SW1A 2BU United Kingdom
+44 (0)300 323 0140
www.nice.org.uk
A5. Please provide references to any key publications describing the development and
use of the EORTC QLQ-MY20 instrument. Specifically, has it been validated?
A6. An efficacy evaluable population is mentioned in Document B page 38, defined as
“The efficacy-evaluable population was defined as ITT patients who met protocol
requirements (either met eligibility criteria and/or had measurable disease at
baseline) and were evaluated after receiving at least one dose of study treatment”.
Please clarify whether any of the results for this population are presented in the
submission or used in the economic model.
A7. The submission states that there were 906 deaths across the treatment groups at the
January 2016 data cut-off (B.2.6.4, page 52). However, the number of reported death
by treatment group (page 78, Document B) equates to 903 patients (284+336+283).
Could you explain the discrepancy?
A8. In Figure 32 in Appendix D.1.2 under the discontinued study heading, there is a
group called ‘other’, which includes 130 patients across treatment groups. Please
explain what ‘other’ refers to.
A9. Please provide results, including hazard ratio (HR) with confidence intervals, median
progression-free survival (PFS) and Kaplan–Meier survival curve, for the investigator
assessment of PFS at the May 2013 cut-off, to allow comparison with the
Independent Response Adjudication Committee (IRAC) assessment of PFS at that
time.
Network meta-analysis (NMA)
A10. Please clarify if any pairwise meta-analysis was conducted for head-to-head
comparisons of MPT vs MP. If so, please state whether the results were consistent
with those of this comparison in the NMA, and whether there was statistical
heterogeneity.
A11. Please clarify what the dashed lines are in Figures 15 and 16 (page 68 and 70,
Document B) – are these credible intervals around the respective hazard ratios
(straight lines)?
A12. On page 68 of Document B, with reference to the time-varying HRs for overall
survival (OS), it is stated that the HR of Rd relative to MPT becomes “statistically
significant at approximately 20 months”. Likewise, on page 70 with reference to the
time-varying HRs for PFS it is stated that the HR of Rd relative to MPT decreases
over time with the difference becoming “statistically important at approximately 18
months”. Please clarify what is meant by this, and how this was measured/quantified.
10 Spring Gardens London
SW1A 2BU United Kingdom
+44 (0)300 323 0140
www.nice.org.uk
A13. Please supply interpretation of the data in Tables 19 and 21 (page 69-71, Document
B). For example, what does the size of the correlation values signify in terms of the
goodness of the model fit?
A14. Priority question: Please elaborate on the choice of fractional polynomial model for
OS and PFS as shown in Table 10 and Table 11 in Appendix D (page 37 to 38). It
appears that the model with the lowest Deviance Information Criterion (DIC) value
was chosen, but were any other considerations taken into account in the choice of
model fit? (E.g. the clinical plausibility of the model chosen with respect to PFS and
OS curves as observed in the trials).
A15. Priority question. Please supply the NMA results for OS and PFS for each of the
other 5 fractional polynomial parametric survival models in Table 10 and Table 11
(Appendix D). Please provide these results in the same format as used in the main
company submission document (e.g. Figures 15 and 16 and Tables 19 and 21). This
will enable us to compare variation in HRs between different order models. In
addition, please supply zero-order fractional polynomial results for OS and PFS. As
we understand it, this corresponds to a proportional hazards estimation and will
enable us to assess comparability with the constant HR NMA. Please provide
updated base-case cost-effectiveness results based on each of these analyses.
A16. Please supply heterogeneity statistics for the fixed-effect constant HRs NMAs
presented in section B.2.9.
A17. Priority question: We acknowledge the statement that a fixed-effect NMA was done
rather than a random-effects NMA due to the sparseness of the network, and the
wide credible intervals for the heterogeneity parameter (as stated in Appendix
D.1.1.5, page 35). For transparency and comparison purposes please supply the
random effects constant HRs NMA results for both OS and PFS.
A18. Table 13 in Appendix D.1.3 contains a quality assessment for Facon 2006 (IFM-
95/01). However, this trial also appears in Table 59 of Appendix D, which lists
excluded studies. Please confirm whether or not this trial should have been quality
assessed as an included study.
Section B: Clarification on cost-effectiveness data
B1. On page 101, Document B, it is stated that patients who died or were censored for
OS prior to 92 weeks were not included in the MSM analysis. Please state how many
patients this applied to.
B2. The weighted costs per model cycle shown in Table 36, Document B, differs from the
values in the economic model in worksheet Drug Costs. Please clarify which values
are correct.
10 Spring Gardens London
SW1A 2BU United Kingdom
+44 (0)300 323 0140
www.nice.org.uk
B3. The pack cost reported for melphalan and prednisolone in Table 35, Document B,
differs from those reported in the economic model in worksheet Drug Costs. Please
confirm which values are correct.
B4. Priority question: Please provide a mapping of EORTC QLQ C30 data for the Rd
and MPT groups to EQ-5D values for cycles 1-6 using the mapping algorithm by
Proskorovsky et al.
B5. Priority question: The submission provides a scenario analysis of VMP vs. Rd using
time-varying HRs using fractional polynomials (Table 52, Document B). Please
conduct a one-way sensitivity analysis for this analysis using the upper and lower
95% credible interval values.
B6. Priority question: Please clarify how you obtained the cost-effectiveness results for the scenario analysis: “Use TTP:PFS to extrapolate Rd and MPT DoT” (Table 52, Document B). Currently, choosing the option of “TTP:PFS” from the drop down menu in cell “DoT.Choice” within Sheet!TTF and KMs in the Excel model gives an error in the cost-effectiveness results”
Section C: Textual clarifications and additional points
C1. The clinical study report for the FIRST trial (reference 43 in the submission) contains
table headings in section 14, but there are no tables provided. Please supply these.
C2. Figure 21 (page 106, Document B), PFS (left hand panel) – should an MPT survival
curve appear in this figure?
10 Spring Gardens London
SW1A 2BU United Kingdom
+44 (0)300 323 0140
1
Single technology appraisal
Lenalidomide in combination with dexamethasone for previously untreated multiple myeloma (ID474)
Dear Company,
The Evidence Review Group, Southampton Health Technology Assessments Centre, and
the technical team at NICE have looked at the submission received on 25 October from
Celgene. In general they felt that it is well presented and clear. However, the ERG and the
NICE technical team would like further clarification on the clinical and cost effectiveness data
(see questions listed at end of letter).
The ERG and the technical team at NICE will be addressing these issues in their reports.
Please provide your written response to the clarification questions by the end of 27
November 2017. Your response and any supporting documents should be uploaded to
NICE Docs/Appraisals
Two versions of your written response should be submitted; one with academic/commercial-
in-confidence information clearly marked and one with this information removed.
Please underline all confidential information, and separately highlight information that is
submitted as commercial in confidence in turquoise, and all information submitted as
academic in confidence in yellow.
If you present data that are not already referenced in the main body of your submission and
that are academic/commercial in confidence, please complete the attached checklist for
confidential information.
Please do not embed documents (PDFs or spreadsheets) in your response because this
may result in them being lost or unreadable.
If you have any queries on the technical issues raised in this letter, please contact Thomas
Strong, Technical Lead ([email protected]). Any procedural questions should be
addressed to Jeremy Powell, Project Manager ([email protected]).
Yours sincerely
Elisabeth George
Associate Director – Appraisals
Centre for Health Technology Evaluation
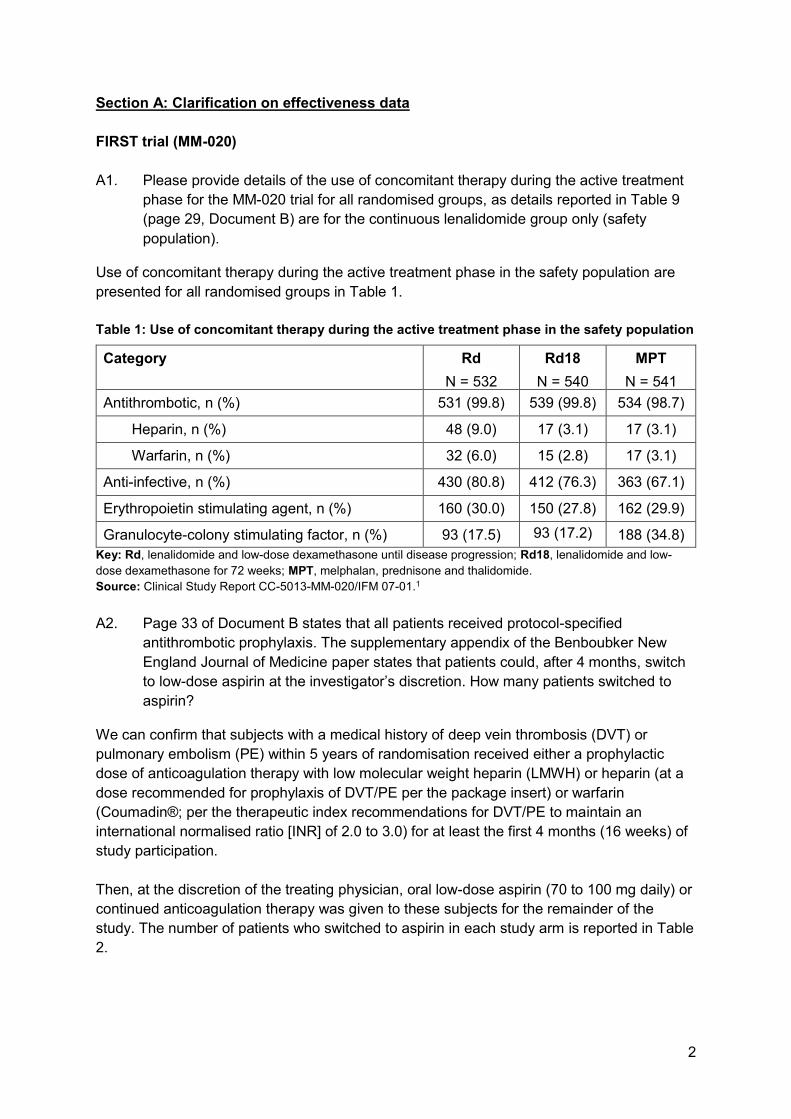
2
Section A: Clarification on effectiveness data
FIRST trial (MM-020)
A1. Please provide details of the use of concomitant therapy during the active treatment
phase for the MM-020 trial for all randomised groups, as details reported in Table 9
(page 29, Document B) are for the continuous lenalidomide group only (safety
population).
Use of concomitant therapy during the active treatment phase in the safety population are
presented for all randomised groups in Table 1.
Table 1: Use of concomitant therapy during the active treatment phase in the safety population
Category Rd
N = 532
Rd18
N = 540
MPT
N = 541
Antithrombotic, n (%) 531 (99.8) 539 (99.8) 534 (98.7)
Heparin, n (%) 48 (9.0) 17 (3.1) 17 (3.1)
Warfarin, n (%) 32 (6.0) 15 (2.8) 17 (3.1)
Anti-infective, n (%) 430 (80.8) 412 (76.3) 363 (67.1)
Erythropoietin stimulating agent, n (%) 160 (30.0) 150 (27.8) 162 (29.9)
Granulocyte-colony stimulating factor, n (%) 93 (17.5) 93 (17.2) 188 (34.8)
Key: Rd, lenalidomide and low-dose dexamethasone until disease progression; Rd18, lenalidomide and low-
dose dexamethasone for 72 weeks; MPT, melphalan, prednisone and thalidomide.
Source: Clinical Study Report CC-5013-MM-020/IFM 07-01.1
A2. Page 33 of Document B states that all patients received protocol-specified
antithrombotic prophylaxis. The supplementary appendix of the Benboubker New
England Journal of Medicine paper states that patients could, after 4 months, switch
to low-dose aspirin at the investigator’s discretion. How many patients switched to
aspirin?
We can confirm that subjects with a medical history of deep vein thrombosis (DVT) or
pulmonary embolism (PE) within 5 years of randomisation received either a prophylactic
dose of anticoagulation therapy with low molecular weight heparin (LMWH) or heparin (at a
dose recommended for prophylaxis of DVT/PE per the package insert) or warfarin
(Coumadin®; per the therapeutic index recommendations for DVT/PE to maintain an
international normalised ratio [INR] of 2.0 to 3.0) for at least the first 4 months (16 weeks) of
study participation.
Then, at the discretion of the treating physician, oral low-dose aspirin (70 to 100 mg daily) or
continued anticoagulation therapy was given to these subjects for the remainder of the
study. The number of patients who switched to aspirin in each study arm is reported in Table
2.
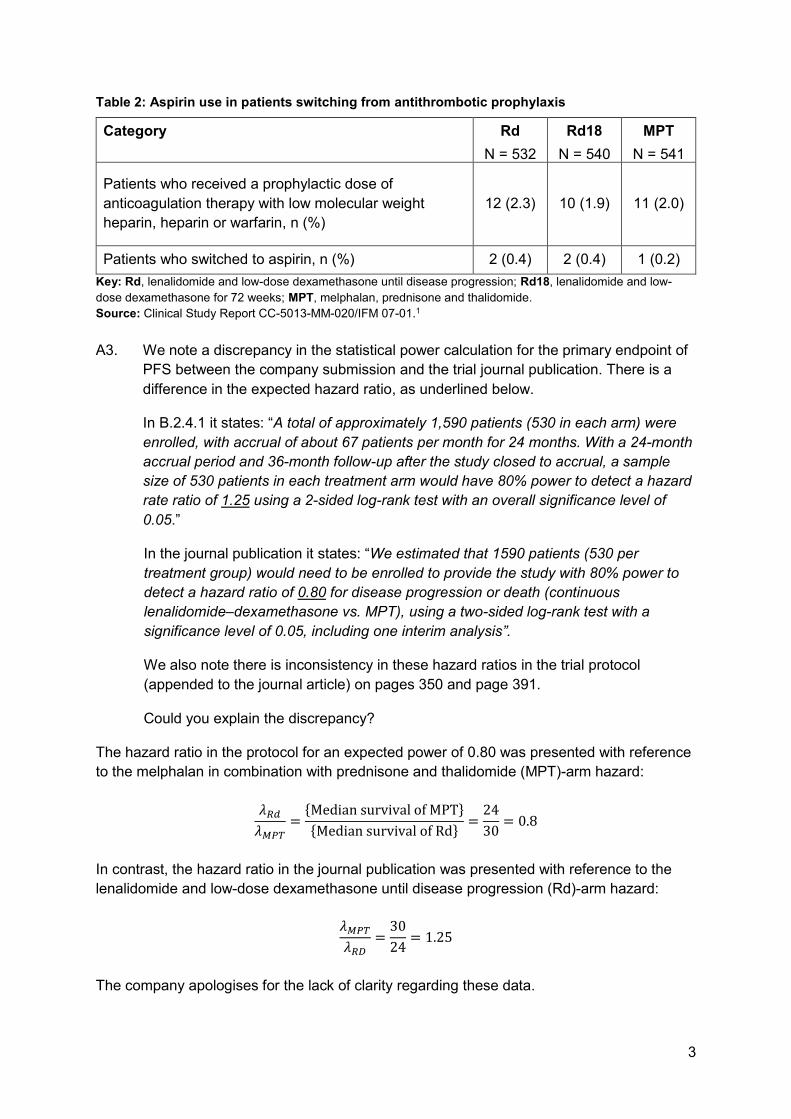
3
Table 2: Aspirin use in patients switching from antithrombotic prophylaxis
Category Rd
N = 532
Rd18
N = 540
MPT
N = 541
Patients who received a prophylactic dose of
anticoagulation therapy with low molecular weight
heparin, heparin or warfarin, n (%)
12 (2.3) 10 (1.9) 11 (2.0)
Patients who switched to aspirin, n (%) 2 (0.4) 2 (0.4) 1 (0.2)
Key: Rd, lenalidomide and low-dose dexamethasone until disease progression; Rd18, lenalidomide and low-
dose dexamethasone for 72 weeks; MPT, melphalan, prednisone and thalidomide.
Source: Clinical Study Report CC-5013-MM-020/IFM 07-01.1
A3. We note a discrepancy in the statistical power calculation for the primary endpoint of
PFS between the company submission and the trial journal publication. There is a
difference in the expected hazard ratio, as underlined below.
In B.2.4.1 it states: “A total of approximately 1,590 patients (530 in each arm) were
enrolled, with accrual of about 67 patients per month for 24 months. With a 24-month
accrual period and 36-month follow-up after the study closed to accrual, a sample
size of 530 patients in each treatment arm would have 80% power to detect a hazard
rate ratio of 1.25 using a 2-sided log-rank test with an overall significance level of
0.05.”
In the journal publication it states: “We estimated that 1590 patients (530 per
treatment group) would need to be enrolled to provide the study with 80% power to
detect a hazard ratio of 0.80 for disease progression or death (continuous
lenalidomide–dexamethasone vs. MPT), using a two-sided log-rank test with a
significance level of 0.05, including one interim analysis”.
We also note there is inconsistency in these hazard ratios in the trial protocol
(appended to the journal article) on pages 350 and page 391.
Could you explain the discrepancy?
The hazard ratio in the protocol for an expected power of 0.80 was presented with reference
to the melphalan in combination with prednisone and thalidomide (MPT)-arm hazard:
𝜆𝑅𝑑
𝜆𝑀𝑃𝑇=
{Median survival of MPT}
{Median survival of Rd}=
24
30= 0.8
In contrast, the hazard ratio in the journal publication was presented with reference to the
lenalidomide and low-dose dexamethasone until disease progression (Rd)-arm hazard:
𝜆𝑀𝑃𝑇
𝜆𝑅𝐷=
30
24= 1.25
The company apologises for the lack of clarity regarding these data.
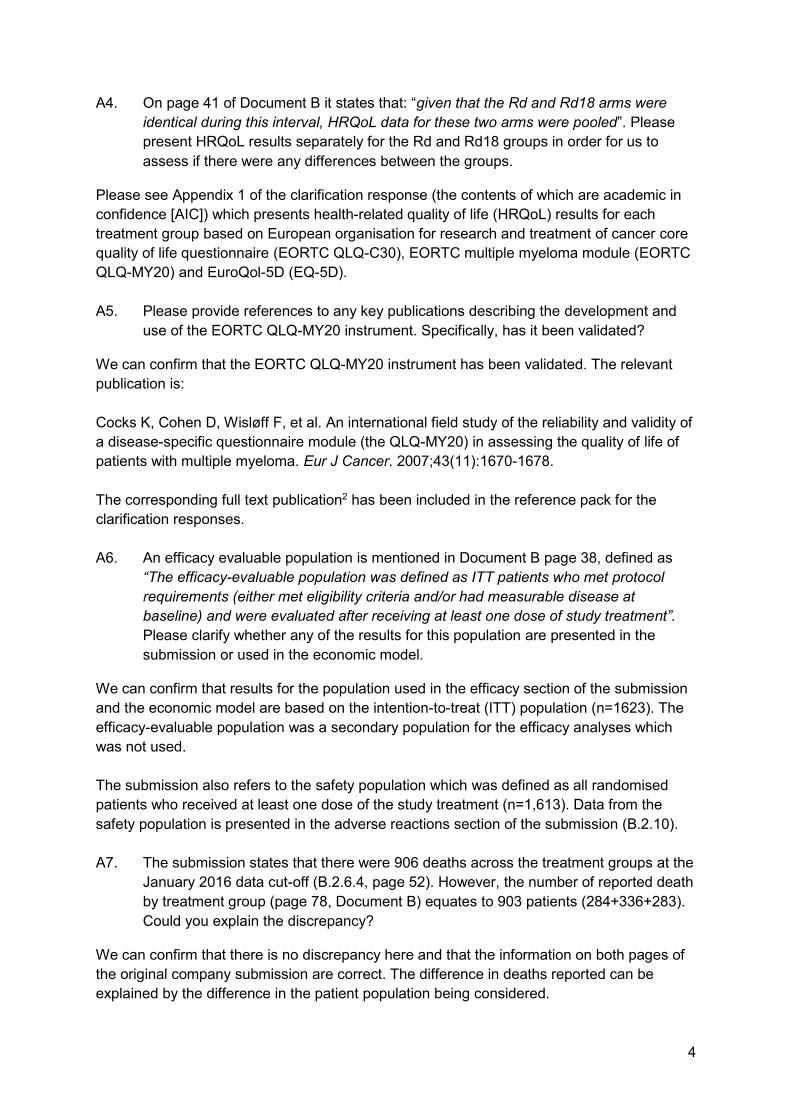
4
A4. On page 41 of Document B it states that: “given that the Rd and Rd18 arms were
identical during this interval, HRQoL data for these two arms were pooled”. Please
present HRQoL results separately for the Rd and Rd18 groups in order for us to
assess if there were any differences between the groups.
Please see Appendix 1 of the clarification response (the contents of which are academic in
confidence [AIC]) which presents health-related quality of life (HRQoL) results for each
treatment group based on European organisation for research and treatment of cancer core
quality of life questionnaire (EORTC QLQ-C30), EORTC multiple myeloma module (EORTC
QLQ-MY20) and EuroQol-5D (EQ-5D).
A5. Please provide references to any key publications describing the development and
use of the EORTC QLQ-MY20 instrument. Specifically, has it been validated?
We can confirm that the EORTC QLQ-MY20 instrument has been validated. The relevant
publication is:
Cocks K, Cohen D, Wisløff F, et al. An international field study of the reliability and validity of
a disease-specific questionnaire module (the QLQ-MY20) in assessing the quality of life of
patients with multiple myeloma. Eur J Cancer. 2007;43(11):1670-1678.
The corresponding full text publication2 has been included in the reference pack for the
clarification responses.
A6. An efficacy evaluable population is mentioned in Document B page 38, defined as
“The efficacy-evaluable population was defined as ITT patients who met protocol
requirements (either met eligibility criteria and/or had measurable disease at
baseline) and were evaluated after receiving at least one dose of study treatment”.
Please clarify whether any of the results for this population are presented in the
submission or used in the economic model.
We can confirm that results for the population used in the efficacy section of the submission
and the economic model are based on the intention-to-treat (ITT) population (n=1623). The
efficacy-evaluable population was a secondary population for the efficacy analyses which
was not used.
The submission also refers to the safety population which was defined as all randomised
patients who received at least one dose of the study treatment (n=1,613). Data from the
safety population is presented in the adverse reactions section of the submission (B.2.10).
A7. The submission states that there were 906 deaths across the treatment groups at the
January 2016 data cut-off (B.2.6.4, page 52). However, the number of reported death
by treatment group (page 78, Document B) equates to 903 patients (284+336+283).
Could you explain the discrepancy?
We can confirm that there is no discrepancy here and that the information on both pages of
the original company submission are correct. The difference in deaths reported can be
explained by the difference in the patient population being considered.
5
• The figures on page 52 of the submission (B.2.6.4) are based on the intent to treat
(ITT) population which was defined as all patients who were randomised,
independent of whether they received study treatment. In total, 1,623 patients were
enrolled and randomised in a 1:1:1 ratio to Rd (n = 535), Rd18 (n = 541) or MPT
(n = 547).
• The figures on page 78 of the submission (the safety section) are based on the
safety population which was defined as all randomised patients who received at least
one dose of the study treatment. Here data for 1,613 patients who received at least
one dose of any study drug were included.
As stated in answer to question A6, we can confirm that efficacy results for the population
used in the economic model are based on the ITT population.
A8. In Figure 32 in Appendix D.1.2 under the discontinued study heading, there is a
group called ‘other’, which includes 130 patients across treatment groups. Please
explain what ‘other’ refers to.
Table 3 provides the full text descriptions of the reasons for study discontinuation for the 130
patients whose reason for discontinuing the study was listed as ‘other’ in the CONSORT
diagram. Due to reporting of these data, there may be categories which are replicated due to
spelling and added specifics.
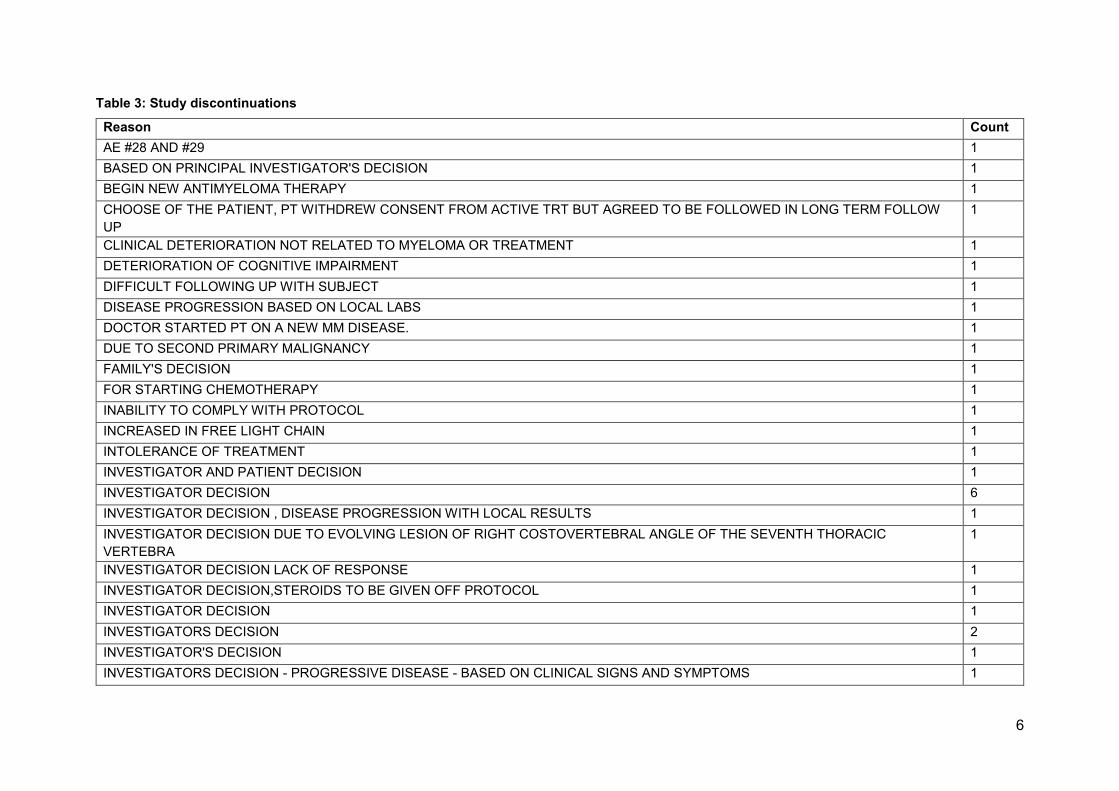
6
Table 3: Study discontinuations
Reason Count
AE #28 AND #29 1
BASED ON PRINCIPAL INVESTIGATOR'S DECISION 1
BEGIN NEW ANTIMYELOMA THERAPY 1
CHOOSE OF THE PATIENT, PT WITHDREW CONSENT FROM ACTIVE TRT BUT AGREED TO BE FOLLOWED IN LONG TERM FOLLOW
UP
1
CLINICAL DETERIORATION NOT RELATED TO MYELOMA OR TREATMENT 1
DETERIORATION OF COGNITIVE IMPAIRMENT 1
DIFFICULT FOLLOWING UP WITH SUBJECT 1
DISEASE PROGRESSION BASED ON LOCAL LABS 1
DOCTOR STARTED PT ON A NEW MM DISEASE. 1
DUE TO SECOND PRIMARY MALIGNANCY 1
FAMILY'S DECISION 1
FOR STARTING CHEMOTHERAPY 1
INABILITY TO COMPLY WITH PROTOCOL 1
INCREASED IN FREE LIGHT CHAIN 1
INTOLERANCE OF TREATMENT 1
INVESTIGATOR AND PATIENT DECISION 1
INVESTIGATOR DECISION 6
INVESTIGATOR DECISION , DISEASE PROGRESSION WITH LOCAL RESULTS 1
INVESTIGATOR DECISION DUE TO EVOLVING LESION OF RIGHT COSTOVERTEBRAL ANGLE OF THE SEVENTH THORACIC
VERTEBRA
1
INVESTIGATOR DECISION LACK OF RESPONSE 1
INVESTIGATOR DECISION,STEROIDS TO BE GIVEN OFF PROTOCOL 1
INVESTIGATOR DECISION 1
INVESTIGATORS DECISION 2
INVESTIGATOR'S DECISION 1
INVESTIGATORS DECISION - PROGRESSIVE DISEASE - BASED ON CLINICAL SIGNS AND SYMPTOMS 1

7
INVESTIGATORS DECISION, TREATMENT RESISTANT, RADIATION THERAY WAS PLANNED 1
INVESTIGATOR'S DECISION'S 1
JUDGMENT BIAS ON ZMWG CRITERIA 2
LACK OF EFFICACY IN VIEW OF TOXICITY 1
LIGHT CHAIN ESCAPE 1
LOCAL LAB'S RESULTS SHOWS PD 1
MEDICAL DECISION 5
MEDICAL DECISION STILL STABLE AFTER 9 CYCLES 1
MEDICAL MONITOR DECISION 1
MISTAKENLY DISCONTINUED FOR PD 1
MOVING TO ANOTHER CITY 1
NEW TREATMENT STARTED 1
NON COMPLIANCE 1
NON COMPLIENCE BY PATIENT 1
NON-COMPLIANCE 1
PATIENT CHOICE 1
PATIENT DECISION 5
PATIENT DECISION TO STOP STUDY MEDICATION 1
PATIENT DECISION TO STOP TREATMENT 1
PATIENT DID NOT ATTEND DISCON VISIT DUE TO LONG TRAVEL DISTANCE, WISHES TO STOP PFS VISITS 1
PATIENT DID NOT WISH TO CONTINUE WITHE THE STUDY AND WITHDREW CONSENT TO FURTHER RX BUT WAS HAPPY TO GON
INTO LONG TERM FOLLOW UP
1
PATIENT HAS CHOOSEN ANOTHER TREATMENT PLAN 1
PATIENT IS NOT WILLING TO TRAVEL EVERY MONTH, WANTS TO BE FOLLOWED CLOSE TO HOME. 1
PATIENT IS UNABLE TO FOLLOW THE STUDY PROCEDURES 1
PATIENT MUST GO 2 MONTH ON VACATION IN WEST INDIES: DECISION OF INVESTIGATOR 1
PATIENT REFUSED CONTINUING MONTHLY PFS VISITS 1
PATIENT REFUSED FURTHER MONTHLY PFS 1
PATIENT REFUSED FURTHER PFS VISITS DUE TO IMMEDIATE TREATMENT NEED FOR BLADDER CANCER 1
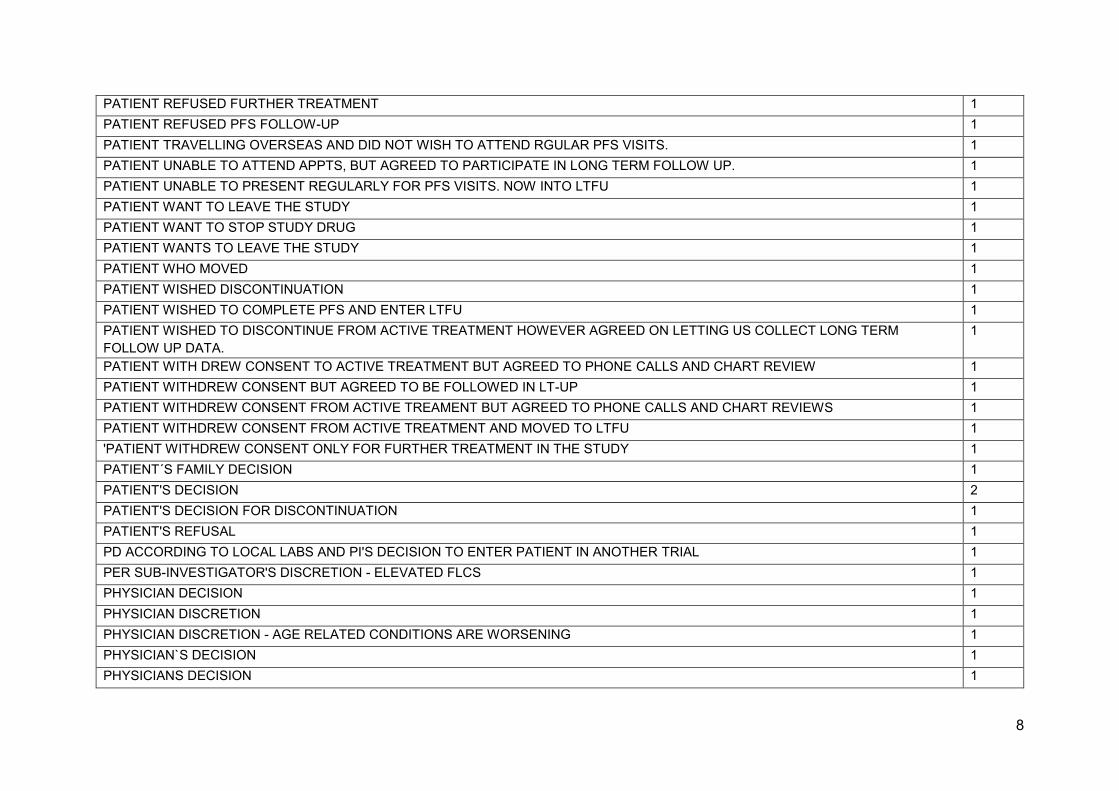
8
PATIENT REFUSED FURTHER TREATMENT 1
PATIENT REFUSED PFS FOLLOW-UP 1
PATIENT TRAVELLING OVERSEAS AND DID NOT WISH TO ATTEND RGULAR PFS VISITS. 1
PATIENT UNABLE TO ATTEND APPTS, BUT AGREED TO PARTICIPATE IN LONG TERM FOLLOW UP. 1
PATIENT UNABLE TO PRESENT REGULARLY FOR PFS VISITS. NOW INTO LTFU 1
PATIENT WANT TO LEAVE THE STUDY 1
PATIENT WANT TO STOP STUDY DRUG 1
PATIENT WANTS TO LEAVE THE STUDY 1
PATIENT WHO MOVED 1
PATIENT WISHED DISCONTINUATION 1
PATIENT WISHED TO COMPLETE PFS AND ENTER LTFU 1
PATIENT WISHED TO DISCONTINUE FROM ACTIVE TREATMENT HOWEVER AGREED ON LETTING US COLLECT LONG TERM
FOLLOW UP DATA.
1
PATIENT WITH DREW CONSENT TO ACTIVE TREATMENT BUT AGREED TO PHONE CALLS AND CHART REVIEW 1
PATIENT WITHDREW CONSENT BUT AGREED TO BE FOLLOWED IN LT-UP 1
PATIENT WITHDREW CONSENT FROM ACTIVE TREAMENT BUT AGREED TO PHONE CALLS AND CHART REVIEWS 1
PATIENT WITHDREW CONSENT FROM ACTIVE TREATMENT AND MOVED TO LTFU 1
'PATIENT WITHDREW CONSENT ONLY FOR FURTHER TREATMENT IN THE STUDY 1
PATIENT´S FAMILY DECISION 1
PATIENT'S DECISION 2
PATIENT'S DECISION FOR DISCONTINUATION 1
PATIENT'S REFUSAL 1
PD ACCORDING TO LOCAL LABS AND PI'S DECISION TO ENTER PATIENT IN ANOTHER TRIAL 1
PER SUB-INVESTIGATOR'S DISCRETION - ELEVATED FLCS 1
PHYSICIAN DECISION 1
PHYSICIAN DISCRETION 1
PHYSICIAN DISCRETION - AGE RELATED CONDITIONS ARE WORSENING 1
PHYSICIAN`S DECISION 1
PHYSICIANS DECISION 1

9
PI DECISION 2
PI DECISION TO DISCONTINUE PATIENT FROM STUDY. 1
PI DISCREATION 2
PI'S DISCRETION 1
PLASMAPHERESIS (PROCEDURE) 1
POOR GENERAL CONDITION 1
POOR PATIENT COMPLIANCE 1
POOR TOLERANCE TO THERAPY 1
PRINCIPAL INVESTIGATOR DECISION 1
PRINCIPAL INVESTIGATORS DISCRETION 1
PROGRESSIVE DISEASE ASSESSED IN ERROR FROM RADIOLOGY REPORTS. PATIENT SHOULD NOT HAVE BEEN DISCONTINNUED. 1
PROTOCOL INCOMPLIENCE DUE TO WORSENING ILLNESS 1
STARTED NEW ANTI MM THERAPY BY SUBJECT'S REQUIREMENT ,SUBJECT HIMESELF WANT TO USE OTHER TREATMENT FOR
THIS DISEASE
1
SUBI PULLED HIM OFF STUDY BASED ON FREE LIGHT CHAIN LOCAL LABS 1
SUBJECT DECIDED TO WITHDRAW STUDY TREATMENT. 1
SUBJECT DID NOT WANT TO COME TO THIS CENTRE ANY MORE; PER SOURCE, SUBJECT ' IS IN AGREEMENT WITH US FOLLOWING
HIS PROGRESS THROUGH MONITORING HIS CHART OR CALLING HIM OR HIS DOCTORS'
1
SUBJECT IS TOO ILL TO RETURN TO CLINIC 1
SUBJECT REFUSE TO CONTINUE STUDY TREATMENT 1
SUBJECT RELOCATED TO ANOTHER PROVINCE AND WITHDREW CONSENT, THEREFORE DISCONTINUED FROM THE STUDY. 1
SUBJECT REQUIRED TO CHANGE TREATMENT 1
SUBJECT WANTS TO MOVE INTO LONG-TERM FOLLOW-UP 1
SUBJECT WITHDREW CONSENT FROM ACTIVE TREATNT AND HAS DECLINE PARTICIPATION FOR PFS PHASE, BUT HAS AGREED
TO BE FOLLOWED FOR OVERAL SURVIVAL (LTFU).
1
THE PAYIENT QUIT THE TRIAL AND REFUSE TO COME TO HOSPITAL FOR EXAMINATON,BUT HE STILL BEEN FOLLOWED UP 1
THERAPY CONVERSION 1
THIS PATIENT REFUSED TO CONTINUE TO PARTICIPATE IN STUDY 1
THIS PATIENT WITHDREW CONSENT ONLY FOR STUDY DRUG NOT FOR LONG TERM FOLLOW UP 1
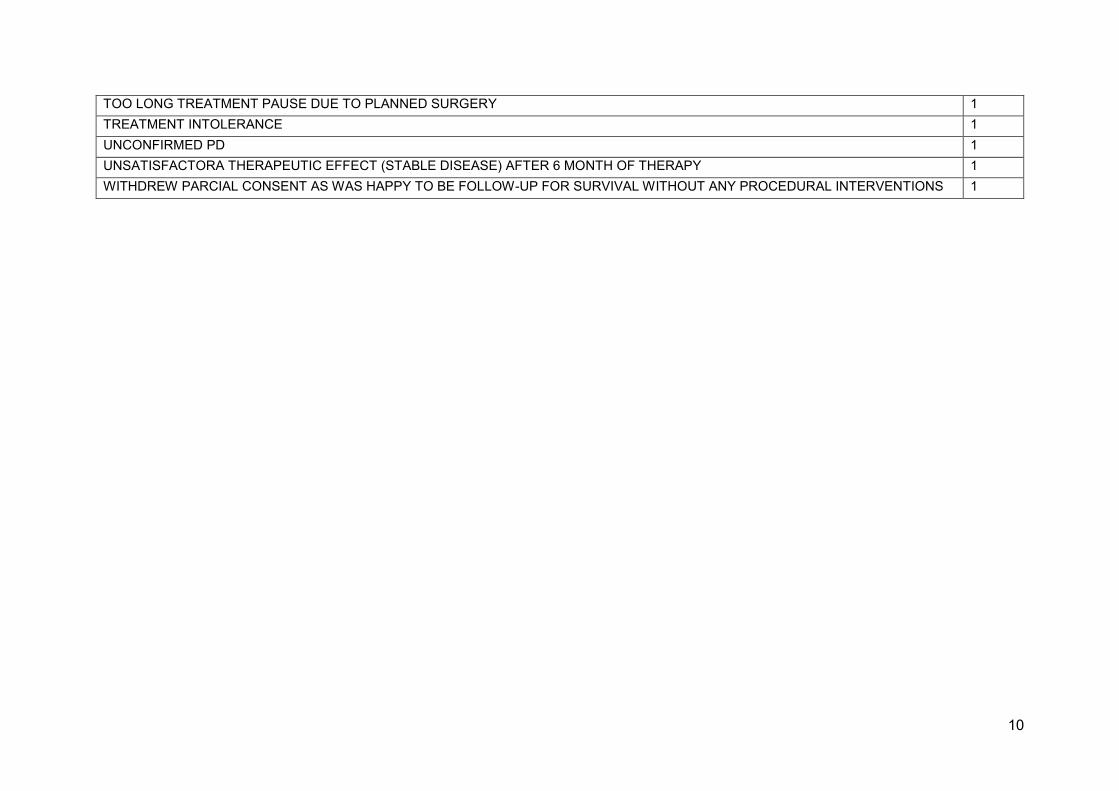
10
TOO LONG TREATMENT PAUSE DUE TO PLANNED SURGERY 1
TREATMENT INTOLERANCE 1
UNCONFIRMED PD 1
UNSATISFACTORA THERAPEUTIC EFFECT (STABLE DISEASE) AFTER 6 MONTH OF THERAPY 1
WITHDREW PARCIAL CONSENT AS WAS HAPPY TO BE FOLLOW-UP FOR SURVIVAL WITHOUT ANY PROCEDURAL INTERVENTIONS 1
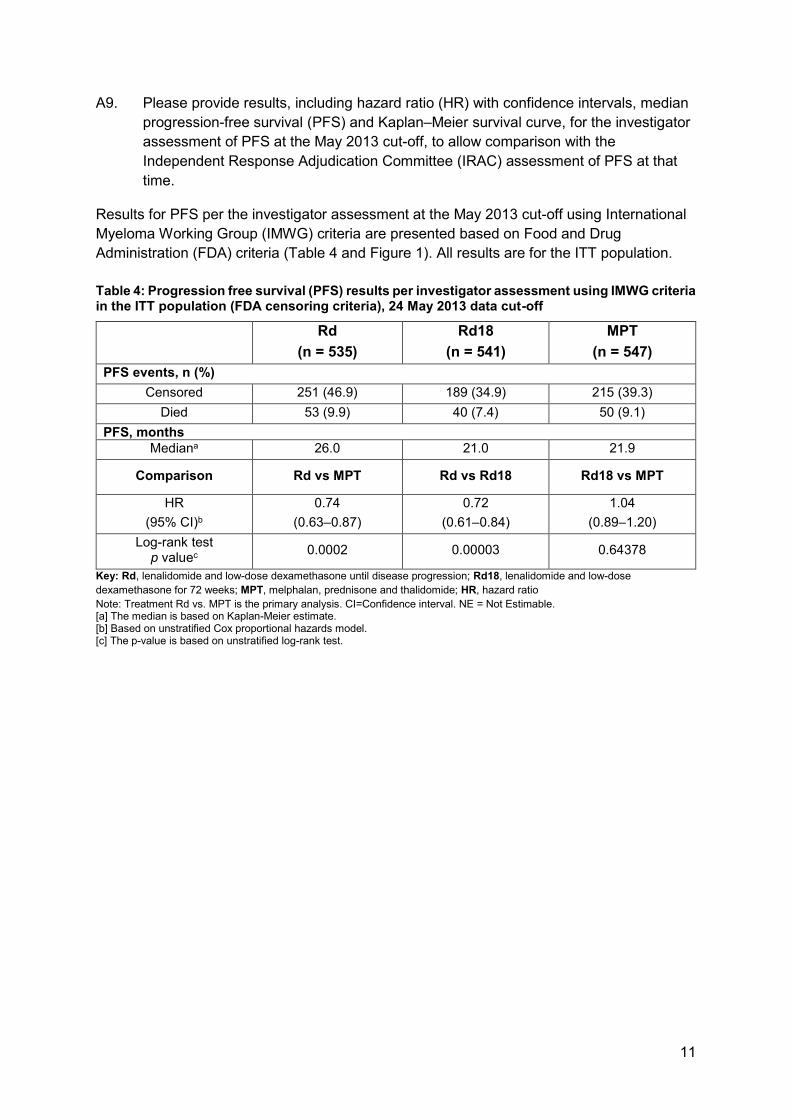
11
A9. Please provide results, including hazard ratio (HR) with confidence intervals, median
progression-free survival (PFS) and Kaplan–Meier survival curve, for the investigator
assessment of PFS at the May 2013 cut-off, to allow comparison with the
Independent Response Adjudication Committee (IRAC) assessment of PFS at that
time.
Results for PFS per the investigator assessment at the May 2013 cut-off using International
Myeloma Working Group (IMWG) criteria are presented based on Food and Drug
Administration (FDA) criteria (Table 4 and Figure 1). All results are for the ITT population.
Table 4: Progression free survival (PFS) results per investigator assessment using IMWG criteria in the ITT population (FDA censoring criteria), 24 May 2013 data cut-off
Rd
(n = 535)
Rd18
(n = 541)
MPT
(n = 547)
PFS events, n (%)
Censored 251 (46.9) 189 (34.9) 215 (39.3)
Died 53 (9.9) 40 (7.4) 50 (9.1)
PFS, months
Mediana 26.0 21.0 21.9
Comparison Rd vs MPT Rd vs Rd18 Rd18 vs MPT
HR
(95% CI)b
0.74
(0.63–0.87)
0.72
(0.61–0.84)
1.04
(0.89–1.20)
Log-rank test p valuec
0.0002 0.00003 0.64378
Key: Rd, lenalidomide and low-dose dexamethasone until disease progression; Rd18, lenalidomide and low-dose
dexamethasone for 72 weeks; MPT, melphalan, prednisone and thalidomide; HR, hazard ratio
Note: Treatment Rd vs. MPT is the primary analysis. CI=Confidence interval. NE = Not Estimable. [a] The median is based on Kaplan-Meier estimate. [b] Based on unstratified Cox proportional hazards model. [c] The p-value is based on unstratified log-rank test.
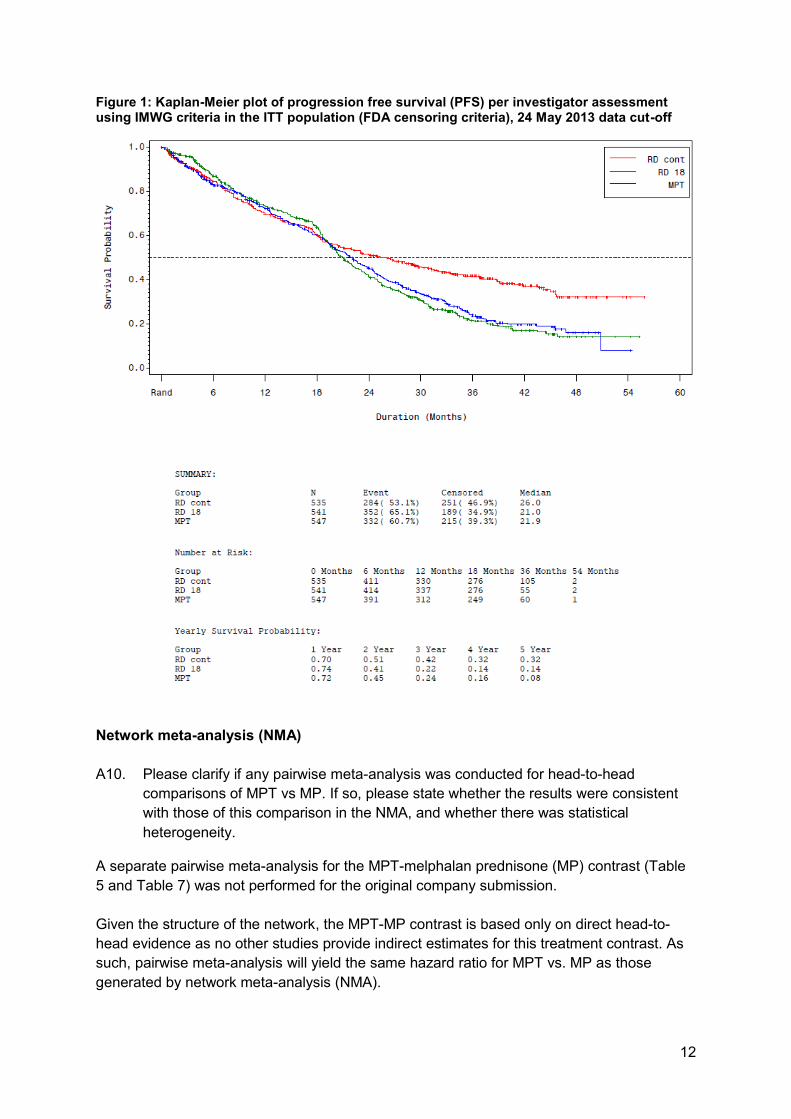
12
Figure 1: Kaplan-Meier plot of progression free survival (PFS) per investigator assessment using IMWG criteria in the ITT population (FDA censoring criteria), 24 May 2013 data cut-off
Network meta-analysis (NMA)
A10. Please clarify if any pairwise meta-analysis was conducted for head-to-head
comparisons of MPT vs MP. If so, please state whether the results were consistent
with those of this comparison in the NMA, and whether there was statistical
heterogeneity.
A separate pairwise meta-analysis for the MPT-melphalan prednisone (MP) contrast (Table
5 and Table 7) was not performed for the original company submission.
Given the structure of the network, the MPT-MP contrast is based only on direct head-to-
head evidence as no other studies provide indirect estimates for this treatment contrast. As
such, pairwise meta-analysis will yield the same hazard ratio for MPT vs. MP as those
generated by network meta-analysis (NMA).
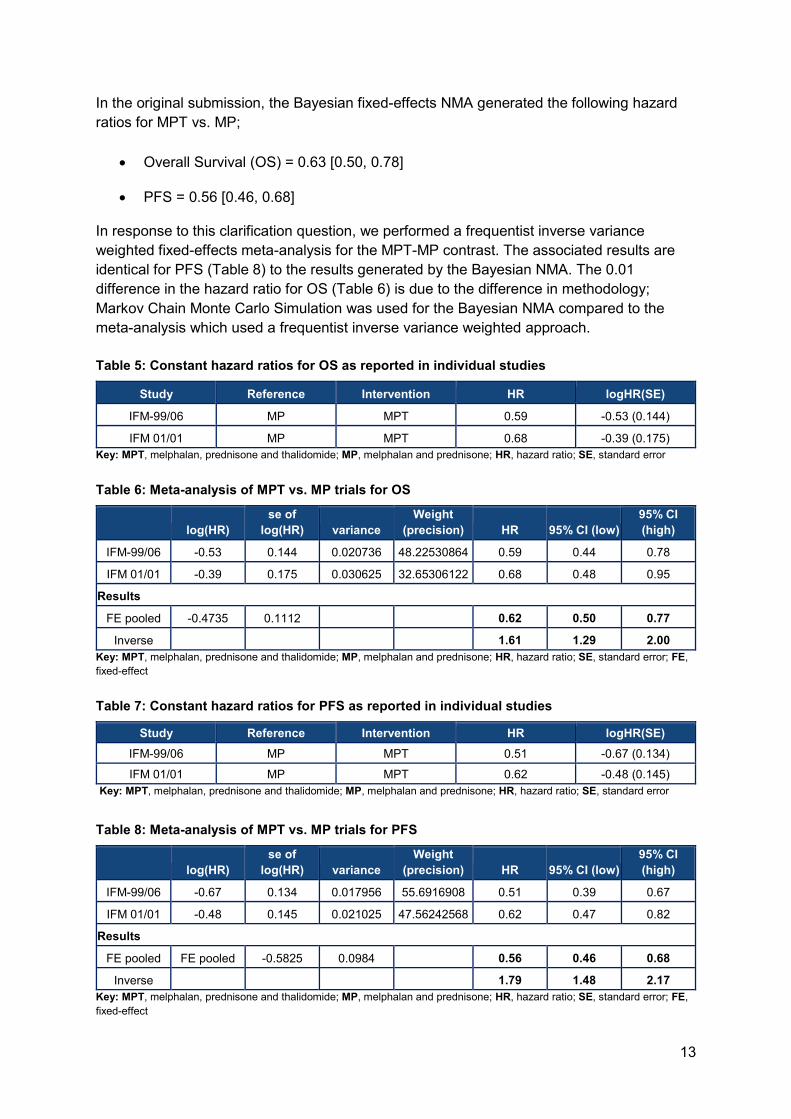
13
In the original submission, the Bayesian fixed-effects NMA generated the following hazard
ratios for MPT vs. MP;
• Overall Survival (OS) = 0.63 [0.50, 0.78]
• PFS = 0.56 [0.46, 0.68]
In response to this clarification question, we performed a frequentist inverse variance
weighted fixed-effects meta-analysis for the MPT-MP contrast. The associated results are
identical for PFS (Table 8) to the results generated by the Bayesian NMA. The 0.01
difference in the hazard ratio for OS (Table 6) is due to the difference in methodology;
Markov Chain Monte Carlo Simulation was used for the Bayesian NMA compared to the
meta-analysis which used a frequentist inverse variance weighted approach.
Table 5: Constant hazard ratios for OS as reported in individual studies
Study Reference Intervention HR logHR(SE)
IFM-99/06 MP MPT 0.59 -0.53 (0.144)
IFM 01/01 MP MPT 0.68 -0.39 (0.175)
Key: MPT, melphalan, prednisone and thalidomide; MP, melphalan and prednisone; HR, hazard ratio; SE, standard error
Table 6: Meta-analysis of MPT vs. MP trials for OS
log(HR)
se of
log(HR) variance
Weight
(precision) HR 95% CI (low)
95% CI
(high)
IFM-99/06 -0.53 0.144 0.020736 48.22530864 0.59 0.44 0.78
IFM 01/01 -0.39 0.175 0.030625 32.65306122 0.68 0.48 0.95
Results
FE pooled -0.4735 0.1112 0.62 0.50 0.77
Inverse 1.61 1.29 2.00
Key: MPT, melphalan, prednisone and thalidomide; MP, melphalan and prednisone; HR, hazard ratio; SE, standard error; FE,
fixed-effect
Table 7: Constant hazard ratios for PFS as reported in individual studies
Study Reference Intervention HR logHR(SE)
IFM-99/06 MP MPT 0.51 -0.67 (0.134)
IFM 01/01 MP MPT 0.62 -0.48 (0.145)
Key: MPT, melphalan, prednisone and thalidomide; MP, melphalan and prednisone; HR, hazard ratio; SE, standard error
Table 8: Meta-analysis of MPT vs. MP trials for PFS
log(HR)
se of
log(HR) variance
Weight
(precision) HR 95% CI (low)
95% CI
(high)
IFM-99/06 -0.67 0.134 0.017956 55.6916908 0.51 0.39 0.67
IFM 01/01 -0.48 0.145 0.021025 47.56242568 0.62 0.47 0.82
Results
FE pooled FE pooled -0.5825 0.0984 0.56 0.46 0.68
Inverse 1.79 1.48 2.17
Key: MPT, melphalan, prednisone and thalidomide; MP, melphalan and prednisone; HR, hazard ratio; SE, standard error; FE,
fixed-effect
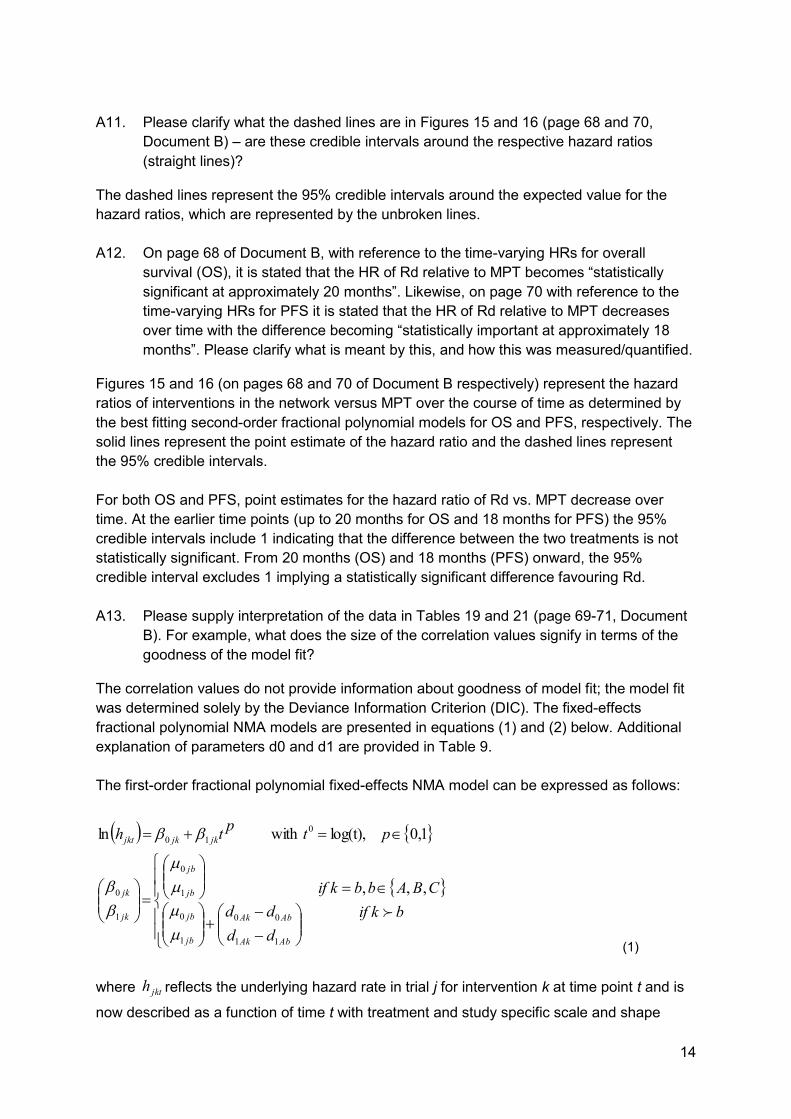
14
A11. Please clarify what the dashed lines are in Figures 15 and 16 (page 68 and 70,
Document B) – are these credible intervals around the respective hazard ratios
(straight lines)?
The dashed lines represent the 95% credible intervals around the expected value for the
hazard ratios, which are represented by the unbroken lines.
A12. On page 68 of Document B, with reference to the time-varying HRs for overall
survival (OS), it is stated that the HR of Rd relative to MPT becomes “statistically
significant at approximately 20 months”. Likewise, on page 70 with reference to the
time-varying HRs for PFS it is stated that the HR of Rd relative to MPT decreases
over time with the difference becoming “statistically important at approximately 18
months”. Please clarify what is meant by this, and how this was measured/quantified.
Figures 15 and 16 (on pages 68 and 70 of Document B respectively) represent the hazard
ratios of interventions in the network versus MPT over the course of time as determined by
the best fitting second-order fractional polynomial models for OS and PFS, respectively. The
solid lines represent the point estimate of the hazard ratio and the dashed lines represent
the 95% credible intervals.
For both OS and PFS, point estimates for the hazard ratio of Rd vs. MPT decrease over
time. At the earlier time points (up to 20 months for OS and 18 months for PFS) the 95%
credible intervals include 1 indicating that the difference between the two treatments is not
statistically significant. From 20 months (OS) and 18 months (PFS) onward, the 95%
credible interval excludes 1 implying a statistically significant difference favouring Rd.
A13. Please supply interpretation of the data in Tables 19 and 21 (page 69-71, Document
B). For example, what does the size of the correlation values signify in terms of the
goodness of the model fit?
The correlation values do not provide information about goodness of model fit; the model fit
was determined solely by the Deviance Information Criterion (DIC). The fixed-effects
fractional polynomial NMA models are presented in equations (1) and (2) below. Additional
explanation of parameters d0 and d1 are provided in Table 9.
The first-order fractional polynomial fixed-effects NMA model can be expressed as follows:
(1)
where reflects the underlying hazard rate in trial j for intervention k at time point t and is
now described as a function of time t with treatment and study specific scale and shape
( )
=
−
−+
=
=+=
bkif
CBAbbkif
dd
dd
ptp
th
AbAk
AbAk
jb
jb
jb
jb
jk
jk
jkjkjkt
,,,
1,0 log(t),ith wln
11
00
1
0
1
0
1
0
0
10
jkth

15
parameters and . If equals 0, a constant log hazard function is obtained,
reflecting exponentially distributed survival times. If ≠ 0 and p=1, a linear hazard
function is obtained which corresponds to a Gompertz survival function. If ≠ 0 and p=0,
a Weibull hazard function is obtained. The vectors are trial-specific and reflect the
true underlying scale and shape parameters of the comparator treatment b. The pooled
difference in the scale parameter β0 of the log hazard curve for treatment k relative to
comparator treatment b is expressed as with .
reflects the log
hazard ratio at time point zero. The pooled difference in the shape parameter of the log
hazard curve for treatment k relative to comparator treatment b is expressed as .
reflects the change in the log hazard ratio over time. For a proportional hazards model,
equals 0. By incorporating in addition to , a multi-dimensional treatment effect
is used.
The second order fractional polynomial fixed-effects NMA model used in this project can be
expressed as follows:
(2)
Here the additional shape parameter of the log hazard curve is assumed to be the same
for all treatment groups within a study thereby assuming that treatment only has an effect on
and . However, this additional parameter leads to better fit to the available data and
therefore better estimates of the hazard ratios over time, despite not contributing directly to
the hazard ratios.
Table 9: Explanation of parameters d0 and d1 from time-varying NMA
Parameter Definition Interpretation Example
d0 The relative treatment effect on the scale parameter of the
The log(HR) at time point 0. For OS under the best-fitting 2nd order FP model, the log(HR) of
jk0 jk1 jk1
jk1
jk1
jb
jb
1
0
AbAk dd 00 − 00 =AAd Akd0
1
AbAk dd 11 −
Akd1
Akd1 Akd1 Akd0
( )( )
0
,,,
)log( with
log
ln
11
00
2
1
0
2
1
0
2
1
0
0
21
21
12
110
22
110
−
−
+
=
=
==
++
++=
bkifdd
dd
CBAbbkif
ttpp
pp
tp
tp
t
pt
pt
h
AbAk
AbAk
jb
jb
jb
jb
jb
jb
jk
jk
jk
jkjkjk
jkjkjk
jkt
2
jk0 jk1
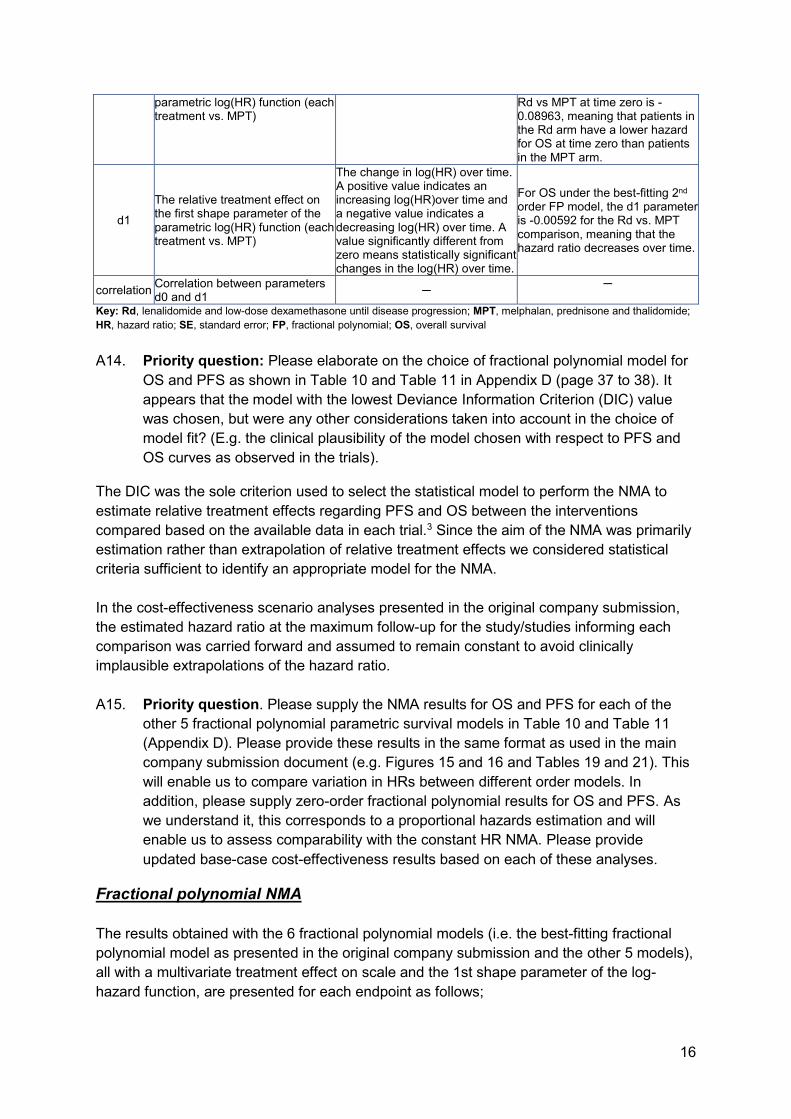
16
parametric log(HR) function (each treatment vs. MPT)
Rd vs MPT at time zero is -0.08963, meaning that patients in the Rd arm have a lower hazard for OS at time zero than patients in the MPT arm.
d1
The relative treatment effect on the first shape parameter of the parametric log(HR) function (each treatment vs. MPT)
The change in log(HR) over time. A positive value indicates an increasing log(HR)over time and a negative value indicates a decreasing log(HR) over time. A value significantly different from zero means statistically significant changes in the log(HR) over time.
For OS under the best-fitting 2nd order FP model, the d1 parameter is -0.00592 for the Rd vs. MPT comparison, meaning that the hazard ratio decreases over time.
correlation Correlation between parameters d0 and d1
─ ─
Key: Rd, lenalidomide and low-dose dexamethasone until disease progression; MPT, melphalan, prednisone and thalidomide;
HR, hazard ratio; SE, standard error; FP, fractional polynomial; OS, overall survival
A14. Priority question: Please elaborate on the choice of fractional polynomial model for
OS and PFS as shown in Table 10 and Table 11 in Appendix D (page 37 to 38). It
appears that the model with the lowest Deviance Information Criterion (DIC) value
was chosen, but were any other considerations taken into account in the choice of
model fit? (E.g. the clinical plausibility of the model chosen with respect to PFS and
OS curves as observed in the trials).
The DIC was the sole criterion used to select the statistical model to perform the NMA to
estimate relative treatment effects regarding PFS and OS between the interventions
compared based on the available data in each trial.3 Since the aim of the NMA was primarily
estimation rather than extrapolation of relative treatment effects we considered statistical
criteria sufficient to identify an appropriate model for the NMA.
In the cost-effectiveness scenario analyses presented in the original company submission,
the estimated hazard ratio at the maximum follow-up for the study/studies informing each
comparison was carried forward and assumed to remain constant to avoid clinically
implausible extrapolations of the hazard ratio.
A15. Priority question. Please supply the NMA results for OS and PFS for each of the
other 5 fractional polynomial parametric survival models in Table 10 and Table 11
(Appendix D). Please provide these results in the same format as used in the main
company submission document (e.g. Figures 15 and 16 and Tables 19 and 21). This
will enable us to compare variation in HRs between different order models. In
addition, please supply zero-order fractional polynomial results for OS and PFS. As
we understand it, this corresponds to a proportional hazards estimation and will
enable us to assess comparability with the constant HR NMA. Please provide
updated base-case cost-effectiveness results based on each of these analyses.
Fractional polynomial NMA
The results obtained with the 6 fractional polynomial models (i.e. the best-fitting fractional
polynomial model as presented in the original company submission and the other 5 models),
all with a multivariate treatment effect on scale and the 1st shape parameter of the log-
hazard function, are presented for each endpoint as follows;

17
• OS:
o Table 10: model fit statistics
o Table 11: estimated hazard ratios for all interventions vs. MPT at 6-monthly
intervals from 0 to 90 months for each of the 6 fractional polynomial models
o Table 12 – Table 17: basic parameter estimates for each of the 6 fractional
polynomial models. The corresponding plots of the hazard ratios over time
are presented in Figure 2 – Figure 7.
• PFS (EMA-censored MM-020 data):
o Table 18: model fit statistics
o Table 19: estimated hazard ratios for all interventions vs. MPT at 6-monthly
intervals from 0 to 90 months for each of the 6 fractional polynomial models
o Table 20 – Table 25: basic parameter estimates for each of the 6 fractional
polynomial models. The corresponding plots of the hazard ratios over time
are presented in Table 9 – Table 14.
Overall survival
Table 10: Model fit statistics for alternative fixed-effects NMA models with a multivariate
treatment effect on scale and 1st shape parameter; OS
Model Dbar pD DIC
Weibull (1st order FP with p=0); treatment effects on 1 scale (d0) and 1 shape parameter (d1) 2161.04 15.96 2177
Gompertz (1st order FP with p=1); treatment effects on 1 scale (d0) and 1 shape parameter (d1) 2129.07 15.93 2145
2nd order FP with p1=0, p2=0; treatment effects on 1 scale (d0) and 1 shape parameter (d1) 2126.21 19.79 2146
2nd order FP with p1=0, p2=1; treatment effects on 1 scale (d0) and 1 shape parameter (d1) 2124.13 19.87 2144
2nd order FP with p1=1, p2=0, treatment effects on 1 scale (d0) and 1 shape parameter (d1)* 2118.10 19.90 2138
2nd order FP with p1=1, p2=1, treatment effects on 1 scale (d0) and 1 shape parameter (d1) 2120.04 19.96 2140
*considered best fitting model. Key: FP, fractional polynomial; DIC, Deviance Information Criterion

18
Table 11: Estimated hazard ratios of competing interventions vs MPT obtained with alternative fixed-effects NMA with a multivariate treatment effect
on scale and 1st shape parameter; OS
Intervention Reference Time point (months)
HR (95% CI)
[1st order FP with p=0; Weibull]
HR (95% CI)
[1st order FP with p=1; Gompertz]
HR (95% CI)
[2nd order FP with p1=0 and p2=0]
HR (95% CI)
[2nd order FP with p1=0 and p2=1]
HR (95% CI)
[2nd order FP with p1=1 and p2=0]
HR (95% CI)
[2nd order FP with p1=1 and p2=1]
RD18 MPT 1 ''''''''''' ''''''''''' ''''''''''' ''''''''''' ''''''''''' '''''''''''
RD18 MPT 6 ''''''''''' ''''''''''' ''''''''''' ''''''''''' ''''''''''' '''''''''''
RD18 MPT 12 ''''''''''' ''''''''''' ''''''''''' ''''''''''' ''''''''''' '''''''''''
RD18 MPT 18 ''''''''''' ''''''''''' ''''''''''' ''''''''''' ''''''''''' '''''''''''
RD18 MPT 24 ''''''''''' ''''''''''' ''''''''''' ''''''''''' ''''''''''' '''''''''''
RD18 MPT 30 ''''''''''' ''''''''''' ''''''''''' ''''''''''' ''''''''''' '''''''''''
RD18 MPT 36 ''''''''''' ''''''''''' ''''''''''' ''''''''''' ''''''''''' '''''''''''
RD18 MPT 42 ''''''''''' ''''''''''' ''''''''''' ''''''''''' ''''''''''' '''''''''''
RD18 MPT 48 ''''''''''' ''''''''''' ''''''''''' ''''''''''' ''''''''''' '''''''''''
RD18 MPT 54 ''''''''''' ''''''''''' ''''''''''' ''''''''''' ''''''''''' '''''''''''
RD18 MPT 60 ''''''''''' ''''''''''' ''''''''''' ''''''''''' ''''''''''' '''''''''''
RD18 MPT 66 ''''''''''' ''''''''''' ''''''''''' ''''''''''' ''''''''''' '''''''''''
RD18 MPT 72 ''''''''''' ''''''''''' ''''''''''' ''''''''''' ''''''''''' '''''''''''
RD18 MPT 78 ''''''''''' ''''''''''' ''''''''''' ''''''''''' ''''''''''' '''''''''''
RD18 MPT 84 ''''''''''' ''''''''''' ''''''''''' ''''''''''' ''''''''''' '''''''''''
RD18 MPT 90 ''''''''''' ''''''''''' ''''''''''' ''''''''''' ''''''''''' '''''''''''
MP MPT 1 ''''''''''' ''''''''''' ''''''''''' ''''''''''' ''''''''''' '''''''''''
MP MPT 6 ''''''''''' ''''''''''' ''''''''''' ''''''''''' ''''''''''' '''''''''''
MP MPT 12 ''''''''''' ''''''''''' ''''''''''' ''''''''''' ''''''''''' '''''''''''
MP MPT 18 ''''''''''' ''''''''''' ''''''''''' ''''''''''' ''''''''''' '''''''''''
MP MPT 24 ''''''''''' ''''''''''' ''''''''''' ''''''''''' ''''''''''' '''''''''''
MP MPT 30 ''''''''''' ''''''''''' ''''''''''' ''''''''''' ''''''''''' '''''''''''
MP MPT 36 ''''''''''' ''''''''''' ''''''''''' ''''''''''' ''''''''''' '''''''''''
MP MPT 42 ''''''''''' ''''''''''' ''''''''''' ''''''''''' ''''''''''' '''''''''''
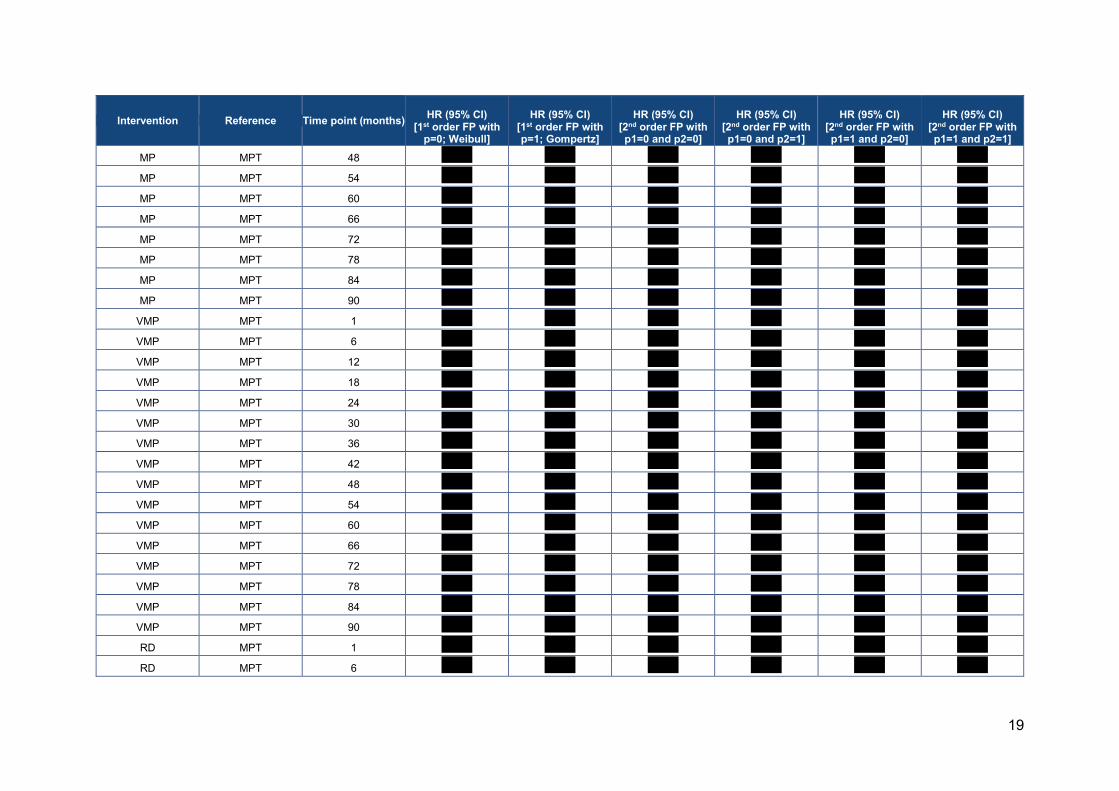
19
Intervention Reference Time point (months)
HR (95% CI)
[1st order FP with p=0; Weibull]
HR (95% CI)
[1st order FP with p=1; Gompertz]
HR (95% CI)
[2nd order FP with p1=0 and p2=0]
HR (95% CI)
[2nd order FP with p1=0 and p2=1]
HR (95% CI)
[2nd order FP with p1=1 and p2=0]
HR (95% CI)
[2nd order FP with p1=1 and p2=1]
MP MPT 48 ''''''''''' ''''''''''' ''''''''''' ''''''''''' ''''''''''' '''''''''''
MP MPT 54 ''''''''''' ''''''''''' ''''''''''' ''''''''''' ''''''''''' '''''''''''
MP MPT 60 ''''''''''' ''''''''''' ''''''''''' ''''''''''' ''''''''''' '''''''''''
MP MPT 66 ''''''''''' ''''''''''' ''''''''''' ''''''''''' ''''''''''' '''''''''''
MP MPT 72 ''''''''''' ''''''''''' ''''''''''' ''''''''''' ''''''''''' '''''''''''
MP MPT 78 ''''''''''' ''''''''''' ''''''''''' ''''''''''' ''''''''''' '''''''''''
MP MPT 84 ''''''''''' ''''''''''' ''''''''''' ''''''''''' ''''''''''' '''''''''''
MP MPT 90 ''''''''''' ''''''''''' ''''''''''' ''''''''''' ''''''''''' '''''''''''
VMP MPT 1 ''''''''''' ''''''''''' ''''''''''' ''''''''''' ''''''''''' '''''''''''
VMP MPT 6 ''''''''''' ''''''''''' ''''''''''' ''''''''''' ''''''''''' '''''''''''
VMP MPT 12 ''''''''''' ''''''''''' ''''''''''' ''''''''''' ''''''''''' '''''''''''
VMP MPT 18 ''''''''''' ''''''''''' ''''''''''' ''''''''''' ''''''''''' '''''''''''
VMP MPT 24 ''''''''''' ''''''''''' ''''''''''' ''''''''''' ''''''''''' '''''''''''
VMP MPT 30 ''''''''''' ''''''''''' ''''''''''' ''''''''''' ''''''''''' '''''''''''
VMP MPT 36 ''''''''''' ''''''''''' ''''''''''' ''''''''''' ''''''''''' '''''''''''
VMP MPT 42 ''''''''''' ''''''''''' ''''''''''' ''''''''''' ''''''''''' '''''''''''
VMP MPT 48 ''''''''''' ''''''''''' ''''''''''' ''''''''''' ''''''''''' '''''''''''
VMP MPT 54 ''''''''''' ''''''''''' ''''''''''' ''''''''''' ''''''''''' '''''''''''
VMP MPT 60 ''''''''''' ''''''''''' ''''''''''' ''''''''''' ''''''''''' '''''''''''
VMP MPT 66 ''''''''''' ''''''''''' ''''''''''' ''''''''''' ''''''''''' '''''''''''
VMP MPT 72 ''''''''''' ''''''''''' ''''''''''' ''''''''''' ''''''''''' '''''''''''
VMP MPT 78 ''''''''''' ''''''''''' ''''''''''' ''''''''''' ''''''''''' '''''''''''
VMP MPT 84 ''''''''''' ''''''''''' ''''''''''' ''''''''''' ''''''''''' '''''''''''
VMP MPT 90 ''''''''''' ''''''''''' ''''''''''' ''''''''''' ''''''''''' '''''''''''
RD MPT 1 ''''''''''' ''''''''''' ''''''''''' ''''''''''' ''''''''''' '''''''''''
RD MPT 6 ''''''''''' ''''''''''' ''''''''''' ''''''''''' ''''''''''' '''''''''''

20
Intervention Reference Time point (months)
HR (95% CI)
[1st order FP with p=0; Weibull]
HR (95% CI)
[1st order FP with p=1; Gompertz]
HR (95% CI)
[2nd order FP with p1=0 and p2=0]
HR (95% CI)
[2nd order FP with p1=0 and p2=1]
HR (95% CI)
[2nd order FP with p1=1 and p2=0]
HR (95% CI)
[2nd order FP with p1=1 and p2=1]
RD MPT 12 ''''''''''' ''''''''''' ''''''''''' ''''''''''' ''''''''''' '''''''''''
RD MPT 18 ''''''''''' ''''''''''' ''''''''''' ''''''''''' ''''''''''' '''''''''''
RD MPT 24 ''''''''''' ''''''''''' ''''''''''' ''''''''''' ''''''''''' '''''''''''
RD MPT 30 ''''''''''' ''''''''''' ''''''''''' ''''''''''' ''''''''''' '''''''''''
RD MPT 36 ''''''''''' ''''''''''' ''''''''''' ''''''''''' ''''''''''' '''''''''''
RD MPT 42 ''''''''''' ''''''''''' ''''''''''' ''''''''''' ''''''''''' '''''''''''
RD MPT 48 ''''''''''' ''''''''''' ''''''''''' ''''''''''' ''''''''''' '''''''''''
RD MPT 54 ''''''''''' ''''''''''' ''''''''''' ''''''''''' ''''''''''' '''''''''''
RD MPT 60 ''''''''''' ''''''''''' ''''''''''' ''''''''''' ''''''''''' '''''''''''
RD MPT 66 ''''''''''' ''''''''''' ''''''''''' ''''''''''' ''''''''''' '''''''''''
RD MPT 72 ''''''''''' ''''''''''' ''''''''''' ''''''''''' ''''''''''' '''''''''''
RD MPT 78 ''''''''''' ''''''''''' ''''''''''' ''''''''''' ''''''''''' '''''''''''
RD MPT 84 ''''''''''' ''''''''''' ''''''''''' ''''''''''' ''''''''''' '''''''''''
RD MPT 90 ''''''''''' ''''''''''' ''''''''''' ''''''''''' ''''''''''' ''''''''''' Key: Rd, lenalidomide and low-dose dexamethasone until disease progression; Rd18, lenalidomide and low-dose dexamethasone for 72 weeks; MPT, melphalan, prednisone and thalidomide; VMP, bortezomib, melphalan, and prednisone; MP, melphalan, and prednisone; HR, hazard ratio; FP, fractional polynomial
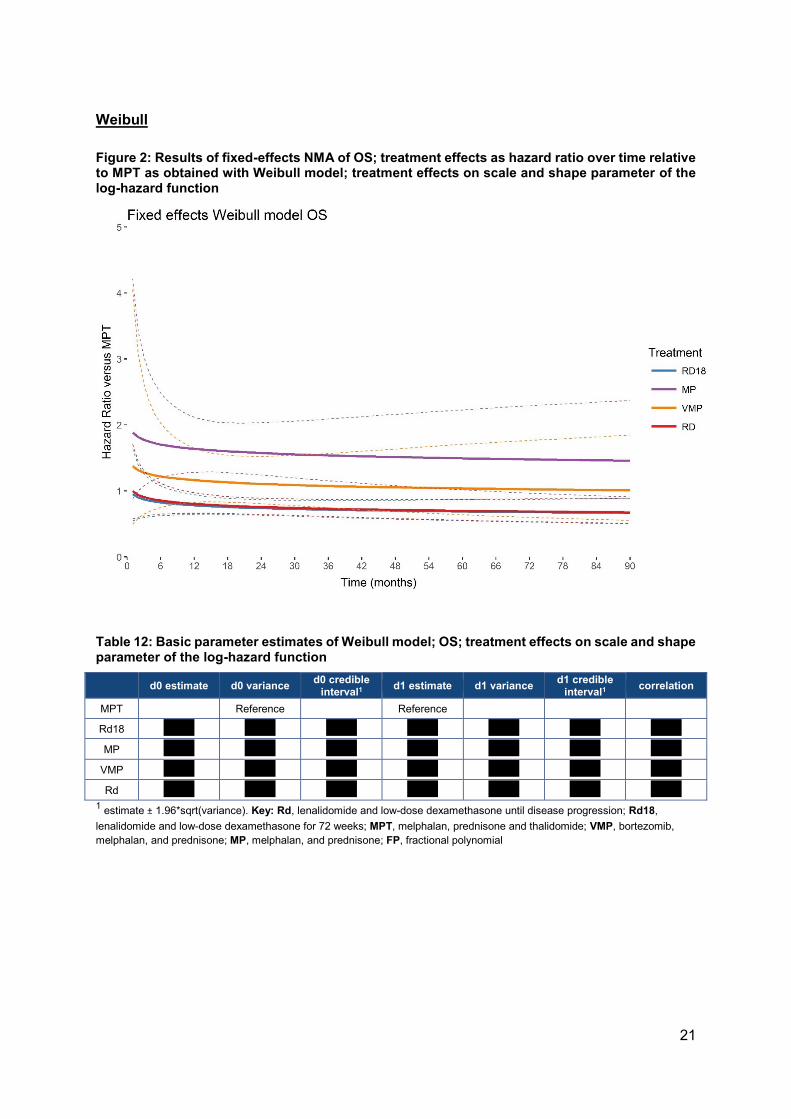
21
Weibull
Figure 2: Results of fixed-effects NMA of OS; treatment effects as hazard ratio over time relative to MPT as obtained with Weibull model; treatment effects on scale and shape parameter of the log-hazard function
Table 12: Basic parameter estimates of Weibull model; OS; treatment effects on scale and shape parameter of the log-hazard function
d0 estimate d0 variance d0 credible
interval1 d1 estimate d1 variance d1 credible
interval1 correlation
MPT
Reference Reference
Rd18 ''''''''''' ''''''''''' ''''''''''' ''''''''''' ''''''''''' ''''''''''' '''''''''''
MP ''''''''''' ''''''''''' ''''''''''' ''''''''''' ''''''''''' ''''''''''' '''''''''''
VMP ''''''''''' ''''''''''' ''''''''''' ''''''''''' ''''''''''' ''''''''''' '''''''''''
Rd ''''''''''' ''''''''''' ''''''''''' ''''''''''' ''''''''''' ''''''''''' ''''''''''' 1 estimate ± 1.96*sqrt(variance). Key: Rd, lenalidomide and low-dose dexamethasone until disease progression; Rd18,
lenalidomide and low-dose dexamethasone for 72 weeks; MPT, melphalan, prednisone and thalidomide; VMP, bortezomib,
melphalan, and prednisone; MP, melphalan, and prednisone; FP, fractional polynomial

22
Gompertz
Figure 3: Results of fixed-effects NMA of OS; treatment effects as hazard ratio over time relative to MPT as obtained with Gompertz model; treatment effects on scale and shape parameter of the log-hazard function
Table 13: Basic parameter estimates of Gompertz model; OS; treatment effects on scale and shape parameter of the log-hazard function
d0 estimate d0 variance d0 credible
interval1 d1 estimate d1 variance
d1 credible interval1
correlation
MPT Reference Reference
Rd18 ''''''''''' ''''''''''' ''''''''''' ''''''''''' ''''''''''' ''''''''''' '''''''''''
MP ''''''''''' ''''''''''' ''''''''''' ''''''''''' ''''''''''' ''''''''''' '''''''''''
VMP ''''''''''' ''''''''''' ''''''''''' ''''''''''' ''''''''''' ''''''''''' '''''''''''
Rd ''''''''''' ''''''''''' ''''''''''' ''''''''''' ''''''''''' ''''''''''' ''''''''''' 1 estimate ± 1.96*sqrt(variance). Key: Rd, lenalidomide and low-dose dexamethasone until disease progression; Rd18,
lenalidomide and low-dose dexamethasone for 72 weeks; MPT, melphalan, prednisone and thalidomide; VMP, bortezomib,
melphalan, and prednisone; MP, melphalan, and prednisone

23
2nd order fractional polynomial (p1=0, p2=0)
Figure 4: Results of fixed-effects NMA of OS; treatment effects as hazard ratio over time relative to MPT as obtained with 2nd order fractional polynomial model (P1 = 0, P2 = 0); treatment effects on scale and first shape parameter of the log-hazard function
Table 14: Basic parameter estimates of 2nd order FP model (p1=0, p2=0); OS; treatment effects on scale and first shape parameter of the log-hazard function
d0 estimate d0 variance d0 credible
interval1 d1 estimate d1 variance
d1 credible interval1
correlation
MPT Reference Reference
Rd18 ''''''''''' ''''''''''' ''''''''''' ''''''''''' ''''''''''' ''''''''''' '''''''''''
MP ''''''''''' ''''''''''' ''''''''''' ''''''''''' ''''''''''' ''''''''''' '''''''''''
VMP ''''''''''' ''''''''''' ''''''''''' ''''''''''' ''''''''''' ''''''''''' '''''''''''
Rd ''''''''''' ''''''''''' ''''''''''' ''''''''''' ''''''''''' ''''''''''' ''''''''''' 1 estimate ± 1.96*sqrt(variance). Key: Rd, lenalidomide and low-dose dexamethasone until disease progression; Rd18,
lenalidomide and low-dose dexamethasone for 72 weeks; MPT, melphalan, prednisone and thalidomide; VMP, bortezomib,
melphalan, and prednisone; MP, melphalan, and prednisone; FP, fractional polynomial
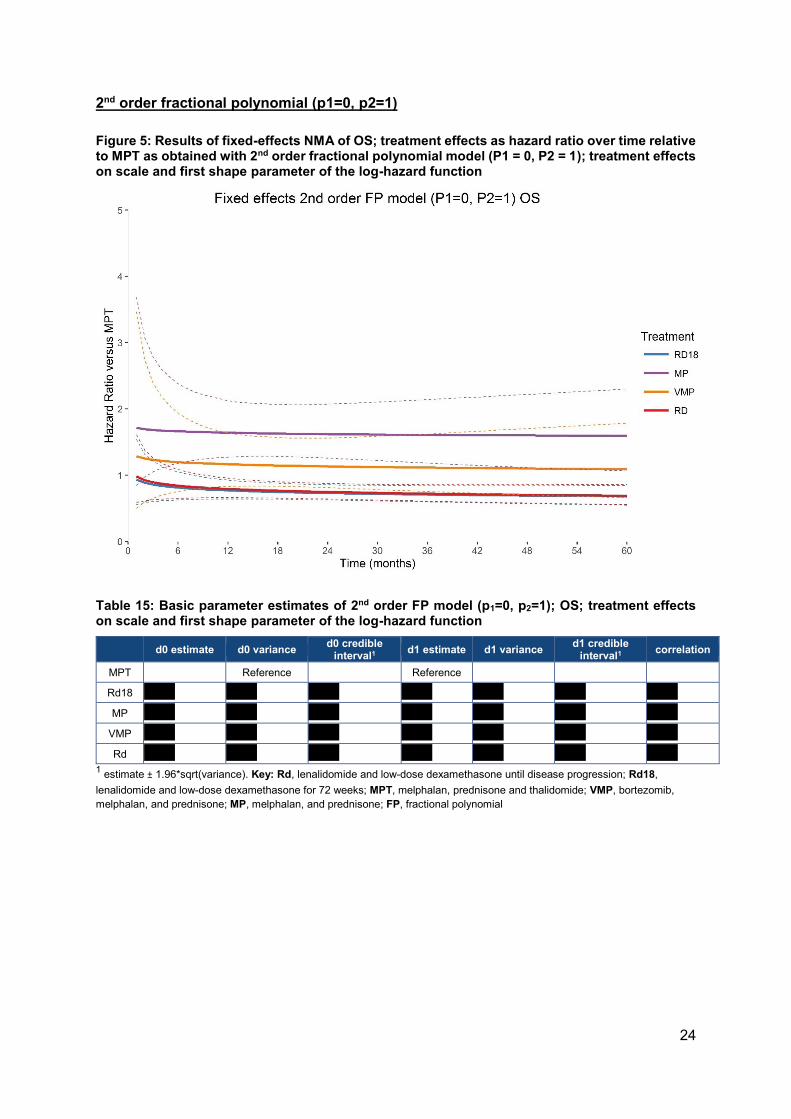
24
2nd order fractional polynomial (p1=0, p2=1)
Figure 5: Results of fixed-effects NMA of OS; treatment effects as hazard ratio over time relative to MPT as obtained with 2nd order fractional polynomial model (P1 = 0, P2 = 1); treatment effects on scale and first shape parameter of the log-hazard function
Table 15: Basic parameter estimates of 2nd order FP model (p1=0, p2=1); OS; treatment effects on scale and first shape parameter of the log-hazard function
d0 estimate d0 variance d0 credible
interval1 d1 estimate d1 variance
d1 credible interval1
correlation
MPT Reference Reference
Rd18 ''''''''''' ''''''''''' ''''''''''' ''''''''''' ''''''''''' ''''''''''' '''''''''''
MP ''''''''''' ''''''''''' ''''''''''' ''''''''''' ''''''''''' ''''''''''' '''''''''''
VMP ''''''''''' ''''''''''' ''''''''''' ''''''''''' ''''''''''' ''''''''''' '''''''''''
Rd ''''''''''' ''''''''''' ''''''''''' ''''''''''' ''''''''''' ''''''''''' ''''''''''' 1 estimate ± 1.96*sqrt(variance). Key: Rd, lenalidomide and low-dose dexamethasone until disease progression; Rd18,
lenalidomide and low-dose dexamethasone for 72 weeks; MPT, melphalan, prednisone and thalidomide; VMP, bortezomib,
melphalan, and prednisone; MP, melphalan, and prednisone; FP, fractional polynomial
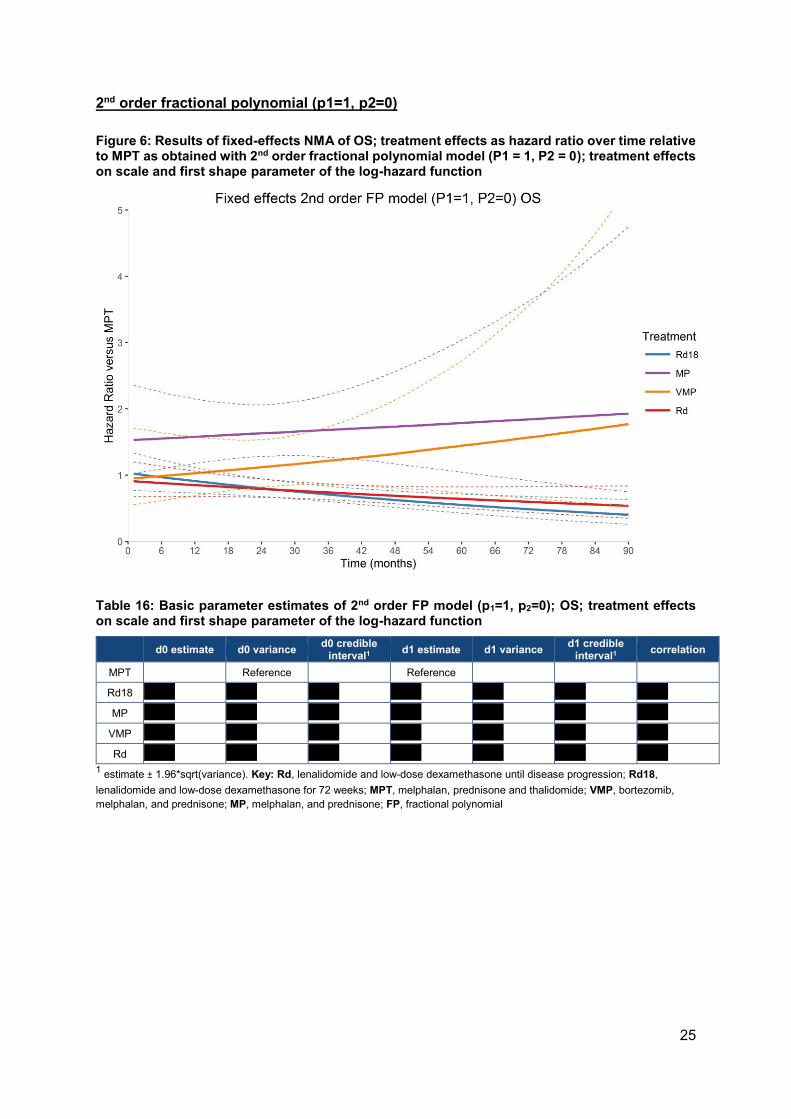
25
2nd order fractional polynomial (p1=1, p2=0)
Figure 6: Results of fixed-effects NMA of OS; treatment effects as hazard ratio over time relative to MPT as obtained with 2nd order fractional polynomial model (P1 = 1, P2 = 0); treatment effects on scale and first shape parameter of the log-hazard function
Table 16: Basic parameter estimates of 2nd order FP model (p1=1, p2=0); OS; treatment effects on scale and first shape parameter of the log-hazard function
d0 estimate d0 variance d0 credible
interval1 d1 estimate d1 variance
d1 credible interval1
correlation
MPT Reference Reference
Rd18 ''''''''''' ''''''''''' ''''''''''' ''''''''''' ''''''''''' ''''''''''' '''''''''''
MP ''''''''''' ''''''''''' ''''''''''' ''''''''''' ''''''''''' ''''''''''' '''''''''''
VMP ''''''''''' ''''''''''' ''''''''''' ''''''''''' ''''''''''' ''''''''''' '''''''''''
Rd ''''''''''' ''''''''''' ''''''''''' ''''''''''' ''''''''''' ''''''''''' ''''''''''' 1 estimate ± 1.96*sqrt(variance). Key: Rd, lenalidomide and low-dose dexamethasone until disease progression; Rd18,
lenalidomide and low-dose dexamethasone for 72 weeks; MPT, melphalan, prednisone and thalidomide; VMP, bortezomib,
melphalan, and prednisone; MP, melphalan, and prednisone; FP, fractional polynomial

26
2nd order fractional polynomial (p1=1, p2=1)
Figure 7: Results of fixed-effects NMA of OS; treatment effects as hazard ratio over time relative to MPT as obtained with 2nd order fractional polynomial model (P1 = 1, P2 = 1); treatment effects on scale and first shape parameter of the log-hazard function
Table 17: Basic parameter estimates of 2nd order FP model (p1=1, p2=1); OS; treatment effects on scale and first shape parameter of the log-hazard function
d0 estimate d0 variance d0 credible
interval1 d1 estimate d1 variance
d1 credible interval1
correlation
MPT Reference Reference
Rd18 ''''''''''' ''''''''''' ''''''''''' ''''''''''' ''''''''''' ''''''''''' '''''''''''
MP ''''''''''' ''''''''''' ''''''''''' ''''''''''' ''''''''''' ''''''''''' '''''''''''
VMP ''''''''''' ''''''''''' ''''''''''' ''''''''''' ''''''''''' ''''''''''' '''''''''''
Rd ''''''''''' ''''''''''' ''''''''''' ''''''''''' ''''''''''' ''''''''''' ''''''''''' 1 estimate ± 1.96*sqrt(variance). Key: Rd, lenalidomide and low-dose dexamethasone until disease progression; Rd18,
lenalidomide and low-dose dexamethasone for 72 weeks; MPT, melphalan, prednisone and thalidomide; VMP, bortezomib,
melphalan, and prednisone; MP, melphalan, and prednisone; FP, fractional polynomial

27
Progression free survival, EMA-censored FIRST data
Table 18: Model fit statistics for alternative fixed-effects NMA models with a multivariate treatment effect on scale and 1st shape parameter; progression free survival, EMA-censored FIRST data
Model Dbar pD DIC
Weibull (1st order FP with p=0); treatment effects on 1 scale (d0) and 1 shape parameter (d1) 1896.02 15.98 1912
Gompertz (1st order FP with p=1); treatment effects on 1 scale (d0) and 1 shape parameter (d1) 1900.22 15.78 1916
2nd order FP with p1=0, p2=0; treatment effects on 1 scale (d0) and 1 shape parameter (d1) 1887.01 19.99 1907
2nd order FP with p1=0, p2=1; treatment effects on 1 scale (d0) and 1 shape parameter (d1) 1876.23 19.77 1896
2nd order FP with p1=1, p2=0, treatment effects on 1 scale (d0) and 1 shape parameter (d1) 1885.04 19.96 1905
2nd order FP with p1=1, p2=1, treatment effects on 1 scale (d0) and 1 shape parameter (d1) 1875.04 19.96 1895
Key: FP, fractional polynomial; DIC, Deviance Information Criterion
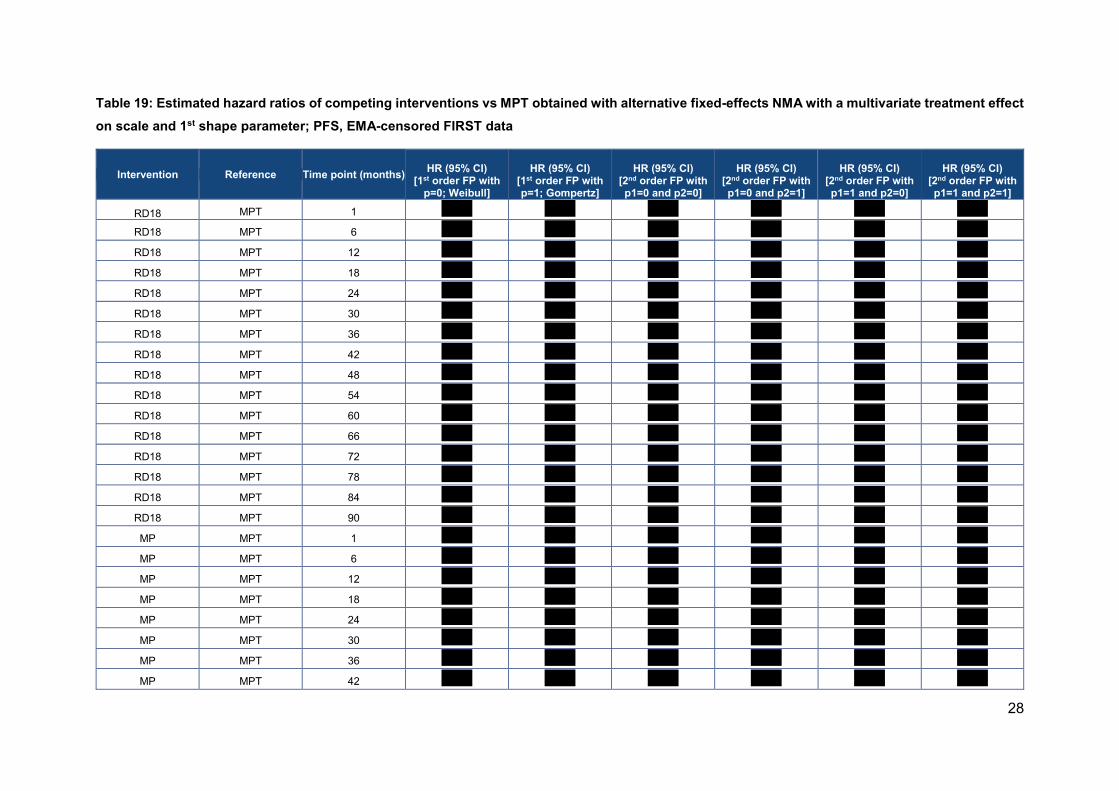
28
Table 19: Estimated hazard ratios of competing interventions vs MPT obtained with alternative fixed-effects NMA with a multivariate treatment effect
on scale and 1st shape parameter; PFS, EMA-censored FIRST data
Intervention Reference Time point (months)
HR (95% CI)
[1st order FP with p=0; Weibull]
HR (95% CI)
[1st order FP with p=1; Gompertz]
HR (95% CI)
[2nd order FP with p1=0 and p2=0]
HR (95% CI)
[2nd order FP with p1=0 and p2=1]
HR (95% CI)
[2nd order FP with p1=1 and p2=0]
HR (95% CI)
[2nd order FP with p1=1 and p2=1]
RD18 MPT 1 ''''''''''' ''''''''''' ''''''''''' ''''''''''' ''''''''''' '''''''''''
RD18 MPT 6 ''''''''''' ''''''''''' ''''''''''' ''''''''''' ''''''''''' '''''''''''
RD18 MPT 12 ''''''''''' ''''''''''' ''''''''''' ''''''''''' ''''''''''' '''''''''''
RD18 MPT 18 ''''''''''' ''''''''''' ''''''''''' ''''''''''' ''''''''''' '''''''''''
RD18 MPT 24 ''''''''''' ''''''''''' ''''''''''' ''''''''''' ''''''''''' '''''''''''
RD18 MPT 30 ''''''''''' ''''''''''' ''''''''''' ''''''''''' ''''''''''' '''''''''''
RD18 MPT 36 ''''''''''' ''''''''''' ''''''''''' ''''''''''' ''''''''''' '''''''''''
RD18 MPT 42 ''''''''''' ''''''''''' ''''''''''' ''''''''''' ''''''''''' '''''''''''
RD18 MPT 48 ''''''''''' ''''''''''' ''''''''''' ''''''''''' ''''''''''' '''''''''''
RD18 MPT 54 ''''''''''' ''''''''''' ''''''''''' ''''''''''' ''''''''''' '''''''''''
RD18 MPT 60 ''''''''''' ''''''''''' ''''''''''' ''''''''''' ''''''''''' '''''''''''
RD18 MPT 66 ''''''''''' ''''''''''' ''''''''''' ''''''''''' ''''''''''' '''''''''''
RD18 MPT 72 ''''''''''' ''''''''''' ''''''''''' ''''''''''' ''''''''''' '''''''''''
RD18 MPT 78 ''''''''''' ''''''''''' ''''''''''' ''''''''''' ''''''''''' '''''''''''
RD18 MPT 84 ''''''''''' ''''''''''' ''''''''''' ''''''''''' ''''''''''' '''''''''''
RD18 MPT 90 ''''''''''' ''''''''''' ''''''''''' ''''''''''' ''''''''''' '''''''''''
MP MPT 1 ''''''''''' ''''''''''' ''''''''''' ''''''''''' ''''''''''' '''''''''''
MP MPT 6 ''''''''''' ''''''''''' ''''''''''' ''''''''''' ''''''''''' '''''''''''
MP MPT 12 ''''''''''' ''''''''''' ''''''''''' ''''''''''' ''''''''''' '''''''''''
MP MPT 18 ''''''''''' ''''''''''' ''''''''''' ''''''''''' ''''''''''' '''''''''''
MP MPT 24 ''''''''''' ''''''''''' ''''''''''' ''''''''''' ''''''''''' '''''''''''
MP MPT 30 ''''''''''' ''''''''''' ''''''''''' ''''''''''' ''''''''''' '''''''''''
MP MPT 36 ''''''''''' ''''''''''' ''''''''''' ''''''''''' ''''''''''' '''''''''''
MP MPT 42 ''''''''''' ''''''''''' ''''''''''' ''''''''''' ''''''''''' '''''''''''

29
Intervention Reference Time point (months)
HR (95% CI)
[1st order FP with p=0; Weibull]
HR (95% CI)
[1st order FP with p=1; Gompertz]
HR (95% CI)
[2nd order FP with p1=0 and p2=0]
HR (95% CI)
[2nd order FP with p1=0 and p2=1]
HR (95% CI)
[2nd order FP with p1=1 and p2=0]
HR (95% CI)
[2nd order FP with p1=1 and p2=1]
MP MPT 48 ''''''''''' ''''''''''' ''''''''''' ''''''''''' ''''''''''' '''''''''''
MP MPT 54 ''''''''''' ''''''''''' ''''''''''' ''''''''''' ''''''''''' '''''''''''
MP MPT 60 ''''''''''' ''''''''''' ''''''''''' ''''''''''' ''''''''''' '''''''''''
MP MPT 66 ''''''''''' ''''''''''' ''''''''''' ''''''''''' ''''''''''' '''''''''''
MP MPT 72 ''''''''''' ''''''''''' ''''''''''' ''''''''''' ''''''''''' '''''''''''
MP MPT 78 ''''''''''' ''''''''''' ''''''''''' ''''''''''' ''''''''''' '''''''''''
MP MPT 84 ''''''''''' ''''''''''' ''''''''''' ''''''''''' ''''''''''' '''''''''''
MP MPT 90 ''''''''''' ''''''''''' ''''''''''' ''''''''''' ''''''''''' '''''''''''
VMP MPT 1 ''''''''''' ''''''''''' ''''''''''' ''''''''''' ''''''''''' '''''''''''
VMP MPT 6 ''''''''''' ''''''''''' ''''''''''' ''''''''''' ''''''''''' '''''''''''
VMP MPT 12 ''''''''''' ''''''''''' ''''''''''' ''''''''''' ''''''''''' '''''''''''
VMP MPT 18 ''''''''''' ''''''''''' ''''''''''' ''''''''''' ''''''''''' '''''''''''
VMP MPT 24 ''''''''''' ''''''''''' ''''''''''' ''''''''''' ''''''''''' '''''''''''
VMP MPT 30 ''''''''''' ''''''''''' ''''''''''' ''''''''''' ''''''''''' '''''''''''
VMP MPT 36 ''''''''''' ''''''''''' ''''''''''' ''''''''''' ''''''''''' '''''''''''
VMP MPT 42 ''''''''''' ''''''''''' ''''''''''' ''''''''''' ''''''''''' '''''''''''
VMP MPT 48 ''''''''''' ''''''''''' ''''''''''' ''''''''''' ''''''''''' '''''''''''
VMP MPT 54 ''''''''''' ''''''''''' ''''''''''' ''''''''''' ''''''''''' '''''''''''
VMP MPT 60 ''''''''''' ''''''''''' ''''''''''' ''''''''''' ''''''''''' '''''''''''
VMP MPT 66 ''''''''''' ''''''''''' ''''''''''' ''''''''''' ''''''''''' '''''''''''
VMP MPT 72 ''''''''''' ''''''''''' ''''''''''' ''''''''''' ''''''''''' '''''''''''
VMP MPT 78 ''''''''''' ''''''''''' ''''''''''' ''''''''''' ''''''''''' '''''''''''
VMP MPT 84 ''''''''''' ''''''''''' ''''''''''' ''''''''''' ''''''''''' '''''''''''
VMP MPT 90 ''''''''''' ''''''''''' ''''''''''' ''''''''''' ''''''''''' '''''''''''
RD MPT 1 ''''''''''' ''''''''''' ''''''''''' ''''''''''' ''''''''''' '''''''''''
RD MPT 6 ''''''''''' ''''''''''' ''''''''''' ''''''''''' ''''''''''' '''''''''''

30
Intervention Reference Time point (months)
HR (95% CI)
[1st order FP with p=0; Weibull]
HR (95% CI)
[1st order FP with p=1; Gompertz]
HR (95% CI)
[2nd order FP with p1=0 and p2=0]
HR (95% CI)
[2nd order FP with p1=0 and p2=1]
HR (95% CI)
[2nd order FP with p1=1 and p2=0]
HR (95% CI)
[2nd order FP with p1=1 and p2=1]
RD MPT 12 ''''''''''' ''''''''''' ''''''''''' ''''''''''' ''''''''''' '''''''''''
RD MPT 18 ''''''''''' ''''''''''' ''''''''''' ''''''''''' ''''''''''' '''''''''''
RD MPT 24 ''''''''''' ''''''''''' ''''''''''' ''''''''''' ''''''''''' '''''''''''
RD MPT 30 ''''''''''' ''''''''''' ''''''''''' ''''''''''' ''''''''''' '''''''''''
RD MPT 36 ''''''''''' ''''''''''' ''''''''''' ''''''''''' ''''''''''' '''''''''''
RD MPT 42 ''''''''''' ''''''''''' ''''''''''' ''''''''''' ''''''''''' '''''''''''
RD MPT 48 ''''''''''' ''''''''''' ''''''''''' ''''''''''' ''''''''''' '''''''''''
RD MPT 54 ''''''''''' ''''''''''' ''''''''''' ''''''''''' ''''''''''' '''''''''''
RD MPT 60 ''''''''''' ''''''''''' ''''''''''' ''''''''''' ''''''''''' '''''''''''
RD MPT 66 ''''''''''' ''''''''''' ''''''''''' ''''''''''' ''''''''''' '''''''''''
RD MPT 72 ''''''''''' ''''''''''' ''''''''''' ''''''''''' ''''''''''' '''''''''''
RD MPT 78 ''''''''''' ''''''''''' ''''''''''' ''''''''''' ''''''''''' '''''''''''
RD MPT 84 ''''''''''' ''''''''''' ''''''''''' ''''''''''' ''''''''''' '''''''''''
RD MPT 90 ''''''''''' ''''''''''' ''''''''''' ''''''''''' ''''''''''' ''''''''''' Key: Rd, lenalidomide and low-dose dexamethasone until disease progression; Rd18, lenalidomide and low-dose dexamethasone for 72 weeks; MPT, melphalan, prednisone and thalidomide; VMP, bortezomib, melphalan, and prednisone; MP, melphalan, and prednisone; HR, hazard ratio; FP, fractional polynomial
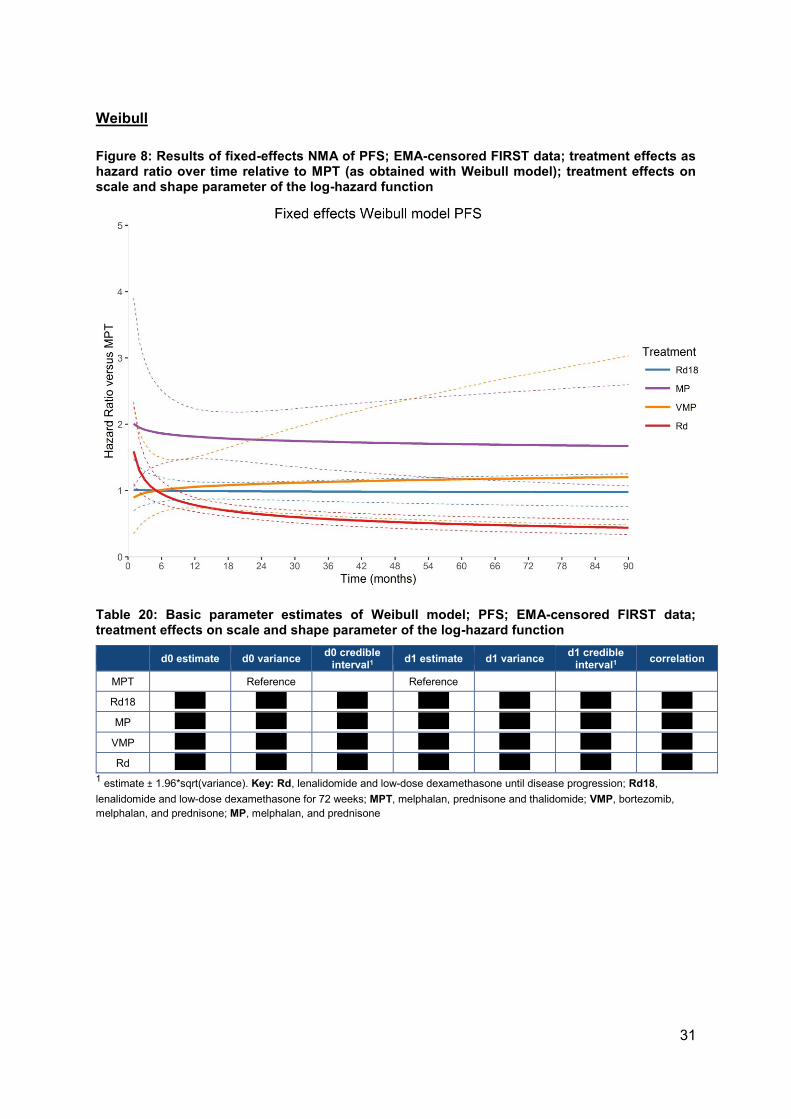
31
Weibull
Figure 8: Results of fixed-effects NMA of PFS; EMA-censored FIRST data; treatment effects as hazard ratio over time relative to MPT (as obtained with Weibull model); treatment effects on scale and shape parameter of the log-hazard function
Table 20: Basic parameter estimates of Weibull model; PFS; EMA-censored FIRST data; treatment effects on scale and shape parameter of the log-hazard function
d0 estimate d0 variance d0 credible
interval1 d1 estimate d1 variance
d1 credible interval1
correlation
MPT
Reference Reference
Rd18 ''''''''''' ''''''''''' ''''''''''' ''''''''''' ''''''''''' ''''''''''' '''''''''''
MP ''''''''''' ''''''''''' ''''''''''' ''''''''''' ''''''''''' ''''''''''' '''''''''''
VMP ''''''''''' ''''''''''' ''''''''''' ''''''''''' ''''''''''' ''''''''''' '''''''''''
Rd ''''''''''' ''''''''''' ''''''''''' ''''''''''' ''''''''''' ''''''''''' ''''''''''' 1 estimate ± 1.96*sqrt(variance). Key: Rd, lenalidomide and low-dose dexamethasone until disease progression; Rd18,
lenalidomide and low-dose dexamethasone for 72 weeks; MPT, melphalan, prednisone and thalidomide; VMP, bortezomib,
melphalan, and prednisone; MP, melphalan, and prednisone
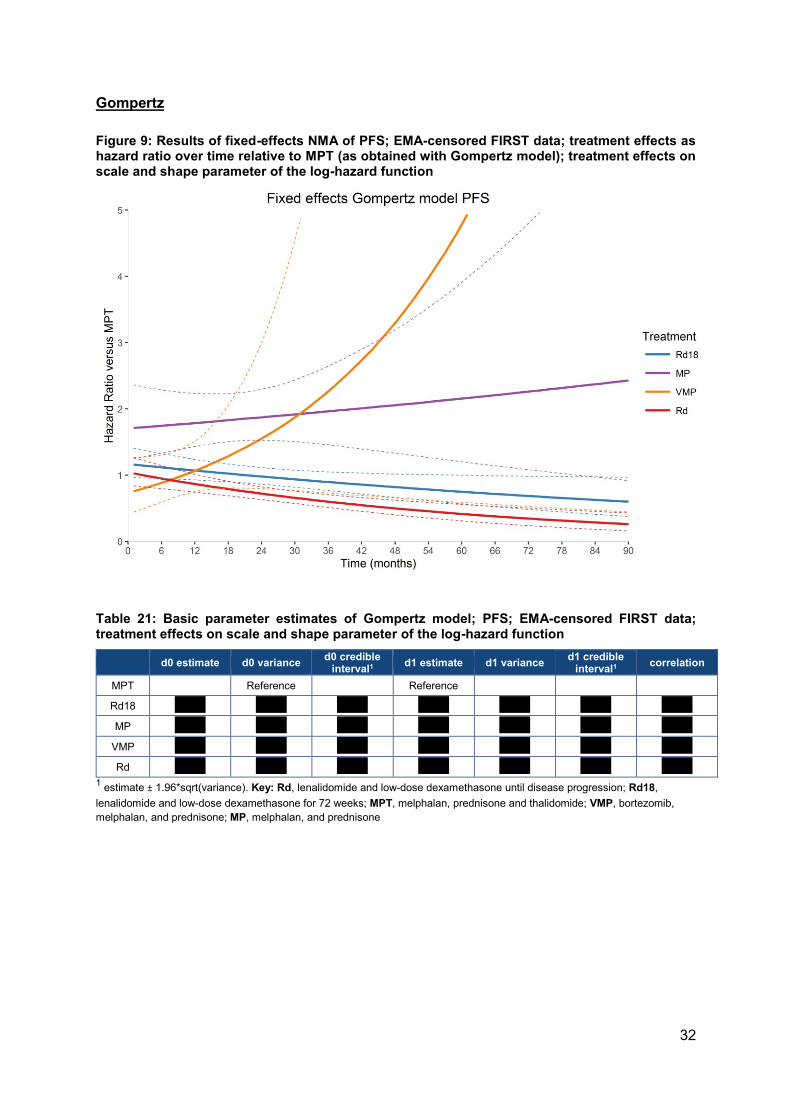
32
Gompertz
Figure 9: Results of fixed-effects NMA of PFS; EMA-censored FIRST data; treatment effects as hazard ratio over time relative to MPT (as obtained with Gompertz model); treatment effects on scale and shape parameter of the log-hazard function
Table 21: Basic parameter estimates of Gompertz model; PFS; EMA-censored FIRST data; treatment effects on scale and shape parameter of the log-hazard function
d0 estimate d0 variance d0 credible
interval1 d1 estimate d1 variance
d1 credible interval1
correlation
MPT Reference Reference
Rd18 ''''''''''' ''''''''''' ''''''''''' ''''''''''' ''''''''''' ''''''''''' '''''''''''
MP ''''''''''' ''''''''''' ''''''''''' ''''''''''' ''''''''''' ''''''''''' '''''''''''
VMP ''''''''''' ''''''''''' ''''''''''' ''''''''''' ''''''''''' ''''''''''' '''''''''''
Rd ''''''''''' ''''''''''' ''''''''''' ''''''''''' ''''''''''' ''''''''''' ''''''''''' 1 estimate ± 1.96*sqrt(variance). Key: Rd, lenalidomide and low-dose dexamethasone until disease progression; Rd18,
lenalidomide and low-dose dexamethasone for 72 weeks; MPT, melphalan, prednisone and thalidomide; VMP, bortezomib,
melphalan, and prednisone; MP, melphalan, and prednisone
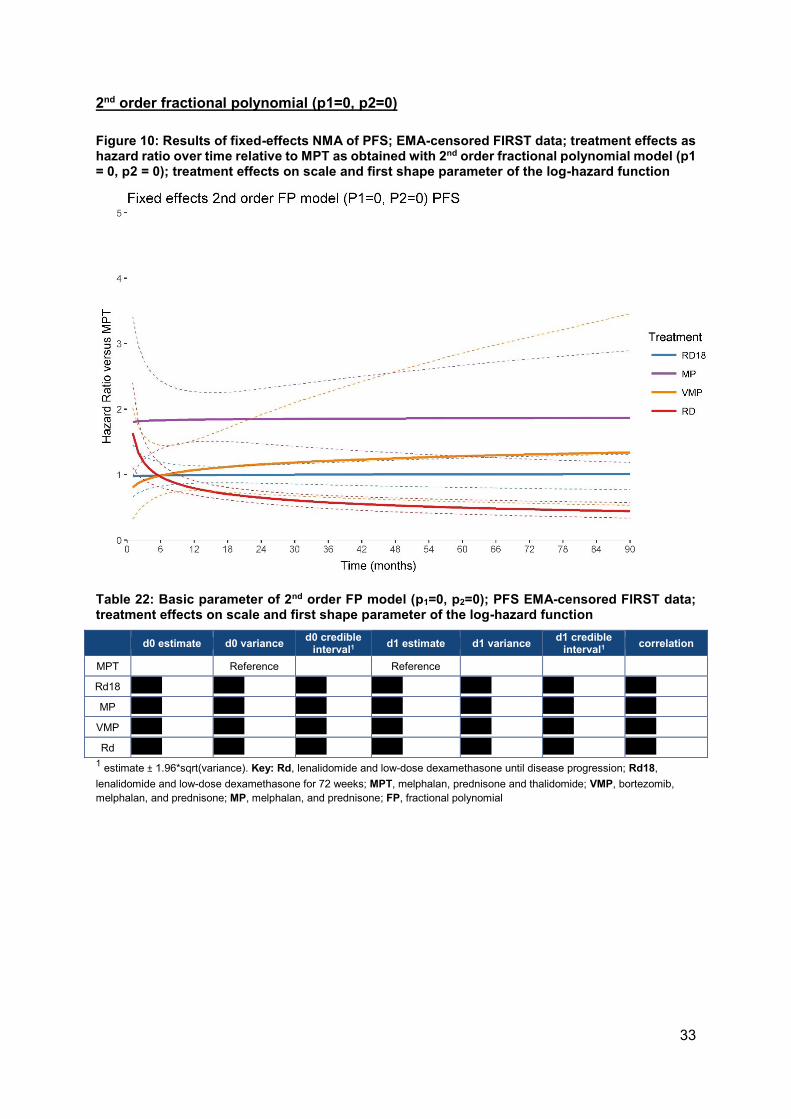
33
2nd order fractional polynomial (p1=0, p2=0)
Figure 10: Results of fixed-effects NMA of PFS; EMA-censored FIRST data; treatment effects as hazard ratio over time relative to MPT as obtained with 2nd order fractional polynomial model (p1 = 0, p2 = 0); treatment effects on scale and first shape parameter of the log-hazard function
Table 22: Basic parameter of 2nd order FP model (p1=0, p2=0); PFS EMA-censored FIRST data; treatment effects on scale and first shape parameter of the log-hazard function
d0 estimate d0 variance d0 credible
interval1 d1 estimate d1 variance
d1 credible interval1
correlation
MPT Reference Reference
Rd18 ''''''''''' ''''''''''' ''''''''''' ''''''''''' ''''''''''' ''''''''''' '''''''''''
MP ''''''''''' ''''''''''' ''''''''''' ''''''''''' ''''''''''' ''''''''''' '''''''''''
VMP ''''''''''' ''''''''''' ''''''''''' ''''''''''' ''''''''''' ''''''''''' '''''''''''
Rd ''''''''''' ''''''''''' ''''''''''' ''''''''''' ''''''''''' ''''''''''' ''''''''''' 1 estimate ± 1.96*sqrt(variance). Key: Rd, lenalidomide and low-dose dexamethasone until disease progression; Rd18,
lenalidomide and low-dose dexamethasone for 72 weeks; MPT, melphalan, prednisone and thalidomide; VMP, bortezomib,
melphalan, and prednisone; MP, melphalan, and prednisone; FP, fractional polynomial

34
2nd order fractional polynomial (p1=0, p2=1)
Figure 11: Results of fixed-effects NMA of PFS; EMA-censored FIRST data; treatment effects as hazard ratio over time relative to MPT as obtained with 2nd order fractional polynomial model (p1 = 0, p2 = 1); treatment effects on scale and first shape parameter of the log-hazard function
Table 23: Basic parameter of 2nd order FP model (p1=0, p2=1); PFS EMA-censored FIRST data; treatment effects on scale and first shape parameter of the log-hazard function
d0 estimate d0 variance d0 credible
interval1 d1 estimate d1 variance
d1 credible interval1
correlation
MPT Reference Reference
Rd18 ''''''''''' ''''''''''' ''''''''''' ''''''''''' ''''''''''' ''''''''''' '''''''''''
MP ''''''''''' ''''''''''' ''''''''''' ''''''''''' ''''''''''' ''''''''''' '''''''''''
VMP ''''''''''' ''''''''''' ''''''''''' ''''''''''' ''''''''''' ''''''''''' '''''''''''
Rd ''''''''''' ''''''''''' ''''''''''' ''''''''''' ''''''''''' ''''''''''' ''''''''''' 1 estimate ± 1.96*sqrt(variance) Key: Rd, lenalidomide and low-dose dexamethasone until disease progression; Rd18,
lenalidomide and low-dose dexamethasone for 72 weeks; MPT, melphalan, prednisone and thalidomide; VMP, bortezomib,
melphalan, and prednisone; MP, melphalan, and prednisone; FP, fractional polynomial
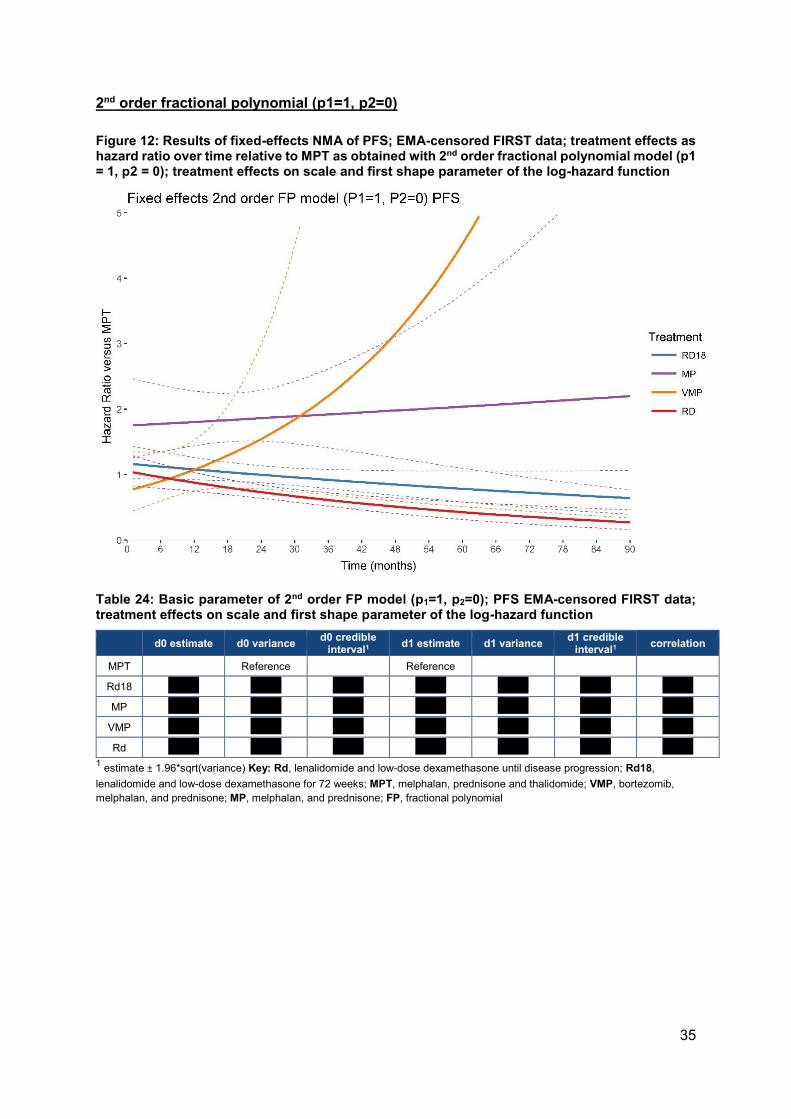
35
2nd order fractional polynomial (p1=1, p2=0)
Figure 12: Results of fixed-effects NMA of PFS; EMA-censored FIRST data; treatment effects as hazard ratio over time relative to MPT as obtained with 2nd order fractional polynomial model (p1 = 1, p2 = 0); treatment effects on scale and first shape parameter of the log-hazard function
Table 24: Basic parameter of 2nd order FP model (p1=1, p2=0); PFS EMA-censored FIRST data; treatment effects on scale and first shape parameter of the log-hazard function
d0 estimate d0 variance d0 credible
interval1 d1 estimate d1 variance
d1 credible interval1
correlation
MPT Reference Reference
Rd18 ''''''''''' ''''''''''' ''''''''''' ''''''''''' ''''''''''' ''''''''''' '''''''''''
MP ''''''''''' ''''''''''' ''''''''''' ''''''''''' ''''''''''' ''''''''''' '''''''''''
VMP ''''''''''' ''''''''''' ''''''''''' ''''''''''' ''''''''''' ''''''''''' '''''''''''
Rd ''''''''''' ''''''''''' ''''''''''' ''''''''''' ''''''''''' ''''''''''' ''''''''''' 1 estimate ± 1.96*sqrt(variance) Key: Rd, lenalidomide and low-dose dexamethasone until disease progression; Rd18,
lenalidomide and low-dose dexamethasone for 72 weeks; MPT, melphalan, prednisone and thalidomide; VMP, bortezomib,
melphalan, and prednisone; MP, melphalan, and prednisone; FP, fractional polynomial

36
2nd order fractional polynomial (p1=1, p2=1)
Figure 13: Results of fixed-effects NMA of PFS; EMA-censored FIRST data; treatment effects as hazard ratio over time relative to MPT as obtained with 2nd order fractional polynomial model (p1 = 1, p2 = 1); treatment effects on scale and first shape parameter of the log-hazard function
Table 25: Basic parameter of 2nd order FP model (p1=1, p2=1); PFS EMA-censored FIRST data; treatment effects on scale and first shape parameter of the log-hazard function
d0 estimate d0 variance d0 credible
interval1 d1 estimate d1 variance
d1 credible interval1
correlation
MPT Reference Reference
Rd18 ''''''''''' ''''''''''' ''''''''''' ''''''''''' ''''''''''' ''''''''''' '''''''''''
MP ''''''''''' ''''''''''' ''''''''''' ''''''''''' ''''''''''' ''''''''''' '''''''''''
VMP ''''''''''' ''''''''''' ''''''''''' ''''''''''' ''''''''''' ''''''''''' '''''''''''
Rd ''''''''''' ''''''''''' ''''''''''' ''''''''''' ''''''''''' ''''''''''' ''''''''''' 1 estimate ± 1.96*sqrt(variance). Key: Rd, lenalidomide and low-dose dexamethasone until disease progression; Rd18,
lenalidomide and low-dose dexamethasone for 72 weeks; MPT, melphalan, prednisone and thalidomide; VMP, bortezomib,
melphalan, and prednisone; MP, melphalan, and prednisone; FP, fractional polynomial
37
Fractional polynomial NMA with a treatment effect only on the scale parameter
of the log-hazard function (i.e. assuming proportional hazards)
In response to the second part of this question, the NMA was run using each of the 6
fractional polynomial models with a treatment effect only on the scale parameter of the log-
hazard function (i.e. assuming proportional hazards).
The question refers to these as “zero-order fractional polynomials”, however this is not a
term the company would advocate using:
• The terms “first-order” and “second-order” relate to the number of time-related
parameters of the parametric function describing the log hazard over time. The
Gompertz or Weibull can be considered first-order models and have a scale and only
1 shape or time-related factor describing the change in hazard over time (i.e. time or
log(time) respectively). Second-order models add an additional time-related factor
and have therefore a scale and 2 shape parameters.
• A “zero-order” model would have no time-related parameter and hazard rates are
therefore constant over time, i.e. an exponential survival distribution. With the
fractional polynomials we can assume the treatment to affect only the scale
parameters of the parametric hazard functions, the scale and the 1st shape
parameter, or the scale and all shape parameters. In order to avoid over-fitting the
second-order models we assumed the treatment to only have an impact on the scale
and the first shape parameter.
In essence, the constant hazard ratio represents the average relative treatment effect over
time, whereas the time-varying hazard ratio shows how the treatment effect changes over
time. For both approaches it is important that the model has sufficient flexibility to capture
the development of the hazards over time across all arms of the trials in the network in order
to obtain unbiased estimates of either the constant or time-varying hazard ratios.
The fractional polynomial models with time-varying hazard ratios as well as the NMA based
on study-specific reported constant hazard ratios (obtained with a Cox model with study
specific non-parametric baseline hazards) allow to obtain valid time varying and constant
hazard ratios with the NMA respectively.
Because the hazard ratios obtained from the best-fitting second-order fractional polynomial
models with a treatment effect only on the scale parameter assume proportional hazards,
the results are consistent with those obtained with the NMA based on reported hazard ratios
(assuming a non-parametric baseline hazard).
For PFS, we are limited by the relatively short follow-up in the VISTA study (27 months). The
fractional polynomial with constant hazard ratios puts too much constraint on the analyses
resulting in constant hazard ratios for VMP vs. MPT (ranging between 0.87 and 0.91
depending on the model). These differ from the corresponding indirect comparison estimate
based on study-specific hazard ratios (1.00; 95% CI 0.72, 1.38), although this difference is
not statistically significant. This suboptimal fit to the data can also be observed by comparing
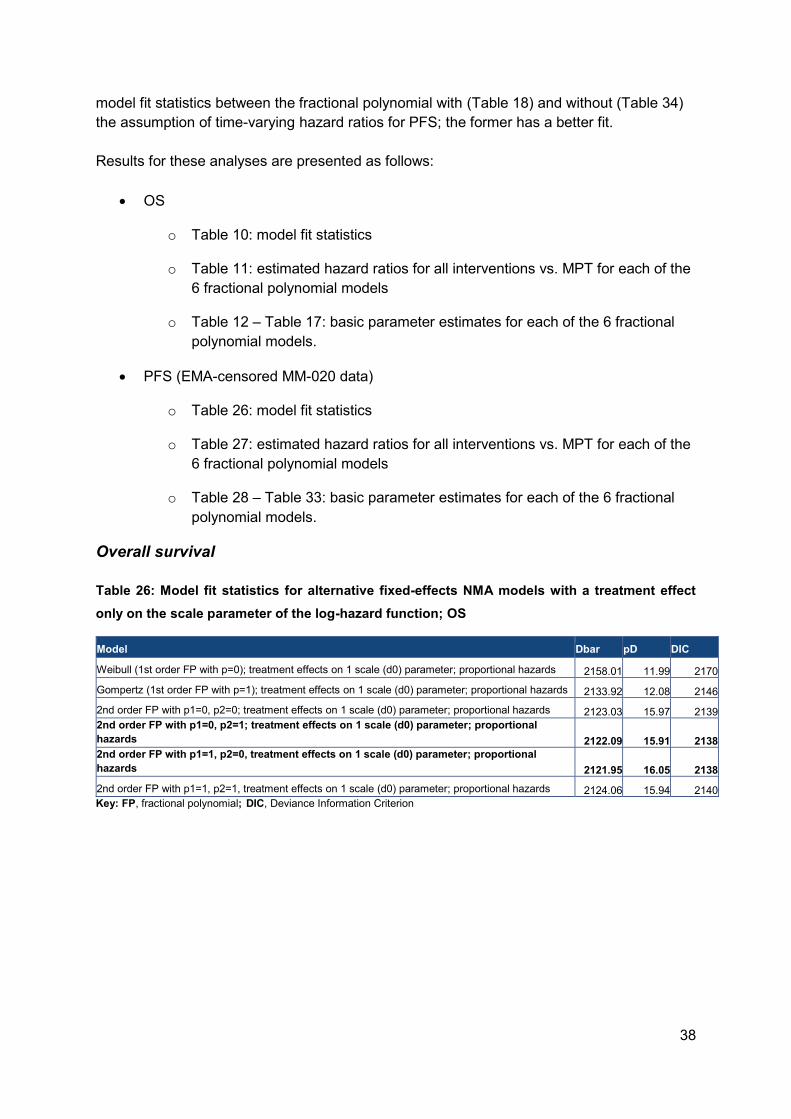
38
model fit statistics between the fractional polynomial with (Table 18) and without (Table 34)
the assumption of time-varying hazard ratios for PFS; the former has a better fit.
Results for these analyses are presented as follows:
• OS
o Table 10: model fit statistics
o Table 11: estimated hazard ratios for all interventions vs. MPT for each of the
6 fractional polynomial models
o Table 12 – Table 17: basic parameter estimates for each of the 6 fractional
polynomial models.
• PFS (EMA-censored MM-020 data)
o Table 26: model fit statistics
o Table 27: estimated hazard ratios for all interventions vs. MPT for each of the
6 fractional polynomial models
o Table 28 – Table 33: basic parameter estimates for each of the 6 fractional
polynomial models.
Overall survival
Table 26: Model fit statistics for alternative fixed-effects NMA models with a treatment effect
only on the scale parameter of the log-hazard function; OS
Model Dbar pD DIC
Weibull (1st order FP with p=0); treatment effects on 1 scale (d0) parameter; proportional hazards 2158.01 11.99 2170
Gompertz (1st order FP with p=1); treatment effects on 1 scale (d0) parameter; proportional hazards 2133.92 12.08 2146
2nd order FP with p1=0, p2=0; treatment effects on 1 scale (d0) parameter; proportional hazards 2123.03 15.97 2139
2nd order FP with p1=0, p2=1; treatment effects on 1 scale (d0) parameter; proportional
hazards 2122.09 15.91 2138
2nd order FP with p1=1, p2=0, treatment effects on 1 scale (d0) parameter; proportional
hazards 2121.95 16.05 2138
2nd order FP with p1=1, p2=1, treatment effects on 1 scale (d0) parameter; proportional hazards 2124.06 15.94 2140
Key: FP, fractional polynomial; DIC, Deviance Information Criterion
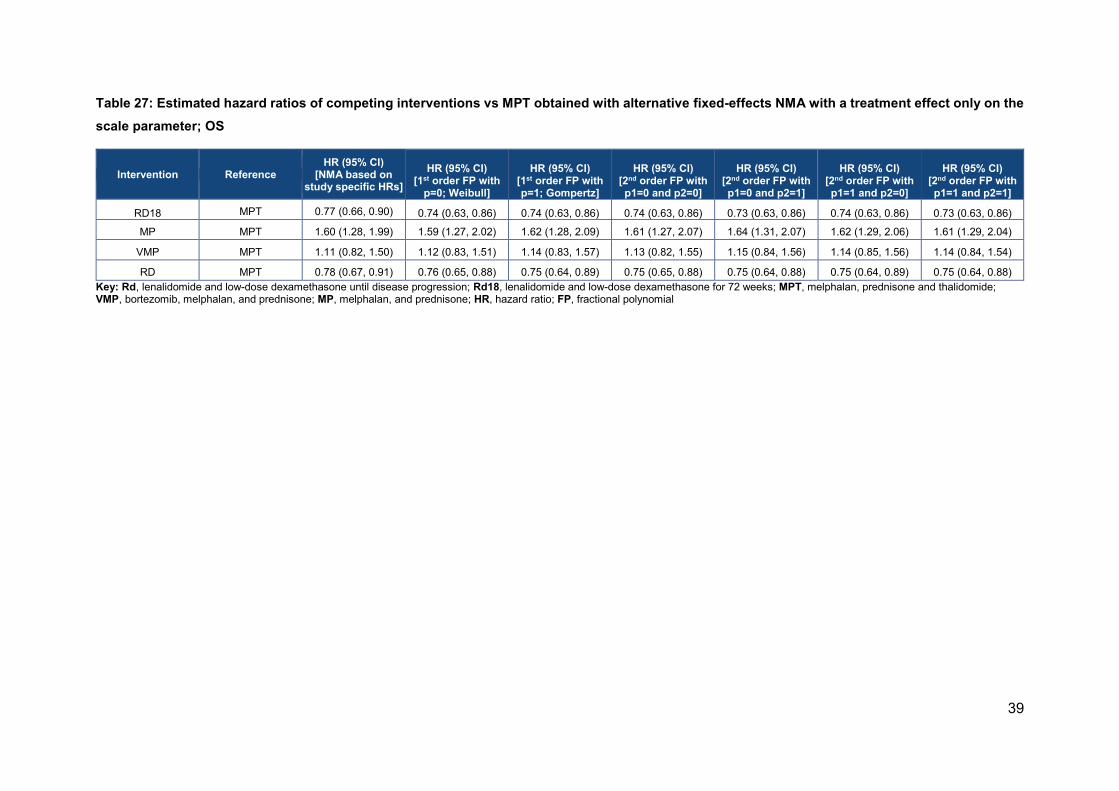
39
Table 27: Estimated hazard ratios of competing interventions vs MPT obtained with alternative fixed-effects NMA with a treatment effect only on the
scale parameter; OS
Intervention Reference HR (95% CI)
[NMA based on study specific HRs]
HR (95% CI)
[1st order FP with p=0; Weibull]
HR (95% CI)
[1st order FP with p=1; Gompertz]
HR (95% CI)
[2nd order FP with p1=0 and p2=0]
HR (95% CI)
[2nd order FP with p1=0 and p2=1]
HR (95% CI)
[2nd order FP with p1=1 and p2=0]
HR (95% CI)
[2nd order FP with p1=1 and p2=1]
RD18 MPT 0.77 (0.66, 0.90) 0.74 (0.63, 0.86) 0.74 (0.63, 0.86) 0.74 (0.63, 0.86) 0.73 (0.63, 0.86) 0.74 (0.63, 0.86) 0.73 (0.63, 0.86)
MP MPT 1.60 (1.28, 1.99) 1.59 (1.27, 2.02) 1.62 (1.28, 2.09) 1.61 (1.27, 2.07) 1.64 (1.31, 2.07) 1.62 (1.29, 2.06) 1.61 (1.29, 2.04)
VMP MPT 1.11 (0.82, 1.50) 1.12 (0.83, 1.51) 1.14 (0.83, 1.57) 1.13 (0.82, 1.55) 1.15 (0.84, 1.56) 1.14 (0.85, 1.56) 1.14 (0.84, 1.54)
RD MPT 0.78 (0.67, 0.91) 0.76 (0.65, 0.88) 0.75 (0.64, 0.89) 0.75 (0.65, 0.88) 0.75 (0.64, 0.88) 0.75 (0.64, 0.89) 0.75 (0.64, 0.88)
Key: Rd, lenalidomide and low-dose dexamethasone until disease progression; Rd18, lenalidomide and low-dose dexamethasone for 72 weeks; MPT, melphalan, prednisone and thalidomide; VMP, bortezomib, melphalan, and prednisone; MP, melphalan, and prednisone; HR, hazard ratio; FP, fractional polynomial
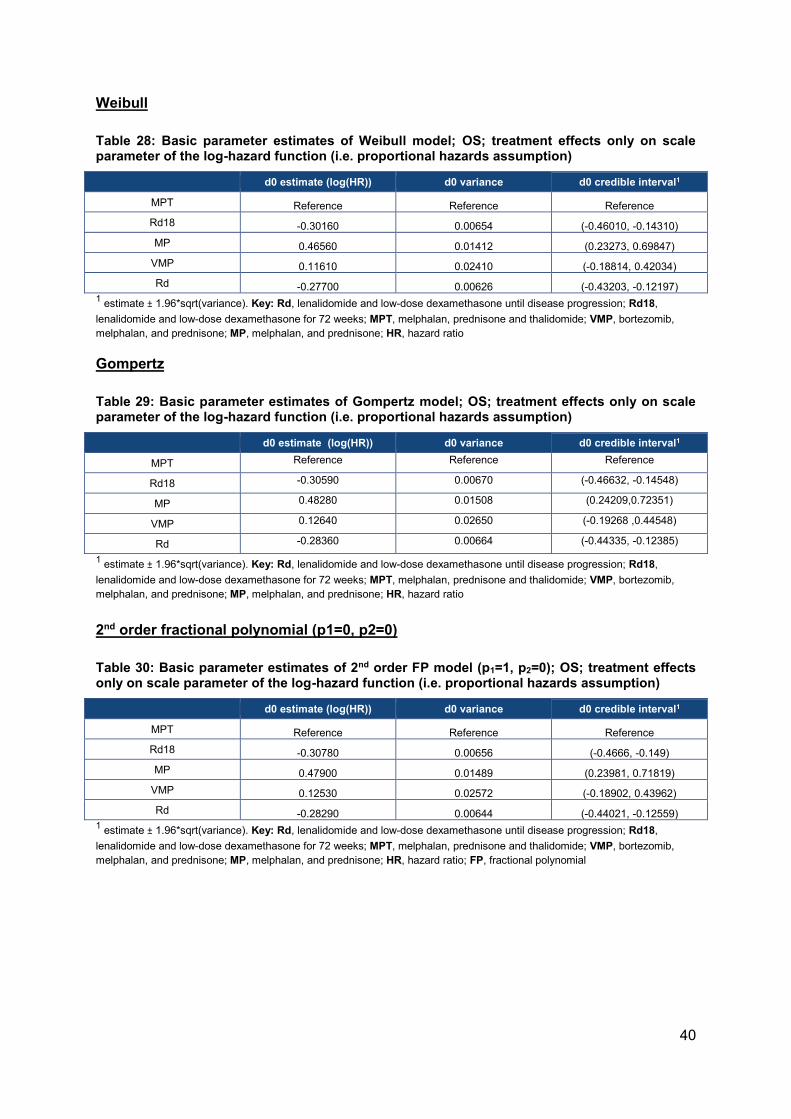
40
Weibull
Table 28: Basic parameter estimates of Weibull model; OS; treatment effects only on scale parameter of the log-hazard function (i.e. proportional hazards assumption)
d0 estimate (log(HR)) d0 variance d0 credible interval1
MPT Reference Reference Reference
Rd18 -0.30160 0.00654 (-0.46010, -0.14310)
MP 0.46560 0.01412 (0.23273, 0.69847)
VMP 0.11610 0.02410 (-0.18814, 0.42034)
Rd -0.27700 0.00626 (-0.43203, -0.12197) 1 estimate ± 1.96*sqrt(variance). Key: Rd, lenalidomide and low-dose dexamethasone until disease progression; Rd18,
lenalidomide and low-dose dexamethasone for 72 weeks; MPT, melphalan, prednisone and thalidomide; VMP, bortezomib,
melphalan, and prednisone; MP, melphalan, and prednisone; HR, hazard ratio
Gompertz
Table 29: Basic parameter estimates of Gompertz model; OS; treatment effects only on scale parameter of the log-hazard function (i.e. proportional hazards assumption)
d0 estimate (log(HR)) d0 variance d0 credible interval1
MPT Reference Reference Reference
Rd18 -0.30590 0.00670 (-0.46632, -0.14548)
MP 0.48280 0.01508 (0.24209,0.72351)
VMP 0.12640 0.02650 (-0.19268 ,0.44548)
Rd -0.28360 0.00664 (-0.44335, -0.12385)
1 estimate ± 1.96*sqrt(variance). Key: Rd, lenalidomide and low-dose dexamethasone until disease progression; Rd18,
lenalidomide and low-dose dexamethasone for 72 weeks; MPT, melphalan, prednisone and thalidomide; VMP, bortezomib,
melphalan, and prednisone; MP, melphalan, and prednisone; HR, hazard ratio
2nd order fractional polynomial (p1=0, p2=0)
Table 30: Basic parameter estimates of 2nd order FP model (p1=1, p2=0); OS; treatment effects only on scale parameter of the log-hazard function (i.e. proportional hazards assumption)
d0 estimate (log(HR)) d0 variance d0 credible interval1
MPT Reference Reference Reference
Rd18 -0.30780 0.00656 (-0.4666, -0.149)
MP 0.47900 0.01489 (0.23981, 0.71819)
VMP 0.12530 0.02572 (-0.18902, 0.43962)
Rd -0.28290 0.00644 (-0.44021, -0.12559) 1 estimate ± 1.96*sqrt(variance). Key: Rd, lenalidomide and low-dose dexamethasone until disease progression; Rd18,
lenalidomide and low-dose dexamethasone for 72 weeks; MPT, melphalan, prednisone and thalidomide; VMP, bortezomib,
melphalan, and prednisone; MP, melphalan, and prednisone; HR, hazard ratio; FP, fractional polynomial
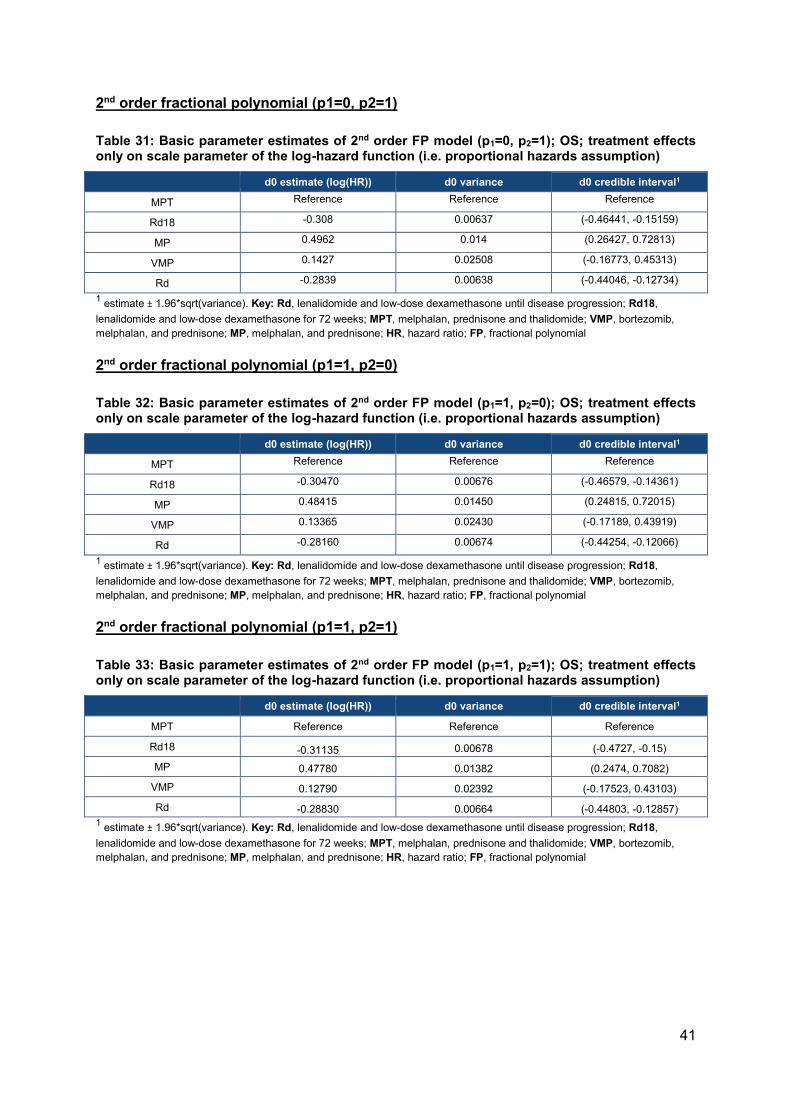
41
2nd order fractional polynomial (p1=0, p2=1)
Table 31: Basic parameter estimates of 2nd order FP model (p1=0, p2=1); OS; treatment effects only on scale parameter of the log-hazard function (i.e. proportional hazards assumption)
d0 estimate (log(HR)) d0 variance d0 credible interval1
MPT Reference Reference Reference
Rd18 -0.308 0.00637 (-0.46441, -0.15159)
MP 0.4962 0.014 (0.26427, 0.72813)
VMP 0.1427 0.02508 (-0.16773, 0.45313)
Rd -0.2839 0.00638 (-0.44046, -0.12734)
1 estimate ± 1.96*sqrt(variance). Key: Rd, lenalidomide and low-dose dexamethasone until disease progression; Rd18,
lenalidomide and low-dose dexamethasone for 72 weeks; MPT, melphalan, prednisone and thalidomide; VMP, bortezomib,
melphalan, and prednisone; MP, melphalan, and prednisone; HR, hazard ratio; FP, fractional polynomial
2nd order fractional polynomial (p1=1, p2=0)
Table 32: Basic parameter estimates of 2nd order FP model (p1=1, p2=0); OS; treatment effects only on scale parameter of the log-hazard function (i.e. proportional hazards assumption)
d0 estimate (log(HR)) d0 variance d0 credible interval1
MPT Reference Reference Reference
Rd18 -0.30470 0.00676 (-0.46579, -0.14361)
MP 0.48415 0.01450 (0.24815, 0.72015)
VMP 0.13365 0.02430 (-0.17189, 0.43919)
Rd -0.28160 0.00674 (-0.44254, -0.12066)
1 estimate ± 1.96*sqrt(variance). Key: Rd, lenalidomide and low-dose dexamethasone until disease progression; Rd18,
lenalidomide and low-dose dexamethasone for 72 weeks; MPT, melphalan, prednisone and thalidomide; VMP, bortezomib,
melphalan, and prednisone; MP, melphalan, and prednisone; HR, hazard ratio; FP, fractional polynomial
2nd order fractional polynomial (p1=1, p2=1)
Table 33: Basic parameter estimates of 2nd order FP model (p1=1, p2=1); OS; treatment effects only on scale parameter of the log-hazard function (i.e. proportional hazards assumption)
d0 estimate (log(HR)) d0 variance d0 credible interval1
MPT Reference Reference Reference
Rd18 -0.31135 0.00678 (-0.4727, -0.15)
MP 0.47780 0.01382 (0.2474, 0.7082)
VMP 0.12790 0.02392 (-0.17523, 0.43103)
Rd -0.28830 0.00664 (-0.44803, -0.12857)
1 estimate ± 1.96*sqrt(variance). Key: Rd, lenalidomide and low-dose dexamethasone until disease progression; Rd18,
lenalidomide and low-dose dexamethasone for 72 weeks; MPT, melphalan, prednisone and thalidomide; VMP, bortezomib,
melphalan, and prednisone; MP, melphalan, and prednisone; HR, hazard ratio; FP, fractional polynomial

42
Progression free survival, EMA-censored FIRST data
Table 34: Model fit statistics for alternative fixed-effects NMA models with a treatment effect only on the scale parameter of the log-hazard function; progression free survival; EMA-censored FIRST data
Model Dbar pD DIC
Weibull (1st order FP with p=0); treatment effects on 1 scale (d0) parameter; proportional hazards 1916.99 12.01 1929
Gompertz (1st order FP with p=1); treatment effects on 1 scale (d0) parameter; proportional hazards 1920.98 12.02 1933
2nd order FP with p1=0, p2=0; treatment effects on 1 scale (d0) parameter; proportional hazards 1907.04 15.96 1923
2nd order FP with p1=0, p2=1; treatment effects on 1 scale (d0) parameter; proportional hazards 1897.03 15.97 1913
2nd order FP with p1=1, p2=0, treatment effects on 1 scale (d0) parameter; proportional hazards 1896.89 16.11 1913
2nd order FP with p1=1, p2=1, treatment effects on 1 scale (d0) parameter; proportional hazards 1887.04 15.96 1903
Key: FP, fractional polynomial; DIC, Deviance Information Criterion
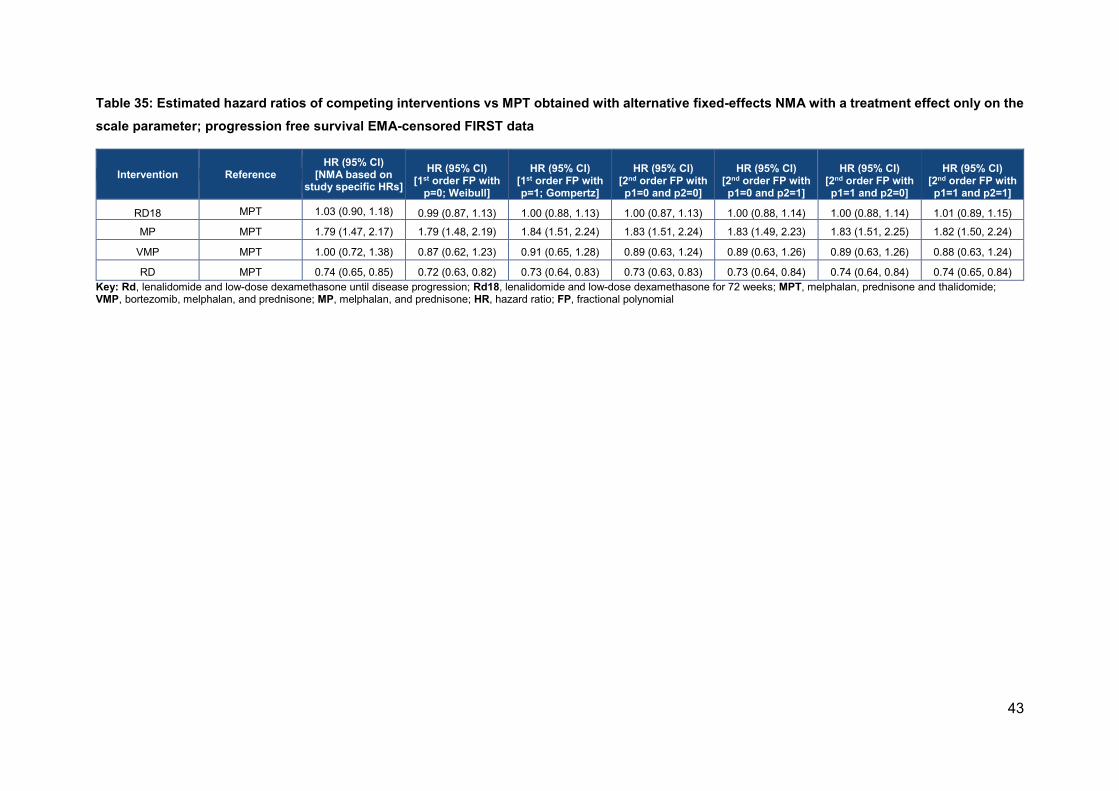
43
Table 35: Estimated hazard ratios of competing interventions vs MPT obtained with alternative fixed-effects NMA with a treatment effect only on the
scale parameter; progression free survival EMA-censored FIRST data
Intervention Reference HR (95% CI)
[NMA based on study specific HRs]
HR (95% CI)
[1st order FP with p=0; Weibull]
HR (95% CI)
[1st order FP with p=1; Gompertz]
HR (95% CI)
[2nd order FP with p1=0 and p2=0]
HR (95% CI)
[2nd order FP with p1=0 and p2=1]
HR (95% CI)
[2nd order FP with p1=1 and p2=0]
HR (95% CI)
[2nd order FP with p1=1 and p2=1]
RD18 MPT 1.03 (0.90, 1.18) 0.99 (0.87, 1.13) 1.00 (0.88, 1.13) 1.00 (0.87, 1.13) 1.00 (0.88, 1.14) 1.00 (0.88, 1.14) 1.01 (0.89, 1.15)
MP MPT 1.79 (1.47, 2.17) 1.79 (1.48, 2.19) 1.84 (1.51, 2.24) 1.83 (1.51, 2.24) 1.83 (1.49, 2.23) 1.83 (1.51, 2.25) 1.82 (1.50, 2.24)
VMP MPT 1.00 (0.72, 1.38) 0.87 (0.62, 1.23) 0.91 (0.65, 1.28) 0.89 (0.63, 1.24) 0.89 (0.63, 1.26) 0.89 (0.63, 1.26) 0.88 (0.63, 1.24)
RD MPT 0.74 (0.65, 0.85) 0.72 (0.63, 0.82) 0.73 (0.64, 0.83) 0.73 (0.63, 0.83) 0.73 (0.64, 0.84) 0.74 (0.64, 0.84) 0.74 (0.65, 0.84)
Key: Rd, lenalidomide and low-dose dexamethasone until disease progression; Rd18, lenalidomide and low-dose dexamethasone for 72 weeks; MPT, melphalan, prednisone and thalidomide; VMP, bortezomib, melphalan, and prednisone; MP, melphalan, and prednisone; HR, hazard ratio; FP, fractional polynomial
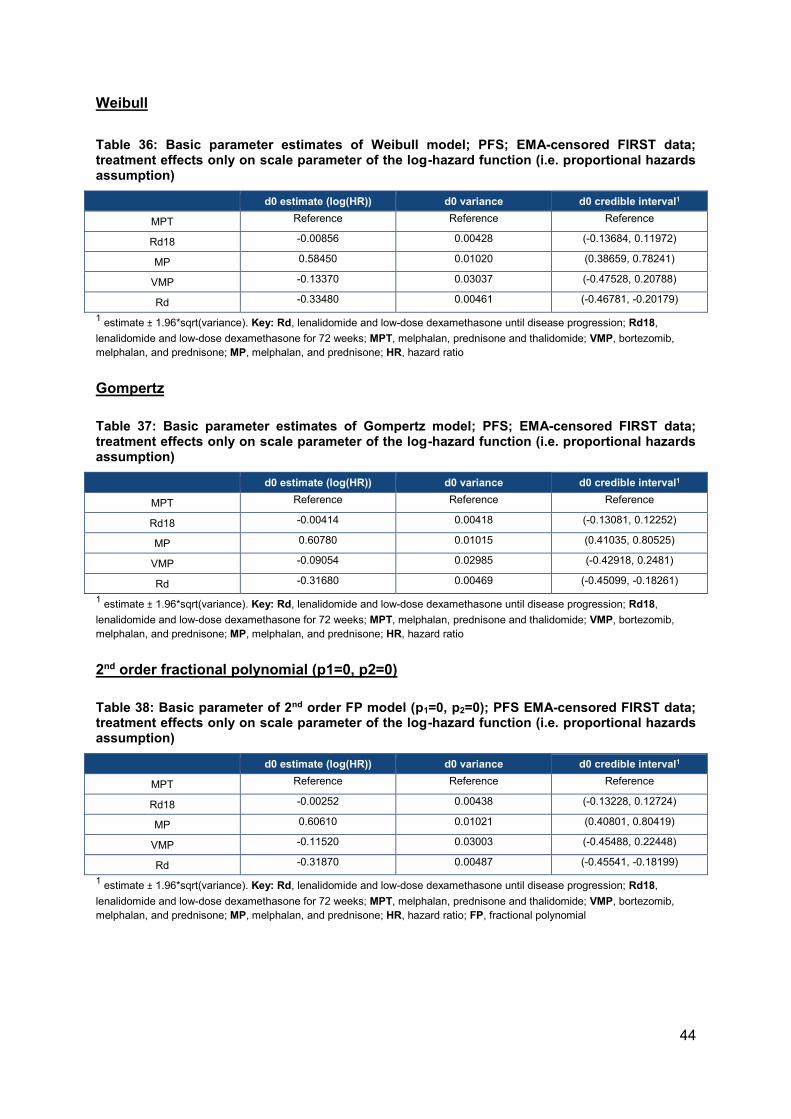
44
Weibull
Table 36: Basic parameter estimates of Weibull model; PFS; EMA-censored FIRST data; treatment effects only on scale parameter of the log-hazard function (i.e. proportional hazards assumption)
d0 estimate (log(HR)) d0 variance d0 credible interval1
MPT Reference Reference Reference
Rd18 -0.00856 0.00428 (-0.13684, 0.11972)
MP 0.58450 0.01020 (0.38659, 0.78241)
VMP -0.13370 0.03037 (-0.47528, 0.20788)
Rd -0.33480 0.00461 (-0.46781, -0.20179)
1 estimate ± 1.96*sqrt(variance). Key: Rd, lenalidomide and low-dose dexamethasone until disease progression; Rd18,
lenalidomide and low-dose dexamethasone for 72 weeks; MPT, melphalan, prednisone and thalidomide; VMP, bortezomib,
melphalan, and prednisone; MP, melphalan, and prednisone; HR, hazard ratio
Gompertz
Table 37: Basic parameter estimates of Gompertz model; PFS; EMA-censored FIRST data; treatment effects only on scale parameter of the log-hazard function (i.e. proportional hazards assumption)
d0 estimate (log(HR)) d0 variance d0 credible interval1
MPT Reference Reference Reference
Rd18 -0.00414 0.00418 (-0.13081, 0.12252)
MP 0.60780 0.01015 (0.41035, 0.80525)
VMP -0.09054 0.02985 (-0.42918, 0.2481)
Rd -0.31680 0.00469 (-0.45099, -0.18261)
1 estimate ± 1.96*sqrt(variance). Key: Rd, lenalidomide and low-dose dexamethasone until disease progression; Rd18,
lenalidomide and low-dose dexamethasone for 72 weeks; MPT, melphalan, prednisone and thalidomide; VMP, bortezomib,
melphalan, and prednisone; MP, melphalan, and prednisone; HR, hazard ratio
2nd order fractional polynomial (p1=0, p2=0)
Table 38: Basic parameter of 2nd order FP model (p1=0, p2=0); PFS EMA-censored FIRST data; treatment effects only on scale parameter of the log-hazard function (i.e. proportional hazards assumption)
d0 estimate (log(HR)) d0 variance d0 credible interval1
MPT Reference Reference Reference
Rd18 -0.00252 0.00438 (-0.13228, 0.12724)
MP 0.60610 0.01021 (0.40801, 0.80419)
VMP -0.11520 0.03003 (-0.45488, 0.22448)
Rd -0.31870 0.00487 (-0.45541, -0.18199)
1 estimate ± 1.96*sqrt(variance). Key: Rd, lenalidomide and low-dose dexamethasone until disease progression; Rd18,
lenalidomide and low-dose dexamethasone for 72 weeks; MPT, melphalan, prednisone and thalidomide; VMP, bortezomib,
melphalan, and prednisone; MP, melphalan, and prednisone; HR, hazard ratio; FP, fractional polynomial
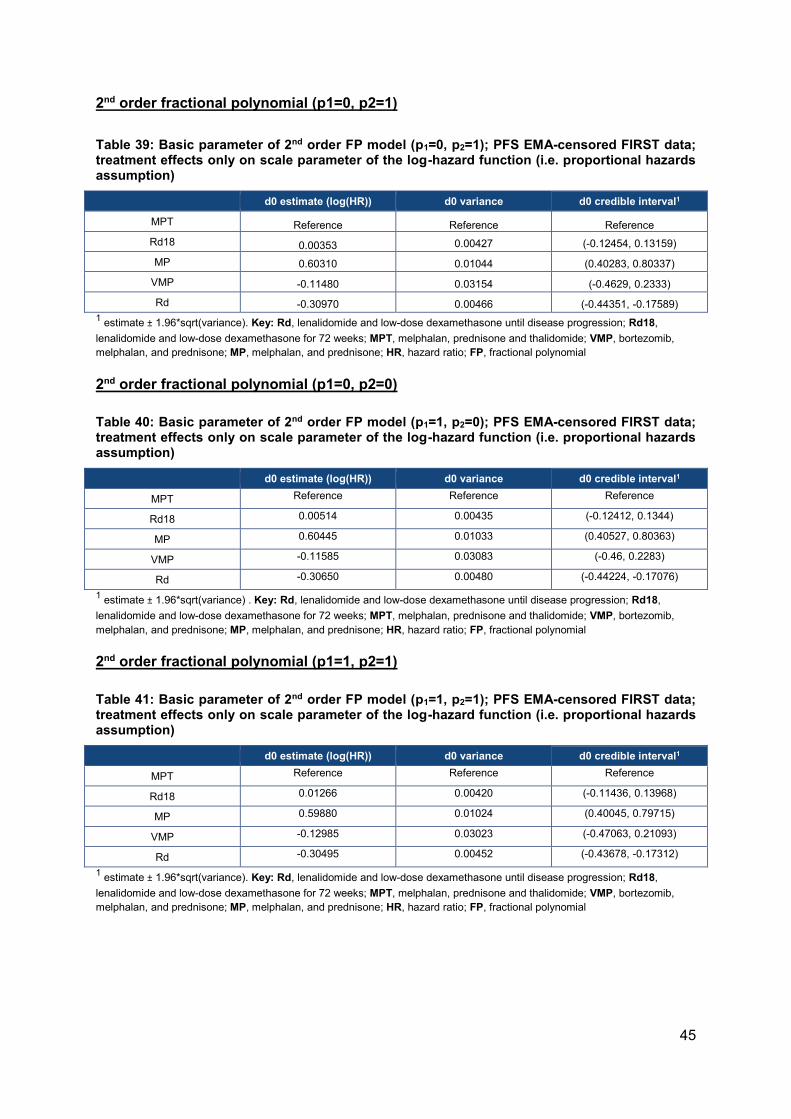
45
2nd order fractional polynomial (p1=0, p2=1)
Table 39: Basic parameter of 2nd order FP model (p1=0, p2=1); PFS EMA-censored FIRST data; treatment effects only on scale parameter of the log-hazard function (i.e. proportional hazards assumption)
d0 estimate (log(HR)) d0 variance d0 credible interval1
MPT Reference Reference Reference
Rd18 0.00353 0.00427 (-0.12454, 0.13159)
MP 0.60310 0.01044 (0.40283, 0.80337)
VMP -0.11480 0.03154 (-0.4629, 0.2333)
Rd -0.30970 0.00466 (-0.44351, -0.17589)
1 estimate ± 1.96*sqrt(variance). Key: Rd, lenalidomide and low-dose dexamethasone until disease progression; Rd18,
lenalidomide and low-dose dexamethasone for 72 weeks; MPT, melphalan, prednisone and thalidomide; VMP, bortezomib,
melphalan, and prednisone; MP, melphalan, and prednisone; HR, hazard ratio; FP, fractional polynomial
2nd order fractional polynomial (p1=0, p2=0)
Table 40: Basic parameter of 2nd order FP model (p1=1, p2=0); PFS EMA-censored FIRST data; treatment effects only on scale parameter of the log-hazard function (i.e. proportional hazards assumption)
d0 estimate (log(HR)) d0 variance d0 credible interval1
MPT Reference Reference Reference
Rd18 0.00514 0.00435 (-0.12412, 0.1344)
MP 0.60445 0.01033 (0.40527, 0.80363)
VMP -0.11585 0.03083 (-0.46, 0.2283)
Rd -0.30650 0.00480 (-0.44224, -0.17076)
1 estimate ± 1.96*sqrt(variance) . Key: Rd, lenalidomide and low-dose dexamethasone until disease progression; Rd18,
lenalidomide and low-dose dexamethasone for 72 weeks; MPT, melphalan, prednisone and thalidomide; VMP, bortezomib,
melphalan, and prednisone; MP, melphalan, and prednisone; HR, hazard ratio; FP, fractional polynomial
2nd order fractional polynomial (p1=1, p2=1)
Table 41: Basic parameter of 2nd order FP model (p1=1, p2=1); PFS EMA-censored FIRST data; treatment effects only on scale parameter of the log-hazard function (i.e. proportional hazards assumption)
d0 estimate (log(HR)) d0 variance d0 credible interval1
MPT Reference Reference Reference
Rd18 0.01266 0.00420 (-0.11436, 0.13968)
MP 0.59880 0.01024 (0.40045, 0.79715)
VMP -0.12985 0.03023 (-0.47063, 0.21093)
Rd -0.30495 0.00452 (-0.43678, -0.17312)
1 estimate ± 1.96*sqrt(variance). Key: Rd, lenalidomide and low-dose dexamethasone until disease progression; Rd18,
lenalidomide and low-dose dexamethasone for 72 weeks; MPT, melphalan, prednisone and thalidomide; VMP, bortezomib,
melphalan, and prednisone; MP, melphalan, and prednisone; HR, hazard ratio; FP, fractional polynomial

46
Cost-effectiveness results
Cost-effectiveness results for each of the fractional polynomial models provided above are
detailed in Table 42. These scenarios were conducted as follows:
• The HRs from the fractional polynomial NMA models were used to predict PFS and
OS for both Rd and bortezomib in combination with melphalan and prednisone
(VMP)
• The estimated HR at the maximum follow-up for each treatment are applied for
lifetime (as described in Section B.3.3.2 of the original company submission)
• When the NMA model is varied for PFS, the model used for OS remains the same as
the original company base case (i.e. constant hazard ratio for VMP vs. MPT, and the
MSM distribution for Rd), and vice versa when OS is varied. This is indicated in the
second part of the “Model” column in Table 42.
Rd remains cost-effective vs. VMP using all models, with scenarios using the fractional
polynomials all providing lower incremental cost-effectiveness ratios (ICERs) than the
original company base case ('''''''''''''''''' per quality adjusted life year (QALY)).
The “Time-varying HRs” worksheet has been adapted in the Excel model provided as part of
the clarification responses to include all fractional polynomial models and switches (columns
C:G and AH:BE changed), and in the “Scenario Analysis” worksheet, rows 16:39 have been
amended to test ICERs for all FP models.
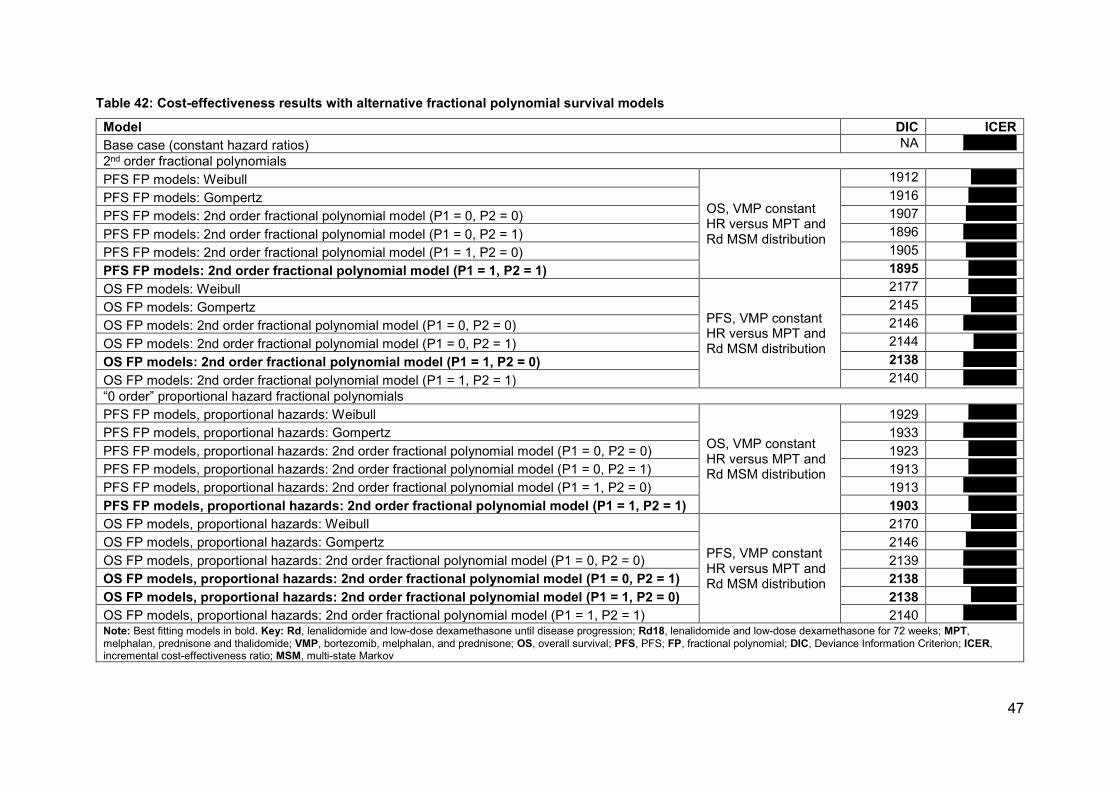
47
Table 42: Cost-effectiveness results with alternative fractional polynomial survival models
Model DIC ICER
Base case (constant hazard ratios) NA '''''''''''''''''''''
2nd order fractional polynomials
PFS FP models: Weibull
OS, VMP constant HR versus MPT and Rd MSM distribution
1912 ''''''''''''''''''
PFS FP models: Gompertz 1916 '''''''''''''''''''
PFS FP models: 2nd order fractional polynomial model (P1 = 0, P2 = 0) 1907 ''''''''''''''''''''
PFS FP models: 2nd order fractional polynomial model (P1 = 0, P2 = 1) 1896 '''''''''''''''''''''
PFS FP models: 2nd order fractional polynomial model (P1 = 1, P2 = 0) 1905 ''''''''''''''''''''
PFS FP models: 2nd order fractional polynomial model (P1 = 1, P2 = 1) 1895 '''''''''''''''''''
OS FP models: Weibull
PFS, VMP constant HR versus MPT and Rd MSM distribution
2177 '''''''''''''''''''
OS FP models: Gompertz 2145 ''''''''''''''''''
OS FP models: 2nd order fractional polynomial model (P1 = 0, P2 = 0) 2146 '''''''''''''''''''''
OS FP models: 2nd order fractional polynomial model (P1 = 0, P2 = 1) 2144 '''''''''''''''''
OS FP models: 2nd order fractional polynomial model (P1 = 1, P2 = 0) 2138 '''''''''''''''''''''
OS FP models: 2nd order fractional polynomial model (P1 = 1, P2 = 1) 2140 '''''''''''''''''''''
“0 order” proportional hazard fractional polynomials
PFS FP models, proportional hazards: Weibull
OS, VMP constant HR versus MPT and Rd MSM distribution
1929 '''''''''''''''''''
PFS FP models, proportional hazards: Gompertz 1933 '''''''''''''''''''''
PFS FP models, proportional hazards: 2nd order fractional polynomial model (P1 = 0, P2 = 0) 1923 '''''''''''''''''''
PFS FP models, proportional hazards: 2nd order fractional polynomial model (P1 = 0, P2 = 1) 1913 '''''''''''''''''''
PFS FP models, proportional hazards: 2nd order fractional polynomial model (P1 = 1, P2 = 0) 1913 '''''''''''''''''''''
PFS FP models, proportional hazards: 2nd order fractional polynomial model (P1 = 1, P2 = 1) 1903 '''''''''''''''''''
OS FP models, proportional hazards: Weibull
PFS, VMP constant HR versus MPT and Rd MSM distribution
2170 ''''''''''''''''''
OS FP models, proportional hazards: Gompertz 2146 ''''''''''''''''''''
OS FP models, proportional hazards: 2nd order fractional polynomial model (P1 = 0, P2 = 0) 2139 '''''''''''''''''''''
OS FP models, proportional hazards: 2nd order fractional polynomial model (P1 = 0, P2 = 1) 2138 '''''''''''''''''''''
OS FP models, proportional hazards: 2nd order fractional polynomial model (P1 = 1, P2 = 0) 2138 ''''''''''''''''''
OS FP models, proportional hazards: 2nd order fractional polynomial model (P1 = 1, P2 = 1) 2140 '''''''''''''''''''''
Note: Best fitting models in bold. Key: Rd, lenalidomide and low-dose dexamethasone until disease progression; Rd18, lenalidomide and low-dose dexamethasone for 72 weeks; MPT,
melphalan, prednisone and thalidomide; VMP, bortezomib, melphalan, and prednisone; OS, overall survival; PFS, PFS; FP, fractional polynomial; DIC, Deviance Information Criterion; ICER, incremental cost-effectiveness ratio; MSM, multi-state Markov
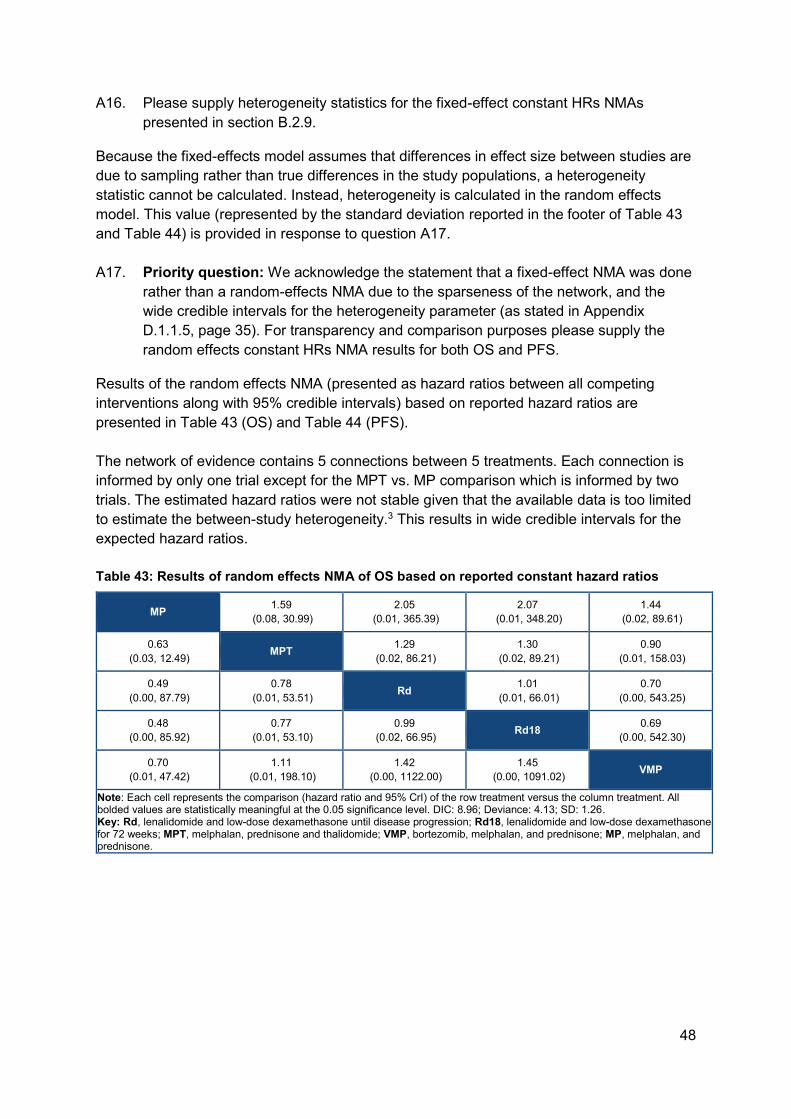
48
A16. Please supply heterogeneity statistics for the fixed-effect constant HRs NMAs
presented in section B.2.9.
Because the fixed-effects model assumes that differences in effect size between studies are
due to sampling rather than true differences in the study populations, a heterogeneity
statistic cannot be calculated. Instead, heterogeneity is calculated in the random effects
model. This value (represented by the standard deviation reported in the footer of Table 43
and Table 44) is provided in response to question A17.
A17. Priority question: We acknowledge the statement that a fixed-effect NMA was done
rather than a random-effects NMA due to the sparseness of the network, and the
wide credible intervals for the heterogeneity parameter (as stated in Appendix
D.1.1.5, page 35). For transparency and comparison purposes please supply the
random effects constant HRs NMA results for both OS and PFS.
Results of the random effects NMA (presented as hazard ratios between all competing
interventions along with 95% credible intervals) based on reported hazard ratios are
presented in Table 43 (OS) and Table 44 (PFS).
The network of evidence contains 5 connections between 5 treatments. Each connection is
informed by only one trial except for the MPT vs. MP comparison which is informed by two
trials. The estimated hazard ratios were not stable given that the available data is too limited
to estimate the between-study heterogeneity.3 This results in wide credible intervals for the
expected hazard ratios.
Table 43: Results of random effects NMA of OS based on reported constant hazard ratios
MP 1.59
(0.08, 30.99)
2.05
(0.01, 365.39)
2.07
(0.01, 348.20)
1.44
(0.02, 89.61)
0.63
(0.03, 12.49) MPT
1.29
(0.02, 86.21)
1.30
(0.02, 89.21)
0.90
(0.01, 158.03)
0.49
(0.00, 87.79)
0.78
(0.01, 53.51) Rd
1.01
(0.01, 66.01)
0.70
(0.00, 543.25)
0.48
(0.00, 85.92)
0.77
(0.01, 53.10)
0.99
(0.02, 66.95) Rd18
0.69
(0.00, 542.30)
0.70
(0.01, 47.42)
1.11
(0.01, 198.10)
1.42
(0.00, 1122.00)
1.45
(0.00, 1091.02) VMP
Note: Each cell represents the comparison (hazard ratio and 95% CrI) of the row treatment versus the column treatment. All bolded values are statistically meaningful at the 0.05 significance level. DIC: 8.96; Deviance: 4.13; SD: 1.26. Key: Rd, lenalidomide and low-dose dexamethasone until disease progression; Rd18, lenalidomide and low-dose dexamethasone for 72 weeks; MPT, melphalan, prednisone and thalidomide; VMP, bortezomib, melphalan, and prednisone; MP, melphalan, and prednisone.
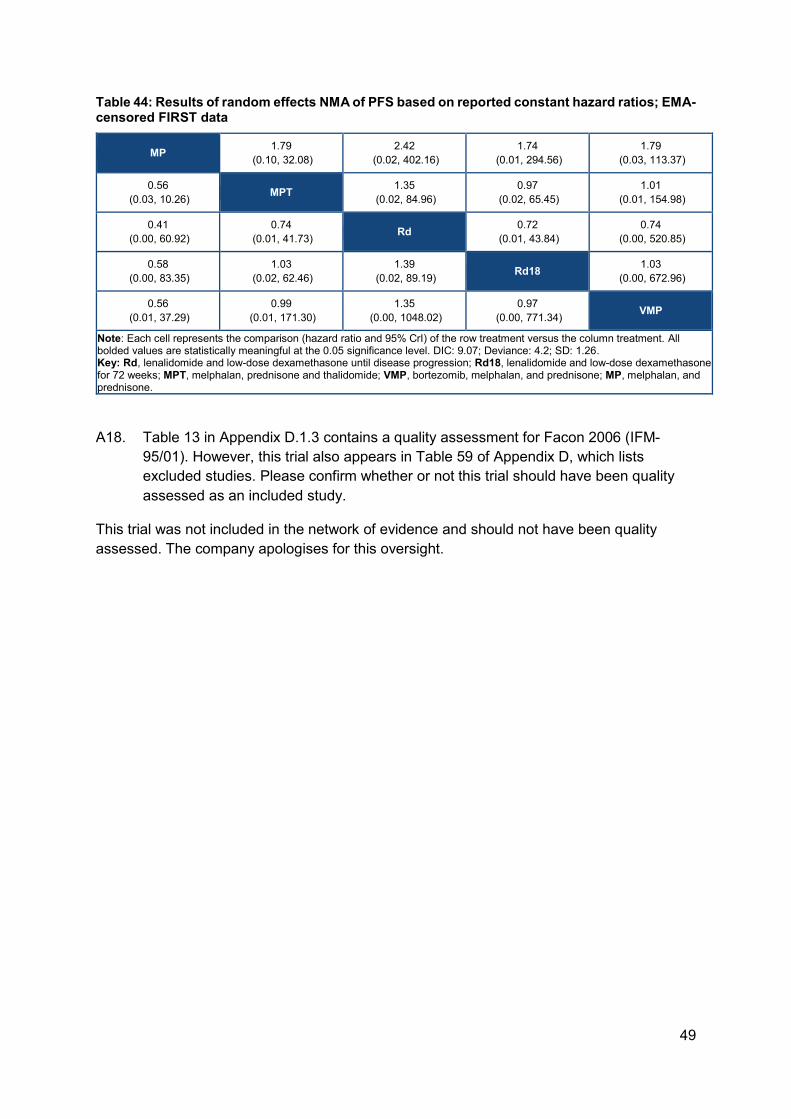
49
Table 44: Results of random effects NMA of PFS based on reported constant hazard ratios; EMA-censored FIRST data
MP 1.79
(0.10, 32.08)
2.42
(0.02, 402.16)
1.74
(0.01, 294.56)
1.79
(0.03, 113.37)
0.56
(0.03, 10.26) MPT
1.35
(0.02, 84.96)
0.97
(0.02, 65.45)
1.01
(0.01, 154.98)
0.41
(0.00, 60.92)
0.74
(0.01, 41.73) Rd
0.72
(0.01, 43.84)
0.74
(0.00, 520.85)
0.58
(0.00, 83.35)
1.03
(0.02, 62.46)
1.39
(0.02, 89.19) Rd18
1.03
(0.00, 672.96)
0.56
(0.01, 37.29)
0.99
(0.01, 171.30)
1.35
(0.00, 1048.02)
0.97
(0.00, 771.34) VMP
Note: Each cell represents the comparison (hazard ratio and 95% CrI) of the row treatment versus the column treatment. All bolded values are statistically meaningful at the 0.05 significance level. DIC: 9.07; Deviance: 4.2; SD: 1.26. Key: Rd, lenalidomide and low-dose dexamethasone until disease progression; Rd18, lenalidomide and low-dose dexamethasone for 72 weeks; MPT, melphalan, prednisone and thalidomide; VMP, bortezomib, melphalan, and prednisone; MP, melphalan, and prednisone.
A18. Table 13 in Appendix D.1.3 contains a quality assessment for Facon 2006 (IFM-
95/01). However, this trial also appears in Table 59 of Appendix D, which lists
excluded studies. Please confirm whether or not this trial should have been quality
assessed as an included study.
This trial was not included in the network of evidence and should not have been quality
assessed. The company apologises for this oversight.

50
Section B: Clarification on cost-effectiveness data
B1. On page 101, Document B, it is stated that patients who died or were censored for
OS prior to 92 weeks were not included in the MSM analysis. Please state how many
patients this applied to.
For Rd, 121 patients were censored or died before 92 weeks, and for MPT, 153 patients
were censored or died before 92 weeks.
B2. The weighted costs per model cycle shown in Table 36, Document B, differs from the
values in the economic model in worksheet Drug Costs. Please clarify which values
are correct.
The weighted costs per model cycle presented in the “Drug Costs” worksheet in the
economic model (S33:S56) are calculated based on mean RDI. However, the base case
analysis calculates drug costs using individual patient data rather than the mean relative
dose intensity (RDI), hence the correct weighted costs per cycle are found on the “Trial
Dosing Costs” worksheet, cells X4:Z4. These provide the weighted cost per cycle before the
patient access scheme (PAS) is applied.
However, the value provided in Table 36 in Document B is an error in the submission, and
should be reported as ''''''''''''''''''''''' for lenalidomide, and ''''''''''''''''' for dexamethasone, as per
the model. The company apologises for this reporting error.
B3. The pack cost reported for melphalan and prednisolone in Table 35, Document B,
differs from those reported in the economic model in worksheet Drug Costs. Please
confirm which values are correct.
The value reported in the economic model for melphalan (Drug Costs I95) should be £45.38
per pack, and £26.19 for prednisolone (Drug Costs I97), as per the original company
submission. The economic model submitted with the clarification responses includes this
correction. However, it should be noted that this has not altered the ICER for Rd versus
VMP, as this cell was linked to trial based dosing calculations for MPT only (L45). All drug
cost calculations for melphalan and prednisolone are now solely linked to I95 and I97.
The “Drug Costs” worksheet in the updated Excel model has been adapted; cells J93, J95,
I97, I95, L47 and L54 now link all drug costs to the same inputs.
B4. Priority question: Please provide a mapping of EORTC QLQ C30 data for the Rd
and MPT groups to EQ-5D values for cycles 1-6 using the mapping algorithm by
Proskorovsky et al.
The requested analysis has been conducted. Table 45 provides the EQ-5D utility values
mapped from EORTC-QLQ-C30 data for Rd and MPT.
51
Table 45: Mapped EQ-5D values for Rd and MPT from the EORTC-QLQ-C30 data from MM-020
Cycle (per 4 weeks) Mapped EQ-5D utility from EORTC-QLQ-C30 MM-020 data*
Rd MPT
1 0.599 (823) 0.596 (546)
2 0.612 (154) 0.635 (385)
3 0.682 (232) 0.665 (208)
4 0.685 (185) 0.649 (195)
5 0.641 (44) 0.684 (53)
6 0.715 (162) 0.669 (109)
*Number of observations provided in brackets. Key: Rd, lenalidomide and low-dose dexamethasone until
disease progression; MPT, melphalan, prednisone and thalidomide; EORTC-QLQ-C30, European
organisation for research and treatment of cancer core quality of life questionnaire
Table 46 compares the differences in Rd and VMP utilities in cycles 1-6 used in the original
company base case (Rd EQ-5D values from MM-020) and the EQ-5D values mapped from
the EORTC-QLQ-C30 data (Table 45). For the latter, the VMP utility has been recalculated
using the new baseline utility for Rd (0.599), to align the approach with the original company
base case.
Per cycle, the differences between the two arms are highly comparable (Table 45).
Moreover, the only discrepancy in the direction of the difference between arms occurs in
cycle 5 when there are low numbers of observations in the Rd arm. Based on these results,
we do not anticipate that using the mapped utility values for Rd would have a material impact
on the cost-effectiveness of Rd, in comparison to the original company base case approach.
Table 46: Rd and VMP utilities
Cycle Original company base case utilities Mapped EQ-5D utility from EORTC-
QLQ-C30 for Rd
Rd VMP Difference Rd VMP Difference
1 0.52 0.54 -0.02 0.60 0.62 -0.02
2 0.56 0.53 0.03 0.61 0.61 0.01
3 0.56 0.52 0.04 0.68 0.60 0.09
4 0.63 0.55 0.08 0.69 0.63 0.06
5 0.63 0.59 0.04 0.64 0.67 -0.03
6 0.63 0.62 0.01 0.72 0.70 0.02
Key: Rd, lenalidomide and low-dose dexamethasone until disease progression; VMP, bortezomib, melphalan,
and prednisone; EORTC-QLQ-C30, European organisation for research and treatment of cancer core quality
of life questionnaire
B5. Priority question: The submission provides a scenario analysis of VMP vs. Rd using
time-varying HRs using fractional polynomials (Table 52, Document B). Please
conduct a one-way sensitivity analysis for this analysis using the upper and lower
95% credible interval values.
This sensitivity analysis was conducted exclusively for the parameters requested, and
tornado diagrams are provided in Figure 14 and Figure 15, with the base case reflecting the
52
scenario where both OS and PFS use the best fitting time-varying hazard ratio model (an
ICER of '''''''''''''''''' and net monetary benefit (NMB) of ''''''''''''''''''' using a willingness-to-pay
threshold of £30,000). Both ICER and NMB tornado plots have been shown due to the
ICERs for the VMP OS d1 estimate reflecting bottom-left quadrant cost-effectiveness plane
results.
It should be noted that these analyses do not (and cannot) correctly account for the inherent
correlation between each of the input parameters for the time-varying HR, hence do not
represent the associated uncertainty correctly. These results should therefore be treated
with caution. Regardless, the only parameters that influence the overall decision were those
relating to VMP OS, which aligns with the findings of the one-way sensitivity analysis
(OWSA) presented in the original company submission.
The updated Excel model includes changes to the “Parameters” worksheet, where additional parameters have been added for the fractional polynomial inputs in rows 677:684.
Figure 14: One way sensitivity analysis (OWSA) results using 95% CrI for the time-varying hazards approach – ICER
Key: Rd, lenalidomide and low-dose dexamethasone until disease progression; VMP, bortezomib, melphalan,
and prednisone; PFS, progression-free survival; OS, overall survival. Notes: Base case ICER is identical to the
scenario using time-varying hazards for PFS and OS for Rd and VMP (£11,329). The ICER for the lower bound
of the OS VMP d1 estimate lies in the lower left quartile of the cost-effectiveness analysis (CEA) plane, and
therefore is not cost-effective.
53
Figure 15: OWSA results using 95% CrI for the time-varying hazards approach – NMB
Key: Rd, lenalidomide and low-dose dexamethasone until disease progression; VMP, bortezomib, melphalan,
and prednisone; PFS, progression-free survival; OS, overall survival. Notes: Base case NMB is identical to the
scenario using time-varying hazards for PFS and OS for Rd and VMP (£21,487).
B6. Priority question: Please clarify how you obtained the cost-effectiveness results for the scenario analysis: “Use TTP:PFS to extrapolate Rd and MPT DoT” (Table 52, Document B). Currently, choosing the option of “TTP:PFS” from the drop down menu in cell “DoT.Choice” within Sheet!TTF and KMs in the Excel model gives an error in the cost-effectiveness results”
An agreement was reached on the clarification questions call (15 November 2017) that a
response to this question is no longer required.
54
Section C: Textual clarifications and additional points
C1. The clinical study report for the FIRST trial (reference 43 in the submission) contains
table headings in section 14, but there are no tables provided. Please supply these.
Please see Appendix 2 and Appendix 3 of the clarification response which present the
following data tables for the 21 January 2016 data cut of the MM-020 study:
• Efficacy results (Appendix 2)
• Demographic and safety results (Appendix 3)
C2. Figure 21 (page 106, Document B), PFS (left hand panel) – should an MPT survival
curve appear in this figure?
As stated in the Notes section of Figure 21 (page 106, Document B), the PFS HR for VMP
versus MPT is 1. This means that the curves are identical, and the VMP curve currently
overlays the MPT curve, which is why the MPT curve is not visible.
55
References:
1) Celgene Corporation. Lenalidomide (REVLIMID®). A phase III, randomized, open-label,
3-arm study to determine the efficacy and safety of lenalidomide (REVLIMID®) plus low-
dose dexamethasone when given until progressive disease or for 18 four-week cycles
versus the combination of melphalan, prednisone, and thalidomide given for 12 six-week
cycles in patients with previously untreated multiple myeloma who are either 65 years of
age or older or not candidates for stem cell transplantation (IFM 07-01). Clinical study
report CC-5013-MM-020/IFM 07-01. 31 August 2016 (data cutoff: 21 January 2016).
2) Cocks K, Cohen D, Wisløff F, et al. An international field study of the reliability and
validity of a disease-specific questionnaire module (the QLQ-MY20) in assessing the
quality of life of patients with multiple myeloma. Eur J Cancer. 2007;43(11):1670-1678.
3) Jansen JP Cope S. Meta-regression models to assess heterogeneity and inconsistency
in network meta-analysis of survival outcomes. BMC Medical Research Methodology
2012, 12:152.
Appendix G – patient/carer organisation submission template
National Institute for Health and Care Excellence Page 1 of 9
Patient/carer organisation submission template (STA)
NATIONAL INSTITUTE FOR HEALTH AND CARE EXCELLENCE
Patient/carer organisation submission (STA)
Lenalidomide for previously untreated multiple myeloma [ID474]
Thank you for agreeing to give us your views on this treatment that is being appraised by NICE and how it could be used in the NHS. Patients, carers and patient organisations can provide a unique perspective on conditions and their treatment that is not typically available from other sources. We are interested in hearing about:
the experience of having the condition or caring for someone with the condition
the experience of receiving NHS care for the condition
the experience of having specific treatments for the condition
the outcomes of treatment that are important to patients or carers (which might differ from those measured in clinical studies, and including health-related quality of life)
the acceptability of different treatments and how they are given
expectations about the risks and benefits of the treatment.
To help you give your views, we have provided a questionnaire. You do not have to answer every question — the questions are there as prompts to guide you. The length of your response should not normally exceed 10 pages.

Appendix G – patient/carer organisation submission template
National Institute for Health and Care Excellence Page 2 of 9
Patient/carer organisation submission template (STA)
1. About you and your organisation
Your name: xxxxxxxxxxxxxxxxxxxxxxx
Name of your organisation: Leukaemia CARE
Your position in the organisation: xxxxxxxxxxxxxxxxxxxxxxxxxxxxxx
Brief description of the organisation:
Leukaemia CARE is a national charity which exists to provide vital support
services to anybody affected by a diagnosis of blood cancer (or any allied
blood disorder). This includes all types of leukaemia, lymphoma; multiple
myeloma; myelodysplastic syndrome (MDS); myeloproliferative neoplasms
(MPN) & aplastic anaemia.
Leukaemia CARE was founded in 1967 and first registered with the charity
commission in 1969. Our current membership database stands at
approximately 13,500 (this includes patients, carers and members of the
patients’ immediate family members.)
Leukaemia CARE offers this support through our head office, based in
Worcester and a network of volunteers all around the United Kingdom.
Support is offered over seven key areas:
24-hour CARE Line and live chat (currently office hours only)
Support groups
Patient and carer conferences
Nurse conferences
One-to-one phone buddy support
Cancer campaigning and patient advocacy
Information and booklets
Since its inception over 25 years ago our CARE-Line has taken many
thousands of calls from patients, their carers, family and friends. Our website
provides extensive information on all aspects of the blood cancer journey,
running from diagnosis to what happens when treatment stops and includes
information on the emotional impact of a blood cancer and help for those
caring for a patient. Our focus is purely on supporting anybody affected by a
diagnosis of blood cancer, simply supporting a quality of life for all (see
http://www.leukaemiacare.org.uk).
Leukaemia CARE also works with other charities and policy/decision makers
to campaign for the rights of all patients affected by a cancer of the blood to
have access to and receive the best possible treatment and care when they
need it.
Appendix G – patient/carer organisation submission template
National Institute for Health and Care Excellence Page 3 of 9
Patient/carer organisation submission template (STA)
Organisational Funding:
Over 85% of our total funding comes from our own fund raising activities,
either via our members and fund raisers, legacies, grants, on-line shop,
Christmas card sales, recycling exercises etc.
Leukaemia CARE receives funds from a wide range of Pharmaceutical
companies, but in total those funds do not exceed more than 15% of our total
income. The funds received from the Pharmaceutical Industry are received
and dispersed strictly within the Guidelines as laid down by the ABPI Code of
Practice 2015, Clause 27 - Relationships with Patient Organisations.1
We also operate strictly within the Guidelines defined by the “Leukaemia
CARE Code of Practice.”2 This Code of Practice governing corporate funding
is a commitment undertaken by Leukaemia CARE regarding our financial
relationships with commercial entities and the pharmaceutical industry in
particular. Both of these documents can be examined via the hyperlinks listed
below, or they are available in hard copy upon request.
We pride ourselves on our independence from any external influence/undue
pressure arising from any of the other stakeholder bodies operating within the
same sphere of activity as ourselves – the Industry, the NHS, the DoH, NICE,
the Medical Profession etc., all bodies that we work closely with but are
independent from. We will maintain our independence to the best of our ability
and eschew any support that could adversely impact our reputation. This fact
is made clear to any drug company (or other body) seeking our
advice/assistance at the time of first contact. Our Code of Practice is also
shared with them at that time.
1 - http://www.pmcpa.org.uk/thecode/InteractiveCode2015/Pages/clause27.aspx
2 - http://www.leukaemiacare.org.uk/code-of-practice
(For example: who funds the organisation? How many members does the
organisation have?)
We are asking for your collective view as an organisation and will be asking
patient experts for their individual input separately. If you have the condition,
or care for someone with the condition, you may wish to complete a patient
expert questionnaire to give your individual views as well.

Appendix G – patient/carer organisation submission template
National Institute for Health and Care Excellence Page 4 of 9
Patient/carer organisation submission template (STA)
2. Living with the condition
What is it like to live with the condition or what do carers experience when caring for someone with the condition?
Myeloma (also known as multiple myeloma) is a rare, incurable, relapsing,
remitting and relentless cancer which affects the plasma cells. Plasma cells
are a type of white blood cell found in the bone marrow which produce
antibodies called ‘immunoglobulins’ to help fight infections. Normally new
plasma cells are produced to replace old cells, but in patients with myeloma,
abnormal amounts of plasma cells are produced which only produce one type
of antibody called ‘paraprotein’, which has no useful function and cannot fight
infection effectively.
The most common symptom of myeloma is severe bone pain. This frequently
occurs in the lower back and can be very disabling, meaning that patients’
quality of life can be vastly reduced. Myeloma affects multiple places in the
body (hence ‘multiple’ myeloma) where bone marrow is normally active in an
adult i.e. within the bones of the spine, skull, pelvis, the rib cage, long bones
of the arms and legs and the areas around the shoulders and hips.
Other common symptoms include:
1. Loss of appetite, feeling sick and constipation
2. Tiredness and lethargy
3. Weight loss
4. Unusual bruising and or bleeding
5. Frequent and persistent infections
6. Kidney problems
Collectively these symptoms can substantially impact on patients’ quality of
life. Myeloma patients experience a number of relapses and remissions, which
require effective treatment at each stage. The relapsing nature of myeloma
can have a major impact on the physical and psychological wellbeing of
patients and their carers, family and friends.
The majority of myeloma patients are over the age of 60, which may produce
a range of complications and co-morbidities. Its multiple, complex
mechanisms of action and this range of co-morbidities set it apart from almost
every other cancer.
Appendix G – patient/carer organisation submission template
National Institute for Health and Care Excellence Page 5 of 9
Patient/carer organisation submission template (STA)
3. Current practice in treating the condition
Which treatment outcomes are important to patients or carers? (That is, what would patients or carers like treatment to achieve?) Which of these are most important? If possible, please explain why.
The most important considerations from the patient perspective will include
survival (both overall and progression-free) and a better quality of life.
It is important to note that for many patients an improvement in quality of life is
often considered to be as important to patients as improved survival (i.e.
quality may be as important as quantity).
Other key aims of treatment would include improved response rates and a
reduction in the side effects of treatment.
What is your organisation’s experience of currently available NHS care and of specific treatments for the condition? How acceptable are these treatments and which are preferred and why?
For newly diagnosed patients who are ineligible for ASCT, common first-line
treatment options would include:
Thalidomide (with an alkylating agent and a corticosteroid)
Bortezomib (with an alkylating agent and a corticosteroid)
Bortezomib is rarely used in myeloma as a first-line treatment, unless people
are unable to tolerate or have contraindications to thalidomide. As such, the
most appropriate comparator treatment in this setting will be thalidomide.
However, it is important to note that there will be a group of patients who are
unable to tolerate or are contraindicated to thalidomide who will be likely to
receive bortezomib. Additionally, there will also be a group of patients who are
unable to tolerate or are contraindicated to both thalidomide and bortezomib,
for whom there are currently very limited treatment options.
4. What do patients or carers consider to be the
advantages of the treatment being appraised?
Benefits of a treatment might include its effect on:
the course and/or outcome of the condition
physical symptoms
pain
level of disability
mental health
Appendix G – patient/carer organisation submission template
National Institute for Health and Care Excellence Page 6 of 9
Patient/carer organisation submission template (STA)
quality of life (such as lifestyle and work)
other people (for example, family, friends and employers)
ease of use (for example, tablets rather than injection)
where the treatment has to be used (for example, at home rather than in hospital)
any other issues not listed above
Please list the benefits that patients or carers expect to gain from using the treatment being appraised.
The key benefits that are expected include:
Improved survival (both progression-free and overall)
Improved quality of life
Improved response rates
Reduction in serious (grade 3 or 4) adverse events
Oral treatment (ease of use)
As outlined above, these are important considerations for patients, for whom
lenalidomide at first-line could have huge benefits.
Please explain any advantages that patients or carers think this treatment has over other NHS treatments in England.
See above.
If you know of any differences in opinion between patients or carers about the benefits of the treatment being appraised, please tell us about them.
N/A – We are not aware of any differences in opinion.
5. What do patients and/or carers consider to be the
disadvantages of the treatment being appraised?
Disadvantages of a treatment might include:
aspects of the condition that the treatment cannot help with or might make worse
difficulties in taking or using the treatment (for example, injection rather than tablets)
side effects (for example, type or number of problems, how often, for how long, how severe. Please describe which side effects patients might

Appendix G – patient/carer organisation submission template
National Institute for Health and Care Excellence Page 7 of 9
Patient/carer organisation submission template (STA)
be willing to accept or tolerate and which would be difficult to accept or tolerate)
where the treatment has to be used (for example, in hospital rather than at home)
impact on others (for example, family, friends and employers)
financial impact on the patient and/or their family (for example, the cost of travel to hospital or paying a carer)
any other issues not listed above
Please list any concerns patients or carers have about current NHS treatments in England.
Please list any concerns patients or carers have about the treatment being appraised.
If you know of any differences in opinion between patients or carers about the disadvantages of the treatment being appraised, please tell us about them.
N/A – We are not aware of any differences of opinion.
6. Patient population
Are there any groups of patients who might benefit more from the treatment than others? If so, please describe them and explain why.
Are there any groups of patients who might benefit less from the treatment than others? If so, please describe them and explain why.
7. Research evidence on patient or carer views of the
treatment
Is your organisation familiar with the published research literature for the treatment?
☐ Yes ☐ No
If you answered ‘no’, please skip the rest of section 7 and move on to section 8.
Please comment on whether patients’ experience of using the treatment
Appendix G – patient/carer organisation submission template
National Institute for Health and Care Excellence Page 8 of 9
Patient/carer organisation submission template (STA)
as part of their routine NHS care reflects the experiences of patients in the clinical trials.
Do you think the clinical trials have captured outcomes that are important to patients? Are you aware of any limitations in how the treatment has been assessed in clinical trials?
If the treatment being appraised is already available in the NHS, are there any side effects that were not apparent in the clinical trials but have emerged during routine NHS care?
Are you aware of any relevant research on patient or carer views of the condition or existing treatments (for example, qualitative studies, surveys and polls)?
☐ Yes ☐ No
If yes, please provide references to the relevant studies.
8. Equality
NICE is committed to promoting equality of opportunity, eliminating unlawful discrimination and fostering good relations between people with particular protected characteristics and others. Protected characteristics are: age; being or becoming a transsexual person; being married or in a civil partnership; being pregnant or having a child; disability; race including colour, nationality, ethnic or national origin; religion, belief or lack of religion/belief; sex; sexual orientation.
Please let us know if you think that recommendations from this appraisal could have an adverse impact on any particular groups of people, such as:
excluding from full consideration any people protected by the equality legislation who fall within the patient population for which the treatment is/will be licensed;
having a different impact on people protected by the equality legislation than on the wider population, e.g. by making it more difficult in practice for a specific group to access the treatment;
any adverse impact on people with a particular disability or disabilities.

Appendix G – patient/carer organisation submission template
National Institute for Health and Care Excellence Page 9 of 9
Patient/carer organisation submission template (STA)
Please let us know if you think that there are any potential equality issues that should be considered in this appraisal.
We would like to draw attention to potential equality issues arising due to the
nature of myeloma:
Myeloma incidence is strongly related to increasing age.
Myeloma disproportionately affects males.
Myeloma disproportionately affects the black populations, and within
that, particularly men.
Are there groups of patients who would have difficulties using the treatment or currently available treatments? Please tell us what evidence you think would help the Committee to identify and consider such impacts.
9. Other issues
Do you consider the treatment to be innovative?
☐ Yes ☐ No
If yes, please explain what makes it significantly different from other treatments for the condition.
Are there any other issues that you would like the Appraisal Committee to consider?
10. Key messages
In no more than 5 bullet points, please summarise the key messages of your submission.
Myeloma is a rare, incurable, relapsing, remitting and relentless cancer.
Myeloma patients may experience a range of symptoms including – bone
pain, tiredness, unexplained weight loss, frequent and persistent infections
etc. These symptoms can collectively and individually impact hugely on
patients’ quality of life.
For the small group of patients who are unable to tolerate or have
contraindications to both thalidomide and bortezomib, there are currently
very limited options.
Lenalidomide appears to offer patients an improvement in progression-free
survival; overall survival; response rates and quality of life.
Patient organisation submission Myeloma UK 1 of 10
Patient organisation submission
Lenalidomide in combination with dexamethasone for previously untreated multiple myeloma [ID474]
Thank you for agreeing to give us your organisation’s views on this technology and its possible use in the NHS.
You can provide a unique perspective on conditions and their treatment that is not typically available from other sources.
To help you give your views, please use this questionnaire with our guide for patient submissions.
You do not have to answer every question – they are prompts to guide you. The text boxes will expand as you type.
Information on completing this submission
Please do not embed documents (such as a PDF) in a submission because this may lead to the information being mislaid or makethe submission unreadable
We are committed to meeting the requirements of copyright legislation. If you intend to include journal articles in your submissionyou must have copyright clearance for these articles. We can accept journal articles in NICE Docs.
Your response should not be longer than 10 pages.
About you
1.Your name
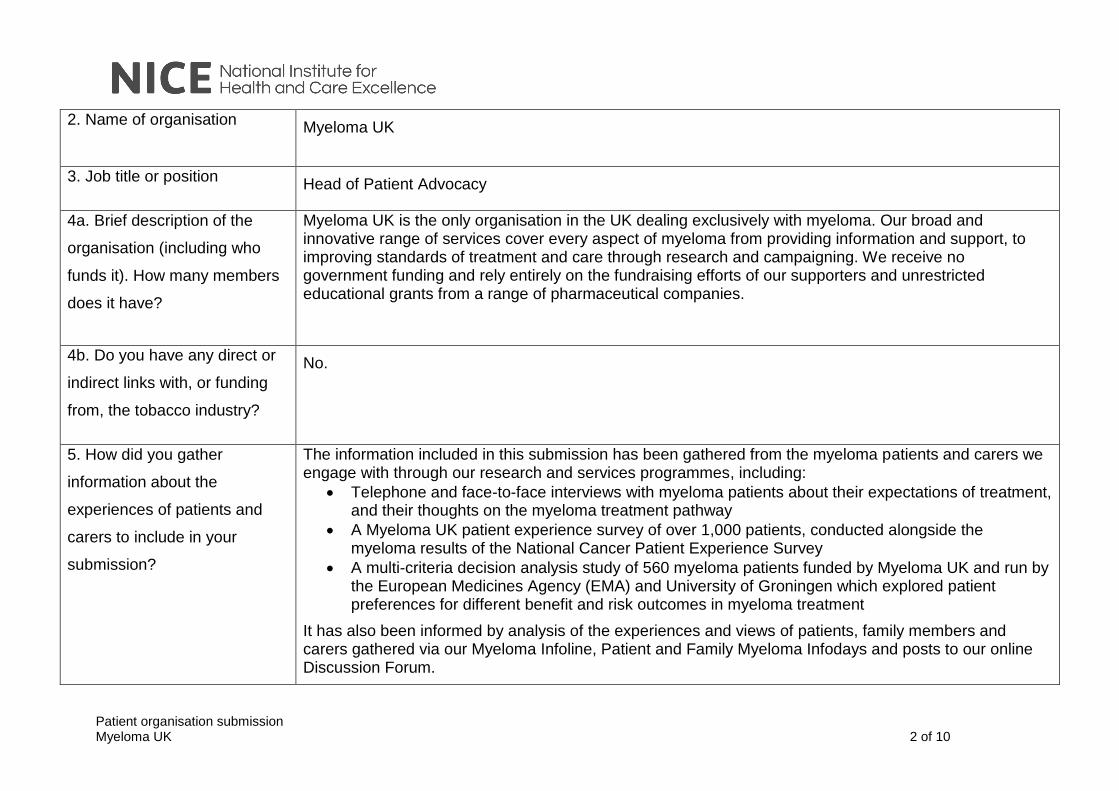
Patient organisation submission Myeloma UK 2 of 10
2. Name of organisation Myeloma UK
3. Job title or position Head of Patient Advocacy
4a. Brief description of the
organisation (including who
funds it). How many members
does it have?
Myeloma UK is the only organisation in the UK dealing exclusively with myeloma. Our broad and innovative range of services cover every aspect of myeloma from providing information and support, to improving standards of treatment and care through research and campaigning. We receive no government funding and rely entirely on the fundraising efforts of our supporters and unrestricted educational grants from a range of pharmaceutical companies.
4b. Do you have any direct or
indirect links with, or funding
from, the tobacco industry?
No.
5. How did you gather
information about the
experiences of patients and
carers to include in your
submission?
The information included in this submission has been gathered from the myeloma patients and carers we engage with through our research and services programmes, including:
Telephone and face-to-face interviews with myeloma patients about their expectations of treatment, and their thoughts on the myeloma treatment pathway
A Myeloma UK patient experience survey of over 1,000 patients, conducted alongside the myeloma results of the National Cancer Patient Experience Survey
A multi-criteria decision analysis study of 560 myeloma patients funded by Myeloma UK and run by the European Medicines Agency (EMA) and University of Groningen which explored patient preferences for different benefit and risk outcomes in myeloma treatment
It has also been informed by analysis of the experiences and views of patients, family members and carers gathered via our Myeloma Infoline, Patient and Family Myeloma Infodays and posts to our online Discussion Forum.

Patient organisation submission Myeloma UK 3 of 10
This provides a comprehensive and in-depth picture of the experience, needs and priorities of people affected by myeloma.
Living with the condition
6. What is it like to live with the
condition? What do carers
experience when caring for
someone with the condition?
What is it like to live with myeloma? “Myeloma creeps up on you, engulfs you and, if you win the battle, leaves you wondering when it will come back.” Myeloma is a highly individual and complex cancer originating from abnormal plasma cells in the bone marrow. There is currently no cure, but treatment can halt its progress and improve quality of life. Myeloma is also a relapsing and remitting cancer which evolves over time and becomes resistant to treatment. Patients experience an increasing sense of despair when they relapse and are faced with limited treatment options. The complications of myeloma can be significant, debilitating and painful and include: severe bone pain, bone destruction, kidney damage, fatigue and a depleted immune system. Myeloma patients are more likely to be diagnosed late and often present in secondary care with bone lesions, fractures and, in the worst cases, collapsed vertebrae. This compounds the distress of their diagnosis and impacts negatively on pain levels, mobility and their ability to complete everyday tasks. Treatment side-effects and frequent hospital visits have a social and practical impact on patients’ lives, including significant financial implications. Reduction in mobility over time and a perceived increase in reliance on carers and family members, also impacts on patients’ sense of control. However, many myeloma patients, including those who are multiply relapsed, can have durable and deep responses to treatment and good quality of life – but only if they have access to new, effective and
Patient organisation submission Myeloma UK 4 of 10
innovative treatments. There is therefore an urgent and continual need for new treatments to ensure that patient survival rates keep improving. What do carers experience? “I feel angry that I’m not going to get the future I wanted, but the hardest thing to feel is how my life at the moment is in limbo” A recent Myeloma UK study1 into the experiences of carers and family members found that looking after someone with myeloma has a significant emotional, social and practical impact. Carers’ lives can change dramatically because of their caring responsibilities: 25 per cent of those in work had been unable to work or had to retire early to care for the person with myeloma. They often carry a heavy emotional burden with 84 per cent always putting the needs of their relative or friend with myeloma before their own. The impact of myeloma on the well-being of carers is also often overlooked; 42 per cent of carers were not given enough information at diagnosis about how myeloma may affect them Living with myeloma is therefore often extremely challenging physically and emotionally for patients, carers and family members.
Current treatment of the condition in the NHS
7. What do patients or carers
think of current treatments and
care available on the NHS?
What treatment outcomes are important to myeloma patients?
We know from our programmes of engagement that myeloma patients and their carers place a very high value on treatments that put their myeloma into remission for as long as possible, prolong their life and allow them to enjoy normal day-to-day life.
To expand on this:
In the joint Myeloma UK, EMA, University of Groningen study, the majority of patients considered progression free survival (PFS) to be the most important attribute to consider when making a
1 The study, conducted between May and June 2016, was designed with the input of carers and involved a survey of 374 carers and a second stage of interviews to explore issues in more depth.

Patient organisation submission Myeloma UK 5 of 10
decision on a new treatment.
Treatments with minimal negative impact on quality of life are very important, particularly those with as few side-effects as possible and of low severity. “The aim is to maintain the best possible quality of life for as long as possible.”
As myeloma is a highly individual, relapsing and remitting cancer which becomes resistant to treatment, patients need and want a range of effective treatment options; treatments with different mechanisms of action, administered in a range of ways, at every stage of the treatment pathway
Again, due to its relapsing and remitting nature, patients do not see the survival benefits of individual treatments in isolation; gains in survival from one treatment are seen as a “bridge” to further treatments coming down the line. “A drug like this can be a gateway to other treatments that can extend your life even further”
What do patients think of current treatment and care? Currently, newly diagnosed myeloma patients ineligible for HDT-SCT can receive either a thalidomide-based regimen or bortezomib (Velcade®) (if they are intolerant/contraindicated to thalidomide). Thalidomide and bortezomib are generally well tolerated by myeloma patients and can prolong survival. However, some patients report that a number of the side-effects of these treatments are difficult to deal with and can be debilitating. Both treatments are associated with peripheral neuropathy (which affects up to 30% of patients receiving bortezomib). This can range from mild and temporary tingling in hands and feet, through to permanent shooting pains requiring significant supportive care and pain relief.
“I have permanent damage in my extremities, my feet constantly feel icy and like they don’t belong to my body – when I touch between my knees and feet I can’t really feel anything. It is because of this I trip up all of the time.”

Patient organisation submission Myeloma UK 6 of 10
“It can only be described as a feeling of walking on rocks. I had a constant burning sensation in my hands and feet, which got much worse at night and meant I struggled to sleep. This combined with having terrible fatigue related to my myeloma, meant that it impacted on my ability to do things.”
Bortezomib is the alternative treatment option for patients who cannot have thalidomide, but this may not always be appropriate for patients who are older and/or frailer (who have a higher susceptibility to side-effects) or for patients who cannot tolerate bortezomib due to peripheral neuropathy (either pre-existing or drug related). If patients have pre-existing neuropathy, or have developed neuropathy through exposure to thalidomide, an alternative treatment is needed. If patients were able to access lenalidomide, it could potentially stop further damage and also prevent permanent damage to nerves. Administering bortezomib subcutaneously has reduced the impact of peripheral neuropathy but this can bring further challenges, particularly for elderly and frail patients. Patients have to attend hospital in order to receive treatment, which can be difficult for patients with mobility problems and also requires all patients to take the time out of their daily routine to attend day clinics. In some circumstances patients are content to attend hospital in order to achieve a good outcome and some patients like the “safety” and sense of community found in day clinics. However, most patients welcome the option of an oral regimen.
8. Is there an unmet need for
patients with this condition?
Yes.
The individual and heterogeneous nature of myeloma means that some patients may tolerate a treatment well and others may not. In addition myeloma evolves and becomes resistant to treatment. It is therefore essential to have a range of treatment options with different mechanisms of action at all stages of the myeloma pathway.
“To say, “Well you already have a treatment.” That’s not good enough. You always have to show myeloma something new.”
Patient organisation submission Myeloma UK 7 of 10
In addition, for the reasons outlined at point 7, above, some patients who cannot receive thalidomide are also not suitable for treatment with bortezomib.
Therefore, there is a particular unmet need for patients who are not suitable for treatment with thalidomide and for whom existing treatment options are limited and sometimes undesirable since they are challenging to deliver and increase the risk of reducing quality of life.
Advantages of the technology
9. What do patients or carers
think are the advantages of the
technology?
Data from the MM - 020 FIRST trial shows that lenalidomide prolongs progression free survival (PFS) and overall survival (OS) in newly diagnosed myeloma patients. These are outcomes we know myeloma patients value greatly. In addition, evidence suggests that patients who attain a good response from their initial treatment have better long term outcomes. Lenalidomide provides doctors with a further front-line option to deliver maximum depth and duration of response. Furthermore, lenalidomide is an innovative treatment, with a different mechanism of action to thalidomide, and its tolerability means that it can be given continuously until disease progression, helping to extend remission. The reduced side effect profile of lenalidomide, particularly the reduced incidence of peripheral neuropathy, is also highly valued by patients. Revlimid is also likely to be given in a two-drug rather than three drug combination, which is particularly beneficial to older/frailer patients. The oral regimen is easy to take and enables patients to have more control over their lives. Myeloma patients who are ineligible to receive HDT-SCT, can often perceive that they are receiving less effective treatment. It is very important therefore for patients and their families to know that the FIRST® trial has shown that patients in the non-intensive pathway can have a near equivalent response to those
Patient organisation submission Myeloma UK 8 of 10
patients undergoing HDT-SCT, providing much needed reassurance that they are receiving the best possible treatment regardless of their age or fitness.
Disadvantages of the technology
10. What do patients or carers
think are the disadvantages of
the technology?
Side-effects of Revlimid include low blood counts and there is a risk of venous thromboembolism and blood clots whilst taking the treatment. Patients also frequently report fatigue which impacts negatively on their quality of life and peripheral neuropathy, although this is a lesser risk than in thalidomide and Velcade. Another side-effect is skin rashes. As with other treatments these side-effects can be largely mitigated or improved through appropriate management by a healthcare professional. Revlimid is also given on a treat until progression basis, so patients do not have long treatment free breaks.
Patient population
11. Are there any groups of
patients who might benefit
more or less from the
technology than others? If so,
please describe them and
explain why.
Frail and elderly patients who are more susceptible to side-effects, potentially less able to travel to receive treatment, and who would benefit from a two drug rather than a three drug combination.

Patient organisation submission Myeloma UK 9 of 10
Equality
12. Are there any potential
equality issues that should be
taken into account when
considering this condition and
the technology?
No.
Other issues
13. Are there any other issues
that you would like the
committee to consider?
Key messages
15. In up to 5 bullet points, please summarise the key messages of your submission:
There is an unmet need for treatments with a different mechanism of action and reduced side effect profile for newly diagnosed
myeloma patients. Lenalidomide is an innovative and effective treatment to add to the myeloma treatment pathway for patients who
are ineligible for HDT-SCT. Approving lenalidomide in this setting significantly improves treatment options for this group of patients,
enabling doctors to personalise treatment and choose the option best suited to the clinical situation.

Patient organisation submission Myeloma UK 10 of 10
Lenalidomide can substantially increase progression free and overall survival; outcomes which are valued highly by patients
Lenalidomide gives patients the opportunity to achieve a deeper response at first treatment which is beneficial to long-term survival
It offers patients improved quality of life through its reduced side effect profile and by treating the underlying disease and reducing symptoms, helping patients to lead enjoyable, fulfilling and productive lives. This also lessens the burden on carers and family members.
Its oral formulation is welcomed by patients, giving them more control over their day to day lives. The oral regimen is especially helpful to older frailer patients who will also derive particular benefit from its reduced side effect profile and the fact it is given in a two drug combination.
Thank you for your time.
Please log in to your NICE Docs account to upload your completed submission.

Professional organisation submission [Insert title here] 1 of 12
Professional organisation submission
Lenalidomide in combination with dexamethasone for previously untreated multiple myeloma [ID474]
Thank you for agreeing to give us your organisation’s views on this technology and its possible use in the NHS.
You can provide a unique perspective on the technology in the context of current clinical practice that is not typically available from the published literature.
To help you give your views, please use this questionnaire. You do not have to answer every question – they are prompts to guide you. The text boxes will expand as you type.
Information on completing this submission
Please do not embed documents (such as a PDF) in a submission because this may lead to the information being mislaid or make the submission unreadable
We are committed to meeting the requirements of copyright legislation. If you intend to include journal articles in your submission you must have copyright clearance for these articles. We can accept journal articles in NICE Docs.
Your response should not be longer than 13 pages.
About you
1. Your name xxxxxxxxxxx
2. Name of organisation Uk Myeloma Forum
Professional organisation submission [Insert title here] 2 of 12
3. Job title or position Consultant Haematologist xxxxxxxxxxxxxxxx
4. Are you (please tick all that
apply):
an employee or representative of a healthcare professional organisation that represents clinicians?
a specialist in the treatment of people with this condition?
a specialist in the clinical evidence base for this condition or technology?
other (please specify):
5a. Brief description of the
organisation (including who
funds it).
UK myeloma forum is the only UK organisation that represents Physicians, Nursing staff, Pharmacists and Healthcare professionals who are directly involved with providing clinical care or research for patients with myeloma. Membership is free by application and members of the executive board are elected by the membership. It aims to improve the care of myeloma patients through the development and promotion of trials and best practice, providing education about both the disease and its management to healthcare professionals.
Funding is derived from charitable donations, educational meeting attendance fees and donations from
Pharmaceutical company sponsors
5b. Do you have any direct or
indirect links with, or funding
from, the tobacco industry?
No
The aim of treatment for this condition
6. What is the main aim of
treatment? (For example, to
Myeloma is currently incurable. Most people diagnosed with myeloma die as a result of complications of the disease. Symptoms and signs include bone pain, fractures secondary to bone deposits, anaemia (fatigue, shortness of breath, chest tightness), recurrent infections, renal failure, high calcium levels and
Professional organisation submission [Insert title here] 3 of 12
stop progression, to improve
mobility, to cure the condition,
or prevent progression or
disability.)
occasionally spinal cord compression. Treatment is primarily aimed at reducing or preventing these symptoms by controlling the disease. There is a direct association between improvement in quality of life and how well the underlying disease is controlled i.e. A complete remission being better than partial response. A primary aim of treatment is to maintain this control (and thereby symptoms) for as long as possible (i.e. lengthen the progression free survival / duration of response), lengthen life (i.e. increase overall survival) and prevent significant morbidity associated with progression of the disease.
7. What do you consider a
clinically significant treatment
response? (For example, a
reduction in tumour size by
x cm, or a reduction in disease
activity by a certain amount.)
There are international agreed criteria for assessing response (International Myeloma Working Group Rajkumar et al. Blood 2011;117:4691-4695
These are based on the proportional reduction on serum paraprotein / serum free light chains (serological markers of myeloma) or urine monoclonal protein + bone marrow proportion of myeloma plasma cells. Generally, a Partial Response (PR) or better is considered clinically significant. Increasingly with more efficacious treatments the aim of the therapy is to achieve Complete Response (CR) or Very Good Partial Response (VGPR) for as many patients as possible. It is apparent in many studies that the greater the depth of response the longer the duration of the response (CR>VGPR>PR). There is also an association between CR and longer overall survival.
8. In your view, is there an
unmet need for patients and
healthcare professionals in this
condition?
Yes. This is a disease that is incurable with current therapy for all but a minority of patients. First line therapy should be aimed at achieving the highest and deepest possible response rates with the longest / most durable responses thereby reducing both the morbidity and mortality associated with the disease. Ideally this is achieved with a well tolerated and oral treatment combination. Currently available first line therapies for non-transplant eligible patients are reported as less effective (e.g. cyclophosphamide /thalidomide/dexamethasone;CTD) or require regular attendance at hospitals for sub-cutaneous (S/C) treatment administration (e.g Velcade /melphalan/prednisolone; VMP).
What is the expected place of the technology in current practice?
9. How is the condition
currently treated in the NHS?
Professional organisation submission [Insert title here] 4 of 12
Are any clinical
guidelines used in the
treatment of the
condition, and if so,
which?
NICE guideline TA229 recommends alkylator therapy + thalidomide + steroid (CTD or MPT) as 1st line therapy for non-transplant eligible patients unless thalidomide intolerant or contraindicated, in which case bortezomib + alkylator + steroid is recommended (VMP). NHSE approved funding support for VMP in 2013 as baseline commissioning although it is reported to be not available in all areas i.e. there is variable access to VMP. NICE declined to review the TA229 guidance in 2016.
European Society of Medical Oncology Guidelines 2017 (Annals of Oncology 28 (suppl 4) iv 52-61 recommends VMP or Rd (lenalidomide / dexamethasone) for 1st line therapy.
Is the pathway of care
well defined? Does it
vary or are there
differences of opinion
between professionals
across the NHS? (Please
state if your experience is
from outside England.)
The pathway of care is well defined. Patients are assessed according to autologous transplant eligibility and then treated on non-transplant eligible or transplant eligible pathways. Whilst it is generally accepted that VMP has been the treatment combination regimen that is associated with the best response rates, longest responses and improvements in overall survival it is not accessible in all localities. It is also recognised that it is potentially less deliverable than all oral combinations (e.g CTD /MPT or Lenalidomide / dexamethasone (Rd)) which means that a significant proportion of patients receive CTD.
Generally in the UK for those receiving thalidomide based treatment CTD is used in preference to MPT as this was one of the arms of the Myeloma IX trial (Morgan et al. Blood 2011;118(5):1231-1238) that influenced clinical practice significantly.
What impact would the
technology have on the
current pathway of care?
This is an effective well tolerated all oral treatment combination. There would be a significant improvement in durable control of the disease with associated improvements on quality of life. It is also well tolerated with minimal side effects and compliance is likely to be good. For patients particularly if they live a long distance from their treatment unit the reduction in the number of attendances and the associated reduction in healthcare resource utilisation (HRU), especially that associated with S/C administration of velcade would be welcomed.
10. Will the technology be
used (or is it already used) in
the same way as current care
in NHS clinical practice?

Professional organisation submission [Insert title here] 5 of 12
How does healthcare
resource use differ
between the technology
and current care?
Yes – it would substitute for CTD/MPT. There are no differences in healthcare resource required for Rd
In what clinical setting
should the technology be
used? (For example,
primary or secondary
care, specialist clinics.)
Specialist clinics
What investment is
needed to introduce the
technology? (For
example, for facilities,
equipment, or training.)
Nil. The combination is currently used at 3rd line and beyond and there is extensive UK experience already.
11. Do you expect the
technology to provide clinically
meaningful benefits compared
with current care?
Do you expect the
technology to increase
length of life more than
current care?
The progression free survival for the continuous Rd treatment arm in the MM-020 trial (Benboubker et al NEJM 2014;371:906-17), which formed the basis of the evidence for the EMA submission and approval, is significantly superior to the control treatment (MPT) and with short follow-up (median 37 months) there is a small but significant improvement in overall survival for continuous Rd treated patients (59% at 4 years HR 0.78 p=0.02) which is likely to increase with extended follow-up. In Real World use it is likely to improve overall survival.

Professional organisation submission [Insert title here] 6 of 12
Do you expect the
technology to increase
health-related quality of
life more than current
care?
Yes. This is a well tolerated oral regiment with limited side effect profile compared with both CTD/MPT and VMP. It has the advantage that it only required monthly attendance at the administration centre.
12. Are there any groups of
people for whom the
technology would be more or
less effective (or appropriate)
than the general population?
No
The use of the technology
13. Will the technology be
easier or more difficult to use
for patients or healthcare
professionals than current
care? Are there any practical
implications for its use (for
example, any concomitant
treatments needed, additional
clinical requirements, factors
Easier than VMP (as less regular hospital attendance required). The main difference compared with
CTD/MPT oral regimens is a much lower rate of peripheral neuropathy resulting in better quality of life.
The main concomitant medication required is the use of aspirin or low molecular weight heparin to reduce
the thrombosis risk (this is also required for thalidomide based treatments).

Professional organisation submission [Insert title here] 7 of 12
affecting patient acceptability
or ease of use or additional
tests or monitoring needed.)
14. Will any rules (informal or
formal) be used to start or stop
treatment with the technology?
Do these include any
additional testing?
No
15. Do you consider that the
use of the technology will
result in any substantial health-
related benefits that are
unlikely to be included in the
quality-adjusted life year
(QALY) calculation?
Yes. Quality of life likely to be improved due to reduced myeloma associated complications, less hospital
attendance and ease of administration.
16. Do you consider the
technology to be innovative in
its potential to make a
significant and substantial

Professional organisation submission [Insert title here] 8 of 12
impact on health-related
benefits and how might it
improve the way that current
need is met?
Is the technology a ‘step-
change’ in the
management of the
condition?
Yes. This is an effective all oral treatment
Does the use of the
technology address any
particular unmet need of
the patient population?
No
17. How do any side effects or
adverse effects of the
technology affect the
management of the condition
and the patient’s quality of life?
The side effect profile for Rd is generally less extensive than that for CTD / MPT or VMP this includes the
risk for peripheral neuropathy which a common dose and treatment limiting side effect for thalidomide /
bortezomib. There is a moderate increase in reported infections, thromboembolic events and cardiac
events with Rd compared with MPT in the MM—020 trial.
Sources of evidence
Professional organisation submission [Insert title here] 9 of 12
18. Do the clinical trials on the
technology reflect current UK
clinical practice?
If not, how could the
results be extrapolated to
the UK setting?
The 2 most commonly used regimens for non-transplant eligible patients are CTD (Morgan et al. Blood
2011;118(5):1231-1238) and VMP (San Miguel et al NEJM 2008;359:906-17; San Miguel et al J Clin Onc
2012;31:448-455). MPT (the comparator in MM-020 trial) is considered relatively equivalent to CTD. A
meta-analysis of 6 clinical trials using MPT has been described (Fayers et al. Blood 2011 118(5);1239-
1247). All of these clinical trials used the same control arm / comparator: Melphalan / Prednisolone (MP).
This allows some extrapolation for cross comparison.
The MM-020 trial used MPT as the control treatment (Benboubker et al NEJM 2014;371:906-17) as this
was considered the international standard for an all oral therapy.
What, in your view, are
the most important
outcomes, and were they
measured in the trials?
Overall response rate including CR, progression free survival, overall survival and adverse events profile
If surrogate outcome
measures were used, do
they adequately predict
long-term clinical
outcomes?
CR rate and Progression free survival are considered good predictors of overall survival in myeloma trials
for non-transplant eligible patients.

Professional organisation submission [Insert title here] 10 of 12
Are there any adverse
effects that were not
apparent in clinical trials
but have come to light
subsequently?
No
19. Are you aware of any
relevant evidence that might
not be found by a systematic
review of the trial evidence?
No
20. Are you aware of any new
evidence for the comparator
treatment(s) since the
publication of NICE technology
appraisal guidance [TAXXX]?
[delete if there is no NICE
guidance for the comparator(s)
and renumber subsequent
sections]
No
Professional organisation submission [Insert title here] 11 of 12
21. How do data on real-world
experience compare with the
trial data?
There is limited experience with Real World Rd for 1st line patients. However, there is an enormous
experience with using the combination for relapsed disease. Response rates, durations of response and
tolerability have exceeded expectations based on the phase 3 trials for relapsed myeloma.
Equality
22a. Are there any potential
equality issues that should be
taken into account when
considering this treatment?
no
22b. Consider whether these
issues are different from issues
with current care and why.
no
Topic-specific questions
23 [To be added by technical
team at scope sign off. Note
that topic-specific questions
will be added only if the
treatment pathway or likely use
of the technology remains
Professional organisation submission [Insert title here] 12 of 12
uncertain after scoping
consultation, for example if
there were differences in
opinion; this is not expected to
be required for every
appraisal.]
if there are none delete
highlighted rows and
renumber below
Key messages
24. In up to 5 bullet points, please summarise the key messages of your submission.
Rd is efficacious and well tolerated. It has the best outcomes for any all oral treatment regimen for newly diagnosed myeloma
This combination should be made available to allow patient choice for 1st line therapy
Current NICE guidance for 1st line therapy requires updating to reflect treatment that is considered current best practice
Thank you for your time. Please log in to your NICE Docs account to upload your completed submission.
Clinical expert statement lenalidomide for previously untreated multiple myeloma [ID474] 1 of 11
Clinical expert statement Lenalidomide for previously untreated multiple myeloma [ID474]
Thank you for agreeing to give us your views on this technology and its possible use in the NHS.
You can provide a unique perspective on the technology in the context of current clinical practice that is not typically available from the published literature.
To help you give your views, please use this questionnaire. You do not have to answer every question – they are prompts to guide you. The text boxes will expand as you type.
Information on completing this expert statement
Please do not embed documents (such as a PDF) in a submission because this may lead to the information being mislaid or make the submission unreadable
We are committed to meeting the requirements of copyright legislation. If you intend to include journal articles in your submission you must have copyright clearance for these articles. We can accept journal articles in NICE Docs.
Your response should not be longer than 13 pages.
About you
1. Your name Dr Karthik Ramasamy
2. Name of organisation Oxford University Hospitals NHS Trust

Clinical expert statement lenalidomide for previously untreated multiple myeloma [ID474] 2 of 11
3. Job title or position Consultant Haematologist
4. Are you (please tick all that
apply): an employee or representative of a healthcare professional organisation that represents clinicians? a specialist in the treatment of people with this condition? a specialist in the clinical evidence base for this condition or technology?
other (please specify):
5. Do you wish to agree with
your nominating organisation’s
submission? (We would
encourage you to complete
this form even if you agree with
your nominating organisation’s
submission)
yes, I agree with it no, I disagree with it I agree with some of it, but disagree with some of it other (they didn‘t submit one, I don’t know if they submitted one etc.)
6. If you wrote the organisation
submission and/ or do not
have anything to add, tick
here. (If you tick this box, the
rest of this form will be deleted
after submission.)
yes
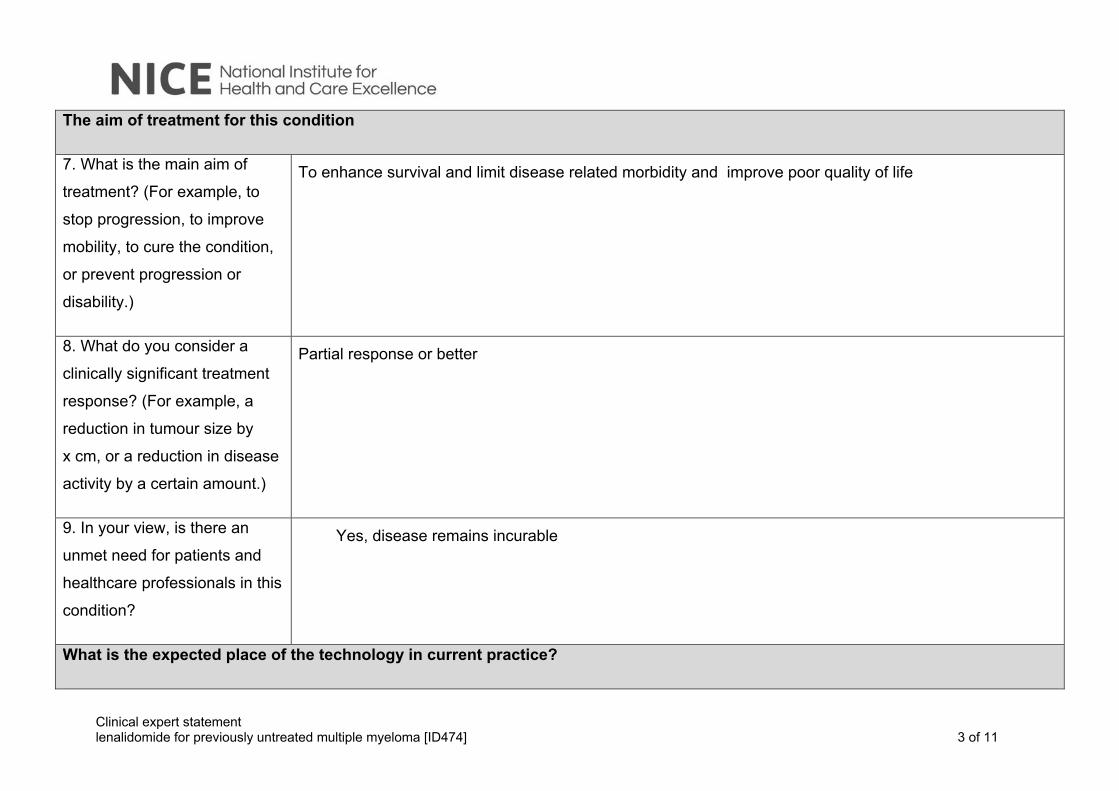
Clinical expert statement lenalidomide for previously untreated multiple myeloma [ID474] 3 of 11
The aim of treatment for this condition
7. What is the main aim of
treatment? (For example, to
stop progression, to improve
mobility, to cure the condition,
or prevent progression or
disability.)
To enhance survival and limit disease related morbidity and improve poor quality of life
8. What do you consider a
clinically significant treatment
response? (For example, a
reduction in tumour size by
x cm, or a reduction in disease
activity by a certain amount.)
Partial response or better
9. In your view, is there an
unmet need for patients and
healthcare professionals in this
condition?
Yes, disease remains incurable
What is the expected place of the technology in current practice?

Clinical expert statement lenalidomide for previously untreated multiple myeloma [ID474] 4 of 11
10. How is the condition
currently treated in the NHS? Thalidomide based or Bortezomib based therapy
Are any clinical guidelines used in the treatment of the condition, and if so, which?
NICE guidance NG35
Is the pathway of care well defined? Does it vary or are there differences of opinion between professionals across the NHS? (Please state if your experience is from outside England.)
Yes
What impact would the technology have on the current pathway of care?
By moving this to newly diagnosed setting, second relapse option will be primarily Bortezomib / dex/ Panobinostat based
11. Will the technology be
used (or is it already used) in
the same way as current care
in NHS clinical practice?
Yes

Clinical expert statement lenalidomide for previously untreated multiple myeloma [ID474] 5 of 11
How does healthcare resource use differ between the technology and current care?
This is oral and therefore easier to deliver than Bortezomib, which is current standard of care. This is better tolerated than Thalidomide which is an oral option for these patients
In what clinical setting should the technology be used? (For example, primary or secondary care, specialist clinics.)
Secondary care clinics
What investment is needed to introduce the technology? (For example, for facilities, equipment, or training.)
Nil required
12. Do you expect the
technology to provide clinically
meaningful benefits compared
with current care?
Yes
Do you expect the technology to increase length of life more than current care?
Yes
Do you expect the Yes

Clinical expert statement lenalidomide for previously untreated multiple myeloma [ID474] 6 of 11
technology to increase health-related quality of life more than current care?
13. Are there any groups of
people for whom the
technology would be more or
less effective (or appropriate)
than the general population?
No particular sub groups have been identified in the trial (MM020)
The use of the technology
14. Will the technology be
easier or more difficult to use
for patients or healthcare
professionals than current
care? Are there any practical
implications for its use (for
example, any concomitant
treatments needed, additional
clinical requirements, factors
affecting patient acceptability
Would be much easier to deliver as since 2009 this therapy was given to second relapse patients. The
system is primed to deliver this therapy and would free up NHS resources (day therapy) for patients who
currently receive Bortezomib
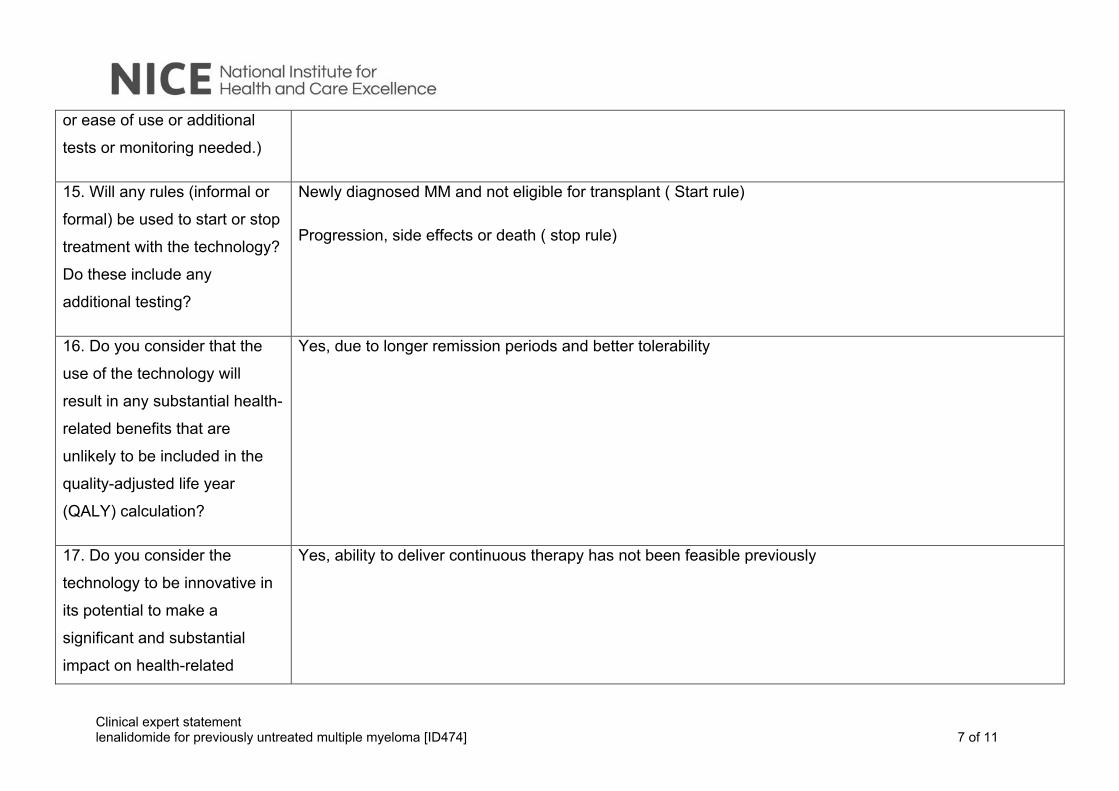
Clinical expert statement lenalidomide for previously untreated multiple myeloma [ID474] 7 of 11
or ease of use or additional
tests or monitoring needed.)
15. Will any rules (informal or
formal) be used to start or stop
treatment with the technology?
Do these include any
additional testing?
Newly diagnosed MM and not eligible for transplant ( Start rule)
Progression, side effects or death ( stop rule)
16. Do you consider that the
use of the technology will
result in any substantial health-
related benefits that are
unlikely to be included in the
quality-adjusted life year
(QALY) calculation?
Yes, due to longer remission periods and better tolerability
17. Do you consider the
technology to be innovative in
its potential to make a
significant and substantial
impact on health-related
Yes, ability to deliver continuous therapy has not been feasible previously

Clinical expert statement lenalidomide for previously untreated multiple myeloma [ID474] 8 of 11
benefits and how might it
improve the way that current
need is met?
Is the technology a ‘step-change’ in the management of the condition?
Yes
Does the use of the technology address any particular unmet need of the patient population?
Ability to receive continuous therapy and be able to deliver therapy for patients with neuropathy
18. How do any side effects or
adverse effects of the
technology affect the
management of the condition
and the patient’s quality of life?
The side effects are manageable and physician learning from using this combination in relapse will come in
handy
Sources of evidence
19. Do the clinical trials on the
technology reflect current UK
clinical practice?
Yes

Clinical expert statement lenalidomide for previously untreated multiple myeloma [ID474] 9 of 11
If not, how could the results be extrapolated to the UK setting?
What, in your view, are the most important outcomes, and were they measured in the trials?
PFS and OS
If surrogate outcome measures were used, do they adequately predict long-term clinical outcomes?
NA
Are there any adverse effects that were not apparent in clinical trials but have come to light subsequently?
No
20. Are you aware of any
relevant evidence that might
not be found by a systematic
review of the trial evidence?
No
21. Are you aware of any new
evidence for the comparator
No
Clinical expert statement lenalidomide for previously untreated multiple myeloma [ID474] 10 of 11
treatment(s) since the
publication of NICE technology
appraisal guidance [TAXXX]?
22. How do data on real-world
experience compare with the
trial data?
Similar results have been obtained in UK MMXI trial. We have no RWE of using this agent outside of trials
Equality
23a. Are there any potential
equality issues that should be
taken into account when
considering this treatment?
Patients in Scotland and Wales receive this drug in newly diagnosed setting
23b. Consider whether these
issues are different from issues
with current care and why.
Key messages

Clinical expert statement lenalidomide for previously untreated multiple myeloma [ID474] 11 of 11
25. In up to 5 bullet points, please summarise the key messages of your statement. Oral therapy
Well tolerated and therefore be able to deliver continuously
Improved PFS and OS
Ability to treat elderly > 75 year age group
Ability to treat patients with neuropathy Thank you for your time. Please log in to your NICE Docs account to upload your completed statement, declaration of interest form and consent form.

Clinical expert statement lenalidomide for previously untreated multiple myeloma [ID474] 1 of 11
Clinical expert statement Lenalidomide for previously untreated multiple myeloma [ID474]
Thank you for agreeing to give us your views on this technology and its possible use in the NHS.
You can provide a unique perspective on the technology in the context of current clinical practice that is not typically available from the published literature.
To help you give your views, please use this questionnaire. You do not have to answer every question – they are prompts to guide you. The text boxes will expand as you type.
Information on completing this expert statement
Please do not embed documents (such as a PDF) in a submission because this may lead to the information being mislaid or make the submission unreadable
We are committed to meeting the requirements of copyright legislation. If you intend to include journal articles in your submission you must have copyright clearance for these articles. We can accept journal articles in NICE Docs.
Your response should not be longer than 13 pages.
About you
1. Your name Dr. Matthew Streetly
2. Name of organisation UK Myeloma Forum / Guys and St. Thomas’ NHS Foundation Trust
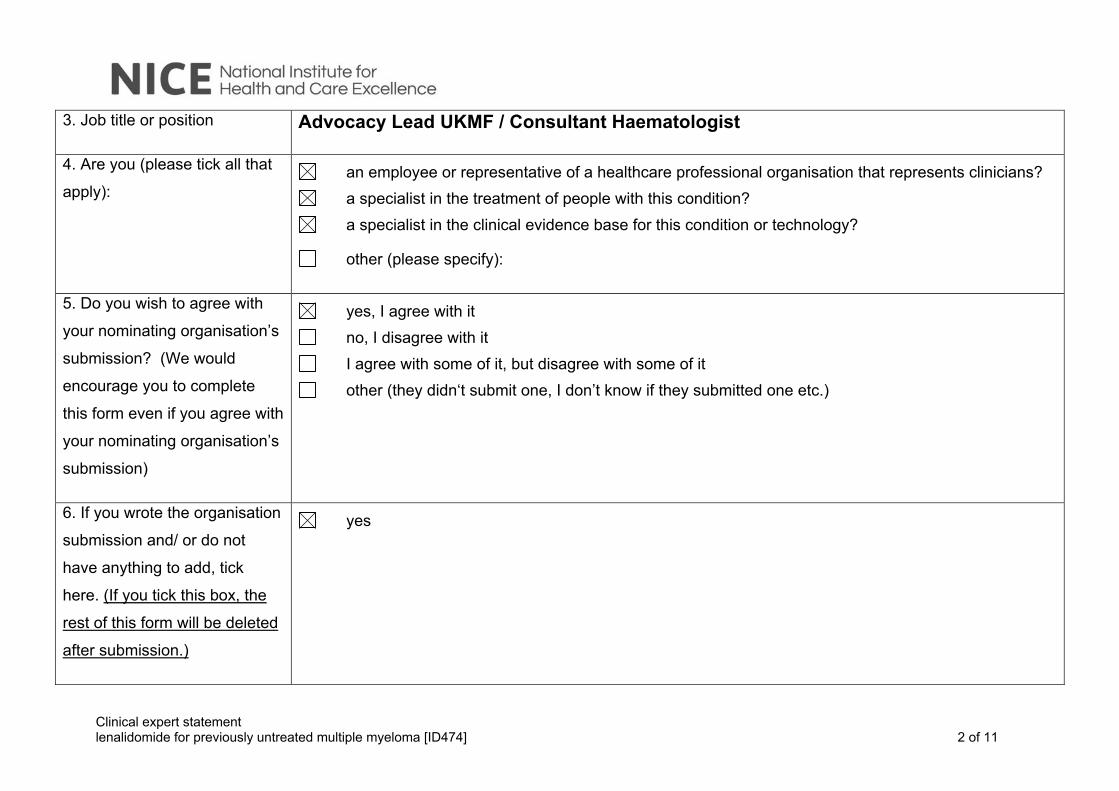
Clinical expert statement lenalidomide for previously untreated multiple myeloma [ID474] 2 of 11
3. Job title or position Advocacy Lead UKMF / Consultant Haematologist
4. Are you (please tick all that
apply): an employee or representative of a healthcare professional organisation that represents clinicians? a specialist in the treatment of people with this condition? a specialist in the clinical evidence base for this condition or technology?
other (please specify):
5. Do you wish to agree with
your nominating organisation’s
submission? (We would
encourage you to complete
this form even if you agree with
your nominating organisation’s
submission)
yes, I agree with it no, I disagree with it I agree with some of it, but disagree with some of it other (they didn‘t submit one, I don’t know if they submitted one etc.)
6. If you wrote the organisation
submission and/ or do not
have anything to add, tick
here. (If you tick this box, the
rest of this form will be deleted
after submission.)
yes
Clinical expert statement lenalidomide for previously untreated multiple myeloma [ID474] 3 of 11
The aim of treatment for this condition
7. What is the main aim of
treatment? (For example, to
stop progression, to improve
mobility, to cure the condition,
or prevent progression or
disability.)
8. What do you consider a
clinically significant treatment
response? (For example, a
reduction in tumour size by
x cm, or a reduction in disease
activity by a certain amount.)
9. In your view, is there an
unmet need for patients and
healthcare professionals in this
condition?
What is the expected place of the technology in current practice?

Clinical expert statement lenalidomide for previously untreated multiple myeloma [ID474] 4 of 11
10. How is the condition
currently treated in the NHS?
Are any clinical guidelines used in the treatment of the condition, and if so, which?
Is the pathway of care well defined? Does it vary or are there differences of opinion between professionals across the NHS? (Please state if your experience is from outside England.)
What impact would the technology have on the current pathway of care?
11. Will the technology be
used (or is it already used) in
the same way as current care
in NHS clinical practice?
Clinical expert statement lenalidomide for previously untreated multiple myeloma [ID474] 5 of 11
How does healthcare resource use differ between the technology and current care?
In what clinical setting should the technology be used? (For example, primary or secondary care, specialist clinics.)
What investment is needed to introduce the technology? (For example, for facilities, equipment, or training.)
12. Do you expect the
technology to provide clinically
meaningful benefits compared
with current care?
Do you expect the technology to increase length of life more than current care?
Clinical expert statement lenalidomide for previously untreated multiple myeloma [ID474] 6 of 11
Do you expect the technology to increase health-related quality of life more than current care?
13. Are there any groups of
people for whom the
technology would be more or
less effective (or appropriate)
than the general population?
The use of the technology
14. Will the technology be
easier or more difficult to use
for patients or healthcare
professionals than current
care? Are there any practical
implications for its use (for
example, any concomitant
treatments needed, additional
clinical requirements, factors
Clinical expert statement lenalidomide for previously untreated multiple myeloma [ID474] 7 of 11
affecting patient acceptability
or ease of use or additional
tests or monitoring needed.)
15. Will any rules (informal or
formal) be used to start or stop
treatment with the technology?
Do these include any
additional testing?
16. Do you consider that the
use of the technology will
result in any substantial health-
related benefits that are
unlikely to be included in the
quality-adjusted life year
(QALY) calculation?
17. Do you consider the
technology to be innovative in
its potential to make a
significant and substantial
Clinical expert statement lenalidomide for previously untreated multiple myeloma [ID474] 8 of 11
impact on health-related
benefits and how might it
improve the way that current
need is met?
Is the technology a ‘step-change’ in the management of the condition?
Does the use of the technology address any particular unmet need of the patient population?
18. How do any side effects or
adverse effects of the
technology affect the
management of the condition
and the patient’s quality of life?
Sources of evidence
Clinical expert statement lenalidomide for previously untreated multiple myeloma [ID474] 9 of 11
19. Do the clinical trials on the
technology reflect current UK
clinical practice?
If not, how could the results be extrapolated to the UK setting?
What, in your view, are the most important outcomes, and were they measured in the trials?
If surrogate outcome measures were used, do they adequately predict long-term clinical outcomes?
Are there any adverse effects that were not apparent in clinical trials but have come to light subsequently?
20. Are you aware of any
relevant evidence that might

Clinical expert statement lenalidomide for previously untreated multiple myeloma [ID474] 10 of 11
not be found by a systematic
review of the trial evidence?
21. Are you aware of any new
evidence for the comparator
treatment(s) since the
publication of NICE technology
appraisal guidance [TAXXX]?
22. How do data on real-world
experience compare with the
trial data?
Equality
23a. Are there any potential
equality issues that should be
taken into account when
considering this treatment?
Clinical expert statement lenalidomide for previously untreated multiple myeloma [ID474] 11 of 11
23b. Consider whether these
issues are different from issues
with current care and why.
Key messages
25. In up to 5 bullet points, please summarise the key messages of your statement.
Thank you for your time. Please log in to your NICE Docs account to upload your completed statement, declaration of interest form and consent form.

Confidential – do not copy or circulate
Version 1 1
CONFIDENTIAL UNTIL PUBLISHED
Evidence Review Group Report commissioned by the
NIHR HTA Programme on behalf of NICE
Lenalidomide in combination with dexamethasone for previously
untreated multiple myeloma
Produced by Southampton Health Technology Assessments Centre (SHTAC)
Authors Dr Keith Cooper, Senior Research Fellow (Health Economics)
Ms Neelam Kalita, Research Fellow (Health Economics)
Ms Petra Harris, Research Fellow
Dr Wendy Gaisford, Research Fellow
Dr Jonathan Shepherd, Principal Research Fellow
Correspondence to Dr Jonathan Shepherd
Southampton Health Technology Assessments Centre (SHTAC)
Wessex Institute
Alpha House
Enterprise Road, University of Southampton Science Park
Southampton SO16 7NS
www.southampton.ac.uk/shtac
Date completed 22nd December 2017
Copyright belongs to Southampton University
Confidential – do not copy or circulate
Version 1 2
Source of funding: This report was commissioned by the NIHR HTA Programme as project
number 11/06/01
Acknowledgements
We would like to thank the following for providing clinical advice and comments on the draft
report: Dr Jenny Bird, Consultant Haematologist, University Hospital Bristol NHS Foundation
Trust; Dr Matthew Jenner, Consultant Haematologist, University Hospital Southampton NHS
Foundation Trust; Professor Kwee Yong, Professor of Clinical Haematology, University College
Hospital London Hospitals NHS Foundation Trust. We would also like to thank Karen Welch,
Information Scientist, SHTAC, for appraising the literature search strategies in the company’s
submission and Jo Picot, Senior Research Fellow, SHTAC, for acting as internal editor for the
ERG report.
Copyright is retained by Celgene for tables 5, 6, 7, 11, 12, 13, 14, 15, 16, 17, 18, 20, 21, 22, 23,
24, 25, 26, 27, 29, 34, 36 and figures 1, 2, 3, 4, 5, 6, 7, 8, 9, 10, 11, 12, 13, 14, 15, 16, 17, 18
and text referenced on page 10, 12, 22, 23, 43, 72, 80, 82.
Declared competing interests of the authors
None from the authors. Dr Jenner has received honoraria to given educational presentations
about myeloma within licensed indications, particularly high risk transplant eligible myeloma
from Janssen (manufacturer of bortezomib) and has received sponsorship to attend American
Society of Hematology Annual Meeting December 2017, Atlanta USA from Janssen. Dr Jenner
has also received honoraria to chair educational meeting about myeloma within current licensed
indications from Celgene (manufacturer of lenalidomide). Dr Jenner is a co-chief investigator on
MUK nine b clinical trial evaluating lenalidomide, bortezomib and daratumumab combinations in
newly diagnosed high risk transplant eligible myeloma and is a member of the Myeloma XI
Trials Management committee which includes lenalidomide and bortezomib in newly diagnosed
myeloma (all ages). Professor Yong has received research funding from Celgene to carry out a
survivorship and exercise study for myeloma patients (study now closed). Dr Bird has chaired
an educational meeting in Bristol on behalf of Celgene in October 2016.
Rider on responsibility for report
The views expressed in this report are those of the authors and not necessarily those of the
NIHR HTA Programme. Any errors are the responsibility of the authors.

Confidential – do not copy or circulate
Version 1 3
This report should be referenced as follows:
Cooper, K., Kalita, N., Harris, P., Gaisford, W., Shepherd, J. Lenalidomide in combination with
dexamethasone for previously untreated multiple myeloma: A Single Technology Appraisal.
Southampton Health Technology Assessments Centre (SHTAC), 2017.
Contributions of authors
Keith Cooper critically appraised the health economic review, critically appraised the economic
evaluation, and drafted the report; Neelam Kalita critically appraised the health economic
review, critically appraised the economic evaluation, and drafted the report; Petra Harris
critically appraised the clinical effectiveness review and drafted the report; Wendy Gaisford
critically appraised the clinical effectiveness review and drafted the report; Jonathan Shepherd
critically appraised the clinical effectiveness review, drafted the report, project managed the
assessment and is the project guarantor.
Word count:
40,922
********************************************
Confidential – do not copy or circulate
Version 1 4
TABLE OF CONTENTS
1 Introduction to ERG Report ................................................................................................19 2 BACKGROUND .................................................................................................................19
2.1 Critique of company’s description of underlying health problem ..................................19 2.2 Critique of company’s overview of current service provision .......................................20 2.3 Critique of company’s definition of decision problem ...................................................21
3 CLINICAL EFFECTIVENESS .............................................................................................22 3.1 Critique of company’s approach to systematic review .................................................22 3.2 Summary statement of company’s approach ..............................................................49 3.3 Summary of submitted evidence .................................................................................50
4 COST EFFECTIVENESS ...................................................................................................72 4.1 Overview of company’s economic evaluation ..............................................................72 4.2 Company’s review of published economic evaluations ................................................73 4.3 Critical appraisal of the company’s submitted economic evaluation ............................76 4.4 Additional work undertaken by the ERG .................................................................... 104 4.5 Conclusions of cost effectiveness ............................................................................. 114
5 End of life ......................................................................................................................... 116 6 Innovation ........................................................................................................................ 116 7 DISCUSSION .................................................................................................................. 117
7.1 Summary of clinical effectiveness issues .................................................................. 117 7.2 Summary of cost effectiveness issues ...................................................................... 118
8 REFERENCES ................................................................................................................ 119 9 APPENDICES .................................................................................................................. 125
LIST OF TABLES
Table 1 Base case results (with PAS) – vs MPT .......................................................................15 Table 2 Base case results (with PAS) – vs VMP in the subgroup of patients who are unable to tolerate or have contraindications to thalidomide .......................................................................15 Table 3 ERG base case analysis results for Rd vs VMP (version 1) ..........................................18 Table 4 ERG base case analysis results for Rd vs VMP (version 2) ..........................................18 Table 5 Current clinical pathway of care for patients with multiple myeloma in England (from CS Table 3).....................................................................................................................................20 Table 6 MM-020 study drug, dose and duration ........................................................................27 Table 7 Baseline characteristics of patients in MM-020 .............................................................28 Table 8 Company and ERG assessment of the MM-020 trial quality .........................................30 Table 9 ERG quality assessment of NMA .................................................................................40 Table 10 Quality assessment - Centre for reviews and dissemination criteria (CRD) of CS review .......................................................................................................................................49 Table 11 Summary of PFS analyses presented in the CS (ITT population) for Rd vs MPT .......50 Table 12 Results of fixed effects constant HRs NMA of PFS (with EMA-censored MM-020 data) .................................................................................................................................................55 Table 13 Results of fixed effects constant HRs NMA of OS ......................................................57 Table 14 Myeloma response rates, 21st January 2016 data cut-off ............................................59 Table 15 PFS2 and second-line therapy, 21st January 2016 data cut-off ...................................61 Table 16 PFS by age and ISS stage for MM-020, Investigator assessment –21st January 2016 data cut-off. ...............................................................................................................................65 Table 17 TEAEs that occurred in ≥ 10% of patients of any grade listed in descending order of frequency of system organ classes for the Rd group and corresponding Grade 3/4 TEAEs (safety population) ....................................................................................................................68

Confidential – do not copy or circulate
Version 1 5
Table 18 Summary of the included studies in the cost-effectiveness review ..............................75 Table 19 NICE reference case requirements ............................................................................76 Table 20 MSM probability transition matrices – 28-day probabilities (CS Table 27) ..................80 Table 21 Mixed effects regression model results of utility for Rd and MPT (from CS Table 30) .85 Table 22 VMP ‘progression-free’ utility relative to baseline over time ........................................86 Table 23 Intervention and comparator regimens (CS Table 26) ...............................................88 Table 24 First-line drug costs (CS Table 35) .............................................................................89 Table 25 Proportion of patients on subsequent therapy and total costs (CS Table 46) ..............90 Table 26 Post-progression treatment durations (CS Table 45) ..................................................91 Table 27 Subsequent treatment time inputs (CS Table 43) .......................................................91 Table 28 Health state costs .......................................................................................................92 Table 29 Comparison of the predicted clinical model outcomes against the observed outcomes .................................................................................................................................................95 Table 30 Comparison of the model findings with the existing literature .....................................96 Table 31 Results of the base case results for Rd versus MPT ..................................................97 Table 32 Results of the base case results for Rd versus VMP ..................................................97 Table 33 Parameters included for DSA .....................................................................................98 Table 34 List of parameters and associated distributions included in the PSA (CS Table 47) . 100 Table 35 Results from the PSA for Rd versus VMP ................................................................ 100 Table 36 Summary of the scenario analyses (CS Table 52) .................................................... 101 Table 37 Additional analyses conducted by the ERG .............................................................. 105 Table 38 ERG Scenario 1 cost-effectiveness results ............................................................... 107 Table 39 ERG scenario 2 Cost effectiveness results ............................................................... 107 Table 40: ERG Scenario 3(i) cost-effectiveness results ........................................................... 108 Table 41 ERG scenario 3(ii) cost effectiveness results. ........................................................... 109 Table 42 Patient combination for subsequent treatments with Rd and VMP patients not receiving thalidomide in second line and third line ................................................................... 109 Table 43 ERG Scenario 4.i Cost effectiveness results ............................................................ 110 Table 44 Patient combination for subsequent treatments in Rd arm not receiving thalidomide and lenalidomide and those in the VMP arm not receiving thalidomide in second line and third line .......................................................................................................................................... 110 Table 45 ERG scenario 4.ii: Cost effectiveness results .......................................................... 111 Table 46 ERG Scenario 4 (iii) cost effectiveness results ......................................................... 111 Table 47 ERG Scenario 5 cost effectiveness results ............................................................... 112 Table 48: ERG base case cost-effectiveness results (Version 1) ............................................ 112 Table 49 ERG Base case Results from the PSA for Rd versus VMP (Version 1) .................... 112 Table 50 ERG base case cost-effectiveness results (Version 2) ............................................. 113 Table 51 ERG base case Results from the PSA for Rd versus VMP (Version 2) ..................... 114
LIST OF FIGURES
Figure 1 Network of trials in the NMA (from CS Figure 14) ........................................................43 Figure 2 Kaplan–Meier plots of PFS - IRAC review (IMWG criteria), ITT population (FDA censoring criteria). 24th May 2013 data cut-off. .........................................................................52 Figure 3 Kaplan–Meier plots of PFS - Investigator assessment (IMWG criteria), ITT population (FDA censoring criteria). 21st January 2016 data cut-off. ...........................................................52 Figure 4 Kaplan–Meier plots of PFS - IRAC review (IMWG criteria), ITT population (EMA censoring criteria). 24th May 2013 data cut-off. ..........................................................................53 Figure 5 Kaplan–Meier plots of PFS - Investigator review (IMWG criteria), ITT population (FDA censoring criteria). 21st January 2016 data cut-off. ...................................................................54
Confidential – do not copy or circulate
Version 1 6
Figure 6 Results of fixed-effects second order fractional polynomial model NMA of PFS with EMA-censored MM-020 data; hazard ratios over time versus MPT ...........................................56 Figure 7 Kaplan–Meier plots of final OS, ITT population. 21st January 2016 data cut-off. ..........56 Figure 8 Results of fixed-effects second order fractional polynomial model NMA of OS; HRs over time versus MPT ...............................................................................................................58 Figure 9 Kaplan–Meier plots of TTF - Investigator assessment, ITT population. 21st January 2016 data cut-off. ......................................................................................................................59 Figure 10 Cross-sectional analysis of mean EQ-5D change from baseline per assessment visit and at study discontinuation in the Rd and MPT groups for MM-020 (CS Fig 11). .....................63 Figure 11 Linear mixed-model repeated-measures analysis of mean change from baseline at 18 months in the Rd and MPT groups for MM-020 (CS Fig 12). .....................................................64 Figure 12 Hazard ratio by subgroup for PFS between the Rd and MPT treatment arm (ITT Population), Investigator assessment, 21st January 2016 data cut-off .......................................66 Figure 13 Markov model schematic (CS Figure 17) ..................................................................78 Figure 14 Kaplan-Meier plots of survival compared with modelled survival (CS Figure 19) .......81 Figure 15 Time to treatment failure curve fits and KM data (CS Figure 22) ...............................83 Figure 16 Results of DSA for Rd versus VMP (CS Figure 26) ...................................................99 Figure 17 Cost-effectiveness acceptability curve (reproduced from CS Figure 25) .................. 101 Figure 18 Cost effectiveness acceptability curves for the ERG Base case (Version 1) ............ 113 Figure 19 Cost effectiveness acceptability curves for the ERG base case (Version 2) ............ 114
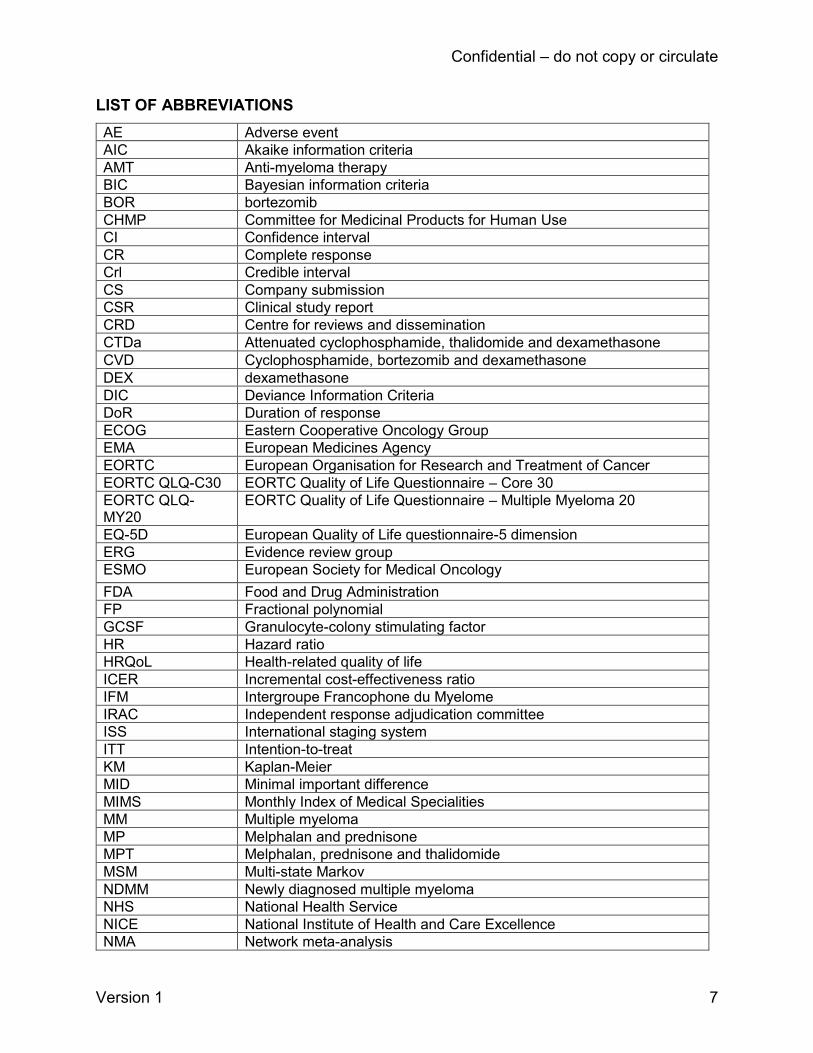
Confidential – do not copy or circulate
Version 1 7
LIST OF ABBREVIATIONS
AE Adverse event
AIC Akaike information criteria
AMT Anti-myeloma therapy
BIC Bayesian information criteria
BOR bortezomib
CHMP Committee for Medicinal Products for Human Use
CI Confidence interval
CR Complete response
Crl Credible interval
CS Company submission
CSR Clinical study report
CRD Centre for reviews and dissemination
CTDa Attenuated cyclophosphamide, thalidomide and dexamethasone
CVD Cyclophosphamide, bortezomib and dexamethasone
DEX dexamethasone
DIC Deviance Information Criteria
DoR Duration of response
ECOG Eastern Cooperative Oncology Group
EMA European Medicines Agency
EORTC European Organisation for Research and Treatment of Cancer
EORTC QLQ-C30 EORTC Quality of Life Questionnaire – Core 30
EORTC QLQ-MY20
EORTC Quality of Life Questionnaire – Multiple Myeloma 20
EQ-5D European Quality of Life questionnaire-5 dimension
ERG Evidence review group
ESMO European Society for Medical Oncology
FDA Food and Drug Administration
FP Fractional polynomial
GCSF Granulocyte-colony stimulating factor
HR Hazard ratio
HRQoL Health-related quality of life
ICER Incremental cost-effectiveness ratio
IFM Intergroupe Francophone du Myelome
IRAC Independent response adjudication committee
ISS International staging system
ITT Intention-to-treat
KM Kaplan-Meier
MID Minimal important difference
MIMS Monthly Index of Medical Specialities
MM Multiple myeloma
MP Melphalan and prednisone
MPT Melphalan, prednisone and thalidomide
MSM Multi-state Markov
NDMM Newly diagnosed multiple myeloma
NHS National Health Service
NICE National Institute of Health and Care Excellence
NMA Network meta-analysis
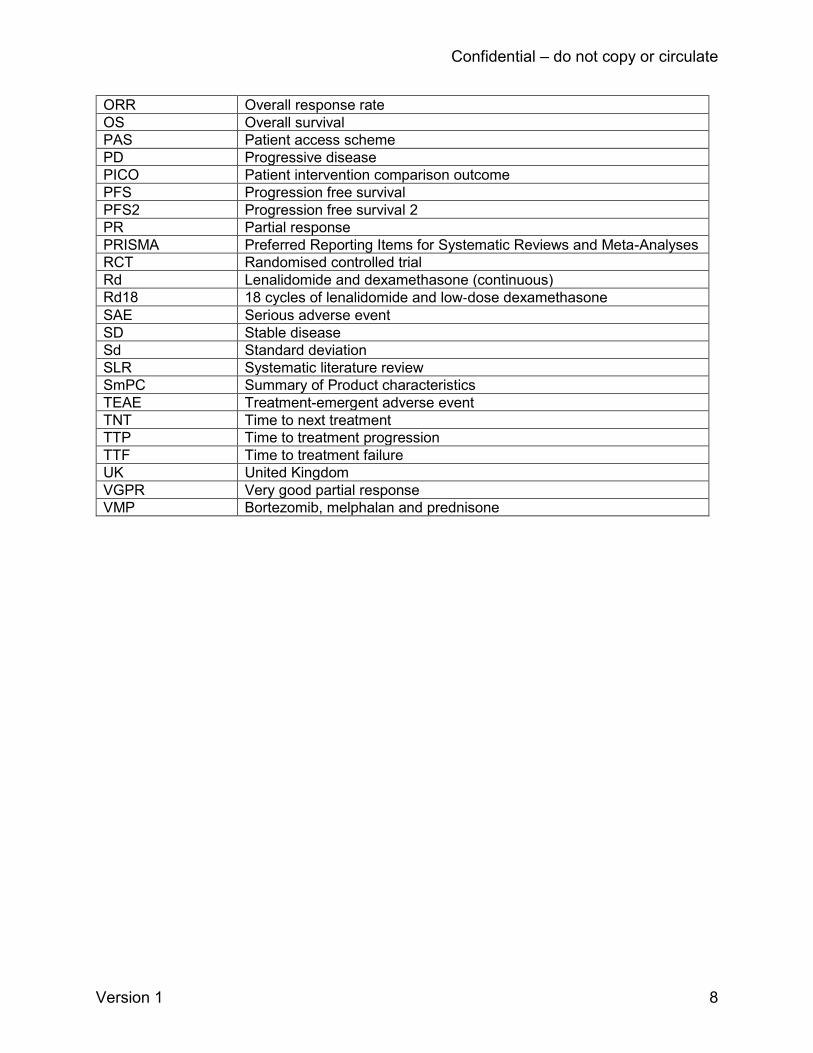
Confidential – do not copy or circulate
Version 1 8
ORR Overall response rate
OS Overall survival
PAS Patient access scheme
PD Progressive disease
PICO Patient intervention comparison outcome
PFS Progression free survival
PFS2 Progression free survival 2
PR Partial response
PRISMA Preferred Reporting Items for Systematic Reviews and Meta-Analyses
RCT Randomised controlled trial
Rd Lenalidomide and dexamethasone (continuous)
Rd18 18 cycles of lenalidomide and low‐dose dexamethasone
SAE Serious adverse event
SD Stable disease
Sd Standard deviation
SLR Systematic literature review
SmPC Summary of Product characteristics
TEAE Treatment-emergent adverse event
TNT Time to next treatment
TTP Time to treatment progression
TTF Time to treatment failure
UK United Kingdom
VGPR Very good partial response
VMP Bortezomib, melphalan and prednisone
Confidential – do not copy or circulate
Version 1 9
SUMMARY
The company submission (CS) presents evidence of the clinical effectiveness and cost
effectiveness of lenalidomide (REVLIMID®) in combination with low‐dose dexamethasone (Rd),
for the first line treatment of patients with newly diagnosed multiple myeloma or untreated
multiple myeloma. Lenalidomide is an oral therapy that provides an alternative treatment to
current intravenous and subcutaneous therapies. Lenalidomide is a synthetic derivative of
thalidomide given as a two drug combination with low-dose dexamethasone (Rd). The
recommended starting dose is 25 mg/day to be taken orally for 21 days followed by a seven day
rest period (28 day cycle), with treatment continued until disease progression or intolerance
occurs.
The patient population in the CS is adults with previously untreated multiple myeloma for whom
stem-cell transplantation is considered inappropriate. The CS reports a comparison of the
effects of Rd versus melphalan, prednisone and thalidomide (MPT) and for people who are
unable to tolerate, or have contraindications to thalidomide, Rd versus bortezomib, melphalan
and prednisone (VMP). The CS does not include an alternative thalidomide combination therapy
comprising attenuated cyclophosphamide, thalidomide and dexamethasone (CTDa) as it is not
licensed in the UK. Expert advice to the ERG is that CTDa is widely used in the UK despite not
being licensed and it can be considered comparable to MPT in effectiveness (both regimens
contain thalidomide, a steroid and an oral chemotherapy agent). Expert clinical advice to the
ERG also highlighted that other bortezomib regimens are used (less commonly) for first line
treatment, e.g. bortezomib with cyclophosphamide, and dexamethasone (CVD). This regimen is
not licensed for first line use in the UK and there does not appear to be much clinical trial
evidence available to facilitate a comparison with lenalidomide.
Summary of submitted clinical effectiveness evidence Systematic literature searches were performed to identify relevant clinical effectiveness studies.
A total of four randomised controlled trials (RCTs) were included in the review, one RCT
evaluated lenalidomide (termed MM-020 / FIRST) whilst the other three evaluated comparator
treatments for inclusion in a network meta-analysis (NMA). MM-020 was an open-label three
arm phase III RCT comparing the efficacy and safety of Rd, delivered either over 18 cycles (18
x 28 days: Rd18; n=541 patients) or continuously (for 21 out of 28 days) until disease
progression (Rd; n=535) to MPT over 18 cycles (n=547). The trial was used to support the
Confidential – do not copy or circulate
Version 1 10
marketing authorisation for lenalidomide for this indication and is a key source of evidence for
the company’s cost-effectiveness analysis.
The trial was carried out in 151 centres across the United Kingdom (n=72 UK patients), Europe,
North and South America and Asia. The primary outcome measure was progression free
survival (PFS). Secondary outcome measures included: overall survival (OS); time to treatment
failure (TTF); time to progression (TTP); time to next treatment (TNT); tumour response
(measured as complete response (CR); very good partial response (VGPR) or partial response
(PR)); duration of response (DoR); time to second line anti-myeloma therapy (AMT), health
related quality of life (HRQoL); adverse events (AEs) and PFS2. PFS2 was defined as “Time
from randomisation to second objective progressed disease, start of third-line therapy or death
from any cause, whichever occurred first” (CS page 41). Patient cross-over between trial arms
was not permitted during the trial, however, upon disease progression patients in all arms
received subsequent lines of treatment with either the same or an alternative anti-myeloma
treatment.
Outcome data were collected at two time points; the 24th May 2013 (a planned final analysis of
PFS and a planned interim analysis of OS) and the 21st Jan 2016 (planned final analysis of OS,
and updated analysis of PFS). PFS, OS, TTF, HRQoL and AEs, obtained at the 21st Jan 2016
data cut-off, were used in the company’s cost-effectiveness analysis.
Results of the MM-020 trial
We focus on the results of the continuous Rd arm of the trial compared to the MPT arm because
the company’s main analysis is for continuous (rather than fixed duration) lenalidomide
compared to MPT or VMP. Final PFS obtained using the Independent Response Adjudication
Committee (IRAC) review and the Food and Drugs Administration (FDA) censoring rules at the
24th May 2013 data cut-off showed a 28% reduction in the risk of disease progression or death
with continuous Rd compared with MPT given for 72 weeks (Hazard ratio (HR) 0.72; 95%
confidence interval (CI) 0.61–0.85; p=0.00006) with a difference of 4.3 months in median PFS
between the groups (25.5 months Rd, 21.2 months MPT). At the 21st Jan 2016 data cut-off, Rd
demonstrated a significant improvement of 10 months for median OS compared with MPT (HR
0.78; 95% CI 0.67–0.92; p=0.002).
Confidential – do not copy or circulate
Version 1 11
The CS reports PFS and OS results for a range of subgroups including baseline International
Staging System (ISS) disease stage, geographical location, sex and parameters of prognostic
significance (e.g. baseline cytogenetic risk categories and baseline renal function). These pre-
planned analyses, presented for the intention to treat (ITT) population at the 21st January 2016
data cut-off, demonstrated a PFS benefit in favour of Rd versus MPT in most subgroups.
The majority of patients (>99%) had at least one treatment-emergent adverse event (TEAE)
regardless of treatment arm, occurring shortly after treatment initiation and decreasing in
frequency over time. In the Rd treatment group, the most common TEAEs at any grade
experienced in ≥10% of patients were diarrhoea (47.2%), anaemia (45.7%), constipation
(44.2%) and peripheral oedema (41.2%). In the MPT group, AEs with the highest proportion of
patients were recorded as neutropenia (60.6%), constipation (52.7%), anaemia (42.3%) and
peripheral oedema (39.7%). Psychiatric disorders (described as including insomnia and
depression) were reported to impact on nearly half of the patients in the Rd group compared to
approximately a third for MPT (49.6% Rd; 30.9% MPT).
Grade 3-4 AEs affecting the greatest proportion of patients in the Rd group included anaemia
(18.8%), neutropenia (29.5%) and vascular disorders (10.9%). In the MPT group common
individual grade 3-4 AEs experienced by patients included neutropenia (44.9%) anaemia
(18.9%) and thrombocytopenia (11.1%). The CS reports that Grade 3 or 4 AEs with Rd occurred
slightly less frequently than with MPT (86.3% vs 88.7% of patients respectively) despite the
longer duration of treatment.
Treatment discontinuations occurred largely as a result of disease progression, rather than as a
result of TEAEs from Rd or MPT. Discontinuations due to TEAEs of lenalidomide or thalidomide
occurred in over 25% of patients in both treatment groups (25.6% Rd and 27.0% MPT). Dose
interruptions, however, were higher across treatment groups (68.0% Rd and 71.9% MPT)
compared to dose reductions (41.4% Rd and 47.0% MPT). In summary, there appears to be no
major safety concerns about treatment with Rd.
HRQoL data were collected using three questionnaires, the generic 5-dimension European
Quality of Life questionnaire (EQ-5D) and six pre-selected and clinically relevant HRQoL
domains from the European Organisation for Research and the Treatment of Cancer Quality of
Life Questionnaire–Myeloma 20 (EORTC QLQ-MY20) and the general oncology-related
Confidential – do not copy or circulate
Version 1 12
EORTC Quality of Life Questionnaire–Core 30 (EORTC QLQ-C30). Patients completed
questionnaires at several time points, at baseline and at the end of cycles 1, 3, 6, 12 and 18. As
the regimens were identical over the 18-month measurement period, HRQoL data for the two
Rd arms were combined into one overall group, post-hoc, for presentation of results. The ERG
considers this to be acceptable in this instance.
Data show improved HRQoL with a number of statistically significant and clinically meaningful
changes from baseline for both Rd and MPT. There were few statistically significant differences
in HRQoL between the trial arms. Rd demonstrated statistical superiority to MPT in terms of
impact of side effects on HRQoL. The ERG note that efficacy endpoint analyses were carried
out using the ITT population, however it was not stated how missing response data or missing
HRQoL data were estimated. This raises uncertainty in the interpretation of the HRQoL results.
Network meta-analysis (NMA) No direct comparison of lenalidomide with bortezomib was identified in the systematic review;
therefore a network meta-analysis (NMA) was conducted to compare the two drugs indirectly.
The process for searching and screening studies for inclusion in the NMA was the same as
used to identify studies of the clinical effectiveness of lenalidomide. Four RCTs were included
in the network. One trial each for lenalidomide (MM-020) and bortezomib (VISTA) were
included, whilst two trials of MPT (versus MP) were included. The company used two different
statistical methods to conduct the NMA. One was a Bayesian NMA using constant hazard ratios
(assuming proportional hazards). The other was a Bayesian time-varying hazard ratio NMA
model using fractional polynomials. Both of these were conducted as “it was not known in
advance which would provide the best combination of fit and parsimony” (CS page 67). The
company subsequently chose the constant hazard ratios NMA as their primary (base case)
analysis. The ERG agrees with this decision.
The CS assessed the methodological quality of the four RCTs included in NMA, using the
Cochrane risk of bias criteria. Overall the studies appear to have been well conducted and the
ERG mostly agreed with the company, however, for a number of domains the ERG’s judgement
was that the risk of bias was unclear due to limitations in study reporting.
Confidential – do not copy or circulate
Version 1 13
Results from the fixed effect NMA showed that patients treated with Rd had a lower risk of
disease progression or death (PFS) compared with those who received MPT (HR 0.74; 95%
(credible interval (CrI) 0.65 to 0.85), or VMP (HR 0.74; 95% CrI 0.52 to 1.05). The CS also
presents PFS time-varying HRs under the best-fitting second order fractional polynomial NMA
model. Results from this model indicate that the HR of Rd relative to MPT decreases over the
course of follow-up (described in the CS as being statistically important (significant) at
approximately 18 months). The credible intervals for the HR of VMP relative to MPT are wide
and therefore very uncertain, particularly after 24 months.
Summary of submitted cost effectiveness evidence
The CS includes:
• A review of published economic evaluations of immunomodulatory drugs for adults with
untreated newly diagnosed multiple myeloma who were ineligible for stem cell
transplantation and/or older than 65 years of age.
• A report of an economic evaluation undertaken for the NICE STA process. The cost-
effectiveness of Rd is compared with MPT and VMP.
A systematic search was conducted by the company to identify economic evaluations in patients
with untreated newly diagnosed multiple myeloma who are ineligible for stem cell
transplantation. Six publications corresponding to five economic studies were identified for full
review. One study by Usmani et al. compared the cost-effectiveness of Rd versus VMP in
transplant ineligible patients with newly diagnosed multiple myeloma from the US payer
perspective. This study is most relevant to this appraisal because it compared lenalidomide with
bortezomib. The study found Rd to be more cost-effective compared to VMP as it was
associated with greater life years and quality adjusted life years (QALYs) with similar overall
costs.
The company constructed a de novo cost-utility model to evaluate the cost-effectiveness of Rd
with MPT and VMP. The model has cycles lasting four weeks and a lifetime horizon of 25 years.
Costs and health benefits are discounted at 3.5% per annum, with a half-cycle correction
applied. The model has three health states: progression-free, progressive disease and death.
The economic model uses clinical effectiveness evidence from the MM-020 trial to compare Rd
and MPT. The NMA provides clinical effectiveness evidence for the comparison of Rd and VMP.
The model uses the Kaplan-Meier data for PFS and OS from the trial for the first 92 weeks and
Confidential – do not copy or circulate
Version 1 14
uses transition probabilities between health states thereafter. VMP was incorporated by
applying a relative treatment effect from the NMA to the PFS and OS predictions generated for
the multi-state Markov model for MPT. The mean hazard ratios for PFS and OS for VMP vs.
MPT were 1.00 and 1.11 respectively.
Utility estimates were taken from the company’s MM-020 trial for Rd and MPT, in which quality
of life data from the EQ-5D questionnaire were collected. For VMP, European Organisation for
Research and Treatment of Cancer (EORTC) Quality of Life Questionnaire–Core 30 (QLQ-C30)
data from the VISTA trial (which compared VMP with MP) were mapped to EQ-5D using a
published algorithm.
The average cost of a course of treatment of Rd is £******* using the list price of lenalidomide.
Lenalidomide is offered with a patient access scheme (PAS), whereby the company proposes to
pay the cost of lenalidomide for any treatment beyond 26 cycles. They propose an adaptation to
this where they will pay the cost of lenalidomide after ** cycles (conditional on a positive
recommendation from NICE). The cost effectiveness results reported in the CS (and in this ERG
report) are for the ** cycle cap, and the results based on the 26 cycle cap are reported in an
appendix. The average cost of Rd including the PAS is £******. Thalidomide is an oral treatment
taken for a maximum of 12 cycles of 42 days (72 weeks). Bortezomib is administered
subcutaneously in the outpatient setting for nine cycles of 42 days each (54 weeks). The
dosages and cost of comparator treatments are taken from the Monthly Index of Medical
Specialities (MIMS). In the company’s base case, dosing data was taken directly from MM-020
for Rd and MPT. Subsequent treatment costs are included using the distribution of subsequent
treatments as seen in the MM-020 and VISTA trials. Health state costs were derived by
estimating health care resources using a survey of seven clinicians. Unit costs for the resources
were obtained from the 2015-16 National Reference Costs.
The results of the economic model are presented as incremental cost effectiveness ratios
(ICERs), measured as the incremental cost per QALY. For the base case the incremental cost
per QALY gained is £****** for Rd compared to MPT and £****** per QALY for Rd compared to
VMP (Table 1 and Table 2). In the CS, the company acknowledges that Rd is not cost-effective
compared to MPT and therefore they suggest the NICE appraisal committee consider the
comparison between Rd and VMP for patients unable to tolerate or with contraindications to
thalidomide.

Confidential – do not copy or circulate
Version 1 15
Table 1 Base case results (with PAS) – vs MPT Technologies Total
costs Total LYs
Total QALYs
Inc. costs
Inc. LYs
Inc. QALYs
ICER (per QALY)
MPT £****** **** ****
Rd £****** **** **** £****** **** **** £******
Table 2 Base case results (with PAS) – vs VMP in the subgroup of patients who are unable to tolerate or have contraindications to thalidomide
Technologies Total
costs
Total
LYs
Total
QALYs
Inc.
costs
Inc.
LYs
Inc.
QALYs
ICER (per
QALY)
VMP £****** **** ****
Rd £****** **** **** £****** **** **** £******
In probabilistic sensitivity analyses, the probability of Rd being cost-effective compared to VMP
is *** and *** at a willingness to pay threshold of £20,000 and £30,000 per QALY respectively.
The company conducted deterministic sensitivity analyses on model parameters. The model
results for Rd compared to VMP were most sensitive to changes in the hazard ratio for OS for
VMP vs. MPT. The company conducted a range of scenario analyses to assess structural and
methodological uncertainties. In none of these analyses did the ICER increase beyond £******
per QALY.
Commentary on the robustness of submitted evidence Strengths
• The literature searches conducted by the company were considered by the ERG to be
appropriate and sufficiently comprehensive to have identified all the relevant clinical
effectiveness evidence. The company’s systematic review methods were also
considered appropriate.
• The clinical effectiveness evidence for lenalidomide is based on a large international
multi-centre RCT, the MM-020 trial (n=1623 patients randomised). The trial included a
range of relevant outcome measures, including survival (e.g. OS, PFS), tumour
response, HRQoL (including the EQ-5D as well as the cancer-specific instruments) and
adverse events. The trial results can be considered mature with a median follow-up of 67
months at the most recent data cut-off (January 2016).
• The trial was judged by the company and the ERG to be of good methodological quality.
However, it was open-label which raises the possibility of bias for some outcomes, such
as self-reported HRQoL. The statistical procedures used in the MM-020 trial are clearly
Confidential – do not copy or circulate
Version 1 16
reported in the CS and appropriate for evaluation of a cancer treatment. The randomised
sample size and number of events achieved was adequate for the trial power
calculations; an adequately defined ITT population was used for efficacy analyses.
However, it is unclear how missing response data for HRQoL outcomes were handled.
• The company’s economic model structure adequately represents the clinical pathway for
patients with multiple myeloma.
• The methods used for the economic evaluations are consistent with the NICE reference
case and methodological guidelines.
• A wide range of sensitivity analyses including one way, probabilistic and scenario
analyses were conducted to assess the structural and methodological uncertainties of
the economic model.
Weaknesses and areas of uncertainty
• The NMA which facilitates the indirect comparison of lenalidomide with bortezomib was
conducted using standard methods. However, due to the limited available evidence the
network containing four RCTs is sparse and most of the comparisons are informed by a
single study. The comparator RCTs are of good methodological quality and have been
included in previous NICE appraisals, though for some risk of bias domains the ERG’s
judgement was unclear, due to limitations in study reporting.
• Of the two statistical methods used to conduct the NMA (constant hazard ratios and
fractional polynomials), the results of the fractional polynomial model varied according to
which ‘order’ of model was chosen. There was wide uncertainty around the HRs for VMP
in some of the fractional polynomial models, including the best fitting second-order
model selected by the company. The constant hazard ratio statistical NMA appears to be
the most appropriate model to inform the assessment as the results are associated with
less uncertainty and the assumption of proportional hazards has been statistically
confirmed.
• The CS suggests that the place of lenalidomide in the care pathway for first line
treatment is as an alternative to bortezomib in patients unable to tolerate or
contraindicated to thalidomide. The results of the economic evaluation show that
lenalidomide can be considered cost-effective compared to bortezomib, but not
compared to thalidomide. However, the MM-020 trial only compared lenalidomide with
thalidomide. This raises the question of whether the results of this trial are generalisable

Confidential – do not copy or circulate
Version 1 17
to patients intolerant or contraindicated to thalidomide. However, expert clinical advice to
the ERG suggests that these results would unlikely to be different in such patients.
• There is a considerable amount of uncertainty associated with the prediction of the OS
HR for VMP, which is estimated from the NMA.
• There is uncertainty about the assumptions made about subsequent treatments after
first disease progression, pertaining to the comparison of Rd and VMP. VMP is only
recommended by NICE in patients who are intolerant or contraindicated to thalidomide,
yet in the company’s base case analysis these patients can be treated with thalidomide
as a subsequent treatment.
Summary of additional work undertaken by the ERG
The ERG conducted a series of additional analyses to address the issues surrounding time to
treatment failure, treatment effectiveness of VMP vs MPT, HRQoL estimation, and subsequent
treatment- and administration costs for VMP.
Our base case contains the following elements: changes to assumption relating to time to
treatment failure, HRQoL estimation, subsequent line treatments and VMP administration costs.
There are two versions of the base case model as shown below:
• Version 1: Includes ERG assumptions relating to time to treatment failure, HRQoL
estimation and VMP administration costs.
• Version 2 (exploratory): In addition to the assumptions outlined in Version 1, this version
includes ERG assumptions relating to subsequent treatments. Patients do not receive
thalidomide as a subsequent treatment and those receiving Rd initially would not receive
Rd as a subsequent treatment. This is considered exploratory as although it is informed
by clinical practice considerations it differs from the subsequent treatments given in the
MM-020 trial.
The results of the ERG base case are shown in Table 3 and Table 4. The ERG base case ICER
for Rd compared to VMP in version 1 is £****** per QALY gained which is an increase of £*****
from the company’s base case ICER of £****** per QALY. For the ERG base case exploratory
version 2, the ICER is £****** per QALY which is a decrease of £***** from the company’s base
case ICER.
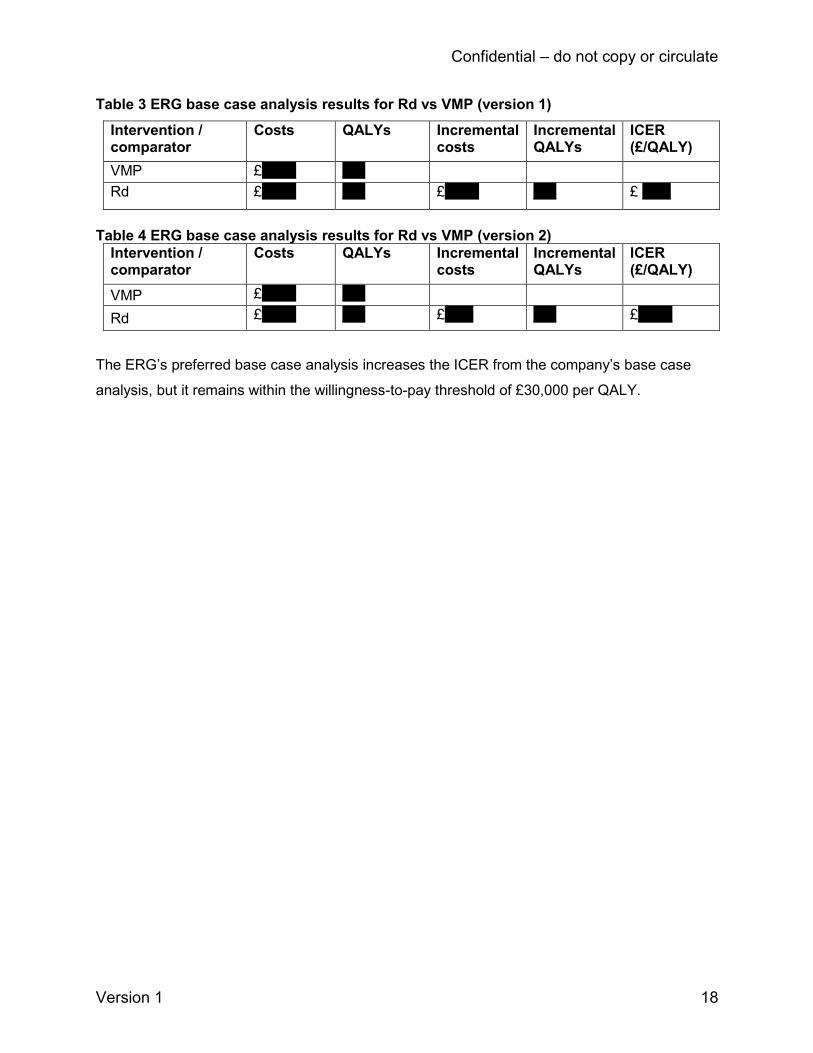
Confidential – do not copy or circulate
Version 1 18
Table 3 ERG base case analysis results for Rd vs VMP (version 1)
Intervention / comparator
Costs QALYs Incremental costs
Incremental QALYs
ICER (£/QALY)
VMP £****** ****
Rd £****** **** £****** **** £ *****
Table 4 ERG base case analysis results for Rd vs VMP (version 2)
Intervention / comparator
Costs QALYs Incremental costs
Incremental QALYs
ICER (£/QALY)
VMP £****** ****
Rd £****** **** £***** **** £******
The ERG’s preferred base case analysis increases the ICER from the company’s base case
analysis, but it remains within the willingness-to-pay threshold of £30,000 per QALY.
Confidential – do not copy or circulate
Version 1 19
1 Introduction to ERG Report This report is a critique of the company’s submission (CS) to NICE from Celgene on the clinical
effectiveness and cost effectiveness of lenalidomide in combination with dexamethasone for
previously untreated multiple myeloma. It identifies the strengths and weakness of the CS.
Clinical experts were consulted to advise the ERG and to help inform this review.
Clarification on some aspects of the CS was requested from the company by the ERG via NICE
on 13/11/17. A response from the company via NICE was received by the ERG on 27/11/17 and
this can be seen in the NICE committee papers for this appraisal.
References to the CS in this report refer specifically to Document B, the main company
evidence submission document. Appendices, where cited, are referred to by the relevant
appendix letter.
2 BACKGROUND
2.1 Critique of company’s description of underlying health problem
The ERG considers that the CS submission provides a clear and accurate overview of the
condition. Multiple myeloma is a rare, incurable form of haematological cancer that arises from
the monoclonal expansion of plasma cells in the bone marrow. These myeloma cells suppress
the development of white and red blood cells that are responsible for fighting infection and
carrying oxygen around the body, as well as platelets required for blood clotting. Multiple
myeloma is primarily a disease of the elderly and at diagnosis, more than two-thirds of patients
are aged ≥ 65 years1 and nearly half are aged ≥ 75 years.2
Patients suffer from a range of debilitating symptoms, including skeletal destruction, leading to
lytic bone lesions, pathological fractures, bone pain, mobility problems and osteoporosis. They
also suffer impaired bone marrow function, recurrent infections, hypercalcaemia, anaemia and
general ill health.3 Myeloma cells secrete large quantities of an abnormal antibody (Ig
paraproteins, termed M protein) which can result in renal insufficiency and kidney failure.3 4 The
CS states that the course of disease is not uniform and varies according to factors such as age,
frailty, renal function, tumour load and genetic factors. Multiple myeloma is characterised by
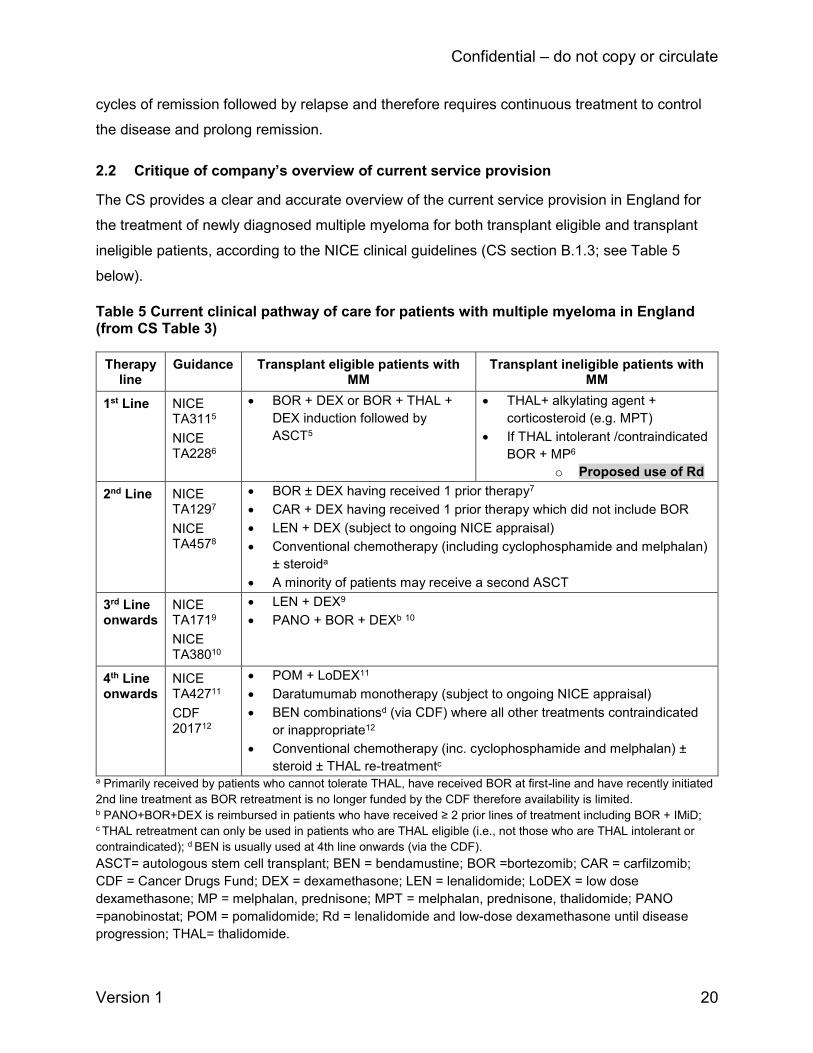
Confidential – do not copy or circulate
Version 1 20
cycles of remission followed by relapse and therefore requires continuous treatment to control
the disease and prolong remission.
2.2 Critique of company’s overview of current service provision
The CS provides a clear and accurate overview of the current service provision in England for
the treatment of newly diagnosed multiple myeloma for both transplant eligible and transplant
ineligible patients, according to the NICE clinical guidelines (CS section B.1.3; see Table 5
below).
Table 5 Current clinical pathway of care for patients with multiple myeloma in England (from CS Table 3)
Therapy line
Guidance Transplant eligible patients with MM
Transplant ineligible patients with MM
1st Line NICE TA3115
NICE TA2286
• BOR + DEX or BOR + THAL +
DEX induction followed by
ASCT5
• THAL+ alkylating agent +
corticosteroid (e.g. MPT)
• If THAL intolerant /contraindicated
BOR + MP6
o Proposed use of Rd
2nd Line NICE TA1297
NICE TA4578
• BOR ± DEX having received 1 prior therapy7
• CAR + DEX having received 1 prior therapy which did not include BOR
• LEN + DEX (subject to ongoing NICE appraisal)
• Conventional chemotherapy (including cyclophosphamide and melphalan)
± steroida
• A minority of patients may receive a second ASCT
3rd Line onwards
NICE TA1719
NICE TA38010
• LEN + DEX9
• PANO + BOR + DEXb 10
4th Line onwards
NICE TA42711
CDF 201712
• POM + LoDEX11
• Daratumumab monotherapy (subject to ongoing NICE appraisal)
• BEN combinationsd (via CDF) where all other treatments contraindicated
or inappropriate12
• Conventional chemotherapy (inc. cyclophosphamide and melphalan) ±
steroid ± THAL re-treatmentc a Primarily received by patients who cannot tolerate THAL, have received BOR at first-line and have recently initiated
2nd line treatment as BOR retreatment is no longer funded by the CDF therefore availability is limited. b PANO+BOR+DEX is reimbursed in patients who have received ≥ 2 prior lines of treatment including BOR + IMiD; c THAL retreatment can only be used in patients who are THAL eligible (i.e., not those who are THAL intolerant or
contraindicated); d BEN is usually used at 4th line onwards (via the CDF).
ASCT= autologous stem cell transplant; BEN = bendamustine; BOR =bortezomib; CAR = carfilzomib;
CDF = Cancer Drugs Fund; DEX = dexamethasone; LEN = lenalidomide; LoDEX = low dose
dexamethasone; MP = melphalan, prednisone; MPT = melphalan, prednisone, thalidomide; PANO
=panobinostat; POM = pomalidomide; Rd = lenalidomide and low-dose dexamethasone until disease
progression; THAL= thalidomide.

Confidential – do not copy or circulate
Version 1 21
The company propose that lenalidomide with dexamethasone would partially displace first line
bortezomib combinations (with an alkylating agent and a corticosteroid) (Table 5). The
population specified in the company’s decision problem is patients with previously untreated
newly diagnosed multiple myeloma who are ineligible for stem cell transplantation. The patient
population matches that specified in the final scope issued by NICE.
Lenalidomide (REVLIMID®), taken orally on days 1 to 21 of a 28 day cycle was granted a
European Medicines Agency (EMA) marketing authorisation on 19th Feb 2015, for use as first
line therapy for newly diagnosed multiple myeloma patients who are ineligible for stem cell
transplantation with exclusion criteria as described in the CS table 6.13 The Summary of Product
characteristics (SmPc), states that the recommended starting dose of lenalidomide is 25 mg
orally, once daily on days 1 to 21 of repeated 28-day cycles.15 Lenalidomide is taken with a
recommended dose of dexamethasone of 40 mg orally once daily on days 1, 8, 15 and 22 of
repeated 28-day cycles. Patients may continue lenalidomide and dexamethasone therapy until
disease progression or intolerance.
2.3 Critique of company’s definition of decision problem
The comparator described in the NICE scope is thalidomide in combination with an alkylating
agent and a corticosteroid. The company chose the combination of melphalan, prednisone and
thalidomide (MPT). An alternative thalidomide combination is attenuated cyclophosphamide,
thalidomide and dexamethasone (CTDa). Expert clinical expert advice to the ERG is that CTDa
is widely used as a first line treatment in the UK. However, the company stated that CTDa is not
considered a relevant thalidomide-based combination as it is unlicensed in the UK. They
therefore used MPT as a suitable proxy. The CS states that MPT was considered by clinical
specialists who took part in NICE TA2286 to be equivalent in terms of toxicity and similar in
terms of cost to CTDa. A meta-analysis published as a conference abstract identified by the
ERG which indirectly compared MPT with CTD reported no difference between the two in PFS
and OS.16 For patients unable to tolerate or who have contraindications to thalidomide, the
comparator in the scope is bortezomib in combination with an alkylating agent and a
corticosteroid. The company included the combination of bortezomib, melphalan and
prednisone (VMP) in the CS. Expert clinical expert advice to the ERG also highlighted that an
additional first line treatment that is used in the UK is cyclophosphamide, bortezomib and
dexamethasone (CVD). However, the ERG notes that although this combination has been used
for first and second line treatment in the UK, it is unlicensed for first line use. Scoping searches
Confidential – do not copy or circulate
Version 1 22
conducted by the ERG did not identify relevant trial evidence for its use in first line treatment
that would allow it to be compared to lenalidomide.
The outcomes stated in the decision problem match with those defined in the NICE scope.
The NICE scope does not mention any patient subgroups to be assessed. The ERG is not
aware of any other relevant subgroups that should have been included. The CS considers
patients who are unable to tolerate, or have contraindications to thalidomide to be a subgroup in
this appraisal stating “The final scope also identifies a subgroup of patients who are unable to
tolerate, or have contraindications to thalidomide. The comparator for this subgroup is VMP”
(CS, p 94). The ERG notes that the scope does not explicitly refer to this as being a patient
subgroup, rather, it notes that bortezomib is the comparator treatment for people who are
unable to tolerate, or have contraindications to thalidomide. Expert advice to the ERG estimates
that around 50% of patients may be intolerant or contraindicated to thalidomide and factors
influencing the choice of treatment vary. Whilst adverse effects of thalidomide can be difficult to
tolerate some patients prefer thalidomide as it is an oral therapy in comparison to bortezomib
which is administered either intravenously or subcutaneously.
The ERG does not consider there are any issues relating to equity or equality.
3 CLINICAL EFFECTIVENESS
3.1 Critique of company’s approach to systematic review
3.1.1 Description of company’s search strategy
The CS reports three systematic searches, all last updated in August 2017:
• Clinical-effectiveness (CS Appendix O)
• Cost-effectiveness (CS Appendix G)
• HRQoL (CS Appendix H)
All three searches were thorough and well documented for transparency. The databases
selected (Medline, Embase, Cochrane Central Register of Controlled Trials) were relevant, the
strategies contained a good range of descriptive subject headings, free text terms, acronyms for
drug administration regimens and application of appropriate search filters. The search syntax
was appropriate and the sets of search terms were correctly combined. It is uncertain why
vincristine appeared as a term in all three searches. Vincristine does not appear in the inclusion

Confidential – do not copy or circulate
Version 1 23
criteria for the systematic review, however the CS states that “eligibility criteria for interventions
and comparators were developed prior to the release of the draft scope and were broader than
required for the decision problem” [Appendix D, p 9]. The inclusion of the term did not detract
from obtaining relevant results. A range of relevant conferences were searched including: the
European Society for Medical Oncology (ESMO), the American Society of Clinical Oncology
(ASCO), the American Society of Haematology (ASH), the European Haematology Association
(EHA), the International Multiple Myeloma Workshop and the International Study for
Pharmacoeconomics (ISPOR). Some hand-searching was undertaken. Further grey literature
manual searching was carried out using the Canadian Agency for Drugs and Technologies
(CADTH), the National Institute for Health and Care Excellence (NICE), National Health Service
Economic Evaluation Database (NHS EED), International Network for Agencies for Health
Technology Assessment (INAHTA) and the National Institute for Health Research (NIHR).
Clinicaltrials.gov was also searched for identification of ongoing studies and the company
specifies in Section B.2.11 of the CS that in respect of “ongoing studies in transplant-ineligible
patients with newly diagnosed multiple myeloma, there are no ongoing company-sponsored
studies from which new evidence will become available in the timeline specified.”
The ERG searched Celgene’s website and the following clinical trial databases: UK Clinical
Trials Gateway (UKCTG) and WHO International Clinical Trials Platform (WHO ICTRP). No
additional RCTs or trials that matched the inclusion criteria were identified. Most results related
to observational studies or to co-administration of drugs which were not specified in the scope
or inclusion criteria. A separate adverse reaction search was not undertaken by the company
as this information was extrapolated from the MM-020 trial. The ERG notes there was not a
separate healthcare resource utilisation search nor were there specific free-text words to
express resource use/utilisation in the cost effectiveness search, although health care costs
were included as a descriptive subject heading.
In summary, the searches were well constructed, up to date and considered to be fit for
purpose.
3.1.2 Statement of the inclusion/exclusion criteria used in the study selection
The company provides the inclusion criteria for their clinical effectiveness systematic review in
CS Appendix D, Table 56.
Confidential – do not copy or circulate
Version 1 24
The ERG’s critique of the eligibility criteria used in the review for the NMA and details about the
studies identified for inclusion are provided in section 3.2.
Population
The inclusion criteria for the population was limited to patients with newly diagnosed or
untreated MM, who are unable to receive stem cell transplantation therapy and patients aged 65
years or over with newly diagnosed or untreated MM. Patients with relapsed or refractory
multiple myeloma and trials with fewer than 10 patients per treatment arm were excluded.
Intervention
The systematic review included the following interventions: lenalidomide, thalidomide,
bortezomib, melphalan plus prednisone, used either as monotherapy or as part of a combination
therapy. Any treatment for newly diagnosed multiple myeloma, other than those stated were
excluded. In what is described as a second phase, the inclusion criteria for the included studies
were subsequently narrowed down to those relevant to the decision problem. The company
states that the eligibility criteria for interventions and comparators were developed prior to
release of the draft scope and were therefore broader than required for the decision problem.
Subsequently, studies had to provide direct or indirect evidence on comparison between
licensed doses of three combinations: Rd, MPT, and VMP.
Comparators
The included comparators were placebo, any of the interventions listed included interventions at
a different dose or duration and any other active drug provided as monotherapy or as part of a
combination therapy.
Outcomes
To be included, trials had to assess at least one of the following outcomes:
• Progression free survival (PFS)
• Overall survival (OS)
• Response
o Complete response
o Very good partial response
o Partial response
o Stable disease
Confidential – do not copy or circulate
Version 1 25
o Progressive disease
o Adverse events
While the company’s study eligibility criteria table (CS Appendix D, Table 56) does not include
(TNT, TTF and HRQoL as outcomes as per the NICE final scope, these outcomes were
included in the CS. TNT was reported in the form of AMT. The specified outcomes are therefore
reflective of the NICE final scope. Overall, the ERG considers the outcomes listed in the
company’s decision problem are appropriate and clinically meaningful.
Design
The company’s inclusion criteria were limited to RCTs published since 1/1/1988 and limited to
those written using the English language. Studies with fewer than 10 patients were excluded.
Setting was not used as an inclusion criterion nor any limits placed on inclusion relating to the
quality of the RCTs, which is appropriate.
Subgroups
Subgroups were clearly stated as age, sex, geographical region and race; baseline International
Staging System (ISS) disease stage and parameters of prognostic significance such as
cytogenic profile, parameters of prognostic significance and biochemical profiles, Creatinine
clearance, baseline albumin and lactate dehydrogenase (Section B.2.7.4). These characteristics
are included as baseline data.
Equality issues
The CS states that no equality issues relating to the use of lenalidomide were identified or are
anticipated.
Searches for the systematic review were conducted in three phases, an original search and two
subsequent updates, detailed in CS Appendix D.1.1.2. The original search was carried out on
March 14th 2016, followed by two further updates (8th Nov 2016 and 8th August 2017). The CS
provides a PRISMA flowchart illustrating the number of records identified and included/excluded
records at each stage of the SLR screening processes (CS Appendix D, Fig 25). Reasons for
exclusion at the full paper stage are provided and references listed in Appendix D (CS Table
58).
Confidential – do not copy or circulate
Version 1 26
Overall, the ERG notes that the systematic review inclusion criteria were broader than the
decision problem and the NICE scope due to the reasons previously stated. Changes made by
the company to the inclusion criteria of included studies during a ‘second phase’ of
inclusion/exclusion screening however, rectified this.
3.1.3 Identified studies
The company’s systematic review included four randomised controlled trials (RCTs), all of which
were included in the network meta-analysis (NMA) (see section 3.1.7 of this report). Two of the
studies compared MPT with MP (IFM-01/01 and IFM 99/06);17 18 one compared VMP with MP
(VISTA)19-21 and one compared Rd with Rd18 and MPT (MM-020).22 23 Only the latter trial met
the inclusion criteria for the clinical effectiveness review and was used for marketing
authorisation.
Some summary details of the MM-020 trial are presented in a table in the CS (CS Table 5), but
the majority of details are presented in Appendix B. Only limited information (including trial
design, patient numbers, study location and some baseline parameters) for the additional three
trials included in the NMA (IFM 01/01; 99/01 and VISTA are provided17-20 (Appendix D, Table 60
and 61).
To be included in the MM-020 trial, patients had to have newly diagnosed symptomatic multiple
myeloma and had to meet the following three criteria for inclusion (Appendix B.2.3.2, Table 6):
• Monoclonal plasma cells in the bone marrow ≥ 10% and/or presence of a biopsy-proven
plasmacytoma
• Monoclonal protein present in the serum and/or urine
• Myeloma-related organ dysfunction AND measurable disease by protein electrophoresis
analyses in serum and/or urine.
Patients had to be age ≥18 years. Patients younger than 65 years of age had to be ineligible for
stem cell therapy (SCT), decline SCT or were only included if SCT was not available. Patients
also had to have an Eastern Cooperative Oncology Group (ECOG) performance status score of
0, 1 or 2.
The CS provides a CONSORT flowchart (CS Appendix D.1.2, Figure 32) detailing the number of
patients that discontinued/dropped out (with reasons). The flowchart also includes the number
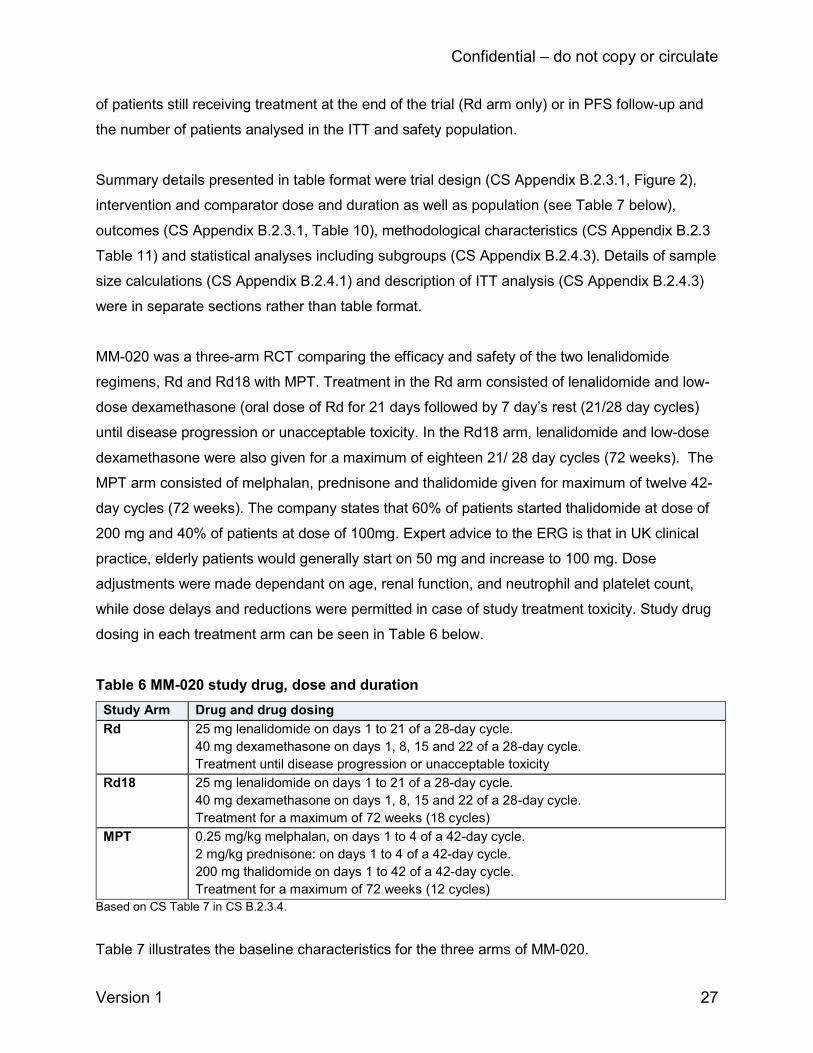
Confidential – do not copy or circulate
Version 1 27
of patients still receiving treatment at the end of the trial (Rd arm only) or in PFS follow-up and
the number of patients analysed in the ITT and safety population.
Summary details presented in table format were trial design (CS Appendix B.2.3.1, Figure 2),
intervention and comparator dose and duration as well as population (see Table 7 below),
outcomes (CS Appendix B.2.3.1, Table 10), methodological characteristics (CS Appendix B.2.3
Table 11) and statistical analyses including subgroups (CS Appendix B.2.4.3). Details of sample
size calculations (CS Appendix B.2.4.1) and description of ITT analysis (CS Appendix B.2.4.3)
were in separate sections rather than table format.
MM-020 was a three-arm RCT comparing the efficacy and safety of the two lenalidomide
regimens, Rd and Rd18 with MPT. Treatment in the Rd arm consisted of lenalidomide and low-
dose dexamethasone (oral dose of Rd for 21 days followed by 7 day’s rest (21/28 day cycles)
until disease progression or unacceptable toxicity. In the Rd18 arm, lenalidomide and low-dose
dexamethasone were also given for a maximum of eighteen 21/ 28 day cycles (72 weeks). The
MPT arm consisted of melphalan, prednisone and thalidomide given for maximum of twelve 42-
day cycles (72 weeks). The company states that 60% of patients started thalidomide at dose of
200 mg and 40% of patients at dose of 100mg. Expert advice to the ERG is that in UK clinical
practice, elderly patients would generally start on 50 mg and increase to 100 mg. Dose
adjustments were made dependant on age, renal function, and neutrophil and platelet count,
while dose delays and reductions were permitted in case of study treatment toxicity. Study drug
dosing in each treatment arm can be seen in Table 6 below.
Table 6 MM-020 study drug, dose and duration
Study Arm Drug and drug dosing
Rd 25 mg lenalidomide on days 1 to 21 of a 28-day cycle.
40 mg dexamethasone on days 1, 8, 15 and 22 of a 28-day cycle.
Treatment until disease progression or unacceptable toxicity
Rd18 25 mg lenalidomide on days 1 to 21 of a 28-day cycle.
40 mg dexamethasone on days 1, 8, 15 and 22 of a 28-day cycle.
Treatment for a maximum of 72 weeks (18 cycles)
MPT 0.25 mg/kg melphalan, on days 1 to 4 of a 42-day cycle.
2 mg/kg prednisone: on days 1 to 4 of a 42-day cycle.
200 mg thalidomide on days 1 to 42 of a 42-day cycle.
Treatment for a maximum of 72 weeks (12 cycles)
Based on CS Table 7 in CS B.2.3.4.
Table 7 illustrates the baseline characteristics for the three arms of MM-020.
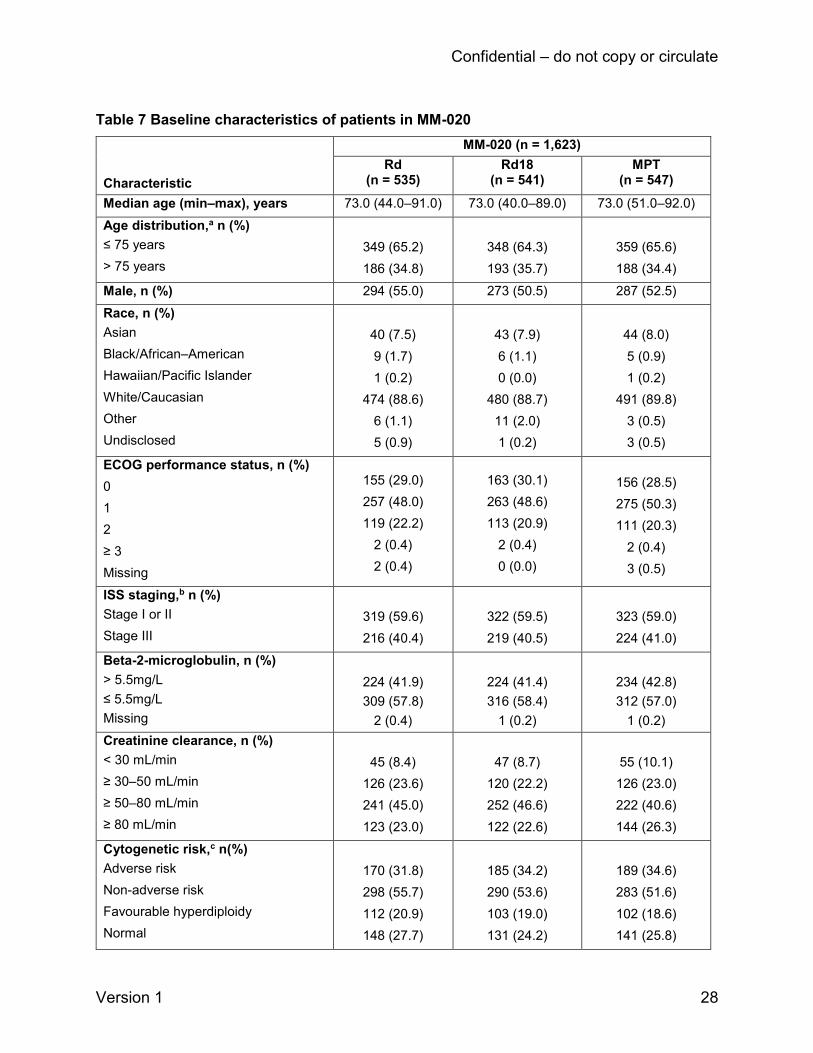
Confidential – do not copy or circulate
Version 1 28
Table 7 Baseline characteristics of patients in MM-020
Characteristic
MM-020 (n = 1,623)
Rd (n = 535)
Rd18 (n = 541)
MPT (n = 547)
Median age (min–max), years 73.0 (44.0–91.0) 73.0 (40.0–89.0) 73.0 (51.0–92.0)
Age distribution,a n (%)
≤ 75 years
> 75 years
349 (65.2)
186 (34.8)
348 (64.3)
193 (35.7)
359 (65.6)
188 (34.4)
Male, n (%) 294 (55.0) 273 (50.5) 287 (52.5)
Race, n (%)
Asian
Black/African–American
Hawaiian/Pacific Islander
White/Caucasian
Other
Undisclosed
40 (7.5)
9 (1.7)
1 (0.2)
474 (88.6)
6 (1.1)
5 (0.9)
43 (7.9)
6 (1.1)
0 (0.0)
480 (88.7)
11 (2.0)
1 (0.2)
44 (8.0)
5 (0.9)
1 (0.2)
491 (89.8)
3 (0.5)
3 (0.5)
ECOG performance status, n (%)
0
1
2
≥ 3
Missing
155 (29.0)
257 (48.0)
119 (22.2)
2 (0.4)
2 (0.4)
163 (30.1)
263 (48.6)
113 (20.9)
2 (0.4)
0 (0.0)
156 (28.5)
275 (50.3)
111 (20.3)
2 (0.4)
3 (0.5)
ISS staging,b n (%)
Stage I or II
Stage III
319 (59.6)
216 (40.4)
322 (59.5)
219 (40.5)
323 (59.0)
224 (41.0)
Beta-2-microglobulin, n (%)
> 5.5mg/L
≤ 5.5mg/L
Missing
224 (41.9)
309 (57.8)
2 (0.4)
224 (41.4)
316 (58.4)
1 (0.2)
234 (42.8)
312 (57.0)
1 (0.2)
Creatinine clearance, n (%)
< 30 mL/min
≥ 30–50 mL/min
≥ 50–80 mL/min
≥ 80 mL/min
45 (8.4)
126 (23.6)
241 (45.0)
123 (23.0)
47 (8.7)
120 (22.2)
252 (46.6)
122 (22.6)
55 (10.1)
126 (23.0)
222 (40.6)
144 (26.3)
Cytogenetic risk,c n(%)
Adverse risk
Non-adverse risk
Favourable hyperdiploidy
Normal
170 (31.8)
298 (55.7)
112 (20.9)
148 (27.7)
185 (34.2)
290 (53.6)
103 (19.0)
131 (24.2)
189 (34.6)
283 (51.6)
102 (18.6)
141 (25.8)

Confidential – do not copy or circulate
Version 1 29
Uncertain risk
Non-evaluable
Missing
38 (7.1)
34 (6.4)
33 (6.2)
56 (10.4)
35 (6.5)
31 (5.7)
39 (7.1)
45 (8.2)
31 (5.7)
Multiple myeloma subtype
IgA
IgA and IgG
IgA and IgM
IgD
IgG
IgM
Not available (includes light chain
disease)
138 (25.8)
7 (1.3)
0 (0.0)
4 (0.7)
334 (62.4)
3 (0.6)
49 (9.2)
142 (26.2)
6 (1.1)
0 (0.0)
7 (1.3)
331 (61.2)
1 (0.2)
54 (10.0)
123 (22.5)
8 (1.5)
1 (0.2)
4 (0.7)
350 (64.0)
1 (0.2)
60 (11.0)
Table based on CS Table 12 in CS section B.2.3.723 a Patients were stratified at randomisation by age (≤ 75 years vs > 75 years). b Patients were stratified at randomisation by stage (stage I or II vs stage III). c Cytogenetic risk categories are mutually exclusive.
Definitions: adverse risk categories: t(4;14), t(14;16), del(13q) or monosomy 13, del(17p), 1q gain; non-adverse risk
categories: favourable hyperdiploidy (t[11;14], gains of 5/9/15, normal, a normal result, gains other than 5/9/15, IgH
deletion, and uncertain risk. Probes used for analysis cannot place patient in any of the other risk categories. Not
evaluable: no specimen received, test failure or insufficient number of cells available for analysis.
Generally, the ERG agrees with the CS that baseline characteristics between study arms for
MM-020 were well balanced and there were no significant differences between age, gender,
race or biochemical parameters between the intervention and comparator groups. There are
some minor differences in creatinine clearance, cytogenetic risk and multiple myeloma subtype
between treatment arms. Upon request from the ERG, the company provided details of the use
of concomitant therapy during the active treatment phase in the safety population per treatment
arm. The safety population was defined as all randomised patients who received at least one
dose of the study treatment. Although the therapies provided during the active treatment phase
were similar between the treatment arms, the ERG noted that a higher number of patients were
given warfarin in the Rd arm (6% vs 2.8% Rd18 and 3.1% MPT) and administration of
Granulocyte-colony stimulating factor (GCSF) was lower in both the Rd and Rd18 treatment
arms compared to MPT (17.5% Rd; 17.2% Rd18; 34.8% MPT).
The ERG consider that all relevant RCTs have been identified in the systematic review and that
included RCTs meet the company’s inclusion criteria.
The company states that in transplant-ineligible patients with newly diagnosed multiple
myeloma, there are no ongoing company-sponsored studies from which new evidence will

Confidential – do not copy or circulate
Version 1 30
become available in the timeline of this appraisal. The ERG has not identified any further
potential studies.
3.1.4 Description and critique of the approach to validity assessment
The company quality assessed the one lenalidomide trial included in the CS (referred to as MM-
020 in the CS and FIRST in the journal publication22) using the NICE suggested criteria.24
The ERG independently assessed the methodological quality of the trial and compared
judgements with those of the company (Table 8). There were no differences in judgements
between the company and the ERG (though note that the company answered three questions
without a direct yes/no judgement). There was an absence of judgement in the CS regarding
the concealment of treatment, blinding and intention-to-treat (ITT) analysis (see section 3.1.6 of
this report for further description and critique of the trial’s statistical methods). Concealment of
treatment and ITT analysis were judged to be adequate by the ERG, with partial blinding used
in the trial (see Table 8), however, it is unclear how missing HRQoL data were handled.
Table 8 Company and ERG assessment of the MM-020 trial quality
NICE quality assessment criteria for RCT24 Judgements MM-02022 23
1. Was the method used to generate random
allocations adequate?
CS: Yes
ERG: Yes
ERG comments: Patients were stratified at randomisation by age (≤ 75 years versus > 75 years), stage
(ISS stages I or II versus stage III) and country.
2. Was the concealment of treatment allocation
adequate?
CS: “Open-label”
ERG: Yes
ERG comments: The company does not provide a judgement for this question, but states that this is an
open-label study. Allocation concealment is different to blinding and means that the person randomising
the patient does not know what the next treatment allocation will be. The trial used interactive voice-
response system to randomly assign patients in a 1:1:1 ratio and concealment of treatment allocation
was therefore judged to be adequate by the ERG.
3. Were the groups similar at the outset of the study
in terms of prognostic factors?
CS: Yes
ERG: Yes
ERG comments: Baseline characteristics across the treatment arms presented in the CS were generally
well balanced, with some minor differences in creatinine clearance, cytogenetic risk and multiple
myeloma subtype between treatment arms (CS Table 12). The CS did not report prior medication at
baseline by treatment arm, but reported in the clinical study report (CSR) that the use of medication prior
to the study was consistent with medical history, with no clinically notable differences observed across
the 3 treatment arms.

Confidential – do not copy or circulate
Version 1 31
4. Were the care providers, participants and
outcome assessors blind to treatment allocation?
CS: “Open-label”
ERG: Partially
ERG comments: The company does not provide a judgement for this question, but states that this was
an open-label RCT, with the independent response adjudication committee (IRAC) blinded to treatment
allocation reviewing the efficacy data independent of investigator-reported response. In addition, the
study team was blinded to the data until after the database lock (CS Appendix B, Table 11). However, it
would appear that patients were not blinded to which treatment they received.
5. Were there any unexpected imbalances in drop-
outs between groups?
CS: No
ERG: No
ERG comments: Study discontinuations (i.e. patients discontinuing treatment and patients no longer in
PFS follow up phase) were generally balanced between the trial arms (86.5% Rd, 95.2% Rd18 and
95.6% MPT). The CS states that the majority of patients in the trial arms discontinued treatment due to
progressive disease (50.7% Rd, 66.9% Rd18 and 61.6% MPT) and adverse events (12.0% Rd, 13.1%
Rd18 and 13.9% MPT). Death was the reason for study discontinuation in 11.2% of patients in the Rd
treatment arm, 5.2% in the Rd18 and 6.8% in the MPT treatment arm. The number of discontinuations
due to loss to follow-up and protocol violations was very low (≤ 0.7%). In response to a clarification
question (question A8), the company provided a breakdown of discontinuations list under ‘other’ [Rd
n=50, Rd18 n=34 and MPT n=46 (CS Appendix D.1.2, Figure 32)]. The table lists the reasons for
withdrawal individual patients, but does not provide an aggregate categorisation of them (response to
clarification question A8, Table 3). The reasons included patient or family withdrawal, non-compliance
and disease-related reasons (i.e. intolerance to therapy).
6. Is there any evidence to suggest that the authors
measured more outcomes than they reported? CS: No
ERG: No
ERG comments: None
7. Did the analysis include an intention-to-treat (ITT)
analysis? If so, was this appropriate and were
appropriate methods used to account for missing
data?
CS: ITT population and safety population, with appropriate censoring methods
ERG: Yes
Yes
ERG comments: The company does not provide a judgement for this question, but states that analysis was by ITT population and safety population, with appropriate censoring methods. The CS states that missing assessments or discontinuations due to reasons other than progressive disease were handled by FDA guidelines25 and that alternative censoring rules based on the EMA guideline26 on the evaluation of anti-cancer medicinal products were used as a sensitivity analysis (Table 66 in Appendix D.1.3). Censoring methods appear to be appropriate. It should be noted that it is unclear how missing HRQoL data were handled.
3.1.5 Description and critique of company’s outcome selection
All of the outcome measures included in the CS match those in the NICE scope. There are no
outcomes from the scope that are omitted from the CS. Data for all of the outcomes are
available from the MM-020 trial, for the comparison of Rd with MPT. For the comparison of Rd
Confidential – do not copy or circulate
Version 1 32
with VMP outcome data for OS and PFS are available from the NMA (see section 3.1.7 of this
report).
CS Table 10 succinctly defines the outcomes included in the CS, the data cut-offs available
from the MM-020 trial as well as which outcome data are used in the economic model.
Additional details on how outcomes were defined in the trial are presented in CS Table 13.
Two data cut-offs are available for the MM-020 trial: 24th May 2013 and 21st January 2016. For
all outcome data used in the economic model the latter data cut-off is used; this represents the
longest follow-up available from the trial (with a median follow-up of 67 months).
3.1.5.1 Survival
PFS was the primary outcome in the MM-020 trial and was defined as time from randomisation
until documented disease progression or death, whichever occurred earlier. This is consistent
with standard definitions of PFS.26 For PFS the 24th May 2013 was the pre-planned data cut-off
with final analysis. Data are provided at this data cut-off based on Independent Response
Adjudication Committee (IRAC) assessment using both FDA and EMA censoring criteria. The
IRAC used the International Myeloma Working Group (IMWG) criteria for assessing
progression.27 PFS data for the 21st January 2016 data cut-off are also provided based on
investigator assessment using FDA and EMA censoring criteria (N.B. the IRAC was disbanded
in 2013 and therefore only an investigator assessment was available for the 2016 data cut-off).
These data are described in the CS as post hoc updated analyses and are used to inform the
economic model.
An additional exploratory (post hoc) PFS analysis was performed: progression-free survival 2
(PFS2). This was defined as the time from randomisation to second objective progressive
disease, start of third-line therapy or death from any cause, whichever occurred first (CS Table
13). This outcome was included to assess response in patients who have progressed following
first line treatment and received a subsequent line of treatment. Specifically, whether the PFS
benefit observed with first line lenalidomide is maintained with the next line of therapy. The CS
suggests that, theoretically, experimental treatments can increase long-term toxicity or alter the
tumour population or microenvironment to induce drug resistance or evolution of an aggressive
clone (CS Appendix L.1.1). Hence, there is a need to assess whether the first line treatment
causes a negative response to subsequent treatment. The CS states that PFS2 has been
acknowledged by the EMA as a suitable alternative endpoint for maintenance regimens. The
Confidential – do not copy or circulate
Version 1 33
PFS2 data presented in the CS is for the 21st January 2016 data cut-off. PFS2 is not included in
the company’s economic model.
Data for OS from the 24th May 2013 data cut-off (a planned interim analysis) are reported in the
trial journal publication, whilst data from the 21st January 2016 data cut-off (final planned
analysis) are reported in the CS. The final OS analysis was planned for when all patients had
been followed for five years or had died or been lost from follow-up before five years. OS data at
the Jan 21st 2016 cut-off are used to inform the economic model.
3.1.5.2 Response rates
Tumour response rates are also available for the 24th May 2013 data cut-off in the journal
publication and the 21st January 2016 data cut-off in the CS. The 2013 data cut-off was based
on investigator and IRAC assessments (the latter using IMWG criteria and described as the
primary response analysis), whilst the 2016 data cut-off was based on investigator assessment
only (as stated above, the IRAC was disbanded in 2013). Tumour response is categorised in
terms of CR, VGPR, PR, SD and PD. These categories are not defined in the CS, though they
are defined in an appendix to the trial journal publication (Table s12)22 and are based on the
International Uniform Response Criteria for Multiple Myeloma.
The CS reports the overall response rates (ORR) for the 21st January 2016 data cut-off, defined
as the number of confirmed responders (CR, VGPR and PR maintained for at least 6 weeks)
divided by the number of patients in the intention to treat (ITT) population for the primary
analysis of response rate (CS Table 13). The CS also reports DoR for the 21st January 2016
data cut-off, which is defined as the time when the response criteria were first met for CR,
VGPR, or PR until the first date the response criteria were met for progressive disease, or until
the subject died from any cause, whichever occurred first (CS Table 13). Time to response
(TTR) is reported in the CS as the time from randomisation to the time the response criteria for
CR, VGPR, or PR were first met (CS Table 13).
The CS also makes brief reference to a “deeper quality” response as including patients with CR
or VGPR (CS section B.2.6.6)
Response rates, whilst an important measure of clinical effectiveness, are not used as an input
parameter to inform the company’s economic model. This is appropriate as survival rates are
the key clinical effectiveness parameters informing the model.
Confidential – do not copy or circulate
Version 1 34
3.1.5.3 Other outcomes
Time to treatment failure (TTF) is defined as the time from randomisation to discontinuation of
study treatment for any reason (e.g. disease progression, toxicity, start of another anti-myeloma
treatment and death). Data are presented for both the 24th May 2013 data cut-off in the trial
journal publication (supplementary appendix) and for the 21st January 2016 data cut-off in the
CS (IRAC and investigator assessment, respectively). TTF is used as an input parameter in the
economic model to calculate the proportion of patients on treatment in each model cycle.
Time to next treatment/second-line anti-myeloma treatment is defined as the time from
randomisation to the start of a non-protocol anti-myeloma treatment. Data are presented for the
24th May 2013 data cut-off in the trial journal publication (supplementary appendix) and for the
21st Jan 2016 data cut-off in the CS (investigator assessment only). These data are not included
in the economic model.
Adverse events are reported for the 24th May 2013 data cut-off in the trial journal publication
(supplementary appendix) and for the 21st Jan 2016 data cut-off in the CS (investigator
assessment only).
HRQoL was assessed in the MM-020 trial using three instruments: the European Organisation
for Research and Treatment of Cancer (EORTC) Quality of Life Questionnaire–Core 30 (QLQ-
C30), the EORTC Quality of Life Questionnaire–Multiple Myeloma 20 (QLQ-MY20), and the
EuroQol 5-dimension European Quality of Life questionnaire (EQ-5D). The EORTC QLQ-C30 is
a standard instrument for assessing HRQoL in cancer studies, and contains 30 items. Disease
specific adaptations have been made for a number of cancers, including multiple myeloma. The
QLQ-MY20 contains 20 questions specific to myeloma, including questions about bone, back
and chest pain, and burning sensations in the eyes. The company report that this instrument
has been subjected to validation in a peer-reviewed publication28 (clarification question A5). The
EQ-5D is a standard five dimension generic quality of life instrument which can generate utility
data. These three instruments were administered to patients at baseline, at the end of selected
study cycles and at study discontinuation (a maximum of 18 cycles (months) to permit a
comparison between Rd and MPT – data cut-off 24th May 2013).
The CS reports that the main HRQoL analysis focused on six pre-selected and clinically
relevant HRQoL domains: two from the QLQ-MY20 (Disease Symptoms and Side Effects of
Confidential – do not copy or circulate
Version 1 35
Treatment) and four from the QLQ-C30 (Global Health Status, Physical Functioning, Fatigue,
and Pain) in addition to the EQ-5D utility value. These domains, chosen before data analysis
were informed by a workshop discussion with haematologists and based on perceived clinical
relevance.
EQ-5D data from this trial are used in the economic model for Rd and MPT. CS Table 10
indicates that data from the 24th May 2013 data cut-off are available, but not the 21st January
2016 data cut-off, though in contradiction, the table indicates that the latter is used in the
economic model. HRQoL data for VMP are based on QLQ-C30 data from the VISTA trial29
which were mapped to EQ-5D using a published algorithm (this is discussed further in section
4.3.6 of this report).
In summary, the CS includes all of the outcomes in the NICE scope, with the MM-020 trial
providing data for all outcomes. All outcome data for this trial are from the most recent data cut-
off on the 21st January 2016. The assessment of the outcomes, in terms of definitions, appears
to be standard for cancer trials.
3.1.6 Description and critique of the company’s approach to trial statistics
3.1.6.1 Sample size
The primary outcome in the MM-020 trial was PFS for the comparison of Rd with MPT. A
statistical power calculation is reported in the CS (section B.2.4.1). For a 24 month accrual
period and a 36 month follow up period, a sample size of 530 patients in each treatment arm
would have 80% power to detect a HR of 1.25 using a two sided log-rank test with an overall
statistical significance level of 0.05. This calculation was based on assumptions including a
clinically relevant improvement in median PFS of 25% and an exponential overall PFS
distribution. The ERG noted a discrepancy between the CS and the trial journal publication,22
with the latter stating that the HR in the power calculation was 0.80 rather than 1.25. The ERG
asked the company to clarify this discrepancy (clarification question A3). The company
acknowledged the lack of clarity and reported that the HR in the CS was presented with
reference to the MPT arm hazard: 0.80, whilst the HR in the journal publication was presented
with reference to the Rd-arm hazard: 1.25. The ERG notes that the required sample size was
achieved as a total of 1623 patients were randomly assigned to treatment groups (Rd n=535;
Rd18 n=541; MPT n=547).
Confidential – do not copy or circulate
Version 1 36
The secondary analysis was between Rd, Rd18 and MPT with 950 patients were required to
have disease progression or to have died across all treatment arms (log-rank test with 80%
power).
For the comparison of final OS, a total of 597 deaths were expected in the Rd and MPT arms
within five years (896 deaths across all three treatment arms). Based on a 25% improvement in
median OS and 597 deaths, a two-sided log-rank test with significance level of 0.05 would give
a power of 78%. The ERG notes that there were a total of 623 deaths across the Rd and MPT
arms and 906 deaths across the three arms, therefore the number or events and thus the
overall sample size was adequate.
3.1.6.2 Analysis populations
The CS defines three patient analysis populations: the ITT population, the efficacy-evaluable
population and the safety population (CS Section B.2.4.2).
The ITT population comprised all randomised patients irrespective of whether they received
study treatment, analysed according to the treatment to which they were randomised rather than
treatment they actually received. This is the standard definition of ITT in clinical trials. The CS
states that all efficacy endpoint analyses were based on the ITT population. The ERG has
checked the results presented in the CS and agrees that ITT analysis was used based on the
information reported. However, it is not stated how missing response data or missing HRQoL
data were estimated. In the case of the latter, the ERG notes that the denominators reported in
a journal publication by Delforge et al.29 are never as high as the total number of randomised
patients, around 88% - 92% at treatment cycle 1 and denominators decline over subsequent
cycles (78 - 84%). This raises an uncertainty in the interpretation of the HRQoL results.
In the case of the latter, the ERG notes that the denominators (i.e. those patients available to be
assessed) reported in a journal publication by Delforge et al.29 are never as high as the total
number of randomised patients, around 88%-92% at treatment cycle one and declining over
subsequent cycles (52%-55% at month 18). The compliance rates at each cycle (that is, the
percentage of patients responding as a proportion of the patients available) ranged from 86% to
92% at cycle one. Compliance rates were similar between Rd and MPT, except at month 18
when there was a lower rate in the MPT group (in the range 15% to 20%). This raises an
uncertainty in the interpretation of the HRQoL results as it is not known how missing data were
imputed in the ITT analysis.
Confidential – do not copy or circulate
Version 1 37
HRQoL data for the two Rd arms were combined into one overall group post-hoc for
presentation of results. This was done because the regimens were identical over the 18 month
measurement period. The ERG requested the HRQoL results for the two Rd treatment arms
separately, for transparency and these were subsequently provided by the company
(clarification question A4). The ERG notes that the results for the two Rd treatment arms, as
supplied by the company on request, ***********. Furthermore, the patient baseline
characteristics were similar between the Rd and Rd18 groups, and the treatment given was
identical over the 18 month period that HRQoL was measured. The decision to pool the two
arms is therefore reasonable in this instance.
The CS states that cross-over to different treatment arms were not permitted, though patients
did receive subsequent lines of treatment after disease progression. The OS estimates from the
MM-020 trial are likely to be influenced by the effects of subsequent anti-myeloma treatment
lines (the planned primary analysis of OS was after all patients had been followed for five years
or had died or been lost from follow-up before five years). Around 56% of patients of the Rd
group and around 70% of both the Rd18 and MPT groups received subsequent treatment with
the same or an alternative anti-myeloma drug upon initial disease progression. The CS does not
discuss the likely impact of this on the trial results. The ERG notes that second and third line
treatment in the Rd arm mainly comprised bortezomib-based therapy (CS Table 46). Second
and third line treatment in the MPT arm comprised mainly bortezomib or Rd. The OS results of
this trial may not necessarily be generalizable to settings in which different subsequent line
treatments are given. For tumour response, responses documented after patients received any
other anti-myeloma treatment were not counted as responses. Thus, the tumour response data
presented only reflect the initial treatment given (i.e. Rd or MPT).
The efficacy-evaluable population comprises ITT patients who met protocol requirements and
were evaluated after receiving at least one dose of study treatment. The CS does not provide
any further details of this population and whether any results for this population are reported in
the CS or used in the economic model. The company clarified that the efficacy-evaluable
population was a secondary population for the efficacy analyses which was not used (response
to clarification question A6).
Confidential – do not copy or circulate
Version 1 38
The safety population comprised ITT patients who met protocol requirements and were
evaluated after receiving at least one dose of study treatment (lenalidomide, dexamethasone,
melphalan, prednisone or thalidomide). Patients were analysed according to the initial treatment
received. The number of patients included in the safety population was 1613 (out of 1623
randomised). This population was used in the analysis of adverse events, deaths and laboratory
test results.
3.1.6.3 Censoring
Censoring was performed for PFS to account for patients who either discontinued the study or
who did not have the event of interest during the study assessment period, or who began a new
anti-myeloma regimen prior to progression. For the primary analysis of PFS the 2007 FDA
censoring rules were used (CS Appendix C.1.2.1). In addition, 2012 EMA censoring guidance
was used for PFS in a sensitivity analysis, thus allowing a comparison with censoring based on
the FDA rules. Both of these censoring methods were used for the 24th May 2013 data cut-off
(primary analysis of PFS) and the 21st January 2016 (post hoc) data cut-off. This latter data cut,
used in the economic model is based on EMA censoring only. The CS states that the PFS
results were similar between both censoring methods and the ERG agrees that this is the case,
noting that the EMA censored results are slightly more conservative (slightly higher HRs as
reported in CS Table 14).
3.1.6.4 Statistical procedures used
The CS reports that a hierarchical group sequential-testing procedure with appropriate alpha-
spending functions, multiple-arm comparison and multiplicity adjustment was used to control the
family-wise type-1 error rate in the interim and final analyses of endpoints (CS section B.2.4.3).
Both OS and PFS were compared between treatment arms using an unstratified log-rank test
with a two-sided significance level of 0.05. The Kaplan-Meier method was used to estimate
survival distributions for each treatment arm, for both PFS and OS.
Procedures for analysing other time to event outcomes (i.e. DoR; TTP; TTF; PFS2) were
reported to be the same as used for analysing PFS. The exception was the TTR outcome which
is stated to have been compared between treatment arms using the Wilcoxon rank sum test,
with subjects with the longest time to response having the highest rank. The statistical
procedures used to assess the other outcomes (e.g. HRQoL; response) are described in CS
Table 13.
Confidential – do not copy or circulate
Version 1 39
3.1.6.5 Sub-groups
Subgroup analyses from the MM-020 trial are reported (CS Section B.2.7, and CS Appendix E).
Pre-planned sub-group analyses comparing Rd with MPT were conducted for PFS, PFS2, OS
and myeloma response outcomes. However, the CS only reports the results of these analyses
for PFS and OS (at the 21st January 2016 data cut-off and for the ITT population). The
subgroups presented in the CS include the trial’s randomisation stratification factors (age,
baseline International Staging System (ISS) disease stage, geographical region) and a number
of other variables such as sex and race and parameters of prognostic significance. One of these
parameters was stated to be baseline cytogenetic categories (high risk versus non-high risk:
non-high risk includes patients with favourable hyperdiploidy, normal, and uncertain risk
cytogenetic risk profiles). Clinical advice to the ERG is that cytogenetics are one of the key
prognostic factors in multiple myeloma. It does not appear that any clinically relevant subgroups
were not included.
The statistical procedures for conducting the sub-group analyses were the same as used for the
main analysis of primary and secondary outcomes. Caution is required in the interpretation of
the results as for some sub-groups the number of patients was relatively small and is therefore
likely to be underpowered.
For both PFS and OS the CS states that exploratory analysis, based on a Cox proportional
hazards regression model, were conducted in order to assess the demographic and prognostic
factors that most affected treatment outcome (CS Table 13). The trial protocol (an appendix to
the trial journal publication) states that this was done so that the treatment comparisons could
be adjusted for these factors.
The CS also reports post-hoc sub-group analyses based on depth of response, for PFS and
OS. This is defined as a best overall response of ≥ VGPR based on investigator assessment
(CS section B.2.7.4.1). This appears to refer to the deeper quality of response to therapy
mentioned on CS page 54, comprising patients with either a CR or a VGPR to treatment.
3.1.6.6 Summary
In summary, the statistical procedures used in the MM-020 trial are clearly reported in the CS
and appropriate for evaluation of a cancer treatment. The randomised sample size and number
of events achieved was adequate for the trial power calculations; an adequately defined ITT
population was used for efficacy analyses and both EMA and FDA censoring rules were
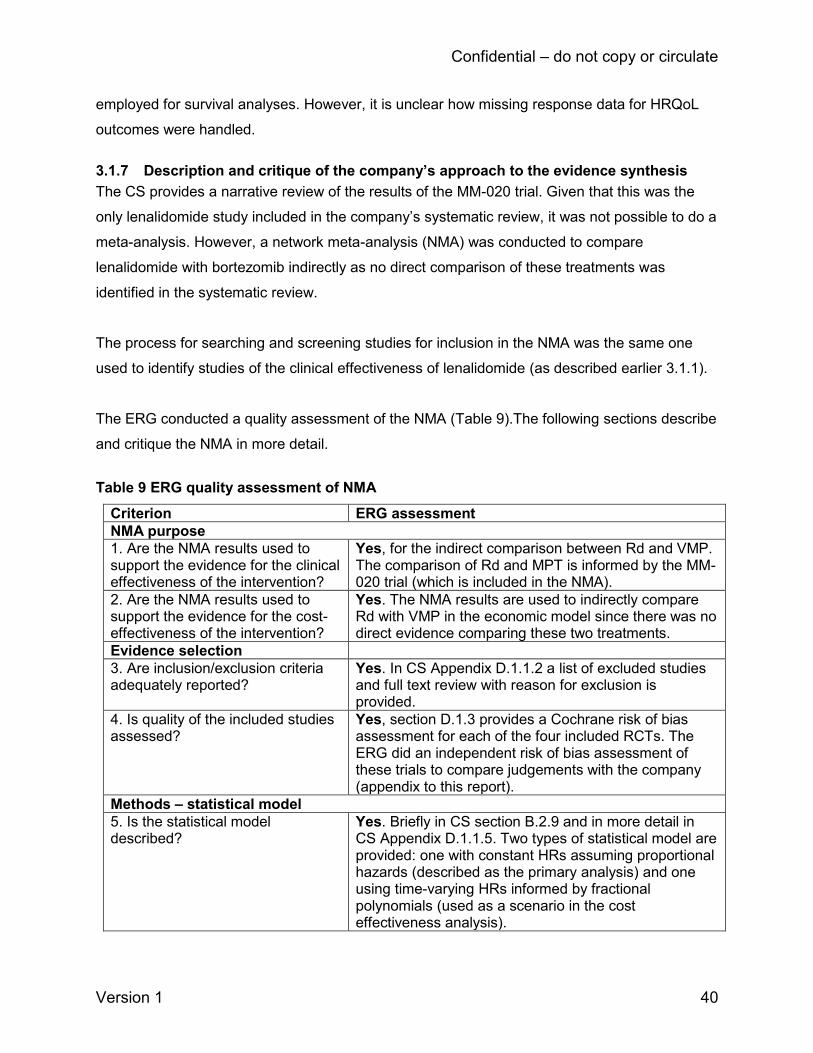
Confidential – do not copy or circulate
Version 1 40
employed for survival analyses. However, it is unclear how missing response data for HRQoL
outcomes were handled.
3.1.7 Description and critique of the company’s approach to the evidence synthesis
The CS provides a narrative review of the results of the MM-020 trial. Given that this was the
only lenalidomide study included in the company’s systematic review, it was not possible to do a
meta-analysis. However, a network meta-analysis (NMA) was conducted to compare
lenalidomide with bortezomib indirectly as no direct comparison of these treatments was
identified in the systematic review.
The process for searching and screening studies for inclusion in the NMA was the same one
used to identify studies of the clinical effectiveness of lenalidomide (as described earlier 3.1.1).
The ERG conducted a quality assessment of the NMA (Table 9).The following sections describe
and critique the NMA in more detail.
Table 9 ERG quality assessment of NMA
Criterion ERG assessment
NMA purpose
1. Are the NMA results used to support the evidence for the clinical effectiveness of the intervention?
Yes, for the indirect comparison between Rd and VMP. The comparison of Rd and MPT is informed by the MM-020 trial (which is included in the NMA).
2. Are the NMA results used to support the evidence for the cost-effectiveness of the intervention?
Yes. The NMA results are used to indirectly compare Rd with VMP in the economic model since there was no direct evidence comparing these two treatments.
Evidence selection
3. Are inclusion/exclusion criteria adequately reported?
Yes. In CS Appendix D.1.1.2 a list of excluded studies and full text review with reason for exclusion is provided.
4. Is quality of the included studies assessed?
Yes, section D.1.3 provides a Cochrane risk of bias assessment for each of the four included RCTs. The ERG did an independent risk of bias assessment of these trials to compare judgements with the company (appendix to this report).
Methods – statistical model
5. Is the statistical model described?
Yes. Briefly in CS section B.2.9 and in more detail in CS Appendix D.1.1.5. Two types of statistical model are provided: one with constant HRs assuming proportional hazards (described as the primary analysis) and one using time-varying HRs informed by fractional polynomials (used as a scenario in the cost effectiveness analysis).

Confidential – do not copy or circulate
Version 1 41
6. Has the choice of outcome measure used in the analysis been justified?
Yes. The NMA includes OS and PFS only. These outcomes directly inform the economic model.
7. Has a structure of the network been provided?
Yes. CS Figure 14 (Figure 1 in this report) provides a visual illustration of the network.
8. Is homogeneity considered? Yes. CS Appendix D.1.1.4 discusses the comparability of the trials in terms of potential effect modifiers.
9. Are the studies homogenous in terms of patient characteristics and study design?
Yes. The company commented that baseline characteristics were well distributed across the four included trials. There is no statistical test of homogeneity for each of the pairwise comparisons in the NMA, however, this is appropriate as there was only one comparison that was informed by more than a single trial (MPT vs MP, n=2 trials).
10. If the homogeneity assumption is not satisfied, is clinical or methodological homogeneity across trials in each set involved in the indirect comparison investigated by an adequate method? (e.g. sub group analysis, sensitivity analysis, meta-regression)
Not applicable, see above.
11. Is the assumption of similarity stated?
Yes, in terms of a discussion about the comparability of the trials (see CS Appendix D.1.1.4). The CS notes that there was an approximate 10% difference in baseline ISS stage between one of the MP vs MPT trials and the MM-020 trial. The company suggested that this degree of variation is unlikely to violate the transitivity assumption for the NMA. Expert clinical advice to the ERG is that a 10% difference in ISS stage would not be important.
12. Is any of the programming code used in the statistical programme provided (for potential verification)?
No.
Sensitivity analysis
13. Does the study report sensitivity analyses?
No. However, the company did supply alternative fractional polynomial model-based NMA analyses at the request of the ERG (clarification question A15).
Results
14. Are the results of the NMA presented?
Yes. In CS section B.2.9 and in response to ERG clarification question A15 for additional fractional polynomial models.
15. Does the study describe an assessment of the model fit?
Yes. The deviance information criterion (DIC) was used to compare the goodness-of-fit of the competing fractional polynomial survival models.
16. Has there been any discussion around the model uncertainty?
No.
17. Are the point estimates of the relative treatment effects
Yes. HRs are provided accompanied by credible intervals (CS Table 18 and Table 20). For the time-

Confidential – do not copy or circulate
Version 1 42
accompanied by some measure of variance such as confidence intervals?
varying HRs generated by the fractional polynomial model, a graphical illustration is given of the HRs curves for each treatment over time accompanied by curves representing the associated credible intervals (CS Figures 15 and 16).
Discussion - overall results
18. Does the study discuss both conceptual and statistical heterogeneity?
Yes. The NMA was conducted using a fixed effect model. The CS states that a random effects model was not used because the network was sparse (only one trial informed each connected node in the network except for the MPT to MP connection) (CS Appendix D.1.1.5).
Discussion - validity
19. Are the results from the indirect/NMA compared, where possible, to those just using direct evidence?
No. This was not necessary as there are no comparisons informed by both direct and indirect evidence.
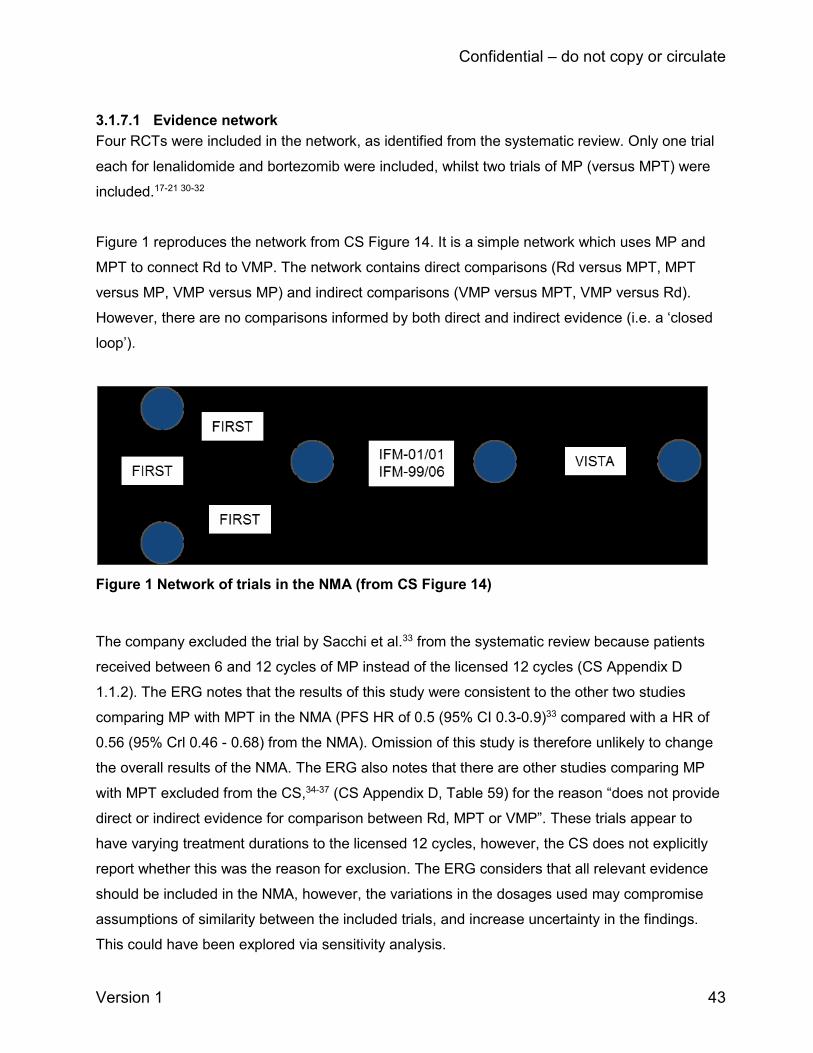
Confidential – do not copy or circulate
Version 1 43
3.1.7.1 Evidence network
Four RCTs were included in the network, as identified from the systematic review. Only one trial
each for lenalidomide and bortezomib were included, whilst two trials of MP (versus MPT) were
included.17-21 30-32
Figure 1 reproduces the network from CS Figure 14. It is a simple network which uses MP and
MPT to connect Rd to VMP. The network contains direct comparisons (Rd versus MPT, MPT
versus MP, VMP versus MP) and indirect comparisons (VMP versus MPT, VMP versus Rd).
However, there are no comparisons informed by both direct and indirect evidence (i.e. a ‘closed
loop’).
Figure 1 Network of trials in the NMA (from CS Figure 14)
The company excluded the trial by Sacchi et al.33 from the systematic review because patients
received between 6 and 12 cycles of MP instead of the licensed 12 cycles (CS Appendix D
1.1.2). The ERG notes that the results of this study were consistent to the other two studies
comparing MP with MPT in the NMA (PFS HR of 0.5 (95% CI 0.3-0.9)33 compared with a HR of
0.56 (95% Crl 0.46 - 0.68) from the NMA). Omission of this study is therefore unlikely to change
the overall results of the NMA. The ERG also notes that there are other studies comparing MP
with MPT excluded from the CS,34-37 (CS Appendix D, Table 59) for the reason “does not provide
direct or indirect evidence for comparison between Rd, MPT or VMP”. These trials appear to
have varying treatment durations to the licensed 12 cycles, however, the CS does not explicitly
report whether this was the reason for exclusion. The ERG considers that all relevant evidence
should be included in the NMA, however, the variations in the dosages used may compromise
assumptions of similarity between the included trials, and increase uncertainty in the findings.
This could have been explored via sensitivity analysis.
Confidential – do not copy or circulate
Version 1 44
3.1.7.2 Risk of bias in trials included in the NMA
The CS provides a Cochrane risk of bias criteria assessment38 of the four RCTs included in the
NMA (CS Appendix D.1.3). The ERG conducted an independent risk of bias assessment of the
trials and compared judgements with those of the company (see Appendix to this report). Of
note, the three comparator studies included in the NMA (that is, of MP vs MPT and VMP vs MP)
were included in a previous multiple technology appraisal of bortezomib and thalidomide for first
line treatment of multiple myeloma (NICE TA228).6 We therefore referred back to our previous
critical appraisal of these trials for this current appraisal to ensure consistency.
The company judged the trials to be at low risk of selection bias (due to adequate
randomisation), detection bias and other sources of bias. However, the CS states that
concealment of random allocation to study groups was poorly described, potentially leading to
selection bias. Most trials were judged unclear or high risk for performance bias due to lack of
blinding of participants. The CS judges the trials to be at low risk for detection bias, as the
outcomes were not likely to be influenced by lack of blinding.
The ERG’s assessment of these trials mostly agrees with those of the company. However,
contrary to the company, the ERG considered that due to the open-label nature of the studies,
the risk for detection bias was high for the MM-020 and VISTA trials. The ERG were unable to
assess whether randomisation was conducted adequately, or whether concealment of allocation
was adequate due to lack of information reported in the study publications. This raises the
possibility of selection bias.
3.1.7.3 Statistical NMA methods
The company used two different statistical methods to conduct the NMA. One was a Bayesian
NMA using constant hazard ratios (assuming proportional hazards). The other was a Bayesian
time-varying hazard ratio model using fractional polynomials (CS Appendix D.1.1.5). Both
methods were conducted as it was not known in advance which would provide the best
combination of fit and parsimony (CS Section B.2.9.2). The company subsequently chose the
constant hazard ratios NMA as their primary (base case) analysis (see below for a discussion of
this).
The Bayesian constant hazard NMA was performed using a fixed effect regression model as
described in the NICE Decision Support Unit technical support document number 2. The
justification for using fixed rather than random effects model was that the network was sparse

Confidential – do not copy or circulate
Version 1 45
and this model did not yield a stable estimate of the heterogeneity parameter, generating
unrealistically wide credible intervals (CS section D.1.1.5). Fixed effects assume there is no
variation in relative treatment effects across studies for a particular pairwise comparison. The
ERG notes that a random effects model is required in the presence of heterogeneity and is a
more conservative approach (it generates wider confidence/credible intervals). However, the
company did not assess statistical heterogeneity as most of the comparisons in the network are
informed by only a single trial. Heterogeneity arising from pairwise comparisons would therefore
not be applicable. For transparency the ERG requested the company to supply NMA results
based on the random effects model (clarification question A17). The company supplied these but
urged caution since the estimated HRs were not considered to be stable as a result of the
available data being too limited to estimate the between-study heterogeneity. The ERG notes
that the random effects HRs are almost identical to the fixed effect model (as would be
expected), but the credible intervals are very wide. Taking into account the sparse network and
the wide intervals generated, the ERG therefore agrees that the fixed effect model is appropriate
for use in this case.
3.1.7.4 Fractional polynomial NMA model
The CS cites a publication by Jansen 201139 as the basis of their fractional polynomial
methodology. Jansen describes this method as an alternative to NMA of survival data in which
the treatment effect is represented by a constant HR. A multi-dimensional treatment effect
approach is used in which hazard functions of interventions compared in an RCT are modelled,
and the difference between the parameters of these fractional polynomials (FPs) within a trial are
synthesized (and indirectly compared) across studies. The FP analysis generates results which
reflect the time course of the log-hazard function and as such can be expressed as log-hazard
function curves and their parameters (intercept and slope). Credible interval curves can be
plotted alongside the log-hazard function curves. The ERG notes that, although this is a relatively
new methodology, FP-based NMAs have also been included in other NICE STAs, for topics such
as urothelial cancer (NICE TA492) and renal cell carcinoma NICE TA591 and TA46340-42.
For each treatment arm of each trial in the company’s NMA, the reported Kaplan-Meier curves
were digitized and divided into consecutive intervals over the follow-up period. For each time
interval extracted survival proportions were used to calculate the patients at risk at the beginning
of that interval and incident number of deaths. A binomial likelihood distribution of the incident
events for every interval was assumed.
Confidential – do not copy or circulate
Version 1 46
Two orders of FP model were considered for inclusion: first-order, which corresponds to the
Weibull model (where exponent P1=0) or the Gompertz model (where exponent P1=1); and
second-order models with exponents P1=0 and P2=0; P1=0 and P2=1; P1=1 and P2=0; and
P1=1 and P2=1. The CS did not include a zero-order FP model which the ERG believes would
be analogous to a proportional hazards-based model. The ERG requested this from the company
(clarification question A15). In response the company ran the NMA using each of the six
fractional polynomial models with a treatment effect only on the scale parameter of the log-
hazard function (thus assuming proportional hazards). The ERG notes that HRs for OS and PFS
generated by this model appear similar to those obtained from the constant hazard ratios NMA.
3.1.7.5 Choice of fractional polynomial NMA model
To select the most appropriate FP model the company used the deviance information criteria
(DIC) to compare goodness-of-fit. The DIC is commonly used to compare the fit of Bayesian
statistical models. The model with the smallest DIC is estimated to be the model that would best
predict a replicate dataset which has the same structure as that currently observed.43 It appears
that the model with the lowest DIC was selected by the company. The CS does not state whether
any other considerations were taken into account in the choice of model, such as clinical
plausibility with respect to OS and PFS as observed in the constituent trials in the NMA.
Responding to a clarification question the company stated that the DIC was the sole criterion to
select the statistical model for the NMA (clarification response A14). They commented that this is
appropriate as the aim of the NMA is primarily estimation rather than extrapolation of relative
treatment effects. For OS the best fitting model selected was the 2nd order (P1=1, P2=0), and for
PFS the best fitting model was the 2nd order (P1=1, P2=1).
The ERG requested the NMA results from the company (in terms of PFS and OS HRs and
accompanying parameter estimates) for each of the other five FP models (clarification question
A15). The company supplied these as requested in their response document and in addition,
HRs for all treatments versus MPT at six monthly intervals from 0 to 90 months for all six FP
models (not originally provided in the CS). The ERG notes from visual inspection of the FP HR
plots (Figures 2 to 7 in the company’s clarification response document) that the OS HRs
(compared to MPT) appear to be broadly consistent between the six fractional polynomial models
(by the slope of the curves). However, there is more variation between fractional polynomial
models for the PFS outcome (Figures 8 to 13 in the company’s clarification response document),
notably for VMP versus MPT which shows a marked increase in HRs over time in the Gompertz
fractional polynomial model, the second order fractional polynomial model (P1=1, P2=0) and the
Confidential – do not copy or circulate
Version 1 47
second order fractional polynomial model (P1=1, P2=1), (the latter being the best fitting fractional
polynomial model chosen by the company, see CS Figure 16). The HRs reach a peak of between
10 to 12 at the end of the observation period (at 90 months), with very wide credible intervals
favouring MPT (Table 19 of the company’s response document also reported these as numerical
values in addition to curves). The company does not discuss the explanations for and
consequences of the differences between the fractional polynomial models. The ERG’s
interpretation of this is that, for PFS, the results of the fractional polynomial NMA results are
sensitive to the model chosen, with much uncertainty around the estimates within some of the
fractional polynomial models, including within the best-fitting model selected by the company.
This potentially over-estimates the comparative effectiveness of Rd compared to VMP which is
demonstrated by lower incremental cost effectiveness ratios (ICERs) when a fractional
polynomial rather than a constant HR model is used to inform the comparison of Rd versus VMP
– as discussed later in this report (section 4.3.10).
3.1.7.6 Choice between a constant hazard ratio NMA and a time-varying fractional polynomials NMA
Having conducted the two statistical methods the CS states that the constant HRs should be
considered for the primary analysis of PFS and OS as the time-varying HRs NMA results did not
indicate a statistically significant time-dependency in the HRs.
CS Table 19 and Table 21 provide the basic parameter estimates of the 2nd order FP model
selected by the company for OS and PFS, respectively. These tables include the d1 (shape)
estimate for each of the treatments included. The company’s interpretation of this is that the
change in log (HR) was not statistically significant from zero for any comparison and therefore, it
is reasonable to assume proportional hazards on this basis. The ERG asked the company to
elaborate on the interpretation of the d1 parameter in a fractional polynomial NMA (clarification
question A13). The company clarified that d1 is the relative treatment effect on the first shape
parameter of the parametric log (HR) function (for each treatment versus MPT). A positive d1
indicates an increasing log (HR) over time, whilst a negative value indicates a decreasing log
(HR) over time. Importantly, a value significantly different from zero indicates statistically
significant changes in the log (HR) over time. As an example, the OS under the best-fitting 2nd
order fractional polynomial model the d1 parameter is -0.00592 for Rd versus MPT, meaning that
the HR decreases over time (clarification response, Table 9). This can be observed graphically in
CS Figure 15 where the HR line for Rd (in red) decreases over the trial observation period (we
reproduce this as Figure 8 later in this report). The d1 credible interval is -0.01212 to 0.00028

Confidential – do not copy or circulate
Version 1 48
and as such includes zero, thus supporting the inference that the d1 parameter value is not
statistically significant from zero. The results of the time-varying fractional polynomial NMA, in
terms of the basic parameter estimates from the second order fractional polynomial model, are
therefore used to justify the company’s decision to use the constant hazard ratio NMA.
The ERG notes that the Kaplan-Meier curves for PFS in the MM-020 trial in the CS (Figures 3 to
6 - we reproduce these in section 3.3.1 of this report) diverge after around 92 weeks indicating
that the proportion hazards assumption may not necessarily hold. The Kaplan-Meier curves for
OS in the MM-020 trial appear more parallel on visual inspection (CS Figure 7 – we reproduce
these in section 3.3.2 of this report). The log-cumulative hazards plots of Rd and MPT in the CS
(CS Figure 18) for PFS and OS respectively show a similar pattern. This is explained in the CS
as a delayed treatment effect for Rd (an increase in the hazard for the fixed duration MPT which
was stopped at this point, whereas Rd was given continuously until progression).
3.1.7.7 Summary of the NMA
The NMA includes four trials and was conducted for two outcomes, PFS and OS. The network
contains direct comparisons (Rd versus MPT, MPT versus MP, VMP versus MP) and indirect
comparisons (VMP versus MPT, VMP versus Rd). However, there are no comparisons informed
by both direct and indirect evidence. The results of the indirect comparison of Rd versus VMP are
used to inform the economic model. Baseline characteristics were well distributed across the four
included trials and the trials appear similar enough to fulfil the assumptions underpinning the
NMA (CS section B.3.2.1).
The company conducted two NMA statistical approaches: one based on constant HRs assuming
proportional hazards, and one based on time-varying HRs as estimated by a fractional
polynomial model (which does not assume proportional hazards). The parameter estimates from
the fractional polynomial NMA (specifically d1, the relative treatment effect on the first shape
parameter of the parametric log (HR) function) were not statistically significant from zero for any
comparison. This indicates that the proportional hazards assumption can be met and supports
the company’s choice of using constant HRs as their primary analysis. The ERG notes that there
is inconsistency between the different fractional polynomial NMA models in the PFS HRs for the
comparison of Rd and VMP, with wide credible intervals. Taking all the above issues into
consideration, the ERG believes that use of the constant hazard ratio NMA as the primary
analysis is appropriate in this instance.

Confidential – do not copy or circulate
Version 1 49
3.2 Summary statement of company’s approach
Table 10 provides the ERG quality assessment of the company’s systematic review of clinical
effectiveness. As the table shows, the systematic review met all of the criteria indicating a good
quality systematic review, though with some caveats. In summary, there is a low chance of
systematic error in the systematic review based on the methods reported in the CS.
Table 10 Quality assessment - Centre for reviews and dissemination criteria (CRD) of CS review
CRD Quality Item: score Yes/ No/ Uncertain with comments
1. Are any inclusion/exclusion criteria
reported relating to the primary studies
which address the review question?
Yes (ERG critique 3.1.2), although a couple of additional
comparators could have been included. The criteria were
interventions based on lenalidomide, thalidomide, bortezomib
and melphalan plus prednisone as monotherapy or as part of
a combination, excluding all other treatments. Comparators
were placebo studies, intervention therapies at a different
dose or duration and any other active drug provided as
monotherapy or as part of a combination therapy. Studies of
thalidomide with melphalan and prednisone (MPT) were
included, but studies of an alternative regimen comprising
thalidomide with attenuated cyclophosphamide and
dexamethasone (CTDa) were excluded as they are not
licensed in the UK. Expert clinical advice to the ERG is that
CTDa is widely used in UK despite not being licensed. It is
regarded to be similar in effectiveness. Bortezomib
combination of bortezomib, melphalan and prednisone
(VMP) were included in the CS, however expert clinical
advice to the ERG suggests that other bortezomib regimens
such as bortezomib (with cyclophosphamide) and
dexamethasone (CVD) are also sometimes used for first line
treatment despite not being licensed for first line use in the
UK.
2. Is there evidence of a substantial effort
to search for all relevant research? i.e. all
studies identified
Yes (ERG critique section 3.1.1), although eligibility criteria
for interventions and comparators were developed prior to
the release of the draft scope and therefore were broader
than required for the decision problem. A wide range of
electronic databases and other sources were searched
(14/3/2016) and searches were subsequently updated twice
Confidential – do not copy or circulate
Version 1 50
(8/11/2016 and 8/8/2017). The company states that the
included studies were narrowed down to those relevant to
the decision problem.
3. Is the validity of included studies
adequately assessed?
Yes (ERG critique section 3.1.4), standard criteria have been
used. CRD criteria are used for the MM-020 trial (CS
Appendix D.1.3, Table 66). In addition, the Cochrane Risk of
Bias criteria are used to assess bias for three comparator
RCTs included in the NMA and also the MM-020 RCT (CS
Appendix D.1.3, Table 67). Data from MM-020 was used
substantially in the CS to inform the economic model.
4. Is sufficient detail of the individual
studies presented?
Yes. Key characteristics are tabulated and reported in the
text, accompanied by illustrative figures. Limited baseline
data are given for the comparator trials included in the NMA.
5. Are the primary studies summarised
appropriately?
Yes, see summary ERG Section 3.4.
3.3 Summary of submitted evidence
3.3.1 Summary of results for progression-free survival (PFS)
Table 11 presents an overview of the PFS analyses presented in the CS for the primary
comparisons of Rd versus MPT and their results.
Table 11 Summary of PFS analyses presented in the CS (ITT population) for Rd vs MPT
PFS, median months Rd (n=535)
MPT (n=547)
Hazard ratio (95% Cl), p-value
24th May 2013 data cut-off, IRAC assessment (FDA censoring)
25.5 21.2 0.72 (0.61 to 0.85), p=0.00006
24th May 2013 data cut-off, IRAC assessment (EMA censoring)
27.3 23.4 0.79 (0.68 to 0.92), p=0.00210
21st January 2016 data cut-off, Investigator assessment (FDA censoring)
26.0 21.9 0.69 (0.59 to 0.79), p<0.00001
21st January 2016 data cut-off, Investigator assessment (EMA censoring)
26.5 23.0 0.74 (95% CI 0.65 to 0.85), p=0.00001
Reproduction of CS Table 14.23 44
3.3.1.1 Primary outcome - progression-free survival (PFS)
The CS presents the IRAC review (IMWG criteria; FDA censoring criteria)25 for the planned
primary comparison of PFS for Rd vs MPT at 72 weeks duration (May 2013 data cut-off, median

Confidential – do not copy or circulate
Version 1 51
follow-up 37 months). Kaplan-Meier plots for the 24th May 2013 data cut-off showed a 28%
reduction in the risk of disease progression or death for Rd (HR 0.72; 95% CI 0.61-0.85; p=
0.000060, with a difference of 4.3 months in median PFS between the groups (25.5 months Rd;
21.2 months MPT) (Figure 2). Patients treated with Rd were more than twice as likely to remain
event-free at four years than those treated with MPT (35% Rd; 15% MPT).23 The ERG requested
from the company the investigator assessment of PFS at the 24th May 2013 data cut-off
(clarification question A9). These were subsequently provided and showed similar results to the
IRAC assessment (results not reproduced here).
PFS at 72 weeks duration for the secondary PFS comparison between treatment with Rd and
Rd18 showed a 30% reduction in the risk of disease progression or death for Rd (HR 0.70; 95%
CI 0.60-0.82; p=0.00001). At four years, 35% of patients receiving Rd compared with 13%
receiving Rd18 remained event-free.
The CS presented an updated analysis of PFS data based on the later 21st January 2016 data
cut-off (Figure 3) by investigator assessment (IMWG criteria; FDA censoring rule), with a median
follow up 67 months. Kaplan-Meier PFS plots remained consistent with results from the earlier
data cut-off (Figure 2). The Rd group had a 31% lower risk of disease progression or death
compared with the MPT group (HR 0.69; 95% CI 0.59 - 0.79; p<0.00001) and 30% compared
with the Rd18 group (HR 0.70; 95% CI 0.60 - 0.81; p<0.00001).23 Median PFS was greatest in
the Rd group (Rd = 26 months; Rd18 = 21 months; MPT = 21.9 months). Patients in the Rd
group had a 6.9 months longer median TTP (p<0.00001) compared to the MPT group (Rd = 31.3
months vs MPT = 24.4 months), with a 36% lower risk of disease progression or death (HR 0.64,
95% CI 0.54 - 0.75). At five years, the highest proportion of patients remaining event-free were
those receiving the continuous lenalidomide combination (27% Rd; 11% Rd18; 9% MPT).

Confidential – do not copy or circulate
Version 1 52
Reproduction of CS Figure 3.23 Horizontal line indicates the median; short vertical lines on each curve indicate patients with censored data.
Figure 2 Kaplan–Meier plots of PFS - IRAC review (IMWG criteria), ITT population (FDA censoring criteria). 24th May 2013 data cut-off.
Reproduction of CS Figure 5.23 44 Horizontal line indicates the median; short vertical lines on each curve indicate patients with censored data.
Figure 3 Kaplan–Meier plots of PFS - Investigator assessment (IMWG criteria), ITT population (FDA censoring criteria). 21st January 2016 data cut-off.

Confidential – do not copy or circulate
Page 53 of 128
3.3.1.2 Sensitivity analysis, IRAC assessment (EMA censoring criteria) 24th May 2013 data cut-off
The company presented a sensitivity analyses for PFS by IRAC assessment (IMWG rules) in
order to assess the robustness of the primary PFS results (FDA censoring rules) (Figure 4).
The data was re-analysed using censoring rules based on 2012 EMA guidance (PFS definition:
time from randomisation to objective disease progression or to death from any cause).45 The
results, although more conservative than those based on FDA criteria, were consistent with the
primary PFS analysis (HR 0.79; 95% CI 0.68–0.92; p=0.00210).
Reproduction of CS Figure 4.23 44
Figure 4 Kaplan–Meier plots of PFS - IRAC review (IMWG criteria), ITT population (EMA
censoring criteria). 24th May 2013 data cut-off.
Updated 2016 data analysis (21st January 2016 data cut-off) using EMA censoring rules were
similarly more conservative compared to the analysis based on FDA censoring rules. The risk
of disease progression or death remained lower for Rd compared to MPT (HR 0.74; 95% CI
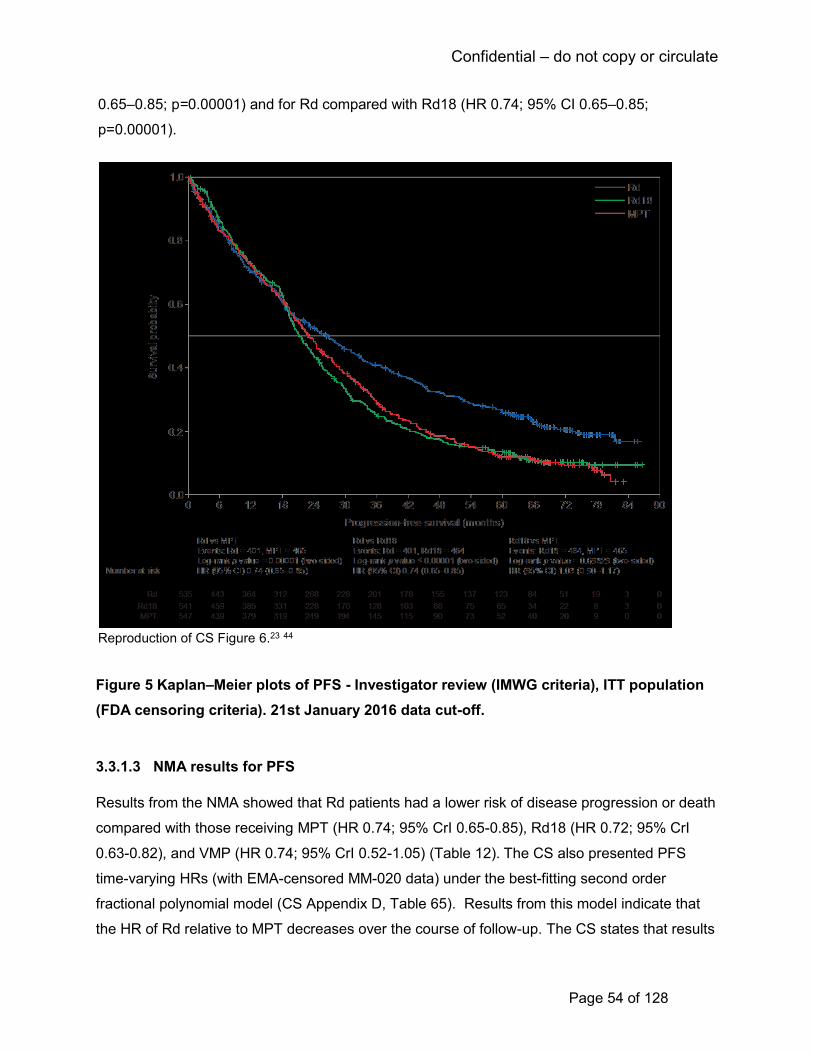
Confidential – do not copy or circulate
Page 54 of 128
0.65–0.85; p=0.00001) and for Rd compared with Rd18 (HR 0.74; 95% CI 0.65–0.85;
p=0.00001).
Reproduction of CS Figure 6.23 44
Figure 5 Kaplan–Meier plots of PFS - Investigator review (IMWG criteria), ITT population
(FDA censoring criteria). 21st January 2016 data cut-off.
3.3.1.3 NMA results for PFS
Results from the NMA showed that Rd patients had a lower risk of disease progression or death
compared with those receiving MPT (HR 0.74; 95% CrI 0.65-0.85), Rd18 (HR 0.72; 95% CrI
0.63-0.82), and VMP (HR 0.74; 95% CrI 0.52-1.05) (Table 12). The CS also presented PFS
time-varying HRs (with EMA-censored MM-020 data) under the best-fitting second order
fractional polynomial model (CS Appendix D, Table 65). Results from this model indicate that
the HR of Rd relative to MPT decreases over the course of follow-up. The CS states that results
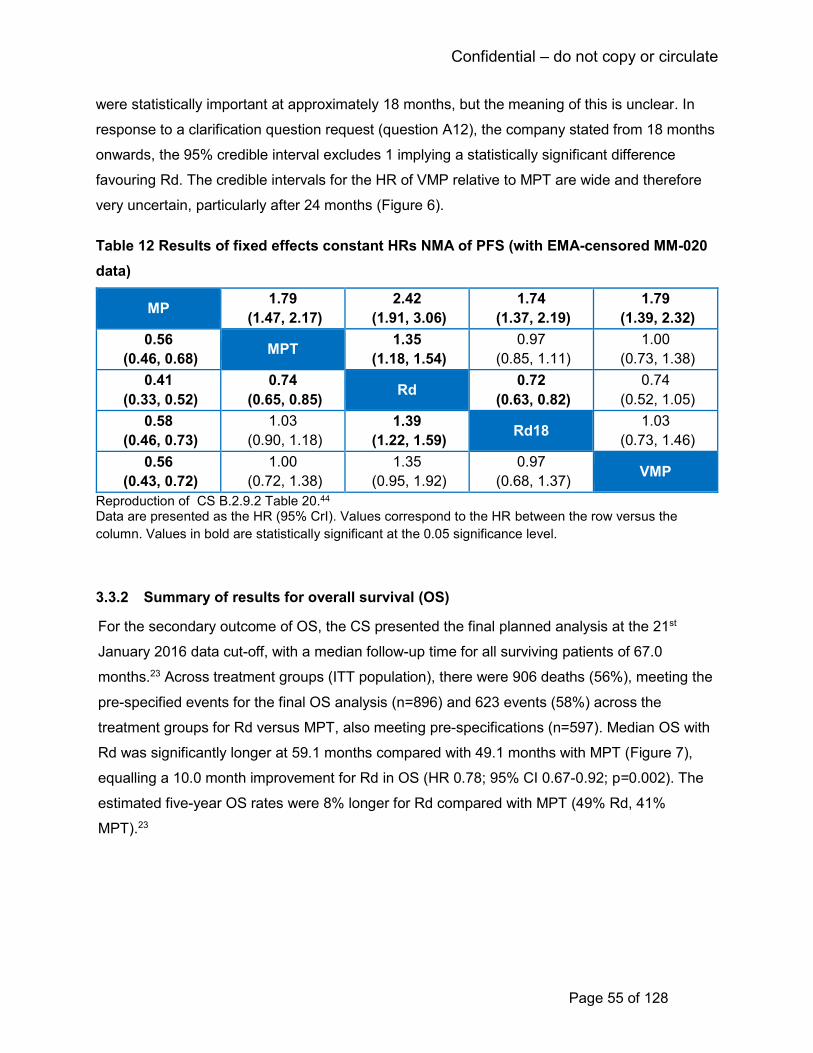
Confidential – do not copy or circulate
Page 55 of 128
were statistically important at approximately 18 months, but the meaning of this is unclear. In
response to a clarification question request (question A12), the company stated from 18 months
onwards, the 95% credible interval excludes 1 implying a statistically significant difference
favouring Rd. The credible intervals for the HR of VMP relative to MPT are wide and therefore
very uncertain, particularly after 24 months (Figure 6).
Table 12 Results of fixed effects constant HRs NMA of PFS (with EMA-censored MM-020
data)
MP 1.79
(1.47, 2.17)
2.42
(1.91, 3.06)
1.74
(1.37, 2.19)
1.79
(1.39, 2.32)
0.56
(0.46, 0.68) MPT
1.35
(1.18, 1.54)
0.97
(0.85, 1.11)
1.00
(0.73, 1.38)
0.41
(0.33, 0.52)
0.74
(0.65, 0.85) Rd
0.72
(0.63, 0.82)
0.74
(0.52, 1.05)
0.58
(0.46, 0.73)
1.03
(0.90, 1.18)
1.39
(1.22, 1.59) Rd18
1.03
(0.73, 1.46)
0.56
(0.43, 0.72)
1.00
(0.72, 1.38)
1.35
(0.95, 1.92)
0.97
(0.68, 1.37) VMP
Reproduction of CS B.2.9.2 Table 20.44 Data are presented as the HR (95% CrI). Values correspond to the HR between the row versus the
column. Values in bold are statistically significant at the 0.05 significance level.
3.3.2 Summary of results for overall survival (OS)
For the secondary outcome of OS, the CS presented the final planned analysis at the 21st
January 2016 data cut-off, with a median follow-up time for all surviving patients of 67.0
months.23 Across treatment groups (ITT population), there were 906 deaths (56%), meeting the
pre-specified events for the final OS analysis (n=896) and 623 events (58%) across the
treatment groups for Rd versus MPT, also meeting pre-specifications (n=597). Median OS with
Rd was significantly longer at 59.1 months compared with 49.1 months with MPT (Figure 7),
equalling a 10.0 month improvement for Rd in OS (HR 0.78; 95% CI 0.67-0.92; p=0.002). The
estimated five-year OS rates were 8% longer for Rd compared with MPT (49% Rd, 41%
MPT).23
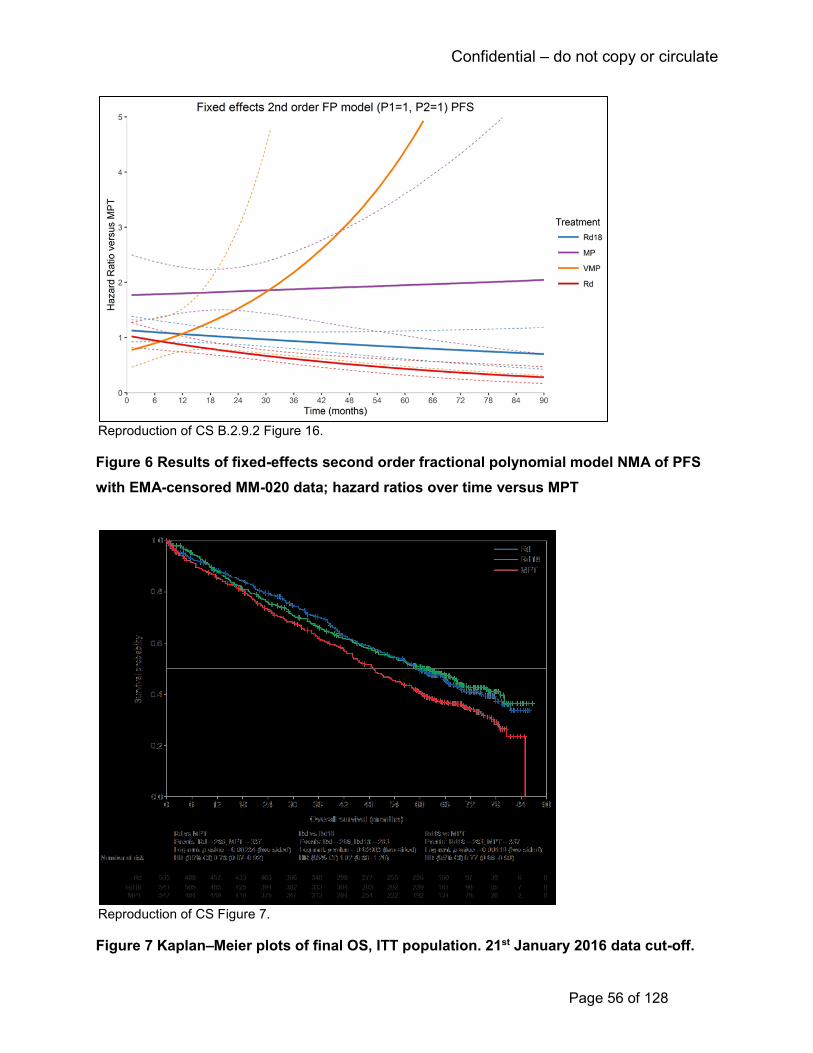
Confidential – do not copy or circulate
Page 56 of 128
Reproduction of CS B.2.9.2 Figure 16.
Figure 6 Results of fixed-effects second order fractional polynomial model NMA of PFS
with EMA-censored MM-020 data; hazard ratios over time versus MPT
Reproduction of CS Figure 7.
Figure 7 Kaplan–Meier plots of final OS, ITT population. 21st January 2016 data cut-off.
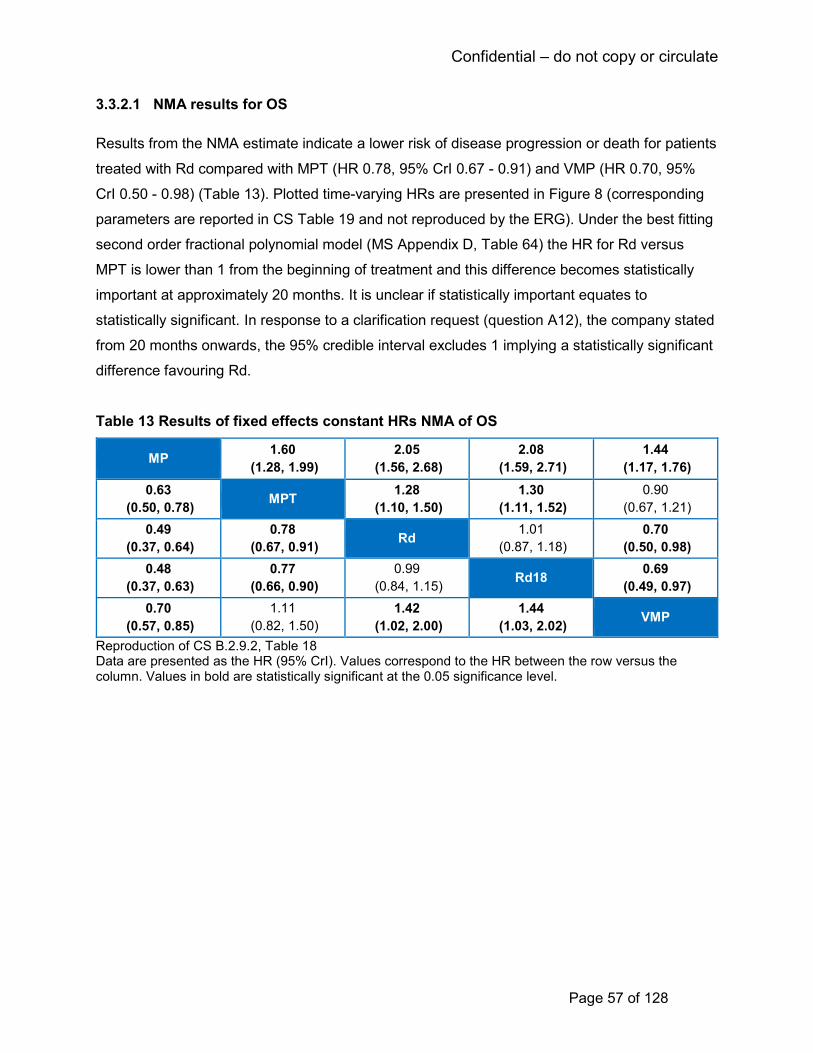
Confidential – do not copy or circulate
Page 57 of 128
3.3.2.1 NMA results for OS
Results from the NMA estimate indicate a lower risk of disease progression or death for patients
treated with Rd compared with MPT (HR 0.78, 95% CrI 0.67 - 0.91) and VMP (HR 0.70, 95%
CrI 0.50 - 0.98) (Table 13). Plotted time-varying HRs are presented in Figure 8 (corresponding
parameters are reported in CS Table 19 and not reproduced by the ERG). Under the best fitting
second order fractional polynomial model (MS Appendix D, Table 64) the HR for Rd versus
MPT is lower than 1 from the beginning of treatment and this difference becomes statistically
important at approximately 20 months. It is unclear if statistically important equates to
statistically significant. In response to a clarification request (question A12), the company stated
from 20 months onwards, the 95% credible interval excludes 1 implying a statistically significant
difference favouring Rd.
Table 13 Results of fixed effects constant HRs NMA of OS
MP 1.60
(1.28, 1.99)
2.05
(1.56, 2.68)
2.08
(1.59, 2.71)
1.44
(1.17, 1.76)
0.63
(0.50, 0.78) MPT
1.28
(1.10, 1.50)
1.30
(1.11, 1.52)
0.90
(0.67, 1.21)
0.49
(0.37, 0.64)
0.78
(0.67, 0.91) Rd
1.01
(0.87, 1.18)
0.70
(0.50, 0.98)
0.48
(0.37, 0.63)
0.77
(0.66, 0.90)
0.99
(0.84, 1.15) Rd18
0.69
(0.49, 0.97)
0.70
(0.57, 0.85)
1.11
(0.82, 1.50)
1.42
(1.02, 2.00)
1.44
(1.03, 2.02) VMP
Reproduction of CS B.2.9.2, Table 18 Data are presented as the HR (95% CrI). Values correspond to the HR between the row versus the column. Values in bold are statistically significant at the 0.05 significance level.

Confidential – do not copy or circulate
Page 58 of 128
Reproduction of CS B.2.9.2 Figure 15. MP, melphalan and prednisone; NMA, network-meta analysis; OS, overall survival; Rd, lenalidomide and low-dose dexamethasone until disease progression; Rd18, 18 cycles of lenalidomide and dexamethasone; VMP, bortezomib, melphalan, and prednisone.
Figure 8 Results of fixed-effects second order fractional polynomial model NMA of OS;
HRs over time versus MPT
3.3.3 Summary of results for time to treatment failure (TTF)
The CS presented a TTF analysis with a 21st January 2016 data cut-off (Figure 9). TTF with Rd
treatment was 2.8 months (median) longer compared with MPT treatment (16.9 months Rd;
14.1 months MPT; HR 0.76; 95% CI 0.67–0.86, p=0.00002). In addition, treatment with Rd
showed a 24% reduction in the risk of discontinuing study treatment for any reason compared
with MPT (HR 0.76, 95% CI 0.67 - 0.86).23
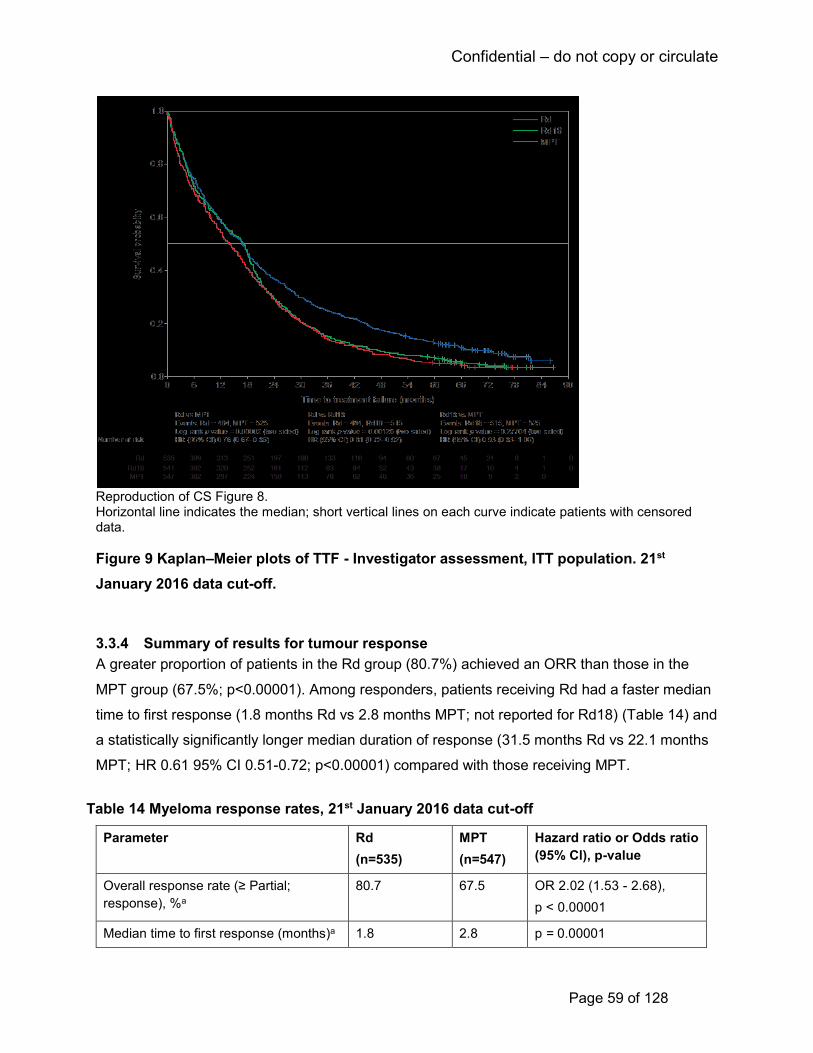
Confidential – do not copy or circulate
Page 59 of 128
Reproduction of CS Figure 8. Horizontal line indicates the median; short vertical lines on each curve indicate patients with censored data.
Figure 9 Kaplan–Meier plots of TTF - Investigator assessment, ITT population. 21st
January 2016 data cut-off.
3.3.4 Summary of results for tumour response
A greater proportion of patients in the Rd group (80.7%) achieved an ORR than those in the
MPT group (67.5%; p<0.00001). Among responders, patients receiving Rd had a faster median
time to first response (1.8 months Rd vs 2.8 months MPT; not reported for Rd18) (Table 14) and
a statistically significantly longer median duration of response (31.5 months Rd vs 22.1 months
MPT; HR 0.61 95% CI 0.51-0.72; p<0.00001) compared with those receiving MPT.
Table 14 Myeloma response rates, 21st January 2016 data cut-off
Parameter Rd
(n=535)
MPT
(n=547)
Hazard ratio or Odds ratio
(95% Cl), p-value
Overall response rate (≥ Partial;
response), %a
80.7 67.5 OR 2.02 (1.53 - 2.68),
p < 0.00001
Median time to first response (months)a 1.8 2.8 p = 0.00001
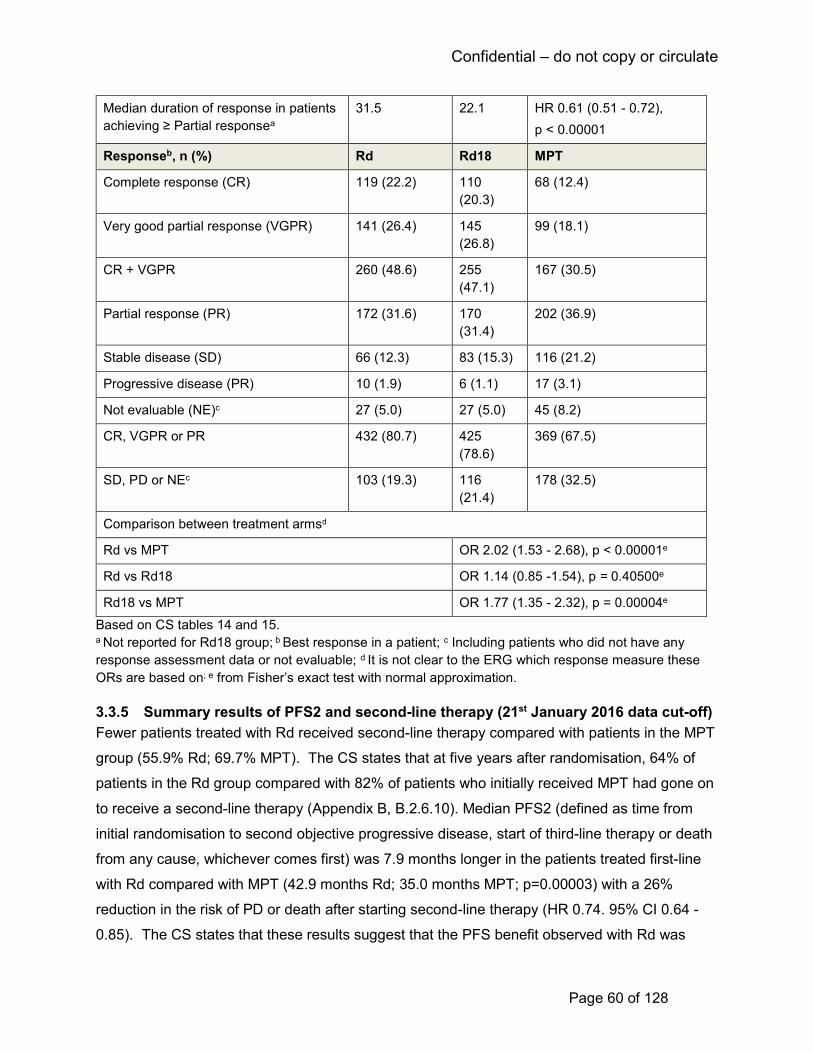
Confidential – do not copy or circulate
Page 60 of 128
Median duration of response in patients
achieving ≥ Partial responsea
31.5 22.1 HR 0.61 (0.51 - 0.72),
p < 0.00001
Responseb, n (%) Rd Rd18 MPT
Complete response (CR) 119 (22.2) 110
(20.3)
68 (12.4)
Very good partial response (VGPR) 141 (26.4) 145
(26.8)
99 (18.1)
CR + VGPR 260 (48.6) 255
(47.1)
167 (30.5)
Partial response (PR) 172 (31.6) 170
(31.4)
202 (36.9)
Stable disease (SD) 66 (12.3) 83 (15.3) 116 (21.2)
Progressive disease (PR) 10 (1.9) 6 (1.1) 17 (3.1)
Not evaluable (NE)c 27 (5.0) 27 (5.0) 45 (8.2)
CR, VGPR or PR 432 (80.7) 425
(78.6)
369 (67.5)
SD, PD or NEc 103 (19.3) 116
(21.4)
178 (32.5)
Comparison between treatment armsd
Rd vs MPT OR 2.02 (1.53 - 2.68), p < 0.00001e
Rd vs Rd18 OR 1.14 (0.85 -1.54), p = 0.40500e
Rd18 vs MPT OR 1.77 (1.35 - 2.32), p = 0.00004e
Based on CS tables 14 and 15. a Not reported for Rd18 group; b Best response in a patient; c Including patients who did not have any
response assessment data or not evaluable; d It is not clear to the ERG which response measure these
ORs are based on; e from Fisher’s exact test with normal approximation.
3.3.5 Summary results of PFS2 and second-line therapy (21st January 2016 data cut-off)
Fewer patients treated with Rd received second-line therapy compared with patients in the MPT
group (55.9% Rd; 69.7% MPT). The CS states that at five years after randomisation, 64% of
patients in the Rd group compared with 82% of patients who initially received MPT had gone on
to receive a second-line therapy (Appendix B, B.2.6.10). Median PFS2 (defined as time from
initial randomisation to second objective progressive disease, start of third-line therapy or death
from any cause, whichever comes first) was 7.9 months longer in the patients treated first-line
with Rd compared with MPT (42.9 months Rd; 35.0 months MPT; p=0.00003) with a 26%
reduction in the risk of PD or death after starting second-line therapy (HR 0.74. 95% CI 0.64 -
0.85). The CS states that these results suggest that the PFS benefit observed with Rd was

Confidential – do not copy or circulate
Page 61 of 128
maintained with the next line of therapy. As would be expected, more MPT patients received a
lenalidomide-based regimen as second line therapy compared to Rd patients (39.4% MPT;
13.7% Rd). The CS states in Appendix L1.1 that the most frequently chosen second-line
treatment across treatment groups was a bortezomib-based regimen (59.9% Rd; 44.6% MPT),
followed by alkylating agents (51.5% Rd; 23.1% MPT). The CS states that thalidomide-based
regimens were seldom used. At the 21st January 2016 data cut-off, a lower proportion of
patients in the Rd arm (56%) had received salvage therapy compared to those in the Rd18 or
MPT arms (70% each) as can be seen in Table 15.
Table 15 PFS2 and second-line therapy, 21st January 2016 data cut-off
Parameter Rd
(n=535)
MPT
(n=547)
Hazard ratio (95% Cl), p-value
Median PFS2, months 42.9 35.0 HR 0.74 (0.64 - 0.85),
p = 0.00003
Median time to second-line AMT, months (%)
36.7
(55.9)
26.7
(69.6)
HR 0.63 (0.54 - 0.73),
p < 0.00001
Salvage Therapy, n (%) Rd (n=535) Rd18 (n=541) MPT (n=547)
Any salvage therapy (ITT population) 299 (55.9) 377 (69.7) 381 (69.7)
Lenalidomidea 75 (25.1) 141 (37.4) 264 (69.3)
Bortezomib/carfilzomiba 236 (78.9) 283 (75.1) 277 (72.7)
Thalidomidea 67 (22.4) 63 (16.7) 38 (10.0)
Glucocorticoida,b 277 (92.6) 357 (94.7) 357 (93.7)
Alkylating agentsa,c 213 (71.2) 245 (65.0) 188 (49.3)
Other therapies a 93 (31.1) 108 (28.6) 99 (26.0)
Partly based on a reproduction of CS Table 14 and Table 16 23
CI, confidence interval; ITT, intention-to-treat. a Percentages were based on the number of patients who received any salvage therapy. b Included betamethasone, deltison, dexamethasone, methylprednisolone, prednisolone, prednisone, and
corticosteroid. c Included betamethasone, carmustine, cyclophosphamide, fotemustine, melphalan, chlorambucil,
busulfan, dihydroxybusulfan, mechlorethamine, lomustine, semustine, dacarbazine, cisplatin, and
carboplatin.
3.3.6 Summary of health related quality of life
In the MM-020 trial, the HRQoL analysis focused on the generic EQ-5D utility value and six pre-
selected and clinically relevant HRQoL domains within the EORTC QLQ-MY20 and the general
oncology-related EORTC QLQ-C30 instruments. These six domains included Disease
Symptoms and Side Effects of Treatment (QLQ-MY20) and Global Health Status, Physical
Functioning, Fatigue and Pain (QLQ-MY30). In order to assess whether statistically significant
Confidential – do not copy or circulate
Page 62 of 128
differences translated to clinically meaningful differences, the minimal important difference
(MID) associated with each domain was considered. For EQ-5D the MID was stated as 0.07
using the Walters and Brazier standard.46 The source of the MID for the EORTC instruments
was not cited however. As stated earlier, the CS pools results for the Rd and Rd18 arms of the
MM-020 trial for this analysis. The ERG agrees this is acceptable in this instance. As also stated
earlier, EQ-5D results from the MM-020 trial (for the comparison between Rd and MPT) are
used to inform the economic model (further detail on this is provided in section 4.3.6 of this
report).
The CS reports percentage questionnaire compliance rates at each assessment time point. The
exact numbers of patients contributing data, although not quoted in the CS, were available from
the journal publication by Delforge et al.47 Compliance rates were calculated as the number of
questionnaire compliant patients divided by the number of patients with clinical data at that
assessment timepoint. The CS states that compliance with the questionnaires was similar
between treatment arms at the end of the first treatment cycle and after three and six months (≥
84%). At months 12 and 18 however, compliance rates were statistically significantly lower
among patients randomised to MPT than to Rd (around 10% - 15% lower) but at study
discontinuation, there was no statistically significant difference between groups, with compliance
rates at 53% – 59% between treatment arms.47
3.3.6.1 EQ-5D utility value
Results for the EQ-5D are reported in the CS as the mean change from baseline in graphical
format, rather than numerically. The absolute EQ-5D values at each assessment time-point are
not given. However, the journal publication by Delforge et al.47 reports that mean EQ-5D utility
value at baseline was 0.5 (SD = 0.4) in both treatment arms. The CS reports statistically
significant improvements from baseline in patients’ EQ-5D HRQoL within both treatment arms,
Rd and MPT at all time points after the first cycle (p < 0.05). However, no statistically significant
differences were reported between treatment arms. Results are summarised in CS Figure 11
which is reproduced below (Figure 10). The CS states that the Rd group demonstrated a
consistent clinically meaningful improvement in HRQoL as measured by EQ-5D at all post-
baseline assessments except at month one. The CS also states that the MPT group only
demonstrated a clinically meaningful improvement at month three. The ERG presumes that the
CS is referring to a MID of 0.07 or greater however, from examination of Figure 10 it appears
that the MPT group had an increase of HRQoL around 0.07 or greater at all time points except
month one.

Confidential – do not copy or circulate
Page 63 of 128
+ Significant within-group change from baseline (p < 0.05, 1-sample t-test).
*Significant between-group difference in change from baseline (p < 0.05, 2-sample t-test). a Stable disease can occur at any time point.
Figure 10 Cross-sectional analysis of mean EQ-5D change from baseline per assessment visit and at study discontinuation in the Rd and MPT groups for MM-020 (CS Fig 11).
The overall mean change from baseline in EQ-5D utility can be seen from Figure 11 (CS Figure
12). The increase in utility was slightly higher for Rd compared to MPT.
3.3.6.2 EORTC QLQ-C30
Statistically significant improvements (p<0.05) from baseline were observed for Rd and MPT for
global health, physical functioning at all time points after the first cycle, however no significant
differences were reported between treatment groups.47 In addition, whilst both Rd and MPT
showed statistically significant (p<0.05) reductions in pain at all post-baseline assessments,
when the MID of 12 for pain was applied, clinically meaningful improvements at 6 and 12
months for Rd compared to MPT were observed. The Rd group showed statistically significant
improvement in fatigue at months 3, 6 and 12 but not at month 18. The MPT group had a
statistically significant improvement at months 6 and 12.

Confidential – do not copy or circulate
Page 64 of 128
Figure 11 Linear mixed-model repeated-measures analysis of mean change from baseline
at 18 months in the Rd and MPT groups for MM-020 (CS Fig 12).
3.3.6.3 EORTC QLQ-MY20
Statistically significant improvements (p<0.05) from baseline were also observed for Rd and
MPT for the domains of the EORTC QLQ-MY20 questionnaire. Rd demonstrated a significantly
greater reduction in disease symptoms compared with MPT at Month 3 (p=0.04) and an overall
lower symptom score across all assessments.47 Although Rd and MPT both showed a
worsening in the QLQ-MY20 side effects of treatment domain, the Rd group showed
consistently lower scores, indicating fewer or less severe side effects, across all post-baseline
assessments, with all but month 18 being statistically significantly (p<0.05) lower than the MPT
group. Results obtained from applying data to a linear-mixed-model repeated measures
analysis (CS section 2.6.11) demonstrated a significant difference in mean change from
baseline for side effects in the Rd arm versus MPT (p=<0.0001). For side effects of treatment,
however, with an MID of 6, the results for both Rd and MPT were not deemed to be clinically
significant.
3.3.7 Sub-group analyses results
The CS reports investigator assessment of selected outcomes (PFS, PFS2, OS and tumour
response) to compare the effect of treatments between specified subgroups.

Confidential – do not copy or circulate
Page 65 of 128
The CS presents median PFS by age and ISS stage subgroups (Investigator assessment, 21st
Jan 2016 cut-off) in Appendix E (CS Table 68). Median PFS was significantly longer for patients
under 75 years of age receiving Rd (28.1 months) compared with patients receiving MPT (22.4
months), with a 36% reduction in the risk of disease progression or death for those in the Rd
group (HR 0.64, 95% CI 0.54-0.77; p<0.00001). The median PFS for patients with ISS stage I or
II multiple myeloma receiving Rd (31.3 months) was also significantly longer compared with
those receiving MPT (24.5 months), with a 33% reduction in the risk of disease progression or
death for the Rd group (HR 0.67, 95% CI 0.55 - 0.81; p=0.00003) (Table 16).
Table 16 PFS by age and ISS stage for MM-020, Investigator assessment –21st January 2016 data cut-off.
Stratification subgroup
Median PFSa (months) HRb (95% CI)c
p valued
Rd Rd18 MPT
≤ 75 years
28.1 (n = 349) 21.6 (n = 348) 22.4 (n = 359) 0.64 (0.54–0.77) <0.00001
> 75 years
20.3 (n = 186) 19.4 (n = 193) 19.8 (n = 188) 0.78 (0.60–0.99) 0.04454
ISS stage I or II
31.3 (n = 319) 23.1 (n = 322) 24.5 (n = 323) 0.67 (0.55–0.81) 0.00003
ISS stage III 18.4 (n = 216) 18.2 (n = 219) 18.9 (n = 224) 0.71 (0.57–0.90) 0.00414 Reproduction of CS Appendix E, Table 6823
a Median PFS is based on the Kaplan–Meier estimate. b Rd vs MPT, based on stratified Cox proportional hazards model comparing the hazard functions associated with
treatment groups. c 95% CI about the median PFS time. d p value is based on the unstratified log-rank test.
Data for the remaining subgroups were presented in a Forest plot (see Figure 12). The CS
states that results were consistent with primary ITT analysis showing a benefit for Rd over MPT
in the majority of subgroups, except for those with too few patients (e.g. LDH levels ≥ 200 U/L
and Asian race).

Confidential – do not copy or circulate
Page 66 of 128
Reproduction of Figure 33, Appendix E
Figure 12 Hazard ratio by subgroup for PFS between the Rd and MPT treatment arm (ITT Population), Investigator assessment, 21st January 2016 data cut-off
3.3.8 Summary of adverse events
3.3.8.1 Treatment duration and intensity
The CS presents AEs for the MM-020 trial at the 21st January 2016 data cut-off for the safety
population (1,613 patients). The median duration of treatment exposure for patients was 80.2
weeks for the Rd group (range 0.7-374.1), 72.0 weeks for the Rd18 group (range 0.9-102.6) and
67.1 weeks for the MPT group (range 0.1-110.0) (CS Section B.2.10.2 and Appendix F, Table
69). The difference in treatment duration between the Rd group and the Rd18 group appears to
be primarily related to the study design, in which the treatment arm Rd18 is limited to 18 cycles
while Rd continues until disease progression. Treatment duration for over a third of patients in
the Rd group (39%) ranged between two and three years, for around a quarter (26%) of patients
between three and four years and around a fifth of patients (18%) between four and five years.
A small proportion of patients (6%) were treated for more than six years (CS B.2.10.2 and
Appendix F, Table 69). Therefore half of the Rd group had a treatment duration in excess of
three years.
Confidential – do not copy or circulate
Page 67 of 128
3.3.8.2 Treatment-emergent adverse events (TEAEs)
Table 17 shows the TEAEs that occurred in ≥10% of patients of any grade, and also
corresponding Grade 3/4 TEAEs. The majority of patients (>99%) had at least one TEAE
regardless of treatment arm. The CS states that AEs were more likely to occur shortly after
treatment initiation and decrease in frequency over time. In the Rd group the greatest number of
TEAEs at any grade, occurring as individual AEs and experienced in ≥ 10% of patients were
diarrhoea (47.2% Rd; 38.5% Rd18), anaemia (45.7% Rd; 35.7% Rd18), constipation (44.2%
Rd; 39.3% Rd18), peripheral oedema (41.2% Rd; 31.3% Rd 18), neutropenia (36.7% Rd; 33.0%
Rd18) and back pain (34% Rd; 26.9% Rd18). All of the AEs listed in Table 17 were lower in the
Rd18 patient group, who experienced a shorter median treatment. In the MPT treatment group,
the greatest number of TEAEs at any grade, occurring as individual AEs and experienced in
≥10% of patients were neutropenia (60.6%), constipation (52.7%), anaemia (42.3%), peripheral
sensory neuropathy (35.3%) and peripheral oedema (39.7%). Neutropenia and constipation had
a far higher occurrence in patients receiving MPT compared with those treated with Rd. In
contrast, over a third of patients receiving Rd had vascular disorders compared with just over a
quarter of patients receiving MPT (37.4% Rd; 27.4% Rd18; 25.5% MPT). In addition, psychiatric
disorders (described as including insomnia, and depression) affected nearly half of the patients
receiving Rd compared with around a third of patients receiving MPT (49.6% Rd; 43.3% Rd18;
30.9% MPT). The CS provided no discussion on these differences.
3.3.8.3 Grade 3–4 TEAEs
Over 80% of patients experienced ≥1 grade 3/4 TEAEs (Rd 86.3%; Rd18 80.2%; MPT 88.7).
For patients receiving Rd, Grade 3/4 TEAEs were common in patients for the following
categories: blood and lymphatic system disorders (44.2% Rd; 39.6% Rd18; 58.2% MPT);
infections and infestations (31.6% Rd; 21.9% Rd18; 17.2% MPT); neutropenia (29.5% Rd;
26.5% Rd18; 44.9% MPT); general disorders and administration site conditions (26.1% Rd;
23.3% Rd18; 19.6% MPT); nervous system disorders (17.9% Rd; 10.7% Rd18; 30.3% MPT);
anaemia (18.8% Rd; 15.7% Rd18; 18.9% MPT), and vascular disorders (10.9% Rd; 6.5% Rd18;
6.5% MPT).

Confidential – do not copy or circulate
Page 68 of 128
Table 17 TEAEs that occurred in ≥ 10% of patients of any grade listed in descending order of frequency of system organ
classes for the Rd group and corresponding Grade 3/4 TEAEs (safety population)
Treatment arm
System Organ Class, n (%)
Rd, (n = 532) Rd18 (n = 540) MPT (n = 541)
All grades Grade 3/4 All grades Grade 3/4 All grades Grade 3/4
Patients with ≥ 1 AE 529 (99.4) 459 (86.3) 536 (99.3) 433 (80.2) 539 (99.6) 480 (88.7)
General Disorders and Administration Site Conditions 446 (83.8) 139 (26.1) 430 (79.6) 126 (23.3) 423 (78.2) 106 (19.6)
Oedema (peripheral) 219 (41.2) 18 (3.4) 169 (31.3) 10 (1.9) 215 (39.7) 16 (3.0)
Fatigue 180 (33.8) 42 (7.9) 177 (32.8) 46 (8.5) 154 (28.5) 31 (5.7)
Asthenia 155 (29.1) 45 (8.5) 123 (22.8) 33 (6.1) 125 (23.1) 32 (5.9)
Pyrexia 125 (23.5) 17 (3.2) 102 (18.9) 7 (1.3) 76 (14.0) 7 (1.3)
Gastrointestinal Disorders 437 (82.1) 82 (15.4) 411 (76.1) 58 (10.7) 412 (76.2) 67 (12.4)
Diarrhoea 251 (47.2) 25 (4.7) 208 (38.5) 18 (3.3) 89 (16.5) 8 (1.5)
Constipation 235 (44.2) 12 (2.3) 212 (39.3) 10 (1.9) 285 (52.7) 29 (5.4)
Nausea 157 (29.5) 5 (0.9) 128 (23.7) 4 (0.7) 165 (30.5) 13 (2.4)
Vomiting 102 (19.2) 4 (0.8) 68 (12.6) 2 (0.4) 109 (20.1) 10 (1.8)
Abdominal pain 73 (13.7) 8 (1.5) 41 (7.6) 6 (1.1) 30 (5.5) 3 (0.6)
Dyspepsia 59 (11.1) 2 (0.4) 28 (5.2) 1 (0.2) 36 (6.7) 0 (0.0)
Dry mouth 38 (7.1) 0 (0.0) 38 (7.0) 0 (0.0) 62 (11.5) 1 (0.2)
Musculoskeletal and Connective Tissue Disorders 414 (77.8) 108 (20.3) 367 (68.0) 91 (16.9) 312 (57.7) 77 (14.2)
Back pain 181 (34.0) 39 (7.3) 145 (26.9) 34 (6.3) 116 (21.4) 28 (5.2)
Muscle spasms 115 (21.6) 3 (0.6) 102 (18.9) 3 (0.6) 61 (11.3) 4 (0.7)
Arthralgia 111 (20.9) 9 (1.7) 71 (13.1) 8 (1.5) 67 (12.4) 8 (1.5)
Bone pain 91 (17.1) 17 (3.2) 77 (14.3) 15 (2.8) 62 (11.5) 14 (2.6)
Pain in extremity 91 (17.1) 9 (1.7) 66 (12.2) 8 (1.5) 61 (11.3) 7 (1.3)
Musculoskeletal pain 72 (13.5) 3 (0.6) 59 (10.9) 5 (0.9) 36 (6.7) 2 (0.4)
Musculoskeletal chest pain 64 (12.0) 6 (1.1) 51 (9.4) 5 (0.9) 39 (7.2) 3 (0.6)
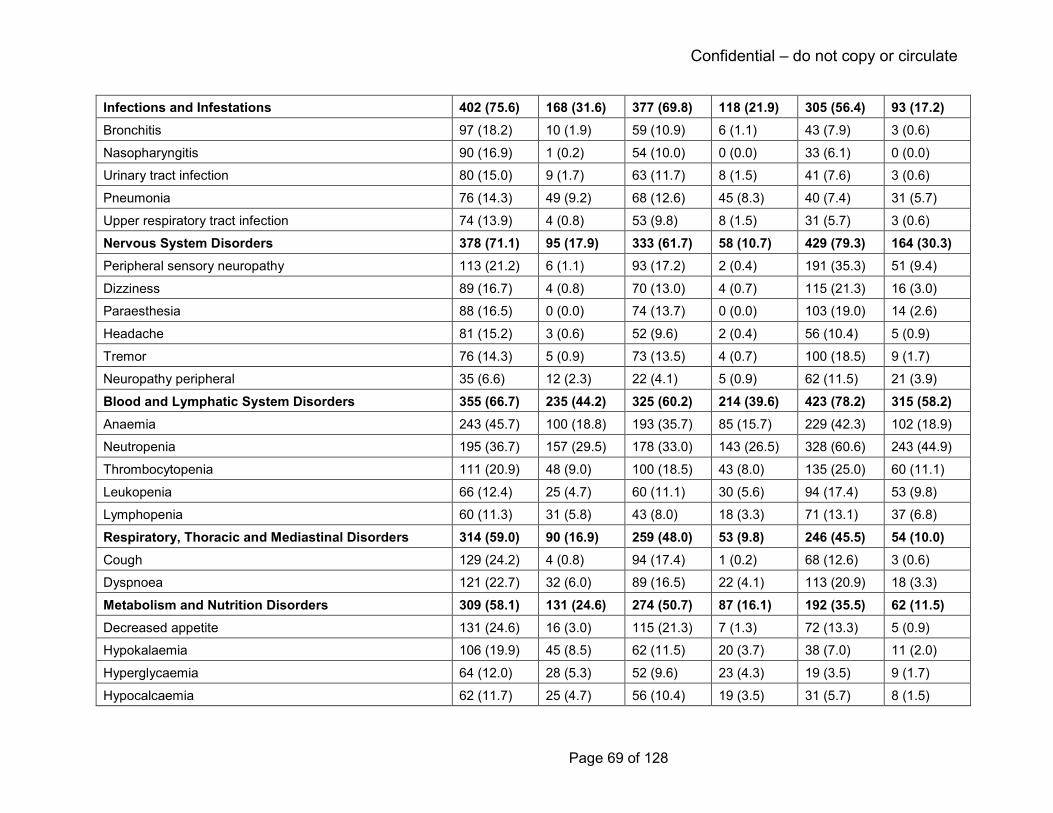
Confidential – do not copy or circulate
Page 69 of 128
Infections and Infestations 402 (75.6) 168 (31.6) 377 (69.8) 118 (21.9) 305 (56.4) 93 (17.2)
Bronchitis 97 (18.2) 10 (1.9) 59 (10.9) 6 (1.1) 43 (7.9) 3 (0.6)
Nasopharyngitis 90 (16.9) 1 (0.2) 54 (10.0) 0 (0.0) 33 (6.1) 0 (0.0)
Urinary tract infection 80 (15.0) 9 (1.7) 63 (11.7) 8 (1.5) 41 (7.6) 3 (0.6)
Pneumonia 76 (14.3) 49 (9.2) 68 (12.6) 45 (8.3) 40 (7.4) 31 (5.7)
Upper respiratory tract infection 74 (13.9) 4 (0.8) 53 (9.8) 8 (1.5) 31 (5.7) 3 (0.6)
Nervous System Disorders 378 (71.1) 95 (17.9) 333 (61.7) 58 (10.7) 429 (79.3) 164 (30.3)
Peripheral sensory neuropathy 113 (21.2) 6 (1.1) 93 (17.2) 2 (0.4) 191 (35.3) 51 (9.4)
Dizziness 89 (16.7) 4 (0.8) 70 (13.0) 4 (0.7) 115 (21.3) 16 (3.0)
Paraesthesia 88 (16.5) 0 (0.0) 74 (13.7) 0 (0.0) 103 (19.0) 14 (2.6)
Headache 81 (15.2) 3 (0.6) 52 (9.6) 2 (0.4) 56 (10.4) 5 (0.9)
Tremor 76 (14.3) 5 (0.9) 73 (13.5) 4 (0.7) 100 (18.5) 9 (1.7)
Neuropathy peripheral 35 (6.6) 12 (2.3) 22 (4.1) 5 (0.9) 62 (11.5) 21 (3.9)
Blood and Lymphatic System Disorders 355 (66.7) 235 (44.2) 325 (60.2) 214 (39.6) 423 (78.2) 315 (58.2)
Anaemia 243 (45.7) 100 (18.8) 193 (35.7) 85 (15.7) 229 (42.3) 102 (18.9)
Neutropenia 195 (36.7) 157 (29.5) 178 (33.0) 143 (26.5) 328 (60.6) 243 (44.9)
Thrombocytopenia 111 (20.9) 48 (9.0) 100 (18.5) 43 (8.0) 135 (25.0) 60 (11.1)
Leukopenia 66 (12.4) 25 (4.7) 60 (11.1) 30 (5.6) 94 (17.4) 53 (9.8)
Lymphopenia 60 (11.3) 31 (5.8) 43 (8.0) 18 (3.3) 71 (13.1) 37 (6.8)
Respiratory, Thoracic and Mediastinal Disorders 314 (59.0) 90 (16.9) 259 (48.0) 53 (9.8) 246 (45.5) 54 (10.0)
Cough 129 (24.2) 4 (0.8) 94 (17.4) 1 (0.2) 68 (12.6) 3 (0.6)
Dyspnoea 121 (22.7) 32 (6.0) 89 (16.5) 22 (4.1) 113 (20.9) 18 (3.3)
Metabolism and Nutrition Disorders 309 (58.1) 131 (24.6) 274 (50.7) 87 (16.1) 192 (35.5) 62 (11.5)
Decreased appetite 131 (24.6) 16 (3.0) 115 (21.3) 7 (1.3) 72 (13.3) 5 (0.9)
Hypokalaemia 106 (19.9) 45 (8.5) 62 (11.5) 20 (3.7) 38 (7.0) 11 (2.0)
Hyperglycaemia 64 (12.0) 28 (5.3) 52 (9.6) 23 (4.3) 19 (3.5) 9 (1.7)
Hypocalcaemia 62 (11.7) 25 (4.7) 56 (10.4) 19 (3.5) 31 (5.7) 8 (1.5)

Confidential – do not copy or circulate
Page 70 of 128
Skin and Subcutaneous Tissue Disorders 298 (56.0) 53 (10.0) 276 (51.1) 47 (8.7) 217 (40.1) 38 (7.0)
Rash 120 (22.6) 33 (6.2) 131 (24.3) 28 (5.2) 93 (17.2) 28 (5.2)
Psychiatric Disorders 264 (49.6) 39 (7.3) 234 (43.3) 34 (6.3) 167 (30.9) 14 (2.6)
Insomnia 150 (28.2) 4 (0.8) 127 (23.5) 6 (1.1) 53 (9.8) 0 (0.0)
Depression 67 (12.6) 10 (1.9) 46 (8.5) 4 (0.7) 30 (5.5) 1 (0.2)
Vascular Disorders 199 (37.4) 58 (10.9) 148 (27.4) 35 (6.5) 138 (25.5) 35 (6.5)
Deep vein thrombosis 55 (10.7) 29 (5.5) 36 (6.7) 20 (3.7) 20 (3.7) 14 (2.6)
Hypotension 57 (10.7) 11 (2.1) 35 (6.5) 8 (1.5) 36 (6.7) 6 (1.1)
Eye Disorders 183 (34.4) 51 (9.6) 126 (23.3) 22 (4.1) 86 (15.9) 7 (1.3)
Cataracts 87 (16.4) 37 (7.0) 31 (5.7) 14 (2.6) 5 (0.9) 3 (0.6)
Investigations 182 (34.2) 55 (10.3) 173 (32.0) 36 (6.7) 142 (26.2) 30 (5.5)
Weight decreased 74 (13.9) 11 (2.1) 78 (14.4) 4 (0.7) 48 (8.9) 4 (0.7)
Reproduction of CS Table 22 (System Organ Classes and Preferred Terms are coded using MedDRA version 15.1).
Confidential – do not copy or circulate
Page 71 of 128
The CS states that incidence of grade 3/4 TEAEs stratified according to age (≤ 75 years and >
75 years) showed similar rates among treatment groups for patients >75 years of age (89.2%
Rd; 85.4% Rd18; 87.5% MPT). Compared to this age group, rates were lower in patients aged
≤75 years receiving Rd, but not in those receiving MPT (84.7% Rd; 77.3% Rd18; 89.4% MPT)
This CS states that reported results of pattern and types of TEAEs for the two age groups were
reflective of the overall ITT populations.
3.3.8.4 Serious adverse events (SAE)
Treatment-emergent SAEs were reported as occurring in ≥ 1% of patients (CS Appendix F,
Table 70 – table not replicated by the ERG) and were over 20% higher in patients receiving Rd
(71.1% Rd; 57.0% Rd18; 49.9% MPT). The most frequently reported SAEs occurring in ≥ 1% of
patients were infections and infestations (33.1% Rd; 23.7% Rd18; 16.5% MPT), pneumonia
(11.1% Rd; 8.9% Rd18; 6.5% MPT) and sepsis (3.2% Rd; 1.9% Rd18; 1.5% MPT). The CS
states that the majority of treatment-emergent SAEs were reported with frequencies of 3% or
less, with the exception of pneumonia (Rd 11.1%; Rd18 8.9%; 6.5% MPT), pulmonary embolism
(3.8% Rd; 2.8% Rd18; 3.1% MPT) and deep vein thrombosis (3.6 Rd; 2.0% Rd18; 1.5% MPT).
The CS suggests that the higher frequency of treatment-emergent SAEs in the Rd group is
reflective of the longer drug-exposure time in this treatment arm, which was around 8 weeks
longer compared to the Rd18 group and around 13 weeks longer that the MPT group based on
medians (see ‘treatment duration and intensity’ above). The CS states that most AEs occurred
within the first 18 months of treatment with continuous Rd, decreasing over time with the
exceptions of infections, which remained stable and the development of cataracts, which
increased with treatment beyond 18 months. Continuing Rd beyond 18 months was associated
with only a small increase in AEs compared with stopping treatment after 18 cycles.
3.3.8.5 Second primary malignancies
Around 12% of all the patients in the safety population experienced at least one second primary
malignancy (192/1,613), with similar proportions in the treatment groups (11.5% Rd; 11.1%
Rd18; 13.1% MPT (CS Appendix F, Table 71). At the 21st January 2016 data cut-off, the median
follow-up time for surviving patients is reported as 67.1 months (range 0.1 - 86.8 months).
Haematological malignancies, although low, were higher in the MPT group than in the Rd
groups (2.6% MPT; 0.8% Rd; 0.4% Rd18) and invasive second primary malignancy were over
2% higher than in the Rd group (8.5% MPT; 6.8% Rd; 7.0 Rd18).

Confidential – do not copy or circulate
Page 72 of 128
3.3.8.6 Death
Fewer patients receiving Rd died (53.4% Rd, 52.4% Rd18) at the January 2016 data cut-off
when compared with patients receiving MPT (62.1%). The CS reports, the most common cause
of death was multiple myeloma (19.9% Rd; 23.5% Rd18; 27.5% MPT). Other reported common
causes of death were infections (9.2% Rd; 5.7% Rd18; MPT 8.5%) and cardiac disorders (5.8%
Rd; 5.2% Rd18; 3.7% MPT).23
3.3.8.7 Treatment discontinuations, dose reductions and dose interruptions
The CS states that most treatment discontinuations occurred due to disease progression
regardless of treatment arm (50.7% Rd; 66.9% Rd18; 61.6% MPT). Discontinuation rates due to
AEs were similar across treatment arms (12.0% Rd; 13.1% Rd18; 13.9% MPT).
Discontinuations due to TEAEs of lenalidomide or thalidomide occurred in over 25% of patients
in both the Rd and the MPT treatment group (25.6% Rd; 17.2% Rd18; 27.0% MPT). Dose
interruptions were around a third higher in both the Rd and MPT treatment group and around
double in the Rd18 group (68.0% Rd; 55.7% Rd18; 71.9% MPT) compared to dose reductions
(41.4% Rd; 28.7% Rd18; 47.0% MPT). Both dose interruptions and dose reductions were more
common in patients receiving MPT. The MPT treatment group also had higher discontinuations
due to AEs in the nervous system disorders system organ class compared to the lenalidomide
treatment groups (3.6% Rd; 1.9% Rd18; 12.6% MPT). Peripheral sensory neuropathy was the
only specific individual AE that led to discontinuation of a study drug in more than 2% of
patients, at 6.7% in the MPT group.
4 COST EFFECTIVENESS
4.1 Overview of company’s economic evaluation
The company’s submission to NICE includes:
• a review of published economic evaluations of immunomodulatory drugs for patients (≥
18 years) with untreated newly diagnosed multiple myeloma ineligible for stem cell
transplantation and/or older than 65 years of age.
• a report of an economic evaluation undertaken for the NICE STA process. The cost
effectiveness of Rd is compared with MPT. For people who are unable to tolerate or
have contraindications to thalidomide, Rd is compared with VMP.
The CS proposes that VMP should be considered as the most relevant comparator for the
purpose of this appraisal. It is stated that “a cost effectiveness case cannot be made against
Confidential – do not copy or circulate
Page 73 of 128
MPT due to thalidomide’s low acquisition cost” (CS page 94). In light of this, the ERG has
primarily concentrated its critique on the comparison of Rd versus VMP for the economic
analyses.
4.2 Company’s review of published economic evaluations
A systematic search of the literature was conducted by the company to identify economic
evaluations in patients with untreated newly diagnosed multiple myeloma who are ineligible or
for stem cell transplantation (see section 3.1 of this report for our critique of the company’s
search strategy).
The inclusion and exclusion criteria for the systematic review are presented in Table 72 in CS
Appendix G.1.1. To summarise, the company included bortezomib, lenalidomide, melphalan,
prednisone and thalidomide within their search criteria. There was no restriction in comparators.
In addition to cost outcomes, studies were included if they reported at least one of the following
endpoints: clinical outcomes, utilities or quality-adjusted life years (QALYs). Studies that
reported cost-effectiveness-, cost-utility-, cost-benefit- or cost-minimisation analyses were
included. Studies reporting cost of illness and budget impact analyses were also included.
Lastly, English language studies published from the year 1988 onwards were included. The
original search was conducted in November 2016 and an updated search was conducted in
August 2017.
Six hundred and eighty three studies were identified from screening 849 records identified from
the original and the updated searches. Of these, 644 studies were excluded (51 of which were
identified and excluded in the original search), mainly as the studies were in a patient population
not relevant to the decision problem. Six publications corresponding to five economic studies
were included for full review. Of these, three studies were based on multiple myeloma patients
who were transplant–ineligible;48-51 one study52 included patients who were ineligible for ‘high
dose chemotherapy’ and the patients in the remaining study53 were not eligible for high-dose
chemotherapy with stem cell transplantation and were unable to tolerate or had
contraindications to thalidomide. All the studies included patients aged 65 years and older;
except the study by Garrison et al.50 in which patients had an average age of 70 years at
treatment initiation. Three studies used partitioned survival models, 48 51 53 while the remaining
two used a Markov model for their analyses.50 52 The five studies included a total of six
treatments: MP, MPT, VMP, CTDa and a combination of melphalan, prednisone and
lenalidomide followed by lenalidomide maintenance (MPR-R) and Rd. All the studies included

Confidential – do not copy or circulate
Page 74 of 128
VMP as a treatment option; MP and MPT were included in four studies each. Two studies
included CTDa; and MPR-R and Rd were included by one study each.
A summary of the included studies is presented in CS Table 24 and their modelling
characteristics are presented in CS Appendix G Table 27. The key aspects of the included
studies are extracted and tabulated below in Table 18.
The study by Usmani et al.51 is the most relevant to this appraisal as it contained a comparison
between Rd and VMP. This study conducted a partitioned survival analysis to model newly
diagnosed transplant ineligible multiple myeloma patients transitioning through three health
states (PFS, post-progression survival, and death) to assess the cost-effectiveness of Rd vs
VMP over patients’ lifetime. The study was sponsored by the company and the perspective
adopted was the US payer. Data for the clinical efficacy were obtained from the VISTA trial20
and NMA. Costs associated with AE, routine care, monitoring, subsequent treatments were
included. The study found Rd to be more cost-effective compared to VMP as it was associated
with greater life years and QALYs with similar overall costs. The differences between the study
by Usmani et al.51 and the results of the company’s analysis are discussed in more detail in
section 4.3.8.2.
The company performed quality assessment of three studies.48 50 51 However, for the remaining
two studies, by Celgene52 and Janssen-Cilag,53 the company reproduced the critical appraisal
conducted by Picot et al48 in NICE technology appraisal of bortezomib and thalidomide for first-
line multiple myeloma (TA228 6). These two studies were submitted as manufacturer evidence
in that appraisal. We view this approach as acceptable. In general, the included studies
appeared to be of good quality.
The ERG views that the company conducted a thorough systematic search of the existing
literature for the cost-effectiveness review. We did not identify any further studies in addition to
those identified and included by the company. The evidence from the included studies were
synthesised and critiqued using appropriate methodologies. The findings of these studies were
used for validation of the company’s economic analysis. Further details are presented in section
4.3.8.

Confidential – do not copy or circulate
Page 75 of 128
Table 18 Summary of the included studies in the cost-effectiveness review
Study ID, year
Patient population Model type Health States Time horizon
Cycle length Treatments
Picot, 201148
49 NDMM patients ineligible for ASCT and/or older than 65 years
Partitioned survival model
1) Treatment 2) Post treatment (first treatment until progression) 3) Post progression until death
Lifetime (30 years)
6 weeks MP CTDa VMP MPT
Garrison, 201350
Untreated transplant-ineligible multiple myeloma patients with an average age of 70 years at treatment initiation
Markov model 1) Stable disease/minimal response 2) Partial response 3) Complete response 4) Treatment-free interval or lenalidomide maintenance 5) Progressive disease 6) Second-line therapy 7) Death
Lifetime (20 years)
Monthly VMP MP MPT MPR-R
Usmani, 201651
Initial treatment for transplant-ineligible patients with NDMM and/or older than 65 years
Partitioned survival model
1) Progression free-survival 2) Post-progression survival 3) Death
Lifetime 4 weeks VMP Rd
Celgene, 200952
Multiple myeloma patients who are older than 65 years or are ‘ineligible for high-dose chemotherapy’
Markov model 1) Pre-progression without AE 2) Pre-progression with AE 3) Post-progression 4) Death
Lifetime (30 years)
6 weeks MP MPT VMP
Janssen-Cilag, 200953
Previously untreated multiple myeloma patients not eligible for high-dose chemotherapy with stem cell transplantation (65 years or older) and unable to tolerate or has contraindications to thalidomide
Partitioned survival model
1) Prior to response to treatment 2) Response but no progression 3) Post-progression; 4) Death
Lifetime (30 years)
Not reported MP CTDa MPT VMP

Confidential – do not copy or circulate
Page 76 of 128
Source: CS Table 24 and Appendix G Table 81;
4.3 Critical appraisal of the company’s submitted economic evaluation
4.3.1 NICE reference case
The NICE reference case requirements have been applied to the submitted economic
evaluation in Table 19. The economic evaluation adheres to the NICE reference case.
Table 19 NICE reference case requirements
NICE reference case requirements:
Included in submission
Comment
Decision problem: As per the scope developed by NICE
Yes Company’s decision problem shown in CS Table 1
Comparator: As listed in the scope developed by NICE Yes Company’s decision problem shown in CS Table 1. Comparator described as thalidomide in combination with alkylating agent and a corticosteroid; bortezomib in combination with alkylating agent and a corticosteroid. Other comparators that fit this description are available (e.g. CTDa) but have not been included in the CS.
Perspective on costs: NHS and PSS Yes CS Table 1
Evidence on resource use and costs: Costs should relate to NHS and PSS resources and should be valued using the prices relevant to the NHS and PSS
Yes Not explicitly stated in the CS
Perspective on outcomes: All direct health effects, whether for patients or, when relevant, carers
Yes
Type of economic evaluation: Cost utility analysis with fully incremental analysis
Yes
Synthesis of evidence on outcomes: Based on a systematic review
Yes Discussed in more detail in section 3.1.
Time horizon: Long enough to reflect all important differences in costs or outcomes between the technologies being compared
Yes 25 years
Measuring and valuing health effects: Health effect should be expressed in QALYs. The EQ-5D is the preferred measure of health related quality of life.
Yes EQ-5D-3L used in the MM-020 trial for MPT and Rd. EORTC QLQ Q30 data mapped to EQ-5D for VMP.
Source of data for measurement of health related quality of life: Reported directly by patients and/or carers.
Yes
Source of preference data: Representative sample of the UK population
Yes
Equity considerations: An additional QALY has the same weight regardless of the other characteristics of the individuals receiving the health benefit.
Yes
Discount rate: 3.5% pa for costs and health effects Yes CS Table 25

Confidential – do not copy or circulate
Page 77 of 128
4.3.2 Model Structure
The company constructed a cost-utility model for treating multiple myeloma patients with Rd,
MPT and VMP. The model has a lifetime horizon of 25 years, discounting of 3.5% per annum for
costs and health benefits, a 28-day cycle length and applies a half-cycle correction. The
perspective of the analysis is the UK NHS. The CS states that the time horizon was sufficiently
long to encapsulate all meaningful differences between the treatments compared given that the
starting age of patients entering the model was aged 65 years and that only <1% of patients
were alive across all the treatment arms at 25 years and 0% were alive at 28 years. The ERG
considers the perspective of the model and the choice of time horizon, cycle length and
discounting rate as appropriate.
The company developed a hybrid model structure consisting of partitioned survival analysis (for
the time-period <92 weeks) and thereafter (i.e. ≥92 weeks) a multi-state Markov model. The CS
stated that owing to the inherent structural link between mortality and earlier progression events,
it was more appropriate to model PFS and OS using a state transition approach. However, the
clinical trial data from MM-020 trial indicated a delayed treatment effect for Rd on PFS which
was due to an increase in the hazard for MPT instead of a decrease in the hazard for Rd. This
was not the case for OS. The company suggested that the delayed treatment effect could be
due to the difference in the treatment duration for Rd (treatment duration of Rd is until toxicity
level is unacceptable or progressive disease) and MPT (treatment duration of MPT is up to 12
42-day cycles).
The Markov model consisted of three health states: progression-free, progressive disease and
death. Patients enter the model in the progression-free state, and they can remain in that state
or transit to either progressive disease or death states. Patients in the progressive disease state
can either remain in that state or transition to death. A schematic of the model (CS Figure 17) is
shown in Figure 13. The company modelled OS as a function of all individual transitions in
which the death rates reflected the proportion of patients in the progressive disease state and
the differences in mortality between progression-free and progressive disease patients.
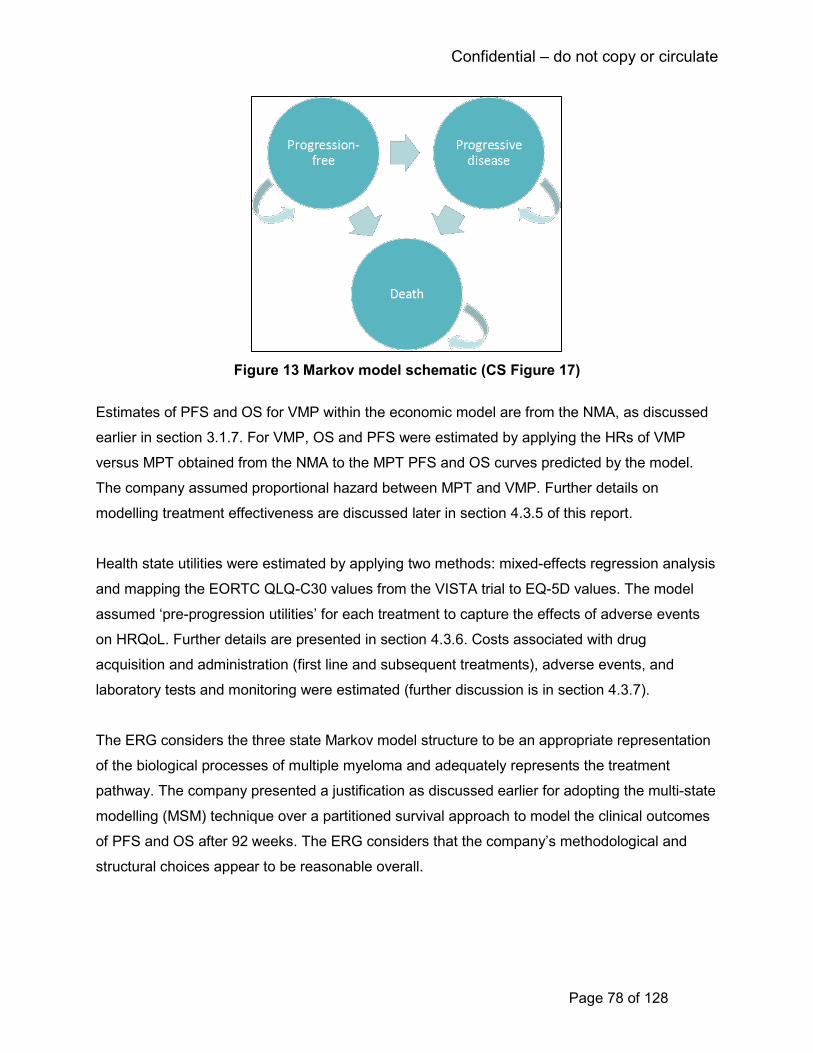
Confidential – do not copy or circulate
Page 78 of 128
Figure 13 Markov model schematic (CS Figure 17)
Estimates of PFS and OS for VMP within the economic model are from the NMA, as discussed
earlier in section 3.1.7. For VMP, OS and PFS were estimated by applying the HRs of VMP
versus MPT obtained from the NMA to the MPT PFS and OS curves predicted by the model.
The company assumed proportional hazard between MPT and VMP. Further details on
modelling treatment effectiveness are discussed later in section 4.3.5 of this report.
Health state utilities were estimated by applying two methods: mixed-effects regression analysis
and mapping the EORTC QLQ-C30 values from the VISTA trial to EQ-5D values. The model
assumed ‘pre-progression utilities’ for each treatment to capture the effects of adverse events
on HRQoL. Further details are presented in section 4.3.6. Costs associated with drug
acquisition and administration (first line and subsequent treatments), adverse events, and
laboratory tests and monitoring were estimated (further discussion is in section 4.3.7).
The ERG considers the three state Markov model structure to be an appropriate representation
of the biological processes of multiple myeloma and adequately represents the treatment
pathway. The company presented a justification as discussed earlier for adopting the multi-state
modelling (MSM) technique over a partitioned survival approach to model the clinical outcomes
of PFS and OS after 92 weeks. The ERG considers that the company’s methodological and
structural choices appear to be reasonable overall.
Confidential – do not copy or circulate
Page 79 of 128
4.3.3 Population
The economic evaluation includes the population defined in the company’s decision problem
(CS Table 1) as adults with previously untreated multiple myeloma for whom stem-cell
transplantation is considered inappropriate. This corresponds with the final scope issued by
NICE and the company’s marketing authorisation for lenalidomide. The patient population is
also consistent with the patient population in the MM-020 trial. However, the company has
indicated that their preferred comparison is between Rd and VMP and the ERG notes that VMP
is only recommended by NICE for patients who are intolerant or contraindicated to thalidomide.
The CS acknowledges that none of the trials in the NMA (including the MM-020 trial) required
patients to be intolerant or contraindicated to thalidomide. The CS states that based on clinical
advice there are patients with predisposing conditions that make them more susceptible to
thalidomide AEs and who would potentially benefit from lenalidomide (e.g. bowel disease,
neuropathy, sleep disorders) (CS page 94). The CS therefore considers that use of data from
the ITT population of the RCTs in the NMA is appropriate for the cost-effectiveness analysis of
lenalidomide in patients who are intolerant or contraindicated to thalidomide. Expert advice to
the ERG is that there is no logical reason why the clinical effectiveness outcomes seen for
lenalidomide in the MM-020 trial would be different to those seen in patients intolerant or
contraindicated to thalidomide. The ERG concludes that the company’s approach is therefore
reasonable.
4.3.4 Interventions and comparators
The cost-effectiveness analysis compares Rd with MPT and with VMP, as stated in the
company’s decision problem. MPT and Rd are oral treatments whilst bortezomib is administered
subcutaneously. As we have stated earlier, clinical advice to the ERG suggests that CTDa is
more commonly used in the UK than MPT as a first line treatment (although it is not licensed for
this indication), and is generally considered to be equivalent to MPT in clinical effectiveness.
4.3.5 Treatment effectiveness and extrapolation
The clinical effectiveness evidence used in the company’s economic model is from the MM-020
trial for Rd versus MPT and from the company’s NMA for the comparison with VMP. We have
described the NMA in more detail earlier in section 3.1.7. The main clinical effectiveness
outcomes modelled are PFS, OS and TTF.
4.3.5.1 Progression-free and overall survival for Rd and MPT
The company uses a hybrid approach to modelling PFS and OS with a 92-week cut point. For
the first 92 weeks the Kaplan-Meier data for the MM-020 trial were used to represent the
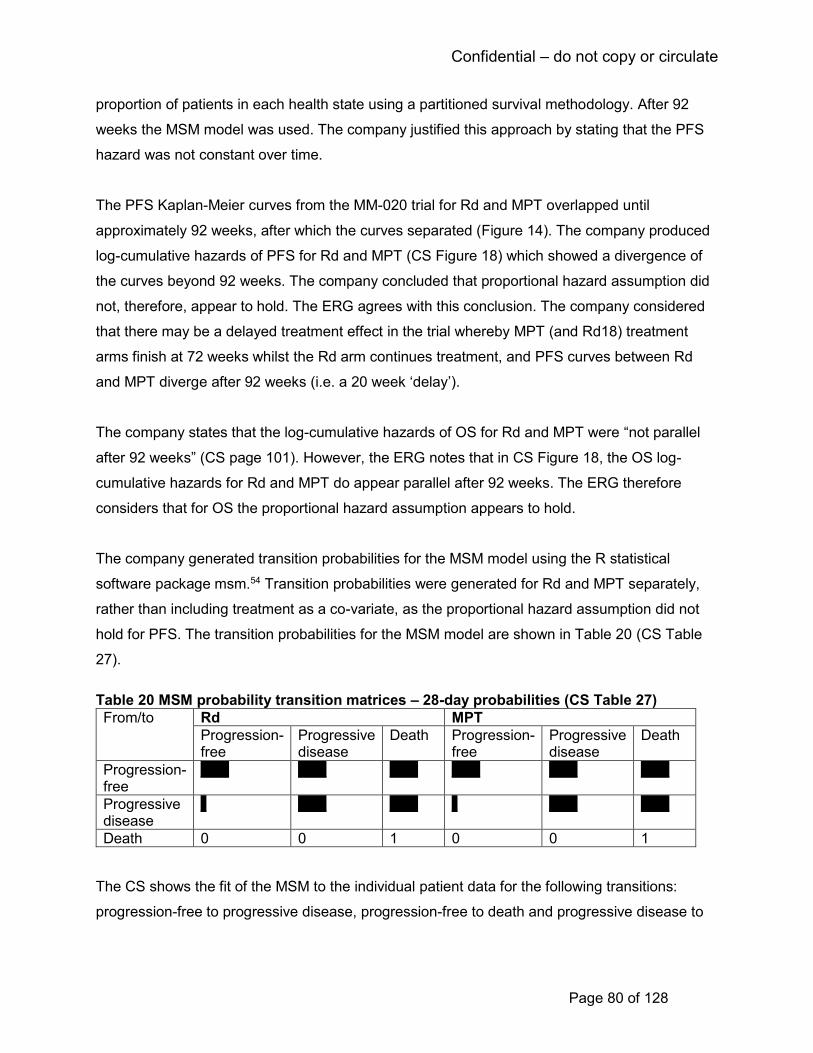
Confidential – do not copy or circulate
Page 80 of 128
proportion of patients in each health state using a partitioned survival methodology. After 92
weeks the MSM model was used. The company justified this approach by stating that the PFS
hazard was not constant over time.
The PFS Kaplan-Meier curves from the MM-020 trial for Rd and MPT overlapped until
approximately 92 weeks, after which the curves separated (Figure 14). The company produced
log-cumulative hazards of PFS for Rd and MPT (CS Figure 18) which showed a divergence of
the curves beyond 92 weeks. The company concluded that proportional hazard assumption did
not, therefore, appear to hold. The ERG agrees with this conclusion. The company considered
that there may be a delayed treatment effect in the trial whereby MPT (and Rd18) treatment
arms finish at 72 weeks whilst the Rd arm continues treatment, and PFS curves between Rd
and MPT diverge after 92 weeks (i.e. a 20 week ‘delay’).
The company states that the log-cumulative hazards of OS for Rd and MPT were “not parallel
after 92 weeks” (CS page 101). However, the ERG notes that in CS Figure 18, the OS log-
cumulative hazards for Rd and MPT do appear parallel after 92 weeks. The ERG therefore
considers that for OS the proportional hazard assumption appears to hold.
The company generated transition probabilities for the MSM model using the R statistical
software package msm.54 Transition probabilities were generated for Rd and MPT separately,
rather than including treatment as a co-variate, as the proportional hazard assumption did not
hold for PFS. The transition probabilities for the MSM model are shown in Table 20 (CS Table
27).
Table 20 MSM probability transition matrices – 28-day probabilities (CS Table 27)
From/to Rd MPT
Progression-free
Progressive disease
Death Progression-free
Progressive disease
Death
Progression-free
***** ***** ***** ***** ***** *****
Progressive disease
* ***** ***** * ***** *****
Death 0 0 1 0 0 1
The CS shows the fit of the MSM to the individual patient data for the following transitions:
progression-free to progressive disease, progression-free to death and progressive disease to

Confidential – do not copy or circulate
Page 81 of 128
death (CS Figure 20). In general, the ERG considers that the plots of the transitions provide a
reasonable fit with the Kaplan-Meier data.
The CS provides a comparison between the PFS and OS from the economic model and the
Kaplan-Meier data from MM-020 for Rd and MPT (Figure 14 and CS Figure 19). The ERG
considers that the modelling approach taken provides a good fit between the economic model
and observed Kaplan-Meier data.
Progression-free survival Overall survival
Key: ITT, intent-to-treat; KM, Kaplan–Meier; MPT, melphalan, prednisone and thalidomide; MSM, multi-state
modelling; Rd; lenalidomide and low-dose dexamethasone until disease progression; trt, treatment.
Notes: Data cut-off = 21st January 2016 (ITT population). The final drop in overall survival is due to the
number at risk going from 1 to 0 at 85 months.
Figure 14 Kaplan-Meier plots of survival compared with modelled survival (CS Figure 19)
The company also provides a scenario using time-varying hazards using the fractional
polynomials NMA for VMP and Rd versus MPT (CS Table 52). The ERG notes that the scenario
with time-varying hazards using fractional polynomials provide a poorer fit to the observed
Kaplan-Meier data than by assuming proportional hazards as in the company’s base case.
4.3.5.2 Progression-free and overall survival for VMP
In the absence of head-to-head data, VMP is compared to Rd and MPT using the constant HR
from the company’s NMA applied to the MPT PFS and OS curves. The NMA is described in
more detail earlier in section 3.1.7. The mean HRs for VMP versus MPT for PFS and OS are
1.00 and 1.11 respectively. The CS states that MPT was chosen as the reference treatment due
to the relative maturity of the MPT data, it also being a fixed-duration therapy and the regimen
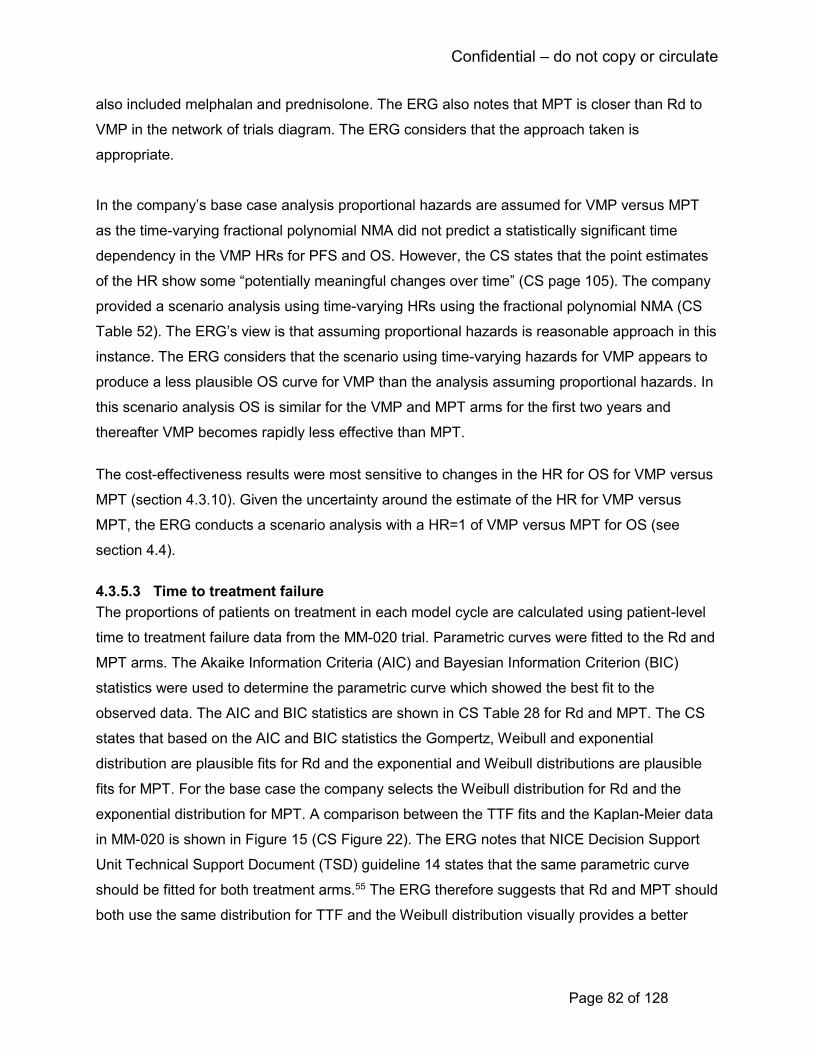
Confidential – do not copy or circulate
Page 82 of 128
also included melphalan and prednisolone. The ERG also notes that MPT is closer than Rd to
VMP in the network of trials diagram. The ERG considers that the approach taken is
appropriate.
In the company’s base case analysis proportional hazards are assumed for VMP versus MPT
as the time-varying fractional polynomial NMA did not predict a statistically significant time
dependency in the VMP HRs for PFS and OS. However, the CS states that the point estimates
of the HR show some “potentially meaningful changes over time” (CS page 105). The company
provided a scenario analysis using time-varying HRs using the fractional polynomial NMA (CS
Table 52). The ERG’s view is that assuming proportional hazards is reasonable approach in this
instance. The ERG considers that the scenario using time-varying hazards for VMP appears to
produce a less plausible OS curve for VMP than the analysis assuming proportional hazards. In
this scenario analysis OS is similar for the VMP and MPT arms for the first two years and
thereafter VMP becomes rapidly less effective than MPT.
The cost-effectiveness results were most sensitive to changes in the HR for OS for VMP versus
MPT (section 4.3.10). Given the uncertainty around the estimate of the HR for VMP versus
MPT, the ERG conducts a scenario analysis with a HR=1 of VMP versus MPT for OS (see
section 4.4).
4.3.5.3 Time to treatment failure
The proportions of patients on treatment in each model cycle are calculated using patient-level
time to treatment failure data from the MM-020 trial. Parametric curves were fitted to the Rd and
MPT arms. The Akaike Information Criteria (AIC) and Bayesian Information Criterion (BIC)
statistics were used to determine the parametric curve which showed the best fit to the
observed data. The AIC and BIC statistics are shown in CS Table 28 for Rd and MPT. The CS
states that based on the AIC and BIC statistics the Gompertz, Weibull and exponential
distribution are plausible fits for Rd and the exponential and Weibull distributions are plausible
fits for MPT. For the base case the company selects the Weibull distribution for Rd and the
exponential distribution for MPT. A comparison between the TTF fits and the Kaplan-Meier data
in MM-020 is shown in Figure 15 (CS Figure 22). The ERG notes that NICE Decision Support
Unit Technical Support Document (TSD) guideline 14 states that the same parametric curve
should be fitted for both treatment arms.55 The ERG therefore suggests that Rd and MPT should
both use the same distribution for TTF and the Weibull distribution visually provides a better

Confidential – do not copy or circulate
Page 83 of 128
overall fit for both Rd and MPT than the exponential distribution. This analysis is explored in the
ERG additional scenario analyses (section 4.4).
As there are no available data for TTF for VMP, the company assumes that the TTF curve for
VMP is equal to PFS up to the maximum treatment duration (nine 42 day cycles). The ERG
considers that assuming the TTF curve for VMP is equal to the PFS curve is inconsistent with
the approach taken for Rd and MPT. The company also conduct a scenario analysis varying this
assumption (CS Table 52) where they assume all patients receiving VMP receive all nine
cycles, i.e. no discontinuations. However, there is also an inconsistency in the approach of
modelling TTF for the treatments in this scenario. As PFS for MPT and VMP are similar (HR=1),
we consider a better approach is for the TTF curve for VMP to be equal to that of MPT. The
ERG explores this in a scenario analysis (section 4.4).
Note: KM data shown are time to treatment failure; completing all 12 MPT treatment cycles does not count as a failure event.
Figure 15 Time to treatment failure curve fits and KM data (CS Figure 22)
Rd Weibull MPT Exponential
Years 0 2 4 6 8 10
Rd 535 204 95 32 0 0
MPT 547 168 46 12 0 0
Number at risk
0
0.1
0.2
0.3
0.4
0.5
0.6
0.7
0.8
0.9
1
0 1 2 3 4 5 6 7 8 9 10
% p
ati
en
ts w
ith
ou
t tr
ea
tme
nt
failu
re
Years
Time to treatment failure Rd KM
MPT KM
Rd Weibull
MPTExponential

Confidential – do not copy or circulate
Page 84 of 128
In summary, the ERG considers that the approach the company has taken for modelling PFS
and OS is reasonable and that the modelled survival curves show a good fit against the trial
data from MM-020 for Rd and MPT. For TTF, the ERG noted a couple of issues. Firstly, the
company has used different parametric curves to model TTF for the treatment arms for MPT
and Rd. Methodological guidance recommends using the same parametric curve for both
treatment arms. Secondly, the assumptions used for modelling TTF for VMP is based on PFS
and is inconsistent with the methods used for Rd and MPT.
4.3.6 Health related quality of life
4.3.6.1 Review of health-related quality of life
The company conducted a systematic literature review to identify health state utility values for
the economic evaluation. The search strategies used are presented in Tables 86-93 of the CS
and we discussed these earlier in this report (section 3.1.1 of this report).
The inclusion criteria used by the company are shown in Table 56 of the CS (Appendix D). The
inclusion criteria permitted RCTs of treatment of adults with newly diagnosed or untreated
multiple myeloma (ineligible for stem cell transplant or aged 65 years or older) treated with
lenalidomide, thalidomide, bortezomib and melphalan plus prednisolone. Studies had to report
HRQoL outcomes as health utility index scores. Studies that were not RCTs and those
recruiting patients before 1988 were excluded. The ERG notes that omitting other study types
may have resulted in some potentially relevant studies being missed.
The company’s search found one relevant study by Delforge et al.47 This study reports the
company’s HRQoL results from the MM-020 trial for Rd versus MPT. We summarised these
results earlier in this report (section 3.3.6).
4.3.6.2 Health-related quality of life from clinical trials
The MM-020 trial collected EQ-5D-3L data (with the UK value set) from patients at several time
points: at baseline, at end of cycles 1, 3, 6, 12, and 18 and study discontinuation. Results over
time since baseline are shown in CS Figure 11 and are reported earlier in this report (see Figure
10).
The company used a mixed-effects regression model to analyse EQ-5D data in order to provide
utility by health state and time for Rd and MPT. The results from the mixed-effects regression
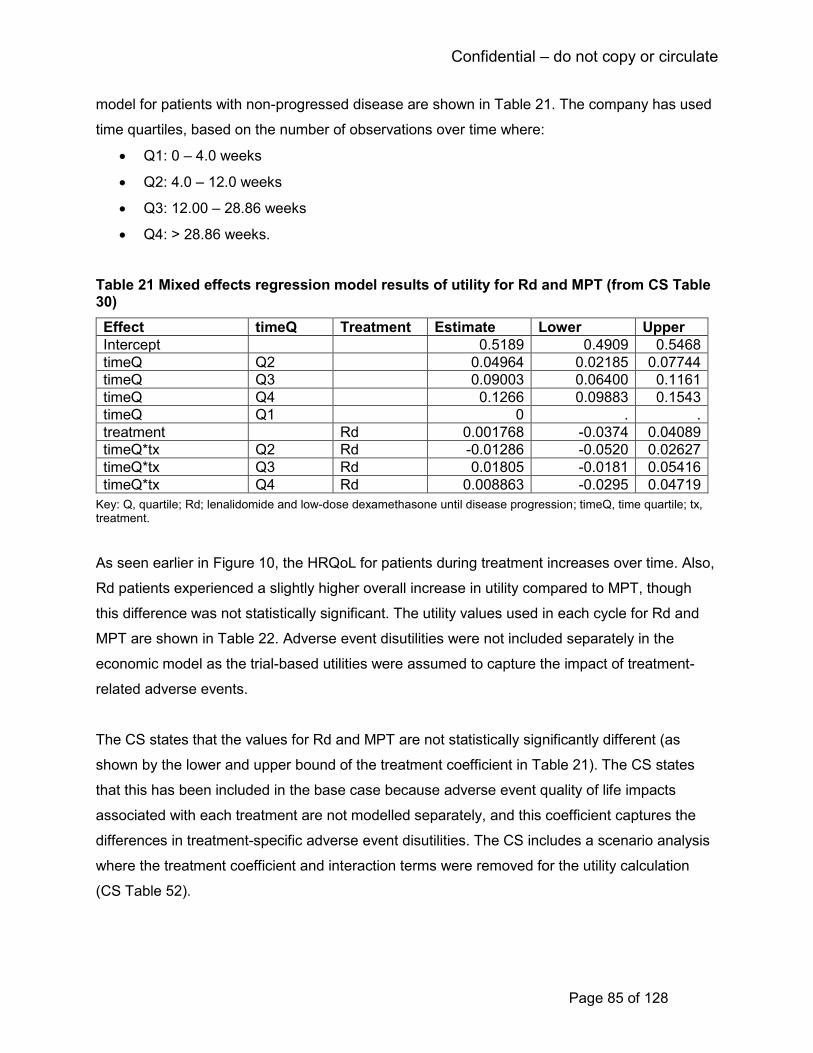
Confidential – do not copy or circulate
Page 85 of 128
model for patients with non-progressed disease are shown in Table 21. The company has used
time quartiles, based on the number of observations over time where:
• Q1: 0 – 4.0 weeks
• Q2: 4.0 – 12.0 weeks
• Q3: 12.00 – 28.86 weeks
• Q4: > 28.86 weeks.
Table 21 Mixed effects regression model results of utility for Rd and MPT (from CS Table 30)
Effect timeQ Treatment Estimate Lower Upper
Intercept 0.5189 0.4909 0.5468
timeQ Q2 0.04964 0.02185 0.07744
timeQ Q3 0.09003 0.06400 0.1161
timeQ Q4 0.1266 0.09883 0.1543
timeQ Q1 0 . .
treatment Rd 0.001768 -0.0374 0.04089
timeQ*tx Q2 Rd -0.01286 -0.0520 0.02627
timeQ*tx Q3 Rd 0.01805 -0.0181 0.05416
timeQ*tx Q4 Rd 0.008863 -0.0295 0.04719
Key: Q, quartile; Rd; lenalidomide and low-dose dexamethasone until disease progression; timeQ, time quartile; tx, treatment.
As seen earlier in Figure 10, the HRQoL for patients during treatment increases over time. Also,
Rd patients experienced a slightly higher overall increase in utility compared to MPT, though
this difference was not statistically significant. The utility values used in each cycle for Rd and
MPT are shown in Table 22. Adverse event disutilities were not included separately in the
economic model as the trial-based utilities were assumed to capture the impact of treatment-
related adverse events.
The CS states that the values for Rd and MPT are not statistically significantly different (as
shown by the lower and upper bound of the treatment coefficient in Table 21). The CS states
that this has been included in the base case because adverse event quality of life impacts
associated with each treatment are not modelled separately, and this coefficient captures the
differences in treatment-specific adverse event disutilities. The CS includes a scenario analysis
where the treatment coefficient and interaction terms were removed for the utility calculation
(CS Table 52).
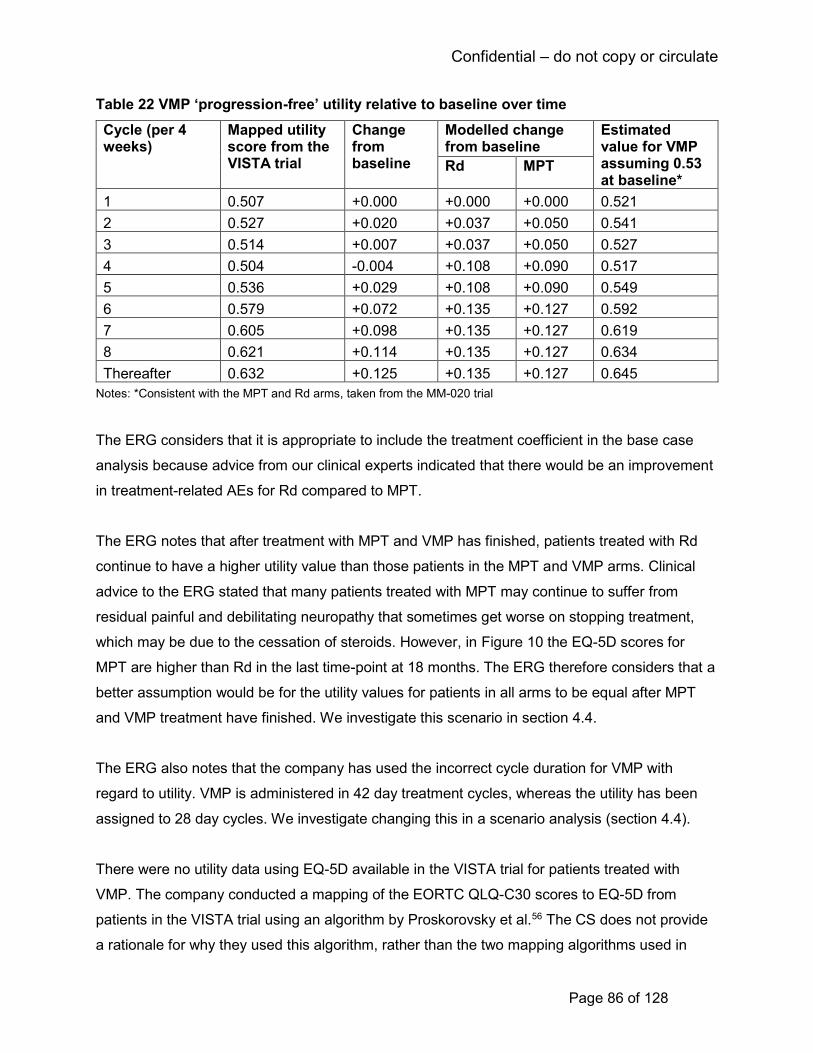
Confidential – do not copy or circulate
Page 86 of 128
Table 22 VMP ‘progression-free’ utility relative to baseline over time
Cycle (per 4 weeks)
Mapped utility score from the VISTA trial
Change from baseline
Modelled change from baseline
Estimated value for VMP assuming 0.53 at baseline*
Rd MPT
1 0.507 +0.000 +0.000 +0.000 0.521
2 0.527 +0.020 +0.037 +0.050 0.541
3 0.514 +0.007 +0.037 +0.050 0.527
4 0.504 -0.004 +0.108 +0.090 0.517
5 0.536 +0.029 +0.108 +0.090 0.549
6 0.579 +0.072 +0.135 +0.127 0.592
7 0.605 +0.098 +0.135 +0.127 0.619
8 0.621 +0.114 +0.135 +0.127 0.634
Thereafter 0.632 +0.125 +0.135 +0.127 0.645
Notes: *Consistent with the MPT and Rd arms, taken from the MM-020 trial
The ERG considers that it is appropriate to include the treatment coefficient in the base case
analysis because advice from our clinical experts indicated that there would be an improvement
in treatment-related AEs for Rd compared to MPT.
The ERG notes that after treatment with MPT and VMP has finished, patients treated with Rd
continue to have a higher utility value than those patients in the MPT and VMP arms. Clinical
advice to the ERG stated that many patients treated with MPT may continue to suffer from
residual painful and debilitating neuropathy that sometimes get worse on stopping treatment,
which may be due to the cessation of steroids. However, in Figure 10 the EQ-5D scores for
MPT are higher than Rd in the last time-point at 18 months. The ERG therefore considers that a
better assumption would be for the utility values for patients in all arms to be equal after MPT
and VMP treatment have finished. We investigate this scenario in section 4.4.
The ERG also notes that the company has used the incorrect cycle duration for VMP with
regard to utility. VMP is administered in 42 day treatment cycles, whereas the utility has been
assigned to 28 day cycles. We investigate changing this in a scenario analysis (section 4.4).
There were no utility data using EQ-5D available in the VISTA trial for patients treated with
VMP. The company conducted a mapping of the EORTC QLQ-C30 scores to EQ-5D from
patients in the VISTA trial using an algorithm by Proskorovsky et al.56 The CS does not provide
a rationale for why they used this algorithm, rather than the two mapping algorithms used in
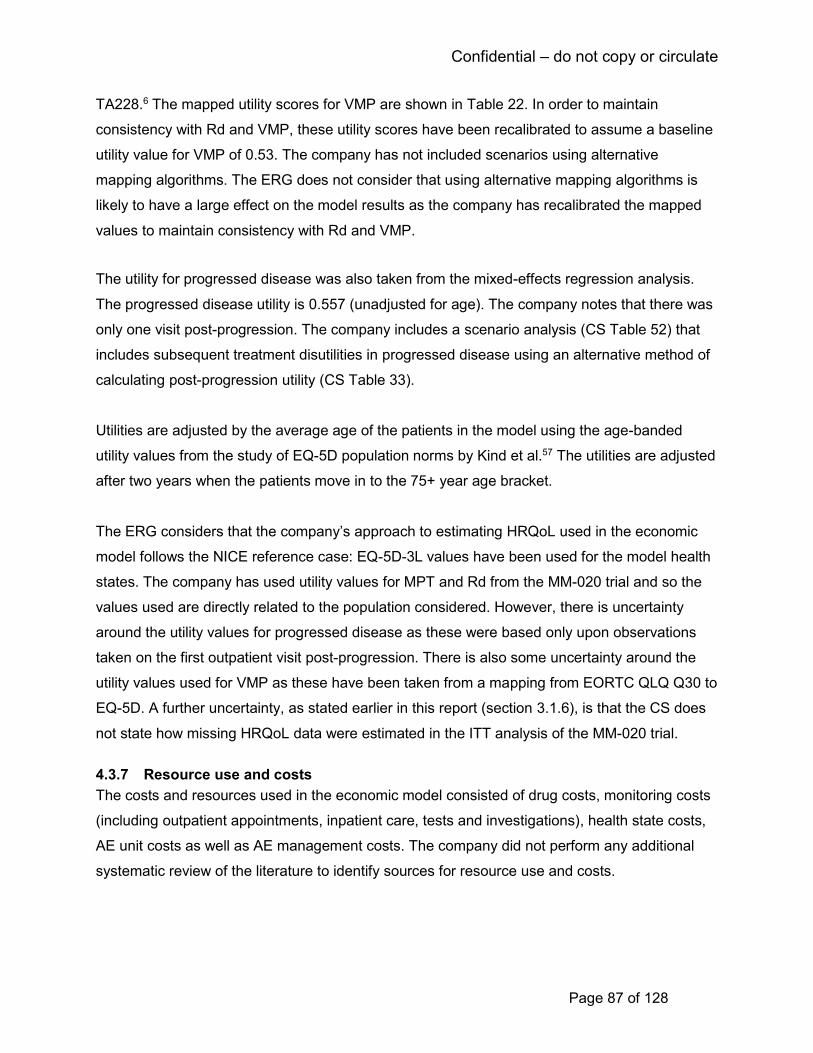
Confidential – do not copy or circulate
Page 87 of 128
TA228.6 The mapped utility scores for VMP are shown in Table 22. In order to maintain
consistency with Rd and VMP, these utility scores have been recalibrated to assume a baseline
utility value for VMP of 0.53. The company has not included scenarios using alternative
mapping algorithms. The ERG does not consider that using alternative mapping algorithms is
likely to have a large effect on the model results as the company has recalibrated the mapped
values to maintain consistency with Rd and VMP.
The utility for progressed disease was also taken from the mixed-effects regression analysis.
The progressed disease utility is 0.557 (unadjusted for age). The company notes that there was
only one visit post-progression. The company includes a scenario analysis (CS Table 52) that
includes subsequent treatment disutilities in progressed disease using an alternative method of
calculating post-progression utility (CS Table 33).
Utilities are adjusted by the average age of the patients in the model using the age-banded
utility values from the study of EQ-5D population norms by Kind et al.57 The utilities are adjusted
after two years when the patients move in to the 75+ year age bracket.
The ERG considers that the company’s approach to estimating HRQoL used in the economic
model follows the NICE reference case: EQ-5D-3L values have been used for the model health
states. The company has used utility values for MPT and Rd from the MM-020 trial and so the
values used are directly related to the population considered. However, there is uncertainty
around the utility values for progressed disease as these were based only upon observations
taken on the first outpatient visit post-progression. There is also some uncertainty around the
utility values used for VMP as these have been taken from a mapping from EORTC QLQ Q30 to
EQ-5D. A further uncertainty, as stated earlier in this report (section 3.1.6), is that the CS does
not state how missing HRQoL data were estimated in the ITT analysis of the MM-020 trial.
4.3.7 Resource use and costs
The costs and resources used in the economic model consisted of drug costs, monitoring costs
(including outpatient appointments, inpatient care, tests and investigations), health state costs,
AE unit costs as well as AE management costs. The company did not perform any additional
systematic review of the literature to identify sources for resource use and costs.
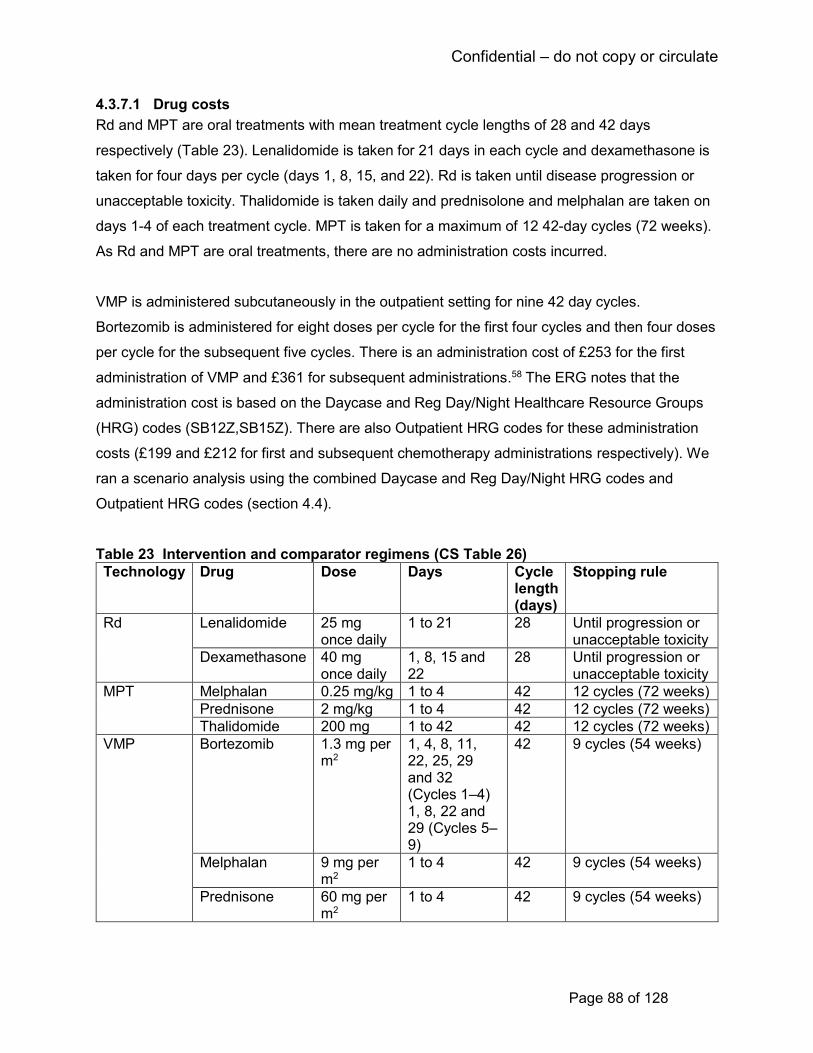
Confidential – do not copy or circulate
Page 88 of 128
4.3.7.1 Drug costs
Rd and MPT are oral treatments with mean treatment cycle lengths of 28 and 42 days
respectively (Table 23). Lenalidomide is taken for 21 days in each cycle and dexamethasone is
taken for four days per cycle (days 1, 8, 15, and 22). Rd is taken until disease progression or
unacceptable toxicity. Thalidomide is taken daily and prednisolone and melphalan are taken on
days 1-4 of each treatment cycle. MPT is taken for a maximum of 12 42-day cycles (72 weeks).
As Rd and MPT are oral treatments, there are no administration costs incurred.
VMP is administered subcutaneously in the outpatient setting for nine 42 day cycles.
Bortezomib is administered for eight doses per cycle for the first four cycles and then four doses
per cycle for the subsequent five cycles. There is an administration cost of £253 for the first
administration of VMP and £361 for subsequent administrations.58 The ERG notes that the
administration cost is based on the Daycase and Reg Day/Night Healthcare Resource Groups
(HRG) codes (SB12Z,SB15Z). There are also Outpatient HRG codes for these administration
costs (£199 and £212 for first and subsequent chemotherapy administrations respectively). We
ran a scenario analysis using the combined Daycase and Reg Day/Night HRG codes and
Outpatient HRG codes (section 4.4).
Table 23 Intervention and comparator regimens (CS Table 26)
Technology Drug Dose Days Cycle length (days)
Stopping rule
Rd Lenalidomide 25 mg once daily
1 to 21 28 Until progression or unacceptable toxicity
Dexamethasone 40 mg once daily
1, 8, 15 and 22
28 Until progression or unacceptable toxicity
MPT Melphalan 0.25 mg/kg 1 to 4 42 12 cycles (72 weeks)
Prednisone 2 mg/kg 1 to 4 42 12 cycles (72 weeks)
Thalidomide 200 mg 1 to 42 42 12 cycles (72 weeks)
VMP Bortezomib 1.3 mg per m2
1, 4, 8, 11, 22, 25, 29 and 32 (Cycles 1–4) 1, 8, 22 and 29 (Cycles 5–9)
42 9 cycles (54 weeks)
Melphalan 9 mg per m2
1 to 4 42 9 cycles (54 weeks)
Prednisone 60 mg per m2
1 to 4 42 9 cycles (54 weeks)
Confidential – do not copy or circulate
Page 89 of 128
The unit costs of the comparator regimens were taken from eMit,59 where available, or MIMS.60
The drug costs and dosages are shown in Table 24 (CS Table 35).
A patient access scheme (PAS) has been approved for lenalidomide whereby the cost of the
drug is capped at 26 cycles, after which point the company bears the cost and the drug is free to
the NHS. The CS proposes an adaptation to the PAS whereby the cost of lenalidomide is
capped at ** cycles, after which point the company pays the drug costs. This PAS is conditional
on a positive recommendation from NICE for this appraisal. After ** cycles, an administration
cost of applying the PAS is included at £22.60 per cycle.
Table 24 First-line drug costs (CS Table 35)
First Line Regimens (Trial data: Rd and MPT)
Treatment Name Drug Dose Unit Pack size List price
Rd Lenalidomide 2.5 mg 21 £3,426.00
Lenalidomide 5.0 mg 21 £3,570.00
Lenalidomide 10.0 mg 21 £3,780.00
Lenalidomide 15.0 mg 21 £3,969.00
Lenalidomide 20.0 mg 21 £4,168.00
Lenalidomide 25.0 mg 21 £4,368.00
Dexamethasone 20.0/40.0 mg 50x2 £28.93
MPT Thalidomide 50.00 mg 50 £298.48
Melphalan 0.25 mg/kg 25x2 £45.38
Prednisolone 2.0 mg/kg 56x25 £26.19
VMP Bortezomib 1.3 mg/m2 3.5 £762.38
Melphalan 9 mg/m2 25x2 £45.38
Prednisone 60 mg/m2 56x25 £26.19
In the company’s base case, dosing data was taken directly from the MM-020 trial for Rd and
MPT. The dosing data included the number of patients on each dosage of each drug at every
cycle. These data were combined with the unit drug costs and the number of patients receiving
treatment to give a total weighted cost per cycle. In the absence of trial-level dosing for VMP,
the company used the proportion of eligible patients on Rd treatment at each 42-day cycle to
estimate VMP costs.
The company includes a sensitivity analysis that uses an alternative method of costing using
mean relative dose intensity from the MM-020 CSR and trial publication.22 23 The scenario is
described in more detail in section 4.3.10.
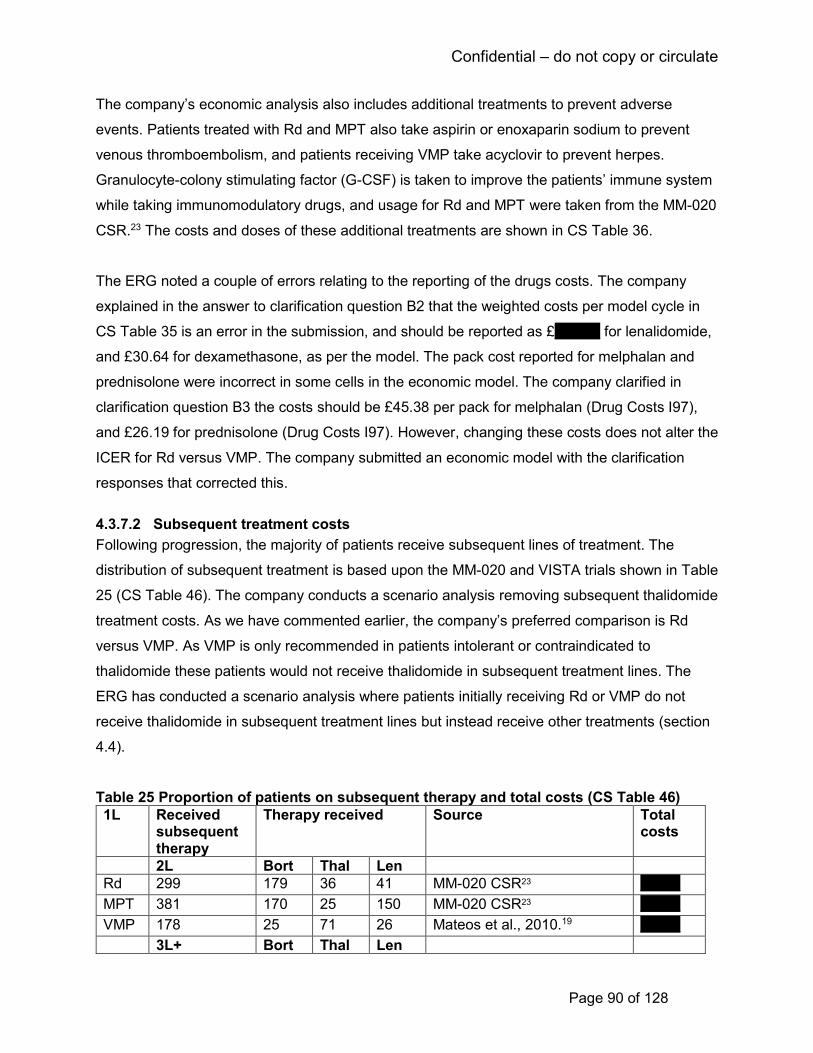
Confidential – do not copy or circulate
Page 90 of 128
The company’s economic analysis also includes additional treatments to prevent adverse
events. Patients treated with Rd and MPT also take aspirin or enoxaparin sodium to prevent
venous thromboembolism, and patients receiving VMP take acyclovir to prevent herpes.
Granulocyte-colony stimulating factor (G-CSF) is taken to improve the patients’ immune system
while taking immunomodulatory drugs, and usage for Rd and MPT were taken from the MM-020
CSR.23 The costs and doses of these additional treatments are shown in CS Table 36.
The ERG noted a couple of errors relating to the reporting of the drugs costs. The company
explained in the answer to clarification question B2 that the weighted costs per model cycle in
CS Table 35 is an error in the submission, and should be reported as £******** for lenalidomide,
and £30.64 for dexamethasone, as per the model. The pack cost reported for melphalan and
prednisolone were incorrect in some cells in the economic model. The company clarified in
clarification question B3 the costs should be £45.38 per pack for melphalan (Drug Costs I97),
and £26.19 for prednisolone (Drug Costs I97). However, changing these costs does not alter the
ICER for Rd versus VMP. The company submitted an economic model with the clarification
responses that corrected this.
4.3.7.2 Subsequent treatment costs
Following progression, the majority of patients receive subsequent lines of treatment. The
distribution of subsequent treatment is based upon the MM-020 and VISTA trials shown in Table
25 (CS Table 46). The company conducts a scenario analysis removing subsequent thalidomide
treatment costs. As we have commented earlier, the company’s preferred comparison is Rd
versus VMP. As VMP is only recommended in patients intolerant or contraindicated to
thalidomide these patients would not receive thalidomide in subsequent treatment lines. The
ERG has conducted a scenario analysis where patients initially receiving Rd or VMP do not
receive thalidomide in subsequent treatment lines but instead receive other treatments (section
4.4).
Table 25 Proportion of patients on subsequent therapy and total costs (CS Table 46)
1L Received subsequent therapy
Therapy received Source Total costs
2L Bort Thal Len
Rd 299 179 36 41 MM-020 CSR23 *******
MPT 381 170 25 150 MM-020 CSR23 *******
VMP 178 25 71 26 Mateos et al., 2010.19 ******* 3L+ Bort Thal Len

Confidential – do not copy or circulate
Page 91 of 128
Rd 180 99 31 34 MM-020 CSR 23 *******
MPT 231 133 13 130 MM-020 CSR23 *******
VMP 79 21 23 34 Mateos et al., 2010.19 ******* Key: 1L, fist line; 2L, second line; 3L, third line;
Subsequent treatments are included in the model by assuming that all patients starting second
or third line treatments receive the mean treatment cycles in the trials (Table 26) and these
costs are incurred in the first cycle of second or third line treatment. The duration of subsequent
treatments is shown in Table 26 (CS Table 45).
Table 26 Post-progression treatment durations (CS Table 45)
Treatment at each line Source(s) of the data Mean cycles used in model
Second line
Lenalidomide-based therapy
MM-009 and MM-010 studies (no multiple prior relapses)
****
Bortezomib-based therapy APEX trial 5.0
Thalidomide-based therapy OPTIMUM trial 7.0
Third line
Lenalidomide-based therapy
MM-009 and MM-010 studies (no multiple prior relapses)
***
Bortezomib-based therapy APEX trial 5.0
Thalidomide-based therapy OPTIMUM trial 7.0
The duration between first progression and second progression is taken from MM-020 CSR for
Rd and MPT,23 and for VMP is assumed to be the same as for MPT. The model converts this
duration into cycle probability of second progression, shown in Table 27 (CS Table 43).
Table 27 Subsequent treatment time inputs (CS Table 43)
1L fatal progression rate from MM-020
Time from 1st to 2nd progression (months)
Time from 1st to 2nd progression (cycles)
Rate of progression (per cycle)
Cycle probability of 2nd progression
Rd 23.1% 16.9 18.4 0.053 0.052
MPT 25.9% 13.1 14.2 0.068 0.066
VMP 25.9% 13.1 14.2 0.068 0.066 Key: 1L, first line; Note: If before the 92-week cut-off values from the MM-020 trial as described are used. After this cut-off, the transitions from the MSM matrices are used: progression-free to death/(progression-free to death + progression-free to progressed).
The costs of subsequent treatments are shown in CS Table 44. The company includes the PAS
for lenalidomide for its use as second and third line treatment where treatment costs are capped
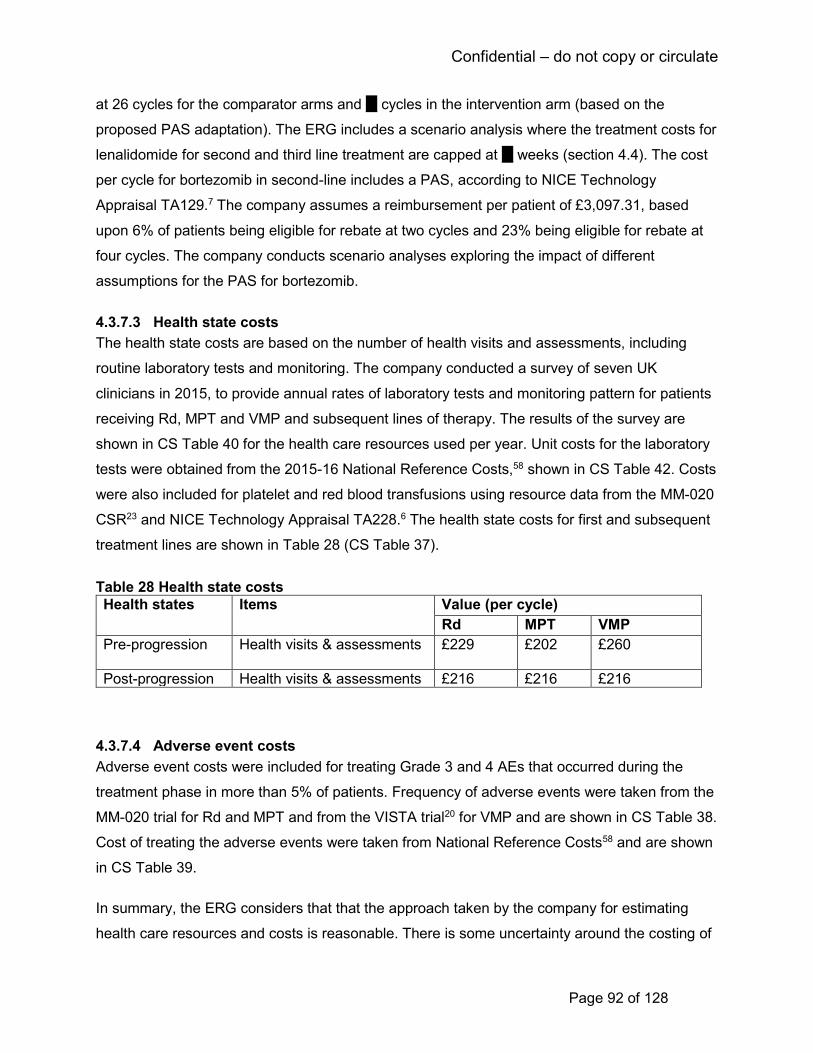
Confidential – do not copy or circulate
Page 92 of 128
at 26 cycles for the comparator arms and ** cycles in the intervention arm (based on the
proposed PAS adaptation). The ERG includes a scenario analysis where the treatment costs for
lenalidomide for second and third line treatment are capped at ** weeks (section 4.4). The cost
per cycle for bortezomib in second-line includes a PAS, according to NICE Technology
Appraisal TA129.7 The company assumes a reimbursement per patient of £3,097.31, based
upon 6% of patients being eligible for rebate at two cycles and 23% being eligible for rebate at
four cycles. The company conducts scenario analyses exploring the impact of different
assumptions for the PAS for bortezomib.
4.3.7.3 Health state costs
The health state costs are based on the number of health visits and assessments, including
routine laboratory tests and monitoring. The company conducted a survey of seven UK
clinicians in 2015, to provide annual rates of laboratory tests and monitoring pattern for patients
receiving Rd, MPT and VMP and subsequent lines of therapy. The results of the survey are
shown in CS Table 40 for the health care resources used per year. Unit costs for the laboratory
tests were obtained from the 2015-16 National Reference Costs,58 shown in CS Table 42. Costs
were also included for platelet and red blood transfusions using resource data from the MM-020
CSR23 and NICE Technology Appraisal TA228.6 The health state costs for first and subsequent
treatment lines are shown in Table 28 (CS Table 37).
Table 28 Health state costs
Health states Items Value (per cycle)
Rd MPT VMP
Pre-progression Health visits & assessments £229
£202
£260
Post-progression Health visits & assessments £216 £216 £216
4.3.7.4 Adverse event costs
Adverse event costs were included for treating Grade 3 and 4 AEs that occurred during the
treatment phase in more than 5% of patients. Frequency of adverse events were taken from the
MM-020 trial for Rd and MPT and from the VISTA trial20 for VMP and are shown in CS Table 38.
Cost of treating the adverse events were taken from National Reference Costs58 and are shown
in CS Table 39.
In summary, the ERG considers that that the approach taken by the company for estimating
health care resources and costs is reasonable. There is some uncertainty around the costing of
Confidential – do not copy or circulate
Page 93 of 128
subsequent treatment costs. The company proposes that the most relevant comparison for this
appraisal is between Rd and VMP, where VMP is currently only recommended in patients who
are ineligible or intolerant to thalidomide. However, the trials from which the data used for
costing subsequent treatment is based include patients who receive thalidomide in subsequent
lines of treatment.
4.3.8 Model validation
The ERG checked the economic model for transparency and validity, in line with the
recommendations developed by a task force of the International Society for
Pharmacoeconomics and Outcomes Research (ISPOR) and the Society for Medical Decision
Making (SMDM)61 for model quality assurance.
4.3.8.1 Model transparency
The model structure, parameter values and their sources, data identification methods and the
assumptions used in the model were clearly described in the CS. The model was technically
transparent and the visual basic code used within the model was accessible. The CS and the
model described the analyses clearly and provided adequate information to assess the model.
4.3.8.2 Model validation
The CS stated that the programming of the economic model was validated by both internal and
external modellers. All the model formulae and labels were reviewed by a programmer who was
not involved in developing the model. In addition, the company conducted extreme value tests
to examine if the model produced the expected results. Finally, an academic health economist
validated and critiqued the modelling strategy and methodology of the company model.
The ERG checked the model for internal and external validity. A discussion is presented below
of the step-by-step approach used for this purpose.
Face validity
The CS presented an extensive review of the existing literature in multiple myeloma, including
NICE appraisals to inform their modelling approaches. The company’s model structure is widely
used for representing patients’ transition in oncology. A systematic search was also conducted
to identify utility studies to inform the quality of life parameters. Further, the CS also presented
the resource use questionnaire in CS Appendix I which the company used as a validation tool
for the resource use data (obtained via physician interviews) associated with the treatment of
elderly patients who are newly diagnosed with multiple myeloma and ineligible for transplant in

Confidential – do not copy or circulate
Page 94 of 128
the UK. The CS presented an example of the extreme value test conducted (i.e. setting all AE
costs to £0), but they did not explicitly document the steps taken to validate the model
calculations and the data sources. Therefore, the ERG is unable to comment on these. Further,
no information was presented to ascertain if the model assumptions were validated by clinicians
or experts.
Internal validity
The ERG adopted two steps for internal validity: checking the individual equations within the
model; and verifying their accurate implementation in code. First, the ERG checked individual
equations for their mathematical correctness focussing primarily on the equations defining
survival functions, patient transition in different health states, costs, QALYs and overall results.
Secondly, the visual basic programming code within the model was checked and appeared to
be correct. Thirdly, the ERG checked for consistency of the parameters reported in the CS and
those utilised within the model as discussed earlier in section 4.3.7.1. Briefly, we identified two
inconsistencies in values reported in the CS and those used in the model relating to the
weighted drug costs per model cycle and pack cost of melphalan and prednisolone. The
company clarified that there was a reporting error of the value used for the weighted drug cost
per model cycle in the CS and that the model used the appropriate value, indicating that there is
no change in the base case model results (Clarification response to Question B2). With respect
to the pack cost of melphalan and prednisolone, the company acknowledged that the model
used incorrect values which were corrected as part of the clarification response (Clarification
response to Question B3). However, this correction did not influence the base case results.
Finally, the ERG conducted a range of extreme value and logic tests to check the plausibility of
changes in results when parameters are changed. The observed outcomes from these tests
matched the expected model outcomes.
The ERG identified a minor calculation error in the model, with respect to the estimation of
terminal care costs in cell F89:I89 within ‘Sheet!Results’ of the company’s model. Correcting this
error did not have any impact on the overall base case model results.
External validity
As part of the external validity checks, the company compared the predicted clinical outcomes
of time on treatment, PFS and OS against the observed values in the MM-020 and VISTA trials
for the treatment options. These are summarised in Table 29.

Confidential – do not copy or circulate
Page 95 of 128
Table 29 Comparison of the predicted clinical model outcomes against the observed outcomes Time to Treatment Failure (median)
Arm Modelled values Observed values
MM-020 trial VISTA trial
Rd ***** 20.05 --
VMP ***** -- --
MPT ***** 16.78 -- Source: CS Appendix J Table 42
PFS months (median)
Arm Modelled values Observed values
MM-020 trial VISTA trial
Rd **** 26.0 --
VMP **** -- 24.0
MPT **** 21.9 -- Source: CS Table 53
Four year OS (%) and median OS months
Arm Modelled values Observed values
4 year (%) Median (months)
MM-020 trial VISTA trial
4 year (%) Median (months)
Median (months)
Rd **** **** 58.99 59.1 --
VMP **** **** -- -- 56.4
MPT **** **** 51.67 49.1 -- Source: CS Table 54
In general, the modelled values appeared comparable with the observed values, except for the
modelled median OS for VMP (**** months) which was shorter than the observed value in the
VISTA trial (56.4 months).20 The CS stated that a potential reason for this difference in values
could be due to using the MPT arm of the MM-020 trial as the reference for the HR for OS for
VMP. Further, the CS cited that the patient population in the VISTA trial was healthier compared
to those in MM-020 trial. The ERG considers the rationale given by the company may explain
the discrepancy. The ERG also notes that the HR of the VMP OS had the most influence in the
base case cost-effectiveness results and there is considerable uncertainty attached to this
parameter. To address this, we conducted a scenario analysis (presented in section 4.4) by
using the assumption of similar effectiveness for the OS HR for MPT vs VMP to replicate the
clinical outcomes in NICE TA228.6 48
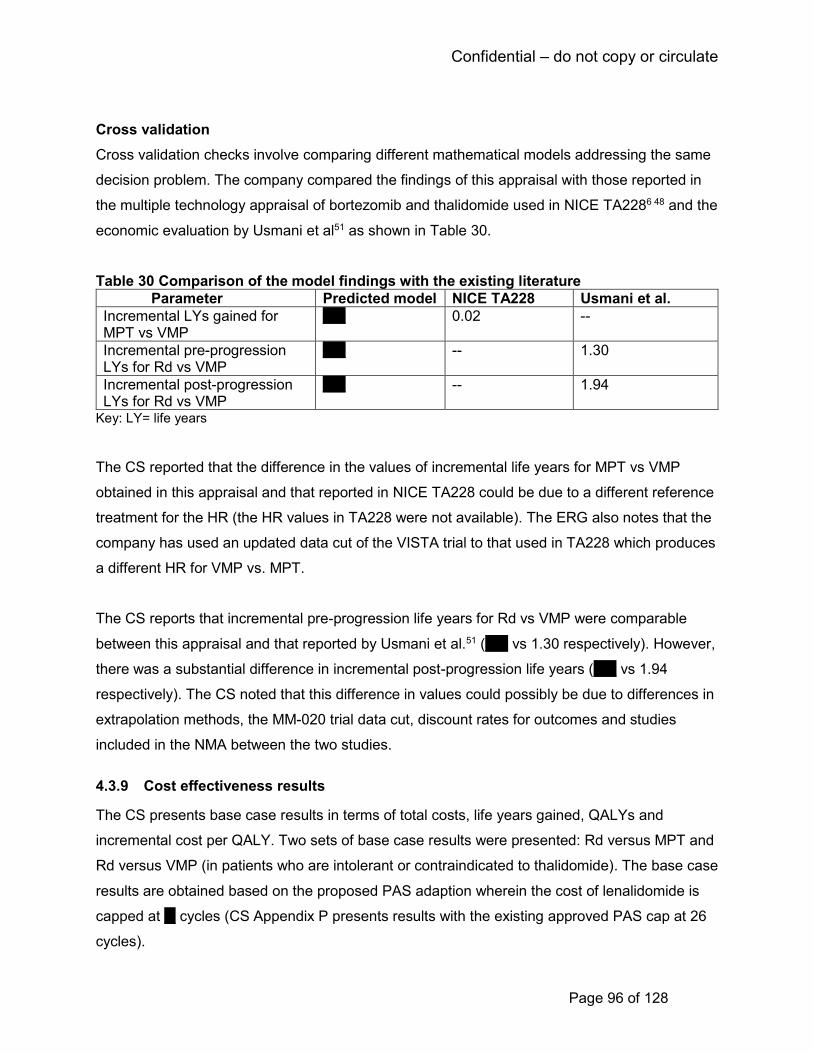
Confidential – do not copy or circulate
Page 96 of 128
Cross validation
Cross validation checks involve comparing different mathematical models addressing the same
decision problem. The company compared the findings of this appraisal with those reported in
the multiple technology appraisal of bortezomib and thalidomide used in NICE TA2286 48 and the
economic evaluation by Usmani et al51 as shown in Table 30.
Table 30 Comparison of the model findings with the existing literature
Parameter Predicted model NICE TA228 Usmani et al.
Incremental LYs gained for MPT vs VMP
**** 0.02 --
Incremental pre-progression LYs for Rd vs VMP
**** -- 1.30
Incremental post-progression LYs for Rd vs VMP
**** -- 1.94
Key: LY= life years
The CS reported that the difference in the values of incremental life years for MPT vs VMP
obtained in this appraisal and that reported in NICE TA228 could be due to a different reference
treatment for the HR (the HR values in TA228 were not available). The ERG also notes that the
company has used an updated data cut of the VISTA trial to that used in TA228 which produces
a different HR for VMP vs. MPT.
The CS reports that incremental pre-progression life years for Rd vs VMP were comparable
between this appraisal and that reported by Usmani et al.51 (**** vs 1.30 respectively). However,
there was a substantial difference in incremental post-progression life years (**** vs 1.94
respectively). The CS noted that this difference in values could possibly be due to differences in
extrapolation methods, the MM-020 trial data cut, discount rates for outcomes and studies
included in the NMA between the two studies.
4.3.9 Cost effectiveness results
The CS presents base case results in terms of total costs, life years gained, QALYs and
incremental cost per QALY. Two sets of base case results were presented: Rd versus MPT and
Rd versus VMP (in patients who are intolerant or contraindicated to thalidomide). The base case
results are obtained based on the proposed PAS adaption wherein the cost of lenalidomide is
capped at ** cycles (CS Appendix P presents results with the existing approved PAS cap at 26
cycles).
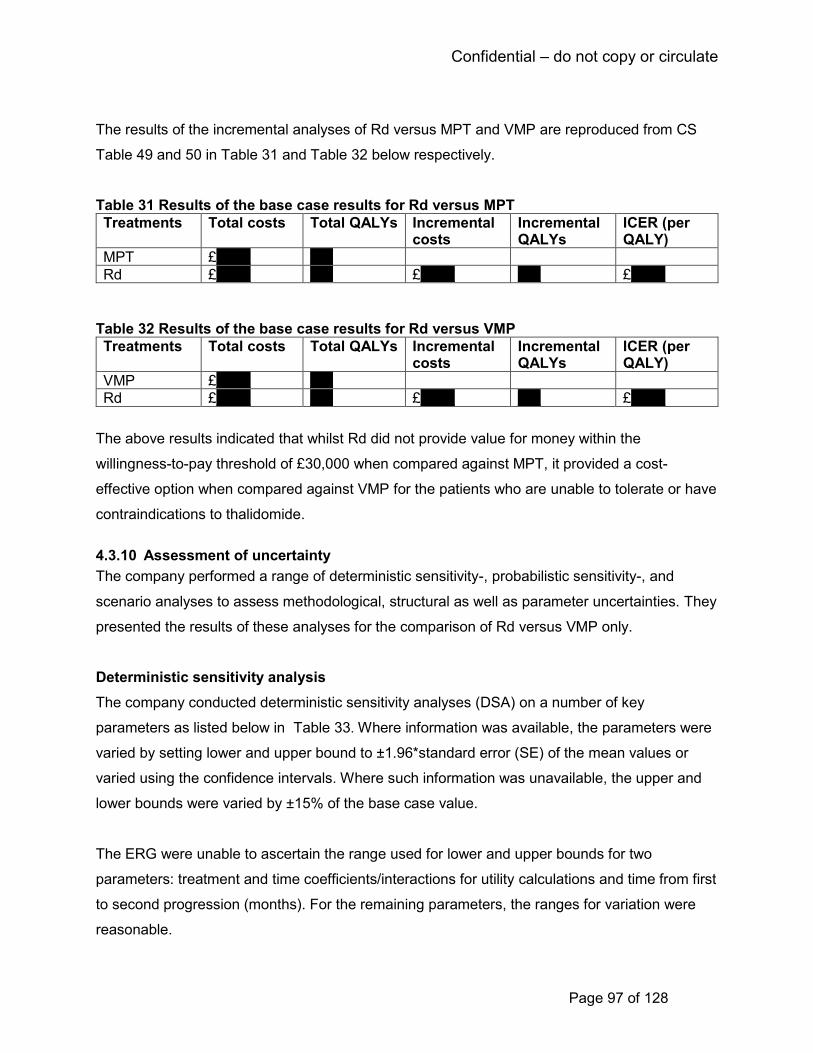
Confidential – do not copy or circulate
Page 97 of 128
The results of the incremental analyses of Rd versus MPT and VMP are reproduced from CS
Table 49 and 50 in Table 31 and Table 32 below respectively.
Table 31 Results of the base case results for Rd versus MPT
Treatments Total costs Total QALYs Incremental costs
Incremental QALYs
ICER (per QALY)
MPT £****** ****
Rd £****** **** £****** **** £******
Table 32 Results of the base case results for Rd versus VMP
Treatments Total costs Total QALYs Incremental costs
Incremental QALYs
ICER (per QALY)
VMP £****** ****
Rd £****** **** £****** **** £******
The above results indicated that whilst Rd did not provide value for money within the
willingness-to-pay threshold of £30,000 when compared against MPT, it provided a cost-
effective option when compared against VMP for the patients who are unable to tolerate or have
contraindications to thalidomide.
4.3.10 Assessment of uncertainty
The company performed a range of deterministic sensitivity-, probabilistic sensitivity-, and
scenario analyses to assess methodological, structural as well as parameter uncertainties. They
presented the results of these analyses for the comparison of Rd versus VMP only.
Deterministic sensitivity analysis
The company conducted deterministic sensitivity analyses (DSA) on a number of key
parameters as listed below in Table 33. Where information was available, the parameters were
varied by setting lower and upper bound to ±1.96*standard error (SE) of the mean values or
varied using the confidence intervals. Where such information was unavailable, the upper and
lower bounds were varied by ±15% of the base case value.
The ERG were unable to ascertain the range used for lower and upper bounds for two
parameters: treatment and time coefficients/interactions for utility calculations and time from first
to second progression (months). For the remaining parameters, the ranges for variation were
reasonable.
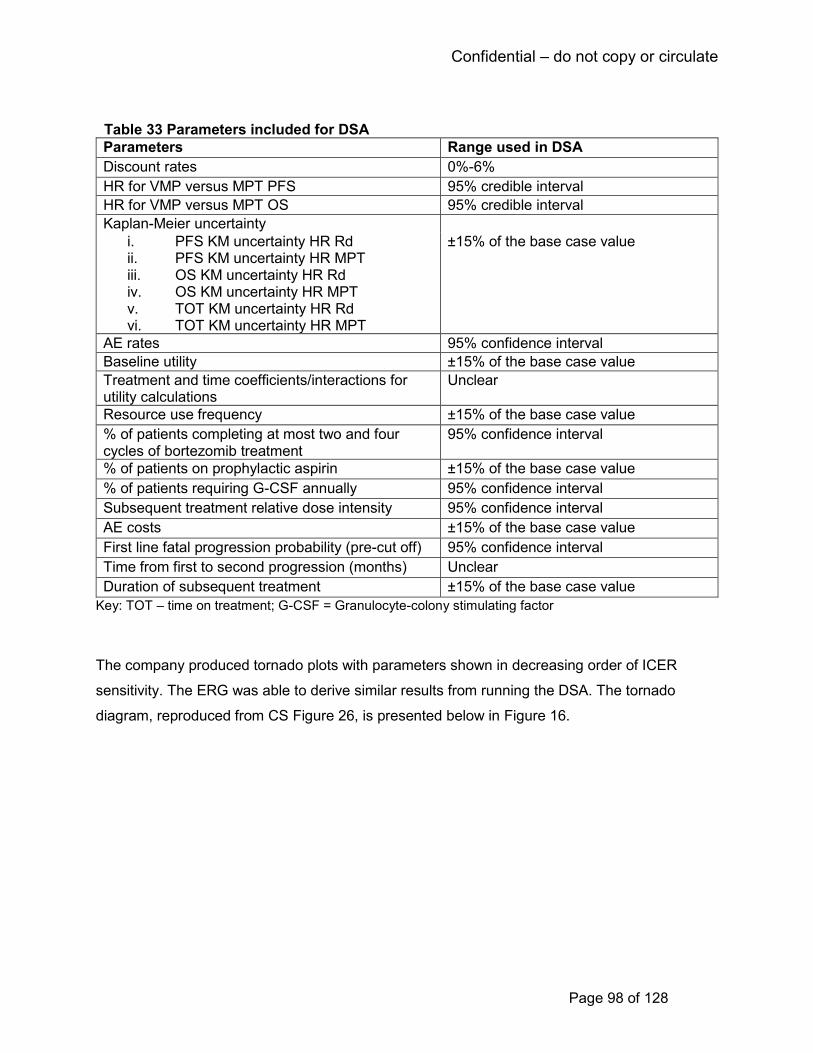
Confidential – do not copy or circulate
Page 98 of 128
Table 33 Parameters included for DSA
Parameters Range used in DSA
Discount rates 0%-6%
HR for VMP versus MPT PFS 95% credible interval
HR for VMP versus MPT OS 95% credible interval
Kaplan-Meier uncertainty
i. PFS KM uncertainty HR Rd ii. PFS KM uncertainty HR MPT iii. OS KM uncertainty HR Rd iv. OS KM uncertainty HR MPT v. TOT KM uncertainty HR Rd vi. TOT KM uncertainty HR MPT
±15% of the base case value
AE rates 95% confidence interval
Baseline utility ±15% of the base case value
Treatment and time coefficients/interactions for utility calculations
Unclear
Resource use frequency ±15% of the base case value
% of patients completing at most two and four cycles of bortezomib treatment
95% confidence interval
% of patients on prophylactic aspirin ±15% of the base case value
% of patients requiring G-CSF annually 95% confidence interval
Subsequent treatment relative dose intensity 95% confidence interval
AE costs ±15% of the base case value
First line fatal progression probability (pre-cut off) 95% confidence interval
Time from first to second progression (months) Unclear
Duration of subsequent treatment ±15% of the base case value
Key: TOT – time on treatment; G-CSF = Granulocyte-colony stimulating factor
The company produced tornado plots with parameters shown in decreasing order of ICER
sensitivity. The ERG was able to derive similar results from running the DSA. The tornado
diagram, reproduced from CS Figure 26, is presented below in Figure 16.

Confidential – do not copy or circulate
Page 99 of 128
Figure 16 Results of DSA for Rd versus VMP (CS Figure 26)
The results of the DSA indicated that whilst the model was relatively insensitive to change in the
majority of the parameters, the OS HR for VMP had the largest impact on the ICER ranging
from £****** per QALY for the upper credible interval value and increasing up to £****** per
QALY for the lower credible interval value. This indicates a considerable amount of uncertainty
associated with the prediction of OS HR for VMP. Other parameters including discount rates,
parameters for TTF and utilities also influenced the base case results, but to a lesser extent.
Probabilistic sensitivity analysis
Parameter uncertainty was assessed by conducting a probabilistic sensitivity analyses (PSA) on
the company’s base case. The parameters, together with the chosen distribution, are
reproduced from CS Table 47 in Table 34 below.
The CS presented the results of the PSA for 1000 simulations. The ERG re-ran the analyses
which took approximately seven minutes to run. We considered the distributions assigned to the
parameters to be appropriate.
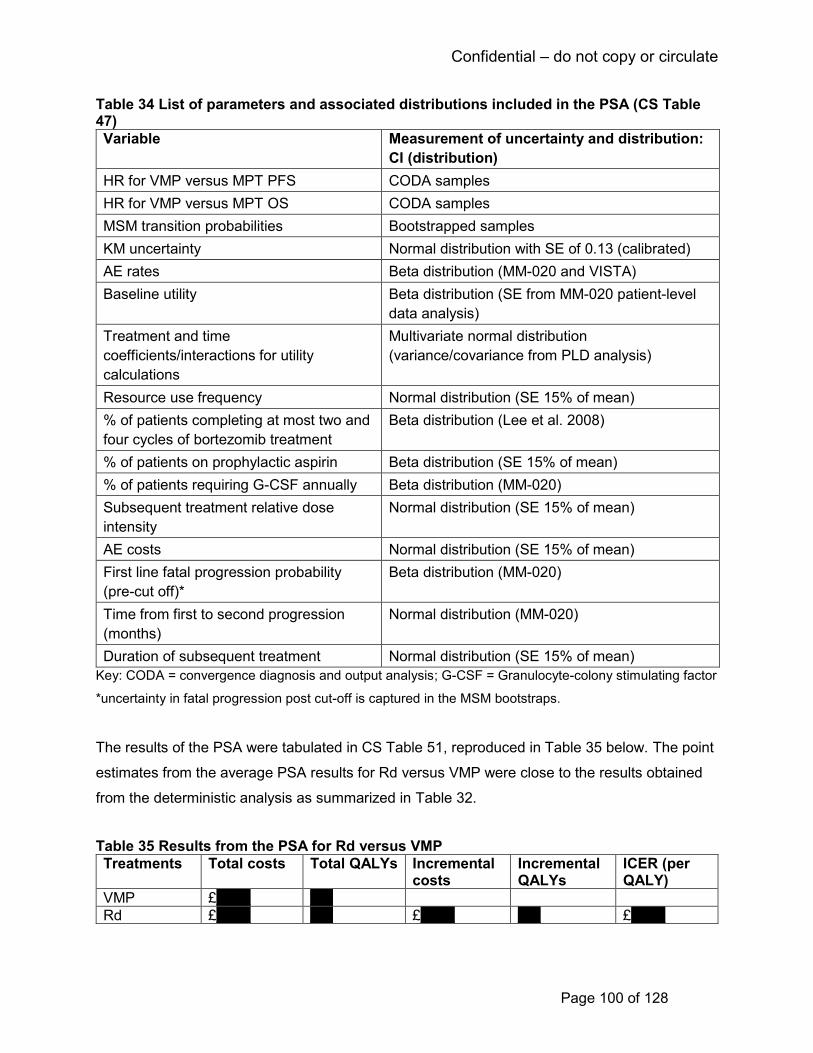
Confidential – do not copy or circulate
Page 100 of 128
Table 34 List of parameters and associated distributions included in the PSA (CS Table 47)
Variable Measurement of uncertainty and distribution:
CI (distribution)
HR for VMP versus MPT PFS CODA samples
HR for VMP versus MPT OS CODA samples
MSM transition probabilities Bootstrapped samples
KM uncertainty Normal distribution with SE of 0.13 (calibrated)
AE rates Beta distribution (MM-020 and VISTA)
Baseline utility Beta distribution (SE from MM-020 patient-level
data analysis)
Treatment and time
coefficients/interactions for utility
calculations
Multivariate normal distribution
(variance/covariance from PLD analysis)
Resource use frequency Normal distribution (SE 15% of mean)
% of patients completing at most two and
four cycles of bortezomib treatment
Beta distribution (Lee et al. 2008)
% of patients on prophylactic aspirin Beta distribution (SE 15% of mean)
% of patients requiring G-CSF annually Beta distribution (MM-020)
Subsequent treatment relative dose
intensity
Normal distribution (SE 15% of mean)
AE costs Normal distribution (SE 15% of mean)
First line fatal progression probability
(pre-cut off)*
Beta distribution (MM-020)
Time from first to second progression
(months)
Normal distribution (MM-020)
Duration of subsequent treatment Normal distribution (SE 15% of mean)
Key: CODA = convergence diagnosis and output analysis; G-CSF = Granulocyte-colony stimulating factor
*uncertainty in fatal progression post cut-off is captured in the MSM bootstraps.
The results of the PSA were tabulated in CS Table 51, reproduced in Table 35 below. The point
estimates from the average PSA results for Rd versus VMP were close to the results obtained
from the deterministic analysis as summarized in Table 32.
Table 35 Results from the PSA for Rd versus VMP
Treatments Total costs Total QALYs Incremental costs
Incremental QALYs
ICER (per QALY)
VMP £****** ****
Rd £****** **** £****** **** £******
Confidential – do not copy or circulate
Page 101 of 128
At a willingness-to-pay threshold of £20,000 per QALY, the probability of Rd being cost-effective
is *** compared to VMP. The probability increases to *** when the threshold is £30,000 per
QALY. The cost effectiveness acceptability curves, obtained from the company’s model are
presented in Figure 17.
Figure 17 Cost-effectiveness acceptability curve (reproduced from CS Figure 25)
Scenario analyses
The company conducted a total of 17 scenario analyses to assess structural and
methodological uncertainties of their base case assumptions. These analyses, along with their
justifications and the results obtained are presented in Table 36 from CS Table 52.
Table 36 Summary of the scenario analyses (CS Table 52)
Scenario and cross reference Brief rationale ICER (vs VMP)
Base case £******
Time horizon of 15 years To observe the impact of the ICER on the model time horizon. This is impact minimal.
£******
Time horizon of 35 years £******
Equal OS and subsequent therapy for VMP and MPT
To observe the impact of equal efficacy of VMP to MPT, which would be reflected with increased subsequent Rd use than reported in VISTA
Rd Dominates

Confidential – do not copy or circulate
Page 102 of 128
Equal PPS for Rd and MPT To observe impact of assuming no post-progression survival benefit for the Rd arm
£******
Time-varying HRs for VMP vs MPT
To observe the impact of relaxing the proportional hazards assumption
£******
Time-varying HRs for VMP and Rd vs MPT
£******
Use TTF:PFS to extrapolate Rd and MPT duration of treatment
An alternative method of estimated costs to parametric modelling of TTF from patient-level data from MM-020
£******
Use Rd TTF:PFS for VMP duration of treatment
In the absence of data, this scenario tests the impact of assuming Rd treatment discontinuation is applicable to the VMP arm
£******
Assume VMP duration of treatment from NICE TA228
In the absence of data, this scenario tests the impact of assuming previous technology appraisal costings
£*****
Use Relative dose intensity for drug costs
An alternative method to estimate drugs costs to the trial-based dosing
£******
VMP G-CSF equivalent to MPT In the absence of data, this scenario estimates the impact of equal G-CSF use between VMP and MPT rather than Rd
£******
Assume 100% VMP patients receive full rebate for bortezomib if achieving less than a partial response by the cut-off duration
Explores the impact of assuming all patients receive the reimbursement, rather than 75%
£******
Exclude bortezomib PAS To observe the impact on the ICER of the bortezomib PAS (minimal)
£******
Remove subsequent thalidomide costs
To observe the impact on the ICER of subsequent thalidomide use given the subgroup explored is patients who are unable to tolerate, or have contraindications to thalidomide
£******
Remove all subsequent treatment costs
To observe the impact on the ICER of subsequent treatment use
£******
Include subsequent-treatment disutilities
An alternative method of calculating post-progression utility
£******
Remove treatment coefficient and interaction terms for utility calculations
To observe the impact on the ICER of the treatment in utility calculations
£******
Confidential – do not copy or circulate
Page 103 of 128
For the scenarios related to treatment effectiveness the company performed a scenario analysis
relating to OS where equal efficacy and subsequent therapy use was assumed for VMP and
MPT, which resulted in Rd dominating VMP. In another scenario, the company removed the
treatment effect of Rd in post progression by assuming equal PPS for Rd and MPT. This had
insignificant impact on the base case ICER. The assumption of proportional hazards was
relaxed in two scenarios where fractional polynomials were used to estimate the PFS and OS
HR for VMP and for VMP and Rd to MPT. The parameters used in these scenarios are shown in
CS Table 19. These assumptions reduced the ICERs to £****** per QALY and £****** per QALY
respectively. In another scenario, they applied the treatment discontinuation of Rd to the VMP
arm which marginally increased the ICER to £****** per QALY.
With respect to costings, the company conducted scenarios where they assume: patients
receive all 9 doses of VMP; use an alternative costing method with relative dose intensity for
Rd, MPT and VMP drug costs; equal usage of G-CSF between VMP and MPT; all patients
receiving VMP receive a full rebate, excluding the PAS associated with bortezomib, removing all
subsequent thalidomide costs and all subsequent treatment costs. All these scenarios had
minimal impact on the base case ICER. Finally, for utilities two scenarios were included: one
used an alternative approach of estimating post-progression utility by including subsequent
treatment disutilities and the other scenario excluded treatment coefficient and interaction terms
for utility calculations. None of these scenarios influenced the base case ICER of Rd vs VMP
significantly.
The ERG re-ran all the above scenarios (presented in Table 36) and replicated the results
reported by the company. The ICERs ranged from Rd dominating VMP (scenario: VMP HR for
OS and subsequent therapy proportions are set equal to MPT) to £****** per QALY (scenario:
using the ratio of TTF to PFS from the Rd and MPT arms of the MM-020 trial, and applying to
PFS to estimate DoT). Overall, we view that the company has appropriately tested a range of
their key model assumptions relating to model time horizon, treatment effectiveness, resource
use and costing, and utility estimation in their scenario analyses. The results, in general,
indicate that alternative scenarios provided broadly similar results to the base case.
Confidential – do not copy or circulate
Page 104 of 128
4.4 Additional work undertaken by the ERG
This section discusses the ERG’s further exploration of the issues and uncertainties raised in
their review and critique of the CS. In particular, the ERG considered the CS base case to be
limited with regard to the assumptions relating to time to treatment failure for VMP, HRQoL
estimation, subsequent treatments and administration costs for VMP.
A summary of the analyses conducted by the ERG are outlined below in Table 37, along with
their justifications and how these analyses changed parameters from the CS base case. These
analyses culminate in the ERG base case (ERG preferred scenario), which we believe to be the
most representative and appropriate analysis for the cost-effectiveness of Rd versus VMP for
treating patients with multiple myeloma. The results of the ERG additional analyses are
presented in the following sub-sections.

Confidential – do not copy or circulate
Page 105 of 128
Table 37 Additional analyses conducted by the ERG
ERG Scenario analysis
Analysis description
Company’s base case assumption
ERG assumption Justification
1 TTF TTF curve for VMP is assumed to equal PFS up to the maximum treatment duration
TTF for VMP is equal to MPT
Current approach for VMP inconsistent with that taken for Rd and MPT. PFS for MPT and VMP is similar (HR=1)
TTF parametric curve for MPT is assigned an exponential distribution
TTF parametric curve for MPT is assigned a Weibull distribution
NICE DSU TSD guidelines advocates the use of same parametric curve for both the treatment arms
2 Treatment effectiveness
OS HR for VMP vs MPT =1.11
OS HR for VMP vs MPT =1.0
To make the assumption of no difference in OS for VMP vs MPT as in NICE TA22848
3 HRQoL estimation
VMP is administered in 42 day treatment cycle whereas the utility is assigned to 28 day cycle
Adjusted the cycle length for VMP
Incorrect cycle duration for VMP with regard to utility: VMP is administered in 42 day treatment cycles, whereas the utility has been assigned to 28 day cycles
Assumes continued HRQoL benefit for Rd after end of MPT treatment for PFS
Assumes no difference in HRQoL Rd after the end of MPT treatment for PFS
Patients treated with Rd continue to have higher utility than those treated with MPT and VMP once their treatment is finished. We consider a better assumption would be to have equal utility values in all the three arms after MPT and VMP treatment has finished, based on EQ-5D data presented by the company
4 (i) Subsequent treatment costs – remove thalidomide
Inclusion of thalidomide as a subsequent treatment for VMP and Rd first line treated patients
Exclusion of thalidomide as a subsequent treatment for VMP and Rd first line treated patients
The comparison of Rd with VMP is only for patients who are intolerant to or contra-indicated to thalidomide

Confidential – do not copy or circulate
Page 106 of 128
(ii) Subsequent treatment costs - remove thalidomide and lenalidomide
Inclusion of thalidomide and lenalidomide as a subsequent treatment for VMP and Rd first line treated patients
Exclusion of thalidomide as a subsequent treatment for VMP and Rd patients, and exclude Rd as subsequent treatment in Rd first line treated patients
Patients who progress on first line Rd would not be given Rd in a subsequent line.
(iii) Rd PAS in subsequent treatment lines
Rd PAS cap restricted to 26 cycles in comparator arm
Adapted Rd PAS cap restricted to ** cycles in comparator arm
NICE request: to reflect cost to the NHS if new PAS adaptation is approved.
5 VMP administration costs
First administration: £253, Subsequent administration: £361
First administration: £236.19, Subsequent administration: £328.10
Using outpatient and Day case HRG codes for administration
ERG base case
Version 1: scenarios 1, 3, and 5
As above As above Reflects the ERG’s preferred most plausible assumptions
Version 2 (exploratory): Scenarios 1, 3, 4 and 5
As above In addition to scenario 1, 3 and 5, this ERG scenario also explores the impact of Rd patients not receiving thalidomide as second line or third line treatment.
To reflect the impact of excluding thalidomide subsequent treatment costs in the ERG base case.
Key: DSU = Decision Support Unit. TSD = technical support document
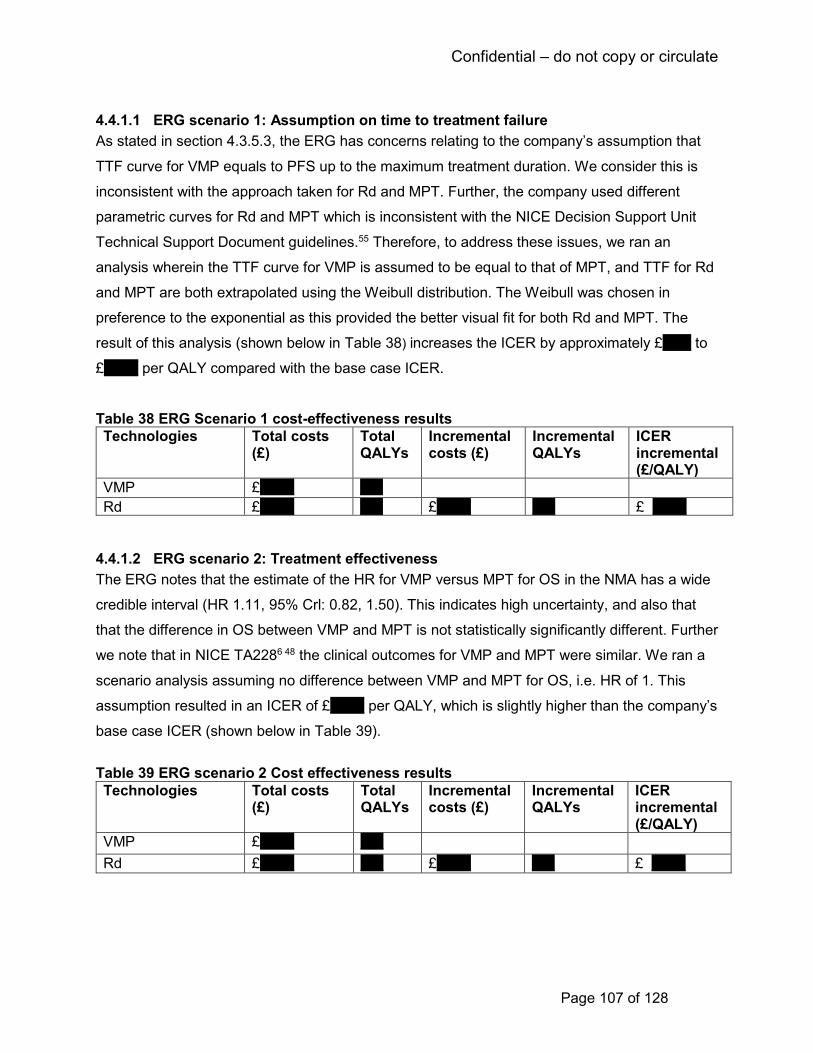
Confidential – do not copy or circulate
Page 107 of 128
4.4.1.1 ERG scenario 1: Assumption on time to treatment failure
As stated in section 4.3.5.3, the ERG has concerns relating to the company’s assumption that
TTF curve for VMP equals to PFS up to the maximum treatment duration. We consider this is
inconsistent with the approach taken for Rd and MPT. Further, the company used different
parametric curves for Rd and MPT which is inconsistent with the NICE Decision Support Unit
Technical Support Document guidelines.55 Therefore, to address these issues, we ran an
analysis wherein the TTF curve for VMP is assumed to be equal to that of MPT, and TTF for Rd
and MPT are both extrapolated using the Weibull distribution. The Weibull was chosen in
preference to the exponential as this provided the better visual fit for both Rd and MPT. The
result of this analysis (shown below in Table 38) increases the ICER by approximately £***** to
£****** per QALY compared with the base case ICER.
Table 38 ERG Scenario 1 cost-effectiveness results
Technologies Total costs (£)
Total QALYs
Incremental costs (£)
Incremental QALYs
ICER incremental (£/QALY)
VMP £****** ****
Rd £****** **** £****** **** £ ******
4.4.1.2 ERG scenario 2: Treatment effectiveness
The ERG notes that the estimate of the HR for VMP versus MPT for OS in the NMA has a wide
credible interval (HR 1.11, 95% Crl: 0.82, 1.50). This indicates high uncertainty, and also that
that the difference in OS between VMP and MPT is not statistically significantly different. Further
we note that in NICE TA2286 48 the clinical outcomes for VMP and MPT were similar. We ran a
scenario analysis assuming no difference between VMP and MPT for OS, i.e. HR of 1. This
assumption resulted in an ICER of £****** per QALY, which is slightly higher than the company’s
base case ICER (shown below in Table 39).
Table 39 ERG scenario 2 Cost effectiveness results
Technologies Total costs (£)
Total QALYs
Incremental costs (£)
Incremental QALYs
ICER incremental (£/QALY)
VMP £****** ****
Rd £****** **** £****** **** £ ******
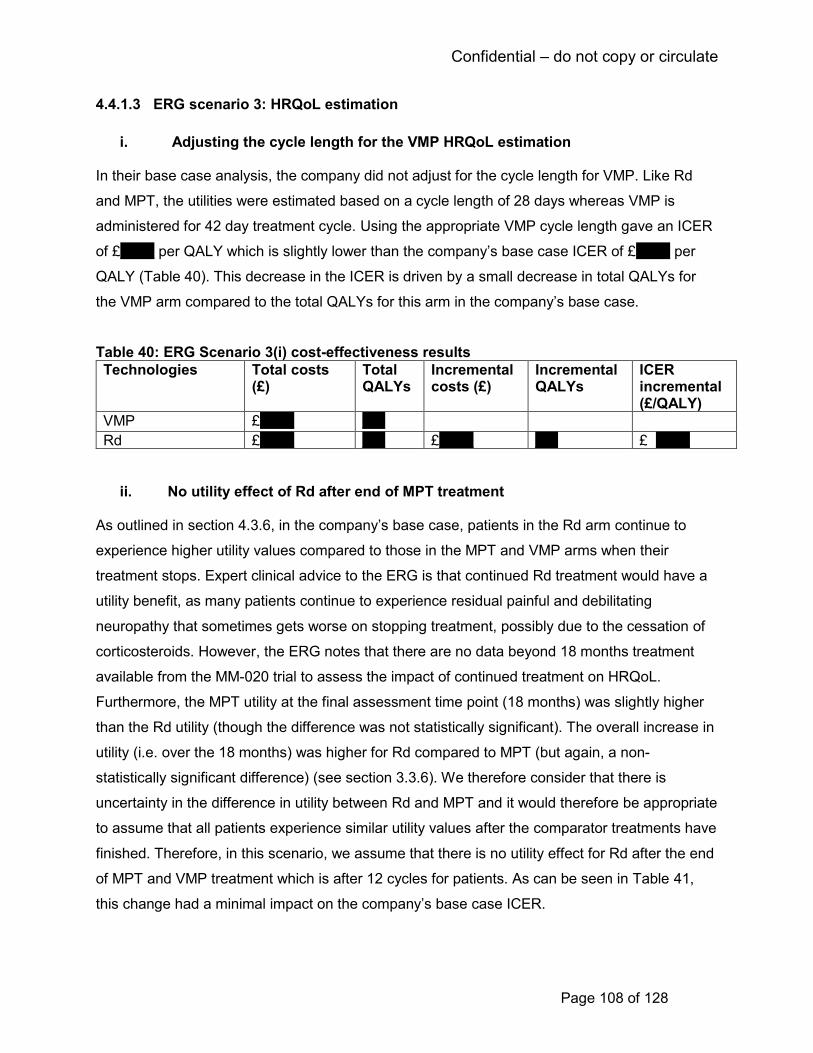
Confidential – do not copy or circulate
Page 108 of 128
4.4.1.3 ERG scenario 3: HRQoL estimation
i. Adjusting the cycle length for the VMP HRQoL estimation
In their base case analysis, the company did not adjust for the cycle length for VMP. Like Rd
and MPT, the utilities were estimated based on a cycle length of 28 days whereas VMP is
administered for 42 day treatment cycle. Using the appropriate VMP cycle length gave an ICER
of £****** per QALY which is slightly lower than the company’s base case ICER of £****** per
QALY (Table 40). This decrease in the ICER is driven by a small decrease in total QALYs for
the VMP arm compared to the total QALYs for this arm in the company’s base case.
Table 40: ERG Scenario 3(i) cost-effectiveness results
Technologies Total costs (£)
Total QALYs
Incremental costs (£)
Incremental QALYs
ICER incremental (£/QALY)
VMP £****** ****
Rd £****** **** £****** **** £ ******
ii. No utility effect of Rd after end of MPT treatment As outlined in section 4.3.6, in the company’s base case, patients in the Rd arm continue to
experience higher utility values compared to those in the MPT and VMP arms when their
treatment stops. Expert clinical advice to the ERG is that continued Rd treatment would have a
utility benefit, as many patients continue to experience residual painful and debilitating
neuropathy that sometimes gets worse on stopping treatment, possibly due to the cessation of
corticosteroids. However, the ERG notes that there are no data beyond 18 months treatment
available from the MM-020 trial to assess the impact of continued treatment on HRQoL.
Furthermore, the MPT utility at the final assessment time point (18 months) was slightly higher
than the Rd utility (though the difference was not statistically significant). The overall increase in
utility (i.e. over the 18 months) was higher for Rd compared to MPT (but again, a non-
statistically significant difference) (see section 3.3.6). We therefore consider that there is
uncertainty in the difference in utility between Rd and MPT and it would therefore be appropriate
to assume that all patients experience similar utility values after the comparator treatments have
finished. Therefore, in this scenario, we assume that there is no utility effect for Rd after the end
of MPT and VMP treatment which is after 12 cycles for patients. As can be seen in Table 41,
this change had a minimal impact on the company’s base case ICER.
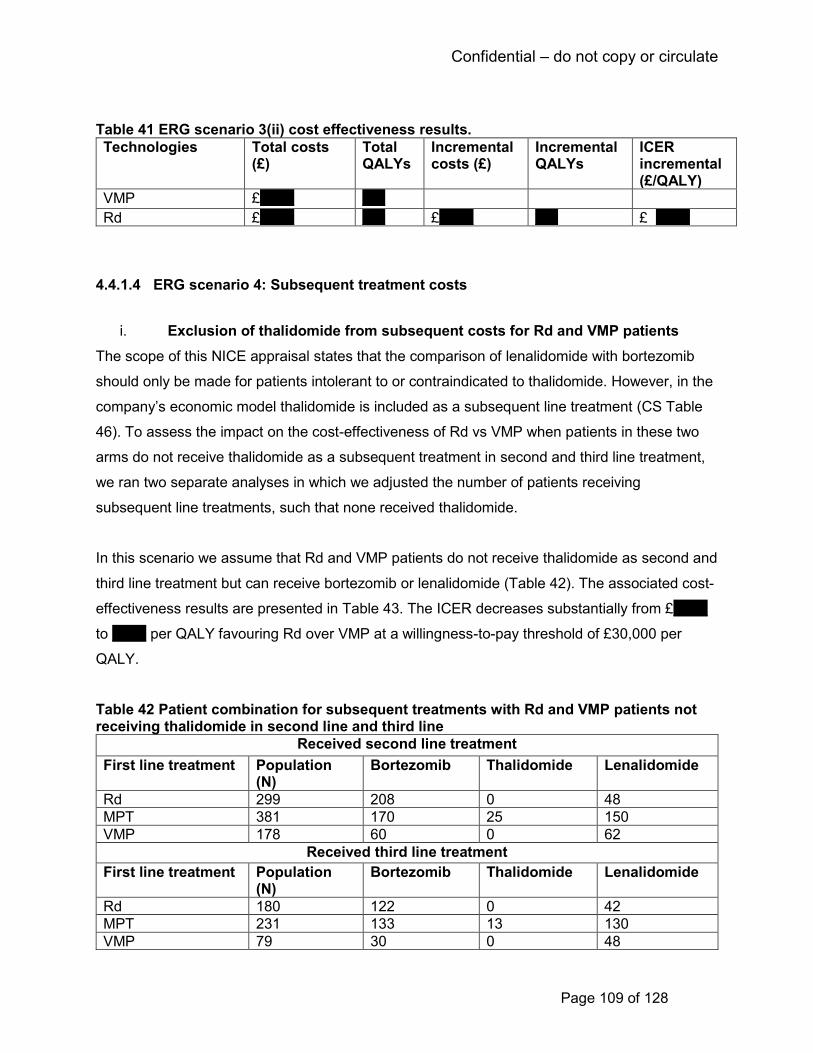
Confidential – do not copy or circulate
Page 109 of 128
Table 41 ERG scenario 3(ii) cost effectiveness results.
Technologies Total costs (£)
Total QALYs
Incremental costs (£)
Incremental QALYs
ICER incremental (£/QALY)
VMP £****** ****
Rd £****** **** £****** **** £ ******
4.4.1.4 ERG scenario 4: Subsequent treatment costs
i. Exclusion of thalidomide from subsequent costs for Rd and VMP patients
The scope of this NICE appraisal states that the comparison of lenalidomide with bortezomib
should only be made for patients intolerant to or contraindicated to thalidomide. However, in the
company’s economic model thalidomide is included as a subsequent line treatment (CS Table
46). To assess the impact on the cost-effectiveness of Rd vs VMP when patients in these two
arms do not receive thalidomide as a subsequent treatment in second and third line treatment,
we ran two separate analyses in which we adjusted the number of patients receiving
subsequent line treatments, such that none received thalidomide.
In this scenario we assume that Rd and VMP patients do not receive thalidomide as second and
third line treatment but can receive bortezomib or lenalidomide (Table 42). The associated cost-
effectiveness results are presented in Table 43. The ICER decreases substantially from £******
to ****** per QALY favouring Rd over VMP at a willingness-to-pay threshold of £30,000 per
QALY.
Table 42 Patient combination for subsequent treatments with Rd and VMP patients not receiving thalidomide in second line and third line
Received second line treatment
First line treatment Population (N)
Bortezomib Thalidomide Lenalidomide
Rd 299 208 0 48
MPT 381 170 25 150
VMP 178 60 0 62
Received third line treatment
First line treatment Population (N)
Bortezomib Thalidomide Lenalidomide
Rd 180 122 0 42
MPT 231 133 13 130
VMP 79 30 0 48

Confidential – do not copy or circulate
Page 110 of 128
NB. The number of patients receiving subsequent line bortezomib, thalidomide or lenalidomide does not sum to the total number who received subsequent line treatments as some patients received other regimens (not defined in the CS).
Table 43 ERG Scenario 4.i Cost effectiveness results
Technologies Total costs (£)
Total QALYs
Incremental costs (£)
Incremental QALYs
ICER incremental (£/QALY)
VMP £****** ****
Rd £******* **** £***** **** £ *****
ii. Exclusion of thalidomide from subsequent costs for Rd and VMP patients, and
exclusion of lenalidomide from subsequent costs for Rd
In this scenario, we also assume that patients receiving Rd would not receive Rd again as a
subsequent treatment. This is because expert advice to the ERG is that patients who progress
on continuous Rd treatment would be unlikely to receive it in a subsequent line, as they have
effectively become resistant to it. All Rd patients therefore receive bortezomib in second or third
line treatment. Patients in the VMP arm are assumed to receive bortezomib and lenalidomide as
subsequent treatments (as in scenario 4 i). The patient combination for this scenario is shown in
Table 44 and the associated cost-effectiveness results are presented in Table 45. As can be
seen, this scenario further reduces the ICER for Rd vs VMP to £***** per QALY.
Table 44 Patient combination for subsequent treatments in Rd arm not receiving thalidomide and lenalidomide and those in the VMP arm not receiving thalidomide in second line and third line
Received second line treatment
Treatments Population (N) Bortezomib Thalidomide Lenalidomide
Rd 299 256 0 0
MPT 381 170 25 150
VMP 178 60 0 62
Received third line treatment
Treatments Population (N) Bortezomib Thalidomide Lenalidomide
Rd 180 164 0 0
MPT 231 133 13 130
VMP 79 30 0 48 NB. The number of patients receiving subsequent line bortezomib, thalidomide or lenalidomide does not sum to the total number who received subsequent line treatments as some patients received other regimens (not defined in the CS).
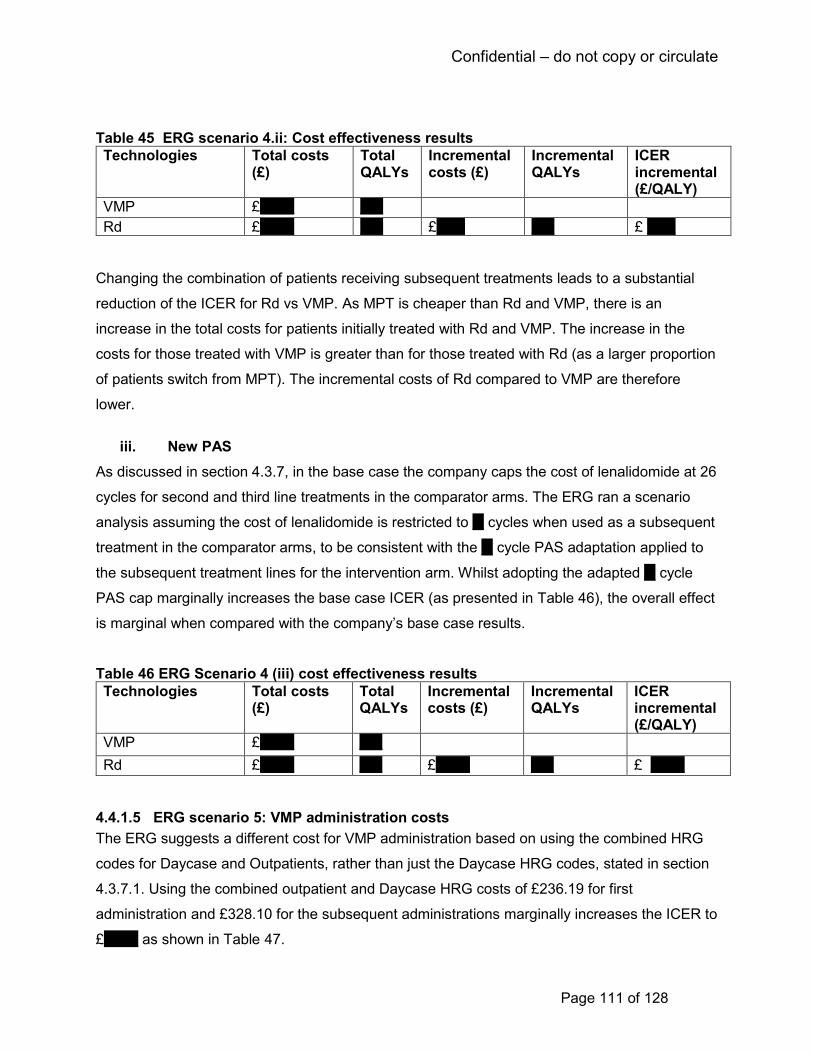
Confidential – do not copy or circulate
Page 111 of 128
Table 45 ERG scenario 4.ii: Cost effectiveness results
Technologies Total costs (£)
Total QALYs
Incremental costs (£)
Incremental QALYs
ICER incremental (£/QALY)
VMP £****** ****
Rd £****** **** £***** **** £ *****
Changing the combination of patients receiving subsequent treatments leads to a substantial
reduction of the ICER for Rd vs VMP. As MPT is cheaper than Rd and VMP, there is an
increase in the total costs for patients initially treated with Rd and VMP. The increase in the
costs for those treated with VMP is greater than for those treated with Rd (as a larger proportion
of patients switch from MPT). The incremental costs of Rd compared to VMP are therefore
lower.
iii. New PAS
As discussed in section 4.3.7, in the base case the company caps the cost of lenalidomide at 26
cycles for second and third line treatments in the comparator arms. The ERG ran a scenario
analysis assuming the cost of lenalidomide is restricted to ** cycles when used as a subsequent
treatment in the comparator arms, to be consistent with the ** cycle PAS adaptation applied to
the subsequent treatment lines for the intervention arm. Whilst adopting the adapted ** cycle
PAS cap marginally increases the base case ICER (as presented in Table 46), the overall effect
is marginal when compared with the company’s base case results.
Table 46 ERG Scenario 4 (iii) cost effectiveness results
Technologies Total costs (£)
Total QALYs
Incremental costs (£)
Incremental QALYs
ICER incremental (£/QALY)
VMP £****** ****
Rd £****** **** £****** **** £ ******
4.4.1.5 ERG scenario 5: VMP administration costs
The ERG suggests a different cost for VMP administration based on using the combined HRG
codes for Daycase and Outpatients, rather than just the Daycase HRG codes, stated in section
4.3.7.1. Using the combined outpatient and Daycase HRG costs of £236.19 for first
administration and £328.10 for the subsequent administrations marginally increases the ICER to
£****** as shown in Table 47.

Confidential – do not copy or circulate
Page 112 of 128
Table 47 ERG Scenario 5 cost effectiveness results
Technologies Total costs (£)
Total QALYs
Incremental costs (£)
Incremental QALYs
ICER incremental (£/QALY)
VMP £****** ****
Rd £****** **** £****** **** £ ******
4.4.1.6 ERG base case
We present two versions of the ERG base case as outlined below:
• Version 1: Combines ERG scenarios 1, 3 and 5
• Version 2: Combines ERG scenarios 1, 3, 4 and 5
Version 1
The ERG base case combines ERG scenarios 1, 3 and 5, i.e. changes to TTF, HRQoL and
VMP administration costs. We consider that this scenario represents the most plausible model
assumptions. The ERG base case cost effectiveness results (presented in Table 48) show an
ICER of £****** per QALY for Rd vs VMP which is an increase of £***** from the company’s
base case ICER of £****** per QALY.
Table 48: ERG base case cost-effectiveness results (Version 1)
Technologies Total costs (£)
Total QALYs
Incremental costs (£)
Incremental QALYs
ICER incremental (£/QALY)
VMP £****** ****
Rd £****** **** £****** **** £******
The results of the PSA are presented in Table 49 below. At a willingness-to-pay threshold of
£20,000 per QALY, the probability of Rd being cost-effective is *** compared to VMP. The
probability increases to ***** when the threshold is £30,000 per QALY. The cost effectiveness
acceptability curves are presented in Figure 18.
Table 49 ERG Base case Results from the PSA for Rd versus VMP (Version 1)
Treatments Incremental costs (mean)
Incremental QALYs (mean)
ICER (per QALY) (mean)
Rd vs VMP £****** **** £******
Confidential – do not copy or circulate
Page 113 of 128
Figure 18 Cost effectiveness acceptability curves for the ERG Base case (Version 1)
Version 2 (exploratory)
This version of the ERG base case combines ERG scenario 4.ii. for changes to subsequent
treatment costs with ERG scenarios 1, 3 and 5. In scenario 4 ii, patients treated initially with Rd
and VMP do not receive thalidomide as a subsequent treatment and those receiving Rd as first
line would not receive Rd as a subsequent treatment (Table 44). Scenario 4 was not included in
version 1 of our base case analysis because the subsequent treatments we have modelled,
although reflective of clinical practice, are different to the subsequent treatments used in the
MM-020 trial and there may have been changes to OS if alternative subsequent treatments had
been used, which we are not able to quantify. For this reason we consider version 2 of our base
case to be exploratory.
The cost effectiveness results of this version of the ERG base case (Table 50) show an ICER
of £****** per QALY for Rd vs VMP which is a decrease of £****** from the results obtained
from the version 1 of the ERG base case of £****** per QALY and a decrease of £***** from
the company’s base case ICER of £****** per QALY.
Table 50 ERG base case cost-effectiveness results (Version 2)

Confidential – do not copy or circulate
Page 114 of 128
Technologies Total costs (£)
Total QALYs
Incremental costs (£)
Incremental QALYs
ICER incremental (£/QALY)
VMP £****** ****
Rd £****** **** £***** **** £******
The results of the PSA are presented in Table 51 below. At a willingness-to-pay threshold of
£20,000 per QALY, the probability of Rd being cost-effective is ****** compared to VMP. The
probability increases to ****** when the threshold is £30,000 per QALY. The cost effectiveness
acceptability curves are presented in Figure 19.
Table 51 ERG base case Results from the PSA for Rd versus VMP (Version 2)
Treatments Incremental costs (mean)
Incremental QALYs (mean)
ICER (per QALY) (mean)
Rd vs VMP £***** **** £******
Figure 19 Cost effectiveness acceptability curves for the ERG base case (Version 2)
4.5 Conclusions of cost effectiveness
The company used a model structure commonly used for economic models of cancer treatment
with health states for progression-free survival, progression and death. The model chosen was
a hybrid structure that consisted of partitioned survival analysis for the first 92 weeks and a
Confidential – do not copy or circulate
Page 115 of 128
Markov modelling structure thereafter. Although it has been more common to use partitioned
survival analysis for the full time horizon in previous cancer technology appraisals, the ERG
considers that the approach taken by the company is appropriate in this instance as we
consider there is a good fit between the economic model and the Kaplan-Meier data. The
company used methods for the economic evaluation that are consistent with the NICE
methodological guidelines. The company compares Rd with MPT using the company’s MM-020
trial and compares Rd with VMP using an NMA.
The population, intervention and comparators accord with those listed in the NICE scope.
However, the company’s preferred comparison of Rd versus VMP is only applicable to patients
who are intolerant or contra-indicated to thalidomide, whereas the MM-020 trial – which
compared Rd with MPT - was not conducted in this population. Expert clinical advice to the
ERG is that this would not influence the generalisability of clinical effectiveness outcomes from
this trial.
The ERG considers that the company’s approach to estimating HRQoL used in the economic
model follows the NICE reference case: EQ-5D-3L values have been used for the model health
states. The company has used utility values for MPT and Rd from the MM-020 trial and so the
values used are directly related to the population considered. However, there is uncertainty
around the utility values for progressed disease as these were based only upon observations
taken on the first outpatient visit post-progression. Also some uncertainty around the utility
values used for VMP as these have been taken from a mapping from EORTC QLQ Q30 to EQ-
5D. The approach taken by the company for estimating health care resources and costs is
reasonable. There is some uncertainty around the costing of subsequent treatment costs.
The model results are most sensitive to changes in the HR for VMP compared to MPT and
assumptions regarding the proportions of patients taking subsequent therapy for patients who
are ineligible for thalidomide. As noted above, the population included in the analysis for Rd vs.
VMP differs from that used in MM-020 trial as the analysis is for patients not eligible for
thalidomide whilst the trial includes patients treated with thalidomide. The impact of excluding
thalidomide from subsequent therapy for patients initially treated with Rd or VMP is more
favourable to Rd (i.e. the ICER reduces) because there are higher additional costs for VMP than
for Rd (more VMP patients receive subsequent line bortezomib-based therapy than the cheaper
thalidomide-based therapy). However, it is unclear how the clinical effectiveness outcomes
Confidential – do not copy or circulate
Page 116 of 128
would be affected by excluding thalidomide as subsequent treatment. Potentially the clinical
benefit of Rd versus VMP would be reduced in this group if patients initially treated with VMP
had Rd second-line rather than MPT, and patients initially treated with Rd had VMP second-line
rather than MPT.
The ERG notes limitations in the company’s approach with regard to treatment failure for VMP,
HRQoL estimation and administration costs for VMP. The ERG conducted analyses with regard
to these issues but, in general, these analyses had only a small impact on the ICER of Rd
compared to VMP.
5 End of life
The CS does not consider that lenalidomide meets all of NICE’s end-of-life criteria (CS Table
B.2.13.5). The ERG agrees with this.
6 Innovation The CS states that the innovative nature of lenalidomide is based on its mechanism of action
and toxicity profile. Lenalidomide is more potent than thalidomide in terms of its anti-proliferative
activity, anti-inflammatory properties and ability to stimulate Th1 cytokines, T-cells and natural
killer cells (CS section B.2.12). It is possible for lenalidomide to be used continuously to
suppress residual disease and extend the period of first remission, unlike the other treatments
which are given for a fixed period.
The CS notes that lenalidomide can also be given in a two-drug combination that does not
include melphalan, thus making treatment more tolerable to older frail patients. Expert clinical
advice to the ERG is that melphalan can be hard for some elderly patients to tolerate.
The CS highlights that in comparison to MPT and current therapies, Rd can be given orally,
providing an alternative treatment to current intravenous and subcutaneous therapies. The
combination of lenalidomide and low-dose dexamethasone can be self-administered by patients
at home, which is proposed to be more convenient, easier and less distressing for patients than
use of either intravenous or injectable combinations (e.g. VMP), particularly for elderly and frail
individuals as well as those who do not live near to a hospital. The CS claims that use of an oral
Confidential – do not copy or circulate
Page 117 of 128
agent provides patients with a greater sense of control over their disease and less interruption
of their daily (including work) lives compared to intravenous and subcutaneous treatments. The
ERG agrees that this is a reasonable suggestion.
7 DISCUSSION
7.1 Summary of clinical effectiveness issues
The clinical effectiveness evidence for lenalidomide comes from the phase III MM-020 RCT.
This was a large international trial (1,600 patients) and was judged to be of good methodological
quality, although it was open-label. The data from this trial can be considered mature as the final
planned analyses of PFS and OS have been conducted. Continuous lenalidomide was
statistically significantly superior to MPT on PFS, OS, tumour response, time to treatment
failure, and time to progression. Expert clinical advice to the ERG considers that these
improvements are clinically meaningful, particularly the increase in PFS (around four months)
which is regarded to be important in the first line treatment of multiple myeloma. The PFS period
is clinically considered to be associated with good HRQoL and better overall health and the aim
is to prolong it as long as possible before initiation of subsequent line treatments.
There were statistically significant improvements in HRQoL in the trial for both Rd and MPT,
with Rd overall having a slightly greater (but not statistically significant) improvement in EQ-5D
during the 18 month assessment period. The CS suggests these are clinically significant based
on published minimal important difference values. Expert clinical advice given to the ERG is that
a meaningful improvement in HRQoL with lenalidomide would be expected given that
thalidomide is regarded to have a poor toxicity profile. Rd showed statistical superiority to MPT
in terms of the impact of side effects on HRQoL as measured by the EORTC QLQ-MY20
instrument at all time points except month 18. Overall, the ERG advises caution in the
interpretation of HRQoL data as it is not clear how missing data were handled in the ITT
analysis.
The proportion of patients with specific grade 3 or 4 adverse events (e.g. infections, metabolism
and nutrition disorders) was higher for Rd than the Rd18 and MPT groups. Other events (e.g.
blood and lymphatic system disorders, nervous system disorders), were experienced by a
greater proportion of patients in the MPT group. Treatment emergent serious adverse events

Confidential – do not copy or circulate
Page 118 of 128
were higher for Rd patients compared to Rd18 and MPT patients, which the CS suggests is due
to the longer drug-exposure time in this arm.
Rd was superior to VMP in terms of PFS and OS as estimated indirectly from a NMA. The NMA
itself was conducted according to methodological guidelines, though is limited by a sparse
network of only four trials. The proportional hazards assumption does not appear to hold for
PFS in the MM-020 trial. After 92 weeks the log cumulative hazard curves for Rd and MPT
diverge. For OS the curves appear more parallel. The NMA was conducted using two different
statistical approaches: one that assumed proportional hazards, and one based on fractional
polynomials that produced time-varying hazard ratios. The company chose the proportional
hazards NMA to inform their base case cost-effectiveness analysis. The ERG considers that the
time varying hazard ratio NMA produces estimates with great uncertainty in some of the
fractional polynomial models, including the one chosen by the company as best fitting. The ERG
notes that OS, but not PFS, was one of the key drivers of cost-effectiveness. Furthermore, the
ICERs for Rd versus VMP based on the fractional polynomials NMA were lower (i.e. less
conservative). Taking all these factors into consideration the proportional hazards NMA
therefore appears to be a more appropriate approach in this instance.
A comparison of Rd and VMP across other outcomes including tumour response, HRQoL and
adverse events was not made, therefore it is not possible to estimate the similarities or
differences between these two treatments on the broader range of clinically relevant outcomes.
7.2 Summary of cost effectiveness issues
The model structure for the economic evaluation is appropriate and consistent with the clinical
disease pathway. The model contains health states of progression-free, progressed disease
and death. A hybrid model is used with partitioned survival analysis for weeks <92 and a
Markov model thereafter with transition probabilities between health states. The clinical
evidence consists of the MM-020 trial for Rd and MPT. VMP is modelled by using the HR for
PFS and OS compared to MPT from the company’s NMA. The approach provided a good fit
against the observed trial data from MM-020.
The company’s base case results include a PAS for lenalidomide whereby lenalidomide is given
free of charge after ** cycles. The CS models produce an ICER of £****** per QALY for Rd
compared to MPT and £****** per QALY for Rd compared to VMP. The company acknowledge
Confidential – do not copy or circulate
Page 119 of 128
that Rd is not cost-effective against MPT and request that the comparison against VMP is most
pertinent to this technology appraisal. The company’s probabilistic sensitivity analyses showed
there is a probability of *** and *** that Rd is cost-effective compared to VMP at willingness to
pay thresholds of £20,000 and £30,000 per QALY respectively.
The ERG conducted two versions of the base case analyses. Version 1 includes changes to the
time on treatment failure, HRQoL estimation and costs of administration of VMP. Version 2 is
considered exploratory and includes all the changes in version 1 along with a change in
subsequent treatments given after initial disease progression. Specifically, this version explores
the impact on the cost effectiveness results when patients do not receive thalidomide as a
subsequent treatment, and those receiving Rd initially would not receive Rd as a subsequent
treatment. The ERG base case ICER for Rd compared to VMP in version 1 is £****** per QALY
gained (an increase of £***** from the company’s base case ICER). For the ERG base case
version 2, the ICER is £****** per QALY (a decrease of £***** from the company’s base case
ICER). In summary, the ERG’s preferred base case analysis increases the ICER from the
company’s base case analysis, but it remains within the willingness-to-pay threshold of £30,000
per QALY.
8 REFERENCES
1. Howlader N, Noon A, Karpcho M et al. Cancer Stat Facts: Myeloma.
https://seercancergov/statfacts/html/mulmyhtml date accessed 1/11/2017 1975-2014.
2. Cancer Research UK. Cancer stats Myeloma - UK. http://wwwcancerresearchukorg/health-
professional/cancer-statistics/statistics-by-cancer-type/myeloma#heading-Two date
accessed 1/11/2017 2014.
3. International Myeloma Foundation. Multiple myeloma: Concise Review of the Disease and
Treatment Options.
ttps://wwwmyelomaorg/sites/default/files/images/publications/UnderstandingPDF/concis
ereviewpdf date accessed 1/11/2017 2016.
4. Dimopoulos MA, Sonneveld P, Leung N et al. International Myeloma Working Group
Recommendations for the Diagnosis and Management of Myeloma-Related Renal
Impairment. . J Clin Oncol 2016;34(1544–57)

Confidential – do not copy or circulate
Page 120 of 128
5. National Institute for Health and Care Excellence. NICE TA311 Bortezomib for induction
therapy in multiple myeloma before high-dose chemotherapy and autologous stem cell
transplantation ERG report https://www.nice.org.uk/Guidance/TA311 [Accessed 25
October 2017]. 2014.
6. National Institute for Health and Care Excellence. NICE TA228 Bortezomib and thalidomide
for the first line treatment of multiple myeloma. https://wwwniceorguk/guidance/ta228 [
date accessed 13/11/2017] 2011.
7. National Institute for Health and Care Excellence. NICE TA129 Bortezomib monotherapy for
relapsed multiple myeloma. https://wwwniceorguk/Guidance/ta129 (Accessed 25
October 2017) 2007.
8. National Institute for Health and Care Excellence. NICE TA457 Carfilzomib for previously
treated multiple myeloma. https://wwwniceorguk/guidance/ta457/chapter/1-
Recommendations [date accessed 2/12/2017] 2017.
9. National Institute for Health and Care Excellence. NICE TA171 Lenalidomide for the
treatment of multiple myeloma in people who have received at least one prior therapy.
https://www.nice.org.uk/guidance/ta171 [Accessed 25 October 2017]. 2014
10. National Institute for Health and Care Excellence. NICE TA380 Panobinostat for treating
multiple myeloma after at least 2 previous treatments.
https://www.nice.org.uk/guidance/ta380 [Accessed 25 October 2017]. 2016.
11. National Institute for Health and Care Excellence. NICE TA427 Pomalidomide for multiple
myeloma previously treated with lenalidomide and bortezomib.
https://wwwniceorguk/guidance/ta427 [Accessed 25 October 2017] 2017.
12. NHS England. Cancer Drugs Fund List. ver1.41 17. https://www.england.nhs.uk/wp-
content/uploads/2017/10/national-cdf-list-v1.47.pdf [Accessed 25 October 2017]. 2017
13. European Medicines Agency. Committee for medicinal products for human use (CHMP)
assessment report, Revimid EMEA/H/C/000717/X/0073/G.
http://wwwemaeuropaeu/docs/en_GB/document_library/EPAR_-_Assessment_Report_-
_Variation/human/000717/WC500210579pdf [date accessed 13/11/2017] 2015.
14. Moreau P., San Miguel J, Sonneveld P et al. Multiple myeloma: ESMO Clinical Practice
Guidelines for diagnosis, treatment and follow-up. Ann Oncol 2017;28::iv52-iv61.
15. Medicines.org.uk. eMC. REVLIMID 25mg hard capsules - summary of product
characteristics. https://wwwmedicinesorguk/emc/medicine/19841 [date accessed
13/11/2017] 2017.
Confidential – do not copy or circulate
Page 121 of 128
16. Buchberger M, Rochau U, Vukicevic D, et al. TREATMENT STRATEGIES FOR ELDERLY
PATIENTS WITH NEWLY DIAGNOSED MULTIPLE MYELOMA: A META-ANALYSIS
AND INDIRECT TREATMENT COMPARISON. Value in Health 2015;18(7):A432. doi:
10.1016/j.jval.2015.09.1031
17. Facon T MJ, Hulin C, et al. Melphalan and prednisone plus thalidomide versus melphalan
and prednisone alone or reduced-intensity autologous stem cell transplantation in elderly
patients with multiple myeloma (IFM 99-06): a randomised trial. Lancet (London,
England) 2007;370(9594):1209-18. doi: 10.1016/s0140-6736(07)61537-2 [published
Online First: 2007/10/09]
18. Hulin C FT, Rodon P, et al.,. Efficacy of melphalan and prednisone plus thalidomide in
patients older than 75 years with newly diagnosed multiple myeloma: IFM 01/01 trial. J
Clin Oncol 2009;27(22):3664-70. doi: 10.1200/jco.2008.21.0948 [published Online First:
2009/05/20]
19. Mateos MV RP, Slag R, Khuageva NK, Dimopoulos MA, et al. Bortezomib plus melphalan
and prednisone compared with melphalan and prednisone in previously untreated
multiple myeloma: updated follow-up and impact of subsequent therapy in the phase III
VISTA trial. J Clin Oncol 2010;28(13):2259-66. doi: 10.1200/jco.2009.26.0638 [published
Online First: 2010/04/07]
20. San Miguel J SR, Khuageva N K, et al. . Bortezomib plus Melphalan and Prednisone for
Initial Treatment of Multiple Myeloma. New England Journal of Medicine
2008;359(9):906-17. doi: 10.1056/NEJMoa0801479
21. San Miguel JF SR, Khuageva NK, Dimopoulos MA, Shpilberg O, Kropff M, Spicka I, Petrucci
MT, et al. Persistent overall survival benefit and no increased risk of second
malignancies with bortezomib-melphalan-prednisone versus melphalan-prednisone in
patients with previously untreated multiple myeloma. J Clin Oncol 2013;31(4):448-55.
doi: 10.1200/jco.2012.41.6180 [published Online First: 2012/12/13]
22. Benboubker L DM, Dispenzieri A, Catalano J, Belch AR, Cavo M, Pinto A, Weisel K, et al.
Lenalidomide and Dexamethasone in Transplant-Ineligible Patients with Myeloma. New
England Journal of Medicine 2014;371(10):906-17. doi: 10.1056/NEJMoa1402551
23. Celgene Corporation. Lenalidomide (REVLIMID®). A phase III, randomized, open-label, 3-
arm study to determine the efficacy and safety of lenalidomide (REVLIMID®) plus low-
dose dexamethasone when given until progressive disease or for 18 four-week cycles
versus the combination of melphalan, prednisone, and thalidomide given for 12 six-week
cycles in patients with previously untreated multiple myeloma who are either 65 years of
Confidential – do not copy or circulate
Page 122 of 128
age or older or not candidates for stem cell transplantation (IFM 07-01). Clinical study
report CC-5013-MM-020/IFM 07-01. 31 August 2016 (data cutoff: 21 January 2016).
Clinical study report, 2016.
24. Centre for Reviews and Dissemination. Systematic reviews: CRD's guidance for undertaking
reviews in health care. York Publishing Services Ltd.: CRD, 2009.
25. Food and Drug Administration. Guidance for industry: clinical trial endpoints for the approval
of cancer drugs and biologics. May 2007. Available at:
http://wwwfdagov/downloads/Drugs/GuidanceComplianceRegulatoryInformation/Guidan
ces/ucm071590pdf May 2007. (accessed 13/11/2017).
26. Committee for Medicinal Products for Human Use (CHMP). Methodological considerations
for using progression-free survival (PFS) as primary endpoint in confirmatory trials for
registration (Appendix 1 to the guideline on the evaluation of anticancer medicinal
products in man (CHMP/EWP/205/95 Rev. 3), 2008.
27. Durie BG HJ, Miguel JS, et al. International uniform response criteria for multiple myeloma.
Leukemia 2006;20(9):1467-73. doi: 10.1038/sj.leu.2404284 [published Online First:
2006/07/21]
28. Cocks K C, D, Wisløff, F, et al. An international field study of the reliability and validity of a
disease-specific questionnaire module (the QLQ-MY20) in assessing the quality of life of
patients with multiple myeloma. European Journal of Cancer 2007;43(11):1670-78. doi:
https://doi.org/10.1016/j.ejca.2007.04.022
29. Delforge M DR, Robinson D, et al. Health-related quality of life in elderly, newly diagnosed
multiple myeloma patients treated with VMP vs. MP: results from the VISTA trial.
European journal of haematology 2012;89(1):16-27. doi: 10.1111/j.1600-
0609.2012.01788.x [published Online First: 2012/04/04]
30. Facon T DM, Dispenzieri, A, Catalano JV, Belch A, Cavo, M, Pinto A, Weisel K, Ludwig H,
et al. . Final Analysis of Overall Survival from the First Trial. Blood 2016;128(22):241-41.
31. Facon T DM, Dispenzieri A, Catalano J, Belch AR, Cavo M. Final Survival Analysis From the
FIRST Trial: Lenalidomide Plus Low-Dose Dexamethasone Until Progression (Rd Cont)
v Melphalan, Prednisone and Thalidomide (MPT), and Rd for 18 Cycles (Rd18) for
Transplant-Ineligible (TNE) Patients (Pts) With Newly Diagnosed Multiple Myeloma.
Clinical Lymphoma, Myeloma and Leukemia 2017;17(1):e63-e64. doi:
10.1016/j.clml.2017.03.116
32. Hulin C FT, Shustik C, Belch A, Petrucci MT, Dührsen U, Lu J, Song K, Rodon P, Pegourie
B, et al. . Effect of Age on Efficacy and Safety Outcomes in Patients (Pts) with Newly
Confidential – do not copy or circulate
Page 123 of 128
Diagnosed Multiple Myeloma (NDMM) Receiving Lenalidomide and Low-Dose
Dexamethasone (Rd): The First Trial. Blood 2014;124(21):81-81.
33. Sacchi S MR, Lazzaro A, Morabito F, Fragasso A, Di Renzo N, Balleari E, Neri S, Quarta G,
et al. A randomized trial with melphalan and prednisone versus melphalan and
prednisone plus thalidomide in newly diagnosed multiple myeloma patients not eligible
for autologous stem cell transplant. Leukemia & lymphoma 2011;52(10):1942-8. doi:
10.3109/10428194.2011.584006 [published Online First: 2011/06/15]
34. Palumbo A, Bringhen S, Caravita T et al. Oral melphalan and prednisone chemotherapy
plus thalidomide compared with melphalan and prednisone alone in elderly patients with
multiple myeloma: randomised controlled trial. Lancet Oncol 2006;367.:825–31.
35. Palumbo A, Bringhen S, Liberati AM et al. Oral melphalan, prednisone, and thalidomide in
elderly patients with multiple myeloma: updated results of a randomized controlled trial.
Blood 2008;112:3107–14.
36. Waage A GP, Fayers P et al. . Melphalan and prednisone plus thalidomide or placebo in
elderly patients with multiple myeloma. Blood 2010; 116:1405–12.
37. Wijermans P, Schaafsma M, Termorshuizen F et al. Phase III study of the value of
thalidomide added to melphalan plus prednisone in elderly patients with newly
diagnosed multiple myeloma: The HOVON 49 study. . Journal of Clinical Oncology
2010;28:3160-66.
38. Higgins J, Green, S. Cochrane Handbook for Systematic Reviews of Interventions Version
5.1.0 [updated March 2011]: The Cochrane Collaboration, 2011.
39. Jansen JP. Network meta-analysis of survival data with fractional polynomials. BMC Medical
Research Methodology 2011;11(1):61. doi: 10.1186/1471-2288-11-61
40. National Institute for Health and Care Excellence. NICE TA492 Atezolizumab for untreated
locally advanced or metastatic urothelial cancer when cisplatin is unsuitable
https://www.nice.org.uk/guidance/TA492 [date accessed 14th November 2017]. 2017.
41. National Institute for Health and Care Excellence. Single Technology Appraisal Tivozanib for
treating renal cell carcinoma [ID591] https://www.nice.org.uk/guidance/gid-
ta10123/documents/committee-papers [date accessed 15th November 2017]. 2017.
42. National Institute for Health and Care Excellence. NICE TA463 Cabozantinib for previously
treated advanced renal cell carcinoma . https://www.nice.org.uk/guidance/ta463 [date
accessed 14th November 2017]. 2017.
43. MRC Biostatistics Unit. DIC: Deviance Information Criteria 2017 [Available from:
https://www.mrc-bsu.cam.ac.uk/software/bugs/the-bugs-project-dic/ accessed 30/11/17.

Confidential – do not copy or circulate
Page 124 of 128
44. Celgene Corporation. Data on File. Clinical study report 2017
45. European Commission. European Commission. Guideline on the evaluation of anticancer
medicinal products in man. Available at:
http://wwwemaeuropaeu/docs/en_GB/document_library/Scientific_guideline/2013/01/WC
500137128pdf December 2012. (accessed 20/11/2017).
46. Walters SJ BJ. Comparison of the minimally important difference for two health state utility
measures EQ-5D and SF-6D. Qual Life Res 2005;14:1523-32.
47. Delforge M ML, Eisenmann J, Arnulf B, Canepa L, Fragasso A, Leyvraz S, LangerC, Ezaydi
Y, et al. Health-related quality-of-life in patients with newly diagnosed multiple myeloma
in the FIRST trial: lenalidomide plus low-dose dexamethasone versus melphalan,
prednisone, thalidomide. Haematologica 2015;100(6):826-33. doi:
10.3324/haematol.2014.120121
48. Picot J CK, Bryant J, Clegg A J. The clinical effectiveness and cost-effectiveness of
bortezomib and thalidomide in combination regimens with an alkylating agent and a
corticosteroid for the first-line treatment of multiple myeloma: a systematic review and
economic evaluation. Health technology assessment (Winchester, England)
2011;15(41):1-204. doi: 10.3310/hta15410 [published Online First: 2011/12/08]
49. Cooper K PJ, Bryant J, Clegg A. Comparative cost-effectiveness models for the treatment of
multiple myeloma. International journal of technology assessment in health care
2014;30(1):90-7. doi: 10.1017/s0266462313000615 [published Online First: 2014/01/24]
50. Garrison LP WS, Huang H, Ba-Mancini A, Shi H, Chen K, Korves C, Dhawan R, Cakana A,
van de Velde H, Corzo D, Duh M S. The cost-effectiveness of initial treatment of multiple
myeloma in the U.S. with bortezomib plus melphalan and prednisone versus thalidomide
plus melphalan and prednisone or lenalidomide plus melphalan and prednisone with
continuous lenalidomide maintenance treatment. The oncologist 2013;18(1):27-36. doi:
10.1634/theoncologist.2011-0380 [published Online First: 2013/01/10]
51. Usmani SZ, Cavenagh JD, Belch AR et al. Cost-effectiveness of lenalidomide plus
dexamethasone vs. bortezomib plus melphalan and prednisone in transplant-ineligible
U.S. patients with newly-diagnosed multiple myeloma. . J Med Econ 2016;19:243–58.
52. Celgene Ltd. Multiple technology appraisal of bortezomib and thalidomide for the first-line
treatment of multiple myeloma. London 2009;NICE 2009
53. Janssen-Cilag. Bortezomib and thalidomide for the first-line treatment of multiple myeloma:
bortezomib (Velcade). London 2009;NICE 2009
Confidential – do not copy or circulate
Page 125 of 128
54. Jackson C. Multistate models for panel data: the msm package for R. J Stat Sofw
2011;38:1-28G.
55. Latimer N. NICE DSU Technical Support Document 14: Survival analysis for economic
evaluations alongside clinical trials - extrapolation with patient-level data. 2013.
56. Proskorovsky I LP, Williams CD, Jordan K, Kyriakou C, Ishak J, Davies FE. Mapping
EORTC QLQ-C30 and QLQ-MY20 to EQ-5D in patients with multiple myeloma. Health
Qual Life Outcomes 2014;12:35. doi: 10.1186/1477-7525-12-35 [published Online First:
2014/03/13]
57. Kind P HG, Macran S,. Population norms for EQ-5D (discussion paper)
https://www.york.ac.uk/che/pdf/DP172.pdf [date accessed 26 October 2017]. 1999.
58. Department of Health. NHS reference costs 2015-2016.
http://wwwdhgovuk/en/Publicationsandstatistics/Publications/PublicationsPolicyAndGuid
ance/DH_122803 2017
59. Department of Health. Drugs and pharmaceutical electronic market information (eMit) 2017.
60. MIMS. Presciption drug database and drug prescribing guide. http://wwwmimscouk/ 2017
61. Eddy DM HW, Caro JJ, Tsevat J, McDonaldKM, Wong JB. Model transparency and
validation: a report of the ISPOR-SMDM Modeling Good Research Practices Task
Force-7. Medical decision making : an international journal of the Society for Medical
Decision Making 2012;32(5):733-43. doi: 10.1177/0272989x12454579 [published Online
First: 2012/09/20]
62. Facon T DM, Hulin C, et al. Updated Overall Survival (OS) Analysis of the FIRST Study:
Lenalidomide Plus Low-Dose Dexamethasone (Rd) Continuous vs Melphalan,
Prednisone, and Thalidomide (MPT) in Patients (Pts) With Newly Diagnosed Multiple
Myeloma (NDMM). Clinical Lymphoma, Myeloma and Leukemia 2015;15:e134. doi:
10.1016/j.clml.2015.07.330
9 APPENDICES
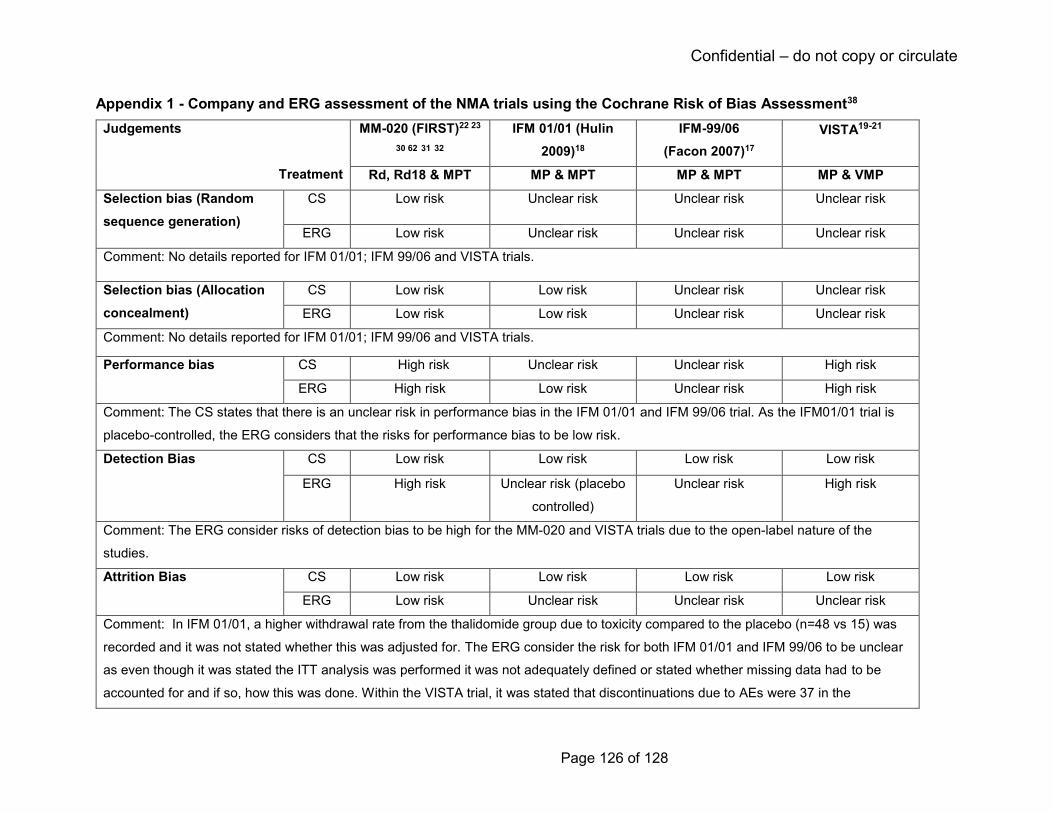
Confidential – do not copy or circulate
Page 126 of 128
Appendix 1 - Company and ERG assessment of the NMA trials using the Cochrane Risk of Bias Assessment38
Judgements
Treatment
MM-020 (FIRST)22 23
30 62 31 32
IFM 01/01 (Hulin
2009)18
IFM-99/06
(Facon 2007)17
VISTA19-21
Rd, Rd18 & MPT MP & MPT MP & MPT MP & VMP
Selection bias (Random
sequence generation)
CS Low risk Unclear risk Unclear risk Unclear risk
ERG Low risk Unclear risk Unclear risk Unclear risk
Comment: No details reported for IFM 01/01; IFM 99/06 and VISTA trials.
Selection bias (Allocation
concealment)
CS Low risk Low risk Unclear risk Unclear risk
ERG Low risk Low risk Unclear risk Unclear risk
Comment: No details reported for IFM 01/01; IFM 99/06 and VISTA trials.
Performance bias
CS High risk Unclear risk Unclear risk High risk
ERG High risk Low risk Unclear risk High risk
Comment: The CS states that there is an unclear risk in performance bias in the IFM 01/01 and IFM 99/06 trial. As the IFM01/01 trial is
placebo-controlled, the ERG considers that the risks for performance bias to be low risk.
Detection Bias CS Low risk Low risk Low risk Low risk
ERG High risk Unclear risk (placebo
controlled)
Unclear risk High risk
Comment: The ERG consider risks of detection bias to be high for the MM-020 and VISTA trials due to the open-label nature of the
studies.
Attrition Bias CS Low risk Low risk Low risk Low risk
ERG Low risk Unclear risk Unclear risk Unclear risk
Comment: In IFM 01/01, a higher withdrawal rate from the thalidomide group due to toxicity compared to the placebo (n=48 vs 15) was
recorded and it was not stated whether this was adjusted for. The ERG consider the risk for both IFM 01/01 and IFM 99/06 to be unclear
as even though it was stated the ITT analysis was performed it was not adequately defined or stated whether missing data had to be
accounted for and if so, how this was done. Within the VISTA trial, it was stated that discontinuations due to AEs were 37 in the

Confidential – do not copy or circulate
Page 127 of 128
bortezomib group and 35 in the control group. However, the ERG note that 19 additional discontinuations were recorded in the
bortezomib group which would have resulted in an imbalance between trial arms. It unclear how this would have affected final analysis.
Reporting bias CS Low risk Unclear risk Unclear risk Unclear risk
ERG Low risk Low risk Low risk Low risk
Comment: None
Other bias CS Low risk Low risk High risk Low risk
ERG Low risk Low risk Unclear risk Low risk
Comment: The IFM-99/06 trial included patients aged between 65 and 75 years, but patients younger than 65 years were included if they
were ineligible for high-dose treatment. It is unclear if this may have had an impact on the results, as baseline characteristics were only
reported for the age ≥70 years. It is therefore unclear if trial arm were balanced with regards to age.

Confidential – do not copy or circulate
Page 128 of 128

National Institute for Health and Care Excellence
Centre for Health Technology Evaluation
Pro-forma Response
ERG report
Lenalidomide for previously untreated multiple myeloma [ID474] You are asked to check the ERG report from Southampton Health Technology Assessment Centre to ensure there are no factual inaccuracies contained within it. If you do identify any factual inaccuracies you must inform NICE by the end of 15 January using the below proforma comments table. All factual errors will be highlighted in a report and presented to the Appraisal Committee and will subsequently be published on the NICE website with the Evaluation report. The proforma document should act as a method of detailing any inaccuracies found and how and why they should be corrected.
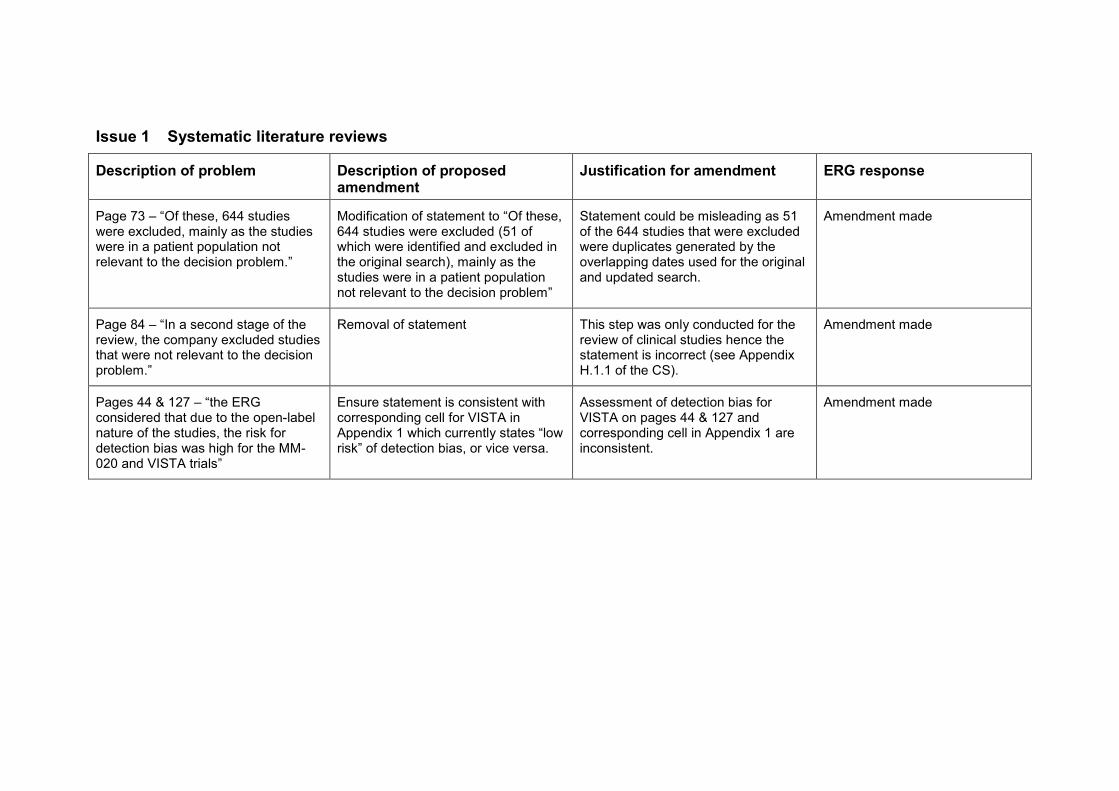
Issue 1 Systematic literature reviews
Description of problem Description of proposed amendment
Justification for amendment ERG response
Page 73 – “Of these, 644 studies were excluded, mainly as the studies were in a patient population not relevant to the decision problem.”
Modification of statement to “Of these, 644 studies were excluded (51 of which were identified and excluded in the original search), mainly as the studies were in a patient population not relevant to the decision problem”
Statement could be misleading as 51 of the 644 studies that were excluded were duplicates generated by the overlapping dates used for the original and updated search.
Amendment made
Page 84 – “In a second stage of the review, the company excluded studies that were not relevant to the decision problem.”
Removal of statement This step was only conducted for the review of clinical studies hence the statement is incorrect (see Appendix H.1.1 of the CS).
Amendment made
Pages 44 & 127 – “the ERG considered that due to the open-label nature of the studies, the risk for detection bias was high for the MM-020 and VISTA trials”
Ensure statement is consistent with corresponding cell for VISTA in Appendix 1 which currently states “low risk” of detection bias, or vice versa.
Assessment of detection bias for VISTA on pages 44 & 127 and corresponding cell in Appendix 1 are inconsistent.
Amendment made
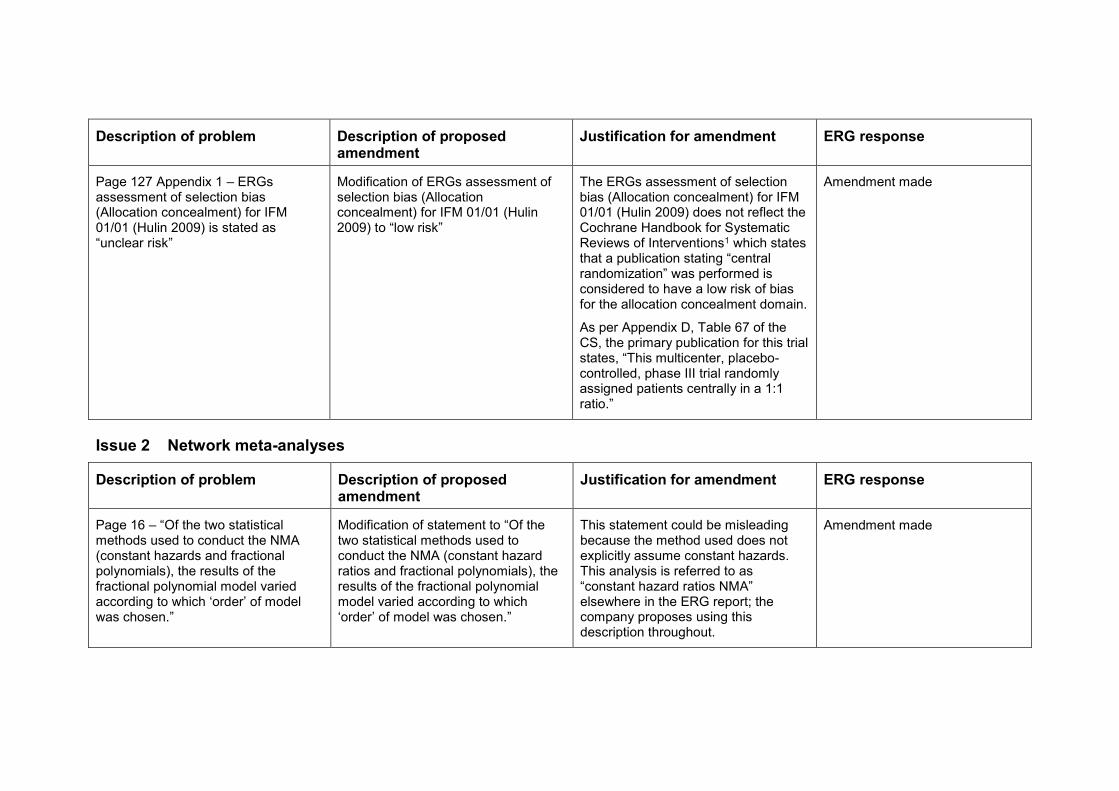
Description of problem Description of proposed amendment
Justification for amendment ERG response
Page 127 Appendix 1 – ERGs assessment of selection bias (Allocation concealment) for IFM 01/01 (Hulin 2009) is stated as “unclear risk”
Modification of ERGs assessment of selection bias (Allocation concealment) for IFM 01/01 (Hulin 2009) to “low risk”
The ERGs assessment of selection bias (Allocation concealment) for IFM 01/01 (Hulin 2009) does not reflect the Cochrane Handbook for Systematic Reviews of Interventions1 which states that a publication stating “central randomization” was performed is considered to have a low risk of bias for the allocation concealment domain.
As per Appendix D, Table 67 of the CS, the primary publication for this trial states, “This multicenter, placebo-controlled, phase III trial randomly assigned patients centrally in a 1:1 ratio.”
Amendment made
Issue 2 Network meta-analyses
Description of problem Description of proposed amendment
Justification for amendment ERG response
Page 16 – “Of the two statistical methods used to conduct the NMA (constant hazards and fractional polynomials), the results of the fractional polynomial model varied according to which ‘order’ of model was chosen.”
Modification of statement to “Of the two statistical methods used to conduct the NMA (constant hazard ratios and fractional polynomials), the results of the fractional polynomial model varied according to which ‘order’ of model was chosen.”
This statement could be misleading because the method used does not explicitly assume constant hazards. This analysis is referred to as “constant hazard ratios NMA” elsewhere in the ERG report; the company proposes using this description throughout.
Amendment made

Description of problem Description of proposed amendment
Justification for amendment ERG response
Page 16 – “The constant hazards statistical NMA appears to be the most appropriate model to inform the assessment as the results are associated with less uncertainty and the assumption of proportional hazards has been statistically confirmed”
Modification of statement to “The constant hazard ratios NMA appears to be the most appropriate model to inform the assessment as the results are associated with less uncertainty and the assumption of proportional hazards has been statistically confirmed”
This statement could be misleading because the method used does not explicitly assume constant hazards. This analysis is referred to as “constant hazard ratios NMA” elsewhere in the ERG report; the company proposes using this description throughout.
Amendment made
Page 44 – “The Bayesian constant hazards NMA was performed using a fixed effect regression model as described in the NICE Decision Support Unit technical support document number 2.”
Modification of statement to “The Bayesian constant hazard ratios NMA was performed using a fixed effect regression model as described in the NICE Decision Support Unit technical support document number 2.”
This statement could be misleading because the method used does not explicitly assume constant hazards. This analysis is referred to as “constant hazard ratios NMA” elsewhere in the ERG report; the company proposes using this description throughout.
Amendment made
Page 46 – “The ERG notes that HRs for OS and PFS generated by this model appear similar to those obtained from the constant hazards NMA”
Modification of statement to “The ERG notes that HRs for OS and PFS generated by this model appear similar to those obtained from the constant hazard ratios NMA”
This statement could be misleading because the method used does not explicitly assume constant hazards. This analysis is referred to as “constant hazard ratios NMA” elsewhere in the ERG report; the company proposes using this description throughout.
Amendment made
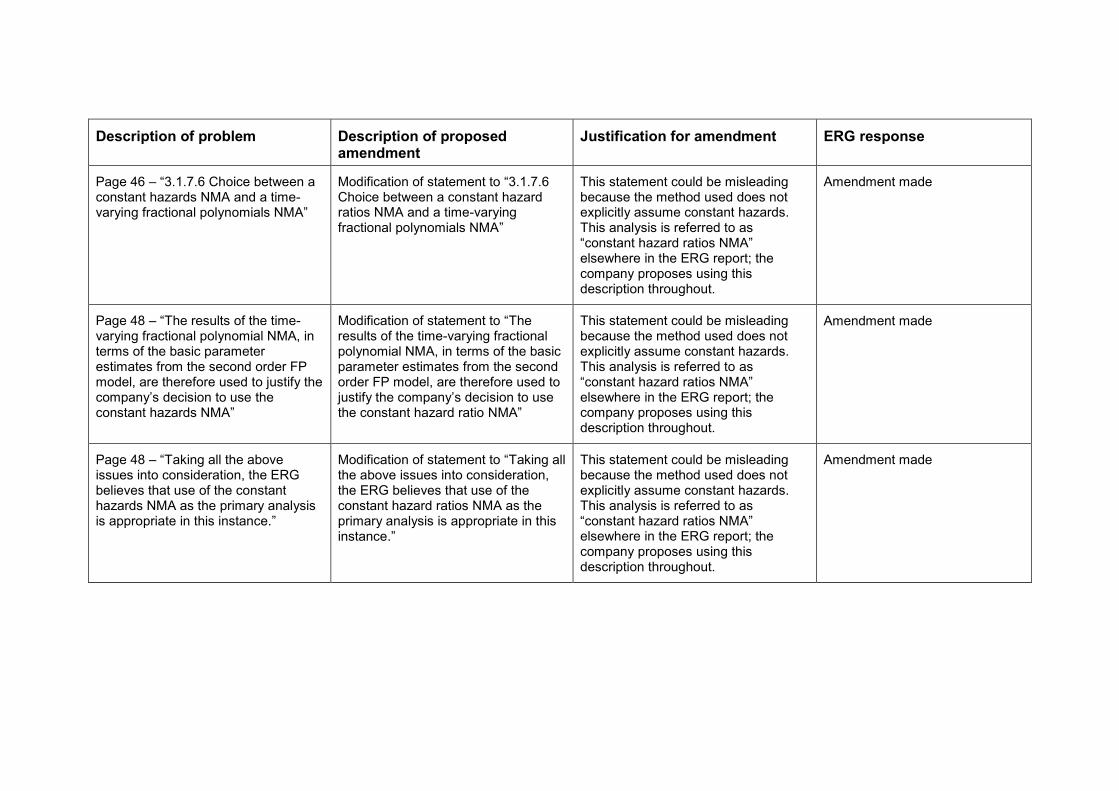
Description of problem Description of proposed amendment
Justification for amendment ERG response
Page 46 – “3.1.7.6 Choice between a constant hazards NMA and a time-varying fractional polynomials NMA”
Modification of statement to “3.1.7.6 Choice between a constant hazard ratios NMA and a time-varying fractional polynomials NMA”
This statement could be misleading because the method used does not explicitly assume constant hazards. This analysis is referred to as “constant hazard ratios NMA” elsewhere in the ERG report; the company proposes using this description throughout.
Amendment made
Page 48 – “The results of the time-varying fractional polynomial NMA, in terms of the basic parameter estimates from the second order FP model, are therefore used to justify the company’s decision to use the constant hazards NMA”
Modification of statement to “The results of the time-varying fractional polynomial NMA, in terms of the basic parameter estimates from the second order FP model, are therefore used to justify the company’s decision to use the constant hazard ratio NMA”
This statement could be misleading because the method used does not explicitly assume constant hazards. This analysis is referred to as “constant hazard ratios NMA” elsewhere in the ERG report; the company proposes using this description throughout.
Amendment made
Page 48 – “Taking all the above issues into consideration, the ERG believes that use of the constant hazards NMA as the primary analysis is appropriate in this instance.”
Modification of statement to “Taking all the above issues into consideration, the ERG believes that use of the constant hazard ratios NMA as the primary analysis is appropriate in this instance.”
This statement could be misleading because the method used does not explicitly assume constant hazards. This analysis is referred to as “constant hazard ratios NMA” elsewhere in the ERG report; the company proposes using this description throughout.
Amendment made
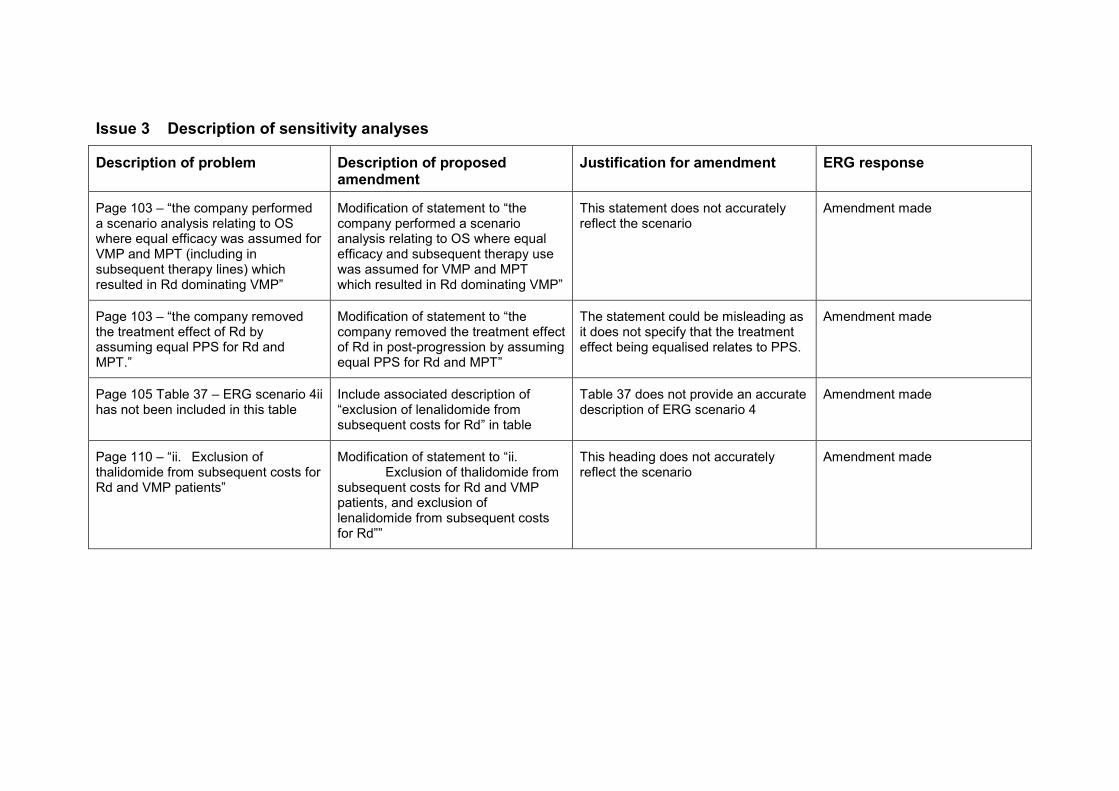
Issue 3 Description of sensitivity analyses
Description of problem Description of proposed amendment
Justification for amendment ERG response
Page 103 – “the company performed a scenario analysis relating to OS where equal efficacy was assumed for VMP and MPT (including in subsequent therapy lines) which resulted in Rd dominating VMP”
Modification of statement to “the company performed a scenario analysis relating to OS where equal efficacy and subsequent therapy use was assumed for VMP and MPT which resulted in Rd dominating VMP”
This statement does not accurately reflect the scenario
Amendment made
Page 103 – “the company removed the treatment effect of Rd by assuming equal PPS for Rd and MPT.”
Modification of statement to “the company removed the treatment effect of Rd in post-progression by assuming equal PPS for Rd and MPT”
The statement could be misleading as it does not specify that the treatment effect being equalised relates to PPS.
Amendment made
Page 105 Table 37 – ERG scenario 4ii has not been included in this table
Include associated description of “exclusion of lenalidomide from subsequent costs for Rd” in table
Table 37 does not provide an accurate description of ERG scenario 4
Amendment made
Page 110 – “ii. Exclusion of thalidomide from subsequent costs for Rd and VMP patients”
Modification of statement to “ii. Exclusion of thalidomide from subsequent costs for Rd and VMP patients, and exclusion of lenalidomide from subsequent costs for Rd””
This heading does not accurately reflect the scenario
Amendment made
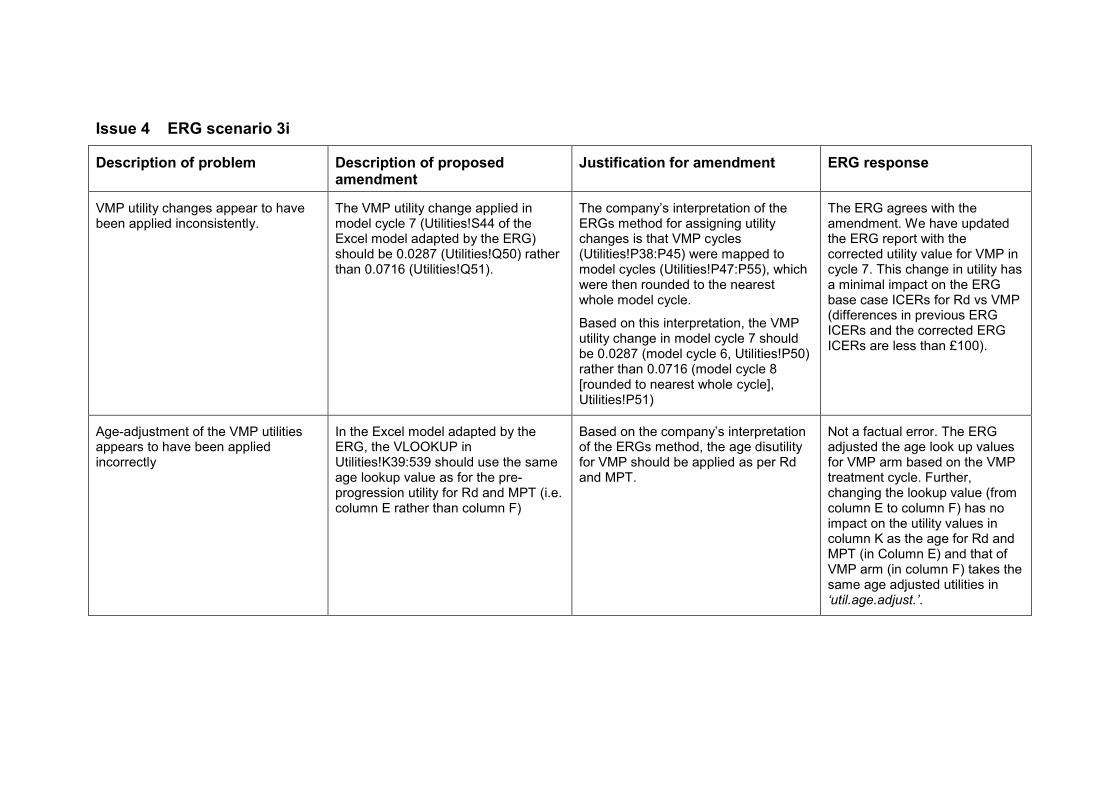
Issue 4 ERG scenario 3i
Description of problem Description of proposed amendment
Justification for amendment ERG response
VMP utility changes appear to have been applied inconsistently.
The VMP utility change applied in model cycle 7 (Utilities!S44 of the Excel model adapted by the ERG) should be 0.0287 (Utilities!Q50) rather than 0.0716 (Utilities!Q51).
The company’s interpretation of the ERGs method for assigning utility changes is that VMP cycles (Utilities!P38:P45) were mapped to model cycles (Utilities!P47:P55), which were then rounded to the nearest whole model cycle.
Based on this interpretation, the VMP utility change in model cycle 7 should be 0.0287 (model cycle 6, Utilities!P50) rather than 0.0716 (model cycle 8 [rounded to nearest whole cycle], Utilities!P51)
The ERG agrees with the amendment. We have updated the ERG report with the corrected utility value for VMP in cycle 7. This change in utility has a minimal impact on the ERG base case ICERs for Rd vs VMP (differences in previous ERG ICERs and the corrected ERG ICERs are less than £100).
Age-adjustment of the VMP utilities appears to have been applied incorrectly
In the Excel model adapted by the ERG, the VLOOKUP in Utilities!K39:539 should use the same age lookup value as for the pre-progression utility for Rd and MPT (i.e. column E rather than column F)
Based on the company’s interpretation of the ERGs method, the age disutility for VMP should be applied as per Rd and MPT.
Not a factual error. The ERG adjusted the age look up values for VMP arm based on the VMP treatment cycle. Further, changing the lookup value (from column E to column F) has no impact on the utility values in column K as the age for Rd and MPT (in Column E) and that of VMP arm (in column F) takes the same age adjusted utilities in ‘util.age.adjust.’.
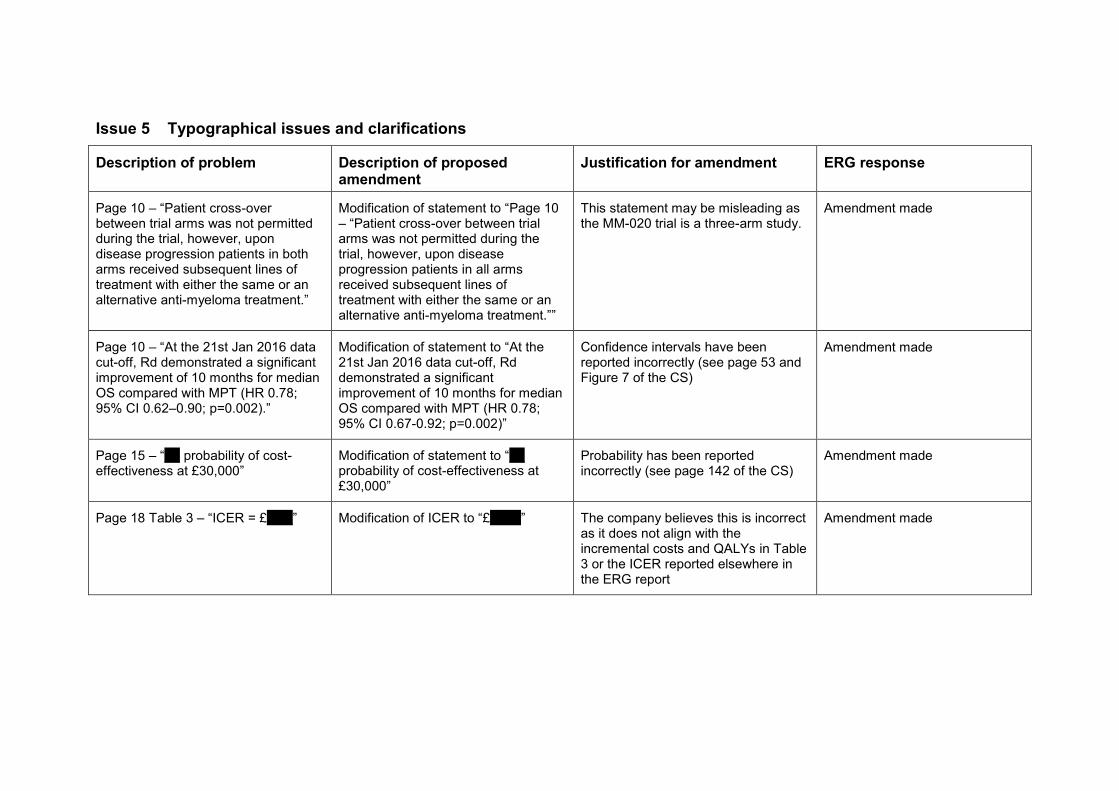
Issue 5 Typographical issues and clarifications
Description of problem Description of proposed amendment
Justification for amendment ERG response
Page 10 – “Patient cross-over between trial arms was not permitted during the trial, however, upon disease progression patients in both arms received subsequent lines of treatment with either the same or an alternative anti-myeloma treatment.”
Modification of statement to “Page 10 – “Patient cross-over between trial arms was not permitted during the trial, however, upon disease progression patients in all arms received subsequent lines of treatment with either the same or an alternative anti-myeloma treatment.””
This statement may be misleading as the MM-020 trial is a three-arm study.
Amendment made
Page 10 – “At the 21st Jan 2016 data cut-off, Rd demonstrated a significant improvement of 10 months for median OS compared with MPT (HR 0.78; 95% CI 0.62–0.90; p=0.002).”
Modification of statement to “At the 21st Jan 2016 data cut-off, Rd demonstrated a significant improvement of 10 months for median OS compared with MPT (HR 0.78; 95% CI 0.67-0.92; p=0.002)”
Confidence intervals have been reported incorrectly (see page 53 and Figure 7 of the CS)
Amendment made
Page 15 – “*** probability of cost-effectiveness at £30,000”
Modification of statement to “*** probability of cost-effectiveness at £30,000”
Probability has been reported incorrectly (see page 142 of the CS)
Amendment made
Page 18 Table 3 – “ICER = £*****” Modification of ICER to “£******” The company believes this is incorrect as it does not align with the incremental costs and QALYs in Table 3 or the ICER reported elsewhere in the ERG report
Amendment made

Description of problem Description of proposed amendment
Justification for amendment ERG response
Page 21 – “It is unclear whether this dosage was the maximum dosage recommended for this indication.”
Removal of statement The SmPC states the starting dose for this indication is 25mg. This is highlighted in Table 2 and Appendix C of the CS
Amendment made
Page 39 – “No further detail appears to be given on the results of this exploratory analysis in the CS”
Removal of statement Results of these analyses are provided in Appendix E Figures 33 and 34 of the CS
Amendment made
Page 51 – “30% reduction in the risk of disease progression or death for Rd (HR 0.70; 95% CI 0.60-0.81; p=0.00001)”
Modification of statement to “30% reduction in the risk of disease progression or death for Rd (HR 0.70; 95% CI 0.60-0.82; p=0.00001)”
Upper confidence interval reported incorrectly (see page 48 of the CS)
Amendment made
Page 58 – “TTF with Rd treatment was 2.8 months (median) longer compared with MPT treatment (16.9 months Rd; 14.1 months MPT; HR 0.75; no CI reported, p=0.00002)”
Modification of statement to “TTF with Rd treatment was 2.8 months (median) longer compared with MPT treatment (16.9 months Rd; 14.1 months MPT; HR 0.76; 95% CI 0.67–0.86, p=0.00002)”
The confidence intervals are reported in Section B.2.6.9 of the CS
Amendment made
Page 60 – “Fewer patients treated with Rd received second-line therapy compared with patients in the MPT group (55.9% Rd; 69.6% MPT)”
Modification of statement to ““Fewer patients treated with Rd received second-line therapy compared with patients in the MPT group (55.9% Rd; 69.7% MPT)”
Proportion of MPT patients receiving second-line therapy is incorrect (see Table 16 of the CS)
Amendment made
Page 63 – “…, clinically meaningful improvements at six and nine months for Rd compared to MPT were observed”
Modification of statement to “…, clinically meaningful improvements at six and twelve months for Rd compared to MPT were observed”
Second time-point is incorrect (see page 58 of the CS)
Amendment made

Description of problem Description of proposed amendment
Justification for amendment ERG response
Page 64 – “The Rd group showed statistically significant improvement in fatigue at months 3, 6 and 12 but not at month 18”
Removal of statement Fatigue is not a domain of the EORTC QLQ-MY20. The company believes this statement was intended for Section 3.3.6.2.
Amendment made Text moved to Section 3.3.6.2
Page 72 – “…, which was around 8 weeks longer compared to the Rd18 group and around 13 weeks longer that the MPT group”
Modification of statement to “…, which was around 8 weeks longer compared to the Rd18 group and around 13 weeks longer that the MPT group, based on medians”
Statement could be misleading as it does not specify that differences in drug exposure times are based on medians for each treatment group
Amendment made
Page 77 – “The CS stated that owing to the inherent structural link between mortality and earlier progression events, it was inappropriate to model PFS and OS independently using a partitioned survival analysis”
Modification of statement to “The CS stated that owing to the inherent structural link between mortality and earlier progression events, it was more appropriate to model PFS and OS using a state transition approach”
This statement is misleading. The CS states that the structural link between health states was considered when selecting the modelling approach, and that the link between mortality and earlier progression events is not captured in partitioned survival models, however does not state that this renders a partitioned survival model inappropriate.
Amendment made
Page 83 – “The ERG therefore suggests that Rd and MPT should both use the same distribution for TTP…”
Modification of statement to “The ERG therefore suggests that Rd and MPT should both use the same distribution for TTF…”
This statement refers to time to treatment failure (TTF) rather than time to progression (TTP)
Amendment made
Page 97 Table 32 – “Total QALYs for Rd = ****”
Modification of total QALYs for Rd to “****”
QALYs have been reported incorrectly (see Table 50 of the CS)
Amendment made
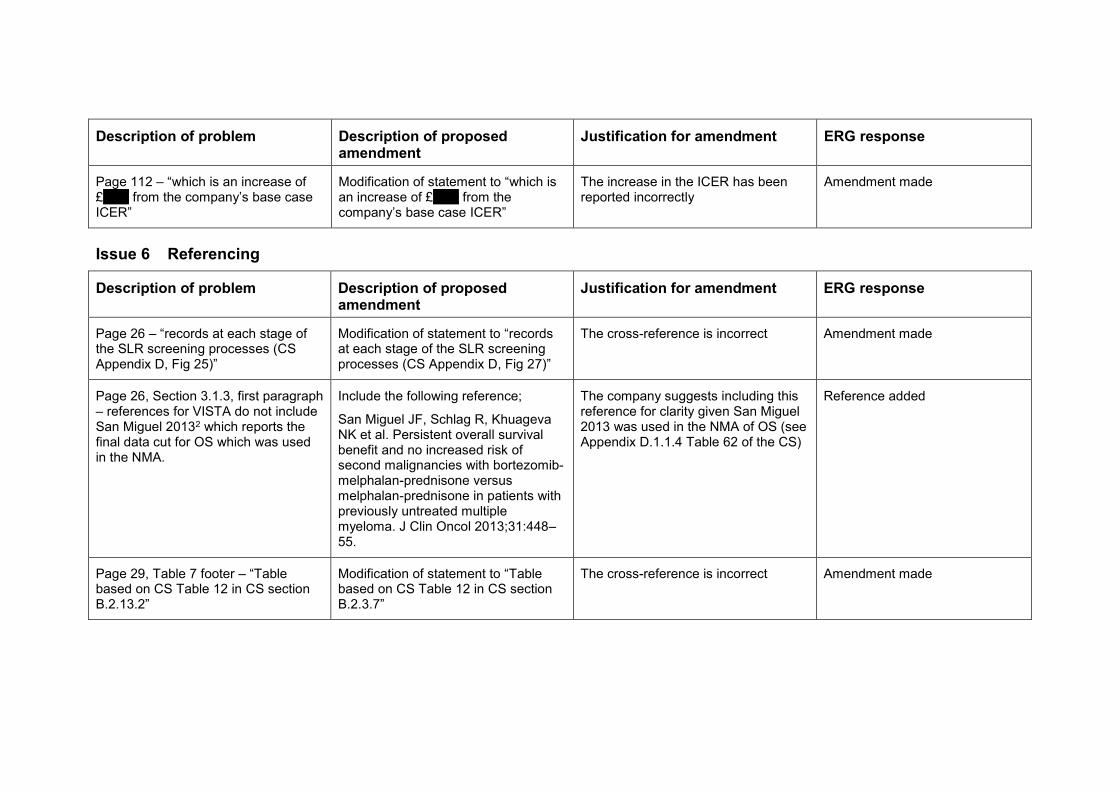
Description of problem Description of proposed amendment
Justification for amendment ERG response
Page 112 – “which is an increase of £***** from the company’s base case ICER”
Modification of statement to “which is an increase of £***** from the company’s base case ICER”
The increase in the ICER has been reported incorrectly
Amendment made
Issue 6 Referencing
Description of problem Description of proposed amendment
Justification for amendment ERG response
Page 26 – “records at each stage of the SLR screening processes (CS Appendix D, Fig 25)”
Modification of statement to “records at each stage of the SLR screening processes (CS Appendix D, Fig 27)”
The cross-reference is incorrect Amendment made
Page 26, Section 3.1.3, first paragraph – references for VISTA do not include San Miguel 20132 which reports the final data cut for OS which was used in the NMA.
Include the following reference;
San Miguel JF, Schlag R, Khuageva NK et al. Persistent overall survival benefit and no increased risk of second malignancies with bortezomib-melphalan-prednisone versus melphalan-prednisone in patients with previously untreated multiple myeloma. J Clin Oncol 2013;31:448–55.
The company suggests including this reference for clarity given San Miguel 2013 was used in the NMA of OS (see Appendix D.1.1.4 Table 62 of the CS)
Reference added
Page 29, Table 7 footer – “Table based on CS Table 12 in CS section B.2.13.2”
Modification of statement to “Table based on CS Table 12 in CS section B.2.3.7”
The cross-reference is incorrect Amendment made

Description of problem Description of proposed amendment
Justification for amendment ERG response
Page 43, Section 3.1.7.1, first paragraph – list of references for studies included in the evidence network does not include San Miguel 20132 which reports the final data cut for OS used in the NMA
Include the following reference;
San Miguel JF, Schlag R, Khuageva NK et al. Persistent overall survival benefit and no increased risk of second malignancies with bortezomib-melphalan-prednisone versus melphalan-prednisone in patients with previously untreated multiple myeloma. J Clin Oncol 2013;31:448–55.
The company suggests including this reference for clarity given San Miguel 2013 was used in the NMA of OS (see Appendix D.1.1.4 Table 62 of the CS)
Reference added
Pages 53-67 – page numbers read as “Page 130 of 130”
Correct page numbers Ensure alignment with cross-referencing in proforma
This does not appear in the master version of the document.
Page 55, Table 12 footer – “Reproduction of CS B.2.8.2 Table 20”
Modification of statement to “Reproduction of CS B.2.9.2 Table 20”
The cross-reference is incorrect Amendment made
Page 57, Table 13 footer – “Reproduction of CS B.2.8.2 Table 18”
Modification of statement to “Reproduction of CS B.2.9.2 Table 18”
The cross-reference is incorrect Amendment made
Page 73 – “The inclusion and exclusion criteria for the systematic review are presented in Table 18 in CS Appendix G.1.1”
Modification of statement to “The inclusion and exclusion criteria for the systematic review are presented in Table 72 in CS Appendix G.1.1”
The cross-reference is incorrect Amendment made

References
1) Version 5.0.1 of the Cochrane Handbook for Systematic Reviews of Interventions*, *Higgins JPT, Altman DG (editors). Chapter 8: Assessing risk of biasies. In: Higgins JPT, Green S (editors). Cochrane Handbook for Systematic Reviews of Interventions. Version 5.0.1 [updated September 2008]. The Cochrane Collaboration, 2008
2) San Miguel JF, Schlag R, Khuageva NK et al. Persistent overall survival benefit and no increased risk of second malignancies with bortezomib-melphalan-prednisone versus melphalan-prednisone in patients with previously untreated multiple myeloma. J Clin Oncol 2013;31:448–55.
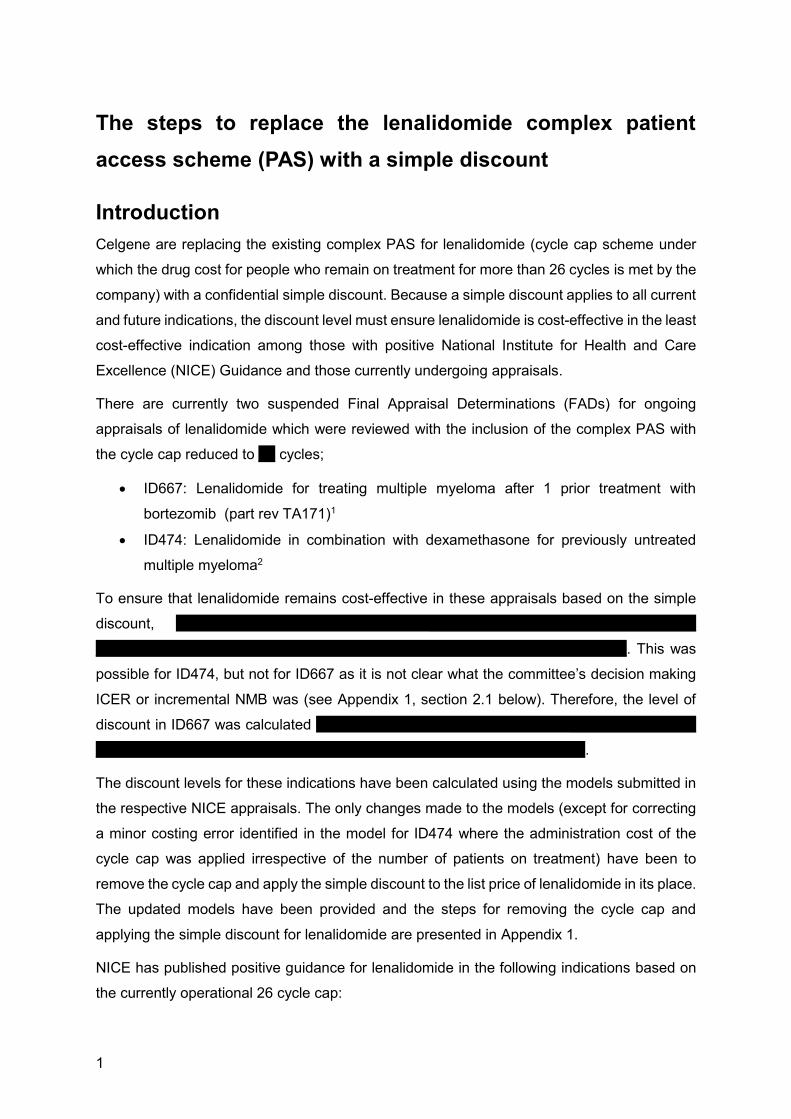
1
The steps to replace the lenalidomide complex patient
access scheme (PAS) with a simple discount
Introduction
Celgene are replacing the existing complex PAS for lenalidomide (cycle cap scheme under
which the drug cost for people who remain on treatment for more than 26 cycles is met by the
company) with a confidential simple discount. Because a simple discount applies to all current
and future indications, the discount level must ensure lenalidomide is cost-effective in the least
cost-effective indication among those with positive National Institute for Health and Care
Excellence (NICE) Guidance and those currently undergoing appraisals.
There are currently two suspended Final Appraisal Determinations (FADs) for ongoing
appraisals of lenalidomide which were reviewed with the inclusion of the complex PAS with
the cycle cap reduced to '''''' cycles;
• ID667: Lenalidomide for treating multiple myeloma after 1 prior treatment with
bortezomib (part rev TA171)1
• ID474: Lenalidomide in combination with dexamethasone for previously untreated
multiple myeloma2
To ensure that lenalidomide remains cost-effective in these appraisals based on the simple
discount, ‘’’’’’’’’’’’’’’’’’’’’’’’’’’’’’’’’’’’’’’’’’’’’’’’’’’’’’’’’’’’’’’’’’’’’’’’’’’’’’'''''''''''''''''''' ''''''''' ''''''''''''' ''''''''' ''''''''''''''
'''''''''''''''''''''''''''''''''''''''''''''' '''''''''''''''''''''' '''' '''''''''''''''''''' ''''' '''''''''''''''''''' ''''''' '''''''''''''''''''''' ''''' ''''''''''''''''''''. This was
possible for ID474, but not for ID667 as it is not clear what the committee’s decision making
ICER or incremental NMB was (see Appendix 1, section 2.1 below). Therefore, the level of
discount in ID667 was calculated ‘’’’’’’’’’’’’’’’’’’’’’’’’’’’’’’’’’’’’’’’’’’’’’’’’’’’’’’’’’’’’’’’’’’’’’’’’’’’’’'''''''''''''''''''' ''''''''' '''''''''''''
''''''''' '''''''''''''' '''''''''''''''''''''''''''''''''''''''''''''' '''''''''''''''''''''' '''' '''''''''''''''''''' ''''' '''''''''''''''''''' ''''''' '''''''''''''''.
The discount levels for these indications have been calculated using the models submitted in
the respective NICE appraisals. The only changes made to the models (except for correcting
a minor costing error identified in the model for ID474 where the administration cost of the
cycle cap was applied irrespective of the number of patients on treatment) have been to
remove the cycle cap and apply the simple discount to the list price of lenalidomide in its place.
The updated models have been provided and the steps for removing the cycle cap and
applying the simple discount for lenalidomide are presented in Appendix 1.
NICE has published positive guidance for lenalidomide in the following indications based on
the currently operational 26 cycle cap:
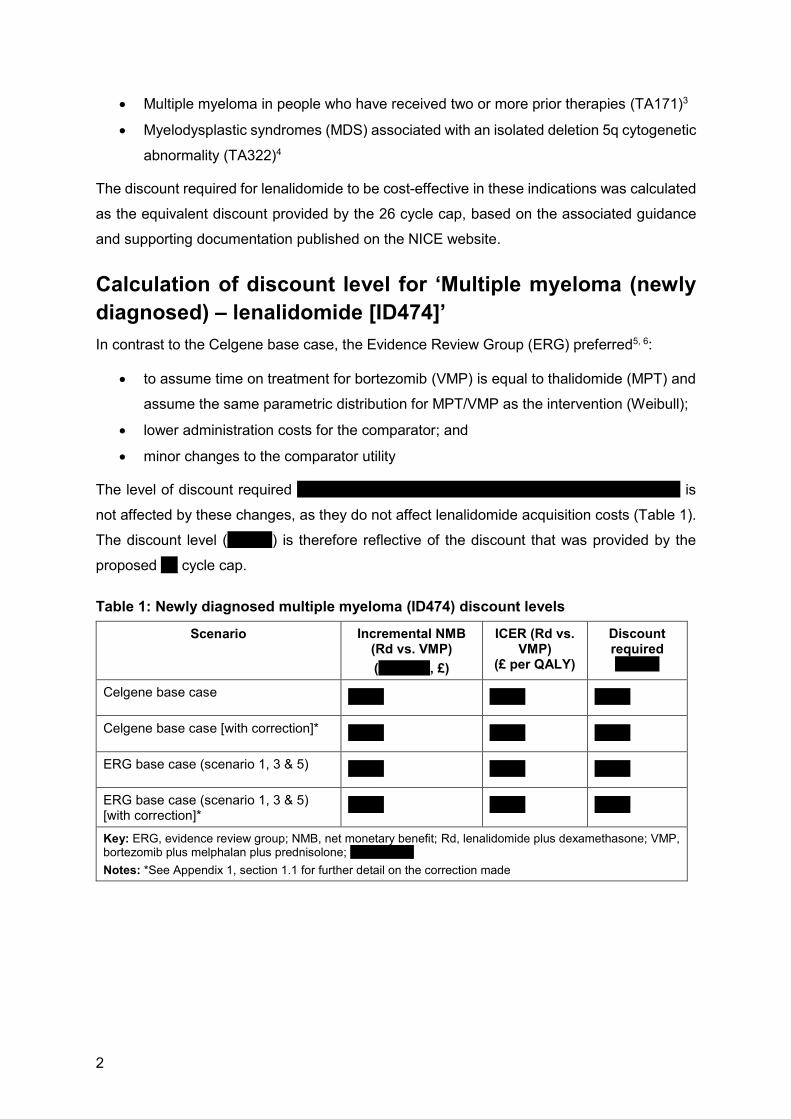
2
• Multiple myeloma in people who have received two or more prior therapies (TA171)3
• Myelodysplastic syndromes (MDS) associated with an isolated deletion 5q cytogenetic
abnormality (TA322)4
The discount required for lenalidomide to be cost-effective in these indications was calculated
as the equivalent discount provided by the 26 cycle cap, based on the associated guidance
and supporting documentation published on the NICE website.
Calculation of discount level for ‘Multiple myeloma (newly
diagnosed) – lenalidomide [ID474]’
In contrast to the Celgene base case, the Evidence Review Group (ERG) preferred5, 6:
• to assume time on treatment for bortezomib (VMP) is equal to thalidomide (MPT) and
assume the same parametric distribution for MPT/VMP as the intervention (Weibull);
• lower administration costs for the comparator; and
• minor changes to the comparator utility
The level of discount required ‘’’’’’’’’’’’’’’’’’’’’’’’’’’’’’’’’’’’’’’’’’’’’’’’’’’’’’’’’’’’’’’’’’’’’’’’’’’’’’’’’’’’’’’’’’’’’’’’’’’’’’’’’’’’’’’’’’’’’’ is
not affected by these changes, as they do not affect lenalidomide acquisition costs (Table 1).
The discount level ('''''''''''''''') is therefore reflective of the discount that was provided by the
proposed '''''' cycle cap.
Table 1: Newly diagnosed multiple myeloma (ID474) discount levels
Scenario Incremental NMB (Rd vs. VMP)
(‘’’’’’’’’’’’’’, £)
ICER (Rd vs. VMP)
(£ per QALY)
Discount required ‘’’’’’’’’’’’
Celgene base case ‘’’’’’’’’’’ ‘’’’’’’’’’’ ‘’’’’’’’’’’
Celgene base case [with correction]* ‘’’’’’’’’’’ ‘’’’’’’’’’’ ‘’’’’’’’’’’
ERG base case (scenario 1, 3 & 5) ‘’’’’’’’’’’ ‘’’’’’’’’’’ ‘’’’’’’’’’’
ERG base case (scenario 1, 3 & 5) [with correction]*
‘’’’’’’’’’’ ‘’’’’’’’’’’ ‘’’’’’’’’’’
Key: ERG, evidence review group; NMB, net monetary benefit; Rd, lenalidomide plus dexamethasone; VMP, bortezomib plus melphalan plus prednisolone; ‘’’’’’’’’’’’’’’’’’’’’’’’
Notes: *See Appendix 1, section 1.1 for further detail on the correction made
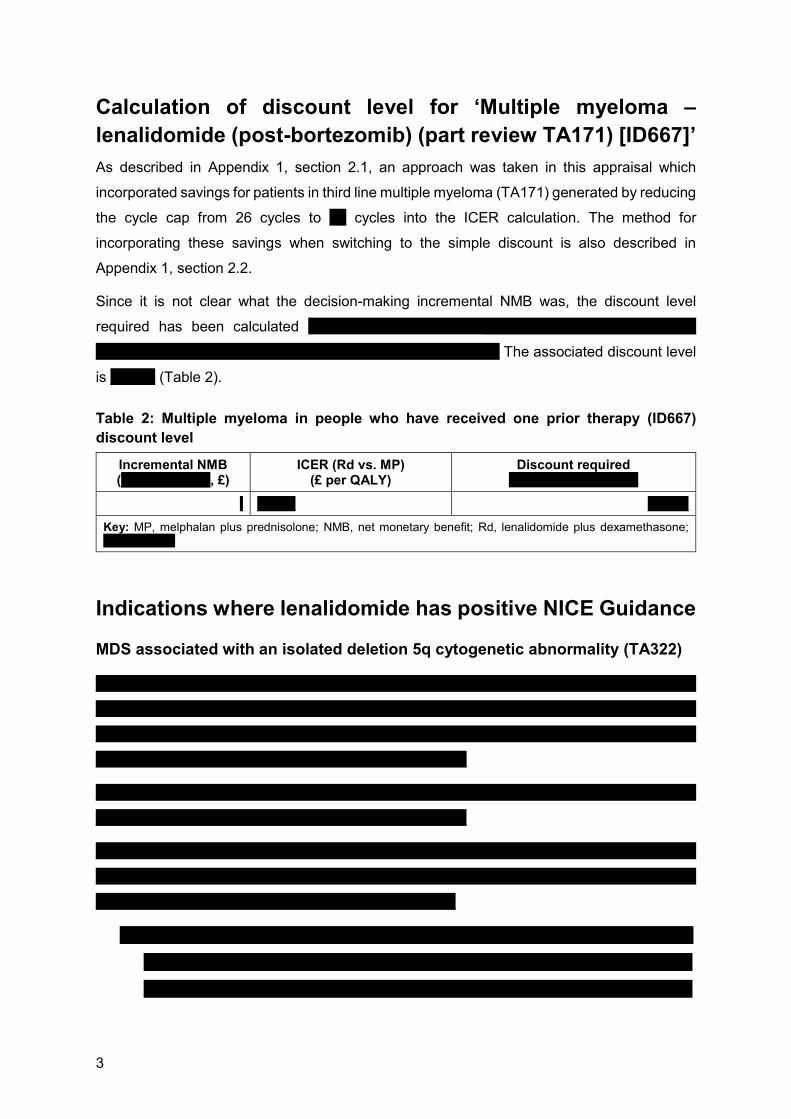
3
Calculation of discount level for ‘Multiple myeloma –
lenalidomide (post-bortezomib) (part review TA171) [ID667]’
As described in Appendix 1, section 2.1, an approach was taken in this appraisal which
incorporated savings for patients in third line multiple myeloma (TA171) generated by reducing
the cycle cap from 26 cycles to '''''' cycles into the ICER calculation. The method for
incorporating these savings when switching to the simple discount is also described in
Appendix 1, section 2.2.
Since it is not clear what the decision-making incremental NMB was, the discount level
required has been calculated ‘’’’’’’’’’’’’’’’’’’’’’’’’’’’’’’’’’’’’’’’’’’’’’’’’’’’’’''''''''''''''''''' ''''''' '''''''''''''''' ''''''''' ''''''''''''
'''''''''''''''''''''''''''''''''''''' '''''''''''''''''''' '''' ''''''''''''''''''''' ''''' '''''''''''''''''' ''''''''' ''''''''''''''''''' The associated discount level
is '''''''''''''''' (Table 2).
Table 2: Multiple myeloma in people who have received one prior therapy (ID667)
discount level
Incremental NMB ('''''''''' ''''''''''''''''', £)
ICER (Rd vs. MP) (£ per QALY)
Discount required ‘’’’’’’’’’’’’’’’’’’’’’’’’’’’’’’’’’’
‘ ''''''''''''''' ''''''''''''''''
Key: MP, melphalan plus prednisolone; NMB, net monetary benefit; Rd, lenalidomide plus dexamethasone; ‘’’’’’’’’’’’’’’’’’’’’’’’’’’
Indications where lenalidomide has positive NICE Guidance
MDS associated with an isolated deletion 5q cytogenetic abnormality (TA322)
''''''''''''''''''''''''''''''' '''''' ''''''''' '''''''''''''''''''''''' ''''' ''''''''''''' ''''''''''''''''''''''''' ''''''''' '''''' '''''''''''''''''''' '''''''''''''''''''' '''''' ''''''''''''''''''''''''''
'''''''''''''''''''''''''' ''''''''' '''''''''''''''''''''' '''''' '''''''''''''''''''''''''''''''''' '''''' '''''''''''' '''''''''' ''''''' '''''' ''''''''''' ''''''''' ''''''''''''''''''''''' ''''''''''''''''
'''''''''' ''''''''''''''''''''''''''' '''''''''''''''''''''''''''' '''''''' ''''''''''''''' ''''''''''''''''''''' '''''''''' '''''''' '''''''''''''''''''''''' '''''''''''''''''''''''' '''''''''''''''''''' '''''
'''''''''' '''''' '''''''' ''''''''''''''' ''''' ''''''' ''''''''''''''''' '''''''''''''''''''''''''''' '''''''''''''''''''''''''
'''''''''''''''''''' ''''''''''''''''''''' ''''''''''''''''''''''''''''''''' '''''' ''''''' ''''''''''''' ''''''''''''''''' ''''''''' ''''''''''''' '''''''''''' '''' '''''''''''''''''''' '''''''
''''''''''''''''''''''' ''''''''''''''''' '''''''''''''''''''' '''''''''''''''''''' ''''' ''''''' ''''''' ''''''''''' '''''''''''
''''''''''''''''''''''''''''''''''''' '''''''''''''' '''''''''''' '''''''''' '''''''''''''''''''''''' ''''''' ''''''''' ''''''''''''' ''''''''''''''''''''''' ''''''''''''''' ''''''''''' ''''''''''''''' '''''
''''''''' ''''''''''' '''''''''''''''''''''' '''''''''''''''''' ''''''''''''''''' '''' ''''''''''''''' ''''' ''''''''''''' '''''''''''''''''' ''''''''''' '''''''''''' ''''''''''''''''''''' ''''''''''' '''''''''''
'''''''''''' ''''''''''''''''''''''' '''''''''' '''''''''''''''''' ''''''''''''''''''' '''''''''''''' ''''''''''''''''''''''''
4
''''''' ''' '''' '''''''''' '''''''''' '''''''''' ''''''''''
'' '''''''''' ''''''''''' '''''''''''''''''' ''''''''''''
o = '''' ''' ''''''''''''''''''''' '' ''''''''''''''''''
o = ''''''''''''''''
Multiple myeloma in people who have received two or more prior therapies
(TA171)
'''''''''''''''''''''''''''''''''' '''''' '''''''' '''''''''''''''''''''' ''''' '''''''''''''''''''' '''''''''''''''''''''''' ''''' ''''''''''''''' '''''''''' ''''''''''' ''''''''''''''''''''' ''''''''' '''''
''''''''''''' ''''''''''' '''''''''''''''''''''' '''''''''' ''''''''''''''''''''' '''''' '''''''''''''''''''''''''''' ''''' ''''''''''''' ''''''''' ''''''' '''''' '''''''''''''' ''''''''' ''''''''''''''
''''''''' ''''''''''''''''''''''''''' '''''''''''''''''''''''' '''''''''' ''''''' ''''''''''''''''''' ''''''''' '''''''''''''''''''''''' ''''''''''''''' ''''''''''' '''''''''''''' ''''' '''''''''''' '''
'''''''''''''''''' ''''''''''' ''''''''''''''''''' ''''''' ''''''''''''''' '''''''''''''''''' ''''''' '''''''' '''''''''''''''''''''' ''''' '''''''''''''''''''' ''''''''' '''''''''' '''''''''''''''''''' ''''''''
''''' '''''''''''' '''''''''''' ''''''''''''''''''''''''''''''''''
'''''''''' '''''''''''''''''''''''' ''''' '''''''' ''''''''''''' ''''''''''''' '''''''''''''''''''''''' '''''' ''''''''' ''''''''''''''''''''''' ''''''''''' '''''''''''''' '''''''' ''''''' ''''''''''''''''''''''
''''''''''''''''''' ''''''''' ''''''''' '''''' '''''''''''' '''''''' ''''''''''''''''''' '''''''''' '''''''''''' ''''''''''' '''''''''''''' '''' '''' '''''''''''''''''''''''''''''
Summary
If a simple discount were to be applied across all indications, the discount level that would
result in lenalidomide being cost-effective '''''''''' ''''''''''''''''''''' ''''''''''''''''''''''''''''''''''''''''''''''''''
'''''''''''''''''''''''''''''''''''''''''''''''''''''''''''''''''''''''''''''''''''''''''''''''''''''''''''''''''''''''''''''''''''''''''''''''''''''''''''''''''''''''''''''''''''''''
''''''''''''''''''''''''''''''''''''''''''''''''''''''''''''
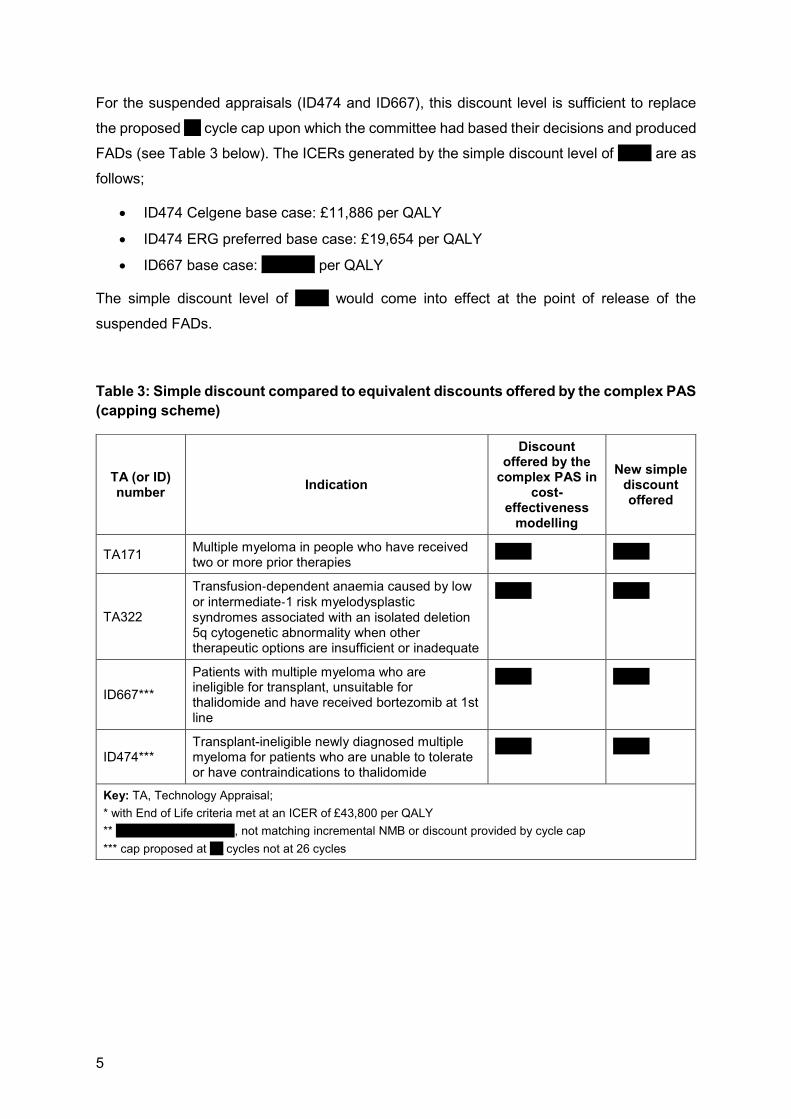
5
For the suspended appraisals (ID474 and ID667), this discount level is sufficient to replace
the proposed '''''' cycle cap upon which the committee had based their decisions and produced
FADs (see Table 3 below). The ICERs generated by the simple discount level of '''''''''''' are as
follows;
• ID474 Celgene base case: £11,886 per QALY
• ID474 ERG preferred base case: £19,654 per QALY
• ID667 base case: ''''''''''''''''''' per QALY
The simple discount level of '''''''''''' would come into effect at the point of release of the
suspended FADs.
Table 3: Simple discount compared to equivalent discounts offered by the complex PAS
(capping scheme)
TA (or ID) number
Indication
Discount offered by the
complex PAS in cost-
effectiveness modelling
New simple discount offered
TA171 Multiple myeloma in people who have received two or more prior therapies
''''''''''''' '''''''''''''
TA322
Transfusion‑dependent anaemia caused by low
or intermediate‑1 risk myelodysplastic syndromes associated with an isolated deletion 5q cytogenetic abnormality when other therapeutic options are insufficient or inadequate
''''''''''''' '''''''''''''
ID667***
Patients with multiple myeloma who are ineligible for transplant, unsuitable for thalidomide and have received bortezomib at 1st line
''''''''''''' '''''''''''''
ID474*** Transplant-ineligible newly diagnosed multiple myeloma for patients who are unable to tolerate or have contraindications to thalidomide
''''''''''''' '''''''''''''
Key: TA, Technology Appraisal;
* with End of Life criteria met at an ICER of £43,800 per QALY
** '''''''''''''''''''''''''''''''''''''''''''''''''''', not matching incremental NMB or discount provided by cycle cap
*** cap proposed at '''''' cycles not at 26 cycles

6
Appendix 1 - Methods
''''''''''''''''''''

7
''''''''''''''''''''

8
''''''''''''''''''''

9
''''''''''''''''''''

10
''''''''''''''''''''

11
''''''''''''''''''
12
References 1. National Institute for Health and Care Excellence. Multiple myeloma - lenalidomide (post bortezomib) (part rev TA171) [ID667]. 2018. (Updated: 22 March 2018) Available at: https://www.nice.org.uk/guidance/indevelopment/gid-tag452. Accessed: 15 November 2018. 2. National Institute for Health and Care Excellence. Multiple myeloma (newly diagnosed) - lenalidomide [ID474]. 2018. (Updated: 22 March 2018) Available at: https://www.nice.org.uk/guidance/indevelopment/gid-tag429. Accessed: 15 November 2018. 3. National Institute for Health and Care Excellence. Lenalidomide for the treatment of multiple myeloma in people who have received at least one prior therapy. 2009. (Updated: 01 April 2014) Available at: https://www.nice.org.uk/guidance/ta171. Accessed: 15 November 2018. 4. National Institute for Health and Care Excellence. Final appraisal determination: Lenalidomide for treating myelodysplastic syndromes associated with an isolated deletion 5q cytogenetic abnormality. 2014. (Updated: 24 September 2014) Available at: https://www.nice.org.uk/guidance/ta322/documents/myelodysplastic-syndrome-deletion-5q-lenalidomide-id480-final-appraisal-determination-document2. Accessed: 15 November 2018. 5. Southampton Health Technology Assessments Centre (SHTAC). Evidence Review Group Report: Lenalidomide in combination with dexamethasone for previously untreated multiple myeloma. 22 December 2017 2017. Data on File. 6. National Institute for Health and Care Excellence. Multiple myeloma (newly diagnosed) – lenalidomide [ID474]: Pre-meeting briefing. 31 January 2018 2018. Data on File. 7. Kleijnen Systematic Reviews Ltd in collaboration with Erasmus University Rotterdam and Maastricht University. Lenalidomide for the treatment of myelodysplastic syndromes associated with deletion 5q cytogenetic abnormality: Addendum to Evidence Review Group’s Report following Celgene’s new evidence submission with approved patient access scheme of 8th November 2013. 2013. Available at: https://www.nice.org.uk/guidance/ta322/documents/myelodysplastic-syndrome-deletion-5q-lenalidomide-evaluation-report2. Accessed: 15 November 2018. 8. National Institute for Health and Care Excellence. Final appraisal determination: Lenalidomide for the treatment of multiple myeloma in people who have received at least one prior therapy. 2009. Available at: https://www.nice.org.uk/guidance/ta171/documents/multiple-myeloma-lenalidomide-final-appraisal-determination3. Accessed: 15 November 2018. 9. Peninsula Technology Assessment Group (PenTAG). The clinical- and cost-effectiveness of lenalidomide for multiple myeloma in people who have received at least one prior therapy: An evidence review of the submission from Celgene (Addendum to the report submitted on 1st September 2008). 2008. Available at: https://www.nice.org.uk/guidance/ta171/documents/addendum-to-the-erg-report2. Accessed: 15 November 2018. 10. National Institute for Health and Care Excellence. Final appraisal determination: Pembrolizumab for treating PD-L1-positive non-small-cell lung cancer after chemotherapy. 2016. Available at: https://www.nice.org.uk/guidance/ta428/documents/final-appraisal-determination-document. Accessed: 15 November 2018.

Confidential – do not copy or circulate
Version 1 1
CONFIDENTIAL
Evidence Review Group Report commissioned by the
NIHR HTA Programme on behalf of NICE
Lenalidomide in combination with dexamethasone for previously untreated multiple myeloma
ERG response to Celgene’s new patient access scheme (PAS)
Produced by Southampton Health Technology Assessments Centre
(SHTAC)
Correspondence to Dr Jonathan Shepherd
Southampton Health Technology Assessments Centre
(SHTAC)
Wessex Institute
Alpha House
Enterprise Road, University of Southampton Science Park
Southampton SO16 7NS
www.southampton.ac.uk/shtac
Date completed 25th March 2019
Copyright belongs to Southampton University
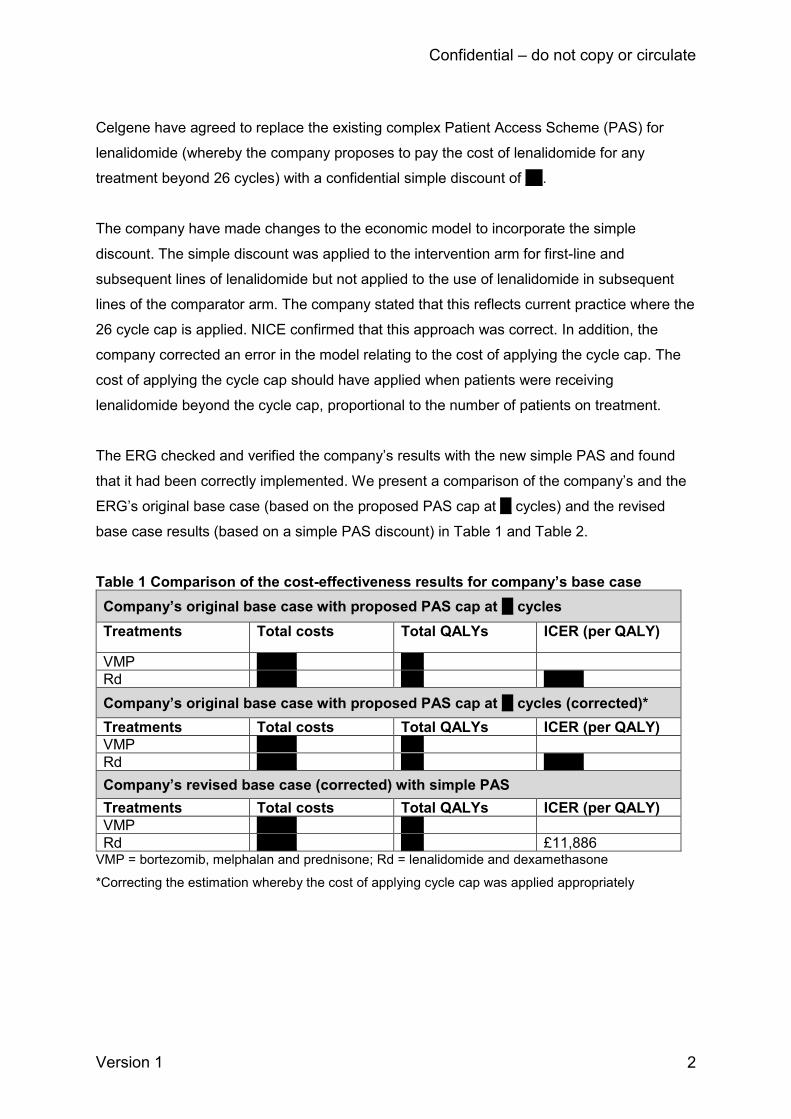
Confidential – do not copy or circulate
Version 1 2
Celgene have agreed to replace the existing complex Patient Access Scheme (PAS) for
lenalidomide (whereby the company proposes to pay the cost of lenalidomide for any
treatment beyond 26 cycles) with a confidential simple discount of ***.
The company have made changes to the economic model to incorporate the simple
discount. The simple discount was applied to the intervention arm for first-line and
subsequent lines of lenalidomide but not applied to the use of lenalidomide in subsequent
lines of the comparator arm. The company stated that this reflects current practice where the
26 cycle cap is applied. NICE confirmed that this approach was correct. In addition, the
company corrected an error in the model relating to the cost of applying the cycle cap. The
cost of applying the cycle cap should have applied when patients were receiving
lenalidomide beyond the cycle cap, proportional to the number of patients on treatment.
The ERG checked and verified the company’s results with the new simple PAS and found
that it had been correctly implemented. We present a comparison of the company’s and the
ERG’s original base case (based on the proposed PAS cap at ** cycles) and the revised
base case results (based on a simple PAS discount) in Table 1 and Table 2.
Table 1 Comparison of the cost-effectiveness results for company’s base case
Company’s original base case with proposed PAS cap at ** cycles
Treatments Total costs Total QALYs ICER (per QALY)
VMP ******* ****
Rd ******* **** *******
Company’s original base case with proposed PAS cap at ** cycles (corrected)*
Treatments Total costs Total QALYs ICER (per QALY)
VMP ******* ****
Rd ******* **** *******
Company’s revised base case (corrected) with simple PAS
Treatments Total costs Total QALYs ICER (per QALY)
VMP ******* ****
Rd ******* **** £11,886 VMP = bortezomib, melphalan and prednisone; Rd = lenalidomide and dexamethasone
*Correcting the estimation whereby the cost of applying cycle cap was applied appropriately
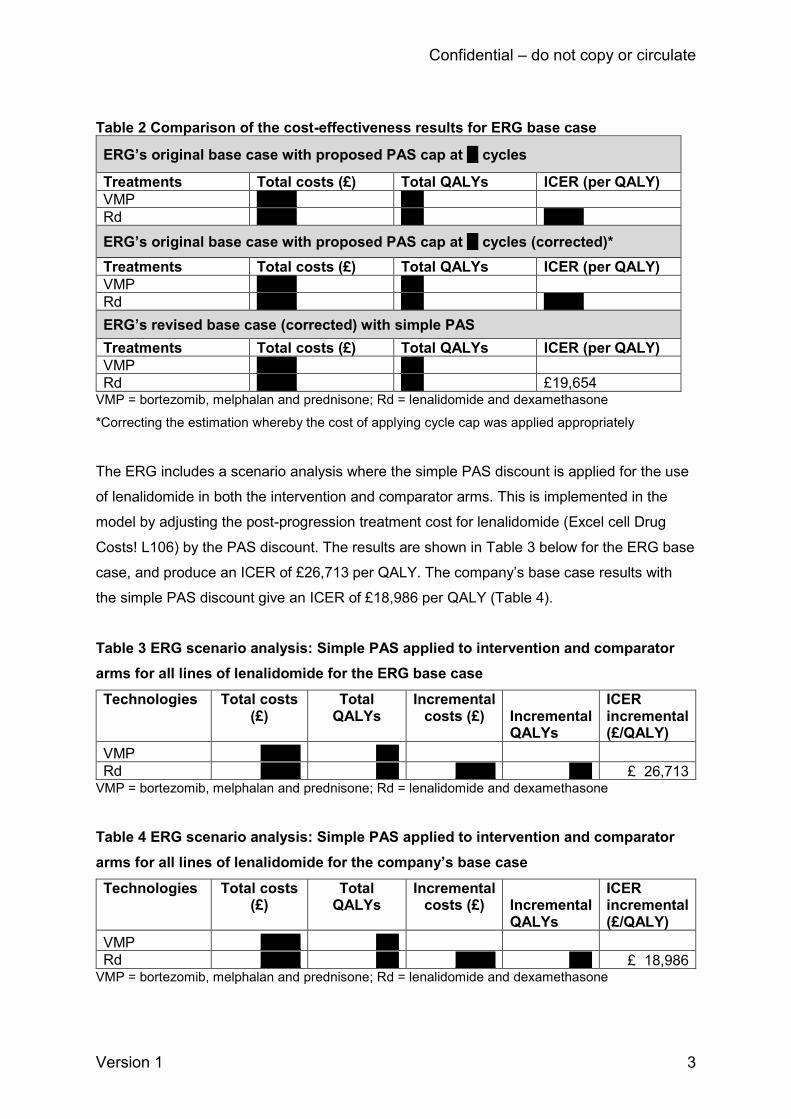
Confidential – do not copy or circulate
Version 1 3
Table 2 Comparison of the cost-effectiveness results for ERG base case
ERG’s original base case with proposed PAS cap at ** cycles
Treatments Total costs (£) Total QALYs ICER (per QALY)
VMP ******* ****
Rd ******* **** *******
ERG’s original base case with proposed PAS cap at ** cycles (corrected)*
Treatments Total costs (£) Total QALYs ICER (per QALY)
VMP ******* ****
Rd ******* **** *******
ERG’s revised base case (corrected) with simple PAS
Treatments Total costs (£) Total QALYs ICER (per QALY)
VMP ******* ****
Rd ******* **** £19,654 VMP = bortezomib, melphalan and prednisone; Rd = lenalidomide and dexamethasone
*Correcting the estimation whereby the cost of applying cycle cap was applied appropriately
The ERG includes a scenario analysis where the simple PAS discount is applied for the use
of lenalidomide in both the intervention and comparator arms. This is implemented in the
model by adjusting the post-progression treatment cost for lenalidomide (Excel cell Drug
Costs! L106) by the PAS discount. The results are shown in Table 3 below for the ERG base
case, and produce an ICER of £26,713 per QALY. The company’s base case results with
the simple PAS discount give an ICER of £18,986 per QALY (Table 4).
Table 3 ERG scenario analysis: Simple PAS applied to intervention and comparator
arms for all lines of lenalidomide for the ERG base case
Technologies Total costs (£)
Total QALYs
Incremental costs (£) Incremental
QALYs
ICER incremental (£/QALY)
VMP ******* ****
Rd ******* **** ******* **** £ 26,713 VMP = bortezomib, melphalan and prednisone; Rd = lenalidomide and dexamethasone
Table 4 ERG scenario analysis: Simple PAS applied to intervention and comparator
arms for all lines of lenalidomide for the company’s base case
Technologies Total costs (£)
Total QALYs
Incremental costs (£) Incremental
QALYs
ICER incremental (£/QALY)
VMP ******* ****
Rd ******* **** ******* **** £ 18,986 VMP = bortezomib, melphalan and prednisone; Rd = lenalidomide and dexamethasone
Copyright © 2022 FDOKUMEN