LAND COVER CHANGES AND STAKEHOLDERS - University ...
94
i LAND USE/ LAND COVER CHANGES AND STAKEHOLDERS: INVESTIGATING SUSTAINABLE NATURAL RESOURCES MANAGEMENT OPTIONS FOR AN A1 FARM A CASE STUDY OF ESSEXDALE FARM IN MARONDERA DISTRICT, ZIMBABWE By Edimus Masona A thesis submitted in Partial fulfilment of the requirements for the degree of Master of Science in Tropical Resource Ecology, University of Zimbabwe. Department of Biological Sciences University of Zimbabwe Harare 30 May 2014
-
Upload
khangminh22 -
Category
Documents
-
view
2 -
download
0
Transcript of LAND COVER CHANGES AND STAKEHOLDERS - University ...

i
LAND USE/ LAND COVER CHANGES AND STAKEHOLDERS:
INVESTIGATING SUSTAINABLE NATURAL RESOURCES
MANAGEMENT OPTIONS FOR AN A1 FARM
A CASE STUDY OF ESSEXDALE FARM IN MARONDERA DISTRICT,
ZIMBABWE
By
Edimus Masona
A thesis submitted in Partial fulfilment of the requirements for the degree of
Master of Science in Tropical Resource Ecology, University of Zimbabwe.
Department of Biological Sciences
University of Zimbabwe
Harare
30 May 2014

i
ABSTRACT
The tracking of the land use/land cover changes that took place in Essexdale Farm (a
communal resettlement area in Marondera District of Zimbabwe) from the period 1985 to
2012 was conducted using the two methods: the Normalised Difference Vegetation Index
(NDVI) Trend Analysis and the calculation of changes in proportions of the land use/land
cover classes. Four land classes: woodland, cropland, wooded grassland and wetland, were
considered. The analysis of the stakeholder management framework was conducted using
both the formal and informal survey methods to offer an explanation for the observed trends
in the land cover changes. The NDVI Trend Analysis results revealed that there is evidence
of woodland and wetland degradation as was shown by the decrease in the NDVI values of
the corresponding land classes from 1985 to 2012. There was however insignificant change in
the trend analysis of the cropland and wooded grassland land classes. There was a general
increase in the proportion of land under woodland from 1985 to 2012. However the effects of
the Fast Track Land Reform process were evidenced by an increase in the proportion of the
cropland at the expense the woodland.
Deforestation was identified by the stakeholders to be the main environmental problem and
its contributing factors being the cutting down of trees for tobacco curing, clearing land for
cultivation, selling of firewood to neighbouring towns and poverty. The clearing of land for
cultivation under the post 2000 era, during the Government of Zimbabwe’s Fast-Track
Resettlement Programme, emerged as the main contributing factor. It was also noticed that
the conversion of the woodland to cropland and wooded grassland was more pronounced
from 2000 to 2005 than was for 2006 to 2012. It was observed that there are now more than
265 families on Essexdale Farm, a figure which is almost double the carrying capacity of 136
families pegged by the land use planners in the Ministry of Lands and Rural Resettlement,
Marondera district. There are also illegal settlers (who are not recorded in the official farm
register at the District Offices) farming on marginal land.
The suggested possible solutions to the environmental challenges were tree planting,
environmental education and awareness campaigns and firebreak construction, as well as
strict environmental law enforcement. It was noted that the practicability and the
effectiveness of these environmental management strategies would only be realised in a well
managed sustainable stakeholder framework. This would demand the necessary political will
to initiate institutional reforms and restructuring, with the major move being to shift the A1
land resettlement mandate from the Ministry of Local Government Rural and Urban
Development to the more accountable Ministry of Lands and Rural Resettlement to deal with
the problem of illegal resettlements. Capacity building of the individual farmers, local
leadership and staff of all the government institutes would greatly benefit the conservation
initiatives, with the major task of coordinating these efforts lying with the Ministry of
Environment and Natural Resources Management.
KEY WORDS: Land Use/ Land Cover Changes, Stakeholders, Natural Resources
Management

ii
ACKNOWLEDGEMENTS
I am most grateful to the following people:
The farmers of Essexdale farm (from all the five villages), their village heads and the
councillor for their participation in the interviews;
Mr Onias Masona, Mr Mukonowatsauka, Mr Masibango for their help during the field work;
Mr Admire Marufu the DLO of Marondera District, for his invaluable information during
both the preliminary studies and the main research; Mrs J. Sakala the Land Use Planner in the
MLRR, Mashonand East Province for her information on land use planning; The staff at the
MLRR Marondera District and Provincial Offices and the Head Office for the
encouragement;
Mr D. Mudyariwa the EMA District Environmental officer Marondera District, Mrs F.
Mbodzi the Marondera Forestry Commission District Extension Officer, Mr Mukosi the
Environmental Technician from Marondera RDC, the Crop Specialist from MAMID at the
Mashonaland East Provincial Offices, Mrs F. Muzulu of the Marondera DA`s Office for their
participation in the interview;
Mr Godfrey Pachavo of SIRDC and Mr Chinembiri of Ministry of Lands and Rural
Resettlement for their advice in GIS and Remote Sensing;
All the lecturers and staff of the TREP Programme, Department of Biological Sciences and
also the lecturers of GIS and Remote Sensing at the Department of Geography and
Environmental Sciences, University of Zimbabwe for their (both direct and indirect)
participation in my training as a Natural Resources Manager.
My special thanks go to my supervisor Professor Isla Grundy for her mentoring skills and
also for the patience which she exercised during the research.
Finally I give all the glory and honour to God Almighty for giving me the grace to do the
project in Jesus Name.

iii
CONTENTS PAGE
ABSTRACT…………………………………………………………………………………..i
ACKNOWLEDGEMENTS…………………..……………………………………………..ii
TABLE OF CONTENTS……………….…………………………………………………..iii
LIST OF ACCRONYMS AND ABBREVIATIONS……………………………...……. ..vi
LIST OF TABLES………………………………………………..…………….….…..…...vii
LIST OF FIGURES……….………………………………………………....…………….viii
LIST OF APPENDICES........................................................................................................ix
CHAPTER 1: INTRODUCTION………………………………………………..…………1
1.1 Background………………………………………………………………………………..1
1.2 Justification………………………………………………………………………………..3
1.3 Research aim………………………………………………………………………………3
1.4 Research objectives………………………………………………………………………..4
1.5 Research questions………………………………………………………………………...4
1.6 Research hypotheses…………………………….………………………………………...4
CHAPTER 2: LITERATURE REVIEW…………………………………………………..5
2.1 Introduction……………………………………………………………………………….5
2.2 Stakeholders………………………………………………………………………………5
2.2.1 De Lopez Methodological Framework………………………………………………….6
2.2.2 Stakeholder analysis……………………………………………………………………..7
2.2.3 Stakeholder mapping…………………………………………………………………….7
2.2.4 Development of Stakeholder Management Strategies…………………………………..9
2.3 Land use and land cover changes………………………………………………………...10
2.3.1 Remote sensing and land cover-changes……………………………………………….11
2.3.2 Using the NDVI as an estimator of vegetation cover………………………………….13
2.4 Natural Resources Management in Zimbabwe…………………………………………..14
2.4.1 Environment Management Agency……………………………………………………15

iv
CONTENTS PAGE
2.4.2 Forestry Commission of Zimbabwe…………………………………………………………………15 2.4.3 Rural District Councils in Zimbabwe………………………………………………….16
2.4.4 District Administrator’s Office………………………………………………………...17
2.4.5 Ministry of Lands and Rural Resettlement…………………………………………….17
2.4.6 Ministry of Agriculture, Mechanisation and Irrigation Development…………………18
2.4.7 Local Leadership in Zimbabwe………………………………………………………...18
CHAPTER 3: MATERIALS AND METHODS………………………………………….19
3.1 Location and description of the study area………………………………………………19
3.2 The A1 Resettlement Model……………………………………………………………..21
3.3 Vegetation and Soils……………………………………………………………………..22
3.4 Measuring the Land Cover Change in Essexdale Farm………………………………….22
3.4.1 Remotely sensed data………………………………………………………………….25
3.4.2 NDVI Sampling in Essexdale Farm……………………………………………………25
3.4.3 Trend Analysis for NDVI values in Essexdale Farm…………………………………..26
3.4.4 Determination of the land class proportion changes for Essexdale Farm……………...26
3.5 Stakeholder Analysis for Essexdale Farm………………………………………………..27
3.5.1 Stakeholder groups interviewed………………………………………………………..27
CHAPTER 4: RESULTS AND ANALYSIS…………………………………………...…28
4.1 NDVI trends and trend analysis………………………………………………………….28
4.1.1 Analysis of variance……………………………………………………………………32
4.2 Land class proportion area changes in Essexdale Farm………………………………….36
4.2.1 Compilation of the error matrix………………………………………………………..40
4.2.2 Calculation of Cohen’s Kappa…………………………………………………………41
4.3 Results from stakeholder analysis at Essexadale Farm…………………………………..43

v
CONTENTS PAGE 4.3.1 EMA Marondera District …...………………………………………………..……….43
4.3.2 Forestry Commission Marondera District…………………………………...………...44
4.3.3 Marondera Rural District Council.……...……………………………………………...44
4.3.4 Marondera District Adminstrator`s Office…………………………………………….45
4.3.5 Ministry of Lands and Rural Resettlement, Marondera District………………………45
4.3.6 Ministry of Agriculture, Mechanisation and Irrigation Development in Marondera…. 46
4.3.7 Local Leadership in Marondera District……………………………………………….46
4.3.8 Farmers on Essexdale farm…………………………………………………………….48
4.3.9 Stakeholder mapping for Essexdale Farm……………………………………………..50
4.3.10 Development of stakeholder management strategies in Essexdale Farm…………….52
CHAPTER 5: DISCUSSION………………………………………………………..…….53
5.1 Land use-land cover changes in Essexdale Farm………………………………………..53
5.2 Natural Resources Management Challenges in Essexadle Farm………………………..55
5.3: Natural Resources Management Strategies and Recommendations……………………56
5.3.1 Capacity building of both government and local institutions…………………………57
5.4: Conclusion………………………………………………………………………………59
REFERENCES …………………………………………………………………………….60
APPENDICES……………………………………………………………………………...63

vi
ACRONYMS AND ABBREVIATIONS USED
DA: District Administrator
DLC: District Land Committee
EMA: Environmental Management Agency
FAO: Food and Agriculture Organisation of United Nations
GOZ: Government of Zimbabwe
LC: Land Cover
LU: Land Use
LUCC: Land Cover, Land Cover Change
MAMID: Ministry of Agriculture, Mechanisation and Irrigation Development
MENRM: Ministry of Environment and Natural Resources Management
MLGRUD: Ministry of Local Government Rural and Urban Development
MLRR: Ministry of Lands and Rural Resettlement
NDVI: Normalised Difference Vegetation Index
RDC: Rural District Council
VIDCO: Village Development Committee
WADCO: Ward Development Committee
ZRP: Zimbabwe Republic Police

vii
TABLES PAGE
2.1: Stakeholder types in a conservation project………………………………………………8
4. 1: Accuracy assessment results for the classified images of Essexdale Farm…………......41

viii
FIGURES PAGE
2.1: Mapping of the stakeholders in a conservation project…………………………………...9
3.1: Geographical location of the study area…………………………………………………20
3.2: Village settlements and land use/land cover classes on Essexdale Farm………….…….24
4.1: Trend graph for the wetland mean seasonal NDVI for Essexdale Farm………………...28
4.2: Trend graph for the woodland mean seasonal NDVI for Essexdale Farm………………29
4.3: Trend graph for the cropland mean seasonal NDVI for Essexdale Farm………………30
4.4: Trend graph for the wooded grassland mean seasonal NDVI for Essexdale Farm……...31
4.5: Scatter plots of the Landsat band combination used in NDVI analysis…………………32
4.6: Mean annual NDVI for land cover classes in Essexdale Farm………………………….33
4.7: NDVI trends for Essexdale Farm in Marondera, Zimbabwe from 1985 to 1995……….34
4.8: NDVI trends for Essexdale Farm in Marondera, Zimbabwe from 1997 to 2012……….35
4.9: Classification of 1985 images for Essexdale Farm……………………………………...36
4.10: Classification of 1992 images for Essexdale Farm…………………………………….37
4.11: Classification of 1999 images for Essexdale Farm…………………………………….38
4.12: Classification of 2006 images for Essexdale Farm…………………………………….39
4.13: Classification of 2012 images for Essexdale Farm……………………………………40
4.14: Proportion of land under different land cover classes in Essexdale Farm……………..42
4.15: Mapping of stakeholders in natural resource conservation on Essexdale Farm……….50

ix
APPENDICES PAGE
1.1: Questionnaire for individual farmers in Essexdale Farm………………………………..63
1.2: Questionnaire Local Leadership in Essexdale Farm…………………………………….68
1.3: Questionnaire for Government Institutions in Marondera District……………………...71
1.4: SPSS Outputs for the analysis of A1 Farmer questionnaire…………………………….73

1
CHAPTER ONE: INTRODUCTION
1.1 Background
Forests currently cover about 4 billion hectares, about 31 per cent of the earth’s land surface
(FAO, 2010). According to FAO (2012), between 2000 and 2010; the world lost about 130
million hectares of forest (about 3.2 per cent of the total forest area in 2000). FAO 2010
concludes that net deforestation at the global level occurred at the rate of 0.14 per cent per
year between 2005 and 2010. This compares with estimated net annual global deforestation
rates of 0.20 per cent between 1990 and 2000, and 0.12 per cent between 2000 and 2005
(FAO, 2012).
In Africa, forests currently cover about 23 % of the land; African countries reported that 75
million hectares of forest land (10 per cent of the total forest area) was converted to other
uses between 1990 and 2010 (FAO, 2012). In sub-Saharan Africa, deforestation and
population have gradually increased together, with the heaviest forest losses coming in areas
where wood is needed for fuel or where forest land is needed for growing crops (FAO, 2012).
In Zimbabwe according to the Forestry Commission (2010), clearing for agriculture is the
major reason for deforestation, with 330,000 ha of woody cover being lost to agriculture each
year, compared to 70,000 ha a few decades ago. Woody cover over the whole country was
reduced by 10.46% between 1992 and 2008; bush land by 1.9%; and wooded grassland was
reduced by 0.53%, while cultivated areas increased by 13.76%. Pristine miombo woodland
on the central watershed of the country is now much diminished (MENRM, 2011).
According to the Millennium Ecosystem Assessment (2005), ecosystem services are broadly
defined as benefits that people obtain from natural ecosystems and they include services

2
related to provisioning, regulating, and supporting, and cultural functions. Their assessment
produced a detailed account of how the use of ecosystems has become unsustainable, getting
worse, and posing serious threats to human societies. The Millennium Ecosystem Assessment
and other international reports ascribe much of the on-going degradation and increasing
scarcity of natural resources to institutional failures (Giuliani et al., 2008). The Millennium
Ecosystem Assessment (2005) identified land-cover change as one of the most important
drivers of change in ecosystems and their services.
On average, in Zimbabwe communal lands have tended to be more intensively cultivated and
have much less woodland cover than the large scale commercial farming areas (Campbell et
al., 2000). Of the total estimated wood stock of 636 million tonnes in 2001, 42%, 40% and
16% were found on the wildlife estate, commercial farming areas and communal areas
respectively (Shumba, 2001). It must be noted that despite having the largest land area,
communal lands have had the least wood stock levels compared to the other two sectors. This
is according to Shumba (2001) is attributed to rampant deforestation that occurs in the
communal sector.
Until 1990 according to Rukuni (2006) about 40 per cent of Zimbabwe`s land fell in the
category of the communal sector where 66% per cent of the estimated 13million people live.
Until the Utete report (2003), official Government of Zimbabwe data indicated that over
225000 new settlers had benefited from the redistribution of about 10 million hectares of land
with about 54 per cent of the land being allocated to the communal sector. Thus the land
redistribution exercise increased land under the communal sector and consequently much
woodland land has been converted to cropland in the past decade.

3
1.2 Justification
Information on the consequences of land cover change for ecosystem services and human
well-being at local scales is largely absent (Reyers et al., 2009). Where information does
exist, the traditional methods used to collate and communicate this information represent a
significant obstacle to sustainable ecosystem management (Reyers et al., 2009). Embedding
science in a social process and solving problems together with stakeholders are necessary
elements in ensuring that new knowledge results in desired actions, behaviour changes, and
decisions (Reyers et al., 2009). This integrated process of research is much more effective if
done at all levels; starting from the community level to the national level.
Not much research on land change has been done in the newly resettled communal farms at
least at farm level. Most deforestation studies in communal areas of Zimbabwe have
concentrated on the drier parts ignoring the higher rainfall areas. According to Mr A. Marufu,
who is the secretary for the Marondera District Land Committee and a committee member of
the Marondera Rural District Council, there has been an increase in reported cases of
deforestation in the newly resettled communal farms (A1 farms) of Marondera in the past five
years and Essexdale farm was mentioned by the two institutions as being a problem farm (A
Marufu personal communication, 22 May 2013). According to Marufu, the problem of
deforestation in the A1 farms is posing different challenges from the conventional communal
areas of Zimbabwe and the new order of stakeholders and power struggles seems to be the
cause for this new challenge (personal communication, 22 May 2013).
1.3 Research aim
This project seeks to address the identified lack of information concerning deforestation and
the subsequent loss of livelihood benefits in Resettlement Areas in Zimbabwe. This will be
made possible by quantifying and qualifying the local-scale consequences of land use and
4
land-cover change for ecosystem service delivery on a communal farm in a tobacco-growing
area of Natural Region II 1 in Zimbabwe. The research will be part of a stakeholder-engaged
process that aims to answer questions inspired by the beneficiaries and managers of
ecosystem services. The outcomes of this research will contribute towards improved land use
planning and decision making for sustainable management in A1 farms of Natural Region 11.
1.4 Research objectives
The research objectives are:
1. To assess and map key ecosystem services available on a communal farm in a
tobacco-growing area of Zimbabwe.
2. To track the land-use and land-cover changes that took place from 1985 to 2012.
3. To carry out a stakeholder analysis of the farm.
4. To make the necessary recommendations for sustainable natural resources
management on the farm.
1.5 Research questions
The research questions are:
1. What are the key ecosystem services available on the farm?
2. What are the land-use and land-cover changes that have taken place for the past 27
years?
3. Who are the relevant stakeholders and how do they interact?
4. How can the results of this study be fed in decision making and policy making in the
A1 resettlement scheme?
1.6 Hypotheses
H0 : There is no effect of time on NDVI
H1 : Time affects NDVI
1 Zimbabwe is divided into five agro-ecological regions, known as natural regions basing on
the rainfall regime, soil quality and vegetation among other factors. The amount of rainfall
and the quality of the land resource declines from Natural Region (NR) I through to NR V
(Moyo, 2000; Vincent and Thomas, 1961)
5
CHAPTER 2: LITERATURE REVIEW
2.1 Introduction
According to Meyer and Turner (1994), the issues involved in land use and its changes over
time are becoming increasingly recognized among concerns about global environmental
change. The planners of the International Geosphere-Biosphere Programme (IGBP) realized
that alterations in land use would be the dominant driver of global change over the next few
decades (Walker, 1998). Changes in LU and LC comprise one of four major, large-scale
environmental perturbations of the earth, together with biodiversity, atmospheric
composition, and climatic change (Walker and Steffen, 1997).To ensure a sustainable
management of natural resources, it is necessary to understand and quantify the processes of
landscape change (Petit et al., 2001).
When inadequate attention is paid to the interests and characteristics of stakeholders, many
conservation initiatives are bound to fail (Grimble and Wellard, 1997). Consequently,
stakeholder analysis has gained increasing attention and is now an integral part of many
participatory natural resource management initiatives (Mushove and Vogel, 2005). The
growing popularity of stakeholder analysis in natural resource management partly reflects an
increasing recognition of the extent to which stakeholders can and or should influence
environmental decision-making processes (Burroughs 1999; Varvasovszky and Brugha,
2000; Duram and Brown, 1999; Selin et al., 2000).
2.2 Stakeholders
The stakeholder concept initially originated in the field of corporate management (De Lopez,
2001a). Grimble &Wellard (1997, pp.) define stakeholders as ‘any group of people, organised
or unorganised, who share a common interest or stake in a particular issue or system; they
can be at any level or position in society, from global, national and regional concerns down to

6
level of household or intra-household, and can be any group of any size or aggregation’.
Stakeholders are usually identified and categorized through a subjective assessment of their
relative power, influence, and legitimacy (Mitchell et al. 1997; Frooman 1999). Stakeholder
analysis can be used to understand environmental systems by defining the aspects of the
system under study; identifying who has a stake in those aspects of the system; and
prioritizing stakeholders for involvement in decisions about those aspects of the system
(Grimble and Wellard 1997; Mushove and Vogel 2005). Although the term ‘stakeholder’ has
been repeatedly used in the conservation of natural resources, the emphasis has been on the
participation of all the stakeholders in a conservation project, rather than on the management
of those stakeholders (De Lopez, 2001a). Stakeholder management can be defined as an
approach to understanding groups and individuals who can affect an organisation and the
managerial behaviour taken in response to them (De Lopez, 2001a).
2.2.1 De Lopez Methodological Framework
De Lopez (2001b) in work at Ream National Park in the South of Cambodia gave an account
of the development and implementation of a stakeholder management framework. The model
was an attempt to explicitly connect the fields of management and natural resource
conservation by adapting stakeholder management to a protected area. In a situation
characterised by conflicting claims on natural resources, park authorities were able to
implement specific management strategies for each group of stakeholders.
The framework is comprised of three steps:
1. stakeholder analysis,
2. stakeholder mapping,
3. development of stakeholder management strategies.

7
The goal of the framework is not to develop a detailed work plan, but rather to produce
strategic guidance for the management of the stakeholders of natural resources management,
particularly forest conservation.
2.2.2 Stakeholder analysis
According to De Lopez (2001b) the general objectives of the stakeholder analysis are:
To determine the primary stakeholders of woodland conservation,
To understand the nature of their stakes, and
To provide an explanation for their behaviour.
2.2.3 Stakeholder mapping
The classification of stakeholders helps project managers to prioritise the claims of the
various groups. Maps are a visual summary of the stakeholder analysis and provide a basis
for the formulation of management strategies. The map consists of a two-dimensional matrix
that divides stakeholders into five broad categories (De Lopez, 2001b). The first dimension
measures the potential of stakeholders for conservation (those who subscribe to the goals of
the project, that is, sustainable and equitable use of natural resources). They are assessed as
having high potential for conservation. They represent a latent opportunity for cooperation
with the project. The role of management is to enhance and achieve this potential (De Lopez,
2001b). The second dimension measures the influence or power of stakeholders on a
conservation project. Table 2.1 shows the five types of stakeholders identified by De Lopez.
Stakeholders who have the strongest impact on the project’s success and failure are the main
concern.

8
Table 2.1: Stakeholder types in a conservation project
Type of Stakeholder
Description
1.Conservationists
Stakeholders with high potential for conservation and high
influence on the project
2. Developers Stakeholders with low potential for conservation and high
influence on the project
3 Marginal conservationists Stakeholders with high potential for conservation and low
influence on the project
4.Marginal Developers Stakeholders with low potential for conservation and low
influence on the project
5.Switchers Stakeholders whose potential for conservation is uncertain
Switchers are at the boundary between stakeholders with high potential for development and
stakeholders with high potential for conservation. Their actions may both contribute to forest
conservation and forest destruction. Switchers have generally low influence on the project,
since their commitment is still undetermined (De Lopez, 2001a). Developers are the greatest
threat to the project’s success. Conservationists represent the greatest opportunities for
cooperation with the project. An alternative way to divide stakeholders according to De
Lopez (2001a) is to first differentiate between those supporting and those opposing
conservation, then between those with strong influence and weak influence on the project.
Five equivalent categories emerge: (1) Supporters, (2) Opponents, (3) Marginal supporters,
(4) Marginal opponents and (5) Switchers. Figure 3.1shows the map of stakeholder categories
for conservation projects.

9
Stakeholder`s influence or power on the project
High
Low
Stakeholder`s
potential for
Conservationists
Marginal
Conservationists
Conservation High (Supporters)
(Marginal Supporters)
Strategy: Coalition
Strategy:
Empowerment
Developers
Marginal Developers
Low (Opponents)
(Marginal Opponents)
Strategy: Marginalisation Strategy: Conversion
or involvement
Figure 2.1: Mapping of the stakeholders in a conservation project (De Lopez, 2001b).
2.2.4 Development of Stakeholder Management Strategies
The mapping of stakeholders into different categories is the basis for the formulation of
management strategies. The conservation and influence matrix locates stakeholders at a given
time. However, the matrix does not remain static; rather it may be subject to manipulation by
the project’s managers. The insight of the stakeholder management theory is that stakeholders
can be actively moved from one quadrant of the matrix to another (De Lopez, 2001a).
De Lopez (2001a) suggested that managers may attempt to shift stakeholders around the
matrix in the following ways:
Coalition between conservationists - no shift,
Marginalization - shift from developer to marginal developer,
10
Involvement - shift from developer to conservationist,
Conversion - shift from marginal developer to marginal conservationist,
Empowerment - shift from marginal conservationist to conservationist,
Switch - shift from switchers to marginal conservationist
A coalition strategy enables the strengthening of the conservationists’ camp. The adoption of
common goals or the pooling of financial, technical and human resources all contribute to
increasing the influence of the members of the coalition. All other strategies consist of
increasing or decreasing a specific stakeholder’s influence on the project, or in increasing its
potential for conservation (De Lopez, 2001a).
2.3 Land use and land cover changes.
Land use (LU) and land cover (LC) have become interchangeable concepts often because of
the demands of different agents and actors involved in the commissioning process and this is
apparent in many studies, surveys, programmes of research and reports (Comber et al., 2008).
LC and LU are two key elements that describe the terrestrial environment in natural and
human activity-related terms, respectively (Cihlar and Jansen, 2001).
According to Squires (2010), land cover refers to the observed physical surface of the earth,
including various combinations of vegetation types, soils, exposed rocks and water bodies.
Comber et al., (2008) gave grass, trees, bare ground, and water as examples of land cover.
The arrangements, activities and inputs people have undertaken on a certain land cover type
to produce, change or maintain it are all characteristics of land use. Furthermore, Land Use
refers to the purpose to which land is committed, including the production of goods and
services (Squires, 2010). Land use is a socioeconomic variable which describes how people

11
utilise the land (Comber et al., 2008). Land use therefore involves considerations of human
behaviour, and one thing of particular importance is that crucial roles are played by decision
makers and or institutions (Nunes and Auge, 1999).
The analysis of land use is a multi-disciplinary study. Maxwell (1993) describes it as ‘the
integrative study of the physical, environmental, economic and social consequences of land
use’). Since LU is the result of the interactions between society and the natural environment,
the knowledge of it is crucial for the studies which enhances improved understanding of
human-induced global changes and the institutional responses to them at all levels, from local
to global (Pritchard et al., 1998).
Information on land cover can be captured by the two primary methods: the field survey
method and through the analysis of remotely sensed imagery (Comber et al., 2008). Field-
based studies make it possible to observe and describe the processes of land-cover change in
a detailed and spatially disaggregated way. Furthermore field studies describe the interactions
between human activities and their environment and thus highlight the driving forces of land-
cover change (Petit et al., 2001). However according to Liverman et al. 2001, field studies
are generally not sufficient to quantify and analyse spatial and temporal patterns of land-
use/land-cover changes at an aggregated level. This means on their own, field studies cannot
provide predictions of future patterns of change (Petit et al., 2001).
2.3.1 Remote sensing and land cover-changes
Remote sensing has emerged as the most useful data source for quantitatively measuring
land-cover changes at the landscape scale (Hudak and Wessman, 1998). The advantage of
satellite remote sensing approaches is that they provide a cost-effective alternative when more

12
information is needed, but budgets are declining. Satellite remote sensing information can play a
useful role in understanding the nature of land cover/land use changes, where they are currently
occurring, and at the same time allowing the projection of possible or likely future changes. Such
information is essential to planning for development and preservation of natural resources and
environment, and is needed by planners and decision makers (Squires, 2010).
Land cover in remote sensing terms according to Comber et al., 2008, is that material which
we see and which directly interacts with electromagnetic radiation and causes the level of
reflected energy which determines the tone or the digital number at a location in an aerial
photograph or satellite image.
The relationship between land use and land cover is complex and cannot be directly inferred
from remotely sensed data in most cases (Comber et al. 2008). Fisher et al. (2005) noted that
land cover and land use have complex many-to-many relationships and cited the example of
the land cover ‘grass’ which can occur in a number of different land uses: sports grounds,
urban parks, residential land, pasture and similarly very few areas of homogenous land use
have a single land cover. Furthermore, Fisher et al. (2005) noted that land use classifications
do not necessarily fulfil the criteria of allocating features on the land surface uniquely into
one class and a single point in space may have a number of different land uses at any given
moment and much land has multiple states of use which may be simultaneous or alternate.
Land cover is essential for environmental modelling (for example climatic and hydrologic
models), but is not directly useful for most policy and planning purposes (planning of the
human or the natural environment), where land use is the relevant phenomenon (Comber et
al. 2008). Land cover maps are much easier to prepare because of the effectiveness of

13
satellite remote sensing tools that facilitate observation over extensive areas at various spatial
scales of both the current status and changes over time (FAO, 1991). Monitoring of land cover
change as a subset of the land cover variable is necessary for understanding the extent and
severity of natural and anthropogenic changes are occurring.
According to Squires (2010), Land cover changes may be classified into one of the two broad
categories: conversion or modification. Conversion refers to the change from one cover type to
another, such as conversion of forests to pasture land. Modification refers to the maintenance of
the same cover type while changes to its attributes are occurring. For instance, a forested area
may be retained as forest while major impacts to its structure or function, such as those involving
biomass or productivity, occur.
2.3.2 Using the NDVI as an estimator of vegetation cover.
The normalized difference of the vegetation index (NDVI) is a non-linear transformation of
the visible (red) and near-infrared bands of satellite information. NDVI is defined as the
difference between the visible (Red) and near-infrared (NIR) bands, over their sum. The
NDVI is an alternative measure of vegetation amount and condition. It is associated with
vegetation canopy characteristics such as biomass, leaf area index and percentage of
vegetation cover (Cihlar et al. 1991). The NDVI represents the plant`s assimilation condition,
its photosynthetic apparatus capacity and biomass concentration (Groten, 1993; Loveland et
al., 1991). In particular vegetation index dynamics in time are correlated with the Canopy
Leaf Index and other functional variables (Cihlar et al., 1991). These variables are in turn
strongly influenced by the behaviour of precipitation, temperature and daily radiation of the
area under observation. Vegetation index therefore is representative of plants' photosynthetic
efficiency, and it is time varying due to changes in meteorological and environmental
parameters. The NDVI values range from -1 to +1 (pixel values 0-255) (Squires, 2010).

14
The NDVI can be calculated from LANDSAT-TM information by using the combinations of
bands 3 (0.63-0.69 mm) and 4 (0.76-0.90 mm) [(B4-B3)/ (B4+B3)]. Healthy vegetation will
have a high NDVI value. Bare soil and rock reflect similar levels of near-infrared and red and
so will have NDVI values near zero. Clouds, water, and snow are the opposite of vegetation
in that they reflect more visible energy than infrared energy, and so they yield negative NDVI
values (Temfli et al., 2009).
2.4 Natural Resources Management in Zimbabwe
In Zimbabwe the ministry with overall responsibility for the environment is the Ministry of
Environment and Natural Resources Management (MENRM). The main focus of the
Ministry is to ensure sustainable use of the country’s natural resources for the benefit of all
Zimbabweans (GOZ, 2009). The Environmental Management Act (Chapter 20:27) provides
for the sustainable management of natural resources and protection of the environment; the
prevention of pollution and environmental degradation. The Act supersedes all other acts that
are in conflict with it. It is implemented by the Environmental Management Agency (EMA)
(a parastatal of MENRM) (GOZ, 2009).
The Ministry of Local Government Rural and Urban Development (MLGRUD) is a powerful
ministry especially in the rural areas of Zimbabwe. This is made possible by two of the
ministry`s departments: the Department of Traditional Leadership Support Services and the
Department of Provincial Administration. The Traditional Leadership Support Services
Department has the mandate for enhancing the management of traditional leadership systems.
The Provincial Administration, according to GOZ (2009) “personifies the mandate of
Government and the Ministry at the sub-national level”. Each of the ten provinces of
Zimbabwe (8 rural and 2 metropolitan) are under the stewardship of a Provincial Governor,
with the Provincial Administrator as the head of administration. Below the Provincial

15
Administrators, there are 73 District Administrators Provincial Governors are appointed in
terms of the Provincial Councils and Administration Act of 1984 and they have a consultative
coordination, developmental and political mandate (GOZ, 2009). Likewise, the Provincial
Administration institutions, which are responsible for development planning and
coordination, are also politically influenced (GOZ, 2009). Other important ministries are the
Ministry of Lands and Rural Resettlement (MLRR), and the Ministry of Agriculture,
Mechanisation and Irrigation Development (MAMID).
2.4.1 Environment Management Agency
According to the Environmental Management Act (Chapter 20:27), the Environment
Management Agency (EMA) was established by the Zimbabwean government to provide for
the sustainable management of natural resources and protection of the environment; the
prevention of pollution and environmental degradation; the preparation of a National
Environmental Plan and other plans for the management and protection of the environment
(GOZ, 2002a).
2.4.2 Forestry Commission of Zimbabwe
The Forestry Commission is another parastatal of the MENRM which has great potential to
significantly contribute to effective natural resources management. The Communal Lands
Forestry Produce Act (19:07) regulates the exploitation of and protects forest produce within
Communal Lands and encourages the establishment of plantations within Communal Lands.
Under this Act the rural district councils have the right to exploit produce from any natural
woodland on public land, to issue licenses and to enter into agreements to non-communal
land inhabitants to utilise woodland resources in communal areas. Licenses and agreements
are subject to the approval of the Forestry Commission (GOZ, 1990).
16
2.4.3 Rural District Councils in Zimbabwe
The districts in Zimbabwe are declared and named by the President under section 7 of the
Rural District Councils (RDC) Act [Chapter 29:13] (GOZ, 2002b) and the responsible
ministry is the MLGRUD. The formation of the Rural District Council and its subsequent
subdivision into Wards is done according to section 8 of the same Act. The RDC comprises
an elected councillor from each Ward according to section 11 of the Act. There are a number
of committees in the RDC but the two committees of special interest are: the Rural District
Development) Committee, the Natural Resources Conservation Committee and
Subcommittees and the Ward Development Committees (WADCO).
According to section 60 of the RDC Act for each council area there shall be a committee, to
be known as the Rural District Development Committee, consisting of: (a) the District
Administrator, (b) the chairman of every other committee established by the Council; and (c)
the Chief Executive Officer of the council and such other officers of the Council as the
Council may determine; and(d) the senior officer in the District of: (i) the Zimbabwe
Republic Police; (ii) the Zimbabwe National Army; (iii) the President’s Department; and (e)
the District head of each Ministry and department of a Ministry within the District that the
Minister may designate by notice in writing to the District Administrator; and (f) such further
persons representing other organisations and interests as the Minister, on the recommendation
of the District Administrator, may permit (GOZ, 2002b). According to subsection 4 of section
60 of the RDC Act the District Administrator shall preside at all meetings of a Rural District
Development committee at which he is present and, in his absence, the members present shall
elect a District head of a Ministry or department referred (GOZ, 2002b).

17
The Environmental Committee and Subcommittees are established according to Section 61
of the RDC Act, upon the recommendation of the Minister responsible for the administration
of the Environmental Management Act (Chapter 20:27) ( GOZ, 2002a).
2.4.4 District Administrator’s Office
The District Administrator (DA) is the head of the department of MLGRUD`s provincial
administration at the district level. The DA`s duties mainly revolve around development
planning and coordination in the District. The DA, of notable interest, presides over the rural
development committee in the RDC and is also the chairman of the District Land Committee
(DLC). The DLC is comprised of all government institutions at district level as represented
by their heads and the traditional chiefs. The DLC deals with land matters from land
allocations to boundary dispute resolutions.
2.4.5 Ministry of Lands and Rural Resettlement
As a government ministry the Ministry of Lands and Rural Resettlement (MLRR) is
mandated to acquire, equitably distribute and manage the agricultural land resource through
the provision of appropriate technical, administrative services for the sustainable socio-
economic development of Zimbabwe (GOZ, 2009). The MLRR has decentralised its
structures from the head office to the Provinces and the Districts. The MLRR through the
District Land Officer is the secretariat of the DLC which is chaired by the DA. The District
Land Office administers the A1 farm register, farm records and farm layouts and is also a co-
signatory with the DA on the A1 land permits (which are temporary entitlement documents
which give the farmer the right to use the piece of land).

18
2.4.6 Ministry of Agriculture, Mechanisation and Irrigation Development
The Ministry of Agriculture, Mechanisation and Irrigation Development (MAMID) is a
member of the DLC and also a member of the Rural District Development committee in the
RDC. It has the capacity to encourage natural resources conservation as it is one of the
unique ministries that has decentralised its agricultural extension services to the Ward level.
2.4.7 Local Leadership in Zimbabwe
According to the Rural District Councils Act [CHAPTER 29:13] (GOZ, 2002b), in each
Ward of a council area there shall be a committee, to be known as a Ward Development
Committee, consisting of: (a) the councillor for the Ward, who shall be the chairman of the
committee; and (b) the chairman and secretary of every Village Development Committee and
Neighbourhood Development Committee in the ward. The Ward Development Committee
(WADCO) is a development committee designated as an environment subcommittee in terms
of subsection (9) of section 61 and a Village Development Committee (VIDCO) means a
village development committee referred to in section 17 of the Traditional Leaders Act
[Chapter 29:17] (GOZ, 2002b).

19
CHAPTER 3: MATERIALS AND METHODS
3.1 Location and description of the study area
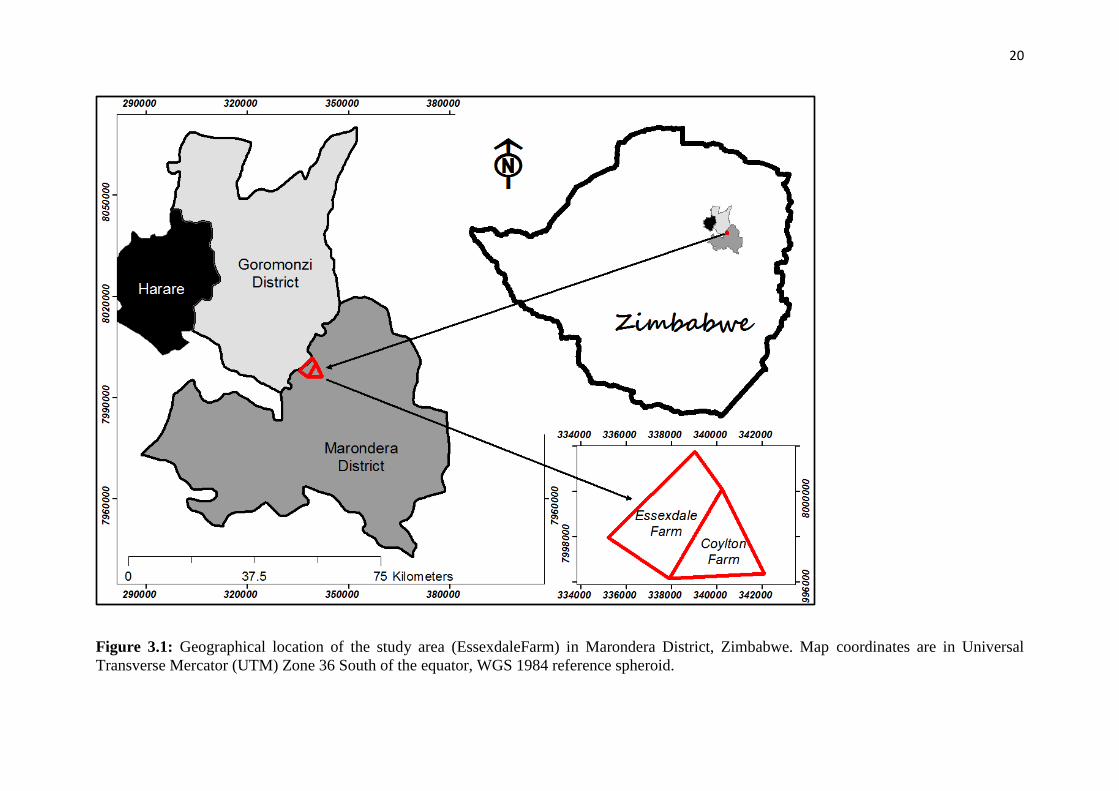
The study was done at Essexdale Farm in Marondera District. In Zimbabwe, Marondera is
one of the eight administrative districts in Mashonaland East Province of Zimbabwe. The
farm is 10km North-west of Marondera town, which is the provincial capital of Mashonaland
East. The farm is at the boundary of Goromonzi and Marondera Districts, so that the adjacent
farm (Weardale Farm) is in Goromonzi District. Fig. 3.1 below shows the study area.
The farm is named as Essexdale in the register at the Ministry of Lands and Rural
Resettlement Marondera District office but in reality the farm is listed as an annexure of two
separate farms or properties in the Department of the Surveyor General`s office and the
Deeds Registry`s office. The two separate properties are Essexdale (which is1278, 220
hectares in extent) and Coylton (which is 797, 459 hectares in extent). The total area of the
farm is thus 2075, 769 hectares. In this study Essexdale Farm is deliberately used to represent
the two properties (Essexdale and Coylton Farms).
The Essexdale and Coylton Farms lie at an elevation above 1000m but less than 1100m. The
two farms are characterised by a gently sloping landscape from South to North. The greater
part of Colyton Farm is occupied by some small hills while Essexdale is generally flatter with
some undulating slopes. Consequently much more arable land is found on Essexdale than on
Coylton.
20
Figure 3.1: Geographical location of the study area (EssexdaleFarm) in Marondera District, Zimbabwe. Map coordinates are in Universal
Transverse Mercator (UTM) Zone 36 South of the equator, WGS 1984 reference spheroid.
21
3.2 The A1 Resettlement Model
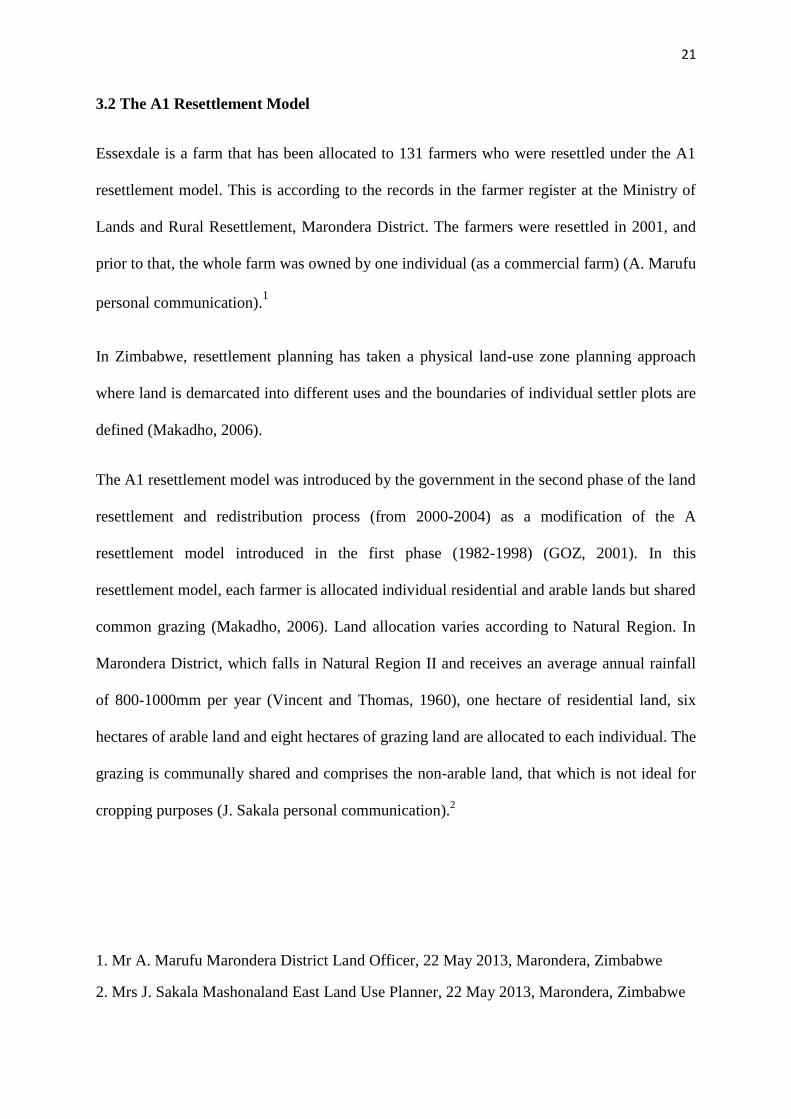
Essexdale is a farm that has been allocated to 131 farmers who were resettled under the A1
resettlement model. This is according to the records in the farmer register at the Ministry of
Lands and Rural Resettlement, Marondera District. The farmers were resettled in 2001, and
prior to that, the whole farm was owned by one individual (as a commercial farm) (A. Marufu
personal communication).1
In Zimbabwe, resettlement planning has taken a physical land-use zone planning approach
where land is demarcated into different uses and the boundaries of individual settler plots are
defined (Makadho, 2006).
The A1 resettlement model was introduced by the government in the second phase of the land
resettlement and redistribution process (from 2000-2004) as a modification of the A
resettlement model introduced in the first phase (1982-1998) (GOZ, 2001). In this
resettlement model, each farmer is allocated individual residential and arable lands but shared
common grazing (Makadho, 2006). Land allocation varies according to Natural Region. In
Marondera District, which falls in Natural Region II and receives an average annual rainfall
of 800-1000mm per year (Vincent and Thomas, 1960), one hectare of residential land, six
hectares of arable land and eight hectares of grazing land are allocated to each individual. The
grazing is communally shared and comprises the non-arable land, that which is not ideal for
cropping purposes (J. Sakala personal communication).2
1. Mr A. Marufu Marondera District Land Officer, 22 May 2013, Marondera, Zimbabwe
2. Mrs J. Sakala Mashonaland East Land Use Planner, 22 May 2013, Marondera, Zimbabwe

22
The 131 farmers are resettled in five villages namely Villages 1 to 5. However, the farmers
are not identifiable by village number from the farm register at the office but only when one
is on the ground or has referred to the village heads` registers. The village settlements are
seen in Fig. 3.2. The three villages 1, 2 and 3 follow a linear type of settlement (the houses
are in a line) but the houses in village 4 and 5 are randomly arranged. The residential stands
are close to the allocated arable plots for convenience and this was the rationale used by the
planners (J. Sakala personal communication)1.
3.3 Vegetation and Soils
The vegetation type is miombo woodland dominated by Brachystegia spiciformis, B.boehmii
and Julbernadia globiflora. The soils are generally granitic sands of low inherent fertility and
are highly susceptible to erosion. However, some portions around village 1 and village 3 are
the red clay type which is usually highly fertile.
The four main land classes: cropland, woodland, grassland and wetland were found to be the
source of key ecosystem services on the farm. Fig. 3.2 shows the land classes and therefore
the spatial distribution of the ecosystem services.
3.4 Measuring the Land Cover Change in Essexdale farm
In this study Land Cover Change was determined by calculating and using both the
proportion changes among the different land cover types and also the NDVI. The land cover
proportion changes depict more of the land class conversion attribute whilst the NDVI targets
the land class modification aspect.
1.Mrs J. Sakala Mashonaland East Land Use Planner, 22 May 2013, Marondera, Zimbabwe

24
Figure 3.2: Village settlements and land use/land cover classes on Essexdale and Farm in Marondera District, Zimbabwe. Map coordinates are
in Universal Transverse Mercator (UTM) Zone 36 South of the equator, WGS 1984 reference spheroid

25
3.4.1 Remotely sensed data
This study used LANDSAT TM 4-5 imagery. LANDSAT has a spatial resolution of 30m by
30m and a temporal resolution of 16 days. Images were taken before the rainy season to
avoid the effect of the crop contributing to the NDVI. Three months prior to the rainy season
were therefore considered, and only cloud free images were selected for the calculation of
NDVI in this study. Images were downloaded and pre-processed using GIS software. The
final NDVI (calculated for each year) is an average obtained for the three months (August,
September and October). Thus, 15 NDVI maps were produced in this study for the years:
1985, 1987, 1989, 1991, 1993, 1995, 1997, 1999, 2001, 2003, 2005, 2007, 2009, 2011 and
2012.
The map projection for the images used in this study is the Universal Transverse Mercator
(UTM) zone 36 South, WGS 1984 reference Spheroid. The Near Infra-Red (NIR) (band 4),
the Red (band 3), Green (band 2) and Blue (band 1) of LANDSAT images were used for the
purpose of visualisation as a colour composite and estimation of vegetation cover.
3.4.2 NDVI Sampling in Essexdale Farm
Digital image classification is the process in which the human operator instructs the computer
to perform an interpretation according to certain conditions as defined by the operator
((Temfli et al., 2009). Stratified sampling was used as follows. The whole farm was
categorised into four land classes: Woodland, Wooded Grassland, Cropland and Wetland
using the supervised classification process. Thus the four land classes became the strata. The
GIS sampling points for each stratum were randomly generated using ArcGIS Software and
the area of each stratum was used to determine the number of sampling points per stratum.
The sampling points were then overlaid on the NDVI maps for the purpose of extracting

26
statistical data for each year. The NDVI values were calculated using the ArcGIS Software
and they were then used as a proxy for vegetation cover.
3.4.3 Trend Analysis for NDVI values in Essexdale Farm
The mean NDVI for each year and the long-term or overall mean for all the years were
calculated. The change in NDVI for each year was calculated by subtracting the long-term
mean NDVI from the average mean annual NDVI for all the years. A trend analysis was
conducted using R Statistical Software to determine the slope and the significance of the
trend in vegetation cover as estimated by the NDVI (Millard, 2002).
3.4.4 Determination of the land class proportion changes for Essexdale Farm
Land-use/land cover maps were created by digitising the land use/land cover maps from five
LANDSAT images for 1985, 1992, 1999, 2006 and 2012. The land use/land cover types
were: woodland, wooded grassland, cropland and wetland. The digitized cover types were
saved as kml files. In ArcView GIS, the kml files were converted into respective shape files
of the study areas. The coordinate system was converted from the geographic (latitude and
longitude) to the UTM Zone 36 WGS 1984 to suit the NDVI maps’ coordinate system. The
same process was done for all the four land use/land cover types (Temfli et al., 2009). The
area for each land use/land cover for each year was calculated using ArcGIS Software and the
descriptive statistics were conducted using the R Statistical Package.
The accuracy assessment was conducted using the error matrix. A point shape file of 40
random points was generated in a GIS environment using the random number generator. The
point shape file was converted to a Key Hole Mark-up Language (KML) and exported to the
digital browser, Google Earth for visualisation and matching of the newly created field IDs.
The newly matched attribute values of the random point shape file were used to extract
27
values to points from the classified raster of the study area using the Spatial Analyst of
ArcGIS 10. An error matrix was derived from the matching of the classified Landsat image
with the corresponding class values as calculated in the GIS environment.
3.5 Stakeholder analysis for Essexdale Farm
The stakeholder analysis was based on a literature review and face-to-face interviews with
stakeholders. The descriptive statistics for the data from the interviews was done using
Statistical Package for Social Sciences (SPSS 16.0). The information from the interviews
served the purpose of updating and or supporting the findings from the literature.
The Marondera District Land Officer from the Ministry of Lands and Rural Resettlement was
the first to be interviewed and he assisted in identifying the other relevant stakeholders in
natural resource management for an A1 farm. Three main groups emerged: (a) government
institutions, (b) local leadership, and (c) the individual farmers. Thus three separate
questionnaires were used to interview the three identified groups. The three questionnaires
used are shown in Appendix 1.
3.5.1 Stakeholder groups interviewed
Ten randomly selected farmers and the village head from each of Villages 1-5 were
interviewed, plus the councillor.
The following institutions were interviewed: Ministry of Local Government Rural and Urban
Development; Ministry Lands and Rural Resettlement; Ministry of Agriculture,
Mechanisation and Irrigation Development; Marondera Rural District Council, Environment
Management Agency; and Forestry Commission.

28
CHAPTER 4: RESULTS AND ANALYSIS
This chapter presents the results and analysis: the NDVI trends are shown and the trend
analysis conducted. The changes in land class proportions are shown and analysed. Finally
the results from the stakeholder analysis are presented.
4.1 NDVI trends and trend analysis
The NDVI trends from 1985 to 1995 and then 1997 to 2012 are shown in Fig 4.7 and Fig 4.8
respectively. The trend analysis results are presented below:
Figure 4.1: A trend graph for the wetland mean seasonal NDVI for Essexdale Farm,
Marondera, Zimbabwe (from 1985 to 2012)
The NDVI trend analysis for the wetland land class is significant as illustrated in
Figure . Furthermore, only 38% of the variation in NDVI is explained by the variation in time
since 1985, leaving the greater part of the variability (62%) to be explained by other factors.

29
The overall trend is a decline in mean annual NDVI (slope = -0.07) over the 27 year period.
The maximum value of Landsat NDVI values observed during the year 1985 is significantly
higher (0.36) compared to mean NDVI value (0.3) and also with other years.
Figure 4.2: A trend graph for the woodland mean seasonal NDVI for Essexdale Farm,
Marondera, Zimbabwe (from 1985 to 2012)
The NDVI trend analysis for the woodland land class is significant at the 95% confidence
level as illustrated in Figure 4.2. Only 28% of the variation in NDVI is explained by the
variation in time since 1985, leaving the greater part of the variability (72%) to be explained
by other factors.
The overall trend is a decline in mean annual NDVI (slope = -0.008) over the 27 year period.
The maximum value of Landsat NDVI values observed during the year 1985 is significantly
higher (0.50) compared to mean NDVI value (0.35) and also with other years. The lower
values of NDVI during the year 1992 and 2012 can be explained by the low rainfall that
resulted in a drought.
30
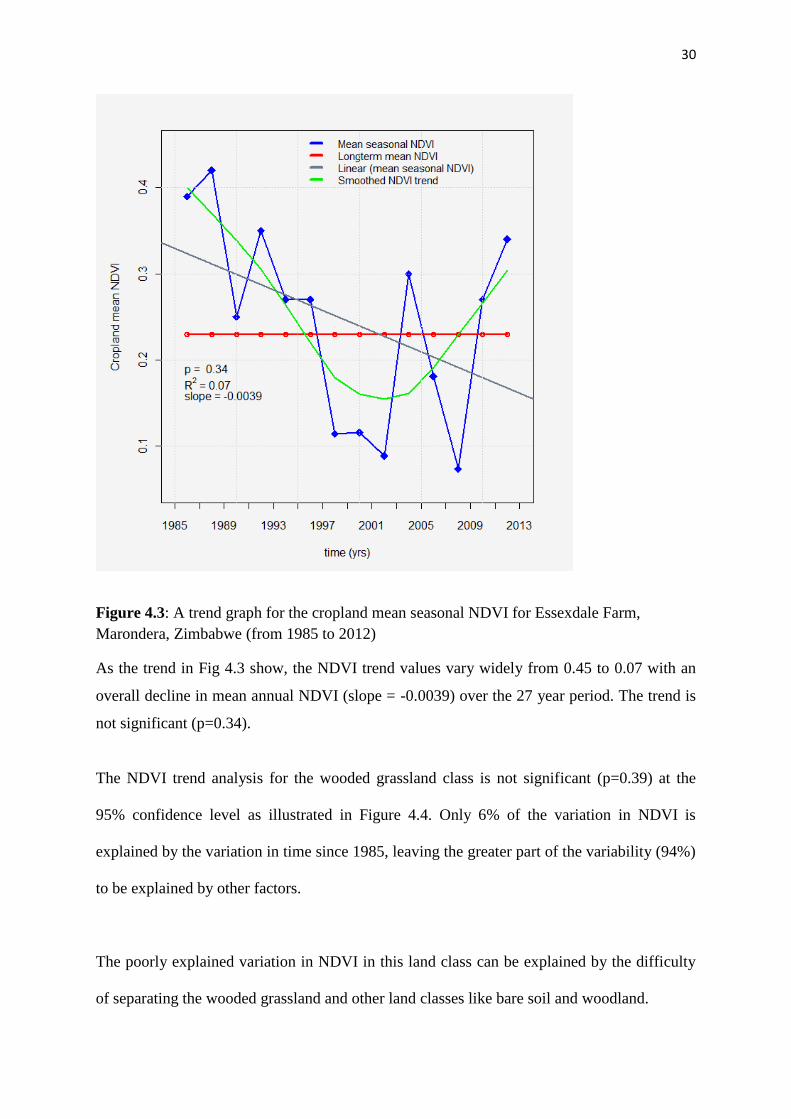
Figure 4.3: A trend graph for the cropland mean seasonal NDVI for Essexdale Farm,
Marondera, Zimbabwe (from 1985 to 2012)
As the trend in Fig 4.3 show, the NDVI trend values vary widely from 0.45 to 0.07 with an
overall decline in mean annual NDVI (slope = -0.0039) over the 27 year period. The trend is
not significant (p=0.34).
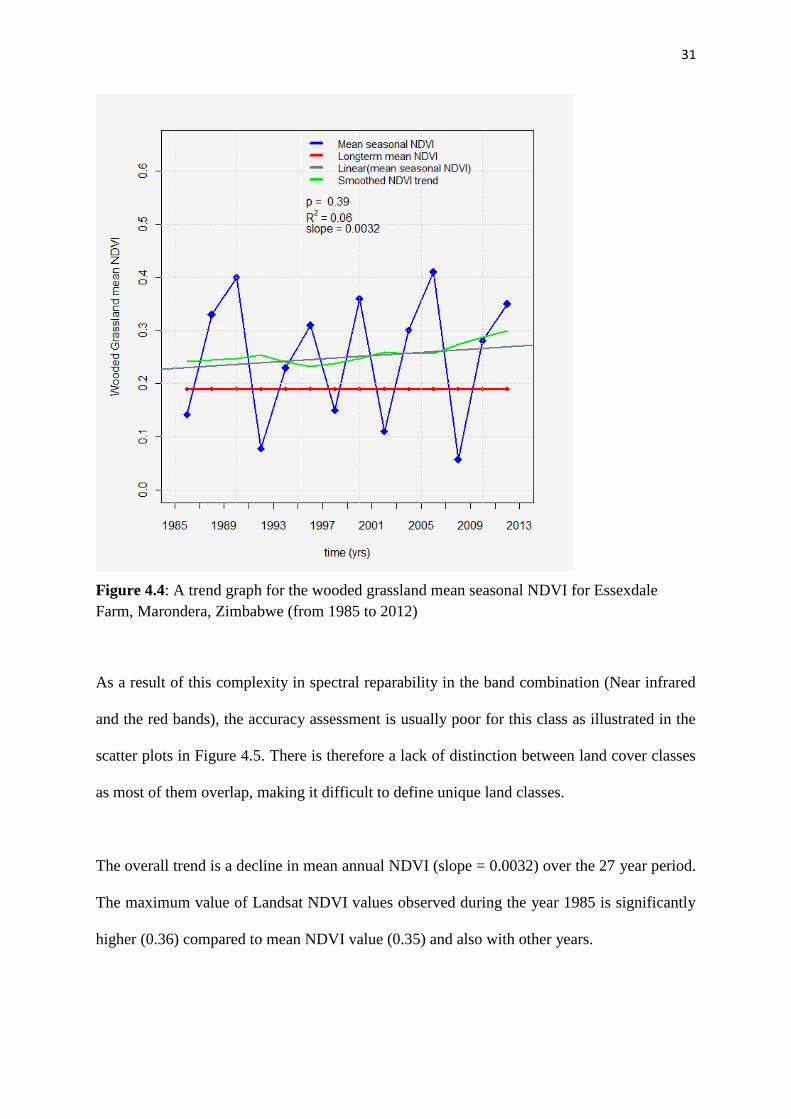
The NDVI trend analysis for the wooded grassland class is not significant (p=0.39) at the
95% confidence level as illustrated in Figure 4.4. Only 6% of the variation in NDVI is
explained by the variation in time since 1985, leaving the greater part of the variability (94%)
to be explained by other factors.
The poorly explained variation in NDVI in this land class can be explained by the difficulty
of separating the wooded grassland and other land classes like bare soil and woodland.
31
Figure 4.4: A trend graph for the wooded grassland mean seasonal NDVI for Essexdale
Farm, Marondera, Zimbabwe (from 1985 to 2012)
As a result of this complexity in spectral reparability in the band combination (Near infrared
and the red bands), the accuracy assessment is usually poor for this class as illustrated in the
scatter plots in Figure 4.5. There is therefore a lack of distinction between land cover classes
as most of them overlap, making it difficult to define unique land classes.
The overall trend is a decline in mean annual NDVI (slope = 0.0032) over the 27 year period.
The maximum value of Landsat NDVI values observed during the year 1985 is significantly
higher (0.36) compared to mean NDVI value (0.35) and also with other years.

32
Figure 4.5: Scatter plots of the Landsat band combination used in NDVI analysis of
Essexdale Farm
4.1.1 Analysis of variance
A graphical box and whisker plot showing the variability of mean annual NDVI in the
different land cover classes shown in Figure 4.6, shows woodland to have the highest mean
annual NDVI (0.35). When a single factor ANOVA model was fitted to the data and analyzed
for significant differences of mean annual NDVI stock amongst the land cover classes of
wetland, woodland, cropland and wooded grassland there was no significant difference of
mean annual NDVI amongst the land cover classes (F3, 52 =1.59, P=0.08). The Turkey-
Kramer (Kramer, 1956) multiple comparison method was therefore not necessary as there
were no significant differences in mean annual NDVI in the land cover classes.

33
Figure 4.6: Mean annual NDVI for land cover classes in Essexdale Farm in Marondera,
Zimbabwe
34
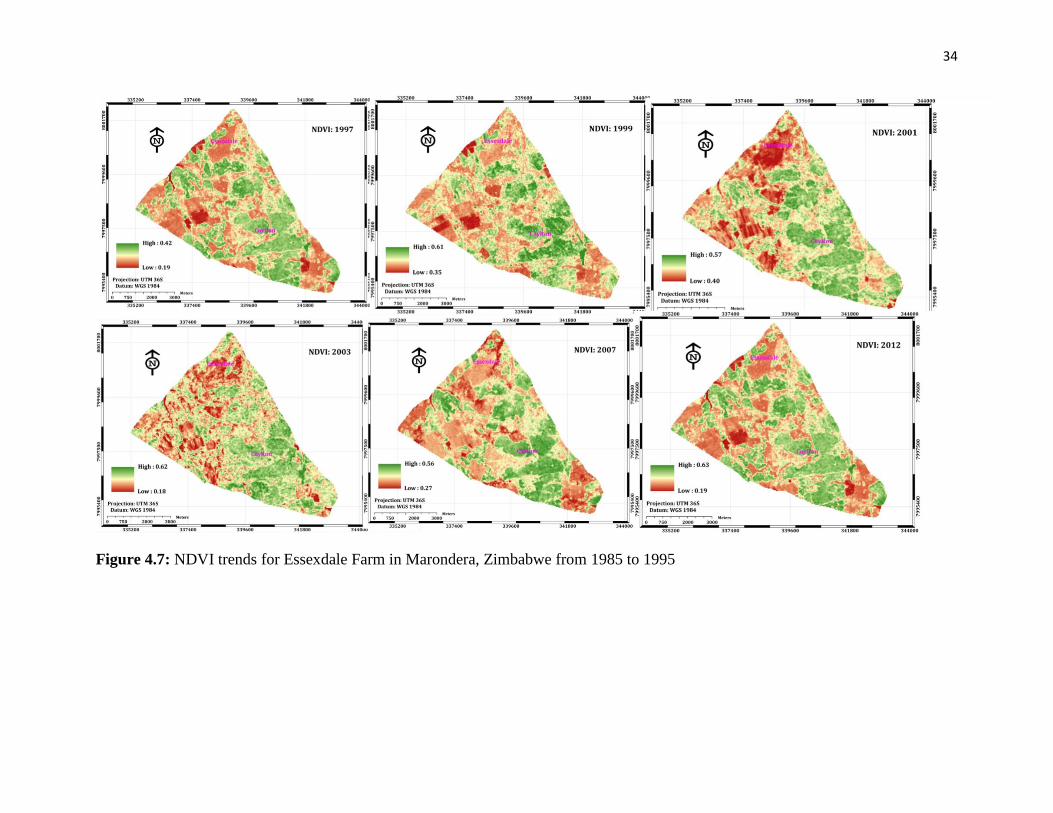
Figure 4.7: NDVI trends for Essexdale Farm in Marondera, Zimbabwe from 1985 to 1995

35
Figure 4.8: NDVI trends for Essexdale Farm in Marondera, Zimbabwe from 1997 to 2012

36
4.2 Land class proportion area changes in Essexdale Farm
The classified images for 1985, 1992, 1999, 2006 and 2012 are shown in the figure below.
Figure 4.9: Classification of 1985 images for Essexdale Farm in Marondera District of
Zimbabwe

37
Figure 4.10: Classification of 1992 images for Essexdale Farm in Marondera District of
Zimbabwe

38
Figure 4.11: Classification of 1999 images for Essexdale Farm in Marondera District of
Zimbabwe

39
Figure 4.12: Classification of 2006 images for Essexdale Farm in Marondera District of
Zimbabwe

40
Figure 4.13: Classification of 2012 images for Essexdale Farm in Marondera District of
Zimbabwe
4.2.1 Compilation of the error matrix
The wetland class was assigned a value of 1, the cropland a value of 2, the woodland class a
value of 3 and the wooded grassland a value of 4. The rest of the calculations were based on a
match between the numbers of points recognized in the Google Earth Image that matched
with the classified values referred to above as shown in Table 4.1.
Overall accuracy is the percentage of random points that are the same in both images. For the
study area classified in this work, that is 29 points (1 for wetland, 17 for woodland, 6 for
cropland and 5 for wooded grassland). This resulted in a total of 40 random points, and
hence, the overall accuracy is 29/40 = 73% as illustrated in Table 4.1

41
Table 4.1: Accuracy assessment result for the classified images of Essexdale Farm
Wetland Woodland Cropland Wooded grassland Total Wetland 1 0 0 0 1
Woodland 0 17 4 2 23
Cropland 0 1 6 3 10
Wooded grassland 0 1 0 5 6
Total 1 19 10 10 29
4.2.2 Calculation of Cohen’s Kappa
Kappa gives an insight into the overall classification scheme and whether or not the
classification achieved the results better than what could have been achieved strictly by
chance. The formula for kappa is:
Kappa= (Observed-Expected) / (1-Expected)…………………………………………. (1)
Observed is overall accuracy. Expected is calculated from the rows and column totals. Hence,
what would be expected based on chance is given as follows:
(Product Matrix) / (Cumulative Matrix)………………………………………………. (2)
From the calculation, the product matrix was 598 and the cumulative sum was 1600 and this
gave an expected frequency of 37%. As such,
37.01
37.073.0
K
= 57%
This means that the classification of the Land sat image (30m x 30m resolution) is 57% better
than what could have occurred strictly by chance.

42
Figure 4.14: Proportion of land under different land cover classes in Essexdale Farm,
Marondera, Zimbabwe
There is a steady increase in the proportion of land under woodland from 1985 to 2012 as
illustrated in Figure 4.14. For instance, the total proportion of land under woodland was 28%
in 1985 and rose sharply to 67% in 1999 and 68% in 2012. On the other hand, the proportion
of land under cropland rose in 2006 to about 35% and the proportion of land under woodland
subsequently dropped from 67% to 50% as shown in Figure 4.14.
43
4.3 Results from stakeholder analysis at Essexadale Farm
The results from the interviews with the relevant stakeholders at Essesdale Farm are as
follows:
4.3.1 EMA Marondera District
The agency has decentralised its functions to all the provinces and districts of Zimbabwe.
EMA is a committee member of the District Land Committee. The District Environment
Officer of Marondera participated in the interview on behalf of the institution. EMA is the
central player in natural resources management in Marondera District; it functions as a
regulatory authority (D. Mudyariwa personal communication)1. The District Environmental
Officer cited deforestation and soil erosion as the main land degradation problems in A1
farms in general, including Essexdale Farm. The main causes of the past land cover changes
were identified to be the conversion of woodland to cropping land and the selling of fuel
wood to Harare and Chitungwiza where there is a lucrative market. Poverty and
unemployment were highlighted as the underlying root causes of such unsustainable
practices.
The EMA is involved in the National Tree Planting Day and they do intensive education and
awareness campaigns in an effort to curb deforestation. They also prosecute those who are
involved in commercial fuel wood selling. However, EMA failed to give a comprehensive
answer as to how they are working together with other stakeholders, or to mention other
relevant stakeholders.
1. Mr D. Mudyariwa, Marondera District Environmental Officer, 22 May 2013, Marondera, Zimbabwe

44
4.3.2 Forestry Commission Marondera District
A Forest Extension Officer in Marondera District participated in the stakeholder interviews.
The Forestry Commission is responsible for implementing forestry extension programmes in
Marondera District. Deforestation, wild fires and steam bank cultivation were cited as land
degradation problem on A1 farms. Poverty and ignorance were mentioned as the main causes
of these environmentally unsustainable practices. People are cutting down fuel wood for sale
in urban areas where there is a ready market. As an institution the Forestry Commission was
holding workshops at Ward level to educate people about the value of planting trees. They
are also encouraging people to plant both indigenous and exotic trees. The officer mentioned
the other important stakeholders in natural resources management as EMA, Marondera Rural
District Council and the Zimbabwe Republic Police.
4.3.3 Marondera Rural District Council
An environmental and agricultural technician participated in the stakeholder interviews
on behalf of the Marondera RDC. He listed illegal extraction of natural resources
(particularly indigenous wood and sand), wetland cultivation and soil erosion as land
degradation problems on A1 farms. The driving factors of the problems according to
him were illegal resettlement of A1 farmers on marginal land, commercialisation of
wood fuel in nearby towns like Chitungwiza. He also mentioned tobacco farming as
causing deforestation.
He said the Marondera RDC have conducted joint law enforcement operations with EMA and
ZRP. They were working with the Forestry Commission in tree planting workshops and were
also doing gully reclamation using the grants they receive from EMA. As an institution they

45
were trying the best they could but he admitted that they were far from achieving their targets
due to human and financial resource scarcity.
4.3.4 Marondera District Adminstrator`s Office
A principal administrative officer in DA`s office participated in the stakeholders interviews.
She admitted that there is land degradation in the A1 farms but was not aware of land cover
changes on Essexdale Farm. She referred every environmental question in the questionnaire
to EMA, Marondera RDC or the Forestry Commission. The role of the DA`s office as far as
natural resources management is concerned, as she said, was to coordinate the natural
resource management activities of the other technical players and link their higher institutions
with the decentralised structures at the grassroots.
4.3.5 Ministry of Lands and Rural Resettlement, Marondera District
The planning section of the MLRR at the district level is responsible for land use planning,
land demarcation and farm layout production. Land use planning starts with land capability
classification (J. Sakala personal communication)1. This is done using aerial photos
accompanied by ground verification. Arable land is demarcated into some six hectare plots on
average. The remaining non arable land is left for grazing purposes. A vegetation resource
assessment is used to determine range carrying capacity. In some cases consultations with the
local community are an important part of the planning process. The main goal of rural
resettlement is to promote enterprise and productivity in agriculture. The environmental
sustainability of the resettlement scheme will be greatly determined by the implementation
phase (whether or not the stakeholders are going to adhere to the plan recommendations).
1. J. Sakala, Mashonaland East Province Land Use Planner, 22 May 2013, Marondera,
Zimbabwe
46
The District Land Officer of Marondera District who had helped to list the stakeholders in
natural resource management in Marondera also participated in the stakeholder interviews.
He identified deforestation, erosion and wetland cultivation as land degradation problems in
the A1 farms. The main root cause of deforestation was identified to be conversion of
woodland to land for crop production and on Essexdale Farm the situation has been
exacerbated by illegal settlers. The other causes of deforestation were tobacco curing and the
commercialisation of fuel wood. He also mentioned some incidences of veld fires which also
destroy vegetation. To address the environmental challenges the officer suggested the need
for educating the farmers on sustainable natural resources management and also the
cooperation of all stakeholders to enforce environmental laws. There was need to adhere to
estimated farm carrying capacities and ensure that the tobacco farmers plant fast growing
exotic plantations to avoid further indigenous tree cutting.
4.3.6 Ministry of Agriculture, Mechanisation and Irrigation Development, Marondera
District
A Crop Specialist responded to the questionnaire on behalf of the institution. Their ministry
is aware of the problem of deforestation in A1 farms of Marondera and Esssexdale Farm
however, she was unable to identify the root cause of the problem. Their main thrust is in
prompting conservation agriculture as it reduces soil erosion.
4.3.7 Local Leadership in Marondera District
The local leadership comprises the councillor of Ward 8 of Marondera (of which Essexdale
Farm is a part) and the village heads of the five villages on the farm.

47
In an A1 farm set-up like Essexdale the VIDCO is known as the Committee of Seven. The
village head is the chairman of the Committee of Seven and other positions are: the
secretary, the security person, the women’s representative, the youth representative
and two committee members. All the five village heads were able to give the list of
names and positions of the seven members of the committee during the interviews. The
Committee of Seven is responsible for the implementation of development and natural
resources management initiatives at the grass root level. The WADCOs prepare and
submit a ward development plan to the rural district development committee (RDC) of
the council.
The local leadership may assist in identifying land for new allocations and recommend
those to be newly resettled to the District Land Committee (DLC) (which is the
committee solely tasked with the AI resettlement scheme by the government). However,
though the local leadership is not allowed to make land allocations, in many cases the
councillor and village heads often illegally resettle new beneficiaries. This is the case
with Essexdale Farm; there are allegations of such illegal land allocations on marginal
land, mostly on steeply sloping or hilly places and on wetlands. The illegal allocations
are ‘legalised’ when the settlers are given permits. The District Administrator (DA) who
is also the chairman of the DLC has issued permits to the illegally settled people.
According to some concerned village heads and other farmers especially those from
villages 1, 2 and 3 (the originally resettled group) these illegal land allocations are the
major source of land degradation, especially deforestation.

48
4.3.8 Farmers on Essexdale farm
According to the Farmer`s Register in the Ministry of Lands and Rural Resettlement,
Marondera District, there are 131 farmers on Essexdale Farm who hold permits to use the
land. The 131 farmers with permits are those that are considered to be the legal settlers of
Essexdale Farm. However, the officers are aware that there are many illegal farmers on the
ground, those who have not been given permits by the office. Out of the 131 farmers 110 are
male and 21 female. The youths (those between the age of 18 and 35) are 72. The average
size of household according to the survey is five persons.
Originally 71 families from Uzumba Maramba Pfungwe District (a remote district in the hot
and dry parts of Mashonaland East Province) were settled on the farm in 2001. They
remained as 71 families up to until 2008 when more farmers were resettled in the farm with
the bigger proportion being the youths. Since then more than 130 families have been added. It
is estimated that there are now more than 260 families on Essexdale Farm. This information
was provided by one of the original farmers. The original settlers were allocated land for
homesteads in three planned villages (village 1, village 2 and village 3). Unfortunately there
is no information on the exact number of people in each village, even in the farm register.
The other two villages (village 4 and village 5) are new villages made up largely of settlers
on marginal land of Coylton farm. The whole of village 5, which apparently has the greatest
number of settlers, is on Coylton farm.
The main source of livelihood is crop production and livestock rearing (64 % and 34
respectively). The main crops grown are maize (49%), groundnuts (37%) and tobacco (27 %)
The farmers are well acquainted with their environment and their natural resources; they were

49
able to mention common tree species and wild animals. The livestock owned include cattle,
goats and poultry.
The majority of the farmers (68%) especially those from village 1, 2 and 3 said they have
adequate arable land whilst 32 % said they needed more arable land. When asked whether
they had access to sufficient grazing land, 58% said the State Land (the undesignated land
which is communally owned) was adequate for grazing whist the other 42% suggested that
they needed more grazing land. The farmers derive some benefits from the woodland which
include livestock grazing, firewood, thatching grass, construction poles and fruits.
As far as natural resource management is concerned, the farmers exhibited an appreciable
level of environmental awareness. Ninety-five percent of the farmers interviewed said they
were aware of some environmental challenges. Deforestation was mentioned as the major
environmental challenge followed by overgrazing. The causes of deforestation were listed as
tobacco curing, clearing land for cultivation, selling of firewood and poverty. Tobacco curing
and clearing land for cultivation were said to the major causes of deforestation. The possible
solutions to the problems suggested were effective legal action; tree planting; environmental
education and awareness campaigns; and use of alternative sources of fuel like electricity,
coal and solar energy.
The stakeholders who were mentioned as participating in ameliorating environmental issues
especially deforestation were: the Environmental Management Agency, the Ministry of
Lands and Rural Resettlement and the Zimbabwe Republic Police. However the farmers said
generally there is very low commitment from the stakeholders as far as curbing the
deforestation is concerned. The farmers were not involved in conservation efforts and they

50
suggested that there was need for more commitment from the stakeholders. They would like
to be involved in the formulation and implementation of conservation projects.
4.3.9 Stakeholder mapping for Essexdale Farm
Stakeholder`s influence or power on the project
High
Low
Stakeholder`s
potential for
EMA
Marondera
RDC
Forestry Commission
Conservation High
MLRR
MAMID
Farmers
Village Heads
DA`s Office
Farmers
Low Ward Councillor
Village Heads
Figure 4.15: Mapping of stakeholders in natural resource conservation on Essexdale Farm,
Marondera, Zimbabwe
The only conservationist group is EMA. They are the primary custodians of natural resource
management and although they are not decentralised to the Ward level, their presence is felt
on the farm as they were the most frequently mentioned institution by the farmers in the
interview (as stakeholders in conservation of natural resources).
Marondera RDC, Forestry Commission, MLRR and MAMID are marginal conservationists.
Marondera RDC has a very sound environmental management framework and has the
51
capacity to become a conservationist; however, due to lack of resources they are not fully
operative in all the farms, at least on Essexdale Farm. The Forestry Commission, although
involved in woodland conservation extension in Marondera District, has not made an impact
on the farm as there are no tree planting projects. The MLRR was mentioned together with
EMA, ZRP, and Forestry Commission by the farmers as stakeholders in natural resources
conservation but they do not have a direct environmental management mandate. Their
MLRR`s indirect contribution is when they develop an environmentally sustainable farm land
use plan. The MAMID is mainly concerned with conservation farming and in the interview
they did not highlight the topical issue of deforestation, hence they can only be marginal
conservationists.
The DA`s office and the Ward councillor are powerful figures in the A1 farming community.
They are influential in the implementation of natural resource and developmental projects
because they largely determine the success or failure of the projects. However, as far as the
farm is concerned, the DA`s office and the councillor are responsible for resettlement of
farmers on unplanned and marginal land. The conversion of woodland, according to almost
all the stakeholders, is the major cause of the deforestation that is evident on the farm. This
qualifies the two stakeholders to be developers.
The village heads and the farmers are switchers, marginal developers and marginal
conservationists. The village heads are local leaders and they are an integral part of the
VIDCOs. However, there has not been devolution of power such that, in their own capacity,
they have little influence on natural resource management and development projects. They
are easily influenced by other more powerful stakeholders and they in turn influence the
individual farmers for better or for worse. Consequently the farmers and the village heads are
52
marginal conservationists especially those from village 1, 2 and 3; some are marginal
developers especially those from village 5, and furthermore there will be always some
switchers.
4.3.10 Development of stakeholder management strategies in Essexdale Farm
The following strategies are possible: (a) Involvement, (b) Conversion, (c) Empowerment
and (d) Switch.
(a) Involvement
The DA`s office and the councillor must shift from being developers to conservationists. This
is possible if they start to fully participate in conservation projects and stop settling people on
marginal land.
(b) Empowerment
The Marondera RDC, MLRR, Forestry Commission, and MAMID can shift from marginal
conservationists to conservationists. The Marondera RDC is in need of more financial and
human resources to strengthen their operations. The Forestry Commission needs to increase
its extension efforts and also engage in tree planting projects. The MLRR`s level of
interaction with A1 farmers is high and if the ministry can capitalise this to directly
participate in environmental law enforcement. The MAMID if engaged in conservation
projects like tree planting can easily and effectively participate because of its unique
advantage of having decentralised structures to the Ward level.
53
CHAPTER 5: DISCUSSION
5.1 Land use-land cover changes in Essexdale Farm
The NDVI trend analysis gave a significant increase for the woodland land class (p=0.04) and
a significant decrease for the wetland land class (p=0.19). There was an insignificant decrease
for the wooded grassland land class (p=0.39) and cropland land class (p=0.34) for the period
under study. Only 28 percent (for woodland) and 38 percent (for wetland) of the variation in
NDVI is explained by the variation in time since 1985 leaving the greater part of variability
(72 percent for woodland and 62 percent for wetland) to be explained by other factors.
Since the NDVI is associated with vegetation canopy characteristics such as biomass, leaf
area index and percentage of vegetation cover (Cihlar et al. 1991) and represents the plant`s
assimilation condition, its photosynthetic apparatus capacity and biomass concentration
(Groten, 1993; Loveland et al., 1991) it is strongly influenced by the behaviour of
precipitation, temperature and daily radiation of the area under observation (Squires, 2010).
Irregularities in vegetation densities and distribution can cause poor reactivity of the Near-
infrared (NIR) bandwidth forest structure parameters. For instance, despite the popular and
widespread application of NDVI and other vegetation indices as predictors of vegetation
activity, many studies, including Danson and Curran (1993) and Puhr and Donoshe (2000)
have reported poor performance of NDVI in predicting forest above ground biomass.
The significant decrease in the wetland NDVI shows that there are effects of climate change;
from 1985 to 2012 generally the wetlands are retaining less and less moisture probably due to
decreased rainfall. Another possible reason is their degradation due to cultivation as was
observed in the field visits (there were some crop fields and gardens on wetlands).
54
There was a steady increase in the proportion of land under woodland from 1985 to 2012 as
was illustrated in Figure 4.14. For instance, the total proportion of land under woodland was
28 percent in 1985 and rose sharply to 67 percent in 1999. The transition between the year
1999 and the year 2000 marked the beginning of the Fast Track Land Reform in Zimbabwe.
The period 1999 to 2006 was accompanied by a decrease in proportion under woodland as
the newly resettled farmers resettled under the Fast Track Land Reform Programme
converted some woodland into cropland. Consequently the cropland increased by 35 percent
during that period and the woodland subsequently dropped from 67 to 50 percent. However,
because the new farmers were operating in a hyperinflationary environment with serious
economic challenges ranging from high unemployment to lack of agricultural financing by
the government, the total proportion of land under cropland significantly dropped by 2012
from 50 percent to 11 percent as most of the newly resettled farmers were unable to manage
the land. Consequently, the total proportion of land under woodland rose from 50 percent in
2006 to 69 percent in 2012.
It is not advisable to rely on the land cover change measurements alone and reject the
deforestation claims which have initiated the research but rather recommend more field or
site methods like biomass measurements to compliment the land cover change measurements.
It is more probable that the woodland degradation is a result of modification than it is due to
conversion. Selective logging of trees will not result in the size of the woodland decreasing
but rather will result in the change of woodland composition whilst conversion of woodland
to cropland will cause a reduction in the size of the woodland.
55
5.2 Natural Resources Management Challenges in Essexadle Farm
The natural resource management problems in Essexdale Farm are deforestation,
overgrazing, soil erosion, veld fires and stream bank cultivation. However, the main problem
is deforestation. The factors contributing to deforestation are the cutting down of trees for
tobacco curing, clearing land for cultivation, selling of firewood to neighbouring towns and
poverty. The clearing of land for cultivation is the main contributing factor. The suggested
possible solutions are tree planting, intensified agricultural production, environmental
education and awareness campaigns, fireguard construction and strict environmental law
enforcement.
These environmental management problems and the possible solutions were suggested by
both the farmers and the governing institutions. It appears that almost all the relevant
stakeholders in A1 resettlement schemes are very aware of the environmental challenges and
also are willing to help solve the problems. There is enough literature on various successful
conservation projects both in Zimbabwe, in the African region and the world at large for the
purpose of sharing of experience. But the question still remains: why is there a continual
trend in environmental degradation in the post 2000 era. After careful and detailed analysis, it
has emerged that the land cover changes in Essexdale are not only due to over-exploitation of
woodland resources, but are a result of complex and conflicting interests among the
stakeholders. The illegal resettlement of farmers beyond the farm`s carrying capacity is the
root cause of deforestation. Currently there are more than 265 families on Essexdale Farm, a
figure which is almost double the carrying capacity of 136 families pegged by the land use
planners in the MLRR, Marondera district. There are illegal settlers (who are not recorded in
the official farm register at the MLRR District Offices) farming on marginal land. Therefore
the strengthening of natural resource conservation is determined to a greater extent by the
effective management of the various stakeholders. It is the effectiveness of the natural

56
resource management stakeholder framework that determines how a community reacts to
environmental challenges.
5.3: Natural Resources Management Strategies and Recommendations
To address the depletion of woodland resources on Essexdale Farm and on A1 communal
farms in general, illegal resettlement should be stopped. There is also a need for capacity
building of all the natural resource management institutions.
Since illegal resettlement is the root cause of deforestation it is therefore imperative to stop it
as soon as possible. This obviously demands the necessary political will. The MLGRUD`s
DA Office and the RDC Ward Councillor were identified to be influential in the conservation
of resources (they determine to a greater extent the success or failure of the conservation
initiatives) and yet they have low potential for successful conservation in the stakeholder
management framework. In fact, they were identified to be involved in the illegal
resettlement of people on marginal land. This was made possible because of their lack of
accountability as far as the conservation of natural resources is concerned. Staff at the DA`s
Office were unaware of the land cover changes on Essexdale Farm and referred almost every
question to the other government institutions (EMA, Forestry Commission and the RDC). As
a local governing body responsible for coordinating natural resource management and
development issues this should not occur.
The DA is an influential civil servant who, because of the nature of the job, is privileged to
interact with many people from various backgrounds, ranging from the ordinary farmers to
high ranking politicians like the constituency members of parliament and cabinet ministers.
The success of the DA will therefore be determined by how he or she strikes the balance
between natural resource management, developmental goals and political goals. It is
recommended that the DA`s office mandate in the allocation of land to A1 beneficiaries be

57
shifted to the more technical and accountable MLRR. The MLRR will therefore have to
ensure that the A1 communal land as governed by the Gazetted Land Act (GOZ, 2006) is
planned and resettled in a sustainable way that promotes effective conservation of woodland
resources. For future economic, social and environmental sustainability there is urgent need
to adhere to the farm carrying capacities as well as resettling people only on suitable (not
marginal) land. There is always a need for a thorough Environmental Impact Assessment
(EIA) prior to a resettlement project as per the requirement of the Environmental
Management Act (GOZ, 2002). The EMA will be responsible for implementing the EIA.
Ward councillors are politicians who are voted into power (GOZ, 2002). This means that
elections make it possible to extend or terminate their office, depending on their
competencies. A community with sufficient environmental awareness will elect a councillor
who fully participates in and promotes natural resources conservation initiatives, so raising
awareness amongst community members is key.
5.3.1 Capacity building of both government and local institutions
The project approach to natural resource conservation prescribes natural resource
management to be viewed as a project cycle in which success is not only determined by
sound planning but also by effective implementation. There is need for sustainable land use
planning and implementation. Participatory project planning which involves all the necessary
stakeholders make project implementation, project evaluation and control effective. Capacity
building, from the individual farmer and local leaders to all the government players, will
enhance successful natural resource management.
According to Shumba (2001), the communal tenure systems that operates in communal and
resettlement areas is a disincentive to long term investment in natural resources such as
forests, mainly because of lack of individual accountability. The erosion of the powers of

58
traditional leaders, who used to oversee the observance of certain environmentally-friendly
resource management and exploitation regimes, has worsened the situation. The power of the
chiefs was not even mentioned during the interviews by both the farmers and the government
institutions. They were only mentioned by the District Land Officer as committee members
of the District Land Committee.
In reality it might be unrealistic to suggest that the A1 communal farmers be given title deeds
which confer private ownership to their pieces of land, but the MLRR could give them long
term 99-year leases (as was suggested by some farmers is in the interview), similar to their
commercial farmer counterparts who were resettled by the GOZ in the post 2000 era.
Capacity building amongst members of local level institutions, so that the community as a
whole can take collective responsibility over the communally owned resources, will
complement their security of tenure.
The MENRM through its departments (the EMA, the Forestry Commission and the
Department of National Parks and Wildlife Management) is the main player in the
management of woodland biodiversity. The ministry needs to be restructured into a more
efficient advisor and regulator of resource conservation. Forging strategic alliances with
relevant government and non-government organisations operating at local, national and
international levels is key, in order to minimise conflict of interests and duplication of roles in
natural resources conservation and therefore reduce costs. The Marondera RDC cited the
shortage of resources as their major problem affecting their effectiveness in stopping illegal
natural resource mining, so supplying sufficient funds to the relevant stakeholders like the
RDCs will also be critical.
An important financial tactic for the MENRM would be to develop a strategy for accessing
financial resources from natural resources related conventions and agreements to which

59
Zimbabwe is a signatory (Shumba, 2001). This will then provide the necessary funds to give
incentives to communities on communal farms for effective participation in the protection
and management of woodland resource projects like tree planting and bee keeping.
An obligatory role of the MENRM (through the Forestry Commission) would be to carry out
some routine forestry resource assessments and evaluations, not only in gazetted forests but
also in communally-owned resettlement areas. This would allow an update of the state of the
environment at meaningful levels like the farm level, where environmental management
decisions are best made.
5.4: Conclusion
The effectiveness of conservation efforts in a communal set-up like Essexdale Farm is
determined to a great extent by the ability of the central environmental player (in this case the
MENRM) to effectively coordinate and manage all the relevant stakeholders in the area.
People are intimately tied to their resources so much that there is need to effectively manage
the people first, before one can start to focus on meaningful natural resource conservation.
There are people with the knowledge to conserve their resources, but in many cases they do
not have the power to act. On the other extreme there are people with enough power to do
what is right, but they choose not to use that power effectively. Good natural resource
governance will always demand the ability to balance the knowledge with the power
relations.
60
REFERENCES
Burroughs, R. 1999. When stakeholders choose: Process, knowledge, and motivation in water
quality decisions. Society Nat. Resources 12:797–809.
Campbell, B., Frost, P., Goebel, A., Standa-Gunda, W., Makamuri, B. and Veeman, M. 2000.
A conceptual model of woodland use and change in Zimbabwe. International Tree
Crops Journal 10: 347-366.
Cihlar, J., Jansen, L.J.M., 2001. From land cover to land use: a methodology for efficient land
use mapping over large areas. The Professional Geographer 53: 275-289.
Cihlar, J., St-Laurent, L. and Dyer, J.A 1991. Relation between the normalized vegetation
index and ecological variables. Remote Sensing of Environment 35: 279-298.
Comber, A. J., Wadsworth, R. A. and Fisher, P. F. 2008: Using semantics to clarify the
conceptual confusion between land cover and land use: the example of ‘forest’,
Journal of Land Use Science, 3: 185-198.
Danson, F. M. & Curran, P. J. 1993. Factors affecting the remotely sensed response of
coniferous forest plantations. Remote Sensing of Environment, 43: 55-65.
De Lopez, T.T. 2001a. Deforestation in Cambodia: a stakeholder management approach.
International Journal of Sustainable Development. World Ecology 8:380-394.
De Lopez, T.T. 2001b. Stakeholder Management for Conservation Projects -A Case Study of
Ream National Park, Cambodia. Environmental Management, 28: 47-60.
Duram, L. A. and Brown, K.G. 1999. Assessing public participation in U.S. watershed
planning initiatives. Society Nat. Resources 12: 455–467.
FAO (Food and Agriculture of United Nations). 1991. Technical report on land cover
mapping of Lebanon. NECP/LEB/001/SAU Project. FAO. Rome.
FAO(Food and Agriculture of United Nations). 2010. Global Forest Resources Assessment
2010 – main report. FAO Forestry Paper No. 163. FAO. Rome. www.fao.org
FAO (Food and Agriculture of United Nations). 2012. State of the World’s Forests 2011.
FAO. Rome. www.fao.org
Fisher, P.F., Comber, A.J., and Wadsworth, R.A. (2005), ‘‘Land use and Land cover:
Contradiction or Complement,’’ in P. Fisher and D. Unwin, Re-Presenting GIS, eds.
Willey, Chichester: pp. 85–98.
Forestry Commission. 2010. Annual Report. Zimbabwe Forestry Commission, Harare.
Frooman, J. 1999. Stakeholder influence strategies. Academy of Management. Rev. 24:191–
205.
Giuliani, A., Wenger, R., and Waymanne von Dach, S. 2008. Shaping Institutions for Natural
Resources Management. Zollikofen, Switzerland.
GOZ (Government of Zimbabwe). 1990. Forest Act [Chapter 19:05].
GOZ (Government of Zimbabwe). 2001. Fast track resettlement: status report, Department of
Land Affairs, Harare, 26 April 2001
GOZ (Government of Zimbabwe). 2002a. Environmental Management Act [Chapter 20:27]
GOZ (Government of Zimbabwe). 2002b. Rural District Councils Act [Chapter 29: 13].
GOZ (Government of Zimbabwe). 2006. Gazetted Land (Consequential Provisions) Act
[Chapter 20:28].
GOZ (Government of Zimbabwe).2009. Government Ministries of Zimbabwe. Government
Printers. Harare.
Grimble, R. and Wellard, K. 1997. Stakeholder methodologies in natural resource
management: A review of concepts, contexts, experiences and opportunities. Agric.
Systems 55:173–193.
Groten S.M.E. 1993. NDVI-crop monitoring and early yield assessment of Burkina Faso.
International Journal of Remote Sensing 14: 1495.

61
Hudak, A. T. and Wessman, C.A. 2001.Textual Analysis of Historical Aerial Photographs
characterise Woody Plant Encroachment in South African Savanna. Remote sensing
of environment. 66 (3): 317.
Kramer, C. Y. 1956. Extension of multiple range tests to group means with unequal numbers
of replications. Biometrics, 12: 309-310.
Loveland, T.R., Merchant,J.W., Ohlen,D.O. and Brown, J.F. 1991. Development of a land-
cover characteristics database for the conterminous U.S. Photogrammetric
Engineering & Remote Sensing 57: 1453-1463.
Makadho, J. 2006. Land redistribution experiences in Zimbabwe 1998-2004. In Mandivamba,
R., Eicher, C., Tawonezvi, P., with Munyukwi-Hungwe M, and Matondi P. 2006.
Zimbabwe`s Agricultural Revolution Revisited. University of Zimbabwe Publications
Harare. 165-186.
Mandivamba, R. 2006: Zimbabwe`s Agricultural Revolution Revisited. In Mandivamba, R.,
Eicher, C., Tawonezvi, P., with Munyukwi-Hungwe M, and Matondi P., 2006
Zimbabwe`s Agricultural Revolution Revisited. University Of Zimbabwe Publications
Harare. 1-18.
Maxwell, J. 1993, Land use science: An integrated approach to land use research and
decision making. In Annual Report Macaulay Land Use Research Institute:
Abberdeen. 37–51.
MENRM (Ministry of Environment and Natural Resources Management. 2011. State of
Forest Genetic Resources in Zimbabwe 2001 – 2011. Forestry Commission, Harare.
Meyer, W. B., and Turner, B. L. II, eds. 1994.Changes in land use and land cover: A global
perspective. Cambridge University Press, Cambridge, UK.
Millard, S.T. 2002. EnvironmentalStats for S-PLUS, Version 2.0. Release 1 for Microsoft
Windows.
Millennium Ecosystem Assessment. 2005. Ecosystems and Human Well-being: Biodiversity
Synthesis. World Resources Institute, Washington, D.C.
Mitchell, R. K., B. R. Agle, and D. J. Wood. 1997. Toward a theory of stakeholder
identification and salience: Defining the principle of who and what really counts.
Acad. Management .Rev. 22: 853–886.
Moyo, S., ed.2000. Zimbabwe environmental dilemma: balancing resource inequities.
Harare, Zimbabwe Environmental Research Organization. 161 pp.
Mushove, P. and Vogel, C 2005. Heads or tails? Stakeholder analysis as a tool for
conservationarea management. Global Environ Change 15:184–198.
Nunes, C., and Auge, J.I. (1999), International Geosphere-Biosphere Programme: A Study of
Global Change of the International Council of Scientific Unions. IGBP, Stockholm.
Petit, C., Scudder, T and Lambin, E. 2001. Quantifying processes of land-cover change by
remote sensing: Resettlement and rapid land cover changes in south-eastern Zambia,
International Journal of Remote Sensing, 22: 3435-3456.
Pritchard, L., Jr., J, Berkes, C. F, Svedin, U and Folke, C. 1998. The problem of fit between
ecosystems and institutions. IHDP Working Paper No. 2 : International Human
Dimensions Programme on Global Environmental Change. Bonn
Puhr, C. B. & Donoghue, D. N. 2000. Remote sensing of upland conifer plantations using
Landsat TM data: a case study from Galloway, south-west Scotland. International
Journal of Remote, 21: 633-646.
Reyers, B., P. J. O’Farrell, R. M. Cowling, B. N. Egoh, D. C. Le Maitre and J. H. J. Vlok
2009. Ecosystem services, land-cover change, and stakeholders: finding a sustainable
foothold for a semiarid biodiversity hotspot. Ecology and Society 14 (1): 38. [Online]
URL: http://www.ecologyandsociety.org/vol14/iss1/art38/

62
Selin, S. W., M. A. Schuett, and D. Carr. 2000. Modeling stakeholder perceptions of a
collaborative initiative effectiveness. Society Nat. Resources 13: 735–745.
Shumba, E.M. 2001. Forestry Outlook Studies Zimbabwe. Forestry Outlook Studies in Africa
(FOSA).
Squires, V.R. 2010. The Subset of UNCCD impact indicators- Land Cover Status. A
Consultancy Report on impact indicators for the United Nations Convention for
Combating Desertification.
Tempfli, K., Kerle, N., Huurneman, G.C. and Janseen L.L.F (eds). 2009. Principles of
Remote Sensing. The International Institute for Geo-Information Science and Earth
Observation (ITC). Enschede, Netherlands.
Varvasovszky, Z. and R. Brugha. 2000. How to do (or not to do) . . . A stakeholder analysis.
Health Policy Plan. 15:338–345.
Vincent, V. & Thomas, R.G.1961. An agro-ecological survey of Southern Rhodesia: Part I
agro-ecological survey. Government Printers, Salisbury.
Utete, C.M.B.2003. Report of the Presidential Land Review Committee, Vol.1, main report,
Government of Zimbabwe, Harare.
Walker, B. 1998.GCTE and LUCC—a natural and timely partnership. LUCC Newsletter 3.
Walker, B., and Steffen, W. eds. 1997. The terrestrial biosphere and global change:
Implications for natural and managed ecosystems. A synthesis of GCTE and related
research. IGBP Science 1: International Geosphere-Biosphere Programme, Stockholm

63
APPENDICES
Appendix 1.1: Questionnaire for individual farmers in Essexdale Farm
EdimusMasona of Ministry of Lands and Rural Resettlement is currently conducting a
research project on Natural Resource Management in Essexdale Farm, Marondera District.
This instrument gathers details of A1 farmers in Essexdale Farm (whether they have permits
or not). All information on this questionnaire should be treated as highly confidential.
SECTION 1: Personal information
1a.What is your name?................................................................................................................
1b.What is your plot number?…………………………………………………………….........
1c.What is your position in the household?................................................................................
1d.What is your age?...................................................................................................................
1e. What is the name of the village?............................................................................................
1f.How long have you been in this farm?...................................................................................
1g.What languages do you speak?...............................................................................................
1h. What is your level of education? [None, Primary, Secondary, Tertiary]
…………………………………………………………………………………………………..
1i. Record names of all people present at the interview:
…………………………………………………………………………………………………
…………………………………………………………………………………………………..
2a. How many people are in the household?
Position in
household
Age Sex Living at home?
1
2
3
4
5
6
7
8
9
10

64
2b. How many houses make up the household?...........................................................................
3a. How many of the children attend school?..............................................................................
3b. How many meals does the household usually eat per day………………………………….
3c. How many times per week does the household eat meat?.....................................................
4. What are the sources of fuel for the household? [Electricity, Firewood]……………………
5. How many other households are in the plot?..........................................................................
6. What are the household`s sources of livelihood? Please list all, giving the largest/most
important first.
[List responses in code, using key below]
………………………………………………………………………………………………….
1=Farming crops
2=Livestock
3=Regular employment
(please specify)
4=Casual labour (please
specify)
5=Arts and crafts
6=Other small business (please
specify)
7=Hunting
8=Fishing
9=Selling firewood
10=Money sent from
abroad
11=Other (specify)
7. What do you think is the greatest threat to your livelihood?
......................................................................................................................................................
[Code using key below]
1=Drought
2=Lack of Security of tenure
3=Lack of farming assistance
4=Crop raiding
5=Theft of livestock
6=Malnutrition of family
7=Disease of family
8=Other (specify)
SECTION 2: Crop Production
[Ignore this section if crops not listed as source of income in question 6]
8a. Which crops do you grow?
[List all in the table below, using key below]
1=Maize
2=Tobacco
3=Soybeans
4=Sugar beans
5=Groundnuts
6=Sunflower
7=Other

65
8b. What quantities of each crop do you grow? [Fill your responses in the table below]
Own area Ha Leased area Ha Total area Ha Expected yield
Maize
Tobacco
Sugar beans
Soybeans
Groundnuts
Sun flower
Other (specify)
[Quantity specifications: 1=tonnes, 2=kgs, other (specify)]
SECTION 3: Livestock production
[Ignore this section if livestock not listed as source of income in question 6]
9a.What livestock does your household own?
[List all in the table below, using key below]
1=Cattle
2=Donkeys
3=Goats
4=Sheep
5=Poultry
6=Dogs
6=Others (specify)
9b. How many of each livestock do you own? [Fill your responses in the table below]
Type Count
Cattle
Donkeys
Goats
Sheep
Poultry
Dogs
Others (specify)
SECTION 4: Vegetation in the farm
10. What tree species are in your area? [Please list all (in order of abundance starting with the
most abundant) in the table below]
Local name Common name Scientific name

66
SECTION 5: Wildlife in the farm
11. What wild animal species are in your area? [Please list all (in order of abundance starting
with the most common) in the table below]
Local name Common name Scientific name
SECTION: Conservation of natural resources
12. Is the current land holding capacity enough for your needs? Explain.
…………………………………………………………………………………………………
13. Is the state land (communally owned) large enough to meet your needs? Explain.
………………………………………………………………………………………………….
14. What benefits do you get from the state land? [Use the key below]
1=Grazing
livestock
2=Browsing
livestock
3=Fire wood
(domestic)
4=Fire wood
(tobacco curing)
5=Fire wood
(bricks)
6=Wood poles
for construction
7=Grass for
thatching
8=Fruits
9=Others
(specify)
12a. What environmental challenges are you facing in Essexdale farm?
......................................................................................................................................................
13a. Are you aware of the land cover changes that have taken place since you were resettled
in this farm?
13b. What do you think have caused these land cover changes?
13c. What can be done to control deforestation?
13d. In your personal capacity what have you done to control deforestation?
14a. What other stakeholders are involved in the conservation of natural resources in the
farm? [List all of them in order of importance]
14b. What projects/ programmes do they have?
14c. Are they promoting any projects like tree planting and gully reclamation?
67
14d. Where do the stakeholders help in reclaiming degraded lands? [Use the key below]
1=Own fields 2=Wood lands 3=Grazing areas 4=Dambos Others (specify)
14e. Are you satisfied with the work done by other stakeholders?
……………………………………………………………………………………………….
14f. In what ways can the work be improved?
......................................................................................................................................................
15a. Have you contributed in any way to the formulation of the natural resource management
programmes or they are entirely new to you?
………………………………………………………………………………………………….
15b. What do you want to be done to facilitate your involvement in the formulation of such
programmes?

68
Appendix 1.2: Questionnaire Local Leadership in Essexdale Farm
QUESTIONNAIRE FOR LOCAL LEADERSHIP
EdimusMasona of the Ministry of Lands and Rural Resettlement is currently conducting a
research project on Natural Resource Management in Essexdale Farm, Marondera District.
This instrument gathers information from local leadership pertaining to natural resources
management in A1 farms. All information on this questionnaire should be treated as highly
confidential.
SECTION 1: Personal information
1. What are the names of the people in the local leadership present at the interview? [List
them]
Name Sex Position Age
1
2
3
4
5
6
7
8
9
10
1. What are your leadership roles?
………………………………………………………………………………………………….
2. What do the farmers get from the environment (in terms of ecosystem services) for
example; fresh air; clean water; fuel; grazing; food; etc.
………………………………………………………………………………………………….
3a. Are there problems of deforestation in your area?
…………………………………………………………………………………………………
3b. If yes, what have been the root cause of this problem?
………………………………………………………………………………………………….

69
3a. Do you promote better land use practices? YES/NO
……………………………………………………………………………………………….
3b. If yes how?
………………………………………………………………………………………………….
3c. What have been the response of your people to your initiatives?
………………………………………………………………………………………………….
4a. What institutions and other stakeholders have been working in this area to rehabilitate
deforested land?
…………………………………………………………………………………………………
4b. What success have they scored?
………………………………………………………………………………………………….
4c. What are their major constraints?
………………………………………………………………………………………………….
5. How do you relate to other stakeholders in the programmes of conservation of natural
resources?
………………………………………………………………………………………………….
6a. Are you satisfied with programmes, innovations and technologies being introduced by
other players?
…………………………………………………………………………………………………..
6b. If not, why?
………………………………………………………………………………………………….
7a. What else can you say as far as natural resources management in the farm is concerned?
………………………………………………………………………………………………….

70
7b. What do you think are the real environmental problems here?
………………………………………………………………………………………………….
7c. What in your opinion would make a big difference to environmental conservation in this
farm?
………………………………………………………………………………………………….
71
Appendix 1.3: Questionnaire for Government Institutions in Marondera District
EdimusMasona of the Ministry of Lands and Rural Resettlement is currently conducting a
research project on Natural Resource Management in Essexdale Farm, Marondera District.
This instrument gathers information from institutions pertaining to natural resources
management in A1 farms. All information on this questionnaire should be treated as highly
confidential.
SECTION 1: Personal Details
1a.What is your name.................................................................................................................
1b.What is the name of your organisation?
…………………………………………………………………………………………………..
1c. What is the structure of your organisation like? [Draw on a separate piece of paper
provided]
1d.What is your position in the organisation?
…………………………………………………………………………………………………..
1e. What is your role in relation to natural resources management?
…………………………………………………………………………………………………
SECTION 2: Conservation of natural resources
2a. Is there any problem of land degradation in the A1 farms? List them.
………………………………………………………………………………………………….
2b. What are the most critical areas?
…………………………………………………………………………………………………
2c. What is your institution doing to reclaim degraded lands and to protect areas under threat?
………………………………………………………………………………………………….
2d. Are your programmes/ projects significant and relevant in tackling the problem of land
degradation? Why do you say so?
………………………………………………………………………………………………….
3a. Are you aware of the land cover changes in A1 farms in Marondera and particularly in
Essexdale farm?
......................................................................................................................................................
3b. What do you consider to be the main cause of the past land cover changes?

72
………………………………………………………………………………………………….
3c. What forms of land use are responsible for the land cover changes in this area?
………………………………………………………………………………………………….
3d. What can be done to control the situation?
………………………………………………………………………………………………….
SECTION 3: Stake holders
4a. What other stakeholders are involved in natural resources management in A1 farms of
Marondera District?
………………………………………………………………………………………………….
4b. How have other stakeholders responded to your programmes/ projects of land
reclamation?
………………………………………………………………………………………………….
5. What are the people`s attitude towards your institution and their plans and policies to
address deforestation?
…………………………………………………………………………………………………
6a. Are you conversant with the natural resource policy in Zimbabwe?
…………………………………………………………………………………………………
6b. If yes, to what extent does it address issues related to land cover changes?
…………………………………………………………………………………………………..
6c. Are you satisfied with the way the policy addresses environmental issues?
………………………………………………………………………………………………….
6d. In what ways have you contributed to the government policy regarding natural resource
management?
………………………………………………………………………………………………….
6e. How does your institution ensure that the (natural resource) policy is implemented?
………………………………………………………………………………………………….
7. What else can you say about the land cover changes, land degradation and in A1 farms and
natural resources management in general?
…………………………………………………………………………………………………
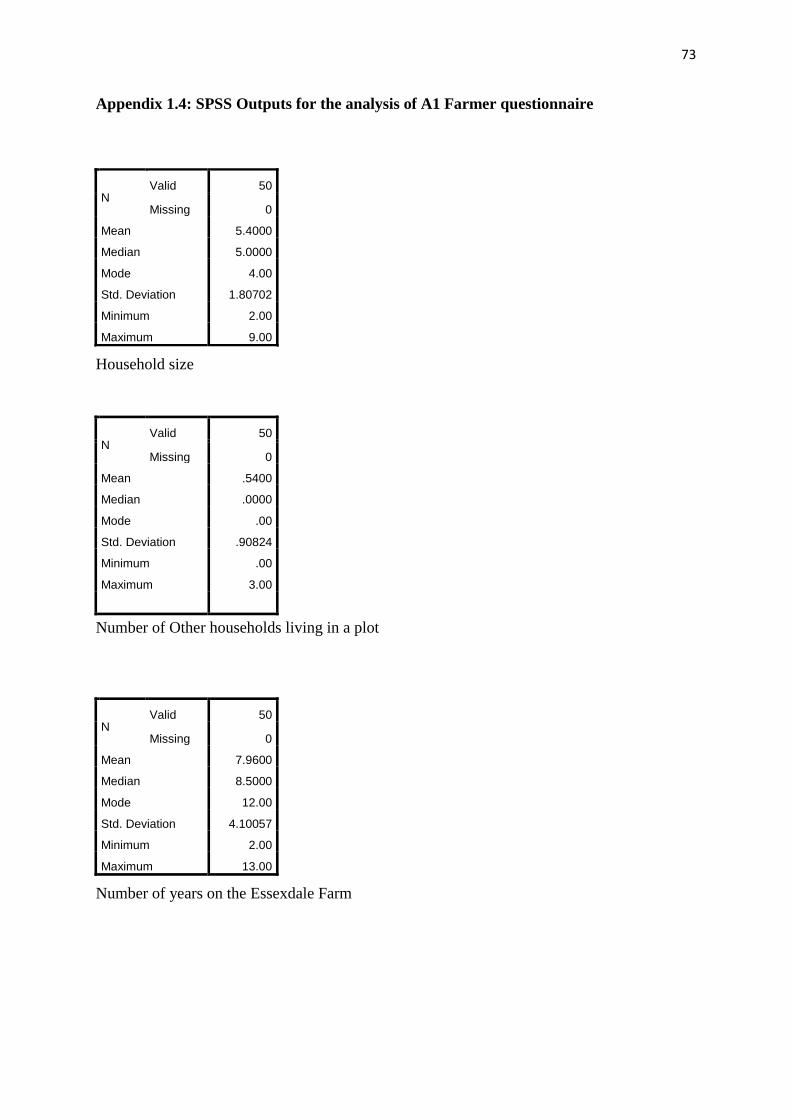
73
Appendix 1.4: SPSS Outputs for the analysis of A1 Farmer questionnaire
N Valid 50
Missing 0
Mean 5.4000
Median 5.0000
Mode 4.00
Std. Deviation 1.80702
Minimum 2.00
Maximum 9.00
Household size
N Valid 50
Missing 0
Mean .5400
Median .0000
Mode .00
Std. Deviation .90824
Minimum .00
Maximum 3.00
Number of Other households living in a plot
N Valid 50
Missing 0
Mean 7.9600
Median 8.5000
Mode 12.00
Std. Deviation 4.10057
Minimum 2.00
Maximum 13.00
Number of years on the Essexdale Farm

74
Sources of fuel in Essexdale Farm
Sources of livelihood in Essexdale Farm
firewood 98%
electricity 2%
49
34
7 5 2 3 5 3 2
0
10
20
30
40
50
60
pe
rce
nta
ge

75
Threats to livelihood in Essexdale Farm
Crops grown in Essexdale Farm
28
16
43
9
17
2
19
drought lack ofsecurity of
tenure
lack offarming
assistance
crop raiding theft oflivestock
malnutritionof family
disease offamily
pe
rce
nta
ge
49
27
4
14
37
11
maize tobacco soyabeans sugar beans groundnuts sunflower
pe
rce
nta
ge
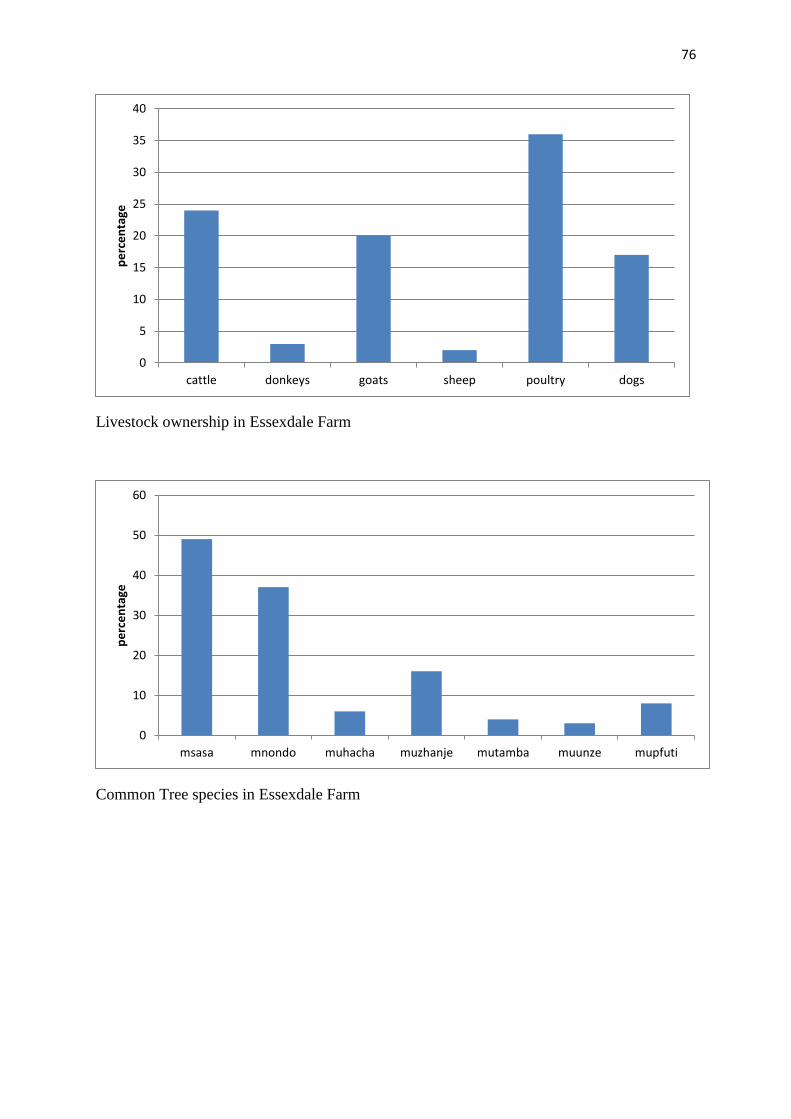
76
Livestock ownership in Essexdale Farm
Common Tree species in Essexdale Farm
0
5
10
15
20
25
30
35
40
cattle donkeys goats sheep poultry dogs
pe
rce
nta
ge
0
10
20
30
40
50
60
msasa mnondo muhacha muzhanje mutamba muunze mupfuti
pe
rce
nta
ge

77
Common wild game species
Adequacy of land
34 31
18
40
33
4
12
nguruve tsoko gudo tsuro mhembwe gava mhene
pe
rce
nta
ge
yes 68%
no 32%

78
Adequacy of state land
Benefits from the state land
yes 58%
no 42%
33
47 46 45 46
livestock grazing firewood grass for thatching poles forconstruction
fruits
pe
rce
nta
ge
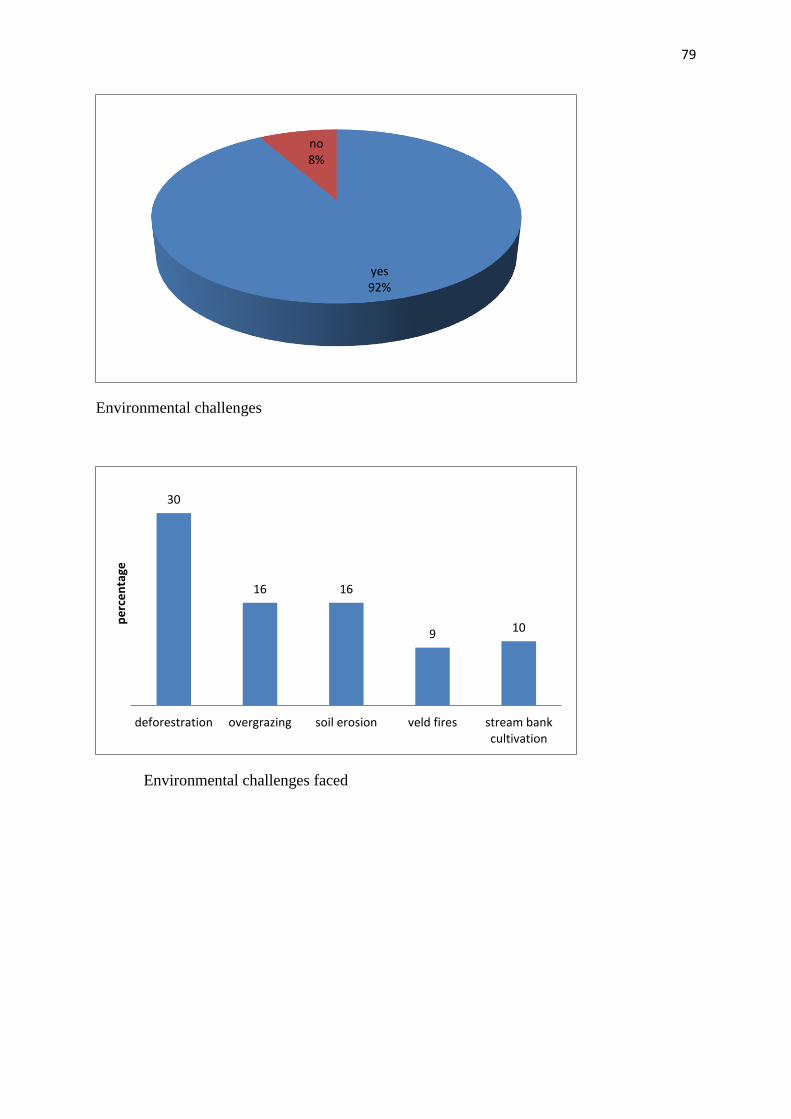
79
Environmental challenges
Environmental challenges faced
yes 92%
no 8%
30
16 16
9 10
deforestration overgrazing soil erosion veld fires stream bankcultivation
pe
rce
nta
ge

80
Possible solutions to environmental challenges
Awareness of deforestation
20
7
13
5
legal action education andawareness
tree planting fire guards
pe
rce
nta
ge
yes 96%
no 4%

81
Causes of deforestation
Possible solutions to deforestation
34
25
17
8
tobacoo curing clearing land forcultivation
selling firewood poverty
pe
rce
nta
ge
19
3
13
10
18
legal action education andawareness
tree planting use of solarenergy
use of coal fortobacco curing
pe
rce
nta
ge

82
Actions by the farmers
Stakeholders active in woodland conservation
13
9
1
13 12
tree planting reporting toEMA/ZRP
contructingfireguards
educatingfellow
communitymembers
none
pe
rce
nta
ge
18
8
12
1 2
EMA Ministry of Lands ZRP ForestryCommission
DA
pe
rce
nta
ge

83
Projects of woodland conservation
Awareness of tree planting and gully reclamation projects
20
11
7
18
13
planting trees legal action education andawareness
none gully reclamation
pe
rce
nta
ge
yes 59%
no 41%

84
Satisfaction with work done by stakeholders
Ways in which the work can be improved
15
21
13
planting down trees legal action education and awareness
pe
rce
nta
ge
yes 47%
no 53%

85
Contribution to natural resources management projects
Participation in woodland conservation management efforts
yes 24%
no 76%
engrafted in to NRM
committees 62%
regular NRM workshops in
the farm 38%