The Staten Island Bluebelt : A case study in urban stormwater ...
This article was downloaded by: [Myongji University]On: 04 March 2015, At: 22:13Publisher: Taylor & FrancisInforma Ltd Registered in England and Wales Registered Number: 1072954 Registered office: Mortimer House,37-41 Mortimer Street, London W1T 3JH, UK
Click for updates
Desalination and Water TreatmentPublication details, including instructions for authors and subscription information:http://www.tandfonline.com/loi/tdwt20
Fecal contamination in Yongin watershed: associationto land use and land cover and stormwater qualityMa. Cristina A. Paulea, Jey-R S. Venturaa, Sheeraz Memona, Bum-Yeon Leea, Deokjin Jahnga,Min-Ji Kangb & Chang-Hee Leea
a Department of Environmental and Energy Engineering, Myongji University, 116 Myongji-ro,Cheoin-gu, Yongin-si, Gyeonggi-do 449-728, Republic of Koreab Water Environmental Research Department, National Institute of Environmental Research,Incheon 404-708, Republic of KoreaPublished online: 05 Jun 2014.
To cite this article: Ma. Cristina A. Paule, Jey-R S. Ventura, Sheeraz Memon, Bum-Yeon Lee, Deokjin Jahng, Min-Ji Kang& Chang-Hee Lee (2015) Fecal contamination in Yongin watershed: association to land use and land cover and stormwaterquality, Desalination and Water Treatment, 53:11, 3026-3038, DOI: 10.1080/19443994.2014.922281
To link to this article: http://dx.doi.org/10.1080/19443994.2014.922281
PLEASE SCROLL DOWN FOR ARTICLE
Taylor & Francis makes every effort to ensure the accuracy of all the information (the “Content”) containedin the publications on our platform. However, Taylor & Francis, our agents, and our licensors make norepresentations or warranties whatsoever as to the accuracy, completeness, or suitability for any purpose of theContent. Any opinions and views expressed in this publication are the opinions and views of the authors, andare not the views of or endorsed by Taylor & Francis. The accuracy of the Content should not be relied upon andshould be independently verified with primary sources of information. Taylor and Francis shall not be liable forany losses, actions, claims, proceedings, demands, costs, expenses, damages, and other liabilities whatsoeveror howsoever caused arising directly or indirectly in connection with, in relation to or arising out of the use ofthe Content.
This article may be used for research, teaching, and private study purposes. Any substantial or systematicreproduction, redistribution, reselling, loan, sub-licensing, systematic supply, or distribution in anyform to anyone is expressly forbidden. Terms & Conditions of access and use can be found at http://www.tandfonline.com/page/terms-and-conditions
Fecal contamination in Yongin watershed: association to land use and landcover and stormwater quality
Ma. Cristina A. Paulea, Jey-R S. Venturaa, Sheeraz Memona, Bum-Yeon Leea,Deokjin Jahnga, Min-Ji Kangb, Chang-Hee Leea,*aDepartment of Environmental and Energy Engineering, Myongji University, 116 Myongji-ro, Cheoin-gu, Yongin-si, Gyeonggi-do449-728, Republic of Korea, email: [email protected] (C.-H. Lee)bWater Environmental Research Department, National Institute of Environmental Research, Incheon 404-708, Republic of Korea
Received 31 July 2013; Accepted 11 December 2013
ABSTRACT
Fecal contaminants in stormwater runoff have a potential threat to impairment anddegradation of water and have a negative impact on public health. Stormwater runoff isincreasing in amount and rate of discharge due to loss of vegetated landscape and increas-ing urbanization. The aim of this study was to investigate the association of fecal contami-nants on four monitoring sites and on stormwater quality in Yongin watershed, SouthKorea. The four experimental catchment sites comprising of construction areas, mixed landuse, agricultural, and urban. It was observed that mixed catchment and urban area havehigher fecal contaminants among other land use and land cover. The results indicate thatan increase in human activities in a particular area may indicate a high contribution in theincreased fecal levels, however, it does not necessarily mean that majority of human-relatedactivities may bring the increase of human source of fecal contamination. Overall, theobtained most probable number values for all fecal tests suggested that the water samplesare not fit for either safe drinking, washing, or bathing as they may cause some serious ill-nesses to human.
Keywords: Fecal contaminants; Land use and land cover; Stormwater; Watershed
1. Introduction
Stormwater runoff, one of the most common formsof non-point source (NPS) pollution, has been identi-fied as a potential threat to impairment and degrada-tion of water quality due to high levels of chemicaland biological contaminants [1]. During precipitation,stormwater runoff picks up natural and human-made
contaminants that are accumulated on the surfaceduring dry days and transports it to receiving waterbodies. The forms and concentrations of contaminantsfrom stormwater runoff are closely related to varioustypes of land use and land cover (LULC) such as agri-culture, commercial, construction sites, and forest use[2]. For instance, urban, agricultural, and forestrystormwater runoff have been shown to contain largequantities of fecal microbes contributing to surface
*Corresponding author.
Presented at the 16th International Conference on Diffuse Pollution and Eutrophication (DIPCON)18–23 August 2013, Beijing, China
1944-3994/1944-3986 � 2014 Balaban Desalination Publications. All rights reserved.
Desalination and Water Treatment 53 (2015) 3026–3038
Marchwww.deswater.com
doi: 10.1080/19443994.2014.922281
Dow
nloa
ded
by [
Myo
ngji
Uni
vers
ity]
at 2
2:13
04
Mar
ch 2
015
water quality impairments [3–5]. Microbes are affectedby numerous physical, chemical, and biologicalfactors. Moisture, temperature, sunlight exposure,nutrient availability, adsorption/desorption processes,hydrologic processes, and predation are factors thatinfluence the microbial fate and transport [6]. Thewatershed characteristics including topography andgeology can influence the stormwater quality [7]. Also,the alteration of LULC, associated with anthropogenicactivities and natural factors [8], may one or moreaffect the stormwater quality parameters. For instance,the conversion of agricultural, forest, commercial, androad use into bare lands due to construction activitiesmay affect the stormwater quality, runoff volume, andflow characteristics [9]. The construction activitiesmake difficult to manage but their impacts on waterquality are transient and can be mitigate throughimplementing good planning and best managementpractices [10]. Therefore, the importance of associationto LULC change and water quality contaminants spe-cifically the fecal contamination need deeper under-standing due to the increasing recognition over thepast two decades that NPS pollution has come intobeing the major environmental concern. Few studieshave addressed the effects and management of waterpollution resulting from rainfall and runoff in EastAsia, including Korea. Nutrients have been focusingon their relationships with stormwater runoff [7,11,12].However, monitoring and controlling the NPS pollu-tion presents great challenges [13] because of their dis-persed origins and the fact that they vary with theseason and the weather, in addition to the fact thatnon-point inputs are often overlooked by humanbeings [14]. At the same time, there is increasing avail-ability of geographic information system (GIS) andstatistical analysis allowed the researchers to investi-gate the association of LULC, stormwater quality onfecal contaminants. In recent years, when Korea hasinitiated her economic reform and open-door policy,rapid urbanization and economic expansion hasresulted in massive land alteration. However, peopleonly focus on the economic growth, and alwaysneglect this factor that economy grows at the expenseof the environmental destruction. In this study, there-fore, we used four different monitoring sites with var-ied LULC in Yongin watershed, South Korea to: (1)evaluate the concentration of stormwater fecal contam-inants; (2) develop an understanding of the variabilityof fecal count in surface water during storm event (ini-tial, peak, and final sampling); (3) determine the influ-ence of LULC, hydrological characteristics, discharge,chemical oxygen demand (COD), and nutrients on thefecal count; and (4) obtain baseline data for storm-water management and microbial modeling.
2. Materials and Methods
2.1. Site description
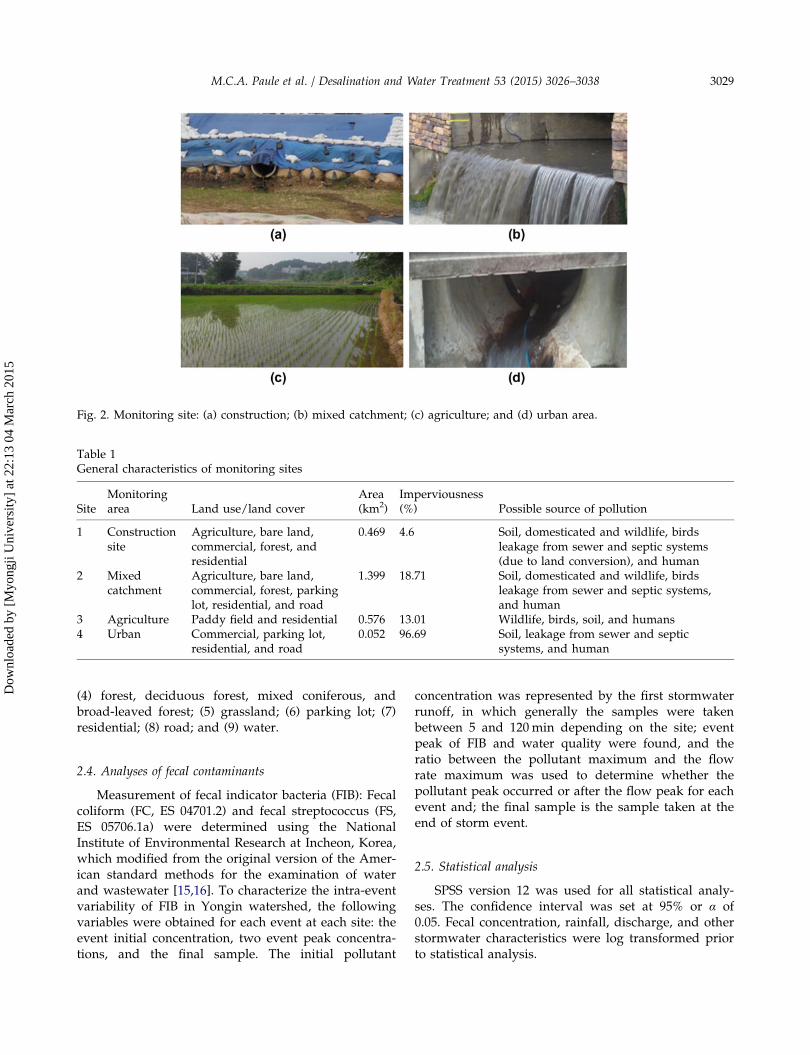
Data were collected in Yongin watershed,Gyeonggi, Republic of Korea (Fig. 1). Yonginwatershed directly drains in Geumhak stream; one ofthe tributary of Paldang reservoir (source of drinkingwater for 23 million residents in Seoul and GyeonggiProvince). Also, it drains in a different LULC withvariable population densities. Four different monitor-ing areas in the watershed were monitored. The moni-toring areas are the following: construction area (Site1), mixed catchment (Site 2), agriculture (Site 3), andurban (Site 4) (Fig. 2). Monitoring sites varied in area,LULC, and imperviousness allowing an analysis offecal contaminants. The characteristics of the monitor-ing sites are presented in Table 1.
2.2. Water sampling and insitu measurement
From June to December 2012, stormwater sampleswere gathered from a total of seven storm events.Rainfall data and runoff flow were measured duringall the time of sampling. Two sites (Site 1 and Site 3),flow rate were measured using the current metervelocity and flow area channel, whereas other sites(Site 2 and Site 4), automatic flow meter was installedand discharged were calculated based on velocity,depth of water, and width of the channel. The amountof rainfall during each runoff event was measuredwith a rain gauge (HB 3207-09) in an open area ofmonitoring sites. Grab sampling (n = 10–20 samples ineach site) was done at 15–20min intervals when theflow is rising and then at 30–60min intervals forreceding. Field measurements included pH and con-ductivity, measured with a U-50 Multi-Probe. Oncesampling was completed for a runoff event, sampleswere transported to the laboratory and analyzedwithin 6–8 h of collection. COD, total nitrogen (TN),and total phosphorus (TP) were measured accordingto the standard methods [15,16].
2.3. LULC analysis
GIS applications and Korean Land Cover 2010data-set were used to develop the LULC alterationmaps in monitoring sites. Monthly field visit, maps,and documentation from local administration wereused to update and validate the LULC mapping crite-ria. The LULC categories according to Korean unitload classification include: (1) agriculture, includingpaddy field and dry land; (2) bare land, includinggravels, bare ground, and bare rocks; (3) commercial;
M.C.A. Paule et al. / Desalination and Water Treatment 53 (2015) 3026–3038 3027
Dow
nloa
ded
by [
Myo
ngji
Uni
vers
ity]
at 2
2:13
04
Mar
ch 2
015
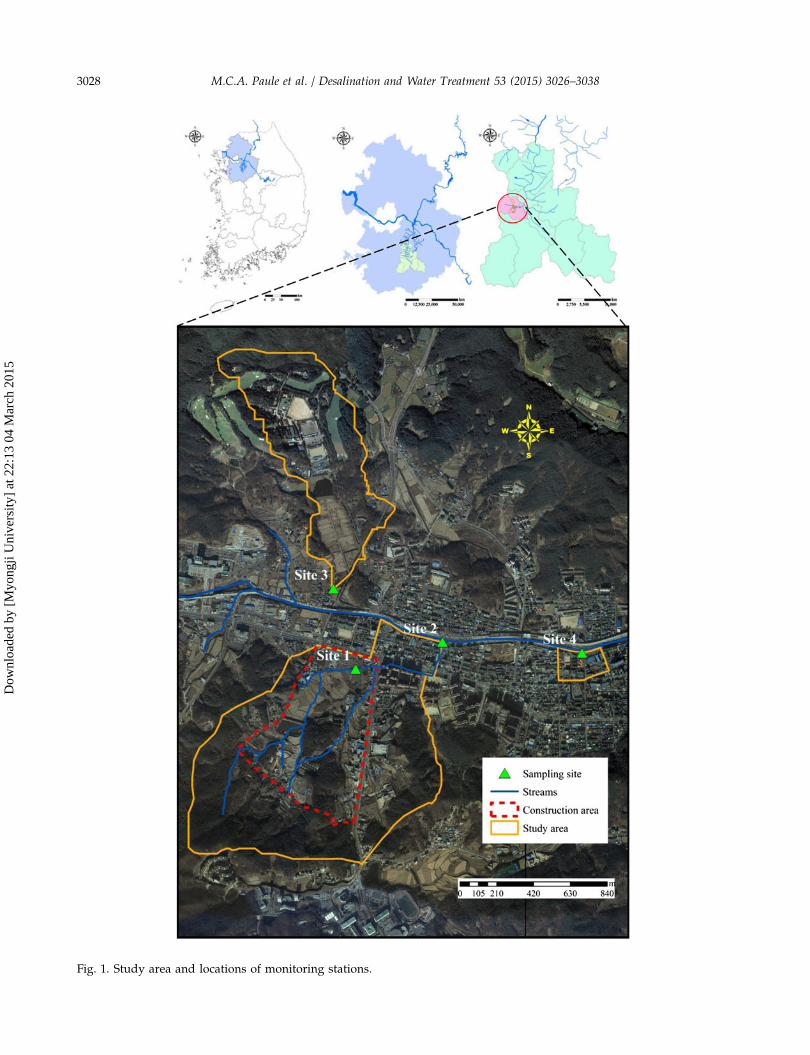
Fig. 1. Study area and locations of monitoring stations.
3028 M.C.A. Paule et al. / Desalination and Water Treatment 53 (2015) 3026–3038
Dow
nloa
ded
by [
Myo
ngji
Uni
vers
ity]
at 2
2:13
04
Mar
ch 2
015
(4) forest, deciduous forest, mixed coniferous, andbroad-leaved forest; (5) grassland; (6) parking lot; (7)residential; (8) road; and (9) water.
2.4. Analyses of fecal contaminants
Measurement of fecal indicator bacteria (FIB): Fecalcoliform (FC, ES 04701.2) and fecal streptococcus (FS,ES 05706.1a) were determined using the NationalInstitute of Environmental Research at Incheon, Korea,which modified from the original version of the Amer-ican standard methods for the examination of waterand wastewater [15,16]. To characterize the intra-eventvariability of FIB in Yongin watershed, the followingvariables were obtained for each event at each site: theevent initial concentration, two event peak concentra-tions, and the final sample. The initial pollutant
concentration was represented by the first stormwaterrunoff, in which generally the samples were takenbetween 5 and 120min depending on the site; eventpeak of FIB and water quality were found, and theratio between the pollutant maximum and the flowrate maximum was used to determine whether thepollutant peak occurred or after the flow peak for eachevent and; the final sample is the sample taken at theend of storm event.
2.5. Statistical analysis
SPSS version 12 was used for all statistical analy-ses. The confidence interval was set at 95% or α of0.05. Fecal concentration, rainfall, discharge, and otherstormwater characteristics were log transformed priorto statistical analysis.
Fig. 2. Monitoring site: (a) construction; (b) mixed catchment; (c) agriculture; and (d) urban area.
Table 1General characteristics of monitoring sites
SiteMonitoringarea Land use/land cover
Area(km2)
Imperviousness(%) Possible source of pollution
1 Constructionsite
Agriculture, bare land,commercial, forest, andresidential
0.469 4.6 Soil, domesticated and wildlife, birdsleakage from sewer and septic systems(due to land conversion), and human
2 Mixedcatchment
Agriculture, bare land,commercial, forest, parkinglot, residential, and road
1.399 18.71 Soil, domesticated and wildlife, birdsleakage from sewer and septic systems,and human
3 Agriculture Paddy field and residential 0.576 13.01 Wildlife, birds, soil, and humans4 Urban Commercial, parking lot,
residential, and road0.052 96.69 Soil, leakage from sewer and septic
systems, and human
M.C.A. Paule et al. / Desalination and Water Treatment 53 (2015) 3026–3038 3029
Dow
nloa
ded
by [
Myo
ngji
Uni
vers
ity]
at 2
2:13
04
Mar
ch 2
015
3. Results and discussion
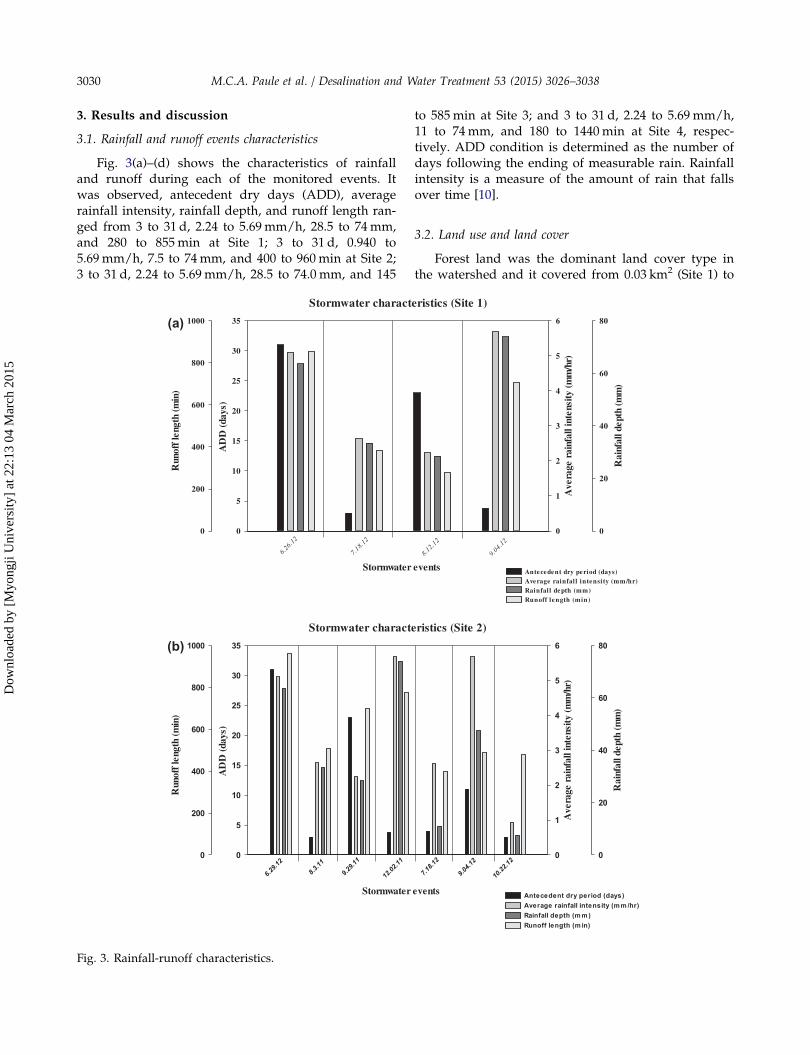
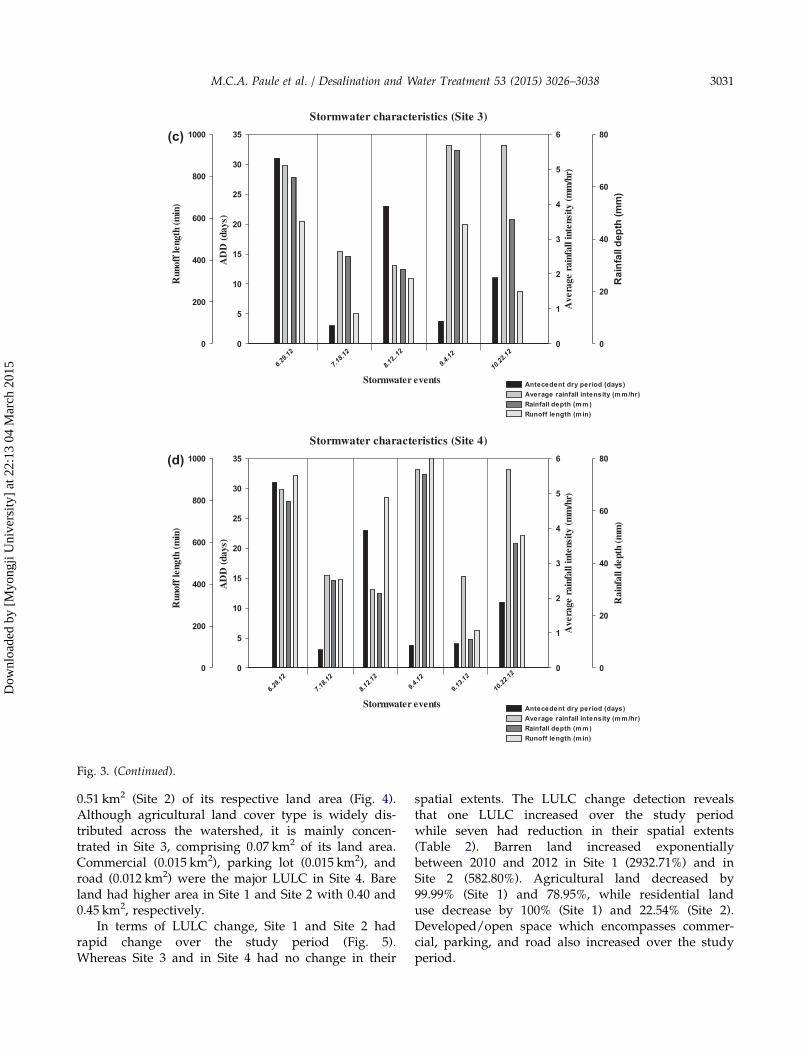
3.1. Rainfall and runoff events characteristics
Fig. 3(a)–(d) shows the characteristics of rainfalland runoff during each of the monitored events. Itwas observed, antecedent dry days (ADD), averagerainfall intensity, rainfall depth, and runoff length ran-ged from 3 to 31 d, 2.24 to 5.69mm/h, 28.5 to 74mm,and 280 to 855min at Site 1; 3 to 31 d, 0.940 to5.69mm/h, 7.5 to 74mm, and 400 to 960min at Site 2;3 to 31 d, 2.24 to 5.69mm/h, 28.5 to 74.0 mm, and 145
to 585min at Site 3; and 3 to 31 d, 2.24 to 5.69 mm/h,11 to 74mm, and 180 to 1440min at Site 4, respec-tively. ADD condition is determined as the number ofdays following the ending of measurable rain. Rainfallintensity is a measure of the amount of rain that fallsover time [10].
3.2. Land use and land cover
Forest land was the dominant land cover type inthe watershed and it covered from 0.03 km2 (Site 1) to
Stormwater characteristics (Site 1)
Stormwater events
AD
D (d
ays)
0
5
10
15
20
25
30
35
Ave
rage
rai
nfal
l int
ensi
ty (m
m/h
r)
0
1
2
3
4
5
6
Rai
nfal
l dep
th (m
m)
0
20
40
60
80
Run
off l
engt
h (m
in)
0
200
400
600
800
1000
Antecedent dry period (days) Average rainfal l intensity (mm/hr) Rainfal l depth (mm) Runoff length (min)
6.26
.12
7.18
.12
8.12
.12
9.04
.12
Stormwater characteristics (Site 2)
Stormwater events
AD
D (d
ays)
0
5
10
15
20
25
30
35
Ave
rage
rai
nfal
l int
ensi
ty (m
m/h
r)
0
1
2
3
4
5
6
Rai
nfal
l dep
th (m
m)
0
20
40
60
80
Run
off l
engt
h (m
in)
0
200
400
600
800
1000
Antecedent dry period (days) Average rainfall intensity (m m /hr) Rainfall depth (m m ) Runoff length (m in)
6.29.12
8.3.11
12.02.11
9.29.11
7.18.12
9.04.12
10.22.12
(a)
(b)
Fig. 3. Rainfall-runoff characteristics.
3030 M.C.A. Paule et al. / Desalination and Water Treatment 53 (2015) 3026–3038
Dow
nloa
ded
by [
Myo
ngji
Uni
vers
ity]
at 2
2:13
04
Mar
ch 2
015
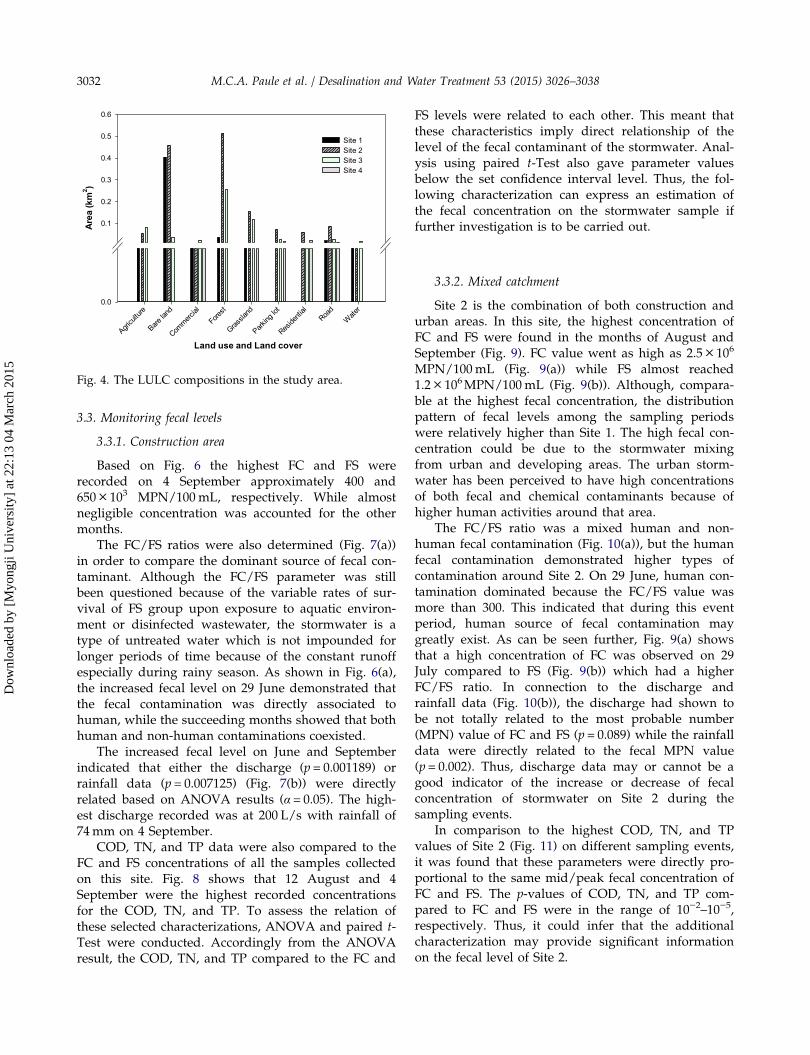
0.51 km2 (Site 2) of its respective land area (Fig. 4).Although agricultural land cover type is widely dis-tributed across the watershed, it is mainly concen-trated in Site 3, comprising 0.07 km2 of its land area.Commercial (0.015 km2), parking lot (0.015 km2), androad (0.012 km2) were the major LULC in Site 4. Bareland had higher area in Site 1 and Site 2 with 0.40 and0.45 km2, respectively.
In terms of LULC change, Site 1 and Site 2 hadrapid change over the study period (Fig. 5).Whereas Site 3 and in Site 4 had no change in their
spatial extents. The LULC change detection revealsthat one LULC increased over the study periodwhile seven had reduction in their spatial extents(Table 2). Barren land increased exponentiallybetween 2010 and 2012 in Site 1 (2932.71%) and inSite 2 (582.80%). Agricultural land decreased by99.99% (Site 1) and 78.95%, while residential landuse decrease by 100% (Site 1) and 22.54% (Site 2).Developed/open space which encompasses commer-cial, parking, and road also increased over the studyperiod.
Stormwater characteristics (Site 3)
Stormwater events
AD
D (d
ays)
0
5
10
15
20
25
30
35
Ave
rage
rai
nfal
l int
ensi
ty (m
m/h
r)
0
1
2
3
4
5
6
Rai
nfal
l dep
th (m
m)
0
20
40
60
80
Run
off l
engt
h (m
in)
0
200
400
600
800
1000
Antecedent dry period (days) Average rainfall intensity (m m /hr) Rainfall depth (m m ) Runoff length (m in)
6.29.12
7.18.12
8.12..12
9.4.12
10.22.12
Stormwater characteristics (Site 4)
Stormwater events
AD
D (d
ays)
0
5
10
15
20
25
30
35
Ave
rage
rai
nfal
l int
ensi
ty (m
m/h
r)
0
1
2
3
4
5
6
Rai
nfal
l dep
th (m
m)
0
20
40
60
80
Run
off l
engt
h (m
in)
0
200
400
600
800
1000
Antecedent dry period (days) Average rainfall intensity (m m /hr) Rainfall depth (m m ) Runoff length (m in)
7.18.12
6.29.12
8.12.12
9.4.12
9.13.12
10.22.12
(c)
(d)
Fig. 3. (Continued).
M.C.A. Paule et al. / Desalination and Water Treatment 53 (2015) 3026–3038 3031
Dow
nloa
ded
by [
Myo
ngji
Uni
vers
ity]
at 2
2:13
04
Mar
ch 2
015
3.3. Monitoring fecal levels
3.3.1. Construction area
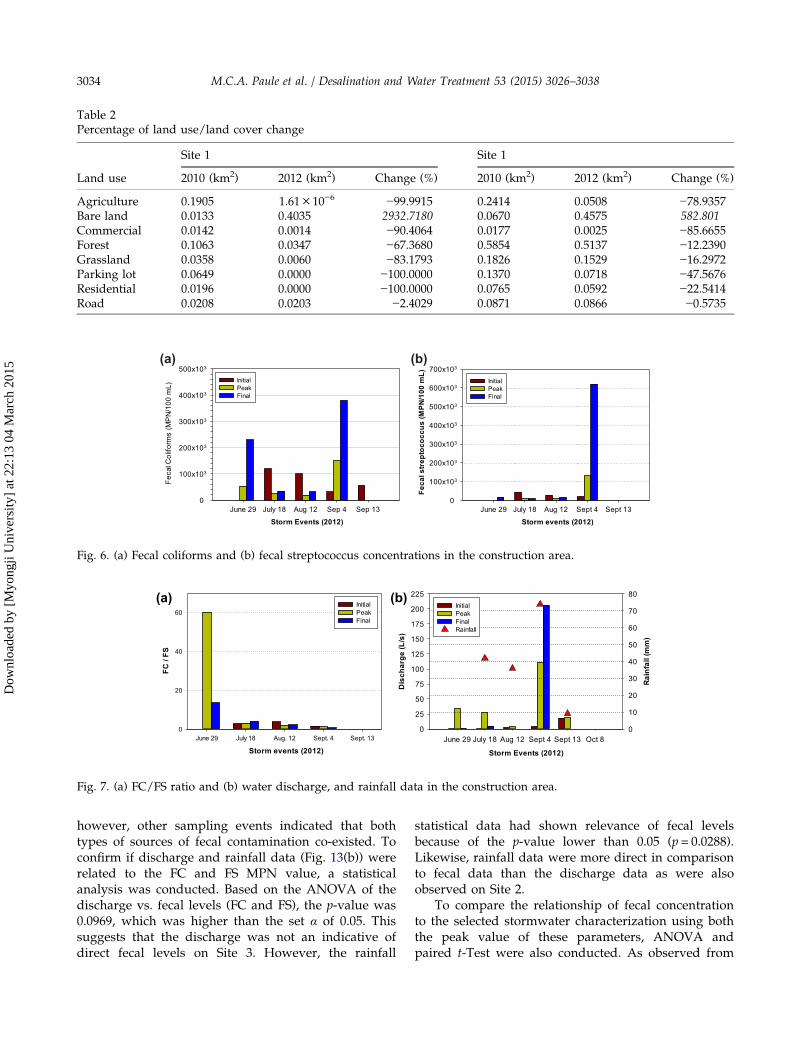
Based on Fig. 6 the highest FC and FS wererecorded on 4 September approximately 400 and650× 103 MPN/100mL, respectively. While almostnegligible concentration was accounted for the othermonths.
The FC/FS ratios were also determined (Fig. 7(a))in order to compare the dominant source of fecal con-taminant. Although the FC/FS parameter was stillbeen questioned because of the variable rates of sur-vival of FS group upon exposure to aquatic environ-ment or disinfected wastewater, the stormwater is atype of untreated water which is not impounded forlonger periods of time because of the constant runoffespecially during rainy season. As shown in Fig. 6(a),the increased fecal level on 29 June demonstrated thatthe fecal contamination was directly associated tohuman, while the succeeding months showed that bothhuman and non-human contaminations coexisted.
The increased fecal level on June and Septemberindicated that either the discharge (p = 0.001189) orrainfall data (p = 0.007125) (Fig. 7(b)) were directlyrelated based on ANOVA results (α = 0.05). The high-est discharge recorded was at 200 L/s with rainfall of74mm on 4 September.
COD, TN, and TP data were also compared to theFC and FS concentrations of all the samples collectedon this site. Fig. 8 shows that 12 August and 4September were the highest recorded concentrationsfor the COD, TN, and TP. To assess the relation ofthese selected characterizations, ANOVA and paired t-Test were conducted. Accordingly from the ANOVAresult, the COD, TN, and TP compared to the FC and
FS levels were related to each other. This meant thatthese characteristics imply direct relationship of thelevel of the fecal contaminant of the stormwater. Anal-ysis using paired t-Test also gave parameter valuesbelow the set confidence interval level. Thus, the fol-lowing characterization can express an estimation ofthe fecal concentration on the stormwater sample iffurther investigation is to be carried out.
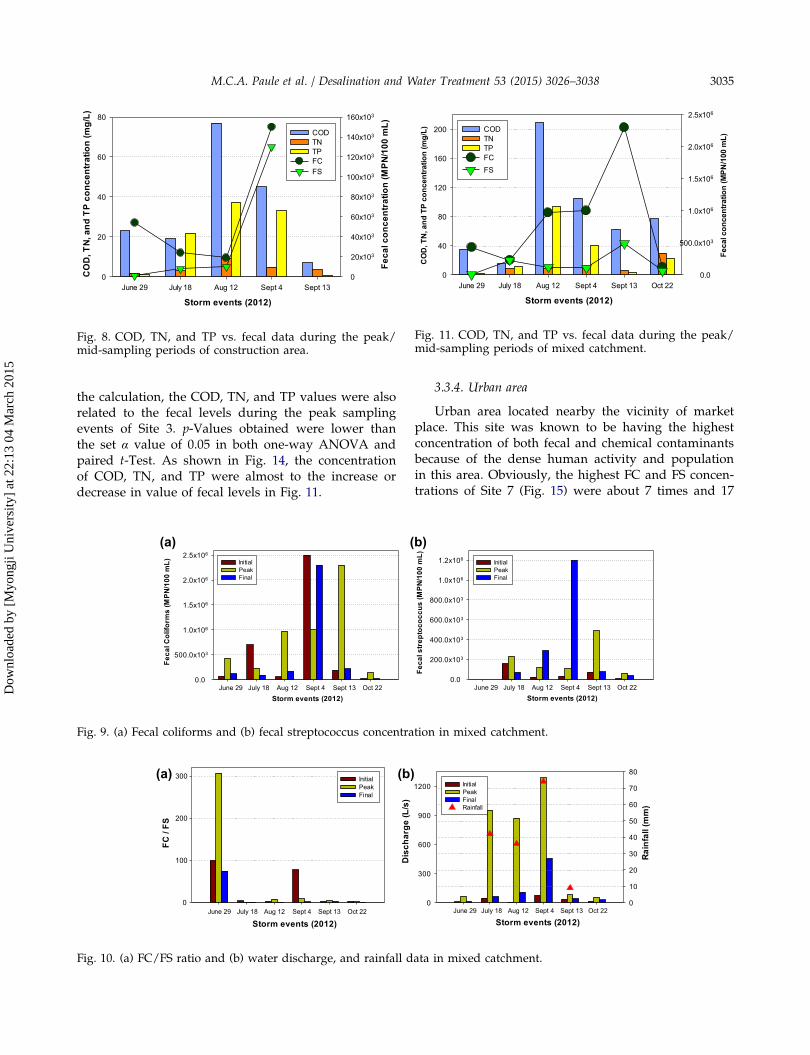
3.3.2. Mixed catchment
Site 2 is the combination of both construction andurban areas. In this site, the highest concentration ofFC and FS were found in the months of August andSeptember (Fig. 9). FC value went as high as 2.5 × 10⁶
MPN/100mL (Fig. 9(a)) while FS almost reached1.2× 106MPN/100mL (Fig. 9(b)). Although, compara-ble at the highest fecal concentration, the distributionpattern of fecal levels among the sampling periodswere relatively higher than Site 1. The high fecal con-centration could be due to the stormwater mixingfrom urban and developing areas. The urban storm-water has been perceived to have high concentrationsof both fecal and chemical contaminants because ofhigher human activities around that area.
The FC/FS ratio was a mixed human and non-human fecal contamination (Fig. 10(a)), but the humanfecal contamination demonstrated higher types ofcontamination around Site 2. On 29 June, human con-tamination dominated because the FC/FS value wasmore than 300. This indicated that during this eventperiod, human source of fecal contamination maygreatly exist. As can be seen further, Fig. 9(a) showsthat a high concentration of FC was observed on 29July compared to FS (Fig. 9(b)) which had a higherFC/FS ratio. In connection to the discharge andrainfall data (Fig. 10(b)), the discharge had shown tobe not totally related to the most probable number(MPN) value of FC and FS (p = 0.089) while the rainfalldata were directly related to the fecal MPN value(p = 0.002). Thus, discharge data may or cannot be agood indicator of the increase or decrease of fecalconcentration of stormwater on Site 2 during thesampling events.
In comparison to the highest COD, TN, and TPvalues of Site 2 (Fig. 11) on different sampling events,it was found that these parameters were directly pro-portional to the same mid/peak fecal concentration ofFC and FS. The p-values of COD, TN, and TP com-pared to FC and FS were in the range of 10−2–10−5,respectively. Thus, it could infer that the additionalcharacterization may provide significant informationon the fecal level of Site 2.
Land use and Land coverAgri
cultu
re
Bare la
nd
Commerc
ial
Forest
Grassla
nd
Parking
lot
Reside
ntial
Road
Wate
r
Area
(km
2 )
0.0
0.1
0.2
0.3
0.4
0.5
0.6
Site 1 Site 2 Site 3 Site 4
Fig. 4. The LULC compositions in the study area.
3032 M.C.A. Paule et al. / Desalination and Water Treatment 53 (2015) 3026–3038
Dow
nloa
ded
by [
Myo
ngji
Uni
vers
ity]
at 2
2:13
04
Mar
ch 2
015

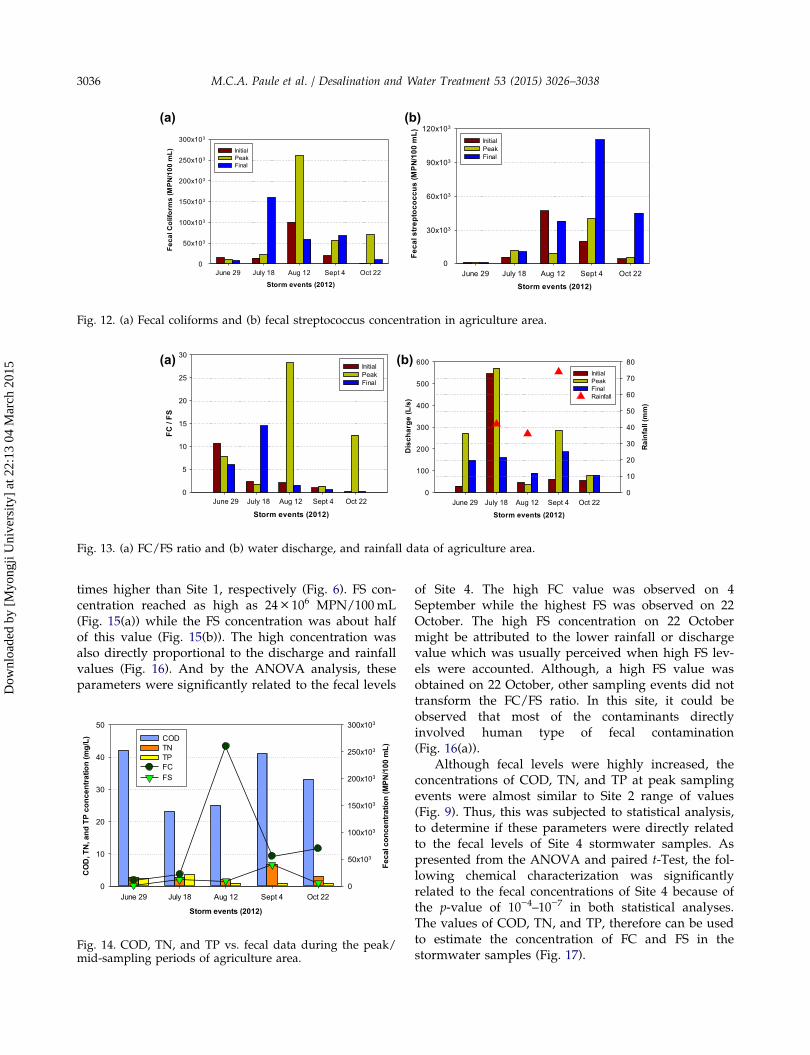
3.3.3. Agricultural area
As observed in this site, a low MPN value of FCand FS were obtained (Fig. 12). Fecal levels of the pre-vious sites may increase as high as 106 MPN/100mL,however, this site just went down at 103 MPN/100mL.In particular, the highest MPN values of FC andFS were at approximately 250 × 103 MPN/100mL(Fig. 12(a)) and 110 × 103 MPN/100mL (Fig. 12(b)),
respectively. This was about 10 times lower FC andtwo to seven times lower FS compared to Sites 1 and 2.The highest fecal counts were observed to be onAugust and September.
Site 3 FC/FS ratio may not be dominated byhuman fecal contamination because of the diversity ofthe observed ratio (Fig.13(a)). June and August mayindicate the domination of human fecal contamination;
Fig. 5. LULC patterns in the study area: (a) 2010, (b) July 2012, and (c) December 2012.
M.C.A. Paule et al. / Desalination and Water Treatment 53 (2015) 3026–3038 3033
Dow
nloa
ded
by [
Myo
ngji
Uni
vers
ity]
at 2
2:13
04
Mar
ch 2
015
however, other sampling events indicated that bothtypes of sources of fecal contamination co-existed. Toconfirm if discharge and rainfall data (Fig. 13(b)) wererelated to the FC and FS MPN value, a statisticalanalysis was conducted. Based on the ANOVA of thedischarge vs. fecal levels (FC and FS), the p-value was0.0969, which was higher than the set α of 0.05. Thissuggests that the discharge was not an indicative ofdirect fecal levels on Site 3. However, the rainfall
statistical data had shown relevance of fecal levelsbecause of the p-value lower than 0.05 (p = 0.0288).Likewise, rainfall data were more direct in comparisonto fecal data than the discharge data as were alsoobserved on Site 2.
To compare the relationship of fecal concentrationto the selected stormwater characterization using boththe peak value of these parameters, ANOVA andpaired t-Test were also conducted. As observed from
Table 2Percentage of land use/land cover change
Land use
Site 1 Site 1
2010 (km2) 2012 (km2) Change (%) 2010 (km2) 2012 (km2) Change (%)
Agriculture 0.1905 1.61× 10⁻⁶ −99.9915 0.2414 0.0508 −78.9357Bare land 0.0133 0.4035 2932.7180 0.0670 0.4575 582.801Commercial 0.0142 0.0014 −90.4064 0.0177 0.0025 −85.6655Forest 0.1063 0.0347 −67.3680 0.5854 0.5137 −12.2390Grassland 0.0358 0.0060 −83.1793 0.1826 0.1529 −16.2972Parking lot 0.0649 0.0000 −100.0000 0.1370 0.0718 −47.5676Residential 0.0196 0.0000 −100.0000 0.0765 0.0592 −22.5414Road 0.0208 0.0203 −2.4029 0.0871 0.0866 −0.5735
Storm Events (2012)June 29 July 18 Aug 12 Sep 4 Sep 13
Feca
l Col
iform
s(M
PN
/100
mL)
0
100x103
200x103
300x103
400x103
500x103
InitialPeakFinal
Storm events (2012)June 29 July 18 Aug 12 Sept 4 Sept 13
Feca
l str
epto
cocc
us (M
PN/1
00 m
L)
0
100x103
200x103
300x103
400x103
500x103
600x103
700x103
InitialPeakFinal
(a) (b)
Fig. 6. (a) Fecal coliforms and (b) fecal streptococcus concentrations in the construction area.
Storm events (2012)June 29 July 18 Aug. 12 Sept. 4 Sept. 13
FC /
FS
0
20
40
60Initial Peak Final
Storm Events (2012)
June 29 July 18 Aug 12 Sept 4 Sept 13 Oct 8
Dis
char
ge (L
/s)
0
25
50
75
100
125
150
175
200
225
Rain
fall
(mm
)
0
10
20
30
40
50
60
70
80InitialPeakFinalRainfall
(a) (b)
Fig. 7. (a) FC/FS ratio and (b) water discharge, and rainfall data in the construction area.
3034 M.C.A. Paule et al. / Desalination and Water Treatment 53 (2015) 3026–3038
Dow
nloa
ded
by [
Myo
ngji
Uni
vers
ity]
at 2
2:13
04
Mar
ch 2
015
the calculation, the COD, TN, and TP values were alsorelated to the fecal levels during the peak samplingevents of Site 3. p-Values obtained were lower thanthe set α value of 0.05 in both one-way ANOVA andpaired t-Test. As shown in Fig. 14, the concentrationof COD, TN, and TP were almost to the increase ordecrease in value of fecal levels in Fig. 11.
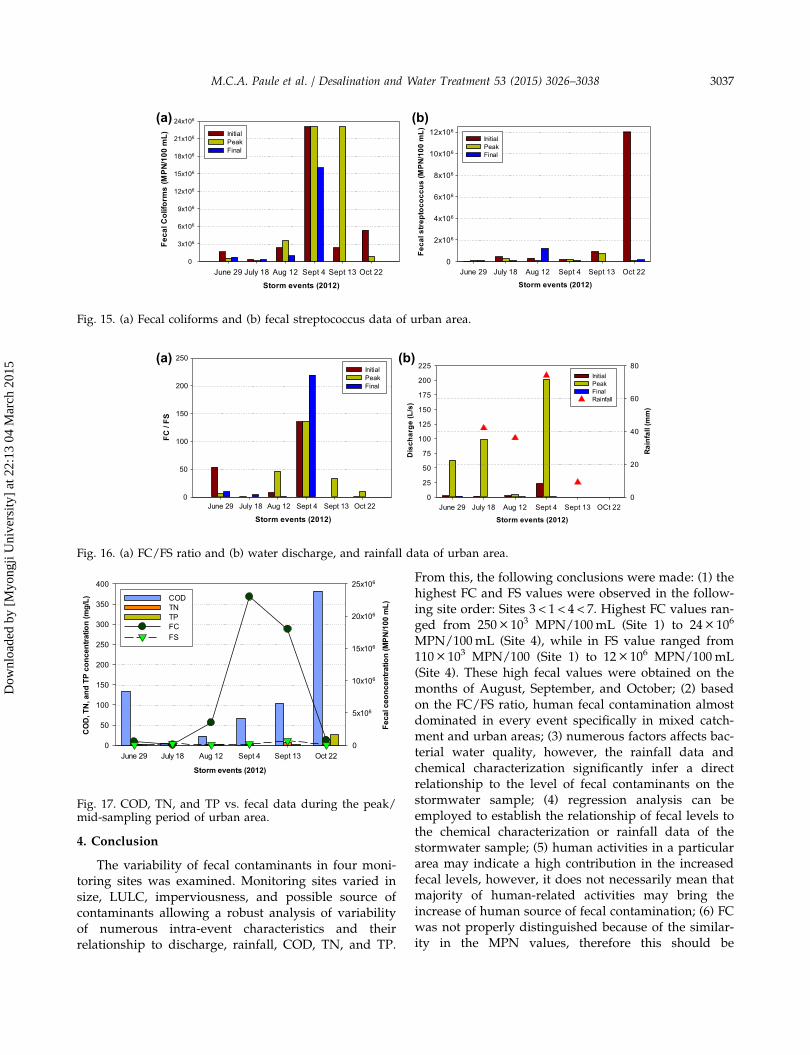
3.3.4. Urban area
Urban area located nearby the vicinity of marketplace. This site was known to be having the highestconcentration of both fecal and chemical contaminantsbecause of the dense human activity and populationin this area. Obviously, the highest FC and FS concen-trations of Site 7 (Fig. 15) were about 7 times and 17
Storm events (2012)June 29 July 18 Aug 12 Sept 4 Sept 13
CO
D, T
N, a
nd T
P co
ncen
trat
ion
(mg/
L)
0
20
40
60
80
Feca
l con
cent
ratio
n (M
PN/1
00 m
L)
0
20x103
40x103
60x103
80x103
100x103
120x103
140x103
160x103
COD TN TP FCFS
Fig. 8. COD, TN, and TP vs. fecal data during the peak/mid-sampling periods of construction area.
Storm events (2012)
Feca
l Col
iform
s(M
PN/1
00 m
L)
0.0
500.0x10³
1.0x10⁶
1.5x10⁶
2.0x10⁶
2.5x10⁶
InitialPeakFinal
Storm events (2012)June 29 July 18 Aug 12 Sept 4 Sept 13 Oct 22 June 29 July 18 Aug 12 Sept 4 Sept 13 Oct 22
Feca
l str
epto
cocc
us (M
PN/1
00 m
L)
0.0
200.0x10³
400.0x10³
600.0x10³
800.0x10³
1.0x10⁶
1.2x10⁶ InitialPeakFinal
(a) (b)
Fig. 9. (a) Fecal coliforms and (b) fecal streptococcus concentration in mixed catchment.
Storm events (2012)
FC /
FS
0
100
200
300 Initial Peak Final
Storm events (2012)June 29 July 18 Aug 12 Sept 4 Sept 13 Oct 22 June 29 July 18 Aug 12 Sept 4 Sept 13 Oct 22
Dis
char
ge (L
/s)
0
300
600
900
1200
Rain
fall
(mm
)
0
10
20
30
40
50
60
70
80InitialPeakFinalRainfall
(a) (b)
Fig. 10. (a) FC/FS ratio and (b) water discharge, and rainfall data in mixed catchment.
Storm events (2012)June 29 July 18 Aug 12 Sept 4 Sept 13 Oct 22
CO
D, T
N, a
nd T
P co
ncen
tratio
n (m
g/L)
0
40
80
120
160
200
Feca
l con
cent
ratio
n (M
PN/1
00 m
L)
0.0
500.0x10³
1.0x10⁶
1.5x10⁶
2.0x10⁶
2.5x10⁶
COD TN TP FCFS
Fig. 11. COD, TN, and TP vs. fecal data during the peak/mid-sampling periods of mixed catchment.
M.C.A. Paule et al. / Desalination and Water Treatment 53 (2015) 3026–3038 3035
Dow
nloa
ded
by [
Myo
ngji
Uni
vers
ity]
at 2
2:13
04
Mar
ch 2
015
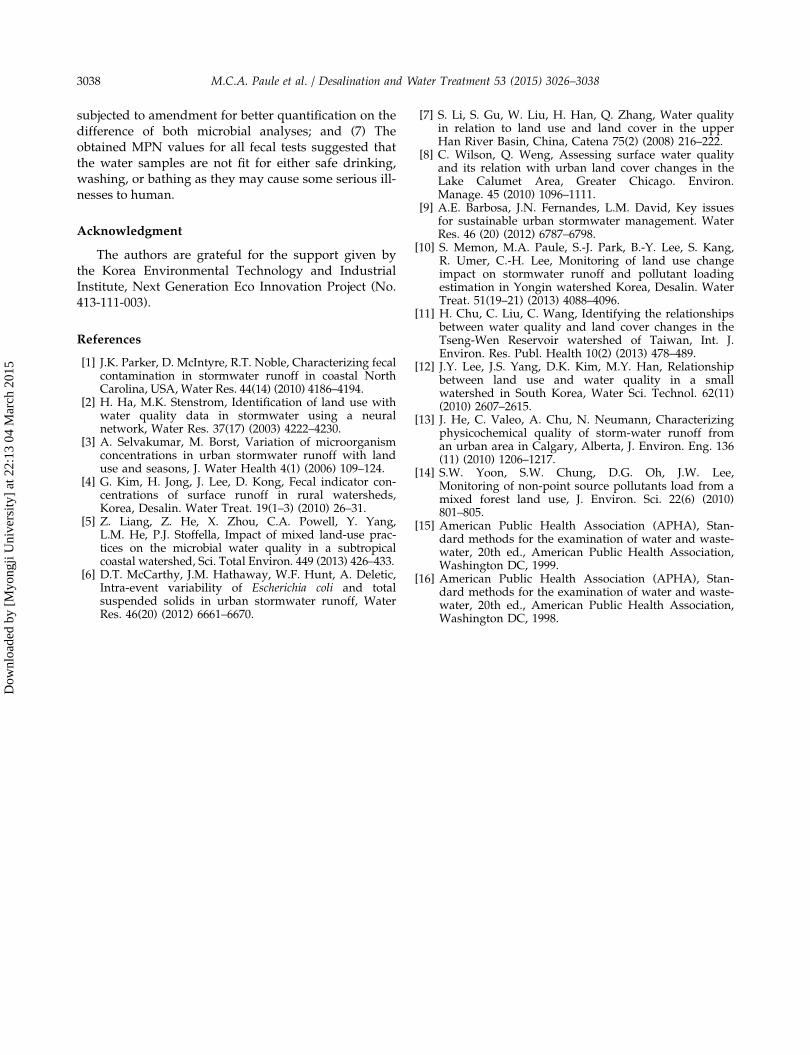
times higher than Site 1, respectively (Fig. 6). FS con-centration reached as high as 24× 106 MPN/100mL(Fig. 15(a)) while the FS concentration was about halfof this value (Fig. 15(b)). The high concentration wasalso directly proportional to the discharge and rainfallvalues (Fig. 16). And by the ANOVA analysis, theseparameters were significantly related to the fecal levels
of Site 4. The high FC value was observed on 4September while the highest FS was observed on 22October. The high FS concentration on 22 Octobermight be attributed to the lower rainfall or dischargevalue which was usually perceived when high FS lev-els were accounted. Although, a high FS value wasobtained on 22 October, other sampling events did nottransform the FC/FS ratio. In this site, it could beobserved that most of the contaminants directlyinvolved human type of fecal contamination(Fig. 16(a)).
Although fecal levels were highly increased, theconcentrations of COD, TN, and TP at peak samplingevents were almost similar to Site 2 range of values(Fig. 9). Thus, this was subjected to statistical analysis,to determine if these parameters were directly relatedto the fecal levels of Site 4 stormwater samples. Aspresented from the ANOVA and paired t-Test, the fol-lowing chemical characterization was significantlyrelated to the fecal concentrations of Site 4 because ofthe p-value of 10−4–10−7 in both statistical analyses.The values of COD, TN, and TP, therefore can be usedto estimate the concentration of FC and FS in thestormwater samples (Fig. 17).
Storm events (2012)June 29 July 18 Aug 12 Sept 4 Oct 22
Feca
l Col
iform
s (M
PN/1
00 m
L)
0
50x103
100x103
150x103
200x103
250x103
300x103
InitialPeakFinal
Storm events (2012)June 29 July 18 Aug 12 Sept 4 Oct 22
Feca
l str
epto
cocc
us (M
PN/1
00 m
L)
0
30x103
60x103
90x103
120x103
InitialPeakFinal
(a) (b)
Fig. 12. (a) Fecal coliforms and (b) fecal streptococcus concentration in agriculture area.
Storm events (2012)
FC /
FS
0
5
10
15
20
25
30Initial Peak Final
Storm events (2012)
June 29 July 18 Aug 12 Sept 4 Oct 22 June 29 July 18 Aug 12 Sept 4 Oct 22
Dis
char
ge (L
/s)
0
100
200
300
400
500
600
Rain
fall
(mm
)
0
10
20
30
40
50
60
70
80InitialPeakFinalRainfall
(a) (b)
Fig. 13. (a) FC/FS ratio and (b) water discharge, and rainfall data of agriculture area.
Storm events (2012)
June 29 July 18 Aug 12 Sept 4 Oct 22
CO
D, T
N, a
nd T
P co
ncen
tratio
n (m
g/L)
0
10
20
30
40
50
Feca
l con
cent
ratio
n (M
PN/1
00 m
L)
0
50x103
100x103
150x103
200x103
250x103
300x103
COD TN TP FCFS
Fig. 14. COD, TN, and TP vs. fecal data during the peak/mid-sampling periods of agriculture area.
3036 M.C.A. Paule et al. / Desalination and Water Treatment 53 (2015) 3026–3038
Dow
nloa
ded
by [
Myo
ngji
Uni
vers
ity]
at 2
2:13
04
Mar
ch 2
015
4. Conclusion
The variability of fecal contaminants in four moni-toring sites was examined. Monitoring sites varied insize, LULC, imperviousness, and possible source ofcontaminants allowing a robust analysis of variabilityof numerous intra-event characteristics and theirrelationship to discharge, rainfall, COD, TN, and TP.
From this, the following conclusions were made: (1) thehighest FC and FS values were observed in the follow-ing site order: Sites 3 < 1 < 4 < 7. Highest FC values ran-ged from 250 × 103 MPN/100mL (Site 1) to 24× 106
MPN/100mL (Site 4), while in FS value ranged from110 × 103 MPN/100 (Site 1) to 12 × 106 MPN/100mL(Site 4). These high fecal values were obtained on themonths of August, September, and October; (2) basedon the FC/FS ratio, human fecal contamination almostdominated in every event specifically in mixed catch-ment and urban areas; (3) numerous factors affects bac-terial water quality, however, the rainfall data andchemical characterization significantly infer a directrelationship to the level of fecal contaminants on thestormwater sample; (4) regression analysis can beemployed to establish the relationship of fecal levels tothe chemical characterization or rainfall data of thestormwater sample; (5) human activities in a particulararea may indicate a high contribution in the increasedfecal levels, however, it does not necessarily mean thatmajority of human-related activities may bring theincrease of human source of fecal contamination; (6) FCwas not properly distinguished because of the similar-ity in the MPN values, therefore this should be
Storm events (2012)June 29 July 18 Aug 12 Sept 4 Sept 13 Oct 22
Feca
l Col
iform
s(M
PN/1
00 m
L)
0
3x10⁶
6x10⁶
9x10⁶
12x106
15x106
18x106
21x106
24x106
InitialPeakFinal
Storm events (2012)June 29 July 18 Aug 12 Sept 4 Sept 13 Oct 22
Feca
l str
epto
cocc
us (M
PN/1
00 m
L)
0
2x10⁶
4x10⁶
6x10⁶
8x10⁶
10x106
12x106
InitialPeakFinal
(a) (b)
Fig. 15. (a) Fecal coliforms and (b) fecal streptococcus data of urban area.
Storm events (2012)June 29 July 18 Aug 12 Sept 4 Sept 13 Oct 22
FC /
FS
0
50
100
150
200
250Initial Peak Final
Storm events (2012)June 29 July 18 Aug 12 Sept 4 Sept 13 OCt 22
Dis
char
ge (L
/s)
0
25
50
75
100
125
150
175
200
225
Rain
fall
(mm
)
0
20
40
60
80InitialPeakFinalRainfall
(a) (b)
Fig. 16. (a) FC/FS ratio and (b) water discharge, and rainfall data of urban area.
Storm events (2012)
June 29 July 18 Aug 12 Sept 4 Sept 13 Oct 22
CO
D, T
N, a
nd T
P co
ncen
tratio
n (m
g/L)
0
50
100
150
200
250
300
350
400
Feca
l ceo
ncen
tratio
n (M
PN/1
00 m
L)
0
5x10⁶
10x106
15x106
20x106
25x106
COD TN TP FCFS
Fig. 17. COD, TN, and TP vs. fecal data during the peak/mid-sampling period of urban area.
M.C.A. Paule et al. / Desalination and Water Treatment 53 (2015) 3026–3038 3037
Dow
nloa
ded
by [
Myo
ngji
Uni
vers
ity]
at 2
2:13
04
Mar
ch 2
015
subjected to amendment for better quantification on thedifference of both microbial analyses; and (7) Theobtained MPN values for all fecal tests suggested thatthe water samples are not fit for either safe drinking,washing, or bathing as they may cause some serious ill-nesses to human.
Acknowledgment
The authors are grateful for the support given bythe Korea Environmental Technology and IndustrialInstitute, Next Generation Eco Innovation Project (No.413-111-003).
References
[1] J.K. Parker, D. McIntyre, R.T. Noble, Characterizing fecalcontamination in stormwater runoff in coastal NorthCarolina, USA, Water Res. 44(14) (2010) 4186–4194.
[2] H. Ha, M.K. Stenstrom, Identification of land use withwater quality data in stormwater using a neuralnetwork, Water Res. 37(17) (2003) 4222–4230.
[3] A. Selvakumar, M. Borst, Variation of microorganismconcentrations in urban stormwater runoff with landuse and seasons, J. Water Health 4(1) (2006) 109–124.
[4] G. Kim, H. Jong, J. Lee, D. Kong, Fecal indicator con-centrations of surface runoff in rural watersheds,Korea, Desalin. Water Treat. 19(1–3) (2010) 26–31.
[5] Z. Liang, Z. He, X. Zhou, C.A. Powell, Y. Yang,L.M. He, P.J. Stoffella, Impact of mixed land-use prac-tices on the microbial water quality in a subtropicalcoastal watershed, Sci. Total Environ. 449 (2013) 426–433.
[6] D.T. McCarthy, J.M. Hathaway, W.F. Hunt, A. Deletic,Intra-event variability of Escherichia coli and totalsuspended solids in urban stormwater runoff, WaterRes. 46(20) (2012) 6661–6670.
[7] S. Li, S. Gu, W. Liu, H. Han, Q. Zhang, Water qualityin relation to land use and land cover in the upperHan River Basin, China, Catena 75(2) (2008) 216–222.
[8] C. Wilson, Q. Weng, Assessing surface water qualityand its relation with urban land cover changes in theLake Calumet Area, Greater Chicago. Environ.Manage. 45 (2010) 1096–1111.
[9] A.E. Barbosa, J.N. Fernandes, L.M. David, Key issuesfor sustainable urban stormwater management. WaterRes. 46 (20) (2012) 6787–6798.
[10] S. Memon, M.A. Paule, S.-J. Park, B.-Y. Lee, S. Kang,R. Umer, C.-H. Lee, Monitoring of land use changeimpact on stormwater runoff and pollutant loadingestimation in Yongin watershed Korea, Desalin. WaterTreat. 51(19–21) (2013) 4088–4096.
[11] H. Chu, C. Liu, C. Wang, Identifying the relationshipsbetween water quality and land cover changes in theTseng-Wen Reservoir watershed of Taiwan, Int. J.Environ. Res. Publ. Health 10(2) (2013) 478–489.
[12] J.Y. Lee, J.S. Yang, D.K. Kim, M.Y. Han, Relationshipbetween land use and water quality in a smallwatershed in South Korea, Water Sci. Technol. 62(11)(2010) 2607–2615.
[13] J. He, C. Valeo, A. Chu, N. Neumann, Characterizingphysicochemical quality of storm-water runoff froman urban area in Calgary, Alberta, J. Environ. Eng. 136(11) (2010) 1206–1217.
[14] S.W. Yoon, S.W. Chung, D.G. Oh, J.W. Lee,Monitoring of non-point source pollutants load from amixed forest land use, J. Environ. Sci. 22(6) (2010)801–805.
[15] American Public Health Association (APHA), Stan-dard methods for the examination of water and waste-water, 20th ed., American Public Health Association,Washington DC, 1999.
[16] American Public Health Association (APHA), Stan-dard methods for the examination of water and waste-water, 20th ed., American Public Health Association,Washington DC, 1998.
3038 M.C.A. Paule et al. / Desalination and Water Treatment 53 (2015) 3026–3038
Dow
nloa
ded
by [
Myo
ngji
Uni
vers
ity]
at 2
2:13
04
Mar
ch 2
015
Copyright © 2022 FDOKUMEN