
Lecture 4 Post-Structuralism - de-composition de-construction de-constructivism
Upload
khangminh22Category
view
2download
0
POST CONSTRUCTION STORMWATER MANAGEMENT REPORT
for
Chatham Financial Kennett Township
Chester County, Pennsylvania
December 20, 2016
D.L. Howell Job# 2731
Prepared for:
Chatham Financial 235 Whitehorse Lane
Kennett Square, PA 19348
Prepared by:
D.L. HOWELL & ASSOCIATES, INC. 1250 Wrights Lane, West Chester, PA 19380
Phone: 6109189002 Fax: 6109189003

Chatham Financial Stormwater Management Report Kennett Township, Chester County Page i
TABLE OF CONTENTS Section Page 1.0 INTRODUCTION .................................................................................................................... 1 1.1 Land Use/Watershed................................................................................................... 1 1.2 Site Soils ....................................................................................................................... 3 1.3 Soils Limitations ....................................................................................................... 34 2.0 RUNOFF MANAGEMENT .................................................................................................... 5 3.0 NPDES STORMWATER COMPLIANCE OVERVIEW ..................................................... 56 4.0 CONCLUSION......................................................................................................................... 7 LIST OF FIGURES Figure 11 Site Location Map ........................................................................................... 2 Table 31 NPDES Compliance Chart ............................................................................. 6 APPENDICES Appendix A NPDES 5Year Infiltration Requirement Calculations Appendix B Kennett Township Post Development Flow Reduction Summary Appendix C SCS Method Runoff Curve Numbers (CN) Calculations
Appendix D Hydraflow Hydrograph Reports Appendix E Stormwater Conveyance Calculations Appendix F NRCS Soils Report Appendix G Infiltration Report Appendix H Dewatering Calculations

Chatham Financial Stormwater Management Report Kennett Township, Chester County Page 1
1.0 INTRODUCTION This Stormwater Management Report presents the temporary and permanent control measures/facilities required to support construction activities for the Chatham Financial Project. The 15.256 +/ acre tract is located in Kennett Township (Figure 11). The property is bounded to the north by business parks, to the south and west by commercial/industrial properties and to the east by McFarlan Road. The proposed land development consists of constructing a parking lot expansion. The expansion consists of 161 additional parking spaces. 1.1 LAND USE/WATERSHED The existing land dating back 5 and 50 years ago was categorized as mostly meadow. The site’s topography slopes moderately towards an existing culvert that runs under a driveway associated with a commercial property located south of the property. The property drains to an UNT to the East Branch of the Red Clay Creek. Per Pennsylvania Department of Environmental Protection, 25 Pa. Code, 93.9g “Water Quality Standards” the watershed is classified as Trout Stocking (TSF).

Figure Number: FIGURE 1-1
Title:SITE LOCATION MAP
Source:United States Department of the Interior Geological Survey7.5 Minute Series (Topographic) MapKennett Square, Pennsylvania Quadrangle
Chatham FinancialKennettTownship
Chester CountyPennsylvania
SITE LOCATION

Chatham Financial Stormwater Management Report Kennett Township, Chester County Page 3
1.2 SITE SOILS Soils information is provided by Penn State College of Agriculture Cooperative Extension, with support from the Natural Resources Conservation Service, United States Department of Agriculture and their Web Soil Survey. Soils attribute data is served from the websoilsurvey.nrcs.usda.gov. All of the below mentioned soils are further evaluated in Appendix F and have been plotted on the Existing Conditions Plan and Erosion and Sedimentation Control Plan. GdB Gladstone gravelly loam, 3 to 8 percent slopes 1.3 SOIL LIMITATIONS: Redoximorphic features were encountered in a few locations during infiltration testing. D.L. Howell has taken into consideration these known soil limitations when designing the infiltration BMPs for the project. The stormwater infiltration facilities have been set a minimum of 2 feet higher than any prohibitive soil limitation elevations witnessed during infiltration testing and adequate infiltration results have been achieved at the adjusted elevations. If during construction, any other unknown soil limitation (i.e. bedrock or high water) is discovered the contractor is responsible for immediately contacting the site geotechnical engineer, design engineer, conservation district and the township engineer for an appropriate solution. The site design drawings contain a pumped water filter bag detail which should be utilized if any excavations need to be dewatered due to high groundwater or excessive rainfall. Geologic formations/soil conditions that may have the potential to cause pollution: Furthermore, there are no known geologic formations or soil conditions that have the potential to cause pollution during earth disturbance activities. If during construction, an unknown geologic formation or soil condition is discovered the contractor is responsible for immediately contacting the Chester County Conservation District and the design engineer.
General Soil Limitations and Resolutions:
Acid soil types: pH lower than 5.5
Soil tests should be taken to determine the actual soil ph reaction. A ph of 5.5 should be achieved to resolve this limitation the soil ph should be adjusted by applying lime rates in accordance with the Penn State Agronomy Guide and the recommendations from a reputable laboratory.
Wet soil types
To resolve this limitation vegetative species that are tolerant to wet conditions should be selected for landscaping.
Poor topsoil

Chatham Financial Stormwater Management Report Kennett Township, Chester County Page 4
Soil should be imported from other areas on site. The Chester County Conservation District must approve any deviation from the E&SC sequence.
Wet soil types / high water table during excavation activities
Water to be pumped to a dewatering structure, see detail
Poor suitability for winter grading / frost action
Adequate compaction of soil is required for the embankments, pipe backfill, road construction and the building pads. If adequate compaction cannot be achieved due to frost action or wet soil type, either soil should be imported from other areas on site or construction of these facilities should not be worked on during periods prone to frost. The Chester County Conservation District must approve any deviation from the E&SC sequence.
Permeable soil for embankment construction
Soil should be imported from other areas on site. The Chester County Conservation District must approve any deviation from the E&SC sequence.
Poorly suited as sources of topsoil
Identifying and resolving characteristics, that render soil types poorly suited as topsoil.
Erodible soil
Types exhibiting k values greater than 0.36 or plasticity index values lower than 10, limit vegetative stabilization of channels. Resolutions: temporary channel lining, providing permanent channel lining, decreasing channel grade, increasing channel width, selection vegetative with greater retardance, selecting permanent linings other than grasses, and implementing combination of these and other methods.
Soils susceptible to sinkhole formation
Locate facilities, such as sediment basins or traps or stormwater detention or retention basins, on other soil types. Line reservoir areas with impermeable linings, limiting standing water depths, limiting retention times and implementing combinations of these and/or other methods.

Chatham Financial Stormwater Management Report Kennett Township, Chester County Page 5
2.0 RUNOFF MANAGEMENT The purpose of the stormwater management design is to quantify and control stormwater runoff generated by the modifications of the ground surface conditions to the site (i.e. parking lot). Postdevelopment stormwater management is achieved at the site through two (2) underground infiltration facilities strategically placed throughout the site to control runoff. There is also a rain garden located just south of the proposed parking lot to capture runoff from lawn area to further reduce peak flow discharge, especially during the 2year storm. The majority of the proposed development is controlled by the underground facilities and rain garden, while a small area of lawn will flow off the site to the south uncontrolled. The infiltration beds have been designed utilizing the Soil Conservation Service (SCS) method and Kennett Township regulations (See Appendix D, Standard Worksheets and Design Calculations attached to this report.). These systems are designed to provide an overall reduction in the postdeveloped runoff for the 10year, 25year, 50year, and 100year, 24hour storm event to the predevelopment runoff rates for the equivalent storm events and a reduction for the 2Year to the 1year predevelopment rate, and 5year storm to the 2year predevelopment rate. A stormwater conveyance system will be utilized to convey runoff from the proposed improvements to the proposed stormwater facilities. The stormwater conveyance system will be designed to convey flows up to the 100year storm event. Flows to the pipes were modeled using the Universal Rational Method and the pipes sized using Manning’s Method and Hydraulic Grade Line calculations which are provided in Appendix E. The infiltration beds have been designed and sized to fully infiltrate the increase in volume, pre to postdevelopment for the 5year storm as required by Kennett Township’s regulations. 3.0 NPDES STORMWATER COMPLIANCE As stated above, the infiltration facilities have been designed and sized to fully infiltrate the 5year increase in volume; therefore the NPDES Phase II infiltration requirement, which requires infiltration of the 2year increase, has been met. Furthermore, as described above, the infiltration beds have been designed to incorporate Pennsylvania Department of Environmental Protectionʹs infiltration guidelines, as stated in Appendix C of the Pennsylvania Stormwater Best Management Practices Manual dated December 2006. The stormwater management systems have been designed to maximize infiltration best management practice (BMP) technologies and minimize point source discharges. This plan will further act to perform/provide the following:
· Preserve the integrity of stream channels and maintain and protect the physical, biological and chemical qualities of the receiving stream by utilizing several BMPs to handle the increase in runoff and volume prior to reaching the stream.
· Prevent an increase in the rate of stormwater runoff by utilizing BMPs to reduce the peak flow rate of all storm events up to the 100 year to below the equivalent storm in the predeveloped condition.
· Minimize any increase in stormwater runoff volume by utilizing infiltration BMPs which are designed and sized to fully infiltrate the 5year increase in volume.
· Minimize impervious areas by not maximizing the number of parking spaces on the property.

Chatham Financial Stormwater Management Report Kennett Township, Chester County Page 6
· Maximize the protection of existing drainage features and existing vegetation by capturing stormwater runoff from the proposed impervious areas and then conveying the flow to stormwater BMPs facilities prior to any release to the existing UNT, thereby protecting it from any sediment.
· Minimize land clearing and grading by designing the parking lot to best match existing grades to preserve and protect the greatest extent possible of the existing vegetation;
· Minimize soil compaction by specifying the installation of orange construction fencing to protect the areas of the proposed infiltration BMPs.
· Utilize other structural or nonstructural BMPs that prevent or minimize changes in stormwater runoff. The structural BMPs are infiltration beds, water quality inlets, vegetated swales, and a rain garden while the nonstructural BMP is landscape restoration.
D.L. Howell & Associates, Inc. has designed Best management Practices (BMP’s) consistent with Chapter 6 of the PA Stormwater Best Management Practices Manual within the stormwater collection and conveyance system in addition to infiltrating the net increase in volume from pre to postdevelopment for the 5year storm event. Mitigating Thermal Impacts: The potential thermal impacts to surface waters are mitigated by the proposed stormwater management system. The BMP facilities are designed to infiltrate volumes greater than the “first flush” of a storm event. It is this “first flush” that carries the highest thermal impact therefore through various infiltration methods, the BMPs mitigate any thermal impacts to the stream by allowing infiltrated runoff to cool prior to reaching surface waters.
Table 3.1
NPDES Compliance Analysis
Drainage Area: L.O.D.
Preconstruction
Post Construction
Net Change
Design storm frequency: 2yr/24 hr Rainfall amount: 3.2"
Impervious area (acres) 0.00 1.41 +1.41
Volume of stormwater runoff acrefeet or cubic feet without planned stormwater BMPs
2,891 18,702 +15,811
Volume of stormwater runoff acrefeet or cubic feet with planned stormwater BMPs
17,573 1,762
Stormwater peak discharge rate for the design frequency storm (cubic feet per second)
0.686 0.141 0.545

Chatham Financial Stormwater Management Report Kennett Township, Chester County Page 7
4.0 CONCLUSIONS D.L. Howell & Associates, Inc. has completed a stormwater engineering design for the proposed project in Kennett Township, Chester County, Pennsylvania. Using sitespecific topography, soils, land cover, hydrologic data, and Township Ordinances, D.L. Howell & Associates, Inc. designed the stormwater management system for the proposed facilities. The objective of the stormwater design was to develop sitespecific stormwater management structures that reduce postdevelopment runoff to predevelopment runoff rates and provide volumetric storage per Township and PADEP NPDES Phase II requirements. Postdevelopment stormwater management is achieved through a stormwater collection system consisting of curbed inlets, swales, stormwater infiltration beds and a rain garden. The postdevelopment flows are summarized in Appendix B.

Chatham Financial Stormwater Management Report Kennett Township, Chester County Page A
APPENDIX A
5YEAR INFILTRATION REQUIREMENT CALCULATIONS

Pennsylvania Stormwater Best Management Practices Manual Chapter 8
PROJECT:Drainage Area:5-Year Rainfall: 4.2 in
Total Site Area: 15.256 acresProtected Site Area: 12.922 acresManaged Area: 2.334 acres
Existing Conditions
Cover Type/Conditions
Soil Type
Area (sf) Area (ac) CN S la (0.2*S) Q Runoff1 (in)Runoff
Volume2 (ft3)
Woodland A 0 25Meadow A 0 30Impervious A 0 98
Woodland B 55Meadow B 101,683 2.33 58 7.2414 1.4483 0.76 6,421Meadow (20% Exist. Iimp.) B 58Impervious (80% Exist.) B 84
Woodland C 70Meadow C 71Impervious C 98
Woodland D 0 77Meadow D 0 78Impervious D 0 98
TOTAL: 101,683 2.33 6,421
Developed Conditions
Cover Type/Conditions
Soil Type
Area (sf) Area (ac) CN S la (0.2*S) Q Runoff1 (in)Runoff
Volume2 (ft3)Lawn C 40,064 0.92 74 3.5135 0.7027 1.74 5,825Impervious N/A 61,619 1.41 98 0.2041 0.0408 3.96 20,358
TOTAL: 101,683 2.33 26,183
5-Year Volume Increase (ft3):
1. Runoff (in) = Q = (P - 0.2S)2 / (P + 08.S)P = 2-Year Rainfall (in)S = (1000/CN) - 10
2. Runoff Volume (CF) = Q x Area x 1/12Q = Runoff (in)Area = Land Use Area (Sq. Ft)
Note: Runoff Volume must be calculated for EACH land use type/condition and HSGI.The use of a weighted CN value for volume calculations is not acceptable.
WORKSHEET 4 . CHANGE IN RUNOFF VOLUME FOR 5-YR STORM EVENT
Chatham Financial
Limit of Disturbance (LOD)
19,762
5-Year Volume Increase = Developed Conditions Runoff Volume - Existing Conditions Runoff Volume
363-0300-002 / December 30, 2006

PROJECT:5-Year Rainfall: 4.2 in
BMP:
Cover Type Soil Type Area (sf) Area (ac) CN S la (0.2*S) Q Runoff1
(in)Runoff Volume2
(ft3)Impervious N/A 27,435 0.63 98 0.2041 0.0408 3.96 9,064Lawn C 18,849 0.43 74 3.5135 0.7027 1.74 2,740
TOTAL: 46,284 1.06 11,805
BMP:
Cover Type Soil Type Area (sf) Area (ac) CN S la (0.2*S) Q Runoff1
(in)Runoff Volume2
(ft3)Impervious N/A 34,134 0.78 98 0.2041 0.0408 3.96 11,277Lawn C 9,763 0.22 74 3.5135 0.7027 1.74 1,419
TOTAL: 43,897 1.01 12,697
RUNOFF VOLUME FOR 5-YR STORM EVENT TO SELECTED BMPS
Chatham Financial
Bed 1
Bed 2
3930-PM-WM0035 / Rev 5/2007

Pipe Material HDPEPipe Size 30 in. Void Ratio 0.40Pipe Size ID 2.50 ft. Void Ratio 0.40Pipe Size OD 2.93 ft.
Pipe Spacing 2.00 ft. Bed Area 7,600Ext. Width 4.00 ft. Bed Area 0.17Number 15.00 pipes
Pipe Length 81 ft. Pipe Width 71.88Bed Length 95.00 ft. Bed Width 80.00Bottom Elev. 375 ELEV (ft.)
Basin Slope 0.000 ft./ft.
d/D Depth Elevation A/Afull Length A1 A2 Stone Stone Stone Total TotalDownstream Upstream Indiv. Total Downstream Upstream Below S.L. Above S.L. Total
(ft.) (ft.) (sf) (lf) (sf) (sf) (cf) (cf) (cf) (cf) (cf) (cf) (cf) (cf) (ac-ft)
Stone 0 375.00 0.000 0.00 0.00 0.00 0.00 0.00 0.00 0.00 0.00 0.00 0.00 0 0.000
ft.
PROJECT - CHATHAM FINANCIAL
KENNETT TOWNSHIP, CHESTER COUNTYJOB NUMBER - 2731
REVISION - 0 12/14/2016BY: CMD CHKD BY:
UNDERGROUND BASIN DESIGN (UG 1)
above springline
below springline
S.F.
ACRES
ft.
STORAGE TABLEAREA VOLUME
Long Pipe(s) Cross Pipe(s)
Stone 0 375.00 0.000 0.00 0.00 0.00 0.00 0.00 0.00 0.00 0.00 0.00 0.00 0 0.000Stone 0.25 375.25 0.000 81.00 0.00 0.00 0.00 0.00 0.00 0.00 760.00 0.00 760.00 760 0.017Stone 0.5 375.50 0.000 81.00 0.00 0.00 0.00 0.00 0.00 0.00 1,520.00 0.00 1,520.00 1520 0.0350.10 0.75 375.75 0.052 81.00 0.26 0.26 20.68 310.13 18.35 18.35 2,135.85 0.00 2,135.85 2483 0.0570.20 1 376.00 0.142 81.00 0.70 0.70 56.46 846.90 50.10 50.10 2,646.37 0.00 2,646.37 3593 0.0820.30 1.25 376.25 0.252 81.00 1.24 1.24 100.20 1,502.96 88.91 88.91 3,101.45 0.00 3,101.45 4782 0.1100.40 1.5 376.50 0.373 81.00 1.83 1.83 148.31 2,224.61 131.60 131.60 3,526.04 0.00 3,526.04 6014 0.1380.50 1.75 376.75 0.500 81.00 2.45 2.45 198.80 2,982.06 176.41 176.41 3,933.99 0.00 3,933.99 7269 0.1670.60 2 377.00 0.625 81.00 3.07 3.07 248.50 3,727.57 220.51 220.51 3,933.99 316.90 4,250.89 8419 0.1930.70 2.25 377.25 0.747 81.00 3.67 3.67 297.01 4,455.19 263.55 263.55 3,933.99 738.72 4,672.71 9655 0.2220.80 2.5 377.50 0.856 81.00 4.20 4.20 340.35 5,105.28 302.01 302.01 3,933.99 1,196.57 5,130.56 10840 0.2490.90 2.75 377.75 0.948 81.00 4.65 4.65 376.93 5,653.98 334.47 334.47 3,933.99 1,701.54 5,635.53 11958 0.2751.00 3 378.00 1.000 81.00 4.91 4.91 397.61 5,964.11 352.82 352.82 3,933.99 2,317.40 6,251.39 12921 0.297
Stone 3.25 378.25 1.000 81.00 4.91 4.91 397.61 5,964.11 352.82 352.82 3,933.99 3,077.40 7,011.39 13681 0.314Stone 3.5 378.50 1.000 81.00 4.91 4.91 397.61 5,964.11 352.82 352.82 3,933.99 3,837.40 7,771.39 14441 0.332
Totals 14441 0.332
Note: Stone Volume Equation Utilizing Void Ratio specified above equal toTotal Bed Volume (Bed Length x Bed Width) - Pipe Area based on O.D. (Long Pipes + Cross Pipes) X Void Ratio
NOTES:
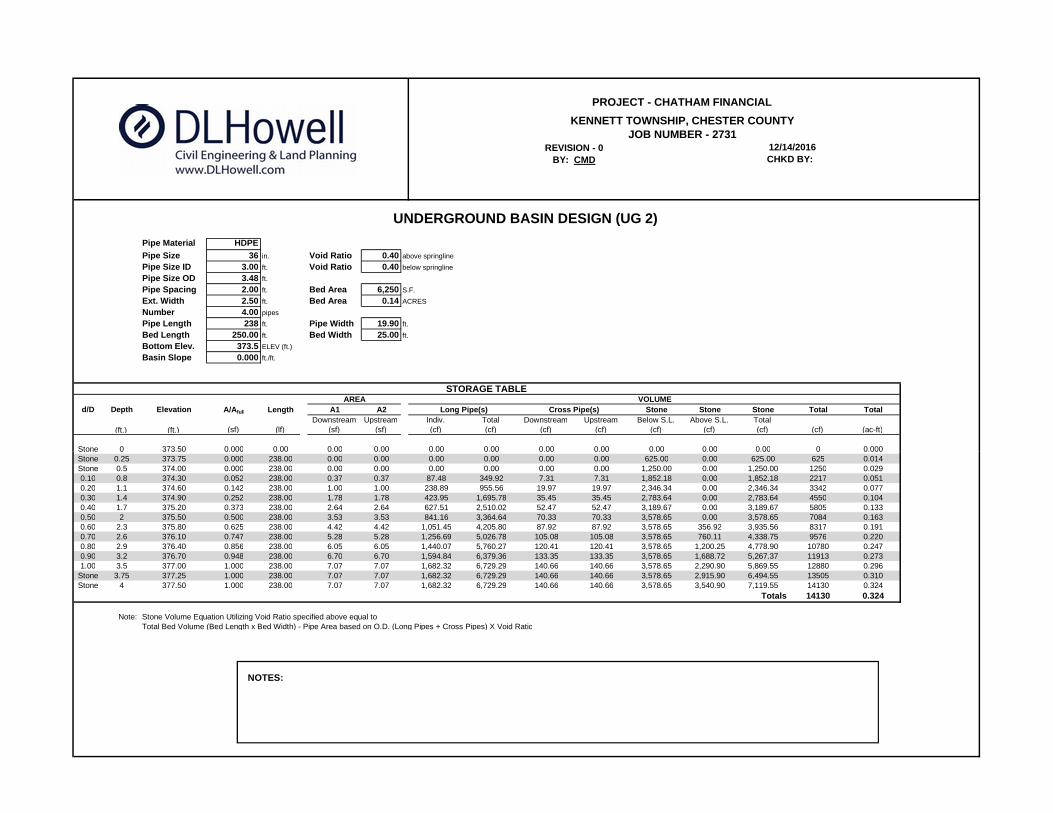
Pipe Material HDPEPipe Size 36 in. Void Ratio 0.40Pipe Size ID 3.00 ft. Void Ratio 0.40Pipe Size OD 3.48 ft.
Pipe Spacing 2.00 ft. Bed Area 6,250Ext. Width 2.50 ft. Bed Area 0.14Number 4.00 pipes
Pipe Length 238 ft. Pipe Width 19.90Bed Length 250.00 ft. Bed Width 25.00Bottom Elev. 373.5 ELEV (ft.)
Basin Slope 0.000 ft./ft.
d/D Depth Elevation A/Afull Length A1 A2 Stone Stone Stone Total TotalDownstream Upstream Indiv. Total Downstream Upstream Below S.L. Above S.L. Total
(ft.) (ft.) (sf) (lf) (sf) (sf) (cf) (cf) (cf) (cf) (cf) (cf) (cf) (cf) (ac-ft)
Stone 0 373.50 0.000 0.00 0.00 0.00 0.00 0.00 0.00 0.00 0.00 0.00 0.00 0 0.000
S.F.
ACRES
ft.
BY: CMD CHKD BY:
UNDERGROUND BASIN DESIGN (UG 2)
above springline
below springline
PROJECT - CHATHAM FINANCIAL
KENNETT TOWNSHIP, CHESTER COUNTYJOB NUMBER - 2731
REVISION - 0 12/14/2016
ft.
STORAGE TABLEAREA VOLUME
Long Pipe(s) Cross Pipe(s)
Stone 0 373.50 0.000 0.00 0.00 0.00 0.00 0.00 0.00 0.00 0.00 0.00 0.00 0 0.000Stone 0.25 373.75 0.000 238.00 0.00 0.00 0.00 0.00 0.00 0.00 625.00 0.00 625.00 625 0.014Stone 0.5 374.00 0.000 238.00 0.00 0.00 0.00 0.00 0.00 0.00 1,250.00 0.00 1,250.00 1250 0.0290.10 0.8 374.30 0.052 238.00 0.37 0.37 87.48 349.92 7.31 7.31 1,852.18 0.00 1,852.18 2217 0.0510.20 1.1 374.60 0.142 238.00 1.00 1.00 238.89 955.56 19.97 19.97 2,346.34 0.00 2,346.34 3342 0.0770.30 1.4 374.90 0.252 238.00 1.78 1.78 423.95 1,695.78 35.45 35.45 2,783.64 0.00 2,783.64 4550 0.1040.40 1.7 375.20 0.373 238.00 2.64 2.64 627.51 2,510.02 52.47 52.47 3,189.67 0.00 3,189.67 5805 0.1330.50 2 375.50 0.500 238.00 3.53 3.53 841.16 3,364.64 70.33 70.33 3,578.65 0.00 3,578.65 7084 0.1630.60 2.3 375.80 0.625 238.00 4.42 4.42 1,051.45 4,205.80 87.92 87.92 3,578.65 356.92 3,935.56 8317 0.1910.70 2.6 376.10 0.747 238.00 5.28 5.28 1,256.69 5,026.78 105.08 105.08 3,578.65 760.11 4,338.75 9576 0.2200.80 2.9 376.40 0.856 238.00 6.05 6.05 1,440.07 5,760.27 120.41 120.41 3,578.65 1,200.25 4,778.90 10780 0.2470.90 3.2 376.70 0.948 238.00 6.70 6.70 1,594.84 6,379.36 133.35 133.35 3,578.65 1,688.72 5,267.37 11913 0.2731.00 3.5 377.00 1.000 238.00 7.07 7.07 1,682.32 6,729.29 140.66 140.66 3,578.65 2,290.90 5,869.55 12880 0.296
Stone 3.75 377.25 1.000 238.00 7.07 7.07 1,682.32 6,729.29 140.66 140.66 3,578.65 2,915.90 6,494.55 13505 0.310Stone 4 377.50 1.000 238.00 7.07 7.07 1,682.32 6,729.29 140.66 140.66 3,578.65 3,540.90 7,119.55 14130 0.324
Totals 14130 0.324
Note: Stone Volume Equation Utilizing Void Ratio specified above equal toTotal Bed Volume (Bed Length x Bed Width) - Pipe Area based on O.D. (Long Pipes + Cross Pipes) X Void Ratio
NOTES:

BMP LOADING RATIOBMP LOADING RATIOCALCULATION WORKSHEET
DATE: 12/21/2016
REV: 0
BY: CMD
JOB NO.: 2731 PROJECT: Chatham Financial TOWNSHIP: Kennett
Drainage Area: Post to Bed 1
1.06 AC 0.63 AC
0.13 AC 0.13 AC
Required Infiltration Surface Area
Total Loading Surface Area = Impervious Loading Area =
Total Drainage Area: Impervious Area:
0.13 AC 0.13 AC
COMMENT0.170.000.00
Total Loading Surface Area = Impervious Loading Area =
BMP Area (acres)BMP/Infiltation Areas:
Subsurface Infiltration Bed
0.000.000.000.000.000.17Total BMP/Infiltation Areas Provided:
6.08 :1 3.61 :1Total Loading Ratio = Impervious Loading Ratio =

BMP LOADING RATIOBMP LOADING RATIOCALCULATION WORKSHEET
DATE: 12/21/2016
REV: 0
BY: CMD
JOB NO.: 2731 PROJECT: Chatham Financial TOWNSHIP: Kennett
Drainage Area: Post to Bed 2
1.01 AC 0.78 AC
0.13 AC 0.16 AC
Total Drainage Area: Impervious Area:
Required Infiltration Surface Area
Total Loading Surface Area = Impervious Loading Area =0.13 AC 0.16 AC
COMMENT0.140.000.00
Total Loading Surface Area = Impervious Loading Area =
BMP Area (acres)BMP/Infiltation Areas:
Subsurface Infiltration Bed
0.000.000.000.000.000.14Total BMP/Infiltation Areas Provided:
7.04 :1 5.44 :1Total Loading Ratio = Impervious Loading Ratio =

Chatham Financial Stormwater Management Report Kennett Township, Chester County Page B
APPENDIX B
KENNETT TOWNSHIP POST DEVELOPMENT
FLOW REDUCTION SUMMARY

Stormwater Summary
DATE: 12/14/2016
Peak Flow Reduction RequirementsWest POI
DATE: 12/14/2016
BY: CMD
JOB NO.: 2731 PROJECT: TOWNSHIP: Kennett
DESCRIPTION: Stormwater Summary
1-year 0.145 cfs Hydrograph 1
1-year 0.089 cfsPre-DevelopedPost-Developed
Chatham Financial
1-year 0.089 cfs Hydrograph 14
2-year 0.686 cfs Hydrograph 1
2-year 0.141 cfs Hydrograph 14
5-year 2.211 cfs Hydrograph 1
5-year 0.237 cfs Hydrograph 14
Post-Developed
Post-Developed
Pre-DevelopedPost-Developed
Pre-Developed
10-year 3.759 cfs Hydrograph 1
10-year 0.390 cfs Hydrograph 14
25-year 5.039 cfs Hydrograph 1
25-year 0.999 cfs Hydrograph 14
50-year 6.636 cfs Hydrograph 1
Post-Developed
Pre-Developed
Pre-Developed
Pre-DevelopedPost-Developed
50-year 6.636 cfs Hydrograph 1
50-year 2.651 cfs Hydrograph 14
100-year 11.910 cfs Hydrograph 1
100-year 6.834 cfs Hydrograph 14
.
Pre-Developed
Pre-DevelopedPost-Developed
Post-Developed
Post Developed 2 Year Flow = 0.141 cfs0.145 cfs
0.237 cfs0.686 cfs
0.390 cfs3.759 cfsPre Developed 10 Year Flow =
Post Developed 10 Year Flow =
Pre Developed 1 Year Flow =
OKPost Developed 5 Year Flow =
OK
Peak Rate Control Requirement (New Development)
Pre Developed 2 Year Flow =
OK
3.759 cfs
0.999 cfs5.039 cfs
2.651 cfs6.636 cfsPre Developed 50 Year Flow =
Pre Developed 10 Year Flow =
Pre Developed 25 Year Flow = Post Developed 25 Year Flow =
Post Developed 50 Year Flow =
OK
OK
OK
6.834 cfs11.910 cfs
OKPost Developed 100 Year Flow = Pre Developed 100 Year Flow =

Chatham Financial Stormwater Management Report Kennett Township, Chester County Page C
APPENDIX C
SCS METHOD CURVE NUMBER (CN) CALCULATIONS
SOIL CONSERVATION SERVICE
DATE: 12/14/2016
REV: 0
BY: CMD
SOIL CONSERVATION SERVICEHYDROLOGIC DATA FOR WATERSHED
RUNOFF COMPUTATIONS
BY: CMD
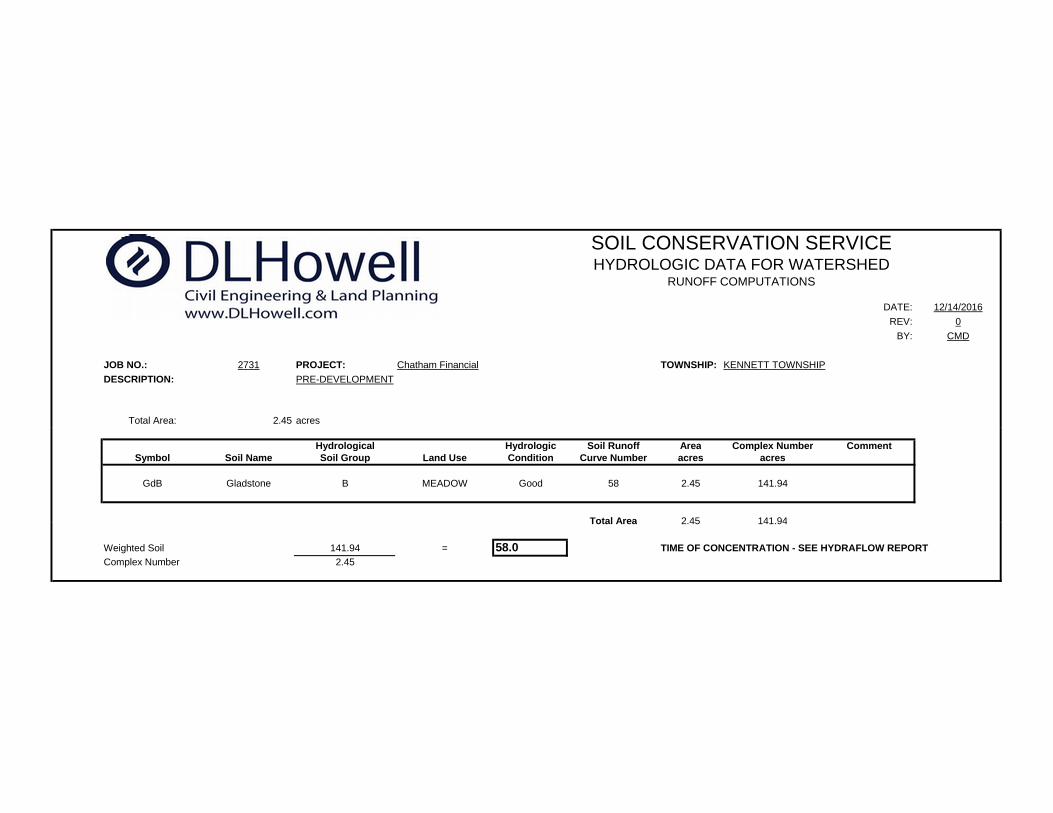
JOB NO.: 2731 PROJECT: Chatham Financial TOWNSHIP: KENNETT TOWNSHIP
DESCRIPTION: PRE-DEVELOPMENT
Total Area: 2.45 acres
Hydrological Hydrologic Soil Runoff Area Complex Number CommentSymbol Soil Name Soil Group Land Use Condition Curve Number acres acres
GdB Gladstone B MEADOW Good 58 2.45 141.94
Total Area 2.45 141.94Total Area 2.45 141.94
Weighted Soil 141.94 = 58.0 TIME OF CONCENTRATION - SEE HYDRAFLOW REPORTComplex Number 2.45

SOIL CONSERVATION SERVICE
DATE: 12/14/2016
REV: 0
BY: CMD
SOIL CONSERVATION SERVICEHYDROLOGIC DATA FOR WATERSHED
RUNOFF COMPUTATIONS
BY: CMD
JOB NO.: 2731 PROJECT: Chatham Financial TOWNSHIP: KENNETT TOWNSHIP
DESCRIPTION: POST DEVELOPMENT - Infiltration Bed 1
Total Area: 1.06 acres
Hydrological Hydrologic Soil Runoff Area Complex Number CommentSymbol Soil Name Soil Group Land Use Condition Curve Number acres acres
GdB Gladstone B (Lowered to C) LAWN Good 74 0.43 32.02N/A N/A IMPERVIOUS Good 98 0.63 61.72
Total Area 1.06 93.74Total Area 1.06 93.74
Weighted Soil 93.74 = 88.2 TIME OF CONCENTRATION - ASSUME 5 MINUTESComplex Number 1.06

SOIL CONSERVATION SERVICE
DATE: 12/14/2016
REV: 0
BY: CMD
SOIL CONSERVATION SERVICEHYDROLOGIC DATA FOR WATERSHED
RUNOFF COMPUTATIONS
BY: CMD
JOB NO.: 2731 PROJECT: Chatham Financial TOWNSHIP: KENNETT TOWNSHIP
DESCRIPTION: POST DEVELOPMENT - Infiltration Bed 2
Total Area: 1.01 acres
Hydrological Hydrologic Soil Runoff Area Complex Number CommentSymbol Soil Name Soil Group Land Use Condition Curve Number acres acres
GdB Gladstone B (Lowered to C) LAWN Good 74 0.22 16.59N/A N/A IMPERVIOUS Good 98 0.78 76.79
Total Area 1.01 93.38Total Area 1.01 93.38
Weighted Soil 93.38 = 92.7 TIME OF CONCENTRATION - ASSUME 5 MINUTESComplex Number 1.01

SOIL CONSERVATION SERVICE
DATE: 12/14/2016
REV: 0
BY: CMD
SOIL CONSERVATION SERVICEHYDROLOGIC DATA FOR WATERSHED
RUNOFF COMPUTATIONS
BY: CMD
JOB NO.: 2731 PROJECT: Chatham Financial TOWNSHIP: KENNETT TOWNSHIP
DESCRIPTION: POST DEVELOPMENT - Rain Garden 1
Total Area: 0.29 acres
Hydrological Hydrologic Soil Runoff Area Complex Number CommentSymbol Soil Name Soil Group Land Use Condition Curve Number acres acres
GdB Gladstone B (Lowered to C) LAWN Good 74 0.29 21.61N/A N/A IMPERVIOUS Good 98 0.00 0.00
Total Area 0.29 21.61Total Area 0.29 21.61
Weighted Soil 21.61 = 74.0 TIME OF CONCENTRATION - ASSUME 5 MINUTESComplex Number 0.29

SOIL CONSERVATION SERVICE
DATE: 12/14/2016
REV: 0
BY: CMD
SOIL CONSERVATION SERVICEHYDROLOGIC DATA FOR WATERSHED
RUNOFF COMPUTATIONS
BY: CMD
JOB NO.: 2731 PROJECT: Chatham Financial TOWNSHIP: KENNETT TOWNSHIP
DESCRIPTION: POST BYPASS
Total Area: 0.08 acres
Hydrological Hydrologic Soil Runoff Area Complex Number CommentSymbol Soil Name Soil Group Land Use Condition Curve Number acres acres
GdB Gladstone B (Lowered to C) LAWN Good 74 0.08 6.29N/A N/A IMPERVIOUS Good 98 0.00 0.00
Total Area 0.08 6.29Total Area 0.08 6.29
Weighted Soil 6.29 = 74.0 TIME OF CONCENTRATION - ASSUME 5 MINUTESComplex Number 0.08

Chatham Financial Stormwater Management Report Kennett Township, Chester County Page D
APPENDIX D
HYDRAFLOW HYDROGRAPH REPORTS

Hydrograph Summary Report1
Hyd. Hydrograph Peak Time Time to Hyd. Inflow Maximum Total HydrographNo. type flow interval Peak volume hyd(s) elevation strge used Description
(origin) (cfs) (min) (min) (cuft) (ft) (cuft)
1 SCS Runoff 0.145 2 726 1,448 ------ ------ ------ PRE-DEV
2 SCS Runoff 0.089 2 718 181 ------ ------ ------ BYPASS
4 SCS Runoff 2.632 2 716 5,347 ------ ------ ------ POST TO BED 1
5 Reservoir 0.000 2 n/a 0 4 376.34 5,347 BED 1 ROUTED
7 SCS Runoff 3.029 2 716 6,348 ------ ------ ------ POST TO BED 2
8 Combine 3.029 2 716 6,348 5, 7 ------ ------ BED 1 ROUTED + POST TO BED 2
9 Reservoir 0.000 2 n/a 0 8 375.32 6,348 BED 2 ROUTED
11 SCS Runoff 0.322 2 718 657 ------ ------ ------ POST TO RAIN GARDEN
12 Reservoir 0.000 2 n/a 0 11 375.23 657 RAIN GARDEN ROUTED
14 Combine 0.089 2 718 181 2, 9, 12, ------ ------ COMBINED
2731 SWM.gpw Return Period: 1 Year Tuesday, 12 / 27 / 2016
Hydraflow Hydrographs Extension for AutoCAD® Civil 3D® 2016 by Autodesk, Inc. v11

Hydrograph ReportHydraflow Hydrographs Extension for AutoCAD® Civil 3D® 2016 by Autodesk, Inc. v11 Tuesday, 12 / 27 / 2016
Hyd. No. 1
PRE-DEV
Hydrograph type = SCS Runoff Peak discharge = 0.145 cfsStorm frequency = 1 yrs Time to peak = 726 minTime interval = 2 min Hyd. volume = 1,448 cuftDrainage area = 2.450 ac Curve number = 58Basin Slope = 0.0 % Hydraulic length = 0 ftTc method = TR55 Time of conc. (Tc) = 10.80 minTotal precip. = 2.60 in Distribution = Type IIStorm duration = 24 hrs Shape factor = 484
2
0 120 240 360 480 600 720 840 960 1080 1200 1320 1440 1560
Q (cfs)
0.00 0.00
0.05 0.05
0.10 0.10
0.15 0.15
0.20 0.20
0.25 0.25
0.30 0.30
0.35 0.35
0.40 0.40
0.45 0.45
0.50 0.50
Q (cfs)
Time (min)
PRE-DEVHyd. No. 1 -- 1 Year
Hyd No. 1

TR55 Tc Worksheet3
Hydraflow Hydrographs Extension for AutoCAD® Civil 3D® 2016 by Autodesk, Inc. v11
Hyd. No. 1
PRE-DEV
Description A B C Totals
Sheet FlowManning's n-value = 0.240 0.011 0.011Flow length (ft) = 100.0 0.0 0.0Two-year 24-hr precip. (in) = 3.20 0.00 0.00Land slope (%) = 6.00 0.00 0.00
Travel Time (min) = 9.20 + 0.00 + 0.00 = 9.20
Shallow Concentrated FlowFlow length (ft) = 284.00 0.00 0.00Watercourse slope (%) = 3.52 0.00 0.00Surface description = Unpaved Paved PavedAverage velocity (ft/s) =3.03 0.00 0.00
Travel Time (min) = 1.56 + 0.00 + 0.00 = 1.56
Channel FlowX sectional flow area (sqft) = 0.00 0.00 0.00Wetted perimeter (ft) = 0.00 0.00 0.00Channel slope (%) = 0.00 0.00 0.00Manning's n-value = 0.015 0.015 0.015Velocity (ft/s) =0.00
0.000.00
Flow length (ft) ({0})0.0 0.0 0.0
Travel Time (min) = 0.00 + 0.00 + 0.00 = 0.00
Total Travel Time, Tc .............................................................................. 10.80 min

Hydrograph ReportHydraflow Hydrographs Extension for AutoCAD® Civil 3D® 2016 by Autodesk, Inc. v11 Tuesday, 12 / 27 / 2016
Hyd. No. 2
BYPASS
Hydrograph type = SCS Runoff Peak discharge = 0.089 cfsStorm frequency = 1 yrs Time to peak = 718 minTime interval = 2 min Hyd. volume = 181 cuftDrainage area = 0.080 ac Curve number = 74Basin Slope = 0.0 % Hydraulic length = 0 ftTc method = User Time of conc. (Tc) = 5.00 minTotal precip. = 2.60 in Distribution = Type IIStorm duration = 24 hrs Shape factor = 484
4
0 120 240 360 480 600 720 840 960 1080 1200 1320 1440 1560
Q (cfs)
0.00 0.00
0.01 0.01
0.02 0.02
0.03 0.03
0.04 0.04
0.05 0.05
0.06 0.06
0.07 0.07
0.08 0.08
0.09 0.09
0.10 0.10
Q (cfs)
Time (min)
BYPASSHyd. No. 2 -- 1 Year
Hyd No. 2

Hydrograph ReportHydraflow Hydrographs Extension for AutoCAD® Civil 3D® 2016 by Autodesk, Inc. v11 Tuesday, 12 / 27 / 2016
Hyd. No. 4
POST TO BED 1
Hydrograph type = SCS Runoff Peak discharge = 2.632 cfsStorm frequency = 1 yrs Time to peak = 716 minTime interval = 2 min Hyd. volume = 5,347 cuftDrainage area = 1.060 ac Curve number = 88.2Basin Slope = 0.0 % Hydraulic length = 0 ftTc method = User Time of conc. (Tc) = 5.00 minTotal precip. = 2.60 in Distribution = Type IIStorm duration = 24 hrs Shape factor = 484
5
0 120 240 360 480 600 720 840 960 1080 1200 1320 1440
Q (cfs)
0.00 0.00
1.00 1.00
2.00 2.00
3.00 3.00
Q (cfs)
Time (min)
POST TO BED 1Hyd. No. 4 -- 1 Year
Hyd No. 4

Hydrograph ReportHydraflow Hydrographs Extension for AutoCAD® Civil 3D® 2016 by Autodesk, Inc. v11 Tuesday, 12 / 27 / 2016
Hyd. No. 5
BED 1 ROUTED
Hydrograph type = Reservoir Peak discharge = 0.000 cfsStorm frequency = 1 yrs Time to peak = n/aTime interval = 2 min Hyd. volume = 0 cuftInflow hyd. No. = 4 - POST TO BED 1 Max. Elevation = 376.34 ftReservoir name = BED 1 Max. Storage = 5,347 cuft
Storage Indication method used.
6
0 120 240 360 480 600 720 840 960 1080 1200 1320 1440
Q (cfs)
0.00 0.00
1.00 1.00
2.00 2.00
3.00 3.00
Q (cfs)
Time (min)
BED 1 ROUTEDHyd. No. 5 -- 1 Year
Hyd No. 5 Hyd No. 4 Total storage used = 5,347 cuft

Pond Report 7
Hydraflow Hydrographs Extension for AutoCAD® Civil 3D® 2016 by Autodesk, Inc. v11 Tuesday, 12 / 27 / 2016
Pond No. 2 - BED 1
Pond DataPond storage is based on user-defined values.
Stage / Storage TableStage (ft) Elevation (ft) Contour area (sqft) Incr. Storage (cuft) Total storage (cuft)
0.00 375.00 n/a 0 00.50 375.50 n/a 1,520 1,5203.00 378.00 n/a 11,401 12,9213.50 378.50 n/a 1,520 14,441
Culvert / Orifice Structures Weir Structures
[A] [B] [C] [PrfRsr] [A] [B] [C] [D]
Rise (in) = 15.00 0.00 0.00 0.00
Span (in) = 15.00 0.00 0.00 0.00
No. Barrels = 1 0 0 0Invert El. (ft) = 375.00 0.00 0.00 0.00
Length (ft) = 27.00 0.00 0.00 0.00
Slope (%) = 0.52 0.00 0.00 n/a
N-Value = .013 .013 .013 n/aOrifice Coeff. = 0.60 0.60 0.60 0.60
Multi-Stage = n/a No No No
Crest Len (ft) = 11.00 4.00 0.00 0.00
Crest El. (ft) = 384.86 378.00 0.00 0.00
Weir Coeff. = 3.33 3.33 3.33 3.33Weir Type = 1 Rect --- ---
Multi-Stage = Yes Yes No No
Exfil.(in/hr) = 0.000 (by Wet area)
TW Elev. (ft) = 0.00
Note: Culvert/Orifice outflows are analyzed under inlet (ic) and outlet (oc) control. Weir risers checked for orifice conditions (ic) and submergence (s).
0.00 0.50 1.00 1.50 2.00 2.50 3.00 3.50 4.00 4.50 5.00
Stage (ft)
0.00 375.00
1.00 376.00
2.00 377.00
3.00 378.00
4.00 379.00
Elev (ft)
Discharge (cfs)
Stage / Discharge
Total Q

Hydrograph ReportHydraflow Hydrographs Extension for AutoCAD® Civil 3D® 2016 by Autodesk, Inc. v11 Tuesday, 12 / 27 / 2016
Hyd. No. 7
POST TO BED 2
Hydrograph type = SCS Runoff Peak discharge = 3.029 cfsStorm frequency = 1 yrs Time to peak = 716 minTime interval = 2 min Hyd. volume = 6,348 cuftDrainage area = 1.010 ac Curve number = 92.7Basin Slope = 0.0 % Hydraulic length = 0 ftTc method = User Time of conc. (Tc) = 5.00 minTotal precip. = 2.60 in Distribution = Type IIStorm duration = 24 hrs Shape factor = 484
8
0 120 240 360 480 600 720 840 960 1080 1200 1320
Q (cfs)
0.00 0.00
1.00 1.00
2.00 2.00
3.00 3.00
4.00 4.00
Q (cfs)
Time (min)
POST TO BED 2Hyd. No. 7 -- 1 Year
Hyd No. 7

Hydrograph ReportHydraflow Hydrographs Extension for AutoCAD® Civil 3D® 2016 by Autodesk, Inc. v11 Tuesday, 12 / 27 / 2016
Hyd. No. 8
BED 1 ROUTED + POST TO BED 2
Hydrograph type = Combine Peak discharge = 3.029 cfsStorm frequency = 1 yrs Time to peak = 716 minTime interval = 2 min Hyd. volume = 6,348 cuftInflow hyds. = 5, 7 Contrib. drain. area = 1.010 ac
9
0 120 240 360 480 600 720 840 960 1080 1200 1320
Q (cfs)
0.00 0.00
1.00 1.00
2.00 2.00
3.00 3.00
4.00 4.00
Q (cfs)
Time (min)
BED 1 ROUTED + POST TO BED 2Hyd. No. 8 -- 1 Year
Hyd No. 8 Hyd No. 5 Hyd No. 7

Hydrograph ReportHydraflow Hydrographs Extension for AutoCAD® Civil 3D® 2016 by Autodesk, Inc. v11 Tuesday, 12 / 27 / 2016
Hyd. No. 9
BED 2 ROUTED
Hydrograph type = Reservoir Peak discharge = 0.000 cfsStorm frequency = 1 yrs Time to peak = n/aTime interval = 2 min Hyd. volume = 0 cuftInflow hyd. No. = 8 - BED 1 ROUTED + POST TO BED 2Max. Elevation = 375.32 ftReservoir name = BED 2 Max. Storage = 6,348 cuft
Storage Indication method used.
10
0 120 240 360 480 600 720 840 960 1080 1200 1320
Q (cfs)
0.00 0.00
1.00 1.00
2.00 2.00
3.00 3.00
4.00 4.00
Q (cfs)
Time (min)
BED 2 ROUTEDHyd. No. 9 -- 1 Year
Hyd No. 9 Hyd No. 8 Total storage used = 6,348 cuft

Pond Report 11
Hydraflow Hydrographs Extension for AutoCAD® Civil 3D® 2016 by Autodesk, Inc. v11 Tuesday, 12 / 27 / 2016
Pond No. 3 - BED 2
Pond DataPond storage is based on user-defined values.
Stage / Storage TableStage (ft) Elevation (ft) Contour area (sqft) Incr. Storage (cuft) Total storage (cuft)
0.00 373.50 n/a 0 00.50 374.00 n/a 1,250 1,2503.50 377.00 n/a 11,630 12,8804.00 377.50 n/a 1,250 14,130
Culvert / Orifice Structures Weir Structures
[A] [B] [C] [PrfRsr] [A] [B] [C] [D]
Rise (in) = 15.00 0.00 0.00 0.00
Span (in) = 15.00 0.00 0.00 0.00
No. Barrels = 1 0 0 0Invert El. (ft) = 374.75 0.00 0.00 0.00
Length (ft) = 135.00 0.00 0.00 0.00
Slope (%) = 0.56 0.00 0.00 n/a
N-Value = .013 .013 .013 n/aOrifice Coeff. = 0.60 0.60 0.60 0.60
Multi-Stage = n/a No No No
Crest Len (ft) = 11.00 2.00 0.00 0.00
Crest El. (ft) = 385.00 376.00 0.00 0.00
Weir Coeff. = 3.33 3.33 3.33 3.33Weir Type = 1 Rect --- ---
Multi-Stage = Yes Yes No No
Exfil.(in/hr) = 0.000 (by Wet area)
TW Elev. (ft) = 0.00
Note: Culvert/Orifice outflows are analyzed under inlet (ic) and outlet (oc) control. Weir risers checked for orifice conditions (ic) and submergence (s).
0.00 1.00 2.00 3.00 4.00 5.00 6.00 7.00
Stage (ft)
0.00 373.50
1.00 374.50
2.00 375.50
3.00 376.50
4.00 377.50
Elev (ft)
Discharge (cfs)
Stage / Discharge
Total Q

Hydrograph ReportHydraflow Hydrographs Extension for AutoCAD® Civil 3D® 2016 by Autodesk, Inc. v11 Tuesday, 12 / 27 / 2016
Hyd. No. 11
POST TO RAIN GARDEN
Hydrograph type = SCS Runoff Peak discharge = 0.322 cfsStorm frequency = 1 yrs Time to peak = 718 minTime interval = 2 min Hyd. volume = 657 cuftDrainage area = 0.290 ac Curve number = 74Basin Slope = 0.0 % Hydraulic length = 0 ftTc method = User Time of conc. (Tc) = 5.00 minTotal precip. = 2.60 in Distribution = Type IIStorm duration = 24 hrs Shape factor = 484
12
0 120 240 360 480 600 720 840 960 1080 1200 1320 1440 1560
Q (cfs)
0.00 0.00
0.05 0.05
0.10 0.10
0.15 0.15
0.20 0.20
0.25 0.25
0.30 0.30
0.35 0.35
0.40 0.40
0.45 0.45
0.50 0.50
Q (cfs)
Time (min)
POST TO RAIN GARDENHyd. No. 11 -- 1 Year
Hyd No. 11

Hydrograph ReportHydraflow Hydrographs Extension for AutoCAD® Civil 3D® 2016 by Autodesk, Inc. v11 Tuesday, 12 / 27 / 2016
Hyd. No. 12
RAIN GARDEN ROUTED
Hydrograph type = Reservoir Peak discharge = 0.000 cfsStorm frequency = 1 yrs Time to peak = n/aTime interval = 2 min Hyd. volume = 0 cuftInflow hyd. No. = 11 - POST TO RAIN GARDENMax. Elevation = 375.23 ftReservoir name = RAIN GARDEN 1 Max. Storage = 657 cuft
Storage Indication method used.
13
0 120 240 360 480 600 720 840 960 1080 1200 1320 1440 1560
Q (cfs)
0.00 0.00
0.05 0.05
0.10 0.10
0.15 0.15
0.20 0.20
0.25 0.25
0.30 0.30
0.35 0.35
0.40 0.40
0.45 0.45
0.50 0.50
Q (cfs)
Time (min)
RAIN GARDEN ROUTEDHyd. No. 12 -- 1 Year
Hyd No. 12 Hyd No. 11 Total storage used = 657 cuft

Pond Report 14
Hydraflow Hydrographs Extension for AutoCAD® Civil 3D® 2016 by Autodesk, Inc. v11 Tuesday, 12 / 27 / 2016
Pond No. 1 - RAIN GARDEN 1
Pond DataContours -User-defined contour areas. Average end area method used for volume calculation. Begining Elevation = 375.00 ft
Stage / Storage TableStage (ft) Elevation (ft) Contour area (sqft) Incr. Storage (cuft) Total storage (cuft)
0.00 375.00 2,648 0 00.50 375.50 3,186 1,459 1,4591.00 376.00 3,787 1,743 3,202
Culvert / Orifice Structures Weir Structures
[A] [B] [C] [PrfRsr] [A] [B] [C] [D]
Rise (in) = 4.00 0.00 0.00 0.00
Span (in) = 4.00 0.00 0.00 0.00
No. Barrels = 1 0 0 0Invert El. (ft) = 375.00 0.00 0.00 0.00
Length (ft) = 18.00 0.00 0.00 0.00
Slope (%) = 2.78 0.00 0.00 n/a
N-Value = .013 .013 .013 n/aOrifice Coeff. = 0.60 0.60 0.60 0.60
Multi-Stage = n/a No No No
Crest Len (ft) = 8.00 0.00 0.00 0.00
Crest El. (ft) = 375.50 0.00 0.00 0.00
Weir Coeff. = 3.33 3.33 3.33 3.33Weir Type = 1 --- --- ---
Multi-Stage = Yes No No No
Exfil.(in/hr) = 0.000 (by Wet area)
TW Elev. (ft) = 0.00
Note: Culvert/Orifice outflows are analyzed under inlet (ic) and outlet (oc) control. Weir risers checked for orifice conditions (ic) and submergence (s).
0.00 0.04 0.08 0.12 0.16 0.20 0.24 0.28 0.32 0.36 0.40
Stage (ft)
0.00 375.00
0.10 375.10
0.20 375.20
0.30 375.30
0.40 375.40
0.50 375.50
0.60 375.60
0.70 375.70
0.80 375.80
0.90 375.90
1.00 376.00
Elev (ft)
Discharge (cfs)
Stage / Discharge
Total Q

Hydrograph ReportHydraflow Hydrographs Extension for AutoCAD® Civil 3D® 2016 by Autodesk, Inc. v11 Tuesday, 12 / 27 / 2016
Hyd. No. 14
COMBINED
Hydrograph type = Combine Peak discharge = 0.089 cfsStorm frequency = 1 yrs Time to peak = 718 minTime interval = 2 min Hyd. volume = 181 cuftInflow hyds. = 2, 9, 12 Contrib. drain. area = 0.080 ac
15
0 120 240 360 480 600 720 840 960 1080 1200 1320 1440 1560
Q (cfs)
0.00 0.00
0.01 0.01
0.02 0.02
0.03 0.03
0.04 0.04
0.05 0.05
0.06 0.06
0.07 0.07
0.08 0.08
0.09 0.09
0.10 0.10
Q (cfs)
Time (min)
COMBINEDHyd. No. 14 -- 1 Year
Hyd No. 14 Hyd No. 2 Hyd No. 9 Hyd No. 12

Hydrograph Summary Report16
Hyd. Hydrograph Peak Time Time to Hyd. Inflow Maximum Total HydrographNo. type flow interval Peak volume hyd(s) elevation strge used Description
(origin) (cfs) (min) (min) (cuft) (ft) (cuft)
1 SCS Runoff 0.686 2 724 3,126 ------ ------ ------ PRE-DEV
2 SCS Runoff 0.141 2 718 282 ------ ------ ------ BYPASS
4 SCS Runoff 3.540 2 716 7,264 ------ ------ ------ POST TO BED 1
5 Reservoir 0.000 2 n/a 0 4 376.76 7,264 BED 1 ROUTED
7 SCS Runoff 3.903 2 716 8,307 ------ ------ ------ POST TO BED 2
8 Combine 3.903 2 716 8,307 5, 7 ------ ------ BED 1 ROUTED + POST TO BED 2
9 Reservoir 0.011 2 1444 74 8 375.82 8,291 BED 2 ROUTED
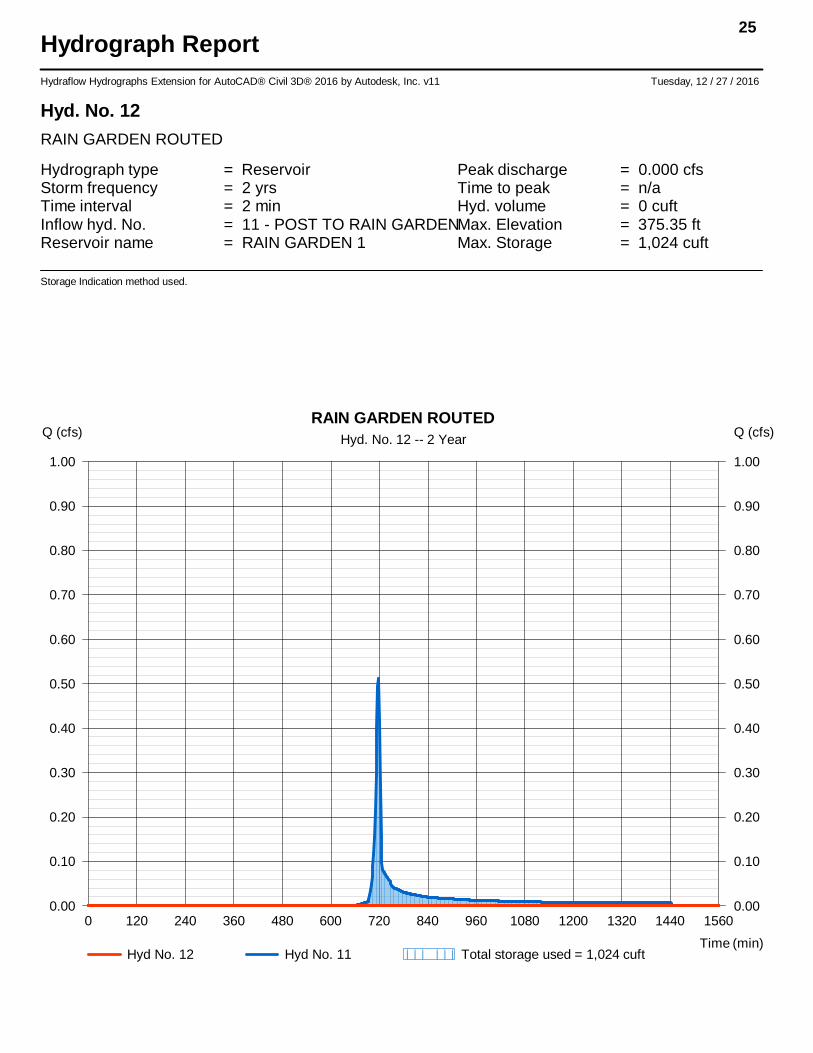
11 SCS Runoff 0.511 2 718 1,024 ------ ------ ------ POST TO RAIN GARDEN
12 Reservoir 0.000 2 n/a 0 11 375.35 1,024 RAIN GARDEN ROUTED
14 Combine 0.141 2 718 356 2, 9, 12, ------ ------ COMBINED
2731 SWM.gpw Return Period: 2 Year Tuesday, 12 / 27 / 2016
Hydraflow Hydrographs Extension for AutoCAD® Civil 3D® 2016 by Autodesk, Inc. v11

Hydrograph ReportHydraflow Hydrographs Extension for AutoCAD® Civil 3D® 2016 by Autodesk, Inc. v11 Tuesday, 12 / 27 / 2016
Hyd. No. 1
PRE-DEV
Hydrograph type = SCS Runoff Peak discharge = 0.686 cfsStorm frequency = 2 yrs Time to peak = 724 minTime interval = 2 min Hyd. volume = 3,126 cuftDrainage area = 2.450 ac Curve number = 58Basin Slope = 0.0 % Hydraulic length = 0 ftTc method = TR55 Time of conc. (Tc) = 10.80 minTotal precip. = 3.20 in Distribution = Type IIStorm duration = 24 hrs Shape factor = 484
17
0 120 240 360 480 600 720 840 960 1080 1200 1320 1440 1560
Q (cfs)
0.00 0.00
0.10 0.10
0.20 0.20
0.30 0.30
0.40 0.40
0.50 0.50
0.60 0.60
0.70 0.70
0.80 0.80
0.90 0.90
1.00 1.00
Q (cfs)
Time (min)
PRE-DEVHyd. No. 1 -- 2 Year
Hyd No. 1

Hydrograph ReportHydraflow Hydrographs Extension for AutoCAD® Civil 3D® 2016 by Autodesk, Inc. v11 Tuesday, 12 / 27 / 2016
Hyd. No. 2
BYPASS
Hydrograph type = SCS Runoff Peak discharge = 0.141 cfsStorm frequency = 2 yrs Time to peak = 718 minTime interval = 2 min Hyd. volume = 282 cuftDrainage area = 0.080 ac Curve number = 74Basin Slope = 0.0 % Hydraulic length = 0 ftTc method = User Time of conc. (Tc) = 5.00 minTotal precip. = 3.20 in Distribution = Type IIStorm duration = 24 hrs Shape factor = 484
18
0 120 240 360 480 600 720 840 960 1080 1200 1320 1440 1560
Q (cfs)
0.00 0.00
0.05 0.05
0.10 0.10
0.15 0.15
0.20 0.20
0.25 0.25
0.30 0.30
0.35 0.35
0.40 0.40
0.45 0.45
0.50 0.50
Q (cfs)
Time (min)
BYPASSHyd. No. 2 -- 2 Year
Hyd No. 2

Hydrograph ReportHydraflow Hydrographs Extension for AutoCAD® Civil 3D® 2016 by Autodesk, Inc. v11 Tuesday, 12 / 27 / 2016
Hyd. No. 4
POST TO BED 1
Hydrograph type = SCS Runoff Peak discharge = 3.540 cfsStorm frequency = 2 yrs Time to peak = 716 minTime interval = 2 min Hyd. volume = 7,264 cuftDrainage area = 1.060 ac Curve number = 88.2Basin Slope = 0.0 % Hydraulic length = 0 ftTc method = User Time of conc. (Tc) = 5.00 minTotal precip. = 3.20 in Distribution = Type IIStorm duration = 24 hrs Shape factor = 484
19
0 120 240 360 480 600 720 840 960 1080 1200 1320
Q (cfs)
0.00 0.00
1.00 1.00
2.00 2.00
3.00 3.00
4.00 4.00
Q (cfs)
Time (min)
POST TO BED 1Hyd. No. 4 -- 2 Year
Hyd No. 4

Hydrograph ReportHydraflow Hydrographs Extension for AutoCAD® Civil 3D® 2016 by Autodesk, Inc. v11 Tuesday, 12 / 27 / 2016
Hyd. No. 5
BED 1 ROUTED
Hydrograph type = Reservoir Peak discharge = 0.000 cfsStorm frequency = 2 yrs Time to peak = n/aTime interval = 2 min Hyd. volume = 0 cuftInflow hyd. No. = 4 - POST TO BED 1 Max. Elevation = 376.76 ftReservoir name = BED 1 Max. Storage = 7,264 cuft
Storage Indication method used.
20
0 120 240 360 480 600 720 840 960 1080 1200 1320
Q (cfs)
0.00 0.00
1.00 1.00
2.00 2.00
3.00 3.00
4.00 4.00
Q (cfs)
Time (min)
BED 1 ROUTEDHyd. No. 5 -- 2 Year
Hyd No. 5 Hyd No. 4 Total storage used = 7,264 cuft

Hydrograph ReportHydraflow Hydrographs Extension for AutoCAD® Civil 3D® 2016 by Autodesk, Inc. v11 Tuesday, 12 / 27 / 2016
Hyd. No. 7
POST TO BED 2
Hydrograph type = SCS Runoff Peak discharge = 3.903 cfsStorm frequency = 2 yrs Time to peak = 716 minTime interval = 2 min Hyd. volume = 8,307 cuftDrainage area = 1.010 ac Curve number = 92.7Basin Slope = 0.0 % Hydraulic length = 0 ftTc method = User Time of conc. (Tc) = 5.00 minTotal precip. = 3.20 in Distribution = Type IIStorm duration = 24 hrs Shape factor = 484
21
0 120 240 360 480 600 720 840 960 1080 1200
Q (cfs)
0.00 0.00
1.00 1.00
2.00 2.00
3.00 3.00
4.00 4.00
Q (cfs)
Time (min)
POST TO BED 2Hyd. No. 7 -- 2 Year
Hyd No. 7

Hydrograph ReportHydraflow Hydrographs Extension for AutoCAD® Civil 3D® 2016 by Autodesk, Inc. v11 Tuesday, 12 / 27 / 2016
Hyd. No. 8
BED 1 ROUTED + POST TO BED 2
Hydrograph type = Combine Peak discharge = 3.903 cfsStorm frequency = 2 yrs Time to peak = 716 minTime interval = 2 min Hyd. volume = 8,307 cuftInflow hyds. = 5, 7 Contrib. drain. area = 1.010 ac
22
0 120 240 360 480 600 720 840 960 1080 1200
Q (cfs)
0.00 0.00
1.00 1.00
2.00 2.00
3.00 3.00
4.00 4.00
Q (cfs)
Time (min)
BED 1 ROUTED + POST TO BED 2Hyd. No. 8 -- 2 Year
Hyd No. 8 Hyd No. 5 Hyd No. 7

Hydrograph ReportHydraflow Hydrographs Extension for AutoCAD® Civil 3D® 2016 by Autodesk, Inc. v11 Tuesday, 12 / 27 / 2016
Hyd. No. 9
BED 2 ROUTED
Hydrograph type = Reservoir Peak discharge = 0.011 cfsStorm frequency = 2 yrs Time to peak = 1444 minTime interval = 2 min Hyd. volume = 74 cuftInflow hyd. No. = 8 - BED 1 ROUTED + POST TO BED 2Max. Elevation = 375.82 ftReservoir name = BED 2 Max. Storage = 8,291 cuft
Storage Indication method used.
23
0 120 240 360 480 600 720 840 960 1080 1200 1320 1440 1560 1680
Q (cfs)
0.00 0.00
1.00 1.00
2.00 2.00
3.00 3.00
4.00 4.00
Q (cfs)
Time (min)
BED 2 ROUTEDHyd. No. 9 -- 2 Year
Hyd No. 9 Hyd No. 8 Total storage used = 8,291 cuft

Hydrograph ReportHydraflow Hydrographs Extension for AutoCAD® Civil 3D® 2016 by Autodesk, Inc. v11 Tuesday, 12 / 27 / 2016
Hyd. No. 11
POST TO RAIN GARDEN
Hydrograph type = SCS Runoff Peak discharge = 0.511 cfsStorm frequency = 2 yrs Time to peak = 718 minTime interval = 2 min Hyd. volume = 1,024 cuftDrainage area = 0.290 ac Curve number = 74Basin Slope = 0.0 % Hydraulic length = 0 ftTc method = User Time of conc. (Tc) = 5.00 minTotal precip. = 3.20 in Distribution = Type IIStorm duration = 24 hrs Shape factor = 484
24
0 120 240 360 480 600 720 840 960 1080 1200 1320 1440 1560
Q (cfs)
0.00 0.00
0.10 0.10
0.20 0.20
0.30 0.30
0.40 0.40
0.50 0.50
0.60 0.60
0.70 0.70
0.80 0.80
0.90 0.90
1.00 1.00
Q (cfs)
Time (min)
POST TO RAIN GARDENHyd. No. 11 -- 2 Year
Hyd No. 11
Hydrograph ReportHydraflow Hydrographs Extension for AutoCAD® Civil 3D® 2016 by Autodesk, Inc. v11 Tuesday, 12 / 27 / 2016
Hyd. No. 12
RAIN GARDEN ROUTED
Hydrograph type = Reservoir Peak discharge = 0.000 cfsStorm frequency = 2 yrs Time to peak = n/aTime interval = 2 min Hyd. volume = 0 cuftInflow hyd. No. = 11 - POST TO RAIN GARDENMax. Elevation = 375.35 ftReservoir name = RAIN GARDEN 1 Max. Storage = 1,024 cuft
Storage Indication method used.
25
0 120 240 360 480 600 720 840 960 1080 1200 1320 1440 1560
Q (cfs)
0.00 0.00
0.10 0.10
0.20 0.20
0.30 0.30
0.40 0.40
0.50 0.50
0.60 0.60
0.70 0.70
0.80 0.80
0.90 0.90
1.00 1.00
Q (cfs)
Time (min)
RAIN GARDEN ROUTEDHyd. No. 12 -- 2 Year
Hyd No. 12 Hyd No. 11 Total storage used = 1,024 cuft

Hydrograph ReportHydraflow Hydrographs Extension for AutoCAD® Civil 3D® 2016 by Autodesk, Inc. v11 Tuesday, 12 / 27 / 2016
Hyd. No. 14
COMBINED
Hydrograph type = Combine Peak discharge = 0.141 cfsStorm frequency = 2 yrs Time to peak = 718 minTime interval = 2 min Hyd. volume = 356 cuftInflow hyds. = 2, 9, 12 Contrib. drain. area = 0.080 ac
26
0 120 240 360 480 600 720 840 960 1080 1200 1320 1440 1560 1680
Q (cfs)
0.00 0.00
0.05 0.05
0.10 0.10
0.15 0.15
0.20 0.20
0.25 0.25
0.30 0.30
0.35 0.35
0.40 0.40
0.45 0.45
0.50 0.50
Q (cfs)
Time (min)
COMBINEDHyd. No. 14 -- 2 Year
Hyd No. 14 Hyd No. 2 Hyd No. 9 Hyd No. 12

Hydrograph Summary Report27
Hyd. Hydrograph Peak Time Time to Hyd. Inflow Maximum Total HydrographNo. type flow interval Peak volume hyd(s) elevation strge used Description
(origin) (cfs) (min) (min) (cuft) (ft) (cuft)
1 SCS Runoff 2.211 2 722 6,948 ------ ------ ------ PRE-DEV
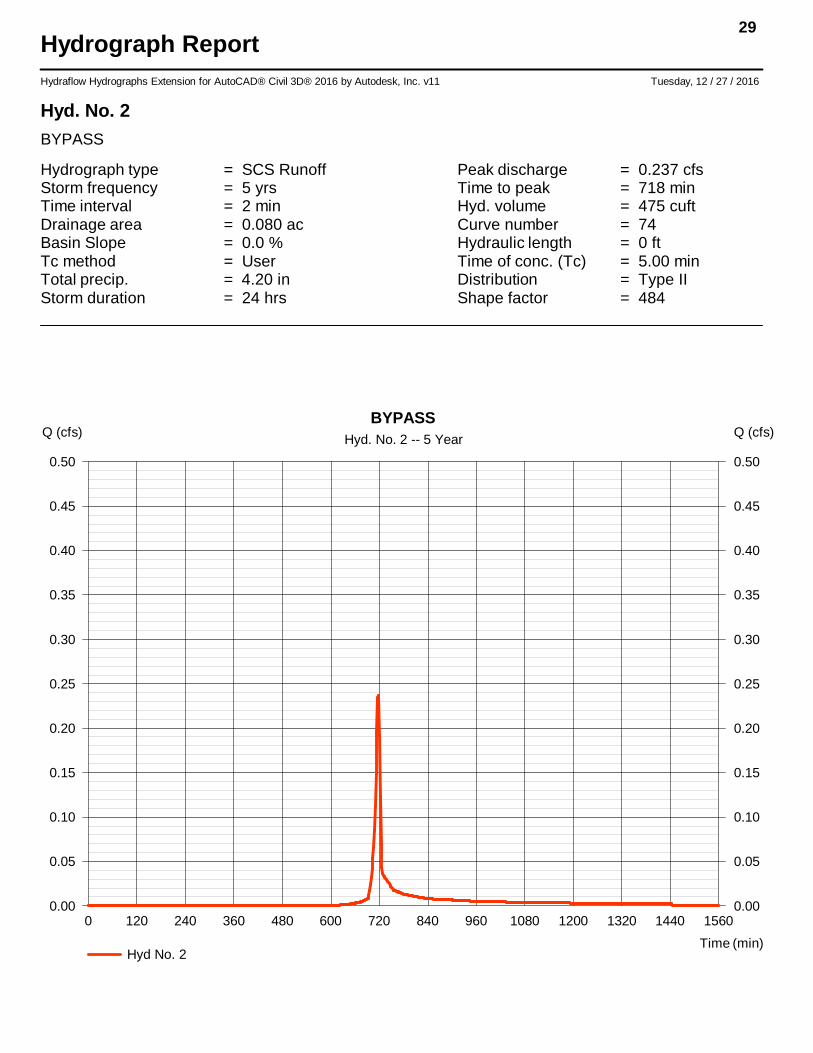
2 SCS Runoff 0.237 2 718 475 ------ ------ ------ BYPASS
4 SCS Runoff 5.069 2 716 10,584 ------ ------ ------ POST TO BED 1
5 Reservoir 0.000 2 n/a 0 4 377.49 10,584 BED 1 ROUTED
7 SCS Runoff 5.349 2 716 11,629 ------ ------ ------ POST TO BED 2
8 Combine 5.349 2 716 11,629 5, 7 ------ ------ BED 1 ROUTED + POST TO BED 2
9 Reservoir 0.116 2 904 3,396 8 375.97 8,870 BED 2 ROUTED
11 SCS Runoff 0.859 2 718 1,722 ------ ------ ------ POST TO RAIN GARDEN
12 Reservoir 0.014 2 1102 263 11 375.50 1,468 RAIN GARDEN ROUTED
14 Combine 0.237 2 718 4,133 2, 9, 12, ------ ------ COMBINED
2731 SWM.gpw Return Period: 5 Year Tuesday, 12 / 27 / 2016
Hydraflow Hydrographs Extension for AutoCAD® Civil 3D® 2016 by Autodesk, Inc. v11

Hydrograph ReportHydraflow Hydrographs Extension for AutoCAD® Civil 3D® 2016 by Autodesk, Inc. v11 Tuesday, 12 / 27 / 2016
Hyd. No. 1
PRE-DEV
Hydrograph type = SCS Runoff Peak discharge = 2.211 cfsStorm frequency = 5 yrs Time to peak = 722 minTime interval = 2 min Hyd. volume = 6,948 cuftDrainage area = 2.450 ac Curve number = 58Basin Slope = 0.0 % Hydraulic length = 0 ftTc method = TR55 Time of conc. (Tc) = 10.80 minTotal precip. = 4.20 in Distribution = Type IIStorm duration = 24 hrs Shape factor = 484
28
0 120 240 360 480 600 720 840 960 1080 1200 1320 1440 1560
Q (cfs)
0.00 0.00
1.00 1.00
2.00 2.00
3.00 3.00
Q (cfs)
Time (min)
PRE-DEVHyd. No. 1 -- 5 Year
Hyd No. 1
Hydrograph ReportHydraflow Hydrographs Extension for AutoCAD® Civil 3D® 2016 by Autodesk, Inc. v11 Tuesday, 12 / 27 / 2016
Hyd. No. 2
BYPASS
Hydrograph type = SCS Runoff Peak discharge = 0.237 cfsStorm frequency = 5 yrs Time to peak = 718 minTime interval = 2 min Hyd. volume = 475 cuftDrainage area = 0.080 ac Curve number = 74Basin Slope = 0.0 % Hydraulic length = 0 ftTc method = User Time of conc. (Tc) = 5.00 minTotal precip. = 4.20 in Distribution = Type IIStorm duration = 24 hrs Shape factor = 484
29
0 120 240 360 480 600 720 840 960 1080 1200 1320 1440 1560
Q (cfs)
0.00 0.00
0.05 0.05
0.10 0.10
0.15 0.15
0.20 0.20
0.25 0.25
0.30 0.30
0.35 0.35
0.40 0.40
0.45 0.45
0.50 0.50
Q (cfs)
Time (min)
BYPASSHyd. No. 2 -- 5 Year
Hyd No. 2

Hydrograph ReportHydraflow Hydrographs Extension for AutoCAD® Civil 3D® 2016 by Autodesk, Inc. v11 Tuesday, 12 / 27 / 2016
Hyd. No. 4
POST TO BED 1
Hydrograph type = SCS Runoff Peak discharge = 5.069 cfsStorm frequency = 5 yrs Time to peak = 716 minTime interval = 2 min Hyd. volume = 10,584 cuftDrainage area = 1.060 ac Curve number = 88.2Basin Slope = 0.0 % Hydraulic length = 0 ftTc method = User Time of conc. (Tc) = 5.00 minTotal precip. = 4.20 in Distribution = Type IIStorm duration = 24 hrs Shape factor = 484
30
0 120 240 360 480 600 720 840 960 1080 1200 1320
Q (cfs)
0.00 0.00
1.00 1.00
2.00 2.00
3.00 3.00
4.00 4.00
5.00 5.00
6.00 6.00
Q (cfs)
Time (min)
POST TO BED 1Hyd. No. 4 -- 5 Year
Hyd No. 4

Hydrograph ReportHydraflow Hydrographs Extension for AutoCAD® Civil 3D® 2016 by Autodesk, Inc. v11 Tuesday, 12 / 27 / 2016
Hyd. No. 5
BED 1 ROUTED
Hydrograph type = Reservoir Peak discharge = 0.000 cfsStorm frequency = 5 yrs Time to peak = n/aTime interval = 2 min Hyd. volume = 0 cuftInflow hyd. No. = 4 - POST TO BED 1 Max. Elevation = 377.49 ftReservoir name = BED 1 Max. Storage = 10,584 cuft
Storage Indication method used.
31
0 120 240 360 480 600 720 840 960 1080 1200 1320
Q (cfs)
0.00 0.00
1.00 1.00
2.00 2.00
3.00 3.00
4.00 4.00
5.00 5.00
6.00 6.00
Q (cfs)
Time (min)
BED 1 ROUTEDHyd. No. 5 -- 5 Year
Hyd No. 5 Hyd No. 4 Total storage used = 10,584 cuft

Hydrograph ReportHydraflow Hydrographs Extension for AutoCAD® Civil 3D® 2016 by Autodesk, Inc. v11 Tuesday, 12 / 27 / 2016
Hyd. No. 7
POST TO BED 2
Hydrograph type = SCS Runoff Peak discharge = 5.349 cfsStorm frequency = 5 yrs Time to peak = 716 minTime interval = 2 min Hyd. volume = 11,629 cuftDrainage area = 1.010 ac Curve number = 92.7Basin Slope = 0.0 % Hydraulic length = 0 ftTc method = User Time of conc. (Tc) = 5.00 minTotal precip. = 4.20 in Distribution = Type IIStorm duration = 24 hrs Shape factor = 484
32
0 120 240 360 480 600 720 840 960 1080 1200
Q (cfs)
0.00 0.00
1.00 1.00
2.00 2.00
3.00 3.00
4.00 4.00
5.00 5.00
6.00 6.00
Q (cfs)
Time (min)
POST TO BED 2Hyd. No. 7 -- 5 Year
Hyd No. 7

Hydrograph ReportHydraflow Hydrographs Extension for AutoCAD® Civil 3D® 2016 by Autodesk, Inc. v11 Tuesday, 12 / 27 / 2016
Hyd. No. 8
BED 1 ROUTED + POST TO BED 2
Hydrograph type = Combine Peak discharge = 5.349 cfsStorm frequency = 5 yrs Time to peak = 716 minTime interval = 2 min Hyd. volume = 11,629 cuftInflow hyds. = 5, 7 Contrib. drain. area = 1.010 ac
33
0 120 240 360 480 600 720 840 960 1080 1200
Q (cfs)
0.00 0.00
1.00 1.00
2.00 2.00
3.00 3.00
4.00 4.00
5.00 5.00
6.00 6.00
Q (cfs)
Time (min)
BED 1 ROUTED + POST TO BED 2Hyd. No. 8 -- 5 Year
Hyd No. 8 Hyd No. 5 Hyd No. 7

Hydrograph ReportHydraflow Hydrographs Extension for AutoCAD® Civil 3D® 2016 by Autodesk, Inc. v11 Tuesday, 12 / 27 / 2016
Hyd. No. 9
BED 2 ROUTED
Hydrograph type = Reservoir Peak discharge = 0.116 cfsStorm frequency = 5 yrs Time to peak = 904 minTime interval = 2 min Hyd. volume = 3,396 cuftInflow hyd. No. = 8 - BED 1 ROUTED + POST TO BED 2Max. Elevation = 375.97 ftReservoir name = BED 2 Max. Storage = 8,870 cuft
Storage Indication method used.
34
0 240 480 720 960 1200 1440 1680 1920
Q (cfs)
0.00 0.00
1.00 1.00
2.00 2.00
3.00 3.00
4.00 4.00
5.00 5.00
6.00 6.00
Q (cfs)
Time (min)
BED 2 ROUTEDHyd. No. 9 -- 5 Year
Hyd No. 9 Hyd No. 8 Total storage used = 8,870 cuft

Hydrograph ReportHydraflow Hydrographs Extension for AutoCAD® Civil 3D® 2016 by Autodesk, Inc. v11 Tuesday, 12 / 27 / 2016
Hyd. No. 11
POST TO RAIN GARDEN
Hydrograph type = SCS Runoff Peak discharge = 0.859 cfsStorm frequency = 5 yrs Time to peak = 718 minTime interval = 2 min Hyd. volume = 1,722 cuftDrainage area = 0.290 ac Curve number = 74Basin Slope = 0.0 % Hydraulic length = 0 ftTc method = User Time of conc. (Tc) = 5.00 minTotal precip. = 4.20 in Distribution = Type IIStorm duration = 24 hrs Shape factor = 484
35
0 120 240 360 480 600 720 840 960 1080 1200 1320 1440 1560
Q (cfs)
0.00 0.00
0.10 0.10
0.20 0.20
0.30 0.30
0.40 0.40
0.50 0.50
0.60 0.60
0.70 0.70
0.80 0.80
0.90 0.90
1.00 1.00
Q (cfs)
Time (min)
POST TO RAIN GARDENHyd. No. 11 -- 5 Year
Hyd No. 11

Hydrograph ReportHydraflow Hydrographs Extension for AutoCAD® Civil 3D® 2016 by Autodesk, Inc. v11 Tuesday, 12 / 27 / 2016
Hyd. No. 12
RAIN GARDEN ROUTED
Hydrograph type = Reservoir Peak discharge = 0.014 cfsStorm frequency = 5 yrs Time to peak = 1102 minTime interval = 2 min Hyd. volume = 263 cuftInflow hyd. No. = 11 - POST TO RAIN GARDENMax. Elevation = 375.50 ftReservoir name = RAIN GARDEN 1 Max. Storage = 1,468 cuft
Storage Indication method used.
36
0 120 240 360 480 600 720 840 960 1080 1200 1320 1440 1560
Q (cfs)
0.00 0.00
0.10 0.10
0.20 0.20
0.30 0.30
0.40 0.40
0.50 0.50
0.60 0.60
0.70 0.70
0.80 0.80
0.90 0.90
1.00 1.00
Q (cfs)
Time (min)
RAIN GARDEN ROUTEDHyd. No. 12 -- 5 Year
Hyd No. 12 Hyd No. 11 Total storage used = 1,468 cuft

Hydrograph ReportHydraflow Hydrographs Extension for AutoCAD® Civil 3D® 2016 by Autodesk, Inc. v11 Tuesday, 12 / 27 / 2016
Hyd. No. 14
COMBINED
Hydrograph type = Combine Peak discharge = 0.237 cfsStorm frequency = 5 yrs Time to peak = 718 minTime interval = 2 min Hyd. volume = 4,133 cuftInflow hyds. = 2, 9, 12 Contrib. drain. area = 0.080 ac
37
0 240 480 720 960 1200 1440 1680 1920
Q (cfs)
0.00 0.00
0.05 0.05
0.10 0.10
0.15 0.15
0.20 0.20
0.25 0.25
0.30 0.30
0.35 0.35
0.40 0.40
0.45 0.45
0.50 0.50
Q (cfs)
Time (min)
COMBINEDHyd. No. 14 -- 5 Year
Hyd No. 14 Hyd No. 2 Hyd No. 9 Hyd No. 12

Hydrograph Summary Report38
Hyd. Hydrograph Peak Time Time to Hyd. Inflow Maximum Total HydrographNo. type flow interval Peak volume hyd(s) elevation strge used Description
(origin) (cfs) (min) (min) (cuft) (ft) (cuft)
1 SCS Runoff 3.759 2 722 10,719 ------ ------ ------ PRE-DEV
2 SCS Runoff 0.319 2 718 644 ------ ------ ------ BYPASS
4 SCS Runoff 6.293 2 716 13,309 ------ ------ ------ POST TO BED 1
5 Reservoir 0.054 2 1402 387 4 378.02 12,976 BED 1 ROUTED
7 SCS Runoff 6.496 2 716 14,316 ------ ------ ------ POST TO BED 2
8 Combine 6.496 2 716 14,703 5, 7 ------ ------ BED 1 ROUTED + POST TO BED 2
9 Reservoir 0.369 2 762 6,470 8 376.13 9,516 BED 2 ROUTED
11 SCS Runoff 1.156 2 718 2,333 ------ ------ ------ POST TO RAIN GARDEN
12 Reservoir 0.049 2 810 874 11 375.51 1,493 RAIN GARDEN ROUTED
14 Combine 0.390 2 762 7,987 2, 9, 12, ------ ------ COMBINED
2731 SWM.gpw Return Period: 10 Year Tuesday, 12 / 27 / 2016
Hydraflow Hydrographs Extension for AutoCAD® Civil 3D® 2016 by Autodesk, Inc. v11

Hydrograph ReportHydraflow Hydrographs Extension for AutoCAD® Civil 3D® 2016 by Autodesk, Inc. v11 Tuesday, 12 / 27 / 2016
Hyd. No. 1
PRE-DEV
Hydrograph type = SCS Runoff Peak discharge = 3.759 cfsStorm frequency = 10 yrs Time to peak = 722 minTime interval = 2 min Hyd. volume = 10,719 cuftDrainage area = 2.450 ac Curve number = 58Basin Slope = 0.0 % Hydraulic length = 0 ftTc method = TR55 Time of conc. (Tc) = 10.80 minTotal precip. = 5.00 in Distribution = Type IIStorm duration = 24 hrs Shape factor = 484
39
0 120 240 360 480 600 720 840 960 1080 1200 1320 1440 1560
Q (cfs)
0.00 0.00
1.00 1.00
2.00 2.00
3.00 3.00
4.00 4.00
Q (cfs)
Time (min)
PRE-DEVHyd. No. 1 -- 10 Year
Hyd No. 1

Hydrograph ReportHydraflow Hydrographs Extension for AutoCAD® Civil 3D® 2016 by Autodesk, Inc. v11 Tuesday, 12 / 27 / 2016
Hyd. No. 2
BYPASS
Hydrograph type = SCS Runoff Peak discharge = 0.319 cfsStorm frequency = 10 yrs Time to peak = 718 minTime interval = 2 min Hyd. volume = 644 cuftDrainage area = 0.080 ac Curve number = 74Basin Slope = 0.0 % Hydraulic length = 0 ftTc method = User Time of conc. (Tc) = 5.00 minTotal precip. = 5.00 in Distribution = Type IIStorm duration = 24 hrs Shape factor = 484
40
0 120 240 360 480 600 720 840 960 1080 1200 1320 1440 1560
Q (cfs)
0.00 0.00
0.05 0.05
0.10 0.10
0.15 0.15
0.20 0.20
0.25 0.25
0.30 0.30
0.35 0.35
0.40 0.40
0.45 0.45
0.50 0.50
Q (cfs)
Time (min)
BYPASSHyd. No. 2 -- 10 Year
Hyd No. 2

Hydrograph ReportHydraflow Hydrographs Extension for AutoCAD® Civil 3D® 2016 by Autodesk, Inc. v11 Tuesday, 12 / 27 / 2016
Hyd. No. 4
POST TO BED 1
Hydrograph type = SCS Runoff Peak discharge = 6.293 cfsStorm frequency = 10 yrs Time to peak = 716 minTime interval = 2 min Hyd. volume = 13,309 cuftDrainage area = 1.060 ac Curve number = 88.2Basin Slope = 0.0 % Hydraulic length = 0 ftTc method = User Time of conc. (Tc) = 5.00 minTotal precip. = 5.00 in Distribution = Type IIStorm duration = 24 hrs Shape factor = 484
41
0 120 240 360 480 600 720 840 960 1080 1200
Q (cfs)
0.00 0.00
1.00 1.00
2.00 2.00
3.00 3.00
4.00 4.00
5.00 5.00
6.00 6.00
7.00 7.00
Q (cfs)
Time (min)
POST TO BED 1Hyd. No. 4 -- 10 Year
Hyd No. 4

Hydrograph ReportHydraflow Hydrographs Extension for AutoCAD® Civil 3D® 2016 by Autodesk, Inc. v11 Tuesday, 12 / 27 / 2016
Hyd. No. 5
BED 1 ROUTED
Hydrograph type = Reservoir Peak discharge = 0.054 cfsStorm frequency = 10 yrs Time to peak = 1402 minTime interval = 2 min Hyd. volume = 387 cuftInflow hyd. No. = 4 - POST TO BED 1 Max. Elevation = 378.02 ftReservoir name = BED 1 Max. Storage = 12,976 cuft
Storage Indication method used.
42
0 120 240 360 480 600 720 840 960 1080 1200 1320 1440 1560
Q (cfs)
0.00 0.00
1.00 1.00
2.00 2.00
3.00 3.00
4.00 4.00
5.00 5.00
6.00 6.00
7.00 7.00
Q (cfs)
Time (min)
BED 1 ROUTEDHyd. No. 5 -- 10 Year
Hyd No. 5 Hyd No. 4 Total storage used = 12,976 cuft

Hydrograph ReportHydraflow Hydrographs Extension for AutoCAD® Civil 3D® 2016 by Autodesk, Inc. v11 Tuesday, 12 / 27 / 2016
Hyd. No. 7
POST TO BED 2
Hydrograph type = SCS Runoff Peak discharge = 6.496 cfsStorm frequency = 10 yrs Time to peak = 716 minTime interval = 2 min Hyd. volume = 14,316 cuftDrainage area = 1.010 ac Curve number = 92.7Basin Slope = 0.0 % Hydraulic length = 0 ftTc method = User Time of conc. (Tc) = 5.00 minTotal precip. = 5.00 in Distribution = Type IIStorm duration = 24 hrs Shape factor = 484
43
0 120 240 360 480 600 720 840 960 1080 1200
Q (cfs)
0.00 0.00
1.00 1.00
2.00 2.00
3.00 3.00
4.00 4.00
5.00 5.00
6.00 6.00
7.00 7.00
Q (cfs)
Time (min)
POST TO BED 2Hyd. No. 7 -- 10 Year
Hyd No. 7

Hydrograph ReportHydraflow Hydrographs Extension for AutoCAD® Civil 3D® 2016 by Autodesk, Inc. v11 Tuesday, 12 / 27 / 2016
Hyd. No. 8
BED 1 ROUTED + POST TO BED 2
Hydrograph type = Combine Peak discharge = 6.496 cfsStorm frequency = 10 yrs Time to peak = 716 minTime interval = 2 min Hyd. volume = 14,703 cuftInflow hyds. = 5, 7 Contrib. drain. area = 1.010 ac
44
0 120 240 360 480 600 720 840 960 1080 1200 1320 1440 1560
Q (cfs)
0.00 0.00
1.00 1.00
2.00 2.00
3.00 3.00
4.00 4.00
5.00 5.00
6.00 6.00
7.00 7.00
Q (cfs)
Time (min)
BED 1 ROUTED + POST TO BED 2Hyd. No. 8 -- 10 Year
Hyd No. 8 Hyd No. 5 Hyd No. 7

Hydrograph ReportHydraflow Hydrographs Extension for AutoCAD® Civil 3D® 2016 by Autodesk, Inc. v11 Tuesday, 12 / 27 / 2016
Hyd. No. 9
BED 2 ROUTED
Hydrograph type = Reservoir Peak discharge = 0.369 cfsStorm frequency = 10 yrs Time to peak = 762 minTime interval = 2 min Hyd. volume = 6,470 cuftInflow hyd. No. = 8 - BED 1 ROUTED + POST TO BED 2Max. Elevation = 376.13 ftReservoir name = BED 2 Max. Storage = 9,516 cuft
Storage Indication method used.
45
0 240 480 720 960 1200 1440 1680 1920
Q (cfs)
0.00 0.00
1.00 1.00
2.00 2.00
3.00 3.00
4.00 4.00
5.00 5.00
6.00 6.00
7.00 7.00
Q (cfs)
Time (min)
BED 2 ROUTEDHyd. No. 9 -- 10 Year
Hyd No. 9 Hyd No. 8 Total storage used = 9,516 cuft

Hydrograph ReportHydraflow Hydrographs Extension for AutoCAD® Civil 3D® 2016 by Autodesk, Inc. v11 Tuesday, 12 / 27 / 2016
Hyd. No. 11
POST TO RAIN GARDEN
Hydrograph type = SCS Runoff Peak discharge = 1.156 cfsStorm frequency = 10 yrs Time to peak = 718 minTime interval = 2 min Hyd. volume = 2,333 cuftDrainage area = 0.290 ac Curve number = 74Basin Slope = 0.0 % Hydraulic length = 0 ftTc method = User Time of conc. (Tc) = 5.00 minTotal precip. = 5.00 in Distribution = Type IIStorm duration = 24 hrs Shape factor = 484
46
0 120 240 360 480 600 720 840 960 1080 1200 1320 1440 1560
Q (cfs)
0.00 0.00
1.00 1.00
2.00 2.00
Q (cfs)
Time (min)
POST TO RAIN GARDENHyd. No. 11 -- 10 Year
Hyd No. 11

Hydrograph ReportHydraflow Hydrographs Extension for AutoCAD® Civil 3D® 2016 by Autodesk, Inc. v11 Tuesday, 12 / 27 / 2016
Hyd. No. 12
RAIN GARDEN ROUTED
Hydrograph type = Reservoir Peak discharge = 0.049 cfsStorm frequency = 10 yrs Time to peak = 810 minTime interval = 2 min Hyd. volume = 874 cuftInflow hyd. No. = 11 - POST TO RAIN GARDENMax. Elevation = 375.51 ftReservoir name = RAIN GARDEN 1 Max. Storage = 1,493 cuft
Storage Indication method used.
47
0 120 240 360 480 600 720 840 960 1080 1200 1320 1440 1560
Q (cfs)
0.00 0.00
1.00 1.00
2.00 2.00
Q (cfs)
Time (min)
RAIN GARDEN ROUTEDHyd. No. 12 -- 10 Year
Hyd No. 12 Hyd No. 11 Total storage used = 1,493 cuft

Hydrograph ReportHydraflow Hydrographs Extension for AutoCAD® Civil 3D® 2016 by Autodesk, Inc. v11 Tuesday, 12 / 27 / 2016
Hyd. No. 14
COMBINED
Hydrograph type = Combine Peak discharge = 0.390 cfsStorm frequency = 10 yrs Time to peak = 762 minTime interval = 2 min Hyd. volume = 7,987 cuftInflow hyds. = 2, 9, 12 Contrib. drain. area = 0.080 ac
48
0 240 480 720 960 1200 1440 1680 1920
Q (cfs)
0.00 0.00
0.05 0.05
0.10 0.10
0.15 0.15
0.20 0.20
0.25 0.25
0.30 0.30
0.35 0.35
0.40 0.40
0.45 0.45
0.50 0.50
Q (cfs)
Time (min)
COMBINEDHyd. No. 14 -- 10 Year
Hyd No. 14 Hyd No. 2 Hyd No. 9 Hyd No. 12

Hydrograph Summary Report49
Hyd. Hydrograph Peak Time Time to Hyd. Inflow Maximum Total HydrographNo. type flow interval Peak volume hyd(s) elevation strge used Description
(origin) (cfs) (min) (min) (cuft) (ft) (cuft)
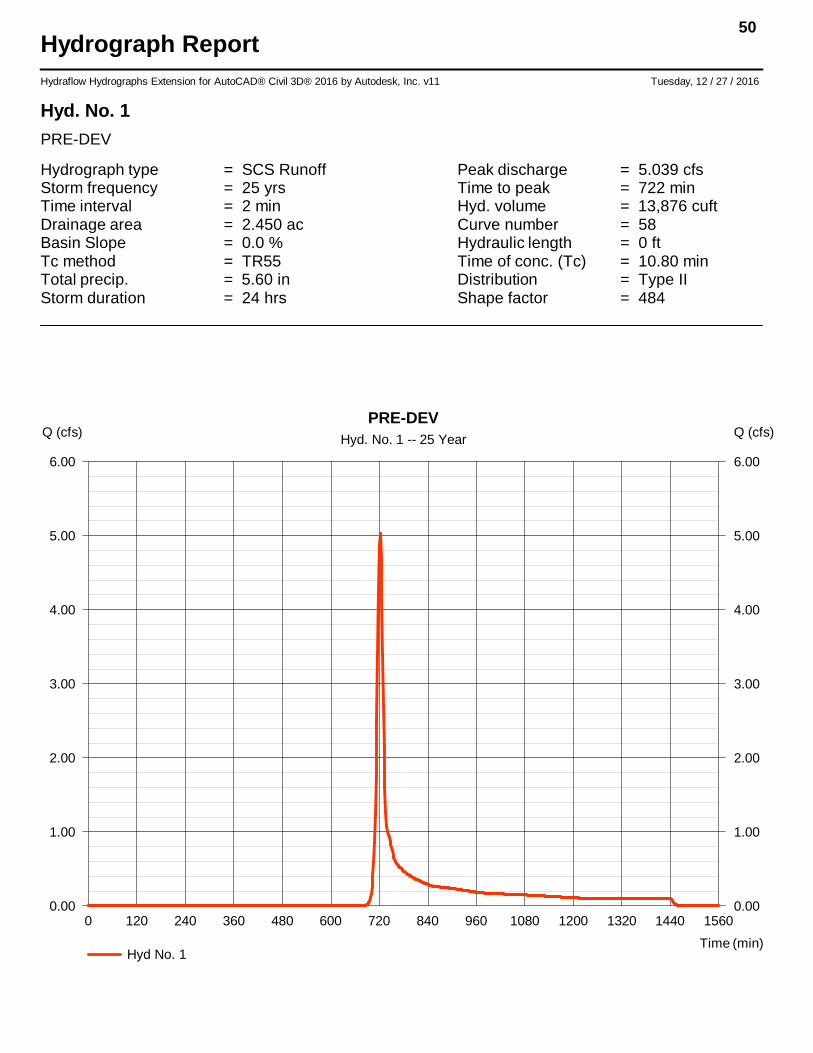
1 SCS Runoff 5.039 2 722 13,876 ------ ------ ------ PRE-DEV
2 SCS Runoff 0.384 2 716 776 ------ ------ ------ BYPASS
4 SCS Runoff 7.208 2 716 15,378 ------ ------ ------ POST TO BED 1
5 Reservoir 0.114 2 1006 2,456 4 378.04 13,037 BED 1 ROUTED
7 SCS Runoff 7.352 2 716 16,342 ------ ------ ------ POST TO BED 2
8 Combine 7.352 2 716 18,798 5, 7 ------ ------ BED 1 ROUTED + POST TO BED 2
9 Reservoir 0.905 2 730 10,564 8 376.24 9,939 BED 2 ROUTED
11 SCS Runoff 1.393 2 716 2,814 ------ ------ ------ POST TO RAIN GARDEN
12 Reservoir 0.116 2 750 1,355 11 375.52 1,539 RAIN GARDEN ROUTED
14 Combine 0.999 2 736 12,696 2, 9, 12, ------ ------ COMBINED
2731 SWM.gpw Return Period: 25 Year Tuesday, 12 / 27 / 2016
Hydraflow Hydrographs Extension for AutoCAD® Civil 3D® 2016 by Autodesk, Inc. v11
Hydrograph ReportHydraflow Hydrographs Extension for AutoCAD® Civil 3D® 2016 by Autodesk, Inc. v11 Tuesday, 12 / 27 / 2016
Hyd. No. 1
PRE-DEV
Hydrograph type = SCS Runoff Peak discharge = 5.039 cfsStorm frequency = 25 yrs Time to peak = 722 minTime interval = 2 min Hyd. volume = 13,876 cuftDrainage area = 2.450 ac Curve number = 58Basin Slope = 0.0 % Hydraulic length = 0 ftTc method = TR55 Time of conc. (Tc) = 10.80 minTotal precip. = 5.60 in Distribution = Type IIStorm duration = 24 hrs Shape factor = 484
50
0 120 240 360 480 600 720 840 960 1080 1200 1320 1440 1560
Q (cfs)
0.00 0.00
1.00 1.00
2.00 2.00
3.00 3.00
4.00 4.00
5.00 5.00
6.00 6.00
Q (cfs)
Time (min)
PRE-DEVHyd. No. 1 -- 25 Year
Hyd No. 1

Hydrograph ReportHydraflow Hydrographs Extension for AutoCAD® Civil 3D® 2016 by Autodesk, Inc. v11 Tuesday, 12 / 27 / 2016
Hyd. No. 2
BYPASS
Hydrograph type = SCS Runoff Peak discharge = 0.384 cfsStorm frequency = 25 yrs Time to peak = 716 minTime interval = 2 min Hyd. volume = 776 cuftDrainage area = 0.080 ac Curve number = 74Basin Slope = 0.0 % Hydraulic length = 0 ftTc method = User Time of conc. (Tc) = 5.00 minTotal precip. = 5.60 in Distribution = Type IIStorm duration = 24 hrs Shape factor = 484
51
0 120 240 360 480 600 720 840 960 1080 1200 1320 1440 1560
Q (cfs)
0.00 0.00
0.05 0.05
0.10 0.10
0.15 0.15
0.20 0.20
0.25 0.25
0.30 0.30
0.35 0.35
0.40 0.40
0.45 0.45
0.50 0.50
Q (cfs)
Time (min)
BYPASSHyd. No. 2 -- 25 Year
Hyd No. 2

Hydrograph ReportHydraflow Hydrographs Extension for AutoCAD® Civil 3D® 2016 by Autodesk, Inc. v11 Tuesday, 12 / 27 / 2016
Hyd. No. 4
POST TO BED 1
Hydrograph type = SCS Runoff Peak discharge = 7.208 cfsStorm frequency = 25 yrs Time to peak = 716 minTime interval = 2 min Hyd. volume = 15,378 cuftDrainage area = 1.060 ac Curve number = 88.2Basin Slope = 0.0 % Hydraulic length = 0 ftTc method = User Time of conc. (Tc) = 5.00 minTotal precip. = 5.60 in Distribution = Type IIStorm duration = 24 hrs Shape factor = 484
52
0 120 240 360 480 600 720 840 960 1080 1200
Q (cfs)
0.00 0.00
2.00 2.00
4.00 4.00
6.00 6.00
8.00 8.00
Q (cfs)
Time (min)
POST TO BED 1Hyd. No. 4 -- 25 Year
Hyd No. 4

Hydrograph ReportHydraflow Hydrographs Extension for AutoCAD® Civil 3D® 2016 by Autodesk, Inc. v11 Tuesday, 12 / 27 / 2016
Hyd. No. 5
BED 1 ROUTED
Hydrograph type = Reservoir Peak discharge = 0.114 cfsStorm frequency = 25 yrs Time to peak = 1006 minTime interval = 2 min Hyd. volume = 2,456 cuftInflow hyd. No. = 4 - POST TO BED 1 Max. Elevation = 378.04 ftReservoir name = BED 1 Max. Storage = 13,037 cuft
Storage Indication method used.
53
0 120 240 360 480 600 720 840 960 1080 1200 1320 1440 1560
Q (cfs)
0.00 0.00
2.00 2.00
4.00 4.00
6.00 6.00
8.00 8.00
Q (cfs)
Time (min)
BED 1 ROUTEDHyd. No. 5 -- 25 Year
Hyd No. 5 Hyd No. 4 Total storage used = 13,037 cuft

Hydrograph ReportHydraflow Hydrographs Extension for AutoCAD® Civil 3D® 2016 by Autodesk, Inc. v11 Tuesday, 12 / 27 / 2016
Hyd. No. 7
POST TO BED 2
Hydrograph type = SCS Runoff Peak discharge = 7.352 cfsStorm frequency = 25 yrs Time to peak = 716 minTime interval = 2 min Hyd. volume = 16,342 cuftDrainage area = 1.010 ac Curve number = 92.7Basin Slope = 0.0 % Hydraulic length = 0 ftTc method = User Time of conc. (Tc) = 5.00 minTotal precip. = 5.60 in Distribution = Type IIStorm duration = 24 hrs Shape factor = 484
54
0 120 240 360 480 600 720 840 960 1080 1200
Q (cfs)
0.00 0.00
2.00 2.00
4.00 4.00
6.00 6.00
8.00 8.00
Q (cfs)
Time (min)
POST TO BED 2Hyd. No. 7 -- 25 Year
Hyd No. 7

Hydrograph ReportHydraflow Hydrographs Extension for AutoCAD® Civil 3D® 2016 by Autodesk, Inc. v11 Tuesday, 12 / 27 / 2016
Hyd. No. 8
BED 1 ROUTED + POST TO BED 2
Hydrograph type = Combine Peak discharge = 7.352 cfsStorm frequency = 25 yrs Time to peak = 716 minTime interval = 2 min Hyd. volume = 18,798 cuftInflow hyds. = 5, 7 Contrib. drain. area = 1.010 ac
55
0 120 240 360 480 600 720 840 960 1080 1200 1320 1440 1560
Q (cfs)
0.00 0.00
2.00 2.00
4.00 4.00
6.00 6.00
8.00 8.00
Q (cfs)
Time (min)
BED 1 ROUTED + POST TO BED 2Hyd. No. 8 -- 25 Year
Hyd No. 8 Hyd No. 5 Hyd No. 7

Hydrograph ReportHydraflow Hydrographs Extension for AutoCAD® Civil 3D® 2016 by Autodesk, Inc. v11 Tuesday, 12 / 27 / 2016
Hyd. No. 9
BED 2 ROUTED
Hydrograph type = Reservoir Peak discharge = 0.905 cfsStorm frequency = 25 yrs Time to peak = 730 minTime interval = 2 min Hyd. volume = 10,564 cuftInflow hyd. No. = 8 - BED 1 ROUTED + POST TO BED 2Max. Elevation = 376.24 ftReservoir name = BED 2 Max. Storage = 9,939 cuft
Storage Indication method used.
56
0 120 240 360 480 600 720 840 960 1080 1200 1320 1440 1560 1680 1800
Q (cfs)
0.00 0.00
2.00 2.00
4.00 4.00
6.00 6.00
8.00 8.00
Q (cfs)
Time (min)
BED 2 ROUTEDHyd. No. 9 -- 25 Year
Hyd No. 9 Hyd No. 8 Total storage used = 9,939 cuft

Hydrograph ReportHydraflow Hydrographs Extension for AutoCAD® Civil 3D® 2016 by Autodesk, Inc. v11 Tuesday, 12 / 27 / 2016
Hyd. No. 11
POST TO RAIN GARDEN
Hydrograph type = SCS Runoff Peak discharge = 1.393 cfsStorm frequency = 25 yrs Time to peak = 716 minTime interval = 2 min Hyd. volume = 2,814 cuftDrainage area = 0.290 ac Curve number = 74Basin Slope = 0.0 % Hydraulic length = 0 ftTc method = User Time of conc. (Tc) = 5.00 minTotal precip. = 5.60 in Distribution = Type IIStorm duration = 24 hrs Shape factor = 484
57
0 120 240 360 480 600 720 840 960 1080 1200 1320 1440 1560
Q (cfs)
0.00 0.00
1.00 1.00
2.00 2.00
Q (cfs)
Time (min)
POST TO RAIN GARDENHyd. No. 11 -- 25 Year
Hyd No. 11

Hydrograph ReportHydraflow Hydrographs Extension for AutoCAD® Civil 3D® 2016 by Autodesk, Inc. v11 Tuesday, 12 / 27 / 2016
Hyd. No. 12
RAIN GARDEN ROUTED
Hydrograph type = Reservoir Peak discharge = 0.116 cfsStorm frequency = 25 yrs Time to peak = 750 minTime interval = 2 min Hyd. volume = 1,355 cuftInflow hyd. No. = 11 - POST TO RAIN GARDENMax. Elevation = 375.52 ftReservoir name = RAIN GARDEN 1 Max. Storage = 1,539 cuft
Storage Indication method used.
58
0 120 240 360 480 600 720 840 960 1080 1200 1320 1440 1560
Q (cfs)
0.00 0.00
1.00 1.00
2.00 2.00
Q (cfs)
Time (min)
RAIN GARDEN ROUTEDHyd. No. 12 -- 25 Year
Hyd No. 12 Hyd No. 11 Total storage used = 1,539 cuft

Hydrograph ReportHydraflow Hydrographs Extension for AutoCAD® Civil 3D® 2016 by Autodesk, Inc. v11 Tuesday, 12 / 27 / 2016
Hyd. No. 14
COMBINED
Hydrograph type = Combine Peak discharge = 0.999 cfsStorm frequency = 25 yrs Time to peak = 736 minTime interval = 2 min Hyd. volume = 12,696 cuftInflow hyds. = 2, 9, 12 Contrib. drain. area = 0.080 ac
59
0 120 240 360 480 600 720 840 960 1080 1200 1320 1440 1560 1680 1800
Q (cfs)
0.00 0.00
0.10 0.10
0.20 0.20
0.30 0.30
0.40 0.40
0.50 0.50
0.60 0.60
0.70 0.70
0.80 0.80
0.90 0.90
1.00 1.00
Q (cfs)
Time (min)
COMBINEDHyd. No. 14 -- 25 Year
Hyd No. 14 Hyd No. 2 Hyd No. 9 Hyd No. 12

Hydrograph Summary Report60
Hyd. Hydrograph Peak Time Time to Hyd. Inflow Maximum Total HydrographNo. type flow interval Peak volume hyd(s) elevation strge used Description
(origin) (cfs) (min) (min) (cuft) (ft) (cuft)
1 SCS Runoff 6.636 2 722 17,852 ------ ------ ------ PRE-DEV
2 SCS Runoff 0.462 2 716 936 ------ ------ ------ BYPASS
4 SCS Runoff 8.272 2 716 17,811 ------ ------ ------ POST TO BED 1
5 Reservoir 0.275 2 818 4,889 4 378.07 13,144 BED 1 ROUTED
7 SCS Runoff 8.346 2 716 18,714 ------ ------ ------ POST TO BED 2
8 Combine 8.346 2 716 23,602 5, 7 ------ ------ BED 1 ROUTED + POST TO BED 2
9 Reservoir 2.269 2 724 15,369 8 376.48 10,861 BED 2 ROUTED
11 SCS Runoff 1.675 2 716 3,394 ------ ------ ------ POST TO RAIN GARDEN
12 Reservoir 0.256 2 728 1,935 11 375.56 1,665 RAIN GARDEN ROUTED
14 Combine 2.651 2 724 18,240 2, 9, 12, ------ ------ COMBINED
2731 SWM.gpw Return Period: 50 Year Tuesday, 12 / 27 / 2016
Hydraflow Hydrographs Extension for AutoCAD® Civil 3D® 2016 by Autodesk, Inc. v11

Hydrograph ReportHydraflow Hydrographs Extension for AutoCAD® Civil 3D® 2016 by Autodesk, Inc. v11 Tuesday, 12 / 27 / 2016
Hyd. No. 1
PRE-DEV
Hydrograph type = SCS Runoff Peak discharge = 6.636 cfsStorm frequency = 50 yrs Time to peak = 722 minTime interval = 2 min Hyd. volume = 17,852 cuftDrainage area = 2.450 ac Curve number = 58Basin Slope = 0.0 % Hydraulic length = 0 ftTc method = TR55 Time of conc. (Tc) = 10.80 minTotal precip. = 6.30 in Distribution = Type IIStorm duration = 24 hrs Shape factor = 484
61
0 120 240 360 480 600 720 840 960 1080 1200 1320 1440 1560
Q (cfs)
0.00 0.00
1.00 1.00
2.00 2.00
3.00 3.00
4.00 4.00
5.00 5.00
6.00 6.00
7.00 7.00
Q (cfs)
Time (min)
PRE-DEVHyd. No. 1 -- 50 Year
Hyd No. 1

Hydrograph ReportHydraflow Hydrographs Extension for AutoCAD® Civil 3D® 2016 by Autodesk, Inc. v11 Tuesday, 12 / 27 / 2016
Hyd. No. 2
BYPASS
Hydrograph type = SCS Runoff Peak discharge = 0.462 cfsStorm frequency = 50 yrs Time to peak = 716 minTime interval = 2 min Hyd. volume = 936 cuftDrainage area = 0.080 ac Curve number = 74Basin Slope = 0.0 % Hydraulic length = 0 ftTc method = User Time of conc. (Tc) = 5.00 minTotal precip. = 6.30 in Distribution = Type IIStorm duration = 24 hrs Shape factor = 484
62
0 120 240 360 480 600 720 840 960 1080 1200 1320 1440
Q (cfs)
0.00 0.00
0.05 0.05
0.10 0.10
0.15 0.15
0.20 0.20
0.25 0.25
0.30 0.30
0.35 0.35
0.40 0.40
0.45 0.45
0.50 0.50
Q (cfs)
Time (min)
BYPASSHyd. No. 2 -- 50 Year
Hyd No. 2
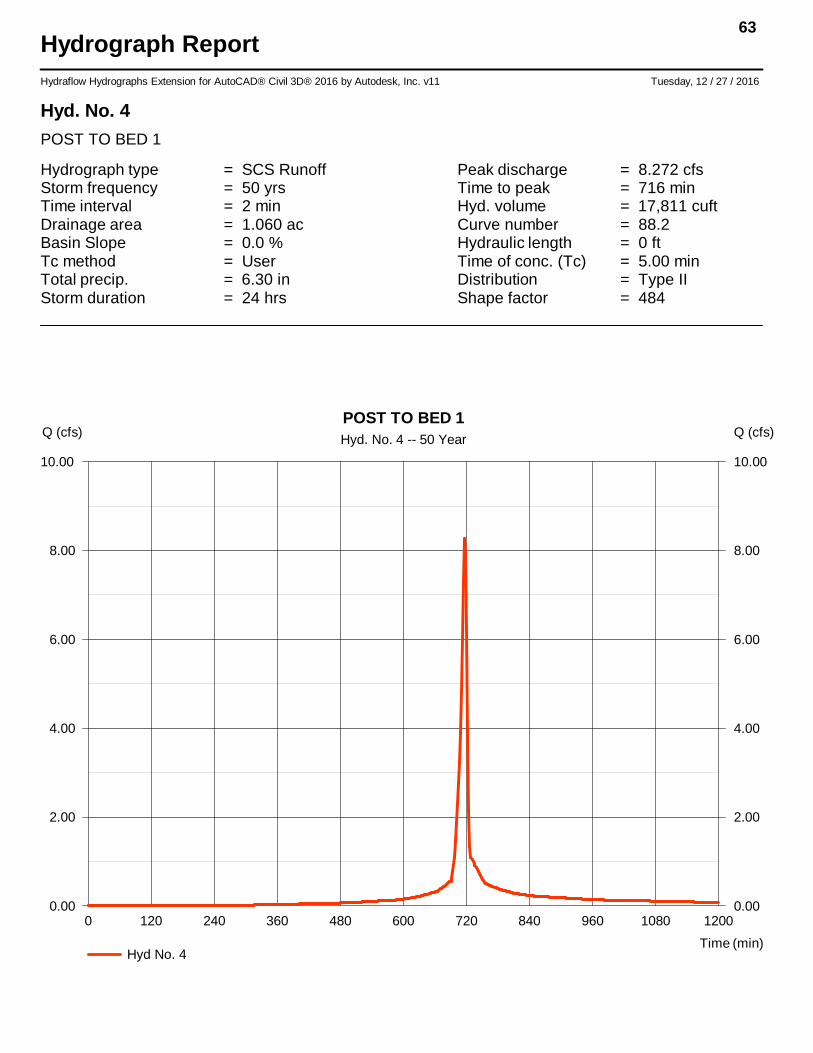
Hydrograph ReportHydraflow Hydrographs Extension for AutoCAD® Civil 3D® 2016 by Autodesk, Inc. v11 Tuesday, 12 / 27 / 2016
Hyd. No. 4
POST TO BED 1
Hydrograph type = SCS Runoff Peak discharge = 8.272 cfsStorm frequency = 50 yrs Time to peak = 716 minTime interval = 2 min Hyd. volume = 17,811 cuftDrainage area = 1.060 ac Curve number = 88.2Basin Slope = 0.0 % Hydraulic length = 0 ftTc method = User Time of conc. (Tc) = 5.00 minTotal precip. = 6.30 in Distribution = Type IIStorm duration = 24 hrs Shape factor = 484
63
0 120 240 360 480 600 720 840 960 1080 1200
Q (cfs)
0.00 0.00
2.00 2.00
4.00 4.00
6.00 6.00
8.00 8.00
10.00 10.00
Q (cfs)
Time (min)
POST TO BED 1Hyd. No. 4 -- 50 Year
Hyd No. 4

Hydrograph ReportHydraflow Hydrographs Extension for AutoCAD® Civil 3D® 2016 by Autodesk, Inc. v11 Tuesday, 12 / 27 / 2016
Hyd. No. 5
BED 1 ROUTED
Hydrograph type = Reservoir Peak discharge = 0.275 cfsStorm frequency = 50 yrs Time to peak = 818 minTime interval = 2 min Hyd. volume = 4,889 cuftInflow hyd. No. = 4 - POST TO BED 1 Max. Elevation = 378.07 ftReservoir name = BED 1 Max. Storage = 13,144 cuft
Storage Indication method used.
64
0 120 240 360 480 600 720 840 960 1080 1200 1320 1440 1560
Q (cfs)
0.00 0.00
2.00 2.00
4.00 4.00
6.00 6.00
8.00 8.00
10.00 10.00
Q (cfs)
Time (min)
BED 1 ROUTEDHyd. No. 5 -- 50 Year
Hyd No. 5 Hyd No. 4 Total storage used = 13,144 cuft

Hydrograph ReportHydraflow Hydrographs Extension for AutoCAD® Civil 3D® 2016 by Autodesk, Inc. v11 Tuesday, 12 / 27 / 2016
Hyd. No. 7
POST TO BED 2
Hydrograph type = SCS Runoff Peak discharge = 8.346 cfsStorm frequency = 50 yrs Time to peak = 716 minTime interval = 2 min Hyd. volume = 18,714 cuftDrainage area = 1.010 ac Curve number = 92.7Basin Slope = 0.0 % Hydraulic length = 0 ftTc method = User Time of conc. (Tc) = 5.00 minTotal precip. = 6.30 in Distribution = Type IIStorm duration = 24 hrs Shape factor = 484
65
0 120 240 360 480 600 720 840 960 1080 1200
Q (cfs)
0.00 0.00
2.00 2.00
4.00 4.00
6.00 6.00
8.00 8.00
10.00 10.00
Q (cfs)
Time (min)
POST TO BED 2Hyd. No. 7 -- 50 Year
Hyd No. 7

Hydrograph ReportHydraflow Hydrographs Extension for AutoCAD® Civil 3D® 2016 by Autodesk, Inc. v11 Tuesday, 12 / 27 / 2016
Hyd. No. 8
BED 1 ROUTED + POST TO BED 2
Hydrograph type = Combine Peak discharge = 8.346 cfsStorm frequency = 50 yrs Time to peak = 716 minTime interval = 2 min Hyd. volume = 23,602 cuftInflow hyds. = 5, 7 Contrib. drain. area = 1.010 ac
66
0 120 240 360 480 600 720 840 960 1080 1200 1320 1440 1560
Q (cfs)
0.00 0.00
2.00 2.00
4.00 4.00
6.00 6.00
8.00 8.00
10.00 10.00
Q (cfs)
Time (min)
BED 1 ROUTED + POST TO BED 2Hyd. No. 8 -- 50 Year
Hyd No. 8 Hyd No. 5 Hyd No. 7

Hydrograph ReportHydraflow Hydrographs Extension for AutoCAD® Civil 3D® 2016 by Autodesk, Inc. v11 Tuesday, 12 / 27 / 2016
Hyd. No. 9
BED 2 ROUTED
Hydrograph type = Reservoir Peak discharge = 2.269 cfsStorm frequency = 50 yrs Time to peak = 724 minTime interval = 2 min Hyd. volume = 15,369 cuftInflow hyd. No. = 8 - BED 1 ROUTED + POST TO BED 2Max. Elevation = 376.48 ftReservoir name = BED 2 Max. Storage = 10,861 cuft
Storage Indication method used.
67
0 120 240 360 480 600 720 840 960 1080 1200 1320 1440 1560 1680
Q (cfs)
0.00 0.00
2.00 2.00
4.00 4.00
6.00 6.00
8.00 8.00
10.00 10.00
Q (cfs)
Time (min)
BED 2 ROUTEDHyd. No. 9 -- 50 Year
Hyd No. 9 Hyd No. 8 Total storage used = 10,861 cuft
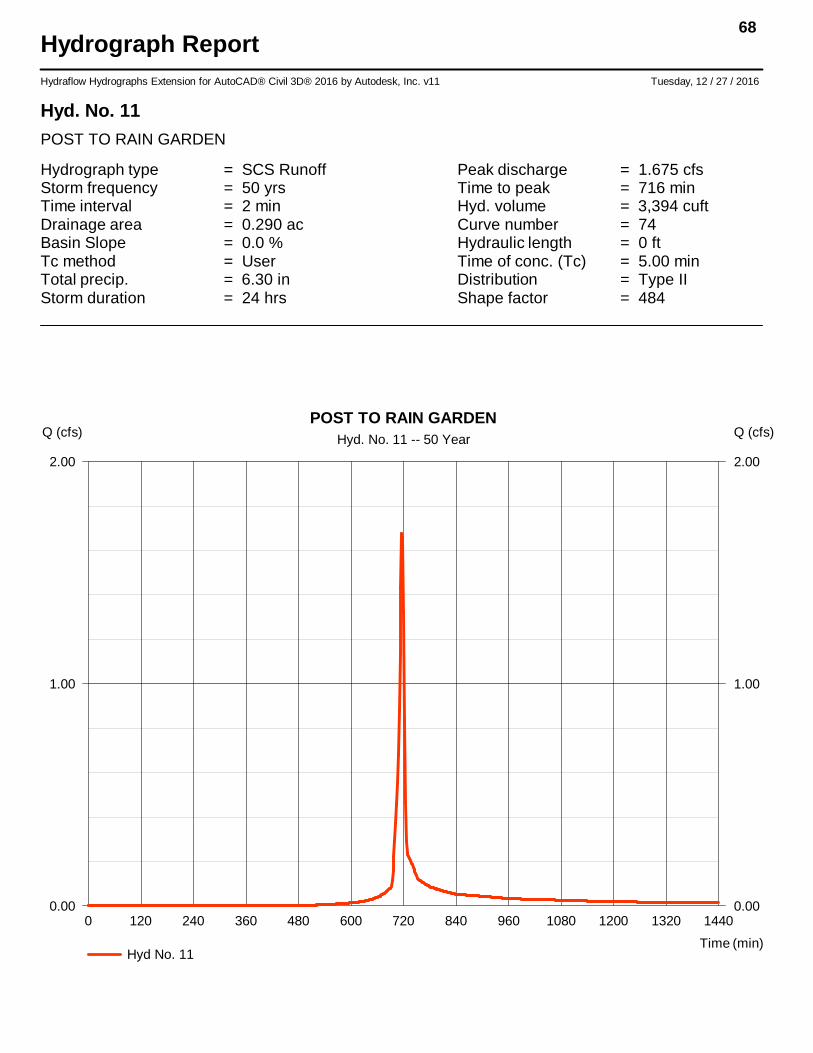
Hydrograph ReportHydraflow Hydrographs Extension for AutoCAD® Civil 3D® 2016 by Autodesk, Inc. v11 Tuesday, 12 / 27 / 2016
Hyd. No. 11
POST TO RAIN GARDEN
Hydrograph type = SCS Runoff Peak discharge = 1.675 cfsStorm frequency = 50 yrs Time to peak = 716 minTime interval = 2 min Hyd. volume = 3,394 cuftDrainage area = 0.290 ac Curve number = 74Basin Slope = 0.0 % Hydraulic length = 0 ftTc method = User Time of conc. (Tc) = 5.00 minTotal precip. = 6.30 in Distribution = Type IIStorm duration = 24 hrs Shape factor = 484
68
0 120 240 360 480 600 720 840 960 1080 1200 1320 1440
Q (cfs)
0.00 0.00
1.00 1.00
2.00 2.00
Q (cfs)
Time (min)
POST TO RAIN GARDENHyd. No. 11 -- 50 Year
Hyd No. 11

Hydrograph ReportHydraflow Hydrographs Extension for AutoCAD® Civil 3D® 2016 by Autodesk, Inc. v11 Tuesday, 12 / 27 / 2016
Hyd. No. 12
RAIN GARDEN ROUTED
Hydrograph type = Reservoir Peak discharge = 0.256 cfsStorm frequency = 50 yrs Time to peak = 728 minTime interval = 2 min Hyd. volume = 1,935 cuftInflow hyd. No. = 11 - POST TO RAIN GARDENMax. Elevation = 375.56 ftReservoir name = RAIN GARDEN 1 Max. Storage = 1,665 cuft
Storage Indication method used.
69
0 120 240 360 480 600 720 840 960 1080 1200 1320 1440 1560
Q (cfs)
0.00 0.00
1.00 1.00
2.00 2.00
Q (cfs)
Time (min)
RAIN GARDEN ROUTEDHyd. No. 12 -- 50 Year
Hyd No. 12 Hyd No. 11 Total storage used = 1,665 cuft

Hydrograph ReportHydraflow Hydrographs Extension for AutoCAD® Civil 3D® 2016 by Autodesk, Inc. v11 Tuesday, 12 / 27 / 2016
Hyd. No. 14
COMBINED
Hydrograph type = Combine Peak discharge = 2.651 cfsStorm frequency = 50 yrs Time to peak = 724 minTime interval = 2 min Hyd. volume = 18,240 cuftInflow hyds. = 2, 9, 12 Contrib. drain. area = 0.080 ac
70
0 120 240 360 480 600 720 840 960 1080 1200 1320 1440 1560 1680
Q (cfs)
0.00 0.00
1.00 1.00
2.00 2.00
3.00 3.00
Q (cfs)
Time (min)
COMBINEDHyd. No. 14 -- 50 Year
Hyd No. 14 Hyd No. 2 Hyd No. 9 Hyd No. 12

Hydrograph Summary Report71
Hyd. Hydrograph Peak Time Time to Hyd. Inflow Maximum Total HydrographNo. type flow interval Peak volume hyd(s) elevation strge used Description
(origin) (cfs) (min) (min) (cuft) (ft) (cuft)
1 SCS Runoff 11.91 2 722 31,228 ------ ------ ------ PRE-DEV
2 SCS Runoff 0.701 2 716 1,439 ------ ------ ------ BYPASS
4 SCS Runoff 11.44 2 716 25,192 ------ ------ ------ POST TO BED 1
5 Reservoir 3.941 2 724 12,270 4 378.46 14,271 BED 1 ROUTED
7 SCS Runoff 11.31 2 716 25,860 ------ ------ ------ POST TO BED 2
8 Combine 11.31 2 716 38,130 5, 7 ------ ------ BED 1 ROUTED + POST TO BED 2
9 Reservoir 6.316 2 724 29,896 8 377.39 13,830 BED 2 ROUTED
11 SCS Runoff 2.542 2 716 5,216 ------ ------ ------ POST TO RAIN GARDEN
12 Reservoir 0.332 2 722 3,757 11 375.83 2,618 RAIN GARDEN ROUTED
14 Combine 6.834 2 724 35,092 2, 9, 12, ------ ------ COMBINED
2731 SWM.gpw Return Period: 100 Year Tuesday, 12 / 27 / 2016
Hydraflow Hydrographs Extension for AutoCAD® Civil 3D® 2016 by Autodesk, Inc. v11

Hydrograph ReportHydraflow Hydrographs Extension for AutoCAD® Civil 3D® 2016 by Autodesk, Inc. v11 Tuesday, 12 / 27 / 2016
Hyd. No. 1
PRE-DEV
Hydrograph type = SCS Runoff Peak discharge = 11.91 cfsStorm frequency = 100 yrs Time to peak = 722 minTime interval = 2 min Hyd. volume = 31,228 cuftDrainage area = 2.450 ac Curve number = 58Basin Slope = 0.0 % Hydraulic length = 0 ftTc method = TR55 Time of conc. (Tc) = 10.80 minTotal precip. = 8.40 in Distribution = Type IIStorm duration = 24 hrs Shape factor = 484
72
0 120 240 360 480 600 720 840 960 1080 1200 1320 1440 1560
Q (cfs)
0.00 0.00
2.00 2.00
4.00 4.00
6.00 6.00
8.00 8.00
10.00 10.00
12.00 12.00
Q (cfs)
Time (min)
PRE-DEVHyd. No. 1 -- 100 Year
Hyd No. 1

Hydrograph ReportHydraflow Hydrographs Extension for AutoCAD® Civil 3D® 2016 by Autodesk, Inc. v11 Tuesday, 12 / 27 / 2016
Hyd. No. 2
BYPASS
Hydrograph type = SCS Runoff Peak discharge = 0.701 cfsStorm frequency = 100 yrs Time to peak = 716 minTime interval = 2 min Hyd. volume = 1,439 cuftDrainage area = 0.080 ac Curve number = 74Basin Slope = 0.0 % Hydraulic length = 0 ftTc method = User Time of conc. (Tc) = 5.00 minTotal precip. = 8.40 in Distribution = Type IIStorm duration = 24 hrs Shape factor = 484
73
0 120 240 360 480 600 720 840 960 1080 1200 1320
Q (cfs)
0.00 0.00
0.10 0.10
0.20 0.20
0.30 0.30
0.40 0.40
0.50 0.50
0.60 0.60
0.70 0.70
0.80 0.80
0.90 0.90
1.00 1.00
Q (cfs)
Time (min)
BYPASSHyd. No. 2 -- 100 Year
Hyd No. 2

Hydrograph ReportHydraflow Hydrographs Extension for AutoCAD® Civil 3D® 2016 by Autodesk, Inc. v11 Tuesday, 12 / 27 / 2016
Hyd. No. 4
POST TO BED 1
Hydrograph type = SCS Runoff Peak discharge = 11.44 cfsStorm frequency = 100 yrs Time to peak = 716 minTime interval = 2 min Hyd. volume = 25,192 cuftDrainage area = 1.060 ac Curve number = 88.2Basin Slope = 0.0 % Hydraulic length = 0 ftTc method = User Time of conc. (Tc) = 5.00 minTotal precip. = 8.40 in Distribution = Type IIStorm duration = 24 hrs Shape factor = 484
74
0 120 240 360 480 600 720 840 960 1080 1200
Q (cfs)
0.00 0.00
2.00 2.00
4.00 4.00
6.00 6.00
8.00 8.00
10.00 10.00
12.00 12.00
Q (cfs)
Time (min)
POST TO BED 1Hyd. No. 4 -- 100 Year
Hyd No. 4

Hydrograph ReportHydraflow Hydrographs Extension for AutoCAD® Civil 3D® 2016 by Autodesk, Inc. v11 Tuesday, 12 / 27 / 2016
Hyd. No. 5
BED 1 ROUTED
Hydrograph type = Reservoir Peak discharge = 3.941 cfsStorm frequency = 100 yrs Time to peak = 724 minTime interval = 2 min Hyd. volume = 12,270 cuftInflow hyd. No. = 4 - POST TO BED 1 Max. Elevation = 378.46 ftReservoir name = BED 1 Max. Storage = 14,271 cuft
Storage Indication method used.
75
0 120 240 360 480 600 720 840 960 1080 1200 1320 1440 1560
Q (cfs)
0.00 0.00
2.00 2.00
4.00 4.00
6.00 6.00
8.00 8.00
10.00 10.00
12.00 12.00
Q (cfs)
Time (min)
BED 1 ROUTEDHyd. No. 5 -- 100 Year
Hyd No. 5 Hyd No. 4 Total storage used = 14,271 cuft

Hydrograph ReportHydraflow Hydrographs Extension for AutoCAD® Civil 3D® 2016 by Autodesk, Inc. v11 Tuesday, 12 / 27 / 2016
Hyd. No. 7
POST TO BED 2
Hydrograph type = SCS Runoff Peak discharge = 11.31 cfsStorm frequency = 100 yrs Time to peak = 716 minTime interval = 2 min Hyd. volume = 25,860 cuftDrainage area = 1.010 ac Curve number = 92.7Basin Slope = 0.0 % Hydraulic length = 0 ftTc method = User Time of conc. (Tc) = 5.00 minTotal precip. = 8.40 in Distribution = Type IIStorm duration = 24 hrs Shape factor = 484
76
0 120 240 360 480 600 720 840 960 1080 1200
Q (cfs)
0.00 0.00
2.00 2.00
4.00 4.00
6.00 6.00
8.00 8.00
10.00 10.00
12.00 12.00
Q (cfs)
Time (min)
POST TO BED 2Hyd. No. 7 -- 100 Year
Hyd No. 7

Hydrograph ReportHydraflow Hydrographs Extension for AutoCAD® Civil 3D® 2016 by Autodesk, Inc. v11 Tuesday, 12 / 27 / 2016
Hyd. No. 8
BED 1 ROUTED + POST TO BED 2
Hydrograph type = Combine Peak discharge = 11.31 cfsStorm frequency = 100 yrs Time to peak = 716 minTime interval = 2 min Hyd. volume = 38,130 cuftInflow hyds. = 5, 7 Contrib. drain. area = 1.010 ac
77
0 120 240 360 480 600 720 840 960 1080 1200 1320 1440 1560
Q (cfs)
0.00 0.00
2.00 2.00
4.00 4.00
6.00 6.00
8.00 8.00
10.00 10.00
12.00 12.00
Q (cfs)
Time (min)
BED 1 ROUTED + POST TO BED 2Hyd. No. 8 -- 100 Year
Hyd No. 8 Hyd No. 5 Hyd No. 7

Hydrograph ReportHydraflow Hydrographs Extension for AutoCAD® Civil 3D® 2016 by Autodesk, Inc. v11 Tuesday, 12 / 27 / 2016
Hyd. No. 9
BED 2 ROUTED
Hydrograph type = Reservoir Peak discharge = 6.316 cfsStorm frequency = 100 yrs Time to peak = 724 minTime interval = 2 min Hyd. volume = 29,896 cuftInflow hyd. No. = 8 - BED 1 ROUTED + POST TO BED 2Max. Elevation = 377.39 ftReservoir name = BED 2 Max. Storage = 13,830 cuft
Storage Indication method used.
78
0 120 240 360 480 600 720 840 960 1080 1200 1320 1440 1560
Q (cfs)
0.00 0.00
2.00 2.00
4.00 4.00
6.00 6.00
8.00 8.00
10.00 10.00
12.00 12.00
Q (cfs)
Time (min)
BED 2 ROUTEDHyd. No. 9 -- 100 Year
Hyd No. 9 Hyd No. 8 Total storage used = 13,830 cuft

Hydrograph ReportHydraflow Hydrographs Extension for AutoCAD® Civil 3D® 2016 by Autodesk, Inc. v11 Tuesday, 12 / 27 / 2016
Hyd. No. 11
POST TO RAIN GARDEN
Hydrograph type = SCS Runoff Peak discharge = 2.542 cfsStorm frequency = 100 yrs Time to peak = 716 minTime interval = 2 min Hyd. volume = 5,216 cuftDrainage area = 0.290 ac Curve number = 74Basin Slope = 0.0 % Hydraulic length = 0 ftTc method = User Time of conc. (Tc) = 5.00 minTotal precip. = 8.40 in Distribution = Type IIStorm duration = 24 hrs Shape factor = 484
79
0 120 240 360 480 600 720 840 960 1080 1200 1320
Q (cfs)
0.00 0.00
1.00 1.00
2.00 2.00
3.00 3.00
Q (cfs)
Time (min)
POST TO RAIN GARDENHyd. No. 11 -- 100 Year
Hyd No. 11

Hydrograph ReportHydraflow Hydrographs Extension for AutoCAD® Civil 3D® 2016 by Autodesk, Inc. v11 Tuesday, 12 / 27 / 2016
Hyd. No. 12
RAIN GARDEN ROUTED
Hydrograph type = Reservoir Peak discharge = 0.332 cfsStorm frequency = 100 yrs Time to peak = 722 minTime interval = 2 min Hyd. volume = 3,757 cuftInflow hyd. No. = 11 - POST TO RAIN GARDENMax. Elevation = 375.83 ftReservoir name = RAIN GARDEN 1 Max. Storage = 2,618 cuft
Storage Indication method used.
80
0 120 240 360 480 600 720 840 960 1080 1200 1320 1440 1560
Q (cfs)
0.00 0.00
1.00 1.00
2.00 2.00
3.00 3.00
Q (cfs)
Time (min)
RAIN GARDEN ROUTEDHyd. No. 12 -- 100 Year
Hyd No. 12 Hyd No. 11 Total storage used = 2,618 cuft

Hydrograph ReportHydraflow Hydrographs Extension for AutoCAD® Civil 3D® 2016 by Autodesk, Inc. v11 Tuesday, 12 / 27 / 2016
Hyd. No. 14
COMBINED
Hydrograph type = Combine Peak discharge = 6.834 cfsStorm frequency = 100 yrs Time to peak = 724 minTime interval = 2 min Hyd. volume = 35,092 cuftInflow hyds. = 2, 9, 12 Contrib. drain. area = 0.080 ac
81
0 120 240 360 480 600 720 840 960 1080 1200 1320 1440 1560
Q (cfs)
0.00 0.00
1.00 1.00
2.00 2.00
3.00 3.00
4.00 4.00
5.00 5.00
6.00 6.00
7.00 7.00
Q (cfs)
Time (min)
COMBINEDHyd. No. 14 -- 100 Year
Hyd No. 14 Hyd No. 2 Hyd No. 9 Hyd No. 12

Chatham Financial Stormwater Management Report Kennett Township, Chester County Page E
APPENDIX E
STORMWATER CONVEYANCE CALCULATIONS

Title:Riprap Apron DesignMinimum Tailwater Condition
Source:PA DEPErosion & Sediment Pollution Control Program Manual
Chatham FinancialKennettTownship
Chester County, Pennsylvania
BYPASS - 24” HDPE
Q100=14.37 cfsBarrel=18”LA=14’Min. Width=4.5’Max. Width=18.5’Rock Size=R-4 (6”)Rock Depth=18”

Title:Riprap Apron DesignMinimum Tailwater Condition
Source:PA DEPErosion & Sediment Pollution Control Program Manual
Chatham FinancialKennettTownship
Chester County, Pennsylvania
UG 2
Q100=6.32 cfsBarrel=15”LA=8’Min. Width=4’Max. Width=12’Rock Size=R-4 (6”)Rock Depth=18”

DESIGN STORM = 100-yrCOMPUTATION TABLE - STORM SEWER DESIGN I 100 = 8.2 IN/HR
DRAINAGE AREA
INLET NO. STA. A CDelta CA
Sum CA
DT �TRAINFALL
INTENSITYENTERING Q INLET
DISCHARGE Q PIPE
LENGTH OF PIPE
SLOPE OF PIPE TYPE OF PIPEMANNINGS N
VALUESIZE OF
PIPEFULL FLOW VELOCITY
PIPE CAPACITY FLOWING
FULL SLOPE
ACRES ACRES ACRES MIN. MIN. IN/HR. C.F.S. C.F.S. FEET FT/FT IN. F.P.S. C.F.S.
44 0.0132 RCP 0.012 12 5.66 4.45
92 0.0200 HDPE 0.012 15 8.09 9.92
BYPASS FLOW COMBINED 14.37 465 0.0050 HDPE 0.012 24 5.53 17.38
BYPASS FLOW EX 15" HDPE
BYPASS FLOW EX 12" RCP
TIME
CHATHAM FINANCIALKENNETT TOWNSHIP, CHESTER COUNTY, PA
JOB NUMBER - 2731REVISION - 0 12/16/2016
BY: CMD


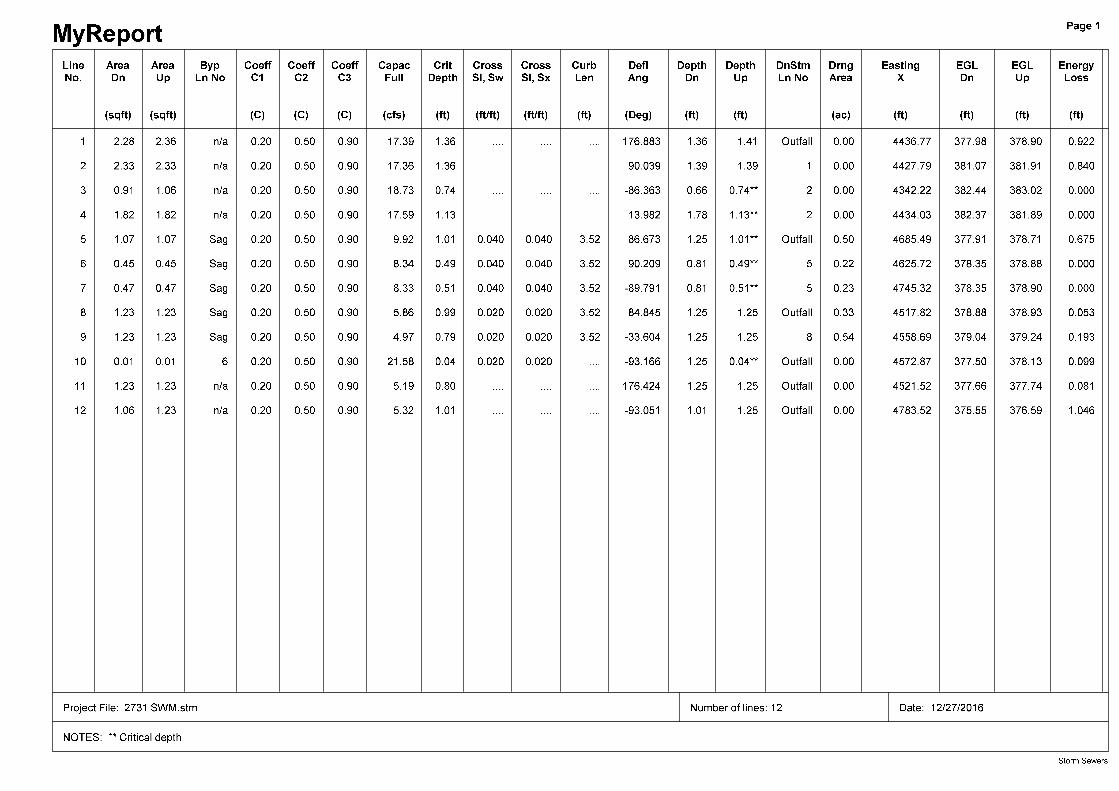


Chatham Financial Stormwater Management Report Kennett Township, Chester County Page F
APPENDIX F
NRCS SOILS REPORT

United StatesDepartment ofAgriculture
A product of the NationalCooperative Soil Survey,a joint effort of the UnitedStates Department ofAgriculture and otherFederal agencies, Stateagencies including theAgricultural ExperimentStations, and localparticipants
Custom Soil ResourceReport for
Chester County,Pennsylvania
NaturalResourcesConservationService
December 14, 2016

PrefaceSoil surveys contain information that affects land use planning in survey areas. Theyhighlight soil limitations that affect various land uses and provide information aboutthe properties of the soils in the survey areas. Soil surveys are designed for manydifferent users, including farmers, ranchers, foresters, agronomists, urban planners,community officials, engineers, developers, builders, and home buyers. Also,conservationists, teachers, students, and specialists in recreation, waste disposal,and pollution control can use the surveys to help them understand, protect, or enhancethe environment.
Various land use regulations of Federal, State, and local governments may imposespecial restrictions on land use or land treatment. Soil surveys identify soil propertiesthat are used in making various land use or land treatment decisions. The informationis intended to help the land users identify and reduce the effects of soil limitations onvarious land uses. The landowner or user is responsible for identifying and complyingwith existing laws and regulations.
Although soil survey information can be used for general farm, local, and wider areaplanning, onsite investigation is needed to supplement this information in some cases.Examples include soil quality assessments (http://www.nrcs.usda.gov/wps/portal/nrcs/main/soils/health/) and certain conservation and engineering applications. Formore detailed information, contact your local USDA Service Center (http://offices.sc.egov.usda.gov/locator/app?agency=nrcs) or your NRCS State SoilScientist (http://www.nrcs.usda.gov/wps/portal/nrcs/detail/soils/contactus/?cid=nrcs142p2_053951).
Great differences in soil properties can occur within short distances. Some soils areseasonally wet or subject to flooding. Some are too unstable to be used as afoundation for buildings or roads. Clayey or wet soils are poorly suited to use as septictank absorption fields. A high water table makes a soil poorly suited to basements orunderground installations.
The National Cooperative Soil Survey is a joint effort of the United States Departmentof Agriculture and other Federal agencies, State agencies including the AgriculturalExperiment Stations, and local agencies. The Natural Resources ConservationService (NRCS) has leadership for the Federal part of the National Cooperative SoilSurvey.
Information about soils is updated periodically. Updated information is availablethrough the NRCS Web Soil Survey, the site for official soil survey information.
The U.S. Department of Agriculture (USDA) prohibits discrimination in all its programsand activities on the basis of race, color, national origin, age, disability, and whereapplicable, sex, marital status, familial status, parental status, religion, sexualorientation, genetic information, political beliefs, reprisal, or because all or a part of anindividual's income is derived from any public assistance program. (Not all prohibitedbases apply to all programs.) Persons with disabilities who require alternative means
2

for communication of program information (Braille, large print, audiotape, etc.) shouldcontact USDA's TARGET Center at (202) 720-2600 (voice and TDD). To file acomplaint of discrimination, write to USDA, Director, Office of Civil Rights, 1400Independence Avenue, S.W., Washington, D.C. 20250-9410 or call (800) 795-3272(voice) or (202) 720-6382 (TDD). USDA is an equal opportunity provider andemployer.
3

ContentsPreface....................................................................................................................2How Soil Surveys Are Made..................................................................................5Soil Map..................................................................................................................7
Soil Map................................................................................................................8Legend..................................................................................................................9Map Unit Legend................................................................................................10Map Unit Descriptions........................................................................................10
Chester County, Pennsylvania........................................................................12GdB—Gladstone gravelly loam, 3 to 8 percent slopes................................12UrkB—Urban land-Edgemont complex, 0 to 8 percent slopes....................13
References............................................................................................................16
4

How Soil Surveys Are MadeSoil surveys are made to provide information about the soils and miscellaneous areasin a specific area. They include a description of the soils and miscellaneous areas andtheir location on the landscape and tables that show soil properties and limitationsaffecting various uses. Soil scientists observed the steepness, length, and shape ofthe slopes; the general pattern of drainage; the kinds of crops and native plants; andthe kinds of bedrock. They observed and described many soil profiles. A soil profile isthe sequence of natural layers, or horizons, in a soil. The profile extends from thesurface down into the unconsolidated material in which the soil formed or from thesurface down to bedrock. The unconsolidated material is devoid of roots and otherliving organisms and has not been changed by other biological activity.
Currently, soils are mapped according to the boundaries of major land resource areas(MLRAs). MLRAs are geographically associated land resource units that sharecommon characteristics related to physiography, geology, climate, water resources,soils, biological resources, and land uses (USDA, 2006). Soil survey areas typicallyconsist of parts of one or more MLRA.
The soils and miscellaneous areas in a survey area occur in an orderly pattern that isrelated to the geology, landforms, relief, climate, and natural vegetation of the area.Each kind of soil and miscellaneous area is associated with a particular kind oflandform or with a segment of the landform. By observing the soils and miscellaneousareas in the survey area and relating their position to specific segments of thelandform, a soil scientist develops a concept, or model, of how they were formed. Thus,during mapping, this model enables the soil scientist to predict with a considerabledegree of accuracy the kind of soil or miscellaneous area at a specific location on thelandscape.
Commonly, individual soils on the landscape merge into one another as theircharacteristics gradually change. To construct an accurate soil map, however, soilscientists must determine the boundaries between the soils. They can observe onlya limited number of soil profiles. Nevertheless, these observations, supplemented byan understanding of the soil-vegetation-landscape relationship, are sufficient to verifypredictions of the kinds of soil in an area and to determine the boundaries.
Soil scientists recorded the characteristics of the soil profiles that they studied. Theynoted soil color, texture, size and shape of soil aggregates, kind and amount of rockfragments, distribution of plant roots, reaction, and other features that enable them toidentify soils. After describing the soils in the survey area and determining theirproperties, the soil scientists assigned the soils to taxonomic classes (units).Taxonomic classes are concepts. Each taxonomic class has a set of soilcharacteristics with precisely defined limits. The classes are used as a basis forcomparison to classify soils systematically. Soil taxonomy, the system of taxonomicclassification used in the United States, is based mainly on the kind and character ofsoil properties and the arrangement of horizons within the profile. After the soilscientists classified and named the soils in the survey area, they compared the
5

individual soils with similar soils in the same taxonomic class in other areas so thatthey could confirm data and assemble additional data based on experience andresearch.
The objective of soil mapping is not to delineate pure map unit components; theobjective is to separate the landscape into landforms or landform segments that havesimilar use and management requirements. Each map unit is defined by a uniquecombination of soil components and/or miscellaneous areas in predictableproportions. Some components may be highly contrasting to the other components ofthe map unit. The presence of minor components in a map unit in no way diminishesthe usefulness or accuracy of the data. The delineation of such landforms andlandform segments on the map provides sufficient information for the development ofresource plans. If intensive use of small areas is planned, onsite investigation isneeded to define and locate the soils and miscellaneous areas.
Soil scientists make many field observations in the process of producing a soil map.The frequency of observation is dependent upon several factors, including scale ofmapping, intensity of mapping, design of map units, complexity of the landscape, andexperience of the soil scientist. Observations are made to test and refine the soil-landscape model and predictions and to verify the classification of the soils at specificlocations. Once the soil-landscape model is refined, a significantly smaller number ofmeasurements of individual soil properties are made and recorded. Thesemeasurements may include field measurements, such as those for color, depth tobedrock, and texture, and laboratory measurements, such as those for content ofsand, silt, clay, salt, and other components. Properties of each soil typically vary fromone point to another across the landscape.
Observations for map unit components are aggregated to develop ranges ofcharacteristics for the components. The aggregated values are presented. Directmeasurements do not exist for every property presented for every map unitcomponent. Values for some properties are estimated from combinations of otherproperties.
While a soil survey is in progress, samples of some of the soils in the area generallyare collected for laboratory analyses and for engineering tests. Soil scientists interpretthe data from these analyses and tests as well as the field-observed characteristicsand the soil properties to determine the expected behavior of the soils under differentuses. Interpretations for all of the soils are field tested through observation of the soilsin different uses and under different levels of management. Some interpretations aremodified to fit local conditions, and some new interpretations are developed to meetlocal needs. Data are assembled from other sources, such as research information,production records, and field experience of specialists. For example, data on cropyields under defined levels of management are assembled from farm records and fromfield or plot experiments on the same kinds of soil.
Predictions about soil behavior are based not only on soil properties but also on suchvariables as climate and biological activity. Soil conditions are predictable over longperiods of time, but they are not predictable from year to year. For example, soilscientists can predict with a fairly high degree of accuracy that a given soil will havea high water table within certain depths in most years, but they cannot predict that ahigh water table will always be at a specific level in the soil on a specific date.
After soil scientists located and identified the significant natural bodies of soil in thesurvey area, they drew the boundaries of these bodies on aerial photographs andidentified each as a specific map unit. Aerial photographs show trees, buildings, fields,roads, and rivers, all of which help in locating boundaries accurately.
Custom Soil Resource Report
6

Soil MapThe soil map section includes the soil map for the defined area of interest, a list of soilmap units on the map and extent of each map unit, and cartographic symbolsdisplayed on the map. Also presented are various metadata about data used toproduce the map, and a description of each soil map unit.
7

8
Custom Soil Resource ReportSoil Map
4411
370
4411
390
4411
410
4411
430
4411
450
4411
470
4411
490
4411
510
4411
530
4411
370
4411
390
4411
410
4411
430
4411
450
4411
470
4411
490
4411
510
4411
530
440500 440520 440540 440560 440580 440600 440620 440640 440660 440680 440700 440720 440740
440480 440500 440520 440540 440560 440580 440600 440620 440640 440660 440680 440700 440720 440740
39° 51' 6'' N75
° 4
1' 4
4'' W
39° 51' 6'' N
75° 4
1' 3
3'' W
39° 51' 0'' N
75° 4
1' 4
4'' W
39° 51' 0'' N
75° 4
1' 3
3'' W
N
Map projection: Web Mercator Corner coordinates: WGS84 Edge tics: UTM Zone 18N WGS840 50 100 200 300
Feet0 15 30 60 90
MetersMap Scale: 1:1,220 if printed on A landscape (11" x 8.5") sheet.
Warning: Soil Map may not be valid at this scale.

MAP LEGEND MAP INFORMATION
Area of Interest (AOI)Area of Interest (AOI)
SoilsSoil Map Unit Polygons
Soil Map Unit Lines
Soil Map Unit Points
Special Point FeaturesBlowout
Borrow Pit
Clay Spot
Closed Depression
Gravel Pit
Gravelly Spot
Landfill
Lava Flow
Marsh or swamp
Mine or Quarry
Miscellaneous Water
Perennial Water
Rock Outcrop
Saline Spot
Sandy Spot
Severely Eroded Spot
Sinkhole
Slide or Slip
Sodic Spot
Spoil Area
Stony Spot
Very Stony Spot
Wet Spot
Other
Special Line Features
Water FeaturesStreams and Canals
TransportationRails
Interstate Highways
US Routes
Major Roads
Local Roads
BackgroundAerial Photography
The soil surveys that comprise your AOI were mapped at 1:24,000.
Warning: Soil Map may not be valid at this scale.
Enlargement of maps beyond the scale of mapping can causemisunderstanding of the detail of mapping and accuracy of soil lineplacement. The maps do not show the small areas of contrastingsoils that could have been shown at a more detailed scale.
Please rely on the bar scale on each map sheet for mapmeasurements.
Source of Map: Natural Resources Conservation ServiceWeb Soil Survey URL: http://websoilsurvey.nrcs.usda.govCoordinate System: Web Mercator (EPSG:3857)
Maps from the Web Soil Survey are based on the Web Mercatorprojection, which preserves direction and shape but distortsdistance and area. A projection that preserves area, such as theAlbers equal-area conic projection, should be used if more accuratecalculations of distance or area are required.
This product is generated from the USDA-NRCS certified data as ofthe version date(s) listed below.
Soil Survey Area: Chester County, PennsylvaniaSurvey Area Data: Version 8, Sep 19, 2016
Soil map units are labeled (as space allows) for map scales 1:50,000or larger.
Date(s) aerial images were photographed: Mar 19, 2011—May 7,2011
The orthophoto or other base map on which the soil lines werecompiled and digitized probably differs from the backgroundimagery displayed on these maps. As a result, some minor shiftingof map unit boundaries may be evident.
Custom Soil Resource Report
9

Map Unit Legend
Chester County, Pennsylvania (PA029)
Map Unit Symbol Map Unit Name Acres in AOI Percent of AOI
GdB Gladstone gravelly loam, 3 to 8percent slopes
5.9 99.4%
UrkB Urban land-Edgemont complex,0 to 8 percent slopes
0.0 0.6%
Totals for Area of Interest 5.9 100.0%
Map Unit DescriptionsThe map units delineated on the detailed soil maps in a soil survey represent the soilsor miscellaneous areas in the survey area. The map unit descriptions, along with themaps, can be used to determine the composition and properties of a unit.
A map unit delineation on a soil map represents an area dominated by one or moremajor kinds of soil or miscellaneous areas. A map unit is identified and namedaccording to the taxonomic classification of the dominant soils. Within a taxonomicclass there are precisely defined limits for the properties of the soils. On the landscape,however, the soils are natural phenomena, and they have the characteristic variabilityof all natural phenomena. Thus, the range of some observed properties may extendbeyond the limits defined for a taxonomic class. Areas of soils of a single taxonomicclass rarely, if ever, can be mapped without including areas of other taxonomicclasses. Consequently, every map unit is made up of the soils or miscellaneous areasfor which it is named and some minor components that belong to taxonomic classesother than those of the major soils.
Most minor soils have properties similar to those of the dominant soil or soils in themap unit, and thus they do not affect use and management. These are callednoncontrasting, or similar, components. They may or may not be mentioned in aparticular map unit description. Other minor components, however, have propertiesand behavioral characteristics divergent enough to affect use or to require differentmanagement. These are called contrasting, or dissimilar, components. They generallyare in small areas and could not be mapped separately because of the scale used.Some small areas of strongly contrasting soils or miscellaneous areas are identifiedby a special symbol on the maps. If included in the database for a given area, thecontrasting minor components are identified in the map unit descriptions along withsome characteristics of each. A few areas of minor components may not have beenobserved, and consequently they are not mentioned in the descriptions, especiallywhere the pattern was so complex that it was impractical to make enough observationsto identify all the soils and miscellaneous areas on the landscape.
The presence of minor components in a map unit in no way diminishes the usefulnessor accuracy of the data. The objective of mapping is not to delineate pure taxonomicclasses but rather to separate the landscape into landforms or landform segments thathave similar use and management requirements. The delineation of such segmentson the map provides sufficient information for the development of resource plans. If
Custom Soil Resource Report
10

intensive use of small areas is planned, however, onsite investigation is needed todefine and locate the soils and miscellaneous areas.
An identifying symbol precedes the map unit name in the map unit descriptions. Eachdescription includes general facts about the unit and gives important soil propertiesand qualities.
Soils that have profiles that are almost alike make up a soil series. Except fordifferences in texture of the surface layer, all the soils of a series have major horizonsthat are similar in composition, thickness, and arrangement.
Soils of one series can differ in texture of the surface layer, slope, stoniness, salinity,degree of erosion, and other characteristics that affect their use. On the basis of suchdifferences, a soil series is divided into soil phases. Most of the areas shown on thedetailed soil maps are phases of soil series. The name of a soil phase commonlyindicates a feature that affects use or management. For example, Alpha silt loam, 0to 2 percent slopes, is a phase of the Alpha series.
Some map units are made up of two or more major soils or miscellaneous areas.These map units are complexes, associations, or undifferentiated groups.
A complex consists of two or more soils or miscellaneous areas in such an intricatepattern or in such small areas that they cannot be shown separately on the maps. Thepattern and proportion of the soils or miscellaneous areas are somewhat similar in allareas. Alpha-Beta complex, 0 to 6 percent slopes, is an example.
An association is made up of two or more geographically associated soils ormiscellaneous areas that are shown as one unit on the maps. Because of present oranticipated uses of the map units in the survey area, it was not considered practicalor necessary to map the soils or miscellaneous areas separately. The pattern andrelative proportion of the soils or miscellaneous areas are somewhat similar. Alpha-Beta association, 0 to 2 percent slopes, is an example.
An undifferentiated group is made up of two or more soils or miscellaneous areas thatcould be mapped individually but are mapped as one unit because similarinterpretations can be made for use and management. The pattern and proportion ofthe soils or miscellaneous areas in a mapped area are not uniform. An area can bemade up of only one of the major soils or miscellaneous areas, or it can be made upof all of them. Alpha and Beta soils, 0 to 2 percent slopes, is an example.
Some surveys include miscellaneous areas. Such areas have little or no soil materialand support little or no vegetation. Rock outcrop is an example.
Custom Soil Resource Report
11

Chester County, Pennsylvania
GdB—Gladstone gravelly loam, 3 to 8 percent slopes
Map Unit SettingNational map unit symbol: 2v7gkElevation: 250 to 1,200 feetMean annual precipitation: 30 to 64 inchesMean annual air temperature: 46 to 79 degrees FFrost-free period: 131 to 178 daysFarmland classification: All areas are prime farmland
Map Unit CompositionGladstone and similar soils: 85 percentMinor components: 15 percentEstimates are based on observations, descriptions, and transects of the mapunit.
Description of Gladstone
SettingLandform: HillsLandform position (two-dimensional): ShoulderLandform position (three-dimensional): Side slopeDown-slope shape: LinearAcross-slope shape: ConvexParent material: Loamy colluvium derived from granite and gneiss and/or loamy
residuum weathered from granite and gneiss
Typical profileAp - 0 to 10 inches: gravelly loamBt1 - 10 to 22 inches: sandy clay loamBt2 - 22 to 37 inches: loamC - 37 to 66 inches: sandy loamR - 66 to 76 inches: bedrock
Properties and qualitiesSlope: 3 to 8 percentDepth to restrictive feature: 60 to 80 inches to lithic bedrockNatural drainage class: Well drainedCapacity of the most limiting layer to transmit water (Ksat): Very low to moderately
low (0.00 to 0.06 in/hr)Depth to water table: More than 80 inchesFrequency of flooding: NoneFrequency of ponding: NoneAvailable water storage in profile: Moderate (about 8.4 inches)
Interpretive groupsLand capability classification (irrigated): None specifiedLand capability classification (nonirrigated): 2eHydrologic Soil Group: BHydric soil rating: No
Minor Components
CalifonPercent of map unit: 5 percent
Custom Soil Resource Report
12

Landform: FlatsLandform position (two-dimensional): FootslopeLandform position (three-dimensional): Base slopeDown-slope shape: ConcaveAcross-slope shape: LinearHydric soil rating: No
AnnandalePercent of map unit: 5 percentLandform: HillsLandform position (two-dimensional): SummitLandform position (three-dimensional): InterfluveDown-slope shape: ConvexAcross-slope shape: LinearHydric soil rating: No
ParkerPercent of map unit: 5 percentLandform: HillsLandform position (two-dimensional): ShoulderLandform position (three-dimensional): Side slopeDown-slope shape: ConvexAcross-slope shape: LinearHydric soil rating: No
UrkB—Urban land-Edgemont complex, 0 to 8 percent slopes
Map Unit SettingNational map unit symbol: pjnbElevation: 500 to 2,400 feetMean annual precipitation: 35 to 50 inchesMean annual air temperature: 46 to 57 degrees FFrost-free period: 120 to 185 daysFarmland classification: Not prime farmland
Map Unit CompositionUrban land: 65 percentEdgemont and similar soils: 30 percentMinor components: 5 percentEstimates are based on observations, descriptions, and transects of the mapunit.
Description of Urban Land
SettingLandform: RidgesLandform position (two-dimensional): Shoulder, summitLandform position (three-dimensional): Nose slope, head slope, side slope,
interfluveParent material: Pavement, buildings and other artifically covered areas
Custom Soil Resource Report
13

Typical profileC - 0 to 6 inches: variable
Properties and qualitiesSlope: 0 to 8 percentDepth to restrictive feature: 10 to 99 inches to lithic bedrockAvailable water storage in profile: Very low (about 0.0 inches)
Interpretive groupsLand capability classification (irrigated): None specifiedLand capability classification (nonirrigated): 8sHydric soil rating: No
Description of Edgemont
SettingLandform: RidgesLandform position (two-dimensional): Shoulder, summitLandform position (three-dimensional): Nose slope, head slope, side slope,
interfluveDown-slope shape: Convex, linearAcross-slope shape: Convex, linearParent material: Residuum weathered from antietam quartzite; residuum weathered
from chickies quartzite and/or slate; residuum weathered from vintage dolomite
Typical profileA - 0 to 9 inches: channery loamBt - 9 to 25 inches: channery fine sandy loamC - 25 to 60 inches: very channery sandy loam
Properties and qualitiesSlope: 0 to 8 percentDepth to restrictive feature: 40 to 84 inches to lithic bedrockNatural drainage class: Well drainedRunoff class: Very lowCapacity of the most limiting layer to transmit water (Ksat): Moderately high to high
(0.60 to 6.00 in/hr)Depth to water table: More than 80 inchesFrequency of flooding: NoneFrequency of ponding: NoneAvailable water storage in profile: Low (about 5.5 inches)
Interpretive groupsLand capability classification (irrigated): None specifiedLand capability classification (nonirrigated): 2eHydrologic Soil Group: AHydric soil rating: No
Minor Components
BuchananPercent of map unit: 3 percentLandform: TerracesLandform position (two-dimensional): FootslopeLandform position (three-dimensional): MountainbaseDown-slope shape: Concave, linearAcross-slope shape: Concave, linear
Custom Soil Resource Report
14

Hydric soil rating: No
AndoverPercent of map unit: 2 percentLandform: DrainagewaysLandform position (two-dimensional): Toeslope, footslopeLandform position (three-dimensional): MountainbaseDown-slope shape: Linear, concaveAcross-slope shape: Linear, concaveHydric soil rating: Yes
Custom Soil Resource Report
15

ReferencesAmerican Association of State Highway and Transportation Officials (AASHTO). 2004.Standard specifications for transportation materials and methods of sampling andtesting. 24th edition.
American Society for Testing and Materials (ASTM). 2005. Standard classification ofsoils for engineering purposes. ASTM Standard D2487-00.
Cowardin, L.M., V. Carter, F.C. Golet, and E.T. LaRoe. 1979. Classification ofwetlands and deep-water habitats of the United States. U.S. Fish and Wildlife ServiceFWS/OBS-79/31.
Federal Register. July 13, 1994. Changes in hydric soils of the United States.
Federal Register. September 18, 2002. Hydric soils of the United States.
Hurt, G.W., and L.M. Vasilas, editors. Version 6.0, 2006. Field indicators of hydric soilsin the United States.
National Research Council. 1995. Wetlands: Characteristics and boundaries.
Soil Survey Division Staff. 1993. Soil survey manual. Soil Conservation Service. U.S.Department of Agriculture Handbook 18. http://www.nrcs.usda.gov/wps/portal/nrcs/detail/national/soils/?cid=nrcs142p2_054262
Soil Survey Staff. 1999. Soil taxonomy: A basic system of soil classification for makingand interpreting soil surveys. 2nd edition. Natural Resources Conservation Service,U.S. Department of Agriculture Handbook 436. http://www.nrcs.usda.gov/wps/portal/nrcs/detail/national/soils/?cid=nrcs142p2_053577
Soil Survey Staff. 2010. Keys to soil taxonomy. 11th edition. U.S. Department ofAgriculture, Natural Resources Conservation Service. http://www.nrcs.usda.gov/wps/portal/nrcs/detail/national/soils/?cid=nrcs142p2_053580
Tiner, R.W., Jr. 1985. Wetlands of Delaware. U.S. Fish and Wildlife Service andDelaware Department of Natural Resources and Environmental Control, WetlandsSection.
United States Army Corps of Engineers, Environmental Laboratory. 1987. Corps ofEngineers wetlands delineation manual. Waterways Experiment Station TechnicalReport Y-87-1.
United States Department of Agriculture, Natural Resources Conservation Service.National forestry manual. http://www.nrcs.usda.gov/wps/portal/nrcs/detail/soils/home/?cid=nrcs142p2_053374
United States Department of Agriculture, Natural Resources Conservation Service.National range and pasture handbook. http://www.nrcs.usda.gov/wps/portal/nrcs/detail/national/landuse/rangepasture/?cid=stelprdb1043084
16

United States Department of Agriculture, Natural Resources Conservation Service.National soil survey handbook, title 430-VI. http://www.nrcs.usda.gov/wps/portal/nrcs/detail/soils/scientists/?cid=nrcs142p2_054242
United States Department of Agriculture, Natural Resources Conservation Service.2006. Land resource regions and major land resource areas of the United States, theCaribbean, and the Pacific Basin. U.S. Department of Agriculture Handbook 296.http://www.nrcs.usda.gov/wps/portal/nrcs/detail/national/soils/?cid=nrcs142p2_053624
United States Department of Agriculture, Soil Conservation Service. 1961. Landcapability classification. U.S. Department of Agriculture Handbook 210. http://www.nrcs.usda.gov/Internet/FSE_DOCUMENTS/nrcs142p2_052290.pdf
Custom Soil Resource Report
17

Chatham Financial Stormwater Management Report Kennett Township, Chester County Page G
APPENDIX G
INFILTRATION TESTING REPORT

Chatham Financial Infiltration Test Report 235 Whitehorse Road Page 1 October 4, 2016 Kennett Township Chester County
STORMWATER INFILTRATION REPORT
FOR
235 WHITEHORSE ROAD
KENNETT TOWNSHIP CHESTER COUNTY
PREPARED FOR:
Chatham Financial 235 Whitehorse Road
Kennett Square, PA 19348
PREPARED BY:
D.L. Howell & Associates, Inc. 1250 Wrights Lane
West Chester, PA 19380
October 2016

Chatham Financial Infiltration Test Report 235 Whitehorse Road Page 2 October 4, 2016 Kennett Township Chester County
Stormwater Infiltration Test Report
235 Whitehorse Road Kennett Township Chester County
On Monday and Tuesday, October 3-4, 2016, D.L. Howell and Associates, Inc. preformed hydraulic conductivity tests for the proposed stormwater management areas for the Chatham Financial property located at 235 Whitehorse Road in Kennett Township, Chester County. The purpose of the hydraulic conductivity testing was to determine site suitability for the proposed stormwater infiltration area associated with proposed improvements at the site (see development plan). Testing was conducted in general accordance with the Pennsylvania Department of Environmental Protection (PADEP)’s Pennsylvania Stormwater Best Management Practices Manual specifications, in a cased, sealed, borehole utilizing the falling head method designed to measure the vertical hydraulic conductivity of the soil. An approximate five inch diameter borehole was hand dug to the depth of the proposed bottom elevation of the infiltration structure and a 3 inch diameter PVC casing was installed. A mixture of bentonite and soil was placed around the annulus of the casing and packed to seal the casing in place. The casing was presoaked immediately prior to the start of the test to simulate field saturated conditions. A measured amount of water was poured into the sealed casing to begin the 30 minute presoak. After the final 30 minute presoaking period, the water in the casing was adjusted to a known depth and consecutively re-adjusted after each reading and the drop of the water column is measured. The test continued until the readings became stabilized or for a maximum of eight readings. A stabilized rate of drop means a difference of ¼ inch or less of drop between the highest and lowest readings of four consecutive readings. Within the proposed infiltration areas, a total of eight hydraulic conductivity tests were run at the elevations associated with the proposed infiltration elevations. One deep test pit was excavated at each test location to identify limiting conditions such as mottling, depth of bedrock, and depth of groundwater. Testing was to be conducted within the footprint of each proposed infiltration area.
� Infiltration Test 1 was conducted at approximately ± 8.0 feet below existing grade, which corresponds to an approximate infiltration elevation of 373.0. One deep test pit was excavated to a depth of approximately 10.0 feet below existing grade. Redoximorphic features were identified between 9-21 inches. It is D.L. Howell and Associates opinion that these redox features are not an indication of a true or permanent water table, but as the result of variable permeability within that soil horizon.

Chatham Financial Infiltration Test Report 235 Whitehorse Road Page 3 October 4, 2016 Kennett Township Chester County
� Infiltration Test 2 was conducted at approximately ± 8.0 feet below existing grade, which corresponds to an approximate infiltration elevation of 374.0. One deep test pit was excavated at this location to a depth of 10.0 feet below existing grade. No limiting conditions were identified at the time of excavation.
� Infiltration Test 3 was conducted at approximately ± 10.0 feet below existing
grade, which corresponds to an approximate infiltration elevation of 374.0. One deep test pit was excavated at this location to a depth of 12.0 feet below existing grade. No limiting conditions were identified at the time of excavation.
Based on the hydraulic conductivity testing for the testing located within the footprint of the seepage bed, D.L. Howell & Associates, Inc., recommends the following infiltration rate for the soils underlying Test 1, 2, and 3: an infiltration rate of 3.663 inches per hour shall be used.
� Infiltration Test 4 was conducted at approximately ± 8.0 feet below existing grade, which corresponds to an approximate infiltration elevation of 374.0. One deep test pit was excavated to a depth of approximately 10.0 feet below existing grade. No limiting conditions were identified at the time of excavation.
� Infiltration Test 5 was conducted at approximately ± 6.0 feet below existing
grade, which corresponds to an approximate infiltration elevation of 372.0. One deep test pit was excavated at this location to a depth of 8.0 feet below existing grade. No limiting conditions were identified at the time of excavation.
� Infiltration Test 6 was proposed at approximately ± 6.0 feet below existing grade.
During excavation, redoximorphic features were identified between 26-96 inches. As a result, no infiltration testing was conducted at this location.
Based on the hydraulic conductivity testing for the testing located within the footprint of the seepage bed, D.L. Howell & Associates, Inc., recommends the following infiltration rate for the soils underlying Test 4 and Test 5: an infiltration rate of 1.723 inches per hour shall be used.
� Infiltration Test 7 was conducted at approximately ± 7.0 feet below existing grade, which corresponds to an approximate infiltration elevation of 375.0. One deep test pit was excavated to a depth of approximately 9.0 feet below existing grade. Redoximorphic features were identified between 15-73 inches. It is D.L. Howell and Associates opinion that these redox features are not an indication of a true or permanent water table, but as the result of variable permeability within the soil horizons.
� Infiltration Test 8 was conducted at approximately ± 7.0 feet below existing
grade, which corresponds to an approximate infiltration elevation of 375.0. One

Chatham Financial Infiltration Test Report 235 Whitehorse Road Page 4 October 4, 2016 Kennett Township Chester County
deep test pit was excavated at this location to a depth of 9.0 feet below existing grade. No limiting conditions were identified at the time of excavation.
Based on the hydraulic conductivity testing for the testing located within the footprint of the seepage bed, D.L. Howell & Associates, Inc., recommends the following infiltration rate for the soils underlying Test 7 and Test 8: an infiltration rate of 1.532 inches per hour shall be used. Please reference plan drawings for exact locations and visual representation of infiltration tests and test pits. Results of the hydraulic conductivity testing and soil horizon descriptions can be found in the enclosed attachments. Hydraulic Conductivity Calculation Coefficient of Permeability: K = [A/(F*D*t)] x ln (h1 / h2) Where: K = permeability (inches per hour) A = cross sectional area of cased hole F = shape factor (2.75 constant of flat bottom) D = cased hole diameter t = time for head change from h1 to h2 h1 = initial height of water column in casing h2 = final height of water column in casing *Reference Soil Hydraulic Conductivity Analysis Form for infiltration testing data and Soil Morphology Form for soil profile data.

2731 DATE:BY:
Kennett Township, Chester County, Pa.Stormwater Infiltration Testing
Sunny 68 °FNone
1st 2nd 3rd 4th 5th 6th 7th 8th
10 10 10 10 10 10 10 108.25 6.25 6.00 6.00 6.00 n/a n/a n/a18 18 18 18 18 n/a n/a n/a
1st 2nd 3rd 4th 5th 6th 7th 8th
10 10 10 10 10 10 10 1013.50 11.75 10.75 10.75 10.75 10.75 n/a n/a
18 18 18 18 18.00 18 n/a n/a
1st 2nd 3rd 4th 5th 6th 7th 8th
10 10 10 10 10 10 10 1012.00 11.50 11.25 11.25 11.25 n/a n/a n/a
Pre-Soak
3018.00
ReadingsPre-Soak
ReadingsHole # Depth (Inches)
18
Time(min.)
Time(min.) 30Test 2 96
Drop(inches) 18.00
Stormwater Infiltration Testing &
Hydraulic Conductivity Calculations
Field Test Results
10/3/2016LOCATION: DD
Drop(inches)
Hole # Depth (Inches)Test 1 96
Initial Water Level Depth (inches)
JOB NO.:
MUNICIPALITY:235 Whitehorse Road
DESCRIPTION:
WEATHER CONDITIONS: TEMPERATURE:PRECIPITATION IN LAST 24 HOURS:
30
ReadingsHole # Depth (Inches) Pre-Soak
Initial Water Level Depth (inches) 18
Drop(inches) 18.00
Test 3 120Time(min.)
12.00 11.50 11.25 11.25 11.25 n/a n/a n/a18 18 18 18 18.00 n/a n/a n/a
Kv = Vertical Permeability 2.0844 (in/hour) 4.6749 (in/hour) 5.0422 (in/hour)A = Cross-sectional area of cased hole 7.0686 (Sq.in.) 7.0686 (Sq.in.) 7.0686 (Sq.in.)F = shape factor (2.75 constant for flat bottom) 2.75 (Units) 2.75 (Units) 2.75 (Units)D = cased hole diameter 3 (Inches) 3 (Inches) 3 (Inches)t = time for head to change from h1 to h2 0.1667 (hrs.) 0.1667 (hrs.) 0.1667 (hrs.)
h1 = initial height of water column in casing 18 (Inches) 18 (Inches) 18 (Inches)h2 = final height of water column in casing 12.00 (Inches) 7.25 (Inches) 6.75 (Inches)
3.934 (in./hr)3.663 (in./hr)
Test 3 ResultsTest 1 Results Test 2 Results
Determination of Hydraulic Conductivity (Kv)
Kv =
Average PermeabilityGeometric Mean
[ A/(F*D*t) ] * ln(h1/h2)
Drop(inches) 18.00Initial Water Level Depth (inches) 18

2731 DATE:BY:
Kennett Township, Chester County, Pa.Stormwater Infiltration Testing
SUNNY 69 °FNone
1st 2nd 3rd 4th 5th 6th 7th 8th
10 10 10 10 10 10 10 1011.25 10.75 10.75 10.50 10.50 n/a n/a n/a
18 18 18 18 18 n/a n/a n/a
1st 2nd 3rd 4th 5th 6th 7th 8th
30 30 30 30 30 30 30 306.00 5.75 5.75 5.75 n/a n/a n/a n/a18 18 18 18 n/a n/a n/a n/a
Pre-SoakTest 5 72
ReadingsPre-Soak
ReadingsHole # Depth (Inches)
3018.00
Initial Water Level Depth (inches) 18
Time(min.)
Time(min.) 30Drop(inches) 6.25
Determination of Hydraulic Conductivity (Kv)
Kv =
Stormwater Infiltration Testing &
Hydraulic Conductivity Calculations
Initial Water Level Depth (inches) 18
Drop(inches)
Hole # Depth (Inches)
Field Test Results
10/4/2016LOCATION: DD
JOB NO.:
MUNICIPALITY:235 Whitehorse Road
DESCRIPTION:
WEATHER CONDITIONS: TEMPERATURE:PRECIPITATION IN LAST 24 HOURS:
[ A/(F*D*t) ] * ln(h1/h2)
Test 4 96
Kv = Vertical Permeability 4.5006 (in/hour) 0.6595 (in/hour)A = Cross-sectional area of cased hole 7.0686 (Sq.in.) 7.0686 (Sq.in.)F = shape factor (2.75 constant for flat bottom) 2.75 (Units) 2.75 (Units)D = cased hole diameter 3 (Inches) 3 (Inches)t = time for head to change from h1 to h2 0.1667 (hrs.) 0.5 (hrs.)
h1 = initial height of water column in casing 18 (Inches) 18 (Inches)h2 = final height of water column in casing 7.50 (Inches) 12.25 (Inches)
2.58 (in./hr)1.723 (in./hr)
Test 4 Results Test 5 Results
Average PermeabilityGeometric Mean

2731 DATE:BY:
Kennett Township, Chester County, Pa.Stormwater Infiltration Testing
SUNNY 69 °FNone
1st 2nd 3rd 4th 5th 6th 7th 8th
30 30 30 30 30 30 30 304.00 4.00 3.75 3.75 n/a n/a n/a n/a18 18 18 18 n/a n/a n/a n/a
1st 2nd 3rd 4th 5th 6th 7th 8th
10 10 10 10 10 10 10 1013.00 12.50 12.25 12.25 12.25 n/a n/a n/a
18 18 18 18 18 n/a n/a n/a
Pre-SoakTest 8 84
ReadingsPre-Soak
ReadingsHole # Depth (Inches)
304.00
Initial Water Level Depth (inches) 18
Time(min.)
Time(min.) 30Drop(inches) 18.00
Determination of Hydraulic Conductivity (Kv)
Kv =
Stormwater Infiltration Testing &
Hydraulic Conductivity Calculations
Initial Water Level Depth (inches) 18
Drop(inches)
Hole # Depth (Inches)
Field Test Results
10/4/2016LOCATION: DD
JOB NO.:
MUNICIPALITY:235 Whitehorse Road
DESCRIPTION:
WEATHER CONDITIONS: TEMPERATURE:PRECIPITATION IN LAST 24 HOURS:
[ A/(F*D*t) ] * ln(h1/h2)
Test 7 84
Kv = Vertical Permeability 0.4003 (in/hour) 5.8665 (in/hour)A = Cross-sectional area of cased hole 7.0686 (Sq.in.) 7.0686 (Sq.in.)F = shape factor (2.75 constant for flat bottom) 2.75 (Units) 2.75 (Units)D = cased hole diameter 3 (Inches) 3 (Inches)t = time for head to change from h1 to h2 0.5 (hrs.) 0.1667 (hrs.)
h1 = initial height of water column in casing 18 (Inches) 18 (Inches)h2 = final height of water column in casing 14.25 (Inches) 5.75 (Inches)
3.133 (in./hr)1.532 (in./hr)
Test 7 Results Test 8 Results
Average PermeabilityGeometric Mean

INVESTIGATOR:
DATE: STATE: COUNTY:
MUNICIPALITY: CLIENT:
SUBDIVISION: SITE LOCATION:
Upper Lower Distrnct Topo A S
0 9 G S 0 SBK
9 21 G S 0 c m MA redox throughout
21 55 A C 0 MA
55 78 G S 0 GRAN
78 120 0 GRAN
TP1 DLH NUMBER:
10/3/2016
Texture NOTES
PA
KENNETT TWP
2731 DWDPIT NUMBER:
Depth BoundaryColor
10 YR 4/2
10 YR 5/1
10 YR 5/3
10 YR 6/2
SILTY CLAY LOAM
SILT LOAM
10 YR 4/4
CHESTER
CHATHAM FINANCIAL
235 WHITEHORSE ROAD
SILT LOAM
%CFsREDOX
Horizon Structure
N/A
CConsistence
MORPHOLOGIC DETERMINATION: SEWAGE STORMWATER SHWT SOILS
Soil Drainage Class:
FRI
d
SILT LOAM
SILTY CLAY LOAM
FRI
FIRM
FIRM
FRI
COMMENTS: This Deep Test pit was conducted at the Test 1 location. During excavation, redoximorphic features were identified between 9-21 inches below existing grade.SOIL TYPE: Soil Scientist Signature:
Soil Morphology Form
1250 Wrights Lane P: (610) 918-9002 West Chester, PA 19380 F: (610) 918-9003
LIMITING CONDITION: None Excessively Drained Somewhat Poorly Drained
Soil Drainage Class:
Moderately Well Drained Very Poorly Drained
SOIL TYPE:
Type: Water Rock Mottling
Depth: +120"
Soil Scientist Signature:
Well Drained Poorly Drained
Excavator
120"
N
METHOD:
EXCAVATION DEPTH:
LANDSCAPE POSITION:
WEATHER:
SLOPE:
COVER:
71° slight breeze
Meadow
REDOX – Redoxymorphic features (Drainage Mottling) A/S/C – Abundance/Size/ContrastRoots/Pores – f – few, c – common, m – many / f – fine, m – medium, c – coarse

INVESTIGATOR:
DATE: STATE: COUNTY:
MUNICIPALITY: CLIENT:
SUBDIVISION: SITE LOCATION:
Upper Lower Distrnct Topo A S
0 8 A C 0 SBK
8 18 A C 0 MA
18 30 G S 0 MA
30 51 A C 0 MA
51 120 0 GRAN
1250 Wrights Lane P: (610) 918-9002 West Chester, PA 19380 F: (610) 918-9003
Soil Morphology Form
REDOX – Redoxymorphic features (Drainage Mottling) A/S/C – Abundance/Size/ContrastRoots/Pores – f – few, c – common, m – many / f – fine, m – medium, c – coarse
71° slight breeze
Meadow
Excavator
120"
N
METHOD:
EXCAVATION DEPTH:
LANDSCAPE POSITION:
WEATHER:
SLOPE:
COVER:
Type: Water Rock Mottling
Depth: +120"
Soil Scientist Signature:
Well Drained Poorly Drained
Moderately Well Drained Very Poorly Drained
FRI
FRI
VFIRM
FRI
COMMENTS: This Deep Test pit was conducted at the Test 2 location. No limiting conditions were identified at the time of excavation.
SOIL TYPE: Soil Drainage Class:
FRISANDY SILT
SILT LOAM
N/A
CConsistence
MORPHOLOGIC DETERMINATION: SEWAGE STORMWATER SHWT SOILS
CHESTER
CHATHAM FINANCIAL
235 WHITEHORSE ROAD
SILT LOAM
%CFsREDOX
Horizon Structure
10 YR 4/2
10 YR 4/4
10 YR 5/2
10 YR 5/6
SILTY CLAY LOAM
SILT LOAM
VAR
LIMITING CONDITION: None Excessively Drained Somewhat Poorly Drained
2731 DWDPIT NUMBER:
Depth BoundaryColor
TP2 DLH NUMBER:
10/3/2016
Texture NOTES
PA
KENNETT TWP

INVESTIGATOR:
DATE: STATE: COUNTY:
MUNICIPALITY: CLIENT:
SUBDIVISION: SITE LOCATION:
Upper Lower Distrnct Topo A S
0 9 A C 0 SBK
9 37 A C 0 MA
37 48 G S 0 MA
48 89 A C 0 MA
89 144 0 GRAN
1250 Wrights Lane P: (610) 918-9002 West Chester, PA 19380 F: (610) 918-9003
TP3 DLH NUMBER:
10/3/2016
Texture NOTES
PA
KENNETT TWP
LIMITING CONDITION: None Excessively Drained Somewhat Poorly Drained
2731 DWDPIT NUMBER:
Depth BoundaryColor
10 YR 4/2
10 YR 5/3
5 YR 4/6
10 YR 5/3
SILTY CLAY LOAM
SILTY CLAY LOAM
VAR
CHESTER
CHATHAM FINANCIAL
235 WHITEHORSE ROAD
SILT LOAM
%CFsREDOX
Horizon Structure
N/A
CConsistence
MORPHOLOGIC DETERMINATION: SEWAGE STORMWATER SHWT SOILS
Soil Drainage Class:
FRISANDY SILT
SILTY CLAY LOAM
Moderately Well Drained Very Poorly Drained
FRI
FIRM
FIRM
FIRM
COMMENTS: This Deep Test pit was conducted at the Test 3 location. No limiting conditions were identified at the time of excavation.
SOIL TYPE:
Type: Water Rock Mottling
Depth: +144"
Soil Scientist Signature:
Well Drained Poorly Drained
Excavator
144"
E
METHOD:
EXCAVATION DEPTH:
LANDSCAPE POSITION:
WEATHER:
SLOPE:
COVER:
71° slight breeze
Meadow
Soil Morphology Form
REDOX – Redoxymorphic features (Drainage Mottling) A/S/C – Abundance/Size/ContrastRoots/Pores – f – few, c – common, m – many / f – fine, m – medium, c – coarse
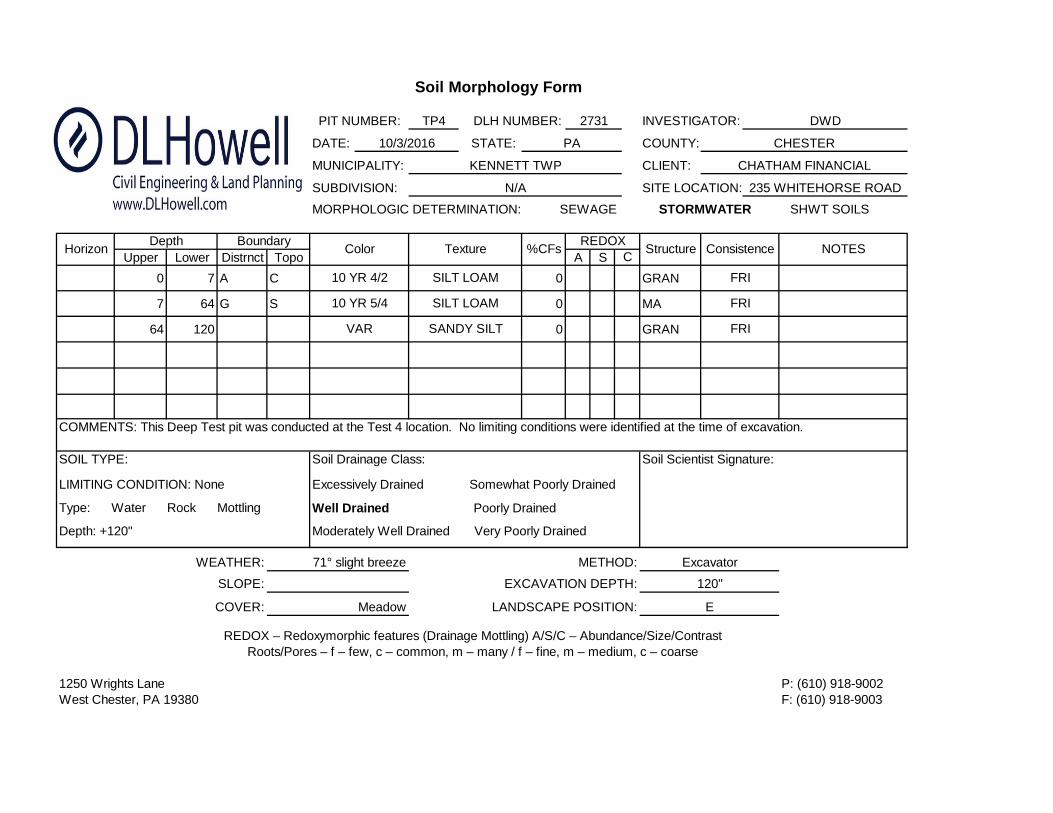
INVESTIGATOR:
DATE: STATE: COUNTY:
MUNICIPALITY: CLIENT:
SUBDIVISION: SITE LOCATION:
Upper Lower Distrnct Topo A S
0 7 A C 0 GRAN
7 64 G S 0 MA
64 120 0 GRAN
1250 Wrights Lane P: (610) 918-9002 West Chester, PA 19380 F: (610) 918-9003
Soil Morphology Form
REDOX – Redoxymorphic features (Drainage Mottling) A/S/C – Abundance/Size/ContrastRoots/Pores – f – few, c – common, m – many / f – fine, m – medium, c – coarse
71° slight breeze
Meadow
Excavator
120"
E
METHOD:
EXCAVATION DEPTH:
LANDSCAPE POSITION:
WEATHER:
SLOPE:
COVER:
Type: Water Rock Mottling
Depth: +120"
Soil Scientist Signature:
Well Drained Poorly Drained
Moderately Well Drained Very Poorly Drained
FRI
FRI
FRI
COMMENTS: This Deep Test pit was conducted at the Test 4 location. No limiting conditions were identified at the time of excavation.
SOIL TYPE: Soil Drainage Class:
SILT LOAM
N/A
CConsistence
MORPHOLOGIC DETERMINATION: SEWAGE STORMWATER SHWT SOILS
CHESTER
CHATHAM FINANCIAL
235 WHITEHORSE ROAD
SILT LOAM
%CFsREDOX
Horizon Structure
10 YR 4/2
10 YR 5/4
VAR SANDY SILT
LIMITING CONDITION: None Excessively Drained Somewhat Poorly Drained
2731 DWDPIT NUMBER:
Depth BoundaryColor
TP4 DLH NUMBER:
10/3/2016
Texture NOTES
PA
KENNETT TWP

INVESTIGATOR:
DATE: STATE: COUNTY:
MUNICIPALITY: CLIENT:
SUBDIVISION: SITE LOCATION:
Upper Lower Distrnct Topo A S
0 11 G S 0 GRAN
11 35 A W 0 MA
35 69 A IR 0 GRAN
69 96 0 GRAN
1250 Wrights Lane P: (610) 918-9002 West Chester, PA 19380 F: (610) 918-9003
TP5 DLH NUMBER:
10/4/2016
Texture NOTES
PA
KENNETT TWP
LIMITING CONDITION: None Excessively Drained Somewhat Poorly Drained
2731 DWDPIT NUMBER:
Depth BoundaryColor
10 YR 4/2
10 YR 5/4
VAR
5 YR 4/4
SANDY SILT
SANDY SILT
CHESTER
CHATHAM FINANCIAL
235 WHITEHORSE ROAD
SILT LOAM
%CFsREDOX
Horizon Structure
N/A
CConsistence
MORPHOLOGIC DETERMINATION: SEWAGE STORMWATER SHWT SOILS
Soil Drainage Class:
SILTY CLAY LOAM
Moderately Well Drained Very Poorly Drained
FRI
FIRM
FRI
FRI
COMMENTS: This Deep Test pit was conducted at the Test 5 location. No limiting conditions were identified at the time of excavation.
SOIL TYPE:
Type: Water Rock Mottling
Depth: +96"
Soil Scientist Signature:
Well Drained Poorly Drained
Excavator
96"
Central
METHOD:
EXCAVATION DEPTH:
LANDSCAPE POSITION:
WEATHER:
SLOPE:
COVER:
69° slight breeze
Meadow
Soil Morphology Form
REDOX – Redoxymorphic features (Drainage Mottling) A/S/C – Abundance/Size/ContrastRoots/Pores – f – few, c – common, m – many / f – fine, m – medium, c – coarse

INVESTIGATOR:
DATE: STATE: COUNTY:
MUNICIPALITY: CLIENT:
SUBDIVISION: SITE LOCATION:
Upper Lower Distrnct Topo A S
0 9 G S 0 GRAN
9 15 A W 0 MA
15 38 G S 0 c c SBK redox throughout
38 73 A C 0 c m MA redox throughout
73 108 0 GRAN
1250 Wrights Lane P: (610) 918-9002 West Chester, PA 19380 F: (610) 918-9003
TP7 DLH NUMBER:
10/4/2016
Texture NOTES
PA
KENNETT TWP
LIMITING CONDITION: None Excessively Drained Somewhat Poorly Drained
2731 DWDPIT NUMBER:
Depth BoundaryColor
10 YR 3/2
10 YR 5/2
10 YR 5/6
10 YR 6/1
SILTY CLAY LOAM
SILTY CLAY LOAM
VAR
CHESTER
CHATHAM FINANCIAL
235 WHITEHORSE ROAD
SILT LOAM
%CFsREDOX
Horizon Structure
N/A
CConsistence
MORPHOLOGIC DETERMINATION: SEWAGE STORMWATER SHWT SOILS
Soil Drainage Class:
FRI
d
d
SANDY SILT
SILT LOAM
Moderately Well Drained Very Poorly Drained
FRI
FRI
FRI
FIRM
COMMENTS: This Deep Test pit was conducted at the Test 7 location. During excavation, redox features were identified from approximately 15-73 inches below existing grade.SOIL TYPE:
Type: Water Rock Mottling
Depth: +108"
Soil Scientist Signature:
Well Drained Poorly Drained
Excavator
108"
NW
METHOD:
EXCAVATION DEPTH:
LANDSCAPE POSITION:
WEATHER:
SLOPE:
COVER:
69° slight breeze
Meadow
Soil Morphology Form
REDOX – Redoxymorphic features (Drainage Mottling) A/S/C – Abundance/Size/ContrastRoots/Pores – f – few, c – common, m – many / f – fine, m – medium, c – coarse

INVESTIGATOR:
DATE: STATE: COUNTY:
MUNICIPALITY: CLIENT:
SUBDIVISION: SITE LOCATION:
Upper Lower Distrnct Topo A S
0 10 A W 0 GRAN
10 23 G S 0 SBK
23 62 G S 0 MA
62 108 0 GRAN
1250 Wrights Lane P: (610) 918-9002 West Chester, PA 19380 F: (610) 918-9003
Soil Morphology Form
REDOX – Redoxymorphic features (Drainage Mottling) A/S/C – Abundance/Size/ContrastRoots/Pores – f – few, c – common, m – many / f – fine, m – medium, c – coarse
69° slight breeze
Meadow
Excavator
108"
SW
METHOD:
EXCAVATION DEPTH:
LANDSCAPE POSITION:
WEATHER:
SLOPE:
COVER:
Type: Water Rock Mottling
Depth: +108"
Soil Scientist Signature:
Well Drained Poorly Drained
Moderately Well Drained Very Poorly Drained
FRI
FIRM
FRI
FRI
COMMENTS: This Deep Test pit was conducted at the Test 8 location. No limiting conditions were identified at the time of excavation.
SOIL TYPE: Soil Drainage Class:
SILTY CLAY LOAM
N/A
CConsistence
MORPHOLOGIC DETERMINATION: SEWAGE STORMWATER SHWT SOILS
CHESTER
CHATHAM FINANCIAL
235 WHITEHORSE ROAD
SILT LOAM
%CFsREDOX
Horizon Structure
10 YR 3/2
10 YR 5/6
7.5 YR 5/6
VAR
SILT LOAM
SANDY SILT
LIMITING CONDITION: None Excessively Drained Somewhat Poorly Drained
2731 DWDPIT NUMBER:
Depth BoundaryColor
TP8 DLH NUMBER:
10/4/2016
Texture NOTES
PA
KENNETT TWP

Chatham Financial Stormwater Management Report Kennett Township, Chester County Page H
APPENDIX H
DEWATERING CALCULATIONS

STORMWATER STRUCTURESTORMWATER STRUCTUREDEWATERING CALCULATIONS
DATE: 12/16/2016
BY: CMD
JOB NO.: 2731 PROJECT: Chatham FinancialJOB NO.: 2731 PROJECT:DESCRIPTION: DEWATERING CALCULATION
TOWNSHIP: Kennett
INFILTRATION BED 1
PERC. RATE 1.532 IN/HR Hydraulic Conductivity Rate - Geometric Mean2 Factor of Safety
Chatham Financial
DESIGN RATE 0.766 IN/HR
BOTTOM AREA 7600 FT
0.1348 CFS DESIGN INFIL. RATE CONVERTED TO CFS
Water Surface Storage Incremental Discharge Average Time AccumulatedSurface Volume Storage Discharge TimeSurface Volume Storage Discharge Time
Elevation (ft) (cu. Ft) Volume (Cu. Ft) (cfs) (cfs) (hrs) (hrs)378.00 12921 0.1348 0.00
6907 0.135 14.24376.50 6014 0.1348 14.24
6014 0.135 12.40375.00 0 0.1348 26.63
Therefore total dewatering time is 26.63 HRS= 1.11 DAYS

STORMWATER STRUCTURESTORMWATER STRUCTUREDEWATERING CALCULATIONS
DATE: 12/16/2016
BY: CMD
JOB NO.: 2731 PROJECT:DESCRIPTION: DEWATERING CALCULATION
TOWNSHIP: Kennett
INFILTRATION BED 2
PERC. RATE 3.663 IN/HR Hydraulic Conductivity Rate - Geometric Mean
Chatham Financial
2 Factor of SafetyDESIGN RATE 1.832 IN/HR
BOTTOM AREA 6250 FT
0.2650 CFS DESIGN INFIL. RATE CONVERTED TO CFS
Water Surface Storage Incremental Discharge Average Time AccumulatedWater Surface Storage Incremental Discharge Average Time AccumulatedSurface Volume Storage Discharge Time
Elevation (ft) (cu. Ft) Volume (Cu. Ft) (cfs) (cfs) (hrs) (hrs)376.00 9156 0.2650 0.00
9156 0.265 9.60373.50 0 0.2650 9.60
Therefore total dewatering time is 9.60 HRS= 0.40 DAYS
Copyright © 2022 FDOKUMEN